News Focus
News Focus
icon url

ReturntoSender

06/11/06 3:56 PM

#6763 RE: ReturntoSender #6755

Amateur Investor Mid Weekend Market Update:

http://www.amateur-investor.net/Weekend_Market_Analysis_June_10_06.htm

The major averages have been in a correction during the past five weeks. The Dow has dropped around 900 points or 7.8% since peaking in early May and failed to hold support at its 40 Weekly EMA (blue line) this week. If the Dow remains under more selling pressure the next area of support appears to be at its 50% Retracement Level (calculated from the October 2004 low to its most recent high) near 10700. The 10700 level is also where the Dow found support at in the late part of 2005 into the early part of 2006 as well (point A). If the Dow fails to hold support at the 10700 level then the next downside support area would be just below 10500 which corresponds to its 61.8% Retracement Level and upward sloping trend line (brown line) originating from the October 2004 low.


Meanwhile if the Dow attempts to bounce from oversold conditions next week look for its first level of resistance in the 11000 to 11200 range. The 11000 area is where the Dow's falling 20 Day EMA (blue line) is nearing and is also where the 38.2% Retracement Level (calculated from the early May high to the most recent low) is close to as well. Meanwhile the 11200 area is where the Dow's 50 Day EMA (green line) resides at and is also near its 50% Retracement Level.


The Nasdaq has fallen around 275 points or 11.6% since peaking in early April and broke below a key longer term support level this week near the 2135 area. The 2135 area corresponded to the Nasdaq's 38.2% Retracement Level (calculated from the August 2004 low to the April 2006 high) and also was along its upward sloping trend line (brown line) originating from the August 2004 low as well. If the Nasdaq remains under more selling pressure its next level of support would either be at its 50% Retracement Level near 2060 (point B) or at its October 2005 low near 2030 (point C).


Meanwhile if the Nasdaq attempts to rally next week from oversold conditions look for initial resistance to occur in the 2195 to 2205 area. The 2195 area is where the Nasdaq's falling 20 Day EMA (blue line) resides at while the 2205 level is where its 38.2% Retracement Level (calculated from the April high to the most recent low) comes into play at. If the Nasdaq were to rise above the 2205 level then look for even stronger resistance at its 200 Day EMA (purple line) near 2225.


One reason the Nasdaq has been clobbered of late is due to the weakness in the Semiconductors. The Semiconductor Index (SOX) continues to act very poorly and is now approaching a key support level near the 430 area which corresponds to its 61.8% Retracement Level (calculated from the September 2004 low to the January 2006 high). If the SOX fails to hold support near the 430 level then look for it to eventually drop back to either its October 2005 low near 410 (point D) or its 76.4% Retracement Level near 400 (point E). As long as the SOX remains under selling pressure the Nasdaq is likely going to trend lower as well. Thus I think next week will be a crucial week for the SOX as it must hold support near the 430 level.


As far as the S&P 500 it has fallen around 90 points or 7% the past five weeks and also has broken below its 40 Weekly EMA (blue line). However so far the S&P 500 has held support above the 1230 level which is an important longer term support area that coincides with its upward sloping trend line (brown line) originating from the August 2004 low and its 38.2% Retracement Level (calculated from the August 2004 low to the most recent high). Thus it's going to be important for the S&P 500 to hold support near the1230 level over the next few weeks. If the S&P 500 were to break below the 1230 level then its next area of support would be at its 50% Retracement Level just below the 1200 level (point F).


Meanwhile if the S&P 500 can hold support at or above the 1230 level and then begins to rally from oversold conditions look for initial resistance in the 1270 to 1272 range. The 1270 area is at the S&P 500's 38.2% Retracement Level (calculated from the early May high to the most recent low) while the 1272 level is at its falling 20 Day EMA (blue line). If the S&P 500 were able to rise above the 1272 area look for even stronger resistance to occur in the 1280 to 1283 range. The 1280 level is at the S&P 500's 50% Retracement Level while the 1283 area corresponds to its 50 Day EMA (green line).


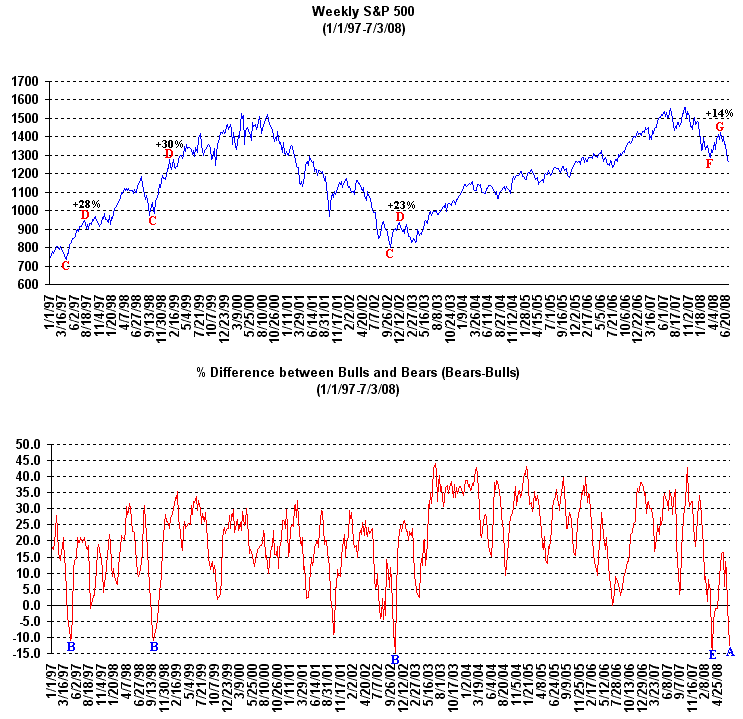
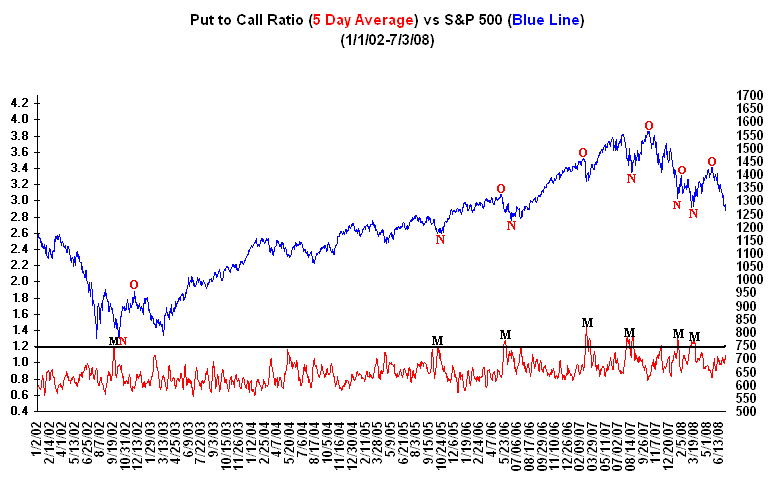
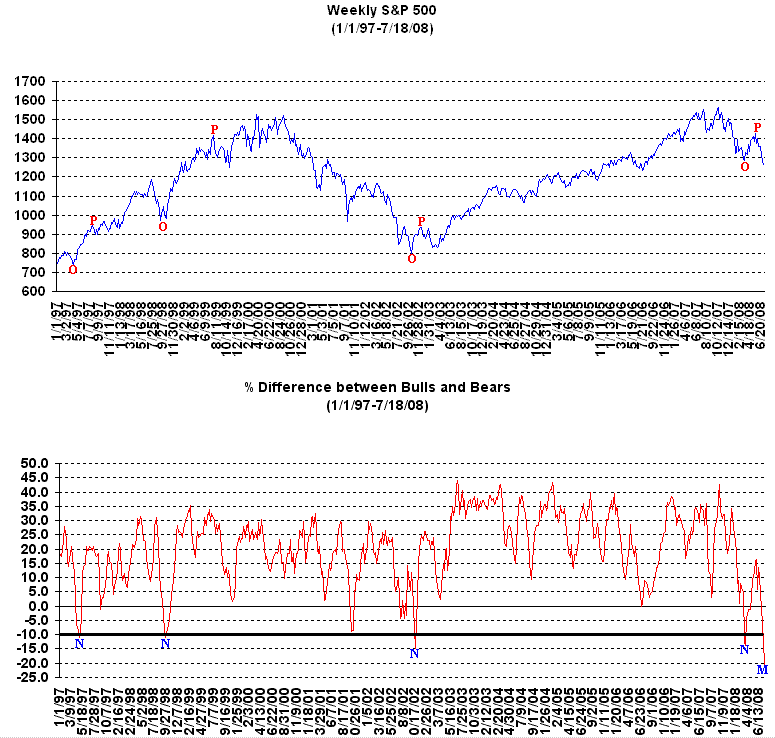
Over the past few weeks there has been a gradually increase in pessimism among investors as the Put to Call Ratio has been well above the 1.0 level while the Volatility Index (VIX) has risen substantially as well. One indicator that has been useful in signaling a meaningful bottom during the past several years has been the % difference between the Bullish and Bearish Investment Advisors. In the past when the % of Bearish Investment Advisors has equaled or exceeded the % of Bullish Investment Advisors the market has made a bottom which was then followed by a substantial rally. The last time the % of Bearish Investment Advisors exceeded the % of Bullish Investment Advisors was in the Fall of 2002 (point G) as the S&P 500 made a bottom (point H) which was then followed by a substantial rally (points H to I) in which it gained over 40% during the next 18 months. Meanwhile as you can see below it's very rare to see the % of Bearish Advisors greater than the % of Bullish Investment Advisors (points J) however when it does occur the S&P 500 has rallied strongly in the past (points K to L).

Currently the % of Bullish Investment Advisors is higher than the % of Bearish Investment Advisors by around 10%. However it will be interesting to watch this over the next 2 to 4 weeks to see if the % of Bearish Investment Advisors eventually outnumbers the % of Bullish Investment Advisors.


I know the past five weeks has been frustrating to many investors however now isn't the time to panic and give up on the market. Corrections are always going to happen and generally clear the way for a new group of stocks to emerge as market leaders once a bottom does occur. Right now just be patient and keep a close eye on those stocks which are holding up the best and developing a favorable chart pattern.

For example ADS from our current Stocks to Watch List has developed a 7 week Flat Base pattern after previously breaking out of a Cup and Handle pattern back in early March.


Signup today for a "Free" 2 Week Trial Membership to Amateur Investors and have access to all of the Stocks in our current Stocks to Watch Buy List which contains stocks that are currently developing a favorable chart pattern such as the Cup and Handle, Double Bottom and Flat Base which can be used with either our Long Term Investing Strategy or Short Term Investing Strategy.

Also you will have access to these other investment products.

Daily Breakout Reports
Market Timing Indicator
Daily ETF Buy and Short Signals


Click Here to Signup for a "Free" 2 Week Trial Membership


Send this Free Newsletter to a Friend or Relative


icon url

ReturntoSender

06/12/06 8:58 AM

#6767 RE: ReturntoSender #6755

From Briefing.com: 7:30AM Advanced Energy to Appoint Lawrence D. Firestone as CFO (AEIS) 13.76 : Firestone will take over as AEIS CFO following completion of his employment responsibilities as CFO of Applied Films (AFCO)

7:24AM Nokia views repetitive legal action by QCOM as recognition that conditions applicable to license negotiations have substantially changed (NOK) 20.06 : Co announces that Qualcomm (QCOM) has filed a complaint with the US ITC asking the commission to open an investigation into the alleged infringement by NOK of six G.S.M standard related QCOM patents. NOK is currently evaluating the filing and will respond as necessary. As disclosed by both parties, NOK's obligations to pay royalties to QCOM under the current license agreement will expire on April 9, 2007. NOK and QCOM are in active negotiations to extend, or replace, the current agreements.

7:04AM Broadcom: Following reports about stock grants, co began a voluntary review of its equity award practices (BRCM) 29.33 : Following various reports raising speculation about a few corporate stock option grants made to BRCM employees in 2000 and 2002, the co began a voluntary review of its equity award practices. The review, initiated May 18, 2006, covers all option grants and other equity awards since BRCM's IPO in 1998. It is being conducted by outside legal counsel reporting to the Audit Committee of the Board of Directors and the co's senior management. The review is ongoing, and BRCM is also consulting with its independent registered public accounting firm, Ernst & Young LLP. BRCM will provide a public statement regarding the conclusions reached in its voluntary review after the review is completed.

7:01AM Powerwave to acquire the wireless infrastructure business of Filtronic plc (PWAV) 8.98 : Cos announce that they have signed a definitive agreement for Powerwave to acquire the majority of Filtronic's Wireless Infrastructure division business for a combination of 20.7 mln newly issued shares of Powerwave common stock and $150 mln in cash. The specific product lines included in this proposed transaction comprise transmit/receive filters, integrated remote radio heads and power amplifier products, all for use in commercial wireless infrastructure base station equipment. The proposed acquisition does not include point to point radio backhaul equipment, as well as Filtronic's other divisions, of Compound Semiconductors and Defence Electronics. The transaction is expected to be accretive without synergies to Powerwave's earnings per share in the first full quarter following the completion of the acquisition, excluding any acquisition related expenses. Powerwave believes that combined revenues for calendar year 2007 will easily exceed $1.4 bln. Powerwave also currently estimates that the proposed acquisition will be accretive to Powerwave's fiscal year 2007 earnings per share in the range of 8 to 12 cents with synergies.

4:04AM On The Wires : Semtech (SMTC) announces that it filed today a Form 12b-25 with the SEC in lieu of its Form 10-Q for the fiscal quarter ended April 30, 2006. The filing extends the due data to June 14...
icon url

ReturntoSender

06/26/06 10:11 PM

#6813 RE: ReturntoSender #6755

3 Year TRIN and TRINQ readings on the 5 and 10 day simple moving averages over 1.5 are bullish while readings below 0.85 are bearish. These readings don't happen often especially with the 10 day sma. They are also early indicators so the market can continue higher or lower for a while but they are reliable for indicating market turns that are about to take place.


icon url

ReturntoSender

06/29/06 9:43 PM

#6820 RE: ReturntoSender #6755

From Briefing.com: 4:20 pm : Stocks soared Thursday as investors rallied around the idea that the Fed may finally take a breather after two years of interest rate increases.

As expected, the Fed raised rates another 1/4% to 5.25%, representing the seventeenth consecutive rate hike since its first bump in June 2004. While higher rates obviously aren't good news for stocks and the language of the policy statement was essentially the same, the Fed reiterating that "inflation expectations remained contained" and saying that "the moderation in the growth of aggregate demand should help to limit inflation pressures over time" helped assuage concerns related to the hawkish Fed commentary that had acted as an overhang since the May 10 meeting.

Before the opening bell even sounded, the market tone was already decidedly bullish, suggesting that today's widely expected 1/4% rate hike had been priced into a market which was on pace for its worst quarterly performance since September 2002. As of Wednesday's close, the Dow, SnP 500 and Nasdaq were down 1.2%, 3.8% and 9.7%, respectively in Q2. By the end of trading Thursday, the Dow finished the quarter up slightly while an impressive 3.0% surge on the Nasdaq wiped out most of its 4.2% year-to-date decline.

Further underscoring renewed bullishness was an 18% drubbing on the VIX (CBOE Volatility Index), dropping it to its lowest level since mid-May when the market began its correction. Known as the "investor fear gauge," the spike lower suggested investors were actively buying call options in anticipation that a short-term bottom had been put in place that will keep investors on the buying track.

Money managers making some last-minute adjustments to their portfolios as Q2 comes to a close tomorrow also helped divert some attention away from what the Fed would or would not say in its policy directive and helped the market to begin thinking about the upcoming earnings season. To wit, the Materials and Energy sectors, which are again expected to contribute the largest percentage to aggregate earnings growth on the SnP 500, turned in the best performances. Both sectors got an additional boost, of course, as the greenback plunging by the most in two months after the Fed implied a potential pause made dollar-denominated commodities like gold and oil more attractive.

Providing even more influential leadership, however, was the rate-sensitive Financials sector, which turned in an impressive 2.2% advance as strength in Treasuries, buoyed by tame word alterations to the Fed directive that gave bond traders hope that the end is near, sent rates lower across the yield curve. The yield on the 10-yr note (+10/32) fell to 5.20%. Among all of the economic sectors posting a gain of at least 1.0%, Technology was another influential area attracting bargain hunters. Renewed enthusiasm for beaten down bellwethers (e.g. MSFT +1.3%, CSCO +3.2%, INTC +3.4% DELL +3.4%, TXN +3.6%) gave the sector a noticeable boost. BTK +3.7% DJ30 +217.24 DJTA +3.4% DJUA +1.0% DOT +2.8% NASDAQ +62.64 NQ100 +3.1% R2K +3.8% SOX +4.0% SP400 +3.8% SP500 +26.87 XOI +2.4% NASDAQ Dec/Adv/Vol 619/2428/2.22 bln NYSE Dec/Adv/Vol 508/2758/1.88 bln

4:15PM Palm beats by $0.06; guides Q1 below consensus, guides FY07 revs above consensus (PALM) 18.66 -0.01 : Reports Q4 (May) earnings of $0.29 per share, excluding non-recurring items, $0.06 better than the Reuters Estimates consensus of $0.23; revenues rose 20.0% year/year to $403.1 mln vs the $405.4 mln consensus. Co issues downside guidance for Q1, sees EPS of 0.18-0.19 vs. $0.22 consensus; sees Q1 revs of $380-385 mln vs. $412.40 mln consensus. Co issues upside guidance for FY07, sees FY07 rev growth of 20-25% to roughly $1.89-1.97 bln vs. $1.83 bln consensus.

09:46 am Medicis: Roth Capital initiates Buy. Target $33. Firm initiates saying that after a brief hiatus, they see a new growth cycle emerging on the heels of SOLODYN, a 90% gross margin acne drug now launching. With street attention focused elsewhere, the firm thinks this brand surprises on the upside, and soon.

09:45 am Auxilium Pharma: Soleil initiates Buy. Target $13. Firm initiates saying long-term growth prospects rest on a promising phase III development candidate, AA4500 (Collagenase), for the treatment of Dupuytren's (trigger finger; PIII), Peyronie's Disease (abnormal curvature of the penis; PII), and Adhesive Capsulitis (frozen shoulder syndrome; PII).

09:44 am AEterna Zentaris: Janney Mntgmy Scott initiates Buy. Firm initiates saying the co now has two approved drugs generating revs and is also pursuing the development of a number of promising drug candidates addressing multiple forms of cancer and other diseases. Firm thinks that the continued development of this pipeline, along with the co's significant ownership stake in publicly-traded, rapidly growing Atrium Biotech (ATB.TO), has the potential to produce solid returns.

09:43 am China Techfaith Wireless: Brean Murray initiates Strong Buy. Target $19. Firm initiates as they believe the co has overcome its weak 1Q06 and is back on a fast-growth track. Firm sees reduced concentration risk. They note CNTF experienced its first major execution bump in 1Q06 -- due to order cancellations, sales slipped 40% YoY and net income decreased 85% YoY. They say that to its credit, the co had been actively reducing client concentration risks and has had some foreign design wins. Firm notes that for 2006, TechFaith expects only 15-20% of design revenue will come from NEC, and no other customer is projected to generate more than 10% of design revenue.

09:42 am Imation: Brean Murray initiates Strong Buy. Target $50. Firm initiates as they believe the continuing growth of e-mails, personal blogs, internet storage and federally mandated compliance issues concerning certain stored data will provide future growth opportunities for the co. Firm thinks the Memorex acquisition should complement IMN's presence in the Business-to-Business market for removable storage. They think acquisition should also strengthen IMN's share in the removable storage market and provide greater geographical access for the combined co's products. Firm believes the acquisition will be highly accretive in 2007 and beyond.

09:38 am Computer Prgms & Syst: Jefferies & Co initiates Hold. Target $41. Firm initiates with a Hold. Firm believes CPSI's integrated financial and clinical hospital system is well positioned for the currently strong HCIT purchasing environment. They note CPSI's gross revenue grew 31% in 2005, pushing the stock to a fully valued level. Firm expects growth rates to moderate in '06.

09:35 am Applied Bio: Am Tech/JSA Research downgrades Buy to Hold. Firm lowers rating saying that while the outlook for ABI's two key growth drivers remain solid and the pending guidance for FY2007 is likely to be in-line with their expectations, ABI shares have reached firm's $33 price tgt. Given that ABI shares are already trading at a premium multiple they see limited upside from current levels. Firm's 12-month price target is based on approx 23 times their calendar 2007 EPS estimate of $1.45. Firm notes their 23x multiple represents a premium to the overall life sciences tools group average, but is in-line with ABI's historical range. Their premium multiple reflects the co's leadership position in the tools space, its strong balance sheet and the potential for further margin expansion.

09:33 am Hexcel: Am Tech/JSA Research upgrades Hold to Buy. Target $18 to $24. -- Technical -- Firm ups rating and price tgt saying co is a pure play on the composites market, with significant exposure to the commercial airliner market. The HXL stock price has declined by 37% since April 21 when the co reported earnings and firm took the stock off their buy list. Because of the differential between cash earnings and the lower reported GAAP earnings, firm has been targeting the stock price based on a forward 4Q P/E of 23x. They view the stock with its financial profile and outlook now as being worth 21x forward 4Q diluted EPS. Achievement of price tgt would provide annualized total rates of return of 46% and 34%, respectively, over the next six and 18 months.

09:31 am Sunterra: Ferris Baker Watts upgrades Neutral to Buy. Target $12. Firm upgrades saying that while the lack of timely financials greatly adds to the risk of holding this stock, they are convinced that more good than bad news is going to come out of this co over the next 4 months and that SNRR stock is worth considerably more than its current trading level.

09:30 am VASCO Data Security: Janney Mntgmy Scott upgrades Neutral to Buy. Firm ups rating saying that with the authentication mkt poised for steady growth throughout the decade, they believe the stock is oversold and now represents a good entry point.

http://biz.yahoo.com/mu/short.html
icon url

ReturntoSender

06/30/06 9:02 AM

#6821 RE: ReturntoSender #6755

COTD - Change From FED Funds Trough

Chart of the Day

http://www.chartoftheday.com/20060630.htm?T

Today, Bernanke & Co. increased rates by 0.25% to 5.25% as expected. However, for the first time since the it began the current tightening phase, the Fed did not say that it was actively considering another rate increase. Wall Street was positive on the dovish stance and surged up over 2% on the day. For some perspective, today's chart (which is updated through July since the Fed won't meet again until August) illustrates the average change (blue line) in the fed funds rate following a major bottom. While the last Fed tightening cycle (gold dashed line) fell a touch short of average, this tightening cycle has already witnessed a run that is a touch more than average. Stay tuned...

Notes:
- The market is at a critical juncture. Where we go from here may surprise you. Find out now with the exclusive & highly regarded charts of Chart of the Day Plus.


icon url

ReturntoSender

07/08/06 3:51 PM

#6826 RE: ReturntoSender #6755

Amateur Investors Weekend Stock Market Analysis:

http://www.amateur-investors.com/Weekend_Market_Analysis_July_8_06.htm

SNIP: As talked about in the past future movement in the Nasdaq will likely depend on what the Semiconductor sector does. A longer term chart of the Semiconductor Index (SOX) shows it completed a bearish Double Top pattern in early January after encountering resistance at its previous high made in early 2004 near 560 (point E). If the SOX is unable to hold support at the low made in October of 2005 near 420 and continues its downward trend then it may eventually drop back to 350 to 380 range.


The 380 level (point F) is very close to the SOX's 50% Retracement Level (calculated from the September 2002 low to the highs made in the early part of 2004 and 2006) while the 350 level (point G) is near the SOX's 61.8% Retracement Level. If the SOX does eventually drop back to the 350 to 380 range at some point then Nasdaq will likely continue downward as well.


icon url

ReturntoSender

07/09/06 1:02 PM

#6827 RE: ReturntoSender #6755

Some pretty impressive dividends with these stocks. FRO 15% dividend, IMH 9%, PVX 10.5% and ELRN almost 31%! How well will these dividends hold up if the market is hit harder by the bear?

http://finance.yahoo.com/q?s=fro+imh+pvx+elrn&d=t

You probably won't be able to see the monthly stocks like I can when I have logged into StockCharts.com with my browser on this page but maybe? PVX looks great technically.


icon url

ReturntoSender

07/09/06 1:51 PM

#6828 RE: ReturntoSender #6755

InvestmentHouse Weekend Update:

http://www.investmenthouse.com/1weekendmarketsummary.htm

- Jobs lighter than expected, but rising wages, earnings warnings jolt a market trying to consolidate for next move.
- Jobs low, wages rising, along with fears of a slower yet inflationary economy.
- ECRI: US inflation has peaked, but Fed needs help from other countries.
- Quiet earnings pre-announcement season gets a rude start, threatens to derail prior follow through rally.

Investors get part of what they want, but the other part is what hurt.

After fears of 368K or some other high number of non-farm jobs as indicated by the private payroll and help wanted firms, jobs were a rather anemic 121K, even less than the 160K anticipated. Taking out government jobs and you get just 90K.

That lower number initially jumped futures higher; after expecting 3 times expectations (that only makes sense with respect to the stock market) investors thought they had what they wanted, i.e. another indication of a slower economy that would get the Fed out of the game. Problem is, the Fed is just about out of the game already. The third consecutive sub-par jobs growth month along with the other economic indicators showed the economy really is slowing. Employment lags, and as we have noted, the economy has been showing those slowing signs since mid-2005. A slowing economy means slowing earnings, and that is not good for the market.

That was not the real issue on Friday, however. Wages rose faster than expected while the workweek hit a 3.5 year high. That took the bloom off the lower jobs as quickly as it came on. Then at 9:00ET, MMM lowered its guidance, citing slowing in its optic film segment, the stuff used for LCD panels and televisions. As MMM cuts across many industrial sectors, however, it was easier to read more into it. One was the high price of oil pushing component prices higher; MMM specifically noted that as well. That came on top of an AMD warning about slower sales due to a price war with INTC. The song says two out of three ain’t bad, but the two were on the bad side and not the good side.

Stocks started lower across the board though NASDAQ and DJ30 took the harder hits given AMD’s implications for techs in general and MMM’s heavy impact on the Dow. As we expected, however, support held and the indices started their rebound. They fought back all morning and into lunch with SP500 turning positive. We had looked for some more selling to lead to a short covering bounce and drive things higher if the jobs report was not as strong as the private firms predicted. Problem is, those other factors suggested to investors that the Fed may still raise rates to combat the wage growth while at the same time the warnings further solidify the idea the economy is slowing.

The prospect of more Fed hikes into a slowing economy ultimately overpowered the rebound attempt. Stocks turned over and sold off into the close, finishing just off session lows. Volume rose on both NASDAQ and NYSE, though the NYSE volume was still quite modest. NASDAQ trade was more of a concern as it started to approach average (still did not make it by a sizeable margin) as NASDAQ and SOX turned over with NASDAQ diving through and closing below next support.

It was somewhat a tale of two markets. The NYSE indices finished still in decent shape with modest volume, modest breadth, and holding near support. DJ30 was whacked, but most of its drop was attributable to MMM and its 9% shellacking. Even with that the Dow held the 18 day EMA on below average trade. That leaves the NYSE stocks with their more industrial, mining, metals base in rather decent shape heading into next week. Their patterns as discussed this past week are still in shape.

NASDAQ did not finish in the same shape. It initially held its 18 day EMA and bounced, but after reaching almost flat it rolled over and dove straight down in the afternoon, taking it below the May lows, the point we wanted to see it hold and put in the bottom of its right shoulder in a potential reverse head and shoulders base. That was tossed out the window and now NASDAQ is looking for a new landing spot. Volume was still below average but it was easily the strongest of the week and matched the late June trade. Distribution as big investors got rid of some tech stocks. Breadth was back over -2.5:1. It basically was not that great.

You would have though semiconductors were dead meat. Many were hit hard such as BRCM, NVDA, XLNX, selling on higher volume. Many such as AMD itself along with INTC, NSM, AMAT, KLAC, however, sold modestly or sold off early and then rebounded nicely. That suggests that maybe, just, maybe, the chips are getting sold out after a 4 to 5 month trend lower this year. Remains to be seen, but when you see a stock warn about earnings and it basically recovers intraday while others in its sector yawn, there is not a whole lot of selling interest anymore.

In the end the action left techs looking weak, anticipating more earnings warnings in the week ahead. At the same time, the action in some of the big chips suggests they are finally approaching a sold out status after declining most of this year. The NYSE indices are still holding their patterns, still setting up for an upside break despite the Friday action. The Fed, despite the Friday numbers, is still just about done. Short interest is still high; there was no rush to sell off the entire market. Techs remain a worry; they have to find some footing this week.

Friday was likely an overreaction to data that was not expected on either side of the coin. NASDAQ is going to have to show some staying power and not fade into another meltdown. It is definitely set up for some upside earnings after the AMD warning, and indeed, the reaction of AMD and its brethren suggest it was not totally unanticipated. There is still more work to do as the dog days of summer drag on. It is always tough going at this time of the year to get an established upside move. The NYSE indices are setting up such an attempt, however, and NASDAQ is likely to get some upside earnings projections this week. Until then we still see many industrial-type stocks in good position as well as some healthcare/medical issues. That is a bit defensive but it also suggests continued strength in the energy, materials, metals that point to no immediate meltdown in the world economy.

THE ECONOMY

Despite the jobs report, US inflation has peaked.

We have often argued that prosperity and jobs are not inflation. When you look in any economics textbook you won’t find the definition of inflation as jobs growth, economic growth, wage growth, etc. Because workers make more money it does not necessarily follow that inflation appears. If someone makes more money they may feel wealthier and indeed they may spend more money. That is good; the economy needs people to consume and thus require the manufacture of more goods and services. It only can lead to inflation, however, if there are not enough goods and services to meet the demand. That would mean there are either constraints on supply and demand through government policies (taxes too high or too many regulations that artificially divert capital from where it is economically needed) or there is too much liquidity fostered by central banks. It is often a combination of the two, but as central banks can do nothing about fiscal or regulatory policy, the focus typically falls onto monetary policy.

Thus when you see all of the hand-wringing and angst over higher wages (+0.5% in June, +3.9% year over year) and an increased workweek (3.5 year high) you have to wonder if the analysts really have their eye on the ball. If wages rise that does not mean inflation is driving them higher; as an economy recovers, skilled workers are in more demand. Further, if workers spend more because they make more, that does not mean prices necessarily rise. The issue is why prices for everything are rising. If there is no increase in supply or demand (or basically no constraints on supply) but you have rising prices, you have too much liquidity in the system. You have to get to the root of the problem which is excess money. Taking action to forestall wages, i.e. slowing the economy, does nothing to solve inflation. As the seventies showed us, you can have a slow economy and high inflation. You have to get rid of the excess liquidity.

Friday there was some renewed worry that the US was falling into something of a 1970’s cycle of higher inflation with slower economic growth. That is about the worst environment imaginable for stocks, and that is why the market took a hit Friday. The Greenspan Fed left rates too low and money supply too high for too long after it killed the bull market and sent us into recession just before 9-11. That was the root of the inflation we see today, exacerbated by fiscal policies that spurred demand over supply during the first part of the Bush presidency. Gold prices, though lower after the blow off top, are stabilizing once more and trying to move higher. Gold is a sign of inflation, like it or not. Yes there are influences from new demand in China and India, but as the recent action has shown us, gold still acts like gold in a technical sense, and it is suggesting inflation fears still exist in the world.

Is it the US or the rest of the world?

And that leads us to a very important point we have to address here in the US. As we have argued the past several months, inflation in the US has peaked. ECRI, the best and most accurate leading indicator of economic activity, continues to show declining inflation pressures in the US. In the US inflation peaked in October 2005. In May ECRI’s future inflation gauge (FIG) growth rate fell to 0.5% from 2.4%. ECRI says the data suggests inflation remains in a gradual easing trend after that 5 year high in October. The US economy was out in front of the rest of the world, and despite the Greenspan Fed keeping rates too low and money supply too high for too long, its remedial action appears to have done the trick in the US. Of course, the Fed can go too far, pushing inflation control above sustained economic growth in its dual mandate, and that is what the Bernanke Fed is grappling with today.

Unfortunately, the rest of the world’s central banks have not been as clear and decisive in fending off inflation, once again leaving the heavy lifting to the US. Ironically, the ECB which supposedly targets inflation, is having the worst time. Of course its antiquated polices and regulations with respect to its economies typically leaves supply and demand in imbalance, and thus it is continually faced with inflation pressures and is staving off economic growth before it can get started.

This time they are not doing enough. UK inflation is, according to ECRI and most analysts, in a cyclical upturn, churning along at a 5.5 year high according to ECRI’s FIG. Overall European inflation pressures continue to rise with its growth rate at an astonishing 7.2%, rising six consecutive months.

The US inflation cycle has peaked. The Fed has done its job, and now we just hope it does not overdo it and send us into recession. With the ECRI US leading economic index (the 4 week annualized index) down 0.9%, growth levels have hit their lowest level in more than a year. The very real danger facing the US is not inflation, but that the Fed feels it has to make up for the other central banks that are not doing their jobs, i.e. keeping inflation in check while they balance that with economic growth. Instead they are focusing on economic growth and letting the US fight inflation. The problem with that is we cannot make that kind of impact on the world inflation front unless we go into recession. That will certainly take the world with it because so much of the world survives by selling their goods to the US. Thus Bernanke not only has to sell his policies to the US markets, but he also has to convince the other central banks to tighten up. Greenspan has left Bernanke in a most unenviable position. Nice parting gift to Bernanke and all of us.

THE MARKET

As noted the prior two weeks, sentiment hit levels that often indicate a market turn. The only caveat is that the market did not turn and rally well at VIX levels that sent the market on sustained runs during the post-2002 rally. When bullish and bearish sentiment touched two weeks back that was a new extreme in that indicator during the post-2002 rally and suggested a bottom may have been put in. Thus far the market is trying to sustain the move after that reading, but it is struggling as is often the case in summer. Leaders are holding but they had a difficult end to last week. Stocks can continue to work on their bases after a follow through session, and what looks like a struggle is part of the build toward a stronger move later in the summer. That looks to be the case now.

MARKET SENTIMENT

Short interest remains high, one of the last touches on the sentiment watch. It is not necessarily a timing mechanism, but it is at a point for a sustainable bounce.

VIX: 13.97; +0.32
VXN: 20.17; +0.37
VXO: 13.48; +0.77

Put/Call Ratio (CBOE): 0.89; +0.09

Bulls versus Bears:

Bulls: 38.7%. With the Thursday advance investment advisors turned more bullish, up from 37.4% and 35.6% the week before. After a decline from 53.2% at the April peak bulls are on the rise once more. On this pullback, however, they hit the lows for this rally, i.e. since 2003. That put it below the 42.3% hit on the last low and the May and October 2005 readings that preceded new upside runs.

Bears: 34.4%. After kissing bulls two weeks back the bears are on the decline this week, down from 36.3% the week before. Just missed crossing over with the bulls, but that in itself is not a bad indication for the upside. That prior week put Bears at a new post-2002 high, eclipsing the March 2006 high (33%) and well above the 2005 highs that spawned new rallies (30% in May 2005, 29.2% in October 2005).

NASDAQ

Stats: -25.03 points (-1.16%) to close at 2130.06
Volume: 1.802B (+9.23%). Trade picked up on NASDAQ as AMD and MMM (LCD component sales slowing) both suggested tech growth may not be what was expected. This was a clear distribution session, and after a follow through two Thursday’s back, you want accumulation as opposed to distribution.

Up Volume: 361M (-389M)
Down Volume: 1.431B (+551M)

A/D and Hi/Lo: Decliners led 2.56 to 1. Decliners were strong. It was not just some selling in the big names as NASDAQ 100 matched NASDAQ in the decline.
Previous Session: Advancers led 1.13 to 1

New Highs: 50 (-30)
New Lows: 103 (+43)

The Chart: (Click to view the chart)

From looking well positioned to rally off of its May low and 18 day EMA near 2150, NASDAQ turned over after a midday recovery attempt to close near the session lows. It is now in its June range and unless it makes a quick recovery it looks to be at best heading for a test of the June low (2072 closing) and a potential double bottom. On this last bounce it was able to beat the 18 day EMA that stalled it in early June, rising to the 50 day EMA (2184). It could not take out that resistance at this juncture, and now it has to regroup. Earnings may come to the rescue, but the concern is not what the Q2 results are but the guidance ahead, and MMM and AMD did not provide the kind of outlook that suggests tech growth.

SOX (-1.52%) was again the loss leader as that index undercut its May closing low, continuing its decline since March. The pace accelerated in May, and since that time SOX has been unable to break back through the 18 day EMA (446) on four attempts, the sign of a rather entrenched downtrend. Given it has made four tries at the 18 day EMA, however, it sill be ripe for a move higher to test the 50 day EMA up at 464 after this current leg lower sells itself out. As AMD, INTC, AMAT and other big names did not really budge Friday on the AMD news, this selling could burn out rather quickly. With all of the short interest in semiconductors we could see a sharp rally in SOX in the next week or so, and that would coincide with the general short covering bounce we expect the market to show.

SP500/NYSE

Stats: -8.6 points (-0.67%) to close at 1265.48
NYSE Volume: 1.427B (+1.23%). Volume rose but it was still paltry, well below average. Hard to categorize this as distribution either. Indeed, we still like the way SP500 and SP600 are setting up with this test of the 200 day SMA.

A/D and Hi/Lo: Decliners led 1.61 to 1. Very modest breadth as the indices pulled back.
Previous Session: Advancers led 1.62 to 1

New Highs: 80 (0)
New Lows: 77 (+11)

The Chart: (Click to view the chart)

SP500 managed to turn positive midday but then rolled over with the rest of the market, undercutting the 50 day EMA (1268) that held on the first downdraft of the session. By the close it had tapped the 200 day SMA (1263) and bounced modestly. That still keeps SP500 in its attempt to form a reverse head and shoulders base using the 200 day SMA and 1260 as support. The key for SP500 was its move back above 1260 on the follow through two Thursdays back, recovering the May low. Unlike NASDAQ, SP500 is still holding that level and still set up to break higher from here. Maybe some OEX and SPY calls up off of this level. Indeed, the OEX held the 50 day EMA on its Friday low and is sitting pretty for a rebound here.

SP600 (-1.43%) undercut its 50 day EMA (373.47) that was acting as support for the nice test lower last week. It dropped to the 18 day EMA (369), just below the May low (371.34). Still in shape to bounce and try to form the right shoulder to its 8 week attempt at a reverse head and shoulders base.

DJ30

MMM was a huge drag on the Dow, accounting for the lion’s share of the decline as heavyweight MMM lost 9%. DJ30 fell through its 50 day EMA (11,112) but after undercutting the 18 day EMA (11,084) it rebounded to close at that level. That keeps it right at the May lows and thus still with the potential to form the right shoulder to its 8 week attempt at a reverse head and shoulders base. The selling was an overreaction to the MMM warning. Looking for a bounce this week.

Stats: -134.63 points (-1.2%) to close at 11090.67
Volume: 253M shares Friday versus 224M shares Thursday. Despite the selling in MMM volume was still well below average.

The Chart: (Click to view the chart)

MONDAY

Another week with a lot of economic data, but with the Fed decision in the bank and the jobs report history, the market is not going to be overly moved by this week’s economic data. Earnings pre-announcements and warnings will take front stage along with the early earnings reports. As always investors will look toward what the future holds as opposed to what just transpired; strong results with strong guidance always wins out.

The wild card remains the Fed and the economy down the road. The Fed is likely close to being through but there are clear indications the economy is slowing as the Fed continues to try and stamp out residual inflation even though inflation appears for the most part to have peaked. Makes sense as noted last week: inflation is lagging, it is still quite tame historically, and according to the leading indicators that are accurate, it peaked at the start of Q4 2005. The Fed wants to stop but we are going to have to wait until August to see if it does. By then it will have a lot more data, including another jobs report, to make its decision.

NASDAQ is weak as is SOX. SOX led lower Friday, taking NASDAQ with it. SOX has already tested the 18 day EMA and failed four times on this trend lower; after a bit more downside it will be ready to try a more sustained move higher. The issue in the interim is whether SOX and NASDAQ take the NYSE lower with them.

The latter are in position for a nice bounce given the patterns, the short interest, etc. Their earnings are likely to be strong as well, and the outlooks based on what we have heard still look solid. We were looking at more upside from those indices Friday, and we are going to continue doing so to start this week. Though a lot of stocks were hit Friday, many solid stocks are still in their patterns, testing their recent moves higher. We are going to continue attacking with those but still not going whole hog. It is a volatile time of the year, and with earnings coming it will be even more so on an individual stock basis as well as for the overall market. Summer is a tough time but the NYSE indices continue to show some upside strength that we are going to continue to play as it builds.

Support and Resistance

NASDAQ: Closed at 2130.06
Resistance:
The 18 day EMA at 2146
2162 to 2155 from December 2005 and September 2006
2163 is the August 2004/April 2005 up trendline.
2177 is the December 2004 high.
2185 to 2182 is the September 2005 peak and interim high from November 2005.
The 50 day EMA at 2184
2205 is the December 2005 closing low
2218 is the August 2005 peak before the sell off through October 2005.
The 200 day SMA at 2228
2234 is the early June high
2240 is closing low in February range.

Support:
2100 from the early and mid-2005 peaks
2072 is the June closing low
2063 is modest, soft support
2050 from the summer 2005 lateral range lows.
2045-47 from June and October 2005 lows and June 2004 highs

S&P 500: Closed at 1265.48
Resistance:
1272 to 1268 is the November and December 2005 closing highs and March 2006 closing low
The 50 day SMA at 1273
1280 is the recent July peak.
The late January peak at 1285
The early June high at 1288
1297.57 is the recent February high.
1315 is the May and May 2001 peaks
1317, the recent intraday highs from April.
1324 to 1329 from the October 2000 lows.

Support:
The 200 day EMA at 1263
The 18 day EMA at 1261
1248 is an old trendline from the August 2003/August 2004/October 2005 lows.
1225 from the March 2005 high
1213 from December 2004 high to 1215
1205 from the August lows

Dow: Closed at 11,090.67
Resistance:
11,097 to 11,137 is the last peak from the February top.
The 50 day EMA at 11,112
The 50 day SMA at 11,175
11,279 is the late May high
The March 2006 highs at 11,329 to 11,335
11,350 from the May 2001 peak
11,401 from the September 2000 peak and April 2001 highs

Support:
The 18 day EMA at 11,084
11,044 is the January high.
10,965 from Q4 2000
10,931 is the November 2005 high
The 200 day SMA at 10,921
10,890 is the December 2005 closing high.
10, 737 to 10,730 from December and February lows
10,705 – 10,965 from July/August 2005 range top to bottom
10,678 to 10,665

Economic Calendar

These are consensus expectations. Our expectations will vary and are discussed in the ‘Economy’ section.

July 10
- Wholesale inventories, May (8:30): 33.8 expected, 33.8 prior
- Consumer Credit, May (3:00): $3.2B expected, $10.6B prior

July 12
- Trade balance, May (8:30): -$65B expected, -$63.4B prior
- Crude oil inventories (10:30)

July 13
- Initial jobless claims (8:30): 313K prior
- Treasury Budget, June (2:00): $20.0B expected, $22.9B prior

July 14
- Retail sales, June (8:30): 0.4% expected, 0.1% prior
- Retail sales ex-auto, June (8:30): 0.5% expected, 0.5% prior
- Michigan sentiment, preliminary, July (9:45): 85.3 expected, 84.9 prior
- Business inventories, May (10:00): 0.4% expected, 0.4% prior

icon url

ReturntoSender

07/19/06 11:57 PM

#6848 RE: ReturntoSender #6755

From Briefing.com: 6:01PM Flextronics Enter Into Outsourcing Relationship (FLEX) 10.38 +0.21 : Flextronics and Juniper (JNPR) announced a global outsourcing relationship whereby Flextronics will provide a portion of new product introduction, manufacturing, and logistics services on a worldwide basis for Juniper's security and networking products.

4:17PM Lam Research beats by $0.12, beats on revs (LRCX) 44.94 +2.49 : Reports Q4 (Jun) ongoing earnings of $0.96 per share, $0.12 better than the Reuters Estimates consensus of $0.84; revenues rose 20.2% year/year to $525.6 mln vs the $507.1 mln consensus.

5:12PM Market Internals (MKTIN) : The Dow increased 1.96% closing at 11011, the Nasdaq was up 1.83% to finish at 2081, and the S&P was up 1.86% to finish at 1260. Leading sectors included: airlines +8.2%, steel +5.1%, computer and electronic retail +4.9%, diversified metals and mining +4.9%, asset management and custody banks +4.8%. Lagging sectors included: IT consulting and services -15.8%, Internet software and services --6.4%, specialized finance -2.4%, soft drinks -0.15%, health care supp --0.04%. Today's movement came from higher volume (NYSE 1865, vs. closing avg of 1712; Nasdaq 2406, vs. 2026), with higher advance/decline ratios (NYSE 2846/468; Nasdaq 2336/697, and with mixed new high/new low ratios (NYSE 76/55, Nasdaq 56/89).

4:28PM Juniper Networks reports in-line Q2 revs, does not report EPS due to additional charges for stock compensation expense (JNPR) 14.14 -0.18 : Reports Q2 (Jun) revenues rose 15.1% year/year to $567.5 mln vs the $567.2 mln consensus. "The Audit Committee of the Company's Board of Directors is conducting an independent investigation regarding stock options. Although the investigation is not complete, and the committee is continuing its review of the matters, the committee has reached a preliminary conclusion that the actual measurement dates for financial accounting purposes of certain stock option grants issued in the past differ from the recorded grant dates of such awards. Accordingly, the Company believes it will record additional non-cash charges for stock-based compensation expense, but is not yet able to determine the amount of such charges or the resulting tax and accounting impact of these actions or which periods, if any, would require restatement. Accordingly, the company is not providing detailed GAAP or Non-GAAP financials for the quarter ended June 30, 2006. In addition, the Company will not file its quarterly report on Form 10-Q for the quarter ended June 30, 2006 until after completion of the investigation, and the Company does not expect the investigation to be completed until after the date the Form 10-Q is required to be filed."

4:24PM Openwave Systems guides revs lower, reschedules July 29 analyst day to Nov. 2006 (OPWV) 7.24 : OPWV says it expects fiscal Q1 2007 revenues will be flat to modestly below the prior quarter. Fiscal Q1 consensus is for revs of $100 mln, vs. $91 mln in fiscal Q4. Co says it's completing its annual operating plan for fiscal 2007, and will present key aspects of the plan at the rescheduled Analyst Day.

4:18PM Intersil reports Q2 results in-line; guides Q3 in-line (ISIL) 23.95 +1.14 : Reports Q2 (Jun) earnings of $0.30 per share, in line with the Reuters Estimates consensus of $0.30; revenues rose 34.9% year/year to $187.6 mln vs the $186.4 mln consensus. Co issues in-line guidance for Q3, sees EPS of $0.32 vs. $0.32 consensus; sees Q3 revs of $193.2-197.0 mln vs. $195.88 mln consensus.

4:15PM Novellus beats by 3 cents (NVLS) 24.43 +0.85 : Reports Q2 (Jun) earnings of $0.42 per share, $0.03 better than the Reuters Estimates consensus of $0.39; revenues rose 24.4% year/year to $410.1 mln vs the $408 mln consensus. Gross margin was 49.9% vs 49% guidance.

4:20 pm : Stocks surged across the board Wednesday as investors rallied around upbeat remarks from Bernanke that implied policy makers may finally take a breather after two years of interest rate increases. Aside from the Fed Chairman's seemingly dovish commentary that sent short sellers fleeing for cover following weeks of market losses, signs of a potential pause pushed bond yields to session lows and allowed equity investors to look beyond a disappointing CPI report, using solid earnings news and another pullback in oil as additional catalysts to get back into a market that was showing signs of being oversold.

At his semi-annual testimony before the Senate Banking Committee, Bernanke acknowledged that "moderation in economic growth" will lead to a "gradual decline in inflation in coming quarters," welcoming news that overshadowed a fourth straight 0.3% rise in core CPI. That left the year-over-year increase at 2.6%, which is well above the Fed's comfort zone of 1.75-2.00%. Be that as it may, Bernanke's commentary superseded a report that typically has the potential to move stocks and bonds in noticeable fashion.

The optimism about a possible pause was further echoed in fed funds futures, which were implying a roughly 90% chance of a 1/4% rate increase to 5.50% on August 8th following the CPI report, but moved back to pricing in only a 68% chance of another hike and are no longer pricing in any tightening at the three FOMC meetings thereafter.

Of the 10 sectors trading higher, the most influential of them all -- Financials -- paced the way to the upside. The sector surged 2.7% and climbed back into positive territory for the year after J.P. Morgan Chase (JPM 42.06 +1.35) said Q2 net income more than tripled and retail banking earnings at Bank of America (BAC 49.01 +0.57) doubled. A decline in borrowing costs provided additional sector support. The yield on the 10-yr note was as high as 5.17% but closed at 5.05% and more than erased yesterday's 16-tick sell-off that lifted the benchmark 10-yr yield to 5.13%.

Health Care also turned in a gain of more than 2.0%. Managed Healthcare -- one of the worst performing industry groups in Q2 -- garnered extra bargain hunting interest after UnitedHealth (UNH 50.66 +2.26) beat analysts' Q2 forecasts on a 57% rise in revenue and increased its full-year profit outlook. Abbott Labs (ABT 45.80 +1.10) topping estimates and raising guidance also helped Health Care nearly halve its 5.0% year-to-date decline.

Technology, which was under pressure early on after Yahoo (YHOO 25.20 -7.04) merely matched forecasts, as Q2 profits fell 80% on lighter than expected sales and the company delayed the much-anticipated release to its search advertisement system, found renewed buying interest. Despite some uncertainty regarding EPS reports from bellwethers Qualcomm (QCOM 36.73 -0.67) and eBay (EBAY 25.93 -0.66) after the bell, Dow component International Business Machines (IBM 76.15 +1.89) beating Wall Street's expectations by a penny helped restore some optimism about tech's growth prospects.

Even Energy, which was under pressure throughout most of the session in sympathy with falling oil prices, and provided an opportunity for investors to rotate into underperforming areas like Tech and Health Care, closed higher. With Bernanke recently saying that "much of the upward pressure on overall inflation this year has been due to increases in the prices of energy," crude oil futures closing below $73 per barrel, following unexpected builds in weekly gasoline and crude oil inventories, was also seen as welcome news for a market reeling from concerns about rising energy prices. DJ30 +212.19 NASDAQ +37.49 SP500 +22.95 NASDAQ Dec/Adv/Vol 713/2326/1.98 bln NYSE Dec/Adv/Vol 477/2839/1.87 bln

3:14PM Bond Watch: Session Ends Stronger on Fed Expectations (BONDX) : The bond market held the strong gains into the close, liking comments from Fed chief Bernanke as players consider that the end of long rate hike season is in sight, while the new chief also sees growth slowing & inflation being contained. The shorter maturities were knocked around pretty good, while the 2-10-yr yield spread cut a wide swath but ultimately ended the session about where it came in. The yields on the 10-yrs were knocked off to below 5.050% as the 2-yrs saw a push to 5.098%. Thurs should follow similar action as the market sees some mid-tier data along with a Bernanke do-over at the House financial committee. The FOMC minutes hit, but there is not much to be expected there on the heels of the Fed testimony. "The one & done camp is leading the way here," notes one long time player adding, "for the moment, anyway." Core CPI was up 0.3% for the 4th consecutive month while the headline number reported inline. Housing starts were worse than expectated at 1850K (consensus 1900K) as were building permits at 1862K (consensus 1920K). The buck was beaten up badly on Bernanke's testimony after getting a little boost on the core inflation number. The euro has spiked up to 1.2609 from a session best 1.2458 (not seen since Apr 27th) while the yen did better at 116.62. The dollar index is way down at 86.44 (-0.57). Spot gold grabbed some shine jumping to 642.15 (+9.10) while Sep's soon-to-be front month crude oil contract is off at 74.85 (-0.41). Tomorrow brings initial jobless claims, leading indicators, Philly Fed & on the Fed front the markets will get the minutes to the Jun FOMC meeting along with more Bernanke. The 10-yr is currently +19/32nds yielding 5.053% (for more bond commentary click here).

12:13 pm Southwest Airlines (LUV)

17.35 +1.41: Southwest Airlines said its second quarter profit more than doubled from a year ago, helped by higher fares and the use of options to hedge its exposure to significantly higher fuel prices. Based on the announcement, shares of the Dallas-based company were up sharply, gaining more than 9% during the regular trading session.

For the most recent quarter, the low-cost carrier said it earned $333 million, or $0.40 per share, up from $144 million, or $0.18 per share, a year earlier. Excluding gains from its hedging activities, the company earned $0.33 per share - largely exceeding the Reuters Estimates consensus of $0.26 per share. Revenue totaled $2.45 billion, up 26% from a year ago and better than the consensus estimate of $2.31 billion. Southwest attributed the increase in revenue to strong demand for its service as competitors reduced capacity, which resulted in higher occupancy rates. The company also boosted revenue by increasing fares four times this year.

Given the current healthy revenue environment, Southwest sees earnings momentum continuing into the fiscal third quarter and expects to exceed its earnings growth target of 15% for the full year. The company said third quarter bookings are strong and the rise in operating costs, excluding fuel, are expected to be lower than the 4.9% increase in the second quarter.

Meanwhile, as higher fuel costs continue to weigh on the industry, Southwest said it is over 73% hedged for the remainder of the year at approximately $36 per barrel. Jet fuel costs for the third quarter, however, are expected to be well above the last year's cost of $0.95 per gallon and exceed the $1.42 per gallon recorded in the second quarter. In the longer term, the company's exposure to fuel costs will increase, with its hedging cover falling to 65% in 2007 at $41 per barrel; 38% in 2008 at $40 per barrel; 34% in 2009 at $44 per barrel; and 12% in 2010 at $61 per barrel.

--Richard Jahnke, Briefing.com

11:27 am Manpower Inc. (MAN)

63.30 +1.40: Shares in Manpower Inc. were higher Wednesday after the employment services company showed a little muscle and said it saw second quarter earnings of $0.91 per share, $0.11 better than the Reuters Estimates consensus of $0.80.

The Milwaukee-based international company, whose stock has gained almost 30% in the last 52 weeks, said revenues rose 9.5% year over year to $4.44 billion versus consensus of $4.29. The company issued in-line guidance for the third quarter, seeing earnings per share of $0.98 to $1.02 versus $1.01 consensus.

The Labor Department's lackluster employment report for the month of June had cast doubt on expectations for the company in the latest period, but Wednesday's results calmed those concerns. The company, which has a market cap of about $5.43 billion, said during a call with analysts that it continues to see growth in the U.S., but that the majority of momentum is from Europe and Asia. Company executives said they expect to see continued improvement in the company's overall profit margin.

At about 20x trailing 12-month earnings, the stock - which has seen gross margins soften a bit over the past few quarters, but operating and net margins hold their ground - is within the range of the industry average and continues to look attractive at current levels. Manpower's network of 4,400 offices in 72 countries and territories enables the company to meet the needs of 400,000 clients per year.

--Christine Marie Nielsen, Briefing.com

11:16 am Ryland Group (RYL)

36.43 +1.61: The Ryland Group on Tuesday reported a lower second quarter profit, but beat analysts' expectations as revenue increased 3.2%. The latest results sent shares of the Calabasas, California-based homebuilder more than 5% higher in early market activity. Other major builders, such as DR Horton (DHI), Toll Brothers (TOL), and KB Home (KBH), also traded higher.

For the quarter, Ryland posted earnings of $94.8 million, or $2.03 per share, compared with $104.3 million, or $2.10 per share, in the year ago period. Total revenue rose to $1.2 billion from $1.16 billion last year, as an 8.5% increase in the average price of a home offset a 5.8% decline in the number of closings. Analysts on average were expecting the company to earn $1.93 per share on revenue of $1.21 billion, according to Reuters Estimates.

Meanwhile, Ryland said new orders for the quarter plunged nearly 40% to 3,023 units, or $890.9 million, from 4,988 units, or $1.48 billion, in the year ago period. While new home orders have slipped in recent months, many homebuilders have lowered their their financial projections for the year, citing rising interest rates, negative new order trends, and higher cancellation rates. Ryland is forecasting full-year earnings of $7.75 and $8.25 per share, in line with the consensus estimate of $7.99 per share.

Amid difficult selling conditions for homebuilders due to rising interest rates and slowing demand, Ryland shares have plunged nearly 50% since the start of the year. At the current level, shares of the company appear cheap at 4.6x this year's projected earnings. However, as highlighted in our Ask An Analyst column, we would avoid the stock as we remain concerned that earnings estimates for the company and other homebuilders will be subject to further downward revisions, with the housing market continuing to show signs of a slowdown.

--Richard Jahnke, Briefing.com

10:59 am UnitedHealth Group (UNH)

48.40: After reeling from questions over the timing of stock options grants and industry fallout over pricing dynamics and higher costs, shares of UnitedHealth tumbled at the end of May. But today is another day and the market is warmly welcoming UNH's second quarter results, sending shares soaring in early trading. Also adding to the fanfare was news that the company expects accelerating earnings per share given seasonal trends in Medicare in the second half of the year .

While convoluted and confusing due to the commencement of Medicare Part D and the PacifiCare acquisition, UNH reported a better than expected quarter. The second largest US health insurer earned $974 mln or $0.70 per share compared to $770 mln or 58 cents in the prior year's period and analysts' expectations of $0.68. Revenue jumped 57% to $17.92 bln propelled by the acquisition - in line with consensus estimates. Operating margins rose to 9.1% from 8.4% in the first quarter but were still down from 11% last year.

UNH said it reached over 4 mln new customers in the first six months of the year through employer health programs, senior and government services and specialty product lines. All eyes were on the medical care ratio, reflecting medial costs as a percentage of premium revenues, that fell by 50 basis points sequentially to 82%. The strong quarter fortified management's expectations of 15% earnings growth in FY07, above the 2006 outlook of $2.91 to $2.95 per share. UNH trades at a forward multiple of 17.4x, compared to other managed care providers Aetna (AET) at 14.4x, Cigna (CI) at 12.4x, Coventry Health (CVH) at 16.4x, WellPoint (WLP) at 16.6x, and Humana (HUM) at 20.4x.

--Kimberly DuBord, Briefing.com

10:53 am JPMorgan Chase (JPM)

42.52 +1.81: Be forewarned, it will take you a while to read through the earnings press release from investment bank JPMorgan Chase. In an effort to spare you some brain cells, here is a brief synopsis of the key takeaways:

The investment banking business was strong as it generated record fees, paced by equity and debt underwriting
Performance-based compensation triggered a 35% jump in noninterest expense for the investment banking business. Noninterest expenses overall fell 14% from the prior-year period. Excluding a rash of items, they would have risen $657 million, or 6.1%, but that is palatable given a 15% increase in net revenue for the quarter
The credit environment was extremely favorable as the provision for credit losses was down 31% from the prior year (management doesn't expect such favorable activity to continue)
Higher deposit and loan balances were offset by narrower spreads earned on loans and deposits; managed net interest margin for its Card Services business slipped to 8.66% from 8.83%
The mortgage banking business was a weak spot and drove an 11% decline in net income for the Retail Financial Services segment. All other business lines - Investment Banking, Card Services, Commercial Banking, Treasury and Security Services, and Asset and Wealth Management - delivered hefty, double-digit percentage gains in earnings versus last year
Altogether JPMorgan Chase reported second quarter net income of $3.5 billion, or $0.99 per share, versus $1.0 billion, or $0.28 per share, last year. The sharp increase was influenced by the absence of a litigation reserve charge of $1.2 billion taken last year, as well as $565 million in after-tax gains from non-recurring items that were offset somewhat by $358 million in after-tax expenses related to merger costs and Treasury portfolio positioning.

Excluding items, JPMorgan Chase indicated that earnings of $0.94 per share were comparable to the consensus EPS estimate of $0.87.

The upside surprise from JPMorgan, along with clear signs of progress with its merger integration efforts, have provided a nice boost to its stock today, which is up 17% since we profiled it on our Bargain Hunting page in October. While the trading environment could grow more challenging in the months ahead, and JP Morgan should do even more to get costs down, we believe its stock still affords investors a good value opportunity. At the current price, it is trading at 1.33x book value, which is a discount to competitors like Citigroup (2.05x), Bank of America (1.75x), and Wachovia (1.75x).

--Patrick J. O'Hare, Briefing.com

10:38 am Unisys Corp. (UIS)

5.69 -0.46: Information technology consulting company Unisys Corp. Wednesday said employee reductions costs and a decrease in service and technology orders resulted in a second-quarter loss of $0.57 per share, including a $141.2 million pre-tax charge. Revenues fell 2.0% year over year to $1.41 billion versus consensus of $1.45 billion.

The company has said it expects total work force cuts of 5,500 to bring it annual savings of more than $325 million by the second half of 2007. Unisys expects to cut another 1,300 jobs in the third quarter and believes the repositioning effort will significantly enhance its profitability and competitiveness over the long term.

With negative earnings, the company does need to do something. The company is trading in the upper portion of its 52-week range as expectations for a turnaround begin to loom, but investors would be best to let this company indicate its fixes are working before they get involved.

--Christine Marie Nielsen, Briefing.com

10:28 am Abbott Laboratories (ABT)

45.89 +1.19 Abbott Laboratories strongly beat consensus estimates for the second quarter, reporting EPS of $0.62 versus the $0.57 estimate. For both these results and the estimates, one-time charges and Guidant-related acquisition costs were excluded. The results are particularly positive for two reasons: margin expansion and higher guidance for the full 2006 year.

The first is that the quarter shows extremely strong margin expansion over the year ago quarter. Although total revenue for the second quarter of 2006 was less than that of a year ago, net income was sharply higher, at $946.7 million versus the year ago income of $877.1 million (both excluding one-time charges). The higher net income is primarily due to higher gross margins, as this quarter showed gross margin of 56.5%, a sharp increase from the year-ago period of 52.4%. Driving the higher gross margins is a larger percentage of the high margin branded drugs as a percentage of total revenue.

Also positive in this quarter's report is the raised guidance for the full 2006 year. Abbott now expects full year EPS of $2.49 to $2.53, up from previous guidance of $2.46-2.52. Consensus estimates for the full year before the raised guidance is $2.47.

All of these results are strong confirmation of the long term investment premise we set forth for Abbott Labs as one of the current stocks followed by the Ahead of the Curve column.

-- Robert V. Green, Briefing.com

10:03 am Yahoo! (YHOO)

26.97 -5.27: Shares of Yahoo Inc. fell sharply after the Internet giant reported second quarter sales that missed analysts' expectations, and said it will delay the release of its new online advertising platform. The stock, which is down about 32% since the start of the year amid increasing competition from rival Google Inc. (GOOG), slipped more than 18% in early market activity and is sitting at a new 52-week low.

For the most recent quarter, Yahoo posted earnings of $164 million, or $0.11 per share, including $73 million of stock-based compensation expense, net of tax, recorded under the fair value method. Last year, the Sunnyvale, California-based company earned $755 million, or $0.51 per share, which included $7 million of stock option expense and a one-time gain for the sale of its stake in Google. The result matched analysts' estimate of $0.11 per share, according to Reuters Estimates.

Revenues for the quarter totaled $1.58 billion, up 26% from $1.25 billion last year, as marketing services revenue grew 27% and fees revenue increased 19%. Excluding traffic acquisition costs, or the commissions paid to advertising partners, revenues increased 28% to $1.12 billion. That was slightly below analysts' target of $1.14 billion.

Although the latest results, along with the delay in releasing new advertising software, were not what investors had hoped for, Yahoo maintained its outlook for the full year and issued in-line guidance for the fiscal third quarter. The company said it still expects revenue of $4.60 to $4.85 billion for the year, versus the consensus estimate of $4.78 billion. For the current quarter, it sees revenue between $1.11 to $1.12 billion, in line with analysts' forecast of $1.19 billion.

(Disclosure: Briefing.com has a business relationship with Yahoo!)

--Richard Jahnke, Briefing.com

09:50 am American Standard (ASD)

39.60: Air conditioning, plumbing products and automotive braking systems company American Standard Cos. Inc. indicated Wednesday that a drop in its bath and kitchen sales resulted in a slight miss in its financials for the latest period.

The company, which has a market cap of about $8.05 billion, said it had second-quarter earnings of $0.92 per share, excluding non-recurring items. That was $0.01 worse than the Reuters Estimates consensus of $0.93. Revenues rose 8.6% year over year to $2.99 billion versus consensus of $2.99 billion.

The company issued in-line guidance for the third quarter, seeing earnings per share of $0.80 to $0.85 versus $0.84 consensus. The company also issued in-line guidance for the full year of 2006, seeing earnings per share of $2.70 to $2.80 versus $2.76 consensus. Fred Poses, chairman and CEO, said growing strength of the commercial part of its air conditioning business, higher truck builds and the improving performance of its bath and kitchen business will enable the company to offset increasing commodity and energy costs.

The N.J.-based manufacturer Friday declared a regular quarterly dividend of $0.18 per share. The company said it will pay the dividend on Sept. 20 to shareholders of record Sept. 1.

The company has a history of returning cash to shareowners through share repurchases and its quarterly dividend. Also making it look solid is the fact that it's on track to achieve 2006 cash-flow targets of $835 to $860 million in net cash provided by operating activities and $575 million to $600 million in free cash flow.

At about 16.4x trailing 12-month earnings, the stock is trading at a slight premium to the industry average. Price dips should be viewed as potential entry points.

--Christine Marie Nielsen, Briefing.com


09:38 am General Dynamics (GD)

68.35: The first wave of earnings reports from the defense contractors continue to annihilate expectations. Following in the tracks of United Technologies (UTX) yesterday, General Dynamics, the largest maker of armored vehicles, reported a three cent upside as second quarter profits rose 24%. Earnings from continuing operations increased to $420 mln, or $1.03 per share as the Iraqi war increased demand for troop transports, weaponry and spare parts.

The quarter was driven by near 30% revenue growth in the Aerospace and Combat Systems groups, yielding total revenue growth of 15.5% to $5.93 bln. Operating margins improved in four of five of its business segments, resulting in an overall 40 basis point improvement to 10.9%. General Dynamics, which also makes Gulfstream business jets, benefited from the ongoing wars in Iraq and Afghanistan and subsequent increased demand for Stryker troop transports and battlefield radios. In April, it won a $464 mln award to build 306 new 8-wheel Stryker vehicles. Its funded backlog grew by $1.3 bln sequentially.

The ongoing growth cycles in the aerospace and defensive industries underscore our Overweight rating on the Industrial sector. The military's operations and modernization and refurbishment efforts continue to drive a positive outlook for the defense contractor. Increasing Army weapons outlays in particular raise expectations for General Dynamics, which produces high-performance armament systems. With two quarters now in the bag, this Falls Church, Virginia-based company took the opportunity to raise full year earnings expectations to $4.15 per share vs. consensus of $4.14.

--Kimberly DuBord, Briefing.com

09:05 am Bank of America (BAC)

48.44: Bank of America Corp., a company we recently featured in our Stock Swap column, said second quarter profits climbed 18% to $5.48 billion, from $4.66 billion a year earlier, driven by strong momentum across its businesses and the acquisition of MBNA Corp. On a per share basis, the Charlotte, North Carolina-based bank earned $1.22, which excludes merger and restructuring charges of $0.03. The result was twelve cents better than the Reuters Estimates consensus of $1.10 per share.

Revenues for the period surged 25.3% from a year ago to $18.52 billion, helped by stronger fees from its investment banking and capital markets businesses. Corporate and investment banking revenues climbed 16% to $5.72 billion, while wealth and investment management increased 9% to $1.96 billion. Capital management revenue jumped 52% to $10.48 billion, as revenue from card services increased 163% to $5.47 billion due to the addition of MBNA Corp.

The company said net interest income rose 14% to $8.93 billion, helped by loan growth and increases in asset-liability management activity, offset by lower core deposits and spread compression. The net interest yield increased 5 basis points to 2.85%. Meanwhile, non-interest income was up 38% year/year to $9.6 billion, due to higher card income, as well as continued strength in service fee income and increases in trading account profits and investment banking income.

In spite of a difficult interest rate environment, Bank of America's latest performance demonstrates its diverse revenue sources and strong execution. Given the strong momentum across its businesses, including investment banking, the company appears well positioned for future earnings growth. As such, it remains one of our favorite companies within the Financial sector, which we currently have a Market Weight rating on.

--Richard Jahnke, Briefing.com

08:44 am St. Jude Medical Inc. (STJ)

32.27: Shares in St. Jude Medical Inc. were poised to open near unchanged Wednesday after the cardiovascular medical device creator and distributor indicated its financials had a steady rhythm, with the company seeing second quarter earnings of $0.38 per share, in-line with a Reuters Estimates consensus of $0.38.

While the company said revenues rose 15.1% year over year to $832.9 million versus the $814.1 million consensus (with unfavorable foreign currency translation comparisons decreasing second quarter sales by about $6 million), it also issued downside guidance. St. Jude said it sees earnings per share of $0.36 to $0.39 in the third quarter versus $0.40 consensus. The company also issued downside guidance for the full year of 2006, seeing earnings per share of $1.49 to $1.55 versus $1.57 consensus.

St. Jude's stock saw some gains Tuesday after the Food and Drug Administration approved two of its defibrillators for treating patients with potentially fatal heart arrhythmias and heart failure.

Briefing.com currently has a Market Weight rating on the health care sector, as its defensive-characteristics in a rising interest rate environment are being overshadowed by concerns over the rising cost of health care and intensifying competition among managed care providers. And at about 30x trailing 12-month earnings, the stock is also looking a little pricy to its closest competitors.
--Christine Marie Nielsen, Briefing.com


08:27 am IBM (IBM)

74.26: Considering the level of pessimism within the technology sector, even a lackluster report from IBM lifted shares. Big Blue posted its second quarter results after the bell on Tuesday and despite pockets of weakness, the tech bellwether was able to beat expectations by a penny. The upside came from the software segment driven by its middleware brands, WebSphere and Tivoli, generating 5% top line growth to $4.2 bln and pre-tax margins of 24.2%, up 410 basis points. In addition, overall profitability greatly improved, as it was up 110 basis points sequentially and 160 basis points yearly, demonstrating IBM's success in reducing operating costs.

The downside came from its two biggest segments, hardware and services. The hardware segment, excluding the divested PC business, posted mixed results due in part to product transition. Revenues rose 3% to $5.1 bln driven by microelectronics (game console chips) and zSeries servers. Services bookings, an indicator of future revenues, declined 34% year/year to $9.6 bln, calling into question management's target of mid-single digit service revenue growth in the second half.

Overall, IBM reported net income of $2.02 bln or $1.30 per share on revenue growth of 1% to $21.9 bln, net of the divested PC business. Meager top line growth is nothing new at IBM, but despite a hazy outlook for IT spending and an increasingly competitive global environment, management reiterated its target of double-digit earnings growth for the full year. Shares are trading at 12.8x trailing earnings vs. a 5-year average of 20.5x.

--Kimberly DuBord, Briefing.com

09:36 am Check Point Sftwr: ICAP reiterates Sell . Target $16.5 to $10.5. Firm cuts price tgt after the co reported Q2 earnings and revenue that were both a touch lower than consensus expectations. The firm noted higher operating expenses, particularly S&M and R&D due to the addition of new personnel, adversely impacted margins.

09:35 am Nevada Gold and Casinos: Merriman Curhan Ford upgrades Neutral to Buy. Firm ups rating saying while the co has posted lackluster results over the past 18 months, they see evidence indicating a turnaround as well as significant share value at current levels. The firm says believes the co has navigated cathrough a good deal of this transition and is poised to begin to deliver solid earnings growth again, and has undervalued assets and additional management depth.

09:33 am Simple Tech: Needham & Co reiterates Buy. Target $6 to $10. Firm raises price tgt following the preannounced Q2. The firm says they believe that the co is well positioned to grow revenues driven by strength in Flash products to O.E.MS and External Hard Disk Drives to the consumer market. They believe that STEC is a gross margin growth story, which will be driven by Flash O.E.M product growth.

09:32 am IBM: ICAP reiterates Sell . Target $73 to $60. Firm cuts price tgt noting the co reported 2Q earnings that were a penny better and matched the Street's expectation for revenue, which was bolstered by a much stronger than exp. Global Services performance. The firm says software improved slightly but guidance across all metrics was a bit weaker than expected.

09:29 am CB Richard Ellis: Credit Suisse initiates Outperform. Target $32. Firm initiates saying their diligence suggests recent trends in sales and leasing transaction volumes, prices, and sizes continue at above trend levels. Combined with market share gains, the firm says these trends should drive CB's rev and earnings above current market expectations.

09:28 am CBL & Assoc: UBS initiates Buy. Target $44. Firm initiates saying although CBL faces more challenges than some of its peers, they believe it has been mispriced. The firm says CBL consistently delivered FFO growth. The firm says they believe recent underperformance represents an opportunity and any sustained N.A.V discount may attract M&A interest.

09:27 am Dvlps Divers Realty: UBS initiates Buy. Target $61. Firm initiates saying despite competitive acquisition environment DDR has continued to grow, either through creative deals or the opportunistic Coventry funds. The firm says above-average F.F.O growth is supported by growing merchant building gains and a robust development pipeline of $1 bln+ through 2009.

09:27 am FormFactor: Cowen & Co initiates Outperform. Firm initiates saying following a bumpy ramp of a new mfg. facility last year, FORM is no longer capacity constrained and is poised to extend its lead into adjacent markets with a slew of new products. The firm notes the strong DRAM cycle the reason to play. The firm says they have been hoping to catch FORM shares lower in this market but their resilience underscores the powerful story that's hard to find fault with. THe see see 20% upside relative to the mkt. over the next 12 months.

09:25 am Yahoo!: Deutsche Securities downgrades Buy to Hold. Target $30. Firm downgrades saying expect the stock to be range-bound in the upper 20s/$30 through 2H 2006. The firm says while the fundamental growth story at Yahoo! looks respectable, the stock catalyst of the search monetization launch has been pushed out to early '07 limiting upside.

09:23 am Forest Labs: RBC Capital Mkts reiterates Sector Perform. Target $46 to $48. Firm ups price tgt following earnings. The firm says they remain encouraged by Forest's recent in-licensing activity, the potential for additional share repurchases, and most importantly, the recent Lexapro patent suit win.


icon url

ReturntoSender

07/21/06 9:43 AM

#6850 RE: ReturntoSender #6755

From Briefing.com: 7:30AM Dell expects lower revenue and Earnings Per Share in Q2 -- sees EPS of $0.21-0.23 vs $0.32 consensus (DELL) 22.10 : Co issues downside guidance for Q2 (Jul), sees EPS of $0.21-0.23 vs. $0.32 Reuters Estimates consensus; sees Q2 (Jul) revs of $14 bln vs. $14.24 bln consensus. These estimates primarily reflect aggressive pricing in a slowing commercial market worldwide. Dell continues to make significant investments in customer service and support capabilities. The co is seeing positive results and will continue to invest to drive a superior customer experience. Dell has also made significant investments in its products and expects to deliver a greatly expanded product line in the second half of the year. According to the most recent IDC numbers, Dell gained 1 share point sequentially, achieving a record 19.2% share, as the industry moves into a new phase of consolidation.

8:17AM Bond Watch: Treasuries Blaze Trail Higher (BONDX) : The bond market is higher this morning as sentiment still benefits from acknowledgement by the Fed that inflation is less of a concern than economic growth. The 10-yr yield is down at 5.018%, a level not seen since June 14th. The 2-10-yr yields spread made a mad dash less-inverted but has thus far fallen a little short at -2.1 from -3.6 as curve traders wrestle with the possibility of a pause in Aug. Bond prices in the EuroZone are better despite concerns that rate hikes will continue beyond early Aug's expected ECB action while in Japan bond prices are down despite weakness in Japanese equities. Treasuries continue to sail at full mast with a likely geopolitical bid adding its winds as the weekend approaches. The 10-yr yield looks poised to push down to a 4 handle as the 5- & 3-yr are already there. The market may become fixated with grabbing a new handle such that it becomes a motivator in & of itself. Either way the bonds are benefiting from multiple sources as the winds accumulate to propel prices higher. The euro has been boosted to 1.2674 as the dollar gave way to lowered expectations for future rate hikes hurt the buck, while the yen has gotten a bump to 116.0500, the best level against the buck in a week. The Dollar index is running at 85.96 (-0.26). The gold has regained some ground but remains well beneath the high levels seen in the safe-haven run seen last week of 676.53, now 629.13 (+0.97). The crude has been boosted as instability in the Mid East continues to escalate with the Sep now 74.69 (+0.42) of 4.7% from last week's highs. The economic & Fed-speak calendars are empty, so the market will chose its own logic. The 10-yr is currently +02/32nds yielding 5.016% (for more bond commentary click here).

5:08AM On The Wires : Silicon Image (SIMG) announces an agreement with the China Video Industry Association under which CVIA will promote and support the use of High-Definition Multimedia Interface by the consumer electronics industry in China... Stora Enso (SEO) announces they have signed a definitive agreement to sell its Pankakoski Mill in Finland to an international group of investors. The debt-free sales price is EUR 20 mln... Boeing (BA) and Futura International Airways, a charter airline headquartered in Spain, announce an order for three Boeing Next-Generation 737-800s and three purchase rights. The order is valued at approx $210 mln.


icon url

ReturntoSender

07/23/06 7:05 PM

#6853 RE: ReturntoSender #6755

InvestmentHouse Weekend Update:

http://www.investmenthouse.com/1weekendmarketsummary.htm

- Earnings trump Fed in an up then down week.
- Growth sectors take their toll on market.
- Earnings, leading indicators point to slowing, Fed futures point to pause
- Market still seeking a floor in light of future economic concerns.

Tech earnings guidance pushes market lower Friday.

In real estate it is location, location, location. In the market its earnings, earnings, earnings. After a Tuesday reversal session the market jumped higher Wednesday when Fed chairman Bernanke gave the market the trigger it was looking for. Though his words were not much different from prior comments and speeches, the market was oversold and looking for a reason to rebound. When Bernanke didn’t come out with fire and brimstone the market took it as a sign from above and bolted higher.

It was expiration week, however, and that often means volatility during the week and on Friday as well. It is also peak earnings season, and while the Fed can undoubtedly influence earnings, this far into the rate hiking cycle the Fed’s action is baked into the cake and earnings are forming up with respect to that action as well as the economic cycle and the other factors in the mix. Earnings as of last week were coming in relatively solid at 65% beating, 22% meeting and 13% missing; at this stage last quarter, 19% had missed.

The market never cares much about what earnings have done lately, however, looking more to the future. Starting midweek investors suffered from future shock as INTC, AMD, DELL and other techs warned the future was not bright enough to require shades. There were bright spots as well as MOT and AAPL posted strong results and guidance, and the ‘industrial’ sectors enjoyed strong earnings and forecast more to come (e.g. UTX, CAT, SLB, NUE). Tech, however, is very much prisoner to economic growth, and as we have reported the past several months, the economy is slowing, showing typical weakening signs after 3.5 years of expansion. Yes inflation has heated up of late, but that is also typical as inflation lags, coming in hotter even as the economy slows, only to dissipate as the cycle progresses.

Fed professes ignorance.

And therein lies the rub. As half of its mandate, the Fed is to maintain price stability, and when the economy slows and inflation peaks the Fed comes under pressure to further increase rates. It should be concerned just with drying up liquidity, but in common parlance raising rates is considered how that is done. Rates certainly have an impact, but really it is a matter of removing excess money, and the best way to do that is simply sell treasuries. After all, when the Fed wants to increase liquidity rapidly it buys treasuries and ‘prints’ money as it exchanges money for treasuries. It will also cut rates, but that as we know is an indirect method and it lags for months to a year in effect. Thus with rate hikes you get that uncomfortable no man’s land that we are in now where the Fed has done its work, but inflation continues higher as the economy waits for the rate hikes to fully take effect. Problem is, with inflation still heating up the common view is the Fed’s work is not done, and thus you get the indecision financial markets despise. If the Fed had focused on drying up the liquidity earlier in the cycle we would not have this issue now. Water under the bridge at this juncture, but that underscores even more the need to dry up liquidity to directly impact inflation versus the literal guesswork of rate hikes.

Guesswork you say? Of course. Just look at the FOMC minutes released Thursday afternoon. At the June meeting the Fed was simply uncertain whether the current level of monetary policy is restrictive, neutral, or accommodative. As we noted Thursday, after two years of hikes, clear economic signals, and most recently slowing earnings guidance, the market found that lack of insight by the body charged with maintaining price stability at maximum economic growth unacceptable. Maybe it now knows it is time to stop with the rate hikes, but Bernanke’s comments Wednesday and Thursday did not really provide that kind of insight even if the market bounced Wednesday (and of course immediately sold off Thursday and Friday).

Growth sectors hammered.

The combination of weakening earnings guidance from growth sectors and the expressed ignorance as to the current state of monetary policy was enough to scuttle midweek gains, and it had a massively negative impact on the growth indices such as NASDAQ, SP600, and SOX. They closed at new lows for the year, undercutting the June and July lows with SP600 and NASDAQ likely turning over any chance for a double bottom to take shape.

The internals all week were big, favoring the direction of the market that day. For example, Wednesday NYSE breadth was 6:1, but all week they were at the 2:1 or better level, either up or down depending upon the market direction. Friday NASDAQ was -2.8:1 as it and SOX sold off. That is quite negative even if it was less than other readings for the week.

The growth indices sold on strong volume Friday as did all the indices, though it was expiration day, making accurate gauging of price/volume action more difficult. Indeed, that made gauging most of the week a bit more difficult. Even with that, however, there are enough signals to give a pretty good idea as to the meaning of the week. Everyone was waiting on earnings to provide a spark. Even we noted that the market had sold into earnings in June and then the early results pushed stocks lower again, setting them up for a rebound as better earnings came out.

That came to be Tuesday and Wednesday, but it was only for Tuesday and Wednesday. The indices stalled at near resistance after the Wednesday move, unable to push higher to the ‘hump’ in the potential double bottoms on the NYSE indices before fading. They continued to fade Friday, and from the point losses and the turn lower ahead of the middle of the pattern it looks as if the potential to form a handle has been lost. That does not mean they are in a breakdown, just that the double bottom attempt is not going to work and that they will need to try and regroup and form a more lateral bottom near the June and July lows.

As for NASDAQ and SOX, as noted they blew out their prior closing lows and are still in downtrends seeking a floor. Volume and breadth were similar to the NYSE indices, positive on the up sessions, negative on the down sessions, but with the overall downtrends, the negatives won out the week. By winning the week they kept the tech indices trending lower with no bottom found yet. That drag worked to pull the NYSE indices lower as we expected, and now the latter are going to have to find their floor as well though they have one ready made at the June and July lows if they can take advantage of it. A hold and further building of a base at that level would actually be the best course of action as it would take the market out of the summer sludge and into the realm of finding a bottom in the fall that is typical for the market. Seems almost too pat, but this summer is acting like summer, with the overlay of the FOMC and slowing earnings, of course.

THE ECONOMY

Data overload the past two weeks as the picture is clearer than ever.

The past few months and more we have discussed the slowing economic picture, something normal as an expansion moves into its fourth year. With the employment report two Fridays back, Bernanke this week along with the FOMC minutes, and the earnings guidance as well, the picture continues to clarify if you want to look at the facts and history.

Problem is, with all of the data and the penchant for the financial media to pore over the minutia, the picture clouds right back up. There are a few factors to watch, and one of them was clearly out front last week, i.e. the earnings and the start of lowered guidance in many technology shares. They are cyclical, meaning they run with the economy, and with the economy slowing, their earnings growth naturally started to slow. That does not mean earnings are declining, just that the growth rate is slowing. Think of it in terms of the monthly manufacturing reports; they can be lower but still expanding just as we have seen. That means they are still growing, just at a slower pace.

ECRI shows continued slowing as well.

The best compilation of leading indicators index, ECRI, continues to show a trend lower as well. Last week its leading business cycle gauge was flat over the prior week. The growth rate rose 0.1% over the prior week, but overall it remains in its downtrend, and that continues to suggest slowing in the US economy ahead.

Okay, slowing, but as discussed above as with the earnings, that does not mean a decline or, in the common vernacular, a recession. This is key. ECRI is very good at forecasting recessions, and right now it is forecasting economic slowing but not the ‘R’ word.

As always, the caveat for this forecast is what the Fed does with rates and money supply in the future. The Fed can always overdo it as the past is littered with nice economies that were broken by a Fed fighting the prior economic cycle and its lagging inflation instead of anticipating the slowdown.

Fed Funds futures take a tumble.

This Fed with its new chairman may be more cognizant of this than its predecessors. Indeed, much of the Bernanke maligning has resulted from his more historical and indeed apparent learned view of monetary policy and economic cycles. He was even called an amateur by one of our esteemed leaders in Congress who likely, we are guessing of course, took only basic economics in college. Hell, he could have been an economics major, however, and made the same statement given that the Phillips Curve was taught as the gospel at one point.

In any event, the Fed Funds futures contract for August took a tumbled again Friday, hitting 35% on the session low before closing at 43%. They were at 67% Wednesday but then fell to 49% and now 43%. Bernanke’s testimony that slowing growth should curb inflation (hmmmm; inflation is caused by too much liquidity, right?) and some commentary in the FOMC minutes by some members about a pause after a June hike. The next meeting is on August 8, and within a couple of weeks the FFF is pretty dead on. We will have to see what next week brings and if it is below 50%, history says the Fed is likely to pause.

THE MARKET

MARKET SENTIMENT

VIX: 17.4; +1.19. An up and down week did not let VIX really sail higher as it needs to do. Volatile action yes, but the Wednesday rebound acted as a relief valve for fear. Still well below the 23 hit in June, and again we note it really did not get any legs during the initial jump in Middle East hostilities.
VXN: 23.2; -0.02
VXO: 16.55; +1.01

Put/Call Ratio (CBOE): 1.31; +0.29. Eight out of nine sessions above 1.0 on the close indicates there is an awful lot of put activity on going, and that typically means speculation or at least expectations of further downside is reaching saturation. The overall ratio closed at 1.13, and the past month it has tickled the 1.0 level many times.

Bulls versus Bears:

Bulls: 42.1%. Ever so slight of a dip in bulls after a continued brutal market, down from 42.2%. There was a big spike higher from 38.7% two weeks back, but we hoped for more here. At this level we note it is below the levels hit on the last market sell offs. On the last pullback bulls hit the lows for this rally, i.e. since 2003. That put it below the 42.3% hit on the last low and the May and October 2005 readings that preceded new upside runs.

Bears: 33.7%. Up slightly from 33.3%, but still lower than the 34.4% hit three weeks back. Kissed the bulls to end June, just missing crossing over with the bulls, but that in itself is not a bad indication for the upside. Hit a new post-2002 high in that late June move, eclipsing the March 2006 high (33%) and well above the 2005 highs that spawned new rallies (30% in May 2005, 29.2% in October 2005).

NASDAQ

Stats: -19.03 points (-0.93%) to close at 2020.39
Volume: 2.41B (+12.92%). Volume was up, matching Wednesday levels when then market was up as well. Big trade all week during expiration, so it loses some instructive value. In the bigger picture the index continued lower overall for the week and volume was up for the week. That makes it a distribution week, adding to the overall pressure on NASDAQ.

Up Volume: 636M (+243M)
Down Volume: 1.703B (-25M)

A/D and Hi/Lo: Decliners led 2.85 to 1. The negative breadth continued as NASDAQ lost ground for the second session. Very weak internals.
Previous Session: Decliners led 2.98 to 1

New Highs: 31 (-23)
New Lows: 275 (+146). New lows expanding this time after hold fairly light on the last test. Given that did not hold the market higher we are looking for a big expansion of lows on this next test lower as another indication of extremes and a flush out of the sellers. Much of finding a bottom is a matter of extremes and getting the sellers finished.

The Chart: (Click to view the chart)

NASDAQ had a tough week ending it with a new closing low for the year. Up and down with most of the market, but ending with tow down sessions on above average volume. Volume was skewed by expiration as indeed were the price moves. Above that, however, the earnings drove the action. While earnings were overall decent, some big names (INTC, AMD, NOK, DELL) failed to produce the results, failed with guidance, or warned ahead of their announcement. That was the kiss of death that scuttled the Tuesday and Wednesday rebound attempts even before NASDAQ could reach near resistance at the 18 day EMA. NASDAQ remains searching for a floor on this round of selling.

SOX (-4.76%) was hammered lower after AMD guided lower in Q3 in the wake of INTC doing the same. It crashed through the bottom of the downtrend channel as the chips have shown incredible weakness, a very good indication of a slowing economy ahead as chips are in everything now, and if prices tumble that is an indication of slowing.

SP500/NYSE

Stats: -8.84 points (-0.71%) to close at 1240.29
NYSE Volume: 1.92B (+13.35%). Volume hit the high over the past month as the NYSE indices turned lower for the second straight session. Expiration trade but selling volume cannot be discounted completely.

A/D and Hi/Lo: Decliners led 1.92 to 1. Downside breadth contracted a bit but remained strong. After the +6:1 on Wednesday everything else paled, but we also have to remember that before this week a 2:1 day was huge. Expiration really jumbled the internals.
Previous Session: Decliners led 2.08 to 1

New Highs: 43 (-24)
New Lows: 167 (+82)

The Chart: (Click to view the chart)

SP500 rallied well Wednesday and approached the 200 day SMA (1265). The next step was a move to 1280ish to test the early July high and then start to work on the handle to the double bottom base. SP500 never took that next step, turning over Thursday and then taking below its old trendline at 1250 on Friday. If this is a handle it is certainly the strangest handle ever for any cup; hard to take a drink from. No, SP500 failed the strength test below the 200 day SMA and has faded toward a test the June and July lows now (1223, 1234) where it will try and hold and continue the work on putting in a bottom. Will be watching that test to see if it tanks through those lows and consummates a potential head and shoulders the move over the last 6 weeks is setting up.

The small caps in the SP600 are getting even smaller capitalization after the Thursday and Friday moves. Similar to SP500, the small caps (-1.56%) turned over well below of the 200 day SMA, stalling at the 18 day and then diving lower to a new low for the year, both intraday and closing. In a quick move the small caps have formed and started the breakdown from a 6 week head and shoulders topping pattern. The break through 350 and the bearish near term pattern put this index at risk of another 10 to 15 points to the downside though after two hard sessions it is likely to try a rebound to test some before rolling over to finish the job.

DJ30

The blue chips had a lot to deal with during the week with the INTC earnings issue but countered with IBM, UTX, and CAT. It suffered the same fate as SP500, unable to clear that next resistance, the 50 day EMA (10,692) for the Dow before turning over Thursday and then crashing the 200 day SMA (10,512) Friday on very strong trade. No handle, but no devastating breakdown either as seen on say SOX. Not a lot of blues in the blue chip index just yet, but though it is not breaking down, it also bears the yoke of technology.

Stats: -59.72 points (-0.55%) to close at 10868.38
Volume: 433M shares Friday versus 330M shares Thursday. Volume jumped above average the last three sessions of the week as earnings stirred the pot with both upside and downside on the blue chip average.

The Chart: (Click to view the chart)

MONDAY

Despite the torrential flow of economic data and Fed information, there is not much slowdown this week with consumer confidence, durables orders, home sales, ECI and Q2 GDP. This is all a lead-in to the August 8 FOMC meeting where we feel the Fed will do the right thing and buck conventional wisdom with a cessation of hostilities. That could start the market on the trail of recovery and set up a bottom near the start of Q3.

Ahead of that the explosion of earnings continues. As noted, the scorecard is solid overall with fewer misses thus far than same time Q1. The issue remains with guidance, and too many big names in tech are warning. Dell’s Friday warning was just dismal. The start of earnings was slow and the second week did more damage than good. You would think things could only get better, but if things are slowing, guidance will continue sluggish.

Some post-expiration bounce, but likely won’t last with economic slowing.

Even with that, the market often bounces early in the week following expiration when expiration closed lower. Given the selling a bounce is indeed likely but it will not result in a lasting change on its own. That would have to come from a change in expectations regarding future earnings, and at this stage the warnings are holding sway, and with an economy 3.5 years into an expansion and showing all the classic signs of slowing, it would be fairly ludicrous to expect guidance to surge ahead. Economies hit slower spots within overall expansions and this is one of those. The most important factor for the next year to come (and that is what the market is worried about) is whether it is just a slow spot or is a serious slowdown pushed by the Fed, high energy prices, etc.

There is also a further escalation in the Middle East as Israel pushes into Lebanon, basically in the process of clearing a ‘fire lane’ of sorts at the border to get the Hezbollah fighters back far enough to neutralize their rocket launches. They started massing at the border late Friday, and that was part of the drag on stocks and bumped oil a bit higher (74.43, +0.16). Thus far energy continues to struggle; we will see if this escalation helps them recover but many are looking weary.

Still seeking a bottom.

Last week kept the market in the early stages of putting in a bottom. The collapse by semiconductors and small caps only made the task more difficult while the NYSE large caps did themselves no favors. The latter are still in position to hold the June and July lows and thus simply continue the basing process without losing ground, just requiring more time. NASDAQ, SOX and SP600 still have the task of defining a possible bottom having broken to new 2006 lows. That means more time to find the low on this move, rebound, and test it.

Finding a bottom is difficult when the economy is slowing. The market started to forecast this as it broke the trends in May and continued lower. Similar to other corrections during this run from late 2002, but also more virulent as the Fed comes down to where it should stop tightening. When the Fed gets off the economy’s throat that will help, but the question becomes whether it went too far with energy prices holding such high levels and the expansion being so old. It is not decrepit, but this is a long expansion in historical perspective and with everything older it is more vulnerable and takes longer to recover (just look at me after my runs. I can pull a muscle just by thinking about it and I need a team of experts to help me recover).

Thus those thinking it will spring back to life once the Fed says it is done with hikes are likely to be disappointed. Indeed, some are suggesting the Fed will be cutting rates by late 2006, early 2007. In 1994 and 1995, there was a lag after the Fed halted and the market started back up (and the market leads the economy, anticipating the move). If the Fed has not gone too far this time and stops in August, we can expect a lag here as well, and that would, what do you know, put the timing of a market rebound for the last quarter of the year.

Again we emphasize how much slowing continues as bearing directly on any recovery. Right now ECRI suggests just a slowdown, but that is taking a picture of the trend at the present and with the currently existing pressures. If oil jumped to $85/bbl or the Fed hikes more that could easily change. One positive to look at if you are so inclined is that the Fed, with talk of a pause, has taken the Greenspan ‘kick them in the groin’ approach of a 50 BP hike to end the campaign off of the table.

That leaves us looking at this week for a bit of a relief move form the harsh end to the week, but one that does not change the complexion much. SP500 and DJ30 are still in the hunt for a possible nearer term bottom, but last week they showed they could not withstand NASDAQ pressure and go about their own way. Indeed a rebound will likely set up some downside plays for the weaker sectors while the defensive sectors will continue to get more money thrown at them.

Now some may wonder why even bother with the defensive sectors if the economy is slowing. There is a difference between a slowing economy and one heading into recession. In a recession a bear market will typically occur and will do so ahead of the economy’s move. You could argue the market is showing this right now. If a recession is to come, then there are really no safe sectors and we are playing all downside. Don’t mind that because the money comes fast, but most people just won’t do that. Thus you look for the defensive sectors. As long as there is no recession, the defensive sectors will perform, and then as the market predicts economic firming, the money will spread elsewhere and start bringing back the growth areas.

There are plenty of strong growth sectors now that are getting money and that can make us some good money. We will use options a bit more to leverage into moves that are not anticipated to be 20% in the underlying stock. That way we can take advantage of these moves, make strong money, and yet not have to have that 15% to 20% move in the stock. Less exposure to the market is always great when it is in transition.

Thus we will continue to look for the right upside plays to be in as well as take advantage of the stocks and sectors that are getting gouged. We have some new upside and downside this weekend so we can be ready to take whatever the market gives us.

Support and Resistance

NASDAQ: Closed at 2020.39
Resistance:
2037 at the October 2005 closing low
2045-47 from June and October 2005 lows and June 2004 highs
2050 from the summer 2005 lateral range lows.
The 10 day at 2050
2072 is the June closing low
2100 from the early and mid-2005 peaks (and the 18 day EMA as well).
The 50 day EMA at 2144
2177 is the December 2004 high.
2185 to 2182 is the September 2005 peak and interim high from November 2005.
2190 is the July 2006 high

Support:
2019 is the April 2005 interim high
2008 is the January 2005 low
1971 from an October 2005 peak and 1973 from a March 2005 low.

S&P 500: Closed at 1240.29
Resistance:
1250 is an old trendline from the August 2003/August 2004/October 2005 lows.
The 18 day EMA at 1252
The 200 day EMA at 1265
1272 to 1268 is the November and December 2005 closing highs and March 2006 closing low
1280 is the recent July peak.
The late January peak at 1285
The early June high at 1288
1297.57 is the recent February high.
1315 is the May and May 2001 peaks
1317, the recent intraday highs from April.
1324 to 1329 from the October 2000 lows.

Support:
1239 from the late June consolidation range.
1225 from the March 2005 high
1223 is the June 2006 closing low.
1213 from December 2004 high to 1215
1205 from the August lows

Dow: Closed at 10,868.38
Resistance:
10,890 is the December 2005 closing high.
10,931 is the November 2005 high
The 200 day SMA at 10,943
10,965 from Q4 2000
11,044 is the January high.
The 50 day EMA at 11,046
11,097 to 11,137 is the last peak from the February top.
11,228 is the July closing high.
11,279 is the late May high
The March 2006 highs at 11,329 to 11,335
11,350 from the May 2001 peak
11,401 from the September 2000 peak and April 2001 highs

Support:
10,737 to 10,730 from December and February lows
10,706 is the June 2006 closing low
10,705 – 10,965 from July/August 2005 range top to bottom
10,678 to 10,665

Economic Calendar

These are consensus expectations. Our expectations will vary and are discussed in the ‘Economy’ section.

July 25
- Consumer Confidence, July (10:00): 104.8 expected, 105.7 prior
- Existing home sales, June (10:00): 6.60M expected, 6.67M prior

July 26
- Crude oil inventories (10:30): 151K prior

July 27
- Durable Goods orders, June (8:30): 1.7% expected, -0.2% prior
- Initial jobless claims (8:30): 304K prior
- New home sales, June (10:00): 1.175M expected, 1.234K prior

July 28
- GDP advance, Q2 (8:30): 3.1% expected, 5.6% Q1
- Chain deflator, Q2 (8:30): 3.7% expected, 3.1% Q1
- Employment cost index, Q2 (8:30): 0.6% prior
- Michigan Sentiment, final July (9:50): 83.0 expected, 83.0 prior


icon url

ReturntoSender

07/26/06 1:41 PM

#6864 RE: ReturntoSender #6755

CMOS LT bot 2000 shares@2.83 - I think the stock is bottoming. Selling way below book value of over $6.00 a share.


http://finance.yahoo.com/q/ks?s=CMOS

RtS

icon url

ReturntoSender

07/29/06 9:23 AM

#6874 RE: ReturntoSender #6755

The Return of Stagflation
July 28, 2006
By John Mauldin

URL: http://www.frontlinethoughts.com/printarticle.asp?id=mwo072806

The Return of Stagflation
The Housing Market Leads the Way
That '70s Show
Where's My WIN Button?
Fishing, Rangers, and Betting on the Economy

The GDP data released Friday suggests the economy seems to be slowing. So naturally the stock market surges forward in a very strong move, convinced the bull market is back. After all, how can the Fed raise rates in a slowing economy? And if the Fed is not raising rates, then it follows, does it not, that the stock market will rise? Or so the logic of a 119-point rise, tantalizingly close to a new high for the Dow, seems to suggest. A review of the data says that may not be case, however. This week we take a look at the economy, housing, and inflation, with a view to pondering whether stagflation will return in earnest. It should make for an interesting letter.

But first, Andy Kessler's new book The End of Medicine that I wrote about three weeks ago seems to have struck a nerve, with both doctors and entrepreneurs. Feedback from readers is running quite positive, but with some very decisive disagreements from doctors denying that changes in medicine are needed or will happen, countered by enthusiastic entrepreneurs who are working on DNA detection chips, on blood tests to detect the likelihood of a stroke in the next year, and on imaging techniques to find all sorts of disease early. Andy tells me his feedback from the book is running hot, with some name calling from doctors but lots of business plans for early detection and even a few for next-generation eye surgery and stomach stapling. It's great to see that medicine is not a static business. No matter what the business model, there will always be entrepreneurs who seek out change, and we'll all be better off for it. I love to get your responses, by the way.

I highly recommend you read The End of Medicine. It is an easy plane-trip or afternoon read, but it will make you think and laugh while you do so. Andy is a great writer. If you did not read my review of the book you can do so here. You can buy the book at www.amazon.com.

The Return of Stagflation

The consensus from economists was that GDP growth would be 3.2%. The actual number was 2.5%, down sharply from 5.6% in the first quarter. This drop-off is not as large as it might seem, as the fourth quarter of last year was only 1.7%. Let's look at the chart of annual changes since 2000, below. What you see is a much smoother sideways movement. The light gray bars are the quarterly numbers. (I picked this up from friend Barry Ritholtz.)


Econoday chart courtesy of Barron's

Why the big move in the first quarter? I think we can see the culprit in Katrina. Enough economic activity was moved from the fourth quarter into the first to show the huge differential. The economy was not as bad as the numbers looked in the last quarter of last year, or as good as it looked in the first quarter.

Nevertheless, this quarter is below the annual trend. It was certainly below the consensus forecast. Can we expect further slowing in the coming quarter? If so, will the Fed finally pause? More importantly, should they pause? Let's look at a few facts and then see how you would vote if you were on the FOMC.

The Housing Market Leads the Way

As I noted last week, in their Quarterly Review and Outlook, Van Hoisington and Lacy Hunt give us a few facts and graphs that are not all that optimistic. The Leading Economic Index (LEI), as compiled by the Conference Board, has now contracted over the past six months. They note this has happened 13 times since the Korean War, and we had outright recession after 9 of those periods and serious economic slowdowns followed the other 4 episodes. As they are bond managers, they also note that both long-term and short-term rates fell in the aftermath of all 13 slumps.

One of the key components of the LEI is new housing starts. The ever astute Paul Kasriel of Northern Trust notes that it might be even more important this time. Why? Because housing has become a larger component of the economy. Look at the chart below:


Obviously, we are way above trend. Part of this can be explained by the explosion in home prices, but a lot is from actual new home sales made possible by creative mortgage financing. With real estate construction being one of the three legs of the economy, it is something that we must pay attention to.

One could make a good argument that the above chart is mean reverting. That is, that the percentage of sales to GDP will fall back toward the mean. Now, that most likely will be a rising number, and not 8.4%. The 8.4% median takes into account a lot of very low numbers in the early years. If you take the above chart and draw an imaginary trend line trying to hit the center of the growth, you get a number that should be in the 12-13% range. And since I do not have the data on a Friday afternoon to do the actual trend line, an imaginary line will have to do.

But that is good enough for the point of the argument. If actual sales drops back to something like 12-13% of the economy, that will be a significant hit to new home construction. Jas Jain (of Financial Sense University) estimates a reversion to a lower total sales trend line could result in a loss to GDP of 3% from the highs in 2005. This is by no means trivial. Add to that the 1.5% (estimated at various sources) that cash-out refinancing adds to the GDP, and you could see an economy slow significantly over the coming year as home values stop rising.

And stop rising they have. Kasriel follows up the chart above with these thoughts and charts:

"Sales of new single family homes fell 3.0% in June to an annual rate of 1.13 million units. The 6-month moving average of sales of single-family homes is down 13.1% from its peak in October 2005 (see chart 1). Sales dropped in the Northeast (-11.3%), Midwest (-7.9%), South (-6.0%), but rose in the West (+8.2%). The housing sector is on the top of the Fed's watch list. Today's new home sales numbers would be an entry on the list of indicators supporting a pause at the close of the August 8 FOMC meeting.


"The median price of a new single-family home dropped 1.3% during June to $231,300 from the prior month. On a year-to-year basis, the median price rose only 2.3%, a sharp deceleration after double digit gains in many months of 2004 and 2005. As the inventory of unsold new single-family homes advanced to a 6.1-month supply in June, up from a 4.3-month supply in June 2005, the year-to-year gains in the median price of a new single-family home posted a deceleration in prices (see chart below). "


Unsold inventories of new homes not only have interest costs but property taxes as well. As interest rates rise to home builders, the cost of carrying that home is starting to loom large. We are already seeing increasing incentives from home builders to move inventory. It will not be long before we start to see price decreases.

Higher energy prices, including gasoline, are having an effect on consumer spending. Not since the first three months of 1991 have home construction, consumer spending on durable goods, and corporate purchases of equipment and software all declined in the same quarter.

The futures market went from setting the probability of a raise at the August 8 Fed meeting of over 90% to 28% this morning. (I must admit, I would be in the 28% thinking they will still raise rates.) So, the market thinks the Fed will look at the gloomy sounding data I mentioned above, plus a number of other negative factors, and pause in August.

In essence, they are making the assumption that because the economy is going to slow inflation will slow as well, and that the Fed will not be worried about inflation. If you are not worried about inflation, and the economy is slowing, it would make sense not to raise rates and maybe to start talking about lowering them in the future.

That '70s Show

But the data I look at tells me something different. The government's personal consumption expenditures (PCE) index, a measure of prices tied to consumer spending, rose at a 4.1% rate after a 2% rise in the first quarter. The index excluding food and energy, a measure favored by Fed policy makers, rose at a 2.9% annual rate after a 2.1% rise the previous quarter.

Let's review. The economy is materially slowing and inflation is materially rising. We've seen this TV show before. It's called "That '70s Show."

It is quite possible for the economy to slow and for inflation to rise. It happened in the '70s and it happened last quarter. If you look at inflation that is in the pipeline, it could easily happen this quarter. You can make a case, as the clear majority of the market obviously believes, that a slowing economy will tame inflation. But I am not sure a central banker will buy it.

Let's return to a theme I am sure may be boring long-time readers, but it is important. When you get appointed to the Federal Reserve, you are taken into a back room and given a DNA transplant. You now have two new genes. One that makes you viscerally fear deflation and another that causes you to hyperventilate when inflation gets too high.

Let's assume that the core PCE inflation is actually the Fed's favored measure of inflation. A materially rising PCE is not something you like to see. And the recent monthly data from the Bureau of Labor Statistics confirms the rise. They peg inflation at 5.1% in the second quarter versus 4.3% in the first quarter. They have inflation less food and energy for the last six months at 3.2% and all items at 4.7%.

Where's my WIN button? Some of us are old enough to remember the Whip Inflation Now buttons of the early '70s. Remember when Nixon set price controls because inflation got to the nosebleed level of 4%?

Gentle reader, this last quarter we are back to the level that caused Nixon to act (even if foolishly). Oddly, the market looks at 4% inflation and sees nothing but smooth sailing. And just as much of inflation was induced by energy costs in the early '70s, much of what we have today is from the same source. Excluding energy does not make sense when it is the main driver of inflation. For the last six month, energy costs rose 22.8%.

The absolute worst environment possible, from a central banker's point of view, would be for inflation to continue to rise. At some point, even if the economy is slowing, you would have to step in and fight inflation. You simply can't risk a rerun of the '70s. No one wants to be forced to "pull a Volker" on the economy. Now those were real recessions when he forcibly bled the inflation out of the economy in the early '80s.

It is all about an obscure statistic used by central banker types called the sacrifice ratio. How much employment and growth do you sacrifice today in order to not have to deal with problem inflation in the future?

The sacrifice ratio is high today. That means the dangers of rising inflation are such that you should risk a slower economy rather than allow inflation to gain a foothold. And at 4%, inflation has not only gotten a foothold, it has started to move into the living room. The sacrifice ratio, which Bernanke has written about and is a leading authority on, says the Fed will raise rates in August. Or at least should.

Last week, I was graciously invited by David Kotok of Cumberland Advisors to go on his annual fishing trip up in Maine. There were a number of financial types there, and the conversation naturally turned to Fed policy, among other things.

Kotok, who is one smart economist, thinks the Fed will raise rates in August and then pause, but inflation will not go away and then the Fed will have to get serious later in the year or early in 2007, even as the economy is weakening. That will be a real recession. He is not optimistic, to say the least.

I think the Fed will look at the inflation numbers that will come out in August and September and then make a decision. If inflation is still rising, they will have no choice but to raise. They are dealing with the problems of too much stimulation in the latter part of Greenspan's years, which is just now catching up. (As an aside, much of the current board is composed of newer members.)

If the Fed pauses in August, it will only be because they think the economy is going to slow down much faster than it already is. I do not see how that can be good for the stock market. And if they raise rates yet again, they indicate that they are going to maintain the fight on inflation, until inflation and then the economy do in fact slow down. I just don't see how that is a good environment for the stock market.

One caveat: inflation data is by definition backward looking. If the Fed decides to ignore the rear-view-mirror rise in inflation and trust a slowing economy to handle the future inflation problem, it will be something new. Maybe this current crop of Fed governors only got the deflation-fighting gene. We will know in less than ten days.

The bond market reacted by lowering rates across the board. Bond traders sense a slowing economy. The yield curve remains inverted. If (when?) the Fed raises rates, it will start to significantly invert. That means the statistical probability of a recession next year rises. This is something we are going to pay close attention to. I may be able to dust off my old August, 2000 e-letters where I suggested the yield cure would have us in recession by mid-2001.

Remember that August six years ago? While the NASDAQ was still down huge, the NYSE index was only 3% from its all-time high and the S&P was not far behind. The economy seemed to be doing very well. Calling for a recession and a bear market seemed rather risky, but the data said it was the right call. We are on the cusp as to whether we see a full recession next year. I think a real slowdown is likely. As an aside, Dennis Gartman, who I really respect, thinks we see a material slowdown this year. Stay tuned.

Fishing, Rangers, and Betting on the Economy

As I mentioned a few weeks ago, I am not lucky when it comes to fishing. But David Kotok was kind enough to invite me to Maine and allow me to bring my youngest son. We had a professional guide named Bobby Bacon who has been guiding since 1952. He knew every spot on Grand Lake. We fished a lot of them. There were 22 guys on this trip; two to a canoe plus a guide. Some of them caught well over 50 fish in the two days we were there.

Alas, my luck followed me. I caught four smallish perch and one small trash fish of dubious provenance. However, 12-year-old Trey caught about 25 fish and a few rather nice-sized bass. He had a lot of fun putting his hook where I had not been able to catch anything for an hour and almost immediately pulling in a fish. He had a blast, and the other members of the trip were very gracious to us. It was a lot of fun.

As an aside, on Saturday night everyone gathered to wager on how the economy would fare over the next year. Basically, it was $5-10 on a particular item. This was a group with a wide variety of viewpoints. The average call for the DOW next summer is 11,442, with the high being 13,000 and the low 8900. I was the low, for what that's worth.

The group expected the dollar to fall to 132 against the euro, Fed funds to be at 5.38, the ten-year bond to be a 6.2% (still inverted!!!), and oil to be at $65. Next year, we will see who the winners are. Closest to the actual number gets the pots.

Writing today was a pleasure. As long-time readers know, I have an office physically in the Ballpark at Arlington where the Rangers play. You can walk out on my balcony and watch the game. My "seats" are closer to home plate than some center field seats. It is a great grown little boy's office.

Today, some of the Rangers came out for early batting practice. Practically no one was in the park. It is so quiet at such times, with the silence being punctuated by the solid crack of a wooden bat. You can hear it even through the thick windows. There is something about that sound that brings a smile to the soul. The Rangers traded Milwaukee for a solid outfielder today (Carlos Lee). Giving up our head-case relief pitcher was the major plus, though. Now if we can just figure out how to get some pitching, maybe we can make the play-offs.

It is time to hit the send button. Have a great week and take some time for family and friends. Solid relationships are something that inflation cannot take a bite out of.

Your can't believe the Yankees swept us again analyst,


John Mauldin
John@frontlinethoughts.com
Copyright 2006 John Mauldin. All Rights Reserved

If you would like to reproduce any of John Mauldin's E-Letters you must include the source of your quote and an email address (John@frontlinethoughts.com) Please write to Wave@frontlinethoughts.com and inform us of any reproductions. Please include where and when the copy will be reproduced.

John Mauldin is president of Millennium Wave Advisors, LLC, a registered investment advisor. All material presented herein is believed to be reliable but we cannot attest to its accuracy. Investment recommendations may change and readers are urged to check with their investment counselors before making any investment decisions.

Opinions expressed in these reports may change without prior notice. John Mauldin and/or the staffs at Millennium Wave Advisors, LLC may or may not have investments in any funds cited above.

PAST RESULTS ARE NOT INDICATIVE OF FUTURE RESULTS. THERE IS RISK OF LOSS AS WELL AS THE OPPORTUNITY FOR GAIN WHEN INVESTING IN MANAGED FUNDS. WHEN CONSIDERING ALTERNATIVE INVESTMENTS, INCLUDING HEDGE FUNDS, YOU SHOULD CONSIDER VARIOUS RISKS INCLUDING THE FACT THAT SOME PRODUCTS: OFTEN ENGAGE IN LEVERAGING AND OTHER SPECULATIVE INVESTMENT PRACTICES THAT MAY INCREASE THE RISK OF INVESTMENT LOSS, CAN BE ILLIQUID, ARE NOT REQUIRED TO PROVIDE PERIODIC PRICING OR VALUATION INFORMATION TO INVESTORS, MAY INVOLVE COMPLEX TAX STRUCTURES AND DELAYS IN DISTRIBUTING IMPORTANT TAX INFORMATION, ARE NOT SUBJECT TO THE SAME REGULATORY REQUIREMENTS AS MUTUAL FUNDS, OFTEN CHARGE HIGH FEES, AND IN MANY CASES THE UNDERLYING INVESTMENTS ARE NOT TRANSPARENT AND ARE KNOWN ONLY TO THE INVESTMENT MANAGER.


icon url

ReturntoSender

07/30/06 1:51 PM

#6877 RE: ReturntoSender #6755

InvestmentHouse Weekend Update:

http://www.investmenthouse.com/1weekendmarketsummary.htm

- Stocks rally on views of a pause and soft landing, but volume continues to lag.
- Q2 GDP helps spark a market rally, but the numbers are not that pleasant.
- Showing momentum ahead of Fed pause, but thus far lacking strong buying heading into another week heavy on earnings, economic data.

Look, up in the sky, it’s the Fed ending its rate hikes.

Certainly that was the idea Friday with Q2 GDP coming in at 2.5%, much less than expected. More to the point, there were many statements that a soft landing was taking place. Bonds had rallied all week, pushing the yields closer and closer to 5%. The GDP data basically sealed the deal Friday with the 2 year closing at 4.97% and the 10 year at 4.99%. The curve reverted to positive by a hair, a good sign, but as noted Thursday, rates are overall very low when compared to a 5.25% Fed Funds rate. That is telling you two things. First, the Fed is indeed done as the Fed Funds futures contract estimates less than a 30% chance of a rate hike on August 8. Second, its telling you that money is too tight given the deteriorating economic conditions and some economic slowing is ahead if the current pace holds. If the Fed backs off perhaps some confidence is restored and the economic investment can continue and thus a resumption in growth.

That is what bulls were talking about Friday with their ‘soft landing’ predictions. At 2.5% they figured if the Fed halted its hikes then things should pick back up a la 1995 and everyone is happy at Christmas. To that end stocks started higher on the bell. A good early surge was followed by a test as the leading DJ30 and SP500 climbed near the July highs and started to waffle. Volume was running lower and that looked as if it could be a problem for a continued move. Stocks caught their second wind, however, rallying into the afternoon with SP500 and DJ30 closing right at the July highs. Even NASDAQ and SOX helped out, moving through near resistance for the first time in two months. After earnings guidance failed to spark a rally and indeed led to selling, it took the idea the Fed would stop rate hikes to get the market back into recovery mode.

To keep it going, however, economic growth will need to pick up. As noted, earnings guidance has been tepid despite 14.5% earnings growth year/year and 70% beating estimates. The market is not being kind to companies in the current economic environment either; if you guide lower you are slaughtered. IBD reports that 39 $10+ stocks suffered a 20+% one day loss the past three weeks. Seventy-six fell 15%, and 185 dropped 10% in one day. That is brutal. In addition, stocks have sold off, bonds have rallied to ridiculous levels versus the Fed Funds rate, and transports, always a leading indicator, have been clocked. They just managed to recover the 200 day SMA on the Friday rally. As if that were not enough, inflation is still showing signs of life with a jumping PCE, and business investment is lower.

Technical action not strong but doing what needs to be done.

Technically it was nice price day. The NYSE indices finally made it to where we said a couple of weeks ago we would like to see them, i.e. the July highs. They acted as if they didn’t want to do it, but the past week picked up some headway. That complements the price pattern on SP500 and DJ30 as they are now at the ‘hump’ in the double bottom patterns that formed with their bottoms in June and July. They even had some help from NASDAQ and SOX as both broke through the 18 day EMA, finally trying to give that long awaited higher bounce in their downtrends.

That last party kind of sums up the move for the week, however. Though prices rose, volume was not kind. Monday’s strong price move was on low volume. Tuesday trade was up but still below average. Wednesday the market churned and lost some ground on above average volume. Thursday they sold on higher volume. Friday’s nice move started the week as it finished: up but disappointing trade levels. In sum, simply not much volume support, indeed some distribution. The buyers were in control, but there were not that many slinging money back into the market.

Leadership tells a lot of the story. There has not been much. Friday there was definitely positive movement in some leadership caliber stocks that are not in too bad of shape. Many, however, still need more work before they are ready to sustain a rally, but they are working on it. While the buying strength has not been what you would want, the fact that the leaders are forming up, massing at the borders so to speak, indicates there is some positive build ongoing

The likely outcome.

The market typically factors in the end of a Fed rate hiking campaign before the actual event. With bonds rallying all week the stock market started factoring in the end as well. NASDAQ and SOX were due for a bounce as well, and they look to be finally making that move, adding some support to the SP500 and DJ30 moves.

Of course, what is factored in ahead of the event is typically taken out some after the fact. After all, Fed rate hikes can take a year to impact the economy, and simply saying ‘we are done’ has some immediate impact, but after that there are still rate hikes out there on their way down to land on the economy. Stopping the hikes won’t change the immediate course of the economy.

Thus after the pause or stop or whatever you want to call it the market will have to get over the excitement of the Fed getting off its back and then deal with the reality of where the economy really is. That will lead to a test where those patterns that started to build during the pre-Fed run will test back. That is likely where the bottom will be set unless it turns out the Fed just went too far given all of the other economic factors (e.g., energy, housing, war). After all, we had an inverted to flat bond curve for over a month, and that was AFTER the inversion in 2005 and early 2006 that was argued to be caused by foreign buying of treasuries.

There is an economic slowdown in progress, and it is likely to continue through Q3. If the Fed is done, however, the economy will likely recover and the market will start pricing that in ahead of the event. Thus the timing of another test after a pre-pause run is just about right for a ‘typical’ year of a bottom in Q3. Of course we have to watch the price/volume action as it unfolds, and very importantly, how leadership continues to develop during that period.

THE ECONOMY

GDP drop rounds out a week of definitely mixed economic data.

From surging durable goods orders to a lower than expected GDP gain in Q2, the week was again all over the map regarding economic data. Of course GPD received the headlines to end the week, particularly given that it showed a lower 2.5% reading than expected (3.0%). That prompted the ‘soft landing’ commentary noted above, even getting the IMF to chime in that the US could have a soft landing if it stayed on top of inflation. Well gee whiz, if the IMF says its so then it must be 180 degrees from reality.

GDP breakdown shows the quarter was not that great.

Despite the hope of a Fed cessation resulting from the lower GDP growth number, the GDP numbers were not very positive, and indeed, one would almost wonder why the market would rally based on the results. Specifically, inflation concerns were compounded with a much higher than expected PCE (personal consumption expenditures), coming in at 4.1%, an all-time high. Even the core was smoking, coming in at 2.9% versus 2.0% before. That is the highest level since 1994 when the Fed was also in a tightening cycle. Further, the Employment Cost Index rose 0.9%, the highest in five quarters. Instead of dwelling on the Fed’s favorite indicator (PCE) or the labor market, stock investors focused on the bond market rally as reason for a Fed halt.

Business investment, the missing ingredient in the 2001 recession, helped lead the economy back after solid investment incentives in the second round of tax cuts restarted business spending. Since then it has been a mainstay of the economy, and indeed many pundits are saying that when the consumer slows, as he has started to do (2.5% growth in Q2 versus 4.8% in Q1), it will be business spending that keeps the economy going. After all, corporate balance sheets are loaded with cash as we hear every day on the financial stations, so they should spend, spend, spend and keep us all happy. Well, they were not spending as much in Q2 with capital spending falling to 2.7%, the smallest gain since early 2004 and far behind the 13.7% registered in Q1. While overall business buying slowed, spending on equipment and software actually declined.

Thus we are starting to see not only slowing growth rates but declines in some areas as the GDP growth rate was almost cut in half from Q1 to Q2. Meanwhile the Fed’s inflation indicators continue to rise, but as we have discussed in the past, those are lagging. As the economy slows, inflation will climb, peaking after the economy. Thus while the readings were higher, they don’t necessarily suggest any big change in the lay of the land: the economy is slowing as we have noted, and inflation that was allowed to jump up due to easy liquidity, is still climbing based on some reports. As we have noted, however, ECRI says that inflation peaked in October 2005 and pressures are actually declining despite the bump higher in the Q2 GDP report.

The market may have gotten ahead of itself with this rally on the likelihood of a Fed pause given the slowing economic data, but as usual there are underlying fundamentals for the rally. It senses the Fed is almost done and it also realizes that very accurate economic forecasting models such as ECRI still suggest just a slowdown and no recession in the economy. After two years of Fed rate hiking, the market is more than happy to come away with economic slowing as opposed to a recession. All things considered, that was reason to rally.

THE MARKET

MARKET SENTIMENT

VIX: 14.33; -0.61
VXN: 19.26; -1.53
VXO: 13.44; -1

Put/Call Ratio (CBOE): 0.88; -0.17. After a series of closes above 1.0 the put/call ratio eased back during the Friday rally.

Bulls versus Bears:

Bulls: 42.2%. Bumped back up to the level two weeks back as bulls are in a lateral holding pattern. (42.1% last wee, 42.2% the week before). There was a big spike higher from 38.7% two weeks back, but we hoped for more here. At this level we note it is below the levels hit on the last market sell offs. On the last pullback bulls hit the lows for this rally, i.e. since 2003. That put it below the 42.3% hit on the last low and the May and October 2005 readings that preceded new upside runs.

Bears: 34.5%. Bears are moving higher the market sold off and then rebounded. Up from 33.7% last week and 33.3% the week before. Still lower than the 34.4% hit three weeks back, but on the climb again. Kissed the bulls to end June, just missing crossing over with the bulls, but that in itself is not a bad indication for the upside. Hit a new post-2002 high in that late June move, eclipsing the March 2006 high (33%) and well above the 2005 highs that spawned new rallies (30% in May 2005, 29.2% in October 2005).

NASDAQ

Stats: +39.67 points (+1.93%) to close at 2094.14
Volume: 1.877B (-14.08%). Substantial volume decline dropped volume back to below average on what many said was an important move. Without the volume it as not that important, however. Sure it was a summertime Friday, but what about all of the other days NASDAQ moved higher on lower volume? One day can be an exception. Several days start making the rule. Last week volume was basically down when it needed to be up, and up when it needed to be down (i.e., on the down days).

Up Volume: 1.54B (+778M). Those that were in the market were buyers.
Down Volume: 326M (-1.079B)

A/D and Hi/Lo: Advancers led 2.32 to 1. Solid advancing breadth as NASDAQ actually recovered through its 18 day EMA and brought more covering into play.
Previous Session: Decliners led 1.66 to 1

New Highs: 83 (+10)
New Lows: 101 (-28)

The Chart: (Click to view the chart)

NASDAQ made its first push through the 18 day EMA (2080) since early July before the earnings tumble lower. That clears near resistance in its downtrend, and when it did not hold and confirm a more severe downtrend, the shorts started to cover, and that helped push NASDAQ even higher. Looks as if 2100 is going to be tested, and if the pre-FOMC pause rally continues, the 50 day EMA (2131) is definitely in play. That would be the lick log for NASDAQ. It stalled at the 50 day on its last rebound attempt, and if it fails there again it will have established a rather well-defined downtrend. That would really keep us on alert for a longer market decline as a leading growth area would have confirmed its downtrend. For now, more of a bump higher appears appropriate ahead of the Fed.

SOX (+3.04%) surged through the 18 day EMA (410.72), clearing it on the close for the first time since early May when the selling really started to get ugly. After that long decline it finally looks ready to make its higher bounce in its downtrend to test higher resistance near the 50 day EMA (436.61).

SP500/NYSE

Stats: +15.35 points (+1.22%) to close at 1278.55
NYSE Volume: 1.689B (-7.2%). Volume could not match the price action as SP500 in particular enjoyed a nice price day. Trade declined but managed to hold average, much better showing than on NASDAQ. NYSE suffered some distribution last week, but not as much as NASDAQ. Pretty much in line with the differences in performance of the two indices the past couple of months.

A/D and Hi/Lo: Advancers led 4.05 to 1. Another very impressive breadth session as stocks were bought across the board. Volume did not match, and it has not matched, the upside breadth figures. They appear too volatile to us, too extreme whether to the upside or the downside, and that suggests the market is still in for more of a struggle.
Previous Session: Decliners led 1.31 to 1

New Highs: 120 (-1)
New Lows: 66 (-26)

The Chart: (Click to view the chart)

Came back from a mid-session wobble to close near the highs and just off the July high at 1280. After volume churned Wednesday and showed some distribution Friday, it was lower as SP500 made its grand move. It tapped right at 1280, but could not punch through without the volume. This is where we figured SP500 should get on this bounce and then do some more work laterally to build a handle and then try to move on. It sort of built the handle Wednesday and Thursday; not much of one, and of course volume was not low as you want in a handle. Thus the move remains a bit under a cloud, but with the FOMC meeting coming and an anticipated ‘no action’ vote, SP500 could push higher to 1290 and even 1300 ahead of the meeting before forming that handle. If that occurs over a 2 week period and then forms the handle, that would just be about perfect timing for a low in September and then a recovery and break higher that month or in October. A test higher will also put in the test of the crossover of the 50 day EMA over the 200 day SMA. Typically an index will make the break and then rebound; the 50 day EMA lags the move back up and thus we can see SP500 continue to rise but still see the crossover hold. That is another important point we are watching as the rebound continues.

SP600 (+1.96%) was stellar in its session gain, but with respect to its pattern it is still in the doghouse. Its pattern here more resembles a head and shoulders than a double bottom, and that is unfortunately in line with a slowing economy and a growth area in the market. That said, with the market bouncing its first test is the 50 day EMA (367) and the 200 day SMA (368), and there it is likely to find some serious resistance. How it reacts at that level will be something of a canary or leading indicator to the rest of the market.

DJ30

Similar to SP500, the blue chips rallied up to the July high (11,228), closing just off that mark. Lower, below average volume on the move; still not a lot of buyers pushing things higher, just more of them than sellers. A solid week for DJ30, the best move since 2004 or something like that. Nice double bottom pattern has set up and as with the other indices it can still run higher here with next resistance from 11,275 to 11,335 and then take time to form the handle.

Stats: +119.27 points (+1.07%) to close at 11219.7
Volume: 270M shares Friday versus 286M shares Thursday. Below average trade all week as DJ30 made its run. As with the other indices, upside volume was the obvious missing element.

The Chart: (Click to view the chart)

MONDAY

No Fed meeting until the following Tuesday. That means just more earnings and another boatload of economic data (Chicago PMI, personal income and spending, ISM, factory orders, and the jobs report.

The market has a lot to chew on once more as the leading indices, SP500 and DJ30 test the July highs. The market has some momentum after its best Dow week since the fall 2004, but the move lacked any volume. A Fed pause is a big incentive to rally further, but even with that idea starting to permeate the market, volume was still missing last week. Thus we can see the indices move higher to next resistance but unless more trade comes in the NYSE large caps start working on a handle to their double bottoms. At the same time we will watch how NASDAQ, SOX and the small caps react to next resistance in their continuing downtrends.

Thus despite the other factors this week the market has some momentum on the Fed anticipation. How long that lasts against lack of real volume on the move, continued earnings guidance, and leadership that still needs more recovery remains to be seen. Scanning several thousand charts this weekend we see some leadership caliber stocks moving into position to put together sustained rallies. We see many more still needing more time to set up, similar to the overall market. We also see a lot of chip and tech stocks that have rebounded, but remain in downtrends. On balance there is improvement, but we have to remain defensive in the sense we stay with well positioned stocks versus jumping into rebounds from downtrodden patterns. The market has rebounded but has not shown a lot of strength on the move, and that keeps it susceptible to another turn lower after this rebound stalls. Even if it does, that is part of the rebuilding process for the next sustained run higher.

Support and Resistance

NASDAQ: Closed at 2094.14
Resistance:
2100 from the early and mid-2005 peaks (and the 18 day EMA as well).
The 50 day EMA at 2131
2177 is the December 2004 high.
2185 to 2182 is the September 2005 peak and interim high from November 2005.
2190 is the July 2006 high

Support:
2072 is the June closing low
2050 from the summer 2005 lateral range lows.
2045-47 from June and October 2005 lows and June 2004 highs
2037 at the October 2005 closing low
2019 is the April 2005 interim high
2008 is the January 2005 low
1971 from an October 2005 peak and 1973 from a March 2005 low.

S&P 500: Closed at 1278.55
Resistance:
1272 to 1268 is the November and December 2005 closing highs and March 2006 closing low
1280 is the recent July peak.
The late January peak at 1285
The early June high at 1288
1297.57 is the recent February high.
1315 is the May and May 2001 peaks
1317, the recent intraday highs from April.
1324 to 1329 from the October 2000 lows.

Support:
The 200 day EMA at 1266
The 50 day EMA at 1263
1252 is an old trendline from the August 2003/August 2004/October 2005 lows.
1239 from the late June consolidation range.
1225 from the March 2005 high
1223 is the June 2006 closing low.
1213 from December 2004 high to 1215
1205 from the August lows

Dow: Closed at 11,219.70
Resistance:
11,228 is the July closing high.
11,279 is the late May high
The March 2006 highs at 11,329 to 11,335
11,350 from the May 2001 peak
11,401 from the September 2000 peak and April 2001 highs

Support:
11,097 to 11,137 is the last peak from the February top.
The 50 day SMA at 11,059
11,044 is the January high.
10,965 from Q4 2000
The 200 day SMA at 10,964
10,931 is the November 2005 high
10,890 is the December 2005 closing high.
10,737 to 10,730 from December and February lows
10,706 is the June 2006 closing low
10,705 – 10,965 from July/August 2005 range top to bottom
10,678 to 10,665

Economic Calendar

These are consensus expectations. Our expectations will vary and are discussed in the ‘Economy’ section.

July 31
- Chicago PMI, July (10:00): 56.0 expected, 56.5 prior

August 1
- Personal Income, June (8:30): 0.7% expected, 0.4% prior
- Personal Spending, June (8:30): 0.4% expected, 0.4% prior
- Construction spending, June (10:00): 0.3% expected, -0.4% prior
- ISM Index, July (10:00): 53.5 expected, 53.8 prior

August 2
- Crude oil inventories

August 3
- Initial jobless claims 298K prior
- Factory Orders, June (10:00): 1.1%, 0.7% prior
- ISM services, July (10:00): 56.5 expected, 57.0 prior

August 4
- Non-farm payrolls, July (8:30): 145K expected, 121K prior
- Unemployment rate, July: 4.6% expected, 4.6% prior
- Hourly earnings, July (8:30): 0.3% expected, 0.5% prior
- Average workweek, July (8:30): 33.9 expected, 33.9 prior

icon url

ReturntoSender

08/01/06 12:26 AM

#6882 RE: ReturntoSender #6755

From Briefing.com: 4:20 pm : Stocks struggled to get any traction all day as last week's impressive rally prompted some modest profit-taking that carried into the close of trading for the month of July.

With August earmarked as the worst month for the S&P 500 over the last 15 years, according to The Stock Traders Almanac, buyers weren't exactly jumping at the chance to extend recent gains ahead of such historically seasonal weakness, especially following last week's average gains for the major indices of 3.3%.

Also, heading into what is expected to be a busy week of economic reports, the next FOMC meeting only eight days away, and the market's focus shifting back to "incoming" data, as roughly two-thirds of the S&P 500 have already reported quarterly earnings, the absence of notable market-moving news and industry leadership to support recent gains stalled momentum in stocks.

The sluggish start got little help from St. Louis Fed President Poole, who said before the opening bell that he still sees a 50% chance of another rate hike on August 8. Since that was slightly more hawkish than the roughly 35% chance being priced in by the fed funds futures, buyers stood on guard to see if upcoming commentary from voting Fed President Yellen echoed Poole's less certain outlook for a possible pause.

As trading worked its way through the New York lunch hour, Yellen saying the Fed is "close to the end of the road" with its tightening helped bonds stabilize and close relatively flat. However, she also acknowledged that there have been no signs of easing inflation pressures in the economic data which, with the Fed's favored gauge of inflation -- core PCE -- hitting the wires tomorrow morning (8:30 ET) only added to reluctance on the part of buyers.

Of the eight sectors trading lower, the lack of follow-through was most evident in the Industrials sector as AGCO Corp (AG 22.95 -2.75) missing forecasts and saying it expects FY06 sales to decline weighed heavily on farm equipment maker Deere & Co. (DE 72.57 -1.35). Another pullback in the transportation group, as a 1.5% rebound in oil prices continued to question valuations, also pushed the sector closer to breakeven for the year.

Crude oil futures climbed back above $74 per barrel after Israeli Prime Minister Olmert said that there will be no cease-fire until the Hezbollah threat is over. Unfortunately for the bulls struggling to extend market gains, the rebound in oil coupled with a 14% surge in natural gas futures to three-month highs amid heat wave warnings throughout much of the Midwest was only beneficial for the Energy sector, which reclaimed its lead over Telecom as this year's best performing sector.

With Health Care turning in the best performance in July (+5.4%), led by Merck (MRK 40.32 -0.80) hitting a 52-week high last Friday, consolidation throughout the drug space overshadowed a rebound in HMOs fueled by a better than expected Q2 report from Humana (HUM 55.84 +4.30).

Consumer Staples was also in focus after Wal-Mart (WMT 44.55 +0.09) said July same-store sales rose 2.4%, toward the high end of its expected 1-3% range, reminding investors that while consumer spending may be slowing, it isn't declining. Be that as it may, as trading at month's end so often dictates, especially after such a huge run-up last week, profit-taking in Tobacco -- the third best performing S&P industry group in July -- as well as Avon Products (AVP 29.00 -3.81) plunging 10% after posting a 35% decline in operating profit, prevented the sector from showing up Monday as a defensive play in a down market. DJ30 -34.02 NASDAQ -2.67 SP500 -1.89 NASDAQ Dec/Adv/Vol 1463/1569/1.62 bln NYSE Dec/Adv/Vol 1580/1653/1.62 bln

5:44PM Brooks Automation announces it files amended Form 10-K for 2005, driven by matters related to past stock option gr (BRKS) 11.29 +0.07 : Driven by matters related to past stock option grants, the co has revised its financial statements for the fiscal years 1996 through 2005 to record cumulative additional non-cash, pre-tax stock-based compensation expense of $64.5 million. Additionally the Company recorded a $1.8 million income tax benefit related to the above charges. The co will hold a conference call on Tuesday, August 1, 2006 at 9:00 a.m. Eastern to discuss the impact of the restatement contained in the filing and the schedule of future filings.

5:29PM Market Internals (MKTIN) : The Dow decreased 0.30% closing at 11186, the Nasdaq was down 0.13% to finish at 2091, and the S&P was down 0.15% to finish at 1277. Leading sectors included: coal and consumable fuels +7.6%, diversified metals and mining +5.7%, tires and rubber +4.1%, oil and gas equip +2.5%, application software +2.1%. Lagging sectors included: personal products -7.5%, wireless telecom services --2.9%, construction materials -2.6%, home furnishings -2.3%, homebuilding --1.7%. Today's movement came from lower than avg. volume (NYSE 1617, vs. closing avg of 1708; Nasdaq 1693, vs. 2009), with advancers outpacing decliners (NYSE 1637/1609; Nasdaq 1582/1444, and with NYSE new highs outpacing new lows and Nasdaq new lows outpacing new highs (NYSE 94/59, Nasdaq 78/79).

4:47PM AMIS Holdings subsidiary to acquire select businesses of NanoAmp Solutions for $21 mln (AMIS) 9.38 -0.57 : AMI Semiconductor, subsidiary of AMIS, today announced that it entered into an agreement to acquire the Ultra Low Power six-transistor SRAM and medical System-on-Chip A.S.I.C. businesses of NanoAmp Solutions for approx $21 mln in cash, plus an adjustment for closing inventory of the business. The businesses to be acquired consist primarily of designs that are still in development; however, the SRAM business is currently providing revenue, anticipated at approx $7 - $8 mln for all of 2006. For the balance of 2006, the acquisition is expected to be neutral to non-GAAP earnings per share and be accretive by $0.01 per share in 2007.

4:30PM Photronics lowers Q3 guidance; sees EPS of $0.09-0.11 vs $0.29 Reuters consensus; revs $106-107 mln vs $123.11 mln Reuters consensus (PLAB) 13.97 -0.32 : Co lowers Q3 guidance; sees EPS of $0.09-0.11 ex items vs $0.29 Reuters consensus; revs $106-107 mln vs $123.11 mln consensus, down from $119-124 mln prior guidance. PLAB stated that the primary reason for the revenue and earnings revision was the result of a shortfall in flat panel display (F.P.D.) mask orders and shipments compared to the Company's initial forecasts. The slower than forecasted growth rate in the demand for F.P.D. mask technology and services was experienced in both the Korean and Taiwanese regions. The co believes that the impact of current market dynamics will be short-term in nature and that F.P.D. design activity continues to be focused on leveraging new manufacturing capability coming on-line from Generation 7 and Generation 8 facilities in both Korea and Taiwan.

1:09 pm Avon Products (AVP)

29.53 -3.28: "Avon calling" was once a popular tag-line for the multi-national beauty supplies company. In looking at Avon's stock today, however, the more appropriate tag-line would seem to be "Avon falling," as a disappointing second quarter earnings report has shares of AVP down 10% in today's session. Regrettably for shareholders, the response appears warranted.

Avon registered a 35% decline in operating profit, a 650 basis point contraction in operating margins, and a 54% drop in net income to $150.9 million, or $0.33 per diluted share. For good measure, the latter was four cents shy of the Reuters Estimates consensus estimate. Total revenue was up 5.0% to $2.10 billion and active representatives increased 4.0%, but those gains were aided by Avon's acquisition of a licensee in Colombia in late-2005.

The sharp drop in net income was the result of several items that included $49 million of restructuring costs, stock-option expensing, a 128% increase in interest expense, and a 78% increase in advertising spending. Operating profit was down at a double-digit percentage rate versus the year-ago in five of six geographic segments while its China segment suffered an operating loss of $4.3 million.

The number of active representatives in North America and Asia Pacific declined 7.0% and 14.0%, respectively, with some offset provided by Latin America and Central and Eastern Europe where active representatives increased 13.0% and 7.0%. China had 114,000 certified sales promoters and more than 31,000 applicants are currently engaged in a sales certification process.

In a Bargain Hunting piece we penned this past April, we discussed Avon's contrarian appeal. In doing so, we indicated that a combination of accelerating top-line growth and margin expansion would be the real catalysts that would validate the success of the company's turnaround plan. That combination wasn't seen in the June quarter and Avon didn't delude one into thinking it will be seen in the near-term as it acknowledged it was in the early days of its turnaround and dubbed 2006 "a transition year." While we still see appeal in Avon as a contrarian play, it is clear that the operating environment for Avon right now isn't a pretty picture. Accordingly, we'd continue to hold the stock, but we wouldn't be averaging down at this point.

--Patrick J. O'Hare, Briefing.com

12:06 pm UAL Corp. (UAUA)

27.59 +0.07: Shares in UAL Corp., parent company of United Air Lines Inc., saw some gains Monday morning as some chose to view better-than-expected revenues as a sign the company is recovering from turbulence. The company said that in the latest period it saw its first profit in six years.

The company, which has a market cap of about $2.73 billion, reported second quarter earnings of $1.09 per share, excluding non-recurring items, $0.03 worse than a Reuters Estimates consensus of $1.12. Revenues rose 15.6% year over year to $5.11 billion versus consensus of $5.03 billion. The earnings made formal preliminary results announced about a week ago.

Company Chairman and CEO Glenn Tilton said the second quarter results speak to the progress the company made to reduce costs, optimize revenue, and improve customer experiences. The Elk Grove Village, Ill.-based company, which emerged from bankruptcy in February, also lowered its full year 2006 consolidated capacity guidance to +2.5 to 3%.

At around $27 a share, UAL's stock price is about 25% lower than where it started trading early in the year, and it's unlikely the tailspin will reverse. Briefing.com mentioned in a Bull vs. Bear column in early February that we hold a bearish opinion on the stock, and that continues to be the case. True, United cut down its expense structure by paring about 30% of its employees, reducing its capacity by 20%, instituting pay cuts, and eliminating its benefit pension plan. It also improved its financial situation by carrying $8 billion less in debt than in December 2002. Despite all of this though, United faces some daunting challenges ahead.

Major airlines have raised ticket prices several times already this year to offset skyrocketing fuel prices. The question now is how much airlines, including United, will be able to raise seat prices in the face of a weakening economy and a slower travel period. Furthermore, United is one of the airlines that has the most exposure to rising fuel prices as it was one of the least hedged going into the fuel market rally.

--Christine Marie Nielsen, Briefing.com

10:33 am Tyson (TSN)

13.69 -0.88: Chicken, beef, and pork producer Tyson Foods Inc. left investors clucking Monday when it said continued weaker performance in its chicken and beef sectors caused it to post a loss in the latest quarter. The company, which has a market cap of about $5.17 billion, also issued downside guidance for the full year of 2006.

The company, which is the largest U.S. meat processor, said it saw losses of $0.07 per share, excluding non-recurring items, $0.03 worse than Reuters Estimates consensus of ($0.04). Revenues fell 4.8% year over year to $6.38 billion versus consensus of $6.64 billion. The company said in a press release that oversupply of chicken and forward sales of leg quarters led to lower sales prices. It added that beef results rose in May and June, but not enough to offset April performance.

The company issued downside guidance for the full year of 2006, seeing losses of $0.41 to $0.51 versus losses of $0.04 consensus. Tyson said Canadian operations "continue to struggle," as the Canadian dollar remains strong. The company also said it has started a review of its tax account balances after noticing differences in deferred tax liabilities during renewal of some leases.

Rival poultry producers Pilgrim's Pride Corp. (PPC) and Sanderson Farms Inc. (SAFM) have also been reporting declines in sales and margins as a result of a glut of animals, due in part to avian flu fears. These concerns have caused Tyson to lose over 21% in share price over the last 52 weeks.

With trailing 12-month earnings of about 31.95, the Springdale, Ark.-based company is currently at over twice the industry average. Unattractive fundamental factors, including about $3.99 billion in company debt in the most recent quarter and renewed fears of mad cow disease which led South Korea and Japan to close their borders to beef imports, make the stock an unattractive purchase at this time.

--Christine Marie Nielsen, Briefing.com

10:17 am Exelon (EXC)

58.45 +0.10: Exelon Corp., which distributes electricity to more than 5 million customers in northern Illinois and in southeastern Pennsylvania through its subsidiaries Commonwealth Edison (ComEd) and PECO Energy, reported a higher second quarter profit on Monday, helped by higher margins on wholesale market sales. Investors, in turn, lifted shares of the Chicago-based power company, which were up slightly in early trading.

Specifically for the quarter, Exelon earned $644 million, or $0.95 per share, up from $514 million, or $0.76 per share. Excluding non-recurring items, the company would have earned $0.85 per share - five-cents better than the Reuters Estimates consensus. Revenues totaled $3.69 billion, up 6% from $3.48 billion last year.

The company, which is in the process of acquiring Public Service Enterprise Group (PEG), said it benefited from higher margins on wholesale market sales and increased output from Exelon Generation, as well as higher electric rates at PECO. Generation margins continued to improve over last year, along with core growth in its delivery service business, the company said. These positive factors, however, were partially offset by the effects of unfavorable weather conditions in the ComEd and PECO service areas, including Chicago and Philadelphia.

Based on its strong performance, which supports our positive view on the stock, Exelon reaffirmed its full-year earnings forecast of $3 to $3.30 per share. Analysts are looking for a profit of $3.27 per share, according to Reuters Estimates. At the current price, the company's shares are trading at 17.8x this year's projected earnings and boast a dividend yield of 2.7%.

--Richard Jahnke, Briefing.com

10:05 am Pfizer (PFE)

26.35 +0.24: Whenever a company makes a major announcement after the close of trading on a Friday, it is usually done for one of two reasons - to try and lessen the trading impact of a negative announcement or to give the market added time (i.e. over the weekend) to digest the ramifications of the announcement. The latter, we suspect, was the intended action by Dow component Pfizer, which announced after Friday's close that it has named a new CEO.

Pfizer's move isn't a minor one by any stretch of the imagination given its leadership position in the pharmaceutical industry and its status as a widely-held stock by professional and retail investors alike. Although it was well-known that Pfizer was considering successor candidates to Hank McKinnell, who has been at Pfizer for 35 years, it was a surprise that the appointment of the new CEO, Jeffrey B. Kindler, is effective immediately. McKinnell, who has been under fire for Pfizer's sagging stock price (down nearly 50% from its April '99 high) and his generous pay package, will remain as chairman of the board until he retires in February 2007.

Like other drug companies, Pfizer has faced patent expiration issues that have weighed heavily on the performance of its stock along with the allegations that use of painkillers Celebrex and Bextra put patients at increased risk of a cardiovascular event. A slower pace of earnings growth has been a telltale signal that the company's fortunes have deteriorated. In time, then, Kindler's appointment may ultimately be viewed as the inflection point that restored Pfizer to blue chip prominence - or not.

Kindler joined Pfizer in 2002 and had been serving as its vice chairman and general counsel. The line on him is that he is smart, and is more than just a lawyer, as he played a key role in driving McDonald's (MCD) decision to buy Boston Market Corporation and then restoring the bankrupt company to profitability before joining Pfizer.

His success at Boston Market notwithstanding, press reports indicate that there is some concern that Kindler lacks the degree of operational experience necessary to get Pfizer turned around. Again, time will tell if that is the case, but we would argue that it is a plus for Pfizer that he doesn't have a lot of experience at the company. At times like these, it often helps to have someone whose thought process about Pfizer might not be as sharply-ingrained as that of his predecessor. That consideration may have ultimately worked against other successor frontrunners - Karen Katen and David Shedlarz - who are longtime Pfizer veterans.

In the press release announcing the CEO change, Kindler is quoted as saying , "we will transform virtually every aspect of how we do business, focusing on actions that crate and sustain value for our shareholders." To his benefit, Kindler is working off a relatively low-priced stock base, so any incremental improvement from an operational standpoint could go a long way to boosting confidence in Kindler and the stock, which is up modestly following news of his appointment.

--Patrick J. O'Hare, Briefing.com

09:15 am Humana (HUM)

51.54: Humana, one of the nation's leading health care providers, said earnings for its fiscal second quarter rose 10%, due to strong results in its Medicare Advantage, commercial, and Tricare businesses. The Louisville, Kentucky-based company also backed its full-year guidance, sending shares sharply higher in pre-market activity. The stock, which has traded between $39.25 and $58.26 over the past 52 weeks, is down about 5% since the start of the year.

For the most recent quarter, Humana reported net income of $89.5 million, or $0.53 per share, up from $81.4 million, or $0.49 per share, in the year ago period. That was $0.18 better than the Reuters Estimates consensus of $0.35 per share. Revenues totaled $5.41 billion, up 52% from $3.55 billion last year, with total premium and administrative service fees also up 52% compared to the prior year period. The company said the increase was driven by higher enrollment in its Medicare Advantage plans and new revenue from stand alone prescription drug plans for Medicare beneficiaries.

Meanwhile, the company's medical cost ratio increased 130 basis points to 85.1%, as improvements in the commercial segment were offset by a higher government segment due to the introduction of Medicare prescription drug plans.

Based on the latest results, Humana reaffirmed its full-year earnings guidance of $2.82 to $2.88 per share on revenue between $21 and $22 billion. Analysts on average are expecting earnings per share of $2.78 on $21.24 billion in revenue, according to Reuters Estimates. For the current quarter, the company projected earnings in the range of $0.95 to $1 per share, versus the consensus estimate of $0.98 per share.

Overall, Humana reported a solid quarter, reaffirming our Market Weight rating on the Health Care sector. Humana shares are currently trading at 18.5x forward earnings, compared to 11.7x for Aetna (AET), 16.2x for Unitedhealth Group (UNH), and 15.8x for WellPoint (WLP).

--Richard Jahnke, Briefing.com

09:05 am Playtex Products Inc. (PYX)

10.15: Shares in Playtex Products Inc. were up over 15% in premarket trade after the personal products company posted better than expected profits for the period Monday thanks to consumer summertime needs. The company said its Banana Boat sunscreen products and Wet Ones hand and face wipes both saw strong sales. Playtex also reiterated its guidance for 2006.

Westport, Connecticut-based Playtex said its saw second quarter earnings of $0.17 per share, $0.02 better than Reuters Estimates consensus of $0.15. Revenues rose 10.1% year over year to $180.3 million versus consensus of $171.8 million.

Excluding net sales of the brands divested in 2005, the company - founded in 1932 - said net sales for 2006 are seen being up mid -single digits versus the prior year. On a reported basis, net sales for 2006 are expected to be down low-single digits versus the prior year due to $48.6 million of divested brand sales in 2005. The company expects 2006 operating income to be between $103 to $108 million.

With a beta of only 0.42, Playtex is 58% less volatile than the market, and that should put the stock on the radar screens of investors as the question of "will they or won't they" continues to loom regarding Federal Reserve rate hikes. Companies selling items that consumers have a hard time living without remain steady in these uncertain times.

In addition, Playtex focuses on building value for shareholders by improving its fundamentals through business process improvements and a focus on cost and debt reduction. With the stock trading at a significant premium to its closest competitors though, investors should wait for a pullback in price before getting involved in the issue.

--Christine Marie Nielsen, Briefing.com

08:29 am Wal-Mart (WMT)

44.46: The retail community will be reporting same-store sales results for July this Thursday. Over the weekend Wal-Mart provided an encouraging indication that industry-wide results should be better than most people were inclined to believe just a few weeks ago.

In a pre-recorded call, Wal-Mart said its same-store sales in the U.S. for the four-week period ended July 28 are estimated to be up 2.4%. That is above the midpoint of the company's prior guidance range of 1-3% and it marks an acceleration from the 1.2% growth rate achieved in June.

There was no other color provided on the call, but various reports are suggesting Wal-Mart benefited from earlier-than-normal back-to-school promotions. With hotter-than-normal temperatures blanketing the U.S. in recent weeks, it stands to reason that strong sales of seasonal merchandise might have also played a role.

We'll know more on Thursday, but for now, Wal-Mart's update is a constructive way to begin the week and a clear-cut signal that consumer spending, while slowing in the face of rising gas prices and interest rates, isn't grinding to a halt. It is an added signal, too, that reinforces our belief that WMT, at 16.3x trailing twelve month earnings, is attractively-priced for the patient-minded investor.

In a separate item, twenty-five workers at a Wal-Mart store in China have reportedly organized to form a union - a move that it is being billed as a sign of things to come in China for Wal-Mart, which shuns the idea of unionization in the U.S. This is a development worth watching as it unfolds.

--Patrick J. O'Hare, Briefing.com

09:16 am Insituform Tech: Morgan Joseph upgrades Hold to Buy. Target $27. Firm upgrades saying despite reporting EPS below their estimate, they believe INSU's 2Q06 results are an inflection point signaling major issues in the co's tunneling business are mostly over. The firm says problem projects that have been plaguing INSU's profitability seem to finally be completed and the co's current tunneling backlog consists of higher margined work, bid with a much more disciplined process.

09:14 am Rightnow Tech: Robert W. Baird upgrades Neutral to Outperform. Target $17. Firm ups rating saying that the recent sell-off presents a good buying opportunity. The firm believes that on-demand software is still in the early stages of growth, and that RightNow is well positioned within the industry.

09:13 am Cisco Systems: UBS reiterates Neutral. Target $23 to $21. Firm cuts price tgt expecting CSCO to report in line with their ests of $7.29 bln in sales and $0.28-0.29 EPS with strength likely from S.M.Bs and S.F.A. THe firm says various datapoints in the food chain imply that QoQ strength in IP Tel, WLAN, Home Networking, set top boxes and routing with help CSCO come in line with their sales est. The firm says given the deteriorating outlook by V.A.Rs in their recent survey and somewhat of a Neutral view from food chain datapoints they are lowering their sales outlook for FY07 to 11.5% YoY growth from 12.4% previously. The firm says CSCO may also be considering strategic actions for part of its Optical business.

09:11 am SLM Corp: Prudential initiates Overweight. Target $60. Firm initiates saying they have a positive view on Sallie Mae's long-term growth outlook and franchise value for three reasons. First, they expect Sallie Mae to continue to benefit from its strong incumbent position in the federally guaranteed student loan business due to a high entry barrier. Second, they believe that Sallie Mae can successfully execute its diversification into private education loans and debt management operations and continue to generate 15%-20% EPS growth.

09:10 am Allegheny Energy: RBC Capital Mkts reiterates Outperform. Target $43 to $48. Firm raises price tgt following Q2 results. The firm notes the continued strong financial performance, on-going plant performance improvements, actual realization of rate increase in PA, agreement with MD regulators on how best to phase in competitive rates, attainment of investment grade credit, and dividend initiation.

09:06 am Pacific Sunwear: BB&T Capital Mkts downgrades Buy to Hold. Firm downgrades saying recent anecdotes and channel checks suggest that sales are trending below plan in July which, coupled with the speculation of an impending inventory write-down in Q2, strongly hint at another earnings revision and/or a sales outlook that remains ambiguous.

09:06 am SanDisk: CIBC Wrld Mkts upgrades Sector Perform to Sector Outperform. Target $60. Firm ups rating following its proposed acquisition of FLSH. Firm believes this merger is a perfect complement, and leaves no doubt as to who the flash king is. On its face, firm says the deal seems extremely attractive for SNDK, as it adds FLSH's imposing system-level mobile technologies and its disruptive X4 IP to SNDK's already-dominant quiver, replete with NAND manufacturing capability, rich IP, and ubiquitous branding. Firm thinks the merger could add about 20 cents to SNDK's FY07 EPS, and says the addition of FLSH makes SNDK a much more formidable NAND force. Firm would be strong buyers at this level.

09:04 am Apple Computer: Banc of America Sec upgrades Neutral to Buy. Firm ups rating and price tgt saying that channel checks show higher end demand for MacBooks than their previous checks. Firm is encouraged that Street expectations have moved lower for iPods, which was part of the reason for their downgrade in Dec 05. Firm sees the same product introduction schedule as they have mentioned previously - a new Nano late in the Sept Q and modestly upgraded Video in Q4, in time for a holiday demand. Further EPS upside potential from iPod of $0.08-0.12. Also, firm is not including the impact of an AAPL phone, which could be $0.03-0.05 in F07.

09:02 am Phelps Dodge: Prudential upgrades Underweight to Overweight. Target $60 to $110. Firm ups rating and price tgt as they believe mid-summer copper markets appear better than expected, the odds will likely shift towards the co becoming a takeover target if it stands alone without completing an Inco buyout or if it combines with Inco as well, and shares will likely rebound if it doesn't succeed in buying Inco as investors don't like the goodwill, new shares, or added debt, in their view


icon url

ReturntoSender

08/03/06 8:59 AM

#6887 RE: ReturntoSender #6755

From Briefing.com: 08:32 am : S&P futures vs fair value: -5.0. Nasdaq futures vs fair value: -9.0. Still shaping up to be a sluggish start for stocks as futures indications continue to languish below fair value. Meanwhile, as investors continue to sift through mixed earnings and monthly retail sales figures they are also digesting the first of three economic reports this morning. Initial claims rose 14K to 315K (consensus 308K); however, the data have had little impact on trading as investors remain more focused on tomorrow's influential July jobs report.

4:51AM TTM Technologies signs definitive agreement to acquire Printed Circuit Group of Tyco Intl (TTMI) 10.71 : Co announces the signing of a definitive agreement to acquire the Tyco Printed Circuit Group business unit from Tyco Intl (TYC). TTM will purchase TPCG for $226 mln. The transaction is expected to be completed in the fall of 2006. TTM expects the transaction to be accretive to earnings within the first year post acquisition.

icon url

ReturntoSender

08/04/06 9:00 AM

#6889 RE: ReturntoSender #6755

Chart of the Day - ECRI Leading Index:

http://www.chartoftheday.com/20060804.htm?T

Federal Reserve Chairman Ben Bernanke recently stated that moderation in economic growth “should help to limit inflation pressures over time.” To get a sense of where the economy is heading, today's chart presents the ECRI leading index. The index is a composite of seven indicators chosen for their ability to signal both the beginning and the end of economic recessions. A downturn in the index of leading economic indicators has preceded the beginning of a recession by about 10 months; an upturn in the index has preceded the end of a recession by an average of 3 months. Where do we stand now? The index peaked nearly three months ago and continues to drift lower which suggests that the overall economy is likely to moderate over the near term. Stay tuned...

Notes:
- What are our latest indicators and studies saying about future stock market trends? Find out now with the exclusive & highly regarded charts of Chart of the Day Plus.

icon url

ReturntoSender

08/05/06 6:52 PM

#6893 RE: ReturntoSender #6755

Short versus Long Term: The Topping Process at Work

http://bigpicture.typepad.com/comments/

NOTE: This Trading alert was originally posted at Ritholtz Research & Analytics on Thu 8/3/2006 3:05 PM EDT; An email went out to subscribers alerting them shortly there after.

This is posted here not as investing advice, but rather as an example of a trading call for potential subscribers. We expect to post future advisories in a similar manner -- after the call, but in the correct chronological location on the blog.

One of the hardest things about analyzing the markets is separating the short term outlook from the longer term situation. There are occasions when they are diametrically opposed to each other.

This is one of those times.

I suspect it is because the market is now beginning to trace out its final top that we are seeing such ambiguous and conflicting signals.

Short term, the markets may react to several developments positively. One of the reasons I did not suggest getting short last week was the risk I see to the upside.

Longer term, I remain more convinced than ever that the economy is now on rocky footing. I put the possibility of a recession by next year somewhere around ~65%. Housing, which has been the prime driver of this economy, has lost its momentum. Job creation has slipped, GDP is softening, durable goods data unimpressive.

For the rest of this year (Q3 and Q4), GDP slides down to the 1 - 2.5% range; I also expect Q3 earnings period to be very problematic. Next year, we expect growth at 0 - 2%. That means the longer term call for the stock market is downwards. If I am correct about the GDP, a 20-30% correction in the S&P over the next 12 months is not that hard to imagine. This remains our long term concern. The recent out-performance by defensive sectors – Utilities, Consumer Staples and Health Care – imply markets are perceiving the same weakness.

Over the short term, however, the market seems to be firming up somewhat.

Although there is lots of volatility, macro bad news hasn't been hurting the market as much as you might imagine. Sentiment measures now show a modest level of bears, which can often support a rally. There has also been a modest improvement in the technicals. When we look at the charts, we see that SPX has sold off from its May5th top, made a bottom on June 13, and almost retested those lows July 17th. Today, it cleared the 1281 level, which suggests a possible retest of the prior highs at 1325. Volume remains weak, but after all, it is the dog days of summer.

But aside from these other factors, the biggest risk to the upside are the whirling dervishes I call the "One & Done" crowd. This is a large group of fund managers and pundits who have whipped themselves into a frenzy on the prospect of a pause by the Fed. Their thinking goes like this: Once the Fed is out of the way, markets are free to rally.

Now, we know that the Fed stopping often bodes ill for equities: If we go back to 1929, 71% of the time the SPX was lower six months after the last rate increase; it was lower 64% of the time 12 months later. We expect this cycle to play the same – lower 6 and 12 months later.

But the "One & Done" crowd is hearing none of that. I believe they have the ability to whip the markets up for a few percentage point gains between now and late August. If we see a weak NFP number tomorrow, that may very well be the final nail in the rate hiking cycle. At the very least, I expect to hear the Fed change its tune when I comes to their statement, which I expect will include a shift in the risks being weighted more heavily towards a slowdown.

So the "One & Done" crowd will get their wish: The Fed will either stop or hike a ¼ point but change their language significantly. This may very well release the animal spirits, and could take the markets higher.

That will leave the markets free to enter the final phase of the topping process.

Those of you who are nimble traders may want to scale into long index positions in advance of NFP tomorrow, and add to these positions over the next few days. If you are short, you may want to cover.

But remember – this is a trade, not an investment, and I very much doubt it lasts longer than a month.

icon url

ReturntoSender

08/06/06 4:56 PM

#6898 RE: ReturntoSender #6755

InvestmentHouse Weekend Update:

http://www.investmenthouse.com/1weekendmarketsummary.htm

- Market surges higher on jobs data, gives it back again, but shift to larger cap industrials remains intact.
- Fed likely to hike and say it is done given the continued rise in commodities.
- Market advance remains tenuous even after pre-FOMC rally.

Market surges then struggles on a weaker jobs report.

Thursday’s reversal from low to high set the market up for a rally on the jobs report, and when jobs came in at 113K (145K expected) and the unemployment rate jumped to 4.8% from 4.6%, it did not matter that hourly earnings rose more than expected, at least not right away.

Stocks were down pre-market on word that AAPL would delay its earnings report as it was further investigating the options scandal involving Jobs and others at the company. As we wrote in April and May, that options scandal is getting to be a problem for NASDAQ, kind of a back up negative for the threat of a slowing economy that impacts NASDAQ’s growth stocks and the small cap growth stocks. Then the employment data hit and bang . . . immediate reversal. Futures not only turned back from negative, they shot higher by 90 at the high point (versus FV) on DJ30.

The open was rip-roaring, but we said in the morning alert it had to be watched even with the solid low to high Thursday reversal. Within minutes it started to come off the early high; nothing necessarily bad about a quick test of the opening gap, but the market did something it is known for in this downtrend, i.e. it just languished the rest of the session in a steady, day-long slide.

In June the market did the same thing on the jobs numbers, but it rallied and started to sell even before the open. This time it made it into the first half hour of ‘live’ trade. After that NASDAQ flipped more than 50 points from the high to the low, SP500 20 points. Huge, huge intraday reversal. Was it the revenge of the average hourly earnings again? No, it was the Hamptons. Sure the initial surge was used to sell into, but volume was still rather modest in that it did not chalk up any huge gains on the session. What happened was a pre-Fed weekend where many fund managers and floor traders left early. After the initial round of profit taking on the first surge bids bit the dust. No one wanted to jump into a lot of new positions on the weekend ahead of the most critical FOMC meeting since June 2004, the month it started this last Quixote campaign. It had its pre-Fed run the past two weeks, and the news got to be as good as it could get before the Fed actually delivers its edict. Time to punch the ticket for the rally.

Technically not a collapse, but this is where it gets interesting.

Technically it was not great action, but it was far from a slaughter. We took some interim gain off the table on the early surge when it was pretty clear the news was as good as it gets for now. Most of our positions held up quite well even with the reversal. Some are back at the lick log, i.e. where they have to put something back in the kitty, but overall there was not much technical damage.

Indeed, that held over to the market as well (generally). DJ30 and SP500 surged higher early, and though they could not hold their gains they along with the other indices recovered in the last hour. The result was they did not damage to their technical position. Volume was lower on the NYSE: it was hard to sustain the move on lower trade, but the rollover was not a surge in selling. As noted, it was just a lack of interest after that first surge.

NASDAQ volume crept higher as it turned over so there was some distribution though volume remained below average. It too rebounded late and shaved 15 points off of its losses, basically two-thirds of its loss on the session it regained in the last hour. Of course it blew a 17 point advance that required the late recovery to saves its bacon. On the high it tapped the 50 day SMA and faded back below its trendline. It held the 18 day EMA, but it made it to the 50 day, must about where we thought it would on this trip and where it stalled in early July. Very important time for the NASDAQ right here. It has looked better the past couple of weeks, but any movement would have been grand compared to its May, June and first half of July. Now it has to put up some real numbers to show this is not just an oversold bounce to resistance in a continuing downtrend.

NYSE remains in good shape outside of the small caps, and more of late the mid-caps as well. There remains the ongoing shift from growth to large caps, e.g. industrials, financials, consumer staples and drugs. Heck, if the economy is slowing, no wonder the drug purveyors are performing better; have to get rid of those business-related headaches. As the expansion ‘matures,’ a nice way of saying slows, the growth areas lag and the large caps traditionally outperform. Now they are doing that. As you recall, the small caps were declared dead for the last two years when the economy was still expanding and thus they were as well. Now that the economy is really slowing we hear touts of small caps as well, but as a group they are likely to start to under-perform overall. If the expansion just slows they will not tank. If it picks up again they will improve once more but typically not as strong as in the first part of the economic recovery.

THE ECONOMY

What the Fed is likely to do in order to save face, avoid a stampede.

We could talk about the jobs report, tear it down and analyze the minute details, but it really did nothing to alter anyone’s view on the economy or change what the Fed thinks. Basically it was the same as last month: job growth (though not as big as some forecasts or as low as others) and a continued rise in worker earnings. Sure the unemployment rate jumped, but that is bad-mouthed so much by the Fed it has, at least on the surface, no significant impact.

What we really need to talk about is where the economy is going based on what the leading accurate indicators say, specifically the financial markets.

First, a look at commodities. Back in 1999 the Fed was hot on the trail of inflation. It hadn’t shown up, but with the expansion lasting so long the Fed was sure it had to be just around the corner. Greenspan forgot is ‘follow the markets’ philosophy and started ‘fine tuning’ the economy in order to prevent the non-existent inflation from showing up. At the time we wrote extensively about the commodities market and what that meant for the economy. Indeed, we were in the middle of a terrible drought and crop yields were literally withering. Corn, bean, wheat, cattle, chickens: they were all dropping around the world. Why, we asked, was the Fed so set on inflation when the commodities were showing more deflationary action? As it turned out, the Fed kept hiking, and when the economy broke one of the main concerns became, not surprisingly, deflation. Commodities were talking but the Fed was not listening.

Now we have commodities running higher and higher, not the sign of deflation, but typically inflation. Oil just hit a new high recently, and while many commodities are off their May highs, after that initial blow off they have recovered and are holding up quite well. Two years into the rate hikes after an extended period of too-easy money, however, the Fed is ready to end the hikes with commodities still very strong. The Fed feels the economy is going to slow and thus commodity prices will fall. As we know, however, a slow economy does not necessarily equal lower inflation. It is a monetary thing; if you have too much money even in a slow economy you still have inflation. As we have written for years: ECONOMIC GROWTH HAS NOTHING TO DO WITH INFLATION. You can have a recession yet have inflation if you have too much liquidity. Commodities are suggesting there is lower liquidity (the hard post-May fall), but still too much in the system.

What about bonds?

Second, the bond market. Bonds have rallied ahead of the FOMC meeting, driving rates for both the 2 year and the 10 year below the 5.25% Fed Funds rate, indeed well below it by a full rate hike. Until last week the curve was slightly inverted again after straightening out in July. This week it ended modestly inverted again with yields at 4.90% on the 2 year and 4.89% on the 10 year. Bond yields are below the Fed Funds rate just as they were in 2000 when the Fed hiked into an inverted curve. When this happens bonds are saying the demand for money longer term will be lower. Indeed, right now bonds are saying the Fed is not going to raise rates but that it needs to cut them in order to try and keep the economy moving forward.

Wow, cut rates. Well, that is not going to happen. At best it is going to pause. Who is right? Is the bond market wrong here in the short term, overreacting to what the Fed may or may not do, or are bonds really saying that the economy is going to fade?

How do you reconcile the bond market with the commodities? Well, the bond market may be overreacting, but it also may be completely in line with reality, saying the higher commodities prices are going to put an end to the world economic expansion given the added strain of higher interest rates. Liquidity may still be a bit high, but rates don’t need to be.

How the Fed will likely do it?

Fed funds futures are back below 40%, and within a couple of days of an FOMC meeting, that historically is a dead-on indicator. Cannot believe I am writing this, but this time it may not be right. The Fed feels there is a slowdown coming, and has suggested that will slow inflation. Inflation is hardly out of control, but 1970’s refugees still fear it a lot; deflation is terrible but inflation is not picnic.

As we have said, inflation is not dependent upon economic activity. The Fed, however, still has to appear tough on inflation despite Bernanke’s closet desires (at least they are now after getting slapped around when he voiced them at the beginning of his term) to stop with the rate hikes and let the economy run. Thus the Fed is likely to hike rates 25BP and say it is done unless things turn around sharply, blah, blah, blah.

What the Fed really needs to do is buy back some treasuries and take money out of the system. That is the surest way to reduce liquidity, and it is very manageable unlike rate hikes. It is the quiet method because the rate hikes get all of the press, but that does not render it ineffective.

But wait a minute. What happens when the Fed buys back bonds? Prices rise and yields fall. What are prices and yields doing? Rising and falling. Hmmmm. The Fed is trying to dry up liquidity behind the scenes of rate hikes, and thus Bernanke is correctly not so gung ho about more hikes. He has been ridiculed in public, even called an ‘amateur’ by a rather preposterous figure of a Congressman. To us he is showing a very real and rather accurate understanding of the economy, though he still talks of inflation targets. Hey, nobody is perfect, and we feel his actions show you don’t have to play to the common but misguided conventional wisdom in order to do the right thing. Even with that, however, it is a toss-up as to whether he raises rates for the final time on Tuesday given this is his first fight with inflation as a new Fed chairman.

THE MARKET

MARKET SENTIMENT

VIX: 14.34; -0.12
VXN: 21.63; +0.51
VXO: 14; -0.01

Put/Call Ratio (CBOE): 1.17; +0.28. Reversals typically rile the options market as short term options players have to close positions, roll out of positions, etc. to keep from getting hammered. Thus the spike in put activity on the surge and then reversal.

Bulls versus Bears: Big jump in bears even as market improved shows a good contrarian indication.

Bulls: 41.5%. Bulls got a little long in the face again, falling from 42.2% the week before. After moving in a holding pattern at 42ish, good to see a bit of a fall back toward the 38.7% level from a month back. It remains below the levels hit on the last market sell offs. On the last pullback bulls hit the lows for this rally, i.e. since 2003. That put it below the 42.3% hit on the last low and the May and October 2005 readings that preceded new upside runs.

Bears: 36.2%. Quite a spike from 34.5%, and the highest in this entire cycle. The past two weeks top the 34.4% hit a month back when bulls and bears kissed, just missing crossing over with the bulls. Hit a new post-2002 high in that late June move, eclipsing the March 2006 high (33%) and well above the 2005 highs that spawned new rallies (30% in May 2005, 29.2% in October 2005).

NASDAQ

Stats: -7.28 points (-0.35%) to close at 2085.05
Volume: 1.895B (+0.75%). Volume climbed closer to average as NASDAQ gapped higher and reversed. Not a big volume surge, but stronger than on the upside sessions this week, indicating once more that the sellers, despite some improvement in NASDAQ’s overall picture, remain in control of the index.

Up Volume: 773M (-348M)
Down Volume: 1.1B (+366M)

A/D and Hi/Lo: Decliners led 1.33 to 1. Quite modest, but such is a reversal session.
Previous Session: Advancers led 1.45 to 1

New Highs: 98 (+9)
New Lows: 78 (-40)

The Chart: (Click to view the chart)

NASDAQ gapped higher and rallied to the 50 day SMA (2116) on the high. That was it. A 50 point reversal from high to low (2.3%) was about as violent as big as it gets in one session. A last hour rebound that recovered 15 points held the 18 day EMA (2081) and kept the session from the ‘complete rout’ category. NASDAQ made it to the 50 day MA, just about where we felt it would rally to on this move. The close took it back below its trendline (2097) and indeed, the 50 day MA is where NASDAQ stalled in early July after a very similar looking June recovery melted away. NASDAQ made its move, showing some modest accumulation and some modest distribution, but more distribution overall. In short, it rebounded form some harsh July selling, but did not show a lot of accumulation. It hit the downtrend and turned back on Friday. It is the lick log time for NASDAQ once more, and technically it is not in a great bargaining position. We will see this week if it has drawn an inside straight.

SOX (-0.96%) rallied up to 425, an interim resistance point from the late June low, and that stalled it Friday. It gave back 13 points from high to the close (late rally helped), but it managed to hold the 18 day EMA (410.66) and the down trendline at 408 on the close. Not great technical action with the tombstone doji, but it did hold the trendline break without rolling right back over. Some promise, but it has to work with NASDAQ to recover, and both are at the point where they test this last recovery attempt to either hold and try higher toward the 50 day EMA or fold for now.

SP500/NYSE

Stats: -0.91 points (-0.07%) to close at 1279.36
NYSE Volume: 1.724B (-4.94%). Volume faded as the NYSE indices ran higher then gave it all back to close modestly lower. A lot of running up and down to get back to flat. No distribution so that is a modest positive, but there was also no accumulation on the upside run. NYSE price/volume action, however, remains more positive overall versus NASDAQ as money flows to the large caps.

A/D and Hi/Lo: Advancers led 1.32 to 1
Previous Session: Advancers led 1.51 to 1

New Highs: 179 (+62)
New Lows: 46 (-13)

The Chart: (Click to view the chart)

The large caps jumped well past 1280 and over the June high (1290.68). Looking good, at least for an hour or so. Then it faded and could not even hold the breakout over the July high. Three sessions, three tries, three failures. The pattern is not a failure, but as with baseball, the market usually gives you three tries. We will see. SP500 remains in its pattern, showing solid volume to end the week as it butts against the breakout. At the same time the 50 day EMA is coming up to test the crossover of the 200 day SMA; the repeated failures may be suggesting something with respect to that crossover. Large caps continue to get the money. Tech rallied the past two weeks, but they were playing catch-up in a relief move. SP500 has a real pattern in progress.

The small cap SP600 (-0.36%) surged through the 200 day SMA (369.17) on the high (371.29) and then it peeled back and closed again below the 50 day EMA (366.05). It is trying to break higher on toward that July high at 378, but the 200 day is where we thought it would reach and it did so only to reverse and close lower. Trying to keep a double bottom attempt together but it has a lot of work just to get back to the ‘hump’ that is the January high.

DJ30

Similar theme: early surge to a new post-May high (11,344) but it could not hold the move, giving back 104 points. Hard to be happy about that at all. DJ30 tested nicely to start the week and then started higher, making the breakout Thursday. Volume did not move with it, however, coming well below average. Then the big surge Friday and failure. May come back some more to test and set up again. Large cap industrials still getting money as the pattern indicates.

Stats: -2.24 points (-0.02%) to close at 11240.35
Volume: 210M shares Friday versus 211M shares Thursday. What a competition in mediocrity. No wonder it could not hold the break higher.

The Chart: (Click to view the chart)

THIS WEEK

FOMC week, a one-day affair this time around with results Tuesday at 2:15PM. The market moved higher for two weeks ahead of the meeting where the bond market is expecting a cessation to the rate hikes. If the Fed does not hike the market may like it but not like it, i.e. it won’t satisfy all of the investors in bonds, gold, etc. and thus turmoil. Actually the best result would likely arise from a rate hike and a statement that says the Fed is done unless it really sees some trouble.

The result? The Fed Funds futures say no hike and as noted, it is typically dead b**ls on accurate at this juncture. That is one reason we feel the Fed will actually raise and then say ‘no mas.’ That would work to satisfy most everyone though it may not be what the economy needs. The economy needs no more rate hikes and a bit less liquidity. The Fed is drying up liquidity with some treasury purchases, and thus helping US inflation, inflation that still shows a peak in October 2005. It was up the past week but still has not reversed the trend lower. As we noted two weeks back, the real problem is the rest of the world; the US has been fighting inflation for everyone else. At least last week the BOE raised rates unexpectedly, thus helping the US out some. See, there are some positives regarding the world’s central banks.

As for the market, it may have had its pre-FOMC last call rally. With the meeting on Tuesday and two weeks of upside (ragged as it was) behind it, there is not a lot to be gained just ahead of the actual result. Look at how Friday turned out: good news, a surge, but then the inevitable ‘what next?’ question. With the bond market pricing in the need for the Fed to lower rates due to economic growth concerns, the market may not like the answer. After all the Fed cut rates on January 3, 2001 for the first time since it started its campaign against prosperity, and the market surged only to rollover the next month. The economy is the most powerful variable with respect to the market, and the market prices in economic moves ahead of time. If bonds are correct, the economy is slowing much more than the Fed thinks, and the need for a 25BP rate cut now may be more if things are not tended to.

Lots of stocks faded after the early move Friday, but lots of stocks held near support on lower volume. As we noted with the NYSE indices, the action was not great but it was not fatal at all with respect to those indices and their stocks. Those have to be the upside focus ahead what with NASDAQ struggling at its downtrend. NASDAQ perked up last week, but this is the key for the move now that it has moved to its trendline and has to show its stripes. We have to be careful of a pause leading to a surge that just does not last. We won’t mind at all as that will let more of our positions run toward their targets, but we will have to see how that move holds to really ramp up a lot of new buys.

Support and Resistance

NASDAQ: Closed at 2085.05
Resistance:
2100 from the early and mid-2005 peaks
The May downtrend at 2100
The 50 day EMA at 2122
2177 is the December 2004 high.
2185 to 2182 is the September 2005 peak and interim high from November 2005.
2190 is the July 2006 high

Support:
2072 is the June closing low
2050 from the summer 2005 lateral range lows.
2045-47 from June and October 2005 lows and June 2004 highs
2037 at the October 2005 closing low
2019 is the April 2005 interim high
2008 is the January 2005 low
1971 from an October 2005 peak and 1973 from a March 2005 low.

S&P 500: Closed at 1279.36
Resistance:
1280.37 is the recent July peak.
The late January peak at 1285
The early June high at 1288
1297.57 is the recent February high.
1315 is the May and May 2001 peaks
1317, the recent intraday highs from April.
1324 to 1329 from the October 2000 lows.

Support:
1272 to 1268 is the November and December 2005 closing highs and March 2006 closing low
The 200 day EMA at 1269
The 50 day EMA at 1265
1254 is an old trendline from the August 2003/August 2004/October 2005 lows.
1239 from the late June consolidation range.
1225 from the March 2005 high
1223 is the June 2006 closing low.
1213 from December 2004 high to 1215
1205 from the August lows

Dow: Closed at 11,240.35
Resistance:
11,279 is the late May high
The March 2006 highs at 11,329 to 11,335
11,350 from the May 2001 peak
11,401 from the September 2000 peak and April 2001 highs

Support:
11,228 is the July closing high.
11,097 to 11,137 is the last peak from the February top.
The 50 day EMA at 11,084
11,044 is the January high.
The 200 day SMA at 10,987
10,965 from Q4 2000
10,931 is the November 2005 high
10,890 is the December 2005 closing high.
10,737 to 10,730 from December and February lows
10,706 is the June 2006 closing low
10,705 – 10,965 from July/August 2005 range top to bottom
10,678 to 10,665

Economic Calendar

These are consensus expectations. Our expectations will vary and are discussed in the ‘Economy’ section.

August 4
- Non-farm payrolls, July (8:30): 113K actual versus 145K expected, 121K prior
- Unemployment rate, July: 4.8% actual versus 4.6% expected, 4.6% prior
- Hourly earnings, July (8:30): 0.4% actual versus 0.3% expected, 0.4% prior (revised from 0.5%)
- Average workweek, July (8:30): 33.9 actual versus 33.9 expected, 33.9 prior

August 7
- Consumer Credit, June (3:00): $4.0B expected, $4.4B prior

August 8
- Preliminary Productivity, Q2 (8:30): 1.1% expected, 3.7% prior
- FOMC decision (2:15)

August 9
- Wholesale inventories, June (10:00): 0.6% expected, 0.8% prior
- Crude oil inventories (10:30)

August 10
- Initial jobless claims (8:30): 315K prior
- Trade balance, June (8:30): -$64.5B expected, -$63.8B prior
- Treasury budget, July (2:00): -$47.8B expected, -$53.4B prior

August 11
- Retail sales, July (8:30): 0.6% expected, -0.1% prior
- Retail sales ex-auto (8:30): 0.5% expected, -.3% prior.
- Business inventories, June (10:00): 0.5% expected, 0.8% prior.


icon url

ReturntoSender

08/10/06 10:17 PM

#6910 RE: ReturntoSender #6755

From Briefing.com: 5:33PM Market Internals (MKTIN) : The Dow increased 0.44% closing at 11124, the Nasdaq was up 0.56% to finish at 2072, and the S&P was up 0.46% to finish at 1272. Leading sectors included: real estate management +6.2%, general merchandise stores +4.7%, computers and electronics +2.9%, specialty stores +2.8%, construction and engineering +2.6%. Lagging sectors included: agricultural products -3.0%, oil and gas refiners --3.0%, coal and consumable fuels -1.8%, gold -1.0%, paper products --1.0%. Today's movement came from lower volume (NYSE 1592, vs. closing avg of 1681; Nasdaq 1795, vs. 1959), with advancers outpacing decliners (NYSE 1963/1297; Nasdaq 1726/1270, and with new lows outpacing new highs (NYSE 59/130, Nasdaq 42/228).

5:17PM MEMC Elec files 2005 financial statements (WFR) 31.67 +0.67 : Co announced that it has filed its 2005 Form 10-K, its Form 10-Q for the third quarter of 2005 and restated Form 10-Qs for the first and second quarters of 2005. Income Statement No changes have been made to the income statement for the full year 2005 compared to the preliminary financials provided in the July 26, 2006 update. A $1 mln movement of income tax expense occurred between the third and fourth quarters of 2005 with no net impact to the 2005 results. Balance Sheet No changes occurred to total assets, total liabilities or stockholder's equity for 2005 compared to the preliminary financials furnished in the July 26, 2006 update, although reclassifications were made within sub-categories. These changes include reclassifications between cash and short-term investments and the reclassification of certain pension and post-employment liabilities into current liabilities from long-term liabilities.

4:20 pm : Despite digesting the biggest terrorist threat since 9/11, stocks demonstrated their resiliency Thursday to such concerns as a sell-off in oil alleviated some of the uncertainty about the impact an economy slowdown is having on corporate profit growth.

With underlying sentiment already cautious about just how much the economy is slowing, reports overnight that 21 extremists were arrested for plotting to blow-up planes traveling between London and the U.S. dominated the headlines Thursday and initially exacerbated economic concerns. As a result, the U.K. and U.S. raised their terrorist alerts to the highest level while the airline industry threat level was raised to its highest ever.

Be that as it may, recognition that the terrorist plot was in fact foiled, coupled with deterioration in oil prices throughout the session, especially after the Fed recently cited the lagged effects of increases in energy prices as inflation risks that could lead to additional monetary tightening, helped investors refocus their attention on the fundamentals -- earnings.

Kicking off another batch of better than expected results was American International Group (AIG 59.03 +0.54), which reported a 29% decline in Q2 profits last night. However, since earnings beat analysts' expectations for the first since the second quarter of 2005, handily no less, weary shareholders applauded the insurance giant's upside surprise, sending the blue chip up 3% to pace the way higher among the 20 Dow components that posted gains.

In addition to leadership from Financials, Consumer Discretionary (+1.4%) paced the way higher and provided notable leadership. Aside from benefiting at the expense of a crude oil prices losing 3.1%, Retailers got a huge boost from Target (TGT 47.51 +2.23) and J.C. Penney (JCP 65.72 +1.72), which by growing Q2 profits 13% and 37%, respectively, lent further credence behind a 12th straight quarter of double-digit earnings growth for the S&P 500. Movies & Entertainment was another group lending sector support, as Viacom (VIA 37.12 +3.37) surged 10% after topping estimates, while Restaurants got a lift after Brinker International (EAT 34.88 +2.88) beat expectations and pleasantly surprised Wall Street by affirming its 15% FY07 EPS growth projection.

Bargain hunting interest was also seen in underperforming areas like Industrials (+0.8%) and Technology (+0.6%); but even more notable perhaps was that, even though oil plunged 3.1%, the Energy sector was quite resilient. Albeit still limiting today's market gains, the sector not closing by nearly as much as such a drubbing in crude might typically warrant was also reassuring for investors, especially since Energy profits continue to account for the majority of earnings growth on the S&P 500.

While concerns that the thwarted terrorist attack may result in lower demand for jet fuel (e.g. canceled flights/delays), OPEC saying supplies would stay strong and more talks of a possible cease-fire in Lebanon also prevented the commodity from ever regaining any momentum. Further, oil's decline diminished the appeal of gold as a hedge against inflation, as the precious metal closing down 2.4% ruled out any flight-to-quality scenarios occasionally characteristic in the wake of terror threats, further underscoring the market's buoyancy to such fears. DJ30 +48.19 NASDAQ +11.46 SP500 +5.86 NASDAQ Dec/Adv/Vol 1254/1734/1.77 bln NYSE Dec/Adv/Vol 1320/1950/1.60 bln

4:36PM NVIDIA reports Q2 revs above consensus, announces voluntary review of the co's stock option practices (NVDA) 24.16 -0.17 : Reports Q2 revenues rose 19.6% year/year to $687.5 mln vs the $677.1 mln consensus. NVIDIA also announced today that the Audit Committee of the Board of Directors is conducting a voluntary review of the co's stock option practices covering the time from the co's initial public offering in 1999 through the current fiscal year. The Audit Committee is conducting this review with the assistance of outside legal counsel. The co has voluntarily contacted the Securities and Exchange Commission staff to inform them about the ongoing review. Although the review is ongoing, the Audit Committee has reached a preliminary conclusion that incorrect measurement dates were used for financial accounting purposes for stock option grants in certain prior periods. As a result, NVIDIA may record additional non-cash stock-based compensation expense related to stock option grants. Any additional non-cash stock-based compensation expense recorded will not affect the co's cash position or reported revenue for the recently completed quarter or any previous periods. At this time, the Company does not expect to be in a position to file its Form 10-Q for the second fiscal quarter by the September 8, 2006 filing deadline or the permitted extension to September 13, 2006.

4:21PM NVIDIA announces voluntary review of the it's stock option practices (NVDA) 24.16 -0.17 : Co announces that the Audit Committee of the Board of Directors is conducting a voluntary review of the co's stock option practices covering the time from the co's initial public offering in 1999 through the current fiscal year. The Audit Committee is conducting this review with the assistance of outside legal counsel. The co has voluntarily contacted the SEC staff to inform them about the ongoing review.

3:19PM Bond Watch: Treasury Market Takes Terror in Stride (BONDX) : The market took a shot at reaching for unchanged at the end of the session, but no such luck on the long stuff. The day saw on & off brushes with volume but action petered out fairly quickly. The early terror related safe-haven boost lost its footing quickly as well, as the market turns it's back on the seemingly escalating terror threats. The not-so-hot 30-yr auction whacked the market off further as it disappointed even amidst lowered expectations. The curve saw some churning action initially making a go at wider, spending a brief stint near the steepest levels since early June before consolidating & then aiming flatter with the 2-10-yr yield spread now running near 0.8. The day ahead is econ-cal lite, with retail sales offering the best bet fro trading opportunities, while the market will keep a floor under prices to some extent if new terror news comes to light. The fact that many in the US & virtually all of Europe is on vacation is not going to help matters much as the thin trade will just exacerbate any decent directional shifts. The buck is way better on the session with the euro down at 1.2791 & the yen weaker at 115.3000. The dollar index is up at 85.12. Spot gold was knocked down to 636.79 (-13.78) while the crude dropped to 74.25 (-2.10). Tomorrow brings retail sales, import/export prices & biz inventories to end the week. For more bond market commentary click here.

3:41 pm Expedia Inc. (EXPE)

14.81 +0.99: With reports this morning that UK officials foiled a terrorist plot to blow up flights traveling between London and the U.S. in mid-air, it wasn't exactly a propitious time for an online travel service provider to report its earnings results. That was the fate, however, that befell Expedia, and fortunately, the world's leading online travel company had good news to share. Had that not been the case, we suspect the market would have doled out some serious punishment to its stock. Instead EXPE is making waves as one of the biggest percentage gainers on the Nasdaq.

The latter is something that hasn't been said for some time, as EXPE has fallen sharply since being spun off by IAC/InterActive Corp. (IACI) last August. Prior to today's report, EXPE was down 42.0% for the year as a pair of disappointing earnings reports for its fourth quarter last year and first quarter this year prompted an exodus from the stock. The company, though, took an encouraging step in reversing the tide of negative sentiment by topping analysts' second quarter earnings expectations, registering a 10% increase in gross bookings, and announcing a new 20 million share buyback plan.

While Expedia reported an adjusted profit of $0.32 per share, Reuters Estimates has informed us that earnings of $0.30 per share, which includes stock-based compensation expense but excludes a number of other items, are comparable to the consensus estimate of $0.24. Any way you slice it, Expedia topped the market's relatively low expectations by a comfortable margin. The catalysts for doing so included a 17% increase in worldwide merchant hotel revenue, solid growth in its international business, and a 25% jump in gross bookings for its Hotels.com business.

Expedia continued to struggle with obtaining air inventory in both its agency and merchant businesses, as airlines have been making the most of record load factors and reduced capacity in the industry. Consequently, Expedia's worldwide air revenues fell 13% due to a 10% drop in revenue per air ticket as airlines continued to reduce the compensation they pay to agencies. That trend isn't expected to reverse in the near-term.

To its credit, Expedia is still generating a healthy amount of cash flow ($689 mln in free cash flow, or nearly $2.00 per share, for the six months ended June 30) and remains a firsthand name in the search for online travel deals. At its current price, EXPE trades at nearly a 15% discount to book value, which underscores the stock's value-based appeal that we highlighted in a recent Bargain Hunting article.

In conjunction with today's earnings report, Expedia also announced it has signed a 5-year agreement with U.S. Airways (LCC) that will make that airline's products and services available through Expedia.com and affiliate sites. Additionally, Expdia plans to privately offer up to $800 million of senior unsecured notes to qualified institutional buyers. Proceeds from the sale of the notes will be used for general corporate purposes that may include share repurchases.

--Patrick J. O'Hare, Briefing.com

12:44 pm Brinker Intl. (EAT)

34.89 +2.89: Brinker International posted its fiscal fourth quarter results today and the market is eating them up, as the results and the company's guidance were better than the market had feared.

The restaurant company, which operates and franchises concepts that include Chili's, Macaroni Grill, On the Border and Maggiano's, reported earnings from continuing operations, before special items, of $0.75 per share. Including stock-based compensation, earnings of $0.70 per share stand up well against the comparable Reuters Estimates consensus estimate of $0.65. Importantly, Brinker also reaffirmed its FY07 forecast that calls for 15% EPS growth and revenue growth of 10-12%.

When taking into account its stock-based compensation expense for FY06, Brinker's FY07 earnings growth forecast translates to approximately $2.59 per share versus the current consensus estimate of $2.48, which includes stock-based compensation.

Lately, the market's treatment of Brinker's stock has been anything but kind as prevailing fears about a slowdown in discretionary spending have weighed heavily on EAT, which dropped 27% between its March high and its August low. The affirmation of guidance, then, can be considered a pleasant surprise that is most likely prompting some short-covering activity that has exacerbated today's gain. A positive response to Brinker's news is not unwarranted, though, as the results show a company that is executing well in a challenging environment. To that end, gross margins for the year jumped 16 basis points to 72.03% and operating margins expanded 63 basis points to 7.91%.

At its current price, Brinker trades at 13.4x estimated FY07 earnings. Although the company's earnings guidance can't be considered static due to the changing nature of the macro-economic environment, Brinker's 15% EPS growth projection has incited some defensible, value-based buying interest for this leading casual dining restaurant operator.

--Patrick J. O'Hare, Briefing.com

12:09 pm Lions Gate Entertainment (LGF)

9.17 +0.01: Lions Gate Entertainment Corp., the world's leading producer and distributor of independent films, posted a smaller loss for its fiscal first quarter, helped by strong growth in its home video and international film divisions. Specifically, the Santa Monica-based company reported a loss of $3.6 million, or ($0.03) per share, compared to a wider loss of $21.8 million, or ($0.21) per share, in the year ago period. That beat Wall Street's expectations for a loss of ($0.09) per share, according to Reuters Estimates.

Revenues fell 11.2% year/year to $172.5 million, below the consensus estimate of $199.5 million. Lions Gate said home video revenue grew 18% to $114.8 million, driven by strong sales of Madea's Family Reunion and two other DVDs from the Tyler Perry catalogue, as well as Crash, Barbie Diaries, and additional revenue from fourth quarter video releases such as Lord of War, Waiting, and Saw II. International revenue of $15.5 million increased 55% from $10.0 million last year.

However, theatrical revenue fell 17% to $18.5 million, with only two wide releases, Akeelah and the Bee and See No Evil, in the period, and television production revenue declined 84% to $7.3 million, due to later delivery of Lions Gate's television programming.

Earlier in July, we reiterated our positive opinion on Lions Gate, due in part to its industry leading video catalogue. Indeed, sales from the company's film and television library rose approximately 67% to $52 million in the first quarter. Backed by a strong slate of upcoming films and expansion of its television business, Lions Gate reaffirmed its forecast for full-year revenue of more than $900 million, free cash flow of $85 million, and pretax income of approximately $32 million. The company ended the quarter with a backlog of $240.5 million in unrecorded revenue from filmed entertainment contracts, which should help drive growth in coming quarters.

--Richard Jahnke, Briefing.com

10:53 am Urban Outfitters (URBN)

14.54 +0.52: Urban Outfitters posted a 16% decline in quarterly earnings on Thursday, weighed by higher fixed store occupancy costs caused by lower comparable store sales and additional markdowns. However, the results fell in line with Wall Street's estimate, sending shares nearly 5% higher in early trading.

Amid a "seismic shift" in fashion trends and subsequent inventory glut, the Philadelphia-based apparel and accessories retailer has seen its stock fall more than 40% since the start of the year. As it continues to adjust to shifting fashion trends, we believe the near-term outlook remains uncertain and would not be committing new money at this time, but would recommend long-term oriented investors be vigilant in holding the stock if they already own it.

The company, which operates under the Anthropologie, Free People, and Urban Outfitters brands, said net income in the latest quarter declined $25.7 million, or $0.15 per share, from $30.6 million, or $0.18 per share, a year earlier. Revenues increased 12.7% year/year to $285.6 million, in line with the company's pre-announcement. According to Reuters Estimates, analysts were expecting earnings of $0.15 per share on sales of $295.52 million.

The company said sales for the quarter were driven by a 29% increase in the number of stores in operation, as well as a 64% jump in Free People wholesale sales and an 11% gain in direct-to-consumer sales. That was offset in part by a 7% decrease in same store sales, which fell by 2% at Anthropologie, 11% at Urban Outfitters, and increased 8% at Free People.

Meanwhile, gross margin decreased by 468 basis points from a year ago, due to higher fixed store occupancy costs related to lower same store sales and additional markdowns to clear seasonal inventory. Total inventories grew by 12%, due primarily to the acquisition of inventory to stock new retail stores, the company said. Importantly, total comparable store inventories fell by 5.9%.

--Richard Jahnke, Briefing.com

10:34 am Viacom Inc. (VIA)

35.41 +1.62: For those just tuning in, it has been a successful run for the Media and Broadcasting group in terms of second quarter results. Following in the footsteps of News Corp (NWS/A) and Disney (DIS), Viacom posted a nice upside quarter after Wednesday's close, spurred by its cable television and movie businesses. The result raised investor confidence after a challenging Q1. The owner of MTV, VH1, Comedy Central, and Paramount can sit back and enjoy the show, watching shares finally escape the bears' grasp after a painful fall.

Profits rose 24% to $437.3 mln, or 61 cents per share, from $353.9 mln or 47 cents in the prior year. Sales matched profit growth, rising to $2.86 bln, reflecting the DreamWorks SKG purchase. Excluding items, per share profits were $0.48 - four cents above expectations. EBITDA rose nicely to $746 mln - up 15% year over year. The Cable Networks division generated an 8% increase in revenues to $1.75 bln driven by an 8% hike in advertising revenues and an 11% rise in affiliate fees. Operating income rose 12% despite a weak international performance in the German and UK markets.

The Entertainment division posted a 56% rise in revenues to $1.12 bln with over 80% of the upside reflecting the DreamWorks SKG acquisition. Home entertainment sales rose 2% to $41.7 mln, while theatrical revenues plowed over estimates with a $168.7 mln increase on the back of its successful animation picture Over the Hedge in addition to international releases of MI III and Failure to Launch. Despite the upside, which was driven by the top and bottom line, Viacom retained its full year guidance.

Overall, it was a solid performance by Viacom, whose CEO Sumner Redstone had to dismiss questions on the possibility of going private given the stock's lackluster performance. He is clearly enjoying a respite today, as shares rise over two bucks in early trading. Viacom's content generation and ownership should enable it to drive digital initiatives as traditional media trends recede over the longer-term. And while we continue to think VIA represents an attractive investment on a risk/reward basis, we prefer DIS and NWS, both suggested holdings in our Active Portfolio, in the space given their earnings potential, market reach, scope, and growth endeavors.

--Kimberly DuBord, Briefing.com

10:32 am Target (TGT)

46.20 +0.92: Retailer Target reported its second quarter results before the start of trading, and in doing so, it took more of a quantitative approach than a qualitative approach, as the company's press release moved dryly from one operating metric to another without offering much color behind the factors that led to Target's reported numbers. Presumably, the added detail will be provided on the conference call, which is scheduled to begin at 10:30 ET.

As of now, it was simply indicated by management that it continues to believe Target will "deliver strong sales and profit performance in 2006 and generate another year of profitable market share growth even in light of the challenges posed by the current economic environment." That outlook came against the backdrop of Target reporting a second quarter profit of $0.70 per share on an 11.3% increase in revenues and a 4.6% jump in comparable store sales. The EPS result was a penny ahead of the Reuters Estimates consensus estimate and compared favorably to the $0.61 per share profit logged in the year-ago period.

Target's gross margin rate of 34.9% was little changed from last year, and to its credit, it was able to achieve a modest increase in its operating margin rate to 8.50% despite an unfavorable expense environment compared to the second quarter of 2005. Additionally, it was noted that the company repurchased 11.3 million shares during the period at an average price of $48.63 per share.

The market's response to the report has been one of guarded enthusiasm, which is understandable given that Target didn't give investors a lot to chew on with its press release. The numbers in a sense speak for themselves, but with the market being a forward-looking entity, it needs more context before it casts a meaningful judgment on the prospects for Target's stock. At its current level, Target trades at 16.1x trailing twelve month earnings, which is down from 17.9x at the time of its first quarter report when we recommended investors take a wait-and-see approach with the stock.

With Target expected to grow earnings at a rate of 15% per year for the next five years, our sense is that Target offers good long-term value at its current price. At this juncture, though, we'd suggest taking only a minor position.

--Patrick J. O'Hare, Briefing.com

09:52 am Advance Auto Parts (AAP)

28.95: Advance Auto Parts said its second quarter profit fell nearly 5% from a year ago, as rising gasoline prices and higher interest rates have weighed on consumers' discretionary income. Specifically, the specialty retailer of automotive aftermarket parts, accessories, batteries, and maintenance items, reported net income of $62.9 million, or $0.59 per share, down from $66 million, or $0.60 per share, last year.

In the second quarter, revenue increased 8.3% to $1.1 billion from $1.02 billion last year. Same store sales edged up 1.2% year/year amid challenging retail conditions, as a 1% decline in do-it-yourself sales offset a 9.1% gain in do-it-for-me. The 1.2% increase compares to a 9% increase in the same quarter last year.

Analysts on average were looking for quarterly earnings of $0.58 per share on revenue of $1.1 billion, according to Reuters Estimates. Earlier in June, however, Advance Auto Parts cut its same store sales guidance to a range of 1% to 2%, from its previous estimate of 3% to 5%, and lowered its earnings per share outlook to $0.57 to $0.59 per share from $0.65 to $0.68 per share, citing the impact of unfavorable macroeconomic conditions on discretionary income for its lower- and middle-income customers.

Based on current sales trends, Advance Auto Parts expects same store sales to range from flat to up 2% in the third quarter, and slightly higher in the fourth quarter. The company also projected earnings to be in a range of $0.50 and $0.55 per share in the current quarter, and between $2.10 to $2.20 per share, including stock option expense, for the full year. Analysts are expecting the company to post a higher profit of $0.56 per share in the third quarter, and $2.20 per share in 2006, according to Reuters Estimates.

--Richard Jahnke, Briefing.com

09:04 am EchoStar Communications (DISH)

31.48: EchoStar Communications, the No. 2 satellite television provider behind DirecTV Group (DTV), on Thursday reported a lower second quarter profit that missed analysts' estimates, while revenues rose 17% on increased subscriptions. Investors, in turn, pushed shares of the Englewood, Colorado-based company higher in pre-market activity.

For the most recent quarter, EchoStar said it earned $169 million, or $0.38 per share, compared with a profit of $856 million, or $1.89 per share, last year, when results were boosted by a non-cash tax benefit of $593 million. Excluding a TiVo litigation expense of $14 million, the company would have earned $0.40 per share - four cents shy of the Reuters Estimates consensus of $0.44 per share.

Revenues at EchoStar totaled $2.46 billion, up from $2.37 billion last year, as monthly average revenue per subscriber improved to $62.71 from $58.53. During the quarter, the company said that it added roughly 195,000 net new subscribers, bringing its total subscriber base to 12.46 million. That is up from approximately 11.45 million total subscribers at the close of the same quarter last year.

Earlier this week, rival DirecTV reported second quarter earnings that matched analysts' estimates on higher revenues, but said subscriber growth slowed as it continued to target higher quality subscribers. Its shares traded sharply lower on the news. Currently, DISH shares are trading at roughly 20x forward earnings, compared to 16x for DTV.

--Richard Jahnke, Briefing.com

08:54 am J.C. Penney (JCP)

64.00: Department store operator J.C. Penney did its namesake proud by delivering second quarter earnings of $0.75 per share from continuing operations that were four cents ahead of the Reuters Estimates consensus estimate. That was a 63.0% increase versus the year-ago period. Although share repurchases and tax credits helped drive the strong bottom-line gain, it wasn't a smoke and mirrors report from J.C. Penney, which showed clear signs of operating success.

All in all, the second quarter was a good one for J.C. Penney and its performance validated one's ownership position in the stock. At roughly 15.0x trailing twelve month earnings, JCP stands out as an investment option for value-oriented investors, as it is priced at a substantive discount to its 10-year historical average of 21.7x.

In the quarter, gross margins expanded 30 basis points to 38.4% while operating margins increased 100 basis points to 6.4% as the company gained SG&A expense leverage with a 6.5% increase in net sales to $4.24 billion (consensus $4.20 bln). Comparable department store sales, meanwhile, were up 6.6% on top of a 4.2% gain in the year-ago period. J.C. Penney noted that it achieved sales increases in all merchandise divisions and regions of the country, with sales of fine jewelry and children's and women's accessories powering the results.

Mindful of the changing macro-economic environment, the company said it felt it was prudent to plan conservatively for the remainder of the year. Be that as it may, its earnings guidance can still be characterized as encouraging relative to current consensus estimates. For the third and fourth quarters, earnings are anticipated to be approximately $1.07 and $1.84 per share, respectively, versus consensus estimates of $1.06 and $1.82. For the full-year, earnings are expected to be approximately $4.55 per share (consensus $4.49), which would represent a 22% jump versus last year. The company is forecasting low single digit comparable store sales increases for the third and fourth quarters.

--Patrick J. O'Hare, Briefing.com

08:45 am American International Group (AIG)

58.49: A year after Martin Sullivan replaced Hank Greenberg as chief executive officer, AIG is still attempting to restore investor confidence after the world's largest insurer joined a notorious list of companies involved in corporate scandals. If recent share performance is any indication, sentiment has soured with shares dropping 2% on Wednesday ahead of its quarterly results, now down almost 15% for the year. But today's upside result may alter the tide for this Dow Industrial that trades at 10.6x forward earnings.

While second quarter profits fell 29% after record underwriting was offset by a decline in the value of derivative instruments held during the period, adjusted earnings exceeded estimates. EPS of $1.58 per share, excluding non-recurring items, came in 19 cents better than the Reuters Estimate. The profit decline occurred as a result of the declining value of derivative hedging against foreign exchange and other risks.

Profits from underwriting soared 93% to $1.37 bln due to lower claim costs and higher premiums. The General Insurance segment reported operating income rose 44.2% to $2.56 bln, excluding adjustments, reflecting favorable pricing, policy terms, and conditions. Premiums rose 9.3% to $11.63 bln. Life Insurance & Retirement Services operating income before realized capital gains, but including pricing net investment gains rose 9.7% to $2.61 bln despite declines in its domestic life business as its foreign business continues to generate solid growth.

There were, however, some areas of weakness in Japan and Taiwan due to unfavorable market conditions, namely an enduring lower interest rate environment, increased competition, tax law changes and a weaker yen. Overall, pretax profit from sales of international life insurance and retirement savings rose 17% to $1.72 bln, while earnings rose 4.2% to $1.6 bln excluding investments and accounting adjustments. AIG is taking action in the region to atone for these challenges, shifting product mix to emphasize higher-margin, investment-linked and health products over traditional savings-oriented life insurance.

--Kimberly DuBord, Briefing.com

09:34 am Countrywide: Banc of America Sec reiterates Sell . Target $35 to $30. Firm cuts price tgt after yesterday morning's reported July monthly YoY 19% decline in production volume. They say that more ominous for 2H06's outlook was the 19.2% YoY pipeline decline and the fall in credit report and appraisal activity; which are strong predictors of future originations.

09:33 am ArvinMeritor: UBS reiterates Reduce . Target $14 to $13. Firm cuts price tgt saying with stainless steel prices up 50% YoY, ARM faces significant earnings headwinds into 2007. They note ARM purchases about 160K tons of steel annually, and these contracts generally reset every 12 months and will be renegotiated in calendar Q4. That said, they think ARM is already bearing some of this impact as it currently funds a portion of steel costs via nickel surcharges.

09:32 am Alltel: Deutsche Securities initiates Buy. Target $60. Firm initiates based on their position as the second largest pure-play wireless co in the US and the only one with double-digit EBITDA growth forecasted and believe the co has significantly differentiated itself from the closest comparable co, Sprint-Nextel

09:31 am Global Crossing: Deutsche Securities initiates Hold. Target $16. Firm initiates as they believe investors will await to witness continued consistent reductions in the co's cost structure before aggressively investing now that they have again begun to produce reasonable top line revenue growth in their key division...

09:25 am Imax: Merriman Curhan Ford downgrades Buy to Sell . Firm downgrades noting no buyers emerge; and the shift in business model to negatively impact short-term results

09:24 am Creative Tech: Credit Suisse upgrades Neutral to Outperform. Firm upgrades saying they expect sales to pick up in 2H06, new launches and XFi announcements should generate positive interest, lower flash costs should help margins, and good progress in reducing opex and inventories.

09:23 am Komag: Maxim Group upgrades Hold to Buy. Target $46. Firm upgrades saying despite disappointing C2Q06 results from STX, lackluster guidance, and the prospects of slowing endmarket growth through the remainder of 2H06, they believe that at its current valuation, of 7x 2007P/E, Komag offers investor compelling upside return.

09:21 am American Science & Engineering: Roth Capital upgrades Hold to Buy. Target $78 to $46. Firm upgrades and cuts price tgt noting yesterday morning AS&E reported June quarter results below Street expectations. However they believe runaway expectations have been tempered and that the recent sell-off presents an opportunity to get shares of a market leader at a discount. The firm says with a focus on an expanding customer base, improved gross margins, positive cash flows, and new product introductions they are upgrading the shares.

09:16 am Supervalu: HSBC Securities upgrades Neutral to Overweight. Target $36 to $34. Firm upgrades and cuts price tgt saying on fundamental basis both the story and its visibility are improving. The firm says integration risks are smaller than they seem on first sight and issues at the core legacy retail business are minor.

icon url

ReturntoSender

08/13/06 11:23 PM

#6916 RE: ReturntoSender #6755

InvestmentHouse Weekend Update:

http://www.investmenthouse.com/1weekendmarketsummary.htm

- Market slides into the weekend status quo as no one wants to commit.
- July retail sales solid, raise fear of FOMC stepping back in.
- Dog days of summer, but expiration week could bring some sharp swings once more.
- A week where the market and leadership has to put something together upside.

Lack of a bid lets market slide lower into the weekend.

Thursday stocks showed some fortitude in the face of a terror threat but Friday they continued the familiar theme of the week: unable to find traction for both the large cap industrials and as well as technology and the small caps, the former at support, the latter at downtrend resistance. It was a tough week for stocks with the FOMC meeting on Tuesday, the terror threat on Thursday, oil surging, and scattered economic reports. Investors waited for the FOMC meeting, got a pause, but then could not decide if that was good or bad as some economic data was stronger while other data and events (terror threat) suggested weakness. The market could not make up its mind, so as we pretty much expected, it punted on Friday, ending a down week with a low volume loss.

Friday started weak, got weaker, and then managed a modest afternoon rebound to cut some losses. Volume was very low. There was no real selling Friday, just a lack of any bids. No one wanted to make any commitments ahead of a weekend when a terror plot was just thwarted and expiration in the week ahead.

Retail sales were stronger but even with the Fed on pause and in all reality very unlikely to hike again, the market took it as bad news and an indication the Fed might have to go active once more. Goodness. With the Fed on the sidelines for now and with worries about a slowing economy, good economic news should be received as just that. The fact that the market still cannot accept good news as a positive indicates the market has more work to do before it will really be ready to put together a sustained upside move.

Technically the market remained bifurcated to an extent even though all indices were lower on the week. SP500 and DJ30 both managed to hang onto support, still trying to set up a breakout, but they both had a harder time maintaining their patterns. DJ30 was particularly hard-pressed when the large cap cyclicals were sold Wednesday after the FOMC meeting was in the books and the transports were hammered Wednesday and Friday. NASDAQ remained in its downtrend as did SP600, but both also held above support on the Friday close. Small details but for reasons stated below, they may turn out to be important.

There was distribution during the week on both NASDAQ and NYSE, showing some institutional selling after the FOMC meeting. On the week as a whole, however, volume was lower on both NASDAQ and NYSE. Thus while the week showed individual distribution sessions, overall the trade was low. Indeed when you look at NYSE in July and August there is only one distribution week. There is only one accumulation week, but SP500 and DJ30 are making a test of their pattern, so lower volume is usually better. NASDAQ shows two distribution weeks thus far in Q3, indicative of its downtrend. As NASDAQ slipped lower this past week, however, the lower trade is a good indication.

While still technically challenged (or at least technically mixed between large cap industrials and growth indices), the market had a lot thrown at it last week and it sold lower. It did not, however, implode to the downside when given every chance and reason to do so. It took most news as bad (e.g. the FOMC pause, retail sales), but even with that ‘the world s**ks’ attitude it did not engage in a sell-a-thon. As we said Thursday, it showed some character. It is building in some toughness (meaning it is getting pretty sold out). It has yet, however, to change its character and alter the status quo (NASDAQ, SP600 in downtrends). SOX is showing promise, NASDAQ is holding its newfound support, and SP500 and DJ30 are still in their handles to the bases. We have been here before during this selling. Now that the Fed is on the sidelines and the market has had a chance to digest that fact, maybe we will see a character change this week. It is in the ‘show me’ phase again.

ECONOMY

Solid news on the retail front gets a cold shoulder, but it should have satisfied all sides.

Retail sales in July rose 1.4%, beating the 0.8% expected and reversing the June losses (-0.4%, revised from -0.1%). It was the best gain since January’s 3% spike. Ex-autos were strong as well at 1% versus the 0.5% expected (and -0.1% in June). It was not all gas either. Yes gasoline sales rose 2.5% (due to higher prices versus a surge in gallons consumed), but they were not the lion’s share of the gains. Durables, down in the Q2 GDP numbers, jumped back in July. Electrical appliances rose 1.9%. Building materials and equipment rose 1.8%. You always like to see the consumer willing to go forth with the big ticket items as it shows some continuing confidence in what lies ahead.

The return of strength from June should have been viewed as a positive given all of the mixed signals the economy has shown this year, mixed enough for the Fed to properly conclude it needed to sit the August meeting out. Instead the market seemed to view it as a problem with respect to the Fed, figuring if the economic data turns strong the Fed will once again turn on the market.

It won’t do that, and there are a few reasons it won’t. First, the Fed is simply not going to reverse course over the span of one meeting and go from a pause to a hike. The Fed paused to let the existing rate hikes show their impact upon the economy. The economic indicators are already mixed, and when they turn from solidly positive to spotty that is always a warning to tread cautiously. Aside from that logical reason, the Fed simply cannot afford to be labeled a flip-flopper. Once you wear that tag it is hard to shake. Just ask John Kerry. You can ask him before he votes for something or after he votes against it.

Second, and this one relates to the retail sales report more directly, retail sales were not all roses in July. Yes they were up more than expected for the month, but you have to look at the trend. As with many economic reports, the trend has weakened. Department store sales fell 0.4% as general merchandise rose only 0.3%. Year over year the signs of a shift in retail spending are changing, something we noted back in the spring would happen as gasoline moved to $3/gallon in the summer drive. Indeed, the year over year gain is just 3.2%.

Consumers are spending less in most all retail categories compared to same time last year as they have to allocate more and more funds to gasoline. It is not just a one-time pop in gasoline prices as it was post-Katrina and Rita, but a sustained rise in prices that forces consumers to adjust. Wages are rising moderately, but it is not enough to wholly offset the rise in energy prices. Thus the shift in consumers’ discretionary spending, something the Fed has no doubt noted and thus is no doubt looking past this report.

In sum, a critical view of the report should satisfy both sides of the growth picture. Well, not satisfy. Both sides can find solace and angst in the report and thus it is likely a very good indication the Fed is doing the right thing. There is a definite slowing in the trend of growth as consumers are forced to spend more on energy and have to adjust as to what discretionary items are bought and how much of those items are bought. At the same time the consumer is not dead, clearly still out there spending. With the continued housing fade that consumption fortitude will be put to the test. The US consumer rarely backs off from consuming, but these gasoline prices are a challenge, and with natural gas rising again, the winter is not going to be a picnic if these levels hold. Again, the Fed did the right thing by backing off, but in the current mindset of the country, polarized views are not that common.

Leading indicators turn lower, indicating continued economic slowing.

ECRI indicators have been showing slower growth in the future, but last week one of its indicators, the 4-week annualized growth rate, turned negative for the first time in 14 months. The index hit an interim peak in January and has trended lower since. This negative reading projects a continued slowing of economic growth for the next few quarters. At this level it is not forecasting a recession, and indeed it would need to fall much, much lower than the current reading to forecast a recession. Again, it looks as if the Fed got off the brake in time, at least we hope so. The index will continue to degrade as the additional rate hikes hit. That is why we also watch the market’s action as a leading indicator.

THE MARKET

MARKET SENTIMENT

VIX: 14.3; -0.16
VXN: 20.06; -0.8
VXO: 14.25; +0.24

Put/Call Ratio (CBOE): 0.93; -0.01

Bulls versus Bears:

Bulls: 40.2%. Down significantly from 41.5% the week before, continuing the retreat toward 38.7% five weeks back. It remains below the levels hit on the last market sell offs. On the last pullback bulls hit the lows for this rally, i.e. since 2003. That put it below the 42.3% hit on the last low and the May and October 2005 readings that preceded new upside runs.

Bears: 37.1%. Up nicely once more, rising from 36.2% and 34.5% the week before. This is the highest level in this entire cycle, easily clearing the 34.4% hit 5 weeks back when bulls and bears kissed, just missing a crossover. Hit a new post-2002 high in that late June move, eclipsing the March 2006 high (33%) and well above the 2005 highs that spawned new rallies (30% in May 2005, 29.2% in October 2005).

NASDAQ

Stats: -14.03 points (-0.68%) to close at 2057.71
Volume: 1.464B (-18.69%). Volume tanked on the session as no one wanted to buy and the sellers were not really active as well. Just a very low volume session that held support once more as NASDAQ fights to keep the lateral move alive. Fights may be a bit strong. Toils? More like struggles.

Up Volume: 393M (-698M)
Down Volume: 1.048B (+390M)

A/D and Hi/Lo: Decliners led 2.03 to 1. Volume was light and with the lack of bids stocks simply faded most of the session.
Previous Session: Advancers led 1.36 to 1

New Highs: 38 (+1)
New Lows: 148 (-54)

The Chart: (Click to view the chart)

NASDAQ was down from the open as Thursday’s mock show of strength was rather quickly rooted out. Another lower close made it four out of five for the week, but with all of the selling NASDAQ still managed to hold above 2050, the bottom of its three week lateral move between this support and 2100 on the upside resistance. Unfortunately, that keeps NASDAQ in its downtrend (2077), getting pushed down from above as that resistance descends. That leaves NASDAQ in a pretty interesting position this week. It is going to have to fish or cut bait with the trendline, or as Bull said on ‘Armageddon,’ it’s time to see who’s gonna’ dance.

SOX (-2.25%) just wasn’t the leader you would want to see after a two week lateral move that included a break above its trendline just over a week back. After a couple of promising sessions Wednesday and Thursday, it tanked back down to the bottom of the range Friday as some big name chips (e.g. NSM) fell similar to stones. Despite that it held its lateral move and thus keeps tantalizing us with the possibility of a continued move off the trendline to at least test the 50 day EMA at 425.

SP500/NYSE

Stats: -5.07 points (-0.4%) to close at 1266.74
NYSE Volume: 1.333B (-16.29%). No volume. Veritable desert of volume. No selling, just no interest ahead of the weekend.

A/D and Hi/Lo: Decliners led 1.85 to 1. Not bad what with the small caps dropping close to a point.
Previous Session: Advancers led 1.51 to 1

New Highs: 42 (-8)
New Lows: 78 (-39)

The Chart: (Click to view the chart)

After trying again to make the breakout above 1280 early in the week the large caps suffered the dips as well. Held the 50 day EMA (1266) through Wednesday, but then dipped lower intraday toward the 50 day SMA (1259) Thursday and Friday. Recovered Thursday for a gain; Friday it did not, but it did manage to close near the 50 day EMA once more. Low, low discount volume, coming in well below average on the selling. The deeper tests Thursday and Friday on the lows and then the rebounds shows some shaking out. That often helps set up a move higher, but we just have to see how this one holds. It is the backbone of the market right now, though it is suffering from some downside curvature of the spine at the moment.

SP600 (-0.87%) gave back the modest upside Thursday gain, continuing its fade that started in early May. It has used the 50 day EMA (364.32) as resistance in its downtrend, most recently failing in a wild attempt to clear that level two Fridays back. It has again faded toward the June low at 350 and the July low (348.69 on the close). Looks as if it is going to test those levels again this week . . . a triple bottom? More like a descending triangle, a bearish pattern where lower and lower highs push down on a constant support level. The small caps are going to have to try and dance this week as well.

DJ30

The blue chips had one really rough session last week, the Wednesday following the FOMC decision. The cyclicals got hammered and then the as did the transports. That left DJ30 struggling to end the week, tapping at the 50 day SMA (11,037) on the Thursday and Friday lows and then rebounding to recoup some losses. As with SP500 that shows some shaking out, but DJ30 is struggling in having to deal with the dying transports. Dow theory has it that the industrials cannot hold up without the transports; the latter is more or less the leader to the industrials. With DJ20 diving lower below the 200 day SMA, the prognosis for DJ30 is not that great. On the other hand, the blue chips are still in their pattern and the selling last week was on very low volume. Seems all of the indices are at the point where they have to put up a move.

Stats: -36.34 points (-0.33%) to close at 11088.03
Volume: 166M shares Friday versus 211M shares Thursday.

The Chart: (Click to view the chart)

NEXT WEEK

There is a cease-fire agreement in the Middle East, though the hostilities may not end for a couple of weeks. That may or may not impact the market much, however, as a lot of this was anticipated.

It is expiration week, and over the past few months we have seen a lot of activity midweek as positions are rolled over. We also see activity on Friday as well. We could see some solid upside moves midweek similar to prior upside moves on expiration Friday, but those were false moves, unable to sustain themselves after expiration ran its course.

In addition the week is loaded with economic data of the Fed type, e.g. PPI, CPI, housing starts, production, leading indicators, Michigan sentiment. There is still this tug of war within the market that wants better economic data that shows the economy is not tanking while on the other hand it is afraid if the data is too solid the Fed will have to step back in. That damn idea that prosperity leads to inflation seems to be the death of all economic expansions.

Despite the rhetoric from the Fed, it looks as if this one is not as dogmatic as the prior Fed would get when it felt prosperity had gone too far. The pause says a lot; it paused when many said it shouldn’t. It is hardly ever (never?) discussed on the financial stations, but the Fed has sold treasuries, thus sopping up extra liquidity as it keeps money supply under control the past six months. Growth in money supply was 6.2% through January 2006, but just 0.5% since that time. M2 money supply growth has dropped from 10% to between 4% and 5% over the past two years.

Thus it appears as if the Fed has made the right moves at the right time. That is why inflation peaked in the US in October 2005 and remains trending lower. The Fed has been withdrawing liquidity when the other central banks were not. Now you see the Bank of England still having to hike (along with other central banks) when the US is in position to cut. The Fed is an easy target to lambaste, and may have gone too far again, but at least this time it is making better, more sensible moves.

Has it gone too far? The market has corrected since May in one of the sharpest drops since the expansion begin off the October 2002 low. Right now SP500 and DJ30 are trying to break from bases while NASDAQ, SOX and SP600 are struggling. NASDAQ and SP600 are in downtrends, trying to put up a fight with some modest lateral moves, but they are not in a position of strength. As noted above, the indices are at a point where they need to dance or give in.

Thus this week could be very interesting. The Fed is in the can. It has paused, giving the market what it should want. And let’s face it, the economic data has weakened as we have discussed for a year or more as the housing market topped (statistically in September 2005). The economy has slowed and the Fed is still slowing it further with the rate hikes yet to hit the economy (they are falling from the sky after the Fed launched them over the past 6 months or more). If the market fails in this attempt to consolidate and move higher then it is a pretty clear sign that the Fed has once again overshot even with Bernanke bucking conventional wisdom and pausing while there were still signs of inflation. Of course we know from experience that inflation lags; last week labor costs hit a level not seen since late 2000, and that immediately preceded the official recession.

Back in 2000 when the market sold off ahead of the recession there was a sharp first plunge and then a rather nice recovery through Labor Day. Then it started the selling again. The point is that we have to stay vigilant to market signals. We need to see a strong breakout from SP500. We need to see NASDAQ and SOX complete bases and then breakout as well. They have quite a bit of work to do before that. Near term they can deliver that bounce we are looking for; they are set up for that. Then they will likely test again into September. How they set up and recover from that, e.g. the market patterns and leadership, will tell us much about the economic future. Right now the market is forecasting a slowdown, but it is at a crossroads between just a slowdown in an otherwise upside economic expansion or a much deeper decline brought about by overly stringent monetary policy even as the expansion matured.

This week we are looking at energy again. It pulled back to end the week with many, many solid stocks at near support. If they are strong and going to move higher again they will use this test to spring higher. Many have set up good bases, and as with the indices, they are at a point where they need to show the move or sell some more. They have led the market and are also something of a harbinger of economic activity; prices fall if they anticipate less economic activity and thus less demand for product. If they break down through support on volume that indicates more of the downside outlook.

In addition to energy there is life in financials, scientific instruments, some telecom, and then a lot of scattered stocks from various sectors. Leadership remains a sore point for the market, and it needs energy and financials to come back strong and pull other areas with them. Another tall order, but there are still some excellent patterns set up.

Support and Resistance

NASDAQ: Closed at 2057.71
Resistance:
2072 is the June closing low
The May downtrend at 2080
2100 from the early and mid-2005 peaks
The 50 day EMA at 2111
2158 from the May 2005 low.
2177 is the December 2004 high.
2185 to 2182 is the September 2005 peak and interim high from November 2005.
2190 is the July 2006 high

Support:
2050 from the summer 2005 lateral range lows. It has held the past three weeks.
2045-47 from June and October 2005 lows and June 2004 highs
2037 at the October 2005 closing low
2020 is the July closing low
2019 is the April 2005 interim high
2008 is the January 2005 low
1971 from an October 2005 peak and 1973 from a March 2005 low.

S&P 500: Closed at 1266.74
Resistance:
The 200 day EMA at 1271
1272 to 1268 is the November and December 2005 closing highs and March 2006 closing low
1280.37 is the recent July peak.
The late January peak at 1285
The early June high at 1288
1297.57 is the recent February high.
1315 is the May and May 2001 peaks
1317, the recent intraday highs from April.
1324 to 1329 from the October 2000 lows.

Support:
The 50 day EMA at 1266
1257 is an old trendline from the August 2003/August 2004/October 2005 lows.
1239 from the late June consolidation range.
1225 from the March 2005 high
1223 is the June 2006 closing low.
1213 from December 2004 high to 1215
1205 from the August lows

Dow: Closed at 11,088.03
Resistance:
11,097 to 11,137 is the last peak from the February top.
11,228 is the July closing high.
11,279 is the late May high
The March 2006 highs at 11,329 to 11,335
11,350 from the May 2001 peak
11,401 from the September 2000 peak and April 2001 highs

Support:
The 50 day EMA at 11,093 is trying to hold
11,044 is the January high.
The 50 day SMA at 11,036 held on the Thursday and Friday intraday lows
The 200 day SMA at 11,007
10,965 from Q4 2000
10,931 is the November 2005 high
10,890 is the December 2005 closing high.
10,737 to 10,730 from December and February lows
10,706 is the June 2006 closing low
10,705 – 10,965 from July/August 2005 range top to bottom
10,678 to 10,665

Economic Calendar

These are consensus expectations. Our expectations will vary and are discussed in the ‘Economy’ section.

August 15
- PPI, July (8:30): 0.3% expected, 0.5% prior
- Core PPI, July (8:30): 0.2% expected, 0.2% prior
- New York Empire State Index, August (8:30): 15.0 expected, 15.6 prior
- Net foreign purchases, June (9:00): $69.6B

August 16
- CPI, July (8:30): 0.4% expected, 0.2% prior
- Core CPI, July (8:30): 0.3% expected, 0.3% prior
- Housing starts, July (8:30): 1.810M expected, 1.850M prior
- Building permits, July (8:30): 1.845M expected, 1.869M prior
- Capacity utilization, July (9:15): 82.6% expected, 82.4% prior
- Production, July (9:15): 0.5% expected, 0.8% prior
- Crude oil inventories (10:30)

August 17
- Initial jobless claims (8:30): 319K prior
- Leading Economic Indicators, July (10:00): 0.1% expected, 0.1% prior
- Philly Fed, August (12:00): 8.0 expected, 6.0 prior

August 18
- Michigan sentiment, preliminary, August (9:45): 84.0 expected, 84.7 prior
icon url

ReturntoSender

08/24/06 12:25 PM

#6931 RE: ReturntoSender #6755

New-Home Sales Drop 4.3%
in Economy | Real Estate
As if you need me to fill in the details fo this stankbox:

http://bigpicture.typepad.com/comments/

Single-family home sales decreased 4.3% to 1.072 million units (seasonally adjusted annual rate) June sales were revised up to a -0.9% (1.12m) from a previous 3.0% decline (1.131m).

Consensus was for a modest 2.7% drop in July sales -- so the negative 4.3% was quite the surprise -- at least to those paying attention.

The big whackage showed up in the year-over-year numbers, with sales plummetting 21.6% since July 2005.

Amazingly, this only brings sales back to where they were in the beginning of 2004 -- which at the time, were a record high. Now, they are a dissappointment (at least to people who believe cyclical phenomena never have down cycles).

While mortgage costs are rising on a monthly basis, the recent rally in the bond market should help lower rates. A 30-year mortgage was about 6.76% in July, slightly higher than June's 6.68% -- but as we come to the end of August, those rates will be appreciably lower.

More later . . .

Thursday, August 24, 2006 | 11:05 AM | Permalink | Comments (0) | TrackBack (0)

Is a Housing Crisis Approaching?
in Consumer Spending | Economy | Federal Reserve | Real Estate
Our conversation yesterday -- and the weak Existing Home Sales data -- lead us to an inevitable question: Is a Housing Crisis Approaching?

For some insight into this issue, let's pull some data from a fascinating discussion in Barron's this past weekend. Lon Witter puts forth a different and intriguing notion. Witter observes that we don't have a Housing bubble, what the U.S. has is a lending bubble. His evidence is how loose the lending standards have become, and why not? The banks ultimately just flip the loans to the Fannie Mae (Federal National Mortgage Association, on the NYSE: FNM), where foreclosures and defaults become the headache of buyers looking for greater risk and return.

Witter claims his careful look at the reasons for the rise in housing give a good indication of the impact housing may have on the stock market. He observes the causes (in chronological order) of the rise and ultimate fall of Housing: "The collapse of the Internet bubble, which chased hot money out of the stock market; rock-bottom interest rates; 50 years of economic history that suggested housing never goes down, and creative financing."

More specifically, Witter's expectations are colored by rather disturbing data:

• 32.6% of new mortgages and home-equity loans in 2005 were interest only, up from 0.6% in 2000;

• 43% of first-time home buyers in 2005 put no money down;

• 15.2% of 2005 buyers owe at least 10% more than their home is worth (negative equity);

• 10% of all home owners with mortgages have no equity in their homes (zero equity);

• $2.7 trillion dollars in loans will adjust to higher rates in 2006 and 2007.

Traditionally, Mortgages have been low risk lending, as the loan is securitized by the underlying property. When banks were lending less than the value of the property (LTV), to people with good credit, who also were invested in the property (substantial down payments) you had the makings of a very good business: low risk, moderate, predictable returns, minimal defaults.

That model seems to have been forgotten. THIS IS REMINSCENT OF THE S&L CRISIS -- where lenders did not have any repercussions for their bad loans!

As bad as the above numbers look, the thinking behind them is worse:

"Lenders have encouraged people to use the appreciation in value of their houses as collateral for an unaffordable loan, an idea similar to the junk bonds being pushed in the late 1980s. The concept was to use the company you were taking over as collateral for the loan you needed to take over the company in the first place. The implosion of that idea caused the 1989 mini-crash.

Now the house is the bank's collateral for the questionable loan. But what happens if the value of the house starts to drop?"

A good example of how this is unfolding at lending institutions comes from Washington Mutual: You may recall Washington Mutual laid off 2500 employees in their mortgage broker department earlier this year. As LTV went above 100%, and then as property values decayed from recent peaks, the collateralized aspect of these mortgages suddenly is at risk.

Here's how this has played out over the past few years via WaMu's ARM loans (data via Washington Mutual's annual report):

- 2003 year end, 1% of WaMu's option ARMS were in negative amortization (payments were not covering interest charges, so the shortfall was added to principal).

- 2004, the percentage jumped to 21%.

- 2005, the percentage jumped again to 47%. By value of the loans, the percentage was 55%.

So each month, the borrowers' debt increases; Note there is no strict disclosure requirement for negative amortization -- Banks do not have an affirmative obligation to disclose this to mortgagees.

Thus, a large part of our housing system have become credit cards. And according to Witter, "WaMu's situation is the norm, not the exception."

Even worse, Witter notes that negative amortization is booked by the banks as earnings. "In Q1 2005, WaMu booked $25 million of negative amortization as earnings; in the same period for 2006 the number was $203 million."

This situation is unsustainable. Witter's housing and market forecast is rather bearish:

"Negative amortization and other short-term loans on long-term assets don't work because eventually too many borrowers are unable to pay the loans down -- or unwilling to keep paying for an asset that has declined in value relative to their outstanding balance. Even a relatively brief period of rising mortgage payments, rising debt and falling home values will collapse the system. And when the housing-finance system goes, the rest of the economy will go with it.

By the release of the August housing numbers, it should become clear that the housing market is beginning a significant decline. When this realization hits home, investors will finally have to confront the fact that they are gambling on people who took out no-money-down, interest-only, adjustable-rate mortgages at the top of the market and the financial institutions that made those loans. The stock market should then begin a 25%-30% decline. If the market ignores the warning signs until fall, the decline could occur in a single week."

As we saw yesterday, the housing data has begin that downside surprise. We have yet to see if July's downard acceleration was a one off or the start of something much more ominous.

Anecdotally, a friend who is a Real Estate attorney in Virginia emailed the following after yesterday's discussion:

'We’re seeing substantial increases in foreclosure volume, with more loans going to sale and being bought back by noteholders. Most are loans which have originated since 1/1/05. many are conventional ARM loans. Foreclosure investors are now sitting on the sidelines.

Huge increases in available real estate up and down the i-95 corridor with stuff sitting for extended periods, even in resort areas."

Thus, our Housing driven Economy has now moved into the next phase: the long glide downwards in prices, sales volume, and foreclosures.

And, we have new Home Sales today at 10am

More on this later . . .

icon url

ReturntoSender

08/27/06 11:02 AM

#6935 RE: ReturntoSender #6755

icon url

ReturntoSender

08/30/06 12:46 PM

#6945 RE: ReturntoSender #6755

SMH ST SS 1000 shares@34.12 - I think a short term top is forming. The SOX may form a double top near 452:

Short Term to Intermediate Indicators. It's best to be cover shorts and enter long positions on cross overs of green lines. Best to go short on cross overs of the red lines and or exit long positions.

The first set of charts for market timing the SMH are based on using the NASDAQ New Highs and similar indexes are shown here. To go long: First wait for the NASDAQ New Highs to set a new low and reverse itself from an approach of the lower Bollinger Band. To go short: Wait for the NASDAQ new highs and other similar new high indices to set a new high print at, near, or above the upper Bollinger Band. I am also now using the NASDAQ McClellan Oscillator (Ratio Adjusted) ($NAMO) to confirm the above - Overbought above 25 - Oversold below -25. These charts do not fully update until after market close.


Short Term Indicators vs. the SMH; any index can be used - The first set of short term indicators I use are based on the put to call ratio. To go long it is best to wait for the put to call ratio to close over 1.0. On the chart below the put to call ratio now updates intraday but it is not always accurate! Intraday reading of the put to call ratio can be found here updated every half hour after the open:

http://www.cboe.com/data/IntraDayVol.aspx

The more days in a row the put to call ratio prints over 1.0 this the more likely the bottom will be a strong one. The link above shows intraday readings of the P/C ratio.

Also closes on the put to call ratio below 0.50 and sometimes a bit above are indicative of a short term top. Watch the simple moving averages as well because periods of too much buying of puts or calls will almost certainly bring about market bottoms and tops respectively. On the CPC/VIX ratio; this is largely a longer term indicator where investors are likely to make more money on the long side once the short-term 21 day sma has crossed above the 200 day sma. The reverse is true as well. An investor will likely make more money on the short side when the 21 day sma crosses below the 200 day sma:


Next I use the VIX, VXO and VXN (Fear Indices) because they can help to refine decision making on tops and bottoms upon reverses from upper or lower Bollinger Bands especially when the index stretches more than 10% above or below its 10 day simple moving average. When a volatility index stretches more than 10% above or below its 10 day sma it will generally reverse direction as will the market in general in the opposite direction.


Also TRIN and TRINQ readings on the 5 and 10 day simple moving averages over 1.5 are bullish while readings below 0.85 are bearish. These readings don't happen often especially with the 10 day sma. They are also early indicators so the market can continue higher or lower for a while but they are reliable for indicating market turns that are about to take place.


icon url

ReturntoSender

09/03/06 6:16 PM

#6963 RE: ReturntoSender #6755

InvestmentHouse Weekend Update:

http://www.investmenthouse.com/1weekendmarketsummary.htm

- Bullish bias holds to the end as stocks drift higher on low volume.
- Economic data paints the same picture: expansion losing steam.
- Bond yields tank as ‘new’ Fed study reveals inversions lead to recessions.
- The return of money supply to monetary policy: why Bernanke is far superior to Greenspan.
- Market ready to start the mean season with a lead in from a late summer rally.

Stocks fight off early attempt to sell, continue the rise for the week.

Stocks handled the jobs report that was basically in line and showed a modest dip in hourly earnings month to month, rising pre-market and on the open. It did not take long for that move to lose its direction. With the lower ISM and tumbling construction report at 10ET the market really got the dips with NASDAQ and SOX turning negative. Indeed, the chips were down pretty much from the open as some gains were booked and some big names struggled (e.g. BRCM had its antitrust case against QCOM dismissed). The upside move looked to be out of gas.

There was not much selling volume, however, and the indices started to show some life an hour into the session. Without the volume the sellers could not keep a lid on a rebound. That rebound turned into a morning, lunch, and then afternoon rally as the bullish bias for the week was not ready to give way to the fall.

Technically SP500 made a nice move, pushing well past 1305 and to the top of the March and April range. Sure wish it would have made the move Thursday; things really could have turned interesting. Instead we get a low volume rise to finish the week, basically on a lack of interest ahead of the start of fall. That does not provide a lot of confidence the move will stick.

NASDAQ rallied over the early July high as it too cleared some resistance, though it again struggled at the old up trendline starting in 2004. SP600 rallied up to the 200 day SMA intraday and then faded to the close; it made it to the resistance we though it would, and it did not go a nickel further.

SOX was the stick in the mud, falling for the second session and the only index t close negative. It was one of the leaders in the rally off the July low; well, maybe it just came to life and seemed to be a leader after a pretty good butt-kicking after peaking in February. In any event, it pulled back toward the 10 day EMA. That can be rather innocuous, just a test after a good run. After all it was moving up while SP500 slid sideways last week. It also tends to be an early warning canary for the techs as was the case when this downtrend started and continued lower. It turned lower ahead of all the other indices and then they followed. That makes this test quite important as SOX has a nice reverse head and shoulders going. If it can continue higher here that is a major support for the SP500 as it breaks toward its highs, not to mention NASDAQ as it tries to clear its own version of a reverse head and shoulders.

Overall it was good to see the market generally hold its gains and push higher even as semiconductors rested. We took some more gain off the table as we had been doing all week in what turned out to be very good timing for the semiconductors that we were cashing in on Wednesday. Most of our positions remain very well . . . positioned, so we let many of them run without closing positions wholesale.

The reason being, aside from the solid patterns, is that early September often gives solid pops higher as new money hits the market. In good economies the move can continue. In so-so economies you get the pop and then some selling. Only in really crappy times (e.g., 2000 and 2001 was there no upside pop. Even in the bottoming process in 2002 when the market was diving, it managed an upside move the first part of September. Moreover, it can rally into September and still continue upside as the new money hits.

Thus we look for some more upside to start the week. After that it depends upon the market’s read of the economic future. Bonds are not necessarily happy, but the indices have fought back into some pretty good patterns. As long as they can hold those even if there is another pullback then the outlook is much improved.

THE ECONOMY

Friday data shows the economy is hanging in but still getting a bit flabby.

The jobs report was mostly in line as was the ISM. 128K jobs created versus 125K expected. The unemployment rate fell back to 4.7% from 4.8%. Hourly earnings rose 0.1% versus the 0.3% expected and the 0.5% in July. The ISM fell to 54.5 from 54.7 (54.7 expected), continuing the weakening from the October 2005 peak over the past year (58). Prices remained over 70 while new orders weakened to 54.2. Interestingly, employment improved to 54 as the rest of the report softened. Typical; we have said all along employment lags in the business cycle. Michigan sentiment moved up nicely from the preliminary reading (82.0 versus 78.7 prior and 79.0 expected). Construction was weak; hard to argue around a 1.2% drop when you expected it to hold steady.

ECRI shows modestly easing inflation and continuing slowing growth.

ECRI’S future inflation gauge continued to soften in August, down to 123.1 from 124 in July. It peaked in October with a 5.5 year high, but it is stubbornly refusing to give us a sharper break lower.

ECRI’s leading economic index held steady but at the 2006 low with its 4-week annualized rate falling again, down 1.7% to a 2 year low. At this level ECRI is still forecasting slowing growth but no recession.

Bond yields continue their fall, cracking below 4.80%. New Fed study reveals what we all knew.

Man what a week for bond yields. They started the week far below the Fed Funds rate (5.25% after the last Fed rate hike) ranging from 4.85% to near 4.9% with an 8 basis point spread between the 2 year and the 10 year. The 2 year and 10 year dove lower Friday with the 2 year outpacing the 10 year to the downside. At the close Friday yields were 4.76% versus 4.73%, just a 3 BP inversion. That is not enough to really scare up a recession, but as discussed Thursday, the spread between the Fed Funds rate and nominal bond yields is huge, almost 50 BP with the 2 year note. What nominal yields are saying, indeed screaming, is that the Fed Funds rate is too high for the economy, not too mildly suggesting the Fed should think about cutting some rates.

Interestingly, the Chicago Fed has produced a study of bond yields and the correlation to economic cycles. The study indicates what we all knew it would: inversions between short term bond treasuries and longer term treasuries tend to foretell economic slowdowns. The Fed study suggested a 30 BP inversion between the very short term yields (e.g. 30 day) indicates a recession. The study also concluded that the longer the inversion the more likely a significant economic slowdown.

Now Mr. Greenspan was telling us last year not to worry about an inversion, that it was due to extraneous factors such as heavy foreign buying of treasuries. There is no doubt that is ongoing, but even Mr. Greenspan said he was not sure to what extent the buying contributed to the inversion. Thus he was saying ‘trust me, don’t worry’ about an inversion, but in the same breath implied the trust was not well placed. Now the Fed itself has concluded it doesn’t matter what the reason is; big inversions or inversions that last a long time foretell economic slowing.

This report is similar to other government grants to fund a study that concludes if kids stay up past midnight and don’t do their homework they don’t perform as well at school. Who needed a study to conclude that? Just look at history. Same with this report. The problem is, Greenspan made it necessary to do this with his speculation and resultant conclusion that the inversion was not as good an indicator as in the past. Of course being a politician Greenspan hedged his statement, but nonetheless that sent us down the wrong path on monetary policy once more, and likely the Fed has raised rates too long without really attacking the root of the problem, i.e. excess liquidity until AFTER Greenspan left.

Money supply coming back into favor as a Fed tool?

We have all heard the past few years about how money supply is no longer a very good indicator for the economy or for what should be done with monetary policy. Seems strange; after all monetary policy is part and parcel money supply. As strange as it seems to anyone with common sense, however, money supply has diminished in its apparent importance, at least to the academics, or more accurately, the Greenspan academics.

That is why, even with 1.5 years of rate hikes under Greenspan, inflation still managed to rise above the Fed’s comfort zone. Up to 2006, when Greenspan retired and Bernanke took over, money supply was growing at a 6.2% annual rate. It was going strong even as Greenspan raised rates to purportedly prevent inflation. But inflation is a monetary phenomenon, i.e. too much money for the economic growth rate. In other words, economic activity is not great enough to absorb all of the money in the system, so that excess money is used to bid up prices because money is seen as cheap. You can raise rates all you want, but if there is still excess money compared to economic activity, prices rise. Indeed, you EXACERBATE the problem with high interest rates and high money supply. Many borrowers cannot gain access to money they need because of high rates, but there is still money circulating that is not being invested because those wanting to invest it cannot borrow at the high rates. Thus the economy slows more but money supply remains high. That equals inflation.

Bernanke’s first order of business, despite saying he was going to continue Greenspan’s policies, was to cut the money supply growth rate in order to sop up the excess liquidity. He started selling treasuries to get money out of the system. Money supply growth dropped from 6.2% to 0.2% this year. He did not pull a Greenspan as back in early 2000 and suck the economy dry of money all at once. He did not even start contracting money supply. After all of the rate hikes he did not want to crush the economy, and he knew the impact of the rate hikes was not fully felt. No, he just curtailed money supply growth in order to let the economy continue to run and work at sopping up the remaining excess itself. Thus you don’t get the vapor lock you got in early 2000 when suddenly there was no more money. Not surprisingly we have seen inflation pressures peak here in the US as shown by ECRI.

We have said it before, despite his public maligning and his ‘loss of economic manhood’ as Kudlow proclaimed, Bernanke has been focused and even-handed in his views and application of monetary policy. We are reminded of Ronald Reagan, who was ridiculed as a simpleton but whose economic policies proved to be right on the mark and brought the US back from an interesting but failed economic experiment in the 1970’s to once again the world economic powerhouse. After years of getting ‘Greenspanned’ and brainwashed by his approach to monetary policy that, despite the ‘maestro’ label was a disaster as shown by a track record no better than any other Fed chairman (indeed the size of his disasters were unprecedented but for the 1929 Fed), we are now seeing what we believe is the work of a true scholar of monetary policy, one that understands, appreciates, and uses history in his formulation of policy. We hope we don’t eat these words; we might still get a recession out of this but there would be an asterisk because Bernanke inherited a system that had inflation built into it due to Greenspan not lowering liquidity, inflation he had to get under control before he could really take action. If he pulls it off without a recession, however, it will be a great feat, similar to winning the World Series after being down three games to none or coming back to win the Rose Bowl after being down 12 points with less than 5 minutes to play.

THE MARKET

MARKET SENTIMENT

VIX: 11.96; -0.35. VIX remains at very low levels, holding in a very tight range the past two weeks. This is the level where the market has run into trouble, i.e. topping in past rotations. It can move at this level, however, for a long time before it takes its toll and the market sells.
VXN: 16.8; -0.59
VXO: 11.02; -0.29

Put/Call Ratio (CBOE): 1; +0.1

Bulls versus Bears:

Bulls: 42.1%. After a sideways move for a few weeks, bulls are starting higher, rising from 40.0% the week before (40.2% and 41.5% the week before). Bulls are still well below the early 2006 highs and even the April high. The low of the cycle was in June at 38.7%. It remains below the levels hit on the last market sell offs in October 2005 and March 2006, but above the June low when it kissed the bears.

Bears: 33.7%. Continuing the decline from 34.7% last week and the 36.6% the week before and 37.1% hit in July. The 37.1% was the highest level in this entire cycle, easily clearing the 34.4% hit in late June back when bulls and bears kissed, just missing a crossover. Hit a new post-2002 high in that late June move, eclipsing the March 2006 high (33%) and well above the 2005 highs that spawned new rallies (30% in May 2005, 29.2% in October 2005).

NASDAQ

Stats: +9.41 points (+0.43%) to close at 2193.16
Volume: 1.383B (-22.19%). Low volume to close out the summer, not expected given the three-day weekend ahead. A decent increase in volume as it moved higher this week, but volume still remained below average; it was, after all a summer rally.

Up Volume: 808M (+134M)
Down Volume: 472M (-613M)

A/D and Hi/Lo: Advancers led 1.19 to 1
Previous Session: Advancers led 1.1 to 1

New Highs: 96 (-8)
New Lows: 28 (-4)

The Chart: (Click to view the chart)

NASDAQ continued its move higher Friday, topping off a solid upside week, the third leg higher in its late summer rally off of the mid-July lows. It made it just past the July high (2195.50) on the Friday close, hugging the August 2004/May 2005 up trendline (2197), unable to punch on through. It showed a hanging man doji on the candlestick chart, and that often indicates a move is running out of gas and needs a breather. NASDAQ is working in a 16 week base, forming a 12 week reverse head and shoulders. It may need a short pullback to set up a better breakout move, perhaps after a move toward the 200 day SMA (2225) to start the week. NASDAQ continues its attempt to put together its recovery base; if it holds up and avoids a serious breakdown that bodes well for the rest of the market.

SOX (-1.05%) lagged all session and was the only index to close lower. It fell back through the 90 day MA (446.71) and below the mid-August closing high (446.11) on the close, but it did hold its 10 day EMA (441.25). This is where we want it to hold and deliver more upside this week. SOX can be a harbinger for the rest of the market. If it holds and rebounds that is a very good signal. We will see; still very concerned about September after the initial few sessions.

SP500/NYSE

Stats: +7.19 points (+0.55%) to close at 1311.01
NYSE Volume: 1.126B (-15.14%). Volume hit the low for the week, but that did not stop prices from climbing. Without any big buyers the market bias for the week took hold and the NYSE indices moved further upside.

A/D and Hi/Lo: Advancers led 1.92 to 1. Solid breadth as the large caps came back to life and joined the small caps in the upside move.
Previous Session: Advancers led 1.49 to 1

New Highs: 178 (-4)
New Lows: 16 (-3)

The Chart: (Click to view the chart)

Sweet price move from SP500 as the large caps came back to life after stalling Wednesday and Thursday on rising trade. They were churning as money moved around, but once that was over the upside drift kicked in and SP500 put the moves on 1305. If it can hold the move to start next week there will be more short covering to drive it higher. SP500 has now risen to the top of its March and April trading range. If it breaks through to the upside the shorts will howl and it will move. It is set up to make that move as long as the buyers come in to start the fall.

SP600 (+0.28%) made it to the 200 day SMA as anticipated, and that was all it wrote for the week. It faded back off that level, holding a modest gain to the close. It continues working on the bottom of its 16 week base, making a couple of higher lows and higher highs in August. That is good technical action in building the pattern, but near term it looks as if it is going to come back after the 200 day SMA test before taking it back on. Key index for the market as it along with NASDAQ is a growth index, relying on an expanding economy to post gains. Thus if it continues base building here that is a good indication for the market down the road.

DJ30

DJ30 jumped higher along with SP500, clearing resistance at 11,400 and taking a bead on the prior high at 11,670. It looked to be slowing and ready for a test, but the large caps enjoyed what buying there was on Friday. Still likely to test before it is able to take on that May high.

Stats: +83 points (+0.73%) to close at 11464.15
Volume: 168M shares Friday versus 156M shares Thursday.

The Chart: (Click to view the chart)

SEPTEMBER BEGINS

One of the more feared months of the year kicked off Friday, and it was a gain. It is often a gain early in the month as some new money is put to work. Even after Labor Day it can post a gain as the summer officially ends and the fall begins. All the players have to get back to work and put some of that money to work. Once that is over, the true colors of the month come out.

The indices overall still look good heading into the fall, but of course it was a low volume rally to end the summer, sort of a late summer fling at the beach before the fall semester starts. Volume started to rise toward the end of the week, but it was still low overall. That is what, despite the nice move to end summer break, is what makes this such a serious transition point.

It is still somewhat of a mixed market with NASDAQ and SP600 still lagging the large cap NYSE indices. The small caps and NASDAQ are still below the 200 day SMA and still have quite a bit of work to do. They are putting in some good work on a bottom, but have not made the break yet. They are growth indices and thus economic indicators, and if they can keep building their bases, even after a September sell off that is a good indication for the market overall.

In other words, even if we get a sell off in September that does not mean the market is saying the economy is going into the tank. They can sell and still hold their current bases, indicating an economic slowdown but no crash. Indeed we expect the market to run into some September issues even given the nice move to end the summer and a few more upside sessions to start the post-Labor Day market.

The changeover in the ‘season’ of the market is always something of a wildcard. The market is set up well heading into September and the leaders look solid. Thus we let many of our plays hold over into next week. We will meet more upside by taking some more gain as it presents itself. Then we see how the leaders move. Really watching the semiconductors to see if the Thursday and Friday test was just that. Strong chips such as NVDA have faded back and are in position to continue the breakout if that is in the cards. If upside volume comes in strong we are going to be ready for these.

This is one of those times that you like what you see but you have to be ready to take what the market is going to give. If the market starts to distribute at some point next week we will be glad we have taken some gain off the table and then move to close out positions. We will be looking at safety zones for the upside such as healthcare and drugs as well as some downside plays. If that strong upside trade comes in we will look for rebounding leaders such as those chips along with technology in general.

Support and Resistance

NASDAQ: Closed at 2193.16
Resistance:
2190 is the July 2006 high and is giving way
2197 is the August 2004/April 2005 up trendline
The 200 day SMA at 2224.5
2230 is the June 2006 peak
2250 is the March 2006 closing low.

Support:
2185 to 2182 is the September 2005 peak and interim high from November 2005.
2177 is the December 2004 high.
2168 is the August intraday high.
The 10 day EMA at 2163
2158 from the May 2005 low.
The 50 day EMA at 2131
2100 from the early and mid-2005 peaks
2072 is the June closing low
2050 from the summer 2005 lateral range lows

S&P 500: Closed at 1311.01
Resistance:
1311 is the April closing high.
1315 is the May and May 2001 peaks
1324 to 1329 from the October 2000 lows.
1326.70 is the May 2006 high
1334 is an October 1999 peak

Support:
1302 the recent August highs
The 10 day EMA at 1300
1294 is the January 2006 high and 1297.57 is the February 2006 high.
The early June high at 1288
The late January peak at 1285
1280.37 is the recent July peak.
The 50 day EMA at 1280
The 200 day EMA at 1277
1262 is an old trendline from the August 2003/August 2004/October 2005 lows.

Dow: Closed at 11,464.15
Resistance:
11,642 is the May 2006 closing high
11,670 is the May intraday high

Support:
11,401 from the September 2000 peak and April 2001 highs
11,384 is the August intraday high.
The 10 day EMA at 11,357
11,350 from the May 2001 peak
The March 2006 highs at 11,329 to 11,335
The 18 day EMA at 11,307
11,279 is the late May closing high
11,243 is the early August peak closing high.
11,228 is the July closing high.
The 50 day EMA at 11,203
11,097 to 11,137 is the last peak from the February top.
The 200 day SMA at 11,068

Economic Calendar

These are consensus expectations. Our expectations will vary and are discussed in the ‘Economy’ section.

September 6
- Productivity, revised (Q2) (8:30): 1.6% expected, 1.1% prior
- ISM services, August (10:00): 55.0 expected, 54.8 prior
- Crude oil inventories (10:30)
- Fed Beige Book (2:00)

September 7
- Initial jobless claims (8:30): 316K prior
- Wholesale inventories, July (10:00): 0.7% expected, 0.8% prior

September 8
- Consumer Credit, July (3:00): $7.0B expected, $10.3B prior
icon url

ReturntoSender

09/07/06 12:50 PM

#6970 RE: ReturntoSender #6755

Gottfried's Semi/SIA Charts - Book to Bill, Semi Bookings, Semi Billings, Booking's Ratio, Billing's Ratio and Backlog Change:


Anyone wishing to refer to a single chart can now obtain the url from http://s105.photobucket.com/albums/m225/maugott/SEMI%20charts/ and insert it in their post.
icon url

ReturntoSender

09/09/06 8:04 PM

#6978 RE: ReturntoSender #6755

The Fat Lady Hasn't Sung
September 8, 2006
By John Mauldin

The Fat Lady Hasn't Sung
A New Measure of Inflation
The Money Supply Is Contracting
A Warning for Politicians
The Japanese Current Account Balance Is Again Shrinking
Consumer Spending Likely to Slow
New York and A Letter from a Reader

URL: http://www.frontlinethoughts.com/printarticle.asp?id=mwo090806

"The opera ain't over 'til the fat lady sings." And speech after speech by members of the Federal Reserve over the past few weeks suggest that the fat lady is still waiting offstage, not sure of her cue. Today we look at a thoughtful speech given last night to a private gathering by Richard Fisher, President of the Federal Reserve Bank of Dallas. We then look at a few worrisome charts on global liquidity and inflation and some more data on housing.

But first, I want to welcome all the new readers. There has been a noticeable upsurge in new subscribers to the letter lately, possibly caused by the fact that more people are forwarding the letter to friends. If you do get this letter as a forward and you would like to join my 1,000,000 closest friends and get your own free copy each week, as well as my Outside the Box, where I feature the work of another writer, often with a different opinion than mine, you can go to www.frontlinethoughts.com and subscribe by simply entering your email address at the website. We don't ask for any other information or need a secret handshake. I like to keep it simple.

Daughter and business partner Tiffani spent a few days this week reviewing readers' comments from the past few months. She wrote them saying she loves that I enjoy researching and writing; and if they did, too, she asked them to refer the letter to their friends and colleagues.

I have copied a reply back to her from David R., a long-time reader, at the end of this week's letter. If you want to know why I work so hard and send out this letter for free each week, this letter is one of the reasons. Feedback (both positive and negative) like this keeps me going.

Tiffani asked me to ask you to take a few moments and use the link below: It will take you to a page to send this week's letter to another friend or colleague.

http://www.2000wave.com/sendfriend.asp?id=mwo090806&ref=FT090806

And speaking of Outside the Box, I sent a special one out yesterday, by good friend George Friedman of Stratfor.com on the Iraq situation. If you have not read it, I suggest you do so. You can click on this link to get the letter: http://www.investorsinsight.com/otb_va_print.aspx?EditionID=383

And now, back to our regularly scheduled letter.

The Fat Lady Hasn't Sung

This Rice University graduate was invited to attend the Dallas Harvard Club last night, to hear a speech by Richard Fisher, President of the Federal Reserve Bank of Dallas. I went mainly for the company but was more than pleasantly surprised by Fisher's very thoughtful and interesting presentation. I have heard a few speeches from Fed officials, and sometimes they can only charitably be described as merely boring. Fisher is not. If you ever get a chance to hear him, you should.

For the next few pages, I am going to paraphrase some of his thoughts and material. I will do my best to get the spirit, if not the exact wording, of his presentation.

First, he made it very clear that he is concerned about inflation. His comments were very similar to two other Fed speeches this week, one in particular by Dr. Janet Yellen, the President of the Federal Reserve Bank of San Francisco. "Speaking in Boise, Idaho, Dr. Yellen said that she was concerned about recent inflationary pressures extant in the US economy, and that as a voting member who voted to hold rates steady at the last FOMC meeting, was prepared to move for further tightening if these inflationary pressures became of an even greater concern.

"Worse, she said that to bring inflationary concerns under control 'could take several years.' She said that she and others on the FOMC preferred seeing the personal consumption expenditures index between 1-2%, and that presently it was rising at an annualized pace of 2.4%. Clearly this is too high, then, and her propensity shall be to err upon the side of tighter rather than easier monetary policies going forward." (Courtesy The Gartman Letter)

A New Measure of Inflation

Interestingly, Fisher noted that the Dallas Fed has its own new calculation of inflation, called the "Trimmed Mean PCE Inflation Rate." Not having heard of it, I went online to check it out today. Turns out it was developed by a researcher at the Dallas Fed named Jim Dolmas. Essentially, he takes issue with the way the Fed calculates inflation. The favorite measure of inflation for the Fed is the core Personal Consumption Expenditures (PCE). The Fed then strips out food and energy, giving us a "core" rate of inflation, or core PCE. Why? Because the monthly food and energy numbers are so volatile that it can make the full PCE number quite volatile. Except that we all know we use food and energy, and inflation in those areas is quite real.

Dolmas notes as much in the introduction to the paper where he presents his work:

"Speaking of the challenge in interpreting monthly inflation numbers during his tenure on the Federal Reserve Board, former Vice Chairman Alan Blinder has said 'The name of the game then was distinguishing the signal from the noise, which was often difficult. The key question on my mind was typically: What part of each monthly observation on inflation is durable and what part is fleeting?

"Blinder's conception of a component of monthly inflation that is 'durable' as opposed to 'fleeting,' that represents 'signal' rather than 'noise,' corresponds to what most economists call core inflation. Core inflation, understood in this way, represents the underlying trend in inflation, once transitory swings have been smoothed out. Because what is transitory and what is lasting can only be known with the benefit of hindsight, the true core inflation rate for any given month cannot be known with certainty until well after the fact. In real time--as the data arrive and policy decisions need to be made--the best that economists can do is to estimate the core rate of inflation." You can read the paper at http://www.dallasfed.org/research/papers/2005/wp0506.pdf.

Dolmas notes (quite correctly, I think) that to exclude food and energy, just because they are volatile, ignores the other quite volatile measures of inflation that are still left in. Further, energy and food inflation do have meaning in the real world.

What Dolmas does is use a statistical device called "trimming." From the field of statistics, trim analysis borrows the idea of ignoring a few "outliers." A trimmed mean, for example, is calculated by discarding a certain number of lowest and highest values and then computing the mean of those that remain.

How accurate is his new measure? Dolmas suggests it is a lot more accurate: "That is to say, compared to the usual ... measure, on average the monthly trimmed mean measure would be expected to come closer to true monthly core inflation by roughly .75 of a percentage point, when the inflation rates are expressed in annual terms." That is huge, at least in my book, especially when we look at how much the difference is with the Fed's favorite methodology.

So what does this new measure show us? Fisher says that by their measure of trimmed core PCE, inflation was 3.1% in July (last month for which data was available) and not the 1.7% the Fed uses as core PCE. That is a big difference. Let's look at the tables from the Dallas Fed web site for the last 6 months. His research, by the way, shows that the 6-month inflation-trimmed core PCE numbers have the highest accuracy in gauging core inflation, and thus the tables below are for 6 months. (http://www.dallasfed.org/data/pce/index.html)


I really like what Dolmas has done. I think it makes sense. I doubt that it will become mainstream this cycle, because Bernanke and company will not want to use something showing higher inflation right now. By the way, this measure shows inflation did not get as low as everyone thought in 2003, dropping only to about 1.5% instead of below 1%.

What this data shows is that inflation has been slowly and steadily rising over the last six months, as opposed to falling, as the Fed's favorite measure has been. And Fisher made it clear that he is not comfortable with this trend.

No central banker, he told us, ever again wants to find himself in the position of Paul Volker, where he was forced to bring about serious and deep recession.

"Why then," I asked in the Q & A at the end of the speech, "was there only one dissenting vote at the last Fed meeting?"

He pointed that he was not a voting member at this meeting (the 12 Fed regional presidents rotate that responsibility). But he hastened to add that he agreed with the move to pause. Why? Because there is considerable lag between the time the Fed raises rates and the effect upon the economy. There had been 17 straight rate hikes, and it was time to see if those were going to have an effect.

But he made it clear that if inflation does not subside, the Fed would (not could!) take action in the future. There was no soft pedaling here. Clearly he understood the effects that such a move would have on the markets and the economy, but he was prepared to do so to keep inflation in check. And he clearly implied the rest of his colleagues agreed with him.

So, what does that mean? "We are data dependent," Fisher tells us. I think it is clear that they do not know what they are going to do. If inflation falls, they have finished raising rates for this cycle. If it does not, they are prepared to raise rates some more. They are gambling that a slowing economy will lower help lower inflation and remove the need for any further rate hikes. We will have to see what the data in the next few months shows us as to whether this approach is working.

Now, let me speculate. My sense is that they will look at the data in September, October, and November, before they decide whether to call in the fat lady for her finale. If inflation is still rising in November, they will likely raise rates at the December 12 meeting. The inflation numbers would have to be pretty bad to raise rates at the October 24-25 meeting in front of an election. The Fed does not have a political tin ear. Remember, this is my speculation and has nothing to do with Fisher's presentation.

This presages some market volatility, as the inflation numbers come out in the middle of every month for the preceding month. As an aside, just a few years ago, the CPI numbers came out before the PPI (Producer Price Index) numbers. Then a few years ago that order was reversed. Bill King tells me that this month they are planning to revert back to bringing out the CPI first. He does not know why. If anyone does know, I am curious as to the rationale.

The Money Supply is Contracting

Fisher noted that about two-thirds of US cash currency is overseas, with two-thirds of the hundred dollar bills in Russia. And that brings to mind the US money supply. The one measure of money supply that the Fed actually has control of is M-1. M-1 is just one measure of the money supply, and includes all coins, currency held by the public, traveler's checks, checking account balances, NOW accounts, automatic transfer service accounts, and balances in credit unions.

M-1 is not growing. In fact, it is actually contracting, as the charts below show. Further, the large majority of the additions to the money supply are physical cash; and cash is deflationary, and much of it ends offshore, effectively reducing our homegrown money supply.

As you can see from the chart below, the money supply has not grown since the middle of 2005. Further, the second chart shows that the money supply has actually fallen over the last year. This, sports fans, is another example of the Fed hitting the brakes. You don't contract money supply unless you are worried about inflation. In tandem with the rate hikes, it is another reason why the Fed is taking a pause to see if their efforts will slow inflation.

Notice that in 2003, when everyone was worrying about deflation, the Fed was clearly and significantly growing M-1. Then when inflation started to rise, they started to back off, and then in 2005 they started to hit the brakes.

(For the record, M-2, which includes money markets and other time deposits, is only growing around 5%, but the Fed does not have direct control of M-2, although they can influence it.)


A Warning for Politicians

Finally, Fisher referred to the national debt and growing social security and Medicare obligations. It is not the Fed's problem, and he flatly asserted they will not monetize the debt in the future. This is a political problem. Congress is going to have to get its own house in order. The Fed will not bring back inflation to accommodate a profligate Congress. He did not have kind words for the lack of spending control in Washington.

There is a probable push of debt coming to a shove of Fed willingness to force Congressional action in our future. Interestingly, the same events are effectively going to be happening in Europe a few years before our problems really kick in. We will get to see what works, or more likely, what doesn't.

The Japanese Current Account Balance Is Again Shrinking

The next chart comes courtesy of Bill King. Readers will remember when I directly connected the contraction of the Japanese Current Account Balance last spring and the resulting fall in stock markets all over the world, as global liquidity dried up. In fact, the Japanese central bank has inflated their current account and then rapidly dropped it three times in the last 20 years, with each inflation giving us a bubble and each drop a crisis. You can see from the chart that the Japanese stopped the slide in June, and the stock markets of the world began to recover.

Since that time they have slowly reversed that increase, and over the last two weeks we have seen another drop. This is worrisome. The Japanese are a big part of the global money supply, and they are drying up liquidity at the same time that the Fed is slowing the rise in our money supply.


Consumer Spending Likely to Slow

I have documented over the years the very strong correlation between the housing market and consumer spending. Housing is a lot more important than stocks or bonds as a driver of consumer spending. The following commentary and chart from my friends at www.contraryinvestor.com show that correlation does not bode well for consumer spending.

"Quite importantly, at least to us, the next little view of life is the NAHB [National Association of Homebuilders] data overlaid on top of the year over year change in real personal consumption expenditures. In other words, we're linking housing to consumer spending. As you can see, at least in the past, there has been a very high degree of correlation between the homebuilders survey and the direction of consumer spending trends. If indeed this continues to be true ahead, it sure as heck appears that a rate of change downtrend in consumer spending has just begun and may become a whole lot deeper before hitting some type of bottom. From current levels near 3%, we think it's fair to say that the forward year over year rate of change in real consumer spending could indeed drop to 1% or lower as we move forward."


If the US economy slows and consumers start to pull back, that means the trade deficit should improve. But be careful for what you wish. In the words of Charles Gave, "Because the US$ is still the reserve currency of the world, and because most trade exchanges are still priced in US$, a reduction in the US current account deficit is equivalent to a liquidity squeeze... Money becomes scarcer. Which is why, with each improvement in the US current account deficit, someone who is in debt and/or in negative cash, goes bust."

That means more tightening of global liquidity. Which is not good for equity markets. I repeat my mantra of the past few months. If the economy is slowing down, it is not good for the stock markets. If the economy is not slowing down, that means inflation is not slowing down either. The clear implication from every Fed speech we hear is that they will raise rates in the face of rising or problematic inflation. That will not be good for the stock market. I think we are going to get a chance to buy the market at a (probably much) lower price than it is at today. Be careful out there.

New York and a Letter from a Reader

I will be in New York week after next for a few days, but then back to continue working on my book plus the usual day-to-day business. It is probably not a surprise I am behind, but I really do want to finish this book project. I am having a lot of fun with it, but have a lot of new projects I want to start and can't until the book gets finished.

I got this kind note from reader David Romero, forwarded to me by my daughter. If you wonder why this letter is free and why I devote so much time to it, letters like this are a partial answer.

"I can't remember the exact date that I first heard of Mr. John Mauldin. It was back in 1998 or maybe 1999. I received an email from a government agency concerned about small investors. It's weird that I can't even remember which one. But the email had Mr. Mauldin's website address and I pulled it up. That was the beginning of a long one-sided relationship between me and Mr. Mauldin. He does all the work and I'm free to sit back and analyze what he says. I was so impressed by his work that I began sending his website address to my family and friends. Today his daughter has asked me to send a link to more of them. I'm stumped because I've already sent so many emails to friends and family I can't remember them all. I know that my cousin in Cheyenne, Wyoming receives John's work. So does my friend in Denver, Colorado. I have another friend in Southern California who reads him too.

"What makes John Mauldin so special is that he doesn't charge anyone for his work. When I first encountered him, I was receiving advertisements from other market observers asking me to subscribe to their work. Believe me they weren't cheap. I would not send somebody a check for $3000 to give me ideas or elucidate areas of the market that I may have overlooked. I was supposed to learn on my own. Do the work myself. Nobody takes you by the hand and guides you through the most competitive arena of all ... the trading pits of futures markets or of stock markets.

"Except for Mr. John Mauldin. Without asking me for a dime he has patiently worked very hard, week after week, writing his weekly commentary. I have even had the audacity to actually criticize him at times. I have written him saying what about this or you didn't mention that. But humility returned in time and I also wrote to him to thank him for what he does.

"Mr. Mauldin has gotten even better than when he first started. Thanks to him we readers of his weekly commentary have been exposed to many other brilliant minds. John cares about us. That makes him very special.

"Mr. Mauldin, it's been a while since I've expressed my appreciation for what you do. I want you to know that it pains me to have to delete your commentaries. Usually I take copious notes. I transfer the information from my computer screen to my ever growing notebook. I know that you are now read by millions of people.

"I certainly hope that each and every one of us is grateful. I am. Thank you for caring enough about the small investor or trader to include all of us in your thoughts. May the good Lord's face ... keep shining upon you ... and your family."

Thanks, David, for the very kind words and to all of you who write me. I think I can go home with a smile on my face with that encouragement. As an aside, I make a special point to read those letters which are critical of my views. And one of my best sources of material is readers who forward me articles they find of interest. Thank you all.

It is late on a Friday, and I am keeping Doug Harrison up (the gentleman who stays up until I finish so he can send this letter out and put it on the web site). So I will hit the send button and let him get to bed. Have a great week!

Your having more fun than I ever have analyst,


John Mauldin
John@frontlinethoughts.com
Copyright 2006 John Mauldin. All Rights Reserved

If you would like to reproduce any of John Mauldin's E-Letters you must include the source of your quote and an email address (John@frontlinethoughts.com) Please write to Wave@frontlinethoughts.com and inform us of any reproductions. Please include where and when the copy will be reproduced.

John Mauldin is president of Millennium Wave Advisors, LLC, a registered investment advisor. All material presented herein is believed to be reliable but we cannot attest to its accuracy. Investment recommendations may change and readers are urged to check with their investment counselors before making any investment decisions.

Opinions expressed in these reports may change without prior notice. John Mauldin and/or the staffs at Millennium Wave Advisors, LLC may or may not have investments in any funds cited above.

PAST RESULTS ARE NOT INDICATIVE OF FUTURE RESULTS. THERE IS RISK OF LOSS AS WELL AS THE OPPORTUNITY FOR GAIN WHEN INVESTING IN MANAGED FUNDS. WHEN CONSIDERING ALTERNATIVE INVESTMENTS, INCLUDING HEDGE FUNDS, YOU SHOULD CONSIDER VARIOUS RISKS INCLUDING THE FACT THAT SOME PRODUCTS: OFTEN ENGAGE IN LEVERAGING AND OTHER SPECULATIVE INVESTMENT PRACTICES THAT MAY INCREASE THE RISK OF INVESTMENT LOSS, CAN BE ILLIQUID, ARE NOT REQUIRED TO PROVIDE PERIODIC PRICING OR VALUATION INFORMATION TO INVESTORS, MAY INVOLVE COMPLEX TAX STRUCTURES AND DELAYS IN DISTRIBUTING IMPORTANT TAX INFORMATION, ARE NOT SUBJECT TO THE SAME REGULATORY REQUIREMENTS AS MUTUAL FUNDS, OFTEN CHARGE HIGH FEES, AND IN MANY CASES THE UNDERLYING INVESTMENTS ARE NOT TRANSPARENT AND ARE KNOWN ONLY TO THE INVESTMENT MANAGER.


icon url

ReturntoSender

09/11/06 7:49 PM

#6984 RE: ReturntoSender #6755

Feom Briefing.com: 4:20 pm : While today's trading paled in importance to a solemn remembrance of the five-year anniversary of the 9/11 terrorist attacks, investors Monday juggled an encouraging sell-off in commodities and mixed sentiment about the tech sector against renewed concerns of decelerating profit growth.

Oil prices fell for a sixth straight day -- the longest losing streak in nearly three years -- and gold prices plunged 3.2% to close under $600 an ounce for the first time since June. That combined retreat eased the worst of inflation fears, but weakness and the loss of leadership from the S&P 500's biggest earnings drivers -- Energy (-3.1%) and Materials (-2.7%) -- created doubts as to whether the S&P 500 can sustain double-digit profit growth. The sell-off in commodities exacerbated ongoing concerns about a slowing economy, especially on the heels of a press report out this morning discussing studies done by some Wall Street investment banks on the prospects for a recession.

The diminishing desire to own commodity-related stocks presented opportunities to rotate into underperforming areas like Technology -- the only sector sporting a loss on the year. The sector was in focus and under pressure early after Dell (DELL 21.19 -0.46) delayed its Form 10-Q filing, suspended share buybacks and cancelled its analyst meeting. However, Texas Instruments (TXN 31.76 +0.76) showing strength ahead of its mid-quarter update, and Freescale Semiconductor (FSL.B 36.84 +5.90) surging 19% to a 52-week high amid reports that a consortium of private equity firms is nearing a deal to acquire it for more than $16 bln, renewed enthusiasm throughout the struggling semiconductor group.

Consumer Discretionary also provided some notable leadership. Aside from another sharp pullback in oil prices easing concerns about consumption patterns, Best Buy (BBY 47.74 +1.43) rallied in anticipation of a strong Q2 earnings report tomorrow while the likes of Home Depot (HD 35.01 +0.73) and Lowes Cos. (LOW 27.84 +0.60) got a lift after Chicago's Mayor Daley vetoed a "living wage" ordinance requiring big box retailers to pay workers more.

In the absence of any scheduled economic reports, the market also looked to more Fed speak to get an idea as to what policy makers will do at the next FOMC meeting on September 20. Among the Fed officials in focus, St. Louis Fed President Poole saying the economy is "really not fragile, it's robust," and reminding investors that inflation is expected to come down in coming quarters, relieved some of the market's worries about interest rates. DJ30 +4.73 NASDAQ +7.46 SOX +2.4% SP500 +0.62 XOI -2.4% NASDAQ Dec/Adv/Vol 1620/1367/1.71 bln NYSE Dec/Adv/Vol 1743/1457/1.58 bln

4:35PM Texas Instruments Q3 mid-quarter update (TXN) 31.78 +0.78 : Co sees Q3 EPS from continuing operations, including sbc, of $0.44-0.46 vs. previous range of $0.42-0.48, consensus $0.45. Co sees Q3 revs of $3.71-3.87 bln vs. previous range of $3.63-3.95 bln, $3.8 bln consensus. Co sees Q3 Semis revs of $3.53-3.67 bln vs. previous range of $3.45-3.75 bln. Co sees Educational & Productivity revs of $180-200 mln unchanged vs. previous range of $180-200 mln.

4:30PM Cree files lawsuit against BridgeLux for patent infringement (CREE) 18.90 +0.67 : Co announces that it has filed suit against BridgeLux for infringement of U.S. Patent Nos. 6,657,236 and 5,686,738. The suit, which was filed in the U.S. District Court for the Middle District of North Carolina, seeks monetary damages and injunctive relief to prohibit BridgeLux from infringing these patents.

1:40 pm OPEC Maintains Production Quotas

As expected, OPEC is maintaining production quotas, but will consider a cut in December. After two days of meetings in Vienna, the Organization of Petroleum Exporting Countries has voted to keep production at current levels despite free-falling oil prices. Easing tensions with Iran, a well supplied oil market, a mild hurricane season, and concerns over the pace of global economic growth have sent oil from $75 to $66 per barrel over the last month. Still, prices are still above year-ago levels and triple the price floor established by the cartel 5 years ago.

OPEC, which supplies 40% of the world's crude oil, has maintained its current production level of 28 mln barrels since July of 2005 in order to ease crude prices. But geopolitical tensions and speculation have ruled over the energy markets, sending prices to historic highs and making OPEC irrelevant in terms of price control. Members, with the exception of Saudi Arabia, have been pumping at or near capacity, reaping a windfall in oil revenues.

Recently, Saudi Arabia has been cutting production, pumping 9.2 mln barrels last month - 6% below peak levels reached in 2004. Saudi Arabia's Oil Minister Ali al-Naimi said, "We are very happy with the situation as it is." Currently, crude oil inventories are 12% above the 5-year historical average, according to the Department of Energy's weekly stockpiles report. Well-supplied market conditions coupled with slowing demand were the basis for our recent downgrade of the Energy sector from Overweight to Market Weight.

Qatari's Oil Minister Abdullah bin Hamad al-Attiyah echoed comments made by Venezuela's oil minister that OPEC may have to cut production. Crude for October delivery dropped 1.8% or 1.18 cents to $65.07 per barrel on the news. Price weakness is typical during the fall shoulder months as the market transitions from the peak driving season to the winter heating season. Today's vote indicates that prices have yet to cross OPEC's threshold - meaning if crude drops into the high fifties or low sixty dollars per barrel, it increases the possibility that members will vote to cut production at its next meeting, which takes place in December.

--Kimberly DuBord, Briefing.com

11:14 am Newell Rubbermaid (NWL)

28.61 +1.61: Consumer products company Newell Rubbermaid has been engaged in an extended restructuring process that has been accented by a decision to divest non-core businesses. Today it has written another chapter in that restructuring story with an announcement that it will sell its Little Tikes division to MGA Entertainment, Inc., which is the maker of the popular Bratz line of dolls.

Financial terms of the transaction were not disclosed. It was indicated, however, that the division will be reclassified as discontinued operations and that Newell Rubbermaid expects to record a net gain of $15-25 million in the fourth quarter when the transaction closes.

In 2005 the Little Tikes unit contributed approximately $250 million, or roughly 4.0%, of Newell Rubbermaid's total revenues. On account of its reclassification to discontinued operations, the company's full-year diluted EPS from continuing operations is expected to be pinched by $0.03-0.04, split evenly between the third and fourth quarters. Despite the negative impact, Newell Rubbermaid is leaving the full-year earnings per share outlook it provided in July of $1.75-1.85, excluding restructuring charges, unchanged.

The market has responded favorably to today's news as it appreciates the ongoing effort to focus on brands that provide it with the best opportunity to bolster its profit prospects. Newell Rubbermaid's affirmation of the third quarter earnings outlook, too, along with the full-year view, has created a sense of optimism that the company is indeed on the right track behind the leadership of CEO Mark Ketchum. As noted after its second quarter earnings report, we like what we see unfolding at Newell Rubbermaid and continue to stand by the stock as a suggested holding in our Active Portfolio.

--Patrick J. O'Hare, Briefing.com

10:29 am Campbell Soup Co. (CPB)

36.40 -0.78: Shares in Campbell Soup Co. lost ground Monday morning after the company said it saw fourth quarter earnings of $0.18 excluding a $14 million tax benefit, $4 million in charges associated with the repatriation of earnings from non-U.S. subsidiaries under the provisions of the American Jobs Creation Act and $61 million of expenses in discontinued operations related to the divestiture of the company's U.K. and Irish businesses. That compared to a Reuters Estimates consensus of $0.23.

Campbell, which has a market cap of about $14.88 billion, said it saw revenues rise 3.6% year over year to $1.45 billion versus the $1.55 billion consensus.

The Camden, N.J. food company, whose brands include Pepperidge Farm cookies, said it expects earnings growth of 5% to 7% for the fiscal year of 2007, equating to $1.73 versus consensus of $1.91. Campbell sees revenue growth of 3% to 4% which equates to $7.56 billion to $7.63 billion versus $7.84 billion consensus.

The company plans to report new pro forma earnings beginning in fiscal 2007 based on adjusted earnings from continuing operations combined with pro forma impact of the anticipated use of $620 million of the net proceeds from the divestiture to repurchase approximately 17 million shares.

While the company was pressured by costs from the sale of its U.K. and Irish businesses, Douglas Conant, Campbell President and Chief Executive Officer, said that in the latest period the company exceeded company expectations for earnings while increasing spending on advertising in its U.S. businesses. In addition, he said, the company achieved successful distribution of its lower sodium soups in the U.S.

Briefing.com took a bullish stance on Campbell Soup in May, noting the defensive nature of the stock and that the company is now trying to carve out new product niches for itself. Indeed, Campbell's improved its gross margin, consistent with its goal for the year and achieved a record level of cash flow from operations in fiscal 2006. That enabled the company to pay down debt, buy back shares and increase its dividend while continuing to invest in core growth initiatives such as its lower sodium soup and premium refrigerated soup.

--Christine Marie Nielsen, Briefing.com

10:10 am Dell Inc. (DELL)

21.65: Dell Inc. on Monday said it will delay filing its fiscal second quarter report, due to questions raised in connection with a previously announced informal investigation by the U.S. Securities and Exchange Commission into accounting issues and a subsequent internal review. The Round Rock, Texas-based company also said it suspended its share repurchase program and postponed an analyst meeting scheduled for September 13, as a result of the ongoing probe.

Shares of the company fell more than 5% on the news. The stock is down approximately 30% since the beginning of the year, mired by sluggish sales in the company's core business, along with a host of other problems. At the current level, shares are trading at roughly 16.9x forward earnings.

The recent investigations have shown that Dell may have misstated prior period financial reports, including issues related to accruals, reserves and other balance sheet items, which may affect previously reported financial results. The SEC requests for information are joined by a similar request from the U.S. Attorney for the Southern District of New York, who has subpoenaed documents related to the company's financial reporting from 2002 to the present, Dell said in its statement.

The company, in cooperation with an internal audit committee, is continuing to investigate the matter fully, but has not yet determined the possible impact of any accounting issues. However, the company said it plans to file the second quarter report "as soon as possible."

--Richard Jahnke, Briefing.com

09:07 am NASDAQ (NDAQ)

29.18: It's apparent that global consolidation continues in the exchange arena as word spreads that Nasdaq Stock Market, Inc. is in talks to acquire Nordic and Baltic stock exchange operator OMX AB.

According to media reports, the talks are still at a very early stage, and Nasdaq continues to view an acquisition of the London Stock Exchange (LSE.L), in which it has amassed a stake of over 25%, as a high priority.

Chief executive of the Nasdaq Stock Market Inc., Bob Greifeld, said on a conference call with analysts in July that this is a transition year for the company. In addition to pondering takeover bids, the company is integrating its Inet electronic trading platform.

The purchase of OMX, which has been the subject of speculation for purchases by other buyers, would certainly be a plus on terms of expanding its global reach. Nasdaq's ambition to be a leading force in driving concentration in the hot exchange space, combined with the fact that the stock is at about half of trailing 12-month earnings of competitor NYSE Group, Inc. (NYX) and that Nasdaq has seen about a 19% quarterly earnings growth year over year, make the stock a good buy at this time.

(Disclosure: Briefing.com has a business relationship with Nasdaq)

--Christine Marie Nielsen, Briefing.com

08:51 am Standard Pacific Corp. (SPF)

22.83: Homebuilder Standard Pacific Corp. on Friday warned that third quarter profit would be "materially below" its previous guidance, due to an increase in cancellation rates and softer demand related to the continued slowdown in the U.S. housing market. Shares of the company, which are down about 38% since the beginning of the year, traded lower in pre-market activity based on the news.

Standard Pacific said net new orders fell 58% in the first two months of the quarter, while gross orders were down about 30% versus the year ago period. Orders were off meaningfully in Southern California, Northern California, Florida, and Arizona, but up in Texas, it added. The company's backlog as of August 31 stood at 4,837 pre-sold homes valued at approximately $1.8 billion.

Based on the current negative order trends, the Irvine, California-based builder expects third quarter earnings to be materially below its previous forecast of $0.80 to $0.85 per share. That compares with analysts' estimate of $0.81 per share, according to Reuters Estimates. It also said it will lower its earnings and delivery guidance for the full year, and will provide an update at the end of October, with its third quarter earnings release.

Standard Pacific is the fourth major homebuilder in the past week to temper its outlook as the nation's housing market cools. Earlier, KB Home (KBH) and Beazer Homes (BZH) cut their earnings forecasts for the full year, while Lennar Corp. (LEN) lowered its third quarter forecast, citing a deteriorating environment. While valuations for homebuilders continue to look compelling, we remain cautious on the industry as earnings are subject to further downward revisions amid challenging conditions.

--Richard Jahnke, Briefing.com

08:37 am Freescale Semiconductor (FSL)

30.75: Shares in Freescale Semiconductor are soaring in the pre-market on rumors that the semiconductor company may be sold for more than $16 bln in the largest buyout in the technology industry. Citing people familiar with the matter, The New York Times is reporting this morning that a group of investors, including Texas Pacific Group, Blackstone Group LP and Permira Advisers LLP, are close to an agreement to buy the Austin, Texas-based company.

Known for its market leadership position in automotive and communication processors, Freescale has generated solid earnings growth compared to the likes of Intel (INTC), which certainly increases its buyout appeal. The Times reported that Carlyle Group and Bain Capital may also join the buyout group, which is facing competition from Kohlberg Kravis Roberts & Co and Silver Lake Partners, which submitted a rival bid. Freescale declined to comment.

The interest in the semiconductor industry comes at a time when global chip sales are forecasted to rise 10% this year to $250.5 bln, after rising 6.8% in 2005, according to the World Semiconductor Trade Statistics. Growth is expected to accelerate to 11% and 13% over the next two years, recovering from 2001 when sales slumped to $139 bln - the steepest decline in history. Private equity firms have amassed a record level of funds, which is good news for investment bankers, spawning a surge in deals. Just last month, KKR and Silver Lake agreed to buy Royal Philips Electronics NV's semiconductor unit for 3.4 bln euros ($4.32 bln).

Freescale was spun off by Motorola (MOT) in July of 2004 for $13.00 per share after being with the company for more than 50 years. The $12.5 bln company ranks as the third largest chipmaker in the US and the ninth largest in the world with customers including Cisco (CSCO) and Apple (AAPL). Before today, the stock had returned over 22% to date, compared to a 22% decline in rival Intel, as the market continues to reward its efforts in improving margins and diversifying its product mix.

--Kimberly DuBord, Briefing.com

09:43 am Under Armour: Thomas Weisel upgrades Peer Perform to Outperform. Thomas Weisel upgrades UARM to Outperform from Peer Perform saying the co has demonstrated both the extensibility of the brand into new categories and the operational capacity to execute on growth initiatives. The firm says they are both impressed with the track record to date and compelled by the long list of opportunity markets. The firm sees near-term opportunity for Under Armour to 1) expand the apparel pad in key accounts (men's, women's, and youth), 2) expand brand representation in other departments and specialty stores (golf, tennis, running, soccer, etc.), and 3) grow the product footprint into new categories and markets (cleated and non-cleated footwear, international, etc.). The firm sayw while their current estimates reflect expectations for 25% rev growth into 2007, successful pursuit of near-term opportunities suggests tangible potential for upside.

09:42 am Silgan Holdings: KeyBanc Capital Mkts / McDonald upgrades Buy to Aggressive Buy. Target $47. Keybanc upgrades SLGN to Aggressive Buy from Buy with a $47 tgt based on several developing catalysts: 1) improved outlook for tomato crops; 2) an inflection point in the Plastics segment that is poised for growth; 3) returns from high return growth and cost reduction projects that should begin to meaningfully contribute going forward; and 4) contribution from recently acquired White Cap assets.

09:42 am Citrix Systems: RBC Capital Mkts upgrades Outperform to Top Pick. Target $40. RBC upgrades CTXS to Top Pick from Outperform and sets a $40 tgt saying over the next few months, Citrix should have multiple catalysts, including the Q3 conference call, customer conference, and annual partner conference. The firm says the Q3 conference call should be a positive catalyst as the co is likely to offer a slight revenue improvement over street estimates with better operating margin performance than was experienced in Q2. The firm says they believe as CTXS progresses into 2007 the street estimates will likely move toward a business model which has revs closer to $1.35 bln and $1.75 in EPS. In addition, they say the co is less likely to do any large acquisition in 2007 as they are focused on growing and improving profitability for its existing business.

09:40 am Frontier Oil: Friedman Billings reiterates Outperform. Target $38 to $42. Friedman Billings upgrades FTO to $42 from $38 saying the co is holding an analyst meeting on Wednesday, during which the firm expects the co to provide more details on its capital projects, which include coker and crude unit expansions. They say this should significantly increase its earnings power. Additionally, given the strong cash flows, the co could announce additional projects and/or an increase the share repurchase program.

09:39 am Airspan Networks: Morgan Joseph initiates Buy. Target $6. Morgan Joseph initiates AIRN with a Buy and a $6 tgt saying emergence of mobile WiMAX should significantly increase the addressable market for Airspan. The firm says mobile WiMAX is a much larger and potentially more competitive market opportunity, which could reach $20.0 bln.

09:38 am Riverbed Technology: WR Hambrecht initiates Buy. Target $11. WR Hambrecht initiates RVBD with a Buy and an $11 tgt saying Riverbed mgmt is currently conducting a roadshow in preparation for the co's initial public offering, which they believe will take place later this month. The firm views Riverbed as the innovation and thought leader in W.D.S-a subset of the application delivery infrastructure market geared specifically towards addressing Wide-Area Network performance. The firm believes that Riverbed has defined the market for W.D.S and should continue maintaining its market and technology leadership position, post explosive revenue growth far outpacing its closest competitors, and grow its share of the market.

09:38 am Scientific Games: Banc of America Sec downgrades Buy to Neutral. BofA downgrades SGMS to Neutral from Buy and cuts their tgt to $31 from $36 based on their visit to Germany, they believe growth expectations there could be difficult to achieve. Instant ticket sales from the two co-op contracts have started off much slower than the firm realized due to legislative issues that hamper Sci-Games' ability to fully distribute and advertise its scratch-off game cards. The firm says Global growth of instant tickets remains a compelling story, but the firm would like to see more visibility to the Germany revenue ramp, more achievable consensus, or a more attractive valuation before considering getting back on board.

09:37 am Redback Networks: Miller Johnson downgrades Outperform to Market Perform. Target $19. Miller Johnson downgrades RBAK to Market Perform from Outperform with a $19 tgt saying their checks show that it is very unlikely that Redback will win the Verizon (VZ) Services Gateway R.F.P. While a contract has not yet been signed, their sources within Verizon have indicated that Juniper (JNPR) is the likely winner of the RFP. Both Cisco (CSCO) and Redback are trying to gain a foothold as second sources. The firm says contacts suggest that even if Redback wins the second source, it would be for only 10% of the total business, which amounts to around $6 mln/year.
icon url

ReturntoSender

09/15/06 8:36 PM

#6992 RE: ReturntoSender #6755

From Briefing.com: 5:38 pm Weekly Wrap

The stock market got back on track this week. The profit-taking from the prior week ended, and good fundamentals gave an added boost to the recent bullish sentiment.

The week was dominated by macro-economic issues. The economy, inflation, and oil prices were the key factors. Corporate news was limited.

On Monday, Saint Louis Fed President Poole said the economy "is not really fragile, it's robust." A key concern for the stock market in recent weeks has been that economic growth might be slowing dramatically. That would cut into earnings growth. Poole's comments served as a reminder that in fact most economic series have showed continued strength. There has been significant weakness in housing, but even there recent weekly data have shown a pick-up in mortgage applications. There is no crash.

The August retail sales data on Thursday reflected the resilience in the economy. Sales were up just 0.2%, but that followed a strong 1.4% jump in July. Data on new claims for unemployment for the week ended September 9, also released on Thursday, dropped to just 308,000. This provided evidence that the labor market is not experiencing serious weakness.

On Friday, August industrial production was reported to have dropped 0.1%, but that was due to a drop in utility output of 0.8% that will probably be aberrant. The September NY Empire State index of manufacturing picked up a bit to 13.8 from 11.0 in August. There is no evidence that manufacturing will experience a sharp downturn.

Friday also saw the report of a pick-up in consumer sentiment for September. This reflected the recent sharp drop in gasoline prices. Oil prices on the global market fell this week to $63 a barrel from $66 a barrel last week. Further declines at the pump are coming.

The concerns about a sharp slowdown in economic growth eased this past week.

There was also good news on the inflation front. The August core CPI was up 0.2%. That was in line with expectations, but still marks the second straight month of a modest increase at that level after four straight months of a 0.3% increase. The lack of an uptrend in core inflation was a great relief to the stock market. The total CPI was also up only 0.2%. There is even an excellent chance of a drop in total CPI next month, as the recent drop in gasoline prices could pare 0.5% off the index.

The inflation news further convinced the financial markets that the Fed will not raise rates at the policy meeting on Wednesday. Fed funds futures incorporate only a 19% chance of any further rate hike this year, and then assume a rate cut in the first half of next year.

The macro-fundamentals all supported the underlying bullish tone. Economic growth is clearly slowing, but there is no evidence of a severe slowdown. The inflation data are steady, but that is good enough as it is expected that inflationary pressures will ease in the months ahead in reaction to slower economic growth. Oil prices are down. The Fed is not expected to raise rates again.

It is therefore not surprising that the S&P was up four out of five days this past week.

The corporate news included good earnings reports from brokers Lehman Brothers, Goldman Sachs, and Bear Stearns. Best Buy and Adobe also posted good numbers. There were no major earnings warnings.

Board room maneuvers made the news as Bristol-Myers and Hewlett-Packard dealt with CEO departures. Merck faced more negative studies on Vioxx. And Ford announced yet more major cuts as they strive to improve margins.

The next two weeks bring the risk of an increased level of earnings warnings. Companies that are going to miss Wall Street estimates typically announce such near the end of the calendar quarter. But the underlying tone in the stock market is moderately bullish, supported by good fundamentals.
 
Index Started Week Ended Week Change % Change YTD
DJIA 11392.11 11560.77 168.66 1.5 % 7.9 %
Nasdaq 2165.79 2235.59 69.80 3.2 % 1.4 %
S&P 500 1298.92 1319.87 20.95 1.6 % 5.7 %
Russell 2000 708.54 729.35 20.81 2.9 % 8.3 %

5:15PM Semtech receives additional Nasdaq deficiency as anticipated (SMTC) 13.32 -0.11 :

4:20 pm : With inflation still the key variable in the stock market outlook, another tame reading at the consumer level lent further support for the Fed's much-desired soft landing and helped the major averages close modestly higher Friday.

Before the bell, the Labor Dept. showed that consumer prices rose just 0.2% in August, half the previous month's pace, as gasoline and home ownership costs rose at a slower rate. Providing even more relief on the inflation front and further proof the Fed may again forgo a rate hike at next Wednesday's FOMC meeting, though, was moderation in the more closely watched core rate. Excluding volatile food and energy costs, core CPI rose just 0.2% for a second straight month. That confirmed a moderation from the recent uptrend and assuaged the worst of inflation fears. In turn, it set a positive tone for stocks from start to finish.

Bonds also rallied on the news, initially pushing yields across the curve to multi-month lows. However, when Kansas City Fed President Thomas Hoenig chimed in, as the afternoon session got underway, with an acknowledgment that today's inflation numbers are "good news" but that lower energy prices may support consumer spending and sustain economic growth, nervousness returned to Treasuries and removed some of the optimism tied to a potential rate cut early next year to close bonds relatively unchanged for the day.

The rate-sensitive Financials sector maintained decent momentum inspired by early declines in borrowing costs to pace the day higher among the nine sectors posting gains.

Also providing notable leadership was the Industrials sector, which got a boost from United Technologies (UTX 64.67 +1.67), which raised its share buyback program to $2 bln from $1.5 bln and reaffirmed its full-year EPS outlook. Technology was also in focus after Adobe Systems (ADBE 37.00 +3.35) topped analysts' expectations and offered reassuring guidance. Strong follow-through in Microsoft (MSFT 26.85 +0.52) provided additional sector support that helped investors look past a 12% drubbing in Ford Motor (F 8.02 -1.07).

The auto maker announced its accelerated "Way Forward" restructuring plan, which included the suspension of its dividend and an announcement that the North American unit will not become profitable before 2009. Merrill Lynch subsequently downgrading the stock to sell exacerbated the selling pressure which left it as the day's worst performing S&P 500 constituent.

Telecom (-0.5%) was the only sector failing to take part in today's advance. Aside from the temptation to lock in profits from this year's best performing sector (+21%), an analyst downgrade on Citizens Communications (CZN 13.55 -0.26) led to today's disinterest for Integrated Telecoms -- one of today's worst performing areas.DJ30 +33.38 NASDAQ +6.86 SP500 +3.59 NASDAQ Dec/Adv/Vol 1439/1539/2.5 bln NYSE Dec/Adv/Vol 1343/1929/1.9 bln

4:35PM Freescale Semi Reaches Agreement with Private Equity Consortium in $17.6 Billion Transaction; Freescale Stockholders Offered $40 per Share in Cash (FSL) 37.16 -0.41 : Co announced today that it has entered into a definitive merger agreement to be acquired by a private equity consortium in a transaction with a total equity value of $17.6 billion. The consortium is led by The Blackstone Group, and includes The Carlyle Group, Permira Funds and Texas Pacific Group. Under the terms of the merger agreement, the consortium will acquire all of the outstanding Class A and Class B shares of Freescale for $40 per share in cash, representing a premium of approximately 36% over Freescale's average closing share price during the 30 trading days ended September 8, 2006. The company first acknowledged it was in discussions with third parties regarding a possible transaction on September 11, 2006. The board of directors of Freescale has unanimously approved the merger agreement and resolved to recommend that Freescale's stockholders adopt the agreement. There is no financing condition to the obligations of the private equity consortium to consummate the transaction, and equity and debt commitments for the full amount of the merger consideration have been received. It is currently anticipated that substantially all of the company's outstanding Notes will either be tendered for or repaid.

8:45AM Micron: Toshiba and Micron confirm agreement to settle all pending Lexar litigation (MU) 17.77 : Toshiba and MU confirm they have entered into agreements where Toshiba will purchase certain of MU's semiconductor technology patents and license patents previously owned by Lexar Media in exchange for payments totaling $288 mln. The agreements settle all outstanding NAND flash memory-related litigation between Toshiba, its subsidiaries and Lexar Media, which MU acquired in June.

11:21 am Daimler-Chrysler (DCX)

49.00 -3.90: Daimler-Chrysler CEO Dieter Zetsche has been seen a lot lately thanks to a national advertising campaign from the auto maker that is built around the slogan "Ask Dr. Z." The intention is to use Dr. Z's presence to highlight the benefits of owning Chrysler products. At this stage, though, that campaign doesn't seem to be working as Daimler-Chrysler announced today that it is widening its third quarter operating loss estimate for its Chrysler Group to $1.5 billion from $0.6 billion. For the full-year the Chrysler Group is expected to lose $1.2 billion from operations.

The explanation for the downward revision sounded all too familiar with the company citing a difficult market environment in the U.S. that was linked to excess inventory, non-competitive legacy costs for employees and retirees, continuing high fuel prices, higher interest rates, and a stronger shift in demand toward smaller vehicles. To no one's surprise either Daimler-Chrysler also pointed to the significant price concessions - particularly on light trucks - that have been made by its competitors.

Fortunately, Daimler-Chrysler's other units are holding up well. As a result, the auto maker anticipates earning 5 billion euros, or $6.4 billion, from operations in 2006. That is down, however, from a prior view of more than 6 billion euros.

Despite the tough showing for Chrysler in the third quarter, the auto maker is expecting the unit to achieve positive results in the fourth quarter with the help of production cuts and the introduction of eight new vehicles in the second half of the year, many of which are in the growing small vehicle segment.

The key variable behind its relatively upbeat assessment is demand, as plenty of demand was pulled forward with the auto industry's 0.00% financing and employee pricing offers. By the same token, General Motors (GM) and Ford (F) have been willful participants in the auto industry's zero-sum game. On the brighter side, it now appears that the Big 3 understand the importance of right-sizing their operations and cutting inventory so they can get back to rational pricing and financing activity that will ensure sustained profitability. As we heard from Ford today, that won't be something that is achieved easily overnight. Hopefully for Daimler-Chrysler shareholders, though, Dr. Z will prove to have the right answers to quickly turn the tide at Chrysler.

--Patrick J. O'Hare, Briefing.com

09:54 am Adobe Systems (ADBE)

37.40 +3.82: Shares in graphic software maker Adobe Systems Inc. were up after the company said late Thursday that it saw third quarter earnings of $0.29 per share, excluding non-recurring items, $0.03 better than the Reuters Estimates consensus of $0.26. Revenues rose 23.7% year over year to $602.2 million versus the $594 million consensus.

The company, which has a market cap of about $19.49 billion, also reported expectations for fourth quarter operating margin of 34.4% versus 34% Street expectations. The company issued in-line guidance for the fourth quarter, seeing earnings per share of $0.32 to $0.34 versus $0.32 consensus. The company also sees fourth quarter revenues of $655 million to $685 million versus $670.44 million consensus. The company also saw fourth quarter gross margins of 37% to 38% versus 37% Street expectations.

The solid financial release this week supports our positive outlook on the stock, with Adobe's upcoming product cycle upgrade and the continued integration of Macromedia (acquired in December 2005). At 35.8x trailing 12-month earnings, the stock is trading at a slight premium to its competitor Apple Computer Inc. (AAPL).

Adobe, which plans to offer its next version of Acrobat software in all major languages late this quarter, will provide a regular fourth quarter update press release on Oct. 31.

--Christine Marie Nielsen, Briefing.com

09:37 am Microsoft (MSFT)

26.33: In the worst kept secret in tech land, Microsoft finally unveiled its answer to Apple's (AAPL) iPod - the Zune. The new 30-gigabyte digital media player is arriving just in time for the holidays, even though Microsoft's bread-and-butter Vista, aimed at challenging Apple's dominance, is not. However, it will take more than a flashy three inch color display for the Zune to dethrone the iPod, which has nearly 80% share of the market.

As we stated in July, while the move by Microsoft doesn't make financial sense as a stand-alone product, it makes enormous business sense as an xBox extension and a way to integrate MSN Music, thus creating a pure MSFT end-to-end solution in the digital home. The first gadget under the Zune name offers built-in wireless technology, 30 gigs of storage, and an FM radio tuner - features not currently available on the iPod.

Microsoft said it designed the Zune around the idea that users want to use and share entertainment files with each other. It also launched an online web site, called Zune Marketplace, where customers can purchase songs individually or buy subscriptions offering an unlimited number of songs for a flat fee. Pricing and availability details are expected within weeks.

The news is slightly positive for Microsoft, whose shares have reversed strongly off recent lows as it aims to take on Apple's dominance, which has gone virtually unchallenged for five years. But we wouldn't expect Steve Jobs to take the move into "his" territory lightly. Despite the substantial investment MSFT has made, the Zune has the look and feel of the iPod, which only further illustrates Apple's ability to bring truly innovative, cutting-edge technology to the market first. But with the growing number of music vendors, Apple won't be MSFT's only competition. Despite the investment in other areas, MSFT's near-term future rests on the upcoming Vista launch as a catalyst for top line growth and price appreciation.

--Kimberly DuBord, Briefing.com

09:06 am Exelon Corp. (EXC)

57.77: Shares in Exelon Corp. rose late Thursday after the Chicago-based company said it would cancel its $17.7 billion takeover of Public Service Enterprise Group Inc. (PEG) after it was unable to reach an agreement with New Jersey regulators.

Industry watchers say the price tag on the deal - which would have represented the largest utility merger in U.S. history - was perceived as being on the high side. Exelon's shares rose because Exelon now won't be exposed to cash flow dilution from the deal.

Public Service Enterprise Chief Executive James Ferland was quoted in media reports as saying his company's prospects remain strong as a stand alone due to favorable pricing in energy markets and improvements to its nuclear plants.

At 42x trailing 12-month earnings, the stock is trading at over twice the industry average. However, the company's strong performance supports our positive view on the stock. On July 31, Exelon reaffirmed its full-year earnings forecast of $3 to $3.30 per share. Analysts are looking for a profit of $3.27 per share, according to Reuters Estimates. The shares boast a trailing annual dividend yield of 2.8%.

--Christine Marie Nielsen, Briefing.com

08:25 am Ford Motor Co. (F)

9.09 Ford is shifting its "Way Forward" program into high gear. The flailing automaker, besieged by high structural costs and lackluster product lines, released an accelerated restructuring plan that it hopes will deliver faster results through 2008. The plan is aggressive in renewing its product portfolio by 2008, but the question remains if its targeted cost savings are enough to improve profitability over the next couple of years. Ford is expected to lose almost $6 bln in its automotive business in 2006, which some insiders believe to be more like $9 bln, and therefore its cost savings of $5 bln may not be enough to restore profitability given the industry's challenging price and mix trends.

Ford plans to reduce its white-collared workforce by a third or the equivalent of 14,000 positions. Blue-collar positions will be slashed by 40%, as Ford announced it has reached buyout agreement offers for all of its UAW employees. Plus it will accelerate its goal of reducing 25-30k NA employees by 2008 - four years ahead of schedule. Further manufacturing capacity reductions are also planned. On the product front, 70% of Ford, Lincoln and Mercury products by volume will be new or significantly upgraded between now and the end of 2008 - well ahead of schedule. It plans major investments in new gasolines, flexible-fuel, diesel, hydrogen, and hybrid powertrains, in addition to putting E-85 ethanol powered and hybrid vehicles on the road by 2008.

Ford also provided a revised financial outlook. It does not anticipate automotive profitability in North America before 2009. And while South America and Europe are still expected to be profitable this year, it now anticipates operating losses in Asia Pacific, Africa, and the Premier Automotive Group. It expects to end the year with gross cash at about $20 bln. Nonetheless, the board has agreed to suspend payment of its quarterly dividend on its common and Class B stock beginning in the fourth quarter.

Newly appointed CEO Alan Mulally echoed statements made by Bill Ford in the press release, saying these measures are critical to turning around Ford's largest and most important NA market. Mulally stated, "Turnarounds of this magnitude succeed when capacity and costs are aligned with a realistic expectation of demand." Ford's future rests on its ability to drive automotive sales, and while the cost reduction part of the equation still may not be enough, Ford is addressing the product side by aggressively pulling forward new products and creating new markets.

--Kimberly DuBord, Briefing.com

09:46 am Multimedia Games: Merriman Curhan Ford downgrades Buy to Neutral. Merriman downgrades MGAM to Neutral from Buy saying recently concluded several outside channel checks involving each of Multimedia's current markets yielded indications of risks in the co's gaming markets that were more significant than previously thought. Given this, the firm believes the co's current equity multiple may remain suppressed until stabilization in some of those markets is demonstrated and they can garner increasing confidence in the co's primary growth vehicles.

09:45 am Noven Pharma: Jefferies & Co downgrades Buy to Hold. Target $24 to $25. Jefferies downgrades NOVN to Hold from Buy, but raises their tgt to $25 from $24. Firm says the stock has appreciated nearly 60% since mid-Feb when the co submitted its full response letter on Daytrana, and is now pricing in an optimistic outlook for Daytrana and giving healthy value to an undisclosed pipeline.

09:43 am Cogent: Miller Johnson initiates Outperform. Target $18. Miller Johnson initiates COGT with an Outperform and an $18tgt saying the A.F.I.S market is estimated to grow from under $400 mln today to roughly $1.0 bln in 2011. The fingerprint sensor market is expected to grow from under $300 mln today to roughly $1.5 bln in 2011. The firm believes Cogent represents roughly 25-30% of the A.F.I.S market today and essentially no share of the verification market. However, they expect Cogent to gain share in both markets over time.

09:43 am Microsemi: Jefferies & Co initiates Buy. Target $32. Jefferies initiates MSCC with a Buy and a $32 tgt saying they believe MSCC is almost finished with a major transformation into a very profitable High Performance Analog company. The firm says its expertise lies in power management and Power/Interface control of the real world into the digital domain.

09:43 am Public Service: Banc of America Sec reiterates Neutral. Target $71 to $60. BofA cuts their tgt on PEG to $60 from $71 after deal with Excelon (EXC) terminated. Firm says PEG's cash flows remain healthy and that PEG could still be a takeout target and firm's $60 target does not include a takeout premium (it's 7.5x EV/EBITDA of regulated utility and 5x to its Energy Holdings). Firm would expect PEG to trade at a slight premium on the basis that it still might be viewed as a take-out candidate. Firm says EXC was the wrong partner due to market power issues. Firm says another partner might be more palatable.

09:42 am Gen Growth Prop: Banc of America Sec downgrades Buy to Neutral. Target $47. BofA downgraded GGP to Neutral from Buy with a $47 tgt based on valuation. Also the firm says, risk to earnings from the land business could hold back the stock. They note the housing market conditions in Las Vegas (where most of GGP's land business is) continue to worsen and further house price erosion is likely as inventories continue to rise.

09:39 am JDA Software: ICAP downgrades Buy to Neutral. Target $18 to $12. ICAP downgraded JDAS to Neutral from Buy and cuts their tgt to $12 from $18 after channel checks showed some disturbing developments at JDA Software. The firm says with earnings coming next month, the risks of trouble appear to be increasing. The firm says the merger with Manugistics may not be going so well.

09:38 am Kroger: UBS reiterates Reduce . Target $24 to $22. UBS cuts their tgt on KR to $22 from $24 saying upon review and after talking to the co in detail about its guidance for the next year the firm thinks current expectations are too high. The firm says consensus for FY07 is $1.59 a figure 6% above the high end of next year's guidance as the firm has derived as ranging of $1.45-$1.50.

09:37 am VeriSign: RBC Capital Mkts upgrades Sector Perform to Outperform. Target $24 to $25. RBC upgrades VRSN to Outperform from Sector Perform and raises their tgt to $25 from $24 noting on Sept 12, 2006, VRSN sold 51% of its Jamba/Jamster business to News Corp (NWS), which removes an often hard to predict revenue and earnings stream. The firm says when investors begin to understand the "apples to apples" comparison of VeriSign excluding Jamba, they will envision a more stable co with margin expansion potential and a more stable growth rate.

09:36 am First Marblehead: Friedman Billings upgrades Underperform to Mkt Perform. Target $36 to $55. Friedman Billings upgrades FMD to Market Perform from Underperform and raised their tgt to $55 from $36 saying with First Marblehead's upcoming securitization significantly larger than expected and more importantly, the co now being able to monetize a portion of its noncash residuals into cash, they believe this helps address much of the near-term risk to the story. The firm says although, their concerns regarding customer concentration, pricing pressure, and the impact of higher borrowing levels from the competing federal loan program all remain, they believe the fact the co is able to establish a secondary market for its residuals is meaningful.
icon url

ReturntoSender

09/17/06 2:24 PM

#7001 RE: ReturntoSender #6755

InvestmentHouse Weekend Update:

http://www.investmenthouse.com/1weekendmarketsummary.htm

- CPI in line and stocks rally but come home mixed after a week of gains and a Fed meeting ahead.
- Core year/year CPI hits 10 year high, but indicators are still not showing inflation worries.
- September not looking like September for hurricanes or the market.
- Market needs a rest ahead of Wednesday FOMC meeting.

Stocks try to rally on the CPI but the afterburners can’t kick in.

Investors breathed a sigh of relief as the CPI came in as expected. Never mind the core year over year hit a 10.5 year high at 2.8%; the monthly figures were in line and some key components fell hard (e.g. gasoline), and will far even further in the next report. In line was just fine for an inflation weary market, particularly with oil still weak, gold going lower, and bonds still trending lower overall.

It was enough to jump stocks higher with NASDAQ gapping up at the open and all of the indices making a run at next resistance. After a week of gains, however, the stomp on the accelerator at the open emptied the tank. A quick test of the early move and stocks were back up at the session highs, but they could not carry it further. They then spent the rest of the day bouncing up and down but whittling away the morning gains all along. NASDAQ even turned negative and SP500 flat midday before an early afternoon bounce. The momentum could not sustain into the close, however, as stocks faded back in the last hour into the bell. Given the FOMC meeting on Wednesday and a week of gains already in the bank, it was hard to make much headway.

Technically the indices continued to lose some strength, unable to hold a morning advance on some decent news. NASDAQ cleared next resistance at the June high but fell back after bumping the bottom of the Q1 trading range. SP500 tapped the May high and retreated and DJ30 did the same. They managed to hold their gains but closed well off the highs. SOX rallied near its June high and then it too faded, and indeed turned negative at the close.

Volume surged but it was expiration as well as an S&P rebalance. Expiration and the run higher in September led to a lot of rollouts for those expecting a market drop. The rebalance resulted in a lot of jumps higher at the close and really pumped up volume. Thus no conclusions can be drawn from the spike in trade. Some leaders were moving, but breadth was just so-so, indicating that outside the leaders not much was able to advance or at least hold the early gain.

Basically another upside session, but relatively weaker than the prior moves. As noted Thursday, that is typical in a move: out of the gate gangbusters, then slowing as the advance matures. No big secret there. The leaders need some more rest as does the rest of the market. With a nice week of gains in the bank and the FOMC meeting next Wednesday, this is a perfect time for stocks to drift a bit and consolidate, with the leaders coming back to test near support. That sets up the next move higher. It is still September and you still have to be on guard for market upsets. It still looks like solid action, but getting past expiration and avoiding a sell off after tapping at next resistance in the form of the post-2002 highs is a key milestone. Thus far it is handling it well, but as we all know, the market is more interested in what will you do for me tomorrow as opposed to what did you do for me lately.

THE ECONOMY

CPI rises in line with expectations but year/year hits a long-term high.

Overall consumer prices rose 0.2% as did the core, right in line with expectations, matching the June level but dropping from the four consecutive 0.3% gains before that. That buoyed spirits about lessening inflation, but the yearly figure rose to 2.8%, a level not seen since March 1996. That, of course is well over the reputed Fed’s ‘comfort zone’ of 1% to 2%, but Friday Kansas City Fed president Hoenig said the CPI “was good news for us” and that would keep the Fed from raising rates next Wednesday. Wow. Not really news to the financial markets the way they have traded, but speaking out less than a week ahead of an FOMC meeting is considered gauche in Fed circles.

On top of the in line inflation data and the Fed’s stamp of approval, many continue to call for slowing inflation based upon a slowing economy and moderation in energy costs. While we can agree with the latter, as you know we believe the former is garbage. Economic speed has little to do with inflation. It is how much money is in the system relative to the economic speed. The Fed has dried up much of the excess money flow that led to the early summer speculation, and perhaps that is why the Fed is making these statements. It is not, however, enlightening us as to the reason for the Fed’s calm. Apparently we have to take it on faith.

Friday also saw the consumer buck up a bit more with the revised Michigan sentiment report up to 84.4 versus 83.5 expected. Other private sentiment polls have shown solid rebounds in sentiment. No doubt a result of the 17% dive in oil prices and gasoline prices falling from $3/gallon to the 2.20’s and 2.30’s in many places. Of course the drop in oil is bringing out the calls that oil will fall into the 50’s and even the 40’s in the not too distant future. That feeds positive sentiment as well, helping fuel that change in inflation expectations we discussed last week.

Not all flowers and candy: ECRI leading indicator improving but not fast.

ECRI’s U.S. leading indicator rose to an 8-week high the past week, up 0.9. Its 4-week annualized growth rate moved up to -0.9%, its third straight weekly advance. Improving, but the overall level is the issue. It is still low enough to indicate some significant economic slowing, and ECRI says the numbers indicate not a choice between growth or economic slowing, but whether we have a soft landing (economic slowing) or a hard landing (recession).

Indeed, as if on cue industrial production shrank 0.1% after gaining 0.4% in July. Capacity fell to 82.4%, down from a 6 year high. Now that is hardly an indication of a major slowdown given the solid preceding numbers, but it continues the series of more volatile economic data that shows gains then declines, gains then declines, etc. When a trend starts turning volatile that is a sign of some change attempting to take root and you have to take note. We have seen the up and down data in other areas, and of course the all down readings in housing.

The market appears to be reading this as no real issue at the moment, given the rebounds in SP500 and DJ30 close to post-2002 highs and the renaissance of NASDAQ and SOX. Bond yields continue to move lower, and while that can be a very good thing for the economy and stocks, if it is forecasting a significant economic downturn or worse that is obviously a bad thing. The short term and long term rates continue their inversion (4.86% on the 2 year, 4.79% on the 10 year); the pesky inversion won’t give in even with indications things are setting up positively (continued solid PMI/ISM, lower gasoline prices, stock market comeback). That keeps us on edge as September progresses because if selling this time of year comes, it often shows up similar to a bullet traveling at high velocity.

THE MARKET

MARKET SENTIMENT

VIX: 11.76; +0.21
VXN: 17.75; +0.26
VXO: 11.01; -0.51

Put/Call Ratio (CBOE): 0.82; -0.12

Bulls versus Bears:

Bulls: 45.8%. Up from 43.2% last week and 42.1% before. Steady climb this month toward the 55% level considered bearish. Still well below the peaks from January and April, and well below the 55% level considered bearish.

Bears: 35.4%. Bulls may be rising but so are the bears. As the market gets higher they are growling, coming back strong from a 33.7% the two prior weeks. This has reversed somewhat the steady decline from the 37.1% hit in July. The 37.1% was the highest level in this entire cycle, easily clearing the 34.4% hit in late June back when bulls and bears kissed, just missing a crossover. Hit a new post-2002 high in that late June move, eclipsing the March 2006 high (33%) and well above the 2005 highs that spawned new rallies (30% in May 2005, 29.2% in October 2005).

NASDAQ

Stats: +6.86 points (+0.31%) to close at 2235.59
Volume: 2.523B (+32.55%). Volume blasted off Friday, more so than many recent expirations. We would like to ascribe accumulation to that move but it was mostly technical given the strong move in NASDAQ

Up Volume: 1.343B (+298M)
Down Volume: 1.152B (+424M)

A/D and Hi/Lo: Advancers led 1.07 to 1. Very narrow move.
Previous Session: Decliners led 1.25 to 1

New Highs: 129 (+43)
New Lows: 42 (-7)

The Chart: (Click to view the chart)

NASDAQ gapped higher on the CPI news rallying to the bottom of the January through March 2006 trading range (2240 to 2315). It met a wall there, fading back intraday but managing to hold the break above the June high (2234) on the close. NASDAQ cleared the 200 day SMA (2223) during the week, and the run to the Friday intraday high capped a 100 point week. Not bad apples, basically matching the mid-August run, the second leg of the late summer rally. After this move NASDAQ is likely to come on back for a test of the move down toward the 200 day SMA and onto perhaps the old up trendline at 2205ish.

SOX (-0.04%) rallied well on the open, running up to tap at the June closing high (475) but then fading to close basically flat. That is a tombstone doji after the strong run to start the week, and that can indicate a pullback ahead. Of course, SOX has already started its test, working laterally since Wednesday. Still likely to come back a bit more, but the action in the index remains solid, and a test back toward the 10 day EMA (454) seems about right for this index.

SP500/NYSE

Stats: +3.59 points (+0.27%) to close at 1319.87
NYSE Volume: 2.204B (+52.03%). The SP500 rebalance shot volume to the moon and thus it is hard to take anything from the volume for the session.

A/D and Hi/Lo: Advancers led 1.42 to 1. Mirrored Thursday’s downside breadth. In short it was rather weak as was the overall move for the day.
Previous Session: Decliners led 1.46 to 1

New Highs: 189 (+84)
New Lows: 31 (+1)

The Chart: (Click to view the chart)

SP500 surged up to the May high (1326.70) on the first hour run and then peeled back with the rest of the market, posting a gain but giving back just over half the move. Solid run to overcome the distribution last week and match that old high. Now it has to make the test of this move, put in a higher low (the 10 day EMA is at 1310) and then break through that old high. Always get a big edgy around these prior highs, particularly at this time of the year; that old bullet coming unexpectedly. A prior high is a natural spot to sell if that is the inclination. Overall the move is showing solid action, not suggesting any imminent selling, and we will wait for a nice, orderly test to complete and then look for leaders making their move back up.

SP600 (+0.33%) bounced up off the 200 day SMA (372.18) once more but closed off its high as well, finding some resistance at 375 again. A very nice string of higher lows and now a break over the 200 day SMA. A lateral move along this level for a few more sessions sets up the next break higher, and as noted before that move will be important for the rest of the market as it indicates the economic expansion still has life given the economic leadership this sector provides.

DJ30

DJ30 flirted with its May high as well (11,670.19), hitting 11,614 on the high before peeling back for a modest gain to make it 5 upside sessions out of 6. Volume ballooned as well on expiration and the S&P rebalance, coming in well above average for the first time since the July expiration. DJ30 remains in solid technical position, but also in the same scenario as SP500 as it has bounced up to the pre-correction high and now has to make the test, hold, and then show the breakout. Many are talking of a new all-time high for the Dow (past 11,750.28) - - it was all the buzz Friday on the financial stations - - and that always makes the move more problematical.

Stats: +33.38 points (+0.29%) to close at 11560.77
Volume: 365M shares Friday versus 203M shares Thursday.

The Chart: (Click to view the chart)

MONDAY

It is Fed week, and the market has rallied in anticipation the Fed will once again hold pat on rates at 5.25% . . . along with oil dropping to $63/bbl. With NASDAQ putting in a 100 point gain and SP500 and DJ30 rallying to the May highs and fading back, the market is still in need of a rest after that nice run. If the market can put in a lateral move ahead of the FOMC meeting it may be able to generate an upside move on the news. Maybe. It definitely needs the rest and the FOMC news would be just about perfect timing to prod it along once more. The market has anticipated the move, however, so it may not provide much mileage. It could, however, provide a trigger to get things moving again after a needed technical rest.

Several things are coming together, helping the rise. The Fed less likely to hike rates again. Practically no storms this year versus last year’s wave upon wave of storms and damn dangerous ones as well. That has definitely influenced oil prices and thus the stock market. Here we are at the height of the storm season and the major ones are spinning off in the Atlantic out of harm’s, or at least shore’s, way. Here we are half way through September and the market is looking solid. Neither is looking like itself in September, and we are all glad for that.

All in all the past week was constructive with rising volume gains as the indices took out some resistance levels, continuing their work to complete bases (NASDAQ, SOX, SP600) or add to the breakouts (SP500, DJ30). Success, however, brings about inevitable pauses or short term selling, and that is what we are looking for this week. The FOMC meeting and the run to this point provide excellent reasons to take a breather and wait for the news. As noted, the news is pretty much factored in, but with a pause (pardon the pun) and slight fade to test ahead of the news it could provide a trigger to push things along once more. It would also give the leaders a chance to test back themselves and then continue their runs.

The good action has many calling for DJ30 12K as noted above as analysts follow the lead of the September hurricanes and veer off of the usual path. The Hurricane Center has changed its outlook, lowering its forecast for storms, and similarly the analysts have changed their outlooks, raising their forecasts for the market. A storm can come at any time, in nature or in the market. Getting a bit cocky as the rise in bullish investment advisors last week shows.

Thus we have to remain icy and pick our entry points and not get into the game of chasing the bus as stocks move higher. That is why we like what looks to be a pullback to test setting up. SOX is already working laterally, and if this market strength continues the semiconductors should be some of the early leaders again. We are going to have to let them finish setting up for the next move, however, and then start the bounce. That is when we move in. This is even more important here in September when selling can start rather quickly; thus what has been a routine pullback can get out of hand.

We like what we see as far as the overall upside move, but the time of year warrants keeping your buys tight and sticking with solid leaders. Thus this weekend we are looking more at stocks that are starting to pullback and will be in position to give us a likely entry point this coming week but likely a few sessions down the road. The market moves in waves with successive moves along the trend (up or down) with tests of the trend after each move. You can buy into the test on faith it is going to hold again, and if everything is solid it likely will. Given it is September, however, and given that there was a bit of distribution two weeks back before expiration week and its elevated trade levels, we want to see a successful test, i.e. one that comes back on low volume and then has leaders jumping higher on volume. That is when we know the big money is moving back in and we want to come to the table with them.

Support and Resistance

NASDAQ: Closed at 2235.59
Resistance:
2234 is the June 2006 peak (intraday): broke it and testing it in the same session.
2250 is the March 2006 closing low.
2316 from interim tops in January and March 2006 (the 2250 to 2316 range is the Q1 trading range for NASDAQ)
2376 is the April high, the post-2002 high

Support:
The 200 day SMA at 2223
2206 is the August 2004/April 2005 up trendline
The 10 day EMA at 2201
2190 is the July 2006 high
2185 to 2182 is the September 2005 peak and interim high from November 2005.
The 18 day EMA at 2182
2177 is the December 2004 high.
2168 is the August intraday high.
2158 from the May 2005 low.
The 50 day EMA at 2151
2100 from the early and mid-2005 peaks
2072 is the June closing low
2050 from the summer 2005 lateral range lows

S&P 500: Closed at 1319.87
Resistance:
1324 to 1329 from the October 2000 lows.
1326.70 is the May 2006 high
1334 is an October 1999 peak

Support:
1315 is the May and May 2001 peaks
1311 is the April closing high.
The 10 day EMA at 1310
The 18 day EMA at 1304
1302 the recent August highs
1294 is the January 2006 high and 1297.57 is the February 2006 high.
The 50 day EMA at 1289
The early June high at 1288
The late January peak at 1285
1280.37 is the recent July peak.
The 200 day EMA at 1279
1265 is an old trendline from the August 2003/August 2004/October 2005 lows.

Dow: Closed at 11,560.77
Resistance:
11,642 is the May 2006 closing high
11,670 is the May intraday high
11,750.28 is the all-time high

Support:
The 10 day EMA at 11,466
The 18 day EMA at 11,413
11,401 from the September 2000 peak and April 2001 highs
11,384 is the August intraday high.
11,350 from the May 2001 peak
The March 2006 highs at 11,329 to 11,335
The 50 day EMA at 11,281
11,279 is the late May closing high
11,243 is the early August peak closing high.
11,228 is the July closing high.
11,097 to 11,137 is the last peak from the February top.
The 200 day SMA at 11,096

Economic Calendar

These are consensus expectations. Our expectations will vary and are discussed in the ‘Economy’ section.

September 18
- Current Account, Q2 (8:30): -213.5B expected, -$208.7B prior
- Net Foreign Purchases, July (9:00): $75.1B prior

September 19
- PPI, August (8:30): 0.3% expected, 0.1% prior
- Core PPI, August (8:30): 0.2% expected, -0.3% prior
- Housing starts, August (8:30): 1.77M expected, 1.795M prior
- Building permits, August (8:30): 1.75M expected, 1.763M prior

September 20
- Crude oil inventories (10:30)
- FOMC policy statement (2:15): No change expected from 5.25% Fed Funds Rate

September 21
- Initial jobless claims (8:30): 308K prior
- Leading Economic Indicators, August (10:00): -0.2% expected, -0.1% prior
- Philly Fed, September (12:00): 14.0 expected, 18.5 prior
icon url

ReturntoSender

09/19/06 1:06 PM

#7005 RE: ReturntoSender #6755

SMH Bot to cover 1000 shares@33.71 - Gain of $775.00
icon url

ReturntoSender

09/21/06 8:51 AM

#7008 RE: ReturntoSender #6755

Chip production rises faster than capacity -survey
Thu Sep 21, 2006 6:15am ET

http://yahoo.reuters.com/news/articlehybrid.aspx?storyID=urn:newsml:reuters.com:20060921:MTFH03935_2...

AMSTERDAM, Sept 21 (Reuters) - Global semiconductor output is rising faster than new production lines are being built, increasing the sector's capacity utilisation to 95 percent in the second half year, a survey found on Thursday.

Chip production will increase 12 percent in 2006, measured in silicon consumption in millions of square inches, up from 2.8 percent in 2005 and 14 percent in 2004, according to U.S.-based market research group VLSI.

Part of the increase is strong demand for NAND flash memory chips, used in MP3 music players and digital cameras, of which shipments rose 55 percent in the first six months of 2006 from 2005. The total number of chips produced in the January to end-June period was 77.8 billion units.

Chip production capacity has lagged behind, growing 1.7 percent in the first quarter and 2.8 percent in the second. VLSI expects quarterly growth of around 2.5 percent for the rest of the year, for a total capacity expansion of 6 percent in 2006.


Factory utilisation rates, a key measure of efficiency, will be around 95 percent in the third and fourth quarter, up from 92.4 percent in the first.

Utilisation rates of more than 90 percent traditionally trigger more aggressive investments from semiconductor companies, which is good news for equipment providers like Applied Materials (AMAT.O: Quote, Profile, Research) and ASML (ASML.AS: Quote, Profile, Research)(ASML.O: Quote, Profile, Research).

ASML raised its third quarter guidance a few weeks ago after it received more orders than expected. It usually takes three to six months before orders translate into shipments of equipment and expansion of production capacity.


© Reuters 2006. All Rights Reserved.

icon url

ReturntoSender

09/23/06 8:47 PM

#7017 RE: ReturntoSender #6755

The Visible Slowdown - A New Trend?
September 23, 2006
By John Mauldin

http://www.frontlinethoughts.com/printarticle.asp?id=mwo092306

The Visible Slowdown - A New Trend?
The Message From the Bond Market
Time For a Little Optimism
Necessity is the Mother of Innovation
New Orleans, the End of the Season and South Africa

Yesterday the Philadelphia Fed Business Economic Survey came in at the lowest level since the recession in 2001. Some argue that it is just one month's worth of data, and "...besides, it is Philadelphia. Those numbers are always quirky." And why pay attention to the Conference Board's Index of Leading Economic Indicators? The bond market has its own opinions, and they are different than that of the stock market. With all of this as backdrop, we will then think about why we should be optimistic. Things are going to get better. All it takes is a little innovation.

The data seems to be pointing to an economic slowdown of some kind. It is getting increasingly difficult to suggest that we are in for a Goldilocks scenario where growth runs at 3%, inflation drops below 2% and housing starts to recover.

The debate is between those who say we are in for a soft landing or a hard landing. A hard landing is one in which the economy enters a recession. A soft landing is normally defined as one where the economy slows but stops somewhere north of an actual recession.

It is not altogether clear which landing shall come to pass. I rather think it will be a mild recession, as that is what the data seems to suggest, and as we shall discuss in this letter.

But I find it interesting that so many are so adamant about the possibility of a soft landing. Soft landings are about as rare as a white buffalo of western B-movie lore. Everyone claims to have seen one or know someone who has, but actually finding one is difficult.

We have seen 16 periods in the modern era where we have ended a Fed tightening cycle. Only one resulted in a soft landing. That was in 1994, which Barry Ritholtz pointed out to me over lunch last Monday in New York (more on that below). But 1994 WAS different. We had the internet/personal computer/wireless growth cycles which were driving the middle innings of a major bull market.

Today we have the housing market visibly in free fall. By many measures, the housing market has been responsible for most of the growth in real GDP and many of the new jobs in the past few years. What industry is poised to step in? Microsoft is still some time away from introducing its next new software which will drive some demand for upgrading computers. The auto manufacturers? No, they are laying workers off. Transportation? Why did Fed-Ex warn, with the very strange provision that earnings would be down, ex labor costs?

Perhaps health care. Business Week Magazine had a very interesting cover article last week. Since 2001, they tell us, the health-care industry has added 1.7 million jobs. The rest of the private sector? None. Zip. Nada.

What about the 900,000 jobs attributed to the housing sector? It seems that this merely kept us even, as so many jobs were lost in manufacturing and the retail sectors. From the article:

"Sure, housing has been a bonanza for homebuilders, real estate agents, and mortgage brokers. Together they have added more than 900,000 jobs since 2001. But the pressures of globalization and new technology have wreaked havoc on the rest of the labor market: Factories are still closing, retailers are shrinking, and the finance and insurance sector, outside of real estate lending and health insurers, has generated few additional jobs.

"Perhaps most surprising, information technology, the great electronic promise of the 1990s, has turned into one of the biggest job-growth disappointments of all time. Despite the splashy success of companies such as Google and Yahoo!, businesses at the core of the information economy -- software, semiconductors, telecom, and the whole gamut of Web companies -- have lost more than 1.1 million jobs in the past five years. Those businesses employ fewer Americans today than they did in 1998, when the Internet frenzy kicked into high gear."

Without health care and government, the economy would be much softer. By the way, I think that trend will continue, as health care grows from around 14% of GDP last year to 17% in the next decade. I contend that is a good thing, as who wants to ration health care for themselves? I want more and better health care, medicine, new procedures and so on. But it does portend problems as this means health care costs, both public and private, are going to rise dramatically.

Interesting sidebar: one of the ways we pay for this increased expense is that our food bills have dropped form 16% of median income to 7% over the last few decades. I doubt we will see any further material drop in our food costs in the coming years, so it will be interesting to see where we find the money for the increased health care.

The Visible Slowdown - A New Trend?

Philadelphia, the City of Brotherly Love, was decidedly not nice this week. The Philly Fed Index survey of manufacturing was ugly. It was expected to come in at +14. It shocked the markets by coming in at a negative -0.4. This was the worst reading since 2001, when the economy gave way to recession. And some of the inner numbers were more troubling. Let's look at the key paragraph that accompanied the release (emphasis mine):

"The pace of activity in the region's manufacturing sector slowed in September, according to firms polled for this month's survey. Indicators for general activity, new orders, and shipments fell substantially from their readings in August and suggest no growth this month. Overall employment, however, was slightly higher. Firms continued to report a rise in prices for inputs, although these cost increases were less widespread than in previous surveys. The region's manufacturing executives were significantly less optimistic about future activity, with most indicators dipping to their lowest readings in six years.

I am the first to stress that one month does not make a trend. But given that a number of economic indicators imply there may be a recession in our future are flashing warning signals, it suggests we should pay attention. For a trend to start, you must have a beginning. And this one is showing up at what should be the right time if the warning signals we have discussed at length in this letter are right.

Two that were flashing this week was the latest round of data from the Conference Board. The Leading Economic Indicators (LEI) were once again negative. That makes it five out of the last eight months. Now that is becoming a trend. When the LEI are down for six months, there has always been a recession or a serious slowdown. It has now been down from its high for eight months.

But good friend Dennis Gartman follows a statistic that he puts more confidence in - the ratio of the Conference Board's coincident to lagging indicators. This ratio has been flashing a warning of recession all year. But let's read what Dennis says. Under the heading "Recession Here We Come" he writes:

"Yes, the Philly Fed's survey made for horrific reading regarding the US economy, for it was surprisingly weak, falling below the 'zero line' for the first time in a very long while. We note that figure and we shall file it away for the moment, for we found another data point yesterday to be even more disturbing: the ratio of Coincident to Lagging Indicators fell yet again.

"Firstly, the 'Leading Indicators' themselves fell 0.2% ,which was as expected, with the 'Coincidents' up 0.1% and the 'Laggers' up 0.3%, the ratio of the two has fallen yet again. The ratio is now down for eight quarters from its highs, and the trend is to the downside. Recession, or at least a very material slowing of growth, lies dead ahead. What we must remember is that the news might well be of continued strength in some sectors, masking the onset of 'recession,' but once that fog is lifted, the weakness shall be more and more evident.

"Will this be a severe recession? No, we think it shall not be. We think it shall be quite mild actually... reminiscent of the recession of earlier this decade rather than reminiscent of the violent recessions of the 70's and 80's."

The Message From the Bond Market

The bond market reacted rather violently the last few days, dropping interest rates in what is a clear anticipation of an economic slowdown. The ten year bond was at 5% in mid-August and 4.8% last Friday. Today it closed at 4.59%, dropping 14 basis points in just the last two days, mostly after the release of the Philly Fed number.

The yield curve is still negative, but not by a lot. That is one of the reasons why I think a coming recession will be of the milder variety. Let's look at the bond figures from Bloomberg, noticing that the ten year is 32 basis points below the 3 month. And also notice the 3 month T-bill at 4.91 is well below the Fed's fund rate of 5.25%. The market seems to clearly think the next Fed rate move will be a cut.


I continue to think that a recession or real slowdown cannot be good for the stock market. We are already seeing companies begin to pre-warn on earnings. This next earnings season (October) could be difficult. Of course, Mr. Market disagrees, with various indexes near multi-year or all time highs. We will see.

Time For a Little Optimism

I would like to remind readers that if we do enter a recession or a slowdown, that it is a normal part of the business cycle. It will pass and the economy will once again start to grow. In fact, we may be able to see the stock market get to valuations that once again make value investors (including me!) happy.

But longer term, there are reasons to be quite optimistic. The world is going to get better and better at an ever faster pace. I was reminded of that this last Monday as I had a lengthy happy hour with Art Cashin and Dennis (and Margaret!) Gartman, before going to dinner with Art. The discussion was wide ranging, with lots of great stories by two of the better story tellers (and true gentlemen) I know.

Last year, I had the fortune to meet with one of my readers who is a well known technology professional and local (Dallas area) angel investor (someone who invests in true start-up technologies). We became good friends, as his Mavericks seats and mine were coincidentally quite close. One day he talked about one of the start-ups he was involved with, and as it was an area I have some minimal knowledge of and interest in, I looked into it, ended up investing some money and eventually went on the board of directors.

As an aside, they have developed what I think is one of the more disruptive communications technologies I know of. Whether they or competitors exploit it (it will be a horse race), is up for grabs. But the world is going to see a round of very (very!) fast, really (really!) cheap wireless broadband hit it over the next ten years. We are going to see 3 billion people who do not have more than passing access to the internet get access, and we are going to see significant improvement in the level of service available to us.

But that is not the reason I am optimistic. I watch as Dave, the innovator of this technology, goes about his work. Though an expert in his own right, he is constantly looking for ways to improve. Sometimes improvements are little ones. Sometimes they are significant. Sometimes they use technology supplied by another firm. On more than a few occasions, he has adapted technologies developed for an entirely different purpose into his work.

I have been involved with several technology businesses in my career, and it is the same process at work. It is the process of innovation.

When James Watts began to work on his steam engine, it was not a new idea. He took apart a Newcomen steam engine and figured out how to improve it. He tinkered and innovated and created something that was a major improvement. But it was one of his customers, John Wilkinson (who made cannons with precision bores), who took apart one of Watts' engines and figured out how to increase the power by a factor of 5 times using his own techniques for creating a smoother bore. He gave the idea to Watts for the rights to sell him the cylinders.

Back then, there were only a few people in the world who could work on and develop steam engines. Today, there are tens of thousands of scientists, engineer, inventors and entrepreneurs working on an inconceivable number of projects, each trying to improve on the work of others.

Necessity is the Mother of Innovation

There are really very few outright new inventions. Most new products or services are innovations. And innovation is usually a slow incremental, collaborative process. You build on the work of others. But it is not just technology where we see innovation. It is everywhere.

Joseph Schumpeter defined innovation in 1934:

1. The introduction of new goods--that is one with which consumers are not yet familiar--or of a new quality of a goods.

2. The introduction of a new method of production, which need by no means be founded upon a discovery scientifically new, and can also exist in a new way of handling a commodity commercially.

3. The opening of a new market, that is a market into which the particular branch of manufacture of the country in question has not previously entered, whether or not this market has existed before.

4. The conquest of a new source of supply of raw materials or half-manufactured goods, again irrespective of whether this source already exists or whether it has first to be created.

5. The carrying out of the new organization of any industry, like the creation of a monopoly position or the breaking up of a monopoly position. (Wikipedia)

You can innovate not just new products, but business models, marketing methods, new organizational structures, new processes, services, supply chains and new financial structures. You can take innovations in one industry and apply them to another. Innovation breeds innovation.

Some will note all the problems we face. The entire War on Terrorism, which is degenerating into a clash of modern thought with Islamic fascism. (Can no one in the Muslim world see the irony of torching churches and the call of death for the pope because he suggested Islam might be a tad violent? Where are the voices of Islamic reason? It is all quite depressing.) Poverty, AIDS, a nuclear Iran, running out of oil, the rise of socialism in the third world, rap music, etc.

Last century saw two World Wars and the Cold War, along with hundreds of smaller conflicts, a major depression, famines, numerous natural disasters, epidemics, serious financial crises, numerous recessions, multiple cases of genocide and so on.

But in spite of all that, the process of innovation in at first a hundred different, and then a thousand different areas, produced a growing world economy and a style of living that is remarkable. "Progress," however you define it, did not stop.

In fact, the innovation cycle has gotten faster and faster. Precisely because there are more people than ever working on new and better innovations.

And in the next ten years, we are going to bring 3 billion more people into the Information Age. The cost of connection to the internet is going to drop more than you can imagine.

Maybe we get 30 million more scientists and engineers and entrepreneurs than we would given today's reality, all working on some small innovation that moves the ball forward in their chosen field, each building on the work of others.

And hopefully out of that a few thousand world class minds, whose potential is now wasted because they are mired in poverty and simply trying to survive, will fulfill their potential and create something entirely new for the betterment of us all. Some kid in Kisangani or Kabul or Kigali or Vladivostok or Mumbai will make that discovery which changes the world, or at least a part of it.

Yes, sadly, some of them will become politicians, but more of them will see the world in a new and different way, and contribute to the betterment of the world.

The cynics will say, "Great. More people who will take US (or European or wherever you live) jobs at cheaper wages." And yes, that is true, but it is missing the point.

In the late 1970s, when the US had seemingly lost its way, unemployment was as high as inflation. We were losing our manufacturing jobs to Japan. It was a time of malaise.

Where would the jobs come from to employ the next generation? Would we all become hamburger flippers?

The correct answer was, "I don't know where they will come from, but they will." And they did, because hundreds of thousands of innovators kept at it, undeterred by circumstances. They worked on their own projects and let the cynics worry about where the jobs would come from. They created the jobs by creating whole new industries.

And yes, we got bubbles and recessions and wars and a whole host of bad stuff. But overall, would you really want to go back to 1976? And in 30 years, when we have seen more technological progress than we have seen in the past 150 years, no one will want to come back to 2006 either.

So call me a pragmatic optimist. I can see the problems. I can deal with the cycles. But I also know there is a time to ride the waves of change. Life is good and going to get better.

Now if we can just figure out this hard landing thing.

New Orleans, the End of the Season and South Africa

It is more than time to hit the send button. You are getting this letter a little later than usual, as I somehow deleted 90% of the first letter I wrote and had to start over. Frustration compounded. It was hard to be optimistic the first few hours of re-writing, I will admit. But now, at the end (3 am), I feel better, if a little tired.

Tomorrow night is the last night of home field baseball for the season for the Texas Rangers. Alas, there will be no post season for us. Ah, well, wait until next year. But soon, the real sport in town will begin. Basketball season and the Dallas Mavericks are almost here.

One of the really great investment conferences every year is the annual New Orleans Investment Conference. Originally started by the late Jim Blanchard, the conference has a strong gold contingent, but has expanded to cover a wide range of themes. Last year, the conference had to be rescheduled because of Katrina, but this year it is back and looks to be better than ever.

In addition to yours truly, they have lined up Steve Forbes, Jim Rogers, Marc Faber, Dennis Gartman, and Newt Gingrich, plus scores of other well-known speakers, workshops, and private sessions. If you register before October 1, you can save $300 on the full price and half off for a friend or spouse. I hope to see you there. Click on the link for more information. (You have to use this link to get the special rate.) Let me know if you are coming so we can make sure you get an invitation to a reception for my readers we hope to be doing.

http://www.jeffersoncompanies.com/affiliate/affiliate_process.php?icode=confreg&acode=JM

I will be going to South Africa in late January. My host will be my South African partner, Prieur du Plessis and his firm, Plexus Asset Management, which is the South African equivalent of Morningstar. They translate some of my essays. It is kind of a hoot to see some of my writing in the local business journals in Afrikaans. I love South Africa, and am looking forward to going.

You may have come close to losing your analyst this last week in New York. Bad cabs? Crossing the wrong way? Mugging? No, my crime was acting like a tourist.

Barry Ritholtz (seems like he's on CNBC all the time) invited me to lunch. The weather was perfect, so he got a reservation at St. Bart's, which is a church that runs an open air (and very good!) restaurant across from the Waldorf Astoria. The UN was having its annual meeting, and there were presidents of this country and that everywhere.

Security was tight, to say the least. There were a dozen police on our side of the hotel and on the restaurant site, which was somewhat elevated. While we were eating, the presidential motorcade pulled up. More security. Very serious looking guys. I stood up to see if I could see George (er, Mr. President now) get out of the car.

"John, sit down," Barry hissed, with some urgency in his voice. I sat back down, assuming that I had embarrassed him by acting like a tourist, and apologized for that.

"No, that was not the problem. When you stood up, every cop around here reached for their gun." I looked around and saw that there were still a few eyeing your analyst with suspicion. I was glad I had not reached into my jacket for my camera. They were correctly taking the whole thing seriously. I made it through the rest of the meal eating slowly with no sudden moves.

In any event, I survived my encounter with New York security. Tomorrow night most of the clan gathers for the last baseball game of the season. While we enjoy baseball, we enjoy getting together with each other more. Life is good, even without innovations. Enjoy your week. And now my internet just went down. We will see if we can get the letter out somehow tonight.

Your having to innovate just to stay even analyst,


John Mauldin
John@frontlinethoughts.com
Copyright 2006 John Mauldin. All Rights Reserved

If you would like to reproduce any of John Mauldin's E-Letters you must include the source of your quote and an email address (John@frontlinethoughts.com) Please write to Wave@frontlinethoughts.com and inform us of any reproductions. Please include where and when the copy will be reproduced.

John Mauldin is president of Millennium Wave Advisors, LLC, a registered investment advisor. All material presented herein is believed to be reliable but we cannot attest to its accuracy. Investment recommendations may change and readers are urged to check with their investment counselors before making any investment decisions.

Opinions expressed in these reports may change without prior notice. John Mauldin and/or the staffs at Millennium Wave Advisors, LLC may or may not have investments in any funds cited above.

PAST RESULTS ARE NOT INDICATIVE OF FUTURE RESULTS. THERE IS RISK OF LOSS AS WELL AS THE OPPORTUNITY FOR GAIN WHEN INVESTING IN MANAGED FUNDS. WHEN CONSIDERING ALTERNATIVE INVESTMENTS, INCLUDING HEDGE FUNDS, YOU SHOULD CONSIDER VARIOUS RISKS INCLUDING THE FACT THAT SOME PRODUCTS: OFTEN ENGAGE IN LEVERAGING AND OTHER SPECULATIVE INVESTMENT PRACTICES THAT MAY INCREASE THE RISK OF INVESTMENT LOSS, CAN BE ILLIQUID, ARE NOT REQUIRED TO PROVIDE PERIODIC PRICING OR VALUATION INFORMATION TO INVESTORS, MAY INVOLVE COMPLEX TAX STRUCTURES AND DELAYS IN DISTRIBUTING IMPORTANT TAX INFORMATION, ARE NOT SUBJECT TO THE SAME REGULATORY REQUIREMENTS AS MUTUAL FUNDS, OFTEN CHARGE HIGH FEES, AND IN MANY CASES THE UNDERLYING INVESTMENTS ARE NOT TRANSPARENT AND ARE KNOWN ONLY TO THE INVESTMENT MANAGER.

icon url

ReturntoSender

09/24/06 1:59 PM

#7019 RE: ReturntoSender #6755

InvestmentHouse Weekend Update:

http://www.investmenthouse.com/1weekendmarketsummary.htm

- Economic worries weigh market down once more, but indices hold their trends in lighter volume.
- Market prospers with a lower PPI, Fed on hold, but regional manufacturing slowdown combined with housing stokes recession fears.
- Bond yields continue their decline as treasuries also benefit from the money flowing out of commodities, emerging markets.
- And suddenly it is the last week of September with the market sporting gains.
- Window dressing versus the need for a further pullback.

Stocks finish lower on the week, testing the last upside leg, holding their trends.

Friday the market started a bit weaker, continuing the Thursday slide. This followed a solid break higher Wednesday after stocks looked ready to test further, spurred by ORCL earnings and a Fed still on the sideline. Though lower Friday, the sellers were still mostly at bay, but the bids dried up, and without anyone willing to buy it doesn’t take many sellers to send things lower. The market spent about three hours trying to find bottom. NASDAQ fell through its 200 day SMA but found footing at the old 2004/2005 up trendline. SOX fell through the 18 day EMA but held its near summer trend. SP600 crashed its 200 day SMA as well, but managed a rather decent move off its 50 day EMA. SP500 and DJ30 performed the best, tapping the 10 day EMA and rebounding modestly.

After that test the indices moved laterally for two and one-half hours, then found a bid in the last hour, rebounding off those support levels. A modest move and mostly driven by some position squaring and covering ahead of the weekend, but it bounced stocks a bit off of that support tested intraday.

It certainly looks simply like a test of the last move higher, the fourth leg off of the July low, particularly for the large cap NYSE indices and NASDAQ. SOX and SP600 are testing as well, but as they started this move lower in their patterns they appear to be under a bit more pressure. Still, this is just what we expected after this fourth leg that saw SP500 and DJ30 reach for the May highs, and the market is acting according to what it showed. Indeed it did fairly well Friday even with the losses as SP500 and DJ30 avoided reversing and selling off after testing their May highs. As noted, all the indices held their trends, and that is also a positive.

Technically, you had some selling once more, but the volume dried up after some Thursday distribution on NYSE. A Jewish holiday had a lot of traders leaving early and that truncated the volume, but regardless of the cause the market avoided another day of distribution as most indices faded for the second straight session (SOX has tested for over a week). As noted, growth indices gave up some near support, but all held their recent, and in the case of NASDAQ, its longer term, trend. Downside breadth swelled to -2.2:1 on NASDAQ, but held more or less steady on NYSE. Leadership mostly faded as well, but managed to hold near support. There were some cases of high to low reversals, i.e. up strong on Thursday with a breakout only to collapse back Friday. That is a sign of some market weariness when breakouts cannot sustain themselves and indeed immediately reverse. As next week begins we will be watching for any renewed distribution and whether breakouts give themselves up.

So far it is just a pullback like all the others on this run. Some distribution but sellers are not in control, and leaders are for the most part still continuing their advances. This time, however, SP500 and DJ30 are coming back from their old May highs and the move is four legs old. Time to be a bit more vigilant in the event more selling starts, but we also have the last week of the quarter working for us. Those stocks that have performed well will likely continue doing so as funds swap out of losers and buy some of the winners for some window dressing in the quarterly reports. Seems kind of silly, but it goes on each quarter, and it can sustain this move

THE ECONOMY

This past week the crowd started changing its tune with respect to the economy . . . again. For most of the past year, the mindset was anything slowing the Fed down was a positive. Sure there was some backwash from time to time as investors worried the economy might slow too much, but overall the party line in equities was you had to get the Fed out of the way first. That is quite true; given the Fed’s history you want it out of the way as soon as possible to avoid overkill. Of course, history also shows the Fed rarely, rarely, rarely (and we mean rarely) ever stops slowing the economy before it does real damage. It doesn’t want to hurt it, but as in ‘Of Mice and Men,’ it has no concept of its strength over the economy and kills off prosperity when it just means to help. Thus it is almost a death wish investors hold: you want to Fed out of the way but you know if it is that likely means interim pain. Maybe not a death wish, maybe just some form of sadomasochism, knowing you have to endure the pain to get to the pleasure.

As in 2000, views of the economy’s ability to continue its expansion remain overall positive in most cases to downright giddy in some. There is the other end of the spectrum warning of a severe problem what with housing cratering and high consumer debt, but just as there are always cheerleaders who see no evil (remember Joe Battipaglia in 2000?), there are gloom and doomers who see only evil. Housing is in a fast fall now. The evidence is very clear in all aspects of the sector, but one of the most telling is the continued decline even as interest rates are in a dramatic decline. If low rates cannot spur buying, that is a sign of a slumping sector.

Thursday the overall sanguine view of the economy was rocked some when the Philly Fed, a very volatile regional manufacturing report anyway, plummeted from 18.5 to -0.4. The swing was so dramatic it almost screams aberration. Still it gave stock investors a dose of economic queasiness and helped spur a reversal of the Wednesday break higher. Stocks have not broken lower by any means. The patterns developing since April and May are still holding, and one of the best indicators of economic slowing is the market. It peaked in early 2000 and sold hard, recovered to a July peak, but then topped again in September and it was all over but the crying.

That is one reason we are watching this test of the May highs by SP500 and DJ30 so closely. This is the fifth base since the October 2002 bottom (on NASDAQ; fourth on DJ30), and while that does not mark in stone a top, it is an indication a bigger test may be near. There are already signs of economic slowing, more than in 2000 when the Fed stopped that hiking campaign. Thus you could argue the Fed hiked further into those slowdown than it did in 2000, and that is not great news. Of course the Fed has been more mature in its handling of money supply this time around, steadily bringing it down but not turning it off cold turkey as did the Greenspan Fed. It yo-yoed money supply up and down, pouring cash in ahead of Y2K even as it tightened rates to slow the economy, then yanked it out 100% in March 2000, put banks on restriction, and hit the economy with a 50BP hike in May. Not good management as the results showed. That doesn’t change the fact, however, that we had signs of slowing even as this Fed continued hiking, and the slowing is only picking up speed. Maybe the bond market is right in predicting rate cuts by year end. That remains to be seen. Stocks have not cracked yet.

Some say bonds are telling a different story this time, but they miss the big picture.

Ah the bond market. Its predictive powers are extolled and dismissed, at times in the same breath. Greenspan was out in 2005 saying the flattened yield curve did not mean anything because it was due, in some part, to foreign buyers of treasuries, recycling all of those petro-dollars, etc. He could never say how much was due to that, however, something he did admit but no one seemed to own up to. They preferred to focus on the foreign buying as the sole reason for the decline in yields.

Bernanke picked up on that theme, but some scholars say he doesn’t really believe it that much, but was in a position of carrying on the Greenspan mantra at the first part of his tenure. Right now with commodities tanking and emerging markets not emerging so fast, a lot of that money that was swinging for the fences in pork bellies and Thai coffee houses has returned stateside, looking for more safety. That, the non-bond believers say, shows the rally in bonds and the drop in yields (and the inversion) is not your father’s flat curve, i.e. is not predictive of an economic slowdown.

Sounds pretty logical; that money has to find a home somewhere when those other markets are not so favorable anymore. But you have to ask WHY is the money going to safe havens? If economic times were going to remain good overseas in these markets the money would stay there. If commodities prices were going to move higher due to demand, they would be soaking up that money. Instead there was a bubble, a blow off top in commodities and emerging markets, and they are now correcting. The money is moving into US stocks and bonds, looking for safety in US securities. That happens in every economic slowdown; money seeks safety. When it does it comes in to US treasuries and that drives down yields, just as in EVERY economic slowdown. Thus this influx of capital that drives US rates lower is a natural part of every economic slowing, and is not an indication of the bond market’s lack of predictive power. It is PART of that predictive power as money anticipates slowing and seeks safer homes.

Further it is not all massive buying as you would assume from the financial stations. The most recent data from July shows net foreign purchases down 50%. With investment taking a dip, you cannot explain lower bond yields on vast quantities of foreign money pouring into the system. It is having its effect as usual, but it is not the only power at work. Thus it is wrong to just say the bond curve doesn’t mean much anymore, just as it is wrong to say the Fed got it right this time. Both remain to be seen, but given history, it is a really aggressive bet that bonds are totally wrong and the Fed is going to deliver one of its rare soft landings. If that is the case, I am buying one lotto ticket this weekend and I expect to win.

As I said, it remains to be seen who is right. Stocks are still moving higher while bond yields are inverted and moving lower. Indeed, this past week the inversion between the 2 year and the 10 year hit its highest (10BP) since March before correcting back to close the week at 7 BP (4.67% on the 2 year versus 4.60% on the 10 year). A modest inversion but a pesky one that won’t go away. For the week, however, bond yields fell a whopping 20BP, the most since April 2005. All the while the spread between the Fed Funds rate (5.25%) set by the Fed widens, indicating the bond market is predicting much slower times than the Fed (after this Wednesday meeting its statement said it was still leaning toward an inflationary bias). As noted above, the bond market anticipates Fed cuts by year end. For now stocks are holding up nicely, but with the Dow and SP500 coming off tests of the May highs after a long run higher it is time to be vigilant and watch how the stock market responds to the pullback from those May highs.

THE MARKET

MARKET SENTIMENT

VIX: 12.59; +0.34
VXN: 18.23; +0.03
VXO: 12.2; +0.24

Put/Call Ratio (CBOE): 0.92; -0.05. Could not close above 1.0 even with the continued selling. Not ratcheting sharply higher, and with this one it takes several closes above 1.0 to start indicating a turn.

NYSE Short Interest:

Closed the week at 6.77, off the 6.94 five year high hit two weeks back but still at high levels. Lots of expectation of a decline, and that is a contrary indicator. It is still a secondary indicator, however, and how the market responds to this stall at the May highs in terms of price and volume and leadership will be the most important indicator.

Bulls versus Bears:

Bulls: 47.4%. Up again, climbing from 45.8%, 43.2% , and 42.1%. Climbing steadily up toward the 55% level considered bearish. Still below the peaks from January and April, and well below the 55% level considered bearish, but it is heading that way and getting too high.

Bears: 33.7%, down from 35.4%, but still well above the 20% level considered bearish. It is the holdout but the bulls are making the move. This matches the 33.7% hit the two prior weeks. Back into the decline from the 37.1% hit in July. The 37.1% was the highest level in this entire cycle, easily clearing the 34.4% hit in late June back when bulls and bears kissed, just missing a crossover. Hit a new post-2002 high in that late June move, eclipsing the March 2006 high (33%) and well above the 2005 highs that spawned new rallies (30% in May 2005, 29.2% in October 2005).

NASDAQ

Stats: -18.82 points (-0.84%) to close at 2218.93
Volume: 1.688B (-17.64%). Good fade in volume, dropping to below average for the first time in two weeks. A holiday had many knocking off early, but nonetheless, no distribution as it came back.

Up Volume: 415M (-183M)
Down Volume: 1.248B (-178M)

A/D and Hi/Lo: Decliners led 2.2 to 1. It was not just a large cap tech move; indeed, the large caps held up a bit better with just a 0.76% decline.
Previous Session: Decliners led 1.74 to 1

New Highs: 47 (-60)
New Lows: 71 (+2)

The Chart: (Click to view the chart)

NASDAQ gapped modestly lower and then sold through its 200 day SMA (2165) before tapping close to its old August 2004/April 2005 up trendline (2209) and the early September high (1207) before rebounding to shave a third of its losses by the close. So far so good as NASDAQ tests the fourth leg in its run off the July low and continues building the base that started in April. Since coming back from the summer, NASDAQ has shown overall accumulation and good market leadership. After this test we want to see that continue with more rising volume on the next break higher. Will likely test the up trendline and perhaps the 18 day EMA (2204) again before it makes the next move, maybe down to the early July high at 2190. That will make things just uncomfortable enough to shake out the index for the next leg.

SOX (-0.61%) fell through the 18 day EMA (451.45) Friday, continuing its decline for the week after moving laterally the week before. SOX started testing earlier than the rest of the market, and we were looking for it to start back up ahead of the market, but it ran into the economic slowing issues. Chips are quite sensitive to that and it faded, but did manage to hold above the trendline (445) from the July low as well as a range of support from June and late August. This is where it needs to hold the line and resume the move.

SP500/NYSE

Stats: -3.25 points (-0.25%) to close at 1314.78
NYSE Volume: 1.448B (-14.32%). Volume faded to below average as the NYSE indices posted their second down session in the pullback. Good to see the volume contract from the modest distribution on Thursday.

A/D and Hi/Lo: Decliners led 1.62 to 1. Very modest once again, coming back from close to -3:1 earlier in the session.
Previous Session: Decliners led 1.4 to 1

New Highs: 71 (-71)
New Lows: 53 (+19)

The Chart: (Click to view the chart)

Nice test of the 18 day EMA (1310) on the intraday low and a rebound to cut more than half its losses. Lower volume on the selling shows no distribution, and the rebound, while mostly due to squaring up before the weekend, was still a good indication. Second downside session since testing the May high on the Wednesday and Thursday highs. It made the test down to next support but this is likely not the extent of it. Another test of that level (also marked by the top of the March/April trading range) is likely, and we could easily see a move to 1300 before it is ready to make another run at the May highs. A bit of distribution on Tuesday and Thursday, and thus we will be watching volumes closely this week.

The small cap SP600 (-1.00%) broke below its 200 day SMA (372) and folded for the largest loss of the session. It managed to rebound off the 50 day EMA (367) as well as the up trendline from July (368) and cut some of its losses. That tap represents just about as far as it needs to come back on this move and still make a higher low. It will likely test again this week before it makes the next attempt higher.

DJ30

The Dow showed that same action the other large caps demonstrated, tapping at the 18 day EMA (11,470) on the low and rebounding to recoup much of its losses. Volume was lower and below average, indicating no dumping, just a modest dip after failing to take out the may high. That beats the heck out of diving on rising volume after that failure. Not sure it is done here, and a test of the 18 day EMA again is in order, and it may come on back to 11,400 where there is some pretty significant support. It will likely want to inflict a bit more pain to the downside before it is done.

Stats: -25.13 points (-0.22%) to close at 11508.1
Volume: 198M shares Friday versus 241M shares Thursday. Volume faded as DJ30 continued its test. Pretty solid action overall but still likely to test further before it is done.

The Chart: (Click to view the chart)

MONDAY

A bit more of a shakeout on Friday as expected, with varying degrees of damage done. SP600 had the roughest go of it, and it also has the most problematical pattern. On the other end of the spectrum you have the large cap NYSE indices, coming off tests of the May high, thus far holding up. In the middle you have NASDAQ and SOX, the backbone of this move off the July lows (before this period they were dead to us). The market needs all indices to pull together, but SOX and NASDAQ are going to be key once more to the next move.

This week brings two opposing forces together. It is the last week in September, and while that conjures some visions of selling just because the market is up for a month often associated with selling, the competition is between window dressing in the last week of the quarter and inflicting more pain on the downside before an upside rebound starts anew.

While it is discounted by some, there is definitely buying of the winners and selling of the losers in the last week of a quarter. Energy has been on the dive, and it will likely see more pressure in the week as additional shares are sold. Big cap techs have been in the news with respect to the upside of late, and thus we could see more buying in those names. Retail surprised many with its strong move, and some of the big names could see some more buy side pressure for the same reason.

There is also the pullback underway, and though the indices rebounded some to close the Friday session, they will also likely sell some more before they are ready for any serious upside move. The market tends to apply enough pressure to get the doubts and fears stirred back up and the selling started, and then it relents and resumes the move. In short, it makes the dip start to hurt and then resumes the move. That is why you often see a near term pullback undercut near support intraday and then stop the bleeding with a rebound.

If we get the continuation test to start the week, say Monday and Tuesday, that would be good. That would keep the pressure on and build up enough for a rebound, particularly if the indices test to the lower support levels. That would be a good set up for buying to end the week as funds move in to pick up the leaders at a lower price to spruce up the quarterly statement. A deeper test might also be enough to break DJ30 and SP500 through the May highs and keep the upside move going.

Now if the upside comes first, i.e. early in the week, that is likely bad for the market overall. After that posturing is over the market then lacks a driver and turns back over. The selling could be much more intense on into October. That is nothing new for anyone who has been in the market for a few years. That may set up a nice October bottom, but there would be considerable pain first.

Thus we look to see how the week opens and that will clue us in to what to expect for the rest of the week and the end of the third quarter. Of course that also means earnings are coming and there is some trepidation about their strength. This is the quarter many predicted a slowdown to finally show up. There is slowing so we will see some earnings deterioration. That could mean a rough October earnings season, but once it is over that may also set the stage for a rebound into year end. First things first, however, and that starts with how the market opens: window dressing buying or a further downside test.

Support and Resistance

NASDAQ: Closed at 2218.93
Resistance:
The 200 day SMA at 2222
2234 is the June 2006 peak (intraday)
2250 is the March 2006 closing low.
2316 from interim tops in January and March 2006 (the 2250 to 2316 range is the Q1 trading range for NASDAQ)
2376 is the April high, the post-2002 high

Support:
2209 is the August 2004/April 2005 up trendline
The 18 day EMA at 2204
2190 is the July 2006 high
2185 to 2182 is the September 2005 peak and interim high from November 2005.
2177 is the December 2004 high.
2168 is the August intraday high.
The 50 day EMA at 2166
2158 from the May 2005 low.
2100 from the early and mid-2005 peaks
2072 is the June closing low
2050 from the summer 2005 lateral range lows

S&P 500: Closed at 1314.78
Resistance:
1324 to 1329 from the October 2000 lows.
1326.70 is the May 2006 high
1334 is an October 1999 peak

Support:
1315 is the May and May 2001 peaks
1311 is the April closing high.
The 18 day EMA at 1310
1302 the recent August highs
1294 is the January 2006 high and 1297.57 is the February 2006 high.
The 50 day EMA at 1294
The early June high at 1288
The late January peak at 1285
The 200 day EMA at 1281
1280.37 is the recent July peak.
1268 is an old trendline from the August 2003/August 2004/October 2005 lows.

Dow: Closed at 11,508.10
Resistance:
The 10 day EMA at 11,516
11,642 is the May 2006 closing high
11,670 is the May intraday high
11,750.28 is the all-time high

Support:
The 18 day EMA at 11,470
11,401 from the September 2000 peak and April 2001 highs
11,384 is the August intraday high.
11,350 from the May 2001 peak
The March 2006 highs at 11,329 to 11,335
The 50 day EMA at 11,330
11,279 is the late May closing high
11,243 is the early August peak closing high.
11,228 is the July closing high.
11,097 to 11,137 is the last peak from the February top.
The 200 day SMA at 11,114

Economic Calendar

These are consensus expectations. Our expectations will vary and are discussed in the ‘Economy’ section.

September 25
- Existing home sales, August (10:00): 6.25M expected, 6.33M prior

September 26
- Consumer Confidence, September (10:00): 102.5 expected, 99.6 prior

September 27
- Durable goods orders, August (8:30): 0.8% expected, -2.5% prior
- New home sales, August, (10:00): 1.05M expected, versus 1.07M prior
- Crude oil inventories (10:30)

September 28
- GDP, final Q2 (8:30): 2.9% expected, 2.9% prior
- Chain deflator (8:30): 3.3% expected, 3.3% prior
- Initial jobless claims (8:30): 318K prior

September 29
- Personal income, August (8:30): 0.3% expected, 0.5% prior
- Personal spending, August (8:30): 0.2% expected, 0.8% prior
- Michigan sentiment, revised (9:45): 85.0 expected, 84.4 prior
- Chicago PMI, September, (10:00): 57.0 expected, 57.1 prior
icon url

ReturntoSender

09/28/06 10:09 PM

#7023 RE: ReturntoSender #6755

From Briefing.com: 8:33PM Maxim Integrated to request NASDAQ hearing regarding stock listing (MXIM) 28.74 +1.01 : Co announced that it will request a hearing before the Nasdaq Listing Qualifications Panel (the "Panel") in response to the receipt of a Nasdaq Staff Determination letter dated September 25, 2006. The letter, which MXIM expected, was issued in accordance with standard Nasdaq procedures as a result of the delay in the filing of MXIM's Annual Report on Form 10-K for the fiscal year ended June 24, 2006 with the S.E.C. Pending a decision by the Panel, Maxim shares will remain listed on the NASDAQ Stock Market. As previously disclosed, a Special Committee of MXIM's Board of Directors has commenced an independent review of MXIM's past stock option grants and practices. MXIM intends to file its Form 10-K as soon as practicable after completion of its internal review.

8:25PM Merix obtains dismissal of federal class action securities complaint (MERX) 9.90 -0.06 : Co announced that the second amended complaint in the securities class action lawsuit (In re Merix Corporation Securities Litigation, U.S. District Court Case No. CV 04-826-MO) filed against MERX, its directors and four of its officers has been dismissed with prejudice. The motion to dismiss was granted with prejudice on September 28, 2006.

4:20 pm : Stocks extended their winning streak to four sessions Thursday, but market gains were again modest at best as investors grappled with volatile oil prices and some resistance after the Dow charged out of the gate and briefly surpassed its all-time closing high of 11,722.98.

Within seven minutes of the opening bell, the bulls finally got what they wished for, the 34 points needed by the Dow to make history for the first time in 6 1/2 years. Be that as it may, with so much hype tied to the blue-chip index reaching such a milestone being priced into equities throughout the week, the Dow's gain also left the door open for some selective consolidation following the market's recent run-up.

In fact, had it not been for continued momentum in this month's best performing Dow components -- General Motors (GM 33.02 +0.74) and Intel (INTC 20.77 +0.38) -- coupled with some bargain hunting interest in Caterpillar (CAT 66.53 +0.85) -- one of the worst performing components in Q3 -- there's a good chance the major averages would have closed relatively unchanged. General Motors hit an intraday 52-week high following reports that billionaire investor Kirk Kerkorian's Tracinda Corp said it may acquire an additional 12 mln GM shares and after GM CEO Rick Wagoner reassured shareholders it can survive even without an alliance. Hewlett-Packard (HPQ 35.96 +0.57) shrugging off the surprise resignation of general counsel Ann Baskins just hours before its Congressional hearing, and turning in an impressive 1.6% performance, provided additional market support.

Meanwhile, with investors already extremely sensitive to signs of economic weakness, the Commerce dept. reporting that Q2 real GDP was unexpectedly revised lower to a 2.6% annual rate of growth from a previously reported 2.9% underpinned a sense of caution. However, given the dated nature of the GDP data and the fact that the final revision won't alter expectations for continued growth in the 2-3% range for Q3 and Q4, which fits the definition of a so-called soft landing, investors eventually shrugged off the data and kept the Q3 rally intact. DJ30 +29.21 NASDAQ +6.63 SP500 +2.56 NASDAQ Dec/Adv/Vol 1429/1599/1.84 bln NYSE Dec/Adv/Vol 1546/1706/1.40 bln

2:22PM Amkor announces it is amending the terms of the consent solicitation (AMKR) 5.26 +0.15 : Co announces that it is soliciting consents from the holders of its following series of notes. The co is seeking consents for a waiver of certain defaults and events of default that may have occurred or may occur under each series of notes from the failure of the co to file with the SEC its Quarterly Report on Form 10-Q for the quarter ended June 30, 2006, and other notices or reports, and the consequences thereof, and the waiver of the application of certain provisions of the indentures governing each series of notes. The co announced that it is amending the terms of the consent solicitation, including to extend the expiration date for the consent solicitation for each series of notes and increase the "Additional Consent Fee" referred to below. The consent solicitation for each series of notes will now expire at 5:00 p.m., New York City time, on October 3, 2006, unless extended or earlier terminated for a particular series of notes. Holders may deliver their consents to the Tabulation Agent at any time before the expiration date.

11:02AM Microsoft and Intel propose new global value chain collaboration standards for high-tech manufacturing industry (MSFT) 27.47 +0.03 : MSFT and INTC in a joint effort to improve supplier collaboration in the high-tech industry, today announce they have proposed the next-generation of open, interoperable business standards for small to medium enterprise supplier collaboration, based on the Microsoft Office Open XML Formats for documents. The two cos are helping drive community consensus and standardization of this approach by co-sponsoring the next-generation RosettaNet Automated Enablement program as part of the RosettaNet consortium.

9:01AM KLA-Tencor announces it will restate financial statements related to stock options (KLAC) 44.51 -0.86 : Co announced that it will restate previously issued financial statements to correct the co's past accounting for stock options. Based on a report received from a Special Committee of the Board of Directors, the Board concluded that incorrect measurement dates for certain stock option grants were used for financial accounting purposes, principally during the periods July 1, 1997 through June 30, 2002. As a result, the co will be required to record non-cash charges for compensation expenses relating to those past stock option grants. The co has not determined the exact amount of such charges, the resulting tax and accounting impact, or which specific reporting periods may require restatement. Accordingly, the co is filing a Form 8-K today stating that the financial statements and all earnings and press releases and similar communications issued by the Company relating to periods beginning on or after July 1, 1997, should no longer be relied upon. KLA-Tencor intends to file its restated financial results and Annual Report on Form 10-K as quickly as practicable. KLA-Tencor does not anticipate that the restatement will have any impact on the co's historical revenues. Any stock-based compensation charges incurred as a result of the restatement would have the effect of decreasing reported income or increasing reported loss from operations, and decreasing reported net income or increasing reported net loss, and decreasing reported retained earnings amounts contained in the co's historical financial statements for the affected periods.

4:41AM AMD announces strategic agreement with Founder Technology, second largest PC provider in China (AMD) 25.32 : Co and Founder Technology announce an agreement to offer Founder customers a range of systems based on AMD64 processors. Founder expects to launch AMD64 processor-based desktop PCs throughout China in early October 2006. The sales agreement will begin with desktop systems and expand to cover both the notebook and the server markets in the near future.

09:15 am Family Dollar Stores, Inc. (FDO)

28.95: Discount retailer Family Dollar Stores Inc. has once again indicated financials that were better than expectations. The company reported fourth quarter earnings of $0.26 per share, $0.03 better than the Reuters Estimates consensus of $0.23. Revenues rose 10.4% year over year to $1.58 billion versus the $1.58 billion consensus. Family Dollar also issued in-line guidance for the first quarter and full year of 2007.

The company, which has a market cap of about $4.39 billion, said it sees earnings per share of $0.34 to $0.38 versus $0.37 consensus for the first quarter. It also said it anticipates earnings per share of $1.57 to $1.69 versus $1.61 consensus for the full year of 2007.

Briefing.com was bullish on Family Dollar in late May, noting the issue appeared to be a typical buy-and-hold stock with room for appreciation. Today's beat on earnings marks the second positive financial release since then. The company recently announced that August same-store sales increased 4.0%, just under Briefing.com consensus for a gain of 4.1%.

The the 47-year-old company has a business plan that makes sense in a tougher economic environment. It offers products at a deep discount and builds stores in areas that offer low-overhead options and are populated by individuals with a lower-than-average personal income.
The company's history of issuing dividends indicates both financial strength and management's confidence that the company will continue to be solid even through bad times. Trading at about 20.7x trailing twelve-month earnings, the stock is at a slight premium to the industry average; therefore any price decline should be viewed as a potential entry point.

--Christine Marie Nielsen, Briefing.com

09:05 am American Greetings (AM)

25.04: American Greetings, the number two U.S. maker of greeting cards (behind Hallmark), said it slid to a loss in the second quarter, due to normal seasonality and the rollout of a new strategy to manage inventory. The Cleveland-based company also declared a regular quarterly dividend of $0.08 per share, which will be paid Oct. 23 to shareholders of record on Oct. 13.

For the most recent quarter, American Greetings posted a loss from continuing operations of $13.2 million, or ($0.23) per share, compared with a year-ago profit of $3.8 million, or $0.06 per share. Analysts, however, were expecting a narrower loss of ($0.16) per share, according to Reuters Estimates. Quarterly revenue fell 6.5% year/year to $360.1 million, also short of the consensus estimate of $363.2 million.

American Greetings' chief executive, Zev Weiss, said the combination of normal seasonality as well as the planned rollout of its card and scan-based trading initiatives put downward pressure on revenues and earnings to cause a loss from continuing operations. However, the company maintained its fiscal year earnings outlook, as the second half of the year is stronger seasonally than the first half. It said it still expects to earn between $0.80 and $1 per share, versus the consensus estimate of $0.87 per share.

--Richard Jahnke, Briefing.com

08:58 am General Motors (GM)

32.28: It's back to the drawing board for General Motors, Renault and Nissan executives. All three have agreed to three more weeks of analysis over the proposed 3-way venture to determine if the potential cost synergies make financial sense. The deadline for the deal, proposed by billionaire GM shareholder Kirk Kerkorian, has been moved back to October 15th.

GM Chief Executive Officer Rick Wagoner said he's "absolutely confident " that the world's largest automaker can survive without an alliance, pointing to the fact that its plan to cut $9 bln in costs is ahead of schedule. In July, the automaker raised its cost savings target by a billion dollars as a result of the high acceptance rate of employee buyouts. At the Paris Auto Show, Wagoner told reporters that his meeting with Carlos Ghosn was "cordial" but wouldn't comment further.

Wagoner certainly has had more solid ground to stand on recently. The execution of the turnaround plan in the North American business has yielded results faster than many have expected. The once $5 bln in cost savings now stands at $9 bln. Kerkorian initiated the 3-way talks after GM posted its longest-ever losing streak in June with its market share dropping to an 80-year low. GM reported a first half net loss of $2.9 bln due to buyout and retirement costs, but revenues, driven by auto sales and financing, actually rose. GM lost $10.6 bln last year.

GM's share prices have risen an astounding 66% this year despite formidable hurdles the company is facing both on a macro and micro level. Investors have been willing to give GM the benefit of the doubt, focusing on the potential turnaround story. All the automakers face a challenging macro environment. Consumers are dealing with a declining housing market, higher interest rates, and record levels of household debt. Plunging gasoline prices are a welcome relief, but it remains to be seen whether they will translate into higher automotive sales. US auto sales have fallen for the last four months, culminating in a 4.3% YTD decline. Most auto analysts anticipate the weakness will continue throughout the remainder of the year into 2007, resulting in declining sales and rising incentives - a toxic mix for profits.

--Kimberly DuBord, Briefing.com

icon url

ReturntoSender

10/01/06 9:06 PM

#7029 RE: ReturntoSender #6755

Trim Inflation Now
September 29, 2006
By John Mauldin

http://www.frontlinethoughts.com/printarticle.asp?id=mwo092906

Trimming Inflation
The Inflation Trend is Not Your Friend
Consumer Spending Slows
My "Debate" on Kudlow
Copper: The Metal with the PH.D
New Orleans, Birthdays and the Passage of Time

It's been a random walk through the data fields this week. The headlines say that inflation rose a mere 0.1% in August. The markets liked that. But digging deeper, the data is not as sanguine. We had the depressing Philly Fed manufacturing index last week, but today we find that Chicago is doing more than fine. The Dow flirted with a new all-time high, but then took the train home early for the weekend, leaving those who care about such things feeling like a teenage boy at a Baptist youth camp, flush with excitement during the day but frustrated as you go back to your dorm. But there's always tomorrow. Or maybe not.

Copper is the metal with a Ph.D in Economics. But has the metal been too smart for its own good? Looking at some recent trends in copper usage, we can learn something about an economic concept called substitution and the cure for high prices. I comment on my "debate" on Kudlow and Company this week, and muse on growing older and the passage of time. Let's jump right in.

Trimming Inflation

Measuring inflation is not easy. The Department of Labor creates the Consumer Price Index (CPI). The Department of Commerce creates the Personal Consumption Index (CPE). The market seems to pay more attention to CPI, but the Fed (read Greenspan and now Bernanke) prefers to look at CPE. And they really like core CPE, which takes out food and energy, because otherwise the number can be too volatile for sensitive central banker stomachs.

But however you measure it, getting it right is important. If you allow inflation to become pervasive and persistent, it does nasty things to economies and markets. No US central banker ever wants to revisit the 70s. While it is popular in certain circles to depict Bernanke as Bomber Ben, a reference to his remark in a speech about dropping cash from helicopters, you can be sure that he understands that inflation at too high a level is just as pernicious as deflation. There is a fine grey line they walk, but the general consensus seems to be that when inflation is over 2% it is too high.

(The dropping cash reference was an economist's attempt at humor. There is a reason why we never become stand-up comedians.)

Inflation is well over 2%. It may even still be rising, as some data we will look at suggests. So why did the Fed stop raising rates? Are they not worried about inflation?

The answer is that they think (hope?) that a slowing economy will ease the pressure on inflation without having to resort to further rate increases. If the economy is indeed slowing, the thinking seems to be that to pile on with more interest rate increases would simply add to the problem and maybe even cause a recession. That has been the pattern in the past. If the economy remains strong or gets stronger, they can always increase rates later.

I think this is the correct approach. But that makes the Fed very data dependent. Each bit of new data becomes ever more important. The futures market is pricing in a 30% chance of a rate cut at the January meeting, and the odds in the futures market of a rate cut increase with each meeting. That means the futures market thinks the economy will be visibly slower in the not too distant future, otherwise why forecast a rate cut? (We will visit this point later when we look at the recent stock market action and my conversation with Larry Kudlow this week.)

The Inflation Trend is Not Your Friend

As noted above, the headlines said that inflation as measured by PCE only rose 0.1% of August. In July PCE rose 0.8%. That means inflation is falling, right? Well, maybe.

June was "only" 0.3%, yet May was 0.7%. As you can see, the monthly numbers can be quite volatile. As I wrote last month, Dallas Fed president Richard Fisher argues that a six month trending average is actually the best measure.

Without going into the detail we did last month, the Dallas Fed has developed a new methodology for measuring inflation, called the Trimmed Mean PCE. It was developed by Dallas Fed economist Jim Dolmas.

Dolmas notes (quite correctly, I think) that to exclude food and energy, just because they are volatile, ignores the other quite volatile measures of inflation that are still left in. Further, energy and food inflation do have meaning in the real world.

What Dolmas does is use a statistical device called "trimming." From the field of statistics, trim analysis borrows the idea of ignoring a few "outliers." A trimmed mean, for example, is calculated by discarding a certain number of lowest and highest values and then computing the mean of those that remain.

How accurate is his new measure? Dolmas suggests it is a lot more accurate: "That is to say, compared to the usual ... measure, on average the monthly trimmed mean measure would be expected to come closer to true monthly core inflation by roughly .75 of a percentage point, when the inflation rates are expressed in annual terms." That is huge, at least in my book, especially when we look at how much the difference is with the Fed's favorite methodology.

The Dallas Fed uses the same data as the Department of Commerce does to create the PCE. I have to compliment them that they have updated their web site from data released today. The charts below compare PCE, core PCE (ex food and energy) and the Trimmed PCE. The numbers show what the rate would be on an annualized basis for one, six and twelve month's worth of data. (www.dallasfed.org/data/pce/index.html)

The trend is not your friend. Inflation on a 6 month and a 12 month basis has been trending up for the last six months in all three series. The 1 month numbers, while more volatile, are well above the 2% comfort threshold. Let's look at the tables:


If you are so inclined, you can make an argument using just the 1 month numbers that inflation may be starting to slow down, but the truth is that one month's worth of inflation data is pretty much useless as a predictor.

What we can see is that inflation, at least through August, has not gone away. If inflation is still this high at the end of the year, then the Fed is going to be forced to think about raising rates, not lowering them. Can you have a slowing economy and rising inflation? The answer is yes. Remember that 70's show? Bottom line? The Fed will fight inflation, even risking as recession, as to not do so risks an even worse recession in the future.

Now, the probability is that a slowing economy will indeed bring inflation down. But it is not the only possibility. That is why the Fed is on hold, waiting for more data. There will only be one more month's worth of data between now and the November meeting. That will not be enough to justify a move either way. But at the January meeting, they will have seen three more month's worth of data. A trend will be established: either up, down or flat. The futures market is betting down.

Which is odd, because that means the economy is going to slow. And a slowing economy is not usually the stuff of higher stock markets.

Consumer Spending Slows

Consumer spending rose just 0.1% in August, which was the slowest increase since November. When you adjust for inflation, consumer spending actually fell 0.1%, the first decline since September 2005, a month when consumers were dealing with the fallout from Hurricane Katrina.

Personal income rose at the lowest rate since last November, at an anemic 0.3%, which depending on how you measure inflation, could actually be down in real terms. But not to worry. We dipped into our savings. Savings were negative for the 17th straight month at -0.5%.

On the positive side of the ledger, the Chicago Business Barometer, also known as the Chicago PMI, rose to 62.1 in September, up from 57.1 in August and far higher than economists had expected. This was in stark contrast to the gloomy Philly number of last week.

How did we do as a nation? We will find out Monday when the national numbers come out. The Chicago numbers come out on the last day of every month and the national numbers from the Institute of Supply Management come out the first day of the (ISM) month. Chicago is a big portion of the manufacturing number. But the correlation between Chicago and the US is not all that tight. Stay tuned.

The Dow failed to close at a new high. (I wish it would go ahead and do it so that they could talk about something else on CNBC in the morning while I am getting dressed.) If Monday's ISM number comes out in line with Chicago, then expect that new high. If it comes out in line with the Philadelphia number, then we have seen the high for this cycle.

My "Debate" on Kudlow

I was on Larry Kudlow's show this last Tuesday. The topic was "Will there be continued growth or a recession in our future?" It will surprise no one that I argued for an economic slowdown or a mild recession. Professor Nouriel Roubini was on with us, and he was even more bearish. But John Rutledge and Kudlow more than balanced our views.

My summary points?

1. You can't ignore the negative yield curve. It is the most reliable forward indicator of future recessions or slowdowns. And it is telling us that a slowdown, at the very least, is on the way. To ignore it must mean you are willing to say "This time it's different." Those are the four most dangerous words you can utter in a trading room. Since the stock market drops an average of over 40% before and during a recession, if the yield curve is right, we are going to get to buy this market at lower prices.

2. There are other indicators suggesting a slowdown/recession, such as the Leading Economic Indicators and the ratio of the Coincident to Lagging Indicators. The data on consumer spending shows it tightly correlated with housing prices, and housing activity has become highly correlated with the S&P on a lagging six month basis, which does not bode well for the stock market, as housing activity is in free fall.

3. Even if we have a "mere" slowdown, that is going to mean disappointing earnings in our future, which will lead to a stock market decline. Yes, earnings are strong now, but we are at a peak in earnings as a percentage of GDP. Earnings growth is mean reverting. That means we will see earnings growth drop back to GDP plus inflation or around 6%, at the very minimum. A recession will mean it drops below that. And that means we get to buy this market at a lower price.

4. The market doesn't look forward, or at least not very well. You can simply go back to August of 2000 and watch the market almost make new highs (other than the NASDAQ and tech stocks). Two and a half quarters later we were in a recession. Oops. The market simply takes the most recent trends, anchors on them and then projects them into the future.

5. Yes, the housing market is only a small part of the overall economy, but it is an important part. It contributed about 1/3 of the new jobs during the recovery. It is highly correlated with consumer spending, which is slowing. Recessions happen at the margin. The world does not end. It merely slows down. If housing slows down by 25-30%, coupled with lower consumer spending, that could easily put us in a mild recession.

When asked about what the rising stock market was telling us, Roubini said he thought it was a sucker rally. I agree. In my view, to be unreservedly bullish on stocks at this point is to ignore what seem to be clear warning signs.

Let me be clear on one thing. I expect the stock market to be higher in 5-7 years than it is today. Maybe in less than 5. I simply think I can buy this market at a lower price at some time in the future. I expect to become more or less bullish during this next recession, or at the very least selectively bullish. But for now, I think it will pay to be patient.

(Usually, when I get asked to be on CNBC, it is with only a day notice. Maybe they will one day let me know a few days in advance and I can alert my readers.)

Copper: The Metal with the PH.D

Copper prices have been increasing rapidly in the last five years. From a low at $.63, today copper is $3.43. It was close to $4 last spring. This has not been a steady rise. The chart below shows that prices have risen rapidly in the last 2 years. (Chart courtesy of my friends at www.kitco.com)


What is the reason? China, strong growth in US housing and solid world GDP growth. Copper is said to have a Ph.D in economics. When copper prices are rising, it means that the economy is booming. But copper may be too smart by half. It may be pricing itself out of the market.

A new report by Simon Hunt, one of the true experts on copper, suggests that copper demand could actually drop over the next three years as companies figure out ways to substitute cheaper metals for copper. With copper trading almost 6 times it low just a few years ago, there is ample reason.

In economic terms, it is called substitution. If beef gets too high, we switch to pork or chicken. While it is a lot harder to switch the metals you use in a product, it is the same principle.

But " ... substitution is not just the use of an alternative material to copper. It is also the 'need to make more with less' through micro-miniaturization, improved design techniques, optimization of materials usage, improved fabrication methods, greater attention to end-product weight and the use of lower copper containing alloys."

As an example, air conditioning manufacturers use about 900kt (kilotons) of copper a year, or about 5.4% of global usage. Two-thirds of that is in copper tubing. They are now working to use thinner and smaller pipes, which will reduce the amount of copper per tune by 25%. In China, they are using aluminum for external tubing.

New designs have air conditioning systems which use all aluminum. Smaller and newer manufacturers which do not have large investments to write off are beginning to produce these new models. They may be able to price them very competitively, forcing larger manufacturers to follow suit.

Even without the new models, global demand for copper from air conditioning manufacturers could drop as much as 300kt in the next three years.

Refrigerators, copper boilermakers, gutters and roofing, telephone wires, cable, and a host of other products are being designed to use less copper. All told, we could see world wide demand drop by almost 15%, and as much as 20% longer term.

Even in a world where GDP is growing, we could see demand for copper soften. Of course, this means that other metals, especially aluminum, will see there demand increase. The old line that the cure for high prices is high prices is true.

And that Ph.D in Economics? It may be as useful as a real one when it comes to making predictions.

New Orleans, Birthdays and the Passage of Time

I will be speaking at the New Orleans Investment Conference November 15-19. In addition to yours truly, they have lined up Steve Forbes, Jim Rogers, Marc Faber, Dennis Gartman, and Newt Gingrich, plus scores of other well-known speakers, workshops, and private sessions. I hope to see you there. Click on the link for more information and to register.

http://www.jeffersoncompanies.com/affiliate/affiliate_process.php?icode=confreg&acode=JM

My friends at Altegris Investments will be hosting a special dinner for high net worth clients and prospects in New Orleans, and we will be arranging private meetings during that week. I hope to see you there!

If you are interested in the world of hedge funds and alternative investments, you can go to www.accreditedinvestor.ws and register for my free e-letter on alternative investments and hedge funds. I have a new letter which will be out shortly. Not only in the US, we have partners world wide who can take you inside the world of alternative investments. You can see the details at the web site. Also, note the risks on hedge funds at the end of this letter as well as on the web site. (In this regard, I am president of and a registered representative of Millennium Wave Investments, member NASD.)

Last weekend was the last home game for the Texas Rangers. There is something about the end of baseball season that has come to mark the passing of time for me. Maybe it would help if we could have a meaningful game in September, rather than saying wait till next year in August. As I look out my window, they are already tearing up the field, replacing grass and getting the field ready for winter. Something about the process makes me reflective.

Then again, it could be that next Tuesday is my birthday. I will be 57. For some reason, that seems a lot older than 56, but it is only a few days from here to there. It seems like only a few months ago we were having my 50th birthday party. But God willing, and if I can steer clear of stepping in front of London cabs (a few encounters with death narrowly avoided), I will be saying that when I turn 67 and 77 and 87. I do have good genes.

My Uncle Jamie died this week. He was 95. Until a few months ago, he was still driving his truck and working two gardens. Mother is 88 and bionic. They keep replacing her parts when they wear out. Her family of 9 siblings regularly make it to their mid-90's. All Dad's family (8 kids) made it into their mid-80's if they did not drink themselves into liver problems. (Mother and Dad were the youngest in their families.)

All the melancholy stuff aside, I am having more fun today than at any time in my life, although it would be good to be able to eat the really bad stuff I did when I was young. I miss unlimited potatoes and bread and butter and ice cream and pie. But that will have to wait 20 years until they have the gene therapy that will allow us to eat anything we want and not get fat. I will be third in line for that one. Now that is a cheery thought. They future looks brighter already. Until then, I will still hit the gym. Iron is my friend.

And the next 30 years will give me time to explore more of the world. I have been to 49 countries but there are a lot more on my list. I must confess to reading International Living and getting some wander lust. (It is a fun read. You can get it at http://www.isecureonline.com/Reports/IL/WILVG970/)

It's time to hit the send button. Have a great week. I can see a birthday steak at Nick and Sam's in my future. Jack's buying.

Note: The Accredited Investor E-letter is not an offering for any investment. It represents only the opinions of John Mauldin and Millennium Wave Investments. It is intended solely for accredited investors who have registered with Millennium Wave Investments and Altegris Investments at www.accreditedinvestor.ws or directly related websites and have been so registered for no less than 30 days. The Accredited Investor E-Letter is provided on a confidential basis, and subscribers to the Accredited Investor E-Letter are not to send this letter to anyone other than their professional investment counselors. Investors should discuss any investment with their personal investment counsel. John Mauldin is the President of Millennium Wave Advisors, LLC (MWA), which is an investment advisory firm registered with multiple states. MWA is also a Commodity Pool Operator (CPO) and a Commodity Trading Advisor (CTA) registered with the CFTC, as well as an Introducing Broker (IB). John Mauldin is a registered representative of Millennium Wave Securities, LLC, (MWS), an NASD registered broker-dealer. Millennium Wave Investments is a dba of MWA LLC and MWS LLC. Millennium Wave Investments and Altegris Investments are independent firms that cooperate in the consulting on and marketing of private investment offerings. Funds recommended by Mauldin may pay a portion of their fees to Altegris Investments, who will share 1/3 of those fees with MWS and thus with Mauldin. Any views expressed herein are provided for information purposes only and should not be construed in any way as an offer, an endorsement, or inducement to invest with any CTA, fund, or program mentioned here or elsewhere. Before seeking any advisor's services or making an investment in a fund, investors must read and examine thoroughly the respective disclosure document or offering memorandum. Since Altegris and Mauldin receive fees from the funds they recommend/market, they only recommend/market products with which they have been able to negotiate fee arrangements.

Your feeling better by the year analyst,


John Mauldin
John@frontlinethoughts.com
Copyright 2006 John Mauldin. All Rights Reserved

If you would like to reproduce any of John Mauldin's E-Letters you must include the source of your quote and an email address (John@frontlinethoughts.com) Please write to Wave@frontlinethoughts.com and inform us of any reproductions. Please include where and when the copy will be reproduced.

John Mauldin is president of Millennium Wave Advisors, LLC, a registered investment advisor. All material presented herein is believed to be reliable but we cannot attest to its accuracy. Investment recommendations may change and readers are urged to check with their investment counselors before making any investment decisions.

Opinions expressed in these reports may change without prior notice. John Mauldin and/or the staffs at Millennium Wave Advisors, LLC may or may not have investments in any funds cited above.

PAST RESULTS ARE NOT INDICATIVE OF FUTURE RESULTS. THERE IS RISK OF LOSS AS WELL AS THE OPPORTUNITY FOR GAIN WHEN INVESTING IN MANAGED FUNDS. WHEN CONSIDERING ALTERNATIVE INVESTMENTS, INCLUDING HEDGE FUNDS, YOU SHOULD CONSIDER VARIOUS RISKS INCLUDING THE FACT THAT SOME PRODUCTS: OFTEN ENGAGE IN LEVERAGING AND OTHER SPECULATIVE INVESTMENT PRACTICES THAT MAY INCREASE THE RISK OF INVESTMENT LOSS, CAN BE ILLIQUID, ARE NOT REQUIRED TO PROVIDE PERIODIC PRICING OR VALUATION INFORMATION TO INVESTORS, MAY INVOLVE COMPLEX TAX STRUCTURES AND DELAYS IN DISTRIBUTING IMPORTANT TAX INFORMATION, ARE NOT SUBJECT TO THE SAME REGULATORY REQUIREMENTS AS MUTUAL FUNDS, OFTEN CHARGE HIGH FEES, AND IN MANY CASES THE UNDERLYING INVESTMENTS ARE NOT TRANSPARENT AND ARE KNOWN ONLY TO THE INVESTMENT MANAGER
icon url

ReturntoSender

10/06/06 10:11 PM

#7045 RE: ReturntoSender #6755

THE DOW REPORT
Conventional Wisdom

http://www.financialsense.com/Market/wrapup.htm

In today’s wrap up I want to take a look at a few of the mainstream views that were so prevalent just a few months ago. The first one that comes to mind is the expectation of $5 per gallon gasoline. I remember hearing this on the news and friends and family were talking about it. Right as gasoline neared it’s peak, one night in a restaurant I recall hearing a conversation in which a man was telling his friends all the reasons that gasoline was going to go to $5 per gallon or even higher. When I heard that conversation, I knew we had to be nearing a top. The week of July 14th my intermediate-term Cycle Turn Indicator turned down telling me that the advance was over. As of this writing gasoline has dropped some 35% on the futures market and in my area it has dropped 28% at the pump. Below is a chart of gasoline showing this decline. I have been saying now for a couple of weeks that gasoline is oversold on an intermediate-term basis and that we should be moving into an intermediate-term low. That low is still trying to form. If it can take root and a full blown intermediate-term buy signal occurs on the Cycle Turn Indicator, then we should see another advance develop. At this time, I believe that advance will be a counter-trend move and I will treat it as such unless I see evidence developing to the contrary.


The same also goes for oil. I specifically recall just a few months ago that it was the opinion of most people that oil was headed to $100 a barrel or even higher. I remember seeing this on my local news, CNBC and even friends and family talked about $100 oil. Well, since the peak of all that talk oil has dipped below $58 a barrel from just under $80. Here too, oil is now getting pretty oversold. Once the intermediate-term Cycle Turn Indicator turns up, we should also see a counter-trend bounce unfold here as well. In the meantime, I cannot yet rule out the possibility of a bit more weakness. However, we should be getting relatively close to a window in which an intermediate-term bounce should have the opportunity to take root. At this time I believe this will be a counter-trend affair. Should evidence to the contrary develop, once a bounce takes root, then perhaps $100 oil will be possible, but for now I seriously have my doubts. We just have to take it one step at a time at.

Right as gold was moving into its peak back in May I recall hearing that it was on its way to $1,000, $2,000 and even $3,000 per ounce. Long-term, I too believe that such price levels may very well be achieved, but I have also maintained that such advance would likely come with the next 9-year cycle up and not this one. Anyway, to get back to the point here, it seemed that just as with gas and oil, as gold approached its peak it had pulled the majority into thinking that it was going much, much higher and that the advance had only just begun. At the time all I knew was that the week of May 19th my intermediate-term Cycle Turn Indicator told me that gold had rolled over and that lower prices were to be expected. Again, this was contrary to “Conventional Wisdom.” From the May high down to the recent low, gold has dropped by some 23%. More recently, last week to be exact, I said that there should be at least one more trip back down before an intermediate-term cycle low was made in gold. Just as with oil and gas, there is an intermediate-term low coming. I’m now waiting for the evidence to tell me if we have seen that low just yet or not. Once the low is confirmed we will have an intermediate-term advance on our hands and I will have to monitor that advance to see how it develops.


In regard to housing, I also specifically remember last year when the talking heads and realtors were telling us that housing was not in a bubble. Living on the Gulf Coast I watched housing prices soar and the building boom was wide open into 2005 and 2006. Yet, my intermediate and even my long-term Cycle Turn Indicator turned down back in mid-2005 telling me that a decline was imminent. Since then we are seeing inventories continuing to grow and sales have virtually stopped. In my area builders are giving away appliances, big screen televisions and even $10,000 cash bonuses to buyers. Now we are seeing these huge inventories beginning to pressure prices. In Daytona Beach, FL, D.R. Horton (DHI) has dropped the price of homes in some of its developments by as much as 26%. “Conventional Wisdom” was not telling people a year ago that this would happen. I have posted a chart of the Housing Index below.


As for the stock market, “Conventional Wisdom” was calling for a 4-year cycle low in October. Everyone was looking to the dreaded months of September and October. Well, we get into September and the market advanced higher. Then, “Conventional Wisdom” was that the June/July lows marked the 4-year cycle low. Since very early in 2006 I have been telling subscribers that the odds were that the 4-year cycle low would not come in the fall of 2006 as most anticipated, but rather in 2007 in a bit of a stretched 4-year cycle.

Now we have the money coming out of commodities and it is looking for a home. At least some of that money is indeed moving into stocks. This has in turn chased the shorts that were positioned for the anticipated September/October 4-year cycle low out of the market. These cash inflows are just the catalyst to stretch the 4-year cycle. As a result the euphoria is running high and in turn “Conventional Wisdom” is that we have dodged the bullet in the stock market and that we now have clear sailing. This is sucking everyone in just like the advance into the highs in gold, gas, oil and even housing did. The fact is that my intermediate and even long-term Cycle Turn Indicators remain bullish on the stock market and have since the Summer rally began. As a result we do not yet have a top, so yes, the picture is still bullish. I will go on to say that given the money that is moving into the market combined with the euphoria, positive Cycle Turn Indicators and an election ahead of us, conditions remain right for still higher prices. I will also add that I did call the low coming out of the June/July lows and at that time I said that the “Summer Rally had begun.” In fairness I will also add that in early September I began to get gun shy and I honestly did not expect to see the 2000 high bettered. Nevertheless, it happened.

But, here is where I believe “Conventional Wisdom” has it wrong once again on the stock market. While everyone is thinking the 4-year cycle low is now behind us, I find absolutely no evidence to support that view. This is not to say that the market can’t still move higher because it absolutely can and the Cycle Turn Indicators are confirming that. However, the decline into the 4-year cycle low still lies ahead, but at present I see no evidence that the top has occurred. Below is a chart showing a few of the more recent 4-year cycle lows. The indicator plotted in green is my monthly Trend Indicator. In going back to 1896 I have found that this indicator has turned down below its trigger line at every 4-year cycle low. It can on occasion turn down at significant sub-cycles within the 4-year cycle low as well. We saw this in conjunction with the April 2005 low, which was a mere 30 months into the 4-year cycle low and that did not mark the 4-year cycle low. Again, this indicator has always turned down at every 4-year cycle low since 1896 and this is just one of the many pieces of data that does not support the “Conventional Wisdom” that this past June/July marked the 4-year cycle low.


Let me add that since 1896 the average decline of ALL 4-year cycles has been 31.52%. The least decline ever into a 4-year cycle low from the intra-day top down into the intra-day low was 12.04% and this occurred with the decline into the 1994 4-year cycle low, which was obviously part of the greatest bull market ever. The second shallowest decline into the 4-year cycle low occurred with the drop into the 1953 4-year cycle low and there the decline was 13.79% on an intra-day basis. I might add that this occurred during the second greatest bull market ever. In the current case, the decline from the May 10th high at 11,670.20 down into the July 18th low at 10,683.30 was a mere 8.46%. Now I have to ask, “Is it logical for us to be sitting in the 48th month of a cycle that averages 47 months in duration, with an indicator still positive that has turned at every 4-year cycle top since the inception of the Dow Jones Industrial Average, along with the non-confirmations we are seeing by numerous other averages that the recent decline of a mere 8.46% actually marked a 4-year cycle low?”

If you are interested in a statistical and technical based source that also utilizes Dow theory and provides statistical probabilities as to what should occur, then Cycles News & Views may be for you. I also provide web-based updates giving specific short and intermediate-term turn points on the stock market, gold, bonds and the dollar, utilizing my Trend and Cycle turn Indictors. The Trend and Cycle Turn Indicators keep us on track with specific turn points and guide us in regard to our longer-term forecasts. The October issue is now available and in it I give all of the updated statistical probabilities, given the recent advance, surrounding the 4-year cycle. A subscription also includes short-term updates three nights a week. Please see www.cyclesman.com.

Tim W. Wood

Copyright © 2006 All rights reserved.

Tim W. Wood, CPA
Editor, Cycles News & Views
www.cyclesman.com


icon url

ReturntoSender

10/11/06 11:33 AM

#7051 RE: ReturntoSender #6755

SMH ST/DT Short Sale 1000 shares@34.63 - The 40 week moving average has served as resistance for the SMH. Will that continue with LRCX announcing tonight. We shall see...

icon url

ReturntoSender

10/11/06 8:16 PM

#7052 RE: ReturntoSender #6755

UPDATE 2-Lam posts higher profit, cautious on outlook
Wed Oct 11, 2006 7:42pm ET

http://yahoo.reuters.com/news/articlehybrid.aspx?storyID=urn:newsml:reuters.com:20061011:MTFH76897_2...

By Scott Hillis

SAN FRANCISCO, Oct 11 (Reuters) - Lam Research Corp. (LRCX.O: Quote, Profile, Research), a supplier of tools for making microchips, posted a higher-than-expected fiscal first quarter profit on Wednesday but gave a cautious outlook for its second quarter. Its stock fell in after-hours trading.

Lam Research said it expected that profit for its second quarter will be lower than the first quarter, while orders will be flat for several quarters as memory chip makers, who accounted for 75 percent of bookings last quarter, ease up on capital spending.


"The direction of memory spending is going to be a lot more difficult to sustain," said Bill Ong, an analyst with American Technology Research. "If memory slows, that will have a dramatic impact on Lam."

Lam, which mainly makes tools for etching circuitry on wafers of silicon, beat Wall Street forecasts for its first fiscal quarter.

Its net income rose to $183.5 million, or $1.27 per share, from $49.5 million, or 35 cents per share, a year earlier.

Earnings excluding special items such as a $15.8 million favorable legal judgment and a $10 million tax benefit, were $1.13 per share.

Excluding special items, the company was expected to earn $1.03 per share, according to the average analyst forecast on Reuters Estimates.

Revenue rose 88 percent to $604.4 million, beating the average estimate of $593.6 million.

Chief Executive Stephen Newberry said he expected Lam to show a profit of $1.07 a share to $1.11 a share on revenue of $605 million to $625 million for its second fiscal quarter ending in December.

"Overall, I expect order rates to stabilize and flatten out for the next few quarters," Newberry told a conference call.

Shares in Lam have fallen by about 10 percent since hitting a year high of $53.49 in May, but are still up 55 percent from a year ago as the company benefited from a strong capital spending by chip companies.


Even after that rise, the company trades at a substantial discount to its rivals. Lam trades at about 13 times expected 2007 earnings, compared to 16 times for Applied Materials Inc. (AMAT.O: Quote, Profile, Research), the industry's biggest player, and 17 times for KLA-Tencor Corp. (KLAC.O: Quote, Profile, Research).

Ong said that with the company notching record margins, revenue and profits, investors were concerned that any misstep may drag the stock down.

"Any kind of hiccup and people are worried."

Lam shares shot up nearly 6 percent after the earnings were announced, but then gave up all those gains and more once executives gave the outlook. The stock traded at $47.75, down 0.8 percent in extended electronic trading after closing at $48.12 on the Nasdaq.

© Reuters 2006. All Rights Reserved
icon url

ReturntoSender

10/13/06 9:51 AM

#7056 RE: ReturntoSender #6755

SMH ST/DT Short Sale 1000 shares@35.32 - A little short term profit taking may be due now.
icon url

ReturntoSender

10/18/06 5:05 PM

#7065 RE: ReturntoSender #6755

Temporary versus Permanent Returns
Investors Insight Publishing

http://www.investorsinsight.com/otb_va_print.aspx?EditionID=404

Introduction

Weekly Market Comment
By John P. Hussman, Ph.D.

Is this the week the Dow will break 12,000? Will we once again see $50 barrel oil? Are we in a Goldilocks economy? These are all questions that investors are confronted with by the financial press. In today's "Outside the Box," we will focus our attention on a well-thought piece by John Hussman, Ph.D. John is the President of Hussman Investment Trust where he manages the Hussman Strategic Total Return Fund - HSTRX and the Hussman Strategic Growth Fund - HSGFX.

In his Weekly Market Comment, John addresses the continued bull market run and compares it in duration to that of previous market cycles. We have currently gone 906 days without a 10% correction. John goes on to further explain the meaning behind this trend by discussing the level of P/E ratios and the climate for bond yields. One particular interesting part of his analysis is when he shows returns over a "full market cycle.

So, how does a money manager with these views cope in today's market? I keep John's comments about what he is doing in his fund so you can see what this highly regarded professional hedges his bets. I think you will find what he is doing to be instructive.

While most investors continue to watch their streaming ticker for new record highs, we are patiently waiting for the raw data to form our investment decisions. I believe you will find this commentary to be both valuable and "outside the box."

John Mauldin, Editor

Temporary versus Permanent Returns

Strategy update:

The current Market Climate in stocks is characterized by unfavorable valuations, but modestly favorable market action. Valuations are sufficiently high that we can already conclude that total returns on the S&P 500 over the coming 5-7 years will probably fall short of Treasury bill yields. The current bull market has already lasted beyond the historical norm, and though the S&P 500's percentage gains of the past several years haven't been spectacular from a historical perspective, this has been among the longest periods the market has ever gone without a 10% correction.

Temporary versus permanent returns

I've noted before that the "median" bull-bear market cycle is 4 years in duration (with a regularity that is typically attributed to the election cycle). Since there's some variation though, the average is closer to 5 years: about 3.75 years of advance, at roughly 28% annualized, and about 1.25 years of decline at roughly -28% annualized. While the individual variations are very wide, an "average" bull market return is 152%, followed by a decline of about -34%, for a total return of about 67% (roughly 10.7% annualized).

It's important to notice what this implies. An average bear market ultimately turns a 152% bull market total return into a 67% total return over the full cycle. That is, less than half of a bull market's trough-to-peak gains are typically preserved when you measure from trough-to-trough. It's hard to emphasize this enough.

Consider even the unusually long advance from December 1994 through September 2000. During that period, the S&P 500 achieved a total return of 277%. During the ensuing bear market decline (to the October 2002 low), the market lost about 46%, resulting in an overall total return of 104% for the complete 8-year period. Even if you take the whole span from 1990-2000 as a single bull market, the ensuing 2-year bear reduced the total return from a 536% total return to a 245% full-cycle return.

In short, bear markets typically nullify over half of the preceding bull market advance. This is helpful to remember as investors rush to chase the speculative tail of an already aged and overvalued bull run.

Defying gravity

Still, market action does provide very useful information about investors' willingness to tolerate overvaluation. Historically, favorable market action (on the basis of breadth, leadership, trading volume, industry action, uniform strength across a wide range of security types, and so forth) has often allowed the stock market to ignore valuations, at least temporarily. This has often allowed seriously overvalued markets to become even more extended for some amount of time.

Think about it. If overvaluation alone was enough to drive stocks lower, we would never observe periods of extreme overvaluation. Clearly, the extreme overvaluations of 1929, 1987 and 2000 were only possible because investors kept speculating despite already high (and ultimately fatal) valuations.

The key is that the market's ability to defy valuations is ultimately temporary. Over the long-term, investors can get perfectly good results by focusing only on valuations and ignoring the quality of market action altogether. Over the short-term, however, this can be very frustrating because the market can defy valuations for months or in some cases years before ultimately wiping out those "speculative" gains by returning to more normal valuations.

I'm keenly aware of the potential for our investment approach to produce this sort of frustration from time to time, and try to limit it as much as possible. However, I'm also keenly aware of the value that our shareholders place on risk management and capital protection. My primary objective is to achieve strong returns over the full market cycle (bull and bear market combined), with added emphasis on risk management. I would much rather experience a transitory period of underperformance than to "time" or "chase" a rally, and in so doing, open our shareholders up to a significant loss of capital in an already overvalued, overbought market.

That doesn't mean that we'll accept no market risk at all here, but rather that I have no intention of exposing the Fund to material downside risks by eliminating our hedge positions. Whatever exposure to market risk we take at present is likely to amount to 1-2% in call option premiums.

Appropriate speculation

In my work, I distinguish favorable valuations ("investment merit") from favorable market action ("speculative merit"). In some cases, favorable market action contains information about future improvements in fundamentals. In other cases, favorable market action just suggests that investors are willing to speculate on some "concept." It's likely that the current rally represents pure speculation, based on hopes of a "Goldilocks" economy. Though I continue to believe the Goldilocks thesis is entirely wrong, it may take weeks or even months for enough data to emerge to contradict it. In the meantime, you can't simply stand in front of investors saying "No. Stop. Don't. This will end badly." To paraphrase Warren Buffett, "a herd of lemmings looks like a pack of individualists compared with Wall Street once it gets a concept in its teeth."

Accordingly, it can be reasonable to accept at least some speculative exposure to market fluctuations on the basis of favorable market action alone, even when favorable valuations are lacking. The extent of that risk-taking is determined by a range of factors including the actual level of valuations, the short-term position of the markets (e.g. overbought or oversold), economic conditions, and broad strength and uniformity market internals. The more "robust" these factors are, the larger a speculative position you accept. The more tenuous and fragile these conditions, the smaller the speculation you accept.

Despite the new highs in the Dow Industrials, the general quality of market action is currently only modestly favorable overall - note, for example, that in recent weeks, the number of stocks achieving weekly new highs hasn't exceeded the levels seen in the January-May period. Meanwhile, the decline in bond yields - which formed the backbone of the recent rally - has reversed enough to put general yield trends back to a neutral condition by our measures. So overall, the favorable condition of market action has to be qualified by "modestly." Conditions aren't robust enough to warrant a large exposure to market fluctuations.

As a result, the Strategic Growth Fund's exposure to market fluctuations here is likely to take the form of a 1-2% exposure to index call options. This would have the effect of "softening" the impact of our fully hedged investment position, by allowing exposure to general market advances without significantly reducing our defense against market losses. With implied option volatilities at very low levels, the time decay of such option positions in the event of a flat market is fairly small.

The Fund presently holds a fraction of 1% in index call options. As always, it's our discipline to add to desired positions on short-term weakness rather than chasing strength when prices are already strenuously overbought. I expect to add to our option positions primarily on short-term market pullbacks (in the range of say, 1-4%). If the market weakens enough to place our measures of market action back to an unfavorable condition, we'll quickly shift back to a fully hedged position by liquidating that small call position.

10% corrections

Even barring a full-fledged bear market, it's notable that the Dow has now gone over 900 trading days without even a 10% correction. The current advance is among the 5 longest uncorrected advances on record. The accompanying table indicates all prior instances where the Dow advanced more than 600 trading days without a 10% correction, along with the price/peak earnings ratio of the S&P 500 and the 10-year Treasury bond yield at the market high, and the extent of the ensuing decline. The declines listed don't necessarily represent bear markets, but only the extent of Dow losses before the next 10% advance (which in many cases was followed by yet another plunge).

Date Trading Days P/E at high T-bond yield Decline
09/03/1929 719 20.6 3.8% -40.0%
03/10/1937 654 11.3 2.5% -14.9%
05/29/1946 1020 16.2 2.1% -23.2%
01/05/1953 617 9.4 2.8% -13.0%
07/12/1957 960 13.0 3.7% -19.4%
02/09/1966 912 17.6 4.6% -25.2%
08/25/1987 780 19.7 8.9% -36.1%
07/16/1990 657 13.6 8.6% -21.2%
08/06/1997 1723 23.7 6.4% -10.6%
10/13/2006 906 18.3 4.8%


Contrary to popular belief, the bulk of history has been accompanied by lower P/E ratios as well as lower interest rates than we presently observe. Neither of these conditions prevented extended market advances from being punctuated by significant declines.

Suffice it to say that even if the market was to advance further by 10% or more (which I view as improbable), the likelihood of investors actually retaining the gain would be fairly negligible. We'll accept those risks that are appropriate, but there's no sense running off to juggle dynamite with the other kids, just because they're having fun right now.

Market Climate

As of last week, the Market Climate for stocks was characterized by unfavorable valuations and modestly favorable market action. The implications of this for the long, intermediate and short-term are reviewed below.

On a long-term basis, we know that rich valuations are closely associated with disappointing long-term returns. Investors can certainly get good results focusing on long-term valuations alone, but as I noted earlier, that can also be very frustrating because it can invite extended periods when the "value-only" approach lags the market. For this reason, we do accept a "speculative" exposure to market fluctuations if our measures of market action are sufficiently favorable.

Indeed, on an intermediate term basis, the current overvaluation is mitigated somewhat by a modestly favorable tone to market action. That's sufficient to warrant a small call option position to "soften" our fully hedged stance. If the market can pull back moderately without losing its favorable internals, I would expect to increase that call position to 1-2% of net assets.

On a short-term basis, despite the modestly favorable tone of market action, the status of the market at the moment can be classified as "overvalued, overbought, and overbullish." The S&P 500 currently trades at 18.3 times record earnings (on record profit margins), stocks are clearly overbought on the basis of a variety of technical measures, and advisory bulls exceed 50%. Historically, this set of conditions has been associated with short-term market losses, on average, even when our broader measures of market action have been favorable.

Conclusion

Your patiently waiting for better valuation analyst,

John F. Mauldin
johnmauldin@investorsinsight.com

Disclaimer

John Mauldin is president of Millennium Wave Advisors, LLC, a registered investment advisor. All material presented herein is believed to be reliable but we cannot attest to its accuracy. Investment recommendations may change and readers are urged to check with their investment counselors before making any investment decisions.

Opinions expressed in these reports may change without prior notice. John Mauldin and/or the staffs at Millennium Wave Advisors, LLC and InvestorsInsight Publishing, Inc. ("InvestorsInsight") may or may not have investments in any funds cited above.

PAST RESULTS ARE NOT INDICATIVE OF FUTURE RESULTS. THERE IS RISK OF LOSS AS WELL AS THE OPPORTUNITY FOR GAIN WHEN INVESTING IN MANAGED FUNDS. WHEN CONSIDERING ALTERNATIVE INVESTMENTS, INCLUDING HEDGE FUNDS, YOU SHOULD CONSIDER VARIOUS RISKS INCLUDING THE FACT THAT SOME PRODUCTS: OFTEN ENGAGE IN LEVERAGING AND OTHER SPECULATIVE INVESTMENT PRACTICES THAT MAY INCREASE THE RISK OF INVESTMENT LOSS, CAN BE ILLIQUID, ARE NOT REQUIRED TO PROVIDE PERIODIC PRICING OR VALUATION INFORMATION TO INVESTORS, MAY INVOLVE COMPLEX TAX STRUCTURES AND DELAYS IN DISTRIBUTING IMPORTANT TAX INFORMATION, ARE NOT SUBJECT TO THE SAME REGULATORY REQUIREMENTS AS MUTUAL FUNDS, OFTEN CHARGE HIGH FEES, AND IN MANY CASES THE UNDERLYING INVESTMENTS ARE NOT TRANSPARENT AND ARE KNOWN ONLY TO THE INVESTMENT MANAGER.

Communications from InvestorsInsight are intended solely for informational purposes. Statements made by various authors, advertisers, sponsors and other contributors do not necessarily reflect the opinions of InvestorsInsight, and should not be construed as an endorsement by InvestorsInsight, either expressed or implied. InvestorsInsight is not responsible for typographic errors or other inaccuracies in the content. We believe the information contained herein to be accurate and reliable. However, errors may occasionally occur. Therefore, all information and materials are provided "AS IS" without any warranty of any kind. Past results are not indicative of future results.

We encourage readers to review our complete legal and privacy statements.

InvestorsInsight Publishing, Inc. -- 14900 Landmark Blvd #350, Dallas, Texas 75254

© InvestorsInsight Publishing, Inc. 2005 ALL RIGHTS RESERVED
icon url

ReturntoSender

10/24/06 12:48 PM

#7075 RE: ReturntoSender #6755

SMH DT/ST bought 1000 shares@33.48 - Looking for a short post FED bounce this afternoon.


icon url

ReturntoSender

10/25/06 3:03 PM

#7079 RE: ReturntoSender #6755

CAMD bought 1000 shares@4.52


icon url

ReturntoSender

10/25/06 5:05 PM

#7080 RE: ReturntoSender #6755

CPC versus QQQQ on 3 Year Daily Chart. This chart will update. Watch the 5 and 10 day sma's:


The more days in a row the put to call ratio prints over 1.0 this the more likely a bottom will be a strong one. Trips above the green horizontal line may align with buying opportunities. Below the red line? That's a clear sell and it has not happened in years.

Closes of the put to call ratio sma's below 0.50 and sometimes a bit above are indicative of a short term top. Watch the simple moving averages as well because periods of too much buying of puts or calls will almost certainly bring about market bottoms and tops respectively.

icon url

ReturntoSender

10/28/06 10:34 PM

#7090 RE: ReturntoSender #6755

October Surprise: No Bottom in Housing
in Economy | Markets | Real Estate

http://bigpicture.typepad.com/comments/

Barron's Alan Abelson cites research by Merrill Lynch's David Rosenberg regarding the recent "stabilization" in Housing. It turns out that the only thing which is stabilizing is inventory -- but at extremely high levels.

To get inventory numbers down to a balance between supply and demand requires a 10% drop in home prices (and hence, more sales), and a 20-25% drop in new Home Starts.

Here are the details:

"In truth, the big October Surprise that the conspiratorial crew anticipated so anxiously is that there was no October Surprise. Unless you count the really punk showing of the economy in the third quarter disclosed last week, with GDP limping to a 1.6% annual gain, the worst performance since the first quarter of 2003, when the recovery from recession was still trying to find its legs. Even with its demonstrated ineptitude, though, it's hard to see the administration conspiring to engineer 1.6% growth.

Merrill Lynch's David Rosenberg nailed the GDP figure when the consensus among the soothsayers on the Street ran to 2.3% and some of the more exuberant types were forecasting 3%.

The incredibly shrinking housing market is unmistakably beginning to exert a vicious drag on the economy as a whole. And that's despite the uptick in the housing stocks, buoyed by talk that the sharp decline in home sales is beginning to bottom out. The talk, it should be noted, comes from analysts desperate to see some signs of life in their group and realtors who are starting to worry about meeting their next mortgage payments. (They couldn't help themselves: They weren't able to resist the lure of adjustable-rate mortgages.)

We imagine neither bunch drew much comfort from the news that prices of existing homes in September suffered their biggest fall in 35 years. October, we're afraid, has been more of the sae.

For his part, David Rosenberg isn't buying the notion of a bottom in housing. He points out that existing house sales last month sank to their lowest level since January '04 and over the past six months have plunged at a 20% annual rate. Only seven times in the past four decades have prices absorbed that sort of pounding and, significantly, in five of those instance, the economy really took it on the chin.

At best, David says without enormous conviction, the inventory of unsold homes and condos up for resale may be stabilizing -- but at awesomely high levels. At last tally, backlogs of houses for sale weighed in at 7.1 months for single- family homes and 8.6 months for condos, a striking 60% higher than the level a year ago. And he points out that if "the inventory situation was truly a good- news story, then home prices wouldn't still be falling." Sounds eminently logical to us...

To judge by past housing cycles, to get to a reasonable balance between supply and demand, he believes, will require at least a 10% drop in home sales and prices and 20%-25% fewer housing starts. Declines of that magnitude, he reckons, would nick the consumer's balance sheet by something between $2.2 trillion and $4.5 trillion. That's "t" as in trillion.

Pretty gruesome prospect. And no small reason why we see a recession looming next year." (emphasis added)

One last tidbit -- Rosenberg also makes the obvservation that the vast majority of the 10 million households that bought an existing home since June 2005 are now underwater on their purchases.

What are the repurcussions of this? If you can afford to stay put, then none. Make your payments, and you will eventually be fine.

In the event of a sale, they take a small hit, perhaps losing some (or all) of what they put down to make the purchase. If they did a no money down, they may not be able to sell the house themselves, as they won't be able to transfer title with a post-sale balance on the existing mortgage. That only happens if a house sells for less than the mortgage price.

The real problem is with those 37% or so of buyers who used variable APRs and/or the Interest Only (I/O) mortgages. As the market value of the asset comes down, they may not have sufficient equity in the property to do a refinance or a conversion from I/O or APR to a traditional 30 year fixed.

Both of the above examples are why we are seeing an ongoing increase in foreclosures.

Pretty gruesome, indeed.


>

Source:
October Surprise
Alan Abelson
UP AND DOWN WALL STREET
Barron's October 30, 2006
http://online.barrons.com/article/SB116198805085606512.html

icon url

ReturntoSender

11/02/06 9:01 AM

#7100 RE: ReturntoSender #6755

Intel shares fall pre-market on Merrill downgrade

http://www.marketwatch.com/News/Story/Story.aspx?guid=%7bB69BF4E6-E93D-40FE-8921-F6768B2EB2FD%7d&....

$INTC0.00, 0.00, 0.0%) fell 2.2% to $20.56 in pre-market trading Thursday after Merrill Lynch downgraded the chip maker to neutral from buy. The broker said weakening demand for its products and persistent excess capacity are likely to "keep a lid" on the stock for the intermediate term. Merrill cut its 2007 earnings estimate for Intel to $1.18 a share from a prior forecast of $1.30 a share. The broker said it is also skeptical about Intel shares performing in an environment in which the sector could show weakening stock price performance.
icon url

ReturntoSender

11/03/06 2:04 PM

#7105 RE: ReturntoSender #6755

THE NAHB/WELLS FARGO HOUSING MARKET INDEX

http://www.nahb.org/generic.aspx?genericContentID=529

NAHB produces the Housing Market Index (HMI), a weighted, seasonally adjusted statistic derived from ratings for present single-family sales, single-family sales in the next six months and buyers traffic. The first two components are measured on a scale of "good" "fair," and "poor," and the last one is measured on a scale of "high," "average," and "low."

A rating of 50 indicates that the number of positive or good responses received from the builders is about the same as the number of negative or poor responses. Ratings higher than 50 indicate more positive or good responses. For more insight, see additional details about the Housing Market Index.

WHAT IS THE NAHB-WELLS FARGO HOUSING MARKET INDEX (HMI)? Printer Friendly

An Overview


The Housing Market Index (HMI) is based on a monthly survey of NAHB members designed to take the pulse of the housing industry, especially the single-family industry. The survey asks respondents to rate general economic and housing market conditions.

The HMI is a weighted average of separate diffusion indices, calculated for three key single family series in the survey: Present Sales of New Homes, Sale of New Homes Expected in the Next 6 Months and Traffic of Prospective Buyers in New Homes.
The first two items are rated on a scale of Good, Fair and Poor and the last is rated on a scale of Very High to High, Average and Low to Very Low. Each diffusion index is calculated by first applying a multiplicative seasonal adjustment procedure to the Good/High and Poor/Low series. Then the formula (Good/High - Poor/Low +100)/2 is applied to the seasonally adjusted numbers.
This formula puts each diffusion index on a convenient scale. If all respondents answer “Good/High” then the index is 100. If all respondents answer “Poor/Low” then the index is 0. If equal numbers of respondents answer “Good/High” and “Poor/Low” then the index is 50.
Although the Federal Reserve calculates the diffusion index in a slightly different way (subtracting Poor from Good and then applying an additive seasonal adjustment model), there appears to be no practical difference between the two methods.
The weights for the HMI are 0.5920 for Single Family Detached Sales at Present Time; 0.1358 for Single Family Detached Starts in Next 6 Months; and 0.2722 for Traffic of Prospective Buyers. The weights are chosen by applying a simple 8-equation model to the data. One of the equations defined the HMI as a latent (unobserved) variable that is a linear combination of the 3 diffusion indices with coefficients constrained to sum to 1. The other 7 equations regress current and future single family starts on the latent variable. Thus, correlation with current and future starts determine the weights for the HMI.
The diffusion index for Single Family sales at Present Time (calculated by either the NAHB or Fed method) correlates slightly better with current starts and starts one month in the future than the HMI. For starts 2 to 6 months in the future, the HMI performs slightly better than any of the 3 component diffusion indices.
icon url

ReturntoSender

11/08/06 10:59 AM

#7116 RE: ReturntoSender #6755

Investors Intelligence - More Bears are hibernating.

http://www.schaeffersresearch.com/streetools/market_tools/inv_intel.aspx?click=jumpto
 
Date Published Percent Bullish Percent Bearish
11/8 52.1 26


A few less bulls though.

Levels of 55% bullish and 20% bearish are consdered overly bullish.

Not there yet.

RtS

icon url

ReturntoSender

11/09/06 10:56 AM

#7118 RE: ReturntoSender #6755

Fed Model Suggests Recession (odds of a recession are now greater than 50-50)
1-November-2006

http://www.businesscycle.com/news/1065/

WASHINGTON (MarketWatch) -- The odds of a recession in the United States in the next year are now greater than 50-50, according to a simplified version of a model developed by an economist at the Federal Reserve.

The model, which relates the shape of the yield curve to the Fed's interest rate target, has been extremely accurate at predicting recessions in the past. But economists who study the business cycle say the model may be delivering a misleading message today.

Fed economist Jonathan Wright developed the model in a paper published earlier this year, based on research by, among others, new Fed Gov. Frederic Mishkin and New York Fed economist Arturo Estrella.

If bond yields stay at current levels for the next three months, Wright's model would predict a recession. Current yields have been in a recession-zone for only a day so far.

In Wright's model, a steep, sustained inversion of the yield curve, combined with a relatively high federal funds rate, would point to a recession.

The inverted yield curve does not cause a recession; it's just a signal of a pending slowdown.

"Forecasters are really bad at forecasting recessions," said Lakshman Achuthan, managing director at Economic Cycle Research Institute, which did forecast the 2001 recession, based on ECRI's own leading economic indicators.

Achuthan doesn't think the yield curve is the "holy grail of economic forecasting."

"The yield curve doesn't pass our test to be included in our leading indicators," he said. His firm is not forecasting a recession this year or next, but is "by no means bullish."

Achuthan said recessions are hard to predict. "Recessions aren't the result of the linear addition of bad things," he said in an interview. But if all the drivers of the economy -- profits, housing, interest rates, confidence and inventories -- move down together, then you have the risk of a downturn.

Wright's paper seemed to influence Fed Chairman Ben Bernanke's comment in March that the flat yield curve of the time was not predicting a recession because the federal funds rate was relatively low. Read Bernanke's remarks.

Inversion has been widening

But now, after three more rate hikes, the federal funds rate can no longer be considered low.
The yield curve represents the yields of various Treasury securities of different maturities. Typically, short-term securities yield less than long-term securities, because investors demand extra compensation for locking up their money for a longer period. This pattern is the basis for a profitable financial industry, which makes money by borrowing short and lending long.

But sometimes, the curve "inverts" and short-term securities yield more than long ones. The yield on a three-month Treasury bill was yielding 5.09% on Wednesday, while the 10-year note was yielding 4.58%.

The yield curve has been inverted for several months, but the inversion widened once the Fed stopped raising the federal funds rate. The inversion is now more than 50 basis points.

The Wright recession indicator moved above 50% late Tuesday for the first time in this business cycle. Following a disappointingly weak reading from the Institute for Supply Management, the bond market rallied further on Wednesday, driving long-term yields lower and sending the recession odds to 52%.

Following the weak economic news Wednesday, the futures market is now predicting that the Fed will cut rates in March.

Yield curve not enough

The recession odds have been above 50% eight times in the past 45 years. Six times, a recession followed within a year. The only occasions the economy avoided a recession were in the mid-1960s and the mid-1980s, both periods when the federal government flooded the economy with fiscal stimulus, noted David Rosenberg, chief North American economist for Merrill Lynch.

Some economists pooh-pooh the link between the shape of the yield curve and the path of the economy. They say the curve is inverted not because of perceived weakness in the U.S. economy, but because of high demand for Treasurys in a global market that's awash in liquidity looking for yield.

"There are structural changes in the credit markets that weaken the signal," said Chris Varvares, chief economist for Macroeconomic Advisers, a top forecasting firm. Varvares said he believes the risk of recession over the next 12 months is "quite low."

In his March speech, Bernanke said the Fed policymakers won't react solely to a signal from the yield curve.
"Policymakers should monitor bond yields carefully in judging the current state of the economy--but only in tandem with the signals from other important financial variables; direct readings on spending, production, and prices; and a goodly helping of qualitative information," Bernanke said.
Privacy Policy Terms of Service
icon url

ReturntoSender

11/12/06 8:43 PM

#7122 RE: ReturntoSender #6755

InvestmentHouse Weekend Update 11/10/06:

http://www.investmenthouse.com/1weekendmarketsummary.htm

- Buyers win the rubber match but it doesn’t change much.
- Battle of economic beliefs has the first shot fired Friday.
- Founding Fathers would try again.
- Its growth versus tired NYSE large caps as growth leaders try to set up for a rebound.

Mixed open, positive close, not much change.

The score was 1 to 1 post-election. Wednesday the market overcame the ‘surprise’ win of Senate control along with the House and posted a solid upside session. Thursday strong CSCO earnings tried to keep the run going with a big gap higher. Harsh reality started to creep back in, however, as investors envisioned the adverse economic impacts coming when the pleasant talk leading up to and immediately after the election inevitably gives way to the same old agendas we all know the parties still seek to push. Friday stocks rebounded to close out the week positive. An endorsement of the action? The market has not really made its decision yet.

Friday there were plenty of positives to try and help pick the market back up from the Thursday selling. The IEA forecast lower oil demand for 2006 and 2007, and that helped push oil right back down after its Thursday jump over $61/bbl (closed at 59.59, -1.57). Oil is extremely volatile day to day, but it is volatile within a range with 57ish on the low and 61ish on the high. Friday it was down again, and as it faded stocks fared better after a soft open. Earnings were also positive with KSS, DIS, AIG and NVDA all beating the street. BA received a $10B helicopter contract. DNA bought TNOX. Once more all of the elements investors like to see cropped up again.

The good news had its counterparts. China announced it was going to diversify out of its dollar holdings (it holds an estimated $1T in dollars) into euros, oil, gold, etc. The dollar matched the August lows while bonds rallied, driving yields lower yet again (4.73% two year, 4.59% 10 year). Suddenly the 10 year is back near 4.5% as bonds continue to bounce up and down similar to the dollar. In addition to China, Clinton’s old Treasury Secretary was again espousing its strange view of how the economy works, proffering that taxes could be raised without affecting the economy, and indeed calling for democrats to raise taxes. More on this later.

Technically, stocks managed to overcome these rather serious issues with all indices positive by the close. It was one of the days where there was all flash but no substance. Yes the buyers won the day, but nothing changed. Volume was puny (Veteran’s Day) though NYSE breadth was solid at 2:1. The relative position of the indices did not change, however.

SP500 still has that toppy look to it with the mini twin peaks spanning late October and early November, spiced with that high volume distribution session Thursday as it came off the second peak. It hasn’t showing this action since this run started, so it is flying a caution flag. NASDAQ was up, sprinting to the close. Volume was lower but NASDAQ made a significant accomplishment considering its last breakout attempt: it managed to rebound from the Thursday selling that threatened to blow another breakout as soon as it started. SP600 and SOX didn’t change position either, but they are in pretty sold lateral moves, working on their bases and trying to set up the next break higher.

Again, the indices finished in the same relative position with the large cap NYSE stocks still looking tired as a group, NASDAQ testing its resolve to hold a breakout, and the small caps and chips trying rather valiantly to hold their lateral ranges and make an upside breakout. As usual leadership is the key, and we see many leaders that have pulled back and are ready to try a bounce. It was not all just easy pullbacks for top stocks on the week, however, as more than a few coughed up their gains. Given that, however, we like what we see with many, and we are looking their way for leadership this week. Heaven knows we are not going to get it from our ‘leaders’ in D.C.

THE ECONOMY

The battle of economic beliefs to come gets a preview Friday.

All week we talked about how the calm and restrained discussions of economic policy, the handshakes and assurances of bipartisan cooperation would not last long when the different views of the federal government’s role the two parties hold ran loggerheads when the talk tried to turn to action. The beliefs are fundamentally opposed. One side thinks the federal government should provide everything to everyone despite the Constitution and the express language limiting the government’s authority to the enumerated powers and reserving all else to the states. They used like-minded courts in the 1960’s and 1970’s to find ‘fundamental rights’ and ‘penumbras’ of rights when there is just no correlation at all with the Constitution’s language. When the Constitution was drafted, more than one founding father noted that the ‘general welfare’ clause so often used to find additional federal powers was limited to providing for the general welfare THROUGH the expressly enumerated powers in the Constitution.

The other side thinks the Feds should be limited and those issues not included in the Constitution are reserved to the states. At least the true believers think that way. The President does not; he came up with Medicare Part D, expanding federal healthcare, not an enumerated power, by hundreds of millions of taxpayer dollars. Through his ‘hybrid’ belief system he estranged the more conservative republicans and they didn’t give any money in the last election and as the turnout shows, the base did not show up. It happened in 1992 and it happened in the mid-terms of 2006. It will happen in the presidential election of 2008 unless there is a major change not yet seen on the horizon or unless Hilary Clinton runs (that is a joke; heard it on Fox).

Friday the views of the new majority in Congress started to emerge, and surprise, surprise, they are no different than they were before the election. Robert Rueben, Clinton’s Treasury Secretary called on democrats to raise taxes, indicating that higher taxes in this economy would not hurt anything. He said this would help reduce the deficit and bring our ‘fiscal house in order.’ How statesmanlike.

Raise taxes, lower revenues.

He is right, but only to a certain extent. You can raise taxes in a strong economy and get more tax revenues . . . at first. The economy has surged, and along with it, tax revenues. Lower tax rates once again equaled higher tax revenues. That paradox proves itself again and again in history, but it is denied again and again by politicians. In the US we have cut taxes few too many times, but each time tax revenues have exploded to levels far in excess of previous receipts in the years leading up to the cuts. The Laffer Curve correctly shows generally that if you continually raise taxes you get fewer tax receipts until you hit a point where you get no revenues because no one wants to work and pay everything to the government. Conversely, if you cut taxes you get increasing tax revenues until you hit a level where further reductions fail to stimulate further investment and thus no further economic activity is generated. To this date in our 230 year history we have NEVER cut taxes to the point where we did not have an explosion in higher tax receipts.

Back to Reuben. If you raise taxes in a strong economy you will get more tax receipts right off the bat. The strong economy is already producing a huge jump in receipts, and if you raise taxes you will tap into even more of the economic productivity. Ultimately, however, you will get less investment. That means slower economic activity, less tax receipts, and critically, you start losing your technological leadership edge. Higher tax rates make tax shelters more lucrative because you get safety (you don’t risk your capital on business ventures that are inherently riskier than holding cash) and get a commensurate return for the risk. Taxes reduce your return, so immediately riskier ventures are curtailed. Thus a lot of our innovation at the far edge of technology is gone when taxes go up and risk capital is pulled to tax shelters. That money gets locked away until the tax environment becomes conducive to risk taking, i.e. you get to keep more of the return by virtue of lower taxes. Thus higher taxes take money away from the economy, and money is the lifeblood of new ventures. As business slows, less and less money is put to risk in productive investments. The snowball starts rolling. The economy doesn’t create as many new businesses, jobs, etc., and tax receipts start to fall. This was the scenario in the 1970’s until Reagan’s tax cuts suddenly made it more lucrative to take money out of tax shelters and put them into new ventures. The government was not trying to take 75% to 90% of that additional dollar you earned so suddenly money came pouring out of tax shelters and was put to work. Investment in the US surged, the economy exploded higher, and tax receipts did the same.

Where does Ruben stand on spending? He didn’t say, but we all know.

A misunderstanding of history and thus how higher taxes impact the economy is just one problem with Reuben’s views. The other is what happened in the 1980’s that causes many democrats and independents to point to the tax cuts and say they did not work. Federal spending. Tax receipts exploded, but so did federal spending. Reagan rebuilt the military to take the fight to the USSR, forcing them to spend to keep up. Its economy could not match ours and generate the revenue needed, and collapsed. Ultimately we did benefit even with all of that spending as the ‘peace dividend’ of the Clinton years showed: we did not have to spend so much on the military and our federal receipts continued to boom. The problem of the 1980’s was that Congress did not cut back in any other spending; that’s the ‘be all to everyone’ mentality discussed above. The result was huge deficits. That wasn’t because of the tax cuts; they sent revenue through the roof. As usual, it was the spending.

Nowhere in Ruben’s comments did he mention curtailing spending, and that is the MAJOR problem for us as the new Congress takes over. Why do we always turn to the taxpayer first in order to solve the Federal government’s profligate spending? We are always asked to tighten our belts for the good of the country, but there is no such attempt by Congress to limit its spending. Congress falls back on the old argument that so-called discretionary spending is such a small part of the government expense that there is no use trying to curtail it. Even Tom DeLay, the supposed leader of a conservative Republican congress, stated in 2005 that there just was not anything more to cut from the spending. What horse crap. No one believed it, especially in his party, and of course, where is DeLay today? Many in his party did not back him when his troubles hit because of such ridiculous statements. Is it ever an answer to a problem to say it is too big to take any remedial steps? Of course not. We wont the cold war not by a big battle but by relentless pressure from all sides that ultimately caused the USSR to collapse. Small victories add up.

The hunger to spend, indeed overspend, is so endemic in Congress, however, that the vast majority still conclude it is folly to consider trying to cut the budget. I was struck in October when I received a letter from Senator McCain asking me to contribute to a private watchdog group that was trying to limit wasteful federal spending. Here we have a senator asking for money to fund a private organization doing what he should be doing. Why isn’t he, drawing a senator’s salary and all of those amazing benefits we can only dream about (dream because in the last attempt to reform social security many of our leaders said we were too stupid to handle our own retirement accounts similar to the senators) not introducing bill after bill after bill to limit spending, thus drawing public attention to it in Congress? It does no good to make speeches to Congress; introduce bills and make them vote on it and talk about it so that it can be used against them in elections. I can only shake my head in amazement as I realize how pervasive the belief is that spending just cannot be controlled.

What would our founding fathers think?

If the founding fathers came back today they would think they had failed. The government is too big and is into every aspect of our lives by virtue of Medicare and Social Security and the IRS. Many people today would counter, pointing to how successful the US is; surely the fathers would be proud. Well, England was the world power when we fought for our independence; size and strength does not mean fair government. A monarchy can be strong and successful and yet tyrannical. The founding fathers wanted a limited central government with most issues controlled by the states. Do we have that today? Many things are handled by the states day to day, but they are controlled by the Feds because if the states don’t toe the line they don’t get those federal dollars that pay for most everything from roads, to schools, to museums, dams, etc. If an individual does not follow federal directives fines and prison time follow. The power of money has put the federal government into every aspect of our lives.

No, the founding fathers would start over, knowing they had failed. How would they fix it? First, make certain parts of the Constitution non-amendable such as how the Federal government can tax incomes. The sixteenth amendment was only supposed to apply to 5% of the population according to its proponents. Yeah, right. It gave the Federal government far too much power to take without due process. The IRS is our own branch of the KGB, using frozen bank accounts, seized property, and suicides to control us as opposed to guns and poisons.

Next, if you are going to limit the president’s term, then limit Senators and House representatives commensurately. Otherwise you have what we have now, 10-term senators waiting out any president whose policies they don’t like. If they knew the president could be there forever then they would have to come to the bargaining table and compromise. That is what a system of checks and balances is all about, i.e. knowing you have to come together to do what the Constitution says you have to.

The fathers would also reign in the courts, giving Congress clearer authority to set the court’s jurisdiction. That is actually in the Constitution. It’s just that no one pays attention to it, especially the courts. I had a conversation with some fellow attorneys about the Chivo case and others, and they were adamant that the Congress could not tell the courts what they could and could not look at. We pulled out the Constitution and there it was in black and white. There was a lot of rationalization and frankly BS to explain how we had let the courts take control of the other two branches of government. When the lawyers are taught the courts are the new King George, then it is hard to change the system.

Finally and most importantly, clearly, clearly, clearly state that the federal government’s powers are limited solely to the enumerated powers, and that no other clause could be used to expand them.

That last fix is why I really like the Missouri initiative on stem cell research. Not that I like the legislation, but that it was argued and voted on at the state level. That is where it should be argued and voted on. The fathers did not want an all-powerful central government making decisions about every aspect of our lives, with those decisions reviewed by 9 people in black dresses without regard for what the rest of the government or people think. Those 9 have taken the views of hundreds of millions of US citizens and replaced them with their own. That was never the intended result of our ‘representative’ form of government, but we have allowed it to turn into an elite group of leaders in D.C. that can raise and lower our incomes at will, appoint unelected Fed chairmen to control our finances, and sanction an untouchable agency to take our money to fund whatever result the select 9 in robes deem fit. Now is that what our founding fathers wanted? Not by a long shot.

New Congress or not, that is the real problem we have in whether we succeed or not in the next 200 years. One of the express powers is to protect and defend the people of the US. With the federal government into everything from healthcare to retirement to your choice of lifestyle to what is moral or immoral, etc., it took its eye off of what it is expressly supposed to do. As a result we were attacked. We had the information to prevent 9-11 but the federal government’s mission, so clearly set out in the Constitution, has become so twisted and tangled that we could not see the forest for the trees. Our founding fathers were so much wiser than we credit them for. They knew a central government could not do everything so they limited it to what it could do and left the rest to the states. That systems also allows us to remain free. They understood why Rome fell and tried to create a system that would avoid that. They came close but the great experiment is falling into the big government pit. I suppose the appropriate saying here is one that ironically was generated because of the ineptitude of a large central government: good enough for government work. Unfortunately, when it comes to our safety and freedom, that is not good enough.

THE MARKET

MARKET SENTIMENT

VIX: 10.79; -0.22
VXN: 15.52; -1.14
VXO: 10.61; -0.39

Put/Call Ratio (CBOE): 0.98; +0.14

Bulls versus Bears:

Bulls: 52.1%. Ticking down from 53.7% last week and also below the 52.7% rung up the prior week. Still flirting with 55%, the level considered bearish. Has caught the April high and is moving closer to the January peak at just over 60%. 55% is considered a bearish indication.

Bears: 26.0%. Moving the opposite from the bulls, bears fell sharply from 28.4% and 30.1% before that, continuing the faster decline. Down from the 37.1% hit in July (the highest level in this entire cycle, easily clearing the 34.4% hit in late June back when bulls and bears kissed, just missing a crossover). It remains above the 20% level considered bearish but is back to heading that way with more speed. Hit a new post-2002 high in that late June move, eclipsing the March 2006 high (33%) and well above the 2005 highs that spawned new rallies (30% in May 2005, 29.2% in October 2005).

NASDAQ

Stats: +13.71 points (+0.58%) to close at 2389.72
Volume: 1.714B (-30.26%). Veteran’s Day light trade gave the upside move little substance, particularly after the big spike in volume Thursday as NASDAQ gapped higher then reversed for a loss. Hardly the kind of trade that overcomes such a reversal distribution session.

Up Volume: 968.201M (-121.771M)
Down Volume: 724.678M (-598.28M)

A/D and Hi/Lo: Advancers led 1.56 to 1. Middle of the road.
Previous Session: Decliners led 1.92 to 1

New Highs: 108 (-33)
New Lows: 50 (-4)

The Chart: (Click to view the chart)

NASDAQ put together a decent price session to end the week, keeping the total week gains solid despite the Thursday distribution session as sellers moved in on the new post-2002 high. The significant move Friday was the hold of the April high (2376) where it closed Thursday and the hold of the breakout. Above that there was nothing really impressive. I guess you could say it avoided immediately reversing the breakout this time, but it is hardly out of the woods after this move. Still some good techs out there are ready to move and with NASDAQ holding a much needed breakout we will be watching them and ready to pick some up if they can show us they are ready to resume their moves.

SOX (+1.01%) recovered some from its own Thursday drubbing, but it had to see more first, dropping to tap at the 50 day EMA on the intraday low and the recovering to close at the session high. That keeps it locked in its trading range, but trying to get on the upside bounce again. The key move to the upside is a break through the 200 day SMA (471.20). It is still moving laterally in its 9 week range, working on its base, just as we wanted it to do. Given NASDAQ’s less than stellar strength, a breakout over the 200 day would be really quite nice.

SP500/NYSE

Stats: +2.57 points (+0.19%) to close at 1380.9
NYSE Volume: 1.423B (-23.41%). Another volume plunge as SP500 posted a modest gain. As with NASDAQ, hardly an offset to the Thursday distribution session.

Up Volume: 789.643M (+57.914M)
Down Volume: 611.915M (-475.4M)

A/D and Hi/Lo: Advancers led 2 to 1. Solid breadth returned as the small caps led all the indices but the semiconductors.
Previous Session: Decliners led 1.42 to 1

New Highs: 210 (-5)
New Lows: 19 (-4)

The Chart: (Click to view the chart)

SP500 bounced modestly, trying to make a higher low, holding above the 10 day EMA (1377) on the close. Maybe it can make that higher low and take out the tops of the twin peaks at 1289; it will have to show more upside strength than that Thursday volume sell off and the short term twin peaks indicate it has. As noted Thursday, this is the first time SP500 has shown this type of action on this run, and it is a toppy look. It is extended, but to this point it has shown excellent strength, and it may be able to work through this shorter term lateral (at least thus far) stumble. A higher low from here would be a good start.

SP600 (+0.71) continues its lateral move over the 18 day EMA after that quick drop the prior week that took it to support near 382. It rebounded crisply and continued its work on the handle to its 6 month cup with handle. Pretty solid action all things considered. Starting to become more important as NASDAQ needs a push.

DJ30

The blue chips held up Friday, showing a doji and closing above the 10 day EMA (12,095). Low volume here as well as it tries to make a higher low at this near support. Still struggling and overextended, but doggedly refuses to give in. As with SP500, it is trying to work through this choppy period, and thus far in the run it has not given in, so there is always the possibility it consolidates and continues on. Given the run thus far and the recent action, however, it is still not a great risk/reward position and it will have to show us the move.

Stats: +5.13 points (+0.04%) to close at 12108.43
Volume: 204M shares Friday versus 275M shares Thursday.

The Chart: (Click to view the chart)

MONDAY

The market is still going to be working through the election aftermath, and it has a boatload of economic data to consider as well, particularly the October retail sales. Retailers have rallied well ahead of the holiday season, and after a hiccup when same store sales were announced early in October they rebounded right back. Now we get the next read. In addition the Fed gets its next look at prices with the PPI and CPI. The market now has to not only worry about what the data shows and what the Fed will do, but also what the government will do as the new majority tries to ‘lead’ us out of the dire straights we are suffering through. Seems when people don’t agree with your means to an end they conclude the end is wrong. No, a solid economy with low unemployment is the end we want. We can continue to work at making it stronger and deeper, but that does not mean we have to try to take away from what we have worked so hard to attain.

Just more fodder for the market to sort through as it also works through something of a dichotomy. The large cap NYSE stocks that led the move are tired, trying to hold on but stumbling some. Growth stocks are trying to move out to some leadership as NASDAQ broke out to a new post-2002 high, though its action since has not been stellar. SP600, and to a lesser extent SOX, are setting up for breakouts of their own. Growth trying to grow, the large cap industrials trying to hang on.

With same store sales missing expectations (recall 60% missed) retail sales expectations have dropped to -0.4% versus September. This is a case where the market can likely handle lower sales, but not sales that fall below expectations. With SP500 struggling, a retail decline greater than anticipated will send it lower. Kind of an acid test ahead for SP500 where we see if this is just a different form of a lateral move on this run or the prelude to a decline. Hard to bet against it on this run, but it is ancient in market years.

We keep looking for NASDAQ to assert itself when SP500 and DJ30 stumble, getting some of their money. It has broken to a new post-2002 as they stumbled last week, so maybe it is. If that is the case, however, it needs to take a few self-assertion courses or read L. Ron Hubbard; this has not been a massive breakout thus far. There are still techs set to move higher, and we will look for volume to come in as they do. Even with that, it still looks as if SP600 is going to play a larger role in any further move higher as it continues constructive action just as the large caps struggle after a strong move higher. With the flood of data coming this week the large caps may need the help as they sort through the election results as well. For that matter, the growth indices that are looking pretty decent may need help as well as more views regarding what direction our leaders are going to try and take us.

Support and Resistance

NASDAQ: Closed at 2389.72
Resistance:
2384 is an interim peak from January 1999
2412 from June 1999 low
2477 from January 1999
2493 is an interim peak from February 1999

Support:
2379 is the October high.
2376 is the April high, the former post-2002 high
2368 is the early October handle high.
The 10 day EMA at 2367
The 18 day EMA at 2354
2333 is the top of the Q1 2006 trading range (the January and mid-March 2006 highs)
2316 from interim tops in January and March 2006 trading range
2300 represents some price support
The 50 day EMA at 2298
2273 is the recent September peak
2250 is the March 2006 closing low.
2234 is the June 2006 peak (intraday)
2237 is the August 2004/April 2005 up trendline
The 200 day SMA at 2233

S&P 500: Closed at 1380.90
Resistance:
1389 is a low from November 1999
1390 is the October high.
1398 is a low from January 2000
1401 is a low from April 2000

Support:
1378 is a low from May 2000
The 10 day EMA at 1377
1371 to 1373 is the December 2000 peak and the January 2001 peak
The 18 day EMA at 1373
1358 to 1362 mark a series of peaks from April 1999 to August 1999 high and the
February 2002 low at 1360.
1354 from the early October consolidation
The 50 day EMA at 1350
1339 is the late September closing high
1334 is an October 1999 peak
1326.70 is the May 2006 high
1324 to 1329 from the October 2000 lows.

Dow: Closed at 12,108.43
Resistance:
October high is 12,167. Making the break through.
7.8% above its 200 day SMA. Has been struggling since it hit near 8% above that level. Tends to start about 10%, so this is a bit early but it has been a long run.

Support:
The 10 day EMA at 12,095
The 18 day EMA at 12,054
11,865 from the early October consolidation
The 50 day EMA at 11,838
11,750.28 is the prior all-time high
11,723 is the January 2000 closing high
11,670 is the May intraday high
11,642 is the May 2006 closing high
11,488 is the early September high.

Economic Calendar

These are consensus expectations. Our expectations will vary and are discussed in the ‘Economy’ section.

November 13
- Treasury Budget, October (2:00): -$47.0B expected, -$47.4B prior

November 14
- Retail sales, October (8:30): -0.4% expected, -0.4% prior
- Retail ex-autos (8:30): -0.2% expected, -0.5% prior
- PPI, October (8:30): -0.4% expected, -1.3% prior
- Business inventories, September (10:00): 0.5% expected, 0.6% prior

November 15
- NY Empire PMI, November (8:30): 16.0 expected, 22.9 prior
- Crude oil inventories (10:30): 435K prior
- FOMC minutes, Oct. 25 (2:00)

November 16
- CPI, October (8:30): -0.3% expected, -0.5% prior
- Core CPI (8:30): 0.2% expected, 0.2% prior
- Initial jobless claims (8:30): 308K
- Net foreign purchases, September (9:00): $116.8B prior
- Industrial production, October (9:15): 0.2% expected, -0.6% prior
- Capacity utilization, October (9:15): 82.0% expected, 81.9% prior
- Philly Fed, November (12:00): 5.5 expected, -0.7% prior
- Housing starts, October (8:30): 1.70M expected, 1.772M prior
- Permits, October (8:30): 1.625M expected, 1.638M prior
icon url

ReturntoSender

11/20/06 11:22 AM

#7135 RE: ReturntoSender #6755

SMH Short Sale 1000 shares@35.58
icon url

ReturntoSender

11/30/06 12:01 PM

#7144 RE: ReturntoSender #6755

UTEK bot 1000 shares@13.00 - Just looking for a trading stock a bit cheaper than the SMH. UTEK seems to swing from 13 to well above 14 quite often. Not that many shares traded though so it might not be suitable for all. In addition just because it has swung in a range before does not mean it will continue to do so. Trade at you own risk as I am doing.


icon url

ReturntoSender

11/30/06 4:34 PM

#7145 RE: ReturntoSender #6755

TARO bot 1000 shares@10.01 - Generic Drug Maker from Israel that's late filing. There's always more than one reason why a stock gets cheap but that's one main reason. Charts below:


icon url

ReturntoSender

12/09/06 10:12 AM

#7159 RE: ReturntoSender #6755

From Briefing.com: 4:43 pm Weekly Wrap

Upbeat economic news gave the stock market a boost this week. Corporate news was very limited and other factors had only minor impact.

There were two big economic releases. The first was one that usually gets little attention -- third quarter productivity. The unit labor cost component of that data was revised sharply lower. For the second quarter, the change in unit labor costs was revised to a -2.4% annual rate of growth from 5.4%. The third quarter was revised to 2.3% from 3.8%. These sharply lower numbers were due to a downward revision to compensation over the same period.

The lower quarterly changes in unit labor costs dropped the year-over-year change 2.9% from a previously reported 5.3%.

This is important because it implies that the cost of output for business is not being pressured nearly as much by rising wages as was previously thought. This is bullish for the inflation outlook.

The economic outlook got a further boost on Friday with the November employment data. Payrolls were up 132,000. That was above expectations of a 100,000 gain. The two prior months were revised upward a net 42,000. That left payrolls a total 74,000 above the expected level. The average monthly gain the past three months is 138,000. The steady rise in payrolls implies that consumer spending power will also continue to rise. That realization helped reduce recession fears.

Other economic data this week included a stronger than expected ISM services index reading of 58.9 for November, and a drop in weekly new claims for unemployment to 324,000 for the week ended December 2 from 358,000 the prior week.

The good news on inflationary pressures and employment were the major factors behind the stock market gains this week.

Also helping were the continued end of year seasonal trends. December has been the strongest month of the year over the past fifty-five years. There are concerns about a possible January consolidation, but most traders remain upbeat about the remainder of this month.

The corporate news was very light. Pfizer stock took a beating when it pulled a key drug under development. Eli Lilly guided profit estimates lower, but Merck reaffirmed their forecasts. Bank of New York and Mellon Financial announced a merger.

Bond yields rose this week in response to the employment data, and the 10-year ended at a still very low 4.55% from 4.43% the week before. Oil prices declined slightly to $62.13 a barrel from $63.43, but were rarely much of a market factor.
 
Index Started Week Ended Week Change % Change YTD
DJIA 12194.13 12307.49 113.36 0.9 % 14.8 %
Nasdaq 2413.21 2437.36 24.15 1.0 % 10.5 %
S&P 500 1396.72 1409.84 13.12 0.9 % 12.9 %
Russell 2000 781.17 792.56 11.39 1.5 % 17.7 %

4:20 pm : After a choppy start to end the week, investors eventually garnered enough notable leadership in some key sectors to finally embrace a strong November jobs report and snap a two-day losing streak for stocks.

Given the Fed's increased policy guidance from "incoming" data, today's employment report -- the last key piece of data policy makers will get their hands on before they meet next Tuesday -- garnered added attention.

Before the bell, the Labor Dept. showed that nonfarm payrolls rose 132K in November (consensus 105K) while payrolls figures for October and September were upwardly revised to account for a net gain of 42K new jobs. With investors concerned about the pace of economic growth, continued payroll gains will keep consumer spending rising at a decent clip against moderate wage growth. Hourly earnings rose just 0.2%, below the 0.3% economists were anticipating, providing additional evidence of the Fed's sought after soft landing.

With all of the S&P 500's impressive 13% year-to-date advance occurring over the last four months, however, concerns that the market has gone up too far too fast initially left investors questioning whether today's solid employment data had already been priced into equities.

Fortunately for the bulls, early trepidation about overbought conditions was put to rest as the morning played out. After briefly using an unexpected decline in consumer sentiment as the latest excuse to take some money off the table, Citigroup (C 51.87 +1.16) spiking to a new 2 1/2-year high helped lift the indices into the green for good. The Dow component surged 2.3% amid speculation of a management change and a possible break-up.

Perhaps giving Citigroup an added boost was some rotation out of rival Bank of America (BAC 51.58 -0.91), which Merrill Lynch believes is interested in acquiring Barclays (BCS 58.53 +2.74). Investors bidding up shares of investment banks in anticipation that several Wall Street firms (e.g. GS +2.5%, LEH +1.3%, and BSC +1.0%) will post record earnings results next week provided additional support for the most influential of S&P sectors -- Financials.

U.S. Treasury Secretary Henry Paulson later praising the payrolls number and saying the economy is growing at a sustainable clip during a CNBC interview offered investors an additional vote of confidence.

Of the seven other economic sectors trading higher, Technology was another influential leader to the upside. Two days of profit taking sparked some bargain hunting interest and helped investors look past some warnings in the chip space. Xilinx (XLNX 24.83 -1.61) plunged 5.3% after lowering its Q3 sales forecasts. A 1.9% surge in the sector's largest component -- Microsoft (MSFT 29.40 +0.55) -- was the biggest reason behind the sector's outperformance.

Investors also applauded a late-day reversal in oil prices. Crude for January delivery, which was up nearly 2.0% earlier at two-month highs, closed down 0.6% near $62/bbl. Forecasts of milder weather conditions trumped concerns earlier in the day about potential supply disruptions tied to unrest in Nigeria. However, removal of key leadership from the Energy sector tarnished the earnings potential of a key contributor to profit growth for the S&P 500 and acted as somewhat of an offset. DJ30 +29.08 NASDAQ +9.67 SP500 +2.55 NASDAQ Dec/Adv/Vol 1507/1546/1.81 bln NYSE Dec/Adv/Vol 1653/1602/1.28 bln

4:05PM Research In Motion does not currently anticipate a material adjustment to the preliminary Q2 operating results reported on Sep 28 (RIMM) 127.69 -1.06 : Co provides this status update pursuant to the alternative information guidelines of the Ontario Securities Commission. The co's management-initiated, voluntary review of stock option grants is ongoing. As previously disclosed, the Audit Committee of RIM's Board of Directors has made a preliminary determination that a restatement of RIM's historical financial statements will be required. The co does not currently anticipate a material adjustment to the preliminary second quarter operating results reported on Sept 28, 2006 or to current or future financial years' operating results. As the review of the co's historical stock option practices has not yet been concluded, the co has notified the O.S.C that it does not anticipate that it will be in a position to file its restated historical financial statements or its financial statements for the second quarter of fiscal 2007 on or before December 17, 2006. If these filings are not made by Dec 18, 2006, RIMM will report on the status of its continuous disclosure obligations to the O.S.C pursuant to the mgmt cease trade order issued by the O.S.C on Nov 7, 2006. On Dec 21, 2006, the co intends to announce preliminary operating results for the third quarter of fiscal 2007. The co expects that the potential impact of any restatement on GAAP and preliminary operating results for the third quarter of fiscal 2007 will be immaterial.

3:58PM Market View: Positive week but Nasdaq lags (TECHX) : A volatile start to the day in the wake of the jobs data with the market finding its footing in the first 45 minutes near short term retrace supports of the Dec 01-Dec 07 advance. The rebound, however, stalled out in late morning with choppy/weaker action noted thereafter. The week as a whole was positive with the small- and mid-caps along with the S&P 500 setting minor new all time or multi-year highs with the Dow falling just shy of achieving the same feat. Action in the tech dominated Nasdaq indices, while higher as well, proved more consolidative as big cap names (ORCL, MSFT, INTC, YHOO, EBAY etc.) have struggled after setting Oct highs. Groups that underpinned today included: Broker/Dealer +1%, Healthcare +0.8%, Media +0.8%, Oil Service HOLDRs +0.7%, Software +0.7% and Coal +0.7%. New two week highs in the 10-yr yield pressured Home Construction -2% with Semi (SOX) -1.1% and Transports -0.7% also weaker.

2:04PM Jabil Circuit provides update on its form 10-K filing (JBL) 28.44 -0.39 : Co announces that it was not able to file its annual report on Form 10-K for its fiscal year ended August 31, 2006 by Nov 29, 2006, the date by which the applicable rules of the SEC required Jabil to file its 2006 Form 10-K in order for it be considered to have filed it in a timely manner. As previously disclosed, Jabil is involved in several shareholder derivative and purported securities class action lawsuits in connection with certain historical stock option grants. Jabil is also responding to an informal inquiry from the SEC and has responded to a subpoena from the U.S. Attorney's office for the Southern District of New York that relate to such grants. Separately, a Special Review Committee of Jabil's Board of Directors was appointed to review the allegations in certain of the derivative actions. Jabil said it is cooperating fully with the Special Review Committee, the SEC and the U.S. Attorney's office. In light of these developments, Jabil, through its legal counsel, assisted by accounting advisors, has been evaluating its historical stock option grant practices. The evaluation is not complete.

9:10AM Varian Semi Board of Directors increases co's existing stock repurchase program by $100 mln (VSEA) 40.55 :

09:02 am National Semiconductor (NSM)

23.92: Shares of National Semiconductor traded lower on Friday, after the Santa Clara-based chip maker reported a 20% decline in second quarter profit, and issued third quarter revenue guidance below analysts' expectations. At the current price level, the stock, which has shed 8% since the beginning of the year, is trading at roughly 20.1x this year's projected earnings.

Briefing.com currently has an Overweight rating on the Technology sector, as strong consumer end markets continue to drive chip demand.

For its most recent quarter, National posted net income of $91.4 million, or $0.27 per share, down from $114.7 million, or $0.32 per share, a year earlier. The result, however, fell in line with analysts' expectations, according to Reuters Estimates.

On the top line, revenue fell 7.8% year/year to $501.6 million, primarily due to lower shipments to distributors who reduced their inventories during the quarter, and an approximately $21 million decline in foundry revenues for previously sold Cordless and PC Super I/O businesses as originally projected, the company said. On a sequential basis, National's revenues were down 7.4%. Meanwhile, the company reported gross margin of 58.9%, which was lower than last quarter's 61.7%, but was an increase over the 57.2% posted a year ago.

Looking to the third quarter, National said it anticipates revenues will decline 8% to 11% sequentially from the second quarter, or approximately $446 to $461 million. Analysts are currently looking for $496.1 million in revenue, according to Reuters Estimates.

--Richard Jahnke, Briefing.com

08:47 am Hewlett-Packard (HPQ)

39.86: Last night Dow component Hewlett-Packard confirmed that it reached a settlement with California's Attorney General in a civil lawsuit that arose from HP's use of some questionable, and perhaps criminal, investigative practices that were employed to uncover the source of a boardroom leak.

Former Chairman Patricia Dunn and former ethics head Kevin Hunsacker have both been indicted on criminal charges related to their role in the investigation. Dunn and Hunsacker have both pleaded not guilty.

As for HP, the leak investigation and how it was handled proved to be a public relations nightmare. Fortunately for shareholders, it did little, if anything, to disrupt the company's business. Subsequently, there hasn't been any fallout in the stock, which is actually up 9.0% since the story broke in the public realm in early September.

The settlement calls for HP to pay $14.5 million and to implement a series of measures to ensure the company's internal investigations are conducted in accordance with California law and with the company's high ethical standards. As part of the settlement, there was no finding of liability against HP and it has been agreed that the Attorney General will not seek civil claims against HP or against its current and former officers, directors and employees.

News of the settlement has had little impact on HP's stock, which makes sense considering the stock was unaffected by the investigation imbroglio. That point notwithstanding, the settlement can be considered a good thing as it is one less distraction for management.

--Patrick J. O'Hare, Briefing.com

09:49 am Advanced Micro: Banc of America Sec reiterates Neutral. Target $27 to $23. Banc of America cuts their AMD tgt to $23 from $27 after last night gross margins were reported worse than anticipated. Firm thinks several factors (detailed within) will likely continue to pressure GMs n-t, and will not be alleviated until at least cross-over from 90nm to 65nm is achieved (2Q07). In the meantime, they think Dell will continue to soak-up AMD's dual core capacity (at a discount), while AMD finds itself juggling between meeting high demand and transitioning to 65nm. Although AMD should be able to recoup two points of GMs in 4Q, they think GMs will stay pressured for sometime. Firm affirms preference for INTC.

09:48 am Apple Computer: Banc of America Sec reiterates Buy. Target $79 to $84. BofA raises their tgt on AAPL to $84 from $79 following earnings. The firm says one major issue they identified yesterday was gross margins. - mgt did indicate that gross margins would be down q/q about 100 basis suggesting that their thesis on recent product price cuts negatively impacting margins is appropriate - though the firm believes that they may have overestimated the magnitude. The firm is modestly increasing their gross margins by 10-30 basis points in the back half of the year, though largely offset by higher op ex, leaving operating margin little changed.
icon url

ReturntoSender

12/15/06 9:56 PM

#7167 RE: ReturntoSender #6755

From Briefing.com: 8:09 pm Weekly Wrap

It was another solid week for the stock market. The indices were close to unchanged after the first three days, but then rallied sharply on Thursday and held the gains on Friday. Strangely, Thursday was the only day on which the news was not bullish.

Monday through Wednesday the indices were essentially flat. There was a lot of talk that the market was "tired" or that a top was forming. This was despite good news virtually every day. On Monday, oil prices were down and there were reports that Sabre Holdings and Biomet might soon be acquired.

Tuesday brought news of a fantastic earnings report from Goldman Sachs. General Electric raised their dividend 12% and reaffirmed guidance for 2007, and most importantly, the Fed kept rates unchanged and made little change to the policy statement. The S&P dipped that day despite that collection of news.

Wednesday was not much different. November retail sales jumped a better than expected 1.1% with across the board strength. Airline stocks got a boost on reports that UAL was in merger talks with Continental. But the S&P managed only a 2 point gain.

Then on Thursday the S&P shot up 12 points even though there was little to prompt the move. The major news was that oil prices were up sharply on reports that OPEC would cut production further in February. That is hardly something to rally on. Nevertheless, as the S&P 500 index broke through some key resistance levels, the market took off.

The most bullish news of the week came on Friday. The core CPI for November was unchanged. That was lower than the expected 0.2% increase and represents a steady downtrend after the 0.1% October number, the three 0.2% increases before that, and two 0.3% gains before that. The price weakness was across a broad array of categories. Inflationary pressures appear to be easing much as desired by the Fed in line with a soft landing. Yet, the S&P 500 index was up only 2 points on Friday.

On balance, the news this past week was bullish. The Fed policy statement reflected a focus on containing inflation, but that is what has to be expected from central bankers. It provided few clues as to whether the Fed will indeed cut rates in the first half of 2007, as the market currently expects. That will depend on incoming data - and the inflation report was important in that respect. Expectations have risen that the Fed will ease policy in 2007.

The economic data this week was also bullish overall. The retail sales report noted above showed that housing weakness has, at least not yet, had much impact on consumer spending. New claims for unemployment for the week ended December 9 dropped to a low level of 304,000, suggesting that a recent pop upward was aberrant. And November industrial production rose 0.2%. That isn't great, but it isn't down either.

The corporate news was generally favorable. Lehman Brothers and Bear Stearns joined Goldman with good earnings reports. Illinois Tool Works and Black & Decker warned of lower earnings, but Procter & Gamble, United Technologies, Merck, and GE reaffirmed current forecasts.

The market is still benefiting from the typical year-end seasonal strength. Now, there is also increased confidence that inflation is coming back under control while economic growth stays moderately positive. Valuations are generally perceived as sufficiently low to provide ongoing support. The week ended with widespread optimism on Wall Street.
 
Index Started Week Ended Week Change % Change YTD
DJIA 12307.49 12445.52 138.03 1.1 % 16.1 %
Nasdaq 2437.36 2457.20 19.84 0.8 % 11.4 %
S&P 500 1409.84 1427.09 17.25 1.2 % 14.3 %
Russell 2000 792.56 792.71 0.15 0 % 17.7 %

4:10 pm : Stock prices inflated at the open after it became known by way of the November CPI report that inflation is being contained. Specifically, both total and core-CPI, which excludes food and energy, were unchanged last month.

The market had been expecting 0.2% increases at both levels, so there was no mistaking that the unchanged readings were good news, particularly since the year-over-year rate in core-CPI slipped to 2.6% from 2.7% as a result. In recognition of the encouraging trend, both stock and bond prices rallied in the early-going on the idea that today's data enhanced the possibility of a rate cut from the Fed occurring sooner rather than later.

The industrial production report, which showed a 0.2% increase in the month of November, didn't do anything to alter that belief as the production trend of late has fit neatly with the Fed's soft landing scenario.

As one might expect, then, stocks started the day on an upbeat note drawing added support from a noticeable drop in market rates and healthy leadership from the financial, technology and industrial sectors.

Earnings warnings from Black & Decker (BDK 78.26, -8.66) and Illinois Tool Works (ITW 46.80, -1.12), a continued uptick in oil prices, a lack of participation by the energy sector, and a sense that the stock market is overbought on a short-term basis, were among the limiting factors that kept the early gains in check on this quadruple witching options expiration Friday.

Although the stock market maintained a position in positive territory throughout the session, it spent a good part of the day seeing the early gains get pared on profit taking efforts. However, the outperformance of influential blue chip components like General Electric (GE 37.36, +1.15), Honeywell (HON 43.62, +0.93), Procter & Gamble (PG 64.11, +0.76), Citigroup (C 54.07, +0.96) and Cisco (CSCO 27.56, +0.25) kept selling efforts in check and the indices above the unchanged mark.

At the end of the day there weren't a lot of big movers from a sector standpoint, with the exception of Energy (-1.24%) which happened to be the prior day's biggest gainer.

Decliners actually outpaced advancers at the NYSE and Nasdaq, but the buying interest in large cap issues proved to be the difference that kept the indices from sporting negative signs at the closing bell.

Volume was heavier than usual which was a function of the increased trading that took place with the expiration of stock options, index options, index futures and single stock futures.DJ30 +28.76 NASDAQ +3.35 SP500 +1.60 NASDAQ Dec/Adv/Vol 1616/1456/2.16 bln NYSE Dec/Adv/Vol 1756/1491/1.72 bln

4:00PM Dell receives NASDAQ notice due to delay in filing of Form 10-Q (DELL) 26.53 -0.34 : Co announces it has received, as expected, a NASDAQ Staff Determination letter on Dec 15, 2006, indicating that the co is not in compliance with the NASDAQ continued listing requirements set forth in Marketplace Rule 4310(c) (14). The Determination letter relates to the company's Form 10-Q for the fiscal third quarter ended Nov 3, 2006. On Nov 2, 2006, the Company appeared before the NASDAQ Listing Qualifications Panel to present a plan for regaining compliance and to request continued listing on The NASDAQ Stock Market. The panel has not yet rendered a decision.

8:06AM Chipmos Technology raises Q4 rev guidance to $176-181 mln vs $172.0 mln consensus (IMOS) 6.02 : Co raises Q4 rev guidance to $176-181 mln vs $172.0 mln consensus, up from $168-172 mln prior guidance. Co expects a gross margin on a consolidated basis for the fourth quarter of 2006 to be in the range of 29% to 32%, compared to prior guidance of 26% to 29%.

09:22 am CalAmp: Ferris Baker Watts upgrades Neutral to Buy. Target $13.5. Ferris Baker upgrades CAMP to Buy from Neutral with a $13.50 tgt saying with CalAmp having recently begun shipping a new generation of products to both DIRECTV (DTV) and Echostar (DISH), they believe the co is poised for strong performance in CY07. The firm expects DIRECTV to be especially aggressive with its HDTV rollouts in mid- to late-2007, but they are already seeing aggressive marketing and anecdotal evidence of waiting lists for HD DVR set-tops. The firm believes CalAmp is very likely to begin seeing significant benefits from the new product cycle beginning in FY08.

icon url

ReturntoSender

12/16/06 7:40 PM

#7169 RE: ReturntoSender #6755

icon url

ReturntoSender

12/17/06 7:49 PM

#7170 RE: ReturntoSender #6755

InvestmentHouse Weekend Update:

http://www.investmenthouse.com/1weekendmarketsummary.htm

- CPI gives investors an early Christmas present, but they almost act as if they want to return it.
- Transition in progress, trying to beat the Christmas rush?
- Soft landing approaching? CPI growth slowing for second month even as retail sales solid.
- Stocks still set to move higher into Christmas despite lukewarm response to CPI.

CPI shows promise, market plays coy.

The big news of the day was the CPI, showing a flat growth rate overall and at the core level. That helped push the core year/year down to 2.6% from the 10 year high hit in August. Time to celebrate and have a good time. Indeed, that news trumped all other in the morning, including some warnings from BDK and ITW (sure seems like a lot for so early in the season), higher oil (attacks on Shell in Nigeria, continued OPEC blustering), and lower capacity readings. Stocks gapped higher, continuing the Thursday breakaway move after a lateral move in December.

What looked to be ‘the’ news the market needed to really extend its gains, however, was trumped itself. Not by any news story, but by a monthly event, expiration Friday (and maybe, just maybe, a bit of top-heaviness). NASDAQ gapped to the November high while SP500 and DJ30 moved to new post-2002 and all-time highs respectively. Nonetheless, it was over in an hour. The early gains were solid, but hardly impressive (69 points on DJ30, 16 points on NASDAQ, 6 points on SP500). Maybe they shot their ammunition on the Thursday jump. The indices are well into their run and they have had a hard time making upside moves stick.

That could explain the fade after the morning surge, but there was also expiration at work. It tends to keep the market on edge and volatile at some point during expiration week. After the move higher Thursday, expiration was prime time to give some back. Looking at the big volume surges on both NASDAQ and NYSE that was the main influence in the pullback. It was no reversal; the indices mostly finished positive and holding the Thursday move. It was expiration Friday following a relatively quiet expiration week and a big move Thursday.

The expiration action makes a technical read rather murky but you have to look at these sessions in context with the overall market picture. There was the big volume related to expiration and narrow breadth with the large cap indices the only ones holding gains. Lots of stocks were moving, but they were moving all over the place. All of this is typical of expiration and thus we don’t want to read something into the tea leaves that is not there. That is an urge you always have to fight; let the market speak and don’t see shadows or sunny skies that are not there. The Fed did that in the late 1990’s just as it did in the 1920’s when it saw stock gains and interpreted them as inevitably leading to inflation. It acted on an incorrect assumption and the results are indexed in history books under ‘P’; not for prosperity but for poverty.

Friday did nothing to change what the market is doing: rising in an uptrend that is aging and is thus showing some signs of age. That does not mean the rally from July is terminal nor the overall rise ready to fall. It may be middle aged and showing some related signs, but middle aged is not on the deathbed.

Some dormant large caps coming to life.

Indeed, the 4 year bull run spurred by renewed economic growth is by comparison fairly old. The leading indicators that matter are starting to show some renewed growth down the road, and that is one reason grow indices such as NASDAQ and SP600 have recovered with the small caps indeed hitting a new all-time high in the past month. The age of the run suggests that the large caps will take over similar to what was seen when this latest rally started, when the small caps stumbled while SP500 and DJ30 led the way higher.

Thursday and Friday saw some of the large cap leadership returning while the small caps lagged the move. Stocks such as C and GE, dormant for years, have suddenly jumped higher. That is an indication that the big money that moves the market is allocating money into large caps of all kinds (leaders and laggards) in preparation for the new year. It could also mean that the world liquidity is looking for anywhere to go, and is now looking to laggards.

That could spell trouble as it suggests things might be getting a bit overcooked as money seeks anything that could turn a profit. It could also represent storm clouds for other areas of the market such as when this current rally started and the small caps took a back seat. They did not breakdown, however, they just moved from leader to follower. Moreover, they recovered and moved to a new high, and as noted above, that indicates good economic action to come as they are growth oriented stocks.

Thus, with liquidity in the world still very high with China, OPEC, and others needing to find homes for that money, perhaps what we are starting to see is simply a further spreading out of the advance. A survey of investment in US equities last week showed more foreign buyers of US stocks than US buyers. Further, the net foreign purchases of US debt and equities released Friday surged to $82.3B, blowing past the consensus of $69.5B and September’s $70.2B (revised higher from $65.1B). Part of the low bond yields is the foreign appetite for US treasuries as a place to park oil money (of course no one has a definitive answer as to how much that is driving lower rates, but it is not the major force as even Greenspan admits).

It takes money to drive economies and markets, and with record US profits and high world liquidity there is money available. We will have to see if this turn toward laggard large caps occurs at the expense of the smaller cap and mid-cap growth indices or if it lifts all boats once more. On Friday the smaller cap indices definitely lagged, turning in negative performances. Overall, however, they are not lagging anymore having both put in new all-time highs this month. In that sense they are leading the SP500 and of course are well ahead of NASDAQ and SOX.

THE ECONOMY

CPI slowing, making Bernanke look like a genius compared to Greenspan’s first year.

We thought CPI would come in less than expected, and it indeed did. Overall consumer price growth has slowed the past four months, even declining in September and October before the November flat reading (+0.2% expected). Lower energy prices drove most of that decline as the core (ex food and energy) stubbornly held its ground. In October, however, the series of 0.2% gains slipped to 0.1%. November fell to flat. That dropped the year over year rise in core inflation to 2.6% from the 10 year high at 2.9% in August. That is still above the 2% cap the Fed wants, but it is getting substantial, and these trends tend to pick up speed as they progress. Indeed, over the past three months core CPI growth rose 2.2% versus 3.5% in July. In three or four months we could see yearly core CPI skipping along the 2% range.

Of course that does not mean a rate cut is imminent. The slowing growth in core inflation merely affirms the Fed’s decision to pause. With the core year/year still well above 2% the Fed is not about to cut rates. Indeed, the bond market seemed to finally get that on Friday. With each indication inflation and the economy were cooling at a ‘soft landing’ pace, bonds have rallied, pushing yields lower and raising the expectations of a rate cut in March. That expectation peaked at 82% just a couple of weeks back. Since then economic data in the service side as well as in jobs reduced that expectation to just 12%. When the news hit Friday bonds rallied and pushed the 10 year back close to 4.50% (4.51%) but bonds then reversed and by the close the 10 year was where it started the day at 4.60%. Even with the core inflation rate finally following what the leading inflation indicators have been saying, bond traders realized all this means is the Fed is going to hold steady well into 2007.

Economic activity set to pick up in second half 2007.

ECRI’s leading indicators continue to rise, hitting yet another yearly high. This long leading indicator looks well down the road, measuring forces that combine to generate growth just as its inflation indicator measures forces that combine to generate inflation 6 months or more down the road. This continued rise still does not eliminate some interim slowing, but it bodes well longer term.

The wildcard is the Fed and how it reads any indications of economic strength. It has so engendered the public over the years with the idea that economic growth leads to inflation that it has hard time doing what is right for fear of confusing everyone with its actions given the economic indicators it claims to use. Former Fed president McTeer summed it up a couple of months back when he noted that growth actually helps REDUCE inflationary pressures. Unfortunately McTeer is no longer on the Fed and his replacement, after sounding good at the start, is basically a wing nut.

THE MARKET

MARKET SENTIMENT

VIX: 10.05; +0.08. Volatility spent another week declining, and as noted the past couple of weeks, the volatility geeks are out warning the sky is falling because volatility is approaching the late 1993, early 1994 lows. Lions and tigers and bears, oh my. Volatility can indeed suggest tops and bottoms in runs, but it is a fickle indicator. Sometimes the correlation sets up and works, sometimes it does not. This is a cycle where it does not. Just as in the early to mid-nineties, the market embarked on a long run even as volatility touched near record lows. When volatility rose dramatically . . . in late 1999 and early 2000 . . . the run was over. The point: low volatility in and of itself does not necessarily mean anything. In this case it has been low, well below the historical range that indicates complacency that can indicate market tops. It has not moved in sync with the market’s ups and down, just hugging the bottom. A correlation can always set up, but it has not done so yet on this cycle.
VXN: 15.15; +1.06
VXO: 9.97; +0.39

Put/Call Ratio (CBOE): 0.74; +0.1

Bulls versus Bears: Bulls eased a bit but remained well above the key 55% level. Bears fell this week, coming closer to 20% considered bearish. Not a great development but as of yet there is still enough money coming in to feed the bulls. That is really the import of this reading: if you get too many bulls, there is no ammunition on the sidelines to keep shooting the market higher. With all of the liquidity in the world (OPEC nations making billions a day), it has to go somewhere. Markets around the world are benefiting from that money, and the US, despite the naysayers, is still a favored destination because of our rule of law, stability, and of course, year in and year out economic growth.

Bulls: 59.6%. Slipped fractionally from the prior jump to 59.8%. It has been a steady move higher from 58.5% and 56.4% the week before. Fourth straight week the bullish advisors topped 55%, the level where the market is viewed as overdone and some corrective activity can enter. A sharp jump from 52.1% the week before and closing in on the January peak at just above 60%.

Bears: 21.3%. Big drop in bears, down from 23.9% after a bounce higher just before that. It is now coming close to that 20% level considered bearish. This is well off the 37.1% hit in July (the highest level in this entire cycle), now so far in the distance you can barely see it. Hit a new post-2002 high in that late June move, eclipsing the March 2006 high (33%) and well above the 2005 highs that spawned new rallies (30% in May 2005, 29.2% in October 2005).

NASDAQ

Stats: +3.35 points (+0.14%) to close at 2457.2
Volume: 2.147B (+10.74%). Explosive volume, the highest in over a month, as NASDAQ closed out expiration. Lots of movement and thus lots of volume. Not calling it accumulation, not calling it distribution. Just expiration. Bigger picture NASDAQ has suffered some distribution and churning bouts the past month, though obviously not enough to sink it.

Up Volume: 1.521B (+91.806M)
Down Volume: 827.673M (+410.294M)

A/D and Hi/Lo: Decliners led 1.1 to 1. Large cap techs led as the index posted a gain while breadth was negative.
Previous Session: Advancers led 1.47 to 1

New Highs: 78 (-29)
New Lows: 11 (-15)

The Chart: (Click to view the chart)

Gapped higher on the CPI news, clearing the November high (2469) but unable to hold it, starting the selling within the first hour of trading. NASDAQ lost ground all session but managed to close with a modest gain, hanging on to the Friday break higher from its lateral consolidation. NASDAQ needs to hold the breakout and then continue from there. Clearing that November high will be key for a run on into Christmas.

SOX (+0.03%) scratched out the bare minimum gain, still trying to get off the 50 day EMA it sold to the past week. Modest double top over the past month sent it down to near support. Still some important chip stocks performing well (e.g. WFR, NVLS), and we will see if they can lead the nation of chips to breakout land.

SP500/NYSE

Stats: +1.6 points (+0.11%) to close at 1427.09
NYSE Volume: 2.102B (+34.1%). Volume hit a 2.5 month high Friday as the last expiration before year end ran its course. As with NASDAQ, no real distribution or accumulation, i.e. no reversal session even though SP500 closed off its high.

Up Volume: 977.771M (-200.422M)
Down Volume: 1.066B (+691.625M)

A/D and Hi/Lo: Decliners led 1.15 to 1. A large cap day at the NYSE as well as the large cap indices were up but breadth was negative.
Previous Session: Advancers led 1.76 to 1

New Highs: 152 (-162)
New Lows: 5 (+1)

The Chart: (Click to view the chart)

SP500 rallied higher early as well, managing to continue rallying even after NASDAQ already peaked out in the first half hour. The writing was on the wall, however, and SP500 slid back all afternoon, failing a mid-afternoon rebound attempt. It managed to hold a modest gain and of course Thursday’s strong break higher. The large caps are getting attention again and that could be very good for them on into Christmas and into 2007.

SP600 (-0.24%) struggled as the small and mid-caps did not attract the money the large caps enjoyed. There was no lump of coal in the stocking, however, just a pullback from the new high hit to start the month. Still in solid shape and still looking for a continued break higher.

DJ30

Volume shot off the scale, posting the highest trade in 7 months. With stocks such as GE, C, JPM and friends jumping higher on strong trade, this was not all expiration volume but some real buying in the large caps. DJ30 is still as extended as a college student at the end of the month before the parents’ check comes, but just as the college student, it keeps finding ways to keep going.

Stats: +28.76 points (+0.23%) to close at 12445.52
Volume: 417M shares Friday versus 253M shares Thursday. As noted, the strongest volume in 7 months as expiration and some real buying in some large caps pushed trade higher.

The Chart: (Click to view the chart)

MONDAY

CPI was big last week along with retail sales and the FOMC meeting, and the data barrage doesn’t slow much this week with housing starts, PPI, final GDP, personal income and spending, and final Michigan sentiment being the highlights. In addition, earnings from some well known stocks such as MS, ORCL, NKE, FDX are on tap, and ‘tis the season for earnings warnings as well with January just two weeks away.

Is the news as good as it is going to get?

There is a confluence of positives hitting the market of late. The economic data has a positive turn despite the sub-50 ISM, the Fed gave a nod at that slower manufacturing rate and noted the housing slowdown was ‘substantial,’ leading indicators are pointing toward more growth, and at the same time consumer inflation is finally starting to turn. As noted in one of our alerts Friday, the news is getting about as good as it can. With earnings season coming and a dozen quarters of growth, the likelihood of some disappointment is higher. Already we are seeing warnings from chips (NSM and others), and Friday saw more from other sectors as BDK and ITW warned.

The market finally broke higher once again last week after working laterally all month even as the good news hit. The inability to rally on the good news was a concern, and the Thursday break higher was good to see. Now it needs to extend that break with a move higher this week. With large caps getting some new money ahead of the new year the momentum is there to carry stocks on into Christmas.

We still have to be wary of any shifts in the various market sectors. For the most part they are all rising together (though chips are struggling). We don’t want to see the small and mid-caps deteriorate as that calls into question the growth prospects for 2007. Want to see that money continue to move into all areas of the market, large and small caps, indicating this overall rally out of the bear market still has significant legs to carry it higher.

Even in that event, there will still likely be a correction of some sort near the first of the year if stocks can continue this move. There will be some redistribution of capital for the new year and a 5% or more correction would not be out of the question. That is an educated assessment of current market condition and historical trends; it is not anything written in stone. As always the market will tell us the direction it is going to take.

We are going with the same game plan: look where the money is flowing and getting in on those stocks starting moves or stocks that are testing good moves and giving us new buying opportunities. That way we will ride the current move as far as possible. As for current positions, we are letting them move as high as they will on this run higher. Positions that have been lagging and not moving with the market are getting closed; if they did not break higher with the market and cannot do so on any further upside moves, we will take the money off the table and use it to focus on those that are getting the money and are moving.

Support and Resistance

NASDAQ: Closed at 2457.20
Resistance:
2468.42 is the November 2006 high
2477 from January 1999
2493 is an interim peak from February 1999

Support:
2438 is the July up trendline
The 18 day EMA at 2435
2412 from June 1999 low
The 50 day EMA at 2385
2384 is an interim peak from January 1999
2379 is the October high.
2376 is the April high, the former post-2002 high
2368 is the early October handle high.
2333 is the top of the Q1 2006 trading range (the January and mid-March 2006 highs)
2316 from interim tops in January and March 2006 trading range
2300 represents some price support

S&P 500: Closed at 1427.09
Resistance:
1444 from February 2000
1475 from peaks in December 1999 and January 2000

Support:
1425 is an interim high from November 1999
The 10 day EMA at 1414
1408 is the November high
The 18 day EMA at 1408
1401 is a low from April 2000
1397 is the July up trendline.
1390 is the October high.
1389 is a low from November 1999
The 50 day EMA at 1385
1378 is a low from May 2000
1371 to 1373 is the December 2000 peak and the January 2001 peak
1358 to 1362 mark a series of peaks from April 1999 to August 1999 high and the February
2002 low at 1360.

Dow: Closed at 12,445.52
Resistance:
At a new all-time high. Back to 8.5% above the 200 day SMA, about the point where DJ30 started to struggle in late October.

Support:
12,361 is the November 2006 high
The 10 day EMA at 12,339
The 18 day EMA at 12,297
October high is 12,167
The 50 day EMA at 12,118
11,986 is price support from mid-October and the early November low.
11,865 from the early October consolidation
11,750.28 is the prior all-time high
11,723 is the January 2000 closing high
11,670 is the May intraday high
11,642 is the May 2006 closing high
11,488 is the early September high.

Economic Calendar

These are consensus expectations. Our expectations will vary and are discussed in the ‘Economy’ section.

December 18
- Current account, Q3 (8:30): -$225.0B expected, -$218.4B prior

December 19
- Housing starts, November (8:30): 1.55M expected, 1.486M prior
- Building permits, November (8:30): 1.540M expected, 1.553M prior
- PPI, November (8:30): 1.2% expected, -1.6% prior
- Core PPI, November (8:30): 0.2% expected, -0.9% prior

December 20
- Crude oil inventories (10:30): -4.295M prior

December 21
- GDP, final Q3 (8:30): 2.2% expected, 2.2% prior
- Chain deflator, Q3 (8:30): 1.8% expected, 1.8% prior
- Initial jobless claims (8:30): 315K expected, 304K prior
- Leading economic indicators, November (10:00): 0.0% expected, 0.2% prior
- Philly Fed, December (12:00): 3.0 expected, 5.1 prior

December 22
- Durable goods orders, November (8:30): 1.0% expected, -8.2% prior
- Personal income, November (8:30): 0.4% expected, 0.4% prior
- Personal spending, November (8:30): 0.7% expected, 0.2% prior
- Michigan sentiment, December revised (10:00): 90.2 expected, 90.2 prior
icon url

ReturntoSender

12/23/06 11:14 AM

#7174 RE: ReturntoSender #6755

From Briefing.com: 5:02 pm Weekly Wrap

The market sagged this past week. The S&P 500 lost all of the gains from the previous week, and the Nasdaq lost even more.

There were no major reasons for the decline and no sharp moves. The recent momentum simply gave way as the S&P 500 index lost 5 points on three seperate days, 2 points on one, and managed a single up day of just 3 points.

The news this week was mixed. The economic reports brought good news on the inflation front, but there were soft economic reports. On Tuesday, it was reported that November PPI had surged 2.0%. That followed a 1.6% drop the prior month, however, and the big jump represented a rebound in a number of key categories, not any underlying price pressures. The core rate followed a very similar pattern of jumping 1.3% in November after a 0.9% October drop.

More significant was the flat November core PCE deflator reported on Friday. That mirrored the previously reported 0.0% for the core November CPI. The year-over-year change in the core PCE deflator dipped to 2.2%. This is the Fed's favorite inflation measure, and the year-over-year rate is sinking back towards the Fed's comfort zone.

The economic news was less bullish. November housing starts bounced 6.7% and appear to be bottoming. That is definitely good news. But there were signs of weakening trends in manufacturing and business investment. November durable goods orders jumped 1.9%, but excluding transportation the change was a weaker than expected -1.1%. The underlying trends in orders are weak, and the year-over-year increase in total orders is now just 0.3%.

The December Philadelphia Fed index reflected a declining manufacturing sector. It was -4.3 from 5.1 in November. This is just one regional monthly survey, but was taken as a signal of an overall weakening trend.

Also released this past week, but of little significance, was a slight downward revision to third quarter real GDP growth to a 2.0% annual rate from a previous 2.2% rate, a weekly unemployment claims level near recent trends of 315,000, and November personal income and spending increases in line with expectations.

The corporate news was slightly bullish. Morgan Stanley, FedEx, Accenture, Nike, General Mills, Micron, and Walgreen all had good earnings reports. Earnings warnings were light for this time of the quarter. Qualcomm and Palm were about the only noteworthy ones. None of the above had broad impact.

More significant was the fact that Oracle stock took a plunge on Tuesday after their earnings report on Monday afternoon. Revenue and profit were in line with expectations, but the company fell a tad short on a key line for new license revenue. The (over)reaction suggests some fragility in tech stocks. This, along with a sharp decline in Google stock, helps explain why the Nasdaq underperformed this week.

The soft trend this week hasn't done much to dissuade traders that a classic "Santa Claus rally" is likely. The market tends to rise in the final days of the year and the first couple of days in the new year. There are concerns, however, that a consolidation of some degree might hit in January.

Oil prices ended the week at $62.41 a barrel, which is still in a acceptable range for stocks. The 10-year note yield ended at 4.62%, little changed from 4.60% a week prior.
 
Index Started Week Ended Week Change % Change YTD
DJIA 12445.52 12343.22 -102.30 -0.8 % 15.2 %
Nasdaq 2457.20 2401.18 -56.02 -2.3 % 8.9 %
S&P 500 1427.09 1410.76 -16.33 -1.1 % 13.0 %
Russell 2000 792.71 780.82 -11.89 -1.5 % 16.0 %

Upbeat economic news gave the stock market a boost this week. Corporate news was very limited and other factors had only minor impact.

There were two big economic releases. The first was one that usually gets little attention -- third quarter productivity. The unit labor cost component of that data was revised sharply lower. For the second quarter, the change in unit labor costs was revised to a -2.4% annual rate of growth from 5.4%. The third quarter was revised to 2.3% from 3.8%. These sharply lower numbers were due to a downward revision to compensation over the same period.

The lower quarterly changes in unit labor costs dropped the year-over-year change 2.9% from a previously reported 5.3%.

This is important because it implies that the cost of output for business is not being pressured nearly as much by rising wages as was previously thought. This is bullish for the inflation outlook.

The economic outlook got a further boost on Friday with the November employment data. Payrolls were up 132,000. That was above expectations of a 100,000 gain. The two prior months were revised upward a net 42,000. That left payrolls a total 74,000 above the expected level. The average monthly gain the past three months is 138,000. The steady rise in payrolls implies that consumer spending power will also continue to rise. That realization helped reduce recession fears.

Other economic data this week included a stronger than expected ISM services index reading of 58.9 for November, and a drop in weekly new claims for unemployment to 324,000 for the week ended December 2 from 358,000 the prior week.

The good news on inflationary pressures and employment were the major factors behind the stock market gains this week.

Also helping were the continued end of year seasonal trends. December has been the strongest month of the year over the past fifty-five years. There are concerns about a possible January consolidation, but most traders remain upbeat about the remainder of this month.

The corporate news was very light. Pfizer stock took a beating when it pulled a key drug under development. Eli Lilly guided profit estimates lower, but Merck reaffirmed their forecasts. Bank of New York and Mellon Financial announced a merger.

Bond yields rose this week in response to the employment data, and the 10-year ended at a still very low 4.55% from 4.43% the week before. Oil prices declined slightly to $62.13 a barrel from $63.43, but were rarely much of a market factor.

6:32AM Amtech Systems announces proposed public offering of common stock (ASYS) 7.13 : Co announced that it plans to offer an aggregate of $15,000,000 of its common stock in a registered public offering through C.E. Unterberg, Towbin, as the managing underwriter. The aggregate offering amount includes proceeds that may be received from the underwriters for the purchase of shares of common stock to cover over- allotments, if any.

09:29 am Micron (MU)

13.49 After a disappointing fourth quarter, Micron delivered a quarter that would make even the Grinch smile. First quarter profits tripled, besting all expectations. A stellar improvement in profitably, coupled with healthy demand, solid pricing and an improved mix all contributed to the standout quarter. The largest memory chip maker released the results as an early Christmas present for shareholders, sending the stock soaring in the after-hours.

We recently argued on behalf of Micron given the Vista-induced demand growth, ramping NAND capacity, and its longer-term diversification strategy. This quarter, Micron delivered the goods, showing gains in each of these areas. Net income came in at $192 mln or $0.25 on sales of $1.58 bln, up 9% sequentially. EPS came in four cents above estimates.

The main driver of the upside was margin expansion achieved in the quarter. Gross margins reached 31%, compared to 24% in the preceding quarter. The gains were derived from improved DRAM pricing, gaining 15% sequentially due to a healthy demand environment and Vista-ready PC builds, positive mix towards higher-priced CMOS image products, and improving trends in the flash memory business.

NAND profitability improved despite a greater than 20% drop in prices due to the currently weak supply/demand environment. Micron is ahead of schedule in building out flash capacity, providing higher scale and fixed cost advantages and recently breaking ground on its fourth wafer fab in Singapore. While improvement in the money-losing flash business was a positive trend, the company cautioned that startup costs at the MU/Intel fab in Utah would likely have a negative impact on operating margins for the next two quarters, offset by positive impact from DRAM pricing.

While risks remain given cost and pricing pressures on profitability, we are retaining our positive view on Micron based on our outlook for the PC DRAM cycle driven by the Vista upgrade, in addition to improving flash operations and its longer-term diversification efforts. The stock trades at 16.8x forward earnings and 1.5x price to sales.

--Kimberly DuBord, Briefing.com

08:56 am Qualcomm (QCOM)

38.54: Qualcomm lowered its first quarter earnings forecast late Thursday, citing increased legal costs and deferred payment from a customer. Shares of the mobile chipmaker traded lower on the news, losing more than 2% in pre-market activity.

Qualcomm said expenses in the quarter have increased above expectations as it continues to defend challenges against its licensing practices and fees. Additionally, the San Diego-based company said it has not received payment from the Pantech Group of South Korea.

As a result, it now expects first quarter earnings to be between $0.41 and $0.42 per share, compared with its previous guidance of $0.42 to $0.44 per share and analysts' expectations of $0.44 per share. Revenues, however, are expected to be at the high end of its previous estimate of $1.98 to $2.08 billion, due to strong sales of its MSM chipsets.

Despite higher than anticipated chipset shipments, persistent legal issues with companies including Nokia (NOK) and Broadcom (BRCM), remain a cloud over the stock. Qualcomm shares have fallen nearly 10% since the beginning of the year, and are off about 27% since reaching a 52-week high in May.

--Richard Jahnke, Briefing.com

09:49 am Advanced Micro: Banc of America Sec reiterates Neutral. Target $27 to $23. Banc of America cuts their AMD tgt to $23 from $27 after last night gross margins were reported worse than anticipated. Firm thinks several factors (detailed within) will likely continue to pressure GMs n-t, and will not be alleviated until at least cross-over from 90nm to 65nm is achieved (2Q07). In the meantime, they think Dell will continue to soak-up AMD's dual core capacity (at a discount), while AMD finds itself juggling between meeting high demand and transitioning to 65nm. Although AMD should be able to recoup two points of GMs in 4Q, they think GMs will stay pressured for sometime. Firm affirms preference for INTC.

09:48 am Apple Computer: Banc of America Sec reiterates Buy. Target $79 to $84. BofA raises their tgt on AAPL to $84 from $79 following earnings. The firm says one major issue they identified yesterday was gross margins. - mgt did indicate that gross margins would be down q/q about 100 basis suggesting that their thesis on recent product price cuts negatively impacting margins is appropriate - though the firm believes that they may have overestimated the magnitude. The firm is modestly increasing their gross margins by 10-30 basis points in the back half of the year, though largely offset by higher op ex, leaving operating margin little changed.

icon url

ReturntoSender

01/06/07 3:34 PM

#7182 RE: ReturntoSender #6755

icon url

ReturntoSender

01/17/07 8:47 AM

#7196 RE: ReturntoSender #6755

From Briefing.com: 08:32 am Intel (INTC)

22.30: With Advanced Micro Devices (AMD) warning of a revenue shortfall for its fourth quarter last week, Intel investors adopted an optimistic view that their company's fourth quarter earnings report would show that AMD's struggles were the result of Intel's success. By most accounts, it did, but in the end, Intel's success didn't compute as profitably as many had hoped.

Intel's fourth quarter revenues of $9.69 billion jumped 10.9% from the third quarter and were at the high end of its guidance range. The increase was driven by higher average selling prices that were a by-product of Intel's upgraded product suite and growth in the mobile business as a percentage of the PC processor mix. Intel noted that records were set in the quarter for total microprocessor unit sales as well as server, mobile and flash unit sales.

Notwithstanding the company's success in the period, it was readily apparent in the gross margin line just how competitive Intel's business has become. To wit, its fourth quarter gross margin of 49.6% was down from 61.8% in the year-ago period. The added rub for investors is that it was no better than the midpoint of expectations which were pegged at 50%, plus or minus a couple of points. In light of the ramp of Intel's dual-core and quad-core processors, that qualified as a disappointment.

Intel acknowledged that higher selling prices helped, but that the positive impact was partially offset by higher factory underutilization charges along with flash memory write-downs and NAND start-up costs. For the quarter, Intel's net income declined 39% and earnings per share slipped 35% from the year-ago period to $0.26 per share.

Equally as disappointing was Intel's forecast for 2007 gross margins to be 50%, plus or minus a few points, as that implied little to no improvement from the 2006 level of 51.49%. Start-up costs related to the 45 nanometer process and factory underutilization charges - the bulk of which will be seen in the first quarter - were cited as factors in the gross margin forecast.

Intel's capex forecast for 2007 calls for spending of $5.5 billion, plus or minus $200 million. The bad news is that that is down from the $5.7 to $5.9 billion that had been forecasted for 2006. The good news for chip equipment makers is that Intel said a higher percentage of its capex budget than it has seen in a long time will be spent on equipment.

With Intel trading down close to 4.0% in pre-market action, there is little mistaking that investors aren't that pleased with its results. Their disappointment is understandable, but we think can easily be reversed in coming quarters since Intel has laid the technological groundwork to reclaim lost market share. Additionally, its aggressive cost-cutting actions combined with prudent inventory management, and the increasing use of higher margin mobile processors, suggests there is a strong likelihood of profit margin surprises down the road barring a meaningful, global economic slowdown.

In brief, we believe Intel is being deliberately conservative with its forecasting and would use interim weakness as a buying opportunity.

--Patrick J. O'Hare, Briefing.com

http://finance.yahoo.com/marketupdate/storystocks
icon url

ReturntoSender

01/22/07 5:19 PM

#7208 RE: ReturntoSender #6755

Texas Instruments Sounds Tenuous Note

By Alexei Oreskovic
TheStreet.com Staff Reporter
1/22/2007 5:13 PM EST
Updated from 4:58 p.m. EST

http://www.thestreet.com/_yahoo/newsanalysis/techsemis/10333971.html?cm_ven=YAHOO&cm_cat=FRE...

Slumping chip demand pressured Texas Instruments' (TXN - commentary - Cramer's Take - Rating) sales in the fourth quarter, with revenue down 8% sequentially.
The Dallas chipmaker's near-term future doesn't look much brighter, as the company guided first-quarter results below current estimates and said it plans to cut about 500 jobs to cut costs.

TI said revenue in the fourth quarter totaled $3.46 billion, slightly ahead of Wall Street's dampened expectations of $3.42 billion.

TI had net income of $668 million, or 45 cents a share, up from $650 million, or 40 cents a share, a year ago.

The results included a 5-cent-a-share benefit from the reinstatement of a federal research tax credit as well as a one-cent benefit from new patent license agreements.

Excluding those results, TI's EPS was 39 cents a share, a penny higher than Wall Street expectations, and at the high end of its guided range of between 37 cents and 40 cents a share.

TI pared back its expectations for the fourth quarter in December, citing a slowdown in demand and rising inventories among distributors.

On Monday, TI said that sales for analog and DSP chips -- the company's two largest businesses -- suffered in the fourth quarter. DSP sales fell 11% sequentially due to lower demand for wireless products, while analog chip sales were off 4% sequentially to a broad-based decline in demand.

Shares of TI were up 56 cents, or 2%, to $29.15 in extended trading.
Looking ahead, TI projected first-quarter sales between $3.01 billion and $3.28 billion with EPS between 28 cents and 34 cents. Analysts were looking for $3.30 billion in sales with EPS of 35 cents.

"Challenges continue in the first quarter as we operate in an environment where customers want lower levels of inventory and where growth in the wireless market is skewed to low-priced, basic featured cell phones, instead of higher-priced full-featured phones," CEO Rich Templeton said in a statement.

TI said it will save about $200 million annually by a series of moves including shuttering a digital factory and moving the manufacturing equipment into several of its analog chip plants, as well as collaborating on future manufacturing processes with its foundry partners. The moves will result in the company eliminated about 500 jobs by the end of the year.
icon url

ReturntoSender

02/01/07 11:03 PM

#7225 RE: ReturntoSender #6755

Chart of the Day - COTD - The January Barometer:

http://www.chartoftheday.com/20070202.htm?T

As goes January, so goes the year. This particular phenomenon is what is referred to as the January Barometer. To test this theory, today’s chart presents the average performance of the S&P 500 one, three, six, and 11 months following a January gain (blue bars) and following a January loss (gray bars). The chart illustrates that the S&P 500 has performed much better (on average) during the months following a January gain. In fact, 11 months following a January gain; the S&P 500 was up 89% of the time. FYI - The S&P 500 was up 1.4% in January 2007.

icon url

ReturntoSender

02/11/07 1:42 PM

#7238 RE: ReturntoSender #6755

InvestmentHouse Weekend Update:

http://www.investmenthouse.com/1weekendmarketsummary.htm

- Market cannot finish the consolidation before distribution again sets in.
- Everything is coming in threes of late, and it is not lucky threes.
- Stocks face an important test heading into expiration week.
- Fed-speak turns to page two of the script.
- Still some great stocks setting up more upside, but have to gear up for some downside as well.

Another NASDAQ breakout attempt gets shipped back to the factory.

After a week of consolidation on the NYSE and a midweek break higher on NASDAQ thanks to Cisco’s earnings, stocks were ready to start higher on Friday. There was even some exasperation among the NYSE floor traders about the market going nowhere for the week. After a 6 month run I guess they get a bit spoiled. That worry added a bit of upside impetus and the indices started the session higher even with oil bumping up against $60/bbl and piercing that level early in the oil session.

After the initial bounce sellers moved in rather quickly and started taking the market lower, but there was nothing major to the downside, just more consolidation in the market. Oil was bumping $60/bbl still, again poking its nose through that resistance a couple of times. There was Fed-speak from a triumvirate of Fed dignitaries, Poole, Pinalto, and Fisher. Though their commentary varied in some respects, it centered around the theme since the last meeting: pleased with the direction of inflation, but not convinced the cycle was over. They even went the next step and said that if the economy remained strong they were not averse to pushing rates higher.

The third shoe falls.

Just as afternoon started the third piece of news hit. At an industry conference MU stated that it did not see any catalysts ahead to push chip sales. Whatever starch was left in the session at that point went limp when this third piece of news hit the market. NASDAQ lost 20 points in 40 minutes, and then wandered lower another 12 points before a last hour bounce cut a few points off the losses. The NYSE indices sold to session lows as well, but the techs were the clear downside leaders. Well, not the only downside leaders. Financials were weak again as well as the effects of the HCS story and sub-prime mortgages lingered even after the Thursday rebound in financials after the story first hit.

NASDAQ and the other indices finished near session lows as volume rose. NASDAQ gave back the Wednesday upside break and more, and it did it on volume as strong as the upside move. That was the third time a distribution session gave back a stronger volume upside break in the past month. As in baseball you typically only get three strikes in the market. While NASDAQ did not break down as a result of the Friday move the distribution continues to show the sellers gaining the upper hand as the index tries to consolidate and break to another post-2002 high.

Technically it was another distribution session, the seventh on NASDAQ since late November. Not a huge amount but it is the timing of three key sessions, all on the heels of upside strong volume and price breaks. Each attempt to break higher gets sold off. The NYSE industries suffered some distribution sessions as well and did so on Friday, but thus far none of them have broken their trends higher. Indeed after the strongest distribution bout in late January they caught support and then surged to new all-time or post-2002 highs.

Friday’s internals were weak along with the distribution with breadth running -2:1 or better. Down volume swamped up volume by a 3:1 margin. The NYSE indices managed to hold near support, the small caps at the 10 day EMA and the large caps at the 18 day EMA, though the move down to that level was mostly a jolt lower. Nonetheless they managed to hold support as did many leaders. We were looking for a pullback to allow some of the strong movers to test and set up for the next run higher. Friday’s drop is giving them the opportunity for a pullback, but they were definitely under pressure and backpedaling Friday as some of their membership crumbled.

Expiration likely to add some extra downside pressure this week.

The concern following a seven month rally is when it is going to correct. The action Friday where NASDAQ once again gave back a solid break higher on a stronger downside move again raises the specter of a looming correction. Leaders breaking lower on rising volume as well only reinforced that concern.

On the other hand, but for the higher volume selling and some leaders giving up, we are getting the pullback we wanted in the leaders to set up some better entry points. Maybe they will once again shake off the effects of the distribution, regroup, and move higher. After all, the indices did not break down Friday though they did suffer a setback, particularly on NASDAQ as it has yet to make and hold a new post-2002 high.

That leaves the indices coming into a key week where they will try to finish out a consolidation and hold their trends for another try upside. It is also expiration week, however, and that tends to exaggerate the momentum. The past two expirations have been down weeks, and this time it has some downside momentum building already. Throw in the continued undercurrent of worry the sub-prime mortgage situation raised last week and you have the potential for a more volatile week.

THE ECONOMY

Fed-speak, page 2: stronger GDP growth means rate hikes.

The Fed speakers were also in threes on Friday with Poole, Pinalto, and wing nut Fisher reading from the tough love script passed around the past couple of weeks. Each one noted that inflation was moving in a positive trend. Hurray. On the other hand, they were not convinced its back was broken. Poole noted that the Fed could not let inflation stabilize above 2%, and if there was an upside GDP surprise the Fed could be prompted into a rate hike. Fisher chimed in that if inflation did not continue its positive trend the Fed would push rates higher.

It seems something of a game of charades with the Fed as they trot out this speech about growth requiring rate hikes. They repeat it often, but most modern economists now concede to history that growth does not cause inflation, bad monetary policies do. The economy can grow gangbusters without inflation as long as there is enough money to keep supply unfettered but not too much such that there are unneeded funds whose only use is to bid up prices for goods and services. It is a fine line to walk and harder for the Fed to explain to laymen. That is strange given that much of the US still remembers the 1970’s when there was no growth, no jobs, but double digit inflation followed by the 1980’s and 1990’s when there was tremendous growth, huge revenue surges, and yet no inflation.

Nonetheless the Fed fosters this fiction that growth means inflation. That is okay as long as things work out and the Fed is able to keep monetary policy right and fiscal policy from the legislature allows business to invest and grow. The problems occur when one or both screw the pooch and the Fed is forced into practicing what it preaches. That is when the real problems arise with unnecessary rate hikes and the deleterious effects the bring because they typically occur at the peak of the business cycle and all they do is foster a more rapid economic decline.

Housing shoe still to drop.

There was a mitigating statement or two from Poole that will keep the Fed in neutral for the foreseeable future. The most important was the recognition that the housing market has not yet stabilized. As long as housing struggles the Fed is not going to think about raising rates. The Thursday news regarding sub-prime mortgages only reinforced the Fed’s current pause. Typically the sub-prime is the first area to crack when the housing market starts to struggle, and then the others start to domino.

Now the Fed could do the wrong thing and view the failures in sub-prime loans indicates lenders are too easy and thus put restrictions on lenders and otherwise tighten credit. It is way too late for that. Once you have problems cropping up the cows have left the barn and Elvis is already in Graceland. If you do the wrong thing and tighten at that point all you get is a further slowing in the economy without fixing inflation. Then you get slower growth and inflation. That starts to look more like the 1970’s, and frankly, there are very few things from the 1970’s that we want to relive.

Bernanke seems a bit too sage to fall into that trap, at least right away. All of his moves thus far appear to show a strong understanding of history along with economic cause and effect. Sure he messed up at first giving Bartiromo an exclusive that she held until her show when the next trading week began and spoke a bit freely in front of Congress, but he did put a lid on it after that, at least until a week ago when he got into the entitlement argument. He needs to watch that and stick to his promise to stay out of the policy arena.

The danger is if inflation as measured by the Fed does not drop off and Bernanke then comes under heavy pressure to hike based upon the Phillips Curve view of economic relationships the Fed espouses in public. More than once the Fed has, as Archie Bunker put it, ‘painted itself into a corner and thrown away the key’ (there we go, dissing the seventies and then quoting a show from that era). If Bernanke is smart he can always use the potential housing issues as kind of the ultimate trump card as that has the potential to get very ugly quickly and without a lot of warning. Thus far Bernanke has acted smart. Smart is as smart does (or something like that).

THE MARKET

MARKET SENTIMENT

VIX: 11.1; +0.66
VXN: 17.11; +0.97
VXO: 10.86; +0.77

Put/Call Ratio (CBOE): 0.94; +0.1. Jumping right back up toward 1.0 as the selling increases. It has to close above 1.0 a few times before you start to thinking about reversals.

Bulls versus Bears:

Bulls: 52.2%. Modest decline from 53.3% after bouncing up from 50.5% a in late January, and after grazing past 55% (the 55.4%) just before. Still quite a bit of bullishness though backing down from the 55% threshold considered bearish as it signals pretty much everyone is in the market.

Bears: 22.2%. Moving in a direction more favorable to market upside as bears bounce back from flirting with the 20% level considered bearish. Up from 21.1% last week and 20.9% before where bears flirted with the 20% bearish threshold. As with the bulls, it is still too close at this juncture as it indicates not enough pessimism. When bears are low it is the same as high bulls: everyone is in. Hit a new post-2002 high in that late June 2006 move, eclipsing the March 2006 high (33%) and well above the 2005 highs that spawned new rallies (30% in May 2005, 29.2% in October 2005).

NASDAQ

Stats: -28.85 points (-1.16%) to close at 2459.82
Volume: 2.147B (+6.16%). Volume jumped back well above average, rivaling the trade from earlier in the week when NASDAQ gapped higher on the CSCO earnings. Once more the selling volume jumped up after an upside break attempt as the sellers entered. Three upside breakout attempts, three downside distribution days on their heels.

Up Volume: 548.684M (-397.833M)
Down Volume: 1.633B (+637.438M)

A/D and Hi/Lo: Decliners led 1.94 to 1. Breadth on the Wednesday upside break was not as strong as this downside breadth.
Previous Session: Decliners led 1.04 to 1

New Highs: 100 (-3)
New Lows: 21 (+4)

The Chart: (Click to view the chart)

Gapped higher but that did not last long. Nonetheless, the downside was not out of hand at all, just a test of the Wednesday break higher. Then the bottom fell out just after lunch as MU commented that there just was nothing in the foreseeable future to push chip prices. That has the same effect on techs as a statement by a presidential candidate that taxes need to be raised: values plummet. NASDAQ dropped a quick 20 and then worked off another 12 before a modest last hour bounce. It gave up the Wednesday break higher, the December high (2471) and the 18 day EMA (2463). It is still in the range that started in November and has the 50 day EMA (2439) in the middle as support. The continued distribution, however, is undermining the lateral move.

SOX (-1.38%). Once more SOX rallied early, helped by a sector upgrade, testing 475 on the high. It then reversed and fell through the 50 day EMA. It closed between that 475 resistance and 450 support, making a lower high in the process. That high coincides with the September and October peaks but is well below the November and December peaks near 490. Something of a toppish pattern forming, but it is still slugging it out. Putting it this way, it is not a pattern we are lining up to buy into.

SP500/NYSE

Stats: -10.25 points (-0.71%) to close at 1438.06
NYSE Volume: 1.636B (+2.17%). Volume was the highest since the new money hit the NYSE to start February. It was on a down session so there was some clear distribution as the financials sold off harder, putting a drag on the indices.

Up Volume: 419.719M (-328.272M)
Down Volume: 1.195B (+362.498M)

A/D and Hi/Lo: Decliners led 2.32 to 1. Rivaling the upside breadth when SP600 and SP400 were breaking to new all-time highs. Shows the selling was strengthening outside of just some volume.
Previous Session: Decliners led 1.09 to 1

New Highs: 156 (-26)
New Lows: 12 (+5)

The Chart: (Click to view the chart)

SP500 plunked down onto the 18 day EMA (1436) hard as volume jumped back above average. It managed a modest bounce late to hold that near support, recovering 4.5 points to do it. That also keeps it close to the January high at 1440, roughly holding its breakout to a new post-2002 high. It is still in its trend after Friday easily above the 50 day EMA (1420). It is under pressure from the financial sector that, after rebounding Thursday from the mortgage scare, had second thoughts. It has shaken off prior distribution bouts and now it has another one to try and work off.

SP600 (-1.03%) struggled as well, but it had a better position to work from having broken to a new high and running higher as the rest of the market moved laterally. It sold to the 10 day EMA and managed to hold that near support similar to SP500 holding the 18 day EMA. Thus far a normal test in the small caps though on rising volume. A new leader in the market rally, and thus important that it holds some semblance of the breakout. The 18 day EMA is at 408, and holding that keeps it on top of the December highs and thus holding the breakout.

DJ30

DJ30 sold to the 18 day EMA (12,585) as well, falling on rising though still below average volume. Once again DJ30 rallied off of the lows in the narrow channel, moved to the highs and is now fading once more within that range. Volume was still below average so this initially has the look of a routine pullback in its not so routine 7 month uptrend. Every pullback is questioned given the length of that run. For now it looks as if DJ30 is heading back for another wave at the 50 day EMA (12,448) as it did twice in January.

Stats: -56.8 points (-0.45%) to close at 12580.83
Volume: 220M shares Friday versus 193.8M shares Thursday. Strongest volume of the week but still below average.

The Chart: (Click to view the chart)

MONDAY

After a quiet week of economic data the floodgates open again with regional PMI reports, retail sales, housing starts, and PPI to hit the high points. Bernanke addresses Congress as well in his son of Humphrey-Hawkins. He is likely not to get into monetary policy details too much but the interesting aspect will be how much he can be drawn into the political fray. He was doing a pretty good job of it but then opened the door last week with his comments on social issues and entitlements.

That economic overlay adds spice to a market that got roiled late in the week with the mortgage and chip issues. Add expiration to the mix and the likelihood of some further downside increases.

A continued pullback will further set up some leaders that ran higher in the last rally and are now testing the move. Many stocks are pulling back in this test and the issue is which ones hold at near support and which ones need s deeper test. There is no economic meltdown despite the sub-prime mortgage problems; we discussed Thursday why they in and of themselves will not present the boogeyman some are predicting. They could be a sign of further mortgage problems down the road, but the economic data, consumer confidence, and the leading indicators do not suggest that is the case.

Thus outside of the sectors directly impacted by the housing issues we can look for continued advances and use the overall market pullback to our advantage. When solid leaders rebound off of their pullbacks we can accumulate some positions and play the next run higher. We want to see the distribution subside and see some good rebounds on decent volume, however, to show us it is more than just a relief bounce. After all the market is still extended and NASDAQ has shown three occasions where a strong, higher volume upside move was tossed back. As of Friday the market is still struggling with some systematic selling in techs with some of the selling branching out.

Accordingly, we are going to selectively look at some strong upside leaders that are in the right sectors and are in the right position to rebound and continue their runs. We are also looking at some more potential downside plays in the event the selling spreads out and continues. Expiration week has suffered a downside bias the past several months only to recover later. We want to be positioned, however, in the event the distribution wins out and the market heads into an overdue correction. The distribution is undermining NASDAQ’s 3-month lateral move; sellers are using the rebounds to unload shares. If it keeps up eventually the foundation gives.

As we said, we want to be ready for some potential downside. The distribution is not good but the market to this juncture has shaken off every selling attempt. Each time it appears the market has had it, the indices find the means to rally again. With the economy still in solid shape there are many strong leaders still in position to rally, and this pullback, even if it takes all next week and turns into a short correction, will leave the strong ones in position to rebound. We want to be very patient in this environment and move in when we see good moves starting. In addition, we don’t need to take a full position at once; even if a move is solid, in a volatile expiration week a strong stock can still show some up and down action. Thus we are going to be patient, pick our shots, and take what the market gives during what could be a transition week.

Support and Resistance

NASDAQ: Closed at 2459.82
Resistance:
2468.42 is the November 2006 high
2471 is the December 2006 high
2509 is the January 2007 high
2493 is an interim peak from February 1999
2523 is price resistance November 2000

Support:
2450 is minor support
The 50 day EMA at 2439
2412 from June 1999 low
2384 is an interim peak from January 1999
2379 is the October high.
2376 is the April high, the former post-2002 high
2368 is the early October handle high.
2333 is the top of the Q1 2006 trading range (the January and mid-March 2006 highs)
2316 from interim tops in January and March 2006 trading range

S&P 500: Closed at 1438.06
Resistance:
1440 is the mid-January high
1447 is the July up trendline
1475 from peaks in December 1999 and January 2000
1444 from February 2000

Support:
The 18 day EMA at 1436.81
1432 is the December 2006 high
1425 is an interim high from November 1999
The 50 day EMA at 1420
1408 is the November high
1401 is a low from April 2000
1390 is the October high.

Dow: Closed at 12,580.83
Resistance:
About 8.5% above the 200 day SMA. Still going strong, overcoming the chop as it pushes to a series of new highs once more.

Support:
The 18 day EMA at 12,585
12,499 is the December intraday high.
The 50 day EMA at 12,448
12,361 is the November 2006 high
October high is 12,167
11,986 is price support from mid-October and the early November low.
11,865 from the early October consolidation
11,750.28 is the pre-2000 all-time high

Economic Calendar

These are consensus expectations. Our expectations will vary and are discussed in the ‘Economy’ section.

February 12
- Treasury Budget, January (2:00): $40.0B expected, $21.0B prior

February 13
- Trade balance, December (8:30): -$59.5B expected, -$58.2B prior

February 14
- Retail sales, January (8:30): 0.3% expected, 0.9% prior
- Retail ex-auto (8:30): 0.3% expected, 1.0% prior
- Business inventories, December (10:00): 0.4% expected, 0.4% prior
- Crude oil inventories (9:30): -449K prior

February 15
- Initial jobless claims (8:30): 311K prior
- NY Empire PMI, February (8:30): 11.0 expected, 9.1 prior
- Net foreign purchases, December (9:00): $60.0B expected, $68.0B prior
- Industrial production, January (9:15): 0.0% expected, 0.4% prior
- Capacity utilization, January (9:15): 81.7% expected, 81.8% prior
- Philly Fed, February (12:00): 5.0 expected, 8.3 prior

February 16
- Housing starts, February (8:30): 1.61M expected, 1.642M prior
- Building permits, February (8:30): 1.59M expected, 1.613M prior
- PPI, January (8:30): -0.6% expected, 0.9% prior
- Core PPI, January (8:30): 0.2% expected, 0.2% prior
- Michigan sentiment prelim, February (10:00): 97.0 expected, 96.9 prior.

icon url

ReturntoSender

02/13/07 4:59 PM

#7242 RE: ReturntoSender #6755

Applied Materials Beats Earnings Estimates

http://www.thestreet.com/_yahoo/newsanalysis/techsemis/10338732.html?cm_ven=YAHOO&cm_cat=FRE...

By Bill Snyder
TheStreet.com Senior Writer
2/13/2007 4:38 PM EST
Click here for more stories by Bill Snyder

Applied Materials (AMAT - Cramer's Take - Stockpickr - Rating) bested Wall Street's first-quarter earnings expectations but came in slightly light on the top line.

The semiconductor equipment maker earned a profit of $403 million, or 29 cents a share, up year over year from $143 million, or 9 cents a share. Net sales were $2.28 billion, up 23% from the same quarter last year.
Analysts polled by Thomson First Call were looking for a profit of 27 cents a share on sales of $2.35 billion.

Gross margin for the quarter was 46.7%, up from 45.1% a year ago but down from 47.1% in the previous quarter.

The company will give second-quarter guidance in a conference call Tuesday afternoon.

"We executed effectively and met our operational objectives for the quarter," said Mike Splinter, president and CEO. "Rapid customer acceptance of our new leading-edge platforms for chemical vapor deposition and metal etch, as well as strong demand for Applied's service products, set the stage for future growth."

New orders of $2.54 billion for the first quarter increased 24% from a year earlier but decreased 6% from the latest fourth quarter. The decline in orders for the first quarter reflected a significant decrease in orders for displays as customers delayed their capacity expansion plans.

I see the stock nicely higher after hours. If anyone has conference call details please share them! Thanks, RtS

icon url

ReturntoSender

02/18/07 6:54 PM

#7249 RE: ReturntoSender #6755

GGC Charts - Worth Watching:


http://finance.yahoo.com/q/ks?s=GGC

http://www.smartmoney.com/pricecheck/index.cfm?story=worksheet&symbol=ggc&nav=pc_snaps

Here is a group of other stocks I found that may be worth watching as under valued as well:

NTE, IMOS, TTI, VCI, NEW and UPFC

RtS


icon url

ReturntoSender

02/24/07 3:50 PM

#7256 RE: ReturntoSender #6755

Amateur Investors Weekend Stock Market Analysis (2/24/07)

http://www.amateur-investor.net/Weekend_Market_Analysis_Feb_24_07.htm
icon url

ReturntoSender

02/27/07 11:43 PM

#7267 RE: ReturntoSender #6755

Technical Analysis: Panic
By Paul Shread

http://www.internetnews.com/bus-news/article.php/3662471

We'll start out with the easy part: last Friday's buy signal under Gerald Appel's Nasdaq-NYSE relative strength ratio is shaping up to be an unmitigated disaster. We'll now note a reason why it's not time to panic just yet: the next five trading days are historically the most positive of the month, as noted by Norm Fosback and others more than 30 years ago (Fosback still publishes a newsletter at Fosback.com; well worth the modest cost). We'll see if the market is on the mend a week from now, but our gut feeling is that the stunning 99% downside volume on the NYSE and 64% spike in the options volatility index (first chart below) could well turn out to be climactic. That said, it could take some time for the market to regain its footing, so expect some rocky trading ahead. One other interesting note about today: famous cycle watcher Martin Armstrong long ago had Feb. 27, 2007 as an important date, so whether this was a panic prompted by followers of his work or the start of a bigger decline remains to be seen. Technically, of course, there was significant damage, as the Dow and S&P (charts two and three) gave up their multi-month rising channels today. The Dow has support at 12,200, 12,100 and 12,000, and 12,350 and 12,500 are upside resistance. 1380-1390 looks like good support on the S&P, and 1410 and 1420 important first resistance levels. The Nasdaq (fourth chart) has important support at 2390-2400, and resistance starts at 2420-2425. Bonds (fifth chart) have had a heck of a run, but they could be in for a breather if stocks bounce.


icon url

ReturntoSender

03/09/07 12:20 PM

#7290 RE: ReturntoSender #6755

Stocks I'm watching:

The channel on the low end is all the way down at 1.59 for LMRA.Buying that low may not happen but why chase a falling knife?


I can't look at GERN without looking at STEM too. GERN has better science but STEM has the right name and symbol. I might look for a retest in the 5's for an almost risk free trade on GERN. STEM around 1.80 would be a great trade:


As for TRID? I would not even consider a trade unless it slips below 17 unless you are daytrading only.


How about IDSY?


http://finance.yahoo.com/q/cq?d=v1&s=LMRA+GERN+STEM+TRID+IDSY

JMHO, RtS
icon url

ReturntoSender

03/10/07 9:28 AM

#7294 RE: ReturntoSender #6755

SENTIMENT JOURNAL: Put Volume Surges Amid Signs of Extreme Bearishness

By Frederic Ruffy, Optionetics.com
Published: March 9, 2007 6:45 PM EST

http://optionetics.com/market/articles/16852

Market Internals: The Dow Jones Industrial Average ($INDU) took a trip down to revisit 12,000 on Monday, but then bounced back in dramatic fashion with a 157-point rally on Tuesday. From that point forward, it was back and forth action with a noticeable decline in market volume and volatility. As we can see from the table above, volume on the New York Stock Exchange [NYSE] declined during every trading day this week and failed to break above 1.5 billion shares on Friday. Nevertheless, while volume was somewhat lacking, market internals were net positive. As the Dow posted a 162-point weekly gain for the week, up volume outpaced down volume during the past four trading sessions. Similarly, advancers beat decliners every day since Monday.

Meanwhile, the NASDAQ Composite Index ($COMPQ) rose during two of this week’s five trading sessions, but, thanks to a big gain on Tuesday, was able to finish the week with small gains. In contrast to last week’s surge in volume, trading was relatively uneventful during the second half of the week. Volume on the NASDAQ Stock Market never broke above 2 billion shares in final three days, when the composite index experienced average daily moves of less than 8 points.

Sentiment Indicators: The market’s rebound on Tuesday along with the quiet trading Wednesday through Friday helped ease market jitters. For example, the CBOE Volatility Index ($VIX), which on Monday rose above 20 percent for the first time in six months, now sits near 14 percent. The decline in the market “fear gauge” is one clear indication that risk perceptions are falling.

Indeed, there seems to be a growing consensus that the worst might be over for the equity markets. I heard one talking head on financial television explaining that many hedge funds and other “pros” are staying fully invested despite the recent turmoil in the US equity market. The main reason is that, last year, when a similar sell-off took share prices down in May and June, many of these same investors sold off risky assets. Consequently, when the market rebounded in the second half of the year, the hedge funds that sold in May and June were left underperforming the market for 2006. This time, they are staying the course. Now, naturally, one might ask if there are similarities between the stock market bottom of June and the situation before this week’s rebound?

Interestingly, many of the sentiment indicators have reached greater extremes than during the May/June market bottom. For example, put volume has been off the charts (relative to calls) and the total put to call ratio (for trading across all six US options exchanges) has been 1.00 or greater in nine of the past ten trading sessions. This ratio is a simple measure of put volume divided by call volume. When investors become anxious and begin looking to put options for portfolio protection, the put to call ratio will rise. The chart below shows the ten-day average. It has easily surpassed its May/June highs and is spiking into uncharted territory near 1.20.


Figure 1: Total Put-to-Call Ratio

In addition, it isn’t just the total put to call ratio that is reaching extremes. Other indicators hit records last week. The Trader’s Index ($TRIN) hit an all time high. The VIX posted its biggest one-day rise ever. The CBOE put-to-call ratio also set a new all-time high. The ISE Sentiment Index [ISEE] has also produced a series of low readings. The index, which measures call volume divided by put volume on the International Securities Exchange, has not rise above 1.00 since March 1. The ten-day average is below 1.00 and also below the levels seen in the summer of last year. Taken together, there is ample evidence to suggest that bearish sentiment has indeed reached levels that exceeded the previous market bottom of June 2006.
Yet, while investor sentiment is clearly very pessimistic, which is a positive from a contrary minded view of the market, there is also a risk of further bloodletting. The main reason is that the recent decline comes after a period of time when bullishness, optimism, and complacency had reached extremes. In addition, the latest decline lasted only a few days and the Dow is less than 4% from its record highs. In short, although bearish sentiment has reached an extreme, the market might not be very close to a bottom due to the mere and simple fact that it remains pretty darn close to a recent market top.

Sentiment Indicators—Past 7 Days

http://optionetics.com/market/articles/16852

Click on link above for more info. RtS

icon url

ReturntoSender

03/12/07 8:53 AM

#7298 RE: ReturntoSender #6755

Cree to Buy Chinese LED Maker for $200M
Monday March 12, 7:43 am ET
Cree to Buy Chinese LED Maker Cotco for $200 Million in Cash and Stock

http://biz.yahoo.com/ap/070312/cree_acquisition.html?.v=1

DURHAM, N.C. (AP) -- Cree Inc., which makes semiconductor materials and electronic devices made from silicon carbide, said Monday it agreed to buy privately held Cotco Luminant Device Ltd. for $200 million in cash and stock.

Cotco, based in Hong Kong, supplies the Chinese market with high brightness LEDs used in lighting, signs and screens.

Under terms of the deal, Cree will pay $70 million in cash and 7.6 million shares, which the company said are worth $130 million based on the stock's average closing price over the past 20 trading days. The stock closed Friday at $16.25 on the Nasdaq Stock Market.

Cree may pay another $125 million in any combination of cash and stock if Cotco reaches unspecified financial targets within two years.

Cree expects the acquisition to boost 2008 earnings per share by 5 percent to 10 percent from the 43 cents currently projected by Wall Street. The company projects sales will be 10 percent to 15 percent higher than the Street's estimate of $415 million.

The transaction, which is subject to customary closing conditions, is targeted to close by late March or April. Cotco also agreed to hold the Cree shares until one year after the closing date, at which time Cotco may sell or transfer up to 50 percent of the stock.
icon url

ReturntoSender

03/18/07 7:09 PM

#7315 RE: ReturntoSender #6755

InvestmentHouse Weekend Update:

http://www.investmenthouse.com/1weekendmarketsummary.htm

- Finish to an interesting week leaves Wednesday reversal issue unanswered.
- Overall picture remains weaker though leadership is holding up.
- CPI not falling, but after rising PPI it was a relief to investors.
- Industrial production jumps 1% but most of it was cold weather utility production.
- A further test to the 200 day SMA is still likely in this correction, but leadership is providing upside plays to go along with the downside.

THE MARKET

MARKET SENTIMENT

VIX: 16.79; +0.36. Spiked to 21.25 on the Wednesday high intraday as the market undercut the prior correction low. That is getting there but is still below the highs in June (23.81). In the bigger picture that is low volatility; in ‘normal’ times it runs from 20ish to 30ish with those ends being the lows and the highs. Still some to go on the upside before the bottom is set.
VXN: 19.6; +0.81
VXO: 16.39; +1.17

Put/Call Ratio (CBOE): 1.23; +0.1. Eighteen days above 1.0. Getting ridiculous here and that means extreme. Extreme typically means change is in the offing. The other sentiment indicators are heading in the right direction (volatility, bulls/bears), but they are not there yet.

Bulls versus Bears:

Bulls: 45.5%, down from 46.2% and well off the 50.5% and 53.3% six weeks back. When it bottomed last summer it was near 36%. That is the lowest level since September 2006. Still a ways to go, but when it cracks it can tumble quickly. A 4.3 point drop is pretty salty.

Bears: 28.9%. Nice fat jumps in the bears, up from 26.9% and 24.2% the week before. Not bad after spending the first two months of 2007. The angst is rising, and as with bulls, it is not all that far from levels that sparked prior rallies. It hit a post-2002 high in that late June 2006 move (hit near 36%), eclipsing the March 2006 high (33%) and well above the 2005 highs that spawned new rallies (30% in May 2005, 29.2% in October 2005). It is not far from those 2005 levels.

NASDAQ

Stats: -6.04 points (-0.25%) to close at 2372.66
Volume: 2.14B (+18.07%). Stronger, slightly above average volume. Volume was not that strong for expiration and was below the Tuesday and Wednesday trade though those days were likely part expiration trade as well as investors positioned ahead of the weekend.

Up Volume: 899M (-98M)
Down Volume: 1.199B (+420M)

A/D and Hi/Lo: Decliners led 1.56 to 1. Rather modest, matching the session.
Previous Session: Advancers led 1.68 to 1

New Highs: 62 (-8)
New Lows: 82 (+20)

NASDAQ CHART: http://www.investmenthouse.com/ihmedia/NASDAQ.jpeg

SP500/NYSE

Stats: -5.33 points (-0.38%) to close at 1386.95
NYSE Volume: 2.072B (+37.44%). Unlike NASDAQ this was quite a volume surge. Technically distribution, but again, it was also expiration Friday and that contributed to this strong trade. But for expiration this would be one heck of a churning session below near resistance at the 10 day EMA.

Up Volume: 630.715M (-467.717M)
Down Volume: 1.397B (+1.007B). Down volume doubled up the upside trade; it was not all just an expiration phenomenon.

A/D and Hi/Lo: Decliners led 1.6 to 1. Pretty mild compared to the prior sessions. Once again we see very volatile breadth readings, running sharply higher on up sessions and sharply lower on down sessions. Recall that is what the market showed before it rolled over into the selling. Volatility, those big back and forth swings, indicate there is still no consensus in the market and thus more selling is likely.
Previous Session: Advancers led 2.44 to 1

New Highs: 86 (+2)
New Lows: 31 (+5)

SP500 CHART: http://investmenthouse.com/ihmedia/SP500.jpeg

As you can see, SP500 closed below the 10 day EMA after the big Tuesday selloff and the Wednesday reversal. Thursday and Friday did not answer the question as to what Wednesday was, but before this is over we still expect to see SP500 down near the 200 day SMA and that general area is likely to be where it finds the bottom. Might undercut it and really scare everyone, but somewhere in that area is the likely end of this.

DJ30

DJ30 didn’t even make it to the 10 day EMA on the rebound off the Wednesday reversal as it showed more weakness to end the week than its pattern indicated. It is still holding above 12,000, but that is going to be violated again before this ends. As with SP500 a test of the 200 day SMA is likely and indeed a move below that is likely as well.

Stats: -49.27 points (-0.41%) to close at 12110.41
Volume: 388M shares Friday versus 232M shares Thursday. Exploded higher on expiration.

DJ30 CHART: http://www.investmenthouse.com/ihmedia/DJ30.jpeg

Support and Resistance

NASDAQ: Closed at 2372.66
Resistance:
2376 is the April high, the former post-2002 high. Bending a bit.
2379 is the October high.
The 10 day EMA at 2385
2400ish from the late November and late December 2006 lows.
The 50 day EMA at 2425
The 90 day MA at 2436
The July/August trendline at 2447
2468.42 is the November 2006 high
2471 is the December 2006 high
2509 is the January 2007 high
2523 is price resistance November 2000

Support:
2368 is the early October handle high.
2340 is the March low
2339 – 2334
2333 is the top of the Q1 2006 trading range (the January and mid-March 2006 highs)
2316 from interim tops in January and March 2006 trading range
2300 represents some price support
The 200 day SMA at 2296

S&P 500: Closed at 1386.95
Resistance:
The 10 day EMA at 1395
1408 is the November high
The 90 day MA at 1415
The 50 day EMA at 1415
1425 is an interim high from November 1999
1432 is the December 2006 high
1440 is the mid-January high
1444 from February 2000
1453 is the late November to February up trendline
1475 from peaks in December 1999 and January 2000

Support:
1389 is the October peak.
1374 is the early March low
1371 to 1373 is the December 2000 peak and the January 2001 peak
1369 from early October 2006
1358 to 1362 mark a series of peaks from April 1999 to August 1999 high and the February
1353 to 1350 is the early October consolidation range
The 200 day SMA at 1350

Dow: Closed at 12,110.41
Resistance:
The 10 day EMA at 12,200
12,361 is the November 2006 high
The 50 day EMA at 12,382
The 90 day MA at 12,397
12,499 is the December intraday high.

Support:
12,039 is the early March low.
October high is 12,167
11,986 is price support from mid-October and the early November low.
11,940 is the March low
11,865 from the early October consolidation
The 200 day SMA at 11,822
11,750.28 is the pre-2000 all-time high
11,723 is the January 2000 closing high
11,670 is the May intraday high
11,642 is the May 2006 closing high
11,488 is the early September high.

Economic Calendar

These are consensus expectations. Our expectations will vary and are discussed in the ‘Economy’ section.

March 20
- Housing starts, February (8:30): 1.44M expected, 1.408M prior
- Building permits, February (8:30): 1.56M expected, 1.571M prior
- FOMC day 1

March 21
- Crude oil inventories (10:30): +1.18M prior
- FOMC day two, policy statement (2:15)

March 22
- Initial jobless claims (8:30): 325K expected, 318K prior
- Leading economic indicators, February (10:00): -0.3% expected, +0.1% prior

March 23
- Existing home sales, February (10:00): 6.35M expected, 6.46M prior

TRANSCRIPT

Well over all we had a very interesting week in the market. The low-volume relief rally from last week ended on Tuesday with a high volume sell off. Wednesday the selling continued, but intraday the market reversed on volume to close positive. Thursday and Friday was anti-climactic as Thursday the market bounced on low volume and was down on Friday on higher volume to close out the week. The market was befuddled. It was expiration Friday, so there were some issues with that higher volume on Friday and indeed probably some of the volatility during the week was on account of expiration. Nonetheless we saw a couple of big moves during the week and the end of the week didn't resolve what that Wednesday reversal meant. It is something that indicates this leg is over, or are we going to sell off further? Thursday and Friday didn't answer that question, and we'll know more this coming week. As we discussed Wednesday night we have our suspicions as to what that day meant.

The overall picture still remains negative. We are in a correction; that has not changed. What happened this week was another down leg that looks like the beginning of another down move in this correction. Wednesday was a reversal off the session lows, but the indices finished the week below the 10 day moving average, and that's where near resistance is and that's where the move last week stalled.

We still have an overall negative picture when you look at the internals. Sure they were talking about the internals being good on Thursday, but when you look at the week over all, the internals were very poor. They were heavily biased to the downside and the negative internals were far stronger than the positive ones. For example, when you look at the internals, i.e. down volume to up volume during a bad day and when you look at the advance/decline during the negative days, they overwhelmed the positive days.

Leadership was interesting. We still have some great leadership in the market and that is always one of the final acid tests of the market. Who is up there leading things higher or it in a weak market, who is or what is leading things lower. We are still seeing metals going up. Copper hit an eight-month high this past week, China still has a lot of demand and basic materials are still doing well. We see semiconductors forming up well in the tech stocks and telecomm stocks are looking pretty good. Software is looking good as well. So, we have an overall weak pattern to the market, but across many sectors of the market, we still have some positives. There are some very good stocks in very good position that are moving up higher. This market has some strong leadership. Therefore, you have an idea there's an underlying strength still in the market.

We have underlying strength right now, but the question is if this market correction continues what is going to happen to that leadership? Most of the time, when you have a severe market correction you are going to lose a lot of that leadership. But there is a big difference here and one that is worth noting between a correction and a sharp correction at that versus a market that is trending lower turning into a long prolonged bear market type pullback. A lot of leadership won't get totally scuttled. I say a lot but I may be exaggerating a bit. However, there will be leadership that won't totally breakdown. It will use the correction to base, to pull back from good moves and set up for the next leg higher. That's what leaders do, They lead the market after a correction. So we'll see a lot of good stocks pulled back to near support or even down to the 50 day moving average and base out. Then they will start back up. We see those right now. That's what we are putting on the reports on the upside plays. We are looking for these strong stocks that are weathering this decline and indeed have done very well in weathering the first two big blows lower. The stocks are setting up to move higher and some of them are moving higher already. So we will keep an eye on it because that tells us that even though the there is probably another leg down in this correction that the overall correction thus far does not indicate that it will be very severe to the downside.

THE ECONOMY

With this pullback we have seen that there has been a lot of negatives with respect to the economy and the idea is now, gee the economy just not doing that well. We have mortgage problems, overseas problems such as China trying to slow our economy down. Industrials are slowing production in the US and we see the PMI reports lower. There are many things that have people worried. What was just basically a mid-cycle slow down has turned into fear that the mortgage issues are spreading. You also have people like Alan Greenspan talking about recession saying that the household problem could be worse than it was first indicated. This only fuels the fire. This talk is leading to some of the near-term worry with respect to what's going with the market. Friday we had the CPI, which came out well as did industrial production. The CPI after a hotter PPI on Thursday was lower, was not really lower, but it seemed lower because the core was in line at 0.2%. Now overall it was higher, but there are reasons for it being higher. One of issue was food which we talked about Thursday night.

The corn issue is going to be big for us. Ethanol is going to soak up all the corn. It hasn't really started yet because it is not producing much more ethanol. The worry is it will, and the market is pricing in that every scrap of corn that we use in the country has to be used for ethanol. This means that it will cost more to feed chickens, cows, pigs and every animal that we eat is going to cost more. That means we pay more for food. Food pricing is already starting to anticipate this and is going up.

Some of the price gains are aberrations. Energy however is not an aberration. We have a problem with energy and it's going to stay high. What we did see was apparel was still up. This is unusual. Apparel should not be up at this point and we anticipate it to fade back. Industrial production on the other hand outside of the PPI that was up 1% when it was only expected to rise .3% and it was down .3% the month before. We thought oh great we already have strengthening in industrial production and we are coming out of this just as some indicators are showing that we are going lower. This really means that we are actually going higher and things are starting to pick up again. The problem is that we had a very cold month and a lot of the gain and the lion’s share of the gain was due to the utilities having to ramp up and having to produce a lot of electricity to keep us warm. Therefore that's why we had the big gain. Another thing to consider with respect industrial production, is that this was only the second gain in 6 months. So it is not taking off right now it's still coming in for a landing. The question everyone is worried about, what we have been talking about all along and what Greenspan has been dealing with (his concerns with recession and the problems in the sub-prime market spreading out) is how rough is the correction in the economic cycle going to get.

We think that it has been just been hyped up lately. We think that a normal slowdown in the mid-cycle of an expansion is being exacerbated by these comments and some of the mortgage issues. This is normal. It is normal for an economic cycle to slow midterm. ECRI is the leading indicator one of the best leading indicator that we can compile as human beings. It shows this slow down and forecasts the slowdown, but it is also forecasting a pickup after the summer. There something that can derail that you can have the mortgage issue really and truly expand out beyond sub-prime and start hitting and impacting the middle of the road mortgages that meet the heart of the mortgages in America and that would really crimp the spending.

We can also have some insane or maybe I should say asinine ideas coming out of Congress such as the one that's filtering through right now which is putting punitive tariffs, or punitive penalties on China if the trade balance is too large or if they don't do enough with respect to the currency according to whatever Congress thinks they should be doing. That can scuttle things in a hurry and of course we also have the tax issue. During the campaign raising taxes was the last choice in raising revenues. Well it seems as though we are at the last choice without ever trying the first, second or third choices.

We are pretty certain that we are going to get some kind of increase in tax proposal over the next year. If one or worse case two of those come to be, then market could really have a problem because the economy would be having a problem down the road. This would be bad news for the economy in general. This expansion in the market it would go down first and the economy would follow.

We still think it is a mid-cycle slow down and we still think that is just been blown out of proportion by some of the events, commentary as well as the mortgages. Everyone always gets scared when mortgage default starts to rise. That's normal to worry about the consumer being able to consume. At this juncture, though it's not anything that is out of the norm considering the out of the norm rise we had in the housing market. You must remember this as well. A lot of the problems that we are experiencing right now in the mortgage market they were put in place less than two years ago, The housing market topped in summer 2005, and that's when all these very strange and fringed type mortgages started when the housing market slowed down. These types of mortgages were used by lenders to get borrowers to the table so they could make more loans, and of course generate more fees. This was a relatively recent phenomenon and not the entire boom was laced with these poor choices in mortgages to individuals who may not be able make the payments once the worm turned a little bit. That is important to keep in mind and is a matter that has been lost here. This is a late cycle part of housing boom and not the meat and the guts of the four years of gains. It is that the latter part of it so the actual damage shouldn't be that severe. This is something that everyone seems to be losing site of in the hype over the mortgages.

THIS WEEK

Well, then that gets us back to just what's happening this week as we said we can look at the charts and see that the indices have another sharp leg lower reversed but then drifted off and waffled into the end of the week and were below, near resistance at the 10 day moving average. In other words it never really answered the question as to what Wednesday meant. Was it really key reversal or was it just one of those things that expiration week during a correction we had a lot of volatility. We still think that we are going to try to test the 200 day moving average. Probably during this leg here may rally up little bit more or may blow down and bounce back. We are looking past the corrections and how the market is shaping up. We think we can get that pullback here down to the 200 day moving average. And we think that will set the low for the correction. We have a bounce back up, and we come down to test that move again. That puts us out five or six weeks and still trying to get this thing resolved. We will see some more stocks blow up during that period and will try to keep pretty tight leash on them.

The performance of a lot of our plays have been very good, so we do not want to cut them off when they are actually showing no real distribution, but just showing nice consolidation just working on their bases. Remember what we said about leaders. They will use a normal correction to pull back in base, but hold support and then power ahead. As long as our positions do that we are game. We are going to keep with them. We have seen a lot of good upside movement from energy stocks and the like. They will give us good gains even while the market corrects. Gains that we can take off the table. We get another good rally and we are looking to take them off the table. We are also looking at playing the downside. This is a correction after all. We want to take advantage of it. The moves can be very quick as you have seen. What with SBUX, SPY, DIA and CSE. There were many indices that went down they gave us quick gains so we want to take advantage of that. And if we have another blow down to the 200 day moving average it is going to happen rather quickly. We are still going to have downside plays to take advantage of that. As we often say in our seminars that greed is a powerful emotion, but fear is the king emotion. That is the one that really moves the market because that is when everyone tries to get out at once.

When the market it going up you can pick your shots and get in, but when the market is going down that is when you fear that they are going to lose the childhood College fund, the trip to the Bahamas and everyone is trying to get out the door as fast as they can. Everyone is eyeing each other from the side line and seeing if he or she is going. When they see the break they go then everyone goes because it is the herd mentality. We want to be ready to take advantage of the downside because it happens very quickly.

Again we want to also take a look at the upside and continue to do to that and look at the leadership plays. Because lets face it, we still have China despite it wanting to cool its economy, it is still sucking up a lot of the commodities and materials across the country and across the world. We want to be able to take advantage of that as well. It is not going to slow its economy overnight and as we have seen even though it tries to slow down it is picking up its imports and those kind of goods. We are going to see them perform well.

It is choppy times. We have to understand we are in a correction and as long as we know that and stay grounded in the fact that we are in a correction and we make our moves accordingly, we will come out of this in really good shape. A.) we are going to take advantage of the downturns as they happen and make us some good fast money and B.) we will be keeping an eye on the leaders. We are going to bird dog them and will be ready to move into those stocks as they show that they should be bought.

Remember we follow what the market says, we do not sit here and guess and think that this is going to happen or this looks good. That is how we get positioned and are ready to move by anticipating what the market would do. We wait to see what the market actually says and move according. This correction has a script to it varies a little. There is a little adlibbing going on every correction. They are always different. But they follow a pretty close script that it is just a correction and there is nothing at this stage to say that it is not. So we are gong to take advantage of the downside and take advantage of the upside and when we get the right moves that tell us BUY ME, BUY ME we are going to step in and buy.

Hope you have a great weekend. Hope you enjoy the video. We get a lot of popular feedback on it and we enjoy doing it. We are not going to do it all the time but maybe a couple times a week. We have a transcript available for this week so you can see the video and look at the transcript as well. I know sometime you see us on TV, but sometimes you do not. But we think it is nice to be able to put a face with a report. Again have a great weekend and we'll see you next week

VIDEO NEWSLETTER & TRANSCRIPT
* * * * * * * * * * * * * * * * * * * * * * * *

This weekend we have another installment of the video newsletter. We also have a transcript available for following along, reading on its own, or other use as you may see fit.

To view the Video Market Summary please browse to the following link:

http://investmenthouse.com/ihmedia/3172007marketsummaryvideo.wmv
icon url

ReturntoSender

03/29/07 9:17 PM

#7331 RE: ReturntoSender #6755

From Briefing.com: 4:20 pm : Riding a shift in sentiment and better than expected economic data, the stock market started Thursday's session on an upbeat note. Its bullish tune quickly changed, however, when the technology sector got hit with selling interest and oil prices spiked more than $2.00 to trade above $66 per barrel.

When it seemed as if the market was destined to suffer another down day, things changed just as quickly in the final hour as a rush of buying interest pushed the major indices back into positive territory. The Nasdaq for its part was down as much as 20 points at its low for the day.

There wasn't any specific news catalyst for the late surge, but it was emblematic of a market that has had a manic demeanor ever since the global stock market sell-off on Feb. 27.

At the end of the day, nine out of ten economic sectors had recorded a gain. The lone holdout was technology (-0.12%) but its loss is better than it appears considering the sector was down close to 1.0% with less than two hours to go in the session.

One of the "rallying" points for the market was the relative strength of the financial sector (+0.57%) which was a main beneficiary of the late-day buying interest.

Energy (+0.91%) was another notable leader as it drafted off the surge in crude prices that followed reports of the death of a presidential candidate in Nigeria. That news, combined with the growing tension in the Persian Gulf between Iran and the UK, added to the sense of uncertainty for traders with respect to supply lines and drove a speculative rally that saw crude futures for May delivery top out at $66.50 per barrel.

Separately, it was reported that initial claims fell 10,000 to 308,000 in the latest week and that Q4 GDP was revised up to 2.5% from 2.2%. Those indications were well-received (even though the GDP data is dated) as they reinforced the view that labor market conditions remain strong and that economic growth is moderating to a point that should help curb inflation.

The late rally pushed the S&P 500 into positive territory for the year (+0.30%). Friday marks the end of the first quarter for traders and the Personal income and Spending report, which contains the Fed's favored inflation indicator in the form of the core-PCE index, should help determine if the first quarter ends on a positive or negative note for the S&P.DJ30 +48.39 NASDAQ +0.78 SP500 +5.30 NASDAQ Dec/Adv/Vol 1471/1515/1.95 bln NYSE Dec/Adv/Vol 1253/2021/1.41 bln

4:23PM Dell: Follow up (DELL) 23.39 +0.04 : Co also announced "As we move toward the conclusion of our investigation, we are committing the time and resources required to ensure a thorough and comprehensive review and resolution of all identified issues and the implementation of appropriate remedial measures," said Thomas W. Luce III, chair of Dell's Audit Committee. The Audit Committee's investigation has identified a number of accounting errors, evidence of misconduct, and deficiencies in the financial control environment. The Audit Committee is working with management and the co's independent auditors to determine whether the accounting errors necessitate any restatements of prior period financial statements, and to assess whether the control deficiencies constitute a material weakness in Dell's internal control over financial reporting. Mgmt continues to be committed to resolving the issues raised in connection with the investigation, and regaining compliance with all SEC filing requirements and all NASDAQ listing requirements, as soon as possible. (DELL is scheduled to resume trading at 16:30)

4:07PM Solectron reports Q2 results in-line; guides Q3 EPS in-line, revs above consensus (SLR) 3.08 -0.03 : Reports Q2 (Feb) earnings of $0.05 per share, in line with the Reuters Estimates consensus of $0.05; revenues rose 16.1% year/year to $2.9 bln vs the $2.91 bln consensus. Co issues guidance for Q3, sees EPS of $0.04-0.06 vs. $0.06 consensus; sees Q3 revs of $2.9-3.1 bln vs. $2.89 bln consensus. "During the second quarter we made progress in our efforts to drive growth, expand gross margins, and deliver positive free cash flow," said Paul Tufano, interim chief executive officer. "As we begin the second half of fiscal 2007, I believe we are well positioned to deliver continued improvement in profitability, working capital management, and cash generation." Co also announces that it is commencing the next phase of its contemplated restructuring pursuant to its phased approach announced in the first quarter of fiscal 2007. Restructuring and impairment charges related to today's announcement are estimated to be in a range of $35-$45 mln, of which approx 90% will be cash expenditures. These actions will reduce the workforce by approx 1,300 to 1,500 employees

4:06PM PMC-Sierra announces Q1 revs are expected to be between the middle to high end of the range of $98 to $105 mln vs $101.99 mln consensus (PMCS) 6.30 +0.22 : Co announces it is undertaking a corporate restructuring that the co expects will reduce on-going annualized operating expenses by an estimated $20 to $24 mln per year. The program will include the closure of two of PMC-Sierra's R&D centers in Winnipeg, Manitoba and Saskatoon, Saskatchewan. The total work force reduction under this restructuring is expected to be approx 175 positions across the organization. The restructuring will begin immediately and is expected to be substantially complete by the end of the third quarter of 2007. The co ests the total costs and charges associated with the restructuring will be approx $12 - $14 mln. These costs and charges include severance costs related to the workforce reduction as well as costs associated with the planned closure of facilities and other related asset write-offs. The co's revs for 1Q07 are expected to be between the middle to high end of the range that was provided during the co's webcast conference call on January 25, 2007 following its fourth quarter 2006 earnings release. At that time, the rev outlook provided was a range of $98 to $105 mln vs $101.99 mln consensus.

4:04PM Dell will delay form 10-K filing pending completion of investigation (DELL) 23.39 +0.04 : Co announces that it will delay the filing of the Form 10-K for its fiscal year ended February 2, 2007 beyond the prescribed due date of April 3, 2007 and the subsequent extension date of April 18, 2007. The co will delay the 10-K filing because that investigation has not been completed.

9:16AM Semtech completes restatement related to past stock option practices (SMTC) 13.82 :

8:28AM Jabil Circuit announces non-cash charges (JBL) 22.04 : Co announces that as a result of its review of its historical stock option grant practices, it concluded that it needed to restate its 2005 financial statements and related disclosures, and that 2005 statements and related disclosures should no longer be relied upon. Jabil's review of its historical stock option practices confirmed that in almost all instances Jabil used the date on which committees of its Board of Directors met or acted to consider long-term compensation grants for purposes of determining both stock option exercise prices and the accounting measurement dates for purposes of calculating stock-related compensation charges. concluded that the Company needed to restate its 2005 financial statements and related disclosures, and that 2005 statements and related disclosures should no longer be relied upon. In the same filing, Jabil said its review of its historical stock option grant practices was ongoing and not complete. As a result of the ongoing review, Jabil concluded on March 21, 2007 that its 2003 financial statements and related disclosures should also not be relied upon and Jabil plans to adjust its 2004 financial statements by an immaterial amount. Jabil's review of its historical stock option practices confirmed that in almost all instances Jabil used the date on which committees of its Board of Directors met or acted to consider long-term compensation grants for purposes of determining both stock option exercise prices and the accounting measurement dates for purposes of calculating stock-related compensation charges.
icon url

ReturntoSender

03/30/07 12:30 PM

#7332 RE: ReturntoSender #6755

MRVL ST/MT bot 1000 shares@16.93


icon url

ReturntoSender

04/08/07 11:26 PM

#7367 RE: ReturntoSender #6755

icon url

ReturntoSender

04/12/07 10:36 PM

#7374 RE: ReturntoSender #6755

Chart of the Day - Dow below 1999 Inflation Adjusted High

http://www.chartoftheday.com/20070413.htm?T

For some long-term perspective, today's chart illustrates the Dow adjusted for inflation since 1925. There are several points of interest. For one, when adjusted for inflation, the bear market that concluded in the early 1980s was almost as severe as the one that concluded in the early 1930s. It is also interesting to note that the inflation-adjusted Dow is now a touch less than three times higher than where was in 1929 and a little over double where it was in 1965. Not that spectacular of a performance considering the time frames involved. However, the magnitude of the bull market of 1982 to 1999 (even when adjusted for inflation) was truly of historic proportions. While the Dow has recently made new record highs on a non-inflation-adjusted basis, today's chart does illustrate that on an inflation-adjusted basis the Dow still trades below (albeit slightly) its 1999 peak.

icon url

ReturntoSender

04/15/07 4:16 PM

#7376 RE: ReturntoSender #6755

InvestmentHouse Weekend Update:

http://www.investmenthouse.com/1weekendmarketsummary.htm

- Enough good news to keep stocks climbing right on through the Friday close.
- Mid-cycle slowdown getting some serious threats from inflation as Bush administration pursues its foolish weaker dollar policy.
- Core PPI shows some promise but the overall is suffering from high energy and high food. Getting hard to hide from inflation in this economy.
- Indices poised for a low volume rendezvous with February highs. We need to be ready when it gets there.

Basket of good news keeps stocks rising.

Thursday was a good answer to the Wednesday distribution, but it was not strong enough to completely quash the higher volume selling that rudely butted in following the low volume rally. Friday morning investors were again mulling whether they should bid stocks higher once more as futures were flat to modestly lower.

Then a stream of solid news began. First there were earnings. GE was good enough. MRK beat, raised guidance, and then got a bonus from a federal judge that ruled investor claims were time-barred. MCD fried up some more strong earnings and raised its guidance as well. It is hardly acting like the oldest fast food burger joint around. The Producers Price Index did not produce investor price angst as the core was flat, pulling the year/year into the Fed’s comfort zone. Energy and food? That was another story, but it was not one investors wanted to deal with early Friday.

Even with that, however, stocks started flat to lower. Then the Michigan preliminary sentiment index came in at 85.3 versus the 87.5 expected (and 88.4 prior), and with that 8 month low (the last at the last market correction) the market pitched lower. Not that much lower, however. The indices easily held above the 10 day EMA and then rebounded, once more showing a steady climb higher. It was not the same as Thursday, however, in that the climb was rather anemic. Positive yes, but unable to make nearly any headway in what was a very lackluster session.

It looked as if a Friday mid-afternoon stall was going to take place as the indices failed to make any real headway for 4 hours from late morning through lunch to mid-afternoon. Then the afternoon, and yeah verily the week’s savior, appeared. The wing nut from the Dallas Fed (Fisher) actually helped for a change, suggesting globalization increased productivity and that will help reducing pricing pressures. That encouraged investors, but the big goose came from CSCO when its COO said sales were running at the high end of estimates and customers were at the front end of an upgrade cycle. NASDAQ jumped 10 points in short order and held the gains to the close, posting a 0.47% gain. The other indices followed suit. Despite all of the talk about being up 8 out of 9 days, etc., that late session move made the week for stocks after that midweek distribution session rattled the rally. It brought the indices one week closer to the February highs and a showdown that will tell the story of this earnings season.

Technically there was more bullish-like action along with some more of the same mediocre indications. The session started weak but once more stocks turned weakness into overall gains. Leadership remained with some of the same groups pricing higher yet again, e.g. refiners, offshore drillers, energy service companies, steel, copper, fertilizer, and chemicals. Their success is dragging others along with them, though a lot of stocks are rising on relatively low volume.

That of course brings up the continuing discussion of volume on this move. Friday it was lower, significantly so on NYSE while still managing an average session on NASDAQ. Lower for the techs but still managing average trade. That average trade is not much lower than the Wednesday distribution trade and may be enough to hold off a selloff. Maybe.

The market is approaching the old highs and the upside moves were on predominantly lower trade all the way up, punctuated with a sharper downside session. The better NASDAQ trade on Thursday and Friday offers some hope that investors will step in at the old peak and drive the market higher, but overall the upside trade is rather low, and as the indices approach the February highs the lower volume cries out for caution. The market can always find a catalyst in earnings season to keep it moving higher, but many years in the market tells us to be very cautious in these situations. Indeed, as the market glides closer to the February highs to start next week we are going to take much of the gain off of the table, close marginal positions, and let the strongest leaders run a bit more if they will. We have a good run in place and we would rather book the gain and have to get back if things hold up than have the lower volume rise get chewed up in a wave of selling.

THE ECONOMY

Can the expansion survive outdated Bush policies?

For the most part the Bush administration has put together a decent economic policy package. Sure the first tax cut only worked to pump up already solid consumer demand and sew the seeds of inflation, but that was all that Congress would pass. It got back on track with the investment incentives, and that brought the business side back into the equation and sparked the 4 year expansion. It tried to derail things with a massive prescription drug plan that would never have passed the republican congress under President Clinton as it would have been properly labeled a tax and spend program. Congress let Bush down when the republicans turned back from their promises and sought re-election versus doing what they were elected to do. They were summarily ousted in the last elections. Bush is not helping rebuild his constituency with the latest attempt at trade barriers against China. One of the most dangerous gambits, however, is not reported on much: the unspoken weak dollar policy.

Sure former Treasury secretary John Snow spoke of a strong dollar as beneficial to the US, but each time he uttered the statement he undermined it by referring to market forces setting the dollar. How disingenuous. Everyone knows governments act to support or weaken currencies, and the US is no different. By saying that market forces had to control the value of the currency when so many non-market forces are acting upon it, Snow was tacitly admitting the US was not going to support a strong dollar policy. Of course now that the Bush administration passed a tariff on Chinese paper products it is becoming clearer; Snow owns a private paper company that produces the same kind of paper the tariffs affect. How convenient. How sadly old school, good ol’ boy politics the administration turns out to be.

As if that is not bad enough, Bush II is calling on Bush I’s cronies to help out in his second term. James Baker and company showed up in D.C. again, talking about how we should cut and run in Iraq. He was part of the cadre in the first Gulf War that convinced Bush I not to finish the job when we had the Iraqi army crushed. Now he is urging the same again; leave tasks undone only to get worse down the road.

Thus, why would you listen to this group who, during the prior Bush administration, practiced the same lower dollar policy that sent the US into the Bush senior recession and lost the re-election bid? These boys buy off on the phony idea that if you lower the dollar you create a stronger market for US exports and thus help out US businesses. No, what you do is worsen the appetite for investment in the US by in part importing inflation and only worsening the economic climate. In history, no country has ever devalued its currency into economic prosperity. The benefits of a few more exports never offsets the damage done. Let’s face it; a few more exports is not going to change our trade balance picture when we have tankers lined up across the Atlantic and Pacific bringing millions of barrels of oil per day to the US. That is a ‘fixed cost’ in terms of our trade imbalance, and it is absurd to think we will balance the trade gap with this big nut every month. We could do it, but we would have to choke off our imports of goods to recession levels. Of course, that is what we would likely have if we go this approach.

If we continue to let the dollar weaken as it is we are going to have inflation jump up to 4% or 5%. First your imports cost more. That oil will cost more money because of a weaker dollar. More countries will price in euros as well, and that will make it even more expensive as the dollar falls faster against that currency. Then some overseas investors will be less inclined to keep as many dollars versus other stronger currencies. They will sell those dollar assets and those funds will return to the US where they will add to the money supply. If the Fed does not sop it up with higher rates and draining money supply then inflation jumps. If the Fed is forced to raise rates and cut money supply, however, we risk recession because a mid-cycle slowdown then loses its momentum and grinds onto the rocks.

Now you understand why the Fed’s job is so hard. It has to try and tailor monetary policy to the acts of Congress and the executive branch. When they string together a series of bonehead actions the Fed loses flexibility as its hand is forced. That is how we get these pernicious recessions when we should just be surging along. In the name of protecting or helping a few businesses the government fails to protect and help the majority.

Unfortunately, with the dollar still diving, more economic nails are being driven into the expansion. Gold is back on the rise. Inflation protected treasury (TIPS) yield spreads are widening. There are storm clouds forming on the horizon because of these foolish policies, and before too long the Fed is going to be forced to do what it does not want to do, and that is raise rates to further fight inflation. The sad irony is, raising rates and slowing money supply growth will hit an already slowing economy and work to slow it further. Housing will take longer to recover. Small businesses won’t get the money they need. Is there any wonder businesses are investing less in capital equipment right now given this climate? Some are seeing the handwriting on the wall and are pulling back to see how things shake out. Unfortunately, that is part of the slowly building snowball affect; if enough pull back to get the lay of the land, then sure enough it turns to weakness.

As you can see, the mid-cycle slowdown is confronting policy missteps that, as we indicated earlier in the year, are its biggest threat. On the one side the democrats are surely going to try and raise taxes versus make any effort at cutting spending while the republicans are implementing what did not work for Bush I and threaten to stall the expansion that could have eliminated the budget deficit but for the profligate spending. It is unlikely Bush will see the light; he is in bunker mode as evidenced by calling upon Baker and company. That makes this last year and one-half a treacherous one and leaves us looking to the next administration and what it might do. We are wondering whether it will be a republican or democrat candidate that is first to propose a flat tax. That would at least spark some hope for the future. Right now the storm clouds are gathering where none were just a few months back. Nonetheless, the market keeps moving higher, and that is one of the indicators with respect to the economic future that you cannot ignore.

PPI core is a push, but food and energy continue higher.

The core price increase was flat versus the 0.2% expected and 0.4% in January. That pulled the year over year rate down to 1.7%, well within the Fed’s comfort level. Of course, this deals with producer prices and not consumers, and the latter is the Fed’s focus. Moreover, the overall number, though often discounted, held strong at 1% (0.8% expected) after a 1.3% showing in January.

The culprit? Food and energy, the two items you strip out to get the core. Food rose 1.4%. That makes four straight months where food prices increased by 1% or more. Gasoline jumped 8.7%. You have to eat, you have to drive to the store to get the food to eat, and you have to drive to work to get the money you need to buy the food. Yes, the ethanol push has really helped us in the short run. Food prices are jumping because of our reliance on corn in our food supply (what we eat and what the animals we eat feed upon) and the fact that there is not enough corn to meet our food and energy demands. Energy prices are jumping because we have no energy plan and have not had one for, well, ever.

It is sadly ironic that we have regulated refineries almost out of existence in a society where the vehicle fleet is integral to our daily lives. This has developed over decades and now we are going to pay for it with $3+/gallon gasoline this summer even without any storms. Of course the proposed remedy is a band aid that will not fix the problem. That is very Washington: don’t fix the root of the problem, just slap some bandages on it and pass it to the next administration.

Once more, however, it comes down to the CPI next week and whether the prices are passing through from producers. At this juncture, inflation pressures are picking up once more after steadily trending lower the past year. The Fed feels it is getting pushed back into a corner, but it also sees weakening economic data so it is at a confusing crossroads. It is likely to do nothing for quite some time; it made the first transition to a pause and with this conflicting data it won’t move until it sees the whites of the eyes of a big slowdown or surging inflation. Thus it is up to the legislative and executive branches to get their act together. The election is not until November 2008 and the campaign is already in full force. That is not a great combination for a republican administration and democratic congress to get together.

THE MARKET

MARKET SENTIMENT

VIX: 12.2; -0.51. Volatility fell through the 200 day SMA and the 90 day MA. The prior lows ahead of the February market selling and the corresponding VIX jump were at 10. That means volatility could fall further here, but with the indices approaching the February highs it is in the range where it could reverse. With the low volume move higher by stocks this is certainly something to keep an eye on.
VXN: 16.84; -0.58
VXO: 11.51; -0.46

Put/Call Ratio (CBOE): 0.96; -0.06

Bulls versus Bears:

Bulls slid and bears rose, a positive development after the converse last week threatened to derail the improvement. Is this enough to sustain a new move? If you were looking just at this indicator, no. Before the last significant market bottom back in August 2006, bulls fell to 36% in late June. Bears rose to 36% as the two kissed before going their separate ways once more as the market started to rally. They are still over 20 points apart, and that is not what new bottoms are made of.

Bulls: 49.5%, down from 50.6%. Fading back a bit though still above the 48.4% two weeks back, and that was up from 46.6% and 45.5% before that. Could be a double top building in as it hit 50.5% level a couple of months back though below 53.3% on the recent high. Bulls bottomed last summer near 36%. That is the lowest level since September 2006.

Bears: 27.5%. Solid jump in bears from 25.8%, putting it right back to the level hit two weeks back though down from 28.4% and 28.9% immediately before that. Well above the 20% where it held to start the year. It hit a post-2002 high in that late June 2006 move (hit near 36%), eclipsing the March 2006 high (33%) and well above the 2005 highs that spawned new rallies (30% in May 2005, 29.2% in October 2005).

NASDAQ

Stats: +11.62 points (+0.47%) to close at 2491.94
Volume: 1.997B (-0.59%). Volume was lower but managed to close average for the third session. Two upside days on average volume, one distribution session on the stronger volume. Thursday and Friday helped bind the wounds from Wednesday but overall the upside remains the weaker volume. Caution as NASDAQ approaches the former high unless volume can really pickup the pace.

Up Volume: 1.209B (-237M)
Down Volume: 606M (+114M)

A/D and Hi/Lo: Advancers led 1.7 to 1. Another day of pretty decent breadth, much better than the sessions preceding the Wednesday distribution session that saw flat to 1.2:1 breadth.
Previous Session: Advancers led 1.84 to 1

New Highs: 170 (+40)
New Lows: 40 (-26)

NASDAQ CHART: http://www.investmenthouse.com/ihmedia/NASDAQ.jpeg

NASDAQ sold off all morning but recovered to flat through mid-afternoon, edging modestly higher but not getting any strength behind it. When the CSCO news hit it jumped 10 points and held the move to the close. It managed to break just over the July/August up trendline for the session, but it will be fighting that level (2493) to start this week. Thus far, however, it has slid higher just below that level as it climbs toward the February high (2532). Good recovery from the midweek dip and looking to challenge the prior highs at 2509 (January high) this week. It is just 40 points from that level.

SOX (-0.72%) faded back to the 50 day EMA on the close, continuing its weeklong lateral move over that support level in the midrange of its 5 month range. Chips were the sector lower on the session, something rather rare for the day. They show promise from time to time but continue to limp along, unable to make headway.

SP500/NYSE

Stats: +5.05 points (+0.35%) to close at 1452.85
NYSE Volume: 1.412B (-5.3%). Volume faded once more, falling significantly below the Thursday level that was already lower than the Wednesday distribution session. Volume was never really that strong, even Wednesday, a characteristic of this move. Low volume at the prior high is typically a recipe for further selling so we will see how this pans out.

Up Volume: 914.354M (-169.094M)
Down Volume: 477.796M (+88.645M)

A/D and Hi/Lo: Advancers led 1.51 to 1. Mediocre breadth after a decent A/D showing on the Thursday gains. Low breadth plagued the pre-Wednesday moves. It improved on the rebound but was not blowout.
Previous Session: Advancers led 1.94 to 1

New Highs: 241 (+64)
New Lows: 16 (-15)

SP500 CHART: http://investmenthouse.com/ihmedia/SP500.jpeg

SP500 broke over the highs for the week and indeed over the early February peak (1450) on the Friday move. That leaves it less than 10 points off the February high (1462), an easy run higher this week. Low volume all the way up to that high, and as noted with NASDAQ, a second peak with low volume is not a good technical indication. Earnings of course can raise volume in a hurry so we will be watching trade closely as SP500 nears that high.

SP600 (+0.47%) stands just 2.40 off its February and all-time high after the Friday move. Best positioned of all the indices, aided by its smaller energy, mining, and metals stocks. It is the leader on this run and it along with SP500 will be hitting their February highs just about the same time. As with the large caps, volume will be important, but as noted, SP600 is home for many of the stocks in sector leaders such as energy, metals, and materials.

DJ30

The Dow cleared its February high on the move with some rising though below average volume. Trade improved with the MCD, GE, and MRK gains. It is lagging the other indices and still has the January high (12,623), early February high (12,700) and the February high (12,796) ahead of it. Steadily climbing, following the other indices higher.

Stats: +59.17 points (+0.47%) to close at 12612.13
Volume: 224M shares Friday versus 218M shares Thursday. Better trade as some Dow components announced solid earnings and enjoyed strong trade on the session.

DJ30 CHART: http://www.investmenthouse.com/ihmedia/DJ30.jpeg

MONDAY

A big week for a number reasons. Earnings really ramp up after the initial results raised some optimism even more. The next wave starts in earnest this week. In addition there are yards of economic data: retail sales, CPI, housing starts, production and capacity, regional manufacturing reports. On top of that it is expiration week. Plenty of potentially market moving events as the indices approach the February highs.

With the positive response to the initial earnings and the CSCO comments it looks as if there is some upside momentum heading into the week. With just a short hop to the February highs for SP500 and SP600, any further upside puts them at those highs.

As with any approach to a new high you have to be a bit cautious. When a stock approaches an old high, even if it is in a good pattern, you want to see some strong breakout volume to show the buyers are still there and willing to buy more. Up to the point it breaks out on volume it is just another pretty picture. This rally to this point has overcome every obstacle it has faced; when it looks as if it is gasping it finds the buyers to push it higher. The low volume, however, is something we don’t want to lose sight of. As we have often said on this run, lower volume rallies tend to fail. If there is no volume at a prior high that means the buyers are not coming in to drive things further. That risks a double top, a topping pattern that can set up more downside.

We have been content to ride this move higher. The indices still have the upward momentum and there are stocks moving higher on solid volume; thus you go with the trend. Even if the overall market struggles the continued strength in overseas economies will drive prices in commodities, gold, materials, and the like. We are content to ride the move higher, buying into good stocks in good sectors that are getting the money when they flash good buy signals.

As the indices approach the prior highs, however, we remain cautious unless earnings can generate more buying volume. NASDAQ trade toward the end of the week was encouraging. Thus we will watch the volume early next week on a move toward those highs. It is expiration week so there could be some higher volume from position squaring and rolling out. If trade continues tracking lower we will take a lot of the gain off the table, leaving some positions in the 'core' leadership in place, e.g. steel, energy, chemicals and then see how the test of the prior highs shakes out. As noted earlier last week, we would rather be in the position of looking for entry points once more (while we continue riding the strongest stocks) versus riding a sell off lower.

This is an important inflection point for the market as the indices show good upward momentum and leadership but don’t have a lot of volume pushing the move to the former highs. How the market handles the move obviously sets up the next month or so of action. Thus the importance of the move, and with the mixed signals all the more reason to treat it with respect. We have some great gains taken on this run already, and we have more that we can still take off the table that we don’t want to lose. Thus we protect what we have if necessary and look for the next opportunity to make money whether that is to the upside or the downside.

Support and Resistance

NASDAQ: Closed at 2491.94
Resistance:
The July/August trendline at 2492
2509 is the January 2007 high
2523 is price resistance November 2000
2528 is the December/January up trendline
2531 is the February high (post-2002 high)

Support:
2471 is the December 2006 high
2468.42 is the November 2006 high
The 10 day EMA at 2464
2460 is the March high
The 50 day EMA at 2439
2405 is the ‘hump’ high
2400ish from the late November and late December 2006 lows.
2379 is the October high.
2376 is the April high, the former post-2002 high.
2368 is the early October handle high.
2340 is the March low
2339 – 2334
2331 is the March intraday low

S&P 500: Closed at 1452.85
Resistance:
1461.57 is the February 2007 high.
1469 is the late November to February up trendline
1475 from peaks in December 1999 and January 2000

Support:
The 10 day EMA at 1441
1440 is the mid-January high
1439 is the March high
The 18 day EMA at 1434
1432 is the December 2006 high
The 50 day SMA at 1427
1425 is an interim high from November 1999
The 50 day EMA at 1425
1410 is the ‘hump’ high
1408 is the November high
1389 is the October peak.
1374 is the early March low
1371 to 1373 is the December 2000 peak and the January 2001 peak
1369 from early October 2006
1364 is the March intraday low

Dow: Closed at 12,612.13
Resistance:
12,623 is the mid-January high
12,700 is the early February peak intraday high
12,796 is the February 2007 and all-time high

Support:
12,511 is the March intraday high.
12,499 is the December intraday high.
The 50 day SMA at 12,453
The 90 day MA at 12,449
The 50 day EMA at 12,427
12,361 is the November 2006 high
12,350 is the March ‘hump’ high
12,039 is the early March low.
October high is 12,167
11,986 is price support from mid-October and the early November low.
11,940 is the March low

Economic Calendar

These are consensus expectations. Our expectations will vary and are discussed in the ‘Economy’ section.

April 16
- Retail sales, March (8:30): 0.4% expected, 0.1% prior
- Retail ex-auto (8:30): 0.7% expected, -0.1% prior
- NY Empire State PMI, April (8:30): 10.0 expected, 1.9 prior
- Net foreign purchases, February (9:00): $80B expected, $97.4B prior
- Business inventories, February (10:00): 0.2% expected, 0.2% prior

April 17
- CPI, March (8:30): 0.6% expected, 0.4% prior
- Core CPI (8:30): 0.2% expected, 0.2% prior
- Housing starts, March (8:30): 1.5M expected, 1.525M prior
- Building permits, March (8:30): 1.515M expected, 1.532M prior
- Industrial production, March (9:15): 0.1% expected, 1.0% prior
- Capacity utilization, March (9:15): 81.9% expected, 82.0% prior

April 18
- Crude oil inventories (10:30): 678K prior

April 19
- Initial jobless claims (8:30): 342K prior
- Leading economic indicators, March (10:00): 0.1% expected, -0.5% prior
- Philly Fed, April (12:00): 3.0 expected, 0.2 prior
icon url

ReturntoSender

04/22/07 10:55 AM

#7390 RE: ReturntoSender #6755

Watching Trading Volume Fade . . .
in Investing | Markets | Technical Analysis

http://bigpicture.typepad.com/

A few weeks ago, someone responded to a discussion about economic slowing with the following comment: "Price and Volume tell all."

Fair enough: "What has VOLUME been telling you over the past few weeks?" I asked. Given the run off of the March lows has come on decreasing volume, its an important question.

Barron's resident technician, Michael Kahn picked up on the same idea in a recent analysis:

THE STOCK MARKET HAS PUT on a nice show with the Dow Jones Industrial Average rising some 5.5% off its March 14 intraday low. Along the way, it has ignored several technical barriers and even saw one major index, the New York Stock Exchange composite, set a new closing high.

But from the start of the rally through this week's action, trading volume has been conspicuous by its absence. Without volume, the market will soon run out of fuel, and under such conditions we cannot expect it to run much longer.


We have noted a similar issue with overall market volumes. Even worse than low volume is the increasing volume during selloffs, and decreasing volume during rallies. This suggests to me that we are now transitioning from a period of accumulation (institutional buying) to a period of distribution (broader selling).

Its not limited to the NYSE or S&P. Trading on diminsihing volume is seen on many popular ETFs, including Dow Industrials (DIA), Nasdaq 100 (QQQQ) and other commonly traded ETFs. Kahn notes that "exchange-traded funds such as those covering the Dow, S&P 500, Nasdaq-100 and Russell 2000 all show the same volume declines, and this confirms that this condition is truly marketwide."

"Of course, volume can pick up at anytime and that would change this analysis. However, we can only analyze what is actually on the charts now and draw our conclusions from the evidence presented.

With most major indexes well below their February peaks, which are respective resistance levels, and volume drying up at a steady pace, the conclusion has to be that the stock market is now running on empty."

That's a fair warning. We will be watching volume activity closely over the next few days and weeks to see how this
develops further . . .

Source:
Stock Market Is Running on Empty
Michael Kahn
Barron's April 11, 2007
http://online.barrons.com/article/SB117624513819465600.html


icon url

ReturntoSender

04/22/07 5:07 PM

#7392 RE: ReturntoSender #6755

InvestmentHouse Weekend Update:

http://www.investmenthouse.com/1weekendmarketsummary.htm

- Earnings and expiration power stocks higher leaving NASDAQ a bit of the odd man out.
- Some say market top, some say part of a continued run higher: economic climate and P/E ratios give nod to the latter.
- Earnings overall lower but beating expectations and pushing that liquidity into the market.

Renewed earnings excitement drive the NYSE to new highs, NASDAQ to new post-2002 closing high.

Thursday night we noted the NASDAQ chart looked poised for a run at the February and a new post-2002 high, just needing a wave of earnings. Well, the earnings came, but outside of GOOG the earnings were mostly on the NYSE side of the ledger, e.g. CAT, HON, MCD, and AXP all reporting results that easily exceeded expectations. Indeed, that is the upside surprise potential we said was there just before the season started given the glum views of the economy and the precipitous decline in expectations over the prior three months. The tech earnings got off to a rough start, and they are still a big question mark heading into the next two weeks, but while they struggled the NYSE earnings filled in the void and pushed stocks higher.

Indeed, even with SP500 showing some churn the prior two sessions, the news was good enough to whisk that index and the other indices higher with ease and with stronger volume. DJ30 and SP400 (mid-caps) hit new all-time highs. SP600 just missed out. SP500 posted a new post-2002 high. NASDAQ posted a new post-2002 high . . . then gave it up though it did manage to log a new post-2002 closing high.

It was a somewhat volatile expiration session, but most of the up and down action was on NASDAQ; the NYSE indices were pretty much locked on target and moved higher all session. Volume ran substantially higher on NYSE, suggesting that expiration had a bit to do with the trade that far outpaced anything NYSE threw up during the week. Overall it was a very solid session with the only real complaint being NASDAQ’s failure to hit an unequivocal post-2002 high by taking out the February intraday high. Outside of that things were quite solid.

Technically it was a solid session on just about all fours. Volume surged on NYSE and was again solidly above average on NASDAQ. Sure expiration had its impact on the volume, but impressive breadth (3.4:1 NYSE, 2.2:1 NASDAQ) indicates there was widespread movement and not just rolling over positions on the large caps. Indeed, large cap tech underperformed overall NASDAQ. As for leadership, it emerged in the industrials once more and financials started to run as well (C, WFC, JPM, AXP). Friday energy started to rebound some from its quick pullback, adding further leadership support. Remember, the market moved higher, albeit it sputtered a bit, as energy took its 3-day breather last week. With energy returning to the leadership fold as it bounces off its pullback to near support there will be more upside strength.

Of course, now everyone is bullish. Bulls rose and bears fell two weeks back and they will be up again after this past week. It is very hard to deny the strength of the move as global liquidity once more drives energy, materials, metals, industrials (e.g. CAT) higher. Just as soon as everyone is convinced the path is higher, however, there is a hitch in the move. Earnings will likely provide more fireworks as tech stocks continue to disappoint. However, given the strength demonstrated and the money behind it, outside of those inevitable hiccups the market is driving to new highs. Be it buybacks and private equity lowering the amount of available stock, expectations about future US and global expansion, better than expected earnings, a lower dollar making US stocks a better value to foreign investors, the earth opening up and swallowing Congress, or any combination of same, money is flowing into US and world markets once more and with a vengeance.

THE ECONOMY

Economic and market top?

With the recent run to new highs on DJ30, SP600 and SP500, Thursday and Friday the financial shows highlighted arguments between the bulls and the bears about the market’s future. Nothing unusual about that; ever since the sub-prime issues the clamor has been about the meltdown of the US economy. The basic premise is the US consumer has been on a consumption binge for years and now that the housing run is over consumers feel a pinch as their ‘piggy bank’ is running dry. Add on top of that the idea that the housing market will bring down the rest of the economy and you have a rather bleak scenario.

Or perhaps things are not so bleak. Housing is important but in every expansion, every one, housing gains do not last through the expansion. This last one was unusual because housing never really slowed during the recession thanks to 9-11. People stayed home and bought houses or added on versus traveling. As interest rates stayed low boomers bought second homes. There are lots of boomers, and they kept prices higher and the market hot with their acquisitions. As is the usual case eventually that turned to speculation and things did overheat. The housing market topped in May 2005 and has been declining since, the pace picking up the most the past 9 months or so. Housing was a hot market and it was hot for longer than normal. There are some places where it is now a cold market. There are a lot of places where it is simply a cooler hot market. It is not a collapse a la the 1980’s; nowhere near that yet.

This scenario is very similar to the mid-1990’s after the US came out of the 1991 recession and ran for a few years. The Fed put a lid on things for a year and the economy went flat along with the market. The Fed backed off and the market started to rally again. It was anticipating the economy returning to expansion. The economy recovered and followed the market higher. A mid-cycle slow down gratis of the Fed and then a resumption when the Fed backed off. Very similar situation this time around with the market bottoming in late 2002, the economy coming out of recession in 2003 and running into 2005, the Fed starting rate hikes, the market staggering, the economy slowing, the Fed backing off, the market starting a new rally within a month. It is not an exact match, but the scenario is a familiar one over the past 50 years.

A look at fundamentals.

Earnings are coming in lower this quarter, no longer growing at the double digit levels of the past few years. Another reason this market and economy are going under, right? Well, this happened in the 1990’s as well; earnings growth slowed as the economy slowed in a mid-cycle downturn, but they were able to pick up the pace again after the Fed was finished and the economy could resume the move.

But let’s forget the 1990’s. The market has rallied since the October 2002 bottom, on and off of course, but it has moved back up. Witness the new highs on DJ30, SP400, SP600 and soon to be the SP500. With those indices reaching new highs that has some bears saying the market is overpriced.

When you look at P/E ratios, however, they are basically the same as they were at the bottom of the market in 2002. That is because earnings have risen so smartly along with the price that the ratio has held. This current slowdown raises the worry that P/E ratios will expand. That remains to be seen, but as we feel this is a mid-cycle slowdown in the economy, the earnings will not continue to lag. Corporate investment will need to rise again, but it too is going through a mid-cycle slowdown after a strong showing for two years.

Indeed, the market is hitting new highs in anticipation of something, and that ‘something’ is usually further economic expansion down the road. That is another indication, though many don’t like to acknowledge the market as an indicator, of an expansion returning. Even the bond yield curve has reverted. It inverted again quickly last week, but it came right back to close the week at 4.65% on the 2 year and 4.67% on the 10 year. That is no mean curve, but the action shows it is in the recovery mode as well.

THE MARKET

MARKET SENTIMENT

VIX: 12.07; -0.47
VXN: 15.71; -0.59
VXO: 11.67; -0.59

Put/Call Ratio (CBOE): 0.75; -0.19

Bulls versus Bears:

Bulls: 52.7%. Well this is hardly good news with the bulls spiking back up over 50 and well on the way to 55% that is considered bearish. Up from 49.5% and 45.5% just a month back. It hit 50.5% level a couple of months back though below 53.3% on the recent high. Bulls bottomed last summer near 36%. That is the lowest level since September 2006.

Bears: 25.3%. Heading the wrong direction as well, falling from 27.5%. Fairly volatile of late as it bounced from 25.8% the week before but down from 28.4% and 28.9% immediately before that. Still above the 20% where it held to start the year. It hit a post-2002 high in that late June 2006 move (hit near 36%), eclipsing the March 2006 high (33%) and well above the 2005 highs that spawned new rallies (30% in May 2005, 29.2% in October 2005).

NASDAQ

Stats: +21.04 points (+0.84%) to close at 2526.39
Volume: 2.161B (+0.14%). Volume edged higher on the session, adding an equal amount of accumulation as distribution Thursday. Expiration week so you cannot put a whole lot of weight on the volume action.

Up Volume: 1.518B (+547M). Not bad with nearly a 3:1 ratio.
Down Volume: 581M (-581M)

A/D and Hi/Lo: Advancers led 2.21 to 1. Breadth improved as NASDAQ continued higher as the overall NASDAQ topped the NASDAQ 100 performance (+0.73%).
Previous Session: Decliners led 1.77 to 1

New Highs: 166 (+56)
New Lows: 52 (-8)

NASDAQ CHART: http://www.investmenthouse.com/ihmedia/NASDAQ.jpeg

NASDAQ managed a close at a new post-2002 high. It did hit a new high since that bottom early on in the session, but it could not hold that momentum and the rebound in the last half of the session could not recapture it. That was the one negative for the session from our perspective: NASDAQ is following along, not making the wake. NASDAQ earnings have not lived up to the NYSE earnings parade and investors are still a bit skeptical as to whether they will be able to do so. Thus NASDAQ is moving higher, it is just not leading the way. Again, kind of ironic as it was NASDAQ that provided the follow through and the renewed breakout off of the March double bottom, yet it cannot take the lead after that.

SOX (+0.18%) tapped the top of its 6 month range but as with NASDAQ, it could not go ahead and clearly punch. It faded back, holding just below the breakout point. SMH, however, did make the move, gapping higher and adding onto the Thursday gains though it could not do much with the gap after it did open. Obviously some chips are looking better, but overall they are still laggards.

SP500/NYSE

Stats: +13.62 points (+0.93%) to close at 1474.35
NYSE Volume: 1.955B (+19.52%). Volume blasted higher as the large caps pushed further to a new high, SP400 did the same, and SP600 matched its prior new high. Volume was up due to expiration but there is also some serious buying ongoing.

Up Volume: 1.566B (+908.49M). Even better than NASDAQ, near 5:1.
Down Volume: 375.837M (-582.942M)

A/D and Hi/Lo: Advancers led 3.45 to 1. Outstanding breadth as the large, mid, and small caps all rallied together. With energy starting to move back up that is only helping the action.
Previous Session: Decliners led 1.75 to 1

New Highs: 341 (+164)
New Lows: 13 (-11)

SP500 CHART: http://investmenthouse.com/ihmedia/SP500.jpeg

SP500 crashed back into the channel, blowing through the November/February up trendline on some impressive trade and breadth. With financials pitching in (and do financials pitch in if the economy and market is tanking?) along with industrials, machinery, metals, etc., SP500 was is showing a lot of pop as money works back in.

SP600 (+1.15%) was edged by the Dow as far as percentage gain. A bit more from the small caps and they would be at a new high as well. Russell 2000 is just a bit back of the SP. Small caps were once more dead and buried but they managed to emerge as a leader in this rally, fading some the prior three sessions as energy took a breather, but when energy was back in the game Friday, they were back in it as well. Looks as if they are going to stay in the game because energy is indicating it is ready to rebound.

DJ30

DJ30 rallied right back up to the November/February up trendline, just missing out on moving back into its channel. Huge volume as stocks such as CAT, HON and AXP posted big upside volume. DJ30 and its stocks are primarily economics driven, and this action suggests a renewed confidence in the economic future of the US and the world as many of these stocks know no borders. Indeed, this is one reason they are performing better than techs as they are not impacted as much by the dollar’s ups and downs (many more downs than ups over the past year).

DJ30 CHART: http://www.investmenthouse.com/ihmedia/DJ30.jpeg

MONDAY

A big expiration Friday with breaks to new highs, lots of volume, lots of euphoria. The market, however, tends to be a ‘what have you done for me lately’ mistress, and thus investors will still be looking toward what earnings say, particularly technology earnings. Tech is the laggard, the lone sector yet to take out that February high. It is following along, but for this market to really take off it has to join in. Thus the importance of the tech earnings coming out this week.

The market has overcome a lot of obstacles to break to these highs. The correction base that was just 5 weeks long fails to provide a sufficient foundation for a rally 4 out of 5 times. This has the look of being that fifth time what with the new highs and the strength of leadership and breadth. As we noted all last week, the market despite its obstacles overcame each one and made key breaks when it had to do so. Then when it reached the necessary point it made the key breakouts. NASDAQ, as noted, is the remaining index to make the move and with earnings over the next two weeks it will have the chance as more tech earnings come forth.

We say two weeks because this was quite a move the past week. It started strong, paused, and then finished strong, those two big days putting together a really impressive tally for the week. After such a move it may need to take a rest; the market tends to swing the opposite way of how expiration closed, and a bit of a pause wouldn’t hurt. With the money moving in, however, and if NASDAQ earnings come around, there may not be much of a pause.

The market cannot continue higher without money, and that worldwide liquidity we saw that kept things running through the end of the year has returned. Again, it will help if NASDAQ can get with the program as well. It won’t hurt if durable goods orders, Q1 GDP, and the Fed Beige Book start to improve; at some point this market rally will look for economics to pick up, and the market has been rallying, with the February and March hiatus, since late summer 2006. Investors will eventually expect some results.

We like what we see with energy after this pullback to near support. Many broke out, rallied again, and tested near support and are setting up to rebound again. In addition to those we still see many stocks from many sectors still setting up to move despite the rally; as we have said before, stocks break higher in waves. The most recent example is with energy: those stocks lead the move higher, and then as they tested this past week other stocks came to the fore and led the market to new highs.

Support and Resistance

NASDAQ: Closed at 2526.39
Resistance:
2531 is the February high (post-2002 high)
2533 is the December/January up trendline

Support:
2523 is price resistance November 2000
2509 is the January 2007 high
The July/August trendline at 2505
The 10 day EMA at 2497
2471 is the December 2006 high
2468.42 is the November 2006 high
2460 is the March high
The 50 day EMA at 2453
2405 is the ‘hump’ high
2400ish from the late November and late December 2006 lows.
2379 is the October high.
2376 is the April high, the former post-2002 high.
2368 is the early October handle high.
2340 is the March low
2331 is the March intraday low

S&P 500: Closed at 1484.35
Resistance:
1496 is a peak from July 2000
1500 from April 2000 peak
1520 from the September 2000 peak
1528 close, 1553 intraday from March 2000 all-time index peak

Support:
1476 is the late November to February up trendline
1475 from peaks in December 1999 and January 2000
1461.57 is the February 2007 high.
The 10 day EMA at 1462
The 18 day EMA at 1451
1440 is the mid-January high
1439 is the March high
1432 is the December 2006 high
The 50 day EMA at 1434
1425 is an interim high from November 1999
1410 is the ‘hump’ high
1408 is the November high

Dow: Closed at 12,961.98
Resistance:
At a new high so not a lot standing in its way other than its own weight after it gets higher.

Support:
12,796 at the February 2007 and all-time high
The 10 day EMA at 12,718
12,700 is the early February peak intraday high
12,623 is the mid-January high
12,511 is the March intraday high.
12,499 is the December intraday high.
The 50 day EMA at 12,498
12,361 is the November 2006 high
12,350 is the March ‘hump’ high
12,039 is the early March low.
October high is 12,167
11,986 is price support from mid-October and the early November low.
11,940 is the March low

Economic Calendar

These are consensus expectations. Our expectations will vary and are discussed in the ‘Economy’ section.

April 24
- Consumer Confidence, April (10:00): 105.0 expected, 107.2 prior
- Existing home sales, March (10:00): 6.50M expected, 6.69M prior

April 25
- Durable goods orders, March (8:30): 2.5% expected, 1.7% prior
- New home sales, March (10:00): 885K expected, 848K prior
- Crude oil inventories (10:30): -994K prior
- Fed Beige Book (2:00)

April 27
- GDP, Q1 advance (8:30): 2.0% expected, 2.5% prior
- Chain deflator (8:30): 3.0% expected, 1.7% prior
- Employment Cost Index, Q1 (8:30): 0.9% expected, 0.8% prior
- Michigan sentiment, revised, April (10:00): 85.3 expected, 85.3 prior
icon url

ReturntoSender

04/23/07 4:47 PM

#7394 RE: ReturntoSender #6755

Texas Instruments profit, sales slip; forecast tops views

http://www.marketwatch.com/News/Story/Story.aspx?guid=%7b50F81AE6-4A12-4E56-AAEE-99C5AFC708DF%7d&...

TXN32.41, -0.09, -0.3%) late Monday said its quarterly profit slipped nearly 12% from a year ago as it faced weaker demand for its chips used in mobile phones and other electronic equipment. TI reported first-quarter net income of $516 million, or 35 cents a share, compared with net income of $585 million, or 36 cents a share, in last year's same period. For the three months ended March 31, TI reported sales of $3.19 billion, down from $3.33 billion a year ago. Analysts polled by Thomson Financial anticipated the company would report sales of $3.1 billion and earnings of 31 cents a share. Dallas, Tex.-based TI is the world's biggest maker of phone chips. Its processors are also used in telecommunications equipment, calculators and high-definition televisions. It also forecasted a better-than-anticipated financial forecast for the second quarter, sending its shares up 8% in late trades.
icon url

ReturntoSender

05/01/07 9:49 AM

#7404 RE: ReturntoSender #6755

TTMI bought 2000 shares@9.18 - Earnings come out tomorrow morning I believe. The stock is still going down but there has been no warning so if they even match expectations the stock should rise tomorrow.

TTMI Charts


http://finance.yahoo.com/q/ks?s=TTMI

RtS
icon url

ReturntoSender

05/02/07 6:33 PM

#7410 RE: ReturntoSender #6755

From Briefing.com: 4:20 pm : Despite some headwinds right out of the gate, it didn't take long for yesterday's momentum to resurface and silence the naysayers still making bets that the market remains overbought. As a result, sellers' attempts to fight the tape again came up short. The Dow posted its 21st advance in 24 tries and the S&P 500 came within a point of hitting the psychologically important 1,500 mark, a level not seen since 2000.

For the 17th time this year the Dow closed in record territory. However, for the first time in weeks, the blue-chip index's gains weren't the direct result of solid earnings reports from some of its components but rather anticipation of an earnings surprise from General Motors (GM 32.49 +1.19) tomorrow morning. The latter paced the way among the 28 Dow stocks posting gains and was just one of many components that helped Consumer Discretionary (+0.9%) provide some notable leadership to the upside.

Some more deal-making news provided additional sector support and contributed to today's decidedly bullish market breadth. The Dolan family confirming it will acquire 100% of the public interest in Cablevision Systems (CVC 35.80 +3.13) for $36.26 per share (or $10.5 bln) in cash earmarked Broadcasting & Cable TV (+1.3%) as a bright spot for buyers.

Movies & Entertainment (+1.1%) was also in focus amid speculation News Corp's (NWS 23.40 +0.41) unsolicited bid Tuesday for Dow Jones (DJ 56.32 +0.12) may start a bidding war. NWS, a suggested holding in the Briefing.com Active Portfolio, recouped nearly half of yesterday's 4.2% sell-off. Restaurants got a boost after Yum! Brands (YUM 66.80 +3.68) beat analysts' expectations and raised its 2007 earnings outlook.

Aside from M&A news and better than expected earnings reports across a wide array of industry groups, investors also rallied around some encouraging economic data. Albeit not typically a market mover, March Factory Orders rising a stronger than expected 3.1% (consensus 2.1%), the biggest gain in a year, gave an added boost to stocks and lifted the industrial-heavy Dow even further into unchartered territory.

Even though the surprisingly strong rise was due to a modest upward revision to last week's durable goods new orders component, and the one month increase does not necessarily mean that manufacturing is back on track, a market concerned about the pace of economic growth and looking for something other than earnings to support market gains embraced the data.

Technology was another influential leader to the upside. Cisco Systems (CSCO 27.67 0.81) surging 3.0% after Goldman Sachs urged investors to buy the stock ahead of its Q3 earnings report next Tuesday was the biggest source of sector support. Financials was also in focus after Dow component American Express (AXP 62.67 +1.35) climbed noticeably after competitor MasterCard (MA 126.15 +11.30) posted a blowout quarter.

With prices at the pump up 11% over the past month and expected to hit all-time highs by the end of the month, according to AAA, another pullback in crude futures helped ease worries about inadequate supplies with less than a month until the official start to the summer driving season.

More noteworthy was the fact that the Energy sector did not sacrifice much in the way of leadership in the face of another oil downturn.

Oil & Gas Drillers (+1.2%) were among the day's best performers after Transocean (RIG 89.15 +2.88), a suggested holding in the Briefing.com Active Portfolio, handily topped Wall Street forecasts last night after Q1 profits more than doubled. Refiners were another bright spot as shares of Sunoco (SUN 77.21 +1.45) ran up ahead of its report tonight with investors reflecting on the 30% jump in earnings from rival Valero Energy (VLO 72.94 +1.79) last Thursday. DJ30 +75.74 DJTA +1.0% NASDAQ +26.31 NQ100 +0.9% R2K +1.5% SOX +0.9% SP400 +1.1% SP500 +9.62 XOI +1.1% NASDAQ Dec/Adv/Vol 949/2132/2.11 bln NYSE Dec/Adv/Vol 842/2447/1.58 bln

5:12PM Sirenza Micro beats by $0.02 (SMDI) 9.16 +0.35 : Reports Q1 (Mar) earnings of $0.12 per share, ex items $0.02 better than the Reuters Estimates consensus of $0.10; revenues rose 87.2% year/year to $39.1 mln vs the $36.7 mln consensus.

5:04PM Maxim Integrated announces acquisition of Wafer Fab facility in Irving, Texas (MXIM) 32.34 +0.41 : Co announces its has acquired a wafer fabrication facility in Irving, Texas from Atmel for approx $38 mln.

4:48PM Luminex beats by a penny (LMNX) 14.35 +0.60 : Reports Q1 (Mar) net of breakeven, $0.01 better than the Reuters Estimates consensus of ($0.01); revenues rose 27.8% year/year to $16.6 mln vs the $15 mln consensus.

4:41PM JDS Uniphase misses by $0.03, revs above consensus; guides Q4 revs below consensus (JDSU) 16.64 +0.42 : Reports Q3 (Mar) earnings of $0.06 per share, excluding non-recurring items, $0.03 worse than the Reuters Estimates consensus of $0.09; revenues fell 1.2% year/year to $361.8 mln vs the $346.2 mln consensus. Co issues downside guidance for Q4, sees Q4 revs of $325-345 mln vs. $355.01 mln consensus.

4:24PM Genesis Microchip beats by 1 cent, issues inline Q1 rev guidance (GNSS) 8.68 : Reports Q4 (Mar) loss of $0.29 per share, $0.01 better than the Reuters Estimates consensus of ($0.30); revenues fell 36.6% year/year to $38.6 mln vs the $37.6 mln consensus. Co issues in-line guidance for Q1, sees Q1 revs of $39-$44 vs. $39.34 mln consensus. "While our fourth quarter results were in line with our guidance, we are disappointed with our overall fiscal 2007 revenues and are continuing to invest in product development to introduce new TV solutions to the market and to ramp up our DisplayPort capabilities..."

4:18PM Trident Microsystems announces resignation of two directors: Special Committee recently became aware that a conflict of interest may have arisen (TRID) 21.19 -0.27 : Co announces Mr. Yasushi Chikagami and Mr. John Luke have decided to resign from the Board of Directors, effective May 1, 2007. As previously announced, a Special Committee of Trident's Board of Directors, composed of Messrs. Ostby and Phelps, has been conducting an investigation of the co's historical stock option granting practices. In connection with this investigation, the Special Committee recently became aware of information that, when reported to the independent members of the Board, led the Board to believe that a conflict of interest may have arisen between Trident and each of Messrs. Chikagami and Luke, individually, in their capacity as directors. While the Board of Directors has not made any findings of wrongdoing, the independent members of the Board and each of Messrs. Chikagami and Luke concluded that it would be in the best interests of Trident and its shareholders for them to resign from their positions as members of the Board of Directors.

3:01PM Motorola: Carl Icahn responds to MOT's letter to shareholders (MOT) 17.59 +0.13 : Icahn says: "Since December 3, 2004 Motorola has achieved negative 0.3% annualized returns. Said another way, $100 invested in Motorola common stock on December 3, 2004 would be worth $99.28 today. Over the past 2 1/2 years shareholder value has been destroyed. There are two reasons why Motorola's statement does not tell the story First, in its May 1 letter Motorola takes full credit for the performance of Freescale subsequent to its spin-off on December 3, 2004. Let me tell you, I wish I could take credit for the stocks or businesses that trade up after I sell or spin them off. I doubt that any of you include the increased value of stocks that you have sold when considering how well your portfolio is doing! Secondly, Motorola selectively chose a date of April 2003, a date which represented a share price near a 15 year low for the stock and 9 months before Ed Zander joined the company."

9:05AM TTM Tech beats by $0.05; issues Q2 guidance (TTMI) 9.18 : Reports Q1 (Mar) earnings of $0.20 per share, $0.05 better than the Reuters Estimates consensus of $0.15; revenues rose 143.3% year/year to $176.9 mln vs the $169.4 mln consensus. Co issues guidance for Q2, sees EPS of $0.13-0.19 vs. $0.19 consensus; sees Q2 revs of $158-167 mln vs. $174.03 mln consensus.

5:00AM United Microelectronics reports Q107 results and anticipates a gradual recovery in Q207 (UMC) 3.30 : Co announces revenue declined 11.8% sequentially to NT$23.03 bln ($696 mln). Net income was NT$1.46 bln ($44 mln). Revenue from 90 nm technology and below was 21% of total revenue. EPS of NT$0.08; EPADS of $0.012. This compares with Q406 EPS of NT$0.33 and EPADS of $0.050.

09:43 am TranSwitch: Dawson James initiates Speculative Buy. Target $2.5. Dawson James initiates TXCC with a Speculative Buy and a $2.50 tgt saying they believes that the I.C semiconductor industry, in particular system-on-chip vendors, will experience high growth during in 2008 and 2009 due to Teleco's and C.A.T.V providers' rapid rollout of triple-play services. The firm says British Telecom's 21st Century Network is only the first of many end-to-end fiber optic IP telecommunications networks which will be built over the next decade.
icon url

ReturntoSender

05/05/07 6:53 PM

#7413 RE: ReturntoSender #6755

Amateur Investors Weekend Stock Market Analysis (5/5/07)

http://www.amateur-investor.net/Weekend_Market_Analysis_May_5_07.htm

To start things off this weekend here is a remarkable statistic going back to the early 1940's. If we look at the yearly returns of the Dow going back to 1900 there is a remarkable pattern that has occurred since 1943. Every year that has followed a Mid Term Election Year since 1943 has seen a positive return in the Dow as shown in the table below. The average return in the Dow during that time for the year following a Mid Term Election Year has been an amazing 15.7%. However prior to 1943 you can see there was a mix of up and down years for the Dow following a Mid Term Election Year. The question is why has the Dow been up every year since 1943 following a Mid Term Election Year? Is this just a coincidence or is there a reason why this pattern has continued intact since World War II? Meanwhile if this pattern continues then 2007 should end up being a positive year for the Dow and based on what has occurred so far it appears this pattern may pan out once again.

Yearly Return of the Dow since 1900 following a Mid Term Election Year
 
Year Return Up/Down
1903 -23.6 D
1907 -37.7 D
1911 0.2 U
1915 81.7 U
1919 30.5 U
1923 -2.7 D
1927 27.7 U
1931 -52.7 D
1935 38.5 U
1939 -2.8 D
1943 13.8 U
1947 2.2 U
1951 14.4 U
1955 20.8 U
1959 16.4 U
1963 17 U
1967 15.2 U
1971 6.7 U
1975 38.3 U
1979 4.2 U
1983 20.3 U
1987 2.3 U
1991 20.3 U
1995 33.5 U
1999 25.2 U
2003 25.3 U
2007 6.2 U
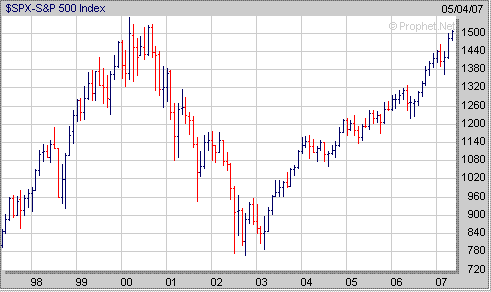
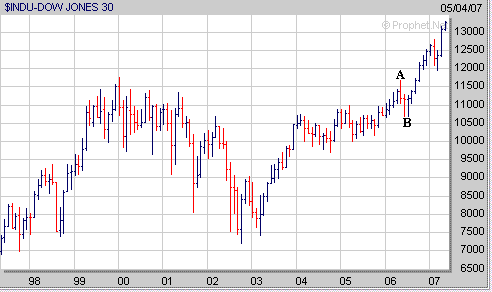
As far as the major averages nothing has changed as overbought has become even more overbought. Pullbacks so far have been very minor and only only lasted a few days. Eventually we are going to see a more substantial pullback occur at some point as the market rarely if ever moves up in a straight line. Meanwhile as mentioned last weekend the S&P 500 is now at a level not seen since 2000 when it peaked on March 24 of that year with a closing high of 1527.


Furthermore as we saw in 2006 when the Dow got close to its previous high that occurred in the early part of 2000 this was followed by a pullback during the months of May and June (points A to B). Thus it wouldn't be much of a surprise if the S&P 500 undergoes a similar pullback as well since it's getting close to its all time closing high.


Finally another thing that is occurring with the S&P 500 is that its Relative Strength Index (RSI) has been trending downward (point C) as it has been making new highs of late. We also saw the same type of pattern develop in February as the S&P 500 made new 52 weeks highs but the RSI was trending downward (point D) which was eventually followed by a sharp 3 week correction in the S&P 500 (points E to F). Of course this doesn't mean a sell off of that magnitude is going to occur again however it does mean we could be nearing a pullback which may last more than just a few days.

Meanwhile also notice in the chart below trends in the RSI can be used to help define a bottom as well. Notice back in March how the RSI began to trend upward (point G) as the S&P 500 made a lower low in mid March which was followed by a strong rally. We also saw the same trend in the early part of 2007 as the RSI was trending upward (point H) as the S&P 500 was nearing a bottom which was then followed by a rally from mid January through mid February (points I to E).


icon url

ReturntoSender

05/05/07 11:58 PM

#7414 RE: ReturntoSender #6755

Markets completed a fifth straight week upwards, with the Dow now rising 23 of the past 26 sessions. Despite the rally, the bourses are looking a bit tired, and overdue for a rest, if not a 2-4% pullback. The levitation continues to astound, with traders shaking their heads and shorts queezed to the max. With April now in the record books, U.S. Markets posted their best monthly performance since October 2002.

The Merger party continued, with announced takeovers sparking the "old media" sector. Murdoch's News Corp made a $5 Billion bid for Dow Jones, Thompson Financial for Reuters, and even the long rumored hook up of Microsoft for Yahoo! was in play this week.

All these elements managed to drive markets higher: The Dow gained 1.1%, and has 13,500 in spitting distance. For the first time in over 6 years, the S&P500 left 1500 behind, gaining 0.8% on the week, and is 1.4% from its all time (March 2000) highs. The Nasdaq, continued its gaining but lagging ways, up 0.6%. Also gaining but lagging: the Russell 2000 lifted 0.4% for the week.

Barron's Streetwise column notes the conflicting sentiment out there:

"Surveys that ask active pros what they think have showed steady if not extreme bullishness, and long-only fund managers are and have been "all in," with cash levels at stock funds reported last week to have fallen to a record low of 3.7%. One notable exception to this outburst of optimism: the latest Barron's Big Money poll, featured in last week's issue. The American Association of Individual Investors poll, on the other hand, dipped below 35% bulls last week, a level breached only nine times in the past 15 years -- and only once after the market posted a gain in the prior month. Clearly, the broad populace is fighting the market trend."

Fighting the trend, or absent alltogether? Trading volumes at the online brokers have been rather anemic. I suspect post 2000-03 crash, the disinterested public has been more interested in real estate and commodities. In the counter-intuitive ways of the market, that may be perversly bullish.

http://bigpicture.typepad.com/
icon url

ReturntoSender

05/08/07 3:46 PM

#7418 RE: ReturntoSender #6755

MFLX ST bought 1000 shares@15.95 - They report after the close today. Printed circuit board company that previously lowered expectations.


http://finance.yahoo.com/q/ks?s=MFLX

Risky?

Probably... RtS
icon url

ReturntoSender

05/09/07 1:56 PM

#7421 RE: ReturntoSender #6755

SMH SS another 1000 shares@37.99 - Now short a total of 2000 shares at 37.24 average.


RtS
icon url

ReturntoSender

05/13/07 3:12 PM

#7428 RE: ReturntoSender #6755

InvestmentHouse Weekend Update:

http://www.investmenthouse.com/1weekendmarketsummary.htm

- Nice rebound to end the week with low overall volume, but strong volume in key sectors.
- Core PPI is in the sweet spot and looking for the CPI to get earnest about following it.
- Retail sales weaker just as everyone expected but no one cares to mention.
- The market is still extended in many respects with some iffy price/volume action of late, but the prior leaders are starting to move up again and with solid volume.

Friday doesn’t put the pullback to rest, but there were definite bright spots.

The disappointing but expectedly so same store sales presaged weaker than expected April retail sales, and the actual numbers bore that out with sales overall down 0.2% (0.4% expected), flat when you took out massively weak auto prices. Based on some of the reactions to the report you would have thought unemployment was at 10%. The wholesale inflation data (PPI), however, dovetailed nicely with the sackcloth and ashes donned after this week’s retail numbers. Core producer prices were flat month over month and fell to 1.5% annually. Many reasoned that if the CPI follows suit that will give the Fed the cover it needs to cut rates and stave off a potentially heinous slowdown (even, of course, as the more recent leading data suggests the economy is already picking up steam again).

That combination was enough to spark up futures a bit, though they were waffling heading into the open. The biggest fear among traders was that an early bounce would turn into another Thursday high to low sell off. Stocks rallied nicely up to midmorning and then the inevitable test came. The pullback held with moderate losses through lunch, then started back up. Just as the move higher got underway a story hit that terrorists had planned to attack US interests (soldiers, etc.) in Germany. That put the rebound on hold, but it did not lead to a sell off. In the last hour stocks sprinted higher into the close as some of that liquidity, seeing the market handled the bad news and was holding its gains, moved in to pick up stocks after that Thursday price thumping.

Nice price gains, good breadth and good leadership, but the volume was light. The move was dismissed by many because of the light trade, but there were some really good underpinnings. The volume was light, but it was concentrated in some of the rally’s early leaders that spent the last run higher testing back to support. They took off on Friday. Energy, metals, industrials and chemicals enjoyed some great bounces on some serious volume. We were looking for these to rebound and on Friday they were doing just that, giving us some great buys, not to mention pushing many of our existing positions sharply higher as they continued their uptrends.

Technically the action was mixed as you would surmise from the above discussion. Nice intraday low to high action that fought off a mid-session negative in the German news story. It was a good answer to the Thursday selling, bouncing up off support levels and reclaiming some lost support with respect to NASDAQ and SP600. Breadth was excellent in response to the very negative downside breadth Thursday. The boogey man is that low overall volume. NASDAQ volume was excellent moving into the Thursday selling, then showed some distribution Thursday and a light trade rebound Friday. Not great action, but one distribution session in a run is not the end of the run. NYSE volume has been more questionable as it was overall low on the last run higher. It was lower on the Thursday selling as well, however, so at least it is consistent, i.e. not leaning one way or the other.

Despite the volume, we have to lean back on the good leadership that showed up Friday from sectors that had led early and tested and rested while the rest of the market posted the latest round of gains. Those strong early leaders are important. Their resurgence here shows money continuing to rotate around the market AND moving back into these stocks in a big way with very selective buys. You have to like that kind of money movement and its focus on specific sectors as it shows smart money is still in the market, still ready to buy and even at some higher prices.

Thus while overall trade was light and leaves the market subject to an additional pullback, some key early leaders were leading once again. That bodes well for the rally as it shows that money is still moving in, rotating to different sectors that are considered ripe for the buy after a pullback to consolidate. These early leaders can make moves higher while the rest of the market continues the pullback, making us money until the market pullback is done and other sectors are ready to make their moves again. Based on this action in these early leaders, it looks as if the market rally is not ready to go into a much deeper test at this juncture.

THE ECONOMY

Is the PPI a precursor to a lower CPI?

The overall PPI was pushed higher by energy prices this time around as food prices posted their weakest gain in five months. Gasoline prices jumped 8% while food rose 0.4%, well off the 1.4%, 1.9%, 1.2%, etc. gains in the prior months. With gasoline jumping the overall PPI rose 0.7%, pretty much in line with the 0.6% forecast but below the 1.0% rise in March.

The core was, as always, the key. It was flat versus the 0.2% rise expected. That kept it flat for the second month and on a steady downtrend. Flat the past two months, a 0.4% February outrider, preceded by a 0.3% and 0.1% rise. That pulled the year over year rise down to 1.5% from 1.7%, matching the October 2006 level. Compare that to the 2.8% rise in core back in July 2005 that marked the decade high. Didn’t we say pressures on prices peaked in October 2005? Go back and check; we sure did.

Regardless of what we said, the trend is lower even with intermediate and crude goods showing big gains year over year. These are not making it into finished goods. Auto prices are falling even as the input prices rise. They cannot pass the cost of the product onto the buyer. Boat manufacturers are trying to pass the costs along but as the forecasts earlier in the year show, buyers are not paying up and a weak 2007 is forecast, forcing boat makers to lower their prices.

This failure to pass along the price increases is a theme that recurs in every expansion. There is the ever-present worry that prices will be foisted upon buyers. The fear in the 1980’s was a pass through. The fear in the 1990’s was a pass through. It never happened. We always look for pass through when the economy is strong but it doesn’t appear. McTeer and Laffer are absolutely correct: when an economy is growing and creating goods, services, jobs . . . the indicia of prosperity . . . supply meets demand. When DID we see pass through? In the 1970’s when the economy was in malaise with no goods, services or jobs. Too much money without any supply creation exploded inflation as demand well in excess of supply allowed producers to pass on costs. Of course the money was worth less because of the rampant inflation, but the costs were passed on. Right now even with low pricing power in another expansion, companies are flush with cash. Now if the Bush administration would get off promoting a weak dollar those dollars would be worth a lot more. At least there is low inflation and thus the dollars we make are not being eaten up by inflation gains.

So does that means CPI will be lower? We believe so. It won’t be at the 1.5% shown by PPI; consumer prices are not as low to start with and they have not fallen off the table. That said, prices are starting to fall at a faster pace, at least overall. No one month tells the entire tale, but as with PPI, CPI is on the trend lower. Inflation is still pesky, but inflation pressures continue to decline.

Leading indicators hit a 3 year high.

The economic recovery officially started in 2003 though we were writing of the robins on the lawn in late 2002 with respect to the economy turning the corner. The signs were there in the leading indicators but many were still talking about the woeful economic conditions. More recently the economy experienced a slowdown that started second half 2006. Of late, however, the economic indicators point to a recovery beginning to take hold even as many are still putting forth doomsday scenarios relating to the housing industry, a tapped out consumer, etc. Even with the solid turn up in the data, however, the pessimism remains.

Last week ECRI, the best man-made leading indicator, showed a solid increase, keeping the string of steady gains alive and well. This week the annualized growth rate rose to 5.2%, a three year high, leaping from 4.4%. Impressive. It also makes sense. After the surge in 2003 that saw GDP gain 7.4% in Q3 of that year, the expansion naturally slowed over the next two years though it was still expanding nicely. In 2006, three years into the recovery, it hit a slow spot. After that it is starting to come back. As it does, growth rates jump again. Thus the best leading indication in three years. With inflation falling (no doubt helped by the growing economic strength) this is a very positive outlook for the economy and thus the market. Why has the market been rallying? Because it was sniffing out this recovery.

THE MARKET

MARKET SENTIMENT

It was a week where there was a lot of sentiment action though you could not measure it via the VIX. There was the ‘this time it is different’ on Wednesday that led to the immediate butt thumping gut punch on Thursday. As we said Thursday, the new rule of thumb: when you hear ‘this time it is different’ expect things to turn on a dime. In any event, there is still the feeling the market is extended among professionals and the so-called ‘retail’ investor as measured by the AAIA. It is extended without doubt, but even with the pessimism we saw money, serious money, moving into energy, metals, chemicals, industrials. Wall of worry, baby. The market is due for a pullback, but it is also showing rotation into areas that led but already made their pullback.

VIX: 12.95; -0.65
VXN: 16.09; -1.29
VXO: 12.91; -1.09

Put/Call Ratio (CBOE): 0.94; -0.17

Bulls versus Bears:

Bulls: 53.5%, up from 51.7% and close to the 55% considered bearish. Seems the market beat it to the punch and sold before 55. It was 45.5% six weeks back. It has not topped its recent high at 53.3% but is well off the 60% hit in December 2006. For reference it bottomed in the summer 2006 near 36%.

Bears: 20.0%. Plunged from 24.7% in the most telling move of the two indicators. This is the level considered bearish, and of course the market was careening lower on Thursday. Quite a drop from the 27.5% hit 5 weeks back. The rally has taken the bears down from the recent highs near 29 (28.4% and 28.9%). It is now matching its January and February lows. For reference, it hit a post-2002 high in that late June 2006 move (hit near 36%), eclipsing the March 2006 high (33%) and well above the 2005 highs that spawned new rallies (30% in May 2005, 29.2% in October 2005).

NASDAQ

Stats: +28.48 points (+1.12%) to close at 2562.22
Volume: 1.802B (-22.76%). That is a significant drop in volume as NASDAQ price/volume action the past couple of sessions was not for spit. Some distribution Thursday and a weak bounce Friday. NASDAQ tried to show some leadership qualities the prior week but gave up on the effort last week. Don’t want to see it collapse, but it was not in the sights of the buyers on Friday, and there were some serious buyers out there based upon the volumes seen in those sectors highlighted above.

Up Volume: 1.427B (+1.113B)
Down Volume: 352M (-1.644B)

A/D and Hi/Lo: Advancers led 2.34 to 1. Not bad upside breadth at all though it fell short of the outsized downside move Thursday. It was really interesting that the large cap NASDAQ 100 led the entire market at +1.26%. Good recovery action, however, much better than what was shown on the prior upside sessions for the week.
Previous Session: Decliners led 3.59 to 1

New Highs: 125 (+7)
New Lows: 86 (-1)

NASDAQ CHART: http://www.investmenthouse.com/ihmedia/NASDAQ.jpeg

NASDAQ gapped up to the 18 day EMA and then rallied back up through the 10 day EMA and just cracked back into its old uptrend channel marked by the November to February trendline. Of course it has poked so many holes in that trendline of late that it doesn’t mean what it used to. NASDAQ struggled last week, rising on lower volume, selling on higher volume Thursday, then bouncing on low trade. It is hardly in a position of strength after the week other than where it managed to close with respect to the trendline. It did hold the break over the late February high on the Thursday thumping, the silver lining. NASDAQ has some work cut out ahead of it, and it appears the path of least resistance is lower, particularly as NASDAQ stocks were not getting the volume and money many of the industrials enjoyed.

SOX (+1.19%) enjoyed a decent gain off the 18 day EMA, but it was not leading as you would expect if the chips and indeed techs were serious about making a move here. It managed to hold the breakout from the six month range, and now it will try to extend once more, something it has had a hard time doing.

SP500/NYSE

Stats: +14.38 points (+0.96%) to close at 1505.85
NYSE Volume: 1.413B (-8.2%). Volume was lower as the NYSE indices bounced off the up trendline in its channel. Volume has been mushy at best on the last run. Good volume as it reversed off the trendline two weeks back and that showed key buying at a critical time. It faded on the rest of the move and at least it did not rise as the index faded Thursday. A good push that kicked off the next leg showed the big buyers were in, using that money. They were not bailing on Thursday. They were not out in force Friday, however.

Up Volume: 1.163B (+1.002B). 4.8:1 up to down volume Friday. Not quite the 8.4:1 downside volume Thursday, but not a bad showing.
Down Volume: 240M (-1.113B)

A/D and Hi/Lo: Advancers led 3.35 to 1. Not bad at all, matching the downside breadth Thursday. The energy and metals were showing some power again on Friday, and that pushed that breadth on up.
Previous Session: Decliners led 3.39 to 1

New Highs: 143 (-2)
New Lows: 27 (-7)

SP500 CHART: http://investmenthouse.com/ihmedia/SP500.jpeg

SP500 bounced up off the 18 day EMA and the November/February up trendline that marks the former (and now the current) channel. Like how it held that test of support, turning soft support into harder support. After a break up through a resistance level it needs a successful test to turn it into hard support. Before that it is considered soft, which is a notch above putty. Stronger volume would have been nice, but it would have been nice if I got a new wakeboard for Christmas as well. I survived just fine without it (and likely because of not getting it). Again, there was key buying in returning leaders, and that was on solid volume.

SP600 (+1.15%) rallied back through the 18 and 10 day EMA. It held the October/January up trendline that marks the bottom of its late 2006 uptrend channel on this last test, something it had to do. It has been rocky of late, dumping down to that trendline in the late April selling then early May buying, managing to hold on and continue the trend higher. It was back down at that level Thursday as energy and metals faded, but they completed their test on that move. Friday they were back up and SP600 jumped up off the trendline once more. The selling was not on high NYSE volume, and if SP600 starts to lead here as we suspect it will given the great moves in energy, metals, etc. on Friday, that is a huge boost of support for the idea the economy is strengthening.

DJ30

The blue chips held the 10 day EMA and bounced right back through the top of the uptrend channel (13,250). Volume was again below average and lower, spending the entire week below average as it continued higher. DJ30 showed some above average trade for the two weeks (straight) prior to last week. Weaker and weaker volume on the trend higher is not a sign of a rally ready to break to new highs. Hold it; we said that in April. Nonetheless it is hard to sustain such moves and the Dow still is not out of the woods after that strong run and the Thursday buck lower.

Stats: +111.09 points (+0.84%) to close at 13326.22
Volume: 210M shares Friday versus 224M shares Thursday. No dumping on the Thursday selling but no heavy buying on the Dow overall Friday. Weak volume all week though the Wednesday upside was the best volume it showed.

DJ30 CHART: http://www.investmenthouse.com/ihmedia/DJ30.jpeg

MONDAY

The market enters this week still extended and showing questionable price/volume action. Been there, done that on this rally, but of course, as soon as you start anticipating something as the norm it is no longer the norm. Thus you have to respect the fact the market is extended and showed some questionable action toward the end of the week. It did this two weeks back when April ended and May began; this time there is no end of month, beginning of new month to explain it. It is extended. Still, as Crash Davis (Kevin Costner) said in ‘Bull Durham,’ you have to respect the streak; the new money thus far has come in at every possible opportunity and pushed things up. Friday some serious money pushed those prior leaders higher. Real substance to that buying, not like a push-up bra. It was not very widespread, however, and that leaves the rest of the market subject to that pullback that Thursday tried to get going.

Thus we are going to keep looking for buys in those leaders that tested while the rest of the market moved higher on this last leg and be ready for those to continue higher this week. As noted, we picked up some of these Friday and will be ready for others this week. In addition, other stocks continue to work on good bases, setting up for the next breakout as the money in the market continues accumulating shares.

This may sound simplistic given all of the theories about the market heading seriously lower, the economy ready to implode, etc., but the market, like baseball, can sometimes be fairly simple. You throw the ball, you hit the ball, you catch the ball (keeping with the ‘Bull Durham’ theme). You see the good patterns, you see the volume move in, you buy the stock. Friday we saw, despite overall low volume in the market, some serious volume in some solid early leaders that were primed to move back up. That was the money moving into a ‘new’ area. It may peter out on us, but we don’t think so. When the market shows you something you need to go with what the market is showing and put all of your logical, reasoned theories aside because the market doesn’t care what you think and often does the opposite of what you consider rational. With the market on the cusp of summer and all of the other issues about the economy and the length of the current run, it only makes sense to follow what the market is showing.

Support and Resistance

NASDAQ: Closed at 2562.22
Resistance:
2563 is the November/February up trendline
2580 is the May high
2590ish is the top of the November/February channel
2590-95 from an April 1999 interim peaks
2778 from a July 1999 peak
2887 from a September 1999 peak
2920 from an October 1999 peak

Support:
The 18 day EMA at 2541
The July/August trendline at 2542
2531.42 is the February high (post-2002 high)
2523 is price resistance November 2000
2509 is the January 2007 high
The 50 day EMA at 2498
2471 is the December 2006 high
2468.42 is the November 2006 high
2460 is the March high
2405 is the ‘hump’ high
2400ish from the late November and late December 2006 lows.

S&P 500: Closed at 1505.85
Resistance:
The upper trendline of the channel at 1518
1520 from the September 2000 peak
1528 close, 1553 intraday from March 2000 all-time index peak

Support:
1500 from April 2000 peak
1496 is a peak from July 2000
The 18 day EMA at 1490
1487 is the late November to February up trendline
1475 from peaks in December 1999 and January 2000
The 50 day EMA at 1463
1461.57 is the February 2007 high.
1440 is the mid-January high
1439 is the March high
1432 is the December 2006 high
1425 is an interim high from November 1999
1410 is the ‘hump’ high
1408 is the November high

Dow: Closed at 13,326.22
Resistance:

Support:
13,255 is the upper channel line in the November/February channel
The 10 day EMA at 13,230
The 18 day EMA at 13,113
13,111 is the former up trendline that marks the lower channel.
12,796 at the February 2007 high
The 50 day EMA at 12,812
12,700 is the early February peak intraday high
12,623 is the mid-January high
12,511 is the March intraday high.
12,499 is the December intraday high.
12,361 is the November 2006 high
12,350 is the March ‘hump’ high
12,039 is the early March low.
October high is 12,167
11,986 is price support from mid-October and the early November low.
11,940 is the March low

Economic Calendar

These are consensus expectations. Our expectations will vary and are discussed in the ‘Economy’ section.

May 15
- CPI, April (8:30): 0.5% expected, 0.6% prior
- Core CPI (8:30): 0.2% expected, 0.1% prior (this will likely be wrong)
- New York Empire State Index, May (8:30): 9.5 expected, 3.8 prior
- Net foreign purchases, March (9:00): $70.0B expected, $58.1B prior

May 16
- Housing starts, April (8:30): 1,48kM expected, 1.581M prior
- Building permits, April (8:30): 1.520M expected, 1.564M prior
- Industrial production, April (9:15): 0.3% expected, -0.2% prior
- Capacity utilization, April (9:15); 81.5% expected, 81.4% prior
- Crude oil inventories (10:30): 5.511M prior

May 17
- Initial jobless claims (8:30): 310K expected, 297K prior
- Philly Fed (12:00): 2.0 expected, 0.2 prior

May 18
- Michigan sentiment, May preliminary (10:00): 87.0 expected, 87.1 prior
icon url

ReturntoSender

05/17/07 1:57 PM

#7434 RE: ReturntoSender #6755

Borrowing Vernon Dunn's BPCOMPQ Chart and Analysis:

Vernon's chart awaiting a confirmed sell signal:

icon url

ReturntoSender

05/20/07 11:42 PM

#7441 RE: ReturntoSender #6755

InvestmentHouse Weekend Update:

http://www.investmenthouse.com/1weekendmarketsummary.htm

- Stocks end a mixed week on an up note.
- Inflation in its death throes.
- With the 1990’s ‘old economy’ stocks now the world’s ‘new economy’ stocks, does SP500 and NASDAQ swap places with respect to growth?
- Extended, but that just means pick quality new positions.

Expiration rally closes out a mixed week.

Yes it was indeed mixed. DJ30 and to a lesser extent SP500 marched higher for yet another week, continuing a rather impressive string of new highs. On the other side of the tracks NASDAQ and SP600, while up on Friday, were down for the week as they struggled in a three week consolidation with NASDAQ sporting a couple of distribution sessions to start the week. Even with that sluggish action the black sheep of the rally did not break down and indeed put in a solid expiration session. Ah the power of massive liquidity: even when an index struggles it does not give up much ground.

Friday the market started higher on another round of generally good news. Earnings were solid with KSS, JWN, and INTU all posting impressive profits. After a pretty weak showing on same store sales, retail sales, and earnings results the prior week, the return of solid retail results fired back at those claiming retail was in a swoon. More M&A as usual with MSFT bidding for AQNT, but the 85% premium was not usual. It was, how do you say it . . . outrageous. Everyone seemed to love it, however, as it added to the takeover craze and vaulted the only remaining player in the sector, VCLK, as everyone figured someone had to pony up for it. Analysts were active again, showing some of that renewed bravado with upgrades of INTC and VZ and a downgrade of JNPR. There was also a splash of economic data. Michigan preliminary sentiment (is this before they have real sentiment?) came in stronger at 88.7 versus the 86.5 expected. They are going bonkers in the great white north.

That started things higher but the sellers made their attempts. The market survived an early run at selling, then once more recovered and rallied on into the afternoon. As on Thursday, the sellers made another afternoon run at the tape and forced a sharp drop in the next to last hour. Unlike the prior session, however, the buyers came back and closed the indices out at their highs. Despite the mixed action for the indices on the week, on Friday they were all working together.

Technically the action was not bad though on an expiration Friday it is hard to precisely rate the result. But we will anyway. It was another low to high move, always a good indication of an underlying bullish theme. This one had the additional benefit of overcoming a couple of selling attempts, though on expiration some volatility is expected. Volume was up as well, moving back above average on both NASDAQ and SP500. Again, expiration tends to cloud up the volume picture, making it harder to say the rising trade on rising prices was accumulation. Expiration also impacts the earlier part of the week as well, however, so if we call Tuesday distribution on NASDAQ we can call Friday accumulation.

As noted above, NASDAQ and SP600 are still struggling in somewhat toppy near term patterns though both did test the breakout and did what they had to do, i.e. bounce. DJ30, and to a slightly lesser extent, SP500 both enjoyed great weeks but both are extended. NASDAQ and SP600 struggling, DJ30 and SP500 extended. Almost anyway you slice it, logic says the indices are not in the best buying position.

Logic says be prudent, but leadership is still strong and still blossoming. As noted Thursday, energy took off after a slight pullback. Impressive surges that continued Friday with even more energy stocks breaking out and joining those that streaked higher Thursday. Financials showed some strength Friday after spending several weeks trying to ‘get right.’ While tech continues to struggle and the ‘old economy’ stocks from the 1990’s enjoy huge success as the rest of the world’s ‘new economy’ stocks in the 2000’s, if the financials break higher that is a bullish, Katy bar the door sign. This market has moved higher on waves of buying moving to new areas, and after waiting on deck for 4 weeks the financials are showing signs of being the next wave.

Again, the problem is the extension of the run on NYSE. It is not a valuation problem or a weak economy problem though you hear some of that on the financial stations. No, it is simply how darn far it has run in a short time with no rest. A bull run no doubt. But bull runs are peppered with sharp sell offs from time to time, and when you get big extensions such as this move, the time is riper, particularly with the kind of sentiment you are seeing from the bulls/bears ratio and the very high option activity levels (driven in large part by another area of fluff, the M&A activity). It is normal to have a sharp correction. With the big strength on the NYSE indices and with NASDAQ and SP500 struggling, you have to be diligent.

Thus Friday we could have taken a lot more new positions than we did. There were several plays dancing around the buy point on decent trade, but with the expiration sprint higher and the often opposite reaction the following Monday (though M&A has altered that of late), there was no hurry to jump in to a lot of new positions. Indeed, we took some gain off the table on the spurt higher in energy stocks. If these stocks are still moving this week coming then we can move in. Over the years we have learned that patience is a primary pillar of investing whether buying into a position, taking some profits, or getting out.

THE ECONOMY

The past two weeks gave the latest ‘official’ read on inflation. Two weeks ago the annualized core PCE attached to personal income and spending fell to 2.1%, finally starting to show a serious decline after inflation pressures peaked way back in October 2006. Last week the annualized core CPI fell to 2.3% as it made a significant drop. Of course, CPI overstates the actual inflation level, so 2.3% is more like 2% or the 2.1% shown on PCE.

Outside the official indicators that the news media has to have in order to put a label on anything, the market indicators are even more emphatic that the inflation war is over. The spreads on inflation protected treasuries (TIPS) are narrowing significantly. Gold is declining off of a double top and is testing a break below its 90 day MA. Key bond indicators are falling as the 90 day treasury yield is at 4.8%, well off the Fed funds rate (5.25%) and now in line with the 2 year, 5 year and 10 year bond yields. In other words, the bond curve has flattened as short end yields fall. Art Laffer, one of the best economists there is, says this is a near perfect scenario.

Why is this happening? It is the resumption of the expansion alleviating the pressures. Conventional Phillips Curve wisdom (though history shows it is not wisdom at all but more akin to an old wives tale) says a stronger economy increases inflation pressures. Reality, as voiced by former Dallas Fed president McTeer just recently (again), is that economic expansion reduces inflationary pressures as supply anticipates and satisfies demand. Thus a return to a stronger growth rate as the recent economic data indicates and the further growth anticipated by ECRI explain the reduction in inflation pressures that swelled some as the economy slowed the second half of 2006.

Some are still calling for a recession based upon the inverted curve. They may ultimately be correct; we could still make the wrong policy decisions and torpedo a revival of the expansion (trade barriers, tax increases on incomes and capital gains), sending us into recession and exacerbating inflation. At least one such pundit has suggested we may already be in a recession. Wow. If this is a recession we can live with that. If it is a recession it is the mildest in recorded history because the stock market correction that preceded it (there is always one because the market looks down the road) was back in the summer of 2006 (before the 2006 second half slowdown) and lasted all of 13 weeks. Since that time the market has been on fire, rising ahead of the next expansion (it does that ahead of time as well). Again, if this is recession we can live with it.

The sum total is inflation is on the decline and is about to break back into the Fed’s comfort zone. Will that lead the Fed to lower rates? Conventional wisdom says no, that the Fed will not lower until something breaks. That is the history of the Fed and thus it is a pretty good bet. Based on our review of Bernanke’s actions since becoming Fed chairman, however, Bernanke talks the old line so everyone understands and does not feel a void after Greenspan, but he acts according to a newer line of thinking, one more in line with reality. With the 90 day treasury falling sharply away from 5.0%, that has flattened the yield curve to a more palatable level, but it also indicates the Fed funds rate is too high. If Bernanke is truly following the market then a reduction of the Fed Funds rate is in order. As noted last week, however, the Fed cannot move until inflation is back in the range, and Bernanke is hanging on as long as he can hoping the economy will avoid any further backsliding.

THE MARKET

MARKET SENTIMENT


VIX: 12.76; -0.75
VXN: 15.91; -0.84
VXO: 12.34; -1.03

Put/Call Ratio (CBOE): 0.98; +0.19

Bulls versus Bears:

Bulls: 54.3%, up from 53.5% last week and 51.7% the week before. This indicator is right at the 55% level considered bearish. Too high, but as noted above, there are other indications that say that there are potential investors out there that are still apprehensive. Still, it is too overdone as would be expected when the indices are hitting new all-time or multiyear highs. It was 45.5% seven weeks back. It has not topped its recent high at 53.3% but is well off the 60% hit in December 2006. For reference it bottomed in the summer 2006 near 36%.

Bears: 19.6%. Below the 20% level considered bearish, the level it hit last week (20.0%). A big plunge the past two weeks from 24.7%. Quite a drop from the 27.5% hit 6 weeks back. The rally has taken the bears down from the recent highs near 29 (28.4% and 28.9%). It is now matching its January and February lows. For reference, it hit a post-2002 high in that late June 2006 move (hit near 36%), eclipsing the March 2006 high (33%) and well above the 2005 highs that spawned new rallies (30% in May 2005, 29.2% in October 2005).

NASDAQ

Stats: +19.07 points (+0.75%) to close at 2558.45
Volume: 2.072B (+2.74%). Volume moved back up to slightly above average on the Friday gain. Hard to call it accumulation given it was expiration Friday, but as noted above, expiration likely influenced the Tuesday distribution as well. Given the prior distribution, however, we still need to watch NASDAQ carefully as it continues the current choppy action.

Up Volume: 1.367B (+446M)
Down Volume: 678M (-398M)

A/D and Hi/Lo: Advancers led 1.76 to 1. Not bad breadth given how it has acted of late.
Previous Session: Decliners led 1.69 to 1

New Highs: 138 (+20)
New Lows: 93 (-15)

NASDAQ CHART: http://www.investmenthouse.com/ihmedia/NASDAQ.jpeg

Gapped higher, then tested the 18 day EMA on the midday test before rebounding to a nice solid close. Higher volume but again it was expiration. NASDAQ is still in a short term toppy pattern. Friday tried to break it up a bit, moving back over the July/August 2006 trendline. It has not done the trick yet, but as noted last week, NASDAQ, while choppy and toppy, has not broken down. It held the February high that marks the breakout during the Tuesday selling. If it continues higher from here on more solid volume that is a coup. As of Friday the battle is still on.

SOX (-0.12%) struggled again, but all was not lost. It rebounded from an intraday test of its 50 day EMA, closing near the highs in its 6 month range. This is the make or break point for SOX, and it did show some positive attributes Friday with a nice doji with tail that held support and prompted an intraday recovery. It is hanging on where it absolutely has to. Now we see if that translates into a rebound.

SP500/NYSE

Stats: +10 points (+0.66%) to close at 1522.75
NYSE Volume: 1.647B (+13.15%). Volume topped average for just the second time in three weeks. Tuesday the high volume was on an intraday reversal from high to low; at least Friday, though expiration aided, was on solid gains.

Up Volume: 1.223B (+542.277M)
Down Volume: 410.52M (-350.583M)

A/D and Hi/Lo: Advancers led 1.63 to 1. Quite modest given the gains in energy and financials showing some life signs.
Previous Session: Decliners led 1.56 to 1

New Highs: 266 (+72)
New Lows: 33 (-10)

SP500 CHART: http://investmenthouse.com/ihmedia/SP500.jpeg

SP500 bolted higher once more. A soft start to the week and then a rousing finish. Volume was up Friday after rising on the Tuesday reversal from nice gains. Price/volume action has not been stellar this month, but that has not stopped the large caps. New post-2002 high Friday and close to a new all-time high. It continues to steamroll higher after the early April breakout from that short double bottom with handle base, and it is acting as if that base was all it needed to put in another solid run that bounces 4 to 5 times off the 18 day EMA on the way up. That still leaves SP500 with plenty of upside on this run though this latest bounce (the third) is already at the upper channel line of its channel, and that stalled the last bounce and sent the index back to the 18 day EMA where it started this latest run. Thus if that pattern holds, this bounce is ready for the fork.

SP600 (+0.75%) held the August/January trendline that it has danced with the past week, posting a solid gain on the session. The move was aided no doubt by the leadership in energy. The action was solid, but as with NASDAQ, the other struggling growth index, it is not out of the woods. It is making a higher low, however, and those woods are thinning, aided by the energy stocks that hit a gusher last week.

DJ30

DJ30 continues its rampage. After a pause Thursday on low volume it jumped to a new all-time high on the strongest volume in a month and one-half. It is now 10.7% above its 200 day SMA, a point where historically it has struggled. As noted last week, it is not struggling. More on this in the review for Monday below.

Stats: +79.81 points (+0.59%) to close at 13556.53
Volume: 282M shares Friday, the best since last expiration. Very solid trade as energy garnered a lot of volume.

DJ30 CHART: http://www.investmenthouse.com/ihmedia/DJ30.jpeg

MONDAY

A paradigm shift with respect to what indices are growth indices?

We have noted how DJ30 historically struggles when it gets 10% above its 200 day SMA and then starts to correct at 15%. On the other hand, NASDAQ historically had more stretch to it, at least prior to the crash. It could get 15% before it would feel any heat, and 20% before it started to struggle.

We talked about this a month back, but with the run in the Dow and SP500 and the strength of their stocks, you have to consider if the paradigm is shifting. We are not saying it is different this time, but there is a shift. The new economy stocks of the 1990’s are not so new anymore. There has been a shift to wireless that salvaged technology after the crash, but overall technology has lagged as the world economy recovered. The ‘old economy’ stocks of the 1990’s are now the new economy stocks in this century as the rest of the world builds out to match the west.

By new economy we mean growth stocks. A lot of old, staid, and mature companies are rallying with the vigor of a 20 year old lifeguard at the pool hosting the Miss America swimsuit press conference. Well, maybe more like a 70 year old who has discovered the virtues of Viagra. Talk about growth. In any event, their products are in hot demand and thus the impressive growth figures.

Thus, should we worry with DJ30 10.7% above its 200 day SMA? Perhaps. At this juncture, however, it is showing no signs of slowing this sprint. SP500 bucked a bit the past couple of weeks, but all the while maintained its trend higher. With all of the growth worldwide and the liquidity fueling that growth as well as stock buys, it is very likely that investors are willing to tolerate larger P/E ratios in these stocks than before. Growth, no matter if it is in the economy, in earnings, or after using Viagra, tends to cure most ills.

How to proceed.

Considering the above, while there is a heck of a run underway that has the NYSE indices extended and many worried about how long it can last, there are also, as we have noted, a lot of quality stocks that are setting up for another move higher either with a fresh breakout or after testing a prior breakout. While some stocks are on extended runs others that were out in front early have tested and started higher as seen with energy last week. In our market scans we still see a significant number of stocks that are or are setting up for a new move higher. Thus you have some extended runs but you also have accumulation in other areas, setting up for new moves. We continue to look at those for potential buys.

At the same time it is hard to throw old standards to measure moves out the window, and it is likely a big mistake to do so. Still, you don’t want to miss out on any moves that are still to come. Recall the 1990’s and how some missed, oh around 5 years of gains that saw the indices more than double because they were convinced the moves had to end. They did, but as always, timing is everything.

So we will continue to look for buys; if DJ30 and SP500 can go 20% above their 200 day SMA before starting to correct, that leaves plenty of fruit to still pick. We don’t want to get crazy, however. We still want to pick quality. Quality stocks with quality buy points setting up. You don’t want to chase the bus because when you get that desperate, i.e. feeling you have to buy at less than good levels just because you don’t want to miss out, then you end up getting run over by the bus you were chasing.

Stick with quality and let the plays come to you, i.e. be patient. Some stocks we were watching broke out last week with gaps and did not come back right away. We did not break ranks and run after them. As we have seen again and again in this market, good breakouts are getting nice tests, and frankly, the test of the breakout is a favorite entry point. Once a stock starts back up after the test that shows us the buyers are back and ready to buy even at this higher price. Now that is bullish as it confirms the breakout and the demand for the stock. Patience also means not buying stocks that are not showing great moves. As noted above, we passed Friday on some stocks that were decent but not showing great moves. No point in rushing in as it was Friday expiration.

The week is rather light on economic data with durable goods orders and home sales (new and existing) highlighting. Jobless claims are the new weekly buzz, however, with their trend lower when the economy, according to some, is swirling in the toilet. Monday after a strong expiration session can react in the opposite direction. That would not be that bad as it would set some plays up for better buys. We are letting many positions continue their trends higher while other plays set up for buys. In this market the money looking for a home keeps things turning over nicely.

Support and Resistance

NASDAQ: Closed at 2558.45
Resistance:
2575 is the November/February up trendline
2580 is the May high
2590-95 from an April 1999 interim peaks
2600ish is the top of the November/February channel
2778 from a July 1999 peak
2887 from a September 1999 peak
2920 from an October 1999 peak

Support:
The July/August trendline at 2555
The 10 day EMA at 2548
2531.42 is the February high (post-2002 high); 2525 intraday
2523 is price resistance November 2000
2509 is the January 2007 high
The 50 day EMA at 2506
2471 is the December 2006 high
2468.42 is the November 2006 high
2460 is the March high
2405 is the ‘hump’ high
2400ish from the late November and late December 2006 lows.

S&P 500: Closed at 1522.75
Resistance:
1520 from the September 2000 peak
The upper trendline of the channel at 1525ish
1528 close, 1553 intraday from March 2000 all-time index peak

Support:
1500 from April 2000 peak
The 10 day EMA at 1508
The 18 day EMA at 1499
1496 is a peak from July 2000
1493 is the late November to February up trendline
1475 from peaks in December 1999 and January 2000
The 50 day EMA at 1471
1461.57 is the February 2007 high.
1440 is the mid-January high
1439 is the March high
1432 is the December 2006 high
1425 is an interim high from November 1999
1410 is the ‘hump’ high
1408 is the November high

Dow: Closed at 13,556.53
Resistance:
Now 10.7% above its 200 day SMA, a point where DJ30 has historically show some struggles.

Support:
The 10 day EMA at 13,382
13,285 is the upper channel line in the November/February channel
The 18 day EMA at 13,261
13,194ish is the former up trendline that marks the lower channel.
The 50 day EMA at 12,929
12,796 at the February 2007 high
12,700 is the early February peak intraday high
12,623 is the mid-January high
12,511 is the March intraday high.
12,499 is the December intraday high.
12,361 is the November 2006 high
12,350 is the March ‘hump’ high
12,039 is the early March low.
October high is 12,167
11,986 is price support from mid-October and the early November low.
11,940 is the March low

Economic Calendar

These are consensus expectations. Our expectations will vary and are discussed in the ‘Economy’ section.

May 23
- Crude oil inventories (10:30): 1.061M prior

May 24
- Durable goods orders, April (8:30): 1.0% expected, 3.7% prior
- Initial jobless claims (8:30): 300K expected, 293K prior
- New home sales, April (10:00): 860K expected, 858K prior

May 25
- Existing home sales, April (10:00): 6.10M expected, 6.12 M prior
icon url

ReturntoSender

05/22/07 2:45 PM

#7444 RE: ReturntoSender #6755

SMH DT/ST Short Sale 1000 shares@37.46


icon url

ReturntoSender

05/22/07 4:49 PM

#7446 RE: ReturntoSender #6755

ADI View on Low Side

By Alexei Oreskovic
TheStreet.com Senior Writer
5/22/2007 4:37 PM EDT

http://www.thestreet.com/_yahoo/newsanalysis/techsemis/10358368.html?cm_ven=YAHOO&cm_cat=FRE...

Analog Devices (ADI - Cramer's Take - Stockpickr - Rating) saw its profit narrow in the second quarter, and served up guidance that was at the low end of Wall Street expectations.
Shares of ADI lost 5.7%, or $2.32, to $38.10 in extended trading Tuesday.

The Norwood, Mass.-based chipmaker said sales in the three months ended May 5 totaled $669 million, up 4% year-over-year, and above the average analyst expectation of $659 million.

ADI earned $125 million, or 37 cents a share, vs. the $146 million profit it recorded at this time last year. Excluding stock compensation expenses and restructuring charges, ADI said it earned 40 cents a share.

It was not immediately clear whether the average analyst expectation of 35 cents a share included any of these items.

"ADI had a very good second quarter as the strong demand we began to see in January continued through the quarter," CEO Jerald Fishman said in a statement.

But ADI's outlook for the current quarter left something to be desired.

The company forecast a third-quarter sales range of $655 million to $685 million, barely hitting the average Thomson First Call analyst expectation of $683.5 million.

EPS will range between 33 cents and 37 cents, or between 37 cents and 41 cents excluding certain items. Analysts expected ADI to earn 40 cents a share.
icon url

ReturntoSender

05/23/07 3:50 PM

#7451 RE: ReturntoSender #6755

MRVL ST/MT maybe even LT bot 2000 shares@16.01


icon url

ReturntoSender

05/27/07 3:49 PM

#7456 RE: ReturntoSender #6755

InvestmentHouse Weekend Update:

http://www.investmenthouse.com/1weekendmarketsummary.htm

- Relief bounce takes back some losses ahead of holiday.
- Existing home sales knock the housing market back to reality, but economy continues to improve even without housing.
- Market not likely done with this round of selling, but don’t tell that to some leading stocks.

Downside momentum fades as stocks rebound ahead of holiday.

After the worst NASDAQ downside session since March the downside momentum dissipated as quickly as it appeared Thursday. Futures were up, not sharply, but a solid advance. Again it was more of the usual: M&A (NASDAQ buying the Nordic exchange, KO buying a private water company), earnings (GPS and ARO in retail beat), and economic data (existing home sales fall 2.6% versus the -0.1% expected). The positives outweighed the negatives and the market was set for an advance, right?

Yes, the positives continue to their bullish trend. Economics are better than most given them credit. Earnings slowed during the economic mid-cycle slowdown, but they were also better than expected as the slowdown was not the end of the expansion as the popular media made it out to be. That helps push buyers back into the market after sentiment turned sour. Now sentiment is much better, even too good according to some measures (though others are still bullish such as individual investor pessimism) and the market is recognizing that the economy is not in the dumpster as the reaction to the strong new home sales on Thursday as well as the rising interest rates indicated. The underlying theme, the continued upside pressure, however, is the money. Lots of buybacks, lots of buyouts, and lots of money looking for a home.

After a sharp downside session buyers came right back in, looking for bargains on stocks that were just sold. Another dip, another move by some to pick up shares at a perceived better value. The market recouped some ground, but it was not a renewal of strong buying. Buyers were few as volume was light. Ahead of the long weekend many fund managers were not active. Some picked up some shares on the dip, and there were some good buys out there, but the best label you can hang onto Friday was a relief bounce after a pretty good thumping on Thursday.

The technical indicators bear out the relief bounce classification. The intraday action was low to high, a bullish indication, and breadth was solid at 2.2:1 on NYSE. There were quite a number of good rebounds from the selling. A nice bounce back. Volume, however, was the tell-tale indicator. It was extremely low, too low to suggest any real return to buying, particularly juxtaposed with the Thursday selling volume and the recent action on NASDAQ (distribution, failing once again its effort to take the lead) and SP500 (inability to clear to a new high).

Now the market has come back from each of these downturns during this rally. Get a down session or two and the money clambers back in and pushes it back up. It looked prime for a dive in late April and then the second week of May, but bounced right back and continued the move higher. Friday was right in line with that kind of action, but as noted, the volume was AWOL.

Perhaps the new week back from the holiday will continue the bounce and do so with more force; has happened before. We have to remain somewhat cautious as to that prospect, however, as these episodes are getting more frequent (three over the past four weeks) and severe (stronger volume). That is a sign of growing weakness on the move in addition to the NASDAQ distribution this month. Moreover, the rebound did not bring NASDAQ or SOX back from their breakdowns from the trend (in the case of NASDAQ) or the breakout (in the case of SOX). Of course, SP500 and DJ30 are the leaders and they are still easily above their trendlines. They did not escape the higher volume selling, however. They are not showing the same weakness as NASDAQ but they are not bulletproof either.

In sum this is a somewhat dangerous place given the higher volume selling that returned Thursday on top of the prior NASDAQ distribution, and, of course, the long run to this point. High volume selling after a long run is never what you want to see; big players are taking money off the table. To this point the market has survived these bouts and kept building onto the gains. We have had misgivings before and the market continued on higher, so we are not in any way discounting a continued move higher from here, particularly with the continuing parade of strong stocks that continue to set up for solid moves. Given all of the baggage, it is incumbent upon us to stick with the really strong stocks in good position. To that extent we took some money off the table from some solid upside moves as well as some laggards as we look to take the gains the market is giving as well as raised some cash to focus in on the strongest stocks that are ready to move again.

THE ECONOMY

Existing home sales don’t have that new home look.

After a scorching 16.2% rise in April new home sales, existing homes were in need of sprucing up. They fell and of course were expected to fall 0.1%. Not close. While the 2.6% drop was not of the magnitude of the new home sales gains, it was quite a miss. Moreover when you consider that existing home sales are 80% of the housing market with 5.99M annualized sales for April versus the 981K for new homes, you can see how that kind of decline has more impact. Sure new home sales are reputedly the litmus test for the housing market as furniture, flooring, etc. feed off of those sales, but the sheer number of existing homes shows the willingness and ability of owners to buy. With inventories jumping 10.4% to an 8.4 month supply, the highest since August 1992, the luster of the new home sales data started to splotch as harsh reality for the housing market came back to roost.

The data was a slap in the face of the hopeful after the new home sales. It dredged up worries the economy would head lower again given the continued weak housing market. There is this idea that the economy cannot survive without the housing market we have had the past 7 years. You know, the housing market that survived the recession and was given steroids after 9-11 as no one wanted to go anywhere and Greenspan would not let interest rates rise. All of that artificially prolonged what is always an early cycle market in each recovery. Housing jumps quickly because pent up demand is released, then it fades because you don’t have to repeatedly buy homes. This one also benefited from the second home boom as boomers bought that home away from home.

Thus housing hung on much longer than usual. It definitely helped prop up the economy during the recession and it did not hurt things during the expansion. As in all expansions, however, the housing market declines and typically, the expansion goes on. There was that mid-cycle slowdown it is still recovering from, and one of the effects is the slowing housing market after the crazy nothing down loans at the end of the cycle as well as a simultaneous slowing in business investment. We are already seeing, however, the effects of a return in business investment (2 consecutive months back in the black) as the economic data improves once more and the leading economic indicators really start to take off. That is hardly an indication of a further economic slowdown.

THE MARKET

MARKET SENTIMENT

An interesting mix of sentiment right now. The CBOE put/call ratio has popped off four straight 1.0+ closes, typically an indication the options market is getting too apprehensive about the market’s ability to rise further. There is also some record short interest on the NYSE (7.48%) this past week, another sign of high anxiety. Individual investors are still apprehensive, something that still has not let go since the 2000 meltdown. The discount brokerages confirm that the so-called ‘retail investor’ is hardly in the market.

The contrast to that is the high level of bullish and low numbers of bearish investment advisors. They are gushing but apparently the average individual investor is not paying any attention. Thus this particular measure of high bullishness is not necessarily representative of the entire spectrum of investors.

VIX: 13.34; -0.74
VXN: 17.07; -0.95
VXO: 12.86; -0.95

Put/Call Ratio (CBOE): 1.05; -0.1. Fourth straight close above the 1.0 threshold that indicates an extreme in the options market.

Bulls versus Bears:

Bulls: 54.3% for the second straight week. Still bumping up against the 55% level considered bearish. It remains too high, but as noted above, there are other indications that say that there are potential investors out there that are still apprehensive. Nonetheless, it is where you would expect when the indices are hitting new all-time or multiyear highs. It was 45.5% eight weeks back, making a steady climb higher. It has not topped its recent high at 53.3% but is well off the 60% hit in December 2006. For reference it bottomed in the summer 2006 near 36%.

Bears: 20.7%. After a month below the 20% level considered bearish (19.6% last week), bears are on the rise. Well, they are stirring; the level hardly indicates they are ready to charge. A big plunge the past three weeks from 24.7%. Quite a drop from the 27.5% hit 6 weeks back. The rally has taken the bears down from the recent highs near 29 (28.4% and 28.9%). It is now matching its January and February lows. For reference, it hit a post-2002 high in that late June 2006 move (hit near 36%), eclipsing the March 2006 high (33%) and well above the 2005 highs that spawned new rallies (30% in May 2005, 29.2% in October 2005).

NASDAQ

Stats: +19.27 points (+0.76%) to close at 2557.19
Volume: 1.569B (-35.45%). Talk about extremes. Volume surged Thursday on the sharp sell off and then dried up on the rebound attempt. More sellers than buyers in the market right now, particularly on NASDAQ where price/volume action has shown more distribution than accumulation this week. After trying to show some leadership this month, techs are showing struggling price/volume action.

Up Volume: 1.149B (+842M)
Down Volume: 363M (-1.63B)

A/D and Hi/Lo: Advancers led 1.87 to 1. Not bad at all but pale in comparison to the Thursday thrashing.
Previous Session: Decliners led 3.15 to 1

New Highs: 89 (-15)
New Lows: 64 (+4)

NASDAQ CHART: http://www.investmenthouse.com/ihmedia/NASDAQ.jpeg

Gapped higher and managed to hold the move to the close. Hurrah. NASDAQ managed to hold above the February peak at 2531 (2525 closing) on the Thursday selling, and it did hold above the lows mid-month. That means it could possibly make a higher low here and resume the upside, but it has dug a hole for itself. It broke the trendline, it closed below the 10 day EMA Friday, distribution surged back onto the picture (on top of the three sessions in the prior two weeks). It has overcome this scenario before on this run, but it is again leaving it up to DJ30 and SP500 to do the heavy lifting.

A rather diminutive bounce by SOX (+0.55%) after the thumping Wednesday and Thursday. At least it held the 90 day MA after diving to that level. Of course it splashed the April breakout from its 6 month base, posting an impressive reversal. Chips are once again in the familiar position of having to recover.

SP500/NYSE

Stats: +8.22 points (+0.55%) to close at 1515.73
NYSE Volume: 1.226B (-30.76%). Lowest volume of the month and indeed since early April, not surprising for the Friday before Memorial Day. Some distribution Thursday as with all indices, but NYSE has not experienced the NASDAQ affliction in that regard.

Up Volume: 899.122M (+576.541M)
Down Volume: 313.244M (-1.124B)

A/D and Hi/Lo: Advancers led 2.27 to 1. Solid breadth even though just half of the downside shown Thursday. That was extreme. The upside breadth Friday was rational.
Previous Session: Decliners led 4.32 to 1

New Highs: 79 (-48)
New Lows: 32 (-12)

SP500 CHART: http://investmenthouse.com/ihmedia/SP500.jpeg

SP500 spent the week flirting with a new all-time closing high, breaking the old closing high (but not the intraday) on four sessions but could not hold the move despite assurances from the financial station jocks that it would happen. The watched pot had a leak in it. In any event the large caps bumped the upper channel along with that old high and fell back to near support at the 18 day EMA to regroup. Thursday was an all-out retreat, but it did hold near support and bounced Friday. Still comfortably above the up trendline and other than that repeated failure to take out the old high and the sell off Thursday it is pretty much business as usual in this uptrend. We will have to see what the new week brings and if it will recover yet again.

SP600 (+0.75%) was again a market leader Friday, bouncing off its up trendline. Just Wednesday it hit the upper channel line on the intraday high. Then the Thursday selling roughed it up as the energy sector had to take some lumps. Now it is testing the October/January up trendline. Thus far it has this trendline since coming out of the March correction, and if it can hold this week along with SP500 that bodes well for the market.

DJ30

DJ30 had its own case of the dips last week, but they were mild compared to the technology issues and even the small caps. It tested the 10 day EMA Thursday then bounced off that level Friday. Some distribution on the blue chips as well, but hardly any major volume. The Dow has enjoyed better upside volume than downside this month. In short, DJ30 is extended, but it is not showing signs of being extended. Hard to argue with that.

Stats: +66.15 points (+0.49%) to close at 13507.28
Volume: 183M shares Friday, a wisp of the 240M shares Thursday that was a notch above average. Some distribution but not a wanton sell off.

DJ30 CHART: http://www.investmenthouse.com/ihmedia/DJ30.jpeg

TUESDAY

A short week but a lot happening. A mountain of economic data starting with consumer confidence, FOMC minutes, Chicago PMI, the jobs report, personal income and spending, the ISM index. You name it, it is next week.

That is just an overlay to the market action that stumbled some last week. NASDAQ is facing a gut check after tumbling from its upper channel line it hit mid-week. A good run to that point and then it was sold hard Thursday, holding the February top that marks the breakout to a new post-2002 high on this move. Key point of NASDAQ. The other indices are in better shape, but if NASDAQ struggles that makes it harder on all of the indices.

It was likely not a one-day event, particularly with the build up over the past few weeks on NASDAQ. Of course, that has yet to slow the move thus far even with NASDAQ showing that distribution and giving up another attempt at leadership. It gets harder and harder to sustain gains the farther a market or stock runs. Recall how a stock runs after a breakout. It surges higher and then makes steady, regular bounces up the short term support. As it gets to the fourth iteration, however, the moves start to get a bit wilder in the moves, surging more but giving back more as the sellers start appearing more. Finally the buyers are not numerous enough to fight off the attacks and the stock then succumbs and has to correct more than the short term support. Kind of like a major mountain climb on the Tour de France where a contender loses his team and the other teams attack and attack.

As noted, thus far the market, and even NASDAQ, has warded off those attacks. There are still many solid stocks in position or just about in position to move higher, and as the market is made up of stocks and moves in accordance with the leaders, the fact that many quality stocks are hanging in and still setting up for upside moves is at least an indication the rally is not ready to go quiet into the night.

Remember our discussions the past month about the ‘new old economy’ stocks whose products are in demand by a robustly expanding global economy. The products are in demand because of growing global economies, and there is a lot of money to buy their stocks because of the growing global economies. For now it is a self-perpetuating cycle that has continued to push the indices, particularly SP500 and DJ30, higher and higher. DJ30 and SP500 did start to struggle as DJ30 moved to 10.7% above its 200 day SMA, something it has historically done. But it is really not laboring at all, at least from its reaction last week when NASDAQ cracked. If there is a paradigm shift taking place where the ‘old economy’ stocks on the SP500 and DJ30 form the 1990’s are now the ‘new economy’ stocks of the 2000’s (and tech stocks, at least the big names from the 1990’s, are ‘old economy’), then there is plenty more upside on this run. With DJ30 and SP500 still solidly in their uptrends, that is still on the table. Pretty cool.

Thus we are still looking at those stocks that are in the leading sectors (metals, energy, industrials, chemicals, etc.) that are in position or are getting close to a point where they will resume their moves. There are many out there, and we are looking at some more positions on current holdings on the report. We love averaging up into winners that have already made us money. We always have to take our cues from the market overall and the leaders, and there are signs to be wary, but if the market speaks through its strong leaders, you have to listen. Otherwise you can rationally talk yourself out of participating in great runs simply because you believe the market is extended. It may be, and it may be showing signs that is the case. If the leaders are moving and moving on volume, however, you have to move with them.

Support and Resistance

NASDAQ: Closed at 2557.19
Resistance:
The July/August trendline at 2568
2580 is the November/February up trendline
2580 is the May high
2590-95 from an April 1999 interim peaks
2607 is the top of the November/February channel
2778 from a July 1999 peak
2887 from a September 1999 peak
2920 from an October 1999 peak

Support:
2540 is a newer trendline from December/January that has propped up NASDAQ in April and twice in May. Interesting.
2531.42 is the February high (post-2002 high); 2525 intraday
2523 is price resistance November 2000
The 50 day EMA at 2517
2509 is the January 2007 high
2471 is the December 2006 high
2468.42 is the November 2006 high
2460 is the March high
2405 is the ‘hump’ high
2400ish from the late November and late December 2006 lows.

S&P 500: Closed at 1515.73
Resistance:
1520 from the September 2000 peak
The upper trendline of the channel at 1531
1528 close, 1553 intraday from March 2000 all-time index peak

Support:
1500 from April 2000 peak
The 18 day EMA at 1507
1501 is the late November to February up trendline
1496 is a peak from July 2000
The 50 day EMA at 1480
1475 from peaks in December 1999 and January 2000
1461.57 is the February 2007 high.
1440 is the mid-January high
1439 is the March high
1432 is the December 2006 high
1425 is an interim high from November 1999
1410 is the ‘hump’ high
1408 is the November high

Dow: Closed at 13,507.28
Resistance:
Now just 9.5% after the selling (hit 10.7% on the prior sessions) above its 200 day SMA

Support:
The 10 day EMA at 13,460
The 18 day EMA at 13,336
13,322 is the upper channel line in the November/February channel
13,245 is the November/February up trendline that marks the lower channel.
The 50 day EMA at 13,034
12,796 at the February 2007 high
12,700 is the early February peak intraday high
12,623 is the mid-January high
12,511 is the March intraday high.
12,499 is the December intraday high.

Economic Calendar

These are consensus expectations. Our expectations will vary and are discussed in the ‘Economy’ section.

May 29
- Consumer confidence, May (10:00): 104.5 expected, 104.0 prior

May 30
- Crude oil inventories (10:30): 1.9M prior
- FOMC minutes (2:00)

May 31
- Q1 GDP preliminary (8:30): 4.0% expected, 4.0% prior
- Initial jobless claims (8:30): 311K prior
- Chicago PMI, May (9:45): 54.3 expected, 52.9 prior
- Construction spending, April (10:00): 0.0% expected, 0.2% prior

June 1
- Non-farm payrolls, May (8:30): 140K expected, 88K prior
- Unemployment rate, May (8:30): 4.5% expected, 4.5% prior
- Hourly earnings (8:30): 0.3% expected, 0.2% prior
- Average workweek, May (8:30): 33.8 expected, 33.8 prior
- Personal income, April (8:30): 0.4% expected, 0.7% prior
- Personal spending, April (8:30): 0.4% expected, 0.3% prior
- Core PCE inflation, April (8:30): 0.2% expected, 0.0% prior
- ISM index, May (10:00): 54.0 expected, 54.7 prior
- Michigan sentiment, May final (10:00): 88.5 expected, 88.7 prior
icon url

ReturntoSender

06/07/07 10:38 PM

#7478 RE: ReturntoSender #6755

Technical Analysis: Selling Turns Intense
By Paul Shread

http://www.internetnews.com/bus-news/article.php/3682211

All-time highs continue to be a big problem for the market, whether it's the Dow, Wilshire or S&P — all three have now caused significant pullbacks in the market in the last year. The S&P doesn't have too much time left before the weakest months of the year, so if it can't clear 1527.46-1552.87 with conviction in the next month or two, we could be in for another "Fall fall." We don't think that time is here yet, though, and we'll cite rising fear indicators such as a spiking options volatility index (first chart) and the Nasdaq's pending buy signal under Gerald Appel's Nasdaq-NYSE relative strength ratio, which would become effective at tomorrow's close if it holds (charts two and three). Perhaps most importantly, the selling reached extremes today, with 90% downside breadth and volume on the NYSE. If we can get the reverse of that within the next few days, the correction may have run its course.

The Nasdaq has significant support at about 2532, with 2500 below that, and resistance is 2555, 2570 and 2581. The S&P (fourth chart) has support at 1487 and 1477, and resistance is 1500, 1506 and 1512-1514. The Dow (fifth chart) lost a whole lot of support today. Next up is 13,200 and 13,100, and resistance is 13,370, 13,424, 13,500 and 13,560. The 10-year yield (sixth chart) continues to price out rate cuts; above last summer's highs and it will begin to price in rate hikes.

Paul Shread is a Chartered Market Technician (CMT) and member of the Market Technicians Association


icon url

ReturntoSender

06/10/07 11:46 AM

#7481 RE: ReturntoSender #6755

InvestmentHouse Weekend Update:

http://www.investmenthouse.com/1weekendmarketsummary.htm

- Stocks bounce as shorts cover heading into the weekend.
- Is the bond rate spike artificial as well?
- Trade deficit drops unexpectedly as strong world economy and even the weaker dollar have their impact.
- Plenty of leaders in position to bounce but the selling has not yet shown its climax.

Shorts cover after three down sessions.

We were expecting the Thursday downside momentum to continue into Friday before the shorts started to cover for fear that too much of a good thing would lure in some more of that global money. It did continue as bond yields jumped further with the ten year hitting 5.12%. That, however, was all pre-market. Before the bell futures started to recover from the start of another down session. The trade deficit was much less than expected. Oil was falling precipitously, giving back all and more of the Thursday gain (closed at 64.52, -2.36). The federal deficit was even lower than expected as tax receipts continue to spike ($152B through May versus $227B in 2006). The dollar, riding the back of bond yields, continued to improve to levels not seen for many months.

That was enough to turn futures to positive and stocks opened higher. The sellers tried to take back the open in the first hour, but that obviously failed. Energy faltered after an early bounce, and that led to the downside test, but then the market, helped by early tech strength thanks to a solid NSM earnings report, led stocks higher even without energy's participation. When rumor hit in the early afternoon that X (US Steel) might be a takeout candidate by a foreign buyer (kind of ironic, huh?), the industrials kicked in their share and stocks really started higher.

The move sent the indices to close at session highs with 1+% gains across the board. Down close to 2% Thursday, sharply bouncing Friday. When the selling dissipates in a world of money, the turns occur quickly. This bounce evoked quite a bit of relief and commentary about a 'recovery' from the selling and other 'whew' type reporting. It is true that this rally has seen only 2 to 3 day pullbacks before the money just could not stand to move back in and take charge once more, and thus the positive commentary as the action seemed 'in line' with the rest of the rally.

Of course, each rally goes through life stages just as each stock does, whether upside or downside, and just because it happened before does not mean it will happen again. As we have noted, the rally was extended, and on Wednesday DJ30 broke through its 18 day EMA for the first time since March, and it crashed its old channel on Thursday. That is not 'in line' with the rally. NASDAQ and SP500 broke their uptrends. They found support at the 50 day EMA where you would expect them to at least make a stand, but their trends had held since recovering them in April. It is pretty clear the rally is getting its comeuppance, at least near term, as is inevitably the case.

The question is always how much it will have to give back. Technically the action Friday was negative. Higher volume selling on all indices, breaking trendlines, some struggles in the leader patch. Friday the indices rebounded with SP500 and NASDAQ bouncing off their 50 day EMA where the big money moves in to support stocks if they are still interested. That was a very good indication. It was backed by some decent breadth (2+:1) as most stocks recovered from the earlier beating.

Other than that the technical indicators were not very convincing. Volume tailed off rather dramatically from the prior selling session, falling well below average on NASDAQ after three downside above volume days. NYSE trade remained just above average; not bad given the Tuesday and Wednesday downside trade was average or less, but it was still dwarfed by the Thursday downside volume. That 2:1 breadth did not stack up to the -11:1 on NYSE Thursday. It was not bad, but when you start getting these wild swings in any indicator it means there is a fight ongoing that has yet to be resolved.

About the only thing that can disprove that is an immediate and strong turn to resume the trend. That may still happen, but Friday was not the day to show it. There is still some great leadership in position to move higher once more next week, and we will be ready if they do as this is the backbone to the market. The money has to come back in and drive the action with volume, i.e. showing that strong return to the trend. Until that happens you have to proceed in accordance with the strongest moves of late, and they are to the downside. Friday was a relief to many, but it was just a relief rally.

THE ECONOMY

Adjustments in mortgage portfolios aiding in bond yield rise.

There are many reasons bond rates are rising (meaning bonds are being sold) other than just the 'I' word that was bandied about last week. As we discussed Thursday, higher rates are not necessarily a bad thing in themselves as long as they don't rocket to 5.5%; that would change the dynamics of stock values unless earnings really shot back up. To some extent they are simply catching up with leading economic indicators as to where the economy is heading longer term.

There are other factors at play. One is rising global interest rates. The ECB hiked last week and New Zealand raised unexpectedly. Yields are rising around the world and that lures some money away from US treasuries though there is always a demand for the safe, stable US bond. This is not a dominating factor, but it is a factor.

There is also the adjustment factor with respect to portfolios. Recall the Greenspan 'conundrum' as to why rates were so low given good economic underpinnings and how he attributed some unknown quantity of this to world demand for US treasuries? The rest of the world economies were improving and providing excess cash (trade imbalances with the US) and surging oil prices left producing countries awash with cash. Some of that additional cash was being recycled into US treasuries, helping tamp down rates.

The sharp drop in treasuries last week (and the commensurate rise in rates) rattled the markets on many levels. Were foreign countries pulling out of the US after years of talk? Was inflation surging? Would this crimp the ability of private equity to borrow to make all of the acquisitions that help drive the market (an IMF official stated something to this effect Friday)?

As with the low rate conundrum, these probably all played a factor to some extent. The sharp drop in bond prices, however, suggests that something else was at work last week. Just as the low rates were somewhat artificially maintained through heavy foreign buying, the quick spike in rates last week was somewhat artificial as well. If you look, most of the rise was on the long end as the yield curve reverted rather nicely to 5.00% versus 5.12%. Still a flat curve but the gains were 2:1 or better at the long end. There are many huge mortgage funds and pools that maintain certain allocations of short and long term bonds as well as certain dollar amounts of bonds. When bonds start to rise or fall they have to adjust the allocations and their holdings. Last week there was something of a perfect storm of factors that turned some normal selling and adjustments into heavy selling. As bonds sold further the need to adjust increased and a snowball effect ensued.

Thus we are likely to see some moderation in this action. Typically when any security breaks a key resistance or support point the immediate push is to further the breach as required reallocations are made. Once the initial reallocation is completed, however, there is a rebound toward the mean. It may not get back there, but the action after the break tells you more abut the true move. Thus the spike will be tested as the pressures from the week balance out. Then we see the true move for treasuries. There is no question, however, that rates are a bit higher because the economy is solid and the bond market is projecting that future expansion.

Trade gap declines more than expected as oil demand offsets some price increase.

April's trade gap clocked in at $58.5B, down from $62.4B in March. Compared to the $63.5B expected, not bad. March was revised lower as well. Oil import prices were higher for the month by 8.1% but a 3% drop in oil consumption lowered the amount imported, dropping the value of imports by about $1B.

Exports rose 0.2%, moving higher now for 10 of the past 12 months, hitting record highs all the way. That is a positive for US businesses of course, and we want to sell as many goods as possible around the world. The weaker dollar is helping along with the overall stronger world economy, but we should not sacrifice our dollar and its attractiveness as an investment vehicle in order to up some overseas sales. A happy balance as with everything else is the answer, but the problem is no one agrees upon what that happy medium is.

THE MARKET

MARKET SENTIMENT

As fast as volatility jumped higher Thursday (+2.19), it gave it back Friday as stocks rebounded. Volatility suggests anxiety is rising, but it is well off the 21.25 hit in March. But face it; volatility is volatile. In February and March when it spiked on that selling it swung up and down in rapid succession.

With volatility it is the trend that is the key. For months and months (since August 2006) the trend was lower to flat as the market rallied off last summer's selling. It spiked in February and March, then settled back down as the rally resumed. Now just a couple of months later it is at it again. It is just a few sessions into this new move so there is no trend established with respect to this specific move.

As for the bigger picture, however, we see two jumps higher in relative short succession after a long dry and quiet spell. This is an indication that the overall market character in this long rally is trying to change as the move is not as steady. Just as a stock turns more volatile as it nears the end of a run, the same can be said with respect to indices. Thus this latest jump, if it continues, is not only an indication of a current increase in worry, but also potentially a bigger problem for the market as it heads into summer.

VIX: 14.84; -2.22.
VXN: 17.12; -2.18
VXO: 14.73; -2.28

Put/Call Ratio (CBOE): 1.12; -0.12

Bulls versus Bears:

Bulls: 52.2%. Down from 53.8% last week and 54.3% the week before. That was last week, however, and the downdraft this week will likely make a significant inroads into this but it won't push it down to 40ish where it needs to be. Of course given the indices were hitting new all-time highs, bulls are at a level you would expect. Still well off the 60% hit in December 2006. For reference it bottomed in the summer 2006 near 36%.

Bears: 22.8%. Good jump higher from 21.5% as it continues off the 20.7% hit two weeks back after spending some time below the 20% level considered bearish (19.6% the prior week). It is still well off the 27.5% hit 2 months back. The rally has taken the bears down from the recent highs near 29 (28.4% and 28.9%), matching its January and February lows. For reference, it hit a post-2002 high in that late June 2006 move (hit near 36%), eclipsing the March 2006 high (33%) and well above the 2005 highs that spawned new rallies (30% in May 2005, 29.2% in October 2005).

NASDAQ

Stats: +32.16 points (+1.27%) to close at 2573.54
Volume: 1.988B (-18.48%). Volume did not match the price gain, fading to below average and well below the Tuesday through Thursday selling volume. NASDAQ bounced, but there were far fewer participants.

Up Volume: 1.631B (+1.31B)
Down Volume: 331M (-1.773B)

A/D and Hi/Lo: Advancers led 2.12 to 1. Respectable breadth as NASDAQ 100 and NASDAQ matched their pace higher. Even with the -3.5:1 Thursday, the breadth was good enough. As noted, however, volume was not.
Previous Session: Decliners led 3.55 to 1

New Highs: 72 (-15)
New Lows: 61 (-30)

NASDAQ CHART: http://www.investmenthouse.com/ihmedia/NASDAQ.jpeg

NASDAQ held where it had to, tapping the 50 day SMA on the session low and bouncing to post a solid price gain. The move took it back to the 18 day EMA (2574) and back through the July/August 2006 up trendline. All in all a good move for the session and a good response to the selling. Bigger picture NASDAQ is in the process of building a head and shoulder; how this bounce plays out will tell more of that story. Suffice it to say that NASDAQ is very choppy the past three weeks. It was okay after that last pullback but this one was a little harsh and left it vulnerable. NASDAQ typically does not perform all that well in summer, and after this past week the pattern turned even more questionable.

SOX (+3.10%) enjoyed a super session as the NSM earnings bounced it right back up to the top of its range, the same one it broke out of in late April and then gave back. Despite this move we are not looking for SOX to provide any real leadership having failed that breakout. Indeed, if it fails at the top of its range again (493) we are looking to short it.

SP500/NYSE

Stats: +16.95 points (+1.14%) to close at 1507.67
NYSE Volume: 1.564B (-18.03%). Volume fell back, coming in just above average on a session that saw SP500 and SP600 rebound. It was not a bad volume session. Trade on the Tuesday and Wednesday selling was lower than the Friday rebound volume. Thus it was a bit better than NASDAQ as there has not been as much distribution and more buying on the rebound.

Up Volume: 1.342B (+1.238B)
Down Volume: 196.555M (-1.595B)

A/D and Hi/Lo: Advancers led 2.28 to 1. On any other day the 2.2:1 breadth would have been a solid performance. On the heels of an 11:1 drubbing it was rather anemic. As noted Thursday, that session's breadth was what you expect when you get extreme readings at the bottom of a sell off. That it occurred in the initial stages of some selling is less of an indicator, but we are not going to ignore that extreme, particularly as volume was not that horrible on NYSE as it sold back.
Previous Session: Decliners led 11 to 1

New Highs: 37 (-3)
New Lows: 97 (-7)

SP500 CHART: http://investmenthouse.com/ihmedia/SP500.jpeg

The large cap index surged back up off the 50 day SMA (1489) test. As with NASDAQ, that is what you would expect it to do if there was any life at all left in the index. The move took it up to the November/February trendline, the next important resistance point if the large caps are to continue the recovery. The Thursday selling was extremely harsh in many ways, but the overall move to that point was primarily positive. While SP500 is arguably due for a more sustained pullback after that long run higher from last August and just a 5 week base in the spring, you can also argue that following the breakout from that base the large caps put in a normal move up the 18 day EMA and are now making the deeper test to the 50 day EMA that sets up the next run higher. Its pattern in that respect is a bit better than NASDAQ, but it will have to show a break of the trendline on rising trade to be back in the upside game.

SP600 (+1.05%) bounced off its 50 day EMA as well, and that level is coincident with the September/January trendline, a nice double layer of ice as we noted Thursday night. That gave it the upward push that kept it in the channel on that lower but slightly above average volume. After breaking out of its channel the prior week, gravity set in. at this stage, however, it is still holding its trend, and how it reacts this week will be key for the rest of the market as the small caps assumed some leadership the past few weeks.

DJ30

DJ30 held some support at 13,250 and bounced cleanly, clearing its upper channel line once again. It did not even make the 90 point dip to test the 50 day EMA before making this rebound. Maybe it can continue this move upside after this test; it has landed on its feet more times than a cat. The pattern sure has turned heavy with last week's sell off, but as with SP500, after a run up the 10 day EMA following the April breakout from its short base, a deeper test at this juncture is a normal set up for a continued run higher. The severity of the selling on DJ30 as well as the other indices, however, warrants a does of caution this week as the indices fight out their issues.

Stats: +157.66 points (+1.19%) to close at 13424.39
Volume: 242M shares Friday versus the big 298M shares Thursday on that harsh selling. Volume remained above average, however, and stronger than the Wednesday trade. Thus Friday was no shrinking violet.

DJ30 CHART: http://www.investmenthouse.com/ihmedia/DJ30.jpeg

MONDAY

Friday allowed the market to come up for some air after three hard downside sessions in what amounted to a technical relief bounce as some shorts covered ahead of the weekend. The strength of the selling, the breaks of trendlines, and the weaker Friday rebound all make up a change in character in the move and suggest there is more to come in this round of selling. It can always simply continue back higher, shaking the week off as if it did not exist, but this move also comes relatively quickly after a sharp downside push in late May. As noted earlier, the frequency of these events tells you as much about the future action as the strength of the individual moves.

With expiration we are likely to see more volume moves on Tuesday and Wednesday as positions are squared ahead of Friday. The addition of last week's selling can exacerbate those moves as traders and funds have to make bigger adjustments. There is some important economic data such as retail sales and the Fed Beige Book on Wednesday, the PPI Thursday, and CPI, production and Michigan sentiment Friday. Thus we are not likely to see things calm down much, and given DJ30 and SP500 broke some important trends last week the action could be what you call interesting.

The start of a new week (and an expiration week) finds many tried and true leaders on the report in good position to rebound and start new moves. We are thus looking at many of those winners as potential new positions in the week ahead. If this was just a short term hiccup in the continuing move higher these stocks will provide that leadership once more as they come back up off of near support tests. If the selling resumes the Friday bounce has set up some better downside entry points; we like those where a stock breaks lower, tests, then fails that test. Basically the opposite of the first test of an upside breakout.

In sum, the market moves last week started to show a change in character from the liquidity and M&A driven rise that spurred the run from March. Interest rate issues were a cause and an excuse for sparking the selling, but after a long run higher the market was due at some point for more of a pullback than two to three days. After the initial rate scare we will see if those fears calm down and more normal action returns in the bond market. There are still many more positives than negatives for the economy and thus the stock market, and once this near term selling runs its course the longer term prospects still remain solid.

Support and Resistance

NASDAQ: Closed at 2573.54
Resistance:
2580 is the May high
2592 is the November/February up trendline
2590-95 from an April 1999 interim peaks
2613 is the top of the November/February channel
2778 from a July 1999 peak
2887 from a September 1999 peak
2920 from an October 1999 peak

Support:
The July/August trendline at 2568
The 50 day EMA at 2539
2531.42 is the February high (post-2002 high); 2525 intraday
2523 is price resistance November 2000
2509 is the January 2007 high
2471 is the December 2006 high
2468.42 is the November 2006 high
2460 is the March high

S&P 500: Closed at 1507.67
Resistance:
1510 is the late November to February up trendline
The 18 day EMA at 1515
1520 from the September 2000 peak
1528 is the March 2000 closing high
1553 high intraday from March 2000 all-time index peak
The upper trendline of the channel at 1540

Support:
1500 from April 2000 peak
The 50 day EMA at 1492
1475 from peaks in December 1999 and January 2000
1461.57 is the February 2007 high.
1440 is the mid-January high
1439 is the March high
1432 is the December 2006 high
1425 is an interim high from November 1999
1410 is the 'hump' high

Dow: Closed at 13,424.39
Resistance:
The 18 day EMA at 13,461
The 10 day EMA at 13,490

Support:
13,325 is the upper channel line in the November/February channel
13,240 is the November/February up trendline that marks the lower channel.
The 50 day EMA at 13,225
12,796 at the February 2007 high
12,700 is the early February peak intraday high
12,623 is the mid-January high
12,511 is the March intraday high.
12,499 is the December intraday high.

Economic Calendar

These are consensus expectations. Our expectations will vary and are discussed in the 'Economy' section.

June 12
- Treasury Budget, May (2:00): -$60B expected, -$42.9B prior

June 13
- Export prices, May (8:30): 0.4% prior
- Import prices, May (8:30): 0.2%
- Retail sales, May (8:30): 0.6% expected, -0.2% prior
- Retail sales ex-Auto (8:30): 0.7% expected, 0.0% prior
- Crude oil inventories: +1.1M prior
- Fed's Beige Book (2:00)

June 14
- Initial jobless claims (8:30): 309K prior
- PPI, May (8:30): 0.5% expected, 0.7% prior
- Core Ppi, May (8:30): 0.2% expected, 0.2% prior

June 15
- Current account, Q1 (8:30): -$202.50B expected, -$195.8B prior
- CPI, May (8:30): 0.6% expected versus 0.4% prior
- Core CPI (8:30): 0.2% expected, 0.2% prior
- New York PMI, June (8:30): 10.0 expected, 8.0 prior
- Net foreign purchases, April (9:00): $67.6B prior
- Industrial production, May (9:15): 0.1% expected, 0.7% prior
- Capacity utilization, May (9:15): 81.5% actual, 81.6% prior
- Michigan sentiment, preliminary, June (10:00): 88.0 expected, 88.3 prior
icon url

ReturntoSender

06/12/07 11:11 PM

#7486 RE: ReturntoSender #6755

From Briefing.com: 4:20 pm : Stocks tumbled Tuesday as a market increasingly sensitive to rising interest rates used the latest uptick in bond yields as an excuse to take some more money off the table. The S&P 500 paced the way lower among the majors as all 10 of its sectors closed sharply lower. Only four of the 147 S&P industry groups finished higher.

China's inflation rising at the fastest pace in more than two years exacerbated concerns about global tightening and was the initial spark behind the exodus out of Treasuries.

More unwinding of mortgage hedges and concerns that upcoming inflation data (e.g. PPI, CPI) may validate last week's sell-off in Treasuries also contributed to the rise in yields. In turn, that stirred concerns for equity investors that bonds will soon be seen as a more attractive alternative to stocks and that a continued rise in borrowing costs will slow down M&A activity.

The jump in bond yields undercut income-oriented sectors like Telecom (-1.8%) and Utilities (-1.5%) which were the day's biggest laggards. The rate-sensitive Financial sector (-1.1%), which held up rather well throughout most of the session, also got hit as the yield on the benchmark 10-year note closed at 5.24%, its highest level since May 2002.

Lehman Brothers (LEH 76.12 +0.44) kicked off the earnings season for Wall Street brokers on a positive note, handily topping expectations with record net revenues in all business segments. However, today's only notable earnings report was by no means enough to get overall buying efforts back on track.

The inability of the transportation stocks to take advantage of a nearly 1.0% decline in oil prices was also noteworthy. Railroads turning in one of the day's worst performances contributed to the 1.1% decline in the Industrials sector. The absence of leadership in Technology (-0.8%) also weighed on sentiment.

Semiconductors were in focus and actually turned positive intraday as Intel (INTC 22.20 +0.27) shareholders applauded a Bloomberg.com report that the Dow component plans to slash chip prices for its high-end processors by 50% as it works to regain market share lost to rival Advanced Micro Devices (AMD 13.80 -0.11).

An Intel spokesman wouldn't verify the accuracy of the article, citing company policy on pricing.

Separately, Texas Instruments (TXN 35.07 -0.72) merely narrowing its Q2 outlook last night failed to impress investors who are growing ever more skeptical about the Tech sector's potential to be a significant contributor this year to aggregate earnings growth on the S&P 500.

It is worth noting that the major averages briefly moved into positive territory a little after 2:00 ET when bonds showed some semblance of stabilizing after former Fed Chairman Greenspan said that he's not worried about China selling U.S. treasuries. However, the recovery in Treasuries was short lived and the higher rates climbed, the further stocks fell. DJ30 -129.95 NASDAQ -22.38 SP500 -16.12 NASDAQ Dec/Adv/Vol 2268/764/2.08 bln NYSE Dec/Adv/Vol 2870/444/1.55 bln

3:30 pm : The indices are spiking to afternoon lows going into the close as the strong inverse correlation between rising interest rates and falling stocks continues to hold true. Further underscoring the market's increasingly pessimistic tone today are gains of 7.8% and 4.1% on the VIX (CBOE Volatility Index) and VXN (CBOE Nasdaq Volatility Index).

Known as the "investor fear gauges," both indexes spiking higher suggest investors are actively buying put options in anticipation of further downside in stocks. Market internals also hold a decidedly bearish bias. As reflected in the A/D line, decliners on the NYSE hold a more than 5-to-1 edge over advancers while those on the Nasdaq hold a 3-to-1 margin.DJ30 -86.63 NASDAQ -17.41 SP500 -11.44 NASDAQ Dec/Adv/Vol 2272/761/1.70 bln NYSE Dec/Adv/Vol 2763/536/1.18 bln

5:57PM California Micro form 10-K posts slightly better financial results than previously reported Q4 and FY07 (CAMD) 4.68 -0.07 : Co released its Form 10-K, posting slightly better financial results than previously reported for Q4 and entire year of FY07, which ended March 31, 2007. Co previously reported Q4 Non-GAAP EPS of $0.02 on May 3. Co now notes that non-GAAP EPS is actually $0.03. The co also revised gross margin upward by ~$215,000. March quarter revenue remained unchanged at $15.5 mln compared to $17.4 mln a year ago.

4:53PM MathStar announces pricing of public offering of common stock at $1.60 (MATH) 1.85 -0.20 : Co announced the pricing of an underwritten public offering of 21,875,000 shares of newly issued common stock at $1.60 per share before underwriting discounts and commissions. MATH has granted to the underwriters a 30-day option to purchase up to an additional 3,125,000 shares of common stock to cover any over-allotments.

3:59PM Market View: Recent recovery attempt derailed by rising Yields (TECHX) : The stock market spent the previous two days in a recovery mode but this modest upswing was derailed by another jump in interest rates with the 10-Yr Yield setting a new five year high (30-Yr Yield at three year high). It is not the absolute level of interest rates as they remain low from a historical standpoint but rather the penetration of the 5.00% level in the 10-yr, which coincided with the break above a multi-year trendline signaling a potential change in trend that has the market on edge and currently in inverse lockstep with yields (click for chart). Sector pressure was virtually across the board (Tobacco +0.15%) with Steel -3%, Home Construction -2.5%, Railroad -2.2%, Coal -2.1%, Airline -2%, Trucking -1.9%, REITs -1.9%, Water (PHO -1.9%) and Broker/Dealer -1.5% pacing the way.

10:28AM Plexus announces COO, Paul Ehlers passes away (PLXS) 21.85 +0.07 : Co announces that Paul Ehlers, passed away on June 10 after a battle with cancer. Mr. Ehlers, who has been on medical leave since January 2007, served most recently as Executive Vice President and Chief Operating Officer of Plexus.

8:31AM Diodes raises Q2 low end of rev growth guidance range (DIOD) 35.98 : Co sees Q2 sequential revenue growth of 3-5% (roughly $94.8-96.6 mln vs $95.1 mln consensus)up from prior guidance of 2-5%.

8:00AM Broadcom to acquire Global Locate (BRCM) 30.74 +0.17 : Co announces that it has signed a definitive agreement to acquire Global Locate, Inc., a privately-held, fabless provider of industry-leading global positioning system and assisted G.P.S semiconductor products and software. G.P.S is expected to join Bluetooth and similar wireless technologies as a pervasive feature in next generation mobile devices. Global Locate's semiconductor solutions are used in mobile phones from leading cellular handset makers and incorporated into products from TomTom NV, the largest personal navigation device vendor in the world. The co expects the demand for G.P.S devices to increase dramatically as the deployment of G.P.S in mobile phones increases. The co expects to pay approx $146 mln net in cash at closing in exchange for all outstanding shares of capital stock and other rights of Global Locate. A portion of the consideration payable to the stockholders of Global Locate will be placed into escrow pursuant to the terms of the acquisition agreement. Additional consideration of up to $80 mln in cash will be reserved for future payment to the former holders of Global Locate capital stock and other rights upon satisfaction of certain performance goals. The co may record a one-time charge for purchased in-process research and development expenses when the closing occurs. The amount of that charge, if any, has not yet been determined.

7:31AM White Elec Designs gets $3 mln medical market contract (WEDC) 5.84 : Co announced that it has received a contract worth approximately $3.0 mln for the design and manufacture of a test strip for a blood monitoring application.

09:20 am Apple (AAPL)

While many people have come to think of Apple (AAPL) as a hardware company, at its core it's a software company that encapsulates its core competencies in world-class, truly innovative, and highly intuitive hardware designs. It's hard to think of another company in recent years that has had a greater impact on how people interact and consume entertainment.

With the excitement around the iPhone reaching a fevered pitch ahead of the launch, Apple focused on its roots at its recent Worldwide Development Conference (WWDC) on Monday. Apple's Leopard, a next-generation Mac OS X operating system (version 10.5), took center stage.

The bells and whistles in the latest version are raising expectations that Leopard could sustain the upward momentum the Mac has been enjoying, possibly sparking a replacement cycle amongst the existing Mac user base and more importantly bringing new users into the Mac world.

Also of note was the release of the Windows version of Safari, Apple's formerly proprietary Internet browser. The software, integrated across all Apple's products, could further drive Mac share gains. Safari, first created in 2003, boasts faster performance versus its rivals Firefox and Internet Explorer, along with secure surfing.

At the WWDC, Steve Jobs announced Safari 3 would run on Microsoft's (MSFT) XP and Vista and works with GoogleDocs and Gmail. There have been reports of bugs, which can be expected in a beta version, but the more important factor is that Safari puts Apple directly in front of consumers, increasing its mindshare by further parleying Apple's "goodness."

--Kimberly DuBord, Briefing.com

2:00 pm : A renewed wave of buying interest within the last 15 minutes, spearheaded by a turnaround in Technology, now has the major averages trading in split fashion. The 10-year yield still backing off its session highs, now standing at 5.19%, appears to be the most noticeable reason behind the resurgence in growth-oriented areas like Tech. In fact, the biggest reason behind the Dow recently turning positive has been a spike higher in Intel (INTC 22.45 +0.52).

Intel, which was already trending higher as shareholders applaud its plans to reportedly slash chip prices to regain market share lost to rival Advanced Micro Devices (AMD 13.97 +0.06), is now up 2.4%. Meanwhile, former Fed Chairman Greenspan was recently quoted as saying the global liquidity boom is near turning point, "enjoy it while you can."

08:24 am Texas Instruments (TXN)

Texas Instruments' (TXN, 35.79) mid-quarter guidance came in generally as expected and did little to alter our positive view on the stock. The company, which is one of the largest semiconductor manufacturers in the world, tightened its revenue and earnings guidance. The revised mid-point is slightly lower than prior guidance, causing some downward pressure on shares in the pre-market. Investors should take advantage of weakness to add to positions as the outlook for TI remains solid.

Revenue estimates went from $3.32-$3.60 billion to $3.36-$3.51 billion, suggesting sequential growth of 7.6%, and EPS from 39-45 cents per share to 40-44 cents for the second quarter. Reported strength in high performance analog, wireless handsets (high-end 3G), and DLP offset weakness in wireless infrastructure and calculators caused by the timing of ordering ahead of the third quarter back to school buying season. Inventories and orders point to a healthy end-market, in addition to a book to bill over one and stable lead times.

We became more constructive on the name back in January due to attractive valuations and an increasingly optimistic view of improved profitability due to product mix and operational and manufacturing efficiencies. Since then, shares have risen notably as the outlook solidified. TXN remains one of our favored stocks within the Technology sector. Shares trade at 20.6x forward earnings.

--Kimberly DuBord, Briefing.com
icon url

ReturntoSender

07/08/07 11:09 PM

#7516 RE: ReturntoSender #6755

Amateur Investors Weekend Stock Market Analysis (7/6/07)

http://www.amateur-investor.net/Weekend_Market_Analysis_July_7_07.htm
icon url

ReturntoSender

07/15/07 8:35 PM

#7524 RE: ReturntoSender #6755

InvestmentHouse Weekend Update:

http://www.investmenthouse.com/1weekendmarketsummary.htm

- Modest gains cap an important breakout week.
- Consumers get weary as June retail sales turn sluggish on steadily higher gasoline prices and housing weakness.
- Business sales are not slowing but are increasing.
- Thursday breakout trying to spread out the gains and improve a flattening A/D line.

Stocks add to Thursday gains in a quiet session.

After the Thursday fireworks you expected a quieter session, and that was Friday. Quiet but up. Retail sales were mushy after better than expected (but still so-so) same store sales. The sales report and a slight hangover from the Thursday blowout started the session indecisive, and an oil price topping $74/bbl intraday (closed at 73.93, +1.43) did not help. Nonetheless, after some morning chop the indices started a slow steady climb to positive territory. Nothing spectacular, but again, the fireworks were Thursday and the Friday session was more of a cleanup day.

The big news was Thursday with the strong breakout from the 7 week choppy, lateral move that threatened to break SP500. That move showed a bit of everything with its low volume ascents, its distribution, breaks of trendlines, faltering large cap and small cap leadership. It was also just two months out from the February and March 3% correction, and its proximity raised questions as to the market’s ability to continue the rally.

As in March, however, with that month’s low volume climbs punctuated by distribution sessions, the market weathered June’s short comings and broke to new highs. With the US economy on the rebound from its mid-cycle slowdown and continued world liquidity in the form of new wealth in India, China, Brazil, and of course petro-dollars requiring a home, the market found its bid once more, and found it in a big way.

Technically the Friday action was a non-event with lower volume, flat breadth and modest gains. Leadership was moving again, however, as GRMN, CMI and friends were on the move yet again. More than that, the moved broadened out as techs cemented their new leadership role and were even joined by SP500 as it found its legs, recovered, and then joined NASDAQ and DJ30 with its own new highs on Thursday and Friday. Even SP600 moved to a new all-time high. The move into tech while keeping, for the most part, with the existing leadership in energy, metals, materials and basically anything to do with the world infrastructure build out, was key. The ‘new’ growth stocks that have led this rally, i.e. the ‘old economy’ stocks of the 1990’s that are the ‘new economy’ stocks as the world builds out, are now joined by tech. That movement or rotation into other areas is crucial for the continuing success of the rally. The Friday numbers didn’t show it, but the pattern for the past three weeks does as NASDAQ held its trend and then rose to the first new high following the June malaise.

THE ECONOMY

Retail sales growth trend flattens.

Same store sales were better than pretty lukewarm expectations, but June retail sales overall were worse than thought. With expectations of flat sales, the -0.9% showing was quite disappointing. Take out autos and the damage moderated, but it was still -0.4% versus an expected 0.2% gain. That was the largest drop in 2 years, but then again, May was the biggest gain in over a year. March and May were much stronger than expected while April and June were much weaker.

The upshot is that the trend is still up but flattening as the mid-cycle slowdown came to an end. That is not as unusual as it sounds. The consumer moves in cycles just as other segments of the economy, and with oil prices moving into the seventies and gasoline prices holding just below the $3/gallon level, the consumer, just as women sometimes do, is getting weary.

Weary for now. The backdrop still shows a strong jobs front as many companies are finding it hard to attract the kind of talent they need. With a strong jobs market the consume rarely ceases spending. More than any other factor, the fear of the pink slip is what drives consumption. Gasoline and housing prices may have their impact, but if a consumer is confident about his or her job, lay your bets on continued consumption. It does not hurt that consumer sentiment remains strong. While sentiment and actual consumption are not directly correlated, it is good to see the consumer still confident, and indeed growing in confidence, as the Michigan sentiment final report for July indicated on Friday (92.4 versus the 85.3 prior).

Business sales continue to grow.

While the headlines Friday focused on the retail sales aspect, the market appeared to pick up on the other story that was the backbone of the Friday economic data: strong business sales. The consumer is important, but as we saw in the last recession, if you don’t have business spending you don’t have a good economy. In 2000 and 2001 the consumer was not running wild, but he was not slowing much either. With the post-September 11 home remodeling and cocooning effect, sales of homes and home-related merchandise prospered even as economic activity turned negative. The complete lack of business investment in the aftermath of the Fed-induced investment collapse left the economy gasping. There was no capital investment for three years, not until the second Bush tax cuts were passed that provided the incentive to buy equipment even though the real need was not there. That jumpstarted a new wave of investment and brought the economy back.

While retail sales were lower, business sales surged, up 1.3% in May or 16.5% annualized. Unlike retail sales, business sales are growing and growing and growing in strength. From December 2006, retail sales have posted annualized gains of 6.5%, 3.9%, 3.6%, 4.5% 11,7% and 16.5% in May. For the past three months that is 16.3% growth. Sure the economy needs both the consumer and retail to prosper, but with continuing strength in the business sector that means continued job creation. As discussed above, jobs equal consumer strength. Thus with businesses buying and investing, that is only good for the jobs picture. Thus we anticipate continued economic expansion. Indeed, looking at the ECRI indicator, it continues to post gains and predicts in the words of its compiler, ‘fairly healthy’ economic growth.

THE MARKET

MARKET SENTIMENT

VIX: 15.15; -0.39. Tuesday volatility spiked over the early June highs and Wednesday it gapped and touched near 18, the rough average high in the spike from early March. That combined with the late June spike to 19 did not match the March high just over 20, but it was enough to bottom out the June consolidation.
VXN: 16.44; -0.81
VXO: 15.05; +0.18

Put/Call Ratio (CBOE): 0.94; +0.18. Just a couple of closes above 1.0 on this last round of selling.

Bulls: 49.5%. Basically flat from last week’s 49.4%. Still high but well off the 53.8% three weeks back and the 56.7% five weeks back. The 55% level is considered bearish, and it topped that level on this last run. Still off the 60% hit in December 2006 but getting closer. For reference it bottomed in the summer 2006 near 36%.

Bears: 21.3%. Nice jump from 18.0% after hanging in that 18% range for three weeks. After hitting near 30% in March it has faded back in the subsequent rebound and this current selling is not jumping it higher. Still is holding lower and did not rise as it did in March. Well off the 27.5% hit in April. For reference, it hit a post-2002 high in that late June 2006 move (hit near 36%), eclipsing the March 2006 high (33%) and well above the 2005 highs that spawned new rallies (30% in May 2005, 29.2% in October 2005).

NASDAQ

Stats: +5.27 points (+0.2%) to close at 2707
Volume: 1.751B (-18.25%). Volume fell well off pace and back below average but as it has done all year, when it mattered, volume was up. Thursday trade surged above average and eclipsed the Tuesday selling volume. That shows that buyers dominated at the key time.

Up Volume: 931.044M (-942.624M)
Down Volume: 805.926M (+485.43M)

A/D and Hi/Lo: Decliners led 1.15 to 1. Up session but decliners led as the large cap techs posted a better overall session (0.55%).
Previous Session: Advancers led 2.48 to 1

New Highs: 123 (-44)
New Lows: 40 (0)

NASDAQ CHART: http://www.investmenthouse.com/ihmedia/NASDAQ.jpeg

NASDAQ started a bit softer then after a choppy morning session it climbed steadily into the close. New post-2002 high but that was about it. After the Thursday breakout from the trading range, who really cared? NASDAQ took the leadership role during the 7 week lateral move, something it tried to do in prior to the February and March correction. This time the move is sticking. With earnings coming out, the break higher the past two weeks has been building in those earnings, anticipating better than expected results. The consolidation led up to this break and now the earnings have to come through. You have to like the action NASDAQ showed this week.

SOX (-0.20%) was down on the session, but as with NASDAQ, you have to like the action it showed. It surged early in the week, continuing the breakout resumption. It made a higher low at the 10 day EMA and then blasted off Thursday. A big part of the NASDAQ breakout as well.

SP500/NYSE

Stats: +4.8 points (+0.31%) to close at 1552.5
NYSE Volume: 1.342B (-19.3%). Volume faded on NYSE as well as SP500 continued its recovery and breakout and SP600 pushed to a new high as well. The real story as we know was the Thursday breakout volume that surpassed the Tuesday selling volume.

Up Volume: 801.224M (-646.692M)
Down Volume: 513.027M (+308.278M)

A/D and Hi/Lo: Advancers led 1.1 to 1
Previous Session: Advancers led 2.65 to 1

New Highs: 236 (-56)
New Lows: 17 (-9)

SP500 CHART: http://investmenthouse.com/ihmedia/SP500.jpeg

Friday saw more upside but it was really a ‘do nothing’ session on the heels of the big surge higher. SP500 rallied past the all-time high at 1553, but faded modestly on the close. That is just a matter of taking it out this week. Volume was lower and well below average, breadth was flat, but the big moves were Thursday and they came with strong breadth, volume, and price gains. Super action when it counted that took SP500 off of the 50 day EMA test and the higher low at that level as SP500 followed NASDAQ and DJ30 higher. Now it has made the break to a new all-time high and its feet are back under it all ready.

SP600 (+0.26%) gapped lower but then recovered, posting a modest gain and edging out to a new all-time high. The small caps are still trying to regain their footing after stumbling and giving up leadership to the large caps as well as to the techs.

DJ30

The blue chips showed us the great breakout Thursday, capping that ever-improving pattern it was showing over the past two weeks. As we said at the time, but for the SP500 pattern we would have been really bullish on the Dow. As it turned out the bulls again proved they were stronger than the bears and the pattern improved and the breakout exploded higher. Friday was a low volume continuation move, adding a few points as an afterthought to the strong breakout.

Stats: +45.52 points (+0.33%) to close at 13907.25
Volume: 222M shares Friday was a pretty dramatic fade from the 300M shares Thursday, but as we noted above, the Thursday volume was what mattered.

DJ30 CHART: http://www.investmenthouse.com/ihmedia/DJ30.jpeg

MONDAY

The breakout is in the bag and now it is show time for the earnings. NASDAQ improved and broke to a new-post 2002 high ahead of the other indices, building in expectations of stronger earnings than what was originally believed. We wrote the past couple of weeks about earnings being stronger than expected what with the stronger quarter 2 GDP that was going to show up, and last week more and more were talking about this. Thus the big break Thursday as the market is now starting to suspect that companies performed better than originally expected.

Friday we got the further move higher after a mixed start, and we took some gain off the table as the market continued higher. As we noted last week, love taking gains as others drive up the price of the stocks and options we bought earlier. Now we have to look at what can still drive higher even after this 3-day run to end last week and make us money. Despite the blast higher Thursday there are still strong stocks that moved ahead of the overall market that are taking a breather, setting up for the next move. There are also others, thanks to the ongoing rotation, that are setting up for breakouts in the next wave of moves.

Earnings are always a wildcard; some surpass expectations and are rewarded, some don’t and are rewarded still, while others are sold whether they beat or miss. Much has to do with expectations as seen in Q1: things were expected to reek, and when the companies reported close to double digit gains once more the market rewarded them. This time 4.3% earnings growth looks light again and that is why we were writing about upside surprises. Last week it seems the market woke up to this and started the process of adjusting expectations through price moves.

That makes the season a bit more dicey than it was a couple of weeks back. Strong earnings will still be rewarded, however, and we are going to continue looking at stocks with solid earnings and sales growth rates that are also in good buying position. There are many good stocks out there making money and moving higher, but with many already logging good moves since the last test there are some to avoid simply because they need to let gravity do some work, pullback, and set up for the next break higher.

That is one reason you have to be careful following some buy recommendations on televisions shows. Often those stocks are mentioned because they have had good runs but that does not mean they are in good buying position at the time. In the worst case those touting them have positions and want some more buying to push them a bit further before cashing out. The usual case is an honest recommendation, just at the wrong time. There is other game you can hunt while the stock sets up for its next move. When it is ready then you move in.

That is what we do; we watch great stocks in great patterns and let them set up. When they make the move we make our move. Our goal is always to make money on the play but we also want to maximize our overall returns by moving in at the right time to catch the more explosive moves out of bases, off tests, etc. In that way our money works harder for us because we are in the stock when it is moving in our direction versus waiting for a base to end, etc. Of course we will let a strong move continue on, but we will also bank some interim gain along the way.

Back to this week and earnings. They kick off big time and we are going to see some big rewards and some big punishment just as we always do when expectations are mixed. More are expecting better gains, and that along with the move higher last week sets the bar a bit higher. That said, we are not going to stay away from all plays or cash out of positions simply because their earnings report is due and the market has rebounded well. This latest breakout is part of a larger trend higher after the 2006 and early 2007 slowdown, and if we have strong stocks in solid position to move higher we will take advantage of that when the opportunity arises.

Support and Resistance

NASDAQ: Closed at 2707.00
Resistance:
2778 from a July 1999 peak
2887 from a September 1999 peak
2920 from an October 1999 peak

Support:
2673 is the July high
2642 is the top of the November/February channel
2642 is the November/February up trendline
The 18 day EMA at 2641
2634.60 is the June peak
2601 is the mid-May intraday peak.
The 50 day EMA at 2596
2589 is the October/December/January trendline
2531.42 is the February high (post-2002 high); 2525 intraday
2523 was price resistance November 2000
2509 is the January 2007 high

S&P 500: Closed at 1552.20
Resistance:
1553 intraday high from March 2000 is the all-time index peak
1558 is the upper channel line from October/December 2006

Support:
1541 is the early June high.
1539 is the mid-June intraday high
1534 is the early July high
1528 is the March 2000 closing high
1531 is the late November to February up trendline
The 50 day EMA at 1510
1490.72 is the early June closing low
1475 from peaks in December 1999 and January 2000
1461.57 is the February 2007 high.
1440 is the mid-January high

Dow: Closed at 13,907.25
Resistance: At a new high so nothing holding it back other than gravity.

Support:
The early June high at 13,676 (closing), 13,692 (intraday)
The mid-June high at 13,689
The early July peak at 13,671
The 10 day EMA at 13,655
The mid-May peak at 13,556
13,535 is the upper channel line in the November/February channel
The 50 day SMA at 13,490
13,470 is the November/February up trendline that marks the lower channel.
The 50 day EMA at 13,414
The 90 day SMA at 13,080
12,796 at the February 2007 high

Economic Calendar

These are consensus expectations. Our expectations will vary and are discussed in the ‘Economy’ section.

July 16
- New York PMI, July (8:30): 17.0 expected, 25.8 prior

July 17
- PPI, June (8:30): 0.1% expected, 0.9% prior
- Core PPI (8:30): 0.2% expected, 0.2% prior
- Net foreign purchases, May (9:00): $70.0B expected, $84.1B prior
- Industrial production, June (9:15): 0.3% actual, 0.0% prior
- Capacity utilization, June (9:15): 81.5% expected, 81.3% prior

July 18
- CPI, June (8:30): 0.1% expected, 0.7% prior
- Core CPI, June (8:30): 0.2% expected, 0.1% prior
- Housing starts, June (8:30): 1.45M expected, 1.474M prior
- Permits (8:30): 1.49M expected, 1.52M prior
- Crude oil inventories (10:30)

July 19
- Initial jobless claims (8:30): 308K prior
- Leading economic indicators, June (10:00): 0.1% expected, 0.3% prior
- Philly Fed, July (12:00): 13.0 expected, 18.0 prior
- FOMC minutes, June (2:00)
icon url

ReturntoSender

07/16/07 2:41 PM

#7525 RE: ReturntoSender #6755

UTSI Bot 2000 shares@5.18

UTSI Charts in various time frames. Selling below book at near 52 week lows earlier today:


http://finance.yahoo.com/q/ks?s=UTSI

RtS


icon url

ReturntoSender

07/22/07 9:20 PM

#7531 RE: ReturntoSender #6755

icon url

ReturntoSender

07/26/07 4:56 PM

#7539 RE: ReturntoSender #6755

I believe we had the highest volume ever today on the NASDAQ. Some might believe that this could signal capitulation and an ultimate reversal. That is possible but usually market bottoms are formed well after the high volume capitulation takes place at even lower levels with very low volume.

Look back at the bottom in 2002 to see what I mean:


Tops are formed with high volume and a great deal of daily volatility. Ultimate bottoms are often formed much later under low volume as there simply are too few sellers left for the market to go any lower.

Volume leads though for the most part. At this point I am hesitant to buy too much of anything until the selling has clearly slowed. An up day tomorrow would not be surprising but an up day of over 3 billion shares to erase today's greater than 3 billion shares of selling?

That will not happen.

RtS
icon url

ReturntoSender

07/29/07 2:35 PM

#7546 RE: ReturntoSender #6755

Just noticed this was last week's...

Sorry, RtS
icon url

ReturntoSender

07/29/07 4:58 PM

#7547 RE: ReturntoSender #6755

InvestmentHouse Weekend Update:

http://www.investmenthouse.com/weekendmarketsummary.htm

- No one wanted to hold stocks ahead of the weekend.
- Some serious issues: Volatility, Frequency of the corrections, and key sector struggles (Financials, cyclicals, and transports struggling together).
- Rising volatility at market peaks is never a good sign.
- GDP solid, inflation low, consumer confident, but credit squeezes the financial markets.
- The key test for this correction is after the relief bounce to come runs its course.

Stocks try a weak rebound, get dumped late ahead of an uncertain weekend.

Futures were lower but the strong GDP coupled with low core inflation gave the pre-market a bracer, turning stocks higher on the open. Almost immediately, however, the market was sold as sellers used the bounce to move in. That rebound enjoyed a half-life of about 30 minutes. Michigan sentiment was released and it blew past the June reading, but it did not help the market. Another bounce over lunch into the last hour, another run by sellers sent the indices negative as NASDAQ peeled off 45 points from its early high, SP500 reversed 30 points, DJ30 260 points into the close.

Credit crunch fear piled on top of mortgage fears on the week, and that ignited the selling. The market held the sellers at bay even with the mortgage worries as it waited for earnings to come out better than expected. When that did not happen there was nothing to hold back the other problems from bubbling up. When the credit issues hit Wednesday and Thursday it was too much to hold back. Earnings finally came around (AMZN, AAPL, WFR, BIDU, CVX, etc.) but it was too late. The contagion fever infected the market and when that emotion laden virus hits, as with its human infecting cousins, it simply has to run its course.

A perfect selling storm.

It wasn't just credit contagion and mortgages, however. There was something of an induced unwinding of the carry trade. The New Zealand central bank raised rates with the primary goal of driving those using the NZ dollar as part of the trade out of the NZ currency. When you look at the action of the yen (the other part of the trade), treasuries, and gold, you could tell there was massive unwinding of this play. In the earlier correction this year there was a partial unwinding and that caused the market to struggle in the spring. This is a much more dramatic unwinding and it further undermined the market weakness.

That put the hammer to the market. Since the recent peaks DJ30 is down 5.3%, NASDAQ 5.9%, and SP500 6.2%. In the spring correction they fell 6.6%, 7.9%, and 6.7% respectively. The losses from the prior correction were hit on the second leg. If we get the bounce this coming week as we anticipate, we could have a very similar pattern to the spring correction in terms of the overall losses. That would also set up some great shorts for the next leg lower. How great depends upon how much of an upside rebound we get.

In the aftermath of the week we heard the usual from both sides of the fence. The bears were calling for more downside while the bulls were saying it was no time to panic. As for the bears calling for more downside, well that tells us this leg is getting close to its bottom. As for not panicking, are you supposed to wait for another 6% down and then panic? Ha! The idea was right though the delivery was less than artful. There is never a time to panic.

You always have to fight that urge, and as always, wait for the right moment and make your move. With the gaps lower last week there was not a lot you could do with some plays. Instead of bailing out on those at the bottom we are playing the percentages, i.e. looking for the rebound that typically lasts from 3 to 5 sessions. If a stock is holding a support level after this week, even a lower support level, it is likely to put in a good bounce on a market relief rally. That will at a minimum give us a better exit point, and some stocks will continue right on up, forming a good base and moving higher. That is why when we have this kind of volatile action we have seen we take interim gains on the way up. Indeed, we always like to take interim gains after a strong run, but when things are choppy there is all the more reason.

Technical issues.

Technically the action was grim once more. Volume was lower but after that huge Thursday selling spike anything seems lower. It was still well above average on both NASDAQ and NYSE. Breadth was still poor at -2:1 and better though that was way off the -13.5:1 seen intraday Thursday on NYSE. Stocks gave up a rebound attempt in the afternoon and closed at the session low. SP500 cracked the February peak as it dove lower again while SP600 broke the 200 day SMA on the close.

Beyond the session there are some disturbing features to this pullback that the prior corrections have not shown.

Volatility is rising at market peaks. After a long dormant period volatility jumped during the spring selling. No big deal there. It fell back but landed in a higher range. It rose modestly with the market as it recovered and then jumped again in the June turbulence. The market recovered and broke higher again and volatility dropped but it also moved higher with the market's gain.

We talked early in the year about volatility and when it becomes an issue warranting concern. We said to watch for rising volatility as the market rises as a sign of a more significant top. With volatility on a slow rise with the market and then shooting past the spring levels we have to watch closely how this next rally and subsequent down leg play out. It will likely be a good time to go to cash on the upside and then look for downside shots if we see volatility continue its trend higher during the next upside bounce.

Frequency of corrections is another issue. There was the summer 2006 correction and then the run into the spring where there was no correction, hiccup or otherwise. Two months later the June double bottom and a convincing looking breakout just over two weeks back. Then in July a sell off that quickly reversed the breakout and in its first week is already matching the spring downside fling. The market is having a harder time making upside moves stick, and a big breakout that is reversed in short order is never a good sign.

Leadership. There are still strong stocks across the market in excellent shape even after a week of heavy market selling. It is always a good sign when there are stocks that shrug off selling and go about their business such as CELG, NVDA, BG, etc. At the same time, however, financials are in the toilet and have been for all of July; some of them longer than that. Cyclical stocks (e.g. raw materials, durables, autos) are in the tank as well, starting their selling well before the past week's downside romp. When those two sectors decline in tandem history says beware as there may be something more serious ahead even if GDP looks good. Throw in some reports we are hearing from the truckers that tonnage never really picked up through the holidays after starting to decline in late summer 2006 (as we reported at the time) and indeed that some are saying there is a freight recession over the past six months, and you have some serious issues that historically do not bode well for the economy and thus the market. And of course, the market prices it in ahead of the economic news.

That said, after this week of selling, the size of the losses to this point, and the weak, disappointing close, the downside actually looks about tapped out on this leg. Another push down Monday and that would likely bring in some covering and a relief bounce. When that runs its course after roughly a week then we need to batten down the hatches and see how these massive undercurrents swirling through the world economies and markets plays out. Of course we will play the downside on that move and if it really breaks we will be able to take the rest of the summer off and then play the upside run on the backside of the year.

THE ECONOMY

Q2 GDP as solid as expected.

At 3.4% the first iteration of the second quarter output was better than the 3.2% expected, and blew away the meager 0.6% bump higher in Q1. Fastest growth since Q1 2006, not surprising since the economy suffered that mid-cycle slowdown the second half of that year.

There was some bad news in the report, however. Personal spending slowed to 1.3%, well off the 3.7% in Q4 2006 and Q1 2007. Even that 3.7% was revised lower. Government spending jumped to 4.2% from 1% in Q1, and government spending is not really a positive for GDP growth given government spending is inefficient to begin with and is made from tax dollars that were taken from the private economy. Moreover, exports jumped and imports fell, pumping up the GDP number but also underscoring the slowing consumption at home.

Offsetting the consumer slowdown was the continued rise in business investment. After slowing to end 2006 and the start of 2007, businesses started buying again, showing an 8.1% gain in the quarter, easily topping 2.1% in Q1 and -1.4% in Q4 2006. Indeed, those Q4 and Q1 readings really look to be the outriders because before that Q4 decline business investment rose 5.1% in Q3 and 4.2% in Q2.

In addition, inflation, at least at the core level, remained under control in Q2. Indeed, it improved over Q1. In Q1 the year/year core PCE was 2.4%, well out of the Fed's 1% to 2% 'comfort zone.' That hurt. The economy was slower with its 0.6% growth rate and yet inflation jumped. Stagflation comments were heard as Phillips Curve worshippers were dazed and confused. Then Q2 with its 3.4% growth rate and the core PCE fell to 1.4% year/year. How is that possible? We have covered this before: growth resolves inflation issues because supply is humming along and it is able to meet demand where it rises. When you have a slowdown in supply as seen in Q4 and Q1, that is when inflation pressures rise. That is why it is absurd for the Fed to try and slow the economy as a way of curbing inflation.

Sentiment rises but not as much as anticipated.

Michigan sentiment (final) for July clocked in at 90.4, down from the 92.4 originally reported but still a significant improvement over June's 85.3. This is the best showing in 5 months, reflecting a 9% jump in expectations and a more modest 2% increase in the present situation measure. The improvement is attributed to a bit lower gasoline prices, a solid labor market, and a better economic outlook versus the housing market slowdown. Interestingly, expectations are holding their trend higher, resuming the move after a June slowdown. Of the two components, it is always good to have a consumer looking for better times down the road.

Of course if the housing market was the drag in July, it will be a drag in August as well given the market worries related to it. On top of that the credit issues will be on consumers' minds. Not in the sense they understand that there is a worldwide credit squeeze right now, but more in the general sense that the stock market is selling as a result of that issue. That creates uncertainty in the consumer, and as with the investor, uncertainty tends to discourage buying.

THE MARKET

MARKET SENTIMENT

VIX: 24.17; +3.43. Volatility has now topped the March level just over 21. In one move it also bested the June 2006 peak at 23.81. Still in the first leg of the selling and already topping the level hit on the initial low in June. Now that brings up to key points. First, often the highs in volatility are hit on the initial selling as the subsequent bounce to test and the relieves some of the pressure that sent VIX higher and thus the second dip does not see as high a level. That happened in last summer's selling. It also happened in 2002 and 2003 when the early correction in 2003 off the late 2002 recovery jacked volatility back up. Thus with the percentage losses almost equaling those last summer and volatility topping that level, you could surmise this leg is almost spent and ready for a relief bounce.

Second, volatility started at a higher level on this run than it did back then. As discussed above, volatility is rising along with the market peaks. Thus it started from a relatively higher level and thus it could go higher here given its higher start. Not a big point, but it does put things in a bit more perspective.
VXN: 23.18; +3.68
VXO: 25.09; +3.32

Put/Call Ratio (CBOE): 1.38; -0.15. Fourth session above 1.0 on the close and again, well past 1.0 at that. Lots of put activity in S&P futures and on the SPY as well with 300% of the normal put volume Friday on the latter. Lots of bets on the downside from both the retail investor and the big money. With volatility spiking as well, this is helping gel a bottom.

Bulls: 53.9%. Rose last week from 52.3%, continuing the move higher from 49.5% and 49.4%, but it is going to change quite a bit after this past week. Hit 56.7% 7 seven weeks back. The 55% level is considered bearish, and it topped that level on this last run. Still off the 60% hit in December 2006 but getting closer. For reference it bottomed in the summer 2006 near 36%.

Bears: 18.0%. Right at the lows for the past two months, falling sharply from 19.3%. That is what that breakout did. Dow below the 20% threshold level considered bearish. Spent a month at 18%, well off the 30% hit in March. Well off the 27.5% hit in April. For reference, it hit a post-2002 high in that late June 2006 move (hit near 36%), eclipsing the March 2006 high (33%) and well above the 2005 highs that spawned new rallies (30% in May 2005, 29.2% in October 2005).

NASDAQ

Stats: -37.1 points (-1.43%) to close at 2562.24
Volume: 2.778B (-20.66%). Hey, volume was lower on the selling. Big deal. After record volume Thursday anything would be lower, and yet volume was still way above average, topping the prior month's trade outside of Thursday. No let up in the selling yet.

Up Volume: 508M (+74M)
Down Volume: 2.18B (-876M)

A/D and Hi/Lo: Decliners led 2.46 to 1. A rather calm reading after the flogging the A/D line took for the week.
Previous Session: Decliners led 4.69 to 1

New Highs: 65 (+1)
New Lows: 297 (-76)

NASDAQ CHART: http://www.investmenthouse.com/ihmedia/NASDAQ.jpeg

Another dive lower to the 90 day SMA, closing just below that level and breaking a bit lower than the Thursday low. About all you can say about the close is that it managed to hold above the lows in the May to June range. What a victory. NASDAQ was pounded, though this weekly loss was not as bad as in March. It is all relative as they say. NASDAQ is down but it also started at a better position than the other indices so it is still well above its early year highs. Nonetheless, it has given up its breakout and is struggling just as hard as the other indices. Despite that, there are technology stocks that are holding their own and that look good even in the selling (e.g. HPQ, NVDA).

SOX (-2.01%). Okay. Another try at the breakout gone bad. SOX looked invincible on this move, but nothing like 5 down sessions out of 6 to break up a nice run. SOX returned all of the early July gain, about 45 points, on the Friday close, and it fell below the May highs. Now it has to rebuild from the rubble.

SP500/NYSE

Stats: -23.71 points (-1.6%) to close at 1458.95
NYSE Volume: 2.233B (-19.84%). Volume was lower on NYSE as well but also the strongest in over a month ex-Thursday. A lot of distribution on the week, and likely a crescendo on Thursday with that record trade.

Up Volume: 406.09M (+300.227M)
Down Volume: 1.849B (-188.727M)

A/D and Hi/Lo: Decliners led 2.15 to 1. Wow. At -2:1 it was almost like a moral victory after -13.5:1 drubbing intraday. The advance/decline line has rolled over after flattening out for the past two months. Another issue confronting this selling bout, but it is not different from the summer 2006 selling when the A/D line did the same maneuver though it was not as protracted as the current flattening.
Previous Session: Decliners led 9.33 to 1

New Highs: 21 (-20)
New Lows: 400 (-343)

SP500 CHART: http://investmenthouse.com/ihmedia/SP500.jpeg

Another big downside session for SP500 capped its worst week of declines since September 2002. Dubious distinction. As we said, the selling in this first leg lower has almost matched that of the low on the second leg of last summer's sell off. A bit more virile this time around though it does have over 300 more points to play with. It was no easy slide as volume remained strong as SP500 closed on its low. Indeed, it cracked the longer term trendline that rose out of last summer's selling after tapping that level and rebounding Thursday. The move took SP500 just below its February peak (1465.30 closing), and that set off alarm bells on technical desks across the country. The 200 day SMA (1448) is just a morning's sell off away, and it seems very likely that SP500 will get there. We would not be surprised, however, to see it feint that way to start next week and then rebound ahead of it. If not, then a breach of that level that brings in more immediate selling, and then a big short covering binge.

SP600 (-1.51%) continued its clubbing as the small caps are sold off along with the rest of the market but also taking a bit more as people are looking toward large caps as the economic expansion reaches its mid-life crisis. On the close the small caps breached the 200 day SMA, the first index to do so. High praise indeed. Some support here at 410 but that is just minor support.

DJ30

The blue chips continued the downside as well, undercutting the Thursday intraday low and landing on the 90 day SMA (13,256) to close. While the cyclical and materials are selling, the technology stocks are, for the most part (e.g. IBM, HPQ), holding the line nicely. This matches the June twin lows. This is a very good point for DJ30 to try its initial bounce from this selling as the next support is the February peak at 12,786 closing. It will likely undercut the 90 day SMA early this week and then try the relief bounce to test before the next move lower.

Stats: -208.1 points (-1.54%) to close at 13265.47
Volume: 337M shares Friday, lower but no shrinking violet to end the week as the blue chips suffer selling from their cyclical and materials components.

DJ30 CHART: http://www.investmenthouse.com/ihmedia/DJ30.jpeg

MONDAY

A big week for a multitude of reasons. Earnings, earnings and more earnings. After an up and down start the earnings finally starting lighting up the scoreboard midweek, but it was too late; the window of opportunity had closed as the credit issues and missed deals as a result surfaced. The market waited and gave earnings a chance, but they were dilatory with the good results and next thing you know, 5% and 6% lower.

It is also a week of big economic news with personal income and spending, the PCE, Chicago PMI, ISM, and the employment report. Big news indeed. Of course the GDP report was huge as well and it failed to spark an oversold bounce on Friday.

The bigger near term news is the decline itself. Over the weekend all of the news stations will headline the decline, the talk shows will be slobbering over it, and the politicians will point to errant policies as leading to this correction (just as they did in March and last summer as well). Hmmm. Errant policies that led to huge growth and a resumption of the expansion after a mid-cycle slowdown. Cannot say we agree with all the policies out of Washington by a long shot, but the tax cuts were of the right type and at the right time to spur the recovery. After all, even Greenspan said so and therefore it must be true.

In any event, after all of this reporting there is often more selling to start the week as the retail investor calls his or her broker on Monday with the 'SELL!' order after hearing about all of the credit issues and the end of the M&A and buyback binge. If it is on television it must be true, and as things look to only get worse according to the reports it is time to get out while you still can. Thus some more selling and a further downside. After the news hits the local news and the non-financial talk shows, however, it is at the point of an extreme and after that final push lower a rebound can take place.

As noted above, however, we are not looking at this as the final downside leg on this selling. It is just a strong first leg to the downside, and after a relief move we look for another leg to test. As we said last summer and again in the spring selling, it sounds too pat, but human emotion tends to play out in the same manner again and again.

We will remain as calm as possible and look for the rebound. There are some stocks that have pulled back but are still in strong position. There are others that bucked the market. We will put those on the report and be ready of they show solid moves and we get a market rebound. They were strong in some heavy selling, and should shine as the market rebounds.

The big issue after that is whether the market continues higher or rolls back over. We expect a rollover but the market can always surprise you. If it continues higher, great. In the likely event it stalls out at the old trendlines or the June highs on NASDAQ or DJ30, and 1500ish on SP500 we will close up most upside positions and look to play the downside leg. That could be quick if this is just another interim correction. If those issues outlined in the summary (volatility, leadership, frequency of the corrections) are coming home to roost it could set in for a longer period. Thus we use the upside for the strong stocks that weathered the selling, close some rebounding positions on the relief move when it starts running out, then play the downside for what it is worth and see if a second bottom can form near the initial bottom.

We still view the overall picture as solid with the economy expanding nicely, but the contagion virus has found an opening and it will allow other issues in. We will see just how strong the market is as it weighs the logs in the road in the way of the expansion. Just for reference, ECRI, a very reliable economic forecaster, saw its weekly index dip modestly (143.7 versus 143.9), but its 4-week annualized growth rate moved up to 6.4%. That shows solid though not spectacular growth. The leading economic indicators are still expanding nicely, but some market indications suggest there could be a deeper problem this time around than last summer or this spring. Thus we will be a bit cautious and use the rebound to close stocks that rebound but don't blast off again and then be ready for the second downside move, the most important move if the relief bounce turns into something unexpected.

Support and Resistance

NASDAQ: Closed at 2562.24
Resistance:
2567 is the 90 day SMA.
2601 is the October/December trendline
2601 is the mid-May intraday peak.
The 50 day EMA at 2617
2634.60 is the June peak
2655 is the November/February up trendline
The 10 day EMA at 2660
2673 is the early July high
2725 is the July high
2778 from a July 1999 peak
2887 from a September 1999 peak
2920 from an October 1999 peak

Support:
2531.42 is the February high (post-2002 high); 2525 intraday
2523 was price resistance November 2000
2509 is the January 2007 high
The 200 day SMA at 2486

S&P 500: Closed at 1458.95
Resistance:
1461.57 is the February 2007 high.
1475 from peaks in December 1999 and January 2000
1490.72 is the early June closing low
The 50 day EMA at 1516
The 10 day EMA at 1522
1534 is the early July high
1539 is the mid-June intraday high
1541 is the early June high.
1542 is the late November to February up trendline
1553 intraday high from March 2000 is the all-time index peak
1562 is the upper channel line from October/December 2006

Support:
1465 is the July 2006/March 2007 up trendline
1440 is the mid-January high
The 200 day SMA at 1448
1427 represents some interim peaks from December 2006

Dow: Closed at 13,265.47
Resistance:
13,545 is the November/February up trendline that marks the lower channel.
The 50 day EMA at 13,529
13,595 is the upper channel line in the November/February channel
The mid-May peak at 13,556
The 10 day EMA at 13,667
The early July peak at 13,671
The mid-June high at 13,689
The early June high at 13,676 (closing), 13,692 (intraday)
The July high at 14,022

Support:
13,121 is minor support from the April peak
The 90 day SMA at 13,256
12,796 at the February 2007 high
The 200 day SMA at 12,749

Economic Calendar

These are consensus expectations. Our expectations will vary and are discussed in the 'Economy' section.

July 31
- Personal income, June (8:30): 0.5% expected, 0.4% prior
- Personal spending, June (8:30): 0.1% expected, 0.5% prior
- Core PCE, June (8:30): 0.2% expected, 0.1% prior
- Employment cost index, Q2 (8:30): 1.0% expected, 0.8% prior
- Chicago PMI, July (9:45): 59.0 expected, 60.2 prior
- Construction spending, June (10:00): 0.3% expected, 0.9% prior
- Consumer confidence, July (10:00): 105.0 expected, 103.9 prior

August 1
- ISM Index, July (10:00): 55.5 expected, 56.0 prior
- Crude oil inventories (10:30)

August 2
- Initial jobless claims (8:30): 301K prior
- Factor orders, June (10:00): 1.3% expected, -0.5% prior

August 3
- Non-farm payrolls, July (8:30): 135K expected, 132K prior
- Unemployment rate, July (8:30): 4.5% expected, 4.5% prior
- Hourly Earnings, July (8:30): 0.3% expected, 0.3% prior
- Average workweek, July (8:30): 33.9 expected, 33.9 prior
- ISM Services, July (10:00): 59.5 expected, 60.7 prior
icon url

ReturntoSender

07/29/07 5:55 PM

#7548 RE: ReturntoSender #6755

icon url

ReturntoSender

07/30/07 11:15 PM

#7553 RE: ReturntoSender #6755

From Briefing.com: 4:20 pm : A day after the Dow, S&P 500 and Nasdaq plunged 1.5% on average, and turned in their worst weekly performances in more than four years, it wasn't overly surprising to see stocks exhibit some sort of a bounce.

However, while today's relief rally was commendable, especially since the beaten-down Financial sector (+1.2%) finally garnered some much needed interest from buyers, the S&P 500 and Nasdaq struggled to even halve Friday's sizable declines.

Before the bell, fears of a possible credit crunch signaling an end to the LBO buyout boom was further echoed by the fact that today didn't mark a Monday of any blockbuster deal making. The day's biggest deal involved Ingersoll-Rand (IR 51.68 +3.54), which agreed to sell some of its business units (e.g. Bobcat) for $4.9 bln in cash. That helped renew some enthusiasm throughout the Industrial sector (+1.5%), but the recent downturn in equities reflecting legitimate concerns about tightening credit conditions was still fresh on investors' minds.

That is until a handful of positive developments began to hit the wires shortly after the afternoon session got underway. A surprise upgrade on Morgan Stanley 's (MS 64.45 +0.08) credit rating, which was raised to "AA-/A-1+" from "A+/A-1" at Standard & Poor's, was the initial catalyst restoring confidence on Wall Street.

Investors also embraced reports that Chicago's Citadel Investment Group is buying the credit positions of Sowood Capital. The Boston-based hedge fund said Friday its bonds lost value as investors fled riskier debt used to fund LBOs; and Citadel's interest suggested there's still plenty of liquidity waiting to be put to work.

Finally, with subprime concerns also acting as a headwind of late, some reassurance on that front gave the market an added boost late in the day. GMAC, which posted a $305 mln loss for Q1 after its home lending unit (ResCap) showed an increase in defaults on subprime loans, reportedly said it had a Q2 gain of $293 mln. The belief that GMAC's upbeat results will bolster earnings for Dow component General Motors (GM 32.62 +1.52), which reports tomorrow morning, fueled a rally throughout the underperforming Auto group and helped keep a bid in a market that languished all morning and, at best, was shaping up to be another victory for the bears. BTK -0.3% DJ30 +92.84 DJTA +1.1% DJUA +0.8% DOT +0.9% NASDAQ +21.04 NQ100 +0.9% R2K +0.8% SOX +1.7% SP400 +0.9% SP500 +14.96 XOI +1.7% NASDAQ Dec/Adv/Vol 1367/1706/2.15 bln NYSE Dec/Adv/Vol 1263/2059/1.86 bln

4:34PM Ixys reports 1Q07 results; expects 2Q07 revs to be relatively flat compared to the June quarter (IXYS) 8.70 +0.26 : Co reports 1Q07 EPS of $0.13, excluding credit adjustments of $4.8 mln and $36.8 mln, vs $0.07 Reuters consensus; revs $75.9 mln vs $71.26 mln Reuters consensus. "We plan to continue buying back shares under our authorized stock buyback program," commented Uzi Sasson, COO and CFO. "Looking forward, we continue to work on improving margins, reducing costs, and building more customer relationships, with the expectation for further company growth. That being said, we typically experience some cyclical weakness during the summer months, especially in Europe. We therefore project revs for the Sept 2007 quarter to be relatively flat as compared to the June quarter."

4:19PM Pixelplus reports 2Q7 results; co expect 3Q07 rev to be greater than revs in 2Q07 (PXPL) 1.53 +0.23 : Co reports 2Q07 EPS of ($0.14) vs ($0.13) Reuters single analyst est; revs $6.1 mln vs $5.90 mln Reuters single analyst est. The Company expects its revenues in the third quarter of fiscal 2007 to be greater than its revenues sustained in the second quarter of fiscal 2007.

4:13PM Advanced Analogic Tech misses by $0.04, issues mixed Q3 guidance (AATI) 9.47 +0.62 : Reports Q2 (Jun) loss of $0.02 per share, $0.04 worse than the Reuters Estimates consensus of $0.02; revenues rose 18.3% year/year to $25.8 mln vs the $24.2 mln consensus. Co issues mixed guidance for Q3, sees EPS of $0.00-$0.02 vs. $0.04 consensus; sees Q3 revs of $26-$28 mln vs. $26.14 mln consensus. For the second half of 2007, the co estimates revenue in the range of $53-$56 mln.

7:15AM KVH Industries announces a 1 mln share repurchase program (or approx 6.7% of the co's outstanding stock) (KVHI) 8.60 :

6:32AM Photon Dynamics acquires Salvador Imaging (PHTN) 10.51 : Co and Salvador Imaging announce that PHTN has acquired all of the outstanding shares of Salvador Imaging in exchange for approximately $20,000,000, of which $8 mln is in cash and the balance in PHTN common stock.

6:31AM Amtech Systems announces $4.9 mln follow-on solar order (ASYS) 10.78 : Co announces it has received a $4.9 mln follow-on solar order for diffusion processing systems from the solar cell industry.

09:56 am QLogic: Needham & Co downgrades Buy to Hold. Needham downgrades QLGC to Hold from Underperform saying suspected, QLGC is not seeing the growth in FCswitches needed to offset slowing growth in Host products (due to a mix shift) and declines in Silicon. The firm says they are changing their rating due to a lack of growth drivers but would expect the stock to have limited downside as QLGC's core business remains highly profitable and steady.
icon url

ReturntoSender

08/05/07 12:05 PM

#7561 RE: ReturntoSender #6755

InvestmentHouse Weekend Update:

http://www.investmenthouse.com/weekendmarketsummary.htm

- Market was holding its own into the weekend until Bear Stearns stirred the bears.
- The interesting side of this volatility.
- Will the Fed try to nip the credit problem in the bud?
- Taking the jobs report with a healthy dose of salt.
- Rollover from a modest bounce paves way for another quick test lower, but will the Fed take that action?

Relief bounce short-circuited by Bear Stearns ‘calming’ conference call.

Stocks recovered Wednesday in a big way from further selling, making the shorts scream as loud as the longs prior to that bounce. Thursday was a modest but steady rebound, continuing the bounce back from the selling that took SP500 down to test its 200 day SMA. Friday started off modestly, but it continued the upside move as well with some back and forth trade that broke to the upside ahead of lunch.

Not bad as the market had to overcome some less than solid jobs growth and a weaker than expected ISM services report. Of course the jobs report was skewed: it reported education lower (summer break?) but no one believes there are fewer teachers out there. Thus the market saw through the lower numbers and recovered. Sure the sellers took their obligatory shot, sending the decent open to negative after the economic reports, but the indices set up an intraday reverse head and shoulders and bounced out of that weakness. Good move, but we noted in a midmorning alert that it was Friday, and the key for the market was how it held into the close on a Friday in a market with an inferiority complex.

Then BSC had its conference call, the one that was going to explain the problems with now its third hedge fund gone bad. It did that, reassuring analysts and investors the company had plenty of funds to ride out a ‘perfect storm’ of bad events. When an analyst then asked whether the company would buy back some of its stock, however, the CEO hedged, saying that the company wanted to preserve liquidity. Ouch. That was interpreted by many along the lines of ‘if BSC won’t buy its own stock then why should I . . .’ It did not help that the reluctance to buy back shares was followed up with comments as to how the debt market was the worst it had been in 22 years (1985). Nice. Good job of allaying investor fears big guy.

Shockingly the market dove lower after those reassuring comments. The market had taken a lot of bad news with a lot of it coming out on Wednesday, the day the market sold but then reversed for gains. Looked as if it had taken its fill of bad news and was sold out. After Bear Stearn’s left-handed ‘assurances,’ however, the market showed it could still sell out to the highest bidder, or indeed any bidder as the indices sold off at a 45 degree down angle.

Sell programs started to hit, and with no uptick rule in place anymore (used to be you could only sell shot on an uptick in a stock or the market) the selling snowballed. The programs built on one another, feeding the downside cycle. There was already a bias to get out ahead of the weekend, and BSC was the catalyst to go ahead and just do it. Equities sold off but bonds surged with a rush to safety. That drove yields lower with the 2 year at 4.50% and the 10 year down to 4.67%. Even a further peel back by oil (75.16, -1.70, down from 78.77 earlier in the week) did nothing to slow the selling.

Technical. As noted, the market was working on a third up side session (at least it covered 3 sessions) in what we anticipated to be about a week of a bounce. Then it reversed and sold off to close at the low. Poor intraday action and with the rollover that relief bounce was dumped. The charts show the story. DJ30 rolled back down through the 90 day SMA and closed at a new low on this leg. SP500, after rebounding from its 200 day SMA Wednesday, blew that apart Friday, closing 17 points below that key level. The large caps are in the midst of a major dive lower. Not that the small caps are any better, but it is very interesting that the ‘time for the large caps’ as many are saying sees those stocks as some of the hardest hit in the market. As for NASDAQ, well it still has some stocks showing relative strength, but it was not spared Friday as it fell back from the 90 day SMA and is set to test its 200 day SMA only 19 points further down. Of course volume was up and breadth was atrocious (-5:1 NYSE) as stocks distributed and the advance/decline line continued to roll over.

The move left DJ30 down 6% from its peak while SP500 and NASDAQ are both down 8% from their recent highs. Not major corrections but much lower than the spring fling. SP500 has corrected 8% from its peak hit in mid-July. That is the extent of its correction in summer 2006. DJ30 has faded 6% from its recent high; it corrected 8.4% in the summer 2006. NASDAQ at 8% is a piker compared to the 15% it lost last summer. Ironically, NASDAQ was a leading index heading into late July and looked to give support to the rest of the market. This last week put it in the ranks of SP500, however, and that index has been the weakest of the big three.

Another look at volatility.

That raises an interesting point regarding volatility. You cannot turn on a financial station without hearing about how volatile this market is. We have discussed it as well, noting in June that day to day volatility was on the rise with large point swings up and down occurring on the heels of one another. It was also rising as the indices hit higher peaks. Those are troubling signs for the market and they led into the current selling.

Volatility has also risen as judged by the VIX. Wednesday it just over 26, topping the summer 2006 highs. It was no slouch Friday, hitting a closing high on this run and it too topped the summer 2006 highs. The VXN, the NASDAQ volatility index, however, has yet to top the summer 2006 levels and it took the Thursday intraday blast higher to top the spring selling levels.

No big deal, right? Wrong. We noted NASDAQ was the leading index in the last part of the rally before the selling started. It eventually sold off hard, but at the same time technology has some leaders that are refusing to give up much ground. While SP volatility has shot past the prior levels on this selling, NASDAQ and tech volatility is no worse than it was in the summer 2006 or in the spring. What that means is that for one of the rare times in the market the SP500 volatility is greater than technology.

It rarely happens that SP500 volatility exceeds the more speculative NASDAQ. Typically it lasts for a few sessions. This past week it was for an entire week. This is out of whack and it is being caused by the meltdown in the financial sector on the sub-prime and credit contagion fears.

What this tells us is two things. One, this is an extraordinary event, not just a market pullback associated with a long climb that needs correcting. It was, but it has morphed into a massive fear of the unknown, impacting all financials and thus the SP500.

Two, it likely won’t last. Historically these volatility events that see SP500 jump ahead of the other indices are short term. Of course you have to ask why. In some notable instances the Fed has acted as a stop gap. Why? Because the Fed is keenly aware of the financial sector of the economy, and if credit collapses the Fed knows the risk of recession triples. It also knows that you get hair-brained members of Congress trying to pass laws to ‘protect’ everyone (the most recent is Senator Schumer’s bill last week) but they only worsen the situation by locking down the housing and credit markets longer than they would be if the market is left to its own devices. We talked about this in May, and it is laughable but for it being so sad that our esteemed leaders are going to make the same mistakes they have made in the past. Thus the Fed is pressured to step in.

THE ECONOMY

Will the Fed cut or won’t it? A continuing discussion of the contagion effect.

The contagion threatens to extend further just as Congress threatens to clamp down. Thus the Fed is faced with an unpleasant choice: let the credit conditions worsen and risk a recession or cut rates and risk a dollar plunge. Some are predicting a rate cut on Monday ahead of the FOMC meeting and then use the meeting to explain the reasons. It could come Tuesday as well at the meeting.

There is a big philosophical debate ongoing as to whether the Fed should ‘bail out’ lenders that made bad loans. Unfortunately it is not that simple. That market has taken care of a lot of those that made the bad loans already. The issue is how far this spreads out beyond the initial wrongdoers. The sub-prime issue is contained. The credit contagion is not because the cat is out of the bag, the camel’s tent is under the nose, etc. It has made it out and how far it goes without being forcibly restrained is the unknown.

Thus even though there is a desire to let those that screwed up work it out themselves, the reality of a contagion situation is that it feeds on itself and spreads tendrils everywhere, even in areas that had nothing to do with it. The world runs on credit, and if it is vapor locked the world economies do likewise NO MATTER HOW FUNDAMENTALLY STRONG THEY WERE AT THE START OF THE CONTAGION. That is why one high ranking former Fed official has said that the academic argument is interesting, but reality does not allow the ‘punish the wrongdoer’ argument to play out. No one in the Fed’s position dares to test out that theory.

Still there are stupid central bankers from New Zealand (sorry goes out to my relatives there) who are taking on the carry trade that is using New Zealand dollars just for the reason they don’t like the currency being used for that reason. There is Schumer here in the US. As is always the case, the lawmakers are behind the times, indignant over the past, fighting the last battle. As with the 1929 US central bank and the 1999 Greenspan Fed, they push the wrong policies at exactly the wrong time and cause the system to break.

The question the Fed has to ask itself is whether it feels lucky. If it takes that role of the dice it will need some luck with respect to the dollar, but it may be willing to take that risk as opposed to taking potentially greater chances with the spread of this mushrooming credit issue.

THE MARKET

MARKET SENTIMENT

VIX: 25.16; +3.94. Surged back up to a new closing high, moving past the summer 2006 high and reaching those April 2003 levels again when it was on the decline after the peaks hit in late 2002 and the market was rallying out of that bear market. By recent standards it is streaking higher. By historical standards it is still low.
VXN: 24.42; +3.18
VXO: 26.42; +4.74

Put/Call Ratio (CBOE): 1.47; +0.37 Ten sessions above 1.0 on the close. As noted last week, this is at the point where it is showing extreme pessimism.

Bulls: 47.2%. Quite a plunge from 53.9% last week, just short of the peak of the recent run higher in positive sentiment 56.7% hit two months back). Getting there but still needs to drop below 40% to really show the kind of dent in optimism that stronger runs are built upon. The 55% level is considered bearish, and it topped that level on this last run. Still off the 60% hit in December 2006 but getting closer. For reference it bottomed in the summer 2006 near 36%.

Bears: 26.4%. The bears came out bawling, blasting higher from 18.0% last week and just over 1 point off of the 27.5% in April and the quickly closing in on the 30% hit in March. Amazing what contagion fears will do to investors. For reference, it hit a post-2002 high in that late June 2006 move (hit near 36%), eclipsing the March 2006 high (33%) and well above the 2005 highs that spawned new rallies (30% in May 2005, 29.2% in October 2005).

NASDAQ

Stats: -64.73 points (-2.51%) to close at 2511.25
Volume: 2.535B (+3.15%). Renewed the plunge lower on rising and continued above average volume.

Up Volume: 274M (-1.328B)
Down Volume: 2.146B (+1.339B). -8:1 down over up volume.

A/D and Hi/Lo: Decliners led 4.26 to 1. Very heavy downside breadth as the techs were slaughtered along with the financials and other SP stocks.
Previous Session: Advancers led 1.29 to 1

New Highs: 78 (-5)
New Lows: 394 (+198)

NASDAQ CHART: http://www.investmenthouse.com/ihmedia/NASDAQ.jpeg

SP500/NYSE

Stats: -39.14 points (-2.66%) to close at 1433.06
NYSE Volume: 2.057B (+4.04%). Volume jacked higher on NYSE as well as SP500 and SP600 tanked through important support. More massive dumping after a modest bounce higher.

Up Volume: 116.59M (-1.097B)
Down Volume: 1.936B (+1.203B). Truly impressive downside trade. Truly impressive. As with the volatility, you just don’t see these levels often.

A/D and Hi/Lo: Decliners led 4.97 to 1. Pretty amazing as well.
Previous Session: Advancers led 1.89 to 1

New Highs: 50 (+1)
New Lows: 390 (+170)

SP500 CHART: http://investmenthouse.com/ihmedia/SP500.jpeg

Held the 200 day SMA (1443) on the Wednesday test but then gave it up like a bad habit Friday, blowing out that support on another jump in volume, a strong jump. There is some support at 1425, but as noted last week, with this kind of vicious selling in the financials each potential support level is just a possible bounce point.

The small cap SP600 (-3.48%) was bombed Friday, failing a test of the 200 day SMA breach rather miserably. The small caps are now in the midrange of the November to January range. The small caps are in freefall, becoming even smaller caps with each session.

DJ30

Recovered the 90 day SMA Wednesday and Thursday just to fail at the 50 day EMA and roll over on Friday with some high volume selling. While the blue chips closed at a new low on this leg they are still above the intraday low (13,132) hit intraday Wednesday. The Dow has formed a head and shoulders and this rollover at the 50 day EMA makes for a lower right shoulder and thus a weaker pattern. It is holding up better than the other indices, but it is on the verge of playing catch-up rather quickly with this break, once more, below the May to July lows. It has thus far refused to head through the door down to the 200 day SMA (12,692), but this could be the move that does it though after a break of support there is typically a flurry of selling followed by a rebound to test.

Stats: -281.42 points (-2.09%) to close at 13181.91
Volume: 301M shares Friday versus 264M shares Thursday.

DJ30 CHART: http://www.investmenthouse.com/ihmedia/DJ30.jpeg

MONDAY

The bulk of S&P earnings are out, but August does not bring much of a slowdown in results. Anyway, results have been pretty solid after that initial hot and cold run, and the market has exploded lower all the same. As we noted before, the market had its chance to continue the rally if earnings had come out strong from the get go. They did not and the contagion got its foot in the door. Now it is in bed with the market. After interest rates hit 5.33% in June and scared many to death that inflation was around the corner, the contagion hit and rates are at 4.67% with everyone scared that deflation is around the corner. Ironic. The market was worried high priced money would kill of deal making. Now money is cheaper that before but no one wants to place the deals despite cheap money. When things get to a tipping point they tend to move quickly.

There is more economic data out in addition to earnings, but the focus is on the FOMC meeting Tuesday and what changes the Fed will make. With the credit issues throwing in with the sub-prime the Fed has to change its bias to neutral. That may have some ceremonial value, but it is not going to stop the contagion from spreading. Will the Fed cut rates? There is precedent, but it is unlikely Bernanke is ready to make that move. The Bush administration trots out its 4 economic horsemen after the GDP report a week back and they tout the strong economy and their control over the sub-prime housing market. The Fed can go ahead and cut, claiming this accelerated quickly and they want to nip it in the bud, but it would have to get with the administration and other central banks to put the proper spin on it and be able to sell it to the financial markets. Of course they could be doing that this weekend.

If the Fed acts then all bets are off. The market could very well act adversely to the news, figuring the Fed was either overreacting or saw something truly heinous coming. After that the market would rebound because Fed rate cuts when the fundamentals remain in good shape are ultimately treated with upside. Thus after any downside it would be time to cover shorts and look for the upside.

That is a lot of speculation. It would be interesting, but I doubt the Fed will cut yet. With the rollover Friday on continued fears that means more downside but after a further blow off following SP500’s undercut of the 200 day SMA and NASDAQ’s likely test of the same early on in the week, another rebound is in order. Just as with the upside, it is not a straight line up or down. The rebound we were looking for only made it two full sessions before more bad news drove it lower. With very little upside bounce to test, there is more downside before the market finds its bottom. In addition, the fact that the BSC news had such a deleterious effect tells you the market has not yet priced in all of the contagion impacts.

We will look to catch some more downside as DJ30 breaks lower toward the 200 day SMA to play catch-up (or is it catch-down?), then button them up and see how the market rebounds. There are still upside positions in tech and other growth areas that refuse to give in to the selling. They may not all be surging higher, but they are using the selling to test and hold support or move laterally in a consolidation of prior gains. If these stocks don’t crack like a weak tour cyclist on Alp d’Huez, this market is not going to suffer a major decline. Why? Because a major decline eventually takes everything down, and growth stocks are typically the first to go.

Thus we continue to watch (and indeed own) stocks such as HPQ and CSCO as they continue to perform notably well in this weak market. If we are presented with the opportunity to own these type of stocks, i.e. an entry position where an upside move is primed to begin, we won’t pass them up, but we won’t load the boat all at once given the contagion is still an unknown quantity.

Again, if the Fed decides to cut or strongly suggests it will do so if things don’t improve rather rapidly, this will ultimately be good for stocks. Unlike 2000 and 2001 when the Fed managed to wreck the expansion, a contagion is fear driven, and with respect to credit, it can be cured with liquidity if nipped in the bud. Thus if the Fed is going to do any good it needs to act quickly before any economic fundamentals are damaged. In that situation the economy will continue it expansion based upon the still solid fundamentals and the financial market will rebound nicely. Thus our focus on the stocks that are not succumbing to this round of selling but that are using it to consolidate or otherwise test near support. Even tests of the 50 day EMA are in the game as many stocks rallied nicely up the 18 day EMA and are making deeper tests during this selling to reset the clock for another run higher. If the Fed cuts or strongly intimates it will if things don’t improve, these stocks are in position to lead higher once more.

Support and Resistance

NASDAQ: Closed at 2511.25
Resistance:
2523 was price resistance November 2000
2531.42 is the February high (post-2002 high); 2525 intraday
The 90 day SMA at 2572
2601 is the mid-May intraday peak.
2603 is the October/December trendline
The 50 day EMA at 2605
2634.60 is the June peak
2662 is the November/February up trendline
2673 is the early July high
2725 is the July high
2778 from a July 1999 peak
2887 from a September 1999 peak
2920 from an October 1999 peak

Support:
2509 is the January 2007 high
The 200 day SMA at 2491
2470 to 2467 are price peaks from November and December 2006
2400 is price support

S&P 500: Closed at 1433.06
Resistance:
The 200 day SMA at 1450
1461.57 is the February 2007 high.
1469 is the July 2006/March 2007 up trendline
1475 from peaks in December 1999 and January 2000
1490.72 is the early June closing low
The 10 day EMA at 1477
The 50 day EMA at 1504
1534 is the early July high
1539 is the mid-June intraday high
1541 is the early June high.
1548 is the late November to February up trendline
1553 intraday high from March 2000 is the all-time index peak
1565 is the upper channel line from October/December 2006

Support:
1440 is the mid-January high
1427 represents some interim peaks from December 2006
1406 – 1407 from March 2007 and November 2006 interim peaks
1389 from October 2006 interim peak
1375 from March 2007 low

Dow: Closed at 13,181.91
Resistance:
The 90 day SMA at 13,304
The 50 day EMA at 13,490
The mid-May peak at 13,556
13,580 is the November/February up trendline that marks the lower channel.
13,630 is the upper channel line in the November/February channel
The early July peak at 13,671
The mid-June high at 13,689
The early June high at 13,676 (closing), 13,692 (intraday)
The July high at 14,022

Support:
13,121 is minor support from the April peak
12,878 is the July 2006/March 2007 up trendline
12,796 at the February 2007 high
The 200 day SMA at 12,783

Economic Calendar

These are consensus expectations. Our expectations will vary and are discussed in the ‘Economy’ section.

August 3
- Non-farm payrolls, July (8:30): 92K actual versus 135K expected, 126K prior (revised from 132K)
- Unemployment rate, July (8:30): 4.6% actual versus 4.5% expected, 4.5% prior
- Hourly Earnings, July (8:30): 0.3% actual versus 0.3% expected, 0.4% prior (revised from 0.3%)
- Average workweek, July (8:30): 33.8 actual versus 33.9 expected, 33.9 prior
- ISM Services, July (10:00): 55.8 actual versus 59.0 expected, 60.7 prior

August 7
- Preliminary productivity, Q2 (8:30): 2.0% expected, 1.0% prior
- FOMC policy statement (1:15)
- Consumer Credit, June (3:00): $7.0B expected, $12.9B prior

August 8
- Wholesale inventories, June (10:00): 0.4% expected, 0.5% prior
- Crude oil inventories (10:30): -6.49M prior

August 9
- Initial jobless claims (8:30): 307K prior

August 10
- Import prices ex-oil, July (8:30): 0.2% prior
- Export prices ex-agri, July (8:30): 0.1% prior
- Treasury budget, July (2:00): -$32.5B expected, -$33.2B prior


Don't miss our Market Summary each evening. It is part of "The Daily" which is available at InvestmentHouse.com. The Daily focuses on enhancing returns through strategic investing using various tools including stock options. The Daily is a must for anyone with an IRA or anyone that enjoys investing in individual stocks.
icon url

ReturntoSender

08/08/07 3:03 PM

#7567 RE: ReturntoSender #6755

It's a good idea to wait for a 90% upside volume day on the NYSE and NASDAQ before becoming fully invested.

Forming a bottom is a process. Here are some indicators to follow in the meantime:

Determining Long Term Tops and Bottoms for the DJIA and S&P 500 based on Market Breadth and a few other indicators. Although potential tops and bottoms are marked by red and green horizontal lines, actual tops and bottoms form when divergences become present. For instance a top might be forming for the DJIA when the number of New Highs on $INDU is lower than it has been even though the $INDU is setting a New High itself. What we look for then is confirmation as the $INDU may fail to continue on to New Highs without broad based participation. Many of these charts will not update until after the market close:


icon url

ReturntoSender

08/09/07 12:06 PM

#7571 RE: ReturntoSender #6755

CMOS bot 2000 shares@1.88


icon url

ReturntoSender

08/13/07 2:08 PM

#7582 RE: ReturntoSender #6755

PLAB bot 1000 shares@12.25


icon url

ReturntoSender

08/14/07 11:09 PM

#7584 RE: ReturntoSender #6755

From Briefing.com: 4:20 pm : Stocks tumbled Tuesday as investors got spooked by everything from renewed credit concerns to worries that consumer spending may be slowing even more than initially anticipated. The major averages closed at their lowest levels in about four months.

Reports that Sentinel Management Group may halt redemptions due to significant requests exacerbated concerns that tight credit conditions are spilling over into what are traditionally thought of as one of the "ultimate safe havens" -- money market accounts. As an aside, Wednesday marks the last day for many hedge fund investors to submit redemption requests for the third quarter.

Since liquidity concerns continue to leave many worried that a real credit crunch is forthcoming, the Sentinel news pulled the rug out from under a Financial sector that was finally enjoying a morning without worrisome headlines related to the credit market turmoil. The sector's 2.5% sell-off, though, removed significant leadership and left the sector down more than 12% year-to-date.

The Consumer Discretionary (-2.7%) turned in an even worse performance, as it paced the way among the 10 sectors losing ground. New evidence that suggested the consumer is pulling back on spending took an added toll on sentiment.

Albeit a component in the Consumer Staples sector, Wal-Mart (WMT 43.77 -2.40), the nation's largest retailer, missed analysts' expectations and cut its full-year profit outlook. Fellow Dow component Home Depot (HD 33.50 -1.74) topped Wall Street's forecasts; but Q2 profits plunged 15% and management said it sees housing-market softness extending into 2008.

A couple of positive takeaways that initially helped investors look past the disappointing quarterly results from the two retailers included a tame inflation read (e.g. core-PPI) and huge demand for the biggest IPO since Google debuted three years ago.

Vmware (VMW 51.00 +22.00), which was spun off from EMC Corp (EMC 18.34 -0.71), priced at the high end ($29 a share) of its range and opened up nearly 80% at $52. A sell-the-news reaction, however, weighed on EMC as well as two of VMware's investors.

Tech bellwethers Intel (INTC 23.80 -0.22) and Cisco Systems (CSCO 30.26 -0.57), which own stakes in VMW of 2.5% and 1.6%, respectively, initially surged on the move but also succumbed to a lack of enthusiasm to own anything. Of the 147 S&P industry groups, 143 posted losses.

With the Fed reiterating that inflation remains its "predominant" concern, the Labor Dept. saying that core PPI in July rose just 0.1% was also noteworthy. That followed gains of 0.2% in May and 0.3% in June. However, an already nervous market plagued by credit worries quickly opted to wait for tomorrow's CPI report to get a better inflation read on Fed policy direction. DJ30 -207.61 NASDAQ -43.12 SP500 -26.38 NASDAQ Dec/Adv/Vol 2250/815/1.99 bln NYSE Dec/Adv/Vol 2886/452/1.71 bln

3:59PM Market View: Broad based pressure and new multi-month lows for Dow and S&P 500 (TECHX) : A mixed, slightly positive start to the day for the market indices elicited no follow through interest as credit fears/subprime woes remain in the headlines. This has kept Financial (Broker/Dealer -3.1%, Bank -1.9%) and Home Construction (XHB -3.7%, REITs IYR -3.9%) on the defensive with negatives in Retail -3.3% (WMT -5.1% misses estimate and cuts forecast, HD -4.9% sees 15% drop in Q2 EPS, MAT -2.4% hurt by recalls) adding to the negative bias. Only minor and short lived bounce attempts were noted with the indices faltering into the close. The Dow, S&P 500 and NYSE Comp slipped under last week's lows to establish fresh multi-month lows while the Nasdaq Comp flirts with similar levels and its 200 day sma/ema. Also on the defensive were Rail -3.7%, Paper -3.7%, Trucking -3.4%, Gold/Silver -3%, Coal -2.6%, Airline -2.5%, Steel -2.4% etc. Minor gains were noted in Biotech +0.8% (DNA +1.9%).

12:18PM ASM Intl NV announces it has repurchased 250,000 shares of its common stock for approx EUR 4.7 (ASMI) 26.02 -0.28 :

09:32 am F5 Networks: CIBC Wrld Mkts initiates Sector Outperform. CIBC initiated F 5 Networks FFIV with an Outperform and an $85 price tgt as they believe the market for application networking solutions still has many years of growth ahead and see F5 as well positioned to capitalize on these strong fundamentals. With a Layer 4-7 chassis product on the way pairing it directly in Cisco's (CSCO) domain, firm expects continued share gains through '08. Furthermore, they expect the integration of F5's TMOS software into its WAN and security products to support solid growth after a mixed track record in these areas.

09:32 am KVH Industries: Needham & Co upgrades Hold to Buy. Target $12. Needham upgrades KVHI to Buy from Hold with a $12 tgt saying while KVHI has historically struggled to get all of the pieces of its business firing at once they believe it is poised to see meaningfully better results in its high-margin defense business in late 2007 and 2008, continued growth in its Marine business and steady, if modest, growth from its Land business. They see a healthy current backlog and the expected receipt of 5-yr/$50 mln contract by the end of September driving a 4Q07/1H08 rebound in KVH's Defense business. Additionally, the firm sees the potential for upside for KVH in '08 if remotely operated weapons systems are specified for high priority M.R.A.P vehicles, which will be being shipped in large numbers in 2008.

09:31 am RF Micro Device: Citigroup upgrades Hold to Buy. Citigroup upgraded RFMD to Buy from Hold, maintaining its $8.60 price tgt. Firm says Sirenza deal begins to change RFMD's story from new product (Polaris II) and OEM recovery from Motorola (MOT) to profitable revenue growth through acquisition-related revenue diversification. Firm says the deal creates the first real prospect in years for gross margin expansion to the 40% range; positive estimate revisions on deal synergies are catalysts over the next six-to-nine months.
icon url

ReturntoSender

08/18/07 10:03 AM

#7588 RE: ReturntoSender #6755

There are lots of good signs that we may have just seen a significant bottom forming. Yesterday was a 90% upside day on the NYSE and 89% to 11% upside on the NASDAQ.

The volatility indexes hit heights not seen in years. The put to call ratio has been very high for a very long time. It's hard to find anything that is not showing long term bottom like numbers. Of course we are still in the midst of what is usually the worst months of the year for the market so a retest is not out of the question but look at the BP numbers overall. Some of those BP numbers have become very low:

Sector Bullish Percentages: BP Consumer Discretionary, BP Transports, BP Industrials, BP Materials, BP Information Technology etc. The Early Recovery Movers:

The Bullish Percent Index (BPI) is a popular market breadth indicator that is calculated by dividing the number of stocks in a given group (an exchange, an industry, etc.) that are currently trading with Point and Figure buy signals, by the total number of stocks in that group. Bullish Percent levels that are above 70% are considered overbought, whereas levels below 30% are considered oversold. Strong buy signals occur when the Bullish Percent Index falls below 30% and then reverses up by at least 6%. Conversely, promising sell signals occur when it goes above 70%, and then reverses down by at least 6%:


Mid Cycle Movers:


BP Telecom Services Sector, BP Healthcare, BP Utilities and BP Financials - Late cycle movers after the market top is in.

The Bullish Percent Index (BPI) is a popular market breadth indicator that is calculated by dividing the number of stocks in a given group (an exchange, an industry, etc.) that are currently trading with Point and Figure buy signals, by the total number of stocks in that group. Bullish Percent levels that are above 70% are considered overbought, whereas levels below 30% are considered oversold. Strong buy signals occur when the Bullish Percent Index falls below 30% and then reverses up by at least 6%. Conversely, promising sell signals occur when it goes above 70%, and then reverses down by at least 6%:


Sector Bullish Percentages: BP Consumer Discretionary, BP Transports, BP Industrials, BP Materials, BP Information Technology etc. The Early Recovery Movers:

The Bullish Percent Index (BPI) is a popular market breadth indicator that is calculated by dividing the number of stocks in a given group (an exchange, an industry, etc.) that are currently trading with Point and Figure buy signals, by the total number of stocks in that group. Bullish Percent levels that are above 70% are considered overbought, whereas levels below 30% are considered oversold. Strong buy signals occur when the Bullish Percent Index falls below 30% and then reverses up by at least 6%. Conversely, promising sell signals occur when it goes above 70%, and then reverses down by at least 6%:


Mid Cycle Movers:


BP Telecom Services Sector, BP Healthcare, BP Utilities and BP Financials - Late cycle movers after the market top is in.

The Bullish Percent Index (BPI) is a popular market breadth indicator that is calculated by dividing the number of stocks in a given group (an exchange, an industry, etc.) that are currently trading with Point and Figure buy signals, by the total number of stocks in that group. Bullish Percent levels that are above 70% are considered overbought, whereas levels below 30% are considered oversold. Strong buy signals occur when the Bullish Percent Index falls below 30% and then reverses up by at least 6%. Conversely, promising sell signals occur when it goes above 70%, and then reverses down by at least 6%:


icon url

ReturntoSender

08/19/07 12:21 PM

#7589 RE: ReturntoSender #6755

Leavitt Brothers - Pullback within an Uptrend or Start of a Downtrend?

http://www.screencast.com/users/LeavittBrothers/folders/Default/media/15da204c-f2b1-4c4f-b121-3fd0bc...
icon url

ReturntoSender

08/20/07 9:41 AM

#7595 RE: ReturntoSender #6755

ACLS LT bot 6000 shares@4.95


icon url

ReturntoSender

08/20/07 12:11 PM

#7597 RE: ReturntoSender #6755

PLAB LT bot 1000 more shares@11.88 - Now holding 2000 at an average price of 12.07


icon url

ReturntoSender

09/06/07 8:40 PM

#7619 RE: ReturntoSender #6755

From Briefing.com: 4:20 pm : After running into some headwinds early on, amid more news tied to lingering credit concerns, additional evidence to suggest Wednesday's widespread sell-off was overdone helped stocks recover some ground.

However, the major averages closed off their highs, volume was light again, and market gains were modest at best as investors weren't willing to place huge bets ahead of tomorrow's influential jobs report.

Since the market sees the August employment report as crucial to the Fed's policy decision on September 18 (or before), payroll growth averaging a strong 132,000 over the last six months doesn't leave investors overly convinced that Friday's jobs data will play into the Fed rate cut that Wall Street has priced into the market since policy makers shifted their stance last month.

Among the handful of encouraging news items giving participants a reason to recoup some of yesterday's losses, the bulk of back-to-school sales results checking in better than expected offered some reassurance that the consumer is holding up rather well.

Atlanta Fed President Dennis Lockhart later saying there are no signs that the housing and subprime mortgage market woes are spilling over into other sectors of the economy lent further validation that consumer spending remains healthy.

St. Louis Fed President and voting Fed official Poole, though, said that he sees evidence for a 'further leg down' in housing, that there was "no question" financial problems would worsen, and that the Fed won't be pushed into a decision.

Of the nine sectors finishing in positive territory, Utilities turned in the best performance, but that also speaks to the more risk-averse mindset that has contributed to the S&P 500 losing 5% of its value since peaking in mid July.

The Materials sector (+1.1%) was the next best performer, due largely to a 2.0% rally in gold prices.

The Industrials sector (+0.9%) got a lift late in the day after Dallas Fed President Fisher said he doesn't see the dynamics of a very strong economy changing overnight in the face of the financial turmoil that we've recently seen.

The Financial sector was the only sector that failed to participate in today's recovery; but its decline was minimal despite a slew of negative developments -- from the three-month Libor rate climbing for an 11th straight session to foreclosures rising to their third consecutive record high -- that continue to plague the heavily weighted sector. DJ30 +57.88 NASDAQ +8.37 SP500 +6.26 NASDAQ Dec/Adv/Vol 1329/1643/1.75 bln NYSE Dec/Adv/Vol 1270/1997/1.16 bln

4:20PM Xilinx Sept quarter sales are expected to be approx flat sequentially (XLNX) 26.31 0.07 : Co announces Sept quarter sales are expected to be approx flat sequentially. This is a slight revision from previous guidance calling for sales to be flat to slightly down sequentially. Sequential sales growth by geography is tracking as expected with sales from Japan expected to be up, sales from Asia Pacific expected to be approx flat and sales from North America and Europe expected to be down slightly sequentially. (Q1 revs were $445.9 mln, consensus is for Q2 revs of $443.6 mln)

4:10PM National Semi beats by $0.05; issues in line Q2 rev guidance (NSM) 26.58 +0.08 : Reports Q1 (Aug) earnings of $0.30 per share, $0.05 better than the Reuters Estimates consensus of $0.25; revenues fell 12.9% year/year to $471.5 mln vs the $468.7 mln consensus. Q1 gross margin increased to 63.0%, driven by the co's portfolio of higher-value analog products, together with strong execution in manufacturing. Co issues in line Q2 guidance, sees Q2 revs up 4-7% sequentially, or roughly $490.4-504.5 mln vs. $497.98 mln consensus. NSM says Q2 gross margin is expected to improve while operating expenses are also projected to increase. "Looking forward, the theme of energy efficiency is becoming more and more pervasive beyond just handsets. We see this as a major opportunity." National's bookings in Q1 increased by 6% sequentially over Q4. This increase was primarily driven by higher orders from the co's OEM customer base. Regionally, the first quarter bookings improvement was most prominent in Asia Pacific and Europe. From a product perspective, new orders for interface and power management products grew at a higher rate than the overall company average. Total company bookings exceeded billings in the first quarter. (Stock is halted)

4:01PM Maxim Integrated announces receipt of additional notice from Nasdaq regarding sock listing (MXIM) 30.81 +0.12 : Co announces that due to its failure to timely file a Form 10-K with the Securities Exchange Commission for its fiscal year ended June 30, 2007 as required by Nasdaq Marketplace Rule 4310(c)(14), it received an Additional Staff Determination letter from Nasdaq on August 31, 2007 stating that this filing delinquency will serve as an additional basis for the delisting of Maxim's common stock from The Nasdaq Stock Market. Timely filing of periodic reports with the SEC is a requirement for continued listing under Nasdaq Marketplace Rule 4310(c)(14).

3:59PM Market View: Choppy, confined action (TECHX) : The market spent most of the day in positive territory but trading action was very choppy and tightly confined with the indices trading range on the day well below average. Early data was initially well received with news from the Retail sector also providing a lift. Opening strength proved fleeting but a second round of data (ISM Services-- improved business conditions, prices paid fell) helped boost the market modestly but broadly higher into midday. However, follow through failed to develop with participants taking a more cautious approach in front of tomorrow's employment data which could be crucial to the Fed's interest rate decision on Sep 18. The choppy/confined trade led to consolidative inside days (higher low, lower highs) for both the Dow and S&P 500 with the Nasdaq Comp accomplishing virtually the same feat for the second day in a row. Solid gains were posted in Energy (XLE +1.2%, Coal +4.9%), Gold/Silver +5.2%, Biotech +1.3%, Steel +1.3%, Utility +1.2% and Paper +1.1%. Weakness was noted in Home Construction -1.4%, Tobacco -1% and Airline -1%.

8:31AM FormFactor says Korea Supreme Court affirms patent court decision invalidating some claims of two FormFactor Korea patents (FORM) 46.50 : Co announces the Korea Supreme Court issued a ruling affirming a 2005 Korea Patent Court decision invalidating certain claims of FormFactor's Korea Patent Nos. 278342 and 399210. The Korea Supreme Court ruling does not address 27 claims of Patent No. 278342 and 77 claims of Patent No. 399210 that were upheld by the Korean Intellectual Property Office and outside of the scope of the Patent Court decision.

8:07AM Transmeta receives letter from Nasdaq confirming compliance with minimum bid price rule (TMTA) 7.85 : (TMTAD)

6:16AM Methode Electronics beats by $0.06; reaffirms FY08 guidance (METH) 15.00 : Reports Q1 (Jul) earnings of $0.22 per share, $0.06 better than the Reuters Estimates consensus of $0.16; revenues rose 20.7% year/year to $125 mln vs the $112.2 mln consensus. Co reaffirms guidance for FY08, sees EPS of $0.65-0.75 vs. $0.75 consensus; sees FY08 revs of $455-475 mln vs. $482.03 mln consensus.

08:57 am Apple (AAPL)

Ahead of the strongest selling season of the year, Apple (AAPL, 134.15) slashed the price of its newly-released iPhone from $599 to $399. The price cut for the 8GB iPhone is sure to set off an upset from early adopters who acquired the hottest product of 2007 at full price only 10 weeks ago. And while the cut does stray from Apple's typical pricing strategy, particularly this early in the product cycle, we think the move will only further stimulate holiday demand in what is a high margin segment of its business.

Market participants, eyeing Apple's hefty profit margins, were less than thrilled with the news. The cut also increased speculation that sales weren't meeting expectations. The stock took a tumble Wednesday, closing at $136.76, down $7.40. In extended trading, the stock price dropped another dollar. We think the reaction is overdone and creates a buying opportunity.

Apple, which also discontinued the 4GB phone which sold for $499, is on track to sell 1 million units by September. But the iPhone wasn't the only news released yesterday. Apple also announced fresh updates for its iPod media players, including the iPod Touch for $399. This is essentially the iPhone without camera and phone that incorporates the tough-screen and adds the ability to download songs wirelessly directly from iTunes WiFi stores (a long awaited feature). The Nano, the top selling iPod, also got a boost with the creation of a 160 GB version that plays videos, dubbed the iPod Classic.

Also announced was a partnership with Starbucks (SBUX, 27.28), whose icon will appear on the screen every time a user nears a shop that has Wi-Fi access. Users can download the song that's playing in that Starbucks or get a list of the 10 most recent songs played.

Apple is heading into its strongest holiday selling season in years with a fully vamped, integrated product line compelling to a wide user base. It will no doubt be an Appleicious holiday with the larger iPod screens, touch-iPods, WiFi capabilities and a more compellingly priced iPhone. But what we think will really be the swing factor this season will be the ramp in iMac demand. After years of languishing in the low single digits in PC market share, the "halo effect" will be in full force.

We continue to hold the opinion that Apple remains one of the best growth stories around. Earnings have risen over the past three years from $0.38, to $1.55, to $2.27 per share and are expected to hit $3.73 this fiscal year, which ends in September. For FY08, the street anticipates earnings of $4.33 per share (equating to a 16% growth rate), followed by $5.36 (23%) in FY09.

Growth stocks are inherently difficult to value as earnings tend to overshoot expectations. Apple's estimates are continuously being revised higher by the street. Currently, APPL trades at 36x FY07 and 31x FY08 earnings, which may seem rich to some but speaks to Apple's growth rate. We think a 35x multiple is applicable, a discount to its 2-year average PE ratio, which puts the price around $150.

--Kimberly DuBord, Briefing.com
icon url

ReturntoSender

09/09/07 10:27 PM

#7623 RE: ReturntoSender #6755

Headline Charts Update:

http://headlinecharts.blog.com/

I'm a big fan of the ECRI Institute. They publish two important weekly indicators that look out about 4-6 months into the future. One is for economic growth and the other for inflation. The inflation gauge has been well contained for some time indicating subdued inflation despite the headlines about oil, gasoline and food. The economic growth indicator has plunged from its high in May-07 to its current level which is a 43-week low. Their current outlook is that economic prospects have clearly dimmed, but not yet indicating recession. Let's hope they are right.

This week's strongest area was gold and gold shares. Both have quickly become extended, and could sell off with the market if there is a re-test of the August lows. But strong gold make sense if the US Dollar weakens along with declining US rates. Strong gold also makes sense as central bankers add liquidity to unlock credit markets.


I don't use Bollinger Bands often, but probably should. GoldStockProphet.com had a really good post the other day using the bands and it inspired me to review the monthly XAU chart with the Bollinger band... and it looks favorable to me for gold stocks. Used in combination with the other indicators, Gold stocks look to be breaking out.


Gold has broken out above the recent highs ready to challenge the highs of April-2006. The shares have followed and the relative strength of gold stocks compared to the SPX is looking to break out as well.

Saturday, September 08, 2007
Saturday Bullish Percents

--------------------------------------------------------------
Disclaimer: All charts and comments are intended for education and discussion purposes only. No investment recommendations are being offered. Please do your own research and take responsibility for all investment decisions that you make. Questions and comments related to this post are encouraged.


--------------------------------------------------------------
Red is a column of O's in a downtrend, blue is a column of X's in an uptrend. Below 30% is oversold, and above 70% is overbought. Yellow is a shift down, green is up.

This week's bullish percents are above. Gold and precious metals stocks finally joined all other indexes and industries and shifted higher to 29% stock with P&F buy signals. This is a 'bull alert' for this group, field position is excellent and risk is generally low with the stop out point close. A stronger buy signal would be issued if there were additional up-and-down in the bullish percent and then a bullish percent breakout above the current 29% occurred.

There were a couple very bad days in the market this past week, an awful jobs report, gloomy news all around... yet there isn't a single shift lower among all the bullish percents tracked here weekly. John Murphy made a very strong case against the equity market in his columns, and there is plenty of reason to expect retesting of the lows, particularly for financials and discretionary stocks, but so far these bullish percents are encouraging to me.
icon url

ReturntoSender

09/23/07 12:10 AM

#7644 RE: ReturntoSender #6755

Amateur Investors Weekend Stock Market Analysis (9/22/07)

http://www.amateur-investor.net/Weekend_Market_Analysis_Sep_22_07.htm

The market rallied strongly due to the 1/2 point interest rate cut by the Federal Reserve on Tuesday and now the major averages are nearing their mid July highs. Personally I believe it would have been better if the August 16th lows would have been retested with the development of potential Double Bottom pattern much like occurred last March which led to a substantial rally from late March through mid July. The current charts of the Nasdaq and S&P 500 show a "V" type bottom pattern has formed which could pose a problem if they are unable to take out their mid July highs accompanied by above average volume as this could lead to the development of bearish looking Double Top patterns.


Meanwhile a few other things to watch include the price of Crude Oil which has rallied to new highs over the past few weeks. In the past when the price of Crude Oil has risen $10 or more (points A to B) this has been followed by some selling pressure in the Dow (points C to D). Currently the price of Crude Oil has once again risen over $10 since the August 22nd low (points E to F) and if the previous pattern continues then we could see some selling pressure redevelop in the market before much longer.


Meanwhile for those following the price of Gold there is an interesting long term correlation between it and the Yield on the 10 Year Treasury Note as shown in the chart below. The last time a significant upward move in Gold occurred was in the 1970's (points G to H) which was followed by a substantial rise in the Yield on the 10 Year Treasury Note (points I to J) which led to higher Interest Rates. However after the price of Gold peaked in the early 1980's and continued lower through 2000 (points H to K) notice the Yield on the 10 Year Treasury Note also dropped substantially as well (points J to M) which led to much lower Interest Rates. Meanwhile even though the price of Gold has risen substantially over the past few years so far the Yield on the 10 Year Treasury Note hasn't risen that much so far. However that could change if what occurred in the 1970's repeats itself.


Finally for those that remember the 1970's into the early 1980's it was a period dominated by a weakening US Dollar, rising Interest Rates and much higher Oil Prices. Thus you really have to wonder if the market will eventually act like it did in the 1970's in the years ahead. A long term chart of the Dow is shown below and as you can see the affects of a weakening Dollar, higher Interest Rates and rising Oil Prices took their toll on the Dow from early 1973 through the early 1980's. In fact the Dow peaked in January of 1973 and didn't exceed that high again until November of 1982 which was nearly 10 years later.


icon url

ReturntoSender

09/29/07 8:07 PM

#7652 RE: ReturntoSender #6755

Amateur Investors Weekend Stock Market Analysis (9/29/07)

http://www.amateur-investor.net/Weekend_Market_Analysis_Sep_29_07.htm

Well the market avoided a weak September mainly because the Federal Reserve cut interest rates. The question is now can the major averages follow through to the upside in October?

The Dow is nearing its mid July high which was just above the 14000 level however volume has remained well below its 10 Week Average (points A) during the past 6 weeks except for the 3rd week in September (point B). Keep in mind when the Dow made a substantial move higher last April through June (points C to D) volume was at or slightly above its 10 Week Average (points E) as it rose above its previous February high (point F). If the Dow rises back to its previous mid July high with volume remaining below average then this could lead to a potential Double Top pattern if it stalls out near the 14000 level. Meanwhile in order for the Dow to avoid a potential Double Top it will need to rise above the 14000 level accompanied by a substantial increase in volume much like we saw earlier in the year when it rallied strongly from April through June.


The Nasdaq also has been rising on below average volume (points G) with the only week reaching its 10 Week Average in the 3rd week of September (point H). When the Nasdaq made a significant move higher from April through June (points I to J) and broke above its previous February high (point K) volume came in well above its 10 Week Average (points L). If the Nasdaq is going to make a significant move higher in the coming weeks and rise well above its previous mid July high near 2525 volume better start to increase or else this could lead to a potential Double Top pattern.


As for the S&P 500 just like the Dow and Nasdaq volume has been below its 10 Week Moving Average (points M) as it has moved higher since the mid August bottom. In addition when the S&P 500 rallied strongly from April through June (points N to O) and rose above its previous February high (point P) volume (points S) came in at or above its 10 Week Moving Average. Currently the S&P 500 has stalled out near the 1540 level and could be potentially developing a Head and Shoulders Top pattern if its unable to rise above its 2nd Shoulder (2SH) near 1540. Meanwhile if the S&P 500 can rise above its 2nd Shoulder accompanied by a substantial increase in volume then that may lead to a significant move upward much like we saw from April through June.


Finally a chart of the Russell 2000 shows that it's also exhibiting a potential Head and Shoulders Top pattern as well. In order for the Russell 2000 to avoid this potential Head and Shoulders it will need to hold support at its 40 Week EMA (blue line) and then rise above the 830 level.


Meanwhile when looking for stocks to invest in focus on those with good Sales and Earnings Growth that are breaking out of a favorable chart pattern such as a "Cup and Handle" pattern.

For example notice EXM formed a 2 1/2 year Cup as it stalled out at its longer term 38.2% Retracement Level and then developed a 7 week Handle (H) before breaking out in June of this year.


Currently I'm are watching NWK which has just completed the right side of a 3 1/2 year Cup a now needs to develop a constructive Handle over the next 3 to 4 weeks.


Click Here to Signup for a "Free 4 Week Trial Membership" and see which additional stocks are currently developing a favorable chart pattern.

In addition I will show you an Indicator which has been accurate 96% of the time since 1987 in forecasting an average gain of 4.3% within 5 trading days in the S&P 500. So far in 2007 there have been "4" Buy Signals using this Indicator with the last one occurring on August 28th which was followed by a gain of 4.5% in the S&P 500 in just 4 trading days.

icon url

ReturntoSender

09/30/07 7:20 PM

#7653 RE: ReturntoSender #6755

InvestmentHouse Weekend Update:

http://www.investmenthouse.com/weekendmarketsummary.htm

- Market closes out the week modestly lower.
- Core inflation continues to fade while Chicago PMI rises, construction rises.
- Looking for some new money to enter to start the week.
- Market looking for a breakout but has the jobs report ahead of it.

Good economic data cannot fight off the end of quarter profit taking.

There was plenty of economic data Friday morning, and the actual data was just fine. It was the prattle about recession that rattled futures. Greenspan reiterated its comments regarding the recession probability being a bit higher than the one-third he assigned to it a few months back. GS issued a report predicting recession. Okay. There is plenty of gloom.

As for the real data, incomes were a bit lower than expected, spending was a bit more than expected, and the core annual PCE inflation reading fell to 1.8%, a 3.5 year low. That was enough to rebound futures some, but they only made it up toward flat by the open. Nonetheless the market jumped higher to start the session. A half hour into the trade the Chicago PMI came out higher than expected and Michigan sentiment held steady. Still looked good.

The market did not react positively, however. After the move higher into quarter end on some low trade, the sellers moved in for some profit taking. That pushed the indices negative to end the first hour. After that, a steady climb higher through the early afternoon session. Nice steady comeback with energy trying to lead as it did early in the session. Then good old St. Louis Fed president Poole suggested that the market would be making a mistake if it bet on another rate cut. That harpooned the recovery, sending the major indices lower back into negative territory. A late rebound improved the picture, but could not push the indices positive.

Technically, while the indices finished lower, they basically closed in the same position as Thursday. NASDAQ, after tapping toward the July high (the post-2002 high), faded back modestly. SP500 and DJ30 remained in their lateral consolidations, still set up nicely to make the break higher. As noted Thursday, the NASDAQ action is questionable with that low volume drift up to the prior high. Maybe it can form a handle here as well and then break higher. That may be wishful thinking, but there was no vigor in the tech selling on Friday.

There was no real leadership either. Energy tried to take the reins early in the session, sold back, and then made another run at it in the afternoon. Then that 'tough love' Fed-speak from Poole that was likely just an attempt at dollar containment. The Fed is not going to come out and say due to lower annual core PCE inflation it was no longer worried about inflation. Might just as well bury the dollar if it did that. In any event, there was no sector willing to take the point Friday. Techs sold back modestly, energy continued its consolidation, and even China stocks took the day off.

Basically there was no change. Volume was up modestly but it was still far below average and thus it is hard to call the action distribution. NASDAQ remains in a vulnerable position, trading just below the prior high on low volume. SP500 and DJ30 are in good shape to break higher. In short, time for some different leadership to step up this coming week after the new money is put to work.

THE ECONOMY

Inflation continues its trend lower.

It is one of the hottest debates there is outside whether the Fed did the right thing or whether the negative confronting the economy will sink the stock market. Inflation.

If you take out food and energy you get a declining reading. Friday was the third straight month core annual inflation declined. It fell to 1.9% in June, held that level in July, and then fell to 1.8% in August. That was a 3.5 year low. That puts core inflation below the Fed's self-stated speed limit of 2% for 3 straight months. Moreover, it is declining at a faster pace, showing less than 1.5% growth rate for the past half year.

Back in late 2005 and early 2006 we reported that it looked as if the inflation pressures that impact the government's measure of inflation had peaked in October 2005. They continued to decline as time passed, though the inflation readings continued to move higher. Pressures, the things that cause higher inflation, abate before inflation does. It took a long time, but the inflation readings themselves finally started to turn and start a descent. We are very happy we made the call on the inflation top so that inflation would finally decline as it is now doing. Hey, why can't we take credit for it? Cramer does.

There is no question that large screen televisions, phones, computers, and other technology related products prices are falling. On the other hand there is no question that prices for items made of steel, copper, petroleum and materials with spiking prices are rising. What the government numbers show is that the decline in prices for those items falling in price is larger than the price increases for those items with rising prices. It makes no judgment on as to what prices are most important, it just tallies up the price changes and spits out the number.

Thus you get the slowing rise in core PCE prices, and right now that is what the Fed tells us it is watching. The argument then asks whether the inflation measures truly reflect the price activity. Maybe they do, maybe they don't. All we can say is that the way government has compiled the PCE for quite some time shows a slowing rise in core prices, and that means prices factoring in the rise in energy costs required to make the products.

Beyond that, however, when you look at the accurate leading inflation indicators (e.g. ECRI), they are also indicating this decline in inflation pressures continues. Thus we are likely to see core PCE prices continue to decline. Gold may not be reflecting this, though we have seen gold come back some from that surge following the Fed rate cut. It has not retraced all of that spike, however, and thus you have a serious split between future inflation indicators.

The dollar and its inflation contribution.

The biggest near term inflation influence is the falling dollar. As you know the dollar is at a record low versus the euro, at part with the Canadian dollar for the first time in 30 years, and the dollar index (DXY0) is at an all-time low since its inception, adding another big drop on Friday after the inflation data showed inflation rates slowing (and thus giving the Fed more free reign at cutting rates).

While a falling dollar is a boon to exports and even shops here in the US (the northeast is enjoying an influx of Canadians coming to the US to buy goods they cannot get in Canada), the broader impact is one of importing inflation from those countries whose currency floats against the dollar. As the dollar weakens it takes more dollars to buy the same amount of foreign goods and thus we experience rising prices on our end.

The effect is very apparent in oil. Sure there is widespread global demand for crude, but as the dollar weakens the price appreciates even more rapidly as price is marked up to keep up not only with demand but to make up the difference in the weaker dollar. Thus oil seems more expensive to us using dollars compared to those using euros. More countries are flirting with the idea of valuing oil in euros, and of course for us the next effect is the same: it is more expensive because the dollar is weaker versus the euro.

The Bush administration opened Pandora's box with its unstated weak dollar policy. It talked strong dollar but did nothing to back up the talk, and thus the world grew to believe the US would not support the dollar (and of course, it did not) and thus the start of the decline. As is often the case when you meddle in markets, what was thought to be a controlled effort at lowering the dollar faced assault from other areas as economic conditions changed around the globe. Imagine that; change occurring. That has hastened the dollar's decline to a point where it is dangerous of no longer being the store of value it once was.

To be sure it is not at that level yet. During the credit crisis where did the foreign investors go? Into US Treasuries, weaker dollar or not. The US still is considered the safety net for the world wealth given our rule of law, stability, and economy (even though its growth is less than that of other expanding nations). Nonetheless, there is an old saying that you never devaluate your way to prosperity. History is littered with wrecked economies that tried.

The Bush weak dollar policy has turned into a real problem as unforeseen pressures are now acting to drive it lower from an already weak level. You would think he would have known better given the issues in the late 1980's when his father let the James Baker group implement their old school (and wrong) policies re the dollar. Of course, when Bush got into trouble over Iraq, who did he bring in? He recycled Baker who came up with a report that basically said we should surrender in Iraq. Surprised it did not say something about letting the dollar weaken as well. The point is, the old line influence is alive and well in the Bush administration, and the same results are occurring. Problem is, we are not in the same position we were back then, i.e. coming out of a recession and the strength that accompanies a recovery.

Chicago PMI echoes the stronger Philly Fed, construction spending rises: data is trying to pick back up.

The regional manufacturing reports are on the upswing once more. After the Philly Fed (the laggard ever since the 2005 Gulf storms) posted a surprise gain in September. Chicago posted a better than expected read for that month as well, coming in at 54.2 versus the 53.0 expected and 53.8 in August. This is down from the 60+ readings in the summer, but the mean is still holding nicely. New orders are in the upper 50's again, backlogs are above 50, and prices paid fell 13 points to 59.0.

Next week we get the national manufacturing report, and with the improvement in the regional indices we are anticipating another solid showing overall. With construction spending in August rising 0.2% versus the -0.2% expected, the economy is trying to regain steam after the mortgage and credit issues hit. The extent of those issues is not fully reflected in the construction number as it was August, but as the PMI reports and the jobless claims indicate, there is no meltdown in the economy just yet.

THE MARKET

MARKET SENTIMENT

VIX: 18; +1
VXN: 21.01; +0.42
VXO: 18.18; +1.43

Put/Call Ratio (CBOE): 1.09; +0.24. Some quarter end shuffling with respect to option positions as well pushed the ratio back up.

Bulls: 55.6%. Bulls jumped again , up from 53.9% and topping the 55% level considered bearish. Big jumps the past few weeks from a low of 40.6%, the low for this round. Never made the thirties. Hit 56.7% in June. The market peaked about a month later. For reference it bottomed in the summer 2006 near 36%, and 35% is considered bullish.

Bears: 25.6%. Falling, indicating bears are declining. Down from 27.0% last week and 31.0% the week before. It held at 37.4% for 3 weeks prior to that. Still well off the very low 18% hit 8 weeks back, and it topped the June 2006 peak (36%) on this run. That June peak eclipsed the March 2006 high (33%) and well above the 2005 highs that spawned new rallies (30% in May 2005, 29.2% in October 2005).

NASDAQ

Stats: -8.09 points (-0.3%) to close at 2701.5
Volume: 1.896B (+7.24%). Higher trade but still below average and in the range of the recent levels. It does change the up on up days, down on down days action we have seen of late, but it was also the end of quarter shuffle and that helped pump up trade a bit.

Up Volume: 875.612M (-149.219M). A dead heat re up to down volume.
Down Volume: 983.672M (+297.357M)

A/D and Hi/Lo: Decliners led 1.47 to 1. Middle of the road and matched the session.
Previous Session: Advancers led 1.41 to 1

New Highs: 28 (-50)
New Lows: 44 (+3)

NASDAQ CHART: Click to view the chart

The internals basically matched the session, i.e. flat. NASDAQ rallied early but then succumbed to some of that quarter end profit taking in its big names as we anticipated once the window dressing was completed. Nothing major on the session, just a bit volatile in a narrow range as the recent leaders suffered some pressure. The problem with the bigger picture is that low volume rise to the post-2002 high and the history behind such moves, i.e. the need to sell back to regroup and try again. There will be some new money coming in to start the week, and that could push NASDAQ over that level. The more important move, however, is after the new money is spent and whether NASDAQ can hold the break or not. Odds are that it typically won't, but there are two positive possibilities if it does not. One is it could form another lateral move at the old high and then make the break higher from there. Two is that SP500 and DJ30 are working in its favor. They have held onto good consolidations and are still ready to break higher. If they do so with some force they could take NASDAQ along with them.

SOX actually gained ground on the session though it was modest and it once again could not clear the 90 day SMA. It is, however, making a higher low the pat week and that puts it in position to make a run at 510 once more, a key level as it tries to recover once more.

SOX CHART: Click to view the chart

SP500/NYSE

Stats: -4.63 points (-0.3%) to close at 1526.75
NYSE Volume: 1.34B (+13.46%). Volume matched the early week levels, but that kept it well below average still. Basically more of a quiet lateral move in its consolidation.

Up Volume: 517.86M (-255.889M)
Down Volume: 803.666M (+411.513M)

A/D and Hi/Lo: Decliners led 1.26 to 1
Previous Session: Advancers led 2.04 to 1

New Highs: 72 (-51)
New Lows: 28 (+3)

SP500 CHART: Click to view the chart

Never really made any pretense it was going to try the breakout move on the session, moving positive by just a few points and then closing lower, just off the middle of the trading range for the day. Volume remained low and the internals matched the slow session. All in all, SP500 remains in excellent shape to make the breakout to a new high. It will get some early week money, but as noted with NASDAQ, the key is how it acts after that money is spent.

SP600 was the percentage loser on the session, and that makes sense given the small caps are the most economically sensitive and right now, while the economic numbers are not bad, they are not suggesting any roaring surge in US economic activity. With their lack of ties to the global economy, they just simply are not attracting the interest of the larger caps. They are not dogs; the overall pattern is still a cup with handle, but they are not setting the pace either.

SP600 CHART: Click to view the chart

DJ30

The blue chips bumped higher the last half of the week, just clearing the highs in the lateral consolidation or handle to the base. No volume on that move so there was no attempt at a breakout, and Friday they did come back some. Still in position to make the breakout along with SP500.

Stats: -17.31 points (-0.12%) to close at 13895.63
Volume: 203M shares Friday versus 156M shares Thursday as the quarter end shuffle raised trade modestly though it was still well below average and below the stronger sessions of the week.

DJ30 CHART: Click to view the chart

MONDAY

September and Q3 are in the books and September was not the boogey man it often can be. The indices posted gains and left the month set up to make breakouts to new highs. This despite a plethora of issues facing the economy (weaker dollar, rising oil, rising gold and commodities, etc.). At this stage the market is not giving much credence to those issues, however, as it focuses on the Fed rate cut and the economic data that is somewhat stronger yet shows weakening inflation. That allows the Fed to act as it feels warranted with respect to the credit issues versus being hamstrung by high inflation numbers AND a credit issue.

Monday brings a new month and quarter, and as we have seen the past few quarters, that means at least an additional bump higher as new money is put to work on the upside. But for NASDAQ's low volume climb to the July high we would be looking for that to break the indices out to new highs. NASDAQ's move makes that more problematical, and indeed we believe something of a test by NASDAQ and a continued consolidation by DJ30 and SP500 (though maybe lower in their consolidation ranges).

If we see a push higher Monday and Tuesday but once again not a lot of volume, we will be inclined to take some gain off the table in anticipation of a test by NASDAQ. We continue to see a lot of stocks still in position to resume their climbs after consolidating the last week or so, but we have to remain patient and move in when they start moving higher or at least slowly accumulate shares as they make their lateral moves. There is likely to be some jockeying as the new quarter starts as the new money hits and the sellers take their shot as well.

The overall action by the indices remains very positive, however, and thus we are continuing to look for those strong stocks that are testing and are preparing for the next run higher. This week holds a lot of economic data from the national manufacturing report (ISM) to the jobs report. After the August negative showing all eyes will be on this one to see if it was an outrider. As we have discussed before, it was the product of the slowdown seen in Q1 as it is a lagging report. Since that time the weekly jobless claims suggest the employment picture is strengthening outside of those storms that swept the nation in the summer.

With the jobs report on Friday we anticipate an early move higher as new money is put to work, then a pause and some retracement as that new money wanes and investors look to the jobs report. We anticipate SP500 and DJ30 holding basically in their consolidations until then. If that is not the case and they try the breakout in anticipation of the jobs data we will act according to what the strong stocks we are looking at as potential new buys and the ones we are already holding to chart our course. In other words, we let them show us if it is time to buy or not and we respond, just as we have been doing on this strong run thus far.

Support and Resistance

NASDAQ: Closed at 2701.50
Resistance:
2725 is the July high
2778 from a July 1999 peak
2729 is the November/February up trendline
2887 from a September 1999 peak
2920 from an October 1999 peak

Support:
2699 is the November/December/February up trendline
2673 is the early July high
2634.60 is the June peak
The 10 day EMA at 2671
The 50 day EMA at 2608
The 90 day SMA at 2601
2531.42 is the February high (post-2002 high); 2525 intraday
The 200 day SMA at 2528
2509 is the January 2007 high
2450 is some price support from November and December 2006
2425 is that old trendline from August 2004 to May 2005
2400 is price support
2386 is the August intraday low

S&P 500: Closed at 1526.75
Resistance:
1534 is the early July high
1539 is the mid-June intraday high
1541 is the early June high.
1553 intraday high from March 2000 is the all-time index peak

Support:
The 10 day EMA is at 1516
The 90 day SMA is at 1497
1502 is the July 2006/March 2007 up trendline
1490.72 is the early June closing low and early August peak.
The 50 day EMA at 1490
1475 from peaks in December 1999 and January 2000
The 200 day SMA at 1467
1461.57 is the February 2007 high.
1440 is the mid-January high
1427 represents some interim peaks from December 2006 and the early August low
1406 - 1407 from March 2007 and November 2006 interim peaks
1389 from October 2006 interim peak
1375 - 70 from March 2007 low
1370 is the August intraday low

Dow: Closed at 13,895.63
Resistance:
13,925 is the old channel line
The July high at 14,022

Support:
The 10 day EMA at 13,759
The August high at 13,696
The mid-June high at 13,689
The early June high at 13,676 (closing), 13,692 (intraday)
The early July peak at 13,671
The mid-May peak at 13,556
The 90 day SMA at 13,485
The 50 day EMA at 13,483
13,242 is the July 2006/March 2007 up trendline
13,121 is minor support from the April peak
The 200 day SMA at 13,020
12,845 is July closing low
12,796 at the February 2007 high
12,518 is the August intraday low

Economic Calendar

These are consensus expectations. Our expectations will vary and are discussed in the 'Economy' section.

October 1
- ISM index, September (10:00): 52.5 expected, 52.9 prior

October 2
- Pending home sales, August (10:00): -12.2% prior

October 3
- ISM Services, September (10:00): 55.0 expected, 55.8 prior
- Crude oil inventories

October 4
- Initial jobless claims (8:30): 298K prior
- Factory orders, August (10:00): -2.5% expected, 3.7% prior

October 5
- Non-farm payrolls, September (8:30): 100K expected, -4K prior
- Unemployment rate (8:30): 4.7% expected versus 4.6% prior
- Hourly earnings (8:30): 0.3% expected, 0.3% prior
- Average workweek (8:30): 33.8 expected, 33.8 prior
- Consumer Credit, August (3:00): $9.0B expected, $7.5B prior
icon url

ReturntoSender

10/06/07 10:08 PM

#7661 RE: ReturntoSender #6755

From Briefing.com: Weekly Recap - Week ending 05-Oct-07

Showing improved sentiment at the outset of the fourth quarter, the stock market finished the week higher as the Labor Department reported strong September job growth, which helped offset concerns of persisting weakness in the housing market and sluggish economic growth.

Despite profit warnings from some large banks on Monday, investors looked past concerns about credit market problems and sent stocks sharply higher in the first day of trading for the fourth quarter.

Monday's gains were supported by new economic data that showed manufacturing conditions have held up well, and offset warnings from UBS AG (UBS) and Citigroup (C), which forecast a substantial decline in third quarter earnings due to disruptions in the credit markets.

The broad-based S&P 500 index gained 1.3% during Monday's session while the Dow Jones Industrial Average increased 1.4% to close above the 14,000 level for the first time since mid-July.

Meanwhile, on Tuesday, more disappointing news on the housing front prompted many investors to take some profits from the prior session's rally. The National Association of Realtors reported pending home sales fell a larger than expected 6.5% in August from July and 21.5% from a year earlier – the lowest reading since records began in January 2001.

The market consolidated for a second consecutive day on Wednesday, as investors digested a mixed report on the services sector of the economy along with news that Germany’s Deutsche Bank AG (DB) would have to take a $3 billion charge in the third quarter due to global credit market problems.

The ISM Services Index for September showed a reading of 54.8. While that was down from 55.8 in the prior month, it still reflects a picture of growth as a number above 50 indicates expansion.

With little in the way of corporate news or market-moving economic data on Thursday, the market remained focused on the government's September jobs report, which was released on Friday, for greater insight into the overall health of the economy.

The Department of Commerce reported that factory orders in August slipped 3.3%, versus analysts' expectations for a decrease of 2.8%. Orders were up 3.4% in July. Weekly initial jobless claims for the week ended September 19th rose to 317k. That was up from the previous reading of 301k, and higher than the consensus estimate of 310k. Neither report had any significant bearing on the overall market.

On Friday, the Labor Department reported strong job growth for September and revised the weak data from August upward. Specifically, payrolls rose a slightly larger than expected 110,000, and, importantly, the 4,000 decline in August was revised to an 89,000 increase.

The report helped to calm recession worries and offset warnings from Merrill Lynch (MER) and Washington Mutual (WM) – the latest financial firms to lower their outlook due to recent turmoil in the credit and mortgage markets. Stocks, in turn, traded sharply higher after the reassuring report with both the Dow and S&P hitting new all-time highs during intraday trading. All in all, it was a bullish end to the week and a bullish start to the fourth quarter.

--Richard Jahnke, Briefing.com
 
Index Started Week Ended Week Change % Change YTD
DJIA 13895.63 14066.01 170.38 1.2 % 12.9 %
Nasdaq 2701.50 2780.31 78.81 2.9 % 15.1 %
S&P 500 1526.75 1557.59 30.84 2.0 % 9.8 %
Russell 2000 805.45 844.86 39.41 4.9 % 7.3 %

3:45PM Market View: New highs all time intraday highs for Dow and S&P 500 (TECHX) : Suggested watching for signs of a correction/pullback in the wake of the knee jerk reaction to the jobs data (Non-Farm 110K vs. consensus 100K, Aug revised to 89K from -4K and Hourly Earnings +0.4% vs. consensus +0.3%) but the index merely drifted to a minor retrace support and extended into midday setting a minor new all time high in the process. Once again only a limited pause was noted with the rally extended as high as 1561.91 during the afternoon. The advance was broad based in nature with Transports (Rail +4.7, Trucking +3.9%, Airline +2.7%) pacing the way along with Steel +3%, Home Construction XHB +2.9%, Paper +3%, Retail +2.5%, Gold/Silver +2.3% and Internet +2.2%. Little other than Oil Service -0.3% and Tobacco -0.2% were in the red. The market is technically extended in the wake of recent advance (S&P 500 +3.6% off last wk's low, +8.5% off Sep low, 14% off Aug low) so still watching for indications that a short term correction will continue develop off the current high or near an equality target at 1565 early next week.

09:31 am RF Micro Device: AmTech Research initiates Buy. Target $10. AmTech initiates RFMD with a Buy and $25 tgt as firm believes co is well-positioned for the 3G ramp with over 50% share of Power Amps (PAs) in WCDMA handsets. Top customers include NOK, MOT, Samsung, Chinese vendors and smaller players. In addition, firm sees RFMD's content increasing from ~$1.50/phone to upwards of $3/phone over the next 12-24 months driven by the increased use of FEMs, the move in WCDMA to multiple band/multi-mode configurations, and the ramp of Polaris 3. Firm believes RFMD will report solid Sept quarter results and outlook on October 23 driven by the strong 3G ramp at NOK and Samsung, the subsiding MOT drag and the initial Polaris 3 ramp.

08:43 am Research In Motion (RIMM)

Investors love Research In Motion's (RIMM 100.54) stock just about as much as consumers love their Blackberries. Can't say we disagree. The stock has tripled since we started recommending the name in June last year, arguing that valuation and the upside potential from its first endeavor into the consumer market offered considerable upside potential.

We reiterated our position in September after the Waterloo, Ontario-based company added another 800k subscribers and released the Blackberry Pearl. We retained our bull position again in December after it added 875k subs, in April after subs reached 8 million after another million were added in the quarter, and finally in June as demand for its Pearl, Curve and 88xx series drove subscriber growth of 1.2 million.

In July, the good news kept on coming. The company won approval, after an eight year effort, to sell its handsets in China. We argued then, "the stock shouldn't be chased but added to when the market inevitably starts second guessing the company's ability to meet heightened expectations." Those expectations were running high into the second quarter results after the stock ran from $85 (post-split) to $100 in one month.

The results themselves were strong, on the top and bottom line. However, the 50 cents in earnings per share, which surpassed estimates by only a penny, may not be enough to continue the upward momentum. As such, we think investors should take some profits off the table, but retain a core holding in the stock. We would be adding back on pullbacks as we head into the seasonally-strongest period of the year.

In the quarter, subscriber additions were strong, up 21% sequentially. A robust topline and ongoing operating leverage drove the quarter. For the first time in the company's history, consumers, not enterprise customers, drove the upside. The company guided 1.65 million net subscriber additions for the third quarter (14% q/q, 89% y/y) ahead of expectations.

Estimates are likely to be revised higher following RIMM's impressive showing. We think strong subscriber growth and accelerating consumer adoption will continue to propel the stock higher over time. The launching of the Touch confirmed even Apple (AAPL) doesn't think it can usurp the Blackberry as the consummate email device on the planet. The bear case going forward is volume growth will lead to margin compression. We side with the bulls on this one, believing RIMM will be able to retain margins while continuing to deliver the topline growth leading to strong earnings growth.

--Kimberly DuBord, Briefing.com
icon url

ReturntoSender

10/07/07 3:40 PM

#7663 RE: ReturntoSender #6755

InvestmentHouse Weekend Update:

http://www.investmenthouse.com/weekendmarketsummary.htm

- SP500, NASDAQ ride in-line jobs report, August revisions to new post-2002 highs.
- Jobs report: Okay, so what if the government was off by 93,000?
- Will Fed cut another one after stronger jobs report?
- Still a lot of negativity regarding the market even as indices break higher.
- With the continuing economic re-recovery, time for industrials to resume their move, and small caps are trying to help as well.

Just right jobs report pushes SP500 to a new high.

The market was set up to move higher and looking for a trigger. The in-line jobs report (110K versus 100K expected) and a rather massive revision to August (+89K from -4K) provided the spark to break the indices higher. Well, it provided the spark, but it was not an explosion higher. Part of the powder didn't ignite. SP500 broke to a new all-time high and NASDAQ added a lot to its earlier move to a new post-2002 high. DJ30 was up, but its move was nowhere near its large cap brethren, and after pushing to a new high intraday it faded. Held a gain, but a mere shell of the other indices.

The jobs report was the keynote address, but there was other news pre-market, some good, some not so good. RIMM was up on its results; once again after hours action does not necessarily represent what happens during the full session. RIMM dragged AAPL along with it along with some other big techs. On the flipside, NBR (drilling) guided lower due to a falling North American rig count. MER warned re its Q3 due to heavy write-downs in assets related to the sub-prime issues. Outside the jobs report, life goes on as usual.

Stocks started higher out of the gate. The dollar started higher as well, pushing oil a bit lower and keeping a lid on the energy stocks again. After that higher open the action was up and down through midmorning. Then the market broke from that range and headed nicely higher. Some word that the commercial paper market was improving as a few companies were placing their paper, and the Fed's Kohn had some decent things to say about the prospects of more Fed action.

The upside move paused over lunch, but stocks were back up into the afternoon session. Techs were the dominant leaders but the small caps were up nicely as well. Metals started to move in the afternoon, one of the leadership groups on the last leg that backed off and was lagging on the current attempt. They were still not blowing things away as some late profit taking took back some of their nice gains. As noted, energy was lagging; still set up well, but thus far unable to take up the leadership mantle it had on the market's last leg higher. That left it to the techs, and they did an all around decent job at holding the gains together.

Technically the action was solid . . . for the most part. SP500 broke to a new all-time high, testing the move intraday and then closing with room to spare over the July high, completing the move out of the cup with handle base. NASDAQ did the same, i.e. breaking out from its cup with handle base as well. It already broke to a new high to start the month and quarter, and the Friday break higher was an exclamation point on that move.

Volume was up and actually not bad on NASDAQ. It topped 2 billion share, approaching the levels hit as NASDAQ started its stronger move higher in mid-September. Still below average, however, given the huge volume during the July and August selling that jacked up the average level of trade. NYSE volume was up as well, but it was rather puny, coming in less than the Monday new money for the month trade. Breadth was great at 3:1 NYSE, but that doesn't really make up for the chronic lack of volume on NYSE.

Notably lacking was DJ30 with respect to a move to a new high. As noted above, it put in a decent move but it could not hold above Monday's peak that took it to a new high. SP600 didn't make a new high either, but unlike DJ30, it was running hard toward the old high, posting the best move in the market outside of NASDAQ 100.

Leadership was clearly in the hands of a few tech stocks such as RIMM and AAPL. Techs continue to perform well in general, though the large cap techs are dominating. Once more, however, the small caps were there as well, posting strong moves as the economy continues to look as if it is going to once more resume its growth plane. As we have discussed, the economy was emerging from a mid-cycle slowdown in Q2 and into Q3 when the credit freeze hit. That really hammered the small caps as the fear was the credit issues would stall the economy, and small caps have to have growth, solid growth, to prosper. They are surging back up, leading the market in percentage moves all week, and that is an indication that the economy is emerging, once again, from a pause and has good growth potential ahead of it.

You won't hear much of that kind of talk on the financial stations. For one thing, there is still a lot of pessimism about the US economy in general. The litany of terrors is cited every day: sub-prime, credit, weak dollar, inflation, declining consumer. You even hear how the market is a poor indicator of future economic performance. Don't tell that to the market back in 2000 when it pitched over and the economy collapsed after it. And of course the rally that started off the October 2002 low and the surge that preceded the huge gains in GDP in Q3 2003 was not forecasting the return to prosperity. Throughout US economic history you have market rallies followed months later by surging economic growth. Yet some still pick at the time or two that growth lagged longer than usual, claiming that is the rule rather than the exception. That is fine. As long as there are those out there refusing to acknowledge fact and remain negative, that is good for the market rally as the market moves its best when there is a lot of doubt and worry. This has been a strong move higher, befitting the amount of issues and worries covered each hour of each trading session on the financial stations.

THE ECONOMY

Jobs report shows August report was wrong. That is what is so right about it.

You have to wonder. The government reports a loss of 4K jobs in August when expectations were for a gain in the 140K range. A month later it issues an 'oops' report, noting that jobs were actually up 89K; nothing like a 93K miss. We figured the August number was an outride, i.e. just plain did not reflect reality, and that was the case. It certainly doesn't add to the already crumbling confidence in the government's ability to collect and compile data about the economy or anything else for that matter.

As for the September report, it was basically in line at 110K versus 100K. With the revisions to the prior two months 118K non-farm jobs were added back in. Average hourly earnings rose 0.4% versus the 0.3% gain they have held for months. That put the year over year level at 4.1%, a very solid expansion considering all of the talk we are hearing about how US wages are terrible. Of course that raised comments about 'wage-led' inflation. For once we would like to have an expansion with some wage increases without having to hear about this bogus, unsubstantiated theory.

Even with the upside revision that brought cheers from many commentators, the market did not run higher because the results were strong. No, the numbers were still quite weak, just not the gut-punch level the initial August report of negative growth suggested. The revision suggested no collapse, but the overall numbers were weak. 89K? Even if that was reported in August it still would have been a big letdown versus the 140K expected. No, all the revision did was put the numbers in the 'just right' category for the market given its desire for continued Fed rate cuts.

Will the Fed still be ready to keep cutting them?

Indeed, despite the 'whew' many were letting out Friday and the talk of a strong economy as evidenced by the jobs report, quite frankly it showed nothing of the sort. To backtrack some, recall how some said the August jobs report and the initially reported 4K jobs loss was why the Fed cut rates. If you believe that, then the revision to +89K would prompt you to conclude that the Fed would not cut again and probably be looking for the opportunity to 'take back' that cut. We heard that on Friday from the uninformed or the shallow thinkers.

The Fed did not cut because of the jobs report. Bernanke's writings show he knows jobs are a lagging indicator, and the other more leading indicators simply did not jibe with that jobs report. As we said at the time, the Fed cut rates because it feared that the credit freeze on top of the sub-prime concerns would stall the economy and lead to recession as such contagions had done in the past. Friday FOMC member Kohn confirmed this with his candid comments as to why the Fed cut by 50 BP: the Fed cut in order to offset tight credit and promote growth, noting it was better to respond too rapidly versus too slowly. He noted that with core inflation trending lower (core annual PCE growth at 1.8% last month) the Fed had room to work with.

As we noted at the time, the weak August jobs number was additional cover the Fed could use to cut rates if it wanted to. Kohn's comments confirm this. Given the Fed cut to prevent a further contagion from leading to recession, the fact that jobs 'recovered' is not going to change anything with respect to whether the Fed cuts rates again or not.

Remember, the Fed was saying before the credit freeze hit that the economy would grow below its potential. Bernanke said this to Congress in his son of Humphrey-Hawkins testimony, and several other Fed presidents and governors echoed this position. After the credit crunch hit the Fed had even less reason to believe the economy would improve its growth, i.e. it likely expected growth to slow even more as a result. Thus with the Fed viewing the economy with even less momentum than before, the jobs revisions won't impact its view regarding rate cuts.

Given the Fed's moves ahead of and during the credit crunch and the Kohn comments, it is pretty clear that the Fed, through Kohn (and likely others to come this week) is outlining why the Fed will likely cut at the next meeting here in October. In short, the Fed was worried about sub-trend growth before all of these issues hit, and now that they have hit and the Fed has cut in response, a few more jobs added due to a revision are not going to change its course of action. The only real question is whether the Fed cuts another 50BP or just 25BP. If the leading economic data continues to improve and show a second re-acceleration out of the mid-cycle slowdown, 25BP is likely the number. Much depends upon how the credit issues improve before that meeting, however. If they are not better, the Fed will do what it has to in order to get that market opened up to avoid any chance of a slowdown leading to a recession.

THE MARKET

MARKET SENTIMENT

VIX: 16.91; -1.53
VXN: 19.77; -1.69
VXO: 16.05; -1.97

Put/Call Ratio (CBOE): 0.78; +0.05

Bulls: 56.5%. A second week above the 55% level considered bearish. The theory is that when too many investors or advisors are bullish then most of the money is in the market and there is nothing ready to come in off the sidelines to drive prices higher. Up from 55.6% last week and on a steady climb from a low of 40.6%, the low for this round. Never made the thirties. Hit 56.7% in June. The market peaked about a month later. For reference it bottomed in the summer 2006 near 36%, and 35% is considered bullish.

Bears: 25.0%, down from 25.6%. Bears continue their decline, falling steadily just as bulls have risen steadily. Down from 27.0% three weeks back and 31.0% the week before. It held at 37.4% for 3 weeks prior to that. Still well off the very low 18% hit in August, and it topped the June 2006 peak (36%) on this run. That June peak eclipsed the March 2006 high (33%) and well above the 2005 highs that spawned new rallies (30% in May 2005, 29.2% in October 2005).

NASDAQ

Stats: +46.75 points (+1.71%) to close at 2780.32
Volume: 2.018B (+16.92%). Volume was the best in two weeks, since back when the Fed cut interest rates. It was still below the pumped up average volume level (due to the July and August selling volumes), but it was good that the trade topped the Monday level when the new money came into the market. This shows that some real buying came into the technology sector. That is what you want to see on breakouts, and that is what this was.

Up Volume: 1.632B (+744.655M)
Down Volume: 364.687M (-450.232M)

A/D and Hi/Lo: Advancers led 2.84 to 1. Very nice breadth as NASDAQ broke higher. The large caps were leading (NASDAQ 100 posted a 2.09% gain) but it was not a large cap only move.
Previous Session: Advancers led 1.28 to 1

New Highs: 139 (+75)
New Lows: 23 (-9)

NASDAQ CHART: Click to view the chart

NASDAQ gapped higher, clearing the early week high on the initial move. It showed the classic bullish intraday action, i.e. the low to high move that shows the session building strength throughout. The fact that it gapped higher and held the gap shows its strength. NASDAQ is not at a new post-2002 high and is leading the market once more after it had conceded some to the SP500 and the industrials, energy and metals. NASDAQ is growth, and with it leading and the small caps surging higher, there is an argument for growth in the US.

SOX (+0.98%) rebounded but it was nothing near a breakout. It remains well-entrenched (mired is more accurate) in its long base. Not a lot of strength found here.

SOX CHART: Click to view the chart

SP500/NYSE

Stats: +14.75 points (+0.96%) to close at 1557.59
NYSE Volume: 1.258B (+14.34%). Volume was up on SP500's breakout and the small cap surge, but it was still lower than Monday and way, way below average. Just not the kind of strength you would like to see on a breakout move.

Up Volume: 1.051B (+401.112M)
Down Volume: 188.261M (-244.59M)

A/D and Hi/Lo: Advancers led 3.14 to 1. Excellent breadth as the small caps again led the market higher.
Previous Session: Advancers led 1.65 to 1

New Highs: 167 (+123)
New Lows: 1 (-7)

SP500 CHART: Click to view the chart

The large caps gapped higher as well and ran on into the close. It moved through the old high at 1553 and the July peak at 1556, but it had to fight to hold the all-time high on the close. It did, but as noted, the volume was not the kind that instills much confidence in the move. That doubt is what we are hearing on a daily basis, and low volume is a very important consideration. For the moment, however, SP500 is following the NASDAQ while the techs do the leading. That is okay for now but you want to see volume improve as the energy and other recent leaders now taking a breather resume their moves.

SP600 (+1.83%) was again one of the percentage leaders in the market as the small caps continue their recovery and surge toward a new all-time high, just 4 points off that level. As discussed above, the rise in the small caps and their recent relative strength comes on the heels of the Fed rate cut and indicates a belief in the market that the economy is going to post better numbers down the road than currently expected.

SP600 CHART: Click to view the chart

DJ30

The blue chips bounced off of that tight doji on the candlestick chart from Thursday and, for a time, traded at a new all-time high (14,124.54). Volume was up but still below the Monday level (as on NYSE), and but the close the Dow faded back from that new high. It held a solid gain but surprisingly faded back from the prior high as the rest of the market broke higher and hdle the moves.

Stats: +91.7 points (+0.66%) to close at 14066.01
Volume: 183M shares Friday versus 143M shares Thursday. No real volume to push the Dow or get it to hold the new high.

DJ30 CHART: Click to view the chart

MONDAY

A heavy week of data once more even after the overly-hyped jobs report is out. FOMC minutes and retail sales are the highlights, but we can also expect a lot of Fed-speak during the week along the lines of Mr. Kohn because this is the last week before the Fed enters the quiet time ahead of the 10-31-07 FOMC meeting (fitting it is on Halloween).

It is also a week that will see more earnings and earnings warnings as earnings season really gets underway. RIMM got the techs off to a good start, but of course, not all stocks, indeed not many, are RIMM.

Whenever the indices break to new highs and earnings season is at hand you have a feeling that stocks have run up ahead of the news and then are subject to fading when the results start to come out. In July stocks were up somewhat heading into the season, and they got a boost with the first earnings. As is typical, however, after the general gist of the season became known the impact faded and so did prices. Of course that was also the time the market was on the precipice of the sub-prime and credit crunch sell off.

There are stocks that ran higher on into the start of Q4, many of which made us a lot of money and are still doing so. They are extended, and earnings likely won't blast them much higher regardless of how good they are. On the other hand the market has broken higher once more, putting the July and August swoon behind it. Volume is not that great overall but investors are pumping money into certain areas, e.g. techs, as the jobs and other data suggest, golly gee, the expansion is not over. Indeed, some industrial stocks will start moving higher again given that the US and world economies are not collapsing. CAT started higher Friday. Metals started to spark up again, and energy stocks still look very good to move higher once more.

There will be a lot of guessing as to what the market will do after this breakout and as earnings start to roll out. As noted, we have a lot of positions that have run high and continue higher. They are more vulnerable to earnings even if the results are good. Thus we have taken some gain on the path higher and we continue to move up our trailing stop points.

As for new plays, as noted we still see a lot of stocks set up nicely to break higher. As the recent leaders run out of gas and test back to set up once more, the next wave will make the break higher. Energy, metals, industrials, and Chinese stocks did much of the running on the last move higher, and as they put in some R&R the past two weeks the techs moved higher. With some of the early running techs and NASDAQ stocks a bit extended, they are likely to test as earnings hit. Then we see if the next wave will come forward and make the break higher and thus extend the breakout. Again, we see many good stocks in position to do just that as the rotation seen the past month continues.

Support and Resistance

NASDAQ: Closed at 2733.57
Resistance:
2887 from a September 1999 peak
2920 from an October 1999 peak

Support:
2778 from a July 1999 peak
2745 is the November/February up trendline
2725 is the July high
The 10 day EMA at 2720
2702 is the November/December/February up trendline
2673 is the early July high
2634.60 is the June peak
The 50 day EMA at 2633
The 90 day SMA at 2612
The 200 day SMA at 2536

S&P 500: Closed at 1557.59
Resistance:
New high!

Support:
1556 is the July intraday high
1553 intraday high from March 2000 used to be the all-time peak
1541 is the early June high
1539 is the mid-June intraday high
The 10 day EMA is at 1536
1534 is the early July high
1509 is the July 2006/March 2007 up trendline
The 50 day EMA at 1500
The 90 day SMA is at 1499
1490.72 is the early June closing low and early August peak.
1475 from peaks in December 1999 and January 2000
The 200 day SMA at 1471
1461.57 is the February 2007 high.
1440 is the mid-January high
1427 represents some interim peaks from December 2006 and the early August low

Dow: Closed at 14,006.01
Resistance:
The July high at 14,022
7.0% above its 200 day SMA (13,038). When it gets near 10% it starts to struggle.

Support:
13,975 is the old channel line
The 10 day EMA at 13,928
The August high at 13,696
The mid-June high at 13,689
The early June high at 13,676 (closing), 13,692 (intraday)
The early July peak at 13,671
The 50 day EMA at 13,582
The mid-May peak at 13,556
The 90 day SMA at 13,513
13,255 is the July 2006/March 2007 up trendline
13,121 is minor support from the April peak
The 200 day SMA at 13,062
12,845 is July closing low
12,796 at the February 2007 high
12,518 is the August intraday low

Economic Calendar

These are consensus expectations. Our expectations will vary and are discussed in the 'Economy' section.

October 9
- FOMC Minutes, Sept. 18 (2:00):

October 10
- Wholesale inventories, August (10:00): 0.3% expected, 0.2% prior.
- Crude oil inventories (10:30): +1.1M prior

October 11
- Initial jobless claims (8:30): 371K prior
- Trade balance, August (8:30): -$59.0B expected, -%59.2B prior
- Treasury budget, September (2:00): $100.0B expected, $56.2B prior

October 12
- Retail sales, September (8:30): 0.2% expected, 0.3% prior
- Retail sales ex-autos, September (8:30): 0.3% expected, -0.4% prior
- PPI, September (8:30): 0.4% expected, -1.4% prior
- Core PPI (8:30): 0.2% expected, 0.2% prior
- Business inventories, August (10:00): 0.3% expected, 0.5% prior
- Michigan sentiment, Oct. preliminary (10:00): 84.0 expected, 83.4 prior
icon url

ReturntoSender

10/09/07 6:24 PM

#7668 RE: ReturntoSender #6755

From Briefing.com: 4:25 pm : The equity market was in a meandering mode for a good part of Tuesday's session, but it soon perked up following the release of the FOMC Minutes from the September 18th meeting.

The end result is that the Dow and S&P 500 both closed at new highs in a low volume move while the Nasdaq logged its fourth consecutive winning session. Remarkably, the Nasdaq is now up 17% from its August 16th low.

With respect to the rally that followed the release of the minutes, we aren't buying the notion that it was predicated on a sense of optimism that the Fed will again cut rates at the October 31 FOMC meeting.

On the contrary, our interpretation of the minutes was that they did more to weaken the case for a rate cut than they did to strengthen it.

The Fed noted that future actions would depend on the economy and market developments. Although the Fed could cut rates again if economic growth weakens, recent data and the behavior of the capital markets suggest otherwise.

In looking at the rally, the explanation that makes sense is that it was driven by a sense of optimism that the economy is in good enough shape that another rate cut isn't needed. To be sure, it is more important for the market that the economy not enter a recession than it is to get another rate cut.

Our view aside, there was no mistaking the bullish bias in the market following the release of the minutes. The late day surge was powered by broad-based buying interest and was led by a resurgent financial sector (+0.8%) that was in negative territory prior to the minutes.

Goldman Sachs (GS 239.20, +12.24) was a winning standout whose outperformance provided a real boost for other financial stocks.

All ten economic sectors closed the day with a gain. The biggest movers were the materials (+2.0%), energy (+1.8%) and utilities (+1.4%) sectors. The consumer discretionary sector (+0.2%) brought up the rear as it was held back by a relatively weak showing from many retailers ahead of the September same-store sales reports later this week.

The tech sector (+0.6%), which has been so strong of late, underpeformed the broader market, yet it was underpinned by leadership from Microsoft (MSFT 30.10, +0.26). The latter stock rose in response to Goldman Sachs lifting its profit estimates for 2008, 2009 and 2010.

Despite the stock rally, the dollar came under some pressure as seen in the 0.2% decline in the dollar index (DXY). The dip in the greenback helped spark buying interest in the commodity arena. Oil futures tacked on 1.4%, rising to $80.13 per barrel, while gold futures jumped 0.6% to $743.10.

In Wednesday's trade, the weekly inventory report from the Dept. of Energy and the earnings report from Alcoa (AA 39.752, +1.42) will be focal points.DJ30 +120.80 NASDAQ +16.54 SP500 +12.57 NASDAQ Dec/Adv/Vol 1244/1711/1.89 bln NYSE Dec/Adv/Vol 1011/2285/1.19 bln

4:30PM Semitool announces it has sold an advanced Raider tool to a customer focused on development of high-efficiency, low cost-per-watt solar devices (SMTL) 9.52 +0.00 :

3:58PM Market View: Late run to new highs (TECHX) : A firmer start to the session with the Nasdaq Comp/100 able to set new multi-year intraday highs in early action amid strength in stocks such as MSFT (2008 through 2010 estimates raised by Goldman) and GOOG. The rest of the indices were higher as well but they did not confirm the breakout above last week highs. This lack of confirmation, pressure in Semi and Retail along with a caution in front of the 14 ET FOMC minutes results in several hours of choppy range trade. The minutes increased volatility but no clear direction for 25 minutes. Once the minutes were fully digested, however, the indices began to lift higher with comments from two Fed members providing support for the late day upside extension. The Dow and S&P 500 ended with new all time highs and the Nasdaq 100/Comp set fresh multi-year highs. The Russell 2000 continues to lag as it failed to break Friday's high and is 11 points shy of its all time high from July. Commodity related sectors paced the way on the upside (Coal +4.2%, Mining +3.6%, Steel +2.8%, Gold/Silver +2.8%, Natural Gas +2.1%, Oil +1.8%, Oil Service +1.8%) along with Broker +1.7%, Chemical +1.4%, Utility +1.3%, Restaurant +1.2%, and Home Construction +1%. Semi (SMH -0.4%) and Retail (RTH -0.2%) rebounded well off their lows but ended with minor declines.

9:01AM Tegal announces that it has received additional orders for 981ACS units from a "leading hard disk drive manufacturer" (TGAL) 5.42 : Co announces that it has received additional orders for 981ACS units from a leading hard disk drive manufacturer to support capacity expansion for magnetic data storage device fabrication. The order also includes additional ACS productivity upgrades for the customer's legacy 900 Series tools.

09:32 am Microchip: AmTech Research downgrades Buy to Neutral. Target $47 to $37. Amtech downgrades MCHP to Neutral from Buy noting yesterday after the close, MCHP pre-announced its FQ2 revenue would be down ~2% vs. previous guidance for flat to up 2%, and the company expects Q4 revenue to be down sequentially vs. their original estimate for 4% sequential growth. The firm says while they continue to believe shares have support at current levels from the 3.4% dividend yield, they do not see any incremental catalyst to drive shares higher in the near-term.

09:32 am Broadcom: AmTech Research reiterates Buy. Target $40 to $45. AmTech notes BRCM and Samsung announced an expanded partnership where BRCM will supply multiple ICs including EDGE basebands, 3G WCDMA co-processors, Bluetooth, power mgmt, and software. Firm views this announcement as a key positive as this is BRCM's third Tier-1 cell phone baseband win with the others being Sony-Ericsson and NOK. Firm believes volumes are likely to be modest however, they would like to note that BRCM has now expanded its geographic coverage at Samsung to include Asia-Pacific, Africa, Australia, and "elsewhere". Firm notes the expanded partnership with Samsung gives them higher conviction in their above consensus ests. Firm raises their tgt to $45 from $40.

icon url

ReturntoSender

10/10/07 11:09 AM

#7671 RE: ReturntoSender #6755

Sentiment is getting pretty bullish. The Investors Intelligence Poll has Bulls up over 60% and Bears are down to 21%.

http://www.schaeffersresearch.com/streetools/market_tools/inv_intel.aspx?click=jumpto

The Weekly charts still look good for more appreciation though and the Bears are not actually below 20%.

http://investorshub.advfn.com/boards/read_msg.asp?Message_id=11425919&txt2find=major

The NASI and NYSI still look good:

http://siliconinvestor.advfn.com/readmsg.aspx?msgid=23946709

Any thoughts?

RtS
icon url

ReturntoSender

10/13/07 12:56 PM

#7676 RE: ReturntoSender #6755

COTD Testing Upper End of the Trend:

http://www.chartoftheday.com/20071012.htm?T

Despite a host of concerns (i.e. weak housing market, subprime crisis, geopolitical issues, etc.), the stock market has remained within a general uptrend. For some perspective, today's chart illustrates the Nasdaq Composite since 2004. As the chart shows, the Nasdaq is up over 37% since bottoming in June of 2006 and is trading at levels not seen since early 2001. However, as today's chart illustrates the Nasdaq is currently testing resistance (see red line) of its three-year uptrend.

icon url

ReturntoSender

10/14/07 2:52 PM

#7678 RE: ReturntoSender #6755

InvestmentHouse Weekend Update:

http://www.investmenthouse.com/weekendmarketsummary.htm

- Economic data helps stocks stage a decent, albeit low volume rebound.
- The moves early this week will be the market's direction for the next leg.
- October surprise, albeit short term, may be in store.

Stocks rebound, but in line with the presidential candidates out there we have to ask where's the beef.

Futures were decent on some deal news (ORCL wants to buy BEAS) and a general rebound in the market following the whiplash session Thursday that saw strong early gains turn into strong late losses. The idea of some deals acted as something of a salve, but alone that would not do the trick. Now when retail sales came out and beat expectations and some rather draconian predictions from some of the more negative pundits (0.6% actual versus 0.2% expected; 0.4% ex-autos versus -0.4% expected) and core PPI rose 0.1% versus the 0.2% expected. Golly Wally, the economy is just not rolling over as so many expect.

The market started higher on that news and a half hour later was goosed a bit higher by the Michigan sentiment report that was a bit lower than expected (82.0 versus 84.0), but after the stronger early data it seemed to play a good foil, i.e. diluting the prior data for the Fed's use and enjoyment.

Stocks opened higher and surged into lunch. Then they moved laterally from lunch to close, gyrating in a rolling range. It took a last half hour surge higher to push them back up to the session highs, but they made it. They recovered some of the Thursday losses, and it was the usual group of leaders doing the leading. It was a good response, but it was not all that powerful.

Technically it was a decent answer to the Thursday reversal, showing a solid price rebound, especially on NASDAQ and even more so on NASDAQ 100 (1.73% gain). The indices gapped higher, moved further upside, fought off some modest selling attempts, and closed right at the session highs. The internals were mediocre. Volume was lower after that strong Thursday reversal surge. Breadth lacked any enthusiasm or punch. Good price moves but not a lot of beef so to speak.

As for the charts, the indices showed inside days or what is known as a Hirami in Japanese candlestick charting. Hirami means 'body with a body', i.e. where the current session high and low traded within the prior session's high and low. That is an indication of indecision, particularly after a well established trend. The way a stock or index moves after such an inside day or hirami historically tells the direction of the next move. It doesn't say that a trend is broken or otherwise, just that the near term direction is moving that way. People get into trouble trying to stretch such indicators further than they can be used.

Combined with that wild, out of left field spike in selling volume Friday, that makes the direction to start the coming week important. Friday the leadership was bouncing back, but as noted, the moves were not all that powerful in many cases. Thursday showed there are sellers out there, ready to strike when they see an opportunity. Thus far they have not been willing to step in front of the upside train. They had some success Thursday, and the Friday buying response was rather tepid. That will embolden them to take some more shots.

NASDAQ remains in need of a breather after it led higher, and the Thursday reversal was likely not enough. Indeed, the Friday action was as we expected, i.e. higher as a response to the selling, but not really showing us one way or the other if the uptrend was back on after Thursday tried to buck it off. With earnings opening up the spigot wide open this week we can expect some more attempts at bucking the uptrend, particularly given the run from upside through September and into mid-October.

Indeed, with the lack of selling pressure and the run into the earnings we could very well see a version of the October surprise, i.e. some selling in the midst of the run higher as investors digest the early rounds of earnings results. The indices broke higher, clearing to new all-time highs on SP500 and DJ30, and new post-2002 highs on NASDAQ. The small & mid-caps have yet to make that move. A sharp, relatively fast October pullback would set them up for a run into the end of the year, and with the action seen Thursday as well as the run from the August low, such a move would actually be healthy for a nice sprint to year end.

Thus it is best to be cautious here with the runners that have come a long way on this move. Thursday the leaders that had run the hardest the past three weeks were the stocks taking the hardest hits. That is normal, but the strength of the selling shows there is something behind the scenes that needs venting before too much more upside. Again, we have to be a bit cautious with those positions; if they start showing more higher volume weakness it is best to take some more gain off the table and then let them test and see how they shake out and if they set up for new buys.

That doesn't mean there are not opportunities out there even as these runners take a deserved break. We have seen money rotating around the market; it did that Thursday when a lot of big names were getting sold back. That will likely continue to happen and we are looking for new buys on stocks emerging from bases, pullbacks or consolidations that get some of the money thrown their way when the leaders test.

THE MARKET

MARKET SENTIMENT

VIX: 17.73; -1.15
VXN: 21.2; -1.22
VXO: 17.42; -1.52

Put/Call Ratio (CBOE): 0.77; -0.14

Bulls: 60.2%. Streaking higher and now well above the 55% level considered bearish. Third week above that level, indicating that the market is getting overdone. The Thursday sharp selling is an indication of that. The theory is that when too many investors or advisors are bullish then most of the money is in the market and there is nothing ready to come in off the sidelines to drive prices higher. On a steady climb from a low of 40.6%, the low for this round. Never made the thirties. Hit 56.7% in June and now it has blown past that. The market peaked about a month later. For reference it bottomed in the summer 2006 near 36%, and 35% is considered bullish.

Bears: 21.5%. Tanked from 25.0% the prior week as bears slide steadily lower toward the 20% level considered bearish. It peaked at 37.4% on this move. Closer to the 18% hit in August, and it topped the June 2006 peak (36%) on this run. That June peak eclipsed the March 2006 high (33%) and well above the 2005 highs that spawned new rallies (30% in May 2005, 29.2% in October 2005).

NASDAQ

Stats: +33.48 points (+1.21%) to close at 2805.68
Volume: 2.008B (-21.05%)

Up Volume: 1.479B (+936.03M)
Down Volume: 512.142M (-1.464B)

A/D and Hi/Lo: Advancers led 1.65 to 1
Previous Session: Decliners led 2.36 to 1

New Highs: 101 (+49)
New Lows: 54 (+8)

NASDAQ CHART: Click to view the chart

SOX CHART: Click to view the chart

SP500/NYSE

Stats: +7.39 points (+0.48%) to close at 1561.8
NYSE Volume: 1.099B (-27.59%)

Up Volume: 671.508M (+53.187M)
Down Volume: 415.776M (-463.779M)

A/D and Hi/Lo: Advancers led 1.59 to 1
Previous Session: Decliners led 1.61 to 1

New Highs: 180 (+97)
New Lows: 22 (+1)

SP500 CHART: Click to view the chart

SP600 CHART: Click to view the chart

DJ30

Stats: +77.96 points (+0.56%) to close at 14093.08
Volume: 178M shares Friday versus 235M shares Thursday on that selling.

DJ30 CHART: Click to view the chart

Support and Resistance

NASDAQ: Closed at 2805.68
Resistance:
2887 from a September 1999 peak
2920 from an October 1999 peak

Support:
2778 from a July 1999 peak
The 10 day EMA at 2768
2755 is the November/February up trendline
2725 is the July high
2710 is the November/December/February up trendline
2673 is the early July high
The 50 day EMA at 2663
2634.60 is the June peak
The 90 day SMA at 2622
The 200 day SMA at 2545

S&P 500: Closed at 1561.80
Resistance:
1576 is the Thursday intraday high.

Support:
1556 is the July intraday high
1553 intraday high from March 2000 used to be the all-time peak
The 10 day EMA is at 1551
1541 is the early June high
1539 is the mid-June intraday high
1534 is the early July high
The 50 day EMA at 1511
1510 is the July 2006/March 2007 up trendline
The 90 day SMA is at 1500
1490.72 is the early June closing low and early August peak.
1475 from peaks in December 1999 and January 2000
The 200 day SMA at 1474
1461.57 is the February 2007 high.
1440 is the mid-January high
1427 represents some interim peaks from December 2006 and the early August low

Dow: Closed at 14,093.08
Resistance:
14,198 is the Thursday intraday high.

Support:
14,088 is the early October closing high
The July high at 14,022
The 10 day EMA at 14,022
13,995 is the old channel line
The August high at 13,696
The mid-June high at 13,689
The early June high at 13,676 (closing), 13,692 (intraday)
The 50 day EMA at 13,672
The early July peak at 13,671
The mid-May peak at 13,556
The 90 day SMA at 13,539
13,275 is the July 2006/March 2007 up trendline
13,121 is minor support from the April peak
The 200 day SMA at 13,103
12,845 is July closing low
12,796 at the February 2007 high
12,518 is the August intraday low

Economic Calendar

These are consensus expectations. Our expectations will vary and are discussed in the 'Economy' section.

October 15
- NY Empire State Index, October (8:30): 14.0 expected, 14.7 prior

October 16
- Net foreign purchases, August (9:00): $19.2B prior
- Industrial production, September (9:15): 0.1% expected, 0.2% prior
- Capacity utilization, September (9:15): 82.2% expected, 82.2% prior

October 17
- CPI, September (8:30): 0.2% expected, -0.1% prior
- Core CPI, September (8:30): 0.2% expected, 0.2% prior
- Housing starts, September (8:30): 1.285M expected, 1.331M prior
- Building permits, September (8:30): 1.3M expected, 1.322M prior
- Crude oil inventories (10:30)
- Fed Beige Book (2:00)

October 18
- Initial jobless claims (8:30): 308K prior
- Leading economic indicators, September (10:00): 0.4% expected, -0.6% prior
- Philly Fed, October (12:00): 8.0 expected, 10.9 prior
icon url

ReturntoSender

10/26/07 10:08 AM

#7694 RE: ReturntoSender #6755

COTD - Chart of the Day - The Halloween Indicator:

http://www.chartoftheday.com/20071026.htm?T

The stock market is now entering what has historically been the strongest half of the year. Today's chart illustrates that investing in the S&P 500 from the last trading day in October (therefore referred to as the Halloween indicator) through the end of April accounted for the vast majority of S&P 500 gains since 1950. While there are some noteworthy periods in which the Halloween indicator didn't produce (i.e. 1973-74 & 2000-01), the overall out performance is compelling.

icon url

ReturntoSender

10/27/07 8:37 PM

#7696 RE: ReturntoSender #6755

Amateur Investors Weekend Stock Market Analysis (10/27/07)

http://www.amateur-investor.net/Weekend_Market_Analysis_Oct_27_07.htm

During the past two weeks there has been an increase in daily volatility as shown by a 30 minute intra day chart of the Nasdaq shown below. Also many of the significant moves are occurring right after the market opens followed by sharp reversals in the opposite direction shortly thereafter. Suffice to say this type of action makes it a very volatile market to invest in and with a Federal Reserve Policy meeting next Wednesday I expect we are going to see a lot more daily volatility leading up to and after this meeting.


As far as the major averages the Dow made a bottom on Monday around 13400 (point A) and has rallied back up to its 20 Day EMA (blue line) near 13800.


If the Dow continues to bounce into next Wednesday's Federal Reserve meeting look for potential upside resistance to occur around the 13900 area which coincides with its 61.8% Retracement Level (point B) calculated from the high made a few weeks ago to the low made on Monday.


As far as the Nasdaq it held support near its 50 Day EMA (green line) on Monday and is attempting to rally back to its previous high made just a few weeks ago near 2835 which may act as a significant area of resistance if it continues to rally leading up the Federal Reserve meeting next Wednesday.


The S&P 500 held support early in the week near 1490 (point C) and has rallied back above its 20 Day EMA (blue line).


If the S&P 500 continues to move higher leading up to the Federal Reserve meeting on Wednesday look for potential resistance to develop near the 1544 level which coincides with its 61.8% Retracement Level (point D) calculated from the high made a few weeks ago to the low made earlier in the week.


Meanwhile one thing to be on the lookout for next week is the possibility of seeing more selling pressure develop much like occurred back in early August. The last time the Dow sold off rather hard was from mid July though early August (points E to F) which was then followed by choppy 6 day rally (points F to G). This was then followed by another round of selling pressure through mid August before the Dow made a true bottom (points G to H).


Finally another thing I'm concerned with in the longer term is the action in the Semiconductors. Historically the Nasdaq and the Semiconductor Index (SOX) have generally trended in the same direction. The SOX which peaked in mid July (point I) has been trending lower (points I to J) while the Nasdaq has been trending higher since mid August (points K to L). The last two times the SOX put in a top back in early 2006 (point M) and further back in early 2004 (point N) this was followed by a significant correction (points M to O and N to P) which was eventually followed by substantial correction in the Nasdaq as well (points Q to R). Thus we shall see if the Nasdaq eventually comes under some significant selling pressure in the months ahead if the SOX continues to trend lower.


With all of the volatility in the market some of your best opportunities will be in the Exchange Traded Funds (ETF). For example last Sunday we told our members to Buy at the open on Monday because the market had become very oversold. This was based on our research that shows when the Volatity Index (VIX) rises by 24% or more from the previous day this leads to a strongly oversold market as shown by the table below.

VIX Change versus Short term Performance in the SPY
  
Signal Previous Next Day VIX Open Price 5 Day Net
Date Close Close Change next Day SPY High SPY Change SPY
10/19/07 18.50 22.96 24.1% 148.84 153.62 +4.78
3/13/07 13.99 18.13 29.6% 138.43 141.05 +2.62
2/27/07 11.15 18.31 64.2% 140.39 141.98 +1.59
5/30/06 14.26 18.66 30.9% 126.58 129.43 +2.85

Here is a recent daily chart of the VIX versus the SPY. Last Friday the VIX rose 24% from the previous days close which was followed by a quick $3 upward move in the SPY over the next two trading days (points A to B).

icon url

ReturntoSender

10/28/07 7:27 PM

#7698 RE: ReturntoSender #6755

InvestmentHouse Weekend Update:

http://www.investmenthouse.com/weekendmarketsummary.htm

- Techs pick themselves back up and financials come back to life, delivering a strong 1 - 2 punch.
- The rest of the world views the US economy as a leper. Expecting a market breakout as a result.
- FOMC decision is on tap for Wednesday and a 50BP cut will spring the next leg.

Market finds some additional leadership as indices attempt to end the choppy earnings trade.

You have to love it. You diligently take positions in stocks when they show you it's time to buy even though the market action is questionable. After you move in, the reason why stocks were telling you to buy in then appears when the good news hits and other investors rush in to buy and drive your stocks higher. That is what occurred Friday.

Looking at Friday in isolation, the action was no different from the up-and-down movement seen day to day over the past two weeks. The forces that cause the movement, however, changed somewhat. With Microsoft's blowout earnings, technology was back in the leadership mode, coming back from some wobbly sessions over the past week, but this time technology was not playing lone Wolf. The financial stocks finally stepped up to the plate and were taking their cuts as well on the heels of Countrywide Financial's prediction that it would return to profitability in Q4. That gave S&P 500 a new shot of energy lacking for the past two weeks. For once, it was not just Goldman Sachs leading the financials while all others sold off.

The earnings and forecasts of profitability were more than enough to take the sting out of a falling Michigan sentiment report (80.9 versus 82.3) and once again surging oil prices ($91.86, +1.40). Futures were sharply higher, and stocks indeed opened the session with gaps to the upside, even S&P 500.

Unfortunately, as is often the case with strong opens, stock started to sell almost immediately. It is always a risk that a strong open is used by sellers to unload positions, particularly when the market is as choppy as it has been over the past two weeks. NASDAQ lost 32 points off of its opening high right before lunch started on the east coast. That was not a good move given that one of the main reasons for the gap higher was the Microsoft earnings. Once more, however, the market found its bottom midmorning (at least by Central Time zone standards) and started to rebound. The market continued to rebound into the close, fighting off a rather eat last our intent to sell the stocks back down, and closing at or near session highs. It was good to see S&P 500 are really pushing hard into the close and moving to a new session high as the closing bell rang.

Technically, the action was solid overall, particularly on NASDAQ and S&P 500. Stocks started higher, but as noted, they immediately started to move lower. As they have done most all week, however, they resumed the move higher into the afternoon. Even though S&P 500 and DJ 30 struggled to move higher on the week, this low to high action intraday shows that there is some underlying strength in the market as buyers moved in on the lows to accumulate shares. You can call it the Fed bid or just plain old buying on the dips, but either way there was steady buying as the indices held key support during the week (e.g. S&P 500 testing 1490).

As for the internals, breadth improved nicely on both NYSE and NASDAQ on Friday, but it was really lopsided to the downsides for most of the week. Volume dropped off on Friday, but it still held the elevated levels that showed up to Fridays back. As discussed Thursday, volume improved as S&P 500 tested key support at 1490. That increased volume showed that big money was stepping in at that support level and buying into stocks. Thus, even though volume was lower on Friday, we do not view that as an overall negative, though we would've preferred volume to surge as stocks broke higher.

The charts showed a pretty good picture for a change after some pretty weak action during the week. NASDAQ broke over 2800 that acted as resistance for the past two weeks. It did not break to a new post-2002 high, but it was a key move as the index installed at that level. S&P 500 broke over the late September highs that represented the left shoulder in a potential head and shoulders topping pattern. The Dow is not quite bear, however, though it did rise nicely on some very solid upside volume thanks to Microsoft. Once more the indices are breaking up a potentially toppy pattern as they've done on many occasions during the runs higher this year. The rather striking feature of the Friday move higher is that with this move you can see an ascending triangle building on DJ 30. It still has a ways to go, but it is making higher lows below a rather constant peak for the past four months.

With respect to leadership, once more technology took the lead gratis Microsoft, but as noted above, financials were there as well, gratis CFC. It was finally not just Goldman Sachs leading higher in the financial sector, and that hold out some hope or S&P 500 as the market moves out of October and into the last two months of the year. China was hotter than a pistol as EJ, CTRP, BIDU, and EDU to name a few posted strong gains. Metals continue to rebound, in agriculture came back to life as well. Energy was not bad either, but given that oil prices were surging higher last week is not all that strong. The drillers, the tar sand plays, independents, and natural gas producers performed well, but service companies and large integrated companies continued to struggle. Leadership is not really spreading out across the market, but instead just returning to the prior leadership after it paused during this last pullback... with the addition of some financials.

THE ECONOMY

One of the reasons the Thursday night report was chock full of typos was that I was traveling and having to use a new voice recognition software program that still has some bugs in it. After having a bout in the hospital couple of weeks back, I was playing catch up on some economic research that I was undertaking when I had to make that unexpected visit to the hospital. I've been traveling around the country to certain real estate locations to ascertain the status of the commercial and housing markets. First, in the formerly hot housing areas such as Phoenix and Sarasota, Florida, the market is as bad as you hear. In Sarasota for instance, but was told by many in the industry, but they're typically 200 300 houses for sale in any given month. That is the land to 800 to 1000 units over the past six months. When you look at several similar markets across the United States, you understand that the housing market is definitely in a deep slump.

In addition to looking at housing markets, we also were talking with many visitors to the United States from foreign countries. Almost unanimously, the people we spoke with, while more than happy to be here to take advantage of shopping opportunities given the weak US dollar, had absolutely no interest in investing in the United States right now. Over and over we were asked when would things improve in the United States. Almost to a person the view was, things were too weak in the US for money to work here.

That kind of negative sentiment would love to hear. Just as with the stock market, sentiment about an economy can get to an extreme level and indicate that a turn is coming. Right now the sentiment in the rest of the world is that the US economy is bad and getting worse with no end in sight. That kind of sentiment starts brewing the recovery as the smart money starts moving in long before sentiment changes. There are indications that the worm may be turning a bit. The Countrywide CEO may conjure up images of a used car salesman, but he is CEO of the largest mortgage lender, and he is no fool. He indicated that there is liquidity returning to the market, and he has changed his forecast to profitability, not sometime in 2008, but in Q4 2007. Moreover, some very savvy people, Florida region were telling us that the market was very near a bottom, and that another quarter of bad results would likely see the money starting to move quietly back into the area. There are some waiting as patiently as possible to move in, but you get its the sense that some very smart people were already a bit itchy to take action.

The stock market typically show the move start before the actual recovery begins. The market is always leading in its view of the economy. Perhaps the moves in the homebuilders, mortgage lenders and the financials on Friday is the start of such a move. It is still much too early to determine that, but with the Fed actively in the game and likely cut another 50 basis points on Wednesday, there is very good reason for the stocks to start moving higher. In the market in general, you can see former leaders took a pause over the past two weeks to a month starting to move once more. There were fears of a global slowdown on top of the US slowdown. Given that the US still plays a dominant role in the world economy even with a slowing economic picture here at home. These indications that the weakest US economic sectors are bottoming might be one of the reasons that we're seeing the materials, metals, agriculture, and other early leaders starting to move once more as the market sniffs out the recovery long before it is evident.

We can prognosticate a bottom if we want to, but that really doesn't do us much good. We can think whatever we want and the market won't give a damn. All we can do is get the best lay of economic landscape and then look to see what the market is doing and whether or not that corroborates what we think we see. In the end, however, the market tells us what to do because as we've said, the market is the best economic prognosticator.

THE MARKET

MARKET SENTIMENT

VIX: 19.56; -1.61
VXN: 25.01; -0.76
VXO: 20.12; -1.93

Put/Call Ratio (CBOE): 0.82; -0.27. After a couple sessions of closing above 1.0, the strong moves and indices pushed the put/call ratio back below that key level. It never really got high enough for long enough to be much of an indicator on this round.

Bulls: 56.5%. As you would expect after a two-week pullback, bullishness declined among investment advisors, falling from a peak of 62.0% last week. This was the fifth week above the 55% level considered bearish. The action this week will likely drop the Bulls a bit further, but it won't do significant damage to the rise. If the market continues to rally that will leave the Bulls still at an elevated level. The theory is that when too many investors or advisors are bullish then most of the money is in the market and there is nothing ready to come in off the sidelines to drive prices higher. On a steady climb from a low of 40.6%, the low for this round. Never made the thirties. Hit 56.7% in June and now it has blown past that. The market peaked about a month later. For reference it bottomed in the summer 2006 near 36%, and 35% is considered bullish.

Bears: 22.9%. Back above 20% level that is considered the thresholds between bullish and bearish conditions. Bears fell to a low of 19.6% last week, after falling rapidly from 25% just couple weeks ago. Bearishness peaked at 37.4% on this move and it fell to 18% in August. It topped the June 2006 peak (36%) on this run. That June peak eclipsed the March 2006 high (33%) and well above the 2005 highs that spawned new rallies (30% in May 2005, 29.2% in October 2005).

NASDAQ

Stats: +53.33 points (+1.94%) to close at 2804.19
Volume: 2.654B (-3.1%). Volume fell back Friday as NASDAQ gap higher on the Microsoft earnings, but it remained well above average and continued the much higher volume shown over the past two weeks as the selling began. Once more we have to comment that the volume did not rise until NASDAQ started to peak out on this run. That's not the best time to see volume pickup, but we do note that many of the high-volume sessions were on upside moves or on recoveries from early selloffs. That still does not totally absolve higher volume selling.

Up Volume: 1.776B (+1.083B)
Down Volume: 846.191M (-1.187B)

A/D and Hi/Lo: Advancers led 1.97 to 1. Some decent breadth showed up, but it still was no match for the downside breadth on the selling sessions last week.
Previous Session: Decliners led 1.41 to 1

New Highs: 81 (+27)
New Lows: 85 (-29)

NASDAQ CHART: Click to view the chart

The internals were at extremely extreme levels, and so quickly into the selling. After an extended period of selling that would signal a cleansing, a catharsis. Not as likely with this just over a week old. Recall early on in the summer selling the internals jerked to extremes and we made the same comment. It took another three weeks to get to the bottom of a pretty quick selling binge. In any event, NASDAQ is still hanging onto its breakout to a new post-2002 high by a gnat's behind, closing right on top of that July peak. It has some room to play with down near 2700, but if it goes much farther than that it is going to be a longer correction. That makes this coming week and how it responds to being dragged lower by the industrials critical to how the market sets up for the run to the end of the year.

Some very interesting aspects to the chart action for NASDAQ on Friday and for the week in general. Without a doubt, it was another very volatile week with the index making a 100 point round-trip twice. That kind of high-volume volatility is typically not a good thing, as it shows sellers using upside moves to unload significant positions. Nonetheless, NASDAQ was able to gap higher on Friday clear some resistance that formed at 2800. It is still below the July peak (2834), but the ability to break through this near resistance was an important move. As for Friday itself, however, we note that NASDAQ gapped higher then it gave back half of the move, testing the 10-day EMA on the low before recovering to close just below its opening price. The inability to push the gap beyond opening price shows up there still overhead resistance for NASDAQ. It is in better shape, but it still has work to do this week.

SOX CHART: Click to view the chart

SP500/NYSE

Stats: +20.88 points (+1.38%) to close at 1535.28
NYSE Volume: 1.405B (-12.92%). Volume fell significantly on NYSE, but managed to hold at average levels to close the week. Again we note that volume surged as S&P 500, tapped at key support on the intraday lows the past week. That shows that there was big money stepping in to support the index at that level, and thus the big bounce higher on Friday when the good news hit.

Up Volume: 1.156B (+386.125M)
Down Volume: 235.023M (-592.887M)

A/D and Hi/Lo: Advancers led 2.83 to 1. Breadth was vastly improved on Friday, after some very negative - 5:1 during the week. With the financials posting gains and independent energy stocks performing better, it was easy for the A/D line to improve at the week's end.
Previous Session: Decliners led 1.06 to 1

New Highs: 164 (+69)
New Lows: 16 (-33)

SP500 CHART: Click to view the chart

After the high-volume testing at the key 1490 level are the large caps held the line, S&P 500 gapped higher Friday and close the session high. You don't see S&P 500 gap a lot, but it gapped four times last week. As with NASDAQ, that shows a lot of fighting between the buyers and sellers. Friday, it sure looked as if the buyers won out as S&P 500 moved above the late September consolidation range. It is still below the June twin peaks at 1541, but is doing what it has to do, i.e. taking out one interim peak at a time.

The small-cap S&P 600 (+1.82%) posted a gain second only to NASDAQ, clearing the 50 day EMA on the close. That still leaves at well below the September peak that marks some strong resistance from 430 to 435. That leaves S&P 600 still in a precarious pattern. If the economy is going to improve in a significant way, you'd expect to see the small caps in better shape as they were at the beginning of October, i.e., ready to make a breakout to a new high. At this juncture they're 17 points off of the October hide that matched the prior all-time highs. That doesn't sound like much, but on small-cap index one is a pretty long road to travel.

SP600 CHART: Click to view the chart

DJ30

The blue chips got a lot of help from Microsoft on Friday, pushing through the 50 day EMA on a very strong shot of volume. They still couldn't top the late September consolidation range, and that leaves the index and a potential head and shoulders top has formed over the past six weeks. The move was significant, however, because DJ 30 rallied off support at 13, 500, and it did so on significantly higher volume. In other words, it made a higher low at support and strong volume reinforced that there was buying ongoing. While the near-term picture is still somewhat cloudy, looking at the past four months, this higher volume move made another higher low as part of what appears to be the formation of an ascending triangle. It looks as if there could be another three to four weeks of work to be done before a major breakout, but DJ 30 can still advance nicely even as it completes the rest of this pattern given that the it consists of higher and higher lows. So, while there is some immediate overhead resistance, the bigger picture is trying to shape up a bullish fashion.

Stats: +134.78 points (+0.99%) to close at 13805.7
Volume: 311M shares Friday versus 274M shares Thursday. What looked to be some churn, just below the 50 day EMA on Wednesday and Thursday turned into some strong buying on Friday after the Microsoft earnings report. That puts the volume in better light and consistent with the blue chips trying to form a larger ascending triangle base.

DJ30 CHART: Click to view the chart

MONDAY

This week is sure to result in information overload with another heavy week of earnings reports, mountains of economic data (Q3 GDP, manufacturing reports, personal income and spending, and the jobs report), and the FOMC meeting on Halloween. A ridiculous amount of data to process.

It is all very important, but what we've seen in the market since the Fed moved in with its 50 basis point Fed Funds rate cut is that the Fed's willingness to cut aggressively has put a bid in the market that has survived significant selling attempts. Thus, anything that does not deter the Fed from cutting again on Wednesday, his overall good for the market. About the only thing that could seriously derail Friday's start of a potentially positive break higher, would be economic data and earnings that are so weak that even Fed action would be viewed as unable to remedy the situation.

We don't think the latter will be the case. Moreover, we think Fed is going to 50 basis points not the 25 basis points, factored into the Fed funds futures contract. Now the Fed funds futures contract is typically very accurate within two weeks of an FOMC meeting. At least that was the case with Greenspan Fed. As seen at the last FOMC meeting, however, that's not the case with Bernanke because Bernanke does what is needed, not what is expected. Big difference.

We are not the only ones talking about a 50 basis point rate cut. More and more are figuring a 50 basis point cut, but they are still a significant minority of opinion. We have to remember, however, that the Fed was worried about the growth prospects for the US in 2007 as well as 2008 even before the credit issues hit during July and August. The housing reports have been horrific subsequent to that first rate cut, earnings have been this morning, and there are continued calls from corporate CEOs about the need for better liquidity and credit. For the last rate cut, the Fed was still fighting inflation until Robert Rubin contacted Bernanke and arranged several meetings with CEOs from various economic sectors. Soon after those meetings, the Fed quickly changed voila, the 50 basis point rate cut. There are indications of improvement in the mortgage market, the credit market, and in corporate investment. It is much too nascent at this juncture, however, at least for the Bernanke Fed, to rest easy and feel that its job is done or that a 25 basis point rate cut would be sufficient. Thus we are looking for a 50 basis point rate cut on Wednesday. That would be a treat, not a trick.

While some are saying the market is building in a 50 basis point rate cut all ready, we don't believe that is entirely the case. Some of that is occurring, but looking at the FFF contract, the bond money isn't going there. Moreover, unless the market runs significantly higher into Wednesday afternoon, we believe 50 basis point rate cut will give the market and other solid boost higher. It may not have the same effect as the initial 50 basis point rate cut, but the fact that the Fed has cut 100 basis points in a short period of time shows the market that the Fed is going to do what it takes to overcome these issues. That is always an upside catalyst for the market.

As the market moves toward the FOMC meeting, we want to be positioned so that we can take advantage of any run up to the meeting as well as any pop subsequent to the announcement. We already have many good positions and leading stocks, but if we see the move spreading out or if we see former leaders shaping up again to step into the lead, we will take advantage of the situation.

The market is hardly out of the woods, but it is weathered some serious attacks over the past two weeks and managed to break higher on Friday when Microsoft finally joined the growth side of technology. The market now definitely has the 'gist' of the earnings season, and after the back and forth action the scales may be tipping to the upside. The fact that Microsoft is now returning to a growth mode after six years of stagnation is a tremendous positive because it shows that the economy is not dead or even critically wounded, as is the common view outside the US as discussed earlier. So much pessimism, yet growth continues. In the bigger picture, Microsoft is still a copycat and is not the savior of the economy, but with all of its antitrust woes around the world, if it can resume the mantle of growth, there is hope for old line tech companies not to mention the actual growth technology companies.

Support and Resistance

NASDAQ: Closed at 2804.19
Resistance:
2834 is the October intraday peak
2887 from a September 1999 peak
2920 from an October 1999 peak

Support:
2778 from a July 1999 peak
2773 is the November/February up trendline
2725 is the July high
2713 is the November/December/February up trendline
The 50 day EMA at 2700
2673 is the early July high
2634.60 is the June peak

S&P 500: Closed at 1535.28
Resistance:
1534 is the early July high
1539 is the mid-June intraday high
1541 is the early June high
1553 intraday high from March 2000 used to be the all-time peak
1556 is the July intraday high
1576 is the Thursday intraday high.

Support:
1519 is the July 2006/March 2007 up trendline
The 50 day EMA at 1516
The 90 day SMA at 1502
1490.72 is the early June closing low and early August peak.
The 200 day SMA at 1479
1475 from peaks in December 1999 and January 2000

Dow: Closed at 13,806.70
Resistance:
The July high at 14,022
14,035 is the old channel line
14,088 is the early October closing high
14,198 is the Thursday intraday high.

Support:
The 50 day EMA at 13,698
The August high at 13,696
The mid-June high at 13,689
The early June high at 13,676 (closing), 13,692 (intraday)
The early July peak at 13,671
The 90 day SMA at 13,570
13,325 is the July 2006/March 2007 up trendline
The 200 day SMA at 13,168
12,845 is the August closing low
12,786 is the June peak

Economic Calendar

These are consensus expectations. Our expectations will vary and are discussed in the 'Economy' section.

October 30
- Consumer Confidence, October (10:00): 100.0 expected, 99.8 prior

October 31.
- GDP, Q3 (8:30): 3.1% expected, 3.8% prior
- Chain Deflator, Q3 (8:30): 2.1% Expected, 2.6% Prior
- Employment Cost Index, Q3 (8:30): 0.9% expected, 0.9% prior
- Chicago PMI, October (9:45): 53.0 expected, 54.2 prior
- Construction Spending, September (10:00): -0.3% expected, 0.2% prior
- FOMC policy statement (2:15)

November 1
- Personal Income, September (8:30): 0.4% expected, 0.3% prior
- Personal Spending, September (8:30): 0.4% expected, 0.6% prior
- Core PCE Inflation, September (8:30): 0.2% expected, 0.1% prior
- Initial Jobless Claims (8:30): 331K prior
- ISM Index, October (10:00): 52.0 expected, the 2.0 prior
- Pending Home Sales, September (10:00): -6.5% prior
- Crude Oil Inventories (10:30): -5.28M prior

November 2
- Nonfarm Payrolls, October (8:30): 90K expected, 110K prior
- Unemployment Rate, October (8:30) 4.7% expected, 4.7% prior
- Average Hourly Earnings, October (8:30): 0.3% expected, 0.4% prior
- Average Work Week, October (8:30): 33.8 expected, 33.8 prior
- Factory Orders, September (10:00): 1.0% expected, -3.3% prior
icon url

ReturntoSender

11/13/07 10:39 AM

#7725 RE: ReturntoSender #6755

90% upside day? Volume on both the NASDAQ and NYSE is currently running very close to 90% upside. This would be a very good indicator of a market directional turn higher if it can close out that way.

The data can be followed on a delated basis on this page on the left side under advances and declines:

http://finance.yahoo.com/marketupdate/overview

Until we get a 90% upside day on both exchanges or two 80% upside days in a row the market may continue to decline.

RtS
icon url

ReturntoSender

11/13/07 4:10 PM

#7726 RE: ReturntoSender #6755

Looks like we got our 90% upside day today. ASYT Charts:


icon url

ReturntoSender

12/16/07 12:35 PM

#7766 RE: ReturntoSender #6755

Sentiment Journal: Two-Week Rally Hits the Skids
Frederic Ruffy, Optionetics.com
December 14, 2007

http://optionetics.com/market/articles/18674

Market Internals: Stocks traded mixed in a week of relatively uninspired market action. Tuesday saw the most volatility, a day when the Dow Jones Industrial Average ($INDU) gave up nearly 300 points and down volume on the New York Stock Exchange [NYSE] surged to 1.44 billion shares, compared to only 100 million shares of up volume. Outside of that, it was mostly business as usual. Through midday Friday the Dow was up during three of five trading sessions, but due to the big loss on Tuesday, was down roughly 200 points for the week. The technical action was lackluster, with advancers beating decliners only twice and the NYSE New High New Low Index [NHNL] falling back into the red. It fell from +90 a week ago to -132 late Thursday (with 164 stocks falling to new 52-week lows and 32 rising to new 52-week highs.)

The technical action on the NASDAQ Stock Market didn’t provide much excitement either. The Composite Index ($COMPQ) rose only twice (through midday Friday) and, thanks to a hefty 67-ponit loss on Tuesday, was down more than 50 points on the week. Market breadth was poor, with advancers trailing decliners during three of five trading sessions. The NASDAQ NHNL slipped deeper into negative territory, from -21 last Friday to -122 late Thursday (with 26 stocks moving to new 52-week highs and 148 setting new 52-week lows.)

Sentiment Indicators: After two weeks of positive market action and signs that investor confidence was improving, the tone of the market changed again this week. The shift in sentiment was obvious in the options market. For example, on Tuesday, more than 7.25 million put options traded across the six options exchanges, the most so far this month. Call volume equaled 7.216 million contracts and, consequently, the total put-to-call ratio rose above 1.00 for the first time since late November. The action continued later in the week. On Thursday, the ratio rose to a three-week high of 1.04.


A rise in the volatility indexes confirms that risk aversion is back on the rise. The CBOE Volatility Index ($VIX) edged up from 20.85 last week to 22.60 midday Friday. The NASDAQ Volatility Index ($VXN) rose from 23.75 to 25.25. The fact that the volatility indexes were rising along with the put to call ratio indicates that, while investors were actively buying puts for protection, they were also willing to pay slightly higher premiums and, for that, VIX and VXN were on the rise. [While VIX tracks the volatility conveyed by S&P 500 Index ($SPX) options, VXN tracks the volatility priced into NASDAQ 100 Index ($NDX) options.] Typically, when risk aversion is on the rise, it will be difficult for the stock market to gain much ground. It reflects a lack of confidence that will keep buyers at bay and the market bears in control.

Yet, while investors stepped up their defensive activity in the latest week of trading, most of that increase in market angst appears related to the big market drop on Tuesday. Outside of that, trading was relatively orderly, with the Dow seeing average daily moves of roughly 70 points. In addition, that pattern should hold into the final two weeks of the year—a historically quiet period for the financial markets.

In fact, there are a few reasons to expect the market to perform much better during the rest of the year and into 2008. For example, Tom Gentile, our Chief Options Strategist, points out that the last two years of an election term have been positive for the stock market since 1944. According to his Presidential Cycle, the fifteen months before the end of the second term is the best time to be bullish on the market. In this cycle, the timeframe spans from October 31, 2007 to December 31, 2008. Mr. Gentile also researched shorter cycles going back to 1967 and found that bullish and bearish cycles tend to persist for a period of 40 weeks, with the most recent bullish cycle beginning on December 7, 2007. Finally, the stock market might also get a lift early next year from a seasonal pattern known as the “January Effect.” This anomaly is the result of tax loss selling that occurs in December and the “Wash Sale” rule. Basically, stocks that are sold in order to book tax losses in December are often bought back in January. The net result is a historically strong period for the equity market during the first month of each year.
icon url

ReturntoSender

12/16/07 2:27 PM

#7769 RE: ReturntoSender #6755

InvestmentHouse Weekend Update:

http://www.investmenthouse.com/weekendmarketsummary.htm

- Inflation numbers add extra weight on a weary market as stocks slide lower to end a down week.
- CPI adds inflation worries to Fed woes as some energy pass-through shows up.
- Dollar has its best week against the euro in over 3 years.
- Market's near term fortunes dependent upon successful Fed auctions starting Monday as well as continued improvements in Fed targeted areas.

Inflation adds another yoke to the market.

The stock market was moving higher on the second leg of its holiday rally, rallying right up to the Tuesday afternoon FOMC monetary policy announcement. The Fed disappointed with a 25BP Fed Funds rate cut (25 on the discount rate as well) and a muddled, repetitive statement that dropped a reference to 'forestalling' an economic slowdown and still harped about inflation. Then the next morning it confused and indeed infuriated many, particularly the financial market traders, with a second day announcement that looked, based on the timing, as if it was a reaction to the market's sell off in response to the size of the rate cut. It could not have been; you cannot coordinate that many central banks in a few hours. Still, the rambling statement and the clumsy chronology of the 2-step action plan lost the financial markets' confidence.

On top of that, the second action sent the market into a temper tantrum. The Fed's second phase actions had an immediate and positive impact (LIBOR spreads narrowed and rates fell, the dollar surged, and US interest rates reversed their deflationary path). The key for the next market move is whether the Monday auction (the first of four) will show enough success to start convincing the market the Fed, despite its left-handed bungling of the action that hurt a lot of investors, at least knows what is necessary to fix the problem and only has to learn better timing.

Obviously Friday the market was not over its tantrum. Indeed, it was not going to get over it as the CPI was much hotter both in the core and overall and with the unknowns regarding the Fed auction next week. With fears that the Fed was failing to forestall, or as its statement indicated, maybe giving up attempts to forestall a slowing economy, the higher inflation reading raised the unspoken worry over stagflation. That CPI number showed why the Fed kept language about inflation worries in its monetary policy statement, but just because the Fed was right ironically provided no comfort to the market. The market is worried the Fed doesn't have a clue, yet Bernanke's tenure to this point has for the most part shown he understands economic cycles and their history. As with Alan Greenspan in his early tenure (when many called for his ouster as well), implementation of the knowledge is the shortcoming that time will help alleviate. Unfortunately, we have to live through the seasoning of another Fed chairman. You can study history all you want as Bernanke has, but the transition from theory to reality is inherently sticky.

There were positives with respect to the issues that are worries to the economy and thus the market. As noted, LIBOR rates continue lower and spreads are narrowing. The dollar surged. It was not enough to offset CPI, earnings issues (BDK reported a shortfall in its guidance), and Greenspan started talking about recession again after a 3-month hiatus (inflation chances are "clearly rising" and "economic growth is close to the stall speed"). As the market balanced out the pros and cons, the cons won again. Most everything was down: gold, oil (91.33, -0.92), financials, metals, energy - - it was widespread to the downside. But, as noted below, while down, many stocks such as the leaders we have positions again held up quite well. That shows there is an undercurrent of strength after the FOMC decision, and that shows there is some recognition out there of the positives developing despite all of the angst over what the Fed did or failed to do.

Technically the action was mixed again, but of course the overall bias was to the downside. The market started lower as the futures tanked after the CPI data came in hot. The market spent the first hour and one-half recovering, and NASDAQ actually turned positive while DJ30 and SP500 missed the green by a couple of points. Unfortunately the bids died out midmorning and stocks slid to close at the session lows. NASDAQ squandered 37 points from its high, DJ30 dumped 145 points, and SP500 frittered away 18 points off the high. There was no Wednesday or Thursday rebound off the session lows as the more bearish intraday action returned.

Internals: Breadth was pretty rotten at -3.6:1 on NYSE and -2.8:1 on NASDAQ. Of course, that included a lot of stocks that lost fractional amounts on the session as they held their near support and performed just fine despite all of the market gloom. Volume was again lower, coming in well below average ahead of the weekend. Though the market dropped to close at session lows, the volume shows the sellers were not rushing in to push it lower. It was a lack of any buyers willing to step in following the FOMC's decision and the subsequent selling Tuesday and the failed rally attempt Wednesday. If the sellers are not pushing when they have every reason and opportunity to do so, you look around to see what else is going on. The leadership as discussed below becomes very interesting in this scenario.

Charts: The week shows a lot for the indices. They rallied up to resistance into the FOMC decision and failed right there when the Fed disappointed. They tried to hold up to finish the week what with the two rebounds off the lows on Wednesday and Thursday, but after the Friday close they are teetering on the edge of another downside leg after the dump on the FOMC decision. DJ30 will try to make a higher low at the 200 day SMA or 13,250, but the patterns for the US indices are again more bearish than bullish after failing at resistance on the FOMC decision.

Leadership: There were not a lot of surges higher on such a down session, but going down the list of plays and stocks that we are watching for opportunities to buy, there are a lot of stocks that are in surprisingly spry shape after the negative four sessions (both in price and in sentiment) in the US indices. That was a continuing theme this week that we discussed every session. May have seemed as if we were beating a dead horse, but their action in the face of the negative sentiment is very important. The leaders showed rubber band action, i.e. stretching down to near support but not breaking. As noted earlier in the week, if you did not hear all of the negative stories about the market and the Fed or see the action in the major indices, you would be pretty excited about the opportunity to move into some great stocks.

Of course you can never forget about or disregard the overall market if it is struggling. But with the split in the global economies, opportunities remain, and quite a few as we can see from the list of strong leaders in good position to move higher. To us that indicates there is a continuing undercurrent of support for these stocks, and if there is improvement in the areas the Fed's second phase approach targets, an oversold market can make a bounce, and these stocks are primed to jump back up, e.g. AAPL, BIDU, CMED, FCX, SNDA, VIP, etc.

THE ECONOMY

CPI heats up, injects stagflation fears.

Consumer prices popped 0.8% (0.6% expected), and the core topped expectations as well (0.3% versus 0.2%). Year over year prices surged 4.3%, 2.3% on the core. That growth rate doubles that in August (2%) before energy prices spiked. This is the highest annual core rate since the 2.9% reading in September 2006.

Gasoline/energy was the biggest component with a 5.7% gain, up 21% year over year. Ouch. Food rose 0.3%, up 5% over last year. Thank you ethanol for pushing up corn prices, the very basis of our diet here in the US. Drugs rose 0.8% for the month, same with apparel. Airline fares spiked 2.6%, and some are saying that is the long-awaited pass through from energy prices.

That looks to be a real problem ahead. Energy prices are up 21% over last year, and they have remained very high for a very long time. As noted earlier last week, the impact of energy prices is cumulative. If they remain high they keep banging into prices and eventually they break through in areas. Airlines have tried to pass on price hikes for several years but have failed miserably. If this one sticks that marks a turning point for prices.

What can the Fed do about that? Can it lower energy prices? No, at least not directly. It can slow the US economy until we all cut back on fuel so much we are living as we did pre-1940's. That may impact the price of oil, but frankly with China, Brazil, India, etc. growing so ravenously, it would not be enough to push oil back into the 40's or 50's. The Fed definitely doesn't want to lower our standard of living in such a manner, but it is torn by the inflation it was worried about on Tuesday in its statement where it emphasized the slowing economy but could not let go of the inflation worries. Then you throw in food inflation on top of that, something driven by the Executive's side of the government thanks to its energy initiative, and the Fed is sweating it out.

Problem is, the Fed cannot accomplish anything if it tries to play both sides of the fence. It has to either attack inflation or attack the slowdown. As we have written over the past year, and as many economic heavyweights such as Bob McTeer are saying, the slowdown and credit issues are the primary concern. You keep inflation in mind, but you solve the credit problems first to get the economy expanding again as that will help alleviate the inflation issues: growth does act as a cure all in most cases.

That takes us back to the disappointment with the Fed action this past week. It has something of this two-faced approach and its statement on Tuesday only underscored the appearance of indecision as to what to attack. That more than anything in our opinion is what really rattled the market. The Fed holds much too much power over our economy and our lives, and thus any appearance of confusion or uncertainty is devastating to investors.

Dollar enjoys a big week.

The dollar advanced the most against the euro since August 2004 on Friday. Indeed, it gained against 14 of the 16 most actively traded currencies. That is on top of a strong week overall that saw the dollar gain 1.6% versus the euro, the largest weekly increase since June 2006. The move got underway in earnest as the dollar broke the $1.4650 resistance level against the euro. The dollar is now down 8.5% versus the euro for the year.

The drivers are two-fold. First, the dollar was down too far, too fast as it moved to the $1.50 level versus the euro. It had to snap back. Moreover, the dollar has been trending lower for an extended period, and we all know that leads to relief moves or even a key reversal that changes the game.

That leads to the second driver: the Fed action. The Fed's rate cut didn't hurt the dollar as many currency traders feared a 50BP move and thus the dollar actually started strengthening on the Fed action. Then the announcement of the swaps and auctions jumped the currency higher as it enjoyed its strongest session in weeks. Then the CPI reduced, at least in currency traders' minds, the likelihood of further Fed rate cuts. That combination of events started by the Fed directly targeting the credit logjam really turned the currency. Add to that the long downtrend and you see a spring that was wound pretty tight.

As a result we could see the dollar at sub-$1.40 by year end. The rally could be just getting started there, however, as the dollar has been underwater a long time and when these moves start to reverse the recovery can be lengthy. If the Fed auction on Monday is a success, then we will see the dollar continue higher and even increase the speed of its gains. Already we are hearing stories of European visitors wondering if they need to think about cutting their stays here in the US shorter. That is how dramatic a move this was in the currency this week. Cannot complain about that, and frankly, despite the market angst over the Fed's actions, this is some pretty excellent news.

THE MARKET

MARKET SENTIMENT

VIX: 23.27; +0.71. The VIX is not reflecting it, but sentiment sure is gloomy in the market and on the financial stations.
VXN: 25.91; +0.39
VXO: 25.52; +1.41

Put/Call Ratio (CBOE): 1.06; -0.01. Another session over 1.0 on the close making it three of four. The clock is on again. When it gets to 9 of 10 or so then it will be interesting.

Bulls: 53.3%. Uncool. Up from 49.4% as bulls continued their run higher, bouncing before it got to 45% as we wanted (hit 40.6% on the low for the last round of selling). It spent 5 weeks above the threshold 55% on the last spike higher. You have to go through the process of wringing out the bulls with a decline of significance, a.k.a. a move into the lower 40's. The theory is that when too many investors or advisors are bullish then most of the money is in the market and there is nothing ready to come in off the sidelines to drive prices higher. On a steady climb from a low of 40.6%, the low for this round. Never made the thirties. Hit 56.7% in June and now it has blown past that. The market peaked about a month later. For reference it bottomed in the summer 2006 near 36%, and 35% is considered bullish.

Bears: 25.6%. Also uncool, falling from 27.6%. That is down from 29.0% after one week at a higher level, jumping from 26.6% the week prior. Up from 22.2% 5 weeks back after bouncing up and down over 20 for several weeks. It is still significantly above the threshold 20% considered bearish. Fell to a low of 19.6% on this round. Bearishness peaked at 37.4% on this move and it fell to 18% in August. It topped the June 2006 peak (36%) on this run. That June peak eclipsed the March 2006 high (33%) and well above the 2005 highs that spawned new rallies (30% in May 2005, 29.2% in October 2005).

NASDAQ

Stats: -32.75 points (-1.23%) to close at 2635.74
Volume: 1.961B (-8.66%). The lower volume discussed above, coming in well below average. Not so much the sellers as a lack of dad-blamed buyers.

Up Volume: 583.899M (-323.694M)
Down Volume: 1.354B (+123.006M)

A/D and Hi/Lo: Decliners led 2.82 to 1. Not pretty with the large cap NASDAQ 100 (-1.08%) barely outperforming.
Previous Session: Decliners led 1.43 to 1

New Highs: 62 (-1)
New Lows: 251 (+54). Getting there but about 200 to 250 off a level that would be more indicative of a bottom.

NASDAQ CHART: Click to view the chart

Gapped lower, recovered smartly to positive. It stalled just below the 50 day EMA (2675), however, and then slid lower from midmorning to the close. That move popped the Thursday intraday low, leaving NASDAQ just above the mid-June peak (2635). Might try to hold there and make a higher low on this leg lower, but it will have to show something it didn't have on Friday, or else a test lower to the 200 day SMA at 2600 takes it below the early December low. That would mean a lower low and open up more negative action. If it cannot hold here it will likely try to set up a double bottom at the November low.

NASDAQ 100 (-1.08%) sold but it did not take out the Thursday low and held above the 90 day SMA as well. As in November when NASDAQ, SP500, and DJ 30 looked to be basket cases but NASDAQ 100 was holding the line moving laterally, it is attempting the same thing here. Very interesting.

NASDAQ 100 CHART: Click to view the chart

SP500/NYSE

Stats: -20.46 points (-1.37%) to close at 1467.95
NYSE Volume: 1.305B (-10.76%). Volume finally broke below average for the week, at least since Tuesday. As discussed with NASDAQ, that shows the sellers were not running away with the session but that buyers wanted nothing to do with NYSE stocks, particularly the financials and the small caps. Gee, nothing new there what with the credit issues for the financials and a weaker economy for the small caps. That is the lifeblood of both indices.

Up Volume: 182.505M (-347.056M)
Down Volume: 1.111B (+188.331M)

A/D and Hi/Lo: Decliners led 3.62 to 1. Pretty ugly negative breadth, but as noted above, there were not a lot of big gainers, just modest losses at support.
Previous Session: Decliners led 1.97 to 1

New Highs: 48 (+15)
New Lows: 242 (+32)

SP500 CHART: Click to view the chart

Failed to hold the 200 day SMA (1486) and undercut the Wednesday and Thursday intraday lows where the index rebounded those sessions. The financials are killing SP500 still. It is not going to turn things around until they are finished bleeding out. GS announces earnings next week, and the mood around the sector is still foul enough that even blowout won't be enough because blowout is expected from this sector leader. If all the others could post similar numbers in the face of the credit and mortgage issues then things would change. For now there is still that big question mark. It does not have to be totally resolved before the market moves; such issues never are when the market bottoms. It is not yet, however, at that point. It has the look of a lower test to 1450 to 1445 on the next leg, but unless the news re the Fed action really turns this week it has 1425 down to 1400 in its sights thanks to those financials.

SP600 (-2.10%) was pelted as usual, thumping to some support at 300. Probably just a rest area, however, before heading to the November closing low at 382.60.

SP600 CHART: Click to view the chart

DJ30

Managed to close above the Wednesday low though it did close on the session low. That kept it above the 200 day SMA (13,298) and some support at 13,250 where it will likely attempt to make some kind of stand. That will be the telling point on this move as the larger picture over the past 6 months is a head and shoulders pattern with this test of 13,5700 the past week and the turn back down forming the peak of the right shoulder. Not the best picture, and a lot riding on this test.

Stats: -178.11 points (-1.32%) to close at 13339.85
Volume: 245M shares Friday versus 248M shares Thursday. At least the volume lightened up as it dumped lower, but not significantly.

DJ30 CHART: Click to view the chart

THIS WEEK

Lots of economic data with some regional manufacturing reports, GDP final revision, income and spending, and sentiment. There are some earnings reports from GS and RIMM, both leaders in their sectors. In addition, there is the first of the Fed's auctions where many different types of collateral will be accepted for loans. The auction platform allows the market to set the prices for the collateral and the loans. No one really knows how this is going to be received. It is a very interesting approach and helped unclog some of the credit roadblocks even upon its announcement. There is reason to be hopeful, but we all know about hope in the market. Results are what matters.

If it goes well the market might try to stem the selling and at least attempt a relief move to test the strength of the post-Fed selling. The market's tantrum was justified in part, not in part. Investors need to see that the Fed actions, while handled less than artfully, are having the desired effect. The early data suggests it started things moving in the right direction, but now the next phase has to prove successful, preferably beyond expectations.

A lot is riding on that first auction given the major indices look like road kill with financials and small caps still under attack from all sides. On the other hand you have a slew of individual stocks across many sectors tied more to the global economies that look very nice, poised to move higher if they get some catalyst. Again, a successful auction would prove quite beneficial. These stocks weathered a lot of negative sentiment last week and even the Friday selling in the major indices. They did not surge higher, but they showed excellent strength; NASDAQ 100 again showed relative strength as well. There is support for these stocks as there was in November, but they will also need another catalyst to send them higher. The second leg of the holiday rally had Kohn and Bernanke. These stocks need a better than expected response to the auction.

We are short SP500 in two ways (SPY puts, SDS calls) and we are short the Russell 2000 small cap index with IWM puts. That covers the really ugly aspects of the market. We are long many of the stocks showing relative strength with their excellent pullbacks. We are still looking at some more positions on those if we can get a catalyst develop and as long as they and NASDAQ 100 continue to show the same kind of relative strength that launched the market higher in November.

Thus heading into this week the keys to the market are the action in these stocks and NASDAQ 100 and how that auction turns out. That will set the scene for the other items such as the GS and RIMM earnings as well as the other economic data. Some traders have stopped for the year, but with the Fed double dose of action, many are staying in the market because of the results the two announcements caused. As for us, when we see such relative strength in a very negative sentiment environment, we keep looking for opportunity, and that is what we are going to do this week as well.

Support and Resistance

NASDAQ: Closed at 2635.74
Resistance:
2673 is the early July high
The 50 day EMA at 2675
The March up trendline at 2705
2725 is the July high
2751 is the November/December/February up trendline
2778 from a July 1999 peak
2834 is the October interim peak
2861.51 is the October peak

Support:
2634.60 is the June peak
The 200 day SMA at 2598
2550 to 2540 from May/June consolidation
2525 is the February closing high
2521 is the August 2004/April 2005/October 2005/March 2007 up trendline
2451 is the August closing low
2386 is the August intraday low

S&P 500: Closed at 1467.95
Resistance:
1475 from peaks in December 1999 and January 2000
The 200 day SMA at 1486
The 50 day EMA at 1486
1490.72 is the early June closing low and early August peak.
1530 to 1535 are the June twin peaks
1534 is the early July high
1539 is the mid-June intraday high
1541 is the early June high
1549 is the July 2006/March 2007 up trendline

Support:
1459 is the February peak
1440 - 1437 from January and March peaks
1441 is the June/July 2006 up trendline
1438 is the November low
1430 from the August interim lows
1425 is some minor support.
1406 is the August closing low
1375 is the March closing low
1370 is the August intraday low

Dow: Closed at 13,339.85
Resistance:
The 50 day EMA at 13,430
The 90 day SMA at 13,479
13,645 is the July 2006/March 2007 up trendline
The early July peak at 13,671
The early June high at 13,676 (closing), 13,692 (intraday)
The mid-June high at 13,689
The August high at 13,696
13,750
13,930 is the late October peak
The July high at 14,022
14,088 is the early October closing high
14,198 is the October intraday high.

Support:
The 200 day SMA at 13,298
12,845 is the August closing low
12,786 is the February peak
12,743 is the November low
12,518 is the August low
12,250 from late March lows
12,050 from the March 2007 low

Economic Calendar

These are consensus expectations. Our expectations will vary and are discussed in the 'Economy' section.

December 17
- Current account, Q3 (8:30): -$183.0B expected, -$190.8B prior
- NY Empire State Index, December (8:30): 21.0 expected, 27.4 prior
- Net Foreign Purchases, October (9:00): -$26.4B prior

December 18
- Housing starts, November (8:30): 1.190M expected, 1.229M prior
- Permits, November (8:30): 1.150M expected, 1.170M prior

December 19
- Crude oil inventories (10:30): -722K prior

December 20
- GDP, Q3 final (8:30): 4.9% expected, 4.9% prior revision
- Deflator, Q3 (8:30): 0.9% expected, 0.9% prior revision
- Initial jobless claims (8:30): 333K prior
- Leading Economic Indicators, November (10:00): -0.1% expected, -0.5% prior
- Philly Fed, December (12:00): 8.0 expected, 8.2 prior

December 21
- Personal income, November (8:30): 0.5% expected, 0.2% prior
- Personal spending, November (8:30): 0.5% expected, 0.2% prior
- Core PCE Inflation, November (8:30): 0.2% expected, 0.2% prior
- Michigan sentiment, December revision (10:00): 74.3 expected, 73.5 prior
icon url

ReturntoSender

12/19/07 10:53 PM

#7772 RE: ReturntoSender #6755

From Briefing.com: 4:20 pm : It was another whipsaw day of trading for the stock market on Wednesday, with several sizable gains and declines during the session. By the end of the trading day, the major indices were mixed with the Nasdaq closing slightly higher, and the S&P and Dow finishing slightly lower. There were no economic reports, but there was plenty of corporate and Federal Reserve news to keep the market occupied.

Yesterday, Goldman Sachs (GS 204.16, +2.65) topped its earnings expectations, but its stock still finished 3.4% lower. Today, fellow Wall Street firm Morgan Stanley (MS 50.08, +2.01) significantly missed earnings expectations, but its stock finished 4% higher.

Morgan Stanley reported a loss of $3.61 per share for its fiscal fourth quarter, well short of analysts' expectations that called for a loss of $0.39 per share. The larger than expected loss was due to $5.7 billion in additional mortgage-related write-downs, bringing the company's total fourth quarter write-down to approximately $9.4 billion.

Investor disappointment was mitigated, however, after the investment bank said it sold a $5 billion stake to China Investment Corp. to further strengthen its capital position amid ongoing credit market turmoil and weakness in the financial sector.

While market participants were able to find an upside in Morgan Stanley's earnings report, the same cannot be said for earnings reports from General Mills (GIS 57.99, -1.08), homebuilder Hovnanian (HOV -0.96, 11.43%) and, Olive Garden operator Darden Restaurants (DRI 28.60, -7.74).

Standard & Poor's added to today's volatility after lowering its outlook on several bond insurers, which caused a steep decline in the indices around 11:30 ET. S&P affirmed its AAA rating on MBIA (MBI 27.02, -0.68) and Ambac (ABK 27.46, +0.48), but changed their outlook to negative. On Monday, Moody's also affirmed its highest rating on MBIA and Ambac, but stated Ambac's outlook was stable, while MBIA's was negative.

Also, Standard & Poor's cut its rating on ACA Capital to CCC from A. Before the rating change, The New York Times reported that several banks were talking about a possible bailout plan for ACA Capital.

Meanwhile, shares of student loan provider SLM Corp. (SLM 22.89, -5.98), known as Sallie Mae, got pummeled. During the company's shareholder meeting call, management seemed combative, and indicated that it may cut its dividend. A failed buyout of SLM earlier this year has taken a toll on its stock, which is down 60% since July.

Four sectors traded higher, with energy (+0.4%) leading the way for the second straight session. Financials (+0.1%) were providing leadership in morning trade, but managed to finish with only a slight gain following the headlines regarding the Standard and Poor's outlook on bond insurers. Telecom (-1.2%) was the main laggard.

Separately, the Federal Reserve released a press release regarding its Dec. 17 $20 billion 28-day credit auction results. The auction drew 93 financial institution, totaling $61.5 billion in bids. The Fed will lend the money at 4.65%, well above the 4.17% minimum bid set by the Fed and below the 4.75% discount rate. This auction is the first of four, which the Fed enacted in hopes to improve liquidity.

In commodities trading, crude oil (+$1.23 to $91.34) closed higher today after the Dept. of Energy said in its weekly report that inventories fell by a larger amount than most analysts expected. DJ30 -25.20 NASDAQ +4.98 NQ100 +0.1% R2K +0.3% SP400 -0.1% SP500 -1.98 NASDAQ Dec/Adv/Vol 1509/1485/1.86 bln NYSE Dec/Adv/Vol 1793/1391/1.23 bln

5:00PM Trident Microsystems announces resignation of CFO (TRID) 6.02 -0.10 : Co announces the resignation of John Edmunds, its Chief Financial Officer, who has accepted a similar position with Inphi Corporation, a privately-held fabless high speed analog components company. Mr. Edmunds will remain with Trident as Chief Financial Officer through January 11, 2008. Trident has begun a search for a new chief financial officer. Trident also expects to announce the appointment of an acting chief financial officer prior to Mr. Edmunds' departure in January.

4:17PM SMSC reports EPS in-line, beats on revs; guides Q4 EPS in-line, revs in-line (SMSC) 34.36 -0.23 : Reports Q3 (Nov) earnings of $0.53 per share, excluding non-recurring items, in-line with the First Call consensus of $0.53; revenues rose 6.8% year/year to $104.7 mln vs the $100.2 mln consensus. Co issues in-line guidance for Q4, sees EPS of $0.46-0.49 vs. $0.48 consensus; sees Q4 revs of $94-97 mln vs. $95.60 mln consensus.

4:12PM LDK Solar reports EPS in-line, beats on revs; guides Q4 EPS in-line, revs above consensus (LDK) 66.11 -3.89 : Reports Q3 (Sep) earnings of $0.37 per share, in-line with the First Call consensus of $0.37; revenues rose 404.6% year/year to $158.7 mln vs the $145.4 mln consensus. Co issues guidance for Q4, sees EPS of $0.40-0.43 vs. $0.41 consensus; sees Q4 revs of $180-185 mln vs. $167.52 mln consensus. "We remain on track to meet our wafer production capacity goal of 400MW by the end of 2007. Additionally, the construction of our polysilicon plant is tracking with our original plan. In addition to the anticipated cost efficiencies we expect to achieve upon completion of our polysilicon plant, we are continuing cost reduction efforts through further advancements of our product processes."

09:17 am Palm Inc. (PALM)

Maker of mobile products and handheld devices, Palm, Inc. (PALM) announced last evening revenue for its second quarter totaled $349.6 million on unit sales of 686,000. However, the company posted a net loss of $0.09 per share, or an adjusted loss of $0.07 per share. Last year the company generated sales of $392.9 million and earned $0.17 per share on an adjusted basis. Analysts had expected the company to report $350.3 million in sales and a loss of $0.08 per share for the company's most recent quarter.

The company continues to produce new smartphone models in an effort to diversify its product offering and bolster future sales. During the second quarter, the company released at least three new models aimed at strengthening its position in various markets.

Next quarter, management anticipates revenues to range between $310 million and $320 million, producing an adjusted per share loss between $0.14 and $0.16. Analysts forecast sales of $358 million and a loss per share of $0.04.

Shares of Palm are set to open sharply lower. The company has been battered in recent months after delaying product launches and tapering its outlook.
icon url

ReturntoSender

12/29/07 12:33 AM

#7786 RE: ReturntoSender #6755

From Briefing.com: 4:55 pm Weekly Wrap

U.S. stocks finished lower during the past week, as further evidence of worsening conditions in the housing market and sluggish business investment trends prompted some broad-based selling late in the holiday-shortened period.

In a shortened session on Monday, stocks were lifted by news that investment bank Merrill Lynch (MER) plans to sell a lending unit to GE Capital and has raised $6.2 billion in new capital from Temasek Holdings – a state-owned Singapore investment firm - and Davis Selected Advisors. The news helped ease investors' concerns about liquidity issues and lent some support for the beaten-down financial sector.

Upon returning from the Christmas break on Wednesday, stocks were little changed as weakness in the retail sector and concerns about holiday spending weighed on investor sentiment.

Target Corp. (TGT) led retail stocks lower during the session, after the discounter lowered its sales outlook due to unfavorable traffic trends and prevailing consumer headwinds.

On Thursday, the major averages dropped sharply, with the Dow Jones Industrials falling nearly 190 points, after the Commerce Dept. reported a lower than expected rise in November durable goods new orders, and an analyst at Goldman Sachs Group (GS) said Citigroup may have to cut its quarterly dividend by 40% to conserve cash and take up to an additional 70% in write-downs given its exposure to bad debt.

Durable goods new orders rose a disappointing 0.1% in November. That was below analysts' expectations for a 2.2% gain, and follows a revised 0.4% decline in October as business investment trends remain sluggish.

However, in other economic news, the Labor Dept. showed initial claims for the week ended Dec. 22 were essentially stable at 349,000, while consumer confidence improved to 88.6 in December from a revised 87.8 in the previous month.

The assassination of Pakistan's former prime minister and opposition leader Benazir Bhutto also weighed on the market Thursday, raising the possibility of further political turmoil and instability in the volatile region.

Stocks opened higher on Friday, but trended lower after a government report confirmed the ongoing problems in the housing sector, which continues to weigh on overall economic activity.

According to a report from the Commerce Dept., new home sales slipped 9% in November from October to a 647,000 annual rate, with builders still grappling with a glut of inventory and slowing demand.

In a bright spot, however, the Chicago PMI survey of regional manufacturing conditions improved to 56.6 for December, up from 52.9 in November and better than an expected reading of 52.0. Although the report is encouraging, the national ISM survey will provide a better read on overall conditions when it is released on January 2.

In corporate news, Warren Buffet's Berkshire Hathaway (BRK.A), which acquired privately-held industrial conglomerate Marmon Holdings for $4.5 billion earlier this week, agreed to buy the reinsurance business unit from Dutch financial services company ING Groep NV (ING) for approximately $440 million. The Omaha, NE-based company also said it has opened a bond insurance business to help reduce borrowing costs for local and state governments amid recent turmoil in the credit markets. Berkshire's entrance into the battered market will challenge other bond insurers like MBIA (MBI) and Ambac Financial (ABK).

--Richard Jahnke, Briefing.com
 
Index Started Week Ended Week Change % Change YTD
DJIA 13450.65 13365.87 -84.78 -0.6 % 7.2 %
Nasdaq 2691.99 2674.46 -17.53 -0.7 % 10.7 %
S&P 500 1484.46 1478.49 -5.97 -0.4 % 4.2 %
Russell 2000 785.60 771.76 -13.84 -1.8 % -2.0 %

4:25 pm : The stock market got out of the gate on a bullish note, underpinned by a belief that Thursday's sell-off in the wake of Benazir Bhutto's assassination was an overreaction. The rebound effort was short-lived, though, as it fell by the wayside in the wake of a much weaker than expected New Home Sales report for November.

With respect to the data, the Dept. of Commerce indicated new home sales declined 9.0% in November to an annualized rate of 647,000 units. That level marked a 12-year low and was well below the consensus estimate which had been pegged at 715,000. Treasuries rallied on the report with the 10-year note jumping a point and bringing its yield down to 4.07%.

The news weighed heavily on the homebuilding stocks, though, which comprised today's worst-performing industry group (-3.2%). The thrifts & mortgage group (-3.0%) followed close behind in an association trade that was tied to a belief that demand for mortgages will remain depressed along with the housing market.

The financial sector (-0.5%), in general, was a laggard and acted as a key restraint on the broader market which finished the day relatively flat.

Bond insurance companies Ambac Financial (ABK 25.12, -4.02) and MBIA (MBI 18.74, -3.53) were among the weakest performers as news that Berkshire Hathaway (BRK.A 141,100, +3300) has started a new bond insurance business for state and municipal bond issuers raised competitive concerns for investors.

The other laggard today was the consumer discretionary sector (-0.2%), which has been the financial sector's counterpart throughout the year. Once again, concerns about a slowdown in spending due to the weakness in the housing market contributed to the underperformance.

Strikingly, the remaining eight sectors ended the day higher, yet the modest nature of their gains, excluding energy (+1.0%), didn't help the broader market forge ahead to any great extent.

Volume, it should be noted, was on the light side with only 1.0 billion shares traded at the NYSE. That is a reflection of the holiday conditions and suggests there wasn't a lot of conviction behind Friday's action.

For the shortened week, the Dow, Nasdaq and S&P 500 slipped 0.6%, 0.7% and 0.4%, respectively. DJ30 +6.26 NASDAQ -2.33 SP500 +2.12 NASDAQ Dec/Adv/Vol 1676/1347/1.33 bln NYSE Dec/Adv/Vol 1572/1611/1.01 bln

9:13AM Clearwire annouced that Arvind Sodhani tendered his resignation from the Board (CLWR) 14.86 : After the close last night, Clearwire (CLWR) announced that Arvind Sodhani tendered his resignation from the CLWR board. Intel (INTC) intends to appoint a new representative to CLWR's board of directors as soon as practicable, replacing Arvind Sodhani, who joined the CLWR board in 2006. Sodhani serves as president of Intel Capital and executive vice president of INTC, and has been one of two members of the CLWR board that are appointed by Intel. Because of the scope of Sodhani's responsibilities as president of Intel Capital and executive vice president of INTC, Sodhani believed that it was prudent that he resign from the CLWR board to avoid any conflicts of interest that might arise.
icon url

ReturntoSender

01/02/08 10:27 AM

#7788 RE: ReturntoSender #6755

10:05 am : Just hitting the wires, November construction spending rose 0.1% (consensus -0.4%). Separately, the ISM Index, a national survey of purchasing managers, dropped to 47.7 from a prior reading of 50.8. Economists expected a reading of 50.5. Any number below 50 is intended to reflect contraction.

Stocks were trading at the unchanged mark, but quickly fell into the red after the disappointing ISM report. Eight of the ten economic sectors are in negative territory. Financials (-1.1%) and telecom (-1.0%) are leading the retreat. Energy is outperforming, aided by a 2.2% rise in crude oil prices.DJ30 -68.44 NASDAQ -6.02 SP500 -5.98 NASDAQ Dec/Adv/Vol 1080/1285/137 mln

http://finance.yahoo.com/marketupdate/overview
icon url

ReturntoSender

01/02/08 12:16 PM

#7790 RE: ReturntoSender #6755

Briefing.com Outlook for 2008:

http://www.briefing.com/GeneralContent/Investor/Active/ArticlePopup/ArticlePopup.aspx?SiteName=Investor&ArticleId=NS20080102083359TheBigPicture

Many thanks to Don Wennerstrom for posting this first over at SI.

RtS


icon url

ReturntoSender

01/05/08 7:26 PM

#7800 RE: ReturntoSender #6755

Sentiment Journal: Bulls Back on Defense Frederic Ruffy, Optionetics.com
January 4, 2008

http://optionetics.com/market/articles/18778

Market Internals: Stocks are back under pressure, with the Dow Jones Industrial Average ($INDU) suffering triple digit losses during three of the past four trading sessions. Through midday Friday, the Dow had given up 475 points on the week and slipped back below the 13,000 level. Market internals on the New York Stock Exchange [NYSE] have been poor. While turnover has been light due to the holidays, the high volume day was on Wednesday when the industrial average plummeted 220 points. Meanwhile, market breadth, as measured by the NYSE advance-decline ratio, has been negative during four of five trading sessions. Up volume trailed down volume every day during the holiday-abbreviated week of trading.

The action on the NASDAQ Stock Market isn’t inspiring much bullishness either. The NASDAQ Composite Index ($COMPQ) has lost ground during six consecutive trading sessions and has given up 190 points, or almost 7 percent, during that time. The tale of the tape paints an equally somber story. Market breadth on the NASDAQ Stock Market has been negative during five of the past five trading sessions. The ratio of up to down volume has also been negative for five days straight.

Sentiment Indicators: To say the market action over the past two weeks is disappointing for the bulls would be a gross understatement. For one, the “Santa Claus Rally,” which is a historically strong period spanning from December 25th to January 1st, failed to lift the market during the last week of December. In addition, the first five days of January, which is also a seasonal strong period, has disappointed as well. During the first three days of 2008, the market has seen one day of lackluster action and two days of heavy selling.

Consequently, investors are back on the defensive and risk perceptions are rising once again. As evidence, the CBOE Volatility Index ($VIX), which dipped to multi-month lows in late-December, is up in six of the past seven trading sessions and hit an intra-day high of 24.30 on Friday, or its best levels since December 18. The market’s “fear gauge” is up nearly 30% from its late-December low. The NASDAQ Volatility Index ($VXN) is up from 20.9 to 28.84 during that time, or roughly 38%.

Heavy levels of put volume accompanied the jump in the VIX. For example, in midday trading Friday, more than 600,000 puts on the iShares Russell 2000 Index Fund ($RUT) had traded, or more than three times the call volume. Active trading was also seen in the S&P 500 Index ($SPX), the S&P Depositary Receipts (SPY), and the PowerShares NASDAQ 100 Index Trust (QQQQ). The fact that put volume was increasing along with the volatility gauges offers confirmation that investors were scrambling to hedge stock portfolios—fear had set in.

Mutual fund investors seem to be a bit more bearish as well. According to AMG Data, stock funds saw net outflows of $8.3 billion in the week ended January 2. Meanwhile, the sentiment surveys also report a decline in bullishness. For example, the American Association of Individual Investors reports that only 25.71% of those polled are bullish and 55.24% are bearish, which compares to 30% bullish and 50% bearish the week before.

At this point, it might be reasonable to assume, from the extreme readings from a number of sentiment indicators, that investors have overreacted somewhat. The recent decline has stirred up a bit too much bearish sentiment and the market is now oversold. However, while it is possible that the market might find a bottom in the near future, the technical action of the market is deteriorating, while bearish sentiment is still rising. This dangerous combination is a powerful force that can push stock prices lower still. In fact, it might take further selling and an episode of “capitulation” to form the foundation for the stock market’s next major advance.

icon url

ReturntoSender

01/06/08 12:39 PM

#7801 RE: ReturntoSender #6755

InvestmentHouse Weekend Update:

http://www.investmenthouse.com/weekendmarketsummary.htm

- Employment report confirms economic plunge, Fed & administration remain indifferent, market responds in kind.
- Job creation not negative but it may as well have been.
- Fed is in a tough position, but doing nothing for fear of inflation definitely won't help.
- Positives: valuations are reasonable, fiscal stimulus will eventually pass, global economy will survive, and that equals a shorter economic hiccup.
- Market getting short term oversold as NYSE indices approach natural support at the November low, but a bounce is not likely to change the market's character.

The first three days are in the book and they are way down.

Futures were up ahead of the jobs report as stocks were going to try and build off of Thursdays push and rebound some in relief to the prior selling. Then the jobs report missed big with unemployment jumping to 5%, the futures tanked and so did the market when the bell rang. They were down, fell hard to midmorning, bounced toward lunch, then rolled over again and sold to the close. The action confirmed the market's weak technical positioning that it has built in since Q3.

On top of the jobs report China issues its quarterly statement that it would 'take measures' to 'slow' its economy. INTC received an analyst downgrade and it was clocked on the session, capping a week that saw it decline 18.5%. The ISM services topped expectations (53.9 versus 53.5 expected) but the impact was similar to a lone raindrop hitting hot pavement.

Investors were waiting on what Fed Vice Chairman Kohn and President Bush had to say about the economy and what Bush intended to do about the economy given the string of weaker data summed up by the jobs report. Kohn didn't even mention the unemployment report in his comments. It was classic denial. The WSJ ran a story for the Fed Friday indicating that price increases in food and energy may keep it from cutting rates at its January meeting. Kohn refused to discuss the jobs report as it flew in the face of the Fed's adamant position that inflation was the primary concern. As for Bush, he did not come out with anything with his meeting with Bernanke and Paulson. Most speculate he will do something at his state of the union address on January 28. He did say the economy had a solid foundation and the financial markets were strong. That was a punch in the nose to investors who know the stock and bond markets are signaling major trouble. You know the result: more fuel to the downside fire as investors realized they waited in vain.

Technically the action was crappy to crappier, at least looking at the major indices. They gapped lower and continued selling through the session. The size of the losses and the close at the lows signaled massive weakness.

Internals: Horrid as you would expect, matching the point declines. -4.4:1 breadth on NASDAQ and -3.4:1 on NYSE. NASDAQ foreshadowed this action as breadth was worse than NASDAQ on Wednesday and Thursday; NASDAQ was losing its relative strength. Volume surged to the downside of course, spiking above average on both NYSE and NASDAQ. After cracking the 200 day SMA on Wednesday and Thursday, big institutions were dumping NASDAQ shares as the growth model they need was formally laid to rest by the jobs report.

Charts: Nothing positive here, at least long term. NASDAQ took awhile to start its selling, but when it did it quickly surpassed the NYSE indices. It broke below its November low, the first of the three large cap indices to do that; again, NASDAQ quickly overtook the NYSE large cap indices when the dam broke. SP500 and DJ30 sold hard as well, but they remain above their November lows though barely. They both closed at this same level in August after that big spike lower intraday mid-month. Maybe they can form a double bottom here, but they will have to prove it and no one was ready to buy into that possibility just yet. One thing that this test of the November lows does is set up an oversold bounce after just over a week of selling.

Leadership: As we expected in the Thursday report, a weaker jobs report sent just about all stocks lower. Technology pretty much gave up. Despite the overall selling, energy, agriculture, heavy construction, metals - - the international plays, all held near support. Of course, so did defensive stocks such as JNJ, PG, MO. Nonetheless, if you look at their positioning you would not expect to see the indices tumbling down six straight sessions and crashing through support. With the market getting oversold and these stocks holding near support, a relief bounce should slingshot them back up. If it does not then when the relief bounce ends things are likely to get really ugly.

THE ECONOMY

Jobs report manages to hold positive by a hair.

Given the weekly jobless claims a negative non-farm jobs report was a possibility. Thus the 18K jobs to the upside was almost a moral victory. Well, not almost. It was not really close. It was the weakest showing since August 2003. That was Q3 2003 and you may or may not recall that the economy grew at a 7.3% pace in that quarter. Cool. So this report means nothing, right? Not quite. At that time the economy had been in the toilet for over a year and one-half and was on the rebound. This time it is heading the other way.

November was written up to 115K from 94K. October was revised down to 159K from 170K. The missing link for December was the private service sector. It was 93K, well below the 152K three-month average. Of course it did not help that the usual monthly losers (construction and manufacturing) were lower as well.

Employment is a lagging indicator. The ISM reports, durable goods, retail sales, leading indicators all were heading lower in advance of this report. ECRI's annualized growth rate hit its lowest level since the end of the 2001 recession. Moreover, the market has struggled since the summer. When the jobs report finally caught up with the other indicators the market figured the die was cast. It was already lower and weakening and this data sealed up the package.

Fed is in a tough position but that is what it is there for.

The Fed has to deal with some issues that its predecessors did not, mainly some modest but persistent inflation left over from Greenspan's low, low interest rates that were left too low way too long. Thus we keep seeing some issues with consumer prices, mainly outside of the core, but within the core prices are quite well contained and the inflation pressures, the things that drive prices in the future, have waned. Indeed, ECRI's future inflation gauge fell to a 31-month low. It is very good in predicting inflation and this report indicates inflation just is not the problem.

What we are seeing as inflation is the rise in food and in energy. Of course, it seems everyone but the Fed knows that the ethanol mandate is what is pushing our food prices higher: a food chain based upon corn syrup will rise in price if corn prices rise. As corn is an inefficient feedstock to make ethanol, it takes a lot of corn to produce a gallon of fuel. Thus we are competing with fuel when we go to the store to buy food. This doesn't even account for the massive amounts of water it takes to produce one gallon of ethanol, another cost we are paying.

The irony of this ethanol folly is that it is doing nothing to dent oil or fuel prices. US consumers and businesses are not pushing prices higher; they are part of it, but it is a world effort, along with a lot of worry and speculation that is keeping a premium in oil prices. The Fed cannot change this unless it can bring down all world economies and thus reduce oil demand. It is as if the energy market knows we are not going to produce enough ethanol to make a difference. If we planted every open space in the US we might have enough to impact energy prices, but all of the fertilizer used and water wasted, not to mention the leveling of all open spaces to plant, are much more costly than the price increases in oil. There is already empirical evidence of the fallout of this planting: along the Mississippi river there is so much planting of corn and a corresponding increased use of nitrogen and other fertilizers, the runoff has killed fish in a 175 mile stretch of the river. We go to all of the expense to clean up our water and then pass a scientifically unsupportable government mandate that provides the incentive to pollute again. Nice, well thought out planning. Instead, energy prices keep climbing, almost mocking this effort.

Unfortunately the Fed is being pressed by the gold bugs and other central banks into maintaining a hawkish stance, one that places inflation fears above growth concerns. On Friday that WSJ article was the Fed attempting to prepare the way for a 'no action' meeting in January. Talk about ill-timed. Did they bother to look at the jobs data that they did have ahead of its Friday release? Worse, did they have it and still run that 'let them eat cake' article? The Fed Funds futures contract has basically priced in a 50BP rate cut in January post-jobs report. Does the Fed still maintain its position post-report as well? It cannot change oil prices by raising rates. It cannot lower food prices by raising rates; indeed, you can track the rise in our food prices to the mandate to produce more ethanol. Raising rates is not going to lower food prices.

So we have a Fed that does not want to cut rates needing desperately to do so as well as continue injecting liquidity into the market. Problem is, it can hack rates 50BP in January and again in February and still not make a difference. Not because that would not finally provide an environment of easier money, but simply because the Fed is too late to the game.

Needed: some fiscal policy stimulus.

Monetary policy cannot solve the issues. The Fed has waited too long as it did in 2000. It cut rates from over 6% to 1% and the economy went steadily lower. It was not until the fiscal stimulus, and specifically the second round that provided investment incentives, that the economy recovered. Right now the economy needs fiscal stimulus.

And aren't we lucky. Friday President Bush met with Bernanke and Paulson to discuss options. He commented after the meeting about the strong markets and solid economic foundation, but gave no details of what he has or doesn't have in mind. Speculation is that he will wait until the State of the Union on January 28 to announce any possible stimulus. As with the Fed action, that is too late.

Of course it will still need to get through a hostile Congress, and with that situation about all that tends to pass, particularly for lame duck President in his last year, is a 'rebate' program such as the first tax cuts in the last recession. They had zero impact. Of course they did. Every time this cheap, politically expedient 'incentive' is used it does nothing. What is needed is a change in corporate tax rates, say down to 0%. Also, some assurance that the dividend treatment will be extended as well as the investment incentives would give certainty and thus capital investment once more. There is some momentum to reduce corporate tax rates and to provide the middle class a tax cut or make those currently in place for the middle class permanent. The latter likely would not have much impact at all, but it is doable. That is a sorry commentary on the current political climate. We hear the democrats are working on a stimulus plan of their own as each party tries to beat the other to the punch in an election year. You can bet that will be targeted at those who don't pay taxes and the dubious benefits that provides the economy. We also hear, however, that a corporate tax cut is another democratic proposal in the offing. Some sow's ears, some pieces of gold.

There is thus potential for some fiscal action, but it has to be the right kind, and unfortunately the parties are philosophically opposed to one another as to what kind of stimulus they will agree to. We all know what works: proposals that incent capital investment. Sadly, what we know works often falls victim to political games, and in an election year where half of the candidates (on both sides) are railing against corporate greed (do they know that most corporations are considered small, i.e. family corporations?), providing the right kind of tax cuts as stimulus is about as likely and the process about as pleasant as passing a quarter-sized kidney stone.

THE MARKET

Well the market made a swan dive Friday, leaping off the cliff after seeing the unemployment report. The selling confirmed the topping action the volatility and quick successive corrections in 2007 foretold. The economy is heading for a significant slowdown whether it reaches recession levels or not. The market has started lower ahead of that and the Friday action spells more economic slowing to come.

There are some positives. There is the continuing strength in the global economy. Sure some of Europe is slowing and China may find out what happens when you try to slow your economy: you get what you wanted and much more. Nonetheless, the strength in the stocks with overseas ties, even with their pullbacks, shows there are some nice upside possibilities still.

Second, valuations remain low, much, much, much lower than in the prior recession. Yes earnings expectations are going to be revised lower and that will hurt valuations, but stocks are also diving lower already, so valuations will hold as the price losses and lowered estimates offset each other. If the selling continues as it looks it will continue to do given the patterns and the economic indications, valuation will only improve.

That means the stock bear market will likely be much less severe than 2000 to 2002. Stocks will not have to shave off massive amounts of points to have very, very appealing valuations. Again, that means the stock bear market will be lighter and the economic slowing should be less severe as well. At this point, much of the cause of the slowdown, i.e. the housing and mortgage issues, are well down the road and much closer to the end than the beginning. The Fed will finally get rates down to the right level, now likely sooner than later, and we will get some kind of fiscal stimulus. If by luck it is the right kind, this whole slowdown could be a year or less. Of course the market sells off ahead of the actual decline and it bottoms and starts to recover ahead of the economic rebound. That means the market should be heading back up before year end.

MARKET SENTIMENT

VIX: 23.94; +1.45. Disappointingly modest bump in VIX as the market dove lower. It will likely surge if the selling continues, but its lack of movement indicates there is more than just a bit of selling to go before it and the other sentiment indicators hit levels that tell us a sustained recovery is ahead.
VXN: 28.62; +2.03
VXO: 26.78; +2.23

Put/Call Ratio (CBOE): 1.12; +0.21. Back above 1.0 on the close. It will take several more of these closes as well as other sentiment indicators to 'get right.'

Bulls: 52.2%. Falling further after breaking back below the 55% threshold last week (54.9%). Down from 56.50% after a jump up from 53.3% and 49.4% the week before. Didn't make it below 45% (it hit 40.6% on the low for the prior round of selling). It spent 5 weeks above the threshold 55% on the last spike higher. You have to go through the process of wringing out the bulls with a decline of significance, a.k.a. a move into the lower 40's. The theory is that when too many investors or advisors are bullish then most of the money is in the market and there is nothing ready to come in off the sidelines to drive prices higher. On a steady climb from a low of 40.6%, the low for this round. Never made the thirties. Hit 56.7% in June and now it has blown past that. The market peaked about a month later. For reference it bottomed in the summer 2006 near 36%, and 35% is considered bullish.

Bears: 24.5%. Bears are rising with the market's inability to hold a rally, up from 23.1% last week. Improving from 22.4% before that. Fell like a stone from 25.6% the prior week and 27.6% the week before. Down from 29.0% after one week at a higher level, jumping from 26.6% the week prior. Up from 22.2% after bouncing up and down over 20 for several weeks. It is still significantly above the threshold 20% considered bearish. Fell to a low of 19.6% on this round. Bearishness peaked at 37.4% on this move and it fell to 18% in August. It topped the June 2006 peak (36%) on this run. That June peak eclipsed the March 2006 high (33%) and well above the 2005 highs that spawned new rallies (30% in May 2005, 29.2% in October 2005).

NASDAQ

Stats: -98.03 points (-3.77%) to close at 2504.65
Volume: 2.525B (+30.27%). Volume surged as NASDAQ dove. All of the low volume in December as NASDAQ rallied and faded resolved in a big downside surge. Volume has jumped as it did in early November when this last round of selling really got underway.

Up Volume: 191.19M (-694.778M)
Down Volume: 2.322B (+1.295B)

A/D and Hi/Lo: Decliners led 4.37 to 1. Heavy downside breadth as techs were finally dumped. NASDAQ 100 led the selling with a 4.3% decline.
Previous Session: Decliners led 1.76 to 1

New Highs: 49 (-14)
New Lows: 475 (+211). With this drop the lows are already reaching levels that can indicate a bottom, but the other indicators are not there yet.

NASDAQ CHART: Click to view the chart

Gapped lower and sold to the close, breaking the summer 2004/summer 2005 up trendline that held in the August selling. That is a serious breach. The August closing low at 2450 looks like a sure thing and the March 2350ish lows are not out of the question. It is down 12.3% from the late October high. That is the longer term picture. Nearer term the NASDAQ is 6 days straight down with an 8.25% loss just on this move. It is a might oversold and with that gap lower it will be trying to fill that gap. It may take another downside session to turn it back up, but with this kind of rapid decline a snapback is in the works.

NASDAQ 100 (-4.30%) broke down as well, breaking both the 200 day SMA and the November consolidation in its plunge. When it broke it broke hard.

NASDAQ 100 CHART: Click to view the chart

SOX CHART: Click to view the chart

SP500/NYSE

Stats: -35.53 points (-2.46%) to close at 1411.63
NYSE Volume: 1.649B (+24.57%). Volume was above average for the first time in two weeks. More dumping of the large caps.

Up Volume: 106.61M (-416.088M)
Down Volume: 1.537B (+758.483M)

A/D and Hi/Lo: Decliners led 3.44 to 1. Not as bad as NASDAQ but hardly great.
Previous Session: Advancers led 1.13 to 1

New Highs: 35 (-26)
New Lows: 561 (+252). Jumping quickly to levels that indicate an oversold condition.

SP500 CHART: Click to view the chart

SP500 rode the financials lower toward the November low (1406). A week of hard selling and approaching the November low. That starts to spell a rebound to test this selling. As noted above, a bounce suggests (though very quietly) an attempted double bottom. It has to prove a character change at this point, however, i.e. a strong surge on with solid volume, and . . . financials recovering. Nothing suggests that at this point, just a relief bounce.

SP600 (-3.24%) screamed lower, undercutting the November and December double bottoms. This is the lowest it has been since October 2006 when it was three months into a year long run to a new high. After this 8.8% drop in six days the small caps are primed for a rebound to test the prior bottoms at 380. That will set up another downside play.

SP600 CHART: Click to view the chart

DJ30

Similar to SP500, the blue chips were in emergency dive mode Thursday, dumping toward the November low (12,724) and the February peak on high, above average volume. That level, either with a slight undercut or not, will likely lead to a relief bounce before the Dow continues its selling.

Stats: -256.54 points (-1.96%) to close at 12800.18
Volume: 304M shares Friday versus 200M shares Thursday.

DJ30 CHART: Click to view the chart

MONDAY

A fairly light week of economic data by comparison though now earnings season gets underway. With a slowing economy the big question facing investors is how much will earnings estimates and guidance fall. Stock prices are already factoring in that decline based upon a slowing economy. As noted above, with valuations starting this correction much lower than in the last correction, how guidance holds up will give us insight into how deep prices will fall.

Near term the momentum is down, but an impressive oversold condition is building. With the NYSE large cap indices just over the November lows and over a week of selling, a rebound move is in the works. The odds are it won't change the character of the market, i.e. turn this hard selling into a new rally. There is that possibility, but the upside, at least for US-tied stocks and the major indices, has to be proven. It is true that a recovery starts when things look bleak, but this is still pretty early in the game for the downturn. After all, the economic data is still mixed and will likely all turn to the downside before this episode is over.

A relief bounce will tell us whether the upside means business by the strength it shows. More than likely it will result in a lower high and the selling will resume. It will also allow us to gauge the strength of some leaders that broke lower as well as those that held up. We anticipate energy and the other groups of leaders, though fewer in number what with tech caving in, will continue to advance as they ride the rest of the global economic story outside the US. The moves may not be as dramatic, but again, how they recover off the past week's selling will tell us more with respect to them as well. Finally, it will allow us to reload some downside plays on SPY, IWM, etc. and ride the next leg lower if the rebound fails (as is the likely scenario).

Thus there could be a bit more near term downside as last week's selling carries over to start the week, then a relief move. It won't change anything and the downside will in all probability continue as the US markets have to find bottom still. That will take quite a bit more work as the indicators, sentiment and otherwise, are not all lined up as you would see at a bottom. We have the wrinkles of having the stronger world economy and the stocks benefitting from that even as the US indices dive, and the overall reasonable P/E levels unlike past bear markets. With that understanding of the lay of the land we will take advantage of the near term and longer term upside opportunities offered as well as the downside as the US markets struggle to find their lows during this economic slowdown.

Support and Resistance

NASDAQ: Closed at 2504.65
Resistance:
2539 is the August 2004/April 2005/October 2005/March 2007 up trendline
2550 to 2540 from May/June consolidation and the November lows
The 200 day SMA at 2615
2634.60 is the June peak
The 50 day EMA at 2658
2725 is the July high
The March up trendline at 2729
2735 is the December intraday high
2765 is the November/December/February up trendline
2778 from a July 1999 peak
2834 is the October interim peak
2861.51 is the October peak

Support:
2451 is the August closing low
2386 is the August intraday low
2379 from the October 2006 peak
2370 from the April 2006 peak
2340 from the March 2007 low

S&P 500: Closed at 1411.63
Resistance:
1430 from the August interim lows
1440 - 1437 from January and March peaks
1452 is the June/July 2006 up trendline
1459 is the February peak
1475 from peaks in December 1999 and January 2000
The 50 day EMA at 1476
The 200 day SMA at 1491
1490.72 is the early June closing low and early August peak.
1524 is the December high
1530 to 1535 are the June twin peaks
1534 is the early July high
1539 is the mid-June intraday high
1541 is the early June high
1566 is the July 2006/March 2007 up trendline

Support:
1406 is the August and November 2007 closing low
1403 is a longer term trendline from the August 2003 and September 2004 lows
1374 is the March 2007 closing low
1370 is the August 2007 intraday low
1325 from May 2006 peak prior to the summer 2006 correction

Dow: Closed at 12,800.16
Resistance:
12,845 is the August closing low
13,050 to 13,000 range
13,092 is the December low
The 200 day SMA at 13,366
The 50 day EMA at 13,352
The 90 day SMA at 13,495
The early July peak at 13,671
The early June high at 13,676 (closing), 13,692 (intraday)
The mid-June high at 13,689
The August high at 13,696
13,740 is the July 2006/March 2007 up trendline
13,750 is where it stalled in early December
13,930 is the late October peak
The July high at 14,022
14,088 is the early October closing high
14,198 is the October intraday high.

Support:
12,786 is the February 2007 peak
12,743 is the November low
12,518 is the August intraday low
12,250 from late March 2007 lows
12,050 from the March 2007 low

Economic Calendar

These are consensus expectations. Our expectations will vary and are discussed in the 'Economy' section.

January 8
- Pending home sales, November (10:00): 0.6% prior
- Consumer Credit, November (3:00): $8.5B expected, $4.7B prior

January 10
- Initial jobless claims (8:30): 336K prior
- Wholesale inventories, November (10:00): 0.5% expected, 0.0% prior
- Crude oil inventories (10:30): -4.05M prior

January 11
- Export prices, December (8:30): 0.8%
- Import prices ex-oil, December (8:30): 0.7%
- Trade balance, November (8:30): -$59.5B expected, $-$57.8B prior
- Treasury budget, December (2:00): $52.0B expected, $42.0B prior
icon url

ReturntoSender

01/08/08 8:56 AM

#7803 RE: ReturntoSender #6755

Credence Systems posts Q4 profit;sees $16 mln Q1 charge
Tue Jan 8, 2008 8:42am EST

http://www.reuters.com/article/marketsNews/idUKBNG12206920080108?rpc=44

Jan 8 (Reuters) - Semiconductor testing equipment maker Credence Systems Corp (CMOS.O: Quote, Profile, Research), which has been in the middle of a restructuring, posted a fourth-quarter profit, helped by lower costs, and forecast a surprise loss for the first quarter of 2008, due to charges.

The company said it expects a 30 percent reduction in its workforce by the end of fiscal 2008 and sees a first-quarter charge of $16 million related to its restructuring.

Separately, Credence named Kevin Eichler chief financial officer, replacing Joy Leo, who resigned last November.

For the latest fourth quarter, Credence Systems reported earnings of $5.6 million, or 5 cents per share, compared with a net loss of $1.9 million, or 2 cents a share, a year ago. Sales fell 23 percent to $97.7 million.

Analysts were expecting earnings of 4 cents a share on revenue of $103.6 million, according to Reuters Estimates.

Costs in the quarter fell to 44.4 million from $60.6 million.

Milpitas, California-based Credence sees a loss of 37 cents to 39 cents a share, on net sales of $58 million to $62 million in the first quarter of 2008.

Analysts on average were expecting earnings of 3 cents a share, before exceptional items, on revenue of $102.1 million.

The company's stock closed at $2.26 Monday on the Nasdaq. (Reporting by Biswarup Gooptu in Bangalore; Editing by Amitha Rajan) ((biswarup.gooptu@reuters.com; within U.S. +1 646 223 8780; outside U.S. +91 80 4135 5800; Reuters Messaging: biswarup.gooptureuters.com@reuters.net))

From Briefing.com

6:18AM Credence reports EPS in-line, misses on revs; guides Q1 EPS below consensus, revs below consensus (CMOS) 2.26 : Reports Q4 (Oct) earnings of $0.05 per share, in-line with the First Call consensus of $0.05; revenues fell 23.1% year/year to $97.7 mln vs the $105.3 mln consensus. Co issues downside guidance for Q1, sees EPS of ($0.37)-($0.39) vs. $0.02 consensus; sees Q1 revs of $58-62 mln vs. $102.75 mln consensus. The company also outlined significant corporate changes intended to build on core technology strengths while simplifying its operations to meet increasing opportunities in Asia-driven consumer semiconductor markets. Credence intends to prioritize its research and development activities in the Diamond and industry-standard ASL platforms to accelerate their deployment in mainstream consumer semiconductor markets. The company intends to focus Sapphire platform development on configurations that support leading-edge applications for the high end of the consumer semiconductor markets. With the highest concentration of consumer semiconductor manufacturers located in Asia, Credence will seek to double its sales and support headcount in the region by the end of 2008. With the addition of approximately 100 employees related to the increased consumer focus, the company anticipates that these restructuring initiatives will result in a net worldwide headcount reduction of 400 people, or approximately 30 percent of the workforce by end of fiscal 2008. Credence intends to take charges of approximately $16 million in the first fiscal quarter of 2008 in connection with this restructuring.


icon url

ReturntoSender

01/08/08 3:06 PM

#7805 RE: ReturntoSender #6755

COHU bought 2000 shares@14.44


icon url

ReturntoSender

01/09/08 11:27 AM

#7807 RE: ReturntoSender #6755

The Investors Intelligence numbers are out and not nearly bearish enough to be a contrarian indicator of a bottom unfortunately.
 
Date Published Percent Bullish Percent Bearish
1/9 48.4 25.8


http://www.schaeffersresearch.com/streetools/market_tools/inv_intel.aspx?click=jumpto
icon url

ReturntoSender

01/10/08 12:28 PM

#7809 RE: ReturntoSender #6755

Here is a Chart of the NASDAQ New Highs Versus the SOX:


All of the market breadth indicators are in market bottom territory. But are they in the final bottom or is any rally here doomed to further failures first:

http://investorshub.advfn.com/boards/read_msg.asp?message_id=11535484
icon url

ReturntoSender

01/10/08 10:44 PM

#7813 RE: ReturntoSender #6755

SOX—Searching for Support

http://optionetics.com/market/articles/18797
icon url

ReturntoSender

01/11/08 10:37 AM

#7815 RE: ReturntoSender #6755

Chart of the Day - COTD Dow Ajusted for Infaltion:

http://www.chartoftheday.com:80/20080111.htm?T

For some long-term perspective, today's chart illustrates the Dow adjusted for inflation since 1925. There are several points of interest. For one, when adjusted for inflation, the bear market that concluded in the early 1980s was almost as severe as the one that concluded in the early 1930s. It is also interesting to note that the inflation-adjusted Dow is now less than three times higher than where was in 1929 and a little over double where it was in 1965. Not that spectacular of a performance considering the time frames involved. However, the magnitude of the bull market of 1982 to 1999 (even when adjusted for inflation) was truly of historic proportions. While the Dow is currently more than a 1000 points above the dot-com peak that occurred eight years ago, today's chart does illustrate that on an inflation-adjusted basis the Dow still trades below its 1999 peak.

icon url

ReturntoSender

01/15/08 11:48 AM

#7825 RE: ReturntoSender #6755

We are pretty close to 90% downside on both exchanges today so far. I know that sounds bad but it is one of the things we need in order to get a bottom. Look on the left side under advances and declines.

http://finance.yahoo.com/marketupdate/overview

We could use a lot less bulls in the Investors Intelligence Poll tomorrow too. Then after a 90% downside day, or more than one, we will need a 90% upside day.

JMHO, RtS
icon url

ReturntoSender

01/15/08 4:42 PM

#7826 RE: ReturntoSender #6755

Intel Feeds the Bear

By Alexei Oreskovic
TheStreet.com Senior Writer
1/15/2008 4:32 PM EST

http://www.thestreet.com/_yahoo/newsanalysis/techsemis/10398850.html?cm_ven=YAHOO&cm_cat=FREE&cm_ite=NA

SAN FRANCISCO -- Intel (INTC - Cramer's Take - Stockpickr - Rating) grew its bottom line 50% in the fourth quarter, but offered a disappointing sales forecast for the current quarter.

Shares of Intel immediately sank nearly 14% to $19.54 in extended trading Tuesday.

Intel's top line for the fourth quarter fell slightly short of Wall Street expectations, growing 10.5% year-over-year to $10.7 billion. The average analyst expectation called for $10.8 billion in revenue.

The Santa Clara, Calif., chipmaker said it earned net income of $2.3 billion, or 38 cents a share, in the three months ended Dec. 29, compared with net income of $1.5 billion, or 26 cents a share, at this time last year.

Intel's EPS included 2.5 cents of restructuring and asset impairment charges relating to its NOR flash memory business.

Analysts polled by Thomson Financial were looking for 40 cents a share, excluding the charges.

Intel grew its gross margin to 58%, compared with 52.4% in the third quarter, and 49.6% in the year-ago period.

That gross margin will dip back down to 56%, plus or minus a couple of points in the first quarter, Intel said.

The chipmaker projected that sales in the first quarter would range between $9.4 billion and $10 billion. The average analyst expectation had called for $10 billion in first-quarter sales with EPS of 34 cents.

icon url

ReturntoSender

01/23/08 8:13 PM

#7844 RE: ReturntoSender #6755

Stocks Stage Dramatic Rebound
By Paul Shread

http://www.internetnews.com/bus-news/article.php/3723486

U.S. stocks staged a dramatic turnaround Wednesday on reports of a possible rescue of troubled bond insurers.

The major indexes lost 3-4% in early trading on rumors of European bank troubles and European Central Bank comments that suggested the ECB won't be following the U.S. Federal Reserve's lead in cutting interest rates. But afternoon reports of a possible New York state-led rescue of bond insurers had the indexes sporting 1-2% gains by the close.

Apple was a big decliner, though, its shares down 10% on a much weaker than expected outlook.

Motorola fell 18% on ongoing troubles in its handset division that will lead to a loss this quarter.

Texas Instruments was up 4.6% on better than expected earnings and in-line guidance.

IBM, Intel and AMD were big winners, up 5-10%, while Google and Amazon were big decliners.

Microsoft was little changed ahead of its earnings report due out after the close on Thursday.

After the close, eBay gave up all of the day's 7% gains after lowering its current quarter outlook and announcing the retirement of CEO Meg Whitman. Qualcomm and Symantec were big winners after beating estimates.

The Nasdaq rose 24 to 2316, the S&P gained 28 to 1338, and the Dow surged 299 to 12,270. Volume rose to 7.48 billion shares on the NYSE, and 3.65 billion on the Nasdaq. Advancers led by a 24-9 margin on the NYSE, and 18-12 on the Nasdaq. Upside volume was 37% on the NYSE, and 56% on the Nasdaq. New highs-new lows were 31-408 on the NYSE, and 32-469 on the Nasdaq.

Technical Analysis: Stocks Snap Back
By Paul Shread


At this week's lows, the market has been as oversold as any in the last 70 years, just based on the depth of the decline in a short amount of time. A weekly close below 11,847 on the Dow would be even better, giving us that oversold reading on a weekly closing basis, but stocks appear to be too stretched to the downside for that, at least for now.

Still, there are other ways to spot bottoms, and we'll be on the lookout for them. For starters, we expect a lengthy basing period after the decline we've had. One good sign of a bottom would be a higher low and higher high in the rate-of-change indictor (ROC at the bottom of tonight's charts below), a sign that momentum has turned back upward. In fact, it's hard to find a major low that hasn't had that positive divergence.

Another would be continued buying by commercial futures traders.

But given the depth of the panic — multiple front-page bearish headlines just about everywhere you look today and yesterday — the credit crisis may largely be priced into stocks at this point. Still, a retest of the lows, and possible lower lows, with positive divergences, may still lie ahead.

1364-1370 on the S&P 500 (first chart below) remains the biggest hurdle for the bulls, with 1350 up first. The first test of that level will likely prove tough. Support is 1320, 1310 and 1270, with 1225-1250 possible below that.

The Dow (second chart) barely held onto yesterday's low (11,635) today, stopping at 11,644. 12,092 is first support before 11,750-12,000 gets tested again, while 12,400-12,500 looks tough to the upside.

The Nasdaq (third chart) faces resistance at 2323, 2350 and 2387-2400, and 2250, 2221 and 2200 are support.

Paul Shread is a Chartered Market Technician (CMT) and member of the Market Technicians Association.

http://www.internetnews.com/bus-news/article.php/3723491
icon url

ReturntoSender

01/23/08 9:57 PM

#7846 RE: ReturntoSender #6755

Market Breadth Charts:


These charts show that we have indeed seen some all time lows in certain market breath readings including a reading of only 3 new highs on the NASDAQ today and only 1 new high on the NYSE recently. What they don't tell you is that it is not always enough to set new lows in market breadth to induce a lasting rally. That often times does not happen until positive divergences occur at even lower lows. In other words the market could go lower still but even as it does the NYSE will likely have more than 1 new high when it hits bottom. The NASDAQ will likely have more than 3 new highs at the real bottom as well.

The top for this market was not that long ago.

So while this could prove to be a 1998 like market rallying on to even higher highs from here I think it will be more like 2000 to 2002. Hopefully it won't take another 17 months to find bottom but I don't think this bottom is the bottom.

RtS
icon url

ReturntoSender

01/26/08 4:51 PM

#7850 RE: ReturntoSender #6755

When using market breadth analysis like the BP Indices one should keep in mind that while no two market bottoms are the same there are often similarities. Some bottoms are V bottoms. Sharp corrections followed by quick ascents but how often do they occur so close to recent highs when certain market breadth numbers are showing new low numbers that have never been seen?

I suppose anything is possible but likely? We should get a retest of the recent lows if not new lows before the market is done going down.

Why? Well first of all we have yet to have had a 90% upside day. Second we have only recently set new lows for BPINFO, NASDAQ New Highs, NYSE New Highs etc and have yet to test the bottom setting up the positive divergences characteristic of a lasting long term bottom.

If you look back 10 years at BPINFO you will see that it is not always enough for the market to form a bottom. Low BP numbers do not on there own guarantee that we have formed the ultimate bottom.

If this market is anything like 2001 when we last got the previous low in BPINFO and most every BP number than the true bottom could be many months away. If it is it will be formed with lower volume in the market and numerous positive divergences.

Divergences like the higher BPINFO bottom in 2002 than what was seen in 2001 even though the final market bottom did not form until October 2002 20%, even more lower on the S&P500 than the one in 2001 that was the previous BPINFO low:


icon url

ReturntoSender

01/26/08 10:34 PM

#7855 RE: ReturntoSender #6755

Amateur investors Weekend Market Update:

http://www.amateur-investor.net/Weekend_Market_Analysis_Jan_26_08.htm

Although we may continue to see an oversold bounce in the near term as the market has become very oversold at some point we may see a retest of the lows made on Wednesday. Once the retest occurs that will likely give us a clue to whether the recent lows will end up being a significant bottom or whether the major averages will eventually go even lower.

Click on the link above to see the charts and past performances after a down January.

RtS
icon url

ReturntoSender

01/27/08 1:01 PM

#7858 RE: ReturntoSender #6755

InvestmentHouse Weekend Update:

http://www.investmenthouse.com/weekendmarketsummary.htm

- Stocks continue the upside reversal on the open, then reverse for a significant loss.
- Investors likely getting too hopeful this bounce is something more than a bounce.
- Big data week ahead as investors look to Fed to see if it is going to continue to 'do what is necessary.'

Stocks get a bit anxious to end the week after the big reversal.

The news was good on the earnings front and foreign markets were surging on the heels of the US gains. MSFT's results and guidance were pleasing; CAT talked of a 'very strong' back order situation, though that was outside of the US that was expected to have 'anemic' growth; HON, JNPR, JAVA, and BRCM all posted results that put investors in a positive mindset. Oil was higher ($90.80, +1.39) and gold was close to $1000 again, but that seemed okay too.

Stocks opened higher, but as anticipated Thursday night, after the big reversal and charge higher, the market hesitated ahead of the weekend, and indeed started to sell back almost immediately after the open. The indices had charged above the 10 day EMA on the open with DJ30 coming within 15 points of 12,500. Then they started to stall. As planned, we used that bounce to take some gain off the table and we also started working into some downside positions. As the session wore on the indices gave up the break above near resistance at the 10 day EMA and closed reversing from that move above that level. The market could still move higher after this pause; it sold hard and had a lot of downside pressure to let off. The action was still worth starting some downside positions, however, particularly with the week ahead chocked full of earnings, economic data, and the FOMC meeting on monetary policy which could likely disappoint the market with a 25BP rate cut given the talk of the Fed panicking over last weekend.

TECHNICALLY the action looked heavy on Friday. After the reversal the indices tested the 10 day EMA on Thursday and struggled. Friday they looked to be making the break on through that initial resistance, but after clearing it, they turned and closed lower. Many stocks showed the same heavy action at resistance after bouncing, i.e. rolling over after a gap higher or showing a doji on the candlestick chart.

INTERNALS: Breadth was negative but not as bad as the 1+% losses on the indices would suggest (-1.3:1 NYSE, -1.1:1 NASDAQ). Volume was lighter; after all of the massive trade on the week it was backing off Thursday on the upside move and Friday on the reversal. That indicates no major selling or dumping, just a loss of interest or buying strength after a wild week that used up a lot of adrenalin and ammunition.

CHARTS: As discussed above, the indices moved through near resistance at the 10 day EMA on the open but could not hold the move and reversed to close negative and below that near resistance. Bearish given the overall market downtrend, but not fatal for this rebound; after such a wild and sharp reversal the market could very well take a pause before continuing higher. It does look heavy, however, and not just the indices.

LEADERSHIP: It was a week that saw a lot of banged up stocks recover some from the blood-letting in the second leg lower in this selloff. While many were calling this a great time to buy some of these stocks, the patterns show a lot of technical damage, and after such huge runs in 2007 leading into the selling, a sharp plunge as we have seen likely won't be all the consolidating they need. Techs tried to make a comeback Friday, but again, they mostly look like oversold bounces. They gave up the gains despite MSFT's earnings. Healthcare stocks took a back seat on the week, struggling as the other sectors rebounded, but their patterns are still solid, and after this rebound they should resume their moves as money moves back their way. Outside of them, the leadership is very scattered, with most former leaders still in downtrends, just bouncing back up after harsh selling.

Quite a bit of positive talk to conclude the week that saw the market bounce.

On Friday we listened to a number of shows recapping the market week. We were frankly surprised by the amount of talk about the 'buying opportunity of a lifetime' or 'the opportunity of the century.' Why? Because if this market is truly factoring in a recession as it tends to do ahead of the actual fact, then we have likely still in the first phase of the market correction.

No doubt there was a sharp and steep decline in the market, and with earnings outlooks we are hearing thus far still positive, P/E ratios are much, much better than they were in 2000 when that market crash started. As we noted three weeks back, this markedly better posture will likely keep this bear market from getting too entrenched. In other words, there is not as much froth this time around to wring out of the market before it can advance again. Have to like that.

Still, the likelihood the Fed with its late stage aggressive rate action and the economic 'stimulus' package that has yet to be even submitted to Congress has already stemmed the tide of the economic slowdown is low. Proposed remedies and fixes are popping up faster this time around versus in 2000 when the Fed hiked right into the recession, and the faster the better as far as length of the economic slowdown. Nonetheless, what we saw last week was not the end of the selling that set up with those massive topping patterns on the indices, particularly the Dow. Three and one-half months of selling are not likely the full consolidation stocks require. For example, many agriculture stocks doubled or tripled on their runs. Two weeks of downside is hardly enough to set up a run to another double.

Even if for argument's sake Tuesday was the low (though as noted earlier in the week, the indicators, e.g. VIX, suggest it was just an interim bottom), the market is still going to have to at least consolidate some more and ultimately make a successful test of the Tuesday and Wednesday intraday lows.

Perhaps foreign economies will still move higher despite the fears that gripped the market early in the week that the US' troubles were the rest of the world's as well. Gold and oil recovered late in the week and as the earnings results and guidance are showing, companies with foreign markets to sell to are still churning and burning.

Back to reality, DJ30 did get close to consummating the selling portion of its big 7 month head and shoulders top. A month ago we discussed the Dow selling down to 11,250 or so in response to the size of the top. DJ30 hit 11,634 on the Tuesday intraday low; that is getting close and could have been enough to do the trick. More likely, however, it will test down to 11,300ish on the third leg lower after this bounce, and that finally may be the start of the bottom to the selling. It will still take time to rebuild a strong foundation after such a beating, but that does not mean that cannot be the bottom, particularly given the positives of good P/E ratios heading into this selling. Of course, that still means there will be more selling, and thus we will likely get the 'opportunity of a lifetime' or of the century once again before this is over and a bottom is set.

THE MARKET

MARKET SENTIMENT

VIX: 29.08; +1.3. Hit 37.57 on the intraday high Tuesday, and that was good enough along with the other indicators (new lows, put/call ratio, falling bullish advisors, etc.) to foster the rebound.
VXN: 33.81; +1.59
VXO: 32.56; +3.3

Put/Call Ratio (CBOE): 1.06; +0.17. Right back above 1.0 on the close after a 1-day dip lower Thursday.

Bulls: 41.6%. Sharp decline from 45.6% as it continues its plunge from 56.50 on the high (48.4%, 52.2%, 54.9% and 56.50%). Very close to the 40.6% hit on the last significant round of selling. A move into the lower 40's is a decline of significance. A bigger move is to 35% which is a big bullish indication. If bulls and bears kiss or better yet cross, that is very bullish. For reference it bottomed in the summer 2006, the last major round of selling ahead of this 2007 top, near 36%, and 35% is considered bullish.

Bears: 31.5%. Massive jump higher from 26.7% as it finally kicked into gear. It has made it over 30%, meaning it is getting into the range that means business. Big move after falling to a low of 19.6% on this round. Bearishness peaked at 37.4% in September 2007. It topped the June 2006 peak (36%) on that run. That June peak eclipsed the March 2006 high (33%) and well above the 2005 highs that spawned new rallies (30% in May 2005, 29.2% in October 2005). Still a bit more work to do to really set a bottom, and that means more selling before it gets there.

NASDAQ

Stats: -34.72 points (-1.47%) to close at 2326.2
Volume: 2.637B (-11.96%). Volume fell as NASDAQ gapped then rolled over. If you have to have that kind of price action, then lower volume is at least decent.

Up Volume: 734.336M (-1.45B)
Down Volume: 1.873B (+1.14B)

A/D and Hi/Lo: Decliners led 1.14 to 1. Negative, but did not match the ferocity of a 1.5% loss in the index. As NASDAQ 100 was down 2.07%, that shows the declines were in the big techs and thus the narrow breadth. A fast change from the large cap techs leading higher on Thursday.
Previous Session: Advancers led 1.34 to 1

New Highs: 42 (-1)
New Lows: 114 (-16)

NASDAQ CHART: Click to view the chart

NASDAQ gapped through the 10 day EMA and above the August intraday low, just clearing 2400 on the high (2408). That put NASDAQ at better than a 2% gain, led by those large cap tech stocks and MSFT's earnings. It did not take long for the selling to enter, and a steady, session long decline set in. It sold to the session low on the close. Not great action on a rebound in a very weak market.

NASDAQ 100 (-2.07%) was leading higher early on with a 2+% gain and then rolled over at resistance for a 2% loss. Those are not just benign ups and downs as an index consolidates a run higher. Even though volume was lower, sellers used the gap to sell. The key is whether the sellers come out in more numbers to start the week.

NASDAQ 100 CHART: Click to view the chart

SOX CHART: Click to view the chart

SP500/NYSE

Stats: -21.46 points (-1.59%) to close at 1330.61
NYSE Volume: 1.885B (-12.15%). Volume was down on NYSE as well though still above average. Would be hard to top the volume earlier in the week in any case.

Up Volume: 501.38M (-877.696M)
Down Volume: 1.365B (+575.878M)

A/D and Hi/Lo: Decliners led 1.33 to 1. Modest declining breadth as well, meaning it was the large caps again doing the damage.
Previous Session: Advancers led 1.78 to 1

New Highs: 21 (+5)
New Lows: 84 (+5)

SP500 CHART: Click to view the chart

SP500 rallied up through the 10 day EMA on the high, hitting the August intraday low (or damn close to it) on the high (1371 is August; 1368 on the high). That also came within a whisker of the March 2007 lows at 1374. It did indeed find some issues at those points as we expected. The reversal was a bit more virulent than expected, however, and that casts some question on whether it can make it to 1400 as we were looking for. Indeed it was enough for us to take the SPY upside trade off the table and start picking up some on the downside.

SP600 (-0.63%) tapped at the 18 day EMA for the second straight session and then turned lower to again close below the 10 day EMA. Certainly has the look it is running out of gas and we took some downside positions on the move.

SP600 CHART: Click to view the chart

DJ30

Same kind of action, rallying through the 10 day EMA and coming within 15 points of the 12,500 resistance (the August intraday low is at 12,518) before reversing for a triple digit loss. Just another 285 point swing on the Dow. Volume was up, but that was MSFT, HON, and CAT as a result of their earnings. Still, it shows some distribution as it reversed at near resistance, not the best indication the rally will continue.

Stats: -171.44 points (-1.38%) to close at 12207.17
Volume: 393M shares Friday versus 387M shares Thursday. Goosed by the earnings noted above, indicating some distribution.

DJ30 CHART: Click to view the chart

MONDAY

After a quiet week of at least scheduled economic data (outside the Fed's intermeeting rate cut, worries of a European slowdown, massive fraud in European markets), this coming week is laden with reports and decisions. The FOMC decision on Tuesday is tops, but Q4 GDP, income and spending, PCE inflation, Chicago PMI, jobs, and the national manufacturing report are just some of the highlights. And of course, lots and lots of earnings. Lots of earnings.

If the earnings continue to come out with strong guidance, perhaps the market can reverse the Friday reversal and selloff and continue the relief rally. It didn't work to end last week as sellers used the good news to sell into. As noted, at least volume was lower on the reversal so there was no out and out dumping.

The marquee event will be the Fed decision. There was a certainty of another 50BP coming, but as the market recovered, a stimulus package agreement was announced, and the Fed was chided for overreacting to Europe's early week woes, that certainty slipped closer to even money.

Problem is, this market rebound was not the end of anything other than the second leg of selling in this initial selloff. As usual it bolstered some false hope about the market recovering and moving into a new bull phase ('buy of the century,' right?), but even if Tuesday and Wednesday were the bottom, there will still be a test of that down the road. Deep down the market knows there is still trouble out there despite the better feelings to end the week and talk of a bottom on Wednesday. Thus if the Fed does what the Fed Funds Futures contract is suggesting, i.e. a 25BP rate cut, the market is likely to be disappointed, and any bounce that may resurrect itself after the Friday reversal will likely get sold off. Even if the market does not bounce, 25BP is a disappointment and won't lead to any new upside.

Thus the market is or at least the psychology could be setting itself up for disappointment. This rebound looked very strong in itself and with the sentiment and secondary indicators to just fizzle out after a couple of sessions. If it does, that is a testament to how pernicious the market sees the economic slowing despite Fed rate cuts and a promised stimulus package (of course the market may not view this as very stimulating).

In our book it is not a matter of whether this past week was the bottom. It wasn't any bottom that marked no more selling. The question near term is whether the market continues lower from the Friday reversal or regroups and continues the relief move higher before stalling. Either way we are going to continue to look for more downside to set up as the market moves higher or continues the selling. If it continues then we can jump on additional downside. If it bounces some more we will look for the stall and then buy in at that point. In our view nothing has changed the downtrend at this juncture, and thus even if the relief bounce continues there is not a lot of room left before it peaks out given the size of the gains on the reversal.

Support and Resistance

NASDAQ: Closed at 2326.20
Resistance:
2340 from the March 2007 low
2370 from the April 2006 peak
The 10 day EMA at 2375
2379 from the October 2006 peak
2386 is the August intraday low
The 18 day EMA at 2430
2451 is the August closing low
Some modest resistance at 2500 from interim August lows.
The 50 day EMA at 2544
2545 is the August 2004/April 2005/October 2005/March 2007 up trendline
2550 to 2540 from May/June consolidation and the November lows

Support:
2315 to 2300 is a range of support from old peaks
2275 is the trendline from the summer 2004/July 2006 lows, Q4 2005 consolidation
2216 from August 2005 peak
2175 from the December 2004 peak

S&P 500: Closed at 1330.61
Resistance:
1356 is the 10 day EMA
1370 is the August 2007 intraday low
1374 is the March 2007 closing low
1380 is the 18 day EMA
1406 is the August and November 2007 closing low
1408 is a longer term trendline from the August 2003/September 2004 lows
The 50 day EMA at 1429
1430 from the August interim lows
1440 - 1437 from January and March peaks
1459 is the February peak
1463 is the June/July 2006 up trendline
1475 from peaks in December 1999 and January 2000
The 200 day SMA at 1487

Support:
1325 from May 2006 peak prior to the summer 2006 correction
1311 is an ancient trendline
1305 to 1302 from an August 2006 peak and matches a range of support from March and April 2006.
1294 from the January 2006 peak
1288 from June 2006
1280 from June and August 2006
1255 from June 2006 lows

Dow: Closed at 12,207.17
Resistance:
The 10 day EMA at 12,364
12,518 is the August intraday low
The 18 day EMA at 12,554
12,743 is the November low
12,786 is the February 2007 peak
12,845 is the August closing low
The 50 day EMA at 12,955
13,050 to 13,000 range
13,092 is the December low

Support:
12,250 from late March 2007 lows
12,050 from the March 2007 low
11,670 is the May 2006 intraday high; 11,642 closing
11,317 is the March 2006 peak
11,228 from a July 2006 peak

Economic Calendar

These are consensus expectations. Our expectations will vary and are discussed in the 'Economy' section.

January 28
- New home sales, December (10:00): 645K expected, 647K prior

January 29
- Durable goods orders, December (8:30): 2.0% expected, -0.1% prior
- Consumer confidence, January (10:00): 87.0 expected, 88.6 prior

January 30
- ADP employment, January (8:15): 40K prior
- GDP advanced, Q4 (8:30): 1.2% expected, 4.9% prior
- Deflator (8:30): 2.6% expected, 1.0% prior
- FOMC policy statement (2:15)

January 31
- Employment cost index, Q4 (8:30): 0.8% expected, 0.8% prior
- Personal income, December (8:30): 0.4% expected, 0.4% prior
- Personal spending, December (8:30): 0.1% expected, 1.1% prior
- Core PCE, December (8:30): 0.2% expected, 0.2% prior
- Initial jobless claims (8:30): 315K expected, 301K prior
- Crude oil inventories (10:30): 2.29M prior

February 1
- Non-farm payrolls, January (8:30): 55k expected, 18K prior
- Unemployment rate, January (8:30): 5.0% expected, 5.0% prior
- Hourly earnings (8:30): 0.3% expected, 0.4% prior
- Average workweek, January (8:30): 33.8 expected, 33.8 prior
- Construction spending, December (10:00): -0.5% expected, 0.1% prior
- ISM Index, January (10:00): 47.5 expected, 47.7 prior
- Michigan sentiment, January revised (10:00): 79.0 expected, 80.5 prior
icon url

ReturntoSender

01/28/08 9:03 PM

#7862 RE: ReturntoSender #6755

SanDisk 'cautious' on current quarter, shares drop
Reuters - January 28, 2008 7:04 PM ET
By Duncan Martell

SAN FRANCISCO, Jan 28 (Reuters) - SanDisk Corp (SNDK), the world's largest maker of data-storage memory chips, on Monday gave a revenue forecast that badly lagged expectations and its shares fell more than 5 percent.

The stock had initially risen in after-hours trade when SanDisk posted a better-than-expected quarterly profit, but it fell sharply on SanDisk's 'cautious' outlook.

SanDisk expects revenue for its current first quarter of $775 million to $875 million, Chief Financial Officer Judy Bruner said on a conference call to discuss quarterly results. Analysts had expected revenue of $991.6 million, according to Reuters Estimates.

"As we enter 2008, there are similarities to early 2007 in terms of the supply-demand balance and the impact this has on pricing and at the same time the macroeconomic environment is uncertain," Bruner said. "As a result, we are cautious in our outlook."

SanDisk executives said on the call that they saw U.S. consumer demand slow in the holiday-sales-fueled fourth quarter, echoing comments made by other tech companies, including chipmaker Cypress Semiconductor (CY).

"There definitely is a little bit of weakness in the retail channel that's showing up with them," said American Technology Research analyst Doug Freedman.

Even so, Chief Executive Eli Harari said in a statement the company expects to grow revenue and profits in 2008 despite "current uncertainties in the worldwide economy and a challenging industry pricing environment in the first quarter."

SanDisk's fourth-quarter net income was $105.8 million, or 45 cents per share, compared with a net loss of $35.1 million, or 17 cents per share, in the year-ago period, when it took charges related to its purchase of Msystems Ltd.

Revenue rose 7 percent to $1.25 billion from $1.16 billion. The company cited strong growth in its mobile business for the advance in revenue and profit.

Excluding the impact of acquisition-related charges, stock-based compensation expense and the related tax effect, SanDisk had a fourth-quarter profit of 69 cents per share.

The Milpitas, California-based company was expected to have a profit before items of 62 cents per share, on average, on revenue of $1.26 billion, according to Reuters Estimates.

Product revenue in the quarter was a record $1.12 billion, up 4 percent on the year-ago period and 22 percent on the previous quarter. License and royalty revenue rose 51 percent from a year ago to $128 million.

For all of 2008, Bruner said she expects SanDisk's revenue to rise 15 percent to 25 percent, implying revenue of $4.48 billion to $4.87 billion.

"This assumes continued softness in consumer demand but continued progress in growing our international market share and continued momentum in the mobile market," Bruner said.

For 2008, analysts expect a per-share profit of $2.28 before items on revenue of $4.82 billion. In 2007, the company had a per-share profit before items of $1.73 on revenue of $3.90 billion.

Analyst Freedman also said that despite the soft revenue forecast for the current quarter, he noted that the company's gross margin forecast is "actually pretty impressive."

Bruner said on the call that she expects the company's product gross margin in 2008 to be 24 percent to 28 percent, compared to 24 percent in 2007.

SanDisk shares fell 5.2 percent in after-hours trade to $24.54 from a regular Nasdaq close of $25.89. So far this year, shares of the company have fallen 28 percent so far this year amid a global stock market sell-off spurred by concerns that the United States might be in a recession. (Reporting by Duncan Martell; Editing by Braden Reddall, Gary Hill)
icon url

ReturntoSender

02/02/08 1:24 PM

#7869 RE: ReturntoSender #6755

HeadlineCharts.blog Weekend Update

http://headlinecharts.blog.com/

IBD remains quite skeptical about the recent strength in the stock market. They haven't seen the type of institutional buying that would translate into rallies qualifying as follow through days. They are seeing few growth stocks building the type of bases they would buy into. Their IBD index has lagged the major exchanges rather than lead them.

Investor's Intelligence has noted excellent accumulation via their stats on buying climaxes. Their newsletter sentiment is favorable from a contrarian view. Insider buying is very bullish. Unfortunately, both their short and long-term momentum indicators have moved very quickly into the overbought range.

ECRI notes that their forward looking economic indicator ticked lower again and that there is now little chance of avoiding recession unless the indicator starts to improve very soon. The future inflation gauge is well into low inflation level but did tick higher this week for the first time in a while.

This week we are reading Trader's Narrative.


We remain mostly in cash. Having missed the big bounce in stocks, we are looking for opportunities in the next retest of the lows. The steep yield curve tradtionally favors financials, but we will continue to avoid.
icon url

ReturntoSender

02/02/08 4:01 PM

#7870 RE: ReturntoSender #6755

Amateur Investors Weekend Stock Market Analysis (2/2/08)

http://www.amateur-investor.net/Weekend_Market_Analysis_Feb_2_08.htm

Since the low made on January 23rd the Dow has rallied around 1150 points or about 10%. The overall pattern looks similar to what occurred from mid October through early December as the Dow initially sold off (points A to B) which was then followed by a brief rally (points B to C). This was then followed by a larger downward move (points C to D) and then a 10 day rally in which the Dow gained over 1000 points (points D to E). Meanwhile from early December through the 3rd week of January a similar pattern has evolved as the Dow came under some selling pressure (points E to F) which was then followed by a brief oversold bounce (points F to G) and was then followed by another substantial move downward (points G to H). Meanwhile this has been followed a 1150 point rally in the Dow over the past 8 trading days. The most likely scenario to play out in the coming weeks is for the Dow to stall out either at its declining 50 Day EMA (green line) near 12900 or its declining 200 Day EMA (purple line) near 13100 which would then be followed by an eventual retest of the January 23rd low near 11630.


The Nasdaq made a bottom near 2200 and has rallied nearly 10% or just over 200 points in 8 trading days. Just like the Dow I expect the Nasdaq will eventually retest its January 23rd low at some point in the weeks ahead. However in the near term if it continues higher look for it to encounter resistance either at its 38.2% Retracement Level near 2450 or at its declining 50 Day EMA (green line) just below 2520.


As for the S&P 500 it has also rallied 10% or 125 points since the January 23d low and has risen above its declining 20 Day EMA (blue line). If the S&P 500 continues higher in the near term look for resistance to occur either at its declining 50 Day EMA (green line) near 1420 or at its declining 200 Day EMA (purple line) just above 1450. Just like the Dow and Nasdaq I expect in the coming weeks the S&P 500 will eventually retest its January 23rd low near 1270 once this oversold rally ends.


As I mentioned above I think the major averages may retest their January 23rd lows at some point in the coming weeks. One of the reasons I think this may happen is based on the % of Bearish Investment Advisor Sentiment which still hasn't reached an extreme level. Going back to the mid 1990's when the 3 week average of Bearish Investment Advisor Sentiment has risen at or above the 35% level (points I) this has signaled a nearing bottom followed by a substantial rally (20% or more) in the S&P 500 (points J to K). Currently the 3 week average of Bearish Investment Advisor Sentiment stands at 30% so this is one reason why I think the January 23rd lows may have to be retested or even broken before a significant bottom occurs.


icon url

ReturntoSender

02/03/08 12:31 PM

#7871 RE: ReturntoSender #6755

InvestmentHouse Weekend Update:

http://www.investmenthouse.com/weekendmarketsummary.htm

- MSFT ignites enthusiasm, jobs report tamps it out, but new money to start the month wins out.
- January jobs slide negative as January weekly claims apparently way off.
- ISM comes right back above 50 after a one-month hiatus.
- Impressive rebound pushed by Fed rate cuts and new money at turn of the month, but the next test is still coming.

Market once again pulls its chestnuts out of the fire.

Once again it looked as if the techs were going to rein in the market's advance. GOOG earnings were a miss and it was looking down 10% in the pre-market. Then MSFT, already interested in YHOO as evident a year ago when they tried to reach a mutually agreeable deal, tried a different tactic, mounting a tender offer boasting a 61% premium for YHOO shares.

Microsoft tender for Yahoo! not a sign of a new wave of deals . . . yet.

That got a lot of folks lathered up, believing that M&A driven by value buying was back and that waves of deals would start to emerge. In every economic breakdown there are sectors and companies therein that get hit and that become consolidation or takeover targets. In this economic slowdown it is the mortgage insurers and bond insurers as well as other financial institutions that got caught naked when the tide went out. Tech is lower, but it is not in the toilet, i.e. not the problem in this slowdown as it was in 2000. No, it is the financials, particularly those deep in the housing slump that are collapsing and in real danger of disappearing as did so many techs and internets in the early 2000's. At this juncture, however, there are no deals, no rescues, bailouts, buyouts or even failed attempts in the financial sector. There are rumors to be sure; each week we hear that Wilbur Ross and/or Warren Buffett are ready to swing in like vultures to feed on the carrion. Each week nothing happens. Even as bad as it is in the sector, they are waiting because with some S&P credit downgrades it is going to get a lot worse.

With things that bad in the financials but still no buyouts, the Yahoo! hostile offer doesn't represent the start of a new wave of tech takeovers. What it represents is a defensive (and somewhat offensive) move by MSFT to compete with GOOG, trying to take the fight to GOOG on search before GOOG starts giving away free operating software as has been discussed for a few months all around the tech world. MSFT is making a pre-emptive move to take the fight to GOOG versus getting further flanked by it. Kudos. Frankly I still don't know why GOOG just didn't go out and buy YHOO! and take it off the market before MSFT could get it. What a coup that would have been, effectively shutting MSFT off from search and allowing GOOG to go with a full out assault against MSFT's only real business, its operating system and Office suite.

Not that the financial sector is not close to deals. Friday there were reports that a consortium of banks in New York were working together to bail out the mortgage and bond insurers. More talk like that and Ross and Buffett will have to make their moves. When that happens the ball is rolling and there really will be a wave of buyouts and takeouts, and that really will mark a bottom in the financial slump, at least from the market's view.

Jobs take back market's Yahoo!

Whatever the MSFT/YHOO bid really means, the market liked it and futures were sharply higher. Then the jobs report came out as we anticipated, with a net loss (-17K). That popped the early euphoria bubble as the futures came back to flat and then modestly negative from up over 100 on DJIA. The bulls were lucky the market had the MSFT deal in the hopper; it boosted futures and acted as a buffer, giving the market some safety margin to absorb the weak jobs report.

Stocks started flat as a three day old Coke and moved slightly lower, but then, just as in the prior sessions the market started a comeback. New money moved in for the new month and stocks surged to positive with DJ30 hitting next resistance at 12,750. The ISM came out better than expected, moving back over 50 (50.7). Instead of furthering its gains the market rolled over and sold back past the opening prices, once again negative on the session. Looked as if the weak jobs report was winning out. But once more a slow steady rebound began, and it continued right on into the close, moving back to the early morning highs as the small caps, large cap financials, and retailers led the way. By the close the market was solidly higher, capping the best weekly gain since 2003. Ironic, isn't it. This strong week follows the worst month for NASDAQ in 17 years. The definition of volatility. 125BP in rate cuts in just 9 days can indeed have an impact.

TECHNICALLY the market continued to show inner strength after appearing gutted following the FOMC meeting. It fought off bad news the last two sessions of the week to close higher. It showed dogged determination to move higher in the face of bad news (AMZN earnings, GOOG earnings, jobless claims, jobs). As noted earlier in the week, a couple of weeks back the market would have soiled itself then curled up in the fetal position and whimpered at this kind of news. Instead it is overcoming the issues and moving higher to the close. Much more bullish though there were other factors at work such as month end positioning and covering on Thursday, and new money going to work Friday. The Fed brought some new money in no doubt, but this coming week, after 1200 points upside in the Dow, we see how much conviction there is in that new buying.

INTERNALS: Mostly strong but there were some mixed signals. Breadth was great on both NASDAQ (2:1) and NYSE (4:1) as the move upside Friday and for the week was broad, telling you there was more than just short covering. Small caps like the prospect of aggressive stimulus leading to a renewed economic expansion, and they surged as a result. Volume was a different story. It was lower on NYSE, indicating all of that surge in the small caps was not backed by a lot of new buyers; that suggests short covering in those beaten up stocks as well. NASDAQ volume spiked over 3B shares, giving the impression of a surge in buying. It was, but just with respect to one stock: YHOO. Its average trade is 28M; Friday it traded 438M, over 15 times average. At best volume would have matched Thursday levels. Setting aside the extra YHOO trade, volume did not pull in as much as on NYSE, but it was not the powerful surge it looked to be at first blush.

CHARTS: More gains across the board as the indices moved through near resistance last week, moving up to the next level Friday. Friday was interesting in that regard: the indices rallied early to that resistance and then sold off even as good ISM data hit. Then it recovered over the entire rest of the session but could not surpass the early highs that stalled at that resistance. We heard comments about a knifepoint turn that made a bottom in the market. No doubt there was a knifepoint turn, but that are never bottoms in and of themselves. There has to be some sort of basing attempt, either double bottom as in traditional bottoms such as 2002, or something like a reverse head and shoulders as in August 2007. It has been a heck of a bounce, but history says there will be a test off of this rebound from such harsh selling.

LEADERSHIP: The leadership for the day was again in the retailers and financials as the big funds and institutions push money into these beaten down areas now that the Fed has moved its rate down more in line (though still behind) market rates. These areas tend to perform quickly after cuts; we picked up HD and TJX because of this. As discussed all week, however, most of what we are seeing are trend reversal moves though there are a few good patterns emerging. Outside of these moves the action is mostly just rebounds from wicked selling. They were technically ripped open and are making a reflex bounce back up. That is not how you have new, sustained bull rally moves. As with the indices they need to a test of some form as part of a new base (double bottom, reverse head and shoulders, cup with handle) to set the foundation for a sustained run higher. That means some more downside and lateral movement still to come. The knifepoint turn might market the bottom more or less, but it still has to be proved up with some kind of base that either tests that level again either fully or as part of a larger basing pattern.

THE ECONOMY

January jobs turn net negative.

The 301K weekly jobless claims the first three weeks of January were, in light of the January jobs report, grossly off. Thursday saw a surge in jobless claims to 375K. From 300K to 375K in a week. Something was wrong, and it turns out it was the seasonal adjustments skewing the results.

How do you know? The January jobs report fell by a net 17K jobs. If weekly claims were truly 300K, jobs would have been much stronger. So, can't trust the weekly numbers now either.

The 17K was well off the 70K expected and the 82K from December. December was written sharply higher from the 18K originally reported. That was good, but then November was written down sharply, basically washing out the December revision. That left January still looking crappy.

It is clear that the declines in jobs is not something anybody wants to see, but there is a historical point to make. The last two recessions occurred at the time the jobs market showed its first back to back decline in jobs. In other words, the economy was already in recession when the monthly jobs reports showed two consecutive declines. January chalked up the first, and as jobs lag the rest of the economy, another negative month is highly likely given the Fed's stimulus has not even hit the economy yet in a manner that would induce companies to hire. Even though Q4 GDP scratched out a modestly positive reading (0.6%) there are still two revisions to come and we could see it negative by the final revision.

Of course if we are in the textbook definition of recession right now, as we discussed last week, that means the cycle is already well along its way and there is a lot of stimulus in the pipeline and more to come from Uncle Sam. As the market looks ahead many months down the road, this low hit two weeks back could be the bottom for this selling, just waiting for the next leg lower to confirm. That will have to play out in the normal course of these bottoming events, but the odds are moving closer to even money that it could be the bottom versus selling off to a significant new low.

National ISM rebounds back above 50 . . . assisted by a change in the calculation.

The rebound was a surprise, moving up to 50.7 from a one-month dip below the breakeven point at 50 (48.4 in December). The move was assisted by a new weighting where five key components are now equally weighted. That takes out some of the volatility injected by the formerly heavily weighted new orders.

In any event, the revisions make comparisons harder, but if you apply the revisions backward, the past five months show a very tight 48 to 51 range with the index hugging the 50 level month after month. Very flat, indicating little growth. One thing to note from January: prices paid surged to 76.0 from 68.0 in December.

You need to keep in mind that the ISM is just another survey; it is not based on any hard data other than what the purchasing managers surveyed have in their possession. What the range over the past six months tells us (the revised range, that is) is that companies are not greatly enthuses about the future as their spending plans are just barely keeping the manufacturing sector expanding.

Finally, one new question was added to the survey in January: is your company finding it difficult to obtain financing it needs to conduct business? Nearly 90% said they had not trouble finding the financing they needed. While the commercial paper market has dried up to a certain extent, companies have shifted to borrowing from financial institutions, making use of the lower rates available.

THE MARKET

MARKET SENTIMENT

VIX: 24.02; -2.18
VXN: 28.25; -2.83
VXO: 25.64; -2.69

Put/Call Ratio (CBOE): 0.82; -0.13. Four straight sessions below 1.0 on the close. That is okay. The put/call ratio did its initial work the past month with weeks of closes above 1.0.

Bulls: 40.2%. Down yes, but the steep drop seen the previous weeks slowed (41.6% last week). Before this past week there were sharp decline from 45.6% the week before and 56.50 on the high (48.4%, 52.2%, 54.9% and 56.50%). Has surpassed the 40.6% hit on the last significant round of selling. A move into the lower 40's is a decline of significance. A bigger move is to 35% which is a big bullish indication. If bulls and bears kiss or better yet cross, that is very bullish. For reference it bottomed in the summer 2006, the last major round of selling ahead of this 2007 top, near 36%, and 35% is considered bullish.

Bears: 32.2%. Up, but as with bulls, the strength slowed some as it managed less than a point gain from 31.5% after the massive jump higher from 26.7% the prior week. It is over 30%, meaning it is in the range that means business. Big move after falling to a low of 19.6% on this round. Bearishness peaked at 37.4% in September 2007. It topped the June 2006 peak (36%) on that run. That June peak eclipsed the March 2006 high (33%) and well above the 2005 highs that spawned new rallies (30% in May 2005, 29.2% in October 2005). Still a bit more work to do to really set a bottom, and that means more selling before it gets there.

NASDAQ

Stats: +23.5 points (+0.98%) to close at 2413.36
Volume: 3.104B (+8.04%). Volume exploded over 3B but the entire increase was due to the volume surge related to GOOG and YHOO and the takeover bid. Volume did accelerate to the end of the week after very low trade on the initial gains, but a lot of that dealt with end of month shuffling given the harsh selling and rebound and then the new month getting underway.

Up Volume: 2.258B (+65.125M)
Down Volume: 823.961M (+190.338M)

A/D and Hi/Lo: Advancers led 2.07 to 1. Some nice breadth Thursday and Friday on the upside for a change shows a bit more than just typical short covering.
Previous Session: Advancers led 2.15 to 1

New Highs: 62 (+9)
New Lows: 92 (-55)

NASDAQ CHART: Click to view the chart

Another gap higher, but the index was still under pressure even with the MSFT/YHOO potential buyout. It tested and held the 10 day EMA on the low and then moved through 2400 and the 18 day EMA (2407). Next resistance is 2440 from the early January lows and 2451 from the August closing low. After that you pretty much have to get to 2500 for next resistance. NASDAQ rallied 200 points in the November to December bounce from the initial leg lower, and it has put in 200 points on this bounce now. Looks as if it still has a bit more upside in it toward that 2440-50 level, but it could reverse quickly off this bounce now that the end of month/beginning of month transition is over.

NASDAQ 100 (+0.75%) was up but it tapped the 18 day EMA and backed off. Right at resistance and struggling as the large cap techs appreciably lagged the market.

SOX (5.77%) finally made its move, breaking sharply higher from its 3 week lateral, tight consolidation. Strong move with several chips forming reverse head and shoulders bases over the past three weeks and ready to break higher. After a long, long drought, some money is moving in here in very much the same way it is moving into the beaten down retailers.

NASDAQ 100 CHART: Click to view the chart

SOX CHART: Click to view the chart

SP500/NYSE

Stats: +16.87 points (+1.22%) to close at 2413.36
NYSE Volume: 1.788B (-16.62%). Volume fell back sharply from the Thursday end of month shuffling volume. Still above average and matching the Wednesday reversal trade, but we note that most of the volume for the week was not positive. That leaves question marks re sustainability of the move as it reaches this next resistance.

Up Volume: 1.498B (-295.396M)
Down Volume: 283.795M (-92.954M)

A/D and Hi/Lo: Advancers led 3.96 to 1. Really strong breadth as the small caps surged higher yet again, relishing the Fed rate cuts.
Previous Session: Advancers led 2.79 to 1

New Highs: 49 (+18)
New Lows: 57 (-35)

SP500 CHART: Click to view the chart

SP500 rallied on through the 18 day EMA and is just below next resistance at 1400 to 1407 (August closing low, November closing low). As noted above, volume was not that powerful on the move outside of Thursday and its end of month action. Friday was decent, but it was even lower than the Wednesday level. Moving higher driven by the reversal and the added Fed rate cuts. It has put in 125 points off the low on this run, a bit more than in the November/December rebound from the first down leg. With this next level of resistance at hand and the questionable price/volume action on the week, this coming week likely will see another pullback begin, though the ferocity likely won't have the intensity of the second leg given the Fed action in the mix now.

SP600 (2.43%) really screamed again with another 2+% session. It moved through the 50 day EMA on the close as the small caps are blowing the other indices out of the water in terms of percentage gains on the week. It has bounced more than the bounce after the first leg and it has cracked key resistance at 382. Lots of momentum as these heavily beaten up stocks rebound sharply.

SP600 CHART: Click to view the chart

DJ30

A big week for the blues as well as they continued the rally, moving through 12,500 that almost stalled it out again, climbing to 12,750 and resistance from the August and November closing lows. This is the next major checkpoint for the Dow on this rebound, the point we thought would cap it if it could make it through the 12,500 resistance. It did and it is here now with similar volume to NYSE, i.e. not 100% convincing it is all long buying. Strip out the MSFT volume on Friday (291M) and trade was pretty darn light. It can coast a bit higher toward the 50 day EMA (12,880), but we are looking for a rollover in this range.

Stats: +92.83 points (+0.73%) to close at 12743.19
Volume: 379M shares Friday versus 394M shares Thursday. Again, if you take out MSFT's 291M shares you have very low trade on the session.

DJ30 CHART: Click to view the chart

MONDAY

A boatload of earnings next week; it is not just a January event as you know. In addition a lot of economic data as well, but with the Fed in the bank and the jobs and ISM reports out as well, the data won't keep the market hanging on each report.

This past week the market had substantial reasons to move higher, and it did just that, while also overcoming some news that would have left it crumpled earlier in the month. That does not mean there won't be another test; there will be. When you have these kind of reversals off some really ugly selling, as the rally continues investors and pundits get more and more attached to the move and view it as the bottom. A strong rip off the bottom and continued momentum dulls the memories of the selling. There is always, however, some form of a test and basing before the real bottom is hit. It is a familiar cycle: sharp selloff on high spikes in fear indicators, recovery that has more momentum than expected, fear turns to hope, rug yanked out again in a move that really gets the fear levels to where they need to be. This occurs with our without the Fed overlay.

Remember: the actual recovery comes well after volatility spikes sharply higher for a period of time. For a major bottom it spikes over a period of weeks. The market can jump higher near term off of those, but it does not make the big turn until several weeks later. With the kind of selling seen here and the major economic slowdown this time versus say the interim selloff in the summer of 2007 that was actually the start of the decline in this bear market, there will likely be another spike in VIX that will be more sustained in the neighborhood of a week or so. Then the market bases after that selling and makes the move higher from there.

As noted during the week, this action seen in response to the FOMC cuts may mean that the bottom will indeed come sooner versus another deeper selloff after the next leg lower. The Fed is on the game earlier, P/E ratios are already at good levels, the economy has already turned lower and stock prices are not split wide open and falling to pieces. Many more positives than in 2000-2001.

Nonetheless, there is still work to be done before this is over, and a big part of that work is a test of some sort of the January low, either a test in a double bottom form that holds near the prior low, or something lower that will require a bit more time to complete the basing process as it requires another bounce and test.

How do we play this? First, we see some very interesting upside patterns still; money is moving into areas in a big way and we bought some of that Thursday and Friday, and we see some more that have set up bases unlike much of the market. Outside of that rather narrow range we use the ride higher on this rebound as an entry point for what will be a longer drop now even if it holds at the January lows in a more traditional double bottom. As noted above, the indices are at next resistance and we are watching to see if they roll over at that level. That will give us a good ride lower, and if it goes further, even more so. After that ride to the January low, however, the market will really try to put in a bottom to this selloff based on the Fed action, fiscal stimulus, P/E's, etc. We will watch to see if stocks can set up good bases and thus shape up for some good buys when the test of that first low is over. Strong stocks should hold the line somewhat on the next leg lower, using that to work on their bases, i.e. slow accumulation as money moves back in off the sidelines in anticipation of a break higher. If they set up some nice patterns they will be ready to surge when the market does put in the bottom. They will be the early leaders and we want to be in them.

Thus even now we are scanning the market for bases that are forming up though in reality it is a bit early for that without seeing how they hold up on the next leg lower. In any event, this is how each selling episode comes to an end, and we want to indentify the stocks that have set up the foundations for strong runs when the market recovers, as they will be the leaders and provide large and sustained moves when this market selling runs its course.

Support and Resistance

NASDAQ: Closed at 2413.36
Resistance:
2451 is the August closing low
Some modest resistance at 2500 from interim August lows.
The 50 day EMA at 2513
2540 is the November closing low
2547 is the August 2004/April 2005/October 2005/March 2007 up trendline
2550 to 2540 from May/June consolidation and the November lows

Support:
The 18 day EMA at 2407
2386 is the August intraday low
2379 from the October 2006 peak
The 10 day EMA at 2377
2370 from the April 2006 peak
2340 from the March 2007 low
2315 to 2300 is a range of support from old peaks
2278 is the trendline from the summer 2004/July 2006 lows, Q4 2005 consolidation
2216 from August 2005 peak
2175 from the December 2004 peak

S&P 500: Closed at 1395.42
Resistance:
1406 is the August and November 2007 closing low
1409 is a longer term trendline from the August 2003/September 2004 lows
The 50 day EMA at 1418
1430 from the August interim lows
1440 - 1437 from January and March peaks
1459 is the February peak
1466 is the June/July 2006 up trendline
1475 from peaks in December 1999 and January 2000
The 200 day SMA at 1484

Support:
1376 is the 18 day EMA
1374 is the March 2007 closing low
1370 is the August 2007 intraday low
1366 is the 10 day EMA
1325 from May 2006 peak prior to the summer 2006 correction
1315 is an ancient trendline
1305 to 1302 from an August 2006 peak and matches a range of support from March and April 2006.
1294 from the January 2006 peak
1288 from June 2006
1280 from June and August 2006
1255 from June 2006 lows

Dow: Closed at 12,743.19
Resistance:
12,743 is the November low
12,786 is the February 2007 peak
12,845 is the August closing low
The 50 day EMA at 12,881
13,050 to 13,000 range
13,092 is the December low
13,250 from price points from June through December 2007
13,362 is the 200 day SMA

Support:
The 18 day EMA at 12,556
12,518 is the August intraday low
The 10 day EMA at 12,498
12,250 from late March 2007 lows
12,050 from the March 2007 low
11,670 is the May 2006 intraday high; 11,642 closing
11,634 is the January intraday low
11,317 is the March 2006 peak
11,228 from a July 2006 peak

Economic Calendar

These are consensus expectations. Our expectations will vary and are discussed in the 'Economy' section.

February 1


- Non-farm payrolls, January (8:30): -17K actual, 70K expected, 82K prior (revised from 18K)
- Unemployment rate, January (8:30): 4.9% actual versus 5.0% expected, 5.0% prior
- Hourly earnings (8:30): 0.2% actual versus 0.3% expected, 0.4% prior
- Average workweek, January (8:30): 33.7 actual versus 33.8 expected, 33.8 prior
- Construction spending, December (10:00): -1.1% actual versus -0.5% expected, 0.1% prior
- ISM Index, January (10:00): 50.7 actual versus 48.4 expected, 48.4 prior (revised from 47.7)
- Michigan sentiment, January revised (10:00): 78.4 actual versus 79.0 expected, 80.5 prior

February 4
- Factory Orders, December (10:00): 2.0% expected, 1.5% prior

February 5
- ISM Services, January (10:00): 53.0 expected, 54.4 prior

February 6
- Productivity, Q4 preliminary (8:30): 1.0% expected, 6.3% prior
- Crude oil inventories (10:30)

February 7
- Initial jobless claims (8:30): 375K prior
- Pending home sales, December (10:00): -2.6% prior
- Consumer Credit, December (3:00): $8.0B expected, $15.4B prior

February 8
- Wholesale inventories, December (10:00): 0.4% expected, 0.6% prior
icon url

ReturntoSender

02/07/08 10:44 PM

#7877 RE: ReturntoSender #6755

History does repeat but it is not an exact science.

Bull market tops are formed with high volume and generally low but rising volatility.

Bear market bottoms are formed after an extremely high volume capitulation phase with corresponding high volatility.

Later when the actual bottom is formed it is with lower volume than the capitulation phase and still high volatility.

But generally both lower volatility and lower volume than what was seen during the higher volume capitulation phase.

Lets take the 2000 top and 2002 bottom as an example and see what we might learn looking at the market decline to date over the last few months. Could we have already seen capitulation? Maybe, but there are a few things different than in 2002. First volume has grown considerably. Second volatility has returned but not to previous heights. Third if we are already forming a bottom then we would be doing it at much higher relative strength than what we saw at the last bear market bottom. Anyway, here is the chart:


RtS
icon url

ReturntoSender

02/15/08 11:52 AM

#7893 RE: ReturntoSender #6755

COTD - Chart of the Day - Dow Downtrend:

For some perspective on the current stock market correction, today's chart presents the short-term trend of the Dow. Today's chart illustrates that, since peaking in October 2007, the Dow has traded within the confines of a downward sloping trend channel. While the Dow is trading above its January lows, it has not been able to break through resistance (red line) and therefore remains in a downtrend until proven otherwise.


The chart below will continue to update.

icon url

ReturntoSender

02/15/08 12:29 PM

#7894 RE: ReturntoSender #6755

Volatility Trading System for the SMH.

As the market has entered an increasingly volatile time period the market remains predictable on a short term trading basis using a short term trading system based on volatility ranges.

The system uses the 10 day SMA versus the volatility indices.

When the volatility indices trade more than 10% above their 10 day sma's they always revert to the norm resulting in a market rally. When the volatility indices fall more than 10% below their 10 day sma's they always revert to the norm resulting in a market sell off. Watching RSI's, MACD, Price Channels and %B can also help determine the best trade times.

The system is show here versus the SMH. But it should be noted that options are available for trading the VIX and VXN now as well so they can be traded outright.

The ten day sma's are marked in green. A simple calculation for determining when volatility is stretched to high and should result in a market rally is simply to see if the VXO, VIX, and VXN have ten day sma's more higher than where the the ten day sma is times 1.10.

A simple calculation for determining when the market is overbought and likely to sell off is to multiply the 10 day sma by .90. If the VXO, VIX and VXN are all below the individual result then the market is due to sell off.

Here are the charts:


icon url

ReturntoSender

02/20/08 7:24 PM

#7905 RE: ReturntoSender #6755

From Briefing.com: 4:11PM Verigy reports EPS in-line, revs in-line; guides Q2 EPS below consensus, revs below consensus (VRGY) 18.74 +0.14 : Reports Q1 (Jan) earnings of $0.52 per share, in-line with the First Call consensus of $0.52; revenues rose 21.2% year/year to $200 mln vs the $200 mln consensus. Co issues downside guidance for Q2, sees EPS of $0.16-0.23 vs. $0.41 consensus; sees Q2 revs of $155-170 mln vs. $179.88 mln consensus.

4:16PM TriQuint Semi beats by $0.02, reports revs in-line; guides Q1 EPS below consensus, revs below consensus; guides FY08 EPS in-line, revs above consensus (TQNT) 4.40 -0.03 : Reports Q4 (Dec) earnings of $0.11 per share, ex items, $0.02 better than the First Call consensus of $0.09; revenues rose 4.6% year/year to $128.5 mln vs the $128 mln consensus. Co issues downside guidance for Q1, sees EPS of 0.02-0.04 vs. $0.08 consensus; sees Q1 revs of 110-115 mln vs. $121.47 mln consensus. Co issues guidance for FY08, sees EPS of $0.35-0.45 vs. $0.42 consensus; sees FY08 revs of $540-580 mln vs. $532.69 mln consensus.

4:10PM Analog Devices reports EPS in-line, misses on revs; guides Q2 EPS in-line, revs below consensus (ADI) 27.60 +0.17 : Reports Q1 (Jan) earnings of $0.40 per share, in-line with the First Call consensus of $0.40; revenues fell 1.5% year/year to $614 mln vs the $623.5 mln consensus. Co issues in-line EPS guidance for Q2, sees EPS of $0.39-0.42 vs. $0.42 consensus; sees Q2 revs of $615-640 mln vs. $644.11 mln consensus.

4:06PM Cadence Design announces authorization of $500 million stock repurchase (CDNS) 10.91 -0.02 :

4:03PM Novatel Wireless beats by $0.03, misses on revs; guides Q1 EPS below consensus, revs below consensus (NVTL) 13.86 +0.28 : Reports Q4 (Dec) earnings of $0.34 per share, $0.03 better than the First Call consensus of $0.31; revenues rose 53.2% year/year to $118 mln vs the $120.7 mln consensus. Co issues downside guidance for Q1, sees EPS of $0.22 vs. $0.29 consensus; sees Q1 revs of $110 mln vs. $119.41 mln consensus.

4:25 pm : Readers may recall that the stock market flip-flopped on Tuesday, rallying in the early-going and then selling off into the close. On Wednesday it was just the opposite. Stocks languished in the early-going amid concerns about credit market liquidity and a worse-than-expected January CPI report, but eventually turned things around and advanced in the afternoon trade.

The performance was remarkable as there seemed to be some legitimate reasons for participants to assume a bearish view of matters and to maintain that view throughout the session.

News that KKR Financial Holdings, the publicly traded credit fund of Kohlberg Kravis Roberts & Co., had delayed repayment of its asset-backed commercial paper debt for a second time, and was involved in restructuring talks with creditors, sparked concerns about liquidity in the credit market that took a heavy toll on foreign markets.

This news, however, soon took a backseat to the CPI report, which revealed a 0.4% increase in total CPI for January and a 0.3% increase in core-CPI, which excludes food and energy. Both numbers were slightly ahead of expectations that called for increases of 0.3% and 0.2%, yet the year-over-year increases of 4.3% and 2.5%, respectively, are what really grabbed the market's attention.

The initial reaction was understandably negative as the report fueled inflation concerns and suggested the FOMC might not be as aggressive with future rate cuts as had been previously anticipated.

On a related note, the FOMC Minutes from the January 29-30 meeting indicated that members felt inflation expectations would remain reasonably well anchored. Still, it was not lost on the market, which saw oil prices top $100 again in Wednesday's trading, that the Fed raised its core inflation forecast for 2008 to 2.0% to 2.2% from 1.7% to 1.9%. The Fed also cut its 2008 GDP forecast to 1.3% to 2.0% from 1.8% to 2.5%.

The takeaway for the market was that the updated forecasts continue to support the view that further rate cuts remain likely. Accordingly, the stock market pressed higher following the release of the minutes.

In a separate release, it was reported that Housing Starts rose 0.8% in January. That seemingly good news was offset by the realization that starts had dropped 21% over the prior two quarters and that building permits slipped 3.0% to a 16-year low of 1.04 million units on an annualized basis.

After digesting the economic data, the stock market found a bullish stride that was helped along by the outperformance of the financial and technology sectors, which rose 1.6% and 1.7%. At the same time, the lack of follow through selling pressure after the negative open led to some bargain hunting activity that, in turn, forced some short covering that aided in the market's turnaround.

Other leading sectors included energy, which gained 1.5%, and basic materials, which jumped 1.2%.

Dow component Hewlett-Packard (HPQ 47.44, +3.49) provided its fair share of support for the broader market as it got a healthy 8.0% boost following its better than expected fiscal first quarter earnings report and full-year outlook. Its good news trickled down to other tech stocks that resulted in technology being the best-performing sector on the day.

Telecom services remained a drag, however, as it slipped 2.9%. Verizon (VZ 35.24, -0.10) and AT&T (T 34.36, -1.53) led the retreat, having been hit by a Credit Suisse downgrade of both stocks to Neutral from Outperform.

Strikingly, the defensive-oriented sectors consumer staples, health care and utilities underperformed today in a trade that was driven by more growth-oriented issues.DJ30 +90.04 NASDAQ +20.90 NQ100 +1.3% R2K +1.1% SOX +2.7% SP400 +1.4% SP500 +11.25 NASDAQ Dec/Adv/Vol 1249/1696/2.29 bln NYSE Dec/Adv/Vol 1198/1936/1.43 bln

8:02AM Chipmos Technology reports January 2008 revenue (IMOS) 3.51 : IMOS announces revenue for the month of January 2008 was NT$1,680.2 mln or US$52.2 mln, a decrease of 11.3% from the month of December 2007 and a decrease of 15.8% from the same period in 2007. (All translations from NT dollars to U.S. dollars were made at the exchange rate of NT$32.17 against US$1.00 as of January 31, 2008.)

11:30 am Hewlett-Packard (HPQ)

It was all good for Hewlett-Packard (HPQ 47.01, +3.06) in its fiscal first quarter. That's the takeaway from its earnings report anyway, which was accented by net revenue growth of 13% and a 38% jump in net earnings. Revenue growth was achieved in all regions and across all product segments.

The company's core Personal Systems Group, which accounted for 38% of total revenue growth, saw revenues jump 24% to $10.8 billion, led by notebook sales. For the period, unit shipments were up 27% versus the prior year.

The broad-based strength in HP's business underscores the demand for its offerings, not just in the Americas where revenue grew 8.0% to $11.2 billion, but worldwide. In fact, revenue from outside the U.S. in the first quarter was 69% of total revenue.

To its credit, HP is doing a good job of managing its growth as costs aren't getting out of whack. That is evident in the margin expansion that HP continues to deliver. In the first quarter, operating margins widened to 9.2% from 7.3% on a GAAP basis and to 9.9% from 8.6% on a non-GAAP basis.

The company's CEO, Mark Hurd, cited the company's confidence in anticipated cost reductions and share gains in key markets as factors for why HP raised its guidance again.

With respect to the guidance, HP sees second quarter earnings per share of $0.83-$0.84, excluding non-recurring items, versus the $0.82 consensus estimate. Revenues are expected to be between $27.7 billion and $27.9 billion (consensus $27.43 billion).

For FY08, HP expects earnings per share of $3.50 to $3.54, excluding non-recurring items, compared to previous guidance of $3.32-$3.37 and the $3.36 consensus estimate. FY08 revenues are projected to be $113.5 billion to $114.0 billion, compared to previous guidance of approximately $111.5 billion (consensus $111.7 billion).

HP is reaping the fruits of its success and its reassuring outlook in the form of a higher stock price. Shares of HP are up 7.0% in a down market, yet the stock is still down 7.0% for the year as it has been taken down with the broader market amid concerns about a potential recession in the U.S. and a spillover effect to the global economy.

The first quarter report from HP, though, shows that it was unfairly punished in the recent pullback. It continues to execute well and it appears to have some pretty good visibility. One would think, then, that HP would trade at a premium to the market multiple of 13.5x estimated earnings. In fact, it trades with a market multiple that strikes as an attractive price to pay for the stock.

--Patrick J. O'Hare, Briefing.com
icon url

ReturntoSender

03/04/08 10:50 PM

#7926 RE: ReturntoSender #6755

From Briefing.com: 4:30 pm : There wasn't any shortage of news on Tuesday. The problem for the stock market is that most of it seemed to skew to the negative side of things.

First and foremost, investors were rattled by accusations from the head of Dubai International Group that Citigroup (C 22.10, -0.99) will need a lot more capital from outside investors than it has already received. Citigroup's stock dropped as much as 8.0% in the wake of the accusation and weighed heavily on the financial sector along with the investment banks, which again saw another round of estimate cuts.

Separately, a warning from Intel (INTC 20.00, -0.01) that it was revising its first quarter gross margin rate guidance downward due to lower than expected NAND flash memory pricing also cast a pall on the broader market in the early going.

Selling activity intensified, though, after Fed Chairman Bernanke told the Independent Community Bankers of America that defaults and foreclosures in the housing market were likely to continue to increase. To help stem "preventable foreclosures," the Fed Chairman suggested banks consider writing down the principal amount on mortgage loans as a means of restoring equity for borrowers.

Bernanke's suggestion didn't help the financial sector as participants viewed it as a reminder that further write-downs look to be in store for the sector. Comments form a bevy of other Fed officials Tuesday, including Fed Vice Chairman Kohn, didn't do anything to lift the market's mood either.

The major indices went on to set new lows for the session around 14:00 ET. For the Dow, Nasdaq and S&P, that translated to losses of 226, 37 and 24 points, respectively.

As one can see from the final standings, those losses were pared considerably in late-afternoon trading.

Strikingly, a sell-off in commodity prices that resulted in a 1.9% decline in the CRB Index didn't act as the primary catalyst for the recovery. That honor in our estimation goes to Cisco (CSCO 24.29, -0.11) whose CEO said in a presentation that he's even more comfortable with the company's long-term guidance than he was following the last earnings conference call. Furthermore, he indicated that he believed the U.S. downturn would be short and shallow.

The comments from Cisco CEO John Chambers sparked a broad-based bargain hunting rally in the technology sector that favored a number of beaten up companies like Intel, Amazon.com (AMZN 65.34, +2.91), Microsoft (MSFT 27.59, +0.60), and Apple (AAPL 124.62, +2.89). Separately, Apple told investors that it isn't planning to start a dividend or to buy back stock right now and that it expects to hit its 10 million iPhone sales target in 2008.

Notably, the financial sector participated in the late recovery effort, also on some bargain hunting activity that kicked in after the sector came within a hair of revisiting its January low earlier in the session. In addition, the umpteenth report that an Ambac Financial (ABK 10.72, +0.78) bailout deal was near aided in the sector's recovery try. The financial sector, down as much as 3.3% earlier in the day, closed with a decline of 0.8%. DJ30 -45.10 NASDAQ +1.68 NQ100 +0.6% R2K -0.5% SP400 -0.6% SP500 -4.59 NASDAQ Dec/Adv/Vol 1786/1138/2.64 bln NYSE Dec/Adv/Vol 2120/1027/1.78 bln

4:30PM Semtech announces new $50 mln stock buyback plan (SMTC) 12.92 +0.33 :

2:00PM Celestica collaborates with Microsoft on the development of BEE3 platform prototypes (CLS) 6.47 -0.36 : Co announces it has collaborated with Microsoft (MSFT) on the design of the BEE3, Berkeley Emulation Engine 3rd version, to improve the ability of Microsoft and other companies to conduct computer architecture research.

1:07PM Tessera Tech confirms PTO Issues Initial Office Action on Patent; reiterates its revenue guidance for the first and second quarters of 2008 (TSRA) 13.81 -9.25 : Co confirms that the U.S. Patent and Trademark Office has issued an initial office action regarding Tessera's 6,133,627 patent ("627") in ex parte reexamination. This initial action is non-final and will be subject to a lengthy review process, including the possibility of appeal. This issued patent is presumed to be valid, intact and enforceable during the reexamination process, which on average takes 24 months to complete, not including appeals. It is not unusual for the PTO to preliminarily reject claims during the reexamination process. Tessera has the right to argue, and will continue to argue, the merits of its position. Tessera is concurrently reiterating its revenue guidance for the first and second quarters of 2008, as contained in its announcement dated January 31, 2008 (guidance is for Q1 revs of $55-57 mln vs. $56.1 mln consensus; for Q2 is $$53.55 mln vs. $54.4 mln consensus). In accordance with company's policy, Tessera's quarterly guidance does not include settlements from the company's current enforcement actions. (stock is halted)

12:11PM STMicroelectronics Supervisory Board confirms "speculations that have appeared in the media concerning possible changes in the highest levels of the top management are without foundation" (STM) 11.34 -0.36 :

9:26AM Applied Materials discloses $1.9 bln solar equipment sales agreement (AMAT) 18.88 : Co discloses that it has entered into sales agreements with a privately-held corporation based outside the United States, under which AMAT will supply equipment and installation/warranty services for multiple solar factories to be constructed by the buyer. The factories, which will feature Applied SunFab thin film tandem junction production equipment, collectively are expected to produce an annual output of solar photovoltaic modules capable of generating electricity on a gigawatt scale. The aggregate purchase price for the equipment and related services (exclusive of post-warranty services) to be provided by AMAT under the agreements is approximately US$1.9 bln.

DigiTimes: With the possibility LCD panel prices for notebook applications may rebound $1-2 in April, some notebook makers recently increased their panel procurement to build up their inventory. Leading notebook vendors such as HPQ and DELL had already started building up their panel inventory since the end of 2007 as they expected to see a panel shortage in 2008. In addition, recently some notebook system makers have been looking to increase their panel inventory by about one week above the 1-2 month levels they usually retain, amid expectations of a price increase for notebook panels in April, according to the system makers.

8:04AM Atmel and PTEC announce the integration of ATMLl's FingerChip biometric security solutions in PTEC's FailSafe and SecureCore Pre-boot Authentication products (ATML) 3.28 :

7:49AM Trina Solar beats by $0.13, beats on revs; guides Q1 revs in-line; FY08 revs above consensus (TSL) 32.62 : Reports Q4 (Dec) earnings of $0.62 per share, $0.13 better than the First Call consensus of $0.49; revenues rose 161.6% year/year to $101.4 mln vs the $95.6 mln consensus. Co issues in-line guidance for Q1, sees Q1 revs of $112-120 mln vs. $115.86 mln consensus. Co issues upside guidance for FY08, sees FY08 revs of $770-808 mln vs. $691.18 mln consensus. "The Company believes gross margin for the first quarter will likely be between 23% and 25% and estimates operating margin to range between 13.5% to 15.5% of total net revenues. The Company is expecting gross margin for the year between 23% and 25% and believes operating margin will likely be in the range of 15% to 17% of total net revenues."

09:31 am Microsoft: AmTech Research initiates Buy. Target $44. Amtech initiates MSFT with a Buy and a $44 tgt saying they believe that excellent fundamentals in MSFT's core Client and Business segments will drive upside to conservative consensus estimates through CY09. The firm also says the long-term challenges from virtualization, open source, and virtualization necessitate MSFT achieve success in the Internet Advertising space. They believe that the most likely scenario is for MSFT to acquire YHOO near the current offer price with potential for significant revenue and cost synergies in the long-term.


--------------------------------------------------------------------------------


10:57 am Intel (INTC)

When Intel (INTC 19.77, -0.24) provided its first quarter guidance in mid-January, it warned that it was taking a conservative line on things due in part to the weak NAND flash memory pricing environment. Its attention to U.S. economic indicators, which had been flashing slowdown signals, was the other driving factor.

After Monday's close, Intel provided updated guidance that qualifies as a disappointment. Interestingly, the company didn't say anything about economic indicators in the U.S., as it pinned a downward revision to its gross margin guidance solely on lower than expected prices for NAND flash memory chips.

Intel didn't clarify if the price deterioration was a function of reduced demand or simply excess supply from industry manufacturers. Either way, Intel now expects its first quarter gross margin rate to be 54%, plus or minus a point, versus prior guidance of 56%, plus or minus a couple of points.

The company didn't make any other changes to the business outlook it provided following its fourth quarter report. That means it didn't adjust its revenue guidance of $9.4 billion to $10 billion. Still, the gross margin guidance will prompt some downward revisions to analysts' EPS estimates for the first quarter.

Intel's stock has held up reasonably well in light of the disappointment. Losses have been tempered by the recognition that Intel wasn't overly-priced to begin with at 14x estimated 2008 earnings, as well as the understanding that PC demand, which is the core driver for its overall operations, is holding up fairly well.

All things considered, we'd continue to hold the stock here. However, given the market's misgivings about the economic and demand outlook, we'd refrain from committing new money just yet.

Intel will be holding an Analyst Day on Wednesday, March 5.

--Patrick J. O'Hare, Briefing.com
icon url

ReturntoSender

03/09/08 6:10 PM

#7931 RE: ReturntoSender #6755

InvestmentHouse Weekend Update:

http://www.investmenthouse.com/weekendmarketsummary.htm

- NASDAQ sells below January lows then market covers ahead of the weekend.
- Jobs report continues the string of bad economic data.
- Fed sense of timing second only to.
- Looking for a few good stocks . . . to hold the line.

Bad news provides a platform to sell, and stocks do, but it is not the rout needed.

The jobs report was weaker than expected but in line with what should have been expected given the weekly jobless claims and flagging economic data the past two months. That was a surprise to investors, yet not; the market was getting used to worse than expected data during its lateral range; thus more bad news is not really surprising even though of late it has started to break the camel's back as the indices sell lower.

As if that was not enough, the Fed announced it was raising its TAF (a.k.a. Taffy) auction amounts to $100B and is taking a lot more different kinds of securities with a 28-day turn versus overnight. I have a few obsolete computers and printers I want to unload; wonder if the Fed would take them now? After all they seem to be bent on doing anything in the hope that it will somewhat help alleviate the once again increasing spreads in corporate bonds and the lack of interest in commercial paper. If I could get rid of those old computers I know the markets would start to calm down.

What the Fed is doing is not a bad idea; it cannot continue running rates down at 50 to 75BP pops and expect to end the credit issues on its own. As discussed last week, the last time this scenario started to unfold the response that worked involved fiscal stimulus in the right places and some higher interest rates. If the Fed had some real help instead of the $600 handouts that worried consumers will save instead of spend (or they spend it on $3/gallon gasoline) it could concentrate on its TAF-like programs that don't fuel inflation as directly as tax cuts yet get money into the system. It worked initially, but the need for more rate cuts worked to undo the narrower spreads and lower LIBOR rates initially achieved. Without the real help it needs from the fiscal side (as evident by the way the market responded to the fiscal stimulus, i.e. selling further) the Fed is locked into its course of action as it has to promote economic growth and stabile prices. It can sit and do nothing or it can try to use the tools it has and Bernanke's speeches pre-Fed indicate that he will act versus sit.

Timing is everything, however, and this action, as the 75BP cut on the heels of the market dive in January, looks to be reactionary as opposed to calculated. Thus over the past couple of weeks the talk has switched to how the ECB is more in control and resolute in its plan of action than the US Fed. As with professional sports fans, monetary policy is a 'what have you done for me lately' game. Friday it looked once more as if the Fed was chasing a bus. Not very dignified considering all of the academic firepower on the committee.

Nonetheless, after a weaker open stocks rebounded in the first hour, turning from negative to positive across the board. We didn't think that would last. The early downside should have been worse but it was not. There was no real spike in fear and the early selling was not ferocious. After that initial rebound a 4 hour selloff ensued that took the indices to new session lows. The Dow came within 200 points of its January low, SP500 just 12 points, while NASDAQ undercut its January low by 15 points. We watched the indices rollover, but anticipated a bounce on some short covering ahead of the weekend given two big back to back downside sessions. When we saw the Russell 2000 hold its early session lows after the other industries undercut, we figured the short covering bounce was read to start. We issued some alerts to take some gain on the downside positions and then watched the market rebound. NASDAQ turned positive; an undercut of support to green. It did not completely stick, but the indices did bounce off the lows.

TECHNICALLY it was not the blowout downside session we were looking for. The market started lower then recovered with relative ease, turning positive midmorning. It did not hold the gains and sold off to new session lows, but it bounced again in the last hour. Did not turn positive but the short covering move ahead of the weekend took some of the downside pressure off. In short, no downside blow off, just more selling that did not provide the catharsis the market needed to put in a bottom.

INTERNALS: The internals were not at the massively negative levels of Thursday with breadth at a more palatable -1.8:1 on NYSE, -1.6:1 on NASDAQ. Volume was up and back above average on both NYSE and NASDAQ. Makes sense that the volume was up on the sorry jobs report, but it was more distribution as the market sold lower. That indicates more selling to come with SP500 and DJ30 heading down toward the January intraday lows.

CHARTS: The big move of the session was NASDAQ undercutting its January intraday lows, then rebounding to hold over those levels. Some will calls this a 'successful' test of the January lows and it may turn out to be that. With SP500 and DJ30 still above those lows, however, NASDAQ is likely going to at a minimum have to wait for them before it can try a sustained upside move.

LEADERSHIP: There was not a whole lot of leadership, at least in terms of stocks posting solid upside gains. There were stocks that showed relative strength, i.e. holding position above near support, weathering the selling, hunkered down and waiting for the test to end and trying to hold support all the while. Indeed those are the stocks we are looking for at the end of this selling; if they are still holding up or are at key support and in buy positions after SP500 and DJ30 test their January lows, then we can look at them to at least play to the upside when the market makes the bounce off of that test. There will likely indeed be a bounce off that move even if the market ultimately sells further, something that is hardly out of the question given the continued weakening economic data and the market's resumption of the downside.

THE ECONOMY

February jobs report posts first back to back declines since early 2003.

The last time the jobs report posted its first 2 consecutive months of declines the US economy was in recession. It was not officially known at the time, but recession was upon us when that report hit. Thus just as then, we are likely in recession given the varied issues facing the economy (housing, credit issues, $100+/bbl oil), the train of falling economic data, and the selling in the market that is forecasting the recession.

The numbers: non-farm payrolls fell 63K, a swing of 88K from expectations at 25K. Hourly earnings were in line at 0.3%, matching the 0.3% rise in January. Private payrolls fell 101K while government added 38K. Services fell 12K well down from the 100K average in Q4. Construction fell 39K and manufacturing fell 52K.

The unemployment rate actually fell to 4.8% from 4.9%. Now when the economy was turning up, the unemployment rate, also known as the household survey (are you working or are you not?) was falling even as non-farm jobs were falling. In other words, the household survey showed more people were working despite what non-farm payrolls said because after the implosion in tech, many people started their own businesses because the big companies were laying off all through the recession and the start of the recovery. Thus in order to put food on the table a lot of former employees turned entrepreneur. Thus the falling unemployment rate was an indication of a recovery in progress.

Does it mean the same this month? No. What pushed the rate lower was an exodus from the jobs pool. The labor force contracted 450K in January. If enough workers give up and leave the work force, i.e. more than the number of lost jobs, then it can look as if the unemployment rate is improving. In that situation, however, all it means is that people are giving up for now and collecting unemployment. Look at the weekly jobless claims trend; it tells that tale.

Earnings versus unemployment rate show an interesting trend. When you chart hourly earnings versus the unemployment rate over the past 20 years you see they move inversely. When hourly rates peak unemployment rates trough. Over the past two quarters hourly earnings growth matched the rates hit in 2001. At the same time the unemployment rate hit its lows both then and now. Hourly earnings are starting a decline the past three months and the unemployment rate has started to creep higher. The recovery starts in earnest soon after the unemployment rate peaks and the hourly rates drop sharply. While both are starting to move in that direction they have not made definitive moves. Thus we are likely to see more of the same movement in these numbers over the next few months before they make the turn. As discussed all last week, however, the market will turn before. Thus after a run lower once more that has the DJ30 and SP500 test the January lows and likely a bit lower.

THE MARKET

MARKET SENTIMENT

VIX: 27.49; -0.06. Rose to 29.29 on the intraday high and some were saying that was enough to turn the market. News flash. It hit this level in early February and the market put together a very modest, mediocre move that led to this current selloff. It is not nearly high enough to indicate a turn from this kind of selling that is preceded by a steadily worsening economic climate that has not seen a change in trend. In short, it will take more than a move to thirty or en the 37.5 hit in the January selling to put in a real bottom.
VXN: 29.25; -0.74
VXO: 30.35; -0.15

Put/Call Ratio (CBOE): 1.24; -0.03. Eight sessions straight of 1.0 or better closes. As noted last week, the ratio is easily at a level to foster a turn.

Bulls: 41.9%. Modest decline from 42.0%, but still holding the line as the market moved basically laterally. That will likely change now that the market has broken its trading range and is heading for the test. The bulls and bears were eye to eye three weeks back, and that was enough to set a bottom. Hit 36.7% three weeks back, the low for this selling round. That put the bulls and the bears eye to eye. Didn't quite make the 35% range considered to be bullish for the market, but was down 20 points from the 56.5 three months back. A move into the lower 40's is a decline of significance, but it needs a bigger move is to 35% which is a big bullish indication. Bears surged over 35%, making that 'kiss' that is quite bullish (even more so if they cross over one another). For reference it bottomed in the summer 2006, the last major round of selling ahead of this 2007 top, near 36%, and 35% is considered bullish.

Bears: 36.6%. Bears continue to rise, albeit much more modestly now, up from 36.4%. Up from 33.7% the prior week when the bulls and bears stared at each other. Bears are chasing the bulls right now; with the current dip they may cross, a very bullish indication. Up sharply from a low of 19.6% on the last rally. It is over 30% and indeed over 35% the prior week, meaning it is in the range that means business. Big move after falling to a low of 19.6% on this round. Bearishness peaked at 37.4% in September 2007. It topped the June 2006 peak (36%) on that run. That June peak eclipsed the March 2006 high (33%) and well above the 2005 highs that spawned new rallies (30% in May 2005, 29.2% in October 2005).

NASDAQ

Stats: -8.01 points (-0.36%) to close at 2212.49
Volume: 2.393B (+8.8%). Not surprisingly with the weak jobs data volume moved back above average. Just barely, however, and that indicates there was no major, cathartic selloff, and that indicates there is likely more to come.

Up Volume: 85.81M (-225.764M)
Down Volume: 1.511B (-366.721M)

A/D and Hi/Lo: Decliners led 1.62 to 1. Much milder than Thursday when the selling was quite ugly.
Previous Session: Decliners led 4.05 to 1

New Highs: 33 (-8)
New Lows: 448 (+111). Now it is getting interesting. Over 500 would be downright poignant.

NASDAQ CHART: Click to view the chart

Gapped lower on the jobs number, hitting the January low (2202) on the open and then breaking through that by 15 points on the session low. It did not give up, roll over and pee itself like a whipped dog. It came back right after the open, rolled over to a session low, but then came back. Sure the last hour was short covering, but it kept it above the January intraday low on the close. That keeps it in the game to bounce from here, but with SP500 and DJ30 still in the hunt for their January lows NASDAQ is not likely to take off form here until they get to their lows. Then we get a bounce in response, and that is when we find out if this is a bottom anticipating better economic times or it gives way and, like the groundhog, sees its shadow and goes underground for another 6 weeks or more.

SOX (+0.60%) was a relative strength leader and it held the lows in its now 8 week trading range. Chips are trying to set up to move higher but not a lot of great patterns in the sector.

NASDAQ 100 CHART: Click to view the chart

SOX CHART: Click to view the chart

SP500/NYSE

Stats: -10.97 points (-0.84%) to close at 1293.37
NYSE Volume: 1.704B (+5.47%). Volume was up and above average and it showed a bit more strength than NASDAQ on the selling. Distribution yes but it did bounce back also.

Up Volume: 561.733M (+473.844M)
Down Volume: 1.116B (-408.476M)

A/D and Hi/Lo: Decliners led 1.82 to 1. After the gutting on Thursday breadth showed in the -2+:1 range intraday but recovered to respectability. Thursday was extreme.
Previous Session: Decliners led 7.55 to 1

New Highs: 29 (-7)
New Lows: 396 (+89). Getting there but no there.

SP500 CHART: Click to view the chart

SP500 came within 12 points of its January low (1270) before rebounding to cut the losses in the afternoon short covering move. Still looking for SP500 to make a full test of the January lows along the lines of NASDAQ. Then we start to see if there is any terra firma at this point or if it is just a shelf before more selling. The economic issues seem to be getting worse, picking up speed to the downside once more. The suggests further market downside, but the market is the leading indicator, not the economic data. Thus we see how the test holds and what SP500 can do with it. As with NASDAQ, we expect a bounce attempt after SP500 and DJ30 make their tests.

SP600 (-0.51%) is still well above its January low while Russell 2000 is much closer, showing a hammer doji Friday just above that level. As with the other NYSE indices, we are still looking for more selling form SP600 before it bottoms.

SP600 CHART: Click to view the chart

DJ30

Cutting significantly lower, leading the downside as the only indices that closed with a loss over 1% and by quite a margin at that. It bounced off the lows but not much. Volume was up. It is 257 points off its January intraday low (11,634) on the close, coming within 200 points of that point intraday. Still looking for the Dow to fully test those lows as well. With NASDAQ already there, a full test by SP500 and DJ30 will likely set off some short covering that lasts more than just the afternoon session. Getting close to the next big test for the market, one that many are watching. You know what they say about watched pot. Have to get the fear up, and if every one is expecting it is there a lot of fear? Needs something unexpected to jack up the worry and it is not there yet.

DJ30 CHART: Click to view the chart

MONDAY

Friday afternoon saw a bounce back up after NASDAQ fully tested its January lows. Some will call for a bottom with that move but there was not enough fear as VIX was mild and volume was ho hum. Sometimes a bottom just comes about with no fanfare; this is not really that type of decline right now. Thus it is looking for more fireworks. Again, Friday was not the fireworks.

They may arise if DJ30 and company rip lower very hard once more with more violence than anticipated. That would start jacking up VIX which is still much too low to indicate a bottom of significance. Many are watching for a bottom at the January lows, and when the indices get there you can almost make book on a rebound unless something very serious and very ugly hits the wires. Selling comes in spurts just as upside runs. When a resistance point is hit after a run upside a stock pauses. Same on the downside; after a hard fall that hits near support, a bounce, even if just a relief bounce, occurs.

If everyone is watching for it, however, then the bounce tends to be modest, contained, almost orchestrated. If nothing changes then you are right back down for the real selling. Either way you need to see the kind of action that makes the longs feel the need to step outside and blow. A high volume, wicked selloff that doesn't look as if it is going to stop. When you see it you can buy some upside positions in anticipation of at least a short term bounce. If there is a follow through about a week later, a strong upside move on strong volume, then you add to positions of stocks that held up well and are leaders of the pack. Those are going to be the best movers in the recovery.

Ah leaders. There are still leaders even after the end of the week selling. The recent leaders in energy, commodities, and some newcomer areas such as medical, biotech, and defense are holding up and setting up as well. If they do a decent job of weathering any further selling they will definitely be in position to carry the torch when the selling exhausts itself.

We are going to watch strong stocks we like on the pullback to see if they hold key levels and thus will at least provide a nice bounce we can play on the move back up. Stocks that use the selling to set up bases are primo. We home in on those and when they break higher after the selling they are buys. This may or may not be the bottom, but that is how you grab the leaders out of the lows just as we grabbled EBAY, TSCO, AMZN and other early runners out of the 2003 test of the late 2002 double bottom. Chips gave us huge gains off the October bottom into February 2003. Then they faded but others that worked on their bases during that period surged out of bases. EBAY more than tripled for us, TSCO doubled, and AMZN almost tripled.

Thus it is definitely worth watching for good bases even during the selling. That is what we are going to do even if we have our reservations as to whether a bounce here ends the overall decline. Again, if we see strong stocks in good patterns moving higher we have to go with them because the market, despite our gut feelings and the 'been here before' knowledge can always put a new wrinkle in things as it tries to hide what it is doing and keep investors confused. As with tackling a shifty running back, you watch what matters, i.e. his core; legs, heads and arms can go all different directions, but the core cannot makes those deceptive moves. Same with leading stocks: despite all of the noise with respect to the indices, sentiment, financial station commentators, etc., if you see good stocks setting up good patterns, you have to tune out all of the stations talking over each other and watch the basics and look for a few good stocks to carry you to big gains out of a selloff.

Support and Resistance

NASDAQ: Closed at 2212.49
Resistance:
2221 is March low
2252 is the early February low
The 10 day EMA at 2269
2286 is the trendline from the summer 2004/July 2006 lows, Q4 2005 consolidation
2340 from the March 2007 low
2370 from the April 2006 peak
2378 is the mid-February peak
2379 from the October 2006 peak
The 50 day EMA at 2380
2386 is the August intraday low
2419 is the January 2008 peak
2451 is the August closing low
Some modest resistance at 2500 from interim August lows.
2540 is the November closing low
2550 to 2540 from May/June consolidation and the November lows
2578 is the August 2004/April 2005/October 2005/March 2007 up trendline

Support:
2216 from August 2005 peak
2202 is the January intraday low
2175 from the December 2004 peak

S&P 500: Closed at 1293.37
Resistance:
1305 to 1302 from an August 2006 peak and matches a range of support from March and April 2006.
1317 is an ancient trendline
1317 is the early February low
1325 from May 2006 peak prior to the summer 2006 correction
The 10 day EMA at 1330
1368 is the high in this recent lateral consolidation
1370 is the August 2007 intraday low
The 50 day EMA at 1372
1374 is the March 2007 closing low
1396 is the January 2008 peak
1406 is the August and November 2007 closing low
1417 is a longer term trendline from the August 2003/September 2004 lows
1430 from the August interim lows
1440 - 1437 from January and March peaks
1459 is the February peak
The 200 day SMA at 1466
1475 is the June/July 2006 up trendline
1475 from peaks in December 1999 and January 2000

Support:
1294 from the January 2006 peak
1288 from June 2006
1280 from June and August 2006
1270 is the January intraday low
1255 from June 2006 lows

Dow: Closed at 11,893.69
Resistance:
12,070 from the early February 2008 lows
12,050 from the March 2007
12,250 from late March 2007 lows is stretching
12,232 is the 10 day EMA
12,518 is the August intraday low
The 50 day EMA at 12,542
12,573 is the mid-February high
12,743 is the November low
12,768 is the February 2008 peak
12,786 is the February 2007 peak
12,845 is the August closing low
13,050 to 13,000 range
13,092 is the December low
13,250 from price points from June through December 2007
13,264 is the 200 day SMA

Support:
11,670 is the May 2006 intraday high; 11,642 closing
11,634 is the January intraday low
11,317 is the March 2006 peak
11,228 from a July 2006 peak

Economic Calendar

These are consensus expectations. Our expectations will vary and are discussed in the 'Economy' section.

March 10
- Wholesale inventories, January (10:00): 0.5% expected, 1.1% prior

March 11
- Trade balance, January (8:30): -$59.5B expected, -$58.8B prior

March 12
- Crude oil inventories (10:30): -3.05M prior
- Treasury budget, February (2:00): -$140.0B expected, -$120.0B prior

March 13
- Retail sales, February (8:30): 0.1%expected, 0.3% prior
- Retail ex-auto, February (8:30): 0.2% expected, 0.3% prior
- Initial jobless claims (8:30): 351K prior
- Export prices, February (8:30): 0.8% prior
- Import prices, February (8:30): 0.6% prior
- Business inventories, January (10:00): 0.3% expected, 0.6% prior

March 14
- CPI, February (8:30): 0.3% expected, 0.4% prior
- Core CPI, February (8:30): 0.2% expected, 0.3% prior
- Michigan Sentiment, preliminary March (10:00): 70.5 expected, 70.8 prior
icon url

ReturntoSender

03/11/08 8:58 AM

#7933 RE: ReturntoSender #6755

From Briefing.com: 08:35 am : S&P futures vs fair value: +20.0. Nasdaq futures vs fair value: +15.8. Futures get a boost to their best levels of the session on news that the Fed announced a new lending tool. The Fed plans to lend up to $200 billion in hopes to improve liquidity. Separately, the January trade balance deficit was $58.2 billion, compared to the prior reading of that saw a deficit of $57.9 billion. Economists expected a deficit of $59.5 billion.
icon url

ReturntoSender

03/14/08 12:48 PM

#7951 RE: ReturntoSender #6755

SNDK MT/LT bot 1000 shares@21.88 - Buying the dip because things can't get much more negative for the market. I think that makes this contrarian buying time.


icon url

ReturntoSender

03/16/08 2:15 PM

#7958 RE: ReturntoSender #6755

InvestmentHouse Weekend Update 3/14/08:

http://www.investmenthouse.com/weekendmarketsummary.htm

- Futures are down, no up, no down. Market whipsaws on every news story but the sellers win out another session.
- It's a bird, it's a plane, no it's the Fed rushing in to make some more history and bail out a brokerage.
- CPI is not bad, showing no increase, but again you have to wonder where this data is coming from.
- Michigan sentiment improves, showing more resiliency than investor sentiment.
- Many are talking about a bottom, and while there are definitely positives, VIX, $110 oil are standing in the way.
- Worries about the next shoe to fall after BSC slaps the pavement. Maybe the market can finally test the lows and try a bottom.

Market sells off to end the week, but it started out Friday as a tennis match.

We were up early to get a fix on just how the market was going to react to the up and down week and the Thursday reversal. Futures were down 10 points plus on S&P, not chicken feed. Then the CPI pulled off a pair of flat readings for the overall and the core, and that reversed the losses and futures were solidly higher, indeed higher than they were lower before the inflation number.

Then a story hit about the Fed authorizing BSC to go to the discount window via member bank JPM. That has not been done since the 1960's and before that in the 1930's. The story is that so many rumors were flying about BSC's solvency that no one wanted to do business with it. From solvent to teetering on bankruptcy in 48 hours. Thus the Fed action to backstop it just so it could do business. Similar to allow the primary lenders to come to the discount window, the Fed authorized BSC, a broker/dealer, to do the same. History making week for sure.

That story did not initially impact the positive reaction to futures, and indeed at the open NASDAQ was looking at a 20+ point gain and DJ30 over 50 points. They did not open that strong, however. As the Dow stocks opened, things did not improve. Indeed they started to turn south. The BSC news and the implications of what the Fed had to do weighed heavily, and within 20 minutes the market was negative and it was going negative in a big way.

The indices did not plow any new ground, but DJ30 was down over 300 points in a quick 15 minute run lower. The indices were all red and sporting 2+% losses. There was a rather quick bounce that suggested maybe the quick selloff was too much. Stocks rallied back sharply with DJ30 cutting its losses in half. Not bad. Then the sellers came back, however, and that was it. The indices resumed selling and started a long, steady decline into the last hour, surpassing the early session lows.

It was Friday, however, and a 300 point loss begs some short covering, particularly when the feds told major banks and brokerages to huddle over the weekend and fix the BSC problem. In short, there may be no BSC on Monday. The concern over potential good brought the shorts back to cover, worried that some good news might come out over the weekend. Again DJ30 and company cut the losses in half in a short but strong 40 minute surge. Even that was not immune to sellers. They came back to smack the indices around a bit before the close keeping the losses significant in the 2% range though still well off their lows. Even with a rebound the indices lost a lot of ground. Pretty tough selling.

TECHNICALLY the action was the bearish high to low as the early buyers were overrun. The late bounce was not much, just some covering ahead of the weekend and some potential good news (and of course, some potential bad news). Definitely a negative session.

INTERNALS: Not surprisingly the internals were skewed to the downside. Stronger, above average volume on NASDAQ. NYSE volume was lower, but just a hair so and still well above average on both. There was plenty of selling as financial stocks again took the brunt of the investor angst. -5:1 breadth on NYSE and -3.5:1 on NASDAQ speak for themselves. New lows did not ratchet much higher, however, on this next test lower. They didn't explode higher earlier in the week either, at least not to the extent in mid-January. A silver lining hiding in there.

CHARTS: SP500 touched down close to the prior lows, but NASDAQ and DJ30 didn't really test those levels. That doesn't mean the losses weren't significant, they just didn't have enough time before the weekend to really get ugly. That is not totally true; they sold hard early and bounced. Some are calling this action a bottom of some sort, and it may turn out that way. Each time the market tried to get there last week to make that full test and perhaps set a bottom the feds, either the Fed itself or Congress, issued a statement or held a conference about what needed to be done. The Fed upped its Taffy to $200B; selloff reversed. Barney Frank proposed the feds being the backstop for mortgages; another selloff reversed just in the nick of time, i.e. before it finally made its test. If no one comes out to save them and just let them sell maybe then we get the VIX spiking, the January lows tested, and enough capitulation to turn the market, at least for now.

LEADERSHIP: It didn't really matter where you were Friday, you got dinged a bit. Stocks tried to come back after that initial plunge lower, but they couldn't make it stick. Nonetheless, though down, energy, commodities and agriculture were still solid as they tested back but roundly held near support. There is, however, still a dearth of new leadership needed to come to the fore. A lot of these ag and commodities stocks have run for months and months and months; sure they are in a bull run, but even bull runs need to retrench from time to time. While they do that a new crop needs to show up. There are some possibilities in tech as one example, but a lot more work has to be done. Many tries at rebounds in the 2000 to 2002 selloff flared out and crashed because no leaders stepped up. And there is an old adage, when energy leads the market for any length of time, trouble tends to follow. That was underscored in red this past week as oil moved above $110/bbl (closed just under $110 Friday). That is an awful burden on the consumer and businesses, and it is only getting worse after a year of pressure already.

THE ECONOMY

CPI takes a respite, but with oil and gasoline showing declines, you have to wonder about the data.

Both the overall and core CPI were flat for February, a nice respite from the monthly increases and the 0.3% and 0.2% expected. It was the first reading below 0.3% since August 2007 and its flat reading. That lowered the annual core to 2.3% from 2.4% in January. After big gains in January, February basically offset them. Apparel fell 0.3% after rising 0.4%; transportation -0.7%. Gasoline was reported as a 2% decline.

After showing a 2% year over year gain in August, the overall rate of increase has doubled thanks to energy costs and rising food prices. We won't go into the whys and what for's; we have done that before. The question is, with prices doubling it is hard to believe that gasoline costs fell that much during the month.

Maybe they did, but that does not break the trend in higher prices a trend that is driven more by the decline in the dollar and our poor choices for use of our food supply than with any shortage of supply. Indeed, as seen Thursday, business inventories are on the rise as sales fall. No the issues for prices are poor policy decisions relating to the dollar and using food for fuel, and I don't mean fueling your body.

Thus while the pause in the overall rise in prices is welcome, it is dubious in fact and deceptive in practice. We are going to have to address the dollar and wasting our food supply in order to get prices, that were relatively nicely in control, back in control. Every time the dollar falls against other currencies our prices rise because we buy less and less with each dollar and thus the prices are raised by those controlling the products to make up for the loss.

Michigan Sentiment tops expectations but no barn burner.

Michigan sentiment for March was 70.5 and that topped the 69.5 expected. Moral victory. It did not reverse the trend as it slid in still lower than Februarys 70.8, and that was a substantial break from 78.4 the month prior. Getting to the point where it can become an issue, particularly with jobless claims rising the past two months, the jobs report falling, and those in the work pool shrinking. Worries about the paycheck are the biggest catalysts when the consumer pulls back. The sentiment reports show how worried, and while not at a panic stage they are not growing in strength.

THE MARKET

A week that saw more lop-sided put action and a crossover between the bulls and the bears with more bears than bulls. That is an unusual and important development. If we could get a volatility spike to complement them we would be looking for a serious spark higher. Then it would be up to leadership to come to the fore.

MARKET SENTIMENT

VIX: 31.16; +3.87. There was a lot of babble from the financial station journalism majors about the VIX hitting over 30. At one point in the last hour one proclaimed that if it closed above 31.09 that would be the highest close since March 2003. Oh my. Lions and tigers and bears. It hit 37.5 in August and matched that in January. While those are getting there, they are also still relatively low as far as significant bottoms go.

Sure they can set up a bounce higher from your average correction in an ongoing bull market, but when the economy moves into recession and the stock market is a bear market, it takes more than an average correction VIX. VIX needs to get into the 40's to really mean anything, and a move into the 50's is really cool.

It is trending higher over the past 8 months; no doubt about the higher and higher lows. Indeed, this move on Friday was a breakout of sorts. In short, we could see VIX explode higher into the mid-forties on another violent selloff over a couple of sessions. That would indicate a rebound though you would then have the issue of the indices exploding below the January lows and needing to bounce and then test them again. Bummer.

VXN: 32.01; +2.15
VXO: 34.14; +4.46

Put/Call Ratio (CBOE): 1.4; +0.18. Getting impressive with a 13 session streak above 1.0 and at 1.4 really blowing out the downside bets. Lots of protection being bought by the big institutions and a lot of options players betting on the downside. This part of the sentiment equation is more than enough for a bottom.

Bulls: 31.1%. Massive decline from 41.9%, one of the largest declines we have ever seen. The bulls and bears were eye to eye in mid-February. A move into the lower 40's is a decline of significance. A move to 35% is a bullish indicator. This is smashing that. For reference it bottomed in the summer 2006, the last major round of selling ahead of this 2007 top, near 36%, and 35% is considered bullish.

Bears: 43.3%. Another massive move, up from an already high 36.6%. Up sharply from a low of 19.6% on the last rally. It is over 30% and indeed over 35% the prior week, meaning it has blown past the range that means business. Big move after falling to a low of 19.6% on this round. Bearishness peaked at 37.4% in September 2007. It topped the June 2006 peak (36%) on that run. That June peak eclipsed the March 2006 high (33%) and well above the 2005 highs that spawned new rallies (30% in May 2005, 29.2% in October 2005).

NASDAQ

Stats: -51.12 points (-2.26%) to close at 2212.49
Volume: 2.555B (+10.09%). Another big volume session as the techs rallied to the 18 day EMA and rolled over. Distribution is what that is, and after an indices tries to mount a rally, distribution is not what you want to see for a rebound. Doesn't rule it out, just makes the road tougher.

Up Volume: 239.469M (-1.347B)
Down Volume: 2.271B (+1.417B)

A/D and Hi/Lo: Decliners led 3.49 to 1. Once more when the going gets tough the breadth gets ugly, much more so than the advancers on an upside session.
Previous Session: Advancers led 1.54 to 1

New Highs: 43 (-2)
New Lows: 278 (-5)

NASDAQ CHART: Click to view the chart

NASDAQ gapped higher on the reversal following the CPI data, but after just a small move over the 18 day EMA (2274) it turned over and sold off. It undercut the January low on the low (2192) then rebounded modestly to finish off the lows but in the bottom quarter of the range. NASDAQ failed at the 18 day EMA earlier in the week as it bounced from the early selling. As noted last week, this is setting up to be the fourth failure at this level since it cracked in December. It is trying its hand at putting in a bottom here but that is a very iffy proposition right now.

SOX (-3.02%) dove right back down to the bottom of the range. It did not blow out the bottom, but it put in a new closing low in the range, still rising above some of the intraday reaches to the downside. Looks as if it could break down from this consolidation attempt.

NASDAQ 100 CHART: Click to view the chart

SOX CHART: Click to view the chart

SP500/NYSE

Stats: -27.34 points (-2.08%) to close at 1288.14
NYSE Volume: 1.857B (-4.43%). Volume faded modestly but was right on par with Thursday and still well above average. As with NASDAQ, it was high on some selling. Not the end of the road; there was some good upside volume last week as well.

Up Volume: 144.884M (-982.732M)
Down Volume: 1.702B (+998.268M). Over 10 to 1 downside to upside.

A/D and Hi/Lo: Decliners led 5.25 to 1. Very strong downside once more as the financials were gutted..
Previous Session: Advancers led 1.39 to 1

New Highs: 48 (+9)
New Lows: 233 (+15)

SP500 CHART: Click to view the chart

Failed at the 18 day EMA as well in what was a very up and down week. Sold further to start things off then a big rebound on the FOMC $200B backstop. Then a stall at the 18 day EMA and the Friday selling thanks to financials. It sold hard but on the lows it still held above the January low; it has come close enough to basically say it tested, but an undercut similar to NASDAQ would be a nice touch. It is still trying to make a bottom here along with the other indices, but it is up and down on a daily basis. That is typically not the stuff of bottoms. It has fought hard to put one in, but thus far each attempt has failed.

SP600 (-2.27%), despite its loss, finished the week in decent position. It failed at the 18 day EMA as well and sold back Friday, but it is well above the January low and indeed the March low. Showing a bit more relative strength, but relative to indices at or near their January lows. Nonetheless, the way the small caps break will tell a lot of the story for the large caps simply because small caps are so economically sensitive.

SP600 CHART: Click to view the chart

DJ30

Again, a pattern more similar to SP600 than the large cap indices. Irony indeed. The blue chips found resistance at the 18 day EMA as well and faded, but it is not going down easily with a series of intraday reversals. It tried it again on Friday in the last short covering, and that is what closed it up off its -300 level. It has never threatened the January low and it is well above the March low. If the other indices fully test the January low as NASDAQ already has, then the Dow could get by without making that test though a triumvirate of indices making that test is more significant.

Stats: -194.65 points (-1.6%) to close at 11951.09
Volume: 380M shares Friday versus 336M shares Thursday. Surging volume in the financials shot Dow volume to the upside.

DJ30 CHART: Click to view the chart

MONDAY

No respite from the news. Already warnings for the Q1 earnings season are popping up as earnings season is so stretched now that it resembles the major league baseball and NBA seasons. The economic news ticker continues with regional manufacturing, production, housing starts, PPI, leading indicators, and the next rendition of Fed policy.

As for the Fed it will be most interesting to see which way it heads. Fed funds futures have priced over a 50% probability of a 75BP rate cut. Ouch. That won't do much good for the dollar or anything else. The other train of thought involves the Fed weaning the market from rate cuts, pulling back to 'just' 50 BP and saying something to the effect it is going to utilize more of the tools it announced last Tuesday.

Either way there is no good to come of it near term, and I do not envy the Fed and the mess it is trying to clean up. The best choice to us is the latter, but the Fed is in a no-win situation. It has cut rates enough to do the job; indeed commodities, gold and just about everything else says inflation is going to be a problem. The real disappointing issue for the Fed is that the feds didn't provide the right kind of supply side incentives to jumpstart the economy to help soak up the excess money. With gasoline at $3.24/gallon average and heading to $4 and jobless claims rising, do you think the people receiving the money are going to rush out and spend it or do what they did last time, i.e. spend some where necessary and save the rest? They have to pay for gas, and that is where a lot of it will go, and that does not add to the economy.

Now the weekend may bring about a deal in the financial sector that again instills some positives to start the week. Sadly there may not be a Bear Stearns as a result. That likely won't change the game at this point. There is still the FOMC decision, and while the Fed will stay very accommodative it also may have to start curtailing expectations of rate cut after rate cut. Again, if it had help from the other side it could be more effective in crafting a statement that says it can slow the rate of cutting as the problems are being attacked from both sides. Pipe dream. That is not the case.

So that leaves us with harsh reality. Weakening economic data, the Fed still having to cut and debase the dollar and thus push prices for energy and everything else higher. The indices are gamely hanging in, thus far holding above the January lows. Regardless of the weekend news, however, unless it is extraordinary, we believe there will be a test of those lows by SP500 and DJ30, and whether they pass the test is problematical.

The lack of new developing leadership is a concern, though even that is holding out some possibilities as transport stocks improve, and they are hardly stocks that perform well in an oncoming major recession. Thus we continue looking at developing patterns, ready to move in if they show solid breaks upside. There are also many current leaders that were touched by some selling to end the week but remain in excellent shape above near support. We are looking at those as good areas to focus money as they are already showing their strength.

As for the downside, we took some positions last week as the market waffled on its rebound, and at this stage it is hard to initiate more for the indices. There are still stocks, however, that are in position to fall rapidly in the event the market makes another dive lower to test the January lows. The downside game is typically faster, and thus we can still take advantage of some downside that is in position to fall when the market decides it is going ahead and making that test.

Support and Resistance

NASDAQ: Closed at 2212.49
Resistance:
2216 from August 2005 peak
2221 is March low
The 10 day EMA at 2246
2252 is the early February low
The 18 day EMA at 2273
2282 is the trendline from the summer 2004/July 2006 lows, Q4 2005 consolidation
2340 from the March 2007 low
The 50 day EMA at 2353
2370 from the April 2006 peak
2378 is the mid-February peak
2379 from the October 2006 peak
2386 is the August intraday low
2419 is the January 2008 peak
2451 is the August closing low
Some modest resistance at 2500 from interim August lows.

Support:
2202 is the January intraday low
2175 from the December 2004 peak
2168 is the March 2008 low
2158 from May 2006
2164 From August 2006
2134 from August, September 2006
2100 from June 2006

S&P 500: Closed at 1288.14
Resistance:
1294 from the January 2006 peak
1305 to 1302 from an August 2006 peak and matches a range of support from March and April 2006.
1317 is the early February low
The 10 day EMA at 1312
1320 is an ancient trendline
The 18 day EMA at 1324
1325 from May 2006 peak prior to the summer 2006 correction
The 50 day EMA at 1359
1368 is the high in this recent lateral consolidation
1370 is the August 2007 intraday low
1374 is the March 2007 closing low
1396 is the January 2008 peak
1406 is the August and November 2007 closing low
1417 is a longer term trendline from the August 2003/September 2004 lows

Support:
1288 from June 2006
1280 from June and August 2006
1272.66 is the March 2008 low
1270 is the January intraday low
1260 from July 2006
1258 to 1255 from May and June 2006 lows

Dow: Closed at 11,951.09
Resistance:
12,050 from the March 2007
12,070 from the early February 2008 lows
The 10 day EMA at 12,106
The 18 day EMA at 12,190
The 50 day EMA at 12,448
12,250 from late March 2007 lows is stretching
12,518 is the August intraday low
12,573 is the mid-February high
12,743 is the November low
12,768 is the February 2008 peak
12,786 is the February 2007 peak
12,845 is the August closing low

Support:
11,731 is the March 2008 low
11,670 is the May 2006 intraday high; 11,642 closing
11,634 is the January intraday low
11,317 is the March 2006 peak
11,228 from a July 2006 peak

Economic Calendar

These are consensus expectations. Our expectations will vary and are discussed in the 'Economy' section.

March 17
- New York Empire Index, March (8:30): -5.0 expected, -11.7 prior
- Net Foreign Purchases, January (9:00): $56.5B
- Industrial production, February (9:15): -0.1% expected, 0.1% prior
- Capacity utilization, February (9:15): 81.3% expected, 81.5% prior

March 18
- Housing starts, February (8:30): 995K expected, 1.012M prior
- Building permits, February (8:30): 1.02M expected, 1.06M prior
- PPI, February (8:30): 0.3% expected, 1.0% prior
- Core PPI (8:30): 0.2% expected, 0.4% prior
- FOMC policy statement (2:15)

March 19
- Crude oil inventories (10:30): 6.177M prior

March 20
- Initial jobless claims (8:30): 353K prior
- Leading economic indicators, February (10:00): -0.3% expected, -0.1% prior
- Philly Fed, March (12:00): -18.0 expected, -24.0 prior

icon url

ReturntoSender

03/16/08 8:20 PM

#7962 RE: ReturntoSender #6755

US Indexes ETF's Continued:

IWD SJF IWM UWM RWM TWM IWO SKK IWN SJH IWV IWZ IWC IWR IWP SDK IWS SJL VTI VUG VTV VV VO VB VBK VBR PWB PWJ DVY RSP


icon url

ReturntoSender

03/18/08 10:25 PM

#7969 RE: ReturntoSender #6755

From Briefing.com: 4:30 pm : What a difference a day makes.

On Monday the market was rattled by the news that Bear Stearns (BSC 5.91, +1.10) agreed to be acquired for $2 per share and the fear that other financial firms might face similar solvency issues that precipitated that fire sale.

On Tuesday those fears were cast aside following better than expected earnings reports from Goldman Sachs (GS 175.59, +24.57) and Lehman Bros. (LEH 46.49, +14.74) that produced reassurances from both firms regarding their liquidity position. The ensuing response led to a massive rally in the financial sector, which gained 8.5% on the day - its largest gain since March 2000 - and led all sectors in the broader market.

The broad-based nature of Tuesday's rally led to gains for all ten economic sectors, the lowest of which was a 1.8% jump in the defensive-oriented utilities sector. That is respectable in its own right, but it qualified as an underperformance in Tuesday's market where the S&P 500 advanced 4.2% - its biggest one-day percentage move since October 2002.

Aside from the aforementioned earnings reports, the FOMC decision served as the other major trading catalyst. The committee ultimately approved a 75 basis point cut in both the fed funds rate and the discount rate to 2.25% and 2.50%, respectively. It should be noted, however, that the vote on the fed funds rate carried dissents from Dallas Fed President Fisher and Philadelphia Fed President Plosser who were in favor of less aggressive action.

The major indices backpedalled some in the wake of the decision as many participants were expecting a cut of 100 basis points. The disappointment soon faded, though, and stocks were quick to regain their winning form.

Notably, the FOMC acknowledged that uncertainty about the inflation outlook has increased, yet it still holds the belief that inflation will moderate in coming quarters. In turn, it left the door open for more rate cuts, saying downside risks to growth remain and that it will act in a timely manner as needed to promote economic growth and price stability.

The bulk of today's gains, however, were achieved ahead of the FOMC decision. To wit, the Dow was up approximately 300 points just minutes ahead of the FOMC decision at 2:15 p.m. ET.

Joining the financial shares in a leadership position were the homebuilding stocks. They got a lift from a better than expected Housing Starts report for February and a measure of hope that conditions may be starting to ripen for improved housing demand with the Fed's actions and reports that the regulator for Fannie Mae (FNM 28.22, +6.01) and Freddie Mac (FRE 26.02, +5.40) may soon ease its excess capital requirement for the government sponsored enterprises in a bid to improve liquidity in the secondary mortgage market.

The Producer Price Index was the other economic release today. It carried mixed news with total PPI up 0.3% (consensus +0.4%) and core-PPI, which excludes food and energy, up 0.5% (consensus +0.2%). The market managed to look past the core-PPI number, however, since it followed a tamer reading on core inflation in the consumer price index.

Separately, the equity market rally sucked some life out of the Treasury market as the 10-year note fell more than a point, driving its yield up to 3.46%. The commodity-driven CRB Index jumped 1.9% while the dollar index increased 0.2% in response to the smaller than expected interest rate cut.DJ30 +420.41 NASDAQ +91.25 NQ100 +4.4% R2K +4.8% SP400 +4.0% SP500 +54.14 NASDAQ Dec/Adv/Vol 690/2296/2.40 bln NYSE Dec/Adv/Vol 341/2863/1.95 bln

4:10PM Adobe Systems beats by $0.03, beats on revs; guides Q2 EPS above consensus, revs in-line; reaffirms FY08 EPS guidance (ADBE) 31.88 +1.09 : Reports Q1 (Feb) earnings of $0.48 per share, excluding non-recurring items, $0.03 better than the First Call consensus of $0.45; revenues rose 37.1% year/year to $890.4 mln vs the $875.8 mln consensus. Co issues mixed guidance for Q2, sees EPS of $0.45-0.47 vs. $0.44 consensus; sees Q2 revs of $855-885 mln vs. $874.69 mln consensus. Co reaffirms guidance for FY08, sees EPS of $1.86-1.92 vs. $1.82 consensus. Co reaffirms FY08 rev growth of ~13%

9:01AM Tegal receives 6540 Plasma Etch System order from the Pennsylvania state university (TGAL) 4.75 : Co announces that it has received an order for a Tegal 6540 plasma etch tool from the Pennsylvania State University. The Tegal 6540 system will be installed in the Penn State Nanofabrication Laboratory, a National Science Foundation National Nanotechnology Infrastructure Network site, where the plasma etch tool will be used to perform research on complex oxide materials. Lead zirconate titanate, which is one of several complex oxide materials being studied at Penn State, is a piezoelectric material useful for fabricating MEMS devices such as wireless communication switches in next-generation cell phone handsets, and medical ultrasound transducers for diagnostic imaging.

6:06AM MIPS Technologies appoints Maury Austin as Chief Financial Officer (MIPS) 3.10 :

09:29 am Applied Materials: Caris & Company upgrades Average to Buy. Target $21 to $27. Caris upgrades AMAT to Buy from Average and raises their tgt $27 from $21. The firm expects the co to announce positive developments for their solar efforts over the next several quarters. They think the announcements will be focused on the growing opportunity in the thin film solar area and will be the primary catalyst for the stock.
icon url

ReturntoSender

03/22/08 4:08 PM

#7975 RE: ReturntoSender #6755

Amateur Investors Weekend Stock Market Analysis (3/22/08)

http://www.amateur-investor.net/Weekend_Market_Analysis_Mar_22_08.htm

As expected it was a very volatile week due to the Federal Reserve Meeting and some key earnings reports from a few big Financial Institutions. Despite all of the volatility the major averages appear to be developing favorable Double Bottom patterns.

The Dow didn't quite retest its January 23rd low but it got close. If the Dow can follow through to the upside over the next few weeks I still think it has a shot to rise up to its 40 Week EMA (blue line) near 12800 or its 50% Retracement Level near 12900.


The Nasdaq also appears to be developing a Double Bottom pattern as well however there is a key resistance level to watch next week near 2320 (point A) which coincides with its 10 Day EMA (green line) and 23.6% Retracement Level. If the Nasdaq can rise above this resistance level then look for a possible move up to its 38.2% Retracement level near 2420 (point B) over the next few weeks.


As far as the S&P 500 it retested its January 23rd low on Monday and then rallied strongly on Tuesday setting up a potential Double Bottom pattern. The S&P 500 encountered resistance on Thursday at its 10 Week EMA near 1342. If the S&P 500 can rise above its 10 Week EMA then it may rally up to either its 38.2% Retracement Level at 1380 (point C) or to the 1420 level (point D) which coincides with its 40 Week EMA (blue line) and 50% Retracement Level.


One thing that gives me some optimism that at least a short term bottom is in place is the fact that the Slow Stochastic made a higher low (points E) as the S&P 500 made a lower low last week. In the past this type of of divergent pattern usually has been followed by a decent upward move in the following couple of weeks.


icon url

ReturntoSender

03/25/08 3:03 PM

#7978 RE: ReturntoSender #6755

Institutional investors have been using puts as a hedge coupled against long investments in increasing numbers. This is a big change versus the bottom in 2002. This chart will continue to be updated each day:


Headline Charts has finally gone bullish on the markets. This despite their contention that ECRI has finally thrown in the towel and admitted we have a recession to deal with.

http://headlinecharts.blog.com/

Yesterday the markets rallied so hard on top of lasts week's rally that two out of three volatility were more than 10% below the 10 day sma's.

http://siliconinvestor.advfn.com/readmsg.aspx?msgid=24316610&srchtxt=volatility%20trading%20system

A return to the norm suggests that there will be some profit taking even though I continue to believe that this bottom will be a lasting one.

http://www.internetnews.com/bus-news/article.php/3736306/Technical+Analysis+Bulls+Back+in+Charge.htm

RtS
icon url

ReturntoSender

03/30/08 12:54 PM

#7987 RE: ReturntoSender #6755

The 60 day sma on the put to call average versus the SOX. It currently is at its highest level in years. Perhaps EVER!


icon url

ReturntoSender

03/31/08 8:55 AM

#7988 RE: ReturntoSender #6755

SIA: Feb. Global Semiconductor Sales Up
Monday March 31, 7:42 am ET

http://biz.yahoo.com/ap/080331/sia_chip_sales.html?.v=1

Industry Group Says Worldwide Chip Sales Rose 1.5 Percent in February

SAN JOSE, Calif. (AP) -- Global semiconductor sales rose 1.5 percent year-over-year in February, with growing demand for electronics outside the U.S., the Semiconductor Industry Association (SIA) said Monday.

The industry group said sales totaled $20.44 billion during the month, compared with $20.14 billion in February 2007.

Global chip sales fell 4.9 percent from January -- when sales totaled $21.48 billion, SIA said.

SIA said the sequential drop followed the industry's normal seasonal patterns.

SIA President George Scalise said in a statement that ongoing price declines in DRAM chips -- or dynamic random access memory, which is the most common type of memory chip used in personal computers -- masked underlying strength in global chip sales. Average selling prices for DRAM chips fell almost 60 percent year-over-year.

Scalise also said, excluding memory products, chip sales rose almost 10 percent year-over-year in February, and shipments for all semiconductor products rose 11.6 percent from a year ago.
icon url

ReturntoSender

03/31/08 10:56 AM

#7989 RE: ReturntoSender #6755

New Solar ETFs: Here Come the Suns
Monday March 31, 2:25 am ET
By Hard Assets Investor

http://biz.yahoo.com/seekingalpha/080331/70451_id.html?.v=1

Hard Assets Investor submits: With the tremendous interest in all things "green" and "clean," it was just a matter of time before ETF and index companies would start to carve out thinner slices of the clean tech universe. In fact, there are two ETFs in registration that target a fast-growing segment of the clean tech market: solar energy.

This month, Claymore and Van Eck registered solar energy ETFs. Claymore's Global Solar Energy ETF will track an index developed by Chicago-based Melvin & Company. The index will be composed of approximately 25 stocks selected "based on the relative importance of solar power within the company's business model." The stocks in the index are involved in some aspect of the solar power business, from gathering raw materials to manufacturing equipment to selling solar energy. Components will be weighted based in part on the importance of solar energy to their business model, so that pure-play companies get more weight than conglomerates that dabble in solar energy.

Van Eck's Market Vectors-Solar Energy ETF will track the Ardour Solar Energy Index. Expected to launch in April 2008, the ETF will contain approximately 25 stocks, selected depending on the companies' revenues, liquidity and market cap. The list of companies isn't available, but the roughly 25 stocks will be taken from Ardour's Global Composite Index, an alternative energy index comprised of 118 stocks. Both ETFs will likely have familiar names, such as major solar energy companies like First Solar (Nasdaq: FSLR), Sun Power (Nasdaq: SPWR), Evergreen Solar (Nasdaq: ESLR) and LDK Solar (NYSE: LDK).

Van Eck and Claymore are counting on solar to generate strong investor interest in the coming years, and for good reason. There seems little doubt that the solar-power industry has a "sunny" future. In January's Scientific American, "A Solar Grand Plan" proposes a way for the U.S. to generate 69% of its electricity and 35% of its total energy from solar power by 2050. Noted technologist and inventor Ray Kurzweil is even more bullish, forecasting that solar will meet 100% of our energy needs in 20 years. Solar currently generates far less than 1% of our energy needs.

Investor interest in solar is strong. Venture capital investment in the industry grew from $150 million in 2005 to more than $1 billion in 2007, according to Greentech Media Research. More money may also come from the government. A bill currently before the Senate could shift about $18 billion of subsidies for oil companies into wind and solar energy. The bill, approved by the House of Representatives, would extend the 30 percent investment tax credit for solar projects.

That's the bullish case. The near-term outlook is a bit cloudier for solar companies. Industry fundamentals are increasingly difficult. At issue is the worldwide shortage of polysilicon, a vital ingredient in photovoltaic cells, which has hounded the industry by pushing spot prices of the material sky high. A turning point will come when capacity exceeds demand, as polysilicon makers have been ramping up production. In a recent report, Citigroup says that could happen as early as the second half of 2009: Citigroup analysts expect the industry to be 33 percent oversupplied in 2010. Another dark cloud for solar is slowing demand in Spain and Germany, both considered key markets because of government incentives that have sped solar development.

With ETF companies now introducing solar funds, fund investors are wondering if there is really any "there there." Are solar companies actually making money? The stock market is certainly signaling that the industry got ahead of itself. After a stellar 2007, solar stocks have recently taken it on the chin. SunPower is down 49 percent in 2008, Evergreen Solar 55 percent, and Solarfun 65 percent.

Amidst the carnage in solar stocks, there are companies with real live revenues, such as China's Suntech Power Holdings (NYSE: STP - News). The company's problem is that it's not generating enough revenue to satisfy Wall Street expectations. Analysts expected revenue of $455 million next quarter, but Suntech projected sales to be only between $370 million and $380 million. Suntech is expected to pass Japan's Sharp Corp. this year to become the world's largest maker of solar cells. With polysilicon prices on the rise, Suntech is focusing on preserving its bottom line rather than on expanding production. The company has shifted more production to the second half of the year in hopes that prices for polysilicon will fall.

Given the bottleneck in polysilicon supply, another company to watch is MEMC Electronic Materials , a leading supplier of silicon wafers to the solar and semiconductor industries. As one of the few companies that make silicon wafers, MEMC has actually benefited from the silicon shortage. MEMC generated over $1.9 billion in revenues in 2007.

As further proof of the viability of solar's business model, there are big tech companies that have offer exposure to solar, such as Applied Materials (NasdaqGS: AMAT - News). The company recently announced that it had signed a $1.9 billion deal to supply and install equipment for "multiple solar factories" for a private company based outside of the United States.

Notwithstanding the recent pullback in stock prices, solar does indeed have a sunny future. Solar is still very early in its growth stage, and solar companies, particularly the producers of solar silicon and integrated modules, will experience more volatility as they navigate roadblocks such as supply constraints and market demand. Most of today's existing solar technologies are becoming more efficient and more affordable, and emerging technologies and manufacturing methods promise to keep the sector going strong. Even though solar stocks have taken a serious hit, that isn't a sufficient reason to sour on the long-term potential of the sector. The Van Eck and Claymore ETFs are certainly coming at an opportune time.
icon url

ReturntoSender

04/04/08 12:54 PM

#7994 RE: ReturntoSender #6755

COTD - Chart of the Day - 4/4/08

http://www.chartoftheday.com:80/20080404.htm?T

Is the stock market performing well? It all depends on how you measure. When measured in US dollars, the Dow currently trades approximately 11% off its all-time record highs. However, when measured with that other world currency (gold), the picture is more bleak. To help illustrate the point, today's chart presents the Dow divided by the price of one ounce of gold. This results in what is referred to as the Dow / gold ratio or the cost of the Dow in ounces of gold. For example, it currently takes 14 ounces of gold to “buy the Dow.” This is considerably less that the 44.8 ounces back in the year 1999. When priced in gold, the 21st century US stock market remains in one big bear market.


icon url

ReturntoSender

04/05/08 7:20 PM

#7996 RE: ReturntoSender #6755

Amateur Investors Weekend Stock Market Analysis (4/5/08)

http://www.amateur-investor.net/Weekend_Market_Analysis_April_5_08.htm

One thing I haven’t talked about recently has been the inverse relationship between the price of Crude Oil and the Dow over the past few years. As we have seen when the price of Crude Oil has risen significantly (points B to A) the Dow has gone through a correction (points C to D) and when the price of Crude Oil has gone through a correction (points A to B) the Dow has rallied (points D to C). If the market is going to continue to move higher over the next several weeks the price of Crude Oil will either having to trade nearly sideways or go through a significant correction. Meanwhile if the price of Crude Oil were to make another significant move higher above the $110 level then that could put an abrupt end to this current rally that began with the lows on March 17th.


As far as the major averages if the Dow continues to follow through to the upside its first area of potential resistance would be at its 40 Week EMA (green line) near 12800. If the Dow can rise above its 40 Week EMA then expect a rise back to either its 50% Retracement Level (calculated from the October high to the March low) near 12900 (point E) or its 61.8% Retracement Level around 13200 (point F). Meanwhile support should occur at or above the Dow’s 10 Week EMA (blue line) which is currently nearing the 12400 level if it goes through a pullback.


The Nasdaq is still exhibiting a Double Bottom pattern and if it continues to follow through to the upside over the next few weeks look for potential resistance either at its 38.2% Retracement Level near 2425 (point G) or at its 40 Week EMA (green line) near 2450. Meanwhile support should occur at or above the Nasdaq’s 10 Week EMA (blue line) which is around 2320 if it goes through a pullback.


As far as the S&P 500 it's also exhibiting a Double Bottom pattern and encountered some resistance on Friday at its 38.2% Retracement Level near 1380 (calculated from the October high to the March low). If the S&P 500 continues to rally look for its next area of resistance in the 1415 to 1420 range which corresponds to its 40 Week EMA (green line) and 50% Retracement Level (point H). Meanwhile support in the S&P 500 should be at or above its 10 Week EMA (blue line) which is around 1345 if it goes through a pullback phase.


As talked about in the beginning the key thing to watch in the weeks ahead is the price of Crude Oil as any significant move lower or higher will likely have a substantial impact on the major averages going forward.


icon url

ReturntoSender

04/17/08 10:52 PM

#8015 RE: ReturntoSender #6755

From Briefing.com: 5:02PM Virage Logic appoints Dr. Alex Shubat to newly created position of Chief Operating Officer (VIRL) 5.43 -0.03 :

4:26PM Advanced Micro reports EPS in-line, revs in-line with guidance; expects Q2 revenue to decrease in line with seasonality (AMD) 6.19 +0.12 : Reports Q1 (Mar) loss of $0.51 per share, in-line with the First Call consensus of ($0.51); revenues rose 22.1% year/year to $1.5 bln, in line with 4/7 guidance for $1.5 bln. AMD expects Q2 revenue to decrease in line with seasonality. As previously disclosed, AMD expects to record a restructuring charge in Q2 of 2008. "A seasonally weak first quarter was amplified by a challenging economic environment for consumers and lower than expected revenues of previous generation products, resulting in lower than expected revenues in all business segments. However, we are encouraged by the market acceptance of our Quad-Core AMD Opteron server processors as well as our new chipset and graphics offerings... We remain committed to achieve operating profitability in the second half of the year, driven by our portfolio of new products and platforms and aggressive restructuring programs."

4:17PM SanDisk misses by $0.05, beats on revs (SNDK) 25.90 -0.80 : Reports Q1 (Mar) earnings of $0.21 per share, $0.05 worse than the First Call consensus of $0.26; revenues rose 8.1% year/year to $850 mln vs the $810.9 mln consensus. Q1 non-GAAP product gross margins 20.9% compared to 18.5% in the prior-year period and 29.7% in Q4. "Product sales were solid on the strength of our international business, Sansa MP3 players and sales to the mobile handset and GPS markets. Pricing was challenging throughout the quarter due to industry-wide excess supply which adversely impacted our product gross margin... We expect demand to increase seasonally during the second quarter and price declines to moderate; however, product margins are expected to continue to be under pressure in Q2 with the anticipated benefit of low cost 43-nanometer and 3-bits per cell coming in the second half of the year. We are focused on cost controls and expense reductions and we continue to believe that the cumulative impact of price declines in recent quarters will accelerate the creation of new markets for Flash storage."

4:10PM PMC-Sierra beats by $0.03, beats on revs (PMCS) 6.37 -0.09 : Reports Q1 (Mar) earnings of $0.11 per share, excluding non-recurring items, $0.03 better than the First Call consensus of $0.08; revenues rose 20.6% year/year and up 1.2% sequentially to $125.0 mln vs the $123.1 mln consensus. Co says that in Q1 it experienced strong demand for its fiber to the home, enterprise storage, and laser printer products. The overall business environment has improved in Asia, and co says it is gaining market share in a number of key target markets.

4:20 pm : Stocks were challenged Thursday to extend the prior day's surge. The indices spent the majority of the session modestly lower until making a late day push to higher ground, but the stock market settled at the unchanged level.

Investor sentiment was initially bolstered by a solid first quarter report from bellwether IBM (IBM 123.08, +2.61). IBM announced after yesterday's close better than expected earnings results and increased its full-year earnings outlook above the consensus forecast.

However, disappointing announcements from investment bank Merrill Lynch (MER 46.71, +1.82) and pharmaceutical company Pfizer (PFE 20.40, -0.70) led to pessimism among investors. Merrill, for its part, announced a loss of $2.20 per share, which fell $0.21 short of the consensus earnings estimate. The firm also announced asset backed security write-downs of $1.5 billion and an additional $3.0 billion in write-downs related to financial guarantees. As for Pfizer, the company reported first quarter earnings of $0.61 per share, which was a nickel short of the consensus estimate.

Despite the announcement from Merrill, brokers and investment banks (+3.0%) were able to advance markedly on the session. Citigroup (C 24.03, +0.59) also climbed after announcing it will sell CitiCapital, its North American commercial lending and leasing business, to General Electric's (GE 32.02, -0.21) GE Capital. Overall, financials (+1.4%) outperformed the other major economic sectors.

Jobless claims for the week ending April 12 totaled 372,000. On average, economists had expected jobless claims to total 375,000. Claims were up from the prior week's revised reading of 355,000 jobless claims.

In other economic news, Philadelphia's regional manufacturing index, the Philadelphia Fed Survey, came in at -24.9, that was worse than the expected reading of -15.0 and down from the prior month's reading of -17.4.

The Conference Board's leading economic indicators report for the month of March posted a 0.1% increase, which matched economists expectations. The previous reading indicated a decline of 0.3%.

Though crude oil finished the session at $114.78 per barrel, near the unchanged mark, it recorded a new intraday high of $115.54 per barrel earlier in the session.DJ30 +1.22 NASDAQ -8.28 NQ100 -0.3% R2K -0.8% SP400 -0.4% SP500 +0.85 NASDAQ Dec/Adv/Vol 1748/1107/1.82 bln NYSE Dec/Adv/Vol 1548/1583/1.23 bln

11:54AM Cypress Semi guides Q2 EPS in-line, revs above consensus (CY) 29.52 +1.46 : Co issues mixed guidance for Q2 (Jun), sees EPS of $0.20-0.24 vs. $0.22 First Call consensus; sees Q2 (Jun) revs of $526-552 mln vs. $477.14 mln consensus.

7:34AM Cypress Semi misses by $0.02, beats on revs (CY) 28.06 : Reports Q1 (Mar) earnings of $0.12 per share, excluding non-recurring items, $0.02 worse than the First Call consensus of $0.14; revenues rose 25.8% year/year to $431.2 mln vs the $412 mln consensus. Co reports Q1 non-GAAP gross margins 34.2% vs 34.3% Street expectation... Note- CY reported in their release that revenues were helped by a record quarter from SPWR (CY owns approx 75% of SPWR). The higher revenue mix was also a primary reason for the lower gross margins as SPWR margins generally run around 24-25%.

9:07AM Photon Dynamics raises Q2 revs above consensus, raises Q2 EPS (PHTN) 10.26 : Co raises Q2 revs to $42-45 mln vs $37.4 mln consensus, up from prior $36-38 mln. Co raises Q2 GAAP EPS to greater than $0.12, may not be comparable to $0.00 consensus, up from prior ($0.11)-(0.05). Co says, "We have received accelerated acceptance on several new systems with ParagonAVIOS that were shipped in the March quarter. The acceleration of acceptance reflects not only the continued strength in the flat panel display business environment but also the growing traction of our strategic initiative of enhancing our competitiveness."

8:07AM Sunpower beats by $0.04, beats on revs; guides Q2 EPS above consensus, revs above consensus; guides FY08 EPS above consensus, revs above consensus (SPWR) : Reports Q1 (Mar) earnings of $0.39 per share, $0.04 better than the First Call consensus of $0.35; revenues rose 92.6% year/year to $274 mln vs the $245.2 mln consensus. Gross margins were 24.0%, within co's guidance of 24-25% but down from 25.3% in prior quarter due to product mix. Co issues upside guidance for Q2, sees EPS of $0.48-0.52 vs. $0.46 consensus; sees Q2 revs of $330-350 mln vs. $295.13 mln consensus. Co issues upside guidance for FY08, sees EPS of $2.10-2.20 vs. $2.07 consensus; sees FY08 revs of $1.3-1.375 bln vs. $1.27 bln consensus.

8:01AM Dell announces plans to sell laptop and desktop computers in Suning stores in China (DELL) 18.72 : Co announces plans today to sell laptop and desktop computers in Suning stores and to expand its relationship with Gome, the consumer electronics retailer in China. Additionally, Dell will sell systems in Hontu stores and through several PC chain retailers including Wuxing, Meicheng, Heng Chang and Heyong stores, making many of Dell's products accessible in China's major urban areas.

7:36AM Fairchild Semi misses by $0.01, misses on revs; guides Q2 revs in-line (FCS) 14.00 : Reports Q1 (Mar) earnings of $0.19 per share, $0.01 worse than the First Call consensus of $0.20; revenues rose 0.9% year/year to $406.3 mln vs the $412.6 mln consensus. Co sees Q2 revs flat to +3%, or roughly $406.3-418.5 mln vs. $415.87 mln consensus. "At the start of the quarter, we had about 89 percent of this sales guidance booked and scheduled to ship. We expect gross margin to be down 75 to 125 basis points sequentially due to the delayed impact of lower factory starts in the first quarter. We expect R&D and SG&A expenses to be approximately $89 to $91 million and net interest and other expenses to be about $5.5 million for the second quarter."

6:10AM Nokia beats by Euro 0.02; reaffirms 2008 industry mobile device growth expectation (NOK) 33.69 : Reports Q1 (Mar) earnings of Euro 0.38 per share, excluding non-recurring items, Euro 0.02 better than the First Call consensus of Euro 0.36; revenues rose 28.4% year/year to Euro 12.66 bln vs the Euro 12.66 bln consensus. Nokia reported device volumes of 115.5 mln vs 115.6 mln street expectation. Co said that it expects industry mobile device volumes in the second quarter 2008 to be up slightly sequentially, similar to the market growth in the second quarter 2007, compared to the first quarter 2007. Co reaffirms its expectation that industry mobile device volumes in 2008 to grow approximately 10% from the approximately 1.14 billion units Nokia estimates for 2007. Nokia expects the mobile device market to decline in value in Euro terms in 2008, compared to 2007. Nokia continues to expect some decline in industry ASPs in 2008. Co continues to target an increase in its market share in mobile devices in 2008.

09:21 am Nokia (NOK)

Shares of mobile phone manufacturer Nokia (NOK 33.69) are getting pummeled in premarket trading, as a disappointing outlook is overshadowing the company's better than expected earnings results.

The Finland-based company reported first quarter earnings rose 15% to 0.38 euro per share, excluding non-recurring items. This is 0.02 euro better than the consensus estimate. Revenues rose 28% year-over-year to 12.66 billion euro, which matched expectations.

Nokia reported device volumes of 115.5 million, which was basically in-line with expectations. The company reaffirmed its expectation that industry mobile device volumes in 2008 will grow approximately 10% from the 2007 level of approximately 1.14 billion units.

However, Nokia expects the mobile device market to decline in value in euro terms in 2008. The firm cited a negative impact from the weakened U.S. dollar, the economic slowdown in the U.S., and some economic slowdown in Europe.

This negative view has its shares trading down nearly 12% ahead of the opening bell. At yesterday's closing price, the firm's shares had already fallen 20% from their 52-week high.

08:12 am IBM (IBM)

IBM's (IBM 120.47) first quarter profit soared thanks to the firm's large global presence and the weak dollar. Big Blue also increased its 2008 outlook.

Total revenue increased 11% to $24.5 billion and net income surged 36% to $1.65 per share. This handily topped the consensus estimate of $23.7 billion in revenue and earnings of $1.45 per share.

The firm benefited from a strong increase in global sales, which now accounts for 65% of revenue. Revenue grew by 16% in Europe/Middle East/Africa and by 14% in Asia-Pacific. By comparison, revenue increased by 6% in the U.S.

However, much of the overseas gains were fueled by the weak dollar, which makes the 6% gain in U.S. revenue more impressive given the weakening U.S. economy. When taking out the favorable currency adjustments revenues rose 4% in Europe/Middle East/Africa, 3% in Asia-Pacific and 11% in growth markets.

In terms of business segments, growth was the strongest in services with a 17% rise (9% adjusted for currency). Software rose 14% (6% adjusted for currency). Continuing its negative trend, revenue in the Systems and Technology segment fell 7% (-14% adjusted for currency).

IBM expects to earn at least $8.50 per share in 2008, which tops the consensus estimate of $8.25. The firm does not expect any negative impact from the economic conditions, and will remain conservative on its balance sheet. IBM reiterated its plan to buyback $12 billion in stock in 2008. CEO Samuel J. Palmisano summed it up by saying, "we feel good about the rest of the year."

IBM's results are good example of what Briefing.com has been arguing -- a weak dollar increases profits for multinational companies.
icon url

ReturntoSender

04/22/08 11:31 PM

#8022 RE: ReturntoSender #6755

From Briefing.com: 6:37PM Teradyne beats by $0.01, reports revs in-line; guides Q2 EPS in-line, revs above consensus (TER) 12.28 -0.30 : Reports Q1 (Mar) earnings of $0.12 per share, excluding non-recurring items, $0.01 better than the First Call consensus of $0.11; revenues rose 14.2% year/year to $297.3 mln vs the $295.6 mln consensus. Co issues guidance for Q2, sees EPS of $0.14-0.19, excluding non-recurring items, vs. $0.14 consensus; sees Q2 revs of $310-330 mln vs. $301.58 mln consensus.

5:00PM Rambus announces IBM to license multi-protocol SerDes (RMBS) 23.19 +0.65 : Co announces that IBM has licensed RMBS' multi-protocol SerDes (Serial/Deserializer) cell designed for advanced networking, server and general ASIC applications. This sophisticated multi-protocol SerDes cell provides IBM with a high-performance and low-power solution for implementation on its 45nm silicon-on-insulator technology. The RMBS multi-protocol SerDes is a single IP cell leveraging a scalable architecture that offers data rates of 1.25 Gbps to 6.4 Gbps.

4:42PM Silicon Image beats by $0.02, beats on revs; guides Q2 revs in-line; guides FY08 revs in-line (SIMG) 5.15 -0.09 : Reports Q1 (Mar) earnings of $0.04 per share, excluding non-recurring items, $0.02 better than the First Call consensus of $0.02; revenues fell 21.3% year/year to $67.1 mln vs the $61.9 mln consensus. Co issues in-line guidance for Q2, sees Q2 revs of $66-68 vs. $66.84 mln consensus. Co issues in-line guidance for FY08, sees FY08 revs of $270-290 mln vs. $276.69 mln consensus.

4:36PM Skyworks beats by $0.01, beats on revs; guides Q3 EPS above consensus, revs above consensus (SWKS) 7.37 +0.06 : Reports Q2 (Mar) earnings of $0.16 per share, $0.01 better than the First Call consensus of $0.15; revenues rose 11.9% year/year to $201.7 mln vs the $199.5 mln consensus. Co issues upside guidance for Q3, sees EPS of $0.17 vs. $0.16 consensus; sees Q3 revs of $210 vs. $207.53 mln consensus.

4:21PM Cree beats by $0.03, beats on revs; guides Q4 EPS in-line, revs in-line (CREE) 31.06 -0.71 : Reports Q3 (Mar) earnings of $0.14 per share, excluding non-recurring items, $0.03 better than the First Call consensus of $0.11; revenues rose 38.4% year/year to $125 mln vs the $122.2 mln consensus. Co issues in-line guidance for Q4, sees EPS of $0.12-0.14 vs. $0.13 consensus; sees Q4 revs of $129-133 vs. $128.26 mln consensus. "Targeted non-GAAP earnings exclude expenses related to the amortization of acquired intangibles of $3.6 million, net of tax, and stock-based compensation expense of $3.6 million, net of tax."

4:14PM Anadigics beats by $0.05, beats on revs; guides Q2 EPS above consensus, revs above consensus (ANAD) 8.33 -0.17 : Reports Q1 (Mar) earnings of $0.15 per share, $0.05 better than the First Call consensus of $0.10; revenues rose 50.1% year/year to $74.4 mln vs the $69.2 mln consensus. Co issues upside guidance for Q2, sees EPS of $0.16-0.17 vs. $0.13 consensus; sees Q2 revs of $77-79 mln vs. $72.96 mln consensus.

4:04PM Molex beats by $0.02, misses on revs; guides Q4 EPS in-line, revs in-line (MOLX) 24.79 -0.47 : Reports Q3 (Mar) earnings of $0.37 per share, excluding non-recurring items, $0.02 better than the First Call consensus of $0.35; revenues rose 1.9% year/year to $822.3 mln vs the $838.5 mln consensus. Co issues in-line guidance for Q4 (Jun), sees EPS of $0.39-0.43, excluding non-recurring items, vs. $0.41 consensus; sees Q4 revs of $850-890 mln vs. $871.6 mln consensus.

4:02PM CalAmp sees Q4 revs of $29.8 mln vs $30.1 mln single analyst est, EPS of ($0.09) to ($0.12) vs ($0.04) single analyst est (CAMP) 2.60 +0.00 : Co issues downside guidance for Q4 (Feb), sees EPS of (0.09) to ($0.12) vs. ($0.04) First Call consensus compared to previous guidance of ($0.01) to ($0.05); sees Q4 (Feb) revs of 29.8 mln vs. $30.10 mln consensus. Which is within the previously provided revenues guidance range of $29 to $33 mln. Commenting on the co's preliminary fourth quarter results, Rick Gold, CalAmp's President and Chief Executive Officer, said, "Despite the fact that the preliminary fourth quarter loss was greater than our original projections, our revenue was within the guidance range and we generated positive operating cash flow during the quarter. We ended the fourth quarter with a cash balance of $6.6 million, which is an increase of $1.5 million on a sequential quarter basis. We also finalized an amendment of our credit agreement with our lenders. As a result we can now move forward into Fiscal 2009 with enhanced financial flexibility as we execute our strategy to return CalAmp to profitability."

4:15 pm : The major indices finished with sharp losses on Tuesday. A bearish bias prevailed throughout the session after traders were disappointed by earnings reports at several notable companies. Meanwhile, crude oil and the Commodity Index spiked to lifetime highs, which did not help matters.

Texas Instruments (TXN 28.82, -1.77) reported earnings grew by a strong 19%, which met analysts expectations. However, its stock got clipped after the company provided a disappointing outlook. Because of uncertainty regarding the near-term economic outlook, the company expects to earn between $0.42 and $0.48 per share in the second quarter. This falls well short of the expected earnings of $0.48 per share.

TI's dour outlook was taken as bearish signal regarding large-cap tech stocks, with the Nasdaq 100 shedding -1.6%. Semiconductors took the brunt of the selling pressure, as the SOX fell 3.3%.

Tech was not the only area under pressure. Healthcare stocks posted a decline of 1.3%. Shares of health insurer UnitedHealth Group (UNH 34.15, -3.66) declined nearly 10% to a fresh 52-week low, bringing its four-month slide to a total of 42%. The company reported earnings that fell short of estimates, and lowered its full year 2008 guidance.

CME Group (CME 483.50, -40.00), operator of the Chicago Mercantile Exchange, faced notable selling interest, with shares falling roughly 8%. The company reported revenue rose 25% and earnings of $4.67 per share. However, that was not enough to meet the consensus estimate that pegged revenue growth at 26% and earnings of $4.80 per share.

The Amex Airline Index (-12.3%) got hammered and hit a fresh 52-week low after UAL Corp (UAUA 13.55, -7.88) reported disappointing earnings. The operator of United Airlines reported a quarterly loss of $4.45 per share, compared to the expected loss of $3.41. Also not helping things, crude hit a fresh all-time high of $119.90 per barrel on supply concerns in Nigeria and reports of a worker strike in the United Kingdom. The gains in crude helped send the CRB Commodity Index (+1.6%) to its all-time high.

Not every company reported worse than expected earnings -- although buying interest was held in check on some cautious outlooks. Dow components McDonald's (MCD 58.35, -0.32) and DuPont (DD 50.16, -2.09) topped their earnings estimates, while AT&T (T 37.81, +0.22) met expectations. In addition, Coach (COH 31.70, -0.80), Wyeth (WYE 43.99, -0.22) and Kimberly Clark (KMB 64.37, +0.34) came out ahead of their respective consensus estimates.

Economic data were light this session, with only one notable release. The market saw a modest boost following the March existing home sales report, but quickly retreated to predata levels as the data were largely in-line with expectations. March existing home sales fell 2.0% to an annualized rate of 4.93 million from the prior reading of 5.03 million. This was slightly better than the expected reading of 4.92 million. Compared to last year, sales are down 19.3%. Prices have fallen 7.7% versus last year. Housing remains in a deep slump, but the rate of decline has slowed in recent months.

In the end, eight of the ten sectors posted a loss. Consumer discretionary (-1.7%) and materials (-1.4%) posted the largest losses. Energy (+0.2%) and telecom (+0.2%) outperformed on a relative basis.DJ30 -104.79 NASDAQ -31.10 NQ100 -1.6% R2K -2.0% SP400 -1.4% SP500 -12.23 NASDAQ Dec/Adv/Vol 2185/705/1.93 bln NYSE Dec/Adv/Vol 2250/882/1.33 bln

1:40PM Rambus confirms DC circuit court overturns federal trade commission orders in Rambus case (RMBS) 23.42 +0.88 : Co confirms that the US Court of Appeals for the DC Circuit has overturned the Federal Trade Commission's decisions regarding Rambus, and remanded the matter back to the FTC for further proceedings consistent with the Court's opinion.

7:42AM KVH Industries beats by $0.01, misses on revs; guides FY08 EPS in-line (KVHI) 8.46 : Reports Q1 (Mar) earnings of $0.11 per share, $0.01 better than the First Call consensus of $0.10; revenues rose 13.3% year/year to $23.1 mln vs the $23.9 mln consensus. Co issues in-line guidance for FY08, sees EPS of $0.36-0.44 vs. $0.39 consensus. Sees revenue growth of 14-23% y/y.

09:19 am Qimonda: . Target $4.5 to $2. Caris says QI demonstrated that it still has the ability to surprise investors, as rev and EPS came in well below expectations, and downbeat mgmt commentary left firm even more bearish than before. QI is now shedding market share in an effort to remain solvent; quite frankly, firm sees the future of the co as in doubt. Firm cuts their tgt to $2 from prior $4.50, which reflects their est for net cash at the end of the June quarter.

09:15 am First Solar: . Target $300 to $450. AmTech is expecting FSLR to report a strong 1Q08 of in-line to better than expected results and give healthy guidance for FY08 in-line with the robust demand the company is seeing. Given that the stock is up significantly since prior to last earnings call (75%), the near-term trade this quarter is difficult to gauge. Despite the near-term price action, however, firm believes current levels represent an attractive long-term entry point. Firm moves their valuation window out to 45x their 2010 EPS est of $9.90 to reach their new $450 tgt (up from $300), a multiple they believe is warranted given FSLR's visibility into end customer demand and internal capacity additions vs. its peers when coupled with projected growth rates.

10:05 am Texas Instruments (TXN)

A tepid earnings forecast from Texas Instruments (TXN 29.08, -1.51) has prompted market participants to shun shares of the semiconductor company in Tuesday's trading.

Texas Instruments reported after Monday's close revenues totaled $3.27 billion for its first quarter of fiscal 2008. That marks a 3% increase year-over-year and meets analysts' expectations. The overall gain in revenues was helped by 20% annual growth in high-performance analog semiconductors. Management stated that analog represents a great growth opportunity for a very long time, given its requirement in electronic equipment.

Operating profits climbed at a healthier clip than revenues. Year-over-year operating profits increased 19% to $807 million.

Earnings, on a per share basis, totaled $0.43 per share, which matched analysts' consensus forecast. Earnings for the quarter were up from $0.35 per share the year before.

Uncertainty surrounding the near-term economic outlook has prompted management to take a more conservative outlook for the second quarter. Revenues are expected to range from $3.24 billion to $3.50 billion, while earnings are expected to range from $0.42 per share to $0.48 per share. Analysts were calling for second quarter sales of $3.44 billion and earnings of $0.48 per share.

Since management's meek earnings outlook leaves room to fall short of the consensus profit forecast, market participants are pushing shares of TXN lower in today's trading. The stock is currently down almost 5% this session.
icon url

ReturntoSender

04/24/08 6:27 PM

#8024 RE: ReturntoSender #6755

MTSN bot 1000 shares@5.00 today as my limit order filled while I was flying somewhere over America:


icon url

ReturntoSender

05/02/08 9:39 AM

#8033 RE: ReturntoSender #6755

Chart of the Day - COTD - Price of Oil Hits All Time Inflation Adjusted High:

http://www.chartoftheday.com:80/20080502.htm?T

Chart of the Day
Today, crude oil closed at over $112 per barrel. As would be expected, this has translated into high prices at the pump. How high? As today's chart illustrates, the cost of one gallon of gasoline has just surpassed the inflation-adjusted peak of 1981. Therefore, as a result of increased global demand, geopolitical tensions, and a declining US dollar we are currently experiencing record high gasoline prices even when adjusted for inflation.

icon url

ReturntoSender

05/05/08 11:12 AM

#8037 RE: ReturntoSender #6755

GLD - This is a potential head and shoulders pattern. I do not believe any chart is a head and shoulders for sure until it breaks the neckline with some volume on the break and then fails to get back through the neckline on a rally attempt. It is all explained here:

http://stockcharts.com/school/doku.php?id=chart_school:chart_analysis:chart_patterns:head_and_shoulders_t

Here is a chart on GLD since we can use volume. If the GLD does not make it through the neckline then look for further losses with a target of about 72.


JMHO, RtS
icon url

ReturntoSender

05/09/08 9:06 AM

#8046 RE: ReturntoSender #6755

From Briefing.com from last night: 4:26PM Brooks Automation misses by $0.02, beats on revs; guides Q3 EPS below consensus, revs below consensus (BRKS) 11.06 +0.06 : Reports Q2 (Mar) loss of $0.05 per share, excluding non-recurring items, $0.02 worse than the First Call consensus of ($0.03); revenues fell 24.3% year/year to $147.6 mln vs the $141.9 mln consensus. Co issues downside guidance for Q3, sees EPS of ($0.12)-$0.00 vs. $0.05 consensus; sees Q3 revs of $125-140 mln vs. $143.80 mln consensus.

4:22PM NVIDIA misses by $0.02, reports revs in-line (NVDA) 21.95 -0.06 : Reports Q1 (Apr) earnings of $0.36 per share, excluding non-recurring items, $0.02 worse than the First Call consensus of $0.38; revenues rose 36.6% year/year to $1.15 bln vs the $1.15 bln consensus. "The growth of GPUs continues to outpace the PC market. We shipped 42 percent more GPUs this quarter compared to the same period a year ago, resulting in our best first quarter ever... This is the era of visual computing. With a few hundred million GeForce GPUs in the market, developers can now confidently create applications with dazzling graphics. Amazing applications with beautiful graphics are showing up on the Web constantly, driving even faster adoption of GPUs. We expect this positive feedback loop to continue to drive our growth."

4:30 pm : Trading in the stock market was largely range-bound Thursday. The S&P 500 bounced between the unchanged mark and 1400, which has been a key level among technical traders, but still finished the session with decent gains.

Positive sales data from a handful of key retailers lent some initial support to market participants, but the data was largely dismissed after the opening bell.

Wal-Mart (WMT 57.16, +0.33), Costco (COST 71.20, -0.88), BJ's Wholesale (BJ 37.73, -1.21), and Target (TGT 52.34, -1.10) all reported positive same-store sales growth for April. Specifically, Wal-Mart reported a 3.2% increase, excluding fuel sales, Costco and BJ's announced an 8.0% and 17.8% increase, respectively. Target noted that its 3.1% increase was slightly below its expectations.

Several noteworthy apparel and accessories retailers posted declining same-store sales for April. Nordstrom (JWN 34.67, -0.82), Limited Brands (LTD 17.93, +0.31), and Gap (GPS 17.84, -0.40) all reported a downturn.

News Corp (NWS.A 19.68, +0.48) offered a positive update upon announcing third quarter results after yesterday's close. The media giant reported earnings of $0.91 per share for the quarter, up from $0.29 per share the year before. News Corp's latest results were helped by a $1.7 billion gain related to a stock and asset exchange with Liberty Media.

Jobless claims for the week ending May 3 totaled 365,000. The consensus estimate called for 370,000 claims. Jobless claims for the prior week were revised slightly higher to 383,000 from 380,000. Notably, the four-week average has increased to 367,000 from 364,500, but remains below levels typically associated with a recession.

Wholesale inventories for March declined 0.1%, which is less than the 0.5% increase that economists forecast. February's inventories increased 0.9%, down from the 1.1% increase initially reported.

The materials sector (+2.3%) was the best performing economic sector in the S&P 500. Particular strength was exhibited by Alcoa (AA 39.65, +1.56) and Freeport-McMoRan (FCX 118.07, +3.71).

The energy sector (+1.9%) also finished with a solid gain after crude set an all-time intraday high of $124.61 per barrel. Oil companies Exxon Mobil (XOM 89.93, +1.11) and Chevron (CVX 97.44, +2.16) were among the leaders.

Financial companies were down noticeably. Bank of America (BAC 37.33, -0.67) and AIG (AIG 44.15, -0.93) were the primary laggards.

Thursday's choppy trading prompted buying in government Treasuries. The benchmark 10-year Treasury Note traded 27 ticks higher, lowering its yield to 3.78%.DJ30 +52.43 NASDAQ +12.75 SP500 +5.11 NASDAQ Dec/Adv/Vol 1307/1482/2.09 bln NYSE Dec/Adv/Vol 1295/1802/1.21 bln

1:00PM Marvell confirms it reached settlement with SEC regarding historic stock option granting practices (MRVL) 13.31 +0.14 : Co confirms that it has entered into a settlement with the SEC in connection with the previously disclosed investigation into the co's historic stock option granting practices. Without admitting or denying the allegations in the SEC's complaint, the co agreed to settle the charges by consenting to a permanent injunction against any future violations of various provisions of the federal securities laws. The co will also pay a civil penalty of $10 mln in connection with the settlement. In a related agreement, Weili Dai also entered into a settlement with the SEC. Dai consented to a permanent injunction against any future violations of various provisions of the federal securities laws, agreed not to serve as a director or officer of a public company for a period of five years, and will pay a civil penalty of $500k.

10:06AM Diodes reports EPS in-line, revs in-line; guides Q2 revs above consensus (DIOD) 27.26 -0.28 : As mentioned at 10:02, DIOD reported Q1 (Mar) earnings of $0.35 per share, in-line with the First Call consensus of $0.35; revenues rose 3.9% year/year to $95.6 mln vs the $96.1 mln consensus. Co issued upside guidance for Q2, sees Q2 revs of $100-106 mln vs. $99.95 mln consensus. In addition, co expects gross margin to be down slightly due a stronger China currency affecting their manufacturing costs, but gross profit will increase 4-9%.

8:02AM UTStarcom awarded contract from United Telecoms Ltd. for broadband network triple play solution (UTSI) 3.36 : Co announces that it has been awarded a contract by United Telecoms Limited to deliver Internet Protocol TV, bandwidth on demand and Voice over IP services in the state of Goa. Upon completion, the Gigabit Ethernet Passive Optical Network/fiber technology network will be the first specifically designed to deliver e-Governance and triple play solutions in India. The end-to-end network will provide more than 100,000 subscribers in Goa with high-speed access to several new services including broadcast-quality IPTV and e-Governance applications.

7:39AM Rudolph Tech receives multiple system order for AXi 940 Inspection Module (RTEC) 9.73 : Co announces that it has received multiple system orders for its recently-introduced AXi 940 macro defect inspection module from a major chip manufacturer based in Singapore. This order for three systems reflects the success of an evaluation for advanced photolithography and CMP applications. Two systems shipped in April, with the third scheduled for June.

6:17AM TTM Tech announces a $125 mln convertible notes offering pursuant to its effective shelf registration (TTMI) 14.22 :

3:57AM United Microelectronics reports net sales for April 2008 (UMC) 3.32 : Co reports net sales for April 2008 increased 4.79% year/year to NT$8.52 bln; net sales increased 0.27% from March 2208.

3:55AM Advanced Semiconductor Engineering announces monthly net revenues (ASX) 5.37 : Co reports April 2008 net revenues increased 13.2% y/y to NT$8.39 bln; net revenues were flat compared to March 2008.

12:43AM Emcore misses by $0.04, reports revs in-line; guides Q3 revs in-line; guides FY08 revs above consensus (EMKR) 7.37 : Reports Q1 (Mar) loss of $0.09 per share, excluding non-recurring items, $0.04 worse than the First Call consensus of ($0.05); revenues rose 42.2% year/year to $56.3 mln vs the $56.4 mln consensus. Co issues in-line guidance for Q3, sees Q3 revs of $77.0-80.0 mln vs. $76.37 mln consensus. Co issues upside guidance for FY08, sees FY08 revs of $280-295 mln vs. $270.02 mln consensus. Co expects net profitability by the September quarter.
icon url

ReturntoSender

05/11/08 11:51 AM

#8050 RE: ReturntoSender #6755

InvestmentHouse Weekend Market Summary 5/9/08

http://www.investmenthouse.com/weekendmarketsummary.htm

- Market logs its first down week in four so the rally must be over, right?
- Trade deficit shrinks. Trade deficit hawks better watch out for getting what they wish for.
- Oil explodes higher, gasoline follows, but oil stocks don't: oil is too far ahead of itself for now.
- Fedex tries the old 'Friday afternoon' warning, and the market is going to feel its pain on Monday.
- Techs are going to have to hold the line.

A down week after indices fail to take out next resistance.

There was not a lot going for the market heading into Friday. Financials were under pressure thanks to AIG and its earnings miss. C added to the financial worries as it is set to cut $400B in assets over the next 3 or 4 years. That is more long range planning than we have heard from many a financial in the past six months, but it didn't seem to help Citi or the rest of the financials. Oil was out of control once more closing at $125.88 and trading at $126 (+2.40) after hours. The run in oil the past week was a spectacle in itself, and not the kind investors and economists like to see.

On top of all of that there were the continued voiced concerns that the rally had failed given the test of resistance and the inability to break through. Interesting given that DJ30 did in fact break resistance two weeks back and NASDAQ followed on strong volume. SP500 did as well, but its break was a no volume snoozer, and thus the slide back to test is no wonder. Even with the selling on the week, however, there was no breakdown Friday.

Stocks started soft but didn't give in as NASDAQ and SP500 made a run for the roses midmorning, making it to positive. There wasn't any power there as volume was very low. Couldn't hold the rebound and faded back, but as noted, no real selloff on those two. DJ30 was dragged down by its financials. AIG is on the 30 so it was a drag. As was C, BAC and GE. All have a financial component, some more than others. DJ30 looks intent on seeing its 50 day EMA thanks to those boys and a few consumer stocks performing quite weakly, but again, NASDAQ and even SP500 with its financials don't have those issues, at least judging from the action last week.

TECHNICAL. The intraday action had promise with a low to positive move, but once again the midmorning proved to be the fulcrum, the lynchpin, the turning point, the (insert clich of choice). A strong, surging move on the indices just ran out of gas and slipped into a quiet, three martini lunch. Juiced up from lunch the market tried an afternoon recovery and did a decent job but could not recover session highs, slipping back in the last half hour, closing all but the mid-caps lower.

INTERNALS: Volume was the key. It was very light on an already low volume NYSE. It was the lowest in about a month on NASDAQ. No selling volume, just no interest. The flat breadth shows the same.

CHARTS: DJ30, after leading the market with the first breakout above the February highs, is now the index fading the most. It has given up its near support at the 18 day EMA and even the 12,750 key level, and is intent on heading to the 50 day EMA. Overall volume is lower on this selling than on the upside move, though volume overall remains woefully light. SP500 was not a pillar of strength on the week, but it checked up at its 18 day EMA Thursday and managed to hold there Friday with a modest rebound off the lows. Right at its February high and not bad considering the financials on the index. NASDAQ was the strong one, or one of them; it gapped lower, held above the 18 day EMA and recovered to hold the 10 day EMA on the close. Outside of that Wednesday distribution session it was a rather nice, orderly pullback. SP400, the mid-cap index, was the best performer as it moved laterally after clearing the 200 day SMA, pausing and preparing for its next move higher. The first index to clear the 200 day SMA, and though not the small caps, an important barometer of economic activity.

LEADERSHIP: Interesting. Energy, despite the gains in oil, pulled back. Metals were up but reversed the Friday gains. With those leaders struggling as the did on Wednesday, the market struggled because financials were nowhere near the lead after AGI and C, and techs were not ready to move higher with AAPL resting after a big move. Transports were modestly lower, but they were just in a routine pullback; will have to see how they respond to the FDX late afternoon warning. It was Friday, and after many leaders rallied into the week, no one wanted to take the point ahead of the weekend. Still many solid leaders in shape to move and hence the just modest pullback in the indices even with the gloom about a failed rally.

SUM: Anyway you describe it, the week was weaker. After three upside weeks any down week would be weaker. Many are saying that the rally has failed because it hit resistance and recoiled. Well, it also broke key resistance and has not clearly given it up. There was some distribution, but most of the selling was on light trade. Financials are still a problem and they raised their heads last week, giving rise to the bucking we saw. It did not, however, result in a clear reversal and high volume selloff. There is reason for concern given the failure at next resistance and some higher volume, but NASDAQ and NASDAQ 100 actually look very good as does SP400. Even SP600 and SP500 look solid despite the financial components on the latter.

THE ECONOMY

The March trade balance fell to -$58.2B from -$61.7B, much better than the -$61.3B expected. Lots of billions in any event.

There is a continuing angst among lawmakers, some economists, and the general populace that a trade deficit implies we are somehow not pulling our weight in the trade game, that we are overspending, that we are basically spendthrifts. Never mind that our citizens invest more than any others; we just don't put our money into savings accounts earning 1% or less. We are, as we always have been, risk takers and thus we put our money into stocks, bonds, new businesses, etc. That is why we are accused each month of not saving based upon the income and spending figures, but that does not take into account our investments. And let's face it, ALL FINANCIAL PLANNERS, EVEN THE GOVERNMENT tell us you have to invest for the future, not stick it in the mattress. Of course you cannot really believe the government; it says a 1% return on our social security 'investment' is an investment. Aside from that, however, ask anyone and you get the response you need to invest versus just save.

These same angst-ridden officials and scholars will argue that if we import more than we export by too great a margin our economy will not prosper. They fear no one will lend to us and that someday the debts are called and we go under. Wow. That is a really, really pessimistic view of our economy and our strength. It is also just flat out wrong when you look at history.

Historically the US imports more and more goods when the economy is strong and citizens feel prosperous. When that is the case we buy a lot of US goods and a lot of foreign goods. When consumers are worried about the future and the economy is weaker, we buy fewer imports.

There is no doubt the economy is weaker. All the data points to it even if there are some signs of some bottoming recently. On top of that the dollar's decline (PC for plummet) is making foreign goods from countries with currencies not tied to the dollar more expensive, e.g. French wine, foreign autos, etc. Even with commodities and goods priced in dollars the decline is killing us. Just look at oil; it is priced in dollars and in order for the producers to maintain their profit margins with a falling dollar, it costs more dollars to buy a barrel. As we all know, that unavoidable expense is killing us here in the US and thus even less dollars to spend on imports or domestic goods and services.

With this one-two punch backdrop, imports fell to their lowest level in 6 years. Is that good? Or put another way, is it better to have imports hit a 6 year low, reduce the trade deficit AND have a weak economy, or would we rather have higher imports, a higher trade deficit, and a strong economy? Of course everyone would prefer the latter; history shows that is a sign of a healthy US. We have ingenuity, we are cutting edge, we have a high standard of living, and we spend money as a result. Gee, sounds just horrible. It is what every other country seeks and yet we are into self-flagellation because we have achieved it.

Of course, the policies of the current 'market economy' administration has fostered the opposite. It did some things right (e.g. tax cuts that stimulated an economic recovery) but then undercut them with other policies (e.g. weak dollar, ethanol boondoggle) that have created the recession out of the expansion it previously created. Talk about giving a helping hand with one hand and then punching you in the face with the other.

Even without the help of the administration the dollar has bottomed for the time being and is going to rally for the time being. May be a few months, may be a year; it was stomped hard and the rebound rally will be more than just a blip. Maybe, just maybe the right policies will be put back in place to turn that bounce into a full blow recovery. With an election year and the politics related thereto, that is not likely.

Oil and gasoline explode higher on the week.

Oil was already up, but speculation took it sharply higher last week with an official close at 125.88. That is pushing gasoline higher and higher as there are not enough refineries, the feedstock is shooting through the roof, and summer is fast approaching (in the 90's here in southeast Texas this week; balmy). Wholesale gasoline was already up to $3.06 Tuesday and hit $3.20 by Friday. Ridiculous.

It is, thankfully, too far ahead of itself for the moment. Oil made its second big run the past week after breaking out, again, in early April. It is nearing the peak of this run because the energy stocks balked, twice last week, as it made the run higher. Wednesday they sold as oil rallied sharply. Thursday they recovered. Friday they balked again as oil surged once more. Oil is moving up but oil stocks are hesitating, not able to match it tick for tick.

That is an indication the move is getting done for now. It may still rally further to start the week, but we can look for oil to make a test as it did in late April/early May shortly. Doesn't mean it is going to break its trend; that is very strong. All we can say it is overdone or very close to being overdone for now.

THE MARKET

MARKET SENTIMENT

Now that the Fed has entered the game with its credit facilities that actually work, the correlation with VIX that set up during the correction is broken. Volatility and hence VIX can decline and hold at low levels for a very long time and have no bearing on any continued rally.

VIX: 19.41; +0.01
VXN: 23.48; +0.3
VXO: 19.83; +0.74

Put/Call Ratio (CBOE): 0.93; +0.04. Spent most of the week below the 1.0 level on the close despite some selling in the market. That shows a little bit more complacency than in the past, and that gives the bears a bit more ammunition but not a whole lot given the ratio stayed above 1.0 for the better part of a month leading up to and through the early stages of this rally.

Bulls versus Bears:

This is a reading of the number of bullish investment advisors versus bearish advisors. The reason you look at this is that it gives you an idea of how bullish investors are. If they are too bullish then everyone is in the market and it is heading for a top: if everyone wants to be in the market then all the money is in and there is no more new cash to drive it higher. On the other side of the spectrum if there are a lot of bears then there is a lot of cash on the sideline, and as the market rallies it drags that cash in as the bears give in. That cash provides the market the fuel to move higher. If bears are low it is the same as a lot of bulls: everyone is in and the market doesn't have the cash to drive it higher.

Bulls: 44.4%. Bulls continue to rise, posting the sharpest increase in a month, rising from 40.9%. The rally is having its impact, pushing bulls higher, up from 39.1% and 37.8% where it held for a few weeks. Crossed back above bears last week, the usual positioning of the two. Fell to 30.9% in mid-March as the low. The indicator did its job with the dive below 35% and the crossover with the bears. The bulls and bears were eye to eye in mid-February and have crossed. A move into the lower 40's is a decline of significance. A move to 35% is a bullish indicator. This is smashing that. For reference it bottomed in the summer 2006, the last major round of selling ahead of this 2007 top, near 36%, and 35% is considered bullish.

Bears: 32.3%. Interestingly, bears rose from 31.8% even with the market rising overall. Down from 35.6% the prior week and 38.9% the weeks before. As with the bulls the jump in bears did its job after hitting 44.7% in the third week of March that was up from an already freakishly strong 43.3% the week before. That was a surge from an already high 36.6% the prior week. Up sharply from a low of 19.6% on the last rally. It is over 30% and indeed over 35% the prior week, meaning it has blown past the range that means business. Big move after falling to a low of 19.6% on this round. Bearishness peaked at 37.4% in September 2007. It topped the June 2006 peak (36%) on that run. That June peak eclipsed the March 2006 high (33%) and well above the 2005 highs that spawned new rallies (30% in May 2005, 29.2% in October 2005). This is a huge turn, unlike any seen in recent history.

NASDAQ

Stats: -5.72 points (-0.23%) to close at 2445.52
Volume: 1.704B (-17.23%)

Up Volume: 735.403M (-525.69M)
Down Volume: 939.944M (+169.306M)

A/D and Hi/Lo: Decliners led 1.09 to 1
Previous Session: Advancers led 1.13 to 1

New Highs: 62 (+34)
New Lows: 86 (-28)

NASDAQ CHART: Click to view the chart

As noted, NASDAQ faded back on the week, falling from 2500 resistance, but it held above the 18 day EMA on the week, closing at near support at the 10 day EMA. Some accumulation, some distribution on the week, but in the bigger picture it is still in good shape even with the pullback from 2500. And you know what? That is exactly what we expected to do, and this weeklong pullback to near support sets it up nicely to take on that level.

NASDAQ 100 (-0.33%) faded as well, but it held the 200 day SMA on the Friday close holding the breakout from early May. Excellent positioning for a new break higher and we are going to look to play that as it starts.

SOX (-0.32%) performed exceptionally, working laterally this week over the 10 day EMA in a flat range. It is just below some resistance from the November low, and this lateral move is measuring that resistance for the breakout. Nice.

SP500/NYSE

Stats: -9.4 points (-0.67%) to close at 1388.28
NYSE Volume: 1.099B (-9.27%). Low volume all week. Low volume. Very low volume.

Up Volume: 393.601M (-257.265M)
Down Volume: 691.779M (+140.497M)

A/D and Hi/Lo: Decliners led 1.14 to 1
Previous Session: Advancers led 1.38 to 1

New Highs: 61 (-19)
New Lows: 36 (-54)

SP500 CHART: Click to view the chart

The large caps struggled on the week given the large financial contingency. Wednesday it suffered a bit of distribution, but it was mild. Friday it had the AIG issues, but it held the 18 day EMA on the close after undercutting that level intraday. It is just below the February peak, but holding up well. It broke through the February peak on low volume, made it up to an old 2003/2004 trendline, then faded back. As with NASDAQ, it is in position to make a break toward that resistance and take it out if it can get the volume.

SP400 (-0.01%) is the mid-cap index. It is one of the top performers in the rally, and last week when the large cap NYSE indices struggled it simply worked laterally over the 10 day EMA, resting after clearing the 200 day SMA to start the month. While everyone is focusing on SP500, NASDAQ, SOX, and SP400 are looking very strong.

SP400 CHART: Click to view the chart

DJ30

The blue chips are now the anchor, taking that mantle from SP500 that it wore on Wednesday. The Dow gave up the 18 day EMA, the only index to do that, and it closed right at key support at 12,750. Could easily tap the 50 day EMA (12,653) on this test. We would love to see it hold 12,750, but anywhere in this range on the continued low volume is okay. Friday was tough; it had both AIG and C to deal with and that was a drag because they pulled down BAC as well. Hard to recover from that. Down but not out, and after a test of the 50 day EMA we will see how the Dow can bounce.

Stats: -120.9 points (-0.94%) to close at 12745.88
Volume: 180M shares Friday versus 195M shares Thursday. Higher selling volume Wednesday showed some distribution, but it backed off Friday on that decline. Livable.

DJ30 CHART: Click to view the chart

MONDAY

The old 'maybe they won't notice if we warn on Friday' still doesn't work.

Friday afternoon volume was lower but that doesn't mean no one was watching. FDX, blaming a nasty spike in oil, guided lower by 20 cents with respect to its earnings to come. Looks as if the news was know ahead of time as it was already down on the session, gapping lower and closing at the 200 day SMA. It will open lower than that Monday.

Question is, how many other stocks will it take with it. Transports have been solid and they even survived when UPS left a brown streak on its earnings early in the season. Now with a second warning can this leadership group still hang in there? They pulled back to near support to end the week and were ready to bounce. A good test of strength coming.

It is never good news when a big company tries to slip in a warning on a Friday afternoon. It is admitting things are bad and it doesn't see them getting better or it would face the music early in the week and say yes things are bad but we are getting it under control. With FDX it was admitting that with oil spiking higher and higher it cannot predict what the heck is going to happen.

Thus we see oil beginning to exact its toll on companies and thus the economy. We are going to see more and more companies do the same whether or not energy is really hitting them. As with a weak economy, it is just too good an excuse to pass up and thus companies can pile all of their garbage assets they want to get rid of, take out all of the trash and the skeletons in the closets, and use the cover of higher oil prices to do it. So, expect more such warnings. A sign of things to come and a company such as FDX is a logical one to start the parade.

With this kind of news we can expect the week to start on a rocky note. DJ30 can go ahead and make the test of the 50 day EMA. SP500 may go ahead and join it given its 50 day EMA is just 16 points away. They need to hold there.

NASDAQ, SP400, and SOX will be the keys to start the week. They possess the best patterns and still see buying support. They were relatively immune to the pullback last week. They did not forge ahead, but they did not recoil as the large cap NYSE indices did. With the weaker start to the week their strength will be the key for the market overall; if they continue to hold the line and even get some breakouts, the large cap NYSE indices can tag along after their tests.

Don't want to seem overly optimistic. There are divergent tensions in the market given that oil is surging to ridiculous levels and is crimping businesses and consumers. That could be the elephant that stomps out any signs attempted economic recovery showing up of late. That leaves technology as a key, however, because technology is historically viewed as less energy dependent. Of course if its customers are, well, do the math. Even with surging oil prices, however, NASDAQ and SOX are performing admirably.

We trimmed some nonperformers last week even as they held up well; just lightening up for caution's sake and to be ready to take advantage of new opportunities developing. Early this week we are going to look at plays that held up during the past week, and if they continue to hold well we will e ready to move in as they bounce, particularly if NASDAQ, SOX, and SP400 start to rebound and the large cap indices can bounce off the 50 day EMA. Again, it is a time to be patient, let the indices make their moves, and let the plays come to us by showing us solid breaks higher.

Seems counterintuitive that stocks would sustain the rally with oil surging as it has, but the market makes the final decisions, and while it was lower last week, after three upside weeks a pullback to retrench is normal, just don't want it to get out of hand and want to see stocks hold near support and then continue higher. No big deal, huh?

Support and Resistance

NASDAQ: Closed at 2445.52
Resistance:
2451 is the August closing low
Some modest resistance at 2500 from interim August lows.
The 200 day SMA at 2518
2604 is an old trendline from summer 2004/summer 2005

Support:
The 10 day EMA at 2443
The 18 day EMA at 2422
2419 is the January 2008 peak and the early February peak
2392 is the April 2008 peak
2386 is the August intraday low
The 50 day EMA at 2381
2378 is the mid-February peak; 2379 from the October 2006 peak
2370 from the April 2006 peak
The 90 day SMA at 2352
2340 from the March 2007 low
2302 is the trendline from the summer 2004/July 2006 lows, Q4 2005 consolidation
2261 is late March higher low
2252 is the early February low
2221 is March low
2216 from August 2005 peak
2202 is the January intraday low
2175 from the December 2004 peak
2168 is the March 2008 low

S&P 500: Closed at 1388.28
Resistance:
The 10 day EMA at 1396
1406 is the August and November 2007 closing low
1427 is a longer term trendline from the August 2003/September 2004 lows
1433 from a pair of August 2007 lows and December mid-month intraday low
The 200 day SMA at 1429
1446 from the December low

Support:
The 18 day EMA at 1389 held Thursday and Friday
1396 is the February 2008 peak
1387 is the April 2008 intraday high
The 50 day EMA at 1372
1370 is the August 2007 intraday low
1374 is the March 2007 closing low
The 90 day SMA at 1360
1335 is an ancient trendline
1325 from May 2006 peak prior to the summer 2006 correction
1317 is the early February low
1305 to 1302 from an August 2006 peak and matches a range of support from March and April 2006.
1294 from the January 2006 peak
1288 from June 2006
1280 from June and August 2006
1272.66 is the March 2008 low

Dow: Closed at 12,745.88
Resistance:
12,750 to 12,768 is the February 2008 peak and a series of lows and highs from August 2007
12,786 is the February 2007 peak
The 18 day EMA at 12,808
12,845 is the August closing low
The 10 day EMA at 12,860
The 200 day SMA at 13,025
13,092 is the December 2007 intraday low
13,250 from price points in second half of 2007
13,563 is the late December peak
13,780 is the early December 2007 peak

Support:
12,743 is the November low
The 50 day EMA at 12,654
12,573 is the mid-February high
12,518 is the August intraday low
The 90 day SMA at 12,495
12,250 from late March 2007 lows
12,070 from the early February 2008 lows
12,050 from the March 2007
11,731 is the March 2008 low
11,670 is the May 2006 intraday high; 11,642 closing
11,634 is the January intraday low

Economic Calendar

These are consensus expectations. Our expectations will vary and are discussed in the 'Economy' section.

May 12
- Treasury Budget, April (2:00): $157.5B expected, $177.7B prior

May 13
- Export prices, April (8:30): 1.2% prior
- Import prices, April (8:30): 1.1% prior
- Retail sales, April (8:30): 0.0% expected, 0.2% prior
- Retail ex-autos, April (8:30): 0.2% expected, 0.1% prior
- Business inventories, March (10:00): 0.5% expected, 0.6% prior

May 14
- CPI, April (8:30): 0.3% expected, 0.3% prior
- Core CPI (8:30): 0.2% expected, 0.1% prior
- Crude oil inventories (10:30): +5.6M prior

May 15
- Initial jobless claims (8:30): 365K prior
- NY Empire State Index, May (8:30): 1.0 expected, 0.6% prior
- Net foreign purchases, March (9:00): $72.5B prior
- Capacity utilization, April (9:15): 80.2% expected, 80.3% prior
- Industrial production, April (9:15): -0.2% expected, 0.3% prior
- Philly Fed, May (10:00): -20.0 expected, -24.9 prior

May 16
- Building permits, April (8:30): 912K expected, 927K prior
- Housing starts, April (8:30): 940K expected, 947K prior
- Michigan sentiment, preliminary May (10:00): 63.0 expected
icon url

ReturntoSender

05/14/08 8:46 AM

#8053 RE: ReturntoSender #6755

Applied Materials sees end to downturn, shares upFont size: A
By Sinead Carew

NEW YORK, May 13 (Reuters) - Applied Materials Inc (AMAT) said on Tuesday the semiconductor equipment industry was nearing the end of its downturn, but industry capital spending this year would fall more than it previously expected.

The microchip equipment maker, which reported a drop in quarterly earnings, forecast a chip equipment spending decline of 25 percent to 35 percent for the calendar year compared with its previous expectation of a 5 percent to 15 percent drop.

"We think there will be an improvement in the next quarter and the first fiscal quarter," Chief Executive Mike Splinter told analysts on a conference call. "We would expect revenues and orders to be coming up in Q4."

The company's shares fell more than 1 percent after-hours when it reported a drop in its second-quarter profit, but were then 2.2 percent higher at $20.29 after it issued its outlook. It had closed at $19.86 in the regular Nasdaq trading session.

Needham & Co analyst Edwin Mok said he was disappointed with the outlook, but investors appeared to be focused on the promise of a turnaround.

"Its guidance is worse than expected. I think they're losing market share," said Mok, but he added: "Maybe people are more forward looking. At least they've put the trough in perspective."

Applied Materials forecast a 50 percent reduction in DRAM chip spending in 2008 and also cited a pullback among its flash memory chip maker customers that was worse than expected.

It forecast third-quarter earnings per share of 10 cents to 14 cents on revenue expected to be down by 10 percent to 18 percent, implying a $1.76 billion to $1.94 billion range.

Analysts, on average, had expected third-quarter earnings per share of 24 cents on revenue of $2.24 billion, according to Reuters Estimates.

The company's rivals include Lam Research Corp (LRCX), Novellus Systems Inc (NVLS) and KLA Tencor Corp (KLAC).

Applied posted a profit of $302.5 million, or 22 cents per share, for the quarter ended April 27, compared with a profit of $411.4 million, or 29 cents per share, a year ago.

Excluding acquisition charges and restructuring and asset impairments, it earned 24 cents per share, beating the average analyst forecast of 22 cents, according to Reuters Estimates.

Revenue fell to $2.15 billion from $2.53 billion, compared with analysts' average estimate of $2.13 billion.

Splinter said in an interview that the company's flat-panel display business was having its best year ever and that its solar equipment business was doing well.

"Our caution is about DRAM manufacturing, primarily," he said, agreeing that investors were focusing on Applied forecasting an end to the industry downturn. "We did call the bottom of the cycle and we are pretty positive that we are calling it accurately," he said.

The company reported new orders of $2.41 billion for the second quarter, down 9 percent from the year-ago quarter. It said the backlog at the end of the quarter was $4.59 billion, compared with $4.10 billion at the end of the first quarter. (Additional reporting by Peter Henderson in Los Angeles; Editing by Andre Grenon and Braden Reddall)
icon url

ReturntoSender

05/14/08 11:01 PM

#8054 RE: ReturntoSender #6755

From Briefing.com: 4:25 pm : The stock market spiked on Wednesday in response to a tamer-than-expected inflation reading, but after testing highs reached earlier in the month, stocks gave up the majority of their gains on technical-based selling interest.

In the end, the S&P 500 posted a modest advance, with nine of the ten economic sectors in positive territory. The Nasdaq saw a steeper retreat from its session high -- after being up 1.3%, it ended the session with a paltry 0.1% gain.

On the economic front, the April Consumer Price Index (CPI) rose 0.2%, while core CPI, which excludes food and energy, rose 0.1%. Economists expected a higher increase in prices, pegging a 0.3% increase in CPI and a 0.2% increase in core CPI. Compared to last year, total CPI is up 3.9% and core CPI up 2.3%. This matches the Fed's view that inflation should moderate, and is a positive report for the stock market.

The better-than-expected CPI data garnered the majority of the market's attention on Wednesday, but several corporate items also attracted some interest.

Department store operator Macy's (M 24.93, +0.87) reported an unexpected first quarter profit and reaffirmed its full year guidance. As a result, its stock rose 3.6% and spurred buying interest within the S&P 500 Retailing Index (+1.6%).

Shares of Freddie Mac (FRE 27.25, +2.29) spiked 9.2% after the company reported a first quarter loss of $151 million, or $0.66 per share, which was better than the expected loss of $0.93. The company also announced plans to raise $5.5 billion in capital. The financial sector advanced 0.9% on the day, outperforming the broader market.

Hewlett-Packard (HPQ 45.64, +1.37) was the best-performing S&P 500 component after its stock rebounded 3.1% from its recent 10% decline. Traders felt the sell-off in HP's stock over the buyout of Electronic Data Systems (EDS 24.34 unch) was overdone. Enthusiasm regarding HP's stock did not translate to other large-cap tech names, with the Nasdaq 100 ending the day down 0.2%.

Meanwhile, Deere (DE 81.25, -8.94), Electronic Arts (ERTS 52.78, -1.78) and Whole Foods (WFMI 28.96, -4.68) all saw their stocks get clipped after market participants responded negatively to their respective earnings reports.

Separately, the government's weekly energy report showed a smaller-than-expected increase in crude stockpiles. However, crude oil prices were unable to find support on the report, falling 1.3% to $124.11 per barrel. The dip in prices weighed on the energy sector (-0.9%), which was the sole sector to post a loss. DJ30 +66.20 NASDAQ +1.58 NQ100 -0.2% R2K -0.1% SP400 +0.4% SP500 +5.62 NASDAQ Dec/Adv/Vol 1443/1451/2.12 bln NYSE Dec/Adv/Vol 1246/1843/1.19 bln

4:08PM Agilent beats by $0.03, beats on revs; guides Q3 EPS in-line, revs in-line; guides FY08 EPS in-line, revs in-line (A) 32.53 : Reports Q2 (Apr) earnings of $0.51 per share, ex items, $0.03 better than the First Call consensus of $0.48; revenues rose 10.3% year/year to $1.46 bln vs the $1.43 bln consensus. Co issues in-line guidance for Q3, sees EPS of $0.52-0.56 vs. $0.55 consensus; sees Q3 revs of $1.44-1.49 bln vs. $1.46 bln consensus. Co issues in-line guidance for FY08, sees EPS of $2.07-2.15 vs. $2.08 consensus; sees FY08 revs of $5.82-5.93 bln vs. $5.83 bln consensus. Co said,"We continue to anticipate tough conditions in U.S. markets and mixed conditions in Europe and Japan... while Asian markets are expected to remain quite robust."

2:23PM Research In Motion and IBM mobilize web 2.0 capabilities (RIMM) 143.44 +2.50 : The co and IBM (IBM) taking mobile work far beyond email by delivering to mainstream business professionals the full line of Web 2.0-powered IBM Lotus collaboration software and information on demand on the BlackBerry platform. The joint initiative enables customers to securely manage their communications, contacts and schedules and collaborate and network through social software, all from within the familiar, intuitive interface of their BlackBerry smartphones.

10:44 am Applied Materials (AMAT)

Continued weakness in the chip market weighed on the second quarter results of Applied Materials (AMAT 19.66, -0.20 ). The company unveiled a drop in sales, new orders, and earnings after yesterday's close, then provided a disappointing outlook for its third quarter.

The company reported revenues decreased 15% year-over-year to $2.15 billion. Analysts were expecting sales of $2.13 billion.

New orders for the quarter totaled $2.41 billion, which is 9% lower than last year. The decline was limited to the company's silicon segment, in which new orders were nearly halved from the prior year.

Earnings per share dipped more than 20% from the same quarter last year, falling to $0.26 per share. Still, the drop was less severe than analysts were expecting. On average, analysts estimated that earnings would total $0.22 per share for the quarter.

Chip orders are expected to continue their decline. According to Reuters, the company forecast a 25% to 35% decline for chip equipment spending this year, which is worse than the 5% to 15% drop previously expected.

Reflecting the weakness, Applied Material forecast third quarter earnings of just $0.10 to $0.14 per share during its quarterly conference call. The outlook fails to meet the $0.25 per share that analysts forecast.
icon url

ReturntoSender

05/19/08 11:42 PM

#8060 RE: ReturntoSender #6755

From Briefing.com: 6:43PM Tower Semicon misses by $0.04; guides Q2 revs below consensus (TSEM) 1.16 -0.07 : Reports Q1 (Mar) ($0.24), $0.04 worse than the First Call consensus of ($0.20); revenues rose 3.6% year/year to $57.6 mln vs the $57.6 mln single-analyst est. Co sees Q2 revs of $56-60 mln vs $63.4 mln single-analyst est.

6:34PM Kopin receives delinquency notice from NASDAQ due to delay in filing of form 10-Q (KOPN) 2.90 -0.04 :

4:31PM Ultratech receives advanced-packaging system order from the "largest foundry in the world" (UTEK) 16.93 -0.02 : Co announces it has received an order from the "largest foundry in the world" for its AP300 advanced-packaging lithography system. This AP300 lithography system order represents the initial step in the foundry customer's volume expansion plans for 300mm wafer-level packaging and solder bump applications.

4:18PM Action Semi announced as the exclusive MPR chip provider (ACTS) 3.62 +0.01 : Co announces it is the exclusive chip provider to China's M.P.R. technology developer, Shenzhen M.P.R. Times Technology. M.P.R. is a newly developed technology which applies Moving Picture Experts Group onto the paper publications.

4:15 pm : On Monday, the stock market rose as much as 1%, but ended the day nearly unchanged following a late-day sell-off. Some negative news out of the tech sector prompted traders to lock in some profits following the S&P 500's strong 2.7% gain in the prior week.

At a JPMorgan tech conference, flash memory maker SanDisk (SNDK 30.02, -2.42) noted it continues to see soft U.S. retail sales, similar to levels it saw in the first quarter. This caused a notable drop in SanDisk's stock, as well as the tech sector (-0.5%), which ended the session as a laggard.

Shares of Microsoft (MSFT 29.46, -0.53) also weighed on the market after traders were disappointed that the company is in talks with Yahoo! (YHOO 27.68, +0.02) about a possible business "transaction" that does not involve acquiring all of Yahoo. Reuters reported Microsoft's proposal involves purchasing Yahoo's search business.

In earnings news, home improvement retailer Lowe's (LOW 24.25, -0.64) reported better-than-expected first quarter earnings, but its revenue fell short of estimates and the company lowered its full year outlook. Competitor Home Depot (HD 28.87, -0.23) -- which reports earnings tomorrow -- fell in conjunction with Lowe's. Separately, shares of Campbell Soup (CPB 33.70, -2.25) posted a hefty 6.3% decline -- the largest in more than eight years -- after the company missed its earnings estimate.

Five of the ten economic sectors posted a loss, led by weakness in financials (-0.5%) and tech. Goldman Sachs (GS 184.40, -2.74), Morgan Stanley (MS 46.20, -1.01) and Lehman Brothers (LEH 42.79, -0.85) were laggards after having their second quarter earnings estimates cut at Citigroup. Meanwhile, the energy sector (+1.0%) provided leadership as crude prices advanced.

With regard to crude oil, the commodity settled with a gain of $0.77 at $127.06 per barrel, marking a new all-time closing high. The current contract for June delivery expires tomorrow.

The session's sole economic release topped expectations. The April leading indicators index -- a basket of economic indicators -- rose 0.1%, marking its second straight increase after five consecutive declines. This was better than the flat reading economists expected, and matched the Briefing.com forecast. Looking ahead, early indications in stock prices, M2 (money supply), yield curve and other indicators suggest an even larger gain in May, reflecting improved prospects for the economy. DJ30 +41.36 NASDAQ -12.76 NQ100 -0.7% R2K -0.4% SP400 -0.3% SP500 +1.28 NASDAQ Dec/Adv/Vol 1693/1189/2.25 bln NYSE Dec/Adv/Vol 1642/1494/1.15 bln

1:10PM Brooks Automation confirms settlement with Securities and Exchange Commission (BRKS) 10.35 +0.35 : Co confirms the resolution of the previously announced investigation by United States Securities and Exchange Commission into the historical stock option granting practices. Co has agreed to settle with the SEC, without admitting or denying the allegations in the Commission's complaint, by consenting to the entry of a judgment enjoining future violations of the reporting, books and records, and internal controls provisions of the federal securities laws. Co was not charged by the SEC with fraud nor was the company required to pay any civil penalty or other money damages as part of the settlement. The option grants to which the SEC refers in its complaint were made between 1999 and 2001.

8:29AM Dell to appoint Brian Gladden Chief Financial Officer (DELL) 21.31 : Co announces that Brian Gladden will succeed Don Carty, vice chairman and CFO, as senior vice president and CFO effective June 13, 2008. Carty has resigned, effective June 13. He will remain a member of the board of directors, which he joined in 1992. Prior to joining DELL, Gladden was President and CEO of SABIC Innovative Plastics Holding BV, formerly GE Plastics.

1:21AM Microsoft issues statement regarding Yahoo! (MSFT) 29.99 : Co issues the following statement: "In light of developments since the withdrawal of the Microsoft proposal to acquire Yahoo! (YHOO 27.66), Microsoft announces that it is continuing to explore and pursue its alternatives to improve and expand its online services and advertising business. Microsoft is considering and has raised with Yahoo! an alternative that would involve a transaction with Yahoo! but not an acquisition of all of Yahoo! Microsoft is not proposing to make a new bid to acquire all of Yahoo! at this time, but reserves the right to reconsider that alternative depending on future developments and discussions that may take place with Yahoo! or discussions with shareholders of Yahoo! or Microsoft or with other third parties. "There of course can be no assurance that any transaction will result from these discussions."

09:32 am ON Semiconductor: . Target $14 to $15. Friedman Billings is more positive about appreciation prospects for ONNN after attending the firm's analyst day, and are raising their 2009 EPS ests slightly and their tgt on the stock from $14 to $15. The firm's efforts to transform itself from a commodity discrete/standard products supplier into a higher value analog supplier are just beginning to bear fruit, and should continue for at least the next several years as a result of heavy investments in new analog products and its Solution Engineering Centers. On the financial front, the firm said its earnings power could grow to $1.32 per year. ONNN remains cheap and mgmt's stellar execution and business transformation gives firm comfort in maintaining their positive stance on shares despite it doubling off the trough-particularly given that the stock is trading at only 10x firm's conservative 2009 EPS ests.

08:16 am Microsoft (MSFT)

The pride of Microsoft (MSFT 29.99) and Yahoo! (YHOO 27.66) may yet to be fully tested. After both companies refused each other's overtures for buyout terms, Microsoft has expressed an interest in striking a business transaction as an alternative.

Microsoft announced this last Sunday it is continuing to explore and pursue its alternatives to improve and expand its online and advertising business. In turn, Microsoft has proposed a transaction with Yahoo, but not an acquisition.

Just as there was no guarantee to the previous buyout effort, there is no guarantee these two companies will reach amicable business transaction terms.

Microsoft's interest in improving and expanding its online and advertising business reflects its commitment to challenging Google (GOOG 580.07) for market share. A marriage of Microsoft and Yahoo was considered a strong move in that direction. If Microsoft can obtain the specific assets it was seeking all along, without the headache of completely merging operations and culture, it may find itself better positioned in the long run.

Microsoft noted that the interest has come since the withdrawal of its buyout proposal. During that time activist investor Carl Icahn is taking a proxy fight to Yahoo and proposing nominees for board seats. It is likely Microsoft sees the shareholder dissent as an opportunity to make a play for certain strategic assets.
icon url

ReturntoSender

05/20/08 11:11 PM

#8061 RE: ReturntoSender #6755

From Briefing.com: 4:30PM KLA-Tencor announces results of tender offer to acquire ICOS Vision Systems for EUR36.50/share (KLAC) 44.53 -1.69 : Co announces the results of its tender offer to acquire I.C.O.S. Vision Systems. The acceptance period for the tender offer ended on Monday, May 19, 2008 at 4 p.m. (CT). At the close of the initial acceptance period for the takeover bid, 10,250,802 shares of I.C.O.S had been tendered, constituting 96.03% of the outstanding shares of ICOS. The shares tendered into the bid during this initial acceptance period are expected to be settled on May 30, 2008.

4:29PM Ascent Solar announces exercise of over-allotment option (ASTI) 14.83 +0.13 : The co announces that the underwriters of its public offering exercised their over-allotment option to purchase an additional 570,000 shares of its common stock at $14.00 per share, before deducting underwriting discounts and commissions.

4:08PM LTX Corp beats by $0.01, beats on revs; guides Q4 EPS below consensus, revs below consensus (LTXX) 3.20 +0.00 : Reports Q3 (Apr) earnings of $0.03 per share, $0.01 better than the First Call consensus of $0.02; revenues rose 26.7% year/year to $39.3 mln vs the $38.8 mln consensus. Co issues downside guidance for Q4, sees EPS of $0.00-0.03 vs. $0.08 two analyst est; sees Q4 revs of $36-40 mln vs. $46.25 mln two analyst est. Co sees Q4 gross margin of approximately 51%.

4:06PM Hewlett-Packard reports Q2 in-line with preannouncement; reaffirms Q3 & FY08 guidance (HPQ) 46.46 -0.25 : Reports Q2 (Apr) earnings of $0.87 per share in-line with company preannouncement of $0.87; revs fell 0.7% yr/yr to $28.3 bln. Co reaffirms guidance for Q3, sees EPS of $0.82-0.83, excluding non-recurring items, vs. $0.82 consensus; sees Q3 revs of $27.3-27.4 bln vs. $27.35 bln consensus. Co reaffirms guidance for FY08, sees EPS of $3.54-3.58, excluding non-recurring items, vs. $3.54 consensus; sees FY08 revs of $114.2-114.4 bln vs. $114.19 bln consensus.

4:04PM Analog Devices beats by $0.03, beats on revs; guides Q3 EPS in-line, revs above consensus (ADI) 34.65 -1.07 : Reports Q2 (Apr) earnings of $0.44 per share, excluding non-recurring items, $0.03 better than the First Call consensus of $0.41; revenues rose 5.8% year/year to $649.3 mln vs the $627.2 mln consensus. Co issues guidance for Q3, sees EPS of $0.43-0.45 vs. $0.43 consensus; sees Q3 revs of $650-665 mln vs. $638.81 mln consensus. Board of Directors has declared a cash dividend up 11% q/q to $0.20.

4:15 pm : On Tuesday, the stock market posted a substantial loss, with market participants concerned that the stock market's rally from its March lows may have been overdone. The S&P 500 settled the day with a 0.9% loss, with seven of the ten economic sectors in negative territory.

Prompting traders to take some money off the table was bearish news on financial stocks, a major retailer's earnings report, and a higher-than-expected core inflation reading. Crude prices set another record high, which did not help matters either.

The financial sector -- which comprises 16.5% of the S&P 500 -- acted as the biggest drag with a 2.2% loss. Oppenheimer analyst Meredith Whitney believes the credit crisis will extend well into 2009, and may go on even longer. Whitney's calls typically move the market, as she has correctly predicted several aspects of the credit crisis, including the Citigroup (C 22.11, -0.88) dividend cut. Meanwhile, Goldman Sachs (GS 182.43, -1.97) and Morgan Stanley (MS 44.80, -1.40) had their second quarter earnings estimates cut at Lehman Brothers. AIG (AIG 38.12, -0.83) was also under selling pressure after the company said it will raise a total of $20 billion, up from its previous plan to raise $12.5 billion, according to reports.

The S&P 500 Retailing Index had a 2.0% decline, which weighed on the consumer discretionary sector (-1.6%). Home Depot (HD 27.37, -1.50) was the worst performing name with a decline of 5.2%. Traders were disappointed with the home improvement retailer's 66% drop in net income -- although the results were good enough to top Wall Street's low expectations. Meanwhile, AutoZone (AZO 126.99, -0.81) and Target (TGT 54.29, -0.69) reported earnings that beat estimates, while Staples (SPLS 23.61, +0.04) met expectations.

A mixed inflation reading also weighed on the broader market. The April Producer Price Index rose 0.2%, while core-PPI, which excludes food and energy costs, rose 0.4%. Economists expected the opposite, forecasting a 0.4% rise in PPI and a 0.2% rise in core-PPI. The difference in total PPI and core-PPI is largely due to a 0.2% drop in energy costs on a seasonally adjusted basis. On a nonadjusted basis, energy prices are up 2.9%.

There were some pockets of strength. The energy sector (+0.8%) climbed to a lifetime high, as crude oil shattered another intraday high, hitting $129.60 per barrel, before settling with a gain of 1.6% at $129.07 per barrel.

A 0.87% drop in the Dollar Index helped lift crude, and the Commodity Index (+1.0%) as a whole.

Despite the retreat, the stock market is still up 12.4% from its March 17 low.DJ30 -199.48 NASDAQ -23.83 NQ100 -0.8% R2K -0.4% SP400 -0.2% SP500 -13.23 NASDAQ Dec/Adv/Vol 1733/1133/2.01 bln NYSE Dec/Adv/Vol 2032/1104/1.24 bln

2:38PM Micrel shareholders overwhelmingly reject OCM's attempt to take over company (MCRL) 9.44 -0.29 : Co announces that, based on preliminary information provided by the co's proxy solicitor, shareholders have rejected all proposals made by Obrem Capital Management at a special meeting held today. The results include an overwhelming rejection of OCM's proposals to remove Micrel's current Board and replace them with OCM's nominees and of their proposal to rescind the co's shareholder rights plan. OCM's proposals to expand Micrel's Board to six members and fill the sixth seat with another of OCM's nominees were also decisively rejected.

12:33AM Tower Semiconductor to acquire Jazz Technologies (TSEM) 1.16 : Co and Jazz Technologies (JAZ 0.85) announce the signing of a definitive agreement by which Tower will acquire all of the outstanding shares of Jazz in a stock-for-stock transaction valuing Jazz at a fully diluted equity value of approx $40 mln, based on Tower's closing price on May 19, 2008. Under the terms of the agreement, each outstanding share of Jazz common stock will be converted into the right to receive 1.8 Tower ordinary shares. The total value of the transaction, including net debt, is approx $169 mln.

08:16 am Microsoft (MSFT)

The pride of Microsoft (MSFT 29.99) and Yahoo! (YHOO 27.66) may yet to be fully tested. After both companies refused each other's overtures for buyout terms, Microsoft has expressed an interest in striking a business transaction as an alternative.

Microsoft announced this last Sunday it is continuing to explore and pursue its alternatives to improve and expand its online and advertising business. In turn, Microsoft has proposed a transaction with Yahoo, but not an acquisition.

Just as there was no guarantee to the previous buyout effort, there is no guarantee these two companies will reach amicable business transaction terms.

Microsoft's interest in improving and expanding its online and advertising business reflects its commitment to challenging Google (GOOG 580.07) for market share. A marriage of Microsoft and Yahoo was considered a strong move in that direction. If Microsoft can obtain the specific assets it was seeking all along, without the headache of completely merging operations and culture, it may find itself better positioned in the long run.

Microsoft noted that the interest has come since the withdrawal of its buyout proposal. During that time activist investor Carl Icahn is taking a proxy fight to Yahoo and proposing nominees for board seats. It is likely Microsoft sees the shareholder dissent as an opportunity to make a play for certain strategic assets.

(Disclosure: Briefing.com has a business relationship with Yahoo! and Microsoft.)
icon url

ReturntoSender

05/25/08 12:05 PM

#8064 RE: ReturntoSender #6755

Amateur Investors Weekend Stock Market Analysis (5/24/08)

http://www.amateur-investor.net/Weekend_Market_Analysis_May_24_08.htm

The sell off this week in the major averages wasn't a surprise as the past two weeks I mentioned the substantial drop in the Volatility Index (VIX) was a signal of too much complacency among the investment community. The overall pattern looks rather similar to what occurred last Fall when the VIX dropped significantly from mid August through mid October (points A to B) which was then followed by a significant drop in the S&P 500 shortly thereafter in which it fell 60 points in one week (points C to D). If the pattern from last Fall repeats itself it's possible there will be an oversold bounce next week like occurred back in late October (points D to E) before the market makes another potential substantial downward move in June much like we saw from late October through November (points E to F).


As far as the major averages the Dow appears to have developed a potential bearish looking Double Top pattern (looks like the letter "M"). However if an oversold bounce develops next week it may occur either at its 50% Retracement Level near 12440 (point G) or possibly as low as it's 61.8% Retracement Level just above 12240 (point H). Both of these Retracement Levels were calculated from the March low to the most recent high.


The Nasdaq has lost around 120 points since peaking last Monday near 2550. The Nasdaq has one key support level around the 2415 level which coincides with its 50 Day EMA (blue line) and upward sloping trend line (black line) from the mid March low while a second support area would be at its 38.2% Retracement Level near 2400 (point I). I suspect the Nasdaq will hold support at one of these two levels next week and then undergo an oversold bounce.


The Nasdaq 100 has dropped around 100 points since peaking last Monday and appears to be trying to hold support around the 1950 area (brown line). However a stronger support area exists near 1915 which coincides with its 50 Day EMA (blue line), 200 Day EMa (green line) and upward sloping trend line (black line) from the mid March low. Thus I expect we will see an oversold bounce develop at one of these two levels next week.


As far as the S&P 500 it has fallen nearly 70 points since peaking last Monday and is nearing a key short term support level around 1370 which coincides with its 50 Day Moving Average (blue line) and 38.2% Retracement Level. If the S&P 500 can hold support around 1370 early next week then we may see an oversold bounce develop. However if it breaks below the 1370 level then the next area for a potential oversold bounce to occur at would probably be at its 50% Retracement Level near 1350 (point J).


Finally when looking for stocks to invest focus on those developing a favorable chart pattern such as the Cup and Handle. As I mentioned last weekend JASO is one of the few stocks which has developed a proper Handle after forming a Cup. The proper time to buy a pattern like this is when the stocks breaks above the top of its Handle which for JASO is at the $27 level.


icon url

ReturntoSender

05/28/08 9:17 PM

#8067 RE: ReturntoSender #6755

From Briefing.com: 4:15 pm : Positive financial results from select retailers and lower oil prices prompted buyers to enter the market in the early going. However, oil bounced back and sent the stock market into the red for the majority of the session, but a late surge in buying helped the S&P 500 close at its session high.

Chico's FAS (CHS 8.14, +0.97) and American Eagle Outfitters (AEO 18.61, +1.39) announced this morning earnings results that surpassed analysts’ estimates for the most recent quarter. Polo Ralph Lauren (RL 69.00, +7.25) also reported pleasing quarterly results, which helped the apparel and accessories industry advance more than 4.0% on the session.

Oil slipped below $126 per barrel in electronic trading earlier this morning, but ended its trading session on the Nymex $2.03 higher at $130.88 per barrel. In turn, the advance helped offset yesterday's declines. Oil has not closed lower for two consecutive sessions since early May.

The Dow Jones Transportation Average was unfazed by oil’s rebound. The index advanced nearly 1.0% Wednesday, helped by component United Parcel Service (UPS 70.54, +2.14). Reports indicated the global delivery and shipment company may see its sales climb if it can complete a deal to provide services for competitor DHL Express. Shares of UPS were also upgraded to Buy from Hold at Merrill Lynch.

Of the major economic sectors, materials (+2.8%) made the largest advance of the session. The sector was helped by fertilizer and agricultural chemical company Monsanto (MON 125.19, +6.12).

9:09AM On The Wires (WIRES) : Tegal (TGAL) announces that the co received an order for an Endeavor AT PVD cluster tool from a leading global manufacturer of discrete and analog semiconductor components for the consumer electronics, industrial, and automotive markets...

Cree (CREE) announces that it has entered into an agreement with Toyoda Gosei providing the companies with access to each other's patented L.E.D chip and packaged L.E.D technology. Toyoda Gosei and Cree have agreed in the future to discuss "have made" rights for LED chips...

7:09AM On The Wires (WIRES) : Rudolph Technologies (RTEC) announces that a major disk drive manufacturer has ordered a suite of inspection and metrology systems...
icon url

ReturntoSender

05/30/08 9:54 AM

#8068 RE: ReturntoSender #6755

From Briefing.com - 08:23 am Marvell Technology Group (MRVL)

Shares of Marvell Technology Group (MRVL 14.08) are soaring more than 17% in premarket trading after the semiconductor company's quarterly earnings topped Wall Street's expectations by 84%.

The Bermuda-based company earned $0.24 per share in the first quarter, trouncing the consensus estimate by $0.11 cents, and reversing a year-ago loss of $0.09 per share.

Revenue fell 4.8% to $804.1 million, but the result still came out ahead of the $783.6 million analysts were anticipating.

Non-GAAP gross margins came in at 52%, an increase over the prior year's gross margin of 48.9%.

08:04 am Dell (DELL)

Dell's (DELL 24.20) first quarter earnings and revenue soared past Wall Street's expectations on strong overseas sales. Shares have traded more than 10% higher in premarket activity in response.

First quarter revenue rose 9% year-over-year to $16.1 billion, topping the the $15.7 billion consensus estimate. Much of the growth was driven by overseas sales, with global consumer revenue up 20%. Notebook sales showed notable strength, growing at 43% year-over-year, which is 1.2 times more than the industry rate.

The Texas-based company earned $0.38 per share, which is $0.04 better than the consensus estimate. Dell benefited from better-than-industry growth of commercial and consumer products and services, and lower operating expense as a percent of revenue.

Dell plans to continue to incur costs as it realigns its business to improve competitiveness, reduce headcount and invest in infrastructure and acquisitions. The firm expects to continue to benefit from improving performance in areas like emerging countries, notebooks, enterprise and services, which collectively are driving a more diversified portfolio of geographies and products.

Abu Dhabi Future Energy is significantly expanding its investment in solar energy by contracting with Applied Materials (AMAT) to purchase three SunFab Thin Film Lines for producing solar modules...

From Last Night: 4:25 pm : The stock market posted a solid gain Thursday, its third consecutive advance. Market participants were encouraged by an upward revision to the first quarter economic growth rate and a sharp drop in crude prices.

Crude oil ended the session down 3.5% at $126.40 per barrel after a volatile trading session. In morning trade, crude spiked to a 1.9% gain after the government reported the largest weekly drop in crude inventory levels since 2004. Prices soon reversed, however, on demand concerns and recognition that the plummet in inventory levels was caused by delivery issues and is only temporary.

The Dollar Index advanced 0.7% which also weighed on crude prices, as well as commodities as a whole (-2.4%). Precious metals (-3.9%) took a notable hit, with gold falling 2.6% and silver falling 5.2%.

The declines in oil and commodities weighed on the energy (-2.0%) and material (-1.3%) sectors, which were the only sectors to finish the day with a loss. The rest of the stock market fared well, as the drop in crude and commodity prices helped ease inflation fears.

Financials posted a solid 1.6% gain in a bit of a rebound trade following its more than 6% drop last week. MasterCard (MA 309.00, +22.11), which is not included in the S&P 500, rose to a new lifetime high after the company forecast long-term net income growth of between 20% and 30%.

Merck (MRK 38.92, +0.26) garnered the market's attention on news that two Vioxx verdicts against Merck were overturned, however the stock underperformed the health care sector (+1.5%).

Retail stocks outperformed following a mixed batch of earnings reports. Discount retailers Costco (COST 72.98, -0.26) and Big Lots (BIG 30.66, +2.13) both posted better-than-expected quarterly earnings results, benefiting from consumers' search for bargains. Conversely, Sears Holdings (SHLD 86.14, -3.22) unexpectedly lost $0.53 per share in its latest quarter, excluding items, compared to a profit of $1.15 per share in the prior year. Analysts were expecting a profit of $0.15 per share.

The session's in-line economic data didn't ignite buying interest, but it helped keep selling interest at bay.

First quarter GDP was revised higher to 0.9% from 0.6%, matching the consensus estimate. The reading remains below the 3% normal growth rate, but the result is much better than the alarmist recessionary talk. The change was primarily due to revisions to net exports (+0.6%), nonresidential construction (+0.2%) and inventories (-0.6%).

In a separate report, the number of weekly jobless claims reading held mostly steady at 372,000, which was roughly in-line with expectations. DJ30 +52.19 NASDAQ +21.62 NQ100 +1.0% R2K +1.0% SP400 +0.5% SP500 +7.42 NASDAQ Dec/Adv/Vol 1101/1733/1.95 bln NYSE Dec/Adv/Vol 1175/1924/1.21 bln

icon url

ReturntoSender

06/04/08 11:44 PM

#8074 RE: ReturntoSender #6755

From Briefing.com: 4:42PM Zoran will acquire Let It Wave in an all cash transaction valued at up to $27.6 mln; will be accretive on a non-GAAP basis no later than the second half of 2009 (ZRAN) 15.00 +0.23 : Co announces it has signed a definitive agreement to acquire Let It Wave, a fabless semiconductor company based in Paris, France. Under the terms of the agreement, co will acquire Let It Wave in an all cash transaction valued at up to $27.6 mln, which includes earnout provisions. Co believes that the transaction will be accretive on a non-GAAP basis no later than the second half of 2009, with minimal impact to its earnings for the remainder of 2008 on a non-GAAP basis. The acquisition is expected to close on or about June 11, 2008.

4:15 pm : The stock market traded in a volatile manner Wednesday, with the S&P 500 trading in a wide range, from up 0.8% at its peak to down 0.4% at its trough. The stock market eventually settled on the unchanged mark as strength in tech offset weakness in financial and energy.

The financial sector (-0.8%) posted a solid gain of 1.1% in early trade, but tumbled on word that Moody's put bond insurers Ambac (ABK 2.50, -0.50) and MBIA (MBI 5.67, -1.02) on review for a possible credit rating downgrade. Both Ambac and MBIA defended their capital position, but the market took little solace in the remarks.

The market dipped noticeably in midafternoon trading after the news wires ran headlines from a speech on inflation that was given by Fed Chairman Bernanke at Harvard. The chairman noted the Fed's concerns about inflation and inflation expectations. In brief, it was largely an academic discussion.

If Bernanke wanted to make a real splash with inflation commentary, he would have done it in Tuesday's speech to the International Monetary Conference and not to a group of seniors (students we mean, not citizens) at Harvard. The inflation headlines were simply an excuse to apply some added selling pressure to a market that was already showing signs of weakness.

The volatile day ended split down the middle, with five of the ten economic sectors posting a gain. Technology (+1.0%) provided leadership, with significant strength in large-cap names. As a result, the tech-heavy Nasdaq handily outperformed the broader market with a gain of 0.9%.

The energy sector (-1.2%) posted the largest loss, as crude prices fell 1.8% to $122.04 per barrel. The weakness in crude followed the government's weekly energy report. An increase in gasoline and distillates inventories offset an unexpected decrease in crude stockpiles.

Telecom (-0.8%) was also a laggard, with Verizon (VZ 36.99, -0.37) falling after CNBC reported it may buy Alltel for $27 billion.

The session's three economic reports were not especially strong, but they were all better than expected. Importantly, the data are reflective of an economy that is not in a recession.

Private nonfarm employment rose by 40,000 in May, according to employment services firm ADP. This came out ahead of the expected drop of 30,000. However, this report has been spotty compared to the government's jobs report, which includes both public and private nonfarm payrolls and is set for release Friday morning.

First quarter nonfarm productivity was revised to a gain of 2.6% from 2.2% (consensus +2.5%).

May ISM services -- a survey of nonmanufacturing purchasing managers -- was nearly unchanged at 51.7 compared to 52.0 in April. Economists forecast a reading of 51.0. Because the reading is above 50, it indicates growth in the services sector. DJ30 -12.37 NASDAQ +22.66 NQ100 +1.2% R2K +0.6% SP400 +0.3% SP500 -0.45 NASDAQ Dec/Adv/Vol 1211/1633/2.19 bln NYSE Dec/Adv/Vol 1699/1408/1.29 bln

9:03AM Xilinx announces it will eliminate about 7% of global workforce; to record restructuring-related charges of approximately $18-22 mln (XLNX) 26.92 : Co announces a corporate reorganization into functional areas to better serve its customers and improve its operating performance. As a result of the reorganization, co will eliminate ~250 positions, or about 7% of the its global workforce. The workforce reduction is expected to be completed by the end of the next fiscal quarter. Co expects to record restructuring-related charges of ~$18-22 mln in connection with the reorganization. These one-time pre-tax charges are comprised of ~$16-19 mln of severance pay expenses, which will be recorded in the first quarter of fiscal 2009 and ~$2-3 mln of facility and other associated costs, a portion of which will be recorded in the second quarter of fiscal 2009. The restructuring charges will adversely impact Q1 operating expenses, which were forecasted to be approximately flat sequentially for the June ending quarter.

12:41AM FormFactor board appoints Mario Ruscev as Chief Executive Officer (FORM) 20.94 : Co announces that its board of directors has appointed Mario Ruscev, currently president, as its next chief executive officer. Ruscev will succeed Igor Khandros, FormFactor's founder, who will become executive chairman of the FormFactor board of directors.
icon url

ReturntoSender

06/08/08 3:40 PM

#8077 RE: ReturntoSender #6755

Amateur Investors Weekend Stock Market Analysis (6/7/08)

http://www.amateur-investor.net/Weekend_Market_Analysis_June_7_08.htm

Over the past few weeks daily volatility has been on the increase with substantial moves occurring in both directions as shown by a 30 minute chart of the S&P 500. I see no reason why this type of action won't continue for several more weeks as the market makes large moves in both directions.


As for the major averages the Dow which completed a bearish looking Double Top pattern a few weeks ago has now dropped back to its 61.8% Retracement Level (calculated from the January low to the May high) near 12200. If the Dow fails to bounce off of this level early next week then we many not see an oversold bounce occur until it drops back to its 76.4% Retracement Level near 12000 (point A).


As for the Nasdaq it also appears to be developing a potentially bearish looking Double Top pattern as well and closed right at its upward sloping trend line (black line) from the mid March low on Friday. If the Nasdaq fails to bounce off its upward sloping trend line on Monday then it may have to drop back to the 2430 level before an oversold bounce occurs which is at its 50 Day Moving Average (blue line).


Meanwhile the Nasdaq 100 is now also exhibiting a potential bearish looking Double Top pattern as well and is right at its upward sloping trend line (black line) from the mid March low. If the Nasdaq 100 fails to bounce off its upward sloping trend line early next week then I expect it will drop back to its 50 Day EMA (green line) near 1945 before an oversold bounce occurs.


As far as the S&P 500 it has been encountering resistance at its 200 Day EMA (blue line) the past two weeks (points D) and broke below a key short term support level at its 38.2% Retracement Level on Friday around 1370 (calculated from the mid March low to the May high). The next support area for the S&P 500 would either be at its 50% Retracement Level near 1348 (point E) or at its 61.8% Retracement Level around 1327 (point F). More than likely the next significant oversold bounce probably won't occur until one of these levels are reached which could occur at some point next week.


icon url

ReturntoSender

06/09/08 9:19 PM

#8079 RE: ReturntoSender #6755

From Briefing.com: 6:01PM Chartered Semi says its Q2 business outlook remains essentially unchanged relative to their expectations in April (CHRT) 6.29 -0.03 : Co updated its Q2 2008 guidance, which was originally provided on April 25, 2008. Co says, "Our business outlook remains essentially unchanged relative to our expectations in April when we provided our guidance for the quarter. Two additional 65 nanometer customers that were expected to enter production this quarter have successfully done so and we continue to expect the momentum at that node to continue into the latter half of the year as more products enter into production. For Q2, we are reiterating our guidance for revenues at the CHRT level and revenues including our share of Silicon Manufacturing Partners. However, we expect our gross profit to be lower by ~$15 mln compared to the mid-point of our prior guidance, due to increased costs. Approximately $9 mln of the cost increase is attributable to a less favorable build-up of work-in-progress inventory, ~$3 mln to higher depreciation in Fab 3E as a result of the valuation exercise that is in progress and ~$2 mln to a weaker US dollar. Despite the lower gross profit we are reiterating our net income guidance due to a tax credit that is expected to offset that decline. Our guidance for average selling prices, utilization and earnings per American Depositary Share remains unchanged."

4:31PM Texas Instruments narrows Q2 guidance to $0.43-0.47 vs $0.46 consensus; revs $3.33-3.46 bln vs $3.37 bln consensus (TXN) 31.33 +0.09 : Co narrows Q2 guidance; sees EPS of $0.43-0.47 vs $0.46 First Call consensus, compared to prior guidance of $0.42-0.48. Co narrows Q2 rev guidance to $3.33-3.46 bln vs $3.37 bln First Call consensus, vs prior guidance of $3.24-3.50 bln. Co sees semiconductor revenue between $3.17-3.28 bln, compared with the prior range of $3.08-3.32 bln; and education technology revenue between $160-180 mln, unchanged from the prior range.

4:25 pm : After a volatile day of trade Monday, the major indices ended the session in mixed fashion. The S&P 500 gained one point, as strength in energy (+2.7%) helped offset weakness in financials (-2.3%).

This result is somewhat disappointing, considering the S&P 500 could only muster a 0.1% gain after falling more than 3% on Friday -- especially taking into consideration that the session's economic data topped expectations and that crude prices posted a steep decline.

Large-cap tech was under pressure, which caused the Nasdaq to fall 0.6%. A better-than-expected same-store sales report from McDonald's (MCD 59.33, +2.38) and speculation that Alcoa (AA 42.17, +2.95) could be a takeover target helped lift the Dow to a 0.6% gain.

Selling interest within financials was fueled by a disappointing earnings preannouncement from Lehman Brothers (LEH 29.62, -2.67). Lehman expects a massive $2.8 billion second quarter loss and plans to raise $6.0 billion in new capital in common and preferred stock offerings -- which is on the high end of previous speculation. The $4.0 billion common stock offering was priced at $28 per share, a 13% discount to Friday's closing price. The firm also priced a $2.0 billion public offering of 2 million shares of 8.75% noncumulative mandatory convertible preferred stock.

The financial sector traded as high as 0.8% in a rebound bid following Friday's decline of roughly 5%, but plummeted to a new five-year low after New York Fed President Geithner said global inflation will probably require tighter policy.

This isn't an earth-shattering revelation since Geithner is simply stating the obvious. Nevertheless, his remarks fit neatly with commentary of late from other Fed officials who are sounding more hawkish about keeping inflation in check than they have in the recent past.

There were some positive items on Monday. Crude oil fell 2.9% to $134.54 as investors took some profits following Friday's 8.4% spike. The dollar gained 0.65% in the wake of hawkish Fed comments, which also played a role in crude's retreat. A Saudi official said the current price of oil is not supported by fundamentals, although OPEC has been expressing this view long before oil hit $100.

In economic news, April pending home sales unexpectedly rose 6.3% on a seasonally adjusted annual rate, according to the National Association of Realtors. Economists expected sales to fall 0.4%.

In corporate news, Honeywell (HON 54.81, +0.80) announced that it signed a definitive agreement to sell its Aerospace Consumable Solutions business to B/E Aerospace (BEAV 29.96, +2.98) for $1.05 billion. Honeywell feels the Consumables Solutions unit no longer fits with Honeywell Aerospace's focus on advanced technologies.

Apple (AAPL 181.61, -4.03) traded in a volatile manner leading up to and following its unveiling of the new iPhone, which is set for release on July 11. AT&T (T 37.56, -0.65), which will remain the exclusive carrier of the phone, got clipped after announcing it expects the phone will pressure its margins and earnings. DJ30 +70.51 NASDAQ -15.10 NQ100 -0.5% R2K -0.7% SP400 -0.1% SP500 +1.08 NASDAQ Dec/Adv/Vol 1952/913/2.13 bln NYSE Dec/Adv/Vol 2004/1111/1.36 bln

2:57PM Apple confirms introduction of MobileMe Internet service (AAPL) 179.47 -6.17 : Co confirmed that it introduced MobileMe, a new Internet service that delivers push email, push contacts and push calendars from the MobileMe service in the "cloud" to native applications on iPhone, iPod touch, Macs and PCs. MobileMe, available on July 11, is a subscription-based service with 20GB of storage for $99 per year for individuals and $149 for a Family Pack, which includes one master account with 20GB of storage and four Family Member accounts with 5GB of storage each.

2:54PM Apple confirms the New iPhone 3G (AAPL) 181.60 -4.09 : Co introduces the iPhone 3G, combining all the features of iPhone with 3G networking, built-in GPS and iPhone 2.0 software. In the US the new iPhone 3G is priced at a $199 for the 8GB model, and $299 for the 16GB model. iPhone 3G will be available in more than 70 countries later this year, beginning with customer availability in 22 countries. iPhone 3G includes the new iPhone 2.0 software.

Bloomberg.com: Via Technologies is cooperating with NVDA to make chips for small-sized desktop computers and mini-notebooks, the com said in an exchange filing after the mkt closed on June 6... WSJ: Six big technology cos are spearheading a plan to jointly license patents that cover the wireless technology called WiMAX hoping to limit royalty rates that could deter customers from using it. The participants are CSCO, INTC, Samsung Electronics, S, ALU and CLWR, according to people familiar with the situation and a document outlining the group's plans.
icon url

ReturntoSender

06/12/08 7:01 PM

#8085 RE: ReturntoSender #6755

From Briefing.com: 4:16PM Lattice Semi narrows Q2 rev guidance to upper end, sees up 2-4%, from prior of 1-4% (LSCC) 3.69 +0.01 : Co announced second quarter revenue is now expected to be up 2% to up 4% sequentially, which equates to $57.17-58.86 mln vs $58.08 consensus. This is a revision from previous guidance of up 1% to up 4% sequentially.

4:10PM Microsoft issues statement regarding Yahoo (MSFT) 28.24 +1.12 : "In the weeks since Microsoft withdrew its offer to acquire Yahoo!, the two companies have continued to discuss an alternative transaction that Microsoft believes would have delivered in excess of $33 per share to the Yahoo! shareholders. This partnership would ensure healthy competition in the marketplace, providing greater choice and innovation for advertisers, publishers and consumers. As stated on May 3rd and reiterated on May 18th Microsoft was not interested in rebidding for all of Yahoo!. Our alternative transaction remains available for discussion." (YHOO)

4:05PM Mattson appoints Andrew Moring as Chief Financial Officer (MTSN) 4.79 +0.21 : Co announces that it has appointed Andrew Moring as CFO, effective immediately. William Turner has tendered his resignation from his position as Executive Vice President and CFO to pursue other opportunities.

4:25 pm : It appeared the stock market would reclaim a substantial portion of its recent losses Thursday, but the session’s optimism faded during afternoon trading as buyers moved to the exits. Still, after dipping into negative ground the stock market was able to close 0.3% higher.

Helping to fuel morning buying interest was a slip in oil prices and renewed interest in financial stocks, along with some positive economic data. Financials gained as investors sought opportunities after the sector was clipped in the previous session. Primary leaders included marquee names from the banking industry, such as Bank of America (BAC 29.44, +0.59), Citigroup (C 19.89, +0.68), and JPMorgan Chase (JPM 38.01, +0.88).

However, investment services firm Lehman Brothers (LEH 22.70, -1.05) failed to attract positive attention. The firm announced today it is ousting its CFO and COO. The news sent its shares sharply lower as investors began to fear Lehman’s problems may be worse than presumed.

Notably, the financial sector was upgraded at Morgan Stanley. The sector closed more than 2.0% higher.

Oil prices were down 3.0% at one point, but staged a comeback to close on the Nymex $0.59 higher at $136.97 per barrel. Oil’s resurgence undercut much of the session’s optimism. Though oil made its way back into positive ground, the energy sector still closed 1.8% lower on Thursday.

In merger and acquisition news, Belgian brewer InBev made an unsolicited $46 billion offer for Anheuser-Busch (BUD 61.40, +3.05). The offer to BUD shareholders is worth $65 per share, or an 11% premium to yesterday’s closing price, but will likely be met with considerable resistance by politicians and brand faithful.

As for Yahoo! (YHOO 23.52, -2.63) and Microsoft (MSFT 28.24, +1.12), the two tech heavyweights failed to reach an agreement related to possible business combinations. Shares of YHOO fell precipitously on the news. Microsoft’s stock closed near its session high as investors believe it will put its dealings with Yahoo! in its past.

From the economic corner, May retail sales increased by 1.2%, excluding autos. The results bested the 0.7% increase that economists expected. April sales, less autos, were revised upward to an increase of 1.0%. The better-than-expected results also encouraged early morning sentiment as the data, paired with last week’s same-store sales data for May, will likely result in upward revisions to second quarter GDP forecasts.

In other economic news, initial jobless claims for the week ending June 7 totaled 384,000, which is more than the 370,000 claims that were expected. In turn, the four week moving average advanced to 371,500 from 369,000. Continuing claims rose to 3.139 million from 3.081 million.

Separately, the 10-year Treasury note fell considerably on Thursday, lifting its yield to 4.22%, which is the note's highest yield this year.DJ30 +57.81 NASDAQ +10.34 NQ100 0.0% R2K +0.3% SP400 +0.1% SP500 +4.38 NASDAQ Dec/Adv/Vol 1309/1541/2.26 bln NYSE Dec/Adv/Vol 1496/1628/1.33 bln

2:28PM Zoran announces preliminary approval of derivative litigation settlement (ZRAN) 13.52 -0.05 : Co announced that the U.S. District Court has granted preliminary approval of an agreement to settle a previously-disclosed shareholder derivative action relating to the company's historical stock option practices. The settlement is subject to final court approval. Notice of the settlement will be sent to shareholders, and the court hearing for final approval has been scheduled for August 18, 2008.

3:41 pm Yahoo! (YHOO)

Shares of Yahoo! (YHOO 22.77, -3.38) plummeted 13% in Thursday afternoon trade on word that talks regarding its potential acquisition by Microsoft (MSFT 28.23, +1.11) have concluded without reaching an agreement.

The two companies had several meetings regarding a total or partial acquisition of Yahoo. Yahoo said Microsoft is no longer interest in pursing an acquisition of all of Yahoo, even at Microsoft's previous offer of $33 per share or $47.5 billion, an offer which was rejected by Yahoo in early May.

Microsoft was interested in purchasing just Yahoo's search business, which Yahoo's board determined would not be in the best interest of its shareholders.

Yahoo said it "remains focused on maximizing value for stockholders by continuing to execute on its strategy of being the 'starting point' for the most consumers on the Internet and a 'must buy' for advertisers."

According to reports, Yahoo is close to announcing a deal with competitor Google (GOOG 549.81, +4.61).

Yahoo is currently trading at $22.77 per share, which is roughly 18% more than its level before Microsoft's initial bid in January.

(Note: Briefing.com has a business relationship with Yahoo and Microsoft.)

11:39 am Qualcomm (QCOM)

Communication equipment company Qualcomm (QCOM 49.00, +2.69) raised its earnings guidance for its fiscal third quarter and its full year 2008.

San Diego-based Qualcomm is benefiting from the global migration to 3G. CEO Dr. Paul Jacobs said "Our updated guidance reflects greater than expected demand for our 1xEV-DO and HSPA chipsets as well as revenues from advanced 3G network upgrades." The company also enjoyed a higher-than-expected average price for CDMA devices.

The company expects fiscal third quarter revenue to be slightly above the prior guidance of $2.5 billion to $2.7 billion, compared to the consensus estimate of $2.6 billion. Qualcomm forecasts earnings of $0.54 to $0.55 per share, excluding nonrecurring items, which tops the consensus estimate of $0.52.

For the full year, the company expects to earn between $2.09 and $2.13 per share, up from its previous range of $2.04 and $2.09. The consensus estimate stands at $2.11 per share.

Shares are up 5.8% on the news, the largest daily advance since Jan. 24, when shares spiked 10% in response to the company's first quarter earnings.
icon url

ReturntoSender

06/15/08 3:13 PM

#8087 RE: ReturntoSender #6755

InvestmentHouse Weekend Update 6/13/08:

http://www.investmenthouse.com/weekendmarketsummary.htm

- Stronger dollar, lower oil help investors ignore hot inflation, weak sentiment and post a week ending gain.
- Michigan sentiment keeps heading lower as gasoline keeps heading higher.
- Inflation has to slow, oil has to fall before overall market finds firm footing.
- Get your cows now: feed corn at its lowest level in 15 years.
- Playing the winning sectors upside, shorting the rest.

Volatile week yields a strong ending gain.

Ugly inflation data and weak sentiment looked to be trouble Friday, but stocks were up pre-market, rallied early, and closed strong. Unlike Thursday, oil started lower and stayed lower for the session, helping stocks fight off an afternoon pullback and close out the session with some impressive gains. For the day the Dow was the laggard but even it posted a 1.37% gain. Impressive upside.

The Friday gains helped put a better look to a weak week and even managed to close DJ30 fractionally higher. It was the only one to post a weekly gain, however. There were two big moves on the week after the prior Fridays breakdown on the heels of the NASDAQ, SP400 and SP600 breakouts. After holding flat Monday and Tuesday in something of a shell-shock state, the indices dumped lower Wednesday on rising NYSE trade, continuing the Friday breakdown. In response the indices bounced Thursday and then posted the strong Friday price gains. NYSE volume declined both sessions, indicating the buyers were not as strong as the sellers. Pretty classic relief bounce that took the indices back up to first resistance, and unless it can show something else, that is what we have to view it as.

Financials were hammered again on the week even with the Friday bounce in those stocks. While the week tested all sectors, even the 'safe sectors' where the Big 3 reside (energy, metals, agriculture), the latter still held up very well and moved higher quite nicely to end the week. Indeed we took positions as they came off the test even though it was Friday and volume was so-so. The market is struggling, managing just a relief bounce after the sharp selling, but these sectors are still getting money thrown their way and thus posted more upside after modest pullbacks.

TECHNICAL. On the week the indices were mostly lower, having continued the prior Friday's breakdown. Only the Friday bounce saves a very ugly week. Friday the intraday action was the opposite, i.e. strong to start, an intraday test, and then strong to finish as the hedge funds squared up positions ahead of the weekend. Good action on an upside day, but looking back over the week, most of the sessions were high to low or closed well off the intraday highs. Thus most of the action for the week was negative intraday.

INTERNALS: As varied as the price moves on the week. Strong to the downside Wednesday. Much better to the upside Friday accompanying the strong price gains with 2.5:1 breadth. Volume was not there, however, at least significantly different volume. All week trade was above average, and all week it was mixed on the indices. In other words, one day NYSE would show lower volume but NASDAQ would show stronger volume. Then it would flip. Overall, however, volume remained elevated above average, and in the summer that is unusual. The overall market direction on that higher than normal volume? Downside. That tells you that overall the volume was more to the downside, indicating the big money players were overall unloading stocks.

CHARTS: While all technical aspects are important, this is key. Wednesday the indices renewed the downside leg on stronger NYSE volume. A breakdown the prior Friday was confirmed with that move. Thursday and Friday the indices bounced on lower NYSE volume. NASDAQ volume was up Thursday; maybe some accumulation but definitely not clearly so, particularly with all of the other sessions and their weaker action. The bounce higher did not clear resistance on the NYSE indices with DJ30, SP500 bouncing to test the 10 day EMA. NASDAQ is a bit better, clearing the 50 day EMA Friday but still at the bottom of its May to early June trading range. The mid-caps look the best with a hold at the 50 day EMA support level. The mid-caps held up, but they were not immune from the selling. There is some strength in some techs and in the usual leaders, but overall the index charts remain weak, Friday bounce or not.

LEADERSHIP: As noted, the 'safe sectors' that include the Big 3 (energy such as oil, natural gas, services, coal; metals and particularly steel; and agriculture) performed well. They pulled back during the week but they held near support and started back up. After a tough week some techs perked up nicely Friday, and those that did not sell off are setting up for some nice buys. Certain areas in medical improved nicely after a test for the week. Industrial electrical equipment and other industrial basics performed nicely as well. Basically those that have performed are still performing while the rest of the market looks pretty crappy. Even some leaders have hit the skids: transports are in serious trouble, falling from grace. Higher inflation rates, surging energy costs tend to do that to stocks.

SUM: While Friday was a nice bounce higher after the selling, the week was volatile with a sharp decline and a sharp bounce. Volatility is not a sign of a steady trend but of change. The market was moving higher off the March low. It reversed after a new breakout and started to sell. Volatility accompanied the move. That volatility on the move lower suggests that is the change taking place and that the volatility is simply the process where the market changes trends.

THE ECONOMY

At what point does the lack of cost 'pass through' not matter?

There is the overall CPI reading that includes most everything we buy regularly, and there is the core that strips out food and energy. The reason for the core is that food and energy are typically volatile and as they bounce month to month they can skew the data. Further, given energy tends to rise first and faster and impacts many areas of services and manufactured goods, it is good practice to strip it out and see whether it is raising other prices or not.

May prices rose 0.6% overall (0.5% expected and 0.2% prior. That puts inflation at 4.2% annually. Whopping. The core rose 0.2%, inline with expectations and remained flat at 2.3% annually. Overall inflation rose while the core remained flat. Sure looks as if inflation is not passing through even though energy rose 4.4% and gasoline 5.7%.

What does this matter? After all, whether energy and food are passing through to other areas doesn't mean we don't pay for food and energy. And indeed we are paying for them as food spikes higher helped by ethanol using our edible corn and our feed corn as well. Feed corn stocks are at a 15 year low; the real price climbs in food are not here yet. Ranchers are putting their cattle to auction early for slaughter and are still telling us that as a result beef prices are going to scream higher after the summer. I have purchased some cattle cheap at auction and using a combination of range and supplement feeding I can provide cheaper beef than what will be in the store later this year.

But I digress. First, at some point energy and food get too expensive and whether there is pass through or not, they dampen other sectors because they eat up more discretionary income. Thus even without pass through of these costs to other areas such that they cost more because of higher energy or food costs, the economy can slow under the burden.

The second point deals more with history and how prices reacted to similar times of surging energy prices. There are comparisons to the seventies right now given the surge in oil prices and the rise in interest rates and inflation coupled with a slowing economy. Stagflation is once again on the financial stations though it is not the buzz topic it was six months ago.

The reason to compare to the seventies is due to the actual pass through of costs in the seventies. You can track the overall and core CPI during that time and you see the two tracking one another move for move and without the spread seen today. This is very important because what we had back then was insidious inflation that choked consumers and businesses every step of the way. It confounded economists using the Phillips Curve because even as the economy slowed and GDP fell, unemployment and inflation, both overall and core, rose.

While higher energy prices subtract from discretionary income, if there is no pass through to other prices you avoid that extra drain that occurs when energy prices start showing up in other goods and services. It helps keep inflation expectations low and that keeps consumers and businesses consuming and producing. In that manner they can work through the rise in inflation, improve supply, and beat back inflation.

As noted all week, however, it will take lower energy prices to bring that inflation down. The jump in inflation may not be passing through much, but at the rate it is rising stocks historically don't perform that well. Energy has to fall and relieve some of the pressure on prices or else the market is going to slog around. If energy does not fall, it ultimately doesn't matter if the costs pass through to other areas or not as the drain from other areas of consumption will eventually take its toll.

ECRI: improving from lows but showing recession levels.

It is no secret that despite the positive GDP results the US economy is in recession. The financial stocks and their contracting business show the recession. ECRI, the best man-made leading indicator, reflects this recession-like slowdown. Its annualized growth index hit near a record low in late March at -11.1%, predicting further slowing that the stock market has started to show the past month. The past week the growth index held at -6.2% for the second week. That is still considered recessionary. The ECRI leading index rose 0.1, the first gain in 5 weeks. A start, but by itself it doesn't suggest a turn in progress; have to see more improvement over the next few weeks. With oil hanging in there at high levels, it will have a hard time showing that kind of improvement.

THE MARKET

MARKET SENTIMENT

VIX: 21.22; -2.11
VXN: 25.3; -2.1
VXO: 22.21; -2.64

Put/Call Ratio (CBOE): 0.91; -0.05

Bulls versus Bears:

This is a reading of the number of bullish investment advisors versus bearish advisors. The reason you look at this is that it gives you an idea of how bullish investors are. If they are too bullish then everyone is in the market and it is heading for a top: if everyone wants to be in the market then all the money is in and there is no more new cash to drive it higher. On the other side of the spectrum if there are a lot of bears then there is a lot of cash on the sideline, and as the market rallies it drags that cash in as the bears give in. That cash provides the market the fuel to move higher. If bears are low it is the same as a lot of bulls: everyone is in and the market doesn't have the cash to drive it higher.

Bulls: 43.0%. Fading as the rally rolls over, down from 44.8%. Bulls dropped sharply to 37.9% before that bounce back up. That followed a string of steady gains: 44.4%, 40.9%, 39.1% and 37.8% where it held for a few weeks. Fell to 30.9% in mid-March as the low. The indicator did its job with the dive below 35% and the crossover with the bears. The bulls and bears were eye to eye in mid-February and have crossed. A move into the lower 40's is a decline of significance. A move to 35% is a bullish indicator. This is smashing that. For reference it bottomed in the summer 2006, the last major round of selling ahead of this 2007 top, near 36%, and 35% is considered bullish.

Bears: 32.6%. Bears gained ground, up from 31.1%. Bears rose during the last part of the market move higher, somewhat of a contrary move, but they had reason to doubt the move. As with the bulls the jump in bears did its job after hitting 44.7% in the third week of March that was up from an already freakishly strong 43.3% the week before. That was a surge from an already high 36.6% the prior week. Up sharply from a low of 19.6% on the last rally. It is over 30% and indeed over 35% the prior week, meaning it has blown past the range that means business. Big move after falling to a low of 19.6% on this round. Bearishness peaked at 37.4% in September 2007. It topped the June 2006 peak (36%) on that run. That June peak eclipsed the March 2006 high (33%) and well above the 2005 highs that spawned new rallies (30% in May 2005, 29.2% in October 2005). This is a huge turn, unlike any seen in recent history.

NASDAQ

Stats: +50.15 points (+2.09%) to close at 2454.5
Volume: 2.113B (-5.94%).

Up Volume: 1.64B (+320.111M)
Down Volume: 461.61M (-443.888M)

A/D and Hi/Lo: Advancers led 2.52 to 1
Previous Session: Advancers led 1.19 to 1

New Highs: 54 (+11)
New Lows: 174 (-9)

NASDAQ CHART: Click to view the chart

Gapped higher Friday, moved through the 50 day EMA and closed just below the 10 day EMA. Has moved back up to the bottom of its 6 week range where NASDAQ formed its double top. Lower volume on the bounce and NASDAQ has now hit the point where it either fails and heads lower once more or continues higher to try and break up that double top at 2550.

NASDAQ 100 (2.17%) rallied up to close just over the 200 day SMA (1963). As with NASDAQ overall, the large caps are up to the bottom of the range where it formed its double top.

NASDAQ 100 CHART: Click to view the chart

SOX CHART: Click to view the chart

SP500/NYSE

Stats: +20.16 points (+1.5%) to close at 1360.03
NYSE Volume: 1.225B (-8.04%)

Up Volume: 971.678M (+200.467M)
Down Volume: 240.894M (-306.095M)

A/D and Hi/Lo: Advancers led 2.69 to 1
Previous Session: Advancers led 1.04 to 1

New Highs: 42 (+10)
New Lows: 159 (-38)

SP500 CHART: Click to view the chart

A rally Friday after SP500 held at the old trendline on Wednesday and Thursday. Held where it had to after resuming the breakdown on Wednesday. It has now bounced back up to the 90 day SMA and the 10 day EMA (1362 and 1363) but on lower, below average volume Friday. Don't expect SP500 to blast back up through that level without oil tanking.

The small cap SP600 (1.84%) gapped higher and bounced up to close at the session high as well. After breaking below its 50 day EMA Wednesday it recovered it with ease Friday. Closed just below the 10 day EMA. Still a shaky pattern and needs to get through the 200 day SMA at 390.56 to turn its pattern back to positive.

SP600 Chart: Click to view the chart

SP400 CHART: Click to view the chart

DJ30

After renewing the breakdown on Wednesday, DJ30 bounced Friday, posting a triple digit gain but still lagging the rest of the market. The move was on lighter though still above average volume, and it took DJ30 to within spitting distance of the 10 day EMA. But it is just the 10 day EMA, the first level of resistance on a rebound. That is not the picture of strength and we are not expecting more upside from DJ30 before it turns back down from this low volume bounce to near resistance.

Stats: +165.77 points (+1.37%) to close at 12307.35
Volume: 247M shares Friday versus 260M shares Thursday.

DJ30 CHART: Click to view the chart

MONDAY

Lots of data out next week with some regional manufacturing reports, PPI, housing starts for May, production. These are important as they will help gauge the impact of the high oil. Much of the improved data seen of late was before this last spike to 135 and more. How the economic data reacts with higher prices will provide some late though interesting comments on the economic condition. As seen the past month on DJ30, the market is already pricing in slower economic data again. NASDAQ is not so bad, but its selling is no less real given the sharp break lower after attempting a new breakout.

The data will also influence short term direction. Friday the news was not that great but stocks still managed to rally for other reasons, namely some pre-weekend short covering and oil selling harder once more (134.86, -2.09). While the economic data has a near term impact, Friday shows that oil as well as the dollar with how it reacts to or influences oil, are the longer term influences on price.

Oil is so key because consumers are reacting to it at this price. Ford came out this past week and said it was not selling any trucks or SUV's, that buyers wanted the more energy efficient vehicles. Ford noted that when gas prices hit $3.50/gallon is when this started. With oil in the mid-130's, gas prices are going to stay in the $4 range, and that is without any Gulf storms. Thus our focus on the price of oil the past two weeks as a major key to the market action. While it may be late in this particular run, oil appears to be setting up for another surge higher nonetheless.

With that background we are going to continue to focus the upside on the leading sectors of the Big 3 as well as some others that are trying to emerge, e.g. medical instruments and related stocks, industrial equipment, and individual techs from chips to software that are showing improvement and can provide growth in this kind of environment. The rest of the market is open for downside as the opportunity presents. For instance the bounce back up Friday is a good start on setting up some stocks at resistance after they broke down. With the market breaking down under the strain of high oil and some inflation worries it will pay to play the downside in addition to the mix of upside with the leaders that continue to capture the money that remains in the market.

Support and Resistance

NASDAQ: Closed at 2454.50
Resistance:
The 18 day EMA at 2464
March 2008 trendline at 2495
2500 from interim August lows.
The 200 day SMA at 2511
2540 from November 2007 low
2552 is the May high
2576 represents a range of interim peaks and troughs from May 2007 into December 2007. At least 8 in that period.
2618 from a June 2207 peak.
2625 is an old trendline from summer 2004/summer 2005
2668 to 2673 from November/December 2007 interim peaks
2720 (July 2007 peak), 2724 (December 2007 peak) are key resistance points

Support:
2451 is the August closing low
The 50 day EMA at 2440
2419 is the January 2008 peak and the early February peak
2392 is the April 2008 peak
2386 is the August intraday low
2378 is the mid-February peak; 2379 from the October 2006 peak
The 90 day SMA at 2371
2370 from the April 2006 peak
2340 from the March 2007 low
2315 is the trendline from the summer 2004/July 2006 lows, Q4 2005 consolidation

S&P 500: Closed at 1360.03
Resistance:
1362 is the 90 day SMA
1370 is the August 2007 intraday low
1374 is the March 2007 closing low
The 50 day EMA at 1378
1387 is the April 2008 intraday high
1396 is the February 2008 peak
1406 is the August and November 2007 closing low
The 200 day SMA at 1421
1433 from a pair of August 2007 lows and December mid-month intraday low
1434 is a longer term trendline from the August 2003/September 2004 lows
1446 from the December low
1460 is the February 2007 peak
1481 represents several peaks and lows ranging from April 2007

Support:
1350 where it held early in the week.
1336 is an ancient trendline that held last week
1324 is the April low
1317 from the February low
1270 is the January low
1257 is the March low

Dow: Closed at 12,307.35
Resistance:
The 10 day EMA at 12,324
The 90 day SMA at 12,504
12,518 is the August intraday low
The 50 day EMA at 12,564
12,573 is the mid-February high
12,743 is the November low
12,750 to 12,768 is the February 2008 peak and a series of lows and highs from August 2007
12,786 is the February 2007 peak
12,845 is the August closing low
The 200 day SMA at 12,945
13,092 is the December 2007 intraday low
13,133 is the May 2008 high
13,250 from price points in second half of 2007
13,563 is the late December peak
13,780 is the early December 2007 peak

Support:
12,250 from late March 2007 lows
12,070 from the early February 2008 lows
12,050 from the March 2007
11,731 is the March 2008 low
11,670 is the May 2006 intraday high; 11,642 closing
11,634 is the January intraday low

Economic Calendar

These are consensus expectations. Our expectations will vary and are discussed in the 'Economy' section.

June 16
- New York Empire State Index, June (8:30): -2.4 expected, -3.2 prior
- Net foreign purchases, April (9:00): $80.4B prior

June 17
- PPI, May (8:30): 1.0% expected, 0.2% prior
- Core PPI (8:30): 0.2% expected, 0.4% prior
- Housing Starts, May (8:30): 980K expected, 1.032M prior
- Building Permits, May (8:30): 950K expected, 978K prior
- Capacity Utilization, May (9:15): 79.7% expected, 79.7% prior
- Industrial production, May (9:15): 0.1% expected, -0.7% prior

June 18
- Crude oil inventories (10:30): -4.5M prior

June 19
- Initial jobless claims (8:30): 384K prior
- Leading Economic Indicators, May (10:00): 0.0% expected, 0.1% prior
- Philly Fed, June (10:00): -12.0 expected, -15.6 prior
icon url

ReturntoSender

06/18/08 4:16 PM

#8092 RE: ReturntoSender #6755

Investors Intelligence back to more BEARS than Bulls:

 
Date Published Percent Bullish Percent Bearish
6/18 36.3 37.4


http://www.schaeffersresearch.com/streetools/market_tools/inv_intel.aspx?click=jumpto

icon url

ReturntoSender

06/24/08 11:25 PM

#8097 RE: ReturntoSender #6755

From Briefing.com: 4:07PM Silicon Labs raises Q2 EPS and revs guidance (SLAB) 35.84 +0.02 : Co sees Q2 EPS of $0.40-0.42, up from $0.37-0.39 vs $0.38 First Call consensus; revs $102-104 mln, up from $98-101 mln vs $100.00 mln First Call consensus. Co cites stronger than expected demand, particularly in the voice and embedded modem businesses. The guidance revision was provided as an update concurrent with the announcement of the acquisition of Integration Associates, also made today.

4:04PM Silicon Labs to acquire Integration Associates; expected to be slightly dilutive to 2008 earnings, accretive in 2009 (SLAB) 35.84 +0.02 : Co announces it has signed a definitive agreement to acquire Integration Associates for net $80 mln. The company has built quarterly revenue to a run rate of approx $8 mln. The acquisition is expected to be slightly dilutive to SLAB in 2008, offset by better than previously anticipated performance in SLABs' existing business. The acquisition is expected to be accretive in 2009.

4:04PM Jabil Circuit beats by $0.06, reports revs in-line; guides Q4 EPS in-line, guides Q4 revs (JBL) 14.29 +0.05 : Reports Q3 (May) earnings of $0.26 per share, excluding non-recurring items, $0.06 better than the First Call consensus of $0.20; revenues rose 2.9% year/year to $3.09 bln vs the $3.08 bln consensus. Co issues guidance for Q4, sees EPS of $0.29-0.33, excluding non-recurring items, vs. $0.29 consensus; sees Q4 revs of $3.2-3.3 bln vs. $3.19 bln consensus.

9:01AM Flextronics announces that its Computing segment has been chosen by HPQ to design and manufacture a high-volume consumer notebook computer (FLEX) 9.81 : (HPQ)

4:20 pm : The stock market posted a modest loss Tuesday, after a volatile trading session. A rebound in financial stocks helped partially offset some disappointment over weak consumer sentiment, falling home prices and an earnings warning from UPS. Small-cap stocks were out of favor, with the Russell 2000 Index falling 1.7% compared to the S&P 500's decline of 0.3%.

The financial sector settled the session with a 1.5% gain after being down as much as 2.2%. According to reports, Wachovia (WB 17.88, +0.96) said it hired Goldman Sachs to "perform analytics on our loans to evaluate various alternatives." Meanwhile, shares of UBS (UBS 22.07, +1.47) rose 7% on speculation that HSBC Holdings (HBC 79.06, +0.01) would make an offer to acquire UBS.

Crude oil prices (+0.2% at $136.96) are up 98% compared to one-year ago, which is taking a toll on energy dependent companies. UPS (62.27, -3.99) lowered its second quarter earnings guidance, citing the increase in fuel costs and the sluggish U.S. economy. UAL Corp (UAUA 6.02, -0.07), parent company of United Airlines, is laying off 950, or 15%, of its pilots and reducing its fleet by 100 aircraft. Dow Chemical (DOW 36.61, -1.01) is again raising prices to combat rising energy costs, with a price increase of as much as 25% in July.

On the economic front, consumer confidence in June slipped 13% to its lowest level since 1992, after consumers were bombarded with reports of spiking food and energy costs and rising unemployment. However, these surveys do not always correlate with actual consumer spending, so Briefing.com puts more emphasis on the consumer spending report -- set for release on Friday.

The housing industry remains sluggish, although the rate of home price declines is slowing. The S&P/Case Shiller Index showed that home prices in 20 major metro areas fell 1.6% compared to last month -- the smallest drop since September. However, home prices are now down 15.2% year-over-year -- the largest drop in the composite's eight year history.

The Fed kicked off its two-day FOMC meeting today. Investors expect that the fed funds rate will remain unchanged, although the wording of tomorrow's directive is likely to move the market. Expect the Fed's policy statement around 2:15 PM ET Wednesday.DJ30 -34.93 NASDAQ -17.46 NQ100 -0.5% R2K -1.7% SP400 -1.3% SP500 -3.71 NASDAQ Adv/Vol/Dec 779/2.18 bln/2089 NYSE Adv/Vol/Dec 970/1.34 bln/2172

09:27 am Micron: . Cowen initiated MU with a Neutral saying even though MU has underperformed the SOX over the past year, they do not expect fundamentals to support a sustained upward move near term. At the same time the firm says, the memory market is not structurally broken, and there are some potentially positive catalysts on the horizon -- it is equally tough to short the stock, particularly in light of the current depressed valuation.

09:27 am Qimonda: . Cowen & Co initiates QI with a Underperform saying QI stock has underperformed the semiconductor universe over the past year, but they still see the stock as a short following an uptick that seems to be based on desperate hopes for successful execution of strategic alternatives. The firm says the analysis suggests that QI's weak position in a highly commoditized market leaves it few options, and even a strategic buyer may not be willing to pay a premium to the current valuation.

09:26 am SanDisk: . Cowen & Co initiates SNDK with a Underperform saying SNDK has helped create an entirely new consumer market, but its products have become commoditized, and profitability and returns diminished. The firm says the stock is well off recent highs, but near-term NAND oversupply will likely cap profitability, while longer term they expect continued margin compression to drive further downside relative to the market.
icon url

ReturntoSender

07/05/08 4:32 PM

#8110 RE: ReturntoSender #6755

Amateur Investors Weekend Stock Market Analysis (7/5/08)

http://www.amateur-investor.net/Weekend_Market_Analysis_July_5_08.htm

At this point it doesn't take a degree from the Wharton School of Business to know the market is very oversold. However as we saw in 2001 oversold can become even more oversold in a Bear Market which we have been in for some time now. The question many of us are probably wondering at this time is how much more damage will be done before we get the next major oversold bounce like we saw from mid March through early May.

One positive development over the past few weeks is that the % of Bearish Investment Advisors is once again 10% greater than the % of Bullish Investment Advisors (point A). Since the mid 1990's this has been a very rare occurrence as shown by the chart below as there has only been "4" of them (points B) prior to this latest occurrence. Also note that each one was eventually followed by a substantial oversold rally (points B to C).

The last time the % of Bearish Investment Advisors was 10% more than the % of Bullish Investment Advisors was in mid March (point E) which was followed by a 14% rally in the S&P 500 over a 44 day period (points F to G).


Now the bigger question is has there been enough fear generated among investors to allow for a bottom to develop in the near term? If we take a look at a weekly chart of the Volatility Index (VIX) so far the VIX has only risen up to the mid 20's (point I). Keep in mind the last three times the S&P 500 made a significant bottom (points J) which was then followed by a substantial oversold rally (points J to K) the VIX rose well above the 30 level (points L).


Furthermore if we look at a 5 Day Average of the Put to Call Ratio, in the past, when it has risen at or above the 1.2 level (points M) this has been followed by an oversold rally (points N to O) of varying magnitudes. Currently the 5 Day Average of the Put to Call Ratio is still well below the 1.2 level. Thus with neither the VIX or the 5 Day Average of the Put to Call Ratio at an extreme level so far there hasn't been an excessive amount of fear generated by investors. At this point I would be much more convinced of a nearing bottom if both the VIX and Put to Call Ratio had reached levels like occurred this past March. However keep in mind all it takes is a few big down days which could lead to a big spike upward in both the VIX and Put to Call Ratio.

icon url

ReturntoSender

07/06/08 5:11 PM

#8111 RE: ReturntoSender #6755

InvestHouse Weekend Update:

http://www.investmenthouse.com/weekendmarketsummary.htm

- Half session continues the same themes from the week, more or less.
- Unemployment rate holds at higher rate, indicating last month was no fluke.
- Jobless claims top 400K
- Service sector falls into contraction just as manufacturing heads higher.
- Energy takes hits even as oil climbs: short-term reallocation or a sign oil has hit the choke point for world economies?

Market slips into the holiday weekend without a bang.

The awaited oversold bounce set up a couple of times over the past week and both times the news swept it away, pushing the indices lower. Most of that news had an underlying theme of higher oil prices though the headlines cover different items: with oil topping $145 Thursday ($145.29, +1.72/bbl) it is impacting everything.

That showed up in the news of the day. The ECB bumped rates up 25BP as expected with the interesting notation that the central bank has 'no bias going forward.' Even with that the dollar held up well though by the end of the session it was back to flat. The jobs report came in a bit less than expected (-62K versus -60K) but the unemployment rate held at 5.5%, indicating the May reading was not an outrider. Jobless claims moved above 400K for the first time in this downturn. The services sector turned to contraction even as the manufacturing sector rebounded.

Lots of information for a short session, but even with the information overload there was not much change. The large caps in the NYSE and NASDAQ were the leaders, but they were not strong leaders as SP500 and NASDAQ 100 squeaked out gains. The Dow led with a 0.65% gain, but that was after a slaughter over the prior 6 weeks. It is trying to bottom and put in a bounce after that hammering, but we have seen that before in this leg lower.

Stocks started higher, but as we said in our early alert, the problem with upside recently is stamina. Sure enough the early rise could have used some Viagra to keep its end up because after the open the selling sent the indices negative. Then a sharp rebound to session highs followed by a lackluster drift lower into the shortened close with the large caps modestly positive, the smaller caps sporting uncomfortable losses. With oil surging, even lower gold and a better dollar could not pave the way for upside for stocks, and consequently they did basically nothing on the session.

TECHNICAL: High to low to so-so on the session. Nothing really new Thursday. The action for the week was bearish: high to low sessions all week outside of a rebound off the lows Tuesday that looked promising, but was washed away Wednesday with renewed selling.

INTERNALS: The large cap indices were higher but that didn't offset the weakness in the small and mid-caps. With those lower, breadth was close to -2:1 on NYSE and -1.7:1 on NASDAQ. Volume was lower; half a session will do that. Cannot glean much from volume, but the breadth tells you there is still weakness in the smaller stocks and that means continued weakness for the economy.

CHARTS: Some dojis on the candlestick charts for SP500 and NASDAQ, and with the Dow's hold at the early week lows the large caps look ready to try a bounce . . . just as they looked ready in mid-June, late June, and even on Tuesday. With the Dow down 1750 points from the May peak there is definitely enough oversold pressure ready to release upside, but each time it starts oil jumps or another financial story hits, sending stocks lower once more. SP600 and SP400 (small caps, mid-caps) are in a full-fledged 'catch-up' dive; after holding solidly in the last rally while DJ30 started to roll over (and indicating there was still a continuing economic expansion attempt) they are plummeting toward their 2008 lows as well.

LEADERSHIP: Definitely taking on a defensive flavor, at least for those stocks left standing. Medical, healthcare, and biotech stocks perked up; they did not surge, but they are perking up as the old standby leadership flags. Last week saw the agriculture and coal names taken out, and indeed some oil and gas stocks as well. This indicates that oil is at a point where the world economies seize up: if oil exploration and production stocks cannot climb as oil climbs, that implies prices at a point where demand stalls and turns lower. Maybe. Each time oil hits new highs on this run oil stocks lag only to come back. There was some allocation out of energy stocks this past week but it has the look of tossing everything out 'just in case' ahead of a long weekend. We are looking for them to rebound this coming week.

THE ECONOMY

May's jump in unemployment rate not so fluky after all.

Unemployment screamed higher to 5.5% from 5.1% in April, and the data indicated that the reason was teens hit the market a bit earlier than usual due to a shakeup as to the date of the end of the spring school semester. Easily explained. Then in June the rate stayed the same, 5.5%. Gee, where was the retrenchment?

Non-farm jobs lost another 62K, same as May. April and May were revised down another 52K, basically leaving jobs creation at zero thus far in 2008. Professionals lost 51K, manufacturing 31K; on the upside education and government gained 29K each, leisure/hospitality gained 24K, while services posted a low 7K gain.

Big picture: the jobs market is not great but it is also not at levels seen in recessions. Doesn't mean it won't go there: as we have said the past month, the market is showing weaker economic data to come, and as the economy was skating just over negative GDP in the first half of 2008, it is likely to turn negative given the stock market is a leading indicator and is diving. That means jobs, the most lagging indicator, still have a ways to go to find bottom and we are likely to see recession levels there before this is over.

Jobless claims top 400K.

404K topped the 385K expected, pushing the weekly claims number over 400K for the first time in this economic slowdown. As a refresher, back in 2001, weekly claims topped 400K in mid-April, and the subsequent data showed the recession started in late 2000. Continuing claims edged lower, but held over 3.1M, as no one is finding jobs out there. No surprise as the increase in data the first part of the year is fading, following the market lower.

ISM Services head back into the hole.

After two months back above 50.0 after slumping into contraction in February and March, services followed the rest of the economic numbers and fell to 48.2, well off expectations of 51.0. Pretty much every category tracked lower, notably employment at 43.8, down from 48.7, except for prices. Prices posted a 67.9 reading in February. They exploded to 84.5 in June, a 24% surge.

Stagflation with a little 's.'

That is a microcosm of the economy as a whole. Prices are surging even as economic activity flags. Just as in the 1970's, energy prices have exploded with gasoline up 24% in just a couple of months. As crude broke out over 80 and almost doubled from May to June, the stock market broke down and the economic data started to turn back down as well. Higher prices have choked the economy, and we have activity declining toward negative even as prices continue to rise.

Very similar to the 1970's, but vastly different in magnitude. Fortunately our free enterprise system is much more free enterprise now than it was in the 1970's. At that point we had gone through a decade of massive, massive regulation of everything from the way we could think to how we could water our lawns. We took a major turn toward European socialism, and our economy acted in kind. It took a revitalization of our capitalistic roots in the 1980's to turn us back on to the path that made us great in the first place.

Right now we don't have that kind of regulation. The federal courts have tried to step in and take up where Congress from the 1970's left off, but even that movement has been truncated by the Supreme Court. The last thing we want is judges making our laws. The Constitution is pretty clear on that: Congress passes the laws; all the judiciary is supposed to do is say 'constitutional' or 'not constitutional' and then shut up. Instead, judges go past that and dictate what the law should be. With unelected officials making the rules, entrepreneurship withers as seen with the 1970's Warren Court. Money moved into tax shelters by the billions and the economy had no new blood.

Right now there is still incentive to invest, but that is all changing as there is a lot of talk of changing tax structures, etc. in a need for change. Ironically, much of what we are hearing are the failed policies of the 1970's that the younger generation was not alive to experience. They sound great with words such as 'change,' 'fairness,' etc. The problem is they try to dictate where we spend our money or who gets to spend it, and in economic terms that means redistribution and removing the reward for risk taking. That always chills the desire to invest and create; why do so if you create and then someone takes it from you. As usual, we reward bad behavior and penalize good behavior.

That is the legacy of the 1960's and 1970's that even the boom of the 1980's and 1990's could not unseat. Then when times get tough and every one suffers (though to differing relative degrees just as they prosper at differing degrees in good times) these ideas of fairness come out and we try to strangle ourselves with regulation to make things fair. What we should focus on is what it takes to give everyone the opportunity to succeed and become rich. That means encouraging risk taking with incentives and then letting those that do reap the reward without then coming with the money police to help themselves to your wallet.

I remember back in the early 1990's during that slowdown and political campaign Al Gore speaking about the need to re-educate yourself so you could find a new job and contribute to the economy. Many people did that, myself included. Then after spending tens of thousands of dollars on a higher degree and just starting to reap the reward, the Clinton/Gore administration jacks up my taxes, saying I make too much money and they need to spread it around to others and pay for a bunch of programs that I wouldn't get any benefit from. Of course then when they took in vastly more revenue than they said was needed thanks to the tech boom that had its roots in the early 1980's investment as a result of massive tax incentives (that ultimately turned into huge surpluses thanks to the end of the Cold War and the total lack of defense spending in the 1990's), did they give it back? Of course not. They hoarded it, and the money that the economy needed to keep moving forward was taken and ultimately that combined with imbecilic Federal Reserve policies crashed the tech boom for good.

I digress, but this is why I emphasize looking back at history so we don't forget the economic mistakes made in the past and can advocate through our senators, House representatives, and presidential choices.

THE MARKET

MARKET SENTIMENT

VIX: 24.78; -1.14. Reached to 26 on the high for the week but for a real bottom it will take more than that. As we are looking just for a relief bounce at this point, no big deal.
VXN: 29.85; -1.07
VXO: 26.37; -0.58

Put/Call Ratio (CBOE): 1.2; +0.12. Six consecutive sessions above 1.0 on the close demonstrates there is sufficient pessimism to help spark a bounce.

Bulls versus Bears:

For the second time this year bears are crossing above bulls, doing so basically where they did in March on their way to much more extreme readings just about the time the market made the March low and started the last rally. Positive for the market and if SP500 is going to hold the long term trendline is the place to do it.

This is a reading of the number of bullish investment advisors versus bearish advisors. The reason you look at this is that it gives you an idea of how bullish investors are. If they are too bullish then everyone is in the market and it is heading for a top: if everyone wants to be in the market then all the money is in and there is no more new cash to drive it higher. On the other side of the spectrum if there are a lot of bears then there is a lot of cash on the sideline, and as the market rallies it drags that cash in as the bears give in. That cash provides the market the fuel to move higher. If bears are low it is the same as a lot of bulls: everyone is in and the market doesn't have the cash to drive it higher.

Bulls: 31.9%. Down again with another healthy drop from 33.7%. Below the 35% level and now a bullish indicator and getting close to the lows hit in March at 30.9%. Down from a rebound high at close to 50% on the run through May. In March the indicator did its job with the dive below 35% and the crossover with the bears. They are crossing over again now even before the prior lows are hit. The bulls and bears were eye to eye in mid-February and have crossed. A move into the lower 40's is a decline of significance. A move to 35% is a bullish indicator. This is smashing that. For reference it bottomed in the summer 2006, the last major round of selling ahead of this 2007 top, near 36%, and 35% is considered bullish.

Bears: 44.7%. Strong surge higher once more, up from 39.3%. Well above the bullish level. Again, that is one of the best indications that sentiment is getting extreme on the negative side. It is again past 35%, the level that historically indicates too much pessimism. As with the bulls the jump in bears did its job after hitting 44.7% in the third week of March that was up from an already freakishly strong 43.3% the week before. That was a surge from an already high 36.6% the prior week. Up sharply from a low of 19.6% on the last rally. Bearishness peaked at 37.4% in September 2007. It topped the June 2006 peak (36%) on that run. That June peak eclipsed the March 2006 high (33%) and well above the 2005 highs that spawned new rallies (30% in May 2005, 29.2% in October 2005). This is a huge turn, unlike any seen in recent history.

NASDAQ

Stats: -6.08 points (-0.27%) to close at 2245.38
Volume: 1.424B (-42.24%)

Up Volume: 491.637M (-9.85M)
Down Volume: 930.381M (-975.62M)

A/D and Hi/Lo: Decliners led 1.59 to 1
Previous Session: Decliners led 2.78 to 1

New Highs: 28 (-11)
New Lows: 399 (-6). Moved over 500 during the week, and that gets it more in the range you can start looking for reversals.

Reached lower and then reversed . . . to still close negative. The early gap higher just did not have the strength behind it, but there was no further collapse. NASDAQ is at the February and late March interim lows that represent some support before the January low (2200) and the March low (2155). Good point to try a bounce but as with the other indices, it has been here before as well.

NASDAQ 100 (+0.01%) was one of the three large cap indices positive on Thursday. It tapped some support at 1800 on the low and bounced to close flat. Still not a very pretty pattern, not one suggesting it is about to make a bounce higher.

NASDAQ CHART: Click to view the chart

NASDAQ 100 CHART: Click to view the chart

SOX CHART: Click to view the chart

SP500/NYSE

Stats: +1.38 points (+0.11%) to close at 1262.9
NYSE Volume: 841.9M (-44.61%)

Up Volume: 0 (-260.264M)
Down Volume: 0 (-1.255B)

A/D and Hi/Lo: Decliners led 1.91 to 1
Previous Session: Decliners led 2.74 to 1

New Highs: 16 (-51)
New Lows: 501 (+89). Topped 600 during the week and held over 500 even on the Thursday 'bounce.' The weakness in the small and mid-caps told the story here.

SP500 CHART: Click to view the chart

SP500 reached lower, down below the 2008 low (1257; hit 1252 on the low) and that sparked a 'rebound.' Well, at least a rebound off the lows. SP500 closed flat at that prior low, a logical place for it to bounce but it has yet to make that move after a parabolic move up from the March low to the May high and then back down.

SP600 (-0.95%) sold sharply, continuing to play catch-up to the large cap indices, and continuing to indicate that an economic recovery is a pipedream for now; not surprising given the rebate checks never, ever work. SP600 bottomed Thursday at the January closing lows near 350 and bounced modestly. As with SP500, it is now close to its 2008 lows and reaching a logical point to bounce.

SP600 Chart: Click to view the chart

SP400 CHART: Click to view the chart

DJ30

Up three days of a four day week and it was still down. Wednesday was a bear of a downside session. Thursday DJ30 reached a bit lower then rebounded positive for a market leading 0.65% gain. Wow. At this juncture DJ30 has undercut its prior bottom in this bear market, and it should now be ready to rebound to test the prior 2008 lows and likely fail there, firming them up as serious resistance that will take some more selling and a good base to move back through. When it gets up there and starts to fail, we will look at the downside here again.

Stats: +73.03 points (+0.65%) to close at 11288.54
VOLUME: 146M shares Thursday (half session) versus 230M shares Wednesday.

DJ30 CHART: Click to view the chart

MONDAY

The market will, in theory, get back to serious business this coming week after a short 3.5 day holiday week. There will still likely be many fund managers on vacation, but volume has been no slouch thus far this summer. Unfortunately, it has accompanied the downside of late.

That selling included leaders such as energy (coal and even oil/gas), as well as metals such as steel. Agriculture failed to sprout new gains and sold as well. The leaders are getting knocked back as well, the leaders that have prospered as demand for fundamental products such as food and energy grows worldwide.

Now there is the question of whether this is just a pullback, a periodic retrenchment as needed from time to time, or has energy hit the point where world economies can no longer prosper. In other words, the cost is too high and thus demand will fall, pushing the price of the stocks lower now in anticipation of declining demand.

Several Asian countries have or are in the process of removing gas and energy subsidies and we hear China is figuring out how to do the same as it simply cannot afford to keep them in place despite its still impressive economic growth. Its stock market is down 50% of late as it factors in the added cost of energy and the resulting demand destruction when the controls are removed. No wonder there is some retrenching in the energy stocks this past week.

There may be some more in the coming week though many are at key support levels, and if they are going to hold that will be the place to do it. We are looking for bounces from them but if those bounces don't have much strength then we can anticipate more downside from them to come. Thus on a weak-kneed rebound from this selling we don't want to hang around.

Once more the indices, particularly DJ30, SP500, NASDAQ, are in position to bounce from a very oversold condition. With oil at $145/bbl we are still looking at just a bounce. DJ30 still has to come back up and test its 2008 lows it broke, and the question is whether SP500 breaks its 2008 lows first or if it bounces from here. It takes a certain amount of intestinal fortitude to step in here and play a bounce, but we are going to look at doing just that, and then play the downside when the Dow gets up to its prior March lows and shows signs, as it is likely to do, of failing and heading back lower.

The market is a full fledged bear now, and while we caught some of the downside on the initial decline, we could have caught more. When a bounce sets up some more downside we are going to take advantage of that turn back down as well. At the same time we see what upside leadership, stocks in truly good position, sets up. We will see some in good patterns such as healthcare and other good stocks ready to bounce after getting sold back. In a bear market you need to move in when the selling gets overdone and key levels are breached and ready to be tested. That looks to be the situation now, especially given that the oil and gas, coal, and agriculture stocks came under heavy fire last week. When they take down the leaders they will try to bounce back at first. Again we will look to play the bounce, get reasonable gains, then get out and see what kind of strength it has at resistance. Then we move into the downside if it was a weak move. Once more we change to take what the market gives.

Support and Resistance

NASDAQ: Closed at 2245.38
Resistance:
2261 is a March 2008 interim low
2286 is the first April 2008 gap up point.
2335 is the trendline from the summer 2004/July 2006 lows, Q4 2005 consolidation
2340 from the March 2007 low
2370 from the April 2006 peak
2378 is the mid-February peak; 2379 from the October 2006 peak
The 90 day SMA at 2379
2386 is the August 2007 intraday low
2388 is the June 2008 low
2392 is the April 2008 peak
The 50 day EMA at 2403
2419 is the January 2008 peak and the early February peak
2451 is the August closing low
The 200 day SMA at 2495
2500 from interim August lows.

Support:
2202 is the January 2008 low
2155 is the March 2008 low

S&P 500: Closed at 1262.90
Resistance:
1270 is the January low
The 10 day EMA at 1291
The 18 day EMA at 1311
1317 from the February low
1324 is the April low
1331 is the June low
1344 is an ancient trendline
The 50 day EMA at 1346
1370 is the August 2007 intraday low
1374 is the March 2007 closing low
1387 is the April 2008 intraday high
1396 is the February 2008 peak
1406 is the August and November 2007 closing low
The 200 day SMA at 1410

Support:
1257 is the March low
1237 is the July 2006 low
1224 is the June 2006 low

Dow: Closed at 11,288.54
Resistance:
11,317 from March 2006
The 10 day EMA at 11,523
11,634 is the January intraday low
11,670 is the May 2006 intraday high; 11,642 closing
11,731 is the March 2008 low
The 18 day EMA at 11,746
12,050 from the March 2007
12,070 from the early February 2008 lows
12,250 from late March 2007 lows
The 50 day EMA at 12,172
The 90 day SMA at 12,400
12,518 is the August intraday low
12,573 is the mid-February high
12,743 is the November low
12,750 to 12,768 is the February 2008 peak and a series of lows and highs from August 2007
12,786 is the February 2007 peak
The 200 day SMA at 12,829
12,845 is the August closing low
13,092 is the December 2007 intraday low
13,133 is the May 2008 high

Support:
11,061 from February 2006
10,912 peak from March 2005
10,854 from December 2004
10,701-10,705 from July 2006, July 2005

Economic Calendar

These are consensus expectations. Our expectations will vary and are discussed in the 'Economy' section.

July 8 - Tuesday
- Pending home sales, May (10:00): -3.0% expected, 6.3% prior
- Wholesale inventories, May 910:00): 0.7% expected, 1.3% prior
- Consumer credit, May (3:00): $7.0B expected, $8.9B prior

July 9 - Wednesday
- Crude oil inventories (10:30): -1.98M prior

July 10 - Thursday
- Initial jobless claims (8:30): 404K prior

July 11 - Friday
- Export prices, June (8:30): 0.4% prior
- Import prices, June (8:30): 0.5% prior
- Trade balance, May (8:30): -$62.1B expected, -$60.9B prior
- Michigan preliminary sentiment, July (10:00): 56.0 expected, 56.4 prior
- Treasury budget, June (2:00): $36.5B expected, $27.5B prior
icon url

ReturntoSender

07/11/08 3:40 PM

#8116 RE: ReturntoSender #6755

I think we are working our way to a good bottom but we may not be there yet. We have even more bearishness than we saw in the Investors Intelligence Poll in March. Fully 47% of the Newsletter Writers are bearsih:


http://www.schaeffersresearch.com/streetools/market_tools/inv_intel.aspx?click=jumpto

The level of fear being reflected in the charts may have to spike nearly as high as it did back in March before this ends however:


Also I think the CPC may have to go higher as well. High enough to move the sma's well over 1.2:


Not here that the 60 day sma may need to hit 1.1 before we get a lasting bottom:


On the plus side we are extremely oversold:


icon url

ReturntoSender

07/13/08 3:26 PM

#8120 RE: ReturntoSender #6755

InvestmentHouse Weekend Update 7/11/08:

http://www.investmenthouse.com/weekendmarketsummary.htm

- Gloom hits full bore and market sells, but it does not implode.
- Stock market in turmoil, bond market bucks the trend Friday.
- VIX starts to run after more than a week of market volatility.
- Import prices spiking and trade balance shrinking as we import more inflation and buy less foreign goods as our prosperity slips
- No one stepping up to deliver any meaningful energy policy.
- Set up for a washout early this week, but without oil breaking down it is only short term.

More financial, oil issues rough up stocks yet again.

Plenty of bad news yet again greeted stocks in the morning. Once more FRE and FNM were under fire; when a story starts on an institution (e.g. BSC), it doesn't seem to go away until something breaks or fixes it. Friday the NY Times ran an article saying it was a distinct possibility that the two mortgage giants would become government property. Investors were understandably mortified at the thought even though the two institutions have not proved themselves as bastions of sound judgment and management. Fear was something would happen similar to BSC and on Monday we would be wondering if we were in Europe or in the US.

Oil was also bubbling up again, rallying to a new high on rumor Israel made another dry run of an Iran attack (it was later denied) and the Nigerian ceasefire was set to expire with no end to hostilities and you know militants: they tend to act like militants. Oil shot up to 145.08 on the close, up $3.43/gallon on the session. Oil fell to the near trendline to start the week and then exploded higher with a vengeance. No breakdown there. A weak dollar (now takes 1.5931 dollars to buy a euro) and surging gold (966.80, +24.80) show the problems our weak dollar policy engenders. More on this later when I discuss the most recent evidence of our importation of inflation.

The news cast a palpable gloom over the stock market. Talking to trading desks and the few floor traders left there was a definite 'throw the hands up' level of frustration. Each time the market was setting up to bounce, the one-two punch of new financial issues and rising oil dashes the bounce attempt. Stocks accordingly sold on the open, bounced modestly, then rolled over into lunch, setting new selloff lows on this leg as well as for the year on SP500 and DJ30. Then the President came on to assure us Bernanke and Paulson were working on the situation. Senator Dodd (senate banking chairman) also hit the airwaves assuring us that FNM and FRE had plenty of capitalization, etc.

Whether it was the 'soothing' words or just coincidence, the indices bottomed and surged. Surged. They made it back to positive after the Dow was down near 250 points. Didn't last. In the last hour the market slipped to negative again as many used the bounce to do the old 'get me the hell out ahead of the weekend' move. We picked up some positions on this action given that some strong stocks shrugged off all of this up and down and emerged from the rubble.

Bonds shine a ray of light through the gloom.

It was not a total recovery from the selling what with the last hour slump back to negative, but it was not nearly as bad as the early gloom suggested. Moreover, bond yields stopped their dive; I expected to see the 2 year yield down to 2.30% or less pre-market, but it was up slightly (2.44% versus 2.42% on Thursday). Investors were not fleeing to the safety of treasuries despite the wailing in the stock market futures. The bond market inverted and showed the economic turmoil to come (housing collapse, financial credit issues, weak dollar, surging oil) even as Greenspan and company tried to explain it away. Turns out bonds were right. Now the curve shows the right curvature for future growth and the bond market wasn't panicking Friday morning and indeed bond yields rose through the session with the 2 year closing at 2.60%, up 18BP from the Thursday close. Bonds are suggesting that the stock market is, at least near term, overreacting a bit.

VIX wakes up.

VIX started to break free some, coming within a gnat's butt of 30 (29.44) as it cleared the 26 resistance level. VIX is starting to gin up a bit to get over 40 where it needs to get. That leaves the likelihood of a further selloff early next week that would help spike volatility higher, flush out the market a bit more, and allow a rebound. History shows that after a Friday such as this one and the one last week that the probability of a further blow down that helps set a bottom, interim or longer term, jumps. Again, the oil issue is still hanging out there, so any bounce would be more of the interim, relief type. One thing Friday did that last Friday did not: many traders lost hope of such a bounce. A watched pot won't boil and an anticipated bounce won't spring as long as the majority is looking for it. With the hands thrown up in anger, despair, and frustration on Friday, many gave up on a bounce over the next week. Good.

TECHNICAL. Low to lower back to positive then giving up the green. Not the best intraday action, but given the alternative that looked to be developing early in the session, the finish well off the lows, though negative, was not bad. It was no turning point, it didn't change the character of the market, but given all the gloom there was no implosion. A bit of backbone at the same support levels that held all week.

INTERNALS: Breadth was weak on NYSE (-2:1), flat on NASDAQ. By the close the number of stocks lower had improved considerably. Volume was up on both exchanges, showing there was some strength in buying that drove stocks back up off their new lows for the year (at least on SP500 and DJ30). Price/volume action has improved over the week, so the market has that going for it. Decent though again, not determinative in itself. A very interesting development was the 791 new low count on NYSE. That is extreme, and while it is not a bell signaling a market turn, these kind of extreme numbers should be noted and logged as they accumulate and tell you to be on the lookout for good patterns developing even in the rubble of a selloff.

CHARTS: DJ30 and SP500 plowed to new lows for the year, but they were alone in the adventure as NASDAQ held the higher of its two 2008 lows as did SP600. In the afternoon rebound SP500 even managed to come back within its prior range though it did close at a new 2008 low. In short, while the indices dumped lower early, they rebounded and did not markedly change their overall standing heading into next week. That means NASDAQ, SP500, and SP600 are all still in their lateral range of the past week and a day, and that leaves them in position to make a long overdue relief bounce though it might take another sharp downside session

LEADERSHIP: There was no real change in leadership either, and while that was a positive for those stocks in the health sectors and the smattering elsewhere in tech, light industrial, and software, for a market that is thin on leadership that was not necessarily good news. Energy was perky, however, especially coal, natural gas as anticipated. In a market bounce they are ready to fill in some of the background and lend support. What the market needs is for new and even some old leadership areas to form up some bases out of the rubble of the selloff. That is ultimately the signal that the market is ready to move higher, i.e. good stocks nearing breakout points of good bases after the sentiment and technical indicators hit extreme levels. The thin leadership ranks right now tell the seasoned market trader and investor that even a near term bounce off of some extreme sentiment indications is likely not THE ultimate bottom in the bear market.

THE ECONOMY

All signs pointing toward recession and 1970's-like policy mistakes.

The trade balance figures for May (nothing like timely numbers) show a narrowing trade gap (-$59.8B actual versus -62.2B expected and -60.5B in April), something everyone was harping about for the past 6 years and indeed even longer (20 years as far as I can recall). Everyone said if we did not get the trade balance down we would lose our influx of foreign capital, default, endure locusts, sterility, etc. Basically the argument is we were threatening our standard of living, our economic strength, because we carried a trade deficit.

There has been no decline in the amount of money moving into US treasuries. When the going gets tough, money from around the world shows up at our shores, begging for the safety of US treasuries. So what if the Chinese economy is still growing at a 7+% clip? If there is trouble in the world economies, the mantra is 'go west young currency.' The monthly influx of foreign money shows this is still the case, trade deficit or not.

But lo, now the trade gap is shrinking as the dollar buys less and less, and our prosperity declines due to a weak economy (and a weak dollar). Yes, history shows the very opposite of the argument of those squeamish about trade gaps. When we are prosperous we buy a lot of goods, foreign and domestic. We tend to have a stronger currency when we are prosperous unless it is undermined by foolish policy (a.k.a. Bush I and Bush II policy), and thus we run a deficit because our prosperity and strong dollar allows us to buy more than we sell.

When we turn to recession we buy less because consumption is naturally curtailed through job loss and income decline and because the dollar typically weakens (makes sense: weaker economy means a weaker currency) and thus our dollars buy even less foreign goods. Thus the buying declines, the dollar weakens and buying declines further, but then US goods become more of a value to foreign buyers, we export more and the trade gap narrows. Bad times, narrower gap. It narrows until we return to prosperity and start buying more foreign goods with a strengthening jobs environment and strengthening currency. Gap expands as our prosperity and dollar strength grows.

Now that the trade gap worriers are getting what they want, we can ask, is this really what the rest of us want? It seems intuitive that you want balance. We hear we need balance in our work and play, in what we eat, etc. We are taught that is good. Maybe that works for diet, but would we like it if our economy was 'balanced' with Europe's where 2% growth is considered blockbuster? We averaged 4+% in our good years of recovery; averaged that. Don't we want to have a stronger economy than other nations so we can have a better standard of living, a strong currency, world leading healthcare, technology, diet, etc.? That comes from imbalance. Trade gaps don't matter as long as you have them for the right reasons, i.e. because you have strength. Our history shows we should not fear trade gaps but want them as long as we are promoting and rewarding enterprise, entrepreneurship, and ingenuity. Right now we are heading the other direction, and that is more evidence that we are heading toward something economically worse than we have had thus far.

Importing more inflation as a result of bad decisions.

We have touched on this before, the administration's fixation on a weak dollar in order to rescue manufacturing. We still have the greatest manufacturing sector on earth, it just isn't as great as it was given the decline in demand for heavy machinery here in the US compared to other places on earth. A lot of what we used to make is manufactured elsewhere because of labor costs, proximity to raw materials, etc. It is a natural migration but through misunderstanding economics, both Bush I and Bush II have made the same mistake of pursuing a weak 'strong dollar' policy. No matter that history shows no country has ever, ever devalued its currency and achieved economic prosperity. Indeed, as we are proving in the present day version of a history of failed attempts throughout history, devaluing your currency undermines your economic prosperity by cheapening the hard work of your citizens and importing inflation.

Once more Friday we see the result of the pursuit a weak dollar. Import prices rose 0.9% month over month topping the 0.7% in May that was revised up from 0.5%. Year over year import prices rose a whopping 20.5%! 20.5% inflation in goods bought overseas. Yes energy makes up a big portion of that, but one of the reasons oil is sitting at $145/bbl is not speculation or world demand, but a dollar that has almost cut its value versus a euro in half (Friday it took 1.5931 dollars to buy a euro; it used to take 80 cents to buy a euro). Now who is in favor of a weak dollar?

Strip out energy and the year over year grow was 6.6%. You may breath a sigh of relief that it is not 20%, but 6.6% inflation is killer. Yet even with this, Paulson is still lobbying China to float the yuan more versus the dollar. With its strong economy the yuan would jump higher if not tied to our greenback. Paulson wants a stronger yuan to shrink our trade gap with China. As discussed above, however, do we want that? China makes a lot of cheap goods that we don't make here. Do we want to pay more for these? Maybe, maybe not.

This would not be a problem, however, if we were not pushing the dollar lower and lower. Promote our dollar and let China float its currency; we both win. We slow the transfer of hundreds of billions of dollars to OPEC nations who would love to hurt us. This is not a policy, it is criminal to allow this to happen. Our leaders, both republican and democrat, have for decades ignored the problem with no energy plan and no foresight as to growth in the rest of the world.

Not hearing any solutions on the campaign trail.

The democratic nominee to be says he was not part of that dilatory view toward these issues and thus vote for him as new blood, the element of change. His plan to stop the wealth transfer, however, doesn't even address the serious issues involved. He wants more rebates to pay for gas, i.e. another wealth transfer that fails to solve the underlying problem. Nothing in his energy plan delivers more or cheaper energy. It is applying a band aid to the issue, and once the money is gone nothing has changed. The republican candidate can only offer drilling as an option. That is part of the solution, but there must be resolve to promote R&D to get us off burning oil products to power our vehicle fleet. There is no short term solution to actually producing more energy, but concrete plans to allow more drilling in areas that hold the most potential reserves, aggressively incenting R&D in alternative energy and transportation areas would immediately impact the futures market for energy.

We who trade in the financial markets all understand that markets control prices and perceptions about the future control markets. If the US allows expedited permitting in key areas KNOWN to hold large reserves such as that desolate wasteland called ANWR where no one visits and the predominant wildlife are mosquitoes and biting flies the size of red wasps, the futures market would start factoring that in. Why are we protecting ANWR versus trading it out for some place here in the 48 states, Hawaii, or even another spot in Alaska where there is great beauty, concentrations of wildlife, and other desirable characteristics such as the ability of US citizens to actually see, visit, and marvel at its beauty? Seems to be more than an equitable trade.

What about the 62M acres of federal land currently leased for drilling that we hear about now every day? If it held the potential to produce oil and gas in quantities that would be marketable, it would be drilled tomorrow. The problem is (and I was in the industry for 10 years), as with most things in the world, most of the resources sought are concentrated in just a few areas. The open oceans are basically empty of fish; most fish are concentrated in areas such as the Grand Banks where the conditions are just right. Gold that is commercial is concentrated so removal is easier and thus less costly. There are tons of gold in the ground that will remain in the ground because it is too thinly dispersed to be commercially mined, particularly with the environmental concerns associated with the mining.

Moreover, listening to the rhetoric concerning drilling in ANWR, one would presume that if the 62M acres were developed, a massive outcry would erupt from these same people desiring to prevent ANWR drilling. The science showing where oil and gas deposits are located is now very precise. The 62M acres hold some oil and gas, but they are not concentrated in quantities that make it commercially viable for large companies to develop. Small companies can do it as their overhead is lower, but it will take thousands and thousands of wells to drill each of these smaller deposits. Those will require thousands of miles of roads and pipelines to spider together the small recovery potential and get it to market. Talk about destructive resource acquisition. On the other hand, the large deposits in ANWR and elsewhere would take few well sites given current technology and thus less infrastructure to produce and get hundreds if not thousands of times more product to market. We win by getting a lot of production at a cheaper per barrel price, and with the amounts we are talking about, the futures market will indeed be favorably impacted. It is a myth that producing this oil, indeed commencing efforts to produce this oil, won't impact the futures market near term. If we are serious about doing it and expedite the process, we will feel the impact much sooner than the 7 to 10 years bandied about on the television.

Drilling is not the only answer. As noted, we need to incent the pursuit of other forms of energy, primarily getting our vehicle fleet off fossil fuels. That is the only way we will solve our addiction to foreign oil and stop the wealth transfer. Right now we are providing no incentive to do this. Indeed, we are providing no incentive for ANY solution to our energy and wealth/standard of living transfer. Incenting alternatives to fossil fuel engines along with increasing current supply of traditional fuels should be our top priorities as it gives us a one-two punch approach to reining in runaway energy costs . . . even with our policy of cheapening our labor and hard work through devaluing our currency.

I got a bit off the path there of inflation importation, but it is all bundled together given that oil is valued in dollars and the policies we are pursuing exacerbate the natural price rises thanks to demand. We have to think big picture and act accordingly. We can get off fossil fuel engines in the time some say it would take to get offshore or ANWR production to market. That does not mean we should not drill more: drilling will lower product price and give us more currency to deal with solving the ultimate problem, i.e. getting off fossil fuels and stopping the transfer of our standard of living overseas.

THE MARKET

MARKET SENTIMENT

VIX: 27.49; +1.9. Finally getting off the dime and moving higher. When it goes, it goes fast, so a selloff in stocks early in the week (Monday) that historically follows a weak ending to a negative week would spike it quickly toward that level.
VXN: 31.67; +1.22
VXO: 29.96; +2.76

Put/Call Ratio (CBOE): 1.15; +0.09. Eleven in a row over 1.0 on the close. Plenty of worry about more downside exhibited in the options market to help firm up a bounce.

Bulls versus Bears:

For the second time this year bears are crossing above bulls, doing so basically where they did in March on their way to much more extreme readings just about the time the market made the March low and started the last rally. Positive for the market and if SP500 is going to hold the long term trendline is the place to do it.

This is a reading of the number of bullish investment advisors versus bearish advisors. The reason you look at this is that it gives you an idea of how bullish investors are. If they are too bullish then everyone is in the market and it is heading for a top: if everyone wants to be in the market then all the money is in and there is no more new cash to drive it higher. On the other side of the spectrum if there are a lot of bears then there is a lot of cash on the sideline, and as the market rallies it drags that cash in as the bears give in. That cash provides the market the fuel to move higher. If bears are low it is the same as a lot of bulls: everyone is in and the market doesn't have the cash to drive it higher.

Bulls: 27.4%. Plunging from 31.9% and blowing past the 30.9% low hit in March and well below the 35% level considered bullish for stocks (gets so low there is plenty of money lying around to fund a rally if things turn). Steep drop from a rebound high at close to 50% on the run through May. In March the indicator did its job with the dive below 35% and the crossover with the bears. Now it is going above and beyond. Bulls and bears have crossed over again, doing so even before the prior lows are hit. The bulls and bears were eye to eye in mid-February and have crossed. A move into the lower 40's is a decline of significance. A move to 35% is a bullish indicator. This is smashing that. For reference it bottomed in the summer 2006, the last major round of selling ahead of this 2007 top, near 36%, and 35% is considered bullish.

Bears: 47.3%. Up sharply from 44.7% and 39.3% the week before. Well above the bullish level and the highest since 1995. Again, that is one of the best indications that sentiment is getting extreme on the negative side. It is again past 35%, the level that historically indicates too much pessimism. As with the bulls the jump in bears did its job after hitting 44.7% in the third week of March that was up from an already freakishly strong 43.3% the week before. Up sharply from a low of 19.6% on the last rally. Bearishness peaked at 37.4% in September 2007. It topped the June 2006 peak (36%) on that run. That June peak eclipsed the March 2006 high (33%) and well above the 2005 highs that spawned new rallies (30% in May 2005, 29.2% in October 2005). This is a huge turn, unlike any seen in recent history.

NASDAQ

Stats: -18.77 points (-0.83%) to close at 2239.08
Volume: 2.392B (+3.49%). Volume was up as NASDAQ reached lower and rebounded off the January low. Finished down but shows buying, whether short covering or long buying, off of that level once more.

Up Volume: 700.999M (-860.35M)
Down Volume: 1.63B (+911.233M)

A/D and Hi/Lo: Decliners led 1.08 to 1
Previous Session: Advancers led 1.24 to 1

New Highs: 37 (+8)
New Lows: 419 (+90)

NASDAQ CHART: Click to view the chart

A new low on this leg of selling, but NASDAQ did not come close to breaking new ground for 2008, tapping right at the January intraday low and rebounding. It missed out closing positive, but the rebound once more at this support and on rising trade shows there is indeed some solid support that is trying to bounce it higher. Got no held from the large caps on Friday and that was its Achilles heel but it did not sink it. NASDAQ is due a bounce to rally up near 2375 or so and form the right shoulder to a head and shoulders trying to form since March. If the market is ultimately going lower from here it will form that pattern over the next four or five weeks.

NASDAQ 100 (-1.58%) was the loss leader on the session, but it too recovered after undercutting some support at 1800 and holding above that on the close. Trying to hold the line and put in a bounce but with AAPL, RIMM, GOOG trading lower, it was not going to bounce on Friday.

SOX (-1.00%) is trying to hold 340ish, the lows from January through March, and Thursday and Friday it did manage to bounce off of that level. It is more of a follower to the upside here as it is suffering from a sharp downside bias.

NASDAQ 100 CHART: Click to view the chart

SOX CHART: Click to view the chart

SP500/NYSE

Stats: -13.9 points (-1.11%) to close at 1239.49
NYSE Volume: 1.734B (+13.05%). Strongest volume of the week as the NYSE indices sold off but then recovered. Similar to NASDAQ, that is not necessarily a bad thing despite the downside finish on the session.

Up Volume: 496.709M (-266.838M)
Down Volume: 1.23B (+488.496M)

A/D and Hi/Lo: Decliners led 2.03 to 1
Previous Session: Advancers led 1.12 to 1

New Highs: 40 (+14)
New Lows: 791 (+318). Some seriously negative indications from the new lows, definitely getting extreme though as noted above, not necessarily a timing indicator.

SP500 CHART: Click to view the chart

Reached to a new 2008 low, reaching down to the June 2006 low, then rebounding to hold its recent range where it has tried to find some footing for a bounce similar to the other indices. Still in a downtrend and quite an ugly one, but at some point it is going to make a bounce to do a bit more than test the 10 or 18 day EMA. With this downside bias the going is tough, but it is showing tenacity at this 2005/2006 range of support.

SP600 (+0.31%) was the lone wolf to the upside on the session, managing to hang onto the gains in the last hour but just by a couple of whiskers. Once more it held above the January and March 2008 lows and bounced positive. No trend reversal, no big change, just working on trying to put in a floor here for a bounce.

SP600 Chart: Click to view the chart

SP400 CHART: Click to view the chart

DJ30

The Dow recovered off its lows as well, but it plowed more new low ground and lagged on its recovery. Its lateral move around 11,250 has sagged through the bottom as the Dow touched down below 11K for the first time since mid-2006. It is oversold having faded roughly the same amount as the initial selloff from October through March (2000 points), and there is support in the 11K range. It will bounce along with the rest of the market at some point in the near future given its losses to this point, but there is likely more downside to come, the first being at 10,700ish but then on down closer to 10,000 and that is time to break out those old Dow 10,000 caps.

Stats: -128.48 points (-1.14%) to close at 11100.54
VOLUME: 275M shares Friday versus 248M shares Thursday. Strongest volume of the week, but not as positive as the other indices (and they were not resounding upside wins) given the lack of serious recovery off its session lows.

DJ30 CHART: Click to view the chart

THE WEEK AHEAD

The market is still in position to rebound as NASDAQ, SP500 and SP600 all held their lateral moves and the same support, but the market finds it nearly impossible to shake off the daily financial story or the steady climb in oil prices. At some point the market simply becomes so oversold it rebounds regardless of the news. That is what we see still developing, it is just to this point the market hasn't been able to spring the upside. Again at some point it makes the snap back even if it is just a bounce in a bear market, and we are definitely in the latter; have been for quite some time.

At this point you start looking at bigger patterns to see just how far down the market has to go. A major selloff often has three major legs lower. As noted in the Dow discussion, it looks as if the Dow is at the last stage of a second leg lower in the selling. NASDAQ, however, looks as if it has only completed one full downside leg and is only half way down its second leg if you measure it by the first 600 point decline. Similar on the SP500 though you can debate the initial 150 points from October through November as the first leg or not. What this shows is that at this juncture is that the market is currently oversold but it is not near the bottom of the bear.

Doesn't mean you cannot make some serious scratch on the screaming upside recoveries, one of which is not too far off, and some more serious scratch on the selloffs after the runs higher. As you know, we are playing the current leaders in anticipation of that upside recovery ahead of playing a lot more downside after the rally runs its course. Of course we have some downside positions now as well; started taking a few as the lateral consolidation is eroding a bit. We are still anticipating a big blow down before the bounce, and we will use that to lock in that downside gain and then catch the wave back up, ride it until it starts to roll over, then have a clear shot at the downside if the technical indications to the upside are as weak as we anticipate.

Support and Resistance

NASDAQ: Closed at 2239.08
Resistance:
2261 is a March 2008 interim low
The 10 day EMA is 2277
2286 is the first April 2008 gap up point.
2335 is the trendline from the summer 2004/July 2006 lows, Q4 2005 consolidation
2340 from the March 2007 low
2370 from the April 2006 peak
2377 is a 50% retracement of the June to July selloff.
2378 is the mid-February peak; 2379 from the October 2006 peak
The 90 day SMA at 2376
The 50 day EMA at 2376
2386 is the August 2007 intraday low
2388 is the June 2008 low
2392 is the April 2008 peak
2419 is the January 2008 peak and the early February peak
2451 is the August closing low
The 200 day SMA at 2484
2500 from interim August lows.

Support:
2202 is the January 2008 low
2155 is the March 2008 low

S&P 500: Closed at 1239.49
Resistance:
1244 is an August 2005 peak
1257 is the March low
1270 is the January low
The 10 day EMA at 1266
The 18 day EMA at 1286
1317 from the February low
1324 is the April low
1325 is a 50% retracement of the May to July selloff
The 50 day EMA at 1329
1331 is the June low
1342 is an ancient trendline
1370 is the August 2007 intraday low
1374 is the March 2007 closing low
1387 is the April 2008 intraday high
1396 is the February 2008 peak
The 200 day SMA at 1403
1406 is the August and November 2007 closing low

Support:
1240 to 1221 are September 2005 peaks1234 is the July 2006 low
1224 is the June 2006 low

Dow: Closed at 11,100.54
Resistance:
11,061 from February 2006
11,317 from March 2006
The 10 day EMA at 11,319
The 18 day EMA at 11,517
11,634 is the January intraday low
11,670 is the May 2006 intraday high; 11,642 closing
11,731 is the March 2008 low
12,000 is a 50% retracement of the May to July selloff
The 50 day EMA at 11,999
12,050 from the March 2007
12,070 from the early February 2008 lows
12,250 from late March 2007 lows
The 90 day SMA at 12,334
12,518 is the August intraday low
12,573 is the mid-February high
12,743 is the November low
12,750 to 12,768 is the February 2008 peak and a series of lows and highs from August 2007
The 200 day SMA at 12,765
12,786 is the February 2007 peak
12,845 is the August closing low
13,092 is the December 2007 intraday low
13,133 is the May 2008 high

Support:
10,912 peak from March 2005
10,854 from December 2004
10,701-10,705 from July 2006, July 2005

Economic Calendar

These are consensus expectations. Our expectations will vary and are discussed in the 'Economy' section.

July 15 - Tuesday
- PPI, June (8:30): 1.3% expected, 1.4% prior
- Core PPI (8:30): 0.3% expected, 0.2% prior
- NY Empire Sate PMI, July (8:30): -4.0 expected, -8.7 prior
- Retail sales, June (8:30): 0.3% expected, 1.0% prior
- Retail ex-auto (8:30): 0.8% expected, 1.2% prior
- Business inventories, May (10:00): 0.5% expected, 0.5% prior

July 16 - Wednesday
- CPI, June (8:30): 0.7% expected, 0.6% prior
- Core CPI (8:30): 0.2% expected, 0.2% prior
- Net foreign purchases, May (9:00): $115.1B prior
- Capacity Utilization, June (9:15): 79.4% expected, 79.4% prior
- Industrial Production, June (9:15): 0.2% expected, -0.2% prior
- Crude oil inventories (10:30): -5.8M prior
- FOMC minutes, June 25 meeting (2:00)

July 17 - Thursday
- Building permits, June (8:30): 970K expected, 969K prior
- Housing starts, June (8:30): 968K expected, 975K prior
- Initial jobless claims (8:30): 346K prior
- Philly Fed, July (10:00): -15.2 expected, -17.1 prior
icon url

ReturntoSender

07/19/08 10:21 PM

#8128 RE: ReturntoSender #6755

Amateur Investors Weekend Stock Market Analysis (7/19/08)

http://www.amateur-investor.net/Weekend_Market_Analysis_July_19_08.htm

As talked about the past few weeks if the Volatility Index (VIX) rose above the 30 level (point A) that would likely lead to an oversold bounce which occurred this week (points B to C). However keep in mind the VIX peaked much lower than what occurred in mid March, mid January and mid August (points D) which were followed by significant oversold rallies (points E to F) ranging from 10% to 15%. Overall the VIX is acting similar to what occurred last November when it rose substantially (points G to H) and got just above the 30 level which was then followed by a sharp pullback (points H to I) as the S&P 500 briefly rallied (points J to K). This was then followed by another move lower before the real bottom occurred a week and a half later in late November (points K to L). Thus although it appears we have seen a short term bottom it's not totally out of the question that something similar to last November could also develop over the next week or so.


Meanwhile the % difference between the Bullish and Bearish Investment advisors reached an 11 year low this week as it dropped to just below -20% (point M). At least since the mid 1990's when the % difference has dropped to -10% or below (points N) this has been followed by some substantial oversold rallies (points O to P).


However keep in mind although this has worked well going back to the mid 1990's if we go even further back to the period from 1970 through 1980 you can see that the % difference between the Bullish and Bearish Investment Advisors reached far more extreme levels than we have seen since the mid 1990's. Back in the 1970's the % difference dropped to -30% or below (points Q) before significant oversold rallies occurred (points R to S). Thus even though the latest % difference between the Bullish and Bearish Investment Advisors has dropped just below -20% it could go even lower if we enter a period like the 1970's.


As far as the major averages if the lows made on Tuesday (7/15) end up being a short term bottom here are some potential upside resistance levels to watch over the next few weeks. The first area of upside resistance for the Dow would be at its 23.6% Retracement Level (calculated from the October 2007 high to the July 15th low) near 11600. If the Dow can rise above that level then the next area of upside resistance would be at its 50 Day EMA (blue line) near 11850.


The Nasdaq has risen back to near its 23.6% Retracement Level around 2320 (calculated from the October 2007 high to the mid March low). If the Nasdaq can rise above the 2320 level then it should make a run up to either its 50 Day EMA (blue line) near 2360 or its 200 Day EMA (green line) around 2425 which also coincides with its 38.2% Retracement Level.


As far as the S&P 500 it's first area of upside resistance would be at its 23.6% Retracement Level (calculated from the October 2007 high to the July 15th low) near 1290. If the S&P 500 can rise above the 1290 level then its next area of upside resistance would be at its 50 Day EMA (blue line) near 1310.


Overall if the major do follow through to the upside over the next few weeks this will likely just be a typical oversold Bear Market Rally which will eventually be followed by another significant downward move some time in the Fall.


icon url

ReturntoSender

07/21/08 6:14 PM

#8130 RE: ReturntoSender #6755

From Briefing.com: 4:38PM Apple beats by $0.11, beats on revs; guides Q4 EPS below consensus, revs below consensus (AAPL) 166.29 +1.14 : Reports Q3 (Jun) earnings of $1.19 per share, $0.11 better than the First Call consensus of $1.08; revenues rose 38.0% year/year to $7.46 bln vs the $7.37 bln consensus. Co issues downside guidance for Q4, sees EPS of $1.00 vs. $1.24 consensus; sees Q4 revs of $7.8 bln vs. $8.32 bln consensus. Gross margin was 34.8 percent (vs flat guidance from Q2 of 32.9%), down from 36.9 percent in the year-ago quarter. Apple shipped 2,496,000 Macintosh computers during the quarter, representing 41 percent unit growth and 43 percent revenue growth over the year-ago quarter. The Company sold 11,011,000 iPods during the quarter, representing 12 percent unit growth and seven percent revenue growth over the year-ago quarter. Quarterly iPhone units sold were 717,000 (vs over 700K guidance) compared to 270,000 in the year-ago-quarter.

4:38PM QLogic beats by $0.02, beats on revs (QLGC) 16.48 -0.12 : Reports Q1 (Jun) earnings of $0.31 per share, $0.02 better than the First Call consensus of $0.29; revenues rose 20.5% year/year to $168.4 mln vs the $161.9 mln consensus. "Our strong revenue performance was driven by sequential growth of 9% for both our Host Products and Network Products from the fourth quarter of fiscal 2008."

4:36PM Texas Instruments misses by $0.02, misses on revs; guides Q3 EPS below consensus, revs below consensus (TXN) 28.52 -0.30 : Reports Q2 (Jun) earnings of $0.44 per share, $0.02 worse than the First Call consensus of $0.46; revenues fell 2.2% year/year to $3.4 bln vs the $3.39 bln consensus. Co issues downside guidance for Q3, sees EPS of $0.41-0.47 vs. $0.51 consensus; sees Q3 revs of $3.26-3.54 bln vs. $3.56 bln consensus. The co says demand slowed unexpectedly in June primarily because distributors reduced inventory levels and did not replenish them late in the quarter. Additionally, Wireless revenue declined in the quarter, continuing its first-quarter weakness. "We believe this slower demand was due to a mix of reasons, including a weaker economic environment and greater confidence in TI's ability to deliver products within short lead times," Templeton said. "Our orders were up in the quarter and backlog grew, but we are cautious given the demand environment we just experienced. If demand strengthens as quickly as it slowed, we are well-positioned to meet it." (stock is halted)

4:30PM Photronics announces Resignation of CEO, Michael Luttati (PLAB) 6.21 -0.04 : The co announces that Michael Luttati will step down as Chief Executive Officer of the co and as a member of the Board of Directors effective immediately. Chairman of the Photronics Board of Directors, Constantine ("Deno") Macricostas will assume the role of interim CEO. Mr. Luttati will remain as a consultant to the Company for a period of time to help with the transition to new leadership. Photronics' Board of Directors has appointed a search committee and will retain an executive search co to lead the task of identifying a new Chief Executive Officer.

4:10PM Volterra Semi beats by $0.07, beats on revs (VLTR) 15.21 +0.03 : Reports Q2 (Jun) earnings of $0.25 per share, $0.07 better than the First Call consensus of $0.18; revenues rose 55.3% year/year to $28.7 mln vs the $27.5 mln consensus. According to President and CEO Jeff Staszak, "Our second quarter was another strong quarter for Volterra, as reflected in our record revenues and earnings per share results. I'm very pleased with our continuing execution and performance, as we scaled our business to achieve growth in each of our target markets."

4:05PM SanDisk misses by $0.23, misses on revs (SNDK) 18.01 +0.44 : Reports Q2 (Jun) loss of $0.10 per share, excluding non-recurring items, $0.23 worse than the First Call consensus of $0.13; revenues fell 1.3% year/year to $816 mln vs the $906.1 mln consensus. Co is delaying the start of the next phase of production ramp in Fab 4 and now expects it to start no sooner than April 2009. The co is also pushing out its decision to invest in Fab 5 until market conditions improve. These actions are aimed at reducing future capital expenditures and inventory growth in order to maintain a strong balance sheet... Co says, "Our Q2 sales were well below our expectations due to the rapid deterioration in consumer confidence which impacted our sales in U.S. retail and to handset OEMs. Product gross margin was negatively impacted by the lower sales volume and a substantial inventory write-down. Overall demand is expected to improve in the upcoming holiday season; however, industry-wide Flash inventories remain excessive and pricing and margins will therefore remain under pressure until supply and demand come into balance. We are taking significant actions to slow our captive supply growth, which will reduce our capital expenditure commitments, and allow us to better manage our inventory. We are also continuing to improve our cost structure through transitions to 43-nanometer MLC and the industry's first commercialized 3-bits per cell NAND flash. While the industry downturn has been more pronounced and severe than expected, we are optimistic about our long-term renewed growth when the market rebounds."

4:20 pm : The stock market posted a slight loss near the unchanged mark on Monday. A rise in oil prices and a steep drop in shares of two major pharmaceutical companies overshadowed a better-than-expected earnings report from one of the world's largest financial firms.

Bank of America (BAC 28.52, +1.03) reported a 43% drop in earnings per share to $0.72. However, the result easily topped Wall Street's forecast of $0.53 per share, due to a lower-than-expected write-down of $1.2 billion. BofA's CEO plans to recommend that the board leave the quarterly dividend at $0.64 per share (9.0% annual yield at current levels).

The financial sector climbed 2.8% shortly after the opening bell, but settled with a loss of 0.9% following some profit-taking efforts after last week's 11.4% surge.

In corporate news, pharmaceutical companies Merck (MRK 35.39, -2.29) and Schering-Plough (SGP 18.99, -2.45) tumbled 6.1% and 11% respectively, due to continued concerns over the cholesterol drug Vytorin. The companies delayed their earnings reports until after the market close to discuss a report that said Vytorin does not lower the risk of major heart valve problems.

European pharmaceutical company Roche Holdings offered to acquire the remainder of Genentech (DNA 93.69, +11.87) for $43.7 billion, or $89 per share in cash. Roche already owns a 56% stake in Genentech. Shares of DNA are trading higher than the offer price on speculation that Roche will have to raise its bid.

Yahoo! (YHOO 21.68, -0.77) and activist investor Carl Icahn have reached an agreement regarding their pending proxy contest. Under the deal, Icahn will be appointed to the board, and two more seats will be filled from a list of nine candidates recommended by Icahn. In turn, Icahn will withdraw his nominees for vote at the annual meeting.

Three of the ten sectors posted a gain. Energy stocks (+2.9%) led the way as crude prices climbed 2.1% to $131.56. The advance in oil prices came as a tropical storm entered the Gulf of Mexico.

Consumer discretionary (-1.3%), health care (-1.2%), and financials (-0.9%) were the main laggards.

On the economic front, June leading indicators fell 0.1%, which is in-line with expectations. For the most part, the report is a collection of previously announced economic indicators, and as a result it had a limited impact on the stock market. DJ30 -29.23 NASDAQ -3.25 NQ100 -0.2% R2K +0.7% SP400 +0.7% SP500 -0.68 NASDAQ Adv/Vol/Dec 1579/1.84 bln/1238 NYSE Adv/Vol/Dec 2034/1.20 bln/1115

icon url

ReturntoSender

07/26/08 6:18 PM

#8138 RE: ReturntoSender #6755

Amateur Investors Weekend Stock Market Analysis (7/26/08)

http://www.amateur-investor.net/Weekend_Market_Analysis_July_26_08.htm

The major averages stalled out at key upside resistance areas on Wednesday and then got sold off pretty hard on Thursday before bouncing some on Friday. The Dow stalled out right at its 38.2% Retracement Level (calculated from the May high to the July 15th low) near 11700 (point A). If the Dow can hold support near Friday's intra day low around 11325 early next week then we may see at least one more move higher through the first week of August. The next levels of upside resistance above 11700 would either be at the Dow's 50 Day EMA (blue line) near 11800 or at its 50% Retracement Level just below 12000 (point B).


As for the the Nasdaq it stalled out on Wednesday right at its 50 Day EMA (blue line) near 2350. If the Nasdaq can hold support early next week around the 2280 level then it could make at least one more move higher with the next level of significant upside resistance near 2425 (point C) which corresponds to its 200 Day EMA (green line) and 38.2% Retracement Level calculated from the late October 2007 high to the low made in mid March.


The S&P 500 just like the Dow stalled out at its 38.2% Retracement Level (calculated from the May high to the July 15th low) near 1290 (point D). If the S&P 500 can hold support early next week near 1250 then it may make at least one more move higher with the next area of upside resistance above 1290 either at its 50 Day EMA (blue line) near 1305 or at its 50% Retracement Level around 1320 (point E).


Meanwhile for those watching the price of Crude Oil further action in the major averages may depend on what the price of Crude Oil does. As we have seen in the past there basically has been an inverse relationship between the price of Crude Oil and the Dow. When the price of Crude Oil has risen (points F to G) the Dow has generally fallen (points H to I) and when the price of Crude Oil has fallen (points G to F) the Dow has risen (points I to H).


As you can see below the price of Crude Oil had risen way above the top of its upward trending channel (black lines) so it was due for a correction as it had gone from the mid $80's to the upper $140's in just 5 months. In the near term the price of Crude Oil may drop back to the top off its upward channel near the $120 level so this will be a key level to watch next week. If the price of Crude Oil stabilizes near the 120 level and then begins to rise again this could put a quick end to the rally that began with the July 15th lows. On the other hand if the price of Crude Oil were to drop below $120 then the next area of support would be at its 40 Week EMA (blue line) just above 110 which would likely help the major averages move higher over the next week or two.


icon url

ReturntoSender

07/26/08 7:18 PM

#8139 RE: ReturntoSender #6755

Headline Charts Blog always worth reading:

http://headlinecharts.blog.com/


I knew there was something I forgot to include yesterday. Above is Ken's latest breakdown of sector leadership for short-term trading, 1-4 weeks. These sectors have really bounced around lately but that is because commodities have finally fallen off the cliff and that significantly impacts all sectors as a result.

I'm still not ready to buy financials or consumer stocks, and their recent strength looks more like a bounce than the beginning of new leadership by these groups. And I really don't like the prospects for a stock market being led by healthcare and staples which are defensive groups.

Tech is a huge disappointment, but its recent weakness makes sense. If commodities have weakened due to expectations of a weak world economy ahead, that weakness also applies to tech which is an early growth leader. In other words, it is too early to be being buying tech as a group.

Some might be surprised by the weakness in the traditionally defensive utilities, but this makes sense too since they seem more tied to energy prices now, particularly natural gas and coal. Also, they have had a huge multi year runnup in prices that needs to consolidate... and they have lot's and lot's of debt, and need to issue lot's more to tackle the long neglected electrical infrastructure challenges ahead.

There is also the issue of dividend payouts and interest rates. Weakness in the high yield utilities could be indicating higher long-term interest rates ahead. That one I'm not so sure about, but it is a topic for another time.

The news isn't all bad. Breaking the backbone of the uptrend in energy prices gives the market and the economy the chance now to regain its footing. Also, the sector rotation is now making a lot of sense with the economy slowing, the defensive groups are the leaders while the inflation groups are the laggards.

Now we watch and wait for the convincing signal (not just an oversold bounce) that the rate sensitive, early growth leaders are starting to lead over the defensive groups. That is the necessary ingredient for a new bull market.

One last note, IBD still sees the market as in a correction, although they acknowledge there have a been a couple days that looked like potential follow throughs... but they didn't pan out. So they continue to recommend waiting for a market buy signal before buying breakout, growth stocks again.

I wonder if they are following their own advice? It is hard not to see this as a short-term opportunity to make some quick trades. But as Ken mentions, that window of opportunity may be close to shutting down again.

Friday, July 25, 2008
Ken Tower Comments

Ken Tower knows how to call the market, as shown by this annotated chart.


He also makes calls on the current trend as in up, down... and a few weeks back I was confused about when he is talking about a "market signal" versus a "trend change". I'll start tracking the trend signals also to see if it is worth tracking both, or whether it just confuses things. Also, talk about confusing, he sends some really good caution signals on the very short term that aren't shown above. I didn't include them because they clutter up the larger signals, even though these are also short term, which he calls "near term 1-4 weeks".

He currently describes his market outlook as cautiously optimistic. Not very original, but makes the point well. Unfortunately, he sees the upside as only to 1300, and then sees a potential retest down to 1200.


icon url

ReturntoSender

08/02/08 9:01 PM

#8145 RE: ReturntoSender #6755

icon url

ReturntoSender

08/02/08 9:42 PM

#8147 RE: ReturntoSender #6755

Amateur Investors Weekend Stock Market Analysis (8/2/08)

http://www.amateur-investor.net/Weekend_Market_Analysis_Aug_2_08.htm

The market has been very volatile during the past several days with big moves in both directions. A 60 minute chart of the Nasdaq 100 going back 20 trading days shows it has been whipsawed all over the place but the end result has virtually been no change at all despite all of the big moves. This type of action is great for Day and Swing traders but not so good for those looking to Buy and Hold stocks or ETFs over a period of several days.


As far as the major averages the Dow which completed a 5 Wave pattern on July 23rd using a 60 minute intra day chart appears to be going through an ABC type correction. The key thing to watch early next week is whether the Dow can hold support along its newly developed upward sloping trend line (black line) originating with the July 15th low which is now nearing the 11250 area.


If the Dow can hold support at or above this trend line then look for one more move higher with upside resistance coming in near the 11700 level which corresponds to its 38.2% Retracement Level (calculated from the May high to the July 15th low) and declining 50 Day EMA (blue line) shown in the chart below. Meanwhile if the Dow drops below its newly developed upward sloping trend line (black line) then that could eventually lead to a retest of the July 15th low (point D) at some point in August.


The S&P 500 also completed a 5 Wave pattern on July 23rd and appears to be going through an ABC correction as well. If the rally from the July 15th low is going to remain intact the S&P 500 will need to hold support at or above its newly developed upward sloping trend line (black line) next week which is currently around the 1250 level.


If the S&P 500 holds support at or above 1250 and then makes one more move higher look for upside resistance to occur either at its 38.2% Retracement Level (calculated from the May high to the July 15th low) around 1290 or at its declining 50 Day EMA (blue line) near 1298 in the chart below. Meanwhile if the S&P 500 falls below its upward sloping trend line (black line) then that may lead to an eventual retest of the July 15th low (point E) at some point in August.


As far as the Nasdaq it has been trending higher since the July 15th low however it has been extremely choppy. The key short term support area to watch next week would be along its upward sloping trend line (black line) which is currently around 2295.


If the Nasdaq can hold support at or above the 2295 level then look for one more move higher with resistance coming in either near 2360 which is at its 50% Retracement Level (calculated from the May high to the July 15th low) or at its 61.8% Retracement Level near 2400. Meanwhile if the Nasdaq were to break below its upward sloping trend line then that may eventually lead to a retest of its July 15th low (point F) at some point in August.


The Nasdaq 100 has encountered strong resistance so far near 1875 which corresponds to its 38.2% Retracement Level (calculated from the June high to the July 15th low) and declining 50 Day EMA (blue line). If the Nasdaq 100 can break above the 1875 level and make one more move higher its next significant area of upside resistance would be at its 200 Day EMA (green line) near 1900. Meanwhile if the Nasdaq 100 falls below the 1800 level then look for a retest of the July 15th low (point G).


Finally for those that are looking for a signal that the market may reverse to the upside on a Short Term basis one thing that you can focus on is the # of Declining Stocks in the NYSE. When you see "3" days in a row in which the # of Declining Stocks has risen at or above 2000 that usually is a pretty reliable signal that at least a brief oversold bounce is going to occur. I have marked the most recent occurrences in the chart below with entry days denoted by the letter "E".


The table below shows all of the Signals so far in 2008 when the # of Declining Stocks in the NYSE has risen at or above the 2000 level "3" days in a row. As you can see the odds of getting a $1 to $2 short term profit in the SPY ETF are very high when this signal occurs. The last signal occurred on July 15th which was followed by a $6 gain in the SPY within 5 trading days.

Signal Entry Entry 5 Day $1 $2 $3 $4+
Date Date Price High Gain Gain Gain Gain
3/10/08 3/11/08 130.72 133.77 Yes Yes Yes No
6/24/08 6/25/08 131.72 133.40 Yes No No No
7/7/08 7/8/08 124.99 127.74 Yes Yes No No
7/15/08 7/16/08 121.45 127.80 Yes Yes Yes Yes


Keep in mind this is just one of several indicators you can use to determine when a short term upside reversal in the market may occur which would lead to additional signals during the year.
icon url

ReturntoSender

08/10/08 7:46 PM

#8158 RE: ReturntoSender #6755

InvestmentHouse Weekend Market Summary 8/8/08:

http://www.investmenthouse.com/weekendmarketsummary.htm

- Sharp upside response to Thursday selling as a stronger dollar, cheaper oil overrun financial fears, a new Russian war.
- Productivity rising on rising unemployment.
- Dollar puts in a years worth of gains in a couple of weeks.
- Market puts in another higher low, breaks some resistance as the summer rally off the July low rides higher.
- After such major declines, oil and gold will retrench, dollar will do the same.

Market acting as if it doesn't want to stay down thanks to lower oil and higher dollars.

Friday capped an upside week in a big way. The week was not all upside, starting out with a sharp decline but then a sharper surge. Thursday tried to take it all back but Friday stocks surged once more as the indices broke through the next level of resistance.

The Friday surge was a good response to Thursdays selling that threatened to scuttle the higher low and the earlier upside moves. Friday was a classic low to high rally as the market rode lower early, following through on the Thursday afternoon Moody's-induced selloff, but then reversed and surged nicely through the first hour and then flattened the trajectory but continued higher in a steady solid rally into the close.

There was reason enough for some early weakness. There was the hangover from the AIG massive earnings miss and Moody's warning on AXP. Russia and Georgia were at it again, this time in all out earnest with tanks rolling and fighter jets bombing. One thousand were said dead in the initial clashes, and the threat to stability all over the area is very worrisome.

Despite those issues, oil came to the rescue, continuing its slide and now dive lower. Russia and Georgia are big oil areas, yet oil paid no heed, falling $4.82 to 115.20, its lowest level in three months. The dollar surged, capping a huge run the past two weeks. Gold fell another 15 points to 863. The oil trades are unwinding and along with them other commodities, the dollar shorts, and the gold longs. This makes for some powerful undercurrents steering the markets as major amounts of money is shuffled.

The result being the summer rally off the July low continues, making another higher low as the indices rallied up through the next resistance point. Some classic stocks are breaking to new all-time highs (MCD, JNJ) as the market leadership tries to fan out. The question is whether NASDAQ has set a double bottom and is control of the action or the NYSE large cap indices that undercut their early 2008 lows (something NASDAQ did not do) are due for a test of that level when this rally runs out of gas.

For now, you cannot argue with the tape. You can take issue with certain areas such as leadership and overall volume on this last part of the move, but that is always the case. It is a very rare rally that hits on all points. That skepticism helps drive it higher as money is slowly dragged in as manager after manager bites the bullet and puts a bit more money to work. When everyone decides the water is safe there is a big surge and then the money is all used up and the market rally fails. Given the sentiment readings and what you hear on the financial stations we are far from that point.

TECHNICAL. Intraday the action was classic as noted above: lower sluggish start followed by a rally to close at session highs with 2+% gains on all of the indices.

INTERNALS. Solid breadth at 2.8:1 on NYSE and 2.5:1 on NASDAQ, a little worse than the Thursday downside on NYSE but better than the 1.9:1 downside on NASDAQ that day. Volume was lower on both NASDAQ and NYSE though just modestly so, but that kept trade below average though NASDAQ was close to that level. NYSE trade continues to lag. Internally a mixed day given the volume, though lower trade on a Friday in late summer is pretty typical. Still, you like to see better trade when the indices make strong upside moves and break through some key resistance points. The volume gives the move legitimacy and typically a longer life. As it is, a raft of new bad financial news could have the AIG/AXP affect all over when those that were out of the market Friday decide to try and sell it again.

CHARTS. SP500 and DJ30 rallied through their 50 day EMA as well as started again to try a move through the January and March 2008 lows they broke during that July selloff. Higher low once more, taking out some resistance. Not bad, but they are still in the teeth of resistance and have yet to recover to the 50% retracement level. NASDAQ on the other hand, has blown past the 50% retracement level as well as the early April peak and early February peak, starting to break up any potential head and shoulders trying to set up. NASDAQ is a growth index for the most part though many of the NASDAQ 100 are not really growth anymore (MSFT, DELL, INTC). SP600 is also a growth index as the small caps thrive or die on the economic winds. SP600 blasted through its 200 day SMA and the February peak, looking ready to take on the June high. The leadership these two indices are providing is a good sign for economic activity ahead, and given the dump in oil prices, some uptick in the economically sensitive stocks makes some sense.

LEADERSHIP. As noted above, some large cap, old school stocks made new highs on the Friday surge, but they were not the only ones as medical/health services came back along with technology and pretty much everything not oil or commodities. Leadership is trying to fan out as this recovery is allowing stocks in technology, retail and even financial to base out and lay the foundation for moves higher. There is still a lot more work to be done, and before it is all over the NYSE indices will likely need to test the July low to finish its base and to let the rest of the market do the same. For now, as we have seen over the past several weeks, however, there are leaders that are moving up and making us money even as most stocks work through the struggle of forming a base, the old up a day or two then give it all back and start over. It is a tedious process but necessary in a recovery after this kind of selling.

SUMMARY. The market rode a precipitous drop in oil and gold and an equally precipitous rise in the dollar to a new high on this rally off the July low. There are problems with it and the lack of a plethora of leadership indicates another decline on NYSE is likely, but for now you ride the trend that is working, and this one is working.

THE ECONOMY

Productivity holding its own, but it is not due to implementing new technology.

Back in the last bust in 2000 and the subsequent recovery, a lot of that tech equipment that was made in the 1990's was actually put to use as companies, after Congress passed tax incentives that made it worthwhile to buy new equipment, finally started to spend again. When they did they bought equipment that would help them produce as well as keep overhead low through fewer employees. The tech bust left many with too many employees and they didn't want to get into that position again. So they bought a lot of productivity enhancing equipment and put it to work. That is one reason jobs just did not rise as they did in prior recoveries. Of course the bigger reason is that many started their own businesses in the last bust because there were no jobs coming back, but you get the point with respect to why there was increased productivity.

Right now the situation is falling non-farm payrolls and a rising unemployment rate, i.e. there are less jobs in the economy. If companies keep producing even with fewer workers, productivity has to rise. This recession is thus far pretty shallow, and that is why production is continuing. With fewer employees productivity is indeed rising. There has not been an investment surge by businesses thus far as there was in the 2000 recession, and so productivity is rising mainly because with the declining number of jobs, those left with jobs have to do more.

Friday we found out productivity rose 2.2% in Q2 versus 2.6% in Q1. As noted, many pundits are saying productivity is rising because of fewer jobs this year. Okay, so if productivity rose 2.6% in Q1 due to lower jobs and it rose just 2.2% in Q2, could this mean job losses are slowing, i.e. the job loss is less and thus the productivity gains are not increasing as fast because jobs are no longer falling as fast? It could. Problem is, this is not an exact measure, just an indirect indication. Thus while it could very well be the case, by itself it is inconclusive. As a matter of fact, the losses in jobs are NOT slowing based on what the weekly claims are telling us, so drawing a conclusion that slowing productivity gains indicates slowing job declines is tenuous.

What the productivity gains do mean is that productivity is holding nicely at or above the long term 2% growth trend. Rising productivity helps companies produce more for less and maintain or improve profit margins and thus earnings. Thus even with declines in the economy and increases in input prices, rising productivity levels help allay or offset some of those cost increases. Now that commodities and fuel prices decline, there is a combination punch helping out the bottom line, again good for these companies and as earnings drive stock prices, that is ultimately good for the market.

Dollar has an incredible two weeks.

If a currency gains 2% or 3% against another currency in a year, it has put in a good move. Over the past two weeks the dollar has moved 3% against the euro. It has put in a year's move in two weeks. It has made up since mid-July most of what it lost from early February to March, the largest part of the gain coming the past week.

A lot of short positions in the dollar, long positions in gold, and long positions in oil are being unwound right now. Those trades worked well for a long time. They became very crowded. The dollar short was a steady date for the big currency trading firms what with the US government unwilling to back the greenback. When the Fed came up with the lending facilities and the wide open discount window, however, the dollar bottomed as some currency players realized the Fed no longer had to cut rates to achieve its goals. It took awhile to gin up, but after a 4 month base it took off last week as the trades in the dollar, oil and other commodities finally turned. It was a crowded trade as stated above, and when the run for the exits started, the declines were precipitous.

That is a strong impetus for dollar upside as dollars are bought back. Moreover, as noted earlier in the week, anticipation of rate cuts from Australia to Europe and beyond due to weaker economic activity is spurring further buying of US dollars. It is a potent combination that is having immediate impact on our standard of living. Raise the currency and lower prices of energy, commodities, and other foreign goods and you improve your standing. Even without the Bush administration's help, the dollar is surging, likely to the Baker boys' dismay. Sadly another major factor in the rise of the dollar and fall of commodities is due to lower demand for commodities as economies slow across the globe. In response powerful forces are unleashed as massive trading positions are unwound. The dollar is making the inevitable rebound, but the cause of the rebound is not really one of strength, just the balancing of out-of-balance trading positions ironically fostered by the Bush administration's clear disregard for supporting the currency. Amazing how markets work to correct the errors of human policy makers, errors that we make time and again and in this case passed down from one generation to the next via the presidency.

THE MARKET

MARKET SENTIMENT

VIX: 20.66; -0.49. As noted Thursday, volatility is back down to mid-June levels and is a range considered low if you consider 20 to 30 a normal range. It ran to 31 in the mid-July selling, and while likely not enough to cement any kind of permanent bottom for NYSE on this bear market, it was enough to kick off this rally.
VXN: 24.24; -0.51
VXO: 21.88; -0.75

Put/Call Ratio (CBOE): 0.92; -0.13. Closed over 1.0 one session last week, the Thursday selloff. Other than that it has hugged 1.0 but closed below. As noted before, it did all of its work in July when it put in three weeks straight of closes above 1.0, indicating that fear and speculation to the downside was overdone.

Bulls versus Bears:

For the second time this year bears are crossing above bulls, doing so basically where they did in March on their way to much more extreme readings just about the time the market made the March low and started the last rally. Positive for the market and if SP500 is going to hold the long term trendline is the place to do it.

This is a reading of the number of bullish investment advisors versus bearish advisors. The reason you look at this is that it gives you an idea of how bullish investors are. If they are too bullish then everyone is in the market and it is heading for a top: if everyone wants to be in the market then all the money is in and there is no more new cash to drive it higher. On the other side of the spectrum if there are a lot of bears then there is a lot of cash on the sideline, and as the market rallies it drags that cash in as the bears give in. That cash provides the market the fuel to move higher. If bears are low it is the same as a lot of bulls: everyone is in and the market doesn't have the cash to drive it higher.

Bulls: 34.0%. Jumped up from 30.0% closing in on that 35% level, below which is bullish. Still bullish though a long way up from the 27.8% on the low this round. Hit 31.9% a month back and the 30.9% low hit in March. Steep drop from a rebound high at close to 50% on the run through May. In March the indicator did its job with the dive below 35% and the crossover with the bears. Now it is going above and beyond. Bulls and bears have crossed over again, doing so even before the prior lows are hit. The bulls and bears were eye to eye in mid-February and have crossed. A move into the lower 40's is a decline of significance. A move to 35% is a bullish indicator. This is smashing that. For reference it bottomed in the summer 2006, the last major round of selling ahead of this 2007 top, near 36%, and 35% is considered bullish.

Bears: 43.6%. Steep drop from the 50.0% peak on this move hit last week. Still well above the 35% threshold so still a LOT of bearishness out there. This bounce off the July lows is instilling some confidence, however. A steady rise to 50% on this move: 48.9%, 47.3%, 44.7% and 39.3% before that. A steady, strong rise. Well above the bullish level and the highest since 1995. Again, that is one of the best indications that sentiment is getting extreme on the negative side. It is again past 35%, the level that historically indicates too much pessimism. As with the bulls the jump in bears did its job after hitting 44.7% in the third week of March that was up from an already freakishly strong 43.3% the week before. Up sharply from a low of 19.6% on the last rally. Bearishness peaked at 37.4% in September 2007. It topped the June 2006 peak (36%) on that run. That June peak eclipsed the March 2006 high (33%) and well above the 2005 highs that spawned new rallies (30% in May 2005, 29.2% in October 2005). This is a huge turn, unlike any seen in recent history.

NASDAQ

Stats: +58.37 points (+2.48%) to close at 2414.1
Volume: 2.245B (-1.51%)

Up Volume: 1.719B (+954.463M)
Down Volume: 498.36M (-956.894M)

A/D and Hi/Lo: Advancers led 2.47 to 1
Previous Session: Decliners led 1.91 to 1

New Highs: 83 (+28)
New Lows: 111 (+8)

NASDAQ CHART: Click to view the chart

NASDAQ broke through the 90 day SMA and some resistance at 2400. In addition it took out the early February closing high and went a good ways toward breaking up a potential 6+ month head and shoulders pattern. It has easily recovered more than 50% of the June to July loss and now is making a run at the 200 day SMA (2439) as its next test. NASDAQ is providing some leadership in this late summer rally. Techs tend to bottom in July and August, and they are certainly giving the look as if they have tried to do the same once more.

NASDAQ 100 (+2.45%) was not the leader but it was the second index of the session and of this rally off the July lows to clear its 200 day SMA. That rounded bottom it was sporting all through July as the market dove lower is paying off with some early leadership. Those RIMM positions picked up Thursday and the others in late July are quite nice right now.

NASDAQ 100 CHART: Click to view the chart

SOX CHART: Click to view the chart

SP500/NYSE

Stats: +30.25 points (+2.39%) to close at 1296.32
NYSE Volume: 1.246B (-2.93%)

Up Volume: 969.344M (+735.169M)
Down Volume: 270.289M (-773.465M)

A/D and Hi/Lo: Advancers led 2.85 to 1
Previous Session: Decliners led 3.2 to 1

New Highs: 48 (+28)
New Lows: 115 (+2)

SP500 CHART: Click to view the chart

Not a powerhouse what with its lower volume and squeaking past the 50 day EMA (1294) and closing at the 50 day SMA, but it made a new high on this rebound and delved deeper past the January and March 2008 lows. There is still a mountain of resistance overhead starting rather close at 1315 and running up to 1375 or so. The financials dug a deep hole for the large caps and they fell into it. Getting out is proving to be difficult as SP500 lags on the rebound. It is making headway, but it is letting the techs and smaller caps doe the work.

Speaking of small caps, SP600 (+2.93%) shot past its February peak and the interim resistance, as well as its 200 day SMA. Impressive strength as they take out resistance levels and move toward the early June peak about 14 points away. If measured by the Friday gain, that would be just a day and one-half away. As noted above, small caps are joined at the hip with the economy, and if they put in a serious rally with serious breakouts that bodes well for the economy.

SP600 Chart: Click to view the chart

SP400 CHART: Click to view the chart

DJ30

Nice higher low and then a push through the old trendline from late 2004 as well as the 50 day EMA (11,686). It tapped the important 11,750 resistance on the high and faded back to close modestly off that level. That represents the March bottom and is significant resistance. After that 12K bears watching as there is minor price resistance, psychological resistance, and that is roughly 50% up off the July low. Climbing out of a pit is never easy as it is a constant test of buyers' will to crawl on out.

Stats: +302.89 points (+2.65%) to close at 11734.32
VOLUME: 212M shares Friday versus 229M shares Thursday. No surge in volume to match the impressive price gains.

DJ30 CHART: Click to view the chart

MONDAY

Boatloads of economic data next week, but does any of it matter what with the dollar soaring and oil plunging? June trade and inventories, July retail sales, CPI, industrial production. Most of this data was compiled before the really big decline in oil and rise in the dollar. Some of the July data reflects falling oil, but the big impacts of these big declines will come later.

But that still doesn't obviate the import of this data. If it is stronger than expected then that means that it will likely get stronger given lower prices for energy and more purchasing power thanks to a stronger dollar. The economy, while in a recession from the standpoint of the size of the decline from the highs, is not a textbook recession, meaning it is rather shallow. If the economic data is improving as it has been in fits and starts, that indicates the recession may run its course without ever entering official bear market territory given the lower costs even if the stimulus checks have, as Wal-Mart noted last week, run their course.

The market will lead before the economic data turns, and the indices are up off the July lows. Not a powerful move but a string of higher lows and a move through some initial key resistance points is a good start. Still a lot of technical resistance to get through and more leadership is needed, and that leaves doubts about the move ultimately being the ONE. As noted early on in the summary, however, it is more than enough to play to the upside and make us some solid scratch. You have to like the small caps making moves again; out of the 2000-2001 recession they took the lead (as they should coming out of recession) and made us a lot of money. It is a nice bonus they are moving along with the large cap techs as that gives the market a bit more backbone, something it finally started to show over the past two weeks. Still developing, but building some character here.

Now oil and gold dropped like rocks the past week and gold gapped lower Friday down to the May low where it found support and rebounded on into July. It will likely attempt some kind of last stand at that point, and it would be normal for the dollar to retrench a bit and oil to bounce a little as well. That means the market retrenches a bit as well as oil's loss and the dollar's gain has been the market's gain. Pretty normal. The important thing for the market, of course, is how it handles the rebound attempts by the commodities. Thus far it has overcome each round of bad news and made higher lows. When the dollar, gold and oil backtrack a bit it will have its chance to do it again.

The market has run nicely the past two weeks and we picked up some nice upside. As noted Thursday, at this stage of the rally the prudent investor scales back a bit, not chasing stocks that have made good moves as they are prone to come back after just a bit more upside, particularly when gold and oil retrench some. Thus we need to be patient with new upside but that does not mean there are not stocks ready to break higher. More and more stocks are trying to join in the upside after building some good bases and they breakout in waves as the market advances, indeed, helping drive the advance. Accordingly we will, as always, have new plays ready at the offing, and if they make their breakouts we can start building some positions.

Support and Resistance

NASDAQ: Closed at 2414.10
Resistance:
2419 is the January 2008 peak and the early February peak
The 200 day SMA at 2439
2451 is the August closing low
2500 from interim August lows.

Support:
2392 is the April 2008 peak
2388 is the June 2008 low
2386 is the August 2007 intraday low
The 90 day SMA at 2386
2378 is the mid-February peak; 2379 from the October 2006 peak
2370 from the April 2006 peak
2343 is the trendline from the summer 2004/July 2006 lows, Q4 2005 consolidation
The 50 day EMA at 2342
2340 from the March 2007 low
2286 is the first April 2008 gap up point.
2261 is a March 2008 interim low
2202 is the January 2008 low
2155 is the March 2008 low

S&P 500: Closed at 1296.31
Resistance:
1317 from the February low
1320 is a 50% retracement of the May to July selloff
1324 is the April low
1331 is the June low
1348 is an ancient trendline
1370 is the August 2007 intraday low
1374 is the March 2007 closing low
The 200 day SMA at 1375
1387 is the April 2008 intraday high
1396 is the February 2008 peak
1406 is the August and November 2007 closing low

Support:
The 50 day EMA at 1293
1285 is the recent July peak
1270 is the January low
1257 is the March low
1244 is an August 2005 peak
1240 to 1221 are September 2005 peaks1234 is the July 2006 low
1234 is the late July low
1224 is the June 2006 low
1176 from the Q4 2005 lows
1167 is the January 2005 low
1154 from the May 2005 lows
1142 is the 2005 closing low

Dow: Closed at 11,734.32
Resistance:
11,731 is the March 2008 low is bending
11,982 is a 50% retracement of the May to July selloff
12,050 from the March 2007
12,070 from the early February 2008 lows
The 90 day SMA at 12,150
12,250 from late March 2007 lows
The 200 day SMA at 12,512
12,518 is the August intraday low
12,573 is the mid-February high
12,743 is the November low
12,750 to 12,768 is the February 2008 peak and a series of lows and highs from August 2007
12,786 is the February 2007 peak
12,845 is the August closing low
13,092 is the December 2007 intraday low
13,133 is the May 2008 high

Support:
The 50 day EMA at 11,686
11,670 is the May 2006 intraday high; 11,642 closing
11,639 is the 2004/2005 up trendline
11,634 is the January intraday low
11,317 from March 2006
11,131 is the late July 2008 low
11,061 from February 2006
10,912 peak from March 2005
10,854 from December 2004
10,701-10,705 from July 2006, July 2005

Economic Calendar

These are consensus expectations. Our expectations will vary and are discussed in the 'Economy' section.

August 12 - Tuesday
- Trade Balance, June (8:30): -$61.9B expected, -$59.8B prior
- Treasury budget, July (2:00): -$69.0B expected

August 13 - Wednesday
- Import prices ex-oil, July (8:30): 0.9% prior. Will they fall given the oil decline?
- Retail sales, July (8:30): 0.5% expected, 0.1% prior
- Retail sales ex-auto (8:30): 0.6% expected, 0.8% prior
- Business inventories, June (10:00): 0.5% expected, 0.3% prior
- Crude oil inventories (10:35): +1.6M prior

August 14 - Thursday
- CPI, July (8:30): 0.4% expected, 1.1% prior
- Core CPI (8:30): 0.2% expected, 0.3% prior
- Initial jobless claims (8:30): 455K prior

August 15 - Friday
- New York Empire State PMI, August (8:30): -5.0 expected, -4.9 prior
- Net foreign purchases, June (9:00): $67.0B prior
- Capacity utilization, July (9:15): 79.8% expected, 79.9% prior
- Industrial Production, July (9:15): 0.0% expected, 0.5% prior
- Michigan sentiment, August preliminary (10:00): 62.0 expected, 61.2 prior
icon url

ReturntoSender

08/24/08 7:08 PM

#8172 RE: ReturntoSender #6755

InvestmentHouse Weekend Market Summary:

http://www.investmenthouse.com/weekendmarketsummary.htm

- Market rebounds as stocks, dollar, oil reverse their tests.
- Retail stocks showing surprising strength for an economy heading toward further angst and recession.
- Calendar says it is a tough time for stocks as they set up to resume the rally and take on key resistance.

Key market elements rebound after their tests.

After a week spent testing and retrenching following strong moves, a triumvirate of key areas resumed their new trend moves to end the week. Stocks, the dollar, and oil all had to test their recent surge, or in oil's case, purge. NASDAQ, NASDAQ 100 and SP600 spent the week testing back to key support at the 50 day EMA and 200 day SMA. The dollar tested its strong surge, finding support at a key level it just cleared. Oil rebounded to test key resistance at 122 where it bottomed in early June before exploding higher on that massive run to 147. They all found support or resistance as the case may be, and on Friday they resumed their more recent trends.

These areas all interrelate. The dollar's strength has weakened oil, breaking the spiral higher in commodities prices as the dollar spiraled lower. Lower oil, along with its failure at key resistance Friday, is breathing life into the US economy and thus stocks as indicated by the strength in small caps and consumer areas such as retail stocks. They moved in new trends together, tested together, and then resumed the tests Friday after the tests.

There was some good news you could attribute as a trigger, e.g. some solid earnings in the retail sector (ARO, GPS, and FL) and a rumored buyout of LEH. That, however, was not the reason for the move. Stocks had tested, the dollar had tested, and oil had tested, and all were ready to resume their moves. That is what they did.

TECHNICAL. Intraday it was low to high, turning back to a more bullish picture as it should. Typically the intraday action reflects the action of the day, i.e. low to high on the upside sessions. You have to look at the transition days, those days where there was no definitely clear winner for the day. On this week the transition days showed some backbone.

INTERNALS. Solid 2.5:1 breadth on both NASDAQ and NYSE. Volume was nonexistent and you can thus downgrade the session based on that, but that is how it goes at the end of summer. There is very little trade right now and what trade there is at least shows higher trade on up sessions. Not much accumulation but some accumulation, and that keeps the rally going near. Longer term this volume no doubt that leaves the rally over the past three weeks subject to getting sold off as more money managers get involved, especially as the rally moves toward September, historically the worst month of the year for stocks. That remains to be seen. For now stocks are moving even if it is on light volume.

CHARTS. SP600 held the 200 day SMA while NASDAQ and NASDAQ 100 held the 50 day EMA and all bounced nicely. That was the key for the week, and while volume was boringly low, they held where they had to and then bounced. That sets up the move back to test those June and July highs.

LEADERSHIP. Rails are rebounding as transports are still in the leadership mix. Rails are helped by high fuel costs given they are cheaper for freight, but truckers are not in the doghouse themselves. Retail continues to improve with more and more basing up and moving higher. Economically sensitive stocks doing well, and that is the hallmark of this move. Medical and healthcare remains solid. Financials are trying to base in this up and down market action, putting in the necessary work to put in a bottom for longer term. It is still tenuous, but stocks are putting in the work to form bases.

SUMMARY. The prior week we talked of the need for SP600 and NASDAQ to test further and this past week they did just that. They went a bit deeper than the 18 day EMA, but they held key support, held tight for a couple of days in a tremendous amount of gloom, then started to bounce Friday. Sure the indices finished lower for the week, but they have done what they needed to do if they are going to make another move: consolidated the last rally, held support, and put leadership in position to bounce again to take on the prior highs and key resistance. That is about all you can ask.

THE ECONOMY

Economic gloom is high yet there are market signs the economy is not as bad as thought.

Friday even Uncle Ben Bernanke voiced his concern about the US' economic future. Yes he believes inflation will mitigate over the next year, but his overriding worry was the economy would remain weak.

You hear it every day about how weak consumers are, the bad housing market, more financial shoes to fall. On top of that Europe is heading lower fast with the UK on Friday reporting a stagnant quarter of growth after a string of gains. Of course it is an election year so the economy is the target for everyone. McCain says it is fundamentally sound and it obviously is as there is not dive lower in output. Still we all know that the slowdown is real, palpable, and painful. Thus it is the punching bag.

Talk is always negative when the economy is in a decline, even if the economy is bottoming. Bottoming? Housing has bottomed even though inventories remain high. Prices are diving appropriately and starts continue to fall, holding below 1M that historically marks a bottom. It is not rebounding but it has bottomed. The data is also spinning off prior recession high levels. How many times have you heard of late that a report has hit a 1981 or 1991 high? Those were real recessions and the current levels are up there. This isn't a deep recession in terms of GDP output (though GDP is inflated thanks to exports and a weak dollar leading to less import buying) and our typical indicia of recession ending economic levels are being matched.

Further, look at those economically sensitive areas that thrive when the economy turns up. Small caps are leading this move higher. While this rally has yet to show it is more than a late summer rally for the large caps, the small cap indices are set up with higher lows to attempt a higher high. If they can do that, they show there is something more here than just an interim rally in a continuing bear market. Retail stocks have formed bases after long, ugly slides. All of the sudden they are popping higher (RL, URBN, JNY, LTD), moving nicely and on volume out of long bases that have built a solid foundation for long rallies. Transports continue to look solid having rallied already, basing/testing of late, and now ready to move back up and lead some more.

These are all inexorably tied to improving economic activity, or more to the point, anticipating improving economic activity. The economic 'stimulus' is spent yet the retail stocks were setting up even before the checks were cut and they are breaking out even after they are spent. Their breakouts are not low volume wisps of hope, but solid volume buying. That is not forecasting more economic slowing but economic recovery 5 to 9 months down the road. We are still watching the small caps closely, but thus far they are forecasting some very interesting times for the economy, and we are not talking more meltdowns in financials, at least not the kind that is going to stymie the economic recovery.

THE MARKET

MARKET SENTIMENT

VIX: 18.81; -1.01
VXN: 22.38; -0.77
VXO: 20.47; -0.79

Bulls versus Bears:

For the second time this year bears are crossing above bulls, doing so basically where they did in March on their way to much more extreme readings just about the time the market made the March low and started the last rally. Positive for the market and if SP500 is going to hold the long term trendline is the place to do it.

This is a reading of the number of bullish investment advisors versus bearish advisors. The reason you look at this is that it gives you an idea of how bullish investors are. If they are too bullish then everyone is in the market and it is heading for a top: if everyone wants to be in the market then all the money is in and there is no more new cash to drive it higher. On the other side of the spectrum if there are a lot of bears then there is a lot of cash on the sideline, and as the market rallies it drags that cash in as the bears give in. That cash provides the market the fuel to move higher. If bears are low it is the same as a lot of bulls: everyone is in and the market doesn't have the cash to drive it higher.

Bulls: 40.7%. Still moving up, rising from 34.0%. After this week, however, bulls should post another decline. Topped the 35% level that is considered the demarcation between bullish and bearish indications. Above 35% is not as bullish. A long way up from the 27.8% on the low this round. Hit 31.9% two months back and the 30.9% low hit in March. Steep drop from a rebound high at close to 50% on the run through May. In March the indicator did its job with the dive below 35% and the crossover with the bears. Now it is going above and beyond. Bulls and bears have crossed over again, doing so even before the prior lows are hit. The bulls and bears were eye to eye in mid-February and have crossed. A move into the lower 40's is a decline of significance. A move to 35% is a bullish indicator. This is smashing that. For reference it bottomed in the summer 2006, the last major round of selling ahead of this 2007 top, near 36%, and 35% is considered bullish.

Bears: 38.4%. Dropping hard from 43.6% and down from 50.0% a month back, the high on this move. Still above the 35% threshold so still a bearish indication. A steady rise to 50% on this move: 48.9%, 47.3%, 44.7% and 39.3% before that. A steady, strong rise. Well above the bullish level and the highest since 1995. Again, that is one of the best indications that sentiment is getting extreme on the negative side. It is again past 35%, the level that historically indicates too much pessimism. As with the bulls the jump in bears did its job after hitting 44.7% in the third week of March that was up from an already freakishly strong 43.3% the week before. Up sharply from a low of 19.6% on the last rally. Bearishness peaked at 37.4% in September 2007. It topped the June 2006 peak (36%) on that run. That June peak eclipsed the March 2006 high (33%) and well above the 2005 highs that spawned new rallies (30% in May 2005, 29.2% in October 2005). This is a huge turn, unlike any seen in recent history.

NASDAQ

Stats: +34.33 points (+1.44%) to close at 2414.71
Volume: 1.396B (-10.43%)

Up Volume: 1.109B (+642.193M)
Down Volume: 248.565M (-799.484M)

A/D and Hi/Lo: Advancers led 2.44 to 1
Previous Session: Decliners led 1.64 to 1

New Highs: 42 (+2)
New Lows: 92 (-14)

NASDAQ CHART: Click to view the chart

NASDAQ, despite its decline for the week, made a higher low at the 50 day EMA Thursday, rallying that session off of that low. It then gapped higher Friday and rallied to the 200 day SMA on the close. That puts it into position to take on the August high and then the key May and June peaks at 2550. It is holding over the February high, but it needs to go ahead and make the next move. Did what it had to this past week but the work is not over.

NASDAQ 100 showed the same action for the week, even holding at the 50 day EMA and bouncing nicely off that level. Set up well to make the run at the August high and key resistance at 2000 and then the peaks at 2050.

NASDAQ 100 CHART: Click to view the chart

SOX CHART: Click to view the chart

SP500/NYSE

Stats: +14.48 points (+1.13%) to close at 1292.2
NYSE Volume: 888.139M (-2.65%)

Up Volume: 649.48M (+184.872M)
Down Volume: 233.11M (-199.54M)

A/D and Hi/Lo: Advancers led 2.54 to 1
Previous Session: Decliners led 1.23 to 1

New Highs: 17 (+8)
New Lows: 61 (-75)

SP500 CHART: Click to view the chart

No volume (as was the case the entire week) but SP500 moved up through the 50 day EMA on the close after making a higher low this past week. Still a big struggle given the financials are still the albatross around its neck, but even the financials are basing - - though they are still way off the point where they are there.

SP600 (+1.74%) was the market leader again, making a higher low over the 200 day SMA and bouncing nicely Friday. SP600 dipped a bit more than we wanted for a run at the prior highs (400 in August, 402 in June), but it has made its test and it is in good position to do it.

SP600 Chart: Click to view the chart

SP400 CHART: Click to view the chart

DJ30

The blue chips held above the early August low and Friday put in one of the best moves. That took it up to the 50 day EMA on the close and in position to take out the August peak. Much less ambitious than the other indices, but with its market leading decline, any solid moves higher are a bonus.

Stats: +197.85 points (+1.73%) to close at 11628.06
VOLUME: 138M shares Friday versus.

DJ30 CHART: Click to view the chart

MONDAY

So now the market did what it needed to do, i.e. test the prior move better and bounce off support, can it make more of what Friday started? Oil tested its breakdown and folded while the dollar tested last week and rebounded. If those continue this same action that will only help to benefit stocks.

The stock market also needs to sidestep or outright avoid any further really bad news from financials. There was a lot of gloomy talk swirling last week, but as noted at the time, even with all of that gloom the market held support and then started to rally back. No great volume, a late summer move, still resistance to deal with, and September looms. Yet it showed some backbone in the face of adversity. It won't withstand truly devastating news in the financial sector, but maybe that won't come. As noted above, there are indications in certain sectors that smart money sees a recovery coming.

We will see. While we see those changes we can only take what the market is giving now, and there is continuing improvement in stock patterns as new stocks work on setting up patterns to present buying opportunities. As long as we see growth stocks setting up and then breaking higher, we will buy into the move and take what the market is giving. If the rally survives the improbability assigned to it by most commentators, huge gains await. If it cannot withstand September and fails to take out those summer highs then we close up the upside and wait for a bottom to try and form after September and sometime in late October. That means we keep watching how SP600, NASDAQ, and the cadre of leadership (retail, healthcare, tech, rails) as they continue to lead this move. We also watch how the financials set up and if they can finally form some plausible bases. The market has to have them moving higher at some point in order to sustain any recovery. Right now they are working on it, but they need the current leaders to buy them more time, and that is what the leaders have been doing.

Support and Resistance

NASDAQ: Closed at 2414.71
Resistance:
2419 is the January 2008 peak and the early February peak
The 200 day SMA at 2420
2451 is the August closing low
2483 is the mid-June interim peak
2500 from interim August 2007 lows and early May 2008 interim peak
2551.50 is the May peak; 2550 is the June peak
2603 is the early January gap down point

Support:
2392 is the April 2008 peak
The 90 day SMA at 2395
2388 is the June 2008 low
2386 is the August 2007 intraday low
2378 is the mid-February peak; 2379 from the October 2006 peak
2370 from the April 2006 peak
The 50 day EMA at 2367
2348 is the trendline from the summer 2004/July 2006 lows, Q4 2005 consolidation
2340 from the March 2007 low
2286 is the first April 2008 gap up point.
2261 is a March 2008 interim low
2202 is the January 2008 low
2155 is the March 2008 low

S&P 500: Closed at 1292.20
Resistance:
The 50 day EMA at 1291 is bending
1317 from the February low
1320 is a 50% retracement of the May to July selloff
1324 is the April low
The 90 day SMA at 1330
1331 is the June low
1351 is an ancient trendline
The 200 day SMA at 1363
1370 is the August 2007 intraday low
1374 is the March 2007 closing low
1387 is the April 2008 intraday high
1396 is the February 2008 peak
1406 is the August and November 2007 closing low

Support:
1285 is the recent July peak
1270 is the January low
1257 is the March low
1244 is an August 2005 peak
1240 to 1221 are September 2005 peaks1234 is the July 2006 low
1234 is the late July low
1224 is the June 2006 low
1176 from the Q4 2005 lows
1167 is the January 2005 low
1154 from the May 2005 lows
1142 is the 2005 closing low

Dow: Closed at 11,628.06
Resistance:
11,634 is the January intraday low
The 50 day EMA at 11,640
11,644 is the 2004/2005 up trendline
11,670 is the May 2006 intraday high; 11,642 closing
11,731 is the March 2008 low
11,982 is a 50% retracement of the May to July selloff
The 90 day SMA at 12,044
12,050 from the March 2007
12,070 from the early February 2008 lows
12,250 from late March 2007 lows
The 200 day SMA at 12,405
12,518 is the August intraday low
12,573 is the mid-February high
12,743 is the November low
12,750 to 12,768 is the February 2008 peak and a series of lows and highs from August 2007
12,786 is the February 2007 peak
12,845 is the August closing low
13,092 is the December 2007 intraday low
13,133 is the May 2008 high

Support:
11,500 is the up trendline off the July low
11,388 is the prior August low
11,317 from March 2006
11,131 is the late July 2008 low
11,061 from February 2006
10,912 peak from March 2005
10,854 from December 2004
10,701-10,705 from July 2006, July 2005

Economic Calendar

These are consensus expectations. Our expectations will vary and are discussed in the 'Economy' section.

August 25 - Monday
- Existing home sales, July (10:00): 4.90M expected, 4.86M prior

August 26 - Tuesday
- Consumer confidence, August, (10:00): 53.0 expected, 51.9 prior
- New home sales, July (10:00): 523K expected, 530K prior
- FOMC minutes (2:00)

August 27 - Wednesday
- Crude oil inventories (10:35): +9.39M prior

August 28 - Thursday
- GDP, Q2 preliminary (8:30): 2.7% expected, 1.9% Q1
- Chain deflator, Q2 (8:30): 1.1% prior
- Initial jobless claims (8:30): 432K prior

August 29 - Friday
- Personal income, July (8:30): -0.1% expected, +0.1% prior
- Personal spending, July (8:30): 0.3% expected, 0.6% prior
- Chicago PMI, August (10:00): 49.9 expected, 50.8 prior
- Michigan sentiment, final August (10:00): 62.3 expected
icon url

ReturntoSender

08/31/08 9:03 PM

#8181 RE: ReturntoSender #6755

The VIX/VXV Ratio. This is a new indicator which I found while reading HeadlineCharts Blog based on some work done by the Vix and More Blog Spot. As usual on my charts I have marked the times to start thinking about being bullish with a blue then green horizontal line. When is it time to bail or go short? Well that is marked by the pink and then red horizontal line versus the 1 day sma. It's pretty simple and may be a great short term market timing indicator for turns based on what I see here versus the SPX shown with a histogram and the SMH using a simple line in orange behind the price performance.

icon url

ReturntoSender

09/01/08 9:36 PM

#8182 RE: ReturntoSender #6755

XLF versus the NYSI and NASI over the last 10 years:


icon url

ReturntoSender

09/02/08 6:17 PM

#8183 RE: ReturntoSender #6755

From Briefing.com: 4:06PM MEMC Elec reaffirms Q3 revs guidance in-line with consensus; co cites continued degree of caution in outlook (WFR) 47.10 -1.99 : Co reaffirms Q3 revs of $560-620 mln vs $596.7 mln consensus. Co also reaffirmed gross margins of 54-55% and raised operating expenses to ~$43 mln, up from the prior target of ~$41 mln, primarily due to one-time, non-cash severance related expenses. Co says, "polysilicon production rates at our Pasadena facility have been at levels that, combined with the strength of demand from solar applications customers, could allow us to achieve results in the upper half of our targeted financial range. However, there is increased softness in demand from semiconductor applications customers, primarily due to their inventory reduction initiatives. In addition, there continues to be the potential for unanticipated events to occur, which could affect our polysilicon production output, as we have experienced over the past year. These elements warrant a continued degree of caution in our outlook given the amount of time left in the quarter." Co also announced that all deposits due from Conergy and Tainergy for 2008 have been received. Consequently, MEMC has commenced wafer deliveries to both customers. MEMC will host a conference call today, September 2, 2008, at 5:00 p.m. ET to discuss this update.

4:15 pm : Tuesday was a disappointing session for stock market bulls. Stocks ran out of steam, giving up strong opening gains to finish the day with a loss.

Shortly after the opening bell, the Dow, Nasdaq and S&P 500 rallied 2.1%, 1.9% and 1.6%, respectively, benefiting from a sharp sell-off in commodities and a relief trade after Hurricane Gustav did not cause any major structural damage. But stocks steadily declined throughout the afternoon, with the Dow, Nasdaq and S&P 500 finishing the day with a loss of 0.2%, 0.8% and 0.4%, respectively.

There was no apparent catalyst for the change in sentiment, although the retreat may have been compounded after traders were disappointed that stocks were unable to maintain their opening gains.

With regard to commodities, the CRB Index fell 3.4% after the damage caused by Hurricane Gustav was less than expected. Crude prices were down 8.7% in overnight trading, but recovered some losses to finish with a decline of 4.5% at $110.30 per barrel.

The drop in commodity prices sparked selling interest within commodity producing stocks. The energy sector declined 4.6% and the materials sector fell 2.5%, acting as a major drag on the broader market.

Conversely, commodity-cost sensitive stocks got a boost, although they gave up much of their intraday advance by the end of the session, and were unable to offset the steep declines in the energy and materials sectors. The consumer discretionary sector rose 1.8%, with retailers climbing 3.0%. Airlines advanced 6.6% and automakers gained 3.1%.

The financial sector outperformed with a 1.8% gain. Bank of America (BAC 32.62, +1.48) provided leadership after Goldman Sachs assumed coverage of BofA with a Buy, citing earnings growth potential, according to the AP. Lehman Brothers (LEH 16.06, -0.03) gave up an early gain to finish near the unchanged mark, despite reports that Korea Development Bank confirmed that it is in talks to invest in Lehman Brothers.

In other corporate news, Merck (MRK 34.83, -0.84) and Schering-Plough (SGP 19.08, -0.32) came under selling pressure due to uncertainty regarding cancer risks of the cholesterol drug Vytorin. The healthcare sector still managed to gain 0.1%.

In economic news, the August ISM Index, a national manufacturing survey, indicated a very slight contraction in the manufacturing sector, although it is still indicative of growth in the overall economy. Specifically, the index slipped 0.1 to 49.9, which was nearly in-line with the expected reading of 50.0. A reading below 50 reflects contraction in manufacturing. On a positive note, the prices paid index declined to 77.0 from 88.5, suggesting an easing in inflationary pressures.

Separately, July construction spending showed a continued poor trend. Housing remains the weakest area in the economy, although Briefing.com expects a leveling off in the months ahead. Specifically, construction spending fell a larger-than-expected 0.6%, versus the expected 0.4% decline. However, the current level of spending is actually above estimates after the June change was revised sharply higher to +0.3% from -0.4%. DJ30 -26.63 NASDAQ -18.28 NQ100 -1.2% R2K -0.1% SP400 -1.0% SP500 -5.25 NASDAQ Adv/Vol/Dec 1367/1.95 bln/1510 NYSE Adv/Vol/Dec 1521/967 mln/1450

1:00PM GT Solar signs $173 mln contract With DC Chemical (SOLR) 12.30 -0.30 : Co announces that on July 11, 2008, it signed a $173 mln contract with DC Chemical Co. Under the terms of the agreement, GT Solar will provide DC Chemical with state-of-the-art polysilicon CVD reactors, which are used to manufacture polysilicon, a key raw material utilized to produce solar cells. This latest agreement marks the third contract between the two companies since GT Solar began offering CVD reactors and related equipment in 2006. Details of this contract were publicly disclosed on July 11, 2008, in a filing with the U.S. Securities and Exchange Commission. The agreement contemplates that GT Solar would begin to deliver reactors to DC Chemical in April 2009.

8:03AM Suntech Power signs second polysilicon supply agreement with DC Chemical; total value of ~$750 mln from 2010 to 2016 (STP) 47.81 : Co announces that it has signed a definitive seven-year polysilicon supply agreement with DC Chemical, a multinational chemicals producer headquartered in Seoul, South Korea. Under the terms of the agreement, DC Chemical will supply Suntech specified annual volumes of polysilicon with a total value of ~$750 mln from 2010 to 2016. The agreement follows Suntech's March 2008 announcement of an eight-year polysilicon supply agreement with DC Chemical, which provided for the delivery of polysilicon to Suntech with a total value of ~$631 mln from 2009 to 2016.

7:33AM July chip sales up 7.6% year-on-year, according to SIA : SIA says worldwide sales of semiconductors grew by 7.6% to $22.2 bln in July from July 2007 sales of $20.6 bln. Sales grew by 2.8% from June when sales were $21.6 bln. Year-to-date sales through July were $148.3 bln, an increase of 5% from the same period of 2007 when sales were $141.3 bln. "Growing sales of consumer electronics, personal computers and cell phones - which account for about 80 percent of chip demand - contributed to a healthy 7.6 percent year-on-year increase in worldwide microchip sales," said SIA President George Scalise. "LCD TV units are projected to increase 32% this year, and digital set top boxes and digital still cameras will both be up around 20%. Taking into account PC unit growth of about 13% and cell phone growth of over 10%, we are enjoying the benefits of the strong 3.3% second quarter GDP growth in the U.S, and continued strength in world markets," Scalise continued. "Overall capacity utilization remains high at 89% - with leading edge above 95 percent," said Scalise. SIA reported that sales of DRAMs and NAND flash memory continued to decline as a result of continuing price erosion. "Total semiconductor sales excluding memory products increased by 11.6% year-on-year and by 3.2% sequentially," said Scalise.

09:39 am Semiconductor Sales Rise

Semiconductor chip sales during July increased 7.6% from last year, according to the Semiconductor Industry Association. In turn, total July sales were $22.2 billion.

Sales were also up from the prior month when they totaled $21.6 billion. Year-to-date, sales have totaled $148.3 billion, reflecting a 5% increase over the same period last year.

Chip sales continue to benefit from healthy demand as consumers continue to buy anything from personal computers to increasingly sophisticated cell phones.

However, sales of DRAM and NAND flash memory declined as a result of continuing price erosion.

Overall the news bodes well for industry players, especially those with strong and healthy end markets. Moreover, tougher global financial and economic conditions has yet to cause the industry to contract.

09:46 am GT Solar: . Target $14.5. Credit Suisse initiates SOLR with a Neutral and $14.50 tgt, approximately 15 times firm's calendar 2009 EPS of $0.96, in-line with its peers. Firm's Neutral rating is primarily a reflection of valuation, but it also balances the upside volume potential for solar equipment capex as solar approaches grid parity, and the downside potential from Asian competition.

09:45 am Microsemi: . Target $30 to $33. Wedbush notes they recently hosted meetings with MSCC mgmt and came away with increased conviction in their BUY rating and raised their tgt to $33 from $30. Despite broad economic concerns, they believe MSCC remains largely immune and near-term fundamentals have been strong across the board. Further, they are optimistic regarding the upcoming push into rad-hard ICs and see potential for solid high margin revenue growth. The firm thinks shares are attractive at current levels.

I think we need to see a big rise in volatility before we get a lasting market bottom. Time will tell... RtS
icon url

ReturntoSender

09/14/08 9:17 PM

#8200 RE: ReturntoSender #6755

The Big Picture SNIP

http://bigpicture.typepad.com/comments/

Dow Futures down 240; SPX Futes off 30; Nasdaq off 36; Weak, and heading back towards the lows.

Roubini says all independent B/Ds are toast, they are highly leverage, and their business model is fundamentally flawed. Its a fundamental, radical change on Wall Street. Expects WaMu to go under, says AIG is in trouble.

Fed Plans Expanded Lending Facilities

AIG CEO turned down PE money, and turns to the Fed. (The currently cannot tap the Fed).

U.S. Opts to Avoid Lehman Rescue

CNBC reports that the Fed told Merrill Lynch to "Sell it self" and MER has been shopping itself for a few days.

Oil is under $100; trading at 99 change.

WSJ reporting Bank America/Merrill deal is done at roughly $44 billion.

The Lehman panel itself is an incompetent parade of horribles, and none of them have any business being there. Harvey "make the SEC toothless" Pitt, Bill "thanks-for-the-bailout" Gross, and Charlies "Dick-Fuld-is-AWESOME" Gasparino.

Love it that they brought on Bill Gross and Harvey Pitt to discuss LEH — the irony’s exquisite. Not to mention Gasparino, but that’s just icing on the cake. (I contacted CNBC earlier and offered my services)

~~~

Vince Farrell says Bank of America is not stupid. He's wrong, their management has made some rather stupid moves -- how about their purchase of Countrywide? That was $4 billion worth of dumb.

Special Fed rules for taking even junkier paper; Cramer talking up Nasdaq, and he is a buyer not a seller. Harvey Pitt blames short seller. He is as clueless a pundit as he was a SEC Chair.
icon url

ReturntoSender

09/15/08 5:24 PM

#8202 RE: ReturntoSender #6755

From Briefing.com: 4:35 pm : Monday marked an extremely ugly session on Wall Street, with the S&P 500 falling 4.7% -- marking the largest one-day percent drop since the first session following the attacks on September 11, 2001.

Losses were driven by severe turmoil in the financial sector –- Lehman Brothers (LEH 0.21, -3.44) filed for bankruptcy, Merrill Lynch (MER 17.06, +0.01) sold itself to Bank of America (BAC 26.55, -7.19) and AIG (AIG 54.76, -7.38) is looking for a massive amount of cash in an attempt to stave off failure.

The S&P 500 closed at its lowest level since 2005 and is now down 18.8% year-to-date and down 24.3% from its October 2007 all-time high.

The financial sector (-10.4%) took the brunt of the selling interest, although weakness was broad-based with all ten economic sectors posting a loss. Decliners outpaced advancers by a whopping 81-to-1 ratio on the NYSE. A total of 1.88 billion shares exchanged hands on the NYSE, which would normally be considered heavy volume, but is somewhat light considering the session's developments.

Lehman Brothers filed Chapter 11 bankruptcy protection after no buyers were willing to save the troubled 158-year-old firm due to a lack of a government backstop. None of Lehman's broker-dealer subsidiaries will be included in the bankruptcy and will continue to operate. Lehman listed $613 billion in debt, which is the largest bankruptcy on record according to reports.

My Comments - First off AIG is now a $4.76 stock - which simply points out that you should never take anything you read at face value. Of interest to me was that if we look back to the last one day loss of this magnitude which was supposedly after 9/11 that it took 4 more sessions before the market made its September bottom:


It was not until October 2, 2002 that the market made an ultimate major bottom. Now back to the Briefing.com commentary:

4:01PM Plexus awarded manufacturing contract with Kirby Lester (PLXS) 22.48 -0.82 : PLXS announced that the co has been awarded the primary contract to manufacture Kirby Lester pharmacy automation systems in its Buffalo Grove, IL facility. Kirby Lester is a provider of automated tablet machines, offering a full line of counting, dispensing and verification systems for pharmacies, pharmaceutical manufacturers and a variety of industries.

11:34AM MEMC Elec reports that their Pasadena facility does not appear to have sustained any major structural damage from Hurricane Ike (WFR) 33.06 -1.28 : Co reports that their Pasadena facility does not appear to have sustained any major structural damage. Co maintained power throughout the storm and the occupancy crew that stayed on site through this period is safe. Co's restart activities commenced as planned over the weekend, however, they have been notified of raw material delays by their suppliers due to their own startup difficulties. Co is working closely with their suppliers to understand and overcome these delays. They are not updating guidance at this time.

11:34AM MEMC Elec provides status update post Hurricane Ike of its facility in Pasadena; does not appear to have sustained any major structural damage (WFR) 33.00 -1.35 : Co provided an update on the status of its facility in Pasadena, Texas, which was threatened by Hurricane Ike. "Pasadena facility does not appear to have sustained any major structural damage. We maintained power throughout the storm and the occupancy crew that stayed on site through this period is safe. Our restart activities commenced as planned over the weekend, however, we have been notified of raw material delays by our suppliers due to their own startup difficulties. We are working closely with our suppliers to understand and overcome these delays. We are not updating guidance at this time."

9:04AM KEMET announces the sale of its Wet Tantalum assets (KEM) 1.09 : Co announces that it has sold its Wet Tantalum assets to a wholly-owned subsidiary of Vishay Intertechnology (VSH) for $35.2 mln and other consideration in the form of a three-year term loan of $15 mln. Sales generated by these assets during the co's fiscal-year ended March 31, 2008 were ~$16.0 mln and $4.4 mln during the quarter ended June 30, 2008. Closing is scheduled to occur by the close of business today.

09:31 am Mattson initiated with a Hold at Needham: . Needham initiates MTSN with a Hold saying while there are good opportunities in etch, they believe Mattson is stretched too thin with too many products/ platforms to support. Firm believes consensus estimates for 2009 are too high, and project several quarters of losses ahead. While MTSN is trading at below fair value of $6 per share, the firm says they would wait for signs of new etch penetration and/or a stronger rebound before getting aggressive.

icon url

ReturntoSender

09/16/08 9:53 AM

#8205 RE: ReturntoSender #6755

The VXN Chart below clearly shows the positive divergence that took place leading up to the October 2002 major market bottom. Note how much higher the lower low was in October 2002 than the recent high of the VXN. What does that mean?

icon url

ReturntoSender

09/17/08 8:48 PM

#8208 RE: ReturntoSender #6755

Technical Analysis: The Dow Falls Below Major Support
The blue chips need to recover quickly here.
September 17, 2008
By Paul Shread:

http://www.internetnews.com/bus-news/article.php/3772296

The Dow (first chart below) fell below major support today, making a quick recovery of 10,683-10,827 essential here. If not, the next major support looks like 9700, although 10,000 is obvious round number support.

The Dow's quick recovery is important here because except for a few breaches in 1947-1949, the midterm election year low has held for four years in every election cycle since 1934. An early breach suggests an ineffective response to economic stimulus, a sign of potential economic turbulence ahead.

Today was the sixth 90% downside volume day on the NYSE since June and fourth this month, the most intense string of selling the stock market has seen since the 1974 lows and the third most intense bout of selling in the last 48 years, lagging only 1974 and 1962. But as we've said repeatedly, it's not a bottom until confirmed by a 90% upside day. What the catalyst will be for that remains to be seen, but at some point credit risk will be judged to be diminished.

The S&P's (second chart) next support levels are 1136, 1100 and 1060, while 1200-1219 is a very big first resistance area.

The Nasdaq's (third chart) next obvious support is 2000, and 2155-2200 is tough first resistance.

Next Article:

http://www.internetnews.com/bus-news/article.php/3772291

Stocks Plummet on AIG Rescue
VMware and Nortel were two of the tech sector's biggest losers on a historic day for the stock market.

September 17, 2008
By Paul Shread:

Stocks plunged to multi-year lows Wednesday after the U.S. government's historic bailout of AIG (NYSE: AIG) did nothing to calm a growing financial panic.

AIG's inability to raise funds led to what appears to be the first failure of a Dow company in the index's 112-year history. The government's decision that an AIG bankruptcy could be catastrophic for financial markets underscored just how much danger lies in the highly leveraged and unregulated debt instruments at the heart of the crisis.

Whether Thursday can provide any relief remains to be seen, as the SEC will reinstate short-selling limits and Washington Mutual (NYSE: WM) and Morgan Stanley (NYSE: MS) are reportedly in merger talks.

With credit markets seized up in a way not seen since the crash of 1987, officials like Fed Chairman Ben Bernanke, a long-time student of the causes of the Great Depression, and Treasury Secretary Henry Paulson are scrambling to provide markets with the credit and liquidity needed to ease the crisis. One idea being floated is for a fund like the Resolution Trust Fund set up to cope with the Savings and Loans crisis of the 1980s. And with the kind of terms the government squeezed out of AIG, the government could eventually wind up making money on the crisis.

A number of tech names suffered equally in Wednesday's decline. Nortel (NYSE: NT) plunged 49% on a warning, and VMware (NYSE: VMW) lost nearly 13% on a downgrade.

SanDisk (NASDAQ: SNDK) was a rare winner, soaring on a takeover offer from Samsung.

Adobe (NASDAQ: ADBE) shares lost 5% despite beating estimates. Oracle (NASDAQ: ORCL) and Palm (NASDAQ: PALM) will report their quarterly results late Thursday.

Apple (NASDAQ: AAPL) lost 8.6% and Google (NASDAQ: GOOG) fell 6.4% despite a green technology deal with GE (NYSE: GE).

The Nasdaq plunged 109 to 2098, the S&P fell 57 to 1156, and the Dow lost 449 to 10,609. Volume declined to 9.4 billion shares on the NYSE, and 3.16 billion on the Nasdaq. Decliners led by a 30-2 margin on the NYSE, and 25-4 on the Nasdaq. Downside volume was 95% on the NYSE, and 85% on the Nasdaq. New highs-new lows were 12-1017 on the NYSE, and 29-425 on the Nasdaq.
icon url

ReturntoSender

09/21/08 3:05 PM

#8226 RE: ReturntoSender #6755

Investhouse House Weekend Market Summary 9/19/08

http://www.investmenthouse.com/weekendmarketsummary.htm

- Government plan spikes market on short covering at open, hangs on to hold most of the gains on the close.
- Oil quietly surges under cover of the financial meltdown and attempted rescue.
- The plan needs work: ban on short selling distorts option spreads and pricing. Just what else did they not think of?
- World was on the brink of a global financial meltdown and depression. The Treasury plan has bought us some time to resolve our issues.
- What to do now? Market's stagnation after the initial Friday surge shows investors are waiting for the next step.

Treasury fix clears out the shorts, finishes the market flat for the week, but for now that is all.

The ban on shorting 799 financial stocks had its intended effect: it gapped the market back up as shorts cleared out and then left the market unmolested, albeit downright stagnant, for the rest of the session. Oh, it also likely put some hedge funds out of business and it made the options market after the first few minutes of action virtually untradeable for the session. Those were unnecessary and unpleasant side effects of the bigger plan by the Treasury of cutting out the diseased part of the US economy, isolating it, and giving the financial institutions time to recover.

As for the market, it surged financials for the second session (Thursday afternoon rumors of a fix were even more powerful) along with most other stocks. After that initial surge of short covering, however, the market stalled and could go nowhere. There were no shorts to take it down, buyers were uncertain as to what to buy and how much given the details of the plan are still vague. Moreover the options market was a shambles because the ban on short selling failed to exempt market makers and thus spreads that were 30 cents Thursday were now over $3 because the market makers had to hedge themselves some way. For example, typically a market maker will sell a put to a buyer and then short the stock as a hedge; if the stock falls the market maker is covered because of the short. Without this mechanism available the market makers had to widen the spread as the hedge, basically stopping the options market. We were able to sell some financial stock options early on the short covering rally, but once that was over and shorts wanted to buy some puts on some non-annointed stocks, the spreads looked more like the Grand Canyon than a typical bid and ask on a put option.

All of this combined to slow the post-morning short covering spree action to a crawl. The indices traded in a range for the rest of the session, holding nice gains, but off the highs and unable to move significantly.

Everyone was so worried about financials and how the market would react not much attention was paid to oil. It continued its rally over $100, closing at $104.55 on the NYME. After the dump lower it has found purchase as something of a hedge against wild financial times and it is also benefitting from a weaker dollar that is down in the aftermath of all of the action to shore up the financial markets. One problem gets the attention and starts to come under control, but another one squeezes out elsewhere. This will definitely be something to watch this week as the details of the financial fixes unfold.

TECHNICAL. You can say the intraday action didn't mean much Friday given the short squeeze induced by the 'no shorts' rule and the glee over the proposed Treasury fix, but you would only be part right. It was very telling how the market gapped open and raced higher only to exhaust itself and collapse back down once the short covering binge at the open subsided. It wandered the rest of the session, unable to really challenge the morning highs. Once the shorts were done there was no driver.

INTERNALS. Upside breadth was impressive with a 7:1 showing on NYSE and a solid 3.5:1 on NASDAQ. Volume surged once more, aided by short covering, expiration, and a lot of initial positioning on the announcement of the Treasury plan. New lows dried up to the 100 range. It was a week of massively negative internals that set the stage for a reversal in the market, and indeed one was trying to take shape on Thursday as these internals were joined by a VIX over 40. The Treasury plan, however, jumpstarted the initial bottoming phase that was setting up given the very negative internal readings.

CHARTS. There was a meeting place for all of the large cap indices on Friday. It is as if they huddled before the open: okay boys, we are going to get a big gap higher today. It is going to be crazy and we might get separated. If we do, meet up at the 50 day EMA. Well, they did gap higher and on the session they all made it to the 50 day EMA and pretty much closed right below that level as they culminated a massive 1.5 day rally that left them flat to up after an extraordinary tail kicking basically since Septembers beginning. The gains moved them up to the bottom of the August trading range. At this point, everything is recovery, but there will be a setback or two along the way as the plan is worked out, and if history holds out (though this is not necessarily ordinary history here) there would be another test.

LEADERSHIP. The same old leadership held the line quite well with the early cycle retail and consumer products avoiding a lot of the selling and minding their own business as the market surged higher. They are steady in their work on their bases. Energy is moving and trying to form up decent patterns now that oil is on a new upswing. Some of the agriculture and chemical stocks are trying to set up again after getting pounded lower in the hedge fund de-leveraging. In short, leadership mostly held the line during the selling and improved a bit during the Thursday afternoon and Friday rally, but it was not a sweep higher. In a way that is good as they stepped aside while the shorts covered. How they respond this week, however, will tell a lot more about the market's posture post-Treasury takeover.

THE ECONOMY

Close, too close, to total meltdown. Now we have bought some time and we need to use it.

After reviewing the available data and talking with people who are involved daily with credit default swaps, corporate bonds offerings, and commercial paper, I realize that Thursday the world financial markets were a day or two if not just hours from a total meltdown.

The signs of a complete freeze up were everywhere that day. No one with dollar-based assets could move them or get credit. That is why the Fed's injection of almost $400B in liquidity was snapped up at absurd interest rates (8% in the UK, 10% in Australia) in just seconds from the auction starting. Credit default swaps tying up trillions of dollars in ETF's and other investments saw insurance rates soar outrageously in short order. A policy covering $10M in CDS' went from $14K to $433K as the market realized such insurance was now perilous, threatening to send a cascade of defaults across the globe. Of the $180B the Fed injected into the US Wednesday night, nary a nickel made it to the credit market as all of it went to money market funds to shore them up and prevent runs on them. That last point more than anything is what we are told rattled Treasury and the Fed. I received a voicemail from a banker dealing with the CDS market telling me to go to my banks, withdraw cash, stuff it into a safe deposit box, and hope it would be worth something next week. I am told from a source that within 3 minutes of the meeting with congressional leaders, Paulson and Bernanke turned those leaders white with the picture they painted of the next week in the world finance markets.

All of this adds up to tap dancing on the edge of global financial perdition. The world needed not a lifeline but a destroyer steaming into the fray. I cannot decide if we are fortunate or not having Paulson as the Treasury secretary. Anyone of lesser stature might not have been able to suck it up and do what he did. On the other hand, perhaps we don't need such a massive bailout to solve the problem. In any event, when Paulson, a former Goldman Sachs honcho, saw the financial virus crawling across Wall Street toward his beloved GS, he acted, not with the Bernanke bazooka, but with nuclear weapons. It is a complete and absolute approach to the problem designed to eliminate any doubt that the feds are serious in their gambit to stop the meltdown in its tracks.

The deal is not done and there will be a lot of public posturing over the final format of the fix. One thing I am telling everyone is that you need to call your US senators and House reps and demand that if there is any surplus as there very well may be in a couple of years when this mortgage issue subsides, it needs to be spelled out in the plan that the surplus will be returned to the taxpayers that underwrote this deal. After all, all of us who pay taxes are the ones funding this gambit, and any gains should be paid to those who took the risk, and that is NOT the federal government. It will want all proceeds to spend as it pleases. No. this is our money. Call your senators and reps.

Will it work? It bought us time. It stopped the assault on our financial institutions allowed by lax enforcement of the existing rules. During this timeout there will be ups and downs in the market based on the perceived progress of the negotiations. It will be a bumpy road. If it is implemented, however, there is likely a backstop to the financial markets, giving entities time to clear their balance sheets and make what deals they need to make in order to survive. Basically this is a timeout in which Paulson is telling the financial institutions it is now or never to get things in order. Again, you wonder if Snow or his predecessor could have pulled this off. I doubt it. Now Congress needs to get the deed done so we can try to get onto the healing process.

THE MARKET

MARKET SENTIMENT

The fear manifested itself differently this time around. Yes VIX finally cracked 40, hitting 42.6 on Thursday during the height of the global financial crisis. Yet, it was a crisis that was hard to put a finger on for most basically because of the complex nature of the calamity and the fact that the impact would hit the average Joe late in the process. The fact that runs on money market funds were occurring Thursday, however, shoes that the average Joe was starting to feel the pressure. That is how close we were.

The inability to move dollar-based assets, the lack of credit, the explosion in costs associated with financial transactions, the fear in those close to the action, those telling others to put cash under the mattress it was not an 'its different this time' moment but a 'its all over moment.' But for the Treasury RTC-like plan VIX would have likely hit 60 or higher on Friday as the meltdown progressed and came more into focus in the public arena. That would have been bottom material for sure; or the entryway to hell. As it is, the feds stepped in and tried to put in their own bottom. This likely only moved up the bottom that was in progress given the spike in the VIX. The 'natural' bottom would take a few weeks after this VIX spike to complete. Still probably will; this is the first leg in the process and it likely has to work through a bottom just as most times.

VIX: 32.07; -1.03
VXN: 34.26; +1.44
VXO: 33.55; -2.51

Put/Call Ratio (CBOE): 0.82; -0.36. Below 1.0 on the close for the first time in 9 sessions. Did its job.

Bulls versus Bears:

For the second time this year bears are crossing above bulls, doing so basically where they did in March on their way to much more extreme readings just about the time the market made the March low and started the last rally. Positive for the market and if SP500 is going to hold the long term trendline is the place to do it.

This is a reading of the number of bullish investment advisors versus bearish advisors. The reason you look at this is that it gives you an idea of how bullish investors are. If they are too bullish then everyone is in the market and it is heading for a top: if everyone wants to be in the market then all the money is in and there is no more new cash to drive it higher. On the other side of the spectrum if there are a lot of bears then there is a lot of cash on the sideline, and as the market rallies it drags that cash in as the bears give in. That cash provides the market the fuel to move higher. If bears are low it is the same as a lot of bulls: everyone is in and the market doesn't have the cash to drive it higher.

Bulls: 37.9%. Down from 38.2% though not as much as you would have anticipated givn the volatility. Down from 40.7% on the high during the rally off the July lows. Turned back up before it got down to 35%, below which is considered bullish for the market as the number of upbeat investors is relatively low. A long way up from the 27.8% on the low this round. Hit 31.9% two months back and the 30.9% low hit in March. Steep drop from a rebound high at close to 50% on the run through May. In March the indicator did its job with the dive below 35% and the crossover with the bears. Now it is going above and beyond. Bulls and bears have crossed over again, doing so even before the prior lows are hit. The bulls and bears were eye to eye in mid-February and have crossed. A move into the lower 40's is a decline of significance. A move to 35% is a bullish indicator. This is smashing that. For reference it bottomed in the summer 2006, the last major round of selling ahead of this 2007 top, near 36%, and 35% is considered bullish.

Bears: 43.7%. On the rise as bulls fall, what you want to see for a bottom. Up from 41.6% last week. If the bulls turn over and crap out below 35% again that would be a strong signal. Interestingly they are still 'crossed over,' i.e. more bears than bulls. Moving toward 50.0%, the high on this move, but a long way off. As the NYSE indices test the lows you would want it higher. Still above the 35% threshold so still a bullish indication. A steady rise to 50% on this move: 48.9%, 47.3%, 44.7% and 39.3% before that. Well above the bullish level and the highest since 1995. Again, that is one of the best indications that sentiment is getting extreme on the negative side. It is again past 35%, the level that historically indicates too much pessimism. As with the bulls the jump in bears did its job after hitting 44.7% in the third week of March that was up from an already freakishly strong 43.3% the week before. Up sharply from a low of 19.6% on the last rally. Bearishness peaked at 37.4% in September 2007. It topped the June 2006 peak (36%) on that run. That June peak eclipsed the March 2006 high (33%) and well above the 2005 highs that spawned new rallies (30% in May 2005, 29.2% in October 2005). This is a huge turn, unlike any seen in recent history.

NASDAQ

Stats: +74.8 points (+3.4%) to close at 2273.9
Volume: 3.965B (+1.31%)

Up Volume: 3.133B (-363.491M)
Down Volume: 810.161M (+403.901M)

A/D and Hi/Lo: Advancers led 3.48 to 1
Previous Session: Advancers led 2.82 to 1

New Highs: 231 (+134)
New Lows: 152 (-244)

NASDAQ CHART: Click to view the chart

Finished the week with a gain with two huge upside sessions. Gapped to the 50 day EMA (2312) on the high and then faded. Still a very volatile pattern with a new reaction low for 2008 it now will likely need to test over the next several weeks as the plan is hammered out and implemented.

NASDAQ 100 CHART: Click to view the chart

SOX CHART: Click to view the chart

SP500/NYSE

Stats: +48.57 points (+4.03%) to close at 1255.08
NYSE Volume: 2.955B (+21.6%). Big volume powered by a lot of covering in the financial sector.

Up Volume: 252.632M (-1.909B)
Down Volume: 418.797M (+157.516M)

A/D and Hi/Lo: Advancers led 7.35 to 1
Previous Session: Advancers led 3.01 to 1

New Highs: 211 (+139)
New Lows: 128 (-913)

SP500 CHART: Click to view the chart

Impressive recovery to the 50 day EMA over Thursday and Friday, but there was that new 2008 low that is way down 1133, and even with the government's attempt at putting in a bottom for the market, it will likely be tested over the course of the next several weeks as concern over the plan and even if it gets passed will swing emotions and thus SP500 all over the place. For now it looks to have made the low for the cycle.

SP600 (+3.39%). Put in a massive reversal and moved up to the June high on the Friday intraday peak (401). Amazing move, but then SP600 is an early economic cycle index that was in the lead before last week's meltdown, holding up very well until that selling. It is now sitting pretty right now even with another test likely to fill that gap as the other indices test their new 2008 lows.

SP600 Chart: Click to view the chart

SP400 CHART: Click to view the chart

DJ30

Finished basically flat on the week thanks to the recovery that took it back up to the 50 day EMA on the Friday high. A new reaction low for the selling cycle, and that will likely need testing before it is ready for a sustained move higher. Nonetheless the pattern has the classic look of a double bottom as it undercut the prior low but reversed it in one day. Thus DJ30 may not need to make that next test.

Stats: +368.75 points (+3.35%) to close at 11388.44
VOLUME: 655M shares Friday versus 488M shares Thursday. Some big short covering volume and expiration as well pumped up the trade.

DJ30 CHART: Click to view the chart

MONDAY

We will have to see what transpires this weekend with respect to the bailout plan. We can expect speech making and posturing despite the call for a nonpartisan approach. It is, after all, an election year. Sooner than later, however, a plan will be adopted because those present Thursday night looked into the pit and blanched.

Even with a plan in place there will still be ups and downs in the market. Just because the Feds step in with the nukes that is not a guarantee and there will be things to iron out as well as doubt creeping in here and there as things progress. Thus we get the up and down action and likely a test on SP500 of those lows before this is over.

What we are going to do is continue looking at strong stocks that held up well during the selling and that remain in solid shape to move higher. We are also looking at solid stocks that sold off ahead of the market dive such as some of the ag and energy stocks. We will watch many and see which show the moves that indicate the big money is moving their way and follow the money. We are not going in 100% on each position, just moving in with partial positions, e.g. a third or half when we get a good entry point; there will likely be plenty of volatility still as the market tries to make the bottom over the Thursday low so we need to move in a bit at a time as we look for a follow through to the Thursday reversal session starting Tuesday. Even if we get it we will still move carefully as there will still likely be that test to set up the market base and more individual stock bases.

Support and Resistance

NASDAQ: Closed at 2273.90
Resistance:
2286 is the first April 2008 gap up point.
2300 is some resistance.
The 50 day EMA at 2312
2340 from the March 2007 low
The 90 day SMA at 2362
2370 is the trendline from the summer 2004/July 2006 lows, Q4 2005 consolidation
2370 from the April 2006 peak
2378 is the mid-February peak; 2379 from the October 2006 peak
2386 is the August 2007 intraday low
The 200 day SMA at 2387
2388 is the June 2008 low
2392 is the April 2008 peak
2419 is the January 2008 peak and the early February peak

Support:
2261 is a March 2008 interim low
The 10 day EMA is 2229
2202 is the January 2008 low
2167 is the July 2008 low
2155 is the March 2008 low
2043-47 from the July 2006 low and October 2005 low
2020 from January and April 2005
1912 from April 2005

S&P 500: Closed at 1255.08
Resistance:
1257 is the March low
The 50 day EMA at 1265
1270 is the January low
1285 is the recent July peak
The 90 day SMA at 1298
1313.15 is the August 2008 peak
1317 from the February low
1324 is the April low
1331 is the June low
The 200 day SMA at 1344
1360 is an ancient trendline

Support:
1244 is an August 2005 peak
1237 is the 2002/2003 up trendline
The 10 day EMA at 1226
1215 is the July 2008 closing low
1200 is the July 2008 intraday low
1176 from the Q4 2005 lows
1167 is the January 2005 low
1154 from the May 2005 lows
1142 is the 2005 closing low
1065 is the Q4 2003 level that SP500 started the run to 2007 after the first run in the recovery.

Dow: Closed at 11,388.44
Resistance:
11,388 is the prior August low
The 50 day EMA at 11,444
11,670 is the May 2006 intraday high; 11,642 closing
11,6700 is the 2004/2005 up trendline
11,700 is the January intraday low
The 90 day SMA at 11,718
11,731 is the March 2008 low
11,867 is the August 2008 peak
12,050 from the March 2007
12,070 from the early February 2008 lows
12,250 from late March 2007 lows
The 200 day SMA at 12,232

Support:
11,317 from March 2006
11,061 from February 2006
10,962 is the July closing low
10,827 is the July 2008 intraday low
10,215 from Q4 2005
10,100 t0 10,000

Economic Calendar

These are consensus expectations. Our expectations will vary and are discussed in the 'Economy' section.

September 24 - Wednesday
- Existing home sales, August (10:00): 4.93M expected, 5.00M prior
- Crude oil inventories (10:35)

September 25 - Thursday
- Durable Goods Orders, August (8:30): -1.3% expected, 1.3% prior
- Initial jobless claims (8:30): 455K prior
- New Home sales, August (10:00): 518K expected, 515K prior

September 26 - Friday
- Q2 GDP final (8:30): 3.4% expected, 3.3% prior
- Michigan Sentiment, September revised (10:00): 73.1 prior
icon url

ReturntoSender

10/07/08 11:11 PM

#8257 RE: ReturntoSender #6755

Technical Analysis: It's the Uptick Rule, Stupid
An SEC decision in July 2007 could well be contributing to the current financial crisis.

October 7, 2008
By Paul Shread: More stories by this author:

http://www.internetnews.com/bus-news/article.php/3776511

Sure, the government needs to rein in leverage, derivatives and hedge funds to prevent a recurrence of the systemic crisis enveloping the globe, but there are simpler steps the government can take right now that might take a little pressure off the stock market.

And the easiest of those steps would be to reinstate the "uptick rule," which required that stocks could only be shorted when they were moving higher and stood for 69 years until the SEC eliminated it in July 2007 — just weeks before the start of the current crisis.

The SEC revoked the rule based on pilot studies in a bull market, but in a bear market, it sure looks like the absence of the rule has brought a return of the 1929-style "bear raids" it was designed to prevent. Shorts piling in on the way down can accelerate a decline, the SEC reasoned way back in 1938. It sure looks like that's what we're getting here.

But rather than revisit what appears to be a flawed decision, the SEC has instead resorted to enforcing naked short selling restrictions it should have been tougher on all along and banning shorting outright — which didn't work when they tried it in 1931 and doesn't seem to be working here either.

Rather than extend the short-selling ban — which expires tomorrow night — the SEC would do better to bring back the uptick rule and permanently ban naked short selling.

It's a simple, long-term solution, and even the head of the NYSE favors it. Individual stock circuit breakers — which the SEC is reportedly considering — would likely not be as effective, as shorts could just wait and pile on for every new leg down.

The purpose of financial markets is for companies to raise money; there's no reason why shorts need to be on an equal footing with longs.

And now on to the charts...

We warned weeks ago that a break of our major support level of 10,683 on the Dow (first chart below) could suggest a systemic crisis, and that's exactly what we're getting here.

The Dow has since given up 10,000 and 9700, which are now first resistance. The next support — and a very important one — is 9043.37, the top of the first leg up off the 2002 lows. Below that level and we could see a complete retest of the 2002 lows.

The S&P (second chart) faces the same support level at 954.28, with first support at 992. To the upside, 1060, 1111 and 1163 are resistance.

The Nasdaq (third chart) is sitting right on critical support at 1750; below that, 1521.44 is the next big level, although 1600 could provide some support. To the upside, 1794, 1889 and 2000 are resistance.

A very tough market indeed. It's deeply oversold, and bearish sentiment is very high, but none of that has yet meant much to the market. If the gloom can lift just a little, the upside could be big.

Had to make my own charts so they would update!


Next Article:

http://www.internetnews.com/bus-news/article.php/3776501

AMD a Rare Gainer as Stocks Plunge Again
But even AMD's big early gains faded as global financial fears continue to spread.

October 7, 2008
By Paul Shread:

AMD (NYSE: AMD) investors were about the ones smiling on Tuesday after stocks were bludgeoned for the fifth straight day on fears of a global credit crisis.

AMD shares rose 8.5% after announcing plans to spin off its manufacturing operations, but the stock ended well off its early gains of more than 30%.

Elsewhere, it was just plain ugly.

The 25 most heavily traded Nasdaq stocks lost 2.6% or more, with Microsoft (NASDAQ: MSFT), Intel (NASDAQ: INTC), Cisco (NASDAQ: CSCO), Oracle (NASDAQ: ORCL), Apple (NASDAQ: AAPL), Applied Materials (NASDAQ: AMAT), Research in Motion (NASDAQ: RIMM), Dell (NASDAQ: DELL), Symantec (NASDAQ: SYMC), eBay (NASDAQ: EBAY), Sun (NASDAQ: JAVA), Broadcom (NASDAQ: BRCM) and Juniper (NASDAQ: JNPR) losing 5% or more, as investors continue to price in a sharp slowdown because of frozen credit markets.

NetApp (NASDAQ: NTAP) lost 12%, following an 8% drop Monday after company CEO Dan Warmenhoven made cautious comments to Business Week.

Google (NASDAQ: GOOG) fell 6.8% to $346.01 and is now down $400 from its 52-week high.

Bank woes and earnings warnings weighed on the broader market, as Federal Reserve efforts to shore up the commercial paper market and hints of more interest rate cuts did little to stop the selling, as the major indexes all ended the day more than 5% lower and the S&P 500 hit a five-year low, falling below 1000 for the first time since October 2003.

The Nasdaq lost 108 to 1754, the S&P fell 60 to 996, and the Dow tumbled 508 to 9447. Volume declined to 7.05 billion shares on the NYSE, and 2.9 billion on the Nasdaq. Decliners led by a 30-4 margin on the NYSE, and 24-5 on the Nasdaq. Downside volume was 95% on the NYSE, and 96% on the Nasdaq. New highs-new lows were 7-1146 on the NYSE, and 5-708 on the Nasdaq.
icon url

ReturntoSender

10/11/08 10:36 AM

#8269 RE: ReturntoSender #6755

No two bottoms are ever quite the same. There are similarities at long term market bottoms. There are numerous positive divergences. None of which are present now after the worst week for the market. This within one of the worst years for the market on record. Right now the high volume can be characterized as high capitulation volume. We should be forming a very good trading bottom. The ultimate bottom may be quite a way down the road. At that time we will look for positive divergences and a low volume apathy before we make a final bottom:


icon url

ReturntoSender

10/11/08 4:48 PM

#8270 RE: ReturntoSender #6755

Amateur Investors Weekend Stock Market Analysis (10/11/08)

http://www.amateur-investors.com/Weekend_Market_Analysis_Oct_11_08.htm

The Volatility in the market is as high as it can get as the Volatility Index (VXO) rose over 100 on Friday which hasn't occurred since October of 1987. The 5 minute chart below shows how ridiculous this market has been recently with extremely large moves within a very short period of time. In fact on Friday there were two 800 point upside moves (points D to E) that occurred in less than 45 minutes.


The late day turnaround on Friday has some people convinced that a major Bear Market bottom has occurred, however, although it could be a short term bottom I believe it's not the real Bear Market bottom based on Elliot Wave Theory.

It appears the S&P 500 is exhibiting a longer term Bear Market Elliot 5 Wave Pattern. For those not familiar with an Elliot 5 Wave Pattern they can occur in both Bull and Bear Markets as described below.

Typically we are used to seeing Elliot 5 Wave Patterns evolve in a Bullish environment where Waves 1, 3 and 5 are to the upside will Waves 2 and 4 are corrective to the downside. Once the 5 Wave Pattern completes itself then this is followed by an ABC type correction to the downside.


Meanwhile Elliot 5 Wave Patterns can also occur in a Bearish environment as well and trends the opposite way such that Waves 1, 3 and 5 are to the downside while Waves 2 and 4 are corrective to the upside. Once the 5 Wave Pattern completes itself then this is followed by an ABC type rally to the upside.


If we take a look at a current chart of the S&P 500 it appears that it's exhibiting Wave #3 at this time which may or may not be nearing completion in the short term based on Friday's action. Keep in mind once the 3rd Wave ends this will be followed by a corrective 4th Wave to the upside before the final 5th Wave to the downside occurs. This whole process could still take several more weeks before the 5 Wave Pattern completes itself.


Meanwhile if we take a look at a long term chart of the S&P 500 going all the way back to the 1980's a few things really stand out. First the S&P 500 is exhibiting a very bearish looking Double Top Pattern which looks like the letter "M". The second thing to notice is that there is a longer term upward sloping trend line (yellow line) that originates from the low made in 1987 (point A) that comes into play just below the 800 level which intersects with the low made in 2002 (point B).


Here is why I think it will be important for the S&P 500 to hold support at the 770 level in the weeks ahead. For example let's look at a chart of a stock (CTX) which formed a Double Top pattern from 2005 into 2006. Notice once CTX failed to hold support in the middle of its "M" pattern (point C) it continued much lower during the past few years. This is why it's going to be extremely important for the S&P 500 to hold support near the 770 level as a break below this level could lead to a much bigger drop in the longer term.


As far as the near term the S&P 500 rallied up to its 20 Day EMA (blue line) near 936 using a 60 minute chart but then stalled out and reversed to the downside near the close on Friday. Thus in the short term one of two things may happen as either the S&P 500 will retest the intra day low made on Friday at 840 or it will rise above its 20 Day EMA and make a significant move up to possibly its 50 Day EMA (green line) near 1000.


As for the Dow it rallied up to around 8800 which was very close to its 20 Day EMA (blue line) on a 60 minute chart but then reversed to the downside on Friday at the close. The key thing to watch early next week will be if the Dow can break above its 20 Day EMA or not. If the Dow can rise above its 20 Day EMA then it could make a quick move up to its 50 Day EMA (green line) which is nearing the 9400 level. On the other hand if the Dow is unable to rise above its 20 Day EMA then we could see a retest of Friday's intra day low around 7880.


Finally the Nasdaq rallied up to its 20 Day EMA (blue line) as well but stalled out near the 1680 area Friday afternoon. Just like the Dow and S&P 500 further upside in the Nasdaq will likely depend on whether it can rise above its 20 Day EMA or not. If the Nasdaq can break above its 20 Day EMA then look for a rally up to its 50 Day EMA (green line) near 1800. Meanwhile if the Nasdaq fails to rise above its 20 Day EMA then it could retest Friday's intra day low near 1542.

icon url

ReturntoSender

10/12/08 2:05 PM

#8274 RE: ReturntoSender #6755

NASDAQ New Lows on 10 Year Histogram. Note the relative outperformance of the SOX versus the other indices shown after the 2002 bottom:


icon url

ReturntoSender

10/13/08 1:25 PM

#8275 RE: ReturntoSender #6755

From the bottom in 2001 the SOX gained 86%! So even a 2001 like bottom would be a welcomed rally by the bulls. Look for divergences (and watch the market breadth) in the future to help determine if we are looking at a 2001 type bottom or something more like 1998 or 2002.

2001 Chart:


One year chart now:

icon url

ReturntoSender

10/23/08 10:35 AM

#8290 RE: ReturntoSender #6755

GE which was a good enough company for Warren Buffett to buy into recently is also trading at new 10 year lows. Yielding over 6% I have to wonder how much cheaper this stock can get before actually bottoming? Is it time to try to beat Buffett on returns as the stock price is below where it was when he bought? Of course he did not buy at market prices.

http://finance.yahoo.com/q?s=ge


RtS
icon url

ReturntoSender

10/24/08 8:57 AM

#8292 RE: ReturntoSender #6755

Stocks head for sharp decline on recession fears
Friday October 24, 8:42 am ET
By Stevenson Jacobs, AP Business Writer
Wall Street heads for big decline as recession fears stir panic, batter world markets

http://biz.yahoo.com/ap/081024/wall_street.html

NEW YORK (AP) -- Wall Street headed for another precipitous drop Friday as fears of a punishing global recession stirred panic among investors and sent world financial markets into a tailspin. The Dow Jones industrial average futures fell 550 points, triggering a halt in selling of stock future contracts.

The massive decline was caused by increasingly grim news from overseas. In Japan, shares of Sony sank more than 14 percent after it slashed its earnings forecast for the fiscal year. In Germany, Daimler's stock dropped 11.4 percent in morning trading after it reported lower third-quarter earnings and abandoned its 2008 profit and revenue guidance.

Japan's Nikkei stock average fell a staggering 9.60 percent. In Europe, Germany's benchmark DAX index was down 10.76 percent, France's CAC40 dropped 10 percent while Britain's FTSE 100 sank 8.67 percent after the government said its gross domestic product fell 0.5 percent in the third quarter, putting the country on the brink of recession.

The dour outlook convinced investors that the world economy is headed for a long and severe downturn despite a raft of government rescue efforts aimed at pulling the financial system from the brink. It also indicated that the tremors caused by the global credit crisis may have only begun to be felt in their true scope and magnitude.

"There's a lot of panic out there today," said Scott Fullman, director of derivatives investment strategy for WJB Capital Group in New York. "People have been saying that we're in a recession. This is the realization."

Fearing more carnage in world equity markets, big hedge funds and other institutional investors have been pulling out their money en masse in a bid to reduce risk and raise cash -- a process known as deleveraging that only intensifies the selling. Meanwhile, individual investors that have seen their holdings decimated in recent weeks have been yanking money out of mutual funds, adding to the downward pressure on markets.

"I think it would be natural to make an assumption that there are some funds in trouble and that we may see some funds shut down," Fullman said.

Ahead of the market's open, Dow Jones industrial average futures fell the maximum allowed limit of 550, or 6.27 percent, to 8,224. That triggered "circuit breakers" that automatically freeze selling until the market's 9:30 a.m. EDT open. However, traders can still buy stocks and send the market higher.

The Standard & Poor's 500 index futures index was also down the maximum allowed 60 points, or 6.56 percent, to 855.20, and the Nasdaq 100 index futures was down the maximum allowed 85.00, or 6.20 percent, at 1,175.75.

The big drop in futures trading raised the possibility that circuit breakers intended to prevent panic selling could be triggered during regular trading -- something that hasn't happened since 1997.

The thresholds that would trigger a halt in trading are set at a decline of 10 percent, 20 percent and 30 percent in the Dow, based on where that index was at the beginning of the current quarter; that would mean declines of 1,100 points, 2,200 points and 3,300 points, respectively.

If the Dow Jones industrial average falls 1,100 points before 2 p.m., the market will shut down for an hour. If the threshold is breached between 2 p.m. and 2:30 p.m., the halt will last 30 minutes. Trading would stop again if the Dow falls by 2,200 points. If the Dow falls by 3,300 points at any time, trading would be halted for the day.

Gary Townsend, president and CEO of, Hill-Townsend Capital Inc., said a halt in trading was a possibility.

"It's a way of smoothing market activity and making it orderly. No one would like to see it," he said.

Elsewhere in Asia on Friday, Hong Kong's Hang Seng index fell 8.3 percent to 12,618. Markets in India, Thailand, Indonesia and the Philippines were also down sharply as investors bailed from emerging markets to cut their exposure to risky assets and meet redemption needs at home.

The intensifiying gloom over growth expectations is having the added impact of putting small economies and currencies under extreme pressure. Investors are pulling money out of countries in Eastern Europe, Latin America and Asia on fears vulnerable countries will not only be hit hard by the financial crisis but may also default on debt.

In Europe, for example, Hungary, Ukraine and Belarus are all, like Iceland, in talks with the IMF to discuss possible loans.

Meanwhile, demand for U.S. Treasurys jumped as investors sought safe places to put their money. The three-month bill, regarded as the safest assets around, yielded 0.72 percent, down from 0.94 percent late Thursday.

The U.S. dollar, meanwhile, plunged below 93 yen, a 13-year low, as traders reacted to dismal U.S. jobs data that spurred speculation the Federal Reserve might cut interest rates. Meanwhile, gold prices plunged.

Light, sweet crude was down $4.64 to $63.20 premarket electronic trading on the New York Mercantile Exchange. The sell-off, another sign that investors fear a severe recession, came despite OPEC's announcement that it will cut production by 1.5 million barrels a day in a bid to shore up sagging prices.

Associated Press writers Carlos Piovano in London, Alex Kennedy in Singapore, Shino Yuasa in Tokyo and Kelly Olsen in Seoul and Sarah Lepro and Stephen Bernard in New York contributed to this report.
icon url

ReturntoSender

10/25/08 10:11 AM

#8293 RE: ReturntoSender #6755

From Briefing.com: 4:30 pm : Stocks may have closed with substantial losses Friday, but the extent of the downturn was far better than many initially feared.

Index futures were limit down ahead of the session's opening bell, which occurs when trading is halted in order to pace losses amid frantic selling efforts. That had participants spooked and anticipating a large scale sell-off.

Stocks fell to their session low early on. At that point, the Dow was down 5.8%, the S&P 500 was down 6.1%, and the Nasdaq fell 6.9% to a new five-year low. Choppy trading gave way to a late session rally that helped stocks finish off their lows.

The bleak mood in early trading stemmed from continued fear of a global recession as England's economy contracted by a worse-than-expected 0.5%. That prompted London's FTSE 100 to close with a 5.0% loss. Other major European markets also saw losses, but none matched the 9.6% drop in Japan and the 8.3% fall in China.

The argument that slower global growth will undercut demand for oil has crude prices down 56% from their July high. That prompted OPEC to schedule an emergency meeting in which it decided to cut daily production by 1.5 million barrels, effective immediately. Oil prices fell further, though. Crude futures were down 7.7% at one point, but ended around 4.5% lower at less than $65 per barrel. Oil last traded there in mid-2007.

A dour outlook from global tech company Microsoft (MSFT 21.96, -0.36) only reaffirmed the fear that earnings prospects are clouded by macro concerns. The company posted better-than-expected revenue and earnings per share results for its latest quarter, but guided profits below the consensus estimate for both the fourth quarter and fiscal 2009.

With economic concerns abounding, markets believe the FOMC is certain to cut the fed funds target rate. Currently, there is a 78% probability it will be taken to 1.00%, and a 22% it will be taken to 0.75%, down from the current 1.50%.

The move by the Fed would complement other government efforts to restore financial and credit markets. For instance, sources indicated the U.S. Treasury is looking to further extend the use of funds in its TARP emergency plan to begin helping regional banks and possibly even insurers. PNC Financial Services (PNC 58.88, +2.00) plans to issue to the U.S. Treasury $7.7 billion of preferred stock and related warrants under the TARP program, which will help in its acquisition of National City (NCC 2.07, -0.68).

Lower interest rates would also aim to help restore the housing market by making loans more affordable. That would help the housing industry, which actually saw existing home sales increase 5.5% in September from the prior month to an annualized rate of 5.18 million units.

Despite the likelihood an interest rate cut and persistent volatility in major stock indices, the dollar continues to appreciate against foreign currencies. The dollar index, which measures the greenback's value against a basket of six major currencies, jumped 1.3% to a two-year high. DJ30 -312.30 NASDAQ -51.88 NQ100 -3.0% R2K -3.8% SP400 -2.9% SP500 -31.34 NASDAQ Adv/Vol/Dec 566/2.65 bln/1713 NYSE Adv/Vol/Dec 561/1.58 bln/2552

09:46 am First Solar tgt cut to $175 at Wedbush; expects solid quarter and positive outlook: . Wedbush notes FSLR is scheduled to report Q3 earnings on Wednesday, October 29. Firm is expecting Q3 rev of $337.7 mln vs. $339.8 mln consensus and EPS of $0.93 vs. $1.01 consensus. Co guided for 475-485 MW for 2008 which could be conservative. Currency exposure adds another risk to the equation. U.S. utility market is a major opportunity but remains in its infancy today. Ther are no changes to firm's revenue/GAAP EPS estimates of $1.185 bln/$3.49 for 2008 $2.297 bln/$6.61 for 2009, and $2.83 bln/$8.64. Firm cuts tgt to $175 from $225.

09:45 am Western Digital upgraded before the open to Strong Buy at Needham; tgt lowered to $22: . Needham upgraded WDC to Strong Buy from Buy and lowers their tgt to $22 from $29 following earnings. The firm says WDC has conservatively forecasted the muted demand that has begun to manifest itself in the PC/consumer world. However the firm says WDC currently trades at book value, $1 above tangible book, materially below historical trough valuations of 0.5x sales.

08:39 am Microsoft (MSFT)

Microsoft (MSFT 22.32) reported better-than-expected results for its latest quarter, although it gave a cautious outlook.

In its fiscal first quarter, which ended in September, Microsoft logged 9.4% year-over-year revenue growth to $15.1 billion, which topped the consensus estimate of $14.8 billion. Strong growth in the business division (+20.2%) and servers and tools (+17.5%) was partially offset by weak results in client (+1.9%) and entertainment (-6.0%).

Earnings rose 6.7% year-over-year to $0.48 per share, benefiting from $6 billion in share repurchases. The result was $0.01 better than the consensus estimate. Operating income grew by only 2.6% to $6.0 billion. The sluggish income growth was due to a drop in client operating income and a larger loss in the online services business.

Microsoft issued downside guidance for its second quarter and fiscal year 2009, citing the balance of risks and the likelihood of a continued economic slowdown.

In the second quarter, Microsoft expects to earn between $0.51 and $0.53 per share, which is short of the $0.55 consensus estimate.

For the full year, Microsoft expects to earn between $2.00 and $2.10 per share, versus the $2.11 consensus estimate.
icon url

ReturntoSender

10/26/08 11:43 AM

#8296 RE: ReturntoSender #6755

For stocks, October can't end soon enough
Saturday October 25, 5:05 pm ET

http://biz.yahoo.com/rb/081025/business_us_column_stocks_outlook.html?.v=1

By Ellis Mnyandu
NEW YORK (Reuters) - Whichever way next week plays out on Wall Street, the market is likely to close out an October that stock investors would rather forget.

So far this month, the Dow is off 22.8 percent, the S&P 500 is off 24.7 percent and the Nasdaq is down 25.8 percent -- putting them on track for their worst month since the October 1987 crash. In the S&P's case, this October could wind up being its worst month ever in the post-World War II era.

Bears are expected to tighten their grip on Wall Street in the week ahead unless there are reassurances by the U.S. Federal Reserve and other central banks that authorities have what it takes to reduce the blows from the menacing economic downturn.

But there's likely to be little comfort until the Fed issues its verdict on the economic outlook and the government releases its advance report on third-quarter real gross domestic product (GDP), due on Thursday.

The GDP data could well be the first negative print for this closely watched gauge of the U.S. economy's health since the revised reading for the fourth quarter of 2007. GDP measures the output of all goods and services within U.S. borders.

"The outlook for the market really depends upon what type of action the Fed may take," said Doug Roberts, chief investment strategist for Channel Capital Research in Shrewsbury, New Jersey. "I wouldn't rule out the possibility of something on a coordinated basis globally as well."

In addition to the Fed, the coming week will be jampacked with numbers -- economic indicators including new home sales, consumer sentiment, a survey on home prices, plus durable goods orders and data on personal incomes and spending -- as well as a deluge of earnings that could confirm investors' worst fears that the outlook for profits and economic growth is becoming grimmer.

Investors will comb through the data and the earnings to get a sense of how deep a recession the United States may face as real estate values keep sliding, stocks continue falling and consumers keep pulling their purse strings even tighter.

EYES AND EARS ON THE FED

The Federal Open Market Committee is scheduled to begin a two-day meeting on Tuesday to decide on interest rates. Their rate decision is expected on Wednesday afternoon at about 2:15 p.m. New York time.

Futures fully price in a rate cut of one-half percentage point, or 50 basis points, in the fed funds rate, to 1 percent from 1.5 percent. If that happens, the fed funds rate, which is the rate that banks charge each other for overnight loans, would be brought back down to where it was in late June 2003, when it was at 1 percent -- the lowest in almost 40 years.

The interest-rate futures market also sees a "more than 20 percent" chance that the Fed could cut the fed funds rate more aggressively, to 0.75 percent -- that's right, to below 1 percent.

"I think that the anticipation is that the Fed will cut rates. The question is: How much?" said Bucky Hellwig, senior vice president at Morgan Asset Management in Birmingham, Alabama.

"A cosmetic rate cut probably won't have much benefit to the market. Psychologically, a bigger-than-expected cut would confirm that the Fed is actually using every weapon at their disposal to try and make the downturn less painful."

But while the Fed's rate pronouncement will get attention, it is the central bank's assessment of the economic conditions and outlook that investors will zero in on to decide whether they should buy, keep or sell stocks, with benchmark indexes at their lowest levels in more than five years.

Fed Chairman Ben Bernanke warned during a congressional hearing on October 20 that the U.S. economy could be dogged by an extended period of subpar growth and, as a result, a second economic stimulus plan might be needed.

A GRUESOME OCTOBER

Wall Street also will wrap up October, a month notoriously troublesome for stocks since the market crashes of 1929 and 1987. So any whiff of encouraging news next week could be fodder for the bulls.

It may not be coincidental that the last trading day of October 2008 happens to be Halloween.

The Stock Trader's Almanac calls October the jinx month because of the crashes in 1929 and 1987, as well as the slide on October 27, 1997, the back-to-back massacres in 1978 and 1979 and Friday the 13th in October 1989.

Yet October sometimes turns out to be a "bear killer" or a turning point when bears, after gorging themselves on stocks, go into hibernation.

The threat of economic upheaval has rattled markets around the globe as panicked investors and institutions, including hedge funds, rush to liquidate risky positions to raise cash.

In a dramatic move before Wall Street's opening bell on Friday, trading in U.S. stock futures were frozen several times as benchmark gauges hit levels that spur authorities to institute measures to prevent disorderly downdrafts amid a global slide.

Concern that the global economic downturn, sparked by the U.S. housing slump, might be deeper than expected drove U.S. stocks down sharply in Friday's session.

For the week, the Dow Jones industrial average (DJI:^DJI - News) was down 5.35 percent for the week, while the S&P 500 (^SPX - News) was off 6.78 percent and the Nasdaq was down 9.31 percent.

MARK YOUR CALENDARS

The data on September new home sales is scheduled for release on Monday, while on Tuesday, investors will wade through the August S&P/Case-Shiller home price index and Oct consumer confidence.

Data on September durable goods is due on Wednesday, while weekly jobless claims will accompany the GDP report the following day.

The report on personal incomes and spending, which includes an inflation gauge watched closely by the Fed, is due on Friday, along with the Chicago PMI, a measure of manufacturing activity in the U.S. Midwest, and the Reuters/University of Michigan Surveys of Consumers. For full economic diary, see (ECI/US)

On the earnings front, investors will focus on energy heavyweights Exxon Mobil Corp (NYSE:XOM - News), due to post third-quarter results on Thursday, and rival Chevron (NYSE:CVX - News), set to report on Friday.

Phone company Verizon (NYSE:VZ - News), food maker Kraft Foods (NYSE:KFT - News), consumer products giant Procter & Gamble (NYSE:PG - News), insurer MetLife (NYSE:MET - News) and United States Steel Corp (NYSE:X - News) also are among the week's marquee names set to report earnings.

The Fed's roster of speakers includes Chairman Ben Bernanke, scheduled to address via satellite a symposium on the mortgage meltdown, the economy and public policy at the University of California at Berkeley. On Thursday, Federal Reserve Bank of San Francisco President Janet Yellen will speak at the UCal-Berkeley conference.


icon url

ReturntoSender

10/26/08 4:12 PM

#8297 RE: ReturntoSender #6755

InvestmentHouse Weekend Market Summary:

http://www.investmenthouse.com/weekendmarketsummary.htm

- Global gloom threatens a real selloff, but when the bell rang it was just another down day in the bear market.
- LIBOR re-freezes for second session.
- A watched bottom never forms.
- Sellers appear out of ammo, unable to finish off the prior lows, indicating market is still working on the first bottom, not the second.
- US path set to follow the same policies that led to the prolonged 1970's malaise.
- If market doesn't break the lows Monday, looking for a bounce to precede another bottom finding attempt.

The gloom was there but not the capitulation selloff.

It looked as if salvation was at hand. The world markets were crushed, down 9% and more. US futures were locked limit down from the wee hours of the morning. The bad news abounded. For a second day the credit thaw suffered an unseasonal frost and failed to decline (LIBOR 3 month was 3.52%; 3.53% Thursday). The UK reported its first negative GDP quarter in 16 years. Not quite keeping the British end up. GE was borrowing from the Fed's commercial paper window. AIG was borrowing too much from the Fed's bailout window ($90.3B versus the $85B originally planned). OPEC cut its production by 1.5M bbl/day. Plenty of negatives and an extremely negative air. Many veterans and newcomers alike were certain judgment day had come, i.e. the big blowout to the downside to clean out the pipes.

Then the opening bell rang, and as expected the market opened lower. We were looking at the DIA pre-market given the futures were locked & no one knew where they were trading. DIA indicated an open near 8050, almost 700 points lower but still well over the October intraday low. The open was not that bad. DJ30 hit 8187 in the first few minutes, down around 500 points for an instant.

That was it for the morning. We posited the market may sell after the initial bounce or even in the last part of the afternoon. A look at the early volume showed it was nowhere near the heavy levels that would take the market down and indicate a real burn off to the downside. It looked as if any real selloff would have to come late in the session. We took some of the SPY and DIA downside gain. Stocks continued to the upside, weakened after lunch, but then rebounded toward the bell. The indices closed near session highs, and though still sporting 3% losses, volume was lighter after no real test of the low on DJ30. Friday was not judgment day, just another down day in the bear market.

TECHNICAL. Low to high action on the indices and the in general means more bullish action, but frankly it varies with the wind of the market each session. Some days the bulls are in charge the next the bears. There was a streak there where the bullish action was winning out, i.e. the market was rising even when the market was noncommittal, but that has given up to the return of the back and forth action. The fact that the NYSE large caps have held their prior lows, however, suggests there is a bit of upside overhang still present.

INTERNALS. Once more the internals climbed. You would expect them to with 3% moves on the indices. Breadth was in the -4:1 range. New lows topped 1100 on NYSE, 840 on NASDAQ. Volume was still above average, but it did back down. Thus even if the selling had been deeper the volume was not really there to clean out the plumbing.

CHARTS. No new lows for the year by DJ30 and SP500 but NASDAQ did make its second straight 2008 low and its third straight closing low. While DJ30 and SP500 did not move below the early October intraday lows they did close below the bottom of their two-week range, joining the other indices in that dubious position. They are still holding above the intraday lows so the chance for a bottom of some sort here is still alive, but the solid floor that was forming has cracked. Precarious, but as discussed below there are reasons to believe a bounce is going to emerge from this particular action.

LEADERSHIP. Leadership bases remain a rare commodity. Right now most of what you can find with respect to strength is stocks holding their 2 week lateral consolidations. Steel and energy stocks held tough through the session and through the week. Quality stocks such as AAPL held up just fine as well. Does that mean they are ready to bottom here? As with the indices they could definitely bounce out of these lateral consolidations, but this is not likely their ultimate bottom as discussed below.

Investors outsmart themselves by waiting on the bottom to form.

I said Thursday that the market cannot form a bottom when everyone expects one. Everyone, us included, watches the action each day and sizes up if there is a bottom and what it will take for a bottom to form. After all sentiment indicators are at very extreme levels, internals hit very extreme levels, and the losses are steep enough to conclude a bottom is at hand.

On the other hand, while the losses are definitely deep enough compared to past bear markets, is this selling deep enough to account for the truly historic problems confronting the entire world with respect to the mortgage and subsequent credit collapses? The largest bailout in the history of the world is underway. While the market started selling a year ago, the selling did not really explode until the past two months when the market logged the lion's share of the losses. If the bailouts don't work the losses could be another 2500 points on the Dow. That will also extend the length of the bear market. If the bailouts do work the market bleeding will stop, but that does not mean the recovery will be quicker.

More to the point, as noted above, with everyone looking for a capitulation bottom on a daily basis there is no 'throw in the towel' mentality. They are hanging on, waiting for the bottom, and without the cathartic selloff or slow motion grind out where even the pros say 'forget it,' then the bottom does not come. The market is not to the point yet where the pros and even a lot of retail players are at the 'fer get it' stage (from 'Urban Cowboy'), and thus the pain lingers.

What will it take to get there? Another rise and then another fall.

All of the pieces looked to be in place Friday for a cathartic bottom, but the market could not follow through on the negatives and take out the prior lows. There just were not enough sellers left to drive the knife home. The NYSE large cap indices once again tested lower but easily held and reversed above the 2008 intraday lows. The sellers tried but they simply didn't have the strength.

That action suggests a bottom is indeed here, but it is not THE bottom. If the bailout plans are indeed going to work, this current action is likely the 2008 equivalent of the 'July' leg of the 2002 bottom, i.e., the first bottom in that double bottom process. It takes a bounce and then a second bottom, the equivalent of the 'October' leg of that 2002 double bottom, to complete the process.

Recall that volatility spikes on the first leg of a major bottom. It fades as the market rebounds from that initial pummeling, preferably a bounce that lasts 4 to 6 weeks to the peak before it starts to turn down again. Then the market starts to fall and volatility starts to climb again. It may or may not hit the prior highs; usually doesn't. On that second leg down, however, the fear rises sharply even if VIX doesn't match the prior highs. Veterans start to question if the market can hold this time as that leg is usually pretty ugly and violent to the downside. When they panic and cough up their shares, THAT is the bottom.

That is how it happened in 2002 when we heard that even the pros on the floor of the NYSE were saying that the old tried and true market indicators just were not working anymore. We saw EBAY, TSCO, AMZN and others finishing up good bases that were not ready by any stretch at the July lows, the first leg down. With good stocks in good bases and the pros throwing in the towel we knew the bottom was in.

The failure to capitulate this week and particularly Friday is thus in keeping with historical bottoms. There are hardly any great stocks in good bases ready to move upside just as there were not any in July 2002. There was still work to do with a rebound and them some more selling to get those bases set up. There are still investors that need to get shaken out of the market when they give up on trying to wait out the bottom. October is a month many look for the market to bottom. That is keeping this market from actually making a bottom. They are looking for THE bottom in October, but it is very likely not going to occur in October this year. An interim bottom could very well start to the upside this coming week, but in all likelihood it won't be THE bottom unless there is a big shakeout to the downside Monday or Tuesday in the nature of 1000 points or so on DJ30. That would likely result in a big massive turn, but it would STILL be better to have that blood curdling, screaming, hair on fire drop to come on the second leg lower to really set the true bottom in cement.

THE ECONOMY

Ignoring history and taking the low road to economic mediocrity.

Now all of this talk of the bottom may be moot if the economy heads into a 1970's-like malaise, the worst economic times since the Great Depression. Not necessarily the worst times for the market in terms of absolute losses, but it was a long, 4 year period of nothing after the surge off the bear market low. The economic times were bad, however, and if we follow that path now that means a lot more economic slowing, a longer, drawn out decline, and thus lower earnings and lower stock prices.

Back in the 1970's the US was pretty much a joke for the rest of the world. Our economic malaise left others talking about the 'failed experiment' of a capitalist economy. The irony is, it was not a failure of capitalism but the incessant tinkering with it by injecting big government controls that led to the near demise of our system. Interest rates hit over 20%, inflation ran almost 10%, unemployment topped 11%. New York almost went broke. It was a nation of stagnation.

The parallels of the 1970's problems and those of today and what is planned are frighteningly similar. The 1970's saw oil spike in price with the oil embargos. The Fed flooded the economy with liquidity, fearing a shutdown due to the high prices. The economy shut down anyway due to the high prices and the massive increase in regulation brought about as a result of the social programs of the 1960's and the new initiatives for cleaning up the environment, conserving energy, education, etc. It simply became too costly to do business compared to the rest of the world. That is when the demise of the US auto industry started as they made cheap, throw away cars compared to their foreign competition because the regulatory costs here were so high. Same with the steel industry, electronics, energy (Windfall Profits Tax)- - just about every industry fell behind the world trying to cope with the new regulations and with the cost of new social programs. The cost was not only to industry but for the taxpayer as well as the programs of the 1960's and 1930's were massively expanded as taxes were raised in the hope of capturing more tax revenue.

The Fed didn't flood the economy with liquidity with respect to the oil price surge; it wanted to avoid doing that. Problem is, it has had to flood the economy with liquidity for other reasons, the most recent the mortgage and credit crisis. There is a backlash against deregulation and a push for massive new regulation in housing, banks (the US is actually taking them over) and, business (Rep Frank and Senator Biden are talking of limiting CEO compensation). Increased income taxes, despite the promises of both candidates, are going to happen (Rep Rangel wants a 45% top bracket rate; Frank is talking about taxing 401k's), and increased taxes on capital (capital gains tax is going to increase).

What happens when you employ these changes? If there is a shift to tax the wealthier as well as businesses including the small business category (10 to 500 employees where 100% of the private sector jobs came from in 2004) so that the revenue can be given to or spent on programs benefitting those not paying federal tax initially the tax revenues will rise. The money is distributed and the recipients spend the money and give it back to the companies that were taxed to produce the revenue. What do they do with it? With higher taxes reducing the risk/reward they start looking for ways to shelter the gain. As in the 1970's they look for tax shelters to protect the gains and wait for a better economic environment when the risk/reward ratio is better to expand their business with that money. That takes that capital out of the economy. That further slows the economy and after that initial jump in tax revenues, they fall below the pre-tax increase levels despite the increased rates.

That is what Congress always fails to understand: if you tax more, money will be removed from the areas that result in additional tax assessment and it won't be put into endeavors that generate taxable income or revenue. Thus tax revenues fall even with the higher tax rates and we get the 1970's stagnation: capital is locked away until the day a new direction is taken that rewards risk taking and capital creation once more. The 1970's set up the Reagan tax cuts and economic recovery incentives and the Volcker interest rate hikes (even in a weak economy) that lead to the massive 'invest in America' boom that we rode for 20+ years.

Unfortunately we are not on the cusp of renewing the Reagan/Volcker combination. Instead we are on the cusp of starting the regulation, tax, and inflation cycle of the 1970's and if we go that route many very smart economists and historians fear we are going to have to live through similar times. I was a teenager in the 1970's. It was really a bad time for the US. There was not a lot of hope for the future as we muddled through bad economic and foreign policy decisions. We need to stay on our Congressmen no matter who is elected because either one of these candidates can go that route as both are populists even though the media tries to contrast them.

THE MARKET

MARKET SENTIMENT

VIX: 79.13; +11.33. VIX hit a new high on this cycle, spiking to 89.53 right out of the box as the opening bell rang. As noted in the earlier discussion, VIX hits its peak on the first leg. It is still moving higher but this might very well be the peak as the indices held their prior lows as it made this spike and in the midst of the morning gloom.
VXN: 78.82; +8.98
VXO: 79.36; +10.8

Put/Call Ratio (CBOE): 1.24; 0. A week above 1.0 on the close as the downside speculators and protection buying hits highs again.

Bulls versus Bears:

This is a reading of the number of bullish investment advisors versus bearish advisors. The reason you look at this is that it gives you an idea of how bullish investors are. If they are too bullish then everyone is in the market and it is heading for a top: if everyone wants to be in the market then all the money is in and there is no more new cash to drive it higher. On the other side of the spectrum if there are a lot of bears then there is a lot of cash on the sideline, and as the market rallies it drags that cash in as the bears give in. That cash provides the market the fuel to move higher. If bears are low it is the same as a lot of bulls: everyone is in and the market doesn't have the cash to drive it higher.

Bulls: 22.2%. Just a modest drop from 22.4%. Down from an already very low 25.3% that was the largest single week drop we have ever seen, down from 33.7% and 37.5% the week before. Well below the 35% threshold considered bullish. Down from 40.7% on the high during the rally off the July 208 lows. Surpassing the 27.8% on the low this round. 30.9% was the March low. In March the indicator did its job with the dive below 35% and the crossover with the bears. A move into the lower 40's is a decline of significance. A move to 35% is a bullish indicator. This is smashing that. For reference it bottomed in the summer 2006, the last major round of selling ahead of this 2007 top, near 36%, and 35% is considered bullish.

Bears: 54.4%. Very respectable rise from 52.9% after pausing at that 53%ish level for a couple of weeks. Surging from 47.2% and 40.9% the week before. Surpassing 50.0%, the high on this move. Well above the 35% threshold so still a bullish indication. This move over 50 takes it to the highest since 1995. Extreme negative sentiment. 35% is the level that historically indicates excessive pessimism. As with the bulls the jump in bears did its job after hitting 44.7% in the third week of March. Bearishness peaked at 37.4% in September 2007. It topped the June 2006 peak (36%) on that run. That June peak eclipsed the March 2006 high (33%) and well above the 2005 highs that spawned new rallies (30% in May 2005, 29.2% in October 2005). This is a huge turn, unlike any seen in recent history.

NASDAQ

Stats: -51.88 points (-3.23%) to close at 1552.03
Volume: 2.684B (-15.02%). Lower trade though it was still above average as volume picked up Wednesday to Friday after below average showings to start the week. Some late week distribution in techs.

Up Volume: 478.313M (-352.454M)
Down Volume: 2.191B (-126.71M)

A/D and Hi/Lo: Decliners led 3.84 to 1
Previous Session: Decliners led 2.54 to 1

New Highs: 3 (+3)
New Lows: 842 (+293). Getting up toward those early October levels (1709) but still not there even with the new low on NASDAQ Friday. That is, again, a positive as it shows there are not as many stocks in NASDAQ selling off.

NASDAQ CHART: Click to view the chart

Another new low for 2008 with the gap lower and then another comeback. Not quite as good as Thursday, but the buyers did pick up a few tech stocks. It is still in a downtrend having broken out the bottom of its attempted October lateral consolidation. It is heading toward the 2001 low (1460) and the December 2002 peak after rallying out of the October 2002 bottom (1485). Got close on Friday and then reversed. That should act as some support and if the rest of the market rallies from this level, NASDAQ is ready to do so as well.

Similar to NASDAQ, NASDAQ 100 (-2.98%) gapped lower and out of its lateral consolidation attempt. It recovered to the two earlier intraday lows in October on the close but that still leaves it outside of its closing range as with NASDAQ overall. This is nothing more than a downtrend right now in need of something to pull it back up.

NASDAQ 100 CHART: Click to view the chart

SOX CHART: Click to view the chart

SP500/NYSE

Stats: -31.34 points (-3.45%) to close at 876.77
NYSE Volume: 1.594B (-5.53%). Volume fell back close to average as the NYSE indices sold off, breaking below the lateral consolidation the prior two weeks. Still higher volume overall as the NYSE indices sold lower on the week. There was renewed distribution. Needs something to reverse them off the intraday lows.

Up Volume: 236.995M (-509.902M)
Down Volume: 1.354B (+426.105M)

A/D and Hi/Lo: Decliners led 4.43 to 1
Previous Session: Decliners led 1.67 to 1

New Highs: 17 (+7)
New Lows: 1148 (+322). Up as on NASDAQ but also below the highs hit on that first spike lower in October (2631). Fewer stocks hitting new lows as the old lows were tested. More are holding their ground and that is a silver lining.

SP500 CHART: Click to view the chart

Undercut the second and third intraday lows of the month, coming within 14 points of the prior intraday low. Bounced up off that level to recover not quite half of the losses. Yes it broke out of the range of closing lows but it has held the intraday lows and is in a good position to make a rebound. Good position but with the renewed distribution last week it will have to prove it. We kept some of the SPY downside positions alive because while it is laying the groundwork for a rebound it has to find some buyers.

SP600 (-3.81%) is in full-fledged selling with four straight sessions lower after failing at the 10 day EMA Tuesday. No double bottom here, just a continuing downtrend. It is oversold and ready to rebound, but it is just a rebound in a continuing downtrend. That is not good news for the economy as small caps are economically sensitive.

SP600 Chart: Click to view the chart

SP400 CHART: Click to view the chart

DJ30

DJ30 again tested lower, and though it undercut the second October intraday low (8199), it has held well above the early October low at 7882, a good 105 points above that level. DJ30 and SP500 are in position to bounce off of this level. The question is whether they do it. The ability to repeatedly hold over those lows and recover indicates the two large cap NYSE indices are sold out on this leg and are going to try and bounce.

Stats: -312.3 points (-3.59%) to close at 8378.95
VOLUME: 335M shares Friday versus 340M shares Thursday. As with the other indices, volume picked up midweek as the selling picked up. Some distribution as it headed lower Wednesday, but it started backing off as the week ended.

DJ30 CHART: Click to view the chart

MONDAY

Earnings will continue at a torrid pace, LIBOR will be watched for a renewed thaw, and no one admits it, but many will watch oil as well. Sure the decline is a result of a lack of demand, but lower prices aren't going to hurt the world economies. All important, but the market is in technical gear now after a week of shots at the lows on SP500 and DJ30.

While NASDAQ and the small and mid-caps hit new lows on the week, SP500 and DJ30, despite the best attempts of the sellers, held above the prior lows. As noted, there was the perfect storm Friday to send them careening lower but instead it was just another day of 'normal' selling. The sellers appear to have shot up their ammunition for now, and if they cannot push SP500 and DJ30 to new lows to start next week they likely will not do it on this leg.

Thus we see how the first of next week plays out. We could very easily get another test lower Monday or Tuesday that still holds the prior lows and sends the market back up. If we get that push lower we take the rest of the DIA, SPY and NSC positions off the table and then flip to the upside with some more DIA and SPY and even some other indices and stocks that can move for us. As noted, steel and energy held up to end the week; they are in position to rally as well as DIA and SPY bounce back, and as seen, at this price they can peel off large percentage gains as the do.

Friday we opened a couple of upside positions already with AAPL and NUE, both in position to move higher in a market bounce. This is still in our view not the bottom but just a set up to bounce to take SP500 and DJ30 higher so they can test and try to put in the real bottom. Nonetheless, we really like how these two performed on the week. They may come back to test some after a bounce, but this might be as low as they go. We will look for more of these all week ahead.

Support and Resistance

NASDAQ: Closed at 1552.03
Resistance:
1565 is the second low in October 2008
1620 from the early 2001 low
1644 from August 2003
The 10 day EMA is 1679
1752 from 2004
The 18 day EMA at 1764
1782 from August 2004
1882 from October 2003
1900 is the gap down point in October; from August 2004
1912 from April 2005
1947 is the point where the market gapped down from in October 2008
1984 is the lat September low
The 50 day EMA at 1993
2070 from September 2008
2099 is the mid-September closing low
2155 is the March 2008 low
2167 is the July 2008 low

Support:
1542 is the early October 2008 low
1521 is the late 2002 peak following the bounce off the bear market low
1387 is the 2001 low
1253 is the March 2003 low on the test of the rally off the 2002 bear market low
1108 is the 2002 low

S&P 500: Closed at 876.77
Resistance:
889 is an interim 2002 peak
The 10 day EMA at 939
965 is the 2003 consolidation low
The 18 day EMA at 983
995 from June 2003 consolidation peak
1065 is the Q4 2003 level that SP500 started the run to 2007 after the first run in the recovery.
1075 from August 2004.
The 50 day EMA at 1102
1106 is the late September low
1133.50 is the mid-September 2008 low
1200 is the July 2008 intraday low
The 90 day SMA at 1203
1244 is an August 2005 peak
1245 is the 2002/2003 up trendline
1257 is the March low
1270 is the January low
1285 is the recent July peak
The 200 day SMA at 1290

Support:
866 is the second October 2008 low
853 is the July 2002 low
839 is the early October 2008 low
800 is the March 2003 post bottom low
768 is the 2002 bear market low

Dow: Closed at 8378.95
Resistance:
The 10 day EMA at 8885
8985 is the closing low in the mid-2003 consolidation
9200 is the July peak in the 2003 consolidation
The 18 day EMA at 9247
9323 From June 2003 peak
9575 from September 2003, May 2001
9814 from August 2004
9852 is 25% off of the October 2008 intraday low
9937 from May 2004 low
10,100 to 10,000
10,127 is an April 2005 low
The 50 day EMA at 10,187
10,215 from Q4 2005
10,365 is the new 2008 low
10,459 is a September 2008 low
10,827 is the July 2008 intraday low
The 90 day SMA at 10,939
10,962 is the July closing low
11,061 from February 2006
11,317 from March 2006
11,388 is the prior August low

Support:
8626 from December 2002
8521 is an interim high in March 2003 after the March 2003 low
8197 is the second October 2008 low
7882 is the early October 2008 low
7702 is the July 2002 low
7524 is the March 2002 low to test the move off the October 2002 low
7282 is the October 2002 low

Economic Calendar

These are consensus expectations. Our expectations will vary and are discussed in the 'Economy' section.

October 27 - Monday
- September New Home Sales (10:00): Expected 445K, prior 450K

October 28 - Tuesday
- October Consumer Confidence (10:00): Expected 52.0, prior 59.8

October 29 - Wednesday
- September Durable Orders (8:30): Expected -1.0%, prior -4.5%
- 10/25 Crude Inventories (10:35): 3.2M prior
- FOMC Policy Statement (2:15): Fed Funds futures indicate a 50BP rate cut to 1.0%

October 30 - Thursday
- Q3 Chain Deflator-Adv. (8:30): Expected 4.0%, prior 1.1%
- GDP-Adv., Q3 (8:30): Expected -0.5%, prior 2.8%
- Initial Jobless Claims, 10/25 (8:30): Expected 473K, prior 478K

October 31 - Friday
- Q3 Employment Cost Index (8:30): Expected 0.7%, prior 0.7%
- Personal Income, September (8:30): Expected 0.1%, prior 0.5%
- Personal Spending, September (8:30): Expected -0.2%, prior 0.0%
- Chicago PMI, October (9:45): Expected 48.0, prior 56.7
- Michigan Sentiment-Rev., October (10:00): Expected 57.5, prior 57.5

icon url

ReturntoSender

10/28/08 10:56 PM

#8302 RE: ReturntoSender #6755

Stocks Soar Despite Dismal Data
The reason for the big rally? Maybe traders just figured it can't get any worse.

October 28, 2008
By Paul Shread: More stories by this author:

http://www.internetnews.com/bus-news/article.php/3781261

The lowest consumer confidence reading in the 41-year history of the Conference Board wasn't enough to hold back buyers on Tuesday, who sent stocks to their second huge gain in a little more than two weeks.

The Dow's 10.9% gain was its sixth best-day ever — with number five the 11.1% gain that came on October 13. The top four single-day gains all occurred during the Great Depression.

A strong overseas rally, good news for Boeing (NYSE: BA) and GM (NYSE: GM) and expectations for a half-point rate cut from the Federal Reserve on Wednesday were cited as reasons for the rally, but it's possible that the consumer confidence reading of 38 was so bad that traders figured it can't get much worse. The previous record — 43.2 — was set at the December 1974 stock market low.

With the Nasdaq up 9.5% on the day, it was hard to find a tech stock that didn't post a big gain.

Microsoft (NASDAQ: MSFT) gained 9% on a look at Windows 7 and other products.

On the Nasdaq's most active list, Nvidia's (NASDAQ: NVDA) 15% gain and Comcast's (NASDAQ: CMCSA) 24% surge led the way. Comcast benefited from positive comments from Credit Suisse a day ahead of its quarterly earnings report.

AMD (NYSE: AMD) slipped after selling its DTV business to Broadcom (NASDAQ: BRCM) for less than expected.

SAP (NYSE: SAP) managed a 6% gain despite a tepid outlook.

The Nasdaq soared 143 to 1649, the S&P gained 91 to 940, and the Dow soared 889 to 9065. Volume rose to 7.23 billion shares on the NYSE, and 2.85 billion on the Nasdaq. Advancers led by a 27-7 margin on the NYSE, and 20-8 on the Nasdaq. Upside volume was 95% on the NYSE, and 87% on the Nasdaq. New highs-new lows were 3-668 on the NYSE, and 1-622 on the Nasdaq.

Next Article:

Technical Analysis: 'Tis the Season
The most positive part of the year for stocks arrives right on schedule.

http://www.internetnews.com/bus-news/article.php/3781266

October 28, 2008
By Paul Shread: More stories by this author:

As we noted last week, the last Monday in October has often marked the end of the weakest half of the year for stocks, but we sure didn't expect it to be announced with an exclamation point.

And today, a MACD buy signal on the Dow confirmed the arrival of the best six months of the year for the market, per the work of Sy Harding.

Of course, the big question is whether it's really going to be this easy, and the days and weeks ahead will answer that question.

Still, the seasonality trade has been one of the more dependable ones since 1950. In the last 10 years, for example, the Dow has returned just 700 points, while buying on November 1 and selling on May 1 during that time has returned about 5,000 Dow points. It remains to be seen whether the seasonal trade remains the pattern in decades to come, but for now, there appears to be more support for stocks during that time of year.

For the trade to work this year, the indexes will have to break out of the large trading ranges they've built over the last two weeks. The upper end of those ranges is at 9794 on the Dow, 1044 on the S&P and 1896 on the Nasdaq.

The Dow (first chart below) has first resistance at 9387, and support is 8900, 8500-8700 and 8200.

The S&P (second chart) has first resistance at 985-1003, and support is 922, 915 (and falling), 894-900, 865-875 and 850.

The Nasdaq (third chart) faces resistance at 1670-1700 and 1770-1782, and support is 1584, 1574, 1565 and 1542.

Lastly, we'll once again attempt to pick stocks out of the Dow for the next six months, based largely on low valuation. This time we'll add screens for profitability, free cash generation and balance sheet strength in deference to the credit crisis, leaving us with just four picks: Boeing (NYSE: BA), HP (NYSE: HPQ), United Technologies (NYSE: UTX) and Exxon Mobil (NYSE: XOM). We'll check back on them in the spring to see how they've fared.


icon url

ReturntoSender

11/02/08 11:38 AM

#8307 RE: ReturntoSender #6755

Volume is one of the best ways to tell where we are at in the market in terms of finding an actual final bear market bottom.


Bear market bottoms are formed after the capitulation phase which is a very high volume event. We have been seeing capitulation as margin calls, government takeovers and hedge fund failures have forced huge numbers of shares to be traded as the economic malaise has spread throughout the world.

During capitulation phases we see a tremendous number of new lows in the market, very few new highs and very few positive divergences in either technical or market breadth analysis.

We have formed a capitulation bottom. That is all this will be unless the bailout can get consumers spending beyond their means worldwide very rapidly.

What we need to form an ultimate bottom is a period of prolonged market apathy. The real major market bottom will form as volume falls off. At that bottom we will see a growing number of new highs, less new lows, additional positive divergences as the market makes a final bottom.

Keep in mind that the NASDAQ has not seen a new high since 2000. Neither has the SMH or SOX! We have been in bear markets there for over 8 years!
icon url

ReturntoSender

11/09/08 10:16 PM

#8322 RE: ReturntoSender #6755

Amateur Investors Weekend Stock Market Analysis (11/8/08)

http://www.amateur-investor.net:80/Weekend_Market_Analysis_Nov_8_08.htm

This week I did some research on previous Bear Markets going back to 1895 involving the Dow which has been around the longest of the three major averages. Typically a Bear Market is defined by a drop of 20% or more over a period lasting more than 2 months. Also I added an additional rule that each 20% drop must have been followed by a sizeable rally of 20% or more as well. A list of all of these occurrences is shown below. The average loss during a Bear Market has been 36.4% with the average length of 363 days.

Since 1895 there have been 33 occurrences when the Dow has dropped by 20% or more which was eventually followed by at least a 20% rally. Also keep in mind some of these occurrences happened within a longer term bearish cycle. For example from late 1929 through 1932 (highlighted in blue) there were 7 different occasions when the Dow dropped more than 20% which was followed by at least a 20% rally.

Meanwhile notice there have been occasions when the Dow hasn't dropped more than 20% for a substantial period of time such as from late 1921 through late 1929, mid 1949 through late 1961 and more recently from late 1990 through 1999. All of these time periods were then followed by an increase in the number of occurrences in which the Dow dropped by 20% or more. For example from late 1990 through 1999 the Dow didn't have any drops of 20% or more however since 2000 there have been 4 occurrences.

Dow Max Min Max Min % # of
# Date Date Value Value Loss Days
1 9/5/1899 9/25/1900 77.61 52.96 -31.8 384
2 6/17/1901 11/9/1903 78.26 42.15 -46.1 875
3 1/19/1906 11/15/1907 103.00 53.00 -48.5 665
4 11/19/1909 9/25/1911 100.53 72.94 -27.4 675
5 9/24/1912 12/24/1914 93.43 53.17 -43.1 821
6 11/21/1916 12/19/1917 110.15 65.96 -40.1 393
7 11/3/1919 8/24/1921 119.62 63.90 -46.6 660
8 9/3/1929 11/13/1929 386.10 195.35 -49.4 71
9 4/16/1930 12/17/1930 297.25 154.45 -48.0 245
10 2/24/1931 6/2/1931 196.96 119.89 -39.1 98
11 7/3/1931 10/5/1931 156.74 85.51 -45.4 94
12 11/9/1931 1/5/1932 119.15 69.85 -41.4 57
13 3/8/1932 7/8/1932 89.87 40.56 -54.9 122
14 9/8/1932 2/27/1933 81.39 49.68 -39.0 172
15 7/18/1933 10/20/1933 110.53 83.57 -24.4 94
16 2/5/1934 7/26/1934 111.93 84.58 -24.4 171
17 3/10/1937 3/31/1938 195.59 97.46 -50.2 386
18 11/10/1938 4/11/1939 158.90 120.04 -24.5 152
19 9/13/1939 6/10/1940 157.77 110.41 -30.0 271
20 11/8/1940 4/28/1942 138.77 92.69 -33.2 536
21 5/29/1946 6/14/1949 213.36 160.62 -24.7 1112
22 12/13/1961 6/25/1962 739.88 524.55 -29.1 194
23 2/9/1966 10/10/1966 1001.11 735.74 -26.5 243
24 12/2/1968 5/26/1970 994.65 627.46 -36.9 540
25 1/11/1973 12/9/1974 1067.20 570.01 -46.6 697
26 9/22/1976 3/1/1978 1026.26 736.75 -28.2 525
27 4/27/1981 8/11/1982 1030.98 772.17 -25.1 471
28 8/25/1987 10/20/1987 2746.65 1616.20 -41.2 56
29 7/17/1990 10/11/1990 3024.26 2344.30 -22.5 86
30 1/14/2000 3/22/2001 11980.50 9047.60 -24.5 433
31 5/21/2001 9/21/2001 11436.40 7926.90 -30.7 123
32 3/19/2002 10/10/2002 10722.80 7198.00 -33.0 205
33 10/11/2007 10/10/2008 14197.00 7884.87 -44.5 365
Average -36.4% 363 Days


Recently I have talked about Elliott Wave Analysis and when using this concept it can be applied to different timescales such as intra day, daily, weekly and monthly charts. After looking through several Bear Market charts going back to 1895 the current chart of the Dow most resembles that of the early to mid 1970's.

A weekly chart of the Dow from 1973 through 1976 is shown below and I have drawn in the Elliott 5 Wave pattern as well which was followed by an ABC type rally once the final 5th Wave down ended in late 1974. The total loss in the Dow from 1973 through late 1974 was -47%. Also notice that the final 5th Wave down only dropped slightly below the bottom of the 3rd Wave down that led to the development of a bullish looking Double Bottom pattern which was followed by an ABC type rally. From late 1974 through the early part of 1976 the Dow rallied 78% after the large drop from 1973 through 1974.


Meanwhile if we look at a current chart of the Dow it looks remarkably similar to that of the period from 1973 through 1974. In fact the Dow dropped nearly 45% from its peak in early October of 2007 through early October of 2008. Currently it appears the Dow is going through its 4th corrective Wave to the upside. The question is will the Dow follow a similar path like occurred in 1974 with the final 5th Wave down dropping below the bottom of Wave 3 down which will lead to the development of a Double Bottom pattern followed by a substantial ABC type rally like occurred from 1975 into the early part of 1976?


As I mentioned last weekend the Dow was in a very choppy trading range from the mid 1960's through the early 1980's with large moves in both directions however the Dow was at nearly the same level in 1981 as it was in 1966 so over a 15 year period the net gain was basically 0%.

icon url

ReturntoSender

11/10/08 7:00 PM

#8324 RE: ReturntoSender #6755

Tech Stocks Lead Market Retreat
Google and Nortel led the way lower Monday despite early enthusiasm over a massive Chinese stimulus package.

http://www.internetnews.com/bus-news/article.php/3784031

November 10, 2008
By Paul Shread: More stories by this author:

U.S. stocks opened sharply higher Monday on news of a nearly $600 billion Chinese economic stimulus package, then spent the rest of the day selling off on worries about the health of the domestic economy.

A Circuit City (NYSE: CC) bankruptcy, huge losses at AIG (NYSE: AIG) and Fannie Mae (NYSE: FNM) and worries about GM's (NYSE: GM) solvency weighed on the broader market.

In the tech sector, a steep loss by Nortel (NYSE: NT) and a downgrade of Google (NASDAQ: GOOG) did the damage, turning a 2% gain for the Nasdaq into a 1.9% loss by the close.

Google shares fell 3.7% after a Barclays analyst lowered estimates on the company, saying the slowing economy will likely be felt in the search market.

Nortel tumbled 19% to close below $1 after reporting a $3.4 billion loss, $3.2 billion of which was related to charges and write-downs.

Applied Materials (NASDAQ: AMAT) lost 4.7% on an Oppenheimer downgrade, while Dell (NASDAQ: DELL) lost 5.5% on reports that it won't have its new portable music player ready in time for the holidays.

Brocade (NASDAQ: BRCD) and Foundry (NASDAQ: FDRY) both gained after they agreed on revised merger terms and Brocade raised guidance.

Centennial Communications (NASDAQ: CYCL) shares doubled on a buyout offer from AT&T (NYSE: T).

The Nasdaq lost 30 to 1616, the S&P fell 11 to 919, and the Dow lost 73 to 8870. Volume fell to 4.66 billion shares on the NYSE, and 1.73 billion on the Nasdaq. Decliners led by a 23-11 margin on the NYSE, and 19-8 on the Nasdaq. Downside volume was 70% on the NYSE, and 77% on the Nasdaq. New highs-new lows were 4-192 on the NYSE, and 8-219 on the Nasdaq.

Next Article

Tech Execs Don't Sugarcoat Economic Woes

There are reasons for optimism, but good news will be slow in coming.

http://www.internetnews.com/bus-news/article.php/3783781

November 10, 2008
By David Needle: More stories by this author:

SAN FRANCISCO - Tech execs gave a dour assessment of the near-erm impact of the faltering economy on the tech industry. "My sense is this is the deepest [economic downturn] I've seen in my lifetime," said Paul Otellini, CEO of Intel at the Web 2.0 Summit here last week.

"The smart people I talk to think we'll have two to three quarters of recession and gradually come out of it in the U.S. and then the rest of the world follows," said the Intel (NASDAQ: INTC) chief.

But the effects of the downturn could be felt longer than two or three quarters. "We're likely to see a lag and much larger unemployment a year from now, which will weigh on consumers' psyche," Otellini added.

That said, Otellini and other speakers here noted several reasons for optimism and, at the least, ways for companies to get through the current problems. Otellini said he met recently with government officials in China, who told him the country's Gross Domestic Product next year would be a healthy nine percent.

GDP is a measure of the total flow of goods and services produced over a specified time period.

"They are putting in place programs to encourage buying," he said. "They are the second-largest PC buying country in the world and they buy lots of consumer goods. So that's good for the world and it puts cash back into the system."

Highly-regarded Silicon Valley venture capitalist John Doerr had an equally pessimistic view of the current economic crisis, though he ticked off a number of initiatives he thinks are needed to kick start the economy.

"For the life of me, I haven't figured out what's going on in this financial crisis," which he said is much deeper than problems with home loans and the mortgage industry. "I think it's a crisis in confidence in our leaders, the government and money."

Tech Execs Don't Sugarcoat Economic Woes

He said the response so far by government has been "disjointed, inadequate and comical. It makes no sense at all to have these people thrown out of their homes when you can reissue their mortgages."

He also urged those startups with great ideas but struggling to hang in there. "I think those companies that do emerge, will emerge much stronger." Though he also added it's likely to be a long haul to a sounder economy and profits.

Doerr said he's encouraged by reports that President-Elect Obama would name the nation's first Chief Technology Officer. "It's a great idea and long overdue," said Doerr.

Asked to name his picks, Doerr said he thought either Sun co-founder Bill Joy (currently a partner, along with Doerr, at Kleiner, Perkins, Caufield & Byers), or computer scientist and inventor Danny Hillis would be great choices.

Doerr hopes the new administration does more to encourage education. "We need more smart people and a program to double the number of engineers we graduate each year, from 30,000 now to 60,000." He said India currently graduates about 300,000 engineers a year while the numbers are in decline in the U.S.

He would also like to see changes in immigration laws to keep more talented people in the U.S. "We bring in foreign nationals, train them and make them go home," said Doerr. "I would staple a green card to their diplomas in the physical sciences and engineering," he quipped.

The Web opportunity

Otellini said the good news is the basic pattern of growth on the Web hasn't changed. "Every piece of data shows consistent growth. Web traffic, ads and the number of people online are up," he said. "That's been undiminished throughout the various economic cycles and I think it will be undiminished here."

He suggested rather than focus on market turbulence, entrepreneurs should look at what products can be developed to take advantage of the growth of the Web.
icon url

ReturntoSender

11/13/08 4:39 PM

#8332 RE: ReturntoSender #6755

It certainly was a constructive day. Higher volume on the turn to positive after taking out some of the lows from November. It was not a 90% upside day so I cannot say the market will not run into further trouble down the road.

Still we could continue to rally for quite some time from here if buyers continue to step in.

Why?

Because the recent sell off came on lower volume than the selling leading into the November bottom.


Now we need the market to continue to advance on higher volume than it declined over the last month for any double bottoms to be meaningful.


If it does then we have numerous positive divergences set in place. If it does not then today was simply another batch of bullish enthusiasm and short covering that will only lead to a test of the 2002 lows.

Finally it is true we had very few new highs yesterday but that is not something new. We have had a several days with zero new highs on the NASDAQ in the last couple of months.


It's hitting a new trading low today with a lower number of new lows than last November that is much more important. It shows that there is some hidden strength in the market outside of my own portfolio <VBG>:

icon url

ReturntoSender

11/14/08 12:15 PM

#8338 RE: ReturntoSender #6755

SMH ST bot 1000 shares@17.20 - Just a short term trade here. Volume on the selling has been low today. We could get an afternoon rally:

icon url

ReturntoSender

11/16/08 1:40 PM

#8341 RE: ReturntoSender #6755

InvestmentHouse Weekend Market Summary:

http://www.investmenthouse.com/weekendmarketsummary.htm

Massive volatility turns a test of the rally into a rollercoaster.
- The overlooked problem: LIBOR rising following treasury change in game plan.
- No surprise: no rosebuds showing up in the economic data.
- More investors throw up their hands after Friday return of unprecedented volatility.
- Friday frayed many nerves, but market is still set up to move higher this week.

Market doesn't want you to get too comfortable.

Thursday's big reversal and gain had many talking market bottom. After Friday many said it was not. As discussed below, Friday did not undo Thursday's significance, but if the US does not take the right steps, the gains made thus far will backslide as seen at the end of this past week.

You would expect the day after a near 900 point swing on the Dow to start a bit softer. Indeed futures were lower, and they turned progressively lower on bad news in the retail sector, earnings, and the Euro-zone. Retail sales fell 2.8% versus the 1.3% expected, the worst decline since 1992 when the data was first compiled. Almost half the loss, however, was from lower costs associated with gasoline purchases. Thus it was not as bad as the headline suggested. Not good, but not a collapse. Earnings were bad with JCP, ANF, JWN, and KSS, all retailers, lowering their guidance. NOK confirmed its musings last month that 2009 handset sales would fall below 2008. The Euro-zone admitted its nations were in an 'official' recession a day after Germany's own 'official' recession declaration. Here in the US we will have to wait for Q4 GDP in January, but it is pretty clear through unofficial channels that we are in an official recession.

The market started lower and made a good effort in the first half hour at rebounding, but things got out of hand. The modest profit taking was not met with any bids and what was modest selling turned into a 4% decline into lunch. At that point the market bottomed and recovered, rallying to positive into the last hour. That was a relief to many seeing Thursday as a bottom in the market. After three hours of recovering to positive, however, the switch was thrown and once again the selling started. Three hours of gains were tossed in a half hour as NASDAQ sold to a new session low and losses ramped up to 3.8% on the low end to 6.5% on the high end.

As is the history of this market selloff, unprecedented volatility can run the indices up or down in a fraction of the time it would take under what were once considered normal conditions. It is both intraday and inter-day. Thursday that volatility surged the market from new 2008 lows in a massive intraday reversal. Friday it pushed the markets lower overall and twice in the same session after a complete recovery to positive. The buyers and the sellers have obviously not worked out all of their differences.

TECHNICAL. As noted, it was just another day at the office Friday with a lower open turning into a 4+% selloff only to recover to positive by the last hour. Of course you can score to take the lead too early, leaving too much time on the clock for the other side. That is what happened, and within a half hour the indices had hit new session lows. Friday it was back to more of the same with respect to the intraday volatility as the market is still not showing it has adopted a changed character with an upside bias when it is not rallying hard.

INTERNALS. A mixed picture internally. Breadth was stronger on the downside Friday (-4:1 NASDAQ, -3.6:1 NASDAQ) than it was on the Thursday upside. Reversal day on Thursday for sure, but Friday showed a lot of up and down action as well. On the other hand, despite new lows on the indices new lows fell sharply. Volume was mercifully lower as well, falling back below average and matching the Wednesday level on that downside session. A positive on balance.

CHARTS. A lower open on all indices and just a weak tap at the 18 day EMA on DJ30 as the all stalled below near resistance at the 10 and 18 day EMA. Even with the Thursday reversal those are still key levels, the next steps after starting the move with the Thursday reversal. Speaking of Thursday, that action was an outside day where the low and the close were outside of the prior session low and high respectively. Technically that is a positive indication that typically leads to more upside given the direction of the action Thursday. Friday was an inside day, and as you can surmise that is where the high and low are inside of the prior session. Those days basically mean nothing. Thus the Friday action while not instilling a lot of confidence, did not undo Thursday.

LEADERSHIP. It was not a great day for leaders but it was not the end of the move either. While most struggled Friday and gave back some Thursday gain there were no major meltdowns in those attempting to set up to break higher and lead the market. Energy led for awhile, smaller financials hung in for the most part, and health related stocks continue to form up. Large cap tech, after a good recovery Thursday that indicated some life, did not fare well. Leadership is still in need of significant improvement to help any rebound turn into something more than just a short term bounce. There are patterns that are similar to the October bottom in 2002 that carried the load early on, but we need to see them set up more as the move continues.

THE ECONOMY

LIBOR rates quietly rise just as other areas show improvement: Treasury coincidence?

For 23 days LIBOR rates declined, falling at a more rapid pace. There were a few days where rates across the spectrum were mixed, but overall rates fell for over three weeks straight.

In the wake of that decline other markets improved. The October data on the commercial paper market issued Thursday and it showed corporate bond sales jumping. Two-year Treasury spreads are narrowing. There is improvement in the financial market at large.

On Wednesday the Treasury announced it would no longer pursue purchasing distressed assets from financial institutions, the heart of the original TARP program for which it was named (Troubled Asset Repurchase Program). Instead it seemed to prefer the direct cash injection option used with the large banks, the one that gave the banks $250B with no strings attached. We are now seeing that cash used for purposes such as paying out bonuses.

Whether the company had the money to pay the bonuses pre-TARP lending or not, the fact that it took public money and then paid bonuses is unseemly to most taxpayers. It is hard to imagine in times of economic hardship such as these that our money is taken, given to another, and then used to pay a bonus to someone at a company that needed our money supposedly to grease the credit wheels so we all benefit. I missed that day in my U.S. History class as to the constitutionality of this. I also must have missed the day in economics class as well that told us how that was economic stimulus or improved credit markets.

Regardless of whether you agree with Treasury's decision or not, the market is responding. That session the LIBOR rates stopped their 23 day decline. It was not much at first, just the overnight rate ticking up 3BP from 0.35% to 0.38%. The 3-month rate held steady at 2.13%. The next session all key levels rose. Overnight moved to 0.40% from 0.38%; 3-month moved to 2.15% from 2.13%. Friday rates rose again with the 3-month jumping to 2.24% from 2.15%.

After the TARP was announced and the authorization bill passed, within a week LIBOR rates and the TED spread started to fall, i.e. improve. That went on for over three weeks. As soon as Treasury abandoned a course of action that everyone signed off on in favor of direct capital injections in businesses, however, LIBOR rates started to rise.

Whether it is simply some short term uncertainty as to just what Treasury is going to do or some deeper seated misgivings about abandoning the troubled asset purchase plan remains to be seen. We do know that it has injected some uncertainty into the market just as it is trying to put in a bottom at the 2008 lows. Thursday the market managed a big reversal despite the change in Treasury's direction. Friday some of the worries came home to roost as the market gyrated in 4% to 6% swings. What we take from this is that the market as always hates uncertainty and it is in need of Treasury once more laying out a clear plan of action with the remaining hundreds of billions in the TARP.

THE MARKET

MARKET SENTIMENT

As discussed Thursday night the bad humor and anticipation of worse times is just about as bad as I have ever seen it. Most people are so beaten down and beaten up they view everything as negative, but as noted the other night, bottoms emerge from the worst of times.

Then along comes Friday and whatever vestige of optimism Thursday brought was spent. We talked with many investors and traders during and after the Friday session and many were throwing up their hands. There are some seasoned ones that viewed Friday as just some lighter volume nervous trade, but many investors are just giving up, throwing up their hands as noted.

This adds to the negative sentiment fires already burning even with the Thursday reversal and the indices still holding over the prior lows. The ongoing nervousness about the market is part of the fuel that ultimately leads to recovery as the sellers finally get done with the selling.

The problem with Friday is the up and down volatility continues even after the Thursday reversal. The buyers and sellers are still fighting. The volume was lower than the Thursday upside reversal volume. With those buyers taking the day off the sellers left could run things up and down. Thus while we don't like the continued and excessive volatility on Friday, we don't think it is going to derail a rally from this point.

Time is an issue here, something I have talked about since this market selling related to the crisis started. As stated months ago, for the magnitude of the problems, this is a pretty short time frame for a selloff, and a pretty modest selloff in percentage terms at that. Financial crises tend to sell quickly and recover quickly. The hope is this one was addressed rapidly enough so the ripples did not spread to the entire economy, causing permanent damage. If the market bottoms here and puts in a good follow through next week starting at the earliest Tuesday, then the meter is still running on the upside.

VIX: 66.31; +6.48
VXN: 66.05; +8.02
VXO: 70.31; +9.71

Put/Call Ratio (CBOE): 1.01; +0.02

Bulls versus Bears:

This is a reading of the number of bullish investment advisors versus bearish advisors. The reason you look at this is that it gives you an idea of how bullish investors are. If they are too bullish then everyone is in the market and it is heading for a top: if everyone wants to be in the market then all the money is in and there is no more new cash to drive it higher. On the other side of the spectrum if there are a lot of bears then there is a lot of cash on the sideline, and as the market rallies it drags that cash in as the bears give in. That cash provides the market the fuel to move higher. If bears are low it is the same as a lot of bulls: everyone is in and the market doesn't have the cash to drive it higher.

Bulls: 31.9%. On the rise again, up from 30.2 and the 5 year low of 21.3% hit to start November. Still below the 35% considered bullish for the market. It was at this level in early October just as the market started to dive lower. This move down showed us the largest single week drop we have ever seen, falling from 33.7% to 25.3%. Hit 40.7% on the high during the rally off the July 2008 lows. 30.9% was the March low. In March the indicator did its job with the dive below 35% and the crossover with the bears. A move into the lower 40's is a decline of significance. A move to 35% is a bullish indicator. This is smashing that. For reference it bottomed in the summer 2006, the last major round of selling ahead of this 2007 top, near 36%, and 35% is considered bullish.

Bears: 46.1%. Down from 48.3% last week and well off the 5 year high at 54.4% hit the last week of October. Well above the 35% threshold so still a bullish indication. This move over 50 takes it to the highest since 1995. Extreme negative sentiment. 35% is the level that historically indicates excessive pessimism. As with the bulls the jump in bears did its job after hitting 44.7% in the third week of March. Bearishness peaked at 37.4% in September 2007. It topped the June 2006 peak (36%) on that run. That June peak eclipsed the March 2006 high (33%) and well above the 2005 highs that spawned new rallies (30% in May 2005, 29.2% in October 2005). This is a huge turn, unlike any seen in recent history.

NASDAQ

Stats: -79.85 points (-5%) to close at 1516.85
Volume: 2.289B (-25.58%). Volume falls significantly below average as NASDAQ sold back. The only above average volume session of the month was Thursday. Looking for more solid volume to come into the index this week as NASDAQ extends its break higher.

Up Volume: 239.577M (-2.451B)
Down Volume: 2.028B (+1.691B)

A/D and Hi/Lo: Decliners led 3.98 to 1. Much higher than the upside Thursday volume.
Previous Session: Advancers led 2.39 to 1

New Highs: 4 (-3)
New Lows: 222 (-498). Nice and low on this test.

NASDAQ CHART: Click to view the chart

Started weak, gapping almost 40 points lower on the open and sold from there. It held above 1500 (1499 is the 2008 closing low) on the early low and on the close. On the high it reached toward the 10 day EMA (1599) and came up short. Still in the pattern, still in the hunt for a move higher after that Thursday high volume reversal.

SOX (-6.40%) fell right back down to the Wednesday close, holding just over that level as the bell rang. SOX and NASDAQ are both trying to hang on and continue the move higher, showing a follow through this coming week after pausing following the initial reversal session.

NASDAQ 100 CHART: Click to view the chart

SOX CHART: Click to view the chart

SP500/NYSE

Stats: -38 points (-4.17%) to close at 873.29
NYSE Volume: 1.449B (-27.21%). Volume dropped off to below average levels, matching the Wednesday selling volume. That leaves the Thursday reversal trade the highest in over a month.

Up Volume: 158.616M (-1.681B)
Down Volume: 1.283B (+1.139B)

A/D and Hi/Lo: Decliners led 3.6 to 1
Previous Session: Advancers led 2.88 to 1

New Highs: 5 (-4)
New Lows: 214 (-471). Well off the prior spike in new lows both Thursday and Friday as those old lows were tested and indeed breached on Thursday. That shows many stocks are acting sold out for now.

SP500 CHART: Click to view the chart

Opened lower, sold off, but then came right back to cross the 10 day EMA (908) and move positive. Of course it did not last and SP500 hit the session low on the close. Still well above the prior lows, and despite this setback Friday, in position to make its next upside move. The 10 day EMA and the 18 day (928) are the first levels of resistance to cross this coming week. Looking for a follow through starting Tuesday through Friday

The small cap SP600 (-6.46%) failed at the 10 day EMA as well and turned lower for a market leading loss. The small caps continue to struggle with larger gains and larger losses than the other indices, but they are also well above the lows and are maintaining their double bottom pattern. Of course, a breakout would help.

SP600 Chart: Click to view the chart

SP400 CHART: Click to view the chart

DJ30

DJ30 actually made it up to the 18 day EMA (8912) on its high hit at the start of the last hour. Then it made the plunge and closed just off the session lows, right at the interim support range near 8500. Still easily above its prior lows. Positive reversal and as with the other indices needs to show a follow through next week to the Thursday move. In short, the index, all indices for that matter, need to do something with the Thursday move other than fritter it away.

Stats: -337.94 points (-3.82%) to close at 8497.31
VOLUME: 304M shares Friday versus 476M shares Thursday. Nice drop-off in volume to back below average.

DJ30 CHART: Click to view the chart

MONDAY

Lots of economic data next week for what it is worth. Some regional manufacturing reports, production and capacity stats, housing starts, inflation statistics, FOMC statistics. All they will really do is confirm what the data in October and thus far confirmed: a rapid slowdown in the economy. Right now the data is not going to show the kernels of growth so desperately sought. The slowdown was so rapid and no one has a handle on even that at this point.

That does not mean there is no action. After dumping stocks a year ago followed by a long dry spell, corporate CEO's are starting to buy again. It is reported that C, GE, DOW, GLW CEO's to name a few are buying their stock again. Buying is a better indicator than selling; they can sell for any number of reasons such as taxes, diversification, divorce. They buy for one reason: to make money. The fact that these guys and girls are buying is a kernel of positive news. Further, the redemption period for November is over this week, and the market escaped in relatively decent fashion. Yes all but the Dow hit new lows on the year, but they also reversed to close the week above the prior lows. Without the redemption, some CEO's buying, and that Thursday reversal, the prospects for a further upside move starting this week are good.

As noted above, that leaves us looking for a follow through to the Thursday reversal that is trying to ignite a new rally off a second low and successful, for now, test of the early October selling. A follow through is a strong percentage gain on strong volume with strong breadth occurring a week to 10 days after the initial reversal. The market often stalls some after the initial surge as some profits are taken by those who think the rally is bunk and simply setting up more selling. If the move is for real the market makes a subsequent upside move with those strong indicators as the backbone. The follow through shows the buyers are picking up the baton from the initial short covering surge.

Friday was not a good day. Never like to answer upside with such negative moves. There was no distribution, however, and the lower volume and wild volatility shows relatively few were pushing it around. As noted above, it did not undo the Thursday move, and indeed we are looking for Thursday to carry the market higher. As for how long remains to be seen. The sentiment and internal indicators are strong enough to suggest a sustained move.

In any event we are looking to play the move higher with more upside despite Friday. That means picking up positions as they present themselves after the Friday pullback and riding them for a nice gain. There are more and more patterns that are establishing themselves and thus more potential leaders to take the ball and run on a continued market rally. We will let the market worry about how far it wants to go.

As for the downside, with the indices bouncing up off the lows last week and the big Thursday reversal, we are going to let this bounce play out and see how strong it is. Again, we will let the market tell the story after it delivers this bounce.

Support and Resistance

NASDAQ: Closed at 1516.85
Resistance:
1521 is the late 2002 peak following the bounce off the bear market low
1542 is the early October 2008 low
1565 is the second low in October 2008
The 10 day EMA is 1596
1620 from the early 2001 low
The 18 day EMA at 1641
1644 from August 2003
1752 from 2004
1782 from August 2004
The 50 day EMA at 1827
1882 from October 2003
1900 is the gap down point in October; from August 2004
1912 from April 2005
1947 is the point where the market gapped down from in October 2008
1984 is the lat September low
2070 from September 2008
2099 is the mid-September closing low
2155 is the March 2008 low
2167 is the July 2008 low

Support:
1499.21 is the 2008 closing low
1493 is the October 2008 low
1428 is the November 2008 low
1387 is the 2001 low
1253 is the March 2003 low on the test of the rally off the 2002 bear market low
1108 is the 2002 low

S&P 500: Closed at 873.29
Resistance:
889 is an interim 2002 peak
899 is the early October closing low
The 10 day EMA at 908
The 18 day EMA at 928
965 is the 2003 consolidation low
995 from June 2003 consolidation peak
The 50 day EMA at 1021
1065 is the Q4 2003 level that SP500 started the run to 2007 after the first run in the recovery.
1075 from August 2004.
1106 is the late September low
1133.50 is the mid-September 2008 low
The 90 day SMA at 1142
1200 is the July 2008 intraday low
1244 is an August 2005 peak
1250 is the 2002/2003 up trendline
1257 is the March low
The 200 day SMA at 1257
1270 is the January low
1285 is the recent July peak

Support:
866 is the second October 2008 low
853 is the July 2002 low
848 is the October 2008 closing low
839 is the early October 2008 low
818 is the November 2008 low
800 is the March 2003 post bottom low
768 is the 2002 bear market low

Dow: Closed at 8,497.31
Resistance:
8521 is an interim high in March 2003 after the March 2003 low
8626 from December 2002
The 10 day EMA at 8772
The 18 day EMA at 8913
8985 is the closing low in the mid-2003 consolidation
9200 is the July peak in the 2003 consolidation
9323 From June 2003 peak
9575 from September 2003, May 2001
The 50 day EMA at 9600
9814 from August 2004
9937 from May 2004 low
10,100 to 10,000
10,127 is an April 2005 low
10,215 from Q4 2005
10,365 is the new 2008 low
10,459 is a September 2008 low
The 90 day SMA at 10,508
10,827 is the July 2008 intraday low
10,962 is the July closing low
11,061 from February 2006
11,317 from March 2006
11,388 is the prior August low

Support:
8451 is the early October closing low. Key level to watch.
8197 was the second October 2008 low
8175 is the October 2008 closing low. Key level to watch.
7882 is the early October 2008 low. Key level to watch.
7702 is the July 2002 low
7524 is the March 2002 low to test the move off the October 2002 low
7282 is the October 2002 low

Economic Calendar

These are consensus expectations. Our expectations will vary and are discussed in the 'Economy' section.

November 17 - Monday
- November NY Empire State Index (8:30): -26.0 expected, -24.6 prior
- Capacity Utilization, October (9:15): 76.6% expected, 76.4 prior
- Industrial Production, October (9:15): -0.1% expected, -2.8% prior

November 18 - Tuesday
- October Core PPI (8:30): 0.2% expected, 0.4 % prior
- PPI, October (8:30): -1.5% expected, -0.4 prior %
- Net Foreign Purchases, September (9:00): $14.0B prior

November 19 - Wednesday
- October Building Permits (8:30): 770K expected, prior 805K
- Core CPI, October (8:30): 0.2% expected, prior 0.1%
- Housing Starts, October (8:30): 780K expected, prior 817K
- Oil Inventories (10:30): 220K prior
- FOMC Minutes, October 29 (2:00)

November 20 - Thursday
- 11/15 Initial Claims (8:30): 516K prior
- Leading Indicators, October (10:00): -0.6% expected, prior 0.3%
- Philadelphia Fed, November (10:00): -30.0 expected, prior -37.5
icon url

ReturntoSender

11/18/08 10:41 PM

#8346 RE: ReturntoSender #6755

From Briefing.com: 4:31PM KLA-Tencor announces global reduction in force by ~15%; to lower expense rate by ~165-170 mln by FY09 (KLAC) 16.81 -0.56 : Co announced that, in response to current market conditions, the company plans to reduce its global workforce by approximately 15 percent by June 30, 2009. This reduction is one of many cost-reduction actions the company is taking in an effort to lower the company's quarterly operating expense run rate to approximately $165-170 million by the end of fiscal year 2009 in response to the current demand environment. KLA-Tencor currently estimates that, in connection with the workforce reduction, it will incur an initial charge in the range of approximately $15 million to $20 million, almost all of which is related to estimated severance costs associated with the workforce reduction.

4:25 pm : Stocks rose 1.0% in a volatile session as traders digested testimony from the head of the Federal Reserve, Treasury and FDIC, upside earnings guidance from Hewlett-Packard and speculation regarding the future of U.S. automakers.

The S&P 500 climbed to a gain 1.8% at midday, dropped to a loss of 2.8% in the final hour of trade before a surge in buying interest sent the S&P 500 back into positive territory. Seven of the ten economic sectors posted a gain. Small- and mid-cap stocks underperformed, with the Russell 2000 (-0.8%) and S&P 400 (-0.3%) both declining.

Fed Chairman Bernanke, Treasury Secretary Paulson and FDIC Chairman Bair were called to testify about the $700 billion financial relief package before the House Financial Services committee. Bernanke said there are some signs that credit markets are improving, although they remain strained. Treasury Secretary Paulson defended scrapping the original plan to buy troubled assets, saying that direct capital injections were more effective given the sharp deterioration in financial markets. Paulson believes the economy will not recover as fast as anyone would like, but will recover at a quicker pace because of the relief package.

On a related note, the Treasury bought $33.6 billion in preferred stock from 21 banks, including $6.6 billion in US Bancorp (USB 25.73, -0.07) and $3.6 billion in Capital One Financial (COF 29.25, -0.62). This brings the totaled preferred stock purchases in banks up to $158.6 billion. The financial sector fell 0.8%.

In corporate news, Hewlett-Packard (HPQ 33.58, +4.24) announced preliminary fourth quarter earnings that topped estimates and issued fiscal year 2009 earnings guidance that was above expectations.

Yahoo! (YHOO 11.48, +0.85) gained after announcing that cofounder Jerry Yang will step down as CEO as soon as a replacement is found, raising speculation that Microsoft (MSFT 19.62, +0.43) may show renewed interest.

The 14.5% gain in HPQ and 8.0% increase in YHOO helped the tech sector (+1.9%) outperform. More than half of tech stocks posted a loss, however, as investors were aware that the upside HPQ guidance was largely a company specific story, and not indication of overall strength.

In earnings news, Saks (SKS 3.27, -0.58) tumbled after missing third quarter earnings expectations, while Home Depot (HD 20.71, +0.71) rose after topping estimates. Both retailers were cautions about the near-term outlook. Retailers a whole fell 0.2%.

Shares of General Motors (GM 3.09, -0.09) and Ford (F 1.68, -0.04) fell to multi-decade lows. The automakers, along with Chrysler and the United Auto Workers, testified before the Senate Banking Committee regarding possible aid for the struggling U.S. auto industry.

In economic news, domestic producer prices in October dropped by a larger-than-expected amount due to the sharp decline in energy prices. Specifically, October PPI dropped 2.8% month over month, compared to the expected decline of 1.9%. Core PPI, which excludes food and energy, rose 0.4%, which was larger than the expected increase of 0.1%. DJ30 +151.17 NASDAQ +1.22 NQ100 +0.3% R2K -0.8% SP400 -0.3% SP500 +8.37 NASDAQ Adv/Vol/Dec 1088/2.41 bln/1719 NYSE Adv/Vol/Dec 1153/1.60 bln/1975

3:48PM General Electric: Additional detail on earlier headline regarding GE's new capital structure (GE) 15.88 -0.23 : The co announces a new GE Capital organization structure designed to execute on those objectives, and accelerate the evolution of the business into a more focused set of higher returning businesses. The new structure consists of operational poles in Europe, Asia and the Americas. Co also has created two new platforms to take advantage of new opportunities and leverage our expertise: one for consumer-focused international banks and JVs, and another focused on optimizing returns on non-strategic assets... Michael Neal, chairman of GE Capital, said, "Over the last two months, we have acted decisively to improve our funding position. We reduced our leverage, successfully raised capital, and accessed government programs that level the competitive playing field for us in financial services. Through these actions, we have strongly improved our 2009 funding outlook, and continue to reposition GE Capital for long-term performance and to play offense as conditions permit. This new organization aligns our operations with our strategic and funding plans."... With this more efficient organization, co is projecting approximately $2 billion in savings at GE Capital in 2009. These savings and the continued focus on optimizing the portfolio increase flexibility and vantage of opportunities created in the current market and drive value for our shareholders.

11:00AM Atmel comments on Microchip and ON announcement to withdraw their unsolicited, unfinanced proposal (ATML) 3.38 -0.65 : Co issues statement in response to the announcement that Microchip Technology (MCHP) and ON Semiconductor (ONNN) have withdrawn their joint proposal to acquire Atmel. "Atmel's Board and management remain focused on executing the transformation plan to ensure that Atmel's stockholders fully realize the value inherent in the Company. We are making significant progress, as evidenced by Atmel's outstanding third quarter results, which included market share gains and the highest gross margins in seven years. The decision by Microchip and ON to withdraw their unsolicited, unfinanced proposal underscores our Board's determination that the proposal was highly conditional and subject to significant execution risk. As previously announced, after a comprehensive review, and with advice from outside financial and legal advisors, Atmel's Board unanimously determined that the October 1, 2008, unsolicited proposal from Microchip and ON was inadequate in multiple respects, including value, conditionality and complexity, and was not in the best interests of Atmel's stockholders."

9:04AM Atmel: ON Semiconductor withdraws from proposal to acquire Atmel (ATML) 3.99 : ON Semiconductor (ONNN) announces that it is withdrawing from its joint proposal with Microchip Technology (MCHP) to acquire ATML. "We have decided to withdraw from the proposal due to the unforeseen deterioration in the semiconductor market since we announced our proposal as well as the unprecedented weakness in the financial markets." MCHP said that: "As a result of ON Semiconductor's withdrawal, Microchip must also withdraw its $5 per share offer for Atmel. However, Microchip intends to evaluate its potential alternatives for pursuing a transaction without ON Semiconductor."

8:30AM Corning withdraws fourth-quarter and 2009 guidance, expect Q4 sales to be below previous guidance and EPS to be at the low end or below guidance range (GLW) 9.01 : Co has withdrawn its previously disclosed financial guidance for the fourth quarter and 2009. "We now expect our fourth-quarter sales to be below our guidance range of $1.1-1.2 bln (vs $1.33 bln First Call consensus), and EPS to be at the low end or below our guidance range of $0.20-0.28*(vs $0.25 First Call consensus). The retail environment and the LCD supply chain are both extremely uncertain. As a result, since the display business is a significant contributor to our overall results, we are unable to offer revised guidance for the fourth quarter or for 2009 at this time." Co will make further LCD glass manufacturing capacity reductions in the fourth quarter, with a resulting impact on gross margins in the Display Technologies segment and the company overall. Co will have restructuring charges in both the fourth quarter of this year and in the first half of 2009 as the company adjusts its capacity and fixed cost structure to reflect the lower demand.

8:10AM Hewlett-Packard guides above consensus for Q4; issues in-line Q1 guidance, mixed FY09 guidance (HPQ) 29.34 : Co issues upside guidance for Q4 (Oct), sees EPS of $1.03, excluding non-recurring items, vs. $1.00 First Call consensus; sees Q4 (Oct) revs of $33.6 bln vs. $33.09 bln consensus. Co issues in-line guidance for Q1 (Jan), sees EPS of $0.93-0.95, excluding non-recurring items, vs. $0.93 consensus; sees Q1 (Jan) revs of $32-32.5 bln vs. $33.72 bln consensus. Co issues mixed guidance for FY09 (Oct), sees EPS of $3.88-4.03, ex items, vs. $3.85 consensus; sees FY09 (Oct) revs of $127.5-130 bln vs. $135.06 bln consensus. In providing its outlook for the first fiscal quarter and the full fiscal year 2009, the company has taken into consideration the current economic environment and the relative strength of the U.S. dollar. Based on current currency exchange rates, the company now expects an unfavorable year-over-year currency impact on revenue of approximately 5 percentage points in the first quarter and roughly 6 - 7 percentage points for the full year and this impact is reflected in its outlook.

8:01AM Broadcom says "Qualcomm again held in contempt of injunction on 3G cellular products previously found to infringe Broadcom patent" (BRCM) 14.72 : Co announced that a federal judge yesterday found Qualcomm Incorporated (QCOM) in contempt of an injunction entered last December that was designed to prevent Qualcomm from continued infringement of two Broadcom patents. As to Broadcom's U.S. Patent No. 5,657,317, the injunction prohibits Qualcomm from making, using, selling, offering for sale, importing, and developing certain EV-DO chips. The injunction also provides a sunset period during which Qualcomm can continue to sell legacy EV-DO chips to legacy customers until January 31, 2009, provided that it pays a royalty to Broadcom. U.S. District Court Judge James V. Selna found that Qualcomm violated both provisions of the injunction by selling and offering to sell enjoined EV-DO chips and by failing to pay royalties on legacy EV-DO chips.

7:30AM Am Superconductor partners with Shenyang Blower Works for development of 2 megawatt wind turbines (AMSC) 10.28 : Co and Shenyang Blower Works signed an agreement for co-development work that positions S.B.W. to become a leading supplier of wind turbines for the Chinese marketplace. Under the terms of the agreement, AMSC's wholly owned AMSC Windtec subsidiary will provide S.B.W. with designs for its 2 megawatt doubly fed induction wind turbine. AMSC will also help S.B.W. localize the supply of all core components for the wind turbines, establish its wind turbine manufacturing line and build and test S.B.W.'s first prototype wind turbines. After receiving certification, S.B.W. will manufacture the turbines and sell them primarily into the Chinese market. AMSC will provide the full electrical systems for all of SBW's wind turbines.

Mattson Technology (MTSN) announces that it has shipped an etch system to a major memory manufacturer, who has entered into a joint evaluation agreement with Mattson for development of next generation memory devices...

07:37 am Microsoft initiated with an Average at Caris- tgt $21: . Caris initiates MSFT with an Average and sets a $21 tgt, as efforts to penetrate faster growth markets have pressured margins and cash flow with no clear sense of time and/or magnitude of payback and see little upside to their below consensus FY09 revenue and EPS estimates which remain dependent on a weak and receding PC market.

08:37 am Hewlett-Packard (HPQ)

Shares of Hewlett-Packard (HPQ 29.34) are seeing some positive support ahead of the session's opening bell as investors react to upbeat guidance.

HP stated this morning that it expects fourth quarter revenue to come in around $33.6 billion, while earnings are expected to come in at $1.03 per share. Wall Street's current consensus calls for revenue of $33.1 billion and earnings of $1.00 per share.

For the first quarter of the coming fiscal year, Hewlett-Packard expects revenue to range from $32.0 billion to $33.5 billion. Earnings are expected to range from $0.93 to $0.95 per share. Meanwhile, the consensus calls for revenue of $33.7 billion and earnings of $0.93 per share.

As for 2009, the company currently estimates revenue will range from $127.5 billion to $130.0 billion with earnings ranging from $3.88 to $4.03 per share. Wall Street forecast a top line of $135.1 billion and earnings of $3.85 per share.

The outlook comes as a refreshing dose of good news as the trend of disappointing quarterly results and downwardly revised outlooks from various businesses have added to investors' gloom. HP's outlook, though, is likely supported by cost cutting and its share repurchase plan.

The company recently authorized an additional $8 billion for stock buybacks, which should prove accretive to earnings per share results by reducing the number of outstanding shares.
icon url

ReturntoSender

11/19/08 1:43 PM

#8347 RE: ReturntoSender #6755

Are we headed towards a test of the 2002 lows?


icon url

ReturntoSender

11/19/08 9:14 PM

#8348 RE: ReturntoSender #6755

From Briefing.com: 4:25 pm : Wednesday marked an ugly session on Wall Street, with the S&P 500 and Nasdaq tumbling to their lowest levels in five years and the Dow dropping to a five-year closing low. Concerns over the fate of U.S. automakers, disappointing economic data, a dour outlook from the Fed and the market's inability to hold its lows fueled the selling interest.

The major indices ended the session at their worst levels, in above average volume. The Dow, Nasdaq and S&P 500 fell 5.1%, 6.5% and 6.1%, respectively.

October CPI fell by the largest amount on record, which is good news in terms of the inflation outlook, but also represents the weakness of the economy. Specifically, CPI fell 1.0% month-over-month as energy prices plummeted 8.6%. Prices also declined outside of energy, indicating weak demand -- core CPI fell 0.1% as used car prices dropped 2.4% and apparel prices fell 1.0%.

The latest new residential construction data fell to the lowest levels on record, and provide another weak point for fourth quarter GDP calculations. October housing starts declined 4.5% month-over-month to a seasonally adjusted annual rate of 791,000, which was slightly higher than the consensus estimate of 780,000. Building permits dropped 12% to a seasonally adjusted annual rate of 708,000, which was worse than the consensus estimate of 774,000.

The Federal Reserve's 2008 and 2009 projections, released today in the FOMC Oct. 29 meeting minutes, mirrored the latest economic data, with the Fed reducing forecasts for GDP growth and inflation. For 2008, the Fed expects the economy will grow between 0.0% and 0.3%, down sharply from its previous forecast of 1.0% to 1.6%. The 2009 forecast now calls for growth between -0.2% and 1.1%, down from the previous forecast of 2.0% to 2.8%. The Fed also raised its unemployment forecast.

The minutes hinted at the likelihood of further monetary easing, as some FOMC members saw potential for further rate cuts.

Although weakness was broad-based with losses posted by all ten sectors and 492 of the 500 components within the S&P 500, the financial sector got hit the hardest with a decline of 11.5%.

Citigroup (C 6.45, -1.91) tumbled 23% to its lowest level since 1995. Citi said it will buy the remaining $17.4 billion in structure investment vehicles it advised.

Automakers (-21.2%) got clipped as executives from General Motors (GM 2.77, -0.32), Ford (F 1.27, -0.41) and Chrysler, and the head of the UAW testified before the House Financial Services Committee in an attempt to secure a government loan. There were plenty of opponents in the House, which was similar to views that were expressed by Senate Banking Committee members yesterday. GM's CEO said on CNBC that the company is doing everything it can to avoid bankruptcy, as he sees a high risk that a Chapter 11 filing (restructuring) could turn into a Chapter 7 (liquidation). Reports that Toyota Motor (TM 59.64, -3.61) is going to cut North America production also weighed on automakers.

A risk aversion trade lifted Treasuries, with the 30-year bound rallying 3 points to yield 3.94% -- marking the lowest yield since the 30-year bond was introduced in 1977. The 10-year note rose 44 ticks to send its yield down to 3.36%.

In commodity trading, crude prices fell 2.4% to $53.10 per barrel. The government's weekly energy inventory showed a larger-than-expected build in crude and gasoline stockpiles, indicating decreased demand.DJ30 -427.47 NASDAQ -96.85 NQ100 -5.9% R2K -7.9% SP400 -7.4% SP500 -52.54 NASDAQ Adv/Vol/Dec 2519/2.36 bln/298 NYSE Adv/Vol/Dec 187/1.63 bln/2998

4:33PM Semtech reports EPS in-line, revs in-line; guides Q4 EPS below consensus, revs below consensus (SMTC) 8.82 -0.36 : Reports Q3 (Oct) earnings of $0.24 per share, excluding non-recurring items, in-line with the First Call consensus of $0.24; revenues rose 1.4% year/year to $79.7 mln vs the $79.3 mln consensus. Co issues downside guidance for Q4, sees EPS of $0.15-0.20, excluding non-recurring items, vs. $0.23 consensus; sees Q4 revs of $64-72 mln vs. $75.95 mln consensus.

07:49 am First Solar target lowered to $120 at Friedman Billings: . Friedman Billings lowers their FSLR tgt to $120 from $170. Recent checks suggest that FSLR's new strategy in the U.S. market is already facing headwinds. Although projects such as Sampra are proceeding well and actually expected to be scaled up to 30 MW-plus, they believe that the distributed segment is where the levelized cost using FSLR's modules does not offer better economics when compared to crystalline modules. They view FSLR as the best in the business to maximize the return on assets (a key differentiating factor in a commodity-type industry such as solar manufacturing), but this does not imply that customers have no choice! They expect FSLR, along with the rest of the solar stocks, to remain under pressure, and they would encourage profit-taking on any rally.

09:28 am Toyota Motor (TM)

Asset and home prices are down, credit is tight, and the economy is on shaky ground. As a result, U.S. auto sales are flagging.

Responding to the trend, Toyota Motor Corp (TM 63.25) will reduce output of its Sienna minivan at one of its manufacturing plants and slow down a production of its Camry Avalon line at another site. Toyota will also eliminate one shift making the Tacoma pickup truck at a third plant, which is actually run as a joint venture with General Motors (GM 3.09), according to The Wall Street Journal.

The Japanese auto maker also stated it will stop production at its plants in the U.S. and Canada for two extra days in December and will cut 250 temporary workers, according to The Wall Street Journal. The article emphasized that Toyota says it will not lay off any full-time employees as part of the changes.

According to the article, the U.S. represents Toyota's largest and most profitable market. With U.S. auto sales continuing to slump and no turn of fortune on the immediate horizon, Toyota cut its full-year profit forecast by more than half.
icon url

ReturntoSender

11/24/08 10:45 PM

#8358 RE: ReturntoSender #6755

80% upside day Friday followed by a 90% Upside day today = Major Market Bottom?

http://www.internetnews.com/bus-news/article.php/3787116

Apple, Amazon Lead Tech Stock Rally

Apple and Amazon benefited from the government's rescue of Citigroup, while HP expanded on its quarterly results after the close.

November 24, 2008
By Paul Shread: More stories by this author:

A massive government rescue of Citigroup (NYSE: C) sent stocks soaring for a second day on Monday, while Apple (NASDAQ: AAPL) and Amazon (NASDAQ: AMZN) led the tech sector higher ahead of the start of the holiday shopping season.

The government's rescue of Citi — the biggest U.S. financial company, with $2 trillion in assets — sent stocks soaring on hopes that the bailout can bring an end to the worst economic crisis since the Great Depression. Also boosting stocks was the appointment of President-elect Barack Obama's economic team, with New York Fed President Timothy Geithner as Treasury Secretary and Harvard economist and former Treasury Secretary Lawrence Summers as a top advisor.

Apple and Amazon rose 12% each on hopes that the deal can boost consumer confidence in time for the critical holiday shopping season.

After the close, HP (NYSE: HPQ) fleshed out the details of its better than expected results preannounced a week ago.

HP's results were boosted by strong notebook and blade sales and the addition of EDS, but printing, industry-standard server and business critical system sales weighed on results.

HP said it expects 2009 to be a tough year, and the company sees more savings from its merger with EDS and also plans to tighten discretionary spending.

Other stocks beating the Nasdaq's 6.3% gain during Monday's trading session included Cisco (NASDAQ: CSCO), Comcast (NASDAQ: CMCSA), Dell (NASDAQ: DELL), Qualcomm (NASDAQ: QCOM), Yahoo (NASDAQ: YHOO) and Symantec (NASDAQ: SYMC).

The Nasdaq surged 87 to 1472, the S&P gained 51 to 851, and the Dow soared 296 to 8443. Volume declined to 8.74 billion shares on the NYSE, and 2.64 billion on the Nasdaq. Advancers led by a 32-4 margin on the NYSE, and 22-7 on the Nasdaq. Upside volume was 93% on the NYSE, and 94% on the Nasdaq. New highs-new lows were 2-153 on the NYSE, and 3-265 on the Nasdaq.

Next Article

Technical Analysis: Bulls Make a Dent
With last week's breakdowns reversed, the advantage has tilted toward the bulls.

http://www.internetnews.com/bus-news/article.php/3787121

November 24, 2008
By Paul Shread: More stories by this author:

One heck of a rally the last two days, and why not? As the financial crisis has now claimed the biggest U.S. financial company by assets, it could certainly be argued that the news can't get any worse.

The indexes have now moved back into their October trading ranges, a nice reversal of last week's breakdowns. They have much more work to do if they're going to put in a major bottom, but the ability to recover from a major breakdown is a good start.

The Nasdaq (first chart below) had a nice breakout above a downtrend line today. 1493-1500, 1542 and 1604 still lie ahead, while 1428-1430 and 1384-1410 are support.

The S&P (second chart) faces resistance at 866, 900 and 950-960, while support is 840, 818 and 800.

The Dow (third chart) faces its first upside test at 8637, with 8929-9153, 9350 and 9500 above that. Support is 8300, 8200, 8000 and 7900.

Finally, the dollar (fourth chart) could be topping out here, which could provide an opportunity for gold (fifth chart).

icon url

ReturntoSender

12/01/08 1:31 PM

#8365 RE: ReturntoSender #6755

There is not much volume but what is there is just plain sellers. So far I am certain it is another 90% downside day. Volume being as light as it is pushes us just that much closer to a bottom but again we need to see volume expand as the market moves higher. The market can remain under low volume pressure for a long time.


Note that when the market made its bottom in October 2002 the SMH made a lower low and then reversed higher on strong volume. That could still happen this month or next especially if volume remains lower than what we saw with previous capitulation as we sell off further.


JMHO, RtS
icon url

ReturntoSender

12/07/08 8:45 PM

#8373 RE: ReturntoSender #6755

Amateur Investors Weekend Stock Market Analysis (12/6/08)

http://www.amateur-investor.net/Weekend_Market_Analysis_Dec_6_08.htm

After the big sell off on Monday the market basically traded nearly sideways in a choppy fashion the rest of the week. Looking at a Daily Chart of the S&P 500 it appears it has completed its 2nd Elliott 5 Wave pattern to the downside and is beginning a potential corrective zig zag rally similar to what occurred last Spring as highlighted by the purple rectangle.


On a short term basis the S&P 500 held support this week near its 50% Retracement Level (calculated from the 11/21 low to the 11/28 high) just below the 820 level and is developing a consolidation pattern (brown lines). If the S&P 500 can rally above the 900 level it's next area of upside resistance would be in the 945 to 955 range which corresponds to its 50 Day EMA (blue line) and downward trend line (purple line) connecting the October 14th and November 4th highs. Meanwhile if the S&P 500 is unable to rise above the 900 level and comes under more selling pressure once again look for support near the 820 level next week.


As for the Dow notice it also held support near its 50% Retracement Level near 8175 (calculated from the 11/21 low to the 11/28 high) as it developed a consolidation pattern (brown lines). If the Dow can rise above 8800 its first area of upside resistance would be at its 50 Day EMA (blue line) near 9075 while the next area would be at its downward trend line (purple line) connecting the October 14th high and November 4th high near 9400. Meanwhile if the Dow is unable to rally above the 8800 level next week then look for support at its 50% Retracement Level near 8185.


The Nasdaq is also developing a consolidation pattern (brown lines) as it held support near the 1400 level this week. If the Nasdaq can rise above the 1535 level then look for resistance to occur either at its downward trend line (purple line) near 1620 or at its 50 Day EMA (blue line) near 1670.


Meanwhile if the major averages are going to make another move higher next week watch the Banking Index (BKX). The BKX has rallied back to its downward trend line (black line) near the 48 level. If the major averages are going to move higher next week the BKX will have to break above this downward trend line with the next area of resistance around 52 which is where its 50 Day EMA (blue line) and 38.2% Retracement Level (calculated from the late September peak to the November 21st low) reside at.


icon url

ReturntoSender

12/17/08 9:42 PM

#8389 RE: ReturntoSender #6755

From Briefing.com: 4:56PM Stocks Slip After Climbing to Gain : Stocks climbed from a loss of nearly 2% to a gain of roughly 0.6% before slipping back into the red to finish the session 1% lower. The relatively modest loss follow's the prior session's 5% surge, suggesting many investors may becoming more willing to ride their gains... Trading came without concerted leadership... Technology, which accounts for the largest weighting in the S&P 500 at roughly 15%, finished 1.7% lower. Its weakness stemmed from large-cap tech names, such as Apple (AAPL 89.16, -6.27). Apple sagged following reports that the company must end its exclusive deal with a French network operator, and that its CEO will discontinue attending a popular conference... Financials (-1.3%) were up 1.7% at their session high, but were unable to lock in gains. Morgan Stanley (MS 16.63, +0.50) posted a larger-than-expected loss for the latest quarter, but traded with strength alongside Goldman Sachs (GS 78.78, +2.78) as investors being to look past the firms' massive losses... Citigroup (C 7.83, -0.40) was a laggard in the financial sector, though. It displayed weakness after an article from The Wall Street Journal indicated regulators are increasing their oversight of Citi due to increased concern regarding the firm's financial status... 2008 has been a dry year for deal making, but Constellation Energy (CEG 23.00, -5.74) and Electricite de France announced a definitive agreement in which EDF will pay $4.5 billion for almost half of Constellation's nuclear operations. The agreement comes despite MidAmerican Energy's offer to pay $4.7 billion for all of Constellation, and makes it unlikely a new suitor or sweetened offer will surface. Shares of CEG plummeted 20% this session... Government debt, which is considered a defensive investment, closed higher. The yield on the benchmark 10-year Note remains at historic lows. The 10-year Note is currently yielding 2.16% after advancing 27 ticks. It was up 50 ticks in the early going... Gold, another safe haven, climbed more than $26 to hit $868.00 per ounce. Meanwhile, March silver added $0.72 to close trading at $11.425 per ounce... Other commodities traded in mixed fashion. March corn slipped, but wheat advanced. January soybeans were also up... Oil prices fell as much as 8.5% before settling $3.36 lower at $40.23 per barrel. The intraday drop took oil prices to a low of $39.88 per barrel. Oil's slide comes after the Department of Energy reported a build of 525,000 barrels for the week ending Dec. 12, though a build of 600,000 barrels was expected, and OPEC stated it is now targeting daily production of 24.85 million barrels, which is down 2.46 million barrels from the current production target level and down 4.2 million barrels from actual September production. The cut from current production targets is essentially in-line with the cut of 2 million barrels per day that was widely expected... Oil's drop came even though the U.S. dollar extended its recent downturn. The dollar fell 2.2%, limiting its year-to-date advance to just 2.9%... Converse to the weakened dollar are stronger foreign currencies, which make the prices of imports more expensive. That played into Honda Motor's (HMC 21.22, -1.63) to reduce its profit forecast and cut its dividend in half... Still, Asian markets concluded their latest session with gains. The MSCI Asia-Pacific Index advanced 2.7% to hit a five-week high. Japan's Nikkei finished 0.5% higher, while Hong Kong's Hang Seng climbed 2.2%... In European markets, London's FTSE locked in a 0.4% advance, reversing early gains. However, Germany's DAX ended 0.5% lower and France's CAC closed with a 0.3% loss... Dow -1.1%... Nasdaq -0.7%... S&P 500 -1.0%... Nasdaq 100 -1.4%... S&P Midcap 400 +1.0%... Russell 2000 +0.8%.

4:38PM MEMC Elec sees Q4 revs of $400-425 mln vs $493.00 mln First Call consensus (WFR) 16.66 +0.84 : The co comments on market conditions impacting its business and provids an update to its fourth quarter financial targets. Over the last few weeks, end demand for many industries, including semiconductor and solar, has continued to decline as a result of the global economic slowdown. In addition, the solar market has been impacted by the reduced availability of credit, which has limited the purchasing ability of some solar customers. Given these factors, combined with the continuing inventory reduction efforts by semiconductor device makers, the company has revised its fourth quarter outlook. The company now anticipates that revenue for the 2008 fourth quarter will be approximately $400 to 425 million, with gross margin of approximately 46%, plus or minus one percentage point. This compares to the company's previously announced targets of $500 million in revenue, plus or minus $25 million, with gross margin of 48% plus or minus two percentage points. Expectations for operating expenses remain unchanged at approximately $27 million.

4:36PM FormFactor lowers Q4 revs guidance below consensus (FORM) 15.11 +0.88 : Co lowers guidance for Q4, sees revs of $37-41 mln vs $52.53 mln First Call consensus, lower than the previous expectation of $48-55 mln, and earnings per share, operating expenses and gross margins to be below the guidance previously communicated. The lower than expected results are due primarily to increased weakness among memory customers. This weakness has resulted in a decrease in design activity and a delay in technology transitions, which are negatively impacting FormFactor's revenue and profitability.

4:31PM LogicVision: Virage Logic revokes proposal to acquire LogicVision (LGVN) 0.81 0.00 : Virage Logic Corporation (VIRL) announces that it sent a letter to the Board of Directors of LogicVision to inform them that Virage Logic is revoking its proposal to acquire the company for $1.05 per share in cash. The proposal, made public on December 3, 2008, offered a premium of 114% to LogicVision's closing price of $0.49 on December 1, 2008, and valued LogicVision at approximately $10.0 million.

4:31PM Cymer Appoints Paul Bowman as interim Chief Financial Officer; announce departure of Nancy Baker (CYMI) 23.30 +0.85 : The co announces that the company's Board of Directors has appointed Paul Bowman as interim Chief Financial Officer. Nancy Baker has tendered her resignation as Chief Financial Officer, effective December 19, 2008, to pursue other opportunities. Mr. Bowman has served as Cymer's Vice President of Investor Relations since May 2008.

4:15PM Integrated Silicon lowers Q4 rev guidance below consensus (ISSI) 1.57 +0.02 : Co issues downside guidance, sees Q4 revs of $33-$36 mln vs $48.11 mln First Call consensus and vs prior guidance of $45-$53 mln. Co states, "Customer orders have slowed considerably since the beginning of November. The worldwide economic slowdown has significantly impacted all of our products and markets. We are taking actions to realign our business with the current economic environment, including company-wide salary reductions, eliminating positions, and additional spending constraints."

9:18AM Motorola announces cost reduction actions (MOT) 4.41 : Co announces additional actions to further reduce costs amid continuing global economic challenges. These measures include changes to employee compensation and benefit programs as well as changes to executive compensation. Effective March 1, 2009, to better align with industry norms, Motorola will permanently freeze its U.S. pension plans, preserving vested benefits accrued by employees and retirees but eliminating future benefit accruals. Motorola intends to continue to provide funding to meet its pension obligations to present and future retirees. Effective January 1, 2009, Motorola also will temporarily suspend all company matching contributions to the Motorola 401(k) Plan. U.S. employees may continue to contribute to the 401(k) plan but will not receive matching contributions from Motorola. The company also announced today that employees in many of the markets in which it operates will not receive a salary increase in 2009. In addition, Motorola co-chief executive officers, Greg Brown and Sanjay Jha will voluntarily take a 25 percent decrease in base salary in 2009. Greg Brown will voluntarily forgo any 2008 cash bonus earned under the Motorola incentive plan. Sanjay Jha's employment contract provides for a guaranteed cash bonus for 2008. His bonus will also be voluntarily reduced by an amount equal to Greg Brown's forfeited bonus and the remainder will be taken in the form of restricted stock units. These actions are expected to lead to cost savings in addition to the $800 million that was previously announced on October 30, 2008.

Micron Technology (MU) announces it has worked with Sun Microsystems to develop a new single-level cell enterprise NAND technology that dramatically extends the lifespan of flash-based storage for enterprise applications...

8:01AM RF Micro Device announces actions to reduce manufacturing costs and increase cash flow; approx 5% of workforce will be affected by actions (RFMD) 0.86 : Co announces actions intended to streamline operations and reduce GaAs semiconductor manufacturing costs. RFMD expects the actions will begin to take effect in the March 2009 quarter and will positively impact cash flow in RFMD's fiscal 2010, beginning March 29, 2009. At RFMD's Greensboro, NC campus, all GaAs manufacturing will be transitioned to the co's 6-inch wafer fabrication facility. The co's 4-inch manufacturing facility will be idled and kept in a clean environment. Prior to this decision, RFMD's 4-inch manufacturing facility accounted for less than 10% of the co's total GaAs manufacturing capacity. As a result, the co anticipates significantly lower direct material costs and higher utilization rates, resulting in lower total manufacturing costs.

7:31AM Western Digital announces steps to realign its cost structure; lowers Dec quarter revenue guidance below consensus (WDC) 12.50 : Co issues downside guidance, sees Q2 revs of $1.7-$1.8 bln vs $1.98 bln First Call consensus and vs prior guidance of $2.025-$2.150 bln. Co says demand for hard drives in the Dec qtr is significantly below the expectations outlined in the co's original revenue guidance. The company has taken action throughout the quarter to adjust supply to industry demand and is taking further action to align inventories with anticipated short-term demand by temporarily halting the majority of its manufacturing operations from Dec 20 through Jan 1, 2009, inclusive. Specifically, these additional actions include: Reductions in compensation of the co's executive officers, board of directors, and senior mgmt; A reduction in worldwide headcount of approx 2,500 people or 5% of the total workforce; A reduction in manufacturing work hours of approximately 20 percent from reduced use of temporary workers, reduced shift overtime and employee attrition; Closure of one of the co's three hard drive manufacturing facilities in Thailand; Closure or disposal of one of the co's two media substrate manufacturing facilities in Malaysia; and a reduction in capital spending for FY09 from $750 mln to approx $500 mln.

09:23 am Cadence Design upgraded to Buy at Needham; tgt $5: . Needham upgrades CDNS to Buy from Hold and sets target price at $5 saying they have thought CDNS shares looked cheap for a while now but have been wary of further shoes dropping as the company dealt with its litany of issues. The firm notes on its 3Q08 call, CDNS cleared up its recent restatement issue and provided guidance, that while disappointing appears achievable even in a tough environment. Firm says while general visibility into 2010 and beyond isn't great, a strong case can be made that CDNS should see solid growth in ‘10/'11 even in a flat spending environment.

08:11 am Adobe Systems (ADBE)

Adobe Systems (ADBE 22.32) reported fourth quarter earnings that topped expectations, but the San Jose-based software firm fell short on revenue.

For the fourth quarter, Adobe posted earnings of $0.60 per share, excluding nonrecurring items. The First Call consensus called for earnings of $0.58 per share. The upside beat comes as a surprise in light of the fact that Adobe revised their earnings guidance to between $0.54 and $0.56 just two weeks ago on Dec. 3.

Revenues rose 0.4% year-over-year to $915.30 million, shy of the consensus estimate of $918.3 million.

Adobe indicated that weaker-than-expected demand for its new Creative Suite 4 family of products was responsible for the shortfall in fourth quarter revenue. The new product cycle is up against strong headwinds as customers on tight budgets are less likely to upgrade to Adobe's latest offerings.

Looking ahead, Adobe reaffirms in-line guidance for its first quarter, projecting earnings between $0.43 and $0.47, excluding nonrecurring items, on revenue between $800 million and $850 million. The current consensus calls for earnings of $0.45 per share on revenue of $842.38 million.
icon url

ReturntoSender

12/18/08 9:25 PM

#8390 RE: ReturntoSender #6755

From Briefing.com: 4:35PM Stocks Slip After GE's Outlook Lowered : Stocks chopped along in a relatively narrow range until economic bellwether General Electric (GE 15.96, -1.43) had its credit outlook lowered late in the session. The announcement induced selling pressure, which took the stock market to a loss of 3.0% before it finished with a loss of 2.1%... Shares of General Electric fell to a multiweek low after Standard & Poor's lowered the company's credit outlook to Negative from Stable, which is not the same as an actual downgrade. GE is one of only a handful of companies to carry a coveted AAA rating. However, Standard & Poor's did indicate there is a one-in-three possibility of a downgrade within the next two years. General Electric traded as a laggard, weighing on the S&P 500 and the Dow Jones Industrial Average... Exxon Mobil (XOM 76.90, -4.16), which also carries a AAA credit rating, was a laggard, too. Exxon's stock dropped markedly as crude futures contracts plunged amid ongoing demand concerns. Integrated oil companies finished the session 5.9%, while oil and gas drillers dropped 11.3%... Though OPEC announced yesterday production cuts intended to bolster prices by realigning supply with demand, oil prices have gone on the slide this week. January crude fell as much as 10.2% to take out a multiyear low of $35.98 per barrel before settling at $36.74 per barrel; contracts for January delivery expire after tomorrow's close. Upon the expiration of the January contracts, February will become the front month. February crude closed at $42.06, down 5.7%... Materials (-4.0%) also traded with weakness as Freeport McMoRan (FCX 23.32, -2.69) dropped more than 10%. Its loss followed weakness in metals... February gold slipped $7.90 to settle at $860.60 per ounce, while and March silver shed $0.30 to settle at $11.12 per ounce. Copper was also down with March contracts slipping $0.072 to $1.302 per ounce... Weakness in commodities was exacerbated by a resurgent dollar. The U.S. dollar was able to snap its recent losing streak by climbing 0.7% this session. It is still down 5.0% for the week, though, as currency traders assess the country's extraordinary spending plans and weak economic conditions... Though a stronger dollar bodes well for U.S. consumers, it can dampen earnings prospects from multinational companies depending on foreign markets for growth. Nike (NKE 52.69, +2.05) and FedEx (FDX 62.60, -1.37), both global companies, posted better-than-expected quarterly earnings results ahead of the opening bell. Their results have been helped by international markets, but economic headwinds will challenge their performance in the future... As such, President-elect Obama is reportedly planning an $850 billion economic stimulus plan that would be phased in over the next couple of years... The current White House administration is reportedly planning to provide automakers with aid before Dec. 25. Treasury Secretary Paulson will take the lead in the planning, but details for the plan remain unknown. Separate reports indicated General Motors (GM 3.66, -0.71) and Chrysler reopened merger talks, but GM later denied the claim... In economic Weekly initial jobless claims and continuing claims were down a bit from the prior week, and essentially in-line with economists' expectations. Claims totaled 554,000 and 4.38 million, respectively. The claims numbers can be considered relatively positive since they didn't surpass the estimated levels, which has been the case in previous weeks, but the decrease may suggest some workers have exhausted their jobless benefits since companies continue laying off workers... Dow -2.5%... Nasdaq -1.7%... S&P 500 -2.1%... Nasdaq 100 -1.7%... S&P 400 -1.8%... Russell 2000 -1.5%.

5:11PM Oracle: On call, sees Q3 EPS $0.34-$0.36 (constant currency) vs $0.34 First Call consensus; sees revs up 8-11%, which equates to approx $6.06- $6.23 bln vs $5.84 bln consensus (ORCL) 16.61 -0.13 :

4:33PM Micrel appoints Ray Wallin as co's new Chief Financial Officer (MCRL) 7.34 -0.49 :

4:30PM Palm misses by $0.35, misses on revs (PALM) 2.20 : Reports Q2 (Nov) loss of $0.73 per share, which excludes stock-based compensation, amortization of intangible assets, restructuring charges, impairment of non-current auction rate securities, accretion of series B convertible preferred stock and the non-cash net impact on the tax provision resulting from the increase of the valuation allowance for the Co's U.S. deferred tax, $0.35 worse than the First Call consensus of ($0.38); revenues fell 45.2% year/year to $191.6 mln vs the $207.3 mln consensus.

4:16PM UTStarcom announces a corporate restructuring and initiatives to improve financial performance (UTSI) 1.62 -0.06 : Co announces a series of corporate initiatives that are expected to reduce its annualized operating expenses by more than 25% or greater than $100 mln. The majority of these measures will have been initiated by the end of January 2009 and a significant portion of the savings will be recognized in the first half of 2009. Co initiated actions to wind down its Korea-based handset manufacturing operation whose principal activity is supplying handsets to Personal Communications Devises. This wind down will occur over the next six months to enable co to meet current customer commitments in North America and the process will be complete by July 2009. The Handset segment will continue to supply handsets to the China market. Additionally, the company has initiated actions to disband its Custom Solutions Business Unit by the end of the first quarter 2009. In the fourth quarter 2008 and first quarter 2009 the company will reduce its global employee base by ~10%. This reduction is in addition to the employees impacted by the identified non-core business rationalizations discussed above. In addition, the company also announced that the non-executive members of the board have agreed to a reduction in their board retainers for a period of one year. Furthermore, Peter Blackmore, UTStarcom's CEO and president, and other executive officers have voluntarily agreed to decline their cash bonuses for 2008.

4:13PM Research In Motion reports EPS in-line; guides Q4 EPS above consensus, revs above consensus (RIMM) 38.44 -2.23 : Reports Q3 (Nov) earnings of $0.83 per share, excluding non-recurring items, in-line with the First Call consensus of $0.83; revenues rose 7.9% year/year to $2.78 bln vs the $2.81 bln consensus. Co issues upside guidance for Q4, sees EPS of $0.83-0.91 vs. $0.83 consensus; sees Q4 revs of $3.3-3.5 vs. $2.98 bln consensus. Sees gross margins of between 40-41% in Q4. Based on RIMM's current expectations for product mix and device average selling prices, RIMM expects gross margins in fiscal 2010 to be similar to or slightly better than Q4. The revenue breakdown for the quarter was approximately 81% for devices, 13% for service, 2% for software and 4% for other revenue. During the quarter, RIM shipped approximately 6.7 mln devices. Approximately 2.6 mln net new BlackBerry subscriber accounts were added in the quarter. At the end of the quarter, the total BlackBerry subscriber account base increased from the prior quarter by approximately 14% to approximately 21 mln. Net subscriber account additions in the fourth quarter are expected to be approximately 2.9 mln.

4:08PM Research In Motion trades to $42.15 in after hours following upside Q4 guidance (RIMM) 38.44 -2.23

4:04PM Oracle reports EPS in-line, misses on revs (ORCL) : Reports Q2 (Nov) earnings of $0.34 per share, excluding non-recurring items, in-line with the First Call consensus of $0.34; revenues rose 5.5% year/year to $5.61 bln vs the $5.84 bln consensus.

4:01PM LSI Logic lowers Q4 revs guidance (LSI) 3.44 -0.33 : Co lowers guidance for Q4 (Dec), sees Q4 (Dec) revs of $570-610 mln, down from $670-710 mln, vs. $681.60 mln First Call consensus. The revised outlook reflects anticipated sales levels that are lower than previously expected due to the weakening global macroeconomic environment. LSI has already begun taking steps to reduce operating expenses as a result of continuing demand uncertainty and expects to maintain tight expense controls for the foreseeable future.

8:02AM O2Micro expects Q4 revenue to be approximately $21-22 mln vs $32.34 mln consensus (OIIM) 2.19 :

6:43AM ASML Holding lowers Q4 rev guidance (ASML) 17.34 : Co announces it has seen a severe deterioration in its order intake due to the global economic crisis. "Never before have we witnessed such a sharp and sudden fall-off in lithography system demand, triggered by an unprecedented mix of falling end-demand for semiconductors, weak memory prices and restricted access to capital for our customers... This steep decline in our business activity is forcing us to adjust our organization in order to lower our cost base significantly by using the full flexibility of our business model, while maintaining our important strategic investments in research and development..." As a result of the severe slowdown, ASML expects sales in the fourth quarter of 2008 to be between EUR 450 mln and EUR 500 mln, compared with guidance issued on October 15 for sales of around EUR 530 mln. A sharp decline in new order intake, in addition to requests from customers to postpone backlog system deliveries, will translate into substantially lower sales in the first six months of 2009. We currently anticipate that sales in the first quarter of 2009 will be between EUR 180 mln and EUR 250 mln.

09:40 am Apple coverage transfered with a Neutral at Amtech: . Amtech transfers coverage of AAPL with a Neutral and a $95 tgt saying the co is arguably the best growth story in the technology sector today. It continues to deliver "hit" products to the marketplace, evidenced by the success of the iPod, the MacBook line of high-end notebook computers, and the emergence of the iPhone over the last 18 months. The firm says despite AAPL's enviable position in the computing/smartphone marketplace, they are concerned expectations into this holiday season and CY09E are too inflated. As the global macroeconomic headwinds increase and the effects of the credit crisis linger, they believe consumers will be more "price conscious" when selecting consumer electronics gear going forward.
icon url

ReturntoSender

12/30/08 10:45 PM

#8400 RE: ReturntoSender #6755

From Briefing.com: 4:31PM Action Semi lowers Q4 guidance (ACTS) 1.70 +0.14 : The Company now expects revenue for the fourth quarter ending December 31, 2008 to be approximately $15-$16 million vs $20.15 mln two analyst estimate. The company's previous guidance was for fourth quarter revenue in the range of $18 million to $22 million. Fourth quarter fully diluted earnings per ADS are now expected to be approximately breakeven vs $0.05 two analyst estimate (previous guidance was for Q4 EPS of $0.04-0.06). The revision in guidance is primarily due to lower sales in the current challenging macroeconomic environment and less-favorable exchange rates against US dollars.

4:25 pm : Stocks staged a solid advance without the help of any major news items or encouraging economic data. Each of the major indices rallied in the final minutes of trading, finishing at session highs.

With news flow slow, participants focused on word that GMAC, the partly-owned financing arm of General Motors (GM 3.80, +0.20), is receiving $5 billion worth of senior preferred equity from the U.S. Treasury. Another $1 billion is expected to make its way into GMAC’s hands since Treasury is lending General Motors money to participate in GMAC’s rights offering.

The new funds are expected to help generate new auto loans, aimed at attracting buyers. Such a move would complement recent efforts by Treasury and Federal Reserve to increase the availability of consumer loans.

A lack of buyers and tighter credit conditions continue to weigh on the housing market. According to the S&P/Case-Shiller Composite Index, October home prices were down 18% year-over-year. That is the largest drop on record.

Plummeting home prices and broader economic headwinds are taking their toll on consumer confidence. According to the U.S. Conference Board, consumer confidence dropped more than expected to an all-time low in December.

Stocks fell to session lows at the same time the consumer confidence report was released, but quickly snapped back to spend the entire session in the green.

Financials (+4.1%) led the late charge. JPMorgan Chase (JPM 31.01, +1.23) and Wells Fargo (WFC 28.80, +0.97) were the sector's best performers. The two outfits have found favor among investors since they avoided many of the toxic assets that crippled other banks and financial outfits. The assets have been so toxic that The Wall Street Journal suggested banks may face their first overall quarterly loss since 1990.

Strong gains were also had by the materials sector. Rohm and Haas (ROH 59.37, +6.03) rebounded from the prior session’s loss after reports indicated the terms of its merger agreement with Dow Chemical (DOW 15.55, +0.23) are unlikely to be renegotiated.

The deal was questioned when a multibillion partnership between Dow and a Kuwaiti petrochemical outfit fell through. That prompted Standard & Poor's and Moody's to lower their credit rating on Dow.

Integrated oil companies (+1.8%) provided leadership to the energy sector for the second straight session. They helped the sector climb from a 0.9% loss to finish 1.8% higher.

Energy’s recovery was also helped when oil prices pulled off their session lows. Crude futures were down more than 5%, but finished closer to 2% lower at around $39.20 per barrel.

The session's gains were broad-based with all 10 economic sectors advancing. Nearly 95% of the companies in the S&P 500 closed higher.

The gains came on light trading volume, though, as many investors remain on vacation, and trading desks continue to be lightly staffed. For the fifth straight session less than 1 billion shares traded hands on the NYSE. The trend will likely continue through the week since the U.S. indices will be closed for another holiday on Jan. 1, which is New Year's Day. Tomorrow, Dec. 31, is a full trading day.DJ30 +184.46 NASDAQ +40.38 SP500 +21.22 NASDAQ Dec/Adv/Vol 918/1951/1.44 bln NYSE Dec/Adv/Vol 591/2548/954 mln

08:47 am Advanced Micro Devices (AMD)

Struggling chip maker Advanced Micro Devices (AMD 2.10) said that it implemented a restructuring plan in its fiscal fourth quarter centered around job cuts.

AMD said that approximately 600 employees were laid off in the fourth quarter.

AMD estimates that it will record a $70 million restructuring expense in the fourth quarter. The company said the restructuring charge includes $34 million related to severance and the costs associated with continuation of certain employee benefits, $13 million in contract termination costs, $17 million in asset impairments and $6 million related to exit costs for facilities that have been consolidated or closed.

The latest figures indicate deeper cuts than AMD originally expected. In its third quarter report, AMD said it expected to layoff approximately 500 employees and take a charge of $50 million.

Shares of AMD have been hammered over the past year and are off more than 70% from their 52-week high.

icon url

ReturntoSender

01/01/09 11:37 PM

#8401 RE: ReturntoSender #6755

From Briefing.com: 4:30 pm : The stock market finished 2008 on a positive note, gaining 1.4% this session, and 3.9% over the past two sessions. The advance comes amid light trading volume, though, suggesting a lack of conviction behind the move.

Still, investors welcome the gains after the stock market plummeted 38.5% this year. That was the worst annual decline since 1937, when the stock market fell 38.6%. The stock market advanced almost 25% in the year following that record decline, so investors are hoping gains in recent sessions will lead the way to a better 2009.

Trading volume and news flow were relatively light in the final trading session of the year. Just 1.3 billion shares traded hands on the NYSE as market participants remain on vacation during the holiday season. Though that was the highest volume in the last seven sessions, it remains below long-term trends.

Without any major news items, participants were left to focus on a better-than-expected weekly jobless claims report. Claims for the week ending Dec. 27 totaled 492,000, down 94,000 from the prior week. The decline was largely treated as an aberration.

That notion was supported by word continuing claims increased to a multiyear record of more than 4.5 million, which was higher than expected.

Weekly crude inventory data also hit the wires this session. Inventories increased by 549,000 barrels. That contrasted with the consensus forecast, which called for a draw of 1.45 million barrels.

Crude oil prices advanced in the face of the bearish data. After spending most of the session trading lower, crude rallied to close roughly 14% higher at around $44.60 per barrel. At its session high, crude was up nearly 17%. It was down nearly 5.4% at its session low.

Despite the advance, crude prices remain pressured by weak demand, which has stemmed from economic headwinds.

To help counter such headwinds, President-Elect Obama is hatching a massive economic stimulus plan. However, The Wall Street Journal reported such a plan may not reach Congress until late January. Many were hoping a plan would arrive sooner.

Meanwhile, the U.S. Treasury announced further detail surrounding its Automotive Industry Financing Program, which will apply to automakers, auto finance companies, and any other firms it views as important to the industry, according to Reuters.

The announcement provides further clarity around the $17.4 billion bailout package the White House previously approved for U.S. automakers.

Shares of General Motors (GM 3.20, -0.60) still slumped, but Ford (F 2.29, +0.00) finished unchanged.

Overall, stocks finished the session with broad-based gains. All 10 of the major economic sectors closed higher after spending virtually the entire session in the green, though there wasn’t a true leader among them.

U.S. stock and bond markets are closed tomorrow, Jan. 1, in observance of New Year’s Day. Markets will reopen Friday, Jan. 2.

End of Quarter Update: The Dow Jones Industrial Average fell roughly 19% this quarter; Nasdaq Composite dropped nearly 25% quarter-to-date, and; S&P 500 fell almost 23% this quarter.

End of Year Update: The Dow Jones Industrial Average fell almost 34% this year; Nasdaq Composite dropped roughly 41% for the year, and; S&P 500 shed about 38% for 2008.DJ30 +108.00 NASDAQ +26.33 NQ100 +0.9% R2K +3.5% SP400 +2.6% SP500 +12.61 NASDAQ Adv/Vol/Dec 2193/1.59 bln/676 NYSE Adv/Vol/Dec 2651/1.31 bln/491

7:48AM Dell announces it will organize globally around three major customer segments (DELL) 10.23 : Co announces it will organize globally around three major customer segments: large enterprise, public sector, and small and medium businesses. Dell's consumer business, led by Ron Garriques, is already organized globally. Dell believes the four groups best capitalize on the company's competitive advantages, while strengthening execution and synergies. Each group will possess greater global accountability and responsibility for responding to customer needs, and for anticipating and leading industry change. Dell said the changes result from listening to customers and responding to their desire for faster innovation and globally standardized products and services. "Customer requirements are increasingly being defined by how they use technology rather than where they use it," said Mr. Dell. "That's why we won't let ourselves be limited by geographic boundaries in solving their needs."

08:41 am Online Holiday Shopping Down 3%

Online holiday spending dipped 3% from the same period last year, according to Internet research firm comScore.

ComScore said that the decline marks the first time it has seen negative growth rates for the holiday season since the company began tracking e-commerce in 2001.

Despite the weaker spending, comScore reported that three of the top five most-visited sites saw increases in traffic from last year.

Among the more popular sites, Apple (AAPL 86.29) saw the biggest traffic increase, up 19% from last year, while Wal-Mart (WMT 55.05) site visits increased 4% and traffic at Amazon.com (AMZN 50.76) rose 7% from last year.

The most visited site remained eBay (EBAY 13.96), but traffic decreased 4% from the prior year.

Online shopping between Nov. 1 and Dec. 23 totaled $25.5 billion, according to comScore.
icon url

ReturntoSender

01/05/09 11:19 PM

#8407 RE: ReturntoSender #6755

Apple Gains as Stocks Stumble

http://www.internetnews.com/bus-news/article.php/3794261/Apple+Gains+as+Stocks+Stumble.htm

As investors braced for a tough month, Apple and the chip sector looked ahead to better times.

January 5, 2009
By Paul Shread: More stories by this author:

Stocks slumped Monday as investors braced for grim economic and earnings news, but Apple (NASDAQ: AAPL) bucked the downtrend on news that Steve Jobs' health problems appear to be manageable.

Apple shares gained 4% as investors hoped that the revelation would put to rest doubts about the health of the company's CEO, but the rest of the market fell ahead of what could be a rough month for economic and earnings news.

Friday's monthly jobs report is expected to show a loss of nearly 500,000 jobs for December, and earnings reporting season begins in earnest next week.

AMD (NYSE: AMD) gained 12% and SanDisk (NASDAQ: SNDK) 9% after a Wachovia analyst said chip sector fundamentals could begin to improve as soon as the second quarter.

Verizon (NYSE: VZ) and AT&T (NYSE: T) fell on a Bernstein downgrade on a slowing wireless market.

Sonic Solutions (NASDAQ: SNIC) and Digi (NASDAQ: DIGI) fell 19% each after lowering guidance.

Best Buy (NYSE: BBY) and Leap Wireless (NASDAQ: LEAP) gained on upgrades.

The Nasdaq lost 4 to 1628, the S&P 500 slipped 4 to 927, and the Dow lost 81 to 8952. Volume rose to 5.5 billion shares on the NYSE, and 1.82 billion on the Nasdaq. Advancers led by a 24-13 margin on the NYSE, and 15-13 on the Nasdaq. Upside volume was 54% on the NYSE, and 51% on the Nasdaq. New highs-new lows were 24-48 on the NYSE, and 16-20 on the Nasdaq.
icon url

ReturntoSender

01/06/09 10:45 PM

#8409 RE: ReturntoSender #6755

From Briefing.com: 4:30 pm : Stocks were up as much as 1.8% before the latest batch of economic data triggered a round of selling pressure. The major indices were able to finish the see-saw session with marked gains, but off their session highs.

November factory orders fell 4.6%. They were expected to decline 2.3% after falling 6.0% in October.

November home sales were down 4.0% month-over-month, which is worse than the 1.0% decline that was widely forecast. Sales were down 4.2% in the prior month.

Bucking the trend of worse-than-expected data, the December ISM Service Index came in at 40.6, which was better than the consensus estimate of 36.5. The reading was also up from a multiyear low of 37.5.

In other economic news, the minutes from the Dec. 16 Federal Open Market Committee (FOMC) meeting indicated there was significant contraction in economic activity during the fourth quarter, and downside risk to growth remains. Unemployment is expected to rise significantly into 2010.

The FOMC noted it stands ready to expand purchases of agency debt and agency mortgage-backed securities; it is also evaluating the potential benefits of purchasing longer-term Treasuries.

Stocks slipped in the wake of the announcement, but found support when they tested afternoon lows. The re-emergence of buyers paired with the realization that the FOMC's comments didn't really tell the market anything new helped stocks ascend to their best levels of the afternoon.

However, the stock market was unable to eclipse its session high and drifted lower to finish the session with a 0.8% gain.

Cyclical plays were among the strongest gainers.

Tech topped the other economic sectors by advancing 3.0% with help from large-cap holdings like Microsoft (MSFT 20.76, +0.24) and Hewlett Packard (HPQ 39.31, +2.98). Other large-cap tech names helped the Nasdaq outperform the other headline indices.

Materials (+1.9%) advanced with help from Mosaic (MOS 38.56, +0.89). Mosaic posted better-than-expected quarterly earnings results but ran into some pressure when it indicated during its conference call it is seeing a tight supply chain. Meanwhile, Dow Chemical (DOW 16.05, +1.00) indicated it will seek to enforce its rights regarding a failed business agreement with a Kuwaiti petrochemical outfit.

Consumer discretionary stocks (+1.8%) and industrials (+1.6%) also outpaced the broader market.

Energy was a leader early on, gaining as much as 3.0%, but it finished just 0.5% higher as oil prices pared early gains to close just above the unchanged mark at $48.85 per barrel. Oil was up as much as 3.4%.

Financials (+1.9%) were the only other economic sector to post a gain. Its advance came in the face of a warning from Bank of America (BAC 14.28, +0.30) chief executive Ken Lewis that 2008 results are expected to be below Wall Street's expectations. Bank of America isn't scheduled to announce its quarterly results until later this month.DJ30 +62.21 NASDAQ +24.35 NQ100 +1.0% R2K +1.9% SP400 +1.6% SP500 +7.25 NASDAQ Adv/Vol/Dec 2013/2.19 bln/758 NYSE Adv/Vol/Dec 2461/1.34 bln/681

5:26PM Cree: U.S. Pentagon to install Cree LR24 recessed LED luminaires (CREE) 17.83 +1.68 : Co announces that more than 4,200 LR24 recessed LED luminaires are planned for installation in Wedge 5 of the Pentagon as part of a major renovation currently underway. In a signing ceremony today at the Pentagon, John J. Kubricky, Deputy Under Secretary of Defense for Advanced Systems and Concepts, and Albert C. Ellet, acting director of the Washington Headquarters Service responsible for overseeing the renovation, signed an intra-departmental Memorandum of Agreement kicking-off the initiative to install LED lighting in the Pentagon.

5:09PM Rambus DDR3 interface solution selected by Panasonic (RMBS) 18.28 +0.90 : Rambus (RMBS) announced that Panasonic Corporation (PC) has licensed Rambus' DDR3 memory controller interface solution for system LSI implementation in consumer electronics products. This fully-integrated macro cell architecture provides the physical layer (PHY) interface between the controller logic and DDR3 DRAM devices to achieve data rates up to 1.6Gbps.

4:47PM Aehr Test Systems receives order for its new Advanced Burn-in and Test System from a European provider of imbedded wireless technology (AEHR) 2.68 +0.01 :

4:33PM Ixys guides Q3 revs below consensus; suspends dividend (IXYS) 7.75 +0.20 : Co issues downside guidance; co sees Q3 revs of $56-58 mln vs $71 mln First Call single-analyst est. Co says in light of the general economic decline, many of the co's customers reduced their orders or delayed delivery into calendar 2009. This caused a significant slowdown in business activity as the December 2008 quarter progressed. To address current economic conditions, the co has implemented several aggressive cost-cutting measures, including, but not limited to, reducing the number of personnel, 10% salary reductions for many U.S. employees (including the CEO and the COO), and 10% reductions in fees paid to the members of its Board of Directors. IXYS is considering additional cost-cutting measures to further reduce its expenses in line with the reduced revenue levels. To conserve cash, the Board of Directors also suspended the company's cash dividend indefinitely. The co's previously announced stock repurchase program remains in effect.

4:20PM Ixia lowers Q4 guidance below consensus (XXIA) 5.85 +0.01 : Co issues downside guidance for Q4 (Dec), sees EPS of $0.02-$0.03, excluding non-recurring items, vs. $0.07 First Call consensus; sees Q4 (Dec) revs of $40.5-41.5 mln vs. $46.50 mln consensus. Fourth quarter 2008 revenues were impacted by lower than expected bookings from service providers in North America and Europe while bookings from our government accounts were seasonally down from the immediately preceding third quarter.

4:16PM Microchip issues downside Q3 EPS guidance (MCHP) 20.01 +0.66 : Co issues downside guidance, sees Q3 EPS of $0.23-$0.26, ex-items, vs $0.32 First Call consensus. Co states, "General economic and semiconductor industry conditions have continued to decline since our October earnings call..As a result of these conditions, we are continuing with a pay cut for all of our worldwide non-manufacturing employees which was implemented during the December quarter. We are also continuing actions to reduce manufacturing capacity in our wafer fabrication facilities in the U.S. and our assembly and test facility in Thailand. These and other actions have been taken to right-size our manufacturing output and keep operating expenses at reasonable levels."

4:03PM SMSC beats by $0.10, reports revs in-line; guides Q4 EPS below consensus, revs below consensus (SMSC) 16.62 -0.28 : Reports Q3 (Nov) earnings of $0.39 per share, $0.10 better than the First Call consensus of $0.29; revenues fell 19.5% year/year to $84.3 mln vs the $83.8 mln consensus. Co issues downside guidance for Q4, sees EPS of ($0.40)-(0.55), excluding items, vs. $0.15 consensus; sees Q4 revs of $45-51 mln vs. $76.40 mln consensus. The recent and ongoing difficult economic conditions and sharp decline in visibility continue to hinder the Company's ability to provide guidance. As a result, management cautions that it is important to consider the following guidance together with the caveats, assumptions and discussion that will be presented during a conference call and webcast as outlined below.

1:36PM Apple confirms 17-inch MacBook Pro with new built-in battery (AAPL) 94.85 +0.26 : Co confirms the new 17-inch MacBook Pro and new built-in battery that delivers up to eight hours of use and up to 1,000 recharges The new 17-inch MacBook Pro includes NVIDIA graphics and the latest generation Intel Core 2 Duo mobile processors.

Broadcom Corporation (BRCM) and Adobe Systems (ADBE) announce the integration of the Adobe Flash platform into Broadcom's latest digital television and set-top box system-on-a-chip platforms...

09:38 am LDK Solar (LDK)

LDK Solar (LDK 13.58, -1.26), maker of wafers for solar cells, issued downside revenue guidance for its fourth quarter.

LDK expects revenue between $425 million and $435 million compared to the First Call consensus estimate of $540.53 million. Earlier revenue guidance from LDK called for revenue between $555 million and $565 million.

LDK also trimmed its gross margin expectations to a range between 10-13% from earlier expectations of 18-21%.

During the fourth quarter, LDK said it experienced lower demand as customers delayed shipments until 2009 in light of the current global economic crisis and tight credit markets.

Shares of LDK are down 9% in Tuesday's early trade.

icon url

ReturntoSender

01/07/09 9:33 PM

#8410 RE: ReturntoSender #6755

From Briefing.com: 4:30 pm : A batch of negative news items provided market participants with an excuse to sell into the stock market's recent gains. Trading volume remains low, though, suggesting there is still little conviction behind the moves.

Heading into the open, stocks were up roughly 3.5% through the first few sessions of 2009. Stocks finished this session a bit off their lows with a 3.0% loss, which is the largest decline in more than one month.

Only 1.2 billion shares traded hands on the NYSE. Though that is in-line with recent levels, it remains well below longer-term trends.

A worse-than-expected ADP employment report and a warning from Intel (INTC 14.44, -0.93) underpinned early weakness.

The ADP report indicated 693,000 jobs were lost in December. The consensus called for 493,000 job losses. The data support economists' opinions that government data will show a rise in the national unemployment rate, which is scheduled to be announced Friday.

Intel cut its fourth quarter revenue estimate for the second time due to continued weakness in its end markets. The company now expects revenue of $8.2 billion, though Wall Street pegged the consensus estimate at $8.7 billion. Shares of INTC traded markedly lower in response. Their weakness weighed on the tech sector (-3.7%) and the Nasdaq.

Dow component Alcoa (AA 10.89, -1.23) also made headlines, though its story wasn't much of a surprise. The company announced it will reduce output, capital expenditures, and its global workforce as it contends with a softer economic environment. Such broader headwinds have been hanging over the stock for the last several months.

Bank of America (BAC 13.71, -0.57) also made headlines when it announced it is selling part of its stake in China Construction Bank for some $2.8 billion.

BAC and peers JPMorgan Chase (JPM 28.09, -1.79) and Wells Fargo (WFC 25.87, -1.67) traded as laggards in the financial sector as investors were reminded that banks have a long way to recovery. Analysts at Oppenheimer expect banks will have to raise capital in 2009, even though banks have already gone on several capital raising campaigns. Such a move could dilute existing shareholders.

Financials finished 5.1% lower, replacing energy as the session's worst performing economic sector.

Energy shed 3.9% as crude futures fell nearly 12% to close at roughly $42.80 per barrel.

Crude dropped as bearish inventory data put demand concerns back into focus. Analysts expected the Department of Energy to report a weekly build of 800,000 barrels, but a build of 6.68 million barrels was reported, instead.

The materials sector was able to limit its losses due to strength in Monsanto (MON 86.16, +12.94). Monsanto reported adjusted earnings of $0.90 per share, and raised its outlook for fiscal 2009. The company now expects earnings to range from $4.40 and $4.50 per share. The outlook remains short of the consensus forecast, though.

Still, MON gained nearly 18% to finish at its highest level in nearly two months. That provided a bit of relief to the beaten down materials sector, which finished 1.6% lower.DJ30 -245.40 NASDAQ -53.32 NQ100 -2.8% R2K -3.4% SP400 -3.3% SP500 -28.05 NASDAQ Dec/Adv/Vol 2027/713/2.07 bln NYSE Dec/Adv/Vol 2490/622/1.24 bln

4:30PM ON Semiconductor lowers Q4 revs guidance and announces additional cost reduction measures (ONNN) 4.04 -0.20 : Co lower guidance for Q4 (Dec), sees Q4 (Dec) revs of $480-490 mln, down from $500-550 mln vs. $510.22 mln First Call consensus. Co also announces that it is taking additional cost reduction measures. In the fourth quarter of 2008. Co is planning a series of additional permanent and temporary actions to reduce its overall cost structure. These planned actions include: Factory closures planned for the end of 2009 will be brought forward to the middle of 2009. Evaluation of other front-end manufacturing locations are ongoing with the objective of closing an additional location by the end of 2009. Factory shutdowns for 4 to 6 weeks in the first and second quarter of 2009. Three weeks of unpaid time off for senior executives in both the first and second quarter of 2009 (Equates to an approximate 23 percent decrease in base salary). Two weeks of unpaid time off or a 4 day work week (based upon local legal requirements) for other employees in both the first and second quarter of 2009 (Equates to an approximate 15 percent decrease in base salary). No annual merit increases. No bonus payments expected to be paid in 2009. A reduction in worldwide personnel of approximately 1,500 which equates to a reduction of approximately 10 percent of total payroll expenses

09:36 am Intel (INTC)

Intel (INTC 14.65, -0.72) said that its fourth quarter revenue will be lower than previous expectations.

The company now projects fourth quarter revenue of $8.2 billion compared to the $8.74 billion First Call consensus. Intel said that further weakness in end demand and inventory reductions by its customers in the global PC supply chain were behind the new forecast.

Intel also said that its preliminary estimate of gross margin for the quarter is at the bottom of the previous expectation of 55%, plus or minus a couple of points.

Intel is scheduled to report its fourth quarter earnings after the close on Jan. 15.

09:35 am F5 Networks downgraded to Hold at Wedbush Morgan; tgt lowered to $24: . Wedbush Morgan downgrades FFIV to Hold from Buy and lowers their tgt to $24 from $25. The firm believes F5's second consecutive negative pre-announcement suggests that there are few catalysts as revenue visibility decreases. Despite the sales miss, the co expects FY09 margin performance to remain in tact, which is a positive. However, the firm is lowering their FY09 revenue estimates to $656.5 mil. and $1.50 from $695.1 mil. and $1.61 (consensus $712.26 and $1.65) respectively, reflecting sales shortfall and our cautious economic view.

icon url

ReturntoSender

01/08/09 9:30 PM

#8411 RE: ReturntoSender #6755

From Briefing.com: 4:20 pm : Disappointing news from retail giant Wal-Mart (WMT 51.36, -4.18) helped invoke cautious trading ahead of tomorrow's unemployment report. Still, stocks managed to finish at session highs with modest gains.

Wal-Mart shaved more than a dime from its fourth quarter earnings outlook, which now ranges from $0.91 to $0.94 per share. Wall Street was expecting $1.06 per share for the quarter.

The company also disappointed investors by announcing December same-store sales increased by a less-than-expected 1.7%.

Many other retailers posted same-store sales results that ranged from disappointing to dismal. Several lowered their earnings forecasts as well.

Retailers were able to shake the weakness, though. They finished 0.8% higher.

Cautious trading led to choppy action in the broader market.

With December nonfarm payroll data due tomorrow morning, fewer investors were willing to buy on weakness stemming from such announcements as Wal-Mart's, or that of Intel in the prior session. Adding to the apprehension is a soon-to-begin earnings season that is full of uncertainty.

Economists expect December nonfarm payrolls to show a decline of 545,000 jobs. If a worse-than-expected figure emerges and investors can shake it off, that suggests an underlying bullish bias in the stock market. A sell-off will suggest caution.

The significance of the report led many to look past the latest weekly jobless claims report. Initial claims for the ended Jan. 3 totaled 467,000, down 24,000 from the prior week. Many viewed the report with skepticism given strong seasonal factors at play.

Eight of the 10 economic sectors finished higher.

Consumer staples stocks (-1.3%) and financials (-0.2%) were the only two sectors to finish lower. Large-cap tech stocks, however, helped the Nasdaq outperform its counterparts.DJ30 -27.24 NASDAQ +17.95 NQ100 +1.1% R2K +1.0% SP400 +0.8% SP500 +3.08 NASDAQ Dec/Adv/Vol 1047/1666/2.01 bln NYSE Dec/Adv/Vol 1177/1911/1.20 bln

3:11PM EMCORE Corporation raises additional cash through the sale of shares of WorldWater & Solar Technologies Corporation (EMKR) 1.40 +0.19 : Co announces that that it has completed the first closing of a two step transaction involving the sale of its remaining interests in WorldWater & Solar Technologies Corporation. The Co recently sold 1,446,428 shares of WorldWater Series D Convertible Preferred Stock and 152,522 Warrants to purchase shares of Series D Convertible Preferred Stock to The Quercus Trust for approximately $5.7 million and expects to complete the second closing, for an additional $5.7 million, within the next 90 days.

10:31AM RF Micro Device reports $40 mln in free cash flow in December 2008 quarter and currently expects March 2009 quarter to be free cash flow positive (RFMD) 0.91 +0.02 : Co provides updated financial information, including forecasts for generation of free cash flow (net cash provided by operating activities less capital expenditures for purchases of property and equipment) for its December 2008 and March 2009 quarters, as well as for its 2010 fiscal year, beginning March 29, 2009. "RFMD today is flexible and agile, as evidenced by our ability to quickly decrease capital expenditures, rationalize our supply chain and reduce expenses to match our current demand environment." RFMD's capital expenditures were ~$5 mln in the December 2008 quarter, and the Company expects capital expenditures to be ~$20 mln in calendar 2009. By comparison, RFMD's capital expenditures had been $113 mln through the 12 months ended September 2008. Also co generated ~$40 mln in free cash flow in the December 2008 quarter. Additionally, RFMD reduced net debt by ~$50 mln during the December 2008 quarter, primarily through the generation of cash and open-market repurchases of convertible notes. RFMD currently expects to be free cash flow positive in its March 2009 quarter, and co continues to anticipate free cash flow will improve in fiscal 2010 to ~$80 -120 mln.

8:00AM Suntech Power achieves 1GW solar cell and module production capacity (STP) 12.00 : The co announces the achievement of reaching 1GW PV cell and module production capacity in Wuxi, China. The co also announced the opening of its new headquarters in Wuxi, China that incorporates a 1MW grid-connected building integrated solar facade, which is the largest in the world.

08:02 am EMC (EMC)

Data storage company EMC (EMC 11.18) reaffirmed its fourth quarter earnings and revenue guidance and announced a program to cut costs.

For the fourth quarter, EMC expects earnings of $0.25 to $0.26 per share, excluding a $0.10 restructuring charge and a $0.02 intangible asset charge. The consensus estimate expects earnings of $0.23 per share.

EMC's expectations for revenues of $4.0 billion match the consensus estimate.

As part of its restructuring program, EMC plans to cut 2,400 jobs, or about 7% of its workforce. EMC expects the program to reduce costs from its 2008 annualized rate by approximately $350 million in 2009, increasing to approximately $500 million in 2010.
icon url

ReturntoSender

01/11/09 3:35 PM

#8413 RE: ReturntoSender #6755

Amateur Investors Weekend Stock Market Analysis (1/10/09)

http://www.amateur-investor.net/Weekend_Market_Analysis_Jan_10_09.htm

The market pulled back this week after becoming rather overbought as it remains in the 4th Wave up in association with a longer term Elliott 5 Wave pattern as I have discussed before. For those that follow Elliott Wave patterns the 4th Wave by definition typically will not retrace more than 38.2% of the move from the peak of Wave 2 to the bottom of Wave 3. In addition volume is usually much less than what occurs with Wave 3. A daily chart of the Dow shows the current Waves and notice overall volume has been dropping off considerably as the corrective 4th Wave up has continued.


Keep in mind based on Elliott Wave Theory once the 4th Wave ends this should be followed by the final 5th Wave down as shown in the illustration below. Once the overall 5 Wave pattern completes itself then this would be followed by an "ABC" type rally.


Meanwhile if we take a look at a weekly chart of the Dow notice the 38.2% Retracement Level calculated from the peak of Wave 2 to the bottom of Wave 3 is near the 9600 level so if the 4th Wave continues then the Dow may not get above this level or its 20 Week EMA (green line) near 9350.


Next if we look at the Nasdaq it’s exhibiting a corrective 4th Wave up as well with its 38.2% Retracement calculated from the peak of Wave 2 to the bottom of Wave 3 near 1775 which is also close to its 20 Week EMA (green line). Thus if Wave 4 does continue the Nasdaq may not rise above the 1750-1775 area.


As far as the S&P 500 its 38.2% Retracement Level calculated from the peak of Wave 2 to the bottom of Wave 3 is at 1008 while its 20 Week EMA (green line) has dropped to around 990. Thus I would expect Wave 4 not to exceed the 990 to 1008 area if it continues higher the rest of this month.


Meanwhile as far as the near term the Dow has a key support level near 8470 which is along its upward trend line (black line) and 38.2% Retracement Level calculated from the 11/21 low to the most recent high. This will be a key support level to watch next week. If the Dow holds support at or above 8470 then we could eventually see another move higher develop. However if the Dow were to break below 8470 then I would expect a drop back to either its 50% Retracement Level near 8275 or its 61.8% Retracement Level near 8100.


The Nasdaq has a key short term support level near 1525 which is along its upward trend line (black line) and 38.2% Retracement Level calculated from the 11/21 low to its most recent high. If the Nasdaq can hold support at or above 1525 then this could be followed by another move higher. Meanwhile if the Nasdaq were to break below 1525 then the next area of support would either be at its 50% Retracement Level near 1480 or at its 61.8% Retracement Level near 1440.


Finally for the S&P 500 it has a key support area in the 880 to 866 range. The 880 level is along its upward trend line (black line) while the 866 level is the 38.2% Retracement Level calculated from the 11/21 low to the most recent high. If the S&P 500 can hold support at or above the 866 level then we could see another move higher. However if the S&P 500 were to break below 866 then look for the next area of support either at its 50% Retracement Level near 842 or at its 61.8% Retracement Level around 818.

icon url

ReturntoSender

01/13/09 2:10 PM

#8416 RE: ReturntoSender #6755

Low volume rallies fail:


But we are past capitulation so the next bottom may finally be the bottom!

RtS
icon url

ReturntoSender

01/14/09 7:01 PM

#8418 RE: ReturntoSender #6755

From Briefing.com: 4:27PM Xilinx reports EPS in-line, beats on revs; guides Q4 revs below consensus (XLNX) 15.50 -0.73 : Reports Q3 (Dec) earnings of $0.32 per share, excluding $0.19 in non-recurring items (or excl $89.7 mln in gains and $18.5 mln in charges), in-line with the First Call consensus of $0.32; revenues fell 3.5% year/year to $458.4 mln vs the $443.7 mln consensus. Xilinx sees Q4 revs down 15-25% sequentially. Co issues downside guidance for Q4, sees Q4 revs down 15-25% sequentially, which equates to ~$343.8-389.6 mln vs. $409.65 mln consensus. Operating expenses are expected to be flat to slightly down sequentially from the December quarter.

4:51PM Motorola announces further 2009 cost reduction actions and sees Q4 revs below consensus (MOT) 4.11 -0.21 : Co issues guidance for Q4 (Dec), sees GAAP EPS loss of $0.07-0.08 including charges of ~$0.06, may not be comparable to $0.03 First Call consensus; sees Q4 (Dec) revs of $7.0-7.2 bln vs. $7.51 bln consensus. During Q4, Mobile Devices shipped ~19 mln units. Sales were adversely impacted by continued weakness in end consumer demand and customer inventory reductions. The Enterprise Mobility Solutions and Home and Networks Mobility businesses continued to perform very well in a challenging environment... Co announces further cost reduction actions, primarily associated with the Mobile Devices business. Co will further reduce its workforce in 2009 by ~4,000 positions. The workforce reductions announced are expected to begin immediately and are incremental to the 3,000 workforce reduction actions previously announced during the fourth quarter of 2008. The workforce reductions, plus other incremental cost-reduction initiatives are expected to result in additional annual cost savings of ~$700 mln in 2009. The savings from these actions, together with the $800 mln of savings from other actions announced during the fourth quarter of 2008 are expected to result in aggregate cost savings of $1.5 bln in 2009...

4:46PM Apple to resume trading at 17:00 ET (AAPL) 85.33 -2.38 : Quote resumption to begin at 16:55 ET.

4:36PM Apple CEO Jobs announces medical leave of absence until the end of June (AAPL) 85.33 -2.38 : Apple CEO Steve Jobs today sent the following email to all Apple employees: "Team, I am sure all of you saw my letter last week sharing something very personal with the Apple community. Unfortunately, the curiosity over my personal health continues to be a distraction not only for me and my family, but everyone else at Apple as well. In addition, during the past week I have learned that my health-related issues are more complex than I originally thought. In order to take myself out of the limelight and focus on my health, and to allow everyone at Apple to focus on delivering extraordinary products, I have decided to take a medical leave of absence until the end of June. I have asked Tim Cook to be responsible for Apple's day to day operations, and I know he and the rest of the executive management team will do a great job. As CEO, I plan to remain involved in major strategic decisions while I am out. Our board of directors fully supports this plan." (Stock is halted)

4:36PM PC market growth evaporates in Q4 as financial crisis hits home, according to IDC : Despite market optimism early in the fourth quarter, the pace at which the economic environment unraveled and the extent to which PC purchases were affected was faster than anticipated. Following roughly six years of growth, with the last five averaging 15% increases, worldwide PC shipments were down 0.4% year on year in the fourth quarter of 2008, according to IDC's Worldwide Quarterly PC Tracker. The dramatic slowdown was enough for a sequential decline of 2.5% from the third quarter in place of an expected increase for the holiday season. The weakening economic environment, including falling home and stock values, deteriorating credit, and implications for trade and consumer spending, was clearly the dominant factor limiting growth. Low-cost portables, vendor competition, and holiday promotions were simply not enough to overcome the economic tide, even with the market for mini notebooks (also known as netbooks) taking off. Growth of portable PCs was cut roughly in half from nearly 40% year on year in the first three quarters of 2008 to roughly 20% in the fourth quarter. Meanwhile, the pressure on desktop PCs pushed volume down roughly 16% from a year ago after only a small decline earlier in the year. Mini notebook volume is estimated at near 5 million units in the fourth quarter, bringing the total for 2008 to about 10 million, accounting for nearly 7% of total portables, with shipments expected to double in 2009. Despite the dramatic slowdown in fourth quarter shipments, annual volume was up 10.5% in 2008. This was on par with 2006, when some vendors struggled with the accelerating transition to portables and replacement rates dropped with economic uncertainty and the pending launch of Vista.

4:00PM SMSC announces cost reduction actions, including worldwide personnel reduction of 5-10% (SMSC) 14.41 -0.39 : Co announces a reduction in worldwide personnel of 5-10%, including a voluntary retirement incentive for most employees 55 years of age and older. SMSC is also planning or has already implemented a series of additional cost reduction actions including: Discretionary spend reductions, including travel, recruitment fees, consultants, temporary employees and other services; Reduction of compensation expenses including deferral of merit increases and adjustments to the management bonus plan; Restricted capital spending; Strict management of working capital, including an inventory reduction program with extended test floor shutdowns and reduced material purchases. The company estimates that these actions will result in a reduction of its expenses of approx $6-$7 mln a qtr compared to the third qtr of fiscal 2009 run-rate.

12:22PM Wavecom: Sierra Wireless announces opening of cash tender offers to acquire Wavecom in friendly deal (WVCM) 11.14 +0.19 : Sierra Wireless (SWIR and Wavecom (WVCM) announce the commencement of cash tender offers in France and the United States, by Sierra Wireless France SAS, a wholly owned subsidiary of Sierra Wireless, for all outstanding shares (including shares represented by American Depository Shares and OCEANE convertible bonds of Wavecom. The offer price for the ordinary shares is (euro) 8.50 per share and the offer price for the ADSs is the U.S. dollar equivalent of (euro) 8.50, based on the Euro/U.S. dollar exchange rate as of the settlement date for ADSs. The offer price for the OCEANE convertible bonds is (euro) 31.93 per bond plus unpaid accrued interest up to and including the date of settlement.

9:51AM Flextronics provides business update following Nortel announcement (FLEX) 2.81 -0.19 : Co provides a business update as a result of Nortel Networks (NT) bankruptcy protection filing. Co has been proactively engaged in executing a risk mitigation plan with respect to its relationship with Nortel for a period of several months. In December 2008, Flextronics engaged The Blackstone Group as its financial advisor to assist with evaluating the Nortel relationship and planning for any Nortel restructuring strategy. As part of its risk mitigation plan, Flextronics entered into an amendment to its relationship agreement with Nortel to address Flextronics's status as a strategic supplier... Co will provide more specific financial details associated with today's news on its previously scheduled third quarter earnings call on January 28, 2009.

09:44 am Advanced Micro initiated with a Sell at Auriga U.S.A; tgt $1.25: . Auriga U.S.A. initiates AMD with a Sell and $1.25 tgt, saying a solid commitment from financial backers with long-term motivations means that a failure of the firm is no longer a likely scenario. However, the planned split into separate manufacturing and design entities doesn't improve the underlying cash burn rate. They think continued deterioration of the PC market combined with limited exposure to the high-growth mobility segment mean that earnings will likely continue to suffer. This raises the possibility that yet more financing will be required -- there are willing cash providers, but existing shareholders run the risk of being diluted even further.

09:43 am Seagate Tech downgraded to Hold at Argus: . Argus downgrades STX to Hold from Buy. The firm notes that the stock recently dropped to all-time lows as the hard-disk drive business is getting hammered by the combination of deteriorating end-user demand in the PC space with increasing competition from solid-state drives. Furthermore, recent management shifts suggest a change in company course is in the offing. The question is which way STX will go. Possibilities include acquiring an outside company in order to shift rapidly away from its focus on HDDs to a new storage medium; being acquired itself; more rapidly moving into the solid-state game; or returning to being a private firm. With all of these options on the table and the stock's dividend now in question, the firm believes investors are better off staying on the sidelines at this time.

09:38 am Suntech Power downgraded to Neutral at Amtech- tgt $7: . Amtech downgrades STP to Neutral from Buy with an $7 tgt following a strong move off of the November lows, and ahead of what they expect will be a difficult solar earnings season defined by limited visibility into 1H09. The firm says checks indicate utilization rates for 1Q09 are expected to be in the 50-60% range. The firm does not view significant 1Q09 Q/Q revenue growth as likely given utilization rates and pricing pressure.

09:36 am Nortel Networks (NT)

Nortel Networks (NT 0.07, -0.25) filed for Chapter 11 bankruptcy protection Wednesday.

Nortel has been hurt by a steep drop in orders from phone company clients. The company also faced a $107 million bond interest payment this week and owes bondholders more than $3.8 billion according to court filings.

Nortel said its normal day-to-day operations are expected to continue without interruption.

08:26 am Citigroup (C)

As expected, Citigroup (C 5.90) said after Tuesday's close that it will merge its Smith Barney brokerage with Morgan Stanley's (MS 18.86) Global Wealth Management Group.

The new unit will be called Morgan Stanley Smith Barney and will have more than 20,000 advisors managing more than $1.7 trillion in client assets.

Under the terms of the agreement, Citi will exchange 100% of its Smith Barney, Smith Barney Australia and Quilter units for a 49% stake in the joint venture and an upfront cash payment of $2.7 billion. Morgan Stanley will exchange 100% of its Global Wealth Management business for a 51% stake in the joint venture.

Citigroup will recognize a pretax gain of $9.5 billion, or approximately $5.8 billion on an after-tax basis.

Many analysts feel that this is the first step in the breakup of Citigroup, as it looks to streamline operations and abandon its "financial-services supermarket" model.
icon url

ReturntoSender

01/17/09 7:57 PM

#8420 RE: ReturntoSender #6755

Amateur Investors Weekend Stock Market Analysis (1/17/09)

http://www.amateur-investor.net/Weekend_Market_Analysis_Jan_17_09.htm

The major averages continued to pullback through the middle part of the week but then attempted to bounce Thursday and Friday into option expiration. The Dow broke just below a key support level at its 61.8% Retracement Level (brown line) calculated from the 11/21 low to the most recent high early on Thursday but then reversed to the upside through Friday. If the oversold bounce continues next week look for the next area of upside resistance either at its 38.2% Retracement Level near 8460 or at its 20 Day EMA (blue line) near 8755. Meanwhile the key support level to watch next week will be at 7995 which was the intra day low on Thursday. If the 7995 level were to be taken out then an eventual retest of the 11/21 low of 7450 (point A) may occur.


The Nasdaq was able to hold support above its 61.8% Retracement level (brown line) this week and bounced from oversold conditions from Thursday into Friday. If the Nasdaq follows through to the upside next week look for possible resistance either at its 20 Day EMA (blue line) near 1552 or at its 50 Day EMA (green line) around 1593. Meanwhile the key support level to watch next week will be at its 61.8% Retracement level at 1440.


As far as the S&P 500 it held support on Thursday right at its 61.8% Retracement Level (brown line) at 818 and then reversed to the upside from Thursday afternoon into Friday. If the S&P 500 continues its oversold rally next week look for resistance either at its 38.2% Retracement Level near 866 or at its 20 Day EMA (blue line) near 880. Meanwhile the key support level to watch will remain at its 61.8% Retracement Level around 818. If the S&P 500 were to drop below the 818 level then that could eventually lead to a retest of the 11/21 low at 741 (point B).


Finally for those of you that follow Elliott Waves (I know some don't like them) there appears to be two camps out there right now with regards to what is evolving. The 1st camp suggests the low made on 11/21 was the completion of a 2nd "5" Wave pattern to the downside which is being followed by an "ABC" corrective rally that may last several more weeks and eventually take the S&P 500 potentially up to the 1000 level. If this is the case then the most recent pullback that began on January 6th is likely the "B" Wave down which will then be followed by the "C" Wave up similar to what occurred last Spring after the 5 Wave pattern completed itself.


Meanwhile the other camp suggests the low on 11/21 was the completion of Wave 3 down which has been followed by a corrective 4th Wave up. Meanwhile the most recent pullback that began on January 6th is the beginning of the 5th Wave down which will eventually take the S&P 500 back below its low of 741 at some point in the coming weeks before a substantial "ABC" corrective rally takes place.


At this point there is enough evidence to support either case so it will be interesting to see which camp ends up being right in the coming weeks.

icon url

ReturntoSender

01/21/09 11:10 AM

#8424 RE: ReturntoSender #6755

BPNDX fell to only 1 on 10/10/08. Remember it was only PETM that had a buy signal then:

http://siliconinvestor.advfn.com/readmsg.aspx?msgid=25055241

Even though StockCharts.com is showing the bottom number at 2 it was one. Regardless, the point that needs to be made is that the next low number will likely be higher than 1 or 2. We got a low of 1 in 2001. At the final bottom in October 2002 the reading was 8!


How long to the next true long term market bottom?

RtS
icon url

ReturntoSender

01/22/09 4:21 PM

#8426 RE: ReturntoSender #6755

2002 is a good analogy for what is going on in the market now. The best comparison of the last 30 years. It does not matter to me that macro economics might be more similar now to 82 or 75 than 2002.

What I am talking about is volume analysis, technical analysis and sometimes sentiment analysis.

True these are not the only factors that should be taken into account when attempting to determine when, or if, a market bottom has actually formed but it is reliable.

StockCharts only has volume for the INDU going back to 1980 so I will use that in my examples.

Even in 1987 on Black Monday there was a huge down draft that led to a one month high volume decline followed the next month by much less selling as the sell off finished quickly. Then the following month the market rallied on volume higher than the previous month:


Over the last ten years the INDU has taken two huge trips below its long term moving averages. It was never under those averages for long until this decade since 1980:


RtS
icon url

ReturntoSender

01/24/09 5:00 PM

#8433 RE: ReturntoSender #6755

Amateur Investors Weekend Stock Market Analysis (1/24/09)

http://www.amateur-investor.net/Weekend_Market_Analysis_Jan_24_09.htm

It was very choppy this week with wild swings in both directions. Overall the Dow dropped below its 61.8% Retracement Level (calculated from the 11/21 low to the 1/6 high) near 8075 but remained above its last level of major support at the 78.6% Level near 7800. It appears the Dow is developing a Triangle pattern (black lines) much like occurred last Summer. If the Dow attempts to make one more move to the upside next week I would look for resistance at the top of the Triangle pattern near 8700 which is also very close to its 50 Day EMA (blue line) as well. Meanwhile if the Dow fails to rally next week and it drops below 7800 then look for a retest of the 11/21 low near 7450 (point A).


As far as the Nasdaq it held support this week at its 61.8% Retracement Level near 1438 (calculated from the 11/21 low to the Jan 6th high). Just like the Dow it appears to be developing a Triangle pattern as well. If the Nasdaq makes one more move to the upside next week look for resistance to occur at the top of the Triangle near 1575 which is also near its 50 Day EMA (blue line). Meanwhile if the Nasdaq doesn't rally next week and drops below the 1438 level then that may lead to a retest of the 11/21 low near 1300 (point B).


The S&P 500 dropped below its 61.8% Retracement Level (calculated from the 11/21 low to the 1/6 high) near 818 this week but held support above its 78.6% Retracement Level at 784. If the S&P 500 rallies next week look for resistance to occur at the top of its Triangle near 900 which is close to its 50 Day EMA (blue line) as well. Meanwhile if the S&P 500 breaks below the 784 level then look for a retest of the 11/21 low at 741 (point C).

icon url

ReturntoSender

01/25/09 3:42 PM

#8434 RE: ReturntoSender #6755

InvestmentHouse Weekend Market Summary

http://www.investmenthouse.com/weekendmarketsummary.htm

- Two unexpected moves yield a positive Friday though down for the week.
- Swap spreads improve ahead of SP500. Historically a rally signal.
- Market holds a new consolidation attempt in the face of more bad economic data, first wave of earnings. All in all, not bad work.
- Holdouts crack as a new crop of stocks stand ready to take their place.

Lots of early depression but market shakes it off.

A day that started somewhat unexpectedly as futures were way down. Overnight they were fine, but a couple of hours before the open they simply lost their nerve. IBM and AAPL goosed earnings but MSFT disappointed, but nonetheless the market recovered Thursday and was in decent shape overnight after GOOG beat as well. In the morning, however, the positives turned over. GE earnings were in line with lowered expectations. It kept its dividend. It didn't have a lot to say about the future. Nothing bad mind you, just couldn't say much of anything, especially nothing positive. The futures seemed to say 'that's it' after that release.

They slid lower and just kept sliding toward the open, indicating 2% losses on the open. No relief from other earnings releases either. COF reported an 11% drop in credit card spending. HOG said worldwide sales fell 13% in Q4 and it couldn't offer guidance. Playboy missed and announced layoffs. Sounds like it is time to go and name your price on a Harley, hire a Playboy bunny to accompany you, and pay for it all on the credit card. Maybe it is time for a bunny bailout. After all, Larry Flynt says the economic downturn is damaging our libido.

Stocks started lower, testing the Tuesday lows right off the bat. That was the start of unexpected move #2. Maybe it was not that unexpected. Yes things were depressingly gloomy at the start but they were so gloomy that when the market opened at the Tuesday lows and held the selling abated. A steady climb from the open to the end of the day took the indices positive sans DJ30. There was no change in character on the session as the indices did not break any significant resistance or change their near term patterns. What the day did was keep them working laterally after the August to November selloff to begin the new year.

This little lateral move is part of the larger 3 month consolidation following that sharp selloff. During this lateral move the market has taken the worst economic news since the Great Depression and has continued to consolidate. As we noted frequently, this is a good indication as the market has reached the point where it has absorbed all the bad news or has anticipated it. There was a hiatus in early January when it sold after the jobs news, but it is trying to catch itself this past week, absorbing more bad news and then getting a bit of decent news in the form of some earnings.

TECHNICAL. Intraday it looked grim at first, but after a much lower open in the midst of a lot of negatives the indices rebounded with all but DJ30 hitting positive. Gloom to positive. Not bad action.

INTERNALS. Given how bad things were and the fight to recover the losses the internals were not bad. Breadth was modestly positive on NYSE, a hair negative on NASDAQ. Volume was down on both, still above average on NASDAQ but lower and just below average on NYSE. Overall, price/volume action has leaned to the positive side the past week. New lows hardly expanded at all on the week. Overall the market internals were pretty solid for the week. Even on the downside days the internals were so extreme they were indicative of reversals in themselves.

CHARTS. Quite an intraday turn, but in the end there were no breakouts or change of character in the indices, but the action was not bad nonetheless. Friday the indices held the lows for the week and bounced, holding their lateral range or shelf that has formed after the selling the second and third week of January. SP500 is holding the early December lows, but it is just a hair away from tripping and falling to test the November and bear market lows. NASDAQ and SP600 are holding the December lows as well. DJ30 is actually holding over the October intraday low. Near term the action this week, coupled with the action in leading stocks, is a near term positive. Looking over the prior 6 weeks you still have those head and shoulders toppy patterns trying to form. This week did nothing to alter that as all the indices did was move laterally. Since October, however, there is that 3 month consolidation that is overall positive. Lots of bad news but managing to hold up.

LEADERHSIP. Friday saw some of those tocks that patiently held support during the market selling jump upside. The chips held their form and then jumped Friday on strong volume. Energy jumped back in the game and on some volume. Metals were up but volume was not. Decent but more trade would be nice. Financials were up as well, but it was a low volume bounce that really has the look of a relief bounce. There are good stocks holding support in their pullbacks even through the bad news and overall market selling. Those will be the emerging leadership if this move and they are stirring. Drugs, health care, tech, chips, small business services, and energy are perking up even before a full test of the November lows by the indices. They can still test those lows, but the action in the leaders is trying to prevent that move.

THE ECONOMY

Nothing but bad reports yet some tidbits of positive news.

Since the September shutdown in the economy the economic reports have been on a one-way express to crap. As of this week the headlines had not improved with housing starts hitting a 50 year low as reported Thursday.

LIBOR had improved quite nicely and indeed it is still is vastly improved from last summer. It is still, however, on a rebound that started when the new administration announced addition regulations for financial institutions receiving TARP funds (a.k.a. federal zombie bank funds) as well as loud democratic grousing about tax cuts contained in the proposed and ever-growing stimulus package. Friday it was up again, hitting 0.24% overnight (0.21% prior, 0.40% 1-month (0.39%), and 1.17% 3-month (1.16%). Modest moves, but the prior gains were more sizeable and pushed the 3-month rate up from 1.09% just a few days back.

Despite this there are modest improvements in a wide array of reports. Most if taken individually would be nothing more than a statistical blip. Putting them all together you get an ever so modest improvement in prospective economic activity.

Swap spreads, a leading indicator, have improved.

The first is a really impressive one though it pertains more to the stock market but it is directly related to the economy. Swap spreads are a measure of the risk involved in financial transactions. Wider spreads mean more uncertainty and risk as more up front profit margin is required by the parties in order to transact the deal. Narrower spreads indicate calmer markets as the parties demand less gain on the exchange. Right now swap spreads have recovered impressively, i.e. narrowing rapidly the past month.

The significance is that spreads reflect improvement or deterioration in areas that facilitate economic activity and are thus precursors to actual movement in the economy. That means they are also precursors to moves in the market. Right now spreads have improved dramatically while the market has note. After a rally off the November low that took the indices up through early January the indices have come back to test. They came back more than you would like, but they are trying to set up the past week. With the 3-month consolidation in place and a cadre of high quality stocks in place as well, the market is trying to set up to follow the spread indicator higher.

Other areas of modest improvement.

Barton Biggs noted today that the PMI reports have shown an uptick the past month. True. Chicago improved to 34.1 from 33.7. Still well below the breakeven at 50, but it is a very bad recession and this is the first tick higher since the plunge. What about the service ISM? It improved to 40.6 from 37.3.

Factory orders showed non-defense capital spending up 3.9% annually, the first gain in 4 months and the best gain in 10. Computers rallied 12.5%. Commercial construction rose 0.7% and is up 12.1% the past three months.

Real disposable income rose 1% and rose 7.1% annually for the past three months. Real spending rose 0.6%. Income is rising as inflation falls, and inflation is falling mainly due to the tumble in oil and gasoline prices. Larry Kudlow estimates that that gasoline price drop is equivalent to a $350B tax cut.

It is not an overwhelming, straight flush of positive data. Then again, it never is in the early stages. We initially scoffed at the modest improvement in the PMI data, noting it would need another couple of months of improvement, but that does not mean it is discounted. Especially so when you factor in the other data that is making its own improvements as well. You can see why the market is firming with leadership that is trying to set up for the next break higher. That keeps us looking for the break higher in the stocks.

THE MARKET

MARKET SENTIMENT

VIX: 47.27; -0.02
VXN: 46.6; +0.77
VXO: 45.63; -1.36

Put/Call Ratio (CBOE): 0.77; -0.11

Bulls versus Bears:

This is a reading of the number of bullish investment advisors versus bearish advisors. The reason you look at this is that it gives you an idea of how bullish investors are. If they are too bullish then everyone is in the market and it is heading for a top: if everyone wants to be in the market then all the money is in and there is no more new cash to drive it higher. On the other side of the spectrum if there are a lot of bears then there is a lot of cash on the sideline, and as the market rallies it drags that cash in as the bears give in. That cash provides the market the fuel to move higher. If bears are low it is the same as a lot of bulls: everyone is in and the market doesn't have the cash to drive it higher.

This is a historical milestone in the making. Bulls are impressively low considering we are in general a very optimistic country. The few bulls is a positive indication because it means most everyone that is getting out is out and there is money on the sidelines. In other words the ammunition boxes are full and as the market recovers investors will start opening up the boxes and firing. Little by little they will be forced to put more money into the market and there will be some rushes higher in fear they are missing the train. You relish times when sentiment is so negative because it means some tremendous buys are setting up. This could indeed be the opportunity of a lifetime, and you take advantage of it by buying quality stocks and letting them work for you as long as they will. If we can hold them for years, great.

Bulls: 38.7%. Substantial drop from 43.0%, the current top of the recovery as the market rallied off the November low. A rise from 25.3% in December and quickly starting to fall once the market encountered the January selling. Remains above the 35% threshold for the second week, below which is considered bullish. It does not mean the action is now bearish. That level is up at 55%. Bullishness bottomed on this leg lower at 21.3% in November 2008. This last leg down showed us the largest single week drop we have ever seen, falling from 33.7% to 25.3%. Hit 40.7% on the high during the rally off the July 2008 lows. 30.9% was the March low. In March the indicator did its job with the dive below 35% and the crossover with the bears. A move into the lower 40's is a decline of significance. A move to 35% is a bullish indicator. This is smashing that. For reference it bottomed in the summer 2006, the last major round of selling ahead of this 2007 top, near 36%, and 35% is considered bullish.

Bears: 37.6%. Right back up from 34.4% after a 2-week decline to the 34's from 38.5% before that and off from the 46.2% hit mid-December. Back above the 35% level considered bullish for stocks, but as with bulls, still well below the level considered bearish for stocks. Bearishness hit a 5 year high at 54.4% the last week of October. The move over 50 took bearish sentiment to its highest level since 1995. Extreme negative sentiment on this move. 35% is the level that historically indicates excessive pessimism. As with the bulls the jump in bears did its job after hitting 44.7% in the third week of March. Bearishness peaked at 37.4% in September 2007. It topped the June 2006 peak (36%) on that run. That June peak eclipsed the March 2006 high (33%) and well above the 2005 highs that spawned new rallies (30% in May 2005, 29.2% in October 2005). This is a huge turn, unlike any seen in recent history.

NASDAQ

Stats: +11.8 points (+0.81%) to close at 1477.29
Volume: 2.16B (-6.56%). Not a bad week for volume. On the Tuesday selling it was lower. It was preceded by a couple of solid, above average volume sessions though expiration played a role in that. Wednesday it was up on a NASDAQ rise. Up big Thursday on the selling, but as noted at the time, it was all the MSFT selling that pushed it above Wednesday. All in all, a net positive for the techs.

Up Volume: 1.63B (+1.199B)
Down Volume: 517.255M (-1.383B)

A/D and Hi/Lo: Decliners led 1.14 to 1
Previous Session: Decliners led 3.1 to 1

New Highs: 5 (-1)
New Lows: 156 (+33). Never moved up much during the test lower.

NASDAQ CHART: Click to view the chart

Down for the week thanks to that ugly Tuesday return from holiday. That closed NASDAQ below the October low but above the early December lows at 1400. It is moving in a lateral shelf for the week as it found some support. Still a very tough near term picture for the techs as they are having a tough time getting back together after a lower low. Indeed, it is the late December consolidation at 1500, the higher low prior to the January selling, that is holding NASDAQ back at this juncture. Improved price/volume action is good along with some building patterns in some big tech stocks. A break over 1500 is a first start.

SOX (+4.15%) jumped back up through the late December pullback consolidation. Tried to move through the 18 day EMA but faded to close at that level. Trying to break up the head and shoulders, but still has to get over 225 to break it up (closed at 208).

NASDAQ 100 CHART: Click to view the chart

SOX CHART: Click to view the chart

SP500/NYSE

Stats: +4.45 points (+0.54%) to close at 831.95
NYSE Volume: 1.42B (-8.64%). Volume faded below average after a week of above average trade. Not a lot of pop Friday; the financials rallied but they did so on lighter trade. Price/volume action has improved some here as well.

Up Volume: 935.132M (+593.109M)
Down Volume: 476.581M (+45.984M)

A/D and Hi/Lo: Advancers led 1.36 to 1
Previous Session: Decliners led 4.38 to 1

New Highs: 34 (-5)
New Lows: 98 (+5)

SP500 CHART: Click to view the chart

SP500 struggled back to flat on the session, holding above 800 as it did all week. That didn't change things other than halting the selling for now. There was no break over the October low (849 closing). The pattern still remains quite bearish near term despite this consolidation. A test of the low down at 741 is still not out of the question given the financials and their continued drag on SP500. The past two sessions they moved in a relief bounce, but they were hitting up against resistance to tend the week and volume was much lower. Not a real hopeful sign that the needed change in attitude toward financials is taking place. We will see. Without their help SP500 looks ready to test the November low.

SP600 (+0.29%) was not in leadership mode Friday. It did hold the low for the week and bounced but it was tough sledding for the small caps. They are below the October low and the mid-December low, and that leaves them still in a bearish head and shoulders. Has some serious upside to do to break up this pattern and avoid a selloff to the prior low in November.

SP600 Chart: Click to view the chart

SP400 CHART: Click to view the chart

DJ30

Similar story for the Dow as it tested the lows for the consolidation of the week and then rebounded. It made it to positive but needed Viagra as it could not keep it up. Holding over the October intraday low but just below the October closing low. It too has work to do, but its pattern is more of a trading range and it has held the lows in the range and is in position to bounce back up toward 9000. With the improvements in some economic data we may just see that move, and we could still look to play it.

Stats: -45.24 points (-0.56%) to close at 8077.56
VOLUME: 370M Friday versus 420M Thursday. See what a major selloff in MSFT can do? After spiking Thursday volume fell right back.

DJ30 CHART: Click to view the chart

MONDAY

Back to a full week of trade and hundreds of earnings reports. A load of economic data on top of that including an FOMC monetary policy 2-day meeting. Information overload. At least it keeps everyone busy trying to figure it all out.

The past week started bad but it did its best to salvage things. Given the bad news and the first really big week of earnings, holding up after the initial Tuesday selling was not bad action. The market remains in a weakened position with a lot of overhead supply near term, but it is also slugging out a 3 month consolidation in the face of continuing bad news.

Indeed the news is bad enough that it has taken down some of the holdouts that were considered safe havens all along. Last week saw STT, one of the so-called safe bank stocks, get ripped open with a dull deer antler after its earnings unexpectedly imploded. WMT capped lower after the first week of January. WMT's recession rise is over, and the money that was camped in there is getting taken out. Consumer staples are also getting taken down, something you would not expect from a truly weak economy for many more months CLX and PG were heading down Friday yet again. When all of the 'safe' stocks are taken down that is typically the sign of a bottom getting put in place whether short term or longer term.

At the same time, as discussed all week, there remain a cadre of high quality stocks that sold off in the 2008 selling but have now rallied off the lows, and unlike many market stocks, have held up nicely with orderly, shallow pullbacks while most of the market sold hard. There are chips (e.g. BRCM, NVLS), metals (SCHN, STLD, RIO), small business (HMSY, EPIQ), energy (NBL, oil service companies), biotech, healthcare, and drug stocks that are set up well and indeed are starting to move higher. They have done their time so to speak, and as the 'safe havens' fall in a sign the bear market is pulling down the last holdouts, they are ready to move in and fill the void. Think of the dinosaurs dying off and the small mammals coming in and filling the void. From small beginnings . . .

So we start the week of massive earnings looking at the stocks that have done their time and are in position to move higher. You have to really like that they are from diverse sectors, lending some credence to an idea they are pointing to a coming upside economic cycle. Maybe it is just another piss-ant rally in an overall bear market, but there are many stocks that can move well that are in good position to do just that. We have positions in some already and will look to add to those as well as pick up positions in new stocks on the move.

As for the downside, well, there are the financials. A low volume bounce to resistance to end the week has some of those looking right for some downside plays. We will look at them and see if they present anything. After all, SP500 is still poised for a fall to the November low. That sounds somewhat tragic for the market, but that would still be part of the consolidation and while not pleasant, not fatal.

Support and Resistance

NASDAQ: Closed at 1477.29
Resistance:
1493 is the October 2008 low & late December 2008 consolidation low.
1499.21 is the 2008 closing low
The 10 day EMA at 1507
1521 is the late 2002 peak following the bounce off the bear market low
The 50 day SMA at 1521
The 18 day EMA at 1524
1536 is the late November 2008 peak
1542 is the early October 2008 low
1565 is the second low in October 2008
The 50 day EMA at 1576
1603 is the December peak
1620 from the early 2001 low
1644 from August 2003
The 90 day SMA at 1662
1752 from 2004
1782 from August 2004
1786 is the November 2008 high. Key level.
1948 is the early October 2008 gap down level

Support:
1440.86 is the low on this selling
1428 is the November 2008 low
1398 is the early December 2008 low
1387 is the 2001 low
1295 is the November 2008 low

S&P 500: Closed at 831.95
Resistance:
839 is the early October 2008 low
The 10 day EMA at 847
848 is the October 2008 closing low
853 is the July 2002 low
857 is the December consolidation low
The 18 day EMA at 860
866 is the second October 2008 low
889 is an interim 2002 peak
The 50 day EMA at 893
896 is the late November 2008 peak
899 is the early October closing low
919 is the early December peak
The 90 day SMA at 940
965 is the 2003 consolidation low
995 from June 2003 consolidation peak
1008 is the November 2008 peak
1065 is the Q4 2003 level that SP500 started the run to 2007 after the first run in the recovery.

Support:
818 is the November 2008 low
815 is the early December 2008 low
804 is the low on the January 2009 selloff
800 is the March 2003 post bottom low
768 is the 2002 bear market low
741 is the November 2008 low

Dow: Closed at 8077.56
Resistance:
8141 is the early December low
8175 is the October 2008 closing low. Key level to watch.
8197 was the second October 2008 low
The 10 day EMA at 8263
8419 is the late December closing low in that consolidation
8451 is the early October closing low
The 50 day SMA at 8506
8521 is an interim high in March 2003 after the March 2003 low
8626 from December 2002
The 50 day EMA at 8659
8829 is the late November 2008 peak
8934 is the December closing high
8985 is the closing low in the mid-2003 consolidation
The 90 day SMA at 9012
9200 is the July peak in the 2003 consolidation
9323 From June 2003 peak
9575 from September 2003, May 2001
9654 is the November 2008 peak

Support:
7965 is the mid-November 2008 interim intraday low.
7882 is the early October 2008 low. Key level to watch.
7702 is the July 2002 low
7524 is the March 2002 low to test the move off the October 2002 low
7449 is the November 2008 low
7282 is the October 2002 low

Economic Calendar

These are consensus expectations. Our expectations will vary and are discussed in the 'Economy' section.

January 26 - Monday
- December Existing Home Sales (10:00): 4.40M expected, 4.49M prior
- Leading Economic Indicators, December (10:00): -0.3% expected, -0.4% prior

January 27 - Tuesday
- January Consumer Confidence (9:00): 38.0 expected, 38.0 prior

January 28 - Wednesday
- Crude oil inventories (10:40): 6.1M prior
- FOMC policy decision (2:15)

January 29 - Thursday
- December Durable Orders (8:30): -1.8% expected, -1.5% prior
- Initial Jobless Claims, 01/24 (8:30): 589K prior
- New Home Sales, December (10:00): 400K expected, 407K prior

January 30 - Friday
- Q4 chain Deflator-Adv. (8:30): 0.5% expected, 3.9% prior
- GDP-Adv., Q4 (8:30): -5.2% expected, -0.5% prior
- Chicago PMI, January (9:45): 34.2 expected, 35.1 prior
- Michigan Sentiment Revised., January (9:55): 61.9 expected, 61.9 prior
- Employment Cost index, Q4 (10:00): 0.7% expected, 0.7% prior

icon url

ReturntoSender

01/26/09 10:38 PM

#8435 RE: ReturntoSender #6755

From Briefing.com: 4:35 pm : Financials threatened to undercut the broader market's gains, but stocks still posted a healthy advance amid a heavy flow of headlines Monday.

Financial stocks finished the session as the worst performing economic sector. They had been up more than 4% in the early going, but finished with a 2.1% loss. The initial advance seemed to come on the back of a rebound in European financial stocks, which have been dogged by profit concerns and fears of nationalization. Still, the gains proved unsustainable and as finacials slipped so, too, did the broader market.

Health care (-0.2%) stocks finished modestly lower, weighed down by Pfizer (PFE 15.65, -1.80). The pharmaceutical giant is acquiring Wyeth (WYE 43.39, -0.35) for $68 billion, or $50.19 per share. The offer comes as a 29% premium to where WYE shares closed before The Wall Street Journal first reported the companies were in talks. Pfizer is looking to fund the offer with a mix of cash, stock, and debt.

Though the deal will help Pfizer bolster its portfolio and further develop its drug pipeline, investors were disappointed when the company announced that in connection with the transaction it will halve its quarterly dividend to $0.16 per share. Coupling that with downside guidance sent shares of PFE to new January lows. As for the latest quarter, Pfizer topped earnings expectations, but Wyeth fell short of the quarterly consensus earnings estimate.

Despite Pfizer's announcement, tight credit conditions are weighing on merger activity elsewhere. Dow Chemical (DOW 13.24, -1.09) announced this morning that it does not intend to close the pending acquisition with Rohm & Haas (ROH 57.10, -8.72) on or before tomorrow. The announcement wasn't a total surprise, though. Tighter credit and a severed deal between Dow and a Kuwaiti petrochemicals outfit put have had the deal on tenuous footing for weeks. Shares of DOW and ROH weighed on the materials sector (-1.5%), as did DuPont (DD 23.18, -0.98). DuPont, which is a Dow component, reports its latest results ahead of tomorrow morning's opening bell.

Caterpillar (CAT 32.28, -3.38) fell to a new multiyear low after reporting dissapointing earnings and issued downside guidance. Challenging macro conditions have the firm looking to cut roughly 20,000 jobs.

One bright spot for the session, McDonald's (MCD 58.51, +0.49) bested the consensus quarterly earnings forecast and indicated that global comparable sales continue to be strong in January. Same-store sales increased more than 7% in the fourth quarter. However, many investors continue to question how long McDonald's can continue logging strong comparables.

Stocks began the session in a relatively quiet manner, but quickly climbed to a gain of 2.5% after it was announced December existing home sales increased 6.5% to an annualized rate of 4.74 million units. The December number was better-than-expected (consensus was 4.40 million). Though the headline alone qualifies as relatively good news, it was supported by a 9.3% drop in median home prices. That is the biggest drop since the 1930s. The month's supply of unsold homes at the current sales rate fell to 9.3 in December from 11.2 in November.

The Federal Open Market Committee begins its two-day meeting tomorrow. It will announce its latest monetary policy decision Wednesday. Tomorrow's focus, then, will be on earnings results from Verizon (VZ 30.99, +0.55), Bristol Myers Squibb (BMY 22.25, -0.14), Yahoo! (YHOO 11.17, -0.15), and a raft of other reports, which are tomorrow morning.DJ30 +38.47 NASDAQ +12.17 SP500 +4.62 NASDAQ Adv/Vol/Dec 1659/1.85 bln/1039 NYSE Adv/Vol/Dec 1983/1.27 bln/1076

4:20PM Zoran beats by $0.08, beats on revs; guides Q1 EPS below consensus, revs below consensus (ZRAN) 6.00 0.0 : Reports Q4 (Dec) loss of $0.21 per share, excluding non-recurring items, $0.08 better than the First Call consensus of ($0.29); revenues fell 42.3% year/year to $74.7 mln vs the $70 mln consensus. Co issues downside guidance for Q1, sees EPS of ($0.53)-($0.48), excluding non-recurring items, vs. ($0.30) consensus; sees Q1 revs of $50-$55 mln vs. $65.27 mln consensus. The co is currently expecting gross margins ranging between 46-48%. Excluding acquisition related amortization costs and stock-based compensation expense, non-GAAP operating expenses are expected to be in a range of $51-$52 mln. Acquisition-related amortization costs are expected to be ~$109K and stock-based compensation expense is expected to range between $2.9-3.4 mln.

4:16PM QLogic beats by $0.05, reports revs in-line (QLGC) 12.32 : Reports Q3 (Dec) earnings of $0.34 per share, $0.05 better than the First Call consensus of $0.29; revenues rose 3.6% year/year to $163.7 mln vs the $164.3 mln consensus.

4:07PM Volterra Semi beats by $0.04, reports revs in-line (VLTR) 6.48 +0.14 : Reports Q4 (Dec) earnings of $0.09 per share, $0.04 better than the First Call consensus of $0.05; revenues rose 10.6% year/year to $21.9 mln vs the $22 mln consensus.

1:34PM Brooks Automation announces restructuring actions; expects to incur ~$10-12 mln in charges (BRKS) 4.70 +0.11 : Co announces that it is in the process of restructuring its operations to enhance performance and improve operating results. Brooks said it is aggressively moving to lower its cash breakeven level while continuing to make strategic product and market development investments to strengthen its position as a leading supplier of automation, vacuum and instrumentation solutions. Co will be combining its formerly separate vacuum pump and robotic product groups into a single Critical Solutions Group. This move will simplify the organizational structure, reduce facility and overhead requirements and more effectively leverage the overall capabilities of the two Chelmsford, Massachusetts-based groups. Co expects to incur ~$10-12 mln in charges related to these restructuring actions, of which $4.1 mln will be recognized in the first quarter of fiscal 2009 and the significant majority of the balance in the second quarter of fiscal 2009.

1:34PM Brooks Automation announces restructuring actions; expects to incur ~$10-12 mln in charges (BRKS) 4.70 +0.11 : Co announces that it is in the process of restructuring its operations to enhance performance and improve operating results. Brooks said it is aggressively moving to lower its cash breakeven level while continuing to make strategic product and market development investments to strengthen its position as a leading supplier of automation, vacuum and instrumentation solutions. Co will be combining its formerly separate vacuum pump and robotic product groups into a single Critical Solutions Group. This move will simplify the organizational structure, reduce facility and overhead requirements and more effectively leverage the overall capabilities of the two Chelmsford, Massachusetts-based groups. Co expects to incur ~$10-12 mln in charges related to these restructuring actions, of which $4.1 mln will be recognized in the first quarter of fiscal 2009 and the significant majority of the balance in the second quarter of fiscal 2009.

http://finance.yahoo.com/marketupdate/update
icon url

ReturntoSender

01/28/09 9:01 PM

#8437 RE: ReturntoSender #6755

From Briefing.com: 5:13PM Jabil Circuit announces restructuring plan; to take $65 mln in pre-tax restructuring and impairment costs (JBL) 6.36 +0.24 : The co announces plans to cut its manufacturing capacity in certain geographies and to shrink its worldwide workforce of 85,000 by approximately 3,000. Jabil said the restructuring will appropriately align its manufacturing sites with the Company's current customer demand outlook and increase operational efficiencies. Approximately ten global plant sites will be impacted, and approximately ten percent of the headcount reductions will take place in the United States. Jabil said that as a result of the restructuring, the Company currently expects to realize $55 million in annualized cost savings. The co currently expects to recognize approximately $65 million in pre-tax restructuring and impairment costs over the course of fiscal years 2009 and 2010. The majority of these costs are currently expected to be recorded in the Company's operating results for the fiscal quarter ending February 28, 2009. The cash cost of such charges is currently estimated to be $54 million incurred over the course of fiscal years 2009 and 2010.

4:20PM Qualcomm misses by $0.16, beats on revs; guides Q2 revs in-line; guides FY09 revs below consensus (QCOM) 36.82 +1.19 : Reports Q1 (Dec) earnings of $0.31 per share, excluding non-recurring items, $0.16 worse than the First Call consensus of $0.47; revenues rose 3.0% year/year to $2.51 bln vs the $2.42 bln consensus. Co issues in-line guidance for Q2, sees Q2 revs of $2.25-2.45 bln vs. $2.41 bln consensus. Co issues downside guidance for FY09, sees FY09 revs of $9.3-9.8 bln vs. $10.25 bln consensus, down from $10.2-10.8 bln previously. "Net income and diluted EPS for the quarter were adversely impacted by other-than-temporary impairments to its marketable securities portfolio... The CDMA inventory channel has contracted as we expected, and the business environment continues to remain uncertain. Reduced visibility in the marketplace makes it difficult to forecast future inventory levels or predict when a recovery will begin. As a result, while we continue to estimate healthy growth in the CDMA-device market, we have lowered our shipment estimate for calendar year 2009."

4:19PM Western Digital beats by $0.24, beats on revs (WDC) 14.40 +0.85 : Reports Q2 (Dec) earnings of $0.55 per share, excluding restructuring charges, $0.24 better than the First Call consensus of $0.31; revenues fell 17.3% year/year to $1.82 bln vs the $1.75 bln consensus. Co says, "Against a backdrop of unprecedented global economic turmoil and a rapid intra-quarter fall off in demand for hard drives, WD acted swiftly to align production and operating expenses with significantly lower-than-originally planned unit volumes... With a strong balance sheet and competitive cost structure, we plan to continue investing in next-generation product platforms and technologies during this downturn. We are focused on maintaining our leadership in technology deployment, ease-of-use features, and availability of the right products for our diversified customer base. We remain enthused about our long-term prospects as a full-line storage supplier in addressing the demands of both the commercial and consumer markets as the digitization of content continues to grow."

4:15PM Lam Research misses by $0.04, beats on revs (LRCX) 23.89 +1.47 : Reports Q2 (Dec) loss of $0.09 per share, $0.04 worse than the First Call consensus of ($0.05); revenues fell 53.6% year/year to $283.4 mln vs the $277.5 mln consensus. "The global semiconductor industry has entered one of the most difficult periods in its history, one that is presenting severe challenges to our customers and thus severely limiting investment in wafer fab equipment."

4:06PM Cirrus Logic beats by $0.03, beats on revs; guides Q4 revs below consensus; co announces $20 mln share repurchase program (CRUS) 2.70 -0.06 : Reports Q3 (Dec) earnings of $0.07 per share, $0.03 better than the First Call consensus of $0.04; revenues fell 10.4% year/year to $43.8 mln vs the $42.8 mln consensus. Co issues downside guidance for Q4, sees Q4 revs of $31-36 mln vs. $37.90 mln consensus. "Our third quarter financial results reflect the sudden decrease in the bookings rate midway through the quarter as a result of the global economic downturn."

4:05PM Plexus beats by $0.04, misses on revs; guides Q2 EPS below consensus, revs below consensus (PLXS) 16.37 +1.00 : Reports Q1 (Dec) earnings of $0.43 per share, $0.04 better than the First Call consensus of $0.39; revenues fell 0.5% year/year to $456.1 mln vs the $462.1 mln consensus. Co issues downside guidance for Q2, sees EPS of $0.17-$0.24, ex items, vs. $0.34 consensus; sees Q2 revs of $375-$405 mln vs. $442.11 mln consensus. "This sequential reduction in revenue reflects significant softness in our customers' end-markets, channel inventory reductions and a seasonal decline driven largely by a significant Medical sector account. While we are ramping a number of new programs won in recent quarters, this incremental business is not sufficient to overcome the difficult end-market environment. The second fiscal quarter will be challenging and while we currently anticipate it will be the trough quarter for the fiscal year, the reduced outlook for the entire fiscal year prompts us to take immediate action on further cost reduction initiatives."

4:04PM Dell announces anticipated Q4 expense toward $3 billion in cost reductions by end of fiscal 2011 (DELL) 10.88 +0.81 : Separately, Dell will incur a pretax, noncash expense of an estimated $145 million related to stock-based compensation, including $106 million for accelerated vesting of previously awarded options. The acceleration, effective Jan. 23, covers 20.9 million shares with a weighted-average exercise price of $22.03. The action means Dell will recognize all expenses associated with these options in Q4, rather than over time. The remaining stock expense is for the annual true-up of full-year, stock-based compensation forfeitures.

4:04PM LSI Logic beats by $0.02, beats on revs; guides Q1 EPS below consensus, revs below consensus (LSI) 3.61 +0.20 : Reports Q4 (Dec) earnings of $0.06 per share, excluding items, $0.02 better than the First Call consensus of $0.04; revenues fell 17.7% year/year to $610 mln vs the $588.1 mln consensus. Co issues downside guidance for Q1, sees EPS of 0.00-($0.07) vs. $0.00 consensus; sees Q1 revs of $440-$500 mln vs. $508.00 mln consensus.

4:03PM Flextronics misses by $0.03, beats on revs; guides Q4 EPS below consensus, revs below consensus (FLEX) 2.72 +0.10 : Reports Q3 (Dec) earnings of $0.16 per share, $0.03 worse than the First Call consensus of $0.19; revenues fell 10.1% year/year to $8.15 bln vs the $7.99 bln consensus. Co issues downside guidance for Q4, sees EPS of $0.02-0.07 vs. $0.14 consensus; sees Q4 revs of $5.5-6.5 bln vs. $7.17 bln consensus. Guidance reflects the unusually low levels of visibility that many of its customers have in the current environment.

4:02PM Celestica beats by $0.08, beats on revs; guides Q1 EPS in-line, revs in-line (CLS) 4.34 -0.01 : Reports Q4 (Dec) earnings of $0.26 per share, including a $0.07 per share benefit resulting from a lower adjusted tax rate, $0.08 better than the First Call consensus of $0.18; revenues fell 12.5% year/year to $1.94 bln vs the $1.83 bln consensus. Co issues in-line guidance for Q1, sees EPS of $0.07-0.13 vs. $0.12 consensus; sees Q1 revs of $1.4-1.6 bln vs. $1.63 bln consensus.

4:30 pm : Market participants spent the session focusing on word the government may be close to creating a "bad bank" that will purchase risky assets from existing banks. Divesting risky assets would help banks protect against further asset write-downs, and increase cash on their books. That would help limit the need to raise additional capital, which can be dilutive to shareholders.

Helping financial companies restore their health is largely seen as the first step in repairing the financial system and the broader economy. The financial sector responded by gaining 13%, leading the broader market more than 3% higher.

Wells Fargo (WFC 21.19, +5.00) provided the most support to the financial sector and the broader market. It gained 31%, marking its best single-session performance in months. Wells Fargo won kudos after announcing it is maintaining its dividend, and has no plans to ask for additional TARP capital. Wells Fargo reported a loss of $0.79 per share including items, but a profit of $0.41 per share after excluding the items. The consensus called for earnings of $0.33 per share.

Dow components Boeing (BA 43.24, +0.02) and AT&T (T 25.91, -0.02) traded as laggards after reporting unimpressive quarterly results. WellPoint's (WLP 44.50, +1.88) latest earnings were in-line with expectations. Yahoo! (YHOO 12.24, +0.90) and ConocoPhillips (COP 50.16, +0.65) both topped earnings estimates. Yahoo, along with other large-cap tech names, helped drive gains in the Nasdaq. ConocoPhillips provided leadership to the energy sector, which was also helped by a modest rebound in crude oil prices.

Crude finished the session roughly 1% higher, just above $42.00 per barrel. Crude was actually down 2.4% in the wake of a larger-than-expected build in weekly inventories. That marked the fifth straight build for weekly inventories.

In its first session of the new year, the Federal Open Market Committee left its fed funds target rate unchanged at 0.00% to 0.25%, as expected. The target rate is likely to remain at exceptionally low levels and reflects the FOMC's view that the economy remains weak. In turn, the Fed says its focus is to support financial markets through open market operations and other measures.

The Fed also stated it continues to purchase large quantities of agency debt and mortgage-backed securities. Such a move helps put cash back into the system, and helps support the mortgage and housing markets. The FOMC stated it is prepared to purchase longer term securities if evolving circumstances indicate that it would be effective in improving conditions in credit markets.

Statements from the FOMC and word that a bad bank plan may be in order helped drive the stock market to its fourth straight gain. Stocks are up roughly 5.5% during that time.DJ30 +200.72 NASDAQ +53.44 SP500 +28.38 NASDAQ Adv/Vol/Dec 2114/2.16 bln/590 NYSE Adv/Vol/Dec 2686/1.55 bln/408

09:40 am Altera resumed with a Hold at Stifel Nicolaus: . Stifel Nicolaus resumes Altera with a Hold, as they believe the secular potential of the PLD industry remains intact with a number of catalysts long term; however, visibility remains limited in the current environment. Firm believes resumption of PLD growth rates exceeding the overall semi market is still likely several quarters away

08:23 am Sun Microsystems (JAVA)

Sun Microsystems (JAVA 3.99) reported a big earnings beat in its fiscal second quarter, but troubles remain for the server maker.

Sun reported earnings of $0.15 per share, excluding a restructuring charge. Sun's results easily topped the First Call consensus that called for a loss of $0.10 per share.

The company was hit by a $222 million restructuring charge primarily related to 5,000 layoffs announced in mid-November. Including the restructuring charge, Sun posted a net loss of $209 million, or $0.28 per share.

Sun said the restructuring would save it $700 million to $800 million annually.

Revenues fell 10.9% year-over-year to $3.22 billion, but managed to top the $3.16 billion consensus.

Total gross margins fell sharply to 41.9% from 48.5% in the same period last year.

Shares of JAVA are up nearly 8% in premarket trading.

08:17 am Yahoo! (YHOO)

Yahoo! (YHOO 11.34) surprised with a better-than-expected fourth quarter report, but the company gave downside guidance for the current quarter as rumors of a deal with Microsoft (MSFT 17.66) continue to swirl.

Yahoo reported earnings of $0.17 per share, $0.04 better than the First Call consensus of $0.13.

Revenues fell 2% year-over-year to $1.38 billion, excluding traffic acquisition costs, in-line with the $1.37 billion consensus.

Yahoo projects first quarter revenues between $1.525 billion and $1.725 billion, excluding any restructuring charges. Given the uncertainty in the market, Yahoo elected not to give more specific guidance.

Forecasts from Yahoo remain clouded by talk of a deal with Microsoft. Yahoo's new CEO didn't rule out the possibility on the company's conference call, so speculation is sure to increase.

(Disclosure: Briefing.com has a business relationship with Yahoo and Microsoft.)
icon url

ReturntoSender

01/29/09 7:41 PM

#8438 RE: ReturntoSender #6755

From Briefing.com: 5:24PM Microsemi Board of Directors announces results of independent inquiry, the Board's Decision to retain Microsemi CEO, and penalties with remedial actions (MSCC) 8.41 -0.08 : Co announces the Governance and Nominating Committee and the Board of Directors of Microsemi Corporation ("Microsemi" or the "Company") (Nasdaq:MSCC) have concluded their review of the academic credentials of MSCC's President and Chief Executive Officer, James J. Peterson. The independent inquiry on behalf of the Committee and the Board of Directors was commenced in December 2008 and was conducted by the law firm of Munger, Tolles & Olson LLP. The Committee and the Board determined that Mr. Peterson did not obtain either a Bachelor's Degree or Masters of Business Administration. The Committee and the Board confirmed that Mr. Peterson earned an Associate's Degree from Ricks College (presently known as Brigham Young University - Idaho) on December 15, 1978 and that he also earned substantial credits toward a Bachelor's Degree at Brigham Young University - Provo from 1979 through 1980. "Under these circumstances, the Board's mission is to protect shareholder interests by balancing the results of the independent inquiry against the great value and strategic vision that Jim Peterson has created at Microsemi," said Dennis Leibel, Chairman of MSCC's Board of Directors. "In the end, the Board concluded that the interests of MSCC's shareholders are best served by retaining Mr. Peterson while imposing appropriate financial penalties and remedial actions."

5:10PM Sierra Wireless announces expense reduction program (SWIR) 5.59 -0.04 : The co announces that it is implementing an expense reduction program. The expense reduction program is expected to reduce labor costs by approximately $5.5 million on an annualized run rate basis. The program includes the elimination of approximately 56 positions, representing 10% of the company's workforce. The positions eliminated will impact all levels and functions of the company. These actions are expected to be largely completed during the first quarter of 2009. The company expects to incur a pre-tax charge of approximately $1.3 million in the first quarter for severance and other costs related to this program.

5:02PM Chartered Semi beats by $0.20, reports revs in-line (CHRT) 1.56 -0.07 : Reports Q4 (Dec) loss of $0.05 per share, $0.20 better than the First Call consensus of ($0.25); revenues fell 0.3% year/year to $351.7 mln vs the $352.9 mln consensus. Capacity utilization in fourth quarter 2008 was 59 percent compared to 81 percent in the year-ago quarter, and 85 percent in third quarter 2008.

5:02PM California Micro beats by $0.01, misses on revs; guides Q4 EPS above consensus, revs in-line (CAMD) 2.19 -0.05 : Reports Q3 (Dec) loss of $0.13 per share, excluding $0.23 in non-recurring items, $0.01 better than the First Call consensus of ($0.14); revenues fell 35.3% year/year to $9.7 mln vs the $10.2 mln consensus. Co issues upside EPS guidance for Q4, sees EPS of ($0.13)-(0.11), excluding non-recurring items, vs. ($0.15) consensus; sees Q4 revs of $8.5-10.0 mln vs. $9.45 mln consensus. Factors affecting the March quarter outlook include the continuing weakness in the global economy and the seasonal weakness typical of this quarter, especially in the handset market.

4:31PM KLA-Tencor misses by $0.06, reports revs in-line (KLAC) 19.03 -1.34 : Reports Q2 (Dec) loss of $0.12 per share, $0.06 worse than the First Call consensus of ($0.06); revenues fell 37.6% year/year to $397 mln vs the $394 mln consensus. Co said, "In light of the current economic environment and our limited visibility regarding future market conditions, KLA-Tencor has been taking aggressive steps to reduce operating expenses and drive structural efficiencies across our organization, while maintaining a high level of investment in research and development, as well as our focus on customer service. We are confident these actions will allow us to sustain our technological and market leadership during this severe downturn and position us well when industry conditions improve, while protecting our balance sheet."

4:25PM Applied Micro announces CEO to step down, COO to take over (AMCC) 4.40 -0.31 : Co announced that Kambiz Hooshmand, President and Chief Executive Officer, will step down on June 1st 2009. Dr Paramesh Gopi, currently the Chief Operating Officer, will take over the role of President and CEO at that time.

4:24PM Broadcom misses by $0.19, beats on revs; guides Q1 revs below consensus (BRCM) : Reports Q4 (Dec) earnings of $0.08 per share, excluding a cumulative $0.40 in charges, $0.19 worse than the First Call consensus of $0.27; revenues rose 9.7% year/year to $1.13 bln vs the $1.07 bln consensus. Co issues downside guidance for Q1, sees Q1 revs of $800-875 mln vs. $953.14 mln consensus. "... As we look into the first quarter of 2009, we believe the current economic slowdown will continue to negatively impact our business as demand continues to decrease and settle into new levels and channel inventory adjusts accordingly..."

4:22PM Integrated Device beats by $0.04, reports revs in-line (IDTI) 5.48 -0.37 : Reports Q3 (Dec) earnings of $0.18 per share, $0.04 better than the First Call consensus of $0.14; revenues fell 16.9% year/year to $167.1 mln vs the $166.6 mln consensus.

4:20PM Varian Semi misses by $0.07, reports revs in-line; guides Q2 revs below consensus (VSEA) 18.92 -2.48 : Reports Q1 (Dec) loss of $0.19 per share, $0.07 worse than the First Call consensus of ($0.12); revenues fell 57.7% year/year to $107.4 mln vs the $107.9 mln consensus. Co issues downside guidance for Q2, sees Q2 revs of $60-70 mln vs. $90.93 mln consensus.

4:18PM Microchip beats by $0.01, beats on revs; guides Q4 EPS in-line, revs in-line (MCHP) 18.39 -0.70 : Reports Q3 (Dec) earnings of $0.23 per share, excluding non-recurring items, $0.01 better than the First Call consensus of $0.22; revenues fell 23.9% year/year to $192.2 mln vs the $188.9 mln consensus. Co issues in-line guidance for Q4, sees EPS of $0.13-0.15 vs. $0.17 consensus; sees Q4 revs of $173 vs. $174.52 mln consensus. "We are continuing actions to reduce production levels in our wafer fabrication facilities in the U.S. and our assembly and test facility in Thailand to moderate inventory growth. We are lowering our production levels by about 40% in the March quarter from peak levels in the September 2008 quarter. We are charging the underutilization to cost of goods sold to reflect lower than normal production levels. We are also implementing various other actions to further reduce operating expenses."

4:17PM Lattice Semi misses by $0.01, beats on revs; guides Q1 revs below consensus (LSCC) 1.52 -0.06 : Reports Q4 (Dec) loss of $0.03 per share, excluding non-recurring items, $0.01 worse than the First Call consensus of ($0.02); revenues fell 13.2% year/year to $50 mln vs the $49.3 mln consensus. Co issues downside guidance for Q1, sees Q1 revs of $40-45 mln vs. $45.50 mln consensus. Gross margin expected to be 52-54%.

4:16PM PMC-Sierra misses by $0.01, reports revs in-line (PMCS) : Reports Q4 (Dec) earnings of $0.07 per share, $0.01 worse than the First Call consensus of $0.08; revenues fell 2.3% year/year to $120.8 mln vs the $119.7 mln consensus.

4:16PM Amazon.com beats by $0.13, beats on revs; guides Q1 revs in-line (AMZN) 50.00 -0.36 : Reports Q4 (Dec) earnings of $0.52 per share, $0.13 better than the First Call consensus of $0.39; revenues rose 18.2% year/year to $6.7 bln vs the $6.44 bln consensus. Co issues in-line guidance for Q1, sees Q1 revs of $4.525-4.925 bln vs. $4.57 bln consensus. Operating income for Q1 is expected to be between $125 million and $210 million, or between 37% decline and 6% growth compared with first quarter 2008. "We remain relentlessly focused on serving customers with low prices, great selection and free shipping offers, including Amazon Prime ... We're particularly grateful for the unusually strong demand for Kindle in the fourth quarter."

4:15PM Ramtron reports Q4 (Dec) results, misses on revs; guides FY08 revs in-line (RMTR) 2.00 +0.02 : Reports Q4 (Dec) earnings of $0.03 per share, may not be comparable to the First Call consensus of $0.05; revenues rose 14.0% year/year to $16.3 mln vs the $16.5 mln consensus. Co issues in-line guidance for FY08, sees FY08 revs of ~$63.5 vs. $63.73 mln consensus.

4:14PM Semitool misses by $0.06, beats on revs; guides Q2 EPS above consensus, revs above consensus (SMTL) 2.60 : Reports Q1 (Dec) loss of $0.23 per share, $0.06 worse than the First Call consensus of ($0.17); revenues fell 31.9% year/year to $33.1 mln vs the $32 mln consensus. Gross margins for the qtr were 43% vs 50% a year ago. Co issues upside guidance for Q2, sees EPS of ($0.07)-($0.02) vs. ($0.18) consensus; sees Q2 revs of $31-$35 mln vs. $25.50 mln consensus.

4:14PM Rambus beats by $0.13, beats on revs (RMBS) : Reports Q4 (Dec) loss of $0.10 per share, $0.13 better than the First Call consensus of ($0.23); revenues fell 7.2% year/year to $37.6 mln vs the $29.9 mln consensus. "It was a challenging year yet we finished the fourth quarter above guidance thanks to strong technology royalties as well as a one-time benefit of withheld royalties received once the FTC's order was vacated."

4:13PM Sunpower beats by $0.13, beats on revs; guides FY09 EPS in-line, revs in-line (SPWRA) : Reports Q4 (Dec) earnings of $0.70 per share, $0.13 better than the First Call consensus of $0.57; revenues rose 78.7% year/year to $401 mln vs the $396.8 mln consensus. Co issues in-line guidance for FY09, sees EPS of $2.20-2.80, ex items vs. $2.66 consensus; sees FY09 revs of $1.6-2.0 bln vs. $1.89 bln consensus. "Long-term solar market fundamentals remain in place and we are encouraged by the commitment to renewable energy by President Obama and Congressional leadership," continued Werner. "Given these factors, we are well positioned to take advantage of growing global demand for solar this year and in the future, despite uncertainty in today's economic and credit environment."

4:12PM Juniper Networks reports EPS in-line, misses on revs (JNPR) 16.97 -1.37 : Reports Q4 (Dec) earnings of $0.32 per share, in-line with the First Call consensus of $0.32; revenues rose 14.1% year/year to $923.5 mln vs the $936.2 mln consensus. "Even in this tough economy, we managed to grow year-over-year quarterly revenue by 14% and non-GAAP diluted earnings per share by 19%. We continue to play offense and grow market share while at the same time taking action to responsibly manage our cost structure. The long-term growth fundamentals of high performance networking remain strong and by strengthening our product portfolio and focusing on the customer, Juniper is positioned for accelerated growth once market conditions improve."

4:10PM Maxim Integrated beats by $0.10, reports revs in-line; guides Q3 revs below consensus (MXIM) 12.87 -0.69 : Reports Q2 (Dec) earnings of $0.14 per share, $0.10 better than the First Call consensus of $0.04; revenues fell 18.1% year/year to $410.7 mln vs the $409.9 mln consensus. Co issues downside guidance for Q3, sees Q3 revs of $290-$330 mln vs. $367.31 mln consensus. The co's fiscal Q2 net realizable bookings decreased by 34% compared to Q1 of fiscal 2009 and the co's 90 day backlog declined by 30% to $206 mln. The co sees Q3 gross margins in the range of 46%-49%. "We finished our December quarter with a very cautious view of the global economy. Revenue as well as customer orders were weak across the board. While our recent review of our markets and customers indicates that bookings pace should improve this quarter, we nevertheless continue to manage expenses prudently. We are on schedule to complete our wafer fab consolidation project. This will improve our manufacturing efficiencies next fiscal year. Additionally, we took several measures to reduce our operating expenses."

4:07PM Applied Micro beats by $0.08, misses on revs (AMCC) : Reports Q3 (Dec) earnings of $0.06 per share, excluding non-recurring items, $0.08 better than the First Call consensus of ($0.02); revenues fell 13.1% year/year to $57.6 mln vs the $58.6 mln consensus.

4:05PM Micrel beats by $0.02, beats on revs (MCRL) 7.19 -0.42 : Reports Q4 (Dec) earnings of $0.09 per share, ex-items, $0.02 better than the First Call consensus of $0.07; revenues fell 14.6% year/year to $55.2 mln vs the $54.3 mln consensus. For 1Q09, the company estimates that revenues will decline between minus 12% to minus 17% on a sequential basis. Gross profit margin is expected to range between 50% to 51%. In addition, the company estimates that GAAP net income will be approx $0.01 to $0.03 per diluted share.

4:20 pm : Dour economic data and mixed earnings announcements gave market participants an excuse to sell stocks and take profits this session. Stocks finished 3.3% lower, ending a four-session streak of gains. Stocks are still up 1.6% week-to-date, though.

Thursday's mood wasn't helped by news that December durable goods orders declined 2.6%, marking the fifth straight monthly decline. Excluding transportation, orders were down 3.6%. The drop in both readings was also steeper than expected.

In other economic news, December new home sales declined more than expected, falling almost 15% from the prior month. The supply of new homes is at an all-time high of nearly 13 months, based on the pace of current sales. Demand for new homes remains weak as weak labor markets limit buyers. Initial jobless claims for the week ended Jan. 24 increased modestly to 588,000, which exceeded the 575,000 claims expected. Continuing claims climbed to 4.78 million, which is the highest level for continuing claims in 40 years.

To help stimulate the ailing economy, the U.S. House of Representatives has approved an $819 billion stimulus plan. Meanwhile, government officials have discussed spending a separate $1 trillion to $2 trillion to help banks restore their health, according to The Wall Street Journal.

With banks at the center of economic concerns, financial stocks continue leading the broader market. Financials tumbled 8.4% to finish at their session low. Losses were widespread in the sector, but life and health insurers (-11.4%) saw some of the worst selling as Allstate (ALL 23.50, -6.14) missed analysts' consensus earnings estimate.

With a market cap that's more than double the collective market caps of the Dow's four financial firms, Exxon Mobil (XOM 77.00, -2.25) was the heaviest weight on the broader market this session. It was also a laggard in the Dow. Exxon reports its latest quarterly results ahead of tomorrow morning's opening bell.

Fellow Dow component 3M (MMM 56.43, +1.01) posted better-than-expected quarterly earnings results, but lowered its 2009 earnings outlook. The revised outlook is still in-line with estimates, though. It finished the session as a relative leader.

In other earnings news, Qualcomm (QCOM 34.55, -2.27) fell short expectations, while Ford (F 1.95, -0.08) reported a loss, as expected, but is drawing on its credit lines. Eli Lilly (LLY 37.97, -1.12) and Colgate-Palmolive (CL 65.22, +1.37) both beat expectations, as did utilities American Electric (AEP 32.70, +0.94) and Dominion (D 36.21, +0.52).

Without any true leadership, the stock market finished near its session lows. All 10 sectors in the S&P 500 finished in the red.

Investors now turn their focus to the advance fourth quarter GDP report, which is due tomorrow morning (8:30 AM ET). Given the challenges facing the economy, the consensus forecast calls for a 5.5% annualized fourth quarter decline in GDP. DJ30 -226.44 NASDAQ -50.50 SP500 -28.95 NASDAQ Adv/Vol/Dec 577/1.93 bln/2128 NYSE Adv/Vol/Dec 513/1.44 bln/2549

9:31AM Trina Solar signs sales agreement with GA Solar (TSL) 7.95 -0.05 : Co announces it entered into a sales agreement with Spanish customer Gestamp Asetym Solar. The agreement was signed during the recent World Future Energy Summit 2009 in Abu Dhabi, held on January 19-21. Under the terms of this agreement, Trina Solar will supply GA Solar between 20 to 36 MW of PV modules for one year at pre-determined prices. Shipments under this agreement have recently been initiated.

8:18AM Ultratech beats by $0.03, misses on revs (UTEK) 11.05 : Reports Q4 (Dec) earnings of $0.17 per share, $0.03 better than the First Call consensus of $0.14; revenues rose 14.8% year/year to $34.1 mln vs the $35.8 mln consensus. Co says, "In 2008, we met our aggressive goals that were set forth at the beginning of the year... Global economic uncertainty has caused many semiconductor manufacturers to aggressively search for ways to minimize costs and optimize processes. While we cannot predict the duration, our strategic focus remains intact to continue to be a market leader and increase market share in 2009 in both advanced packaging and laser processing. We believe this strategic focus and our strong balance sheet, along with cost control discipline, will enable us to extend our market leadership in our served markets and emerge even stronger when the economy recovers."

7:32AM Fairchild Semi beats by $0.01, reports revs in-line; guides Q1 revs below consensus (FCS) 5.02 : Reports Q4 (Dec) earnings of $0.06 per share, excluding non-recurring items, $0.01 better than the First Call consensus of $0.05; revenues fell 25.7% year/year to $320.9 mln vs the $320.1 mln consensus. Co issues downside guidance for Q1, sees Q1 revs of $220-245 mln vs. $289.40 mln consensus. Co said, "We are encouraged by the recent stabilization of order rates in January and we are now building backlog for Q1. Fairchild is committed to taking advantage of this market to speed improvements and to build a higher value business. We have a strong balance sheet today and expect to maintain this strength throughout 2009."

4:16AM SanDisk and Toshiba sign definitive agreement to restructure Flash manufacturing joint ventures (SNDK) 12.69 : Co announces that it has signed a definitive agreement with Toshiba to restructure their Flash manufacturing joint ventures operating at the 300-mm Fab 3 and Fab 4. As part of the agreement, more than 20% of the joint ventures' capacity will be transferred to Toshiba. The restructuring will result in the transfer of equipment lease obligations from SanDisk to Toshiba and a cash payment to SanDisk for the transfer of certain equipment currently owned by the joint ventures. The total value to SanDisk is approx 80 bln yen, or approx $890 mln based on current exchange rates. Approximately two-thirds of the total amount will reduce SanDisk's current equipment lease obligations by about 28% and approx one-third will be received by SanDisk in cash. The lease transfers and cash payment are expected to be completed by the end of the first calendar quarter of '09.

12:18AM Teradyne misses by $0.06, misses on revs; guides Q1 EPS below consensus, revs below consensus (TER) 5.25 : Reports Q4 (Dec) loss of $0.19 per share, excluding non-recurring items and includes $0.03 loss per share as a result of Eagle Test Systems, $0.06 worse than the First Call consensus of ($0.13); revenues fell 25.2% year/year to $194.8 mln vs the $201.1 mln consensus. Co issues downside guidance for Q1, sees EPS of $(0.38)-(0.31) vs. ($0.15) consensus; sees Q1 revs of $125.0-145.0 mln vs. $183.89 mln consensus. Co will reduce worldwide staff by approx 14% and implementing a 10% broad-based temporary pay cut. These actions, along with other cost reduction, will reduce expenses by approx $140 mln on an annualized basis.

08:17 am Qualcomm (QCOM)

Qualcomm (QCOM 36.82) reported disappointing earnings and issued downside guidance for 2009 as it expects demand to continue shrinking.

For its fiscal first quarter, Qualcomm reported earnings of $0.31 per share, excluding nonrecurring items, $0.16 worse than the First Call consensus of $0.47. Earnings per share were down 40% year-over-year.

Revenues rose 3.0% year-over-year to $2.51 billion, topping the $2.42 billion consensus, driven primarily by the mix of higher-end chipsets, and higher-priced data capable devices. Qualcomm said it saw "healthy demand" for 3G as CDMA-based device shipments in the quarter were at the high end of its expectations and reflect more than 30% year-over-year growth.

Qualcomm said that it would not provide earnings per share guidance "due to the volatility of financial markets and the impact it has had and may have on our investment portfolio and net income." The company did provide revenue guidance for its second fiscal quarter, projecting revenues between $2.25 billion and $2.45 billion. The consensus calls for revenues of $2.41 billion. Qualcomm's guidance translates to a year-over-year revenue decline between 6% and 14%.

The company also gave downside full year 2009 revenue guidance, projecting revenue between $9.3 billion and $9.8 billion, well short of the $10.25 billion consensus and below the company's earlier outlook that called for revenue between $10.2 billion and $10.8 billion.
icon url

ReturntoSender

01/30/09 12:36 PM

#8439 RE: ReturntoSender #6755

When we get the Major Market Bottom it will be retested just like in March of 2003. These charts will show that we should expect that we will get a higher low with plenty of positive divergences. The rise off the bottoms will come under heavier volume than the previous day, week or month. These charts will show why the November bottom 2008 is very questionable and not likely to be the major market bottom we are hoping for in the future.


Daily chart now on the Industrials is not too bad but it is not clearly showing the November bottom was the final bottom:


The Weekly Charts of the INDU back in 2002/2003 also showed lower lows on the VIX and higher volume weeks on the rallies:


The Weekly Chart now looks bad. Not a single up week on higher volume since July:


The Monthly Chart from 2002/2003 show the same confirmation:


The Monthly Chart now clearly shows we are still in a downtrend but many still hope that the triangle will resolve to the upside:


icon url

ReturntoSender

01/31/09 6:32 PM

#8441 RE: ReturntoSender #6755

Amateur Investors Weekend Stock Market Analysis (1/31/09)

http://www.amateur-investor.net/Weekend_Market_Analysis_Jan_31_09.htm

The Dow had it's worst January Monthly Performance on record as it finished down -8.8%. Some of you have probably heard of the January Effect which says how January goes will be a reflection of the Yearly Performance. Here are the actual statistics going back to 1897 involving the Dow as shown by the table below.
 
(+) Jan (+) Jan (-) Jan (-) Jan
(+) Year (-) Year (-) Year (+) Year
# of Years 59 14 26 13
81% 19% 67% 33%


Since 1897 if January has had a Positive Return then the chance of a Positive Yearly Return is 81%. Meanwhile if January had a Negative Return then the chance of a Negative Yearly Return has been 67%. Thus statistically there has been a stronger correlation with a Positive Return in January versus a Negative Return.

As far as the major averages the Dow stalled out near its 20 Day EMA (blue line) on Wednesday and then came under selling pressure Thursday and Friday. The Dow has dropped back to the bottom of its Triangle pattern and appears to be at a key inflection point. If the Dow takes out the low made on 1/23 near 7900 then look for an eventual retest of the 11/21 low of 7450 at some point in February. Meanwhile if the Dow can hold support at the bottom of its Triangle then look for a potential rally back to 8400 or its 50 Day EMA (blue line) near 8600.


The Nasdaq stalled out on Wednesday right at its 50 Day EMA (blue line) and then pulled back Thursday and Friday. The support level to watch next week is at the bottom of its Triangle pattern near 1450. If the Nasdaq can hold support at 1450 then we could see a rally develop with an eventual move back to around 1550 or up to the top of its Triangle near 1600. Meanwhile if the Nasdaq drops below the bottom of its Triangle and takes out the 1/23 low of 1434 then that may eventually lead to a retest of the 11/21 low near 1300 at some point in February.


As far as the S&P 500 it stalled out below its 50 Day EMA (blue line) on Wednesday and is nearing the bottom of its Triangle pattern near the 810 level. If the S&P 500 can hold support near the 810 level then we could see a rally develop with a potential move up to its 50 Day EMA at 885 or the top of its Triangle which is nearing the 900 level. Meanwhile if the S&P 500 drops below the bottom of its Triangle and takes out the 1/21 low at 804 then its likely a retest of the 11/21 low at 741 will occur in February.


Finally for those that follow Elliott Wave Theory right I favor the scenario that Wave (4) may have ended on 1/6 and the sell off that followed is the beginning of Wave 1 (5) down. This scenario would be confirmed if the S&P 500 drops below the 800 level.


The charts seen above are my own while the commentary is Amateur Investors. Their charts do not update while my will so we will be able to follow how accurate the commentary proves to be. RtS
icon url

ReturntoSender

01/31/09 8:19 PM

#8443 RE: ReturntoSender #6755

Update on the SMH. It looks pretty good on the daily chart to hold the lower triangle support trendline:


The weekly chart still has some positives but nothing too great on the monthly.

RtS
icon url

ReturntoSender

02/01/09 12:37 PM

#8444 RE: ReturntoSender #6755

InvestmentHouse.com Weekend Update 1/30/09:

http://www.investmenthouse.com/weekendmarketsummary.htm

- Month ends on a low note, matching the month.
- Inventories help Q4 GDP salvage a 27 year low. Guess it could have been worse.
- Chicago PMI improvement gone with the economy.
- Pet project spending bill goes to Senate in need of its own rescue package.
- Stocks break lower but financials, even with the 'bad bank' snag, hold up nicely.
- Negative sentiment is pumping up again.
- Ready to test the January lows, but can a new 'bad bank'-like proposal rekindle enthusiasm to hold that support?

Rebound attempt can't find anything to bank on.

Stocks tried to rally early and get back that blown follow through thanks to the Thursday selloff. GDP was not as bad as expected thanks to rising unsold inventories (only a government report could score higher on unsold goods), but it was still the worst showing in 27 years. Michigan sentiment was a bit more positive; I guess an auto bailout will do that. Chicago manufacturing was a disappointment as the blip higher the prior month rolled back over.

The higher open held a bit of promise, but it didn't last. The indices turned over and sold off through midmorning, turning negative. A bounce try looked decent; stocks turned at midmorning, often a turning point for the intraday action. A respectable recovery was underway at lunch and was picking up strength. A story about a snag with the 'bad bank' proposal (pricing issues that stymied the Bush administration as well) and the possibility it was indefinitely on hold cut that rebound off at the knees. The indices immediately tanked, failed a relief bounce, and headed to new session lows at the close. A down finish on the last trading day of a down month to start the year.

TECHNICAL. Intraday the market started positive, but the sellers hit and by midmorning stocks were in the red. A bounce attempt through lunch almost got them positive, but an afternoon rollover took them to session lows. After flipping back to bearish action Wednesday, the market remained that way to close the week.

INTERNALS. Modest downside breadth for a change after the Thursday -7:1 or so on NYSE (-2.7:1 NYSE, -2:1 NASDAQ). Not horrific, but the volume rallied, returning to above average on both exchanges. Distribution, i.e. higher volume selling than buying, shows investors were in the stock dumping mode on Friday as stocks turned harder to the downside and broke some potential support. A distribution session shortly after a rally makes a break higher is typically not bullish for that rally.

CHARTS. The key move of the week was the Wednesday follow through on volume but then the Thursday and Friday turn back from resistance. NASDAQ rallied to resistance at the 50 day EMA Wednesday, just below the December peaks and indeed clearing them on a closing basis. Turned back. SP500 showed similar action though not quite making the 50 day. It broke lower and fell through the October closing low. Ditto SP600 and DJ30. SOX started the downturn in better position, so it is a bit better overall after the Thursday and Friday selling. It is nothing to get all excited about, however: chips led the move higher but got roughed up Thursday and Friday on some earnings disappointments. Without their leadership the indices stumbled and broke that potential support at the October closing lows. The head and shoulders tops in the indices look to be heading toward completion if not already there. A test of the January low appears inevitable given the momentum after rolling over. That will be an important test.

LEADERSHIP: As noted the chips fell off leadership pace to end the week. Without them and with the financials and the rest of the market back under some pressure after before and after the bad bank news headline the rally just ran out of steam. Metals fell as they suffered selling pressure as well. With the leadership pretty much all in a general pullback the market was weak. Most leaders managed to hold up well enough, continuing the pullback from Thursday, still holding their general consolidations. You see, many leaders were out in front on the Wednesday rally session, and with this end of week selling are right back where they started from, i.e. back in their patterns or consolidations. They are still livable here, but they are going to have to find some support here as well.

SUMMARY: It was one of those weeks where you have a break higher and things look good, then it gets thrown back at you. We expected some pullback after a 4 day move higher and solid Wednesday surge, but Thursday was more than a pullback from a price standpoint, and Friday the indices broke some potential support on higher, above average volume. That of course is not bullish action; as noted at the time it shows that buyers left and stood by idly on Thursday as the market sold and then on Friday sellers took over as volume jumped back above average. Looks as if a test of the January lows is up next, the point where the indices found some backbone and rallied. That didn't work and how the indices handle those lows will be a fulcrum for the next move.

THE ECONOMY

GDP terrible but not as terrible as thought.

The 3.8% loss was the worst in 27 years, meaning back in the bad recession to start the 1980's that ended the 1970's malaise. A major benefit of that recession was that it broke inflation. With all of the spending, money printing, and more spending right now, I think it is safe to say there won't be any victory over inflation, and indeed the real risk is the worst inflation seen since the 1970's. Not a pleasant thought train as it takes you around in circles and does not get you out of the problem. Lends some credence to those arguing we should just let the downturn run its course and clean out the pipes. But, that is not going to happen, at least not without us first spending several trillion dollars that we don't have.

In any event the -3.8% was better than the -5.5% expected. Of course but for the government's fictional method of gauging economic output GDP would have been -5.1%. When the government figures out put it adds inventories. When the economy is starting to boom and production surges while sales are still strong, then that is a somewhat accurate way of measuring economic activity. When the economy is slowing or as in this case belly flopping, rising inventories are not a good measure of economic activity. Inventories balloon because no one is buying. Manufacturing has curtailed production but inventories are still rising because buyers curtailed consumption faster. Thus the data is doubly inaccurate as it registers more activity when actually manufacturers and consumers are both slowing.

Consumer spending fell 3.5% in Q4 on top of the 3.8% Q3 decline. That is the first back to back 3% declines in spending since 1947.

The PCE inflation measure fell 0.1% for the quarter the largest decline since 1954. The fall in commodities prices led the fall in inflation. Core prices rose 0.6% in the quarter, and that was the slowest pace since 1962. You want stats? You've got stats.

Business investment fell 19%. That pretty much sums it up. No one was spending, manufacturing was falling, and businesses, a big driver in the economy because they not only spend on capital equipment but then use that to make goods and provide services that require jobs, slowed their capital investments even further. Incredibly rapid decline. Incredibly deep decline.

Chicago PMI turns further south.

The last round of regional PMI reports suggested, or more accurately hinted, at a turn in manufacturing. Friday the January Chicago report didn't support any notion of a trend change. It came in at 33.3, less than the 34.9 expected and the 35.1 in December. Of course December was revised higher from 34.1. Positive revision. Worth watching, but at these levels it is not going to turn any heads.

What it did turn was more economists gloomy. There is no doubt the economy is in the crapper. The question is when will it reach the treatment plant and turn into something more appealing. After the pathetic durable goods orders Thursday most economists Friday were in the towel throwing mood as in throwing in the towel on the economy and any recovery in the economy. You would think it will never recover.

Or at least it will take a while. We are hitting really low historical levels in economic activity, and if the spending bill is passed versus a stimulus bill, we could be in a lateral stagnation for years to come. Unlike the early 1980's that some of the current numbers are matching, the proposed stimulus is not the kind that causes immediate investment in the US in new equipment and funding of new ideas and products. It is make work and pork-laden. As noted Thursday, if government spending created a lot of jobs, why do we ever hesitate to just ratchet up government spending any time there is a worry jobs are started to turn scarce. Why not? Because it just doesn't work that way.

Here's to a stimulus bill versus a spending wish list.

$1B for Amtrak. You know Amtrak, right? The subsidized rail boondoggle that has lost money non-stop since inception and bleeds tens of millions a year from our pockets? A bad business in line for $1B of your dollars.

$2B for child care subsidies. Laudable, but stimulus? $50M for the National Endowment of Arts. Sometimes when I am stimulated I paint or draw something. That doesn't mean the economy jumps or 10 jobs are created when I do. $650M for digital television converter box coupons. $400M for global warming research. I thought Obama and Al Gore saw eye to eye that there was global warming and that we are causing it. Why research it further? Both say a consensus of scientists believe that GW exists and that we cause it and thus conclude it is proven.

Of course the consensus of scientists are always right. It was a consensus that said the earth was flat. A fellow named Columbus went out on his own and proved the consensus wrong. A consensus said the sun revolved around the earth. Galileo was almost burned alive for saying otherwise. A consensus said the sound barrier could not be broken. A consensus said we would be out of oil by the 1990's.

The point: scientific advancement is not done by consensus. It occurs when someone that does not buy the conventional wisdom or as in the case of global warming, looks objectively at the data, finds the truth is otherwise. NASA data shows the sun heated up recently, but that data is not taken into account in the global warming theories. Ocean temperature readings show the oceans are cooling in many places. Mount Kilimanjaro glaciers have receded and advanced several times over the past 100 years, yet it is ALWAYS below freezing on the top of the mountain. Could it be the active volcano beneath the glacier on the mountain that is the cause? As my brother always used to say when working on a motor, check the easy stuff first. Change the spark plugs before tearing up the carburetor. Let's look at the facts we already have before spending another $400M.

This is not stimulus. Stimulus that produces jobs is getting individuals and businesses to take risks and invest in the US, i.e. in their businesses, in their lives, etc. Tax incentives do that very nicely because it puts money immediately into the hands that use it. Some say that tax cuts are not good because the recipient may not use it. That is true with the 'rebates.' If you are scared for your job you squirrel it away. No, you have to make it 'use it or lose it' tax breaks. A tax credit for buying new equipment, investing in a start up, putting money into an investment in the financial markets. If you act, you get the tax break. And the best is a tax credit because that comes off the bottom line of taxes. If you don't use it you send the money to the government. If you use it you get the investment as well as don't send the money into the government. Only the truly ignorant don't take advantage of these.

You can also cut the corporate tax rate. That would lower the cost of goods to consumers of all kinds. It would free up capital for investment and expansion. Money would be unlocked as it would flow into corporations for R&D, innovation, production, and oh my goodness, jobs.

What won't work? A tax credit for hiring someone. That has been tried and even the democrats say it doesn't work. Why not? Because hiring someone is a HUGE outlay in time and dollars, and it does not go away. Business has to improve of the job will be lost shortly after creation, i.e. once the tax benefit is used up. The only way it would even come close to working is providing a credit in the amount of the first year's cost. That is way too high for the result. You need to use the multiplier effect of investment credits to generate jobs versus just trying to pull a job out of the air. Let's face it, if there is no need for an employee because business is slow you are not going to hire one unless you get a credit worth every penny you spend on the new employee. That just isn't going to happen.

There is a turning point in the citizenry, however. New poles show that a majority disfavor the proposed stimulus. Why? Because they see it as unnecessary spending on things that will not benefit them one bit. How will contraception help create jobs? Is the National Endowment of the Arts going to spend all that money on employees it doesn't need? If things are as bad as they appear do we really need to get converter boxes for everyone? Just put off the changeover to digital until times are better. I combed the bill and there is not one thing the average small business person would benefit from. It is an amalgamation of wish lists that some congressmen have held for years and years, waiting for the opportunity to scoop the cash out of the public coffers (a.k.a. your wallet or purse). This is it. We are about to shoot another $1T down the hole with no economic benefit. Insane.

THE MARKET

MARKET SENTIMENT

The market is wearing on everyone but we are always interested when it becomes obvious it is wearing down the professionals. When the traders on the floor in New York or Chicago or the trading desks become exasperated and dejected, that is worth noting. Friday we heard comments about Wal-Mart not working anymore, and that runs counter intuitively to the recession/discount relationship. WMT is getting torn down as well because it was a refuge for money and was propped up a bit too long. That money is coming out and WMT is down. That is fine because the visible big names have to be taken down before this is over. Look at XOM. It reported big results but it was down on the session. It has held its gains while all other energy stocks fell. It is acting as a refuge for money as well. It might start coming out now as it could not move on rather impressive earnings. This shows that the necessary tearing down of icons is occurring.

VIX: 44.84; +2.21
VXN: 44.93; +2.35
VXO: 45.85; +3.91

Put/Call Ratio (CBOE): 1.03; +0.08. Back over 1.0 after an almost 2 week drought. Will need several more sessions over 1.0 to make a difference.

Bulls versus Bears:

This is a reading of the number of bullish investment advisors versus bearish advisors. The reason you look at this is that it gives you an idea of how bullish investors are. If they are too bullish then everyone is in the market and it is heading for a top: if everyone wants to be in the market then all the money is in and there is no more new cash to drive it higher. On the other side of the spectrum if there are a lot of bears then there is a lot of cash on the sideline, and as the market rallies it drags that cash in as the bears give in. That cash provides the market the fuel to move higher. If bears are low it is the same as a lot of bulls: everyone is in and the market doesn't have the cash to drive it higher.

This is a historical milestone in the making. Bulls are impressively low considering we are in general a very optimistic country. The few bulls is a positive indication because it means most everyone that is getting out is out and there is money on the sidelines. In other words the ammunition boxes are full and as the market recovers investors will start opening up the boxes and firing. Little by little they will be forced to put more money into the market and there will be some rushes higher in fear they are missing the train. You relish times when sentiment is so negative because it means some tremendous buys are setting up. This could indeed be the opportunity of a lifetime, and you take advantage of it by buying quality stocks and letting them work for you as long as they will. If we can hold them for years, great.

Bulls: 34.8%. Back below the 35% threshold and that becomes a more bullish indication. Down from 38.7% the prior week and a substantial drop from 43.0%, the current top of the recovery as the market rallied off the November low. A rise from 25.3% in December and quickly starting to fall once the market encountered the January selling. Remains above the 35% threshold for the second week, below which is considered bullish. It does not mean the action is now bearish. That level is up at 55%. Bullishness bottomed on this leg lower at 21.3% in November 2008. This last leg down showed us the largest single week drop we have ever seen, falling from 33.7% to 25.3%. Hit 40.7% on the high during the rally off the July 2008 lows. 30.9% was the March low. In March the indicator did its job with the dive below 35% and the crossover with the bears. A move into the lower 40's is a decline of significance. A move to 35% is a bullish indicator. This is smashing that. For reference it bottomed in the summer 2006, the last major round of selling ahead of this 2007 top, near 36%, and 35% is considered bullish.

Bears: 38.0%. Rose modestly from 37.6%. Right back up from 34.4% after a 2-week decline to the 34's from 38.5% before that and off from the 46.2% hit mid-December. Back above the 35% level considered bullish for stocks, but as with bulls, still well below the level considered bearish for stocks. Bearishness hit a 5 year high at 54.4% the last week of October. The move over 50 took bearish sentiment to its highest level since 1995. Extreme negative sentiment on this move. 35% is the level that historically indicates excessive pessimism. As with the bulls the jump in bears did its job after hitting 44.7% in the third week of March. Bearishness peaked at 37.4% in September 2007. It topped the June 2006 peak (36%) on that run. That June peak eclipsed the March 2006 high (33%) and well above the 2005 highs that spawned new rallies (30% in May 2005, 29.2% in October 2005). This is a huge turn, unlike any seen in recent history.

NASDAQ

Stats: -31.42 points (-2.08%) to close at 1476.42
Volume: 2.126B (+7.57%). Volume was back up as NASDAQ sold again. This time there was distribution and on the heels of the follow through that is not a good indication for the rally attempt.

Up Volume: 404.246M (+151.726M)
Down Volume: 1.681B (+18.604M)

A/D and Hi/Lo: Decliners led 2.05 to 1
Previous Session: Decliners led 3.55 to 1

New Highs: 6 (-3)
New Lows: 113 (+27)

NASDAQ CHART: Click to view the chart

Broke below the October closing low on rising volume. A test of the January low (1434) looks on as it does with SP500 after Thursdays session. The test of the 50 day EMA on Wednesday and the turn back down has formed a lower high and that right shoulder to a 7 week head and shoulders. That more bearish near term pattern held sway, knocking back a NASDAQ attempt to break it up with the follow through session. Thus it looks downside near term but it is also still in the 3.5 month lateral consolidation since the selling started to slow in October.

SOX (-1.92%) sold as well. It tried to move higher but hit the 50 day EMA and stalled. It too is in a head and shoulders. SOX tried to break up the pattern with the Wednesday close above the December peak, but it could not hold as some key chips fell hard. Still in better position than the other indices as it was up faster, but it still has its work cut out for it as the indices have all set up the same patterns nearer term.

NASDAQ 100 CHART: Click to view the chart

SOX CHART: Click to view the chart

SP500/NYSE

Stats: -19.26 points (-2.28%) to close at 825.88
NYSE Volume: 1.51B (+5.18%). As with NASDAQ, rising and above average volume on the selling as SP500 made a clear break lower. Distribution.

Up Volume: 208.214M (+85.7M)
Down Volume: 1.29B (-19.038M)

A/D and Hi/Lo: Decliners led 2.71 to 1
Previous Session: Decliners led 6.7 to 1

New Highs: 28 (-1)
New Lows: 125 (+33)

SP500 CHART: Click to view the chart

Tried to hold the October low Thursday but gave it up big on Friday. Heading to the January low (804.30) as SP500 breaks lower from its own head and shoulders. Now it is a question of where it holds in the 3.5 month consolidation range. Can it again hold at the 800 level and set up an intra-pattern double bottom or will it need to go on down and test the low in November. We are playing the move down to the 800 level with some SPY puts and then we see how it reacts at that level. Interestingly, the financials were in quite decent shape Friday. They were down but they were not rolling over hard along with the indices. That was one of the most interesting features of the session. Even with the news on the 'bad bank' hang up the financials did not lead the dive lower. Some of the big names held some support and were actually positive on the session. If they show some strength here that changes the dynamic of the Thursday and Friday selling in terms that they were not as potent as they appeared.

SP600 (-2.12%) gapped lower and closed near the low. Same pattern as other indices, i.e. the 7 week head and shoulders as part of the larger 3.5 month consolidation. Heading toward the January low quickly. Some good support at 225, a key support point.

SP600 Chart: Click to view the chart

SP400 CHART: Click to view the chart

DJ30

DJ30 sold off again on rising average volume and is already back at the January lows. Likely to break this level and the Dow could be the first to hit the November lows. It has been a laggard on this entire move, never really getting a good push off the January consolidation. It can sell to the November low and not really hurt much else. If the financials hold, however, it will have something to lean on given its financial contingency.

Stats: -148.15 points (-1.82%) to close at 8000.86
Volume: 303M shares Friday versus 247M shares Thursday.

DJ30 CHART: Click to view the chart

MONDAY

The market heads into the new week on a bearish note with the reversal of the Wednesday follow through session and the crack below the October closing lows on all the indices. The nearer term patterns for the indices are head and shoulders tops and that indicates more downside momentum. Indeed we expect SP500 to test the January low, and indeed most indices should do that.

That level, however, is the fulcrum for the next move. As one of the traders here says, it will make it or break it, meaning it will determine the next several weeks for the market. If it holds that is the surprise and sends the indices up to the January highs. If it fails they run down to test the November low. That still leaves them in their consolidation ranges, but it puts a new aspect in the mix, i.e. the jump off point between a nearer term recovery or a much longer bear market.

If the financials show the same kind of moxy in the face of selling pressure as they did Friday they may be turning a corner. They had every reason to sell given the news about the 'bad bank' but many closed the session positive, rising off session lows to do so. They acted as if there will be some kind of plan. The talk is an insurance or guaranty plan. Heard that before? That is what the House republicans wanted in the original TARP. Seems as if they were more prescient than the Wall Street professionals in charge of the back room deals that gave away hundreds of billions of our tax dollars. Something will have to be announced whether a blend of 'bad bank' and guarantees or something else. If they assume a real leadership role that changes the market dynamic as they have held the throttle for SP500 for many months.

Thus you bet we are watching the likes of JPM, GS, WFC, MS. What about C and BAC? Don't think they really matter now. They are kept banks now and they are on the liquidation trade because their stock will be worthless due to the federal ownership. It is a long shot but the action Friday was interesting.

As the indices test the January low we will watch the leadership that is currently testing back with the market and see how it holds support. Best case is if it holds the same pattern, waits out the test of the January lows and can break back to the upside. Many are making good tests putting them in buying position if the indices can find support and once gain move higher. A bounce off January support is a solid indication, but after this reversal off of a solid follow through the character is more bearish. As long as our positions hold support that is fine.

Support and Resistance

NASDAQ: Closed at 1476.42
Resistance:
1493 is the October 2008 low & late December 2008 consolidation low.
1499.21 is the 2008 closing low
The 50 day SMA at 1518
1521 is the late 2002 peak following the bounce off the bear market low
1536 is the late November 2008 peak
1542 is the early October 2008 low
The 50 day EMA at 1564
1565 is the second low in October 2008
1603 is the December peak
1620 from the early 2001 low
The 90 day SMA at 1624
1644 from August 2003
1752 from 2004
1782 from August 2004
1786 is the November 2008 high. Key level.
1948 is the early October 2008 gap down level

Support:
1434 is the January low (1440.86 closing)
1428 is the November 2008 low, the bear market low
1398 is the early December 2008 low
1387 is the 2001 low
1295 is the November 2008 low

S&P 500: Closed at 825.88
Resistance:
The 10 day EMA at 845
848 is the October 2008 closing low
853 is the July 2002 low
The 18 day EMA at 854
857 is the December consolidation low
866 is the second October 2008 low
The 50 day EMA at 885
889 is an interim 2002 peak
896 is the late November 2008 peak
899 is the early October closing low
919 is the early December peak
The 90 day SMA at 920
965 is the 2003 consolidation low
995 from June 2003 consolidation peak
1008 is the November 2008 peak
1065 is the Q4 2003 level that SP500 started the run to 2007 after the first run in the recovery.

Support:
839 is the early October 2008 low
818 is the November 2008 low
815 is the early December 2008 low
804 is the low on the January 2009 selloff
800 is the March 2003 post bottom low
768 is the 2002 bear market low
741 is the November 2008 low

Dow: Closed at 8000.86
Resistance:
8141 is the early December low
8175 is the October 2008 closing low. Key level to watch.
The 10 day EMA at 8191
8197 was the second October 2008 low
8419 is the late December closing low in that consolidation
8451 is the early October closing low
The 50 day SMA at 8471
8521 is an interim high in March 2003 after the March 2003 low
The 50 day EMA at 8569
8626 from December 2002
8829 is the late November 2008 peak
The 90 day SMA at 8854
8934 is the December closing high
8985 is the closing low in the mid-2003 consolidation
9200 is the July peak in the 2003 consolidation
9323 From June 2003 peak
9575 from September 2003, May 2001
9654 is the November 2008 peak

Support:
7965 is the mid-November 2008 interim intraday low.
7909 is the January low
7882 is the early October 2008 intraday low. Key level to watch.
7702 is the July 2002 low
7524 is the March 2002 low to test the move off the October 2002 low
7449 is the November 2008 low
7282 is the October 2002 low

Economic Calendar

These are consensus expectations. Our expectations will vary and are discussed in the 'Economy' section.

February 2 - Monday
- December Personal Income (8:30): -0.4% expected -0.2% prior
- Personal Spending, December (8:30): -0.9% expected, -0.6% prior
- Construction Spending, December (10:00): -0.9% expected, -0.6% prior
- ISM Index, January (10:00): 32.0 expected, 32.4 prior

February 3 - Tuesday
- December Pending Home Sales (10:00): 0.0% expected, -4.0% prior

February 4 - Wednesday
- January ADP Employment Change (8:15): -515K expected, -693K prior
- ISM Services, January (10:00): 39.0 expected, 40.1 prior
- Crude Oil Inventories, 1/30 (10:30): 6.2 min prior

February 5 - Thursday
- 1/31 Initial Jobless Claims (8:30): 592K expected, 588K
- Productivity-Prel, Q4 (8:30): 1.0% expected, 1.3% prior
- Unit Labor Costs, Q4 (8:30): 3.0% expected, 2.8% prior
- Factory Orders, December (10:00): -3.0% expected, -4.6% prior

February 6 - Friday
- January Average Workweek (8:30): 33.3 expected, 33.3 prior
- Hourly Earnings, January (8:30): 0.3% expected, 0.3% prior
- Nonfarm Payrolls, January (8:30): -500K expected, -524K prior
- Unemployment Rate, January (8:30): 7.5% expected, 7.2% prior
- Consumer Credit, December (14:00): -$2.3B, -$7.9B
icon url

ReturntoSender

02/02/09 10:38 PM

#8445 RE: ReturntoSender #6755

From Briefing.com: 4:25 pm : Market-moving news was lacking this session. In turn, stocks traded with little direction and finished with mixed results.

All three major indices fell to losses in excess of 1% in the early going. Only the Nasdaq was able to finish with a gain, thanks to help from large-cap tech stocks. Microsoft (MSFT 17.83, +0.73) was a primary leader in its space. It staged its largest single-session advance in more than one week, enabling it to reclaim losses in the prior two sessions.

Large-cap industrial stocks sent the the Dow to new lows for 2009. The Dow is up 6.5% from its bear market low, though. General Electric (GE 11.62, -0.51) was a primary laggard in the Dow and the industrial sector (-2.5%), which was the worst performing sector in the S&P 500. Shares of GE actually registered a 13-year low amid ongoing concerns regarding the health of the company's capital arm. GE remains one of the only companies to boast a AAA credit rating, though.

Financial stocks, which have led the market in recent weeks, managed to finish a volatile session with a 0.2% gain. Financials were down as much as 3.5%.

Investors continue awaiting further details regarding a government-led plan to help restore the nation's financial system. Though there is doubt that any such plan will spur an immediate recovery, investors are anxious to make progress. According to The Wall Street Journal, Treasury Secretary Geithner indicated he will lay out plans for the financial crisis in his speech next week.

With the health of the financial system and the broader economy still uncertain, companies continue to issue warnings and make cuts where necessary. Macy's (M 8.59, -0.36) projects lower earnings for fiscal 2009 and is cutting dividend to $0.05 per share from $0.1325 per share. Macy's also plans to eliminate some 7,000 jobs. Shares of M dragged retailers 0.3% lower this session.

Earnings news was light this morning. Humana (HUM 40.13, +2.20) was one of the few widely-held companies to report; it announced lower fourth quarter earnings, strong revenue growth, and reaffirmed its full-year outlook. Humana's report was largely in-line with expectations.

There was some economic data released this morning, but it came with little surprise. Hard pressed by ongoing headwinds, personal spending in December was down 1%, while personal income decreased 0.2%. The personal spending data was largely reflected already in last week's advance fourth quarter GDP report.

Meanwhile, January ISM Manufacturing came in a better-than-expected 35.6. The consensus called for a reading of just 32.5. Still, the data reflect continued contraction in manufacturing.

Construction spending in December fell 1.4%, which is a bit steeper than the 1.2% decline that was widely expected. The drop in December indicates an accelerated decline from the 1.2% decline registered in the prior month. DJ30 -64.11 NASDAQ +18.01 SP500 -0.45 NASDAQ Dec/Adv/Vol 1248/1451/2.02 bln NYSE Dec/Adv/Vol 1656/1378/1.33 bln

4:08PM Tessera Tech beats by $0.04, beats on revs; guides Q1 revs below consensus (TSRA) 10.60 -1.16 : Reports Q4 (Dec) earnings of $0.16 per share, $0.04 better than the First Call consensus of $0.12; revenues rose 30.3% year/year to $69.1 mln vs the $67.9 mln consensus. Co issues downside guidance for Q1, sees Q1 revs of $54-$58 mln vs. $58.66 mln consensus. Co states, "We remain committed to protecting our intellectual property and leveling the playing field for our customers. Our IP protection efforts in 2008, which included litigation and compliance efforts, resulted in increased royalty payments from various licensees..."

10:22AM Canadian Solar opens new research center and signs agreements with R&D organizations (CSIQ) 5.22 -0.24 : Co announces the opening of its new PV Cell Research Center. Co has signed research partnership contracts with DuPont, University of Toronto and Shanghai Jiao Tong University. The 1500 M2 facility will cost a total of USD $10 million, with the bulk of the expenditures paid in 2008.

8:39AM On the Wires : Micron Technology (MU) and MOSAID Technologies announce that the companies have entered into agreements whereby Micron will license MOSAID's patent portfolio and MOSAID will acquire 400 Micron patents. The agreements settle all of the pending litigation between the companies... pSivida (PSDV) announces that Paul Ashton has been named President and Chief Executive Officer.

:10AM DSP Group misses by $0.02, misses on revs (DSPG) 6.51 : Reports Q4 (Dec) earnings of $0.15 per share, excluding non-recurring items, $0.02 worse than the First Call consensus of $0.17; revenues fell 16.0% year/year to $71.6 mln vs the $76.6 mln consensus.

7:09AM Global semiconductor sales fell by 2.8% in 2008 : Global sales of semiconductors were severely impacted by the world-wide economic turmoil in 2008 resulting in the first year-on-year drop in sales since 2001, the Semiconductor Industry Association reported. Total sales for 2008 were $248.6 billion compared to $255.6 billion in 2007, a decrease of 2.8%. Sales fell from $22.3 billion in December 2007 to $17.4 billion in December 2008, a decline of 22%. December sales declined by 16.6% from November 2008 when sales were $20.9 billion. "The global economic recession severely dampened semiconductor sales in the fourth quarter of 2008, historically a strong quarter for the industry," said SIA President George Scalise. "Weakening demand for the major drivers of semiconductor sales - including automotive products, personal computers, cell phones, and corporate information technology products - resulted in a sharp drop in industry sales that affected nearly all product lines. Once again, the steepest revenue declines were in the memory sector where price pressure more than offset significant growth in total bit shipments."

icon url

ReturntoSender

02/03/09 10:41 PM

#8446 RE: ReturntoSender #6755

From Briefing.com: 4:30 pm : Market participants had to wade through a heavy flow of earnings announcements this morning. None of the reports inspired an immediate change in sentiment, though, leaving stocks to trade in mixed fashion for much of the session. Still, the major indices were able to put together a broad-based advance and finish with strong gains.

Merck (MRK 30.24, +1.81) and Schering-Plough (SGP 18.91, +1.44) each announced this morning better-than-expected earnings results, driving pharmaceutical stocks 2.8% higher. Archer Daniels Midland (ADM 27.65, +0.15), Emerson Electric (EMR 33.60, +1.90), Automatic Data Processing (ADP 39.04, +2.40), and Tyco (TYC 24.27, +3.93) also beat earnings estimates. The reports seemed to help their stocks more than the broader market.

Investors also got their share of disappointments. UPS (UPS 45.00, +2.58), Dow Chemical (DOW 11.35, +0.30), Aflac (AFL 22.63, -0.40), SanDisk (SNDK 8.66, -2.62), Avon Products (AVP 21.00, +1.66), Motorola (MOT 4.04, -0.50), and PNC Financial (PNC 29.85, -2.33) all failed to meet analysts' earnings estimates.

With many big banks and financial institutions having already reported quarterly results, PNC's announcement gave investors a reminder that the financial sector remains strained. As such, investors await further clarity regarding government-led initiatives to help restore the financial system and, in turn, the broader economy. Some expect the government will create a "bad bank" to purchase distressed assets from banks to help protect against further losses. That would require the government to set a price for distressed assets, which could risk rewarding banks at taxpayers' expense, or drive further capital raises to offset write-downs if prices are too low.

The government may also be considering guarantees or loss sharing agreements, which would limit the toll of write-downs on banks' balance sheets. That could require banks to sell a stake to the government, which could further dilute shareholders. If the government takes a preferred stake, banks may be forced to issue special dividends that also drain their capital.

Investors remain mindful that any such plan will have its share of consequences. So it is doubtful that any plan will immediately drive the financial system to recovery. Still, investors anxiously await further detail, which is expected to be announced early next week.

In the meantime, Treasury released details announcing it invested approximately $1.15 billion in 42 banks as part of the Capital Purchase Program. The plan is aimed at helping banks meet lending needs and keeping credit flowing. Citigroup (C 3.46, -0.19) announced its own plans to increase lending. The financial supermarket will use roughly $36.5 billion of the TARP funds it has received for new loans.

Investors also continue to await another fiscal stimulus plan. Reports surfaced midafternoon indicating Republican Senators are crafting proposals to add to the package. One such feature is a temporary reduction in the corporate tax rate.

Automakers continue to struggle. Ford (F 1.96, +0.08) announced January sales declined approximately 40% year-over-year, while General Motors (GM 2.85, -0.04) reported a near 51% year-over-year drop in January sales. Toyota Motor (TM 65.59, +1.71) reported that January sales decreased more than 34% from the prior year.

Nine of the 10 S&P 500 sectors were able to register a gain as stocks closed a bit off their session highs. Financials (-2.5%) were the only sector to post a loss. The broader market's advance was bolstered by a late lift in trading volume. Trading volume had been light for much of the session, reflecting investors' apathy amid a lack of market-moving headlines. Nearly 1.4 billion shares traded hands on the NYSE this session, but that is still below the 50-day moving average.

Economic data was light this session. The National Association of Realtors reported that pending home sales increased 6.3% in December, exceeding the consensus estimate, which called for a flat reading. The hike in pending sales reflects the helpful impact of lower mortgage rates and prices. Tomorrow's economic calendar features the January Challenger Jobs Report and the January ADP Employment report. The January ISM Service Index is also due tomorrow morning.DJ30 +141.53 NASDAQ +21.87 NQ100 +1.7% R2K +0.7% SP400 +0.8% SP500 +13.07 NASDAQ Dec/Adv/Vol 1146/1524/2.09 bln NYSE Dec/Adv/Vol 1166/1841/1.35 bln

4:03PM Pericom Semi beats by $0.03, beats on revs; guides Q3 revs below consensus (PSEM) : Reports Q2 (Dec) earnings of $0.07 per share, $0.03 better than the First Call consensus of $0.04; revenues fell 24.6% year/year to $30.7 mln vs the $29.9 mln consensus. Gross margin was 34.9%, down from 36.4% last quarter, and down from 36.9% in the comparable period last year Co issues downside guidance for Q3, sees Q3 revs of $23-26 mln vs. $27.70 mln consensus. Gross margins are expected to be in the 33.0% to 34.5% range.

7:09AM Motorola misses by $0.01, reports revs in-line; guides Q1 EPS below consensus; suspends dividend (MOT) 4.54 : Reports Q4 (Dec) loss of $0.01 per share, ex-items, $0.01 worse than the First Call consensus of ($0.00); revenues fell 26.0% year/year to $7.14 bln vs the $7.15 bln consensus. Co issues downside guidance for Q1, sees EPS of ($0.12)-($0.10) vs. ($0.06) consensus. MOT is implementing cost-reduction actions of approximately $1.5 billion for 2009 and is suspending their quarterly dividend. Q4 mobile devices sales were $2.35 bln; shipped 19.2 mln handsets. Co also announces that Edward Fitzpatrick, senior vice president and corporate controller, has been named to the additional role of acting CFO, effective immediately, replacing Paul Liska, former CFO. The company has initiated a search to identify a replacement.

08:10 am SanDisk (SNDK)

Flash memory company SanDisk (SNDK 11.33) reported a steep loss as the company continues to deal with shrinking demand for its products.

For the fourth quarter, SanDisk reported a non-GAAP loss of $1.65 per share, excluding nonrecurring items, $1.05 worse than the First Call consensus that expected a loss of $0.60 per share.

Revenues plummeted 30.6% year-over-year to $864 million compared to the $766.7 million consensus.

Underscoring the rapid drop off in demand, average price per megabyte sold in the fourth quarter declined 70% on a year-over-year basis and 28% from the third quarter.

SanDisk's CEO said, "We are very disappointed with our fourth quarter bottom line results, which included significant asset impairment and inventory related charges. We are focused on managing our business through the difficult global economic climate and limited visibility in 2009. We are taking significant steps to curtail our captive output, conserve cash, and reduce capital and operating expenditures."

On the company's conference call, SanDisk issued downside revenue guidance for Q1, expecting revenue between $475 million and $575 million, well below the current consensus of $631.7 million. SanDisk also said it sees substantial gross margin loss in the quarter and will run output at approximately 70% of capacity.
icon url

ReturntoSender

02/05/09 9:16 PM

#8448 RE: ReturntoSender #6755

From Briefing.com: 4:38PM Skyworks beats by $0.02, reports revs in-line; guides Q2 EPS in-line, revs below consensus (SWKS) 5.02 +0.11 : Reports Q1 (Dec) earnings of $0.17 per share, excluding non-recurring items, $0.02 better than the First Call consensus of $0.15; revenues fell 0.1% year/year to $210.2 mln vs the $211.2 mln consensus. Co issues mixed guidance for Q2, sees EPS of $0.10-0.11 vs. $0.10 consensus; sees Q2 revs of $168.0 vs. $189.71 mln consensus. "The ongoing inventory contraction is exacerbating traditional market seasonality, and as a result, we believe the supply chain sell-in will decline 20 to 30 percent sequentially in the March quarter. Against this backdrop, we are forecasting our revenue to decrease 20 percent sequentially."

4:33PM Multi-Fineline beats by $0.05, reports revs in-line; guides Q2 revs below consensus (MFLX) 19.02 -1.00 : Reports Q1 (Dec) earnings of $0.56 per share, $0.05 better than the First Call consensus of $0.51; revenues rose 17.6% year/year to $216.6 mln vs the $215.3 mln consensus. Co issues downside guidance for Q2, sees Q2 revs of $170-190 mln vs. $200.58 mln consensus. Co says, "We remain concerned regarding the potential impact that a prolonged economic slowdown could have on customer demand, and recently we have begun to see softness in customer orders. While our second quarter net sales projections reflect expected year-over-year growth, we currently expect a sequential decline due in part to the economic downturn and in part due to the seasonal effect of the December holidays and the Chinese New Year in January."

4:31PM Lattice Semi appoints Michael Potter Corporate Vice President and CFO (LSCC) 1.55 +0.07 : The co announces that it has appointed Michael Potter as its Corporate Vice President and Chief Financial Officer effective February 17, 2009. Potter was most recently Senior Vice President and Chief Financial Officer of Neophotonics.

4:18PM Ixia misses by $0.01, reports revs in-line (XXIA) 5.53 +0.26 : Reports Q4 (Dec) earnings of $0.02 per share, $0.01 worse than the First Call consensus of $0.03; revenues fell 11.6% year/year to $41 mln vs the $41 mln consensus.

4:17PM Intl Rectifier reports Q2 (Dec) results, revs in-line; guides Q3 revs below consensus (IRF) 14.09 +0.27 : Reports Q2 (Dec) loss of $2.56 per share, includes a $48.9 million asset impairment charge for the Company's Newport, Wales fabrication facility, a $10.3 million investment impairment charge primarily related to long-term investments to reflect the decline in fair market value of the Company's mortgage- and asset-backed securities, and a $102.5 million tax provision charge related to reserves that have been recorded against the Company's tax assets, may not be comparable to the First Call consensus of ($0.15); revenues fell 25.9% year/year to $175.8 mln vs the $176.8 mln consensus. Co issues downside guidance for Q3, sees Q3 revs of $115-150 mln vs. $162.95 mln consensus.

4:15PM Silicon Image beats by $0.21, beats on revs; guides Q1 revs below consensus (SIMG) 2.99 +0.13 : Reports Q4 (Dec) earnings of $0.21 per share, excluding non-recurring items, $0.21 better than the First Call consensus of ($0.00); revenues fell 30.4% year/year to $59.4 mln vs the $56.7 mln consensus. Co issues downside guidance for Q1, sees Q1 revs of $40-45 mln vs. $51.67 mln consensus, sees Q1 gross margin of 56% - 57%. "We focused on development of our technology to expand the breadth of our product offering, and the continued improvement of the efficiency of our operating model by enhancing our gross margin and lowering operating expenses. During the last twelve months, we have introduced industry-leading new technology developments such as Mobile High-Definition Link and LiquidHD along with supporting products. Going forward we are well positioned to grow revenue and earnings when the economy and the consumer electronics industry rebound."

4:12PM MEMC appoints Ahmad Chatila Chief Executive Officer effective March, 2, 2009 (WFR) 14.58 +0.58 : Co announces the appointment of Ahmad Chatila as President and Chief Executive Officer, effective March 2, 2009. Mr. Chatila will also become a member of MEMC's Board of Directors. Marshall Turner, who has served the company as Interim CEO since November 2008, will continue as a member of MEMC's Board of Directors.

4:09PM Rudolph Tech beats by $0.04, misses on revs (RTEC) 3.38 +0.02 : Reports Q4 (Dec) loss of $0.08 per share, ex-items, $0.04 better than the First Call consensus of ($0.12); revenues fell 57.9% year/year to $16.4 mln vs the $17.8 mln consensus.

4:07PM Cohu misses by $0.01, beats on revs; Board approves cash dividend (COHU) : Reports Q4 (Dec) loss of $0.17 per share, $0.01 worse than the First Call consensus of ($0.16); revenues fell 27.5% year/year to $41.4 mln vs the $39.5 mln consensus. Orders for the fourth quarter of 2008 were $34.4 million compared to $46.0 million for the third quarter of 2008. Orders for semiconductor equipment decreased to $21.0 million in the fourth quarter of 2008 from $31.0 million in the third quarter of 2008. Backlog was $46.6 million at December 27, 2008 compared to $52.0 million at September 27, 2008. Backlog and orders include amounts associated with Rasco and were $1.8 million in orders received after December 9 and $2.8 million in year end backlog. Cohu expects first quarter 2009 sales to be approximately $33 million. Cohu's Board of Directors approved a quarterly cash dividend of $0.06 per share payable on April 24, 2009 to shareholders of record on March 10, 2009. Cohu has paid consecutive quarterly cash dividends since 1977.

4:02PM Magma Design Automation announces cost-cutting actions expected to save $20 million (LAVA) 1.32 +0.18 : Co announces a series of actions designed to reduce operating costs, including a 17 percent cut in worldwide employment, salary reductions and consolidation of some facilities. These measures, initiated in the third and fourth quarters of Magma's fiscal year 2009, are expected to reduce total annual costs by approximately $20 mln in fiscal year 2010. In connection with these measures, Magma expects to record restructuring charges ranging from $2.75 mln to $3.75 mln in its fiscal 2009 third quarter, ended Feb. 1, 2009. In addition to reducing employment levels, Magma instituted a 20 percent salary reduction for senior management during the third quarter, followed by a smaller salary reduction for most other employees. Magma closed two sales and support offices in North America and one in Europe, and plans to consolidate its Beijing, China, operations into a single facility and its Shanghai, China, operations into a single facility.

4:30 pm : Stocks put together a fairly strong rebound Thursday. Financials spurred the advance as investors bought into the idea that the government's forthcoming plan to shore-up banks could provide an impetus for a rally.

Financials were down as much as 4.7% in the early going, but managed to climb to a gain of 4.1% after analysts at UBS stated that bank bailout news could induce sizable rallies. Senate Banking Chairman Dodd told reporters it might be possible to modify its mark-to-market rules, which would be a boost to banks hurt by write-downs. Financials finished the session 1.4% higher.

Reuters cited a Treasury official when it reported Treasury Secretary Geithner is expected to unveil a comprehensive financial framework plan Monday. With the government progressing toward a comprehensive plan to help restore the financial system, investors were willing to look past mixed earnings and economic data that had actually put stocks under pressure in the early going.

Cisco (CSCO 16.35, +0.51) topped quarterly earnings expectations, but disappointed investors when it issued downside revenue guidance. Cisco was able to rebound with the help of other large-cap tech stocks. Large-cap tech led the Nasdaq in outperforming the other headline indices.

Visa (V 53.74, +4.61) and MasterCard (MA 159.84, +19.69) both announced better-than-expected quarterly earnings and optimistic forecasts. However, analysts question whether they card companies can continue growing their earnings at rapid rates amid a pullback in consumer activity.

Softer consumer spending prompted numerous retailers to issue cautious forecasts amid lower January same-store sales. However, many retailers' comparables were not as bad as feared, which induced gains in the group. The S&P 500 Retail Index finished 3.3% higher. Meanwhile, Wal-Mart (WMT 48.56, +2.14), BJ's Wholesale (BJ 29.56, -0.70), Aeropostale (ARO 22.81, +1.68), and The Buckle (BKE 23.36, +1.61) distinguished themselves by reporting same-store sales increased.

Weekly initial jobless claims were up for the fourth straight week, this time climbing 35,000 to 626,000 for the week ending Jan. 31. The number exceeded the 580,000 claims that were expected, and was the highest level since 1982. The shock from such heightened claims is tempered by the knowledge that the workforce has grown in recent decades. For that reason, some economists do not believe the unemployment rate will break into the double digits -- the government's official jobs report is due ahead of Friday's opening bell.

The drop in employment actually helped inflate fourth quarter productivity. Since hours worked has fallen at a faster clip than economic output, fourth quarter productivity increased 3.2%. An increase of 1.5% was expected.

Meanwhile, soft economic conditions are undercutting inflationary pressures. Fourth quarter unit labor costs increased 1.8%, which is less than the consensus forecast of a 2.8% increase.

Trading volume hit a two-week high this session, exceeding 1.6 billion shares on the New York Stock Exchange. All 10 of the S&P 500 sectors finished higher.DJ30 +106.41 NASDAQ +31.19 NQ100 +2.4% R2K +1.5% SP400 +1.6% SP500 +13.62 NASDAQ Adv/Vol/Dec 1735/2.15 bln/945 NYSE Adv/Vol/Dec 1947/1.63 bln/1088

08:10 am Cisco Systems (CSCO)

Cisco Systems (CSCO 15.84) surprised Wall Street with better-than-expected earnings and revenue for its fiscal second quarter, although earnings and revenue slipped year-over-year.

The San Jose, Calif.-based network equipment maker reported earnings of $0.32 per share, excluding nonrecurring items, $0.02 better than the First Call consensus of $0.30. Cisco's earnings per share declined 15.8% year-over-year.

Revenues fell 7.1% year-over-year to $9.1 billion, slightly ahead of the $9.0 billion consensus.

Gross margins game in at 63.0%, behind the company's guidance of 64%.

During the quarter, Cisco repurchased 37 million shares of common stock for an aggregate purchase price of $600 million. The company has $6.8 billion remaining in its repurchase plan, with no termination date.

Cisco generated $3.2 billion in cash flows in the quarter, up from $2.4 billion in the same period a year ago and higher than the $2.7 billion in the company's fiscal first quarter.

On its earnings conference call, Cisco said it expects revenue for the current quarter to drop between 15% and 20% year-over-year. The guidance equates to revenues between $7.83 billion and $8.32 billion, well behind the $8.71 billion consensus.
icon url

ReturntoSender

02/06/09 2:05 PM

#8449 RE: ReturntoSender #6755

SMH; I am actually considering that due to the failure of volume to expand here as a sign of this being a false breakout.

There are other negative divergences too but who knows?

icon url

ReturntoSender

02/08/09 7:31 PM

#8454 RE: ReturntoSender #6755

InvestmentHouse Weekend Market Summary:

http://www.investmenthouse.com/weekendmarketsummary.htm

- Market looks past jobs to bank bailout package next week, puts an exclamation point on the recovery rally.
- Lots of rally converts after Friday. Seen it before, and we made a lot of money as a result.
- Jobs purportedly give Congress more motivation and supposedly a compromise is reached.
- Signs of improvement amidst signs of implosion.
- Looking for a pullback before the next run but will need some selling on the news to blunt the new found momentum.

NASDAQ 100 posts a higher high, leads market through jobs report and toward bank bailout announcement.

The jobs report was terrible at -598K but with all the gloom and worry about the economy, the whisper was again well over 600k. On top of that an additional 311K jobs were added to 2008 via downward revisions, ballooning the 2008 losses to 2.97M. Bad, but not as bad as the 500M jobs Speaker of the House Pelosi says will be lost if the spending bill is not passed (someone tell her the US population is just 305M; must be a hell of a lot of undeclared workers out there). Kidding aside, this was the most since the 1970's and shockingly, half of the 2008 losses occurred in Q4. The plunge after the credit crisis is staggering. LIBOR wasn't any better though it wasn't worse. Not great news but then again, not worse than imagined.

That data was countered by China announcing another major stimulus plan. Commodities, particularly copper, surged in response. Futures were somewhat below fair value but rose into the open despite the bad news, and by the bell were positive. Stocks gapped higher at the open, shot higher quickly, and then kept on heading higher. During the session definitive news came out regarding the bank bailout to come. An announcement would come at noon Monday and would include a 'bad bank' to buy bad assets. In addition, some foreclosure mitigation measures are to be announced later in the week. That kept the upside burn as investors anticipate the aid to come. 3% gains on solid volume capped a week of upside.

For the week there were key developments. Of course the market rallied, putting in a higher low and some higher highs on NASDAQ 100, NASDAQ and SOX. Commodities jumped with copper rising 15%. Nickel prices (used in stainless steel) surged. Oil is holding its recent lows, looking as if it has put in a bottom for now. Bond yields are up, a historical indication of improving economics. The 2 year bond closed at 1.00%; not long ago it was trading at 0.2%. There is some inflation fear mixed in there as well, but that is not the only reason yields are rising. There was even some good company news. GLW, flat panel maker, sees demand rebounding in Q2. Retail same store sales were down but better than expected with even some upside guidance.

TECHNICAL. Intraday action saw a straight run higher. The afternoon stalled the move but it did not stall the gains as the indices closed near session highs. This caps a week of much better intraday action, but it was late in the week that improvement showed up. Okay, we will take it.

INTERNALS. Excellent upside breadth at 4.9:1 on NYSE, 2.9:1 on NASDAQ. Volume slipped after the strong Thursday trade, but it was still strong and still well above average. Very good upside trade to close out the week and accompany some important price moves. Again many were calling this short covering and there was no doubt some short covering once the market started moving higher. As noted Thursday, however, there was positive price/volume action in a broad range of leaders and that means they were under accumulation. Add in the indices were in 4 month consolidations and showing improving price/volume action that says there is long term buying ongoing. Positives.

CHARTS. Thursday NASDAQ 100 moved to a higher high, leading the way for the rest of the market. Friday it was on point again, moving past the January closing high. Very solid. NASDAQ followed, clearing the late January high and the December closing highs. SOX blew past 225 marking the December peak. Solid action in techs. NYSE was up but from where it came from it could not match the techs. SP500, DJ30 and SP600 all finally moved past the October low. No higher highs, no change in character. The question ahead is whether they will tag along or end up as anchor chains. With some key financials moving up as well (GS, MS, regionals) there is some upside pull. All in all the developments are a big positive. The indices put in a very solid and somewhat lengthy lateral consolidation, weathering bad headline after bad headline, weak earnings reports, and political nonsense. Just about when the frustration was too much to take with the selloff after the follow through session in late December (and indeed it was for many), the market breaks higher showing great fundamentals.

LEADERSHIP. Part of that nice consolidation was the leadership. It had its ups and downs, but through the consolidation it mostly held on. When the follow through was roughed up some took on water and went under. Most held their patterns, repaired any damage, and this week broke higher ahead of the rest of the market just as leaders should. Moreover there was diversity. Key financials were up, early tech leaders had rested and then took the lead again. Metals, energy, industrials - - the 'over there' trades from 2007 - - showed life once more as well. Good moves all around .

Use your head, not your gut.

The following discussion is intended to demonstrate a point about watching what the market is actually telling you, the signposts it leaves along the way, regardless of what your emotions or the emotions of the now many financial stations and news stations fan within you. It is not intended as a bragging session about seeing a good bottom shape up. It has just been a gratifying week to see the moves after hanging tough during the trying times, and all of you who hung in as well took a huge step to becoming seasoned investors. Congratulations.

After Friday there were a lot of converts to the rally, extolling the virtues of the market. Many, as late as Friday morning, were still saying it was the same old bear market. Recall that Thursday evening some were saying the move was not broad, something a scan of market movers would have shown incorrect. After Friday many were jumping on the bandwagon. After a week of upside, Thursday's break higher by NASDAQ 100, and Friday's surge by the techs, some finally saw the good moves. Cramer was one of the negative ones even after Thursday. At least Friday when he extolled the virtues of the move he admitted he had been down on the market. Hey, maybe we really are going into full recovery if Cramer will admit it was not he that single handedly turned the market, the economy, an asteroid heading directly toward earth, etc. Kind of makes you worried when they all buy into the move after it has rallied for a week. Lends some credence to our view, discussed later, that some giveback next week when rumor turns to fact will likely occur.

It is easy to poke fun at them as we watched them buy our stocks and send our positions higher and higher. In reality it is not easy to cut away the emotions, the frustration of a long consolidation that seems to undermine each positive move. That, however, is the key to market success. Things were dicey. We said each night the indices had a big hole to dig out of. The underpinnings were improving but it is a long struggle not only for the market but for us as investors. Fighting off the frustration is tough. That is how it is at inflection points. Many pundits were talking with their gut feelings and not looking rationally and coolly at what the market was showing us.

We said there was still a lot to prove, but that there were high caliber stocks setting up good bases and consolidations and indeed moving higher. Price/volume action was improved. A higher low was put in and attempting to be cemented. Dicey yes, uncertain for sure. But instead of letting emotion control we looked at what the indices were showing (e.g. NASDAQ and SOX relative strength) and what the leaders were showing (and there were leaders).

Most importantly, not only did we see this, we did not let our emotions dissuade us from putting our money to work. We bought the leaders as they flashed the 'buy me' sign. Not just a day, but a series of buys over time as they set up and broke out. Thus on Friday we were letting the rest of the investors push our stocks and options higher, making us money. We took a lot of gain. We didn't' buy anything. We could have, but after five upside sessions and a Friday gap higher we knew we should focus on locking in some gains and then picking up new positions after the rush higher on the rumor of a bank bailout and stimulus deal became fact and profits were taken. Then we can move back in as others sell, picking up stocks that gapped away from us at a better price and be in position for the next move upside after the test.

We have seen this before in other market bottoms. We talked about it a couple of months ago as we compared the 2002 through 2003 bottom. Remember we said people were getting frustrated and selling out because the market was going nowhere? It was building a base, consolidating while showing good price/volume action and great improvement in leadership. After getting beaten up since Q4 2007, however, it is hard to overcome the notion this is just another blip in the bear. Nonetheless we saw what the market was showing and we were buying even though you wanted to keep the Pepto on the desk with you. But we had seen this before and knew it had real potential. Thus we kept calm and bought leaders as the broke higher, and Friday we were reaping some reward.

Cool thing is, now all of the converts are saying the rally will continue to surge. As noted above that likely means there is a test to come early in the week when rumor becomes fact, and after the first of the week pullback we can step in and buy good stocks that we passed on Friday at better prices than we could get chasing the gap higher.

THE ECONOMY

Jobs really bite, get some republicans to knuckle under and favor the spending bill.

The jobs report with its outsized losses was simply sauce for the goose. Stimulus fever is already all over DC and it is now, as reported Thursday, more a political issue than economic concern. Each side wants its type of stimulus. The democrats want spending and bigger government while the newly reformed republicans want to block bigger government (apparently figuring they made it big enough under Bush) and leave more money with those who earn it and make the jobs and the products and services that make economy go.

It has finally come down to just a partisan push. The usual fence sitting republicans (Collins and Specter) were swayed by cutting the bill back down to the size the House proffered (remember that the Senate boosted it close to $1T), feeling they did something important by keeping it the same size. Interestingly Olympia Snow, usually an easy convert, was a holdout but finally conceded though she did not join in on the self indulgent back patting in front of the cameras. Many republicans gave up because they realized it had become a political objective after Obama woke up and realized that the stimulus was not going to pass even with his senate majority given the Pelosi bill was so loaded with partisan crapola ($50M to ACORN; couldn't get it in the TARP so lets put it in the stimulus bill, right?) that nearly everyone in the US outside of DC was turning against it.

When it became political it was over because of the majorities in Congress. Throw Specter and Wilson a bone so they could get in front of the cameras and proclaim how they had come together and built a consensus (as if all democrats and 2 republicans a consensus be) and you have your bill. Of course a consensus to jump off a cliff doesn't make it a good decision now does it? They claim the senate version is 42% tax cuts now, but what kind of cuts? Not all tax cuts are equal, and from what we see there are none of the 'use it or lose it' tax incentives needed to get people to actually spend the money on things that lead to capital investment and thus economic growth that produces lasting jobs. Friday evening the talk shows were filled with the spending plan supporters fending off those wanting more tax cuts. Heard yet another one say that tax cuts were discredited as a means of stimulus. Hmmm. Early 2003 saw the second round of Bush tax cuts and these had the right kind of tax cuts, i.e. incentives to invest in the US. The stock market surged off the Q1 test of the October to December rally off the low almost to the day the taxes were passed. That was in anticipation of the quick impact of these tax incentives. If they did not work then why did Q3 GDP explode 7.4% higher? Discredited? How about proved?

Anyway, figured there was a snowball's chance in hell of getting a real stimulus bill out of Pelosi's 'everything you ever wanted to pass but couldn't without a crisis bill to sneak stuff in' spending package. What can you expect from someone who says 500M jobs will be lost by the 300M total people living in the US? Sad that we are going to shoot the money down the hole. As some are saying on the radio talk shows now, the only way to stop the runaway government started by the Bush administration and already accelerating under Obama is to cut off the funds with everyone choosing not to participate in our so-called voluntary income tax system. Stop feeding the fat man as Ronald Reagan said about our federal government.

Of course the feds act just as things appear to be turning.

Pretty much on cue the government gets the fever pitch to push stimulus just as things appear to be turning. Surely I am joking, right? I mean all of the headlines discuss the downward economic spiral that is heading to Depression. Obama said without the bill we faced economic 'catastrophe.' I posit that with the bill we are in greater jeopardy because it could stall the economic bounce that is trying to occur right now thanks to the fed sucking money out of the private sector into government programs that massively expand the federal government, not just temporarily, but permanently.

How could things be better given the bad headlines? ISM services is up two straight months. Regional PMI manufacturing reports are showing the volatility and bounces that appear at turns. Despite the reportedly horrid retail environment, same store sales did not collapse as anticipated and indeed many retailers affirmed guidance or in many cases actually guided higher. Friday GLW, the flat panel maker, said that it saw a bounce for Q2. On top of that you have swap spreads narrowing. Bond yields are rising. That can signal inflation worries given all of the free and easy spending, but with all of the other improving indications, it is clearly reflecting an improving outlook. The commercial paper market is improving. Oil and commodities prices appear to have bottomed. Overseas stocks in China and elsewhere are jumping once more.

These are all leading indicators. As with the market over the past several weeks the data is still dicey and there is still a long way to go, but there is improvement in areas that historically have indicated economic turns coming. As is historically the case as well, Congress is focusing on lagging indicators, e.g. jobs. Not that the right kind of stimulus would not hurt. Some of those Reagan tax credits for investment in the US would be very timely. Problem is, since Reagan no one in the Presidency has understood what makes a free enterprise economy great. Clinton at least didn't kill it immediately, buying time with his capital gains tax cuts after raising marginal rates. He did kill it, however, with the pay down of debt, bleeding money from the economy. Bush didn't get it. He did some good in 2003 but he grew government dramatically, undoing any good he may have started. The ignorance train continues with Obama. It may take another 20 years to dig out of this hole we are digging.

THE MARKET

MARKET SENTIMENT

VIX: 43.37; -0.36
VXN: 41.95; -1.35
VXO: 42.79; +0.08

Put/Call Ratio (CBOE): 0.71; -0.04

Bulls versus Bears:

This is a reading of the number of bullish investment advisors versus bearish advisors. The reason you look at this is that it gives you an idea of how bullish investors are. If they are too bullish then everyone is in the market and it is heading for a top: if everyone wants to be in the market then all the money is in and there is no more new cash to drive it higher. On the other side of the spectrum if there are a lot of bears then there is a lot of cash on the sideline, and as the market rallies it drags that cash in as the bears give in. That cash provides the market the fuel to move higher. If bears are low it is the same as a lot of bulls: everyone is in and the market doesn't have the cash to drive it higher.

This is a historical milestone in the making. Bulls are impressively low considering we are in general a very optimistic country. The few bulls is a positive indication because it means most everyone that is getting out is out and there is money on the sidelines. In other words the ammunition boxes are full and as the market recovers investors will start opening up the boxes and firing. Little by little they will be forced to put more money into the market and there will be some rushes higher in fear they are missing the train. You relish times when sentiment is so negative because it means some tremendous buys are setting up. This could indeed be the opportunity of a lifetime, and you take advantage of it by buying quality stocks and letting them work for you as long as they will. If we can hold them for years, great.

Bulls: 35.2%. Up from 34.8% the prior week after a one-week move below the 35% threshold considered a bullish indication. Down from 43.0%, the current top of the recovery as the market rallied off the November low. A rise from 25.3% in December and quickly starting to fall once the market encountered the January selling. Above 35% does not mean the action is now bearish. That level is up at 55%. Bullishness bottomed on this leg lower at 21.3% in November 2008. This last leg down showed us the largest single week drop we have ever seen, falling from 33.7% to 25.3%. Hit 40.7% on the high during the rally off the July 2008 lows. 30.9% was the March low. In March the indicator did its job with the dive below 35% and the crossover with the bears. A move into the lower 40's is a decline of significance. A move to 35% is a bullish indicator. This is smashing that. For reference it bottomed in the summer 2006, the last major round of selling ahead of this 2007 top, near 36%, and 35% is considered bullish.

Bears: 36.3%. Falling from 38.0%, the recent peak over the past month as bearishness rose again. Hit the 34's on the lows, falling from 38.5% and 46.2% in mid-December. Still above the 35% level considered bullish for stocks, but as with bulls, still well below the level considered bearish for stocks. Bearishness hit a 5 year high at 54.4% the last week of October. The move over 50 took bearish sentiment to its highest level since 1995. Extreme negative sentiment on this move. 35% is the level that historically indicates excessive pessimism. As with the bulls the jump in bears did its job after hitting 44.7% in the third week of March. Bearishness peaked at 37.4% in September 2007. It topped the June 2006 peak (36%) on that run. That June peak eclipsed the March 2006 high (33%) and well above the 2005 highs that spawned new rallies (30% in May 2005, 29.2% in October 2005). This is a huge turn, unlike any seen in recent history.

NASDAQ

Stats: +45.47 points (+2.94%) to close at 1591.71
Volume: 2.439B (-4.32%)

Up Volume: 2.008B (-131.22M)
Down Volume: 404.602M (-2.966M)

A/D and Hi/Lo: Advancers led 2.88 to 1
Previous Session: Advancers led 1.82 to 1

New Highs: 7 (+2)
New Lows: 62 (-63)

NASDAQ CHART: Click to view the chart

Broke through the 50 day EMA, the December closing highs, and the 90 day SMA though it could not take out the intraday peaks at 1600. A higher high, however, the first in the move since the early January rally fizzled. NASDAQ now has another month under its belt since then and is making another run. Excellent volume and great leadership on this move are lending support.

NASDAQ 100 (+2.60%) broke to a second higher high on this move, clearing the January closing high (1275) and making a new higher high on the rally off the November low. Key move. A leading move. The other indices need to follow.

SOX (+3.56%) cleared the key 225 level that marks the December peak and the late January peak. Higher lows and a higher high. Still the early January peak to clear but running well.

NASDAQ 100 CHART: Click to view the chart

SOX CHART: Click to view the chart

SP500/NYSE

Stats: +22.75 points (+2.69%) to close at 868.6
NYSE Volume: 1.612B (-1%)

Up Volume: 1.48B (+305.064M)
Down Volume: 123.594M (-306.883M)

A/D and Hi/Lo: Advancers led 4.89 to 1
Previous Session: Advancers led 1.86 to 1

New Highs: 34 (+4)
New Lows: 66 (-31)

SP500 CHART: Click to view the chart

Cleared the October closing low and broke into the upper half of the consolidation range. Still well, well below the deeds the techs are pulling off. Heck, even still below the late January peak (878). Lots of work to do and has to drag a lot of the financials with it. Perhaps the banking bill can give it a B-12 injection.

SP600 (+3.59%) broke through the October low as well but it too is below the late January peak, the 50 day SMA, the 50 day EMA, the December peaks . . . you get the picture. Small caps have lagged and that is disappointing as you want to see them starting to take the point given the nascent turn in economic data. The stimulus package is not stimulus for small businesses. No businessman I have interviewed sees anything that will make him or her spend money to expand or promote business. That is the downfall of this plan. Without the jobs providers spending on business and creating more jobs there won't be any serious, lasting job creation. Thus the hesitancy of the small caps.

SP600 Chart: Click to view the chart

SP400 CHART: Click to view the chart

DJ30

Coming off the short double bottom from the January low and the early February low. Volume up the past two sessions, up solidly. Some promise here as it clears the October closing low but as with the other NYSE indices, it is one step at a time with 8500 the next key level and that is just a prelude to serious resistance at 9000 from the December and early January peaks.

Stats: +217.52 points (+2.7%) to close at 8280.59
Volume: 396M shares Friday versus 390M shares Thursday.

DJ30 CHART: Click to view the chart

MONDAY

Monday the plan for the bank bailout is revealed, one of the main reasons the market was rallying to end the week, or at least had the extra hot sauce on the upside surge. A bad bank will be formed to buy up to $500B in assets. With the new restrictions on everything a bank accepting help has to agree to many are going to try and avoid taking any money. GS and MS have already said they are going to get out from under the TARP as fast as they can and they shot higher as a result. They were two of the institutions forced at gunpoint (or is it the Paulson bazooka point?) to take the original TARP funds. I guess we will find out what institutions are really in the crapper because any bank that can avoid it will.

We are concerned that given the solid 5 day rally through Friday and the key breaks over some resistance by the NASDAQ indices, when the rumor of the bank bailout and the spending bill become fact there will be some profit taking. Hence when we had some solid gains on Friday we took them.

With this kind of breakout and explosive upside move there is always the possibility it can just keep going. When NASDAQ broke higher in March 2003 after a 3.5 month pullback to test the initial rally off the low (3.5 month, 4 months just recently) it exploded 12% in 5 sessions with most of the move coming on two days. A similar move would put NASDAQ at 1635 on this move, another 43 points higher or the equivalent of Friday's move. Thus we feel that given the reasons for the break higher and the week of rallying already under the belt that the market is closer to taking a pause than doubling the move already made without one.

The fact that many of the converts Friday night were talking of a continued strong rally is only evidence that there will be a pause. They missed the signs showing the rally was laying its foundation, and now that they missed it they want to get on the bandwagon quickly. Thus we look for a pause once the rumor becomes fact and the great compromise in the senate is revealed to be just another reconfigured spending and welfare bill (i.e. giving tax 'cuts' to those that don't pay taxes).

That will be a dose of reality that will force some profit taking. We watch to see how the stocks hold up, how they come back to test those Friday gaps higher. We anticipate they will fill the gap and/or hold near support in some form and set up new entry points for us. We can position ourselves well once more for the next run higher with this kind of test.

It will be tumultuous once more. One thing this consolidation has shown us is that, despite the ability to absorb bad news and allow good stocks to move higher, it can still throw curves. That is why many did not believe what the market was showing. A break higher by NASDAQ 100 and NASDAQ will tempt some sellers as did the last breakout. Once more we need to keep our wits, let the market test, and then take what it gives us.

Support and Resistance

NASDAQ: Closed at 1591.71
Resistance:
The 90 day SMA at 1591
1603 is the December peak
1620 from the early 2001 low
1644 from August 2003
1666 is the January 2009 peak
1752 from 2004
1782 from August 2004
1786 is the November 2008 high. Key level.
1948 is the early October 2008 gap down level

Support:
1569 is the late January 2009 peak
1565 is the second low in October 2008
The 50 day EMA at 1558
1542 is the early October 2008 low
1536 is the late November 2008 peak
The 50 day SMA at 1530
1521 is the late 2002 peak following the bounce off the bear market low
1493 is the October 2008 low & late December 2008 consolidation low.
1434 is the January low (1440.86 closing)
1428 is the November 2008 low, the bear market low
1398 is the early December 2008 low
1387 is the 2001 low
1295 is the November 2008 low

S&P 500: Closed at 868.60
Resistance:
The 50 day EMA at 877
878 is the late January 2009 peak
889 is an interim 2002 peak
896 is the late November 2008 peak
899 is the early October closing low
The 90 day SMA at 901
919 is the early December peak
944 is the January 2009 high
965 is the 2003 consolidation low
995 from June 2003 consolidation peak
1008 is the November 2008 peak
1065 is the Q4 2003 level that SP500 started the run to 2007 after the first run in the recovery.

Support:
866 is the second October 2008 low
857 is the December consolidation low
853 is the July 2002 low
The 18 day EMA at 850
848 is the October 2008 closing low
The 10 day EMA at 846
839 is the early October 2008 low
818 is the November 2008 low
815 is the early December 2008 low
804 is the low on the January 2009 selloff
800 is the March 2003 post bottom low
768 is the 2002 bear market low
741 is the November 2008 low

Dow: Closed at 8280.59
Resistance:
8419 is the late December closing low in that consolidation
8451 is the early October closing low
The 50 day SMA at 8467
The 50 day EMA at 8477
8521 is an interim high in March 2003 after the March 2003 low
8626 from December 2002
The 90 day SMA at 8700
8829 is the late November 2008 peak
8934 is the December closing high
8985 is the closing low in the mid-2003 consolidation
9088 is the January 2009 peak
9200 is the July peak in the 2003 consolidation
9323 From June 2003 peak
9575 from September 2003, May 2001
9654 is the November 2008 peak

Support:
8197 was the second October 2008 low
8175 is the October 2008 closing low. Key level to watch.
8141 is the early December low
The 10 day EMA at 8128
7965 is the mid-November 2008 interim intraday low.
7909 is the January low
7882 is the early October 2008 intraday low. Key level to watch.
7702 is the July 2002 low
7524 is the March 2002 low to test the move off the October 2002 low
7449 is the November 2008 low
7282 is the October 2002 low

Economic Calendar

These are consensus expectations. Our expectations will vary and are discussed in the 'Economy' section.

February 6 - Friday
- January Average Workweek (8:30): 33.3 actual versus 33.3 expected, 33.3 prior
- Hourly Earnings, January (8:30): 0.3% actual versus 0.2% expected, 0.4% prior (revised from 0.3%)
- Nonfarm Payrolls, January (8:30): -598K actual versus -540K expected, -577K prior (revised from -524K)
- Unemployment Rate, January (8:30): 7.6% actual versus 7.5% expected, 7.2% prior
- Consumer Credit, December (14:00): -$6.6B actual versus -$3.5B expected, -$11.0B prior (revised from -$7.9B)

February 10 - Tuesday
- December Wholesale Inventories (10:00): -0.7% expected, -0.6% prior

February 11 - Wednesday
- December Trade Balance (8:30): -$37.0B expected, -$40.4B prior
- Crude Oil Inventories, 2/06 (10:35): 7.2M prior
- Treasury Budget, January (2:00): -$75.0B expected, -$83.6B prior

February 12 - Thursday
- 02/07 Initial Jobless Claims (8:30): 610K expected, 626K prior
- Retail Sales, January (8:30): -0.3% expected, -2.7% prior
- Retail Sales ex-auto, January (8:30): -0.4% expected, -3.1% prior
- Business Inventories, December (10:00): -0.6% expected, -0.7% prior

February 13 - Friday
- February Preliminary Michigan Sentiment (9:55): 61.5 expected, 61.2 prior
icon url

ReturntoSender

02/09/09 10:25 PM

#8455 RE: ReturntoSender #6755

From Briefing.com: 4:25 pm : Stocks closed a relatively quiet session modestly higher as market participants continue awaiting Treasury's bank rescue plan. Though the advance was only modest, the takeaway from this session is largely positive.

Investors were made to wait one more day for Treasury's bank bailout plan. The plan will be announced at 11:00 AM ET Tuesday.

Though less likely to have an immediate impact on the financial sector or capital markets, market participants are also still waiting for the Senate to pass the more comprehensive economic recovery plan. Senators are expected to vote on an $827 billion spending and tax cut plan early this week. The plan still has to be reconciled with that which was already approved by the House of Representatives.

Financial stocks continue to benefit as investors move into the sector ahead of tomorrow's announcement from Treasury. The financial sector closed 1.3% higher with leadership from diversified financial services companies (+2.3%) and regional banks (+4.0%). Insurers (+5.1%) also showed strength after Treasury indicated insurers will have access to TARP funds.

Shares of General Electric (GE 12.64, +1.54) made their best-single session gain in years. There wasn't a particular news item underpinning the move, but many analysts point to the exposure of the firm's capital business to financial markets as a reason for the renewed interest. GE provided support to the Dow, S&P 500, and industrial stocks, which bested every other sector with a 2.6% gain.

Energy (+0.1%) and technology (+0.3%) were able to finish in the green.

Energy advanced even though crude oil futures prices closed 1.8% lower at $39.42 per barrel. Crude had been up as much as 5.6% after officials from OPEC indicated supply cuts could take place. Despite lower oil prices, select oil and gas equipment companies gained after Reuters reported analysts at Goldman Sachs issued upgrades on certain industry players. As a group, oil and gas equipment companies finished 0.8% higher.

Large-cap tech provided continued strength to the tech sector and the Nasdaq 100 (+0.3%). Their influence limited losses in the broader Nasdaq Composite (unch.), helping it preserve its year-to-date gain of 0.9%.

Earnings news was rather light and had little impact on the session's mood. Whirlpool (WHR 37.13, +0.74) announced lower earnings that were partly weighed down by charges. The company also issued downside guidance. Rohm and Haas (ROH 56.28, -0.22) announced better-than-expected fourth quarter adjusted earnings, and issued a statement that Dow Chemical (DOW 10.65, -0.23) has not been focusing on the necessary steps to complete its acquisition of ROH.

The major indices all finished the session near the neutral line. Though a quiet session, market participants should view it positively since stocks have thus far held on to gains registered in recent sessions. Stocks are still up 4.5% over the course of the last three sessions. DJ30 -9.72 NASDAQ -0.15 NQ100 +0.3% R2K -0.6% SP400 -0.2% SP500 +1.29 NASDAQ Adv/Vol/Dec 1197/1.90 bln/1458 NYSE Adv/Vol/Dec 1653/1.26 bln/1383

5:58PM Cisco prices $4 bln of senior unsecured notes (CSCO) 16.85 -0.19 : Co announced the pricing of two series of senior unsecured notes for an aggregate principal amount of $4 billion. The offering is expected to close on February 17, 2009. Of these notes, $2 bln will mature in February 2019 and will bear interest at an annual rate of 4.95%, and $2 billion will mature in February 2039 and will bear interest at an annual rate of 5.90%. The 4.95% notes due February 2019 and the 5.90% notes due February 2039 were priced to yield 4.979% and 5.916%, respectively. CSCO intends to use the net proceeds from this offering for general corporate purposes and to repay $500 mln in aggregate principal amount of its floating rate notes due 2009.

4:34PM Veeco Instruments announces LG Innotek of Korea orders four Veeco TurboDisc K465 GaN MOCVD Tools for LED Production (VECO) 6.22 +0.03 : Co announces that LG Innotek has ordered an additional four TurboDisc K465 gallium nitride Metal Organic Chemical Vapor Deposition Systems to make high brightness light emitting diodes (HB-LEDs). The orders were received in the fourth quarter of 2008.

4:06PM Veeco Instruments beats by $0.03, reports revs in-line; guides Q1 below consensus (VECO) 6.22 +0.03 : Reports Q4 (Dec) earnings of $0.11 per share, excluding non-recurring items, $0.03 better than the First Call consensus of $0.08; revenues rose 3.3% year/year to $110.3 mln vs the $109.8 mln consensus. Co issues downside guidance for Q1, sees EPS of $(0.25)-(0.17), excluding non-recurring items, vs. ($0.07) consensus; sees Q1 revs of $60-70 mln vs. $88.5 mln consensus. Co anticipates a very weak start to 2009. Some of Veeco's key LED and data storage customers have pushed out approximately $30 mln of equipment deliveries originally slotted for revenue in Q1 due to current industry overcapacity, financing constraints and their weak business outlook. As a result, co says nearly half of its $147 mln end-of-year backlog is currently forecasted for revenue in 2H09. Also, co says it implemented a significant restructuring program in Q4 which included a 26% reduction in force, a majority having already occurred.

4:20PM Verigy issues downside Q1 rev guidance; implementing cost-cutting and restructuring actions (VRGY) 9.56 +0.01 : Co issues downside guidance for Q1 (Jan), sees Q1 (Jan) revs of $66-68 mln vs. $97.53 mln First Call consensus. The further deterioration of the global economic environment coupled with the sudden erosion of consumer demand have resulted in both memory and system-on-chip semiconductor manufacturers significantly cutting their capital expenditures. In addition, non-payment for several systems previously shipped to a large memory customer contributed to the sharp shortfall in revenues for Verigy's first quarter. While Verigy cannot predict the length of this downturn, the company expects its business will be negatively impacted through at least the first half of calendar 2009. Accordingly, Verigy is implementing cost-cutting and restructuring actions in addition to those announced last quarter. These actions include further cuts in regular and contract personnel, shortened work time and temporary salary reductions. The specific timing and scope of the restructuring actions will be based on business needs and local legal requirements and, when fully implemented, are expected to yield annual cost savings of approximately $90 to $100 million. The company expects that its workforce reduction plans will be substantially completed by the end of calendar 2009.

4:03PM Brooks Automation misses by $0.26, misses on revs (BRKS) 5.46 -0.40 : Reports Q1 (Dec) loss of $0.48 per share, excluding restructuring and impairment charges, $0.26 worse than the First Call consensus of ($0.22); revenues fell 50.3% year/year to $73.4 mln vs the $82.9 mln consensus. Co says, "The 31% sequential decline in revenues compared to the prior quarter mirrors declines reported by major semiconductor capital equipment OEMs in recent weeks. The rate of change in customer requirements over the past three months has been unprecedented and the resultant burden of excess capacity severely depressed our operating results.

1:01PM SMSC sees Q4 revs at high end of the prior guided range of $45-51 mln vs $47.15 mln First Call consensus (SMSC) 15.02 -0.53 : Co announced at the Thomas Weisel Annual Technology & Telecom Conference that it expects revenue for its fourth quarter of fiscal 2009 to be at the high end of the prior guided range of $45-51 million vs $47.15 mln First Call consensus. Co also stated that its book-to-bill ratio has been improving and is currently greater than one. Lastly, SMSC also commented that it continues to expect revenues in the first quarter of fiscal 2010 to be higher sequentially (consensus for Q1 is vs $53.32 mln

10:06AM Diodes misses by $0.01, misses on revs; guides Q1 revs below consensus (DIOD) 7.75 -0.37 : Reports Q4 (Dec) earnings of $0.04 per share, $0.01 worse than the First Call consensus of $0.05; revenues fell 19.0% year/year to $87.1 mln vs the $90.9 mln consensus. Co issues downside guidance for Q1, sees Q1 revs declining 20% sequentially, which calc to ~$69.68 mln vs. $81.22 mln consensus. "Looking at Q1, we expect that the economy and global demand will continue to deteriorate and well beyond the typical seasonality associated with the quarter. As a result of these factors, we estimate that the first quarter revenue will decrease ~20% sequentially,. Furthermore, as a result of the weakened demand, we will reduce our 2009 capital authorizations to a maintenance level of ~2% of revenue, and we plan to reduce inventory, which will further reduce loading at our manufacturing facilities. As a result, we expect Q1 gross margin to be ~16 to 20% and expect to generate positive cash flow from operations as well as positive free cash flow for the quarter... We are implementing further cost reductions while working to maintain strong cash flow. In addition to the 7% headcount reductions initiated in the fourth quarter, we will be reducing headcount by an additional 17% in the first quarter, primarily at our manufacturing operations."

(AMKR) has paid Tessera $58.8 mln, as per the terms of the International Chamber of Commerce's International Court of Arbitration award to Tessera for Amkor's material breach of its license agreement. The remainder of the entire $64.1 mln award is due by Feb. 15, 2009.

12:43AM Linear Tech revises the charge taken for accelerating the vesting of all 'out-of-the-money' stock options and issues revised Q209 results increasing diluted EPS by $0.05 (LLTC) 25.77 : Co announces that its previously reported results for Q209 ended December 28, 2008 have been revised to exclude a non-cash charge of $15.0 mln pertaining to accelerating the vesting of stock options for 1.4 mln shares representing all of the "out-of-the-money" stock options previously awarded to its non-officer and non-director employees under its stock option plans. The effect of this change in the Consolidated Statements of Income for the second quarter and the first six month period of FY09 was to increase GAAP operating income by $15.0 mln, GAAP net income by $11.0 mln and to increase GAAP diluted earnings per share by $0.05. These revised results will be included in the co's Form 10-Q for the quarterly period ended December 28, 2008 filed this afternoon.

icon url

ReturntoSender

02/16/09 9:01 AM

#8463 RE: ReturntoSender #6755

InvestmentHouse Weekend Market Summary

http://www.investmenthouse.com/weekendmarketsummary.htm

- Volatile in a narrow range to end the week.
- Michigan sentiment falls.
- China stimulus looks to be working while our social engineering package won't.
- Hard to believe but there are signs of economic improvement.
- Leadership, regardless of why it is leading, is still leadership.

No short covering as indices hold status quo on a down week.

Stocks were all over the road Friday, but they more or less kept it in the lanes. In other words it was up and down all day but the range was rather narrow. Stocks traded on both sides of the flat line all session long and with 30 seconds left in the session the indices slightly positive. Then some late trades dumped stocks into negative territory on the close. Light volume, flattish breadth. Ahead of the 3-day weekend there was no short covering of note, just undecided trade pushing stocks up and down.

There were the usual strong sectors such as chips and some metals, but overall things were quiet. That is not a bad thing; stock after stock on the report, the leaders in the market, held steady in their solid patterns. Hard to be upset with that. As noted Thursday, if not for the Dow stinking the place up even the continuing lethargy in the NYSE indices would not be that big of a deal.

The news was rather quiet though there were quite a few earnings out. Pepsi was in line on earnings and guidance. ANF in retail beat. WYN in hotels beat after MAR missed big. Toyota announced it was buying out 18K contracts of US workers. Michigan sentiment fell to 56.2 from 61.2, missing the 60.2 expected. Some said that it was due to a loss of confidence that the new Administration could handle the economic morass. Of course to buy that you have to believe that most felt the Administration, or any Administration for that matter, could handle the problems we have. China helped out as reports continue to emerge that China's stimulus package is already yielding results.

All of the news was not enough to push stocks positive even with a 3-day weekend and the chance of more policy announcements ahead. There was simply no interest in pushing stocks higher, and the sellers, while not rushing to cover, were not ready to sell aggressively.

TECHNICAL. After some decent closes in the upper end of the daily trading ranges, Friday was a train wreck. Up and down all session with the indices turning negative in the last seconds of the session on a sharp decline that was, frankly, of the same magnitude of the up and down swings all session.

INTERNALS. Sleepy with flat breadth and volume down 16% to 18%. Up and down and nowhere. On the week the price/volume action was a push with the sellers and buyers putting in the same number of accumulation and distribution sessions.

CHARTS. No movement, at least nothing that changed the character heading into Friday. The indices finished lower for the week with NASDAQ, NASDAQ 100 and SOX in the top half of their 4 month range as well as the more recent 4 week range, and the NYSE indices closed in the bottom half of that same range. DJ30 looks quite ill as it bled to a new post-November closing low twice on the week, the second on Friday. It appears to have a date with the November low. SP500 is a relative laggard, but it is also in a rather well defined 4 week trading range from 800 to 875 that is part of a larger 4 month lateral consolidation. Struggling but not wheezing as is the Dow. NASDAQ is in a rather narrow range itself, managing, however, to make a higher low last week at support at 1500. It is not a thing of beauty but it is a solid pattern. NASDAQ 100 is also trying to put in a higher low and it closed on top of its 50 day EMA after holding the 50 day SMA on the lows for the week. Even with RIMM imploding NASDAQ 100 held up well. SOX is very similar to NASDAQ 100, making a higher low at the 50 day SMA. None are in the clear, but the NASDAQ related indices are in a building process while NYSE is in a bleeding process. Indeed, the NASDAQ indices are pinching off as the pattern narrows after making higher lows and higher highs. A break is coming.

LEADERSHIP. Despite the hacking, sickly DJ30 and the SP500 limping along, many stocks continue to show strong patterns and are in position to break higher. Chips, techs, metals, biotech, healthcare, energy, agriculture, Chinese stocks. Many quality stocks are in good patterns that show accumulation (buying). It is hard to turn your back on the market just because the Dow and its 30 stocks is in the toilet. Remember, DJ30 can sell off to the November low and still be in its consolidation. Thus selling to that level is not the end of the consolidation. If it holds at that level, it is an affirmation. More importantly, what will the LEADERS do during that time? Thus far, when DJ30 struggles and falls these stocks are either moving higher or putting in the work on solid bases.

THE ECONOMY

Signs of improvement defy gloom.

No one thinks the economy is worth a damn right now. Why would we allow $800B to be authorized for spending, stimulus or otherwise, to supposedly help the economy if things were good? The Philly Fed came out Friday and predicted -5.2% Q1 GDP growth, revised from -1.4%. Not much hope in Philly.

No one is looking but there are modest signs of improving data. It is not that the data is out and out strong or showing a clear turn. It never does at first. There are subtle shifts that individually mean little. We are seeing many different areas, however, showing improvement, and historically when you get a lot of different areas perking up that is a sign of change. It may not mean a turn right back up, but if it sustains it means the worst is over.

That would not be a surprise. By the time our government acts it is often out of step with the cycle. Or you can take the even more cynical view: why was there such a rush to pass a stimulus bill that was really a social engineering bill without letting anyone see it as promised and indeed required by our law?

In any event, there are signs that the economy may be trying to bottom. Hopefully it is not just a rest station or a pause before more weakness, but some firming that will lead to improvement. Needs to; the stimulus bill is going to be a dud.

Examples. This week we saw several indications that retail sales were not continuing down the sewer as many expected. Same store sales last week were not that great, but as noted at the time they were not down nearly as much as expected. Moreover, some were actually good. Retail sales were out and they rose for the first time in seven months. We tried to tear it apart but could not find any gaping hole or reason that wiped away the strength. Thursday several restaurants reported sales much better than expected. Friday ANF beat street earnings estimates.

Further: Regional manufacturing reports are rebounding from recent lows. The ISM service has improved for two months after its low. The ISM is showing a bounce after hitting a low. Pending home sales and existing home sales are up with existing home inventories well off the highs. Foreclosures jumped but then fell. The price drops and mortgage rate drops in the market have worked to flush out a lot of the weakness in California, Las Vegas, Florida, and some parts of Arizona.

Credit markets are improving. Bond yields rallied with the 10 year topping 3% and the 2 year 1%. They slid back some but are on the bounce and that indicates firming conditions. As reported a couple of weeks back swap spreads are narrowing considerably, a sign of a healthier market. Friday we learned that the junk bond market sales tripled in the latest report to the highest level since June, well BEFORE the major issues in the financial crisis hit.

As noted, any one of these or even two or three is a yawner. All together, however, and it shows there is something afoot. Again it can be just a bump or a pause before things worsen again. Maybe. What we do know is that this is the kind of stuff we saw back in late 2002 when the market showed signs of trying to bottom similar to what we are seeing now. At that time it paid to keep close attention to these and also to leading stocks. We are, as you know, doing both. There are many great stocks from many sectors that are in very good position technically. That is something a weak rally or a failing rally won't have. Interesting.

China economy picks up speed as we use an emergency to forge social policy.

A bit of soap box so skip it if you don't want to hear it. Just a warning.

A 1,071 page bill is being voted on without the 48 hours promised for everyone in America to read it before voted upon. That 'new transparency' is worth the words it was stated with, i.e. nothing. The bill was available at 11PM Thursday night.

China put its stimulus bill to work and of course it didn't need any votes. It was hatched and put into action. That is how a communist system can work: it has some efficiency. Of course we would not trade our system for that just for efficiency.

No, instead our leaders use emergencies and crises to forge policy they would otherwise not survive the light of scrutiny. Obama's chief of staff is on video in November 2008 saying that no crisis or emergency should be allowed to pass without using it to force social agendas that would not otherwise be able to pass. My stomach fell as I saw that. I thought that perhaps it was just Pelosi and company running over the President and inserting whatever they wanted in the bill. Given his chief of staff's comments it is not too hard to draw the lines of concerted action. It confirms every fear the Founding Fathers had in big government: when able it would do whatever it could to grow and foist new regulation and rights limitations on its people.

Never mind that it is chocked full of waste and useless spending that was tried and failed in the Great Depression. That is sickening in itself as we will pour $800B of our money down the drain. What is worse is that we are giving up our right as citizens to have social policies altered without any debate or discussion on the floor of the Congress. The most horrific is the national healthcare foundation that is laid in the bill as discussed Thursday night. Without ANY discussion this was slipped in just as Tom Daschle had advised Obama in 2008. Just as Obama's brass knuckles chief of staff said should be done, the bill was used to change policy.

In short we have been lied to and treated as the stupid sheep our leaders think we are. They don't have the guts to stand up and say what they are doing. They try to be sly and clever and trick us all. That is not the legacy of our Founding Fathers who stood up on principle and on threat of death when they created our country. I have seen political chicanery up close all my life. This is just about the most disgusting abuse of the public trust, at least on this massive scale, ever. As I told my wife, if this continues it won't matter if you stay in the US or go to Australia, Europe or any supposed republic or democracy as we will be the same.

THE MARKET

MARKET SENTIMENT

VIX: 42.93; +1.68
VXN: 43.11; +1.12
VXO: 42.75; +0.95

Put/Call Ratio (CBOE): 0.89; -0.01

Bulls versus Bears:

This is a reading of the number of bullish investment advisors versus bearish advisors. The reason you look at this is that it gives you an idea of how bullish investors are. If they are too bullish then everyone is in the market and it is heading for a top: if everyone wants to be in the market then all the money is in and there is no more new cash to drive it higher. On the other side of the spectrum if there are a lot of bears then there is a lot of cash on the sideline, and as the market rallies it drags that cash in as the bears give in. That cash provides the market the fuel to move higher. If bears are low it is the same as a lot of bulls: everyone is in and the market doesn't have the cash to drive it higher.

This is a historical milestone in the making. Bulls are impressively low considering we are in general a very optimistic country. The few bulls is a positive indication because it means most everyone that is getting out is out and there is money on the sidelines. In other words the ammunition boxes are full and as the market recovers investors will start opening up the boxes and firing. Little by little they will be forced to put more money into the market and there will be some rushes higher in fear they are missing the train. You relish times when sentiment is so negative because it means some tremendous buys are setting up. This could indeed be the opportunity of a lifetime, and you take advantage of it by buying quality stocks and letting them work for you as long as they will. If we can hold them for years, great.

Bulls: 35.2%. Held steady for the second week. Up from 34.8% the prior week after a one-week move below the 35% threshold considered a bullish indication. Down from 43.0%, the current top of the recovery as the market rallied off the November low. A rise from 25.3% in December and quickly starting to fall once the market encountered the January selling. Above 35% does not mean the action is now bearish. That level is up at 55%. Bullishness bottomed on this leg lower at 21.3% in November 2008. This last leg down showed us the largest single week drop we have ever seen, falling from 33.7% to 25.3%. Hit 40.7% on the high during the rally off the July 2008 lows. 30.9% was the March low. In March the indicator did its job with the dive below 35% and the crossover with the bears. A move into the lower 40's is a decline of significance. A move to 35% is a bullish indicator. This is smashing that. For reference it bottomed in the summer 2006, the last major round of selling ahead of this 2007 top, near 36%, and 35% is considered bullish.

Bears: Held steady at 36.3% as well. Down from 38.0%, the recent peak over the past month as bearishness rose again. Hit the 34's on the lows, falling from 38.5% and 46.2% in mid-December. Still above the 35% level considered bullish for stocks, but as with bulls, still well below the level considered bearish for stocks. Bearishness hit a 5 year high at 54.4% the last week of October. The move over 50 took bearish sentiment to its highest level since 1995. Extreme negative sentiment on this move. 35% is the level that historically indicates excessive pessimism. As with the bulls the jump in bears did its job after hitting 44.7% in the third week of March. Bearishness peaked at 37.4% in September 2007. It topped the June 2006 peak (36%) on that run. That June peak eclipsed the March 2006 high (33%) and well above the 2005 highs that spawned new rallies (30% in May 2005, 29.2% in October 2005). This is a huge turn, unlike any seen in recent history.

NASDAQ

Stats: -7.35 points (-0.48%) to close at 1534.36
Volume: 2.006B (-18.59%)

Up Volume: 840.232M (-812.186M)
Down Volume: 1.171B (+389.112M)

A/D and Hi/Lo: Decliners led 1.14 to 1
Previous Session: Advancers led 1.03 to 1

New Highs: 11 (+3)
New Lows: 98 (-40)

NASDAQ CHART: Click to view the chart

NASDAQ 100 CHART: Click to view the chart

SOX CHART: Click to view the chart

SP500/NYSE

Stats: -8.35 points (-1%) to close at 826.84
NYSE Volume: 1.241B (-16.15%)

Up Volume: 360.295M (-329.712M)
Down Volume: 870.082M (+109.017M)

A/D and Hi/Lo: Decliners led 1.62 to 1
Previous Session: Decliners led 1.16 to 1

New Highs: 2 (-3)
New Lows: 29 (-7)

SP500 CHART: Click to view the chart

SP600 Chart: Click to view the chart

SP400 CHART: Click to view the chart

DJ30

Stats: -82.35 points (-1.04%) to close at 7850.41
Volume: 331M shares Thursday versus 270M shares Wednesday.

DJ30 CHART: Click to view the chart

TUESDAY

Not a great week for the market with that Tuesday drop on the Geithner plan without a plan. After that the indices held their ground, at least outside of the Dow. As discussed Thursday, the drop was on disappointment about the lack of a plan. As seen Thursday, however, as the 'plan' is released piece by piece the market bounces. Thus despite the loss on the week the indices remain in decent shape, particularly NASDAQ and its brethren.

One thing this market has is some solid leadership. While the NYSE indices were down and rather weak, the plays on the report held solid. More than that, they worked on their patterns, building toward another break higher. As noted above there are chips, techs, metals, biotechs, agriculture, energy and others in good patterns that went through the week in very solid fashion.

Some say the leadership stocks are performing because China is recovering. There is already a pickup in materials demand again as China emerges from its post-Olympics hangover. The building binge leading up to the Olympics was at an unsustainable pace. Now that the party is over, the dust has settled, and China has put in a massive stimulus plan directly into its economy, it is moving again and demand for products is up again. Just look at oil. It appears to have bottomed in the mid-thirties.

Okay, so it is China. Or the moon phase. The Steelers winning the Super Bowl. Putin dissing Michael Dell. Do we really care? That might be nice for the history books, but we want to make some money off of stock market moves, and these solid bases in quality stocks say some good things about the upside despite a pathetic pattern on DJ30.

There are lots of theories as to what will happen and why. Friday there was the usual speculation about what point the Dow would fall to. Six thousand was thrown out and that is a plausible level given the 1996 lateral consolidation, but that is a bit high; more like 5600 if that is the case. Before that there is a lot of support at 6900ish. Below that the 1994 year long consolidation at 3900 to 4000 is a possibility. ANY of these could act as support if the Dow crumbles through the November low and the 2002 at 7200. Given DJ30 has come within 250 points of that low in November and has held in the current consolidation, that indicates there is some pretty good support there.

The point: if DJ30 breaks down it is going lower and there is nothing we can do to stop it. We just have to take what the market gives us. Right now it has not crumbled through that level. It has not even made it to that level. It could and even then that doesn't mean NASDAQ, NASDAQ 100 and SOX will follow it all the way down. Indeed there are many of those good leadership stocks in good patterns showing strength. This kind of leadership is unusual for a market that is going lower. They could always crack and follow, but they sure did not show that as something they wanted to do last week when they had, once again, a golden opportunity to do so. Thus we go with what looks and acts strong right now, and there is a rather broad range of stocks that applies to.

Support and Resistance

NASDAQ: Closed at 1534.36
Resistance:
1536 is the late November 2008 peak
The 50 day SMA at 1537
1542 is the early October 2008 low
The 50 day EMA at 1556
1565 is the second low in October 2008
The 90 day SMA at 1566
1569 is the late January 2009 peak
1603 is the December peak
1620 from the early 2001 low
1644 from August 2003
1666 is the January 2009 peak
1752 from 2004
1782 from August 2004
1786 is the November 2008 high. Key level.
1948 is the early October 2008 gap down level

Support:
1521 is the late 2002 peak following the bounce off the bear market low
1493 is the October 2008 low & late December 2008 consolidation low.
1460 is the February low
1434 is the January low (1440.86 closing)
1428 is the November 2008 low, the bear market low
1398 is the early December 2008 low
1387 is the 2001 low
1295 is the November 2008 low

S&P 500: Closed at 826.84
Resistance:
839 is the early October 2008 low
The 10 day EMA at 839
The 18 day EMA at 844
848 is the October 2008 closing low
853 is the July 2002 low
857 is the December consolidation low
866 is the second October 2008 low
The 50 day EMA at 870
878 is the late January 2009 peak
The 90 day SMA at 885
889 is an interim 2002 peak
896 is the late November 2008 peak
899 is the early October closing low
919 is the early December peak
944 is the January 2009 high
965 is the 2003 consolidation low
995 from June 2003 consolidation peak
1008 is the November 2008 peak
1065 is the Q4 2003 level that SP500 started the run to 2007 after the first run in the recovery.

Support:
818 is the November 2008 low
815 is the early December 2008 low
812 is the February low
804 is the low on the January 2009 selloff
800 is the March 2003 post bottom low
768 is the 2002 bear market low
741 is the November 2008 low

Dow: Closed at 7850.41
Resistance:
7867 is the early February low
7882 is the early October 2008 intraday low. Key level to watch.
7909 is the early January low
7965 is the mid-November 2008 interim intraday low.
The 10 day EMA at 8014
8141 is the early December low
8175 is the October 2008 closing low. Key level to watch.
8197 was the second October 2008 low
The 50 day EMA at 8386
The 50 day SMA at 8413
8419 is the late December closing low in that consolidation
8451 is the early October closing low
8521 is an interim high in March 2003 after the March 2003 low
The 90 day SMA at 8560
8626 from December 2002
8829 is the late November 2008 peak
8934 is the December closing high
8985 is the closing low in the mid-2003 consolidation
9088 is the January 2009 peak
9200 is the July peak in the 2003 consolidation
9323 From June 2003 peak
9575 from September 2003, May 2001
9654 is the November 2008 peak

Support:
7702 is the July 2002 low
7694 is the February intraday low
7524 is the March 2002 low to test the move off the October 2002 low
7449 is the November 2008 low
7282 is the October 2002 low

Economic Calendar

These are consensus expectations. Our expectations will vary and are discussed in the 'Economy' section.

February 17 - Tuesday
- February Empire State Mfg. (8:30): -24.0 expected, -22.2 prior
- Net Long-Term TIC Flows, December (8:30): $20.0B expected, -$21.7B prior

February 18 - Wednesday
- January Housing Starts (8:30): 530K expected, 550K prior
- Building Permits, January (8:30): 525K expected, 547K prior
- Capacity Utilization, January (9:15): 72.5% expected, 73.6% prior
- Industrial Production, January (9:15): -1.4% expected, -2.0% prior
- Crude oil inventories (10:30): 4.72M bbl prior

February 19 - Thursday
- January Core PPI (8:30): 0.1% expected, 0.2% prior
- PPI, January (8:30): 0.2% expected, -1.9% prior
- Initial Jobless Claims, 2/14 (8:30): 615K expected, 623K prior
- Leading Economic Indicators, January (10:00): 0.0% expected, 0.3% prior
- Philadelphia Fed, January (10:00): -25.0 expected, -24.3 prior
- Crude Oil Inventories, 2/13 (11:00): NA expected, 4.72 prior

February 20 - Friday
- January Core CPI (8:30): 0.1% expected, 0.0% prior
- CPI, January (8:30): 0.3% expected, -0.7% prior
icon url

ReturntoSender

02/17/09 10:47 PM

#8464 RE: ReturntoSender #6755

From Briefing.com: 4:25 pm : Renewed financial and economic concerns spurred an unrelenting selling effort that took stocks to multimonth lows and kept them there for virtually the entire session. Both the blue chip Dow Jones Industrial Average and the broader S&P 500 closed the session at its lowest point since registering bear market lows in November.

The major indices are back at key technical levels after climbing above them last week. Revisiting the support levels has led to conjecture whether stocks will find support at technical levels and rally, or break to new bear market lows. There S&P found some support at 790 during the session, but still closed below that level.

Weakness was deep and broad-based. All 10 of the major sectors in the S&P 500 spent the entire session in the red. Approximately 98% of all the companies in the S&P 500 closed lower.

Financials were the worst performing sector. The sector closed 9.8% lower with particular weakness in consumer finance (-11.9%), diversified financial companies (-12.2%), and diversified banks (-13.1%). Financials registered a new 52-week intraday low and a new 52-week closing low.

The financial sector's drop reflects continued concerns that bank balance sheets may still be under pressure amid waning capital.

Such was the case in Europe, where word a Moody's report citing stress in Eastern Europe's banks undercut major European bourses. Meanwhile, Asian financial stocks fell in the wake news Woori Financial became South Korea's first lender to tap a bank recapitalization fund, and Japan's Mitsubishi UFJ Financial issued a larger debt offering than initially planned. The declines overseas helped fuel initial weakness in the U.S.

As part of an effort to distinguish strong banks and arrange a blend of public and private capital, regulators may begin stress-testing banks this week. Still, there is skepticism that such a move will have any immediate impact on restoring conditions in the financial system or the broader economy.

Investors also remain unimpressed by the $787 billion economic stimulus plan, which was signed into law this afternoon. The plan isn't expected to provide an immediate boost to conditions in the near term.

Weak economic conditions continue to weigh on oil prices. Crude oil futures fell nearly 7% to finish the session at $34.95 per barrel. Crude futures prices are now down 75% from their highs.

The general weakness this session has also led to buying in gold. Gold is up 3.2% to $971.30 per ounce. It has gained in four of the last five sessions.

Given the weight of concerns for the financial system and broader economy, a relatively positive batch of earnings data was generally treated with disinterest. Wal-Mart (WMT 48.24, +1.71) bested quarterly earnings estimates, and issued in-line guidance. It was the only Dow component to trade with a gain, but its report provided little support to the broader market. Teva Pharmaceuticals (TEVA 45.78, +1.77) posted better-than-expected results and increased its quarterly dividend. Medtronic (MDT 34.56, +1.75) also topped expectations. Illinois Tool Works (ITW 32.96, -2.16) issued in-line earnings guidance. Kraft (KFT 24.72, -0.48) and ConAgra (CAG 16.26, +0.04) both reaffirmed their earnings outlooks. DJ30 -297.81 NASDAQ -63.70 NQ100 -4.0% R2K -4.3% SP400 -4.2% SP500 -37.67 NASDAQ Adv/Vol/Dec 399/2.15 bln/2280 NYSE Adv/Vol/Dec 218/1.61 bln/2895

4:34PM Ultra Clean Holdings beats by $0.01, reports revs in-line; guides Q1 EPS below consensus, revs below consensus (UCTT) : Reports Q4 (Dec) loss of $0.16 per share, excluding non-recurring items, $0.01 better than the First Call consensus of ($0.17); revenues fell 48.8% year/year to $47.1 mln vs the $46.9 mln consensus. Co issues downside guidance for Q1, sees EPS of (0.25-0.36) vs. ($0.16) consensus; sees Q1 revs of $20-28 mln vs. $39.17 mln consensus.

4:31PM Photronics misses by $0.01, misses on revs (PLAB) 1.35 -0.08 : Reports Q1 (Jan) loss of $0.21 per share, excluding items, $0.01 worse than the First Call consensus of ($0.20); revenues fell 14.7% year/year to $88 mln vs the $90 mln consensus.

4:08PM Agilent misses by $0.08, misses on revs (A) 17.65 -0.82 : Reports Q1 (Jan) earnings of $0.20 per share, ex-items, $0.08 worse than the First Call consensus of $0.28; revenues fell 16.0% year/year to $1.17 bln vs the $1.26 bln consensus. Co states, "Forecasting in the current environment is almost futile, as visibility is virtually nil. Our current best guess is that second quarter revenues and operating earnings, which are normally seasonally stronger, will be roughly in line with first quarter results..."

2:03PM Research In Motion announces settlement with the SEC (RIMM) 44.77 -3.74 : Co announces that RIMM and four of its officers, Jim Balsillie, Mike Lazaridis, Dennis Kavelman and Angelo Loberto, have entered into settlements with the Securities and Exchange Commission that resolve the previously-disclosed SEC investigation of RIMM's historical stock option granting practices. RIMM previously disclosed a management-initiated, voluntary review of its historical stock option granting practices that had commenced in 2006 and had been self-reported to the SEC and the Ontario Securities Commission. In the settlement with the SEC that was filed today, RIM consented, without admitting or denying allegations in a complaint filed by the SEC, to the entry of an order enjoining it from violations of certain provisions of the U.S. federal securities laws, including the antifraud provisions. RIM is not required to pay disgorgement or a monetary penalty.

8:25AM Canadian Solar sees Q4 revs of $66-$71 mln vs $69.29 mln First Call consensus (CSIQ) 5.00 : Co issues in-line guidance, sees Q4 revs of $66-$71 mln vs $69.29 mln First Call consensus. Co expects gross margin in Q4 to be negative, reflecting the weak Euro, a decline in module pricing in December, and an inventory revaluation provision that resulted from a rapid decline in the raw material pricing in December, 2008. Co says it "believes it was successful in achieving its cash management objectives: For the end of the fourth quarter, we anticipate reporting a cash position in excess of $130 million. Our accounts receivables are expected to be in the range of $56 to $64 million as of December 31, 2008, compared to $153 million net at the end of the third quarter, 2008. During the fourth quarter, we chose to pay down approximately $78 million of short-term and related party debt, which brings our outstanding short-term loan balance to approximately $92 million at the end of 2008."

Xilinx (XLNX) announced that the Board of Directors has elected Philip Gianos to serve as its Chairman to succeed Willem Roelandts in that role effective February 12, 2009...

7:35AM STMicroelectronics announces FINRA awards STMicroelectronics $406 mln against Credit Suisse Securities (STM) 5.61 : Co announced that an arbitration panel of the Financial Industry Regulatory Authority (FINRA) awarded STMicroelectronics, in connection with the sales by Credit Suisse Securities to the Company of unauthorized "auction rate securities," an amount of ~$406 mln comprising compensatory damages, as well as interest, attorney's fees, and consequential damages, which were assessed against Credit Suisse. In addition, co is entitled to retain the about $25 mln interest award which had already been paid. Over time, as the credit market negatively developed, the co recorded other-than-temporary impairment charges for a cumulated amount of $173 mln. Payments by Credit Suisse pursuant to the arbitration award will result in a further strengthening of financial position by increasing current liquidity by about $406 mln, against a $242 mln less balance in Non Current Assets. At collection, co will transfer ownership of its portfolio of unauthorized "auction rate securities" with Credit Suisse, and should be able to record a pre-tax gain of about $163 mln to reverse impairment losses accrued in Income Statement of prior periods.

7:09AM Trina Solar sees total net revs for Q4 exceeding previous guidance range of $190-$210 mln (consensus is $194.1 mln) (TSL) 8.54 : Co announces the following selected estimated financial results for the quarter and the full year ended December 31, 2008. For 4Q08, it expects: 1) total net revenues for Q4 to exceed its previous guidance range of $190-$210 mln (consensus is $194.1 mln); 2) Q4 positive net operating cashflow to be approximately $60 mln; 3) short-term debt to be reduced by approximately $41 mln to $249 mln; and 4) a non-cash inventory provision between $16 mln and $18 mln. The Company also announced that it anticipates a non-cash inventory provision between $16 mln and $18 mln mainly due to the revaluation of its silicon inventory linked to notable market price declines in the fourth quarter of 2008. The provision is expected to have a negative gross margin impact of 7% to 8%. With this provision, the Company expects its fourth quarter gross margin to be in the range of 9% to 10%, compared to its earlier previous guidance of 13% to 15%. The Company also expects its operating and net margins would be correspondingly affected.

icon url

ReturntoSender

02/21/09 9:56 PM

#8466 RE: ReturntoSender #6755

From Briefing.com: Weekly Recap - Week ending 20-Feb-09Banks were under pressure this holiday-shortened week, first in Europe on Tuesday after rating agency Moody's said the recession in emerging European economies will be more severe than elsewhere, which is likely to pressure the Western European parent companies, then in the U.S. Friday on nationalization fears.

Despite a late-session rebound today, the major averages closed sharply lower on the week -- Dow -6.2%, S&P -6.9%, Nasdaq -6.1%, Russell -8.3%. Notably, the Dow declined to a new five year low of 7249.47, stopping just shy of a six year low at 7197.49, last hit in March 2002. All ten of the S&P economic sectors closed in the red for the week, ranging from a 1.5% decline in Consumer Staples to a 15.9% plunge in Financials.

The week began with a sharply lower open on Tuesday, with domestic banks following European banks lower after the Moody's report. There was also additional pressure on the market from the Empire Manufacturing Survey, which showed a steep drop to -34.7 in February from -22.2 in the prior month, well below the -23.8 consensus estimate. However, the initial move proved to be it for the major averages that day, as the S&P, which at its lows lost 4.6%, traded sideways through the majority of the session.

The market followed that up with two more consolidative sessions on Wednesday and Thursday. That action came despite President Obama announcing the details of his mortgage relief plan Wednesday morning.

The Homeowner Affordability and Stability Plan has three main components: 1) Refinancing for up to 4 to 5 million "responsible" homeowners to make their mortgages more affordable; 2) A $75 billion homeowner stability initiative to reach up to 3 to 4 million at-risk homeowners; and 3) Supporting low mortgage rates by strengthening confidence in Fannie Mae and Freddie Mac.

What wasn't discussed is that the plan stops at conforming loans. If a homeowner has a jumbo loan, as many do, he is not covered. The plan itself appears rooted in a trickle-up principle, as it is believed that fortifying home values for 7 to 9 million families will be the pricing elixir for all homeowners.

President Obama's announcement ironically followed the lowest Housing Starts reading since records began in 1959. Starts fell to an annualized rate of 466K units in January, below the 529K consensus estimate. That marked a 16.8% decline from the revised December reading of 560K and is 56.2% below the year-ago level.

The consolidative trade ended Friday, however, as the major averages opened lower and sharply extended those declines on bank nationalization fears, particularly for Bank of America and Citigroup. Shares of BAC and C fell as much 35.6% and 35.9% to multi-decade lows. They only rebounded, along with the overall market, after a White House spokesman reiterated the government's support of the privately-held banking system and Rochdale analyst Richard Bove appeared on CNBC, saying Bank of America is one of the best buys he's ever seen on the NYSE. Shares of BAC and C closed 3.6% and 22.3% lower on the session.

Notably, the major averages showed little effect from hotter than expected inflation data. On Thursday, core PPI showed a 0.4% month/month increase in January, well above the 0.1% consensus estimate; on Friday, core CPI showed a 0.2% month/month increase, above the 0.1% consensus estimate.

The Economic Calendar is on the light side next week, but it features the Existing Home Sales report on Wednesday, the Durable Goods Orders report on Thursday, and the revised Q4 GDP report on Friday. The big event of the week is Fed Chairman Bernanke's semi-annual monetary policy report on Tuesday.

--Dave Campione, CFA, Briefing.com
 
Index Started Week Ended Week Change % Change YTD %
DJIA 7850.41 7365.67 -484.74 -6.2 -16.1
Nasdaq 1534.36 1441.23 -93.13 -6.1 -8.6
S&P 500 826.84 770.05 -56.79 -6.9 -14.7
Russell 2000 448.36 410.96 -37.40 -8.3 -17.7


8:22AM SEMI reports North American Semiconductor Equipment Industry posts January 2009 book-to-bill ratio of 0.48 : North America-based manufacturers of semiconductor equipment posted $285.6 million in orders in January 2009 (three-month average basis) and a book-to-bill ratio of 0.48 according to the January 2009 Book-to-Bill Report published today by SEMI. A book-to-bill of 0.48 means that $48 worth of orders were received for every $100 of product billed for the month. The three-month average of worldwide bookings in January 2009 was $285.6 million. The bookings figure is about 51% less than the final December 2008 level of $579.1 million, and about 75% less than the $1.14 billion in orders posted in January 2008. The three-month average of worldwide billings in January 2009 was $592.2 million. The billings figure is about 12% less than the final December 2008 level of $672.4 million, and about 54% less than the January 2008 billings level of $1.28 billion. "Sales of semiconductor manufacturing equipment continue to decline, exacerbated by the diminished demand for consumer electronics, and the global economic turmoil," said Stanley Myers, president and CEO of SEMI. "As a result, bookings are at the lowest levels since 1991."

8:17AM TrimTabs estimates all equity mutual funds post outflow of $10.7 billion in week ended Wednesday, February 18th : TrimTabs Investment Research estimates that all equity mutual funds posted an outflow of $10.7 billion in the week ended Wednesday, February 18th, versus a revised outflow of $2.4 billion in the previous week. Equity funds that invest primarily in U.S. stocks posted an outflow of $6.3 billion, versus a revised outflow of $460 million in the previous week. Equity funds that invest primarily in non-U.S. stocks had an outflow of $4.3 billion, versus a revised outflow of $2.0 billion in the previous week. In addition, bond funds had an outflow of $4.8 billion, versus a revised inflow of $5.8 billion in the previous week, and hybrid funds had an outflow of $1.5 billion, versus a revised outflow of $186 million in the previous week. Separately, TrimTabs reports that exchange-traded funds that invest in U.S. stocks posted an outflow of $6.9 billion, versus an outflow of $6.3 billion, in the previous week. ETFs that invest in non-U.S. stocks had an outflow of $203 million, versus an inflow of $419 million in the previous week.

09:35 am LDK Solar downgraded to Sell at ThinkEquity; tgt lowered to $4.50: . ThinkEquity downgrades LDK to Sell from Buy and lowers their tgt to $4.50 from $45 noting in October 2007, Charley Situ, LDK's former controller, alleged discrepancies in the company's accounting for possibly unusable inventory. In December 2007, after conducting an audit, LDK announced that the investigating committee found no material errors. The firm says were it not for the overhang of this whistleblowing incident, LDK's $210 to $220 mln inventory write-down on Wednesday would likely have been accepted as "normal" in today's market where solar PV wafers are facing rapid price declines. However the firm says, investors were quick to notice that the write-down amount matched closely the "two-thirds" estimate (of the $350 mln inventory balance as of December 31, 2007) that Mr. Situ claimed could be unsuitable
icon url

ReturntoSender

02/24/09 10:09 AM

#8470 RE: ReturntoSender #6755

We could bounce any time. I don't think we have hit the bottom yet though. That may not happen for quite a few more months.


The Put to call ratio may need to be higher before we hit bottom:


The NASDAQ Summation Index may have to fall below -1000 again before we hit the bottom too:

icon url

ReturntoSender

03/02/09 8:11 PM

#8477 RE: ReturntoSender #6755

Technical Analysis: Stocks Give Up Another Big Level
http://www.internetnews.com/bus-news/article.php/3808081/Technical+Analysis+Stocks+Give+Up+Another+Big+Leve.htm

As the Dow and S&P give up decade-old support, investor fear is nowhere to be found.

March 2, 2009
By Paul Shread: More stories by this author:

It's genuinely ugly out there, and perhaps the ugliest thing of all is that sentiment gauges have yet to show much in the way of fear.

Put-call ratios and sentiment surveys are nowhere near the extremes they hit just a few months ago, which suggests that stocks may need to fall further to generate the capitulation necessary for a major bottom.

The Dow and S&P (first two charts below) are giving up 10-year trading ranges here, and those old lows are now likely to become formidable resistance. Those levels begin at 741-752 and 768-804 on the S&P and 6971-7192 and 7450-7552 on the Dow.

So how low can stocks go?

The S&P's next support zone is right here, at 680-700, with 600-620 below that, while the Dow has potential support at 6300-6500 and 5800-6000.

The Nasdaq (third chart) and the broad market may be performing better, but that's been little help. The Nasdaq's November low was 1295.48, with 1253 the last strong support below the 2002 low of 1108. To the upside, the Nasdaq faces resistance at 1386-1400 and 1434.

And finally, the Wall Street Journal noted today that former Fed Chairman Alan Greenspan recently related how in the late 1950s he found that stock prices and corporate equipment orders were related, a relationship that he said continues to hold true. Just one more reason why the study of stock market movement is anything but academic. It is the ultimate gauge of corporate and consumer confidence, and the message continues to be bleak.


Upgrades Can't Save Dell, Cisco

Good news for Dell, Cisco and Apple investors just meant falling less than the rest of the stock market.

Share this Article
Digg Del.icio.us furl StumbleUpon BlinkList Newsvine Magnolia Facebook Tailrank Slashdot Technorati Google Bookmarks Yahoo Favorites Windows Live Ask
Print this Article
Comment on this article
Email this Article

March 2, 2009
By Paul Shread: More stories by this author:
http://www.internetnews.com/bus-news/article.php/3808076/Upgrades+Cant+Save+Dell+Cisco.htm

The 16-month-old bear market added another "worst ever" to its list of accomplishments today, sending stocks plunging in the weakest start to the month of March in market history.

Every stock in the big-cap Nasdaq 100 ended the day lower — with the lone exception of drug developer Warner Chilcott (NASDAQ: WCRX), which added 0.8% on an upgrade.

The major indexes lost 4% or more each, and even Dell (NASDAQ: DELL) and Cisco (NASDAQ: CSCO) lost more than 1% each despite Argus Research upgrades.

Apple (NASDAQ: AAPL) was another stock not suffering too badly, off 1.5% on speculation that the company could make an iMac product announcement later this month.

Nokia (NYSE: NOK) lost 6.6% on problems with its 5800 touch screen smart phone. Research In Motion (NASDAQ: RIMM) lost 7.7%, while Palm (NASDAQ: PALM) managed a 1% gain.

Seagate (NASDAQ: STX) and Nvidia (NASDAQ: NVDA) also suffered steep declines.

The cause of the market's troubles was yet another steep loss and bailout of AIG (NYSE: AIG). With no end in sight for financial woes, the Dow and S&P ended the day at fresh 12-year lows.

The Nasdaq lost 55 to 1322, the S&P 500 fell 34 to 700, and the Dow tumbled 299 to 6763. Volume declined to 8.98 billion shares on the NYSE, and 2.37 billion on the Nasdaq. Decliners led by a 35-3 margin on the NYSE, and 25-3 on the Nasdaq. Downside volume was 98% on the NYSE, and 96% on the Nasdaq. New highs-new lows were 10-877 on the NYSE, and 1-602 on the Nasdaq.
icon url

ReturntoSender

03/08/09 6:46 PM

#8484 RE: ReturntoSender #6755

Headline Charts Blog Update:

http://headlinecharts.blog.com/


The above chart is free from BreakPointTrades.com. It's a bit hard to see because I had to shrink it. The 62% retrace puts the Dow Industrials at 5488 about 1200 points below where we are now.

Funny thing though, the chart shows Elliott Waves so it appropriately labels the Fibonnaci retracement levels, but the author seems to ignore them in his estimates of the future direction for the market. What gives? I think if we draw an Elliott Wave then we respect its influences, so I see the future similarly to this author, but with the bottom corresponding with the 62% level.

If they are right that the current leg of the market is A down, and almost complete, then we rally here as wave B up... then in my view wave C down brings us to 5488 at the intersection of the 62% retrace and the gigantic uptrend line off the bottoms of the depression and the 1982 low.

I do like that they see the lows of the market defined by the uptrend line, and the inverted head and shoulders pattern. But based on the patterns in the 1930's and 1970's, I think we are likely to move in more of a sideways range with an upper limit at about 8850 and the lower defined by the uptrend.

That means a 5 to 10-year consolidation. After the necessary consolidation, a break above the 8850 level defines the next secular bull market? And if 8850 is breached to the upside before the lower levels are adequately tested, and before enough time has passed, it will likely be a trap and will probably fail.

The key I think is that we need enough time to pass for all the many market forces to realign and play out. So I guess that means we don't need to be in any rush to buy the market indexes, and the money will be made by finding the smaller or more focused opportunities, or by investing in the new secular trends once they become clear.

Regarding the ECRI leading index, there is nothing positive to report, more bad economic news lies ahead... they say, "The US Recession has not yet hit a bottom".

Their index is able to predict out into the future about four months. The leading and coincident indicators are near all time lows, and now we wait for the lagging indicators to get near their all time lows as well. Unemployment figures are the key lagging indicators and will probably hit the levels of the last secular bear market. Sorry for all the gloom, just trying to give my best shot.


Continuing from yesterday's post... somebody correct me if I have labeled the chart above incorrectly based on the chart from Breakponttrades.com.

One principle of Ettiott Wave is that correction patterns alternate. So if the 1930's was a zig zag, then the 1970's was a flat, meaning the 2010's will likely be another zig zag.

The bad news is that we have a bad period ahead of us. But the good news, I suppose, is that a big chunk of the correction in stocks has already happened. That is, unless the bottom falls out and we are destined to hit the 76.4% retrace, in which case we have another 50% decline in stock prices to go. Let's hope not, but don't rule it out either.

Maybe I have taken this far enough for now. Let's see how it plays out. Both the larger A and C waves down will be smaller impulse 5 wave patterns, and the larger B wave up will be a smaller 3 wave corrective pattern.. probably very choppy and confusing, and drifting upwards.

Before we are done, I'm betting most people will have their retirement and savings in CD's and not stocks. Very few kids coming out of school will choose Wall Street as an occupation. At that point, the secular uptrend resumes and most of us won't know about it because we'll have new hobbies.

Friday, March 06, 2009
Friday Market Sentiment

Disclaimer: All charts and comments are intended for education and discussion purposes only. No investment recommendations are being offered. Please do your own research and take responsibility for all investment decisions that you make. Questions and comments related to this post are encouraged.

Not Sure Jan-31 The downtrend in the VIX favors stocks, but the put/call 60-day average works against stocks. Feb-7 Conflicting sentiment indicators. Mar-6 The VIX showing diverging strength works in favor of stocks.


The bear has finally pulled down just about every stock, commodity and currency. But at some point maybe, just maybe, a bottom will be in. One positive sign is the VIX which led the market lower by a wide margin last year, but now is diverging nicely. The inverted VIX looks to me as though it is making a near term higher high and higher low? That's good, right? Please, somebody tell the stock market.
icon url

ReturntoSender

03/10/09 10:33 AM

#8487 RE: ReturntoSender #6755

So far today we are off to a very good start. 95% upside on the NYSE and 95% upside on the NASDAQ.

http://finance.yahoo.com/marketupdate/overview

We have seen a few 90% upside days over the last year but too many 90% downside days to count.

At some point the market will have a high volume 90% upside day that leads the market back into full recovery mode.

Is today that day?

I admit I simply don't know. One day needs to morph into one week followed by a month of higher upside volume. The recent volume has been pretty high on the downside so this could be just another false start.

But it's a good start so far.

RtS
icon url

ReturntoSender

03/11/09 7:55 PM

#8490 RE: ReturntoSender #6755

From Briefing.com: 4:30 pm : Stocks showed solid gains in the early going, but the advance was rebuffed by a round of profit taking. Choppy trading ensued, leading stocks to close with a modest gain.

Financials were up more than 5% in the early going. Diversified banks (+3.2%) and other diversified financial services companies (+4.3%) were among the sector's strongest performers. Citigroup (C 1.54, +0.09) also traded higher, though it wasn't quite the leader that it was in the prior session.

Market watchers await details from tomorrow's congressional committee meeting, which will examine mark-to-market accounting rules. The rules have driven massive write-downs at banks and other financial companies; temporarily suspending the rules could remove an overhang from many financial companies, potentially allowing their shares to rip higher.

Removal of the uptick rule is another regulatory change that has been proposed. However, Washington has sent mixed signals regarding the rules, so basing trades on speculation the government may change existing rules could prove treacherous.

A mix of profit taking and uncertainty surrounding financial stocks turned the financial sector's early gain into a fractional loss. Financials were able to climb back, though. They finished 2.4% higher.

The broader market seemed to take its cues from the financial sector for the second straight session.

Each of the major indices climbed more than 1% in the early going. However, the S&P 500 was rebuffed after failing to push through 730, while the Dow failed to crack 7000.

The stock market's failure to extend its advance amid ongoing uncertainty in the financial system and broader economy opened the door for profit taking, which resulted in a choppy session. Stocks retreated into the red, but rebounded. Sellers redoubled their efforts in the final leg of trading, limiting the gains for the session.

Health care (-2.0%) was the session's worst performing sector. Pfizer (PFE 12.79, -0.30) was a primary laggard. Its credit rating was lowered by Moody's to Aa2 from Aa1.

Energy (-1.2%) was also a notable laggard. Its weakness followed a 7.4% drop in crude oil prices, which finished pit trading near $42.35 per barrel.

There were no earnings announcements or economic reports of consequence to influence the direction of trade, though a CNBC report indicated JPMorgan Chase (JPM 20.40, +0.90) was profitable in the first two months of the year.

Tomorrow's earnings calendar is also absent of market movers. However, advance retail sales for February are due tomorrow, along with January business inventories, and weekly jobless claims data.

Treasury Secretary Geithner will testify tomorrow before the Senate Budget Committee on the 2010 Budget.

The G-20 also meets this week. Agenda items include how to ensure economic recovery and restart growth, and how to reform and coordinate the international regulatory and supervisory system to ensure that no such crisis occurs again. DJ30 +3.91 NASDAQ +13.36 NQ100 +1.2% R2K -0.4% SP400 +0.4% SP500 +1.76 NASDAQ Dec/Adv/Vol 1343/1342/2.15 bln NYSE Dec/Adv/Vol 1263/1822/1.75 bln

8:02AM ON Semiconductor announces settlement of patent dispute with Samsung Electronics (ONNN) 3.62 : Co announces that it has entered into a settlement agreement with Samsung Electronics that resolves the outstanding patent infringement actions that were pending in the District of Delaware involving technology relevant to DRAM products. Under the terms of the confidential settlement agreement, the parties have cross-licensed their respective patent portfolios for a significant term of years.

6:31AM Amtech Systems announces $3 million in solar orders (ASYS) 3.00 : Co announces that its solar subsidiary, Tempress Systems, has received approximately $3 mln in follow-on solar orders for its diffusion processing systems from two new customers, both located in Asia.

1:49AM U.S. District Court enters final judgment for $397 mln against Hynix in favor of Rambus (RMBS) 8.77 : Co announcesthat the U.S. District Court for the Northern District of Calif. has entered final judgment in the Hynix Semiconductor matter. Judgment was entered against Hynix in the amount of approx $134 mln for infringement through December 31, 2005 and approx $215 mln for its infringement from January 1, 2006 through January 31, 2009. In addition, the Court awarded about $48 mln in pre-judgment interest to Rambus. The Court also ordered Hynix to pay Rambus royalties on net sales after January 31, 2009 and before April 18, 2010 of 1% for SDR SDRAM and 4.25% for DDR SDRAM memory devices. The latter rate applies to DDR, DDR2, DDR3, GDDR, GDDR2 and GDDR3 SDRAM devices, as well as DDR SGRAM devices.

3:08 pm National Semiconductor (NSM)

National Semiconductor (NSM 11.28, -0.42) reported a steep drop in revenues and said it will eliminate jobs and consolidate manufacturing operations.

National Semiconductor reported earnings of $0.09 per share for its fiscal third quarter. The results include $11 million in discrete tax benefits and may not be comparable to the First Call consensus that expected a loss of $0.05 per share.

Revenues fell 35.5% year-over-year to $292.4 million; the consensus expected $295.6 million.

The Santa Clara, Calif.-based company said it will immediately eliminate 850 jobs worldwide in sales and marketing, manufacturing and support functions. Another 875 positions will be eliminated in phases over several quarters as the company closes an assembly and test plant in China and a wafer fabrication plant in Arlington, Texas. The total job cuts amount to approximately 26% of National Semiconductor's workforce.

The company said it will incur between $160 million and $180 million in charges as a result of its restructuring actions.

Looking ahead, the company said it expects sales in its fiscal fourth quarter to decrease sequentially by 5-10%. The outlook calculates to fiscal fourth quarter revenues between $263 million and $278 million. The consensus currently stands at $292.6 million.
icon url

ReturntoSender

03/15/09 12:39 PM

#8493 RE: ReturntoSender #6755

Amateur Investors Weekend Stock Market Analysis (3/14/09)

http://www.amateur-investor.net/Weekend_Market_Analysis_Mar_14_09.htm

After seeing 4 straight weeks to the downside we finally got a decent oversold bounce this week. Overall we remain in the final 5th Wave of a longer term Elliott Wave pattern. Once again a classic looking 5 Wave pattern is shown below and notice once the final 5th Wave down ends this should be followed by a substantial ABC type corrective rally.


A longer term chart of the S&P 500 going back to the October 2007 peak is shown below with all of the Main Waves and Sub Waves as well. Notice we are in the final 5th Wave down with sub wave 4 (5) occurring with this latest oversold bounce. If this pattern follows the typical sub wave pattern we should see one more minor sub wave 5 (5) occur leading to a final bottom unless it truncates which I will comment on below.


A more detailed daily chart of the current 5th Wave is shown below with the sub waves. It's still possible the S&P 500 may rally up to the 772 level before the final sub wave 5 (5) develops.


As mentioned above there is one thing we have to be on the lookout for as it's always possible the final sub wave 5 (5) may end up truncating and never drop back below the low made on 3/6/09 of 667. The odds of this occurring would increase substantially if the S&P 500 were to rally back above the 50% Retracement Level of 772 (point B) and approach the bottom of sub wave 1 (5) which was at the 804 level.

Here is an example of what I'm talking about. If we look at a chart of the 1937-1938 time period you can see a nice longer term 5 wave pattern as I have labeled the sub waves within the final 5th Wave down. Notice how sub wave 4 (5) rose back above the 50% Retracement Level from the peak of sub wave 2 (5) to the bottom of sub wave 3 (5) which was around 115 and then pierced the bottom of Wave 1 (5). In this example Wave 5 (5) truncated as the Dow never dropped back below the low made with 3 (5) as a substantial ABC type rally developed. This something we will have to be on the lookout for in case the S&P 500 does rise back above its 50% Retracement Level next week.


Finally although the market bounced nicely from oversold conditions we need to be alert for a possible pullback early next week. The 5 Day Average of the Put to Call Ratio has now dropped to its lowest level (point B) since the market peaked in October of 2007. Over the past few years when the 5 Day Average of the Put to Call Ratio has dropped below 0.85 (points C) this has been followed either by a pullback or substantial sell off (points D to E) shortly thereafter. Considering how far along we are in the final 5th Wave down I don't expect a huge drop.


Keep in mind no matter what transpires over the next few weeks we are likely nearing a significant bottom in the market which will be followed by a substantial ABC type oversold rally that could last from 3 to 6 months.
icon url

ReturntoSender

03/15/09 3:03 PM

#8494 RE: ReturntoSender #6755

This Chart shows that as recently as Feb 9, 2009 that the NASDAQ could not continue to rally while the put to call ratio was so low on a relative basis. There are lots of positives right now for a continued rally but volume and the CPC are still not supportive of a lasting rally.

icon url

ReturntoSender

03/15/09 3:07 PM

#8495 RE: ReturntoSender #6755

InvestmentHouse Weekend Market Summary 3/13/09

http://www.investmenthouse.com/weekendmarketsummary.htm

- Market does what it has to, hangs onto gains heading into the weekend.
- China worried about its US Treasury holdings, announces more stimulus to come.
- LIBOR ticks lower for the first time in weeks.
- Michigan sentiment shows its own signs of thaw.
- Pattern of the week: the explosive Ascending triangle
- Starting the week looking for a follow through while the indices are extended.

Sellers leave early for Spring Break as market holds its gains to the close.

The bulls cannot complain about the action as SP500 and NASDAQ held their gains right up to the Friday bell. Both are bumping at next resistance, but instead of turning right back down in a dive as they would have done, oh say, anytime over the past seven months, they held the gains, all of them, into the weekend. They were not huge absolute numbers with NASDAQ scoring 5 points, DJ30 54 points and SP500 6 points, but then again they were huge in that 162 points on NASDAQ and 678 points on DJ30 for the week did not draw the fire of short sellers. It is just a week of gains off the lows, but this is a notable character change heading into a new week, and in this market we know what can happen: anything.

Friday had its bad news and good news, or good news and bad news depending upon whether you are long or short the market. The Bad: Berkshire Hathaway credit downgraded to AA+. China says it wants guarantees from the US that the couple of trillion dollars in US Treasuries it holds will remain solid. Imports were down again as consumers continue to lay off the imports, something history shows we do in recessions. No surprise there, especially compared to China seeking guarantees. As Hawkeye said to Hot Lips Houlihan in the television's 'MASH' when she asked what kind of guarantees the nurses could get with respect to potential repeated violations, 'what kind of guarantee do you want?'

The Good: China wanted a guarantee on one hand and on the other its premier offered it would adopt additional stimulus. Earlier he pulled a Geithner and did not follow through with the much heralded announcement of more stimulus to come. He does it Friday after slapping some at the US. Don't think China is gaming the markets a bit? More good. Fund outflows from US mutual funds totaled $8.4B for the week. Money leaves the market at the bottom. We have been putting it in and we are already taking gain off the table on this run. It always happens this way and is thus good news bigger picture and smaller picture for us right now.

More Good (had to make a new paragraph): Citi followed GE's Thursday announcement with its own 'we don't need no stinking federal funds' headline Friday morning. Copper and materials prices were up again. Michigan sentiment is thawing (56.6 actual versus 56.3 prior and 55.0 expected), another kernel of better economic data. Three-month LIBOR, after more than a month of gains, ticked down one one-hundredth to 1.32% from 1.33%. It had flattened the prior three sessions and made the first downside tick. Spark up the cigars.

TECHNICAL. Another soft start and a comeback. Not as impressive as Thursday where the indices rose arrow straight all session, but it had its own version. The indices dipped midday into lunch hitting session lows, but then they recovered and rallied on into the close. Good intraday action all week.

INTERNALS. The indices were up modestly on the session and the internals matched the action. Breadth at 1.5:1. No new highs, few new lows. Volume faded back near average on NYSE and put in its first below average session on NASDAQ in over a month. It was Friday after a bear market rally took off, and there simply were not as many participants wandering Wall Street.

CHARTS. Not a lot of change in the chart patterns from Thursday, but as noted above, given the bear market and the sharp rebound this week from the downtrends, that is a victory in itself as the sellers did not come back even as SP500 continued to flirt with the November low. SP500 closed over that level, but not enough to really mean much. It will have to test it this week and then put some distance on it during a second run higher for the break to mean something and for the level to become support once more. NASDAQ moved up to its January low and is somewhat in no man's land above the December low yet below the 1500 level considered key. SOX broke free of some congestion, but it still has overhead resistance. It is, however, in a much better bargaining position heading into a test this coming week.

Speaking of tests, after the rush higher and to resistance the market is a bit extended and could face some downside early next week as the gains are tested a bit by some sellers. The market can do anything at that point. One of the ways we are going to be ready to take advantage of any move is to look at good stocks that test last week's move and then start back up. AMZN, DRIV, QCOM, ISIL and others moved well and tested a bit Friday. If they test some more early in the week and start back up, groovy. We move in with more positions. Others, thankfully, are setting up to make new moves themselves. Need more leadership. If the sellers turn up with their axes and blowtorches, then we have to be ready to play the downside with those stocks that jerked higher in their downtrends to resistance. The market should have more upside momentum, and indeed that would be best for both the upside and the downside (more base building, a better point to play some downside, more base building), but if the rally rolls over time to jump to the downside quickly.

LEADERSHIP. There was leadership last week and from the same areas that were leading in December and into early January before the selling started returning ahead of the February gutting. Chips were the one clearly identifiable leadership group. Metals were not bad though a little less flamboyant. Techs are not all pulling together, but they are trying to get to that point. China stocks remained solid. Some smaller business services stocks that led the early moves off the November and December lows (e.g. BR, HMSY) were up. If there was a bigger sector for guns it would have led as SWHC (Smith & Wesson) surged on fears of an attempt to disarm the populace. Sounds alarmist, but given the Supreme Court's 5-4 gun decision last session, nearly taking away a right we have held for 233 years, with this Congress many are quite concerned. Bottom line: Leadership is trying to improve and is improving some. This action is working to build some bases and that is what the market needs. Chips are out front as they were in late 2002 when the market bottomed out of that bear market. Some retailers are moving up as they did at that time as well (e.g. AMZN). Similarities.

THE ECONOMY

We pretty much went through the economic scene Thursday, i.e. the modest signs of improvement in many economic areas: manufacturing, oil finding its bottom, same store and retail sales improving, copper and economically sensitive commodities finding a bottom and increasing, China posting three upside PMI reports, housing markets clearing out in California, Florida and Vegas. Nothing is racing up, but a lot of quite diverse economic areas are showing some bottoming action.

Mind you, all of this before any of the so-called stimulus hits the economy. There is a theory that businesses and people with money are making investments and moving money now versus waiting for the changes in the tax system that start in October, not in 2011 as the Administration says. That could very likely be the explanation for the modest increase in economic activity. If it is, that is not something that will provide ongoing recovery and indeed sets us up for harder economic downside. Kind of like when you are sick, you start to get better and jump up and get back to the old routine, then you relapse and are worse than you were the first time you were sick.

As we have said, there were similar indications in late 2002 and they proved correct. The ultimate indicator, however, were the financial markets and the leadership off the bottom. There were some nascent signs of economic recovery and the markets, despite immense gloom (and indeed that was part of the reason for the move to come), found the floor and shot higher. This market has not shot higher. It is trying to find the floor. Will it find it and shoot higher?

It could. The element here that was not present in 2002 and early 2003 is massive, massive government intervention (a.k.a. meddling) in the markets themselves, in private contracts, in social structure, in tax policy, in healthcare, in private business, and in our form of government. It is extremely difficult for any market to find a bottom when the federal government is moving the floors around under you. Thus we have to be very, very careful here because this is not a carbon copy of the last recession when the government loosened capital restrictions and then relied on the free markets to solve the problem as they have done for 233 years . . . outside the Great Depression when government meddling prolonged the depression by at least 7 years.

THE MARKET

MARKET SENTIMENT

As noted above, money flowed out of stock mutual funds to the tune of $8.4B. That is just part of the steady weekly outflows. That is also an indication of a reason for the market to try this bounce and why it might have some more legs. Investors are bailing and historically when the crowd bails out the market is getting ready to move higher.

VIX: 42.36; +1.18
VXN: 41.25; +0.48
VXO: 45.08; +2.32

Put/Call Ratio (CBOE): 0.71; 0

Bulls versus Bears:

This is a reading of the number of bullish investment advisors versus bearish advisors. The reason you look at this is that it gives you an idea of how bullish investors are. If they are too bullish then everyone is in the market and it is heading for a top: if everyone wants to be in the market then all the money is in and there is no more new cash to drive it higher. On the other side of the spectrum if there are a lot of bears then there is a lot of cash on the sideline, and as the market rallies it drags that cash in as the bears give in. That cash provides the market the fuel to move higher. If bears are low it is the same as a lot of bulls: everyone is in and the market doesn't have the cash to drive it higher.

This is a historical milestone in the making. Bulls are impressively low considering we are in general a very optimistic country. The few bulls is a positive indication because it means most everyone that is getting out is out and there is money on the sidelines. In other words the ammunition boxes are full and as the market recovers investors will start opening up the boxes and firing. Little by little they will be forced to put more money into the market and there will be some rushes higher in fear they are missing the train. You relish times when sentiment is so negative because it means some tremendous buys are setting up. This could indeed be the opportunity of a lifetime, and you take advantage of it by buying quality stocks and letting them work for you as long as they will. If we can hold them for years, great.

Bulls: 26.4%. Down from 29.7% and at the lowest level since December 2008. Well down from 43.0%, the current top of the recovery as the market rallied off the November low. A rise from 25.3% in December and quickly starting to fall once the market encountered the January selling. Bullishness bottomed on this leg lower at 21.3% in November 2008. This last leg down showed us the largest single week drop we have ever seen, falling from 33.7% to 25.3%. Hit 40.7% on the high during the rally off the July 2008 lows. 30.9% was the March low. In March the indicator did its job with the dive below 35% and the crossover with the bears. A move into the lower 40's is a decline of significance. A move to 35% is a bullish indicator. This is smashing that. For reference it bottomed in the summer 2006, the last major round of selling ahead of this 2007 top, near 36%, and 35% is considered bullish.

Bears: 47.2%. Bounced back up after slipping last week. this is the peak for the run this year but is still below the December and October peaks. Hit the 34's on the lows, falling from 38.5% and 46.2% in mid-December. Still above the 35% level considered bullish for stocks, but as with bulls, still well below the level considered bearish for stocks. Bearishness hit a 5 year high at 54.4% the last week of October. The move over 50 took bearish sentiment to its highest level since 1995. Extreme negative sentiment on this move. 35% is the level that historically indicates excessive pessimism. As with the bulls the jump in bears did its job after hitting 44.7% in the third week of March. Bearishness peaked at 37.4% in September 2007. It topped the June 2006 peak (36%) on that run. That June peak eclipsed the March 2006 high (33%) and well above the 2005 highs that spawned new rallies (30% in May 2005, 29.2% in October 2005). This is a huge turn, unlike any seen in recent history.

NASDAQ

Stats: +5.4 points (+0.38%) to close at 1431.5
Volume: 2.064B (-16.51%)

Up Volume: 1.216B (-943.489M)
Down Volume: 798.559M (+516.413M)

A/D and Hi/Lo: Advancers led 1.33 to 1
Previous Session: Advancers led 3.42 to 1

New Highs: 7 (-1)
New Lows: 33 (-68)

NASDAQ CHART: Click to view the chart

An impressive surge after undercutting the November low two weeks back. NASDAQ recovered that low as well as the December low, moving up to the bottom of the January attempt at consolidation (1441 closing). There is still resistance on up at 1500 and some serious price top resistance at 1598. It would be quite surprising to see NASDAQ reach those outer limits on this particular leg. The 50 day EMA (1461) is the closest and quite logical resistance after such a run. What kind of test? Maybe the December low but more likely that old black magic at the November low (1316 closing).

SOX (+1.26%) bounced off the mid-November to start the week and rallied through the 50 day EMA to come within 5 points of a key level at 225. It somewhat triple bottomed off the late February low. Best index in the market, never coming close to its November low. Similar action in 2002 when SP500 held the line as the other indices fell through prior lows. Chips have the bonus of being leaders off lows and as in 2002, though hardly to that scale thus far, they are firmly in the lead of what leadership there is.

NASDAQ 100 (+0.33%) never took out its November low either and it rebounded up to resistance at the 50 day EMA and 1200 to end the week. It could put in a double bottom here and provide a second layer of leadership off the low.

NASDAQ 100 CHART: Click to view the chart

SOX CHART: Click to view the chart

SP500/NYSE

Stats: -5.81 points (-0.77%) to close at 756.55
NYSE Volume: 1.611B (-10.73%)

Up Volume: 995.183M (-699.546M)
Down Volume: 601.279M (+513.569M)

A/D and Hi/Lo: Advancers led 1.54 to 1
Previous Session: Advancers led 7.72 to 1

New Highs: 7 (0)
New Lows: 62 (-50)

SP500 CHART: Click to view the chart

The financials led SP500 off of its new bear market low, taking the index just back up above the November low (752 closing). That is the point everyone is watching. Cleared it right? Yes, but not by enough to mean anything. It will come back to test it and the question is whether it goes up onto 800 resistance first. That is the best upside scenario, a higher test and then a test of that November low. A hold there makes the old low key support and a good point to move up and attack next resistance. We see this week if the sellers come out with the ax.

SP600 (+0.97%) recovered as well and moved right up to its November closing low to end the week. The small caps are going to get a close watch this week, not by many, but we will watch. We have to because they are one of the market canaries. They don't necessarily have to lead the market higher, but they need to be in there pitching and following closely along. If they start to sell, unable to make a definitive move through the bear market low, that puts the rest of the market at risk as they are then broadcasting the economy is not ripe to recover. With the financial and credit markets still in chaos, that is not too hard to believe.

SP600 Chart: Click to view the chart

SP400 CHART: Click to view the chart

DJ30

The Dow enjoyed a good week as well, but it was so far down in the barrel that a 10% moved from the Monday close only took it up to the late February consolidation, still well below the November low at 7552. If SP500 continues higher to start the week and tests 800, then the Dow will likely go on up and test the November low and then things get interesting with what kind of test it brings on.

Stats: +53.92 points (+0.75%) to close at 7223.98
Volume: 479M shares Friday versus 488M shares Thursday. Still very strong volume as the Dow continued its move higher. Some longer term buying, a lot of short covering, but as we often say, all rallies start with short covering.

DJ30 CHART: Click to view the chart

MONDAY

The market showed no ill effects to end the week. No sellers were ready to come in. A new week always brings the possibility of sellers returning, but sellers have to feel they are in a good position to move in and start selling. SP500 is just over the November low; not a bad place to try and sell some. The SP600 is at its low, unable to make the move through; a sign it is the weakest in the litter and thus a target.

But is there enough oversold pressure released from this four days? Likely we see the Dow try on up to 7500, SP500 to 800, and NASDAQ to near 1500. It may not do it right out of the box but start back up after another day or two of rest. That would not be unusual and gives some strong movers off the lows a chance to finish the 1-2-3 pullbacks they started on Friday (e.g. DRIV, ISIL, AMZN). Then it starts back up and heads toward those levels.

We can keep riding this move higher with our current positions, a few new ones set up to move well and quickly, as well as those that led early and make a quick test. Then when the indices approach these levels we evaluate the move with its volume and chart patterns as well as the leadership. That would be, regardless, a great point to take some more gains off the table.

If the sellers come back with their blow torches blazing Monday or Tuesday, well, that changes the game a bit from the get go. Close down the upside that was in rebound mode versus breakout mode, and even close the upside that is pretty solid but not impressively so. Put on some more downside plays. Do the same thing if the indices move up to those next resistance levels and then get flattened by a bunch of sellers in Mack trucks heading south.

The market is trying to pull itself up off the mat and it may not be successful. There is leadership and more trying to emerge; a spanking from the Friday close on high volume will likely tamp that out those trying to emerge. It is a real drag trying to come off the bottom. You cannot trust it, you cannot put your faith in it. At the same time you cannot trust the downside and put your faith in it either, because it has had too much fun and its avarice often leads to its own downfall just as the upside's greed ultimately exhausts all buyers. So close to the bottom you cannot trust another selloff, but if the Dow is going to 5700 or so, then the bottom is not that close.

So you play the good patterns and ride them to logical targets, upside or downside. We have made money on this bounce and will make more as it continues to those next resistance levels but it is important not to sink your teeth into the belief this is the bottom or this is just a bear market rally. In 2002 we saw similar signs as here, liked the odds, and more importantly liked the patterns. We played those patterns to the upside through December, then had to close them all while the market tested. It did not show a renewed bear from the technical action, however, despite the almost three months it dragged on. It was tough to hang in their. We even made some money on the downside but the price/volume action and action in some solid leadership stocks kept us saying the upside was coming. It did.

We play this one the same, way, i.e. taking what the market gives on the runs while keeping an eye on the bigger picture of economics and market technical action. Seems basic, but it is always a fight to keep things in perspective in the heat of the battle, particularly when there is a serious crisis with the government intervening anew every few days.

PATTERN OF THE WEEK

Ascending Triangle: Seeing it set up off of the November to February lows and these can yield explosive breakouts.

This pattern is known by its series of higher highs below a constant, flat top. Draw a line through the tops and an up trendline through the rising lows. It narrows from left to right, forming something of a right triangle laying on its side with the hypotenuse on the bottom side. As with any base you like to see the volume quiet down as it moves through though you prefer to see more rising days on rising trade versus falling days on rising trade as that shows overall accumulation during the base. You can count up the weeks of price gains on rising trade and compare to the weeks of price declines on rising volume and determine if there was overall accumulation or distribution during the pattern. You want a majority of up weeks on volume.

Take a look at the following chart to see what we are talking about:

http://www.investmenthouse.com/ihmedia/driv.jpeg

You can see the triangle shape setting up. The pattern builds pressure from below, and when the top is blown the breakouts are explosive:

http://www.investmenthouse.com/ihmedia/driv2.jpeg

Here is another one to check out. You should recognize this one as well and get a bit jazzed by it:

http://www.investmenthouse.com/ihmedia/sohu.jpeg

Support and Resistance

NASDAQ: Closed at 1431.50
Resistance:
1434 is the January low (1440.86 closing)
1460 is the February low
The 50 day EMA at 1461
The 50 day SMA at 1480
1493 is the October 2008 low & late December 2008 consolidation low.
The 90 day SMA at 1503
1521 is the late 2002 peak following the bounce off the bear market low
1536 is the late November 2008 peak
1542 is the early October 2008 low
1565 is the second low in October 2008
1569 is the late January 2009 peak
1603 is the December peak
1620 from the early 2001 low
1644 from August 2003
1666 is the January 2009 peak

Support:
1428 is the mid-November 2008 low
The 18 day EMA at 1391
1398 is the early December 2008 low
1387 is the 2001 low
1316 is the November 2008 closing low
1295 is the November 2008 low
1271 from is the March 2003 low, 1253 intraday
1262 from July 2002
1192 is the July 2002 intraday low
1114 is the October 2002 low, the bear market low

S&P 500: Closed at 756.55
Resistance:
768 is the 2002 bear market low
The 50 day EMA at 797
800 is the March 2003 post bottom low
804 is the low on the January 2009 selloff
812 is the February low
815 is the early December 2008 low
818 is the early November 2008 low
839 is the early October 2008 low
The 90 day SMA at 842
848 is the October 2008 closing low
853 is the July 2002 low
857 is the December consolidation low
866 is the second October 2008 low
878 is the late January 2009 peak
889 is an interim 2002 peak
896 is the late November 2008 peak
899 is the early October closing low
919 is the early December peak
944 is the January 2009 high

Support:
752 is the November 2008 closing low but it is not broken and done away with
741 is the November 2008 intraday low
The 18 day EMA at 741
722 is a December 1996 low
681 is the June 1996 intraday peak, 673-71 closing
665 from August 1996
656-654 from January, April 1996
607-05 from November 1995

Dow: Closed at 7223.98
Resistance:
7282 is the October 2002 closing low in the prior bear market.
7449 is the November 2008 low
7524 is the March 2002 low to test the move off the October 2002 low
The 50 day EMA at 7663
7694 is the February intraday low
7702 is the July 2002 low
7867 is the early February low
7882 is the early October 2008 intraday low. Key level to watch.
7909 is the early January low
7965 is the mid-November 2008 interim intraday low.
8141 is the early December low
The 90 day SMA at 8169
8175 is the October 2008 closing low. Key level to watch.
8197 was the second October 2008 low
8419 is the late December closing low in that consolidation
8451 is the early October closing low
8521 is an interim high in March 2003 after the March 2003 low
8626 from December 2002
8829 is the late November 2008 peak
8934 is the December closing high
8985 is the closing low in the mid-2003 consolidation
9088 is the January 2009 peak

Support:
7197 is the intraday low from October 2002 bear market
7115 is the February 2009 closing low
The 18 day EMA at 7105
7008 from February 1997 closing peak
6528 is the November 1996 peak
6489 from December 1996 closing peak
6356 is the April 1997 intraday low

Economic Calendar

These are consensus expectations. Our expectations will vary and are discussed in the 'Economy' section.

March 16 - Monday
- March Empire Manufacturing (8:30): -32.0 expected, -34.65 prior
- Net Long-Term TIC Flows, January (9:00): $34.8B prior
- Capacity Utilization, February (9:15): 71.1% expected, 72.0% prior
- Industrial Production, February (9:15): -1.2% expected, -1.8% prior

March 17 - Tuesday
- February Building Permits (8:30): 510K expected, 531K prior
- Core PPI, February (8:30): 0.1% expected, 0.4% prior
- Housing Starts, February (8:30): 453K expected, 466K prior
- PPI, February (8:30): 0.4% expected, 0.8% prior

March 18 - Wednesday
- February Core CPI (8:30): 0.1% expected, 0.2% prior
- CPI, February (8:30): 0.3% expected, 0.3% prior
- Current Account Balance, Q4 (8:30): -$136.7B expected, NA prior
- Crude Oil Inventories, 03/13 (10:30): +749K prior
- FOMC Rate Decision (14:15): No change expected

March 19 - Thursday
- 03/14 Initial Jobless Claims (8:30): 654K prior
- Leading Indicators, February (10:00): -0.6% expected, 0.4% prior
- Philadelphia Fed, March (10:00): -40.0 expected, -41.3 prior
icon url

ReturntoSender

03/19/09 8:30 PM

#8500 RE: ReturntoSender #6755

I'm on record here stating that it would not surprise me if the market did not bottom until October 2009. That would give us a bear market of pretty much the same duration as the bear that led to the October 2002 bottom.

But I have learned a lot more about reading markets and sentiment since 2002 when I was uncertain if we had a real bottom then. I have very little concern about fundamentals, unemployment and consumer demand.

What I watch is volume, market breadth, sentiment and the like. I can tell you that I would love to see one more big sell off but I fear it will not be coming.

We are very likely going to have the first higher volume up week for all the major averages in a very long time. We have also been seeing great moves in the broader market underpinned by strength where it counts most, transportation stocks, financials and our favorite sector technology. If we don't sell off too much real soon here we are also going to have our first up month on higher volume.


The bottom line with that is that even if this bottom does not hold any better than the August 2002 bottom it should prove to be a good time to buy on weakness. The October 2002 low was lower. It was tested in March of 2003 but it held.

Then as now we have seen higher lows in many indicators like the BPNDX. The VIX recently was high but not as high as earlier in this bear market. The number of new lows was high but it has been declining even when the market hit new lows. I could go on and on but with the number of 90% upside days, broad market participation and volume looking better all the time I will just say I believe it is time to buy the dips again and hold for a while.

I could be wrong but I know my read on the market is not. Things are looking up.

JMHO, RtS

icon url

ReturntoSender

03/21/09 7:11 PM

#8502 RE: ReturntoSender #6755

From Briefing.com: Weekly Recap - Week ending 20-Mar-09

Following its largest weekly gain in many months, the stock market managed to extend those gains in the beginning of this week, culminating with a sharp spike higher Wednesday afternoon after the Federal Reserve surprisingly increased its balance sheet. However, investors have taken profits over the last two sessions, resulting in only modest gains for the major averages this week -- S&P +1.6%, Dow +0.8%, Nasdaq +1.8%, Russell +1.8%.

Looking at sectors, Utilities led the way with an 8% advance, while Financials gave up their weekly gains on Thursday and Friday, losing 8% and 5%, respectively, to close nearly unchanged.

Financials helped the market begin the week on positive note. UK banks led the way after Barclays (BCS +19%) announced it is shopping its iShares ETF business. However, the overall market saw profit taking in the afternoon, closing modestly in negative territory.

The first big piece of economic data was also released on Monday, as Industrial Production showed a slightly larger-than-expected decline of 1.4% in February (consensus -1.3%), while the prior month was revised slightly lower to -1.9% from -1.8%.

But Tuesday the market resumed its upward trend, albeit in choppy trade, with gains across the board. Financials once again were a key determinant in the direction of the broader market, but they weren't the only source of strength as the Nasdaq's 4.1% advance was the biggest among the major averages, led by large-cap technology shares, while the Russell 2000 Small-Cap Index outperformed all others, rallying 4.6%.

It was a big day for economic data as well, as Housing Starts and Building Permits both showed large, unexpected jumps in February. Starts increased 22.2% month-over-month to 583,000 (consensus 450,000), while Permits increased 3% to 547,000 (consensus 500,000). The primary swing factor for Starts was the increase in multi-unit structures. Specifically, Starts on dwellings with five units or more surged 80% to 212,000 units, while single-family Starts rose just 1.1% to 357,000 units. Nevertheless, the February report was better-than-feared economic news and could factor favorably in revised forecasts for Q1 GDP.

Wednesday proved to be the biggest day of the week, though very little happened until the Federal Open Market Committee (FOMC) rate decision and policy statement at 14:15ET. The FOMC announced the decision to increase the size of the Federal Reserve's balance sheet further by purchasing up to an additional $750 billion of agency mortgage-backed securities, bringing its total purchases of these securities to up to $1.25 trillion this year, and to increase its purchases of agency debt this year by up to $100 billion to a total of up to $200 billion. Moreover, to help improve conditions in private credit markets, the Committee decided to purchase up to $300 billion of longer-term Treasury securities over the next six months.

The Treasury purchase sent the bond market rocketing higher, with the 30-year bond up more than 6 points at one point. The stock market followed suit, and a plunge in the dollar sent precious metals sharply higher.

While definitely overshadowed, there was also inflation data released on Tuesday and Wednesday. First was the Producer Price Index (PPI) on Tuesday. The core rate, which excludes food and energy, continued to defy the weak demand that is undoubtedly pressuring producers by advancing a larger-than-expected 0.2% (consensus 0.1%). Total PPI was up a smaller-than-expected 0.1% (consensus 0.4%). Next came the Consumer Price Index (CPI) on Wednesday. Both readings came in hotter-than-expected, with the core rate up 0.2% (consensus 0.1%) and total up 0.4% (consensus 0.3%).

The profit taking began on Thursday, despite commodities and commodity-related stocks soaring on the weaker dollar following the Federal Reserves announcement the previous day -- Energy +1.4%, Materials +1.4%. Two factors came into play for the expected weakness. The first was the understanding that the market was apt to encounter some profit taking after gaining as much as 20% between its low on March 6 and its high on March 18. The second was the recognition that the rally had left the S&P testing its 50-day simple moving average (now at 800), which has provided stern resistance during prior rebound attempts.

The market followed through to the downside on Friday. It was a slow session, despite the quadruple-witching options expiration, with the move lower broad-based and not related to any specific headline.

Things should pick up next week, with a number of notable pieces of economic data and some key testimony on tap. Looking at the economic calendar, Existing Home Sales are out Monday (3/23) morning, while Durable Goods Orders and New Homes Sales are out Wednesday (3/25). Looking at the Fed/Treasury calendar, Chairman Bernanke and Secretary Geithner testify before the House Financial Services Committee on Tuesday (3/24) on the government's rescue of AIG, while Mr. Geithner goes before the committee again on Thursday (3/26), this time on financial market regulation.

--David M Campione, CFA, Briefing.com
 
Index Started Week Ended Week Change % Change YTD %
DJIA 7223.98 7278.38 54.40 0.8 -17.1
Nasdaq 1431.50 1457.27 25.77 1.8 -7.6
S&P 500 756.55 768.54 11.99 1.6 -14.9
Russell 2000 393.09 400.11 7.02 1.8 -19.9

09:33 am Research In Motion initiated with a Buy at Caris & Company; tgt $60: . Caris & Company initiates RIMM with a Buy and price target of $60. The firm notes that even while their estimates are well below consensus, and they still expect reduced enterprise IT budgets and weak consumer spend to sharply slow RIMM's Y/Y growth in handsets and subscriber additions in CY09, they nevertheless see BlackBerry continuing to post solid organic growth as one of the best positioned platforms in smartphones, increasing share of the cell phone pie. The firm believes that Apple's iPhone is actually the new gold standard, but with RIMM stock >70% off its highs and trading at just ~12x their CY09E EPS forecast of $3.26, combined with a solid balance sheet the firm sees ~50% upside at current valuation.

09:29 am Sony Ericsson

Handset maker Sony Ericsson warned Friday that it expects to post a loss for its first quarter as customer demand continues to shrink.

Sony Ericsson, a joint venture between Sony (SNE 20.52) and Ericsson (ERIC 9.30), said it expects a first-quarter loss ranging from 340 million euros to 390 million euros ($465 million to $533 million).

The company said weak sales are behind the outlook and that gross margins are expected to fall year-over-year and sequentially.

Sony Ericsson plans to ship 14 million handsets in the quarter, at an average selling price of a approximately 120 euros each.

08:54 am Palm (PALM)

Palm (7.71) reported a loss for its fiscal third quarter, but the company said its highly anticipated Pre smartphone is "coming along great" and the company is "poised to usher in a new era."

For its fiscal third quarter, Palm reported a loss of $0.86 per share, excluding nonrecurring items. The earnings per share figure excludes stock-based compensation, amortization of intangible assets, restructuring charges, a casualty loss, an impairment of non-current auction rate securities, a gain on a series C derivative and accretion of series B and series C preferred stocks and may not be comparable to the First Call consensus that expected a loss of $0.59 per share.

Revenues fell 71.0% year-over-year to $90.6 million, at the high end of the company's previous guidance of revenue between $85 million and $90 million, but below the consensus estimate of $105 million.

For Palm, all eyes are on the launch of its new Pre smartphone. On its earnings conference call, the company said it has to "polish things up" but that the phone is still planned to be available in the first half of 2009.

Palm's gross margins suffered markedly in the quarter, slipping to 5.0% from 20.1% in the prior quarter. Lower selling prices on its older product line contributed to the decline. Palm expects margins to improve as the next generation products are released.

Shares of PALM are down nearly 3% in premarket trade.

08:32 am Xerox (XRX)

Xerox (XRX 5.34) dramatically cut its first quarter earnings estimates due to lower sales of equipment and printer-based supplies in January and February.

Xerox said it now expects first quarter earnings to range from $0.03 to $0.05, well below the consensus of $0.18 and down from the company's previous range of $0.16-$0.20.

Xerox said the reduction includes a $0.06 impact from its share of Fuji Xerox's restructuring and a lower-than-expected Fuji Xerox profit contribution. The balance of the cut stems from an industry-wide slowdown in technology spending, putting pressure on revenue and earnings.

The Norwalk, Conn.-based company said that total revenue in January and February declined 18%, including a 5 point currency impact.

"We're expediting further cost savings that help to offset the economic impact on revenue while fueling our operating cash flow," said CEO Anne Mulcahy.

Xerox said it is on track to deliver $250 million in savings throughout this year from previous restructuring actions, and has identified an additional $300 million in cost and expense reductions that will flow through to earnings and cash generation.

08:09 am 3Com (COMS)

3Com (COMS 2.74) topped earnings estimates in its fiscal third quarter and swung to a profit after posting a net loss in the same period last year.

3Com reported earnings of $0.13 per share, excluding nonrecurring items, in its fiscal third quarter. The results were $0.03 better than the First Call consensus of $0.10.

Revenues fell 3.5% year-over-year to $324.7 million; the consensus expected $332.3 million.

CEO Bob Mao said, "Our China business remained strong in the quarter. Our TippingPoint segment achieved record revenue. The strength in these two segments, combined with stringent cost management, allowed us to offset weakness in other geographies and deliver substantially higher year-over-year profit."
icon url

ReturntoSender

03/23/09 7:57 PM

#8504 RE: ReturntoSender #6755

From Briefing.com: 4:30 pm : The Treasury Department released details related to its plan to remove bad assets from banks' balance sheets, sparking a massive surge in the stock market. In addition, the market benefited from a better-than-expected existing home sales report.

In the end, the S&P 500 spiked 7.1%, settling at session highs thanks to a late afternoon rally.

The Treasury plans to create a series of public-private investments funds to buy $500 billion to $1000 billion in legacy loans and securities. To encourage participation from the private sector, the government is taking on much of the risk and offering subsidies. In a show of support, Bill Gross, co-Chief Investment Officer of the world's largest bond fund, told Reuters that Pimco plans to participate in the program.

Meanwhile, FDIC Chairman Bair said that the public-private investment program will likely make money for the FDIC, according to Reuters. Bair also said that 6-to-1 is the outer range of leverage it will provide for the program, Reuters reported.

The financial sector rallied a massive 17% on the news, with diversified financial services climbing 24.5% and diversified banks up 22.3%.

The move was broad-based as all ten of the economic sectors rose, with gains of at least 3.8%. The energy sector (+7.8%) finished second to financials, outperforming as May crude oil futures climbed 3.5%. Defensive sectors however, underperformed on a relative basis, but still posted solid advances.

In economic news, existing home sales in February rose 5.1% month-over-month to a seasonally adjusted annual rate of 4.72 million, according to the National Association of Realtors. Economists expected a 0.9% month-over-month drop to 4.45 million. A substantial portion of the sales were from first time homebuyers and distressed properties.

The increase is a positive for the market, though sales still remain at depressed levels. While low interest rates and increased affordability are encouraging developments, the housing sector continues to face high levels of inventory, tight credit conditions and the deleveraging of consumers.

Looking ahead, Bernanke and Geithner testify to the House Financial Services Committee on AIG (AIG 1.48, +0.22) at 10:00ET tomorrow morning.DJ30 +497.48 NASDAQ +98.50 SP500 +54.38 NASDAQ Adv/Vol/Dec 2262/2.26 bln/429 NYSE Adv/Vol/Dec 2863/1.91 bln/259

icon url

ReturntoSender

03/23/09 10:00 PM

#8505 RE: ReturntoSender #6755

Tech Stocks Soar on Bailout Plans

http://www.internetnews.com/bus-news/article.php/3811731/Tech+Stocks+Soar+on+Bailout+Plans.htm

Chip stocks led the way higher, with AMD soaring 13% on hopes that the worst is over.

March 23, 2009
By Paul Shread: More stories by this author:

Tech stocks soared Monday after the government unveiled its long-awaited plan to relieve banks of toxic assets that are clogging the financial system.

All the major stock indexes rose 7% on the day, and the gains were evenly distributed across the tech sector, with Microsoft (NASDAQ: MSFT), Intel (NASDAQ: INTC), Cisco (NASDAQ: CSCO), Apple (NASDAQ: AAPL), Research in Motion (NASDAQ: RIMM), Amazon (NASDAQ: AMZN), IBM (NYSE: IBM), HP (NYSE: HPQ) and VMware (NYSE: VMW) gaining 6% or more each.

Chip stocks were especially strong, with AMD (NYSE: AMD), SanDisk (NASDAQ: SNDK) and Micron (NYSE: MU) scoring double-digit percentage gains after ThinkEquity became the latest analyst firm to say that the worst may be priced in to chip stocks.

Sun Microsystems (NASDAQ: JAVA) was one of the few stocks left out of the rally, slipping 2% as investors continued to wait for news of a merger deal with IBM (NYSE: IBM).

Applied Materials (NASDAQ: AMAT), Comcast (NASDAQ: CMCSA), NetApp (NASDAQ: NTAP), Juniper (NASDAQ: JNPR), Nvidia (NASDAQ: NVDA) and Broadcom (NASDAQ: BRCM) were just some of the names besting the Nasdaq's 6.8% gain.

The major indexes are having their best month since October 2002, helped in part by a number of better than expected economic reports that have raised hopes that the economy may be near a bottom. Better than expected existing home sales today also helped fuel the gains.

The Nasdaq soared 98 to 1555, the S&P 500 rose 54 to 823, and the Dow surged 497 to 7775. Volume rose to 8.83 billion shares on the NYSE, but declined to 2.26 billion on the Nasdaq. Advancers led by a 34-4 margin on the NYSE, and 23-4 on the Nasdaq. Upside volume was 97% on the NYSE, and 94% on the Nasdaq. New highs-new lows were 14-76 on the NYSE, and 12-26 on the Nasdaq.
icon url

ReturntoSender

03/24/09 9:13 AM

#8506 RE: ReturntoSender #6755

Five 90% upside days since the start of the rally? The first 90% upside day was March 10. I wrote in a post that day when we started out strong that it could be the start of something really good:

http://siliconinvestor.advfn.com/readmsg.aspx?msgid=25480690&srchtxt=90%%20Upside

I listened to CNBC yesterday and I heard the 5 90% upside day comment. Here are the actual statistics. There is a little rounding up but not much:

Chip Stocks Soar on TI, Citi News - 03/10/2009

http://www.internetnews.com/bus-news/article.php/3809616/Chip+Stocks+Soar+on+TI+Citi+News.htm

Upside volume was 96% on the NYSE, and 95% on the Nasdaq. New highs-new lows were 8-158 on the NYSE, and 6-195 on the Nasdaq.

eBay, Intel Power Stocks to Third Straight Gain - 03/12/2009

http://www.internetnews.com/bus-news/article.php/3810111/eBay+Intel+Power+Stocks+to+Third+Straight+Gain.htm

Upside volume was 94% on the NYSE, and 88% on the Nasdaq. New highs-new lows were 7-112 on the NYSE, and 9-108 on the Nasdaq.

Apple, Cisco Send Tech Stocks Soaring - 03/17/2009

http://www.internetnews.com/bus-news/article.php/3810881/Apple+Cisco+Send+Tech+Stocks+Soaring.htm

Upside volume was 90% on the NYSE, and 92% on the Nasdaq. New highs-new lows were 9-65 on the NYSE, and 4-56 on the Nasdaq.

Sun, Fed Keep Tech Stocks Rallying - 03/18/2009

http://www.internetnews.com/bus-news/article.php/3811066/Sun+Fed+Keep+Tech+Stocks+Rallying.htm

Upside volume was 89% on the NYSE, and 89% on the Nasdaq. New highs-new lows were 10-72 on the NYSE, and 14-45 on the Nasdaq.

Tech Stocks Soar on Bailout Plans - 03/23/2009

http://www.internetnews.com/bus-news/article.php/3811731/Tech+Stocks+Soar+on+Bailout+Plans.htm

Upside volume was 97% on the NYSE, and 94% on the Nasdaq. New highs-new lows were 14-76 on the NYSE, and 12-26 on the Nasdaq.

icon url

ReturntoSender

03/24/09 6:12 PM

#8507 RE: ReturntoSender #6755

From Briefing.com: 4:30 pm : Stocks spent virtually the entire session trading with losses as participants moved to take profits following the prior session's surge. A midsession rebound by financials attempted to help the broader market move into positive territory, but a rekindled selling effort ultimately caused stocks to close at session lows with a sizable loss.

Despite gains in Asia and some mixed action in Europe, the major indices were unable to follow through from Monday's near 7% surge. Instead, stocks opened the session with broad-based losses as a lack of news or data left the direction of stocks up to the whims of traders.

Financials initially came under the most pressure, but rallied from a loss of more than 4% to briefly sport a gain. That helped the S&P 500 and the Dow move into positive territory as well. However, sellers redoubled their effort and the financial sector finished at session lows with a 6.5% loss. The broader market also finished at lows.

With financials under pressure, the broader market was left without a clear leader. In turn, all 10 sectors finished lower.

Energy closed with a 2.2% loss. Stocks in the sector were unable to benefit from a rebound in crude oil futures prices. Crude contract prices spent the majority of the session in negative territory, but mustered enough strength to close pit trading 0.5% higher at $54.05 per barrel.

Tech finished 1.6% lower, but steeper drops in large-cap names like Microsoft (MSFT 17.93, -0.40) and Intel (INTC 15.01, -0.51) hampered the Nasdaq, which underperformed its counterparts for the entire session.

The benchmark 10-year Treasury Note closed 13 ticks lower. It had been showing greater weakness, but trimmed losses when news reports indicated the New York Fed will begin purchasing Treasuries Wednesday.

In other news, reports indicate the SEC is considering modifying its uptick rules. Separate reports suggest major exchanges like the New York Stock Exchange and the Nasdaq are urging such changes.

Fed Chairman Bernanke and Treasury Secretary Geithner were put at the mercy of a House Financial Services Committee hearing regarding the rescue of AIG (AIG 1.41, -0.07). The table pounding by committee members appeared to be little more than grandstanding as Bernanke and Geithner expressed their own frustrations and opinions regarding executive compensation, efforts to protect the economy, risk-taking constraints. DJ30 -115.65 NASDAQ -37.18 SP500 -16.57 NASDAQ Adv/Vol/Dec 793/2.02 bln/1872 NYSE Adv/Vol/Dec 917/1.65 bln/2144

4:05PM Jabil Circuit beats by $0.01, beats on revs; guides Q3 EPS below consensus, revs below consensus (JBL) 4.45 +0.14 : Reports Q2 (Feb) earnings of $0.13 per share, excluding non-recurring items, $0.01 better than the First Call consensus of $0.12; revenues fell 5.6% year/year to $2.89 bln vs the $2.81 bln consensus. Co issues downside guidance for Q3, sees EPS of ($0.08)-$0.08 vs. $0.11 consensus; sees Q3 revs of $2.5-2.7 bln vs. $2.75 bln consensus. The company has commenced performing a goodwill impairment analysis using the two-step approach as required under Statement on Financial Accounting Standards, No. 142 "Goodwill and Other Intangible Assets". The Company currently anticipates having such analysis completed in early April. In the event that the Company determines that its goodwill is impaired in whole or part, a non-cash charge, which is likely to be significant and would further increase reported GAAP net loss and loss per share for the fiscal second quarter of 2009.

1:08AM Teradyne lowers Q109 revenue and EPS guidance; sees Q209 sales flat with Q1 and announces cost reductions (TER) 4.48 : Co issues downside guidance for Q1 (Mar), sees EPS of ($0.42)-($0.40), excluding non-recurring items, vs. ($0.34) First Call consensus; sees Q1 (Mar) revs of $115.0-120.0 mln vs. $135.03 mln consensus. Co projects that its sales in Q209 will be about flat with Q109. "Global economic conditions and consumer demand further weakened this quarter, causing our customers to reduce their test needs to unprecedented levels," said Mike Bradley, CEO. "While there are some indicators suggesting that we have reached the bottom of this cycle, we cannot currently predict when we will see meaningful improvement in demand. In response to these very difficult market conditions, we are taking steps to further lower our annualized costs by approximately $50 million, with a majority of those savings estimated to be in place by the end of the second quarter. These new reductions will bring our total planned 2009 cost reductions to approximately $190 million. We will continue to adjust our costs as necessary, while pressing ahead with new products and supporting our customers in this challenging market."

icon url

ReturntoSender

03/25/09 7:39 PM

#8508 RE: ReturntoSender #6755

From Briefing.com: 4:20 pm : A batch of better-than-expected economic data induced broad-based buying for the first part of the session, but the upbeat tone fell apart as stocks pushed through intraday support levels and a Treasury auction produced disappointing results. However, an underlying bid emerged late in the session, setting off a rally in the last few minutes of trading.

The latest durable goods orders data and new home sales figures both turned out to be better than expected.

February durable goods orders increased 3.4%, marking the first time in six months that orders increased. Excluding transportation, orders increased 3.9%. Economists expected respective declines of 2.5% and 2.0%.

February new home sales increased 4.7% month-over-month to an annualized rate of 337,000. Economists predicted a 2.9% decline.

The upbeat data helped the financial sector build on early strength. Financials had climbed as high as 6.5%, led by diversified financial services stocks (+7.4%). Bank of America (BAC 7.70, +0.48) was a top performer after a report indicated the company plans to soon repay federal aid. Financials turned sharply lower amid a broad-based, afternoon selling effort, which took the sector to a loss of 2.5%, but financials rebounded to close with a 4.6% gain.

The afternoon's selling effort gained momentum after the S&P 500 failed to find support at the 818 level, which had provided intraday support in the early going. Selling intensified after weak demand for a government auction of 5-year Treasuries led to a jump in yields. The disappointing auction followed an auction of Gilts, or British debt securities, by the United Kingdom that failed to attract enough buyers.

The weak auctions suggest investor appetite for government debt carrying low interest rates is waning, which will bring future auctions into closer focus. As such, tomorrow's auction of 7-year notes now has a much higher level of importance.

Sellers took the stock market to a loss of 1.8%, but a late, broad-based rally effort helped stocks close the session with a solid gain. The blue chip Dow Jones Industrial Average outperformed the other headline indices by closing 1.2% higher, but the Small-Cap Russell 2000 fared even better by putting together a 2.3% gain. The Nasdaq 100, which is rich in large-cap tech names, lagged by closing just 0.2% higher.

Tech giant IBM (IBM 97.89, -0.41) closed lower after an article from The Wall Street Journal stated the company is planning layoffs, despite its profile as a strong company. The announcement comes as a reminder that near-term economic prospects haven't improved materially.

On a related note, Automatic Data Processing (ADP 35.62, -0.81) lost ground after trimming its outlook. The company expects revenue for fiscal 2009 to grow from 1% to 2%, which is down from the prior range of 2% to 3%. The company also expects earnings growth from continuing operations to come in at the low end of the range 10% to 14%.

The final fourth quarter GDP reading is due tomorrow morning, as are weekly jobless claims (8:30 AM ET). Best Buy (BBY 33.46, +0.22), ConAgra (CAG 15.56, +0.14), and GameStop (GME 26.84, -0.21) also report before Thursday's opening bell.DJ30 +89.84 NASDAQ +12.43 NQ100 +0.2% R2K +2.3% SP400 +1.2% SP500 +7.76 NASDAQ Adv/Vol/Dec 1692/2.15 bln/979 NYSE Adv/Vol/Dec 2137/1.77 bln/923

4:59PM Amkor reported that Q1 net sales are tracking to a sequential decline of 30% to 34% YoY, within the favorable end of the range of the co's previously announced guidance (AMKR) 2.59 +0.033 : Co reported that first quarter net sales are tracking to a sequential decline of 30% to 34% from the quarter ended December 31, 2008, which is within the favorable end of the range of the co's previously announced guidance. The co also noted that gross margin for Q1 is expected to be 8-12% of net sales, which is above its previously announced range of 5% to a negative 2%. Gross margin for Q1 is expected to benefit from reductions in labor and other costs and foreign government subsidies of employee wages, as well as the strength of the U.S. dollar against certain foreign currencies. However, gross margin is affected by a number of estimates and other factors which will be reviewed after the end of the quarter and the final gross margin for Q1 could vary from our current estimate. AMKR estimates that its current global cash balance has declined to ~$275 mln, reflecting payments relating to a patent license dispute, employee benefit and severance payments and the repurchase of outstanding notes due in 2011. It is too early for the co to provide other 2009 Q1 financial information and therefore, it is neither updating nor reaffirming its prior guidance regarding net income.

4:59PM Amkor proposes to offer $240 million convertible senior subordinated notes due 2014 (AMKR) 2.59 +0.03 : Co announces that it proposes to offer $240 mln aggregate principal amount of convertible senior subordinated notes. The notes would be due in 2014 and are to be offered and sold to qualified institutional buyers and to James J. Kim, Chairman and Chief Executive Officer of Amkor and Amkor's largest shareholder, and certain entities controlled by Kim. Kim and his affiliates have agreed to purchase at least $150 mln of the notes and up to an additional $50 mln of the notes, depending on market demand. In connection with such investment, Kim and his affiliates will agree to enter into a voting agreement with Amkor restricting the voting of shares of Amkor acquired by Kim or his affiliates upon conversion of the notes. Amkor also intends to grant to the initial purchasers of the notes an option to purchase up to an additional $10 mln aggregate principal amount of notes solely to cover over-allotments.

RF Micro Devices (RFMD) announces that the co has been selected by a "leading manufacturer" of smartphones to supply its high performance RF1450 single-pole 4-throw switch into an upcoming multi-featured CDMA smartphone device. No terms given.

08:10 am Jabil Circuit (JBL)

Jabil Circuit (JBL 3.81) reported better-than-expected earnings for its fiscal second quarter, but the company issued downside guidance for the current quarter, saying its end-markets "remain difficult with limited visibility."

For its fiscal second quarter, Jabil reported earnings of $0.13 per share, excluding nonrecurring items, a penny better than the First Call consensus of $0.12.

Revenues fell 5.6% year-over-year to $2.89 billion, slightly better than the consensus that expected $2.81 billion.

Due to further deterioration of the macro-economic environment and the continued decline of its stock price, Jabil said it is currently performing a goodwill impairment analysis, likely to be completed in early April. The company said that it will take a non-cash charge that is "likely to be significant" if it determines its goodwill is impaired in whole or part.

The company issued downside guidance for its third quarter, saying it expects to post earnings ranging from a loss of $0.08 to a profit of $0.08; the consensus currently stands at $0.11. Jabil expects revenues to range from $2.5 billion to $2.7 billion vs. a consensus of $2.75 billion.
icon url

ReturntoSender

03/26/09 11:02 PM

#8509 RE: ReturntoSender #6755

From Briefing.com: 4:30 pm : The major indices closed near session highs in a broad-based advance. Some better-than-expected corporate earnings and a satisfactory Treasury auction helped participants build on the prior session's gains. The latest batch of economic data was met with a muted response.

The major indices spent the entire session in positive territory, undeterred by choppy trading. Gains were widespread as all 10 major sectors in the S&P 500 closed the session higher.

Contrary to recent form, the gains came without leadership from the financial sector. Financials lagged for the entire session, frequently trading in the red. Financials were able to close 1.0% higher, though.

Tech (+4.0%) was one of the session's strongest performers. Large-cap tech names underpinned strength in the Nasdaq Composite, which outperformed the other headline indices for the entire session.

A better-than-expected earnings announcement and upbeat forecast from Best Buy (BBY 37.67, +4.21) breathed fresh air into investors, helping to further improve spirits ahead of the opening bell. Retailers responded by advancing 4.4%, supporting a 4.0% gain in the consumer discretionary sector.

Stocks spiked in early afternoon trading following the results from a 7-year Treasury Note auction. The satisfactory turnout helped moderate concern regarding the government's cost of capital and investors' risk appetites which stemmed from Wednesday's weaker 5-year Note auction.

Economic data did little to disrupt trading. The final fourth quarter GDP reading showed a 6.3% annualized rate of contraction, which wasn't as bad as the 6.6% decline that was expected.

Weekly initial jobless claims climbed 8,000 from the prior week to 652,000. However, that was essentially in-line with expectations. Continuing claims climbed more than expected to a record high of 5.56 million, though.

Several Regional Fed Presidents gave speeches today. The speeches covered a range of topics, but many believe the economic malaise will last for a few more months.

Treasury Secretary Geithner testified before the House Financial Services Committee that an overhaul of financial regulation is needed. The changes would aim to limit risk in order to prevent future financial crises. DJ30 +174.75 NASDAQ +58.05 NQ100 +3.6% R2K +4.4% SP400 +3.9% SP500 +18.98 NASDAQ Adv/Vol/Dec 2206/2.15 bln/509 NYSE Adv/Vol/Dec 2435/1.81 bln/615

4:52PM NVIDIA files countersuit against Intel for breach of contract (NVDA) 10.56 +0.62 : The co announces that it has filed a countersuit in the Court of Chancery in the State of Delaware against Intel (INTC) for breach of contract. The action also seeks to terminate Intel's license to NVIDIA's valuable patent portfolio. NVIDIA's countersuit was brought in response to a filing by Intel last month in the Delaware court, alleging that the four-year-old chipset license agreement does not extend to Intel's future generation CPUs with "integrated" memory controllers, such as its Nehalem processor. "NVIDIA did not initiate this legal dispute," said Jen-Hsun Huang, president and CEO of NVIDIA. "But we must defend ourselves and the rights we negotiated for when we provided Intel access to our valuable patents. Intel's actions are intended to block us from making use of the very license rights that they agreed to provide."

12:00PM Fairchild Semi announces plans to streamline and consolidate wafer manufacturing (FCS) 3.90 +0.07 : Co announces plans to streamline and consolidate wafer manufacturing. Co will close its wafer fabrication plant in Mountaintop, PA leading to a closure of the site, and one of its wafer fabs in Bucheon, South Korea. Co anticipates the consolidation of the South Korea fabrication processes and the closure of the Mountaintop facility will be completed by June, 2010. Fairchild expects to incur ~$18 to $23 mln of cash charges, primarily for severance and other costs associated with transfer activities beginning in the second quarter. The company will also take additional non-cash charges of approximately $25 to $30 mln for impairments and accelerated depreciation over the course of the next six quarters. In addition, roughly 200 jobs will be eliminated at the Mountaintop site. Once completed, the company expects to realize annual savings ranging from $20-25 mln as a result of these closures.

8:35AM Agilent restructures electronic measurement businesses (A) 15.96 : The co announces a major restructuring of its Electronic Measurement businesses in response to the most severe global downturn in the company's history. Fiscal 2009 revenue in the company's Electronic Measurement Segment is expected to be down roughly 30% from 2008 to the lowest level in the company's 10-year history. Revenue in the Semiconductor & Board Test Segment is expected to be down over 50% from last year and off 65% from its peak volume... The co announces it would reduce costs in its Electronic Measurement Segment by an annualized $300 million over the course of the next four quarters, sizing the Segment to achieve a 12% operating margin and a 21% ROIC at annualized revenues of $2.3 billion. It also announced a further restructuring of its Semiconductor & Board Test Segment to reduce annual costs by an additional $10 million. This restructuring will affect approximately 2,700 employees and have a cash cost of about $160 million... In order to fully fund the restructuring and conserve cash in an environment of severely constrained financial markets, the company also announced it was temporarily suspending its share repurchase program until the end of its 2009 fiscal year.

08:39 am Best Buy (BBY)

Best Buy (BBY 33.46) easily topped fourth quarter earnings estimates and issued upside guidance for the full year, sending shares of the consumer electronics retailer more than 8% higher in Thursday's premarket trade.

For the fourth quarter, Best Buy reported earnings of $1.61 per share, excluding nonrecurring items, $0.21 better than the First Call consensus of $1.40.

Revenues rose 9.7% year-over-year to $14.72 billion; the consensus expected $14.82 billion.

Best Buy said the revenue increase reflected the inclusion of Best Buy Europe's revenue and gains from the net addition of 213 new stores in the past 12 months. Revenue gains were offset by a same-store sales decline of 4.9% and the unfavorable impact of foreign currency fluctuations. Excluding foreign currency effects and the impact of adding Best Buy Europe, total fiscal fourth quarter revenue declined 2% versus the prior-year period.

While same-store sales declined, Best Buy noted that the majority of the drop off was in December, when same-store sales plunged 6.8%, compared to a 2.5% decline in the combined January-February period.

Best Buy estimates that its domestic market share grew 1.2 percentage points year-over-year to nearly 22%, driven by strength in key product categories such as notebook computers and flat-panel TVs and aided by the demise of Circuit City.

The company issued upside earnings guidance for the full year, expecting earnings between $2.50 and $2.90 per share, ahead of the $2.47 consensus with plenty of room for an upside surprise. Best Buy expects full year revenues to range from $46.5 billion to $48.5 billion; the consensus stands at $48.05 billion.
icon url

ReturntoSender

03/28/09 6:53 PM

#8511 RE: ReturntoSender #6755

Amateur Investors Weekend Stock Market Analysis (3/28/09)

http://www.amateur-investor.net/Weekend_Market_Analysis_Mar_28_09.htm

From October of 2007 through early March of 2009 the Dow lost 54% of its value. Some other notable drops going back to 1896 include 1906-1907 when the Dow lost 49%, 1929 (-49% in 3 months), 1931-1932 (-79%), 1937-1938 (-50%) and 1973-1974 (-48%). After these substantial drops these were followed by sizeable rallies which included +89% (1907-1908), +52% (1929-1930), +375% (1932-1936), +64% (1938) and +80% (1973-1974). Thus as you can see there have been some impressive Rallies after the Dow has fallen around 50% in the past.

Since the early March Lows the Dow has gained 22.5%, Nasdaq (25.4%) and S&P 500 (24.7%) in 14 trading days which is equivalent to 3 trading weeks. The overall pattern we are currently seeing is rather similar to what occurred from 1937 through 1938. A weekly chart of the Dow from that time period is shown below. The first thing to notice is the Elliott 5 Wave pattern that occurred from early 1937 through the early part of 1938 in which the Dow lost 50% of its value. After Wave 5 (5) completed this was followed by a an ABC type corrective rally. The "A" Wave up had a 5 wave structure to it as the 1st Wave up 1 (A) saw the Dow gain 25% in 3 weeks. This was then followed by a minor abc type pullback for Wave 2 down (2 A) in which the Dow dropped back to its 61.8% Retracement Level for a 12% correction. Next Wave 3 up (3 A) occurred in which the Dow gained 36% in 10 weeks as it stalled out right at its 50% Retracement Level calculated from the 1937 high to the 1938 low. This was then followed by another minor abc type pullback for Wave 4 down (4 A) in which the Dow lost 12% again before the final 5th Wave up occurred in which the Dow gained another 24% before peaking at its 61.8% Retracement Level near 158 which completed the "A" Wave up. Overall from the low of Wave 5 (5) in early 1938 to the high made in late 1938 the Dow gained 64%.


Now let's look at a current chart of the Dow. Notice the same type of Elliott 5 Wave pattern occurred from late 2007 to the final Wave 5 (5) in early March in which the Dow lost 54% of its value. Over the past 3 weeks the Dow has rallied just over 22% so its possibly it may rise another 3% or so before we see completion of Wave 1 (A). This would then be followed by Wave 2 (A) down which would be a minor abc pullback with support coming in either at the 50% or 61.8% Retracement Level. Once Wave 2 (A) ends then a strong Wave 3 (A) would occur with the Dow potentially rising back above the 9000 level at some point later this year if we did see a repeat of the 1938 pattern.


Meanwhile if we take a longer term look at the Dow from the late 1930's through the early 1940's notice once the "A" Wave peaked in late 1938 this was followed by the "B" Wave down in which the Dow dropped 24%. Then after the "B" Wave pullback the Dow rallied again but stalled out just below the peak of Wave "A" as it completed Wave "C" to the upside with a gain of 31%. Meanwhile once the ABC corrective rally ended then the Dow went through another 5 Wave pattern to the downside before finally making a low in early 1942 just below the low made in early 1938 as it fell 42% from late 1939 through early 1942.


So far the period from late 2007 through early 2009 looks rather similar to the period from early 1937 through early 1938 so it will be interesting to see if the same type of pattern occurs once again in the years ahead. At this time I know many investors are frustrated because they missed the rally over the past 3 weeks. However if we are seeing a 5 Wave pattern developing for Wave "A", as mentioned above, there will be plenty of opportunities to reenter the market after we see a substantial pullback occur.
icon url

ReturntoSender

03/29/09 12:00 PM

#8512 RE: ReturntoSender #6755

InvestmentHouse Weekend Update 3/27/09:

http://www.investmenthouse.com/weekendmarketsummary.htm

- Market pensive ahead of the weekend as quarter end buying stalls.
- Prices eat into incomes but disposable income is still rising.
- Nothing showy, but economic data continues its attempt at stopping the bleeding.
- A potential transition week ahead as the quarter winds down and earnings ready to roll out.

Not a great Friday, but a somewhat normal pullback nonetheless.

Friday did not pan out with another good rally to end the week and maybe tap resistance. Didn't even try. Futures were down before the economic data hit, and afterwards they stayed down even though the US side of the equation was not that bad. Spending was up 0.2%, in line with expectations though well off the upwardly revised 1.0% in January. Spending is now up 2 months straight. Incomes, however, fell 0.2%, more than the -0.1% expected and the 0.2% gain in January. Higher prices are eating into incomes. Still, disposable real income was up for its fifth straight month.

On the other side of the oceans the news did not have the same positive shifting undercurrents the US data is showing (manufacturing, retail sales, same store sales, home sales). Japanese retail sales posted the worst drop in ten years, not exactly what you look for when an economy is expected to emerge from depression. The UK GDP fell 1.6% versus the -1.5% expected. That was not a terribly horrible miss, but the whisper was the number was going to beat expectations. It did, just not the right way. The overall EU reported that industrial orders fell 34%. Ouch.

So, futures found nothing positive heading into the open and they accordingly opened lower. Michigan sentiment proved to be better than anticipated at 57.3 (56.8 expected, 56.6 prior), but that did not liven up the sour mood, at least not right off. Stocks sold lower but then caught a bid and rallied to session highs though the indices never came close to positive on that run. Indeed they never came close to positive. They peaked at lunch and continued the selling, hitting new session lows mid-afternoon. A bounce attempt in the last two hours couldn't hold it together and the indices closed at their previous session lows.

Seems the quarter end buyers were not interested in new positions ahead of the weekend. Perhaps they stopped buying due to the 3-day clear period on stock trades (the end of the quarter is Tuesday), perhaps it was just the weekend. Buyers left and stocks lost their bid. Didn't help matters that the dollar was up and thus some of the recent leaders sensitive to the dollar, e.g. commodities, were substantially lower. That does not excuse losses in the 2+% range, but at least sellers didn't surge into the market as the lower volume shows. They also could not take the leaders down; leaders rather normally tested their good moves. We will see if there is a new spark early in the week, end of quarter or no.

TECHNICAL. Started down, made a weak attempt at rallying that just could not catch hold, and then sold off the last 3.5 hours, finishing at the lows. This time there was no concerted buyer push in the afternoon to take stocks back to positive. Superman didn't show up. The ninth inning rally failed, the 2 minute offense ran out of clock.

INTERNALS. Nothing special. Breadth was negative. What a surprise. 2+% losses will push decliners to the -3:1 level. The most interesting feature was the plummet in volume. NYSE trade hit the lowest level in 1.5 months. Not a lot of sellers, certainly much fewer than the recent buyers. Nonetheless, it was a complete abdication by the buyers that let the few sellers push the market around without any challenge. Jimmy Carter era d j vu.

CHARTS. NASDAQ had the momentum Thursday, but it exited with the closing bell Thursday and that left the techs unable to push further toward 1600 resistance, much more the January peak. Same story across all the market as the indices faded back from just below their next resistance level. Even SOX faded from its November peak it was just getting ready to challenge, but SOX looks great still as it comes back to test the PRIOR post-November high, not just bouncing around inside its big range. Always like dealing from a position of strength. Now the losses were something of a drop in the bucket versus the moves higher in this rally and were in line with the losses on this move (SP500 losses the past two weeks: -2%, -2%, -1.3%). The move was not devastating by any stretch but it was not the lead in to next week that we wanted for a last push ahead of quarter end. We will see if there is a last gasp higher attempt early in the week. As for a test, SP500 can still test back to 800ish and NASDAQ 1500ish and still be in fine shape. You just don't want to see the leaders start to break down.

LEADERSHIP. Speaking of leadership, not many stocks were up but not many were in trouble either, at least among the leadership. They are testing but not violating near support. Kind of what you would expect after a strong run, and as noted Thursday, without quarter end and earnings it would be just a normal pullback. Indeed a test ahead of earnings, outside of a huge surge into the new month we can use to sell out our positions, is typically a good thing as it takes the froth off the move and allows good results, if there are any, can be rewarded. That remains to be seen. Leaders are holding up very well as the plays on the report show, but we are still more gun shy than not about the market move holding through earnings and thus holding upside positions through earnings.

THE ECONOMY

Data Still Showing Modest Gains.

Hear that? Sounds like whips hitting a dead horse carcass again. Once more last week revealed more economic data that, while hardly indicative of a surging economy, shows a slowing of the rush to the depression. Existing home sales, new home sales, and factory orders all topped expectations and more than that, the revisions were positive as well.

I have said it many times before, but when the revisions start taking back what the prior assumptions offered that is when you start to see the true turns in the economy. As with the stock market, weather forecasting, or any other prognostication endeavor, the humans that man the controls tend to fall into a trend in line with the current trend and they don't change their ways even as the trend starts to change. Thus they continue on in the belief the trend will hold even when the data suggests it is at least pausing. Thus their forecasts and assumptions are based on the current trend, and when there is a true change they have to revise their assumptions as more and more data comes in so they can reconcile with the facts.

The facts right now show slowing in the rate of decline and more than that, showing it for more than just a month. Regional manufacturing is stringing together a series of 'slower declines', meaning contraction continues but the pace is slowing more and more. Durable goods orders and factory orders are bouncing back and forth, showing the volatility that is associated with every change in any trend. I use a weather analogy frequently. When a season is well established the weather patterns are trending in one direction and forecasting the weather is easy. Summertime on the coast means a high around 90, still winds, and a 20% chance of a shower coming in off the Gulf. When the fall starts to roll around, however, the winds shift, fronts race through at differing intervals, violent storms kick off when cold air slams into warm moist Gulf air. Volatility. Then as the fall takes control you get nice days that get shorter and shorter. That holds up until winter hits and things get choppy once more.

The economic data is trying to get choppy, trying to show a bit of volatility. The attempts have not been that forceful yet, kind of like a defector from the Eastern Block learning to speak up with freedom's voice. Pensive at first, then gains confidence as he or she is not hauled off and never heard from again. Maybe these are all head fakes, just blips in an otherwise ongoing death spiral. All we know is that the attempts at improvement cover the waterfront and the market responded ahead of them with this initial bounce that, by the way, has the chips out in front just as it was in late 2002 when the market initially rallied off the bottom before the long, drawn out spring 2003 test that nearly had investors slashing their wrists.

THE MARKET

MARKET SENTIMENT

VIX: 41.04; +0.68
VXN: 41.45; +0.87
VXO: 43.39; +1.96

Put/Call Ratio (CBOE): 0.92; 0

Bulls versus Bears:

This is a reading of the number of bullish investment advisors versus bearish advisors. The reason you look at this is that it gives you an idea of how bullish investors are. If they are too bullish then everyone is in the market and it is heading for a top: if everyone wants to be in the market then all the money is in and there is no more new cash to drive it higher. On the other side of the spectrum if there are a lot of bears then there is a lot of cash on the sideline, and as the market rallies it drags that cash in as the bears give in. That cash provides the market the fuel to move higher. If bears are low it is the same as a lot of bulls: everyone is in and the market doesn't have the cash to drive it higher.

This is a historical milestone in the making. Bulls are impressively low considering we are in general a very optimistic country. The few bulls is a positive indication because it means most everyone that is getting out is out and there is money on the sidelines. In other words the ammunition boxes are full and as the market recovers investors will start opening up the boxes and firing. Little by little they will be forced to put more money into the market and there will be some rushes higher in fear they are missing the train. You relish times when sentiment is so negative because it means some tremendous buys are setting up. This could indeed be the opportunity of a lifetime, and you take advantage of it by buying quality stocks and letting them work for you as long as they will. If we can hold them for years, great.

Bulls: 28.9%. A fraction more bulls (28.4% last week) but not really commensurate with the market gains. Not a lot of belief in it just yet. 29.7% three weeks back, down from that 'optimism' Well down from 43.0%, the current top of the recovery as the market rallied off the November low. A rise from 25.3% in December and quickly starting to fall once the market encountered the January selling. Bullishness bottomed on this leg lower at 21.3% in November 2008. This last leg down showed us the largest single week drop we have ever seen, falling from 33.7% to 25.3%. Hit 40.7% on the high during the rally off the July 2008 lows. 30.9% was the March low. In March the indicator did its job with the dive below 35% and the crossover with the bears. A move into the lower 40's is a decline of significance. A move to 35% is a bullish indicator. This is smashing that. For reference it bottomed in the summer 2006, the last major round of selling ahead of this 2007 top, near 36%, and 35% is considered bullish.

Bears: 43.3% versus 44.3% the prior week. Slowing the decline from 47.2% as here as well there were not many believers in the run higher. Still showing plenty of worry. 47.2% is the peak for the run this year but is still below the December and October peaks. Hit the 34's on the lows, falling from 38.5% and 46.2% in mid-December. Still above the 35% level considered bullish for stocks, but as with bulls, still well below the level considered bearish for stocks. Bearishness hit a 5 year high at 54.4% the last week of October. The move over 50 took bearish sentiment to its highest level since 1995. Extreme negative sentiment on this move. 35% is the level that historically indicates excessive pessimism. As with the bulls the jump in bears did its job after hitting 44.7% in the third week of March. Bearishness peaked at 37.4% in September 2007. It topped the June 2006 peak (36%) on that run. That June peak eclipsed the March 2006 high (33%) and well above the 2005 highs that spawned new rallies (30% in May 2005, 29.2% in October 2005). This is a huge turn, unlike any seen in recent history.

NASDAQ

Stats: -41.8 points (-2.63%) to close at 1545.2
Volume: 2.06B (-18.07%)

Up Volume: 460.521M (-1.991B)
Down Volume: 1.633B (+1.486B)

A/D and Hi/Lo: Decliners led 2.97 to 1
Previous Session: Advancers led 4.23 to 1

New Highs: 18 (-6)
New Lows: 13 (-3)

NASDAQ CHART: Click to view the chart

After coming to 13 points from 1600 on Thursday, NASDAQ gapped lower and closed at the session low, never really attempting any upward movement. Disappointing it did not challenge the resistance but it is also in the top of the range, holding well over support near 1500. Low volume. No heavy selling. Just ran out of buyers. Those are positives, but whenever an index makes it back up to key resistance that has pushed it back before it is a gut check moment. We will see how it responds early in the week; some upside and we close out some more positions as we use the upside to bank gain and see if it can make the breakout move.

SOX (-2.08%) lost some ground after the Thursday breakout, but it is holding over the prior highs after coming close but not quite taking out the November peak. Big and important moves by the chips, clear market leaders. How they respond early this week is key. Recall back in December we were talking about the chips and their relative strength and building patterns. They were showing strength then and while they had a couple more tests to make, they finally broke to a new post-November high and are leading the market higher.

NASDAQ 100 CHART: Click to view the chart

SOX CHART: Click to view the chart

SP500/NYSE

Stats: -16.92 points (-2.03%) to close at 815.94
NYSE Volume: 1.443B (-20.26%)

Up Volume: 192.082M (-1.127B)
Down Volume: 1.246B (+765.008M)

A/D and Hi/Lo: Decliners led 3.07 to 1
Previous Session: Advancers led 3.86 to 1

New Highs: 12 (-6)
New Lows: 87 (-4)

SP500 CHART: Click to view the chart

The large caps turned back before hitting 850, 875, or 900 to 910. It also turned back below the 90 day SMA (828). As noted earlier, the loss was in line with other losses on the upside run. Just the location where this one occurred as well as the time on the calendar make it more interesting as they say. Very low volume here as well and that leaves SP500 in technically good position to test the 800 level and try to find a higher low. Again, the concern is approaching earnings season and whether SP500 will make a normal test of support or the sellers use this run to jump all over the downside.

SP600 (-3.34%) move dup to test the bottom of its January range and there it stalled, at least on Friday. It is holding at the December low but it has not shown any leadership quality thus far, just tagging along with the other indices as they recovered.

SP600 Chart: Click to view the chart

SP400 CHART: Click to view the chart

DJ30

Similar action after DJ30 rallied toward resistance at 8000, bumping into the bottom of the January/early February consolidation range and fading modestly on very low volume. As noted earlier in the week a test back to 7552 (the November closing low) is a logical point for it to fade to, but sure would like to see a sprint up toward 8175 to 8250 first. We will see how it responds to start the new week, but we keeping our expectations low.

Stats: -148.38 points (-1.87%) to close at 7776.18
Volume: 323M shares Friday versus 397M shares Thursday. No sellers at least.

DJ30 CHART: Click to view the chart

MONDAY

Lots of economic data. Lots. The market is also preparing for earnings season. It has a 20% run under its belt. The quarter is ending. Just your usual start to a week.

Friday was a disappointment as the market did not make another push higher and give us an easy opportunity to take a lot more gain off the table. As noted above, a bit of profit taking and nervousness ahead of the weekend, something similar to the prior two Fridays. They were followed by two good upside Mondays.

If we get another good Monday we will book quite a bit of gain. If the market continues to test then we have the decision of whether to see if we get a bounce after a test of 7500 on the Dow and 800ish on SP500. Oh yes, and 1500 or so on NASDAQ and 235ish on SOX. While the market is showing good upside strength and volume, and while we have banked a lot of gain on the recent upside moves, we are inclined to stick with some tight stops and take the rest of the gain on plays that have it and avoid any serious losses on more recent entries and then see how any test holds up.

We have enjoyed many good moves by many stocks as the indices move into resistance, and with earnings coming on top of everything else we would prefer to bank more gain. We can always get back in if the market rebounds after holding support. Might be the wrong call if earnings turn out better than expected, but with a good run in the bank we would rather not take the gamble, at least not on all positions.

So we enter the week playing it a bit cautious, happy to see another upside Monday again if it will show itself, but either way ready to protect gains and our positions. As for new positions, for the upside we will have to see what kind of test comes off of this most recent tap at resistance or whether it blows on through, making it harder to get in as that involves more chasing the bus toward earnings. We will see what kind of opportunities provide some fast upside in that situation to augment our current positions, i.e. current leaders coming off tests of their moves.

In sum the market is at a potential transition moment thanks to its move thus far, key resistance at hand, quarter end, and earnings season. We have taken gain on the way up and will continue to do so given the opportunity. We will also protect positions from any further downside given you just don't know what the market is going to do after this run to resistance. If things get really dicey, we have some downside positions that we can turn to for some downside gain as well.

Support and Resistance

NASDAQ: Closed at 1545.20
Resistance:
1569 is the late January 2009 peak
1598 is the February 2009 peak, the last peak NASDAQ made
1603 is the December peak
1620 from the early 2001 low
1644 from August 2003
The January closing low at 1653
1666 is the intraday January 2009 peak
1780 is the November 2008 peak

Support:
1542 is the early October 2008 low
1536 is the late November 2008 peak
1521 is the late 2002 peak following the bounce off the bear market low
1505 is the late October 2008 closing low.
1493 is the October 2008 low & late December 2008 consolidation low
The 50 day EMA at 1476
The 18 day EMA at 1475
The 50 day SMA at 1463
1440 is the January 2009 closing low
1434 is the January intraday low
1428 is the mid-November 2008 low
1398 is the early December 2008 low
1387 is the 2001 low
1316 is the November 2008 closing low
1295 is the November 2008 low
1271 from is the March 2003 low, 1253 intraday
1262 from July 2002
1192 is the July 2002 intraday low
1114 is the October 2002 low, the bear market low

S&P 500: Closed at 815.94
Resistance:
818 is the early November 2008 low
The 90 day SMA at 828
839 is the early October 2008 low
848 is the October 2008 closing low
853 is the July 2002 low
857 is the December consolidation low
866 is the second October 2008 low
878 is the late January 2009 peak
889 is an interim 2002 peak
896 is the late November 2008 peak
899 is the early October closing low
919 is the early December peak
944 is the January 2009 high

Support:
815 is the early December 2008 low
805 is the low on the January 2009 selloff. KEY Level
800 is the March 2003 post bottom low
The 50 day EMA at 798 held on the Wednesday low
The 50 day SMA at 792
The 18 day EMA at 783
768 is the 2002 bear market low
752 is the November 2008 closing low but it is not broken and done away with
741 is the November 2008 intraday low
722 is a December 1996 low
681 is the June 1996 intraday peak, 673-71 closing
665 from August 1996
656-654 from January, April 1996
607-05 from November 1995

Dow: Closed at 7776.18
Resistance:
7867 is the early February low
7882 is the early October 2008 intraday low. Key level to watch.
7909 is the early January low
7965 is the mid-November 2008 interim intraday low.
The 90 day SMA at 8022
8141 is the early December low
8175 is the October 2008 closing low. Key level to watch.
8197 was the second October 2008 low
8419 is the late December closing low in that consolidation
8451 is the early October closing low
8521 is an interim high in March 2003 after the March 2003 low
8626 from December 2002
8829 is the late November 2008 peak
8934 is the December closing high
8985 is the closing low in the mid-2003 consolidation
9088 is the January 2009 peak

Support:
7702 is the July 2002 low
7694 is the February intraday low
The 50 day EMA at 7639
7552 is the November closing low. KEY Level.
7524 is the March 2002 low to test the move off the October 2002 low
The 18 day EMA at 7460
7449 is the November 2008 intraday low
7282 is the October 2002 closing low in the prior bear market.
7197 is the intraday low from October 2002 bear market
7115 is the February 2009 closing low
7008 from February 1997 closing peak
6528 is the November 1996 peak
6489 from December 1996 closing peak
6356 is the April 1997 intraday low

Economic Calendar

These are consensus expectations. Our expectations will vary and are discussed in the 'Economy' section.

March 31 - Tuesday
- rch Consumer Confidence (9:00): 27.0 expected, 25.0 prior
- S&P/Case-Schiller Home Price Index, January (9:00): - 18.5% expected, 18.55% prior
- Chicago PMI, March (9:45): 34.7 expected, 34.2 prior

April 01 - Wednesday
- March ADP Employment Change (8:15): -648K expected, -697K prior
- ISM Index, March (10:00): 36.0 expected, 35.8 prior
- Construction Spending, February (10:00): -1.6% expected, -3.3% prior
- Pending Home Sales, February (10:00): -2.0% expected, -7.7% prior
- Crude Oil Inventories, 3/27 (10:00): +3.3M prior
- Auto Sales, March (14:00): NA expected, 2.9M prior
- Truck Sales, March (14:00): NA expected, 3.5M prior

April 02 - Thursday
- 3/28 Initial Jobless Claims (8:30): 653K expected, NA prior
- Factor Orders, February (10:00): -0.3% expected, -1.9% prior

April 03 - Friday
- Nonfarm Payrolls, March (8:30): -656K expected, -651K prior
- Unemployment Rate, March (8:30): 8.5% expected, 8.1% prior
- March Average Workweek (8:30): 33.3 expected, 33.3 prior
- Hourly Earnings, March (8:30): 0.2% expected, 0.2% prior
- ISM Services, March (10:00): 42.0 expected, 41.6 prior

icon url

ReturntoSender

03/30/09 10:23 PM

#8513 RE: ReturntoSender #6755

From Briefing.com: 4:30 pm : The possibility that General Motors and Chrysler may be facing bankruptcy along with renewed concerns that banks may need more federal financing provided market participants with two good reasons to sell stocks Monday. The downward move was underscored by broad-based weakness, which took the S&P 500 to a 3.5% loss. The S&P 500 has fallen more than 5% during the course of the last two sessions.

Stocks were under pressure for the entire session. Pessimism was provoked by news the U.S. government's auto task force determined that neither General Motors (GM 2.70, -0.92) nor privately held Chrysler submitted viable restructuring plans. The task force also indicated bankruptcy may be required for the two companies. Shares of GM lost one quarter of their market cap as a result.

In a statement, GM indicated it will address the issues to improve its long-term viability, including restructuring financial obligations.

Though automakers (-8.3%) and autoparts and equipment companies (-5.9%) displayed marked weakness for the entire session, financial stocks weighed the most on trading. Financials fell 9.4% after Treasury Secretary Geithner stated this last weekend that banks may need more bailout funds. The news weighed most heavily on diversified banks (-13.5%) and diversified financial services companies (-12.0%).

Consumer finance companies (-12.9%) also showed weakness, but their decline was more closely related to an article in The Wall Street Journal indicating an accounting rule change could block capital for certain credit card issuers.

Gains among financials were few and far between, but Fifth Third Bancorp (FITB 2.48, +0.13) was able to trade higher after announcing it will sell a majority stake in its processing business to Advent for $561 million in cash. The two companies will operate the business as a joint venture.

Though all 10 sectors in the S&P 500 closed lower, health care (-0.7%) was the only one able finish with a loss of less than 1%. Abbott Labs (ABT 47.89, +1.29) provided support to the sector, thanks to favorable reports about one of the company's stents, and separate reports late in the session that indicated Abbott held preliminary talks with Wyeth (WYE 43.00, -0.11), which suggest the company is open to ride the sector's recent merger wave.

The session's broad sense of pessimism prompted a broad-based selling effort, in which more than 90% of the companies in the S&P 500 closed with losses. Still, stocks were able to pare a portion of their losses heading into the close as the S&P 500 found support at a key technical support level around 781.

Participants return to Tuesday's trading without many market-moving earnings or economic reports to digest. There are no earnings reports of consequence heading into tomorrow's open, and the only noteworthy items on the day's economic calendar include the S&P/Case-Shiller Home Price Index for January and the Consumer Confidence Index for March. However, investors are heading into quarter-end, which could lead to additional volatility in the coming session.DJ30 -254.16 NASDAQ -43.40 NQ100 -2.5% R2K -3.0% SP400 -3.5% SP500 -28.41 NASDAQ Dec/Adv/Vol 2045/619/2.04 bln NYSE Dec/Adv/Vol 2740/356/1.51 bln

4:30PM STMicroelectronics announces completion of $500 mln medium-term committed credit-facilities program (STM) 4.77 -0.26 : Co announced as part of its ongoing efforts to improve liquidity and financial flexibility, STM announced the completion of its $500 mln medium-term committed credit-facilities program. The $500 mln of credit facilities have been provided on a bilateral basis by Intesa-San Paolo, Societe Generale, Citibank, Centrobanca (UBI Group) and Unicredit. The loan agreements have been executed between October 2008 and March 2009 with commitments from the banks for up to 3 years. STM does not currently envisage any utilization of these credit facilities, which have been set up for liquidity purposes to strengthen the co's financial flexibility.

4:30PM KLA-Tencor announces 10% reduction in global workforce and other cost-saving actions (KLAC) 20.09 -1.39 : Co announces that it will reduce its global workforce by ~10%. This reduction is in addition to the workforce reduction that was announced in November 2008. The reduction is one of many cost-saving actions being undertaken by KLA-Tencor that are designed to help reduce the quarterly non-GAAP operating expenses to a range of $140-145 mln per quarter by the end of calendar year 2009, adjusted from the previously announced target of $165-170 mln per quarter. Co currently estimates that, in connection with the cost-reduction activities announced today, it will incur charges in the range of ~$20-30 mln, including ~$18-22 mln related to estimated severance costs associated with the workforce reduction, with the remainder of such charges related to facilities consolidation. A significant portion of these restructuring charges will be recorded in KLA-Tencor's fiscal quarter ending March 31, 2009. Co anticipates incurring additional restructuring charges, which will likely include severance costs, lease termination charges, other exit costs associated with facility site consolidations or closures, and other related expenses in connection with the cost reduction actions announced today through the remainder of calendar year 2009, but is unable to estimate the aggregate amount of such additional charges at this time.

icon url

ReturntoSender

04/01/09 8:52 PM

#8515 RE: ReturntoSender #6755

From Briefing.com: 4:30 pm : A handful of economic reports helped stocks reverse early losses to post strong gains. The advance was challenged by a late selling effort for the second straight session, but buyers stepped in to offer their bids.

Stocks initially traded with weakness as participants reacted to an ADP Employment Report that indicated 742,000 jobs were lost in March. Economists expected 663,000 job losses. While the report isn't always a precise predictor of the government's official nonfarm jobs report, which is due Friday, it does present a glimpse into labor market conditions.

Stocks were given a boost upon the release of several other economic reports.

Though the ISM Manufacturing Index for March showed continued contraction in manufacturing, it was essentially in-line with expectations at 36.3, and was up slightly from February's 35.8.

Meanwhile, monthly construction spending for February decreased 0.9%, but that was met with a positive reaction since it wasn't as severe as the 1.9% decline that was widely expected.

A surprise 2.1% increase in February pending home sales also helped improve sentiment. Pending home sales were expected to remain unchanged after declining 7.7% in January.

The broad-based buying effort that followed the reports helped push the S&P 500 past the 800 level, but the move slowed as the benchmark index encountered 810. Still, the S&P 500 was able to close just above that technical hurdle.

Meanwhile, the Dow swung some 275 points from its session low to its close. The reversal was brought about by broad-based strength as 27 of its 30 components logged a gain.

General Motors (GM 1.93, -0.01) was a laggard in the Dow after the company reported U.S. sales for March fell 45% year-over-year. The consensus estimate called for a 48% year-over-year drop.

Ford (F 2.74, +0.11) reported U.S. sales for March fell almost 41% from the prior year, which was slightly less severe than the 45% drop that was expected.

Given the troubles facing global automakers, Honda Motor Company (HMC 25.90, +2.20) announced it will further curtail production in North America, while also reducing salaries.

Health care was the only sector to finish the session with a loss; it spent the entire session in the red before closing 0.3% lower. Biotech stocks traded with considerable weakness after Celgene (CELG 38.47, -5.93) reaffirmed a disappointing forecast. DJ30 +152.68 NASDAQ +23.01 NQ100 +1.3% R2K +1.5% SP400 +1.1% SP500 +13.21 NASDAQ Dec/Adv/Vol 903/1755/2.15 bln NYSE Dec/Adv/Vol 709/2326/1.50 bln

3:48PM Fairchild Semi announces the U.S. Patent Office to re-examine the validity of the remaining Power Integrations patent asserted against Fairchild Semiconductor (FCS) 4.04 +0.31 : Co announced the latest in a string of decisions in which the United States Patent and Trademark Office questioned the validity of Power Integrations (POWI) patents asserted against Fairchild.

1:26PM Teradyne prices convertible senior notes offering and increases offering size to $175 million (TER) 4.50 +0.12 : Co announces that it has increased its previously announced offering of convertible senior notes due 2014 from $150 mln to $175 mln, and also announced the pricing of the offering. The convertible senior notes due 2014 will pay interest semi-annually at a rate of 4.50% per annum, beginning on September 15, 2009, and will mature on March 15, 2014.

icon url

ReturntoSender

04/02/09 8:27 PM

#8518 RE: ReturntoSender #6755

From Briefing.com: 4:35 pm : A renewed sense of optimism helped stocks trade with impressive gains for the entire session, but a weak closing took the exclamation point off of what was the stock market's third straight gain.

The major indices spent the entire session in the green, bolstered by broad-based buying. All 10 major sectors in the S&P 500 closed higher as a result.

Industrial stocks (+5.5%) and consumer discretionary stocks (+5.2%) registered the best gains. Their advance came amid improved investor confidence, which prompted many participants to look for opportunities beyond the financial sector (+2.9%).

Financials have provided leadership in recent weeks, but actually lagged for much of the session. Financials were able to close in-line with the broader market, though, following a muted response to news that the FASB has decided to ease mark-to-market accounting rules for banks. The decision was widely expected.

Health care was a relative laggard for the second straight session, advancing just 0.1%. The sector was held back by continued weakness in pharmaceutical stocks (-0.9%).

Broad-based buying has taken the S&P 500 up almost 6% during the course of the past three sessions, while the Dow is up just over 6% during that time. The Nasdaq is up 6.7% over the past three sessions, and is now sporting a 1.6% year-to-date gain. The S&P 500 and Dow are still down 7.6% and 9.1% for the year, respectively.

The upbeat tone was undeterred by a worse-than-expected weekly jobless claims report, largely because the market knows that labor conditions remain gloomy. Initial jobless claims jumped 12,000 to 669,000 for the week ending March 28. They were expected to come in at 650,000. Continuing claims exceeded expectations as well. They totaled 5.73 million, while economists expected 5.59 million claims. The reaction to tomorrow's nonfarm payrolls report could prove to be an affirmation of investors' growing willingness to look past data that isn't truly horrendous.

February factory orders climbed a more-than-expected 1.8%, providing another headline to feed optimism. The consensus had called for an increase of 1.5%. Orders for the prior month were revised lower to reflect a 3.5% decline.

Optimism was shared by overseas markets. Britain's FTSE advanced 4.3%, Germany's DAX gained 6.1%, and France's CAC climbed 5.4%. Their gains followed news that the ECB cut its target interest rate 25 basis points to 1.25%, while ECB President Trichet indicated more cuts could follow.

Coordinated actions from the G-20 meeting in London also made headlines. The G-20 agreed to double financing for the IMF to nearly $500 billion.

With investors feeling emboldened, many moved against gold. Gold futures contracts finished pit trading at $908.90 per ounce, down 2.0%.

Friday's focus turns to the government's nonfarm payrolls report for March and the March ISM Nonmanufacturing Index. Fed Chairman Bernanke will also be delivering an address at a credit market symposium.DJ30 +216.48 NASDAQ +51.03 NQ100 +3.3% R2K +4.9% SP400 +4.3% SP500 +23.30 NASDAQ Adv/Vol/Dec 2204/2.82 bln/591 NYSE Adv/Vol/Dec 2617/1.87 bln/370

4:11PM Valence Tech applies for Federal Loans to build U.S.-based lithium-ion battery production facilities (VLNC) 2.17 +0.03 : Co announces it has submitted an application under the U.S. Department of Energy's Advanced Technology Vehicles Manufacturing Incentive Program (ATVMIP) for up to $608 million in low interest loans. These loans will help finance the construction of a new $760 million world-class lithium iron magnesium phosphate battery manufacturing facility to be located in Central Texas.

4:10PM Micron reports Q2 (Feb) results, misses on revs (MU) 4.63 +0.45 : Reports Q2 (Feb) loss of $0.97 per share, including items may not be comparable to the First Call consensus of ($0.64); revenues fell 29.2% year/year to $993 mln vs the $1.14 bln consensus. These results reflect a number of cash and non-cash items resulting in a net charge of $120 mln in the 2Q09. The co ended the quarter with cash and investments of $932 mln. The imbalance of supply and demand for semiconductor memory products continued in the second quarter, resulting in significant decreases in the company's per gigabit average selling prices compared to the preceding quarter. Revenue from sales of DRAM products decreased approximately 30% in the second quarter compared to the first quarter principally due to a 30% decrease in selling prices. Sales volumes for DRAM products remained relatively stable comparing the same periods. Revenue from sales of NAND Flash products decreased 20% in the second quarter compared to the first quarter due to a 13% decrease in selling prices and an eight percent decrease in sales volume. Memory production in the second quarter was relatively flat compared to the preceding quarter... The company's gross margin on sales of memory products improved 11 percent in the second quarter compared to the previous quarter, resulting from decreases in per gigabit manufacturing costs and the benefit in the second quarter from sales of products previously written-down, partially offset by decreases in selling prices.


10:07AM Intel and GE to form healthcare alliance (INTC) 15.51 +0.48 : GE (GE) and Intel (INTC) announces an alliance to market and develop home-based health technologies that will help seniors live independently and patients with chronic conditions manage their care from the comfort of their home or wherever they choose.

icon url

ReturntoSender

04/04/09 5:32 PM

#8520 RE: ReturntoSender #6755

Amateur Investors Weekend Market Analysis (4/4/09)

http://www.amateur-investor.net/Weekend_Market_Analysis_April_4_09.htm

This week I plotted the Inflation Adjusted data for the S&P Composite (Blue Line) versus the Historical PE Ratio (Red line) going back to 1896. This data was calculated by Robert Shiller who is an Economics Professor at Yale. The first thing to notice in the chart below is that the S&P actually peaked in 2000 (point A) and not in 2007 based on Inflation Data. Thus the Bear Market actually began several years ago and not in 2007 which is portrayed by most media outlets.

Meanwhile another interesting thing about this chart has been the direct relationship between the PE Ratio and the Performance of the S&P Composite going all the way back to 1896. Furthermore since 1896 there have been 3 Cyclical Bear Markets prior to the one we are currently in now. In each prior Cyclical Bear Market notice the PE Ratio dropped below a reading of 8.0 (denoted by green line) before a bottom occurred (points A) which was eventually followed by another significant Bull Market lasting several years (points A to B). Currently the PE Ratio has dropped to around around 13 (point C) which is still above the historical 8.0 level that has led to significant Bear Market Lows in the past. If history does eventually repeat itself then the S&P may not make a Cyclical Bear Market bottom until the PE Ratio drops below the 8.0 level.


Of course the big question is how long will this current Cyclical Bear Market last as so far it has already been in place for 9 years based on the Inflation Adjusted data. A lot of parallels have been made with Japan's market so lets take a look at their chart. Notice the Nikkei had a big run in the 1980's which peaked in late 1989 near the 39000 level. Since then the Nikkei has been in a downward trend over the past 20 years and lost over 80% of its value as it has generally made a series of lower Highs (points H) and lower Lows (points L). It's debatable whether the United States problems are similar to or even worse than what Japan experienced in the 1990's with their Financial system. If the United States does follow a similar path to that of Japan then we are only about halfway through our current Cyclical Bear Market.


Furthermore if we compare the current Inflation Adjusted S&P Composite to the period from the 1960's and 1970s there are some similar patterns developing. First of all notice the similar ABC type corrective Wave structure between the two charts. Secondly also notice that the S&P Composite lost 58% from its peak in late 1968 to the bottom of Wave C in late 1974. Meanwhile from the peak in 2000 to the most recent bottom in March the drop was -59% which is nearly identical to what occurred from 1969 through 1974. Meanwhile notice after the 58% drop from 1969-1974 the S&P then rallied nearly 50% from 1975 through 1976 as it went through a corrective rally (points C to D). This was then followed by a 39% drop over the next 6 years from late 1976 through late 1982 before a bottom occurred (points D to E). Thus the Bear Market which began in late 1968 didn't bottom until late 1982 which was 14 years in length based on the Inflation Adjusted data. Considering that the current US Economy is in a recession that is potentially just as bad as that of the 1970's it's entirely possible the current Bear Market could last for several more years as we see a similar pattern evolve like occurred from the 1970's through the early 1980's. However as I mentioned above the S&P did rally nearly 50% after the 58% drop from 1968-1974 so it's certainly possible we are now seeing the development of a similar rally that will last several more months after the recent 59% drop.


Finally as far as the market for those that follow Elliott Waves the primary consensus is that the S&P 500 completed a 5 Wave pattern to the downside as it bottomed on 3/6/09 at 667 which is now being followed by an ABC type corrective type rally. Thus far the S&P 500 has gained 26% in 4 weeks as the "A" Wave up has developed. Once the "A" Wave peaks then this will be followed by a "B" Wave pullback before the "C" Wave up occurs. Some upside targets for the S&P 500 based on longer term Retracement Levels and EMA's range from 960 to 1014. The 960 area corresponds to the S&P 500's 40 Week EMA (green line) while the 1014 level coincides with its 52 Week EMA (blue line) and 38.2% Retracement Level calculated from the October 2007 high to the March 2009 low. I expect at some point in the coming months once of these levels will eventually be reached.


In 2008 our ETF Strategies worked the best with which had a return of +33% versus the S&P 500 which was down -38.5% for the year.

Meanwhile our 401K Strategy finished up +17.3% for the year.

Signup for a "Free 4 Week Trial Membership" or save up to 50% on a Premium Membership and you will have access to these Investment Products which include the following:

1. "ETF Daily Buy and Short Signals" which can be used to trade the DIA's, QQQQ's, SPY's and OIH's. Our ETF Strategy returned 33% in 2008.

2. "401K/Thrift Savings Plan (TSP) Timing Service" which can be used to help improve your return in your 401k/TSP Account which was up +17.3% in 2008.

3. The "End of Month Strategy" finished up +36.3% in 2008. This Strategy focuses on the typical End of Month markup by the Institutional Money.

4. "Stocks to Buy List" which can be used with either our Short Term Strategy or Long Term Strategy. In 2007 our Long Term Strategy finished even for the year versus the S&P 500 which was down -38.5%.

Our Spring Membership Special for new Members is shown below
which are 50% Off our normal Monthly Rate of $39.95
icon url

ReturntoSender

04/05/09 11:52 AM

#8521 RE: ReturntoSender #6755

Four Bad Bear Markets:

http://dshort.com/charts/bears/four-bears-large.gif


Many thanks to Gottfried for sharing this at SI.

icon url

ReturntoSender

04/05/09 11:15 PM

#8523 RE: ReturntoSender #6755

InvestmentHouse Weekend Market Summary 4/3/09

http://www.investmenthouse.com/weekendmarketsummary.htm

- Upside resilience continues.
- ISM services backsliding some after trying to turn the tide.
- LIBOR resumes its improvement.
- Lagging indicator's leading indicator is not promising for jobs.
- Market extended or just starting its next leg? Earnings season is the next big indicator.

Market holds tough as buyers use dips to do what buyers do.

The big news of the morning, the jobs report, was in line, and with the whisper at -700K and more that was something of a win. Sort of. Modestly higher futures ahead of the number remained modestly higher afterwards as a quick spike fizzled and the status quo resumed. The jobs report was not as bad as expected, and while that can propel the market higher at times, after the kind of run stocks have put in off the March low, it takes more than a not as bad as feared economic report to send stocks rampaging again. Thus there was no new big surge Friday similar to the Thursday upside juggernaut. RIMM's earnings got the large cap tech juices flowing along with once again the semiconductors, and steel stocks as well as retail were up again, and okay, so was GS. Basically the leaders were leading again. But outside of those . . . there was not the same hoopla as on Thursday.

Stocks opened upside and after a short spurt the sellers took a shot. We all knew they would given the run higher and the weak jobs report. Sellers are probing for their opportunity and they sent out a recon team early in the session. The ISM Services was less than expected and below February and stocks slid lower, but then bounced along in a range until lunch. Must have been a 3-martini lunch because stocks were jovial the rest of the day, rallying to the session high as lunch ended, then to new session highs mid-afternoon. With that kind of recovery the sellers took another shot. A few minutes into the last hour we saw the same kind of selling seen in the prior closing hours last week. Stocks sold steadily, but when they hit the lunchtime high they reversed and bounced in the last half hour to yet new session highs.

That is a long description of the events of the day, but the bottom line: the entire week showed resilience. After Monday's butt-kicking gap lower, the indices held support and started a weeklong solid recovery to higher highs on this leg. Each time the market looked about to get its tail caught in the door the upside bias asserted itself. Sure it got some help from the mark to market changes announced on Thursday and the anticipation of that news earlier in the week. But it also overcame a really bad ADP report on Tuesday, reversing a gap lower that session. It rallied in the face of adversity, it held onto gains, and it moved higher even on Friday when there was not a lot of reason to move higher. There is a definite upside bias and continuing resilience, but the sellers are also there, probing for the opportunity to sell into an upside move that may be a bit extended. They are likely to have more success after earnings get underway, but if there are more than a few bad warnings next week they could step in earlier. The key, as always, is whether the sellers can just push a normal pullback after a good run or if they can really get violent and wreck the moves in the leaders. Given the resilience shown of late you would anticipate more of a normal pullback to support but it always helps to stay vigilant.

TECHNICAL. Bounced around from modestly higher to modestly negative and then rallied to 1% to almost 3% gains on the close. Shook off a couple of selling attempts again to close at session highs. Resilience.

INTERNALS. Modest breadth (2:1 NYSE, 1.5:1 NASDAQ) that pretty much matched the action. Volume, however, was much, much lower. Way lower, not even reaching average. There was no real driver, but the market still moved higher into the close. There is that upside bias noted above. But . . . the entire week moved on low volume outside of Thursday, the Mark to Market session. Without additional volume coming in the move has an increasing probability of running out of upside gas and making a test back much more quickly even though it looks as if a second leg to the March rally just started. Now the low volume was good on the downside sessions as there was no distribution, and we did see rising volume on the upside sessions. That is a positive as it shows the buyers are stronger, but again, the volume was not as strong overall. In other words the buyers were stronger but the number of players was smaller, kind of like 7 on 7 football versus 11 on 11. When everyone gets on the playing field things can change in a hurry.

CHARTS. NASDAQ put some more mileage on 1600 and the February high, making that higher high so critical to new rising uptrends. It is moving on up to the January high, the last peak before the serious stuff in early November. SP500 rallied again, but even though it closed higher, it was still below the Tuesday intraday high that tested 850 resistance. Still more work to do there. The lighter trade tells us the Friday moves didn't mean a whole lot other than the continued upside bias currently in the market. Well, not for all indices. SOX broke through its November peak, meaning it has hit a new high for the recovery attempt, a very important move. The indices may be a bit extended as they only took three and one-half days off from the three week run off the March low, but this can also be just the start of a new leg in the rally. See the Leadership section below.

LEADERSHIP. Chips came to life Thursday along with the techs, and that really boosted the market. They were joined by commodities as well after the Thursday 'we are back baby' statement about its economy. Very good to see them back in the game. True some leaders are a bit extended, e.g. the China stocks that exploded higher again, but many leaders have made good pullbacks and are embarking on another leg. DRIV, BIDU, CME, WFR, and BRCM are quality stocks that can lead higher and just got started on new moves. There are some key financials that have rallied and are now in a two week lateral move, starting to break higher (e.g. JPM, GS). They too can help lead higher while other leaders take a rest. Many view the market as extended at next resistance, and it is somewhat, but if new and not so new leaders keep pushing to the front as happened when the techs and chips re-engaged late in the week, the market finds new fresh legs. Indeed, we felt the market was done this week but it kept moving higher, making us money. That is why we always think about what COULD happen but watch the market for the 'buy me' and 'sell me' indications as to what will happen. We still like what we see in the leaders but have an eye on the lower volume the past week.

THE ECONOMY

ISM Services improvement attempt takes a month off.

The ISM manufacturing report put in an upside month in March, showing some more slow and not so steady improvement, but improvement nonetheless. The Services ISM Friday could not match that modest improvement, falling to 40.8 from 41.6 in February and 42.9 in January. Still higher than the manufacturing survey, but also below 50, meaning that it is still contracting though at an overall slower pace the past few months.

Does the market lower read mean the improvement attempt is over? Of course not. Turns are never perfectly smooth arcs from higher to lower or lower to higher. Change means volatility. Look at any move in stocks that is reversing. A steady trend higher starts to buck and gyrate before it turns. Same with economic trends and trends in nature. All trends run smoothly until they change, and then it is back and forth jockeying as the true believers try to keep the trend alive while those voting for change try to derail it. Thus a reversion to a lower month doesn't mean a whole lot. It does if it doesn't get back on track.

After holding steady for two weeks, LIBOR makes a serious move.

Three-month LIBOR, the key LIBOR rate to watch along with the US 3-month Treasury, hung around at 1.23% for over a week. Recall that after a very positive decline to close to 1% it rebounded sharply on all of the spending from the 'spendulus' package, the weekly bailout packages, and the 'budget' (a.k.a. spendthrift manifesto), it jumped back up to the 1.25% range. That is still well below the 4+% level in September 2008, but it was a reversal of the progress, a setback, a bitter pill to swallow, and not at all good for the credit market that has to be fixed in order for the economy to recover.

So much riding on it, yet so rarely covered. Well last week it turned over a new leaf, rallying lower as the stock market rallied higher. It appears that both are forecasting some better times at least for the near term. 3-month LIBOR broke the logjam and fell from 1.22% the prior week to 1.16% Friday. Cool. The other levels are lower but basically the same. The three month is the key, and we are happy to see it finally make a serious drop once more. That indicates the road to improvement is moving once more.

Average Workweek indicates jobs will continue to struggle near term.

Thursday I went to some lengths explaining how the jobs report is a lagging indicator and does not tell us anything about the economic status. By the time jobs improve the other evidence of economic recovery is overwhelming. So the jobs report is much discussed but it is all academic.

You can, however, look inside the jobs report to find indications of whether the lagging indicator is trying to change. The best indication is the average workweek. When the economy slows the workweek typically slows as well as companies have less to do but are loathe to layoff trained and productive workers. It costs a lot of money to train a worker, and you want to keep them on if possible to avoid the costs of new training if those laid off find work elsewhere and thus don't come back when business improves. The same number of workers doing less work means the workweek falls.

At some point in a recession layoffs become inevitable no matter how much the business wants to hang onto its trained employees. That is what we have seen with the millions of lost jobs the past year. Fewer workers but still slow business, so the workweek remains low.

Then, when things start to improve the business waits to hire new workers and demand more from those still with jobs. Productivity rises as workers have to handle the increased workload without increased help. What happens? The average workweek starts to rise because more work is required. You start to see overtime and the workweek rises even more. Finally the company has to hire new workers or else risk losing the employees it held through the recession either by direct revolt from having to do too much work or getting cherry-picked by other companies looking for talent.

So on Friday when the average workweek FELL to 33.2 from 33.3 where it has held for months on end, that indicates the employment picture is not improving at all. There is not even the little uptick in the workweek to pique interest. It is instead heading lower, still on the downside slope. Hardly encouraging given all of the supposed 'jobs saved' by the stimulus package. I guess if you have not lost your job you would be considered as a job saved. How else are you going to measure it? Got to Caterpillar where a speech was made about how a few hundred jobs would be saved immediately if the stimulus was passed only to see CAT announce layoffs of several thousand workers just weeks after passage. Guess that is not the example the Administration wants to tout. Better go back to Ohio and find those 12 police officers who were kept on the payroll and milk that one more.

THE MARKET

MARKET SENTIMENT

VIX: 39.7; -2.34
VXN: 40.6; -1.69
VXO: 41.63; -2.84

Put/Call Ratio (CBOE): 0.83; +0.14. The ratio means most when it closes over 1.0 or is down at the 0.4 range. Those are the extremes, the former indicating high anxiety about the market while the latter indicates apathy and thus a potential fall in the works. It is interesting how the ratio jumped Friday even as the market posted gains. This shows that the funds are nervous at this level and are buying protection (not condoms but puts) in the event the market falls. That is actually a good contrary indicator, i.e. the big funds getting nervous about the upside prospects.

Bulls versus Bears:

This is a reading of the number of bullish investment advisors versus bearish advisors. The reason you look at this is that it gives you an idea of how bullish investors are. If they are too bullish then everyone is in the market and it is heading for a top: if everyone wants to be in the market then all the money is in and there is no more new cash to drive it higher. On the other side of the spectrum if there are a lot of bears then there is a lot of cash on the sideline, and as the market rallies it drags that cash in as the bears give in. That cash provides the market the fuel to move higher. If bears are low it is the same as a lot of bulls: everyone is in and the market doesn't have the cash to drive it higher.

This is a historical milestone in the making. Bulls are impressively low considering we are in general a very optimistic country. The few bulls is a positive indication because it means most everyone that is getting out is out and there is money on the sidelines. In other words the ammunition boxes are full and as the market recovers investors will start opening up the boxes and firing. Little by little they will be forced to put more money into the market and there will be some rushes higher in fear they are missing the train. You relish times when sentiment is so negative because it means some tremendous buys are setting up. This could indeed be the opportunity of a lifetime, and you take advantage of it by buying quality stocks and letting them work for you as long as they will. If we can hold them for years, great.

Bulls: 31.0%. A little rally and a climb in the bulls, up from 28.9% and jumping over the highs a month back at 29.7%. Still well below the 43.0%, the prior top of the recovery as the market rallied off the November low. A rise from 25.3% in December and quickly starting to fall once the market encountered the January selling. Bullishness bottomed on this leg lower at 21.3% in November 2008. This last leg down showed us the largest single week drop we have ever seen, falling from 33.7% to 25.3%. Hit 40.7% on the high during the rally off the July 2008 lows. 30.9% was the March low. In March the indicator did its job with the dive below 35% and the crossover with the bears. A move into the lower 40's is a decline of significance. A move to 35% is a bullish indicator. This is smashing that. For reference it bottomed in the summer 2006, the last major round of selling ahead of this 2007 top, near 36%, and 35% is considered bullish.

Bears: 38.0%. Quite the drop from 43.3% and 44.3% the prior week. The decline was slowing its fall from 47.2%, the peak for the run this year but no more. Hit the 34's on the lows, falling from 38.5% and 46.2% in mid-December. Still above the 35% level considered bullish for stocks. Bearishness hit a 5 year high at 54.4% the last week of October 2008. The move over 50 took bearish sentiment to its highest level since 1995. Extreme negative sentiment on this move. 35% is the level that historically indicates excessive pessimism. As with the bulls the jump in bears did its job after hitting 44.7% in the third week of March. Bearishness peaked at 37.4% in September 2007. It topped the June 2006 peak (36%) on that run. That June peak eclipsed the March 2006 high (33%) and well above the 2005 highs that spawned new rallies (30% in May 2005, 29.2% in October 2005). This is a huge turn, unlike any seen in recent history.

NASDAQ

Stats: +19.24 points (+1.2%) to close at 1621.87
Volume: 2.086B (-23.03%)

Up Volume: 1.512B (-914.846M)
Down Volume: 594.908M (+215.85M)

A/D and Hi/Lo: Advancers led 1.53 to 1
Previous Session: Advancers led 3.68 to 1

New Highs: 15 (-14)
New Lows: 15 (+5)

NASDAQ CHART: Click to view the chart

NASDAQ kept on pushing upside, finding renewed strength as the techs and chips rejoined the fray Wednesday and particularly Thursday. That ignited the upside move. Cleared the February and December peaks near 1600 and closing in on the January peak at 1666. Strong move off the early march low, the bear market low, a short rest to end March, then a renewed upside move to start the new quarter. New money definitely made its way in, but the leaders were moving on good volume so it was not a fluke. Still, when the new money is spent NASDAQ will have to find still more buyers. Good start to a new leg, we will see how many more buyers come back to the buy side this week.

NASDAQ 100 (+1.69%) gapped higher again and definitively cleared the January and February peaks and is looking at the November peak though that is still a good throw upside. Nice move and another upside push sets up a test of the prior peaks it just broke through. Nice action.

SOX (+2.94%) continues its surge as it moved PAST its November peak, making a new high for the recovery. Seriously solid movement and of course we have banked a lot of gain from the chips on this run. A further push toward the 200 day SMA at 265 gives it a good point to shoot for and then test the breakout. Letting our SMH positions run higher for now but ready to take some gain after another move higher early in the week.

NASDAQ 100 CHART: Click to view the chart

SOX CHART: Click to view the chart

SP500/NYSE

Stats: +8.12 points (+0.97%) to close at 842.5
NYSE Volume: 1.484B (-20.82%)

Up Volume: 1.159B (-550.923M)
Down Volume: 300.19M (+139.809M)

A/D and Hi/Lo: Advancers led 2.08 to 1
Previous Session: Advancers led 5.95 to 1

New Highs: 5 (-10)
New Lows: 54 (-14)

SP500 CHART: Click to view the chart

A further push higher but on below average volume and unable to take out the next resistance at 850ish. Similar to NASDAQ, SP500 tested its March move late that month and has resumed the move, aided by that big Thursday surge on big volume. This week we see if that was a Lone Ranger move or the start of a new leg higher. Still resistance at 875 from the February peak and then up at 920. Now this 850 level is also the series of October lows where the index tried to hold after the straight dive to the bottom. That means some extra resistance at this point and SP500 might have some trouble moving through. So, watching SP500 closely and its financials as a barometer of the strength of this new attempted move.

SP600 (+1.62%) moved through the Thursday peak and right up to the October low. Basically in the same position as SP500, but showing a nice reverse head and shoulders formation setting up. Would be sweet if SP600 could go ahead and breakout and become a leader once more. That would be huge and sweet.

SP600 Chart: Click to view the chart

SP400 CHART: Click to view the chart

DJ30

Leader on the week but not Friday, meekly rising to close at the 90 day SMA on light trade. New high on the move off the March low but still stacks of resistance ahead and DJ30 is moving right into the teeth of it at the January and February consolidation lows.

Stats: +39.51 points (+0.5%) to close at 8017.59
Volume: 308M shares Friday versus 442M shares Thursday.

DJ30 CHART: Click to view the chart

MONDAY

Friday did not give us the test of the Thursday gap move and with the market gains on the day many stocks we were looking at just before the Thursday gap remain out of reach. Why out of reach? Because chasing the bus at this level is a lower probability play. It is a play without a really good edge. It is trying to beat the train across the tracks.

Now that does not mean there are not very good stocks still in position to move higher. That is why we were looking at DRIV for example on Friday. While many stocks have rallied other good stocks have been consolidating previous upside moves and are ready to run higher. As noted earlier, they can keep the market moving if enough of them advance. There are still quite a few of those but there are also quite a few that are a bit too extended to chase right now. Not necessarily so extended the entire market has to correct back; there can always be rotation by stocks and sectors, and indeed that is the healthiest of all market action. When groups of leaders take turns taking the point similar to a breakaway working together in a bike race good moves can be made.

So we are going to keep looking for prime upside plays ready to move. We are also going to look for tests of breakouts. Some of the stocks that broke higher Wednesday shot to the upside and Friday were testing back some. A quick test by these stocks often sets up another surge so we will be looking at those in the light of getting a pullback early in the week and moving in on the bounce.

As seen Friday, there are also downside opportunities even as the market rallied. If the market runs out of gas prematurely on this attempt at a second upside leg off the March low that is a signal of weakness. That means the financials and some other stocks are going to head lower and we have to see what kind of test they make. We are trolling for stocks ripe to turn lower such as GENZ and MCK in the event this upside move just doesn't quite cut it.

It was a good week and we banked a lot of gain, still letting good positions run higher, and picking up other good positions as the opportunity arose. We had to avoid taking everything off the table because even as we bank gain on the way up we also let at least a part of our winners run higher to keep logging gains as long as the move holds its ground. That way we have some solid gain in the bank and can get in on the really bigger runs without feeling the need to sell out altogether and miss out on the really strong moves.

The key now, as always, is to be patient and let the plays set up and try to avoid chasing that bus. Better to jump out and ambush the position as it initiates its move. So, we keep our eyes on leaders and look for opportunities to get in as they test or set up new solid bases and buy points.

Support and Resistance

NASDAQ: Closed at 1621.87
Resistance:
1620 from the early 2001 low
1644 from August 2003
The January closing low at 1653
1666 is the intraday January 2009 peak
1780 is the November 2008 peak

Support:
1603 is the December peak
1598 is the February 2009 peak, the last peak NASDAQ made
1587 is the March 2009 high
1569 is the late January 2009 peak
The 10 day EMA at 1549
1542 is the early October 2008 low
1536 is the late November 2008 peak
1521 is the late 2002 peak following the bounce off the bear market low
1505 is the late October 2008 closing low.
1493 is the October 2008 low & late December 2008 consolidation low
The 50 day EMA at 1492
The 50 day SMA at 1471
1440 is the January 2009 closing low
1434 is the January intraday low
1428 is the mid-November 2008 low
1398 is the early December 2008 low
1387 is the 2001 low
1316 is the November 2008 closing low
1295 is the November 2008 low
1271 from is the March 2003 low, 1253 intraday
1262 from July 2002
1192 is the July 2002 intraday low
1114 is the October 2002 low, the bear market low

S&P 500: Closed at 842.50
Resistance:
848 is the October 2008 closing low
853 is the July 2002 low
857 is the December consolidation low
866 is the second October 2008 low
878 is the late January 2009 peak
889 is an interim 2002 peak
896 is the late November 2008 peak
899 is the early October closing low
919 is the early December peak
944 is the January 2009 high

Support:
839 is the early October 2008 low
833 is the March 2009 peak
The 90 day SMA at 828
818 is the early November 2008 low
815 is the early December 2008 low
The 10 day EMA at 811
805 is the low on the January 2009 selloff. KEY Level
800 is the March 2003 post bottom low
The 50 day EMA at 800
768 is the 2002 bear market low
752 is the November 2008 closing low but it is not broken and done away with
741 is the November 2008 intraday low
722 is a December 1996 low
681 is the June 1996 intraday peak, 673-71 closing
665 from August 1996
656-654 from January, April 1996
607-05 from November 1995

Dow: Closed at 8017.59
Resistance:
8141 is the early December low
8175 is the October 2008 closing low. Key level to watch.
8197 was the second October 2008 low
8375 is the late January 2009 interim peak
8419 is the late December closing low in that consolidation
8451 is the early October closing low
8521 is an interim high in March 2003 after the March 2003 low
8626 from December 2002
8829 is the late November 2008 peak
8934 is the December closing high
8985 is the closing low in the mid-2003 consolidation
9088 is the January 2009 peak

Support:
The 90 day SMA at 8006
7965 is the mid-November 2008 interim intraday low.
7932 is the March 2009 peak
7909 is the early January low
7882 is the early October 2008 intraday low. Key level to watch.
7867 is the early February low
The 10 day EMA at 7739
7702 is the July 2002 low
7694 is the February intraday low
The 50 day EMA at 7666
7552 is the November closing low. KEY Level.
7524 is the March 2002 low to test the move off the October 2002 low
The 18 day EMA at 7511
7449 is the November 2008 intraday low
7282 is the October 2002 closing low in the prior bear market.
7197 is the intraday low from October 2002 bear market
7115 is the February 2009 closing low
7008 from February 1997 closing peak
6528 is the November 1996 peak
6489 from December 1996 closing peak
6356 is the April 1997 intraday low

Economic Calendar

These are consensus expectations. Our expectations will vary and are discussed in the 'Economy' section.

April 7 - Tuesday
- February Consumer Credit (14:00): -$1.5B expected, $1.8B prior

April 8 - Wednesday
- February Wholesale Inventories (10:00): -0.6% expected, -0.7% prior
- Crude Oil Inventories, 04/03 (10:30): +2.84M prior

April 9 - Thursday
- March Export Prices ex-aq. (8:30): 0.1% prior
- Import Prices ex-oil, March (8:30): -0.6% prior
- Initial Jobless Claims, 04/04 (8:30): 699K prior
- Trade Balance, February (8:30): -$36.5B expected, -$36.0B prior

April 10 - Friday
- March Treasury Budget (14:00): -$157.0B expected, -$48.2B prior
icon url

ReturntoSender

04/07/09 10:50 PM

#8527 RE: ReturntoSender #6755

From Briefing.com: 4:30 pm : There weren't any major headlines to digest Tuesday, leaving market participants to prepare for earnings season, which unofficially starts this evening when Dow component Alcoa (AA 7.79, -0.12) reports its latest quarterly results.

With what is expected to be another downbeat earnings season on the horizon, participants moved to take profits for the second straight session. The decision to hedge against further disappointment has led participants to send stocks 3.2% lower during the course of the past two sessions. The selling effort has also helped lock in gains registered in recent weeks; stocks are still up 22% from their March lows.

This session's losses were broad-based as more than 90% of the companies in the S&P 500 closed lower. Losses ranged from telecom's 3.7% drop to health care's 0.8% decline.

Health care's relative resilience was largely owed to strength in shares of managed health care providers (+4.3%). The group was able to rebound from weakness in prior sessions after 2010 Medicare Advantage rates turned out to be better than initially feared.

Financial stocks performed in-line with much of the broader market for almost the entire session, but a late selling effort forced the sector to close at its session low with a 3.2% loss. REITs were some of the worst performing holdings in the financial sector. Industrial REITs lost 13.2%, diversified REITs fell 11.5%, and residential REITs sank 10.5%.

The influence of financials caused the broader market to close in weak fashion.

Banks and financial services companies were at the center of weakness in Europe, where Britain's FTSE fell 1.6%, Germany's DAX declined 0.6%, and France's CAC closed 0.9% lower.

Royal Bank of Scotland (RBS 7.72, -1.16) announced the United Kingdom government will take a 70% stake in RBS. The bank is also cutting 9,000 jobs during the next couple of years, according to reports.

Financial giants Mitsubishi UFJ (MTU 4.94, -0.12) and Mizuho Financial (MFG 3.86, -0.08) undercut Japan's Nikkei, which closed 0.3% lower. Hong Kong's Hang Seng slipped 0.5%.

Commodities trading was mixed as crude oil futures contracts faced selling pressure throughout the session and closed at $49.28 per barrel, down 3.5%. In contrast, June gold futures contracts closed 1.2% higher to close at $883.30 per ounce, just below its session high.DJ30 -186.29 NASDAQ -45.10 NQ100 -2.9% R2K -3.5% SP400 -3.3% SP500 -19.93 NASDAQ Adv/Vol/Dec 649/1.88 bln/2033 NYSE Adv/Vol/Dec 647/1.26 bln/2368

09:34 am Motorola (MOT)

In a regulatory filing, Motorola (MOT 4.69) said it expects to take a total of $229 million in charges in its fiscal first quarter related to workforce reductions and other cost reduction initiatives.

Motorola said it expects to take a pretax charge of approximately $110 million in the first quarter of 2009 related to severance costs and $13 million for other exit-related activities, including termination of contractual commitments and asset impairments.

When coupled with earlier restructuring charges, Motorola expects the pretax charge in the first quarter of 2009 to total $229 million.
icon url

ReturntoSender

04/08/09 8:25 PM

#8528 RE: ReturntoSender #6755

From Briefing.com: 4:30 pm : Sellers threatened to drag stocks lower for the third straight session, but buyers showed resolve and pushed all three of the major indices higher.

Helped by news that the Treasury is planning to extend bailout funds to insurers, stocks started the session on positive footing. Though an official statement has yet to be made, many expect beaten down names like Lincoln National (LNC 9.15, +2.26) and Hartford (HIG 9.59, +1.14) to benefit.

Despite the strength of insurers, the financial sector, as a whole, lagged the broader market for virtually the entire session. Regional banks (-2.4%), investment banks and brokerages (-1.2%), and diversified financial services stocks (-0.9%) weighed on the sector.

Pulte Homes (PHM 9.64, -1.13) proved the housing market still has a pulse by announcing it will acquire Centex (CTX 9.06, +1.41) for $10.50 per share, which marks a premium of almost 38% for shares of Centex from their closing price Tuesday.

However, some of the hope that the housing market may be turning was dashed when the minutes from the FOMC March 18 meeting indicated that committee members did not consider an uptick in February housing starts to be the beginning of a new trend. The minutes served as a reminder to investors that economic conditions remain weak and that downside risks predominate the near term, stirring midday selling pressure.

Separately, The Federal Reserve announced that its second TALF auction received $1.7 billion in requests, which is down markedly from the $4.7 billion that was requested in March.

Earnings are back in focus. Dow component Alcoa (AA 8.06, +0.27) unofficially kicked off earnings season Tuesday evening with a deeper-than-expected loss. Mosaic (MOS 45.61, +2.67) also reported, and missed expectations as well.

However, Bed Bath & Beyond (BBBY 31.70, +6.19) reported better-than-expected earnings, and Juniper Networks (JNPR 17.51, +1.89) preannounced quarterly results that were in-line with the company's prior forecast. Bed Bath & Beyond's report helped retail stocks bounce 4.5% higher, but strength in both companies helped the Nasdaq outperform the other headline indices.

Sellers put together a coordinated effort on a couple of occasions, twice sending stocks back to the unchanged mark. However, on both occasions stocks found support and eventually finished the session with broad-based gains.

In regulatory news, the Securities and Exchange Commission is looking to vote on short sale restrictions. The restrictions focus on using a short sale price tests and circuit breakers. DJ30 +47.55 NASDAQ +29.05 NQ100 +2.0% R2K +2.4% SP400 +1.5% SP500 +9.61 NASDAQ Adv/Vol/Dec 1937/1.85 bln/733 NYSE Adv/Vol/Dec 2259/1.32 bln/775

icon url

ReturntoSender

04/09/09 9:40 PM

#8529 RE: ReturntoSender #6755

From Briefing.com: 4:15 pm : A better-than-expected earnings preannouncement from Wells Fargo sent the financial sector surging 15.5%, which induced buying in the broader market and helped the Dow move back above 8,000.

Wells Fargo (WFC 19.61, +4.72) isn't scheduled to officially announce first quarter earnings results until April 22, but came out this morning to let investors know it expects to earn $0.55 per share for the quarter. Analysts had forecast earnings of just $0.24 per share. Wells Fargo also indicated its combined net charge-offs are down sequentially and that the legacy Wachovia business is operating well.

Wells Fargo's announcement seemed to contradict a handful of pessimistic comments and reports, and helped restore investor confidence in bank stocks. Diversified banks advanced 28.9%, while the KBW Banking Index climbed 20.1%.

Leadership from banks and other financial stocks helped bring about broad-based buying in each of the major indices. In turn, all three major indices were able to log their best single session percentage gain in two weeks and close at session highs. Each index advanced more than 3%. Small- and mid-cap stocks fared even better; the Russell 2000 Small-Cap Index spiked 5.9%, while the S&P 400 Mid-Cap Index tacked on 5.5%.

There weren't any market-moving earnings announcements released today. However, plenty of retailers were out reporting same-store sales results for March. Though the numbers generally showed declines, they weren't necessarily as bad as many had expected. That, combined with a positive bias in the broader market, helped retailers climb 4.6%.

Wal-Mart (WMT 50.66, -1.95) was a laggard, though. The company posted positive March same-store sales, but the increase wasn't as strong as expected. Still, Wal-Mart hasn't reported a negative monthly same-store sales figure since May 2007.

Wal-Mart's string of positive same-store sales results largely comes from strapped consumers looking for bargains amid stiff macro headwinds, including rising job losses. Initial jobless claims for the week ending April 4 totaled 654,000, which is down 20,000 from the week before, but generally in-line with the 660,000 initial claims that were expected. Continuing claims climbed to a new record high of 5.80 million.

A strong bias in the equity markets didn't really carry over into commodities trading. Crude oil futures closed pit trading with oil priced 5.2% higher at $51.97 per barrel, but natural gas contracts closed pit trading roughly 0.6% lower at $3.60 each. Gold finished at $883.00 per ounce, down 0.3%. Silver closed pit trading at $12.33 per ounce, just below the unchanged mark.

As a reminder, stock and bond markets are closed Friday for holiday observance.DJ30 +246.27 NASDAQ +61.88 NQ100 +3.0% R2K +5.9% SP400 +5.5% SP500 +31.40 NASDAQ Adv/Vol/Dec 2290/2.15 bln/455 NYSE Adv/Vol/Dec 2741/1.84 bln/366

4:16PM MEMC Elec reaffirms Q1 revs; cuts gross margin guidance (WFR) 17.95 +1.08 : Co reaffirms Q1 rev guidance, sees revs of $214 mln vs $225.03 mln First Call consensus. As a result of lower pricing and additional underutilization charges, gross margin for the quarter is now expected to be approx 9% of sales, compared to the company's previous outlook of gross margins declining to the 20% range.

4:07PM Canadian Solar and Helio Micro Utility sign 5 megawatt purchase agreement (CSIQ) 6.88 +0.34 : The co and Helio Micro Utility announce a five-megawatt solar photovoltaic module purchase agreement. This agreement will expand CSIQ's U.S. presence while enabling HmU to accelerate its provision of Investment Grade equipment to its own projects and other installers. Distribution will include the full line of Canadian Solar photovoltaic (PV) modules, which cover a wide range of power ratings from 0.03W to 300W. The line is backed by a 25-year performance warranty. All modules meet international standards of quality and safety. Canadian Solar is the first solar module manufacturer in the PV industry to apply ISO: TS16949 (The automotive quality management system) to module production.

9:06AM Jabil Circuit reaffirms Q3 guidance (JBL) 6.01 : Co reaffirms Q3 guidance; sees Q3 EPS of ($0.08)-$0.08 vs $0.02 consensus; co sees revs of $2.5-2.7 bln vs 2.61 bln consensus. Co has been undergoing an impairment analysis of its consolidated balance sheet goodwill. The macro-economic environment has resulted in customer demand declines and a sustained decline in the co's market capitalization below its carrying value at February 28, 2009. As a result of this analysis, the co has determined that all goodwill was impaired except for approximately $23.3 mln associated with the Aftermarket Services reporting unit. Jabil determined that the goodwill related to the Consumer reporting unit is fully impaired and has recorded a non-cash goodwill impairment charge of approximately $82.7 mln for the three months ended February 28, 2009. Further, the co has also determined that the goodwill related to the EMS reporting unit is impaired and has recorded a preliminary non-cash goodwill impairment charge of approximately $622.4 mln for the three months ended February 28, 2009.

1:44AM Micron prices 60.24 mln common shares at $4.15/share (MU) 4.28 : Co also announces the pricing of its public offering of $200 mln aggregate principal amount of 4.25% convertible senior notes due October 15, 2013.

icon url

ReturntoSender

04/11/09 10:36 PM

#8530 RE: ReturntoSender #6755

Amateur Investors Weekend Market Analysis (4/11/09):

http://www.amateur-investor.net/Weekend_Market_Analysis_April_11_09.htm

I have been receiving a lot of questions this week asking if the Bear Market is finished? Let's go back to the last Bear Market from 2000-2002 and look at a Weekly Chart of the S&P 500. Notice how the S&P 500 made a series of lower Lows which with each one substantially lower than the first which were followed by some impressive Bear Market rallies of greater than 20% at times before the real bottom occurred in late 2002. Also note that this part of the Cyclical Bear Market didn't end until the last Low (point A) was just slightly below the previous Low. Furthermore this Bear Market Low wasn't confirmed until early 2003 when the S&P 500 made a higher Low which was then followed by a Bull Market run from 2003 through late 2007. Of course the bullish run from 2003 until late 2007 set the stage for an even bigger drop from late 2007 through early 2009.


Now if we look a current Weekly Chart of the S&P 500 we have been seeing a similar pattern since late 2007 as the S&P 500 has made a series of lower Lows followed by some decent Bear Market rallies. Although the latest rally from the 667 low has been impressive it's just another Bear Market rally unless the S&P 500 can break the string of lower Lows in the future like we saw in early 2003.


As I have mentioned in the past the current rally isn't a surprise as the major averages completed a longer term Elliott 5 Wave pattern in early March. Remember once the final 5th Wave ends an impressive ABC type rally follows and that is exactly what we are seeing develop.


At this time the major averages are likely nearing completion of the "A" Wave up in association with the ABC pattern shown above which will be followed by a "B" Wave pullback in the weeks ahead. So far the Nasdaq has been acting the best as it has risen above its previous downward trend line (brown line) and has rallied just above its 23.6% Retracement Level calculated from the October 2007 high to the March 6th, 2009 low. After we see a "B" Wave pullback occur then the Nasdaq may eventually rally up to its longer term 38.2% Retracement Level near 1870 for Wave "C".


The Dow has now rallied back up to a key resistance area near 8100 which is close to its 23.6% Retracement Level calculated from the peak of Wave 2 to the bottom of Wave 5. In addition its 20 Week EMA (green line) and downward trend line (brown line) also come into play near the 8100 level as well. After a "B" Wave pullback occurs then the Dow may eventually rally up to the 9000 level for Wave "C" which is at the 38.2% Retracenment Level and 40 Week EMA.


As for the S&P 500 it has also rallied up to a key resistance area in the 850's which coincides with its 38.2% Retracement Level calculated from the peak of Wave 2 to the bottom of Wave 5. Also its downward trend line and 20 Week EMA also reside in the 850's as well. After a "B" Wave pullback occurs the S&P 500 may eventually rally up to around the 960 area for Wave "C" as this is where its 38.2% Retracement Level and 40 Week EMA reside at.


Keep in mind at this point the major averages are extremely overbought on a Weekly timeframe so I would be on the lookout for a pullback to develop before much longer which would likely act as the "B" Wave as talked about above.

Finally here is one type of potential chart pattern to watch for in the weeks ahead like occurred in late 2002 and 2003. Notice back then the Dow made a lower High in early 2003 which led to the development of a bullish Inverse Head and Shoulders pattern.


A current chart of the Dow is shown below and it's possible if the "B" Wave drops back to around 7400 or so then this could lead to another bullish Inverse Head and Shoulders pattern like occurred in early 2003. Thus this is one potential pattern to watch for in the coming weeks.


In 2008 our ETF Strategies worked the best with which had a return of +33% versus the S&P 500 which was down -38.5% for the year.

Meanwhile our 401K Strategy finished up +17.3% for the year.

Signup for a "Free 4 Week Trial Membership" or save up to 50% on a Premium Membership and you will have access to these Investment Products which include the following:

1. "ETF Daily Buy and Short Signals" which can be used to trade the DIA's, QQQQ's, SPY's and OIH's. Our ETF Strategy returned 33% in 2008.

2. "401K/Thrift Savings Plan (TSP) Timing Service" which can be used to help improve your return in your 401k/TSP Account which was up +17.3% in 2008.

3. The "End of Month Strategy" finished up +36.3% in 2008. This Strategy focuses on the typical End of Month markup by the Institutional Money.

4. "Stocks to Buy List" which can be used with either our Short Term Strategy or Long Term Strategy. In 2007 our Long Term Strategy finished even for the year versus the S&P 500 which was down -38.5%.

Our Spring Membership Special for new Members is shown below
which are 50% Off our normal Monthly Rate of $39.95
icon url

ReturntoSender

04/12/09 8:46 PM

#8531 RE: ReturntoSender #6755

InvestmentHouse Weekend Market Summary

http://www.investmenthouse.com/weekendmarketsummary.htm

- Wells Fargo pre-announcement ignites a strong continuation of the rally's second leg.
- WMT lackluster March sales seen as disappointing but it could herald the start of consumer recovery.
- Earnings season thus far rewarding as earnings top expectations. Investors now expecting too much?

Thursday was more than just a bounce, at least for part of the market.

Wednesday night we said the move up was not as strong a rebound as you want to see, but we could live with it given the leadership. Thursday was strong enough, at least on the NYSE indices given the financial stocks' rampage. The reason for the rampage was Wells Fargo pre-announced $0.53 versus $0.23. Futures were up before that news, but that is what upped the horsepower tenfold.

That was enough to overcome sloppy same store sales that saw WMT March sales +1.4%, quite off from the 3.2% expected. Overall retail sales were slimmer at -1.8% versus the -0.9% expected and the +0.3% in February. With weekly jobless claims still high (654K versus 660K and 674K prior) and continuing claims hitting an all-time high at 5.8M, a bit of consumer upset is expected. On the other hand, Japan put forth a larger than expected stimulus package and reported an increase in machinery orders. On balance the negatives were nowhere near enough to stand in front of the financials and their lead engine on the day, WFC.

Stocks gapped higher and never came back. After that initial gap and run in the first half hour stocks and the indices moved laterally for 5 hours, basically the rest of the session before a late drift higher and bump upside into the close. The indices cleared the early April peak and made some significant moves with NASDAQ 100 making a new breakout, SOX pushing the November high, the previous high since the bear market started, into the dirt, and NASDAQ moving over the January closing high.

Despite the great set ups after the pullback, the gap did not give us a chance to enter many positions. That happens. Fortunately we had taken some new positions as the opportunity presented during the past week. Moreover, an upside session ahead of a holiday typically leads to some downside early the following week and that can produce some buys. Thing is, the market is strengthening as the second upside leg breaks to a new high given the better than expected earnings and earnings pre-announcements. Thus maybe we get an entry point early next week or maybe those that gapped Thursday require a week or two to consolidate the gap and set up the next move as we cull through earnings season. There will be others stepping up in the interim and as always we just have to be patient and not chase the bus. We have some great positions we are riding higher, e.g. AMZN, BRCM, MRVL, QCOM, TSM, and we will let them move along with the newer positions we picked up the past week as well as on Thursday. You have to like how the market is rotating new leadership into the fold as the early leaders rest and set up for their next move as well. Thus you see the waves of good movers and while Thursday was hard to get in on given the gaps, the market is giving series after series of entry points. That is another sign of a healthy market.

TECHNICAL. Intraday was positive again with the gap higher, the long flat intraday consolidation, then the rise into the close. The market shot higher and held its gains without any serious test. Given the type of news that drove stocks higher it is not surprising the shorts didn't want any part of the action.

INTERNALS. Very strong breadth as you would expect with 6:1 on NYSE and 5:1 on NASDAQ. All sectors were strong as financials led the move but other sectors found reason to rally: if the financials are doing well that is good for the economy and hence the market. Volume surged back above average on NYSE though NASDAQ could not turn above average volume though trade was the best of the week. The shorts had to cover desperately once more as the market did not turn over at next resistance. There was also long buying however as you saw leaders make strong moves; most leaders have no sizeable short positions in their stocks and thus their moves are typically long buying. The drawback is volume was NOT spread out over the entire market. Most of it was concentrated in the financials as shorts are still present and they were again forced to cover.

CHARTS. There were some very key moves. SOX, the clear leader in the rally, put in a new bear market recovery high. SP600 broke out of a reverse head and shoulders pattern though it rallied right up to next resistance. NASDAQ closed over the January closing high, starting the breakout from what is more or less a 5 month Double bottom w/handle base. NASDAQ 100 made a clean break out of its 6 month base. SP500 broke from its own reverse head and shoulders pattern on that stronger, above average volume. These are all bullish indications as noted above, and they show strengthening as the upside move continues. The indices are currently on the second leg of the rally off the March low, renewing the move after the 1-2-2.5 pullback (as opposed to a 1-2-3) last week.

Some are saying that the market has to go back and test the prior lows before a sustained, long-term upside move. First, the market never has to do anything and those that expect certain things are typically disappointed. Figuring market moves is all about probabilities based upon patterns, volumes, leadership, etc. We have discussed the need for another test before. In the last bear market only one index did not undercut its prior low; all the others did and that did not require a test. This time around SOX held above the lows, never testing November. The other indices did make tests: NASDAQ 100 formed a nice double bottom as has NASDAQ. SP500 undercut its November low but again, it is not necessary that every index return to the point of origin in the selloff.

That does not mean it is all clear sailing from here. SP500 is still in a range of thick resistance from 900 to 945 and it just crossed the October lows that represent important resistance as well. SP500 will continue to work hard to get through this level, though the Friday breakout from the reverse head and shoulders gives it some upside momentum near term toward 900. From there it likely tests and extends laterally as it bumps resistance and tries to consolidate for a new breakout.

LEADERSHP: Financial leaders were of course surging along with most other financials, leader or not. Leaders in semis, tech, commodities (coming back nicely), and retail (more or less) were all moving. There were breaks higher by industrials such as DE and CMI, but their gaps were big and they never came back, and we did not want to chase the bus. Volume outside the financials, even in commodities that jumped higher, was weak. Hence the lower NASDAQ volume even as NYSE with its large financials contingent saw jumping trade. Not bad action; it is always good when leaders lead and new leaders continue to emerge. Friday saw both, and we enjoyed other investors pushing our positions taken earlier further to the upside.

THE ECONOMY

WMT March sales miss expectations. Good or bad?

Wednesday we discussed whether tumbling wholesale inventories was a good or bad indication for the economy. At this juncture, low inventories are good as that will require a rebuild and that means future production. It doesn't say much for the current situation, but it is a positive when demand rises.

Thursday there were gloomy faces with regard to the retail sector as same store sales fell 1.8% versus the 0.9% anticipated and the 0.3% gain in February. The big cherry on top (or the black rose if you want) was WMT's miss of expectations. Sales were up, but the 1.4% fell far short of the 3.2% expected.

Woe is retail, woe is retail. The giant reported worse sales and thus all must be lost. Okay there was not that level of wrist-slashing despair, but the headlines on all the financial stations, just under the Wells Fargo news, was the WMT miss and what it meant for the state of the consumer. On top of that there was the February trade gap that hit a record low (-$26.0B) as consumers shun imported goods. Of course that was February data and same store sales rose 0.3% that month so the correlation is somewhat weak; still, when the US is in recession that is the only time consumers don't consume a lot of foreign goods.

But is a WMT miss automatically a bad thing for the economy? No. WMT is huge and it has an indelible footprint on US retail sales. Nonetheless, it is still a recession stock as its sales rise in recessions along with its stock price. After a run to a peak in September 2008 WMT peaked. The market peaked as well so it is not necessarily an indication of a change specific to WMT. What does show something WMT specific is the tumble this month after WMT recovered to the 200 day SMA only to roll over and drop 10% this month as the rest of the market rallies.

WMT does worse when the economy improves because consumers no longer feel compelled to pinch as many pennies and spread out to boutiques, specialty stores, and the high end stores as well. Note that WMT started its run higher ahead of the economic downturn, outperforming nearly all retailers as investors anticipated its rising sales due to a declining economy. When investors anticipate an economic recovery, they will start unloading WMT. The rise and fall occurred in the 2000 to 2002.

Is it starting right now? WMT is not participating in the new run higher and sales have slowed. It is hard to extrapolate March alone into a decline slope for WMT sales. One month alone can be an outrider and other stores failed to show great sales either. In any event the stock price will fall ahead of a sales drop and thus we are looking at the failure to participate in this rally as a significant development. It is not definitive in itself, but with the other indications of economic improvement the past few months WMT's action is something to log with the other data. And to answer the above question, a decline in WMT's stock price is not a bad thing for retail overall and indeed generally is a positive portent for other retailers that see their business improve as consumers feel positive about a recovery and start spreading their disposable dollars around versus buying WMT's functional but painfully bland product lineup.

THE MARKET

MARKET SENTIMENT

VIX: 36.53; -2.32
VXN: 38.23; -2.27
VXO: 37.41; -1.86

Put/Call Ratio (CBOE): 0.81; -0.04

Bulls versus Bears:

This is a reading of the number of bullish investment advisors versus bearish advisors. The reason you look at this is that it gives you an idea of how bullish investors are. If they are too bullish then everyone is in the market and it is heading for a top: if everyone wants to be in the market then all the money is in and there is no more new cash to drive it higher. On the other side of the spectrum if there are a lot of bears then there is a lot of cash on the sideline, and as the market rallies it drags that cash in as the bears give in. That cash provides the market the fuel to move higher. If bears are low it is the same as a lot of bulls: everyone is in and the market doesn't have the cash to drive it higher.

This is a historical milestone in the making. Bulls are impressively low considering we are in general a very optimistic country. The few bulls is a positive indication because it means most everyone that is getting out is out and there is money on the sidelines. In other words the ammunition boxes are full and as the market recovers investors will start opening up the boxes and firing. Little by little they will be forced to put more money into the market and there will be some rushes higher in fear they are missing the train. You relish times when sentiment is so negative because it means some tremendous buys are setting up. This could indeed be the opportunity of a lifetime, and you take advantage of it by buying quality stocks and letting them work for you as long as they will. If we can hold them for years, great.

Bulls: 36.0%. Sharp jump in the bulls, moving back above 35%. Below 35% is a bullish indication. Above is not so bullish but is not bearish until higher levels. 31.0% the prior week up from 28.9%. Still well below the 43.0%, the prior top of the recovery as the market rallied off the November low. Bullishness bottomed on this leg lower at 21.3% in November 2008. This last leg down showed us the largest single week drop we have ever seen, falling from 33.7% to 25.3%. Hit 40.7% on the high during the rally off the July 2008 lows. 30.9% was the March low. In March the indicator did its job with the dive below 35% and the crossover with the bears. A move into the lower 40's is a decline of significance. A move to 35% is a bullish indicator. This is smashing that. For reference it bottomed in the summer 2006, the last major round of selling ahead of this 2007 top, near 36%, and 35% is considered bullish.

Bears: 37.1%. Fewer bulls but not a commensurate fall compared to bulls and their rise (38.0% last week). Big drop from 43.3% and 44.3% before that. The decline was slowing its fall from 47.2%, the peak for the run this year but no more. Hit the 34's on the lows, falling from 38.5% and 46.2% in mid-December. Still above the 35% level considered bullish for stocks. Bearishness hit a 5 year high at 54.4% the last week of October 2008. The move over 50 took bearish sentiment to its highest level since 1995. Extreme negative sentiment on this move. 35% is the level that historically indicates excessive pessimism. As with the bulls the jump in bears did its job after hitting 44.7% in the third week of March. Bearishness peaked at 37.4% in September 2007. It topped the June 2006 peak (36%) on that run. That June peak eclipsed the March 2006 high (33%) and well above the 2005 highs that spawned new rallies (30% in May 2005, 29.2% in October 2005). This is a huge turn, unlike any seen in recent history.

NASDAQ

Stats: +61.88 points (+3.89%) to close at 1652.54
Volume: 2.099B (+16.85%)

Up Volume: 1.98B (+494.461M)
Down Volume: 191.13M (-166.801M)

A/D and Hi/Lo: Advancers led 4.8 to 1
Previous Session: Advancers led 2.58 to 1

New Highs: 25 (+19)
New Lows: 7 (-3)

NASDAQ CHART: Click to view the chart

NASDAQ 100 CHART: Click to view the chart

SOX CHART: Click to view the chart

SP500/NYSE

Stats: +31.4 points (+3.81%) to close at 856.56
NYSE Volume: 1.836B (+39.54%)

Up Volume: 1.713B (+757.883M)
Down Volume: 115.554M (-230.456M)

A/D and Hi/Lo: Advancers led 5.94 to 1
Previous Session: Advancers led 2.73 to 1

New Highs: 14 (+10)
New Lows: 64 (+16)

SP500 CHART: Click to view the chart

DJ30

The Dow bounced off the 10 day EMA support and moved through 8000. That takes it into the lower ranges of the January/February consolidation but that only puts DJ30 right in the middle of resistance up to 8375. It made a new closing high on this move off the March low so there are positives; it is just that DJ30 has been less than inspiring, letting the other indices do the work.

Stats: +246.27 points (+3.14%) to close at 8083.38
Volume: 462M shares Thursday versus 255M shares Wednesday. The financial issues on the Dow were jumping on strong volume.

DJ30 CHART: Click to view the chart

MONDAY

The market finished the shortened week with strength, moving higher on rising volume. Often when the market closes strong ahead of a holiday it is down to start the next week. With the gaps higher Thursday that makes some sense; so many stocks gapped higher and not all were worthy but were just caught in the whoosh higher. Thus we could very easily see some backfilling to start next week despite the strong move to continue the second leg higher off the March low shown on Thursday. That could give us some good entry points on some of those great stocks that jumped higher Thursday such as CMI, SCHN, DE, MR, and quite a few others. Patience; let them come to us. As noted above it could be a day or two or it could be a week or two before they are ready depending upon what the overall market does with the move.

As for what Thursday and the WFC pre-announcement means we need to get past the initial euphoria the shock of 2x expectations placed in investors' minds. The WFC earnings on top of RIMM's earnings have investors starting to consider that things are not as bad as everyone thought. Some are even saying that we could get a positive GDP reading in Q2.

Maybe we will, but we need to put things in perspective. The WFC earnings were very nice to see as they showed mortgages are recovering and that basically banks can make money in this environment. But what is the environment? The Fed has reduced the cost of lendable funds to banks to virtually zero, and banks can turn around and loan the money from 2% on up to 5% and more. With many individuals and companies starved for credit to operate, banks such as WFC are making money hand over fist with this incredible gift from the Fed. Let's face it, a trained monkey could make money in this circumstance. Maybe not even trained monkeys.

Does that translate to other sectors of the economy? No. They don't have the no cost funds to operate with. Indeed, when you are dealing with banks right now there is massive unfairness and indeed a lack of equal protection under the Constitution. The Congress has set up zones of the country where loans are not equal. If you live in Florida, parts of New York or California, a jumbo loan is not limited to $417K to be conforming as it is in all the rest of the country. This involves mostly individuals, but the point is the same: the banks are getting a sweetheart deal, some people by virtue of where they live are getting a sweetheart deal, but none of the rest of us are.

Thus the euphoria spawned by the RIMM/WFC earnings could be setting up disappointment as more earnings come out if the majority view these two reports (and we will throw in BBBY because it too had good earnings) as definitive of the earnings season. Harsh reality could quickly turn the excitement to some consternation.

Hopefully earnings will continue to surprise. That will continue to help the market . . . to a point. At some point, even in good earnings seasons, the market hits its good news saturation level. Despite continuing good tidings there comes a point where each additional positive story has a lower marginal impact until they have no impact. The market cannot ride news higher indefinitely, and when that point is hit then there is a correction. If earnings continue to turn up better the market will rally on this second leg until the saturation point and then it will sputter along with the second leg.

That is of course not the case right now. The earnings are new, fresh, and better than expected. The stock move is strengthening as of Friday. That means we will continue looking for opportunity to invest in this second upside leg and that means some testing by stocks that gapped higher Thursday or were already moving well ahead of the news. It also means we look for newly emerging stocks as well because as we know, stocks in rallies come out in waves. The early leaders take off, run higher, then test. As they were making their moves others were setting up bases and then make their break higher as money moves from the early leaders to the newly emerging. It flows around the market, eventually getting back to the early leaders after they test and come back to near support and we see them rally off that test once more. Have said it before: rotation is not just good for tires.

So we enter this week with a strengthening second upside leg and that means we continue looking for entry points on solid stocks whether it is an early week pullback to test the gaps higher or new stocks emerging from bases. At the same time there is the earnings overlay. Thus far so good but we are not counting on that holding up. And as noted, even if it does, at some point the news is no longer news. The beauty of that is we get a nice run for our positions, take some nice gain, and then are more than ready to see the market test back.

Support and Resistance

NASDAQ: Closed at 1652.54
Resistance:
The January closing peak at 1653
1666 is the intraday January 2009 peak
1780 is the November 2008 peak
1947 is the October gap down point

Support:
1644 from August 2003
1623 is the April peak
1620 from the early 2001 low
1603 is the December peak
1598 is the February 2009 peak, the last peak NASDAQ made
1587 is the March 2009 high is getting put to bed again
The 10 day EMA at 1581
1569 is the late January 2009 peak
1542 is the early October 2008 low
1536 is the late November 2008 peak
1521 is the late 2002 peak following the bounce off the bear market low
The 50 day EMA at 1508
1505 is the late October 2008 closing low.
1493 is the October 2008 low & late December 2008 consolidation low
The 50 day SMA at 1478
1440 is the January 2009 closing low

S&P 500: Closed at 856.56
Resistance:
857 is the December consolidation low
866 is the second October 2008 low
878 is the late January 2009 peak
889 is an interim 2002 peak
896 is the late November 2008 peak
899 is the early October closing low
919 is the early December peak
944 is the January 2009 high

Support:
853 is the July 2002 low
848 is the October 2008 closing low
846 is the April peak
839 is the early October 2008 low
833 is the March 2009 peak
The 90 day SMA at 827
The 10 day EMA at 825
818 is the early November 2008 low
815 is the early December 2008 low
805 is the low on the January 2009 selloff. KEY Level
The 50 day EMA at 805
800 is the March 2003 post bottom low
768 is the 2002 bear market low
752 is the November 2008 closing low but it is not broken and done away with
741 is the November 2008 intraday low

Dow: Closed at 8083.38
Resistance:
8141 is the early December low
8175 is the October 2008 closing low. Key level to watch.
8197 was the second October 2008 low
8375 is the late January 2009 interim peak
8419 is the late December closing low in that consolidation
8451 is the early October closing low
8521 is an interim high in March 2003 after the March 2003 low
8626 from December 2002
8829 is the late November 2008 peak
8934 is the December closing high
8985 is the closing low in the mid-2003 consolidation
9088 is the January 2009 peak

Support:
The April peak at 8076
The 90 day SMA at 7975
7965 is the mid-November 2008 interim intraday low.
7932 is the March 2009 peak
7909 is the early January low
7882 is the early October 2008 intraday low. Key level to watch.
7867 is the early February low
The 10 day EMA at 7846
The 50 day EMA at 7703
7702 is the July 2002 low
7694 is the February intraday low
7552 is the November closing low. KEY Level.

Economic Calendar

These are consensus expectations. Our expectations will vary and are discussed in the 'Economy' section.

April 14 - Tuesday
- PPI, March (8:30): 0.1% expected, 0.2% prior
- Core PPI (8:30): 0.0% expected, 0.1% prior
- Retail sales, March (8:30): 0.3% expected, -0.1% prior
- Retail ex-auto (8:30): 0.1% expected, 0.7% prior
- Business inventories, February (10:00): -1.1% expected, -1.1% prior

April 15 - Wednesday
- CPI, March (8:30): 0.2% expected, 0.4% prior
- Core CPI (8:30): 0.1% expected, 0.2% prior
- New York PMI, April (8:30): -35.0 expected, -38.2 prior
- Capacity Utilization, March (9:15): 69.7% expected, 70.9% prior
- Industrial Production, March (9:15): -0.9% expected, -1.4% prior
- Crude oil inventories (10:30): +1.6M prior
- Fed Beige Book (2:00)

April 16 - Thursday
- Housing starts, March (8:30): 550K expected, 583K prior
- Building permits, March (8:30): 550K expected, 547K prior
- Initial jobless claims (8:30): 654K prior
- Philly Fed, April (10:00): -32.0 expected, -35.0 prior

April 17 - Friday
- Michigan Preliminary sentiment, April (9:55): 58.5 expected, 57.3 prior
icon url

ReturntoSender

04/13/09 10:33 PM

#8532 RE: ReturntoSender #6755

From Briefing.com: 4:20 pm : Thanks to leadership from financial stocks, the stock market reversed an early 1.3% decline to finish with a modest gain.

Weakness was widespread and trading was listless in the early going. Financial stocks had been among the session's worst performing sectors in the first few minutes of action, falling as much as 2.7% as traders took profits following the strong gains that financials registered late last week. However, buyers provided support by buying the dip in financials, as has been the case in recent weeks.

Goldman Sachs (GS 130.60, +6.27) provided a strong, positive influence to the financial sector. Goldman announced that it raised $5.5 billion in capital to fund another private equity operation, and while the company previously stated it does not intend to raise any more capital through share offerings, it reneged by announcing after the closing bell a $5 billion public offering of common equity. Goldman used the announcement as an opportunity to report its quarterly results, which were scheduled to be announced Tuesday morning. Goldman posted earnings of $3.39 per share, which is far better than the $1.60 per share that was widely expected. Goldman also trimmed its quarterly dividend to $0.35 per share from almost $0.47 per share.

Financials were able to close with a 4.8% gain, a bit shy of their session high, and are now down 11.0% year-to-date. That means financials are no longer the worst performing sector this year.

Industrials have replaced financials as the year's worst performing sector. Industrials are down 12.9% this year, but they logged a 0.4% gain this session. General Electric (GE 12.12, +0.79) was the primary leader among industrial stocks.

Health care stocks traded with gains for virtually the entire session, but they weren't really a source of leadership for the broader market. Health care gained 0.3% amid support from Express Scripts (ESRX 56.81, +7.64) and WellPoint (WLP 43.62, +3.28). The companies have signed a definitive agreement in which Express Scripts will acquire WellPoint's NetRx subsidiaries for $4.675 billion.

Health care stocks will likely remain in focus tomorrow as Dow component Johnson & Johnson (JNJ 51.10, -0.31) reports quarterly results tomorrow morning.

The energy sector lagged the broader market for the entire session, and closed 1.3% lower. Energy stocks were hampered by news that Chevron (CVX 67.98, -1.25) expects sequential earnings to be down sharply, partly due to lower oil prices.

Crude oil contracts fell under a stiff bout of selling pressure. Contract prices closed 4.2% lower at $50.05 per barrel after the IEA cut its 2009 global oil demand forecast by 1 million barrels per day.

Participants will have plenty to assess tomorrow. In addition to several widely watched earnings announcements the March Producer Price Index, March Advance Retail Sales data, and February Business Inventories are all due tomorrow morning.DJ30 -25.57 NASDAQ +0.77 SP500 +2.17 NASDAQ Adv/Vol/Dec 1353/1.83 bln/1358 NYSE Adv/Vol/Dec 1782/1.48 bln/1264

8:44AM Taiwan Semi discloses March 2009 sales of NT$13.62 bln (TSM) 9.82 : From today's 6-K: "TSMC announced its net sales for March 2009: on an unconsolidated basis, sales were approximately NT$13.62 bln, an increase of 18.4% over February 2009 and a decrease of 48.7% from March 2008. Revenues for January through March 2009 totaled NT$37.56 bln, a decrease of 55.9% compared to the same period in 2008. On a consolidated basis, net sales for March 2009 were approximately NT$ 14.20 bln, an increase of 16.6% over February 2009 and a decrease of 47.7% from March 2008. Revenues for January through March 2009 totaled NT$39.50 bln, a decrease of 54.8% compared to the same period in 2008."

8:36AM MEMC Elec: Color on preannouncement (WFR) 18.94 : Collins Stewart notes that WFR Thursday announced it expects revs of $214 mln vs $225 mln consensus. It further indicated its gross margin would be 9% for the quarter, well below the 20% it had indicated in Jan. They have lowered their forecast to reflect these changes, with their revised forecast calling for a $0.06 LPS in 1Q09 (consensus $0.31). Demand for semiconductor wafers was weak industry wide in 1Q09, limiting WFR's sales; they note gross margins for its wafer division were likely negative for the quarter. In its solar business, wafer sales were likely extremely depressed; The co's bulk polysilicon shipments were negatively impact in 1Q09 due to most potential buyers experiencing weak demand and dealing with excess inventory.

8:35AM TrimTabs ests all equity mutual funds post inflow of $11.9 billion in week ended Wednesday, April 8th : TrimTabs Investment Research estimates that all equity mutual funds posted an inflow of $11.9 billion in the week ended Wednesday, April 8th, versus a revised inflow of $3.0 billion in the previous week. Equity funds that invest primarily in U.S. stocks posted an inflow of $11.1 billion, versus a revised inflow of $2.7 billion in the previous week. Equity funds that invest primarily in non-U.S. stocks had an inflow of $844 million, versus a revised inflow of $287 million in the previous week. In addition, bond funds had an inflow of $1.7 billion, versus a revised inflow of $6.8 billion in the previous week, and hybrid funds had an inflow of $361 million, versus a revised inflow of $409 million in the previous week. Separately, TrimTabs reports that exchange-traded funds that invest in U.S. stocks posted an outflow of $1.4 billion for the second consecutive week. ETFs that invest in non-U.S. stocks had an inflow of $1.9 billion, versus an inflow of $502 million in the previous week.

8:31AM Altera and Zilog settle patent infringement suit; Zilog made a one-time payment of an undisclosed amount (ALTR) 17.75 : Co announces settlement of its patent litigation with Zilog (ZILG). As part of this agreement, Zilog made a one-time payment of an undisclosed amount to Altera and both parties agreed to dismiss their pending patent infringement lawsuits. All other terms of the agreement are confidential.

8:04AM Seagate Tech preannounces revs above consensus for Q3; guides above consensus for Q4 (STX) 6.65 : Co issues upside guidance for Q3 (Mar), sees Q3 (Mar) revs of $2.1 bln vs. $1.88 bln First Call consensus. Co sees Q4 revs of $1.9-2.2 bln vs $1.86 bln consensus.

7:59AM Seagate Tech announces offering of $430 mln of senior secured second-priority notes (STX) 6.65 :

7:59AM SanDisk: ThinkEquity raises their estimates and tgt to $17 due to expected NAND price increases (SNDK) 14.48 : ThinkEquity raises their tgt for SNDK to $17 from $12 and raises their estimates to ($0.43) from ($0.77) (consensus ($0.50). The firm notes that checks in the NAND flash market indicate continued constrained supply, while none of the major NAND OEMs such as Toshiba and Samsung are adding NAND supply. Given a one-month NAND production cycle, the firm believes that any capacity increase in NAND will likely hit the market only in June, virtually ensuring NAND price increases through the June quarter. The firm also believes that SNDK is seeing significant handset orders from Nokia, as suppliers such as Samsung are constrained by AAPL. Given NAND supply cuts in the channel, the firm notes that retail ASPs for lower-density NAND cards are already starting to increase into the June quarter.

1:48AM SanDisk issues statement regarding ITC ruling fo non-infringement of two patents (SNDK) 14.48 : Co was informed that an Administrative Law Judge for the U.S. International Trade Commission issued an Initial Determination which found that certain accused flash memory products did not infringe the remaining two SanDisk U.S. Patents. "SanDisk is disappointed by the Initial Determination of the Administrative Law Judge," said E. Earle Thompson, vice president and chief intellectual property counsel, SanDisk. "We will continue to vigorously pursue actions against companies that use SanDisk's patented technology without a license. SanDisk expects that the Initial Determination will not adversely impact existing licensing agreements or the royalties expected from those agreements."

09:37 am Microsoft initiated with a Neutral at AmTech Research: . AmTech Research initiates MSFT with a Neutral. The firm notes that their checks indicate that while PC end demand has turned somewhat positive in recent weeks, it remains lackluster in markets that benefit MSFT the most. The firm believes the PC market has entered into a mature stage where demand is driven more by consumer spending than by new product releases. The firm also expects MSFT to enter into financially unfavorable exclusive search and other advertising deals, which could have a negative impact on its margins. Nevertheless, the firm believes shares fairly reflect near-term risks regarding lackluster PC demand will likely remain at current valuation levels relative to the industry averages until PC demand rebounds.

09:31 am Microsoft (MSFT)

The long-running courtship of Microsoft (MSFT 19.67) and Yahoo! (YHOO 13.47) appears to be heating up, according to a report from The Wall Street Journal.

According to the Journal, Microsoft and Yahoo have resumed talks about search and advertising partnerships. The paper cited sources who said that Yahoo CEO Carol Bartz met with Microsoft CEO Steve Ballmer last week as part of the discussions.

Some kind of agreement between the two companies has been rumored for more than a year but nothing has advanced past preliminary talks. The recent installation of Bartz as Yahoo's CEO renewed expectations that a deal would be worked out, but the Journal's sources said it is unclear whether the companies will reach a deal.

(Disclosure: Briefing.com has a business relationship with Microsoft and Yahoo.)
icon url

ReturntoSender

04/14/09 11:44 PM

#8533 RE: ReturntoSender #6755

From Briefing.com: 4:30 pm : Participants put an end to a three session streak of gains by sending stocks 2% lower Tuesday. The downward push came as financial stocks fell out of favor and disappointing retail sales data led some to second guess the prospects of retailers.

Financial stocks weighed on the broader market for the entire session and finished with a 7.7% loss. The sector's weakness was widespread, but investment banks and brokerages (-10.7%) suffered some of the steepest declines after Goldman Sachs (GS 115.92, -14.23) announced a $5 billion common equity offering that was discounted from the prior session's closing price. The offering will also prove dilutive to existing shareholders, but is intended to help repay TARP funds.

Goldman did manage to generate strong trading results, which helped it overcome weakness in its investment banking and consulting arm. That helped the company post better-than-expected earnings results.

A better-than-expected earnings announcement and a reaffirmed outlook from Johnson & Johnson (JNJ 51.37, +0.22) helped health care stocks fend off most of the session's selling effort, though shares of JNJ inevitably closed near their session low. Health care closed 0.3% lower, but was still the best performing sector this session.

Due to widespread weakness, nearly 80% of the companies in the S&P 500 finished lower. Sellers were particularly unkind to small- and mid-cap stocks as the Russell 2000 fell 3.2% and the S&P 400 dropped 2.6%. Both indices posted declines in each of the past two sessions, but are still up 15.3% and 14.3%, respectively, in the past month.

Shares of retailers fell 2.5% this session after data showed retail sales for March declined 1.1%, which is worse than the 0.3% increase that was expected. That caused a number of investors to second guess the recent run seen in retail stocks; retailers climbed more than 4% last week and almost 6% the week before.

In other economic news, producer prices for March declined 1.2% month-over-month. Economists had expected the index to remain flat after a monthly increase of 0.1% in February. Core producer prices were flat month-over-month, which was relatively in-line with the 0.1% increase that was widely expected. February core PPI had increased 0.2% month-over-month.

Meanwhile, February business inventories decreased 1.3%, which is generally in-line with the 1.2% decline that was expected. Inventories also decreased 1.3% in the prior month.DJ30 -137.63 NASDAQ -27.59 NQ100 -1.1% R2K -3.2% SP400 -2.6% SP500 -17.23 NASDAQ Adv/Vol/Dec 867/1.43 bln/1850 NYSE Adv/Vol/Dec 932/1.21 bln/2111

5:01PM Linear Tech beats by $0.03, misses on revs (LLTC) 23.25 +0.00 : Reports Q3 (Mar) earnings of $0.25 per share, $0.03 better than the First Call consensus of $0.22; revenues fell 19.4% year/year to $200.9 mln vs the $203.1 mln consensus.

4:23PM Intel beats by $0.08, beats on revs; plans Q2 revs to be flat sequentially (INTC) 16.01 +0.03 : Reports Q1 (Mar) earnings of $0.11 per share, $0.08 better than the First Call consensus of $0.03; revenues fell 26.1% year/year to $7.14 bln vs the $6.98 bln consensus. Co issues rev outlook for Q2, plans Q2 revs flat from Q1, equates to ~$7.1 bln vs. $7.05 bln consensus. Co reports Q1 gross margins of 45.6% vs 43.55% consensus. Gross margin percentage for Q2 is expected to be in the mid-40s. Spending (R&D plus MG&A) for Q2 is expected to be approximately flat to the first quarter and restructuring and asset impairment charges of approximately $115 million. Co says the effective tax rate was 1%, lower than the expectation of approximately 27%. "We believe PC sales bottomed out during the first quarter and that the industry is returning to normal seasonal patterns."

7:02AM Silicon Motion says informed Admin Law Judge issued determination that its flash memory controllers did not infringe the patent of SanDisk (SIMO) 2.81 : Co announces it was informed that the Administrative Law Judge of the United States International Trade Commission had issued an initial determination that Silicon Motion flash memory controllers and products containing these Silicon Motion controllers did not infringe the patent of SanDisk (SNDK).

icon url

ReturntoSender

04/15/09 7:53 PM

#8534 RE: ReturntoSender #6755

From Briefing.com: 4:30 pm : A late surge of buying interest was accompanied by a spike in trading volume, which helped all three major indices finish at their session highs.

The buying effort was largely focused on financial stocks. The sector reversed early weakness to trade with gains for the entire afternoon, but it wasn't until a surge in the final hour that financials were able to climb to their session high. Financials finished with a gain of 5.6% for the session.

JPMorgan Chase (JPM 32.56, +1.86) was a primary leader in the move by financials. Interest in shares of JPM comes ahead of the company's first quarter earnings announcement, which takes place tomorrow morning.

The move by financials helped spur buying in the broader market so that nine of the 10 sectors in the S&P 500 closed in the green.

Technology was the only sector to finish with a loss. It closed 0.7% lower amid weakness in shares of large-cap tech stocks like Intel (INTC 15.62, -0.39). Intel actually announced last evening better-than-expected first quarter earnings results and indicated during its conference call that a bottom has been reached in the personal computer market. Intel went on to say that the worst is behind them from an inventory and demand perspective.

Traders' decision to sell such good news comes in contrast to the trends seen in recent weeks. Nonetheless, Intel's weakness bled into other semiconductor and large-cap tech stocks. As such, the Philadelphia Semiconductor Index fell 1.5%, while the Nasdaq 100 slipped 0.4%.

While most large-cap tech stocks lagged, Google (GOOG 379.50, +10.59) traded with strength ahead of its earnings announcement tomorrow evening. Google's strength helped lift the Nasdaq Composite out of negative territory in the final few minutes of trade, but Google's strength didn't prevent the Nasdaq from lagging its counterparts for the entire session.

Economic data did little to move investors this session. March industrial production fell a more-than-expected 1.5%, while capacity utilization came in at 69.3%.

Consumer prices for March slipped 0.1%, but core prices increased 0.2%. Economists expected a respective increase of 0.1% and an increase of 0.1%.

The Fed released its Beige Book, which didn't contain any real surprises. Though five of 12 districts reported contraction slowed last month, the bigger message is that activity still contracted. Essentially, the report fit Fed Chairman Bernanke's recent pronouncement that there are tentative signs the decline in economic activity may be slowing.DJ30 +109.44 NASDAQ +1.08 NQ100 -0.4% R2K +1.8% SP400 +1.4% SP500 +10.56 NASDAQ Adv/Vol/Dec 1702/2.06 bln/998 NYSE Adv/Vol/Dec 2162/1.48 bln/872

4:30PM Xilinx confirms restructuring plans, expects to generate cost savings and operating expense savings of approx $4-$5 mln per quarter (XLNX) 20.59 -0.12 : Co confirms restructuring measures designed to drive structural operating efficiencies across the company. The company expects to reduce its global workforce by up to 200 positions, or 6%, resulting in a pre-tax charge of approximately $11 to $13 mln in the June quarter primarily related to severance pay expenses. Additionally, Xilinx is implementing other short-term cost savings including executive salary reductions and a broad-based employee salary freeze. As a result, Xilinx expects to generate cost and operating expense savings of approximately $4 to $5 mln per quarter beginning in the June quarter. Restructuring charges will not impact the recently ended March quarter. Over the longer term, the company expects to implement further supply chain efficiencies resulting in additional restructuring charges totaling approximately $10 million over the September, December and March quarters of fiscal 2010.

8:56AM Ultra Clean Holdings announces the departure of Jack Sexton as CFO (UCTT) 1.97 : Co announces the departure of Jack Sexton, its Vice President and Chief Financial Officer. Ultra Clean will immediately begin a search to identify a candidate to fill the position of Chief Financial Officer.

8:03AM Suntech Power and Soleos expand partnership (STP) 15.09 : Co and Soleos announce that they have entered into agreements for Suntech to supply Soleos with at least 6MW of modules in the first half of 2009.

1:23AM ASML Holding misses by EUR 0.01, misses on revs; guides Q2 revs in-line (ASML) 19.59 : Reports Q1 (Mar) loss of EUR 0.27 per share, EUR 0.01 worse than the First Call consensus of EUR (0.26); revenues fell 80.0% year/year to EUR 183.6 mln vs the EUR 191 mln consensus. Co issues in-line guidance for Q2, sees Q2 revs of EUR 210.0-230.0 mln vs. EUR 228.21 mln consensus. Q109 gross margin was 6.7%, the result of extraordinarily low net sales levels. ASML's order backlog as of March 29, 2009 was EUR 853 mln, totaling 38 systems with an average selling price of EUR 22.4 mln. ASML's backlog as of December 31, 2008 was valued at EUR 755 mln. "Although we will continue to be affected by the global economic recession and very limited capacity demand, we are seeing signs of a pick-up in technology purchases from the current low run rate. We estimate a normalized pattern of technology transitions to yield between EUR 400-500 mln quarterly sales for ASML and, in view of the current technology transition activities by our customers, we expect to reach this level some time during the 2H09... yet we remain cautious as to the short-term and mid-term market developments and continue managing the company for cash generation and long term cost structure optimization, while keeping our current aggressive technology development roadmap," CEO Eric Meurice said. Co expects Q209 gross margin of approx 9%. R&D expenditures are expected to be at EUR 118 mln net of credits and SG&A costs are expected at EUR 41 mln. ASML plans for cash from operations and investments to be neutral in 1H09.

1:02AM Cabot Microelectronics provides update on Q209 financial performance, expects to report non-recurring expenses (CCMP) 26.66 : Co issues downside guidance for Q2 (Mar), sees Q2 (Mar) revs of $45.0-46.0 mln vs. $46.80 mln First Call consensus. Revenue declined significantly in Q209, reflecting the impact of the global economic recession on demand for electronics, a correction of excess semiconductor device inventories, and traditional seasonal weakness. Co expects to report gross profit of around 28% of revenue for Q209, and approx 38% of revenue for the fiscal year to date. Based on the performance for the first half of the fiscal year, it no longer expects to achieve gross profit within what had been its full year guidance range of 46-48% of revenue for FY09. In addition, the co also expects to report the following pre-tax, non-recurring expenses; these non-cash items adversely impacted operating expenses for the second fiscal quarter: $1.5 mln write-off of in-process research and development expenses related to its February 2009 acquisition of Epoch Material, as required by purchase accounting rules; $1.1 mln impairment related to certain research and development equipment; and, $1.0 mln increase in reserve for bad debt expense due to of the impact of adverse global economic conditions on customer collections.

09:32 am Zoran downgraded to Hold at Kaufman Bros: . Kaufman Bros downgrades ZRAN to Hold from Buy. The firm notes that while they remain confident in ZRAN's competitive position and ability to come out of the current downturn, the firm expects an unclear path to profitability to warrant a discount valuation for the stock and believe a discount to sales remains warranted until the firm gets greater clarity into profitability. However, the firm believes that the consumer segments ZRAN is exposed to are stabilizing, helped in part by China's stimulus boosting sales of televisions, consumer goods and set-top boxes.

08:05 am Intel (INTC)

Intel (INTC 16.01) reported better-than-expected first quarter earnings, while CEO Paul Otellini said, "We believe PC sales bottomed out during the first quarter and that the industry is returning to normal seasonal patterns."

Intel reported earnings of $0.11 per share for its first quarter, $0.08 better than the First Call consensus of $0.03.

Revenues fell 26.1% year-over-year to $7.14 billion, but topped the $6.98 billion consensus.

Intel said its gross margins shrunk to 45.6% in the quarter, down from 53.1% in the fourth quarter, but better than the consensus estimate that expected 43.55%. The company said the decrease was primarily due to higher factory underutilization charges and startup costs.

Intel's results were boosted by a lower-than-expected effective tax rate of 1%; the company had expected 27%.

Looking ahead, Intel said economic uncertainty and limited visibility will keep it from providing specific revenue guidance, but the company is planning for flat revenue sequentially. That equates to second quarter revenues of approximately $7.1 billion; the consensus currently stands at $7.05 billion.

Gross margins for the second quarter are expected to be in the mid-40s, while spending is expected to be flat compared to the first quarter.

Shares of INTC are down 4.5% in premarket trade.
icon url

ReturntoSender

04/16/09 7:40 PM

#8535 RE: ReturntoSender #6755

From Briefing.com: 4:25 pm : Despite a slow, choppy start, stocks climbed in afternoon trading and finished with healthy gains. The Nasdaq outperformed the other headline indices as shares of large-cap tech stocks rebounded from their losses in the prior session.

Tech was the only sector to finish in the red Wednesday, but it bounded back this session to close with a 3.2% gain. The sector's rebound was led by large-cap tech holdings.

Though tech's move was impressive, consumer discretionary stocks staged the best advance. The sector closed 3.4% higher as 78 of its 81 components logged gains.

Financial stocks also closed higher, but they lagged the broader market. The sector made a late rally effort, which took it to a 2.4% gain, but the move lost momentum into the close. Financials finished with a gain of 0.6%.

JPMorgan Chase (JPM 33.24, +0.68) provided leadership to the financial sector for the entire session after the company announced first quarter earnings results of $0.40 per share, which bested the $0.32 per share that was widely expected. The company reminded investors that all isn't well just yet by reporting higher loss provisions.

Financial giant Citigroup (C 4.01, +0.68) also made strong gains. The company is scheduled to announce its latest results tomorrow morning.

Economic bellwether General Electric (GE 12.27, +0.44) also reports tomorrow morning. Interest in its shares helped send the industrial sector 2.9% higher.

In economic news, the latest jobless claims data suggest that the pace of layoffs is slowing, but that it isn't getting any easier to find work. Initial claims for the week ending April 11 totaled 610,000, which is down more than expected from the prior week, but continuing claims climbed more than expected to a new record of 6.02 million.

Separately, housing starts disappointed investors hoping to find signs of a recovery in home building. Housing starts for March totaled 510,000, which was below the 540,000 starts that were expected and down from the prior month. Meanwhile, building permits in March totaled 513,000, which is below the 549,000 permits that were expected, and down from February.DJ30 +95.81 NASDAQ +43.64 NQ100 +2.8% R2K +2.8% SP400 +2.7% SP500 +13.24 NASDAQ Adv/Vol/Dec 1969/2.02 bln/743 NYSE Adv/Vol/Dec 2430/1.60 bln/623

5:49PM Seagate Technology announces pricing of $430 mln of senior secured second-priority notes (STX) 6.35 +0.50 : Co announced the pricing of its previously announced offering of $430 mln aggregate principal amount of 10.00% Senior Secured Second-Priority Notes due 2014 (the "Notes"). The Notes will be issued by Seagate Technology International, an indirect wholly-owned subsidiary of Seagate Technology, and guaranteed by Seagate Technology, Seagate Technology HDD Holdings and all of Seagate Technology's other subsidiaries that guarantee its senior secured credit facility, on a full and unconditional basis and secured by a second-priority lien on the assets that secure the senior secured credit facility.

4:06PM Google beats by $0.23, reports revs in-line (GOOG) 388.74 +9.24 : Reports Q1 (Mar) earnings of $5.16 per share, ex items, $0.23 better than the First Call consensus of $4.93; revenues after deducting TAC (traffic acquisition costs) rose 10.1% year/year to $4.07 bln vs the $4.08 bln consensus. Aggregate paid clicks, which include clicks related to ads served on Google sites and the sites of their AdSense partners, increased approximately 17% over the first quarter of 2008 and increased approximately 3% over the fourth quarter of 2008. Operating expenses, other than cost of revenues, were $1.52 billion in the first quarter of 2009, or 28% of revenues, compared to $1.65 billion in the fourth quarter of 2008, or 29% of revenues.

9:38AM Additional details of IDC's Worldwide Quarterly PC Tracker : Last night, IDC came out with its Worldwide Quarterly PC Tracker. IDC says while the economic crisis continues to unfold, low-cost Portable PCs continue to appeal to Consumers and support growth in the PC market. Worldwide PC shipments were down 7.1% year over year in the first quarter of 2009 (1Q09) - slightly better than a projected decline of 8.2% - according to IDC's Worldwide Quarterly PC Tracker. While concern over the global recession and the fear of rising unemployment continues to weigh on commercial spending and consumer confidence, PC demand has nevertheless remained somewhat resilient compared to the last downturn. Falling prices, fueled in part by Mini Notebook PCs and added efforts in channel development, have helped to minimize the market contraction. The United States fared well, with shipments falling only 3% as HP, Acer, and Toshiba leveraged Portable sales into solid growth. Europe, Middle East and Africa and Asia/Pacific excluding Japan also came in slightly better than expected. "Tight credit and economic concerns have certainly taken a toll on PC shipments in the last couple quarters, but the move to portables, fueled by Mini Notebooks and falling prices, has mitigated the impact," said Loren Loverde, program director for IDC's Worldwide Quarterly PC Tracker. "Following a drawdown in inventory throughout the supply chain, we expect more stable production over the next couple quarters, with growth returning around the end of the year." (See yesterday's comment 16:38 for initial comment)

9:01AM Super Micro Computer lowers Q3 guidance; sees EPS of $0.05-0.06 vs $0.09 First Call consensus; revs $109-110 mln vs $117.52 mln First Call consensus (SMCI) 5.56 : Co issues downside guidance for Q3 (Mar), sees EPS of $0.05-0.06 vs. $0.09 First Call consensus previous guidance called for EPS of $0.11-0.14; sees Q3 (Mar) revs of $109-110 mln vs. $117.52 mln consensus, previous guidance called for a range of $115 to $125 mln. Non-GAAP gross margin is expected to be approximately 15%. Gross margin was lower than expected principally due to greater price competition in light of the recent economic conditions and in advance of the release of new products incorporating Intel's new Nehalem CPU. Co says, "The March ending quarter was challenging principally due to the global economic recession. In addition, the third quarter was adversely impacted by customer order delays in advance of Intel Nehalem CPU launch."

8:36AM Xilinx: Credit Suisse raises estimates and tgt to $22 following opex cuts (XLNX) 20.59 : Credit Suisse raises their 2Q 09 to $0.21 from $0.19 (consensus $0.17) and also raises their tgt to $22 from $20 following the co's 6% global workforce reduction, which prompted an $11-13 mln onetime charge in C2Q09 but also a $4-5 mln per quarter opex reduction starting from C2Q09. The firm notes that the action was already factored into mgmt's comments to target cutting opex from the low $170 mln level to the low-mid $160 mln level over the next few quarters. However, the firm is trimming a further $8 mln from their 2009 opex but suspect street needs to cut even a bit more opex now that the actions are more concrete. The firm notes that they expect a flat calendar 2Q09 outlook - but an EPS boost from the lower opex when the co reports on April 22.

8:36AM On the Wires : Microsemi Corp (MSCC) announces that it acquired the Space Level Power Products business of Spectrum Microwave, a wholly-owned subsidiary of Spectrum Control (SPEC)...

8:16AM Ultratech misses by $0.03, misses on revs (UTEK) 13.05 : Reports Q1 (Mar) earnings of $0.01 per share, $0.03 worse than the First Call consensus of $0.04; revenues fell 17.4% year/year to $25.7 mln vs the $27.3 mln consensus.

8:05AM Cypress Semi beats by $0.01, beats on revs; gross margin below consensus, book-to-bill 1.12 (CY) 7.33 : Reports Q1 (Mar) loss of $0.22 per share, $0.01 better than the First Call consensus of ($0.23); revenues fell 15.6% year/year to $139.3 mln vs the $123.5 mln consensus. Non-GAAP consolidated gross margin for the first quarter was 34.6% (consensus 40.1%), down 7.9 percentage points from the previous quarter due mainly to record low utilization levels and inventory reserves. Co said, "Cypress's gross margin fell short of our guidance as we proactively decreased inventory and drove factory utilization to an all-time low of 34%. We expect gross margin to increase significantly over the next two quarters as we ramp production to meet increased demand and continue to reduce costs. Pricing continues to be fairly stable. Our corporate average selling price (ASP) increased 10.9% sequentially to our highest level since Q304. Our semiconductor book-to-bill ended the first quarter at 1.12, with all divisions above unity. Ordering patterns began to stabilize in early Q1 and we entered the second quarter 62% booked. Customers are beginning to place backlog orders and to restock depleted inventory levels."

7:34AM Fairchild Semi beats by $0.02, misses on revs; guides Q2 revs above consensus (FCS) 4.75 : Reports Q1 (Mar) loss of $0.32 per share, excluding non-recurring items, $0.02 better than the First Call consensus of ($0.34); revenues fell 30.4% year/year to $223.3 mln vs the $235.1 mln consensus. Co issues upside guidance for Q2, sees Q2 revs of $250-270 mln vs. $242.68 mln consensus. For this range of revenue, they anticipate gross margin to be between 21-24%. Gross margin was 15.2%, down 11 percentage points sequentially and 15 percentage points lower than in the 1Q08. Co says, "Our first quarter sales were well below customer consumption levels as the industry worked through the current inventory correction. The reduction in sales was broad-based across all end markets. However, order rates improved during the quarter and in the first weeks of Q2, enabling us to increase backlog. Overall product pricing was down about 2% sequentially which is slightly less favorable than prior quarters. We maintained lead times within a stable range of 4 to 6 weeks during the quarter."

7:06AM Plexus reaffirms second quarter fiscal 2009 guidance (PLXS) 16.04 : Co issues guidance for Q2 (Mar), sees EPS of above the high end of $0.17-0.24 vs. $0.19 First Call consensus; sees Q2 (Mar) revs of $375-405 mln vs. $385.13 mln consensus.The co also announced it recorded a non-cash charge in the amount of $5.7 mln in the second fiscal quarter ended April 4, 2009, to write off the entire carrying value of its goodwill. The impairment charge was driven by adverse macroeconomic conditions that contributed to an overall reduction in demand for the co's offerings in the Kelso, Scotland facility. These conditions led to interim goodwill impairment testing in connection with the preparation of Plexus' financial statements for the quarter, which resulted in the determination that the goodwill was impaired. This non-cash charge does not impact the Company's normal business operations, liquidity or availability under its credit facilities. Additionally, the co has implemented further cost-cutting measures in response to the difficult economic environment and incurred restructuring costs of approx $2.3 mln during the second fiscal quarter, higher than the $500,000 originally anticipated for the quarter. Restructuring costs were primarily related to severance costs and fixed assets written down as a result of the closing of the manufacturing facility in Ayer, Massachusetts in March 2009.

7:05AM Tessera Tech extends agreement With Motorola (TSRA) 13.55 : Co announces that Motorola (MOT) has extended its option agreement with Tessera that enables MOT to enter into a pre-negotiated license agreement with Tessera and settle all outstanding litigation between the companies. Motorola extended the option until 14 calendar days after the Final Determination in Tessera's ongoing U.S. International Trade Commission Investigation 337-TA-605. Other detailed terms of the agreements, including option fees, license fees and license royalties, are confidential.

6:42AM Nokia beats by Euro 0.01, misses on revs (NOK) 13.36 : Reports Q1 (Mar) earnings of Euro 0.10 per share, Euro 0.01 better than the First Call consensus of Euro 0.09; revenues fell 26.7% year/year to Euro 9.28 bln vs the Euro 9.77 bln consensus. Nokia reports Q1 mobile device volumes of 93.2 million units, down 19% year on year and down 18% sequentially. Nokia 5800 XpressMusic volumes of 2.6 million units, with cumulative shipments of more than 3 million units since the smartphone's launch in late November 2008. Nokia estimated mobile device market share of 37% in Q1 2009, down from 39% in Q1 2008 and unchanged from Q4 2008. Nokia mobile device ASP of EUR 65, down from EUR 71 in Q4 2008. Devices & Services gross margin of 33.8%, unchanged from Q4 2008. Nokia operating cash flow of EUR 276 million. Total cash and other liquid assets of EUR 8.1 billion at the end of Q1 2009. Nokia expects industry mobile device volumes in the second quarter 2009 to be at approximately the same level or up slightly sequentially. Nokia expects its mobile device market share in the second quarter 2009 to increase sequentially. Nokia continues to expect 2009 industry mobile device volumes to decline approximately 10% from 2008 levels. Nokia continues to expect the decline to be greater in the first half than in the second half of the year. Nokia continues to target its annualized non-IFRS operating expense run rate in Devices & Services to be lower than EUR 6 billion by the end of 2010.

08:40 am Nokia (NOK)

Nokia (NOK 13.36) reported first quarter earnings that topped expectations, but the world's No. 1 mobile phone maker saw sales plunge.

Nokia reported first quarter earnings of euro 0.10 per share, euro 0.01 better than the First Call consensus of euro 0.09.

Revenues plunged 26.7% year-over-year to euro 9.28 billion, below the euro 9.77 billion consensus.

Nokia said Q1 mobile device volumes of 93.2 million units was down 19% year-over-year and 18% lower sequentially.

The Helsinki-based company estimated its mobile device market share at 37% in the first quarter, down from 39% in the same period the prior year and unchanged sequentially. The average selling price of its mobile devices dipped to euro 65, down from euro 71 in the fourth quarter.

Looking ahead, Nokia said it expects industry mobile device volumes in the second quarter 2009 to be at approximately the same level or up slightly sequentially. Nokia expects its mobile device market share in the second quarter to increase sequentially.

For the full year, the company continues to expect industry mobile device volumes to decline approximately 10% from 2008 levels, with the decline greater in the first half than in the second half of the year.

The company's report wasn't as bad as feared and has shares of NOK up 12.7% in premarket trading.

icon url

ReturntoSender

04/19/09 11:01 AM

#8539 RE: ReturntoSender #6755

From HeadlineCharts Blog:

http://headlinecharts.blog.com/

The ECRI has turned optimistic on the economy and that is great news and of course quite favorable for stocks. It means the market rally is more than just a bounce, but it don't think it means we won't see a retest of the market lows. Here is the latest from ECRI:

Reuters

April 17, 2009 - A weekly measure of U.S. future economic growth slipped, while its annualized growth rate climbed to levels last seen in October 2008, indicating that economic recovery is probable in the coming months, a research group said Friday.

The Economic Cycle Research Institute, a New York-based independent forecasting group, said its Weekly Leading Index slipped to 107.2 for the week ending April 10 from 107.4, which was revised lower from 107.9.

But the index's annualized growth rate -- which has seen nearly a six-month upswing -- rose to negative 19.7 percent from the prior week's rate of negative 20.9 percent, revised lower from negative 20.6 percent.

It was the highest yearly growth reading since the week of Oct. 17, 2008, when the rate plunged to a 33-year low of minus 17.1 percent, according to ECRI data.

"With the upturn in Weekly Leading Index growth continuing for over five months now, growth in U.S. economic activity will begin to improve in short order," said Lakshman Achuthan, managing director at ECRI.

The weekly index level fell because of higher interest rates and weaker housing activity and was partly offset by higher commodity prices, Achuthan said.


icon url

ReturntoSender

04/20/09 9:29 PM

#8541 RE: ReturntoSender #6755

From Briefing.com: 4:30 pm : Sellers had their way with stocks for the entire session, causing the stock market to finish at session lows with its worst loss by percent in more than one month.

While all 10 major sectors in the S&P 500 suffered sharp losses, the selling effort was rooted in the financial sector. Financials finished 11.4% lower after Bank of America (BAC 8.02, -2.58) reported that its first quarter credit loss provisions totaled $13.4 billion, up almost $5 billion from the fourth quarter. The announcement provided an excuse for participants to sell bank stocks after watching them rally in recent weeks. Just last week bank stocks spiked after BB&T (BBT 19.79, -3.63) stated banks could still post profits while building reserves. To that point, Bank of America actually generated pretax, preprovision income of $19 billion, which exceeded expectations. Diversified banks finished 15.6% lower and diversified services stocks sank 15.9%.

Credit card companies were also out of favor. Their weakness stemmed from fear that tighter regulation may be in order. Consumer finance stocks dropped 15.0%.

Sun Microsystems (JAVA 9.15, +2.46) managed to make a gain amid the session's declines. The stock soared after Oracle (ORCL 18.82, -0.24) announced it will acquire the company for $9.50 per share, which marked a premium of more than 40% above JAVA's closing price last week.

The announcement comes after talks between IBM (IBM 100.43, -0.84) and Sun Microsystems faltered. IBM stated it has no intention to return to discussions with Sun Microsystems, according to reports.

PepsiCo (PEP 49.86, -2.27) announced it is doing some buying as well. PepsiCo will purchase remaining stakes in Pepsi Bottling Group (PBG 30.73, +5.53) for $29.50 per share and PepsiAmericas (PAS 25.04, +5.16) for $23.27 per share, which translates to respective premiums of roughly 17% over last week's closing prices. PepsiCo also announced better-than-expected first quarter adjusted earnings per share results.

With stocks dropping, investors sought the safety of gold. Gold prices closed at $887.50 per ounce, up 2.3%. Interest in gold was strong enough to help gold prices overcome a resurgent dollar, which climbed roughly 0.8%, according to the Dollar Index.

The dollar's bounce came about after ECB President indicated that more rate cuts may be in order for the European economy, though such cuts would come in measures of 25 basis points.

The stronger dollar weighed heavily on crude oil prices. May contracts finished 8.8% lower at $45.90 per barrel. DJ30 -289.60 NASDAQ -64.86 NQ100 -3.3% R2K -5.6% SP400 -5.4% SP500 -37.21 NASDAQ Adv/Vol/Dec 444/2.92 bln/2257 NYSE Adv/Vol/Dec 295/1.76 bln/2800

4:35PM Texas Instruments beats by $0.04, beats on revs; guides Q2 in-line (TXN) 17.32 -0.65 : Reports Q1 (Mar) earnings of $0.01 per share, $0.04 better than the First Call consensus of ($0.03) (consensus includes restructuring charges); revenues fell 36.2% year/year to $2.09 bln vs the $1.9 bln consensus. Co reports Q1 gross margin of 38.6% vs 39.29% consensus. Co issues in-line guidance for Q2, sees EPS of 0.01-0.15, includes restructuring charges, vs. $0.02 consensus; sees Q2 revs of 1.95-2.40 vs. $1.94 bln consensus. Co said, "Demand for our products has begun to stabilize after sharp drops in the past two quarters. Many customers have increased orders for TI products as they have begun to slow down their inventory reductions. However, we remain sensitive to continuing weakness in the global economy, and we have yet to see signs of a broad-based recovery in our business. In this environment, we will keep our operations flexible so that we can respond quickly to any shifts in demand, whether up or down... We reduced our own inventory by $277 million, and at the same time worked with distributors to reduce channel inventory by $132 million. Our inventory reductions are essentially complete, and we expect to moderately increase production levels in our factories during the second quarter".

4:16PM IBM beats by $0.04, misses on revs; reaffirms 2009 guidance, ahead of pace for 2010 roadmap (IBM) 100.43 -0.84 : Reports Q1 (Mar) earnings of $1.70 per share, $0.04 better than the First Call consensus of $1.66; revenues fell 11.4% year/year to $21.71 bln vs the $22.51 bln consensus. Reports Q1 gross margin 43.4% vs 42.4% consensus. IBM reaffirms prior 2009 EPS guidance for "at least $9.20", consensus is for $9.03. IBM says ahead of pace for 2010 roadmap of $10.00-11.00; consensus is for $9.78. Co said revs were impacted by strong U.S. dollar, down 11% YoY, down 4% adjusting for currency. "IBM continued to perform well in a very difficult economic environment. This was due to our long-term strategic focus: shifting into software and services, divesting of commodity businesses, and creating solutions that help clients reduce cost and conserve capital. At the same time we have a disciplined approach to cost and expense management giving us a strong financial position." IBM's tax rate in the first-quarter 2009 was 26.5% compared with 27.5% in 1Q08, a decline of 1.0 point. IBM ended the first quarter of 2009 with $12.3 bln of cash on hand and generated free cash flow of $1.0 bln, up $450 mln year over year, excluding Global Financing receivables. The balance sheet remains strong, and the company is well positioned to take advantage of opportunities.

4:06PM Volterra Semi beats by $0.03, beats on revs (VLTR) 10.37 +0.10 : Reports Q1 (Mar) earnings of $0.03 per share, excluding non-recurring items, $0.03 better than the First Call consensus of ($0.00); revenues fell 20.6% year/year to $18.3 mln vs the $17.4 mln consensus.

9:44AM KLA-Tencor: Looking positive into earnings - Barclays (KLAC) 24.06 -0.80 : Barclays expects KLAC shares to outshine other front-end stocks this week due to consensus ests likely heading higher, results that are approaching breakeven, and recent strength in June orders that only started tracking higher recently. Firm is looking for a generally in-line March qtr (revs/EPS of $301 mln/-$0.25 vs cons $300 mln/-$0.26) with mgmt guiding to June revs of $300 mln +/- $20 mln. Firm is positive on KLAC shares going into earnings but maintain our long-term Equal Rate rating and $25 tgt.

8:11AM Trina Solar announces three new sales agreements in Germany (TSL) 12.38 : Co announces that it has entered into three sales agreements totaling approximately 42 MW of PV modules for delivery in 2009 with customers in Germany, including 12 MW with Bull Solar GmbH. These sales agreements, which were signed in the first quarter of 2009, reflect continued demand for Trina Solar's quality products from established customers in Germany and their commitment to new solar projects despite uncertain economic conditions.

09:33 am Cymer upgraded to Above Average at Caris & Company; tgt raised to $32: . Caris & Company upgrades CYMI to Above Average from Average and raises their tgt to $32 from $21. The firm notes that they are not making a call on the quarter, but they believe that CYMI has the best chance for sustained recovery of revs and earnings due to their higher contribution of service revenues and a rebound in the stepper market. The firm believes that market share losses have bottomed and CYMI is in better shape to gain share going forward. The firm notes that CYMI has also been very aggressive in cutting costs and they expect the leverage in the current cycle will be higher than previous cycles.

09:01 am Oracle (ORCL)

Oracle (ORCL 19.06) said Monday that it will buy Sun Microsystems (JAVA 6.69) for $9.50 per share in cash, a 42% premium to Friday's closing price.

The transaction is valued at approximately $7.4 billion, or $5.6 billion net of Sun's cash and debt.

Oracle said it expects the acquisition to be accretive to earnings by at least $0.15 per share on a non-GAAP basis in the first full year after closing. Oracle estimates that Sun will contribute over $1.5 billion to operating profit in the first year, increasing to over $2 billion in the second year.

Sun's board unanimously approved the deal, which is expected to close this summer.

News of the acquisition comes two weeks after merger talks between IBM (IBM 101.27) and Sun broke down. Reports at the time indicated IBM had offered up to $9.40 per share for Sun.

Shares of JAVA are soaring 36.5% higher in premarket trade.

08:47 am Bank of America (BAC)

Bank of America (BAC 10.60) reported first quarter net income of $4.2 billion, but the bank added to its loss reserves and said credit quality deteriorated further across all lines of business.

After preferred dividends, including $402 million paid to the U.S. government, diluted earnings were $0.44 per share. The figure may not compare to the First Call consensus that expected $0.04.

Revenues rose 111.7% year-over-year to $36 billion; the consensus called for $27.13 billion.

Results for the quarter include Merrill Lynch and Countrywide Financial. Merrill Lynch contributed $3.7 billion to net income, excluding certain merger costs, on strong capital markets revenue. Countrywide also added to net income as mortgage lending and refinancing volume increased.

Bank of America said that credit quality deteriorated further across all lines of business as housing prices continued to fall and the economic environment weakened. The bank said the provision for credit losses of $13.4 billion rose from $8.5 billion in the fourth quarter and included a $6.4 billion net addition to the allowance for loan and lease losses.

Nonperforming assets were $25.7 billion compared with $18.2 billion at Dec. 31, 2008 and $7.8 billion at March 31, 2008, reflecting the continued deterioration in portfolios tied to housing.

Shares of BAC are more than 6% lower in premarket trading.
icon url

ReturntoSender

04/21/09 9:29 PM

#8542 RE: ReturntoSender #6755

From Briefing.com: 4:35 pm : Uninspired by the latest batch of earnings announcements, bulls initially yielded control of stocks to sellers for the second straight session. However, the early decline in stocks compelled buyers looking for more attractive entry prices to move in and offer their support. That helped stocks rebound midmorning and climb higher for the rest of the session.

Financials attracted the most support. The sector was down more than 1% in the early going, but finished with an 8.2% gain at its best levels of the session. Buying in the sector was broad-based, but US Bancorp (USB 19.27, +3.33) provided some of the most positive influence to diversified banks (+13.6%) and the overall financial sector after it reported better-than-expected first quarter earnings.

Meanwhile, Regions Financial (RF 6.14, +0.34) attracted buyers into regional banks (+6.9%) after holding an upbeat conference call. The stock was initially sent lower after the company announced a small profit for the latest quarter. Shares of RF swung nearly 28% from their session low to their closing price.

Buying among financials also helped lift investment services stocks. State Street (STT 36.15, +5.50) surged after topping earnings estimates, but even Bank of New York (BK 27.98, -0.05) and Northern Trust (NTRS 56.17, -1.98) were able to pare losses after both falling short of analysts' expectations.

Semiconductors (+3.3%) were supported when Texas Instruments (TXN 17.11, -0.21) reported better-than-expected results and indicated that demand has begun to stabilize.

Dow components IBM (IBM 102.31, +1.88), Coca-Cola (KO 43.09, -1.24), Caterpillar (CAT 31.39, +0.91), DuPont (DD 28.06, +1.32), Merck (MRK 23.54, -1.68), and United Technologies (UTX 47.99, +2.18) all issued quarterly results for participants to digest. The results were generally mixed, leaving the blue chip average to trail the other headline indices for virtually the entire session. Still, the Dow managed to close with a solid gain.

Small-cap stocks saw some of the strongest gains. The Russell 2000 Small-Cap Index tacked on 3.9% this session. Emulex (ELX 9.70, +3.09) was a primary leader among small-cap stocks. Its gain came after the company received an offer from Broadcom (BRCM 20.52, -1.27) to be acquired for about $764 million.

Airlines also made a strong performance by climbing 10.0% after Delta Air Lines (DAL 8.11, +1.30) reported a first quarter loss that wasn't quite as bad as feared.

Educational services stocks were absent from this session's advance. Prior to the opening bell, analysts at Credit Suisse downgraded several service providers. The group fell 7.0%.

Health care stocks also lagged. Health care was the only sector to finish in the red; it closed 0.9% lower. United Health (UNH 22.80, -1.41) and Schering-Plough (SGP 22.11, -0.94) both were laggards, despite better-than-expected earnings.

There were no economic reports today, but Treasury Secretary Geithner spoke before a congressional committee. He indicated that there was still about $109.6 billion available from the $700 billion rescue package passed last year, and he expects to get at least an additional $25 billion back, bringing the total to $134.6 billion.DJ30 +127.83 NASDAQ +35.64 NQ100 +1.5% R2K +3.9% SP400 +3.1% SP500 +17.69 NASDAQ Adv/Vol/Dec 2021/1.94 bln/671 NYSE Adv/Vol/Dec 2409/1.67 bln/634

4:30PM Yahoo! beats by $0.07, misses on revs; issues Q2 total revs guidance; to reduce headcount by approx 5% worldwide (YHOO) 14.38 +0.72 : Reports Q1 (Mar) earnings of $0.15 per share, $0.07 better than the First Call consensus of $0.08; revenues after deducting traffic acquisition costs, fell 14.5% year/year to $1.16 bln vs the $1.2 bln consensus. Co issues guidance for Q2, sees Q2 total revs of $1.42-1.63 bln, not comparable to consensus. YHOO expects to reduce employees worldwide by approx 5%. Co said, "Yahoo! is not immune to the ongoing economic downturn, but careful cost management in the first quarter allowed our operating cash flow to come in near the high end of our outlook range... While we experienced pressure in both display and search advertising in the first quarter, we believe Yahoo! remains one of the most compelling advertising buys on the Internet."

4:18PM Advanced Micro beats by $0.04, beats on revs (AMD) 3.36 +0.05 : Reports Q1 (Mar) loss of $0.62 per share, ex items, $0.04 better than the First Call consensus of ($0.66); revenues fell 20.8% year/year to $1.18 bln vs the $977.8 mln consensus. First quarter 2009 AMD gross margin was 43 percent, including a positive impact of 5 percentage points due to a $64 million benefit from the sale of inventory written down in the fourth quarter of 2008. Considering current macroeconomic conditions, limited visibility and historical seasonal patterns, AMD expects its Product Company revenue to be down for the second quarter of 2009.

4:10PM Cree beats by $0.02, reports revs in-line; guides Q4 EPS above consensus, revs above consensus (CREE) 26.06 -0.32 : Reports Q3 (Mar) earnings of $0.13 per share, excluding non-recurring items, $0.02 better than the First Call consensus of $0.11; revenues rose 4.9% year/year to $131.1 mln vs the $130.6 mln consensus. Co issues upside guidance for Q4, sees EPS of $0.13-0.15, excluding non-recurring items, vs. $0.13 consensus; sees Q4 revs of $137-143 mln vs. $136.42 mln consensus. "Growth in LED lighting partially offset lower demand for auto, mobile and consumer applications in Q3, and we target total LED revenue to rebound in Q4 driven by increased demand for commercial lighting and video screens. As we look ahead to Fiscal 2010, we are targeting our LED lighting and LED component product lines to continue to grow, and we are planning to continue to invest in R&D and capacity to enable this growth."

4:10PM Seagate Tech reports EPS in-line, beats on revs; guides Q4 EPS in-line, revs in-line (STX) 6.67 +0.21 : Reports Q3 (Mar) loss of $0.45 per share, in-line with the First Call consensus of ($0.45); revenues fell 30.7% year/year to $2.15 bln vs the $2.01 bln consensus. Co issues in-line guidance for Q4, sees EPS of ($0.29)-($0.39) vs. ($0.30) consensus; sees Q4 revs of $1.9-2.2 bln vs. $1.98 bln consensus. For the June quarter, in light of the company's view of the current market environment, the company is planning for the overall demand for disk drives to be relatively flat as compared to the March quarter. The co believes opportunities exist to reduce operating costs in product development, marketing/administrative and manufacturing areas to target a cost structure that generates positive cash flow and earnings within its fiscal year 2010.

4:08PM SanDisk beats by $0.28, beats on revs (SNDK) 13.71 +0.31 : Reports Q1 (Mar) loss of $0.48 per share, excluding non-recurring items, $0.28 better than the First Call consensus of ($0.76); revenues fell 22.4% year/year to $659.5 mln vs the $537.7 mln consensus. "Industry fundamentals improved in the first quarter. We are encouraged that industry supply and demand balance is becoming better aligned, resulting in higher flash pricing. Our financial results improved substantially from the prior quarter driven by better than expected demand, strong product cost reductions and lower operating expenses."

1:16PM Emulex confirms receipt of unsolicited proposal; Board will review the proposal (ELX) 9.46 +2.85 : Co confirms that its Board of Directors has received an unsolicited proposal from Broadcom (BRCM) to acquire Emulex for $9.25 per share in cash. The Board will review the proposal in due course, consistent with its fiduciary duties, in consultation with its financial advisor, Goldman, Sachs and its legal advisor. Emulex noted that there is no need for Emulex stockholders to take any action at this time.

8:06AM Emulex: Broadcom offers to acquire ELX for $9.25 per share (ELX) 6.61 : BRCM announces that it has made a proposal to ELX to acquire all the outstanding shares of ELX common stock for $9.25 per share in cash, representing a total equity value of approximately $764 mln. The offer represents a 40% premium above the closing price of Emulex common stock on April 20, 2009, a 62% premium to trailing 30 day average price per share and an approximately 85 percent premium to enterprise value. Broadcom's cash offer will be funded from its approximately $2.0 bln of existing cash and marketable securities on hand... Today, Mr. McGregor sent a letter to Emulex's Board of Directors outlining the proposal, with the goal of moving rapidly to the negotiation and closing of a transaction. "I am writing on behalf of the Board of Directors of Broadcom Corporation to propose that Broadcom acquire all of the outstanding shares of Emulex common stock for $9.25 per share, payable in cash. Our proposal is not subject to any financing condition. We are confident that if we are given the opportunity to engage directly with Emulex we will be able to negotiate a mutually acceptable merger agreement, which we believe we would be able to complete expeditiously... To move forward quickly, we have retained Banc of America Securities as our financial advisor and Skadden, Arps, Slate, Meagher & Flom LLP as our legal advisor, which, alongside our senior management team, have already completed extensive analysis and due diligence based on publicly available information. Broadcom has a well-established record as an acquiror, having completed more than forty such transactions over the past decade."

4:25AM First Solar secures financing for 53 MW solar power plant in Germany (FSLR) 138.48 : Co and Juwi Holding AG announce they have secured financing for a 53 megawatt DC photovoltaic power plant near the German city of Cottbus. More than 80% of the required project capital is financed through non-recourse debt from a consortium of banks. First Solar and Juwi intend to sell the majority of the project after its completion. Construction of the project began in January 2009, and the first 15MW have been completed. The remaining 38MW are scheduled to be completed by the end of 2009.

08:15 am Texas Instruments (TXN)

Texas Instruments (TXN 17.32) reported first quarter earnings that topped expectations and said that demand for its products has begun to stabilize after sharp drops in the past two quarters.

Texas Instruments reported first quarter earnings of $0.01 per share, $0.04 better than the First Call consensus that called for a loss of $0.03 per share. The consensus estimate includes restructuring charges.

Revenues plunged 36.2% year-over-year to $2.09 billion; the consensus expected $1.9 billion. Texas Instruments said the decline from a year ago was due to lower revenue in all segments and the associated lower gross profit, as well as the impact of underutilized manufacturing assets and restructuring charges.

The company's gross margins in the quarter were shy of the consensus estimate, coming at 38.6% compared to the consensus of 39.29%.

For the second quarter, Texas Instruments said it expects to post earnings per share from $0.01 to $0.15, including restructuring charges. The consensus currently stands at $0.02. The company expects revenues to range from $1.95 billion to $2.40 billion; the consensus calls for $1.94 billion.

CEO Rich Templeton said many customers have increased orders for Texas Instruments products as they begin to slow down their inventory reductions. In fact, said Templeton, the company expects to "moderately increase production levels" during the second quarter.

Shares of TXN are up 2% in premarket trade.

08:06 am IBM (IBM)

IBM (IBM 100.43) posted first quarter earnings that topped the consensus estimate and reaffirmed its earnings outlook for 2009, but the company's revenue results were hurt by the stronger U.S. dollar.

IBM reported earnings of $1.70 per share for its first quarter, $0.04 better than the First Call consensus of $1.66.

Revenues were down 11.4% year-over-year to $21.71 billion; the consensus expected $22.51 billion. IBM said revenues would have been down only 4% when adjusting for the impact of foreign currency.

By region, revenues in the Americas were down 7% year-over-year, while Europe, Middle East and Africa revenues fell 18% and Asia-Pacific dropped 6%.

IBM improved its gross margins to 43.4% in the first quarter, better than the 41.5% recorded in the same period last year and ahead of the consensus estimate of 42.4%. The company said improved margins in services and software were behind the increase.

IBM ended the first quarter with $12.3 billion of cash on hand and generated free cash flow of $1.0 billion, up $450 million year-over-year.

Looking ahead, IBM said that it expects full year 2009 earnings of "at least" $9.20 per share; the consensus currently stands at $9.03 per share. In addition, IBM CEO Samuel J. Palmisano said, "We remain well ahead of pace for our 2010 roadmap of $10 to $11 per share."

Shares of IBM are down 2.4% in Tuesday's premarket trading.
icon url

ReturntoSender

04/22/09 10:59 PM

#8543 RE: ReturntoSender #6755

From Briefing.com: 4:30 pm : For the second session in a row, stocks opened lower but buyers moved in to bid the major indices higher. However, upward momentum stalled as the S&P 500 approached the 850 level in the final hour of trading, which prompted sellers to re-enter the fold and hand stocks a sizeable loss.

The late selling effort focused on financial stocks, which closed with a loss of 3.8%, worse than any other sector in the S&P 500. Shares of Morgan Stanley (MS 22.44, -2.21) weighed heavily on the financial sector after the company reported a larger-than-expected first quarter loss and a dividend cut.

Wells Fargo (WFC 18.18, -0.63) worked to offset weakness in the financial sector. Its shares spent most of the session in higher ground after the company reported slightly better earnings than it previewed on April 9. Heading into the close, the stock surrendered its gains to join the sector's many decliners; declining issues in the financial sector outnumbered advancers by more than 6-to-1.

Industrial stocks saw the strongest gains of any sector by closing 1.1% higher. Their advance was led by General Electric (GE 11.80, +0.10), which showed relative strength as the company held a shareholder meeting.

Despite the industrial giant's strength, the Dow lagged the other headline indices and finished 1.0% lower.

Meanwhile, the Nasdaq outperformed its counterparts for nearly the entire session. Its advance was largely led by Gilead Sciences (GILD 46.22, +2.49), which garnered support after reporting better-than-expected quarterly earnings.

There were several other earnings reports for market participants to digest this session. AT&T (T 25.74, +0.46), McDonald's (MCD 54.25, -1.38), and Yahoo! (YHOO 14.48, +0.10) all topped estimates, but Boeing (BA 37.30, +0.65) and Capital One (COF 14.38, -0.67) missed estimates.

Earnings results will remain in focus heading into tomorrow's session. However, there will also be a couple of economic reports to provide direction to participants. Weekly jobless claims data is due prior to the open (8:30 AM ET), and existing home sales data for March will be released shortly after the opening bell (10:00 AM ET).DJ30 -82.99 NASDAQ +2.27 NQ100 +0.5% R2K +0.1% SP400 +0.3% SP500 -6.53 NASDAQ Adv/Vol/Dec 1393/2.62 bln/1278 NYSE Adv/Vol/Dec 1617/1.77 bln/1402

5:11PM Advanced Micro downgraded to 'CCC+' at S&P; Outlook Negative (AMD) 3.33 -0.03 : S&P removed its ratings on Advanced Micro Devices from CreditWatch and lowered its corporate credit and senior secured ratings on the company to 'CCC+' from 'B'. The outlook is negative. "The rating action reflects our view of the risk that current liquidity, at both AMD as a stand-alone entity and the consolidated group, may be insufficient to adequately fund expected near-term operating losses and debt amortization requirements."

4:34PM Apple beats by $0.24, beats on revs; guides Q3 EPS below consensus, revs below consensus (AAPL) 121.51 -0.25 : Reports Q2 (Mar) earnings of $1.33 per share, $0.24 better than the First Call consensus of $1.09; revenues rose 8.7% year/year to $8.16 bln vs the $7.96 bln consensus. Co issues downside guidance for Q3, sees EPS of $0.95-1.00 vs. $1.12 consensus; sees Q3 revs of $7.7-7.9 bln vs. $8.28 bln consensus. Apple reports Q2 gross margins of 36.4% vs 33.1% consensus. Apple reports Q2 iPods sales of 11.01 mln vs Street expectation for 10 mln. Apple reports Q2 iPhones sales of 3.79 mln vs Street expectation for 3.5 mln. Apple reports Q2 Mac sales of 2.22 mln vs Street expectation for 2.2 mln. Co said, "We are extremely pleased to report the best non-holiday quarter revenue and earnings in our history... Apple's financial condition remains very robust, with almost $29 billion in cash and marketable securities on our balance sheet."

4:27PM Xilinx beats by $0.08, beats on revs; guides Q1 revs above consensus (XLNX) 21.17 +0.46 : Reports Q4 (Mar) earnings of $0.26 per share, $0.08 better than the First Call consensus of $0.18; revenues fell 17.0% year/year to $395 mln vs the $383.1 mln consensus. Co calls for sales are expected to be up 4% to down 4% sequentially;this is upside guidance for Q1, calculated to be revs of $379.2-410.8 mln vs. $376.45 mln consensus. Gross margin is expected to be in the range of 61% to 63%.

4:21PM eBay beats by $0.05, beats on revs; guides Q2 EPS in-line, revs in-line (EBAY) 14.78 +0.49 : Reports Q1 (Mar) earnings of $0.39 per share, excluding non-recurring items, $0.05 better than the First Call consensus of $0.34; revenues fell 7.8% year/year to $2.02 bln vs the $1.94 bln consensus. Co issues in-line guidance for Q2, sees EPS of $0.34-0.36 vs. $0.35 consensus; sees Q2 revs of $1.85-2.05 vs. $1.98 bln consensus. Net charge off rate rose to 8.95% from 8.75% at Dec 31; 90-day delinquency rate rose to 4.57% from 3.94% at Dec 31. Gross merchandise value declined 6% sequentially. "With a macroeconomic environment that remains challenging, we are focused on operating discipline and strong execution of our three-year growth priorities in our core ecommerce and online payments businesses." Skype contributed $153.2 mln in revenue for the quarter, representing 21% year-over-year growth. Skype added 37.9 mln new users during the quarter and ended the period with more than 443.2 mln registered users. In addition to growing its user base, Skype is focused on product strategies to enhance customer engagement. On April 14, 2009, eBay Inc. announced plans to separate Skype into an independent company commencing with an initial public offering during the first half of 2010.

4:20PM Intersil appoints Jonathan Kennedy Senior Vice President and Chief Financial Officer (ISIL) 12.60 +0.26 :

4:20PM Qualcomm reschedules earnings release due to settlement discussions with Broadcom; says Q2 revenue and operating income met or exceeded prior guidance (QCOM) 40.12 -0.15 : The co is postponing its earnings release and call until Monday, April 27, 2009 due to advanced settlement discussions with Broadcom (BRCM) regarding a global settlement of all disputes between the parties which, if reached, would have an impact on the co's financial results for the fiscal second quarter. No assurance can be given that the co and Broadcom will be able to reach agreement on the terms of a global settlement. Neither co will comment further at this time. Revenue and operating income for the second quarter of fiscal 2009, excluding the potential impact of the Broadcom agreement, met or exceeded prior guidance. Further details on the co's second fiscal quarter results and full fiscal year guidance will be provided in the earnings release and conference call. Except for the impact of this agreement, the co had completed all of its period ending accounting processes and procedures necessary to report its second fiscal quarter results.

4:15PM Intersil misses by $0.01, beats on revs; guides Q2 revs above consensus (ISIL) 12.60 +0.26 : Reports Q1 (Mar) earnings from continuing ops of $0.02 per share, excluding non-recurring items, $0.01 worse than the First Call consensus of $0.03; revenues fell 42.0% year/year to $118.2 mln vs the $110.3 mln consensus. Co issues guidance for Q2, sees GAAP EPS of $(0.01)-0.03, may not be comparable to $0.05 consensus; sees Q2 revs of $123-132 mln vs. $114.34 mln consensus.

4:15PM Advanced Analogic Tech misses by $0.02, beats on revs; guides Q2 revs above consensus (AATI) 4.92 +0.11 : Reports Q1 (Mar) loss of $0.12 per share, $0.02 worse than the First Call consensus of ($0.10); revenues fell 34.3% year/year to $16.5 mln vs the $14.8 mln consensus. Co issues mixed guidance for Q2, sees EPS of ($0.13)-($0.10), including SBC expense, not comparable to ($0.09) consensus; sees Q2 revs of $18-21 mln vs. $15.94 mln consensus. The second quarter 2009 estimates include pre-tax quarterly share-based compensation expense in the range of $1.7 to $1.9 million.

4:10PM Novellus beats by $0.04, misses on revs (NVLS) 17.26 +0.61 : Reports Q1 (Mar) loss of $0.47 per share, $0.04 better than the First Call consensus of ($0.51); revenues fell 68.6% year/year to $98.9 mln vs the $101.7 mln consensus. Bookings in 1Q09 were $77.8 mln, down $4.9 mln or 5.9% from 4Q08 bookings of $82.7 mln. "The economic environment continues to be challenging and we remain disciplined and focused on cash flow and cost containment. We are cautiously optimistic that our customers' order activity levels have stabilized and are beginning to rebound, although still at relatively low levels compared to our expectations."

4:09PM Lam Research misses by $0.05, reports revs in-line (LRCX) 25.96 +0.61 : Reports Q3 (Mar) loss of $0.71 per share, excluding non-recurring items, $0.05 worse than the First Call consensus of ($0.66); revenues fell 71.6% year/year to $174.4 mln vs the $175.9 mln consensus.

4:09PM TriQuint Semi misses by $0.02, beats on revs; guides Q2 EPS above consensus, revs above consensus (TQNT) 3.59 -0.02 : Reports Q1 (Mar) loss of $0.11 per share, excluding non-recurring items, $0.02 worse than the First Call consensus of ($0.09); revenues fell 20.2% year/year to $118.9 mln vs the $114 mln consensus. Co issues upside guidance for Q2, sees EPS of $0.02-0.04, excluding non-recurring items, vs. $0.01 consensus; sees Q2 revs of $140-150 mln vs. $137.83 mln consensus. "We are now seeing signs of inventory normalization in some of our markets which should translate into stronger demand in the coming months. While first quarter sales and factory utilization were low, excess inventory both in the channel and at TriQuint was largely burned off.

8:07AM Conexant sells Broadband Access product line to IKAN for $54 mln and assumption of certain liabilities (CNXT) 1.28 : Ikanos Communications (IKAN) announces it will purchase the Broadband Access product line from CNXT. Under the terms of the agreement, which was unanimously approved by the boards of directors of both cos, Ikanos will purchase Conexant's Broadband Access product line for $54 mln in cash and the assumption of certain employee and facility related liabilities. In connection with this transaction, Tallwood Venture Capital has agreed to purchase 24 mln shares of Ikanos common stock at $1.75 per share. Tallwood will also receive warrants to purchase an additional 7.8 mln shares of common stock at $1.75 per share. The warrants will have a term of five years. Upon completion of the transactions, Tallwood Venture Capital will own approximately 45% of the outstanding shares of Ikanos (excluding the warrants). Ikanos expects that the transaction will more than double the co's revenue, while providing significant leverage in its cost and spending structure. Ikanos also expects that the transaction will be accretive to its non-GAAP earnings per share within the first year after the close of the transaction.

icon url

ReturntoSender

04/24/09 12:35 AM

#8544 RE: ReturntoSender #6755

From Briefing.com: 4:35 pm : For the second straight session, the S&P 500 encountered resistance at the 850 level in the final hour of trading, but this time buyers responded by bidding shares higher to help the stock market to close just above 850 at its best level of the session. Financials were integral to the late rebound.

Financial stocks outperformed the broader market for the entire session and provided leadership to the stock market's late-session advance. The sector closed with a 4.5% gain, thanks largely to an 8.4% bounce by diversified bank stocks.

Bank stocks bounded as participants prepare for the Treasury's announcement regarding bank stress test measures. The announcement is scheduled for tomorrow, but actual stress test results won't be released until May 4.

With actual results of the tests still unknown, some investors are treating regional bank stocks with caution. Such caution caused regional bank stocks to trade as laggards in the financial sector for much of the session. Still, they finished 3.2% higher as PNC Financial (PNC 40.93, +2.87) garnered support after reporting better-than-expected earnings.

Better-than-expected earnings results from Apple (AAPL 125.40, +3.89), eBay (EBAY 16.62, +1.82), and ConocoPhillips (COP 39.93, +1.87) actually supported a stronger overall bias ahead of the opening bell. Disappointing earnings and guidance from UPS (UPS 53.33, -1.42) and Nucor (NUE 40.00, -4.07) did little to disrupt the early, positive tone.

However, stocks reversed early gains and spent the rest of the morning trading in choppy fashion after participants found out that existing home sales for March fell 3.0% month-over-month to an annualized rate of 4.57 million. Annualized home sales for March were expected to total 4.65 million units. At the current sales pace, the supply of unsold homes increased to 9.8 months from 9.7 months.

In other economic news, initial claims for the week ending April 18 were up 27,000 from the prior week to 640,000, which is spot on with expectations. Continuing claims advanced to another record high of 6.14 million.

Tomorrow's economic calendar features March durable goods orders data and new home sales data for March. 3M (MMM 54.21, +1.15), Ford (F 4.49, +0.21), and Honeywell (HON 32.38, +0.69) are among the more widely held companies due to report their quarterly earnings results tomorrow morning before the opening bell.DJ30 +70.49 NASDAQ +6.09 NQ100 +0.7% R2K -0.9% SP400 -0.4% SP500 +8.37 NASDAQ Adv/Vol/Dec 993/2.45 bln/1660 NYSE Adv/Vol/Dec 1848/1.57 bln/1173

5:32PM Hewlett-Packard: California Dept. of Corrections signs $245 mln agreement with EDS, an HP Company, to transform its technology environment (HPQ) 34.76 +0.08 : Co announced a $245 mln, 4.5-year agreement with the California Department of Corrections and Rehabilitation to transform the agency into a digital environment by automating manual business processes to improve productivity, accuracy and, ultimately, enhance staff, public and offender safety.

5:01PM Intersil: Earnings correction (ISIL) 11.65 -0.95 : In our original ISIL earnings comment, we incorrectly compared GAAP EPS to a non-GAAP estimate. The co reported GAAP Q1 EPS of $0.02 vs the ($0.03) consensus; revenues fell 42.0% year/year to $118.2 mln vs the $110.3 mln consensus. Co issued guidance for Q2 GAAP EPS of $(0.01)-0.03 vs the ($0.02) consensus; co sees Q2 revs of $123-132 mln vs. $114.34 mln consensus... Our original comment has been removed.

4:32PM Skyworks beats by $0.02, beats on revs; guides Q3 EPS above consensus, revs above consensus (SWKS) 9.25 +0.46 : Reports Q2 (Mar) earnings of $0.12 per share, excluding non-recurring items, $0.02 better than the First Call consensus of $0.10; revenues fell 14.2% year/year to $173 mln vs the $168.2 mln consensus. Co issues upside guidance for Q3, sees EPS of $0.14 vs. $0.12 consensus; sees Q3 revs of $181.7 vs. $178.22 mln consensus. Co says, "Offsetting general market weakness, our performance was highlighted by strength in energy management and smart grid technologies, China 3G base stations, smart phones and push-to-talk applications. At a higher level, we believe our results demonstrate that Skyworks is gaining share in the broader analog semiconductor market and is creating a highly differentiated business model."

4:25PM Microsemi beats by $0.01, misses on revs; guides Q3 EPS in-line (MSCC) 12.84 -0.17 : Reports Q2 (Mar) earnings of $0.19 per share, $0.01 better than the First Call consensus of $0.18; revenues fell 16.6% year/year to $105.7 mln vs the $107 mln consensus. Co issues in-line guidance for Q3, sees EPS of $0.19-0.21 vs. $0.19 consensus. All Auction Rate Securities Monetized at Full Par Value of $46.6 Million

4:22PM KLA-Tencor misses by $0.08, beats on revs (KLAC) : Reports Q3 (Mar) loss of $0.34 per share, $0.08 worse than the First Call consensus of ($0.26); revenues fell 48.5% year/year to $310 mln vs the $299.9 mln consensus. "We executed our cost containment programs well during the quarter and met our bookings and revenue guidance, in spite of the continued weakness in the global economy and the semiconductor equipment market. Although demand remains at low levels today, we are encouraged to see investments in technology development activity in the March quarter for customers at the leading edge..."

4:18PM Western Digital beats by $0.18, beats on revs (WDC) 21.79 -0.32 : Reports Q3 (Mar) earnings of $0.30 per share, excluding $14 mln for in-process research and development related to the SiliconSystems acquisition, and $4 mln associated with the restructuring plan announced Dec 17th 2008, $0.18 better than the First Call consensus of $0.12; revenues fell 24.6% year/year to $1.59 bln vs the $1.48 bln consensus. The co generated $355 mln in cash from operations during the March quarter, ending with total cash and cash equivalents of $1.6 bln. "We are pleased with our financial performance in the March quarter, reflecting continued profitability and cash generation... We managed our market segment participation, product mix and costs to optimize our returns in a challenging environment. We have taken a series of actions to resize and restructure the business to remain profitable and cash flow positive at a $1.5 bln quarterly revenue level and the effects of these actions are already showing up in our results.

4:17PM Lattice Semi beats by $0.01, reports revs in-line; guides Q2 revs in-line (LSCC) 1.68 -0.10 : Reports Q1 (Mar) loss of $0.03 per share, $0.01 better than the First Call consensus of ($0.04); revenues fell 13.4% year/year to $43.3 mln vs the $42.9 mln consensus. Co issues in-line guidance for Q2, sees Q2 revs of $41.1-45.5 mln vs. $43.27 mln consensus.

4:16PM Ixia beats by $0.01, misses on revs (XXIA) 5.59 -0.37 : Reports Q1 (Mar) earnings of $0.01 per share, $0.01 better than the First Call consensus of ($0.00); revenues fell 11.0% year/year to $37.1 mln vs the $38.3 mln consensus. As of March 31, 2009, Ixia had cash, cash equivalents and investments of $202.2 million and no debt. Of this total, over $180 million is invested in short-term debt obligations of the U.S. government. The Company also owns interest bearing auction rate securities with a current value of $1.8 million.

4:15PM Silicon Image beats by $0.02, misses on revs; guides Q2 revs below consensus (SIMG) 2.99 -0.10 : Reports Q1 (Mar) loss of $0.05 per share, excluding non-recurring items, $0.02 better than the First Call consensus of ($0.07); revenues fell 31.8% year/year to $40.5 mln vs the $41.4 mln consensus. Co issues downside guidance for Q2, sees Q2 revs of $40-42 mln vs. $43.75 mln consensus; sees gross margins of 54-55%

4:14PM Sunpower misses by $0.19, misses on revs; guides FY09 EPS in-line, revs in-line (SPWRA) 25.93 -1.37 : Reports Q1 (Mar) earnings of $0.05 per share, $0.19 worse than the First Call consensus of $0.24; revenues fell 21.8% year/year to $214 mln vs the $269.1 mln consensus. Sunpower also revised its 2009 capital expenditure outlook from $350 mln - $400 mln to $250 mln - $300 mln . Sunpower also revised its 2009 capital expenditure outlook from $350-400 mln to $250-300 mln. Non-GAAP gross margins fell 506 bps to 24.3% from 29.9%. Co issues in-line guidance for FY09, sees EPS of 1.25-1.75 vs. $1.90 consensus.

4:13PM PMC-Sierra beats by $0.05, beats on revs (PMCS) : Reports Q1 (Mar) earnings of $0.06 per share, excluding non-recurring items, $0.05 better than the First Call consensus of $0.01; revenues fell 15.1% year/year to $102.6 mln vs the $95.8 mln consensus. "In the first quarter of 2009, we experienced strong demand for our wireless and wireline communications products in China. We lowered operating expenses during the first quarter and will maintain our focus on keeping our operating expenses in line with our business opportunities."

4:10PM Cohu beats by $0.05, beats on revs; guides Q2 revs below consensus (COHU) 8.37 -0.15 : Reports Q1 (Mar) loss of $0.20 per share, excluding non-recurring items, $0.05 better than the First Call consensus of ($0.25); revenues fell 37.3% year/year to $36.6 mln vs the $33 mln consensus. Co issues downside guidance for Q2, sees Q2 revs of about $31 mln vs. $39.50 mln consensus. Total consolidated backlog was $44.4 mln at March 28, 2009 compared to $46.6 mln at December 27, 2008. Co says, "After a sequential decrease of 32% in the fourth quarter of 2008, orders for Cohu's semiconductor equipment were down only 4% sequentially in Q1. This is in line with recent comments from some semiconductor cos that business may have reached a bottom in the first quarter."

4:10PM Juniper Networks reports EPS in-line, revs in-line (JNPR) : Reports Q1 (Mar) earnings of $0.17 per share, excluding non-recurring items, in-line with the First Call consensus of $0.17; revenues fell 7.1% year/year to $764.2 mln vs the $764.4 mln consensus. "The reduction in revenue was a reflection of the current macro economic environment and I am pleased with how quickly the team was able to implement cost reductions and deliver on our operating margin and EPS targets. In addition, we posted strong cash flows from operations and maintained a strong balance sheet. We will continue to take the actions needed in order to align our cost-structure with anticipated revenue levels."

4:06PM Power Integrations beats by $0.09, beats on revs; guides Q2 revs above consensus (POWI) 20.61 +1.09 : Reports Q1 (Mar) earnings of $0.14 per share, $0.09 better than the First Call consensus of $0.05; revenues fell 5.0% year/year to $40.3 mln vs the $34.1 mln consensus. Co issues upside guidance for Q2, sees Q2 revs of $39-43 mln vs. $36.90 mln consensus. "Given the volatility and short-term nature of recent order patterns, projecting future revenues remains challenging. While business has picked up significantly since the end of 2008, orders have moderated somewhat following a strong surge in the latter part of March, and we remain cautious about the outlook for end-market demand in light of the weak global economy."

4:03PM Advanced Energy beats by $0.04, misses on revs; guides Q2 EPS in-line, revs in-line (AEIS) 8.49 -0.77 : Reports Q1 (Mar) loss of $0.41 per share, $0.04 better than, ex-items, vs the First Call consensus of ($0.45); revenues fell 63.3% year/year to $32.6 mln vs the $33.3 mln consensus. Co issues in-line guidance for Q2, sees EPS of ($0.41)-($0.34) vs. ($0.37) consensus; sees Q2 revs of $30-$36 mln vs. $33.07 mln consensus.

7:11AM Benchmark Elec misses by $0.04, misses on revs; guides Q2 below consensus (BHE) 13.71 : Reports Q1 (Mar) earnings of $0.16 per share, excluding non-recurring items, $0.04 worse than the First Call consensus of $0.20; revenues fell 27.4% year/year to $496.8 mln vs the $535.8 mln consensus. Co issues downside guidance for Q2, sees EPS of $0.13-0.21 vs. $0.21 consensus; sees Q2 revs of $460-520 mln vs. $546.91 mln consensus.

7:10AM EMC Corp reports EPS in-line, misses on revs (EMC) 12.70 : Reports Q1 (Mar) earnings of $0.16 per share, in-line with the First Call consensus of $0.16; revenues fell 9.2% year/year to $3.15 bln vs the $3.25 bln consensus. EMC's best estimate is that 2009 global IT spending will decline as a percentage in the very-high-single-digit to very-low-double-digit range compared with 2008. EMC also expects second-quarter 2009 global IT spending will probably be flat compared with the first quarter of 2009, and the second half of 2009 will be stronger than the first half of the year. Co says in 2009, savings from cost reduction actions are expected to reduce the company's 2008 cost base by $450 mln, up $100 mln from the company's previous estimate of $350 mln. The savings are expected to be weighted toward the latter half of 2009. Due to pressure on IT spending, EMC anticipates lower gross and operating margins for 2009 compared with 2008. Operating profitability should show signs of improvement from first-quarter 2009 levels in the second half of 2009.

7:06AM Celestica beats by $0.04, misses on revs; guides Q2 EPS in-line, revs below consensus (CLS) 4.66 : Reports Q1 (Mar) earnings of $0.13 per share, $0.04 better than the First Call consensus of $0.09; revenues fell 20.0% year/year to $1.47 bln vs the $1.51 bln consensus. Co issues guidance for Q2, sees EPS of $0.07-0.13 vs. $0.09 consensus; sees Q2 revs of $1.30-1.45 bln vs. $1.49 bln consensus.

6:01AM Cabot Micro misses by $0.02, reports revs in-line (CCMP) 27.15 : Reports Q2 (Mar) loss of $0.34 per share, excluding non-recurring items, $0.02 worse than the First Call consensus of ($0.32); revenues fell 28.0% year/year to $45.4 mln vs the $45.7 mln consensus.

08:56 am Apple (AAPL)

Apple (AAPL 121.51) reported the best non-holiday quarter revenue and earnings in its history, driven by solid iPod and iPhone sales.

For its fiscal second quarter, Apple reported earnings of $1.33 per share, $0.24 better than the First Call consensus of $1.09.

Revenues rose 8.7% year-over-year to $8.16 billion, beating the $7.96 billion consensus.

Sales for Apple's flagship products were better than expected, with iPod sales of 11.01 million vs. Wall Street expectations for 10 million and iPhone sales of 3.79 million beating the 3.5 million expectation. Mac sales of 2.22 million were in-line with Street expectations of 2.2 million.

Apple traditionally issues conservative guidance, and its outlook for the current quarter is no exception. For the current quarter, the company's fiscal third quarter, Apple expects earnings of $0.95 to $1.00 per share, below the $1.12 consensus. The company's revenue expectations of $7.7 billion to $7.9 billion are also shy of the $8.28 billion consensus.

Apple's downside guidance isn't stopping investors from scooping up shares, as AAPL is currently 4.8% higher in premarket trading.

09:37 am TriQuint Semi upgraded to Buy at Charter Equity: . Charter Equity upgrades TQNT to Buy from Mkt Perform, following Q109 revenue and loss per share that exceeded firm estimates and based on a normalized inventory with share gains in Smartphone RF modules that will continue to drive revenue growth even after the faux-upside of channel normalization passes. Higher OPEX could threaten EPS and increased CAPEX depress cash flow, but neither appears likely given the low levels of utilization and disciplined cost controls, in their view. Firm believes TriQuint should lead the industry's recovery by a quarter or two and outperform its peer group and the market during the rebound.

icon url

ReturntoSender

04/25/09 11:16 AM

#8546 RE: ReturntoSender #6755

From Briefing.com: Weekly Recap - Week ending 24-Apr-09 The major indices ended the week mixed following volatile trade that was dominated by earnings reports, including 13 Dow components, and speculation regarding the government's "stress-test" on financial institutions.

In the end, the Dow and S&P 500 finished with losses of 0.7% and 0.4% respectively, with the Nasdaq outperforming with a 1.3% gain thanks to some better-than-expected results from tech companies. Five of the ten sectors advanced, led by materials (+2.2%) and tech (+2.0%). Defensive sectors healthcare (-3.7%), consumer staples (-2.8%), telecom (-2.4%) and utilities (-2.0%) underperformed.

As a whole, first quarter earnings reports were poor, although relative to estimates, EPS was generally better-than-feared, though sales did fail to live up to expectations.

For the week, 143 S&P 500 companies reported and although EPS fell ~40%, roughly 80 companies reported better-than-expected, while 40 were worse-than-expected. Revenue declined 10.6%, with roughly 30 posting positive results and 70 reporting sales that were worse-than-expected.

Of the13 Dow components that reported EPS, 10 were upside or in-line with estimates and three downside, though growth fell 26% with only two showing positive growth. Sales rose 3.5%, though gains were concentrated to only two components.

Some of the more notable companies that beat or met earnings estimates include IBM (IBM), DuPont (DD), Caterpillar (CAT), AT&T (T), McDonald's (MCD), Microsoft (MSFT), American Express (AXP), Apple (AAPL), eBay (EBAY), Amazon.com (AMZN), and Ford (F), among others.

Companies that missed include Amgen (AMGN), 3M (MMM), Boeing (BA), Capital One (COF), Merck (MRK), and Morgan Stanley (MS).

Financials (+-1.3%) saw of the largest movements in reaction to earnings. Bank of America (BAC) reported better-than-expected first quarter earnings, but investors showed concern after the company's first quarter credit loss provisions totaled $13.4 billion, up almost $5 billion from the fourth quarter. Meanwhile, Morgan Stanley (MS) reported a larger-than-expected loss and cut its dividend.

Also driving volatility within the financial sector and the broader market was the Treasury's stress test of financial institutions. The preliminary results of the Fed's first stress test states that most U.S. banking organizations have capital levels well in excess of amounts necessary to be well capitalized, but details were lacking with no indications if any banks failed the stress test. The release on Friday sparked some volatility, but financials settled the session largely unchanged from prereport levels. The results will reportedly be made public May 4.

There were some notable M&A items. Sun Microsystems (JAVA) rallied 37.5% on the week after Oracle (ORCL) announced it will acquire the company for $9.50 per share, which marked a premium of more than 40% above JAVA's closing price last week. IBM, which had earlier been interested in buying JAVA, is no longer interested, according to reports. Separately, PepsiCo (PEP) will purchase remaining stakes in Pepsi Bottling Group (PBG) for $29.50 per share and PepsiAmericas (PAS) for $23.27 per share, which translates to respective premiums of roughly 17% over last week's closing prices. PepsiCo also announced better-than-expected first quarter adjusted earnings per share results.

In economic news, existing home sales in March declined 3.0% to an annualized rate of 4.57 million units. According to the National Association of Realtors, distressed sales accounted for just over half of all transactions in March. First-time buyers were behind 53% of transactions. Notably, the median sales price increased 4.2% from February to $175,200, which is 12.4% below the year-ago level and slightly below the level seen in December.

New home sales for March were at a seasonally adjusted annual rate of 356,000, easily beating the the consensus estimate of 337,000. February sales, however, were revised up to 358,000 from an originally reported level of 337,000. Sales fell -0.6% +/- 19% from February. Median prices were down 3.5% from February to $201,400, which is down 12.2% from the year-ago period.

Though the housing market has the benefit of low interest rates and increased affordability, rising unemployment, steep levels of inventory and tighter credit conditions continue to act as a notable drag.

March durable orders fell 0.8%, topping the consensus estimate that called for a decline of 1.5%. Excluding transportation, orders declined 0.6%, which was also better than expected (consensus -1.2%). Shipments were down1.7% after a 0.8% decline in February. That won't factor well for Q1 GDP. Meanwhile, the continued weakness in business investment was evident with a 1.7% drop in nondefense capital goods, excluding aircraft. This report is mixed news at best as far as expectations are concerned and it isn't particularly good news as far as the economy is concerned.

New unemployment claims for the week ended April 18 matched the consensus estimate of 640,000, representing a 4.4% increase from the 613,000 claims in the prior week. The Easter holiday looks to have influenced the two-week swing in initial claims. But continuing claims continue to trend in the wrong direction. They jumped 1.5% to another new record level of 6.137 million, underscoring the difficulty in finding a new job.

In the coming week earnings will remain in focus, as will the FOMC policy statement Wednesday, and economic data with first quarter GDP set for release Wednesday.
 
Index Started Week Ended Week Change % Change YTD %
DJIA 8131.33 8076.29 -55.04 -0.7 -8.0
Nasdaq 1673.07 1694.29 21.22 1.3 7.4
S&P 500 869.60 866.23 -3.37 -0.4 -4.1
Russell 2000 479.37 478.74 -0.63 -0.1 -4.1

08:24 am Microsoft (MSFT)

Microsoft (MSFT 18.92) reported fiscal third quarter earnings that matched analyst expectations, but revenues were a bit short and the company's CFO said "we expect the weakness to continue through at least the next quarter."

Microsoft reported fiscal third quarter earnings of $0.39 per share, excluding $0.06 in charges. The results were exactly in-line with the First Call consensus of $0.39. The $0.06 in charges consisted of $290 million in severance charges related to Microsoft's previously announced plan to eliminate 5,000 jobs and $420 million of impairments to investments.

Revenues slipped 5.6% year-over-year to $13.65 billion, short of the $14.09 billion consensus.

Microsoft said revenue in Client, Microsoft Business Division, and Server & Tools was negatively impacted by weakness in the global PC and server markets. Revenue from enterprise customers remained stable during the quarter.

On the company's conference call, CFO Chris Liddell said, "Geographically mature markets slowed noticeably, while emerging markets, which has historically been sources of strong revenue growth for us reported even deeper declines than mature markets."

Looking ahead, Microsoft said it expects operating expenses for the full year ending June 30 to range from $26.7 billion to $26.9 billion, including severance charges. Operating expenses were $24.7 billion in the prior year.

Shares of MSFT held up well after-hours in the wake of the report and are nearly 5% higher in Friday's premarket trade.
icon url

ReturntoSender

04/26/09 1:07 PM

#8547 RE: ReturntoSender #6755

Amateur Investors Weekend Stock Market Analysis (4/25/09)

http://www.amateur-investor.net/Weekend_Market_Analysis_April_25_09.htm

This was interesting week as the major averages dropped substantially on Monday and then wedged their way higher the rest of the week. The S&P 500 continues to bounce off its 20 Day EMA (blue line) and the bottom of its upward channel as investors keep buying every dip. Also notice the S&P 500 hasn't had more than "2" down days in a row since the March 6th bottom.

The question for next week is will the S&P 500 rise above the 876 level and rise up to the top of its channel in the lower 890's (point A) or will it stall out below the 876 level and reverse to the downside and retest the 20 Day EMA and bottom of the rising channel near 835 (point B) and actually drop below it to trap all of those who have been buying every dip of late.


Meanwhile a few things that should be watched closely next week are the Volatility Index (VIX) and the Put to Call Ratio. On a weekly scale the VIX has tested the bottom of its -2.0 Bollinger Band the last two weeks which is similar to what occurred back in May of 2008 (point C). This was followed by a rise back to the top of its +2.0 Bollinger Band over the next 8 weeks (points C to D) in which the S&P 500 dropped 17% (points E to F) after rising the previous 9 weeks. Keep in mind I don't think the S&P 500 will drop 17% from its current level however an 8% to 10% drop is not out of the question.


Furthermore if we look at an intra day chart of the VIX the past several days notice it's developing a Triangle pattern and setting up to make a big move in one direction or the other. Considering how oversold the VIX is I would be leaning towards a potential breakout to the upside.


Meanwhile if we look at a daily chart of the 5 Day Average of the Put to Call Ratio it has remained well below the 1.0 level (green line) for a considerably period of time and is also developing a Triangle pattern which means a big move is coming. Considering the overall patterns in the VIX and Put to Call Ratio it looks like they may breakout to the upside before much longer which would lead to a more substantial correction in the market than we have seen since the March 6th lows.


Finally as I mentioned last weekend the chart of the Dow looks similar to the 1938 time period as it went through a quick pullback (points 1 to a) after rallying 25% in 3 weeks which was then followed by a sharp 2 1/2 day rally in which the Dow gained 7% (points a to b). This was then followed by a more substantial pullback in which the Dow lost 8% over a period of 5 days (points b to c).


A current chart of the Dow shows a potential similar pattern developing although on a somewhat longer timeframe. The Dow gained 26.7% over a 6 week period which was followed by a quick 5% drop (points 1 to a) early this week. This has been followed by a 4% rally since the low made on Tuesday (points a to b). If the 1938 pattern is repeating itself then next week we could see a pullback occur.


In 2008 our ETF Strategies worked the best with which had a return of +33% versus the S&P 500 which was down -38.5% for the year.

Meanwhile our 401K Strategy finished up +17.3% for the year.

Signup for a "Free 4 Week Trial Membership" or save up to 50% on a Premium Membership and you will have access to these Investment Products which include the following:

1. "ETF Daily Buy and Short Signals" which can be used to trade the DIA's, QQQQ's, SPY's and OIH's. Our ETF Strategy returned 33% in 2008.

2. "401K/Thrift Savings Plan (TSP) Timing Service" which can be used to help improve your return in your 401k/TSP Account which was up +17.3% in 2008.

3. The "End of Month Strategy" finished up +36.3% in 2008. This Strategy focuses on the typical End of Month markup by the Institutional Money.

4. "Stocks to Buy List" which can be used with either our Short Term Strategy or Long Term Strategy. In 2007 our Long Term Strategy finished even for the year versus the S&P 500 which was down -38.5%.
icon url

ReturntoSender

04/29/09 10:31 PM

#8551 RE: ReturntoSender #6755

From Briefing.com: 4:30 pm : Participants shrugged off a worse-than-expected GDP reading to hand stocks their best single-session gain in one week. Financial stocks led the charge and helped keep the broader market in the green for the entire session.

The advance first quarter GDP report indicated that the U.S. economy fell 6.1% between January and March. A drop of 4.7% had been expected. Despite the ugly headline number, participants weren't deterred from bidding stocks higher. Some took heart that economic conditions may be turning since personal consumption climbed 2.2% after dropping 4.3% in the fourth quarter. The swing in spending was also better than expected as the consensus called for an increase of 0.9%.

However, the FOMC's latest policy statement, released today, noted that household spending will continue to be pressured by job losses, decreased housing wealth, and tight credit conditions. The committee expects continued weak economic activity, but feels its policy actions combined with fiscal stimulus should help contribute to a gradual resumption of sustained economic growth. The FOMC kept the federal funds rate unchanged at 0.00% to 0.25%, as expected. Its quantitative easing targets were also unchanged.

Stocks showed some volatility and climbed to a gain of 3.1% following the announcement, but eventually pulled back. Meanwhile, Treasuries moved lower; the 10-year Note finished down roughly 23 ticks, which lifted its yield to almost 3.1%.

Still, hope for an economic recovery in the second half of this year helped prop up oil prices. Oil prices gained 2.2% to close at $51.00 per barrel, despite a massive build of 4.05 million barrels during the week ending April 24. A build of 1.8 million barrels was expected.

The uptick in crude prices combined with broad-based optimism helped lift energy stocks 2.8%. Exxon Mobil (XOM 68.44, +1.36) provided additional support by increasing its quarterly dividend to $0.42 per share from $0.40 per share.

Financials (+4.8%) were the best performing sector, though. Their advance was led by diversified financial services stocks (+5.8%) and diversified bank stocks (+3.7%). Their gains came despite news from Bloomberg.com that at least six of the 19 largest U.S. banks may require additional capital, reflecting participants' willingness to pick up bank stocks after watching the shares slide in each of the past two sessions.

Leadership from financials helped take nine of the 10 major sectors in the S&P 500 higher for the session. Telecom (-0.5%) was the only sector to finish in the red.

Earnings news was upbeat heading into Wednesday's trading, but participants generally looked past the announcements. However, earnings will dominate headlines ahead of Thursday's opening bell as approximately 150 companies are scheduled to announce their latest results tomorrow morning. Initial jobless claims data and personal spending data for March are also scheduled for early release.DJ30 +168.78 NASDAQ +38.13 NQ100 +1.5% R2K +3.9% SP400 +2.8% SP500 +18.48 NASDAQ Adv/Vol/Dec 2073/2.38 bln/604 NYSE Adv/Vol/Dec 2560/1.48 bln/484

6:39PM Teradyne beats by $0.02, beats on revs; guides Q2 EPS below consensus, revs above consensus (TER) 5.40 +0.27 : Reports Q1 (Mar) loss of $0.38 per share, $0.02 better than the First Call consensus of ($0.40); revenues fell 59.4% year/year to $120.6 mln vs the $119.3 mln consensus. Co issues downside EPS guidance for Q2, sees EPS of (0.44)-(0.40), excluding non-recurring items, vs. ($0.33) consensus; sees Q2 revs of $120-130 mln vs. $119.00 mln consensus.

5:58PM STMicroelectronics beats by $0.02, reports revs in-line; guides Q2 revs in-line (STM) 6.59 +0.26 : Reports Q1 (Mar) loss of $0.31 per share, excluding non-recurring items, $0.02 better than the First Call consensus of ($0.33); revenues fell 33.0% year/year to $1.66 bln vs the $1.67 bln consensus. Co issues in-line guidance for Q2, sees Q2 revs of $1.73-1.93 vs. $1.72 bln consensus. Co says, "As ST continues its efforts to reduce inventory levels during this timeframe, fab loading will run at levels of about 50%, driving gross margin to an extraordinary low level which the co is planning for internal purposes to be in the mid 20s, as a percentage of sales. Gross margin is subject to changes in demand levels and pricing that could impact fab loading, inventory write-offs, mix and unit costs, and combined with currency fluctuations could potentially create additional margin variability.

4:26PM Cadence Design beats by $0.02, reports revs in-line; guides Q2 EPS in-line, revs in-line; guides FY09 EPS in-line, revs in-line (CDNS) 4.81 +0.20 : Reports Q1 (Mar) loss of $0.10 per share, excluding non-recurring items, $0.02 better than the First Call consensus of ($0.12); revenues fell 23.8% year/year to $206.3 mln vs the $204.7 mln consensus. Co issues in-line guidance for Q2, sees EPS of ($0.09)-(0.07), excluding non-recurring items, vs. ($0.09) consensus; sees Q2 revs of $205-215 mln vs. $208.50 mln consensus. Co issues in-line guidance for FY09, sees EPS of ($0.33)-(0.21), excluding non-recurring items, vs. ($0.31) consensus; sees FY09 revs of $830-870 mln vs. $851.27 mln consensus.

4:24PM Virage Logic misses by $0.04, misses on revs; guides Q3 EPS in-line, revs in-line (VIRL) 3.33 +0.00 : Reports Q2 (Mar) loss of $0.08 per share, excluding non-recurring items, $0.04 worse than the First Call consensus of ($0.04); revenues fell 25.2% year/year to $11 mln vs the $11.7 mln consensus. Co issues in-line guidance for Q3, sees EPS of ($0.03)-$0.00 vs. ($0.03) consensus; sees Q3 revs of $11.5-12.5 mln vs. $11.70 mln consensus. The Company expects to realize, before tax, approximately $0.8 mln to $1.0 mln in non-GAAP adjustments comprised primarily of FAS123R stock compensation and acquisition-related expenses.

4:21PM Cray beats by $0.03, beats on revs; guides FY09 revs in-line (CRAY) 4.33 +0.09 : Reports Q1 (Mar) loss of $0.15 per share, $0.03 better than the First Call consensus of ($0.18); revenues rose 185.4% year/year to $74.5 mln vs the $65.6 mln consensus. Co issues in-line guidance for FY09, sees FY09 revs of $260 mln vs. $258.75 mln consensus. Co says it sees a small operating loss for FY09, compared to consensus of ($0.19).

4:17PM Flextronics misses by $0.01, misses on revs; guides Q1 EPS in-line, revs below consensus (FLEX) 3.89 +0.19 : Reports Q4 (Mar) earnings of $0.03 per share, $0.01 worse than the First Call consensus of $0.04. Co issues mixed guidance for Q1, sees EPS of 0.04-0.08 vs. $0.06 consensus; sees Q1 revs of $5.0-$6.0 bln vs. $6.2 bln consensus. "Our main focus remains on managing the controllable aspects of our business and positioning the Company for future growth and profitability," said Mike McNamara, chief executive officer of Flextronics. "Top priorities are to control costs, improve internal efficiencies, reduce inventory levels, manage our working capital, generate strong cash flow and improve our capital structure. We are confident in our ability to adapt to economic headwinds while maintaining our scale and competitive advantages."

4:06PM Amkor beats by $0.16, beats on revs; guides Q2 EPS above consensus, revs above consensus (AMKR) 4.06 +0.26 : Reports Q1 (Mar) loss of $0.12 per share, $0.16 better than the First Call consensus of ($0.28). Co issues upside guidance for Q2, sees EPS of -0.04 to $0.00 vs. ($0.25) consensus; sees Q2 revs to increase 18% to 22% from the first quarter, which calculates to roughly $459.02-$474.58 mln vs. $419.12 mln consensus. Co says "Our sales were adversely impacted by the sharp global economic downturn and weakness in consumer demand. However, there remains significant uncertainty regarding the full scope and duration of the current downturn, and it is difficult to predict future results in this very challenging economic environment... Gross margin for the first quarter of 2009 was 12%, and we expect that gross margin for the second quarter of 2009 will be between 17% and 19%. In the current environment, we are focused on gross margin and cash flows. Starting in early 2008, we began implementing wide-ranging, but carefully selected cost reduction measures to align our cost structure with decreasing levels of demand. Our first quarter operating results compared to the fourth quarter of 2008 benefited by approximately $55 million from these cost reduction programs,"

4:03PM First Solar spikes to $160 following earnings (FSLR) 151.67 +5.01 : ~$159 is the March high and ~$165 is the 2009 high

4:03PM Plexus beats by $0.04, reports revs in-line; guides Q3 EPS in-line, revs below consensus (PLXS) 21.36 +0.80 : Reports Q2 (Mar) earnings of $0.25 per share, excluding non-recurring items, $0.04 better than the First Call consensus of $0.21; revenues fell 13.8% year/year to $389 mln vs the $385.6 mln consensus. Co issues mixed guidance for Q3, sees EPS of $0.18-0.25 vs. $0.22 consensus; sees Q3 revs of $355-385 mln vs. $392.31 mln consensus.

4:02PM Cirrus Logic beats by $0.02, reports revs in-line; guides Q1 revs above consensus (CRUS) 4.43 +0.43 : Reports Q4 (Mar) loss of $0.01 per share, excluding non-recurring items, $0.02 better than the First Call consensus of ($0.03); revenues fell 25.2% year/year to $33.5 mln vs the $33.2 mln consensus. Co issues upside guidance for Q1, sees Q1 revs of $36-40 mln vs. $33.90 mln consensus; co also sees gross margin for 1Q10 of 52-54%.

4:02PM LSI Logic beats by $0.01, beats on revs; guides Q2 EPS in-line, revs in-line (LSI) 3.98 +0.23 : Reports Q1 (Mar) loss of $0.03 per share, $0.01 better than the First Call consensus of ($0.04); revenues fell 21.0% year/year to $482 mln vs the $469 mln consensus. Co issues in-line guidance for Q2, sees EPS of ($0.06)-$0.01 vs. ($0.03) consensus; sees Q2 revs of $470-530 mln vs. $479.79 mln consensus.

2:10PM ASM Intl NV: Tokyo Electron Limited acquires 4.9% shareholding in ASM International (ASMI) 11.25 +0.33 : Co announces today that it has confirmed with Tokyo Electron Limited, that it has acquired on the open market an interest in ASMI. Tokyo Electron Limited has informed ASMI that this interest amounts to 4.9% of ASMI's total common share capital. TEL has told ASMI that its participation in ASMI is intended as a long-term investment.

8:19AM Keithley reports loss per share of $0.66, misses on revs; guides Q3 revs below consensus (KEI) 3.48 : Reports Q2 (Mar) loss of $0.66 per share, including special items, may not compare to the First Call consensus of ($0.24); revenues fell 39.8% year/year to $24 mln vs the $25 mln consensus. Co issues downside guidance for Q3, sees Q3 revs of $21-$26 mln vs. $27.00 mln consensus.

8:01AM Silicon Labs beats by $0.09, beats on revs; guides Q2 revs above consensus (SLAB) 29.02 : Reports Q1 (Mar) earnings of $0.22 per share, excluding non-recurring items, $0.09 better than the First Call consensus of $0.13; revenues fell 14.7% year/year to $83.7 mln vs the $77.8 mln consensus. Co issues upside guidance for Q2, sees Q2 revs of $92-97 mln vs. $81.24 mln consensus.

7:01AM O2Micro beats by $0.09, beats on revs (OIIM) 3.89 : Reports Q1 (Mar) loss of $0.10 per share, $0.09 better than the First Call consensus of ($0.19); revenues fell 38.6% year/year to $23.1 mln vs the $19.4 mln consensus.

6:40AM Akeena Solar misses by $0.01, misses on revs (AKNS) 1.10 : Reports Q1 (Mar) loss of $0.17 per share, $0.01 worse than the First Call consensus of ($0.16); revenues fell 39.2% year/year to $7.6 mln vs the $9.2 mln consensus.

4:48AM United Micro beats by $0.04, misses on revs (UMC) 2.61 : Reports Q1 (Mar) loss of $0.09 per share, $0.04 better than the First Call consensus of ($0.13); revenues fell 59.6% year/year to $319 mln vs the $337.5 mln consensus. UMC expects Q2 revenues to grow significantly with loss turning to profit.

1:20AM Sunpower prices 9.0 mln common shares at offering price of $22.00/share (SPWRA) 22.61 : Co also prices its $200 mln aggregate principal amount of 4.75% senior convertible debentures due 2014.

1:02AM First Solar to supply modules to Solar Shop Australia (FSLR) 146.66 : Co announces that it will supply photovoltaic modules to Solar Shop Australia, Pty Ltd., for a 1 megawatt DC rooftop project. The solar power system will be installed on six separate buildings at the Adelaide Showground in South Australia.

icon url

ReturntoSender

05/02/09 9:04 PM

#8552 RE: ReturntoSender #6755

From Briefing.com: Weekly Recap - Week ending 01-May-09

The major indices resumed their two-month advance this week, albeit modestly, with the bulk of gains coming on Wednesday -- S&P 500 +1.3%, Dow +1.7%, Nasdaq +1.5%, Russell 2000 +1.7%. It was a choppy, volatile week of trade due to a myriad of catalysts, beginning with swine flu on Monday and ending with the announcement on Friday of a delay for the release of the government's bank stress tests.

Investors got into work Monday morning with equity futures sharply lower on reports of a swine flu outbreak. On Sunday, Janet Napolitano, U.S. Homeland Security Secretary, declared a "public health emergency" in the U.S. as about 20 people at the time were confirmed to have been infected, though none seriously ill. The influenza remained a headline throughout the week, and by Friday the World Health Organization announced that the worldwide total for confirmed cases of the virus had risen to 331, up from 257 the prior day. Mexico has officially reported seven deaths from the virus and the U.S. has reported one, while no other countries have reported deaths.

A number of industries have felt the effects of the outbreak, most notably the pork industry. The travel industry was also under pressure this week, including airlines and cruise operators. Hotels were under pressure early in the week, but managed to regain most of their losses on a number of better-than-expected earnings releases. There were benefactors, however, particularly the drugmakers.

Switching gears, economic data based on surveys have been strong over the last couple of weeks, and that trend continued this week. On Tuesday, Consumer Confidence came in at a better-than-expected 39.2 for April, well above the 29.7 consensus estimate. On Thursday it was Chicago PMI's turn, as it came in at a better-than-expected 40.1 for April vs. the 35.0 consensus. Finally on Friday, ISM Manufacturing came in at a better-than-expected 40.1, above the 38.4 consensus.

That's not to say all economic data have been positive. Wednesday's Advanced reading for first quarter GDP came in at a much weaker-than-expected -6.1% (consensus -4.7%), in part because inventory contraction sliced a whopping 2.8% off the change. Real PCE rose at a stronger-than-expected 2.2% annual rate, but the business data were terrible -- investment in software and equipment fell at a 33.8% annual rate, while nonresidential construction spending fell at a 44.2% annual rate. Residential construction spending continued to plunge, and was down at a 38.0% annual rate, while government spending fell at a 3.9% annual rate as state and defense spending contracted.

However, Wednesday proved to be the market's big day as stocks shrugged off the GDP figure and rallied ahead of the FOMC's rate decision and policy statement that afternoon. The FOMC kept its key interest rate in a range of 0.00%-0.25%, as expected, and seemed to carefully word its policy statement so as not to spook the market. But as always, the release was followed by volatility, with the major indices spiking to new highs shortly after, only to see aggressive profit taking in the final hour of trade. In the end, the S&P gained 2.1%.

Thursday was another volatile session for the market, as it got off to an impressive start, only to lose those gains after reports confirmed Chrysler would declare bankruptcy. Talks between the Treasury Department and lenders aimed at keeping the automaker out of bankrupcty broke down Wendesday evening, particularly with a group of hedge funds that owned approximately 30% of the company's debt and voted no to the government's offer.

Friday proved to be an extremely slow, but modestly higher session. The big headline of the day came late morning when a government source said it would announce information on the bank stress tests late afternoon on Thursday, May 7, later than the original date of May 4. This follows a slew of headlines on the tests throughout the week. They began on Tuesday when reports indicated regulators had told Bank of America (BAC) and Citigroup (C) that they may need to raise additional capital based on early results of the tests. Reportedly, Bank of America's capital hole is in the billions, while it wasn't clear how big a capital deficit Citigroup faces. Speculation continued throughout the week until today's announcement.

Looking ahead to next week, earnings results will continue to come out at a fast pace, but note a number of the bigger companies have already reported. Economic data will be light until Friday's (5/8) Nonfarm Payrolls report for April. And before that, as mentioned above, investors will finally see the results of the government's bank stress tests late afternoon on Thursday (5/7).
  
Index Started Week Ended Week Change % Change YTD %
DJIA 8076.29 8212.41 136.12 1.7 -6.4
Nasdaq 1694.29 1719.20 24.91 1.5 9.0
S&P 500 866.23 877.52 11.29 1.3 -2.8
Russell 2000 478.74 486.98 8.24 1.7 -2.5

4:08PM Pericom Semi beats by $0.01, reports revs in-line; guides Q4 revs above consensus (PSEM) 8.63 -0.28 : Reports Q3 (Mar) earnings of $0.01 per share, $0.01 better than the First Call consensus of ($0.00); revenues fell 40.8% year/year to $24.4 mln vs the $24.6 mln consensus. Co issues upside guidance for Q4, sees Q4 revs of $27.0-30.0 mln vs. $25.27 mln consensus. Gross margin of 35.5% improved 63 basis points on a sequential basis and decreased 205 basis points year-over-year. "Over the past two quarters we have experienced a sharp decline in revenue, which was consistent with declining end-market demand and inventory reduction initiatives across the supply chain. As a result, we have taken steps to reduce our operating expenses to better match lower revenue expectations for our business... We believe the inventory reduction initiatives have been or will soon be completed. Our bookings began improving towards the end of the March quarter and resulted in our having an improved backlog as we entered the June quarter. We believe our revenues reached a low point in the March quarter, and we expect to see significantly improved revenues this quarter as demand levels more closely align with end user demand."

7:48AM SIA says March chip sales rebound slightly from February : Worldwide sales of semiconductors were $14.7 billion in March, a gain of 3.3% from the prior month when sales were $14.2 billion, the SIA reported. Sales for the first quarter of 2009 amounted to $44.0 billion, a 29.9% decline from the first quarter of 2008 when sales were $62.8 billion. Sales declined by 15.7% from the fourth quarter of 2008 when sales were $52.2 billion. Sales in all geographic regions except Japan showed month-to-month gains. Sales in Japan were sharply lower, reflecting a drop in the country's economic output. All geographic regions reported lower first-quarter sales compared to the same period of 2008. "The modest sequential rebound in worldwide sales in March suggests that demand has stabilized somewhat, albeit at substantially lower levels than last year," said SIA President George Scalise. "While all major product sectors showed month-on-month growth, there continues to be limited visibility in end markets. There are some bright spots such as 'smart phones' and 'netbook' PCs, but there are no clear signs of early firming of demand in other major end markets such as automotive, corporate information technology, and consumer electronics.

icon url

ReturntoSender

05/03/09 11:46 PM

#8554 RE: ReturntoSender #6755

Chart of the Day - COTD - Bear Market Rallies

http://www.chartoftheday.com/20090501.htm?T

Many investors are looking to the early 1930s for some insight into the current economic/stock market environment. While there are significant differences (global economy, credit default swaps, TARP, FDIC, etc.) between the current environment and that what occurred in the early 1930s, there are also many similarities (bank failures, bankruptcies, severe market declines, etc.). After all, history may not repeat but it often does rhyme. For some perspective on the current stock market rally that began on March 9th, today's chart illustrates the duration (calendar days) and magnitude (percent gain) of all significant Dow rallies that occurred during the 1929-1932 bear market (solid blue dots). For example, the bear market rally that began in October 1931 lasted 35 calendar days and resulted in a gain of 35%. As today's chart illustrates, the current Dow rally (hollow blue dot labeled you are here) is slightly below average in both duration and magnitude relative to the average 1929-1932 bear market rally (hollow red dot).

icon url

ReturntoSender

05/04/09 9:35 PM

#8556 RE: ReturntoSender #6755

From Briefing.com: 4:35 pm : Stocks are now sporting a modest year-to-date gain after a strong session in which strength in foreign markets, better-than-expected economic data, and leadership from bank shares helped the S&P 500 ascend to its best level since January.

Monday's gains were broad-based amid relatively high trading volume, which had showed signs of tapering off late last week. More than 1.7 billion shares traded hands on the NYSE this session.

Buyers took early cues from overseas markets, where Asian stocks marched higher following word that several Asian finance ministers ordered an emergency liquidity fund of $120 billion to be pooled. News that China's second quarter GDP is expected to outpace that of the first quarter, and a better-than-expected April PMI report, provided additional support.

European bourses fed off the good news, shrugging off news that the European Commission expects the European Union economy to shrink 4% this year, which is down from the 1.8% contraction that it had previously forecast, according to The Wall Street Journal. Germany's DAX gained 2.8% and France's CAC advanced 2.5%. Britain's FTSE was closed for holiday observance.

The upbeat tone abroad helped support a positive sentiment heading into the U.S. open. Optimism was further bolstered by news that pending home sales for March advanced by a better-than-expected 3.2% month-over-month. Though the news feeds into the housing recovery argument, it threatens to stall a housing recovery since interest rates could respond by moving higher.

Construction spending in March increased 0.3% month-over-month, exceeding the 1.6% decrease that was expected. In turn, the March report will likely be an incremental positive when contemplating first quarter GDP revisions.

The better-than-expected data helped propel the major indices markedly higher in a broad-based advance, but financials garnered the most interest. Led by diversified bank stocks (+20.5%), the financial sector gained 10.1%.

Despite what seemed to be a vote of confidence in banks, participants expect that several banks may need additional capital to satisfy the government's bank stress tests, which are scheduled to be released on May 7. In fact, an AP report said that regulators told Wells Fargo (WFC 24.25, +4.64) to shore up its balance sheet since the bank would have trouble surviving a deeper recession. Earlier in the morning, billionaire investor Warren Buffett indicated in a CNBC interview that Wells Fargo and US Bancorp (USB 20.34, +2.38) would be fine if macro conditions deteriorated further. US Bancorp was actually put on watch negative by Standard & Poor's, according to Dow Jones.

Participants' determination to bid financial stocks higher supported buying in the broader market. All 10 major sectors in the S&P 500 finished with gains of at least 1.5%, helping the S&P 500 cross the 900 level for the first time in months.

The positive tone in equity markets lent itself to the commodities trade, helping the CRB Commodity Index climb 1.5%. June crude oil contracts closed at $54.43 per barrel, up 2.3%. Gold futures shot above $900 per ounce to close 1.6% higher at $902.00 per ounce.

Meanwhile, the U.S. dollar slid 0.7% against a basket of major foreign currencies.DJ30 +214.33 NASDAQ +44.36 NQ100 +2.2% R2K +4.1% SP400 +4.2% SP500 +29.72 NASDAQ Adv/Vol/Dec 2108/2.54 bln/630 NYSE Adv/Vol/Dec 2618/1.71 bln/455

4:00PM ASM Intl NV: Intel Capital invests in ASM International (ASMI) 12.42 +0.59 : Intel Capital, Intel Corporation's (INTC) global investment organization, today announced an investment in ASM International. Intel Capital's investment through open market stock purchases is 4% of ASMI's total common share capital, based on approximately 54 million common shares outstanding.

9:05AM Canadian Solar announces new 5 MW contract with Topinfrasolar (CSIQ) 6.86 : Co announces that it has signed a new sales agreement with Topinfrasolar, a Korean systems integrator, which will expand the relationship and supply agreement by an additional 5 MW. The contracted deliveries may include both regular and e-Modules and stipulates deliveries for Korean installations in 2009. Canadian Solar and Topinfrasolar have had a successful business relationship since the beginning of 2009 that has already resulted in the successful delivery to five projects of approx 3 MW in total.

8:31AM Emulex Board unanimously rejects unsolicited proposal from Broadcom (ELX) 10.37 : Co announces that its Board of Directors has completed its evaluation of the unsolicited, non-binding proposal received on April 21 from BRCM to acquire ELX for $9.25/share in cash and has unanimously determined that the BRCM proposal significantly undervalues ELX and is not in the best interest of ELX stockholders. In a letter to BRCM, the ELX Board of Directors stated that BRCM's unsolicited proposal is not in the best interests of ELX stockholders because it: 1) Significantly undervalues ELX's long-term prospects, particularly with respect to our opportunities in network convergence, which are more than doubling ELX's addressable market; 2) Is opportunistic given BRCM is aware of significant new unannounced design wins that ELX has secured with tier-one OEMs, at the expense of BRCM and other competitors, and their potential long-term value creation for ELX and its stockholders; and 3) Is clearly timed to take advantage of ELX's depressed stock price during the current unprecedented macroeconomic conditions.

7:02AM DSP Group beats by $0.13, beats on revs (DSPG) 6.40 : Reports Q1 (Mar) loss of $0.18 per share, excluding non-recurring items, $0.13 better than the First Call consensus of ($0.31); revenues fell 45.1% year/year to $39.9 mln vs the $39.4 mln consensus.

icon url

ReturntoSender

05/06/09 8:25 PM

#8558 RE: ReturntoSender #6755

From Briefing.com: 4:20 pm : Profit takers attempted to reverse early gains that were spurred by better-than-expected economic data, but an underlying bid helped stocks rebound to finish at their best levels in months.

The latest ADP Employment Report estimated that 491,000 jobs were cut from private payrolls in April. Though that is certainly a high number, it isn't nearly as bad as the 645,000 job cuts that were expected. It is also down substantially from the 708,000 job losses recorded for the prior month, which fits the idea that the economy is bottoming.

The idea that the economy has started to bottom has lured money in from the sidelines in recent weeks. Recently released data indicate that the end of March brought the biggest sequential inflow of funds into mutual fund assets on a percentage basis since April 2003, and the biggest inflow of absolute funds since April 2008.

The inflow of money has compounded gains in recent weeks, taking the stock market up 38% from its March 6 low. That has many market watchers anticipating a pullback.

However, there is a persistent bid that seems to stymie downside moves from gaining traction. Just so, this session's early gains were reversed by profit takers, but that gave way to a rebound that gathered momentum as participants looked to scoop up financials.

Financials were under pressure in premarket trading, but actually rallied into the open after reports quelled concern that major banks may need to raise outside capital in order to satisfy the government's bank stress tests. The Wall Street Journal reported JPMorgan Chase (JPM 37.22, +2.40) does not need additional capital and Citigroup's (C 3.86, +0.55) capital hole is considerably smaller than Fed officials initially identified, while separate reports indicated that Bank of America (BAC 12.69, +1.85) needs only to convert its capital to a larger proportion of common stock.

The official findings of the bank stress tests aren't due until after tomorrow's close, but leaking the news should help mitigate against any shock that would result from unveiling the results all at once.

Financial stocks won additional favor after news sources reported that the Senate has approved an amendment that could make it less costly to exit the TARP program. Shares of diversified banks and regional banks both finished 12.7% higher. The broader financial sector closed near its session high with an 8.1% gain.

Energy stocks climbed 3.6%, contributing to the broader market's advance. Energy stocks were bolstered by higher oil prices, which advanced 4.6% to settle at a five-month closing high of $56.34 per barrel. The move was helped largely by the notion that demand will improve with economic conditions in the back half of this year. Crude's advance was also helped along by relatively bullish inventory data, which indicated oil inventories for the week ending May 1 increased by 605,000, far less than the 2.5 million barrel build that was widely expected.

With oil prices on the rise, shares of oil and gas explorers advanced 7.1%, while oil and gas equipment companies climbed 4.0%, and drillers gained 2.6%. Offshore specialist Transocean (RIG 74.59, +1.62) was able to win additional support by posting this morning better-than-expected quarterly results.

United Technologies (UTX 52.29, +0.46) reaffirmed its full year 2009 guidance, but General Electric (GE 13.67, +0.57) was the primary leader among industrial stocks. Industrials finished with a 1.7% gain.

Despite the early efforts of profit takers, the S&P 500 spent the entire session in positive territory. Though it encountered some resistance when it approached the 920 level, the stock market still closed at its best level since early January.

The move was supported by strong trading volume. Nearly 1.9 billion shares traded hands on the NYSE this session; that's the most in a single session since mid-April, and above recent averages. DJ30 +101.63 NASDAQ +4.98 NQ100 +0.0% R2K +0.5% SP400 +0.9% SP500 +15.73 NASDAQ Adv/Vol/Dec 1504/2.91 bln/1193 NYSE Adv/Vol/Dec 2171/1.88 bln/898

4:33PM Action Semi reports EPS in-line, beats on revs; guides Q2 revs in-line (ACTS) 2.03 +0.04 : Reports Q1 (Mar) loss of $0.02 per share, in-line with the First Call consensus of ($0.02); revenues fell 24.2% year/year to $12.2 mln vs the $8.6 mln consensus. Co issues in-line guidance for Q2, sees Q2 revs of $9-12 mln vs. $9.24 mln consensus.

4:31PM California Micro misses by $0.01, reports revs in-line; guides Q1 EPS in-line, revs in-line (CAMD) 2.94 -0.16 : Reports Q4 (Mar) loss of $0.15 per share, $0.01 worse than the First Call consensus of ($0.14); revenues fell 38.7% year/year to $9.2 mln vs the $9.2 mln consensus. Co issues in-line guidance for Q1, sees EPS of ($0.12)-($0.14) vs. ($0.13) consensus; sees Q1 revs of $8.5-10.0 vs. $9.55 mln consensus.

4:29PM ON Semiconductor beats by $0.10, beats on revs; guides Q2 revs above consensus (ONNN) 6.09 -0.01 : Reports Q1 (Mar) earnings of $0.03 per share, $0.10 better than the First Call consensus of ($0.07); revenues fell 22.4% year/year to $379.1 mln vs the $362.4 mln consensus. Co issues upside guidance for Q2, sees Q2 revs of $395-410 mln vs. $372.60 mln consensus. Sees gross margin in the range of 31.5-32.5%; operating expenses $130-135 mln.

4:22PM Cisco Systems continuing to grind higher, now at $20.80 (CSCO) 19.61 -0.02 :

4:09PM Cisco Systems beats by $0.05, beats on revs (CSCO) 19.61 -0.02 : Reports Q3 (Apr) earnings of $0.30 per share, excluding non-recurring items, $0.05 better than the First Call consensus of $0.25; revenues fell 16.6% year/year to $8.16 bln vs the $8.07 bln consensus. Cash and cash equivalents and investments were $33.6 billion at the end of the third quarter of fiscal 2009, compared with $26.2 billion at the end of fiscal 2008, and compared with $29.5 billion at the end of the second quarter of fiscal 2009. Co said, "Cisco delivered solid financial performance despite a challenging global economy and period of evolving market dynamics... These results demonstrate our ability to drive operational excellence and manage profitability across varying economic cycles. We will use this period of market transition to align and optimize resources, make strategic investments, move into market adjacencies and enhance relationships with our customers. As we exit the quarter with a compelling financial position and an innovation engine from both a products and business model perspective, we believe we are well-positioned for the eventual economic recovery."

09:33 am Atmel downgraded to Neutral at AmTech Research: . AmTech Research downgrades ATML to Neutral from Buy following earnings. They believe ATML is too broadly exposed to expect a strong snap-back this year, even if key MCU business continues to gain share. Given the steeper trough, they believe ATML is now properly priced at $3.50-$4.00, as additional leverage and ASIC sale upside are not likely to move the stock higher at this time.

icon url

ReturntoSender

05/07/09 11:47 PM

#8559 RE: ReturntoSender #6755

From Briefing.com: 4:30 pm : Inspired by a downturn in initial jobless claims and strength in financials, stocks started the session with strong gains, but profit takers stomped out the early advance to send the major indices lower. The selling effort snowballed as disappointing Treasury auction results hit news wires.

Though its stay in positive territory was short-lived, the stock market climbed to an early gain of 1%. The upbeat tone was supported by news that initial jobless claims for the week ending May 2 totaled 601,000, which is less than expected and down from the preceding week. That helped fit the argument that economic conditions are bottoming, even though it doesn't appear that it has become any easier to find a job -- continuing claims climbed to a new record of 6.35 million, which was in-line with expectations.

In other economic news, a preliminary reading of nonfarm productivity showed a 0.8% increase for the first quarter, but that was mostly due to reduced work hours.

Financials lent their support to the stock market's early advance by climbing more than 3.5% higher. However, participants quickly moved against the sector and caused it to close with a 3.5% loss. The swing came as participants prepare for the government's bank stress tests, which are scheduled to be released at 5:00 PM ET. Most of the government's findings have already been leaked, so the announcement shouldn't cause too much of a shock. However, officially announcing the results should help remove an element of uncertainty from the market.

Tech stocks (-3.2%), which represent the largest sector in the S&P 500 by market weight, also traded with material weakness. Despite better-than-expected earnings and an upside revenue outlook from Cisco (CSCO 18.95, -0.66), the company was a primary laggard. It and other large-cap tech holdings dragged the Nasdaq 100 to a 2.4% loss. Meanwhile, semiconductors fell 5.9%.

Without the support of tech stocks and financial stocks, the stock market was unable to resist sellers' efforts. Those efforts intensified as Treasuries fell out of favor following a $14 billion 30-year Bond auction, which failed to offer investors the yield that was desired. The results suggested that investors are less willing to invest in the government's debt at its offered rate. The 30-year Bond shed 89 ticks, which lifted its yield to 4.27%. The benchmark 10-year Note lost 36 ticks, which pushed its yield to 3.31%, a high for this year.

The broad-based selling effort sent shares of retailers 1.3% lower, even though many retailers reported monthly same-store sales results that were generally better than expected. Wal-Mart (WMT 49.89, +0.38) reported that same-store sales increased 5.0% for April, but indicated it will no longer provide monthly sales results going forward. Wal-Mart also issued downside revenue guidance for the first quarter.

There were some areas of strength, however. Consumer staples stocks (+0.4%), utilities (+0.6%), and health care stocks (+2.5%) managed to advance. The outsized gains by health care stocks came with help from managed health care providers (+8.1%).

Trading volume reached its highest level in more than one month with nearly 2 billion shares exchanging hands on the big board.DJ30 -102.43 NASDAQ -42.86 NQ100 -2.4% R2K -2.4% SP400 -2.5% SP500 -12.14 NASDAQ Adv/Vol/Dec 847/2.78 bln/1839 NYSE Adv/Vol/Dec 1063/1.97 bln/2010

4:32PM Multi-Fineline misses by $0.02, misses on revs; guides Q3 revs below consensus (MFLX) : Reports Q2 (Mar) earnings of $0.34 per share, $0.02 worse than the First Call consensus of $0.36; revenues rose 6.2% year/year to $174.1 mln vs the $182.7 mln consensus. Co issues downside guidance for Q3, sees Q3 revs of $160-180 mln vs. $190.73 mln consensus. "The quarter proceeded generally in line with our expectations, as customer orders reflected challenging global economic conditions... From the sales mix perspective, we saw a continuation of the trends we have experienced over the past few quarters, with the majority of our sales consisting of flex assemblies for smartphones and portable consumer electronic devices that continue to experience strong end-user demand."

4:18PM Microchip beats by $0.04, reports revs in-line; guides Q1 EPS above consensus, revs above consensus (MCHP) 22.67 -0.68 : Reports Q4 (Mar) earnings of $0.15 per share, $0.04 better than the First Call consensus of $0.11; revenues fell 33.5% year/year to $173.3 mln vs the $172.1 mln consensus. Co issues upside guidance for Q1, sees EPS of $0.16 vs. $0.14 consensus; sees Q1 revs of $182 mln vs. $178.66 mln consensus.

4:09PM Novatel Wireless beats by $0.03, beats on revs; guides Q2 EPS above consensus, revs above consensus (NVTL) 8.61 +0.86 : Reports Q1 (Mar) loss of $0.08 per share, $0.03 better than the First Call consensus of ($0.11); revenues fell 19.8% year/year to $70.4 mln vs the $66.4 mln consensus. Co issues upside guidance for Q2, sees EPS of ($0.04)-($0.01) vs. ($0.09) consensus; sees Q2 revs of $75-80 vs. $67.23 mln consensus. "First quarter gross margins rebounded significantly to approximately 23% from 12% reported in the fourth quarter of 2008... Based on current order flow, we expect demand to increase in North America for USB products in the second quarter, and we believe that our new next generation product introductions will begin to have a positive impact in upcoming quarters. Additionally, both Verizon Wireless and Telefonica Spain announced their launch of our innovative family of MiFi(TM) products today, and we expect one additional North American carrier launch during the second quarter. MiFi is the industry's first Intelligent Mobile Hotspot, a new category of mobile broadband that creates a personal cloud of high-speed Internet connectivity that can be easily shared between multiple users and Wi-Fi devices."

08:04 am Cisco Systems (CSCO)

Cisco Systems (CSCO 19.61) reported fiscal third quarter earnings that topped Wall Street expectations, sending shares of the tech bellwether nearly 2% higher ahead of the Thursday's opening bell.

Cisco reported fiscal third quarter earnings of $0.30 per share, excluding nonrecurring items, $0.05 better than the First Call consensus of $0.25.

Revenues fell 16.6% year-over-year to $8.16 billion, but were slightly ahead of the $8.07 billion consensus.

Cisco said its cash and cash equivalents and investments were $33.6 billion at the end of the third quarter, compared with $26.2 billion at the end of fiscal 2008.

Cisco provided fiscal fourth quarter revenue guidance on its conference call, saying it expects revenues to slip 17-20% year-over-year. The outlook equates to fourth quarter revenues of between $8.29 billion and $8.6 billion; the First Call consensus stands at $8.26 billion.

"These results demonstrate our ability to drive operational excellence and manage profitability across varying economic cycles," said CEO John Chambers. "We will use this period of market transition to align and optimize resources, make strategic investments, move into market adjacencies and enhance relationships with our customers."
icon url

ReturntoSender

05/08/09 9:23 PM

#8560 RE: ReturntoSender #6755

From Briefing.com: 4:35 pm : The major indices settled with solid gains on Friday, as financial institutions rallied after the government released the results of its stress test. Meanwhile, the number of job losses in April slowed, another indication that the pace of economic contraction is decelerating.

Eight of the ten economic sectors posted a gain. Financials led the way, surging 8.3%. The energy sector also had a strong showing, climbing 4.2%, after crude prices rose 3.1% to $58.47. Defensive sectors underperformed, with telecom (-0.4%) falling into the red after shares of AT&T (T 25.25, -0.20) slid on reports that the company is near a deal to buy $2.5 billion in Alltel assets from Verizon (VZ 29.85, -0.01).

The strength in financials came after the close Thursday when the government announced the findings of its much anticipated stress test on 19 major financial institutions. The government has instructed 10 financial institutions to raise more capital by June 8. The $75 billion in new capital requirements includes: Bank of America (BAC 14.17, +0.66), $33.9 billion; Wells Fargo (WFC 28.18, +3.42), $13.7 billion; GMAC, $11.5 billion; Citigroup (C 4.02, +0.21), $5.5 billion and Morgan Stanley (MS 28.20, +1.06), $1.8 billion.

The remaining five banks that need more capital are regional banks: Regions Financial (RF 6.53, +1.30), $2.5 billion; SunTrust Banks (STI 20.77, +2.25), $2.2 billion; KeyCorp (KEY 6.97, +0.19), $1.8 billion, Fifth Third Bancorp (FITB 8.49, +3.14), $1.1 billion; PNC Financial Services (PNC 53.08, +8.61), $600 million.

The companies are utilizing several ways to increase their common equity ratios, including common stock offerings, converting preferred shares and selling assets.

BofA plans to raise $17 billion in a common stock issue, with the remaining coming from preferred stock to equity conversion and asset sales. Wells Fargo is issuing common stock (~$7.5 bln announced this morning), retaining earnings and utilizing other internally generated sources. Citigroup will expand its previously announced conversion of preferred to common. GMAC said it may issue new common equity, issue mandatory convertible preferred shares or convert existing equity into a form of Tier 1 common equity. In addition, Morgan Stanley, which was directed to raise $1.8 billion by the government, priced 146 million shares of its stock, and a 21.9 million over-allotment, at $24 per share.

In other notable corporate news, shares of McDonald's (MCD 54.94, +1.55) rose 2.9% after the fast food giant reported that April same-store sales rose 6.9%, the 72nd consecutive monthly increase. In economic news, released at 10:00 ET, wholesale inventories dropped 1.6% in March, after falling 1.7% in February. The decline was worse than the consensus estimate that called for a 1.0% decline. The major indices gave up some gains after the release, but the market managed to trend higher throughout the session, eventually climbing above pre-release levels.

Separately, the April employment report was released at 8:30 ET. The April decline in payrolls of 539,000 was better than the expected decline of 600,000, but still represents bad economic news. Part of the smaller decline is explained by a 72,000 jump in government payrolls, compared to the sharp drop in the private sector, including a 149,000 decline in manufacturing and 110,000 in construction. Also on the negative side, several prior months were revised lower, and the unemployment rate jumped to 8.9% from 8.5%, as expected. The stock market had a relatively muted response in premarket trade compared to the typical response to this release. For the week, the Dow, Nasdaq, S&P 500 rose 4.4%, 1.2% and 5.9%, respectively. Financials spiked 23% on the week.DJ30 +164.80 NASDAQ +22.76 SP500 +21.84 NASDAQ Adv/Vol/Dec 2112/3.20 bln/704 NYSE Adv/Vol/Dec 2645/1.90 bln/431

8:33AM MIPS Techs announces divestiture of its analog business group (MIPS) 3.51 : Co announces the divestiture of its Analog Business Group. Synopsys (SNPS) acquired the business unit in an all-cash transaction for $22 million, effective immediately.

8:15AM Suntech Power announces additional repurchase of $150.4 mln 2012 convertible senior notes (STP) 16.70 :

icon url

ReturntoSender

05/09/09 10:33 AM

#8561 RE: ReturntoSender #6755

Buy the upcoming dip:

icon url

ReturntoSender

05/09/09 6:29 PM

#8562 RE: ReturntoSender #6755

Amateur Investors Weekend Stock Market Analysis (5/9/09)

http://www.amateur-investor.net/Weekend_Market_Analysis_May_9_09.htm

Overall over the next several months we have two potential scenario's that may play out into the end of the year. I will start with the Bullish scenario first to make everyone happy. The bullish scenario is that the major averages are going through a longer term corrective ABC type rally after completing a 5 Wave pattern to the downside which ended with the lows in early March. Currently the major averages are nearing completion of the "A" Wave up which will then be followed by a "B" Wave pullback before Wave "C" up occurs.

A chart of the Dow shows the B Wave could potentially pullback to around the 7450 area which would then be followed by the "C" Wave up to either the 9400 level which is the 38.2% Retrace from the October 2007 high to the March 2009 low or as high as the 50% Retrace which is at 10400.


As for the Nasdaq if we see a "B" Wave develop soon look for a possible pullback to around 1500 or so which would then be followed by Wave "C" either up to the 38.2% Retrace near 1890 or the 50% Retrace around 2045.


Meanwhile as for the S&P 500 if we begin to see a Wave "B" pullback look for a potential drop back to the mid to upper 700s before Wave "C" up begins. The potential target prices for Wave "C" would either be at the 38.2% Retrace near 1014 or potentially as high as the 50% Retrace near 1120.


Now there are always two sides to every story so now we will look at a more more Bearish scenario. The bearish scenario assumes that the March 6th lows were only the end of Wave 3 (5) and not Wave 5 (5) like most believe and that the latest rally is Wave 4 (5) which will then be followed by Wave 5 (5) and lower Lows at some point.


Although I currently favor the Bullish scenario we can't completely ignore the Bearish scenario either as unforeseen world events could quickly change market dynamics. I know many investors are frustrated they missed the initial move off the early March lows however keep in mind if the "C" Wave does occur after a "B" Wave pullback it may end up being just as powerful as the current "A" Wave.

Finally keep in mind there is no guarantee that the major averages will just keep zooming higher over the next 3 to 5 years like occurred from late 2002 through late 2007. Remember we could go through a similar pattern like Japan has seen during the past 20 years. After the Nikkei 225 had its big run in the 1980's this was followed by a 59% drop from late 1989 through the middle part of 1992 (points D to E) which is very similar to what occurred in our market. This was then followed by a sharp 47% rally (points E to F) which was then followed by a series of choppy upward and downward moves from mid 1993 through mid 1996 in which the Nikkei 225 gained +35% and +54% and lost -26% and -34%.


In 2008 our ETF Strategies worked the best with which had a return of +33% versus the S&P 500 which was down -38.5% for the year.

Meanwhile our 401K Strategy finished up +17.3% for the year.

Signup for a "Free 4 Week Trial Membership" or save up to 50% on a Premium Membership and you will have access to these Investment Products which include the following:

1. "ETF Daily Buy and Short Signals" which can be used to trade the DIA's, QQQQ's, SPY's and OIH's. Our ETF Strategy returned 33% in 2008.

2. "401K/Thrift Savings Plan (TSP) Timing Service" which can be used to help improve your return in your 401k/TSP Account which was up +17.3% in 2008.

3. The "End of Month Strategy" finished up +36.3% in 2008. This Strategy focuses on the typical End of Month markup by the Institutional Money.

4. "Stocks to Buy List" which can be used with either our Short Term Strategy or Long Term Strategy. In 2007 our Long Term Strategy finished even for the year versus the S&P 500 which was down -38.5%.

Our Spring Membership Special for new Members is shown below
which are 50% Off our normal Monthly Rate of $39.95
icon url

ReturntoSender

05/10/09 9:21 PM

#8563 RE: ReturntoSender #6755

InvestmentHouse Weekend Market Summary

http://www.investmenthouse.com/weekendmarketsummary.htm

- Stress test medicine is painless, jobs report within tolerance, stocks rally again.
- NASDAQ gains ground but techs are struggling. After the stress test and jobs report the financials need to find more near term buyers.
- Massive liquidity, 'chase money' fueling the stock market rally, but a poor bond auction and bond rates forecast the problems ahead.
- A lot of enthusiasm over poor economic data versus a lot of pessimism over truly improving economic data.
- Liquidity means more stock market gains but near term techs have to prove themselves again and financials have to continue to lead.

Stress test, jobs report no obstacle to a further rally.

Financial institutions that did not 'pass' the stress test, 9 of the 19, are engaged in the next rush, the rush to raise their own capital, non-government assisted, so they can cast off the TARP. The Treasury surprised us all this week when it announced that any institution could repay the TARP and throw down the government yoke when it can raise needed capital without the government backing. Thus a lot of bond issuances were announced Friday. Banks that were basically forced at gunpoint to take the funds are showing how much they detest the governmental interference.

The jobs report was also quite palatable at -539K versus the 610K officially expected, though the whisper was in the -550K range. March was revised to -699K, however, so the April number was really at expectations. That was not worse than expected, however, so that was enough to keep things going. Of course the unemployment rate hit 8.9%, already topping the Administration's estimates on the peak for this downturn. Moreover, the improvement in the overall number was due to growth in the federal government with the hiring of census workers. Now THAT is real improvement in the jobs picture. The real story is in the temp workers. Temp workers are the first to get hired in a recovery as companies gingerly get back into hiring. If things work out they make those temps permanent offers. At +68K temp hiring is still very anemic, indicating no improvement in hiring. That is nothing unusual. The economic numbers, as discussed below, are still pathetic and you would expect hiring, a lagging indicator, to remain muted at this point. It is.

Nothing was stopping the move higher, however. There are reasons for that as discussed the past week and later in this report, but it was not all upside. Stocks again gapped higher but that move did not hold and NASDAQ was negative by midmorning. At that point, however, the buyers moved back in and it was upside for the rest of the session with stocks rising back to the morning highs and beyond, at least on SP500 (+2.41%). SOX closed down almost 2%. NASDAQ 100 scratched out a 0.3% gain. Gains again but there are some cracks. Of course thus far cracks have been filled by liquidity.

TECHNICAL. Intraday a gap higher, a test midmorning, and then a move higher into the close that once again ended with gains. Eight straight weeks higher for NASDAQ, 7 of 8 for SP500. Same old story.

INTERNALS. Solid to the upside once more with 3:1 advancers on NASDAQ and 5.5:1 on NYSE. Volume was lower but still huge on NASDAQ (3B) and it was no slouch on NYSE. Volume is pouring in since Wednesday. Is it good volume? NASDAQ showed churn on Tuesday and really on Wednesday, and Thursday NASDAQ was down on the strongest volume since November. Strong volume is the most telling volume. On NASDAQ it is showing distributive action, and with SOX failing its breakout this volume is setting up an important inflection point for this rally this coming week. NYSE is running higher on the strength of financials and also the liquidity run in commodities and industrials.

CHARTS. SP500 broke to a new post-March closing high, clearing the December twin peaks at 319. Still below the January peak at 944 and the closing January high at 935, but showing no signs of wear and tear as the financials continue to move higher as money chases them. Of course when they are getting money for free and can invest it in the market, money should chase them as it is free money. We are not only giving financials money to shore up their balance sheets, we are subsidizing them with all the free money the Fed has injected into the system that no one wants to borrow and the banks are putting it in the market, driving up prices and making them money. How easy is that?

NASDAQ posted a gain but it was after the Thursday hit down to 1700. Pretty modest rebound though volume remained strong. As noted, volume is an issue for the techs as there is churn and some distribution. NASDAQ looks toppy near term and a test to the mid-April high at 1675 looks easy and 1600ish is more reasonable for this test. SOX was down on an up day and this former leading group and has broken its trendline from March. It held over the November high with a late recovery, but we are looking for a deeper test down toward the 232 level. SP600 (+3.59%) HIT A NEW POST March high as well and is a gnat's butt from the January peak. Strong day for small caps but they are also at two layers of resistance at that January high and the descending 200 day SMA.

LEADERSHIP. Financials. Energy. Industrials. Commodities. Financials are rallying as they can basically print their own money. The other three are rallying on the liquidity explosion via world monetary policy that makes these sectors attractive from both a recovery perspective and an inflation perspective. Techs are struggling with many toppy patterns near term. Chips were hammered. Retail doesn't look very good at all even with the supposedly 'stronger' April same store sales. Overall leadership remains strong, but after such a rush higher there is some typical retrenching by the early leaders. Okay, some are more than retrenching; some are digging trenches. Overall leadership remains in good shape, however.

THE ECONOMY

Fed liquidity is having its impact, but it is not healthy for the longer term.

After making trillions of dollars available in direct loans, guarantees, etc. we are seeing the effect. Money is everywhere but there is a problem. The economy remains weak and there is no incentive to invest in the economy. Despite the trumpeting of the 'shoots' of economic recovery, the economy is in very poor shape. There is no real stimulus to invest in your business as there was in with the second round of economic stimulus under Bush that jolted the economy and resulted in 7.4% GDP growth in Q3 2003, just a couple of quarters after passage. The Obama plan is government spending to states to keep some local government employees at work. And don't let the $17B in cuts announced this week make you think the spending has anyone in DC worried. These are the same spending cuts Bush proposed and the democratic Congress rejected. Sadly $17B in cuts is as insignificant as a smudge of excrement on a tissue being washed out to sea with a ton of other garbage ('Sideways'). That is pretty much the total of the 'stimulus' for the first year. It creates no incentive to spend on your business as do investment tax credits. With ITC's you either pay the money to the government in taxes and arguably get back nothing or spend the money on some equipment or other items you need instead of paying the tax. THAT gets people and businesses to spend when there is no demand to otherwise give a reason to improve your business.

Fed money going into world financial markets, not loans.

So what is the money doing? Despite the TARP and TALF, hardly any money is being lent. We have talked to many businesses and even Donald Trump is saying that the government's and Fed's statements about lending are flat wrong. All that money has to be put somewhere, however, and as in the second half of 1999 when Alan Greenspan flooded the economy with billions of dollars ahead of Y2K, dollars that were not needed and just idle, it is being invested by the banks. That is one reason their profits jumped so much beyond expectations: they are getting this money for nothing and investing in the markets. They are buying commodities, oil, stocks, etc. Voila. Stock market takes off and shows unnatural strength just as in the 75% NASDAQ run in the second half of 1999.

An example is oil. It is surging, closing Friday at 58.62, up another $1.91. Huge move in a short period. Huge move indeed, given that US demand is at 2001 levels. You remember 2001: recession, 9-11. Our commodities market contacts tell us there are large buys of futures that are driving oil prices higher. We are getting that same kind of speculation of sorts that was so maligned during the presidential campaign. This extra money is chasing hard assets as a safe way to hedge against the inflation that this very money is going to create.

Talk about a vicious cycle or a self-fulfilling prophecy. The money is creating demand for products, but it is artificial demand. It is sewing inflation because there is demand but no corresponding increase in supply as there is no investment in the US. The very low inventory levels (Friday showed wholesale inventories at a -1.6% on top of February's 1.7% decline. Demand with no production or increase in supply creates inflation as more money (lots more money) heightens demand and chases fewer goods.

Inflation and a 1970 malaise ahead.

What lies ahead as a result: look at the Thursday bond auction and what happened to treasury yields afterwards. Yields are steadily rising, some say due to economic recovery. Again, look at the Thursday bond auction. There were very few takers and demand for US bonds was slack. Thus the Treasury had to offer better interest rates to get buyers to take what we were offering. That is the problem with you put $12T of spending, lending and guarantees out in the real world. Your buyers get nervous about your ability to pay. A bookie that lends you $100K for a couple of days is making a risky deal and thus you pay a high interest rate. The Treasury is not at bookie status yet, but Geithner is still new on the job, right? Nonetheless, our debt buyers wanted more interest for their perceived risk and the 10 year yield jumped to 3.35%. Just a couple of weeks back it was at 2.8%. This is the second poorly received bond auction in a month and it shows the increasing worry about the US and its massive spending on healthcare the general 'Europeanization' of the US. Hell, even the Europeans are damn worried about us doing this (recall the 'road to hell' comment).

The weak bond auctions underscore the problem of rising interest rates that are signaling rising inflation, not the improving economy that some claim this indicates. Yes the economy is slowing its fall but that is all it is doing. The rise in bond yields is disproportionately high compared to any improvement in the economic data. If things do not change this is going to lead to a humdinger of an inflation spike, and with massive expansion of government, more regulation, and forced government programs just as in the 1970's, we can look for 1970's style results, i.e. stagflation and its malaise.

Never have so many been so enthusiastic about an economy so weak.

Okay, okay you say, but isn't the economy improving? Didn't we say the economy was getting better? Yes. The data is getting better. It is slowing its decline as all of that liquidity creates some demand. It is not creating supply because the numbers are still so weak no one is investing in business, but it is ginning up a bit of demand.

And of course, the fall has to slow before it turns, and with all of this liquidity it is likely to continue to improve, but there is nothing to give it a real jolt and thus the improvement, as noted above, is likely to be very tepid, very 1970's.

Look at the manufacturing reports. Even before the stock market bottomed the ISM started to turn positive. Not slow the contraction, but turned to expansion. We were harping on this as a super positive development even as sentiment remained very negative. Indeed in October, the day the market turned, the despair was huge but the manufacturing data had turned the corner and the market picked up on it when not many others did.

Right now the manufacturing reports are off their lows (32.9), lows that were much worse than in 2001 and 2002. This was a bad recession, one teetering on depression. The ISM improved to 40.1 in April as the economy started to pull out of the depression dive. It has not turned positive and indeed is not close to turning positive unless someone monkeys with the data.

There is improvement in other areas as well, i.e. factory orders, durables orders, ECRI's indicators. They are pointing to an end of the recession, but there are two important points to consider. First, this recession was deeper and longer than any in recent history so we are starting at a much LOWER level in the recovery. Thus an end to the recession means it is over but are you 2 feet underwater or 20 feet underwater? This one we are the latter. Second, as noted all last week. An end to the recession doesn't equal rapid recovery. There are many reasons we are looking at a hockey stick, i.e. sharp down, long, slow and flat recovery. Weak dollar, inflation to come, overregulation, overspending. Many reasons.

YET, with such horrid data enthusiasm is erupting. Back in 2002 and early 2003 when the turn was being made the morale was horrible. The October to December stock market rally made everyone feel a bit better, but the whole time it was calls a bear market rally, and when the January to March test/correction ate up the gains the gloom was literally depressing. That correction actually showed great action with low volume down sessions, up volume rising sessions, and stocks setting up great patterns. We were positive and said so repeatedly just waiting for the moves by stocks such as EBYA, TSCO, AMZN and company to make the breaks higher. Man did they ever.

Right now everyone is gushing over and economic recovery when quite frankly the numbers on a comparative basis are much worse and the 'recovery' thus far still leaves all indicators massively underwater. Bernanke was not kidding when he said the pace of the decline was slowing. He did not say the economy was turning because it is not. It is halting the slide into depression but it needs a kick of stimulus to get everyone investing in the US again. As we saw again last week, foreigners are lukewarm in doing so with the weak bond auction. Thus it is up to us to create the investment, but the current policies are not doing that this year and it is highly debatable if they will ever do so as government spending historically fails to excite growth. It does debase your currency and lead to inflation, something that is happening faster than the economy's attempts at recovering.

No Great Depression II, but after this market run another bad recession.

In sum, because we were looking at Great Depression II in the face, the slowing of the swan dive in the economic data has elicited an over-exuberant conclusion that the economy is turning the corner. No, it is staving off another depression thanks to massive amounts of liquidity. Indeed the programs of government spending are the very things that are said to have prolonged the original Great Depression by 10 years. Thus the excitement about this turn is going to ultimately lead to disappointment and a pretty crushing double dip recession.

The good news? With all of this liquidity it might take two years to occur and the financial markets are likely to continue running higher. After all, even in the malaise of the 1970's the stock market had some very good upside years and indeed there was enough up and down volatility to make money trading the moves.

THE MARKET

MARKET SENTIMENT

VIX: 32.05; -1.39. VIX ready to bounce and watching this along with NASDAQ and SOX as an indication a correction is coming near term.
VXN: 33.67; -0.8
VXO: 32.77; -1.38

Put/Call Ratio (CBOE): 0.87; +0.06

Bulls versus Bears:

This is a reading of the number of bullish investment advisors versus bearish advisors. The reason you look at this is that it gives you an idea of how bullish investors are. If they are too bullish then everyone is in the market and it is heading for a top: if everyone wants to be in the market then all the money is in and there is no more new cash to drive it higher. On the other side of the spectrum if there are a lot of bears then there is a lot of cash on the sideline, and as the market rallies it drags that cash in as the bears give in. That cash provides the market the fuel to move higher. If bears are low it is the same as a lot of bulls: everyone is in and the market doesn't have the cash to drive it higher.

This is a historical milestone in the making. Bulls are impressively low considering we are in general a very optimistic country. The few bulls is a positive indication because it means most everyone that is getting out is out and there is money on the sidelines. In other words the ammunition boxes are full and as the market recovers investors will start opening up the boxes and firing. Little by little they will be forced to put more money into the market and there will be some rushes higher in fear they are missing the train. You relish times when sentiment is so negative because it means some tremendous buys are setting up. This could indeed be the opportunity of a lifetime, and you take advantage of it by buying quality stocks and letting them work for you as long as they will. If we can hold them for years, great.

Bulls: 40.4%. As expected with the gains the bulls are jumping, starting to snort and stomp. Up from 36.0% the prior week though still below the 43.2% hit a month back before anticipation of stress tests and SOX' issues. Over the 35% threshold, below which is considered bullish, but this is not a bearish indication yet. Has to get up to the 60% to 65% level to be bearish. Dramatic rise from 21.3% in November 2008, the bottom on this leg. This last leg down showed us the largest single week drop we have ever seen, falling from 33.7% to 25.3%. Hit 40.7% on the high during the rally off the July 2008 lows. 30.9% was the March low. In March the indicator did its job with the dive below 35% and the crossover with the bears. A move into the lower 40's is a decline of significance. A move to 35% is a bullish indicator. This is smashing that. For reference it bottomed in the summer 2006, the last major round of selling ahead of this 2007 top, near 36%, and 35% is considered bullish.

Bears: 31.5%. Bears plummeted from 37.2% and the 37.1% four weeks back. As with bulls, below the 35% threshold considered bullish though not at bearish levels. Now far from off the high on this run at 47.2%. For reference, bearishness hit a 5 year high at 54.4% the last week of October 2008. The move over 50 took bearish sentiment to its highest level since 1995. Extreme negative sentiment. Prior levels for comparison: Bearishness peaked at 37.4% in September 2007. It topped the June 2006 peak (36%) on that run. That June peak eclipsed the March 2006 high (33%) and well above the 2005 highs that spawned new rallies (30% in May 2005, 29.2% in October 2005). That was a huge turn, unlike any seen in recent history.

NASDAQ

Stats: +22.76 points (+1.33%) to close at 1739
Volume: 3.05B (-2.04%). Big volume Wednesday to Friday, and it was not all positive buying volume as NASDAQ struggles below the November peak.

Up Volume: 1.965B (+1.279B)
Down Volume: 1.212B (-1.338B)

A/D and Hi/Lo: Advancers led 3 to 1
Previous Session: Decliners led 2.04 to 1

New Highs: 29 (+3)
New Lows: 8 (+2)

NASDAQ CHART: Click to view the chart

Sold negative after the gap higher, but with the financials rallying again SP500 pulled NASDAQ back up with it. NASDAQ is struggling below the November high and with SOX getting slapped around and the large cap techs fighting to hold up this coming week is a key one for the techs. Again, the January peak is at 1666 and a logical retracement point though 1600 would be better. The question is whether the liquidity allows NASDAQ to make this kind of 'normal' retracement.

NASDAQ 100 (+0.31%) was a clear laggard to end the week but its pattern is fine as it holds right over the November peak and the 200 day SMA. Indeed it showed a doji on the candlestick chart Friday, tapping the 200 day on the low. NASDAQ 100 remains in good technical position, holding these twin support levels as volume rises. Unlike NASDAQ, the large cap techs are sitting on top of support versus below resistance.

SOX (-1.92%) took it on the chin again Friday though it recovered off the low to hold its break over the November peak. The problem we have here is that SOX broke out Monday after a three week lateral consolidation and then it gave it right back up, falling into the range on Friday. The only thing it did not do is give up the November peak. Early leader in trouble, putting a drag on NASDAQ. How SOX responds this week is key.

NASDAQ 100 CHART: Click to view the chart

SOX CHART: Click to view the chart

SP500/NYSE

Stats: +21.84 points (+2.41%) to close at 929.23
NYSE Volume: 1.897B (-3.82%). Another solid above average volume session as SP500 moves toward the November peak. Some churn Thursday but the upside strength continued.

Up Volume: 1.68B (+1.071B)
Down Volume: 212.138M (-1.145B)

A/D and Hi/Lo: Advancers led 5.5 to 1
Previous Session: Decliners led 1.84 to 1

New Highs: 28 (+1)
New Lows: 72 (-7)

SP500 CHART: Click to view the chart

Financials continued higher along with energy and commodities. A potent combination for the SP500 as it pushes toward November closing high at 935 and the intraday high at 944. The strength remains impressive as chase money chases the financials and the Fed liquidity makes commodities, materials, industrials, etc. attractive. Thus far no real slowing in SP500 but if NASDAQ stumbles SP500 is likely to test back from the November peak to at least give it a breather. It is liquidity driven right now and thus far that has made it all but bulletproof.

SP600 (+3.59%) enjoyed the same success as the large caps, rallying closer to the January peak and setting a new post-March high. Long, long run and a logical place to test back, but that was the case for the SP500 as well and that hasn't stopped it.

DJ30

Followed SP500 higher, breaking to a new post-March high itself, clearing 8500. Still in a thick raft of resistance on up to 9000, and as long as SP500 moves higher on the back of financials and industrials, DJ30 is going to do the same.

Stats: +164.8 points (+1.96%) to close at 8574.65
Volume: 409M shares Friday versus 476M shares Thursday. Lower average trade Friday as volume remains stronger since Wednesday after three weeks of slow, low below average trade.

DJ30 CHART: Click to view the chart

MONDAY

The jobs report is history and the stress test dog and pony show is over, but a flood of earnings continue along with plenty of economic data. Retail sales, PPI, CPI, production and capacity utilization. They are not expected to show much improvement outside of retail sales and the new-found excitement for the consumer. Given all of the slobbering over the 'shoots of growth' this past week you would think expectations would jump.

Liquidity is driving SP500 and if that holds the market is likely to keep running overall. For this week, however, SOX is in trouble and NASDAQ is struggling. With the stress tests in the bank so to speak and the jobs report logged SP500 is looking for another catalyst and if NASDAQ corrects more SP500 will likely do the same. Then we have to see how much it does correct. When these liquidity rallies run history shows they have sharp, high volume corrections, but they don't last long. The market is more than due for a correction and NASDAQ is in the initial stages, and we think the techs will give back some this week. As they do, how the financials respond will tell the rest of the tale.

If techs correct we will look for points of entry for the upside after they hit key support levels, but we are also looking to play the overall move lower with some Q's. Energy stocks have shot higher and need a pullback. Commodities are still interesting as are industrials and we looking at them for upside positions from here. As money continues to move into the market, 'hard' stocks (materials, agriculture, industrials, commodities, etc.) and other stocks tied to inflation will continue to perform. Those should provide continued upside opportunity as all of this liquidity chases those areas as a hedge against inflation and as a way to play a new rise in China, India and company.

Many stocks surged in this last move that many are still very extended, but at the same time others are stepping up as money continues to move in and look for new targets. That pushes new stocks and sectors to the fore and we will continue looking for them to provide new opportunity.

Support and Resistance

NASDAQ: Closed at 1739.00
Resistance:
The 200 day SMA at 1742
1770 is the mid-October interim peak
1773 is the May peak
1780 is the November 2008 peak
1947 is the October gap down point

Support:
The 10 day EMA at 1721
The 18 day EMA at 1693
1673 is the prior April peak
1666 is the intraday January 2009 peak
1661 is the April 2009 prior peak
The January closing peak at 1653 (intraday)
1623 is the early April peak
1620 from the early 2001 low
The 50 day EMA at 1611
1603 is the December peak
1598 is the February 2009 peak, the last peak NASDAQ made
1587 is the March 2009 high is getting put to bed again
1569 is the late January 2009 peak
1542 is the early October 2008 low
1536 is the late November 2008 peak
1521 is the late 2002 peak following the bounce off the bear market low
1505 is the late October 2008 closing low.
1493 is the October 2008 low & late December 2008 consolidation low

S&P 500: Closed at 929.23
Resistance:
919 is the early December peak
935 is the January closing high
944 is the January 2009 high
The 200 day SMA at 955

Support:
899 is the early October closing low
896 is the late November 2008 peak
The 10 day EMA at 896
888.70 is the April intraday high.
The 18 day EMA at 879
878 is the late January 2009 peak
The prior April peak at 876
866 is the second October 2008 low
857 is the December consolidation low; cracking but not broken
853 is the July 2002 low
848 is the October 2008 closing low
846 is the April peak
The 50 day EMA at 845
842 is the early April peak
839 is the early October 2008 low
833 is the March 2009 peak
The 90 day SMA at 826
818 is the early November 2008 low
815 is the early December 2008 low
805 is the low on the January 2009 selloff. KEY Level
800 is the March 2003 post bottom low
768 is the 2002 bear market low
752 is the November 2008 closing low but it is not broken and done away with
741 is the November 2008 intraday low

Dow: Closed at 8574.65
Resistance:
8626 from December 2002
8829 is the late November 2008 peak
8934 is the December closing high
8985 is the closing low in the mid-2003 consolidation
9088 is the January 2009 peak

Support:
8521 is an interim high in March 2003 after the March 2003 low
8451 is the early October closing low
8419 is the late December closing low in that consolidation
8375 is the late January 2009 interim peak
The 10 day EMA at 8333
8315 is the February 2009 peak
8307 is the April 2009 intraday high
8197 was the second October 2008 low
8191 is the prior April peak
8175 is the October 2008 closing low. Key level to watch.
8141 is the early December low
The early April intraday peak at 8113
The early April peak at 8076
The 50 day EMA at 7970
7965 is the mid-November 2008 interim intraday low.
7932 is the March 2009 peak
7909 is the early January low
7882 is the early October 2008 intraday low. Key level to watch.
7867 is the early February low
7702 is the July 2002 low
7694 is the February intraday low
7552 is the November closing low. KEY Level.

Economic Calendar

These are consensus expectations. Our expectations will vary and are discussed in the 'Economy' section.

May 8 - Friday
- April Average Workweek (8:30): 33.2 actual versus 33.2 expected, 33.2 prior
- Hourly Earnings, April (8:30): 0.1% actual versus 0.2% expected, 0.2% prior
- Nonfarm Payrolls, April (8:30): -590K actual versus -620K expected, -699K prior (revised from -663K)
- Unemployment Rate, April (8:30): 8.9% actual versus 8.9% expected, 8.5% prior
- Wholesale Inventories, March (10:00): -1.6% actual versus -1.0% expected, -1.7% prior (revised from -1.5%)

May 12 - Tuesday
- March Trade Balance (8:30): -$29.2B expected, -$26.0B prior
- Treasury Budget, April (14:00): -$63.0B expected, $159.3B prior

May 13 - Wednesday
- April Export Prices ex-aq. (8:30): 0.1% prior
- Important Prices ex-oil, April (8:30): -0.6% prior
- Retail Sales, April (8:30): -0.1% expected, -1.2% prior
- Retail sales ex-auto (8:30): 0.0% expected, -1.0% prior
- Business Inventories, March (10:00): -1.1% expected, -1.0% prior
- Crude Oil Inventories, 05/08 (10:30): +605K prior

May 14 - Thursday
- April Core PPI (8:30): 0.1% expected, -0.0% prior
- Initial Jobless Claims, 05/09 (8:30): 601K prior
- PPI, April (8:30): 0.1% expected, -1.2% prior

May 15 - Friday
- Core CPI, April (8:30): 0.1% expected, 0.2% prior
- CPI, April (8:30) 0.0% expected, -0.1% prior
- Empire Manufacturing, May (8:30): -15.00 expected, -14.65 prior
- Net Long-Term TIC Flows (9:00): NA expected, $22.0B
- Capacity Utilization, April (9:15): 68.9% expected, 69.3% prior
- Industrial Production, April (9:15): -0.6% expected, 69.3% prior
- Michigan Sentiment-Preliminary, May (9:55): 65.0 expected, 65.1 prior
icon url

ReturntoSender

05/11/09 8:24 PM

#8564 RE: ReturntoSender #6755

From Briefing.com: 4:20 pm : Declining issues outnumbered advancers by 4-to-1 in the S&P 500 as profit-takers pressured stocks for the entire session. Financials felt the brunt of the selling effort, but strength in large-cap tech helped the Nasdaq outperform its counterparts.

There weren't any major earnings announcements or economic reports to act as positive catalysts for the stock market Monday. The dearth of data seemed to encourage a round of profit taking by participants who had watched stocks climb nearly 6% last week.

As has been the recent trend, financials were the best performers last week, which made them an easy target for sellers looking to lock in gains. In turn, the financial sector shed 6.8%, cutting into last week's 23% gain.

Diversified banks slipped 6.7% and regional banks dropped 8.5% after several companies announced plans to raise capital.

In a common equity offering, Wells Fargo (WFC 26.53, -1.65) announced it raised $8.6 billion, which is more than it originally set out to raise. The bank was told by regulators last week that it needs to come up with $13.7 billion in capital. Wells Fargo indicated future earnings will help plug the company's capital shortfall.

Meanwhile, Bank of America (BAC 12.94, -1.23) was told last week that it needs more Tier 1 capital, but the company didn't offer any immediate plans to satisfy the measure during a conference call today.

Despite the weakness in bank stocks, multiline insurers (-7.5%) and life and health insurers (-10.5%) saw some of the steepest losses. Their weakness comes as debate over health care reform is set to intensify during coming days. The threat of reform also weighed on managed health care providers, which finished 4.7% lower.

Sellers intensified their efforts against the financial sector into the close, which exacerbated weakness in the broader market and caused the S&P 500 to finish near session lows.

The Nasdaq was able to limit its losses, thanks to the relative strength of large-cap tech stocks. Large-cap tech rebounded from hefty losses in the early going as participants considered the early gap down to be an opportunity to rotate into the sector, which didn't see the trend chasing that financials saw the week before.

Despite the strength of large-cap tech, the broader tech sector finished just above the unchanged mark.

Telecom was the only sector to log a respectable gain, thanks to leadership from AT&T (T 25.36, +0.11), which will pay Verizon (VZ 29.82, -0.03) $2.35 billion for certain wireless assets. Meanwhile, AT&T has also agreed to sell certain wireless assets to Verizon for $240 million.

With equities under pressure, Treasuries were able to snap back after contending with weakness last week. The benchmark 10-year Note regained a full point, which lowered its yield to 3.17%.

There are only a few earnings announcements scheduled for Tuesday morning, none of which are expected to act as catalysts for the broader market. In terms of tomorrow's economic data, the March trade balance (8:30 a.m. ET) is expected to show continued contraction as countries contend with ongoing economic headwinds. The Treasury's budget statement for April is expected to be released later (2:00 p.m. ET). DJ30 -155.88 NASDAQ -7.76 NQ100 +0.1% R2K -1.9% SP400 -2.3% SP500 -19.99 NASDAQ Adv/Vol/Dec 1087/2.49 bln/1637 NYSE Adv/Vol/Dec 862/1.49 bln/2179

6:10PM Silicon Motion beats by $0.03, misses on revs; guides Q2 revs in-line (SIMO) 3.54 -0.02 : Reports Q1 (Mar) loss of $0.03 per share, excluding non-recurring items, $0.03 better than the First Call consensus of ($0.06); revenues fell 33.0% year/year to $21.5 mln vs the $22.2 mln consensus. Co issues in-line guidance for Q2, sees Q2 sequential revs growth of 10-15%, which equate to ~$22.6-24.7 mln vs. $23.42 mln consensus.

QLogic Corp (QLGC) announces that it continues to strengthen its number one position in storage area network Fibre Channel adapters and take significant market share from its nearest competitor, according to new data published by the Dell'Oro Group in its Q1 2009 SAN Report.

4:09PM Nuance Communications beats by $0.02, misses on revs (NUAN) 13.08 -0.26 : Reports Q2 (Mar) earnings of $0.24 per share, excluding non-recurring items, $0.02 better than the First Call consensus of $0.22; revenues rose 17.5% year/year to $238.8 mln vs the $243.7 mln consensus. Non-GAAP operating margins rose to 31.3%, compared to 24.0% in the second quarter 2008. Nuance achieved non-GAAP gross margins of 68.2% in the second quarter 2009, compared to 66.8% in the same period last year
icon url

ReturntoSender

05/12/09 6:18 PM

#8565 RE: ReturntoSender #6755

Intel, AMAT Offer Mixed Views of Chip Market

Intel and Applied Materials had some good things to say about the chip market late Tuesday, but headwinds remain.

http://www.internetnews.com/bus-news/article.php/3819976/Intel+AMAT+Offer+Mixed+Views+of+Chip+Market.htm

May 12, 2009
By Paul Shread: More stories by this author:

Intel (NASDAQ: INTC) and Applied Materials (NASDAQ: AMAT) had some mixed news for the chip sector late Tuesday.

Intel CEO Paul Otellini said at an analyst event that order and billing patterns are "better than expected" so far in the second quarter. Intel shares were up more than 3% in after-hours trading on the news.

AMD (NYSE: AMD) also gained on Intel's outlook.

But Applied Materials painted more of a mixed picture. The chip equipment maker posted quarterly sales that were down 53% from the year-ago quarter, but still 10% better than Wall Street analysts expected. But the company's declining new orders and backlog show that business remains tough. Even so, the company issued a sales outlook that is potentially better than expected. AMAT shares traded modestly lower on the news.

Tech stocks were weak ahead of the Intel and Applied Materials events, but solid state drive maker STEC (NASDAQ: STEC) was a standout, soaring 31% on much better than expected results and guidance, as the company continues to benefit from solid state drive adoption in corporate data centers.

Insight Enterprises (NASDAQ: NSIT) was another big gainer, up 17% on its results.

Microsoft (NASDAQ: MSFT) bucked the downtrend, rising 3% on a bond offering.

Ciena (NASDAQ: CIEN) fell 7% on a JMP Securities downgrade on a tough sales environment for the telecom equipment company.

Apple (NASDAQ: AAPL) was another decliner, off 4%.

The Nasdaq lost 15 to 1715, the S&P 500 slipped 1 to 908, and the Dow rose 50 to 8469. Volume rose to 6.87 billion shares on the NYSE, and declined to 2.54 billion on the Nasdaq. Decliners led by a 20-16 margin on the NYSE, and 17-10 on the Nasdaq. Downside volume was 71% on the NYSE, and 73% on the Nasdaq. New highs-new lows were 13-56 on the NYSE, and 25-16 on the Nasdaq.
icon url

ReturntoSender

05/13/09 9:05 AM

#8567 RE: ReturntoSender #6755

The $NASI turned down yesterday. This supports the probable short term trend change we discussed last weekend.

The Summation Index is a proxy that tells the swing trader whether money is flowing into or out of the market. When the Summation Index is in a strong uptrend, it indicates that the bulls are stronger than the bears. In a downtrend, it communicates just the opposite.


INTC is up in the premarket this morning but not much else is higher.

RtS
icon url

ReturntoSender

05/13/09 11:23 AM

#8568 RE: ReturntoSender #6755

I use both the $NYSI and $NASI to help determine intermediate directional turns. They have both reached extreme overbought status. That said the strength there is very good in pointing out that after this selling runs its course we are quite likely to see a significant bull run.


The $NYSI should go negative after this evening's numbers are factored in. The chart actually is closer to approximating the ascent after the March 2003 bottom than the retest that preceded it but I just can't believe we won't get some additional selling that will bring the market breadth indicators like BPNDX back into more traditional buy ranges nearing a reading of only 30 buy signals.


RtS
icon url

ReturntoSender

05/13/09 8:53 PM

#8570 RE: ReturntoSender #6755

From Briefing.com: 4:25 pm : A broad-based selling effort weighed on stocks for the entire session and sent buyers recoiling as more than 90% of the companies in the S&P 500 finished lower, which resulted in the S&P 500's third consecutive loss.

A negative bias loomed in premarket trading as sellers prepared to continue their efforts amid weakness among major foreign indices. Their cause was strengthened by an unexpected decline in advance retail sales data for April, which was released ahead of the opening bell and supported the notion that consumers aren't completely ready to lead an economic turnaround.

According to the data, April total retail sales decreased 0.4%, and sales less autos decreased 0.5%. The April figures failed to meet the consensus forecast, which called for total sales to be flat and sales excluding autos to increase 0.2%. However, the decline wasn't as sharp as what was seen in March, when total sales slid 1.3%, and sales less autos declined 1.2%.

Shares of retailers slid 3.3%. Retail giant Wal-Mart (WMT 50.03, -0.59) also finished with a loss, but outperformed the broader market on a relative basis. The company is scheduled to announce its latest quarterly results tomorrow morning, ahead of the opening bell.

Financials dropped 5.2%, more than any other major sector, and extended their week-to-date decline to more than 13%. While financials logged the worst loss of any sector this session, sellers weren't entirely focused on financial stocks. Cyclical plays also saw outsized losses as materials stocks (-4.5%) and industrials stocks (-4.0%) sank. Small-cap and mid-cap stocks were also strongly out of favor as the Russell 2000 Small-Cap Index sank -4.7% and the S&P 400 Mid-Cap Index made a 4.4% drop.

Large-cap tech had showed relative weakness in the early going, but managed to firm up a bit. Intel (INTC 15.13, -0.08) was a relative leader among its peers after stating that the second quarter is going better than the company had expected. That overshadowed news that Intel has been hit by the European Commission with a $1.45 billion fine for breaking antitrust laws. The fine represents nearly 14% of Intel's cash and short-term investments.

IBM (IBM 102.26, -1.68) attempted to drum up support by stating that earnings for fiscal 2009 will be least $9.20 per share, which is above the current consensus estimate of $9.11 per share.

Energy stocks finished 3.0% lower amid the broader market's downward bias and a downturn in crude oil prices. Crude oil contracts finished 1.4% lower at $58.02 per barrel after surrendering solid gains that were bolstered by bullish inventory data midmorning. Enthusiasm was partly capped by a lowered demand forecast from OPEC.

All 10 major sectors finished the session lower amid relatively high trading volume (approx. 1.8 billion shares on NYSE). Even health care, which had spent most of the session as the only sector in positive territory, buckled in late trading. Health care closed 0.1% lower, though pharmaceuticals were able to finish 0.7% higher.

The latest business inventory data had no real impact on this session's trading. Nonetheless, March data showed a 1.0% decrease in inventories, which was largely in-line with expectations. Tomorrow's economic data carries a bit more weight and will be in closer focus; both the April Producer Price Index and weekly initial jobless claims data are due at 8:30 AM ET Thursday morning.DJ30 -184.22 NASDAQ -51.73 NQ100 -2.7% R2K -4.7% SP400 -4.4% SP500 -24.43 NASDAQ Adv/Vol/Dec 395/2.15 bln/2294 NYSE Adv/Vol/Dec 337/1.77 bln/2745

4:31PM Univ Elec Chairman and Chief Executive Officer Adopts a 10b5-1 Trading Plan (UEIC) 19.94 -1.26 : Co announces that announced Paul Arling, chairman and CEO, has established a new trading plan in accordance with Rule 10b5-1. Under the plan, Arling intends to exercise up to 100,000 employee stock options, which were granted in October 1999 and are set to expire in October of 2009, and to immediately sell the underlying shares of UEI common stock beginning immediately and continuing from time to time until the expiration date of the options, subject to the market price of the company's common stock, all as set forth in his trading plan.

8:39AM Advanced Micro comments on European Commission ruling that Intel violated EU law and harmed consumers; says ruling is an important step toward establishing a 'truly competitive market' (AMD) 4.38 : "Today's ruling is an important step toward establishing a truly competitive market. AMD has consistently been a technology innovation leader and we are looking forward to the move from a world in which Intel ruled, to one which is ruled by customers. After an exhaustive investigation, the EU came to one conclusion - Intel broke the law and consumers were hurt. With this ruling, the industry will benefit from an end to Intel's monopoly-inflated pricing and European consumers will enjoy greater choice, value and innovation."

8:09AM On The Wires : Clearwire (CLWR) and Cisco (CSCO) announce an alliance designed to enhance and expand CLEAR 4G mobile WiMAX services throughout the United States. Under terms of the agreement, Clearwire has selected Cisco as its national Internet Protocol Next-Generation Network core infrastructure provider, and Cisco has announced plans to build new mobile WiMAX devices for the CLEAR 4G mobile WiMAX service...Valence Technology (VLNC) announces that it has been named as a supplier of battery systems to Oxygen SpA of Padua, Italy...

8:02AM Seagate Tech has initiated a restructuring plan that includes a reduction of ~2.5% of the company's global workforce (STX) 7.34 : The co announces it has initiated a restructuring plan that includes a reduction of approximately 1,100 employees or 2.5% of the company's global workforce. This reduction is required to support a targeted run rate of product development and marketing and administrative costs of less than $300 million per quarter and to position the company to be cash flow and earnings positive within its fiscal year 2010. The restructuring plan, which the company expects to be largely complete by the end of July 2009, is expected to result in total pretax restructuring charges of approximately $72 million. These charges will primarily be incurred in the June 2009 quarter and consist mainly of cash based employee termination costs which are expected to be substantially paid in the September 2009 quarter. The annual savings generated from this restructuring action is expected to be approximately $125 million.

6:30AM Intel says co takes strong exception to European Commission decision on Intel's business practices (INTC) 15.21 : The co issued the following statement regarding the European Commission decision on Intel's business practices: "Intel takes strong exception to this decision. We believe the decision is wrong and ignores the reality of a highly competitive microprocessor marketplace - characterized by constant innovation, improved product performance and lower prices. There has been absolutely zero harm to consumers. Intel will appeal. We do not believe our practices violated European law. The natural result of a competitive market with only two major suppliers is that when one company wins sales, the other does not. The Directorate General for Competition of the Commission ignored or refused to obtain significant evidence that contradicts the assertions in this decision. We believe this evidence shows that when companies perform well the market rewards them, when they don't perform the market acts accordingly. Intel never sells products below cost. We have however, consistently invested in innovation, in manufacturing and in developing leadership technology. The result is that we can discount our products to compete in a highly competitive marketplace, passing along to consumers everywhere the efficiencies of being the world's leading volume manufacturer of microprocessors."

09:39 am Intel (INTC)

The European Commission fined Intel (INTC 15.30, +0.09) 1.06 billion euros ($1.45 billion) Wednesday for breaking European antitrust laws.

The Commission found that Intel engaged in illegal anticompetitive practices to exclude competitors, primarily Advanced Micro Devices (AMD 4.48, +0.13), from the market for computer chips. Specifically, the Commission found that Intel engaged in two forms of illegal practice.

First, Intel gave wholly or partially hidden rebates to computer manufacturers on condition that they bought all, or almost all, their x86 CPUs from Intel. Intel also made direct payments to a major retailer on condition it stock only computers with Intel x86 CPUs.

Second, Intel made direct payments to computer manufacturers to halt or delay the launch of specific products containing competitors' x86 CPUs and to limit the sales channels available to these products.

Intel said it "takes strong exception" to the ruling and will appeal. Intel said, "The natural result of a competitive market with only two major suppliers is that when one company wins sales, the other does not."

For its part, AMD said "Today's ruling is an important step toward establishing a truly competitive market."

Separately, shares of INTC are moving higher after the company's CEO told an investor conference last night that chip orders have been better than expected so far in the second quarter.

09:00 am Verizon Communications (VZ)

Frontier Communications (FTR 7.57) strengthened its position among rural phone providers today with the announcement that it will acquire approximately 4.8 million access lines from Verizon (VZ 30.40) in an all-stock transaction valued at approximately $8.6 billion.

Under the terms of the agreement, Verizon will establish a separate newly formed entity (SpinCo) for its local exchanges and related business assets in 14 states. SpinCo will be spun off to Verizon's shareholders and simultaneously merged with and into Frontier. Frontier will also assume about $3.3 billion in debt as part of the deal.

Depending on the trading prices of Frontier shares prior to the closing, Verizon shareholders will own between 66% and 71% of the new company.

Frontier CEO Maggie Wilderotter said, "This is a truly transformational transaction for Frontier. With more than 7 million access lines in 27 states, we will be the largest pure rural communications provider of voice, broadband and video services in the U.S."

The deal allows Verizon to focus its growth profile on wireless, broadband and global IP, the company said.

08:05 am Applied Materials (AMAT)

Applied Materials (AMAT 11.48) reported a fiscal second quarter loss that matched the expectations of analysts as weak demand cut revenues in half from the prior year.

Applied Materials reported a loss of $0.10 per share for its fiscal second quarter, matching the First Call consensus. The company reported a non-GAAP net loss of $136 million for the quarter, compared to earnings of $362 million in the same period last year.

Revenues fell 52.5% year-over-year to $1.02 billion, topping the $906.1 million consensus.

The Santa Clara, Calif.-based company reported a $3.16 billion backlog at the end of the second quarter, down from $4.05 billion at the end of the first quarter.

"In a period of exceptionally weak demand, Applied preserved its strong balance sheet, returned a dividend to our stockholders and made substantial investments in our future," said CEO Mike Splinter.

On its conference call, Applied Materials said it sees fiscal third quarter revenues to be flat to down 15%, which equates to approximately $867 million to $1.02 billion; the consensus currently stands at $931.15 million. In addition, the company said it expects to post a fiscal third quarter loss ranging from $0.06 to $0.14 per share; the consensus expects a loss of $0.07 per share.

At Tuesday's closing price shares of AMAT are up 13.3% year-to-date but are under pressure in premarket trading, down 4.6% about 90 minutes ahead of the opening bell.
icon url

ReturntoSender

05/15/09 8:59 AM

#8571 RE: ReturntoSender #6755

Rambus, Chip Stocks Lead Market Rebound From last night - RtS

There was all sorts of good news in the chip sector on Thursday.

http://www.internetnews.com/bus-news/article.php/3820436/Rambus+Chip+Stocks+Lead+Market+Rebound.htm

May 14, 2009
By Paul Shread: More stories by this author:

Stocks bounced back from Wednesday's drubbing today, led higher by a 14% gain in shares of Rambus (NASDAQ: RMBS).

Rambus rose after the FTC dropped the rest of its 7-year-old antitrust case against the company after losing a recent Supreme Court appeal. The FTC had argued that Rambus improperly withheld information about patents it holds from the JEDEC standards group.

The rest of the chip sector (PHI: SOX) gained more than 3%, with Intel (NASDAQ: INTC) up 2.7% in a delayed reaction to the company's upbeat outlook.

AMD (NYSE: AMD) lost ground, but Micron (NYSE: MU) and SanDisk (NASDAQ: SNDK) were big gainers, and Atmel (NASDAQ: ATML) surged 17% on takeover speculation. Novellus (NASDAQ: NVLS) gained on a Bank of America-Merrill Lynch upgrade.

Helping the mood was a Wall Street Journal report that companies have finally stopped slashing IT budgets, good news ahead of earnings reports from HP (NYSE: HPQ) next week and Dell (NASDAQ: DELL) the week after.

Apple (NASDAQ: AAPL), Research in Motion (NASDAQ: RIMM), Brocade (NASDAQ: BRCD) and eBay (NASDAQ: EBAY) were some of the day's other winners.

DigitalGlobe (NYSE: DGI) gained 14% in its IPO.

CA (NASDAQ: CA) jumped 5.5% after beating earnings estimates, while Clearwire (NASDAQ: CLWR) and CommVault (NASDAQ: CVLT) fell on their results.

The Nasdaq rose 25 to 1689, the S&P 500 gained 9 to 893, and the Dow rose 46 to 8331. Volume declined to 6.13 billion shares on the NYSE, and 2.22 billion on the Nasdaq. Advancers led by a 26-10 margin on the NYSE, and 18-8 on the Nasdaq. Upside volume was 79% on the NYSE, and 75% on the Nasdaq. New highs-new lows were 6-43 on the NYSE, and 11-18 on the Nasdaq.

icon url

ReturntoSender

05/16/09 6:26 PM

#8573 RE: ReturntoSender #6755

Amateur Investors Weekend Stock Market Analysis (5/16/09)

http://www.amateur-investor.net/Weekend_Market_Analysis_May_16_09.htm

During the past 110 years the US has gone through a series of Economic Cycles which has been reflected in the stock market. Once again if we compare the Historical PE Ratio to the Inflation Adjusted Chart of the S&P Composite a few things standout. First each Cyclical Bear Market has not bottomed until the PE Ratio has dropped below a value of 7 (green line). This occurred in 1982, 1932 and even further back in 1921. Currently the PE Ratio is around 15 so if history repeats itself then it would have to drop back to around 7 before a bottom would occur. Meanwhile if we compare the charts of the "3" previous Cyclical Bear Markets to the most recent one the overall pattern looks similar to that of 1968-1982 and 1906-1921. Both of these Cyclical Bear Markets were drawn out affairs in which the S&P Composite took the form of an elongated ABC type corrective pattern that lasted from 14 to 15 years.


Furthermore when you breakdown the 1906-1921 and 1966-1982 time periods what's amazing is that after completing their "B" Waves it took 9 years for both of them to complete their elongated "C" Waves. Now if we look at the current Cyclical Bear Market a similar ABC type corrective pattern appears to be developing as the "B" Wave completed in late 2007. If we see a similar pattern evolve for Wave "C" then it will elongate out and could take several more years to complete like occurred back in 1968-1982 and 1906-1921. Meanwhile also notice the S&P Composite is still well within its longer term upward channel and its entirely possible it may eventually drop back to the bottom of its channel before a Bear Market bottom occurs.


Meanwhile if we compare the 1968-1982 time period to the current pattern it appears we are basically in the same spot as we were in the mid 1970's in which the S&P Composite had a decent rally from 1975 through the early part of 1976 (points D to E) before going through an extended downtrend which finally bottomed in 1982 (points E to F) as the "C" Wave ended. Keep in mind these are Inflation Adjusted Charts so the non Adjusted Inflation Charts will look somewhat different when you compare the two.


In 2008 our ETF Strategies worked the best with which had a return of +33% versus the S&P 500 which was down -38.5% for the year.

Meanwhile our 401K Strategy finished up +17.3% for the year.

Signup for a "Free 4 Week Trial Membership" or save up to 50% on a Premium Membership and you will have access to these Investment Products which include the following:

1. "ETF Daily Buy and Short Signals" which can be used to trade the DIA's, QQQQ's, SPY's and OIH's. Our ETF Strategy returned 33% in 2008.

2. "401K/Thrift Savings Plan (TSP) Timing Service" which can be used to help improve your return in your 401k/TSP Account which was up +17.3% in 2008.

3. The "End of Month Strategy" finished up +36.3% in 2008. This Strategy focuses on the typical End of Month markup by the Institutional Money.

4. "Stocks to Buy List" which can be used with either our Short Term Strategy or Long Term Strategy. In 2007 our Long Term Strategy finished even for the year versus the S&P 500 which was down -38.5%.
icon url

ReturntoSender

05/17/09 3:02 PM

#8574 RE: ReturntoSender #6755

InvestmentHouse Weekend Market Summary 5/15/09

http://www.investmenthouse.com/weekendmarketsummary.htm

- Stocks put on a game face early, but cannot hold modest gains.
- NY PMI puts on the brakes, but capacity, production, and EU economic data are not as pleasant.
- Michigan sentiment better but still at recession levels.
- Economic data not showing the same improvement in prior recoveries, but that doesn't mean we don't make money.
- Bankers forced to accept TARP or else.
- Expecting more pullback this coming week and watching solid leaders as it does.

Midmorning lets the upside down.

After a string of upside weeks, we finally had a down week. There's nothing wrong with that. After 30% gains and more, getting a little downside is no problem at all. In fact, it's healthy. We're going to make some money from the downside, and thus the downside becomes a positive. We always take whatever the market gives, whether it's upside or downside, we're going to take it. And with the market primed to give us downside, that is exactly what we want to look for. We like to look for those easy setups where we can just walk up and pick the money up off the ground. If we can do that, that's great. We did that with the Potash, the POT play this week; the money was there on the ground, we stepped up and picked it up. Got to love that.

As for Friday, it was really what we expected and what we wanted. We had that big down day on Wednesday -- it's expiration week -- and sometimes you get the big moves mid-week, and that's what we had. Friday was rather calm. It was up, at first, as we thought it would be, and then it came back. We didn't really know if it was going to come back Friday or not. As stocks went ahead and declined that gave us a chance to move in and get into some downside positions, to position ourselves for next week. We got a little Amazon, we got a little Apple, we got some of the Q's (QQQQ) to the downside to get ready for more of the downside move. We were getting in position for what we think will be a down Monday as the downside resumes. We also have some continuing upside plays with some pulling back, some continuing higher. CME was down Friday, but it was a great mover for us this week. As a matter of fact, this week we had a bunch of good moves that went to the upside, even when the market was going down. We had Potash. We had CME. We had Amazon to the downside; nothing wrong with going with the market direction. That was nice. We doubled up on some more of Amazon puts Friday. We took some Priceline gain off the table as retail was having some issues. Digital River gave us some more gains. That's the way we do it. We let them go up, we take some gains as they go up, taking money off the table as key moves are made. But we still get bigger gains, because we're leaving some on the table as we go. As long as the stock remains in its trend, whether it's up or down or sideways, we can make money by just letting some of the position run for free after we bank some nice gain on strong surges. That's what we've been doing, and it pays off; we had a good week that way.

As for Friday in specific, we had a lot of economic data. We had the CPI. It was basically in line, but the core was hotter (no food and energy), and it was hotter at 0.3% versus the 0.2% expected. We had the New York PMI. It was much better at -4.55. Still contracting, as is all the economic data, but it was a lot better than the -14 prior, and the -12 expected and showing that little bit of improvement. Again, slowing on the way down, slowing the fall into the abyss. Indeed, it no longer looks like we're going to fall in the abyss. Just the ditch. That can hurt too, but not as bad as never finding the bottom.

Industrial production fell -0.5 versus -0.6, better than the -1.7 before. That's improvement a little bit. Capacity was down though above expectations at 69.1, but that is still very low.

That is what we're finding with all the economic data. It may be slowing, but it's still really low. It still, pardon the expression, sucks. It's trying to slow down and make the turn, but we're not there yet. Michigan Sentiment is another example. It was better, it tried to give the market a boost even, and it did. It came in at 67.9, topping 67 expected, and the 65.1 prior.

60s are still recession levels. When we see 60s and 50s, you're thinking recession. That's all there is to it. People are feeling a little bit better because they see some better economic activity. They see the stock market going up. Maybe they don't feel like their job is in as much jeopardy. Although, with 5.6 million continuing claims, there's not many jobs out there as companies are not hiring, and indeed they're still losing jobs. No job creation, and as we talked about Thursday, we're not going the get it for awhile. But, first things first: the economy has to turn the corner in other indicators before jobs improve. My concern is, and we'll talk about it later, we are not getting there yet.

Finally, we had some news out of Europe and Asia, and it's not good. The first quarter European Union (EU) GDP fell -2.5%. Not great. Not horrible, but not great. In Germany, the largest economy in the European Union, was down 3.8%. Ouch! The largest economy is down 3.8%. Of course some countries fared better because, over all, it was just down 2.5% even with Germany dragging it lower. Nonetheless, Germany has a lot of output, and when its down, the rest of the continent feels it. Very similar to when California has a problem. The rest of the US feels it.

Russia was down 23% in its first quarter. Lower demand for oil and gas (Russia's only real production item) even though product prize prices are higher -- approaching $60 last week - yet Russia's GDP tanked. The commodities are improving in prices, but demand for energy is still low. It's at 2001 levels but prices are rising on speculation it will go up. In theory versus reality. I have a great joke about that and someday I will tell you; just send an email. Anyway I digress. Demand is at 2001 levels and what was happening in 2001? We had 9/11 and we were in recession. That kind of puts things in perspective and underscores how things are not good for the world economies. Indeed, they're bad all over the world, not just "not good."

The dollar was up on all of this, because it had been hammered pretty hard over the last few weeks and it's trying to bounce back some. So it came back a little bit on the economic news and really jumped on the terrible European news. The Euro got slammed, so the dollar naturally rose against it due to all the bad data out of the EU.

Oil was down, closing at 56.34, -$2.28 after it approached $60 this last week. Gasoline prices are well over $2.00 now. Demand for gasoline is still pretty low, yet prices are rising and we aren't in the summer yet. Memorial Day is coming soon, however, and we could easily see $3.00 again. Of course, last year it got to $4.00. It doesn't look too promising right now and we could have some of the same problems with the consumer having its wallet pinched once again.

TECHNICAL

INTRADAY. Stocks rallied into mid-morning. Despite the lackluster economic news, they opted to look for the good, but it was more of a relief bounce similar to Thursday, as we anticipated. By mid-morning, stocks had peaked after moving through near-term resistance. Mid-morning is often a fulcrum for the session, and Friday stocks turned back down and skidded all afternoon into the last hour. A late bounce failed and they slid again into the close. That late bounce allowed us to get into our downside positions. We saw it bounce up, we saw they were going to close lower, and we moved in, getting ready for some more downside next week.

INTERNALS. The internals were really mediocre on Expiration Friday. No volume as trade skidded. It was below average on both the NYSE and NASDAQ. Expiration Friday, yet below average volume. All of the position shuffling occurred midweek. Now the one thing is, there was no vicious selling all week. There was selling, yes, but it was not vicious. The market is just top-heavy.

CHARTS. We describe the patterns as top heavy quite a bit lately. What happens is you get these nice moves, they bounce off near support, they bounce off they're trendlines, and the 10- and 18-day EMA, and then they flatten out and roll over. Kind of umbrella shaped. Sometimes it's a big umbrella, sometimes it's a little umbrella. Sometimes they bounce, them make a bigger bounce, then a smaller bounce, forming that little head and shoulders peak. Look at the charts for NASDAQ, NASDAQ 100, SP600 and even SP500 and you see they are starting to show the same thing. That little head and shoulders, then the roll over and downside selling that should about equal the size of the formation from the neckline up to the top of the head. That's how far a stock or index should fall from this pattern, all things equal.

What we're looking at is more of a relief bounce from Thursday. A sell-off on some higher volume Wednesday, and expiration had something to do with that. Then we had a little bounce back up on Thursday, your basic relief bounce. Tried a little more upside on Friday - then failed. Look at NASDAQ, NASDAQ 100, SP600. They moved up through that near resistance, whether it was the 18-day moving average or the 200-day moving average on NASDAQ 100. They moved above it, and then they just couldn't hold it. The buyers continued push them back up, but the sellers jumped on top of them with more strength, and they pushed it to close lower. Even SP500 showed this action though to a lesser extent. It is right below its 18-day moving average, but not in any real trouble. It's still above 875, after bumping up at 900, again still in really good shape. It is, however, getting that little top-heavy look itself. Makes sense. The financials have run and then early in the week many announced new issues of common stock coming, and they started to turn down.

So we're getting a little bit of a pull-back. The market is ripe for it. As I said earlier, it's not a bad thing, it's a normal thing. It's even healthy for the market to do this. We're just going to use it to make a little bit of money. Make money as it goes down. Nothing wrong with that at all.

LEADERSHIP. Leadership showed some problems, but not a breakdown. Energy was down with some pretty big drops in energy stocks. Some techs had problems. Chips have already had issues as we've seen. They tried to bounce, tried to break out again, but then tumbled back down. They were THE early leader and they are still struggling. There's a lot of that earlier leadership that is in a little bit of trouble right now, such as the chips and large cap technology. Not major trouble, but definitely selling back with the kind of retracement you would expect. Commodities were down again. Oil was down, metals were down - again, not terribly. We see some good steel stocks for instance, trying to set up for a new bounce. They are down, they were a little soft, but they're still in good shape. Industrials struggled as well all week, but again, they are not imploding. There are stocks such as CAT and Joy Global (JOYG) that are in good shape. They're holding up well in the pullback, trying to set up for a new run. If they can ride through this selling, we're going to have some great buys from those stocks as well as many other quality stocks.

SUMMARY. I want to state again just as I've said all week and the week before: this is not a really major sell-off. This is a normal sell-off. The market is going to have good leadership stocks pull back and get in great buying position. We just want to take advantage of the downside while that happens. We aren't sitting here saying the world's going to come to an end. As a matter of fact, we have avoided The Great Depression II. Nonetheless, we are going to have pull-backs. We want to take advantage of that. And while we do that, we want to watch for good stocks, i.e. the leaders setting up, and when they complete their tests and start to move we're going to get those. Visa, Caterpillar, BTU, XTO are examples, and there are many more. For now we watch them as this market pulls back. We make money on the downside, but we also watch these good stocks -- we own some already -- and others that we're looking at buying. And if they hold up, hold at support, and don't sell off vigorously, they're going to be ready to lead and bounce right back up. Then they make us money as the market swings back to the upside. So for now we have positioned ourselves for the downside and will continue to do it some more as opportunities arise, then be ready to pick up shares to the upside, along with the ones we already have, when things turn back up.

THE ECONOMY

Indicators say recession may end this summer, but what about the upside?

One of the things subscribers and others tell us is, "You're so negative on the economy." Well, not really. We were championing the turn in the data, or more accurately the slowing dive in the data before it was mainstream. And we are getting better data.

ECRI says things look better and we are going to be at the end of the recession by the end of the summer." Well, that's true. The economy could very well do that. Problem is, bottoming is not recovering. Bottoming is stopping the bleeding, and that's what the Fed has tried to do with all of these facilities that the Fed and that the Treasury have put in place -- to stop the bleeding. The bleeding is slowing.

But one of the problems that we have, and one thing that's telling to us, is that right now people are so ebullient about the economy with such crappy numbers. Back in 2002 and early 2003, the economic numbers were much better, and people were in terrible moods. They were so depressed about the economy. And the economy took off. Now, we've avoided Great Depression II, and thank goodness we're not going into depression, but pundits are having a party over that.

Well, the data is still going down. It hasn't turned and some cheerleaders and as a whole we are way too enthusiastic and optimistic given the data. It's great that we feel good that the economy is not going into the toilet totally, and flushing into the septic tank - but, I digress. It's not the same as making a turn up. ECRI could be right. A recession could end but we then could have no growth. This would be very much like the 1970's, like the early 1980s. We've done it before. We've made the same policy mistakes that we're making now. And thus we likely get the same outcome as before. Does that make sense? It sure does to me, and anyone who reads some history books could figure it out. But, apparently, a lot of people in D.C. haven't read much history. Or they've selectively forgotten what they read, or maybe they never learned it in class.

In any event, does that mean that we're done with the stock market? Do we stick a fork in it? Not at all. Even in the 1970s, and even in the 1980s, there was bursts higher and bursts lower. And, just like right now, when we're going to make money on the downside after we've been making money on the upside, we're going to make money during those bursts to the upside and then sell-offs that follow. To us, we take what the market gives day in and day out and we're going to keep doing just that. This kind of action can be depressing, it can be boring. You worry about your kids' and grandkids' futures. But, the best thing to do for them is to take what the market gives and make money off of it and hope we don't go into that 18% inflation that eats away your wealth similar to the past when I wondered as a kid of the 1970's if I'd ever be able to afford a house. Well we've been there, and I don't want my kids to go there. But, if they do, I want to teach them how to make it through those times ahead of the curve, just like you're going the make it through.

FOIA request turns up a document from the original TARP meeting, alters the Administration's plans with the nation's banks.

Well, as I was saying all along, it turns out that last fall at the start of the crisis the nation's banks were actually forced to take the TARP money whether they needed or wanted it. Surprise, surprise. We find out that there were memos, handwritten, and afterwards transcribed, where Paulson came in and basically said, you're going to take this money. If you don't, you're regulators are going to find that you need to take the money - wink, wink. In other words, no matter what the books were like, the Treasury was going to find, or the FDIC was going to find that the banks were undercapitalized and needed to take the funds. FDIC's Baird was there. Bernanke was there. Or course Paulson was there. And now we know that current Treasury Secretary Giethner was there as well. The big guns were going to let the banks CEO's know that, hey, you're going to go with the plan, or you're going to get the shaft. So everyone signed up. It took quite a while to do so. State Street had to get board approval, and it took three hours. Some things went on during those three hours with STT and other banks in the same position that we'll never know about. Political intrigue at its best. That's a nice way of putting it.

Anyway, they all signed up under coercion, and late Friday we learned Goldman Sachs will probably be the first one to get out from under the TARP. It didn't want to be there in the first place, it was just basically told by Paulson, "I used to work here. You're going to do it; take the lead on this." So it did. And now they're going to get out of it. We hope that all the others can get out of it and pay the money back. Maybe we can all then feel better about what we have going forward. We'll see.

The most interesting thing is, that this document, when it came out through a Freedom of Information Act request, is probably what changed what the Treasury and the Administration was going to do with the banks. When hard evidence surfaced that the banks were forced to take this whether they needed it or not, that took away the hand of the administration to say, "We stepped in to save you when you needed it, therefore we can take stock and take shares and tell you what to do." Just the past two weeks there was a big uproar as to whether the BAC CEO was telling the truth about being forced to take TARP funds 'or else.' This document puts that 'controversy' to rest.

The Administration and Treasury were very tight lipped about banks getting out of the TARP. Then this document was apparently made known to them before it was released via the FOIA request. Recall how just before the stress test results came (and recall that they were DELAYED almost a week without any explanation) the tone changed. Geithner was out saying he foresaw most banks passing and able to get out from under TARP. No problem mate. To us it is pretty clear that when it was known there was a smoking gun out there the Administration's plans had to change course to all our benefit. Thank goodness someone filed the Freedom of Information Act request.

THE MARKET

MARKET SENTIMENT

VIX: 33.12; +1.75
VXN: 33.14; +0.5
VXO: 33.77; +2.13

Put/Call Ratio (CBOE): 0.8; -0.08

Bulls versus Bears:

This is a reading of the number of bullish investment advisors versus bearish advisors. The reason you look at this is that it gives you an idea of how bullish investors are. If they are too bullish then everyone is in the market and it is heading for a top: if everyone wants to be in the market then all the money is in and there is no more new cash to drive it higher. On the other side of the spectrum if there are a lot of bears then there is a lot of cash on the sideline, and as the market rallies it drags that cash in as the bears give in. That cash provides the market the fuel to move higher. If bears are low it is the same as a lot of bulls: everyone is in and the market doesn't have the cash to drive it higher.

This is a historical milestone in the making. Bulls are impressively low considering we are in general a very optimistic country. The few bulls is a positive indication because it means most everyone that is getting out is out and there is money on the sidelines. In other words the ammunition boxes are full and as the market recovers investors will start opening up the boxes and firing. Little by little they will be forced to put more money into the market and there will be some rushes higher in fear they are missing the train. You relish times when sentiment is so negative because it means some tremendous buys are setting up. This could indeed be the opportunity of a lifetime, and you take advantage of it by buying quality stocks and letting them work for you as long as they will. If we can hold them for years, great.

Bulls: 41.0%. Modest bump higher from 40.4% as bullishness hung around even as the market turned to some chop though still finished that week higher. After this week bullish spirits may be dampened some. Still a strong move, up from 36.0% just three weeks back and moving in on the 43.2% hit mid-April before anticipation of stress tests and SOX' issues. Over the 35% threshold, below which is considered bullish, but this is not a bearish indication yet. Has to get up to the 60% to 65% level to be bearish. Dramatic rise from 21.3% in November 2008, the bottom on this leg. This last leg down showed us the largest single week drop we have ever seen, falling from 33.7% to 25.3%. Hit 40.7% on the high during the rally off the July 2008 lows. 30.9% was the March low. In March the indicator did its job with the dive below 35% and the crossover with the bears. A move into the lower 40's is a decline of significance. A move to 35% is a bullish indicator. This is smashing that. For reference it bottomed in the summer 2006, the last major round of selling ahead of this 2007 top, near 36%, and 35% is considered bullish.

Bears: 33.7%. Interesting rise in bearishness (from 31.5%) even as the bulls rose and the market moved higher though was much choppier. Well off the 37.2% and the 37.1% in mid-April as the rally continued higher. As with bulls, below the 35% threshold considered bullish though not at bearish levels. Now far from off the high on this run at 47.2%. For reference, bearishness hit a 5 year high at 54.4% the last week of October 2008. The move over 50 took bearish sentiment to its highest level since 1995. Extreme negative sentiment. Prior levels for comparison: Bearishness peaked at 37.4% in September 2007. It topped the June 2006 peak (36%) on that run. That June peak eclipsed the March 2006 high (33%) and well above the 2005 highs that spawned new rallies (30% in May 2005, 29.2% in October 2005). That was a huge turn, unlike any seen in recent history.

NASDAQ

Stats: -9.07 points (-0.54%) to close at 1680.14
Volume: 2.03B (-3.95%). Low volume again as NASDAQ tried to reach higher but could not hold it with the weak trade.

Up Volume: 932.465M (-699.919M)
Down Volume: 1.237B (+700.31M)

A/D and Hi/Lo: Decliners led 1.53 to 1
Previous Session: Advancers led 2.14 to 1

New Highs: 11 (-2)
New Lows: 12 (-1)

NASDAQ CHART: Click to view the chart

Rallied to the 10 day EMA on the high but then slid back to close below the 18 day EMA (1693) yet again. Nothing seriously dangerous, just a near term toppy pattern that is the set up for NASDAQ to consolidate the big run off the March low. NASDAQ is holding off the January peak (1665 intraday) but that is likely to give in to a test of the February peak at 1600. That is roughly at a 38% retracement (1592) and matches the 50 day SMA. The 50 day EMA is at 1626 so that is a good logical range to shoot for on this test.

NASDAQ 100 (-0.34%) rallied intraday as well but after clearing the 200 day SMA (1365) it reversed and gave up the gains. It is showing the same kind of short head and shoulders top and is showing a tombstone doji on the candlestick chart. Great set up to head lower near term.

NASDAQ 100 CHART: Click to view the chart

SOX CHART: Click to view the chart

SP500/NYSE

Stats: -10.19 points (-1.14%) to close at 882.88
NYSE Volume: 1.481B (-2.93%). Well below average on the decline so no distribution, just top heavy.

Up Volume: 292.615M (-905.46M)
Down Volume: 1.18B (+861.639M)

A/D and Hi/Lo: Decliners led 1.8 to 1
Previous Session: Advancers led 2.53 to 1

New Highs: 6 (0)
New Lows: 47 (+4). Note the new lows rising faster than the new highs the past couple of weeks.

SP500 CHART: Click to view the chart

SP500 is holding tough above 875 and the late January/early February highs (878 and 875 respectively), refusing to give up that level thus far. The key points: it rallied up close to the January high (NASDAQ and NASDAQ 100 topped the January high on their runs) so it is still lagging, but it also made something of a double top there. A first failure at resistance is not the end of the run as we saw in Aril as SP500 tested the late January/February peaks. It failed but then recovered. This time, however, it has broken its March up trendline and has another 50+ points under its belt. It has also set up that same near term toppish head and shoulders pattern. Not consummated, and the H&S can fool you because it really has to make the break lower, but with all the indices showing this a test to the 50 day EMA (854) makes a lot of sense. There is a range of support there and it will try to hold there. Then we see if it fails, i.e. the economic data takes a turn for the worse, and that makes the 825 range to watch as that is the 38% retracement.

DJ30

Very similar to SP500 though in a bit better pattern. It is holding the 18 day EMA just above the October closing low at 8175. This is a very mild test that does not look nearly as top heavy as the other indices. DJ30 will tend to follow SP500 right now, but it could very easily hold up above 8000 (just 268 points away) as SP500 tests lower.

Stats: -62.68 points (-0.75%) to close at 8268.64
Volume: 308M shares Friday versus 323M shares Thursday. Anemic volume all week even with expiration.

DJ30 CHART: Click to view the chart

THE WEEK AHEAD

Housing starts, building permits, crude inventories (taking on new significance with the crude price rise), Fed Minutes, leading indicators (though they are not really leading), and the Philly Fed. The Fed minutes are always interesting given the quantitative easing mode the Fed is in, and any indications of its thought process regarding how long this lasts is useful. Outside of that, the Philly Fed will be the interesting one as manufacturing tends to lead us out of economic troubles. Everyone will look at the jobless claims, but they're going to stink, so that's not going to change. We've got to get improving economic data for those to turn up.

There will still be some more earnings, but we're basically over that. Right now the market is in a technically-driven move. We've had a huge run. They cheered through earnings. They had a stress test, they cheered through the stress test. Then the financial companies make it out to the other side of the test and start offering common stock. Finally investors stopped cheering: "No, we don't want you to do that." So some selling started. That was the reason to sell. Now the market is in a technical downside move, a correction, after a big run. Look at the pattern. Look at the ones that you have in your report. You'll see that little head and shoulders forming up and a little rollover. That's okay; we're expecting more downside this week and have positioned for it.

Now the question is, and what everyone always wants to know is: How long is this selling going to last? Well, the market is a living, breathing entity. We always say this: it acts like we do. If it runs real fast, it gets tired and has to take a rest. If it runs real fast for too far - or, I like to use bicycling analogies used in the Grand Tours-- if it goes so hard, so fast in the red line that it pops, then it collapses; it's over, it's done. It's going to go way back down.

Well, we've gone a long way off the bottom, but we haven't gone that far. The way things look now, we've got a rather normal pullback underway. One indicator we look at are Fibonacci levels. They are one indicator we use, though we look at a lot of other things as well. But Fibonacci's are nice. They give you round figures to look at. NASDAQ could come back to 1600-ish. 1600 looks good at the February high, but just below that at 1565ish that is the 38% Fibonacci level. That's a normal continuation retracement. In other words: you go up, you sell back that 38% level, boom, you can take off right from there again. You can go back to 50%, boom, take off from there again, as well.

Now on SP500, we're looking at 875 right now. But a trip to 850 looks totally normal, and a Fibonacci 38% retracement is all the way down to 824. Wow, 825. That's a nice even, round number. It may not make it down to 806 like we wanted it to originally, but 825 would be just a normal retracement. And what would 50% be, by the way? Fifty percent would be right at 794.

Fibonacci's are basically natural rhythms in nature, and we're big into the market being rhythms. We always talk about weather analogies, and volatility being the weather change, and that sort of thing. So we really like the Fibonacci's, trendlines, and moving averages, because they're that same ebb and flow. Traders and big money technicians look at these. That's why they work. They're emotionally driven. The markets are emotionally driven. We're humans; we're live by emotions. And we tend to cling to our guns, religion, . . . just kidding. We cling to to trends and patterns that have held in the past. Therefore, when a market hits these certain levels, people tend to react the same way. Whether it was a thousand years ago, or five thousand years ago, or five minutes ago, they tend to react the same way.

So, what we're looking for now is this market to keep coming back in a normal retracement. It will find it's level, whether it's 20%, whether it's 10%, whether it's 38%. It will find it's level. It will give us the sign posts along the way, telling us it's getting ready. How will we know? If it's getting ready to turn, we'll see leaders start to hold again. And leaders, by definition, are leaders. They start up before everyone else. As I mentioned earlier, we've got Visa, there's CAT, there's Joy G, there's others out there - XTO - that are holding up very well. And if they hold up well during the selloff, they'll be out leading again. And we'll be seeing them turn up, and we'll be buying them. A lot of times, we're not smart enough to figure out exactly what the market is going to do. All we can say is the big money is buying these stocks; they're going back up. So we join in and buy them, too.

We saw things getting ready to turn over so we joined in and started downside positions. We're letting some of our upside positions ride because they're still in good shape. Some are giving us a little heartburn at times, but they're still in good shape. We're aren't expecting massive sell-offs from these stocks that look really good still. We'll have to play it and see how they work and how they hold up, but, overall, we really like what we see from the market still.

Again, we're not saying that the rally is over, that it's going to end in a massive selloff. That is a worry if the economic data cannot make a real turn and the economy double dips. Right now the market is not saying that, and the market has the last word. Some are really negative with prognostications of the Dow at 4000, 5000; SP at 600 by Memorial Day - I'm just throwing those out, that's nonsense, but that's the kind of fear you still hear. You always hear that. Every time there is a top, or turn in the market; every time there's a bottom, you hear "huge upside" or "huge downside," and it's always worst case. But, are things ever that bad? Sometimes they are, as we found out last fall, but usually not. This is an unusual time, of course, but we're starting to see the biorhythms get back in the way they usually work. We're starting to see patterns work the way they should work. And money is coming into the market again. Which, of course, is another reason why it probably topped right now. With everyone feeling good about the market rally, several billion dollars flowed into the market over the past week or two. And of course, as usual, the money flowed in just as the market topped. So that's another indication that we're in for some more selling right now. The money's just coming in. That usually means the market has stopped near term. That money will be put to work at some point, just not right now.

For now we are going to make some money on the downside and we are going to look at some more downside positions this coming week. Then when we start to see good stocks bottom, we're going to have them on the report (we are already doing that of course), and you're going to be ready to buy them just as in "Trading Places", "Buy 'em!" We'll be doing that. And we'll be riding the next CME up, we'll be riding the next POT up, and those kind of stocks that have soared and made money for us to the upside when the market was moving down on the week.

I hope you had a great week, and I hope you have a great weekend. Because what we need to do is hammer the market, take everything that it gives us, but also take everything that life gives us as well. And that's why we do this. We do this so you can do what you want to do. That's our definition of retirement: Being able to do what you want to do, when you want to do it. We love providing information to people who are where we were years ago. Hope you have a great weekend, take care of yourself, and very good investing to you.

Support and Resistance

NASDAQ: Closed at 1680.14
Resistance:
The 18 day EMA at 1693
The 10 day EMA at 1702
The 200 day SMA at 1727
1770 is the mid-October interim peak
1773 is the May peak
1780 is the November 2008 peak
1947 is the October gap down point

Support:
1673 is the prior April peak
1666 is the intraday January 2009 peak
1661 is the April 2009 prior peak
The January closing peak at 1653 (intraday)
The 50 day EMA at 1626
1623 is the early April peak
1620 from the early 2001 low
1603 is the December peak
1598 is the February 2009 peak, the last peak NASDAQ made
1587 is the March 2009 high is getting put to bed again
1569 is the late January 2009 peak
1542 is the early October 2008 low
1536 is the late November 2008 peak
1521 is the late 2002 peak following the bounce off the bear market low
1505 is the late October 2008 closing low.
1493 is the October 2008 low & late December 2008 consolidation low

S&P 500: Closed at 882.88
Resistance:
The 10 day EMA at 894
896 is the late November 2008 peak
899 is the early October closing low
919 is the early December peak
930 is the May peak
935 is the January closing high
944 is the January 2009 high
The 200 day SMA at 946

Support:
888.70 is the April intraday high.
The 18 day EMA at 885
878 is the late January 2009 peak
The prior April peak at 876
866 is the second October 2008 low
857 is the December consolidation low; cracking but not broken
The 50 day EMA at 854
853 is the July 2002 low
848 is the October 2008 closing low
846 is the April peak
842 is the early April peak
839 is the early October 2008 low
833 is the March 2009 peak
The 90 day SMA at 825
818 is the early November 2008 low
815 is the early December 2008 low
805 is the low on the January 2009 selloff. KEY Level
800 is the March 2003 post bottom low
768 is the 2002 bear market low
752 is the November 2008 closing low but it is not broken and done away with
741 is the November 2008 intraday low

Dow: Closed at 8268.64
Resistance:
The 10 day EMA at 8336
8375 is the late January 2009 interim peak
8419 is the late December closing low in that consolidation
8451 is the early October closing low
8521 is an interim high in March 2003 after the March 2003 low
8588 is the May high
8626 from December 2002
8829 is the late November 2008 peak
8934 is the December closing high
8985 is the closing low in the mid-2003 consolidation
9088 is the January 2009 peak

Support:
The 18 day EMA at 8264
8315 is the February 2009 peak
8307 is the April 2009 intraday high
8197 was the second October 2008 low
8191 is the prior April peak
8175 is the October 2008 closing low. Key level to watch.
8141 is the early December low
The early April intraday peak at 8113
The early April peak at 8076
The 50 day EMA at 8039
7965 is the mid-November 2008 interim intraday low.
7932 is the March 2009 peak
7909 is the early January low
7882 is the early October 2008 intraday low. Key level to watch.
7867 is the early February low
7702 is the July 2002 low
7694 is the February intraday low
7552 is the November closing low. KEY Level.

Economic Calendar

These are consensus expectations. Our expectations will vary and are discussed in the 'Economy' section.

May 19 - Tuesday
- April Building Permits (8:30): 530K expected, 516K prior
- Housing Starts, April (8:30): 527K expected, 510K prior

May 20 - Wednesday
- 5/15 Crude Oil Inventories (10:30): -4.63M prior

May 21 - Thursday
- 5/16 Initial Jobless Claims (8:30): 610K prior
- Leading Economic Indicators, April (10:00): 0.6% expected, -0.3% prior
- Philadelphia Fed, May (10:00): -18.0 expected
icon url

ReturntoSender

05/18/09 10:33 PM

#8575 RE: ReturntoSender #6755

From Briefing.com: 4:30 pm : Stocks closed at session highs as diversified bank stocks and financial services stocks steadily led the broader market to its best single-session percentage advance in nearly two weeks.

Bank of America (BAC 11.73, +1.06) was a primary leader among financials after reports indicated that analysts at Goldman Sachs added shares of BAC to their Conviction Buy List. Even in the face of persistent capital concerns, regional banks jumped 7.1%, diversified banks finished 8.5% higher, and diversified financial services companies advanced 7.6%. The KBW Banking index climbed 7.5%.

Strength in bank stocks led the financial sector to a 7.2% gain, and helped carry the S&P 500 back above 900 as the broader market's advancing issues outnumbered its decliners by 10-to-1.

The positive bias also helped pare losses in the utilities sector, which looked as if it would close lower for its fourth straight session. Instead, utilities finished flat.

Buyers favored cyclical stocks for most of the session, bidding materials stocks (+3.6%), industrial stocks (+3.2%), and shares of retailers (+4.5%) higher. Retailers received added support after better-than-expected top and bottom line quarterly results and an upbeat earnings outlook from home improvement outfit Lowe's (LOW 20.13, +1.68) helped home improvement retailers tack on 7.0%.

Home improvement retailers will likely have their gains tested Tuesday as April housing starts and building permits data hits news wires (8:30 AM ET). No other economic data is scheduled for release ahead of tomorrow morning's opening bell.

According to Reuters, Macy's (M 12.14, +0.81) was added to the Conviction Buy List at Goldman Sachs, winning additional favor for retailers. Reuters also reported that Goldman cut its rating on Nordstrom (JWN 22.96, +0.38), but shares of JWN were able to overcome sellers' initial efforts and close higher with its peers.

Energy stocks (+3.1%) climbed as crude oil futures rallied 4.8% to settle pit trading just above $59 per barrel at a six-month closing high.

Precious metals fell out of favor, though, as equities bounded in broad-based fashion. Gold prices settled 1.0% lower at $921.70 per ounce, while silver slipped 1.3% to settle the session at $13.93 per ounce.

Also a defensive benchmark, the 10-year Treasury Note dropped 23 ticks, lifting its yield to roughly 3.22%.

Trading volume during the session was rather low, however. Roughly 1.4 billion shares traded hands on the NYSE.DJ30 +235.44 NASDAQ +52.22 NQ100 +2.8% R2K +4.0% SP400 +3.8% SP500 +26.83 NASDAQ Adv/Vol/Dec 2158/2.02 bln/543 NYSE Adv/Vol/Dec 2722/1.42 bln/361

4:55PM LSI Logic LSI announces redemption of Agere Systems 6.5% convertible subordinated notes due 2009 (LSI) 3.87 +0.08 : Co announced that all of the outstanding 6.5% Convertible Subordinated Notes due 2009 of Agere Systems Inc. have been called for redemption on June 15, 2009, at a redemption price of 100.43% of the principal amount of each note plus accrued interest to the date of redemption. LSI has guaranteed the notes. Prior to close of business on June 12, 2009, holders may convert their notes into shares of LSI common stock at a conversion price of $15.3125 per share. On May 18, 2009, the last reported sale price of LSI common stock on the New York Stock Exchange was $3.87 per share.

4:04PM Trident Microsystems announces Q4 non-GAAP operating loss is projected to be in the range of $15 to $17 mln (TRID) 1.47 +0.05 : Co announces an update to its outlook for the fourth quarter of fiscal year 2009. Trident's outlook for the fourth quarter of fiscal year 2009, described below, is based on current expectations, includes expected results from the recently completed acquisition of certain consumer business division assets from Micronas Semiconductor Holding AG, and is subject to various factors, including those set forth in the Forward-Looking Information statement below. Actual results may differ materially. Fourth Quarter Fiscal Year 2009 Outlook Net revenues are expected to be in the range of $15 to $18 mln (may not be comparable to $6.67 mln consensus). Non-GAAP Gross Margin in the low 30% range. Non-GAAP operating loss is projected to be in the range of $15 to $17 mln. The company expects to end the quarter with a cash balance of approx $177 to $182 mln.

6:02AM SMSC updates business outlook (SMSC) 15.20 : Co announces that it expects revenues for the first quarter of FY10, which ends on May 31, 2009, to increase approx 20% sequentially. This compares to the earlier expectation of a 10% increase at the midpoint of the guided range. "We have continued to see an improvement in sales, primarily due to a faster than expected recovery in our PC business," said Christine King, President & Chief Executive Officer. "We have completed actions to right-size our business and we expect to deliver on our previously guided sequential non-GAAP operating expense reductions of 5 to 8 percent. The book-to-bill ratio continues to be greater than 1.1, contributing to our confidence that we will see continued sales improvements into our fiscal second quarter."

09:56 am Cymer upgraded to Buy at Stifel Nicolaus; tgt $34: . Stifel Nicolaus upgrades CYMI to Buy from Hold and sets target price at $34. The firm notes that while the key driver for their upgrade is their more positive industry stance, they also believe Cymer is well positioned in an above-average industry growth sub-segment and is currently the technology leader, diversifying its business model and capitalizing on its large installed base with its new OnPulse program and strengthening its operating model through aggressive cost cuts and internal changes to its finance team

09:55 am Marvell upgraded to Outperform at Credit Suisse; estimates and tgt raised to $14: . Credit Suisse upgrades MRVL to Outperform from Neutral and raises their tgt to $14 from $9 as the firm believes upside to near-term results on rebound in hard drives off January lows and stabilization across the communications business coupled with significant market share gains at Seagate and Hitachi in FY11 provides relative support in a broader pullback and allows the stock to outperform if a broader recovery gains momentum. The firm also expect some upside to April results and July guidance when the co reports Thursday May 28th.

icon url

ReturntoSender

05/19/09 7:23 PM

#8576 RE: ReturntoSender #6755

From Briefing.com: 4:30 pm : A late selling effort caused stocks to close a choppy session in mixed fashion. The session's lack of direction followed disappointing housing data and a pullback by financial stocks.

News that housing starts and building permits recently fell below expectations jostled participants in the early going and undermined what was a positive bias ahead of the opening bell. Housing starts during April came in at an annualized rate of 458,000, while building permits for April hit a rate of 494,000. Both marked record lows.

However, there is a silver lining to the report. Fewer housing starts and building permits means there will be fewer homes on the market, which should help clear the glut of existing homes and improve pricing.

Contrasting its performance in the prior session, financials were the worst performing sector in the S&P 500. They finished 2.6% lower amid weakness in consumer finance stocks and banking stocks.

Consumer finance companies (-4.8%) saw their shares come under increased pressure following news that the Senate has passed legislation to place new restrictions on the credit card industry. Dow component American Express (AXP 24.79, -1.34) showed particular weakness, even though the company announced plans to save $800 million this year by slashing jobs, investments, and costs.

Diversified banks dropped 4.9% as participants shrugged off news that the Fed has expanded collateral eligible under its TALF to include high-quality commercial mortgage-backed securities in order to ease balance sheet pressures. The Fed's announcement was made in the wake of a report from The Wall Street Journal that suggested commercial real-estate loans could generate $100 billion in bank losses by next year.

Meanwhile, CNBC reported that TARP repayment announcements will not be made until after June 8, and that the Treasury will announce a process for auctioning TARP warrants in the next several days.

On a similar note, Financial Times reported that Britain has begun talks with sovereign wealth funds and other investors about selling stakes in its part-nationalized banks.

Health care stocks also traded as laggards. They finished with a 0.6% loss, though AmerisourceBergen (ABC 35.96, +0.38) showed strength after it announced better-than-expected earnings, raised its guidance, hiked its quarterly dividend by 20%, and issued a 2-for-1 stock split.

There weren't many earnings reports for participants to assess this session. However, Dow component Home Depot (HD 24.63, -1.39) did post better-than-expected earnings for the latest quarter. That wasn't enough to win the company favor among participants, though. The stock surrendered nearly all of its gains from the prior session, and traded as a laggard among retailers, which finished the session 0.3% higher.

Utilities made up the best performing sector by finishing 1.7% higher. The strong performance followed a flat finish in the prior session, and losses in the three preceding sessions.

Only a handful of companies are scheduled to announce earnings results ahead of tomorrow's opening bell. The minutes from the FOMC's April 29 meeting are due at 2:00 PM ET and should help provide investors with details regarding the Fed's quantitative easing efforts.DJ30 -29.23 NASDAQ +2.18 NQ100 +0.4% R2K -0.3% SP400 +0.2% SP500 -1.58 NASDAQ Adv/Vol/Dec 1348/2.13 bln/1315 NYSE Adv/Vol/Dec 1806/1.35 bln/1219

4:13PM Hewlett-Packard reports EPS in-line, revs in-line; guides Q3 EPS in-line; reaffirms FY09 EPS guidance, see revs at lower end of prior range (HPQ) 36.58 +0.85 : Reports Q2 (Apr) earnings of $0.86 per share, excluding non-recurring items, in-line with the First Call consensus of $0.86; revenues fell 5.0% year/year to $27.35 bln vs the $27.42 bln consensus. Co issues in-line guidance for Q3, sees EPS of $0.88-0.90 vs. $0.89 consensus; sees Q3 revs flat to down 2% vs current consensus for roughly flat sequential revs. Co reaffirms guidance for FY09, sees EPS of $3.76-3.88 vs. $3.71 consensus. HPQ sees FY09 revs down 4-5% vs current consensus of a ~4% decline and previous guidance of down 2-5%. "Our services business continued to deliver strong profitability with an increased deal pipeline and the EDS integration tracking ahead of schedule."

4:06PM Analog Devices beats by $0.12, beats on revs; guides Q3 EPS above consensus, revs above consensus (ADI) 20.58 +0.68 : Reports Q2 (Apr) earnings of $0.21 per share, excluding non-recurring items, $0.12 better than the First Call consensus of $0.09. ADI gross margin 55.1% vs 53.5% consensus; Q2 revenues decreased 27% y/y to $475 mln compared to First Call consensus of $427 mln. Co issues upside guidance for Q3, sees EPS of 0.17-0.19 vs. $0.11 consensus; sees Q3 revs 'flat sequentially' (~$475 mln) vs. $441.76 mln consensus. Regarding the outlook for Q3 co stated, "Orders to ADI and our distributors recovered significantly in the second quarter, as customer inventory reductions subsided. Our book-to-bill ratio for the second quarter, as measured by end customer bookings, was slightly above one for the first time since the third quarter of fiscal 2008, and our third quarter opening backlog was up from last quarter. In addition, order levels were stable throughout the second quarter and have remained at these levels through the first two weeks of May. Nevertheless, our lead times remain short and we are still receiving a significant portion of new orders as turns orders, thereby limiting visibility. Given these factors, we're planning for our third quarter revenue to be approximately flat on a sequential basis. We plan to continue to reduce inventories in the third quarter, and to keep very tight control over operating expenses. As a result, we expect gross margins to be approximately 54% to 55%, depending on end market revenue mix and factory utilization, and are planning for operating expenses to remain approximately flat sequentially. In addition, we expect our tax rate to be approximately 21% for the remainder of the fiscal year. As a result, we are planning for diluted EPS from continuing operations for the third quarter to be approximately $0.17 to $0.19."

4:06PM Hewlett-Packard spiking down over a point following earnings (HPQ) 36.63 +0.90 : $35 is support, while support at $34 is even stronger. Last trade at $35.75

4:06PM Electro Scientific announces that has adopted a new shareholder rights agreement; terms of the new rights agreement are virtually identical to the terms of ESI's prior rights agreement (ESIO) 8.70 -0.04 :

4:05PM Nanometrics announces the shipment of a Lynx cluster metrology system (NANO) 1.73 +0.01 :

10:16AM VIX Volatility Index moves below the 30.00 mark to lowest level since Sept 19, 2008... VIX is currently -0.33 at 29.91 :

7:48AM JA Solar misses by $0.13, misses on revs; believes unlikely to hit prior guidance (JASO) 3.24 : Reports Q1 (Mar) loss of $0.18 per share, $0.13 worse than the First Call consensus of ($0.05); revenues fell 79.4% year/year to $33.9 mln vs the $107.9 mln consensus. The first quarter results and the continuing market uncertainty are translating into less visibility for the coming quarters. At this time, JA Solar believes it is unlikely to achieve the results as given in the 2009 guidance provided on March 10, 2009, which was for revs of $830-952 mln (consensus is $734 mln) and production output of 500 MW to 550 MW. JA Solar has no plans to give further guidance on its 2009 rev or production unless and until the co has better visibility of the global solar market conditions in the coming quarters. Co says, "The global industry conditions were particularly difficult, with the market affected by worse than normal seasonality, a weak macro-economic environment and the continuing impact of the credit crisis resulting in some issues with customer project financing. However, we are actively managing our business to prepare for what we hope to be the market's recovery in the latter part of this year and we are seeing encouraging signs of market improvement in key end markets. We have sufficient liquidity to sustain the current downturn and we are positioning ourselves for growth in the second half of 2009 and beyond."

7:33AM Solarfun Power beats by $0.15, reports revs in-line (SOLF) 5.07 : Reports Q1 (Mar) loss of $0.02 per share, $0.15 better than the First Call consensus of ($0.17); revenues fell 41.5% year/year to $100.1 mln vs the $100.1 mln consensus. Gross margin improved to 7.2% from negative 33.7% in 4Q08. Average selling price (ASP) declined further, as expected, to US$2.78 from US$3.37 in 4Q08 due to the competitive environment. The co previously announced signed contracts with key customers totaling 200 MW and is actively negotiating others. Excluding the aforementioned manufacturing services agreement with Q-Cells, Solarfun has an ongoing dialogue with other customers to ensure that both partners find a sustainable way forward on these contracts. They note, however, that this is a very fluid business environment and their ability to predict is less certain. The co continues to expect full-year demand to exceed these levels as markets rebound and begin to build momentum, particularly in the latter half of 2009. Co says, "We continue to remain optimistic for the remainder of 2009 and beyond. With both module and raw material prices declining, we think volume growth is imminent. Incentives already in place, and new ones from the United States and China in particular, bode well for a resumption of healthy growth in the long term."

7:02AM Hewlett-Packard and Microsoft expand alliance in unified communications and collaboration (HPQ) 35.73 : Co and Microsoft (MSFT) announce a four-year strategic global initiative to deliver an end-to-end unified communications and collaboration solution. As part of their Frontline Partnership, the two companies expect to invest up to an additional $180 mln in product development, professional services, as well as joint sales and marketing, to help organizations lower costs and improve productivity.

09:41 am Microchip initiated with a Buy at Caris & Company; tgt $26: . Caris & Company initiates MCHP with a Buy and price target of $26. The firm believes that the co is a unique microcontroller pure play possessing one of the highest quality chip business models. The firm notes that they expect increasingly-visible 16-bit MCU rev growth in 2009, a rebound in analog, and emerging 32-bit MCU growth in 2010. The firm believes that competitors TXN, SLAB, and ATML bear watching, though fieldwork suggests MCHP software, training, and online resource advantages are powerful tailwinds, while the combination of competitors NEC and Renesas create a share gain opportunity. Additionally, mgmt team stability and experience lend ballast to execution prospects while small technology and product deals enhance 2-3 year growth prospects.

icon url

ReturntoSender

05/20/09 10:33 PM

#8577 RE: ReturntoSender #6755

From Briefing.com: 4:15 pm : Recovering from losses last week, a bullish bias has supported buying in recent sessions, which helped participants begin Wednesday with strong gains. The upbeat tone was supported by continuing gains among commodities and an early advance by financial stocks. However, stocks began drifting lower midway through the session and ultimately closed with a loss as participants turned against financials.

Early gains were helped along by investors that chased commodities and materials stocks, which have benefited from the assumption that stronger economic conditions in the back half of the year will rekindle commodity demand. A weaker dollar has also helped bolster commodity prices.

The minutes from the April FOMC meeting indicated that participants project a contraction for real GDP this year, and that committee members believe the near-term economic outlook has weakened relative to the projections made in January. However, a recovery in sales and production is still expected to begin in the second half of this year.

With the dollar dropping more than 1% against a basket of major foreign currencies, gold prices advanced 1.2% to settle pit trading at seven-week high of $937.40 per ounce. Gold stocks like Newmont Mining (NEM 45.55, +1.98) provided leadership to the materials sector (0.5%), which had spent most of the session trading with gains exceeding 2%. Meanwhile, metals and mining stocks climbed 1.0%.

Oil prices built on the prior session's advance to register fresh six-month intraday highs and closing highs. The advance was helped along by bullish inventory data, which showed a 2.1 million barrel draw for the week ending May 15 while a draw of 400,000 barrels was expected. Crude contracts settled more than 3% higher just above $62 per barrel.

Financials proved to be a weak link during the session. The financial sector spiked to a near 3% gain in the early going, helping drive the broader market higher, but the move ultimately collapsed. Financial stocks closed the session with a 2.4% loss.

Though Bank of America (BAC 11.50, +0.25) showed strength after announcing that it raised $13.5 billion through a previously announced share offering following government stress tests, banks were among the sectors weakest performers. The KBW Banking Index slid 2.8%.

Consumer finance companies (-3.5%) also showed considerable weakness amid continued concern that new rules are in order for credit card companies. Following the Senate's approval yesterday, the House of Representatives approved a bill imposing changes for the credit card industry.

Retailers had a seesaw session, which saw the sector trade with a 3.0% gain before settling with a 1.6% loss. Despite the disappointing finish, Target (TGT 42.95, +1.01) still logged an impressive gain following better-than-expected earnings.

Dow component Hewlett-Packard (HPQ 34.63, -1.95) generated in-line earnings for its latest quarter and issued an in-line forecast for the current quarter. The company's upside outlook for fiscal 2009 wasn't enough to win it favor, though. The stock traded as a laggard among tech issues (-0.7%). DJ30 -52.81 NASDAQ -6.70 NQ100 -0.3% R2K -0.7% SP400 -0.6% SP500 -4.66 NASDAQ Adv/Vol/Dec 1239/2.23 bln/1453 NYSE Adv/Vol/Dec 1591/1.65 bln/1452

5:54PM Qualcomm disagrees with ITC determination in Tessera Matter (QCOM) 42.57 +0.23 : Co stated that it is disappointed with the U.S. International Trade Commission's (ITC) final determination that QCOM's accused chip packages infringe two patents asserted by Tessera (patents '326 and '419), which it also found valid. The ITC also issued a limited exclusion order banning QCOM and other respondents from importing into the United States the accused chip packages except to the extent those products are licensed.

5:32PM Tessera Tech: ITC rules Tessera patents valid and infringed (TSRA) 16.61 +1.00 : Co announced that the International Trade Commission (ITC) issued a final determination in the action brought by Tessera against certain wireless manufacturers, Investigation No. 337-TA-605 (Wireless ITC action), finding Tessera's asserted patents are valid and infringed. The ITC issued a Limited Exclusion Order that prohibits the importation of certain infringing electronic devices that use Tessera's patented technology, which are imported by or on behalf of the named respondents. The Commission also issued a Cease and Desist Order against Motorola, Qualcomm, Freescale and Spansion, directing them to cease their unfair acts including selling infringing articles out of their US inventories.

4:29PM Emcore announces long term supply agreement with Space Systems/Loral (EMKR) 1.19 +0.08 : Co announces that Space Systems Loral (SS/L) has awarded a long term supply agreement contract to EMCORE's Photovoltaics Division to manufacture and deliver high-efficiency, multi-junction solar cells for Space Systems/Loral's spacecraft programs. The period of performance for the contract is 2009 through 2014.

8:38AM Photronics to enter into new lease agreement (PLAB) 2.45 : The co announces that it has reached agreement with Micron Technology to enter into a new operating lease agreement for the NanoFab and terminate its original capital lease agreement. Under the terms of the agreement, quarterly lease payments will be reduced from $3.8 million to $2.0 million, and the lease term will be extended from December 31, 2012 to December 31, 2014. In connection therewith, the outstanding debt and assets associated with the NanoFab will be reduced by approximately $30 million.

8:31AM Axcelis Tech announces workforce reduction; estimated to yield savings of $25 mln annually (ACLS) 0.38 :

8:04AM Atmel and ARM expand strategic relationship with subscription license agreement (ATML) 3.78 : Co and ARM (ARMH) announce an extension to their strategic relationship with a new subscription license agreement. Under the terms of the agreement, Atmel gains access to a number of existing and future ARM Cortex processors for use in products aimed at a broad variety of applications and markets.

08:04 am Hewlett-Packard (HPQ)

Profits and sales both dropped at Hewlett-Packard (HPQ 36.58), but the company was able to meet analyst expectations for its fiscal second quarter.

The Palo Alto, Calif.-based company reported second quarter earnings of $0.86 per share, excluding nonrecurring items, in-line with the First Call consensus of $0.86.

Revenues fell 5.0% year-over-year to $27.35 billion; the consensus expected $27.42 billion.

By region, revenues were down 9% in the Americas to $12.1 billion. Revenue declined 11% in Europe, the Middle East and Africa and 10% in Asia Pacific to $10.6 billion and $4.7 billion respectively. Revenues from outside of the U.S. accounted for 64% of total revenue.

Looking ahead, HP said it expects fiscal third quarter earnings to range from $0.88 to $0.90 per share, in-line with the $0.89 consensus. The company expects revenues in the quarter to be flat to down 2%; the consensus expects roughly flat sequential revenues.

For the full year, HP sees earnings from $3.76 to $3.88 per share, above the current consensus of $3.71. Full year revenues are expected to fall between 4% and 5%; the consensus currently expects a decline of approximately 4%.

Shares of HPQ are down 3.3% in premarket trading.

09:35 am Analog Devices upgraded to Buy at Caris & Company; tgt raised to $28: . Caris & Company upgrades ADI to Buy from Above Average and raises their tgt to $28 from $26. The firm notes that the positives that they have expected from the co are coming sooner and more significantly, contributing to a strong F2Q09 beat down the income statement and a positive round of Street estimate changes. Most significantly, the firm notes that industrials revenue is troughing at a structurally higher-than-feared level while depreciation and opex drop to structurally lower-than-hoped levels -- a potent positive for operating margin leverage, which the firm believes is the key ADI stock price driver.

09:34 am JA Solar upgraded to Buy at AmTech Research; tgt raised to $5: . AmTech Research upgrades JASO to Buy from Neutral and raises their tgt to $5 from $4 noting JASO reported worse than expected revenue and pro-forma EPS results of $33.9 mln and ($0.18), respectively. The firm says weak results were due to extreme under-utilization, inventory write-downs, and declining ASPs. The firm says they would expect a significant sequential improvement in Q3 as BP ramps more core-cell business and utilization rates improve to 70%+ from ~15% in 1Q09. They also believe that margins for JASO are set to improve dramatically through the balance of the year as utilization rates improve and high-cost poly inventory is worked through. Firm believes module pricing is beginning to stabilize as financing shows initial signs of improvement.

icon url

ReturntoSender

05/21/09 11:11 PM

#8578 RE: ReturntoSender #6755

From Briefing.com: 4:15 pm : Emboldened by economic concerns, sellers took control of stocks and handed the major indices a marked loss. Though declines were deep and broad, stocks still finished off of their session lows.

A sharp pullback by the U.S. dollar helped gold prices close 1.5% higher at $951.20 per ounce and oil prices pare their losses to settle pit trading with a 1.6% loss at $61.02 per barrel. The greenback's 0.8% slide took the dollar index to a four-month low and came as global investors showed concern about the U.S. economic outlook in the wake of Standard & Poor's decision to lower its outlook for the United Kingdom. Just yesterday the Fed lowered its outlook for U.S. economic growth.

Worse-than-expected jobless claims supported the premise that economic conditions remain tenuous. Initial claims for the week ending May 16 totaled 631,000, while continuing claims climbed to a new record of 6.66 million.

Treasuries took a pounding amid the economic concerns. The benchmark 10-year Note fell 43 ticks, which pushed its yield near 2009 highs. Disappointing buybacks by the Fed also provided a catalyst for the downward move by Treasuries; investors have expected that the Fed will be expanding the size of such repurchases.

Participants largely dismissed a 1.0% increase in leading economic indicators for April even though the data was better than expected and marked the first increase in ten months.

Financials (+0.2%) attempted to provide support to the broader market. They oscillated between positive and negative ground before finishing as the only sector to log a gain. Regional banks (-4.5%) were a heavy drag on the financial sector as Fifth Third (FITB 6.95, -0.76) became the latest bank to come to market looking to raise capital in the wake of the government's stress tests. Fifth Third filed a $750 million common stock offering. Meanwhile, Regions Financial (RF 4.15, -0.74) disappointed investors by pricing its previously announced offering markedly below recent averages.

Losses were broad-based for the entire session. In the end, roughly 85% of the companies listed in the S&P 500 closed in the red. The S&P 500 did find some technical support as it encountered last week's lows.

General Motors (GM 1.91, +0.46) was one of only a handful of Dow components to log a gain. GM was supported by news the company has reached a labor contract deal with the United Auto Workers Union (UAW) and the Treasury, along with more reports indicating that GM's finance arm, GMAC, will receive $7 billion from the Treasury. Including this session's spike, shares of GM are up 77% week-to-date.DJ30 -129.91 NASDAQ -32.59 NQ100 -1.9% R2K -1.7% SP400 -1.8% SP500 -15.14 NASDAQ Adv/Vol/Dec 779/2.15 bln/1912 NYSE Adv/Vol/Dec 808/1.44 bln/2214

4:10PM LDK Solar misses by $0.13, beats on revs (LDK) 9.30 -0.55 : Reports Q1 (Mar) loss of $0.21 per share, $0.13 worse than the First Call consensus of ($0.08); revenues fell 33.6% year/year to $283.3 mln vs the $240 mln consensus. Gross margin for 1Q09 was 1.7%, compared to negative 49.6% in 4Q08 and 27.7% in the first quarter of fiscal 2008. For 2Q09, LDK estimates its wafer shipments between 200 MW to 220 MW. Co states, "...We continue to adjust our expansion plans in order to most effectively reduce near-term capital expenditure outlays and to best align with the decrease in demand seen industry-wide. We continued to ramp polysilicon production in our 1,000 MT polysilicon plant and are pleased with the progress in the construction our 15,000 MT plant and look forward to the increasing cost savings that in-house polysilicon production will afford as our polysilicon production grows."

4:08PM Verigy beats by $0.21, beats on revs; guides Q3 revs above consensus (VRGY) 11.31 -0.33 : Reports Q2 (Apr) loss of $0.44 per share, excluding non-recurring items, $0.21 better than the First Call consensus of ($0.65); revenues fell 56.2% year/year to $71 mln vs the $61.6 mln consensus. Co issues upside guidance for Q3 (Jul), sees Q3 revs up 10-25% sequentially, which we compute as $78.1-88.8 mln vs. $67.6 mln consensus.

11:01AM Agilent partners with China Environmental Center to detect toxins in water and soil (A) 17.82 -0.82 : Co announces it has jointly developed a method to detect and identify perfluorinated compounds (PFCs) in water and soil using High-Performance Liquid Chromatography Mass Spectrometry (HPLC/MS) with the China National Environmental Monitoring Center (CNEMC).

10:12AM LDK Solar determined that a further write-down of ~$87.5 mln to its inventories and additional provision for doubtful recoveries of ~$12.3 mln for its prepayments to suppliers (LDK) 8.72 -1.07 : Co announces update to its Q4 financial report. Co announces that during the course of the preparation of its 2008 annual report, LDK Solar's management determined that a further write-down of ~$87.5 mln to its inventories and an additional provision for doubtful recoveries of ~$12.3 mln for its prepayments to suppliers at December 31, 2008 are required to properly adjust previously announced preliminary unaudited financial results for the fourth quarter and fiscal year ended December 31, 2008. The additional write-down of inventories was primarily due to updated information about the estimated net realizable value of LDK Solar's inventories as at December 31, 2008. The additional provision for doubtful recoveries of prepayments to suppliers was also based on updated information about LDK Solar's suppliers' ability to honor existing contractual terms for delivery of product or refund of amounts paid.

7:11AM Research In Motion executives adopt automatic securities disposition plans (RIMM) 75.81 : Co announced that Jim Balsillie and Mike Lazaridis, RIMM's Co-Chief Executive Officers, have each adopted new automatic securities disposition plans in accordance with the Securities and Exchange Commission's Rule 10b5-1, applicable Canadian provincial securities legislation, including the guidance under Ontario Securities Commission's Staff Notice 55-701, and RIMM's Insider Trading Policy.

6:59AM Suntech Power files mixed shelf offering; files for 20 mln ADS offering under offering (STP) 15.83 : Co files for a mixed shelf offering for an indeterminate amount; then files for a 20 mln share ADS offering under that shelf.

icon url

ReturntoSender

05/25/09 9:42 PM

#8579 RE: ReturntoSender #6755

From Briefing.com: Weekly Recap - Week ending 22-May-09

The stock market kicked off the week with a strong start, but gave up a substantial portion of the advance throughout the week, eventually settling with modest 0.5% gain. Economic data did not help matters with the number housing starts falling to a record low, and the number of continuing unemployment claims hitting a fresh record high.

Stocks surged on Monday, led by a 7.2% gain in financials as Bank of America (BAC) rallied after being added to Goldman Sachs' Conviction Buy List. Goldman cited "another solid mortgage and capital markets quarter, given observable activity levels since March." Lowe's (LOW) also added to the bullish sentiment after the home improvement retailer posted better-than-expected earnings and issued upside guidance.

But the positive bias was short-lived.

Economic data were poor. The housing industry remains weak, with both housing starts and building permits falling to record laws. Starts fell -12.8% from March to an annualized rate of 458,000 units (consensus 520,000) while permits dropped -3.3% to an annualized rate of 494,000 (consensus 530,000).

Meanwhile, initial unemployment claims for the week ended May 16 totaled 631,000 (consensus 625,000), which was down from an upwardly revised reading of 643,000 (from 637,000) in the prior week. Continuing claims jumped by 75,000 to a record 6.662 million, which brought the four-week moving average for this series to 6.48 million from 6.35 million. This reflects the weak U.S. labor market.

The Fed released the minutes from the April FOMC meeting, which didn't bring much in terms of surprises. The Fed did, however, lower its real GDP projections for 2009, 2010, and 2011. The FOMC also discussed increasing purchases of agency and Treasury securities, but all members felt it was appropriate to wait further to see how policy actions implemented to date influence the economy and financial conditions before adjusting the size and timing of such purchases.

The U.K. had its sovereign debt rating outlook downgraded to negative from stable at Standard & Poor's, which cited an increasing debt-to-GDP ratio. In turn, this spurred a sharp decline in the dollar and Treasuries on concern that the U.S. may also face a negative outlook on its AAA rating. For the week, the dollar fell 3.6%.

The drop in the dollar gave commodities a boost, with crude prices surging 9.4% and the CRB Index advancing 3.3%

In corporate news, earnings flow was on the slow side, although there were a larger number of retailers announcing their quarterly results. For the most part, earnings were better than expected, with Target (TGT), Saks (SKS), TJX (TJX), Lowe's (LOW), Home Depot (HD), Sears (SHLD), and Gap (GPS) beating estimates.

Outside of retail, Hewlett-Packard (HPQ) reported in-line earnings, while Deere (DE) beat but provided downside guidance.

There was some action on Capitol Hill, with Treasury Secretary Geithner testifying before the Senate Banking Committee and House Financial Services regarding the state of the financial market. In addition, the Senate passed a bill increasing restrictions on the credit card industry, which was subsequently signed into law by President Obama.

Meanwhile, General Motors (GM) was back in the news on word it reached an agreement with the UAW, though it still has to reach a deal with bondholders.

In the end, six of the 10 sectors advanced. Materials (+2.6%) led the way thanks gains in commodities. The telecom sector (-3.2%) was the main laggard.

The U.S. stock and bond markets are closed Monday in observance of Memorial Day.
  
Index Started Week Ended Week Change % Change YTD %
DJIA 8268.64 8277.32 8.68 0.1 -5.7
Nasdaq 1680.14 1692.01 11.87 0.7 7.3
S&P 500 882.88 887.00 4.12 0.5 -1.8
Russell 2000 475.84 477.62 1.78 0.4 -4.4

9:02AM Advanced Analogic Tech comments on United States Court of Appeals ruling (AATI) 4.38 -0.11 : Co commented on the ruling by the United States Court of Appeals for the Federal Circuit. "The ruling affirmed-in-part, reversed-in-part and vacated-in-part the Final Determination of the United States International Trade Commission's relating to U.S. Patent No. 6,580,258 ('258 Patent) owned by Linear Technology Corporation (LLTC). The case is now remanded to the ITC for proceedings consistent with yesterday's ruling. Importantly, AATI's earlier victory in its dispute with Linear over U.S. Patent No. 6,411,531 was completely unaffected by this decision... The effect on the Company remains consistent, in that the products affected by today's ruling constitute only a tiny and declining percentage of the Company's total revenue, and AnalogicTech has several newer generations of switching regulators that remain unaffected by this decision. It is, and has been, our plan to focus our efforts on these newer designs."

7:24AM Linear Tech announces Federal Circuit validates its BurstMode technolgy (LLTC) 21.71 : Linear Technology Corporation (LLTC) announced that the United States Court of Appeals for the Federal Circuit has issued its opinion in Linear's and Advanced Analogic Technologies (AATI) cross appeals from the investigation that Linear brought against AATI at the United States International Trade Commission directed to infringement of one of Linear's power and battery saving patented technologies. The Federal Circuit found that AATI's 1143 and 1146 family of parts infringe Linear's U.S. Patent No. 6580,258 ('258 patent) and that Linear's litigated claims 2, 3, and 34 are valid. The Federal Circuit also reversed the Commission's finding that AATI's 1151 and 1265 family of parts do not infringe Linear's asserted method claim 34. Similarly, the Federal Circuit reversed the Commission's finding that Linear's claim 35 was invalid and not infringed. The Federal Circuit's decision expands the scope of the exclusion order from the United States that the Commission issued against AATI to encompass their 1146 family of products and raises the possibility that the Commission might find the remaining accused AATI products infringe Linear's patent as well.

3:09AM Suntech Power prices 20.0 mln ADS follow-on offering at $12.50 per ADS (STP) 13.47 :

09:34 am Suntech Power upgraded to Hold at Ardour Capital; tgt raised to $12: . Ardour Capital upgrades STP to Hold from Reduce and raises their tgt to $12 from $8 as the firm is encouraged by the co's solid gross margin performance. The firm notes that gross margins in Q1 came in at 17.8% exceeding mgmt guidance of 12 to 15%. The uptick was mainly due to a 25% sequential decline in polysilicon costs, a trend the firm believes will likely continue in 2009
icon url

ReturntoSender

05/27/09 9:01 PM

#8582 RE: ReturntoSender #6755

From Briefing.com: 4:30 pm : A mixed batch of corporate headlines led to listless and choppy trading in the early going, but concerns that higher Treasury yields could complicate an economic recovery effort drove a flurry of selling pressure.

Downside guidance from Monsanto (MON 79.88, -5.37) and news that a $27 billion bond exchange offer from General Motors (GM 1.15, -0.29) proved unsuccessful led to some early weakness in stocks. Better-than-expected earnings and forecasts from several retailers (-2.2%) helped temper the tone, making for mixed trading in the early going.

The broader market did make a temporary move into positive territory in a knee-jerk reaction to news that existing home sales for April made a stronger-than-expected month-over-month increase. Overall sales were in-line with expectations.

Stocks moved markedly lower following an auction of 5-year government Notes carrying a 2.3% yield. Though the auction itself was solid, bid-to-cover ratio hit 2.3, mortgage origination sellers moved to hedge their positions and pressured the long-end of the yield curve. That sent the benchmark 10-year Note more than one point lower, which pushed its yield above 3.7% to a fresh 2009 high.

The higher borrowing costs associated with higher yields undermine the government's efforts to keep rates down in order to help along an economic recovery. With that, stocks went on the retreat.

Their descent stalled as the S&P 500 hit the 900 level, but sellers redoubled their efforts and pushed stocks down another leg to finish near session lows. The downturn has taken the S&P 500 back into negative territory for the year (-1.1%).

With the exception of technology, every major sector in the S&P 500 finished with a loss of at least 1%. Strength in large-cap technology holdings limited losses in the tech sector to 0.7%.

Energy stocks showed periodic strength by climbing more than 1% as oil prices reached fresh six-month highs. However, the sector faltered and finished 1.3% lower amid the broader market's sell off.

Meanwhile, crude oil prices logged multimonth closing highs by settling $63.45 per barrel, up 1.6% for the session. Oil prices remain in focus Thursday as weekly inventory data hits news wires midmorning and the latest OPEC meeting gets underway. DJ30 -173.47 NASDAQ -19.35 NQ100 -0.8% R2K -2.1% SP400 -1.8% SP500 -17.27 NASDAQ Adv/Vol/Dec 935/2.16 bln/1768 NYSE Adv/Vol/Dec 925/1.33 bln/2120

4:05PM Sigma Designs beats by $0.07, beats on revs (SIGM) 16.63 -0.02 : Reports Q1 (Apr) earnings of $0.30 per share, excluding non-recurring items, $0.07 better than the First Call consensus of $0.23; revenues fell 10.0% year/year to $51.2 mln vs the $47.8 mln consensus. "We are pleased to report a sequential increase in our revenue for the first quarter, which we feel provides continued signs of stabilization and strength in our primary markets. We are continuing to place heavy efforts on bolstering sales as well as expanding the breadth of our market opportunities. The IPTV market is continuing to show resilience to current economic issues and we are confident that it will continue to demonstrate some level of growth for this year. We are also pursuing design activity in the cable industry and helping to drive the transition to Tru2way IP cable solutions, which will substantially increase our addressable market. We are also pushing forward with our consumer products agenda by working with a widening range of vendors for Blu-ray player designs, digital media adapter products and home entertainment connectivity devices. Additionally, we are encouraged about the potential opportunities addressed by our recent acquisition of the Z-Wave brand home control products and anticipate a growing synergy within the set-top box market."

10:46AM RF Micro Device updates investors at conference, says demand for products in the June 2009 quarter is better than expected (RFMD) 2.76 +0.03 : Bob Bruggeworth, president and CEO, said during the conference that demand for RFMD's products in the June 2009 quarter is better than expected, and the co's factory utilization rate in the June quarter is currently above 75%, versus ~25% in the March 2009 quarter. Co also commented that RFMD's new, higher-margin products are representing an increasing percentage of total revenue. As a result, RFMD's gross margin is trending above plan. The expenses are on plan, and co is executing on its free cash flow projections of ~$80-120 million in RFMD's fiscal 2010. RFMD's capital expenditures were ~$4 million in the March 2009 quarter, and co expects capital expenditures to be ~$3-5 million in the June 2009 quarter. RFMD currently expects to decrease its net debt during the June 2009 quarter.

7:13AM Microsoft announces the expansion of the Zune entertainment service to new platform and markets; confirms new Zune HD portable media player (MSFT) : Co announces that Zune will extend its video service to Xbox LIVE internationally this fall. In addition, Microsoft confirmed the next generation of the Zune portable media player, Zune HD. Available in the U.S. this fall, Zune HD is the first portable media player that combines a built-in HD Radio receiver, high-definition video output capabilities, organic light-emitting diode touch screen, Wi-Fi and an Internet browser.

7:09AM On The Wires : Lexicon Pharmaceuticals (LXRX) announces that the it will be giving oral presentations on two of its clinical-stage drug development programs: LX103 and LX1032...The Alameda-Contra Costa Transit announces the signing of a contract with EnerDel, Ener1 (HEV) lithium-ion battery subsidiary, to produce batteries for 16 new, next-generation, hybrid-electric fuel cell buses..

7:06AM Suntech Power and National Semi collaborate on SolarMagic technology for PV systems (STP) 13.93 : Co and National Semiconductor (NSM) have signed a memorandum of understanding to evaluate NSM's SolarMagic technology with the intention of jointly promoting the technology and developing future solutions.

icon url

ReturntoSender

05/28/09 10:58 PM

#8583 RE: ReturntoSender #6755

From Briefing.com: 4:30 pm : Stocks spent the first half of the session seeking direction, but they were able to move markedly higher after a 7-year Treasury Note auction went off without any surprises.

Concern that economic recovery efforts could by complicated by higher borrowing costs stemming from rising yields had market participants closely watching today's 7-year Treasury Note auction. The auction's bid-to-cover ratio came in just below 2.3, which was in-line with the past three auctions.

The lack of surprise helped take the benchmark 10-year Note 28 ticks higher after it had oscillated in the early going. The yield on the 10-year Note reached 2009 highs during the prior session; it currently stands at 3.64%, just shy of the 3.7% to 4.0% range that bond guru Bill Gross stated would mark an attractive entry point during a CNBC interview.

With Treasury yields moving off of their highs, stocks were able to put together a sustainable advance and nearly reverse the prior session's losses.

Gains were broad-based, but financials scored the best gains by advancing 3.6%.

Meanwhile, tech giant Microsoft (MSFT 20.45, +0.32) was a primary leader in the Nasdaq amid reports that the company is no longer in serious discussions with Yahoo! (YHOO 15.09, +0.15) to combine search efforts.

General Motors (GM 1.12, -0.03) made gains early on after the company announced that its bondholders accepted an amended debt-for-equity offering. However, it finished with a loss as investors continue to question whether the company will be able to avoid bankruptcy.

Shares of retailers (-1.3%) underperformed the broader market for the entire session. Home improvement retailers Home Depot (HD 22.70, -0.63) and Lowe's (LOW 19.02, -0.61) were primary laggards in the group after first quarter mortgage delinquencies clicked higher to 9.1%, threatening to add to housing inventory and depress building activity.

To that point, annualized new home sales for April came in near expectations, but the monthly change fell short of expectations.

In other economic news, April durable goods orders, both including and excluding transportation, topped expectations. However, March orders were revised markedly lower.

Continuing jobless claims continue climbing to record levels, most recently coming in close to 6.8 million. However, initial weekly claims came in at 623,000, suggesting that the pace of layoffs is slowing.

In commodities trading, oil prices settled 2.5% higher above $65 per barrel for the first time since November. The advance was helped along by bullish inventory data, which followed news that OPEC will hold production steady, as expected.

Gold prices closed at $960.80 per ounce, up 0.7%. Gold prices are now up more than 10% since hitting their 2009 lows in mid-April.DJ30 +103.78 NASDAQ +20.71 NQ100 +1.3% R2K +0.5% SP400 +0.8% SP500 +13.77 NASDAQ Adv/Vol/Dec 1475/2.24 bln/1177 NYSE Adv/Vol/Dec 2001/1.37 bln/1042

4:46PM OmniVision beats by $0.03, beats on revs; guides Q1 EPS above consensus, revs above consensus (OVTI) 10.58 -0.04 : Reports Q4 (Apr) loss of $0.30 per share, excluding non-recurring items, $0.03 better than the First Call consensus of ($0.33); revenues fell 47.3% year/year to $89.1 mln vs the $68.2 mln consensus. Co issues upside guidance for Q1, sees EPS of ($0.16)-(0.07), excluding non-recurring items, vs. ($0.23) consensus; sees Q1 revs of $90-100 mln vs. $74.37 mln consensus.

4:26PM Xilinx receives an adverse judicial ruling from the U.S. Court of Appeal for the Ninth Circuit (XLNX) 20.51 +0.32 : The co announces that on May 27, 2009, it received an adverse judicial ruling from the U.S. Court of Appeal for the Ninth Circuit regarding a previously-disclosed dispute with the Internal Revenue Service concerning the co's cost sharing agreement with its wholly owned subsidiary, Xilinx Ireland. As the Company has previously disclosed, on August 30, 2005, the U.S. Tax Court issued an opinion where the Court agreed with the Company that no amount for stock options was to be included in the Company's cost sharing agreement with Xilinx Ireland. The IRS appealed the decision to the U.S. Court of Appeals for the Ninth Circuit. Although the Company opposed that appeal, believing that the Tax Court decided the case correctly, the Ninth Circuit has now ruled against the Company in a 2-1 majority decision. The Ninth Circuit decision does not impact the operational direction of the Company. Considering the reserves that the Company has already recorded, the Company does not believe this decision will have a material impact on the future earnings of the Company. While the Company does not agree with the Appeals Court decision, it is premature at this time to comment on the Company's next steps as a result of the decision.

4:08PM Marvell reports EPS in-line, revs above consensus (MRVL) 11.69 +0.19 : Reports Q1 (Apr) earnings of $0.05 per share, excluding non-recurring items, in-line with the First Call consensus of $0.05; revenues rose 1.7% year/year to $521.4 mln vs the $517.4 mln consensus. Non-GAAP gross margin for the first quarter of fiscal 2010 increased to 51.6%, compared to 51.3% for the fourth quarter of fiscal 2009 and 52.0% for the first quarter of fiscal 2009. Free cash flow, defined as cash flow from operations less capital expenditures and purchases of IP licenses, was $131.8 mln, up 42% sequentially from $92.7 mln in the fourth quarter of fiscal 2009 and up 32% from $99.7 mln in the first quarter of fiscal 2009. "We also delivered improved profitability and cash flow during the first quarter, a positive reflection of the actions we undertook in recent quarters to control costs and expenses as well as tightly managing our working capital. We are continuing to monitor the changing economic environment and will manage our business accordingly. However, recent trends indicate an improvement in near term order patterns."

4:05PM Dell beats by $0.01, misses on revs (DELL) 11.48 +0.36 : Reports Q1 (Apr) earnings of $0.24 per share, excluding $0.09 charge for for organizational effectiveness actions, $0.01 better than the First Call consensus of $0.23; revenues fell 23.2% year/year to $12.34 bln vs the $12.66 bln consensus. Co said, "Along with generating strong cash flow, we maintained solid operating margins and made further progress toward reducing annualized costs by $4 billion by the end of fiscal 2011". Indicators of global IT demand remain mixed, and the broader environment is still challenging. The company is positioning itself for improvement in IT spending by focusing on customer requirements and their experience with Dell, along with internal operating efficiency and costs.

8:33AM Corning raises 2Q LCD volume expectations (GLW) 14.62 : Stronger-than-expected demand for LCD glass has caused GLW to raise its expectation for second-quarter sequential volume growth. "Our recent checks indicate the LCD supply chain is in full recovery mode. The LCD supply chain continues to replenish; glass supply and demand is very tight right now, much stronger than we anticipated. This has led to an imbalance in glass supply and demand that will likely last through the end of the third quarter. As a result, we are raising our second-quarter glass volume expectations." The company now expects glass volume at its wholly owned business to grow by more than 75% sequentially in the second quarter, compared to its original guidance of more than 50%. At Samsung Corning Precision Glass Co., Ltd. (SCP), the company's equity venture, second-quarter volume is now expected to be up more than 40% sequentially, versus previous expectations of 25%. However, the company is taking a conservative approach to relighting idled glass capacity. The company expects second-quarter glass price declines to be in line with its previous guidance. Given current market conditions, the company now believes that its sequential price declines in the third quarter will be very minor and consistent with customer agreements.

8:06AM Trina Solar beats by $0.10, misses on revs (TSL) : Reports Q1 (Mar) earnings of $0.02 per share, excluding non-recurring items, $0.10 better than the First Call consensus of ($0.08); revenues rose 9.5% year/year to $132.1 mln vs the $142.5 mln consensus. Gross margin was 17.2%, exceeding the Company's previous guidance of between 15% and 17%, compared to 9.6% in the fourth quarter of 2008 For the second quarter of 2009, the Company expects to ship between 60 MW to 65 MW of PV modules. The Company believes gross margin for the second quarter will likely be between 18% and 20%. For the full year of 2009 the Company reiterates the guidance for total PV module shipments between 350 MW to 400 MW, representing an increase of 74% to 99% from 2008. As of March 31, 2009, the Company had $194.1 million in cash and cash equivalents, and restricted cash. The Company's working capital balance was $81.8 million. Total bank borrowings stood at $320.2 million, of which $14.6 million were long-term borrowings. Shareholders' equity was $423.4 million, compared to $433.1 million as of December 31, 2008. As of April 30, 2009 the Company's total short term credit lines increased to approximately $523 million, which includes approximately $183 million of unused available credit line. The Company increased its foreign currency hedging program during the first quarter of 2009 using foreign currency forward contracts between the Euro and the US dollar, with the goal of mitigating, to some extent, the effects of exchange rate volatility.

09:33 am FEI Company initiated with a Buy at Stifel Nicolaus; tgt $28: . Stifel Nicolaus initiates FEIC with a Buy and price target of $28 as the firm believes that with the relatively new management team on board at the co, it is now properly focused in terms of its business and its financial goals. Additionally, the firm notes that the company has rationalized its vast product and technology portfolio in key market segments, and with share gain opportunities, should grow faster than the respective growth rates in the market segments it participates.
icon url

ReturntoSender

05/31/09 9:02 PM

#8584 RE: ReturntoSender #6755

Amateur Investors Weekend Stock Market Analysis (5/30/09)

http://www.amateur-investor.net/Weekend_Market_Analysis_May_30_09.htm

During the past 4 weeks the S&P 500 has been stuck in a trading range between 930 and 879. The 879 level is very close to the 23.6% Retrace from the October 2007 high of 1576 to the March 6th low of 667 and is also just above the 10 Week EMA (green line). Meanwhile the 930 level is just below the 40 Week EMA (blue line) which is around 940 and a longer term descending trend line (black line). This trading range won’t last much longer so either we will see a breakout above the 930 level and 40 Week EMA leading to higher prices or a drop below the 879 level leading to a more substantial pullback.


If the S&P 500 were to break out of this trading range and below its 10 Week EMA to the downside the next major support levels would be one of the Retracement Levels calculated from the 667 low to the recent high of 930. The 38.2% Retrace is at 830 while the 50% Retrace is around 800.


Meanwhile if the S&P 500 were to break out of this trading range to the upside and above its 40 Week EMA and descending trend line then the next significant area of resistance would be in the 985 to 1014 range. The 985 level is at the 12 Month EMA while the 1014 area is the 38.2% Retrace from the 1576 high to the 667 low.


I believe the 985 level may act as a significant resistance area based on what has happened in the past with the 12 Month EMA. Notice from 2000 through 2002 the S&P 500 stalled out several times at or just above its 12 Month EMA (points A) and wasn’t able to close above it on a Monthly basis which was followed by a series of lower Lows. Meanwhile in early 2003 the S&P 500 was finally able to close above its 12 Month EMA (point B) which was followed by a significant rally through late 2007. Also notice each time the S&P 500 dropped back to or below its 12 Month EMA that by the end of the month it was able to close back above it (points C) as it moved higher from mid 2003 through late 2007.

Meanwhile since the October 2007 high the S&P 500 has only tested its 12 Month EMA twice since breaking below it in January of 2008 which was in May and June of 2008 (points D). My guess would be that the S&P 500 will test its 12 Month EMA at some point this Summer and what transpires when it gets there will tell us a lot about the longer term direction of the market.


In 2008 our ETF Strategies worked the best with which had a return of +33% versus the S&P 500 which was down -38.5% for the year.

Meanwhile our 401K Strategy finished up +17.3% for the year.

Signup for a "Free 4 Week Trial Membership" or save up to 50% on a Premium Membership and you will have access to these Investment Products which include the following:

1. "ETF Daily Buy and Short Signals" which can be used to trade the DIA's, QQQQ's, SPY's and OIH's. Our ETF Strategy returned 33% in 2008.

2. "401K/Thrift Savings Plan (TSP) Timing Service" which can be used to help improve your return in your 401k/TSP Account which was up +17.3% in 2008.

3. The "End of Month Strategy" finished up +36.3% in 2008. This Strategy focuses on the typical End of Month markup by the Institutional Money.

4. "Stocks to Buy List" which can be used with either our Short Term Strategy or Long Term Strategy. In 2007 our Long Term Strategy finished even for the year versus the S&P 500 which was down -38.5%.

Our Summer Membership Special for new Members is shown below
which are 50% Off our normal Monthly Rate of $39.95
icon url

ReturntoSender

05/31/09 9:55 PM

#8585 RE: ReturntoSender #6755

InvestmentHouse Weekend Market Update:

http://www.investmenthouse.com/weekendmarketsummary.htm

- Quiet session gets a last hour burst on end of month mark-ups.
- Economic data fails still fails to show any economic recovery, or any slowdown in selling first.
- Is the stock market the leading indicator? Liquidity and thus inflation drive stocks higher.
- Why is the market rallying? We bought the rally with trillions of dollars in liquidity.
- Have to keep looking at the same leading sectors.

End of month book marking drives stocks higher.

Friday was a quiet session, trading on the flat line, at least until the tail end. A last-hour burst of buying due to end-of-the-month portfolio bookmarking sent stocks higher and closed the indices out with 1% (or better) gains. A quiet session turned into quite a rip-roaring session by the closing bell.

The early news did not do much to excite investors. GDP came in at -5.7%; that was less than the -5.5% expected, though it was better than the -6.1% previously reported. Consumption was down 2.2% - originally it was reported down to 1.5%. It was not a very encouraging report; we did not see any kind of revisions that showed things are getting better, and that is what everyone is looking for and talking about in the economy. As you know, we have been saying that things are not getting much better - they did look promising for awhile, but things are turning back down.

Oil was up again. It closed at $66.31, up $1.23. Gold surged up to $978.90, up $17.40 - back near that magic (or maybe not so magic) $1K mark that it hit in February. With the dollar getting shredded again, closing at 1.4160 Euros, there is no surprise at all to see gold and oil spiking higher. The 10 year bond yield was really the only surprise on the day. It fell to 3.46% after hitting 3.71% this week. This was mainly some backfilling due to such a tremendous rise over the past three to four weeks, where the 10 year bond yield rose 150BP.

Stocks opened slightly positive, but chopped around all session - in other words, they traded back and forth, above and below the flat line. There were little loses, little gains; quiet trading to end the week and month. In the last half hour, bids hit. Friday was the end of the month when mutual funds want to put good stocks on the books to send out to their investors. It does not only happen at the end of each quarter, it happens at the end of each month. A lot of mutual funds have missed out on the rally, so they want to buy these stocks and show off what they have in their portfolios; of course their performance does not reflect the performance of the stocks they say they own, but they do not bother to tell people that they bought them in the last half hour of the last session of the month. In any event, the end results were the 1+% gains on the indices that made the session look quite good overall, though it was basically end-of- the-month bookmarking, or markups, as mutual funds strive to make their performance appear better.

TECHNICAL.

INTRADAY. Intraday, the action was flat for most of the session with a burst of buying at the end. Technically that is good action. It looks good; the market started soft and built into nice +1% gains - true, but we know why, so we cannot put much credence into why the market showed good intraday action Friday. It moved up, made us money on our positions, so we are happy with that.

INTERNALS. Breadth went from pancake levels to close out at 2.2:1 on NASDAQ, 3:1 NYSE. Not bad, and in line with what we have seen on moves up and down - we will get 2:1 to 3- 5:1 ranges either way when this market moves - it tends to move with a lot of authority. The textbooks would call that volatility, and we are in a trading range, so that makes sense.

Volume was much stronger on both the NASDAQ and the NYSE. NASDAQ topped 2.5B shares, while the NYSE cleared 1.8B shares. Both were above average, with the NYSE being much more above average; indeed this is the first time that either exchange showed above average trade in three weeks -basically since the beginning of May.

Again, with the markup at the end of the month, we cannot put a lot of emphasis on how important, or more accurately, not important, volume was. The moves were end-of-the-month moves, and as with expiration volume, you have to put that in perspective. Once more, we had a good move to end the week and that is all you can really say.

CHARTS. Given the rush higher late in the day, the indices all moved up toward their May peaks. NASDAQ topped its May high, as did NASDAQ 100. The SOX matched its May high - remember, the SOX is much higher than the rest of the indices in its recovery move, having cleared all interim highs after the bear market low. So the SOX has shown a lot more relative strength and leadership than the rest of the indices, but they are all trading well as they move in this consolidation range, bumping up at the top of the range. We will just have to see in the coming week what happens - whether they can continue up with the move and break out, or stall and trade back down in the range.

If you were only looking at the higher Friday volume you might conclude there was a chance that they could make the breakout this week and make it stick. They still can, but again, the volume was the result of end-of-the-month bookmarking, and so one should not anticipate a breakout to start next week.

LEADERSHIP. The late move took everything higher. Financials were lagging, but with the rush into the last half hour, they picked up and lifted the SP500 higher. Everything else came up as well, but to really get a flavor for what was leading the market, you have to look at what happened before the last-hour rush. The same group of leaders taking things to the upside all week - and really ever since this rally stalled out in May - led the Friday move.

Early in the rally semiconductors and techs led the way, with financials coming on strong as well. Energy moved well- it was not sleeping at the bottom - but it has come into its own leadership as the market has moved laterally in the consolidation range. Commodities of all types have been moving up as well; they were leading again on Friday - copper and steel stocks were moving up as part of the continuing inflation trade that we discussed rather extensively.

Outside of commodities and energy, other stocks are moving up well, also part of the inflation trade. When you have trillions of dollars, marcs, pounds, and Euros being printed by the world's central banks with no economic activity around the world - and as we are seeing in many places, the activity is backsliding - what you have is a lot of with nowhere to go. Over the last couple of months the money is being put into financial markets in general; that is what is pushing stocks higher. Not only are we seeing commodity stocks, energy stocks and gold stocks move up on the inflation trade, but there is also technology, semiconductor, and even industrial stocks moving up as well as this money is put to work. It is being spread out all over the world and all over the market, and therefore, we are seeing many sectors in the financial markets rising higher and higher.

THE ECONOMY

More economic data shows no recovery and indeed a turn toward the downside again.

Friday was more of the same. The economic data is failing to show any real economic recovery; indeed, now it is failing to show any slowdown in the decline in economic data. That is what got everyone excited over the last couple of months - when the data started to slow its collapse. It was not falling as fast as it had been, so it looked like a bottom could be developing - makes sense; you have to slow down before you hit bottom. The problem we are seeing is a slowdown in the decline is not necessarily the case.

The Chicago PMI, the monthly Midwest manufacturing report, came in less than expected. It came in at 34.9 when 42.0 was anticipated- 40.1 was registered the prior month. That does not show the slowing decline, that shows a resumption of decline. These regional manufacturing reports are very important in terms of determining an economic recovery. They were the first to turn positive back in 2002, and gave us a heads up as to what was going on with the recovery. They are not making the turn right now and that is telling us that there is still downside to come in economic activity.

Thursday we saw the durable goods orders. They were better than expected, but the revisions were terrible; they were revised almost quadruple to the downside, and we saw that most of the bump in spending was due to government spending as business spending fell even more - it fell for the second month in a row, well over 1% (-1.5%). We are not seeing the actual manufacturing - or the real data that is more leading - indicate any kind of turn.

Michigan Sentiment was released on Friday; similar to the consumer confidence report that was released last week, it was better than expected, coming in at 68.7, versus the 68.0 expected, and 65.1 in April. Consumers feel better - why? The stock market is going up and their 401(k)s do not look so deathly ill - they do not look great, but the stock market is going up, so people think it must be getting better; they have all been trained to believe that the stock market is the ultimate leading indicator. It is, but there are times when you have to read behind the front headlines to see what is really going on - this is one of those times.

Stock market is not the best leading indicator right now.

There is a lot of liquidity in the world and as a result there is a lot of inflation building in the pipeline. It does not always mean inflation if there is a lot of liquidity; if supply is ramping up that takes the liquidity and drains it from the system, creating new businesses, new products, new jobs - that leads to economic growth and thus new jobs. All the excess liquidity is sopped up and goes to work in the economy. What we have now, however, is all over the world the economies are in recession, unable to mop up that excess money.

ECRI, which is a great economic indicator with respect to what will happen down the road -says the recession could end in the summer. It very well can end, but that does not mean we will have recovery; if you have a recession end without recovery, and there is still all that liquidity in the system, there is still the age-old problem of too much money chasing a finite amount of goods. That is the textbook definition of inflation.

While some are saying that we are seeing the bottom forming because the stock market is rallying, they are missing a big part of the picture. There are clear signs of inflation out there.

Oil. Oil prices are one example. Oil demand is that 2001 levels, yet oil has hit a new high on this particular run, closing at $66.31 on Friday. The fundamentals simply do not support oil at these prices. The economic data shows that there is no US demand for oil at levels supporting $66 a barrel. Germany's GDP is at a 40-year low. The Japanese slump continues; production may have ticked up, but consumption is down. The UK's economy is crashing at a faster rate than Germany. Russia's GDP is down 23%.

In short, there are major problems in the world's economies that are not showing recovery, yet oil prices are surging up. What that tells us is that it is not a fundamental reason for the price rise. One of the reasons it is rising is because the dollar is crashing. The crashing dollar - thanks to our monetary policy and poor fiscal policy that we are putting into place - is telling the smart investors in the world that the dollar is not going to be worth much because our economy is not going anywhere. The dollar is plunging in price, and since oil is denominated in dollars, it is going up; we are importing inflation with every barrel of oil we bring in from overseas. Every time our dollar ticks down a fraction of a penny, our prices rise. Exporters have to raise oil prices more in order to make up the difference due to the loss of value in the dollar. If we lived in a bubble and did not have to import anything, that would not matter, but the problem is we are importing the majority of our oil every day from overseas, which gets us right in the wallet and kills the economy.

Commodities. Commodities in the CRB index just logged there largest one-month spike since 1974. That is an important time - we have been talking a lot about similarities between now and the 1970's; in 1974, the economy was in real trouble and we had a major oil shock with the Arab oil embargo. Right now the world economies are struggling and again there is a spike in energy prices, this one ongoing for over a year now. Why are prices rising when the economy is weak? In the 1970's OPEC had clout. Right now it is not OPEC but a weak dollar AND speculation as investors buy oil as a hedge against inflation.

Gold. Gold is another hedge. Gold prices are spiking, and that is a classic inflation signal. After crashing when prices hit 1K in February, they are right back up there again just three short months later. Is this in anticipation of more Chinese or Indians wearing gold in the "If you have got it, flaunt it" philosophy of their newly high-powered expanding economies? Not really, because their economies are not going up that much right now. That could play a role in the rise, but let us get serious: gold is not at $1K-per-ounce merely on anticipation of consumer demand.

Bond yields. We have talked about yields a lot this week - indeed this past month - but they are very important. Bond yields often rise in anticipation of the economy improving. The bond market looks down the road, and as with the stock market, people look at the bond market and are encouraged by the 10 year rates jumping up to 3.71%, rising 150BP in a month. They think the economy is ready to rock 'n' roll because money is going to be more in demand, and interest rates rise in anticipation of that demand. That is the theory and is actually how it usually works in normal times. There are other reasons that are floating around in the world that tell us that is not the case in this instance.

The data simply does not support this idea. The economic data is terrible and is turning worse right now. Fiscal and monetary policies around the world are not conducive to growth. China has a pretty good fiscal stimulus policy; it fits their form of government. It would not work well over here - though it would work better than the one we have adopted. What really works in the U.S. are supply-side economics used in the early 1980's when the government gave tax credits and said we could either send the money to the government in the form of a tax, or buy a piece of equipment and write that right off the bottom our taxes. Any sane person would buy that piece of equipment and spend the money that way, versus sending the check to the government where in theory you would receive some services, but we all know it is not the same benefit as a tax credit. . Credits jumpstart the economy as they ignite investment in the country by entrepreneurs, sprout new technologies and new companies that really sparks the economy. We are not doing that now, and we have a sluggish economy; none of the stimulus is going to really hit until next year - even then it will not really be stimulus, it is just government spending . But, I digress.

This sudden massive spike in bonds is not the kind of rise you get when there is an economic recovery anticipated. Remember, yields spiked 150BP in less than four weeks.

All of these signs (oil, commodities, gold price spikes, bond yield surges) show that there is inflation, yet we are trying to ignore it. We want it to be different this time, and are willing to ignore that the world economies are still heading lower, and that there are trillions in additional currency floating around the globe.

Think back - this is the Greenspan argument from mid-2005. Remember, we had an inverted yield curve at that time, and that says that economic slowdown is coming; the short-term rates are higher than the long-term rates, indicating demand for money is expected to decrease. Greenspan tried to explain this away as the result of heavy buying of US Treasuries as a form of safety, and therefore it was not clear how much of the curve inversion was due to a flight to safety in US bonds. Thus he questioned the curve's forecasting ability. It turns out it was absolutely right - it did not matter what percentage it was because the yield curve was inverted, and it was saying trouble was coming. Man, did we have trouble; we had a housing bubble and the cascade of events after that.

Right now, just as Greenspan, many are trying to ignore this huge spike in yields, the huge spike in gold, a surge in commodities as big as any since 1974, and oil prices blasting higher when on no fundamental reason to do so. They are saying it is different this time. It is NOT different this time. We have inflation coming. We have been here before - open a history textbook, read about economics. I do not think they even cover it anymore in school, and that is the problem - you have to get an older textbook that actually covers the 1970's and tells it like it is. We have been here before and we are going down that road again as these are the exact problems and indicators in the 1970's, but we are ignoring them and doing so at our peril. We do not want to go back to the 1970's, but we are going whether we like it or not.

An interesting and poignant point to make is that the Fed has short-term rates at less than 0% - they want people to borrow and are sitting on rates to accomplish this. Even with the Fed desperately buying treasuries and doing anything it can to keep interest rates down, the longer end of the bond curve is shooting higher. The Fed cannot control it; it is going to have to raise interest rates sooner than anybody thinks because the short end and the long end cannot stay so far out of balance as this creates economic havoc. The only people who will benefit are the banks. They will be able to effectively print money as they borrow at 0% short-term rate while a 3 - 4% 10 year Note allows them to lend much higher. Good for the banks, but a recipe for disaster long-term.

Another interesting fact: Treasury Inflation Protection Securities - TIPS - had basically a 0% spread between the short and longer end. Over the last three weeks, the spread is now 2% - it is showing us that there is a lot of inflation building in the pipeline and a lot of trouble out there.

I am a history buff - an economic history buff. I learned that if I watch history, I can figure out what will happen in the future. Unfortunately, it is all too clear to me and a lot of other people that we are on the same wrong path as before.

Some argue that there are 'bond vigilantes' that are trying to show the Obama Administration what it is doing wrong as they drive rates higher. There are no vigilantes - this is smart money just anticipating what will happen in the future. You do not go out in the market to teach anyone a lesson - what happens if you do that? You get your head cut off. If you are lucky, you do not get your legs cut off, too. This is smart money trying to make more money, nothing more. We worry about this for our kids and our retirements - our retirements shrink as dollars lose their value and inflation digs into it every month.

Buying the rally: back to the 1970's.

Let us get back to the market, though. We always say it is a great indicator of economic activity, but we have pretty much debunked that at this point because we can see why inflation is a problem - but why is the market not sniffing this out, seeing the trouble and rolling over?

First, we bought and paid for this 30% rally. Trillions and trillions of dollars printed and promised has been enough to buy this rally off the lows. We printed a bunch of money, threw it in the market, and no one is using it - none of the banks and financial institutions that have this money are lending it; they are hoarding deposits as discussed last week. What they are doing with this excess money is putting it in the market. There is a lot more money chasing the same amount of stocks, the same amount of commodities, and that spells inflation. What we are having is inflation in stock prices - no problem with that because we own stocks to the upside; we are enjoying the run higher right now. We know that cannot last, however.

Back in 1999, the Fed pumped tens of billions of dollars into the economy ahead of Y2K. The NASDAQ rose 75% for July 1999 to March 2000; that was all money that was not needed by any of the consumers - there was no panic and rush on the banks with people putting 10-, 15-, 30- $100K in their mattress. So, the unused money went into the markets and the markets took off - then the Fed called the money back, the markets crashed and we went into recession.

This time around the Fed with will have to raise rates - it cannot hold rates at 0% for long if long-term rates continue to surge. Those long-term rates may come back and retrench as we saw on Friday - that is a pretty hefty drop down to 3.46% from 3.7% in just a day, but those are the kind of moves we will see when there are such large swings upside. We will probably see more retrenchment next week, but it likely will not stop there - rates will go back up. It went up too fast and will crash back down some, but just because they fall back does not mean we are not going to get inflation. The big spikes are similar to 'get ready' spikes before a stock takes off. The spiking rates indicate rates are moving higher.

When is this rally going to reverse? When the Fed has to start raising interest rates. We do not know when it will do that; it does not want to (and right now cannot) do that because it has bet the farm on keeping rates low and pumping a lot of money in the system in order to get the economy moving. The problem is, while we have avoided the Depression, we are in the longest recession we have had since the Great Depression now. The Fed, by raising interest rates would undermine its attempt at fostering a recovery. At some point, however, the Fed will have to raise rates to match the higher end rates - when it does that, we will have the malaise like back in the 1970's. We will have a weak dollar, high inflation, massive government spending - in the trillions - and our debt will be in the trillions yearly as far as we can see into the future. We'll have thousands of new government regulations for the cap and trade, for the healthcare system -- that is going to make the federal register quadruple in size each month. The CFR - the Code of Federal Regulations - is going to surge in size as well.

If you want to be socialist, you have to have a lot of regulations. The EU has about 10:1 regulations over the United States when it comes to regulating each business. We seem want to be like Europe, so we will have that as well - we will have a lot of big government and a lot of trees being burned to make the CFR bigger because of it. Maybe the environmentalists will get on the side of getting the economy going in some other direction than socialism - we will have to see. I am on my soapbox again, but this is dear to me - it is dear to all of us because we all have kids and grand kids, and we want them to have the same opportunity we did. I do not want them to go through the 1970's - we are going to do it, but we can try to truncate it as best we can if we recognize the problems and we talk to your Senators and Congressmen and tell them we are making the same mistakes. Maybe if they hear enough of us, they will change.

THE MARKET

MARKET SENTIMENT

VIX: 28.92; -2.75
VXN: 29.44; -2.08
VXO: 29.62; -0.84

Put/Call Ratio (CBOE): 0.77; +0.01

Bulls versus Bears:

This is a reading of the number of bullish investment advisors versus bearish advisors. The reason you look at this is that it gives you an idea of how bullish investors are. If they are too bullish then everyone is in the market and it is heading for a top: if everyone wants to be in the market then all the money is in and there is no more new cash to drive it higher. On the other side of the spectrum if there are a lot of bears then there is a lot of cash on the sideline, and as the market rallies it drags that cash in as the bears give in. That cash provides the market the fuel to move higher. If bears are low it is the same as a lot of bulls: everyone is in and the market doesn't have the cash to drive it higher.

This is a historical milestone in the making. Bulls are impressively low considering we are in general a very optimistic country. The few bulls is a positive indication because it means most everyone that is getting out is out and there is money on the sidelines. In other words the ammunition boxes are full and as the market recovers investors will start opening up the boxes and firing. Little by little they will be forced to put more money into the market and there will be some rushes higher in fear they are missing the train. You relish times when sentiment is so negative because it means some tremendous buys are setting up. This could indeed be the opportunity of a lifetime, and you take advantage of it by buying quality stocks and letting them work for you as long as they will. If we can hold them for years, great.

Bulls: 40.9%, up a fraction from 40.7% and 41.0% the prior week. Bullishness is still creeping up as the market holds its gains. Makes sense, but there are also those that feel the good times cannot last, undermining the number some. Still a strong move, up from 36.0% just three weeks back and moving in on the 43.2% hit mid-April before anticipation of stress tests and SOX' issues. Over the 35% threshold, below which is considered bullish, but this is not a bearish indication yet. Has to get up to the 60% to 65% level to be bearish. Dramatic rise from 21.3% in November 2008, the bottom on this leg. This last leg down showed us the largest single week drop we have ever seen, falling from 33.7% to 25.3%. Hit 40.7% on the high during the rally off the July 2008 lows. 30.9% was the March low. In March the indicator did its job with the dive below 35% and the crossover with the bears. A move into the lower 40's is a decline of significance. A move to 35% is a bullish indicator. This is smashing that. For reference it bottomed in the summer 2006, the last major round of selling ahead of this 2007 top, near 36%, and 35% is considered bullish.

Bears: 28.4% versus 29.1%. Bears continue to fall, growling less and less. Down from 33.7% three weeks back. Well off the 37.2% and the 37.1% in mid-April as the rally continued higher. As with bulls, below the 35% threshold considered bullish though not at bearish levels. Now far from off the high on this run at 47.2%. For reference, bearishness hit a 5 year high at 54.4% the last week of October 2008. The move over 50 took bearish sentiment to its highest level since 1995. Extreme negative sentiment. Prior levels for comparison: Bearishness peaked at 37.4% in September 2007. It topped the June 2006 peak (36%) on that run. That June peak eclipsed the March 2006 high (33%) and well above the 2005 highs that spawned new rallies (30% in May 2005, 29.2% in October 2005). That was a huge turn, unlike any seen in recent history.

NASDAQ

Stats: +22.54 points (+1.29%) to close at 1774.33
Volume: 2.495B (+12.32%)

Up Volume: 1.747B (+123.972M)
Down Volume: 682.236M (+133.903M)

A/D and Hi/Lo: Advancers led 2.26 to 1
Previous Session: Advancers led 1.27 to 1

New Highs: 49 (+10)
New Lows: 20 (+9)

NASDAQ CHART: Click to view the chart

NASDAQ cracked the top of it is May range on rising trade. It is moving toward that November peak, but it is not there yet. It is typically promising when you have a run to the top of a range and a crack threw it on high volume, but there were extenuating circumstances on Friday, which makes this move not as reliable as you would normally attribute to it, given the volume and the breadth, and the moving by the leadership stocks. It could still break higher this coming week and keep going; believe me, there is enough money in the markets to send it higher. There is so much liquidity out there that it could go right on threw - that was the miracle of the 1999 rally; it never stopped. Everyone is scratching their head and wondering what is going on; it is unnerving to continue to invest in a market that will not stop and keeps moving higher and higher after big gains and a very mild consolidation. If it breaks higher, however, we will continue to look at them because you have to go with what the market is giving you. We will keep buying the tech stocks, continue to look at the semiconductor stocks that set up and make breaks higher if that is what they are doing.

NASDAQ 100 CHART: Click to view the chart

NASDAQ 100 broke over it is May high as well, rising up 1.0 7%. Large cap techs look strong. When people have extra money and are not sure what to do with it, they put them in their favorites such as Apple and Research and Motion and their companions - that is what we are seeing now.

SOX CHART: Click to view the chart

The SOX was up 0.9 9% - it is at its May high as well, higher than the rest of the indices, and it is up there leading again. All the big techs, chips - things that go into things - are doing have well right now because they are getting the money put into them. The reason techs do well is because when smart investors see that there is a lot of money going into stocks, they see potential and look for stocks that are going to rally rapidly. You know that technology - chips, large cap techs - can tear off big chunks of real estate in short order. That is why money is going into them in addition to all the commodities and all the energy stocks.

SP500/NYSE

Stats: +12.31 points (+1.36%) to close at 919.14
NYSE Volume: 1.854B (+35.48%)

Up Volume: 1.373B (+349.181M)
Down Volume: 455.763M (+116.002M)

A/D and Hi/Lo: Advancers led 2.88 to 1
Previous Session: Advancers led 1.95 to 1

New Highs: 31 (+15)
New Lows: 65 (+15)

SP500 surged above it is mid-point level in the trading range and toward the may high; it did not make it, it is got a ways to go to get up to that May high, but it is showing really go action inside of it is lateral consolidation range. This is exactly what you would expect: You see it come down and test, it downs up, volume pick us up on the way up - and again, volume is suspect on Friday, but it is still showing the kind of action you want to see in a trading range; it is very positive. The financials kicked in late and gave it a good boost.

SP500 CHART: Click to view the chart

SP600 Chart: Click to view the chart

DJ30

Stats: +96.53 points (+1.15%) to close at 8500.33
Volume: 361M shares Friday versus 290M shares Thursday.

DJ30 CHART: Click to view the chart

MONDAY

This week we expect SP500 to go up and bump into that range. What it does - similar to NASDAQ - depends on how much money continuing to flow into the market. This is a market driven by billions and now trillions of dollars, and it is finding a home in stocks because it is not finding a home with any investment in economic development. This is a rally that is similar to the rally that has no close - like the emperor that has no clothes - because this is money that has been printed in Washington, D.C. and other capitals around the world, and being pushed into world financial markets and driving stock prices higher. There is no reason for it other than money chasing the same number of stocks and commodities and bonds - actually they are getting rid of bonds right now, but you get my point.

Next week there is a lot of activity. Earnings are basically over; they will continue to trickle in this week - we saw Dell come in - but that story is known. GM is likely to file bankruptcy early next week. It has been unable to strike any deals and has basically burned the $15B that we loaned the auto industry, so we are back to bankruptcy and $15B poorer - and none the wiser; we are sure to make the same mistakes again.

As far as economic data, it is a huge week. Personal spending and income, we have the ISM, which is the national manufacturing report, we have the ISM Services - the national services report - we have factory orders and also job reports at the end of the week. Everyone looks as job reports and they will STINK. Yes, weekly jobless claims are better, but no one is hiring anybody. Continuing claims continue to rise; there are no jobs out there.

I hate to be a pessimist, but I want to be realistic as well - we have to have economic growth and recovery before there will be jobs. If there is a bump up in the number, the market will be happy, but it will all be false because it will not be able to sustain any continued job growth without sustained continued economic growth. As we saw from the regional manufacturing reports this week, they are still well below the zero line - still contracting, and indeed picking up speed to the downside despite better consumer confidence out in the world.

What will we do? We will keep looking for upside buys because the money is there. Inflation helps stocks rise early on; it helps inflate stock values, so early on it is a positive. That is why, between the inflation signs coming up and all the liquidity pushing stocks higher in the market, we have to keep looking for the upside. There are still downside plays out there because stocks will break down, but the majority of the plays we have will need to be on the upside because of all the money in the inflation trade. Eventually the inflation will hurt stock prices because inflation will crimp off the economy so badly that it is going to impact stock prices. Even though there is a lot of liquidity out there, the Fed will eventually have to pull the plug on that and raise interest rates at the short end (which is what it controls). That will crimp the rally.

Ultimately the Fed has no choice or it runs the risk of very pernicious inflation and stagnation similar to the 1970's. During that period the Fed unwittingly fed the inflation after the oil embargo by cutting interest rates and increasing money supply as it wanted to mitigate the oil shock that it felt would send the world economies into horrible depression. We avoided that, but ignited stagflation. The economies did not recover because of the high oil prices, and all we did was liquefy all the energy prices and other prices in the world and make them rise up when the world economies were still burdened by heavy spending and ever-increasing government regulation. That sounds like the 2000's - oh, it IS the 2000's. We are doing the same thing we did in the 1970's.

So, surprise, we are going to look at commodity stocks, energy stocks, China stocks (as China is still showing signs of economic recovery). Medical stocks and healthcare stocks are also perking up as the money pushed into the market looks for other areas. Even some consumer discretionary looks good, but more on the discount side of the equation as the economic data is weakening again.

There will be hiccups along the way; it will not be a straight shot up. In 1999 it was a frighteningly straight shot higher that never really slowed down, but there were some violent pullbacks, 1-, 2-, 3-day pullbacks on high volume. They sold hard but then we bounced right back up.

The good aspect of this move is the lateral consolidation range. Very solid action. That sets a foundation for a new move higher. The 1999 rally did not have that and it crashed horribly. There are some positives here in that it is building a good base, though, each rally leaves you with a bit more trepidation that it cannot last. But as the trend is still higher, we will continue to invest in these areas when they show good entry points.

On Monday, the market is likely going to try those May highs. The SP500 may try to bump up there as well. There may be some new money that comes in to start the month. They put new money to work, and there is money coming into mutual funds; so we could get some more upside into Monday. After that money is spent the indices can come right back down in the range. That is the lick log for this move; what happens when the SP500 gets up to that May high - is it going to break through?

We are going to get bumps and hiccups in the road, but we will use them to get better entry points because at this point, the bias is still higher. I will repeat: The bias is still higher despite the runs thus far. We will continue to look for opportunities in the leading areas. We did not get many on Friday. Buying on Friday is tricky because Fridays often lead to lower Mondays, but we did see some that were moving, and we did not want to miss the boat completely on them - such as SNDA - so we bought some positions on it. We will wait for next week and see how stocks come back and how the May peaks treat the indices; we may get some very good buys off of those tests from that level.

I know I was a little impassioned tonight about what was going on and what is happening with the economy and the market, but it is a passion with a purpose. We have to understand what is going on now to be able to block out what we hear on TV and invest in what the market is showing us. While we are concerned that the market is going way too high without a serious rest, there is a realization that we have seen this movie before and have to play what is out there and take what the market gives.

Support and Resistance

NASDAQ: Closed at 1751.79
Resistance:
1770 is the mid-October interim peak
1773 is the May peak
1780 is the November 2008 peak
1947 is the October gap down point

Support:
The 18 day EMA at 1714
The 200 day SMA at 1702
1673 is the prior April peak
1666 is the intraday January 2009 peak
1664 is the May 2008 low
1661 is the April 2009 prior peak
The 50 day EMA at 1654
The January closing peak at 1653 (intraday)
1623 is the early April peak
1620 from the early 2001 low
1603 is the December peak
1598 is the February 2009 peak, the last peak NASDAQ made
1587 is the March 2009 high is getting put to bed again
1569 is the late January 2009 peak
1542 is the early October 2008 low
1536 is the late November 2008 peak
1521 is the late 2002 peak following the bounce off the bear market low
1505 is the late October 2008 closing low.
1493 is the October 2008 low & late December 2008 consolidation low

S&P 500: Closed at 906.83
Resistance:
919 is the early December peak
930 is the May peak
935 is the January closing high
944 is the January 2009 high
The 200 day SMA at 931

Support:
899 is the early October closing low
896 is the late November 2008 peak
The 18 day EMA at 894
888.70 is the April intraday high.
882 is the early May low
878 is the late January 2009 peak
The prior April peak at 876
866 is the second October 2008 low
The 50 day EMA at 866
857 is the December consolidation low; cracking but not broken
853 is the July 2002 low
848 is the October 2008 closing low
846 is the April peak
842 is the early April peak
839 is the early October 2008 low
833 is the March 2009 peak
The 90 day SMA at 827
818 is the early November 2008 low
815 is the early December 2008 low
805 is the low on the January 2009 selloff. KEY Level
800 is the March 2003 post bottom low
768 is the 2002 bear market low
752 is the November 2008 closing low but it is not broken and done away with
741 is the November 2008 intraday low

Dow: Closed at 8403.30
Resistance:
8419 is the late December closing low in that consolidation
8451 is the early October closing low
8521 is an interim high in March 2003 after the March 2003 low
8588 is the May high
8626 from December 2002
8829 is the late November 2008 peak
8934 is the December closing high
8985 is the closing low in the mid-2003 consolidation
9088 is the January 2009 peak

Support:
8375 is the late January 2009 interim peak
The 18 day EMA at 8335
8315 is the February 2009 peak
8307 is the April 2009 intraday high
8221 is the May 2008 low
8197 was the second October 2008 low
8191 is the prior April peak
8175 is the October 2008 closing low. Key level to watch.
8141 is the early December low
The 50 day EMA at 8135
The early April intraday peak at 8113
The early April peak at 8076
7965 is the mid-November 2008 interim intraday low.
7932 is the March 2009 peak
7909 is the early January low
7882 is the early October 2008 intraday low. Key level to watch.
7867 is the early February low
7702 is the July 2002 low
7694 is the February intraday low
7552 is the November closing low. KEY Level.

Economic Calendar

These are consensus expectations. Our expectations will vary and are discussed in the 'Economy' section.

June 1 - Monday
- April Personal Income (8:30): -0.2% expected
- Personal Spending, April (8:30): -0.2% expected
- Construction Spending, April (10:00): -1.8% expected
- ISM Index, May (10:00): 42.0 expected

June 2 - Tuesday
- April Pending Home Sales (10:00): 3.2% prior
- Auto Sales, May (14:00): 3.2M prior
- Truck Sales, May (8:15): 3.8M prior

June 3- Wednesday
- May ADP Employment Change (8:15): -543K expected, -491K prior
- Factory Orders, April (10:00): 0.3% expected, -0.9% prior
- ISM Services, May (10:00): 45.0 expected, 43.7 prior
- Crude Oil Inventories, 5/29 (10:30): -5.41M prior

June 4 - Thursday
- 5/30 Initial Jobless Claims (8:30): 623K prior
- Productivity-Rev. , Q1 (8:30): 1.2% expected, 0.8% prior
- Unit Labor Costs, Q1 (8:30): 2.9% expected, 3.3% prior

June 5 - Friday
- May Average Workweek (8:30): 33.2 expected, 33.2 prior
- Hourly Earnings, May (8:30): 0.2% expected, 0.1% prior
- Nonfarm Payrolls, May (8:30): -550K expected, -539K prior
- Unemployment Rate, May (8:30): 9.2% expected, 8.9% prior
- Consumer Credit, April (14:00): -$6.0B expected, -$11.1B prior

Don't miss our Market Summary each evening. It is part of "The Daily" which is available at InvestmentHouse.com. The Daily focuses on enhancing returns through strategic investing using various tools including stock options. The Daily is a must for anyone with an IRA or anyone that enjoys investing in individual stocks.
icon url

ReturntoSender

06/01/09 9:27 PM

#8587 RE: ReturntoSender #6755

From Briefing.com: 4:30 pm : Thanks to a concerted, broad-based buying effort amid pleasing economic data, the S&P 500 climbed to fresh highs for 2009 and managed to close above its 200-day moving average for the first time since December 2007.

There wasn't any individual catalyst for the upward push, just pleasing economic data in the U.S. and abroad.

Personal spending for April declined a moderate 0.1%, which was better than expected and an improvement from the previous month, while personal income for April showed a surprise 0.5% increase in the face of loose labor conditions.

Construction spending for April also registered an unexpected increase by climbing 0.8% month-over-month.

The ISM Manufacturing Index for May came in at 42.8, which was largely in-line with expectations, but up from the prior month. Though the reading indicates manufacturing activity continues to contract, the pace of contraction is decelerating.

Meanwhile, upbeat PMI data in both China and Europe supported foreign indices, and even looped back to the U.S. to help extend the surge that U.S. stocks saw in the final hour of trading last week.

Given the impressive gains in the U.S. and abroad, the Dow Jones World Index climbed 2.6% Monday.

Retailers in the S&P 500 saw some of the best gains. They spiked 6.1%, which helped the consumer discretionary sector climb 4.6%. The sector was also helped by a 6.4% advance by automakers, even as General Motors (GM 0.75, +0.00) confirmed all previous suspicion by announcing that it will enter bankruptcy with the help of the U.S. government, which is investing $30 billion for a 60% stake in the company.

As a result of the filing, GM will lose its long-held position in the Dow. Cisco (CSCO 19.50, +1.00) will replace GM in the Dow Jones Industrial Average, effective June 8. In addition, Dow Jones announced that it will remove Citigroup (C 3.69, -0.03) from the average effective June 8, replacing it with Travelers (TRV 41.91, +1.25). Dow Jones said the large and ongoing government stake in Citigroup prompted the change.

Strength in blue-chips helped the Dow cut into its year-to-date loss, which now stands at less than 1%.

Industrial stocks climbed 4.7%, more than any other major sector. Tech tacked on 3.3%, helping the Nasdaq Composite outperform the other headline indices and close above its 200-day moving average for the fifth consecutive session.

The broad-based buying effort helped nine of the 10 major sectors in the S&P 500 finish higher. Telecom (-0.4%) was the only sector to finish lower, but financial stocks (+0.5%) and health care stocks (+0.5%) also lagged the broader market.

Commodities also logged an impressive session as the CRB Commodity Index spiked 3.1% to log its best single-session advance by percent in two months. It was helped along by rising crude oil prices, which logged another 2009 closing high by finishing pit trading 3.2% higher at $68.40 per barrel.

Treasuries were knocked around again. The benchmark 10-year Note shed 58 ticks, which pushed its yield up to 3.68%. The 10-year Note had been down more than two full points during the session.DJ30 +221.11 NASDAQ +54.35 NQ100 +2.9% R2K +3.9% SP400 +3.7% SP500 +23.73 NASDAQ Adv/Vol/Dec 2042/2.60 bln/647 NYSE Adv/Vol/Dec 2507/1.50 bln/568

4:16PM Altera reaffirms its prior revenue guidance for second quarter sales to be up 2-7% sequentially; current First Call consensus is for a 5% increase (ALTR) 17.66 +0.64 : Co reaffirms its prior revenue guidance for second quarter sales to be up 2-7% sequentially (First Call Consensus is for a 5% increase). As expected, demand from OEMs providing equipment for Asian 2G and 3G wireless networks remains strong. Altera's new products have been the company's growth drivers during the second quarter. Sales of the company's 65-nanometer devices are up sharply. As anticipated, sales of Altera's 40-nanometer devices are on track to double from first quarter levels as the company is now shipping its Stratix IV GX, Stratix IV GT, and Arria II GX FPGAs.

9:03AM SIA says April semiconductor sales increase month on month : Worldwide sales of semiconductors rose to $15.6 bln in April, an increase of 6.4% from March when sales were $14.7 billion, the Semiconductor Industry Association reported. April sales were 25% lower than April 2008 when sales were $20.9 billion. All sales numbers represent a three-month moving average of global semiconductor sales. "The better-than-expected 6.4 percent sequential increase in April sales was driven by moderate improvements in a number of end-demand drivers and inventory replenishment," said SIA President George Scalise. "The PC market - a major consumer of semiconductors - has been stronger than predicted earlier in the year. Consensus forecasts currently project that PC unit sales in 2009 will decline by about 6% compared to earlier forecasts of a decline in the range of 12%. Analysts are also more optimistic about cell phone unit sales, which are now projected to decline by around 7% compared to earlier forecasts of 15%. PCs and cell phones account for nearly 60% of all semiconductor consumption," Scalise stated... "Visibility remains limited," Scalise continued. "Two consecutive months of sequential sales growth may be an indication of a return to more normal seasonal sales patterns in some market sectors, albeit at lower sales levels than last year," Scalise concluded.

icon url

ReturntoSender

06/02/09 9:56 PM

#8588 RE: ReturntoSender #6755

From Briefing.com: 4:30 pm : Choppy, listless trading kept stocks restricted to a relatively narrow range for most of the session, but stocks were still able to close higher for the fourth consecutive session -- a feat that hasn't been accomplished in nearly two months.

Though there weren't any primary leaders this session, gains were still respectable and broad-based. More impressive gains were sporadic.

Ford (F 6.41, +0.28) extended its four-session run up to 20% after announcing that it has achieved its highest market share in three years, while its U.S. auto sales for May fell a less-than-expected 24%. Recently bankrupt General Motors said its May U.S. sales fell almost 30%.

Meanwhile, Honda Motor (HMC 29.66, -0.11) said total American vehicle sales for May dropped 39% since the past year, and Toyota Motor (TM 80.99, -0.73) said May vehicle sales fell nearly 38% year-over-year.

PepsiCo (PEP 55.37, +2.24) logged its best single-session percentage gain this year after analysts at UBS raised their target for PEP shares. UBS also raised its target for shares of Pepsi Bottling (PBG 34.17, +0.96). Pepsi Bottling won additional favor by issuing upside guidance for 2009.

JPMorgan Chase (JPM 34.50, -1.61) led financial shares (-1.2%) lower after it announced plans to repay TARP funds by raising $5.0 billion in common equity. Also looking to get out from the yoke of government oversight and remove the stigma of holding TARP funds, American Express (AXP 24.71, -1.28) announced a $500 million common stock offering, while Morgan Stanley (MS 30.09, +0.20) announced it is looking to raise $2.2 billion.

Though the share offerings are aimed at raising capital to repay TARP funds, the announcements mark an extension of the stock offerings that financial companies have made in recent weeks. With financials up more than 100% since their March low, companies have been able to raise more funds with fewer shares, thus limiting the dilutive impact of recent offerings.

Banks have been among those to issue the most offerings as they attempted to quell capitalization concerns. To that point, Moody's stated that it expects U.S. rated banks will incur some $470 billion pretax loan losses and write-downs in 2009 and 2010, and also expects many banks will be unprofitable this year. Moody's is keeping a negative outlook on the banking industry rating and the industry's credit outlook. Shares of diversified banks dropped 4.1%.

Semiconductor stocks (-3.3%) showed weakness for the entire session. Their downturn came after Applied Materials (AMAT 11.61, -0.44) chief executive Mike Splinter stated that there will be more failures in the semiconductor equipment sector amid declining customers, according to Reuters.

Stocks started the session in the red, but were able to finish with a rather modest gain, which was near the middle of the session's trading range. Highs were hit early on following a surprise 6.7% monthly increase in April pending home sales, which is one of the best monthly increases on record and the third straight increase.DJ30 +19.43 NASDAQ +8.12 NQ100 +0.2% R2K +1.0% SP400 +0.4% SP500 +1.87 NASDAQ Adv/Vol/Dec 1506/2.41 bln/1146 NYSE Adv/Vol/Dec 1810/1.41 bln/1239

4:06PM Tessera Tech raises Q2 revenue guidance to $59-$61 mln vs $47.8 mln consensus; announces it enters into technology license agreement with Motorola (TSRA) : Co raises its Q2 revenue guidance guidance to range between $59- $61 mln vs $47.8 mln consensus, and vs prior guidance of $46-$49 mln. Second quarter 2009 Micro-electronics revenue, all of which will be royalty and license related, is now expected to range between $53.0- $55.0 mln, driven by the signing of the Motorola license agreement and better than anticipated revenue from other licensees. The company has greater visibility into its 2Q09 Imaging & Optics total revenue, which is now expected to be approx $6.0 mln. Prior guidance, given on April 30, 2009, was $6.0-$7.0 mln. The company reiterated its guidance on its other 2Q09 items, which remain unchanged: Non-GAAP operating expenses are projected to range between $31.0-$32.0 mln, excluding litigation expenses; Stock-based compensation is projected to be approximately $7.3 mln; Amortization charges are expected to be approximately $2.8 mln. Additionally, the company announced that Motorola (MOT) has signed a pre-negotiated license agreement with Tessera, settling all outstanding litigation between the companies. Under the worldwide license, Motorola will pay royalties on shipments of certain electronic products including cell phones, set-top boxes, and radio equipment that incorporate unlicensed chips that use Tessera's patented T.C.C. technology. The license, which charges a volume based fee for otherwise unlicensed chips, enables Motorola to avoid interruption of supply to its customers through compliance with the orders recently issued by the International Trade Commission in Investigation No. 337-TA-605 (Wireless ITC action). Co states, "In addition to an exercise fee payable under the pre-existing option agreement, the license agreement announced today includes an initial license fee as well as volume based, forward royalties that will be collected over the term of the license. Motorola's action not only rewards Tessera's past innovative efforts but also sends a positive message to other innovators that depend on the patent system to receive appropriate compensation for their inventions. Tessera will continue to support our licensees and partners in good standing, like Motorola, through our ongoing efforts to ensure we are fully compensated for the unlicensed use of our technology."

10:27AM Anadigics has been granted four new U.S. patents for pioneering advancements in the design and development of radio frequency power amplifier technology (ANAD) 4.55 +0.32 :

9:03AM NVIDIA announces U.S. Patent and Trademark Office rejects patent claims that Rambus is asserting against NVIDIA (NVDA) 10.94 : Co announces the U.S. Patent and Trademark Office has initially rejected all 41 claims challenged by NVIDIA in seven patents which Rambus has asserted in litigation against NVIDIA. NVIDIA has challenged patent claims that stem from a complaint filed by Rambus (RMBS) in November 2008 against NVIDIA in an International Trade Commission action. The patents involve memory controllers related to graphics processors. "We are pleased that the USPTO decided to review the patentability of Rambus' patents and agreed with NVIDIA's challenge to all 41 claims," stated David Shannon, NVIDIA executive vice president and general counsel. "We will continue to vigorously defend this matter in the ITC." In addition to the seven patents reviewed thus far, two additional Rambus patents are subject to the same challenge by NVIDIA and remain pending before the USPTO. A decision on the final two patents is expected in the next 60 days.

6:32AM Amtech Systems comments further on significance of research agreement with Yingli and the ECN to develop high efficiency N-type solar cells (ASYS) 5.00 : Co provided further comment on the significance of its previously announced three-party research collaboration agreement between Amtech's Tempress Systems subsidiary, Yingli Green Energy (YGE) and the Energy Research Centre of the Netherlands. "We are excited about this joint agreement with leaders in the industry and its potential to contribute to significant improvements in solar cell efficiency and bring solar energy closer to achieving grid parity. PANDA is true validation for our Tempress in-depth diffusion expertise and our capability for supplying reliable diffusion and automation equipment to the solar industry. Additionally, a European independent research and consulting firm, Yole Development, concluded that our Tempress(R) diffusion furnace had captured the number one position in terms of market share, or over 35 percent of the solar diffusion market."

12:56AM Micron reaches agreement with Riverwood Capital and TPG Capital to sell Aptina Imaging (MU) 5.32 : Co announces it has signed an agreement to sell a majority interest in its imaging solutions business, Aptina Imaging, to Riverwood Capital and TPG Capital. As part of the agreement, Micron will retain a 35% minority stake in the independent, privately held co. Riverwood and TPG will also contribute significant primary capital to Aptina's balance sheet, and Micron will continue to manufacture products and provide services for Aptina at its worldwide facilities. After the transaction is completed, Micron expects to record a loss of approx $10 mln in the fourth quarter of its fiscal year in connection with the sale, and Aptina's separate financials will no longer be consolidated in Micron's financial statements.

icon url

ReturntoSender

06/08/09 9:07 PM

#8591 RE: ReturntoSender #6755

From Briefing.com: 4:30 pm : A late session squeeze helped the major indices recover from sizable losses, but the move lost steam in the final few minutes of trading, leaving the major indices to pull back from positive ground and settle flat to modestly lower.

Stocks had been under pressure for nearly the entire session as many participants began to question whether the run up by stocks in recent weeks has become overextended and whether positive economic news has already been priced into stock prices. That line of thought was supported by the recognition that stocks have rallied more than 40% from their March lows amid better-than-feared data, but failed to hold gains last Friday despite what was conclusively an encouraging jobs report.

Catalysts will be lacking during the next several weeks, which could make for a slow start to the summer, but could also prove challenging for recent gains. Amid a lack of clear catalysts or headlines this session, most of the action was driven by traders' emotions.

Participants showed favor for financial stocks ahead of the Fed's official announcement regarding which companies will be allowed to repay TARP funds. Financials spent most of the session as the only major sector in positive ground, but saw their gains compound as buying intensified after the broader market moved past its afternoon highs. That prompted many short-sellers to quickly cover their positions. Financial stocks finished 1.1% higher as the best performing sector in the S&P 500.

Shares of large-cap tech weighed on the Nasdaq Composite. Apple (AAPL 143.85, -0.82) lagged after revealing a new iPhone and reducing prices on other products. Meanwhile, shares of Palm (PALM 12.16, -0.84) sunk after releasing this last weekend a highly anticipated mobile phone meant to rival Apple's iPhone.

Semiconductor giant Cisco (CSCO 19.87, +0.00) mostly showed weakness, but managed to close at the unchanged mark in its debut session on the Dow. Monday also marked the first session that Travelers (TRV 43.92, +0.47) traded in the blue chip index. The two stocks replaced shares of General Motors and Citigroup (C 3.42, -0.04) in the Dow.

Treasuries continue to grapple with sellers. In turn, the benchmark 10-year Note was knocked roughly 17 ticks lower, which pushed its yield to 3.89% from 3.86% Friday. Treasuries will remain in focus tomorrow as participants prepare for a $35 billion auction of 3-year Notes.DJ30 +1.36 NASDAQ -7.02 NQ100 -0.3% R2K -1.1% SP400 -0.7% SP500 -0.95 NASDAQ Adv/Vol/Dec 1026/1.99 bln/1657 NYSE Adv/Vol/Dec 1106/1.08 bln/1890

4:30PM Texas Instruments raises Q2 outlook (TXN) : The company currently expects its financial results to fall within the following ranges: Revenue: $2.30 - $2.50 billion, First Call consensus is $2.21 bln, prior guidance was in the range of $1.95 - $2.40 billion; EPS: $0.14 - $0.22, First call consensus is $0.10, prior guidance was in the range of $0.01 - $0.15.

5:36PM Plexus to host investor day on June; during the meeting co will reaffirm Q3 revs and earnings guidance in-line with consensus (PLXS) 20.59 -0.03 : Co is hosting a meeting on June 11, 2009 in New York, NY to update investors on the co and its strategy, growth initiatives and financial performance. During the meeting, PLXS will confirm its prior fiscal Q3 guidance of revenue from $355-385 mln vs $373 mln First Call consensus and EPS, excluding any restructuring or similar charges, of $0.18-0.25, including ~$0.04 per share of stock-based compensation expense, vs $0.23 consensus.

9:04AM NVIDIA: Rambus Moves to Withdraw Patents From ITC Proceedings Against NVIDIA (NVDA) 10.83 : Co announced that Rambus (RMBS) has asked an administrative law judge at the International Trade Commission to terminate the investigation of NVDA relating to four patents stemming from a complaint filed in November 2008. Rambus has conceded that NVDA products do not infringe on its four patents before the ITC, and has also asked for termination of several claims from a fifth patent in the ITC action. "We are pleased Rambus has recognized the weakness of these patents and claims... These withdrawals represent essentially half of the patents and one third of the claims asserted against us, and we look forward to addressing the remainder of the case."

8:40AM Diodes raises Q2 guidance due to continued improvement in demand and order rates (DIOD) 15.68 : Co raises Q2 guidance due to continued improvement in demand and order rates, primarily in Asia, the Company is raising its previous guidance and now expects Q2 revenue to increase 22-30% over Q1 revenue (which calc to revs ~$95.22-101.47 mln vs $93.47 mln First Call consensus), up from prior guidance of 14-22%. Co is also raising its guidance for gross margin and now expects Q2 gross margin to be ~24 to 28% versus the prior guidance of 20 to 24%. The revenue increase is driven primarily by demand for the products utilized in equipment such as LCD televisions and panels, set-top boxes, mobile handsets and netbooks as well as the production ramp up of previous design wins, which are leading to market share gains. Co continues to expect operating expenses to be in line with Q1 2009 levels. In accordance with FSP APB 14-1, GAAP results will include ~$2.2 million of non-cash interest expense from the amortization of debt discount related to the Company's Convertible Senior Notes. In addition, the Company expects income tax expense to be ~$2.0 to 2.5 million as the effective tax rate for Q2 of 2009 is based on improved profitability from Q1 of 2009 and will include non-cash U.S. income tax expense associated with repatriating earnings of foreign subsidiaries to the U.S. parent during Q1 of 2009.

8:11AM SunPower Announces Multi-Year Manufacturing Agreement With Jabil Circuit, Inc. (JBL) 8.58 : Co announced that it has signed a multi-year solar panel manufacturing agreement with Jabil Circuit, Inc., to build panels for SunPower's North American solar market. Jabil will begin manufacturing panels for SunPower in Mexico in the second half of 2009. SPWRA is also continuing to evaluate establishing localized manufacturing facilities in large solar markets in the U.S. Separately, Jabil will collaborate with SunPower in the company's participation in the Solar America Initiative (SAI), a U.S. Department of Energy effort to accelerate the development of advanced solar energy technologies. SunPower has participated in the initiative since September 2007. SunPower and Jabil intend to evaluate establishing world-class panel and system manufacturing locations in the U.S., which would result in the creation of highly skilled jobs.

icon url

ReturntoSender

06/14/09 2:31 PM

#8592 RE: ReturntoSender #6755

From Briefing.com: Weekly Recap - Week ending 12-Jun-09It was a relatively quiet week of trade, with the S&P 500 settling with a modest 0.4% gain.

For the week, seven of the ten sectors posted a gain, led by utilities (+3.9%). Consumer staples underperformed with a 1.3% loss.

Semiconductors had a solid showing after Texas Instruments (TXN) raised its second quarter guidance, saying all of its major product lines are growing and that manufacturing utilization has improved. The company now expects revenue of between $2.3 billion and $2.5 billion, versus the $2.2 billion consensus and the prior range of $1.95 billion to $2.4 billion. TXN forecast EPS of between $0.14 and $0.22, versus the consensus of $0.10 and the prior guidance of $0.01 to $0.15 per share. Shares of TXN rose 5.6% for the week, with the Semiconductor Index climbing 1.5%.

Meanwhile, Qualcomm (QCOM) raised its fiscal third quarter revenue and operating income guidance based on stronger-than-expected demand for the company's chipsets. QCOM rose 1.4% for the week.

In other corporate news, the Treasury announced that 10 of the 19 largest U.S. financial institutions, including US Bancorp (USB), JPMorgan Chase (JPM) and Goldman Sachs (GS), will be allowed to repay $68 billion of TARP funds.

In economic news, the Fed's Beige Book stated that there are signs that the economic decline is slowing, with several districts indicating that their expectations have improved.

Initial unemployment claims for the week ended June 6 fell 24,000 to 601,000, which was better than the consensus estimate of 615,000. Continuing claims, however, continued to rise, reflecting the weak labor market. For the week ended May 30, continuing claims rose 59,000 to 6.816 million.

The May retail sales numbers were about as expected, posting a moderate increase of 0.5% for both total sales and excluding autos. Gasoline sales, which rose 3.6%, helped boost the numbers. Excluding this component, retail sales were up 0.2%. Retail sales may be challenging over the months ahead given declining payrolls and weakening wage gains.

Treasuries had a volatile week, coming under pressure early in the week on reports that the Russian Central Bank is set to cut its Treasury holdings and a disappointing 10-year note auction. The 10-year note yield hit nearly 4.00%, but ended the week at 3.79% after a solid 30-year auction, reassuring comments from Japan and a Wall Street Journal report that the Fed may increase its purchase program.

The dollar saw swings in conjunction with Treasures, falling 0.6% for the week.

In commodity trading, oil rose 5.5%. The CRB Index rose 1.7%.
 
Index Started Week Ended Week Change % Change YTD %
DJIA 8763.13 8799.26 36.13 0.4 0.3
Nasdaq 1849.42 1858.80 9.38 0.5 17.9
S&P 500 940.09 946.21 6.12 0.7 4.8
Russell 2000 530.36 526.83 -3.53 -0.7 5.5

Flextronics (FLEX) announces that it is extending the Early Tender/Consent Deadline for its previously announced cash tender offer to purchase up to $100 mln of the aggregate principal amount outstanding of its 6 1/2% Senior Subordinated Notes due 2013, and up to $100 mln of the aggregate principal amount outstanding of its 6 1/4% Senior Subordinated Notes due 2014, and its related consent solicitation to adopt certain proposed amendments to the restricted payments covenants and certain related definitions contained in each of the indentures under which the Notes were issued.

Altera Corporation (ALTR) announced that Timothy Morse, senior vice president and chief financial officer, will resign effective June 12 to pursue another opportunity. A search for a replacement is underway. James W. Callas, vice-president finance and corporate controller, will serve as acting chief financial officer...

7:27AM RF Micro Device estimates and tgt raised to $4 at Oppenheimer as demand trends create a postive outlook (RFMD) 3.43 : Oppenheimer raises their Q1 and FY10/11 EPS ests to $0.01 from $(0.01) (consensus $0.00) and to $0.08/$0.13 from $0.02/$0.09 (consensus $0.08 and $0.17), respectively. The firm also raises their tgt to $4 from $3. The firm notes that RFMD has been vocal during the quarter with respect to the pace of its recovery, suggesting demand trends are better than guided to on its last earnings call. The firm's checks support the positive outlook and also reveal that part of the strength stems from market share gains at Nokia and Samsung. The firm expect RFMD's momentum to carry over into the September quarter, with revenue growth likely to remain stronger than the underlying handset market. In addition, the firm expects the stronger volumes to drive higher yields and likely near-term gross margin upside as well.

1:20AM Rambus reaches tentative settlement with European Commission (RMBS) 15.09 : Co announces that it has reached a tentative settlement with the European Commission to resolve the pending case against the co. Under the proposed resolution, the Commission would make no finding of liability relative to JEDEC-related charges, and no fine would be assessed against Rambus. In addition, Rambus would commit to offer licenses with maximum royalty rates for certain memory types and memory controllers on a forward-going basis. European Commission antitrust procedures stipulate that a final decision must be preceded by a consultation of interested third parties on the terms of the commitments offered; this consultation was initiated today. Under the proposed resolution, Rambus will offer licenses with maximum royalty rates for five-year worldwide licenses of 1.5% for DDR2, DDR3, GDDR3 and GDDR4 SDRAM memory types. Licensees who ship less than 10% of their DRAM products in the older SDR and DDR DRAM types will enjoy a royalty holiday for those older types, subject to compliance with the terms of the license. In addition, Rambus will offer licenses with maximum royalty rates for five-year worldwide licenses of 1.5% per unit for SDR memory controllers through April 2010, dropping to 1.0% thereafter, and royalty rates of 2.65% per unit for DDR, DDR2, DDR3, GDDR3 and GDDR4 memory controllers through April 2010, then dropping to 2.0%.

08:07 am National Semiconductor (NSM)

National Semiconductor (NSM 14.49) posted a narrower-than-expected loss for its fiscal fourth quarter, and issued upside guidance for its fiscal first quarter after the company said it has seen a pick up in orders.

National Semiconductor posted a loss of $0.28 per share in its fiscal fourth quarter, $0.10 better than the First Call consensus that expected a loss of $0.38 per share. The net loss of $64 million includes a pre-tax restructuring charge of $116 million primarily related to severance and asset impairments.

Revenues fell 39.2% year-over-year to $280.8 million but managed to top the consensus estimate of $273.4 million.

National Semi said that total company bookings in the quarter increased approximately 30% sequentially over the third quarter. The increase was attributable to increased orders from manufacturers of wireless handsets and other personal mobile devices as well as increased bookings from distributors who serve the broader electronics market.

"Business conditions improved throughout the quarter," said CEO Brian L. Halla. "We saw increasing orders from our wireless handset customers as they began ramping production of new smartphone models."

The improved conditions prompted National Semiconductor to issue upside guidance for its fiscal first quarter. The company expects first quarter revenues to range from $285 million to $305 million; the consensus currently stands at $282.52 million. The company's revenue forecast translates to approximately 2-9% growth sequentially.

Shares of NSM are up 43.7% year-to-date but remain well off the 52-week high of $24.21.
icon url

ReturntoSender

06/14/09 8:38 PM

#8594 RE: ReturntoSender #6755

InvestmentHouse Weekend Market Summary 6/12/09

http://www.investmenthouse.com/weekendmarketsummary.htm

- Lackluster close for a market that was mixed on the week.
- Market has to digest news re the G8, bond auctions, and some plain old retrenching.
- Dollar bounces to end the week, trying to keep its attempted trend reversal intact.
- Tired NASDAQ trying to lead but receiving no support.
- Rising oil spikes import prices.
- EU industrial production falls at a record pace. Remove the stimulus?
- Nothing fundamental has changed in the inflation and liquidity trades, just some tired leaders after pulling the train.

Market manages to come back from selling after giving up gains on Thursday.

Friday was a lackluster close for a market that was mixed on the week. Friday was the mirror image of Thursday where the market rallied higher early but was unable to hold the moves and reversed with SP500 giving up a breakout over 944. Friday, the market was weak early but then managed to rally back late and cut the losses, actually turning positive on the Dow and SP500. The entire week was choppy - a series of advances and a series of declines (or declines and then recoveries) as the market digested some actually new news that it had not considered up to this point during the inflation and liquidity rally higher.

There were several factors impacting the market's trade this past week. The G8 talked of removing the stimulus and investors suddenly realized that the Federal Reserve may have to raise interest rates much sooner than anticipated - that bears directly on the inflation trade. After surging higher, all of the inflation sectors (such as commodities, precious metals and energy) retrenched, digesting that news. They have been riding high on the trillions of dollars printed by the central banks' printing presses, but if they are going to pull back some of that stimulus, there will not be as much inflation impetus, at least that is the initial hope - investors had to adjust to this change in the landscape.

The specifics on the inflation trade: Oil sold some on Friday but still closed the week at $72.19. It was down, but just a modest $0.49. It closed near the high for the week even with pulling back due to a stronger dollar on the Friday session. Gold was down as well, closing at $939.66, off $22.40. Gold rallied up near $1K over the past three weeks, but it came back this week doing some retrenching on its own.

A better 30 year bond auction was another reason that some of the inflation trades retrenched. Wednesday, a weak 10 year auction jumped interest rates much higher. The 2 year Note finally got in on the action and it broke sharply higher. The 10 year Note, which has been leading the move higher, hit 4% on Wednesday though it backed down to end the week. It had to pull back; nothing can run that high that sharply and maintain the moves. It came back as the dollar gained a little strength on Friday, closing at 3.79%. The 2 year surged all week, hitting the zenith at 1.43% on Wednesday after that poor 10 year bond auction. Friday it closed at 1.27%, but this is still a huge move for the 2 year that was basically holding just over 1% - and indeed right below 1% - before this latest move started.

The third factor was just some plain old retrenching and backfilling after some great moves in commodities. We saw the steel stocks continue to move up through Thursday but take a little bit of a hit on Friday. It was a small hit because there were no major trend breaks or downturns by those stocks; indeed, many of the energy and commodity stocks, while they have pulled back a little bit from their recent runs, have just pulled back inside of continuing uptrends. This is not a break of the trend because really nothing has changed on the landscape. Investors were digesting the news that there could potentially be some stimulus withdrawal from the G8 countries. They are a long way from reaching that point, however, and so the moves back were basically taking some gain off the table after a good rally higher. Another way of saying that: profit taking.

All of this allowed the dollar to bounce in relief. It hit 1.389 Euros on the session Friday. That was a nice drop compared to trading well over 1.4 Wednesday after the 10 year bond auction. Another reason that the dollar rallied was that Japan came out on Friday and said that it had 100% confidence in the US Treasury - that is the only vote of confidence the Treasury has received over the past several months. China, Brazil, Russia, even our ally South Korea, are all bad mouthing the dollar. They want some world currency that they can have more control over. Of course we do not want that as it is not in our best interest - as every administration has said over the past 20 years, a strong dollar is in our best national interest. Some had more force behind them than others, though the last two executives appear to have the same problem with just lip service to a strong dollar. We are not standing up for it and we are paying the price.

There are also some very weak output numbers from the European Union (EU) helping strengthen the dollar. When major economies show weakness, investors around the world run to the dollar. Even with those gains, the dollar could not hold. It is struggling; it is not a relief bounce. It hit to 1.389 - much stronger, but it closed Friday at 1.4007. The dollar is choppy and volatile just as the commodities are at this point.

TECHNICAL

INTRADAY. The action was not bad for half of the market and it was not great for the other half of the market. Friday showed a soft start, a recovery to flat, and then a run higher in the last hour and a half. It almost squandered that move as well. On Thursday the buyers did not come in and finish the job. They did not hold the breakout and when stocks fell back late, they did not have the buyer support and surge back up as seen over the last several weeks. Friday the buyers almost abandoned the late rally as well. The gains in the last hour and a half were lost, and it took a late rally right into the close to retake those gains and mitigate the losses on NASDAQ and close the Dow and SP500 positive. There was nothing strong about this move, but that was in character with what the market showed late in the week. A good break, a continued move higher by NASDAQ, but it ran out of gas because it was getting no support. It was no surprise to see the market limp on into the weekend given the 'no decision' with respect to SP500's consolidation.

INTERNALS. Very flat breadth on the session. Volume dried up to the extent that it was a veritable dustbowl, particularly on NYSE. Trade did not even touch 1B shares, closing at 858M. That is as low as you would find on Christmas Eve. Terrible volume, even beyond typical low volume for the summertime. What this tells us is the action was totally untrustworthy on Friday. When volume is this low you cannot trust the moves because there are too few players. Perhaps we will see more when the new week starts, but recall that the past Monday volume was very low again. Down here in Texas this week, summer really hit. Last week was beautiful, but this week a high pressure system moved in and it is oppressively hot. We are already in the dog days of summer here in Texas, and it sure looks as if the market hit the dog days of summer and it is only mid-June.

CHARTS. NASDAQ continued its rally on the week though Friday it came back some. It was 25 points lower intraday from where it closed, so there was a substantial move back up from the selling in big-name techs and semiconductors. On Thursday it was the flipside, giving up a chunk of its move - 2/3 of its upside move - by the close. On Friday it was able to recover most of its losses and almost close flat-to-positive even though it had the look of a tired hound dog. Since breaking higher, NASDAQ has rallied over the November peak to take a look at challenging the October gap-down point. It came within 30 points but then it has stalled without really giving it a go. Again, NASDAQ is acting tired as it simply is not getting any help from the other indices. Doesn't' mean it is in serious trouble or in bad shape in any way. It is looking for a pullback after a breakout, and it looks like a rather typical pullback.

SP500 was flat, and the other NYSE indices are all showing the same pattern - a two-week, flat-as-a-board move, very tight ranges and low volume. Thursday it looked like it would make the breakout but it couldn't keep it up. It gave it up, and did soon a little higher volume. It turned what was really a good, positive consolidation (with all the leadership and NASDAQ leading the way) into a consolidation that is back to the 50/50 range as to which way it is going to break. When you see these tight consolidations, the break is typically sharp. What the trade and action to end the week showed was that SP500 is a coin toss at this point. I know no one likes hearing that, but that is what it is giving us. We are seeing erosion in the strength of NASDAQ given its run, and the financials refuse to participate in any move.

LEADERSHIP. With the dollar rising, we saw the same old leaders - commodities, energy, techs, chips and industrials - lag toward the end of the week. There were no breakdowns, and indeed many are fading and already setting up for another potential move higher. Several of them, even Friday, looked to be in position to make the break higher, but we always say it is just a pretty picture until they make the move. We have had liquidity under the market and the inflation trade to drive things higher. There has been a small monkey wrench thrown into the works this past week with the G8 talking about removing some stimulus. We had some retrenching, but we still saw good enough patterns to take positions in BJS in the oil services sector into the close. It is at a very good risk-reward position: if the trade works, we make a lot of money, and if it does not work and breaks down below its pattern, we get out with a minimal loss. Great risk-reward, and worth taking the position going into Monday when we could see the dollar start to weaken further as it did weaken intraday on Friday.

The chips stocks remain somewhat of a worry. They held their latest breakout - and I do mean latest. They broke higher, they gave it up, they broke higher again, and now they are waffling. They managed to hold the breakout over the late October peak with the late comeback, but they were struggling. A lot of the semiconductor stocks had to fight their way back, and some did not make it. We had to take NSM off the table because it did not recover from its early breakdown. Chips were playing a little game with us. They goose us, look great, but then crawl back into the bottle and stew for a bit.

Health stocks were stronger again. They have been playing a cat-and-mouse game with us as well. They look better, their patterns are developing better, but every time they start to look good when the dollar and the inflation trades weaken, then the dollar weakens once more, the inflation trades come back to life and the healthcare stocks fade away and fritter back into their bases. We will keep watching them because there is something building there (which we see in the biotechs as well), but they just have not made serious moves yet.

Financials are still a big zero, and as a result the leadership is very mushy. They are still holding the gains but there is some top-heavy action going on late in the week - more accurately, there are patterns that could easily turn. This is not the case in a lot of the leadership, but in some of them. For instance, OPLK held up very well when the NASDAQ was waffling somewhat after its initial breakout move in June. OPLK kept moving up and volume was solid, but it has not been able to follow through. It is angling ever so slightly upside with small moves and waning momentum. It is flagging a bit, and I am not referring to the flag pattern. It is "getting tired" flagging - when you see that pattern and the momentum runs dry, you can see breakdowns. Pull up the stops and be ready on that one. If it does not improve, we likely take it off the table.

At this juncture that is the kind of diligence we have to have on positions that have not built in a cushion of gain yet. We have to be careful - if they start to show signs that they are not going to be able to continue the move they started, then we need to consider taking them off the table and then seeing how things shake out. We have built some great gains on these moves, so we want to protect that. We have also taken some beautiful gain off the table, including this past week. We can let some of those positions ride back because we have a nice cushion. If we let them ride back, correct, test, and then move forward, that is where we get the big gains - the 3:1, 4:1, 5:1 moves on our option plays and the 2- to- 3:1 moves on our stock plays. If the market starts to sell on heavy volume, however, that changes the picture and we need to lock them down.

For the leadership and for the market overall, it is time to be patient and time to be a bit careful and pick our shots. That is why we sold positions on the week as they were moving up. We saw some stocks this week fail to make any headway (what we called "on the bubble" stocks), so we took them off the table. We were not going to take the chance that they would run out of steam and gap down on us. We were basically involved in a little tidying up in case SP500 breaks down from this consolidation instead of breaking out.

SUMMARY.

At the end of the week, we were left with NASDAQ continuing its two-week breakout, but struggling late. To start June, NASDAQ broke sharply higher and has rallied up toward the October gap-down points. It cleared the November high on that move, which was a very important point that had held it in check until the start of June. It finished positive for the week, but it was backsliding. It simply looks tired at this point. It is the one that made the breakout and rallied, but it is getting absolutely no support from any of the NYSE indices. SP500 has been flat lining for the past two weeks and SOX, though it did break out and support NASDAQ, is once again having a hard time maintaining the breakout. So it is understandable that NASDAQ is a bit tired and is coming back some. A test back down of the breakout would not be atypical at this point.

SP500 continued to its two-week, pancake-flat move, and it can break either way from this. When you have a flat move up against some resistance, it is a good consolidation if there is leadership build to support the move. The problem we have now with SP500 is that NASDAQ is looking a bit tired, as is the SOX, and there is no help from the financials. If NASDAQ and the semiconductors come back to retrench then we could very well get a shakeout or a pullback in SP500 as well. In other words, SP500 could fall back from the 944 level and move down more toward the 925 or even the 875 level if NASDAQ decides to take a significant rest after a significant breakout.

THE ECONOMY

Import prices spike gratis oil.

Import prices rose 1.3% and it was all thanks to oil. Oil prices have been spiking which is no secret, and it is no secret that we import tremendous amounts of oil every day. Oil makes up the bulk of the products that we import, and thus has the largest impact on pricing. This was the largest monthly jump in import prices since July of 2008. Since then, oil has made its biggest jump because we all know oil ran up to $140 last summer. Now the same thing is happening and voila, another spike in prices.

If you take out oil, it was a 2% rise in prices. There you go - cannot be much clearer than that as to the impact of oil on our wallets. Once more we are importing inflation; as the dollar declines, oil goes up. So we have a double whammy here in that we have to pay more for the oil, and the inflation is eating away at other aspects of our life as well. Even at a time when our wages are down due to the recession you also have inflation eating into wages, even inflation adjusted. So it is really a triple whammy when you add on the recession. We are struggling and it is very hard for the American citizen to get off the mat when gasoline prices are now running over $2.66 a gallon, well on their way to $3.00. They may not hit the $4.00 of last summer, but the speculation is already working on driving them higher, and it would not take much of a shock to send them up.

EU industrial woes make one wonder about removing any stimulus anytime soon.

The EU posted some very disappointing numbers. The industrial production for the entire region fell 21.6% and of course that was a record. The EU's bank bailouts have now topped $6.8T. That is greater than Germany's GDP. Germany is the largest EU economy; similar to the United States, the EU is mortgaging everything it owns. I said similar to the United States, but we are actually following the EU. I suppose those who want us to be more like Europe can take heart since we are having the same debt problems that Europe has always has. Those debt problems always help kill every advance their economy tries to make.

THE MARKET

MARKET SENTIMENT

VIX: 28.11; -0.35
VXN: 29.73; -0.04
VXO: 27.16; -0.01

Put/Call Ratio (CBOE): 0.77; -0.09

Bulls versus Bears:

This is a reading of the number of bullish investment advisors versus bearish advisors. The reason you look at this is that it gives you an idea of how bullish investors are. If they are too bullish then everyone is in the market and it is heading for a top: if everyone wants to be in the market then all the money is in and there is no more new cash to drive it higher. On the other side of the spectrum if there are a lot of bears then there is a lot of cash on the sideline, and as the market rallies it drags that cash in as the bears give in. That cash provides the market the fuel to move higher. If bears are low it is the same as a lot of bulls: everyone is in and the market doesn't have the cash to drive it higher.

Bulls: 47.7%. Bulls are running on Wall Street, spiking from 42.5%. Broke free from the 40.9% where it hung around for three weeks. Steady rise from 36.0% just 6 weeks back. Has passed 43.2% hit mid-April before anticipation of stress tests. Over the 35% threshold, below which is considered bullish, but this is not a bearish indication yet. Has to get up to the 60% to 65% level to be bearish. Dramatic rise from 21.3% in November 2008, the bottom on this leg. This last leg down showed us the largest single week drop we have ever seen, falling from 33.7% to 25.3%. Hit 40.7% on the high during the rally off the July 2008 lows. 30.9% was the March low. In March the indicator did its job with the dive below 35% and the crossover with the bears. A move into the lower 40's is a decline of significance. A move to 35% is a bullish indicator. This is smashing that. For reference it bottomed in the summer 2006, the last major round of selling ahead of this 2007 top, near 36%, and 35% is considered bullish.

Bears: 23.3%. Bears are scarcer, falling from, well off the 37.2% and the 37.1% in mid-April as the rally continued higher. As with bulls, below the 35% threshold considered bullish and starting to approach bearish levels (for the overall market). Now far from off the high on this run at 47.2%. For reference, bearishness hit a 5 year high at 54.4% the last week of October 2008. The move over 50 took bearish sentiment to its highest level since 1995. Extreme negative sentiment. Prior levels for comparison: Bearishness peaked at 37.4% in September 2007. It topped the June 2006 peak (36%) on that run. That June peak eclipsed the March 2006 high (33%) and well above the 2005 highs that spawned new rallies (30% in May 2005, 29.2% in October 2005). That was a huge turn, unlike any seen in recent history.

NASDAQ

Stats: -3.57 points (-0.19%) to close at 1858.8
Volume: 2.005B (-16.58%)

Up Volume: 880.674M (-602.186M)
Down Volume: 1.164B (+320.092M)

A/D and Hi/Lo: Decliners led 1.15 to 1
Previous Session: Advancers led 1.8 to 1

New Highs: 34 (-17)
New Lows: 5 (-2)

NASDAQ CHART: Click to view the chart

NASDAQ is acting as if it is tired, but it has good reason. It is the only index that has made a strong breakout and made it stick. It has run well, its components have led the entire move, and it deserves a rest. If it was a human being you would think it would be a little miffed that none of the other indices are pulling their weight. The problem is that NASDAQ is tired, but it is a symptom of the rest of the market; NASDAQ cannot lead the market by itself. It can temporarily put in an uptrend or a downtrend with a strong move- as it has done with this move higher - but ultimately the rest of the indices have to come along or it fails. This repeats time and again in the market, about once a decade: A few generals lead the pack, but if the rest do not show up or they decide not to follow, after awhile the generals cannot continue to forge ahead and take new ground by themselves. At this point we have to be careful and watch NASDAQ closely. It may not make it up to the October gap-down point at 1897, and if it does not, it could come back down and easily test the November peak that it broke out over to start June at 1785 intraday and 1780 on the close. That is an 80-point decline. Nothing out of the ordinary there - it is still well above any Fibonacci near term retracement level, so this would be typical and normal. We would not have a problem with this but for the fact that we are not getting any help in the technology area from SP500, or now the small caps.

NASDAQ 100 CHART: Click to view the chart

SOX CHART: Click to view the chart

SP500/NYSE

Stats: +1.32 points (+0.14%) to close at 946.21
NYSE Volume: 858.232M (-29.84%)

Up Volume: 388.663M (-387.554M)
Down Volume: 458.72M (+52.899M)

A/D and Hi/Lo: Decliners led 1.25 to 1
Previous Session: Advancers led 1.8 to 1

New Highs: 51 (+10)
New Lows: 88 (+32)

SP500 CHART: Click to view the chart

You would think SP500 was well rested after two weeks of flat, lateral trade and would have all the vim and vigor it needed to make the breakout. It is still holding near 944 and above the 918 support level for this range. It keeps coming down and tapping it on the low and bouncing right back. It is maintaining this range but is weakening somewhat given the Thursday action. The longer it stretches out and we see other areas start to come back and retrench, then it may have a problem making the break and may have to come back and test further itself. If it does fade and breaks below the 918 level, then 880 to 875 would be the next area that you would really look for it to hold. 900 maybe, but those lower levels are where the real support lies. If NASDAQ comes back and finishes its test before SP500 breaks down and is ready to move back up, maybe NASDAQ can drag it back up once more. We will have to see. The action in the SP500 and refusal of the financial stocks to join the fray leaves the market vulnerable coming into next week. It is going to break one way or the other; SP500 cannot maintain this pattern forever. It just is not tipping its hand right now, and the longer it takes and the more trouble the other indices have, the more likely is it to give us a deeper shakeout before it rallies back up and tries to move higher once more.

SP600 Chart: Click to view the chart

DJ30

Moved higher on the session after tapping and holding the 10 day EMA on the low. Extremely low volume and still in the flat, 2-week range. As with SP500 it could break either way and will likely follow the large cap index. The Dow is a touch read given the new components so we are not paying too much attention to it right now.

Stats: +28.34 points (+0.32%) to close at 8799.26
Volume: 164M shares Friday versus 250M shares Thursday.

DJ30 CHART: Click to view the chart

THIS WEEK

There is a pile of economic data coming. We have the regional PMI reports from New York City and Philadelphia, we have housing starts, we have industrial production and capacity utilization, and we have the CPI. A lot of these showed trouble last time around. Housing starts looked pretty good because of low mortgage rates and distressed sales. Prices are going to remain low, but now we have interest rates that jumped 1% in one week. That is going to impact sales as rates have been heading up over the past few weeks. That is going to impact the number of mortgage applications.

There is going to be a lot of economic data, and we are not sure we will get anything pleasing. Indeed, the data may revert some thinking with respect to thinking the G8 will not have to move any stimulus near term because these economic numbers stink. What will be driving the action is how the dollar fairs - whether or not it continues its relief bounce or if it is done, cooked, and ready to go back down again.

At close Friday, if you look at a chart of the DXY0 you will see that broke its April to early June downtrend with a nice push higher last week. It tested this entire week, a very choppy week, but it always held above the downtrend. On Friday it broke higher again. So we could very well see the dollar continue its relief bounce next week which would pressure the commodity and inflation trades again. They would be doing some more backfilling and we would be watching to see if they can hold their pullbacks and if they can hold near support or continue the little six-week bases they had been working on.

Remember, these stocks had a long, six-month base, they broke higher in May and into early June, and then they were testing back. They have been testing back over the last five to six weeks, forming these shallow, nice patterns whether they are ascending bases, pennants, double bottoms with handles, cup with handles - they run the gamut, but they are all nice consolidations. We want to see them ride those out as the dollar rebounds. If they hold, that is a very good sign of strength and that they will make the next break higher.

We may see more retrenching and backfilling as a result of the dollar, as a result of bonds firming up a bit more, but we will watch the important points: what leadership does with respect to its bases. Of course we will also watch what NASDAQ does with its pullback and whether it heads into a full-fledged pullback of the November breakout or it flattens out itself, similar to SP500. If SP500 cannot move, that suggests NASDAQ is going to come back and make potentially a full test of the breakout over the November high.

For our positions, this past week we took a lot of them off the table that were equivocating. In other words, they were unable to move up as NASDAQ and the rest of the market moved up. When they cannot show any kind of continued momentum after trying to break higher, we thought it best to take them off the table, with some gain in a lot of cases, and then others we just decided to nip it in the bud in case SP500 was unable to maintain its consolidation after the Thursday reversal. Indeed, on the Thursday move when we saw it start to come back, we were taking these positions off the table along with some gain as well.

We are still holding onto a lot of nice positions, but we have taken a lot of gain off of those and we have comfortable cushion there where we can let them come back and test a logical support level and then bounce again. As far as the others that are newer positions that have not had time to build that gap, we need to watch them, and if they cannot hold near support we will close them. If SP500 breaks down, usually these moves out of this flat time of consolidation are pretty brisk. If that is the case, the best option is to go ahead and play it a bit safe and get out of the positions. If they gap lower on you that is a problem, but we do not think we will see a gap right away to start the week.

What you have to do on positions with a lot of gain built in and that you have already taken some, is decide whether or not you want to ride them back. Do you want to just take the money off the table, especially in our short term option positions, and then ride them back down and see if you can get back in? If you banked a lot of gain and you are taking a free ride on them, if nothing changes for the worse in the market, then you want to let them come back and make the bounce back up. It depends on how nimble you are and if you feel like you can get in and out quickly enough to make the trade when it presents itself again.

As for new positions, we will watch for some downside opportunities given the market's action, or in SP500's case, the lack of action. We put some on the report the past week toward the end of the week and we picked up some downside positions. We are not looking for a really big rollover but that does not mean that will not happen or cannot happen, and that we cannot make good money if it is just a 'normal' pullback. We are looking to see if NASDAQ comes back and tests the November high and whether SP500 fades as well. Remember, it can still go down to 900, it can still go down to 875 or 870 and be very typical. Indeed, that would be a very small pullback considering the strong run off of the March low. So that will not be anything huge in the overall picture of the market, but if you are in short term option positions, that could be a big deal for you. That is why we take the interim gains on the way up, and then we are letting you know right now that it is not as positive as it was heading into Thursday. You need to adjust your mindset a little and know what you want to do in the event SP500 breaks lower. If you want to play it safe and take them off the table, there is nothing wrong with that, but you have to be ready to get back in if it hold and shows it is ready to bounce back up.

We are going to be looking at some downside, but still looking at some upside because, as of the close Friday, there are still a lot of great stocks in position to move higher. If the dollar continues to strengthen, commodity trades may take more time. If they hold their near support, and if they hold their patterns right before the shakeout, that is fine. They can break down intraday, but if they snap back and continue to hold, that is what you want to see. What that means is the sellers are taking it down, but the buyers are jumping right back in and pushing it up. The sellers lack the strength to hold it down. If the liquidity remains in the market, in other words if investors get used to the idea that the G8 may be taking off some stimulus - once they digest that and the liquidity is still there, they will be looking for opportunity. If we see that happening, we are happy and can stay in those positions and look for upside positions after they make that shakeout, close higher and then go into the next session closing higher again. That is when we can move in.

To sum up, nothing has really changed in terms of inflation trade or the liquidity trade. There was a little news this week with the G8 which caused some hiccups along the way, and it caused the dollar to get a little stronger. Some of our allies said they believe in the United States, and that caused the dollar to strengthen. It does not take much when you have been beaten up and kicked to make a little bit of a comeback and feel better. Relatively, however, things are still pretty weak. Since there is no real change in the market's character, we are going to continue to look for these inflation trades and liquidity trades, and that includes technology after this test. What would change this is if there was a serious character-changing move, such as seeing the sellers piling in on strong volume. We saw sellers try to come in later in the week, especially on Thursday when they reversed a breakout. We will have to watch and see if they show up any more. The liquidity is out there, the market is a little tired, though. SP500 and the financials are not playing ball with the semiconductors and NASDAQ. If they do not, they are going to test and we need to be ready for that. Have a great weekend - stay cool, it is hot out there. Good investing to you.

Support and Resistance

NASDAQ: Closed at 1862.37
Resistance:
1897 is the October post gap intraday high.
1947 is the October gap down point
1984 from late September
2099 is the mid-September low
2169 is the March 2008 double bottom low

Support:
The 10 day EMA at 1831
1780 is the November 2008 peak
1773 is the May peak
1770 is the mid-October interim peak
The 50 day EMA at 1715
The 200 day SMA at 1673
1673 is the prior April peak
1666 is the intraday January 2009 peak
1664 is the May 2008 low
1661 is the April 2009 prior peak
The January closing peak at 1653 (intraday)
1623 is the early April peak
1620 from the early 2001 low
1603 is the December peak
1598 is the February 2009 peak, the last peak NASDAQ made
1587 is the March 2009 high is getting put to bed again
1569 is the late January 2009 peak
1542 is the early October 2008 low
1536 is the late November 2008 peak
1521 is the late 2002 peak following the bounce off the bear market low
1505 is the late October 2008 closing low.
1493 is the October 2008 low & late December 2008 consolidation low

S&P 500: Closed at 944.89
Resistance:
944 is the January 2009 high
1000
1050

Support:
935 is the January closing high
The 10 day EMA at 935
930 is the May peak
919 is the early December peak
The 200 day SMA at 913
899 is the early October closing low
896 is the late November 2008 peak
The 50 day EMA at 891
888.70 is the April intraday high.
882 is the early May low
878 is the late January 2009 peak
The prior April peak at 876
866 is the second October 2008 low
857 is the December consolidation low; cracking but not broken
853 is the July 2002 low
848 is the October 2008 closing low
846 is the April peak
842 is the early April peak
839 is the early October 2008 low
The 90 day SMA at 838
833 is the March 2009 peak
818 is the early November 2008 low
815 is the early December 2008 low
805 is the low on the January 2009 selloff. KEY Level
800 is the March 2003 post bottom low

Dow: Closed at 8770.92
Resistance:
8829 is the late November 2008 peak
8934 is the December closing high
8985 is the closing low in the mid-2003 consolidation
9088 is the January 2009 peak
9387 is the mid-October peak
9625 is the October closing high

Support:
The 10 day EMA at 8692
8626 from December 2002
8588 is the May high
8521 is an interim high in March 2003 after the March 2003 low
8451 is the early October closing low
8419 is the late December closing low in that consolidation
8375 is the late January 2009 interim peak
The 50 day EMA at 8330
8315 is the February 2009 peak
8307 is the April 2009 intraday high
8221 is the May 2008 low
8197 was the second October 2008 low
8191 is the prior April peak
8175 is the October 2008 closing low. Key level to watch.
8141 is the early December low
The early April intraday peak at 8113
The early April peak at 8076
7965 is the mid-November 2008 interim intraday low.
7932 is the March 2009 peak
7909 is the early January low
7882 is the early October 2008 intraday low. Key level to watch.
7867 is the early February low
7702 is the July 2002 low
7694 is the February intraday low
7552 is the November closing low. KEY Level.

Economic Calendar

These are consensus expectations. Our expectations will vary and are discussed in the 'Economy' section.

June 15 - Monday
- NY Empire Manufactur, Jun (08:30):-5.10 expected, -4.55 prior
- Net Long-Term TIC Fl, Apr (09:00): $52.9B expected, $55.8B prior

June 16 - Tuesday
- Housing Starts, May (08:30): 483K expected, 458K prior
- Building Permits, May (08:30): 500K expected, 498K prior
- PPI, May (08:30): 0.6% expected, 0.3% prior
- Core PPI, May (08:30): 0.1% expected, 0.1% prior
- Capacity Utilization, May (09:15): 68.4% expected, 69.1% prior
- Industrial Productio, May (09:15): -0.8% expected, -0.5% prior

June 17 - Wednesday
- Core CPI, May (08:30): 0.1% expected, 0.3% prior
- CPI, May (08:30): -0.9% expected, -0.7% prior
- Current Account Bala, Q1 (08:30): -$85.0B expected, -$132.8B prior
- Crude Oil Inventories, 06/12 (10:30): -4.38M prior

June 18 - Thursday
- Initial Jobless Claims, 06/13 (08:30): 610K expected, 601K prior
- Leading Indicators, May (10:00): 0.9% expected, 1.0% prior
- Philadelphia Fed, Jun (10:00): -17.0 expected, -22.6 prior
icon url

ReturntoSender

06/21/09 8:34 PM

#8598 RE: ReturntoSender #6755

From Briefing.com: Weekly Recap - Week ending 19-Jun-09Investors took profits this week following an aggressive three-month rebound, with the stock market selling off on Monday and Tuesday before mixed trade finished out the week -- S&P 500 -2.6%, Dow -2.9%, Nasdaq Comp -1.7%, Russell 2000 -2.7%.

Market participants now believe that things are less bad than before with the economy and earnings prospects, but the lack of action suggests investors are waiting for headlines to drive the market. Lackluster volume can be partially explained by the typical summer lull, but participants are also awaiting further data that confirms signs of an economic recovery, second quarter earnings season, legislation on regulatory reform for the Financial sector and reform proposals for the Health Care sector, among other items.

Nine of the 10 S&P sectors finished in the red this week, led by Energy (-6.5%), Materials (-6.4%) and Industrials (-5.6%). Health Care (+2.1%) was the only one in the black as that volatile sector seems to move on every reform headline.

As mentioned above, the stock market made its largest move on Monday, with the S&P declining 2.4%. The negative disposition was attributed to reports that G-8 ministers discussed over the weekend how they should prepare to unwind stimulus spending as the economic recovery begins to take root. The commodities market and material stocks were also under pressure following a surge in the dollar after Russian Finance Minister Alexei Kudrin reassured investors of Russia's confidence in the U.S. currency and the BRIC nations said they do not intend to discuss new global reserve currencies at their first summit.

Stocks attempted to rebound on Tuesday, but ended up extending Monday's declines. Industrial Production came in at -1.1% for May (consensus -1.0%), while the prior month was revised lower to -0.7% from -0.5%. That more than offset better-then-expected housing data, as Housing Starts came in at 532,000 in May (consensus 485,000) and Building Permits came in at 518,000 for the month (consensus 508,000).

The stock market actually continued its sell-off on Wednesday morning, as FedEx (FDX) issued disappointing fiscal Q1 (August) guidance and ratings agency Standard & Poor's lowered its ratings and revised its outlooks on 22 banks. But stocks were able to recover from their lows, finishing the session with mixed results.

Thursday and Friday produced more of the same. Volume was extremely low yesterday, with the NYSE hardly trading 1 billion shares. While it doubled today, trading over 2 billion shares, that was due to quarterly options expiration.

Looking ahead to next week, there are a few notable earnings releases, including Walgreen (WAG) on Monday (6/22), Oracle (ORCL) on Tuesday (6/23) and Monsanto (MON) on Wednesday (6/24). There will also be some important economic releases, including Existing Home Sales on Tuesday, Durable Goods Orders on Wednesday and the Final reading for Q1 GDP on Thursday (6/25). However, market participants will still be awaiting resolutions for those items mentioned above, which could impact (further lull) trading.
 
Index Started Week Ended Week Change % Change YTD %
DJIA 8799.26 8539.73 -259.53 -2.9 -2.7
Nasdaq 1858.80 1827.47 -31.33 -1.7 15.9
S&P 500 946.21 921.23 -24.98 -2.6 2.0
Russell 2000 526.83 512.72 -14.11 -2.7 2.7

09:41 am Research In Motion tgt raised to $110 at Amtech following solid quarter and outlook: . Amtech raises their tgt to $110 from $90 following the co's impressive quarter and outlook. The firm notes that RIMM continues to grow in a challenging market and they are encouraged by the uptick in gross margins and the lean channel inventory. The firm believes that with some of the higher expectations reset, investors can increase their long positions.

09:22 am Apple (AAPL)

The new iPhone from Apple (AAPL 135.88) went on sale Friday, but it doesn't appear to be generating quite the buzz that earlier versions had.

Reuters reported that crowds weren't swarming the Apple and AT&T (T 24.13) stores like they had at previous iPhone launches. The new iPhone 3GS was unveiled last week at Apple's Worldwide Developers Conference and features a faster processor, longer battery life and the ability to take videos.

In a separate story, Reuters reported that AT&T said it has sold hundreds of thousands of iPhone 3G S phones via preorders. AT&T said the 3GS has "exceeded our own expectations."

Shares of AAPL are about 1.6% higher ahead of Friday's opening bell while shares of T are up nearly 1%.

08:20 am Research In Motion (RIMM)

BlackBerry maker Research In Motion (RIMM 76.55) topped the consensus earnings estimate in its first quarter and issued in-line guidance for the second quarter.

Research In Motion reported first quarter earnings of $0.98 per share, excluding nonrecurring items, $0.04 better than the First Call consensus of $0.94.

Revenues rose 52.7% year-over-year to $3.42 billion, in-line with the $3.43 billion consensus. Gross margins of 43.6% were also in-line with the 43.3% consensus.

The company added approximately 3.8 million net subscribers in the quarter and has a total subscriber account base of approximately 28.5 million.

Looking ahead, Research In Motion projects second quarter earnings of $0.94 to $1.03 per share; the consensus expects $0.97. The company projects second quarter revenues between $3.45 billion and $3.70 billion; the consensus stands at $3.61 billion.

Gross margins for the second quarter are projected between 43% and 44% and the company expects net subscriber additions between 3.8 million and 4.1 million.

Shares of RIMM are up more than 88% year-to-date but are currently valued at less than half of the 52-week high of $148.13.
icon url

ReturntoSender

06/24/09 8:57 PM

#8603 RE: ReturntoSender #6755

From Briefing.com: 4:30 pm : After starting the day strong, the stock market sold off sharply midday. The major averages climbed higher toward the end of the session, but the Dow still ended modestly lower and the S&P 500 only managed a slight gain.

The Nasdaq was a leader for most of the day following Oracle's (ORCL 21.26, +1.39) better-than-expected fourth quarter results and upside first quarter earnings per share guidance after the close last night. Other large-cap tech stocks also fared well, including Apple (AAPL 136.22 +2.21), Intel (INTC 16.10 +0.29), and Cisco (CSCO 18.61 +0.04).

After a couple of slow days in terms of noteworthy, material news items, there were a few market-moving events today, including the release of the FOMC policy statement. The major averages were putting in solid gains prior to the release, but the market moved decidedly lower afterwards. While the statement said that the pace of economic contraction is slowing, it also stated that economic conditions are likely to warrant exceptionally low levels of the federal funds rate for an extended period of time. The Fed left the fed funds rate unchanged at 0.00% to 0.25%, as expected.

While growth remains the Fed's policy concern, the wording of the June directive can be characterized as balanced since it provides the Fed the leeway to move as it sees fit based on incoming economic data and changes in the financial markets.

The FOMC also stated that its Treasury purchase program size remains unchanged. That pressured Treasuries and took the benchmark 10-year Note from positive ground to negative ground and pushed its yield up more than 10 basis points to 3.69%.

There was also some key economic data out today. Durable goods orders for May showed a surprise 1.8% increase and durable goods less transportation increased a better-than-expected 1.1%. New orders for durable goods increased 1.8% in May and were up 1.1%, excluding transportation. That was good news from the standpoint that each number easily topped the consensus estimates, which called for a 0.9% decline in total orders and a 0.5% decline, excluding transportation. Shipments, though, were still weak as they declined -2.1% to $169.9 billion.

Shortly thereafter, May new home sales data were released, which showed an annualized rate of 342,000 units, below the 360,000 unit consensus. Given the revisions to the prior month, new home sales were down 0.6% month-over-month versus an expected increase of 2.3%. Stocks initially sold off following the new homes data, but quickly rebounded and resumed their strength.

In terms of leading sectors, materials stocks (+0.8%) were strong today despite considerable weakness from Monsanto (MON 76.08 -3.22), which reported third quarter results that topped consensus expectations. However, the company typically carries high expectations, and it only reaffirmed its guidance, which may have been viewed as a disappointment to participants.

Energy stocks finished flat as oil and gas refiners (-3.5%) undercut the sector. Drillers (+1.1%) were strong, though.

Looking ahead to tomorrow morning, there are more economic releases that will garner some attention. At 8:30 AM ET, initial claims are scheduled to be released with current expectations at 600,000, and the final first quarter GDP number will be released, expected to remain at -5.7%.DJ30 -23.05 NASDAQ +27.42 NQ100 +1.6% R2K +1.1% SP400 +1.3% SP500 +5.84 NASDAQ Adv/Vol/Dec 1584/2.16 bln/1099 NYSE Adv/Vol/Dec 2188/1.10 bln/839

4:02PM Seagate Tech raises Q4 revs guidance and issues Q1 revs guidance above consensus (STX) 9.87 +0.27 : Co updates Q4 expected results and issues initial planning assumptions for Q1. For Q4, unit demand and pricing, in aggregate, are tracking favorably as compared to the outlook provided on April 21, 2009. Co sees improved operational efficiencies, product management and the continuing successful transition to the Company's new products, which is allowing the Company to optimize product mix and gross margin. Co and industry channel inventory continue to be below historic levels. As such, co now expects total available market (the "TAM") for hard disk drives to be ~120 million units, or slightly higher, versus our original assumption of 114 million units and revs of ~$2.20-2.30 bln, up from prior guidance of $1.9-2.2 bln, vs $2.09 bln First Call consensus and gross margin as a percent of revenue of approximately 15%... For Q1, co sees overall TAM for hard disk drives is expected to increase seasonally by ~6% to 8% with the exception of the enterprise market which will be flat compared to the June quarter. Supply and demand will be in relative balance, therefore price declines will be similar in nature to the June quarter. As such, co is planning for: revs of ~$2.35-2.50 billion vs $2.27 bln First Call consensus and gross Margin as a percent of revenue will improve to approximately 18%, which is ahead of plan due to improved operational efficiencies and product management, and reaches the low end of the targeted range of 18% - 24%.

4:01PM Juniper Networks and NYSE Euronext (NYX) announces the companies are working together to design a state-of-the-art, ultra-low latency core network for NYSE Euronext's new consolidated global data centers (JNPR) 22.67 0.80 :

4:16AM Rambus prices $150 mln 5% Convertible Senior Notes offering due 2014 (RMBS) 14.85 :

09:34 am Palm target raised to $18 at RBC ahead of earnings: . RBC Capital Mkts raises their PALM tgt to $18 from $14 ahead of the co's Q4 earnings tomorrow. Investors are expected to look past soft Q4 financials and focus on the ramp-up of the Palm Pre and the WebOS franchise. Newly appointed CEO Jon Rubenstein and CFO Doug Jeffries are expected to highlight Palm, WebOS plans and progress. Firm ests Q4 Pre sell-in of 50k at $450 ASP. Demand, however, remains strong; they estimate Sprint (S) has sold 150k units to date, above their prior 120k forecast.

09:31 am Jabil Circuit (JBL)

Jabil Circuit (JBL 7.12) reported better-than-expected fiscal third quarter earnings and issued in-line guidance for the fourth quarter as CEO Timothy L. Main said he sees "genuine stabilization across most of our end-markets."

For its fiscal third quarter Jabil reported earnings of $0.04 per share, a penny better than the First Call consensus that expected $0.03.

Revenues fell 15.3% year-over-year to $2.62 billion, in-line with the $2.62 billion consensus.

Looking ahead, Jabil issued in-line guidance for its fiscal fourth quarter, forecasting earnings of $0.02 to $0.12 per share; the consensus expects $0.09. The company forecasts revenues between $2.5 billion and $2.7 billion; the consensus stands at $2.72 billion.

09:11 am Oracle (ORCL)

Oracle (ORCL 19.87) reported fiscal fourth quarter earnings and revenue that beat consensus estimates and issued first quarter earnings per share guidance that tops the current First Call consensus.

For its fiscal fourth quarter, Oracle reported earnings of $0.46 per share, excluding nonrecurring items, $0.02 better than the First Call consensus of $0.44.

Revenues fell 5.2% year-over-year to $6.86 billion but still topped the $6.47 billion consensus.

"We executed substantially better than we expected on both the top and bottom line for the quarter," said Oracle CFO Jeff Epstein. "We grew Q4 non-GAAP operating margins by a faster than expected 240 basis points to over 51 percent. That helped us generate $7.7 billion in free cash flow for fiscal 2009."

Looking ahead, Oracle said it sees fiscal first quarter earnings of $0.31 to $0.33 per share; the First Call consensus currently stands at $0.30. Oracle projects revenues flat to up 2% in the quarter, which equates to $5.15 billion to $5.44 billion. The consensus calls for $5.15 billion.

Shares of ORCL are up 12% year-to-date and are more than 4% higher in Wednesday's premarket trading.
icon url

ReturntoSender

06/25/09 8:26 PM

#8604 RE: ReturntoSender #6755

From Briefing.com: 4:25 pm : Stocks managed to reverse modest losses in the first few minutes of trading to spend the rest of the day trading with impressive gains. There was some fleeting selling pressure heading into the close, but the effort was resisted and stocks finished near session highs.

Thanks to strength among retailers, consumer discretionary stocks(+2.9%) led most of the buying in the broader market. Retailers tacked on 3.8% after Bed Bath & Beyond (BBBY 31.08, +2.69) reported better-than-expected first quarter earnings.

Home builder Lennar (LEN 9.19, +1.37) provided leadership to consumer discretionary stocks despite reporting a worse-than-expected quarterly loss.

Meanwhile, Nike (NKE 51.28, -1.74) was a laggard in the group, though it beat quarterly earnings expectations. However, the company indicated that global futures orders dropped 12% from the prior year.

All 10 major sectors in the S&P 500 were able to log gains of 1.0% or more. Financials had lagged for most of the session and even traded with a modest loss early on, but spiked into the close to finish with a 1.7% gain.

Bond markets also saw plenty of buying this session after a $27 billion auction of 7-year Notes saw better-than-expected results. The auction drew a yield of 3.33% and a bid-to-cover ratio of 2.82. Buying at the long-end of the yield curve pushed the benchmark 10-year Note up more than one full point, sending its yield more than 10 basis points lower to just above 3.5%. The 30-year Bond was bid almost two points higher, which dropped its yield 11 basis points to roughly 4.3%.

This session's broad-based buying also extended into commodities, which helped the CRB Commodity Index climb 1.4%. Energy-based commodities saw particularly strong gains as crude oil prices advanced 2.2% to $70.15 per barrel in pit trading. Natural gas prices settled at $3.84 per contract, up 2.2% after weekly inventory data showed a smaller-than-expected build.

In economic data, initial jobless claims for the week ending June 13 totaled 627,000, which is more than expected and up from the previous week. Continuing claims crept up to 6.74 million. Though that is still off of its record high, it exceeded forecasts.

The final reading for first quarter GDP showed a 5.5% annualized decline, which is a slight improvement from the 5.7% annualized decline that was previously reported. The revision came from a smaller decline in inventories than previously reported, but personal consumption expenditures were revised downward to show a 1.4% increase.DJ30 +172.54 NASDAQ +37.20 NQ100 +2.0% R2K +2.9% SP400 +2.5% SP500 +19.32 NASDAQ Adv/Vol/Dec 2172/2.25 bln/517 NYSE Adv/Vol/Dec 2460/1.23 bln/571

4:08PM Palm beats by $0.22, beats on revs (PALM) 14.02 +0.08 : Reports Q4 (May) loss of $0.40 per share, $0.22 better than the First Call consensus of ($0.62); revenues fell 70.7% year/year to $86.8 mln vs the $80.6 mln consensus. "The launch of Palm webOS and Palm Pre was a major milestone in Palm's transformation; we have now officially reentered the race... We have more to accomplish, but the groundwork is laid for a very promising future here at Palm. Our senior management team is capable, motivated and focused on execution; there is a large group of developers waiting to build great applications for Palm webOS; and we have a new product pipeline that we think will set a standard for the industry." The company shipped a total of 351,000 smartphone units during the quarter, representing a 6 percent increase from the third quarter of fiscal year 2009 and a year-over-year decline of 62 percent. Smartphone sell-through for the quarter was 460,000 units, down 5 percent vs. the third quarter of fiscal year 2009 and down 52 percent year-over-year.

4:04PM Micron beats by $0.07, misses on revs (MU) 5.30 : Reports Q3 (May) loss of $0.36 per share, $0.07 better than the First Call consensus of ($0.43); revenues fell 26.2% year/year to $1.11 bln vs the $1.18 bln consensus. The company's gross margin on sales of memory products improved from negative 30 percent in the second quarter of fiscal 2009 to positive 11 percent in the third quarter, resulting from significant decreases in per gigabit manufacturing costs and the benefit in the third quarter from sales of products previously written down. As a result of these decreases in per gigabit manufacturing costs and increases in average selling prices, there was no lower of cost or market write-down of memory inventories during the third quarter. Cost of goods sold in the third quarter includes approximately $30 million of charges for unused production capacity at the company's Inotera and IM Flash joint ventures and an estimated benefit of $242 million from sales in the third quarter of products written down in previous periods.

4:03PM SMSC beats by $0.08, beats on revs; guides Q2 EPS in-line, revs above consensus (SMSC) 19.16 +1.04 : Reports Q1 (May) loss of $0.15 per share, excluding non-recurring items, $0.08 better than the First Call consensus of ($0.23); revenues fell 32.7% year/year to $62.5 mln vs the $56.9 mln consensus. Co issues in-line EPS guidance for Q2, sees EPS of $(0.08)-0.00, excluding non-recurring items, vs. ($0.08) consensus; sees Q2 revs of $68-72 mln vs. $59.67 mln consensus.

9:16AM Microsoft outlines revenue recognition for the Windows 7 upgrade option program (MSFT) 23.47 : Co announces the start of the Windows 7 Upgrade Option program enabling consumers and small businesses to receive Windows 7 when they purchase a qualifying Windows Vista personal computer starting June 26, 2009. Under the program, designated PCs pre-installed with premium versions of Windows Vista will qualify for licenses of the equivalent Windows 7 product. In association with the Windows 7 Upgrade Option program, Microsoft will defer approximately 50% of the revenue from eligible sales under the program to the earlier of the program fulfillment date or the program's expiration. For the fourth quarter fiscal year 2009, Microsoft will defer an estimated $200 to $300 million of revenue. The deferral only impacts the timing of revenue recognition and will not impact cash flows from operations. The Company made a similar revenue deferral for the Windows Vista Technology Guarantee program during the 2007 fiscal year.

8:02AM Trina Solar secures $57 mln credit facilities; total credit facilities now stand at approximately $520 mln (TSL) 24.30 :

icon url

ReturntoSender

06/27/09 9:35 PM

#8605 RE: ReturntoSender #6755

From Briefing.com: Weekly Recap - Week ending 26-Jun-09

The stock market had some swings this week, but eventually settled essentially unchanged as early losses were offset by gains later in the week. Trading was highlighted by corporate news from some widely-held names, economic data and the FOMC policy announcement.

Stocks got off to a rough start, with the S&P 500 falling 3.1% on Monday. Although there was no particular catalyst for the sell off, the World Bank cutting GDP forecasts on the U.S. and other major economies did not help sentiment.

But the S&P 500 managed to regain ground, with most of the advance coming on Thursday. In the end, the stock market fell 0.3%, with the telecom (+3.7%) and healthcare (+1.4%) sectors outperforming. The energy (-2.3%) and financial (-1.1%) sectors were the main laggards.

Although only a handful of companies reported earnings, there were several big names announcing, which kept corporate news in focus.

Walgreen (WAG) tumbled after missing its consensus estimate on lower margins, sending the stock down 5.2% for week. Oracle (ORCL) topped estimates and issued upside guidance, settling with a weekly gain of 2.8%.

Nike (NKE) shares fell 10.3% for the week. Although the company beat expectations for its latest quarter, investors were disappointed that future orders fell 12% year-over-year.

In other corporate news, Boeing (BA) pushed back the first flight date of its long anticipated and much delayed 787 Dreamliner. Shares fell 13.5%..

In economic news, new home sales data showed an annualized rate of 342,000 units, below the 360,000 unit consensus. Given the revisions to the prior month, new home sales were down 0.6% month-over-month versus an expected increase of 2.3%.

Meanwhile, existing home sales increased 2.4% from April to an annualized rate of 4.77 million units. According to the National Association of Realtors. Despite the gain, the reading was slightly below the consensus estimate of 4.82 million.

Initial jobless claims for the week ended June 13 totaled 627,000, which was worse than expected and up from the previous week. Continuing claims crept up to 6.74 million. Though that is still off of its record high, it was worse-than-expected.

The final reading for first quarter GDP showed a 5.5% annualized decline, which is a slight improvement from the 5.7% annualized decline that was previously reported. The revision came from a smaller decline in inventories than previously reported, but personal consumption expenditures were revised downward to show a 1.4% increase.

The FOMC left the benchmark rates unchanged (fed funds at range of 0.00% and 0.25%), noting that there is a slowdown in the economic contraction. But the committee also stated that economic conditions are likely to warrant exceptionally low levels of the federal funds rate for an extended period of time

Bond markets saw plenty of action during the week. A $27 billion auction of 7-year Notes had better-than-expected demand. The auction drew a yield of 3.33% and a bid-to-cover ratio of 2.82. Buying at the long-end of the yield curve pushed the benchmark 10-year note yield down to 3.55% from 3.79%.
 
Index Started Week Ended Week Change % Change YTD %
DJIA 8539.73 8438.39 -101.34 -1.2 -3.9
Nasdaq 1827.47 1838.22 10.75 0.6 16.6
S&P 500 921.23 918.90 -2.33 -0.3 1.7
Russell 2000 512.72 513.22 0.50 0.1 2.8

10:08 am Micron Technology (MU)

Micron Technology (MU 5.22, -0.08) reported third quarter results that beat consensus on the bottom line, but missed on the top line.

The company reported a loss after the close yesterday of $0.36, which came in $0.07 higher than the First Call consensus. However, revenue for the quarter of $1.11 billion declined 26.2% from the prior year's quarter and fell short of expectations of $1.18 billion.

Gross margins on sales of memory products improved from negative 30% in the second quarter of fiscal 2009 to positive 11% in the third quarter, resulting from significant decreases in per gigabit manufacturing costs and the benefit in the third quarter from sales of products previously written down. As a result of these decreases in per gigabit manufacturing costs and increases in average selling prices, there was no lower of cost or market write-down of memory inventories during the third quarter.

The company also said that memory production in the third quarter was significantly higher compared to the preceding quarter. Increases in bit production resulted from the company's continued transition to higher density 34 nanometer (nm) NAND Flash products and 50nm DRAM products.

10:00 am Palm (PALM)

Palm (PALM 15.32, +1.30) reported fourth quarter results after the close yesterday that were well above consensus estimates.

The company reported a loss of $0.40 per share, which came in $0.22 better than the First Call consensus of a loss of $0.62. Also, the company reported GAAP revenue of $86.8 million; First Call consensus was $80.6 million.

The company shipped a total of 351,000 smartphone units during the quarter, representing a 6% increase from the third quarter of fiscal year 2009 and a year-over-year decline of 62%. Smartphone sell-through for the quarter was 460,000 units, down 5% vs. the third quarter of fiscal year 2009 and down 52% year-over-year.

The company said, "The launch of Palm webOS and Palm Pre was a major milestone in Palm's transformation; we have now officially reentered the race... We have more to accomplish, but the groundwork is laid for a very promising future here at Palm. Our senior management team is capable, motivated and focused on execution; there is a large group of developers waiting to build great applications for Palm webOS; and we have a new product pipeline that we think will set a standard for the industry."
icon url

ReturntoSender

06/28/09 9:35 PM

#8607 RE: ReturntoSender #6755

InvestmentHouse Weekend Market Summary 6/26/09

http://www.investmenthouse.com/weekendmarketsummary.htm

- Friday basically a throwaway session as quiet trade leads up to Russell rebalance.
- Sentiment climbs, but Consumers continue to save much more than they spend.
- Quiet positives: business profits, business investment rising more than thought.
- The lateral consolidation continues at a higher level for NASDAQ but the same old range for SP500. Not that bad for the summer.

Most just waited for Friday to end.

The Russell rebalance dominated the Friday action though the flat as a board trade up to the last half hour makes the choice of the word 'dominated' somewhat curious. But that is what the rebalance did: the market just sat around all day in anticipation of the volatility and volume to come in late and thus no one did much of anything leading up to the last hour. When it hit, volume spiked, some prices surged, and some prices purged. It was over and done in about an hour.

So there was the Russell rebalance that kept the indices basically flat on Friday, and the end of quarter window dressing on Thursday that influenced the last half of the week after that Monday dive lower to get things started. Again, Thursday was end of quarter window dressing; the program trading that took over and the areas sold and sectors subsequently purchased show the fund managers were sprucing up the portfolios for the quarterly statements. Why Thursday? Because Friday was the Russell action and next week is a short week (Friday off) for Independence Day when many on Wall Street are gone. Thus the dressing up was taken care of Thursday.

The end result for SP500 on the week was similar to Friday's action, i.e. pancake flat. The Monday dive and the Thursday rebound evened things out. Even Steven as Kramer called Jerry on 'Seinfeld.' That kind of action doesn't tell you a whole lot. Monday SP500 looked just a session away from 875, but it turned as fast as it sold. That leaves SP500 in the middle of its 900 to 950 trading range and us waiting for next week once more to fill in more of the picture.

Maybe, however, what the market did not do, sell off, is the real story. Yes SP500 went nowhere on the week, but it did test just below the 900 level and recovered. NASDAQ sold on Monday as well, but it bounced and rallied on through Friday. The underlying bias remains positive, there remains an overall bid under the market, thanks to all of that liquidity still getting pumped into markets around the world. The G8 may have talked about removing some stimulus at some point, but they have done nothing along those lines. That means the presses are still running and money is still hitting the world economies.

Even with leadership from energy and commodities dropping like stones the past two weeks, the overall market has not dropped significantly, i.e. it has not broken down. Yes the dipped but they are also holding support levels and working laterally. After 30% runs off the lows, lateral consolidations are very decent action. It can frustrate investors but we continue to see good stocks set up and give us good runs. This past week saw some key Chinese stocks break higher again along with, of all things, steel stocks. Early leaders lead early, and while SP500 was not surging higher, it was not breaking down and indeed NASDAQ managed to hold its breakout and rebound with a quite decent move.

This is very telling action in the bigger picture as stocks move into the heat of the summer quarter. It may not be that stocks get away without SP500 testing the 875 level before any significant upside move transpires. It takes awhile to consolidate those kind of gains, and a test of 875 is, as DeNiro said in 'The Untouchables', NOTHING. The fact SP500 is so obstinate in giving up any ground toward that level only underscores the continuing, underlying liquidity bias.

TECHNICAL

INTRADAY. Lower to flat on the open, lower to flat midmorning, lower to flat in the afternoon, and then, finally, moving positive in the last hour. It could not hold, of course, at least for the large cap NYSE and the chips. Still flat overall though SP600 managed a 1.25% gain; lots of Russell type stocks in the small cap area.

INTERNALS. Breadth was pretty decent considering the flat session (1.8:1 NASDAQ, 1.6:1 NYSE). Volume surged; rebalance trade. Thus the internals tell you squat, at least for Friday. Indeed they told us basically squat for the entire week, particularly with Thursday getting the window dressing treatment followed by the Russell rebalance on Friday.

CHARTS. NASDAQ added to its rebound after testing the May peaks and holding its range of support. Its breakout is intact, and the techs are looking very much like the leaders they are. SP500 was down then recovered, coming within 13 points of 875. Maybe you can call that the test. We are still looking for it to make at least that drop as things even out next week and the one-off events of this past week are put behind it. Nonetheless, as noted above, there is that continuing bid under the market, and the indices continue to hold support and work slightly higher as they consolidate. That is underscored by the rising 50 day EMA crossing over the 200 day SMA on NASDAQ in early June and on SP500 on Wednesday. That crossover has historically been positive for the stock market. Stocks tend to gain, in the aggregate, 20% in the year following such a crossover. Again, another indication of a continuing and serious bid under the market.

LEADERSHIP. China is here, Mr. Burton. Again with the quote from 'Big Trouble in Little China;' didn't make sense to Kurt Russell in the movie, but it makes sense here. MR and CTRP are running higher and we wish we were in more of the China stocks; just missed some that gapped away on us this past week. And if you look up in the sky you see not the man of steel, but steel stocks moving back up. Some big techs are moving, some chips, and some industrials are recovering. It is not, however, a broad advance with patterns in great shape to move higher. Energy remains in serious trouble; the rebound late in the week only makes for good points to roll back over. There are many good stocks, but as far as good sectors loaded with leaders, that is not the case right now. The recent leadership fell apart and only a few are stepping back up. That is consistent with a consolidation, but more stocks will have to form up better in order to eventually lead things out of the consolidation.

THE ECONOMY

Better sentiment once more but more savings as well.

Michigan sentiment reported a brighter outlook at 70.8, up from 68.7 (revised from 69.0) and the 60.0 expected. Stock market gains accounted for most of the rise as higher gasoline and a bleak jobs outlook continue to weigh on citizens.

Indeed present conditions jumped to 73.2 from 67.7 while the outlook down the road fell to 69.2 from 69.4. That is typically the case when stocks rise and the consumer has a bit more money in the bank.

And in the bank is where it is. Incomes rose 1.4% thanks to the government tax rebates to certain segments of society. That beat the 0.3% expected and the 0.7% in April (revised from 0.5%). Real disposable income rose to 1.6%, but if you take out those tax rebates real disposable income rose a measly 0.2%. Private wage and salary payments fell 0.2%, the ninth straight month the private sector sees shrinking payrolls. Companies are still cutting back as the jobless claims and these figures show.

Spending, however, rose only 0.3%. That was up from the 0.0% prior (revised from -0.1%; see there IS progress), but it is not much. That pushed the savings rate up to 6.9% from 5.6% in April. As noted previously, citizens are scared. They are not spending extra money they receive because they are concerned about their jobs and the future. It thus goes under the mattress, and that sure doesn't help the economy much.

Even more, it again underscores what we should know from history, i.e. that if you want sudden impact (staying with my movie theme for the night) on the economy you have to require performance. In other words you only get the benefit if you spend. That insures the money hits the economy. Moreover, you don't tie it to obtuse purchases such as solar panels where you get $1,000 off a system that will cost you $40K to install. It simply is not going to happen unless you are a Hollywood type who feels it is 'cool' to spend some of your millions to be green (sticking with that movie theme), but of course if you make over $200K per year the credit is phased out. So, you have a credit for a $40K system that even if the credit was used those that can use it simply cannot afford even in GOOD times.

The moral of the story (or the simply lesson from history): you have to be smart about incentives. Tax cuts are good in general but they are not all created equal. More accurately, they are typically manipulated in a manner that makes them hardly useful. Thus an administration can crow about the tax cuts or incentives it provided but the real test is whether they work or are used. A credit unused is a recovery deferred, or something like that.

Could there be some economic recovery taking place?

The news remains bad on the economic front. You can try to sugar coat it or adjust the lights just right and make it look better, but the data is still bad. Sure it blipped higher for a couple of months but the recent more leading data is backsliding once more.

Our fear voiced a couple of months back was a double dip recession. That is where the economy rebounds some when it is recognized that Great Depression II is avoided. Businesses and consumers that had totally shut down then start to engage in some business again, not with the idea that everything is fine, but that they can emerge from the bomb shelters and walk around again. There is also a ton of monetary stimulus unleashed as the Fed slashes rates, buys treasuries, makes credit facilities available, etc.

Thus you have an improvement from the total shutdown. That is not the same, thing, however, as a recovery. It is a step back from the threshold of hell but the people are still feeling damned so to speak. You get that improvement and that ignites all of the excitement heard on the news channels about recovery underway. After that relief bounce from disaster, however, something has to take over and ignite real honest to goodness economic activity. With consumers not spending, credit and lending problematical, and the stimulus not really stimulus at all, the recovery is either very slow or mired in the mud.

Not ALL are backsliding.

That is why there is the backsliding in some of the key numbers. There are also key numbers, however, that are showing improvement.

Wednesday saw a solid increase in durable goods orders, up 1.8% for the second straight month. Most importantly, business spending rose 4.7%, its second gain in the last four months. That is hardly a string of winners, but the improvement is strong. There is some replacement buying ongoing and some inventory replenishment; you can only hold off for so long without getting restocked, though you need to talk to Home Depot about that. Went in there the other day to pick up some electrical connectors and of course the most popular sizes were out of stock. Went to get some PVC fittings and again, out of stock. With gas prices at $2.50/gallon it gets kind of expensive to go to HD and only get half of your items, then drive to Lowe's to try and get the other half. You would think with a recession there would be plenty of stock on hand, but then again you are dealing with HD. Will I never learn.

Of course, I digress yet again. That is what happens on a slow market day. So business expenditures on equipment and the like rose 4.7% in May. The Thursday GDP revision showed a loss of 'just' 5.5% versus -5.7% previously reported. There was another revision, however, and it dealt with corporate profits. They were revised higher $120B. Seems corporations are cutting back along with the consumer and saving money where they can. But as the durables figures show (and they are post-Q1 at that so things could be even better this quarter), business spending is up as well. So maybe they are spending some of the money they are able to save.

The irony of all of this is that consumers are saving at a 6.9% rate and businesses are cutting costs to improve their bottom lines as well (just look at the jobless claims continuing their strong weekly levels), yet the government is spending as if happy days are here once more. Stimulus that is not stimulus. A bloated budget loaded with pork when no pork was to be included in the Obama budgets; though we learned you CAN eliminate all of the earmarks by just not calling them earmarks. Brilliant! You can eliminate tax hikes as well by just saying you are letting rates go back to where they were. Push an energy bill that will spike gasoline prices and utility rates in a recession with the idea of reducing greenhouse gases, but then give every major polluter impacted free credits. Moreover the plan, by the most generous standards, would only impact temperature one-half of one-tenth of a percent. Oh, and at the bargain price of $1.7T over 10 years.

Of course what plan is complete without taking over healthcare. It is estimated by the administration to cost $1T over 10 years. Of course it is supposed to save us money. Yet it will cost $1T. I missed that day in math class. Of course I did make it to history class and if you apply the typical government cost multiplier to these kinds of projects and you get a minimum of $10T over 10 years. Just look at Medicare as your guide. So happy to see the federal government tightening its belt some. All of course, in the name of saving money. My wife 'saved' me several hundred dollars recently when she bought a bunch of stuff on sale. I am still trying to recover from that savings.

It strains the imagination at how our government can spend so much with so little economic activity to back it up. Of course it is using cheaper dollars. It has gutted the dollar (closed at 1.4069 Friday after making it into the 1.37ish range during the week) so at least we are spending cheaper dollars. Wow, that makes you feel better, right? Man, maybe someday even I could make it in politics if I am able to disassociate myself with reality. I tried that once, but alas, I did not inhale.

Now who do you really work for?

Now I think I began this section talking about how some areas might be improving. When you juxtapose the improvements against the anticipated outlays and you feel a bit, just a bit, the despair many of us are experiencing as we realize in just 5 short months the federal government has strapped another $500K in debt on every man, woman, and child in the US. That is just if the projected costs are accurate. They are not, so the debt is even more massive. Many people do not make that much money in their lives. They are going to WORK THEIR ENTIRE LIVES to pay off the government's debt. They are now in effect working full-time for the government.

The next tragic irony is that the government is going to raise taxes on those now working for it through the private sector in order to further pay for the bills. It won't just be on the 'rich'. The burden is too huge. Some quick calculations show rates need to rise 18% to 20% on everyone to even approach paying for this. Of course if you raise taxes, particularly in a recession, you will ultimately get much less tax revenue. Clinton got more revenue because the boom was underway; he could have kept tax rates flat and would have still had surpluses. The higher taxes combined with poor monetary policy decisions, however, doomed the very boom that brought the surpluses.

Now the feds may not raise income taxes on everyone, but they are going to raise taxes on things that everyone uses. Gasoline, health insurance benefits, corporate 'loopholes' (items designed in the law to make our businesses better able to compete abroad given our high tax rates), certain foods, activities. Heck they are even talking about imposing huge taxes on people like you and me that make money buying and selling in the stock market. They basically want to tax short term swing traders (anything less than a year) and particularly day traders out of business as they think we are leeches on the system. Surely they jest when they see the taxes we pay on our profits.

Mark my words: there will be a tax increase mania coming to pay for these bills. Income taxes on the 'rich' will be raised (and the definition of 'rich' will continue to drop in dollars) while the lower incomes Obama said would not have their taxes raised will see taxes on goods go up. The President might be saying he won't raise taxes, but all the President's men (another movie reference) are saying they will rise. That has been the pattern: President says 'no,' but then the actions say 'yes.' Actions, as always speak louder than words. The hikes will be framed as doing the patriotic thing, but people, there is NOTHING patriotic about funding a runaway government that is exceeding the bounds of our law of the land, the Constitution. It is our duty as laid out by our founding fathers and those that died for this country to hem in the government when it goes astray. With both the democrats and republicans runaway spenders that will sacrifice their principals for money in times of need it likely will come upon us, the taxpayers that fund the madness, to simply say 'no.' And unlike the Administration, we will mean it.

THE MARKET

MARKET SENTIMENT

VIX: 25.93; -0.43
VXN: 26.53; -0.72
VXO: 25.35; -0.52

Put/Call Ratio (CBOE): 0.81; -0.09

Bulls versus Bears:

This is a reading of the number of bullish investment advisors versus bearish advisors. The reason you look at this is that it gives you an idea of how bullish investors are. If they are too bullish then everyone is in the market and it is heading for a top: if everyone wants to be in the market then all the money is in and there is no more new cash to drive it higher. On the other side of the spectrum if there are a lot of bears then there is a lot of cash on the sideline, and as the market rallies it drags that cash in as the bears give in. That cash provides the market the fuel to move higher. If bears are low it is the same as a lot of bulls: everyone is in and the market doesn't have the cash to drive it higher.

Bulls: 43.6%. Down from 44.8% as the choppy market is still culling the herd some. Fading from 47.7% it spiked to up from a low of 42.5%. Broke free from the 40.9% where it hung around for three weeks. Steady rise from 36.0% just 8 weeks back. Has passed 43.2% hit mid-April before anticipation of stress tests. Over the 35% threshold, below which is considered bullish, but this is not a bearish indication yet. Has to get up to the 60% to 65% level to be bearish. Dramatic rise from 21.3% in November 2008, the bottom on this leg. This last leg down showed us the largest single week drop we have ever seen, falling from 33.7% to 25.3%. Hit 40.7% on the high during the rally off the July 2008 lows. 30.9% was the March low. In March the indicator did its job with the dive below 35% and the crossover with the bears. A move into the lower 40's is a decline of significance. A move to 35% is a bullish indicator. This is smashing that. For reference it bottomed in the summer 2006, the last major round of selling ahead of this 2007 top, near 36%, and 35% is considered bullish.

Bears: 28.7%. Up from 26.4% and 23.3% the week before. Still well off the 37.2% and the 37.1% in mid-April as the rally continued higher. As with bulls, below the 35% threshold considered bullish and starting to approach bearish levels (for the overall market). Now far from off the high on this run at 47.2%. For reference, bearishness hit a 5 year high at 54.4% the last week of October 2008. The move over 50 took bearish sentiment to its highest level since 1995. Extreme negative sentiment. Prior levels for comparison: Bearishness peaked at 37.4% in September 2007. It topped the June 2006 peak (36%) on that run. That June peak eclipsed the March 2006 high (33%) and well above the 2005 highs that spawned new rallies (30% in May 2005, 29.2% in October 2005). That was a huge turn, unlike any seen in recent history.

NASDAQ

Stats: +8.68 points (+0.47%) to close at 1838.22
Volume: 3.433B (+57.95%). That is some volume. Means nothing but that is a lot of volume.

Up Volume: 1.953B (-2.504M)
Down Volume: 1.665B (+1.399B)

A/D and Hi/Lo: Advancers led 1.81 to 1
Previous Session: Advancers led 4.16 to 1

New Highs: 93 (+55)
New Lows: 12 (+4)

NASDAQ CHART: Click to view the chart

Gapped lower and then continued its bounce off the Tuesday test of the May highs. Held that 'range' of support from the November peak to the May highs and bounced nicely. Has set some good support at that level: it should act as support, but until it is tested and holds a bounce it is just soft support. Still not likely to break through the October gap down point, but NASDAQ is in the lead and showing great strength.

SOX (-0.08%) continued its bounce off the Tuesday low as well (where it held support at 250 to the dime), but it could not hold the gains scored Friday. Indeed on the upside it hit the March/May trendline and faded back. Chips remain important, but they also remain very volatile the past 2 months. Gave up a pair of breakouts and sold aggressively back to support. Holding for now but the action suggest more work to do.

NASDAQ 100 CHART: Click to view the chart

SOX CHART: Click to view the chart

SP500/NYSE

Stats: -1.36 points (-0.15%) to close at 918.9
NYSE Volume: 2.128B (+80.73%)

Up Volume: 1.167B (+168.831M)
Down Volume: 1.08B (+957.415M)

A/D and Hi/Lo: Advancers led 1.58 to 1
Previous Session: Advancers led 3.99 to 1

New Highs: 36 (+11)
New Lows: 40 (-7)

SP500 CHART: Click to view the chart

Tight range, showing a doji at resistance at 918. Big Thursday bounce, nothing doing Friday given it was a day for the small and mid-caps. SP500 is holding the 900 level, falling to 888 on the week low, just over 875. SP500 is working in a higher range and a narrow range at that. For next week? SP500 showed good support just over 875, but we feel the trend lower to test 875 will continue with the end of quarter window dressing ending and the Russell out of the way. Overall, however, that still means a consolidating SP500 versus one rolling over and selling off.

SP600 (+1.25%) is making higher lows off the May test, two major ones thus far, the most recent last week on Tuesday. As with SP500 the small caps looked ready to dive lower then recovered, making that higher low. The pattern, as with the other indices, is still in transition.

SP600 Chart: Click to view the chart

DJ30

Bounced off support at 8250, but stalled at 8500 on Friday. This keeps DJ30 right in the middle of its range from 8250 to 8800 with some inside resistance at 8588 from the May highs. Still working on it.

Stats: -34.01 points (-0.4%) to close at 8438.39
Volume: 307M shares Friday versus 222M shares Thursday. Gee, didn't even make it to average. Not much of a Russell influence on these stocks, however.

DJ30 CHART: Click to view the chart

NEXT WEEK

The FOMC is out of the way, window dressing likely won't be too much of a factor given it is a shortened holiday week, and the annual Russell rebalance is in the books. Of course there is the Chicago PMI, ISM index, ADP, and jobs report. Plenty packed into a shortened week. Earnings kick off again less than two weeks away, and that means warnings as well.

What does this mean? To us, the overall trends will reassert themselves and that means we are still watching for the indices to consolidate in this lateral move but also watching for SP500 to test 875. The indices are in a transition phase, consolidating the 30% rallies off the March low. Outside of NASDAQ with its clean breakout and hold of support the indices are in that in between phase where overall the patterns remain positive but they could form a head and shoulders bearish pattern. With all of the liquidity out there that is less likely. What it does mean is that the indices still have work to do.

Overall that means most stocks are in the same position, i.e. working through a transition, trying to base, trying to fight off some selling the past two weeks such as seen with energy stocks and commodities. Many energy stocks are still in trouble; they have bounced but not authoritatively. As with the indices, a lot of stocks still have work to do.

Picked up some good upside this past week or so even with the indices bouncing around. Looking for some more upside as the early leaders set up and attempt to make breaks higher. At the same time there are downside setups with the energy, industrials, and some commodities stocks bouncing back to resistance, forming some bearish flags that are good entries into the downside. With quite a few stocks in the bearish position near term that is another indication there is some more consolidation work ahead and that means SP500 could indeed show us that downside test.

Thus even though the indices are in a transition phase and not trending strongly (outside of NASDAQ though it is not a strong surge at this point), the market is yielding some good plays. We need to have some 'transition phase' targets, i.e. willing to shorten our profit horizons a bit near term, then if they continue to move we can let the remaining positions continue to run. Then if the market breaks out or breaks down we are well-positioned to reap strong returns. Right now we want to concentrate on entry points, i.e. picking good risk/reward points where the move is just starting. Then if it works we capture more of it and if it doesn't we have a good stop point to limit the downside.

Support and Resistance

NASDAQ: Closed at 1838.22
Resistance:
1880 is the June peak
1897 is the October post gap intraday high.
1947 is the October gap down point
1984 from late September
2099 is the mid-September low
2169 is the March 2008 double bottom low

Support:
1786 is the November intraday high
1780 is the November 2008 closing peak
1773 is the May intraday peak
1770 is the mid-October interim peak
The 50 day EMA at 1748
1716 is the May closing high
1673 is the prior April peak
1666 is the intraday January 2009 peak
1664 is the May 2008 low
1661 is the April 2009 prior peak
The January closing peak at 1653 (intraday)
The 200 day SMA at 1645
1623 is the early April peak
1620 from the early 2001 low
1603 is the December peak
1598 is the February 2009 peak, the last peak NASDAQ made
1587 is the March 2009 high is getting put to bed again
1569 is the late January 2009 peak
1542 is the early October 2008 low
1536 is the late November 2008 peak
1521 is the late 2002 peak following the bounce off the bear market low
1505 is the late October 2008 closing low.
1493 is the October 2008 low & late December 2008 consolidation low

S&P 500: Closed at 918.90
Resistance:
919 is the early December peak is bending
930 is the May peak
935 is the January closing high
944 is the January 2009 high
956 is the June intraday peak
1000
1050

Support:
899 is the early October closing low
The 200 day SMA at 894
The 50 day EMA at 899
896 is the late November 2008 peak
888.70 is the April intraday high.
882 is the early May low
878 is the late January 2009 peak
The prior April peak at 876
866 is the second October 2008 low
857 is the December consolidation low; cracking but not broken
853 is the July 2002 low
848 is the October 2008 closing low
846 is the April peak
842 is the early April peak
839 is the early October 2008 low
833 is the March 2009 peak
818 is the early November 2008 low
815 is the early December 2008 low
805 is the low on the January 2009 selloff. KEY Level
800 is the March 2003 post bottom low

Dow: Closed at 8438.39
Resistance:
8451 is the early October closing low
The 10 day EMA at 8467
8521 is an interim high in March 2003 after the March 2003 low
8588 is the May high
8626 from December 2002
8829 is the late November 2008 peak
8934 is the December closing high
8985 is the closing low in the mid-2003 consolidation
9088 is the January 2009 peak
9387 is the mid-October peak
9625 is the October closing high

Support:
8419 is the late December closing low in that consolidation
The 50 day EMA at 8382
8375 is the late January 2009 interim peak
8315 is the February 2009 peak
8307 is the April 2009 intraday high
8221 is the May 2008 low
8197 was the second October 2008 low
8191 is the prior April peak
8175 is the October 2008 closing low. Key level to watch.
8141 is the early December low
The early April intraday peak at 8113
The early April peak at 8076
7965 is the mid-November 2008 interim intraday low.
7932 is the March 2009 peak
7909 is the early January low
7882 is the early October 2008 intraday low. Key level to watch.
7867 is the early February low
7702 is the July 2002 low
7694 is the February intraday low
7552 is the November closing low. KEY Level.

Economic Calendar

These are consensus expectations. Our expectations will vary and are discussed in the 'Economy' section.

June 30 - Tuesday
- Consumer Confidence, June (09:00): 55.1 expected, 54.9 prior
- S&P/Case-Shiller, Apr (09:00): -18.75% expected, -18.70% prior
- Chicago PMI, June (09:45): 38.5 expected, 34.9 prior

July 01 - Thursday
- ADP Employment Chang, June (08:15): -363K expected, -532K prior
- Construction Spendin, May (10:00): -0.5% expected, 0.8% prior
- ISM Index, June (10:00): 44.0 expected, 42.8 prior
- Pending Home Sales, May (10:00): 1.1% expected, 6.7% prior
- Crude Inventories, 06/26 (10:30): -3.87M prior
- Auto Sales, June (14:00): 3.3M prior
- Truck Sales, June (14:00): 4.1M prior

July 02 - Friday
- Nonfarm Payrolls, June (08:30): -370K expected, -345K prior
- Unemployment Rate, June (08:30): 9.6% expected, 9.4% prior
- Hourly Earnings, June (08:30): 0.2% expected, 0.1% prior
- Average Workweek, June (08:30): 33.1 expected, 33.1 prior
- Initial Claims, 06/27 (08:30): 627K prior
- Factory Orders, May (10:00): 0.2% expected, 0.7% prior


icon url

ReturntoSender

07/01/09 9:35 AM

#8608 RE: ReturntoSender #6755

GSIG ST/MT bought 10,000 shares@0.628


http://finance.yahoo.com/q?s=GSIG

RtS
icon url

ReturntoSender

07/01/09 9:59 PM

#8609 RE: ReturntoSender #6755

From Briefing.com: The S&P 500 climbed 1.4% to its best level since mid-June following a barrage of economic reports, which didn't really offer much inspiration to market participants.

The ADP Employment Change report isn't always a precise indicator of what is in store with the official nonfarm payrolls report, but the ADP report does do a good job of handicapping the government's figure. So, with the latest ADP report showing a higher-than-expected the 473,000 job losses for June, many believe job losses in tomorrow's report could exceed the 363,000 that is currently being forecast.

Many economists are worried that continued weakness in labor markets and recent increases in Treasury yields could stymie a recovery in housing. According to the latest data, pending home sales for May increased just 0.1% month-over-month. They were expected to be flat after spiking 7.1% the month before.

Meanwhile, construction spending during May fell 0.9% month-over-month and missed expectations.

The June ISM Manufacturing Index came in at an in-line 44.8, which means manufacturing activity continues to contract since the Index is below 50. The monthly reading was last above 50 in February 2008. However, the pace of contraction continues to slow as the ISM has now increased six consecutive times.

Despite the generally mixed bag of economic reports, stocks were able to log broad-based gains. Consumer staples (+1.7%) were the strongest performers, thanks to General Mills (GIS 58.18, +2.16). Better-than-expected earnings and an upbeat forecast earned shares of GIS their best single-session advance by percent in nearly one month. The consumer staples sector made its best percentage gain in roughly two weeks.

Financial stocks were some of the session's worst performers. The sector shed 0.5% and finished at session lows as diversified banks (-0.8%) and regional banks (-1.0%) came under pressure.

Energy stocks struggled to remain in positive territory as sellers pressured the sector amid falling oil prices. The energy sector was up more than 2% at its session high, but finished with a modest 0.2% gain. Crude oil prices were also up more than 2% at their session high, but finished 0.8% lower at $69.35 per barrel. The reversal in oil prices came in the face of a larger-than-expected draw in weekly inventories.

Despite weakness in energy-related commodities, precious metals were able to advance amid a weaker U.S. dollar. Amid reports that China would like to debate proposals for a new global reserve currency at next week's G8 meeting, the Dollar Index dropped 0.6%. That helped gold prices climb 1.5% to $941.30 per ounce. The broader CRB Commodity Index climbed 0.5%.

Participation was lacking again this session as less than 1 billion shares traded hands on the NYSE. That's the least amount of trading volume in nearly three weeks. Volume is also expected to be light tomorrow since it is the week's final trading session ahead of the long weekend. U.S. markets will be closed on Friday in observance of Independence Day.DJ30 +57.06 NASDAQ +10.68 NQ100 +0.3% R2K +1.8% SP400 +1.1% SP500 +4.01 NASDAQ Adv/Vol/Dec 1776/2.09 bln/865 NYSE Adv/Vol/Dec 2211/950 mln/767

9:13AM FormFactor: ITC issues initial determination in FormFactor's wafer probecard ITC Action, declining to find a violation of Section 337 (FORM) 17.37 : Co announces the Administrative Law Judge assigned to the International Trade Commission's investigation of probecard manufacturers Phicom Corporation and Micronics Japan Company issued an Initial Determination declining to find a violation of Section 337. The Initial Determination is directed to four FormFactor patents: U.S. Patent Nos. 5,994,152, entitled "Fabricating Interconnects and Tips Using Sacrificial Substrates," 6,509,751, entitled "Planarizer for a Semiconductor Contactor," 6,615,485, entitled "Probe Card Assembly and Kit, And Methods of Making Same," and 7,225,538, entitled "Resilient Contact Structures Formed and Then Attached to a Substrate." The Initial Determination found all of the asserted claims of U.S. Patent Nos. 6,509,751, 6,615,485 and 7,225,538 not invalid, and all but one of the asserted claims of U.S. Patent No. 5,994,152 not invalid, but declined to find infringement of any of the asserted claims.

8:00AM Corning announces improved Q2 LCD volume performance (GLW) 16.27 : Co updates guidance of sequential Q2 LCD glass volume growth, citing significant improvement in demand for LCD glass. "Second-quarter glass demand is much stronger than we anticipated even a few weeks ago. As a result, we now expect Q2 sequential volume to be up ~100% at our wholly owned business." Co pointed out that it has met much of the improved demand by drawing down its existing inventory. Additionally, co has begun shipping glass from melting tanks that were restarted earlier in the quarter. Corning originally forecasted a Q2 volume increase of more than 50%, and at the end of May revised volume growth expectations to more than 75%. Samsung Corning Precision Glass Q2 sequential glass volume is expected to be up about 50%, an increase from both the more than 40% figure announced May 28 and the original expectation of more than 25% growth. Co pointed out that Samsung Corning Precision volume did not decline as steeply as Corning's wholly owned business did in the first quarter. Regarding LCD glass pricing, Flaws said that second-quarter prices were moderate and substantially below the first-quarter price declines.

2:04AM Broadcom raises all-cash tender offer for Emulex to $11.00/share (ELX) 10.88 : Broadcom (BRCM) announces that it raised its tender offer for all of the currently outstanding shares of common stock (including the associated preferred stock purchase rights) of Emulex from $9.25 to $11.00 per share in cash, representing a total equity value of approx $912 mln. As required by law, Broadcom will extend its tender offer for an additional 10 business days, until 12:00 AM EST, July 14, 2009.

icon url

ReturntoSender

07/05/09 1:08 PM

#8610 RE: ReturntoSender #6755

From Briefing.com: 4:20 pm : A disappointing jobs report prompted sellers to knock stocks sharply lower in the first few minutes of trading. Stocks then locked into an extremely narrow trading range until the S&P 500 slipped below the psychologically significant 900 level in the final half-hour of trading.

Following an uninspiring finish to the previous session, stocks had already been showing weakness ahead of the government's latest jobs report, which was released shortly before the opening bell. However, sellers became emboldened when the June Nonfarm Payrolls report indicated that 467,000 jobs were lost last month. That marked pickup from the 322,000 jobs that were lost in May, and topped the 365,000 losses that were widely expected.

Meanwhile, the national unemployment rate now stands at 9.5%, which isn't quite as bad as the 9.6% that was expected, but it still marks a 25-year high. According to Reuters, the White House expects unemployment rate to climb to 10% in next two to three months. Average weekly hours came in at a slightly worse-than-expected 33.0. Since hours often lead payrolls and employers are cutting back hours suggests that hiring remains a long ways off, which will damper consumer spending and hopes of a consumer-led economic recovery.

May factory orders made a surprisingly strong 1.2% increase, which bested the 0.9% increase that had been forecast. The stock market attempted to pare some of its losses following the orders announcement, but the disappointing jobs report dominated headlines and overshadowed the encouraging orders data.

Since U.S. market's are closed Friday in observance of Independence Day, this session's decline gave stocks their third straight weekly loss. During that time, stocks have shed more than 5%. This session's weakness was widespread as declining issues outnumbered advancers by more than 20-to-1 in the S&P 500.

Losses were steepest among energy and financial stocks. They both finished 3.7% lower. Energy was hampered by a 3.7% drop in crude oil prices, which closed at $66.73 per barrel. Crude has fallen for three consecutive sessions. Meanwhile, financials were severely undercut by losses among insurers.

Elan (ELN 7.66, +0.66) was one of the few stocks to post a gain this session. The company garnered support following the announcement that Johnson & Johnson (JNJ 55.97, -1.10) will acquire certain drug assets from Elan and will invest $1 billion in Elan through an affiliate.

In other corporate news, Exelon (EXC 49.03, -2.53) has increased its exchange offer to acquire NRG Energy (NRG 24.59, -1.46) by 12%. The increase was widely expected and neither stock was able to attract buyers amid the session's broad-based selling effort.

Trading volume was extremely light ahead of the long, holiday weekend. Hardly 700 million shares traded hands on the NYSE in what was the most thinly traded session this year. That's even after trading had been extended by 15 minutes in order to address system irregularities. DJ30 -218.94 NASDAQ -49.20 NQ100 -2.4% R2K -3.8% SP400 -3.2% SP500 -26.18 NASDAQ Adv/Vol/Dec 447/1.93 bln/2214 NYSE Adv/Vol/Dec 538/685 mln/2435

4:19PM LDK Solar guides Q2 revs below consensus; raises solar shipments ests (LDK) 10.91 -0.34 : Co guides Q2 revs to $215-225 mln vs $247.19 mln First Call consensus. For the second quarter of 2009, LDK Solar estimates shipments between 220 and 230 megawatts ("MW"). This compares to its previously issued guidance for the second quarter of 2009 of wafer shipments in the range of 200 to 220 MW. The company expects to record between $215 and $225 million in revenues. LDK Solar additionally provided an update on its financing activities. The company secured a loan in the aggregate principal amount of RMB 500 million (equivalent to approximately US$73 million), with a term of one year, from The Export-Import Bank of China. The company also secured a loan in the aggregate principal amount of RMB 500 million (equivalent to approximately US$73 million), with a term of three years, from Huarong International Trust Co., Ltd. to support LDK Solar's polysilicon plant construction. Huarong International Trust Co., Ltd. is a state-controlled company permitted under the relevant PRC laws and regulations to provide enterprises with financing facilities. LDK Solar had a healthy cash position of more than $250 million and pledged bank deposits and time deposits of more than $170 million as of June 30, 2009.

6:05AM Methode Electronics beats by $0.06, beats on revs (MEI) 7.28 : Reports Q4 (Apr) loss of $0.10 per share, excluding non-recurring items, $0.06 better than the First Call consensus of ($0.16); revenues fell 42.3% year/year to $89.1 mln vs the $79.3 mln consensus. Automotive segment net sales were negatively impacted by the continuing softness of the global economic environment, especially the effect on the North American automotive industry, and by negligible Chrysler sales volumes as compared to the prior period due to co's decision to exit the Chrysler business. The transfer of the Chrysler product was substantially completed during the Q209. Additionally, as a result of agreement with Ford Motor to transfer all production at Methode's Reynosa, Mexico, facility to another supplier, sales to Ford were further reduced in Q409. Methode expects to complete the transfer of this Ford business by August 2009.

09:35 am Corning target raised to $17 at RBC as demand for LCD TVs so far has proved resilient: . RBC raises their GLW tgt to $17 from $16 as the supply chain may have over-corrected in recent months and the co cited that June volumes will increase by 100% in LCD glass vs prior expectations of 75%. Over-reaction earlier this year on the negative side means GLW is now readjusting it production on the positive side, although GLW's newfound optimism remains guarded. More swings are expected as panel makers adjust their utilization rates and retail demand becomes more predictable, in their view. And with most investors having already factored in healthy sequential volume growth, the stock may now enter a trading range until visibility toward year-end improves; they maintain their Sector Perform rating.

10:30 am Xilinx (XLNX)

Chip maker Xilinx (XLNX 20.34, -0.23) this morning disclosed that its June quarter sales are expected to be down approximately 5% sequentially vs. consensus of a sales increase of ~0.5% quarter-over-quarter. This is a revision from previous sales guidance of down 4% to up 4% sequentially.

The company said the shortfall in sales is primarily due to supply constraints on certain Virtex-5 devices that are in high demand. Xilinx currently expects most of the existing delinquency issues to be resolved in the September quarter.

Gross margin guidance of 61% to 63% and operating expense guidance of flat to slightly down sequentially remain unchanged.
icon url

ReturntoSender

07/05/09 1:27 PM

#8611 RE: ReturntoSender #6755

Amateur Investors Weekend Stock Market Analysis (7/3/09)

http://www.amateur-investor.net/Weekend_Market_Analysis_July_4_09.htm

Right now depending on your point of view the current Wave Counts can be considered either bullish or bearish in the S&P 500. From a bullish perspective the S&P 500 completed a 5 Wave pattern in early March which was followed by a 43% rally for Wave A of an ABC type corrective rally. What we are seeing now is the beginning stages of a typical Wave B pullback which by definition can retrace anywhere from 38.2% to 61.8% of Wave A which was 289 points. Thus a 38.2% Retrace would yield a value of 846 (blue line) while a 50% Retrace would lead to 812 (green line). A deeper retrace of 61.8% would lead to a value of 777 (brown line) for Wave B. Meanwhile once the Wave B pullback ends then this would then be followed by a C Wave higher which could eventually rally up to the 1066 to 1135 range depending on how deep of a retrace Wave B undergoes and also assumes that the length of Wave C will equal to the length of Wave A.


Now for the bearish crowd one could argue that the rally from early March through early June was just Wave 4 of (5) as the early March low was just Wave 3 (5) and not Wave 5 (5) as most believe. This scenario remains a possibility since the S&P 500 appears to have stalled out just below its 38.2% Retrace from the peak of Wave 2 (5) to the bottom of Wave 3 (5). Typically a Wave 4 will rally back to its 38.2% Retracement Level so this is something that can't be completely discounted. If 956 was the peak of Wave 4 (5) then we are now potentially in the beginning stages of the final 5th Wave down. Typically a 5th Wave can be equal the length of the 1st Wave which was 319 points so if you subtract 319 from 956 that yields a potential target of 637 for the S&P 500 which would be just below the previous low of 667. Also notice this is how Wave 1 (5) ended back in the early part of 2008 as the final sub wave 5 ended up being just slightly lower than sub wave 3.


As far as the near term the S&P 500 has developed a Head and Shoulders Top pattern with a key support level to watch next week at 879 which was the May low. If the 879 level fails to hold then the next support level would be at 846 which is the 38.2% Retrace calculated from the 667 low to the 956 high.


The Dow is also exhibiting a Head and Shoulders Top pattern with a key support level near 8200 which is where it held support at in May. If the Dow breaks below 8200 then the next support level would be at 7958 which is the 38.2% Retrace calculated from 6470 to 8878.


As far as the Nasdaq look for support next week in the 1755 to 1735 range which coincides with its 200 Day EMA (blue line) and 23.6% Retrace calculated from the early March low to the early June high.

http://www.amateur-investor.net/NasJuly09.GIF

In 2008 our ETF Strategies worked the best with which had a return of +33% versus the S&P 500 which was down -38.5% for the year.

Meanwhile our 401K Strategy finished up +17.3% for the year.

Signup for a "Free 4 Week Trial Membership" or save up to 50% on a Premium Membership and you will have access to these Investment Products which include the following:

1. "ETF Daily Buy and Short Signals" which can be used to trade the DIA's, QQQQ's, SPY's and OIH's. Our ETF Strategy returned 33% in 2008.

2. "401K/Thrift Savings Plan (TSP) Timing Service" which can be used to help improve your return in your 401k/TSP Account which was up +17.3% in 2008.

3. The "End of Month Strategy" finished up +36.3% in 2008. This Strategy focuses on the typical End of Month markup by the Institutional Money.

4. "Stocks to Buy List" which can be used with either our Short Term Strategy or Long Term Strategy. In 2007 our Long Term Strategy finished even for the year versus the S&P 500 which was down -38.5%.

Our Summer Membership Special for new Members is shown below
which are 50% Off our normal Monthly Rate of $39.95
icon url

ReturntoSender

07/07/09 10:01 PM

#8614 RE: ReturntoSender #6755

From Briefing.com: 4:30 pm : After holding above key technical levels midway through the session, the S&P 500 rolled over and violated its 200-day moving average amid broad-based selling pressure. In turn, stocks finished near session lows and the S&P 500 closed below its 200-day moving average for the third time in the past 26 sessions.

The afternoon sell-off was generally an extension of the market's recent weakness, which became more recognizable following last week's disappointing jobs report. Buyers are also showing reluctance ahead of earnings season, which unofficially begins when Alcoa (AA 9.41, +0.15) announces its latest results after Wednesday's closing bell. Alcoa won favor ahead of the report amid reports today that the company is optimistic about demand. The comments came despite persistent macro headwinds.

Concern that economic conditions remain tenuous led President Obama to indicate that a second fiscal stimulus isn't off the table. However, Dow Jones reported that Senate Majority Leader Reid doesn't believe there is any case at this stage for another economic stimulus package.

Meanwhile, the government is expected to unveil its Public-Private Investment Plan (PPIP) tomorrow. According to news sources, BlackRock (BLK 162.17, -4.06), which is the largest money manager by assets under management, will be one of the PPIP managers.

Losses were steep and broad-based as all 10 major sectors in the S&P 500 finished lower. Industrials suffered the largest blow by dropping 3.3%.

Energy was a laggard for the entire session and finished 2.5% lower as falling oil prices undercut the sector. Crude oil futures closed 1.8% lower at $62.90 per barrel, which marks the fifth straight decline and the lowest closing price for pit trading in more than one month. Still, crude oil prices are up 40% year-to-date.

Weakness among other commodities caused the CRB Commodity Index to shed 1.5%. The CRB is down nearly 4% so far this week. According to The Wall Street Journal, the U.S. Commodity Futures Trading Commission will hold hearings this summer to consider imposing position limits for commodities of finite supply. That would include oil and natural gas.

Despite succumbing to selling pressure, health care was able to limit its losses. The sector closed roughly 0.3% lower after spending nearly all of the session trading with a gain. The relative strength followed reports that hospitals have agreed to contribute funds toward covering the uninsured in the future. The agreement removes an element of uncertainty from the sector amid ongoing efforts to reform health care.

Large-cap tech issues weighed on the Nasdaq for the second straight session and caused the tech-rich index to underperform its counterparts. Semiconductors failed to provide support and shed 2.9% instead. Their decline came despite analyst upgrades for shares of Marvell Tech (MRVL 11.50, +0.10) and Intel (INTC 16.25, -0.29).DJ30 -161.27 NASDAQ -41.23 NQ100 -2.5% R2K -2.0% SP400 -2.2% SP500 -17.69 NASDAQ Adv/Vol/Dec 643/2.06 bln/2004 NYSE Adv/Vol/Dec 660/1.11 bln/2351

4:46PM Motorola announces that CTDI acquires its fiber-to-the-node product portfolio (MOT) 6.15 +0.02 : Motorola (MOT) and Communications Test Design announces that Motorola has divested its proven Fiber-to-the-Node product family to CTDI, effective 2 July 2009. The transaction will enable both companies to focus on technologies that will grow their businesses and position their customers for success in the long-term.

8:01AM Suntech Power announces operations management changes (STP) 17.11 : The co announces changes to the operations management team to further improve management effectiveness. Mr. Johnson Chiang resigned from his position as Chief Operating Officer of the Company effective July 3, 2009 for personal reasons. Mr. Guangchun Zhang, Suntech's Vice President of Manufacturing Technology and Quality, will take over management of all crystalline silicon PV manufacturing operations in China. Dr. Zhengrong Shi, Suntech's Chairman and CEO, will temporarily oversee management of the Shanghai thin film plant, KSL Kuttler and BIPV manufacturing operations at Suntech Japan until a suitable replacement is found.

7:12AM Palm confirms Pre will launch in Europe with O2 and Movistar (PALM) 15.73 : Co confirms that the Palm Pre phone is scheduled to be available initially in the UK, Ireland and Germany exclusively on the O2 network, and in Spain exclusively on the Movistar network, in time for the holidays.

icon url

ReturntoSender

07/09/09 11:27 PM

#8615 RE: ReturntoSender #6755

From Briefing.com: 4:30 pm : Stocks made modest gains amid choppy trading that followed Alcoa's latest earnings announcement, disappointing retail sales data, and a mixed weekly jobless claims report.

Dow component Alcoa (AA 9.23, -0.23) kicked off earnings season last night with its second quarter earnings announcement. The company posted an adjusted loss of $0.26 per share, but that wasn't as bad as what had been expected. Alcoa showed strength in the early going and provided a boost to the materials sector, but the aluminum giant's shares inevitably faltered. Still, the broader materials sector was able to log a 1.0% gain as commodities prices rebounded amid a weaker U.S. dollar.

Crude oil futures prices rebounded from six straight losses to finish pit trading near $60.30 per barrel, up 0.2%. Though oil's advance was modest, energy stocks were able to log a 1.1% gain.

By climbing 1.4%, financial stocks saw the strongest gains of any major sector. However, the financial sector's strength failed to inspire a concerted buying effort in the broader market.

Semiconductor stocks also showed strength and helped the Semiconductor Index climb 2.8%. Strength among semiconductors did little to support the headline indices, though.

Retailers spent the entire session trading in-line with the broader market. Though their 0.4% gain appears modest, the upturn was a rather impressive since it came amid a barrage of disappointing June same-store sales reports that were highlighted by negative results.

The broader market was restrained a bit by news that continuing jobless claims marched to another new record high by coming in at 6.88 million. That feat overshadowed news that the latest initial jobless claims fell more than expected to 565,000. Though that marked the first time since January that initial claims came in below 600,000, participants recognized that the lower claims number came during a holiday week and that the number will likely be offset in coming weeks. DJ30 +4.76 NASDAQ +5.38 NQ100 +0.2% R2K -0.1% SP400 +0.3% SP500 +3.12 NASDAQ Adv/Vol/Dec 1304/1.90 bln/1301 NYSE Adv/Vol/Dec 1812/1.01 bln/1178

8:16AM Emulex guides Q4 EPS to high end of range, revs slightly above consensus (ELX) 9.70 : Co issues guidance for Q4 (Jun), sees EPS at the high end of $0.01-0.05 vs. $0.04 First Call consensus; sees Q4 (Jun) revs of $78-79 mln vs. $77.27 mln consensus. Co said, "I'm very pleased with the team's focus and execution during the quarter, coming in at the high end of our guidance. In addition to strong near term operational performance we expanded our design wins for both our core Fibre Channel HBAs and our CNAs further reinforcing the strength of the Company's future prospects."

SMSC (SMSC) announces that it has signed an agreement to acquire Tallika Corp, a team of approx 50 engineers located in design centers in Chennai, India and Phoenix, AZ. SMSC has agreed to pay approximately $3.4 mln to purchase Tallika. The acquisition is expected to be non-dilutive and to close in August 2009.

7:06AM Silicon Motion lowers Q2 revenue guidance below consensus (SIMO) 3.33 : Co lowers sequential revenue guidance from +5-15% to (5%)-(10%) which equate to roughly $19.39-20.46 mln vs. $23.54 mln First Call consensus. Co raises gross margin guidance to 47-48% from prior guidance of 44-46%. Co said, "The Company continued to be impacted by the effects of the global economic slowdown and the NAND flash shortage that our customers have been facing. We had anticipated an increase in NAND flash supply from chipmakers in the second quarter as a result of their higher fab utilization rates, but availability of supply to our customers remained limited and this in turn limited their procurement of controllers.. Our gross margins are however significantly higher than planned due to better product mix management, which partially offset our anticipated lower revenue. While our anticipated second quarter sales are weaker than expected, we remain optimistic about our long-term prospects and product roadmap, whether relating to flash controllers, mobile TV ICs, or other products."

1:13AM On The Wires : Photronics (PLAB) will close its its integrated circuit photomask manufacturing facility in Shanghai, China; closure is consistent with Photronics strategy to reduce costs and lower its operational breakeven point. Co expects to record an after tax charge of approx $10-14 mln in FY09; approx 90% of the total charges will be attributed to non-cash items...

icon url

ReturntoSender

07/12/09 1:25 PM

#8617 RE: ReturntoSender #6755

From Briefing.com: 4:27 pm Weekly Wrap

The S&P 500 lost ground for the fourth straight week as investors stuck to the sidelines for the most part, held back by the specter of upcoming second quarter earnings reports and festering concerns about prospects for an economic recovery in the U.S.

Concerns about the economy shined through in a number of areas. In particular, commodities -- and oil in particular -- had a very tough week. The CRB Commodity Index dropped 5.0% while crude futures slumped 10.3% to $59.83 per barrel, settling below $60 for the first time since mid-May.

Not surprisingly, the energy sector (-3.8%) was a major laggard, underperforming the broader market along with the industrial sector (-2.7%) and the basic materials sector (-2.9%).

As it so happened, all 10 economic sectors lost ground this week, with the defensive-oriented health care (-0.3%) and consumer staples (-0.3%) sectors faring the best of a bad lot.

The defensive leaning didn't end there, though.

U.S. Treasuries were scooped up eagerly in spite of $170 billion of new supply hitting the market this week alone. The 10-Year Note auction on Wednesday, in fact, saw a very strong bid-to-cover ratio of 3.28 (i.e. 3.28 bids received for every bid accepted) that was the highest in the last 12 months.

For the week, the yield on the 10-Year Note dropped 21 basis points to 3.29%. That should carry some positive implications for mortgage rates, yet given the obvious flight-to-quality bid, that positive consideration failed to excite the equity market.

In the midst of all of this were press reports calling attention to the idea that a second stimulus program was being discussed as a possibility.

That's a long way from saying it's a sure thing. After all, we're still discussing in Chicago the possibility of the Cubs going to the World Series this century; nonetheless, it was a stunning idea for investors to contemplate given Senate Majority Leader Harry Reid's assertion during the week that a little less than 90% of the initial $787 billion stimulus package has yet to be disbursed.

Separately, Dow component Alcoa (AA) disbursed the first, official earnings report for the June quarter after Wednesday's close. Well, actually it disbursed the first, official net loss report since the aluminum maker didn't make any money in the quarter despite a 2% sequential increase in revenues to $4.24 billion.

Alcoa threw some cold water of its own on recovery prospects when it said its aim was to cut capital expenditures 50% in 2010 on top of a 50% reduction for 2009.

Alcoa gained as much as 7% following its report, but ultimately gave that all back and closed with a 2% loss on Thursday. For the week, Alcoa was down 5.3%.

Switching gears, the limited offering of economic data proved to be a fairly mixed bag. The ISM Services Index for June crossed better than expected at 47% (consensus 46%; prior 44%), yet a number below 50% is still indicative of a contraction in services sector activity. The uptick from May simply suggests the rate of decline has slowed.

The initial claims report was the ultimate mixed bag. According to the Department of Labor, 565,000 people filed for jobless benefits in the week ended July 4. That was the first reading below 600,000 since January and was well below the consensus estimate of 603,000.

The claims number came with an asterisk, though, as it is believed the July 4 holiday skewed the level of claims in a favorable manner. The presumption was that there should be some reversal of that improvement in the coming week. Beyond that, the recognition that initial claims at 565,000 is still a lousy number and that continuing claims spiked to a record high 6.883 million in the week ended June 27 were other factors that tempered the market's enthusiasm for the report.

On a brighter note, the May trade data came with a silver lining. Specifically, the deficit narrowed to -$26.0 billion from an upwardly revised -$28.8 billion in April.

Imports dropped again, from $150.2 billion to $149.3 billion. Exports, however, rose to $123.3 billion from $121.4 billion. Although that could still prove to be a one-month blip, it offered some hope that exports could now be stabilizing following a precipitous drop from last July when they hit $164.4 billion.

The net exports component of GDP should be solidly positive for the second quarter and it is our presumption that it may help produce a GDP decline closer to 1% rather than the 2% decline we currently expect.

The latter point aside, the market still flailed through Friday's session in another low volume trade at the NYSE. A disappointing consumer sentiment number provided by the University of Michigan got in the way and followed a batch of weak same-stores sales results from the retailers that were reported on Thursday and lent a reminder that the consumer is still in the mode of saving more and spending less.

The G8 Summit was held in Italy, yet there weren't really any key declarations that came out of it -- at least none that the market didn't already know were being discussed.

There will be some key, market-moving happenings in the week ahead, though.

We'll hear earnings reports from the likes of CSX Corp., Goldman Sachs, Johnson & Johnson, Intel, YUM! Brands, JPMorgan Chase, Google, IBM, Bank of America, Citigroup and General Electric. The economic calendar, meanwhile, brings the latest data for PPI, Retail Sales, CPI, Industrial Production, Initial Claims, and Housing Starts, as well as the minutes from the June 24 FOMC meeting.

A market that has been in a lull since early May (the S&P closed Friday less than 2 points above its closing level on May 1) should come to life in one form or another in the coming week since there will be a lot to chew on. In the meantime, enjoy your weekend.

Things are about to get interesting again in the stock market.

--Patrick J. O'Hare, Briefing.com
 
Index Started Week Ended Week Change % Change YTD
DJIA 8280.74 8146.52 -134.22 -1.6 % -38.6 %
Nasdaq 1796.52 1756.03 -40.49 -2.3 % -33.8 %
S&P 500 896.52 879.13 -17.39 -1.9 % -40.1 %
Russell 2000 497.36 480.98 -16.38 -3.3 % -37.2 %

9:24AM Microtune announces agreement to acquire Auvitek (TUNE) 2.20 : Co announces the signing of a definitive agreement to acquire privately-held Auvitek International, Ltd. for approximately $9 mln in cash and stock and with a potential earn-out if certain performance targets are met, all subject to various standard closing conditions. Under the terms of the agreement, Microtune will pay approximately $6.8 mln in cash and one mln shares of Microtune stock, with a current value of approximately $2.2 mln, for the Auvitek business.

8:01AM Suntech Power announces draw down of convertible loan facility with IFC (STP) 15.63 : The co announces that it has satisfied the conditions precedent to draw down the convertible loan facility with IFC, a member of the World Bank Group, and has drawn down the full $50 million amount of the facility. Under the terms of the loan facility, IFC has the option to convert the loan to Suntech's American Depository Shares (ADS) at any time prior to maturity at an initial conversion price of $18.00 per ADS. Proceeds from the facility will be used to support Suntech's transition to the high efficiency Pluto technology and debt financing requirements.

8:00AM Verigy prices of its offering of $120 million aggregate principal amount of its 5.25 percent Convertible Senior Notes (VRGY) 10.49 : Co announced the pricing of its offering of $120 million aggregate principal amount of its 5.25 percent Convertible Senior Notes due 2014. Co also granted to the initial purchasers of the notes an option to purchase up to an additional $18 million aggregate principal amount of the notes solely to cover over-allotments.

icon url

ReturntoSender

07/13/09 11:52 PM

#8619 RE: ReturntoSender #6755

From Briefing.com: 4:20 pm : Thanks to leadership from the financial sector, the broader stock market was able to overcome an early fit of selling pressure and march higher for the remainder of the session. Stocks finished at session highs in what was their best single-session percentage advance in six weeks.

Well regarded Wall Street analyst Meredith Whitney encouraged buying in the financial sector by indicating that bank stocks have strong potential in the near-term and by stepping out to upgrade Goldman Sachs (GS 149.44, +7.57) ahead of its latest quarterly earnings announcement, which is scheduled for tomorrow. Expectations are high for Goldman, given its best-of-class status.

Strength among regional banks (+6.3%) and diversified banks (+8.0%) helped the KBW Banking Index spike 6.5%. Meanwhile, the broader financial sector also surged 6.5% in its best single session advance by percent in almost two months.

Financials have been challenged in recent weeks to provide leadership to the broader market. Participants have been allowing the sector to consolidate after surging approximately 120% from its March low to its May high. However, the financial sector's renewed strength induced buying in the broader market this session; that led all 10 major sectors to finish with gains of at least 1%.

The financial sector had an easier time taking center stage amid a dearth of data. Data picks up tomorrow, though, as earnings announcements, corporate forecasts, June PPI, June retail sales data, and business inventory data for May hit news wires.DJ30 +185.16 NASDAQ +37.18 NQ100 +2.0% R2K +2.6% SP400 +2.4% SP500 +21.92 NASDAQ Adv/Vol/Dec 1927/1.93 bln/705 NYSE Adv/Vol/Dec 2526/1.19 bln/489

6:04PM Teradyne, AATI announce multiple system order for ETS-88 (TER) 6.62 +0.29 : TER and Advanced Analogic Technologies (AATI) announced that AATI has placed a multiple system order for the ETS-88 test system from Teradyne's Eagle Test business unit. The first unit, which will test power management, battery chargers, regulators and LED driver devices, has been delivered and accepted.

5:05PM Kulicke & Soffa Chief Financial Officer Maurice Carson resigns (KLIC) 3.15 +0.04 : Co announced that Maurice E. Carson, Senior Vice President, Chief Financial Officer and Principal Accounting Officer, has resigned to accept a position with a semiconductor company in Northern California. Michael J. Morris, Vice President of Finance and Treasurer, has been appointed interim Chief Financial Officer and Ran Bareket, Vice President and Corporate Controller, has been appointed interim Principal Accounting Officer. Mr. Carson's last day is scheduled to be August 4, 2009, and both interim appointments will be effective on August 5, 2009.

4:09PM Novellus misses by $0.03, reports revs in-line (NVLS) 18.66 -0.67 : Reports Q2 (Jun) loss of $0.41 per share, excluding non-recurring items, $0.03 worse than the First Call consensus of ($0.38); revenues fell 53.7% year/year to $119.2 mln vs the $119.2 mln consensus. Bookings in Q2 were $111.2 million, up $33.4 million or 42.9% from Q1. Q2 shipments of $120.0 million were up by $27.9 mln or 30.2% from $92.1 million reported for 1Q09. Deferred revenue at the end ofQ2 was $43.8 million, an increase of $3.6 million or 8.9% from $40.2 mln at the end of 1Q09. Cash, cash equivalents, and short-term investments as of June 27, 2009 were $476.3 mln, a decrease of $21.4 mln or 4.3% from 1Q09 ending balance of $497.7 million. Long-term investments and restricted cash and cash equivalents as of June 27, 2009 were $223.4 million, an increase of $19.0 million or 9.3% from the first quarter 2009 ending balance of $204.4 million.

4:00PM Ascent Solar announces the appointment of Dr. Farhad Moghadam as the company's President and CEO effective Aug 3, 2009 (ASTI) 7.74 :

10:49AM EZchip provides investor update ahead of its earnings release (EZCH) 11.58 +0.39 : "As we have always said, in-house designs at our tier-1 customers are our biggest competition. Our chips are incorporated in customers' strategic products, and we expect that they will want to maintain in-house chip development to provide options for alternative solutions. The analyst report suggests that Juniper (JNPR) will be announcing new line cards fairly soon, using in-house solution for these line cards. This is obviously disappointing, but as noted we do not expect that our customers will cease in-house ASIC designs... On the subject of Juniper, I want to provide an update to our first quarter 2009 release, which spoke of an expected drop in sales to Juniper in the second quarter of 2009. I am pleased that shipments of our NP-2 to Juniper returned to previous levels in June 2009, and are forecast to grow further in the second half of the year."

9:26AM STEC Inc announces deployment of Solid State Drives into U.S. Military project with $28 mln supplier contract (STEC) 23.53 : Co announces that it has partnered with a defense systems contractor and will supply its MACH8 Solid State Drives (SSD) for integration into a platform designed on behalf of the U.S. Military. Shipments of the MACH8 SSDs will begin during the third quarter of 2009 as part of a 12 month, $28 mln supply contract.

9:01AM MIPS Techs announces planned retirement of CEO John Bourgoin (MIPS) 2.90 : Co announces that long-time President and CEO John Bourgoin intends to retire at the end of the calendar year. The Co's board of directors plans to begin an immediate search for a successor, which is expected to take three to six months. Bourgoin will remain president and CEO through the end of the calendar year unless his successor is appointed earlier.

12:59AM Hoku Scientific and Suntech amend supply agreement to adjust milestone and shipping schedules (HOKU) 2.28 : Hoku Materials, a wholly owned subsidiary of Hoku Scientific (HOKU) and Suntech Power Holdings (STP) announce that they have amended their polysilicon supply contract to delay the deadlines for Hoku to achieve three polysilicon plant operation milestones. The effectiveness of the amendment is contingent on Hoku entering into a definitive agreement that would result in a change of control of Hoku, and the closing of any such transaction by March 31, 2010. Hoku Scientific confirmed that it has retained Deutsche Bank Securities as its financial advisor to seek a possible sale of Hoku Materials. Before the amendment becomes effective, Suntech has the right to terminate the contract if Hoku is unable to successfully complete a polysilicon reactor test demonstration, ship the first monthly quantity of polysilicon, or achieve a trichlorosilane plant operation milestone, by September 30, 2009, December 31, 2009, and December 31, 2009, respectively. As amended, Hoku's deadlines to achieve these milestones may be moved to December 31, 2009, March 31, 2010, and December 31, 2010, In exchange for Suntech extending these deadlines, Hoku has agreed in the amendment to reduce Suntech's aggregate prepayment obligation. The prepayment reduction is effected through the elimination of the TCS plant operation milestone payment. In addition, Hoku has authorized Suntech, prior to the effectiveness of the amendment, to immediately replace its cash-collateralized, stand-by letter of credit that was issued by ABN AMRO NV, with a stand-by letter of credit issued by a bank in China, which may be collateralized with non-cash assets. Suntech expects that this will have the immediate impact of freeing Suntech's restricted cash.

10:22 am Suntech Power (STP)

Suntech Power (STP 14.38, +0.03) announced that it recently entered into a number of strategic agreements with each of Shaanxi provincial government, Shizuishan city government, Ningxia province, Qinghai provincial government and Panzhihua city government, Sichuan province to develop 300MW, 500MW, 500MW and 500MW of solar projects respectively. These projects, with an aggregate of 1.8 gigawatts, are expected to be developed in several stages.

The company said the implementation of these projects is subject to the satisfaction of a number of conditions including obtaining related permits from the National Development and Reform Commission and other relevant government bodies; drafting project designs; and attracting the necessary investment and project financing to implement the projects. Suntech also said these provinces enjoy significant solar resources making them ideal locations to generate solar electricity.

icon url

ReturntoSender

07/14/09 7:28 PM

#8620 RE: ReturntoSender #6755

From Briefing.com: 4:21PM Intel beats by $0.10, beats on revs; guides Q3 revs and gross margins above consensus (INTC) 16.83 +0.34 : Reports Q2 (Jun) earnings of $0.18 per share, ex-items, $0.10 better than the First Call consensus of $0.08; revenues fell 15.3% year/year to $8.02 bln vs the $7.28 bln consensus. INTC reports Q2 gross margin of 50.8% vs guidance of "mid-40s" and consensus of 46.4% Co issues upside guidance for Q3, sees Q3 revs of $8.1-8.9 bln vs. $7.81 bln consensus; sees Q3 gross margin of 51-55% vs 49.76% consensus. For FY09, co sees spending (R&D plus MG&A) of between $10.6-10.8 bln, up from the prior outlook of $10.4 to $10.6 bln. Sees capital spending of $4.7 bln plus or minus $200 mln, down from $5.2 bln in 2008... "Intel's second-quarter results reflect improving conditions in the PC market segment with our strongest first- to second-quarter growth since 1988 and a clear expectation for a seasonally stronger second half... Intel's strategy of investing in new technologies and innovative products, combined with ongoing focus on operating efficiencies, continues to yield benefits that are evident in our strengthening financial performance." (Stock is halted; set to resume trading at 16:35)

4:35PM Intel jumps +1.17 (+7%) to 18.00 upon resumption of trading, following earnings (INTC) 16.83 +0.34 : See 16:21 comment for earnings details.

4:22PM Altera reports EPS in-line, revs in-line; guides Q3 revs below consensus (ALTR) 16.56 +0.19 : Reports Q2 (Jun) earnings of $0.16 per share, includes $0.04 in additional tax charges, in-line with the First Call consensus of $0.16; revenues fell 22.4% year/year to $279.2 mln vs the $277.6 mln consensus. Altera sees Q3 revs down 1-5% sequentially. Co issues downside guidance for Q3, sees Q3 revs down 1-5% sequentially, which equates to ~$265.2-276.4 mln vs. $279.23 mln consensus.

4:30 pm : Despite a lack of leadership, stocks were able to log modest gains following upbeat earnings announcements from Goldman Sachs and Johnson & Johnson and a mixed batch of economic data.

Goldman Sachs (GS 149.66, +0.22) unveiled earnings of $4.93 per share for the second quarter. Excluding a one-time preferred dividend, diluted earnings came in at $5.71 per share. The consensus was pegged at $3.54 per share. The better-than-expected results were helped by improvements in Goldman's fixed income, currency, and commodities segment, which generated record quarterly net revenues, and the trading and principal investments segment, which saw net revenue nearly double year-over-year.

Though Goldman's results were impressive, many had expected the company to top the consensus earnings estimate. Despite the firm's best-in-class status, many also question the sustainability of earnings from its trading and investments division.

The financial sector lagged for the entire session after showing leadership the day before. Financials closed 0.3% lower. Telecom (-0.7%) was the only other major sector to post a loss.

Pharmaceutical and health care products giant Johnson & Johnson (JNJ 58.23, +0.51) reported today better-than-expected earnings of its own by bringing in $1.15 per share. However, the Dow component didn't provide much leadership. Health care stocks advanced 0.4%.

Some health care stocks were weighed down by news that House Democrats proposed a bill to expand health benefits in a plan that includes a public health plan option to compete against private insurers. Managed care providers fell 0.8%.

Technology stocks, which collectively carry the heaviest market weight in the S&P 500, made a modest 0.3% gain. Dell (DELL 11.97, -1.05) weighed on things by stating it expects gross margins to decrease even though it expects revenue to make a slight sequential increase. Oracle (ORCL 20.63, -0.09) still expects its acquisition of Sun Microsystems (JAVA 9.17, +0.01) to be accretive to its adjusted earnings even though Sun believes fourth quarter losses could range from $0.16 to $0.06 per share, which would be worse than the loss of $0.01 per share that analysts currently expect.

Semiconductor stocks showed strength ahead of the latest earnings announcement from Intel (INTC 16.83, +0.34). The Philadelphia Semiconductor Index climbed 1.6%.

By climbing 1.5%, consumer discretionary stocks logged the best gains of any major sector. Their strength was owed to retailers, which climbed 1.6% in the face of mixed retail sales data.

Higher gasoline and auto purchases helped retail sales for June increase 0.6%, which was more than expected. However, when excluding autos, sales increased just 0.3%, which was less than expected.

In other economic news, the June Producer Price Index increased 1.8%. That was twice the increase that had been expected and was the sharpest jump since late 2007. Core PPI also increased more than expected by coming in with a 0.5% increase, which is the biggest jump since late 2008. The latest consumer price data is due tomorrow morning.

Businesses continue to pare inventories amid persistently weak demand. May business inventories fell a sharper-than-expected 1.0% in what was the ninth straight decline.

Trading volume was low even though there were plenty of news items to act as catalysts or cues for trading. Fewer than 1 billion shares traded hands on the NYSE this session. That's well below recent trends.DJ30 +27.81 NASDAQ +6.52 NQ100 +0.4% R2K +0.6% SP400 +0.8% SP500 +4.79 NASDAQ Adv/Vol/Dec 1497/1.88 bln/1125 NYSE Adv/Vol/Dec 2121/978 mln/891

9:29AM Rambus: U.S. Patent and Trademark Office rejects additional patent claims that Rambus is asserting against NVIDIA (RMBS) 15.48 : NVIDIA (NVDA) announced that the U.S. Patent and Trademark Office (USPTO) has initially rejected an additional eight claims challenged by NVIDIA in two patents that Rambus has asserted against it in litigation. This follows the USPTO's rejection last month of 41 other claims in seven patents that Rambus had asserted against NVIDIA.

9:04AM Actel announces that Maurice Carson has joined the company as executive vice president and CFO, effective August 17, 200 (ACTL) 10.95 :

8:32AM Apple's App Store downloads top 1.5 billion in first year (AAPL) 142.34 : Co announces that customers have downloaded more than 1.5 bln applications in just one year from its App Store. The App Store is also growing with more than 65,000 apps and more than 100,000 developers in the iPhone Developer Program. "The App Store is like nothing the industry has ever seen before in both scale and quality," said Steve Jobs, Apple's CEO. "With 1.5 billion apps downloaded, it is going to be very hard for others to catch up."

Aehr Test Systems (AEHR) announces it has received a follow-on order for the company's new Advanced Burn-in and Test System from Integrated Service Technology in Taiwan.

10:15 am Dell (DELL)

After the close Monday, Dell (DELL 12.16, -0.86) issued second quarter guidance that expects a slight increase in revenue from the first quarter.

The company said year-over-year demand for its information-technology products appears to have stabilized, and that it expects to report a slight sequential revenue increase in its fiscal second-quarter 2010 (First Call consensus is for 1.6% growth), which ends July 31.

The company said it also anticipates a modest decline in second quarter gross margins, the result of higher component costs, a competitive pricing environment, and an unfavorable mix of product and business-segment demand.

In a statement in advance of a Tuesday meeting in Austin with securities and industry analysts, CFO Brian Gladden said that while demand for Dell's products and services seems to have stabilized, it varies significantly by customer segment and geography.

He added that Dell remains focused on optimizing liquidity, profitability and growth in the midst of a still-challenging operating environment, and is on course to reduce annual costs by more than $4 billion by the end of fiscal 2011.

The company stated that, over a longer time horizon, it will be targeting 5% to 7% compounded annual sales growth, operating income at or above 7% of revenue, and cash flow from operations exceeding net income. However, Dell warned that the results are dependent on broad global economic improvement accompanied by higher worldwide IT spending, including a sustained double-digit growth rate in demand for computer systems.

08:38 am Sun Microsystems (JAVA)

Preliminary fiscal fourth quarter results released Tuesday by Sun Microsystems (JAVA 9.16) call for a wider loss than analysts expected.

Sun said that it expects a fourth quarter net loss of $0.06 to $0.16 per share, on a non-GAAP basis, a wider loss than the current First Call consensus that expects a loss of $0.01 per share.

Sun said it expects revenues for its fiscal fourth quarter (ended June 30) to range from $2.58 billion to $2.68 billion, well shy of the $3.03 billion First Call consensus.

After reviewing the results, Oracle (ORCL 20.72), which announced plans to acquire Sun for $9.50 per share in cash in April, said that it still expects the Sun acquisition to be accretive to its earnings by at least $0.15 per share on a non-GAAP basis for the first full year after closing.

In addition, Oracle reaffirmed estimates that the acquisition of Sun will contribute over $1.5 billion to Oracle's non-GAAP operating profit in that year, increasing to over $2 billion in the second year.

Year-to-date, shares of ORCL are 16.9% higher, while shares of JAVA have surged nearly 140%.
icon url

ReturntoSender

07/15/09 11:51 PM

#8622 RE: ReturntoSender #6755

From Briefing.com: 4:40 pm : An outstanding second quarter report from semiconductor giant Intel helped the S&P 500 and the Dow log their third straight gain and gave the Nasdaq its fourth consecutive finish in higher ground. The major equity averages spent the entire session ascending steadily before finishing with some of their best gains in the last few months.

The positive tone was actually set after the previous session's close when Intel (INTC 18.05, +1.22) announced better-than-expected adjusted earnings of $0.18 per share in its latest quarter, thanks partly to fatter profit margins. The company went on to issue an upside revenue forecast for the third quarter.

Intel was able to lead the tech sector to a 4.2% gain, which was more than any other sector. Perhaps more importantly, Intel encouraged buying in the broader market. In turn, more than 95% of the companies in the S&P 500 finished higher, while McDonald's (MCD 57.08, -0.38) was the only company in the 30-member Dow Jones Industrial Average to finish lower. American Express (AXP 27.22, +2.76) was a primary leader in the Dow after the company posted better-than-expected trust data.

Strength in AmEx and other financial issues helped send the financial sector 4.1% higher. Financials proved to be a leader for the broader market, a position that was reclaimed earlier this week amid positive analyst comments about the short-term prospects of banks. Financials are currently up more than 10% week-to-date.

Renewed strength among financials has helped carry the broader market. Week-to-date, the Dow and the S&P 500 up 5.8% and 6.1%, respectively, while the Nasdaq is up 6.1% this week. That helped all three major indices close above their 50-day moving averages. What's more, should the gains hold, stocks will log their best weekly performance since March.

Health care stocks have spent the week trading as laggards. They managed to advance 0.8% this session, but are up 2.7% for the week. Abbott Labs (ABT 45.28, -1.21) weighed on the sector as investors reacted negatively to the company's in-line earnings and forecast in the latest round of trading.

Trading volume came in near longer term averages by hitting almost 1.4 billion shares on the NYSE. Still, more recent levels have been unimpressive. That often signals a lack of conviction. However, many participants are likely waiting to see if earnings announcements continue to top expectations. Banking giant JPMorgan Chase (JPM 36.26, +1.56) is scheduled to report tomorrow morning before the opening bell. Bank of America (BAC 13.42, +0.51), Citigroup (C 3.17, +0.25), and General Electric (GE 12.24, +0.60) are all scheduled for Friday morning.

Market participants will likely be looking for encouraging guidance from major industry players. Optimistic forecasts would complement economic reports that suggest economic conditions are bottoming and even showing signs of improving.

Manufacturing activity in the New York area declined a fractionally in July; the Empire State Manufacturing Index came in at a better-than-expected -0.55, which is the best reading since April 2008.

However, a 0.4% drop in June industrial production meant that production has fallen in 17 out of 18 months. Still, the decline was less than expected and the softest downturn since a positive reading in October 2008.

Meanwhile, capacity utilization was in-line at 68%.

The Consumer Price Index, a widely-watched inflationary gauge, showed a sharper-than-expected increase for June by coming in with a 0.7% increase. That is the sharpest increase since July 2008. However, core prices increased 0.2%, which is more in-line with recent trends, even if it was slightly above what had been expected.

The FOMC released the minutes from its June meeting. They didn't have much of an impact on trading even though the Fed raised its 2009-2010 forecast for the economy.DJ30 +256.72 NASDAQ +63.17 NQ100 +3.3% R2K +3.9% SP400 +3.1% SP500 +26.84 NASDAQ Adv/Vol/Dec 2232/2.53 bln/466 NYSE Adv/Vol/Dec 2782/1.37 bln/289

4:26PM Xilinx reports EPS of $0.21, ex items, misses on revs; guides Q2 revs above consensus (XLNX) 20.66 +0.83 : Reports Q1 (Jun) earnings of $0.21 per share, excluding non-recurring items, and may not be comparable to the First Call consensus of $0.19; revenues fell 4.8% year/year to $376.2 mln vs the $381.4 mln consensus. Co issues upside guidance for Q2, sees Q2 revs of $384-399 mln vs. $381.93 mln consensus. Sales are expected to be up ~2-6% sequentially. Gross margin is expected to be approximately 61%.Operating expenses are expected to be approximately flat including $5 million in charges relating to restructuring activity announced on April 15, 2009. Interest and other is expected to be a net expense of approximately $3 million. Fully diluted share count is expected to be approximately 278 million, flat with the prior quarter. September quarter tax rate is expected to be approximately 16%.

1:11AM ASML Holding reports EPS in-line, beats on revs; guides Q3 revs above consensus (ASML) 22.00 : Reports Q2 (Jun) loss of EUR 0.24 per share, in-line with the First Call consensus of EUR(0.24); revenues fell 67.2% year/year to EUR276.6 mln vs the EUR216 mln consensus. Co issues upside guidance for Q3, sees Q3 revs of EUR450 mln vs. EUR358.77 mln consensus. ASML's order backlog as of June 28, 2009 was EUR 1,064 mln, totaling 43 systems with an average selling price of EUR 24.7 mln. ASML's backlog as of March 29, 2009 was valued at EUR 853 mln, totaling 38 systems with an average selling price of EUR 22.4 mln. 2Q09 gross margin was 12.5%, compared with the 1Q09 gross margin of 6.7%, reflecting an increase in sales from extremely low levels in 1Q09. Co expects gross margin in 3Q09 of approx 30%.

08:29 am Intel (INTC)

Intel (INTC 16.83) easily topped second quarter estimates for earnings and revenue, reporting results that CEO Paul Otellini said, "reflect improving conditions in the PC market segment."

Intel reported earnings of $0.18 per share for its second quarter, excluding items, $0.10 better than the First Call consensus of $0.08.

Revenues fell 15.3% year-over-year to $8.02 billion but managed to surpass the consensus estimate of $7.28 billion.

Intel's gross margins also were better than expected, coming in at 50.8%, well ahead of the company's earlier guidance of "mid-40s" and the consensus of 46.4%.

The PC maker issued upside guidance for the third quarter, expecting revenues to range from $8.1 billion to $8.9 billion; the consensus estimate currently stands at $7.81 billion. The company projects third quarter margins between 51% and 55% vs. the consensus of 49.76%.

Shares of INTC are 14.8% higher year-to-date and are approximately 7.7% higher in Wednesday's premarket action.
icon url

ReturntoSender

07/16/09 9:04 PM

#8623 RE: ReturntoSender #6755

From Briefing.com: 4:20 pm : Stocks spent most of the session moving sideways in choppy fashion as participants allowed the heady gains from earlier this week to consolidate. However, follow-through buying in tech helped offset weakness among financials and helped hand stocks another positive finish.

Financial stocks failed to provide leadership as participants took a breather after watching the sector climb more than 10% during the three previous sessions. That run left the sector looking ripe for some profit taking since it seemed that good news was largely priced into the sector. In turn, JPMorgan Chase (JPM 36.13, -0.13) grappled with selling pressure for virtually the entire session, even though it posted this morning better-than-expected second quarter earnings. Still, the sector was able to recover from a near 2% loss to finish with a modest 0.2% loss.

Other earnings announcements this morning were mixed. Global handset maker Nokia (NOK 13.46, -2.22) posted in-line earnings, but expects 2009 industry volumes to decline approximately 10% from 2008 levels. Baxter International (BAX 54.74, +1.65) topped earnings estimates. Marriott (MAR 20.44, -1.36) did, too, but it issued downside guidance.

Tech gets credit for providing a boon to the broader market. While the major indices were stuck in sideways movement, tech saw some follow-through from the previous session's advance and logged a 1.7% gain. What's more, many tech issues that typically lag were able garner continued support, which supports the notion that the market's overall bias has improved.

Typical tech leaders IBM (IBM 110.64, +3.42) and Google (GOOG 442.60, +4.43) were able to garner support of their own. Both companies reported their latest quarterly results after the closing bell (Note: Both firms announced earnings that topped expectations within minutes of the close). Bank of America (BAC 13.17, -0.25), Citigroup (C 3.03, -0.14), and General Electric (GE 12.40, +0.16) all report Friday morning.

With tech looking strong and buyers willing to step in, the Nasdaq registered its seventh straight gain. Such a feat hasn't been made in more than one year. Meanwhile, the S&P 500 and the Dow were able to log their fourth straight gain, which hasn't been done in more than one month.

Though tech showed leadership in the latest advance, the upward move was generally broad-based as advancing issues outnumbered decliners by nearly 4-to-1 in the S&P 500.

Some of the most encouraging jobless claims data in months was met with a muted response this morning and failed to induce more than a modest, temporary uptick in stock futures ahead of the opening bell. Initial claims for the week ended July 11 came in at 522,000, which is the lowest since January. Continuing claims pulled back sharply from record highs of 6.9 million to less than 6.3 million, which is the lowest tally since April. DJ30 +95.61 NASDAQ +22.13 NQ100 +1.2% R2K +1.2% SP400 +1.4% SP500 +8.06 NASDAQ Adv/Vol/Dec 1660/2.10 bln/961 NYSE Adv/Vol/Dec 2113/1.18 bln/881

4:11PM IBM beats by $0.30; guides FY09 EPS above consensus (IBM) 110.64 +3.42 : Reports Q2 (Jun) earnings of $2.32 per share, $0.30 better than the First Call consensus of $2.02; revenues fell 13.3% year/year to $23.25 bln vs the $23.59 bln consensus. Gross profit margin was 45.5% in Q2 compared with 43.2% in 2Q08, led by improving margins in services and software. Co issues upside guidance for FY09, sees EPS of "at least $9.70" vs. $9.15 consensus and vs prior guidance of $9.20"... We are optimistic about how IBM is positioned to make the most of current growth opportunities as well as those that emerge as the economy recovers. We are well ahead of pace for our 2010 roadmap of $10 to $11 per share."

4:06PM Google beats by $0.27, reports revs in-line (GOOG) 442.60 +4.43 : Reports Q2 (Jun) earnings of $5.36 per share, ex items, $0.27 better than the First Call consensus of $5.09; revenues (after deducting traffic acquisition costs ) rose 4.5% year/year to $4.07 bln vs the $4.06 bln consensus. International Revenues - Revenues from outside of the United States totaled $2.91 bln, representing 53% of total revenues in the second quarter of 2009, compared to 52% in the first quarter of 2009 and second quarter of 2008. Paid Clicks - Aggregate paid clicks, which include clicks related to ads served on Google sites and the sites of our AdSense partners, increased approximately 15% over the second quarter of 2008 and decreased approximately 2% over the first quarter of 2009. Operating Income - GAAP operating income in the second quarter of 2009 was $1.87 bln, or 34% of revenues. This compares to GAAP operating income of $1.58 bln, or 29% of revenues, in the second quarter of 2008. Non-GAAP operating income in the second quarter of 2009 was $2.17 bln, or 39% of revenues. This compares to non-GAAP operating income of $1.85 bln, or 34% of revenues, in the second quarter of 2008.

12:43PM Cymer joint venture receives first purchase order for crystallization tool for flat panel display manufacturing (CYMI) 30.52 -0.16 : TCZ, a joint venture of Cymer and Carl Zeiss SMT AG announces that it has received its first order--from a large Korean display maker--for the TCZ-900A, TCZ's production tool for flat panel display fabrication.

10:50AM Palm announces Mojo Software Development Kit is available; 1.8 mln apps downloaded so far (PALM) 14.54 -0.38 : Co announces via their corporate blog that Palm's Mojo Software Development Kit is available to all interested app developers. Any interested developer with a valid email address can access the SDK, its associated documentation, and new Mojo developer forums. Co says the initial response to Palm webOS apps -- from both developers and customers -- has been enthusiastic. Co announces that over 1.8 million apps have been downloaded from the beta App Catalog since Palm Pre was released less than six weeks ago.

9:26AM STEC Inc signs a $120 mln supply agreement for ZeusIOPS SSDs for 2H09 and now forecasts sales of ZeusIOPS SSDs to exceed $220 mln in 2009 (STEC) 27.59 : Co announces that it has signed an agreement with one of its largest enterprise storage customers for sales of $120 mln of ZeusIOPS SSDs in 2H09. STEC believes that this agreement reflects the enterprise storage manufacturer's continued commitment to integrate STEC's SSD technology into the manufacturer's systems and validates significant storage system performance improvements enabled by STEC's ZeusIOPS SSDs in these enterprise systems. With this agreement signed, STEC now forecasts revenue from the sale of its ZeusIOPS drives will exceed $220 mln in 2009. "We are pleased to see that sales of our customer's enterprise storage systems utilizing our ZeusIOPS drives have grown significantly over the past few years," said Manouch Moshayedi, Chairman and CEO of STEC. "Our customers have helped evangelize this technology and we are glad to be partnered with them as we expect that they will help drive further innovation in SSD usage in the highest-end of the enterprise storage markets."

8:37AM PC outlook improves as consumer spending stabilizes shipments, according to IDC : As in the first quarter of 2009, global PC shipments again came in slightly ahead of expectations in the second quarter (2Q09), lessening fears over the extent of the PC market slump. Worldwide PC shipments (including Desktop and Portable PCs, but excluding x86 Servers) were down 3.1% from the second quarter of 2008 - a notable improvement over an expected decline of 6.3%, according to IDC's Worldwide Quarterly PC Tracker. All regions either met or surpassed expectations. Although the global downturn is still making its effects felt in the PC industry, the slump has been mitigated by a PC market which has seen the computing experience evolve to be more personal, portable, and cost-oriented rather than performance-driven. Portable PCs continue to be the primary driver of volume and growth with all regions seeing strong Portable shipments. "These results are a very positive indicator for the second half of the year," said Loren Loverde, program director for IDC's Tracker Program. "We are seeing continued demand from consumers and limited impact from supply chain factors such as inventory balancing. New product launches in the second half of the year combined with seasonal growth and greater economic confidence resulting from factors such as government stimulus, a more liquid housing market, relatively stable stock market and interest rates, and progress in the auto and financial industries, should support the expected return to growth by year-end." While the market has outperformed expectations for a second consecutive quarter, the lack of commercial activity remains a drag on growth. The commercial segment remains more conservative with spending, focusing on other priorities and preserving cash. As a result, the segment has not been as motivated by falling prices and new portable designs as the consumer segment.

8:01AM Cypress Semi beats by $0.06, beats on revs; sees "above-average seasonal revenue growth" in Q3 (CY) 9.66 : Reports Q2 (Jun) loss of $0.03 per share, excluding non-recurring items, $0.06 better than the First Call consensus of ($0.09); revenues fell 25.7% year/year to $155.8 mln vs the $152.5 mln consensus. Non-GAAP consolidated gross margin was 44.2%, up 9.5 percentage points from the previous qtr due mainly to increased factory utilization, better product mix, and continued cost reductions. "Our book-to-bill ended Q2 at 1.28 with all divisions above unity. Ordering patterns have begun to stabilize, leading to increased backlog. Our Q2 backlog grew 51% quarter-on-quarter to $184 mln. The macro environment seems to have stabilized but longer term visibility continues to remain limited and we remain cautiously optimistic on the pace of the economic recovery. We are projecting that we will have above-average seasonal revenue growth in Q3..."

7:36AM Fairchild Semi beats by $0.08, beats on revs; guides Q3 revs above consensus (FCS) 8.69 : Reports Q2 (Jun) loss of $0.03 per share, excluding non-recurring items, $0.08 better than the First Call consensus of ($0.11); revenues fell 33.6% year/year to $277.9 mln vs the $264.8 mln consensus. Co issues upside guidance for Q3, sees Q3 revs of $300-325 mln vs. $288.89 mln consensus. "We delivered strong sequential sales and margin growth even as we further improved our inventory position in the second quarter. Distribution sell-through was better than expected which helped us to again reduce channel inventory while still posting sales higher than our original expectations entering the quarter. Order rates improved throughout the quarter across a broad range of end markets enabling us to significantly increase our backlog position from a quarter ago. Overall product pricing was down about three percent sequentially which is slightly weaker than prior quarters, but we believe the trend is now moderating as order rates improve. We maintained lead times within a stable range of five to six weeks during the quarter. Our scheduled backlog for third quarter shipments is currently about $300 million which is roughly $50 million higher than this point a quarter ago. Included in this amount is approximately $25 million of backlog that we booked in the first two and a half weeks of this quarter. Assuming we continue to record positive backlog fill consistent with the current order patterns, we believe sales in the range of $300 to $325 million are possible for the third quarter. For this range of revenue, we anticipate adjusted gross margin to be between 25-27%. Adjusted gross margin for Q2 was 24.8%, up nearly 10 percentage points sequentially and 4 percentage points lower than in the second quarter of 2008."

7:01AM Research In Motion and Visto Corporation sign definitive agreement to settle outstanding litigation (RIMM) 70.15 : The co and Visto Corporation announce they have entered into a definitive agreement to settle all outstanding worldwide patent litigation between the companies. The key terms of the settlement involve RIMM receiving a perpetual and fully-paid license on all Visto patents, a transfer of certain Visto intellectual property, a one-time payment by RIMM of $267.5 mln and the parties executing full and final releases in respect of all outstanding worldwide litigation. The settlement is expected to be completed during the week of July 20, 2009 and is subject to certain closing conditions.

6:52AM Nokia reports EPS in-line, misses on revs (NOK) 15.68 : Reports Q2 (Jun) earnings of EUR 0.15 per share, excluding non-recurring items, in-line with the First Call consensus of EUR 0.15; revenues rose 6.9% year/year to EUR 9.91 bln vs the EUR 10.3 bln consensus. Nokia reports mobile device volumes of 103.2 mln units, down 15% year on year and up 11% sequentially. Nokia estimated mobile device market share of 38% in Q2 2009, down from 40% in Q2 2008 and up from 37% in Q1 2009. Nokia mobile device ASP of EUR 62, down from EUR 65 in Q1 2009. Co expects industry mobile device volumes in the third quarter 2009 to be at approximately the same level or up slightly sequentially; expects its mobile device market share in the third quarter 2009 to be approximately at the same level sequentially. Nokia continues to expect 2009 industry mobile device volumes to decline approximately 10% from 2008 levels. Nokia now expects its market share in mobile devices to be approximately flat in 2009, compared with 2008. This is an update to Nokia's earlier target to increase its market share in mobile devices in 2009. Nokia now expects its non-IFRS operating margin in Devices & Services in the second half 2009 to be at approximately the same level as in the first half 2009.

09:52 am Nokia (NOK)

Nokia (NOK 13.71, -1.97) reported second quarter earnings this morning that were in-line with consensus while revenue fell short.

The company reported second quarter earnings of euro 0.15 per share, which excluded nonrecurring items and was in-line with the euro 0.15 First Call consensus.

Revenues rose 6.9% to euro 9.91 billion, below the euro 10.3 billion consensus.

Nokia reported mobile device volumes of 103.2 million units, down 15% year-over-year and up 11% sequentially. Estimated mobile device market share of 38% in the second quarter 2009 was down from 40% in the second quarter 2008 and up from 37% in the first quarter 2009.

Nokia mobile device ASP of euro 62 was down from euro 65 in the first quarter of 2009.

The company expects industry mobile device volumes in the third quarter 2009 to be at approximately the same level or up slightly sequentially. For its part, Nokia expects its mobile device market share in the third quarter 2009 to be approximately at the same level sequentially. Additionally, Nokia continues to expect 2009 industry mobile device volumes to decline approximately 10% from 2008 levels.

The mobile device maker updated its market share targets for 2009. Nokia said it now expects its market share in mobile devices to be approximately flat in 2009 compared to 2008. The company's earlier target called for market share in mobile devices to increase in 2009.
icon url

ReturntoSender

07/18/09 11:44 AM

#8624 RE: ReturntoSender #6755

From Briefing.com: 4:49 pm Weekly Wrap

The S&P 500 declined 7.0% over a span of four weeks leading up to this past week. Now, stop for a moment and let this next thought sink in: over the span of the first four days of the past week, the S&P 500 gained 7.0%.

To be sure, nobody can say the second quarter earnings reporting period didn't start with a bang. It was about as good as it could get with nearly every company of note that reported earnings in the past week exceeding consensus earnings estimates.

There were some big names on the reporting roster this week, too. Names like CSX Corp. (CSX), Goldman Sachs (GS), Johnson & Johnson (JNJ), Intel (INTC), YUM! Brands (YUM), Harley-Davidson (HOG), JPMorgan Chase (JPM), Marriott (MAR), Nokia (NOK), Google (GOOG), IBM (IBM), General Electric (GE), Mattel (MAT), Bank of America (BAC) and Citigroup (C).

By most accounts, these companies and others that joined them followed the primary rule of medicine: first, do no harm.

The earnings reports -- Intel's in particular -- proved to be just what the ailing stock market needed.

The bullish tone for the week was set Monday, however, when earnings news was inconsequential. The trendsetter, if you will, was influential analyst Meredith Whitney who raised her rating on Goldman Sachs (GS) ahead of its earnings report to Buy from Neutral and took the occasion to suggest that she felt it was possible the financial sector could put together a rally of 15% or so in the short-term.

Whitney has been off the mark so far. The financial sector gained only 9.4% this week.

Taking our tongue out of our cheek, we'll note that Goldman had a banner report, blowing past estimates and raising the bar for peer companies to a level that couldn't be reached. Still, most of the financials easily topped consensus estimates. The banks, however, weren't exactly pounding the table on the outlook for credit quality and neither was Harley-Davidson, which has a financing business.

The market worked through those issues, though, preferring to trade the line yet again that the overall earnings news wasn't as bad as feared. This approach caught plenty of people leaning in the wrong direction and presumably prompted a wave of short covering that augmented this week's gains.

By and large, the market seemed to have a one-track mind as it keyed off the headlines trumpeting positive earnings surprises while ignoring a slate of qualitative comments that suggested the economic outlook still isn't as bright as the market wants to believe it is.

Railroad operator CSX Corp., for example, said volumes continued to decline across the board and that the rate of decline in the coal market accelerated in the quarter. Marriott, meanwhile, said it is still too early to say the company is seeing green shoots.

Separately, financing company CIT Group (CIT) was rumored to be on the verge of filing for bankruptcy if it couldn't get bailed out by private investors after the government took a rescue pass.

The week's economic data took a backseat to the earnings reports, but it didn't do any harm either.

Inflation readings provided by the PPI and CPI reports were higher than expected due largely to rising energy prices, but the core rate of consumer inflation, which excludes food and energy, was still within the Fed's comfort zone, up 1.7% on a year-over-year basis. More importantly perhaps, the inflation data helped dampen deflation concerns for the time being.

The Retail Sales and Industrial Production reports both showed end demand remains generally weak. Granted total retail sales were up 0.6% versus May, but when gasoline, autos, and building materials sales were excluded, they were down for the fourth straight month. That is notable because this core retail sales figure is used by the government in computing GDP.

Industrial production declined -0.4% in June. That was the 17th decline in the last 18 months, but since it was the smallest rate of decline since last July, the market put a positive spin on it, thinking it was a sign of better numbers to come. One would hope so given that it was also reported that total capacity utilization and manufacturing capacity utilization hit their lowest level -- 68.0% and 64.7%, respectively -- since records have been kept.

These weak capacity utilization numbers should help dampen inflation expectations as they are a clear reminder that there is plenty of slack on both the production and labor resource side of things to keep wage demands in check.

Initial claims fell noticeably for the second straight week while continuing claims plunged by 642,000 to 6.273 million. That marked the biggest drop ever in continuing claims. In fact, it was so big that few people (including us) believed it. Nonetheless, the headlines themselves didn't hurt at all the way the market behaved in the past week.

Housing starts and building permits data were also stronger than expected and provided some added cover for the Federal Reserve, which raised its central tendency projections for real GDP for 2009, 2010 and 2011. The market found that out by way of the minutes from the June 23-24 FOMC meeting that were released Wednesday.

In conjunction with the raised GDP outlook, the Fed also boosted its projections for the unemployment rate for 2009, 2010 and 2011 to levels that are higher than the White House's current assumptions. We suspect the White House will have to revise its estimates upward in due time.

The White House was a focal point throughout the week for a different reason, as President Obama continued to press the urgency of passing a health care reform act.

The Democrats in the House stepped forward with some draft legislation that would impose a surtax on American families making over $350,000 ($280,000 for individuals) to help pay for the reform effort. The Senate was still throwing around various proposals. The lack of any perceived agreement there we think helped the market move past the House headlines, seemingly resigned not to get caught up in the bouncing headlines until there is an actual compromise bill between the two chambers to debate.

With that, we'll come back to the earnings discussion. The heavyweights that reported in the past week did what they are expected to do at an economic time like this -- put up results that were generally better than expected and extol efforts at picking up market share.

These industry leaders helped smooth things over after an anxious 4-week trading period ahead of the reporting season. Where the market goes from here in the near-term will likely hinge on whether the smaller players in their industries can provide the same calming effect with their earnings results.

The bar of expectations has risen, along with our concerns that the peloton of smaller companies that have yet to report won't be able to keep up with the lead pack. Accordingly, we wouldn't be chasing this rally just yet.

--Patrick J. O'Hare, Briefing.com
 
Index Started Week Ended Week Change % Change YTD
DJIA 8146.52 8743.94 597.42 7.3 % -0.4 %
Nasdaq 1756.03 1886.61 130.58 7.4 % 19.6 %
S&P 500 879.13 940.38 61.25 7.0 % 4.1 %
Russell 2000 480.98 519.22 38.24 8.0 % 4.0 %

4:05PM Tessera Tech receives PTO office action in '627 patent re-exam (TSRA) 28.79 +0.10 : The co announces that it has received a Final Office Action, dated July 14, 2009, from the U.S. Patent and Trademark Office (PTO) addressing the ongoing ex parte reexamination of Tessera's U.S. Patent No. 6,133,627 ('627 patent). The office action rejected certain claims subject to reexamination and confirmed certain other claims as patentable and valid over the prior art. In confirming certain claims added in reexamination as patentable, the PTO Examiner considered claim language based on claim constructions that have been applied in Tessera's litigations involving the '627 patent, including Investigation No. 337-TA-630 (DRAM ITC action).

10:42 am General Electric (GE)

General Electric (GE 11.86, -0.54) reported second quarter earnings that topped expectations but profit fell sharply from last year.

GE reported second quarter earnings of $0.26 per share, including a $0.02 transaction gain and $0.07 in restructuring and impairments. The results may not be comparable to the First Call consensus estimate of $0.23 per share. GE's earnings from continuing operations were $2.9 billion, down 47% from the second quarter of 2008.

Revenues fell 16.6% year-over-year to $39.08 billion, short of the $42.16 billion consensus.

GE said 13% growth at Energy Infrastructure was more than offset by an 80% decline at Capital Finance and a 41% decrease at NBC Universal.

"Our service businesses had positive order and earnings growth in the first half of 2009, and we see this strength carrying over to the second half," said CEO Jeff Immelt. "Global growth continued to be strong: second-quarter industrial revenues grew 31% in China; 46% in India; and 10% in the Middle East."

Immelt said the company is targeting stimulus projects across the globe. "While we have only realized limited revenue to date," he said, "we believe that activity will increase in the second half of 2009."

10:24 am Google (GOOG)

Google (GOOG 428.10, -14.50) reported second quarter earnings that beat consensus, while revenue met expectations.

For the second quarter, the company reported earnings per share of $5.36, excluding nonrecurring items, $0.27 better than the First Call consensus of $5.09.

Revenue (after deducting traffic acquisition costs ) rose 4.5% year-over-year to $4.07 billion vs. the $4.06 billion consensus. Revenues from outside the U.S. totaled $2.91 billion, representing 53% of total revenues in the second quarter of 2009, compared to 52% in the first quarter of 2009 and second quarter of 2008.

Google reported aggregate paid clicks, which include clicks related to ads served on Google sites and the sites of its AdSense partners, increased approximately 15% over the second quarter of 2008 and decreased approximately 2% over the first quarter of 2009.

The company reported GAAP operating income in the second quarter of 2009 was $1.87 billion, or 34% of revenues. This compares to GAAP operating income of $1.58 billion, or 29% of revenues, in the second quarter of 2008. Non-GAAP operating income in the second quarter of 2009 was $2.17 billion, or 39% of revenues, which compares to non-GAAP operating income of $1.85 billion, or 34% of revenues, in the second quarter of 2008.

"These results highlight the enduring strength of our business model and our responsible efforts to manage expenses in a way that puts us in a good position for the economic upturn, when it occurs," said CEO Eric Schmidt.

10:10 am Citigroup (C)

Citigroup (C 3.13, +0.10) reported second quarter earnings of $0.49 per share, which included a gain from the Smith Barney sale and is not comparable to the First Call consensus that called for a loss of $0.37 per share.

Managed revenue, excluding Smith Barney gain on sale, was $22.02 billion vs. the $22.36 billion consensus.

Second quarter net income of $4.3 billion, includes an $11.1 billion pretax ($6.7 billion after-tax) gain associated with the Morgan Stanley Smith Barney joint venture transaction, which closed on June 1, 2009.

Total revenues were $30.0 billion, up $12.4 billion from the second quarter of 2008, due primarily to the Smith Barney gain on sale and favorable net write-ups and gains relative to the prior year period in Citi Holdings, partially offset by the impact of foreign exchange and declines in Regional Consumer Banking revenues, primarily in Cards.

The company reported that its Tier 1 capital ratio rose to approximately 12.7%.

Credit costs increased to $12.4 billion, including an addition of $3.9 billion to loan loss reserves, bringing the total allowance for loan losses to 5.6% of total loans.

Operating expenses were $7.8 billion, down 21% from the prior year period, primarily due to re-engineering initiatives, the impact of foreign exchange and reduced marketing.

Credit costs were $2.8 billion, up 57% from the second quarter of 2008, reflecting $1.6 billion of net credit losses and a $1.2 billion reserve build.

09:50 am Bank of America (BAC)

Bank of America (BAC 13.32, +0.15) reported second quarter earnings that beat consensus estimates but revenues fell short of expectations.

The company reported second quarter earnings of $0.33 per share, which was $0.05 better than the First Call consensus of $0.28. Revenue rose 60.6% year-over-year to $32.77 billion, below the $33.1 billion consensus.

The company reported a Tier 1 Capital ratio of 11.93% and said it holds a leading liquidity position among global banks. Also, the company said the Merrill Lynch integration is on track and meeting expected goals.

For 2009, Bank of America expects to achieve in excess of 40% of the previously announced goal of approximately $7 billion in cost savings, ahead of the original goal of 25% for the year. The company also noted that the Countrywide transition and related cost savings are on track.

BofA noted that credit quality deteriorated further as the economic environment weakened. The company said that consumers remained under significant stress as unemployment and underemployment increased and individuals spent longer periods without work, which led to higher losses in almost all consumer portfolios compared with the prior quarter. The provision for credit losses was $13.4 billion, flat with the first quarter.

Bank of American reported credit losses were higher than the prior quarter and reserves, which were increased by $4.7 billion, were added across most consumer portfolios and the commercial portfolio, reflecting the impact of the weak economy. Nonperforming assets were $31.0 billion compared with $25.6 billion at March 31, 2009, reflecting the continued deterioration in economic conditions, while Global Card Services swung to a net loss of $1.6 billion as credit costs rose in the weakening economies in the U.S., Europe and Canada. Managed net revenue declined 2% to $7.3 billion mainly due to lower fee income partially offset by higher net interest income, as lower funding costs outpaced the decline in average managed loans.

08:21 am IBM (IBM)

IBM (IBM 110.64) posted second quarter earnings that easily beat the consensus estimate and issued upside guidance for the full year.

For the second quarter IBM reported earnings of $2.32 per share, $0.30 better than the First Call consensus of $2.02.

Revenues fell 13.3% year-over-year to $23.25 billion, shy of the $23.59 billion consensus. All geographic areas saw revenues dip, with the Americas down 9%, Europe/Middle East/Africa down 20% and Asia-Pacific down 7%.

IBM said its gross profit margin was 45.5% in the quarter compared to 43.2% in the same quarter last year, led by improving margins in services and software.

IBM's results were driven by lower expenses, as the company said its total expense and other income decreased 19% year-over-year to $6.3 billion.

Big Blue issued upside guidance for 2009, saying it expects earnings of "at least $9.70" per share. IBM previously expected $9.20 per share while the consensus estimate currently stands at $9.15.

"We are optimistic about how IBM is positioned to make the most of current growth opportunities as well as those that emerge as the economy recovers," said CEO Samuel J. Palmisano. "We are well ahead of pace for our 2010 roadmap of $10 to $11 per share."

Shares of IBM are more than 31% higher year-to-date and are about 1.9% higher an hour ahead of Friday's opening bell.
icon url

ReturntoSender

07/19/09 9:57 PM

#8625 RE: ReturntoSender #6755

Amateur Investors Weekend Stock Market Analysis (7/18/09)

http://www.amateur-investor.net/Weekend_Market_Analysis_July_18_09.htm

I thought this week I would revisit the data done by Robert Shiller who is an Economics Professor at Yale University. The chart below is a comparison of the long term PE Ratio versus an Inflation Adjusted S&P Composite going back to the mid 1890’s.

As you can see historically significant Cyclical Bear Market Bottoms haven’t occurred until the PE Ratio has dropped back to or below a reading of 7.0 (points A) as denoted by the green line. This was the case in 1920, 1932 and more recently in 1982. So far the lowest PE Ratio based on Shiller's data has been around 13 which is still far above the 7.0 level that has led to historical bottoms in the past. Meanwhile the current chart of the S&P Composite looks similar to that of the Cyclical Bear Markets from 1905-1920 and 1966-1982 which were drawn out affairs that lasted from 15 to 16 years before the Inflation Adjusted S&P Composite made a Cyclical Bear Market bottom. Based on this data the most recent Cyclical Bear Market likely started in 2000 and not 2007 when you use the Inflation Adjusted data. Furthermore if this current Cyclical Bear Market follows the 1905-1920 and 1966-1982 time periods then this Cyclical Bear Market could last another 6 to 7 years if history were to repeat itself as each Economic Cycle goes through their Bearish and Bullish phases.


Next if we add some longer term trend lines (black lines) to the Log chart of the Inflation Adjusted S&P Composite notice the longer term channel has been to the upside despite all of the market volatility during the past 114 years. Also it wouldn’t be too surprising if the Inflation Adjusted S&P Composite, at some point in the future, eventually tests the bottom of its longer term upward channel before the current Cyclical Bear Market bottoms.


Now if we display the Inflation Adjusted S&P Composite on a Linear Scale instead of a Log Scale and add the longer term upward trend line (black line) and extend it out in time it appears support would eventually be somewhere in the 350 to 400 range. Meanwhile also notice the 1966 to 1982 time period looks similar to that from 2000 through 2008, albeit on a smaller scale, as it went through an ABC affair which was then followed by a decent oversold rally (points C to D) which could be similar to what we are seeing now with the latest rally from the early March low. Furthermore after the decent oversold rally ended back in the mid 1970’s this was then followed by a gradual downtrend until the bottom occurred in 1982 (points D to E). Thus we shall see if this is what eventually evolves in the longer term after this latest oversold rally eventually peaks.


Finally after each Cyclical Bear Market bottom this was followed by a Cyclical Bull Market such as from 1921-1929, 1943-1965 and more recently from 1983-1999. So once this current Cyclical Bear Market does end, based on historical patterns, this should eventually be followed by another substantial Cyclical Bull Market.


In 2008 our ETF Strategies worked the best with which had a return of +33% versus the S&P 500 which was down -38.5% for the year.

Meanwhile our 401K Strategy finished up +17.3% for the year.

Signup for a "Free 4 Week Trial Membership" or save up to 50% on a Premium Membership and you will have access to these Investment Products which include the following:

1. "ETF Daily Buy and Short Signals" which can be used to trade the DIA's, QQQQ's, SPY's and OIH's. Our ETF Strategy returned 33% in 2008.

2. "401K/Thrift Savings Plan (TSP) Timing Service" which can be used to help improve your return in your 401k/TSP Account which was up +17.3% in 2008.

3. The "End of Month Strategy" finished up +36.3% in 2008. This Strategy focuses on the typical End of Month markup by the Institutional Money.

4. "Stocks to Buy List" which can be used with either our Short Term Strategy or Long Term Strategy. In 2007 our Long Term Strategy finished even for the year versus the S&P 500 which was down -38.5%.

Our Summer Membership Special for new Members is shown below
which are 50% Off our normal Monthly Rate of $39.95
icon url

ReturntoSender

07/20/09 11:34 PM

#8627 RE: ReturntoSender #6755

From Briefing.com: 4:30 pm : The stock market's upward momentum continued today as each of the major averages finished with solid gains of more than 1%. The higher close put the Dow Jones in positive territory for the year (+0.82%), as the S&P 500 closed at its best levels of the year, and the Nasdaq has now put together nine straight winning sessions and is up a remarkable 21% for the year.

A favorable bias was set before the open when the Wall Street Journal reported that CIT Group (CIT 1.25 +0.55) has reached an agreement with its bondholders to secure $3 billion in last minute, rescue financing. While there hasn't been a formal announcement from the company regarding the details of this deal, it is believed that the financing will charge a high interest rate and is not a long term fix to the company's financial needs. However, the deal should keep the lender out of bankruptcy court and buy the company time to restructure.

The CIT news may have been the most widely reported and covered story today, but there were other catalysts that supported today's strength. Corporate earnings continue to surprise to the upside, with Halliburton (HAL 22.33 +0.95) Hasbro (HAS 26.45 +1.07), Johnson Controls (JCI 23.08 +1.56), and Eaton (ETN 48.94 +3.99) all reporting better-than-expected second quarter results before the open. Additionally, a majority of the overseas markets posted strong gains, and Goldman Sachs raised their 2009 target for the S&P 500 to 1060.

The economic calendar was light today, but did include the June leading indicator data, which was better than expected at +0.7% vs. the +0.5% consensus. This marked the third straight monthly increase, although it was a slower pace of increase than the 1.3% and 1.0% increases posted for May and April, respectively. The main drivers of the June increase were the interest rate spread (0.35%), building permits (0.22%), stock prices (0.10%), jobless claims (0.08%), the average workweek (0.06%), the pace of deliveries (0.05%), and consumer goods orders (0.02%). This economic data was viewed positively by the market as the major averages steadily moved higher following the release.

In commodities, August crude oil closed higher by $0.56 to $64.12 and August natural gas ended up 1.3 cents to $3.683. Gold was strong for the entire session and finished higher by $11.70 to close at $949.20 on weakness in the U.S. dollar (-0.79%). After moving in a fairly wide range today, the 10-Year Treasury Note finished the session higher by 9/32 with a yield of 3.608%.

Looking ahead to tomorrow, the pace of earnings releases will pick up considerably and includes closely followed names such as Caterpillar (CAT 36.65 +2.66), Coca-Cola (KO 51.03 +0.71), Apple (AAPL 152.91 +1.16), Yahoo (YHOO 17.01 +1.01), and UnitedHealth (UNH 24.84 -0.25). There are no major economic releases scheduled for tomorrow. DJ30 +104.21 NASDAQ +22.7 SP500 +10.8 NASDAQ Adv/Vol/Dec 1808/2071/858 NYSE Adv/Vol/Dec 2314/1126/706

4:37PM Texas Instruments beats by $0.02, beats on revs; guides Q3 EPS and revs above consensus (TXN) 23.61 : Reports Q2 (Jun) earnings of $0.20 per share, $0.02 better than the First Call consensus of $0.18; revenues fell 26.7% year/year to $2.46 bln vs the $2.41 bln consensus. EPS includes $0.05 in restructuring charges (consensus appears to include this charge as well). Co issues upside guidance for Q3, sees EPS of 0.29-0.39 vs. $0.27 consensus; sees Q3 revs of 2.5-2.8 vs. $2.52 bln consensus. For the full year of 2009, TI expects approximately the following: R&D expense: $1.5 bln; Capital expenditures: $300 mln; Depreciation: $900 mln. Compared with the prior quarter, operating profit increased in the Analog, Embedded Processing and Other segments primarily due to higher revenue. "After sharp inventory corrections in our markets during the prior two quarters, our revenue levels are beginning to more closely reflect end demand... As it will likely take some time before the economy strengthens, we have aligned our operations and expenses to be consistent with the weak environment. As a result, we are seeing healthy trends in our profitability... Analog was the biggest driver of sequential growth this quarter with all three major businesses contributing. Of particular note, our High-Volume Analog & Logic business is now showing early signs of progress from our efforts over the past couple of years to reinvigorate growth... Operationally, TI performed well. Despite low visibility at the start of the quarter, our factories were able to respond to a surge in demand resulting in 18 percent sequential growth in revenue. At the same time, TI inventory again declined, and by working with our distributors we were able to further reduce channel inventory by about 10 percent... Looking ahead, we expect solid sequential growth in the third quarter. As end demand trends remain uncertain, we will keep our operations flexible so we can quickly respond to our customers' needs."

4:15PM Intel to offer $1.5 billion of junior subordinated convertible debentures (INTC) 18.90 +0.11 : Co intends to use a majority of the proceeds to purchase shares of its common stock concurrently with, and shortly after, pricing of the debentures. Transactions effected as part of such repurchases could affect or maintain the market price of Intel's common stock. Intel intends to use the remainder of the proceeds for general corporate purposes.

8:47AM Data Domain: EMC acquires majority ownership of Data Domain (DDUP) 33.49 : EMC Corporation (EMC) announced that it has acquired majority ownership of DDUP. Data Domain stockholders have tendered approximately 78.2 percent of the outstanding Data Domain shares (not including shares tendered by notice of guaranteed delivery). Together with the 3.9 percent of outstanding Data Domain shares previously held by EMC, EMC now controls approximately 82.1 percent of Data Domain shares outstanding.

8:01AM Conexant announces it has filed for a $20 mln mixed shelf offering (CNXT) 1.32 :

icon url

ReturntoSender

07/25/09 9:14 PM

#8629 RE: ReturntoSender #6755

From Briefing.com: Weekly Recap - Week ending 24-Jul-09

The stock market logged another impressive week as investors cheered better-than-expected earnings reports, with the S&P 500 surging 4.1%, marking an 11% gain since July 10.

The best performing sectors were materials (+8.1%), energy (+5.6%) and utilities (+5.6%).

The week got off to a positive bias on report from The Wall Street Journal that CIT Group (CIT) had reached an agreement with its bondholders to secure $3 billion in rescue financing, which was later confirmed by the struggling lender. Whether CIT will be able to avoid bankruptcy remains to be seen, although this will give the lender some time to explore its options.

With only a handful of economic releases, the main focus this week was the large amount of earnings reports -- 142 S&P 500 companies reported their quarterly results, including 12 Dow components.

Earnings for the most recent quarter largely came out ahead of expectations, with 111 beats, 10 in-line and 21 misses. But the earnings beats were largely due to cost cutting measures, not upside surprises on the top line. Specifically, 72 companies posted revenue that failed to live up to expectations, and 102 reported year-over-year declines in revenue.

For instance, Microsoft met analyst EPS estimates in its fiscal fourth quarter at $0.36, but the software giant's revenue decline of 17% y/y to $13.1 bln was well short of the $14.4 bln consensus. Shares of MSFT fell 4.0% for the week.

There were 11 other Dow components that reported -- Merck (MRK), United Tech. (UTX), DuPont (DD), Coca Cola (KO), Caterpillar (CAT), Boeing (BA), Pfizer (PFE), 3M (MMM), AT&T (T), McDonald's (MCD), American Express (AXP) -- all of which topped EPS expectations. Yet the revenue results reflect the difficult corporate environment -- only two companies posted positive (nearly flat) y/y revenue, and seven missed the consensus revenue estimate. The market's reaction to the earnings reports were mostly positive, led by a 23.6% surge in shares of CAT.

The economic calendar was light this week, although there are a handful of notable mentions. Initial claims for the week ended July 18 jumped 30,000 to 554,000. The consensus estimate stood at 557,000 so the increase was expected. The latest figure left the four-week moving average at 566,000, which is down from 585,000 in the prior week. Although the decline in the four-week moving average is a welcome sign, new jobless claims are still well above normal levels.

Existing Home Sales in June increased 3.6% from May to a seasonally adjusted annual rate of 4.89 million units. That was above the consensus estimate of 4.84 million, yet with the slight downward revision for May to 4.72 million from 4.77 million, the 2-month period was precisely in-line with estimates. The June report validates the notion that existing home sales are stabilizing at a depressed base. Still, housing faces significant hurdles, such as rising unemployment and excess inventory.

In other news, Fed Chairman Bernanke addressed Senate and House finance committees this week in his semiannual report. The chairman did not give any real surprises, noting that current economic conditions warrant the low fed funds rate for an extended period of time. Bernanke expects a gradual economic recovery in 2010, with some acceleration in 2011.

The advance this week sent the Dow, Nasdaq and S&P 500 to their best levels of the year, with the Dow now in positive territory.

The coming week brings another barrage of earnings reports, as well as a pickup in economic data. The advance Q2 GDP reading, due on Friday, is expected to show a decline of 1.5%.
 
Index Started Week Ended Week Change % Change YTD %
DJIA 8743.94 9093.24 349.30 4.0 3.6
Nasdaq 1886.61 1965.96 79.35 4.2 24.7
S&P 500 940.38 979.26 38.88 4.1 8.4
Russell 2000 519.22 548.46 29.24 5.6 9.8

08:32 am Microsoft (MSFT)

Shares of Microsoft (MSFT 25.56) are under pressure Friday after the company's fiscal fourth quarter report failed to impress investors.

Microsoft reported fiscal fourth quarter earnings of $0.36 per share, including the effect of revenue deferral which reduced earnings per share by $0.02 and excluding $0.02 of legal charges, impairments to investments and additional severance charges related to the previously announced plan. The results matched the First Call consensus that expected earnings of $0.36 per share. Operating income of $3.99 billion represented a 30% year-over-year decline.

Revenues fell 17.3% year-over-year to $13.1 billion, well short of the $14.37 billion consensus.

"Our business continued to be negatively impacted by weakness in the global PC and server markets," said CFO Chris Liddell.

On the company's conference call, Liddell said that Microsoft sees tough comparables for the rest of the calendar year but he also added that there are some signs that things may have bottomed out.

Despite those assurances, shares of MSFT are down more than 7.5% about an hour ahead of Friday's opening bell.
icon url

ReturntoSender

07/26/09 4:22 PM

#8631 RE: ReturntoSender #6755

InvestmentHouse Weekend Market Update 7/24/09

http://www.investmenthouse.com/weekendmarketsummary.htm

- Market had enough reason to sell, but it didn't.
- Market enjoys the gridlock on healthcare and cap and trade.
- EU shows hints of more economic stabilization. So what is new?
- Michigan sentiment on the rise but still quite low.
- Liquidity in control once more but could get a test before further gains.

MSFT stalls the gains but does not lead to a turnover or reversal of the gains.

Microsoft missed on the bottom line and the top line and was gapped lower. As noted Thursday night, MSFT was one of the reasons for the tech move with its renewal of its business given Bing and its new operating system on schedule for August to replace the pathetic Vista. MSFT rallied sharply ahead of its results as investors almost feverishly anticipated its revival. That revival needs some CPR or at least a bit more time for the new operating system to hit the market and spur, hopefully for tech, a new upgrade cycle.

There was other less than rosy news. UK GDP was lousy at -0.8% in Q2, twice the expected -0.4%. DeBeers announced that diamond sales were down the most in 30 years. Thirty years. That is back in the 1970's. More amazing parallels to the past. It repeats again and again, and unfortunately, comparisons to the 1970's are never, ever good unless it is preceded by words such as 'unlike the 1970's' or 'in complete contrast to the 1970's'. I recall that in the late 1970's and the turn into the 1980's investment class gemstones, those that make what you buy in the stores look like paste, lost value for the first time ever. That really put the fear into the ultra-rich that used those as a last safe haven. Yes, parallels to the 1970's are never good indications.

This bad news was offset by some decent news. German business confidence rose again in July after a quick June dip. EU manufacturing 'improved' as it fell less than estimates. Many are interpreting this as a turnaround in Europe though as we argued the past few months, stabilization is not a recovery. Indeed we have seen this stabilization now for months. Hitting bottom does not mean a turn. If the same fiscal and monetary mistakes are made again then 'stabilization' can give way to another downside leg.

Michigan sentiment was up (66.0 versus 65.0 expected and 64.6 prior), but at these levels it is still low. It tried to bounce the market but could not in itself do the trick.

It's not the economy, stupid, it is the failing support for national healthcare.

The really good news for the week, however, was the death of the arbitrary and absurd August 'deadline' for a healthcare bill. Friday a leading blue dog democrat walked out of a meeting on the healthcare plan, telling the House leader that the plan was not going to fly. Senator Reed echoed what was said Thursday, i.e. that no vote on healthcare would occur before the August recess. As I noted a few weeks back, the spending was going to damage the Obama administration and that, ironically, it could be saved by failing to get nationalized healthcare passed. The market would rally on that news.

Indeed, when you consider the crappy economic data that is nowhere near where it was when the market and economy bottomed out of the last recession in late 2002 and the low quality of the top line earnings despite the bottom line surprises, it becomes clearer that the market is rallying in large part on the idea that healthcare will not be poisoned by a national healthcare plan. Remember, the UK system and Canadian system were both supposed to be an 'option' to private coverage just as the proposed plan in the US. In both cases the national plan swallowed the private plans. The market sniffed out the growing wave of opposition to this plan and rallied ahead of the news.

TECHNICAL

INTRADAY. Stocks started weak and sold further. Michigan sentiment tried to bounce it but in itself was not enough. The upside bias took over, however, and the market recovered from midmorning to the close. No major gains but again, in the absence of anything else, the market moved higher.

INTERNALS. Flat breadth and much lower volume to finish out the week after some really strong upside volume Thursday as the indices made the definite break higher. The indices are showing the big volume when it is needed and meaningful.

CHARTS. Nothing really changed Friday following that big break higher Thursday. The indices tried to sell back some but ended up rebounding off the lows; not much downside impetus there. The breakouts over the June, January and October gap points (as the case may be for each index) were solid as money poured into the market after the early summer hiatus following the March to early June rally. Remember all the talk about the head and shoulders patterns on SP500 and the other NYSE indices? They set up, started to break, and then the market reversed. Look at the bigger picture from November to July: that is a reverse head and shoulders on SP500 and DJ30, a bullish pattern. We are already saw the growth sectors breakout (NASDAQ, SOX, NASDAQ 100), leading the way as they should. For now, despite the fiscal policies and those to come, the market is rallying in relief over healthcare and has plenty of fuel with all of the paper money printed by the world's central banks.

LEADERSHIP. Energy, retail, commodities, industrials, chips and techs enjoyed solid weeks even if some did not participate as much Friday thanks to MSFT. Indeed the MSFT could likely be the catalyst to a pullback for NASDAQ after a 12 day winning streak and a similar 2 week run on SP500. There is plenty of leadership right now. It just needs to step back after this run, take a few breaths, consolidate, and then set up for the next run.

SUMMARY. After trying their hand in June to early July, sellers have lost their nerve and are unwilling to commit and challenge the liquidity driven upside. That liquidity is now actively moving into the market once more after the rest following the initial move off the March low. With this liquidity we can see moves continue that should stop and consolidate. Thus we will look for any opportunities such as tests of trendlines and breakouts to enter additional positions. New breakouts can also show up as we know the market moves in waves with new stocks stepping up after the leaders spring out and rest.

Even with the liquidity we can get a pullback such as the 1-2-3 pullbacks seen in late March and in April as the market rallied. Those gave opportunities to move in to the leaders and catch the next nice bounce higher.

The near term problem is the move has been very steep just as the initial move off the March low. Indeed this move is amazingly similar to that initial run off the March low in its steepness and unrelenting upside. Now we can and should see a couple of days of testing back to the trendline such as the 10 day EMA and then a resumption of the rally. Again, we use the pullback to pick up shares in stocks such as RIMM that are set up well to rally higher once more.

THE MARKET

MARKET SENTIMENT

VIX: 23.09; -0.34
VXN: 24.67; -1.2
VXO: 23.06; -1.01

Put/Call Ratio (CBOE): 0.93; +0.06

Bulls versus Bears:

This is a reading of the number of bullish investment advisors versus bearish advisors. The reason you look at this is that it gives you an idea of how bullish investors are. If they are too bullish then everyone is in the market and it is heading for a top: if everyone wants to be in the market then all the money is in and there is no more new cash to drive it higher. On the other side of the spectrum if there are a lot of bears then there is a lot of cash on the sideline, and as the market rallies it drags that cash in as the bears give in. That cash provides the market the fuel to move higher. If bears are low it is the same as a lot of bulls: everyone is in and the market doesn't have the cash to drive it higher.

Bulls: 36.7%. Rebounding as you would expect as the market put in its second week of rallying. After falling to 35.6% last week the market bounce caught up with sentiment. Hit a high of 47.7% mid-June on the run from the March lows. Steady rise from 36.0% in late April. Barely over the 35% threshold, below which is considered bullish. Of course it will jump after this past week. Has to get up to the 60% to 65% level to be bearish. Dramatic rise from 21.3% in November 2008, the bottom on this leg. This last leg down showed us the largest single week drop we have ever seen, falling from 33.7% to 25.3%. Hit 40.7% on the high during the rally off the July 2008 lows. 30.9% was the March low. In March the indicator did its job with the dive below 35% and the crossover with the bears. A move into the lower 40's is a decline of significance. A move to 35% is a bullish indicator. This is smashing that. For reference it bottomed in the summer 2006, the last major round of selling ahead of this 2007 top, near 36%, and 35% is considered bullish.

Bears: 35.6%. Bears matched last week's 35.6%, showing that the bears are not convinced by this rally. That is a good indication for the market as there are bears still holding back their money. When the market rallies more it continues to find new fuel from the bear's money as they pitch in and buy to the upside. Nice surge higher from 30.3% in early July. Up from 23.3% in mid-June. Still well off the 37.2% and the 37.1% in mid-April as the rally continued higher. Cracking above the 35% threshold considered bullish. Still off the high on this run at 47.2%. For reference, bearishness hit a 5 year high at 54.4% the last week of October 2008. The move over 50 took bearish sentiment to its highest level since 1995. Extreme negative sentiment. Prior levels for comparison: Bearishness peaked at 37.4% in September 2007. It topped the June 2006 peak (36%) on that run. That June peak eclipsed the March 2006 high (33%) and well above the 2005 highs that spawned new rallies (30% in May 2005, 29.2% in October 2005). That was a huge turn, unlike any seen in recent history.

NASDAQ

Stats: -7.64 points (-0.39%) to close at 1965.96
Volume: 2.191B (-24.83%)

Up Volume: 1.182B (-1.316B)
Down Volume: 1.014B (+469.233M)

A/D and Hi/Lo: Advancers led 1.23 to 1
Previous Session: Advancers led 3.25 to 1

New Highs: 81 (-54)
New Lows: 12 (+3)

NASDAQ CHART: Click to view the chart

NASDAQ 100 CHART: Click to view the chart

SOX CHART: Click to view the chart

SP500/NYSE

Stats: +2.97 points (+0.3%) to close at 979.26
NYSE Volume: 1.025B (-26.61%)

Up Volume: 639.531M (-521.251M)
Down Volume: 353.97M (+128.467M)

A/D and Hi/Lo: Advancers led 1.75 to 1
Previous Session: Advancers led 4.64 to 1

New Highs: 85 (-56)
New Lows: 65 (-32)

SP500 CHART: Click to view the chart

SP600 Chart: Click to view the chart

DJ30

Stats: +23.95 points (+0.26%) to close at 9093.24
Volume: 214M shares Friday versus 247M shares Thursday.

DJ30 CHART: Click to view the chart

MONDAY

As noted in the 'Summary' above, the liquidity is back in town and driving stocks higher similar to the start of the rally back in March. It has made that similar initial move off the bottom of the range at 875 SP500. As with that earlier move a quick test would be normal and then a move higher.

Would this be a week or two week test? It could be if earnings worries sink in, but the earnings got it going, and what we saw happen at the end of the week re the healthcare debate quite likely usurped the earnings theme. It triggered the money move back into the market and now instead of a week or so pullback a 2 or 3 day test is more in line if the liquidity is truly back.

Therefore we are going to look for more upside. As seen late in the week, despite the apparent need for a pullback the upside plays kept setting up. We are going to continue looking for those although the surge higher put many good stocks in extended buy positions. Thus a short 1-2-3 pullback (i.e. 3 days, maybe 2) to near support sets them up for buys that we want to take if offered. Banked a lot of gain the past week, still have a lot of good positions working for us, and looking to put some more money to work given the changes driving the market.

Support and Resistance

NASDAQ: Closed at 1965.96
Resistance:
1984 from late September
2099 is the mid-September low
2169 is the March 2008 double bottom low

Support:
1947 is the October gap down point
1897 is the October post gap intraday high.
The 10 day EMA at 1902 is worth watching given the strength of the move
1880 is the June peak
1862 is the July peak
The 50 day EMA at 1805
1786 is the November intraday high
1780 is the November 2008 closing peak
1773 is the May intraday peak
1770 is the mid-October interim peak
1673 is the prior April peak
1666 is the intraday January 2009 peak
1664 is the May 2008 low
1661 is the April 2009 prior peak
The January closing peak at 1653 (intraday)
1623 is the early April peak
1620 from the early 2001 low
The 200 day SMA at 1620
1603 is the December peak
1598 is the February 2009 peak, the last peak NASDAQ made
1587 is the March 2009 high is getting put to bed again
1569 is the late January 2009 peak
1542 is the early October 2008 low
1536 is the late November 2008 peak
1521 is the late 2002 peak following the bounce off the bear market low
1505 is the late October 2008 closing low.
1493 is the October 2008 low & late December 2008 consolidation low

S&P 500: Closed at 979.26
Resistance:
The November 2008 peak at 1006
1050
1106 is the September 2008 low

Support:
956 is the June intraday peak
The 10 day EMA at 947
944 is the January 2009 high
935 is the January closing high
932 is the July peak
930 is the May peak
919 is the early December peak is bending
The 50 day EMA at 914
899 is the early October closing low
896 is the late November 2008 peak
888.70 is the April intraday high.
882 is the early May low
878 is the late January 2009 peak
The prior April peak at 876
The 200 day SMA at 871
866 is the second October 2008 low
857 is the December consolidation low; cracking but not broken
853 is the July 2002 low
848 is the October 2008 closing low
846 is the April peak
842 is the early April peak
839 is the early October 2008 low
833 is the March 2009 peak
818 is the early November 2008 low
815 is the early December 2008 low
805 is the low on the January 2009 selloff. KEY Level
800 is the March 2003 post bottom low

Dow: Closed at 9093.24
Resistance:
9088 is the January 2009 peak. Not entirely broken
9387 is the mid-October peak
9625 is the October closing high
10,365 is the late September low

Support:
8985 is the closing low in the mid-2003 consolidation
8934 is the December closing high
8878 is the June peak
8829 is the late November 2008 peak
The 10 day EMA at 8802
The 18 day EMA at 8674
8626 from December 2002
8588 is the May high
8581 is the July peak
8521 is an interim high in March 2003 after the March 2003 low
The 50 day EMA at 8496
8451 is the early October closing low
8419 is the late December closing low in that consolidation
8375 is the late January 2009 interim peak
8315 is the February 2009 peak
8307 is the April 2009 intraday high
8221 is the May 2008 low
8197 was the second October 2008 low
8191 is the prior April peak
8175 is the October 2008 closing low. Key level to watch.
8141 is the early December low
The early April intraday peak at 8113
The early April peak at 8076
7965 is the mid-November 2008 interim intraday low.
7932 is the March 2009 peak
7909 is the early January low
7882 is the early October 2008 intraday low. Key level to watch.
7867 is the early February low
7702 is the July 2002 low
7694 is the February intraday low
7552 is the November closing low. KEY Level.

Economic Calendar

These are consensus expectations. Our expectations will vary and are discussed in the 'Economy' section.

July 27 - Monday
- New Home Sales, June (10:00): 352K expected, 342K prior

July 28 - Tuesday
- Consumer Confidence, July (09:00): 48.7 expected, 49.3 prior
- S&P/Case-Shiller, May (09:00): -17.80% expected, -18.12% prior

July 29 - Wednesday
- Durable Goods Orders, June (08:30): -0.5% expected, 1.8% prior
- Durables, Ex Transportation, June (08:30): 0.1% expected, 1.1% prior
- Crude Oil Inventories, 07/24 (10:30): -1.80M prior

July 30 - Thursday
- Initial Jobless Claims, 07/25 (08:30): 585K expected, 554K prior

July 31 - Friday
- GDP-Adv., Q2 (08:30): -1.5% expected, -5.5% prior
- Core PCE, Q2 (08:30): 2.4% expected, 1.6% prior
- Chain Deflator-Adv., Q2 (08:30): 1.0% expected, 2.8% prior
- Employment Cost Index, Q2 (08:30): 0.3% expected, 0.3% prior
- Chicago PMI, July (09:45): 42.0 expected, 39.9 prior
icon url

ReturntoSender

07/28/09 4:04 PM

#8632 RE: ReturntoSender #6755

TRID MT/LT bot 3000 shares@1.62 - Disappointed again on earnings but upped revenue guidance. Has zero debt - Too cheap to pass up here even if it takes a while to get into the money.


http://finance.yahoo.com/q?s=trid

JMHO, RtS
icon url

ReturntoSender

07/30/09 9:14 PM

#8635 RE: ReturntoSender #6755

From Briefing.com: 4:10 pm : Better-than-expected earnings and a lack of negative headlines fueled strong gains that were supported by broad-based buying and short covering. Though stocks surrendered a chunk of their gains late in the session, they still registered new closing highs for 2009.

A positive tone governed action for the entire session, due largely to a flood of upside earnings surprises from an array of industry players. What's more, the gains that followed came in the face of ongoing calls for a pullback from market pundits, which has encouraged short sellers to bet that the stock market's recent run will falter. However, stocks continue to be supported by those looking to put idle money into play.

Though the benchmark index was unable to cross the psychologically significant 1000 mark, the Nasdaq broke above 2000 for the first time since early October. Both indices finished off of their session highs, but they still managed to close at their best levels of the year.

All 10 major sectors in the S&P 500 logged gains, which ranged from energy's 0.1% gain to the materials sector's 3.0% gain.

Dow Chemical (DOW 21.51, +1.24) provided leadership to the materials sector. The company reported better-than-expected earnings for its latest quarter.

Materials stocks were also supported by higher commodity prices, though. A sharp rise in commodities gave the CRB Commodity Index a 3.9% gain, which is its best single-session percentage gain since March.

Oil was a primary driver behind the CRB's advance. Oil prices rebounded 5.8% to settle at $67.00 per barrel after dropping nearly 6% in the previous session.

Higher oil prices and positive earnings surprises from Noble (NBL 59.93, +3.27) and Apache (APA 82.29, +4.37) helped garner support for the energy sector as Exxon Mobil (XOM 70.64, -0.79) faltered after missing the consensus earnings estimate.

Some of the best gains this session came from within the financial sector, which finished almost 2.7% higher. Multi-line insurers along with life and health insurers spiked a respective 5.2% and 4.6% after Hartford (HIG 16.98, +2.02), Lincoln National (LNC 20.34, +2.29), and Aflac (AFL 37.81, +2.36) reported pleasing quarterly results.

Visa (V 67.05, +0.27) and MasterCard (MA 194.17, +5.62) both reported upside earnings results of their own and also provided support to the financial sector.

The session's upbeat tone was generally bolstered by news that the four-week moving average for initial jobless claims fell to its lowest level in months, even though weekly claims climbed more than expected. Continuing claims declined more than expected for another straight week. Continuing claims now stand at levels not seen since April, but many economists caution that the labor market remains far from good.

The advance second quarter GDP announcement is due tomorrow morning and will dominate financial headlines. The current consensus calls for an annualized decline of 1.5% following the 5.5% annualized decline registered in the first quarter. The report is due at 8:30 AM ET.DJ30 +83.74 NASDAQ +16.54 NQ100 +0.6% R2K +1.7% SP400 +1.3% SP500 +11.45 NASDAQ Adv/Vol/Dec 1810/2.52 bln/822 NYSE Adv/Vol/Dec 2409/1.35 bln/649

4:39PM Sierra Wireless beats by $0.07, misses on revs; guides Q3 revs below consensus (SWIR) 7.36 +0.50 : Reports Q2 (Jun) loss of $0.19 per share, $0.07 better than the First Call consensus of ($0.26); revenues fell 13.1% year/year to $135.3 mln vs the $136.8 mln consensus. Co issues guidance for Q3, sees EPS of $0.06, ex-items, may not be comparable to ($0.16) consensus; sees Q3 revs of $135 mln vs. $144.45 mln consensus. The EPS guidance is presented on a non-GAAP basis, which excludes Wavecom transaction and integration costs, restructuring costs, stock-based compensation expense, acquisition amortization and foreign exchange on amounts related to the Wavecom acquisition. Our guidance for the third quarter of 2009 reflects the uncertain macro economic environment. Our guidance also includes some rev contribution from expected new product launches and the uncertainties associated with these launches could affect our ability to achieve guidance.

4:37PM First Solar coming in sharply here, more than $12 off the highs and only up ~$6.00 after hours (FSLR) 173.55 +5.56 :

4:35PM Power Integrations beats by $0.10, beats on revs; guides Q3 revs above consensus (POWI) 27.45 +0.40 : Reports Q2 (Jun) earnings of $0.25 per share, excluding non-recurring items, $0.10 better than the First Call consensus of $0.15; revenues fell 8.0% year/year to $49.3 mln vs the $41.2 mln consensus. Co issues upside guidance for Q3, sees Q3 revs of $54-58 mln vs. $44.67 mln consensus. Third-quarter gross margin and operating expenses are expected to be similar to second-quarter levels. Non-GAAP gross margin for the second quarter was 49.7%. "We delivered quarterly revenues well above our original expectations and had an outstanding quarter in terms of profitability and cash flow. We believe that recent design-win momentum is now translating into strong top-line performance. In fact, we had record bookings in the second quarter, and orders have continued at a strong pace in July. While we remain cautious about the global economic outlook, and forecasting revenues remains challenging, we expect our revenues to grow on a year-over-year basis in the third quarter."

4:25PM Applied Micro beats by $0.02, reports revs in-line (AMCC) 7.68 +0.19 : Reports Q1 (Jun) earnings of $0.01 per share, excluding non-recurring items, $0.02 better than the First Call consensus of ($0.01); revenues fell 26.3% year/year to $45.1 mln vs the $44.8 mln consensus. Co says, "We have been able to refocus the business over the last few quarters resulting in a significant reduction to operating expenses and improved asset management as shown on our balance sheet. With these now behind us we should see steady improvement in our profitability as revenues ramp back to last year's levels."

4:25PM Extreme Networks beats by $0.01, beats on revs (EXTR) 2.30 +0.05 : Reports Q4 (Jun) earnings of $0.03 per share, $0.01 better than the First Call consensus of $0.02; revenues fell 17.3% year/year to $81.3 mln vs the $78.4 mln consensus.

4:19PM Nanometrics misses by $0.12, misses on revs (NANO) 3.80 -0.08 : Reports Q2 (Jun) loss of $0.38 per share, $0.12 worse than the First Call consensus of ($0.26); revenues rose 43.6% year/year to $14.5 mln vs the $16 mln consensus.

4:14PM Varian Semi beats by $0.05, beats on revs; guides Q4 EPS above consensus, revs above consensus (VSEA) 29.82 : Reports Q3 (Jun) loss of $0.20 per share, excluding non-recurring items, $0.05 better than the First Call consensus of ($0.25); revenues fell 59.8% year/year to $73.4 mln vs the $68.9 mln consensus. Co issues upside guidance for Q4, sees EPS of $0.01-0.06 vs. ($0.09) consensus; sees Q4 revs of $104-114 mln vs. $87.28 mln consensus.

4:11PM Novatel Wireless reports EPS in-line, beats on revs; guides Q3 EPS above consensus, revs above consensus (NVTL) 9.23 +0.66 : Reports Q2 (Jun) loss of $0.03 per share, in-line with the First Call consensus of ($0.03); revenues fell 6.1% year/year to $84.1 mln vs the $77.4 mln consensus. Co issues upside guidance for Q3, sees EPS of $0.07-0.14 vs. ($0.01) consensus; sees Q3 revs of $90-95 vs. $79.35 mln consensus. "Second quarter 2009 revenues increased sequentially by 19%; however, our results were impacted by $2.1 million of cancellation costs related to a significant customer order... Gross margins were 22.1%. Excluding the cancellation costs, gross margin would have been 24.5% and EPS would have been $0.02 per diluted share. During the quarter, we increased our cash position and ended the quarter with total cash and equivalents of approximately $146 million or $4.76 per share."

4:05PM Ingram Micro reports EPS in-line, misses on revs (IM) 18.58 +0.44 : Reports Q2 (Jun) earnings of $0.20 per share, ex-items, in-line with the First Call consensus of $0.20; revenues fell 25.4% year/year to $6.58 bln vs the $6.67 bln consensus. Gross margin was 5.87%, an improvement of 34 basis points compared to the prior-year quarter, driven by the company's recent efforts to shed underperforming businesses, pursue an improved mix of higher-margin accounts and products, control margin leakage and enhance its service-based revenues. "Looking to the third quarter, we expect the overall demand environment to follow historical seasonal patterns. While we do not anticipate an economic rebound in the near term, our larger regions will begin to leverage some of the benefits of our recent cost-reduction and operational-improvement actions. Our efforts to protect return on invested capital and improve our business mix have delivered industry-leading balance sheet metrics and solid gross-margin performance but have also contributed to the sales decline in recent quarters. We now plan to place a greater emphasis on securing incremental sales while maintaining our focus on operational excellence and profitability."

4:05PM Evergreen Solar signs contract manufacturing agreement with Jiawei Solar (ESLR) 2.38 +0.09 : Co announces that it has finalized its agreements with Jiawei Solarchina Co., and the Wuhan Government's Hubei Science & Technology Investment Co. Under these agreements Evergreen Solar will manufacture String Ribbon wafers at a leased facility being built by Jiawei in Wuhan, China on Jiawei's campus. Jiawei will convert the String Ribbon wafers into Evergreen Solar-branded panels on a contract manufacturing basis. Evergreen Solar will reimburse Jiawei for its cell and panel conversion costs, plus a contract manufacturing fee. The actual price paid to Jiawei will be negotiated annually. Evergreen Solar will invest $17 mln in cash and equipment in the Wuhan String Ribbon operation. HSTIC will provide Evergreen Solar $33 mln of 7.5% financing, which Evergreen Solar must repay no later than July 2014. Jiawei will make a similar investment for its cell and panel operations with the support of HSTIC. The co notes that initial capacity will be approximately 100 MW. Factory construction has begun and the parties expect that wafer, cell and panel production will begin in the spring of 2010.

4:03PM Monolithic Power beats by $0.03, beats on revs; guides Q3 revs in-line (MPWR) 23.79 : Reports Q2 (Jun) earnings of $0.17 per share, $0.03 better than the First Call consensus of $0.14; revenues fell 0.7% year/year to $41.2 mln vs the $38.9 mln consensus. Co issues in-line guidance for Q3, sees Q3 revs of $42-$46 mln vs. $42.05 mln consensus. Co sees gross margins at the lower end of its target range of 58%-63% for Q3.

4:03PM First Solar trading up ~$10 following earnings (FSLR) 173.55 +5.56 : Spiked as high as $188.55 Resistance at $187.50. Last trade at $184.40

4:02PM First Solar beats by $0.49, beats on revs (FSLR) 173.55 +5.56 : Reports Q2 (Jun) earnings of $2.11 per share, $0.49 better than the First Call consensus of $1.62; revenues rose 25.8% year/year to $525.9 mln vs the $459.1 mln consensus.

8:19AM On The Wires : EMCORE (EMKR) announces an industry team led by The Boeing Company (BA) has received a contract from the Defense Advanced Research Projects Agency for work on Phase 2 of the Fast Access Spacecraft Testbed program. The $15.5 mln cost-plus-fixed-fee contract is currently funded to $13.8 mln... Caedence Design Systems (CDNS) announces that it has delivered an end-to-end CPF-based low power and DFM-aware design, verification, and implementation solution tuned for semiconductor foundry UMC in support of its 40-nanometer process technology... Entropic Communications (ENTR) and Sigma Designs (SIGM) announce their cooperative relationship to develop high definition, MoCA compliant Cable TV and IPTV Set-Top-Box reference designs...

7:05AM Am Superconductor beats by $0.12, beats on revs; guides FY10 EPS above consensus, revs above consensus (AMSC) 26.28 : Reports Q1 (Jun) earnings of $0.12 per share, excluding non-recurring items, $0.12 better than the First Call consensus of ($0.00); revenues rose 83.4% year/year to $73 mln vs the $61.1 mln consensus. Co issues upside guidance for FY10, sees EPS of $0.41-0.47, excluding non-recurring items, vs. $0.03 consensus; sees FY10 revs of $260.0-270.0 mln (previous $225.0-235.0 mln) vs. $238.99 mln consensus. Gross margin for FY10 is expected to be 32.0-34.0%, up from previous forecast of 30.0-32.0%. Co reports backlog as of June 30, 2009 of approx $497 mln compared with $558 mln as of March 31, 2009. The decrease is due primarily to shipments made under AMSC's multi-year contract for wind turbine core electrical components with Sinovel.

3:39AM Taiwan Semi beats by $0.01, beats on revs (TSM) 10.10 : Reports Q2 (Jun) earnings of $0.14 per share, $0.01 better than the First Call consensus of $0.13; revenues fell 22.6% year/year to $2.24 bln vs the $2.16 bln consensus. Gross margin for the quarter was 46.2%, operating margin was 33.9%, and net margin was 32.9%. Co issues upside guidance for 3Q09, sees revenue fo NT$88-90 bln vs NT$79.19 bln First Call consensus. Gross profit margin is expected to be 46.5-48.5%. Operating profit margin is expected to be 35.0-37.0%. Co expects capital expenditure of approx $2.3 bln vs preivous guidance of $1.5 bln.

1:09AM FormFactor beats by $0.14, beats on revs (FORM) 23.00 : Reports Q2 (Jun) loss of $0.33 per share, excluding non-recurring items, $0.14 better than the First Call consensus of ($0.47); revenues fell 40.0% year/year to $31.2 mln vs the $28.9 mln consensus.

icon url

ReturntoSender

08/04/09 11:01 PM

#8636 RE: ReturntoSender #6755

From Briefing.com: 4:30 pm : A surprisingly strong increase in pending home sales and considerable strength in the financial sector struggled to prop up stocks and keep choppy trading at bay, but a late move by buyers made for a strong finish.

Stocks started the session in negative territory as participants were left largely unimpressed by the latest batch of earnings announcements, which didn't contain any real market movers. News that June personal income fell a larger-than-expected 1.3% and June spending made a generally in-line 0.4% increase also failed to stir action.

However, a much better-than-expected monthly increase of 3.6% for June pending home sales bounced stocks off of morning lows. The move proved unsustainable, but financials emerged to provide support to the broader market.

Financials stocks were down more than 1% in the early going, but rebounded to settle with an 2.1% gain, just shy of their session high. There wasn't any particular catalyst to account for the sharp reversal from red to green other than momentum buying. That momentum helped carry the major indices into positive territory midsession.

Despite leadership from the financial sector, the broader market was unable to break free from its fit of choppiness. Still, the apparent instability couldn't disrupt a strong advance into the close that gave stocks their fourth straight advance.

The stock market's latest winning streak has only added to an already impressive run that has stocks up nearly 15% in just over three weeks. Such a strong move has many calling for a pullback, but buyers remain in control.

Amid an increased willingness to move into stocks and take on risk, small-caps in the Russell 2000 and mid-caps in the S&P 400 outperformed the headline indices this session. Small- and mid-caps tacked on 0.9% and 0.8%, respectively.

Meanwhile, Treasuries fell out of favor after starting the session in higher ground. The benchmark 10-year Note shed some 12 ticks, which pushed its yield back toward 3.7%. The yield had been above 3.7% midway through the session.DJ30 +33.63 NASDAQ +2.70 NQ100 +0.0% R2K +0.9% SP400 +0.8% SP500 +3.02 NASDAQ Adv/Vol/Dec 1509/2.27 bln/1153 NYSE Adv/Vol/Dec 1851/1.25 bln/1168

4:17PM GT Solar misses by $0.01, misses on revs; reaffirms FY10 EPS guidance, revs guidance (SOLR) 5.91 -0.16 : Reports Q1 (Jun) earnings of $0.05 per share, $0.01 worse than the First Call consensus of $0.06; revenues rose 25.7% year/year to $71.8 mln vs the $85.9 mln consensus. Co reaffirms guidance for FY10, sees EPS of $0.45-0.60 vs. $0.51 consensus; sees FY10 revs of $450-550 vs. $508.69 mln consensus. At quarter's end, the company's backlog was $1.12 billion, with $330 million in the PV segment and $785 million in the polysilicon segment. Net bookings for the quarter were $9.8 million.

4:14PM Tessera Tech beats by $0.10, beats on revs; guides Q3 revs above consensus (TSRA) 28.55 -0.37 : Reports Q2 (Jun) GAAP earnings of $0.24 per share, $0.10 better than the First Call consensus of $0.14; revenues rose 10.7% year/year to $62.3 mln vs the $59.9 mln consensus. Co issues upside guidance for Q3, sees Q3 revs of $60-$62 mln vs. $56.77 mln consensus. 3Q09 Micro-electronics revenue is expected to range between $54.0 mln and $56.0 mln, all of which will be royalty and license related. Revenue will reflect the second quarter financial performance of the company's DRAM and Wireless licensees, which may have been stronger than anticipated, but was still down year-over-year. Q3 Imaging & Optics revenue, in total, is expected to be $6.0 mln. Imaging & Optics royalty and license fees revenue is expected to be $3.0 mln. Imaging & Optics products and services revenue is expected to be $3.0 mln.

4:09PM Intersil to Acquire Quellan, Creator of Q:ACTIVE (ISIL) 14.31 -0.09 : Co announces that it has signed a definitive agreement to acquire Quellan, Inc., a privately held leader in the design of high performance analog signal processing integrated circuits. The boards of directors of both companies have unanimously approved the merger. Intersil expects the acquisition will have an immaterial impact on revenue or earnings for the third quarter 2009 results.

4:02PM Coherent misses by $0.01, beats on revs (COHR) 19.90 -0.50 : Reports Q3 (Jun) loss of $0.09 per share, excluding non-recurring items, $0.01 worse than the First Call consensus of ($0.08); revenues fell 37.3% year/year to $98.5 mln vs the $95.1 mln consensus. Co says, "We anticipate that total orders will begin their recovery in the current fiscal quarter, led by microelectronics systems and service, and continue through fiscal 2010. As these orders convert to revenue, we can begin to realize the benefits from our footprint consolidation projects that have thus far been masked by the pullback in revenue."

7:32AM California Micro: Dialectic Capital Management files definitive proxy statement and sends letter to California Micro Devices Stockholders (CAMD) 3.08 : Dialectic Capital Management announces it has filed with the SEC definitive proxy materials in connection with the 2009 annual meeting of stockholders of California Micro Devices Corporation (CAMD) to be held on September 17, 2009. Dialectic also has sent a letter to the Company's stockholders urging them to elect three highly qualified and experienced director nominees, John Fichthorn, J. Michael Gullard and Kenneth Potashner, by signing, dating and returning the gold proxy card. The Dialectic group is the second largest stockholder of the Company and beneficially owns 2,025,011 shares, representing approximately 8.8% of the Company's outstanding.

7:16AM Cray beats by $0.10, beats on revs; guides FY09 revs above consensus (CRAY) 8.16 : Reports Q2 (Jun) earnings of $0.10 per share, $0.10 better than the First Call consensus of ($0.00); revenues rose 34.3% year/year to $62.7 mln vs the $61.1 mln consensus. Co issues upside guidance for FY09, sees FY09 revs of $290 mln vs. $262.72 mln consensus. Co says a modest income from operations for 2009 is likely; First Call Consensus is ($0.13). For 2010, Cray expects its revenue to continue to grow, perhaps modestly, and expects to be profitable.

icon url

ReturntoSender

08/05/09 11:16 PM

#8637 RE: ReturntoSender #6755

From Briefing.com: 4:15 pm : Despite continued strength among financial issues, the major equity averages surrendered some of their recent gains in the wake of a generally unimpressive batch of economic data.

Financials outperformed the broader market with relative ease for the second straight session. They jumped out to an early gain and were able to remain in positive ground for virtually the entire session before closing with a 3.3% gain. Financials are now up more than 8% this week.

Better-than-expected earnings from Marsh & McLennan (MMC 22.62, +1.12) gave insurers a lift and helped drive short-covering in left-for-dead names like AIG (AIG 22.00, +8.48), but bank stocks provided some of the most support to the broader market. Regional banks advanced 2.9%, diversified banks climbed 5.4%, and diversified financial services stocks (+5.4%) like Bank of America (BAC 16.62, +0.98) and JPMorgan Chase (JPM 41.78, +1.57) bounded.

Materials stocks also garnered support and finished 0.8% higher after spending the middle half of the session in the red. Besides financials, it was the only other sector in the S&P 500 to make a gain. The sector benefited from a rebound in commodity prices, which saw oil prices rebound from a loss of more than 2% to close 0.8% higher at nearly $72 per barrel. Oil prices were initially pressured by a larger-than-expected weekly inventory build of 1.67 million barrels.

Steel stocks (+2.6%) also provided support to the materials sector after AK Steel (AKS 21.92, +0.98) said it would raise prices.

The rest of the stock market struggled for most of the session. Losses were broad-based and considerable as most of the major sectors in the S&P 500 traded at least 1% into the red. Their weakness wasn't necessarily caused by the day's economic data, but the data certainly didn't stir up any support for stocks either.

Released before the opening bell, the latest ADP Employment Report indicated that 371,000 jobs were slashed in July, but that was greater than the 350,000 job losses that had been forecast. Meanwhile, job losses for June were revised lower to reflect 463,000 job cuts. The figures come ahead of the government's nonfarm payrolls report, which is expected to show 328,000 job losses when it is released Friday.

The ADP data was followed by some modest selling pressure in premarket trading, but stocks still started the session flat. Selling pressure intensified ahead of the latest ISM Service Index and factory orders data.

The ISM Services Index for July unexpectedly slipped to 46.4 from 47.0 in June. It was expected to come in at 48.0. The disappointing reading caused participants to generally dismiss the third straight monthly increase in factory orders, which most recently turned 0.4% higher in June.

The broader market did attempt another upward push into the close, but this time the advance was rebuffed. Still, the S&P 500 held above the 1000 mark as its decliners outnumbered its advancing issues by 2-to-1 in relatively high volume. Declining issues outnumbered advancers by more than 2-to-1 in the Dow. Procter & Gamble (PG 53.91, -1.55) was a primary laggard among blue chips, even though the company bested the consensus earnings estimate for the latest quarter. Fellow Dow component Kraft (KFT 28.33, -0.01) also lagged, despite posting a positive earnings surprise. DJ30 -39.22 NASDAQ -18.26 NQ100 -0.9% R2K -0.8% SP400 -0.3% SP500 -2.93 NASDAQ Adv/Vol/Dec 969/2.36 bln/1701 NYSE Adv/Vol/Dec 1388/1.88 bln/1640

10:58AM GT Solar: Downgrade details (SOLR) 6.54 +0.63 : As mentioned earlier, Ardour Capital downgraded SOLR to Hold from Reduce and increased their tgt to $6 from $3.50. The firm notes that the co's Q1 results were a mixed bag, as revenues fell short primarily because of revenue recognition timing of large orders. In addition, the firm notes that despite the Chinese govt implementing a series of new solarspecific incentives, order activity is still slow; the firm looks for an up-tick by mid-calendar 2010 as utilization rates return to healthy levels. As such, they view the stock as fairly valued at this time.

8:49AM Tower Semicon: Dongwoon Anatech selects Tower Semiconductor as sole manufacturing partner for high volume LED lighting devices (TSEM) 0.88 : Dongwoon Anatech announces it has selected Tower Semiconductor as its sole manufacturing partner for high volume, energy saving LED lighting devices used in both home and industrial applications. Tower was chosen for its 20V to 60V scalable LDMOS power management process technology which provides design optimization and the lowest die size at any given breakdown voltage. Due to the high market demand for LED drivers, Dongwoon Anatech is expanding from Korea to China, U.S., and Japan markets, introducing four new devices this year... Dongwoon Anatech's major customers are Samsung and Sony to which they have shipped 155 million units since the company was formed in 2006. Their aggressive approach to the LED lighting market enables them to set technical standards such as their DW8520 device, the first driver in Korea that can adopt both AC & DC power. Dongwoon Anatech anticipates customers' needs and invests faster than its competitors. Besides LED lighting, the company has started developing DC/DC (sync, buck, boost) and an AMOLED power driver, which very few companies are able to achieve.

10:18 am Electronic Arts (ERTS)

Electronic Arts (ERTS 20.54, -1.35) reported a second quarter loss of $0.02 per share after the close Tuesday, but the results were $0.11 better than the First Call consensus that expected a loss of $0.13.

Revenue rose 34% to $816 million, far better than the $729.5 million consensus.

Additionally, the company provided fiscal year 2010 earnings guidance of $1.00 per share; the consensus stands at $0.97. Electronic Arts expects revenue of $4.3 billion vs. $4.28 billion consensus.

The company said, "Good execution delivered better-than-expected financial results in the first quarter and we are very pleased with the success of both The Sims 3 and EA SPORTS Active. Our first quarter performance was driven by our previously announced cost-cutting initiatives and a strong frontline slate. Also, we had a solid first quarter both top and bottom line and we are focused on delivering the balance of the year."
icon url

ReturntoSender

08/06/09 10:34 PM

#8638 RE: ReturntoSender #6755

From Briefing.com: 4:30 pm : For the second straight session stocks saw a relatively solid start turn into a loss, but this time the financial sector joined the broader market in negative territory.

The major indices opened higher following a smaller-than-expected weekly initial jobless claims tally of 550,000. Though continuing claims were more-than-expected at 6.31 million, up from the previous week, the overall reaction to the data was moderately positive.

With jobless claims still at uncomfortable levels, participants await the government's nonfarm payrolls report for July in order to get an updated read on the employment picture. The report is due tomorrow morning before the opening bell. There was some chatter that recent payrolls numbers could show a major, negative revision, but the CNBC reported that official statistic sources said revisions that may occur will be reported in February.

Financials finished 0.7% lower after logging gains in each of the five previous sessions. Multiline insurers (+1.3%) provided a supportive boon for the sector, but general weakness in the rest of the sector caused it to underperform. The sector had actually been up more than 1% in the early going.

Industrials made up the only sector to hold its initial gains into the close. It finished 0.6% higher. Utilities comprised the only other sector to log a gain; it garnered support into the close to finish with a 0.2% gain.

Tech lagged for the entire session as Cisco Systems (CSCO 22.31, +0.14) underperformed during morning trade. However, the company was able to recover in afternoon trading and close with a gain. The company posted last evening better-than-expected quarterly earnings, but issued an uninspiring revenue forecast during its conference call.

Other earnings announcements were generally met with little reaction. July same-store sales results for retailers were largely unimpressive, as well, but upside guidance from Gap (GPS 18.14, +1.37), Kohl's (KSS 51.02, +1.51), and Macy's (M 15.01, +0.79) helped push the group up 1.1%. That essentially erased the group's losses during the past two sessions.

Despite two consecutive losses, the broader market is still up 1% week-to-date. Should the gains hold through Friday's action, the stock market will have logged four consecutive weekly advances.DJ30 -24.71 NASDAQ -19.89 NQ100 -0.9% R2K -1.5% SP400 -0.8% SP500 -5.64 NASDAQ Adv/Vol/Dec 816/2.43 bln/1812 NYSE Adv/Vol/Dec 1147/1.38 bln/1878

8:35AM Diodes beats by $0.07, beats on revs; guides Q3 revs above consensus (DIOD) 19.36 : Reports Q2 (Jun) earnings of $0.06 per share, excluding non-recurring items, $0.07 better than the First Call consensus of ($0.01); revenues fell 10.4% year/year to $103.9 mln vs the $98.6 mln consensus. Co issues upside guidance for Q3, sees Q3 revs +10-15% sequentially or roughly $114.3-119.5 mln vs. $104.50 mln consensus.

Integrated Device Technology (IDTI) and Taiwan Semiconductor Manufacturing Company (TSM) announce that they have entered into an agreement to transfer product fabrication processes and related activities currently running in the IDT Hillsboro, Oregon facility to TSMC foundries. The transfer, which has already received approval by both companies and the IDT Board of Directors, is expected to take up to two years to complete and will cover the lifecycle of all products involved...

7:38AM Kulicke & Soffa prices 7 mln share common stock offering at $5.00 per share (KLIC) 5.68 :

12:52AM Pericom Semi announces it will delay 4Q09 results; announces accounting review (PSEM) 9.49 : Co announces that it will delay its 4Q09 and full year earnings release and investor conference, which typically occurs in early August of each year. Pericom is undertaking a review of accounting matters relating to the first three fiscal quarters of FY09. Pericom cannot state at this time when the full review will be completed or when fiscal 2009 results will be announced, and intends to provide appropriate updates on these matters as soon as practicable. To date, Pericom has identified two errors in the course of this review, but continues to examine other accounting issues that may or may not require further accounting adjustments. These two errors are: -- For 1Q09, Pericom did not record a decline in value of $414,000 on its income statement relating to an obligation owed by Lehman Brothers Holdings after Lehman filed for bankruptcy on September 15, 2008. Pericom's internal accounting review failed to conclude that this impairment was other-than-temporary and to include this impairment in the income statement for 2009 Q1. For 2Q09, in connection with the conversion of Pericom's enterprise resource planning software, there was an inadvertent misclassification of cost data. This misclassification led to an understatement of cost of goods sold by $772,000. This error was not quantified or identified until balance sheet reconciliations with subledgers became available and were completed after 3Q09 results were reported.

08:31 am Cisco Systems (CSCO)

Cisco Systems (CSCO 22.17) reported sharply lower earnings and revenue for its fourth quarter, but managed to top Wall Street estimates and said that it is seeing "positive signs" in the economy.

Cisco reported fiscal fourth quarter earnings of $0.31 per share, $0.02 better than the First Call consensus of $0.29. Non-GAAP net income of $1.8 billion was down 23.2% from the same quarter last year.

Revenues fell 17.6% year-over-year to $8.54 billion; the consensus expected $8.52 billion.

"We saw a number of positive signs this quarter in the economy and in our business, especially comparing our sequential quarter-over-quarter order trends," said CEO John Chambers. "If we continue to see these positive order trends for the next one to two quarters, we believe there is a good chance we will look back and see that the tipping point occurred in our business in Q4."

Cisco provided revenue guidance on its earnings conference call, saying it sees revenues down 15% to 17% in its fiscal first quarter, which equates to $8.57 billion to $8.78 billion; the consensus expects $8.59 billion.

Shares of CSCO are 36% higher year-to-date but are down 1% in Thursday's premarket trade.
icon url

ReturntoSender

08/10/09 9:06 PM

#8643 RE: ReturntoSender #6755

From Briefing.com: 4:20 pm : Monday made for a rather boring day for stocks. There wasn't any market-moving news and the major indices spent the entire session trading with relatively modest weakness.

At their session lows, stocks were down roughly 1%. The downturn came after a choppy start and a couple of failed attempts to pare losses in the early going. Stocks did manage to retrace the downturn into the close, though.

McDonald's (MCD 56.27, +1.07) provided leadership to blue chips after reporting another monthly increase in global sales. However, the announcement did little for the overall market.

Health care stocks finished the session with some of the best gains. Health care stocks advanced nearly 0.8%. The sector drew support from a broad range of industry players, though Eli Lilly (LLY 33.83, -1.06) lagged after Reuters reported that analysts at Goldman Sachs placed the stock on the Americas Conviction Sell List.

Utilities (+0.2%), consumer staples stocks (+0.2%), and energy stocks (+0.3%) also made gains. The first two sectors put together their advance late in the session, but energy stocks spent the majority of the session in higher ground even as oil prices gyrated. Crude oil futures finished 0.4% lower at $70.62 per barrel.

Gold prices contended with considerable selling pressure for the entire session. They dropped 1.3% to settle at $946.90 per ounce. General weakness among commodity prices weighed on basic materials stocks for the entire session. In turn, the materials sector fell 1.6%, worse than any other major sector in the S&P 500.

Trading volume was light this session. Hardly 1 billion shares exchanged hands on the NYSE. That's the fewest in two weeks and considerably below the near 1.5 billion that have been averaged during the last 200 sessions.DJ30 -32.12 NASDAQ -8.01 NQ100 -0.6% R2K -0.1% SP400 -0.7% SP500 -3.38 NASDAQ Adv/Vol/Dec 1285/1.86 bln/1386 NYSE Adv/Vol/Dec 1444/1.09 bln/1595

9:10AM Microsoft and Publicis Groupe confirm they have signed agreement in which Publicis will acquire Razorfish for approximately $530 mln (MSFT) 23.56 : In a press release out yesterday, Publicis Groupe and Microsoft (MSFT) confirmed that they have signed an agreement under which Publicis Groupe will acquire Razorfish in a transaction valued at approximately $530 mln, expected to be provided in a combination of cash and Publicis Groupe treasury shares. In addition, the parties announced they have signed a Strategic Alliance Agreement that will become effective at the closing of the transaction. The total consideration is expected to be paid in a combination of cash and delivery of 6.5 mln Publicis Groupe treasury shares. The cash component of the purchase price will be determined based on the value attributed to the shares calculated by the average closing price of Publicis Groupe stock during the 20-trading-day period ending on the eighth business day prior to the closing date of the transaction.

NVIDIA (NVDA) announces that Intel (INTC), and motherboard manufacturers, including ASUS, EVGA, Gigabyte, and M.S.I., have all licensed NVIDIA S.L.I. technology for inclusion on their Intel P55 Express Chipset-based motherboards designed for the upcoming Intel Core i7 and i5 processor in the LGA1156 socket...

9:01AM California Micro eliminates stockholder rights plan (CAMD) 3.00 : Co announces that the CMD Board of Directors has unanimously voted to redeem the rights accompanying the company's outstanding common stock, effective August 8, 2009, for $0.001 per right. Stockholders of record on that date do not need to take any further action to receive the redemption price which will paid in the next sixty days. As part of its ongoing communications with CMD stockholders, CMD has discussed the concerns of certain of its major stockholders regarding the rights plan, and has previously considered redeeming the plan or submitting it to a stockholder vote no later than the Company's 2010 stockholder meeting, and submitting any subsequent rights plan to stockholder vote. As a result of more recent communications with stockholders, the Board has decided to accelerate the elimination of the rights plan. The Board further has adopted a policy to submit any future rights plan to a stockholder vote.

United Microelectronics (UMC) reports unaudited net sales for July 2009 increased 3.2% year/year to NT$8.81 bln; month/month sales increased 6.97%

icon url

ReturntoSender

08/10/09 10:32 PM

#8644 RE: ReturntoSender #6755

Bear Market Rally or the Real Deal?

http://headlinecharts.blogspot.com/


Marty Chenard pointed out on Friday that the NDX is trading at an important long-term technical level. He showed only the standard chart, so I added the log chart for contrast. Below is a comment from his blog.

"Since this current rally has remained below its long term resistance line, this has technically been a bear market rally. Now the important question hangs before us ... will the NASDAQ 100 fail at resistance, or will it continue up and peek over the Bull market's fence?"

He considers the rally off the March low a bear rally until the NDX breaks above the down trendline. So we wait and watch.
Posted by HeadlineCharts at 7:57 AM 0 comments
icon url

ReturntoSender

08/11/09 10:41 PM

#8646 RE: ReturntoSender #6755

From Briefing.com: 4:25 pm : Weakness among financial stocks led to a broad-based selling effort that resulted in the stock market's worst single-session percentage decline in one month. Though stocks finished off of session lows, they still closed in weak fashion, unable to garner support and limit losses as they did in the previous session.

The downturn left the S&P 500 just below 995, which is considered a support level below the psychologically significant 1000. Many market watchers regard 990 as the next level of support, followed by 980.

Tuesday started with modest losses until sellers made a concerted move against financials. The financial sector shed 3.5% as regional banks and diversified banks fell a respective 4.2% and 5.6%. Diversified financial services firms fell 4.4%.

CIT Group (CIT 1.20, -0.28) was one of the worst performers by percent lost. The company fell sharply out of favor by delaying its quarterly filing.

All 10 major sectors in the S&P 500 finished in the red. Behind financials, energy was the next worst performing sector. It finished with a 1.7% loss, less than half the loss that hit financials. Energy was dragged lower by weakness in the broader market and 1.6% decline in crude oil prices. Oil settled at $69.45 per barrel.

Neither corporate news nor economic data had any meaningful or lasting impact on the broader market this session. Stock futures did show some knee-jerk buying before the opening bell when participants learned that second quarter productivity increased a better-than-expected 6.4%, which was the strongest increase since the third quarter of 2003, and unit labor costs during the second quarter fell 5.8%, which was sharper than expected and the steepest drop in eight years. In other economic news, wholesale inventories fell for the 10th straight month by dropping a sharper-than-expected 1.7% in June.

Tomorrow afternoon the FOMC announces its rate decision and releases its latest policy directive, which could provide a meaningful catalyst to trading. Participants will also be keeping an eye on the results of tomorrow's 10-year Treasury Note auction, which carries significantly more importance than today's $37 billion auction of 3-year Treasuries. Today's auction drew a yield of 1.78% and carried a bid-to-cover ratio of nearly 2.9, which is above recent averages.

Treasuries made a bit of a pullback in the wake of the announcement, but recovered into the close. In turn, the benchmark 10-year Note gained 27 ticks, which sent its yield well below 3.7%. The yield on the 10-year Note has shed more than 10 basis points so far this week.DJ30 -96.50 NASDAQ -22.51 NQ100 -1.0% R2K -1.7% SP400 -1.4% SP500 -12.75 NASDAQ Adv/Vol/Dec 719/1.94 bln/1931 NYSE Adv/Vol/Dec 788/1.20 bln/2235

Applied Materials beats by $0.08, beats on revs
4:05 PM ET 8/11/09 | Briefing.com

Reports Q3 (Jul) net of breakeven, $0.08 better than the First Call consensus of ($0.08); revenues fell 38.7% year/year to $1.13 bln vs the $958.4 mln consensus.

Co reports Q3 gross margin of 28.7% vs 22.4% consensus. Co reports New orders for the quarter totaled $1.07 billion.

Regional distribution was: Southeast Asia and China 25 percent, Taiwan 24 percent, Japan 14 percent, North America 14 percent, Europe 12 percent, and Korea 11 percent. Within the Silicon Systems Group (SSG), new order composition was: foundry 42 percent, DRAM 25 percent, logic and other 18 percent, and flash 15 percent.

Backlog for the company as of the end of the quarter was $2.95 billion, down from $3.16 billion in the previous quarter.

9:46 AM Microsoft slips below its 50-day simple moving average for the first time since March (MSFT) 23.24 -0.18 : Note that it's 50-day ema lies below at 23.03.

9:46AM Corning Shizuoka glass production disrupted (GLW) 15.99 -0.40 : Co announces production at its LCD glass manufacturing facility in Shizuoka, Japan was disrupted by the earthquake that occurred in Honshu yesterday. "We are relieved that initial reports indicate no Corning employees were injured," James B. Flaws, vice chairman and chief financial officer, said. "However, our glass-making operations at the facility are currently suspended and we believe they will remain so for some time. We are assessing options to meet customer demand and accelerating the restart of idled glass melting tanks at other facilities. It is clear that glass volume at our wholly owned business will be lower than originally planned for the third quarter. At the present time it does not appear that this outage will have a material impact on our fourth-quarter shipments based on our current view of the market. We will update investors on any significant changes to this outlook." "Our adjusted estimate now places sequential volume at our wholly owned business to be down between 5% and 10% in the third quarter, versus our original expectation of flat to up slightly, following a particularly strong second-quarter performance," Flaws added. Corning did not provide specific sales guidance for the third quarter, but the company did note that the lower glass volume would have a negative impact on sales by approximately $65 million.

icon url

ReturntoSender

08/12/09 9:43 PM

#8647 RE: ReturntoSender #6755

From Briefing.com: 4:35 pm : Neither the FOMC's latest policy directive nor a key Treasury auction delivered any negative surprises, so this session's buying effort generally went without being thwarted. Though the major indices did fall from session highs in the final minutes of the session, stocks still finished broadly higher.

The FOMC left its target range for the fed funds rate unchanged at 0.00% to 0.25% and will keep the interest rate at exceptionally low levels for an extended period. That was expected, though. In turn, participants turned their focus to the Fed's accompanying statement, which indicated that the FOMC expects inflation to remain subdued for some time and economic activity is likely to remain weak for some time. The FOMC did say sluggish income growth will constrain household spending, though members hold the belief that economic activity is leveling out.

The FOMC also said that it anticipates the full amount of Treasury securities will be purchased by the end of October. Prior to the FOMC decision, the pace of purchases had suggested the Fed would likely be done with its purchases in September.

A $23 billion auction of 10-year Treasury Notes today produced a high yield of roughly 3.73%, which is in step with the current yield on the benchmark Note. The auction also produced a bid-to-cover ratio of 2.49, which is right around the average for the previous 10-year Note auctions this year.

The announcements had little overall impact on trading, but didn't dissuade buying efforts, either. In turn, buyers were able to cut into losses incurred in the past two down sessions.

Consumer staples stocks were the only sector to finish lower. They suffered a fractional loss. Conversely, financials posted the best gain by climbing 2.0%. They still have a way to go before negating their 3.5% loss Tuesday, though.

Large-cap tech stocks garnered support following better-than-expected earnings and strong guidance from both Applied Materials (AMAT 13.66, +0.44) and Cree (CREE 34.04, +2.21). Shares of CREE have been given an added boost by Bank of America Merrill Lynch's decision to upgrade the stock. Their strength helped the Nasdaq outperform its counterparts.DJ30 +120.16 NASDAQ +28.99 NQ100 +1.6% R2K +1.8% SP400 +1.3% SP500 +11.46 NASDAQ Adv/Vol/Dec 1907/2.18 bln/782 NYSE Adv/Vol/Dec 2237/1.23 bln/813

09:18 am Applied Materials (AMAT)

Applied Materials (AMAT 13.22) delivered a better-than-expected report for its fiscal third quarter and issued upside guidance for the current quarter.

Applied Materials reported breakeven fiscal third quarter earnings, $0.08 better than the First Call consensus that expected a loss of $0.08 per share.

Revenues dropped 38.7% year-over-year to $1.13 billion, but managed to top the $958.4 million consensus.

The Santa Clara, Calif.-based company said its Q3 gross margin was 28.7%, easily topping the 22.4% consensus. New orders for the quarter totaled $1.07 billion.

On its conference call, Applied Materials said it expects fiscal fourth quarter revenue growth of 10-20%, which equates to approximately $1.24 billion to $1.36 billion, well ahead of the current First Call consensus of $1.067 billion. Applied Materials said it expects Q4 earnings of breakeven to $0.04 per share; the consensus currently expects a loss of $0.04.

Shares of AMAT are 30.5% higher year-to-date.
icon url

ReturntoSender

08/13/09 10:45 PM

#8648 RE: ReturntoSender #6755

From Briefing.com: 4:20 pm : Unexpected economic growth out of Germany and France helped set a positive tone this morning, but a generally disappointing batch of U.S. economic data undermined the bias, leaving stocks to trade with modest gains for most of the session.

News that the German and French economies both exceeded expectations by posting second quarter growth of 0.3% brought about broad-based buying overseas and propped up U.S. stocks ahead of the opening bell. However, the positive bias was dialed down following news that the latest round of initial jobless claims were greater than expected at 558,000. That hiked the 4-week moving average up to 565,000 from 556,500. Meanwhile, continuing claims made a larger-than-expected retreat to 6.20 million, but the drop is most likely from unemployed workers losing their benefits.

Total retail sales for July made an unexpected 0.1% decline and sales less autos fell a sharper-than-expected 0.6%. That, combined with elevated jobless claims totals, pressured shares of retailers. However, Wal-Mart's (WMT 51.88, +1.37) better-than-expected earnings and solid outlook provided support to the group and helped it finish 0.3% higher.

With consumers still hesitant to open purse strings, demand for imports remains soft. With that, July import prices fell for their first time since January by declining a steeper-than-expected 0.7% month-over-month. Despite the persistently weak state of things, stocks were able to close near their best levels of the session.

Materials stocks made the best gains, helping the sector advance 2.1%. Steel (+3.0%) and diversified metals and miners players (+4.8%) were underpinned the sector's strength.

Financials were key in the broader market's strong close. The sector tacked on 2.0% amid buying in Bank of America (BAC 17.00, +1.07), which benefited from news that insiders are accumulating positions in the stock and that Paulson & Co. disclosed new positions in the stock. Shares of BAC were among the most active by trading volume this session, though trading volume in the broader market was exceptionally low with fewer than 1 billion shares trading hands on the NYSE.

Defensive-oriented sectors trailed for the entire session. Telecom and utilities both settled 0.2% lower, while health care advanced just 0.1%. Collective weakness among defensive issues actually dragged the broader market into the red in the early going, but buyers quickly stepped in to provide support.

Treasuries made strong gains following a $15 billion auction of 30-year Treasury Bonds. The auction produced a high yield of 4.54% and a bid-to-cover ratio of 2.54, which was above the average of 2.32 for the previous five auctions for 2009. That encouraged enough buying to send the benchmark 10-year Note up nearly one full point and the Note's yield back below 3.6%.DJ30 +36.58 NASDAQ +10.63 NQ100 +0.6% R2K +0.5% SP400 +0.8% SP500 +6.92 NASDAQ Adv/Vol/Dec 1495/2.11 bln/1209 NYSE Adv/Vol/Dec 1999/896 mln/1043

3:35 pm : Materials and financials are leading the broader market this session; they are up 1.9% and 1.7%, respectively.

Precious metals netted gains this session as the dollar moved lower. Both gold and silver futures opened the pit trade higher after the dollar had already made a move to the downside. December gold came off its session highs late in the session to close at $956.50 per ounce, up 0.4%. September silver finished strong, off session lows of $14.82 per ounce, to close at $14.99 per ounce, up 2.7%.

Natural gas futures prices spiked into positive territory and set a fresh session high following a slightly lower-than-expected build in inventories reported this morning. However, these gains were short-lived as the futures sold off for the rest of the session. September natural gas futures closed at $3.33 per contract, down 4.3%, just off session lows.

Meanwhile, September crude oil futures traded in positive territory for almost the entire session and closed up 0.7% at $70.65 per barrel.DJ30 +20.33 NASDAQ +6.42 SP500 +4.71 NASDAQ Adv/Vol/Dec 1354/1.75 bln/1281 NYSE Adv/Vol/Dec 1873/590 mln/1118

icon url

ReturntoSender

08/15/09 5:15 PM

#8649 RE: ReturntoSender #6755

Amateur Investors Weekend Stock Market Analysis (8/15/09)

http://www.amateur-investor.net/Weekend_Market_Analysis_Aug_15_09.htm

Right now we have two scenario's to watch for as we approach the end of Summer and move into the Fall. The first scenario is that the entire move up from the March low is just Wave A of a larger ABC corrective rally as the S&P 500 has encountered resistance at the 38.2% Retrace near 1014 calculated from the October 2007 high to the March 2009 low. If that is the case then look for Wave B to develop in the Fall with support coming above the 869 level. Once Wave B ends then we would see one more significant move higher for Wave C with resistance possibly coming in around 1120 which is the 50% Retrace and along the longer term downward sloping trend line (black line).


Meanwhile the second scenario is that Wave C is in play as Waves A and B have already occurred. Since Wave B was a rather shallow pullback then Wave C would probably end up being shorter in length than Wave A with a possibly target price in the 1040 to 1050 area. If this is the case then the July low of 869 will be a key level to watch in the longer term.


At this point nobody really knows which one of these scenario's may eventually play out in the longer term however I would watch the US Dollar in the coming weeks. As we have seen in the past the USD and the S&P 500 have been trending in opposite directions. When the USD has been weak (points A to B) the S&P 500 has rallied (points C to D) and when the USD has been strong (points B to A) the S&P 500 has sold off (points D to C). Thus if this trend continues a weakening US Dollar would likely help the stock market rise in the future while a strengthening US Dollar would probably hurt the stock market .


In 2008 our ETF Strategies worked the best with which had a return of +33% versus the S&P 500 which was down -38.5% for the year.

Meanwhile our 401K Strategy finished up +17.3% for the year.

Signup for a "Free 4 Week Trial Membership" or save up to 50% on a Premium Membership and you will have access to these Investment Products which include the following:

1. "ETF Daily Buy and Short Signals" which can be used to trade the DIA's, QQQQ's, SPY's and OIH's. Our ETF Strategy returned 33% in 2008.

2. "401K/Thrift Savings Plan (TSP) Timing Service" which can be used to help improve your return in your 401k/TSP Account which was up +17.3% in 2008.

3. The "End of Month Strategy" finished up +36.3% in 2008. This Strategy focuses on the typical End of Month markup by the Institutional Money.

4. "Stocks to Buy List" which can be used with either our Short Term Strategy or Long Term Strategy. In 2008 our Long Term Strategy finished even for the year versus the S&P 500 which was down -38.5%.
icon url

ReturntoSender

08/16/09 12:28 PM

#8651 RE: ReturntoSender #6755

InvestmentHouse Weekend Market Summary 8/14/09

http://www.investmenthouse.com/weekendmarketsummary.htm

- Stocks close the week lower, the first in 4 weeks.
- Michigan sentiment rattles investors.
- Sellers have a chance to take the indices out of their range, but stocks bounce back from lows.
- CPI shows no inflation for now as production and capacity post nice surprises.
- Philly Fed sees growth. Some signs of real recovery . . . maybe.
- Leaning to the downside but the market is still in its range and ignoring calls for selling.

Lower close but sellers not able to close the deal.

The market sold off on Friday. It closed down for the week for the first time in four weeks. This renewed the speculation as to whether or not the market has topped near term. All week long I have been talking about the market moving laterally and that there are indications that it might be at the near term peak. On Monday I discussed the VIX and how it set up similarly to the way it was before the crash last fall. I also discussed the put options on the SP500 and how they are at the same level they were at before the crash, and then again in June when the market sold off.

There are concerns that the market is going to pull back down, but then again it does not do that. It was down on Friday and it closed lower, but it also held the range that it has been moving in for the past two weeks. That does not mean it will do that without selling off further. In June the market, particularly the SP500, moved laterally in a tight range for two weeks just as it is doing now, and then it sold down, found bottom, and rallied up at that big 15% move in July. That shows that even though things look good right now, it might not be that way next week; that is the life in the market. You play the probabilities, you look at what could happen, you weigh the probabilities on the scale and see what comes out. You skew your actions toward that, but also have to realize that the market often does the exact opposite thing that people anticipate. Despite a lot of talk about this market having peaked right now, there is a very good chance that it might continue to consolidate and continue higher, which is why I am looking both at upside and downside plays. If it shows opportunity, then we will take a little here and there, and when the market makes its break we will go more heavily in that direction and close out the others. The beauty of it is that you are in a good risk/reward position either way. The upside stocks are in very good position as they have pulled back into near support, while the downside has bounced up against resistance. If they fall they will be in a good risk/reward position as well. If it moves against us, we have a very clear and near stop level that we will use to close our positions, and then we will let the other positions that are working in sync with the market run to maximize our gain.

Friday saw a soggy market, no doubt. The interesting thing was that, even though it was down on the day with NASDAQ losing over 1% and the Dow and SP500 losing about 0.8% each, both NASDAQ and SP500 managed to hold the bottom of their recent range (that is 992 on SP500 and 1962 on NASDAQ). That is very positive because the market continues to show buyers at that level. On Thursday, I said it would be very likely that, after this rally up to the top of the range, that those two indices and the market in general would come back and test the bottom of the range. They are doing that. They did not get all the way down to the bottom of the range on Friday, and we may see them come down more on Monday - this will be more of the acid test as to whether or not the indices are going to hold up inside of this trading range.

Friday was another of those days where the market had every reason to sell. Even though it did sell somewhat, it did not sell off and the sellers could not push the market down and hold it down for the entire session. The market started a bit soft, sold very rapidly in the first half hour, and then held in a lateral move for 5 1/2 hours. It bounced higher again in the last hour and cut the losses more than in half on some of the indices. Once again, the sellers could not close the deal entirely. They could not take the market below its recent range lows and could not even keep most of the losses on the day. There was a bid coming in at the end of the day which may be due to it being Friday. There was some covering going on because a lot of traders do not like to stay in the market over the weekend, but nonetheless, it did bounce back.

The market showed weakness on Friday because that initial selloff was severe and sharp. It was already at the top of its range and due for somewhat of a pullback, and there is no real catalyst to send it higher right now. We have seen earnings and the economic data - some has been better than thought and others worse than thought. There is nothing to drive it through that range at the moment, so some sideways range trading makes a lot of sense from a historians view looking at the market. There was also a push downside from the Michigan Sentiment number. It was much worse than expected coming in at 63.2 versus the 69.0 expected and the 66.0 in July. This is a preliminary reading of this number and it only covers 200 people, so you cannot put a lot of significance in it. The market, however, without any catalyst to push it either way, took it the wrong way and it went lower as a result.

There was also better economic news out before the market. The CPI was out and it was basically flat. It is showing no inflation at all so there is no concern about that at this point, but I feel it is baked in the cake given all of this rather wild spending on the fiscal side and very easy money and Fed's facilities on the monetary side of the ledger.

There was also information out with respect to industrial production and capacity. They were much better than expected, and that had people scratching their heads. You cannot dismiss those numbers, but a lot the same time they were so much stronger that it looked as if it was an anomaly. You can never pin your hopes on one data point on one month; we will have to see what happens over the next few months to see if there is a trend developing. What we saw on Friday was positive. What was interesting about this was that the sellers took their shot once more. The sellers have been in the market the last three weeks, and they stalled out this rally in July. After 15% you would expect some profit taking to come in, and the sellers have been coming in a couple of times a day. On Friday it was just once early on, and then they backed off. They pushed it down but were not able to close it down. The important point is that the sellers are here and taking their shots, so know they will try to push the market done below this consolidation range which is going to be one of the keys moving ahead of next week.

TECHNICAL

INTERNALS.

Breadth was pretty negative. It closed at -3.5:1 on NASDAQ and -2.5:1 on the NYSE. That was much better than it was intraday when we saw levels of -5:1. There was very negative trade across the entire market spectrum. In other words, every sector was getting hit - all the leaders and laggards were being taken out because they had had a good run and there was some worry about the economy (that was the reason du jour for the selloff according to the financial stations).

Volume on NASDAQ was down at 1.8B shares; there was no distribution and no nothing going on with NASDAQ. NYSE rose to $1.17B shares. On Thursday it did not even reach $1B shares, so while it was down 30% on Thursday, it was up 29% on Friday. So you might think that gives you some distribution, but that is not necessarily true. The market sold off, and did not really test the bottom of the range (though it came close). Then the market bounced back up, taking back more than half of what it lost. If you have a little rising volume, that does not necessarily show distribution, it just shows that some sellers came back in and pushed it back up. It is not necessarily a bad thing to have a rebound on some better volume.

On the NYSE, you have had three days of gains on rising volume versus just one day of losses on rising volume. You have three accumulation days to one distribution day, and that is not bad at all. That shows that, net, there is accumulation on the NYSE during this lateral consolidation. That is very positive. On the NASDAQ it is 3:2, so you have three up days on rising volume versus two down days on rising volume. That is not as clear cut as on the NYSE and NASDAQ has struggled quite a bit because it was one of the early leaders. The chips struggled and some of the big cap techs struggled as well during this consolidation. Nonetheless, a simple majority wins this game, and thus far NASDAQ is showing positive accumulation in this lateral consolidation. Put the two together, and that is a pretty good indication that things are not falling off of a cliff, although it still does not mean we will not get more of a pullback.

CHARTS.

The indices are holding their lateral range and doing so nicely. It was going down more than you would anticipate in one day, but they held above those lows and bounced back up. They are holding that range but could still easily sell down further as it did in June. Just because it is moving laterally is no guarantee it will stay that way. The key will be whether or not SP500 breaks the 992 level - if it closes below that, say it goes down to 989 - 988 and closes, then you are looking at pretty much a trade likely down to 950 (the June peak).

You have to watch these technical indications. A lot of times it looks like a stock breaks down or breaks out only to then reverse and sell off sharply or reverse and rally sharply. That last little breakdown shakes out the rest of the sellers, and it can be on high volume. It look like you have a clean break, but then you have a reversal and are left holding the bag and hating life. One of the things that you need to avoid or limit - unless you have a great pattern and great other indicators behind it - is playing that first move. Whether it breaks higher and comes back to test or breaks down and comes back up to kiss that resistance level, you should let it make that test and see if it can break back through or not. If it can, then you have a great signal to the upside or downside because it has held and will continue to move. If it does not and it falls back down, you have a great signal as well, but just in the other direction. While we may see it break these levels, which will get a lot of people excited, we are not going to go flying into the tempest right off the bat. 95% of the time it pays to be patient in the market. Let them set up and take the easier money instead of trying to guess. I will be watching these key areas, but an initial break does not mean it is going there. We will have to see how it tests. If it breaks below 950, then you have a test down to 900-905 because that is where it gapped up to start this move. That is a pretty big selloff that takes back everything it has gained, and we will have to see how it plays out. Those are all contingencies however, and we are not even out of the bottom of the range yet.

For NASDAQ, the key is the 1962 level. If it breaks that, holds, stays down, and then comes up and tests, you are looking at 1860 (its June peak). If that breaks, it will get ugly because then you are looking down at the 1765-1745 range. That is getting to more of a serious correction. I have been concerned all along that the economic data did not support a continued market rally because it is just a comeback from the essential shutdown of the economy back in the fall of 2008.

LEADERSHIP.

Friday everything pulled back, and you will see these pullbacks with that kind of negative breadth in the market. All of the stocks that did well were actually down. One of the reasons for this was that the dollar improved nicely on Friday. It closed at 1.4192 Euros, from 1.4284 the prior session. That put a lot of pressure on commodities and oil, which closed at $67.56, down $2.96. Oil rallied up to its peak again in the top of its range and is selling off again. Some are saying this is a double top. It could be, but it may very well just be more of trade inside its range. I think that is the situation.

Bond yields were down. Investors moved toward bond as they often do when the market is sold. The 2 year closed at 1.07% and the 10 year closed at 3.57%. It was up at 3.75% just a couple of days ago, which shows you that the bond market can be as volatile as the stock market.

Because the dollar was so strong, you saw many of the commodities and metals trade down. Energy stocks were down also. Everything went down across the board including the leaders and industrials, big tech, and chips. Semiconductors were up over 2% on Thursday, but they were down over 2% on Friday. There is some volatility there, and that is a sign of potential change. Overall, the leaders are all maintaining their uptrends, and they have recent consolidations and are setting up nicely in those as well. Sure there is day-to-day bouncing up and down - some days look worse than others. In the bigger picture, however, they are holding their trends and patterns and we have great leadership that is still in good shape. That is another reason that even though there are calls for a market top, you still have to take it with a grain of salt with leadership in such a good position. That does not mean they will hold up as well. As we saw in June, the leaders were in good shape, though we did have the semiconductors lagging at that point which they are not doing now. Watch for good plays that set up, and as long as the leaders are holding their patterns, we see the potential for the market to rise again. Of course, that is a positive when you couple that with the fact that the indices are also maintaining their uptrends quite nicely.

THE ECONOMY

CPI shows no inflation for now.

The CPI showed no inflation in the picture for right now; it was flat again and that was what was expected. That was a nice reprieve from the 0.7% gain in June. The core was up 0.1% and that was expected, down from 0.2% in June.

The particulars are always interesting to look at. Cars were up 0.5%. Used car values have shot through the roof. Gasoline was down 0.8%. Apparel was up 0.6% and housing down 0.2%. Computers were down 3.2%, food was down 0.2%. Education was up 0.5% (it seems like you cannot get away from rising education costs). Inflation near term is under control. There is concern about inflation down the road, and that is one of the reasons we continue to see a bid in commodities and those things that, if they fall and hit the ground, make a lot of noise.

Same Store Sales provide better guidance, but that is already factored in.

More same store sales came out on Friday, and they were quite good overall. Abercrombie and Fitch sales were down 30%, but it had good guidance. JCPenney and Nordstom both increased their guidance as well, and they all sold off because they already announced that things are getting better. After the surprise in the earnings season that caught analysts flat-footed, they have all raised their estimates, and it is not that surprising when these retailers come out and say things are not as bad as they thought. Not to beat a dead horse, but this fits into the entire theme that things are not really expanding, they are just recovering from a standstill in the fall of 2008 when the market and the rest of the economy when into a panic.

Capacity and industrial production show signs of real improvement.

Industrial production topped expectations at 0.5%, which was much better than the -0.4% in June. Capacity rose to 68.5 from 68.1, revised higher from 68.0. We love to see upward revisions because it shows that the analysts may be wrong - they are still too negative - and momentum is changing. These are significant gains. It is hard to ignore them, but then again they are one data point. How to you reconcile that? You say this was a strong month. It will either be an anomaly or we will see an improvement over the next few months, and that will be the proof in the pudding. The interesting thing is it is going to dovetail with the lower wholesale inventories and lower business inventories. If you see capacity and production picking up, that is a good indication that we will see the inventories pick up and the GDP rise accordingly, since inventories add to GDP. We are not there yet since in the last couple of days inventories were down over 1% in both categories. The GDP is still struggling in that respect, but we will get a build at some point in our inventories because they are doing to get sold out and will have to replenish.

Philly Fed sees some growth ahead even with weaker employment.

The Philly Fed comes out every once in awhile and hits the market with a forecast of the future. It sees better growth ahead. From its region, things are looking better from a manufacturing point of view. Unemployment is going to be the pits; it says it will keep going up, but it thinks manufacturing is trying to turn. That is interesting because I talked on Thursday about how unemployment will peak just as the economy hits bottom and makes its turn. The Philly Fed's observations of what it is seeing in its district are rather interesting because, once more, we see some data dovetailing with historical actions in the direction of recovery.

Some real signs of improvement.

We have looked at the economy again and we know that we only essentially have a recovery right now from a panic, but there are some tantalizing indications of improvement. These are not the green shoots that everyone has been talking about, but these are real areas of improvement, and that is why I am interested and not as dismissive as I was one or two months back. I will keep watching these and see if there is a change. The reason that I am getting more excited is that I am seeing them dovetail with historical norms when there has been a recovery. The other stuff is nonsense, but these are showing some signs of positives and signs of hope.

THE MARKET

MARKET SENTIMENT

VIX: 24.27; -0.44
VXN: 25.24; +0.15
VXO: 23.99; +0.19

Put/Call Ratio (CBOE): 0.95; +0.17

Bulls versus Bears:

This is a reading of the number of bullish investment advisors versus bearish advisors. The reason you look at this is that it gives you an idea of how bullish investors are. If they are too bullish then everyone is in the market and it is heading for a top: if everyone wants to be in the market then all the money is in and there is no more new cash to drive it higher. On the other side of the spectrum if there are a lot of bears then there is a lot of cash on the sideline, and as the market rallies it drags that cash in as the bears give in. That cash provides the market the fuel to move higher. If bears are low it is the same as a lot of bulls: everyone is in and the market doesn't have the cash to drive it higher.

Bulls: 49.4% versus 42.2% and 36.7% the week before that. Bulls are leaping higher, moving well past the 35% level considered the threshold for bullish or bearish action. Hit a high of 47.7% mid-June on the run from the March lows, and now it has surpassed that level. This is an additional indication that the market is getting overbought and in need of a correction or consolidation. To be seriously bearish it needs to get up to the 60% to 65% level. Dramatic rise from 21.3% in November 2008, the bottom on this leg. This last leg down showed us the largest single week drop we have ever seen, falling from 33.7% to 25.3%. Hit 40.7% on the high during the rally off the July 2008 lows. 30.9% was the March low. In March the indicator did its job with the dive below 35% and the crossover with the bears. A move into the lower 40's is a decline of significance. A move to 35% is a bullish indicator.

Bears: 21.3% versus 31.1% and 35.6% the prior week. Continuing the massive exodus from the ranks of bears. For reference, cracking above the 35% threshold considered bullish. Hit a high on this run at 47.2%. For reference, bearishness hit a 5 year high at 54.4% the last week of October 2008. The move over 50 took bearish sentiment to its highest level since 1995. Extreme negative sentiment. Prior levels for comparison: Bearishness peaked at 37.4% in September 2007. It topped the June 2006 peak (36%) on that run. That June peak eclipsed the March 2006 high (33%) and well above the 2005 highs that spawned new rallies (30% in May 2005, 29.2% in October 2005). That was a huge turn, unlike any seen in recent history.

NASDAQ

Stats: -23.83 points (-1.19%) to close at 1985.52
Volume: 1.876B (-7.64%)

Up Volume: 450.071M (-1.062B)
Down Volume: 1.455B (+870.814M)

A/D and Hi/Lo: Decliners led 3.5 to 1
Previous Session: Advancers led 1.23 to 1

New Highs: 22 (-43)
New Lows: 1 (-6)

NASDAQ CHART: Click to view the chart

NASDAQ 100 CHART: Click to view the chart

SOX CHART: Click to view the chart

SP500/NYSE

Stats: -8.64 points (-0.85%) to close at 1004.09
NYSE Volume: 1.177B (+28.9%)

Up Volume: 223.791M (-353.88M)
Down Volume: 853.229M (+658.233M)

A/D and Hi/Lo: Decliners led 2.47 to 1
Previous Session: Advancers led 2.01 to 1

New Highs: 63 (-29)
New Lows: 41 (-2)

SP500 CHART: Click to view the chart

SP600 Chart: Click to view the chart

DJ30

Stats: -23.83 points (-1.19%) to close at 1985.52
Volume: 172M shares Friday versus 93.6M shares Thursday.

DJ30 CHART: Click to view the chart

MONDAY

We have the indices in a narrow range. We have been here before - not so long ago, in June - and the market was not able to hold up and it sold off. Was there a major roll over and a crash down to the March lows? Absolutely not. The chips sold, the techs sold, the commodity trade sold, all of the BRIC trades (China and Brazil related) sold off, but they did not collapse and they came back.

So what do we do now? We are right in the middle of a range. We have some upside and some downside plays in place, and we anticipate taking some money on either side depending on which way the market goes. We did not do much on Friday. We did not close many positions and only bought one downside position. We have plenty of upside exposure, and I wanted to have more exposure to the downside just in case. The reason I did not want to go hog wild is because the market held its range and it bounced back. Some of the plays we could have gotten into but, like on some of the downside plays where we wanted to buy puts, the spread was too wide. Even though it was a good technical position to get in, the option spreads did not narrow as I wanted them to, so I did not want to get into them because that would ruin our risk/reward position. We simply had to take a pass in stocks such as PFWD. It is a great downside move, but with the option spread so wide, we would not get the kind of gain that would make this a good risk/reward play.

As is usual on Friday, we did not do a whole lot, but that does not mean that will be the case on Monday. What we are going to be watching is how the market responds inside of this range. It is time to be patient. We have great upside positions and some great downside positions ready to move, and we also have some waiting in the wings that we can move into if the market makes a break.

What are the odds of the market making a definitive move next week? It could definitely break upside or downside, and frankly I am leaning toward the downside at this point. We saw what happened in June, so even though things still look good now, I still do not see a catalyst at this point to send it higher. Next week we are going to have a couple of regional PMI reports, there will be housing starts and there will be other data along those lines. Earnings are mostly over and we kind of know what the economic data is right now, so there is not going to be a lot of catalysts to move it higher. Based on that, I am leaning toward the downside for the market to move next, but as long as the indices and the leaders hold their trends, I am not going to say that I am smarter than the market. We have a lot of gain build into a lot of positions, and we have the stocks in place and will let them take us out. On the close Friday, a lot of the stocks that had sold down during the day bounced and cleared up above their stock points, so we did stop out of them. We will be watching because even if it breaks sharply lower, it may come back up and test and continue higher. Or it may not; we will be minding our stops. We do not want to get caught out in this thing if it turns down sharply.

We can always get back in, which is something that I say all the time. It is always easier to get back in the market if you are coming back in with a nice wad of profit behind you that you made on the last run. Now is a time to be patient. The market is moving laterally. It made a strong run. It takes time to change a trend up or down, so it is moving laterally. The bulls and bears, buyers and sellers, are fighting it out right now to see which way they will push the market. We are going to sit back and take good shots when the opportunity presents itself and we have a good risk/reward point where we can enter. We like to stack the deck in our favor, and one of those things is having a great stock in great position and in good risk/reward. We can come out smelling great whether or not we win all of our trades are not, and the ones we win we will make a bunch of money on.

While I am leaning to the downside, as soon as you commit to one way, the market will slap you in the face. Remember it has not committed yet. Everyone thinks that just because it stopped moving up it is going to move down, but that is not the case. What we will do is let the market show us the break, be patient, move in after it tests or at least move in significantly. We will always take positions on a break, but we will not load the boat. Let them come back and test and see which way that test holds, and that is when you really load the boat.

I hope you have fun whenever you are this weekend. We have had a great run in the market and have made a lot of money on this, so take some out and enjoy life with it. Do the things you want to do and that you know you need to do. Have a great weekend.

Support and Resistance

NASDAQ: Closed at 1985.52
Resistance:
2010 from the Thursday peak
2015 is turning out to be near term resistance
2099 is the mid-September low
2169 is the March 2008 double bottom low

Support:
1984 from late September
The 18 day EMA at 1967
1962 is the bottom of the August 2009 range.
1947 is the October gap down point
1897 is the October post gap intraday high.
The 50 day EMA at 1888
1880 is the June peak
1862 is the July peak
1786 is the November intraday high
1780 is the November 2008 closing peak
1773 is the May intraday peak
1770 is the mid-October interim peak
1673 is the prior April peak
1666 is the intraday January 2009 peak
1664 is the May 2008 low
1661 is the April 2009 prior peak
The January closing peak at 1653 (intraday)
The 200 day SMA at 1643

S&P 500: Closed at 1004.09
Resistance:
The August intraday peak at 1018
1050
1106 is the September 2008 low

Support:
The November 2008 peak at 1006
The 10 day EMA at 1000
The 18 day EMA at 988
962 is the August 2009 consolidation low
956 is the June intraday peak
The 50 day EMA at 952
944 is the January 2009 high
935 is the January closing high
932 is the July peak
930 is the May peak
919 is the early December peak is bending
899 is the early October closing low
896 is the late November 2008 peak
888.70 is the April intraday high.
882 is the early May low
878 is the late January 2009 peak
The prior April peak at 876
The 200 day SMA at 875
866 is the second October 2008 low
857 is the December consolidation low

Dow: Closed at 9321.40
Resistance:
9387 is the mid-October peak
9625 is the October closing high
10,365 is the late September low

Support:
The 10 day EMA at 9285
The 18 day EMA at 9173
9088 is the January 2009 peak
8985 is the closing low in the mid-2003 consolidation
8934 is the December closing high
8878 is the June peak
8829 is the late November 2008 peak
The 50 day EMA at 8844
8626 from December 2002
8588 is the May high
8581 is the July peak
8521 is an interim high in March 2003 after the March 2003 low
8451 is the early October closing low
8419 is the late December closing low in that consolidation
8375 is the late January 2009 interim peak
8315 is the February 2009 peak
The 200 day SMA at 8312
8307 is the April 2009 intraday high
8221 is the May 2008 low

Economic Calendar

These are consensus expectations. Our expectations will vary and are discussed in the 'Economy' section.

August 17 - Monday
- Empire Manufacturing, August (08:30): 2.20 expected, -0.55 prior
- Net Long-Term TIC Fl, June (09:00): $17.5B expected, -$19.8B prior

August 18 - Tuesday
- Building Permits, July (08:30): 576K expected, 570K prior
- Core PPI, July (08:30): 0.1% expected, 0.5% prior
- Housing Starts, July (08:30): 598K expected, 582K prior
- PPI, July (08:30): -0.2% expected, 1.8% prior

August 19 - Wednesday
- Crude Inventories, 08/14 (10:30): +2.52M prior

August 20 - Thursday
- Initial Claims, 08/15 (08:30): 553K expected, 558K prior
- Leading Indicators, July (10:00): 0.6% expected, 0.7% prior
- Philadelphia Fed, August (10:00): -2.0 expected, -7.5 prior

August 21 - Friday
- Existing Home Sales, July (10:00): 5.00M expected, 4.89M prior
icon url

ReturntoSender

08/19/09 9:37 PM

#8654 RE: ReturntoSender #6755

From Briefing.com: 4:20 pm : Stocks started the session in the red as participants reacted negatively to further selling pressure overseas, but a jump in oil prices helped the energy sector lead a turnaround that took the broader market to a solid gain above near-term resistance levels. Participation remains unimpressive, though.

The dour mood among global participants left investors unimpressed with better-than-expected earnings from Deere (DE 43.73, -1.36) and Dow component Hewlett-Packard (HPQ 43.83, -0.13) and, instead, focused on Deere's pessimistic outlook and Hewlett-Packard's reaffirmed guidance. While shares of HPQ pared losses, DE spent the entire session markedly lower, which weighed on the industrial sector and left it to finish fractionally lower.

Financials also finished fractionally lower and made up the only other major sector to settle in negative ground.

Comments from renowned investor Warren Buffett in a New York Times article offered a reminder that the U.S. economy is on a slow path to recovery. With that in mind, the mood on trading floors started to change as chatter began to circulate that a second fiscal stimulus plan could be possible, but that was downplayed when a White House spokesman said in a Bloomberg.com article that there is no imminent economic announcement.

However, market participants jumped into the energy sector following news that weekly oil inventories showed a draw of roughly 8.40 million barrels in the face of calls for an inventory build. Oil prices had been down in early pit trade, but settled 4.7% higher at $72.42 per barrel. Energy stocks were able to recover from a loss of roughly 1% to finish with a 1.9% gain, better than any other major sector.

The run up in oil prices helped provide leadership to other commodities, which gave the CRB Commodity Index 1.5% gain -- its best performance in two weeks.

The improved tone among participants helped stocks build on the previous session's gain. In turn, stocks are down less than 1% week-to-date after Monday's 2.4% drop, which marked the stock market's worst single-session percentage loss in six weeks. The back-to-back gains have also taken stocks above near-term resistance levels, which stood just above 990.

Trading volume was exceptionally low again, however. For the second straight session fewer than 1 billion shares exchanged hands on the NYSE, suggesting that there hasn't been much conviction behind the recent moves.DJ30 +61.22 NASDAQ +13.32 NQ100 +0.6% R2K +0.9% SP400 +0.7% SP500 +6.79 NASDAQ Adv/Vol/Dec 1683/1.98 bln/928 NYSE Adv/Vol/Dec 1848/988 mln/1141

4:13PM Network Appliance beats by $0.02, beats on revs; sees 2Q10 non-GAAP gross margin of 62.5-63.0% vs the 61.0% consensus (NTAP) 22.89 +0.04 : Reports Q1 (Jul) earnings of $0.22 per share, excluding non-recurring items, $0.02 better than the First Call consensus of $0.20; revenues fell 3.5% year/year to $838 mln vs the $828.3 mln consensus. Co sees Q2 non-GAAP gross margins to be between 62.5-63.0% vs the 61% consensus. "Given the economic backdrop, NetApp performed well in the first quarter. With year over year revenue growth roughly flat on a constant currency basis, our revenue performance clearly outpaced the storage industry at large. Our operating income and operating margin both increased year over year, and we produced our highest gross margin percentage in over five years."

09:57 am Analog Devices (ADI)

Analog Devices (ADI 26.94, -0.28) reported fiscal third quarter earnings that beat the consensus estimate and provided upside earnings guidance for its fiscal fourth quarter.

Analog Devices reported fiscal third quarter earnings of $0.22 per share, excluding nonrecurring items, $0.02 better than the First Call consensus of $0.20.

Revenues fell 25.3% year-over-year to $492 million but managed to top the $479.6 million consensus.

"There are near-term indications that business conditions are improving," said CEO Jerald G. Fishman. "Order rates strengthened throughout the third quarter and have remained strong during the first two weeks of August. Our book-to-bill ratio for the third quarter, as measured by end customer bookings, was above one, and our fourth quarter opening backlog was up from last quarter."

The improved business conditions prompted Analog Devices to issue upside guidance for its fiscal fourth quarter. The company expects Q4 earnings of $0.24 to $0.26 per share on revenues of $510 million to $530 million. The consensus expects earnings of $0.24 per share on revenue of $498.3 million.

08:44 am Hewlett-Packard (HPQ)

Hewlett-Packard (HPQ 43.96) reported fiscal third quarter earnings that topped expectations and said it expects fourth quarter earnings to come in ahead of current estimates as the company's business begins to stabilize.

Hewlett-Packard reported fiscal third quarter earnings of $0.91 per share, $0.01 better than the First Call consensus of $0.90. Non-GAAP operating profit of $3.0 billion excludes $568 million of adjustments on an after-tax basis, or $0.24 per diluted share, related primarily to amortization of purchased intangible assets, restructuring charges and acquisition-related charges.

Revenues fell 2.1% year-over-year to $27.45 billion, in-line with the $27.25 billion consensus. Revenue grew 8% in the Americas but declined 12% in Europe, the Middle East and Africa and dipped 4% in Asia Pacific. Revenue from outside the U.S. accounted for 62% of HP's total revenue.

HP issued upside earnings guidance for the current quarter, saying it expects fiscal fourth quarter earnings of $1.12 per share; the consensus currently stands at $1.07. HP said Q4 revenues will be up 8% sequentially, which equates to revenue of $29.6 billion; the consensus stands at $29.82 billion.

"Business is stabilizing, and we are confident that HP will be an early beneficiary of an economic turnaround and will continue to outperform when conditions improve," said CEO Mark Hurd.

The Palo Alto, Calif.-based company reaffirmed its guidance for 2009, saying it expects revenues and earnings to be at the midpoint of its prior range. HP previously said it expects full year earnings to range from $3.76 to $3.88 per share and for revenue to decline 4-5%, which equates to $112.4 billion to $113.6 billion. The current consensus estimate is for earnings of $3.75 per share on revenue of $113.2 billion.

Shares of HPQ are 21% higher year-to-date but are in negative territory ahead of Wednesday's opening bell.
icon url

ReturntoSender

08/23/09 5:43 PM

#8656 RE: ReturntoSender #6755

Amateur Investors Weekend Market Analysis (8/22/09)

http://www.amateur-investor.net/Weekend_Market_Analysis_Aug_22_09.htm

As I mentioned last weekend the market is being driven by the US Dollar (USD). For the last several years there has basically been an inverse relationship between the USD and the major averages such that weakness in the USD (points A to B) has been followed by strength in the major averages (points C to D) while strength in the USD (points B to A) has been followed by weakness in the major averages (points D to C). This inverse relationship has continued in 2009 as the USD peaked in March as the S&P 500 made a bottom which has been followed by a 54% rally in the S&P 500 during the past 6 months.


In addition even on a shorter timeframe over the past month you can see the same inverse relationship between the USD (blue line) and S&P 500 (purple line).


The bigger question is will the USD continue to fall or is it nearing a potential bottom? As I have pointed out before there was a clear 5 Wave move down from the peak in the Summer of 2001 to the bottom in early 2008 and the rally from early 2008 through early 2009 could be defined as Wave A of a corrective ABC type rally. The latest move down could be Wave B which has retraced 61.8% from the March peak. If we are seeing an ABC type pattern developing then Wave C should develop this Fall which could eventually see the USD rally back into the 90's at some point in 2010. Thus if the inverse relationship between the USD and the major averages would continue in the future then a substantial rise in the USD would likely have an adverse impact on the major averages in the longer term.

Meanwhile the alternative scenario is that the USD continues to get sold off through the end of the year with an eventually retest of the early 2008 low which was in the lower 70's. If that were to occur then that would likely have a positive affect on the major averages through the end of the year.


Meanwhile another thing to watch is the price of Crude Oil. Looking at a chart of Crude Oil it appears to be developing a longer term Head and Shoulders Top pattern. If the price of Crude Oil rallies back to the upper 70s that would be a 38.2% Retrace from the peak near 150 to the bottom which was in the mid 30's and would allow for the development of the 2nd Shoulder.


Also keep in mind there has been an inverse relationship between the price of Crude Oil and the US Dollar (USD) in the past as well. When Crude Oil has rallied (points E to F) the USD has fallen (points G to H) and when the price of Crude Oil has fallen (points F to E) the USD has risen (points H to G). Thus if the Head and Shoulders Top pattern were to pan out with an eventual drop in the price of Crude Oil then that would likely lead to a rally in the USD.


In 2008 our ETF Strategies worked the best with which had a return of +33% versus the S&P 500 which was down -38.5% for the year.

Meanwhile our 401K Strategy finished up +17.3% for the year.

Signup for a "Free 4 Week Trial Membership" or save up to 50% on a Premium Membership and you will have access to these Investment Products which include the following:

1. "ETF Daily Buy and Short Signals" which can be used to trade the DIA's, QQQQ's, SPY's and OIH's. Our ETF Strategy returned 33% in 2008.

2. "401K/Thrift Savings Plan (TSP) Timing Service" which can be used to help improve your return in your 401k/TSP Account which was up +17.3% in 2008.

3. The "End of Month Strategy" finished up +36.3% in 2008. This Strategy focuses on the typical End of Month markup by the Institutional Money.

4. "Stocks to Buy List" which can be used with either our Short Term Strategy or Long Term Strategy. In 2008 our Long Term Strategy finished even for the year versus the S&P 500 which was down -38.5%.

Our Summer Membership Special for new Members is shown below
which are 50% Off our normal Monthly Rate of $39.95


icon url

ReturntoSender

08/23/09 5:50 PM

#8657 RE: ReturntoSender #6755

InvestmentHouse Weekend Market Summary 8/21/09

http://www.investmenthouse.com/weekendmarketsummary.htm

- Economic data provides a catalyst, expiration Friday skews some of the data.
- SP500, NASDAQ rise for fifth week in six, dispatch the August high for now.
- Liquidity continues to be the theme.
- Existing home sales make it four in a row but check the sales mix.
- Bernanke says economies leveling out but recovery hampered by credit.
- Europe manufacturing jumps to positive, takes the lead over US.
- Late Friday OMB says deficit to rise, not fall as Administration claimed Thursday.
- Stocks enter Monday with a stronger bargaining position.

Liquidity finds an opening Monday, trowels the money in to fill the dip.

The common theme in this market: have dip, will buy. 15% gain in July? So what? There was a dip on Monday and that means backup the cash truck and buy. All of that money printed by the world banks is not, as Bernanke once again confirmed Friday, is not, due to continuing credit issues, getting into the system. Thus it goes into the world financial markets. As seen in 1999 when the Fed flooded the US with Y2K money, when the cash is not used it goes into the market. Have dip, will buy.

Friday the buy on dips mentality was still in place though there was no dip. The futures were positive and stocks gapped higher at the open, then gapped again half an hour into the session as existing home sales data rose past expectations. Then there was the usual 4.5 hour flat line (usual for this week) followed by a rise into the last hour.

The action took SP500 past its August intraday peak as well as its November 2008 peak. NASDAQ and SP600 moved through the August highs as well, all notching new post-March highs. After the first down week in five last week, the market was back to notching weekly gains. We thought there might be more downside this week just to give the market a more normal consolidation, and thus we had the SPY puts to hedge for our upside. Didn't work out this week but after an upside expiration Friday, particularly with a breakout, a test often ensues to start the next week.

As for other markets, the dollar was off rather sharply thanks to some stronger European economic data (1.4340 versus 1.4223 Thursday). The dollar is once again quite weak, moving back toward its early August low. It is trying to work a lateral consolidation after the selloff into June and thus far it is holding over early August. That bounced oil up a bit further to 73.80, +0.89. A rather modest session for oil but the moves for the week were strong; so much for the double top that some predicted. If oil breaks $75 it is a short trip to 85. Gold was up; Bernanke spoke Friday and implied that credit would remain easy and that fueled some inflation concerns. That drove gold to 955.40, +13.70; knocking at $1,000 again and thus far that has been the barrier. Bond yields rose as investors continued to move away from treasuries after racing to them early in the week (1.09% 2 yr, 3.43% 10 yr). The 2 year is moving back up near the top of its range and we will see if it breaks on through this time. The short end is rising faster than the long end, but nothing right now that would indicate economic ramifications, i.e. no flattening to the extent of predicting economic slowing.

TECHNICAL

INTERNALS. Expiration Friday, and without any big moves midweek that are sometimes characteristic of expiration, Friday was set to show some big moves. Breadth jumped (2.8:1 NASDAQ, 4:1 NYSE); that did not really rival the Monday downside breadth but it was much stronger than the upside A/D line shown the prior up sessions. Does that mean much? It was expiration and a lot of positions were rolled out as the shorts were again squeezed since the market did not hold the downside. Thus you can't put a whole lot of stock in the move. Volume was strong as well, jumping above average on NYSE to 1.8B, rising 64% over Thursday. Impressive, but again driven by the same forces as breadth. Hard to draw a lot of concrete conclusions from it.

CHARTS. Thursday I detailed the concerns SP500 and NASDAQ approached the August peaks. Similar to June there was a small double top formed thanks to the Monday drop, and this third try at the level would be the lick log. Both SP500 and NASDAQ jumped over the log Friday, easily clearing that level with SP500 jumping the intraday August high as well. It still has 1044 to deal with, but one step at a time, right? It has been shooting down the resistance points one at a time and it is still at it. NASDAQ made a new post-March high as well though its pattern is not as convincing as SP500. NASDAQ sold harder and has rebounded sharply; maybe a V bottom here right at the top, but that is not the typical case. On the other hand it is getting a lot of help; SP600 jumped to a new post-March high as well, and Thursday I discussed the significance of the small caps hitting new highs and the better tidings that brings for the economy ahead.

Not all was candy and roses, however. SOX, an early leader in this rally, is lagging as it rebounds. A decent rebound no doubt off of the 50 day EMA and the June peak, but it has yet to take out the prior week's peak and still has the August high after that. That said, it is not that unusual for a leadership group to fall back some in a continuing rally as other sectors take the point. If SOX cannot make a new high as well, however, we will see what kind of drag that puts on the rest of the market.

LEADERSHIP. Energy was back in vogue the past week, particularly the last half, and it was leading Friday. With oil trying to breakout from the top of its range that is entirely within reason. With Europe and the US showing signs of manufacturing life (as discussed below), that only reinforce the gains. Further, it looks as if energy has further to go. For the same reason industrials were stronger, particularly on Friday; nothing like manufacturing improvement to send them higher. Transports are on a tear as well; the rails are running . . . on rails. After making a lot of money off of them in 2007 and early 2008 we did not catch this move. Some well placed kicks in the rear on that one. Truckers are not there yet, however, and they will be a key. The truckers have been in dire straits for three years now. Why are they not moving as are the railroads? Because rails deal with commodities, truckers with consumers. Commodities prices are being driven by Chinese hoarding, maybe some pickup in the rest of the world, and inflation. They are getting bought and sold and that means they are moved on rails. Now if truckers start showing life that, similar to the rise in the small caps, is a real economic positive. Software continues to improve as well, and some large cap techs are still moving higher. In short, there is still plenty of leadership, and after some old hands at the game such as energy pulled back they are moving up once more.

THE ECONOMY

It was a good week for the data with regional PMI's starting to swing positive, leading indicators putting in a fourth upside month, and existing home sales, 80% of the market, posting a strong surge. Those helped offset some weaker starts and rising weekly jobless claims, and indeed, that is a rather typical cycle: jobs lag the rest of the economy, and at 549K last week, we had better hope they are still lagging.

Existing home sales one part of a strong Friday data day.

Existing home sale rose 7% from June to July, and that was the largest gain in 2 years and marked the fourth straight month of gains. Finally some good news in the housing market.

Good news but look at the mix and you see what is driving the market. Most of the sales, over 30%, came from units priced at less than $100K. The next biggest segment was $100K to $200K. After that activity fell off rapidly. $250K to $500K was still down, and when you get to the higher prices it really tanked. $1M to $2M fell 23% while houses priced over $2M fell 32%. The $1M to $5M range was the fastest growing during the boom as many branched out into bigger homes and second houses in luxury resort areas. Those prices are really struggling as the second house market is very weak. Even primary dwellings in the high end are struggling. Hugh Hefner sold his house adjacent to the Playboy Mansion recently, but he got nowhere near his asking price; it went for $18M versus the $28M he wanted. Even Hugh had a hard time getting it up, price-wise at least.

The point: with the low priced units by far dominating the existing home sales market there are two conclusions. First, the first-time home buyers credit is the driving force right now. Prices are very low as most sales are still buys out of foreclosure properties. Lower prices combined with the first-time credit are motivating buyers, particularly as the credit is set to expire. That is moving them off the fence even though many still anticipate further housing price declines over the next few quarters. They buy now and risk some more downside versus losing out on the credit.

Second, the remainder of the housing market is still a long way from price recovery. Thousands upon thousands of new homes were built during the last boom to fill the desire for second luxury homes as well as big primary residences. Those are late cycle homes, very much discretionary versus early cycle need-based purchases (more of what we are seeing now). That means those markets are going to remain weak as long as the economic cycle is anemic. Thus we can see economic improvement, but without the kind of seriously strong economic growth that fuels new jobs and thus new big salaries, the high end of the market is going to languish. Not the very high end; the ultra-wealthy will have the means and thus that very tip end of the market will recover faster. It is the bulk of the higher end that will struggle. And that brings up point three: real estate agents are not getting rich off this market so don't go and try to tax them Congress.

Europe manufacturing jumps to positive as the US policies put us in the unusual position of playing catch up.

And we thought our regional PMI news was good. Both the NY and Philly PMI manufacturing reports turned positive in August. Well in Europe, the overall reports are already positive. The entire EU union rose to 50 in July. Germany, the largest economy in the union, surged 54.2%. All of the mixed data in the EU appears to be resolving to the upside.

Of course that sent the dollar crashing versus the euro, and the US ISM coming in a week will need to turn positive itself in order to avoid further degradation of our currency. It is an unusual situation of the US having to catch up with its European competition.

If there is anything that shows us the error of our fiscal ways, it is the fact that we are lagging Europe in a recovery. 2% GDP growth causes Europe to shut down for a month just to celebrate (as well as its central banks to raise rates to slow down the 'runaway' growth). 2% isn't even trend in the US.

What is clear: the stimulus passed has not unleashed the power of the US system. When the right stimulus is put in place our economy surges. In 2003 when the Bush administration finally got on track and passed supply side stimulus, almost to the day of passage the stock market took off (this was the second rally, the one after the initial surge off the lows in October 2002) and so did economic activity. Less than two quarters later GDP rose 7.3%. The stimulus thus far has helped employ some people in road work and the like, and it has sold some cars (at the expense of other items), but it is not generating that immediate surge of growth that gets things started as well as the following sustained growth as investment in business leads to new ideas, new companies, and ultimately new jobs.

Deficit: the Administration plays games with the numbers, but they keep rising.

Earlier last week the Administration lowered its deficit forecast to the $1.5T range. Why? Because it was not going to spend as much money on the bank bailout. It was going to withhold money it felt was no longer necessary. Less spending is always good and that was the reason for the reduction. No complaints about spending less money. Of course that doesn't mean the money won't be spent elsewhere (read healthcare), but as far as authorized spending, there would be less at least in one area.

Then on Friday, late Friday, the OMB came out with its updated deficit projections that take into account the reduced bank bailout spending. Even better right? You wish. The Deficit projection for 2009 was raised, not from $1.5T, but from $1.7T to $2T. The 10 year projection was raised from -$7T to -$9T. The reason: a slower than expected economy.

Wait a minute. Slower than expected? That spells a lot of trouble. Why? Because the Obama administration projected what were some pretty rosy recovery scenarios based on its $800B boondoggle stimulus. Those projections are not living up to expectations. Surprising? No. Worrisome? Yes, because the administration still has huge spending plans to come.

This projection does not even include, remotely, any of its healthcare change out. The plan is estimated, by the Obama administration, to cost $1T. First, the administration shows it doesn't understand economics as its projections are already significantly off. Second, history shows it is the nature of government programs to cost far in excess of rosy projections.

When passed Medicare was projected to cost $9B in 1990. In reality, Medicare costs that year were $67B. A mere rounding error by a factor of 6. Medicaid when passed in 1987 was supposed to cost $100M per year. Just six years later it required $11B of taxpayer dollars; off by a factor of 11 in less than a decade.

So, does anyone really believe in $1T? Take the average of the two and say the multiplier is 8.5. That adds $8.5T to the 10 year projection and makes the $9T look blissful. At $17.5T the US is pretty much insolvent. Picture a currency worth nothing.

THE MARKET

MARKET SENTIMENT

VIX: 25.01; -0.08
VXN: 24.69; -0.28
VXO: 23.81; +0.02

Put/Call Ratio (CBOE): 0.59; -0.13. Massive drop in the ratio as calls were bought to offset the downside speculation by the shorts.

Bulls versus Bears:

This is a reading of the number of bullish investment advisors versus bearish advisors. The reason you look at this is that it gives you an idea of how bullish investors are. If they are too bullish then everyone is in the market and it is heading for a top: if everyone wants to be in the market then all the money is in and there is no more new cash to drive it higher. On the other side of the spectrum if there are a lot of bears then there is a lot of cash on the sideline, and as the market rallies it drags that cash in as the bears give in. That cash provides the market the fuel to move higher. If bears are low it is the same as a lot of bulls: everyone is in and the market doesn't have the cash to drive it higher.

Bulls: 48.3% down from 49.4%. This follows a steady rise past the 35% level that is the threshold for what is considered a bullish climate. It does not mean things are bearish; that takes a reading in the 60% range. Hit a high of 47.7% mid-June on the run from the March lows. Again, to be seriously bearish it needs to get up to the 60% to 65% level. Dramatic rise from 21.3% in November 2008, the bottom on this leg. This last leg down showed us the largest single week drop we have ever seen, falling from 33.7% to 25.3%. Hit 40.7% on the high during the rally off the July 2008 lows. 30.9% was the March low. In March the indicator did its job with the dive below 35% and the crossover with the bears. A move into the lower 40's is a decline of significance. A move to 35% is a bullish indicator.

Bears: 23.1% up from 21.3%. Rebounding some from the big drop two weeks back from 31.1% and 35.6% the prior week. Still a massive exodus from the ranks of bears. For reference, cracking above the 35% threshold considered bullish. Hit a high on this run at 47.2%. For reference, bearishness hit a 5 year high at 54.4% the last week of October 2008. The move over 50 took bearish sentiment to its highest level since 1995. Extreme negative sentiment. Prior levels for comparison: Bearishness peaked at 37.4% in September 2007. It topped the June 2006 peak (36%) on that run. That June peak eclipsed the March 2006 high (33%) and well above the 2005 highs that spawned new rallies (30% in May 2005, 29.2% in October 2005). That was a huge turn, unlike any seen in recent history.

NASDAQ

Stats: +31.68 points (+1.59%) to close at 2020.9
Volume: 2.258B (+14.84%)

Up Volume: 1.859B (+484.792M)
Down Volume: 403.92M (-165.883M)

A/D and Hi/Lo: Advancers led 2.79 to 1
Previous Session: Advancers led 1.89 to 1

New Highs: 70 (+20)
New Lows: 8 (-3)

NASDAQ CHART: Click to view the chart

Not a lot now ahead of NASDAQ up until near 2100 and the two lows from 2008. There is an intraday low at 2070, but that is still pretty clear sailing for NASDAQ to that point.

NASDAQ 100 CHART: Click to view the chart

SOX CHART: Click to view the chart

SP500/NYSE

Stats: +18.76 points (+1.86%) to close at 1026.13
NYSE Volume: 1.836B (+64.03%). Now THAT is expiration volume. Trade shot above average, almost matching the early August spike.

Up Volume: 1.374B (+449.057M)
Down Volume: 91.574M (-92.735M)

A/D and Hi/Lo: Advancers led 4 to 1
Previous Session: Advancers led 2.68 to 1

New Highs: 135 (+44)
New Lows: 81 (+44)

SP500 CHART: Click to view the chart

Nice breakout over a key, key level. There is still an intraday high at 1044 from October 2008, but after that there is a clean shot at 1100. That is why this November peak was such an important level.

SP600 Chart: Click to view the chart

DJ30

Stats: +155.91 points (+1.67%) to close at 9505.96
Volume DJ30: 293M expiration shares Friday versus 151M shares Thursday.

DJ30 CHART: Click to view the chart

MONDAY

A big upside expiration Friday can often lead to a weaker start to the week, but that is not always the case. Percentages say yes, but there are times it does not apply, say when there is too much world liquidity. Even with that, however, some testing of a break to a new high is normal.

Indeed, TESTING a breakout to start a new week is always better than leaving unfinished breakout business after a good rally to recover early losses as seen last week. That helps reduce the chances of a reversal from the resistance though you can always have a reversal session after a breakout. Given the surge higher in July that is what some are looking for and you have to be cognizant it could happen, but with all of the money in the market as evidenced by last week's recovery, the reversal scenario is less likely.

Now a pullback to test the breakout is great. There are stocks that jumped higher with gaps that we did not chase, and a pullback to test the gaps would provide great opportunity again. At the same time we have a lot of god new upside in place that we can let run on this new breakout by the indices as long as it holds and continues. And of course, if we get 2 or 3 more upside days under the belt many of our plays will be in prime position to bank some gain. It is running in a 2 to 4 week cycle of gains to profits and with this new crop of great plays we have positions in we will be looking to again bank some gain and enjoy the fruits of our labors a bit more.

Support and Resistance

NASDAQ: Closed at 2020.90
Resistance:
2070 is the September 2008 intraday low
2099 is the mid-September 2008 closing low
2169 is the March 2008 double bottom low

Support:
2016 is the August peak
1984 from late September
The 10 day EMA at 1983
1962 is the bottom of the August 2009 range.
1947 is the October gap down point
The 50 day EMA at 1904
1897 is the October post gap intraday high.
1880 is the June peak
1862 is the July peak
1786 is the November intraday high
1780 is the November 2008 closing peak
1773 is the May intraday peak
1770 is the mid-October interim peak
1673 is the prior April peak
1666 is the intraday January 2009 peak
1664 is the May 2008 low
1661 is the April 2009 prior peak
The January closing peak at 1653 (intraday)
The 200 day SMA at 1650

S&P 500: Closed at 1026.13
Resistance:
1044 is the October 2008 intraday high
1106 is the September 2008 low
1133 from a September 2008 intraday low
1185 from late September 2008
1200 from the July 2008 low

Support:
The August intraday peak at 1018
The November 2008 peak at 1006 closing 1007.53 intraday
992 is the August 2009 consolidation low
The 18 day EMA at 994
The 50 day EMA at 961
956 is the June intraday peak
944 is the January 2009 high
935 is the January closing high
932 is the July peak
930 is the May peak
919 is the early December peak is bending
899 is the early October closing low
896 is the late November 2008 peak
888.70 is the April intraday high.
882 is the early May low
878 is the late January 2009 peak
The prior April peak at 876
The 200 day SMA at 876
866 is the second October 2008 low
857 is the December consolidation low

Dow: Closed at 9505.96
Resistance:
9625 is the October 2008 closing high
10,365 is the late September low

Support:
9387 is the mid-October peak
The 18 day EMA at 9235
9116 is the August low
9088 is the January 2009 peak
8985 is the closing low in the mid-2003 consolidation
8934 is the December closing high
The 50 day EMA at 8927
8878 is the June peak
8829 is the late November 2008 peak
8626 from December 2002
8588 is the May high
8581 is the July peak
8521 is an interim high in March 2003 after the March 2003 low
8451 is the early October closing low
8419 is the late December closing low in that consolidation
8375 is the late January 2009 interim peak
8315 is the February 2009 peak
The 200 day SMA at 8313
8307 is the April 2009 intraday high
8221 is the May 2008 low

Economic Calendar

These are consensus expectations. Our expectations will vary and are discussed in the 'Economy' section.

August 25 - Tuesday
- S&P/Case-Shiller, June (09:00): -16.40% expected, -17.06% prior
- Consumer Confidence, August (10:00): 48.0 expected, 46.6 prior

August 26 - Wednesday
- Durable Orders, July (08:30): 3.2% expected, -2.5% prior
- Durables, Ex Transportation, July (08:30): 1.0% expected, 1.1% prior
- New Home Sales, July (10:00): 390K expected, 384K prior
- Crude Inventories, 08/21 (10:30): -8.40M prior

August 27 - Thursday
- Initial Jobless Claims, 08/22 (08:30): 565K expected, 576K prior
- Q2 GDP - Prelim, Q2 (08:30): -1.4% expected, -1.0% prior
- GDP Deflator, Q2 (08:30): 0.2% expected, 0.2% prior
- Core PCE, Q2 (08:30): 2.0% expected, 2.0% prior

August 28 - Friday
- Personal Income, July (08:30): 0.1% expected, -1.3% prior
- Personal Spending, July (08:30): 0.2% expected, 0.4% prior
- PCE Core, July (08:30): 0.1% expected, 0.2% prior
- Michigan Sentiment-Rev, August (09:55): 64.8 expected, 63.2 prior

Don't miss our Market Summary each evening. It is part of "The Daily" which is available at InvestmentHouse.com. The Daily focuses on enhancing returns through strategic investing using various tools including stock options. The Daily is a must for anyone with an IRA or anyone that enjoys investing in individual stocks.
icon url

ReturntoSender

08/24/09 9:39 PM

#8658 RE: ReturntoSender #6755

From Briefing.com: 4:30 pm : The broader market was led higher in the early going by financial stocks, but the sector succumbed to an afternoon selling effort that caused it to upend the major indices. In turn, the S&P 500 settled just below the neutral line, but that was still enough to end its winning streak at four sessions.

Stocks in the S&P 500 looked as if they were going to make their fifth straight advance as buyers chased the stock market's recent advances for fear of missing out on future gains. Their rather bullish bias was further supported by broad-based buying overseas and came in the face of a warning from New York University Professor Roubini about a double-dip recession in a Financial Times article.

Though there weren't any economic reports or noteworthy earnings announcements to act as catalysts this session, participants reacted strongly to an upgrade of American Express (AXP 32.67, -0.18) and Capital One (COF 36.45, -0.03) by analysts at Barclays. That propelled consumer finance stocks up more than 3% during the session, but the group finished with a gain of just 0.1% as participants pushed back against financial stocks.

Banks saw the worst of the selling effort. Diversified banks fell 2.3% and regional banks dropped 3.2%. Their weakness took the broader financial sector from a gain of roughly 2% to a 0.9% loss, which was only matched by the consumer discretionary sector.

In contrast, energy stocks were able to preserve most of their strength. The sector finished 1.3% higher, which was the best of any major sector in the S&P 500. Drillers (+1.4%) and refiners (+1.8%) saw some of the best gains, but it was integrated oil (+1.7%) that provided the most leadership, thanks to the market weight of such heavy hitters as Exxon Mobil (XOM 71.30, +1.38). The blue chip proved to be a primary leader in the Dow, which was the only major index to eke out a gain.

Energy stocks were buoyed by continued gains by oil prices, which set fresh highs for the year by making their way to $74.81 per barrel. Oil prices pulled back a bit to settle at $74.37 per barrel, up 0.6%.

Prior to the afternoon pullback the S&P 500 also registered fresh highs for 2009. It remains up almost 5% during the course of the last five sessions and up nearly 17% during the last six weeks. DJ30 +3.32 NASDAQ -2.92 NQ100 -0.2% R2K -0.2% SP400 -0.4% SP500 -0.56 NASDAQ Adv/Vol/Dec 1223/2.05 bln/1455 NYSE Adv/Vol/Dec 1543/1.23 bln/1474

09:30 am Nokia (NOK)

Nokia (NOK 12.49), the world's largest mobile phone maker, said Monday that it will offer a netbook computer. The move marks the Finland-based company's first foray into the PC business.

The Nokia Booklet 3G is a Windows based PC that weighs 1.25 kilograms and measures slightly more than two centimeters thick. Nokia said it will offer a broad range of connectivity options, an HDMI port, integrated Bluetooth and a video camera.

A growing number of people want the computing power of a PC with the full benefits of mobility," said Kai Oistamo, Nokia's executive vice president for devices. "We are in the business of connecting people and the Nokia Booklet 3G is a natural evolution for us."

icon url

ReturntoSender

08/25/09 8:09 PM

#8659 RE: ReturntoSender #6755

From Briefing.com: 4:30 pm : Stocks spiked to a gain of more than 1% following a better-than-expected consumer confidence reading, but the major indices quickly faltered to settle the session with modest gains. Though that made for an unimpressive finish, the gain helped stocks register a new closing high for 2009.

The major indices hit session highs in the moments following the Consumer Confidence Index for August, which came in at 54.1. That was above the 47.9 that was widely expected and marked an improvement from the upwardly revised July reading of 47.4. However, market participants should remember that consumer confidence is not highly correlated with actual spending.

Despite that consideration, retailers showed steady strength through the entire session. They finished 1.8% higher, led by Big Lots (BIG 25.60, +1.57). The discount retailer reported better-than-expected earnings. Chico's FAS (CHS 12.79, +0.90) also provided support with its own positive earnings surprise. The strength behind retailers helped the consumer discretionary sector finish 1.2% higher, the best of the major sectors in the S&P 500.

In other earnings news, Medtronic (MDT 37.86, -0.14) spent the entire session chopping along in negative territory despite posting in-line quarterly earnings. That detracted from the tech sector, which finished just 0.1% higher.

Financial stocks were a primary source of support to the broader market, though. They led gains for virtually the entire session before settling with a 1.1% gain. Bank stocks and shares of insurers underpinned the sector's strength.

Separately, Ben Bernanke has been nominated to a second term as Chairman of the Federal Reserve. His nomination comes as the U.S. economy continues to contend with considerable macro headwinds.DJ30 +30.01 NASDAQ +6.25 NQ100 +0.3% R2K +0.5% SP400 +0.5% SP500 +5.43 NASDAQ Adv/Vol/Dec 1458/1.95 bln/1244 NYSE Adv/Vol/Dec 1830/1.30 bln/1185

4:06PM LDK Solar announces it has entered into agreement with Yancheng City of Jiangsu Province for the development of PV power projects (LDK) 8.85 -0.14 : Co announces that it has entered into an agreement with Yancheng City of Jiangsu Province for the development of PV power projects. According to the agreement, LDK Solar will develop a number of PV power projects, including PV ground-power stations, and roof and building integration systems totaling up to 500 MW over the next five years. The terms, including financing, design and specific location of each of the projects, will require a feasibility study as well as final approval from relevant state departments prior to initiation.

9:15AM Flextronics selected by LG Electronics to manufacture assorted LCD TV products for North and South American markets (FLEX) 5.64 : Co announces that it was chosen by LG Electronics to manufacture 19, 22, 26, 32, and 37-inch LCD TVs at its Juarez, Mexico facility for distribution to the North and South American markets. In addition to its Juarez, Mexico facility, Flextronics' Doumen and Brazil facilities will also provide services to support this business.

9:03AM Nanometrics announces multiple purchase orders for Caliper Mosaic Overlay and Atlas OCD Metrology Systems (NANO) 5.26 : Co announces multiple system orders for its Caliper Mosaic overlay metrology systems and its complete NanoCD suite including Atlas OCD systems, NanoDiffract software, and NanoGen cluster computing solutions.

icon url

ReturntoSender

08/26/09 10:28 PM

#8660 RE: ReturntoSender #6755

From Briefing.com: 4:30 pm : Despite some encouraging economic data, stocks had a listless session and made another lackluster finish. Nonetheless, the major indices managed to eke out a fractional gain, which means that the Dow has finished higher seven straight times.

There weren't any individual leaders for the broader market this session, but retailers (+0.7%) did garner support following better-than-expected earnings and an upside forecast from Dollar Tree (DLTR 50.13, +2.23) and Williams-Sonoma (WSM 17.21, +1.74). Home improvement retailers (+1.4%) also gained, but their strength was owed to an encouraging new home sales report.

Annualized new home sales for July hit 433,000 units, which is well above the 390,000 that had been expected. What's more, the 9.6% month-over-month increase for July is the sharpest rise since 2005. That helped bring inventory down to a 7.5 month supply from an 8.5 month supply.

The better-than-expected new home sales report brought about a broad-based buying effort that took stocks to their best levels of the session. However, gains were capped as buyers seemed unwilling to chase stocks higher. That left the major indices to drift lower.

With participants sitting on the sidelines the rest of the day's news items didn't have much of an impact on the overall market. As such, participants were essentially unimpressed by news that durable goods orders made their sharpest increase in two years by spiking 4.9% in July. Economists had called for a 3.0% increase. Though the increase exceeded expectations, the results were generally the result of the Cash for Clunkers program. Excluding autos, durable goods orders increased 0.8%, which was largely in-line with expectations.

Stocks did drift to afternoon lows following news that an auction of 5-year Treasuries produced a high yield of roughly 2.49% and a bid-to-cover ratio of approximately 2.5. A lack of conviction behind the selling effort enabled the stock market to make its way back to neutral territory.

The lack of interest on the part of participants was also made evident by the lack of trading volume this session. Hardly 1 billion shares traded hands on the NYSE.DJ30 +4.23 NASDAQ +0.20 NQ100 -0.2% R2K +0.1% SP400 -0.1% SP500 +0.12 NASDAQ Adv/Vol/Dec 1392/2.08 bln/1262 NYSE Adv/Vol/Dec 1429/1.05 bln/1561

4:19PM Kulicke & Soffa CEO re-establishes rule 10b5-1 stock trading plan; may sell up to 660,000 shares of K&S common stock over a one year period beginning in Nov 2009 (KLIC) 5.38 -0.02 :

4:06PM Sigma Designs reports EPS in-line, revs in-line (SIGM) 17.15 +0.50 : Reports Q2 (Jul) earnings of $0.28 per share, excluding non-recurring items, in-line with the First Call consensus of $0.28; revenues fell 11.9% year/year to $51.3 mln vs the $51.5 mln consensus. SIGM reports Q2 gross margins of 45.3% vs 48.2% consensus. Co says, "We feel that our primary markets have shown continued stability in the face of a difficult economy and we are continuing to place heavy efforts on bolstering sales as well as expanding the breadth of our market opportunities. The IPTV market has remained relatively flat during this year and we remain confident that it will start to demonstrate growth by the end of the year. We are also pursuing design activity in the cable industry and helping to drive the transition to Tru2way IP cable solutions, deployments of which could substantially increase our addressable market. We are continuing to pursue consumer opportunities on multiple fronts, including Blu-ray players, digital media adapters and home entertainment connectivity devices. Finally, we have begun to pursue strategic relationships in the set-top box market with our Z-wave brand of wireless home control solutions."

7:03AM Canadian Solar obtained development rights for a 500 MW project in China (CSIQ) 14.93 : Co announces it obtained rights to design, install, operate, and maintain a 500 MW solar power plant system. Under a letter of intent with the Administration Committee of Baotou National Rare Earth Hi-Tech Industrial Development Zone in Baotou, Inner Mongolia, the solar power plant will be located in CPT. The project is subject to a feasibility study and government approvals and is divided into three phases. The first phase, expected to run from September 2009 to December 2011, calls for the installation of a 100 MW PV system. The second and third phases each call for the installation of 200 MW PV systems. There are no binding commitments until the feasibility study is completed and approvals are obtained.

icon url

ReturntoSender

08/27/09 10:00 PM

#8661 RE: ReturntoSender #6755

From Briefing.com: 4:30 pm : Weakness underscored the first part of the session as little attention was given to the latest dose of economic data, but a positive tone emerged in afternoon trading as select financial stocks were squeezed higher and a sudden drop by the U.S. dollar helped lift energy and materials stocks. Their combined strength helped lead a midday recovery effort that gave the Dow its eighth straight advance, a feat that hasn't been accomplished in years.

The preliminary second quarter GDP report caused little stir among participants, though the headline number showed a better-than-expected 1.0% annualized decline, unchanged from the advance reading. Consumer spending during the second quarter also topped expectations by contracting 1.0%, which was an improvement from the 1.2% decline that was previously reported.

The latest batch of initial jobless claims came in 570,000, which is down 10,000 from the previous week and essentially in-line with expectations. Meanwhile, continuing claims came in at 6.13 million, below expectations and down more than 100,000 from the previous week as more unemployed workers lost their jobless benefits.

The reports neither drove selling pressure in the early going nor provided support to the broader market. Instead, the lack of drivers in the early going left stocks to slip in broad fashion so that all 10 major sectors traded with losses, but a short term floor offered support for stocks to rebound. The move from session lows was made easier by the lack of trading volume, which has exacerbated the market's ability to swing meaningfully despite a lack of catalysts in recent sessions.

Nonetheless, the emergence of buyers proved particularly beneficial to the financial sector, which swung from a loss of nearly 1% at its low to finish with a gain of 1.0%. AIG (AIG 47.84, +10.15) surged as short-sellers scrambled to cover their positions in the holding, while banks also provided support. Their advance came in the face of news that the FDIC's Problem List of banks has expanded to a 15-year high and that noncurrent loans and leases increased for a 13th consecutive quarter. However, loans between 30-89 days past due declined by a record amount.

Dollar-sensitive stocks in the materials and energy sectors garnered support as the Dollar Index fell from positive territory to a 0.7% loss late in the session. In turn, materials stocks finished with a 0.6% gain and energy stocks cut their loss to 0.4% after being down roughly 2% as crude oil prices swung from a loss in excess of 1% to settle with a 1.5% gain at $72.49 per barrel.

Industrial stocks traded with relative strength for the entire session and settled with a 0.8% gain. Boeing (BA 51.82, +4.00) buoyed the sector after the company said it plans to deliver the highly-anticipated 787 Dreamliner aircraft in late 2010 and stated that it expects to incur a noncash charge of some $2.5 billion in the third quarter.

Treasuries had a relatively quiet session, which concluded with the benchmark 10-year Note down some 8 ticks following an auction of 7-year Treasuries that was met with a bid-to-cover ratio of 2.74 and a high yield of just 3.09%.DJ30 +37.11 NASDAQ +3.30 NQ100 +0.2% R2K +0.0% SP400 +0.4% SP500 +2.86 NASDAQ Adv/Vol/Dec 1271/2.15 bln/1368 NYSE Adv/Vol/Dec 1612/1.16 bln/1368

5:14PM Marvell sees Q3 EPS of $0.18-0.26 vs $0.17 First Call consensus (MRVL) 14.63 +0.23 :

5:13PM Marvell sees Q3 gross margins of 55% +/- 50 bps vs 52.31% First Call Consenus (MRVL) 14.63 +0.23 :

5:11PM Marvell sees Q3 revs of $680-730 mln vs $648.39 mln First Call consensus (MRVL) 14.63 +0.23 :

4:08PM Marvell beats by $0.04, beats on revs (MRVL) 14.57 +0.17 : Reports Q2 (Jul) earnings of $0.18 per share, excluding non-recurring items, $0.04 better than the First Call consensus of $0.14; revenues fell 24.0% year/year to $640.6 mln vs the $619.8 mln consensus. MRVL reports gross margins of 55.3 % vs Street expectations of ~ 52.15%. Co said, "Our sequential revenue growth reflects both an improving economy and the acceptance by customers of our new and existing products. Additionally, the financial discipline we have adopted continued to deliver positive benefits during the Q2, allowing us to achieve our long-term profitability and cash flow targets well ahead of schedule."

4:10PM OmniVision beats by $0.03, beats on revs; guides Q2 EPS above consensus, revs above consensus (OVTI) 13.30 +0.00 : Reports Q1 (Jul) loss of $0.08 per share, $0.03 better than the First Call consensus of ($0.11); revenues rose 18.5% year/year to $105.6 mln vs the $99.1 mln consensus. Co issues upside guidance for Q2, sees EPS of $0.10-0.20 vs. ($0.04) consensus; sees Q2 revs of $155-170 vs. $111.81 mln consensus. Gross margin for the first quarter of fiscal 2010 was 22.4% vs. the 24.2% consensus, as compared to 17.0% for the fourth quarter of fiscal 2009 and 25.2% for the first quarter of fiscal 2009. The sequential increase in gross margin resulted primarily from the shipment of fresh inventory at the completion of the Company's inventory reduction effort, combined with an increase in average selling prices due to a more favorable product mix.

3:59PM Dell beats by $0.04, beats on revs and gross margins (DELL) 23.11 +0.86 : Reports Q2 (Jul) earnings of $0.28 per share, excluding pretax expenses of $87 mln, or four cents per share, for organizational effectiveness actions, $0.04 better than the First Call consensus of $0.23; revenues rose 3.4% sequentially (down 22% YoY) to $12.76 bln vs the $12.59 bln consensus. DELL reports Q2 gross margins of 18.7% vs. 17.7% consensus, 17.6% last quarter. Co attributes higher gross margins to strong improvement in cost of goods sold, disciplined pricing, a sequential increase in sales from enterprise products, and a $69 million buyout of a revenue-sharing agreement by a vendor offset previously highlighted pressure from component costs, competitive pricing and revenue mix in client systems... In the third quarter, the company expects seasonal demand improvements from the Consumer and U.S. federal government businesses, but the quarter is also generally a period of slower demand from large commercial customers in the U.S. and Europe. Dell believes a refresh cycle in commercial accounts is more likely to occur in 2010, with IT spending improving first in the U.S. The company continues to see pressure in the form of component costs and areas of aggressive pricing in the near term, and continues to take actions to offset these items. The company will continue to focus on implementing cost improvements and strategic investments to improve operations for the long term.

9:34AM Seagate Tech trades up 2% after the co's CEO discloses a big stock purchase near 11-month highs (STX) 12.37 +0.24 : In a filing out last night, STX's CEO Stephen Luczo disclosed that he bought 100K shares at $12.38 per share on Tuesday, worth $1.2 mln. We'd note that this is the first purchase by Luczo since he bought 1 mln shares back in late Jan/early Feb after he was appointed CEO on Jan 12 (he was previously the co's Chairman, and continues to hold that position as well). Those purchases took place at $3.55-4.45, worth ~$4 mln... Additionally, this week's purchase is the first insider purchase in STX since an SVP bought 150K shares back in May, at $8.24 per share... Luczo's latest purchase is especially noteworthy as it comes with STX near 11-month highs of 12.78.

7:30AM Cray acquires PathScale Compiler Suite assets from SiCortex (CRAY) 7.71 : Co announces it has acquired the PathScale Compiler Suite assets from SiCortex. Financial terms of the deal were not disclosed. Cray plans to leverage some of the PathScale intellectual property to enhance Cray's own compiler offerings over time.

7:28AM Microsoft confirms Xbox 360 price drop (MSFT) 24.55 : Co announces that beginning Aug. 28, the price of an Xbox 360 Elite console will drop by $100, now priced at $299.99 estimated retail price in the United States. The Xbox 360 Pro console will now be priced at $249.99, reflecting a price reduction of $50 and $199.99 for the Xbox 360 Arcade console.

icon url

ReturntoSender

08/29/09 10:51 AM

#8662 RE: ReturntoSender #6755

From Briefing.com: Weekly Recap - Week ending 28-Aug-09The stock market logged another winning week -- albeit a slight one -- as a solid gain in financials was offset by losses in six of the ten economic sectors. Overall it was a relatively slow news week with very few earnings reports, though participants did have some economic and banking data to digest.

In the end, the S&P 500 rose 0.3%, hitting fresh highs for 2009. The financial sector led the way, advancing 0.7%, followed by the tech sector (+0.3%) which benefited from better-than-expected earnings and guidance from two bellwethers. Defensive sectors underperformed, with utilities shedding 0.7% and health care giving up 0.9%.

Economic data was mostly better-than-expected, though it failed to provide a sustainable lift for the market. Housing was in focus with two more reports coming out ahead of estimates, though from depressed levels.

New home sales for July rose at a 9.6% annualized rate to 433,000 units, which is well above the 390,000 that had been expected -- the sharpest percent rise since 2005. That helped bring inventory down to a 7.5 month supply from an 8.5 month supply. The new home sales increase comes on the heels of multiple positive reports in the housing market, signaling that the bottoming of the housing market may be near. The Case-Shiller 20-city home price index rose on a month-month basis, and the year-over-year drop impred to 15.4%. This was better than the 16.4% year-over-year drop that economists had forecasted.

The preliminary Q2 GDP reading was unchanged from the advance reading at a 1.0% annualized decline, better than the 1.5% drop that was expected. The reading benefited from a smaller-than-expected drop in consumer spending.

The latest weekly jobless claims data continue to reflect a challenging employment environment. There were 570,000 new unemployment claims, down 10,000 from the previous week but slightly higher than expectations. Continuing claims fell by 121,000 to 6.133 million. However, the downward trend of continuing claims should not be confused with a strengthening of the labor market. Jobs are not plentiful and the drop-off is due to workers losing their unemployment benefits.

August consumer confidence rose to 54.1 from 47.4, which was well above the 47.9 consumer confidence. Likewise, the revised University of Michigan consumer sentiment survey for august came in at 65.7, ahead of the 64.3 consensus.

Finally, the June personal income and spending report illustrated the weak economic conditions. Income was flat after falling 1.1% in June, worse then the expected rise of 0.1%. Meanwhile, real personal spending rose 0.2%, in-line with expectation. The gain was primarily due to the jump in auto sales due to the Cash for Clunkers package.

Banks were in focus following the release of second quarter statistics from the FDIC. The FDIC list of problem banks expand to a 15-year high to 416 problem institutions from 305. Although this is certainly a negative, most of the banks on the list are smaller firms as the combined assets of the problem institutions total $299.8 billion (to put this in perspective, the two largest bank holding companies -- JPMorgan Chase and Bank of America -- have more than $4 trillion in assets). Meanwhile, noncurrent loans and leases increased for the 13th consecutive quarter, though loans between 30-80 days past due declined. The FDIC said it is running low on funds and may need to borrow from the Treasury. We expect banks to continue to face challenges, especially regional banks that have high exposure to commercial real estate.

In other financial regulation news, Fed Chairman Ben Bernanke was nominated by President Obama for a second term, as was widely expected.

In corporate news, Boeing (BA) said it plans to deliver the highly-anticipated and several-times delayed 787 Dreamliner aircraft in late 2010. Boeing expects to incur a noncash charge of roughly $2.5 billion in the third quarter.

Technology bellwether Intel (INTC) raised its Q3 revenue guidance to $9 billon, plus or minus $200 million, citing stronger-than-expected demand for microprocessors and chipsets. The company's prior guidance was for revenue of $8.5 billion, plus or minus $400 million.

Fellow tech company Dell (DELL) reported a 23% drop in Q2 profit to $0.28 per share, but that was better than the consensus of $0.23. Dell also said it expects improved IT spending in 2010, though that is not a real surprise given depressed spending in 2009.

Year-to-date, the S&P 500 is now up 13.9%, the Dow is up 8.7% and the Nasdaq is leading the way with a 28.6% gain.
 
Index Started Week Ended Week Change % Change YTD %
DJIA 9505.96 9544.22 38.26 0.4 8.7
Nasdaq 2020.90 2028.77 7.87 0.4 28.6
S&P 500 1026.13 1028.93 2.80 0.3 13.9
Russell 2000 581.51 579.86 -1.65 -0.3 16.1

5:00PM Tessera Tech announced the Administrative Law Judge in the ITC issued an Initial Determination finding Tessera's asserted patents are valid, but not infringed by the respondents (TSRA) 25.06 -0.25 : Co announced the Administrative Law Judge (ALJ) in the International Trade Commission (ITC) action brought by Tessera against certain DRAM manufacturers issued an Initial Determination finding Tessera's asserted patents are valid, but not infringed by the respondents. The action is Investigation No. 337-TA-630 (DRAM ITC action). The ALJ's decision, termed an "Initial Determination," is subject to review by the full Commission. Within 120 days of the issued Initial Determination, the Commission can affirm, modify or reverse the ALJ's decision in developing the ITC's final determination. "We intend to once again seek review of the Initial Determination by the full Commission," said Henry R. Nothhaft, president and CEO of Tessera. "The Commission previously agreed in our Wireless ITC Action that our technology was valid and that we had proven infringement at trial. We hope that it will again reverse the ALJ's Initial Determination. Furthermore, we have not taken into account any revenue based on the outcome of this ITC action in preparing our financial guidance. We remain focused on developing innovative technologies and are confident in the future of our business."

3:05PM China Sunergy to enter into renegotiation with REC for the long term supply contract (CSUN) 4.58 -0.06 : Co announces that it has entered into the renegotiation with the counterparty regarding to a June, 2008 supply agreement signed with REC SiTech AS. On June 25, 2008, China Sunergy entered into a Standard Agreement for the Supply of Monocrystalline Silicon Ingots and/or Wafers with the European wafer provider REC SiTech As for the supply of monocrystalline 156- millimeter wafers for seven years from 2009 through 2015. It has been revealed that REC SiTech As now is dissolved as a result of a merger early this year. As the polysilicon supply market has changed dramatically since the fourth quarter of 2008, key raw material suppliers such as REC have indicated the renegotiation of supply agreements with their respective customers and against this background, China Sunergy has entered into the renegotiation with its counterparty in respect to the overall arrangement of the supply agreement, with the good faith to reach a mutually beneficial agreement between both parties.

3:00PM Weekly Insider Trading Summary: Notable Purchases -- STX, FLO, PRE, VRX, TBSI, CPN, DK, HGT, INT; Notable Sales -- ITW, HNZ, PSA, DLTR, CBSH, SYK, LL, CSCO, ITWO (INSID) : Over the past week we've seen notable insider buying in the following stocks: Seagate (STX) CEO bought 100,000 shares at $12.19-12.38 on 8/25... Flower Foods (FLO) Chairman Emeritus and Director bought 7,020 shares at $23.66-23.69 on 8/24-8/25... ParterRe (PRE) Director bought 2,800 shares at $71.93 on 8/21... Valeant Pharmaceuticals (VRX) COO bought 9,007 shares at $24.98 on 8/24... TBS International (TBSI) CEO and EVP bought 90,000 shares at $6.99-7.48 on 8/21-8/25... Calpine (CPN) 10% owner Harbinger Capital Partners bought 328,046 shares at $11.98-12.52 on 8/14-8/20... Delek US Holdings (DK) 10% Owner Delek Petroleum bought 65,798 shares at $7.73-7.85 on 8/20-8/21... Hugoton Royalty Trust (HGT) Director bought 287,138 shares at $13.79-14.40 on 8/25-8/27... World Fuel Services (INT) President bought 10,101 shares at $46.40-47.50 on 8/25-8/26... We've seen notable insider selling in the following stocks: Illinois Tool Works (ITW) Director sold 200,000 shares at $42.40-42.52 on 8/24... Heinz (HNZ) Director Nelson Peltz's Trian Fund Management sold 650,000 shares at $38.91-39.32 on 8/24-8/25... Public Storage (PSA) Chairman sold 1,000,000 shares at $70.58-71.00 on 8/26... Dollar Tree (DLTR) Chairman (pursuant to a Rule 10b5-1 plan) sold 150,000 shares at $50.34 on 8/26... Commerce Bancshares (CBSH) CEO and Vice Chairman sold 211,633 shares at $38.00-38.92 on 8/24-8/26... Stryker (SYK) Director sold 240,000 shares at $41.37-41.81 on 8/21-8/26... Lumber Liquidators (LL) Chairman (pursuant to a Rule 10b5-1 trading plan) sold 775,000 shares at $21.20-22.65 on 8/21-8/25... Cisco (CSCO) CEO (pursuant to a Rule 10b5-1 plan) sold 400,000 shares at $22.50-22.51 on 8/24... I2 Technologies (ITWO) 10% Owner S. Sidhu sold 1.0 mln shares at $15.27 on 8/25... All sales exclude option sell offs... For regular updates on our insider summaries and commentary, please add Briefing ticker INSID to ticker alerts.

Chinese solar co LDK Solar (LDK 9.25 +0.13) saw a pickup in volume as takeover rumors circulated...

9:32AM NVIDIA: Already strong after Dell's better than expected results, jumps further after INTC raises revenue guidance, citing stronger than expected demand (NVDA) 14.75 +0.74 :

9:01AM Intel raises Q3 revenue guidance to $9 bln, plus or minus $200 mln, above $8.55 bln consensus; raises gross margin expectations (INTC) 19.47 : Co raises guidance for Q3, sees revenue of $9 bln, plus or minus $200 mln, vs. $8.55 bln consensus, compared to prior guidance of $8.5 bln, plus or minus $400 mln. Co cites stronger than expected demand for microprocessors and chipsets. The gross margin percentage for the third quarter is expected to be in the upper half of the previous range of 53%, plus or minus two percentage points (consensus for Q3 gross margins is 53.2%). All other expectations are unchanged.

09:32 am Intel (INTC)

Intel (INTC 20.26, +0.79) raised its third quarter revenue expectations Friday morning, driven by stronger-than-expected demand for microprocessors and chipsets. The news, which came out about 30 minutes ahead of the opening bell, gave a boost to shares of INTC and equity futures.

Intel said that it now expects third quarter revenue of $9 billion, plus or minus $200 million. The company's prior guidance was for revenue of $8.5 billion, plus or minus $400 million. The updated forecasts surpasses the current consensus estimate of $8.55 billion.

Intel also expects gross margins for the third quarter to be in the upper half of the previous range of 53%, plus or minus two percentage points. The consensus for Q3 gross margins stands at 53.2%.

Intel said all other expectations are unchanged.

09:15 am Marvell Technology (MRVL)

Marvell Technology Group (MRVL 14.57) posted better-than-expected second quarter earnings and issued an upside forecast that has shares of the chipmaker spiking more than 7.5% in Friday's premarket action.

Marvell reported second quarter earnings of $0.18 per share, excluding nonrecurring items, $0.04 better than the First Call consensus of $0.14.

Revenues fell 24.0% year-over-year to $640.6 million, topping the $619.8 million consensus.

Gross margins for the quarter came in at 55.3%, well ahead of Wall Street expectations of approximately 52.15%.

"We are pleased with the results reported for the second quarter of fiscal 2010," said CEO Dr. Sehat Sutardja. "Our sequential revenue growth reflects both an improving economy and the acceptance by customers of our new and existing products. Additionally, the financial discipline we have adopted continued to deliver positive benefits during the second quarter, allowing us to achieve our long-term profitability and cash flow targets well ahead of schedule."

For the third quarter Marvell sees earnings between $0.18 and $0.26 per share; the current First Call consensus calls for $0.17. Marvell forecast third quarter revenues between $680 million and $730 million, well ahead of the $648.39 First Call consensus.

Shares of MRVL have advanced more than 119% year-to-date.

08:38 am Dell (DELL)

Dell (DELL 15.65) reported earnings that topped the consensus estimate and issued an upbeat outlook, saying it expects an improvement in IT spending in 2010.

Dell reported second quarter earnings of $0.28 per share, excluding pretax expenses of $87 million, or $0.04 per share, for organizational effectiveness actions. The results were $0.04 better than the First Call consensus of $0.23. Net income fell 23% year-over-year to $472 million.

Revenues were down 22% year-over-year to $12.76 billion; the consensus expected $12.59 billion. Dell did show sequential improvement, with shipments up 10% from the first quarter and revenue up 3%.

Gross margins for the quarter came in at 18.7%, better than the consensus estimate of 17.7% and improved from the 17.6% registered in the first quarter. Dell said "strong improvement in cost of goods sold, disciplined pricing, a sequential increase in sales from enterprise products, and a $69 million buyout of a revenue-sharing agreement by a vendor offset previously highlighted pressure from component costs, competitive pricing and revenue mix in client systems."

Dell said it expects seasonal demand improvements from the consumer and U.S. federal government businesses in the third quarter, but the quarter is also generally a period of slower demand from large commercial customers in the U.S. and Europe. Dell said it believes a refresh cycle in commercial accounts is more likely to occur in 2010, with IT spending improving first in the U.S.

"We have been reducing complexity in our organization and significantly lowering operating costs, in anticipation of improvement in the global economy and IT spending," said CEO Michael Dell. "If current demand trends continue, we expect revenue for the second half of the year to be stronger than the first half."

Shares of DELL are about 4.5% higher an hour ahead of Friday's opening bell.
icon url

ReturntoSender

08/30/09 4:11 PM

#8664 RE: ReturntoSender #6755

InvestmentHouse Weekend Market Summary 8/28/09

http://www.investmenthouse.com/weekendmarketsummary.htm

- Market ends the week flat line but does so by giving up a Friday gap higher.
- Techs try to lead but cannot while metals, energy remain solid.
- Personal income flat, spending rises on clunkers.
- Michigan sentiment decent, needs improvement.
- Cash for big companies laying off workers.
- Friday action and tired techs make Monday more interesting.

Flat close but a gap and reversal on some volume.

MRVL and DELL, two strong companies in technology, had the futures pretty ginned up on Friday. They came out with better than expected earnings Thursday night and had positive guidance and good things to say about a technology upgrade cycle to come. Futures were up and looking strong. Personal income and spending came out, and they were, at best, in line with a little bit lower number on the income which knocked the futures back a bit but did not destroy things. INTC came out and it had positive things to say about its sales in the quarter. That helped rev the futures back up for what was going to be a strong open.

As expected, the techs were in front. With that kind of news out, you would expect they would make a move. They have been lagging up to this point. Sure, they are up to new post-March highs with the other indices, but they have somewhat abdicated the leadership role over the past couple of weeks. They had a perfect opportunity on Friday to reestablish themselves. The red carpet was rolled out, and they gapped higher and were looking strong as was expected. Indeed, there was also energy and the metals stocks. Industrial metals such as steel were also performing well. That was anticipated as well because they had some good looking patterns, indeed much better than the tech patterns overall, and we were looking to them to be a market leader - maybe not today but down the road when other things falter.

Speaking of faltering, the techs did that. The zenith for the move of the day was at the open. After that, the sellers came in and the market started to fall back. Again, this was somewhat expected to happen. The tech patterns were not strong enough to support a sustained breakout here. After they opened higher we were taking some gain off of the table and using that bounce to do it, then they started to peel back; indeed, they were negative by mid-morning and through lunch. They started building up in the afternoon session after lunch, and they made it to positive, but then there was a late half hour sell back that pushed the indices to mixed. NASDAQ gained all of a whopping point, while the Dow lost 37+ and the SP500 closed modestly lower as well. The SOX closed up 2% which you would expect given the good news from MRVL and INTC. They helped get the sector excited. As you can see when you look at the charts, of some of the big name semiconductors had a good start with a gap higher, they rallied from there, but then were pulling back by the end of the day. We had a bunch of gaps to dojis, and that may or may not mean anything. Sometimes a stock or index will gap to a doji, and then gap back the other way the next day creating something of an evening star with a maybe an island reversal. That can lead to more downside. We'll have to see how that plays out, but basically it was as expected on the day. A strong gap open led by the techs, but they did not have the stomach to keep it up for the entire session. It was not a total collapse, but we were not dealing from a position of strength when you looked how things played out and closed at the end of the day.

I also felt that while there would be a reversal and that perhaps the market would not fully tip its hand as to what it was going to do, and that was somewhat of the case. If you look at what happened on the day, they did move higher and they did sell back at the end of the session, but they are still holding the breakout from expiration Friday (two Fridays back) when they gapped higher and spent the entire week moving laterally in a very tight closing range. Maybe the intraday range was not as tight, but the closing range is almost a flat line. They did not change much of anything when you look at that perspective. What you did see on Friday was the gap higher and then the reversal. Some of the other days like Thursday we saw a sell down and then it rebounded, and that was different from earlier in the week when the market moved higher and then gave back its gains on the high (although it still did close positive on those days). On balance looking back at the week, it held the gains, and they were up from the week, but the problem was earlier in the week they gave back a good chunk of gains. It is like in baseball when a lot of runners are left on base. Maybe you score a run per inning, but you leave the bases loaded for several innings, and those are wasted opportunities. That is what we saw in the beginning of the week when a lot of points were gained but then lost. On Thursday it looked like we were in a recovery mode with that reversal only to see a gap and then a give back on Friday, thanks to the news and poor patterns in tech. It was not the strongest action if you look at the intraday picture over the entire week, although it is hard to argue with the result by the bell on Friday since the indices held their gains. You can bad mouth it all you want, you can say what you want about intraday reversals and higher volume selling, but they held their gains for the week and held that breakout to the new post-March highs.

Despite that, you always have to look at what happened at the end of the week. You are always saying "what have you done for me lately?" or in the market's case, "What have to done TO me lately?" One of the key takeaways on Friday was the fact that there was very good news. This is the kind of stuff that was not shown in the earnings season, i.e., companies saying "Things look good." Whole Foods has done it, DELL, and MRVL have done it. There are others who are starting to come out after this last earnings round and say that things are looking better, but it was not enough on Friday to hold some serious gains. It could not do it. That tells you a lot about the kind of sentiment that was out there among investors. The sellers tried to come back in and sell the market even on good news. It was Friday, so maybe that was not the whole picture - we will see more of it next week. You always get a better read on what is happening on the following Monday and Tuesday. Either it sticks and looks fine, or there is a shift. The sellers on the buyers will use that to step in and make their move and try to make their positions known.

TECHNICAL

Intraday was the gap higher on the strong earnings led by techs and we also had good moves by a bunch of the metals, industrials, and energy. They did not surge, they did not hold great gains, but they held nice patterns and that was a key. Even during the selling on the day, those leaders went back as well but did not selloff. They just held flat, and when the market came back late, they moved up to good position again and it did not bother them when the market frittered away at the end. There was the gap, the selloff and the recovery, and then just drifting off into the end of the day. That is not terrible action, but the indices never came close to recovering the early morning high. The sellers sold it off at that point, and while the buyers tried to come back in, they never had the kind of strength they had at the open. To me that is a much more telling picture of the intraday action.

INTERNALS.

The breadth was pretty much flat as one would expect, although on NASDAQ it jumped up on 1.8:1, thanks to the 2% gain in the semiconductors. They had a great session led by MRVL and INTC, so they posted solid gains and were not kicked back as much as the rest of the market when the selling got under way.

CHARTS.

Volume is the key once more, and it was interesting all week. It was up Thursday as the market sold off and then reversed. I heralded that as a positive, and it always is when the market sells off and then buyers rally back on stronger volume. That shows they are coming in with some, well, volume. Friday was the opposite story, the market gaped higher and sold off and it was on even higher volume. Both NASDAQ and the NYSE volume moved above average, up 9% on NASDAQ to 2.3B and up 8.2% on the NYSE to 1.4B. Both were above average, and that is very significant volume. Coupling that with the price action, you see there was a big rush in the morning and then it was drop kicked back down on higher volume. That is never a good sign when you see stocks trying to break to a new high, particularly when they are trying to break out of a previously four-day lateral move. There were four days of lateral movement on the close, they tried to make the breakout, but were drop kicked right back in. They did not break down, but they were not able to hold the move and sometimes it showed the sellers were a bit stronger. Sometimes this can portend a further move down in the coming sessions or the coming week because a lot of times when a market is tired you will see stocks try to make a break to a new high (and as you look at the techs you can see their patterns are tired because they have rallied along way). It looks like they are making a break only to immediately reverse. That happens on the bottom, too. It looks like a stock is breaking out of a range or breaking through key support and its goose is cooked, but then it reverses - maybe not that day, but on the next session it reverses and then rallies right back up. Had a little shake out there, hit a key point - if it was at a key support point, you always have to watch that because you can get a reversal. Here we have the indices on a new high following the March rally; they rose up and then reversed back. You can see that turn back on you and turn what looked to be a positive into a negative and a selloff. That is what you have to watch when you see these kinds of moves.

There are still positives here. The indices are all still in uptrends, no question about that. This is not really a threat to them at this point (at least not to the uptrends), a there is still a world of liquidity out there - literally a world of liquidity. There are funds here in the US with pockets and briefcases full of money waiting to be put into the market. The money is not loaned and needs to go somewhere, so it is going in the market. This is not a serious threat to the market yet. Sure it rallied up and turned over, but it is still in the same lateral move it was in before the day. It did not break down. It reversed and sold off, but the indices closed flat on the day. There was not any huge break down. Friday was not a major change of character, but it was an indication that NASDAQ is still very tired and it could reverse, but it was not a reversal in and of itself.

LEADERSHIP.

The techs tried. They had a red carpet rolled out for them, and they could have been leaders once again, but then they decided they could not hold the gain. Some of them did hold gains; some of the chips gapped up and managed to hold their moves for the day, but they were also well off of the highs. Many of them were showing those gaps to dojis, and we have to watch how those play out next week.

Always keep a list of gapping stocks on your watch lists. Keep them around whether they gapped up on good news, down on bad news, or just gapped for no apparent reason at all. If they go through a key area, they often continue on in the direction of the gap, whether it is up or down. Keep an eye on them. They can gap up and then reverse and gap right back down, and that can give you a play as well. It is always worth keeping an eye on gaps because if they fill or whatever they do down the road, you may not play them for two or three weeks, you may have to let the play form up and then when it is ready you move in. You can get some nice trades whether it is a gap fill and then rebound the other way, or if it is a continuation of a breakaway type of gap.

We saw the tech retire and we saw techs such as AMZN break below the 50 day EMA. We picked up a little of that just in case. If there is a reversal, the big techs are tired, but AMZN has been a good one - kind of a portent for what is going on. We saw BRCM gap higher, and it gapped up to a doji and may give us a downside play yet. We will see if it sets up, but we are not going to jump into it any time soon.

Software was interesting because it had been leading quite nicely. I was looking at some of the plays, but it had a tough day on Friday. There was good news in the techs in general, but software lost some money. Some stocks sold off sharply in price and on volume. We have to watch that because they were an emerging leadership group in technology, and it looked like they may be able to give technology a new breath of life, yet they got shot right in the solar plexus on Friday and they are wheezing. That may hurt NASDAQ next week.

As for the good, the industrial metals were quite solid, and gold was up as well. Gold may be trying to make a price breakout. It is not as high as it was a few months back, but it has been bumping into the $955 level and struggling. On Friday, it closed above that level at $957.20, up $9.20. It has been banging around that $955, so it is not a clean break by any stretch, but it did gap higher, and it could make a breakout and try to make a run back to $1,000. Other metals look solid; they are in great patterns and look like they could break up as well, hence that bit of Reliant Steel we picked up. That was a good buy, and I will be looking for those kinds of buys in the next week as well because their patterns are still very solid. They did not reverse back on the day as did techs and some other stocks.

Retail has been a leader of late, but it took the day off of Friday. It has put in its work, and it was time to take a tax-free holiday. There were no major losses there, there was just a pullback. We could use some good pullback for about three days in retail because it would give us some better buys on some stocks that have made good moves and then form little flag patterns (that 1, 2, 3, 4 pullback that we can use to move in). There is still plenty of leadership out there, but a lot of it is tired. Retail is kind of tired right now, and it has had a good run. Tech is obviously tired, but maybe it will pull something out of the hat and continue higher. Sometimes indices and sectors just do that no matter what you think or how bad they look - they just continue to run. I do not think that will happen, but we will see. Leadership was tired, but there is a new group of leadership coming up in the metals and in energy that has had a nice base going for the last 8-12 weeks. These stocks have chopped around while some of the other sectors moved higher, and they are getting set up nicely. That is good because it is kind of an inflation play.

There may not be inflation tomorrow or next month or the next quarter, but something must change with respect to all of the liquidity in the world. It is not being used, and we have more money chasing the same amount of goods because we are not getting ramp up in inventories right now. Business inventories are falling, and maybe that will reverse. Maybe they will start going through the roof, but the problem is that the textbook definition of inflation is more money chasing the same or fewer number of goods. Right now we have the same or fewer number of goods; there is no doubt about that with the contraction in wholesale and business inventories. The question is whether that will lead to immediate inflation, or if there will be a burst of supply development that is going to alleviate this problem and put the money to work and create more supply. We will see if that is the case, but that is a very strong reason that we are seeing metals move higher, along with improvement in the European economy.

China has been buying, but has not been buying anymore for economic advancement, it is buying to hoard and stockpile. It is going to slow down its buying, and that will not keep the pressure on the prices. What keeps pressure on the prices is real demand and inflation. These are hedges. These are hard assets that people want to hold in times of inflation because, as we all know, paper currency are not a good store of value in times of inflation.

THE ECONOMY

Michigan sentiment improving.

This week was another week of better economic data. We saw the confidence improve in Europe, and in the United States. We saw the manufacturing continue to improve in Europe and we saw some regional manufacturing results turn positive here in the US last week. Home inventories were down, new home and existing home sales were up. There was improved confidence and sentiment in the US, even though Michigan Sentiment was not great on Friday. It came in at 65.7 which beat expectations of 64, but it was less than the previous iteration that was at 66.0. It was not a blowout sentiment number, just as the conference board's improvement in their consumer confidence number early last week was not that great either. It is still at recession levels and not showing a major upturn in confidence, but it is showing a turn - something that we have not had for many, many quarters. With a little improvement in confidence, maybe it can get the ball rolling along with these other indications that we are seeing.

Spending juiced by cash for clunkers.

One of the big reports out on Friday was personal spending and income. Incomes were actually flat instead of the 0.1% gain expected, but that was much better than the -1.1% in June that was revised from -1.3% originally. A better revision is always a positive, but it was not that much of a positive in this case. Spending was as expected, up 0.2%, and in June it was revised higher to 0.6% from 0.4%. Why did we have this bump? Everyone is saying it was the "cash for clunkers" where the government decided it would help the car dealerships and give everybody money to turn in their cars and get new ones. It is a great plan if you want to sell cars, but you have to really want a car because it is an incentive to you to get $4,500 cash back, but you might have to buy a $25-40K car. That means taking on extra debt unless you have your car paid off but, gosh, who does that anymore, right? Just most people who have common sense. Getting a car probably means getting a new extended loan or debt obligation out there, so you really need a good reason, like your current car truly is a clunker. I know some people who did turn theirs in and, believe me, they were clunkers. It is good to have them off of the road.

The government now wants to push an appliance deal; they want to give people rebates or cash back to go and buy appliances. There are no details out yet whether it is a stove, oven, dishwasher or that sort of thing that you have to buy. I guess we will see "cash for junk boxes" or what have you, and I guess that is fine. The problem that I have with this is that the government is picking which sectors win and lose. It is always better when the government says it will give a credit for buying assets for your business or buying assets that you can use in your home. It is better when it does not try to pick and choose the winners, but when it just says they want to get production up everywhere, to get supply and demand going. Let the consumer decide where the money should go. Let the market decide and the market will push the money to where it is most needed and its most efficient use. It is bad news when the government picks the winners and losers. That is the kind of structured, organized government that we have seen fail throughout history, and why we would want to emulate that is beyond me.

Who makes the jobs in the US?

Case in point, Whirlpool announced on Friday that it is closing a plant in Illinois and is going to lay off 1100 workers. Its stock price is going up because there is some anticipation of economic recovery, but also because it has been cutting costs like crazy and bleeding jobs accordingly. It is just the same as all major companies, whether it is GE or GM or any of them. They are bleeding jobs and have been doing so for 15 years. They do not create jobs, so we do not need to be giving GE massive amounts of money for green initiatives that are going to save that company. They are in bed with the current administration and lobbying for these green initiatives that they will make money off of, yet GE has not created any jobs in 15 years. It has had net losses of jobs. The government's own statistics show that over 75% of all new jobs come from what are designated as small businesses with 500 employees or less. That includes mom and pop, that includes me, and that includes a lot of you that are seeing this. We create most of the jobs, so why would we want to have programs that are targeted to companies that are not creating jobs? The administration says is its primary concern is creating jobs, but that is not the case. If they truly do want to create jobs, why give money to companies that will be laying employees off even as they get the benefits of these programs? Think about that and talk to your Senators and House representatives and ask them about the logic of that. There is an incongruity with what we hear out of Washington and what actually happens, between who is being helped and who actually creates the jobs. You can see the disconnect here. Washington has it backwards. We have reverse incentives for those who actually make the economy work, and that is one of the reasons I am concerned that we will have a hard time seriously recovering.

We are having economic improvement, but it is just a matter of how strong will it be. Eventually the economy has to balance with trillions of dollars circulating through it and that is what we are seeing. There has also been the readjustment with worry about another Great Depression where the economy just shuts down completely, but now prices have adjusted back and the economy is starting to work again. That means you are naturally and necessarily going to have an improvement in the economic numbers, but the question is if it will be a boom or if we will just skate by with 1% GDP growth. Top estimates are at 2.2% for next year. That is terrible. That is not even at European standards really. Is the stimulus working? We will have to see what results we will get over the next year. Maybe it will, but odds are (and history says) that it will not be that strong of a recovery.

THE MARKET

MARKET SENTIMENT

VIX: 24.76; +0.08
VXN: 24.93; -0.08
VXO: 23.61; +0.22

Put/Call Ratio (CBOE): 0.76; -0.06

Bulls versus Bears:

This is a reading of the number of bullish investment advisors versus bearish advisors. The reason you look at this is that it gives you an idea of how bullish investors are. If they are too bullish then everyone is in the market and it is heading for a top: if everyone wants to be in the market then all the money is in and there is no more new cash to drive it higher. On the other side of the spectrum if there are a lot of bears then there is a lot of cash on the sideline, and as the market rallies it drags that cash in as the bears give in. That cash provides the market the fuel to move higher. If bears are low it is the same as a lot of bulls: everyone is in and the market doesn't have the cash to drive it higher.

Bulls: 48.3% down from 49.4%. This follows a steady rise past the 35% level that is the threshold for what is considered a bullish climate. It does not mean things are bearish; that takes a reading in the 60% range. Hit a high of 47.7% mid-June on the run from the March lows. Again, to be seriously bearish it needs to get up to the 60% to 65% level. Dramatic rise from 21.3% in November 2008, the bottom on this leg. This last leg down showed us the largest single week drop we have ever seen, falling from 33.7% to 25.3%. Hit 40.7% on the high during the rally off the July 2008 lows. 30.9% was the March low. In March the indicator did its job with the dive below 35% and the crossover with the bears. A move into the lower 40's is a decline of significance. A move to 35% is a bullish indicator.

Bears: 23.1% up from 21.3%. Rebounding some from the big drop two weeks back from 31.1% and 35.6% the prior week. Still a massive exodus from the ranks of bears. For reference, cracking above the 35% threshold considered bullish. Hit a high on this run at 47.2%. For reference, bearishness hit a 5 year high at 54.4% the last week of October 2008. The move over 50 took bearish sentiment to its highest level since 1995. Extreme negative sentiment. Prior levels for comparison: Bearishness peaked at 37.4% in September 2007. It topped the June 2006 peak (36%) on that run. That June peak eclipsed the March 2006 high (33%) and well above the 2005 highs that spawned new rallies (30% in May 2005, 29.2% in October 2005). That was a huge turn, unlike any seen in recent history.

NASDAQ

Stats: +1.04 points (+0.05%) to close at 2028.77
Volume: 2.315B (+9.42%)

Up Volume: 1.596B (+296.593M)
Down Volume: 729.483M (-62.044M)

A/D and Hi/Lo: Decliners led 1.82 to 1
Previous Session: Decliners led 1.07 to 1

New Highs: 79 (+28)
New Lows: 12 (+3)

NASDAQ CHART: Click to view the chart

NASDAQ 100 CHART: Click to view the chart

SOX CHART: Click to view the chart

SP500/NYSE

Stats: -2.05 points (-0.2%) to close at 1028.93
NYSE Volume: 1.392B (+8.26%)

Up Volume: 890.386M (+25.865M)
Down Volume: 484.688M (+85.288M)

A/D and Hi/Lo: Advancers led 1.06 to 1
Previous Session: Advancers led 1.2 to 1

New Highs: 106 (+10)
New Lows: 66 (+30)

SP500 CHART: Click to view the chart

SP600 Chart: Click to view the chart

DJ30

Stats: -36.43 points (-0.38%) to close at 9544.2
Volume DJ30: 205M shares Friday versus 163M shares Thursday.

DJ30 CHART: Click to view the chart

MONDAY

Lots of data to come and a technical picture to resolve.

There is going to be a lot happening in the coming week, and it will be a data week as well as a technical week. We are going to see the Chicago PMI and the national ISM - this is the one people have been waiting for. We have seen Europe turn positive, and we have seen some of the regions turn positive. Can the nationwide number on the US pop over 50? Expectations are right now that it is going to be 50.2 versus 48.9 in July. The bar is set and we will see if it can jump over it. There is also the ADP, the employment report, and you know what that means for Friday. We have the FOMC minutes coming out, and we get to see just where the Fed is with respect to withdrawing any stimulus. That has been a hot topic, if not this week than the week before. Of course there is the jobs report on Friday. -225 nonfarm jobs expected. That is terrible, but it is an improvement.

We have a market that was flat for the entire week. It went up, then moved flat for the rest of the week. There was a gap on expiration Friday, holding at post-March highs, but the market could not push it when there was good news on Friday. Maybe that was just a Friday in the summer and no gain would hold anyway. You have to go back to the fact that volume was higher, though. It moved above average on both of the major exchanges, so it was not a fact that there was no one trading and no one ready to buy - they were there and ready to buy and they gapped them higher, but then they got sold back on more volume. It was not your average Friday in the summer that was just languid and slipped into the weekend to imbibe some alcoholic beverages. That was not the case.

That makes next week another interesting week, as the Chinese would say. This could have been an inflection point this last week. We had the gap higher on expiration and it did nothing with it. The market deferred the next major move until the following week. We will see what happens this coming week. The fact that the market rallied, gapped on Friday and reversed makes it somewhat more interesting and indicates to me that there could be a decision made this week about where the market is going to go in the near term. While I see a lot of tired patterns in NASDAQ, the big cap techs, one thing had been a constant in this market and that is that every time the sellers have tried to sell it, the money has come in and refused to let them take the market down. Indeed, when it has gone down, the money has come in and driven the indices back up.

When a company that has reported great earnings and has always beat and has been on a great run for several quarters or two or three years - what happens when they finally do not beat? It is either already been built into the stock or they get crushed if expectations are that they will beat. If the market does not make a rebound, if it sells off and the money does not bounce it back up, then that will be a very important move. Thus far it has done it. Two Mondays ago, it gapped lower and did not come back that session. That looked pretty grim, but it rebounded after that. It is not always the first session that happens, it is what leads up to it and then how the buyers come back in after the selloff. Remember, we are in a world full of money now, and it is the buyers' to lose. If they do not want to come in and back up to truck and pick up stocks on any dip, we will all see that happen. These tired patterns on NASDAQ are giving a hint of saying that something could be up because they had cruddy patterns, gapped on Friday, and could not hold it even though it had good news. They are trying to tell us something and we will watch what happens and see if the sellers come in and can keep the market down, or if the buyers just back off for now and want to wait until prices get a bit better. That is why we took some downside positions.

Our SPY and SMAs are kind of beating us up around the head and shoulders, but they were somewhat of a hedge anyway against these patterns that were developing, and our upside that we have, and if they roll down we will be fine on those. We also took a few others that are in good shape, and if the market sells back we will make good money on those. If the market sells back enough, we have a lot of stocks that we have gain built into - we will just let the market take us out on those and go home with the rest of our gain. We took some gain on the early gap higher on Friday figuring it would roll back over. We have our stocks in good positions, we have taken good position as far as the risk/reward. If the play does not work out and turns down, we can get out of it without any major losses and protect a lot of the money that we have made on the way up. If it sells down, then we make money as it comes back. I will also be looking to the upside with those energy and metals stocks and a few others that I will be looking at this weekend. If they decide to lead and if the money stays around and comes back in, those stocks that are the next wave and have set up good bases are going to be the leaders. NASDAQ stocks are tired and are going to fade even if the market continues higher. They may follow along, but they will not be blazing higher and leading the way. That will be up to these others that look quite solid and we will be dealing with them and buying into them as they make their breakouts. As I said, we took some gain in them on Friday.

We have our plan laid out there. We have tech that is tired and reversed. We have retail which has been a leader, but it took a day off and we will see if it gets worse or just takes a breather and comes back. We have some great stocks in energy and metals and industrials that continue to perform well and look ready to break out if the money is going to stay in the market and send it higher. More of the same story - we are still seeing whether we can hold these highs, but thus far the money has won the day. Have a great weekend, and I will see you on Monday.

Support and Resistance

NASDAQ: Closed at 2028.77
Resistance:
2070 is the September 2008 intraday low
2099 is the mid-September 2008 closing low
2169 is the March 2008 double bottom low

Support:
2016 is the August peak
The 18 day EMA at 1994
1984 from late September
1962 is the bottom of the August 2009 range.
1947 is the October gap down point
The 50 day EMA at 1926
1897 is the October post gap intraday high.
1880 is the June peak
1862 is the July peak
1786 is the November intraday high
1780 is the November 2008 closing peak
1773 is the May intraday peak
1770 is the mid-October interim peak
1673 is the prior April peak
1666 is the intraday January 2009 peak
1664 is the May 2008 low
1661 is the April 2009 prior peak
The 200 day SM A at 1660
The January closing peak at 1653 (intraday)

S&P 500: Closed at 1028.93
Resistance:
1044 is the October 2008 intraday high
1106 is the September 2008 low
1133 from a September 2008 intraday low
1185 from late September 2008
1200 from the July 2008 low

Support:
The August intraday peak at 1018
The 18 day EMA at 1009
The November 2008 peak at 1006 closing 1007.53 intraday
992 is the August 2009 consolidation low
The 50 day EMA at 973
956 is the June intraday peak
944 is the January 2009 high
935 is the January closing high
932 is the July peak
930 is the May peak
919 is the early December peak is bending
899 is the early October closing low
896 is the late November 2008 peak
888.70 is the April intraday high.
882 is the early May low
The 200 day SMA at 879
878 is the late January 2009 peak
The prior April peak at 876
866 is the second October 2008 low
857 is the December consolidation low

Dow: Closed at 9544.20
Resistance:
9625 is the October 2008 closing high
10,365 is the late September low

Support:
9387 is the mid-October peak
The 18 day EMA at 9367
9116 is the August low
9088 is the January 2009 peak
The 50 day EMA at 9039
8985 is the closing low in the mid-2003 consolidation
8934 is the December closing high
8878 is the June peak
8829 is the late November 2008 peak
8626 from December 2002
8588 is the May high
8581 is the July peak
8521 is an interim high in March 2003 after the March 2003 low
8451 is the early October closing low
8419 is the late December closing low in that consolidation
8375 is the late January 2009 interim peak
The 200 day SMA at 8329
8315 is the February 2009 peak
8307 is the April 2009 intraday high
8221 is the May 2008 low

Economic Calendar

These are consensus expectations. Our expectations will vary and are discussed in the 'Economy' section.

August 31 - Monday
- Chicago PMI, August (09:45): 47.2 expected, 43.4 prior

September 01 - Tuesday
- Construction Spendin, July (10:00): -0.2% expected, 0.3% prior
- ISM Index, August (10:00): 50.2 expected, 48.9 prior
- Auto Sales, August (14:00): 4.2M prior
- Truck Sales, August (14:00): 4.2M prior

September 02 - Wednesday
- ADP Employment Chang, (08:15): -246K expected, -371K prior
- Productivity-Rev., Q2 (08:30): 6.1% expected, 6.4% prior
- Factory Orders, July (10:00): 1.5% expected, 0.4% prior
- Crude Inventories, 08/28 (10:30): +128K prior
- FOMC Minutes, August. 12 (14:00)

September 03 - Thursday
- Initial Claims, 08/29 (08:30): 570K expected, 570K prior
- ISM Services, August (10:00): 48.0 expected, 46.4 prior

September 04 - Friday
- Average Workweek, August (08:30): 33.1 expected, 33.1 prior
- Hourly Earnings, August (08:30): 0.1% expected, 0.2% prior
- Nonfarm Payrolls, August (08:30): -225K expected, -247K prior
- Unemployment Rate, August (08:30): 9.5% expected, 9.4% prior
icon url

ReturntoSender

08/31/09 10:38 PM

#8665 RE: ReturntoSender #6755

From Briefing.com: 4:25 pm : Both stocks and commodities spent the entire session trading with considerable weakness as a broad-based selling effort took hold following a steep sell-off in China's Shanghai Composite Index.

The Shanghai Composite dropped 6.7% on Monday to hit a three-month closing low and log its second worst monthly performance in 15 years amid valuation concerns and fears that tighter lending in China will impede the flow of investment funds. Investors and traders responded to the selling effort by sending many of the major global averages lower. In turn, the Dow Jones World Index lost 0.8%.

The major U.S. indices managed to trim some of their losses into the close, though. The late lift came as consumer staples stocks garnered enough support to finish with a 0.3% gain, the only one seen among the major sectors in the S&P 500.

Health care stocks finished just 0.2% lower and financials limited their loss to 0.4% after being down nearly 2% in the early going. The financial sector's rebound came amid buying in diversified bank stocks (+0.8%), even though Reuters reported that a highly regarded analyst expects U.S. bank earnings to remain dismal this year. However, the report indicated that regional banks (-0.8%) would be the ones to continue booking losses into 2010.

Weakness among stocks bled into commodities pits and sent oil prices down 3.9% to $69.92 per barrel. Meanwhile, gold prices lost 0.5% to settle at $953.50 per ounce. In a broader measure of the weakness surrounding commodities, the CRB Commodity Index dropped 1.6%.

The decline among basic commodities and weakness in the equity market left materials stocks and energy stocks to suffer some of the worst losses in the broader market. They dropped a respective 1.4% and 1.8%. BJ Services (BJS 16.06, +0.63) was one of the few energy holdings to garner support, but that was only because Baker Hughes (BHI 34.45, -3.64) announced it will pay cash and stock to acquire the smaller oil services company in a transaction valued at roughly $5.5 billion.

Disney (DIS 26.04, -0.80) announced that it will make an acquisition of its own. The broadcasting and entertainment company will take over Marvel Entertainment (MVL 48.37, +9.72) for $30 per share in cash and approximately 0.745 shares of DIS.

Outside of the M&A news, there weren't many corporate headlines for participants to digest. Such will likely be the cast tomorrow since there aren't any major companies scheduled to announce their quarterly results prior to Tuesday's opening bell. However, ISM manufacturing data for August, construction spending data for July, and pending home sales data for July are likely to provide participants with direction.

Vehicle sales data are also expected to be released tomorrow, although Ford (F 7.60 -0.13) already stated that its U.S. auto sales for August were up year-over-year earlier. The specific number of sales has yet to be released, but many believe that the results were driven by the one-time incentives of the Cash for Clunkers program.

Trading volume climbed above its 50-day moving average by coming in near 1.4 billion shares on the NYSE. That's the first non options-expiration session in which trading volume surpassed the moving average mark since early August.DJ30 -47.92 NASDAQ -19.71 NQ100 -1.1% R2K -1.3% SP400 -1.3% SP500 -8.31 NASDAQ Adv/Vol/Dec 749/2.29 bln/1938 NYSE Adv/Vol/Dec 795/1.38 bln/2205

9:15AM Tower Semicon: TAEJIN selects Tower Semiconductor's power management process (TSEM) 1.20 : TAEJIN Technology, a supplier of linear and switching regulators to a wide variety of consumer and mobile applications, today announced it has selected Tower Semiconductor, a global specialty foundry, to manufacture its low power, high efficiency voltage regulator ICs. Tower was chosen for its advanced power management platform to enable TAEJIN to quickly address the needs of the multi-billion dollar voltage regulators market which, according to iSuppli is expected to grow from $5 billion in 2009 to approximately $7 billion in 2013.

8:42AM Marvell's communications and application processors selected for China Mobile open mobile system phones (MRVL) 15.36 : Co announces that its communications and application processors were selected for the new line of handsets launched as part of China Mobile's (CHL) Open Mobile System. China Mobile, the world's largest mobile phone operator by number of subscribers, introduced the phones in Beijing earlier today.

8:26AM Global chip sales increase 5.3% month-on-month : Worldwide sales of semiconductors in July were $18.2 billion, an increase of 5.3% from June 2009 when sales were $17.2 billion, the Semiconductor Industry Association reported today. SIA noted that the year-on-year rate of decline has moderated as the year has progressed. The first six months of 2009 saw an average monthly year-on-year decline of approximately 25%, while July 2009 sales were 18.2% lower than July 2008. All monthly sales numbers represent a three-month moving average of global semiconductor sales. "The fifth-consecutive month of sequential increases in semiconductor sales reflects improving demand in the consumer sector," said SIA President George Scalise. "Sales of consumer products such as netbook PCs and cell phones are supporting the modest recovery in demand that is now under way. Purchases of Information Technology products by the enterprise sector continue to be tempered by caution and longer replacement cycles. There is also evidence of a return to seasonal industry patterns," Scalise concluded.

4:07AM LDK Solar partners with Susian City on PV projects (LDK) 9.24 : Co announces that it has entered into an agreement with Suqian City of Jiangsu Province for the development of PV power projects. According to the agreement, LDK Solar will develop PV power projects in buildings, plants and integration systems, totaling up to 300 MW by 2015. The terms, including financing, design and specific location of each of the projects, will require a feasibility study as well as final approval from relevant governmental departments prior to initiation.

09:44 am Intel target raised to $24 at Deutsche Bank following raised guidance: . Deutsche Bank raises their INTC tgt to $24 from $22 following the co's raised 3Q09 rev guidance Friday which firm believes reflects healthier endmarket demand for PCs and is well beyond simple inventory refill. Although macro-economic headwinds persist firm believes MPU supply is tight, with firm more concerned with potential shortages than excess supply. Slower supply growth should continue to support margins and ASPs. Firm notes its 2010E operating profit is still 20% below 2005 levels suggesting there is further room for growth.

09:55 am Sun Microsystems (JAVA)

Sun Microsystems (JAVA 9.31, -0.03) reported earnings late Friday which were slightly worse than Wall Street estimates.

The company reported a fiscal fourth quarter loss of $0.20 per share, which was $0.01 worse than the First Call consensus of a loss of $0.19 per share.

Revenue declined 30.6% year-over-year to $2.63 billion, but managed to beat consensus estimates of $2.37 billion.

Sun is being acquired by Oracle (ORCL 21.98, -0.18) for $7 billion, a transaction that recently won U.S. antitrust approval; European antitrust approval is expected soon.

icon url

ReturntoSender

09/02/09 7:18 PM

#8667 RE: ReturntoSender #6755

From Briefing.com: 4:30 pm : Despite plenty of trading catalysts, participants kept stocks confined to a relatively narrow trading range as they allowed the previous session's sell-off to consolidate in low-volume trade.

There weren't any widely-held companies making announcements this morning, so economic data dominated headlines. The ADP Employment Change Report for August topped the calendar, but its suggestion that 298,000 private jobs were lost last month proved disappointing since economists were expecting 250,000 job losses. Given the magnitude of the miss, many are wondering whether the current consensus forecast for 225,000 job losses in the government's official nonfarm payrolls report is too conservative. The official jobs report for August will be released Friday.

Concerns about job losses and the weakness of labor markets were expressed in the minutes from the FOMC's latest meeting, which concluded on Aug. 15.

The FOMC minutes also indicated that some of the committee members disagreed about whether slack in the economy will keep inflation low. At least for now, though, inflationary pressures remain in check. That was made evident by news that unit labor costs for the second quarter were down a sharp 5.9%, which was slightly steeper than what had been expected, while second quarter productivity spiked 6.6% in its sharpest percentage increase since 2003. The increase in productivity was slightly better than the 6.4% increase that was widely expected.

Factory orders made for July made their sharpest increase since June 2008 by climbing 1.3%, but that was still short of the 2.2% increase that had been generally expected. Despite the less-than-stellar batch of economic data, stocks spent nearly the entire session trading just a few points to either side of the neutral line before sliding a bit into the close.

Aside a rather weak close, the overall temperament of participants contrasted that of the previous session, when stocks were sent sharply lower following a bevy of generally upbeat reports. Trading volume wasn't what it was in the previous session, either. Some 1.6 billion shares traded hands in the NYSE on Wednesday, but 1.3 billion shares were exchanged this time around.

Action was largely listless this session, though materials stocks managed to sport solid gains for most of the session. Aside from a 0.2% advance by the consumer staples sector, materials stocks made up the only major sector in the S&P 500 to log a gain. They advanced 0.6% as metals and mining stocks followed a surge in gold prices.

Gold prices settled pit trading 2.3% higher at $978.50 per ounce, near its best level since June.

Oil prices weren't quite so fortunate. Early in the session oil prices pushed higher as they shrugged off weekly inventory data that showed a smaller-than-expected draw of 372,000 barrels. Oil actually made its way to roughly $68.70 per barrel, but finished flat at $68.05 per barrel.

Treasuries had a strong session. Helped by a subdued mood among equity traders and the FOMC minutes, the benchmark 10-year Note added 18 ticks, which pushed its yield below 3.3% for the first time since May.

There aren't any widely-held companies scheduled to make quarterly announcements tomorrow, but several retailers will be out with their latest same-store sales results. Still, most of the session's focus will be on the latest batch of economic data, which includes the latest jobless claims numbers and the August ISM Service Index. DJ30 -29.93 NASDAQ -1.82 NQ100 -0.1% R2K -0.4% SP400 -0.5% SP500 -3.29 NASDAQ Adv/Vol/Dec 1266/2.00 bln/1386 NYSE Adv/Vol/Dec 1159/1.38 bln/1836

4:01PM Agilent separates bio-analytical business into Life Sciences and Chemical Analysis Groups (A) 25.26 -0.64 : Co announces the separation of its Life Science and Chemical Analysis Group into two businesses, Chemical Analysis and Life Sciences. The change in structure reflects the growth opportunities of each business and supports Agilent's continued evolution as a leading bio-analytical company

5:03AM Tower Semiconductor raises Q3 revenue guidance (TSEM) 1.04 : Co expects Q3 revenue to exceed previous guidance given on August 12, 2009 due to increased customer demand. The co now expects Q3 revenue of $77.0-80.0 mln vs $61.1 mln single-analyst estimate.

09:21 am Research In Motion ests raised at AmTech on higher units/sub adds/lower margins: . AmTech expects a solid report and outlook from RIMM on 9/24. Firm raised its FY10/FY11 pro-forma ests to $4.30/$5.25 from $4.27/$5.20 ($4.13/$4.86 consensus) on higher units and subscriber additions and slightly lower margins. Firm forecasts August at the upper-end of the guided range driven by the Tour launch at VZ, continued momentum of Javelin and Gemini, and geographic expansion. Forecasts GAAP EPS of $1.01 on $3.7 bln vs guidance of $0.94-1.03 on $3.45-3.7 bln ($1.00/$3.6 bln consensus) based on 8.5 mln units, 4.0 mln subscriber additions and a 43.1% gross margin. Firm is looking for a seasonal build and the launch of Bold 2 and Storm 2 to drive November.

icon url

ReturntoSender

09/03/09 11:17 PM

#8668 RE: ReturntoSender #6755

From Briefing.com: 4:30 pm : A late squeeze gave stocks a strong finish after they had spent most of the session in a rather narrow range that was largely underscored by thin trading. Though there were several trading catalysts to drive action this session, the overall mood among participants was subdued ahead of the August nonfarm jobs report.

A near 5% spike by China's stock market helped stir a positive bias ahead of the U.S. open. However, another dismal dose of jobless claims disrupted the strong tone. Initial claims for the week ending Aug. 29 totaled 570,000, down just 4,000 from the previous week, but slightly more than the 564,000 that were expected. The week-over-week increase took the 4-week moving average up to 571,300, leaving economists with the impression that the weekly trend isn't headed lower any time soon.

With the labor market mired in weakness, continuing claims jumped to 6.23 million from 6.14 million. Economists, on average, expected continuing claims to remain steady since many unemployed workers are losing their benefits.

Still, stocks were able to start the session in higher ground, but they quickly came under pressure ahead of the August ISM Services Index, which topped the consensus estimate of 48.0 by coming in at 48.4, a high for the year.

Shortly after the ISM's release the major indices dipped into the red, but managed to rebound after holding above the previous session's lows. Financials were a primary source of support as they led gains for the entire session -- financials finished 2.3% higher amid strong buying in diversified banks (+2.7%) and multiline insurers (+3.5%).

Retailers like Gap (GPS 21.18, +1.49), Limited (LTD 15.53, +0.81), and Target (TGT 47.07, +0.80) posted this morning negative same-store sales results for August. However, their results weren't as bad as feared, so investors responded by sending the group 2.0% higher.

Materials stocks (+1.6%) fared well as gold and silver extended their recent run amid technical buying and short covering. Gold prices made their way to fresh six month highs and just $0.50 short of the $1,000 per ounce mark before pulling back a bit. Still, gold prices settled at $997.70 per ounce, up nearly 2%. That comes on the back of a 2.3% breakout in the previous session. Silver fared even better. Contract prices for the precious metal registered fresh 52-week highs of $16.31 per ounce and held steady into the close. Silver finished at $16.29 per ounce, up 6%.

Friday's attention will be focused on the August nonfarm payrolls report, which is due ahead of tomorrow's opening bell, since many economists believe that it is a telling sign of the economy's health.DJ30 +63.94 NASDAQ +16.13 NQ100 +0.7% R2K +1.2% SP400 +1.4% SP500 +8.49 NASDAQ Adv/Vol/Dec 1781/1.87 bln/854 NYSE Adv/Vol/Dec 2325/1.16 bln/688

11:30AM First Solar announces that Robert Gillette has been appointed chief executive officer, succeeding Mike Ahearn (FSLR) 119.54 +1.22 :

7:04AM Ciena beats by $0.08, beats on revs; sees Q4 revs flat sequentially, in-line with consensus (CIEN) 12.27 : Reports Q3 (Jul) loss of $0.05 per share, excluding non-recurring items, $0.08 better than the First Call consensus of ($0.13); revenues fell 34.9% year/year to $164.8 mln vs the $152.6 mln consensus. Adjusted gross margin was 46%. "Industry sentiment has improved somewhat over the first half of the calendar year as a result of what seems to be a stabilizing macro environment combined with continued pressure on service providers to increase network capacity and deliver more services," said Smith. "While we continue to believe our network vision and portfolio align well with our customers' current and future business priorities, customers in general continue to spend cautiously. As result, we expect our fiscal fourth quarter revenue will be roughly flat with our fiscal third quarter level" (this is in-line rev guidance, as consensus calls for Q4 revs of $163.8 mln vs Q3 revs of $164.8).

4:46AM Solarfun Power secures RMB400 mln credit facility with Bank of Shanghai (SOLF) 4.79 :

3:42AM Tower Semiconductor raises $15.8 mln from institutional investors (TSEM) 0.96 : Co announces it has received and accepted orders from Israeli institutional investors of approx $15.8 mln for cash investment in the co's equity. In consideration for this cash investment, TSEN has committed to issue to the investors 15.8 mln ordinary shares, based on a price of NIS 3.80 (approx $1.00) per share as well as warrants to purchase 3.95 mln ordinary shares.

09:28 am Cisco Systems tgt raised to $27 at RBC Capital Mkts on growth initiatives: . RBC Capital Mkts notes Cisco is turning up the offensive as it focuses to reclaim lost market share and grow its addressable market. Add these initiatives to a recovering enterprise market and investors may expand Cisco's multiple. The downturn may be behind us and Cisco is opportunistically adding headcount to target rich verticals such as education, healthcare and public safety while proactively adjusting its channel programs to lock in its loyal customer base. For planning, Cisco is not factoring in any service provider spending flush late this year, implying that any incremental spend by AT&T, Verizon, or others may prove to be upside to Cisco's Jan. qtr. RBC raises its CSCO tgt to $27 from $25.
icon url

ReturntoSender

09/07/09 8:52 PM

#8669 RE: ReturntoSender #6755

From Briefing.com: Weekly Recap - Week ending 04-Sep-09

Just a few weeks ago, with U.S. equity markets in the middle of their most recent upturn, market sentiment was so high that investors ignored poor economic data, only focusing on positive numbers. That trend seemed to go out the window Tuesday as the major indices sold off sharply following a batch of better-than-expected data, but then rebounded ahead of and following poor employment data Friday.

In the end, the major indices closed the week with declines ranging from -0.5% to -1.6%. Nine of the ten sectors that make up the S&P 500 fell, led by Financials (-3.59%). Consumer Staples was the only sector in the black (+0.56%).

Following modest declines on Monday, presaged by a 6.7% plunge in China's Shanghai Composite on continued liquidity concerns, the major indices began the month of September, historically the worst for stocks, slightly higher. At 10:00ET economic data showed that ISM Manufacturing returned to the expansion stage -- which Chicago PMI had done the day before -- with a better-than-expected reading of 52.9 in August (consensus 50.5). Pending Home Sales also came in positive for a sixth consecutive month, rising 3.2% in July (consensus 1.5%).

The market, however, failed to react strongly (unlike prior weeks), and that led to selling pressure as the non-response was interpreted as a confirmation that the good news was already priced into the market and was viewed as another sign of the rally being exhausted. The S&P dropped 20 points between 10:30ET and 11:30ET, closing with a decline of 2.2%.

The Financial sector saw the most severe declines Tuesday, causing some to make the point that the selling was the byproduct of rumors that a negative development in the banking sector was about to be announced. Heavy put buying in Wells Fargo (WFC) on rumors of a dilutive secondary offering made the rounds, but they proved untrue as the company came out just before the close to announce it intended to repay the TARP funds it borrowed without raising equity.

After some consolidative trade over most of the next two sessions -- which included investors shrugging off Initial Claims and ADP data ahead of Friday's employment report -- the major indices staged a late recovery on Thursday as investors covered their short positions in front of the August employment report.

The data in the employment report was les than desirable, as a weaker-than-expected unemployment rate of 9.7% (consensus 9.5%) and downward revisions for nonfarm payrolls in June and July more than offset a slightly better-than-expected number in August nonfarm payrolls (-216,000 vs. the -230,000 consensus).

Despite the otherwise bad news, the market trended higher Friday and logged a gain of 1.3%. Perhaps investors have already reverted back to focusing on only the positive aspects of economic data, namely the upward trend in nonfarm payrolls (August brought the smallest job loss since August 2008), but it's difficult to say when taking into account that trading volume was remarkably light Friday ahead of the Labor Day weekend.

Things may clear up during the coming week's holiday-shortened activity, although there is very little on the economic calendar other than the Federal Reserve's Beige Book on Wednesday, Sept. 9, and the weekly Initial Claims data on Thursday, Sept. 10.

Treasury auctions may return to the forefront. After $38 billion in 3-year Notes on Tuesday, Sept. 8, there is a $20 billion 10-year Note offering reopening on Wednesday and a $12 billion 30-year Bond offering reopening on Thursday.
 
Index Started Week Ended Week Change % Change YTD
DJIA 9544.22 9441.27 -102.95 -1.1 % 7.6 %
Nasdaq 2028.77 2018.78 -9.99 -0.5 % 28.0 %
S&P 500 1028.93 1016.40 -12.53 -1.2 % 12.5 %
Russell 2000 579.86 570.50 -9.36 -1.6 % 14.2 %

Rambus INC: RMBS (17.13 +1.22) is trading up almost $1.25 on takover chatter. it is rallying sharply off of the sloped support line it tested earlier this week, made up of the lows from July and August.

Rambus (RMBS 17.28 +1.35) is trading up 8.5% after a rumor that Samsung could be interested in the co made the rounds...

Research In Motion: RIMM (76.93 +0.95) is testing a major sloped resistance line around $77 as it attempts to break out of a multi-month triangle. A triangle pattern is usually followed by a period of increased volatility. There is no real news driving this move, it's primarily a technical move

Shares of LED producer Cree (CREE 37.89 +1.36) are trading up 4% after a rumor circulated suggesting IBM could be interested in the co. CREE September 40 calls are very active following the rumor, with 8190 contracts trading vs. open interest of 1680, although the increased options volume in no way confirms the validity of the rumor...

TriQuint Semiconductor (TQNT) announces its acquisition of TriAccess Technologies, a leading provider of Cable TV and Fiber-to-the-Premise integrated circuits for the amplification of high-quality multimedia content. Terms of the acquisition were not disclosed. TriAccess' results are not expected to materially impact TriQuint's net income.

08:30 am Novellus (NVLS)

Shares of Novellus (NVLS 19.08) are moving nearly 4% higher in Friday's premarket action after the company raised the bottom end of its third quarter earnings guidance and said that it expects to report fourth quarter earnings well above current Wall Street estimates.

Novellus said that it expects third quarter earnings to range from a loss of $0.06 per share to breakeven. The company's earlier guidance projected a loss of $0.15 per share to breakeven. The First Call consensus expects Novellus to report a loss of $0.06 per share for the third quarter.

Novellus also narrowed its Q3 revenue guidance to between $160 million and $180 million, from prior guidance of $150 million to $180 million. The consensus estimate currently stands at $167.8 million.

The San Jose, Calif.-based company issued upside guidance for the fourth quarter, saying it expects earnings of $0.10 to $0.20 per share, well ahead of the First Call consensus of $0.01. Revenue expectations from the company are also substantially higher than Street estimates, as Novellus expects fourth quarter revenues of $220 million to $230 million while the consensus stands at $181.3 million.

Shares of NVLS are 54% higher year-to-date.
icon url

ReturntoSender

09/08/09 10:50 PM

#8672 RE: ReturntoSender #6755

From Briefing.com: 4:30 pm : Thanks to broad-based buying, the S&P 500 made solid gains in its first trading session of the week, but the broad market benchmark encountered resistance as it approached last week's highs. Still, stocks settled near their best levels of the session.

Energy stocks and materials stocks led gains for the entire session. They settled 2.6% and 1.5% higher, respectively. Their gains were largely underpinned by strong moves among basic commodities and natural resources as the International Monetary Fund fed economic hopes by saying that the global recovery may begin early next year, sooner than it had previously expected. Commodity prices were also helped by a weaker U.S. dollar, which fell 1.0% against a basket of major foreign currencies to hit an 11-month low after the U.N. said that the greenback should be replaced by a new global reserve currency.

The confluence of positive factors drove gold prices to fresh 18-month highs above $1,008 per ounce, but prices eventually reversed course to settle with a fractional gain at $999.50 per ounce. Oil prices made one of their best single-session percentage gains in more than one month by jumping 3.1% to $71.19 per barrel. That move came ahead of tomorrow's OPEC meeting.

Though energy and materials stocks performed well throughout the session, the broader market fell into a few fits of choppy trading. The more dramatic moves to the downside came as stocks approached last week's highs. However, buyers did show some resolve by bidding stocks back toward session highs ahead of the closing bell.

Health care was the only sector unable to participate in the day's gains. The sector settled 0.4% lower amid ongoing health care reform efforts, including a public option, which New York Times reported is being weighed by the White House. Separate articles suggested nonprofit cooperatives could be proposed as a compromise. Both types of plans have already been part of the contentious debate regarding plans to provide affordable health care to Americans.

There weren't any widely-held companies out with their latest earnings results this morning, so corporate headlines were dominated by news that Cadbury PLC (CBY 51.88, +14.42) refused a $16.7 billion merger offer from Dow component Kraft (KFT 26.45, -1.65). Investors responded by handing shares of CBY one of their best single-session percentage advances on record, while sending KFT markedly lower.DJ30 +56.07 NASDAQ +18.99 NQ100 +1.0% R2K +1.0% SP400 +1.3% SP500 +8.99 NASDAQ Adv/Vol/Dec 1606/2.03 bln/1017 NYSE Adv/Vol/Dec 2280/1.32 bln/746

4:22PM Entegris reports net sales for sales were approximately $71 mln through the first nine weeks of Q3, and indicated it currently estimates net sales will be at least $100 mln for the full quarter (vs $91.9 mln consensus) (ENTG) 4.11 +0.04 : Co reports that its net sales were approximately $71 million through the first nine weeks of the third quarter, which ends September 26, 2009, and indicated it currently estimates net sales will be at least $100 million for the full quarter (vs $91.9 mln consensus). The co also announced it commenced a 12 mln share common stock offering.

4:18PM Altera sales outlook improves; sees 3Q sales to be in the range of flat to up 3% from Q2 vs. a fall of 2.75% First Call Consensus (ALTR) 20.34 +0.74 : Co announces that based on quarter-to-date results and a broad improvement in market conditions, the company now expects third quarter sales to be in a range of flat to up 3 percent from the second quarter vs. -2.75% First Call Consensus. Previous guidance had been for sales to decline 1 to 5% sequentially. All market segments, except for the telecom and wireless segment, will be up sequentially in the third quarter. The decline in telecom and wireless is more moderate than previously anticipated as a result of better than forecast demand from OEMs supplying Asian wireless networks... Design wins for Altera's newly launched 40-nm products continue to be very strong. As anticipated, third quarter sales of 40-nm products are likely to approximate $10 million, more than double second quarter levels.

4:16PM Microchip raises net sales and EPS guidance for 2Q10 (MCHP) 27.08 +0.36 : Co raises guidance for 2Q10, sees non-GAAP EPS of $0.26-$0.27 vs. $0.20 First Call consensus and vs. prior guidance of $0.23-$0.26. Based on good starting backlog and strong bookings and sales activities for the first two months of the quarter, MCHP now expects its net sales for its second fiscal quarter to be up 12-14% sequentially vs prior guidance of up 7-11%. This equates to approximately $216.05-$219.9 mln vs. $211.3 mln consensus. Gross margins are now expected to be up approximately 350 to 400 basis points sequentially versus a prior guidance of up 250 to 350 basis points.

4:07PM Flow misses by $0.01, misses on revs (FLOW) 2.46 +0.00 : Reports Q1 (Jul) loss of $0.07 per share, ex-items, $0.01 worse than the First Call consensus of ($0.06); revenues fell 13.5% year/year to $37.8 mln vs the $38.4 mln consensus. Co states, "The pace of recovery remains slow in certain markets, but we have made many cost reductions this year that we expect to positively impact our results throughout fiscal 2010. These reductions, combined with our recent capital raise and the amendments to our bank covenants, position us well to exit this recession as a stronger company. We appreciate the active engagement of our secured lenders and the support of our shareholders as we position the company for a return to economic growth."

4:03PM Advanced Micro announced that Clevo is now providing notebooks powered by AMD platform technology (AMD) 5.19 +0.66

12:23PM First Solar to team with Ordos City on major solar power plant in China Desert (FSLR) 129.22 +7.76 : Co announces a memorandum of understanding (MOU) with the Chinese government to build a 2 gigawatt solar power plant in Ordos City, Inner Mongolia, China. Pursuant to the MOU, signed in the presence of Chairman Wu Bangguo of the Standing Committee of the National People's Congress of China, the solar project in Ordos will be built over a multi-year period. Phase 1 will be a 30 megawatt demonstration project that will begin construction by June 1, 2010 and be completed as soon thereafter as practicable. Phases 2, 3 and 4 will be 100 megawatts, 870 megawatts, and 1,000 megawatts. Phases 2 and 3 will be completed in 2014 and Phase 4 will be completed by 2019.

9:11AM Seagate Tech tgt raised to $19 at Caris following Silicon Valley Investor Tour (STX) 13.68 : Caris raises their STX tgt to $19 from $15 following the firm's Silicon Valley Investor Tour. The firm notes that STX's views appear to confirm the firm's established beliefs and checks that HDD unit demand is running above plan, pricing remains benign and inventories remain lean. Moreover, the firm remains buyers of both STX and Western Digital (WDC) not just on rebounding PC/HDD markets but also because of their belief that they are uniquely out-executing Asian competitors in a consolidating market. Already something of a 2-horse race in 3.5in desktop HDDs, the firm continues to think 2.5in notebook could be the next area where STX and WDC catapult forward by ramping new-gen 320GB/p while others still struggle at 250GB.

9:02AM MEMC Elec guides Q3 revs below consensus & prior guidance; announces consolidation of wafer manufacturing operations (WFR) 16.59 : Co issues downside guidance for Q3 (Sep), sees Q3 (Sep) revs of $285-315 mln vs. $326.87 mln First Call consensus, prior guidance $300-350mln. The company disclosed that it experienced a disruption in production at its polysilicon facility in Pasadena, Texas due to an equipment failure on August 7, 2009, requiring a large portion of the facility to be shut-down. Initial reports indicated that the company's silane and polysilicon inventory levels would cover the lost output caused by this disruption until normal production levels were achieved. Although the failed equipment has been replaced, subsequent rebuild and restart difficulties have delayed the resumption of normal operations at this facility. The company expects to be back to normal production levels before the end of September. The lost production and related costs are expected to negatively affect the company's revenue and margins in the third quarter of 2009. The company also announced the planned closings of the Sherman, Texas plant and portions of the St. Peters, Missouri plant. The company expects that the facility closings will result in an annualized savings beginning in third quarter of 2010 of approximately $10 million, rising to approximately $55 million of annualized savings beginning in the second quarter of 2011.

7:30AM Cray announces it is awarded supercomputer contract from the Korea Meteorological Administration valued at more than $40 mln (CRAY) 7.35 : Co announces that it has signed a multi-year, multi-phase contract to provide the Korea Meteorological Administration with a next-generation supercomputer. The contract is valued at more than $40 mln.

United Microelectronics (UMC) reports unaudited net sales in August 2009 increased 10.9% year/year to NT$9.06 bln; sales increased 2.85% from July 2009...

LDK Solar (LDK) announces it has entered into a framework agreement with Best Solar to cooperate on downstream photovoltaic projects. Under terms of the agreement, LDK Solar will supply the solar wafers and Best Solar will manufacture the solar modules...

09:28 am IBM (IBM)

IBM (IBM 117.46) reaffirmed its fiscal 2009 and 2010 earnings per share guidance in a regulatory filing Tuesday morning.

In an 8-K filing IBM reaffirmed its fiscal 2009 earnings guidance of "at least 9.70" per share. The First Call consensus stands at $9.76.

For fiscal 2010, IBM sees earnings of $10.00 to $11.00 per share, in-line with the current consensus of $10.67.

Shares of IBM are nearly 40% higher year-to-date.

icon url

ReturntoSender

09/09/09 10:10 PM

#8673 RE: ReturntoSender #6755

From Briefing.com: 4:20 pm : The major indices started the session with modest losses, but that was met by buyers looking to extend the stock market's recent gains. Stocks did hand back a chunk of their gains following a disappointing Fed Beige Book, but participants shrugged off the commentary and pushed stocks broadly higher into the close.

There weren't many news items to drive action in the early going, but that didn't stop participants from looking to continue the stock market's recent ride higher. Their efforts helped take the stock market back above last week's highs, but gains stalled as the S&P 500 came within close range of 2009 highs near 1039.

Industrial stocks showed leadership for the entire session. As a group, they settled 1.6% higher.

Financials had lagged in the early going, but managed to make their way to a 1.4% gain and provide support to the broader market. AIG (AIG 38.89, +3.04) was a primary leader as it bounced back from a two-session slide. Capital One (COF 37.47, +2.03) was also a leader in the financial sector. It benefited from an upgrade by analysts at Citigroup. Citigroup's analysts also upgraded shares of MasterCard (MA 210.31, +2.86), while JPMorgan upgraded Morgan Stanley (MS 28.55, +0.75).

Thanks to a late rebound by the broader market, energy and materials stocks were able to close with strength. They had faltered after energy prices and precious metals prices finished in weak fashion. Gold prices closed pit trade at $997.10 per ounce, down nearly 0.3%, and silver prices settled down 0.2% at $16.47 per ounce. Crude oil prices showed considerable strength early on, but finished with a 0.5% gain at $71.49 per barrel. The gyrations came ahead of the latest OPEC meeting, which is expected to culminate with oil output unchanged. Meanwhile, natural gas prices settled 1.2% higher at $2.84 per contract after being up nearly 7%.

Consumer staples stocks struggled for the entire session. They closed with a 0.1% loss. Utilities stocks were also weak and finished with a 0.1% loss.

Stocks showed little reaction to the results of a $20 billion 10-year Note auction, which showed a high yield of 3.51% and a bid-to-cover ratio of nearly 2.8, which is well above the 2009 auction average of 2.5. The benchmark 10-year Note moved lower a while after the results were released, but it eventually made its way to a fractional gain before the closing bell.

The only positive news from the Beige Book came from the manufacturing sector, which has seen an increase in orders, but improvements for the rest of the economy have largely been mediocre and show a slowing decline in economic activity, not an increase. The Fed's commentary also indicated that downward pressure on home prices continued in most districts.

Though stocks were initially let down by the Fed's commentary, it didn't take long for participants to brush the report aside to support a broad-based rebound, which ensured a fourth straight gain for the stock market. DJ30 +49.88 NASDAQ +22.62 NQ100 +0.9% R2K +1.7% SP400 +1.4% SP500 +7.98 NASDAQ Adv/Vol/Dec 1896/2.49 bln/772 NYSE Adv/Vol/Dec 2182/1.24 bln/842

4:07PM Photronics announces offering of 6,275,000 shares of its common stock and $50,000,000 convertible senior notes maturing in 2014 (PLAB) 4.87 +0.09 :

2:07PM Apple confirms new product releases (AAPL) 172.43 -0.52 : Co confirms it introduced iTunes 9, the latest version of software application to purchase, manage and play media, packed with features such as iTunes, Home Sharing and Genius Mixes, as well as a redesigned store and improved syncing. Co also confirms it introduced the new iPod nano, adding a video camera, mic and speaker. The new iPod nano is available today in an 8GB model for $149 and a 16GB model for $179. Co also confirms it announced that iPod shuffle available starting at just $59.

8:31AM Diodes Incorporated increases Q3 revenue guidance; sees revs +13-17% vs prior guidance of +10-15%, consensus +13.2% (DIOD) 21.80 : Co's guidance equates to revs of roughly $117.4-121.6 mln vs $117.6 mln consensus. growth. The Company is maintaining its guidance for gross margin at the previous level of approximately 28 to 32 percent. The revenue increase is driven primarily by demand for the Company's products utilized in equipment such as LCD televisions and panels, set-top boxes, mobile handsets and netbooks.

Informatica (INFA) announces that it has partnered with Intel (INTC) to embed Informatica B2B Data Transformation software as an integral part of the Intel SOA Expressway.

7:03AM Palm cuts price of Palm Pre by $50 to $149 with 2 yr agreement; announces Palm Pixi (PALM) 14.98 : Co announces that, effective today the Palm Pre phone from Sprint (S) is available for $149.99 with a two-year service agreement and after a $150 instant rebate and $100 mail-in rebate. Co also introduced its next WebOS phone, the Palm Pixi, which will be available from Sprint in time for the holidays.

3:45AM On The Wires : LDK Solar (LDK) announces that it has successfully completed the first production run and initiated production ramp-up of operations of its first 5,000 metric ton train in its 15,000 MT annualized capacity polysilicon plant in Xinyu, China on September 5, 2009...

1:21AM Tessera Tech: Federal Circuit denies stay of ITC wireless orders (TSRA) 25.37 : Co announces that the Court of Appeals for the Federal Circuit has denied the respondents' motion to stay the U.S. International Trade Commission's Limited Exclusion Order and Cease and Desist Orders in Investigation No. 337-TA-605 (Wireless ITC Action). Under the Federal Circuit's order denying a stay, the ITC's LEO and CDOs will remain in full effect while the Federal Circuit considers the respondents' appeal.

09:33 am Cisco Systems: Positive momentum in Q4 has extended into 1Q10 - Credit Suisse: . Credit Suisse's checks indicate that the positive momentum CSCO experienced in its 4Q09 has extended into its current 1Q10. While only the first month of the quarter, and the slowest month of the year to boot, they are hearing of favorable Aug order book trends both in general and spanning a number of different key product lines including enterprise switching, carrier routing, and Cisco's newly launched Unified Computing Services integrated virtualized storageserver-networking data center solution. While they are leaving their ests unchanged at present given the early stage of the quarter, they believe CSCO is on track to deliver operating performance in-line to ahead of their 1Q10 $8.72 bln and $0.28 (incl. ESO) ests (consensus $8.71 bln and $0.30). Longer term, they believe there could be meaningful incremental upside to their $25 tgt.

09:30 am Intel: Core notebooks strong; atom dominates, but CULV has less followers - ThinkEquity: . ThinkEquity's Taiwan checks indicate the notebook market is very strong, though the key drivers have changed. Core notebooks are growing faster than CULV (Consumer Ultra-Low Voltage) and netbooks. ODMs indicating 3Q09 notebook unit shipments growing 20% QoQ and another 10% QoQ in 4Q09. But key is that the majority of the 3Q09/4Q09 builds will be concentrated in Sept-Oct ahead of the Oct. 22 Win7 launch, potentially creating concerns of inventory creep and demand. They note netbooks have been slowing, flat into Q4, a positive for Intel, in their view, while CULV appears to be more overhyped. Nonetheless, they believe strength in core Notebooks playing well for INTC.

icon url

ReturntoSender

09/13/09 1:39 PM

#8674 RE: ReturntoSender #6755

From Briefing.com: Weekly Recap - Week ending 11-Sep-09Market participants drove the S&P 500 up 2.6% during the holiday shortened week, with gains seen on three of the four sessions, and the benchmark index hitting fresh highs for 2009. The advance came despite a relatively slow week, with only a handful of earnings and economic reports. Investors showed increased risk appetite, with cyclical and small cap stocks leading the way.

Buying interest was broad-based, with nine of the ten sectors posting gains. Cyclical sectors rose the most, with industrials (+4.2%) and energy (+4.3%) both logging more than 4% gains. Defensive sectors underperformed on a relative basis, with utilities shedding 0.3%.

In economic news, weekly jobless claims fell to 26,000 to 550,000, topping the the 560,000 consensus. Although the beat was welcome, the claims still remain at elevated levels and will result in the unemployment rate ticking upward. Continuing claims declined 159,000 to 6.088 million. The consensus expected continuing claims to decline a more modest 34,000. But the drop in continuing claims is not due to a decrease in jobless workers -- rather workers are running out of unemployment benefits.

The Fed's Beige Book, a collection of anecdotal economic data from the Fed districts, continued to show that the rate of economic decline is slowing, with manufacturing showing improvement. But areas such as employment, consumer spending, and construction remain weak.

In corporate news, Kraft (KFT) offered to buy London-based Cadbury (CBY) for $16.7 bln, which Cadbury subsequently rejected. Shares of Kraft fell 7.1% on the week, as traders speculated the company would raise its offer.

Texas Instruments (TXN) raised its Q3 outlook, though the news had a limited impact on shares. TXN said it now expects EPS between $0.37-0.41, versus its previous forecast of $0.29-0.39. The updated guidance tops the $0.35 consensus.

FedEx (FDX) issued upside earnings guidance for its fiscal first quarter, saying that strict cost management and better-than-expected volume in international shipments helped its performance. FedEx said it sees fiscal first quarter earnings of $0.58, well ahead of the $0.44 First Call consensus and up from the company's prior guidance of $0.30 to $0.45. FDX rose 9.1% for the week.

In other news, Treasury Secretary Geithner aided stocks during his testimony before congress. He said that policymakers are in a position to evolve their strategy with the goal of repairing and rebuilding the economy's foundation for future growth. Geithner also said that it is unlikely more bank bailout money will be needed, so its contingency provision can be removed from the budget.

In commodity trading, commodities saw a busy weak. Oil rallied on news that OPEC is keeping its output unchanged, IEA raised its demand forecast and weekly inventories showed an unexpected decline. Crude settled the week up only +1.8%, however, after giving up more than 3% on Friday. Meanwhile gold settled at $1006.70, crossing the $1000 mark for the first time since February.

Best performing stocks this week: (AMD, +25.4%), (GNW, +21.6%), (TIE, +18.1%), (PCS, +17.7%), (CHK, +17.7%).

Worst performing stocks this week: (KFT, -7.1%), (AIG, -6.2%), (AEE, -5.4%), (FDO, -5.2%), (MON, -5.1%).
 
Index Started Week Ended Week Change % Change YTD %
DJIA 9441.27 9605.41 164.14 1.7 9.4
Nasdaq 2018.78 2080.90 62.12 3.1 32.0
S&P 500 1016.40 1042.73 26.33 2.6 15.4
Russell 2000 570.50 593.59 23.09 4.0 18.8

6:45AM Photronics announces that it has agreed to sell 9,638,554 shares of its common stock at a public offering price of $4.15 per share (PLAB) 4.17 : Co announces that it has agreed to sell 9,638,554 shares of its common stock at a public offering price of $4.15 per share. Photronics has also granted the underwriters an option to purchase up to an additional 1,445,783 shares of common stock to cover over-allotments.

icon url

ReturntoSender

09/14/09 8:57 PM

#8677 RE: ReturntoSender #6755

From Briefing.com: 4:35 pm : Weakness overseas and concerns regarding trade with China weighed on sentiment in the early going, but stocks worked their way out of negative territory to finish the session at fresh highs for 2009.

The stock market started the session with a loss of roughly 0.7% as several major foreign markets were knocked lower by profit takers. The case for paring positions also seemed appropriate since it appeared that the major U.S. indices were losing momentum after slipping from 2009 highs last Friday to log a loss and finish last week on a down note. Participants were also a bit unsettled by news that China's trade officials have threatened to restrict chicken and auto product imports from the U.S. in response to the decision by U.S. officials to place punitive sanctions on Chinese tire imports. Goodyear Tire (GT 17.78, +0.51) and Cooper Tire (CTB 15.60, +1.03) were helped by the story, but Sanderson Farms (SAFM 40.01, -0.28) and Tyson Foods (TSN 12.45, -0.30) were hurt.

Despite the inclination to sell this morning, buyers showed resolve and began pushing stocks higher. Their efforts gained momentum as short sellers were forced to cover their positions. Stocks did run into a bit of resistance as they encountered the 2009 highs that were registered late last week. However, a final push in the closing minutes of trade helped the stock market settle at its best level of the year. The S&P 500 is now up more than 16% year-to-date.

Sprint Nextel (S 4.15, -0.38) provided the most leadership to the broader market this session. The stock benefited from news that Deutsche Telekom may be interested in making a bid for the company, though Deutsche Telekom later stated that it doesn't plan to make a major U.S. purchase before year end. Still, the stock made its biggest single-session percentage advance in five months. Its leadership wasn't enough to prevent a 0.2% loss in the telecom sector, which was the only major sector to finish in the red.

Gains were strongest among utilities stocks, which have lagged in recent sessions. The sector advanced 1.6% after electric utilities (+1.7%) were given positive coverage in a Barron's article.

Financial stocks also showed leadership in the late move. They were down as much as 1% in the early going, but finished 1.6% higher.

Materials stocks also finished 1.6% higher, though commodities saw mixed action. Crude oil futures closed down 0.6% at $68.85 per barrel, while gold settled 0.5% lower at $1,001 per ounce following a report from the Daily Telegraph that said London's leading gold forecaster has advised clients to liquidate holdings of the yellow metal. Still, the broader CRB Commodity Index was able to rebound to a 0.6% gain. DJ30 +21.39 NASDAQ +10.88 NQ100 +0.5% R2K +1.1% SP400 +1.1% SP500 +6.61 NASDAQ Adv/Vol/Dec 1623/2.17 bln/1046 NYSE Adv/Vol/Dec 2000/1.21 bln/966

4:24PM Emulex: Broadcom sues Emulex for patent infringement (ELX) 10.53 +0.27 : Broadcom (BRCM) announced that it has commenced litigation against Emulex Corporation (ELX) for infringement of Broadcom patents related to networking and communications technologies. In its complaint, filed today in the U.S. District Court for the Central District of California, Broadcom alleges that Emulex infringes 10 Broadcom patents. These patents cover a broad range of high speed data and storage networking technologies, including integrated circuit design, serializer/deserializer (SerDes), TCP offload engine (TOE), remote direct memory access (RDMA), Fibre Channel, and Fibre Channel over Ethernet technologies.

9:02AM Cymer raises 3Q09 revenue outlook; expects revenue to be up approx 30% sequentially (CYMI) 36.81 : Co raises guidance for 3Q09, now sees revenue to to be up approximately 30% compared to revenue of $62 mln in 2Q09, vs. prior guidance of an approximate 15% increase. This equates to approximately $80.63 mln vs $72.21 mln First Call consensus. Demand for new light sources has increased and Installed Base Products revenue has continued to rise as business conditions in the lithography sector have strengthened.

O2Micro International (OIIM) announces that the Japanese Patent Office has upheld OIIM's Patent No. 3,758,165 entitled "Sequential Burst Mode Activation Circuit."...

8:30AM Sanmina-SCI announces that Bob Eulau Joins company as Chief Financial Officer (SANM) 7.15 : The co announces that Bob Eulau has joined the Company as Executive Vice President and Chief Financial Officer. Eulau brings over 20 years of financial and operational management experience to Sanmina-SCI, most recently as Executive Vice President, Chief Operating Officer and Chief Financial Officer of privately owned Alien Technology Corporation

8:09AM On The wires : Skyworks Solutions (SWKS) announces that Samsung is leveraging both quad-band GSM/EDGE and next-generation WCDMA front-end solutions to power a variety of new 3G smart phones including the Pixon12, the world's first 12 megapixel touchscreen camera phone...

Tower Semiconductor (TSEM) announces that it received and accepted additional orders from institutional investors of approx $5.3 mln for cash investment in the co's equity, on similar terms to the fundraising announced on September 3, 2009... DivX (DIVX) and Motorola (MOT) announce a licensing agreement to adopt DivX technology and certify a new series of Motorola IPTV set-top boxes.
icon url

ReturntoSender

09/15/09 11:07 PM

#8678 RE: ReturntoSender #6755

From Briefing.com: 4:30 pm : Despite stumbling in the early going, stocks worked their way higher to log their seventh gain in eight sessions as buyers chased materials stocks and basic commodities.

The major indices started the session in higher ground with help from the August Producer Price Index, which came in with a greater-than-expected 1.7% month-over-month increase, and a stronger-than-expected 0.2% month-over-month increase in core prices. The Empire State Manufacturing Survey for September climbed more than expected to 18.9, which is a new best for 2009, but the advance retail sales report for August was the headliner after it made the sharpest monthly jump in more than three years by climbing a better-than-expected 2.7%. Sales less autos were also better than expected; they increased 1.1%.

Despite the overall positive nature of the data, stocks ran into a flurry of selling pressure midmorning. However, the dip was shallow and short-lived, which led to some short covering that complemented a broader market rebound.

Participants paid little attention to news that July business inventories fell a slightly steeper-than-expected 1.0% and Fed Chairman Bernanke's statement that the recession is very likely over.

Materials stocks attracted plenty of interest, however. The sector climbed 2.3% to finish with the best gains of any major sector. Steel stocks (+3.0%) were the sector's primary leaders, but a run up in commodities prices helped stir interest in the rest of the sector as well.

Strong gains among commodities helped the CRB Commodity Index climb 2.2%, which is its best single-session percentage advance in more than one month. The move was helped along by a 3.0% gain in crude oil prices, which settled at $70.93 per barrel. Gold also continued to garner support -- it finished the session 0.5% higher at $1006.30 per ounce. The case for commodities was partly helped by continued deterioration in the U.S. dollar, which took the Dollar Index down to fresh 11-month lows before easing up to settle with a 0.2% loss.

Health care stocks closed 0.8% lower. They were the worst performing sector in the S&P 500. However, consumer staples stocks (-0.6%) weren't far behind, due to weakness in Kroger (KR 20.46, -1.65). The grocer disappointed by posting an earnings miss and lowered guidance.

Best Buy (BBY 38.32, -2.09) also posted worse-than-expected earnings, but it noted that it successfully captured a record market share increase last quarter.

Citigroup (C 4.12, -0.40) was a drag on the financial sector, which finished with a 0.1% gain. Reports indicated that the company is reportedly considering raising capital through a share issuance to help it reduce the government's stake. Conversely, Regions Financial (RF 6.06, +0.55) won favor after its CEO said at a Barclays conference that the company absolutely will not need to raise additional capital.

Trading volume was solid as 1.5 billion shares exchanged hands on the NYSE. Longer-term averages stand closer to 1.4 billion shares.DJ30 +56.61 NASDAQ +10.86 NQ100 +0.3% R2K +0.8% SP400 +0.8% SP500 +3.29 NASDAQ Adv/Vol/Dec 1566/2.39 bln/1098 NYSE Adv/Vol/Dec 2142/1.50 bln/893

4:09PM Adobe Systems beats by $0.01, beats on revs; guides Q4 EPS in-line, revs in-line (ADBE) 35.62 +0.43 : Reports Q3 (Aug) earnings of $0.35 per share, $0.01 better than the First Call consensus of $0.34. As a percent of revenue, GAAP operating income in 3Q09 was 24.0%, compared to 24.7% in 3Q08 and 22.9% in 2Q09. Co issues in-line guidance for Q4, sees EPS of $0.33-0.39 vs. $0.37 consensus; sees Q4 revs of $690-740 mln vs. $719.23 mln consensus. "We are pleased with the solid revenue and earnings results we were able to deliver in Q3," said Shantanu Narayen, president and CEO of Adobe. "Our focus remains on driving growth in our core businesses, as well as investing in promising new opportunities."

2:38PM Virage Logic declares offer to acquire ARC International unconditional (VIRL) 5.00 0.00 : Co announcesthat it has declared its recommended cash offer to acquire publicly held ARC International, provider of consumer IP to OEM and semiconductor companies globally, unconditional in all respects. With 84.68% of the ARC shares already tendered into the offer, Virage Logic will proceed to consummate the purchase of this ownership interest in ARC and will have ARC immediately apply to the UK Listing Authority and the London Stock Exchange for the delisting of ARC's shares. This all-cash transaction values ARC at 16.25 pence per share, or an equity value of ~$42.0 million on a fully-diluted basis. Furthermore, if it receives sufficient valid acceptances of the offer (being not less than 90% of the ARC shares), Virage Logic intends to exercise its rights to acquire compulsorily the remaining ARC shares on the same terms as the offer.

9:32AM S&P 500 stock buybacks hit record low : Standard & Poor's announced that S&P 500 stock buybacks have fallen to their lowest level since the first quarter of 1998 - when Standard & Poor's began tracking the data. According to Standard & Poor's Index Services, preliminary results show that S&P 500 issues spent $24.2 bln on stock repurchases during the second quarter of 2009, representing a 72% decline from the $87.9 bln spent during the second quarter of 2008, and an 86% decline from the record $172.0 billion spent on stock buybacks during the third quarter of 2007.

8:44AM Tower Semicon announces co-development of 700V power platform (TSEM) 0.93 : The co announces co-development of a 700V power platform to address next-generation industrial LED lighting requirements. The collaboration will combine GrandTek's 700V technology capability with Tower's advanced power management process and leading design kits to deliver the industry's most complete 700V foundry solution. An ultra low mask layer count will be achieved to provide the most cost-effective solution in a voltage regime with very few foundry providers. As an indication of strong market demand for 700V, SemiHow, a Korean-based fabless company has already signed on as an early adopter to use Tower's 700V power platform for AC to DC conversion targeting the industrial LED market. Tower expects to realize product revenue from SemiHow in the second quarter of 2010.

Canadian Solar (CSIQ) announces that it has signed a joint technology development and transfer agreement with Energy Research Center of the Netherlands to apply the technology for metal wrap-through cells to Canadian Solar's production lines... JA Solar Holdings (JASO) announces that it is working to commercialize a new generation of high-performance solar products using silicon ink technology from Innovalight.

6:25AM Emulex comments on patent complaint rfom BRCM (ELX) 10.53 : Co issued the following statement regarding the complaint alleging patent infringement filed today by Broadcom (BRCM) against the co. "Emulex is reviewing the patents associated with the complaint filed today by Broadcom. Emulex has a policy of vigorously defending the co against assertions of this kind. Due to the pending litigation, we are unable to comment further."

icon url

ReturntoSender

09/16/09 9:55 PM

#8679 RE: ReturntoSender #6755

From Briefing.com: 4:30 pm : Continued buying helped the stock market march higher for the third straight session. More impressive was that steady momentum helped stocks close the session at new highs for the year.

The latest leg of the stock market's run came with broad-based support and gave the S&P 500 its best single-session gain in nearly one month.

Strength was most pronounced in the financial sector, which settled 3.4% higher. Multiline insurers (+5.9%), diversified banks (+3.1%), and regional banks (+4.9%) were the sector's standouts. Several widely-held financial companies attempted to win support for their shares by expressing expectations for their business and the financial industry at professional conferences.

Despite the impressive closing prices, stocks actually slipped in the first few minutes of trading. However, buyers quickly stepped in as stocks hit the unchanged mark after retreating from opening levels.

Initial gains were helped along by rallying overseas markets, which helped the Dow Jones World Index, excluding the U.S., advance 2.0%, its best single-session percentage advance in more than one month. The upbeat tone was kept intact by some generally solid economic reports, including an August Consumer Price Index that showed a 0.4% month-over-month increase, which was a tad higher than the expected 0.3% increase. Core consumer prices for August increased 0.1% month-over-month, but that was spot on with the consensus forecast. CPI data for August was much more tame than the August PPI data that were released yesterday. Meanwhile, industrial production for August climbed 0.8%, which exceeded the 0.6% increase that had been widely expected. Capacity utilization for August came in at 69.6%, which was slightly above the 69.0% that was widely expected.

Participants showed continued favor for commodities, which helped the CRB Commodity Index advance 1.8% as gold prices settled 1.4% higher at $1020.20 per ounce and silver prices climbed 2.5% to a new 12-month high of $17.43 per ounce. Oil prices jumped 2.2% to $72.51 per barrel. Not to be outdone, natural gas prices settled 12.2% higher at $3.77 per contract. Natural gas prices are now up more than 55% from the 7-year lows that were set earlier this month.

Adobe (ADBE 33.35, -2.27) was one of the few companies to recently announce quarterly earnings results. The company posted better-than-expected third quarter earnings of $0.35 per share and issued in-line guidance for the fourth quarter, calling for earnings from $0.33 to $0.39 per share. The company announced that it will acquire Omniture (OMTR 21.88 +4.56) for $21.50 per share in cash, which values the deal at $1.8 billion. Though participants pushed against shares of ADBE, large-cap tech still gained 1.4%, based on the Nasdaq 100.

In the face of strong buying in stocks and commodities Treasuries managed to limit losses. The benchmark 10-year Note finished a modest four ticks lower. It had spent part of the session in positive territory. DJ30 +108.30 NASDAQ +30.51 NQ100 +1.4% R2K +2.1% SP400 +2.0% SP500 +16.13 NASDAQ Adv/Vol/Dec 1899/2.76 bln/792 NYSE Adv/Vol/Dec 2543/1.58 bln/513

4:05PM Oracle reports EPS in-line, misses on revs (ORCL) 22.13 -0.53 : Reports Q1 (Aug) earnings of $0.30 per share, in-line with the First Call consensus of $0.30; revenues fell 5.2% year/year to $5.05 bln vs the $5.25 bln consensus. Non-GAAP operating income was up 7% to $2.3 bln and non-GAAP operating margin was up 570 basis points to 46%. Oracle's results were impacted by the reduced value of foreign currencies when compared to US dollars, reducing Q1 GAAP earnings by $0.02 per share. Without this impact, Oracle's Q1 GAAP and non-GAAP earnings per share would have been $0.24 and $0.32, respectively. GAAP and non-GAAP new software license revenues would have been down 14%, and our software license updates and product support revenues would have been up 11% on a GAAP basis and up 8% on a non-GAAP basis. GAAP and non-GAAP operating income would have been up 21% and 11%, respectively. "By substantially improving operating margins we were able to increase Q1 earnings per share even though revenues decreased slightly," said Safra Catz, ORCL's President. "We grew non-GAAP operating margins by 570 basis points to 46 percent in our seasonally smallest quarter. Our operating model continues to drive earnings for our stockholders."

4:04PM Oracle spiked down to test the September lows of $21.22 following earnings (ORCL) 22.13 -0.53 : Has bounced back about $0.50 off the reaction low at $21.09. $21 was support back in August as well. (last trade at $21.58)

12:00PM Amkor, Nakaya Microdevices and Toshiba are continuing their negotiations on joint venture (AMKR) 7.38 -0.09 : Nakaya Microdevices, Amkor Technology and Toshiba announce that they are continuing their negotiations of definitive agreements pursuant to the non-binding memorandum of understanding announced on April 28, 2009 for the formation of a joint venture in Japan to provide system LSI assembly and testing services. The initial target date of October 1 for the start of operations will be extended and the parties plan to announce the proposed commencement date when definitive agreements are finalized. The terms of the joint venture have not yet been determined and the formation of the joint venture remains subject to the negotiation of definitive agreements.

8:34AM Phoenix Tech announces an agreement to distribute "HyperSpace" with Intel Desktop Boards (PTEC) 3.92 : Co announces an agreement to distribute HyperSpace, an instant-on computing environment, with Intel Desktop Boards featuring the integrated Intel Atom processors 230 and 330

7:02AM Kulicke & Soffa increases Q4 revs outlook (KLIC) 6.29 : Co issues upside guidance for Q4 (Sep), sees Q4 (Sep) revs of $100-105 mln, up from $85-90 mln, vs. $86.73 mln First Call consensus."The recovery in overall business conditions that began near the end of our March quarter is continuing. Improvements are being seen in all areas of our business, particularly in ball bonders, wedge bonders and expendable tools."

icon url

ReturntoSender

09/17/09 9:41 PM

#8680 RE: ReturntoSender #6755

From Briefing.com: 4:30 pm : Participants sold the news of a better-than-expected batch of economic reports and handed stocks their first loss in four sessions. Losses were rather contained, though, as stocks are still up more than 2% week-to-date.

Despite stumbling a bit in the moments following the opening bell, stocks looked as if they were going to extend their recent gains. That is until the Philadelphia Fed Index for September showed that it hit a two-year high of 14.1, which was better than expected. Rather than provide fodder for further buying, the data prompted selling pressure as participants looked to lock in profits after they had watched stocks advance in eight of the previous nine sessions.

The better-than-expected Philly Fed Index complemented several other upbeat economic reports, including housing starts and building permits data for August. Housing starts hit an annualized rate of 598,000, which was spot on with the consensus forecast. More impressive was that the August rate marked the best pace since November 2008. Building permits came in at an annualized rate of 579,000, which is just below the rate of 583,000 that was widely expected, but it still marked the best pace this year.

In other economic news, initial jobless claims for the week ending Sept. 12 totaled 545,000. Though that marks an uncomfortable level of claims, it wasn't as bad as the 557,000 initial claims that were expected. It also marked a drop of 12,000 from the previous week. Meanwhile, continuing claims climbed to 6.23 million from 6.10 million, even in the face of expiring jobless benefits. According to a Reuters report, Nobel Prize-winning economist Paul Krugman said that unemployment in the U.S. will peak in early 2011 because of a slow and painful recovery from the global economic crisis.

With most participants partial to selling, the stock market wasn't able to sustain a couple of bounces in the first half of the session. In turn, stocks spent the second half of the session chopping along in negative territory.

There wasn't a single major sector that was able to post a gain. Telecom fell 1.3% to log the weakest performance for the second straight session. Health care finished flat; it was the best performing sector.

Tech giant Oracle (ORCL 21.52, -0.61) was among the most active names by trading volume this session. The company posted in-line earnings results and issued an in-line earnings forecast last evening. However, shareholders were displeased with the company's top line since it suggested that demand remains relatively weak.

Global delivery outfit FedEx (FDX 76.46, -1.74) was also out with its latest earnings results, but the numbers didn't cause any surprise since the company had already made an announcement last week.

Overall trading volume came on the NYSE came in near 1.5 billion shares for the third straight session. The high volume comes ahead of tomorrow's quadruple witching and quarterly S&P rebalance. Those events could induce added volatility. DJ30 -4.79 NASDAQ -6.40 NQ100 -0.2% R2K -0.3% SP400 -0.6% SP500 -3.27 NASDAQ Adv/Vol/Dec 1324/2.64 bln/1366 NYSE Adv/Vol/Dec 1338/1.52 bln/1704

4:30PM Texas Instruments increases quarterly dividend by $0.01 to $0.12 (TXN) 23.60 -0.53 :

4:14PM Palm beats by $0.15, beats on revs; guides Q2 (Nov) revs below consensus; guides FY10 (May) revs above consensus; announces 16 mln share stock offering (PALM) 14.44 -0.22 : Reports Q1 (Aug) loss of $0.10 per share, $0.15 better than the First Call consensus of ($0.25); revs declined 1.6% YoY to $360.7 mln vs $290.70 mln First Call consensus. Palm prelim reports Q1 gross margin 27.9% vs 25.6% consensus. Co issues downside rev guidance for Q2 (Nov), sees Q2 (Nov) revs of $240-270 mln vs. $346.8 mln consensus. Co issues upside rev guidance for FY10 (May), sees FY10 (May) revs of $1.6-1.8 bln vs. $1.57 bln consensus. The company shipped a total of 823,000 smartphone units during the quarter, representing a 134% increase from the fourth quarter of fiscal year 2009 and a year-over-year decrease of 30%. Smartphone sell-through for the quarter was 810,000 units, up 76% from the fourth quarter of fiscal year 2009 and down 21 percent year-over-year. Palm's quarterly operating results are, and will continue to be, significantly impacted by the timing and size of product launches. The company's non-GAAP first quarter results reflected the scale of the launch of Palm Pre with Sprint at the beginning of the quarter and the subsequent launch of Palm Pre with Bell Mobility in Canada. Due to the timing and scale of expected product launches in Palm's second fiscal quarter compared to those which took place in Palm's first fiscal quarter, and due to lower anticipated demand for legacy products, the company expects non-GAAP Adjusted Revenues for its second quarter of fiscal year 2010 to be between $240-270 million... The company's planned product launches with additional carriers in the second half of its fiscal year, together with continuing sales from products launched in the first half of its fiscal year, are expected to yield stronger operating performance... We're launching more great Palm webOS products with more carriers, and turning our sights toward growth..." Separately, co announced that it intends to offer approx 16 mln shares of common stock.

2:44PM Emcore enters into a long term supply agreement for space solar cells with Northrop Grumman (EMKR) 1.45 +0.18 : Co announces that Northrop Grumman (NOC) Aerospace Systems Sector has entered into a long term supply agreement with EMCORE's Solar Photovoltaics Division to manufacture and deliver high-efficiency, multi-junction solar cells for Northrop Grumman's satellite programs. EMCORE solar cells will help provide power for Northrop Grumman's space-based global climate monitoring capabilities and other satellite missions. The period of performance for the supply agreement is 2009 through 2012, with a potential value of more than $17 million.

8:58AM Solarfun Power provides updated 3Q 2009 business outlook; says total module shipments will exceed 100 MW (SOLF) 6.20 : Co announces an update on its outlook for the third quarter of 2009. For the third quarter of 2009, Solarfun estimates: 1) total module shipments will exceed 100 MW; 2) total revenues will be between RMB918 million and RMB984 million; and 3) gross margin will be approximately 17%.

8:32AM O2Micro settles ITC case with BenQ and LG (OIIM) 5.20 : Co announces that it has settled a dispute before the U.S. International Trade Commission relating to BenQ Corporation, BenQ America Corporation, LG Electronics and LG Electronics U.S.A. LG Electronics and BenQ now license certain O2Micro patents relating to inverter technology.

8:00AM First Solar to supply 27 megawatts of solar modules to Juwi for U.S. utility installations (FSLR) 146.99 : Co announces that it has been selected by Colorado-based developer and EPC contractor juwi solar, a subsidiary of juwi Holding A.G., to supply solar modules for two U.S. projects. These projects represent new supply orders and do not fall within the existing long-term framework agreement between First Solar and juwi solar GmbH. The projects include a 15 megawatt installation for the Jacksonville Electric Authority, the eighth largest community-owned electric utility in the U.S. First Solar will also supply another 12MW for juwi solar's project with American Electric Power in Ohio. The two installations are expected to begin construction in the fourth quarter of 2009 and to be completed before the end of 2010.

7:08AM Tessera Tech raises Q3 revenue guidance above consensus (TSRA) 27.95 : Co raises guidance for Q3 (Sep), sees Q3 (Sep) revs of $65-66 mln vs. $62.09 mln First Call consensus, prior guidance $60-62 mln. The company now has greater visibility into its Imaging & Optics business, and as a result, is raising its third quarter 2009 Imaging & Optics Total Revenue to be approximately $7.0 mln, of which approximately $4 mln will be Royalties and License Fees. Prior guidance, given on Aug. 4, 2009, was Imaging & Optics Total Revenue of $6.0 mln, of which approximately $3.0 mln was Royalties and License Fees. Tessera also announced that today it will file a Petition for Review of the Initial Determination issued on Aug. 28, 2009 by the Administrative Law Judge in the International Trade Commission Investigation No. 337-TA-630 brought by Tessera against certain DRAM manufacturers and sellers.

09:29 am Advanced Micro estimates and tgt raised to $7 at FBR Capital after PC checks: . FBR Capital raises their FY09 and FY10 EPS ests to ($1.85) and ($0.20) from ($1.95) and ($0.40) (consensus ($1.93) and ($0.99)) as recent checks into 3Q PC builds with the top five notebook ODMs and top four desktop motherboard makers are again better than the firm's month-ago checks. In addition, the firm raises their AMD tgt to $7 from $5.25. Overall, the firm forecast 3Q PC builds to grow +22% QOQ, better than their month-ago forecast of +18% QOQ. The firm's contacts now expect notebook units to grow +25% QOQ (up from +21% growth one month ago), while desktop builds are forecast to grow +17% QOQ (up from +13% QOQ one quarter ago). The firm believes that stronger 3Q notebook builds are due to demand momentum for consumer ultra-low-voltage models, new netbook launches, and some upcoming Windows 7 related stimulative impacts. While stronger 3Q desktop builds, are due to better demand from Europe thus far in September.

08:26 am Oracle (ORCL)

Shares of Oracle (ORCL 22.13) are under pressure in Thursday's premarket trading after the company reported disappointing sales figures in its latest quarterly report.

Oracle reported fiscal first quarter earnings of $0.30 per share, in-line with the First Call consensus of $0.30. Non-GAAP net income was flat at $1.5 billion compared to the same quarter last year.

Revenues fell 5.2% year-over-year to $5.05 billion, falling shy of the $5.25 billion consensus.

The most troubling aspect of Oracle's report for investors was the 17% decline in new software license revenues, a steeper decline than the company had forecast.

The company was able to grow operating margins by 570 basis points to 46%. ""By substantially improving operating margins we were able to increase Q1 earnings per share even though revenues decreased slightly," said Safra Catz, Oracle's president.

On the company's conference call, Oracle said it expects fiscal second quarter revenue to range from down 1% to an increase of 2%, which equates to approximately $5.55 billion to $5.72 billion; the First Call consensus currently stands at $5.72 billion.

The company said it sees fiscal second quarter earnings of $0.35 to $0.36 per share; the First Call consensus stands at $0.36.

Shares of ORCL are about 2.7% lower an hour ahead of Thursday's opening bell.
icon url

ReturntoSender

09/19/09 10:40 PM

#8681 RE: ReturntoSender #6755

From Briefing.com: Weekly Recap - Week ending 18-Sep-09

U.S. equity markets picked up where they left off last week, rallying in four out of five sessions to close with solid gains. The S&P 500 rose 2.5%.

There were bullish developments, but for the most part this week's rally was just a continuation of the recent upward trend. With the possible exception of Wednesday's 1.5% advance, there were no sharp moves, just a slow upward drift with any market pullbacks limited in scope.

All ten sectors that make up the S&P 500 rose, led by Materials (+4.7%) and Financials (+4.5%).

Investors received good news on the economy this week. On Tuesday the Advance read on Retail Sales came in at 2.7% (consensus 1.9%), Sales ex-autos came in at 1.1% (consensus 0.4%) and Empire Manufacturing came in at 18.9 (consensus 15.0). That was followed by better-than-expected Industrial Production on Wednesday (0.8% vs. 0.6% consensus) and Philadelphia Fed business outlook survey on Thursday (14.1 vs. 8.0 consensus).

The Empire and Philly Fed numbers clearly signalled that the manufacturing sector is beginning to come on-line and we should expect strong manufacturing production over the next few months. Unfortunately it is still to early to declare how the increase in production will play out in GDP growth.

There was also positive commentary during the week. On Tuesday Federal Reserve Chairman Ben Bernanke stated that the recession is "very likely over". That same day reports circulated that investor Warren Buffett had returned to the market. Mr. Buffett confirmed it the next day, saying that while the economy "hasn't gotten worse" it also hasn't "gotten much better" over the past three months, and that he doesn't expect a 'double-dip' recession.

But not all of this week's headlines were positive. There was a slow trickle of earnings results that failed to live up to expectations, including Oracle (ORCL), Best Buy (BBY) and FedEx (FDX), although the latter was known after preannouncing results last week. Whether those expectations have been raised too far, reflecting more the equity markets' view of the economic recovery vs. reality, remains in question. Certainly, in our view, the concern next earnings season will be on the revenue line, which is where many companies fell short this week.

Looking ahead, next week will be extremely busy. There will be the usual economic data, most notably Existing Home Sales on Thursday, Sept. 24 and Durable Goods Orders on Friday, Sept. 25. But the Fed is up first on Wednesday, Sept. 23, with investors watching to see if the FOMC has changed its policy directive. Longer term Treasury auctions also return, including $43 billion of 2-years on Tuesday, Sept. 22, $40 bln of 5-years on Wednesday and $29 bln of 7-years on Thursday.
  
Index Started Week Ended Week Change % Change YTD %
DJIA 9605.41 9820.20 214.79 2.2 11.9
Nasda 2080.90 2132.86 51.96 2.5 35.2
S&P 500 1042.73 1068.30 25.57 2.5 18.3
Russell 2000 593.59 617.88 24.29 4.1 23.7

12:49PM Palm 'CCC' Corporate Credit Rating placed on watch positive at S&P on planned stock sale announcement (PALM) 13.86 -0.57 :

Qualcomm (QCOM): Stock broke to new 2 month lows this morning on decent volume. The $44 level has a fair amount of support from the April and May highs while the 2004 highs are at ~$45. There is more support underneath at $43.50 and $43 from the lows of the June-July range. (44.31 -0.71)

Flextronics (FLEX) announces that it has completed the sale of its equity investment and note receivable in Aricent; total cash consideration received by Flextronics amounted to $255 mln.

09:33 am Hewlett-Packard: Stifel Nicolaus is buyer ahead of analyst day: . Stifel Nicolaus notes HPQ will be hosting its 2009 Analyst Day next Thursday. Firm would be a buyer of the shares ahead of this event. Firm expects mgmt to offer up a generally positive tone regarding the current PC and enterprise server/storage demand environment, though likely to remain reluctant in calling an overall demand recovery. Firm believes HPQ will provide evidence of a recovery in IPG supplies growth trends, comfort in a back-to-school PC sell-thru demand environment, and its thus far very successful integration of EDS.

09:55 am Palm (PALM)

Palm (PALM 13.95 -0.49) reported a first quarter loss after the close yesterday that was better than expected and provided mixed financial guidance. Separately, the company announced that it intends to offer approximately 16 million shares of common stock.

The company reported a first quarter loss of $0.10 per share, which was $0.15 better than the First Call consensus of a loss of $0.25. Revenue declined for the quarter by 1.6% on a year-over-year basis to $360.7 million vs. the $290.7 million. Gross margins were reported at 27.9% vs. the 25.6% consensus.

For the second quarter, the company issued revenue guidance of $240 million to $270 million, which is well below the $346.8 million consensus. For the fiscal year 2010, the company issued slightly upside revenue guidance of $1.6 billion to $1.8 billion vs. the $1.57 billion consensus.

The company shipped a total of 823,000 smartphone units during the quarter, representing a 134% increase from the fourth quarter of fiscal year 2009 and a year-over-year decrease of 30%. Smartphone sell-through for the quarter was 810,000 units, up 76% from the fourth quarter of fiscal year 2009 and down 21% year-over-year.

Palm's quarterly operating results are, and will continue to be, significantly impacted by the timing and size of product launches. The company's non-GAAP first quarter results reflected the scale of the launch of Palm Pre with Sprint at the beginning of the quarter and the subsequent launch of Palm Pre with Bell Mobility in Canada.

The company issued second quarter non-GAAP adjusted revenue guidance in the range of $240 million to $270 million because of the timing and scale of expected product launches in Palm's second fiscal quarter compared to those which took place in Palm's first fiscal quarter and due to lower than anticipated demand for legacy products.

The company's planned product launches with additional carriers in the second half of its fiscal year, together with continuing sales from products launched in the first half of its fiscal year, are expected to yield stronger operating performance.

icon url

ReturntoSender

09/21/09 8:48 PM

#8684 RE: ReturntoSender #6755

From Briefing.com: 4:15 pm : The Nasdaq logged a modest gain as biotech stocks advanced in the face of broader market selling pressure, which kept the Dow and S&P 500 in the red for the entire session.

Coming off of a gain of more than 2% last week, participants moved against stocks in broad fashion. Of the 10 major sectors in the S&P 500, health care was the only one to sport a steady gain for the vast majority of the session. It finished 0.7% higher as biotechs climbed 2.4%.

Biotechs were also primary leaders in the Nasdaq Composite and the Nasdaq 100, where large-cap technology typically determines the direction of trade. Tech stocks finished fractionally higher, but Dell (DELL 16.01, -0.68) was dropped for a sizable loss. It announced that it will acquire Perot Systems (PER 29.56, +11.65) for $3.9 billion, or $30 per share in cash, which represents a near 70% premium to the closing price of PER last Friday.

This session's losses were steepest among financials, energy stocks, and materials stocks. All three shed 0.9%. Financials fell as consumer finance stocks (-2.5%) and life and health insurers (-2.1%) faltered, but energy and materials stocks were pressured by falling natural resource prices.

Oil futures prices dropped 3.2% to $69.71 per barrel, while natural gas fell 5.4% to $3.57 per contract. Gold prices finished 0.5% lower at $1004.90 per ounce, while silver prices settled 1.1% lower at $16.88 per ounce. Their collective weakness took the CRB Commodity Index down 2.2%, which is its worst single-session percentage loss in more than one month.

A rebounding U.S. dollar, which lifted the Dollar Index to a 0.5% gain, only emboldened the desire of participants to dump commodities.

For the fifth consecutive month, the Leading Indicators Index posted positive growth. However, the 0.6% increase for August was slightly less than the 0.7% increase that was widely expected and was also down from the upwardly revised 0.9% increase that was registered in July. There wasn't much importance placed on the report since it has done a poor job in past recessionary cycles of predicting the shape of economic recovery.DJ30 -41.34 NASDAQ +5.18 NQ100 +0.4% R2K -0.3% SP400 -0.3% SP500 -3.64 NASDAQ Adv/Vol/Dec 1243/2.41 bln/1430 NYSE Adv/Vol/Dec 1010/1.20 bln/2003

10:07AM LTX-Credence announces that Unisem selected the X-Series for volume production testing (LTXC) 1.65 -0.02 :

STEC(STEC) releases a whitepaper based upon the growing interest in Solid State Drive technologies for the Enterprise-Storage and -Server markets. Company highlights that most SSDs are not enterprise SSDs.

9:01AM Molex raises guidance for Q1 above consensus (MOLX) 20.36 : Co issues upside guidance for Q1 (Sep), sees EPS of $0.12-0.16 vs. $0.07 First Call consensus, prior guidance $0.04-0.10; sees Q1 (Sep) revs of $650-665 mln vs. $615.98 mln consensus, prior guidance $590-630 mln. Co said, "Customer orders in all key markets have continued to trend higher in the September quarter, leading to the higher outlook for revenue".

8:31AM Axcelis Tech announces that "Major Asian Foundry" selects it for high energy implant multiple tool order (ACLS) 0.82 : Co announces that that it has received a multiple system order for its industry leading high energy ion implanter from a major foundry in Asia. The tools will be used for high volume manufacturing of logic and memory products, as well as for the development of next generation devices.

8:18AM Tutor Perini subsidiary Rudolph and Sletten awarded a contract to build phase one of the new $733 mln thin-film solar panel manufacturing facility for Solyndra (TPC) 20.25 : Rudolph and Sletten, a wholly owned subsidiary of TPC, announced that the company has been awarded a contract to build phase one of the new $733 million thin-film solar panel manufacturing facility for Solyndra, Inc. in Fremont, California. The first phase of the Solyndra's Fab 2, will contain 609,000 square feet of manufacturing plant floor area, utility and support space, shipping and receiving, and administrative and professional office areas.

TriQuint Semiconductor (TQNT) announces it has signed a memorandum of understanding with Huawei to supply driver amplifiers and related products for new optical transport systems.

LDK Solar (LDK) has qualified Applied Materials' (AMAT) HCT MaxEdge wire saws for volume production, certifying that the system has met all performance and quality specifications. The successful completion of this factory acceptance testing (FAT) is part of the installation of more than 50 MaxEdge systems at LDK Solar that is due to be finished next month... In relation to the case to use of trademarks and buying keywords for search engines

7:25AM Applied Materials announced a reorganization of certain members of its executive staff (AMAT) 13.03 : Co announced a reorganization of certain members of its executive staff. Tom St. Dennis has announced his intention to resign as senior vice president, general manager Silicon Systems effective October 2. Randhir Thakur will assume leadership of the Silicon Systems Group. In order to take advantage of increasing overlap in the crystalline silicon and thin film solar markets and align more deeply on strategy, investments and business development, Applied Materials' solar organizations will be combined under the leadership of Mark Pinto as senior vice president and general manager of Energy and Environmental Solutions. Manfred Kerschbaum will assume the role of chief of staff, helping to drive the company's business strategy around the world. Kerschbaum had previously been senior vice president and general manager of Applied Global Services.

7:07AM Novatel Wireless announces it has filed a universal shelf registration statement for up to $125 million of equity, debt or other types of securities (NVTL) 11.94 :

7:00AM Dell to acquire Perot Systems for $3.9 bln or $30 per share in cash (PER) 17.91 : Dell (DELL) and Perot Systems announce that they have entered into definitive agreement for Dell to acquire Perot Systems in a transaction valued at approximately $3.9 bln. Terms of the agreement were approved yesterday by the boards of directors of both companies. Under the terms of the agreement, Dell will commence a tender offer to acquire all of the outstanding Class A common stock of Perot Systems for $30 per share in cash. The transaction is not subject to a financing condition. The transaction, which is subject to customary government approvals and the satisfaction of other customary conditions, is expected to close in Dell's November-January fiscal quarter. Once the acquisition is complete, Perot Systems will become Dell's services unit and be led from Plano by Peter Altabef, the current Perot Systems chief executive officer. At the same time, Dell directors are expected to consider Ross Perot Jr., Perot Systems' chairman of the board, for appointment to the Dell board. Based on current estimates, the transaction is expected to be accretive to Dell's GAAP earnings in its fiscal 2012.

09:41 am SanDisk: Near-term data flow positive, but cash flow is still a problem - Auriga: . Auriga maintains their negative bias on SanDisk (SNDK) stock, as despite recent checks that suggest significant upside potential to 2H09 ests, they still do not see evidence of sustainable cash generation. Near-term unit and pricing upside leaves us with less conviction in shorting the stock for now, but with ROE, ROIC, and cash flow all likely to remain low or negative through CY10, they cannot justify the current valuation. They maintain Sell, but have raised their tgt to $15 from $11.

09:39 am Brooks Automation upgraded to Buy at Stifel Nicolaus; tgt $12: . Stifel Nicolaus upgrades BRKS to Buy from Hold and sets target price at $12. The firm notes that while they still hold to their view that the co was somewhat late to the game in terms of the restructuring efforts needed to reposition itself, they are now more confident that the plans are now in place, on a going forward basis, and believe they should see the benefits of these moves in future cycles. The firm also believes the company has seen a pickup in business, in line with many of its semi cap peers, and they would not be surprised at upside to its 4Q09.

icon url

ReturntoSender

09/22/09 10:57 PM

#8685 RE: ReturntoSender #6755

From Briefing.com: 4:25 pm : A falling dollar drove buying in commodities and commodity-related stocks to help the broader market start the session on positive footing, but it was the financial sector that emerged to provide the most leadership.

In complete contrast to the previous session, the S&P 500 spent the entire session trading in positive territory. Early gains were led by the energy sector (+1.4%), materials sector (+1.2%), and financial sector (+2.3%) after the trio had lagged in the previous session.

Advances by energy stocks and materials stocks were underpinned by sharp gains among commodity prices. Specifically, crude oil futures prices climbed 2.6% to $71.78 per barrel, while gold gained 1.1% to settle at $1015.80 per ounce.

The strong bounce by commodities came as the U.S. dollar slumped. That left the Dollar Index to drop 0.9%, which is its worst single-session percentage loss in nearly two months. However, the Dollar Index could not fully penetrate the 2009 lows that it set last week.

Despite a compelling case for commodities, buyers scooped up financials with conviction. That gave the financial sector a gain of more than 2%, the best of any major sector, and helped it settle near session highs.

Real estate trusts saw some of the sharpest moves as momentum buying took the holdings higher ahead of several REIT initial public offerings, but the influence of diversified financial services stocks (+3.5%) had the most impact on the broader financial sector. Shares of Bank of America (BAC 17.61, +0.36) traded as leaders after the stock had its price target raised by influential bank analyst Richard Bove.

Even though there was plenty of leadership from the financial sector, the broader market was range bound for nearly the entire afternoon. That left it to settle a few points off of session highs.

Treasuries saw strength at the long end of the yield curve after the results from a $43 billion auction of 2-year Treasuries showed a bid-to-cover ratio of 3.2 and a high yield of 1.03%. The 2-year Note tacked on 2 ticks to yield 0.95%, but the benchmark 10-year Note gained 9 ticks to yield 3.44% and the 30-year Bond climbed 21 ticks to yield nearly 4.20%. DJ30 +51.01 NASDAQ +8.26 NQ100 +0.1% R2K +0.8% SP400 +0.7% SP500 +7.00 NASDAQ Adv/Vol/Dec 1526/2.50 bln/1155 NYSE Adv/Vol/Dec 2168/1.27 bln/873

4:10PM MEMC Elec confirms it entered into amendment to solar wafer supply agreement between Gintech - 8-K (WFR) 19.03 +0.40 : In an 8-K filing, co entered into Amendment Number 4 to Solar Wafer Supply Agreement between Gintech Energy Corporation and the Company's subsidiary, MEMC Singapore, dated October 25, 2006, pursuant to which the Company had agreed to sell solar grade silicon wafers to Gintech over a ten-year period. Similar to amendments effected for the Company's other long-term solar wafer supply agreements, the Amendment provides that aggregate revenues to the Company over the ten-year life of the Agreement will remain unchanged, but additional price reductions for the remainder of 2009 and an increase in the minimum quantity of wafers required to be purchased by Gintech in 2009 have been effectuated. The Amendment also provides a mechanism to defer potential purchase shortfalls for a particular contract year resulting from the increased volume commitment if certain conditions are met.

4:06PM Seagate Tech sees revs at or slightly above high end of original guidance; guides margins above consensus (STX) 15.68 +0.23 : Co announces that it now expects revenue to be at or slightly above the high end of its original guidance of $2.4-$2.6 bln (consensus is for $2.54 bln in revs). In the event OEM demand is stronger than co anticipates during the last two weeks of the quarter, as occurred last quarter, revenue for the first fiscal quarter could be greater than the revised guidance. "As a result of our rapid transition to market leading notebook and desktop products, as well as improving factory efficiencies and utilization, gross margin as a percent of revenue is now expected to be approximately 23-24%." Consensus is for gross margin of 20.3%. Seagate believes disk drive inventory in all channels continues to be at appropriate levels, with supply in balance with demand. The demand and pricing environment during the remaining weeks of the quarter will be key factors in determining the operating results for the first fiscal quarter of 2010.

7:30AM Applied Materials awarded multi-year service contract from ENN Solar Energy (AMAT) 12.66 : Co announces that it has signed a five-year contract with ENN Solar Energy to support ENN's solar photovoltaic module manufacturing facility in Langfang, China, which features an Applied SunFab Thin Film Line. Through its highly flexible SunFab Performance Service program, Applied will provide ENN with continuous operating cost reductions while enabling optimal performance from the SunFan production line at a predictable cost that scales with factory loading. Applied's SunFab Performance Service program has been selected by all of Applied's customers currently producing single and tandem junction modules on SunFab lines. Under the agreement, Applied will leverage its dedicated, world-class service infrastructure to provide ENN's SunFab Thin Film Line with preventive and corrective maintenance, spare parts management, and analytical services.

09:46 am Newport resumed with a Buy at Needham; tgt $11: . Needham resumes coverage of NEWP with a Buy and sets target price at $11 saying the co has made significant progress lowering its breakeven and addressing its under-performing laser business. Firm says in July, NEWP completed a strategic exchange with Oclaro of its struggling diode laser manufacturing operation in Tucson in return for acquiring the New Focus photonics components business. As a result of these initiatives, they believe NEWP will emerge from the economic downturn in stronger shape, although they acknowledge the execution risk, particularly in the current economic environment.

09:46 am SanDisk ests and tgt raised at Caris on contract pricing and royalties: .
Caris is increasing SNDK ests for 3Q09 and 4Q09 reflecting an upward revision to 2H09 contract pricing outlook and the positive implications for SNDK royalty revs and product sales and gross margins. The move follows through on late-August Caris checks signaling strong 3QTD product pricing in Asia and occurs against a backdrop of multiple co-specific positives including mgmt's Samsung royalty re-negotiation, a Toshiba manufacturing JV restructuring, and strong C09 OpEx reduction. Overall, its C09E/10E/11E EPS rise to $0.83/$1.00/$1.54 from $0.51/$0.65/$1.42 while tgt increases to $20 from $17.

09:45 am Research In Motion: Credit Suisse previews F2Q Thursday after the close; sees in-line qtr: . For F2Q Credit Suisse expects revs/EPS of $3.6 bln/$0.99 in-line with the mid-pt of guidance ($3.6 bln/$0.99) and consensus. Ests are based on units/ASPs of 8.4 mln units (+8% qoq)/$345 vs consensus of 8.5 mln/$344. Despite competitive launches (iPhone 3GS, Pre) during the qtr, firm believes RIMM's volumes held up, driven by the Tour at Verizon/Sprint, as well as the reinstatement of the "BOGO" offer at Verizon. For F3Q (Nov), firm remains comfortable with unit/ASP ests of 9.0 mln (+7% qoq)/$338, driven by new product launches (Storm 2, Onyx), continued momentum of recently launched products (Tour, 8520, 8900), and timing of competitive launches (CLIQ, Pixi). Rev/EPS ests are $3.8 bln/$1.04 vs street at $3.9 bln/$1.05.

09:45 am Apple: Barclays Capital sees big enterprise opportunity for iPhone: . Barclays Capital believes the enterprise smartphone mkt represents a major incremental opportunity for Apple. While penetration into this mkt could be gradual, signs are pointing toward a few players emerging as leaders, including Apple and RIMM. Checks indicate continued pent-up demand for the iPhone globally, with a strong new product pipeline overall. Firm views the enterprise as an incremental market for AAPL and an interesting development for the handset industry. The key takeaway from firm's call on the subject is that the smartphone industry has major growth potential and that the iPhone should get its fair share of this mkt over time given its consumer appeal and industry leading apps.

icon url

ReturntoSender

09/23/09 9:46 PM

#8686 RE: ReturntoSender #6755

From Briefing.com: 4:35 pm : Action was muted ahead of the latest FOMC policy statement, which spurred buying and sent stocks to their best levels of the year. However, the new highs proved unsustainable as stocks rolled over and closed at session lows with their worst loss since the first of the month.

The tone to premarket trading had been mildly positive, but stocks lost their way after the opening bell and spent most of the morning drifting in mixed fashion. As such, gains and losses in the broader market were relatively contained.

However, telecom steadily outperformed for the entire session. It finished 1.6% higher as the only major sector to post a gain. However, its lack of relative size limited its leadership.

Energy stocks traded with considerable weakness for the entire session. It finished 1.9% lower, hampered by bearish oil inventory data, which showed a build of 2.86 million barrels when a draw of 1.40 million had been expected. Crude prices to finish 3.9% lower at $68.99 per barrel.

Despite the drop in oil prices, airline stocks slumped. In turn, the Amex Airline Index shed 4.3%. US Airways (LCC 4.52, -0.71) disappointed by announcing the sale of 26 million shares of common stock. Meanwhile, AMR Corp (AMR 7.78, -0.66) priced its 48 million common share offering at $8.25 per share, which is slightly below the previous session's closing price.

Financials were the worst performing major sector in the S&P 500, despite trading quietly in the early going. Late pressure sent the sector 2.1% lower.

Materials stocks finished not far behind financials, however. The sector dropped 2.0% amid weakness in commodities stocks and commodities prices. Softer commodities prices sent the CRB Commodity Index down 1.0%.

Weakness among commodities was exacerbated by a stronger dollar, which fell to new 2009 lows immediately after the release of the latest Fed policy statement. However, it was able to rebound to a 0.3% gain. Despite its strong finish, many currency traders continue to bet against the greenback.

The latest FOMC policy statement, which indicated that economic activity has picked up since its severe downturn. Neither that, nor the Fed's belief that economic conditions are likely to warrant exceptionally low levels of the fed funds rate (left unchanged at 0.00% to 0.25%, as expected) for an extended period came as much of a surprise. The FOMC went on to say that it will purchase $1.25 trillion of agency mortgage backed securities and $200 billion agency debt, but it will gradually slow the pace of purchases to promote a smooth transition in markets.

Stocks in the broader market attracted support with the statement's midafternoon release. That drove the S&P 500 to session highs and a gain of 0.8%. Ford (F 7.36, +0.35) and General Mills (GIS 63.80, +2.83) were primary gainers. Ford benefited from its view that the U.S. auto market is looking good and vehicle sales are expected to increase, while General Mills posted better-than-expected earnings for its latest quarter and issued upside guidance.

Still, their strength wasn't enough to stop some late-session selling, which culminated in a 1.0% loss for the S&P 500. This is only the second time this month that the S&P 500 lost at least 1%, though.

Treasuries responded favorably to the Fed's announcement, but were able to hold their gains. The benchmark 10-year Note finished roughly 10 ticks higher, which put its yield back near 3.40%. Prior to the announcement they had been showing weakness, uninspired by news that a $40 billion auction of 5-year Treasuries produced a high yield of 2.47% and a bid-to-cover ratio of 2.4. DJ30 -81.32 NASDAQ -14.88 NQ100 -0.6% R2K -1.2% SP400 -1.5% SP500 -10.79 NASDAQ Adv/Vol/Dec 1023/2.70 bln/1668 NYSE Adv/Vol/Dec 1063/1.32 bln/1958

4:06PM Conexant announces that it intends to sell 7 mln shares of common stock (CNXT) 3.39 +0.07 :

Marvell (MRVL) announces that its Marvell 88DE2710 video processor is a featured component of Sony's BDP-CX7000ES 400-disc Blu-ray Disc MegaChanger, thus furthering the integration of Marvell technology into consumer electronics devices...

8:12AM Xilinx raises Q2 sales outlook (XLNX) 22.72 : Co reports Q2 sales are expected to be up approximately 10% sequentially vs the 4.1% consensus, we calculate this to be revs of $413.8 mln vs the $391.6 mln consensus. This is a revision from previous sales guidance of up approximately 2-6% sequentially. The increased sales guidance is primarily due to broad based strength across nearly all end markets and geographies. Virtex-5 sales are expected to increase significantly in the Sept quarter, surpassing 20% of total sales. They expect to ship the majority of last quarter's delinquencies in the Sept quarter. Co issues gross margin guidance of approximately 61% vs the 61.02% consensus and operating expense guidance of approximately $175 mln, including $5 mln in restructuring charges, both are unchanged.

American Superconductor (AMSC) and LS Cable formed a strategic alliance to advance commercial sales of superconductor cables. Under the alliance, LS Cable and AMSC will work collaboratively to deploy at least 10 kilometers of superconductor power cables in commercial power grids over the next five years...

8:01AM Palm confirms that it prices public offering of 20 mln common shares at $16.25/share (PALM) 17.07 : See original comment from 7:48 ET.

09:37 am Apple ests raised at RBC Capital Mkts on higher Mac/iPhone momentum: . RBC Capital Mkts' survey data shows 25% of respondents bought a Mac laptop last 90 days, up from 18% in July. Firm is raising its Q4 Mac units to 2.8 mln (prior 2.66 mln). On higher Mac momentum, EPS ests become $5.92/F09 and $7.30/F10 (prior $5.90/$7.23 - $5.85/$6.89 consensus). The strong recovery in laptops is likely due to: a) recovering consumer electronics spending; b) iPhone-related store traffic; c) price cuts, promotions; d) Snow Leopard; e) Apple's rising brand awareness and popularity. Apple is now the laptop mkt share leader in its survey, ahead of DELL (24%), HPQ (21%). Surging iPhone Demand is shown in a separate RBC survey with iPhone representing 30% of Smartphone users, up from 25% June. New iPhone buyers are surprisingly strong at 81%.

09:36 am Western Digital ests and tgt raised to $46 at Caris as HDD market continues to rebound: .
Caris is raising their Q3 ests to $1.02 from $0.83 (consensus $0.80) and taking another step up in their FY10 EPS ests to $4.45 from $4.20 (consensus $3.44). Additionally, the firm raises their WDC tgt to $46 from $40 with Seagate (STX) pre-announcing better-than expected Sep-qtr revs/margins as the HDD market continues to rebound. Still the firm's preferred way to invest in a strengthening PC market, they believe: HDD unit demand is now showing upside across segments, pricing remains benign and inventories remain lean. Moreover, the kicker perhaps still underappreciated by investors, the firm believes STX and WDC are uniquely outexecuting their 3-4 remaining Asian competitors in a consolidating market, thereby taking the market's incremental upside and leverage. Already something of a 2-horse race in 3.5in desktop HDDs, the firm continues to see 2.5in notebook as the next area STX and WDC could catapult forward as they now ramp new-gen 320GB/p.

icon url

ReturntoSender

09/25/09 9:20 PM

#8692 RE: ReturntoSender #6755

From Briefing.com: 4:25 pm : Stocks looked as if they were going to trim losses amid some afternoon buying, but sellers redoubled their efforts late in the session to ensure that the stock market would log its third straight loss, which hasn't happened for three weeks.

Stocks initially looked as if they would firm up after sliding nearly 2% during the course of the previous two sessions, but the mood among participants dampened amid a surprise 2.4% drop in durable goods orders during August. Economists had expected a 0.4% increase. Excluding transportation, orders were flat, which missed the consensus forecast for a 1.0% gain.

Meanwhile, annualized new home sales figures for August came in at 429,000 units, which is a bit below the consensus call of 440,000 units. Though the sales rate was softer than expected, it still reflected a 0.7% monthly increase, but that didn't help stocks garner support.

Instead, broad-based weakness weighed on stocks for nearly the entire session. At their session lows, the S&P 500 was down nearly 1%, while the Nasdaq was down slightly more than 1%. Though the extent of their losses at session lows was similar, the Nasdaq lagged the other headline indices for most of the session, primarily due to weakness among large-cap tech issues. Large-cap tech was hampered by a rather conservative revenue forecast from Research In Motion (RIMM 68.91, -14.15) and the company's failure to quell concern regarding falling handset prices. Shares of RIMM responded by making their worst single-session percentage drop this year.

Hewlett-Packard (HPQ 47.02, +0.15) also issued its latest outlook, which was in-line with the consensus 2010 forecast, but that won it limited favor.

Meanwhile, McDonald's (MCD 56.95, +0.83) helped the Dow Jones Industrial Average hold up better than its counterparts against the efforts of sellers for the second straight session. McDonald's won support by lifting its quarterly dividend 10% to $0.55 per share.

Despite support from McDonald's, the Dow still lost 1.6% since last week. The Nasdaq Composite dropped 2.0% this week, while the S&P 500 logged a weekly loss of 2.2%. Their collective losses made for the stock market's worst week since July.

Amid weakness in the equity market, Treasuries ticked higher. Gains were especially strong at the long end of the yield curve. As such, the 30-year Bond gained more than one full point while the benchmark 10-year Note tacked on 16 ticks. The 2-year Note slid three ticks.DJ30 -42.25 NASDAQ -16.69 NQ100 -0.9% R2K -0.5% SP400 -0.6% SP500 -6.40 NASDAQ Adv/Vol/Dec 1145/2.38 bln/1520 NYSE Adv/Vol/Dec 1358/1.20 bln/1633

4:09PM Pericom Semi beats by $0.01; guides Q1 revs in-line (PSEM) 9.81 +0.15 : Reports Q4 (Jun) earnings of $0.04 per share, $0.01 better than the First Call dual-analyst est of $0.03; revenues rose 22.0% year/year to $29.7 mln vs the $30.07 mln consensus. Co sees Q1 revs of $31.5-32.5 mln vs $32.4 mln consensus. Net income from unconsolidated affiliates PTI and JCP of $0.4-0.5 mln. Co says, "Our bookings have continued to grow during the June quarter, and resulted in our having an improved backlog as we entered the September quarter. We believe our revenues are now better aligned with end user demand, which we believe will gradually strengthen in the coming months."

12:32PM Daily Momentum Movers (TECHX) : Research in Motion (RIMM): Company reported earnings last night and the stock is down about 13 points and is trading in a tight range around $70 support. If it breaks that level, there is some support at $68 and more at $66 and $64. Last trade at 69.91

Applied Micro Circuits (AMCC) and Taiwan Semiconductor Manufacturing (TSMC) announced a collaboration enabling AppliedMicro's Power Architecture microprocessors to be manufactured on TSMC's industry-leading technology platform first at 90nm then moving to 65nm and 40nm soon after... Ascent Solar Technologies, (ASTI) announced the signing of a definitive Cooperation Agreement with Energy Technologies of Mansfield, Ohio. The agreement focuses on the development of new photovoltaic products intended for the U.S. military...

08:53 am Hewlett-Packard (HPQ)

Hewlett-Packard (HPQ 46.87) issued in-line guidance for fiscal 2010 at an analyst meeting Thursday afternoon, saying that it expects the IT industry to return to growth in 2010.

HP said it expects fiscal 2010 earnings of $4.20 to $4.30 per share, excluding $0.60 in charges. The company's forecast is in-line with the First Call consensus of $4.25.

Hewlett-Packard's revenue projections are also in-line with the consensus as the company sees fiscal 2010 revenue between $117 billion and $118 billion; the consensus stands at $118 billion.

"We expect the IT industry to return to growth in 2010 and believe that HP will outpace the market," said CEO Mark Hurd.

Shares of HPQ are 29% higher year-to-date.

08:37 am Research In Motion (RIMM)

Shares of BlackBerry maker Research In Motion (RIMM 83.06) are plunging more than 13% ahead of Friday's opening bell after the company's most recent quarterly report and forecast raised fears of slow growth.

Research In Motion reported fiscal second quarter earnings of $1.03 per share, $0.03 better than the First Call consensus of $1.00.

Revenues rose 36.8% year-over-year to $3.53 billion but fell short of the $3.62 billion consensus.

The company added 3.8 million net subscribers in the quarter, at the low end of its guidance of 3.8 million to 4.1 million.

RIM issued mixed guidance for its fiscal third quarter, saying it expects earnings of $1.00 to $1.08 per share; the consensus currently stands at $1.05.

The company's sales forecast disappointed investors, as Research In Motion forecast third quarter revenues of $3.60 billion to $3.85 billion, shy of the $3.92 billion consensus. Net subscriber additions in the third quarter are expected to be in the range of 4.0 million to 4.3 million.

icon url

ReturntoSender

09/27/09 7:41 PM

#8693 RE: ReturntoSender #6755

Amateur Investors Weekend Market Analysis (9/26/09)

http://www.amateur-investor.net/Weekend_Market_Analysis_Sep_26_09.htm

The major averages are very overextended in both price and time so a more substantial pullback is certainly possible at any time much like occurred from mid June through mid July. The chart of the Dow shows it's still pretty far above its upper trend line that connects the March low with the July low. At some point I would expect a retest of either the 50 Day EMA (blue line) which is approaching 9400 or the upward trend line which is nearing 9200.


As for the Nasdaq notice how it held support in earlier this month (point A) right along its upward trend line (black line) connecting the March low with the July low. Currently the upward trend line is nearing 2040 while the 50 day EMA (blue line) is around 2010 so those will be some initial support levels to watch if a more substantial pullback occurs in the Nasdaq.


The S&P 500's upward trend line (black line) connecting the March low with the July low is just above 1000 which is close to the 50 Day EMA (blue line) of 1010 as well. Thus if a more substantial pullback were to occur I would look for a potential retest of the longer term upward trend line.


Meanwhile a key thing to watch in the longer term is the 12 Month EMA (yellow line). Remember back in 2003 once the S&P 500 rose above its 12 Month EMA it was able to hold support above it on a Monthly Closing basis all the way through late 2007. Notice each time the S&P 500 dropped below its 12 Month EMA (points A) it was able to close back above it by the end of the month. Right now the 12 Month EMA is at 992 so that is a key level to watch over the next few months. Also note that the early September low was at 992 so it's probably not a coincidence that the 12 Month EMA is being watch by the Institutional Money that controls the market.


Finally last week I showed you an Inflation Adjusted Chart of the S&P 500. Many people have been wondering why the market made a bottom in March. When you look at a longer term Inflation Adjusted Chart notice that the S&P 500 made a Cyclical Bull Market high in 1968 which was in the mid 660's (point B). Meanwhile back in early March of this year the S&P 500 bottomed at 667 (point C) so I don't think this happened by accident as there was a key long term support level in the mid 660's based on the Inflation Adjusted values.


Signup for a "Free 4 Week Trial Membership" or save up to 50% on a Premium Membership and you will have access to the following products.

1. "ETF Daily Buy and Short Signals" which can be used to trade the DIA's, QQQQ's and SPY's.

2. "401K/Thrift Savings Plan (TSP) Timing Service" which can be used to help improve your return in your 401k/TSP Account.

3. The "End of Month Strategy". This Strategy focuses on the typical End of Month markup by the Institutional Money.

4. "Stocks to Buy List" which can be used with either our Short Term Strategy or Long Term Strategy.

icon url

ReturntoSender

09/27/09 9:10 PM

#8694 RE: ReturntoSender #6755

InvestmentHouse Weekend Market Summary 9/25/09

http://www.investmenthouse.com/weekendmarketsummary.htm

- Economic worries set the tone as the technical pullback continues.
- Durable goods orders, new home sales strike a sour note to end the week.
- Dollar stabilizes some to end the week but still remains very weak.
- Dire predictions for the government and the economy as the US prints excessive money without the backstop of recessions past.
- Pullback likely to continue as indices are set for a June-like test.

Stocks never get on track as earnings, economic issues provide no reason to reverse the pullback.

The market was in no mood to rally on Friday. Thursday night, RIMM set the tone when its revenues missed and its guidance was below expectations. Friday morning, durable goods orders were much worse than expected and new home sales were not up to par either (just as we saw with existing home sales on Thursday). The confidence was up in Michigan, but that was not enough to give investors any confidence. Renewed economic worries pervaded the market on Thursday and Friday as the economic data, after a couple of months of improvement, all of a sudden took a step back. As it stepped back, so did investors. They continued the selling that started on Wednesday afternoon when the market reversed late.

Is this something that we can blame on any particular catalyst? We could blame the dollar; it's rebounding some from the slaughter it took the week before, but the dollar was not that strong on Friday and did not recoup much ground. There is also that renewed worry about the US economy. There is a concern that the economy is going to come back after the initial bust higher and double dip. This was more of a technical correction. The market had a strong run in July and then a resumption of that move in September. It has pretty much duplicated the length of time the market moved off of the lows in March through May. We are seeing what I consider to be a technical pullback after two very solid runs -- the most recent being in the first part of September which was supposed to be a bad month for stocks.

With those two factors playing in, that set the stage for when Mr. Warsh of the Fed wrote an op-ed that came out on Friday morning and said that, despite the FOMC saying on Wednesday that interest rates would remain low for a long time to come, that the Fed may have to quickly raise interest rates and remove some of the facilities in place to help foment the recovery. On one hand there are worries about the economy not being that strong, and on the other hand there are worries that the Fed feels like it has to take the stimulus back because of fears of massive inflation. With those competing factors, the investors decided to punt on Friday and continue the pullback that started on Wednesday afternoon with the reversal.

There was too much worry in the market for any buyers to come back in, so the market basically said, "We're out of here" and decided to go into the weekend with losses. There were modest losses. The market gapped lower and it sold some more, but then it managed to recover a little bit of the ground in the afternoon. It was not a significant recovery as the indices still closed lower.

SP600 - 0.34%, NASDAQ 100 - 0.9 1%, NASDAQ - 0.79%, SP500 - 0.6 1%. They were down but, unlike on Thursday when the small and mid-cap growth areas were hit the hardest, on Friday it was spread out to technology and to the financials in the SP500. That allowed some of the smaller areas to recover or show a relatively better day than on Thursday. The end result is that the market is making a pullback and the indices are still at near support. Trendlines still remain intact and the uptrend is in place. The question moving into next week is just how much of a pullback are we going to get? It may be something mild that comes back to basically where it is now, or we might see more of a June-like pullback where the indices lost roughly 9% as we consolidated that strong, initial run.

TECHNICAL

INTERNALS. The internals saw some mild distribution last week, particularly on NASDAQ. When the selling started on Wednesday, volume spiked up on NASDAQ. Volume was above average as it has been for the last three weeks, but it spiked up on Wednesday when the market reversed late. Even though it was lower on Thursday and Friday, it was still relatively strong compared to the upside sessions earlier in the rally. Even though it was modest in terms of not increasing in strength, it was still showing relative strong volume to the downside. You could call that distribution. SP500 was not nearly as prone to distribution last week; it had difficulty even making it to average as far as volume is concerned. All week long volume was below average. On Thursday it was average, but that was a day of selling. There was mild distribution, but it was modest relative to the upside in the early part of the rally in September.

CHARTS. This was more of a technical pullback than any other real catalyst impacting the market such as the possibility of a weaker economy. Stocks had rallied a long way starting in July. There were 10-11 weeks of rallying very similar to the rally from March to early June. There was a strong, long rally and now we are seeing basically a technical pullback. The question is how far will it pull back this time? Is it going to be just a test of near support, or is it going to be something deeper, similar to what we saw in June and early July? Right now, SP500 is at a support level which is near the October intraday high. That is not very serious support. That is not going to be something in and of itself that holds it up, but there is a double hump in August that has good support. That puts it around 1012 at the low end from early August, or later in the month from 1030. For all intents and purposes, SP500 is at the peaks from late August. It would be very easy for it to sell down to the early August levels around 1010.

NASDAQ is holding a similar pattern. It is holding the mid-September low that was the point where it bounced before it turned over and fell off of the table. Will it hold there? That is a good place for it, but there is more support down (as with SP500) at the early August level near 2015. If you take it down to the lows of that range, what you see is a range of support from roughly 2015 in early August to around 1950-1960. That is a very reachable area for NASDAQ on this turn down, and that is a significant area because that is part of the gap point in October of 2008 when NASDAQ gapped lower. What if there is a decline that is similar to those back in June and July? On both NASDAQ and SP500 there was a 9% decline from the June peak to the July low. Right now, the indices are down roughly 3.5%, about 1/3 of the way of that selling. If we go 9% on SP500, that puts it down to 982 and puts it at about the mid-August low.

If NASDAQ takes a 9% decline on this, roughly matching the June pullback, that will drop NASDAQ down to roughly 1972 which would be near the early September low. Again, an interesting point because this coincides very neatly with NASDAQ falling back to the gap points from October 2008. It is a very neat, logical place for it to pull back, and that puts it also just above the June peak. We will be watching it as it pulls back, both NASDAQ and SP500, to see what kind of Fibonacci retracements we get on that. I will be watching to see if we get a 38% or a 50-61% or if it goes all the way to 78%. We will see what kind of pullback we get, and that will give an indication of how much strength there is in the move and how much strength there is in the selling that has cropped up in the market.

In sum, this is a technical pullback brought about by none other than the success that the indices have had in this July-September run. You typically cannot have this kind of move without having a pullback. Even though all of the liquidity was still there in June and July, the market declined 9%. There has been another move of not the same percentage but of the same time period. We could very easily have a pullback over the same period of time, which was about six weeks. Maybe it is not 9%, but that is a pretty logical level when you examine the charts.

LEADERSHIP. Leadership was kicked around last week, but it was not trounced by any means. The financials were up but they pulled back. Biotechs continued to look solid even though they were knocked around a little bit. CELG bounced back up on Friday. The financials had a great first part of the month, and they are pulling back as well. There were big names that had good moves but, very similar to the large indices, they are not suffering much at all. Software is very strong and now it is also pulling back. It is not in bad shape and is one of the leadership groups right now. We will look for some pullbacks over this next week or two and see if we can get new buys there as well. Telecom has performed well, and we'll see if there will be some kind of pullback that gives us a buy. The theme is that the money is still plentiful out there, but we are probably going to have something of a pullback in the leaders despite that. Even plentiful money cannot keep the market moving up forever.

The irony of leadership and the theory that the economy may be starting to falter and double dip is that retail still remains quite solid. If there are fears of economic weakness, the retail stocks are not showing it (and, of course, retail plays right into the hands of the consumer). Retail stocks are going to rally ahead of consumer strength. I am a believer of what the market shows as a leading indicator, so when I see a lot of retail stocks that have enjoyed good runs and are still in good shape, I want to pay some attention to that. There is a whole group of stocks in retail that are in good shape. Some or pulling back while some are extending their gains. If you read the message of the market, it is saying that while there are concerns about whether or not the economy is going to continue to improve as we have seen, the retail stocks say that it is going to improve.

THE ECONOMY

Durable goods orders join the recent disappointments.

The theme toward the end of the week was whether or not the US was going to be able to sustain the somewhat modest recovery it has been enjoying over the past couple of months. The durable goods orders were down on Friday (-2.4% versus +0.4% expected; 4.8% shown in July). There is a serious issue with respect to orders of those goods that are supposed to last three years or more. That was a bit of salt in the wounds on top of the existing home sales that fell on Thursday.

New home sales fall but inventories are trending nicely lower.

After the durable goods orders were out, the new home sales came out and they were disappointing as well (429K, less than expectations; 426K in July). These were disappointing numbers. The inventory level fell (-7.3 months from 7.6 in July). There is movement again with respect to the inventories, and that is what has to recover to a level where there is a tight enough market where buyers will have to face a stiffer price competition. That is what sellers need - they want to have some equity built back into their house and enjoy some gains again and feel like the bottom is not falling out of one of the primary investments that most Americans have. If your house keeps falling in value, while you have a place to live, you have a concern as to whether your store of wealth will actually be a store of wealth when you need it. A lot of people have bigger homes when they get older, they want to retire, sell out, and be able to take some equity out of their house when they sell it. Right now they are worried that that may not be the case, and that is one of the things that is somewhat stymieing the consumer.

Then again, the consumer did quite well in the last round of retail sales. The consumer, as they said in Monty Python and the Holy Grail, ain't dead yet. Do not give up on them just yet, and maybe we can get more of a boost out of the consumer (and the businesses as well) as this little fledgling economic bounce continues. That was a positive. We did see some decent recovery.

In Michigan, the sentiment was solid (73.5 versus 70.5 expected; 65.7 in August). That was much stronger and indeed it was much better than expected, but it was not enough to get things moving in the stock market on Friday. There are more serious issues as far as investors are concerned, and again there was the overriding technical reason of the market needing somewhat of a pullback and correction.

The dollar did bounce a bit last week and showed some strength after getting hit so hard (closing 1.4675 Euros versus 1.4651 Thursday). The problem the dollar is having right now is the Yen because the dollar is becoming something of the carry trade currency. It is getting sold, and that is continuing to put pressure on it because it is the currency feature in the carry trade.

Some dire predictions. There always are, right?

I want to talk about some longer term predictions. There is an individual I admire named Marc Faber, and he has some pretty stark predictions about what is going to happen to the US economy in 5-6 years. Basically, he is calling for a collapse of the government in about 6 years. He is not talking about just a collapse of the economy, but a collapse of the government because of all of the debt that has been taken on. Trillions upon trillions have been added and, as he has noted, history has shown us that when you have economic collapses or economic bubbles break as a result of excessive credit creation, you cannot fix the problem by simply creating more liquidity and more credit. You can inflate your way higher and kick the can down the road, but eventually the road ends and there is a cliff at the end. Like Wile E. Coyote, you end up falling over the cliff and leaving a little puff of dust when you hit the bottom. Of course, when you have the world's largest economy, it will be a little bit more than just a puff of dust when you fall off and hit that bottom.

His concern is that we are trying to once again inflate our way out of it. He notes that Greenspan was the king of this - he started the ball rolling. He got the modern Fed in the position it is in now where its hand is forced to inflate and print money on the way to trying to stave off a systemic collapse. The interesting thing that Mr. Faber notes is that if your economy was improving, if this credit extension was really working, then our currency should be rising. I have said that before - a strong economy begets a rising currency, and that is just not happening right now. Our currency is getting pounded, and although there are other factors pushing it lower (such as it being the target of a renewed carry trade in the world), when you print trillions of dollars with nothing backing it, then you do have problems with your currency and it will decline. Mr. Faber says that the dollar will continue to plummet and gold should rise. It had broken $1K but now it is back under, but he predicts gold is going to $3K. The basic premise is that we had an economic shutdown last fall based upon loose credit, and the house of cards collapsed. Our response has been not to let the banks that made bad loans fall and not to let people lose their homes, but it has been to try to create inflation and give more credit out in an attempt to produce enough of a economic recovery to jump-start the great economic engine again here in the US so we could produce our way out of it. We have been lucky and able to do that in the past, but here is where my analysis comes in.

The reason we are not going to be able to do it (or not as easily able) this time is because there are other countries out there now - China, Brazil, India - that are becoming industrial powerhouses. They do not need to look to the US to buy their goods to get them out of economic troubles; they can look at home. These countries are becoming wealthy, and I always said that that was one of the serious problems that the US faced with such a large current account deficit and budgetary deficit. One day the economies that are funding our debt will wake up and realize they are rich and do not have to sell their stuff to the US but can sell it to their own people. Then they do not have to keep buying our currency. Our currency is already under pressure, and that would be the death knell that would send it down to nothing - or close to it. We will not have people wanting to produce goods to fund our economy so we can produce and consume our way out of it. We have the stimulus that the Obama administration passed, and I have been critical of it. I have said that it is the 1930's and 1970's type of stimulus, where it is into digging ditches and refilling them versus trying to invest in the US and produce an educated populace and put money into entrepreneurs hands to produce the new businesses that will lead to the new technologies like we saw in the 1980's and 1990's.

Even if we use the Reagan or Kennedy-style supply side economics that unleashed tremendous investment booms in the US and catapulted us into the technological lead in the world, could it stave off the kind of collapse that Mr. Faber is suggesting is going to happen? With the spending that we have thus far, and if we are going to try to pass the healthcare plans that are being kicked around, the costs are going to be staggering. Whether it is the Medicare multiplier, which is ten times what they anticipated it would be, or the Medicaid multiplier which was 100 times what it was anticipated to be, this is pretty much break-the-bank kind of spending. The irony of this is that this administration is telling us that we have to spend more money in order to save money. I do not know about you, but my wife used to come home from big sales that were 40-60% off saying "Look how much money I saved buying stuff that I would not have bought but for the fact that it was on sale." It appears that this is the kind of mentality that has taken over Washington. Somehow they think this is going to save us money, but has there ever been a program that the federal government has started that has saved us money? No, to the contrary, they always cost 10-100 times more than anticipated, and we are taking about break-the-bank kind of spending at those levels.

This debate has become not driven by logic but ideology. It is always very dangerous when we start forgetting what we know about the past and make the same mistakes again - this time on a colossal scale that we may not ever be able to recover from. What do we do? If this country is going to print such massive amounts of money that our currency becomes basically worthless, then buy some gold. Right now, stocks in the US are rallying, so participate in that. It is not a good place to necessarily be in interest bearing accounts because the Fed is keeping the rates at basically zero, and the Fed said it would be comfortable with a 6% inflation rate right now. The Fed will be happy with 6% inflation which means you would be getting 0% on your dollars and inflation would eat 6% annually into your money. On top of that, your dollars would be losing value because of the currency exchange risk. As we print more and more money and the other economies in the world that are industrializing become more and more confident in their ability to sustain themselves, then they buy less dollars and we go down in price further. Not only that, but everything we import becomes more and more expensive because anything priced in dollars has to inflate in value in order to make up the difference to the producer due to the falling dollar.

I heard a fairly smart economist the other day make a fool out of himself by saying that it does not really matter because if you buy everything in the US you will be okay. That is absolute nonsense. Most of our oil does not come from the United States, it comes from other countries and it is valued in dollars. Every time that we allow our dollar to fall, we are raising the prices of all of our energy costs. Energy is a main input cost in nearly everything that we produce, whether it is the actual energy used to power the machines or the petrochemicals that go into much of what we produce.

The problem that we have is that we are willingly debasing our currency by printing dollars that we do not have and we are ready to spend tens of trillions of dollars - at a minimum - that we do not have. That is why our currency is falling and, while it is not collapsing yet, it is on a steady decline. Maybe we can produce our way out of this. I do not have much faith in that just because of the kind of stimulus we have and the overhang of all the trillions of dollars that we are printing and spending. We are digging a hole that will be very difficult to get out of and have to think about what may happen down the road. It is one of those situations like last fall when one of my friends called me and said, "Jon you need to take all of your money out of everything and put your dollars in a safe deposit box because you may not be able to get any if nothing is done." My response to him was, "Well, it will not be worth anything if that happens, so why bother?" He thought about it a minute and agreed. If you have Armageddon, does it really matter? In the long run, not really. If we have that, then everyone is going to suffer. Realize that gold will go up in value, however, and hard things will go up in value because those are things you can hold and sustain. The question is where are you going to store them? If the system breaks down and there is chaos, you are not going to be able to do anything with them or be able to get anyone to give you them just because you hold a piece of paper saying you have a right to them.

That is something to think about. I always hate doom and gloom, but this is interesting. Mr. Faber is a very smart man. He called the crash, and he called this little rally we have had off of the bottom - he has made a number of very good calls in the past. He is quite prescient and it is interesting to listen to what he has to say.

THE MARKET

MARKET SENTIMENT

VIX: 25.61; +0.66
VXN: 25.77; -0.13
VXO: 24.85; +0.93

Put/Call Ratio (CBOE): 0.96; -0.03

Bulls versus Bears:

This is a reading of the number of bullish investment advisors versus bearish advisors. The reason you look at this is that it gives you an idea of how bullish investors are. If they are too bullish then everyone is in the market and it is heading for a top: if everyone wants to be in the market then all the money is in and there is no more new cash to drive it higher. On the other side of the spectrum if there are a lot of bears then there is a lot of cash on the sideline, and as the market rallies it drags that cash in as the bears give in. That cash provides the market the fuel to move higher. If bears are low it is the same as a lot of bulls: everyone is in and the market doesn't have the cash to drive it higher.

Bulls: 47.9%. While the market moved higher the past two weeks bullish sentiment fell. It hit 50.6% three weeks back but some worry is creeping in. Success breeds doubters, eh? Still well over the 35% level that is the threshold for what is considered a bullish climate. It does not mean things are necessarily bearish; that takes a reading in the 60% range. Hit a high of 47.7% mid-June on the run from the March lows. Again, to be seriously bearish it needs to get up to the 60% to 65% level. Dramatic rise from 21.3% in November 2008, the bottom on this leg. This last leg down showed us the largest single week drop we have ever seen, falling from 33.7% to 25.3%. Hit 40.7% on the high during the rally off the July 2008 lows. 30.9% was the March low. In March the indicator did its job with the dive below 35% and the crossover with the bears. A move into the lower 40's is a decline of significance. A move to 35% is a bullish indicator.

Bears: 24.4%. Bears continue to bounce higher on that same skepticism impacting the bullish figures, but the bounce is slowing (24.1% 2 weeks back). Hit a low of 21.3% on this leg. Rebounding some from the big drop 31.1% and 35.6%. For reference, cracking above the 35% threshold considered bullish. Hit a high on this run at 47.2%. For reference, bearishness hit a 5 year high at 54.4% the last week of October 2008. The move over 50 took bearish sentiment to its highest level since 1995. Extreme negative sentiment. Prior levels for comparison: Bearishness peaked at 37.4% in September 2007. It topped the June 2006 peak (36%) on that run. That June peak eclipsed the March 2006 high (33%) and well above the 2005 highs that spawned new rallies (30% in May 2005, 29.2% in October 2005). That was a huge turn, unlike any seen in recent history.

NASDAQ

Stats: -16.69 points (-0.79%) to close at 2090.92
Volume: 2.282B (-10.24%)

Up Volume: 825.516M (+397.132M)
Down Volume: 1.543B (-634.168M)

A/D and Hi/Lo: Decliners led 1.34 to 1
Previous Session: Decliners led 3.09 to 1

New Highs: 37 (-12)
New Lows: 11 (+2)

NASDAQ CHART: Click to view the chart

NASDAQ 100 CHART: Click to view the chart

SOX CHART: Click to view the chart

SP500/NYSE

Stats: -6.4 points (-0.61%) to close at 1044.38
NYSE Volume: 1.195B (-11.43%)

Up Volume: 378.85M (+203.985M)
Down Volume: 795.856M (-367.717M)

A/D and Hi/Lo: Decliners led 1.27 to 1
Previous Session: Decliners led 3.19 to 1

New Highs: 175 (-7)
New Lows: 31 (0)

SP500 CHART: Click to view the chart

SP600 Chart: Click to view the chart

DJ30

Stats: -42.25 points (-0.44%) to close at 9665.19
Volume DJ30: 189M shares Friday versus 201M shares Thursday.

DJ30 CHART: Click to view the chart

MONDAY

This week we will likely see a continuation of this technical pullback that I have been talking about. There has been a move higher in the market, and it is roughly equal in time from March to May. The question is how deep this pullback will be? 9% as in June, or is this the extent before a bounce? No one knows for sure, but the selling has not been very intense thus far, and there is still plenty of liquidity in the market although the Fed did inject some uncertainty about that at the end of the week. After Wednesday it said it would keep the money going, but on Friday, Mr. Warsh (who many look at as a surrogate speaker for Mr. Bernanke) said the Fed may have to turn the ship pretty quickly if things sour on the inflation front (and the currency as well). When you print this much money, that could happen relatively quickly. That could cause them to turn the ship, and that is what made investors somewhat nervous on Thursday and Friday. Add that it was just technically ready to pull back, and you have the making for a pullback ahead.

In anticipation we lightened up a lot of positions during the week. On Friday a lot of stocks were pulling back a little more but were fading into support, and you do not like to sell stocks at support. Let them bounce and see how they bounce. If they bounce with any strength, you let them run. If they bounce and fizzle out, you pull the cord and get out of them and then look for more downside plays and watch for other plays to develop to the upside.

As for the leaders, the money is still spreading out around the market to set back up whether it be in biotech, energy, software or telecom. There are stocks in sectors that are setting back up, so we watch for them. One thing about the choppy action in some sectors the past couple of week: there are a lot of ABCD patterns setting up. We have put those on the report and now we wait to see if they break upside or if the entire market is going to make the test. For now be patient and do not rush into a lot of positions. When the time is right, we will move in and make some money. Have a great weekend and I will see you on Monday.

Support and Resistance

NASDAQ: Closed at 2090.92
Resistance:
2155 is the March 2008 intraday low
2167 from the July 2008 intraday low
2169 is the March 2008 closing low (double bottom)
2099 is the mid-September 2008 closing low

Support:
The 18 day EMA at 2087
The March up trendline at 2075
2070 is the September 2008 intraday low
2060 is the August peak
2016 is the early August peak
The 50 day EMA at 2010
1984 from late September
1962 is the bottom of the August 2009 range.
1947 is the October gap down point
1897 is the October post gap intraday high.
1880 is the June peak
1862 is the July peak
1786 is the November intraday high
1780 is the November 2008 closing peak
1773 is the May intraday peak
1770 is the mid-October interim peak
The 200 day SM A at 1717

S&P 500: Closed at 1044.38
Resistance:
1106 is the September 2008 low
1133 from a September 2008 intraday low
1185 from late September 2008
1200 from the July 2008 low

Support:
The 18 day EMA at 1045
1044 is the October 2008 intraday high
The August peak at 1040
The early August intraday peak at 1018
The 50 day EMA at 1011
The November 2008 peak at 1006 closing 1007.53 intraday
992 is the August 2009 consolidation low
956 is the June intraday peak
944 is the January 2009 high
935 is the January closing high
932 is the July peak
930 is the May peak
919 is the early December peak is bending
899 is the early October closing low
896 is the late November 2008 peak
The 200 day SMA at 896
888.70 is the April intraday high.

Dow: Closed at 9665.19
Resistance:
9855 is the early September peak in its lateral range
9918 is the September 2008 peak
10,365 is the late September low

Support:
9654 is the November 2008 high
The 18 day EMA at 9644
9625 is the October 2008 closing high
9620 is the August 2009 peak
9387 is the mid-October peak
The 50 day EMA at 9359
9116 is the August low
9088 is the January 2009 peak
8985 is the closing low in the mid-2003 consolidation
8934 is the December closing high
8878 is the June peak
8829 is the late November 2008 peak
8626 from December 2002
8588 is the May high
8581 is the July peak
8521 is an interim high in March 2003 after the March 2003 low
8451 is the early October closing low
The 200 day SMA at 8441
8419 is the late December closing low in that consolidation

Economic Calendar

These are consensus expectations. Our expectations will vary and are discussed in the 'Economy' section.

September 29 - Tuesday
- Case-Shiller Housing, July (09:00): -14.20% expected, -15.44% prior
- Consumer Confidence, September (09:00): 57.0 expected, 54.1 prior

September 30 - Wednesday
- ADP Employment, September (08:15): -200K expected, -298K prior
- GDP - Final, Q2 (08:30): -1.2% expected, -1.0% prior
- Chicago PMI, September (09:45): 52.0 expected, 50.0 prior
- Crude Inventories, 09/25 (10:30): 2.85M prior

October 01 - Thursday
- Personal Income, August (08:30): 0.1% expected, 0.0% prior
- Personal Spending, August (08:30): 1.1% expected, 0.2% prior
- Initial Claims, 09/26 (08:30): 535K expected, 530K prior
- Continuing Claims, 09/19 (08:30): 6178K expected, 6138K prior
- Construction Spending, August (10:00): -0.2% expected, -0.2% prior
- ISM Index, September (10:00): 54.0 expected, 52.9 prior
- Pending Home Sales, August (10:00): 1.0% expected, 3.2% prior
- Auto Sales, September (14:00)
- Truck Sales, September (14:00)

October 02 - Friday
- Average Workweek, September (08:30): 33.1 expected, 33.1 prior
- Hourly Earnings, September (08:30): 0.2% expected, 0.3% prior
- Nonfarm Payrolls, September (08:30): -180K expected, -216K prior
- Unemployment Rate, September (08:30): 9.8% expected, 9.7% prior
- Factory Orders, August (10:00): 0.5% expected, 1.3% prior
icon url

ReturntoSender

09/28/09 9:42 PM

#8695 RE: ReturntoSender #6755

From Briefing.com: 4:25 pm : News of renewed merger and acquisition activity didn't bring many participants to the market, but stocks were still able to sport broad-based gains for the entire session and log their best gain in one month.

Stocks were given support in the early going by news that Xerox (XRX 7.68, -1.29) will pay $6.4 billion in cash and stock for Affiliated Computer Systems (ACS 53.86, +6.61), while Abbott Labs (ABT 48.58, +1.12) will pay $6.6 billion in cash for Solvay's drug business.

Though it was overshadowed by the larger deals, American Securities announced it will acquire GenTek (GETI 37.77, +10.77) for $38.00 per share, which represents a near 40% premium over GETI's closing price last Friday.

The supportive role played by Monday morning's M&A news helped stocks to recover from their worst weekly loss since July.

Several sectors had their moments of leadership, but by the end of the session financials logged the best gains. The sector settled with a gain of little more than 3.4%, which marks the sector's best single-session percentage advance in two months. Multiline insurers (+6.0%) underpinned the financial sector's impressive move.

Consumer staples stocks lagged on a relative basis as Dow component Kraft (KFT 26.17, -0.07) showed moderate weakness. Still, the sector netted a gain of 0.5%.

Though stocks traded with broad-based gains, there wasn't much behind them. Trading volume on the NYSE fell to its lowest level in one month, coming in below 1 billion shares.

Despite broad-based buying among equities, Treasuries were still able to advance. As such, the benchmark 10-year Note gained 11 ticks, which sent its yield down to multimonth lows of 3.28%.

The U.S. dollar also showed strength, which drove the Dollar Index to a 0.2% gain. Despite that move, commodities were still able to garner support and send the CRB Commodity Index up 0.6%.

Advancing Sectors: Financials +3.4%, Materials +2.0%, Consumer Discretionary +2.0%, Technology +1.7%, Energy +1.7%, Industrials +1.6%, Telecom +1.5%, Health Care +1.4%, Utilities +0.9%, Consumer Staples +0.5%
Declining Sectors: (None)DJ30 +124.17 NASDAQ +39.82 NQ100 +1.8% R2K +2.4% SP400 +2.1% SP500 +18.60 NASDAQ Adv/Vol/Dec 1987/1.91 bln/662 NYSE Adv/Vol/Dec 2419/979 mln/607

4:30PM Palm announces closing of public offering (PALM) 16.92 : Co announcesthe closing of the previously announced public offering of common stock. In total, 23 million shares were sold in the offering for a public offering price of $16.25 per share, including shares subject to the over-allotment option and approximately 2.15 million common shares acquired by Elevation Partners.

4:28PM Silicon Image announces departure of CEO; Harold Covert appointed as President and COO (SIMG) 2.90 -0.05 : The co announces the resignation of its president and chief executive officer, Steve Tirado. Hal Covert, chief financial officer, will be taking over as president and chief operating officer, effective immediately. Covert joined Silicon Image from Openwave Systems Inc. in 2007, and has more than 30-years of management experience at technology and telecommunications companies. "Moving forward, Silicon Image has strong talent, leading-edge technology, and a solid balance sheet with no debt and approximately $160M in cash. The management team is focused on our customers, executing on our product strategy, and enhancing shareholder value." Silicon Image has retained the services of an executive search firm to find a new CEO.

4:08PM Silicon Image lowers Q3 revs guidance below consensus (SIMG) 2.89 -0.06 : Co lowers Q3 revs guidance to $37-39 mln vs $44.8 mln First Call consensus, down from $44-46 mln prior guidance. Co says, "During Q3 of 2009 we continued to experience the impact of the product transition the co has been undergoing since 2008, in particular its effect on legacy products' declining average selling prices. This factor, combined with our customers' shift in production from high-end products to mid-range and low-end products, has put more pressure than anticipated on Silicon Image's goal of improving revenue generation. We are looking forward to entering 2010 with our new product line-up that features HDMI 1.4, Mobile High-Definition Link, and SteelVine Series 3 technologies... In other news, a separate press release was issued announcing the formation of the Mobile High-Definition Interface Working Group with Nokia Corporation, Samsung Electronics Co., Ltd, Silicon Image, Inc., Sony Corporation, and Toshiba Corporation. This is an important step in the process of Silicon Image moving forward with its strategy around Mobile High-Definition Link technology."

9:01AM NVIDIA collaborates with Microsoft on high performance GPU computing (NVDA) 14.50 : Co announces work with Microsoft to promote NVIDIA Tesla graphics processing units for high performance parallel computing using the Windows HPC Server 2008 operating system. NVIDIA Research developed several GPU-enabled applications on the Windows HPC Server 2008 platform, such as a ray tracing application that can be used for advanced photo-realistic modeling of automobiles. Related to this, NVIDIA worked with Microsoft Research to install a large Tesla GPU computing cluster and is studying applications that are optimized for the GPU.

STEC (STEC) announces that STEC's enterprise-class ZeusIOPS Solid State Drives are now available for the LSI Engenio 7900 Storage System.

7:30AM Applied Materials awarded service contract by Fujitsu Microelectronics (AMAT) 13.10 : Co announces that it has been awarded an integrated service contract by Fujitsu Microelectronics to support its advanced 300mm semiconductor factory in Mie, Japan. Under the program, Applied will service over 100 Applied chipmaking systems utilizing its Applied Performance Service solution that scales service levels to match factory loading. In addition, Applied will implement its Applied E3 advanced equipment and process control technology on Fujitsu Microelectronics Mie plant's entire toolset.

7:19AM On The Wires : ARM (ARMH) and Broadcom Corporation (BRCM) announced that they have signed a major licensing agreement for the ARM Cortex -A9 MPCore multicore processor. Broadcom intends to target the technology towards next-generation mobile, wireless and other consumer electronics applications...

6:33AM Amtech Systems has received a follow-on multi-system order for its diffusion processing equipment (ASYS) 5.34 : Co announces its solar subsidiary, Tempress Systems, Inc., has received a follow-on multi-system order for its diffusion processing equipment from an existing customer in Asia. The order for multiple systems is expected to ship within the next six to nine months.

09:46 am Micron: Wedbush expects FQ4 to come in ahead of the Street; good news likely priced in: .
Wedbush notes MU reports FQ4 (Aug) after the close on Tuesday, Sept. 29. Firm expects FQ4 results to come in ahead of the Street (($0.19)/$1.27 bln) and its ests largely due to better than expected NAND pricing, gross margin, and the continued transition to DDR3. Firm looks for positive FQ1:10E (Nov) outlook from mgmt driven by (1) strong NAND pricing, (2) modest improvement in server demand, (3) constrained supply of DDR3 and DDR2 pushing DRAM ASPs higher and (4) CQ4 seasonality. Although firm expects on the conf call nothing but very positive comments from mgmt on the near-term outlook for the overall memory mkt, firm believes with the 400+% move in the stock off its 52-wk low of $1.59, that much of the good news is likely already priced in.

icon url

ReturntoSender

09/29/09 11:00 PM

#8696 RE: ReturntoSender #6755

From Briefing.com: 4:30 pm : Tuesday's trade concluded in lackluster fashion as an absence of leadership left stocks to drift during the afternoon, unable to reclaim their initial gains.

Stocks had started the session in higher ground as a better-than-expected S&P/Case-Shiller Home Price Report for July brought about some modest support. The report's 20-City Composite showed a 13.3% year-over-year decline, which wasn't as bad as the 14.2% decline that was expected.

However, the solid state of things quickly became unsettled by news that the September Consumer Confidence Index pulled back to 53.1 from 5.4.5 in August. The dip was unexpected; economists, on average, had been expecting a reading of 57.0.

The major indices were unable to fully recover from the flurry of selling that followed the disappointing consumer confidence reading.

News that the FDIC will require insured institutions to prepay estimated quarterly risk-based assessments into 2012 seemed to weight on bank stocks, though the announcement was generally expected. Diversified bank stocks fell 1.9%.

Consumer finance stocks were hit just as hard. They fell 1.9% amid news that the Fed has approved rules amending the transparency and disclosure of terms in credit card agreements.

Bright spots were limited, but shares of Walgreen (WAG 37.35, +3.16) logged their best single-session percentage advance in six months after the company posted better-than-expected quarterly earnings. The drug retailer helped consumer staples stocks stay in the green for the entire session.

Advancing Sectors: Consumer Discretionary +0.5%, Consumer Staples +0.4%, Utilities +0.2%, Materials +0.1%
Declining Sectors: Tech -0.7%, Energy -0.6%, Financials -0.5%, Telecom -0.5%, Industrials -0.2%, Health Care -0.1%DJ30 -47.16 NASDAQ -6.70 NQ100 -0.4% R2K -0.5% SP400 +0.3% SP500 -2.37 NASDAQ Adv/Vol/Dec 1111/2.10 bln/1568 NYSE Adv/Vol/Dec 1435/1.18 bln/1555

4:07PM Micron trading up about $0.30 following earnings (MU) 8.40 -0.04 : 2009 highs are at $8.80 while the 2008 high is $8.97. Last trade at 8.67

4:07PM Jabil Circuit beats by $0.08, beats on revs; guides Q1 EPS in-line, revs in-line (JBL) 12.28 -0.10 : Reports Q4 (Aug) earnings of $0.16 per share, excluding non-recurring items, $0.08 better than the First Call consensus of $0.08; revenues fell 15.2% year/year to $2.8 bln vs the $2.66 bln consensus. Co issues in-line guidance for Q1, sees EPS of $0.24-0.32, excluding non-recurring items, vs. $0.18 consensus; sees Q1 revs of $3.0-3.2 bln vs. $2.88 bln consensus.

4:05PM Oracle buys HyperRoll, financial details not disclosed (ORCL) 21.11 -0.06 : Co announces that it has agreed to acquire certain assets of HyperRoll, a provider of financial reporting acceleration solutions. It is expected to further strengthen Oracle Enterprise Performance Management solutions with additional reporting acceleration technology and continues to emphasize Oracle's product strategy to provide best-in-class offerings that help ensure a rapid, reliable and compliant financial close process for customers. Financial details of the transaction were not disclosed.

4:05PM Micron beats by $0.09, beats on revs (MU) 8.40 -0.04 : Reports Q4 (Aug) loss of $0.10 per share, $0.09 better than the First Call consensus of ($0.19); revenues fell 10.1% year/year to $1.3 bln vs the $1.27 bln consensus. Micron prelim reports gross margin 12%. When adjusted to exclude the effects of selling products subject to previous lower of cost or market write-downs and the idle capacity costs from Inotera and IM Flash, gross margins on sales of memory products improved to positive 8% in the fourth quarter compared to negative 12% in the third quarter as a result of significant decreases in per gigabit manufacturing costs. Consensus called for gross margins of 8.3%... "The market, while still challenging, is beginning to improve. Micron has been one of the only companies in the industry able to generate positive operating cash flow every quarter during this downturn. Our operating performance and ongoing cost improvements put Micron in a great competitive position going forward." Revenue from sales of DRAM products increased 28% in the fourth quarter compared to the third quarter due to a 19% increase in sales volumes and an 8% increase in average selling prices. Revenue from sales of NAND Flash products increased 10 percent in the fourth quarter compared to the third quarter due to a 23% increase in sales volumes. This was partially offset by an 11% decrease in average selling prices resulting primarily from reduced manufacturing costs associated with products sold to Intel Corporation, the company's NAND Flash manufacturing partner. Prices for NAND Flash products sold to Intel approximate cost, which decreased significantly in the fourth quarter compared to the third quarter as the transition to the company's 34 nanometer (nm) NAND process technology was substantially completed. Average selling prices for NAND Flash sales excluding those to Intel were relatively stable in the fourth quarter compared to the previous quarter.

4:05PM Am Superconductor and Sinovel Sign $100 million follow-on electrical components contract for 3 megawatt wind turbines (AMSC) 30.36 : The co announces that it and Beijing-based Sinovel Wind Corporation Limited (Sinovel) have signed a new contract worth more than $100 million (excluding value added tax) for core electrical components to be utilized in Sinovel's 3 megawatt (MW) wind turbines, known as the SL3000. AMSC expects to begin shipping sets of core components under the new contract in March 2010 and to complete all shipments by the end of calendar year 2011. Sinovel is China's largest wind turbine manufacturer and expects to be the world's fifth largest wind turbine manufacturer by the end of 2009.

Finally we heard renewed Rambus (RMBS 17.53 +0.26) takeover chatter, with the acquirer named in the rumor being Hewlett-Packard (HPQ 47.50 -0.38). RMBS is often the subject of rumors, and like others, this one also seems like a stretch. RMBS shares did pop on the initial rumor, but have since given back much of the gains. While many rumors circulate during the day, and the validity of the source of these rumors can be questionable, the speculation may increase volatility in the stocks in the near term.


icon url

ReturntoSender

09/30/09 9:01 PM

#8697 RE: ReturntoSender #6755

From Briefing.com: 4:25 pm : An early selling effort dropped stocks from an initial gain to a loss of more than 1%, but stocks gradually made their way back to positive ground before falling under a second wave of selling pressure. Although they finished the session with a loss, stocks still logged impressive gains for the month.

Better-than-expected earnings from several companies, including Nike (NKE 64.70, +4.61) and Jabil Circuit (JBL 13.41, +1.13) helped prop up the bias in the broader market this morning. The tone of trade improved further from news that second quarter GDP was revised upward to show an annualized decline of 0.7%, which is better than the 1.2% annualized decline that had been expected.

The GDP headline overshadowed the latest ADP Employment Change Report, which indicated that 254,000 private jobs were lost during September. Since that is worse than the consensus forecast for 200,000 job losses, some wonder whether the government's official nonfarm payrolls report on Friday will be worse than expected.

Despite early signs of strength, stocks reversed direction in the first few minutes of trade. The slide was exacerbated by news that the Chicago PMI reading for September came in at 46.1, below the consensus forecast of 52.0 and down from the previous reading of 50.0.

Within the first hour of trading the S&P 500 saw a modest gain turn into a loss of 1.3%. However, buyers waded back into the action and helped stocks turn their losses into a midday gain. The rally was challenged, though, as the S&P 500 failed to push through its opening highs.

Tech had been a primary source of support for the midsession advance, but renewed selling pressure in the second half of the session left the sector to finish with a mere 0.2% gain. Semiconductor stocks were able to hold on to a near 0.9% gain, however.

Materials stocks had also provided leadership as commodities prices soared. Though the sector faltered and finished with a 0.5% loss, the CRB Commodity Index jumped 2.9% in its best single-session percentage gain in nearly two months.

The CRB's impressive performance came as bullish gasoline inventory data helped underpin a 5.7% gain by crude oil prices, which settled at $70.49 per barrel. Meanwhile, gold prices shot up a strong 1.5% to settle at $1009.50 per ounce.

The strong performance by commodities helped give the CRB Commodity Index a 0.6% gain for September and a 3.8% gain for the third quarter.

Though stocks finished September on a rather dour note, the S&P 500 was still able to book a monthly gain of 2.7% and a quarterly gain of 14.9%, which is the second best quarterly performance for the S&P 500 this decade. The best quarter came in the second quarter of this year, when the stock market advanced 16.7%.

With the end of the quarter at hand, investors and portfolio managers drove trading volume in the NYSE sharply higher as they juggled their portfolios. In turn, nearly 1.8 million shares traded hands on the NYSE. That's the second highest single-session tally this month.

Advancing Sectors: Technology +0.2%, Consumer Staples +0.2%
Declining Sectors: Industrials -0.9%, Utilities -0.9%, Energy -0.5%, Materials -0.5%, Health Care -0.5%, Financials -0.5%, Consumer Discretionary -0.4%, Telecom -0.3%DJ30 -29.92 NASDAQ -1.62 NQ100 +0.1% R2K -1.0% SP400 -0.6% SP500 -3.53 NASDAQ Adv/Vol/Dec 996/2.67 bln/1704 NYSE Adv/Vol/Dec 1257/1.77 bln/1757

9:38AM Qualcomm confirms Japan Fair Trade Commission Order (QCOM) 45.62 +0.12 : Co confirms that the Japan Fair Trade Commission (JFTC) has issued an order relating to its license agreements with Japanese manufacturers. The order is unchanged from the draft order that was issued by the JFTC on July 24, 2009. It alleges that Qualcomm forced Japanese licensees to accept cross-license provisions without compensation, and to accept a provision under which the Japanese licensees agreed not to assert their essential patents against other licensees that had agreed to a similar provision. The order directs Qualcomm to eliminate these provisions from its license agreements with its Japanese licensees. Co will exercise its right under Japanese law to have a full evidentiary hearing. If the JFTC affirms the order following administrative review, Qualcomm will pursue an appeal before the Japanese courts. In the interim, Qualcomm will seek to have the order suspended or stayed during the pendency of administrative and judicial review.

9:07AM On The Wires : MIPS Technologies (MIPS) announces that it has joined the Open Handset Alliance, a group of more than 45 technology and mobile companies working to offer consumers a richer, less expensive, and better mobile experience...

8:35AM Axcelis Tech receives multiple orders for yield enhancing upgrade (ACLS) 1.02 : Co announces that it has introduced a significant performance enhancing upgrade for its industry leading high energy ion implanter product line. Axcelis has already made several successful installations and received multiple follow-on orders from customers as they realize compelling technology and device performance benefits. The Low Angle Implant upgrade is designed to deliver higher yields and improved overall device performance.

8:00AM Trina Solar announces extension of long-term supply agreement with GCL-Poly (TSL) 31.88 : The co announces announced that it has extended its eight year long-term supply agreement with Jiangsu Zhongneng Polysilicon Technology Development Co. Ltd, a subsidiary of GCL-Poly Energy Holdings Limited ("GCL-Poly") by another five years. Initial delivery of polysilicon to Trina Solar started in April 2008. Under the adjusted terms of this agreement, the total consideration will remain unchanged from the combined total of the original and supplemental agreements signed in 2008, whereas additional polysilicon and wafer deliveries will be provided starting in 2016 for a five year period at pre-determined shipment volumes and prices. The agreement also contains a price adjustment clause that offers a market-linked price formula. GCL-Poly will supply the Company with high-quality polysilicon and wafers sufficient to produce approximately 8,500 MW of solar modules over 13 years. Wafer deliveries to commence in 2010 are expected to support production above the Company's in-house integrated manufacturing capabilities to address growing customer demand.

09:42 am ON Semiconductor tgt raised to $10 at Wedbush Morgan following channel checks: . Wedbush Morgan raises their ONNN tgt to $10 from $9 as the firm believes that ONNN's 3Q orders are tracking extremely well following a round of channel checks. The firm notes that their distributor checks indicate upside to orders in recent notebook design wins, Korean handsets, and infotainment shipments for autos following the lull in 1H09. In addition, 4Q bookings appear to be shaping up as well. The firm thinks the significantly improved visibility is enabled by some lead times stretching up to 16 weeks, lean inventory levels, and ramping seasonal builds. Notably, the firm did pick up a single order cancellation; however, the magnitude was small, was a 1-off, and they have not heard of any others since

09:50 am Jabil Circuit (JBL)

After the close Tuesday, Jabil Circuit (JBL 13.27 +0.99) reported fourth quarter earnings of $0.16 per share, excluding non-recurring items, which was $0.08 better than the First Call consensus of $0.08.

Revenues fell 15.2% year-over-year to $2.8 billion for the quarter, which was above the $2.66 billion consensus.

For the first quarter, the company estimated that its core operating income would be in a range from $85 million to $105 million, driven by the continued demand from its customers, further manufacturing efficiencies and the benefit of cost reductions.

First quarter earnings are expected to range from $0.24 to $0.32 per share, excluding nonrecurring items, which is well above the consensus of $0.18. For the top line, the company sees first quarter revenue of $3.0 billion to $3.2 billion vs. the $2.88 billion consensus.

The company said, "Marked improvement in our sequential performance was aided by cost cutting, increased productivity, market share gains and a more benign end-market environment. Income gains were matched with cash flow generation and balance sheet improvements during the quarter."

08:09 am Micron Technology (MU)

Micron Technology (MU 8.40) reported a narrower-than-expected loss for its fiscal fourth quarter and said that the market for its memory chips is still challenging but beginning to improve.

Micron reported a fiscal fourth quarter loss of $0.10 per share, $0.09 better than the First Call consensus that expected a loss of $0.19 per share.

Revenues fell 10.1% year-over-year to $1.3 billion; the consensus expected $1.27 billion.

Revenue from sales of DRAM products increased 28% from the third quarter due to a 19% increase in sales volumes and an 8% increase in average selling prices. Revenue from NAND Flash products increased 10% sequentially due to a 23% increase in sales volumes, partially offset by an 11% decrease in average selling prices.

Micron reported gross margins of 12%. When adjusted to exclude the effects of selling products subject to previous lower of cost or market write-downs and the idle capacity costs from Inotera and IM Flash, gross margins on sales of memory products improved to positive 8% in the fourth quarter compared to negative 12% in the third quarter as a result of significant decreases in per gigabit manufacturing costs. Consensus called for gross margins of 8.3%.
icon url

ReturntoSender

10/01/09 10:51 PM

#8698 RE: ReturntoSender #6755

From Briefing.com: 4:30 pm : A deluge of data and concern regarding tomorrow's jobs report pushed buyers to the sidelines. That left stocks to drop sharply in broad-based fashion, resulting in the stock market's worst single-session percentage loss since July.

The dour mood among participants was evident from the start. Stocks started in the red as the previous session's lackluster finish carried over into morning trade and foreign markets faltered. News that the International Monetary Fund raised its forecast for 2010 global economic growth to 3.1% from 2.5% had no real positive impact.

Though the IMF forecast was widely disregarded, market participants were focused on several other reports, including another disappointing jobless claims tally. Initial claims climbed 17,000 to 551,000, which is a higher count than had been expected. Continuing claims came in at 6.09 million, which is below the consensus estimate and down 70,000 from the previous week, but that is largely due to the expiration of jobless benefits. The ugly claims numbers and the disappointing ADP report on Wednesday serve as salient reminders that the government's nonfarm payrolls report for September could be disappointing. The official payrolls report is due Friday morning.

Personal income and spending for August were up 0.2% and 1.3%, respectively. Both exceeded expectations, while core personal consumption climbed a mere 0.1%, as expected.

The ISM Manufacturing Index for September came in at 52.6, which is below what was expected, but the figure still indicates growth in the manufacturing sector.

Construction spending during August made a surprise 0.8% increase, while pending home sales for August surprised some by increasing 6.4% in August.

Stocks were also dogged by a stronger U.S. dollar, which was helped partly by supportive comments from Fed Chairman Bernanke, who said that there is no immediate risk to the dollar. With the Dollar Index up nearly 0.7%, basic materials stocks and commodities showed weakness for the entire session. Materials stocks finished 3.9%, while the CRB Commodity Index dropped 1.5%.

Financials were the worst performers for the session, though. The sector dropped 4.4%. Banks were some of the worst performers as regional banks dropped 5.5%, diversified financial services fell 5.2%, and diversified banks dropped 5.1%. Bank of America (BAC 16.21, -0.71) was one of the few companies to make headlines this session. The company's Chief Executive, Ken Lewis, announced that he will retire by year's end. No successor has been named, though.

With 95% of the companies listed in the S&P 500 logging losses, many participants pursued Treasuries. That helped send the benchmark 10-year Note more than one full point higher. In turn, its yield fell to fresh multimonth lows below 3.2%.

Trading volume made a considerable pullback from the previous session, now that quarter-end window dressing and portfolio rebalancing has come to an end. Only 1 billion shares traded hands on the NYSE this session. DJ30 -156.44 NASDAQ -54.41 NQ100 -3.1% R2K -3.4% SP400 -3.1% SP500 -22.21 NASDAQ Adv/Vol/Dec 498/2.19 bln/2181 NYSE Adv/Vol/Dec 533/1.04 bln/2475

5:39PM First Solar: News Corp will replace Wyeth in the S&P 100 and First Solar will replace Wyeth in the S&P 500 (FSLR) : S&P 500 constituent News Corp. (NWSA) will replace Wyeth Corp. (WYE) in the S&P 100, and First Solar (FSLR) will replace Wyeth in the S&P 500 on a date to be announced. Wyeth is being acquired by S&P 100 & 500 constituent Pfizer Inc. (PFE) in a deal expected to close soon pending final approvals.

4:02PM SMSC beats by $0.08, beats on revs; guides Q3 EPS in-line, revs above consensus (SMSC) 22.84 -0.37 : Reports Q2 (Aug) earnings of $0.08 per share, excluding non-recurring items, $0.08 better than the First Call consensus of ($0.00); revenues fell 22.7% year/year to $75.1 mln vs the $72 mln consensus. Co issues guidance for Q3, sees EPS of $0.19-0.24, excluding non-recurring items, vs. $0.20 consensus; sees Q3 revs of $82-86 mln vs. $81.50 mln consensus.

9:20AM Ascent Solar announces that it prices its 4.6 mln share offering of common stock at $6.50/share (ASTI) 7.54 :

8:04AM Teradyne raises guidance above consensus; sees Q3 EPS of $0.10-0.13 vs $0.01 First Call consensus (TER) 9.25 : Co raises Q3 guidance, now sees Q3 EPS of $0.10-0.13 vs $0.01 First Call consensus, up from prior guidance of ($0.02)-$0.02; sees Q3 revs $250-260 mln vs $201.49 mln First Call consensus, up from prior guidance of $190-205 mln. The gross margin and operating expenses by business segment are expected to be consistent with their models. Although both segments reflect greater than expected revenue, forecasted profitability will reflect a greater proportion of revenue from Systems Test Group than expected. In light of the expected return to profitability and generally improving conditions, the temporary salary reductions implemented in late 2008 and 2009 will be eliminated in the fourth quarter. "We continue to see improving demand within our Systems Test and Semiconductor Test businesses.

09:43 am Apple ests and tgt increased to $210 at Oppenheimer on increasing recognized iPhone revs: . Oppenheimer is raising ests across the board (F4Q09 to $1.50 from $1.37 and F2010 to $7.76 from $6.49 (consensus $1.38/$6.90)) to better reflect the increasing proportion of recognized, high-margin iPhone revenue. Incredibly, despite all the ink spilled over iPhone accounting, firm thinks the Street continues to highly underestimate Apple's GAAP earnings. Firm notes this will likely become a moot point within six months, as co incorporates new FASB accounting rules and recognizes more iPhone sales at time of sale. But until then, Apple's EPS will continue to surprise to the upside, even if rev comes merely in line with Street expectations. Tgt to $210 from $185.

09:45 am Cisco Systems (CSCO)

Cisco Systems (CSCO 23.46, -0.08) said Thursday that it will acquire Tandberg, a Norway-based video communications company, for approximately $3 billion.

Under the terms of the agreement, Cisco will commence a cash tender offer to purchase all the outstanding shares of Tandberg for 153.5 Norwegian kroner per share for an aggregate purchase price of approximately $3.0 billion. This represents an 11.0% premium to the previous day closing price of Tanberg's stock.

Cisco said it expects the acquisition to be accretive to its non-GAAP earnings in fiscal year 2011.

09:08 am Teradyne (TER)

Shares of Teradyne (TER 9.25), a maker of automatic test equipment used to test complex electronics, are moving higher Thursday morning after the company substantially raised its third quarter guidance based on improved demand for its products.

Teradyne said it now sees third quarter earnings of $0.10 to $0.13 per share, well ahead of the $0.01 First Call consensus and up from prior guidance that expected a loss of $0.02 to a profit of $0.02 per share.

Teradyne expects third quarter revenues to range from $250 million to $260 million, easily topping the $201.49 million consensus and up from the company's prior guidance of $190 million to $205 million.

"We continue to see improving demand within our Systems Test and Semiconductor Test businesses," said CEO Mike Bradley. "Our supply chain is responding well to this step-up in demand in what remains a short lead time environment."

Shares of TER are nearly 6% higher about 30 minutes ahead of Thursday's opening bell.

icon url

ReturntoSender

10/03/09 5:35 PM

#8699 RE: ReturntoSender #6755

From Briefing.com: Weekly Recap - Week ending 02-Oct-09Despite a strong start on Monday, U.S. equity markets closed lower for the second straight week as a raft of poor data suggested the economic recovery may be losing momentum. The S&P 500 declined 1.8% and probed key resistance around 1,020 on Friday, near its 200-day moving average.

Nine of the ten sectors that make up the index declined this week, led by Industrials (-3.5%). Consumer Staples played defense, rising a modest 0.7%.

Last week the market saw the return of IPOs (there were three more this Thursday and Friday), and this week merger and acquisition activity resumed. Specifically, Abbott Labs' (ABT) $6.6 billion acquisition of the Salvoy Group's pharmaceutical business and Xerox's (XRX) $6.4 billion cash and stock acquisition of Affiliated Computer Services (ACS) helped the S&P climb 1.8% on Monday.

But that just shows how sharp the decline was over the remainder of the week. Most of the damage was done on Thursday, when back-to-back days of poor employment data painted a bearish picture for Friday's highly-anticipated Nonfarm Payrolls figure. Specifically, the ADP Employment change showed a larger-than-expected decline of -254,000 on Wednesday vs. the consensus of -200,000 and Initial Jobless Claims rose by a larger-than-expected 551,000 on Thursday vs. the consensus of 535,000.

Investor fears were realized this morning, when Nonfarm Payrolls showed a larger-than-expected decline of -263,000 vs. the consensus of -175,000. Surprisingly, it looks like the market had already priced in a poor number on Thursday, as the S&P followed up its 2.6% plunge with a much more modest 0.5% decline.

But it wasn't just employment data that was poor this week, as investors were more attentive to weaker-than-expected data, when in past weeks it was quick to dismiss any disappointments in favor of a belief that future reports would only show improvement.

Specifically, the market saw quick moves downward following disappointing Consumer Confidence (53.1 vs. 57.0 consensus), Chicago PMI (46.1 vs. 52.0 consensus) and ISM Manufacturing (63.5 vs. 66.0 consensus) figures throughout the week.

There will be little chance of changing that economic perspective next week, as the calendar is very thin. But we will see another round of key Treasury auctions, including $39 billion in 3-year Notes, $7 billion in 10-year TIPS reopening, $20 billion in 10-year Notes reopening and $12 billion in 30-year Bonds reopening. They all precede this weekend's G-7 meeting in Istanbul, which already had a positive effect on the dollar , as euro region finance ministers and central bankers will reportedly discuss the euro's strength and signal that further dollar weakness is unwelcome.
 
Index Started Week Ended Week Change % Change YTD %
DJIA 9665.19 9487.67 -177.52 -1.8 8.1
Nasdaq 2090.92 2048.11 -42.81 -2.0 29.9
S&P 500 1044.38 1025.21 -19.17 -1.8 13.5
Russell 2000 8.94 580.20 -18.74 -3.1 16.2

9:04AM Enbridge to acquire Ontario Solar Project from First Solar (ENB) 37.73 : Co announces that they have entered into an agreement for Enbridge to acquire a 20 megawatt solar energy project that First Solar has developed and is constructing near Sarnia, Ontario. The Sarnia Solar Project is expected to be completed by the end of 2009 and be the largest photovoltaic solar energy facility in operation in Canada and one of the largest in North America. At 20 MW, Enbridge expects the project will generate enough power to meet the needs of about 3,200 homes and help to save the equivalent of approximately 6,600 tonnes of CO2 per year.

9:01AM Advanced Analogic Tech announces that the ITC ruled in favor of motion proposed jointly by AnalogicTech and Linear Technology to terminate a portion of the ongoing patent proceedings (AATI) 3.49 : Co announces that the ITC ruled in favor of a motion proposed jointly by AnalogicTech and Linear Technology (LLTC) to terminate a portion of the ongoing patent proceedings between the two companies. As part of this ruling, Linear agreed to remove certain of AnalogicTech's products from consideration by the ITC. In turn, AnalogicTech agreed that it will not seek to import these products in the future. The parties hope that the removal of these products (which are based on an older architecture and represent a non-material portion of AnalogicTech's revenue) will streamline the remaining issues between the two companies. Today's announcement of the consent decree maintains the same scope of the dispute between the two parties. No new actions have been filed by either party.

8:01AM Canadian Solar and Satcon Tech announce they have signed a turnkey solution distribution agreement (CSIQ) 16.13 : Canadian Solar and Satcon Technology (SATC) announces they have signed a turnkey solution distribution agreement. As part of the contract, Canadian Solar and Satcon will market Canadian Solar's commercial solar PV systems with Satcon's commercial solar PV inverters for commercial rooftop and ground mounted power stations.

8:01AM Chipmos Technology raises Q3 rev guidance (IMOS) 0.94 : The co now expects revenue growth of 13% to 15% in the Q3 2009 compared to Q2 2009. This upwardly revised guidance compares to the co's previous outlook for a high single digit percentage revenue growth in the Q3 2009 compared to Q2 2009. The improvement in Q3 revenue guidance is primarily due to better than expected results in the Company's DRAM and mixed-signal/logic businesses.

7:50AM Volterra Semi announced that U.S. District Court granted Volterra's motion for a preliminary injunction against Infineon (VLTR) 17.26 : Co announced that at a September 30, 2009 hearing, the U.S. District Court granted Volterra's motion for a preliminary injunction against Infineon Technologies AG (IFNNY) Infineon Technologies North America Corporation and Primarion Inc. (Infineon/Primarion) in a patent infringement lawsuit.

7:39AM Linear Tech: ITC Judge issues consent order prohibiting Advanced Analogic Technologies from importing 69 voltage regulator products into the United States (LLTC) 26.70 : Linear Technology announces that the judge issued a consent order against Advanced Analogic Technologies in Linear's enforcement proceeding at the U.S. International Trade Commission. The ITC previously found that AATI violated Section 337 of the Tariff Act by importing voltage regulator chips that infringe claims 2, 3, and 34 of Linear's U.S. Patent No. 6,580, 258. These patent claims protect Linear's "sleep mode" invention, comprising circuitry that significantly extends battery life for a wide range of portable electronic devices by allowing the device to "sleep" when little power is needed. Specifically, the ITC determined that AATI's infringing products include AAT1143, AAT1123, AAT1125, AAT1126, AAT2500, AAT2506, AAT2510, AAT2511, and AAT2512. The Commission then issued an exclusion order barring importation of the named semiconductor products and any other AATI chips that infringe Linear's patent claims.

7:23AM Global chip sales increase 5% month-on-month, SIA says : Worldwide sales of semiconductors in August were $19.1 billion, an increase of 5% from July 2009 when sales were $18.2 billion, the SIA reported. Sales declined 16.1% from August 2008, when sales were $22.7 billion. Sales were up sequentially in all geographic regions. Year-to-date sales through August are down 21.3% to $133.8 billion from $170.1 billion at this time last year. The rate of decline has slowed from the first six months of 2009 during which sales declined by 25% year-on-year... "Continuing recovery of consumer spending led the sixth-consecutive month of sequential growth in semiconductor sales," said SIA President George Scalise. "Various incentive programs for energy-efficient products, ranging from automobiles to home appliances, have bolstered demand for semiconductors, which deliver critical enabling technology for reducing energy consumption. Growing sales of netbook personal computers, which now account for approximately 17% of notebook PC unit sales, have created an important new market segment, filling a gap between 'smart cell phones' and conventional laptop PCs," Scalise continued. "Personal computers have become especially attractive to consumers as average selling prices for PCs have declined by around 14% while memory content has increased by 25% during the past year. This translates into significantly more computing power at a significantly lower price." Scalise noted that consumers now account for approximately 50% of all PC unit sales. "Notwithstanding the slow recovery of demand from the enterprise sector, we are encouraged that industry momentum has turned positive following the steepest downturn in more than a decade," Scalise concluded.

icon url

ReturntoSender

10/05/09 9:27 PM

#8703 RE: ReturntoSender #6755

From Briefing.com: 4:30 pm : A strong advance by the financial sector and a weaker U.S. dollar helped give the stock market its first gain in five sessions.

The major indices started the session with modest gains, but shares of diversified banks wasted little time putting together their best percentage gain in two months. The group was helped along by news that analysts at Goldman Sachs raised their rating on the U.S. large-cap bank sector. Diversified banks finished the session 5.6% higher, which lifted the broader financial sector to a 3.3% gain and helped it outperform every other major sector.

The U.S. dollar declined 0.5% against a basket of major foreign currencies despite concerns that its weakness could disrupt the global economy. However, the weaker dollar proved beneficial to both stocks and commodities once again.

Amid the dollar's drop the CRB Commodity Index gained 1.3%. The advance reflected a sharp a sharp 1.3% gain in gold prices, which settled at $1017.80 per ounce. A rebound in oil prices also helped. Crude futures had been as low as $68.05 per barrel, but rallied to finish with a 0.7% gain at $70.41 per barrel.

Oil's rebound helped the energy sector climb to a 2.2% gain. The materials sector finished 2.0% higher.

Though broad-based buying helped all 10 major sectors finish in higher ground, stocks did have to overcome a fit of midmorning selling pressure. Sellers had stepped in just minutes after the September ISM Services Index showed a better-than-expected reading of 50.9, but stocks rebounded when the Dow and Nasdaq Composite came in contact with the neutral line. Stocks spent the rest of the session working higher and closed a few points off of session highs.

Advancing Sectors: Financials (+3.3%), Energy (+2.2%), Materials (+2.0%), Industrials (+1.9%), Consumer Discretionary (+1.8%), Utilities (+1.2%), Telecom (+0.8%), Tech (+0.8%), Health Care (+0.5%), Consumer Staples (+0.2%)
Declining Sectors: (None)DJ30 +112.08 NASDAQ +20.04 NQ100 +0.8% R2K +1.9% SP400 +2.1% SP500 +15.25 NASDAQ Adv/Vol/Dec 1964/2.17 bln/730 NYSE Adv/Vol/Dec 2539/1.11 bln/521

3:30 pm : A weaker U.S. dollar helped stocks start the session on stronger footing and also helped spur a supportive bid for commodities. With the Dollar Index currently down 0.5%, near session lows, the CRB Commodity Index is up 1.3%, near session highs.

Precious metals were a primary source of support for the CRB. Following a slow start, gold prices spiked midsession and held strong into the close. Gold prices settled 1.3% higher at $1017.80 per ounce. Silver also netted a strong gain; it settled nearly 2.3% higher at $16.54 per ounce.

Oil prices opened lower and fell as low as $68.05 per barrel before rallying midsession. Contract prices for crude oil settled almost 0.7% higher at $70.41 per barrel. Meanwhile, natural gas prices finished a sharp 5.7% higher at $4.99 per contract.DJ30 +120.39 NASDAQ +21.60 SP500 +15.76 NASDAQ Adv/Vol/Dec 1997/1.72 bln/684 NYSE Adv/Vol/Dec 2555/721 mln/478

5:05PM ANADIGICS and WIN Semiconductors announce strategic foundry relationship (ANAD) 4.59 +0.17 : Co and WIN Semiconductors, the world's largest pure-play Gallium Arsenide (GaAs) foundry, announced a strategic agreement for the design and manufacture of GaAs microwave monolithic integrated circuits. GaAs ICs are used in wireless handsets and data devices that allow people to connect and communicate anywhere, anytime.

4:02PM Cirrus Logic raises Q2 rev guidance to $55.7 mln vs $49.84 mln First Call consensus; expects gross margin to be at the upper end of 50-52% guidance range (CRUS) 5.13 +0.02 : Co raises Q2 rev guidance to $55.7 mln vs $49.84 mln First Call consensus, an increase from the previous forecast of $48-52 mln. The increase in revenue is primarily driven by stronger than previously anticipated demand for audio products. The co expects gross margin to be at the upper range of the previous guidance estimate of 50-52% (consensus is for gross margin of 51.4%). Combined R&D and SG&A expenses are now expected to be approximately $24.1 mln, and include an estimated $1.8 mln in share-based compensation, and amortization of acquisition-related intangible expenses.

7:35AM MKS Instruments raises Q3 revenue and EPS guidance (MKSI) 18.77 : Co issues upside guidance for Q3 (Sep), sees EPS of $0.02-0.04, excluding non-recurring items, vs. ($0.10) First Call consensus, compared to its original guidance of a net loss of ($0.18) to ($0.07) per basic share; sees Q3 (Sep) revs of $105-107 mln vs. $87.50 mln consensus, surpassing the co's high end guidance of $92 mln. "The increase in our business reflects the higher levels of sales at our semiconductor OEM customers and is consistent with recent, positive announcements by industry research firms. Chip unit sales are increasing, semiconductor front end equipment utilization rates are now above 95%, and a number of our Semiconductor OEM customers have increased their third quarter revenue guidance. As we have demonstrated this quarter, we are well positioned to meet the increased demand."

09:37 am Am Superconductor initiated with a Equal Weight at Barclays Capital; tgt $36: . Barclays Capital initiates AMSC with a Equal Weight and price target of $36. The firm notes that AMSC is a leading provider of proprietary wind turbine design technology, power electronics as well as smart grid infrastructure technology. The firm believes AMSC remains well positioned to benefit from rapid growth in China/global wind market and global power grid build-out. However, given relatively rich valuation, uncertainty with respect to timing of new wind customer ramp cycles as well as superconductor business profitability, the firm sees balanced risk/reward with downside limited to $25.

icon url

ReturntoSender

10/06/09 11:06 PM

#8704 RE: ReturntoSender #6755

From Briefing.com: 4:30 pm : Despite a downward drift in afternoon action, stocks were able to march considerably higher in broad-based fashion for the second straight session as overseas gains and a weaker U.S. dollar kept buyers in the market.

The major indices started markedly higher as the previous session's gains were extended amid news that by Australia's Reserve Bank hiked its key lending rate by 25 basis points to 3.25%. Though the rate hike may strike some as an unlikely impetus for higher stock prices, global participants were encouraged by the symbolism of the act, since it suggests that the global economy has strengthened. That consideration helped drive the Dow Jones World Index to a 1.9% gain, which is its best percentage gain in two months.

Weakness in the U.S. dollar continues to bode well for stocks, especially for shares of multinationals. The Dollar Index dropped 0.5% this session, but it is still trading above its 2009 lows.

Commodities were helped considerably by the dollar's decline. In turn, the CRB Commodity Index tacked on 1.3%. Gold was one of the best performing assets this session. It spiked to a record intraday high of $1045 per ounce, before it settled with a 2.2% gain at a record closing high of $1039.70 per ounce.

The dollar's drop and gold's gains helped materials stocks show leadership in the early going, but as the greenback pared its losses midsession and pulled the materials sector back from its near 3% gain, the broader market drifted off of its midday highs. A pullback by financials, which were leaders in the previous session, also undercut the broader market. Goldman Sachs (GS 186.98, +0.51) weighed considerably on the sector as participants pressured the stock in high volume.

However, the stock market was able to recover from the afternoon drift as materials stocks and financial stocks rebounded. Materials stocks settled with a 1.9% gain, while financials finished 1.2% higher. That helped the stock market finish on a relatively positive note and book a two-session gain of 2.9%, its best back-to-back performance in more than one month.

There weren't any economic releases this session and only a handful of companies made announcements ahead of earnings season's start tomorrow night. Participants had little reaction to results from an auction 3-year Treasuries. Key tests of interest will come later this week with the auctions of 10-year Notes and 30-year Bonds.

Advancing Sectors: Energy (+2.1%), Materials (+1.9%), Tech (+1.9%), Consumer Discretionary (+1.5%), Telecom (+1.2%), Financials (+1.2%), Industrials (+1.1%), Consumer Staples (+0.9%), Health Care (+0.8%), Utilities (+0.7%)
Declining Sectors: (None)DJ30 +131.50 NASDAQ +35.42 NQ100 +1.8% R2K +1.8% SP400 +1.4% SP500 +14.26 NASDAQ Adv/Vol/Dec 2007/2.42 bln/675 NYSE Adv/Vol/Dec 2414/1.23 bln/621

4:16PM Juniper Networks expects to begin trading on the NYSE on October 29, 2009, retaining its current symbol "JNPR" (JNPR) 26.95 +0.57 :

10:06AM Microsoft unveils new Windows phones worldwide (MSFT) 25.00 +0.36 : Co announced the availability of a new line of Windows phones around the world that are available in a broad range of styles and prices. With a Windows phone, people can navigate their phone easily with the touch of a finger and browse the Internet on a great mobile browser. People can also connect to two new services that allow them to back up and share data from their phone to the Web and buy a variety of useful applications from the Windows Marketplace for Mobile. Microsoft expects partners to deliver more than 30 new phones in more than 20 countries by the end of 2009.

9:01AM FormFactor acquires technology assets of Electroglas (FORM) 21.72 : Co announces that the Delaware Bankruptcy Court has approved FormFactor's acquisition of intellectual property rights and certain technology assets of Electroglas, Inc. related to precision motion control automation. The purchase provides FormFactor with IP and physical assets the company will use in its manufacturing operations. The acquisition does not include physical assets and technology solely used in the Electroglas prober business, which are expected to be purchased by a third party as part of a separate auction process. The assets acquired by FormFactor were made available at auction as part of activities related to Electroglas' bankruptcy proceedings.

09:44 am Microsoft: Collins Stewart expects in-line revs and bottom line beat for Q1: .
Collins Stewart notes MSFT reports on Oct 23rd before the market opens. They expect an in-line top line and bottom line beat. Strong product pipeline until Q1-CY10, better than expected cost-cutting measures, promising outlook in the Internet business, and additive nature of opportunities from Cloud Computing will continue to help MSFT as the co comes out of the slowdown in PC shipments and IT spending. They visited Taiwan to primarily focus on business trends for MSFT and to evaluate the likely response to Windows 7. They believe that PC shipments started stabilizing in June and that a favorable buzz is building around Windows 7. Additionally, three consecutive months of search market share gains by Bing is a big shift from four years of largely disappointing Internet ad business trends.

09:34 am LSI Logic tgt raised to $7 at Wedbush as they expect a top-line beat for the Sept quarter: . Wedbush is raising their tgt to $7 from $6 ahead of earnings Oct 21. They note STX has indicated that they expect the market for Hard Disk Drives (HDD) to be better than the high end of original expectations (indicated at the end of July). BRCD (customer) has also tracked well for the Oct quarter. They also expect other SAN customers (such as ELX and QLGC) to report good Sept quarter numbers. LSI should handily beat Q3 Street rev est of $554 mln. Q3 non-GAAP gross margins should also come in at the high end of guidance range of 43-45%. LSI should be able to guide the midpoint of Q4 revs to be better than the current Street estimate of $585 mln. They believe most investors expect good Q3 results from semi cos and IT hardware cos in general.

icon url

ReturntoSender

10/07/09 9:50 PM

#8705 RE: ReturntoSender #6755

From Briefing.com: 4:25 pm : Leadership from the financial sector helped stocks log their third straight gain after they spent most of the session chopping along in negative territory amid a moderately stronger U.S. dollar. Though the greenback's gains weighed on the stock market and many commodities, it didn't deter gold from extending recent gains.

Stocks spent most of the session trading listlessly as the Dollar Index recovered from losses in the past three sessions to advance 0.2% Wednesday. However, bank stocks emerged with strength after struggling to find direction in the early going. With banks finishing strong, the KBW Bank Index netted a 1.2% gain and the broader financial sector settled at session highs with a 1.0% gain.

The energy sector was the next best performing sector. It finished 0.6% higher even though oil prices closed pit trade 1.7% lower at $69.66 per barrel. Oil prices were hampered by bearish gasoline inventory data, which overshadowed news of a 978,000 barrel draw in crude oil. The consensus had called for a build of 2 million barrels of crude.

Though a stronger dollar likely added to oil's woes this session, it didn't derail gold from continuing its ascent. Gold futures closed at $1044.70 per ounce, up 0.5%, but had been as high as $1049.70 per ounce in overnight trade. Small-cap gold stocks and precious metals stocks of a lower quality benefited most from gold's gains as momentum money trickled into the group. That helped the materials sector (+0.2%) offset general weakness among commodities-related stocks and basic materials stocks that stemmed from a 0.4% decline in the CRB Commodity Index.

Monsanto (MON 74.33, -1.04) was also a drag on the materials sector. The company posted better-than-expected adjusted earnings of $0.02 per share, but reaffirmed downside guidance for fiscal 2010.

Other earnings announcements were generally positive as Yum! Brands (YUM 34.37, -0.49), Costco (COST 59.00, +1.07), and Family Dollar (FDO 28.21, -0.27) each bested earnings expectations for the latest quarter.

Leadership from the financial sector may have led the S&P 500 to a strong finish, but it couldn't prevent the telecom sector from logging an outsized loss of 2.9%. Weakness among integrated telecom giants AT&T (T 26.18, -0.56) and Verizon (VZ 29.38, -0.31) kept the Dow from making a gain of its own.

Separately, Treasuries made solid gains. The benchmark 10-year Note settled some 22 ticks higher, which pushed its yield back below 3.2%, following strong results from a $20 billion auction of 10-year Notes.

Advancing Sectors: Financials (+1.0%), Energy (+0.6%), Tech (+0.5%), Consumer Staples (+0.3%), Materials (+0.2%), Health Care (+0.2%), Consumer Discretionary (+0.1%)
Declining Sectors: Telecom (-2.9%), Industrials (-0.3%), Utilities (-0.2%)DJ30 -5.67 NASDAQ +6.76 NQ100 +0.3% R2K unch% SP400 unch% SP500 +2.86 NASDAQ Adv/Vol/Dec 1300/2.23 bln/1319 NYSE Adv/Vol/Dec 1567/1.09 bln/1384

4:11PM Finisar (FNSRD) announces its intention to offer $75 million aggregate principal amount of convertible senior notes due 2029 (FNSR) 9.52 -0.15 :

9:06AM Adobe Systems reaffirms Q4 revenue and EPS outlook (ADBE) 33.51 : Co reaffirms guidance for Q4 (Nov), sees EPS of $0.33-0.39, ex-items, vs. $0.37 First Call consensus; sees Q4 (Nov) revs of $690-740 mln vs. $723.00 mln consensus, with a non-GAAP operating margin of 33-36%.

CB Richard Ellis Group (CBG) announces it has been selected by worldwide networking leader Cisco Systems (CSCO) to be its preferred provider of project management services globally. These services will encompass capital construction projects within Cisco's 506 locations spanning 87 countries and totaling 23.6 mln square feet...

8:01AM FSI Intl receives follow-on order for FSI ORION single wafer cleaning technology from U.S. based semiconductor manufacturer (FSII) 1.19 : Co announced the receipt of a repeat order for the FSI ORION single wafer cleaning technology from a major U.S. based semiconductor manufacturer. The system is expected to ship prior to calendar 2009 year end. The FSI ORION system sells for $2.5 to $6.0 million, depending on the number of process chambers, chemical flows and its applications configuration.

2:34AM Advanced Semiconductor Engineering announces monthly net revenues (ASX) 4.17 : Co announces September unaudited consolidated net revenues of NT$8,807 mln, a +5.9% y/y increase and +5.5% from August 2009. 3Q09 revenue was NT$25,205 mln, -2.4% y/y and +20.7% from 2Q09.

09:06 am Cisco Systems upgraded to Outperform at William Blair: . William Blair upgrades Cisco Systems (CSCO) to Outperform from Market Perform, as recent enterprise VAR checks reveal strong business momentum for Cisco and extending lead times-major channels have seen lead times stretch from 3-4 days to 3-4 weeks. Firm believes that there has been significant pent-up demand building over the last year for Cisco's products (across the board), which has started to loosen up over the past few months, and more recently, this demand trend has accelerated. Cisco appears to be benefitting from the double positive of new projects starting to get cleared and overdue network maintenance needs, in their view

icon url

ReturntoSender

10/08/09 9:10 PM

#8706 RE: ReturntoSender #6755

From Briefing.com: 4:35 pm : The broader equity market logged its fourth straight gain amid encouraging corporate headlines, continued weakness in the U.S. dollar, and a better-than-feared weekly jobless claims report. However, technical resistance capped the move by stocks.

Dow component Alcoa (AA 14.35, +0.15) kicked off earnings season last evening in positive fashion. The company brought in an adjusted $0.04 per share, which was considerably better than the loss of $0.09 per share that had been widely expected. Alcoa went on to issue a relatively upbeat outlook. Shares of AA started the session at fresh highs for 2009, but the stock drifted off of its opening levels for the rest of the session.

Still, Alcoa's report was enough to set the materials sector on a strong course. The sector finished 2.0% higher.

Materials stocks were also helped by higher commodity prices, which were bolstered by a weaker dollar. With the greenback shedding 0.6% against a basket of major foreign currencies, the CRB Commodity Index climbed 2.1%.

Once again, gold was a standout among commodities. The yellow metal finished 1.1% higher at $1056.20 per ounce, but had been as high as $1062.70 per ounce, which marks a new record high.

Oil futures also garnered strong interest. Crude contracts settled with oil priced 3.0% higher at $71.68 per barrel. Oil's enviable gain helped lift oil and gas drillers 4.3% and oil and gas explorers 3.9%, which gave the broader energy sector a 2.3% gain, better than any other major sector.

Retailers were also among the session's better performers. As a group, they finished with a 1.8% gain. The advance followed a flurry of same-store sales results for September. Though many companies continued to see softer sales results, the numbers showed an improvement from previous months and were also better than expected. JCPenney (JCP 35.16, +0.25) and Kohl's (KSS 59.97, +1.43) went so far as to raise their outlook in the wake of their monthly sales results.

The broader market was also helped by news that initial claims for the week ending October 3 fell 33,000 to 521,000, which is below the 540,000 that was widely expected. Meanwhile, continuing claims fell 72,000 to 6.04 million, which is below the consensus call of 6.11 million. Though the numbers were better than feared, there is cold comfort in knowing that initial claims remain at uncomfortable levels and continuing claims have come down as a result of expired jobless benefits.

Though the broader market traded with strength for the entire session, it did encounter some resistance as the S&P 500 attempted to push through levels in-line with its 2009 closing highs. Failure to push through that mark coincided with the dollar's move off of its session low, which was marked when the Dollar Index was down 0.8%, and left stocks to pare some of their gains in afternoon trading.

The pullback was particularly hurtful to the financial sector, which had been up as much as 1.3% before finishing with a modest 0.2% gain. Regional banks weighed on the sector after several were assigned a Sell rating by analysts at UBS. Regional banks closed with a 1.1% loss.

Health care stocks also underperformed. The sector settled with a fractional loss amid weakness in managed care stocks (-4.6%), which were pressured on comments regarding possible windfall taxes for insurers.

Telecom stocks were the worst performers for the second straight session, however. The sector surrendered 0.8%.

Treasuries encountered some of their own weakness following an auction of 30-year Bonds. The auction produced a bid-to-cover ratio of roughly 2.4 and a high yield of 4.0%. The 30-year Bond responded to the auction by surrendering more than one full point, while the benchmark 10-year Note dropped some 18 ticks, which put its yield back around 3.25%.

Advancing Sectors: Energy (+2.3%), Materials (+2.0%), Consumer Discretionary (+1.5%), Industrials (+1.2%), Consumer Staples (+0.6%), Tech (+0.4%), Utilities (+0.2%), Financials (+0.2%)
Declining Sectors: Telecom (-0.8%), Health Care (-0.1%)DJ30 +61.29 NASDAQ +13.60 NQ100 +0.4% R2K +0.9% SP400 +1.4% SP500 +7.90 NASDAQ Adv/Vol/Dec 1535/2.42 bln/1131 NYSE Adv/Vol/Dec 2203/1.28 bln/817

4:11PM CalAmp reports Q2 EPS of ($0.17) vs ($0.08) Single analyst estimate; co reports revs of $23.9 mln vs $25.00 mln Single analyst estimate (CAMP) 2.66 +0.46 : Co sees Q3 EPS in the range of ($0.04) to $0.00 vs $0.00 First Call consensus and sees Q3 revs to be in the range of $29 to $32 mln vs $31 mln First Call consensus. With the increased demand and strong operating momentum the firm expects further growth in 4Q10 and sees revs of $34 to $38 mln vs $32 mln First Call consensus.

11:02AM NVIDIA and GE Fanuc Intelligent Platforms sign agreement to develop new hardware (NVDA) 13.49 -0.40 : GE Fanuc Intelligent Platforms (GE) announced that it had signed an agreement with NVIDIA for GE Fanuc to develop new hardware products using NVIDIA graphics processing units based on the award-winning CUDA architecture, for military and aerospace applications. These new products will deliver substantial increases in processing capability for applications and environments that require leading edge computing such as radar, signals intelligence and video surveillance and interpretation.

9:00AM Advanced Micro names Thomas Seifert Chief Financial Officer (AMD) 5.54 : Co announced the appointment of Thomas Seifert as senior vice president and chief financial officer. Seifert joins AMD from Qimonda, where he most recently was a member of the Management Board as well as chief operating officer and chief financial officer.

7:35AM On The Wires : Rudolph Technologies (RTEC) announces that it has received an order for multiple back-end inspection tools from Advanced Semiconductor Engineering (ASX)...

7:24AM United Micro reports Sept net sales increased 18.41% YoY to NT$9.53 bln (UMC) :

Rogers Wireless (RCI) and Research In Motion (RIMM) launched the BlackBerry Curve 8520 smartphone..

09:38 am Motorola: Broadpoint AmTech expects meet and keep with improvement in handsets: . Broadpoint AmTech expects MOT to meet its $0.00 on $5.5 bln est, which is in-line with consensus when it reports earnings October 29. Firm expects MOT's core businesses to perform in-line. AmTech reduced its Sept. handset units to 14 mln from 14.8 mln last qtr, but believe cost cuts will keep losses in-line with its original forecast. Firm is comfortable with its Dec. est of $0.05, which assumes a less than seasonal improvement for MOT's core businesses and the initial ramp of MOT's new Android handsets. Firm is encouraged that MOT is on track with its stated goal for Android, with the CLIQ ramping to three global carriers and the Sholes announcement forthcoming from VZ.

icon url

ReturntoSender

10/11/09 7:42 PM

#8708 RE: ReturntoSender #6755

Amateur Investors Weekend Market Analysis (10/10/09)

http://www.amateur-investor.net/Weekend_Market_Analysis_Oct_10_09.htm

On a weekly chart the S&P 500 found support right at its 10 Week EMA (blue line) and looks to be consolidating for at least one more potential move higher. Back in May the S&P 500 consolidated for basically 3 weeks (point A) after making a large move from mid March through the first week in May. This was then followed by a two week breakout in which the S&P 500 moved up to 956 before going through a more substantial correction from mid June through early July (points B to C).


During the past 3 weeks the S&P 500 has been trading between 1080 and 1020 so if it does eventually break out of its recent consolidation pattern the next major resistance area is at 1121 which coincides with its 50% Retrace (blue line) calculated from the October 2007 high to the March low of this year. In addition notice the longer term downward trend line (black line) also comes into play near the 1121 level as well. Thus it's certainly possible if the S&P 500 does eventually make one more move higher to around 1121 that this would signal the end of Wave C of a larger ABC corrective rally that began with the March low of 667. If the S&P 500 were to reach the 1121 level before the end of the month that would be a 68% rally in basically 8 months.


Of late there has been a lot of bullish comments made by the media that the next major Bull Market is here and that a repeat of the late 2002 through late 2007 time period is going to occur. However I would caution everyone that there is a strong possibility that once this rally ends the market could get stuck in an extended trading range or even potentially retest the March lows at some point in the longer term.

First let's look at the mid 1970's which is one potential pattern the S&P 500 is currently exhibiting. The S&P 500 had a truncated 5th Wave to complete is 5 Wave pattern to the downside in late 1974 after dropping 48% from its early 1973 peak. This was then followed by an ABC rally that saw the S&P 500 gain 68% over a period of 22 months before peaking in the latter half of 1976 which was then followed by a 20% drop through the early part of 1978.


However when you factor in Inflation the above chart looks much different in real dollars as shown below. The top panel is the S&P 500 Adjusted for Inflation while the bottom panel is Non Inflation Adjusted. As you can see there is a huge difference between the two charts especially from the mid 1970's through the early 1980's. Notice the Non Inflation Adjusted chart bottomed in late 1974 while the Inflation Adjusted Chart didn't bottom until the Summer of 1982. Meanwhile another thing to notice is that after peaking in the late 1976 the Inflation Adjusted Chart shows the S&P 500 in real dollars lost 44% of its value from late 1976 through mid 1982 (points D to E) before the major bottom occurred. On the other hand the non Inflation Adjusted Chart shows that from late 1976 through mid 1982 the S&P 500 had virtual no change as it was basically at the same level as the late 1976 peak (points F to G). Thus after the big oversold rally from late 1974 through mid 1976 the S&P 500 basically went nowhere for the next 6 years on a Non Inflation basis but in real dollars (Inflation Adjusted) it actually lost 44% of its value during the same period.


Meanwhile the next period of time that is exhibiting similar characteristics to now is that from the late 1930's. Notice from early 1937 through early 1938 the non Inflation Adjusted chart of the S&P 500 had a 5 wave pattern to the downside in which it lost 54% of its value which was then followed by a 62% rally over a period of 8 months. Once the ABC corrective rally ended the S&P 500 then lost 46% of its value from late 1938 through the early part of 1942 as it eventually retested its prior low (points C to D).


Next if we look at the Inflation Adjusted chart of the same time period the S&P 500 lost 53% of its value from late 1938 through early 1942. Keep in mind during this period of time inflation was tame as it was more of a deflationary environment. However the key thing to note from both of these charts is that the S&P 500 went through a 3 1/2 year correction with an eventual retest of the previous low after rallying 62% in just 8 months.


Next when you look at a very long term chart of the S&P Composite based on data calculated by Robert Shiller going back to 1871 you can see there have been 4 Secular Bull Markets (points E to F) and 3 previous Secular Bear Markets (points F to E). Currently we are now experiencing a 4th Secular Bear Market which began in 2000. The previous 3 Secular Bear Markets lasted on average 17 years with the minimum of 15 years (1906-1920) and the longest 20 years (1930-1949). Thus if the previous Secular Bear Markets are any indication of the current Secular Bear Market then we are still not close to the beginning of another Secular Bull Market. Furthermore the current chart of the S&P 500 looks more like the 1966-1982 and 1906-1921 time periods versus the 1929-1949 timeframe.


The rally from the March low has been impressive however as pointed out above it's no different than what has occurred in previous Secular Bear Markets. Personally I wish the next Secular Bull Market was just around the corner as it would be much easier to trade a Secular Bull Market however history suggests that we still may have a ways to go before this current Secular Bear Market ends.

icon url

ReturntoSender

10/12/09 10:59 PM

#8710 RE: ReturntoSender #6755

From Briefing.com: 4:25 pm : A breakdown in technical support caused stocks to rollover midsession, but the S&P 500 successfully fended off sellers to log its sixth straight gain, which is the best streak this year for the stock market.

Strong gains by European markets and renewed weakness in the U.S. dollar helped stocks start the session on strong footing and the S&P 500 climb above its 2009 closing high, which had represented significant resistance late last week.

Early gains were broad-based, but energy stocks were easily the best performers for the entire session. The sector settled with a 1.2% gain as oil and gas drillers (+2.5%) and oil and gas equipment stocks (+1.9%) responded to a 1.9% gain in crude oil prices, which closed pit trade at $73.15 per barrel.

Financial stocks lagged for most of the session and even dipped into negative territory in the early going. However, the sector was able to regroup and finish at a session high with a 0.9% gain, second only to the energy sector.

Within the financial sector, diversified banks (+2.8%) showed particular strength. Their gains came amid comments from widely followed analyst Dick Bove during a CNBC interview that Wells Fargo (WFC 30.28, +1.07) will most likely provide a positive surprise for the latest earnings reporting season. Bove also said that Morgan Stanley (MS 31.76, -0.33) and Goldman Sachs (GS 190.15, +0.85) should do pretty well, but 60% of regional banks will probably post losses this quarter and next quarter.

Despite strength in the broader market, the S&P 500 could not push through its 2009 intraday high, which stands near the 1080 level. Stocks traded sideways just below that technical hurdle, but a sudden fit of selling pressure soon snowballed and dropped the S&P 500 way back to neutral line, where it garnered support and reclaimed gains into the close.

Meanwhile, the Dow finished with a modest gain, but the Nasdaq settled with a fractional loss.

Trading volume was paltry this session. Not even 950 million shares exchanged hands on the NYSE this session. That's the lowest level two months.

Treasury markets reopen Tuesday. They were closed this session for Columbus Day.

Advancing Sectors: Energy (+1.2%), Financials (+0.9%), Utilities (+0.5%), Health Care (+0.4%), Tech (+0.3%), Materials (+0.3%), Consumer Staples (+0.2%), Consumer Discretionary (+0.1%)
Declining Sectors: Telecom (-0.1%), Industrials (-0.1%)DJ30 +20.86 NASDAQ -0.14 NQ100 +0.1% R2K -0.2% SP400 +0.1% SP500 +4.70 NASDAQ Adv/Vol/Dec 1221/1.79 bln/1438 NYSE Adv/Vol/Dec 1640/946 mln/1352

2:02PM Intel to publish CFO commentary prior to quarterly earnings conference call (INTC) 20.45 +0.28 : As a supplement to its earnings report, co will publish a commentary about its quarterly results by Stacy J. Smith, vice president and chief financial officer. The commentary will provide detail that has previously been disclosed during the conference call, reducing the time spent on prepared remarks and allowing for more interactive questions and answers with senior management. The commentary will be posted at 1:30 p.m. PDT on Oct. 13, after the earnings press release.

9:37AM Tower Semicon selected as preferred foundry by C&S Technology in Korea for power automotive devices (TSEM) 1.10 +0.16 : Co was selected by C&S Technology in Korea as its preferred foundry to manufacture its power automotive devices. C&S Technology will now supply a power device to the automotive manufacturer. The device can integrate multiple ICs that are typically independent within the vehicle, resulting in a more cost-effective solution. As this IC is being designed for current models of automobiles, the volume ramp will be several years sooner. This customer engagement for Tower is one of several recently announced in Korea as momentum grows for its advanced Bipolar-CMOS-DMOS power management process.

3:11AM Virage Logic and NXP Semiconductors announce strategic agreement (VIRL) 5.71 : NXP Semiconductors and co announce a strategic agreement that calls for the transfer of a part of NXP's advanced CMOS intellectual property rights and certain engineering talent and equipment to Virage Logic. This arrangement includes a long-term licensing and IP development relationship between the two companies. Under the terms of the multi-year agreement, NXP will transfer over 160 employees and the assets associated with selected advanced CMOS libraries, IP blocks and SoC architecture along with other classes of semiconductor IP, including approx 25 associated patent families. In consideration for the assets, NXP will receive 2.5 mln shares of Virage Logic common stock, which will be subject to transfer restrictions, and a share of the future revenue generated by Virage Logic from licensing the transferred IP portfolio. In addition, Virage Logic will provide to NXP services surrounding the transferred IP for a 3.5-year period, and NXP will receive a 3.5 year license to Virage Logic's extensive standard-products semiconductor IP portfolio for all future SoC designs. In consideration for the services and the license of the Virage Logic IP portfolio, NXP will pay Virage Logic $60 mln over four years from the closing of the transaction.

09:30 am Seagate Tech initiated with a Buy at Brean Murray; tgt $20: . Brean Murray initiates STX with a Buy and price target of $20 saying they believe upside to Street estimates still exists, potentially in 2H09. Firm says checks indicate notebook drives are strongest relative to expectations, with desktop somewhat better and enterprise a bit stronger than expected. They believe linearity through the Q was better than historic trends (consistent with recent quarters), which is encouraging for Dec Q demand.
icon url

ReturntoSender

10/13/09 11:00 PM

#8711 RE: ReturntoSender #6755

From Briefing.com: 4:30 pm : Despite a weaker dollar and a strong third quarter report from pharmaceutical giant Johnson & Johnson, the S&P 500 saw its six-session streak of gains come to an end Tuesday.

A weaker greenback has been a strong underpinning of the stock market's recent gains, but its affect on stocks this session was mitigated by caution among participants ahead of a flurry of upcoming earnings announcements. The Dollar Index returned to 52-week lows early this session, but participants paid more attention to the third quarter report from Dow component Johnson & Johnson (JNJ 61.01, -1.52), which brought in better-than-expected third quarter earnings of $1.20 per share and offered an increased earnings outlook of $4.54 to $4.59 per share for fiscal 2009. Those accomplishments were tainted by a softer top line, however. Johnson & Johnson's report came as a reminder that earnings for the latest quarter could very likely be driven by cost cutting rather than resurgent demand.

Participants get a better feel for things when JPMorgan Chase (JPM 45.66, -0.42) reports tomorrow morning and Goldman Sachs (GS 187.23, -2.92), IBM (IBM 127.02, -0.02), and Google (GOOG 526.11, +2.04) report Thursday. Bank of America (BAC 17.81, -0.22) and General Electric (GE 16.39, +0.06) lead the list for Friday.

Market participants were also unsettled this session by news that shares of Goldman Sachs were downgraded by Meredith Whitney Advisors, which was founded by analyst Meredith Whitney, who is credited with calling out many of the troubles facing banks and the broader financial sector during the last couple of years. The call on shares of GS weighed on the financial sector, which finished the session with a 1.1% loss, worse than any other sector.

Financials weighed on trade for virtually the entire session, though the broader market did manage to finish in mixed fashion after recovering from morning lows

Telecom stocks finally showed some strength after underperforming in each of the previous four sessions. The sector tacked on 0.4%.

Retailers saw some of the best gains, though. As a group, retailers advanced 0.9%.

Meanwhile, materials stocks settled 0.5% higher, helped by higher commodity prices.

Gold prices jumped to new record highs of $1069.70 per ounce in early trade, but saw some of those gains pared before finishing with a 0.7% gain at $1064.60 per ounce. Oil futures prices opened the session with a gain of roughly 1%, but reversed into the red as the U.S. dollar worked its way up from its lows. However, oil contracts garnered support and finished with a 1.2% gain at $74.15 per barrel.

Advancing Sectors: Materials (+0.5%), Consumer Discretionary (+0.4%), Telecom (+0.4%)
Declining Sectors: Financials (-1.1%), Health Care (-1.0%), Utilities (-0.6%), Consumer Staples (-0.2%)
Unchanged: Energy, Industrials, TechDJ30 -14.74 NASDAQ +0.75 NQ100 unch.% R2K -0.3% SP400 -0.4% SP500 -3.00 NASDAQ Adv/Vol/Dec 1192/2.05 bln/1463 NYSE Adv/Vol/Dec 1289/1.14 bln/1706

4:45PM Intel jumps to 21.65 upon resumption of trading (INTC) 20.49 +0.09 : See 16:19 and 16:38 comments for details of co's Q3 earnings.

4:19PM Intel beats by $0.05, beats on revs; guides Q4 revs and gross margins above consensus (INTC) 20.49 +0.09 : Reports Q3 (Sep) earnings of $0.33 per share, $0.05 better than the First Call consensus of $0.28; revenues fell 8.0% year/year to $9.4 bln vs the $9.04 bln consensus. Intel reports Q3 gross margin 57.6% vs 55.5% consensus and prior guidance to upper half of 51-55% range. Co issues upside guidance for Q4, sees Q4 revs of $9.7-10.5 bln vs. $9.51 bln consensus. Intel guides Q4 gross margin 59-65% vs 56.7% consensus... Full Year Capital spending is expected to be $4.5 billion plus or minus $100 million, down from the prior expectation of $4.7 bln plus or minus $200 mln. The average selling price (ASP) for microprocessors was slightly down sequentially. "Intel's strong third-quarter results underscore that computing is essential to people's lives, proving the importance of technology innovation in leading an economic recovery... This momentum in the current economic climate, plus our product leadership, gives us confidence about our business prospects going forward. As we look ahead, Intel's game-changing 32nm process technology will usher in another wave of innovation from new, powerful Intel Xeon server platforms to high-performance Intel Core processors to low-power Intel Atom processors." From the close of business on Nov. 25 until publication of the company's fourth-quarter earnings release, Intel will observe a "Quiet Period" during which the Business Outlook disclosed in the company's news releases and filings with the SEC should be considered as historical, speaking as of prior to the Quiet Period only and not subject to an update by the company... Stock is halted.

4:18PM Semiconductor stocks trading aggressively higher following INTC's earnings report (SMH) : SMH is up about $0.60 or more than 2%. Last trade at $26.80

4:16PM Altera reports EPS in-line, revs in-line; guides Q4 revs above consensus (ALTR) : Reports Q3 (Sep) earnings of $0.19 per share, in-line with the First Call consensus of $0.19; revenues rose 2.7% year/year to $286.6 mln vs the $284.5 mln consensus. Co issues upside guidance for Q4, sees Q4 revs of $303-314 mln vs. $291.50 mln consensus. Co sees gross margins of 67-68% vs. 67.1% consensus.

4:15PM LDK Solar announces changes to its management team (LDK) 8.35 -0.09 : The co announces organizational changes to its management team. Mr. Xingxue Tong, President and Chief Operating Officer will temporarily take over all manufacturing operation functions, including polysilicon and wafer production, as a result of the resignation of Mr. Nicola Sarno, Senior Vice President of Manufacturing. Mr. Sarno will leave the Company on October 16, 2009 to pursue personal interests.

4:08PM Canadian Solar expects 3Q 2009 shipments to exceed prior guidance; sees 3Q09 revs of $210-$215 vs $202.7 mln consensus (CSIQ) 17.54 -0.50 : Co announced that based on selected unaudited financial results, it expects shipments for the third quarter of 2009 will exceed the high-end of its prior guidance. The Company also announced it is raising its guidance for the full year of 2009. Based on its selected unaudited financial results, Canadian Solar believes that its net revenues for the third quarter of 2009 will be approximately $210 million to $215 million (First Call consensus $202 mln), with shipments of approximately 101 MW to 103 MW, compared to prior guidance for shipments of approximately 90 MW to 100 MW. We expect to report a gross margin of 16% to 17% for the third quarter of 2009. Based on the high level of interest in Canadian Solar's products at the Hamburg trade show and subsequent purchase orders, the Company is raising its guidance for full year 2009 shipments to approximately 295 MW to 305 MW, including expected shipments of 127 MW to 137 MW for the fourth quarter of 2009. This compares to prior guidance for shipments of approximately 260 MW to 270 MW for the full year 2009, and earlier full year 2009 guidance of 200 MW to 220 MW. The Company continues to make improvements in its cost structure, which it expects will positively impact ongoing profitability. Dr. Shawn Qu, Chairman and CEO said: "Demand has continued to be strong among our core customer group as well as among new customers. We anticipate that Q4 2009 will be even stronger than Q3 2009 in terms of shipments and we expect to maintain similar gross margins. We plan to increase our solar module manufacturing capacity to 1 GW, our solar cell capacity to 700 MW and our ingot and wafer capacity to 350 MW by the end of 2010 to meet demand levels."

9:40AM Fitch says no improvement for U.S. RMBS roll rates; 60% performing borrowers underwater : With a majority of borrowers in U.S. RMBS transactions owing more on their mortgages than their homes are currently worth, negative home equity is preventing sustained improvement in U.S. mortgage performance, according to the new monthly report 'Fitch RMBS Performance Metrics." Fitch estimates approximately 60% of the remaining performing borrowers from the 2006-2007 vintages are in a negative home equity position, or 'underwater'. According to Senior Director Grant Bailey, 'negative equity reduces a borrower's incentive to pay their mortgage and limits their options when faced with financial difficulties.' After notable improvement through the first half of this year, the percentage of previously performing borrowers rolling into a delinquency status stabilized at an elevated level through the summer months and increased modestly in the month of September. The sustained negative pressure on the remaining performing borrowers has also been driven in part by the continued rise in unemployment, which has reached 9.8% nationally and a record level of 12.2% in California, where the greatest percentage of RMBS borrowers is located. As projected in its Oct. 1 'Global Economic Outlook', Fitch projects U.S. unemployment will continue to rise and peak at 10.3% in the middle of 2010.

Emulex (ELX) and Ixia (XXIA) have partnered to produce a definitive guide to the technological characteristics of Converged Network Adapters and the proper methodology for testing these new devices.

09:42 am EMC Corp ests and target raised to $22 at Credit Suisse ahead of Q3 results: . Credit Suisse raises their EMC tgt to $22 from $19 as it believes the co had a healthy qtr, with rev upside likely. Firm is modestly raising Q3 forecast to revs of $3.45 bln and EPS of $0.21 from $3.43 bln/$0.20, and consensus of $3.44 bln/$0.21. After facing a challenging demand environment and uncertain macro conditions in the first half, firm believes storage utilization rates have continued to exceed optimal levels. Firm believes that this positions networked storage for a V-shaped recovery as macro pressures ease, and expect to get initial confirmation of this in EMC's earnings report. EMC is scheduled to report results on Thursday, October 22 before the market opens.

09:38 am Juniper Networks upgraded to Buy at Jefferies & Co; tgt raised to $34: . Jefferies & Co upgrades JNPR to Buy from Hold and raises their tgt to $34 from $21 saying Juniper is well positioned to benefit from secular growth trend in service provider routing as well as from market share gains in high-end switches. Firm says nNew product cycles in edge routing and modular switching should help competitive position. They are also increasing their estimates to reflect improvement in demand and project activity

09:44 am Cisco Systems (CSCO)

Cisco Systems (CSCO 23.75, -0.03) and Starent Networks (STAR 34.24, +5.21) announced a definitive agreement for Cisco to acquire Starent Networks. Under the terms of the agreement, Cisco will pay $35 per share in cash in exchange for each share of Starent Networks and assume outstanding equity awards for an aggregate purchase price of approximately $2.9 billion.

The acquisition has been approved by the boards of directors of both companies. The acquisition is expected to close during the first half of calendar year 2010; however, the close date is subject to customary closing conditions and regulatory reviews.

Cisco expects the acquisition to be dilutive to non-GAAP earnings in fiscal years 2010 and 2011 and accretive to non-GAAP earnings in fiscal year 2012.

icon url

ReturntoSender

10/14/09 9:12 PM

#8712 RE: ReturntoSender #6755

From Briefing.com: 4:35 pm : Strong earnings from a couple of industry bellwethers and a weaker U.S. dollar brought about a concerted buying effort that sent all three major indices to new 2009 highs. Stocks lost a bit of their upward momentum as they headed into the close, but the Dow was still able to settle above 10,000 for the first time in one year.

Stocks traded solidly higher in broad-based fashion for the entire session. Their advance came on the heels of better-than-expected third quarter earnings from chipmaker Intel (INTC 20.83, +0.34) and diversified financial services outfit JPMorgan Chase (JPM 47.16, +1.50). For its part, Intel brought in $0.33 per share and also issued upside revenue guidance. JPMorgan brought in $0.82 per share for its latest quarter, even though it added $2.0 billion to consumer credit reserves, and said during its conference call that it hopes to raise its dividend back to $0.75 per share in the first half of 2010.

JPMorgan's report sent the broader financial sector to a 3.4% gain, which was better than any other sector this session. However, the bank's report set a high bar for peers like Bank of America (BAC 18.59, +0.78), which reports Friday.

Pharmaceuticals company Abbott Labs (ABT 51.20, +1.55) announced better-than-expected third quarter adjusted earnings of its own by bringing in $0.92 per share and went on to raise its fiscal 2009 guidance. That helped pharmaceutical stocks overcome continued weakness in shares of Johnson & Johnson (JNJ 60.55, -0.46) and drive the health care sector 1.5% higher.

Rail company CSX (CSX 47.06, +2.78) was one of this session's best performers following its upside earnings surprise of $0.74 per share. Fellow rail stocks shared in its strength and sent the industrial sector to a 2.6% gain, second only to financials.

Telecom was the only sector that failed to post a gain. Though its loss was fractional, this session marked the fifth time in the past six sessions that telecom underperformed.

Still, broad-based buying sent stocks to fresh highs for 2009. Since registering March lows, the Dow has climbed roughly 55%, the S&P 500 has jumped approximately 64%, and the Nasdaq has surged almost 72%.

Continued weakness in the U.S. dollar sent the Dollar Index down 0.7%. It registered new 52-week lows in afternoon trade. Though the dollar wasn't in focus this session, its doldrums continue to provide a boon for the stock market.

The positive mood among participants this session was reinforced by pleasing September retail sales data, which showed a softer-than-expected decline of 1.5%. Excluding autos, retail sales increased a better-than-expected 0.5%.

Import prices for September were up 0.1% month-over-month, which is largely in-line with what had been expected, while business inventories for August fell a sharper-than-expected 1.5%. Those reports were overshadowed, though.

In other economic news, minutes from the September 23 FOMC meeting indicated that policymakers feel that the economic outlook has improved and that job losses are slowing. In turn, most members have upwardly revised economic projections, though overall activity is still quite weak.

The minutes supported the stock market's bullish trend, but Treasuries didn't respond so well to them. Comments that increasing the scale of asset purchases could aid in the economy's recovery caused the benchmark 10-year Note to drop roughly 20 ticks and the 30-year Bond to surrender more than one full point.

Advancing Sectors: Financials (+3.4%), Industrials (+2.6%), Materials (+2.0%), Energy (+1.2%), Consumer Discretionary (+1.5%), Tech (+1.5%), Health Care (+1.5%), Consumer Staples (+0.5%), Utilities (+0.4%)
Declining Sectors: (None)
Neutral: Telecom DJ30 +144.80 NASDAQ +32.34 NQ100 +1.4% R2K +2.0% SP400 +1.8% SP500 +18.83 NASDAQ Adv/Vol/Dec 2048/2.39 bln/698 NYSE Adv/Vol/Dec 2278/1.35 bln/769

4:31PM Conexant announces over-allotment exercise on recent common stock offering (CNXT) 3.18 +0.03 : Co announces that the underwriter of its recently concluded public offering of 7,000,000 shares of common stock exercised its over-allotment option to purchase an additional 1,050,000 shares of the company's common stock, bringing the total shares sold to 8,050,000 at a price of $2.85 per share. The offering of 7,000,000 shares closed on September 29, 2009.

4:25PM Xilinx beats by $0.03, beats on revs; guides Q3 revs above consensus (XLNX) 24.00 +0.07 : Reports Q2 (Sep) earnings of $0.25 per share, excluding non-recurring items, $0.03 better than the First Call consensus of $0.22; revenues fell 14.2% year/year to $415 mln vs the $410.2 mln consensus. Co reports gross margin 61.9% vs 61.04% consensus and previous guidance of 61%. Co issues upside guidance for Q3, sees Q3 sequential revs growth of 6-10%, which equates to ~$439.9-456.5 vs. $422.45 mln consensus. Co guides Q3 gross margins of 62-63% vs 62% consensus.

9:27AM Coherent acquires product lines from StockerYale (COHR) 24.88 : Co announces that it has acquired the North American operations of StockerYale in an asset purchase for $15 million dollars in cash. The Company acquired all the assets and certain operating liabilities of the laser module product line in Montreal, Canada and the specialty fiber product line in Salem, New Hampshire.

1:33AM ASML Holding beats by EUR0.06, beats on revs; guides Q4 revs above consensus (ASML) 31.65 : Reports Q3 (Sep) earnings of EUR0.05 per share, EUR0.06 better than the First Call consensus of (EUR0.01); revenues fell 20.3% year/year to EUR555.3 mln vs the EUR454 mln consensus. ASML's order backlog as of September 27, 2009 was EUR1,353 mln, totaling 54 systems with an average selling price of EUR25.1 mln. ASML's backlog as of June 28, 2009 was valued at EUR1,064 mln, totaling 43 systems with an average selling price of EUR24.7 mln. 3Q09 gross margin was 34.4%, compared with the 2Q09 gross margin of 12.5%, reflecting the better coverage of fixed production costs as a result of increased sales. Co issues upside guidance for Q4, sees Q4 revs of EUR550.0 mln vs. EUR472.35 mln consensus. Briefing.com note: Co issued upside 4Q09 revenue guidance on Sept. 10; stated they expected to see revenue of > EUR500 mln. Co expects gross margin in 4Q09 of approx 37%. R&D expenditures are expected to be at EUR115 mln net of credits and SG&A costs are expected at EUR37 mln. Firm expects cash balance in 4Q09 to be at a similar level as per end-Q3, even as they prepare to ramp NXT shipments in the first half of 2010 and to build EUV systems planned for delivery in 2H10.

09:38 am Intel tgt raised to $29 from $25 at Broadpoint Amtech following blowout 3Q results: .
Broadpoint Amtech raises their INTC tgt to $29 from $25 following the co's blowout 3Q results. The firm notes that the co reported a $0.06 EPS beat on stronger than expected revenue of $9.39 bln (above whispers of ~$9.2 bln+) from a continued consumer-led recovery. However, the co's gross margins stole the show at 57.6% this quarter (vs. the firm's 54.8% estimate and the Street's 54.6%), with guidance of 62% +/- 3 for the December quarter (vs. the firm's 57% estimate and the Street's 57.2%). The firm believes that plenty of earnings leverage exists through structural efficiencies, multiple gross margin tailwinds, aggressive PC and non-PC initiatives, and a material improvement in IT Enterprise spending boosting Nehalem. Firm raises their Dec 09 rev ests to $10.1 bln from $9.78 (consensus is $9.5 bln) and raises their Dec 09 EPS est to $0.46 from $0.39, consensus is $0.34.

08:32 am Intel (INTC)

Intel (INTC 20.49) pleased the market Tuesday evening after it posted better-than-expected third quarter earnings and issued upside guidance for its fourth quarter revenues and gross margins.

Intel reported third quarter earnings of $0.33 per share, $0.05 better than the First Call consensus of $0.28.

Revenues fell 8.0% year-over-year to $9.4 billion, topping the $9.04 billion consensus. Intel said sales were particularly strong in China. Strong consumer sales and a back-to-school cycle that exceed the company's expectations drove sales in the U.S.

Intel's third quarter gross margin of 57.6% easily topped the 55.5% consensus and was well ahead of the company's prior guidance in the upper half of the 51-55% range. A statement from Dell's CFO indicated that the company's factories executed "particularly well," with improvements in throughput time and yields.

Looking ahead to the fourth quarter, Intel said it expects revenues to range from $9.7 billion to $10.5 billion, better than the $9.51 billion consensus. Intel expects its fourth quarter gross margins to range from 59-65%, easily topping the current consensus estimate of 56.7%.

Shares of INTC are about 4.2% higher an hour ahead of Wednesday's opening bell.
icon url

ReturntoSender

10/15/09 11:38 PM

#8713 RE: ReturntoSender #6755

From Briefing.com: 4:30 pm : The major stock indices extended their 2009 highs late this session by overcoming losses that stemmed from a sell-the-news reaction to quarterly reports from Goldman Sachs and Citigroup.

The broader market spent most of the session with modest losses, which came amid considerable weakness in the financial sector. Financials were down as much as 1.7% following better-than-expected earnings from Goldman Sachs (GS 188.63, -3.65) and Citigroup (C 4.75, -0.25), both of which benefited in the previous session from an upbeat report from JPMorgan Chase (JPM 47.16, +0.00). However, the gains during the previous session effectively priced in this morning's positive surprise, prompting participants to sell the shares and take profits as the news hit.

Weakness in the financial sector weighed on the broader market for the entire session, but a late lift helped the sector pare its losses so that it finished with a loss of 0.7%.

The late lift was led by the energy sector, which settled with a 2.0% gain. That is more than twice the gain of the next best performing sector (utilities, +0.9%). Energy's advance came as refiners (+8.0%) surged and oil and gas equipment stocks (+3.4%) and oil and gas driller stocks (+3.2%) spiked with a sharp rise by oil prices. News that weekly oil inventories increased by a smaller-than-expected 334,000 barrels helped send oil futures prices to new 2009 highs of $77.97 per barrel. Oil prices settled at $77.58 per barrel with a 3.2% gain.

Energy's strength helped the broader market finish at session highs, which extended the gains made in the previous session. The broader market is now up more than 21% year-to-date. Despite that accomplishment, the S&P 500 is just now at levels first seen in 1998.

Market participants were generally unfazed by the latest batch of economic data, which featured a 0.2% increase in consumer prices and core consumer prices for September. The consensus called for a 0.2% increase in CPI and a 0.1% increase in core CPI. Initial jobless claims for the week ending October 10 totaled 514,000, which was a bit below the consensus forecast of 520,000 initial claims and down 10,000 from the previous week. Continuing claims slipped below 6.0 million for the first time since March by coming in at 5.99 million. The consensus called for an even 6.00 million continuing claims.

The Empire State Manufacturing Index for October came in at 34.57, which topped the 17.25 that was widely expected, while the Philadelphia Fed Index for October came in at 11.5, which is fractionally below the 12.0 reading that was expected. Still, the Philly Fed Index has showed three straight positive readings, which hasn't happened for roughly two years.

Advancing Sectors: Energy (+2.0%), Utilities (+0.9%), Consumer Staples (+0.8%), Telecom (+0.7%), Health Care (+0.6%), Materials (+0.4%), Industrials (+0.3%), Consumer Discretionary (+0.1%)
Declining Sectors: Financials (-0.7%)
Unchanged: Tech DJ30 +47.08 NASDAQ +1.06 NQ100 -0.1% R2K -0.1% SP400 +0.3% SP500 +4.54 NASDAQ Adv/Vol/Dec 1162/2.18 bln/1508 NYSE Adv/Vol/Dec 1509/1.36 bln/1502

4:20PM Advanced Micro beats by $0.24, beats on revs (AMD) 6.19 -0.06 : Reports Q3 (Sep) loss of $0.18 per share, $0.24 better than the First Call consensus of ($0.42); revenues rose 17.9% year/year to $1.4 bln vs the $1.26 bln consensus. Third quarter 2009 AMD gross margin was 42% compared to 37% in the prior quarter. AMD expects its Product Company revenue to be up modestly for the fourth quarter of 2009; consensus calls for 7.3% sequential rise on revs. "Strong demand for our product and platform offerings combined with disciplined execution resulted in AMD Product Company achieving profitability in the third quarter. Growth in microprocessor and graphics unit shipments drove an 18 percent sequential revenue increase, while improved factory utilization rates, higher microprocessor average selling price and an increase in 45nm product shipments resulted in a gross margin improvement from the prior quarter."

4:10PM IBM beats by $0.02, reports revs in line; guides FY09 EPS above consensus (IBM) 127.98 -0.37 : Reports Q3 (Sep) earnings of $2.40 per share, $0.02 better than the First Call consensus of $2.38; revenues fell 6.9% year/year to $23.57 bln vs the $23.4 bln consensus. IBM reports Q3 gross margin of 45.1% vs 45.2% consensus. Co raises guidance for FY09, sees EPS of $9.85 vs. $9.78 consensus (up from $9.70 prior guidance). Remains well ahead of pace for 2010 roadmap of $10 to $11 per share (consensus is for 2010 EPS of $10.76). Total Global Services revenues decreased 7% (5%, adjusting for currency); pre-tax income increased 11%. Global Technology Services segment revenues decreased 4% (2%, adjusting for currency) to $9.4 bln. Global Business Services segment revenues decreased 11%(11%, adjusting for currency) to $4.3 bln. IBM's tax rate in the third-quarter 2009 was 26.5% compared with 27.5% in the third quarter of 2008. "Our long-term strategic shift to higher-value businesses again enabled us to deliver outstanding margin, earnings and cash flow growth in the third quarter... We also saw improved revenue trends in our business and share gains in software and hardware... We continued to invest for growth in areas where clients see potential for value creation including Smarter Planet solutions, cloud computing and advanced business analytics. We are optimistic about 2009 as we again raise our full-year expectations and we remain well ahead of pace for our 2010 roadmap of $10 to $11 per share."

4:05PM Google beats by $0.47, beats on revs (GOOG) 529.91 -5.41 : Reports Q3 (Sep) earnings of $5.89 per share, $0.47 better than the First Call consensus of $5.42; revenues rose 8.4% year/year to $4.4 bln vs the $4.24 bln consensus. Aggregate paid clicks, which include clicks related to ads served on Google sites and the sites of our AdSense partners, increased approximately 14% over the third quarter of 2008 and increased approximately 4% over the second quarter of 2009. Briefing Note: Street expectations were for paid clicks to increase about 15% or better. Average cost-per-click, which includes clicks related to ads served on Google sites and the sites of our AdSense partners, decreased approximately 6% over the third quarter of 2008 and increased approximately 5% over the second quarter of 2009. Revenues from outside of the United States totaled $3.14 billion, representing 53% of total revenues in the third quarter of 2009, compared to 53% in the second quarter of 2009 and 51% in the third quarter of 2008. Co states, "While there is a lot of uncertainty about the pace of economic recovery, we believe the worst of the recession is behind us and now feel confident about investing heavily in our future."

4:02PM Brooks Automation sees Q4 revs of $64 mln ( $56.1 mln consensus) (BRKS) 8.05 : Co announces that pending the completion of the fiscal 2009 year-end audit it expects to report revenues for the fourth quarter ended September 30, 2009 of approximately $64 million, a sequential quarterly increase of about 45%. At the time of the Company's third quarter earnings release in early August, Brooks said it expected sequential revenue growth of at least 25% in the September quarter.

8:16AM Ultratech beats by $0.05, beats on revs (UTEK) 15.44 : Reports Q3 (Sep) earnings of $0.04 per share, $0.05 better than the two analyst estimate of ($0.01); revenues fell 27.6% year/year to $24.9 mln vs the $20.1 mln estimate. "Demand for our advanced-packaging products during the quarter drove the performance of the company, as evidenced by Ultratech's increase in new orders... As our customers continue to pursue advanced technologies to produce new semiconductor and semiconductor-related products, Ultratech is demonstrating the capabilities to move customers' ideas to market."

8:01AM Cypress Semi beats by $0.04, beats on revs (CY) 10.28 : Reports Q3 (Sep) earnings of $0.10 per share, excluding non-recurring items, $0.04 better than the First Call consensus of $0.06; revenues rose 14.7% year/year to $178.7 mln vs the $174.4 mln consensus.

Flextronics (FLEX) announced that it will expand its presence in China through the development of a new facility in Wuzhong. The new facility will support the growing demand for computing products in China and will include a design center and extended manufacturing capabilities in the Wuzhong Export Processing Zone. The design center will be completed by the end of 2009 and the manufacturing facility is expected to be completed by the end of 2010...

Vodafone (VOD) and Research In Motion (RIMM) introduced the BlackBerry Storm2 smartphone for customers in seven European countries as well as South Africa... Jazz Semiconductor, a Tower Group Company (TSEM) announced their SERDES solution has been selected by NASA for its Lunar Atmosphere Dust Environment Explorer mission...

7:36AM Fairchild Semi beats by $0.05, beats on revs; guides Q4 revs above consensus (FCS) 9.62 : Reports Q3 (Sep) earnings of $0.12 per share, excluding non-recurring items, $0.05 better than the First Call consensus of $0.07; revenues rose 19.4% year/year to $331.8 mln vs the $321.9 mln consensus. Co issues upside guidance for Q4, sees Q4 revs of $333-343 mln vs. $328.96 mln consensus. Co sees Q4 gross margin of 28-30% vs the 27.5% consensus. Q3 adjusted gross margin was 26.9%, up 2 percentage points sequentially and 3 percentage points lower than in the third quarter of 2008. "Our scheduled backlog for fourth quarter shipments is currently about $333 million which is roughly $33 million higher than this point a quarter ago. Included in this amount is approximately $20 million of backlog we booked in the first two and a half weeks of this quarter... We under-shipped distribution sell-through again in the third quarter resulting in about an $11 million reduction in channel inventory. Our channel inventory is now at a record low 9.6 weeks. Order rates were solid throughout the quarter across a broad range of end markets enabling us to increase our backlog position from a quarter ago. Overall product pricing in Q3 improved to down about 2 percent sequentially which we believe marks the inflection point for prices in this cycle. Stronger demand caused lead times to increase to a more normal range of 6 to 8 weeks during the quarter."

10:15 am Xilinx (XLNX)

Xilinx (XLNX 23.43, -0.57) reported second quarter earnings after the close Wednesday that topped estimates.

The company reported second quarter earnings of $0.25, excluding nonrecurring charges, $0.03 better than the First Call consensus of $0.22.

Revenues fell 14.2% year-over-year to $415 million, which was above the consensus of $410.2 million. Also during the quarter, the company reported gross margins of 61.9% vs. the 61.04% consensus and previous guidance of 61%.

Looking ahead to the third quarter, the company is forecasting sequential revenue growth of 6% to 10%, which equates to approximately $439.9 million to $456.5 million, well above consensus estimates of $422.5 million. Also, for the third quarter the company provided its gross margin expectation of 62% to 63%, in-line with the 62% consensus.

10:02 am Nokia (NOK)

Nokia (NOK 13.84 -1.55) reported third quarter earnings this morning that beat Wall Street estimates.

The company reported third quarter earnings of EUR 0.17, 0.04 better than the First Call consensus of EUR 0.13. Revenue declined 19.8% year-over-year to EUR 9.81 billion, below the EUR 10.02 billion consensus.

In the quarter, estimated industry mobile device volumes of 288 million units were down 7% year-over-year and up 7% sequentially, while Nokia mobile device volumes of 108.5 million units were down 8% year-over-year and up 5% sequentially.

Nokia's estimated mobile device market share of 38% in the third quarter of 2009 was at the same level as in the third quarter in 2008 and in second quarter 2009. Mobile device average selling prices (EUR 62) remained at the same level as the second quarter.

Looking into the fourth quarter, Nokia expects industry mobile device volumes to be up sequentially and expects its mobile device market share in the same quarter to be approximately at the same level sequentially.

For the industry, Nokia expects mobile device volumes to be approximately 1.12 billion units in 2009, down approximately 7% from approximately 1.21 billion units Nokia estimated for 2008. This is an update to Nokia's earlier estimate of industry mobile device volumes declining approximately 10% in 2009 from 2008 levels.

Nokia expects its non-IFRS operating margin in Devices & Services in the fourth quarter 2009 to be up by one percentage point or more sequentially.
icon url

ReturntoSender

10/19/09 8:45 PM

#8717 RE: ReturntoSender #6755

From Briefing.com: 4:15 pm : Broad-based buying helped stocks bounce back from a dip at the open to log fresh highs for 2009, but the S&P 500 met resistance when it hit the 1100 mark, which was last seen just over one year ago.

Strong gains in overseas markets helped set a positive tone for participants in the early going, but weakness in the financial sector quickly undercut the broader market's opening gain. Regional banks (-1.7%) were the primary source of weakness for the financial sector. Their losses came after BB&T (BBT 27.03, -1.22) unveiled its latest quarterly results, which actually featured better-than-expected earnings of $0.23 per share. However, the regional lender also reported a sharp year-over-year rise in loss provisions and couldn't confirm whether its charge-offs have peaked.

Though stocks stumbled in early trade as a result of weakness among financial issues, it didn't take long for participants to step in and bid stocks higher. Ensuing gains were strong and broad-based and pushed all three major indices to new highs for the year.

Stocks in the S&P 500 weren't able to push through the psychologically significant 1100 level, but they didn't roll over after being rebuffed, either. Some of the best gains were had by consumer discretionary stocks and materials stocks. Both advanced 1.4%.

Gains by the consumer discretionary sector came even though Hasbro (HAS 28.42, -1.10) traded as a laggard. Shares of the company were sold off after the stock had pushed considerably higher in the sessions leading up to this morning's earnings report, which featured an upside earnings surprise.

Meanwhile, materials stocks benefited from both broader market interest and higher commodity prices, which sent the CRB Commodity Index to a fresh high for the year.

A weaker dollar proved beneficial for both commodities and stocks this session. The greenback shed 0.3% against a basket of major foreign currencies this session. That has left the Dollar Index fractionally above its 12-month lows.

Trading volume was unimpressive this session. Hardly 1 billion shares traded hands on the NYSE. Recent averages stand above 1.2 billion shares.

Advancing Sectors: Utilities (+1.5%), Materials (+1.4%), Discretionary (+1.4%), Energy (+1.2%), Health Care (+1.0%), Tech (+1.0%), Consumer Industrials (+0.9%), Telecom (+0.8%), Consumer Staples (+0.5%), Financials (+0.5%)
Declining Sectors: (None)DJ30 +96.28 NASDAQ +19.52 NQ100 +1.0% R2K +1.0% SP400 +1.1% SP500 +10.23 NASDAQ Adv/Vol/Dec 1715/1.97 bln/943 NYSE Adv/Vol/Dec 2240/1.08 bln/799

4:38PM Volterra Semi misses by $0.01, reports revs in-line (VLTR) 18.40 +0.21 : Reports Q3 (Sep) earnings of $0.19 per share, excluding non-recurring items, $0.01 worse than the First Call consensus of $0.20; revenues fell 2.9% year/year to $29.7 mln vs the $29.7 mln consensus.

4:36PM Texas Instruments beats by $0.03, beats on revs; guides Q4 EPS above consensus, revs above consensus (TXN) 23.52 +0.77 : Reports Q3 (Sep) earnings of $0.42 per share, $0.03 better than the First Call consensus of $0.39; revenues fell 15.0% year/year to $2.88 bln vs the $2.82 bln consensus. Co issues upside guidance for Q4, sees EPS of $0.42-0.50 vs. $0.40 consensus; sees Q4 revs of $2.78-3.02 bln vs. $2.78 bln consensus. Co reports gross margins of 51.4% vs. 49.1% street expectation. Analog revenue declined 8% y/y, while embedded revenue also fell 8%. Wireless revenue declined 26% y/y. The decline in Analog revenue from a year ago was due to lower high- volume analog & logic and high-performance analog revenue. Power management revenue increased slightly. The increase in Analog revenue from the prior quarter was due to growth in all three product categories. Co states, "Our performance in the quarter exceeded our expectations and was led by a second consecutive quarter of 20-percent growth in Analog. We are encouraged with the strong sequential increase in demand for our products over the past two quarters as our customers are winding down their inventory corrections and have begun to increase production levels in their factories. This revenue growth, combined with our early actions to pare costs so that we would not be dependent upon an uncertain rebound in the overall economy, has resulted in solid improvements in our profitability.

4:33PM Apple beats by $0.40, beats on revs; guides Q1 EPS below consensus, revs in-line (AAPL) 189.86 +1.81 : Reports Q4 (Sep) earnings of $1.82 per share, $0.40 better than the First Call consensus of $1.42; revenues rose 25.0% year/year to $9.87 bln vs the $9.2 bln consensus. Co reports Q4 Mac sales of 3.05 mln vs ~2.8 mln Street est, 7.4mln iPhones sold vs ~7 mln Street est, and 10.2 mln iPods sold vs 10.5 mln iPods Street. Apple prelim reports gross margin 36.6% vs 35.5% consensus. Co issues mixed guidance for Q1, sees EPS of $1.70-1.78 vs. $1.91 consensus; sees Q1 revs of $11.3-11.6 bln vs. $11.45 bln consensus. "We are thrilled to have sold more Macs and iPhones than in any previous quarter," said Steve Jobs, Apple's CEO. "We've got a very strong lineup for the holiday season and some really great new products in the pipeline for 2010."

4:09PM SolarWinds beats by $0.02, beats on revs; guides Q4 EPS in-line, revs in-line (SWI) 22.81 1.27 : Reports Q3 (Sep) earnings of $0.17 per share, excluding non-recurring items, $0.02 better than the First Call consensus of $0.15; revenues rose 23.6% year/year and 20% sequentially to $32.4 mln vs the $31.1 mln consensus. Co issues in-line guidance for Q4, sees EPS of $0.15-0.16, excluding non-recurring items, vs. $0.16 consensus; sees Q4 revs of $32.8-34.2 mln vs. $33.18 mln consensus.

4:07PM Atheros Communications has shipped well over 10 million of its Align chips (ATHR) 27.80 +1.04 : Co announces that it has shipped well over 10 million of its Align chips based on the single-stream 802.11n standard. The company began shipping the popular Align AR9285 single-chip PCI Express (PCIe) solution in the fourth quarter of 2008, targeting value-class netbook, notebook and desktop PCs, wireless routers, and consumer electronics (CE) devices.

09:33 am Sunpower ests raised at Broadpoint AmTech ahead of earnings: . Broadpoint AmTech is moving its Q309 ests higher due to better than expected demand in Germany and Italy. In addition, firm now believes the risk to its FY10 ests is to the upside given an expanding utility-scale pipeline and strength in the US ahead of ITC grant expiration, along with an improving commercial installation financing environment. Firm is modeling revenue of $435 mln (consensus $418 mln) and pro-forma EPS $0.42 (consensus $0.39). Key inputs include a 52% q/q increase in total shipments against a 7% q/q decline in ASPs. Firm is modeling a 55% increase in MW installed for the Systems business against moderate ASP declines. Co reports 10/22.
icon url

ReturntoSender

10/20/09 10:35 PM

#8718 RE: ReturntoSender #6755

From Briefing.com: 4:25PM SanDisk resumes trading; jumps to $23.50 (SNDK) 21.48:

4:08PM SanDisk beats by $0.49, beats on revs (SNDK) 21.47 +0.01 : Reports Q3 (Sep) earnings of $0.75 per share, excluding non-recurring items, $0.49 better than the First Call consensus of $0.26; revenues rose 13.8% year/year to $935.2 mln vs the $787.9 mln consensus. SanDisk reports gross margin 46.6% vs 31.3% consensus. Co says, "We are encouraged by improved industry fundamentals and our increasingly diversified global markets, which bode well for further growth in Q4 and in 2010."

4:34PM Cymer beats by $0.19, beats on revs; guides Q4 revs above consensus (CYMI) 38.85 -0.12 : Reports Q3 (Sep) earnings of $0.36 per share, $0.19 better than the First Call consensus of $0.17; revenues fell 16.5% year/year to $92.3 mln vs the $82.2 mln consensus. Co issues upside guidance for Q4, sees Q4 revs to be comparable to Q3 revs, which equates to ~92.3 mln vs. $90.62 mln consensus. Co said, "In Q3, we responded to increased demand that resulted in Q3revenue increasing almost 50%, as compared to the prior quarter. In Q4, we anticipate maintaining this increased level of demand for light sources and Installed Base Products."

4:09PM PMC-Sierra and Entropic Communications collaborate to extend reach of fiber for cable operators (PMCS) 9.54 -0.17 : PMC-Sierra and Entropic Communications (ENTR) announce that they are collaborating to develop an innovative and cost-effective solution for delivering >100Mb/s broadband connectivity to each customer in MSO fiber deployments. The companies will demonstrate this concept during the SCTE Cable-Tec Expo in Denver, Colorado, October 28-30, 2009.

4:08PM Cree beats by $0.08, beats on revs; guides Q2 EPS above consensus, revs above consensus (CREE) 41.16 +0.05 : Reports Q1 (Sep) earnings of $0.30 per share, excluding non-recurring items, $0.08 better than the First Call consensus of $0.22; revenues rose 20.5% year/year to $169.1 mln vs the $164.5 mln consensus. Cree reports gross margin 43.6% vs 40% consensus and co guidance. Co issues upside guidance for Q2, sees EPS of $0.28-0.30, excluding non-recurring items, vs. $0.23 consensus; sees Q2 revs of $180-190 mln vs. $173.18 mln consensus. Targeted non-GAAP earnings exclude expenses related to the amortization of acquired intangibles of $0.02 per diluted share, and stock-based compensation expense of $0.06 per diluted share. "We are benefitting from continued LED lighting adoption and high factory utilization and are well positioned for solid growth in Q2. As a result of the recent equity offering, we have the balance sheet to invest in the growth of our business as we look to continue to lead the LED lighting revolution."

4:05PM Cree testing the 2004 high at $42.44 (CREE) 41.16 +0.05 : Volume is really light. Last trade at $42.00

4:01PM Universal Display awarded U.S. Army SBIR ~$334k contract extension for Flexible OLED displays built on metal foil (PANL) 13.59 -0.06 :

4:30 pm : Positive earnings surprises from Apple (AAPL 198.76, +8.90), Texas Instruments (TXN 23.66, +0.14), Caterpillar (CAT 59.61, +1.76), Pfizer (PFE 17.93, -0.05), and UnitedHealth (UNH 25.96, +1.04) couldn't keep the broader market from slipping to a loss as a stronger dollar pressured stocks and commodities alike.

Stocks looked poised to start the session on strong footing and extend the previous session's gains, but the positive tone among participants dwindled in the opening minutes as enthusiasm faded for the strong earnings of several widely-held companies. A bounce by the U.S. dollar also undercut stocks; basic materials stocks (-1.1%) and energy stocks (-0.9%) were hit particularly hard, given their correlation to commodity prices.

With the Dollar Index climbing 0.4% this session, the CRB Commodity Index retreated to a 0.5% loss as oil futures prices fell 0.7% to $79.09 per barrel. Gold prices were able to recover from negative territory to finish fractionally higher at $1058.60 per ounce, however.

Health care stocks also struggled this session. The sector shed 1.0% as Boston Scientific (BSX 8.57, -1.59) slumped in the wake of its quarterly earnings report, which actually contained a positive earnings surprise and an in-line earnings forecast. That couldn't stop a Wells Fargo downgrade from dragging down the stock, though.

Meanwhile, managed care providers (+2.2%) looked strong following better-than-expected earnings and reaffirmed upside guidance from UnitedHealth, but their gains couldn't overcome weakness in the rest of the health care sector.

Tech stocks settled as the best performing sector, even though it closed unchanged. The sector found strength as participants flocked to shares of Apple in the wake of its strong quarterly results. Apple was also a primary leader in the Nasdaq.

In economic news, the Producer Price Index for September made a surprise month-over-month drop of 0.6%, while core producer prices made a surprise 0.1% slip. Housing starts for September came in at an annualized rate of 590,000, which is below the rate of 610,000 units that was widely expected. DJ30 -50.71 NASDAQ -12.85 NQ100 +0.0% R2K -1.4% SP400 -0.9% SP500 -6.85 NASDAQ Adv/Vol/Dec 726/2.14 bln/1965 NYSE Adv/Vol/Dec 1051/1.24 bln/1996

12:00PM Apple confirms new iMac line and updated MacBook (AAPL) 199.31 +9.45 : Co unveiled new iMac line featuring LED-backlit 21.5 and 27-inch widescreen displays in a new glass design and aluminum enclosure. The new iMac line is starting at $1,199. Every new iMac ships with a wireless keyboard and the all new wireless Magic Mouse, the world's first mouse with Multi-Touch technology pioneered by Apple on the iPhone, iPod touch and Mac notebook trackpad... Co also updated its popular MacBook with a new, durable polycarbonate unibody design featuring a LED-backlit display, a glass Multi-Touch trackpad and built-in battery for up to seven hours of battery life. The new MacBook is available for $999.

8:02AM Cirrus Logic beats by $0.01, reports revs in-line; guides Q3 revs above consensus (CRUS) 5.86 : Reports Q2 (Sep) earnings of $0.11 per share, excluding non-recurring items, $0.01 better than the First Call consensus of $0.10; revenues rose 4.5% year/year to $55.7 mln vs the $55.7 mln consensus. Co issues upside guidance for Q3, sees Q3 revs of $58-62 mln vs. $53.96 mln consensus. Gross margin is expected to be between 52 percent and 54 percent; and combined R&D and SG&A expenses are expected to range between $23 million and $25 million, which include approximately $2 million in share-based compensation and amortization of acquisition-related intangibles expenses. Gross margin for the quarter was 52 percent, down from 56 percent in the quarter a year ago and flat compared to 52 percent reported for the previous quarter.

09:55 am Texas Instruments (TXN)

Texas Instruments (TXN 24.00, +0.48) reported third quarter earnings that topped consensus estimates and issued upside guidance for the fourth quarter, saying that its customers have begun to increase production.

Texas Instruments reported third quarter earnings of $0.42 per share, $0.03 better than the First Call consensus of $0.39. Operating profits increased $17 million from the same period last year primarily due to lower operating expenses as well as lower manufacturing costs.

Revenues fell 15.0% year-over-year to $2.88 billion, but managed to top the $2.82 billion consensus estimate. Revenues were up 17% sequentially, driven by growth in all segments, particularly the company's analog segment.

Gross margins of 51.4% beat the 49.1% Street expectation.

"We are encouraged with the strong sequential increase in demand for our products over the past two quarters as our customers are winding down their inventory corrections and have begun to increase production levels in their factories," said CEO Rich Templeton. "This revenue growth, combined with our early actions to pare costs so that we would not be dependent upon an uncertain rebound in the overall economy, has resulted in solid improvements in our profitability."

Texas Instruments issued upside guidance for the fourth quarter, saying it expects earnings of $0.42 to $0.50 per share; the consensus expects $0.40. Texas Instruments sees fourth quarter revenues ranging from $2.78 billion to $3.02 billion; the consensus currently stands at $2.78 billion.

09:33 am SanDisk ests raised at Wedbush ahead of tonight's earnings: . Wedbush notes SanDisk is set to report Q3 results after the market close. Firm expects the Q3 print to be above the Street and its ests driven by strong retail card pricing and limited NAND supply bolstering gross margin, rev and earnings. Firm is increasing its gross margin est for Q3 to 32.5% up from 30.9% and pro forma EPS to $0.26 from $0.20 on rev of $795 mln (9% Q/Q growth) up from $770 mln above Street at $0.25/$787 mln. Firm looks for SanDisk management to provide a bullish out look for Q4 given its strong positioning in the retail/USB card market due to the limited supply of NAND impeding its competitors from having products on the shelf to compete.

08:36 am Apple (AAPL)

The fiscal fourth quarter report from Apple (AAPL 189.86) easily topped Wall Street's expectations, with strong sales of Macs and iPhones driving the upside surprise.

Apple reported fiscal fourth quarter earnings of $1.82 per share, $0.40 better than the First Call consensus of $1.42.

Revenues rose 25.0% year-over-year to $9.87 billion, ahead of the $9.2 billion consensus.

Apple sold 3.05 million Macs in the quarter, topping the 2.8 million Street expectation, while sales of iPhones (7.4 million vs Street expectation of 7 million) also did better than expected. Apple sold 10.2 million iPods, slightly lower than the expectations for 10.5 million and down 8% year-over-year. Sales of Macs were up 17% year-over-year, while iPhone sales improved 7% from the same quarter last year.

Apple improved its gross margin to 36.6%, beating the consensus expectation of 35.5%.

The company issued mixed guidance for its first quarter, saying it expects earnings of $1.70 to $1.78 per share; the consensus estimate currently stands at $1.91. Apple sees first quarter revenues of $11.3 billion to $11.6 billion, in-line with the $11.45 billion consensus.

Shares of AAPL are surging to all-time highs ahead of Tuesday's opening bell, climbing over 6.5% to crack the $200 level.
icon url

ReturntoSender

10/21/09 8:18 PM

#8719 RE: ReturntoSender #6755

From Briefing.com: 5:17PM QLogic sees Q4 EPS of ~$0.22-0.24 vs $0.21 First Call consensus; sees Q4 revs of ~$134-140 mln vs $133.4 mln First Call consensus; sees gross margins of ~66% vs 65.9% consensus (QLGC) 18.08 -0.71 :

4:20PM QLogic beats by $0.03, beats on revs (QLGC) 18.08 -0.71 : Reports Q2 (Sep) earnings of $0.21 per share, $0.03 better than the First Call consensus of $0.18; revenues fell 23.2% year/year to $131.5 mln vs the $125.7 mln consensus. "We are pleased with our strong financial performance during the second quarter, which was driven by a 7% sequential increase in revenue over our prior fiscal quarter. Our revenue performance, combined with effective operating expense management, yielded results that exceeded our guidance... We are cautiously optimistic given the signs of stability and early indicators of recovery we are experiencing in our business. We are encouraged by the improvements we experienced in order trends and shipments during the second quarter and believe we are well positioned to experience continued improvement in financial results."

4:32PM Mattson reports 3Q09 loss per share of ($0.31), ex-items, vs. ($0.32) First Call consensus; revenue decreased 62.7% y/y to $11.2 mln vs. $10.9 mln consensus (MTSN) 2.64 -0.23 :

4:32PM Ixia says Q3 revs will be ~$46.4 mln vs $ 45.2 mln consensus, compared to prior $42-47 mln guidance; co announces it will Buy Agilent Technologies' N2X data network testing product line for $44 mln (XXIA) 8.04 -0.09 : Co announced that it has signed a definitive agreement with Agilent Technologies (A), under which Ixia will acquire Agilent's N2X Data Networks Product Line for $44 mln in cash. Co says its evenue estimate includes a full quarter of results for Catapult Communications Corporation, which Ixia acquired in June of this year, but does not include any revenues related to its planned acquisition of Agilent's N2X business.

4:13PM Novellus beats by $0.01, beats on revs (NVLS) 21.61 : Reports Q3 (Sep) loss of $0.03 per share, excluding non-recurring items, $0.01 better than the First Call consensus of ($0.04); revenues fell 29.3% year/year to $176.9 mln vs the $172.4 mln consensus. Bookings in the third quarter of 2009 were $171.5 million, up $60.4 million or 54.3 percent from second quarter 2009 bookings of $111.2 million. Third quarter 2009 shipments of $165.4 million were up by $45.5 million or 37.9 percent from $120.0 million reported for the second quarter of 2009. Deferred revenue at the end of the third quarter of 2009 was $32.3 million, a decrease of $11.5 million or 26.3 percent from $43.8 million at the end of the second quarter of 2009. "This quarter was characterized by strong customer order activity driven by improved fab utilization levels, increased memory prices and demand for PCs and smartphones."

4:09PM LDK Solar announces a supply contract with Enfinity (LDK) 7.81 -0.13 : Co announces that a supply contract with Enfinity for the largest rooftop solar energy installation project in Benelux. LDK Solar will provide approximately 18,000 solar modules to be installed on the Balta Group's factory rooftop in Sint-Baafs-Vijve, Belgium.

4:08PM TriQuint Semi reports EPS in-line, misses on revs; guides Q4 EPS below consensus, revs below consensus (TQNT) 8.10 -0.12 : Reports Q3 (Sep) earnings of $0.10 per share, excluding non-recurring items, in-line with the First Call consensus of $0.10; revenues rose 2.3% year/year to $173 mln vs the $177.8 mln consensus. On a non-GAAP basis, gross margin was 35.0%, up from 33.2% in the prior quarter. Gross margin increased due to improved factory utilization and the elimination of inefficiencies associated with high sequential revenue growth in the second quarter. Co issues downside guidance for Q4, sees EPS of $0.10-0.12, excluding non-recurring items, vs. $0.13 consensus; sees Q4 revs of $175-185 mln vs. $188.03 mln consensus.

4:08PM F5 Networks trading over 2 points following a beat on both the top and bottom line (FFIV) 41.53 -0.60 : $44.19 is the 52 wk high. Last trade at $44.05

4:08PM Lam Research beats by $0.11, beats on revs (LRCX) 35.85 -1.15 : Reports Q1 (Sep) earnings of $0.03 per share, $0.11 better thanthe First Call consensus of ($0.08); revenues rose 46.3% year/year to $318.5 mln vs the $287.5 mln consensus. Ongoing gross margin for the September 2009 quarter was $131.3 million or 41.2%, compared to ongoing gross margin of $67.8 million, or 31.1%, for the June 2009 quarter -- may not be comparable to 38.1% First Call consensus.

4:25 pm : An aggressive selling effort in the final hour of trade took the stock market from a solid gain to a considerable loss. The downturn was broad based and left many of the major sectors to settle at session lows.

Stocks had been showing moderate weakness ahead of the opening bell, but jumped out to a strong gain in the early going. The S&P 500 even made its way to a near 1% gain so that it fractionally set a new high for 2009.

Financials underpinned the stock market's early advance. The sector traded to a gain of 1.3% following strong earnings from Morgan Stanley (MS 34.08, +1.56) and U.S. Bancorp (USB 24.43, +0.63). However, financials rolled over in late trade and settled with a 1.9% loss as pressure intensified against Wells Fargo (WFC 28.90, -1.56), which was hit with a midday downgrade by widely-followed analyst Dick Bove. Bove, and others, were unimpressed with Wells Fargo's report, even though it featured better-than-expected earnings.

As financials fell under a strong fit of selling pressure, the broader market also buckled.

Even energy stocks couldn't hold their gains into the close. The sector overcame an early loss of roughly 0.9% to climb to a gain of nearly 2% before falling back into the red to finish with a 0.2% loss. Energy stocks had been helped by higher oil prices, which reached new 2009 highs around the $82 per barrel mark following the latest oil inventory data. Crude oil inventories increased 1.31 million barrels, which is below the 1.5 million barrel build that had been expected. Gasoline inventories had a draw of 2.21 million barrels, which is larger than the draw of 850,000 barrels that was widely expected. Oil futures prices closed at $81.37 per barrel, up 2.9%.

Stocks and commodities paid little attention to a weaker dollar in the early going, but the greenback garnered more attention as it extended its slide. The dollar's drop came amid comments from a British central bank governor that suggested higher interest rates could be in the offing. That strengthened the British pound, but helped send the Dollar Index to a fresh 12-month low.

Nine of the 10 major sectors fell to a loss -- only utilities (+0.2%) posted a gain.

Health care stocks had lagged for virtually the entire session as participants shrugged off better-than-expected earnings and an upside forecast from Eli Lilly (LLY 33.66, -1.58). They finished with a 1.3% loss.

Consumer discretionary stocks also settled with a steep loss. They shed 1.5% as retailers fell to a 1.9% loss. Retailers had actually been up as much as 1.3%.

Trading volume was higher this session than in recent sessions, but still shy of longer-term averages. Nonetheless, trading volume spiked into the close, which is when this session's selling effort intensified.

Advancing Sectors: Utilities (+0.2%)
Declining Sectors: Financials (-1.9%), Consumer Discretionary (-1.5%), Health Care (-1.3%), Materials (-1.3%), Consumer Staples (-0.9%), Industrials (-0.9%), Energy (-0.2%), Tech (-0.2%)
Unchanged: TelecomDJ30 -92.12 NASDAQ -12.74 NQ100 -0.2% R2K -1.4% SP400 -1.1% SP500 -9.66 NASDAQ Adv/Vol/Dec 869/2.58 bln/1806 NYSE Adv/Vol/Dec 995/1.41 bln/2031

11:14AM Advanced Energy and Suntech announce multi-year agreement for Solaron Inverter Solutions (AEIS) 13.98 +0.35 : Co announced that it has entered into a multi-year agreement with Suntech Power Holdings (STP). This agreement includes the range of AE's expanding Solaron offerings, including utility-scale, photovoltaic inverters, Remote PV Tie accessories and SafeGuard support and service options. As a part of this agreement, Solaron inverters and services will contribute to the innovation, dependability and cost-effectiveness of Suntech's Reliathon platform, a simplified, integrated program for designing and building utility-scale PV plants.

9:17AM On the Wires : Flextronics (FLEX) is expanding its medical disposables offering and has signed an agreement to acquire Slomedical S.R.O through a share purchase agreement. Slomedical is a European manufacturer of disposable medical devices ranging from tubing sets to complex devices for minimally-invasive surgery.

8:39AM On The Wires : Phoenix Technologies (PTEC) announces a strategic agreement with Samsung Electronics to bring to market notebooks and netbooks that are instant on/off, more user-friendly, fun, automated and secure, with extended battery life...

7:00AM ATMI beats by $0.08, beats on revs (ATMI) 18.00 : Reports Q3 (Sep) earnings of $0.17 per share, excluding $0.04 of tax benefits, $0.08 better than the First Call consensus of $0.09; revenues fell 16.3% year/year to $72.6 mln vs the $68.5 mln consensus. "Our performance in the quarter was largely consistent with the market. Revenues from our major product lines improved sequentially, reflecting higher wafer starts and improved utilization rates. Combined with our cost control efforts, this enabled us to achieve a solid level of profitability at this stage in the recovery. During the recent downturn we continued to invest in our High Productivity Development capabilities, and believe we have improved our position in emerging technology node-driven opportunities. While industry forecasts point to a more or less flat wafer start environment in the fourth quarter and early 2010, we expect leading customers to begin ramping production at the most advanced nodes, and we remain confident about our long term growth opportunities. Our sequential revenue growth during the quarter was driven by strong demand for our copper materials and improved revenue contribution from our SDS product line. We have executed our cost reduction plans and, in line with the recovery, are beginning to selectively incur certain expenses that had previously been deferred."

icon url

ReturntoSender

10/24/09 9:33 PM

#8720 RE: ReturntoSender #6755

From Briefing.com: Weekly Recap - Week ending 23-Oct-09Following a volatile week of trade, U.S. equity markets closed with modest declines. Small cap stocks notably underperformed, though, as evidenced by a 2.5% decline in the Russell 2000. The S&P 500 lost a more modest 0.7%.

The declines were broad-based as nine of the ten sectors that make up the index ended lower, led by Materials (-1.8%). Only IT finished in positive territory (+1%), benefitting from blowout results from the likes of Apple (AAPL) and Amazon.com (AMZN).

Third quarter earnings results remained in focus, and the list of companies that surprised to the upside this week goes on and on, including names such as Amazon.com, American Express (AXP), Apple, AT&T (T), Capital One (COF), Caterpillar (CAT), McDonald's (MCD), Texas Instruments (TXN), UPS (UPS) and Yahoo! (YHOO).

But as mentioned above, the better-than-expected results did not translate to market gains. Once again corporate America demonstrated a unique ability to wring out operating costs. In the process it also revealed just how chubby operating budgets had gotten in the credit-driven bacchanal of recent years.

Basically, it appears as if we're seeing a tired market. That was never more evident than on Wednesday afternoon when the market plunged in the final 45 minutes of trade, with the move attributed to a late-session downgrade of Wells Fargo (WFC).

The ease with which the market broke, however, suggested to us that investors knew they was operating on borrowed time, trying to climb a wall of worry while staring at $81 a barrel oil, digesting word of government mandated pay cuts for select companies receiving bailout funds and realizing that the 1,100 mark for the S&P 500 proved to be another tough nut to crack earlier that day.

There were also disappointing pieces of economic data this week, particularly Initial Jobless Claims, which after falling the prior two weeks climbed in the week ended Oct. 16 (531,000 vs. 515,000 consensus). Housing data was mixed, as a jump in Existing Home Sales in September (5.57 million vs. 5.35 million consensus) offset weaker-than-expected Housing Starts and Building Permits.

Looking ahead to next week, third quarter earnings results and economic data, particularly the Advance reading for third quarter GDP on Thursday (10/29), will be in focus. There is also another potential catalyst as the calendar is full of Treasury auctions -- 5-year TIPS reopening Monday (10/26), $44 billion in 2-year Notes Tuesday (10/27), $41 billion in 5-year Notes Wednesday (10/28) and $31 billion in 7-year Notes Thursday.
 
Index Started Week Ended Week Change % Change YTD %
DJIA 9995.91 9972.18 -23.73 -0.2 13.6
Nasdaq 2156.60 2154.47 -2.13 -0.1 36.6
S&P 500 1087.68 1079.60 -8.08 -0.7 19.5
Russell 2000 616.18 600.86 -15.32 -2.5 20.3

8:55AM Juniper Networks: Color on Quarter (JNPR) : Credit Suisse raises their JNPR tgt to $28 from $24 following the co's Q3 results that beat on both the top and bottom line. The firm notes that although JNPR's commentary all point to improvement in near-term demand, they still need to see further evidence of growth or oper margin expansion, in order for them to become more constructive. The firm remains concerned longer term re incremental pricing pressure in SP IPG business... Broadpoint Amtech raises their FY10 EPS est to $1.15 from $1.05 (consensus $1.02) following the co's beat and raise quarter post-close yesterday. Though up less than enterprise, the company suggested it is seeing the early phases of a recovery in service provider. Additionally, the co noted that networks are running hotter and service provider appears to be returning to more normal seasonal patterns for Q4. The firm believes that JNPR's premium multiple may be justified by the upside opportunity in enterprise and a recovery in service providers. However, the firm finds the stock fully valued in the high $20s/ low 30's... RBC Capital Mkts raises their JNPR tgt to $30 from $29 following the co's beat and raise quarter in which the co posted a 5% sequential rebound in revenues of $824 mln and EPS of $0.23 ahead of the consensus of $799 mln and $0.21. The firm notes that guidance healthy as well and a return to spend by carriers and enterprise customers helped Juniper post a book to bill greater than 1.0. Additionally, the firm notes that overall deferred revenues at $643 mln were flat sequentially yet product deferred revenues grew ~6% QoQ. It generally feels like smooth sailing for Juniper until the end of the year, in the firm's opinion.

8:35AM Microsoft beats by $0.08, beats on revs (MSFT) 26.59 : Reports Q1 (Sep) earnings of $0.40 per share, $0.08 better than the First Call consensus of $0.32; revenues fell 14.2% year/year to $12.92 bln vs the $12.32 bln consensus. Microsoft reports gross margin 78.0% vs 78.8% consensus. Microsoft is reducing FY10 operating expense guidance to $26.2-26.5 bln, prior guidance $26.6-26.9 bln. These financial results reflect the deferral of $1.47 billion of revenue, an impact of $0.12 of diluted earnings per share, relating to the Windows 7 Upgrade Option program and sales of Windows 7 to OEMs and retailers before general availability. Adding back the deferred revenue, revenue totaled $14.39 billion, a 4% year-over-year decline, and EPS totaled $0.52 per share, an increase of 8% over the same period of the prior year.

8:03AM Power Integrations beats by $0.03, beats on revs; guides Q4 revs above consensus (POWI) 32.46 : Reports Q3 (Sep) earnings of $0.36 per share, $0.03 better than the First Call consensus of $0.33; revenues rose 21.7% year/year to $60 mln vs the $57 mln consensus. Co issues upside guidance for Q4, sees Q4 revs of $63-66 mln vs. $55.65 mln consensus. Q4 Non-GAAP gross margin is expected to be 50%, plus or minus half a percentage point. GAAP gross margin is expected to be between 49 and 50%. Operating expenses are expected to be between $19.5 million and $20 million including approximately $2.5 million of stock-based compensation expenses.

Amkor Technology (AMKR) and Toshiba announced that they have signed definitive agreements for the formation of a joint venture to provide semiconductor assembly and final testing services in Japan. Amkor is expected to invest ~$17 million in J-Devices and to purchase certain assembly and test equipment from Toshiba for ~$45 million and lease such equipment to J-Devices...

09:35 am Microsoft (MSFT)

Microsoft (MSFT 29.29, +2.70) reported fiscal first quarter earnings and revenue that surpassed Wall Street estimates, but both profits and sales were down from the same period last year.

Microsoft reported first quarter earnings of $0.40 per share, $0.08 better than the First Call consensus of $0.32. Net income of $3.57 billion was down 18% year-over-year.

Revenues fell 14.2% year-over-year to $12.92 billion; the consensus expected $12.32 billion.

Microsoft said it is reducing its fiscal 2010 operating expense expectations to between $26.2 billion and $26.5 billion; the company's previous range was $26.6 billion to $26.9 billion.

"We are very pleased with our performance this quarter and particularly by the strong consumer demand for Windows," said CFO Chris Liddell. "We also maintained our cost discipline, which allowed us to drive strong earnings performance despite continued tough overall economic conditions."

icon url

ReturntoSender

10/25/09 11:56 AM

#8721 RE: ReturntoSender #6755

Amateur Investors Weekend Stock Market Analysis (10/24/09)

http://www.amateur-investor.net/Weekend_Market_Analysis_Oct_24_09.htm

I'm just going to mention a few random thoughts this weekend. First the chart of the Nasdaq 100 looks very similar to that of the Dow from the 1920's through the late 1930's. Notice in late 1938 the Dow stalled out near its 61.8% Retrace (point A) calculated from the early 1937 high to the early 1938 low after rallying strongly from March of 1938 through October of 1938. Currently the Nasdaq 100 has now reached its 61.8% Retrace (point B) calculated from the October 2007 high to the November 2008 low. Once the Dow reached its 61.8% Retrace in late 1938 this was then followed by a sharp pullback (points A to C) before another retest occurred in late 1939 (points C to D) which was followed by a gradual decline though early 1942 (points D to E).


Meanwhile another thing I keep hearing is that the US will not repeat the same mistakes Japan did in the 1990's with regards to their economy which has been followed by a 20 Year Secular Bear Market that began in late 1989. Thus it's certainly not totally impossible the US Market could suffer an extended Secular Bear Market as well. Notice the Nikkei 225 has had some significant Bear Market rallies the last 20 years but the overall trend has been for lower Lows.


As far as the near term the S&P 500 so far hasn't been able to rally back to its next key resistance area near 1121 which corresponds to its 50% Retrace (green line) calculated from the October 2007 high to the March 2009 low. In addition the longer term downward trend line (black line) also comes into play near 1121 as well. Meanwhile as you can see the S&P 500 has been holding support along its upward trend line from the March low (blue line) as it traces out an ABC corrective rally. Once this trend line is broken then that may signal a change in longer term direction.


Meanwhile for those that believe the next major Bull Market has begun watch the 200 Month EMA (blue line) as that will be a key support area in the months ahead. When the S&P 500 made a bottom in late 1974 and eventually rallied back above its 200 Month EMA it was able to hold support at or above it (points D) for the next several years. Furthermore also notice when the S&P 500 bottomed in late 2002 (point E) it found support right at its 200 Month EMA as well. Currently the 200 Month EMA in the S&P 500 is just above the 1000 level.


Finally I haven't talked about the 5 Day Average of the Put to Call Ratio in awhile however notice how it has changed in 2009 from the previous 2 years. In 2007 and 2008 significant oversold rallies occurred (points F to G) after the 5 Day Average of the Put to Call Ratio rose above 1.15 (points H). However in 2009 the 5 Day Average of the Put to Call Ratio has only been rising just above the 1.0 level (points I) before signaling a nearing oversold rally (points F to G). Thus the question is will this recent trend continue during the next several months or will we see an eventual transition back to higher readings in the future?


Signup for a "Free 4 Week Trial Membership" or save up to 50% on a Premium Membership and you will have access to the following products.

1. "ETF Daily Buy and Short Signals" which can be used to trade the DIA's, QQQQ's and SPY's.

2. "401K/Thrift Savings Plan (TSP) Timing Service" which can be used to help improve your return in your 401k/TSP Account.

3. The "End of Month Strategy". This Strategy focuses on the typical End of Month markup by the Institutional Money.

4. "Stocks to Buy List" which can be used with either our Short Term Strategy or Long Term Strategy.

icon url

ReturntoSender

10/25/09 1:27 PM

#8722 RE: ReturntoSender #6755

InvestmentHouse Weekend Market Summary 10/23/09

http://www.investmenthouse.com/weekendmarketsummary.htm

- Market posts its second reversal for the week.
- UK having trouble escaping recession.
- Existing home sales show a nice September surge though again it was at the lower end.
- Market still holding its lateral move but having trouble putting good earnings to positive use.

Overall solid results but market reverses off gains once again.

More of the same with respect to earnings: some outstanding results shot individual stocks higher, e.g. AMZN, while most others were solid but not as spectacular. Indeed Friday saw AMZN and INTC beat across the board while others beat the bottom line but were light on revenues, e.g. HON. Thus far 40% of those reporting earnings are beating on the top line as well as the bottom line. Not bad given that in Q2 most saw zero top line growth and indeed top line declines. The mood created by AMZN and MSFT, at least early Friday, was enough for investors to overlook the top line misses. It was enough for investors to even overlook the UK failing to post its first positive GDP reading in six quarters.

Almost immediately after the bell, however, stocks started to peel back from the opening gains. A half hour into the session September home sales posted an unexpected 9.2% gain. The indices bolted higher . . . then rolled over and hit new session lows, all within minutes. That led to sharper selling and then after lunch a slow steady lateral slog into the close.

Second time in three days the market reversed from gains and did so on higher volume. There is definitely some overhead at DJ30 10K and 1100 for SP500.

The dollar was a bit stronger so maybe that was the plague on the market Friday. Oil sold (79.93, -1.26) after topping $80 on the week. Gold fell as well (1055.10, -3.50), continuing its lateral consolidation of the past three weeks. That fit the 'new normal' action of the market, i.e. a weak dollar driving near term gains. Bonds, however, sold even as stocks sold. There was no 'usual' flight to the safety of US bonds. That has cropped up on a few sessions the past two weeks. Bond and stock investors are either betting this is not a big deal pullback.

On the other hand, maybe they are saying the US just isn't what it used to be in terms of safety. We no longer honor contracts as seen when the secured debt holders were basically ignored when the Administration decided to take over Chrysler. We have not supported the dollar for two administrations now. The current Administration openly attacks insurance companies, news agencies, threatens a value added tax on top of the income tax, is planning limiting salaries of ANY publicly traded company, prints money as if it is worthless (it is getting there), and plans on adopting more entitlements requiring additional massive spending. Gee, put my money there honey.

Maybe that is a red herring, but even with all the liquidity in the market, investors take pause at this kind of bald faced power grab by the federal government. There are no controls on its actions; the Constitution is not even an afterthought. Once the liquidity rally abates the harsh reality of an unfriendly federal government, the decline of the rule of law and sanctity of contract, not to mention a second rate currency, will have their effect.

TECHNICAL

INTERNALS. Weak breadth at -3:1 on NYSE and -3.2:1 NASDAQ. Pretty serious downside breadth even though the indices held their lateral range for October. Volume bounced on NASDAQ (+6%), returning to above average for the second time this week, both on reversals from high to low. SP500 volume kindly faded, coming in below average as the NYSE indices turned lower and sold. Mixed price/volume action, and part of NASDAQ's big volume jump related to AMZN (58M versus 6M average) and MSFT (281M versus 48M average). So . . . not such a slap of distribution as it looks to be on first blush.

CHARTS. Higher on the open but as on Wednesday the indices turned over, this time quickly, and sold sharply with 1% and more losses on the NYSE indices. NASDAQ would have been worse but for AMZN and INTC surging. Even with the rollovers, the indices still held their lateral trading ranges. Good to get out of the week in the range, but the two intraday high to low reversals isn't giving traders warm feelings.

LEADERSHIP. Big techs named AMZN and INTC gave NASDAQ relative strength. The rest of tech was sluggish at best. Of course they fared better than the financials. Thursday the regional banks led the move higher; Friday they all were clocked. Energy's strength was sapped Friday as many strong stocks in those sectors sold on volume while posting significant price declines as well. Even industrials felt the sting; they were not down thanks to powerful earnings from BUCY, but they closed well off their intraday highs. About the only stocks that did not fade from their intraday peaks were the Chinese internet stocks; BIDU and SOHU surged for us. Overall, leadership enjoyed a good week once more but the end was not that great. Pullbacks are necessary, however, and they end up giving us new buy points on strong stocks. A little silver lining to a week that saw a couple of sharp downside moves.

THE ECONOMY

UK stays in recession. Harbinger for the US?

After 5 negative quarters the elite in the UK were quietly confident that the sun would not again set on the British economy. Well, they better still be good at keeping a stiff upper lip. Mark it six in a row. At -0.4% GDP the UK marked its worst recession on record, unable to join Germany, Hong Kong, New Zealand, and even France in emerging from recession.

Unfortunately for the US, the UK and the US appear to be joined at the hip with respect to our economic woes. Most pundits expect the US to emerge from recession in Q3 as well . . . just as the UK did. Everything looked positive - except for the numbers. Things look positive here as well and indeed the US could very easily bounce positive after its longest recession since WWII. Results are out Thursday. But 3% or better as some are suggesting? I guess if you count from where we came from last fall you get there, but the activity is not huge. The average of all experts is for a 3.2% gain. Wow.

That said, there are signs other than just government numbers. The trucking industry was deep in the muck long before last fall. For the two prior holiday seasons the industry never saw the rise in freight ahead of the holidays that indicates the build in sales heading into the season. CEO's sounded the alarm, suggesting that the US was heading into economic trouble. How prescient.

The trucking industry was hard hit and the pessimism in the sector was rife. Companies would not even talk to a vendor if it had anything to do with other than tires, oil or diesel, i.e. things that made the trucks roll. Just over the past month, however, trucking companies are interested once again in products other than tires. Indeed they are interested in new products and innovations, not just the standard fare. That indicates that there is not only something of a recovery underway, it suggests some optimism. Cool.

Trucking is one of the basics of the economy. If truckers see and feel things are turning, that is a positive. It is also a rather quick turn. Just a month ago we surveyed drivers and many were struggling to find routes as freight levels remained low. The trucking industry must indeed feel more optimistic about the future.

Existing home sales up again.

Sales surged once more, indeed at a record 9.4% pace. The driving factor: the looming deadline for the first time homebuyer credit. Just as sales surge when the Fed is expected to raise interest rates (beating the hike), when a credit is set to expire it gets the fence-sitters moving.

You can tell the action was predicated on the credit as the bulk, indeed almost all, of the sales are at the two lowest segments of the housing market. These are the homes first time buyers acquire.

There was enough action to push inventories down to 7.8 months. It kept price declines to their lowest in thirteen months, down 8.5%. That is the smallest? That simply shows the magnitude of the decline to this point.

Of course realtors are screaming for the credit extension to keep sales moving along. Of course most of these are FHA loans and that means at the prices of the houses, the $8K credit basically pays for the down payment FHA still only require 10%. The credit is basically putting people in the houses for 'nothing down' and that has many concerned if the government isn't just filling up the bubble that the housing crash deflated.

Then there is the issue of middle and higher level housing markets that are in terrible shape. Most of the citizens' wealth in this country is tied up into that end of the market, and until that is addressed the impact of the first time tax credit, while very helpful to those at the lower end, is minimal.

I am not suggesting the higher levels should get some kind of relief other than simply fixing our economic problems. Housing issues tend to fix themselves when the economy recovers. Thus real incentives that promote investment and R&D in the United States is what turn the economy and thus the housing market.

Tax cuts, investment incentives, a flat tax all things Europe, Australia and New Zealand have already done and they are all already out of recession. Malaysia just cut its income tax and its spending and its economy is prospering. German business confidence is surging as its recovery accelerates. China is predicted to add 11M jobs as its recovery expands as well.

It is so basic. Those countries are taking the plays right out of the US free enterprise handbook and prospering magnificently as a result. We have thrown away the playbook we wrote and are using the European manual from the 1960's and 1970's. The results are the same: crap.

THE MARKET

MARKET SENTIMENT

VIX: 22.27; +1.58
VXN: 22.62; +1.04
VXO: 21.58; +1.4

Put/Call Ratio (CBOE): 0.86; +0.06

Bulls versus Bears:

This is a reading of the number of bullish investment advisors versus bearish advisors. The reason you look at this is that it gives you an idea of how bullish investors are. If they are too bullish then everyone is in the market and it is heading for a top: if everyone wants to be in the market then all the money is in and there is no more new cash to drive it higher. On the other side of the spectrum if there are a lot of bears then there is a lot of cash on the sideline, and as the market rallies it drags that cash in as the bears give in. That cash provides the market the fuel to move higher. If bears are low it is the same as a lot of bulls: everyone is in and the market doesn't have the cash to drive it higher.

Bulls: 48.9%. Paring back from the 50.6% the prior week. Tough week of selling knocked the bulls back but the bounce will bring them up again. Still well over the 35% level that is the threshold for what is considered a bullish climate. It does not mean things are necessarily bearish; that takes a reading in the 60% range. Hit a high of 47.7% mid-June on the run from the March lows. Again, to be seriously bearish it needs to get up to the 60% to 65% level. Dramatic rise from 21.3% in November 2008, the bottom on this leg. This last leg down showed us the largest single week drop we have ever seen, falling from 33.7% to 25.3%. Hit 40.7% on the high during the rally off the July 2008 lows. 30.9% was the March low. In March the indicator did its job with the dive below 35% and the crossover with the bears. A move into the lower 40's is a decline of significance. A move to 35% is a bullish indicator.

Bears: 24.4%. Climbing on the market selloff, up from 23.6%. That puts it back up to the level hit three weeks back, still showing sufficient pessimism. Hit a low of 21.3% on this leg. Rebounding some from the big drop 31.1% and 35.6%. For reference, cracking above the 35% threshold considered bullish. Hit a high on this run at 47.2%. For reference, bearishness hit a 5 year high at 54.4% the last week of October 2008. The move over 50 took bearish sentiment to its highest level since 1995. Extreme negative sentiment. Prior levels for comparison: Bearishness peaked at 37.4% in September 2007. It topped the June 2006 peak (36%) on that run. That June peak eclipsed the March 2006 high (33%) and well above the 2005 highs that spawned new rallies (30% in May 2005, 29.2% in October 2005). That was a huge turn, unlike any seen in recent history.

NASDAQ

Stats: -10.82 points (-0.5%) to close at 2154.47
Volume: 2.356B (+6.34%)

Up Volume: 727.187M (-785.94M)
Down Volume: 1.728B (+982.802M)

A/D and Hi/Lo: Decliners led 3.25 to 1
Previous Session: Advancers led 1.68 to 1

New Highs: 105 (+43)
New Lows: 15 (-2)

NASDAQ CHART: Click to view the chart

NASDAQ 100 CHART: Click to view the chart

SOX CHART: Click to view the chart

SP500/NYSE

Stats: -13.31 points (-1.22%) to close at 1079.6
NYSE Volume: 1.265B (-3.77%)

Up Volume: 147.355M (-816.11M)
Down Volume: 1.054B (+719.088M)

A/D and Hi/Lo: Decliners led 3.01 to 1
Previous Session: Advancers led 1.89 to 1

New Highs: 252 (+50)
New Lows: 36 (+7)

SP500 CHART: Click to view the chart

SP600 Chart: Click to view the chart

DJ30

Stats: -109.13 points (-1.08%) to close at 9972.18
Volume DJ30: 305M shares Friday versus 231M shares Thursday. Volume was up on the pullback but a lot of that was MSFT's soaring volume on its earnings.

DJ30 CHART: Click to view the chart

MONDAY

Earnings season is about half over and the revenues are posting beats. Not across the board, but the leaders are performing as leaders should: AAPL, INTC, AMZN, JPM, MS, CAT. The market made initial gains on the news, particularly with INTC's beat that gapped the indices over the September peak and to a new rally high.

Since that time the market has had numerous opportunities to extend the gap on stellar earnings reports, but has failed to do so. Indeed two breaks higher were reversed to losses on Wednesday and again on Friday. Sellers are stepping in despite the revenue beats and stymieing attempts to extend higher.

Thus far the indices are still in the lateral range, still moving sideways as they consolidate the early October run. This has been the pattern for this rally, i.e. surging with strong 2 to 3 week runs then lateral to slightly lower moves to consolidate before repeating. This move is not quite the magnitude of the March to early June run, but it is with respect to time. Not sure if I want to go down that road; comparisons to the initial run have yet come true in terms of the May to June consolidation. Thus far the trendline remains in very solid shape, not even challenged on SP500. Betting on the downside without more reason than the length of the run has been a losing proposition. It may be even more so now that the market has seen the earnings and they are not bad. The sprint to the year end could be underway.

At the same time the action late last week was shaky and many strong stocks and sectors were under pressure. Financials sold, surged Thursday, then sold again Friday. Retail stocks did the same. As with financials the stocks in the sectors are mixed with some heading higher, some in danger of rolling over.

We will see how they play out. We have some downside positions in these sectors. If the selling continues and the downside setups are showing up with more frequency we will add more downside.

What we are seeing is that with the modest chop and pullback there are some good upside setups taking shape. Modest and rather shallow pullback to the near Fibonacci retracement level and other good patterns are forming, and we are looking at several as potential upside vehicles for next week. As they set up and show good entry points we will move in, still looking for the run higher to end the year.

Support and Resistance

NASDAQ: Closed at 2154.47
Resistance:
2155 is the March 2008 intraday low
2167 from the July 2008 intraday low
The March up trendline at 2170
2168 is the September 2009, intraday peak
2169 is the March 2008 closing low (double bottom)
2177 is a low from March 2008
2191 is the October 2009 peak
2210 (from September 2008) to 2212 (the July 2009 closing low)
2275 - 2278 from the February 2008 and April 2008 lows

Support:
2143 is the October range low
The 18 day EMA at 2140
2099 is the mid-September 2008 closing low
The 50 day EMA at 2080
2070 is the September 2008 intraday low
2060 is the August peak
2016 is the early August peak
1984 from late September
1962 is the bottom of the August 2009 range.
1947 is the October gap down point
1897 is the October post gap intraday high.
1880 is the June peak
1862 is the July peak
1786 is the November intraday high
1780 is the November 2008 closing peak
1773 is the May intraday peak
The 200 day SM A at 1774

S&P 500: Closed at 1079.60
Resistance:
1101 is the October high
1106 is the September 2008 low
1133 from a September 2008 intraday low
1185 from late September 2008
1200 from the July 2008 low

Support:
1080 is the September 2009 peak
1078 is the October range low
The 18 day EMA at 1076
1070 is the late September 2009 peak
The March/July up trendline at 1066
The 50 day EMA at 1045
1044 is the October 2008 intraday high
The August peak at 1040
The early August intraday peak at 1018
The November 2008 peak at 1006 closing 1007.53 intraday
992 is the August 2009 consolidation low
956 is the June intraday peak
944 is the January 2009 high
935 is the January closing high
932 is the July peak
930 is the May peak
919 is the early December peak is bending
The 200 day SMA at 914

Dow: Closed at 9972.18
Resistance:
10,365 is the late September low
10,609 from the Mid-September 2008 interim low
10,963 is the July 2008 low

Support:
9918 is the September 2008 peak
The 18 day EMA at 9901
9855 is the early September peak in its lateral range
9835 is the late September 2009 peak
9654 is the November 2008 high
The 50 day EMA at 9646
9625 is the October 2008 closing high
9620 is the August 2009 peak
9387 is the mid-October peak
9116 is the August low
9088 is the January 2009 peak
8985 is the closing low in the mid-2003 consolidation
8934 is the December closing high
8878 is the June peak
8829 is the late November 2008 peak
8626 from December 2002
8588 is the May high
8581 is the July peak
The 200 day SMA at 8557

Economic Calendar

These are consensus expectations. Our expectations will vary and are discussed in the 'Economy' section.

October 27 - Tuesday
- Case/Shiller Home Price Report, August (09:00): -11.90% expected, -13.30% prior
- Consumer Confidence, October (09:00): 53.5 expected, 53.1 prior

October 28 - Wednesday
- Durable Orders, September (08:30): 1.0% expected, -2.4% prior
- Durable Orders ex Transportation, September (08:30): 0.7% expected, 0.0% prior
- New Home Sales, September (10:00): 440K expected, 429K prior
- Crude Inventories, 10/23 (10:30): 1.31M prior

October 29 - Thursday
- Chain Deflator-Adv., Q3 (08:30): 1.3% expected, 0.0% prior
- GDP-Adv., Q3 (08:30): 3.2% expected, -0.7% prior
- Initial Claims, 10/24 (08:30): 525K expected, 531K prior
- Continuing Claims, 10/17 (08:30): 5915K expected, 5923K prior

October 30 - Friday
- Personal Income, September (08:30): 0.0% expected, 0.2% prior
- Personal Spending, September (08:30): -0.5% expected, 1.3% prior
- PCE Prices, September (08:30): -0.5% expected, -0.5% prior
- Core PCE Prices, September (08:30): 0.2% expected, 0.1% prior
- Chicago PMI, October (09:45): 48.7 expected, 46.1 prior
- Michigan Sentiment-Rev, October (09:55): 70.0 expected, 69.4 prior
- Employment Cost Index, Q3 (10:00): 0.4% expected, 0.4% prior
icon url

ReturntoSender

10/26/09 9:23 PM

#8723 RE: ReturntoSender #6755

From Briefing.com: 4:30 pm : Stocks dropped in broad-based fashion after they failed to extend an early gain and the U.S. dollar made another strong move off of its yearly low.

The major indices were up solidly in the early going, but the S&P 500 struggled to break above the 1090 zone and the Nasdaq 100 ran into resistance when it approached the 2009 highs that it had set last week. As stocks stalled, sellers stepped in and undercut the early advance. That caused stocks to drop sharply and spend the rest of the afternoon trading in negative territory.

A stronger dollar also weighed on stocks. The greenback has now gained ground against a basket of foreign currencies for three straight sessions, the latest of which took it 0.7% higher in its best single-session percentage move of the past month. That made for particular trouble against multinationals and materials stocks, which dropped 2.5%.

Monsanto (MON 70.69, -4.54) created an additional drag on the materials sector. The stock was caught up in chatter that an analyst issued pessimistic comments about the chemical company's pricing efforts.

Financials were also among the worst performers this session. The sector sank 2.5% as bank stocks tumbled 4.1%, based on the KBW Banking Index. Weakness surrounding banking issues stemmed from a downgrade by Rochdale of regional lenders Fifth Third (FITB 9.52, -0.82) and SunTrust (STI 19.85, -1.14).

There weren't any real leaders for participants to follow this session. Dow component Verizon (VZ 28.64, -0.21) was one of the only widely-held companies to report its latest results this morning. The integrated telecom giant posted better-than-expected adjusted earnings of $0.60 per share for the third quarter, but they were largely dismissed, leaving telecom to fall to a 1.3% loss.

All 10 major sectors finished the session in the red. Seven of them suffered losses in excess of 1%.

Despite widespread weakness in the equity markets, Treasuries suffered. As such, the benchmark 10-year Note dropped roughly 18 ticks, which took its yield above 3.5% for the first time since August. Its weakness seemed to worsen in the wake of better-than-average results for an auction of 5-year TIPS.

Advancing Sectors: (None)
Declining Sectors: Financials (-2.5%), Materials (-2.5%), Energy (-1.5%), Telecom (-1.3%), Utilities (-1.3%), Health Care (-1.1%), Industrials (-1.0%), Consumer Staples (-0.8%), Consumer Discretionary (-0.5%), Tech (-0.3%)DJ30 -104.22 NASDAQ -12.62 NQ100 -0.4% R2K -1.2% SP400 -1.1% SP500 -12.65 NASDAQ Adv/Vol/Dec 763/2.33 bln/1914 NYSE Adv/Vol/Dec 713/1.39 bln/2317

4:12PM Veeco Instruments beats by $0.15, beats on revs; guides Q4 EPS above consensus, revs above consensus (VECO) 25.07 -0.49 : Reports Q3 (Sep) earnings of $0.16 per share, excluding non-recurring items, $0.15 better than the First Call consensus of $0.01; revenues fell 14.5% year/year to $98.9 mln vs the $86.4 mln consensus. Co issues upside guidance for Q4, sees EPS of $0.29-0.35 vs. $0.12 consensus; sees Q4 revs of $120-130 mln vs. $100.01 mln consensus. Co said, "Veeco's backlog at the end of September was $287 million, with $239M in LED & Solar. We continue to experience positive business trends in our MOCVD business, with a high level of demand for our K465 MOCVD System due to its industry-leading productivity. We are ramping up our manufacturing capacity to satisfy customer demand. While it is challenging to predict quarterly bookings trends in this dynamic environment, it is clear to us that MOCVD quoting activity remains well above historic levels."

4:05PM Flextronics beats by $0.04, beats on revs; guides Q3 EPS in-line, revs in-line (FLEX) 7.11 : Reports Q2 (Sep) earnings of $0.13 per share, $0.04 better than the First Call consensus of $0.09; revenues rose 0.8% year/year to $5.83 bln vs the $5.77 bln consensus. Co issues in-line guidance for Q3, sees EPS of $0.14-0.16 vs. $0.13 consensus; sees Q3 revs of $6.0-6.4 bln vs. $6.24 bln consensus.

4:05PM Veeco Instruments announces public offering of up to 5,000,000 shares of its common stock (VECO) 25.07 -0.49 :

6:54AM Corning beats by $0.03, beats on revs; co sees Q4 glass volume flat to down slightly with pricing similar QoQ (GLW) 15.65 : Reports Q3 (Sep) earnings of $0.42 per share, excluding non-recurring items, $0.03 better than the First Call consensus of $0.39; revenues fell 4.9% year/year to $1.48 bln vs the $1.42 bln consensus. Corning expects glass volume in its wholly owned display business to be flat to down slightly sequentially in Q4. At SCP, glass volume is expected to be consistent quarter to quarter. The co also anticipates glass pricing at both its wholly owned business and SCP to be consistent with the third quarter. Flaws noted that without the temporary loss of glass production from Taichung, Corning had expected a quarter-over-quarter volume increase of approximately 5%... "demand, along with our expectation that panel manufacturers may lower utilization rates later this quarter, should allow the industry to maintain healthy inventory levels and alleviate any over-supply concerns," This demand is expected to result in a worldwide glass market of at least 2.7 bln square feet in 2010, an annual increase of approximately 15%. "We believe the amount of glass capacity that is currently being restarted by the industry is in line to meet these end market demand expectations." The co stated glass demand will likely vary quarter to quarter next year. "We believe panel makers may respond to the seasonal decline in demand by reducing utilization rates in the first quarter. As a result, we would also expect first-quarter glass demand to be sequentially lower. Looking ahead to the second quarter, we would expect utilization rates at the panel makers to snap back as the supply chain expands to meet the seasonally stronger second half. In this environment, we would expect second-quarter glass demand to also increase significantly." Display Technologies combined glass volume, including Corning's wholly owned business and Samsung Corning Precision Glass (SCP), increased 4% over a very strong second quarter. Volume in the company's wholly owned business was consistent with the second quarter, while SCP's volume increased 7%. Glass pricing was comparable to the previous quarter. The co's gross margin for the quarter was 41%. "At the same time, we expect to see normal seasonal declines in our Telecommunications and Environmental Technologies businesses."

6:31AM SolarWinds announces intention to file registration statement for public offering of common stock (SWI) 19.84 : Co announces that it intends to file a registration statement with the Securities and Exchange Commission for a proposed public offering of common stock. SolarWinds intends to offer 1.5 mln shares of common stock and selling stockholders intend to offer 8.5 mln shares of common stock. To the extent that the underwriters sell more than 10.0 mln shares of common stock, the selling stockholders intend to grant the underwriters an option for a period of 30 days to purchase up to 1.5 mln additional shares of common stock.

5:24AM Marvell raises 3Q10 revenue guidance (MRVL) 14.58 : Co raises guidance for Q3 (Oct), sees Q3 (Oct) revs of $760.0-775.0 mln (prior range $680.0-730.0 mln) vs. $710.57 mln First Call consensus. The increase in projected revenues is due to broad improvement in demand within multiple end markets. Marvell anticipates a one-time tax benefit during 3Q10 as a result of the reversal of previously recorded tax reserves as a result of the expiration of the related statute of limitations. Co expects the reversal will result in a net tax benefit for 3Q10 of approx $25 mln, or approx $0.05 per share on a GAAP basis.

11:37 am Marvell Technologies (MRVL)

Marvell Technology (MRVL 15.11, +0.53) raised its revenue guidance for the third quarter due to what it called a "broad improvement in demand within multiple end markets."

Marvell said it currently projects net revenue for the third quarter to range from $760 million to $775 million, an increase of 19-21% sequentially from the second quarter and well ahead of the $710.57 million First Call consensus. The company previously forecasted third quarter revenue of $680 million to $730 million.

Marvell also said it anticipates a one-time tax benefit during the fiscal third quarter as a result of the reversal of previously recorded tax reserves as a result of the expiration of the related statute of limitations. Marvell currently expects the reversal will result in a net tax benefit for the third fiscal quarter of 2010 of approximately $25 million, or approximately $0.05 per share on a GAAP basis.

11:13 am Corning (GLW)

Corning (GLW 15.83, +0.18) reported third quarter earnings this morning which modestly beat expectations.

The company reported third quarter earnings of $0.42, excluding non-recurring items, $0.03 better than the First Call consensus of $0.39. Revenue fell 4.9% to $1.48 billion vs. the $1.42 billion consensus.

In the fourth quarter, the company expects glass volume in its wholly owned display business to be flat to down slightly sequentially. At Samsung Corning Precision Glass (SCP), glass volume is expected to be consistent quarter to quarter. The company also anticipates glass pricing at both its wholly owned business and SCP to be consistent with the third quarter.

CFO James B. Flaws said, "In our Display segment, global retailers are expected to offer attractive pricing for LCD televisions, which is likely to result in continuing robust demand through the fourth quarter. This retail demand, along with our expectation that panel manufacturers may lower utilization rates later this quarter, should allow the industry to maintain healthy inventory levels and alleviate any over-supply concerns."

The company anticipates that worldwide unit sales of LCD televisions next year could reach 156 million, a 20% increase over 2009. Additionally, computer notebook sales are forecasted to grow by about 20%, while desktop monitor sales are expected to increase about 4% for the year. This demand is expected to result in a worldwide glass market of at least 2.7 billion square feet in 2010, an annual increase of approximately 15%. "We believe the amount of glass capacity that is currently being restarted by the industry is in-line to meet these end market demand expectations," said Flaws.

Corning said glass demand will likely vary quarter to quarter next year and said it expects first quarter glass demand to be sequentially lower but the second quarter could show an increase in demand as the supply chain expands ahead of the seasonally stronger second half.

10:13 am Verizon Wireless (VZ)

Verizon Wireless (VZ 29.01, +0.16) reported third quarter earnings and revenue this morning which were slightly higher than consensus.

The company reported third quarter earnings of $0.60 per share, excluding non-recurring items, $0.01 better than the First Call consensus of $0.59.

Revenue rose 10.2% year-over-year to $27.27 billion vs. the $27.17 billion consensus.

For the quarter, the company reported 89.0 million total wireless customers, up 25.7%; 86.3 million retail customers, up 25.4%; 1.2 million net customer additions, excluding acquisitions and adjustments.

The company's Wireless segment showed a 24.4% increase in total revenues compared with 3Q 2008; continued low retail postpaid churn, 1.13%; data revenues up 48.1%; 28.3% operating income margin and 46.1% EBITDA margin on service revenues (non-GAAP).

Monthly cash expense per customer (non-GAAP) decreased in the third quarter 2009 to $27.52 from $28.42 in the comparable period in 2008 on a pro forma basis.

For wireline, Verizon reported 198,000 net new FiOS Internet customers and 191,000 net new FiOS TV customers, with increased sales penetration for both services; 3.3 million total FiOS Internet customers and 2.7 million total FiOS TV customers and a 12.6% increase in consumer ARPU.
icon url

ReturntoSender

10/27/09 10:32 PM

#8724 RE: ReturntoSender #6755

From Briefing.com: 4:25 pm : An aggressive selling effort in the final hour of trade took the stock market from a solid gain to a considerable loss. The downturn was broad based and left many of the major sectors to settle at session lows.

Stocks had been showing moderate weakness ahead of the opening bell, but jumped out to a strong gain in the early going. The S&P 500 even made its way to a near 1% gain so that it fractionally set a new high for 2009.

Financials underpinned the stock market's early advance. The sector traded to a gain of 1.3% following strong earnings from Morgan Stanley (MS 34.08, +1.56) and U.S. Bancorp (USB 24.43, +0.63). However, financials rolled over in late trade and settled with a 1.9% loss as pressure intensified against Wells Fargo (WFC 28.90, -1.56), which was hit with a midday downgrade by widely-followed analyst Dick Bove. Bove, and others, were unimpressed with Wells Fargo's report, even though it featured better-than-expected earnings.

As financials fell under a strong fit of selling pressure, the broader market also buckled.

Even energy stocks couldn't hold their gains into the close. The sector overcame an early loss of roughly 0.9% to climb to a gain of nearly 2% before falling back into the red to finish with a 0.2% loss. Energy stocks had been helped by higher oil prices, which reached new 2009 highs around the $82 per barrel mark following the latest oil inventory data. Crude oil inventories increased 1.31 million barrels, which is below the 1.5 million barrel build that had been expected. Gasoline inventories had a draw of 2.21 million barrels, which is larger than the draw of 850,000 barrels that was widely expected. Oil futures prices closed at $81.37 per barrel, up 2.9%.

Stocks and commodities paid little attention to a weaker dollar in the early going, but the greenback garnered more attention as it extended its slide. The dollar's drop came amid comments from a British central bank governor that suggested higher interest rates could be in the offing. That strengthened the British pound, but helped send the Dollar Index to a fresh 12-month low.

Nine of the 10 major sectors fell to a loss -- only utilities (+0.2%) posted a gain.

Health care stocks had lagged for virtually the entire session as participants shrugged off better-than-expected earnings and an upside forecast from Eli Lilly (LLY 33.66, -1.58). They finished with a 1.3% loss.

Consumer discretionary stocks also settled with a steep loss. They shed 1.5% as retailers fell to a 1.9% loss. Retailers had actually been up as much as 1.3%.

Trading volume was higher this session than in recent sessions, but still shy of longer-term averages. Nonetheless, trading volume spiked into the close, which is when this session's selling effort intensified.

Advancing Sectors: Utilities (+0.2%)
Declining Sectors: Financials (-1.9%), Consumer Discretionary (-1.5%), Health Care (-1.3%), Materials (-1.3%), Consumer Staples (-0.9%), Industrials (-0.9%), Energy (-0.2%), Tech (-0.2%)
Unchanged: TelecomDJ30 -92.12 NASDAQ -12.74 NQ100 -0.2% R2K -1.4% SP400 -1.1% SP500 -9.66 NASDAQ Adv/Vol/Dec 869/2.58 bln/1806 NYSE Adv/Vol/Dec 995/1.41 bln/2031

5:31PM Amkor reports EPS in-line, beats on revs; guides Q4 EPS above consensus, revs above consensus (AMKR) 6.74 -0.09 : Reports Q3 (Sep) earnings of $0.19 per share, excluding non-recurring items, in-line with the First Call consensus of $0.19; revenues fell 14.4% year/year to $616.2 mln vs the $603.5 mln consensus. Co issues upside guidance for Q4, sees EPS of $0.17-0.23 vs. $0.16 consensus; sees Q4 revs plus or minus 2% from Q3 revs, which equates to ~$603.9 -628.5 mln vs. $592.23 mln consensus.

4:39PM Actel beats by $0.10, beats on revs; guides Q4 revs above consensus (ACTL) 12.00 -0.15 : Reports Q3 (Sep) earnings of $0.09 per share, $0.10 better than the First Call consensus of ($0.01); revenues fell 11.3% year/year to $47.2 mln vs the $45.5 mln consensus. Co issues upside guidance for Q4, sees Q4 revs of $48.1-50.0 mln vs. $47.75 mln consensus.

4:35PM Molex beats by $0.03, beats on revs; guides Q2 EPS in-line, revs in-line (MOLX) 21.20 -0.01 : Reports Q1 (Sep) earnings of $0.18 per share, excluding non-recurring items, $0.03 better than the First Call consensus of $0.15; revenues fell 19.7% year/year to $674 mln vs the $661 mln consensus. Co issues in-line guidance for Q2, sees EPS of $0.18-0.22 vs. $0.19 consensus; sees Q2 revs of $680-720 mln vs. $683.62 mln consensus. "We continue to see month over month improvements in revenue and orders in virtually all of our key markets. The increase in orders of 26% from the June quarter was the second consecutive quarter of increasing orders and gives us strong momentum going into the December quarter. Order rates in two key markets, consumer electronics and data, surpassed prior year levels. As in the June quarter, we saw significant operating leverage as gross margin benefited from the increase in revenue and ongoing cost containment actions. This is strong evidence that our restructuring program is yielding the intended results. Looking forward, we are assessing the sustainability of the recovery as well as the impact of rising raw material costs and the weaker dollar."

4:18PM Anadigics beats by $0.05, beats on revs; guides Q4 EPS in-line, revs above consensus (ANAD) 3.44 -0.12 : Reports Q3 (Sep) loss of $0.10 per share, $0.05 better than the First Call consensus of ($0.15); revenues fell 36.8% year/year to $36.7 mln vs the $34.4 mln consensus. Co issues mixed guidance for Q4, sees EPS of ($0.10)-($0.08) vs. ($0.10) consensus; sees Q4 revs of $38.5-39.6 mln vs. $38.03 mln consensus.

4:03PM Integrated Device beats by $0.05, beats on revs (IDTI) 6.14 -0.02 : Reports Q2 (Sep) earnings of $0.07 per share, $0.05 better than the First Call consensus of $0.02; revenues rose 20.3% year/year to $139.5 mln vs the $131.3 mln consensus.

11:01AM Dell and Juniper Networks confirm plan to collaborate on Next-Generation Networking (DELL) 15.34 -0.03 : Dell (DELL) and Juniper Networks (JNPR) confirm an agreement to offer networking solutions under Dell's PowerConnect brand that enable customers to deploy a common network management platform and network operating system to help reduce operating expenses. In addition, the companies plan to work together on open, standards-based solutions for virtualized data centers and deliver technology solutions using Converged Enhanced Ethernet, also known as Data Center Bridging and iSCSI to improve network economics.

10:41AM IBM Board approves quarterly cash dividend; authorizes $5.0 bln for stock repurchase (IBM) 121.50 +1.50 : Co announces its board of directors today declared a regular quarterly cash dividend of $0.55 per common share, payable December 10, 2009 to stockholders of record November 10, 2009. The board today also authorized $5 billion in additional funds for use in the company's stock repurchase program. IBM said it will repurchase shares on the open market or in private transactions from time to time, depending on market conditions. This amount is in addition to approximately $4.2 billion remaining at the end of September 2009 from a prior authorization. With this new authorization, IBM will have approximately $9.2 billion for its stock repurchase program. IBM expects to request additional share repurchase authorization at the April 2010 board meeting.

8:30AM GT Solar announces that it has received final acceptance for the design, installation and commissioning of one of the most technologically-advanced turnkey wafer fabrication lines in Spain (SOLR) 5.48 :

8:01AM Emulex announces that it has entered into a technology agreement with IBM (ELX) 11.19 : Co announces it has entered into a technology agreement with IBM to deliver storage and networking solutions, including 10Gb/s Ethernet Network Interface Cards and 16Gb/s Fibre Channel Host Bus Adapters for the entire IBM Power Systems product line.

7:33AM Vishay announces intention to spin off measurements and foil resistor businesses to stockholders (VSH) 6.86 : Co announced that it intends to spin-off its measurements and foil resistor businesses into an independent, publicly-traded company to be named Vishay Precision Group. The spin-off is expected to take the form of a tax-free stock dividend to Vishay's stockholders and it is anticipated that holders of Vishay common stock will receive common stock of Vishay Precision Group and holders of Vishay Class B common stock will receive Class B common stock of Vishay Precision Group. Vishay has not yet finalized details of the spin-off.

7:12AM DSP Group beats by $0.07, beats on revs (DSPG) 7.00 : Reports Q3 (Sep) earnings of $0.18 per share, excluding non-recurring items, $0.07 better than the First Call consensus of $0.11; revenues fell 25.1% year/year to $65.5 mln vs the $64.7 mln consensus. "Our financial results for the third quarter were at the higher end of our forecast and reflect solid execution in what remains a challenging environment in which our customers' visibility remains limited."

7:04AM Benchmark Elec beats by $0.07, beats on revs; guides Q4 EPS in-line, revs above consensus (BHE) 17.45 : Reports Q3 (Sep) earnings of $0.27 per share, $0.07 better than the First Call consensus of $0.20; revenues fell 20.4% year/year to $510.5 mln vs the $493.6 mln consensus. Co issues guidance for Q4, sees EPS of $0.22-0.26, excluding non-recurring items, vs. $0.22 consensus; sees Q4 revs of $520.0-560.0 mln vs. $518.23 mln consensus.

7:03AM Silicon Motion issues statement regarding US ITC non-infringement ruling (SIMO) 3.71 : Co confirms it was informed on October 23, 2009 that the United States International Trade Commission had issued its final determination that the Company's flash memory controllers and products containing these controllers do not infringe upon SanDisk Corporation's patents as previously alleged by SanDisk. The US ITC's final determination upholds an earlier determination by the administrative law judge in April 2009 that the Company's controllers and products containing them do not infringe SanDisk's (SNDK) patents.

3:36AM LDK Solar updates 3Q09 outlook (LDK) 7.13 : Co issues upside guidance for Q3 (Sep), sees Q3 (Sep) revs of $270.0-290.0 mln (prior range $240.0-270.0 mln) vs. $249.89 mln First Call consensus. Co expects wafer shipments of 310-330 MW and module shipments of 5-10 MW. Previous estimates called for wafer shipments of 260-300 MW and module shipments of 10-20 MW.

3:22AM ARM Holdings reports Q3 (Sep) earnings of 1.34 pence/share vs 1.38 3Q08; revenues declined 8% year/year to $123.0 mln vs $120.16 mln two-analyst consensus (ARMH) 7.37 : Co reaffirms FY09 revenue guidance will be at least in line with market expectation (two-analyst consensus $492.01 mln).

icon url

ReturntoSender

10/29/09 11:29 PM

#8726 RE: ReturntoSender #6755

From Briefing.com: 4:30 pm : A better-than-expected third quarter GDP reading helped the stock market snap back from its worst loss in weeks, but it wasn't enough to prevent stocks from heading into Friday with a week-to-date loss in excess of 1%.

Despite some wavering in the first few minutes of trade, stocks put together a steady ascent that took all 10 major sectors higher. The broad-based gains stemmed from news that third quarter GDP surged to an annualized growth rate of 3.5%. GDP was expected to increase 3.2% after contracting 0.7% in the second quarter.

The stronger-than-expected growth overshadowed news that initial jobless claims for the week ending Oct. 24 totaled 530,000, which is more than the 525,000 initial claims that were widely expected and still uncomfortably high.

Financial issues garnered the most support of the major sectors. The sector surged 4.3%, which is its best single-session percentage gain in three months. Life and health insurers (+7.6%) and multiline insurers (+6.7%) saw some of the strongest gains following a positive earnings surprise from Lincoln Financial (LNC 25.34, +3.09) and an upgrade of Genworth Financial (GNW 10.18, +1.49).

Materials stocks also fared well. The sector climbed 3.2% as broader market support and commodities and basic materials prices were propped up by a drooping U.S. dollar, which sank 0.6% against a basket of major foreign currencies in its first down session in one week.

Traders pushed oil prices up 3.1% to $79.89 per barrel, which helped the energy sector to a 2.4% gain. Exxon Mobil (XOM 73.96, +0.12) eked out a gain, but was generally a drag on the sector after it missed the consensus earnings estimate.

Fellow Dow component Procter & Gamble (PG 59.54, +2.31) posted a positive earnings surprise, as did its competitor Colgate-Palmolive (CL 78.94, +1.26). Though their results were strong, the consumer staples sector underperformed the broader market.

Telecom lagged for the entire session and even spent the first half trading with a loss as integrated telcos (-0.1%) offset strength in Motorola (MOT 8.74, +0.78), which posted better-than-expected third quarter earnings and issued an upside fourth quarter forecast.

With participants pushing many defensive-oriented issues aside in favor of riskier holdings, Treasuries also came under pressure. That took the benchmark 10-year Note down some 20 ticks, which lifted its yield back toward 3.5%. Treasuries caught additional attention as results from a $31 billion auction of 7-year Treasuries drew a slightly stronger-than-expected bid-to-cover ratio of 2.65.

Advancing Sectors: Financials (+4.3%), Materials (+3.2%), Consumer Discretionary (+2.7%), Energy (+2.4%), Industrials (+2.0%), Tech (+1.9%), Consumer Staples (+1.8%), Health Care (+1.0%), Utilities (+0.9%), Telecom (+0.6%)
Declining Sectors: (None)DJ30 +199.89 NASDAQ +37.94 NQ100 +1.7% R2K +2.5% SP400 +2.2% SP500 +23.48 NASDAQ Adv/Vol/Dec 1877/2.33 bln/788 NYSE Adv/Vol/Dec 2502/1.45 bln/546

6:04PM Silicon Motion beats by $0.10, beats on revs; guides Q4 revs in-line (SIMO) 3.61 -0.15 : Reports Q3 (Sep) earnings of $0.02 per share, excluding non-recurring items, $0.10 better than the First Call consensus of ($0.08); revenues rose 13.8% year/year to $23.1 mln vs the $21.7 mln consensus. Co issues in-line guidance for Q4, sees Q4 revs flat to up 10% sequentially, which equates to ~$23.1-25.4 mln vs. $24.64 mln consensus.

4:36PM Conexant reports Q4 EPS of $0.07 vs $0.01 First Call consensus; revs $56.2 mln vs $54.15 mln First Call consensus (CNXT) 2.44 +0.31 : Conexant sees Q1 $0.11 vs $0.09 First Call consensus; sees revs $60.00 mln vs $56.45 mln First Call consensus. The company also said that its imaging and audio businesses grew 18% on a sequential basis and accounted for 58% of total revenues.

4:34PM Varian Semi beats by $0.05, beats on revs; guides Q1 EPS above consensus, revs above consensus (VSEA) 30.68 +1.20 : Reports Q4 (Sep) earnings of $0.10 per share, $0.05 better than the First Call consensus of $0.05; revenues fell 17.3% year/year to $117.5 mln vs the $110 mln consensus. Co issues upside guidance for Q1, sees EPS of $0.15-$0.20 vs. $0.11 consensus; sees Q1 revs of $134-$144 mln vs. $123.85 mln consensus. "Our fourth quarter gross margin of 45.4% exceeded both our guidance of 43% to 44% and our past performance at this point in a recovery. We project this trend of increasing gross margin to continue into the first quarter of fiscal year 2010."

4:21PM MIPS Techs beats by $0.01, beats on revs (MIPS) 3.74 +0.18 : Reports Q1 (Sep) earnings of $0.06 per share, excluding non-recurring items, $0.01 better than the First Call consensus of $0.05; revenues fell 23.5% year/year to $15 mln vs the $14.2 mln consensus.

4:19PM KLA-Tencor beats by $0.13, beats on revs (KLAC) 34.28 +1.03 : Reports Q1 (Sep) non-GAAP earnings of $0.15 per share, $0.13 better than the First Call consensus of $0.02; revenues fell 35.6% year/year to $343 mln vs the $332.3 mln consensus. GAAP EPS came in at $0.12. KLA-Tencor reports gross margin 50.0% vs 48.5% consensus. "KLA-Tencor delivered stronger-than-expected results and returned to profitability in the first quarter of fiscal 2010, led by a sharp increase in demand from foundry customers. Our results were also favorably impacted by a one-time non-operating gain and by a lower than normal tax rate... We announced several new products targeted at addressing our customers' next-generation wafer and reticle inspection requirements. As our customers increase their technology investments at the leading edge, we are advancing our market leadership while remaining focused on cost discipline."

4:19PM Tessera Tech beats by $0.03, reports revs in-line; guides Q4 revs below consensus (TSRA) 26.86 +1.58 : Reports Q3 (Sep) earnings of $0.24 per share, $0.03 better than the First Call consensus of $0.21; revenues rose 4.1% year/year to $66.1 mln vs the $65.7 mln consensus. Co issues downside guidance for Q4, sees Q4 revs of $60-62 mln vs. $69.97 mln consensus. "Better than anticipated results from our Micro-electronics customers drove our third quarter 2009 revenue to $66.1 million," said Henry R. Nothhaft, president and chief executive officer, Tessera. "Roughly 60% of DRAM sold today is in the DDR2 format. DDR3, also packaged in our patented chip-scale packaging technology, is expected to become the primary DRAM format by mid-2010. Due to improvements in speed and performance, it is anticipated DDR3 will remain the primary format through at least 2013. Tessera is well positioned to benefit from this transition and the long-term growth of the DRAM market, which we expect will drive growth in our Micro-electronics business. With respect to our Imaging & Optics business, we signed three new licensing agreements in the third quarter, for technologies ranging from our Wafer-level Packaging to Optical and Embedded Image Enhancement, and expect them to further drive our Imaging & Optics royalty revenue growth in 2010..."

4:11PM Novatel Wireless beats by $0.10, beats on revs; guides Q4 EPS in-line, revs below consensus (NVTL) 12.19 +0.22 : Reports Q3 (Sep) earnings of $0.20 per share, $0.10 better than the First Call consensus of $0.10; revenues rose 12.1% year/year to $94.3 mln vs the $92.6 mln consensus. NVTL reports Q3 gross margins of 31.6% vs 28.3% consensus. Co issues mixed guidance for Q4, sees EPS of $0.04-0.12 vs. $0.10 consensus; sees Q4 revs of $85-95 mln vs. $95.69 mln consensus. NVTL sees Q4 gross margins of 28-30% vs. 28.2% consensus. "Our 12% sequential revenue growth and significant margin improvement was primarily driven by strong demand for our industry-leading MiFi Intelligent Mobile Hotspot platforms, as well as strong core product sales in North America... During the third quarter, MiFi was launched by numerous international carriers and distribution channels as we gained traction with this innovative new product category. Currently, we expect fourth quarter MiFi sales to be similar to third quarter levels as improving sell through catches up to initial stocking orders. We continue to receive new orders for MiFi and are encouraged by new roll outs. In addition, we continue to extend the MiFi platform with new features and functionality, building an ecosystem through organic development and strategic partners. We are actively driving the development of a software and application community that utilizes the power of MiFi."

4:08PM Applied Micro beats by $0.01, beats on revs (AMCC) 8.03 +0.03 : Reports Q2 (Sep) earnings of $0.02 per share, excluding non-recurring items, $0.01 better than the First Call consensus of $0.01; revenues fell 23.5% year/year to $49.2 mln vs the $48.7 mln consensus.

4:05PM AXT announces that Raymond A. Low has been appointed Chief Financial Officer (AXTI) 1.92 +0.02 :

4:05PM Maxim Integrated beats by $0.01, beats on revs; guides Q2 revs in-line (MXIM) 17.86 +0.65 : Reports Q1 (Sep) earnings of $0.13 per share, excluding $0.03 in special items, $0.01 better than the First Call consensus of $0.12; revenues rose 13.9% year/year to $449.2 mln vs the $438.4 mln consensus. Co issues in-line guidance for Q2, sees Q2 revs of $450-465 mln vs. $454.81 mln consensus.

4:04PM Nanometrics beats by $0.14, beats on revs (NANO) 7.21 -0.03 : Reports Q3 (Sep) earnings of $0.08 per share, $0.14 better than the First Call consensus of ($0.06); revenues rose 11.5% year/year to $25.8 mln vs the $21.1 mln consensus. Co said, "Looking ahead, we see continued improvements in our served markets and further growth in revenues, albeit at a slower rate than what we have achieved in the last two quarters. Our business is on a positive trajectory, with momentum building for continued success in our served markets and improved operational and financial performance."

8:06AM Motorola beats by $0.02, misses on revs; guides Q4 EPS above consensus (MOT) 7.96 : Reports Q3 (Sep) earnings of $0.02 per share, excluding non-recurring items, $0.02 better than the First Call consensus of ($0.00); revenues fell 27.1% year/year to $5.45 bln vs the $5.54 bln consensus. Co issues upside guidance for Q4, sees EPS of $0.07-0.09, excluding non-recurring items, vs. $0.06 consensus. Co said, "We delivered on our commitment to improve the financial performance of Mobile Devices and to commercially launch two smartphones in time for the fourth- quarter holiday season. The introductions of our new products powered by Android are important milestones as we begin to address the mobilization of the Internet and the growing demand for modern smartphones. Next year, we will continue to expand our smartphone portfolio and deliver improved financial results."

7:39AM Am Superconductor beats by $0.06, beats on revs; guides FY10 EPS above consensus, revs above consensus (AMSC) 28.84 : Reports Q2 (Sep) earnings of $0.19 per share, excluding non-recurring items, $0.06 better than the First Call consensus of $0.13; revenues rose 85.0% year/year to $74.7 mln vs the $69 mln consensus. Co issues upside guidance for FY10, sees EPS of $0.59-0.64, excluding non-recurring items, vs. $0.47 consensus; sees FY10 revs of $300-310 mln vs. $272.25 mln consensus. Raises gross margin guidance for FY10 to 34-35% from 32-34%. "We expect to increase revenues quarter over quarter through the remainder of fiscal 2009," Henry continued. "We now expect to generate a GAAP profit in the third fiscal quarter, whereas we previously forecasted the potential for a small GAAP net loss. Non-GAAP earnings per share for the third fiscal quarter are expected to be approximately half of our second-quarter non-GAAP earnings per share (approx $0.09-0.10 compared to First Call consensus of $0.09) due to lower-margin shipments and a planned increase in operating expenses to support future growth. Earnings are expected to increase again in our fourth fiscal quarter, consistent with our current full fiscal year forecast."

3:55AM Taiwan Semi reports EPS in-line, revs in-line; issues upside revenue guidance for Q4 (TSM) 9.62 : Reports Q3 (Sep) earnings of $0.18 per ADR, in-line with the First Call consensus of $0.18; revenues fell 8.1% year/year to $2.74 bln vs the $2.76 bln consensus. Gross margin was 47.7%, 1.5% higher than 2Q09 and 1.4% higher than 3Q08. Operating margin was 35.6%, 1.7% higher than 2Q09 and 0.2% higher than 3Q08. Co issues upside guidance for Q409, sees revenue of NT90.0-92.0 bln vs NT$85.76 bln consensus. Co sees GPM of 47.0-48.5% and operating margin of 35.5-37.0%.

icon url

ReturntoSender

11/01/09 2:13 PM

#8727 RE: ReturntoSender #6755

Amateur Investors Weekend Market Analysis (10/31/09)

http://www.amateur-investor.net/Weekend_Market_Analysis_Oct_31_09.htm

Based on this week's action it's possible an intermediate top has occurred. As you may remember there was a clear 5 Wave downward move from the October 2007 high to the March 2009 low. The question is at this point was the move from 667 to 1101 just Wave A of a larger ABC corrective rally or was it a completed ABC pattern?

The bullish scenario is that the move from 667 to 1101 was just Wave A which would be followed by a Wave B pullback potentially back to the 38.2% Retrace at 935 or the 50% Retrace at 884. Once the Wave B pullback completes then this would be followed by another move higher as Wave C occurs. If this pattern is going to develop in the longer term the S&P 500 should hold support above the July low which was at 869.


An example of this pattern occurred in the mid 1970's as the S&P 500 completed a 5 Wave pattern which was followed by an ABC corrective rally. Notice how the B Wave found support near the 38.2% Retracement Level before the C Wave occurred.


Meanwhile the bearish scenario is that the entire move from 667 to 1101 is a completed ABC corrective rally as 1101 will end up being a significant top. This would then be followed by a gradual decline with the S&P 500 potentially retesting the March low at some point in the longer term.


An example of this pattern occurred back in the late 1930's as the ABC corrective rally ended in late 1938 which was then followed by a gradual decline until a bottom occurred in early 1942 (point D).


Meanwhile as we have seen the past few years the action in the US Dollar (USD) has had a substantial affect on the market. Generally when the USD has rallied (points E to F) the S&P 500 has fallen (points G to H) and when the USD has fallen (points F to E) the S&P 500 has rallied (points H to G). For the past several months the USD has been in a downtrend however this week it rose above its longer term downward trend line (yellow line). The key to future action in the market may depend on what the USD does over the next several months. If the USD begins to rally strongly and reverse its previous downward trend then this would likely be bearish for the major averages.


Signup for a "Free 4 Week Trial Membership" or save up to 50% on a Premium Membership and you will have access to the following products.

1. "ETF Daily Buy and Short Signals" which can be used to trade the DIA's, QQQQ's and SPY's.

2. "401K/Thrift Savings Plan (TSP) Timing Service" which can be used to help improve your return in your 401k/TSP Account.

3. The "End of Month Strategy". This Strategy focuses on the typical End of Month markup by the Institutional Money.

4. "Stocks to Buy List" which can be used with either our Short Term Strategy or Long Term Strategy.
icon url

ReturntoSender

11/01/09 9:11 PM

#8733 RE: ReturntoSender #6755

Leavitt Brothers Calls Top (at least in the short term):

http://leavittbrothers.com/blog/?p=2171

My comments below:

Over time the market often develops direct or indirect relationships to a certain indicator, commodity or in this case currency which is the dollar. Market analysts and gurus can always find a way to explain why the market acts as it does.

Does it really matter?

Not to me. There is now as there has been for quite some time an inverse relationship between the dollar and the market. Dollar goes up the market goes down and visa versa. This will not continue on forever but it is still what it is for now.

Although the Leavitt Brothers discussion includes a chart of the dollar I think the discussion of under performance of small caps prior to the market top and the increase in volume on the current sell off is much more dependable in the long term of determining a market top.

RtS
icon url

ReturntoSender

11/01/09 10:52 PM

#8734 RE: ReturntoSender #6755

Market Tops are often preceded by a lower number of stocks in the market moving higher even as the market makes new highs. As such the Russell 2000 being a broader measure of smaller stocks would likely stop making new highs before the S&P 500:


Here we see the relationship again on a different type of chart where the action of the S&P 600 Small Cap Index/S&P 100 turns south prior to even the Russell 2000 and of course the S&P 500.


Same deal here. The Russell 2000/Russell 1000 should be advancing as long as the market is strong. It will often hit a top before the market actually does.


The next two charts show the NYSE and NASDAQ Advance/Decline ratios on ten day simple moving averages. While you cannot expect the advance decline line to continue on higher forever in a market advance when the trend breaks down it reflects the formation of a market top.

[chart]stockcharts.com/c-sc/sc?s=$NYAD&p=D&yr=1&mn=0&dy=0&i=p23423028322&a=0&r=7639>


Same thing here. Volume should be increasing to the upside into a healthy market advance. When a sell off is eminent the advance decline volume will break trend lower as well:


Same idea here. If the number of new highs is lower at a new high for the market then the market is at risk of a market top and bigger correction:


Finally for now the US Dollar has been declining as the market advanced. Recently it formed a bottom that may be significant. Time will tell if the dollar will advance further as the market declines. Eventually the inverse relationship between the dollar and the market will decouple in my humble opinion.


Some of these charts were inspired by the fine work at Leavitt Brothers.

http://leavittbrothers.com/blog/?p=2171

Much of this I have watched for years although probably not as closely Leavitt Brothers but my charts will continue to update! ;-)

RtS
icon url

ReturntoSender

11/02/09 8:37 PM

#8736 RE: ReturntoSender #6755

From Briefing.com: 4:30 pm : Better-than-expected economic data helped the S&P 500 ascend to a 1.5% gain, but a bout of selling and technical resistance sent stocks to a 0.7% loss before buyers stepped back in to drive stocks to a positive finish.

News that the ISM Manufacturing Index for October came in at 55.7, construction spending in September spiked 0.8%, and pending home sales for September made a 6.1% monthly increase helped bring about some early, broad-based buying, which sent all 10 major S&P 500 sectors into the green.

Financials were a standout as the sector climbed to a 2.5% gain. Investors in the sector paid little attention to news that regional lender CIT Group will enter bankruptcy after weeks of struggling to secure financing and put together a plan for sustainability.

However, financial stocks soon saw their gains reverse as weakness among insurers spread to the rest of the sector. That took the financial sector to a 1.7% loss before buyers stepped back in and helped it finish with a 0.8% gain.

Midsession weakness among financials undercut the broader S&P 500, which was having trouble extending its gains past its 50-day moving average of 1052. Such technical resistance combined with weakness in one of the stock market's leading sectors eventually caused the broader market to roll over and surrender all of its gains.

Stocks were able to garner some support as an underlying bid limited the stock market's move to the downside. That support inevitably helped it settle the session with a gain.

Materials stocks finished the session with some of the strongest gains. The sector closed 1.0% higher, partly helped by a weaker dollar, which oscillated for the entire session before settling roughly 0.1% lower. The greenback's move lower helped the CRB Commodity Index climb 1.2%.

Other solid gains were made by consumer staples stocks (+1.0%) and consumer discretionary stocks (+0.9%), which were helped by strength in shares of Ford (F 7.58, +0.58). The automaker posted this morning better-than-expected earnings and also announced an increase in market share.

In other earnings news, Humana (HUM 37.01, -0.57) posted better-than-expected earnings of its own, but offered a mixed forecast that weighed on the stock. Managed care providers still advanced 1.5% as a group, though.

Advancing Sectors: Consumer Staples (+1.0%), Materials (+1.0%), Industrials (+1.0%), Consumer Discretionary (+0.9%), Financials (+0.8%), Health Care (+0.6%), Energy (+0.5%), Tech (+0.4%)
Declining Sectors: Telecom (-0.4%), Utilities (-0.3%)DJ30 +76.71 NASDAQ +4.09 SP500 +6.69 NASDAQ Adv/Vol/Dec 1277/2.43 bln/1414 NYSE Adv/Vol/Dec 1627/1.55 bln/1411

6:30PM Cisco Announces agreement to acquire DVN Set-Top Box Business (CSCO) 23.00 +0.19 : Co announced a definitive agreement to acquire the set-top box business of DVN (Holdings) Limited (SEHK: 0500). Listed in Hong Kong with major operations in China, DVN is a market and technology leader in digital cable solutions in China and shares Cisco's vision of a high-performance, scalable and services-rich cable interactive platform extending into every home. Under the terms of the agreement, CSCO will pay up to $44.5 mln for the set-top box business of DVN. Of this amount, ~$17.5 mln will be paid upfront, with an additional maximum amount of $27 mln to be paid over four years based on the achievement of specific sales milestones. The acquisition is expected to close in the first half of calendar year 2010.

4:40PM Nanometrics announces a multi-system order (NANO) 7.47 -0.73 : Co announced a multi-system order from a semiconductor foundry for its Integrated Metrology and NanoCD suite solutions. The systems will be delivered in the fourth quarter of this year for optical critical dimension metrology on 22nm gate etch applications.

4:07PM Rudolph Tech beats by $0.10, beats on revs (RTEC) 5.92 -0.42 : Reports Q3 (Sep) loss of $0.07 per share, ex-items, $0.10 better than the First Call consensus of ($0.17); revenues fell 40.1% year/year to $23.3 mln vs the $18.9 mln consensus. Third quarter gross margin was 41% and was negatively impacted by under-utilized manufacturing facilities costs and acquired inventory sold in the quarter that was written up to fair value in purchase accounting. Excluding these items, gross margins would have been approximately 44% in the 2009 third quarter.

4:04PM Diodes beats by $0.02, beats on revs; guides Q4 revs above consensus (DIOD) 16.63 +0.25 : Reports Q3 (Sep) earnings of $0.21 per share, ex-items, $0.02 better than the First Call consensus of $0.19; revenues fell 8.9% year/year to $122.1 mln vs the $120.2 mln consensus. Co issues upside guidance for Q4, sees Q4 revs of $126-$130 mln vs. $123.01 mln consensus. Co states, "Our fourth quarter revenue guidance represents an increase of nearly 50% over 4Q08. Additionally, we expect further improvements in utilization at our wafer fabrication facilities with fourth quarter gross margin expected to range between 31-33%. Fourth quarter operating expenses are anticipated to remain comparable to third quarter levels on a percent of revenue basis. In terms of capital expenditures, we will resume our more normalized range of between 10-12% of revenues, primarily due to equipment lead times and our preliminary forecast of demand growth in the seasonally higher quarters of 2010."

9:01AM GT Solar sees Q2 EPS of $0.06-0.07 vs $0.06 First Call consensus; revs $100-105 mln vs $86.84 mln First Call consensus; announces CEO transition (SOLR) 5.25 : Co sees Q2 EPS of $0.06-0.07 vs $0.06 First Call consensus; revs $100-105 mln vs $86.84 mln First Call consensus. The company also reaffirmed its revenue and EPS guidance for the fiscal year ending April 3, 2010 in the ranges of $450-550 mln and $0.45-0.60, respectively (consensus is for $505.7 mln and $0.50). The co also announced a chief executive officer transition: Tom Gutierrez has been elected president, chief executive officer and a member of the board of directors, succeeding Tom Zarrella, who served as GT Solar President, CEO and a director since 2007 and in a senior management role since 2004. The changes were effective on October 28, 2009.

Altera Corporation (ALTR) announces the new Cyclone IV FPGA family...

7:07AM Tessera Tech provides update on legal actions (TSRA) 22.11 : Co announces on Oct. 30, 2009, the International Trade Commission announced that it will review portions of the Initial Determination by the Administrative Law Judge in the ITC action brought by Tessera against certain DRAM manufacturers and sellers. The Commission will review, among other things, whether the respondents infringed the Tessera patents asserted in the action. The Commission's Final Determination is scheduled to be issued by Dec. 29, 2009. Tessera expects to file its Answer and Counter Complaint today in the International Chamber of Commerce arbitration proceedings it has with Amkor. Amkor filed for arbitration with Tessera on Aug. 7, 2009.

09:42 am Juniper Networks upgraded to Buy at Stifel Nicolaus; tgt $31: . Stifel Nicolaus upgrades JNPR to Buy from Hold and sets target price at $31. The firm notes that they came away from Juniper's analyst day less concerned about share losses to Cisco due to the new Trio chipset/MX-3D products and with better visibility on Juniper's plan for a wireless packet core product. The firm notes Cisco's new edge router, the ASR, has gained limited traction over the past 6 months, and while the ASR could certainly start delivering meaningful customer additions over the next 12 months, the firm believes that JNPR's MX-3D products have leapfrogged the ASR in scale and bandwidth capabilities. Furthermore, the firm notes that checks show that there is pent up demand for the MX-3D products, particularly at AT&T.

09:38 am Apple: Caris raises Dec qtr ests; believes powerful Dec-qtr is brewing at Apple: . Caris notes the market's sell-off has returned AAPL to pre-earnings levels, and while they certainly don't mean to fight market sentiment, their confidence in AAPL's outlook is boosted by sales/production momentum to date. Indeed, inputs already reinforce their expectation that AAPL is tracking to a big Dec-qtr, driven by iPhone supply now catching up to demand (their 10 mln unit est unchanged) and Macs running even hotter than plan (they raise our Mac units to 3.4 mln from 3.2 mln w/ less-than-expected ASP decline), driven by recent MacBook/iMac refresh. Firm raising their Dec-qtr revs/EPS to $12.5 bln/$2.13 (from $12.0 bln/$2.00; vs. consensus of $11.9 bln/$2.05).
icon url

ReturntoSender

11/03/09 10:35 PM

#8737 RE: ReturntoSender #6755

From Briefing.com: 4:35 pm : Despite a stronger dollar and some sloppy action, the S&P 500 was able to net a modest gain in Tuesday's trade.

Stocks had started the session in negative territory as the U.S. dollar gained ground against a basket of major foreign currencies and drove the Dollar Index up almost 0.8% to a near one-month high. In the face of broader market weakness and a stronger greenback, materials stocks (+1.2%) were able to make strong gains as gold prices raced higher.

Gold shook free from its correlation to the greenback by trading higher for the entire session. It settled with a 2.9% gain at $1084.90 per ounce, but that was after it hit a new record high of $1087.30 per ounce. Gold's record high came about as the dollar handed back a large chunk of its gains, such that the Dollar Index closed with a near 0.2% gain.

The greenback's pullback also brought some buyers back into the broader equity market. Buyers showed favor for industrial stocks, which finished 1.4% higher, better than any other major sector. Among industrial plays, railroad stocks (+12.0%) garnered particular interest, thanks to a cash and stock offer of $100 per share for Burlington Northern Santa Fe (BNI 97.00, +20.93) from Warren Buffett's Berkshire Hathaway (BRK.A 100,450.00, +1,700). Despite that vote of confidence, stocks still lacked leadership.

Financials, a frequent leader for the broader market, traded erratically before settling with a 0.4% gain. Insurers (+4.4%) proved helpful in the advance, offsetting weakness in MasterCard (MA 219.20, -3.45), which posted better-than-expected third quarter earnings, but reaffirmed that it wouldn't hit its long-term revenue growth target due to recent macro weakness.

In other corporate news, Dow component Johnson & Johnson (JNJ 58.93, -0.56) reaffirmed an in-line earnings outlook for fiscal 2009, but also said it will eliminate 6% to 7% of its global workforce as it works to strengthen its position.

Factory orders for September were the only piece of data on the economic calendar. Orders increased a stronger-than-expected 0.9%, but that didn't have an impact on trade.

Economic data will be in sharper focus tomorrow, though. The ADP Employment Report for October is due, along with the ISM Services Index for October. The FOMC also issues its latest policy statement.

Advancing Sectors: Industrials (+1.4%), Materials (+1.2%), Energy (+1.1%), Financials (+0.4%), Consumer Discretionary (+0.3%)
Declining Sectors: Consumer Staples (-0.7%), Telecom (-0.5%), Tech (-0.3%), Utilities (-0.2%), Health Care (-0.1%)DJ30 -17.53 NASDAQ +8.12 NQ100 +0.4% R2K +1.5% SP400 +1.2% SP500 +2.53 NASDAQ Adv/Vol/Dec 1611/2.18 bln/1070 NYSE Adv/Vol/Dec 1841/1.38 bln/1185

FEATURES

Market Coverage
Market Overview
Market Update
In Play®
Story Stocks
Short Stories
Tech Stocks

Market Events
Earnings Calendar
Economic Calendar
Splits Calendar
Conference Call Calendar
IPO Calendar
Upgrades/Downgrades

Market Statistics
Market Digest
U.S. Market Indices
World Market Indices
Currency Exchange Rates

InPlay

6:50PM Seaspan misses by $0.01, reports revs in-line (SSW) 8.80 +0.36 : Reports Q3 (Sep) earnings of $0.25 per share, excluding non-recurring items, $0.01 worse than the First Call consensus of $0.26; revenues rose 28.6% year/year to $74.1 mln vs the $73.6 mln consensus.

6:47PM W. R. Berkley Corp names W. Robert Berkley, Jr. President and Chief Operating Officer (WRB) 24.81 +0.05 : Co announced the election by the Board of Directors of W. Robert Berkley, Jr. as president and chief operating officer of the Company. The appointment is effective immediately. He has been responsible for the oversight of the co's domestic insurance operations, including its specialty, regional and alternative markets businesses, since 2005.

6:45PM BioMimetic Therapeutics receives first orthopedic marketing approval for Augment Bone Graft (BMTI) 11.18 -0.07 : Co announced today that it has received approval from Health Canada to begin the marketing of its lead orthopedic product, Augment Bone Graft, as an alternative to the use of autograft in midfoot, hindfoot and ankle fusion indications in Canada.

6:41PM Magna announced that it has been advised by General Motors that the GM Board of Directors has decided to terminate the sale process for Opel (MGA) 40.17 +0.18 :

6:28PM Alaska Air Group reports October traffic (ALK) 25.90 -0.13 : Co reported an increase in load factor to 77.0% in October 2009, compared to 73.6% in October 2008, on a 1.6 percent decline in available seat miles compared to the prior-year period. Alaska also reported that 85.8% of its flights arrived on time in October 2009, a 1.4-point increase compared to the 84.4% reported in October 2008. The following tables show the operational results for October 2009 and for the first ten months of 2009, compared to the prior-year periods:

6:18PM Getty Realty sees Q3 FFO's of $0.54 vs. single-analyst est of $0.47 (GTY) 24.87 +0.28 :

6:03PM Douglas Emmett reports Q3 in-line (DEI) 11.81 +0.11 : Reports Q3 (Sept) funds from operations of $0.31 per share, in-line with the First Call consensus of $0.31; revenues fell 10.9% year/year to $140.4 mln vs the $139.7 mln consensus.

5:44PM PPG Architectural coatings announces 2010 pricing action (PPG) 57.98 +0.49 : Co announced today its Architectural Coatings business unit will execute price increases across distribution channels in January 2010 in response to a resurging escalation of raw material costs.

5:34PM Buckeye Tech beats by $0.01, reports revs in-line (BKI) 9.15 +0.56 : Reports Q1 (Sep) earnings of $0.11 per share, excluding non-recurring items, $0.01 better than the First Call consensus of $0.10; revenues fell 19.9% year/year to $177.3 mln vs the $177 mln consensus.

5:33PM Essex Property beats by $0.43; guides FY09 FFO above consensus (ESS) 76.80 +0.94 : Reports Q3 (Sep) funds from operations of $1.69 per share, $0.43 better than the First Call consensus of $1.26. Co issues upside guidance for FY09, sees FFO of $6.72-6.82 vs. $6.31 consensus.

5:29PM Quality Distribution beats by $0.04, beats on revs (QLTY) 3.98 +0.01 : Reports Q3 (Sep) earnings of $0.06 per share, excluding non-recurring items, $0.04 better than the First Call consensus of $0.02; revenues fell 24.2% year/year to $162.8 mln vs the $154.7 mln consensus.

5:27PM MasTec announces proposed $100 mln private offering of senior convertible notes due 2014 (MTZ) 12.36 +0.45 :

5:22PM BGC Partners correction: Beats by $0.01, beats on revs; guides Q4 revs below consensus (BGCP) 4.92 -0.07 : Earlier, we incorrectly reported that BGCP reported revs of $265.8 mln, which was incorrect. The company actually reported revenues of $291.2 million, down 3.8% YoY vs. $277.3 consensus... The co reported Q3 (Sep) post-tax distributable earnings of $0.10 per share, $0.01 better than the First Call consensus. The co issued downside guidance for Q4, sees Q4 distributable earnings revenues of between $255-275 mln vs. $290.78 mln consensus. BGC Partners expects Q4 2009 post-tax distributable earnings to be in the range of $9-15 mln versus $8.0 mln in the year-earlier quarter.

5:19PM CB Richard Ellis announces launch of at-the-market public stock offering of up to $300 million (CBG) 10.78 +0.22 : Co announces that it intends to sell shares of its Class A common stock, having an aggregate offering price of up to $300 million, from time to time, pursuant to an at-the-market offering program through BofA Merrill Lynch, as sales agent and/or principal. The Company intends to use the net proceeds from the offering for general corporate purposes, which may include repayment of a portion of its outstanding indebtedness under its senior secured credit agreement.

5:16PM Tesco reports Q3 EPS of ($0.01) vs ($0.10) First Call consensus; revs $72.6 mln vs $64.89 mln First Call consensus (TESO) 9.45 +0.96 : "The continued depressed drilling markets, particularly in North America, have reduced our revenue streams across all our business lines. However, our competitive positioning and balance sheet continue to improve. During the quarter, we generated positive cash flow and reduced our net debt outstanding to a net cash position of $11.9 million. We have taken measures to right size the Company to meet the current economic circumstances and market demands. In addition, we have reduced capital spending by 70% year over year. Longer term, we believe the fundamentals driving the growth of our global business remain intact, which we believe will give us the ability to maintain our core strengths and take advantage of opportunities as the market recovers."

5:16PM UAL Corp reported an October consolidated passenger load factor of 83.1% (UAUA) 6.64 : Co reports its preliminary consolidated traffic results for October 2009. The company reported an October consolidated passenger load factor of 83.1%. Total consolidated revenue passenger miles decreased in October by 1.6% on a consolidated capacity decrease of 4.3% in available seat miles compared with the same period in 2008.

5:13PM FelCor Lodging reports EPS in-line, misses on revs; guides FY09 FFO below consensus (FCH) 3.24 +0.09 : Reports Q3 (Sep) funds from operations of $0.14 per share, in-line with the First Call consensus of $0.14; revenues fell 17.1% year/year to $230.2 mln vs the $234.8 mln consensus. Co issues downside guidance for FY09, Assuming full-year 2009 RevPAR for our 85 consolidated hotels decreases between 18-18.5% sees FFO of $0.31-0.34 vs. $0.70 consensus.

5:11PM Central European Dist beats by $0.03, misses on revs; guides FY09 EPS in-line, revs in-line; guides FY10 EPS above consensus, revs in-line (CEDC) 31.74 +0.16 : Reports Q3 (Sep) earnings of $0.49 per share, $0.03 better than the First Call consensus of $0.46; revenues fell 13.8% year/year to $390.1 mln vs the $421.6 mln consensus. Co issues in-line guidance for FY09, sees EPS of $2.35-2.50 vs. $2.42 consensus; sees FY09 revs of $1.58-1.70 bln vs. $1.66 bln consensus. Co issues mixed guidance for FY10, sees EPS of $3.00-3.15 vs. $2.96 consensus; sees FY10 revs of $1.8-2.0 bln vs. $1.94 bln consensus. "As we move into the fourth quarter of 2009, we have launched two new lower mainstream vodkas in Russian where our current product portfolio does not address. We believe that the middle class will continue to evolve in Russia over the next three to five years which should drive the growth of the mainstream and sub-premium sectors in Russia where we currently are market leaders. Our export and import portfolios continue to show strong growth over third quarter 2008 even in the face of market softness and we believe we are well positioned to accelerate top line growth as regional and global consumer demand picks up."

5:07PM Cott prices offer of $215.0 mln of senior notes (COT) 8.92 +0.44 : Co announced that its wholly owned subsidiary, Cott Beverages, priced a private placement offering of $215 mln in aggregate principal amount of senior notes (the "New Notes"). The New Notes will mature on November 15, 2017 at the rate of 8.375% per annum. The New Notes will yield gross proceeds to Cott Beverages of ~$212 mln.

5:05PM Ritchie Bros. to sell fleet of tow trucks in Las Vegas unreserved auction (RBA) 22.63 +0.30 : Co will conduct a large, multi-million dollar unreserved public auction at its Las Vegas auction site on Friday, November 6, 2009 starting at 7:00 a.m. More than 1,300 equipment items and trucks from close to 160 owners will be sold unreserved to the highest bidders on auction day, regardless of price. Items to be sold on auction day include 13 tow trucks and 11 rollback trucks as part of a complete dispersal of close to 40 equipment items for Northstar Towing.

5:04PM Healthsouth beats by $0.14, reports revs in-line; raises FY09 guidance range to above consensus (HLS) 15.73 +0.61 : Reports Q3 (Sep) earnings of $0.38 per share, $0.14 better than the First Call consensus of $0.24; revenues rose 3.8% year/year to $472.7 mln vs the $474 mln consensus. Co raises FY09 guidance range, now sees EPS of $1.45-$1.50 (vs. $1.32 consensus), up from the previous range of $1.15-$1.25. Adjusted consolidated EBITDA guidance for 2009 has been increased to a range of $375-$380 mln from a range of $354-$362 mln .

5:03PM North American Energy misses by $0.02, beats on revs (NOA) 5.32 -0.08 : Reports Q2 (Sep) earnings of CDN$0.02 per share, CDN$0.02 worse than the First Call consensus of CDN$0.04; revenues fell 39.0% year/year to CDN$171.1 mln vs the CDN$163.3 mln consensus. "Overall, our results for the current period were in line with our expectations. Going forward, we expect to see continued strength in our recurring services business through the second half of the fiscal year. We anticipate that our project development business will continue to face challenging market conditions in the near term. However, our longer-term outlook remains positive as a result of our recent contract wins and further improvement in oil sands industry fundamentals."

5:02PM Mueller Water reports Q4 (MWA) 4.60 +0.23 : Reports Q4 (Sept) ($0.03), excl non-recurring items, $0.05 better than the First Call consensus of ($0.08); revenues fell 24.6% year/year to $374.8 mln vs the $369.9 mln consensus.

4:52PM MasTec to acquire Precision Pipeline, LLC for a purchase price consideration of $150 mln (MTZ) 12.36 +0.45 : Co announces that it has signed a definitive agreement to acquire Precision Pipeline, LLC, a leading natural gas, crude oil and refined products transmission pipeline infrastructure services provider in North America for a purchase consideration of $150 mln, subject to certain purchase price adjustments and an earnout. The transaction is contingent on financing availability on terms and conditions acceptable to MasTec, in its sole discretion, and there is no break-up fee if such financing is not available. Precision has experienced significant growth over the past several years. Precision generated $303 mln of revenue and $37 mln in EBITDA in 2007 and $507 mln of revenue and $93 mln in EBITDA in 2008. For the full year of 2009, Precision estimates revenue of slightly less than $300 mln and EBITDA of about $60 mln. The reduction in earnings in 2009 as compared to 2008 is primarily due to lower revenue as the result of a softer natural gas and petroleum pipeline construction market amidst a global economic downturn. Precision had over $500 million in backlog as of September 30, 2009. The acquisition is expected to be accretive for MasTec in 2010 by at least $0.08 earnings per share, before amortization of acquisition-related intangibles.

4:49PM Exco Resources misses by $0.02 (XCO) 16.61 +1.26 : Reports Q3 (Sep) earnings of $0.20 per share, $0.02 worse than the First Call consensus of $0.22; revenues fell 28.0% from $332 mln year/year to $239 mln.

4:48PM Approach Resources reports Q3 EPS of $0.05 vs $0.08 consensus; revs fell 64% YoY to $8 mln vs $12 mln consensus (AREX) 8.08 +0.55 : The co also provided an update regarding 2009 drilling activity and guidance and 2010 capital budget and guidance. The Company has resumed drilling and currently is operating two rigs in Cinco Terry. During the fourth quarter of 2009, the co plans to drill 11 gross (5.5 net) wells in Cinco Terry. The co's Board of Directors has approved a 2010 capital budget for exploration and development expenditures of up to $53 mln. For 2009, the co has lowered the top end of its production guidance; co now sees total production of 8700-9000 MMcfe, compared to the previous range of 8700-9400 MMcfe. For 2010, the co sees total production of 8900-9400 MMcfe.

4:47PM CIT Group (CITGQ.PK) announced that the U.S. Bankruptcy Court has scheduled a hearing to consider prepackaged plan of reorganization for December 8, 2009 (CIT) 0.24 -0.01 :

4:46PM Schweitzer-Mauduit beats by $0.46 (SWM) 53.52 +2.57 : Reports Q3 (Sept) earnings of $1.39 per share, excluding per share restructuring and impairment expense of $1.12, $0.46 better than the First Call consensus of $0.93; revenues fell 7.0% year/year to $184.5 mln vs the $185.9 mln consensus.

4:45PM Time Warner Tcom beats by $0.01, reports revs in-line (TWTC) 13.23 +0.47 : Reports Q3 (Sep) earnings of $0.05 per share, $0.01 better than the First Call consensus of $0.04; revenues rose 4.5% year/year to $304.8 mln vs the $304.1 mln consensus. Co says the increase in net income sequentially primarily reflects M-EBITDA growth and a decrease in income tax.

4:45PM RXi Pharmaceuticals will present data exemplifying the robust performance of RXi's self-delivering rxRNAs (RXII) 2.17 -0.01 : Co announced it will be giving presentation that will describe RXi's therapeutic platform, including RXi's next generation rxRNA compounds and advanced delivery approaches. The talk will focus on self-delivering rxRNA (sd-rxRNA) compounds. Co will present data exemplifying the robust performance of RXi's self-delivering rxRNAs across multiple genes, cell types, target tissues and animal species. "The results presented by Dr. Samarsky demonstrate the robustness and potential for broad-based applications of self-delivering rxRNA to multiple therapeutic areas. Scientists are seeking RNAi-delivery solutions to disease tissues, and RXi's results represent some of the most impressive delivery data in the field".

4:45PM Anworth Mortgage misses by $0.04, misses on revs (ANH) 7.04 +0.07 : Reports Q3 (Sep) earnings of $0.27 per share, $0.04 worse than the First Call consensus of $0.31; revenues rose 20.9% year/year to $35.3 mln vs the $37.9 mln consensus. Book value per share increased to $7.58 at September 30, 2009, from $7.30 at June 30, 2009. At September 30, 2009, the current yield on our Agency MBS portfolio was 5.23%, based on a weighted average coupon of 5.33% divided by the average amortized cost of 101.86%, as compared with a yield of 5.35% at June 30, 2009, based on a weighted average coupon of 5.42% divided by the average amortized cost of 101.36%.

4:40PM Discovery misses by $0.05, reports revs in-line; guides FY09 revs in-line (DISCA) 28.01 +0.73 : Reports Q3 (Sep) earnings of $0.22 per share, $0.05 worse than the First Call consensus of $0.27; revenues rose 1.1% year/year to $854 mln vs the $849.6 mln consensus. Co issues in-line guidance for FY09, sees FY09 revs of $3.45-3.50 bln vs. $3.48 bln consensus.

4:40PM Pegasystems beats by $0.05, beats on revs; guides FY10 revs above consensus (PEGA) 28.62 +0.44 : Reports Q3 (Sep) earnings of $0.16 per share, $0.05 better than the First Call consensus of $0.11; revenues rose 23.0% year/year to $64.8 mln vs the $62.8 mln consensus. Gross margins of 62.9% is above the consensus estimate for 61.9%. Co issues upside guidance for FY10, sees FY10 revs in excess of $300.00 mln vs. $298.38 mln consensus. "This is the ninth consecutive quarter that we have set new records for quarterly revenue. We expect that in 2010 we will surpass another milestone with revenue in excess of $300 million. This is preliminary guidance that will be refined when we are able to evaluate business conditions at the end of 2009."

4:40PM Excel Maritime Carriers beats by $0.79, beats on revs (EXM) 5.82 +0.32 : Reports Q3 (Sep) earnings of $0.81 per share, $0.79 better than the First Call consensus of $0.02; revenues fell 24.7% year/year to $174.4 mln vs the $101 mln consensus.

4:39PM Jack Henry beats by $0.01, misses on revs (JKHY) 23.20 +0.22 : Reports Q1 (Sep) earnings of $0.31 per share, $0.01 better than the First Call consensus of $0.30; revenues fell 0.4% year/year to $182.3 mln vs the $188.8 mln consensus. Co says backlog, which is a measure of future business and revenue, increased 9% compared to year-ago levels to $291.2 mln ($61.8 mln in-house and $229.4 mln outsourcing) at September 30, 2009. Backlog at September 30, 2008, was $266.2 mln ($65.1 mln in-house and $201.1 mln outsourcing) and at June 30, 2009, it was $289.4 mln ($66.8 mln in-house and $222.6 mln outsourcing).

4:39PM Oil States beats by $0.14, beats on revs (OIS) 36.06 +1.15 : Reports Q3 (Sep) earnings of $0.54 per share, $0.14 better than the First Call consensus of $0.40; revenues fell 44.0% year/year to $456.1 mln vs the $430.7 mln consensus.

4:39PM 3D Systems beats by $0.08, beats on revs (TDSC) 8.35 -0.08 : Reports Q3 (Sep) earnings of $0.04 per share, $0.08 better than the First Call consensus of ($0.04); revenues fell 22.2% year/year but rose 12% sequentially to $27.7 mln vs the $25.4 mln consensus.

4:37PM FEI Company sells Phenom product line (FEIC) 23.35 -0.36 : Co annouces that Phenom-World, a majority-owned subsidiary of NTS Group B.V. of Eindhoven, The Netherlands, has acquired FEI's Phenom product line. NTS has been FEI's manufacturing partner and was closely involved with the development of the innovative desktop scanning electron microscope before it was introduced in 2007. NTS will continue to manufacture the product, and Phenom-World will assume responsibility for marketing, sales and distribution of the product worldwide, as well as service and warranty repairs for the installed base. FEI will retain a minority position in Phenom-World and will retain certain related intellectual property. FEI expects this transaction will have a minimal impact on its 2009 fourth quarter earnings and will have a modest positive impact in 2010. Terms of the transaction were not disclosed.

4:30PM Ultratech receives follow-on order for TSV Applications (UTEK) 12.90 -0.02 : The co announces that it has received a follow-on order for its AP200 lithography system, which features an innovative dual-side alignment (DSA) system for through-silicon via (TSV) applications. Built on its customizable Unity Platform, Ultratech's systems are the exclusive tool of record at this customer's facility--one of the first Japanese companies to enter into volume production of image sensors. According to Jan Vardaman, president and founder of TechSearch International, "The level of TSV activity in the last few quarters has increased dramatically. Today, image sensors with TSVs are shipping in high volume for cameras in mobile phones. The next target for mobile phones is memory and processor applications. By the year 2012, millions of wafers will ship with TSVs."

4:11PM STEC Inc beats by $0.03, beats on revs; guides Q4 EPS in-line, revs below consensus (STEC) : Reports Q3 (Sep) earnings of $0.50 per share, $0.03 better than the First Call consensus of $0.47; revenues rose 54.3% year/year to $98.3 mln vs the $96.6 mln consensus. Co issues mixed guidance for Q4, sees EPS of $0.51-$0.53 vs. $0.52 consensus; sees Q4 revs of $101-103 mln vs. $105.98 mln consensus. Non-GAAP gross profit margin was 49.8% for the third quarter of 2009, vs 49.9% street expectation, and compared to 34.1% for the third quarter of 2008 and 50.1% for second quarter of 2009. Co states, "One of our customers entered into a $120 million supply agreement us for shipments covering the second half of 2009. We recently received preliminary indications that our customer might carry inventory of our ZeusIOPS at the end of 2009 which they will use in 2010. In light of this development, we have jointly initiated a strategic sales and marketing incentive program designed to promote the integration of STEC's SSDs into their systems. As of September 30, 2009, we have accrued $1.5 million of estimated costs for this marketing incentive program. Both companies believe that we will be successful in increasing the pace of the replacement of HDDs with SSDs. If our marketing program is not successful in increasing the demand flow of SSDs, our first quarter of 2010 orders from this customer will be negatively affected; however, the actual impact cannot be quantified at this time."

4:04PM FEI Company beats by $0.06, reports revs in-line; guides Q4 EPS below consensus, revs in-line (FEIC) 23.40 -0.31 : Reports Q3 (Sep) earnings of $0.17 per share, excluding non-recurring items, $0.06 better than the First Call consensus of $0.11; revenues rose 0.4% year/year to $140.8 mln vs the $140.3 mln consensus. Co issues mixed guidance for Q4, sees EPS of $0.19-0.24, excluding non-recurring items, vs. $0.25 consensus; sees Q4 revs of $145-152 mln vs. $151.52 mln consensus. Bookings are expected to be at least $150 mln.

9:25AM EMC Corp and Cisco introduce the Virtual Computing Environment coalition (EMC) 16.43 : Cisco (CSCO) and EMC, together with VMware (VMW), introduced the Virtual Computing Environment coalition, a collaboration of three information technology "industry leaders. The coalition has been created to accelerate customers' ability to increase business agility through greater IT infrastructure flexibility, and lower IT, energy and real estate costs through pervasive data center virtualization and a transition to private cloud infrastructures."

9:11AM UTStarcom secures commercial contract with Shandong Electric Power (UTSI) 1.73 : Co announces that it has secured a contract with Shandong Electric Power for its recently launched NetRing Transport Network product portfolio.

09:42 am Juniper Networks upgraded to Buy at Stifel Nicolaus; tgt $31: . Stifel Nicolaus upgrades JNPR to Buy from Hold and sets target price at $31. The firm notes that they came away from Juniper's analyst day less concerned about share losses to Cisco due to the new Trio chipset/MX-3D products and with better visibility on Juniper's plan for a wireless packet core product. The firm notes Cisco's new edge router, the ASR, has gained limited traction over the past 6 months, and while the ASR could certainly start delivering meaningful customer additions over the next 12 months, the firm believes that JNPR's MX-3D products have leapfrogged the ASR in scale and bandwidth capabilities. Furthermore, the firm notes that checks show that there is pent up demand for the MX-3D products, particularly at AT&T.

09:38 am Apple: Caris raises Dec qtr ests; believes powerful Dec-qtr is brewing at Apple: . Caris notes the market's sell-off has returned AAPL to pre-earnings levels, and while they certainly don't mean to fight market sentiment, their confidence in AAPL's outlook is boosted by sales/production momentum to date. Indeed, inputs already reinforce their expectation that AAPL is tracking to a big Dec-qtr, driven by iPhone supply now catching up to demand (their 10 mln unit est unchanged) and Macs running even hotter than plan (they raise our Mac units to 3.4 mln from 3.2 mln w/ less-than-expected ASP decline), driven by recent MacBook/iMac refresh. Firm raising their Dec-qtr revs/EPS to $12.5 bln/$2.13 (from $12.0 bln/$2.00; vs. consensus of $11.9 bln/$2.05).
icon url

ReturntoSender

11/04/09 7:52 PM

#8738 RE: ReturntoSender #6755

From Briefing.com: 4:30 pm : The latest FOMC policy statement and a weaker dollar helped bolster buying in stocks, but some late selling caused stocks to rollover in the final hour and close near the neutral line.

The major indices started the session in higher ground as participants responded to strong overseas gains and a downturn in the U.S. dollar. Gains among the major indices were both broad and strong.

Participants also digested in the early going the ADP Employment Change Report for October. The report indicated that last month private payrolls fell by 203,000, which is a bit worse than the 198,000 job losses that were widely expected. The ADP Report is a precursor to the official nonfarm payrolls report on Friday.

In other economic news, the ISM Services Index for October came in at 50.6. Though any reading above 50 denotes expansion, the October reading fell short of the 51.5 that had been forecast.

Reaction to the data was relatively muted as participants were largely focused on the latest FOMC policy statement, which was released midafternoon. The directive indicated that the FOMC will maintain the target range for the federal funds rate at 0.00% to 0.25% and it continues to anticipate that economic conditions are likely to warrant exceptionally low levels of the federal funds rate for an extended period.

The statement was met with a volatile response by stocks, while the Dollar Index extended its losses. It settled with a 0.7% decline, its worst single-session percentage drop in two weeks.

As the dollar slid, both stocks and commodities showed strength. Gold futures prices had hit a new intraday record high around $1096.50 per ounce, but settled at $1087.30 per ounce with a fractional gain. However, in electronic trade, gold prices have ticked higher toward $1098 per ounce.

Meanwhile, oil futures prices settled 1.0% higher at $80.36 per barrel, helped along by the weaker greenback and an unexpected draw in weekly inventories. The gains by gold and oil helped drive the materials sector and energy sector more than 1% higher, respectively. Those gains vanished late in the session, though. The two sectors settled with losses of 0.1% each.

Late weakness came about as a broad-based selling effort took hold of stocks. Financials were at the center of the downturn, however. Financials were up as much as 1.6% in the early going, but steadily saw their gains erode before dropping sharply to a 1.5% loss late in trading. Multiline insurers (-3.8%) were among the worst performers in the sector.

However, managed care providers (+3.8%) fared well and helped the health care sector to a 1.3% gain, which was the best of any major sector. Strength in the sector came amid news from the Associated Press that the Senate's top Democrat signaled that Congress may fail to meet a year-end deadline for passing health care legislation. That could make for an uncertain outcome in 2010.

Earnings played somewhat of a supportive role in the early going, but had little lasting impact on this session's trade. Kraft (KFT 26.67, -0.87) was the only Dow component to report. It struggled as light revenue results overshadowed its better-than-expected earnings.

In other earnings news, broadcasters Time Warner (TWX 30.10, -0.06) and Comcast (CMCSA 14.06, -0.45) topped earnings expectations, but oil drillers and services outfits Baker Hughes (BHI 40.89, -2.54) and Transocean (RIG 84.41, -1.50) missed earnings estimates.

Advancing Sectors: Health Care (+1.3%), Tech (+0.7%), Utilities (+0.7%), Consumer Staples (+0.5%), Telecom (+0.4%)
Declining Sectors: Financials (-1.5%), Industrials (-0.2%), Consumer Discretionary (-0.1%), Energy (-0.1%), Materials (-0.1%)DJ30 +30.23 NASDAQ -1.80 NQ100 +0.1% R2K -1.3% SP400 -0.5% SP500 +1.09 NASDAQ Adv/Vol/Dec 1048/2.23 bln/1631 NYSE Adv/Vol/Dec 1623/1.35 bln/1398

4:44PM Microchip declares quarterly cash dividend on its common stock of 34 cents per share, up from 33.9 cents per share (MCHP) 24.41 +0.26 :

4:34PM Multi-Fineline reports EPS in-line, revs in-line; guides Q1 revs above consensus (MFLX) 27.94 +0.20 : Reports Q4 (Sep) earnings of $0.45 per share, in-line with the First Call consensus of $0.45; revenues fell 6.5% year/year to $199.2 mln vs the $198.8 mln consensus. Co issues upside guidance for Q1, sees Q1 revs of $225-240 mln vs. $222.96 mln consensus.

4:15PM Pericom Semi beats by $0.01, beats on revs; guides Q2 revs above consensus (PSEM) 9.23 -0.42 : Reports Q1 (Sep) earnings of $0.05 per share, $0.01 better than the First Call consensus of $0.04; revenues fell 24.7% year/year to $33 mln vs the $32 mln consensus. Co issues upside guidance for Q2, sees Q2 revs of $34-36 mln vs. $33.20 mln consensus. Gross margins are expected to be in the 32.5% to 34.0% range. Margins are influenced by the product mix of turns business and sales, if any, of previously reserved inventory. Gross margin in Q1 was 32.0%, increased from 28.7% last quarter, and down from 36.5% in the comparable period last year. "Our business has continued to improve with increased billings and bookings in FYQ1. We also entered the December quarter with higher backlog coverage as compared to last quarter. "In the first quarter we saw gross margins recover from the reduced levels of the previous quarter, a result of increased shipping volumes, reduced product costs and improved product mix. We expect to see continued improvement in our gross margins in FYQ2.

4:13PM ON Semiconductor beats by $0.06, beats on revs; guides Q4 revs above consensus (ONNN) 6.83 +0.30 : Reports Q3 (Sep) earnings of $0.16 per share, ex-items, $0.06 better than the First Call consensus of $0.10; revenues rose 12.6% year/year to $472.9 mln vs the $454.9 mln consensus. Co reports Q3 gross margin of 38.5% vs. 36.7% street expectation. Co issues upside guidance for Q4, sees Q4 revs of $480-$495 mln vs. $467.25 mln consensus. Co sees Q4 gross margin of 38-39% Co states, "Backlog levels at the beginning of the fourth quarter of 2009 were up from backlog levels at the beginning of the third quarter of 2009 and represent over 90 percent of our anticipated fourth quarter 2009 revenues. We expect that average selling prices for the fourth quarter of 2009 will be down approximately one to two percent, sequentially."

4:09PM Cisco Systems beats by $0.05, beats on revs; increases buyback by $10 bln (CSCO) 23.29 +0.38 : Reports Q1 (Oct) earnings of $0.36 per share, $0.05 better than the First Call consensus of $0.31; revenues fell 12.6% year/year to $9 bln vs the $8.74 bln consensus. Cisco Systems reports gross margin 65% vs 64.3% Street estimate, 64% guidance. "We delivered earnings per share on a GAAP basis of $0.30 and non-GAAP of $0.36, which were above our expectations, driven by balance across a broad portfolio and intense focus on execution. Our results validate our strategy and portfolio approach of balancing disciplined expense management with strategic investment, to drive continued profitability through varying economic environments... Building off what we saw as a clear tipping point in Q4, our Q1 results continued to reflect strong sequential growth trends that meet or exceed expectations during normal economic times. We view the improving economic outlook, combined with solid execution on our growth strategy, as creating unparalleled opportunity to drive more value into the core of the network. Simply said, we believe that key market transitions across collaboration, virtualization and video will drive productivity and growth in network loads for the next decade, and are evolving even faster than expected... "Our ability to launch four proposed acquisitions, the ecosystem-shifting coalition with EMC/VMware, and five new products and industry solutions into the Cisco pipeline in the past few months alone underscore this momentum. Our build -- buy -- partner innovation engine is clearly running on all cylinders, while our operational machine is pulling costs out of the business even as we scale new models for growth. Execution and results over time will demonstrate the long-term impact of this vision and strategy -- but a new model of productivity based on collaboration is clearly emerging and we believe this may be the most profound opportunity for businesses in our 25 years as a company." Cisco also announced that on November 4, 2009 its board of directors authorized up to $10 billion in additional repurchases of its common stock. Cisco's board had previously authorized up to $62 billion in stock repurchases. There is no fixed termination date for the repurchase program. The remaining authorized amount for stock repurchases under this program, including the additional authorization, is approximately $13.1 billion.

4:07PM O2Micro misses by $0.02, misses on revs (OIIM) : Reports Q3 (Sep) earnings of $0.01 per share, $0.02 worse than the First Call consensus of $0.03; revenues fell 3.2% year/year to $36.6 mln vs the $37.4 mln consensus.

9:13AM Suntech Power: enXco announced agreement with Suntech to supply up to 115 megawatts of solar panels in 2010 (STP) 12.71 : EDF Energies Nouvelles announced yesterday that it has entered into a sales agreement with STP to supply up to 115 megawatts of photovoltaic modules in 2010.

STEC (STEC) announces that its ZeusIOPS SSDs have been integrated into IBM's SAN Volume Controller system delivering improved system efficiency over SVC systems using traditional hard disk drives.

Cree (CREE) has been selected to provide energy-efficient LED lighting to Walmart (WMT) for new stores and renovations. Walmart plans to install Cree LRP-38 LED light bulbs in 650 stores during the first year, replacing ceramic metal halide in the produce and electronics departments...

Powerwave Technologies, Inc. (PWAV) announced the expansion of its worldwide operations with the grand opening of its newest manufacturing facility located in Laem Chabang in Chonburi Province, Thailand...

icon url

ReturntoSender

11/05/09 11:15 PM

#8739 RE: ReturntoSender #6755

From Briefing.com: 4:25 pm : Broad-based buying on the back of a strong quarterly report from Cisco and a couple of pleasing economic reports helped stocks net robust gains ahead of tomorrow's potentially pivotal nonfarm payrolls report.

Cisco (CSCO 23.93, +0.64) won support for itself and other large-cap tech issues by posting better-than-expected top and bottom line results for its latest quarter and announcing that it has authorized an additional $10 billion to add to its share repurchase plan, which now stands at roughly $13 billion. Cisco went one step further and issued a solid outlook during its conference call.

Strength among large-cap tech issues helped hand the Nasdaq its best single-session percentage advance since July. Meanwhile, all 30 Dow components advanced and helped the blue chip index close above 10,000 for the first time in two weeks.

The positive tone among this session's participants was also helped by news that third quarter nonfarm productivity surged 9.5% in its preliminary report. That is considerably better than the 6.5% increase that had been widely expected. The surge marked the largest gain in productivity since 2003. It was fueled by the sharp increase in third quarter output and the considerable drop in hours worked. With job conditions still weak, unit labor costs dropped 5.2% in the third quarter. They were expected to fall 4.2%.

The latest initial jobless claims total came in 512,000, down 20,000 from the previous week and not as bad as the 522,000 initial claims that had been widely expected. Continuing claims came in at 5.75 million, which is in stride with what had been forecast and down from 5.82 million in the previous week. That decline, though, is primarily rooted in the trend that unemployed workers are losing their benefits, not finding jobs.

That trend has many market watchers looking ahead to the government's official nonfarm jobs report, which will be released before the opening bell Friday morning. The consensus forecast is that the October unemployment will hit 9.9%, which would be the highest level since 1982.

Despite concerns for that matter, all 10 major sectors finished the session with a gain. Only consumer staples failed to gain more than 1%. Disappointment over the pharmacy benefit management business at CVS Caremark (CVS 28.87, -7.28) overshadowed the company's better-than-expected earnings and additional share repurchase authorization, and caused the stock to drag on the consumer staples sector. Consumer staples, as a group, settled with a relatively modest gain of 0.6%.

Insurers also lagged as participants shunned Allstate (ALL 29.05, -0.57) and Prudential Financial (PRU 44.64, -1.92). Allstate missed the consensus earnings estimate, but Prudential actually posted a positive earnings surprise. Despite their weakness, financials still advanced 2.5%.

Only the consumer discretionary sector had a better gain. It advanced 2.6% in the face of mixed monthly same-store sales results from retailers.

Advancing Sectors: Consumer Discretionary (+2.6%), Financials (+2.5%), Industrials (+2.5%), Materials (+2.4%), Tech (+2.2%), Utilities (+1.7%), Health Care (+1.6%), Energy (+1.6%), Telecom (+1.2%), Consumer Staples (+0.6%)
Declining Sectors: (None)DJ30 +203.82 NASDAQ +49.80 NQ100 +2.4% R2K +3.2% SP400 +2.4% SP500 +20.13 NASDAQ Adv/Vol/Dec 2125/2.23 bln/579 NYSE Adv/Vol/Dec 2495/1.30 bln/542

4:38PM Action Semi promotes Niccolo Chen to Chief Executive Officer (ACTS) 2.50 +0.03 : Co announces that Niccolo Chen, Chief Strategy Officer and General Manager, has been promoted to the position of Chief Executive Officer as Nan-Horng Yeh steps down from this position to pursue personal interests. Mr. Yeh will remain a board member. Additionally, the Board appointed Robin Pan as an independent director.

4:32PM Skyworks beats by $0.02, beats on revs; guides Q1 EPS above consensus, revs above consensus (SWKS) 10.97 +0.64 : Reports Q4 (Sep) earnings of $0.24 per share, excluding non-recurring items, $0.02 better than the First Call consensus of $0.22; revenues fell 1.9% year/year to $228.1 mln vs the $222.3 mln consensus. Co issues upside guidance for Q1, sees EPS of $0.25, excluding non-recurring items, vs. $0.22 consensus; sees Q1 revs of $238-242 mln vs. $230.77 mln consensus. "Skyworks' improving financial performance reflects the growing momentum of the mobile internet and increasing demand for always-on connectivity, particularly given the ubiquity of social networking applications and the proliferation of smart phones, notebooks, netbooks and embedded wireless devices. At a higher level, we believe we are at the beginning of three powerful, multi-year waves including broadband access growth, infrastructure capacity expansion and smart grid implementations. Skyworks is leading the way through analog semiconductor innovation, enabling better battery performance, signal quality and network coverage. As a result, we are entering a new and exciting growth phase which is positioning Skyworks to further differentiate, demonstrate even greater operating leverage, and most importantly, create shareholder value."

4:29PM NVIDIA beats by $0.09, beats on revs; guides Q4 revs above consensus (NVDA) 12.27 +0.29 : Reports Q3 (Oct) earnings of $0.19 per share, excluding non-recurring items, $0.09 better than the First Call consensus of $0.10; revenues rose 0.6% year/year to $903.2 mln vs the $838.1 mln consensus. NVIDIA prelim reports gross margin 41% vs 37.3% consensus. Co issues upside guidance for Q4, sees Q4 revs expected to be up slightly, approximately 2 percent, from the third quarter, equates to $921 mln vs. $868.11 mln consensus. "Revenue was up from a year ago, with improvement in each of our PC, professional solutions and consumer businesses. It's great to see us shipping orders with our Tegra mobile-computing solution, and growing enthusiasm for our Tesla platform for parallel computing in the server and cloud-computing markets."

4:27PM Univ Elec beats by $0.01, beats on revs; guides Q4 EPS below consensus, revs in-line (UEIC) 21.17 +1.10 : Reports Q3 (Sep) earnings of $0.30 per share, $0.01 better than the First Call consensus of $0.29; revenues rose 8.8% year/year to $83.2 mln vs the $80 mln consensus. Co issues guidance for Q4, sees EPS of $0.38-0.42 vs. $0.47 consensus; sees Q4 revs of $81-84 mln vs. $83.57 mln consensus.

4:18PM Atmel misses by $0.02, beats on revs; guides Q4 revs above consensus (ATML) 3.91 +0.12 : Reports Q3 (Sep) loss of $0.04 per share, $0.02 worse than the First Call consensus of ($0.02); revenues rose 11.7% year/year to $317.7 mln vs the $303.6 mln consensus. ATML sees Q4 revs up 3-7% QoQ vs the 4.4% consensus. Co issues upside guidance for Q4, sees Q4 revs of $327.2-340 mln vs. $317.01 mln consensus.

4:14PM Coherent beats by $0.05, beats on revs; guides FY10 revs above consensus (COHR) 26.17 +1.33 : Reports Q4 (Sep) loss of $0.04 per share, $0.05 better than the First Call consensus of ($0.09); revenues fell 24.2% year/year to $107.6 mln vs the $96.5 mln consensus. Co issues upside guidance for FY10, sees FY10 revs of $475-500 mln vs. $456.47 mln consensus. "The fourth quarter lived up to our expectations as a turning point for bookings with double-digit, sequential growth in all four end markets. Microelectronics was particularly robust as service orders responded to higher fab utilization rates, capacity expanded for OLEDs and mobile touch screen displays and additional design wins were secured. The scientific research market was also very active with record total bookings and record unit volumes for our Chameleon(TM) and amplifier product lines due to the strength of the products as well as benefits from U.S. stimulus funds. Finally, a number of our instrumentation and medical OEM customers reverted to annual buying patterns, which signals confidence in their end markets."

4:09PM JDS Uniphase beats by $0.02, beats on revs; guides Q2 revs above consensus (JDSU) 6.07 +0.29 : Reports Q1 (Sep) earnings of $0.04 per share, excluding non-recurring items, $0.02 better than the First Call consensus of $0.02; revenues fell 21.0% year/year to $297.8 mln vs the $291.8 mln consensus. Co issues upside guidance for Q2, sees Q2 revs of $320-345 mln vs. $306.14 mln consensus.

8:48AM SIA forecast 2009 - 2011: moderate growth returning to key segments : The SIA released its annual forecast of global semiconductor sales projecting worldwide sales of $219.7 billion for 2009, a decline of 11.6 percent from the $248.6 billion reported in 2008. The forecast projects that sales will grow by 10.2 percent to $242.1 billion in 2010 and by 8.4 percent to $262.3 billion in 2011. "The new forecast is brighter than our earlier projections, reflecting an improving global economy," said SIA President George Scalise. "Unit sales of key demand drivers - including PCs and cell phones, which together account for about 60 percent of semiconductor demand - have been stronger than previously predicted. We remain cautiously optimistic for the longer term. The current forecast is closely tied to projections of continuing improvement in the worldwide economy."

6:09AM Research In Motion announces its Board has authorized a buyback of up to $ 1.2 bln, or approx 21 mln common shares based on current trading prices (RIMM) 57.61 :

09:32 am EMC Corp: Wedbush discusses VMware-Cisco-EMC Joint Venture: . Wedbush notes EMC, Cisco (CSCO) and VMware (VMW) announced a partnership called the Virtual Computing Environment (VCE) coalition to accelerate and simplify the move towards virtualized cloud based infrastructures. The concept of a tested and qualified solution combined with management commitment to simplify the combined sales, integration and customer support processes should appeal to IT managers, but firm believes that it will not add materially to EMC's top line in CY 2010. Wedbush thinks that the partnership will increase the attach rate of EMC storage to Cisco servers and switches, but will not add significantly to EMC's top line for the next calendar year given that Cisco is new to the server market. Firm does not anticipate material changes to VMware's top line as a result of the partnership.

09:51 am Qualcomm (QCOM)

Qualcomm (QCOM 43.31, +1.71) issued a fourth quarter report that featured lower profit and revenue from the prior year and issued downside guidance for fiscal 2010, but shares of the company are more than 4% higher in the first few minutes of Thursday's trade.

Qualcomm reported fiscal fourth quarter earnings of $0.48 per share. The results include a number of items and may not be comparable to the First Call consensus of $0.52. GAAP net income of $803 million was down 9% year-over-year and up 9% sequentially.

Revenues fell 19.6% year-over-year to $2.68 billion; the consensus expected $2.72 billion.

Qualcomm issued mixed guidance for its fiscal first quarter, saying it sees earnings between $0.54 and $0.58 per share; the consensus stands at $0.56. The company projects revenues between $2.55 billion and $2.75 billion, shy of the current consensus of $2.84 billion.

For fiscal 2010, Qualcomm said it sees earnings of $2.10 to $2.30 per share, below the current consensus of $2.32. Qualcomm's revenue expectations are also a bit short of the consensus, as the company expects $10.5 billion to $11.3 billion while the consensus estimate currently stands at $11.61 billion.

08:32 am Cisco Systems (CSCO)

Cisco Systems (CSCO 23.29) reported fiscal first quarter earnings and revenue that fell from last year, but the results topped Wall Street expectations.

Cisco reported fiscal first quarter earnings of $0.36 per share, $0.05 better than the First Call consensus of $0.31. Non-GAAP net income of $2.1 billion was down 15.3% year-over-year.

Revenues fell 12.6% year-over-year to $9 billion, topping the $8.74 billion consensus estimate.

Gross margins of 65% came in ahead of the 64.3% Street estimate and the company's guidance of 64%.

"Building off what we saw as a clear tipping point in Q4, our Q1 results continued to reflect strong sequential growth trends that meet or exceed expectations during normal economic times," said CEO John Chambers.

Cisco said that its board authorized up to $10 billion in additional purchases of its stock. Including the new authorization, Cisco has approximately $13.1 billion authorized for share buybacks.

Shares of CSCO are about 3.5% higher about an hour ahead of Thursday's opening bell.
icon url

ReturntoSender

11/07/09 11:59 PM

#8740 RE: ReturntoSender #6755

From Briefing.com: Weekly Recap - Week ending 06-Nov-09The S&P 500 gained every session this week, with the bulk of the gain coming on Thursday following solid results from Cisco (CSCO) and a surge in nonfarm productivity. The much talked about stock market correction continues to fail to materialize with the S&P 500 just 2.9% from its 2009 highs and up 60% from it's march low.

All ten sectors advanced during the volatile week of trade, though cyclical stocks saw the most buying interest. Industrials surged 6.1%, consumer discretionary advanced 4.7% and materials gained 5.0%. Defensive areas underperformed on a relative basis, with telecom and consumer staples both gaining just 1.0%.

In economic news, third quarter nonfarm productivity surged 9.5% in its preliminary report. That is considerably better than the consensus which called for an increase of 6.5% increase. The surge marked the largest gain in productivity since 2003. It was fueled by the sharp increase in third quarter output and the considerable drop in hours worked. With job conditions still weak, unit labor costs dropped 5.2% in the third quarter. They were expected to fall 4.2%.

October nonfarm payrolls fell 190,000 in October, which was worse than the expected decline of 175,000. Meanwhile, the unemployment rate rose to 10.2% from 9.8%, which was worse than the 9.9% consensus. The rise in unemployment was not due to more workers entering the workforce -- the labor force declined by 31,000 people as 259,000 workers left the workforce over the last month. The jump in unemployment was solely due to an increase in the number of unemployed. and reflects the continued challenges in the labor market

In other economic news, ISM Manufacturing Index for October came in at 55.7 (53.0 consensus), the ISM Services Index for October came in at 50.6 (51.5 consensus), construction spending in September spiked 0.8% (-0.2% consensus), and pending home sales for September made a 6.1% monthly increase (consensus unchanged).

In monetary policy news, the Federal Reserve didn't provide much a surprise in its statement, keeping it's language unchanged that low interest rates are warranted for an extended period of time. The Bank of England and European Central Bank also opted to keep their rates unchanged, as expected.

There were a fewer amount of big names among the 94 S&P 500 companies that reported earnings this week as Q3 earnings season starts to wind down, there was . The trend of better than expected earnings continued (75 beat), with revenue failing to match the EPS performance (45 beat).

Of the larger market cap companies reporting this week -- Cisco, CVS, Kraft (KFT), Qualcomm (QCOM) and Time Warner (TWX) -- all reported better-than-expected results. Kraft, however, came up came up short on revenue, and as a result fell 2.7% for the week. With regard to Cisco, the tech bellwether authorized $10 billion more in share buybacks issued a solid outlook during its conference call, helping its shares rise 4.3% on the week.

In other corporate news, Warren Buffet's Berkshire Hathaway (BRK.A) announced a cash and stock offer for Burlington Northern (BNI) at $100 per share. The news sent BNI up 29% for the week, with peers Union Pacific (UNP) and CSX (CSX) also posting healthy gains of 13%.

In commodity trading, gold gained nearly 6% to hit an all-time nominal intraday high of just over $1100 per ounce. Oil prices also gained in a volatile week of gain, up about 1% as the dollar dropped about 0.8%.
 
Index Started Week Ended Week Change % Change YTD %
DJIA 9712.73 10023.42 310.69 3.2 14.2
Nasdaq 2045.11 2112.44 67.33 3.3 34.0
S&P 500 1036.19 1069.30 33.11 3.2 18.4
Russell 2000 562.77 580.35 17.58 3.1 16.2

1:30PM Applied Materials acquires the assets of Advent Solar (AMAT) 12.41 +0.01 : Co announces it has acquired substantially all the assets, including the intellectual property, of Advent Solar for an undisclosed cash amount. Advent Solar is a developer of advanced technology for crystalline silicon (c-Si) PVs. This acquisition is expected to complement Applied's portfolio of solar PV technologies and enhance its leadership in the c-Si equipment market.

NVIDIA (NVDA 12.27) reported third quarter earnings results after the close yesterday of $0.19 per share. After excluding non-recurring items, this was $0.09 better than the First Call consensus of $0.10.

Revenue rose 0.6% to $903.2 million, which was well above the $838.1 million consensus. The company's gross margins for the quarter were 41%, also well above consensus, which was 37.3%.

Looking ahead, the company issued upside guidance for the fourth quarter, saying it expects revenue to be up slightly, approximately 2%, from the third quarter, which equates to approximately $921.0 million vs. $868.11 million consensus.

The company said, "Revenue was up from a year ago, with improvement in each of our PC, professional solutions and consumer businesses. It's great to see us shipping orders with our Tegra mobile-computing solution, and growing enthusiasm for our Tesla platform for parallel computing in the server and cloud-computing markets."
icon url

ReturntoSender

11/08/09 12:05 PM

#8742 RE: ReturntoSender #6755

InvestmentHouse Weekend Market Update

http://www.investmenthouse.com/weekendmarketsummary.htm

- Investors mull jobs report in a volatile first hour then punt and leave for the weekend.
- Dollar/Stocks/Oil relationship may be waning.
- Non-farm jobs versus household survey: which is supreme?
- Recovery yes, but it is not a strong one by historical standards.
- Stock market not predicting the economy this time around.
- Rebound quality not that great as stocks may opt for a consolidation before a new rally.

Jobs report dominates but investors decide to leave it for next week.

Friday was all about the monthly jobs report. They came in a bit heavier than expected (-190K versus -175K expected) but investors could handle that. The problem was that the unemployment aspect of the household survey came in at 10.2%, leapfrogging expectations of 9.9% and topping that 10% level that everyone feared could get here. That is the worst showing since 1983.

There was good and there was bad in the report for the market. The good, on top of the decent non-farm payrolls, were their revisions from August and September. There were some other bad areas that I will discuss later. Suffice to say, the market was a bit confused after the report came out, and the futures turned lower. They were up a bit, but turned lower after the number. The market opened lower as well, but it was not a tanking. The market almost immediately rebounded and went up to a session high, turning positive within an hour. It then turned back down and was negative once more. It was a volatile open because investors had to chew on the numbers and decide whether the good outweighed the bad or vice versa. By the end of the day, the investors went out and the market flat-lined for the rest of the session and went out with virtually no gains. The big indices posted modest gains, while the small caps and semiconductors posted modest losses. Investors punted and did not tell us anything about what they were going to do with respect to the overall patterns in the indices that I will talk about in the technical section.

With that "nothing happening" action, we did not do a lot either. The market was not conducive to great buys. There were stocks that were moving higher and continuing a move from earlier in the week. There were some moving lower, continuing what they had been doing and setting up some downside patterns. We have a split market right now. Some stocks are setting up downside such as semiconductors, while others (most of the same leaders we have seen all along) continue to hold up very well.

The market has run a long way and is running into some important resistance levels, so it has decided to consolidate somewhat. This was seen in June and July, and seems more likely versus a major, massive rollover given all the liquidity that is out in the world. If that were the case, you would think that the same forces that have been driving the market higher are still in place. If the market decides to consolidate as opposed to running into the end of the year as I was looking for it to do, that is fine because then the money is still out there. There will be consolidation, and maybe another run higher just as there was after the June and July consolidation. There has been a little change here, just the fact that it has run further now having put in another 30%. In addition, there was some heavy-volume selling over the past two weeks, and that has to be factored into the equation. When you look at the picture, there was not a lot of change, and that is how the market seems to have viewed it on Friday.

The dollar closed slightly stronger (1.4849 versus 1.4877 Euros on Thursday). That bit of strengthening took its toll on oil ($77.70, -1.92). Gold was up again to a new high ($1,095.90, + 6.60). The 10 year bond was down (3.5% from 3.53% on Thursday). Bonds rallied a bit after the jobs report, but there were not a lot of issues overall. One of the interesting things this week was that the dollar was stronger, only by fractions of a cent, yet oil lost almost $2.00. That seems disproportionate, and that is very interesting. There was this relationship between the dollar and oil and the market. If the dollar went up, then the market went down (and consequently energy went down as well) and vice versa. There was a bit of a break in that relationship this past week. On Thursday, the market rallied and the dollar was moving up, but it was not hurting the market. There is a cutting of the link between the two. It may or may not stay that way, but this is the first significant change that has happened in this relationship. It did not completely do away with it, but it is something to watch as the market moves forward because it was definitely working last week. Friday was another example. Energy was killed, but the dollar was just slightly higher. Maybe it will take more pounding of the dollar in order to make the same impact on energy and the market overall. Maybe not. Maybe the link is getting broken. Maybe the dollar is going to try to rally and the market will say that that trade is over and will look at something else (like a liquidity trade). We will see how it plays out.

That does not change the game a lot for us. We may redefine the parameters somewhat and maybe also the sectors that we are going to be playing in more, but we look at good stocks and good patterns. We look for stocks that have broken down, have hit resistance, and will roll back over. We have been hitting the industrials, energy, metals, and that type quite hard over the past six months. That may change if the relationship between the dollar and the market and energy changes. I will keep an eye on that.

TECHNICAL

INTRADAY

The market started quite volatile. The jobs report was somewhat of a mixed quantity with positive and negative aspects, and investors took their time to digest exactly what it meant. The market opened lower and SP500 gapped down. It quickly recovered to positive only to return to negative just as quickly, but the market was able to bounce after that. Though it whittled away the gains for most of the day, the indices held positive in the end by a slim margin. It was not a great day as far as the market was concerned. The best you can say is it did not sell off early on as one might have expected given the jobs report.

INTERNALS

The internals were not too impressive. There were small gains on each of the indices, and losses on the SOX and SP600. Breadth was slightly negative on NASDAQ at -1.1:1. On the NYSE, advancers led 1.1:1. After some hefty days of 4:1 advancers on the NYSE on Thursday, things calmed down to end the week.

Volume was terrible. Volume fell below average for the fourth day in a row on NASDAQ. This was all during gains, so it was not the best volume week as far as price/volume action. I like to see buyers coming in quantity and pushing stocks higher. When that is not the case, two things can happen. It can continue to work its way up with these kinds of gains if there is no selling impetus, or what goes up on light volume typically comes down on heavier volume, like what we saw in late October.

The volume on SP500 was down 16%. It turned just over $1B shares, but that pushed the trade well below average. The NYSE ended the week with two days of below-average volume preceded by two days of average to slightly above-average trade. There is higher volume selling in late October, and then there is a rebound with volume declining. Price is going one direction and volume is going the other, and that is not good price/volume action. It does not show that buyers are stepping in with any kind of force, and that means these kinds of moves are more subject to upset in the event that more investors show up in the market deciding to be sellers.

CHARTS

I have been saying that it would be the quality of the bounce after the October selling that would determine whether the market would continue rallying or run into trouble. Thus far, the quality is so-so. The indices are bouncing and they moved up the entire week; SP500 was up for the week and those gains are great. That may have been a good feat given the amount of data and some of the negative data that was out this week. There was lower volume, however, so the quality was not beautiful. That being said, is the SP500 in a lot of trouble? It looks like it will be up to SP500 to do a lot of the leading if the market is going to continue the rally. As it turns out, SP500 sold off hard to end October, but made a higher low again. Even though it did break its trendline from March, it nonetheless made the higher low and the overall upside bias remains. It held above some key support levels in August and the early-October low, so you cannot complain. Nothing will keep SP500 from moving higher as long as the liquidity comes back in and pushes it that way. SP500 is very much can continue the run higher and lead the market. It looks like there will have to be some leadership when you look at the other markets.

The NASDAQ is not in terrible shape either, but it did break its trendline a long time ago and made a lower low. It has recovered, but it did so on declining volume. It is not as severe a decline as on the NYSE because there were a couple of days of upside pop, but it was below-average and, indeed, much lower than the downside trade to end October. There is a bounce from NASDAQ. It held above some support in the August peaks as well, and it did manage to break some resistance in the 2,100 area. It is now in that band of resistance that takes it up to the September peak. The September peak is key because that is where the market bottomed three times in 2008. There is some serious resistance there, and that is why it turned back and will need a hand (perhaps from SP500) to get through that resistance next week. It is not in terrible shape, but is also not showing a lot of pop. This is not a slam-dunk roll over. It looks like a June and July type of correction. What has happened to NASDAQ over the past three weeks is not necessarily the kiss of death. Even though this bounce was not great, it held where it needed to hold.

The small caps are not so cheery. They made the higher high but also a lower low, and it broke through the August levels that the other two indices held. That put it below the early-October low. It made a lower low, it has rebounded on the lower NYSE volume, and it is now at a lower peak in August and is having an issue. There is a doji on the candlestick chart. It is not definitive, but given the fact that it has bumped resistance, it suggests that it is going to face trouble. The SP600 is a growth index, so you have to be concerned when it starts to show signs of rollover.

The SOX is really in trouble. There was a double top, and it broke below a key support level in the July and August peaks as well as the early October low. It managed to bounce at some support in the June peaks and August low. It has rebounded but gone back up to resistance, and (similar to SP600) it is showing doji. There is something of a tombstone doji, and that could suggest that it is not going to have a lot of upside unless it gets help from some of the other indices. When you look at the individual semiconductor stocks, you see that they are mirroring this type of action. This is not just a couple of stocks in the SOX index that are showing this kind of action, but semiconductors in general that look to be in trouble.

The SP500 has to do the lion's share of work in order to get the rest of the indices moving higher toward the end of the year. It can do it. The overall bias remains intact to the upside because it did not make the lower low; in fact, it bounced off of that level and just above it. I do not want to say that it is heading down for sure because it has not broken its overall trend. As I talked about earlier in the week, there are some serious issues that the index has to face. The first issue is the trendline from late 2007. That trendline is at the 1,100 level, and that is what SP500 has started to bunch up against. Looking at the 1,100 area where the trendline is rapidly approaching, that is the bottom of the 2004 consolidation. That is where market moved laterally for nearly a year after the 2002-2003 run higher. There are other lows and price points at that level as well from back in 2001 and 2002. It is a significant level. There are two important pieces of resistance coming together at the point where SP500 is approaching, and that is at the October peaks. It failed there once, and it did not turn over and drop dead, but it is a serious level. There has been a huge run off of the lows, similar to 2003. After the end of this year, there could very easily be a lateral move in 2010 similar to 2004. Keep that in mind as we move into next week.

We can still get more upside out of the indices because there is still room to move to the upside. SP500 closed at just about 1,070. If it moves up to 1,100, that gives it some leeway to work higher toward Thanksgiving. The real test is going to be after it gets there. 1,075 is going to be interesting in and of itself because this pattern might be trying to develop a little head and shoulders. We have seen that before back in May, June, and July. That did not pan out too well as it sprinted from 875 up to 1,100. You have to take this pattern with a grain of salt, but it is worth watching and seeing how SP500 behaves at 1,075.

Looking at NASDAQ again, it is setting up a looping top as well. Its peak is at 2,150, and it is not even close to it having closed at 2,112. There is still some work ahead, and there is a definite neckline formed. If it breaks down or stalls out in the 2,150 level, then that makes it interesting, particularly if SP500 stalls out at 1,075.

In summary, there are issues, but that is always the case after a big run. Stocks cannot go up forever in a straight line. This correction is similar to June and July, where the initial trend off the March low was broken, and then it formed a new trend off the July low. That is the one that has held up to this point, and now it has been broken. What is going to happen? You cannot keep the steep, 45-degree angle of attack indefinitely; it has to break off, consolidate, and then move higher. The only thing different right now versus back in June and July is the gain. That is a big difference, no doubt, but there is all that money flowing through the world with not much of it being used to get the economies going. If it is not going to be used by the economy, it will be used by the financial markets. After the market gets a consolidation, maybe there will not be that sprint to the end of the year that I am anticipating. The markets are a bit weary, and some of the funds that have made good money might not want to blow it all in the last month of the year. They may sit on it and let other funds do the driving if they can. If that is the case and the liquidity is still out there, we could have a nice consolidation into the end of the year. Then with the liquidity hitting, we could see a good January effect, so to speak. This January effect would be a liquidity effect as money runs into the market and pushes stocks higher once more.

LEADERSHIP

Leadership has not changed a lot, although there is an interesting addition recently with the regional airlines. Oil has gone down as the dollar has strengthened over the last couple of weeks, and some of the regional airlines are performing better and setting up nice patterns. JBLU has an ABCD pattern, and it broke higher on stronger volume on Friday. RJET did not fare as well on the day, but it has an interesting pattern. It has an ABCD pattern as well, with a big reach down on the Friday intraday low and a reversal with a hammer doji. That could be a very interesting race higher from this point.

Things might turn a bit defensive, so drugs might be more interesting. AUXL has a set up an ABCD pattern as well and is bouncing up. There is no volume, but you cannot argue with the pattern and what it is doing right now.

Retail is still holding up quite well. BBY has formed something of a triangle that you can see rather clearly. It has resistance levels, but is banging back and forth and making a series of higher lows. It would be very interesting if it comes back up to the 41 level, pulls back down, and holds. You would then look for a play off of the bottom trendline because it is in the last part of the triangle and the odds of a breakout are much improved. You can get a good risk/reward point off of that lower uptrend line. That is not ready yet, but it will be if it keeps doing what it is doing. TJX is a leader. It is not in great shape as far as a buy right now, but shows its continuing uptrend. There is no issue with the trend higher, but it is just putting in a lateral consolidation. We will see in it shapes up better. Retail is still looking good despite the worries about the consumer.

Even with the dollar rising and oil falling, there is a good uptrend in energy. HAL had a good day. APC has a bit of a triangle trying to form which makes it interesting. There is a higher low and there could be a breakout. There are patterns setting up in these leaders even though a lot of them are tired.

In industrials, CAT is still trending higher, and is still in its channel and looking solid. TEX, even though it sold down, has an interesting pattern itself. It is almost an ABCD, and is consolidating at a nice support level. If it sets up a triangle, it might be a good break higher.

Leadership is still there. Some of it is winded, but that does not mean there is not good money going into other stocks. The neat thing that keeps happening is that leadership groups pull back, consolidate, and then money hits them fresh again and pushes them back higher. We have that going for us, and the liquidity trade is basically all there is out there. There are issues with there being some wear and tear on the indices. They look like they want to consolidate. If they do get a big boost of money at the end of the year, that could trump all patterns altogether and push them higher. If you are looking at them just from a technical perspective, that does not look like the case. It looks like they want to consolidate, and we could use that to play some downside and set up good upside for when the money does hit. If it does not hit before the end of the year, and it has a nice, long consolidation, we can bet that it will come in to start the new year. There could be quite a rush higher in January. It may be a rally deferred, but there is nothing confirmed in that respect as of Friday.

THE ECONOMY

Jobs report has some good and some bad, but the bad is much more worrisome.

The jobs report was the big news on Friday. It was one of the most important jobs reports in quite some time because the non-farm payrolls have been trending lower and everyone is looking to when they actually get to zero. It is the same with the weekly claims - right now, we just want it to get below 500K. Not much luck with that. It did not make it on Friday either, but there were interesting parts to feed the people who feel there are positives in the job market.

Jobs were down more than expected (-190K. Revised -154K from -201K in August; -219K from -263K in September). The revisions more than made up for the miss on the non-farm payrolls number, and that heartened people. They said they are seeing the improvement. Indeed some are saying that the rate of change in the trend shows positive job creation sometime in the spring, probably toward the end of Q1. That is, if everything stays the same and the trend remains. That is a positive.

The non-farm payrolls are interesting because it is mostly the large companies that they survey. They try to factor in the smaller companies and small businesses, but it is very difficult for the government to get that information accurately and quickly enough. That was a positive and they are saying things are looking good for the future. On the other hand, there is a 10.2% unemployment rate, and that is the highest since 1983. There is an argument about whether the non-farm payrolls or the household survey is more important. Greenspan always said the non-farms payroll was more important, but as we saw coming out of the recession in 2001, the household survey was more accurate. We saw that it was improving, and it was showing the right kind of improvement because there were many small businesses that were created thanks to tax incentives. We saw S corporations proliferate. The filings for those proliferated and small partnerships also surged. We are not seeing that this time, however. There is not a surge of any kind of small businesses as the non-farm payrolls number improved, and the household number is getting worse and worse. It is my view, and the view of many smart economists, that household is more important when you come out of recession because many of the jobs are gone. JNJ and GE and those places are not going to be hiring people because they are still laying people off. The jobs are going to come from the smaller businesses, and if the smaller ones are still saying things are bad, then things are bad.

There was a 10.2 unemployment rate, but there were interesting figures with respect to the headlines below the headlines. 17.5% of the work force is either unemployed or underemployed. Underemployed means they would like to work more but cannot get the jobs. That is why we are seeing the temporary jobs growing. That is a key factor, and it has been up for two months in a row. People want to work but they cannot. Some of the protagonists are saying that more people came into the market looking for jobs, and that is why the number rose to 10.2%. I saw people tonight taking about that, but they are wrong. They did not go back, look at the figures, and figure out what was going on. The job pool actually decreased by 500K workers. At the same time, the new unemployed increased by 1M. It was not just a factor of more people entering into the jobs market and thus pumping up the number of people out there unemployed. The number of new employed rose, so we have a serious problem. The headlines under the headlines are showing that things are not improving in employment, but they are worsening. Some of the anecdotal data from Challenger says that the layoffs are fewer, but those are only the big companies. They do not cover the small ones as closely and cannot cover them as accurately. Some of the anecdotal evidence that that things are improving is belied under the actual jobs report and what it is showing underneath the headline numbers.

More than that, the average workweek is critical. It has to increase before there will be new hires. It stayed flat at 33.0, and that is after declining from 33.3 to 33.2, to 33.1 and now holding at 33.0 for two months in a row. We have a serious problem because it has to get up to 3.5 - 3.6 before they get to the point of thinking about adding even temporary workers. All the productivity we saw and talked about on Thursday does not mean a lot does it? You can have a lot of productivity, but if companies do not feel things will get better, they are not going to hire anyway. They are just going to reap the benefits of having higher productivity and then stockpile the cash. That is good for earnings, but we are looking for jobs and getting the economy back on track. If companies are worried that jobs are going to be bad in 2010, so much so that they are not spending any of their cash on new employees, then that is a serious problem.

They are not spending money because there is a lot of uncertainty out there. There is cap and trade, and though no one knows exactly how that will impact them, they know it will not be good. There is the healthcare bill that, if it passes, will place taxes on the businesses that provide the healthcare for their employees. Either they have to pay the tax, or they are going to jettison the program altogether. That is uncertainty, and that leads to indecision. They are not going to act on it because it is always the case when the governments are considering promulgates serious legislation. Everyone waits to see how it will affect them. If they think interest rates will go down or if they think tax cuts will be passed, they are going to wait and see if they pass so they can take advantage of them. On the other hand, they may be inclined to spend if things get worse, but if they do not know what to spend it on, that could be foolish admission, so they sit back and do nothing. I am afraid that is what we are seeing now. There is a lot of stockpiling of cash that is being reaped by the increase in productivity without the usual hiring of new employees. That is not a great scenario for the rest of the country.

One to have things I heard today was comparisons to 1983. This was the worst unemployment since 1983 when there was a bad recession coming out of the long 1970's malaise. People are saying that we have the kind of issues there were back then, but that we knocked the cover off the ball coming out of that recession. That is true, but we had already gone through the 70's and then had to break the back of inflation and rally higher.

We may be going into the 70's all over again. What made the 1980's special were the policies put in place that propelled us out of that long, terrible recession. It was called the Emergency Economic Recovery Act of 1981, and it created tax incentives, it slashed marginal rates, it gave tax credits, and it gave accelerated depreciation. It gave all kinds of incentives to invest once more in the United States. All the money had been put in tax shelters because it was too expensive to do business or to live in the US. That money came crawling out of the woodwork because it became cheaper to invest in the US and make a return and pay a lower tax than to have exotic tax shelters. The tax shelters tied up your money and kept it from being taxed, but they were expensive to create and run, so the incentives brought it all out. Russia had the same thing when it slashed its flat tax to 11%. Billions upon billions of dollars came flying out that they did not know they had, and it set off an economic boom. Of course, they mismanaged it and had problems, but nonetheless, you see where I am going.

We do not have the same policies that there were in the 1980's; indeed, we are going in the exact opposite direction. Ronald Reagan said the solution was less government, not more government. The new administration says the solution the more government, not less. We are having more regulation, there are massive bills being contemplated and passed, and it is creating uncertainty, creating regulation, and is going to stifle out the entrepreneurship in the US. You can say that as bad as it was, in 1983 we were coming out big time. I have a bad feeling that in 2009 we are going back in 2010. 2009 and the liquidity rally there was in the stock market may go back in and hibernate if the Fed has to eventually (and it will) have to raise interest rates and stop its 0% interest rate policy that Japan did. It did not get it anywhere, right? It is going to have to do that, and if there are no policies to invest in the United States, then we have serious problems. We heard today that we might need another stimulus package. We are talking about more infrastructure, maybe some job incentives - but no one is going to hire anyone for a job if you do not know if you will have to provide insurance for them or how costly it will be - if you are going to be taxed another $8,000 or 40% on what you provide if you do. I am not going to do that, and I know many small businesses who feel the same way. There is just too much uncertainty, and you cannot bet the company on just a tax credit when there is something much more serious that could take away many of your revenue streams or what you have already made. You cannot risk it, and it is not the right kind of incentive. You want to invest in your business and in America, not just do busy work and try to put band-aids on things. That is the way we have to do it, however, and what we have to live with for now.

This recovery is not a 1980's style recovery.

You cannot deny that we are having a recovery, but it is relative. If you came from zero, it is different from coming from another output. This was one of the worst shutdowns since the Great Depression. Even though the percentages may be impressive and comparable to other eras and recoveries, it is where we came from that makes the difference. Even though we are recovering, that makes this not a very strong recovery. The output factors we showed from Thursday were not that great, and they are not nearly what they were in the 2001 recovery. There has been analysis done of the 1980's recovery, and this is, at best, half the strength of that recovery.

There are many issues to deal with. This recovery is no doubt a recovery, but it is not the best we can do. As history has shown, we can try other tactics that get people to invest in the United States. I am very concerned that we are going to have this 10.2% rate go up to unprecedented levels in early 2010, maybe touching 10.8 or 11%. That seems totally off-the-wall, and some people could be howling with dismay. Even the people who think this is a bogus recovery just do not want to contemplate that kind of unemployment. I hate to be a downer, but we have to prepare for what may come. The key right now, and one of the things that is throwing everyone a curve, is the stock market and the reason it is up.

The stock market typically forecasts economic expansion. I believe in that, but there are times when that is not the case, such as when there is a tremendous amount of liquidity driving the market. There have been other times, no doubt, that the Fed is lowered rates to practically nothing and they had a bunch of money printed. Why then was the stock market recovery not indicative of an economic recovery? This time the money is not being used because banks are not lending money. There are stats everywhere showing what is and is not being lent, and the money is not getting out there, so it is being pushed into the financial markets. That makes this a bogus rally in terms of economic forecasts. It is just not that strong. There were times where it looked good, but now we see serious issues with the small caps. They are in trouble and breaking down, and they are the canary with respect to the economy. Stocks that are doing well are the exporters - those that are tied overseas. That is not going to help the companies that make the US great, and those are the small businesses that generate all of the jobs. We are going to have serious issues coming this year because this recovery is nothing compared to the strong recoveries we have had in the past. Thus, comparisons to the 1980's are not just wrong, but are horribly wrong.

THE MARKET

MARKET SENTIMENT

VIX: 24.19; -1.24
VXN: 24.6; -1.24
VXO: 22.97; -1.57

Put/Call Ratio (CBOE): 1.02; +0.15. Not much downside but a big jump in put activity. Too quick on the trigger for the put buyers?

Bulls versus Bears:

This is a reading of the number of bullish investment advisors versus bearish advisors. The reason you look at this is that it gives you an idea of how bullish investors are. If they are too bullish then everyone is in the market and it is heading for a top: if everyone wants to be in the market then all the money is in and there is no more new cash to drive it higher. On the other side of the spectrum if there are a lot of bears then there is a lot of cash on the sideline, and as the market rallies it drags that cash in as the bears give in. That cash provides the market the fuel to move higher. If bears are low it is the same as a lot of bulls: everyone is in and the market doesn't have the cash to drive it higher.

Bulls: 48.3%. Surprisingly holding steady for the second week after a drop from 49.5% two weeks back. Still a lot of believers in the rally, and that may be to investors' detriment near term as the market consolidates a bit more. Bulls have held in the 48% to 50% range for several weeks now though that will start changing some now, and that is for the better in terms of a renewed upside move. Still well over the 35% level that is the threshold for what is considered a bullish climate. It does not mean things are necessarily bearish; that takes a reading in the 60% range. Hit a high of 47.7% mid-June on the run from the March lows. Again, to be seriously bearish it needs to get up to the 60% to 65% level. Dramatic rise from 21.3% in November 2008, the bottom on this leg. This last leg down showed us the largest single week drop we have ever seen, falling from 33.7% to 25.3%. Hit 40.7% on the high during the rally off the July 2008 lows. 30.9% was the March low. In March the indicator did its job with the dive below 35% and the crossover with the bears. A move into the lower 40's is a decline of significance. A move to 35% is a bullish indicator.

Bears: 24.7%. A rise as expected, but not a surge despite the rather sharp, high volume selling to end October. Bears remains relatively low, hardly in excess numbers but not so low to start looking for a reversal. Last week 22.5%, and hanging around in the 23% range before that. Hit a low of 21.3% on this leg. Rebounding some from the big drop 31.1% and 35.6%. For reference, cracking above the 35% threshold considered bullish. Hit a high on this run at 47.2%. For reference, bearishness hit a 5 year high at 54.4% the last week of October 2008. The move over 50 took bearish sentiment to its highest level since 1995. Extreme negative sentiment. Prior levels for comparison: Bearishness peaked at 37.4% in September 2007. It topped the June 2006 peak (36%) on that run. That June peak eclipsed the March 2006 high (33%) and well above the 2005 highs that spawned new rallies (30% in May 2005, 29.2% in October 2005). That was a huge turn, unlike any seen in recent history.

NASDAQ

Stats: +7.12 points (+0.34%) to close at 2112.44
Volume: 1.878B (-9.19%)

Up Volume: 1.134B (-867.977M)
Down Volume: 678.705M (+457.841M)

A/D and Hi/Lo: Decliners led 1.14 to 1
Previous Session: Advancers led 3.56 to 1

New Highs: 80 (+30)
New Lows: 21 (-4)

NASDAQ CHART: Click to view the chart

NASDAQ 100 CHART: Click to view the chart

SOX CHART: Click to view the chart

SP500/NYSE

Stats: +2.67 points (+0.25%) to close at 1069.3
NYSE Volume: 1.08B (-16.39%)

Up Volume: 509.025M (-593.706M)
Down Volume: 498.584M (+325.522M)

A/D and Hi/Lo: Advancers led 1.09 to 1
Previous Session: Advancers led 4.07 to 1

New Highs: 127 (+15)
New Lows: 39 (+7)

SP500 CHART: Click to view the chart

SP600 Chart: Click to view the chart

DJ30

Stats: +17.46 points (+0.17%) to close at 10023.42
Volume DJ30: 181M shares Friday versus 211M shares Thursday.

DJ30 CHART: Click to view the chart

MONDAY

SP500 and NASDAQ may end up leading the market. It looks like there is a consolidation when you look at the semiconductor index and the small caps. Those are the growth areas and they are in trouble. They are not ready to roll over and give back the entire rally; I do not think that is the case at all. The liquidity has not gone away. It is going to keep supporting the rally unless something devastating happens where it will not matter what money is or is not out there.

I think the market may go into a June-like correction or consolidation. It has had every opportunity to move higher, but it has not done so. Indeed, it was shedding shares on high volume to end October. It looks like that was the start of a corrective move and now the volume has dried up. We have bounced up and now we see how hard it breaks to the downside. I am looking for it to hold in a range and start moving somewhat laterally as it did in June. That would mean this is not the end of the world and the liquidity is still out there to prop things up. It will be one of two things. I think we are going to go into a correction toward the end of the year where the big-money funds play it safe and do not make any new bets to end the year. They will not drive the market higher, but things will pick up in the new year. For now, leadership is still in good shape, and I see some buys there. There are always some struggling areas that we can take advantage of to the downside. It looks like there is that kind of dichotomy where you can play upside and downside a bit as the market chops through this. I will be looking for trades in the range and looking for bouncing up and down. There will always be those that go up or down regardless of what everything else does, and I will be looking at those as well.

We have been pulling back, as you know. We have been taking a few buys here and there, but now we will be able to shift gears and play the moves in the range. We are going to play some downside as well, and we will take what the market gives. We will not be able toll look at huge runs right now unless it breaks to the downside big time. If it does that, we will let it run and take those as far as they can go. I think it will be more like June, however, so we will just play the moves back and forth and take what the market gives. We will not have as huge of gains, but we can pile them up and make good money there. I will see you on Monday.

Support and Resistance

NASDAQ: Closed at 2112.44
Resistance:
2143 is the October 2009 range low
2155 is the March 2008 intraday low
2167 from the July 2008 intraday low
2168 is the September 2009, intraday peak
2169 is the March 2008 closing low (double bottom)
2177 is a low from March 2008
2191 is the October 2009 peak
2210 (from September 2008) to 2212 (the July 2009 closing low)
2275 - 2278 from the February 2008 and April 2008 lows

Support:
2099 is the mid-September 2008 closing low
The 50 day EMA at 2081
2070 is the September 2008 intraday low
2060 is the August peak
2048 is the early October 2009 closing low
2016 is the early August peak
1984 from late September
1962 is the bottom of the August 2009 range.
1947 is the October gap down point
1897 is the October post gap intraday high.
1880 is the June peak
1862 is the July peak
The 200 day SM A at 1802

S&P 500: Closed at 1069.30
Resistance:
1070 is the late September 2009 peak
The March/July up trendline at 1078
1078 is the October range low
1080 is the September 2009 peak
1101 is the October high
1106 is the September 2008 low
1133 from a September 2008 intraday low
1185 from late September 2008
1200 from the July 2008 low

Support:
The 50 day EMA at 1048
1044 is the October 2008 intraday high
The August peak at 1040
The early October 2009 closing low at 1025
The early August intraday peak at 1018
The November 2008 peak at 1006 closing 1007.53 intraday
992 is the August 2009 consolidation low
956 is the June intraday peak
944 is the January 2009 high
935 is the January closing high
932 is the July peak
930 is the May peak
The 200 day SMA at 925
919 is the early December peak is bending

Dow: Closed at 10,023.42
Resistance:
10,120 is the October 2009 peak
10,365 is the late September 2008 low
10,609 from the Mid-September 2008 interim low
10,963 is the July 2008 low

Support:
9918 is the September 2008 peak
9855 is the early September peak in its lateral range
9835 is the late September 2009 peak
The 50 day EMA at 9717
9654 is the November 2008 high
9625 is the October 2008 closing high
9620 is the August 2009 peak
9430 is the early October low
9387 is the mid-October peak
9116 is the August low
9088 is the January 2009 peak
8985 is the closing low in the mid-2003 consolidation
8934 is the December closing high
8878 is the June peak
8829 is the late November 2008 peak
The 200 day SMA at 8637

Economic Calendar

These are consensus expectations. Our expectations will vary and are discussed in the 'Economy' section.

November 06 - Friday
- Nonfarm Payrolls, October (08:30): -190K versus -175K expected, -219K prior (revised from -263K)
- Unemployment Rate, October (08:30): 10.2% actual versus 9.9% expected, 9.8% prior
- Average Workweek, October (08:30): 33.0 actual versus 33.1 expected, 33.0 prior
- Hourly Earnings, October (08:30): 0.3% actual versus 0.1% expected, 0.1% prior
- Wholesale Inventories, September (10:00): -0.9% actual versus -1.0% expected, -1.3% prior
- Consumer Credit, September (2:00): -$14.8B actual versus -$10.0B expected, -$12.0B prior

November 12 - Thursday
- Initial Claims, 11/07 (08:30)
- Continuing Claims, 10/31 (08:30)
- Crude Inventories, 11/06 (11:00): -3.94M prior
- Treasury Budget, October (14:00): -$150.0B expected, -$155.5B prior

November 13 - Friday
- Export Prices ex-ag., October (08:30)
- Import Prices ex-oil, October (08:30)
- Trade Balance, September (08:30): -$31.9B expected, -$30.7B prior
- Michigan Sentiment-Preliminary, November (09:55): 71.8 expected, 70.6 prior
icon url

ReturntoSender

11/10/09 10:50 PM

#8744 RE: ReturntoSender #6755

From Briefing.com: 4:30 pm : The stock market spent most of the session trading without clear direction as participants took a bit of a breather following the previous session's heady advance. That left the major indices to settle in mixed fashion.

Stocks oscillated throughout the session as the U.S. dollar fluctuated against other major currencies after it dropped sharply in the previous session. The greenback initially found support as the British pound weakened in the wake of news that credit analysts at Fitch said Britain is the most likely of the major economies to lose its AAA credit rating. Representatives from the United Kingdom maintain that the credit rating remains safe. That helped the pound trim its losses and undercut the dollar; the Dollar Index finished flat after being up as much as 0.3%.

The dollar's failure to sustain its gain helped materials stocks reverse a loss of more than 1% to settle with a modest gain of 0.2%. Monsanto (MON 73.66, +3.66) provided late leadership to the sector after it had lagged into midafternoon trade. Investors had been unimpressed with the company's reaffirmed 2010 outlook, but comments during its investor conference helped improve their mood.

Financials had also lagged for most of the session, but failed to make their way into positive ground. In turn, they finished with a 0.5% loss. AIG (AIG 37.59, +1.41) helped provide support to the sector, though. According to Bloomberg.com, Moody's said the insurer will be able to repay its Federal Reserve credit line and much or all of the Treasury's investment if financial markets stabilize.

Though stocks finished in mixed fashion, the Dow was able to set a fractionally better 2009 closing high. Meanwhile, the S&P 500 continues to encounter resistance as it approaches its own 2009 highs; it settled flat.

Treasuries saw some mixed interest this session, too. The benchmark 10-year Note was up modestly in early trade, but surrendered its gains following the results from a $25 billion auction of 10-year Notes. The auction attracted a bid-to-cover ratio of 2.8, which is above the recent average of 2.6, but below the last auction's bid-to-cover of 3.0. The auction also produced a yield of 3.47%. The 10-year Note was able to reclaim gains and settle fractionally higher, however.

Advancing Sectors: Health Care (+0.5%), Utilities (+0.3%), Materials (+0.2%), Consumer Discretionary (+0.1%), Consumer Staples (+0.1%)
Declining Sectors: Financials (-0.5%), Industrials (-0.3%)
Unchanged: Energy, Tech, TelecomDJ30 +20.03 NASDAQ -2.98 NQ100 +0.3% R2K -0.9% SP400 -0.2% SP500 -0.07 NASDAQ Adv/Vol/Dec 873/2.01 bln/1798 NYSE Adv/Vol/Dec 1269/1.07 bln/1749

6:36AM On The Wires : Lattice Semiconductor (LSCC) announces that it will collaborate with Beyond Semiconductor in the development of compiler tools for Lattice's soft processors. The collaboration will include updates and performance improvements for Lattice's embedded processor IP compilers and development tools...

6:22AM Semi Manufacturing settles all pending lawsuits with TSMC: anticipates no disruption to customers (SMI) 2.42 : Co announcesthat it entered into a settlement agreement with Taiwan Semiconductor Manufacturing to resolve all pending lawsuits between the parties, including the legal action filed by TSMC in California for which a verdict was returned by the jury against SMIC on 4 November 2009 and the legal action filed by SMIC in Beijing. SMIC and TSMC have entered into a settlement agreement on 9 November 2009 to settle and dismiss the California Case, including all claims and defenses of SMIC yet to be decided in that case and SMIC's appeal in the Beijing Case, thus concluding all pending court litigation between the parties. Key provisions of this settlement include: (a) mutual release of all claims that were or could have been brought in the pending lawsuits; (b) termination of SMIC's obligation to make remaining payments under the prior settlement agreement between the parties (approx $40 mln); (c) payment to TSMC of an aggregate of US$200 mln (with $15 mln paid upon execution, funded from SMIC's existing cash balances, and the remainder to be paid in installments over a period of four years - $15 mln payable by 31 December, 2009, US$80 mln payable by 31 December, 2010, $30 mln payable by 31 December, 2011, $30 mln payable by 31 December, 2012 and $30 mln payable by 31 December, 2013); (d) grant to TSMC of 1,789,493,218 shares of SMIC (representing approx 8% of SMIC's issued share capital as of October 31, 2009) and a warrant (exercisable within three years of issuance) to subscribe for 695,914,030 shares of SMIC, subject to adjustment, at a purchase price of HK$1.30 per share (which would allow TSMC to obtain total ownership of approx 10% of SMIC's issued share capital after giving effect to the share issuances), subject to receipt of required government and regulatory approvals; and (e) certain remedies in the event of breach of this settlement.

icon url

ReturntoSender

11/11/09 8:17 PM

#8745 RE: ReturntoSender #6755

From Briefing.com: 4:30 pm : A rebound by the U.S. dollar and some technical resistance caused stocks to make an early pullback from 2009 highs and spend the rest of the session trading in lackluster fashion.

Broad-based buying in overseas markets amid strong economic data from Asia and solid earnings from some major industry players in Europe helped inspire a positive tone among U.S. participants in the early going. That combined with renewed weakness in the U.S. dollar to send the S&P 500 1.1% higher to a fractionally better 2009 high in the first hour of trade.

However, the dollar managed to garner support and swing the Dollar Index from a 0.3% loss and a fresh 52-week low to a gain of 0.3% at its session high. It settled with a gain closer to 0.1%, but that was enough to keep stocks from extending their earlier gains.

Stocks were also stymied by technical resistance as the 500 S&P flirted with the trend line for 2007-2008 highs, while the Dow tested its 50% retracement of the bear market decline. Despite the resistance, the Dow was able to log its sixth straight gain and register a new intraday high and closing high for 2009. The S&P 500 also set a fractionally better 2009 closing high, but a close above 1100 continues to elude the broader market index.

Technical resistance and a firmer dollar kept the financial sector from providing the broader market with much leadership, even though the sector spent virtually the entire session showing strength. After being up more than 2%, financials settled with a 1.4% gain.

Materials stocks also finished solidly higher. The sector settled with a 0.9% gain, helped by strength among commodities prices, which were generally higher in the face of the firmer dollar. Before settling pit trade 1.1% higher at $1114.50 per ounce, gold hit another record high of $1119.10 per ounce. That gave gold stocks a gain of 1.6% and the SPDR Gold Trust (GLD 109.60, +1.21) a new record high.

Gains were generally broad based as nine of the 10 major sectors finished with a gain. Utilities were the only sector to post a loss; they settled 0.3% lower.

Retailers also had a weak session after Macy's (M 17.86, -1.57) issued downside guidance, but the group's 0.3% decline wasn't enough to derail the consumer discretionary sector (+0.5%).

Advancing Sectors: Financials (+1.4%), Materials (+0.9%), Tech (+0.6%), Consumer Discretionary (+0.5%), Industrials (+0.5%), Consumer Staples (+0.3%), Telecom (+0.2%), Health Care (+0.2%), Energy (+0.1%)
Declining Sectors: Utilities (-0.3%)DJ30 +44.29 NASDAQ +15.82 SP500 +5.50 NASDAQ Adv/Vol/Dec 1672/1.87 bln/1006 NYSE Adv/Vol/Dec 1875/1.05 bln/1129

4:58PM Applied Materials: During call, sees 1Q10 EPS in range of $0.04 - $0.08 vs First Call consensus of $0.07 (AMAT) 13.25 +0.25 :

4:10PM Applied Materials beats by $0.08, beats on revs; guides FY10 revs in-line (AMAT) 13.21 +0.21 : Reports Q4 (Oct) earnings of $0.11 per share, excluding non-recurring items, but includes stock-based comp expense, $0.08 better than the First Call consensus of $0.03; revenues fell 25.3% year/year to $1.53 bln vs the $1.32 bln consensus. Co reports Q4 gross margin of 36.5% vs First Call consensus of 33.2%. Co issues in-line guidance for FY10, sees FY10 revs growth of more than 30%, which equates to more than $6.52 bln in revs vs. $6.2 bln consensus... In fiscal 2010, co is implementing various cost reduction initiatives and a restructuring plan expected to achieve total annualized cost savings of ~$450 mln when completed. Under the restructuring plan, AMAT expects to reduce its global workforce by ~1,300-1,500 positions, or 10-12%, over a period of 18 months. The co anticipates the pre-tax cost of the plan to be between $100-125 mln, most of which is expected to be recognized in Q1 of FY10. The anticipated savings of $450 mln are in addition to the structural cost reductions of $460 mln achieved in FY09.

4:13PM Hewlett-Packard announces preliminary Q4 results; raises fiscal year 2010 earnings and revenue outlook (HPQ) 50.00 +0.04 : Co issues upside guidance for Q4 (Oct), sees EPS of $1.14 vs. $1.12 First Call consensus; sees Q4 (Oct) revs of $30.8 bln vs. $29.79 bln consensus. Co raises guidance for FY10 (Oct), sees EPS of $4.25-4.35 from its previous estimate of $4.20 to $4.30 vs. $4.28 consensus; sees FY10 (Oct) revs of $118-119 bln up from its previous estimate of $117.0 to $118 bln vs. $118.1 bln consensus. These estimates for both the first fiscal quarter and full fiscal year of 2010 do not reflect the potential impact of the acquisition of 3Com Corporation that HP announced today. (stock is halted)

4:12PM 3Com to be acquired by HPQ for $7.90 per share in cash (COMS) 5.69 +0.28 : HP (HPQ) and COMS announced that they have entered into a definitive agreement under which HPQ will purchase COMS at a price of $7.90 per share in cash or an enterprise value of approximately $2.7 bln. The terms of the transaction have been approved by the HP and 3Com boards of directors. The transaction is expected to close in the first half of calendar 2010. HPQ anticipates that the transaction will be slightly dilutive to fiscal 2010 non-GAAP earnings. (Both stocks are halted)

3:59PM QLogic increases its lead in market share during Q3 (QLGC) 18.87 +0.20 : Co announces that it continues to strengthen its position in storage area network (SAN) Fibre Channel adapters as it increased market share, according to new data published by the Dell'Oro Group in its Q3 2009 SAN Report. QLogic increased its overall Fibre Channel adapter revenue share and strengthened its number one position in Q3 to 54.4%. QLogic also boosted its lead over its nearest rival by 1.9 percentage points, achieving a lead of 17.9 percentage points for Q3.

4:00AM LDK Solar announces People Rep. of China court injunction against guarantee banks from payments to Q-Cells (LDK) 5.81 : Co announces that, upon its motion, the Superior People's Court in Jiangxi Province has issued a civil order freezing any payment that may be made by the relevant guarantor/counter-guarantor banks pursuant to the guarantee and/or counter-guarantee issued in connection with the prepayments made by Q-Cells SE. Q-Cells made prepayments in the aggregate amount of $244.5 mln under the solar wafer supply agreement with LDK Solar. The injunctive relief also takes certain other asset preservation actions in aid of execution and will remain effective for a period of six months until May 8, 2010. Separately, LDK Solar has appealed the decision of the Regional Court of Berlin that lifted its preliminary injunction on the drawdown by Q-Cells under the German bank guarantee. LDK is also making arrangements to speed up the ICC arbitration process as permitted and required under the supply agreement for a fair determination on the substance of the dispute over the supply agreement.

09:39 am Sigma Designs downgraded to Sell at Collins Stewart; tgt $9: . Collins Stewart downgrades SIGM to Sell from Hold and sets target price at $9 on concerns of greater than anticipated share loss to BRCM. Their checks indicate that CSCO/MOT will move exclusively to BRCM SOCs for next-gen MSFT Mediaroom IPTV STBs in 2H CY'10. Their previous estimates had anticipated a dual-source scenario with more modest share loss assumptions. They believe that a motivating factor in SIGM's acquisition of Coppergate was to mitigate the revenue impact of share loss to BRCM on MSFT Mediaroom platforms especially at AT&T.

08:54 am Adobe Systems (ADBE)

Adobe Systems (ADBE 36.60) said in a regulatory filing Tuesday that it will cut approximately 9% of its workforce in an effort to reduce costs.

Adobe said it will eliminate approximately 680 full-time positions worldwide.

The company expects to record approximately $65 million to $71.0 million in pretax restructuring charges associated with the plan.

Included in the charges are $17.0 million to $19.0 million primarily related to the consolidation of leased facilities and $48.0 million to $52.0 million related to employee severance arrangements.

Adobe said it expects to record approximately $18.0 million to $20.0 million in charges in its fourth fiscal quarter and will complete the restructuring by the end of fiscal 2010.

Shares of ADBE are 71.9% higher year-to-date.
icon url

ReturntoSender

11/12/09 11:12 PM

#8746 RE: ReturntoSender #6755

From Briefing.com: 4:30 pm : A stronger dollar dampened the mood of participants for the entire session, resulting in broad-based losses for stocks.

Stocks had spent the first part of the session chopping around listlessly, but began to slide as the U.S. dollar was able to further extend its rebound from the previous session, when the Dollar Index registered a fresh 52-week low. Though the greenback made a couple of pullbacks in the early going, it never left positive territory. That induced some short covering, which helped it finish the session with a 0.8% gain, its best single-session percentage advance in more than one month.

Stocks chopped along in listless action during the early going and briefly made their way to modest gains amid momentary pullbacks by the greenback, but stocks soon fell into the red as the dollar firmed up its gains. Amid the dollar's strong advance, the S&P 500 logged its worst performance by percent of this month, though to be fair, the only other loss this month took place earlier this week when the broader market slipped less than 0.01%.

Energy stocks were the worst performers this session. Their weakness was worsened by sharply lower oil prices, which dropped 3.0% to settle pit trade at $76.91 per barrel. Oil prices had started pit trade lower amid gains in the greenback, but its slide was exacerbated by disappointing weekly inventory data. Both crude oil and gasoline had surprisingly large builds.

Strength in the dollar weighed on other commodities, too. In turn, the CRB Commodity Index fell 1.6%. That didn't hurt materials stocks too much, though. The materials sector settled a relatively tame 0.6% lower, but that is owed to a strong run up in shares of Dow Chemical (DOW 28.60, +1.89), which announced today a handful of divestitures and business agreements.

Among the other corporate announcements, Wal-Mart (WMT 53.24, +0.27) posted better-than-expected third quarter earnings of $0.84 per share and raised its fiscal 2010 forecast to range from $3.57 to $3.61 per share, which still brackets the consensus estimate of $3.58 per share, but allows for more of an upside surprise. On a similar note, Hewlett-Packard (HPQ 49.70, -0.30) issued upside guidance for the fourth quarter, saying that it expects to bring in $1.14 per share, and also raised its forecast for fiscal 2010 to the range $4.25 to $4.35 per share so that there is more room to exceed the current consensus of $4.28 per share. HP's announcement was made in conjunction with news that it will acquire 3Com (COMS 7.46, +1.77) for some $2.7 billion in cash. Applied Materials (AMAT 12.82, -0.43) reported that it brought in better-than-expected adjusted earnings of $0.11 per share. It went on to issue a strong revenue forecast that predicts top line growth in excess of 30% for fiscal 2010.

Improved jobless claims data did little to lift the mood of participants. The latest initial jobless claims tally drifted to a lower-than-expected 502,000, which is the lowest weekly total since January. Meanwhile, continuing claims came in at 5.63 million, which is the lowest level since March. That decline is owed to the expiration of unemployed benefits, not new hiring, however.

Treasuries had a solid session, despite an initially negative response to news that a $16 billion auction of 30-year Bonds produced a lower-than-expected bid-to-cover ratio of 2.26 and a lower-than-expected yield of almost 4.47%. The 30-year Bond finished the session up some 14 ticks, while the benchmark 10-year Note advanced 12 ticks. Their respective yields stand at 4.39% and 3.44%.

Separately, the Treasury budget for October came in with a $176 billion deficit, which is worse than the $165 billion deficit that had been widely forecast. According to CNBC, that is the steepest October deficit on record.

Advancing Sectors: (None)
Declining Sectors: Energy (-2.0%), Financials (-1.8%), Utilities (-1.3%), Industrials (-1.0%), Consumer Discretionary (-1.0%), Telecom (-0.8%), Materials (-0.6%), Health Care (-0.5%), Consumer Staples (-0.5%), Tech (-0.4%)DJ30 -93.79 NASDAQ -17.88 NQ100 -0.6% R2K -2.1% SP400 -1.5% SP500 -11.27 NASDAQ Adv/Vol/Dec 625/2.23 bln/2034 NYSE Adv/Vol/Dec 626/1.05 bln/2398

4:08PM Microsemi beats by $0.01, reports revs in-line; guides Q1 EPS in-line, revs in-line (MSCC) 14.66 -0.27 : Reports Q4 (Sep) earnings of $0.24 per share, $0.01 better than the First Call consensus of $0.23; revenues fell 18.6% year/year to $109.7 mln vs the $109.4 mln consensus. Co issues in-line guidance for Q1, sees EPS of $0.24-0.26 vs. $0.25 consensus; sees Q1 revs to increase 1-4% sequentially, which equates to ~$110-114 mln vs. $112.20 mln consensus.

4:02PM Emcore awarded solar panel manufacturing contract from Dutch Space (EMKR) 0.98 -0.07 : Co announces that they have been awarded a contract by Dutch Space of Leiden, The Netherlands to manufacture, test, and deliver the solar panels to power the Cygnus spacecraft being developed by Orbital Sciences Corporation (ORB) for NASA's Commercial Resupply Service project. With all options exercised the total value of the contract would be in excess of $15 mln.

9:19AM Intel updates Q4 guidance, expense for legal settlement with AMD to be taken in Q4 (INTC) 19.84 : Co announces as a result of the legal settlement announced today with Advanced Micro Devices (AMD), Intel Corporation adjusted its fourth-quarter financial expectations to reflect the impact of the $1.25 bln settlement payment. Intel now expects spending (R&D plus MG&A) in the fourth quarter to be approx $4.2 bln, up from $2.9 bln. In addition, the effective tax rate is expected to be approx 20%, down from 26%. All other expectations are unchanged. (stock is halted)

9:03AM Brooks Automation beats by $0.03, beats on revs (BRKS) 7.44 : Reports Q4 (Sep) loss of $0.22 per share, excluding non-recurring items, $0.03 better than the First Call consensus of ($0.25); revenues fell 40.0% year/year to $64.1 mln vs the $62.1 mln consensus. "We continue to see a sharp and continuing ramp in requirements from our semiconductor OEM customers. As previously announced, on top of the 46% increase in sales just reported we anticipate another increase in revenues in the December ending quarter that will exceed 45%. Based on current order booking activity and discussions with our major customers we have gained a growing confidence in projecting strong sales growth well into calendar year 2010. In addition, we presently anticipate converging on at least break even results in the current quarter and positive earnings for our full fiscal year."

RF Micro Devices (RFMD) announces that it has received its first purchase order from a tier-one wireless base station original equipment manufacturer for a product featuring RFMD's gallium nitride process technology...

10:07 am Hewlett-Packard (HPQ)

Hewlett-Packard (HPQ 49.81, -0.19) took a major step toward expanding its business Wednesday when it announced that it will acquire 3Com (COMS 7.46, +1.77), a provider of networking switching, routing and security solutions, in a deal valued at approximately $2.7 billion. Hewlett-Packard also issued an upside forecast for its fiscal fourth quarter.

Hewlett-Packard said it will acquire 3Com for $7.90 per share in cash. The $2.7 billion deal represents a nearly 39% premium on Wednesday's closing price of COMS.

"By acquiring 3Com, we are accelerating the execution of our Converged Infrastructure strategy and bringing disruptive change to the networking industry," said Dave Donatelli, executive vice president of Enterprise Servers and Networking at HP.

Separately, Hewlett-Packard announced its preliminary fourth quarter results. The company said it expects Q4 earnings of $1.14 per share, ahead of the $1.12 First Call consensus. HP forecasts revenue of $30.8 billion while the consensus estimate expects $29.79 billion.

HP also issued guidance for the first quarter of 2010, saying it expects earnings of $1.03 to $1.05 per share (First Call consensus is $1.03) on revenues of $29.6 billion to $29.9 billion (First Call consensus of $29.24 billion).

For fiscal 2010, Hewlett-Packard expects earnings of $4.25 to $4.35 per share, up from its earlier estimate of $4.20 to $4.30; the consensus currently expects $4.28. HP projects fiscal 2010 revenues of $118 billion to $119 billion, up from an earlier range of $117 billion to $118 billion. The consensus anticipates $118.1 billion.

The company said that both the first quarter and full fiscal year 2010 estimates do not reflect the potential impact of the acquisition of 3Com.

09:35 am Applied Materials (AMAT)

Applied Materials (AMAT 13.04, -0.21) reported fiscal fourth quarter earnings and revenue that easily topped analyst estimates as improved demand gave a lift to the top and bottom lines. The company also announced a cost reduction and restructuring plan that includes an approximately 10-12% cut in its workforce over the next 18 months.

Applied Materials reported fiscal fourth quarter earnings of $0.11 per share, excluding nonrecurring items, $0.08 better than the First Call consensus of $0.03.

Revenues fell 25.3% year-over-year to $1.53 billion, but still managed to top the $1.32 billion consensus.

The company's gross margin of 36.5% easily topped the First Call consensus of 33.2%.

On its earnings conference call, Applied Materials said that it expects earnings in the first fiscal quarter of 2010 to range from $0.04 to $0.08 per share; the First Call consensus currently stands at $0.07. Applied Materials expects revenues in the first quarter to grow between 10% and 25%, which equates to approximately $1.45 billion to $1.65 billion; the consensus estimate expects $1.41 billion.

For fiscal 2010, Applied Materials said it expects revenues to grow more than 30%, which equates to more than $6.52 billion in revenues compared to the $6.2 billion consensus estimate.

Despite the upturn in demand for its products, Applied Materials said it is implementing various cost reduction initiatives and a restructuring plan that is expected to achieve total annualized cost savings of $450 million when completed.

Under the plan, approximately 1,300 to 1,500 positions will be eliminated, or 10-12% of its workforce, over a period of 18 months. The pretax cost of the plan is expected to range from $100 million to $125 million, most of which will be recognized in the first quarter of fiscal 2010, the company said.
icon url

ReturntoSender

11/14/09 5:51 PM

#8747 RE: ReturntoSender #6755

Amateur Investors Weekend Market Analysis (11/14/09):

http://rivals.yahoo.com/ncaa/football/boxscore?gid=200911140020

All of the major averages have rallied back to longer term Retracement Levels calculated from the October 2007 highs to the March 2009 lows except for the S&P 500. The Dow has reached its 50% Retracement Level (point A) just below the 10400 level.


So far the S&P 500 hasn't quite reached its 50% Retracement Level which is at 1121.


Meanwhile the Nasdaq is about halfway between its 50% Retracement and 61.8% Retracement Levels.


On a daily chart the Nasdaq is exhibiting a potential Broadening Top pattern with an example shown below. This chart pattern consists of 3 higher highs (Waves 1, 3 and 5) while the 4th wave makes a low lower than Wave 2. Once the pattern completes then a reversal of the trend occurs.


A daily chart of the Nasdaq shows that it's developing a similar Broadening Top pattern and if it makes one more slightly higher high around 2215 then that would complete the pattern.


Meanwhile for those that follow Bullish-Bearish Sentiment let's look at some longer term charts going back to the late 1960's. The chart below is a Bull-Bear Ratio such that negative values mean sentiment is Bearish while positive values are Bullish. The actual sentiment values are in gray while a 20 Week Moving Average is denoted by the red line. Meanwhile the blue line is the weekly close of the S&P 500 which isn't adjusted for inflation.

Since the late 1960's significant bottoms in the S&P 500 have occurred when the 20 Week Moving Average (red line) has dropped to at least a value of -20 as denoted by black line which includes the years of 1970, 1974, 1982 and 1994 (points A). All of these were then followed by substantial rallies ranging from 64% up to 232%. In addition a secular Bear Market Low occurred in late 1974 as the 20 Week Average spiked down to below -30. Meanwhile notice the low made in late 2002 wasn't accompanied by an excessive amount of bearishness as the 20 Week Average never dropped below the 0 line (point B). Recently in March of 2009 the 20 Week Average reached -15% (point C) which has been followed by a 65% rally in the S&P 500.


Thus the question is did enough bearishness occur earlier this year to define a secular Bear Market Low like occurred from the mid 1970's through the early 1980's? To answer that question I increased the moving average to 100 weeks instead of 20 weeks as shown in the chart below. The thing that stands out is that prior to the beginning of the last Secular Bull Market (1982-1999) the red line remained below the zero line (black line) for a substantial period of time from 1978 through 1982 as there was a considerable amount of built up bearishness in the market. In addition notice all of the weeks the gray lines were well below the zero level as denoted by the pink box. Furthermore notice there was a lot of pessimism prior to the big upward move from 1995-1999 as well as the 100 Week Average dipped below the zero line (point D). Meanwhile if you compare the recent bearishness to that of the late 1970's and early 1980's so far the amount of bearishness (brown box) hasn't reached the same intensity as we saw in the late 1970's and early 1980's prior to the beginning of the last Secular Bull Market. Maybe this time will end up being different.


Signup for a "Free 4 Week Trial Membership" or save up to 50% on a Premium Membership and you will have access to the following products.

1. "ETF Daily Buy and Short Signals" which can be used to trade the DIA's, QQQQ's and SPY's.

2. "401K/Thrift Savings Plan (TSP) Timing Service" which can be used to help improve your return in your 401k/TSP Account.

3. The "End of Month Strategy". This Strategy focuses on the typical End of Month markup by the Institutional Money.

4. "Stocks to Buy List" which can be used with either our Short Term Strategy or Long Term Strategy.

icon url

ReturntoSender

11/15/09 9:42 PM

#8749 RE: ReturntoSender #6755

InvestmentHouse Weekend Market Summary 11/13/09:

http://www.investmenthouse.com/weekendmarketsummary.htm

- Dollar falls, market bounces, but no change in relative position as market waits to see if liquidity comes back or the technical weakness prevails near term.
- EU emerges from recession, just not as strong as it wanted.
- Trade deficit jumps on imports, but they are not good imports.
- Return the TARP repayments to the taxpayers versus throwing it down the hole of federal debt retirement.
- Michigan a bit gloomier as jobs become a leading indicator.
- Market is technically ready to trade back in its range, but it all depends first upon the liquidity and second upon the dollar.

Market rebounds from the Thursday loss but no relative change.

The market went nowhere on Friday. It was higher, but it only recaptured some of the ground it lost on Thursday when it sold back from resistance.

The market was banging its head against the next key resistance for the entire week. SP500 has its 2007 downtrend, the bottom of the 2004 lateral consolidation, and the October highs. NASDAQ has very important lows from the past three years that it is banging up against. There is that resistance met after a technically weak bounce on the one hand, and there is the liquidity held by all the financial institutions in the world on the other hand. Those are the dollars that the rest of the central banks have printed up that they are not lending out to anyone. That is what is going to determine the next move. In other words, when are the financial institutions going to push the "buy" button and move back into the market? Do they want the indices to test back inside their range over the next few weeks, or do they want to break things out now ahead of the Thanksgiving holiday and send the markets racing to new highs? That will be the determining factor as to whether the market moves higher.

On Friday, with the liquidity not coming into the market, the next most important factor was the dollar. The dollar was weaker, and it sold off after bouncing higher on Thursday (1.4915 Euros versus 1.4839 Thursday). The market sold on Thursday, but Friday when the dollar lost some strength, the market recovered and bounced back up. That did not change anything; it is still in the same position it was on Thursday and the entire week. It is bumping up against the next key resistance after a low-volume rally following higher-volume selling from the same resistance level back in mid-October. No change, only the dollar made the difference.

As the dollar goes up in price, usually you can bet that all the inverse indices - metals, energy, etc. - would go down. That was not the case. Even though the dollar did weaken on Friday, oil was down ($76.43, -0.51 versus $80 on the last bounce). It ran out of steam there again and pulled back. Gold surged ($1,119.40, +12.80).

The bond market was somewhat interesting. The 10 year closed lower (3.42%. versus 3.48% earlier in the week). There was some movement back to bonds late in the week. That shows there may be weakness ongoing in the stock market as the bond market anticipates some more selling. Stocks were higher on Friday, and bonds were higher as well. Money was moving into bonds and that usually is an inverse relationship - that could be foretelling. There may be that pullback next week starting down into the range, and that would not be such a bad thing. All it would do is put some extended stocks back into a better buy position and give the market a good breather for a move higher toward the end of the year - indeed, a move higher onto the January area where we get a January effect (or what I will call a "liquidity effect" this year).

The worst news out on Friday was that the EU GDP grew at 0.4%. It pulled out of recession, and some of its components had already done that. The gain was not as big as anticipated. Germany gained 0.7%, France 0.3%, and Italy 0.6%. Fashion and fast cars in Italy are doing the trick. On the other hand, the UK lost -0.4% and Spain was down -0.3%. There were not huge changes in the GDP, but enough to keep the overall level lower than anticipated. It was good news overall, just not quite as good as hoped. That was the case with the Michigan Sentiment report. It was lower than expected. After the market started higher, that gapped it lower, but it did not keep things down.

It was a Friday, and even though the sellers have been in the market, they are still leery of all the liquidity out there. Even though they tried to sell it off in mid-afternoon, they were not able to close the deal simply because there is a weekend coming. Liquidity is still out there, and sellers lost their nerve. The market was able to bounce back and close with gains across the board.

TECHNICAL

INTRADAY

The SP500 gapped higher at the open and continued higher. When the Michigan Sentiment came out it gapped lower, recovered, and then moved higher for the entire session only to fade back in the afternoon. Then the market bounced back in the last hour to recoup some of the mid-afternoon losses. That closed out the indices with decent gains. NASDAQ 0.88%, Dow 0.72%, SP500, 0.57%, SP600 0.9%.

It looked like a pretty strong, up session. The Friday high was at about 1097. If you go back to Thursday, there was a high hit in the morning, and then it trended lower for the rest of the session. There was a high early in the session on Wednesday, and then a trade down all day long. That tells us that we have had a series of progressively lower highs. Even though SP500 finished up for the week, it still finished below key resistance in the form of the October peaks as well as the 2004 trading range and the 2007 downtrend line. It made a series of lower highs to end the week. While that does not look too bad on a daily chart, there are issues at work on SP500. It is not necessarily as strong as the week shows, and looking at the intraday action is one way to tell that.

INTERNALS

SP400 is one of the reasons the internals were not bad on Friday at 2:1 advancers on NASDAQ and 2.7:1 advancers on the NYSE. The mid-caps held up well. Even though they made a lower low in early November, they have not sold off as hard and have not been lagging as bad as the small caps. They are very similar to NASDAQ's pattern, though they are still below key resistance in September that they never got through. The small caps were up almost 1% on the session. When that happens, it helps push the breadth higher. There was an improvement in the breadth, but on Thursday when the SP600 sold off, the NYSE breadth was -4:1. It was significantly stronger to the downside.

Volume on the NYSE was low once more, and it continued a string of lower session. It was slightly higher on the Thursday selling, but not significantly so. It was flatline and it is low trade, so not showing much of anything at this level. That does not necessarily mean it will hold and continue to move higher because when there is lower and lower volume as a market moves higher, it is running out of buyers. There are three levels of key resistance that it is butting up against. With the lower volume, it could simply have no buyers. It had plenty of sellers on the way down from this level in October, but there are not a lot of buyers on the way up. There can be low-volume deaths of indices. On the NASDAQ, trade was lower as well, dropping 13% and back below average as NASDAQ bounced up and hit the September peak and the middle of the October range. Thursday volume was higher as it sold back, touching average. That was the highest volume since the first day of the month, and it occurred on the downside. Once again, we see an overall lack of volume on the buy side, and plenty of volume on the downside. On the one session that it was down, the volume spiked up. We could be having the same type of issue here - a low volume (lack of buyers) death on the NASDAQ.

CHARTS

There are two key factors at loggerheads. There is resistance on both NASDAQ (long term resistance line) and on the SP500 with its three levels of resistance: one near term at the October peak, one longer term at the bottom of the 2004 consolidation range (where it spent a year moving laterally), and there is also the downtrend line from 2007. Three layers of ice all running together - that is a thick layer to break through. That resistance is opposed by the continuing liquidity in the market, gratis the US Fed and the other central banks in the world that have indicated that there will be no near term reduction in the amount of easy money and credit that is circulating the globe. There are two opposing forces right now, and the indices are at yet another inflection point where they will decide what they will do near term. They were at an inflection point in early November, and the liquidity won out. The volume has faded considerably as the buyers have been fewer on the rebound back up to this resistance level.

Friday's action left no relative change in the indices. They were up across the board, but after selling back on Thursday, that left them in the same place right below key resistance. SP500 is not showing any kind of major rollover. It has moved up to the resistance level, and that is important. It sold off on Thursday, but there was no real volume. It bounced up on Friday. The internals continued to be weak, and the action on the rebound was weak. It is not a strong move back up, but none of these moves have failed. Over this entire rally since March, the only moves that started to fail were in the June-July consolidation. It may very well get something like that with a low volume move higher. With all the resistance, certainly the market will need something to push it through. It would not hurt if SP500 came back and moved laterally for 2-4 weeks, consolidated and then rebounded back up. There is no major rollover, but the liquidity has not been able to drive it through the key resistance level.

As for NASDAQ, it has a clearer weakness than the SP500 as the sellers showed their hand on Thursday when volume spiked up as the index sold lower. That showed that the sellers were still a bit stronger than the buyers overall. The stronger selling volume is still outperforming the upside move, and the inability to move through that October peak and the higher volume on Thursday again shows the sellers were trying to assert their hand. There is still no definitive break down. There is a lower low and then a rebound. It is definitely not a strong technical position, and not as strong as it was in the move from July to October, but it is not a breakdown yet. It is showing indications that that may be the case, but there are still a lot of leaders on NASDAQ holding up just fine. It could come back down if it fails, and trade in the range to the 2,025 level. That would be fine. It would set up many more positive patterns for another move higher when the liquidity comes back in the market.

SP600 has been a focus because it has been lagging, and because it is the canary for the rest of the economy. Many people are saying (particularly the government) that the economy is improving while the small caps have been lagging. Indeed all of the growth indices have been lagging somewhat, and that is a concern. SP600 moved up as well this week, but it came nowhere near its prior highs, the prior peak in October, and not even the lower peak in September. It has made the lower low and is struggling at a resistance level. It sold off on Thursday, tried to recover on Friday after a selloff, but was not able to break back through that level; indeed, it closed right at the 50 day EMA.

It did rebound off the low, so there were buyers coming in and trying to push it back up, but it is still a very weak pattern. I still believe that this may be the lead for the rest of the market and it could trade down to the 290 level. That could send NASDAQ and SP500 down as well, but again they would just be in their trading range - down toward the bottom of their trading range, or even half or three quarters of the way down versus a complete selloff. I do not think the liquidity will allow a complete selloff. It will allow trading inside the range and then a move higher when buyers feel the time is right, i.e., after some of the extended leaders pull back to support or consolidate or form new bases and are ready to break higher once more. That will be a boon for a new buying opportunity if that occurs. I would like to see a pullback. We have taken some downside positions in anticipation of a potential pullback, and we now have to see how it plays out.

In sum, we have a technical setup for a failure. If it were not for the liquidity, this would be ripe for a rollover, and a serious one at that. Given the liquidity, if the buyers decide to come back in ahead of the end of the year, they could push the market higher even from these resistance levels at the October peaks. They can still push it higher from here. I am anticipating more of a pullback, but that means the buyers are willing to wait a bit.

The two forces at loggerheads are a weak technical position versus the liquidity that has been pushing the market higher. I think the liquidity will win out, but now I am leaning toward a test lower in the range. We have positions to the downside, and if they do not hold and it breaks higher over the peaks, we will close them out and will be in decent shape because we are in a very good risk/reward point.

LEADERSHIP

The dollar was down on the session. There was no change in the leadership other than bouncing back somewhat after being boxed around Thursday as the dollar rebounded.

The dollar's double bottom is still holding right now. It is trying to hold at a key level back in late 2007 and 2008. If you look at the weekly chart, you see a reach down to the same lower support level and a sharp recovery. There was buying of the dollar as it reached lower. Then, as you go back to a daily chart, there was a nice surge up. It was down on Friday, and early next week will be an important time for the dollar. We will see if the 1.5-Euro level still holds and if it can make a break higher up to the 77.25-78 level. If that is the case, we will get the pullback in the indices that will take them back down toward the bottom of their trading range. Again, that is not a terrible outcome at all. It sets up some good upside buys for when it is over, and it gives great downside gains on the positions we have taken.

With that, you know that energy was higher on the session. HAL, which was in a bit of trouble, sold off early but came back. SLB looks just fine, bouncing higher on rising trade. The oil stocks are not in any serious trouble. RIG is holding up above a support level as well. There is no issue here.

Looking at metals, you see the same thing. We have a position in CLF, and it is going to town. It broke to a new rally high on higher volume, clearing the October peaks and doing so with panache as volume moved above average. Of course, there is copper and FCX. The two go hand and hand, and you cannot look at metals without looking at copper. It is making a pullback, but it is holding at support nicely. I would not be surprised if it holds the gap, continues higher, and breaks to a new high. There is nothing wrong with this chart pattern. No lower lows and nothing of the sort - just continuing strength all the way up.

While we are looking at metals, let us look at GLD, the gold ETF. We sold some gold positions on Wednesday when it gapped higher to a hanging man doji. It sold off on Thursday and it looked like that was a prescient move, but gold recaptured all of that loss on Friday and is back at a rally high. We are looking for more of a pullback - down to 106 or 105 would be an excellent opportunity to add to positions. We did not sell our entire position. We will let our current position run higher and then look for opportunities to step in as they present themselves.

Industrials were fine on the session. CAT showed a nice, tight doji at the 10 day EMA. There was a modest pullback, low volume, no lower lows, and no issues here. You can look at this and say it is a potential double top, but there is no sign of trouble at all with the rising lows. Looking across the board, most industrials are in the same position.

Retail is good and it is also not so good. ANF announced decent results and guidance, and it was rewarded. We have a play on BBY. What a nice pullback it has to test the breakout of the ascending triangle. A great pullback and low volume. It tapped near that peak, bounced up, and continues its move higher; it is going to be a buy as well. Retail is not in bad shape.

There is no change in leadership overall, but it has pulled back modestly. A lot of leadership is extended and could use a 2-3 week consolidation in the overall market to set up better positions to buy into. The question is whether the liquidity will allow the market to pull back at the end of the year. There is extension in leadership, and it would be great to have a consolidation for entry. The technical pattern looks as if the market is ripe to pull back. The question is whether the investors - the big money banks and financial institutions - are going to put that money into the financial markets before the end of the year, or if they will wait for a pullback. If they decide to pull the trigger, and the money goes into the market, it is going to trump because there is plenty of money to go into the market. There has been no removal of any liquidity around the globe. That is what we are watching and waiting for. We are playing what the market tells us to play while we wait to see what the money does. It adds that element that is not usually in the market where you can look at technicals and make decisions based on that. You look at the technical position, realize what the stocks and indices can do short term, and then overlay the liquidity on that and take your positions accordingly. That is why we are taking downside positions up against the resistance on SP500 and the NASDAQ. If it works out, we make great money to the downside. On the other hand, if the liquidity runs into the market, we have near term stops so we do not get hurt. We can have one of the scenarios where the market gaps higher or races higher and then reverses. If it does, it will usually show its hand relatively quickly. We will likely get stopped out of some positions - maybe not all of them. If we do and the market does reverse, we will get right back into it. In other words, if SP500 makes the breakout over the resistance levels and we are stopped out, when it tests this, we see whether it reverses and closes back in this range on higher volume. That would show that there has been a reversal in the move and it is going to trade lower. It could also hold and bounce up. If so, we have an upside play, and we will take it whatever way the market goes. A lot of that is dependent on when the big financial institutions want to pull the trigger with respect to putting more money to work in the markets.

THE ECONOMY

Trade deficit jumps sharply as imports surge.

Trade deficit numbers were out on Friday. Without going into specifics, I will note that it was much larger than expected and the fastest-rated growth in over a decade. Imports were up much more than expected, swamping exports that were still relatively high. The dollar is low, and the administration wants to promote exports as our way out of this mess (versus helping small business), so there are more exports as the dollar was being crushed. That tends to help our GDP number. The problem is that imports totally outstripped that number, so there is legitimate concern that the GDP will be revised to something like 3.1% growth from the 3.5% originally reported. That is usually not a bad thing. History shows that when the economy is good in the United States, imports go up. When the consumer feels good, they buy a lot of domestic and foreign goods, and that typically means the dollar is stronger and we can buy more with our money. That is not the case right now, so there is to wonder how the consumer is driving the imports that high with a weak dollar. The consumer is NOT buying that much. Do not be fooled. Oil imports cost a lot more because the dollar is so much weaker, and as we come out of the zero growth from Q4 of 2008, we are using more oil than we were using then. Remember, it is not just the amount used, but how much it costs. We have to pay more as the dollar is crushed, and that drives up the deficit.

We are importing more than oil. We are importing autos and auto parts, but we are not buying a bunch of BMWs, Ferraris, and Porsches. If you look deeper than the headlines of the less-than-reputable news agencies, you see that the imports are from Canada and Mexico. That is where we get all of our auto parts. Cash for Clunkers depleted some of the inventory of cars and auto parts, so that was the gain in imports. We were not buying a bunch of foreign cars. These are domestic parts for domestic cars for our government motors, GM and Chrysler. This is no surge in consumer consumption that would indicate a healthy market. We are getting the double whammy of inflated oil prices through the dollar's decline as well as having to restock domestic parts and autos after the Cash for Clunkers program. That program cost the taxpayers over $20K per vehicle sold through the program. That sounds like the $303K-per-job saved or created through the stimulus package. What a deal for the American taxpayers. I prefer they give me the $20K and let me buy a car than to have this nonsensical government giveaway.

I had to get on my soapbox because it has been that kind of week. It has been one thing after another that just makes you shake your head and sigh. There is to laugh to keep from crying when you see what is happening in our government.

TARP to taxpayers versus to debt.

There was news that the banks are paying back their TARP funds with interest. That is nice, but Treasury Secretary Giethner says we are going to use that to pay down the deficit. What good will it do to pay it down if we do not get any growth in the economy? Even though it does sound good, it will only take money out of the economy. History has shown that the best way to pay down our deficit is for the economy to surge in a massive recovery. That has cured all deficits in the past, and it is how we got the surpluses of the 1990s. There was huge growth in R&D and a tech revolution that started in the 1980s - it has its roots there from those tax cuts that invested money in the United States. We then paid down our debt with the surplus.

We had a surplus because President Clinton raised taxes to pay our debts, and it brought in more money than anticipated because the economy boomed more than anticipated. There was only a slowdown in 1991-1992 rather than a serious recession. The economy was still throwing off billions, even trillions of dollars in revenues, so there was a huge surplus. Did the government return the excess money back to the citizens after saying it had to raise taxes in order to pay our debts? They paid them, and kept the rest of the money that would have been pumped back into the economy through the businesses, in R&D, and through the citizens consuming more. Instead of keeping the economy going, that became one of the factors (along with Greenspan's blunders) that contributed to the crash in 2000. Earned money is the lifeblood of the economy, and that taxation threw it down the hole of retiring our debt. The growth had already retired our debt and we were in surplus territory, so we should have pumped it back into the economy. That is what a good business does. It keeps some money for a rainy day, but it pumps the rest of it into growth - getting the business bigger and stronger, getting more employees, and funding more R&D. There is to do that to be a leader. That is not what we did, and it is one of the reasons we crashed.

We are getting some money back on our investment in these companies through TARP, and we are going to throw it down a rat hole of retiring debt instead of trying to revitalize small business, which is the engine of the United States (and the world) economy. Be sure to look at my video from Thursday. It was posted incorrectly because my computer played a trick on me and renamed the one from Wednesday for Thursday. We are going to keep it on so you can take a look, and in it I talk about the death of the small business in the United States. We are not going to give money and stimulate the small businesses through incentives, we are instead going to retire debt. As I said, history shows the way we get out of debt and retire our debt is to grow our economy, but they are choosing to take more money out of the system. We have taken it out of the system in these giveaways, and the money they are paying back is not going to come back to those who footed the bill. It is going to go to retiring debts that our government has accumulated and is going to continue to accumulate. I dare say it will have the same effect. We are not going to have a strong recovery. All of the metrics that gauge the strength of recovery say this is a weak recovery at best. It does not take a think tank to figure that out. You need only look at how poor the jobs are [8:56] and the prediction that the unemployment rate is going to be over 10% through mid-2010 at least. The administration is finding out that its great stimulus plan that was going to peak unemployment at 8% and create all these jobs has not done that, and it is not going to do that. History has a nasty way of repeating itself.

Today in a small business I was visiting, they were saying that we have a Jimmy Carter times two in the White House now. That is the joke among the small businesses that were almost killed off entirely in the 1970s. I got on the soapbox again, but it helps to rail at the government sometimes, right?

Michigan sentiment shows jobs are now a leading indicator.

Michigan Sentiment came in on Friday (66 versus 70.6 prior and 71.0 expected). That was a three-month low, and it was the unemployment rate that brought it down. That is what is weighing on the respondents (maybe we should call them "despondents" instead). With the new expectations of a 10% + unemployment rate through at least mid-2010, that has respondents worried about their future and spending less. Those planning to make a major purchase over the next six months fell almost 10%. It is a very difficult situation for consumers and the small businesses out there. Just to put this in perspective, the 66 level is a recession level. From the recovery in late 2001, the Sentiment recovered and averaged 89 from late 2001 to the peak in December 2007. We are nowhere near that level. 66 is a tad lower than 89. Suffice to say that when we were in late 2001 and starting to come out of that recession, Sentiment was rising rapidly because people sensed a recovery coming. Right now, it is heading the other way again - a double dip. They are despondent, and they are worried about jobs.

Jobs are a lagging indicator and are generally the last thing to turn, but when the numbers get this bad, it becomes a leading indicator because small businesses are crushed and have no money to invest. They are also getting no loans. It is an out-and-out lie when you hear the financial institutions that were bailed out by the government say that they are loaning to anybody. I had lunch with some Wells Fargo and other bankers, and we talked candidly about loans to small businesses. They said small businesses cannot have enough collateral and they cannot have a good enough balance sheet to get a loan right now. They are making more money in the stock market than they would lending it to small businesses, so they are not doing it. With small business despondency and consumer despondency over jobs, we have a serious problem creating this leading effect that the jobs report is showing. We are not recovering as rapidly as we could be. The administration is pushing exports and depressing the dollar so we can buy less here. We are hurting our small businesses because energy is purchased with dollars, so every time the dollar goes lower it costs them more to do their business when they cannot get the money they need.

WMT recognizes the problem and is cosigning with its apparel manufacturers that supply it so they can get the money they need to make the goods that WMT sells. It sees the problem and is taking proactive steps to help it. The problem is that the company that usually does this, CIT Group, was allowed to go bankrupt without one iota of concern from the administration. It is the primary lender for small businesses so they can make their payrolls and put the money down to get their goods manufactured. This administration says it is for the small guy, but every policy that it is promulgating only helps the big boys. It is pushing the strongest driver of US economy - the small businesses -out of business. When they go, it is going to be left with the big companies it is in bed with through the stimulus package such as GE and others that have made deals with the administration to get the money. It is not a good situation for the US economy, so do not be beguiled by what is going on.

THE MARKET

MARKET SENTIMENT

VIX: 23.36; -0.88
VXN: 22.92; -1.13
VXO: 22.27; -0.95

Put/Call Ratio (CBOE): 1.01; +0.16. More bets that the market is going to fall nearer term. Not enough closes over 1.0 to mean anything at this point.

Bulls versus Bears:

This is a reading of the number of bullish investment advisors versus bearish advisors. The reason you look at this is that it gives you an idea of how bullish investors are. If they are too bullish then everyone is in the market and it is heading for a top: if everyone wants to be in the market then all the money is in and there is no more new cash to drive it higher. On the other side of the spectrum if there are a lot of bears then there is a lot of cash on the sideline, and as the market rallies it drags that cash in as the bears give in. That cash provides the market the fuel to move higher. If bears are low it is the same as a lot of bulls: everyone is in and the market doesn't have the cash to drive it higher.

Bulls: 48.3%. Surprisingly holding steady for the second week after a drop from 49.5% two weeks back. Still a lot of believers in the rally, and that may be to investors' detriment near term as the market consolidates a bit more. Bulls have held in the 48% to 50% range for several weeks now though that will start changing some now, and that is for the better in terms of a renewed upside move. Still well over the 35% level that is the threshold for what is considered a bullish climate. It does not mean things are necessarily bearish; that takes a reading in the 60% range. Hit a high of 47.7% mid-June on the run from the March lows. Again, to be seriously bearish it needs to get up to the 60% to 65% level. Dramatic rise from 21.3% in November 2008, the bottom on this leg. This last leg down showed us the largest single week drop we have ever seen, falling from 33.7% to 25.3%. Hit 40.7% on the high during the rally off the July 2008 lows. 30.9% was the March low. In March the indicator did its job with the dive below 35% and the crossover with the bears. A move into the lower 40's is a decline of significance. A move to 35% is a bullish indicator.

Bears: 24.7%. A rise as expected, but not a surge despite the rather sharp, high volume selling to end October. Bears remains relatively low, hardly in excess numbers but not so low to start looking for a reversal. Last week 22.5%, and hanging around in the 23% range before that. Hit a low of 21.3% on this leg. Rebounding some from the big drop 31.1% and 35.6%. For reference, cracking above the 35% threshold considered bullish. Hit a high on this run at 47.2%. For reference, bearishness hit a 5 year high at 54.4% the last week of October 2008. The move over 50 took bearish sentiment to its highest level since 1995. Extreme negative sentiment. Prior levels for comparison: Bearishness peaked at 37.4% in September 2007. It topped the June 2006 peak (36%) on that run. That June peak eclipsed the March 2006 high (33%) and well above the 2005 highs that spawned new rallies (30% in May 2005, 29.2% in October 2005). That was a huge turn, unlike any seen in recent history.

NASDAQ

Stats: +18.86 points (+0.88%) to close at 2167.88
Volume: 1.833B (-13.18%)

Up Volume: 1.407B (+553.779M)
Down Volume: 477.105M (-952.991M)

A/D and Hi/Lo: Advancers led 2.01 to 1
Previous Session: Decliners led 3.13 to 1

New Highs: 59 (-10)
New Lows: 41 (-6)

NASDAQ CHART: Click to view the chart

NASDAQ 100 CHART: Click to view the chart

SOX CHART: Click to view the chart

SP500/NYSE

Stats: +6.24 points (+0.57%) to close at 1093.48
NYSE Volume: 971.403M (-7.52%)

Up Volume: 681.453M (+534.117M)
Down Volume: 273.51M (-603.846M)

A/D and Hi/Lo: Advancers led 2.73 to 1
Previous Session: Decliners led 3.93 to 1

New Highs: 157 (-49)
New Lows: 34 (-3)

SP500 CHART: Click to view the chart

SP600 Chart: Click to view the chart

DJ30

Stats: +73 points (+0.72%) to close at 10270.47
Volume DJ30: 167M shares Friday versus 183M shares Thursday.

DJ30 CHART: Click to view the chart

MONDAY

There are the loggerheads of a weak technical picture versus the liquidity. When are the big financial institutions going to put that money back in the market? It is like Hamlet: To invest or not to invest? That is the question for the guys with all the money. If they hold off, the dollar could continue with its double bottom bounce higher. That would send the market lower, and it would be something of a blessing for investors because it would come down, and we would make money on our downside positions. It would put many extended leaders in new position to buy. When they are ripe, when they base out a bit and consolidate, they will be ready to buy and we could move in because you can bet that the big boys holding the money will see that as an opportunity as well and push the button. We can hope that that is what they do. If they hold off, then we get a nice rally on into Christmas and into January with the liquidity effect for early 2010. We will have to see how it plays out.

We have downside positions in play, and we were not taking any new positions on Friday. We have upside positions that we are letting run higher as well. We can see which way the market goes. If it goes higher and makes the breakout, then we will close our downside positions because we picked them up at a good place right at the resistance level. We will not lose much on it, but it is a good bet for a rollover because the technical picture certainly indicates that that is what the market wants to do (but for that liquidity hanging out there). The liquidity is the wildcard rolling around on the deck, and we have to play ball with it. When it comes in, it is the 800-pound gorilla in the room - can I string together enough metaphors? In any event, when the liquidity comes in, we have to make note of it and play accordingly.

We will look for the pullback. The market is ripe for that technically, and we will see if we get it. If we do, it will be a nice payday that sets up new buys, and we will go forward. We will have upside plays and downside plays for the start of next week, so we can take it whichever way it goes. We still have the three scenarios in effect. There could still be the breakout and the reversal. There could be a stall out as it has been doing thus far. We could also get the breakout, then it comes back, tests, holds, and then moves higher. We will play whichever one the market wants to give us. I will see you next week.

Support and Resistance

NASDAQ: Closed at 2167.88
Resistance:
2167 from the July 2008 intraday low
2168 is the September 2009, intraday peak
2169 is the March 2008 closing low (double bottom)
2177 is a low from March 2008
2191 is the October 2009 peak
2210 (from September 2008) to 2212 (the July 2009 closing low)
2275 - 2278 from the February 2008 and April 2008 lows

Support:
2155 is the March 2008 intraday low
2143 is the October 2009 range low
2099 is the mid-September 2008 closing low
The 50 day EMA at 2095
2070 is the September 2008 intraday low
2060 is the August peak
2048 is the early October 2009 closing low
2016 is the early August peak
1984 from late September
1962 is the bottom of the August 2009 range.
1947 is the October gap down point
1897 is the October post gap intraday high.
1880 is the June peak
1862 is the July peak
The 200 day SM A at 1818

S&P 500: Closed at 1093.48
Resistance:
The March/July up trendline at 1094
1101 is the October high
1105 is the 2007 down trendline
1106 is the September 2008 low
1133 from a September 2008 intraday low
1185 from late September 2008
1200 from the July 2008 low

Support:
1080 is the September 2009 peak
1078 is the October range low
The 18 day EMA at 1075
1070 is the late September 2009 peak
The 50 day EMA at 1056
1044 is the October 2008 intraday high
The August peak at 1040
The early October 2009 closing low at 1025
The early August intraday peak at 1018
The November 2008 peak at 1006 closing 1007.53 intraday
992 is the August 2009 consolidation low
956 is the June intraday peak
944 is the January 2009 high
935 is the January closing high
932 is the July peak
The 200 day SMA at 931
930 is the May peak
919 is the early December peak is bending

Dow: Closed at 10,270.47
Resistance:
10,365 is the late September 2008 low
10,609 from the Mid-September 2008 interim low
10,963 is the July 2008 low

Support:
10,120 is the October 2009 peak
The 18 day EMA at 10,019
9918 is the September 2008 peak
9855 is the early September peak in its lateral range
9835 is the late September 2009 peak
The 50 day EMA at 9813
9654 is the November 2008 high
9625 is the October 2008 closing high
9620 is the August 2009 peak
9430 is the early October low
9387 is the mid-October peak
9116 is the August low
9088 is the January 2009 peak
8985 is the closing low in the mid-2003 consolidation
8934 is the December closing high
8878 is the June peak
8829 is the late November 2008 peak
The 200 day SMA at 8689

Economic Calendar

These are consensus expectations. Our expectations will vary and are discussed in the 'Economy' section.

November 16 - Monday
- Retail Sales, October (08:30): 0.9% expected, -1.5% prior
- Retail Sales ex-auto, October (08:30): 0.4% expected, 0.5% prior
- Empire Manufacturing, November (08:30): 30.00 expected, 34.57 prior
- Business Inventories, September (10:00): -0.7% expected, -1.5% prior

November 17 - Tuesday
- Core PPI, October (08:30): 0.1% expected, -0.1% prior
- PPI, October (08:30): 0.5% expected, -0.6% prior
- Net Long-term TIC Fl, Sep (09:00): $35.0B expected, $28.6B prior
- Capacity Utilization, October (09:15): 70.8% expected, 70.5% prior
- Industrial Production, October (09:15): 0.4% expected, 0.7% prior

November 18 - Wednesday
- Housing Starts, October (08:30): 600K expected, 590K prior
- Building Permits, October (08:30): 580K expected, 573K prior
- CPI, October (08:30): 0.2% expected, 0.2% prior
- Core CPI, October (08:30): 0.1% expected, 0.2% prior
- Crude Inventories, 11/13 (10:30): 1.76M prior

November 19 - Thursday
- Initial Claims, 11/14 (08:30): 504K expected, 502K prior
- Continuing Claims, 11/13 (08:30): 5600K expected, 5631K prior
- Leading Indicators, October (10:00): 0.4% expected, 1.0% prior
- Philadelphia Fed, November (10:00): 12.0 expected, 11.5 prior


icon url

ReturntoSender

11/16/09 10:03 PM

#8750 RE: ReturntoSender #6755

From Briefing.com: 4:35 pm : Broad-based buying on the back of a weaker dollar drove the major indices to new highs for 2009. Strength in the broader market also helped stocks offset a late slip by financials so that the S&P 500 could settle above the 1100 mark for the first time in more than one year.

The U.S. dollar came under considerable pressure early. That helped perpetuate a positive tone among participants, who were already inspired by overseas gains in the wake of a renewed commitment by Asian officials to economic stimulus. With a 0.6% drop by the greenback against a basket of foreign currencies, the Dollar Index was left to trade near its 52-week lows.

Though the dollar's decline continues to support the broader market, energy and materials stocks benefited the most. The two sectors finished with respective gains of 2.5% and 2.3%.

In addition to broader market support, energy stocks and materials stocks were helped by higher commodity prices, which drove the CRB Commodity Index to a 2.8% gain. That was its best single-session percentage advance in more than one month. Crude oil prices were a primary underpinning of the move; contracts closed pit trade with oil priced 3.4% higher at $78.94 per barrel. Gold stood out for making its way to another new record high; this time it hit $1143.40 per ounce before it settled with a gain of 2.0% at $1139.20 per ounce.

Though a positive tone was present among both commodities and stocks for the entire session, the broader equity market pared a small part of their gains in the final hour of trade. The slip came as financials were knocked off of their perch by word from influential analyst Meredith Whitney during a CNBC interview that she expects banks to raise another round of capital. That turned a near 2% gain for diversified financial services giants into a gain of hardly 0.4%.

Still, consumer finance stocks finished with a solid 2.9% gain following the latest trust data from the likes of American Express (AXP 41.44, +1.09) and Discover Financial (DFS 16.11, +0.71). AmEx reported that its 30 day past delinquency rate for October held steady at 4.1%, while Discover disclosed that delinquencies increased 15 basis points to 5.72%.

Home improvement retailer Lowe's (LOW 21.74, -0.11) was out with its latest results, which featured in-line earnings. Even amid broad-based buying that wasn't enough to spur interest in the stock. Meanwhile, Illinois Tool Works (ITW 51.02, +2.04) found favor after it issued an in-line outlook of its own.

Even as market participants showed favor for riskier asset classes, Treasuries still managed to make impressive gains. In fact, the benchmark 10-year Note climbed 19 ticks, which pushed its yield down to 3.35%. That marks its lowest point in roughly three weeks.

Treasuries were helped a bit by comments from Fed Chairman Bernanke during a speech at the Economic Club of New York. Bernanke noted that the best thing about the labor market right now is that it may be getting worse more slowly.

In terms of actual data, the October Advance Retail Sales Report said that total retail sales were up 1.4% last month. Economists, on average, had expected a 0.9% increase. Excluding autos, retail sales increased 0.2% last month, but that rate is below the 0.4% increase that economists had come to expect.

The Empire Manufacturing Survey for November came in at 23.5, below expectations for a reading of 30.0 following the 34.6 that was posted in the previous month.

Business inventory data for September showed a 0.4% decrease, which is softer than the 0.7% decrease that had been widely expected. That announcement had no real impact on trade, though.

Advancing Sectors: Energy (+2.5%), Materials (+2.3%), Industrials (+2.0%), Consumer Discretionary (+1.7%), Health Care (+1.4%), Utilities (+1.3%), Financials (+1.2%), Tech (+1.0%), Telecom (+0.8%), Consumer Discretionary (+0.7%)
Declining Sectors: (None)DJ30 +136.49 NASDAQ +29.97 NQ100 +1.1% R2K +2.8% SP400 +1.8% SP500 +15.82 NASDAQ Adv/Vol/Dec 2073/2.13 bln/638 NYSE Adv/Vol/Dec 2485/1.15 bln/576

4:48PM Sunpower internal review identifies unsubstantiated accounting entries (SPWRA) 27.23 +0.81 : Co announces that based upon an internal review of its Philippine manufacturing operations, the company believes there may have been unsubstantiated accounting entries made in the first three qtrs of 2009, some of which relate to the company's fiscal year ended December 28, 2008. Mgmt informed the Audit Committee of the Board of Directors of these entries and the Audit Committee immediately commenced an investigation of the matter, which is ongoing. Based upon the preliminary findings of the ongoing investigation, the Audit Committee to date has identified accounting entries in the Philippines that may have overstated expenses in its cost of goods sold of approximately $1 mln in the first quarter ending March 29, 2009, and understated expenses in its cost of goods sold of approximately $14 mln in the second quarter ending June 28, 2009 and approximately $2 mln in the third quarter ending September 27, 2009. The company previously reported 2009 quarterly revenues and operating income under Generally Accepted Accounting Principles of $213.8 mln and a loss of $2.5 mln, respectively, in the first quarter, $297.6 mln and $9.9 mln, respectively, in the second quarter and $466.3 mln and $34.6 mln, respectively, in the third quarter. Full-year 2008 revenues were reported of $1,434.9 mln and GAAP operating income of $167.5 mln. If the preliminary investigation findings prove to be final, they could impact the company's previously reported interim 2009 financial results. The company is also in the process of evaluating the financial impact of these adjustments on its previously reported results for the fiscal year and interim periods ended December 28, 2008. The company currently estimates that approximately $9 mln of the identified accounting entries should have been recorded in 2008. Operationally, the company's outlook for the fourth quarter of 2009 remains consistent with its previous expectations for sales and operating income, subject to any costs, charges, and tax-related impacts relating to the ongoing investigation.

4:00PM Atmel Enters into Stipulation to Settle Microchip Offer Shareholder Litigation (ATML) 4.13 +0.07 : Co announced that it has entered a Stipulation and Agreement of Compromise, Settlement and Release to settle previously disclosed litigation regarding Atmel's response to a subsequently-withdrawn acquisition proposal by Microchip Technology (MCHP) and ON Semiconductor (ONNN), including Atmel's adoption of an amendment to its Amended and Restated Preferred Shares Rights Agreement, dated as of October 18, 1999.

9:03AM Intel announces 12.5% increase in cash dividend to $0.1575/share (INTC) 19.82 : Co announces that its board of directors has approved a 12.5% increase in the quarterly cash dividend to 15.75 cents per share (63 cents per share on an annual basis), beginning with the dividend that will be declared in the first quarter of 2010. "Intel's industry-leading product portfolio, outstanding execution and focus on the next wave of innovation and growth set the company up solidly for the future," said Paul Otellini, Intel president and CEO. "With one of the highest dividend yields in the technology industry, the dividend increase is another sign of our confidence in business prospects going forward."

8:37AM RF Micro Device expects free cash flow in fiscal 2010 will exceed its previous guidance (RFMD) 4.34 : Co announced that it has successfully completed all previously announced restructuring activities. With the successful completion of its restructuring activities, the Company expects continued strength in financial results, with an emphasis on non-GAAP operating income, free cash flow (net cash provided from operating activities minus property and equipment expenditures) and return on invested capital, or ROIC. In the fiscal 2010 second quarter ended October 3, 2009, RFMD delivered year-over-year and sequential improvements in gross margin, operating margin and earnings per share. Free cash flow was $45.8 million in the fiscal 2010 second quarter and $80.3 million through the first half of fiscal 2010. RFMD now expects free cash flow in fiscal 2010 will exceed its previous guidance of $130 million, provided on October 27, 2009. Additionally, RFMD currently expects to be net cash positive in fiscal 2011, ending April 2, 2011.

8:32AM RF Micro Device repurchases and retires $197 mln of convertible notes due 2010 (RFMD) 4.34 :

6:04AM Cisco increases offer price and extends acceptance period for recommended offer period to acquire TANDBERG (CSCO) 23.71 : Co announces a revised recommended voluntary cash offer to acquire TANDBERG. Under the revised terms, Cisco will offer to purchase all the outstanding shares of TANDBERG for 170 Norwegian Kroner per share for an aggregate purchase price of approx $3.4 bln. Cisco will also increase the interest payable on the offer price to a rate of 3.00% from a rate of 1.75%. This revised offer represents Cisco's final price for this transaction.

4:17AM TTM Technologies signs definitive agreement to create business combination with Meadville Holdings Ltd's printed circuit board business (TTMI) 11.21 : Co announces the signing of a definitive agreement to create a business combination with Meadville Holdings Limited's PCB business. The combination is expected to be accretive to earnings without synergies within the first year post-closing. Meadville PCB had unaudited revenue for the trailing 12 months ended June 30, 2009, of approx $641 million and adjusted EBITDA of approx $119 million. Services offered by Meadville PCB range from circuit design through volume production manufacturing.
icon url

ReturntoSender

11/17/09 10:28 PM

#8751 RE: ReturntoSender #6755

From Briefing.com: 4:25 pm : The major indices overcame broad losses to finish incrementally higher as the U.S. dollar handed back a portion of its gains this session. The greenback's pullback helped materials stocks offset weakness among retailers.

After falling to a fresh 52-week low in the previous session, the Dollar Index rebounded as much as 1% before easing back to a 0.5% gain. The greenback's bounce gave the equity market an excuse to take a breather after setting new 2009 highs in the previous session. However, stocks showed a willingness to push even higher as the dollar pared its gains; in turn, stocks trimmed their losses to find higher ground late in the session.

Materials stocks garnered particular support late. The sector settled with a 0.9% gain after being down nearly 1%. The sector's turnaround stemmed from a rebound in commodity prices, which took the CRB Commodity Index to a 0.2% gain, and news from a regulatory filing that showed George Soros added 1 million shares of Potash (POT 110.60, +6.42) to his existing stake.

Though the materials sector showed strength, it didn't hold much sway with the broader market; the sector represents a mere 3.6% of the S&P 500's overall market weight. Still, the advance by materials stocks helped mitigate weakness among retailers. Shares of retailers slid 1.4%, even though Home Depot (HD 26.99, -0.66), TJX Companies (TJX 38.91, -0.61), Saks (SKS 6.67, +0.26), and Pacific Sunwear (PSUN 3.88, -1.13) all bested earnings expectations. TJX even went on to raise its earnings outlook, while Home Depot delivered an upside forecast. Pacific Sunwear's outlook proved displeasing, though; that resulted in the stock's sharpest single-session percentage slide of the year.

Though stocks settled the session with fractional gains, each of the three major indices was able to book new 2009 closing highs. The Nasdaq Composite was led by large-cap tech issues, while wireless services stocks provided leadership to the S&P 500. The Dow was led by Exxon Mobil (XOM 75.03, +0.60), which was upgraded by analysts at Barclays.

Data did little for stocks for the second straight session. Producer prices increased 0.3% in October, but that is a slower pace than the 0.5% increase that had been expected. Core producer prices fell 0.6% in October. A 0.1% increase had been expected.

Meanwhile, industrial production for October increased 0.1%, which is weaker than the 0.4% that had been expected. Capacity utilization came in at 70.7%, which is essentially in step with the consensus.

Among the day's economic speakers, Reuters reported that Richmond Fed President Lacker said that sluggishness in pockets of the economy should not deter the Fed from beginning to remove its extraordinary level of support. Though not a new observation, Lacker said he expects the economy to grow at a reasonable rate next year. He did indicate, though, that he won't look at the removal of monetary stimulus until economic growth is strong enough and well-enough established.

Advancing Sectors: Materials (+0.9%), Telecom (+0.6%), Tech (+0.5%), Consumer Staples (+0.2%), Financials (+0.1%), Health Care (+0.1%)
Declining Sectors: Consumer Discretionary (-0.7%), Utilities (-0.4%)
Unchanged: Industrials, EnergyDJ30 +30.46 NASDAQ +5.93 NQ100 +0.3% R2K -0.1% SP400 -0.2% SP500 +1.02 NASDAQ Adv/Vol/Dec 1.23 bln/1.90 bln/1416 NYSE Adv/Vol/Dec 1347/971 mln/1653

4:31PM LDK Solar sells 15% ownership stake in its 15,000 MT polysilicon plant (LDK) 6.71 -0.27 : The co announces that it has entered into an agreement to sell a 15% ownership stake in its 15,000 metric ton annualized capacity polysilicon plant in Xinyu City, China. Jiangxi International Trust and Investment has agreed to purchase this interest for approximately RMB1.5 billion (equivalent to approximately $219 million).

3:32PM Intel confirms seven new Intel Capital investments that total ~$25 mln (INTC) 20.32 +0.09 : Intel Capital, Intel Corporation's global investment organization, confirms seven new investments, which span three continents and total ~$25 million. The new investments, almost all led by Intel Capital, include U.S.-based Joyent (cloud computing) and Active Storage (RAID storage systems for Apple users), Korea-based Crucialtec (optical modulation technology), Taiwan-based Gudeng Precision Industrial Co (semiconductor front-end equipment manufacturing), Japan-based V-cube (Web-based videoconferencing systems), China-based Phoenix New Media (Web information portal) and United Arab Emirates-based NeuString (telco pricing analytics software).

7:31AM Semitool to be acquired by Applied Materials for $11/share in cash (SMTL) 8.40 : Applied Materials (AMAT) and SMTL announced a definitive agreement for AMAT to acquire the outstanding shares of SMTL for $11 per share in an all-cash tender offer. Under terms of an agreement approved by the boards of directors of both companies, AMAT Materials will pay an aggregate purchase price of approximately $364 million based on the fully diluted capitalization of SMTL. The acquisition will be conducted pursuant to a tender offer for all of the outstanding shares of SMTL and is conditioned on the tender of at least 66 2/3 percent of SMTL's outstanding stock on a fully-diluted basis and other customary closing conditions including regulatory approval. Directors and executive officers of SMTL holding approximately 32 percent of SMTL's outstanding common stock have entered into agreements to tender their shares. AMAT expects to commence the tender offer promptly and expects the offer to close by the end of calendar 2009. Following completion of the tender offer, AMAT will acquire any remaining shares of SMTL through a second-step merger at the same price paid in the tender offer. SMTL will be operated as a business unit of AMAT's Silicon Systems Group.

7:30AM Am Superconductor receives $10 mln order for wind turbine core eectrical cmponents from China's CSR-ZELRI (AMSC) 32.17 : Co announces that it has received a follow-on order for $10 mln worth of wind turbine core electrical components from China's CSR Zhuzhou Electric Locomotive Research Institute Co. CSR-ZELRI will use the components in the 1.65 megawatt wind turbines designed by AMSC's wholly owned AMSC Windtec subsidiary. This is the largest order AMSC has received from CSR-ZELRI. To date, CSR-ZELRI has ordered more than $20 mln of core electrical components from AMSC.

7:05AM Canadian Solar beats by $0.15, beats on revs (CSIQ) 19.70 : Reports Q3 (Sep) earnings of $0.69 per share, $0.15 better than the First Call consensus of $0.54; revenues fell 15.6% year/year to $213.1 mln vs the $210.9 mln consensus. "We are reiterating our fourth quarter 2009 guidance of shipments of approximately 128 MW to 138 MW, with gross margin expected to be in the high- teens on a percentage basis vs the 17.5% consensus. We expect shipments of approximately 295 MW to 305 MW for FY09. For FY10, we believe our shipments will be in the range of 600 MW to 700 MW. We believe that the demand for our high quality solar modules will come from all major markets, including Germany, Italy, the U.S., the Czech Republic, South Korea and Spain. We also expect strong growth from our newer markets, such as Canada, Japan and China. Given the demand forecast, the co plans to increase our solar module production capacity from today's 820 MW to 1 GW by the end of April 2010, and to increase our internal cell production capacity from 420 MW to 700 MW by June 2010. We also intend to slightly increase our internal ingot and wafer capacity in 2010." Shipments for 3Q09 were 102.6 MW, compared to shipments of 48.2 MW for 2Q09 and 60 MW for 3Q08. Q3 sales came from all geographic markets important to the solar industry, with Europe continuing to be the Company's largest contributing geographic market. Sales in that region grew strongly in the quarter, increasing 179% from 2Q09. Gross margin of 16.3% vs the 16.7% consensus, compared to Q209 gross margin of 20.2% and Q308 gross margin of 15.5%.

icon url

ReturntoSender

11/18/09 8:58 PM

#8752 RE: ReturntoSender #6755

From Briefing.com: 4:25 pm : Despite weakness in the U.S. dollar, stocks spent nearly the entire session mired in weakness. Losses remained contained, however.

Participants showed indifference to renewed selling against the greenback, which took the Dollar Index back toward the 52-week lows that it set earlier this week. It settled with a 0.4% loss.

Though the dollar spent the entire session in the red, the broader market struggled to shake free from its own spell of weakness. Large-cap tech issues were among the primary laggards; that caused the Nasdaq to trail the other headline indices.

Financials helped lead the broader market on a late charge back toward the neutral line, though. The sector had outperformed for the entire session and was able to finish with a 0.9% gain. Its strength was rooted in banking issues. As such, the KBW Banking Index advanced 1.4%.

Zimmer Holdings (ZMH 58.03, +1.28) helped the health care sector put together a solid 0.4% gain. Shares of the medical equipment and supplies company were upgraded by analysts at UBS.

Several consumer staples stocks ripped higher late in the session amid news from Daily Telegraph that Reckitt Benckiser is close to announcing a cross-border transaction that is suspected to involve a consumer staples play. The consumer staples sector settled flat, though.

Though the dollar's drop did little for stocks, it helped prop up precious metals prices. Gold futures hit another new all-time high of $1153.40 per ounce, but settled fractionally higher at $1141.20 per ounce.

Oil prices oscillated. Bullish inventory data drove oil prices up more than 1% in midmorning trade, but it then rolled over in midafternoon trade. Crude managed to rebound and close up 0.5% at $79.52 per barrel.

The latest dose of economic data indicated that consumer prices for October increased 0.3%, which is a bit stronger than the 0.2% increase that had been widely expected. Core prices increased 0.2%, which is also bit stronger than the 0.1% monthly increase that had been widely forecast.

Housing starts for October came in at an annualized rate of 529,000, which is below the rate of 600,000 that had been widely expected. Meanwhile, building permits came in at an annualized rate of 552,000, which is a slower pace than the annualized rate of 580,000 that economists, on average, had forecast.

Advancing Sectors: Financials (+0.9%), Health Care (+0.4%), Telecom (+0.2%)
Declining Sectors: Tech (-0.5%), Utilities (-0.5%), Industrials (-0.4%), Energy (-0.3%), Consumer Discretionary (-0.3%), Materials (-0.1%)
Unchanged: Consumer StaplesDJ30 -11.11 NASDAQ -10.64 NQ100 -0.6% R2K -0.4% SP400 -0.5% SP500 -0.52 NASDAQ Adv/Vol/Dec 1045/2.00 bln/1629 NYSE Adv/Vol/Dec 1381/1.06 bln/1640

4:06PM Semtech announces definitive agreement to acquire Sierra Monolithics (SMTC) 16.98 -0.17 : Co announces it has entered into a definitive agreement to acquire Sierra Monolithics for $180 million in cash. The transaction is expected to be accretive to Semtech's GAAP earnings per share within twelve months of the transaction closing and is expected to be immediately accretive to Semtech's Non-GAAP gross margins and Non-GAAP earnings per share. Sierra Monolithics expects to generate approximately $50 million of revenue for calendar year 2009 with gross margins towards the high end of Semtech's stated gross margin model of 55% to 60%.

4:05PM NetApp beats by $0.07, beats on revs; guides Q3 EPS in-line, revs in-line (NTAP) 29.56 -0.16 : Reports Q2 (Oct) earnings of $0.37 per share, excluding non-recurring items, $0.07 better than the First Call consensus of $0.30; revenues fell 0.2% year/year to $910 mln vs the $881 mln consensus. Co issues in-line guidance for Q3, sees EPS of $0.36-0.37, excluding non-recurring items, vs. $0.36 consensus; sees Q3 revs of $935-955 mln vs. $920.91 mln consensus.

Fujitsu and NetApp (NTAP) announced their intention to deepen their partnership globally and provide more tightly integrated and automated storage and data management solutions. Cos ihntend to jointly develop integrated products and services specifically in the areas of virtualization, storage and data management, and storage services and solutions...

1:25PM Semiconductors Hldrs Trust continues to display relative weakness, vacillating near early low (SMH) 25.95 -0.37 : Highlighted the relative weakness in the group this morning and it continues to lag with it recently retesting it late morning low. Support is at 25.91/25.87 which is of interest on an intraday and close basis. Other sectors pacing the way lower on a relative basis during the recent slide include: Oil Service OIH, Energy XLE, Steel SLX, Coal KOL, Gold Miners GDX.

7:30AM Am Superconductor receives second wind turbine electrical control systems order from Hyundai Heavy Industries (AMSC) 31.78 : Co announces that it has received a follow-on order for 30 sets of electrical control systems from Hyundai Heavy Industries Co for its 1.65 megawatt wind turbines now in production in South Korea. AMSC also has received an electrical control systems order for HHI's 2 MW wind turbine prototypes. All of the systems will be shipped to HHI by the end of May 2010.

7:04AM Advanced Micro commences tender offer for its 5.75% convertible senior notes due 2012 and announces redemption of 7.75% senior notes due 2012 (AMD) 6.62 :

7:03AM Solarfun Power beats by $0.22, reports revs in-line (SOLF) 5.83 : Reports Q3 (Sep) earnings of $0.37 per share, $0.22 better than the First Call consensus of $0.15, rev fell 23% YoY to 144.6 mln vs the $145.07 mln consensus. Co sees Q4 shipments to be approximately 110 MW, with module processing services accounting for about 20% of the total shipments, with average selling prices to decline by approximately 5% from the previous quarter, in constant currency. For the first quarter of 2010, the co expects to see continuing good demand, with prices declining slightly from levels in 4Q09. Average selling price, excluding module processing services, declined, as expected, to US$2.03 per watt in the third quarter of 2009 from US$2.66 per watt in the second quarter of 2009, primarily due to the decrease in the market prices of PV products. Gross margin was 20.7% in the third quarter of 2009, compared to negative 6.2% in the second quarter 2009. Accounts receivable increased to RMB 707.2 million (US$103.6 million) as of September 30, 2009 from RMB 514.3 million as of June 30, 2009. This increase was primarily due to an increase in shipments as well as a large percentage of shipments occurring in the latter part of the third quarter of 2009. "We expect to see a healthy demand environment in 2010. The preliminary shipment target for 2010 is 500 MW. We expect strong demand from Germany as project development is accelerated in response to expected feed-in-tariff reductions, from new markets like China and the United States, and as the general availability of funding for solar projects improves."

09:43 am Microsoft ests and tgt raised to $36 at Jefferies following positive reviews of Windows 7: . Jefferies raises their FY10 and FY11 EPS ests to $1.83 and $2.16 from $1.73 and $2.04 (consensus $1.82 and $2.07), respectively, as recent positive comments by retailers have led the firm to increase their estimates for Windows 7. In addition, the firm raises their MSFT tgt to $36 from $32. Anecdotally, the firm notes that they have heard that some very large, savvy corporate IT buyers are leaning towards Win7 adoption in early calendar 2010, well before the expected release of SP1. Additionally, the firm surveyed >50% of the channel for PCs distributed to consumers inside the US. The comments the firm received ranged from neutral to strongly positive. The firm notes that without any significant out-of-the-box security problems, and strong anecdotal evidence of sell-through in the consumer and corporate channel, it looks like Windows 7 is living up to its reputation as a solid, reliable OS.

icon url

ReturntoSender

11/19/09 11:15 PM

#8753 RE: ReturntoSender #6755

From Briefing.com: 4:35 pm : Sellers were able to dog stocks for the entire session and hand the S&P 500 its worst single-session percentage loss of the month as buyers stepped to the sidelines amid a lack of positive catalysts. Buyers showed some mild interest late in the session and helped stocks make a couple of upward spurts, but the moves were quickly repressed.

Strength in the dollar kept many buyers at bay this session. The Dollar Index had been up as much as 0.7%, but settled with a gain of 0.3%. Though it settled off of session highs, its advance was enough to pressure both the equity market and commodities pits.

That blend of weakness proved troubling for energy stocks (-2.1%) and materials stocks (-1.5%). The two sectors traded with some of the worst losses of any major sector this session, but materials were able to improve their position late as gold prices rebounded to finish fractionally higher at $1141.90 per ounce.

Consumer staples stocks were able to maintain modest losses this session. The sector closed just 0.3% lower. Health care held up relatively well, too. The sector finished 0.5% lower following news that Senator Reid presented last evening a health care reform bill from the Senate.

Treasury Secretary Geithner appeared before the Joint Economic Committee on Financial Reform today. Geithner told Congress that the reform effort was essential for the health of the economy, but representatives were critical of Geithner.

Once again, data did little for stocks. Initial jobless claims for the week ending November 14 hit 505,000, which is in-line with what had been expected. The four-week moving average now stands at 514,000, down from 520,500. Meanwhile, continuing claims came in at 5.61 million, which is in step with what had been widely forecast.

In other economic news, leading economic indicators for October increased 0.3%, which is not as strong as the 0.4% that was expected. The Philadelphia Fed Survey for November came in at 16.7, which is better than the reading of 12.2 that had been widely forecast. Third quarter mortgage delinquencies hit 9.6%, which is up from the 9.2% that was registered in the second quarter.

On a similar note, the OECD said that U.S. GDP would likely grow 2.5% in 2010, while its collective 30-member nations would expand 1.9%.

Advancing Sectors: (None)
Declining Sectors: Energy (-2.1%), Financials (-2.0%), Tech (-1.6%), Industrials (-1.5%), Materials (-1.5%), Utilities (-1.2%), Consumer Staples (-1.2%), Telecom (-0.7%), Health Care (-0.5%), Consumer Staples (-0.3%)DJ30 -93.87 NASDAQ -36.32 SP500 -14.90 NASDAQ Adv/Vol/Dec 549/2.27 bln/2127 NYSE Adv/Vol/Dec 572/1.08 bln/2480

4:51PM Applied Materials commences tender offer for all outstanding shares of Semitool at $11.00 (SMTL) 10.94 -0.03 :

4:09PM Verigy beats by $0.08, reports revs in-line; guides Q1 EPS above consensus, revs in-line (VRGY) 9.00 -0.40 : Reports Q4 (Oct) loss of $0.12 per share, $0.08 better than the First Call consensus of ($0.20); revenues fell 35.3% year/year to $97 mln vs the $96.4 mln consensus. Co issues mixed guidance for Q1, sees EPS of ($0.09)-($0.02) vs. ($0.14) consensus; sees Q1 revs of $105-115 mln vs. $105.60 mln consensus. "While we are coming off a low base, we are encouraged by the improved demand that we are seeing from customers with revenue increasing for the third consecutive quarter," said Bob Nikl, Verigy's chief financial officer. "As we enter the new fiscal year, we can expect improvements in our operating leverage as a result of the significant benefits from our restructuring programs."

4:05PM Dell misses by $0.05, misses on revs (DELL) 15.87 -0.19 : Reports Q3 (Oct) earnings of $0.23 per share, excluding non-recurring items, $0.05 worse than the First Call consensus of $0.28; revenues fell 14.9% year/year to $12.9 bln vs the $13.18 bln consensus. Sees sequentially higher revs in Q4 vs the +2.7% QoQ consensus. Dell reports Q3 gross margin of 17.3% vs 18.1% Street consensus. For the fourth quarter, Dell expects seasonal demand improvement in its Consumer business, while demand in Public is typically lower during the quarter. "We are seeing improvement in overall underlying IT demand that is continuing into the fourth quarter. The same is true with momentum in Dell's business, specifically in our Large Enterprise and SMB segments. The launch of Windows 7 is being very well received by SMBs and consumers, and we'll see the benefits of that more fully in our fiscal Q4."

1:19PM Microsoft outlines growth agenda at annual shareholder meeting (MSFT) 29.84 -0.27 : Speaking at Microsoft Corp.'s Annual Shareholder Meeting today, Chief Executive Officer Steve Ballmer highlighted the company's execution over the past year, and announced sales figures for Windows 7, and detailed the company's plans to continue to deliver shareholder value in the long term. "Windows 7 is the simply best PC operating system we have ever built... Since launch, we've already sold twice as many units of Windows 7 than any other operating system we've ever launched in a comparable time." Ballmer also pointed to the momentum the company was experiencing in other key areas of its business, with delivery of products and services including Bing, Windows Server 2008, Windows Azure, and the upcoming release of Microsoft Office 2010.

RF Micro Devices (RFMD) announces that RFMD has been selected by a leading manufacturer of smartphones to support two upcoming CDMA smartphones.

7:25AM Kulicke & Soffa beats by $0.05, beats on revs; guides Q1 revs in-line (KLIC) 5.30 : Reports Q4 (Sep) earnings of $0.09 per share, $0.05 better than the First Call consensus of $0.04; revenues rose 80.6% year/year to $110.5 mln vs the $102.7 mln consensus with gross margins at 42.7%. Co issues in-line guidance for Q1, sees Q1 revs of $115-120 mln vs. $116.50 mln consensus.

6:33AM Suntech Power beats by $0.08, beats on revs (STP) 15.09 : Reports Q3 (Sep) earnings of $0.16 per share, $0.08 better than the First Call consensus of $0.08; revenues fell 20.4% year/year to $473.1 mln vs the $426.6 mln consensus. Suntech expects 4Q09 shipments to be at least 10% higher than 3Q09. Gross margin in 4Q09 is expected to be relatively flat compared to 3Q09 (17.8% vs the 19.3% consensus). Suntech has increased FY09 PV shipment target from 600MW to a range of 640-660MW. Capital expenditures are expected to be approximately $120 million for FY09. Looking into next year, Suntech expects at least 75% shipment growth in 2010. The co targets to expand to 1.4GW of PV cell and module production capacity by the middle of 2010, of which 450MW will be Pluto-enabled. Accordingly, Suntech expects capital expenditures to be approximately $200 million in 2010. Gross profit margin for the core wafer to module business was 20.0% in 3Q09, compared with 19.1% in the second quarter of 2009. Consolidated gross profit margin was 17.8% in 3Q09 vs the 19% consensus, compared with 18.6% in 2Q09. The lower gross margins were primarily due to low profitability of the systems integration business in China that has been implementing some of China's first utility scale solar.

09:38 am Advanced Micro upgraded to Buy at Broadpoint AmTech Research; tgt raised to $10: . Broadpoint AmTech Research upgrades AMD to Buy from Neutral and raises their tgt to $10 from $5.80 as the recent positive events (Analyst Day/INTC settlement/capital structure) lead the firm to believe that AMD's risk/reward is now compelling. The firm notes that AMD's capital structure improved as a result of INTC's $1.25 bln settlement and yesterday's announcement of debt restructuring actions. The firm believes that AMD's debt of ~$3.7 bln will be reduced by ~25%, while also lowering interest expense slightly less, ~20%. Should Global Foundries and ATIC's chartered purchase be consolidated, the firm believes that they could see deconsolidation in the following 3-6 months. Furthermore, the firm feels that revenue growth in the coming quarters will prove to be stronger than the Street is modeling, driven by: a healthy Win7 cycle; leadership in the Evergreen GPU platform; more focused marketing; and possible tailwind from INTC settlement headlines entering the selling season.

08:55 am NetApp (NTAP)

NetApp (NTAP 29.56) reported fiscal second quarter results Wednesday evening that beat expectations and issued upside revenue guidance for its third quarter, news that has shares of the Sunnyvale, Calif.-based company about 4% higher in Thursday's premarket action.

NetApp reported fiscal second quarter earnings of $0.37 per share, excluding nonrecurring items, $0.07 better than the First Call consensus of $0.30.

Revenues fell 0.2% year-over-year to $910 million but easily topped the $881 million consensus.

"NetApp delivered a strong quarter with record gross margins, record revenue from our SAN products, and overall revenue that exceeded our expectations," said CEO Tom Georgens. "Our value proposition resonates particularly well with customers who look to gain efficiency and streamline operations as they begin to build out their next-generation virtualized data centers. Driven by this demand, NetApp is forecasting record revenues for our next fiscal quarter."

NetApp said it expects fiscal third quarter earnings of $0.36 to $0.37 per share, excluding nonrecurring items; the consensus estimates $0.36. NetApp sees fiscal third quarter revenues of $935 million to $955 million. The company's forecast tops the current consensus estimate of $920.91 million.

Shares of NTAP have more than doubled year-to-date.
icon url

ReturntoSender

11/21/09 8:29 PM

#8754 RE: ReturntoSender #6755

From Briefing.com: Weekly Recap - Week ending 20-Nov-09The major indices kicked off the week on a strong note, with the S&P 500 hitting fresh highs for 2009. But selling pressure eventually emerged, resulting in a mixed finish. Overall it was a relatively slow week, with earnings season winding down and a small amount of corporate news.

For the week, the S&P 500 fell 0.2% in mixed trade as six of the 10 sectors posted a loss. Tech (-1.4%) and consumer discretionary (-1.1%) underperformed, while healthcare (+1.9%) and materials (+1.4%) outperformed.

Retailers made up the bulk of the major companies to report earnings this week, a clear sign that third quarter earnings season is coming to end.

Of the 17 S&P 500 companies that reported earnings this week, 11 topped EPS estimates, two reported in-line results and four missed the consensus.

Among retailers, Target (TGT 47.46) posted upside EPS results ($0.58 versus the $0.50 consensus), while revenue came in-line with expectations.

TJX Cos (TJX 38.80), Limited Brands (LTD 17.25), Sears Holdings (SHLD 72.64) and Gap (GPS 21.95) all posted upside EPS results, while Lowe?s (LOW 21.35) posted in-line earnings.

In other notable earnings news, Dell (DELL 14.29) disappointed investors after its earnings ($0.23 versus $0.28 consensus) and revenue came up short of the consensus. Shares of Dell dropped 7.2% on the week despite the company saying that it is seeing improvement in overall underlying IT demand.

In economic news, initial claims met consensus expectations at 505,000, but was unable to drop below the 500,000 barrier. The labor market remains weak, with claims holding to a range between 500,000 and 515,000 since July.

The talk that housing starts were stabilizing hit a snag in October as new housing starts plummeted 10.6% to 529,000 units from 592,000. The consensus forecasted an increase in starts to 600,000.

October retail sales surged 1.4%, topping the +0.9% consensus on higher auto demand.

In currency trading, the dollar saw some substantial swings throughout the week, settling with a 0.4% gain, helped by supportive comments from Fed Chairman Bernanke that drove some buying interest.


Index Started Week Ended Week Change % Change YTD %
DJIA 10270.47 10318.16 47.69 0.5 17.6
Nasdaq 2167.88 2146.04 -21.84 -1.0 36.1
S&P 500 1093.48 1091.38 -2.10 -0.2 20.8
Russell 2000 586.28 584.68 -1.60 -0.3 17.1


09:38 am Advanced Micro upgraded to Buy at Broadpoint AmTech Research; tgt raised to $10: . Broadpoint AmTech Research upgrades AMD to Buy from Neutral and raises their tgt to $10 from $5.80 as the recent positive events (Analyst Day/INTC settlement/capital structure) lead the firm to believe that AMD's risk/reward is now compelling. The firm notes that AMD's capital structure improved as a result of INTC's $1.25 bln settlement and yesterday's announcement of debt restructuring actions. The firm believes that AMD's debt of ~$3.7 bln will be reduced by ~25%, while also lowering interest expense slightly less, ~20%. Should Global Foundries and ATIC's chartered purchase be consolidated, the firm believes that they could see deconsolidation in the following 3-6 months. Furthermore, the firm feels that revenue growth in the coming quarters will prove to be stronger than the Street is modeling, driven by: a healthy Win7 cycle; leadership in the Evergreen GPU platform; more focused marketing; and possible tailwind from INTC settlement headlines entering the selling season.

09:00 am Dell (DELL)

Dell (DELL 15.87) reported disappointing third quarter numbers Thursday evening, missing both earnings and revenue estimates, but the company said it is seeing improvement in overall underlying IT demand.

Dell reported third quarter earnings of $0.23 per share, excluding nonrecurring items, $0.05 worse than the First Call consensus of $0.28.

Revenues fell 14.9% year-over-year to $12.9 billion, short of the $13.18 billion consensus. Sales in China, India, Brazil and Russia were up 18% sequentially and 5% from the prior year. Dell said that sales in China, its second-largest country in terms of revenue, were up 20% sequentially and 8% year-over-year.

"We are seeing improvement in overall underlying IT demand that is continuing into the fourth quarter. The same is true with momentum in Dell's business, specifically in our Large Enterprise and SMB segments," said CEO Michael Dell. "The launch of Windows 7 is being very well received by SMBs and consumers, and we'll see the benefits of that more fully in our fiscal Q4."

For the fourth quarter, Dell said it expects seasonal demand improvement in its consumer business and revenue to improve over the third quarter.

Shares of DELL are down 6.8% in premarket trading 30 minutes ahead of Friday's opening bell.

icon url

ReturntoSender

11/22/09 8:15 PM

#8755 RE: ReturntoSender #6755

Amateur Investors Weekend Market Analysis (11/21/09):

http://www.amateur-investor.net/Weekend_Market_Analysis_Nov_21_09.htm

Since 2002 there has been basically an inverse relationship between the US Dollar (USD) and the Equities. When the USD has trended lower (points A to B) the Dow has risen (points C to D) and when the USD has rallied (points B to A) the Dow has fallen (points D to C).


However when we look at a longer term chart of the USD and the Dow going back to the 1970's this inverse relationship hasn't always worked. Notice from the mid 1990's through 1999 both the USD and the Dow trended higher (points E to F). Meanwhile from the mid 1970's through 1980 both the USD and the Dow generally trended lower (points G to H). In addition when the Dow bottomed in the early 1980's both it and the USD rallied together (points I to J). Thus although the inverse relationship between the USD and the Dow has worked since 2002 it hasn't always been that way in the past.


As far as the major averages the Dow and S&P 500 have been making a series of higher highs and higher lows during the past 19 weeks after putting in a bottom in early July. If this pattern is going to continue as we end the year then the Dow should hold support above the 9800 level if it makes another higher Low.


As for the S&P 500 if it pulls back and makes a higher Low then it should hold support above the 1040 level.


Meanwhile the Nasdaq broke its previous pattern of making higher Lows back in early November as it dropped below the early October low.


With the Nasdaq making a new high this week after making a lower Low this has set up a potential Broadening Top pattern as I talked about last weekend. This chart pattern consists of 3 higher highs (Waves 1, 3 and 5) while the 4th wave makes a low lower than Wave 2. Once the pattern completes then a reversal of the trend occurs.


The chart of the Nasdaq shows that it has now developed a similar Broadening Top pattern with the new highs made this week. Now in order for it to be confirmed the Nasdaq would have to break below the 2010 level in the weeks ahead.


Finally keep an eye of Goldman Sachs (GS) as there is a divergence developing between it and the S&P 500 as the S&P 500 made a higher High while GS may have peaked back in mid October (point A). The reason why I point this out is that in late 2008 GS bottomed out (point B) several weeks before the S&P 500 did (point C).


Signup for a "Free 4 Week Trial Membership" or save up to 50% on a Premium Membership and you will have access to the following products.

1. "ETF Daily Buy and Short Signals" which can be used to trade the DIA's, QQQQ's and SPY's.

2. "401K/Thrift Savings Plan (TSP) Timing Service" which can be used to help improve your return in your 401k/TSP Account.

3. The "End of Month Strategy". This Strategy focuses on the typical End of Month markup by the Institutional Money.

4. "Stocks to Buy List" which can be used with either our Short Term Strategy or Long Term Strategy.


icon url

ReturntoSender

11/23/09 9:43 PM

#8757 RE: ReturntoSender #6755

From Briefing.com: 4:25 pm : A drop by the dollar brought buyers in from the sidelines after stocks had fallen for three straight sessions. Early support helped the S&P 500 come within just a couple of points of a new 2009 high, but resistance at current highs left stocks to gradually pare gains for the remainder of the session.

The Dollar Index erased its gains from the previous two sessions with a 0.6% fall. Indian Prime Minister Singh offered support for the greenback, but comments by Chicago Fed President Evans and St. Louis Fed President Bullard stirred selling pressure against the currency. Evans made it known that he thinks near-zero interest rates will remain well into 2010, while Bullard wants to keep the Fed's Mortgage-Backed Securities program active beyond the first quarter of 2010.

There weren't many market-moving headlines for participants to digest this session, though the latest home sales figures proved pleasing. Existing home sales for October made a sharp 10.1% month-over-month spike, which lifted sales to an annualized rate of 6.10 million units. The consensus had called for a 2.3% monthly increase to an annual rate of 5.70 million units. The stronger-than-expected increase in sales took supply down to 7.0 months, the lowest since February 2007.

All 10 major sectors were able to put together solid gains as a result of broad-based support. Telecom settled with the best gains; it advanced 2.6% after AT&T (T 26.78, +0.76) received positive coverage by Barron's.

The energy sector had been a leader in the early going. It had benefited from broader market support and a sharp rise in oil prices, which were also bolstered by the dollar's downturn. However, energy surrendered some of its advance to finish with a 1.6% gain as oil prices pulled back to settle with a fractional gain at $77.52 per barrel.

Gold prices maintained steady strength, though. The precious metal ascended to a new all-time high at $1174.00 per ounce and closed with a 1.6% gain at $1164.80 per ounce. That sent gold stocks up 2.1% and the SPDR Gold Trust (GLD 114.29, +1.35) up solidly.

Treasuries were able to resist an early selling effort and finish fractionally higher. That put the yield on the benchmark 10-year at 3.35%, while the yield on the 2-year stands at 0.72%. Treasuries came into closer focus with the results of a $44 billion auction of 2-year Treasuries. The auction drew a yield of 0.80% and a bid-to-cover ratio of 3.16, which is better than recent averages.

Overall trading volume on the NYSE was well below the 50-day moving average of 1.28 billion shares. The light action is expected to continue with the Thanksgiving holiday coming up on Thursday.

Advancing Sectors: Telecom (+2.6%), Tech (+1.6%), Energy (+1.6%), Industrials (+1.5%), Financials (+1.5%), Utilities (+1.4%), Health Care (+1.1%), Consumer Staples (+1.0%), Consumer Discretionary (+0.9%), Materials (+0.9%)
Declining Sectors: (None)DJ30 +132.79 NASDAQ +29.97 SP500 +14.86 NASDAQ Adv/Vol/Dec 1911/1.86 bln/772 NYSE Adv/Vol/Dec 2343/980 mln/665

4:15PM TranSwitch announces one-for-eight reverse stock split (TXCC) 0.34 :

4:14PM Hewlett-Packard experiencing muted reaction to earnings, trading down 0.20 in after hours to $50.80 (HPQ) 51.02 +0.98 : Note: Company preannounced on Nov. 11

4:11PM Rambus comments on order in price-fixing case (RMBS) 16.72 -1.38 : The co announces that Judge Richard Kramer of the San Francisco Superior Court has issued recommendations that the Rambus antitrust case against certain memory manufacturers and the Tessera Technologies (TSRA) antitrust case against Hynix be coordinated and assigned to the San Francisco Superior Court. "At the hearing regarding coordination on November 6, 2009, Judge Kramer made clear that he would recommend coordination so long as it does not delay the commencement of the Rambus antitrust jury trial on January 11, 2010," said Thomas Lavelle, senior vice president and general counsel of Rambus. "Consistent with those statements, we are preparing to start our trial in January and we look forward to confirmation from Judge Kramer when he returns to court next week."

4:11PM Advanced Micro announces pricing of private offering of $500 mln of senior notes (AMD) 6.99 +0.04 : Co announced that it has agreed to sell $500 mln aggregate principal amount of its 8.125% Senior Notes due 2017 in a private offering. AMD intends to close the transaction on November 30, 2009. AMD estimates that the net proceeds from the issuance and sale of the senior notes will be ~$439 mln after deducting original issue discount of 10.204%, the initial purchasers' discounts and estimated transactions expenses. AMD intends to use the net proceeds, along with existing cash, to purchase its 5.75% Convertible Senior Notes due 2012 validly tendered pursuant to the company's tender offer for such notes, which was previously announced. Net proceeds not used in the tender offer, if any, will be used for general corporate purposes.

4:09PM Hewlett-Packard reports results in-line with November 11 preannouncement; reaffirms Q1 and recently raised FY10 outlook (HPQ) 51.02 +0.98 : Hewlett-Packard reports Q4 EPS of $1.14 vs the $1.14 preannouncement on Nov. 11 and the $1.13 consensus; HPQ reports Q4 revs down 8% YoY to $30.8 bln vs the $30.8 bln preannouncement and $30.36 bln consensus. Co reaffirms 1Q10 EPS of $1.03-1.05 vs the $1.04 consensus; revs of $29.6-29.9 bln vs the $29.70 bln consensus. Hewlett-Packard reaffirms recently raised FY10 guidance; sees non-GAAP EPS of $4.25-4.35 vs the $4.31 consensus; revs of $118-119 bln vs the $119.06 bln consensus. Revenue for Q4 was down 17% in Europe, the Middle East and Africa and 1% in Asia Pacific to $11.7 billion and $5.4 billion, respectively. When adjusted for the effects of currency, revenue was down 1% in the Americas while declining 10% in Europe, the Middle East and Africa and 1% in Asia Pacific versus the prior-year period. Revenue from outside of the United States in the fourth quarter accounted for 64% of total revenue, with revenue in the BRIC countries (Brazil, Russia, India and China) declining 4% over the prior-year period while accounting for 10% of total HP revenue. China revenue increased more than 20% from the prior year. "Relentless focus on driving efficiencies across the business has given HP a significant competitive advantage. Our skill in executing strong acquisitions and integrating them seamlessly improves the value of our portfolio, strengthens the business and contributes to our ability to expand in key growth markets in the future."

4:05PM Hewlett-Packard reports Q4 EPS of $1.14 vs the $1.14 preannouncement on Nov. 11 and the $1.13 consensus (HPQ) 50.96 +0.92 : HPQ reports Q4 revs of $30.8 bln vs the $30.8 bln preannouncement and $30.36 bln consensus.

4:08PM Analog Devices beats by $0.10, beats on revs; guides Q1 EPS above consensus, revs above consensus (ADI) 27.94 +0.46 : Reports Q4 (Oct) earnings of $0.36 per share, $0.10 better than the First Call consensus of $0.26; revenues rose 16.3% year/year to $572 mln vs the $523.8 mln consensus. Co issues upside guidance for Q1, sees EPS of 0.36-0.37 vs. $0.28 consensus; sees Q1 revs flat with Q4 levels of $572 mln vs. $532.53 mln consensus. Co sees gross margin for the first quarter increasing to approximately 58.0% to 58.5%, as a result of lower infrastructure costs and a richer mix of industrial sales. Co states, "During the fourth quarter of 2009, order rates from end customers accelerated significantly, growing by approximately 17% sequentially, and as a result, our first quarter opening backlog grew substantially from last quarter. We believe that the atypically strong growth in Q4 was the result of gradual improvements in many economies; customer inventory replenishment; and the benefits ADI is beginning to see from its rich new product cycle as a result of more focused investments over the past few years."

12:45PM Research In Motion sued by Klausner Technologies for patent infringement (RIMM) 60.12 +0.40 : Klausner Technologies announces that it has filed suit against Research in Motion for patent infringement. The lawsuit is based on the recent unveiling by RIM of certain new 3G "BlackBerry Bold 9700" mobile phones which use Klausner Technologies' Visual Voicemail patented technology. Various Blackberry models with the Visual Voicemail feature are already covered under Klausner Technologies Visual Voicemail patent licenses granted to mobile operators.

Skyworks Solutions (SWKS) announces that the Co's expanded ISO/TS 16949 certification now includes its entire Mexicali, Mexico manufacturing facility. Skyworks' 2007 ISO/TS 16949 certification previously covered only certain facets of its Mexicali operations...

8:35AM Integrated Device divests micro networks business for approximately $13 mln (IDTI) 5.97 : Co announces it has signed an agreement to divest its Micro Networks business to Spectrum Control for approximately $13 mln. The transaction, which has already received approval by the IDT Board of Directors, is expected to close by the end of November.

8:02AM First Solar sells California solar power project to NRG; no terms disclosed (FSLR) 121.18 : Co announced the sale of the 21 megawatt (MW) AC solar energy project it has developed and constructed in Blythe, Calif., to NRG Energy. Construction began in September and is expected to be completed by year-end. Electricity from the plant will be sold to Southern California Edison under a 20-year power purchase agreement. First Solar will provide operations and maintenance services at Blythe under a long-term contract with NRG. Financial terms of the agreement were not disclosed.

7:18AM Tower Semicon signs definitive agreement with Asian entity to provide know-how, training, and turnkey manufacturing solutions at a revenue of $130 million (TSEM) 1.00 :

7:05AM LDK Solar beats by $0.37, beats on revs; guides Q4 revs above consensus (LDK) 8.00 : Reports Q3 (Sep) earnings of $0.27 per share, $0.37 better than the First Call consensus of ($0.10); revenues rose 23.5% year/year to $281.9 mln vs the $277.2 mln consensus. Gross margin for Q3 was 20.1% (consensus is for 8.2%). Operating margin for the third quarter of fiscal 2009 was 13.2% compared to negative 102.9% in the second quarter of fiscal 2009 and 19.9% in the third quarter of fiscal 2008. Co issues upside guidance for Q4, sees Q4 revs of $280-310 mln vs. $258.72 mln consensus, with wafer shipments between 320 MW to 340 MW and module shipments between 20 MW to 30 MW. "We were pleased to see wafer demand strengthen across multiple geographies during the quarter, rebounding from the lower levels seen earlier this year. Our financial results for the third quarter reflect the recent improvement in the operating environment for the solar industry... During the third quarter, we continued to take steps to further strengthen our business."

1:42AM Cabot Microelectronics receives ruling on pending summary judgment motions in patent infringement enforcement action against DuPont Air Products NanoMaterials, LLC (CCMP) 31.08 : Co announces that on November 16, 2009, the U.S. District Court for the District of Arizona issued its ruling on summary judgment motions, pending in Cabot Microelectronics' ongoing patent infringement litigation against DuPont Air Products NanoMaterials. Cabot Microelectronics believes the Summary Judgment Order will be made accessible by the Court in redacted form, and at such time will be made available electronically by the co. In the Court's Summary Judgment Order, the Court denied a motion filed by DuPont Air Products NanoMaterials for summary judgment of invalidity of three Cabot Microelectronics patents at issue in the case, which are fundamental patents in the field of tungsten CMP. The Court also denied DuPont Air Products NanoMaterials' motion for summary judgment of non-infringement of these patents. In addition, the Court denied DuPont Air Products NanoMaterials' motion for summary judgment of non-infringement of another Cabot Microelectronics patent that is considered to be a foundational CMP patent. The Court also denied Cabot Microelectronics' motion for summary judgment of infringement of the tungsten patents. The Court has ordered the parties to submit pretrial filings by December 16, 2009.

11:28 am LDK Solar (LDK)

LDK Solar (LDK 8.77, +0.77), a China-based manufacturer of multicrystalline solar wafers used in solar cells, reported earnings that easily topped consensus estimates and issued upside revenue guidance for the fourth quarter.

LDK Solar reported third quarter earnings of $0.27 per share, $0.37 better than the First Call consensus that expected a loss of $0.10 per share.

"We were pleased to see wafer demand strengthen across multiple geographies during the quarter, rebounding from the lower levels seen earlier this year." said CEO Xiaofend Peng. "Our financial results for the third quarter reflect the recent improvement in the operating environment for the solar industry."

LDK Solar issued upside guidance for the fourth quarter, saying it sees revenues between $280 million and $310 million; the current consensus stands at $258.72 million.

Shares of LDK are down nearly 34% year-to-date.

11:11 am Ciena (CIEN)

Ciena (CIEN 12.09, -1.08) announced Monday that it has been selected as the successful bidder in the auction of Nortel's optical networking and Ethernet assets.

Ciena will buy the businesses from Nortel, which declared bankruptcy in January, for $769 million. The offer consists of $530 million in cash and $239 million in convertible notes.

Ciena said it expects the transaction to be significantly accretive to its results in fiscal 2011 and will make employment offers to at least 2,000 Nortel employees.
icon url

ReturntoSender

11/24/09 10:45 PM

#8758 RE: ReturntoSender #6755

From Briefing.com: 4:30 pm : There were plenty of trading catalysts this session, but participants were generally subdued and left stocks to trade with moderate losses in light volume ahead of the Thanksgiving holiday.

The stock market spent virtually the entire session in negative territory after stocks had logged solid gains in the previous session. Unlike the previous session, though, the dollar bounced between moderate gains and losses before it finished flat. Overseas markets also offered little support as they were hampered with weakness; the Shanghai Composite closed 3.5% lower due, in part, to concern for a lack of market-supportive measures from the country's officials.

Upon a second look, U.S. GDP was determined to have expanded at a 2.8% rate in the third quarter. That was in step with expectations, but it marked a considerable downward revision to the 3.5% increase that was posted as part of the advance GDP estimate.

Despite expectations for the downward revision, the Fed raised its GDP target for 2009 to the range -0.4% to -0.1% from the range -1.5% to -1.0%, according to the minutes from the November 4 FOMC meeting.

Though there is no empirically proven corollary between consumer confidence and spending, participants showed a short-lived, positive response to news that the November Consumer Confidence Index improved to a better-than-expected reading of 49.5. Retailers showed some strength early, but settled the session flat.

However, American Eagle Outfitters (AEO 15.01, +0.47) was a strong performer after it posted third quarter adjusted earnings that met expectations. Discount retailer Dollar Tree (DLTR 51.33, +2.23) brought in better-than-expected earnings and issued in-line guidance.

The biggest earnings announcement came from Dow component Hewlett-Packard (HPQ 50.19, -0.83), however. The company posted in-line earnings that reflected its preannouncement and affirmed an in-line outlook, which it had recently raised. Still, the lack of positive surprises in the report left it to lag for the entire session.

Financials proved to be the biggest drag on trade, though. The sector fell 0.8%. Bank stocks had been under pressure in the early going after Financial Times reported that the Federal Reserve has asked nine of the nation's largest banks to outline how they intend to repay TARP. Though regional banks (-0.3%) and diversified banks (-0.4%) were able to limit their losses, diversified financial services institutions (-1.5%) suffered. Even Bank of America (BAC 16.10, -0.19) couldn't be helped by news that analysts at Fitch placed the lender's Individual Rating on Rating Watch Positive.

At the other end of the performance scale was telecom. The sector finished 1.0% higher, but its lack of weight in the broader market kept it from providing any real leadership. Nonetheless, its gains extended its 2.6% advance in the previous session.

Health care was also a solid performer. The sector closed with a 0.8% gain. Dow component Merck (MRK 36.22, -0.20) failed to participate in the advance, but announced to investors a new $3 billion share repurchase program.

Treasuries found support after a directionless start. In turn, the benchmark 10-year Note advanced 12 ticks, which lowered its yield to 3.30%. The advance followed results from an auction of 5-year Treasuries. The auction fetched a bid-to-cover ratio of 2.81, which is the highest bid-to-cover of the year for the maturity.

Trading volume on the NYSE failed to eclipse 1.0 billion shares for the second straight session. The low level of participation is expected to continue through this week, due to the observance of Thanksgiving on Thursday.

Advancing Sectors: Telecom (+1.0%), Health Care (+0.8%), Energy (+0.4%), Utilities (+0.3%), Consumer Staples (+0.1%)
Declining Sectors: Financials (-0.8%), Tech (-0.5%), Industrials (-0.3%), Materials (-0.3%), Consumer Discretionary (-0.2%)DJ30 -17.24 NASDAQ -6.83 NQ100 -0.4% R2K -0.4% SP400 -0.3% SP500 -0.59 NASDAQ Adv/Vol/Dec 1096/1.87 bln/1584 NYSE Adv/Vol/Dec 1386/952 mln/1628

5:09PM Microsoft CFO to leave co Dec. 31; Peter Klein assuming CFO role (MSFT) 29.91 -0.03 : Co announced that Chris Liddell will be leaving the company at the end of 2009, and named Peter Klein as the company's new chief financial officer. "Chris and his finance team have accomplished a great deal over the past four and a half years. The team is deep and strong, and has an excellent record of building value for our shareholders," said Steve Ballmer, Microsoft chief executive officer. "Peter brings great finance and operations expertise and a deep understanding of the company, and I am looking forward to a smooth transition that continues our commitment to cost containment and finance excellence."

4:05PM NVIDIA: U.S. Patent Office rejects all 17 claims in three Rambus patents asserted against NVIDIA in International Trade Commission action (NVDA) 12.92 -0.08 : The co announces that the assigned patent examiner at the U.S. Patent and Trademark Office (USPTO) has rejected all 17 claims in three Rambus (RMBS) patents that the company had asserted against NVIDIA in the International Trade Commission (ITC). The action, known as filing an action closing prosecution, follows preliminary rejection of the claims earlier this year by the USPTO. "This continues our string of victories against Rambus patents in the USPTO," said David Shannon, NVIDIA executive vice president and general counsel. "We believe these patents are invalid and are confident that a similar decision will be made on the patents that continue to be examined." There are still eight claims in two other patents involved in the case, which the USPTO has yet to finally determine but which it had preliminarily rejected.

4:01PM Ultra Clean Holdings Acquires Facility in Singapore (UCTT) 6.20 +0.17 : Co announces the launch of its new manufacturing operation in Singapore at the Spectrum 1 complex in the Woodlands Industrial Estate. Ultra Clean took over the 35,000 sq. ft. facility from Allegro Manufacturing in early November 2009. In addition to acquiring the facility and installed equipment, Ultra Clean has taken over ongoing systems integration business in the facility.

8:52AM Analog Devices upgraded to Buy at Broadpoint AmTech Research; tgt raised to $35 (ADI) : Broadpoint AmTech Research upgrades ADI to Buy from Neutral and raises their tgt to $35 from $32 following the co's beat and raise report. The firm notes that although the co's revenue recovery is in-line with peers, the firm admits that they under-estimated the EPS power of a faster than expected revenue and gross margin recovery. Though not the firm's favorite "Buy" in Analog, the firm raises their FY10 EPS estimate to $1.74 from $1.37 (consensus $1.32) and raises their tgt to $35 from $32. The firm believes that they have been accurately modeling ADI's leverage; however, they feel further multiple compression is unlikely as focus shifts toward increased absolute earnings, not growth rates.


09:09 am Hewlett-Packard (HPQ)

Hewlett-Packard (HPQ 51.02) reported fiscal fourth quarter results Monday evening that matched its preannouncement from Nov. 11 and reaffirmed its recently raised fiscal 2010 outlook.

Hewlett-Packard reported fourth quarter earnings of $1.14 per share, matching the Nov. 11 preannouncement and a penny better than the $1.13 consensus.

Revenues fell 8% year-over-year to $30.8 billion, also matching the preannouncement but slightly ahead of the $30.36 billion consensus.

HP said revenue for Q4 was down 17% in Europe, the Middle East and Africa and 1% in Asia Pacific to $11.7 billion and $5.4 billion, respectively. When adjusted for the effects of currency, revenue was down 1% in the Americas while declining 10% in Europe, the Middle East and Africa and 1% in Asia Pacific versus the prior-year period.

Revenue from outside of the United States in the fourth quarter accounted for 64% of total revenue, with revenue in the BRIC countries (Brazil, Russia, India and China) declining 4% over the prior-year period while accounting for 10% of total HP revenue. China revenue increased more than 20% from the prior year.

HP reaffirmed its outlook for its fiscal first quarter. The company expects earnings to range from $1.03 to $1.05 per share; the consensus expects $1.04. HP projects first quarter revenues ranging from $29.6 billion to $29.9 billion; the consensus currently expects $29.70 billion.

HP also reaffirmed its full year 2010 guidance, saying that it expects non-GAAP earnings of $4.25 to $4.35 per share (consensus at $4.31) on revenues of $118 billion to $119 billion (consensus $119.06 billion).

Shares of HPQ are 40.6% higher year-to-date.

icon url

ReturntoSender

11/29/09 6:11 PM

#8759 RE: ReturntoSender #6755

From Briefing.com: Weekly Recap - Week ending 27-Nov-09A surprising sell-off in overseas markets triggered by Dubai debt concerns led to sharp losses in U.S. equity markets on Friday, wiping out the gains made earlier in the week.

Sector activity was mixed. Financials (-2.8%) led the way lower on Friday, but Telecom (+3.1%) and Health Care (+1.9%) were strong early in the week.

The market's only notable move higher this week came at the open on Monday, when a weaker U.S. dollar and much better-than-expected Existing Home Sales report helped stocks surge. Sales in October rose 10.1% to 6.1 million homes, greatly outpacing expectations of 5.7 million as the first-time home buyers tax credit provided much of the incentive for the increase.

Stocks held those gains through Monday's session, and into Tuesday and Wednesday as volume slowed ahead of the Thanksgiving Day holiday. But one headline from Wednesday, that the UAE government was restructuring Dubai World, didn't initially receive much of a reaction.

But on Thursday, with U.S. markets closed, European markets plunged as concerns grew, helping to change investors' risk appetite. The Dubai government asked creditors, which reportedly include many European banks, particularly in the United Kingdom, to defer payments on some $20 billion in debt coming due over the next 18 months.

Asian markets, which had traded lower on Thursday, plunged overnight on Friday, and the weakness carried over to U.S. markets, with the S&P 500 losing 1.7%.

While the actual direct impact on the U.S. markets may be minimal, the news acted as a nudge to those that may have already been considering locking in their gains after the incredibly strong rebound in global equity markets over the past eight months. It also triggered a flight-to-quality -- the dollar has been stronger against the euro and pound over the last two days -- increased volatility and impacted emerging markets, where historically a macro event that adversely affects one region has typically raised the risk profile for other developing regions.

With limited participation in today's shortened session and the early-stage nature of the Dubai situation, it is still difficult to say how this will ultimately play out. We will get a better read on the implications next week as more information is known and participants return to the market.

It will most likely be the main topic in the marketplace, as next's week calendar is thin. Earnings season has ended and there are no notably Treasury auctions. But the economic calendar is full, with the ADP Employment change on Wednesday preceding the key Nonfarm Payrolls figure and Unemployment Rate on Friday.


Index Started Week Ended Week Change % Change YTD %
DJIA 10318.16 10309.92 -8.24 -0.1 17.5
Nasdaq 2146.04 2138.44 -7.60 -0.4 35.6
S&P 500 1091.38 1091.49 0.11 0.0 20.8
Russell 2000 584.68 577.21 -7.47 -1.3 15.6


11:53 am Corning (GLW)

Corning (GLW 16.91, +0.38) is interested in acquisitions and is confident that revenue in its fourth quarter will top $1 billion, according to a report from The Wall Street Journal.

Corning CEO Peter Volanakis told the paper that the company has about $3 billion in cash and is looking at targets across all of its divisions, but isn't in any concrete talks right now.

Volanakis also told The Wall Street Journal that the company expects revenue in the fourth quarter will come in at more than $1 billion -- the First Call consensus expects $1.41 billion.

Corning, which produces glass used in LCD TVs, said the global glass supply remains "very tight" in the fourth quarter and heading into the first quarter.

Shares of GLW are more than 77% higher year-to-date.
icon url

ReturntoSender

11/30/09 9:17 PM

#8763 RE: ReturntoSender #6755

From Briefing.com: 4:30 pm : Stocks spent the afternoon trading with modest losses after rolling over in the early going, but they managed to make a late push into positive ground during the final hour of trade. The move was led by the financial sector, which actually had been unable to provide a lift to the broader market for most of the session.

Financial stocks outperformed the broader market with relative ease for the entire session. The sector settled with a 2.7% gain, which is more than triple the gain of the next best performing sector, utilities (+0.8%). The financial sector's strength came as banks (BKX 44.48, +1.44) rebounded from the previous session's slide, which came amid concerns regarding the exposure of banks to possible defaults by Dubai World, the corporate flagship of Dubai. Concerns over the matter persisted this morning as reports indicated that the central bank of the United Arab Emirates did not say that it would provide support specifically to Dubai.

However, Dubai World released word this afternoon that its talks with banks revolve around the treatment of roughly $26 billion in debt, a number that is much smaller than what had previously been considered. That recognition propelled financials higher so that they closed at their best levels of the session. The news also quelled some of the broader market's concern and helped it climb out of the red to settle near its own session highs.

The greenback oscillated amid concerns coming from Dubai. However, the Dollar Index surrendered its midsession gains and fell to a fractional loss, which also helped give support to the broader market.

Retailers still struggled, though. Their weakness stemmed from word that sales were soft during "Black Friday." As a group, retailers finished 0.5% lower, dragging the consumer discretionary sector to a 0.4% loss.

Advancing Sectors: Financials (+2.7%), Utilities (+0.8%), Materials (+0.7%), Tech (+0.3%), Industrials (+0.2%), Energy (+0.1%)
Declining Sectors: Consumer Staples (-0.5%), Telecom (-0.5%), Consumer Discretionary (-0.4%), Health Care (-0.3%)DJ30 +34.92 NASDAQ +6.16 SP500 +4.14 NASDAQ Adv/Vol/Dec 1376/2.01 bln/1317 NYSE Adv/Vol/Dec 1753/1.35 bln/1278

6:35PM Microchip raises Q3 guidance (MCHP) 26.24 +0.19 : Co announced that based on solid bookings and sales activities in October and November that it's raising Q3 guidance to be up 6-8% sequentially, which equates to ~$240.3-244.8 mln vs. $241.0 mln First Call consensus, up from prior guidance of up 4-8%, which equates to ~$235.7-244.8 mln. Separately, the co raised Q3 EPS guidance to $0.29 vs. $0.29 consensus, up from prior guidance of $0.27-0.29... Co said, "The first two months of our December quarter have progressed nicely and we are narrowing our net sales guidance to the upper half of our previous expectations. We currently expect gross margins to come in at the high side of our previous guidance and operating expenses to be at the low end of our previous guidance. We continue to see excellent design win traction in our strategic product lines and believe we are positioned well for future market share gains."

4:55PM OmniVision beats by $0.11, beats on revs; guides Q3 EPS in-line, revs below consensus (OVTI) 13.96 +0.55 : Reports Q2 (Oct) earnings of $0.27 per share, excluding non-recurring items, $0.11 better than the First Call consensus of $0.16; revenues rose 11.8% year/year to $183.3 mln vs the $163.9 mln consensus. Co issues mixed guidance for Q3, sees EPS of $0.14-0.24, excluding non-recurring items, vs. $0.20 consensus; sees Q3 revs of $145-160 mln vs. $168.56 mln consensus.

4:07PM Elec For Imaging: German Court declares EFII victorious in patent litigation against Durst (EFII) 12.01 +0.32 : Co announced victory in its German patent litigation with Durst Fototechnik Digital Technology GmbH involving EFI's VUTEk QS series printers with white ink technology. Durst brought the lawsuit in the Mannheim Regional Court on February 27, 2007, accusing EFI's VUTEk QS series printers of infringing Durst's utility model DE 20 2005 012 179 U1. From the outset, EFI has maintained that it employed the technology in its QS printers well before Durst obtained its utility model. Under German law, a utility model is an intellectual property right to protect inventions, very similar to a U.S. patent.

icon url

ReturntoSender

12/01/09 10:40 PM

#8764 RE: ReturntoSender #6755

From Briefing.com: 4:30 pm : Tempered concerns related Dubai's debt debacle prompted participants to put pressure on the U.S. dollar as they rotated into riskier plays. The move favored stocks, which logged impressive, broad-based gains.

Affirmations from Dubai World that it is working to restructure a smaller load of debt than initially feared helped calm concerns about a potential default by the state-owned conglomerate. On Monday afternoon word had begun to circulate that Dubai wanted to renegotiate the terms of $26 billion in debt, rather than the $60 billion that was first rumored.

The news helped give a lift to global indices and caused currency traders to step away from the greenback. With the dollar drooping again, the Dollar Index returned to 52-week lows before paring losses to finish with a 0.5% loss.

The pullback in the greenback stirred broad interest in both equities and commodities. That combination proved particularly beneficial for materials stocks and energy stocks, which finished with respective gains of 1.6% and 1.4%.

Materials stocks were led by gold plays, which advanced 3.8% as gold prices climbed to a new record high near $1204 per ounce before they closed pit trade with a 1.5% gain at $1200.20 per ounce. Newmont Mining (NEM 55.66, +2.02) was a primary leader while Kinross Gold (KGC 21.10, +1.08) also provided support. Shares of KGC had the added benefit of an upgrade from analysts at JPMorgan.

Oil prices also fared well. Crude contract prices closed 1.5% higher at $78.46 per ounce. That favored oil and gas exploration outfits (+2.1%).

Retailers rebounded to a 1.8% gain after a slip in the previous session. Better-than-expected earnings and a strong revenue forecast from Guess (GES 41.82, +4.77) helped the company's shares outperform the rest of the pack and log their best single-session percentage gain since March.

Though all 10 major sectors finished in higher ground, financials lagged. The sector settled with a mere gain of 0.1% as consumer finance stocks (-0.8%) dragged. Bank stocks (unchanged) also had a lackluster session, even though analysts Citigroup upgraded shares of regional lenders Fifth Third (FITB 10.18, +0.10) and BB&T (BBT 25.60, +0.70). Banking issues had been one of the best performing industry groups in the previous session.

There were only a few corporate headlines this session, including news from CNBC that General Electric (GE 16.17, +0.15) has reached a deal to sell NBC Universal to Comcast (CMCSA 14.97, +0.31). Many of GE's investors have long called for the divestment in favor of higher growth opportunities. NBC Universal accounted for less than 10% of GE's revenue in 2008.

Ford Motor (F 8.88, -0.01) surrendered its gains following news that its November sales were flat, which is short of the 4.1% increase that many had come to expect. Meanwhile, Toyota Motor (TM 81.45, +2.91) said its U.S. division saw sales increase 11.5% in November. Honda Motor (HMC 32.36, +1.37) saw November North American sales increase 5.5%.

Economic data did little for participants. The ISM Manufacturing Index for November came in at 53.6, which is below the 55.0 that was widely expected and down from the 55.7 that was registered in October.

Construction spending for October was flat month-over-month. It was expected to decline 0.5%. The previous month's 0.8% increase was completely reversed to reflect a 1.6% decline.

Pending home sales for October made a month-over-month jump of 3.7%, which is better than the 1.0% decline that many had expected. The increase for October wasn't quite as strong as the 6.0% increase that was registered in September.

Advancing Sectors: Utilities (+1.8%), Telecom (+1.7%), Materials (+1.6%), Energy (+1.4%), Industrials (+1.4%), Consumer Discretionary (+1.3%), Consumer Staples (+1.3%), Health Care (+1.3%), Tech (+1.3%), Financials (+0.1%)
Declining Sectors: (None)DJ30 +126.74 NASDAQ +31.21 NQ100 +1.2% R2K +1.6% SP400 +1.5% SP500 +13.23 NASDAQ Adv/Vol/Dec 1883/2.19 bln/849 NYSE Adv/Vol/Dec 2431/1.13 bln/615

9:26AM STEC Inc SSDs now qualified across Fujitsu's storage system offerings with latest integration into new ETERNUS DX80 platform (STEC) 12.39 : Co announces that Fujitsu Storage Systems has qualified the industry-leading ZeusIOPS within the innovative design of its recently announced DX80 Storage System. The integration further expands Fujitsu's SSD deployment of STEC SSDs from the high-end ETERNUS DX8000 and mid-range ETERNUS DX400, where ZeusIOPS performance advantages are also being leveraged.

9:10AM Suntech Power signs 17MW memorandum of understanding with Pure energies, expanding its footprint in Ontario solar market (STP) 14.95 : Co announces it has signed a memorandum of understanding with Ontario, Canada's Pure energies to supply up to 17MW in 2010. The MOU, which also provides a framework for module supply from Suntech to Pure energies through 2011, is focused on bringing solar systems to Ontario's rapidly growing residential solar market. Pure energies, while meeting the domestic content requirement for 2010, will deploy STP's panels for its offering to the Ontario residential market, enabling the development of 'eco friendly' homes.

8:03AM Trina Solar announces China market sales updates (TSL) 46.58 : Co announces the recent progress of its PV module sales in the Chinese domestic PV market. In Q4, Trina Solar entered into a new sales agreement to supply approximately 8 MW of PV modules products. Shipments commenced in November and are scheduled to continue through to the end of Dec. The Company also recently received government approval for a project of approximately 2 MW under the Golden Sun program, which aims to install approximately 20 MW of solar power capacity in every province.

8:01AM RF Micro Device shipments of RFMD's industry-leading 2G transmit module surpass 25 million, are expected to exceed 100 million units in calendar 2010 (RFMD) 4.32 :

7:59AM Altera raises Q4 sales growth outlook (ALTR) 21.03 : The co last night raised its Q4 sales outlook; it now expects sales for the fourth quarter to be 15-18% above third quarter levels (we calculate this to be revs of $330-338 mln vs the $326 mln consensus), previous guidance was for sales growth of 6-10%. The company expects all four of its vertical markets to be up sequentially in the fourth quarter reflecting a strong new product cycle as well as improving end market trends and customer desire for appropriate inventory to support sales levels. Sales to wireline and wireless telecommunications equipment manufacturers will likely be the largest contributor to fourth quarter growth as demand for Chinese and Indian deployments has continued to improve.

icon url

ReturntoSender

12/02/09 8:36 PM

#8765 RE: ReturntoSender #6755

From Briefing.com: 4:20 pm : Some early buying sent the S&P 500 up to a fractionally better 2009 high, but a lack of support left stocks to roll over and settle at the neutral line. A firmer U.S. dollar also dragged down interest in stocks.

Despite a tepid tone to premarket trade, stocks made their way to solid gains in the early going. Materials stocks (+1.1%) were leaders, yet again, as precious metals prices continued to push higher. In fact, gold hit a new record high near $1218 per ounce overnight. It closed pit trade slightly off of that mark with a 1.1% gain at $1213 per ounce.

Gold managed to hold its gains in the face of a modest rebound by the greenback. The Dollar Index had traded near 52-week lows in the previous session, but managed to make its way to a 0.3% gain this session.

The dollar's advance helped undercut the stock market's gains, which had already begun to fade from fractionally improved 2009 highs as buyers took a breather. Stocks were left to surrender their gains and spend the afternoon with modest losses until some moderate support helped the broader market finish with a fractional gain.

Amid the broader market's fractional gain, the major sectors finished in mixed fashion. The defensive-oriented utilities sector saw the strongest gain. It advanced 1.3% after analysts at Deutsche Bank initiated shares of American Electric (AEP 33.94, +0.90) and Edison International (EIX 35.18, +0.58) with Buy ratings.

Meanwhile, analysts at Credit Suisse upgraded shares of regional banks BB&T (BBT 26.19, +0.59) and SunTrust (STI 23.29), which helped win support for the group (+1.3%) despite a report from analysts at Oppenheimer that suggested regional banks have reported only 36% of net charge-offs expected in this credit cycle.

Still, strength among regional banks wasn't enough to give the broader financial sector a lift out of negative ground. Instead, the financial sector finished with a 0.1% loss as it lagged for the second straight session.

Energy was the worst performing sector this session, though. It surrendered 0.8%, primarily due to markedly lower crude oil prices, which fell 2.3% to close pit trade at $76.60 per barrel. Sellers stepped up their efforts against oil after weekly inventory tallies showed a build of 2.09 million barrels. A draw of 400,000 barrels had been expected.

This session's headlines were limited in quantity and impact. Participants had a muted reaction to the latest ADP Employment Change Report, which showed that 169,000 private payrolls were shed in November. That figure is down from the 203,000 job losses reported in the October ADP Report, but it is worse than the 150,000 job losses that had been widely expected.

Though the ADP figures don't always match those of the government's official nonfarm payrolls report, which is due Friday morning, it is often directionally accurate relative to expectations. The consensus currently calls for a loss of 123,000 private jobs.

On a similar note, the Fed's latest Beige Book stated that employment conditions remain generally weak. However, it did indicate that economic conditions have generally improved modestly, while consumer spending improved moderately.

Corporate headlines had little lasting impact on the broader market. Boeing (BA 53.78, +0.06) benefited early from news that competitor Northrop Grumman (NOC 55.27, +0.01) will not pursue certain tanker contracts, but shares of BA eventually rolled over.

Meanwhile, General Motors CEO Fritz Henderson announced his resignation. The announcement comes after the company said its November U.S. vehicle sales fell an unadjusted 2% year-over-year, while its retail sales increased 1% for the month.

Advancing Sectors: Utilities (+1.3%), Materials (+1.1%), Telecom (+0.7%), Health Care (+0.3%), Consumer Discretionary (+0.3%)
Declining Sectors: Energy (+0.8%), Tech (-0.1%), Industrials (-0.1%), Financials (-0.1%)
Unchanged: Consumer StaplesDJ30 -18.90 NASDAQ +9.22 NQ100 +0.2% R2K +1.2% SP400 +0.7% SP500 +0.38 NASDAQ Adv/Vol/Dec 1661/2.07 bln/1048 NYSE Adv/Vol/Dec 1973/1.03 bln/1032

4:05PM Nanometrics announces follow-on order for Atlas XP Metrology Systems from leading memory customer (NANO) 13.10 +1.46 : The co announces a follow-on order for ten of its Atlas XP metrology systems, as well as industry-leading NanoDiffract software, from a leading memory customer. These systems are incremental to systems previously ordered and announced earlier this year. The systems are to be delivered to multiple factories throughout the fourth quarter of 2009 and first quarter of 2010 in support of technology re-tooling for next-generation DRAM and Flash manufacturing.

4:04PM Sigma Designs reports Q3 EPS of $0.09, including items; misses on revs (SIGM) 11.51 -0.14 : Reports Q3 (Oct) earnings of $0.09 per share, including charges, may not compare to the First Call consensus of $0.19; revenues fell 30.8% year/year to $35.5 mln vs the $46 mln consensus. Co states, "We are disappointed to report a shortfall in revenue for the third quarter. This shortfall is due to a number of factors affecting our IPTV demand, some of which are believed to be one-time events. We do feel that the IPTV market in general has a positive outlook and that next year will see renewed market growth. Sigma powered set-top boxes are currently being deployed at a total of 36 individual telco providers around the world, providing a broad portfolio of demand for this segment..."

1:23PM Helmerich & Payne says Executive VP and CFO, Douglas Fears, announced his plans to retire on April 30, 2010 (HP) 37.90 +0.02 : Co announces Executive Vice President and Chief Financial Officer, Douglas Fears, announced his plans to retire on April 30, 2010. Effective April 30, 2010, Juan Pablo Tardio will be promoted to Vice President and Chief Financial Officer.

11:31AM Micron confirms the release of RealSSD C300 Solid-State Drive (MU) 8.13 +0.36 : Co confirms its RealSSD C300 SSD, for notebook and desktop PCs. Co says The RealSSD C300 drive is the first to leverage the SATA 6Gb/s interface, providing read speeds of up to 355 megabytes per second and write speeds of up to 215MB/s. The drives will be available in 1.8-inch and 2.5-inch form factors, with both drives supporting 128GB and 256GB capacities. Micron is currently sampling the C300 SSD in limited quantities and expects to enter production in the first quarter of calendar 2010. (Briefing.com note: Earlier Stec (STEC) shares fell ~$0.80 after wire services reported MU's new product)

9:40AM Semiconductors Hldrs Trust edges above Nov peak (SMH) 26.43 +0.25 : A new multi-week high for the SMH with it vacillating just above its Sep peak at 26.43 in early trade (session high 26.45). Its 52-wk close high from Oct is at 26.57 with the 52-wk intraday high from Oct at 26.92.

6:58AM Nokia sets key financial targets and devices & services operational priorities for 2010 (NOK) 13.41 : Co announces today, at its annual Capital Markets Day event, Nokia (NOK) set key targets and forecasts for the company and its industry for 2010. Senior company executives outlined how Nokia's focus on execution combined with its core competitive advantages, position the company to achieve and sustain broad-based success in the mobile devices market. "In 2010, we will drive user experience improvements, and the progress we make will take the Symbian user interface to a new level... and we have measures in place to push smartphones down to new price points globally, while growing margins. I see great opportunity for Nokia to capture new growth in our industry, by creating what we expect to be the world's biggest platform for services on the mobile." Targets and forecasts for Nokia and the mobile device industry - Nokia expects industry mobile device volumes to be up approx 10% in 2010, compared to 2009. - Nokia targets its mobile device volume market share to be flat in 2010, compared to 2009. - Nokia targets lower average selling price erosion of its mobile devices in 2010, compared to recent years. - Nokia targets to increase its mobile device value market share slightly in 2010, compared to 2009. - Nokia targets non-IFRS operating expenses in Devices & Services of approx EUR 5.7 bln in 2010. - Nokia targets bringing Devices & Services non-IFRS research and development expenses below 10% of net sales in 2010. - Nokia targets Devices & Services non-IFRS operating margin of 12% to 14% in 2010. - Nokia continues to target Services net sales of EUR 2 bln or more in 2011. - Nokia continues to target to have 300 mln active users for its services by the end of 2011. Nokia and NAVTEQ target NAVTEQ operating margin to be higher than Devices & Services operating margin in 2010, on a non-IFRS basis. - Nokia targets its financial income and expense to be approximately EUR 250 mln expense in 2010.

Elektrobit Inc, a subsidiary of EB, Elektrobit, a developer of embedded technology solutions for automotive and wireless industries, and TerreStar (TSTR), have expanded their relationship to include EB's provision of turnkey product delivery services to TerreStar for the TerreStar GENUS Smartphone, an EB design. EB has sub-contracted with Flextronics (FLEX) to help provide these product delivery services...

icon url

ReturntoSender

12/03/09 11:22 PM

#8766 RE: ReturntoSender #6755

From Briefing.com: 4:15 pm : For the second straight session stocks failed to hold fractionally improved 2009 highs. This session's reversal came as financials fell out of favor and concerns mounted for tomorrow's jobs report. A disappointing ISM reading didn't offer any help.

Bank of America (BAC 15.76, +0.11) helped put stocks on an upward path with news that it will repay its $45 billion TARP loan with $26.2 billion in excess liquidity and $18.8 billion in proceeds from the sale of common equivalent securities. That prompted several brokerage firms to issue upgrades on the stock, while analysts at Fitch upgraded the company's credit ratings.

In light of Bank of America's announcement, FDIC Chairman Bair stated that regulators are being very careful and very measured about letting banks repay TARP funds, Reuters reported. Meanwhile, Fed Chairman Bernanke felt the need to defend initial bank bailouts during his reconfirmation hearing. Bernanke didn't offer any new insights into the health of the financial system or the broader economy, though.

Conversely, European Central Bank President Trichet provided an increased 2010 GDP forecast for Europe, but also made dovish comments regarding policy. That caused the euro to slide and the U.S. dollar to gain ground. Initial weakness in the greenback had helped support a positive tone among participants in the early going. The dollar finished with a 0.1% gain against other currencies.

Financials also failed to provide steady support. The sector had been up as much as 1.8% early on, but it tumbled to a 2.1% loss. Principal Financial Group (PFG 22.52, -3.46) proved to be a heavy drag on the sector. Its shares endured their worst single-session percentage slide in more than six months after the company issued downside guidance for fiscal 2010.

The broader market was also undercut by concerns about the government's official nonfarm payrolls report, which is due tomorrow morning, even though White House representatives stated that they have no figures that suggest an increase in the unemployment rate. Unemployment already stands at a 25-year high.

On a related note, initial jobless claims for the week ending November 28 totaled 457,000, which is not as bad as the 480,000 initial claims that had been expected and marks a one-year low for initial claims. Continuing claims came in at 5.47 million, which is above the 5.40 million that many had come to expect and is also up from the previous week's 5.44 million continuing claims.

A disappointing ISM Service Index for November added to morning selling pressure. The sub-50 reading of 48.7 suggests that last month's service sector activity contracted, which is a surprise since the consensus estimate had been pegged at 51.5 following the October's reading of 50.6.

After sellers knocked stocks from their early perch, the market spent most of the afternoon moving sideways in a narrow range. However, pressure mounted late in the session to hand stocks a broad-based loss -- telecom (+0.2%) and utilities (+0.3%) were the only two sectors to advance.

Due to a generally disappointing batch of monthly same-store sales results, retailers struggled for the entire session. They finished with a 1.2% loss. Macy's (M 15.81, -0.49), JCPenney (JCP 28.35, -0.82), and TJX Companies (TJX 37.31, -1.08) were among the worst performers in the group. November same-store sales for Macy's slid 6.1%, while JCPenney said its monthly sales fell 5.9%. TJX Companies actually logged an 8.0% increase in its same-store sales, but that was disregarded when the company reaffirmed its downside guidance.

Comcast (CMCSA 15.91, +0.97) had a strong session, however. It announced that it has entered a definitive agreement to take majority control of NBC Universal from General Electric (GE 16.00, -0.07). Comcast will pay GE $6.5 billion to secure that stake, while GE will have the option to sell its remaining stake in coming years.

Advancing Sectors: Utilities (+0.3%), Telecom (+0.2%)
Declining Sectors: Financials (-2.1%), Materials (-1.7%), Energy (-1.4%), Consumer Staples (-0.8%), Consumer Discretionary (-0.7%), Industrials (-0.7%), Health Care (-0.6%), Tech (-0.2%)DJ30 -86.53 NASDAQ -11.89 NQ100 -0.4% R2K -1.2% SP400 -1.0% SP500 -9.32 NASDAQ Adv/Vol/Dec 852/2.01 bln/1811 NYSE Adv/Vol/Dec 1068/1.13 bln/1947

4:30PM Rambus: Samsung to Offer 1 Gigabit XDR DRAM (RMBS) 20.24 +1.65 : Co announced that Samsung Electronics Co., Ltd. will offer a 1 Gigabit XDR DRAM memory device. XDR DRAM is a key component of Rambus' award-winning XDR memory architecture. Samsung's 1Gb XDR DRAM device will broaden the availability of XDR technology for gaming, computing and consumer electronics applications.

4:29PM Marvell beats by $0.08, beats on revs (MRVL) 16.53 : Reports Q3 (Oct) earnings of $0.35 per share, excluding non-recurring items, $0.08 better than the First Call consensus of $0.27; revenues rose 1.5% year/year to $803.1 mln vs the $770 mln consensus. MRVL reports Q3 non-GAAP gross margins of 57.8% vs 55.2% consensus. Co said, "Cash flow from operations for Q of FY10 was $203.5 mln, up 12% sequentially from $182.3 mln in Q2 of FY10 and down 21% from $258.5 mln in Q3 of FY09. Free cash flow, defined as cash flow from operations less capital expenditures and purchases of IP licenses, was $195.9 mln, up 12% sequentially from $175.3 mln in Q2 of FY10 and down 20% from $244.3 mln in Q3 of FY09."

Cree (CREE) announces that it has acquired a portfolio of patents and patent applications related to semi-insulating silicon carbide material and power device technology from Daimler AG...

7:33AM Canadian Solar announces intention to build solar panel manufacturing facility in Ontario (CSIQ) 22.95 : Co announces that it is commencing the site selection and approvals process to establish a 200 megawatt module manufacturing facility in Ontario. The new facility is expected to result in 500 new direct manufacturing jobs in Ontario and sufficient capacity to supply electricity to 60,000 homes per year. The estimated cost of the plant will be CDN$24 mln, and once completed, it will be one of the largest solar panel manufacturing facilities in North America, further strengthening Canadian Solar's position as the country's leading, Canadian-owned manufacturer of solar modules. The plant will be completed in stages, with the first phase of operations expected to commence in 2010.

AMD (AMD) announced its involvement in the development of one of the first industry benchmark testing suites for OpenCL. The benchmark suite includes remote analysis, benchmarking and diagnostic features for PCs, servers, mobile devices and networks, and can be used to test OpenCL performance on ATI Stream technology... ASML (ASML), along with its subsidiary Brion Technologies, announced a broad-scoped joint development project with STMicroelectronics (STM) to accelerate 28-nm node deployment and 22-nm node development...

icon url

ReturntoSender

12/05/09 6:47 PM

#8767 RE: ReturntoSender #6755

From Briefing.com: Weekly Recap - Week ending 04-Dec-09

The major indices logged another winning week -- hitting fresh 2009 highs -- thanks to mostly broad-based buying interest. The week got off to a solid start on decreased concerns over Dubai's debt situation and ended on an upbeat note as the U.S. unemployment rate unexpectedly dropped.

Nine of the 10 sectors posted a gain, led by utilities (+3.9%), telecom (+2.4) and financials (+2.3%). Commodity-related stocks underperformed, with energy shedding 1.5% on the week.

With only one S&P 500 company reporting earnings, economic data was in full focus as investors awaited the November employment report.

The employment report was better-than-expected on all the major metrics. Employers shed 11,000 nonfarm payrolls in November, far less than the 125,000 median estimate. In addition, prior months were revised to show smaller drops. In turn, the unemployment rate declined to 10.0%, from a previous reading of 10.2%.

Although corporate news was on the slow side due to the lack of major earnings reports, there were some notable items as retailers reported same-store sales and another major bank moved to repay government bailout loans.

Overall same-store sales disappointed, resulting in retailers logging some of the biggest declines on the week. Of the 27 retailers that Briefing.com follows, 19 missed the consensus estimate and 16 posted negative numbers. Among the biggest losers on the week, Game Stop (GME) shed 15.8%, Abercrombie & Fitch (ANF) lost 9.7% and Macy's (M) fell 6.0%.

Separately, Bank of America (BAC) announced plans to repay $45 billion in TARP funds as it looks to find a new CEO. In commodity trading, the CRB Index had an active week, with movements exacerbated by sharp moves in the dollar.

Gold prices hit a record nominal high of $1226 per ounce, but ended the week at $1161 per ounce after plunging 4.6% on Friday as the dollar rallied following the better-than-expected jobs report.

Crude prices fell 0.5% on the week, coming under pressure following a bearish inventory reading.


Index Started Week Ended Week Change % Change YTD %
DJIA 10309.92 10388.90 78.98 0.8 18.4
Nasdaq 2138.44 2194.35 55.91 2.6 39.1
S&P 500 1091.49 1105.98 14.49 1.3 22.4
Russell 2000 577.21 602.79 25.58 4.4 20.7


11:11AM LDK Solar confirms continuation of supply contract with Q-Cells (LDK) 9.15 +0.77 : Co announces that the two cos have reached an agreement to continue their supply contract for solar wafers from 2009 to 2018. The two cos resolved all differences of opinion over the interpretation of the agreement and neither side will pursue legal action. Q-Cells also agreed to no longer pursue measures to collect the bank guarantee. Joint business activities between the two cos remain unchanged. LDK Solar and Q-Cells have agreed to increase the flexibility of the delivery schedule. Flexible pricing based on market levels and Q-Cells' preferred customer status will apply for the entire remainder of the contract term. A portion of shipments scheduled in the years 2009-'11 have been postponed to the period 2012 to 2018. Q-Cells will receive around 20% in the current year and at least one third of the originally agreed volumes in '10 and '11. Q-Cells also has the option to increase these volumes if needed. The total delivery volume for the entire ten-year term of the contract remains unchanged at approximately 6 Giga Watts. In addition to the amendment, the parties have finalized an agreement to expand their cooperation in the areas of cell and module processing. Q-Cells will supply solar cells to LDK Solar on a tolling basis and LDK Solar will supply modules to Q-Cells on the same basis.

2:48AM Cisco receives second request from DOJ regarding proposed acquisition of TANDBERG (CSCO) 23.83 : Co announces that it has received a Request for Additional Information from the U.S. DOJ with respect to its previously announced proposed acquisition of TANDBERG. The request for information from the DOJ, often referred to as a "second request," is part of the regulatory process under the Hart-Scott-Rodino Antitrust Improvements Act of 1976. Co continues to expect the transaction will close during the first half of CY10.

08:52 am Marvell Technology Group (MRVL)

Shares of Marvell Technology Group (MRVL 16.53) are surging ahead of Friday's opening bell after the company posted solid third quarter earnings and issued upside guidance for the fourth quarter.

Marvell reported third quarter earnings of $0.35 per share, excluding nonrecurring items, $0.08 better than the First Call consensus of $0.27.

Revenues rose 1.5% year-over-year to $803.1 million, easily topping the $770 million consensus.

CEO Dr. Sehat Sutardja said that "order momentum improved across all our addressable end-markets."

On its earnings conference call, Marvell issued upside guidance for the fourth quarter, saying that it expects earnings to range from $0.33 to $0.39 per share on revenues of $820 million to $850 million. The First Call consensus expects earnings of $0.27 per share on revenue of $779.57 million.

Shares of MRVL are 147.8% higher year-to-date and are about 8.3% higher in Friday's premarket action.
icon url

ReturntoSender

12/06/09 3:37 PM

#8769 RE: ReturntoSender #6755

InvestmentHouse Weekend Market Summary 12/4/09

http://www.investmenthouse.com/weekendmarketsummary.htm

- Jobs report surprises with some positives but is not out of the woods yet.
- Dollar explodes higher and the related trades take a hit.
- Stocks and bonds acting as they should with a better economic outlook: growth is growing, bonds are selling.
- Leadership may be starting to rotate away from dollar trades to growth trades.
- Despite the rally on good news, the indices remain in their ranges: watching the small and mid-caps for the true direction.

Jobs report shows some tantalizing progress.

All the action was related to the jobs report on Friday. It was much better than expected (-11K non-farm payrolls versus -125K expected). There was a sharply reduced number for October (-111K versus original -190K) and September, with a net of 159K fewer lost jobs than originally anticipated. The unemployment rate fell to 10.0% from 10.2% on top of that. It was expected to clone that for the month, so there was a significant gain. Those positives gapped futures higher; indeed, it gapped it over the midday action on Thursday. The SP futures topped out over the Thursday peak and then fell off. There were fewer losses, the revisions were positive, and the most important factor (for us) was the average workweek. It went up to 30.2 hours from 30.0. This is not just a one tenth bump as usual, so that shows significant action. Temporary employees were up. There have not been any temporaries hired of late, and those are where the full-time employees usually come from. It is good to see temps being picked up.

It was not all candy and roses, however. The work force fell by 100K. Those people have given up. It now stands at 861K, and that is significant. They say 65% of the workforce is disgruntled that is something to consider. When people start seeing the good job numbers, they will come back out in the labor force and the unemployment rate will likely rise even more. The administration was hinting at that today because that is the way it works. People hear that things are better and they go looking for jobs, but there are no real jobs yet. They will have rejoined the pool and not found a job, so the unemployment rate will tick higher. For people putting a lot of stock in 10% versus 10.2%: Remember there was a drop from 9.5% to 9.4% in September, and Robert Gibbs said this was a sign that the economy had pulled back from the brink and everything would be okay. It then immediately ran up to 10% and 10.2%, so you cannot put too much stock in one month. It could be a rogue month. The good news is the 10.2% may have been overly negative. There will be a move back up to 10.1-10.3 (or even higher) as the months unfold because more people will be looking for work given the "good news" shown on Friday.

Emergency benefits were up 265K even though the job market is supposedly getting better. They have been extended repeatedly. Someone can effectively have been on unemployment for two years now, and it is the small businesses paying that. The government keeps coming back to extort more money from them for people who are no longer working. It is a tough racket when you are a small business and your business is down. You cannot afford to have the employees anymore, yet you still have to pay for them.

Another thing to consider is the non-farm jobs versus the unemployment rate. Coming out of recessions, the unemployment rate is more important. The big companies do not create jobs. They have been net job losers for 20 years. The startups create the jobs, and that is what makes the job summit such a joke in the eyes of many: the large companies were there, and they do not do much of the hiring or innovation. They are getting handouts from the government stimulus package (GE and the like) but are not creating any jobs. The unions were there, and they are not going to create any jobs in and of themselves. 11K non-farm jobs lost does not mean a lot; you have to look at is what the unemployment rate is. It did come down, and that is positive, but it will not stay down yet. The jobs report was not the perfect news I would like to see, but I am not going to deny that it was good news.

The jobs report set the stage, and stocks opened much higher. The DXY0 had a massive surge all the way back to the EMA that held it in check in early November. This is a big move. It cleared some resistance, and it is approaching some other serious price resistance, but it was a big move. If the US economy will recover (as the data seemed to suggest), then the dollar will strengthen. That is the reason for the move. The Fed will raise rates and it makes the currency worth more as the economy recovers. There was short covering in the dollar, of course, and an unwinding of the dollar carry trades that contributed to the move in the dollar. You have to get out of those if it looks like the economy (and thus the dollar) will be stronger. If you do not move out, you can be in a word of hurt. You have to unwind those trades, and that gets the snowball rolling faster down the hill.

Gold dove lower ($1,162.50, -55.70). It was down $60, and pushing $70 at one point. We took nice gain over 200% on our GLD options, but gold took quite a hickey. That will happen with worry about money printing the Fed being incessantly lax. When there is an indication that something else may be afoot, the knee-jerk reaction was to sell off hard. The dollar closed well off yesterday's close (1.4846 Euros, versus 1.5069 Thursday). Oil did not sell off tremendously ($75.74, -0.72), but many energy stocks were hit hard. They have been under pressure the last few days, which is why we took several off the table and looked at downside plays in energy. We entered a bonus play on Friday with DUG.

Oil and gold were both under pressure. Bonds sold hard. The TIPS gapped lower indeed, the 10 year closed at 3.47%, up 10 basis points from 3.37 the day before. Bonds have been selling and yields have been rallying. Over the last week, it seems like the bond market, after looking for trouble, anticipated a better jobs report. Rates have been swinging violently over the last week: It was at 3.19% just over a week ago.

The SP500 and the Dow both surged to new highs but were unable to hold them. The small caps and NASDAQ surged and held most of their gains. The semiconductors had an explosive move -- like bonds, it looked like they anticipated this news. They rallied and closed at a new high for 2009. There was a lot of strength in growth areas, and that is what we like to see. Stronger growth stocks are an indication of a stronger economy, and that is why I have been watching SP600 so closely over the last few weeks to see if it could rally.

The sum total was positive action. It is the right kind of action. The dollar is up, and the stock market is up; they are anticipating a stronger economy in the future. The growth areas were moving while those that have been tied to the dollar and exports (and a second-rate US economy) were down. The NYSE large caps, the SP500, and the Dow were unable to hold their moves and showed much less relative strength than the other indices. Where SOX gained 2%, the SP500 gained 0.5%. The Dow gained 2%. NASDAQ posted a solid 1% gain and was at 1.5% at one point. Things are moving in the right direction, but the big question is whether it can last.

TECHNICAL

INTERNALS

The advance/decline line was not bad on NASDAQ at 2.8:1, but it was not huge. It was not the 3:1 or 4:1 one could expect on great news about jobs. NYSE was 2.1, which was also not great considering that decliners led nearly 2:1 on Thursday.

The volume was key. It rose 14% on NASDAQ and 22% on the NYSE, pushing both of them above average. That is not bad. We want to see the growth indices like NASDAQ rise on strong, above-average volume. The NYSE rallied to a new high but gave it back. As a matter of fact, it gave back 14 points off the high more than two times what it gained on the session and it kept it in this range. The high volume indicates that a lot of the stocks tied to the dollar were selling back. Commodities and energy were taking it on the chin, and industrials were not performing well either. They have been feeding off the weak dollar in the export market. They were knocked around a little, and that will keep happening if things continue this way.

The small caps posted a 2.3% gain. They have not moved over the November peak, but they are challenging it, and this will be a very important move. They are trying to make a higher low, and if they can make a higher high, they may keep the whole upside trend moving even after a lower low. As the small caps and mid-caps moved higher, the strong NYSE volume shows that the action was mixed. There was buying in the growth areas, while there may have been some higher volume selling in dollar-related areas. That shows that the action was mixed but still positive given the news on the day.

There is obviously short covering going on, some dollar selling, and some selling to the dollar-related stocks. That had to happen because they have had such a good rally. When things appear to change, they are quick to bail. There were positive developments related to growth areas.

CHARTS

SP500 moved to a new rally high, but could not hold it and traded in the same range. There was great news out there, but it could not hold onto the move. That is a negative for SP500 because many of the financial stocks were up on the news, but not substantially. The Dow did the same thing: It rallied to a new high and turned back unable to hold that new high on tremendous volume. There are still issues with the large cap stocks tied to the dollar. NASDAQ did not finish at its high and did not finish were it gapped open. It did hold a very solid gain and is trying to push out of this range, but it could not quite do it. It moved to a new high but could not close there. It is in the same position it was before, even though it is showing more strength. Until it clears that range, it is still in the same boat. The small caps held almost all of their gains, but they are still below the November peak. This is a good move. It has held its gain, but still has to make the break, and that is what we want to see. How it moves from here will be the key. It was not able to clear that high on a very good news day, and this is a concern.

The SOX moved to a new closing high, but just by a hair after a strong week of gains as if it was anticipating the news as well. It gapped to a doji, and that may show it needs a pullback, but the semiconductors have been on fire and they came out of nowhere to do it. This is an important growth area, so it is another example that feeds into the idea that things are improving and looking better down the road. Then again, the small caps and mid-caps still need to break out. Growth definitely led the market and led the gains on Friday, while the dollar-related stocks suffered that is how it should be. When looking at the overall picture, there was no real change in any of these indices (other than SP500) even with what many were saying was excellent news. This is a problem. Maybe they were too far down in their range to make the break on Friday. We will find out next week.

LEADERSHIP

The chips were in the lead and have been doing very well. NVLS gapped higher and continued its run. RMBS continued its run with a gap higher. They are running and getting a lot of money on a lot of volume. It was trading in that range, made a higher low, and made a big breakout. We are lamenting that one because we were trying to get in and play it.

Tech was not doing badly at all. GLW has been running higher. AAPL was off again, but it looks like it has made a test of support and may be ready to run. Net stocks were doing fine. AKAM was having a good day. NTGR had a nice day; it was not runaway, but it moved up out of a good pullback. Many good stocks were making moves, but others (such as energy) were struggling. We are playing HAL to the downside. OII is heading lower. BTU hit its 50 day EMA and it has bounced off it many times before. It has some serious downside volume. The metals were also in trouble. AKS is a good indication, and it has had two tough days. It is not totally broken down, but it is struggling. If the idea holds that the economy is recovering and the dollar continues to gain, there could be more of this.

Agriculture has been leading up, and it is still okay after the breakouts. MOS sold back hard, and that is how it was across the agricultural sector, just as it was with energy and metals. There is a bifurcation here as in the major indices. Growth areas were moving higher, and areas tied to the rest of the world and the weaker dollar moved lower. There is still a plethora of leadership out there, but it is rotating. Rotation is not only good for the tires on your car, but it is good for the stock market. New money has to move into other areas when stocks become overextended as many of these have. It is healthy for the stock market when they pull back as others move higher. This change in leadership is not bad at all.

THE MARKET

MARKET SENTIMENT

VIX: 21.25; -1.21
VXN: 23.1; -0.9
VXO: 20.53; -1.13

Put/Call Ratio (CBOE): 0.85; +0.17

Bulls versus Bears:

This is a reading of the number of bullish investment advisors versus bearish advisors. The reason you look at this is that it gives you an idea of how bullish investors are. If they are too bullish then everyone is in the market and it is heading for a top: if everyone wants to be in the market then all the money is in and there is no more new cash to drive it higher. On the other side of the spectrum if there are a lot of bears then there is a lot of cash on the sideline, and as the market rallies it drags that cash in as the bears give in. That cash provides the market the fuel to move higher. If bears are low it is the same as a lot of bulls: everyone is in and the market doesn't have the cash to drive it higher.

Bulls: 50.6% Up from 44.4%. Moving to a high on this last run, matching the levels from September and October. Hitting highs again just as SP500 bumps prior peaks yet again. Believers may have waned but the liquidity did not. Still well over the 35% level that is the threshold for what is considered a bullish climate. It does not mean things are necessarily bearish; that takes a reading in the 60% range. Hit a high of 47.7% mid-June on the run from the March lows. Again, to be seriously bearish it needs to get up to the 60% to 65% level. Dramatic rise from 21.3% in November 2008, the bottom on this leg. This last leg down showed us the largest single week drop we have ever seen, falling from 33.7% to 25.3%. Hit 40.7% on the high during the rally off the July 2008 lows. 30.9% was the March low. In March the indicator did its job with the dive below 35% and the crossover with the bears. A move into the lower 40's is a decline of significance. A move to 35% is a bullish indicator.

Bears: 17.6%. Bears are leaving the building the past three weeks, falling sharply from 26.7%. This is the lowest level of the entire rally and is at a bearish level. Just in time for the SP500 testing the prior peak. Peaked near 28% on this round, falling short of the 35.6% hit in July 2009. For reference, cracking above the 35% threshold considered bullish. Hit a high on this run at 47.2%. For reference, bearishness hit a 5 year high at 54.4% the last week of October 2008. The move over 50 took bearish sentiment to its highest level since 1995. Extreme negative sentiment. Prior levels for comparison: Bearishness peaked at 37.4% in September 2007. It topped the June 2006 peak (36%) on that run. That June peak eclipsed the March 2006 high (33%) and well above the 2005 highs that spawned new rallies (30% in May 2005, 29.2% in October 2005). That was a huge turn, unlike any seen in recent history.

NASDAQ

Stats: +21.21 points (+0.98%) to close at 2194.35
Volume: 2.247B (+14.34%)

Up Volume: 1.722B (+1.011B)
Down Volume: 547.684M (-711.032M)

A/D and Hi/Lo: Advancers led 2.81 to 1
Previous Session: Decliners led 2.1 to 1

New Highs: 142 (+38)
New Lows: 34 (+4)

NASDAQ CHART: Click to view the chart

NASDAQ 100 CHART: Click to view the chart

SOX CHART: Click to view the chart

SP500/NYSE

Stats: +6.06 points (+0.55%) to close at 1105.98
NYSE Volume: 1.383B (+22.04%)

Up Volume: 974.742M (+652.839M)
Down Volume: 382.883M (-415.125M)

A/D and Hi/Lo: Advancers led 2.01 to 1
Previous Session: Decliners led 1.78 to 1

New Highs: 387 (+39)
New Lows: 68 (+7)

SP500 CHART: Click to view the chart

SP600 Chart: Click to view the chart

DJ30

Stats: +22.75 points (+0.22%) to close at 10388.9
Volume DJ30: 460M shares Friday versus 243M shares Thursday. Some unwinding of the dollar related trades led to some massive volume.

DJ30 CHART: Click to view the chart

MONDAY

If SP600 can break over the November peak, then maybe the rally to the end of the year is coming early. We can get a nice run, kick started by the jobs report, after the indices have traded for a month in a lateral range. However, the action shows that there was no relative change in the position of any of the indices other than the SOX. They could not make the breakout even with the good news. You have to take the jobs claims with a grain of salt. There was good news, but it has not been able to break the market free and rally into the end of the year. It is very possible it could do it next week; I am only saying it was not able to do it on Friday despite all the good news.

That does not mean there are not good stocks out there. We picked up several on Friday that were in good position and making moves higher. I am definitely going to keep looking for those. The chips have rallied. They are a bit overextended and we may still find buys there, but there may be pullbacks over the next week as they come back and test. That will give us good entry points. There are small techs looking good and some business services looking good. These are all areas that you want to see do well if the economy is going to improve because they will tend to lead the way up. Remember, in late 2008 and early 2009, small business stocks started to move higher. They tend to lead out if things are going to recover. That was a false lead, but it happens. We got the stimulus package passed and optimism was higher, so those stocks built in some gains in anticipation of economic recovery. That has obviously taken longer than many hoped, and some have fallen to the wayside. We should see growth stocks and small and mid-cap stocks start to perform again (as they seem to be doing now) if there is going to be economic recovery.

What to look for over the next week: stocks that are moving up those smaller ones doing well and ready to make the breaks higher as we watch how SP600 plays off the prior November peak. I sound like a broken record, but it touched that level and pulled back on Friday. This is going to be important. It needs to make a higher high, and then take on the two levels at 325 and up to the October peak. If it makes a breakout, things look good for a January effect rally with the small caps leading the way. That could be positive for the economy, but we will see. It looked good earlier in the year as well. The small caps were trying to lead higher, it looked positive, but then things waffled. They still went higher but lost their leadership move in August. It was overtaken by SP500 and the Dow the dollar-related stocks. That will have to change to avoid the double dip recession. If the unemployment rate can be brought down to where it is no longer a leading indicator of trouble, but falls in line with some of the economic data, then that is a huge positive. The small and mid-caps should rally in that case. We will be right in there with them because they will be on the reports. As they make the move, we will move into them.

Have a great weekend. I will see you Monday, and we will see how the SP600 fairs with respect to that November peak.

Support and Resistance

NASDAQ: Closed at 2194.35
Resistance:
2205 is the November 2009 peak
2210 (from September 2008) to 2212 (the July 2009 closing low)
2275 - 2278 from the February 2008 and April 2008 lows

Support:
2191 is the October 2009 peak
2177 is a low from March 2008
2169 is the March 2008 closing low (double bottom)
2168 is the September 2009, intraday peak
2167 from the July 2008 intraday low
The 18 day EMA at 2163
2155 is the March 2008 intraday low
2143 is the October 2009 range low
The 50 day EMA at 2128
2099 is the mid-September 2008 closing low
2070 is the September 2008 intraday low
2060 is the August peak
2048 is the early October 2009 closing low
2016 is the early August peak
1984 from late September
1962 is the bottom of the August 2009 range.
1947 is the October gap down point
1897 is the October post gap intraday high.
1880 is the June peak
The 200 day SM A at 1865
1862 is the July peak

S&P 500: Closed at 1105.98
Resistance:
1106 is the September 2008 low
1114 is the November 2009 peak
The March/July up trendline at 1121
1133 from a September 2008 intraday low
1185 from late September 2008
1200 from the July 2008 low

Support:
1101 is the October high
The 18 day EMA at 1097
1090 is the 2007 down trendline
1080 is the September 2009 peak
1078 is the October range low
The 50 day EMA at 1077
1070 is the late September 2009 peak
1044 is the October 2008 intraday high
The August peak at 1040
The early October 2009 closing low at 1025
The early August intraday peak at 1018
The November 2008 peak at 1006 closing 1007.53 intraday
992 is the August 2009 consolidation low
956 is the June intraday peak
The 200 day SMA at 950

Dow: Closed at 10,388.90
Resistance:
10,496 is the November 2009 high
10,609 from the Mid-September 2008 interim low
10,963 is the July 2008 low

Support:
10,365 is the late September 2008 low
The 18 day EMA at 10,324
10,120 is the October 2009 peak
The 50 day EMA at 10,065
9918 is the September 2008 peak
9855 is the early September peak in its lateral range
9835 is the late September 2009 peak
9654 is the November 2008 high
9625 is the October 2008 closing high
9620 is the August 2009 peak
9430 is the early October low
9387 is the mid-October peak
9116 is the August low
9088 is the January 2009 peak
8985 is the closing low in the mid-2003 consolidation
8934 is the December closing high
8878 is the June peak
The 200 day SMA at 8866
8829 is the late November 2008 peak

Economic Calendar

These are consensus expectations. Our expectations will vary and are discussed in the 'Economy' section.

December 04 - Friday
- Nonfarm Payrolls, November (08:30): -11K actual versus -125K expected, -111K prior (revised from -190K)
- Unemployment Rate, November (08:30): 10.0% actual versus 10.2% expected, 10.2% prior
- Average Workweek, November (08:30): 33.2 actual versus 33.1 expected, 33.0 prior
- Hourly Earnings, November (08:30): 0.1% actual versus 0.2% expected, 0.3% prior
- Factory Orders, October (10:00): 0.6% actual versus 0.0% expected, 1.6% prior (revised from 0.9%)

December 07 - Monday
- Consumer Credit, October (14:00): -$9.3B expected, -$14.8B prior

December 09 - Wednesday
- Wholesale Inventories, October (10:00): -0.5% expected, -0.9% prior
- Crude Inventories, 12/04 (10:30): 2.09M prior

December 10 - Thursday
- Initial Claims, 12/05 (08:30): 465K expected, 457K prior
- Continuing Claims, 12/04 (08:30): 5435K expected, 5465K prior
- Trade Balance, October (08:30): -$37.0B expected, -$36.5B prior
- Treasury Budget, November (14:00): -$134.1B expected, -$176.4B prior

December 11 - Friday
- Export Prices ex-ag., November (08:30): 0.3% prior
- Import Prices ex-oil, November (08:30): 0.4% prior
- Retail Sales, November (08:30): 0.7% expected, 1.4% prior
- Retail Sales ex-auto, November (08:30): 0.4% expected, 0.2% prior
- Michigan Sentiment-Preliminary, December (09:55): 68.5 expected, 67.4 prior
- Business Inventories, October (10:00): -0.3% expected, -0.4% prior
icon url

ReturntoSender

12/06/09 4:56 PM

#8770 RE: ReturntoSender #6755

Technical Analysis: Vanishing Bears

With no fear among investors and the market facing some tough levels, is this the place to look for a correction?

http://www.internetnews.com/bus-news/article.php/3851041/Technical+Analysis+Vanishing+Bears.htm

December 3, 2009
By Paul Shread: More stories by this author:

The stock market has made little progress since our last update six weeks ago, with only the Dow trading significantly higher among the major indexes.

One interesting development recently has been the vanishing act by the bears in the weekly Investors Intelligence market sentiment survey. This week, the ratio clocked in at 50 percent bulls to 16.7 percent bears, the lowest number of bears since a 60-16 reading in June 2003. But as the market didn't begin to correct until early 2004, that reading by itself didn't turn out to mean much.

But with the market still stalled at some critical levels here, it's nonetheless worth noting the apparent complacency.

The biggest hurdles for the bulls remain 1133, 1150 and 1200 on the S&P and 10,683-10,827 on the Dow (see first two charts below). As we've noted for some time, 10,683 could prove to be an important market fulcrum for some time, as it was the first mid-term election year low to be broken prematurely since 1930.

The S&P has support at 1080-1083, and retest of 1020-1030 is possible below that. The Dow has support at 10,231, 10,000 and 9679.

Looking ahead, the Nasdaq (third and fourth charts below) will face a very difficult hurdle at 2400, a trendline connecting the 2000 and 2007 peaks. 2205 and 2300 are first resistance levels, and 2114 and 2024 are support.


Paul Shread is a Chartered Market Technician (CMT) and member of the Market Technicians Association. He is a co-author of the book "Dow Theory Unplugged" from W&A Publishing.
icon url

ReturntoSender

12/07/09 8:30 PM

#8771 RE: ReturntoSender #6755

From Briefing.com: 4:15 pm : Last Friday's mixed finish was extended into this session's early action as a lack of market-moving headlines left participants with few cues for trade. That left the day's direction to be largely determined by the U.S. dollar, which came into closer focus amid comments from Fed Chairman Bernanke.

In a speech before the Economic Club of Washington D.C., Fed Chairman Bernanke indicated that the FOMC is looking to keep interest rates low for an extended period of time. The comment is consistent with the Fed's previous statements, but it helped quell concern that the better-than-expected November jobs figures released on Friday would lead the Fed to raise interest rates sooner than later. Such concern had caused some profit taking on Friday.

Bernanke's comments helped drive the greenback from a one-month high against competing currencies to a 0.6% loss. Stocks responded with a climb to afternoon highs, where they traded with modest gains.

However, stocks were unable to extend their upturn beyond morning highs and eventually rolled over. Their downturn also came in conjunction with greenback's move off of its lows -- the Dollar Index finished with a 0.2% loss. The broader equity market settled above its session low with a modest loss.

Financials felt considerable weakness for most of the session; they fell to a 1.6% loss. The financial sector was weighed down by weakness in shares of banks (-1.6%) and diversified financial services outfits (-1.8%). Citigroup (C 4.03, -0.03) was unable to win favor for the sector's many players after news reports said the company has asked to repay $20 billion of its bailout funds. Last week's news that Bank of America (BAC 15.89, -0.39) plans to repay its $45 billion TARP loan helped win temporary favor for financials.

On a related note, The Wall Street Journal reported that the total cost of TARP could be cut by $200 billion.

Telecom was the best performing sector this session. The sector booked a 1.8% gain, which added to its gains from last week. Telecom stocks have gained 4.2% during the last six sessions. That's second only to utilities, which gained 4.6% during that time.

Commodities finished in mixed fashion. Gold prices settled 0.5% lower at $1164 per ounce, while contract prices for oil closed 2.0% lower at $73.94 per barrel. However, natural gas prices surged 8.7% to $4.98 per contract amid reports of the return of cold weather. Strength in natural gas gave the CRB Commodity Index a modest 0.1% gain. That put an end to its three consecutive advances.

There was only a small dose of data this session, but it caused little reaction among market participants. As expected, consumer credit declined for the ninth consecutive month in October, but the drop far less than expected. The consensus called for a $9.4 billion decline, but the actual drop was only $3.5 billion. September's drop in consumer credit was revised upward to reflect a $8.8 billion decline. The positive surprise for October and the upward revision to September's figures suggest that consumer demand for additional funding has not been wiped out as consumers deleverage themselves. In fact, if the recent trends continue, growth in consumer credit could actually occur by year's end.

Advancing Sectors: Telecom (+1.8%), Utilities (+0.7%), Consumer Discretionary (+0.5%), Consumer Staples (+0.1%), Materials (+0.1%)
Declining Sectors: Financials (-1.6%), Tech (-0.5%), Energy (-0.3%), Health Care (-0.2%), Industrials (-0.1%)DJ30 +1.21 NASDAQ -4.74 NQ100 -0.5% R2K +0.1% SP400 -0.1% SP500 -2.73 NASDAQ Adv/Vol/Dec 1381/1.88 bln/1329 NYSE Adv/Vol/Dec 1630/941 mln/1402

8:31AM Zilog: IXYS announces acquisition of Zilog for ~$3.59 a share (ZILG) 2.96 : IXYS announces that it has entered into a definitive agreement to acquire Zilog. Under the terms of the agreement, IXYS will acquire all of Zilog's outstanding common shares for $3.5858 per share in cash, or approximately $62.4 million. The acquisition is subject to the approval of Zilog shareholders and other customary closing conditions. The transaction is expected to be completed during the quarter ended March 31, 2010. The combination of the two companies with complementing technologies will allow IXYS and Zilog to leverage analog power management with digital control. Zilog has a focused MCU business with technologies that will complement IXYS' product portfolio. IXYS has a broad based and diversified range of products geared toward industrial, telecommunications, medical, automotive, alternative energy and consumer applications. By introducing MCUs that enable digital power management and embedded control, IXYS will be able to create more cost-effective system integration solutions for its diversified customer base.

QLogic (QLGC) announces that QLogic 5802V 8Gb Fibre Channel switches and iSR6250 10GbE Intelligent Storage Routers are now available from Hitachi Data Systems, a wholly owned subsidiary of Hitachi (HIT), and over 500 authorized Hitachi Data Systems resellers worldwide...

10:35 am Research In Motion (RIMM)

Research In Motion (RIMM 60.38, +1.63) said Monday that it has reached an agreement with Digital China Holdings Ltd. to distribute its BlackBerry handsets in China.

"Digital China's extensive knowledge and market presence will further expand the opportunity for RIM in China," said Jim Balsillie, co-CEO of Research In Motion.

Digital China is the largest IT services provider in China, with regional centers in 19 major cities across the country.

icon url

ReturntoSender

12/08/09 11:07 PM

#8772 RE: ReturntoSender #6755

From Briefing.com: 4:30 pm : Stocks spent the entire session mired in weakness as cautionary comments about the U.S. debt rating and strength in the U.S. dollar weighed on the minds of participants. Broader sentiment remains mixed, though, as participants continue to assess the market's near-term direction.

Sellers were stirred to action amid word from The Wall Street Journal that Moody's Investors Service believes the U.S. and U.K. need to trim their respective deficits in order to help protect against a downgrade to their triple-A ratings. Meanwhile, analysts at Fitch stripped Greece of its A-rated status. It wasn't apparent whether Greece's downgrade was referenced by European Central Bank member Stark when he suggested that there may be more surprises beyond the debt debacle in Dubai, but the comment raised eyebrows nonetheless.

Despite concerns for a mounting U.S. deficit, President Obama suggested that the U.S. needs to continue to spend its way out of recession as he called for new infrastructure projects and tax breaks for small businesses that will help temper unemployment. Concerns for the financial health of the U.S. have weighed on the U.S. dollar for many months, but support for the greenback this session lifted the Dollar Index 0.7% to a fresh one-month high.

Per usual, the greenback's gain weighed on the broader stock market, but its impact was most considerable against energy and materials stocks. Broad-market pressure and lower commodity prices conspired to take both sectors to losses of 1.7%.

Commodity prices, as measured by the CRB Commodity Index, fell 0.8% -- its fourth loss in five sessions. Oil prices were a primary detractor of the CRB; crude oil futures finished at $72.74 per barrel as they fell 1.6% in their fifth straight loss.

There were a handful of corporate announcements from some relatively widely held names, but they didn't cause much of a stir among participants.

Dow component 3M (MMM 77.11, -0.80) reaffirmed that it expects adjusted earnings for fiscal 2009 to range from $4.50 to $4.55 per share, but that remains below the consensus forecast for $4.57 per share. The company expects earnings in fiscal 2010 to range from $4.85 to $5.00 per share, which brackets the $4.94 per share consensus estimate.

FedEx (FDX 89.88, +2.36) issued last evening a forecast for earnings of $1.10 per share in the second quarter. That is below the $1.58 per share that it earned in the same period of the previous year, but up markedly from the company's previous guidance, which called for earnings to range from $0.65 to $0.95 per share. It also exceeds the consensus call of $0.85 per share for the quarter.

McDonald's (MCD 60.61, -1.32) recorded a 0.6% dip in U.S. same-store sales during November. That undercut global comparable sales, which increased a modest 0.7% during the month.

Though stocks were mired in weakness for the entire session, Treasuries garnered moderate support as the benchmark 10-year Note climbed just seven ticks. Treasuries came under closer focus midsession as news that a $40 billion auction of 3-year Notes produced a bid-to-cover ratio of nearly 3.0, which is better than the 2009 average ratio of 2.7, but not as strong as the ratio of 3.3 that came about in the previous auction.

Weakness in the broader market handed the S&P 500 its second straight loss and its fourth decline in eight sessions. The split between advancing sessions and declining sessions comes as participants try to determine the near-term direction of trade after stocks repeatedly failed to hold new 2009 highs last week. The most notable rollover came as stocks faltered after an impressive monthly payrolls report. That move suggested that the positive economic news had already been priced into the stock market and that something more was needed to help stocks hold gains amid a simultaneous advance by the dollar.

Advancing Sectors: (None)
Declining Sectors: Energy (-1.7%), Materials (-1.7%), Industrials (-1.3%), Consumer Staples (-1.2%), Telecom (-1.0%), Financials (-0.9%), Consumer Discretionary (-0.8%), Tech (-0.8%), Health Care (-0.8%), Utilities (-0.4%)DJ30 -104.14 NASDAQ -16.62 SP500 -11.31 NASDAQ Adv/Vol/Dec 856/2.00 bln/1836 NYSE Adv/Vol/Dec 920/1.18 bln/2066

5:31PM Actel announces Q4 revs guidance of 2-6%; sees gross margin to be above the previous guidance of 59-60% (ACTL) 11.74 -0.06 : Co reaffirms Q4 revs growth of 2-6% sequentially, which equates to ~$48.2-50.1 mln vs. the $49.1 mln First Call consensus. Co announced operating expenses are anticipated to come in at ~$26.6 mln, which excludes an estimated $2.0 mln of stock-based compensation expense. The previous guidance was ~$26.9 mln. The guidance for operating expenses does not include the ongoing amortization of intangibles and deferred compensation for the Pigeon Point Systems acquisition of ~$0.6 mln or an estimated $1.2 mln charge for Q4 reduction in force, which is unchanged from the previous guidance.

4:32PM TXN raises Q4 revs guidance to $2.9-3.02 bln vs $2.93 bln consensus, up from $2.78-3.02 bln :

4:31PM TXN raises Q4 EPS to $0.47-0.51 vs 0.47 consensus, up from $0.42-0.50 :

4:31PM Photronics reports Q4 EPS of ($0.07) vs ($0.07) First Call consensus; revs $94.7 mln vs $97.23 mln First Call consensus (PLAB) 4.91 -0.09 : "During the fourth quarter we successfully recapitalized our balance sheet and paid down $65 million in debt. We also benefited from continued traction at the nanoFab where we gained additional market share with new qualified and volume production customers, while sequentially improving its operating cash flow. For the year Photronics significantly reduced fixed operating costs and realigned its global manufacturing network to better match customer demand. We enter 2010 in a solid position to capitalize on market improvement."

Rudolph Technologies (RTEC) announces the receipt of multiple orders for its latest Explorer Inspection Cluster from a "major Taiwanese foundry." The orders include new systems as well as upgrades for previously installed equipment...

8:05AM Xilinx sees raises Q3 sales and gross margin outlook; sees revs up 16-20% QoQ vs the 8.6% consensus; up from 6-10% previously (XLNX) 23.24 : Co has raised its Q3 sequential sales outlook to be up 16-20% from 6-10% previously, consensus calls for a 8.6% increase in sales. We calculate this to be revs of $481-498 mln vs the $450 mln consensus. The increased sales guidance is primarily due to broad-based strength across all our end market categories and geographies. Gross margin is expected to be approximately 64% vs the 62.5% consensus, up from prior guidance of approximately 62-63%.

Flextronics (FLEX) announced that it has signed an agreement with Lenovo to expand the scope of its existing Electronics Manufacturing Services relationship. As part of the arrangement, Flextronics enlarges its geographic service area for Lenovo products to include Europe and increases the number of EMS services it delivers for Lenovo...

icon url

ReturntoSender

12/09/09 7:41 PM

#8773 RE: ReturntoSender #6755

From Briefing.com: 4:30 pm : Frequent swings by the U.S. dollar caused stocks to spend most of the session chopping along in a relatively narrow range, but some late support helped the major equity averages make modest gains. Still, the action hasn't provided any clarity to the market's near-term direction.

Stocks slipped in early trade as the greenback trimmed its losses against competing currencies. The dollar's move came as word surfaced that Standard & Poor's revised its outlook for Spain to negative from stable. The news release came a day after Greece's credit rating was cut by Fitch and Moody's made cautionary comments regarding the potential consequences of the ballooning deficits of the U.S. and U.K.

Reports indicated that the U.S. government is not yet ready to leave the financial system completely to itself when word surfaced that the $700 billion financial bailout plan, TARP, will likely be extended until October 2010.

In other political news, Senate Democrats reached a tentative agreement to remove the government-run insurance portion of their health care reform plan. The announcement gave an early lift to shares of managed care providers, but the group rolled over to settle with a 0.2% loss.

Though the Dollar Index looked like it got a lift from an early flight to safety, it was unable to trade with any clear direction. Each of its attempts to pare losses was met with resistance at the neutral line. It finished with a 0.3% loss.

The greenback was unable to make a gain this session, but commodities still fell under a stiff bout of selling pressure. That caused the CRB Commodity Index to drop 1.5%, its worst showing this month.

Oil prices were a primary drag on the CRB. Contracts for crude closed pit trade with oil priced 2.6% lower at $70.70 per barrel, near fresh two-month lows. The move came even though weekly inventory data showed a surprise draw of 3.82 million barrels.

Gold prices slid for a fourth straight session. In the latest round of pit trade, prices for the yellow metal fell 2.0% to settle at $1120.90 per ounce.

Despite such weakness, gold stocks garnered particular support. The group gained 2.8%. That helped the materials sector put together a 1.3% gain, which was the best of any major sector.

Semiconductor stocks had a relatively solid session. They advanced 0.6%, according to the Philadelphia Semiconductor Index, even though Texas Instruments (TXN 25.99, -0.34) fell sharply after it issued an increased earnings forecast.

While Texas Instruments traded with weakness, many large-cap tech issues showed strength for the second straight session. That helped the Nasdaq 100 gain 1.0%, more than double the gain seen by the headline indices.

A weak session for Treasuries concluded with the benchmark 10-year Note down roughly 11 ticks, which put its yield back above 3.4%. Its weakness was worsened by softer-than-expected demand in an auction of 10-year Notes. The auction produced a bid-to-cover ratio of 2.6, which was right at the average for the year, but down from the previous auction's ratio of 2.8.

Consistent with recent trade, action in the broader market this session was largely mixed and lacked clear direction. Though stocks have struggled to hold fresh highs for 2009 in recent weeks, dips have been short and shallow as many market participants continue to step in and provide support as they try to chase the easy gains that have been made since March.

Advancing Sectors: Materials (+1.3%), Tech (+0.9%), Health Care (+0.6%), Financials (+0.4%), Utilities (+0.4%), Energy (+0.1%)
Declining Sectors: Consumer Discretionary (-0.2%)
Unchanged: Consumer Staples, Industrials, TelecomDJ30 +51.08 NASDAQ +10.74 NQ100 +1.0% R2K +0.1% SP400 +0.1% SP500 +4.01 NASDAQ Adv/Vol/Dec 1355/1.92 bln/1326 NYSE Adv/Vol/Dec 1644/1.08 bln/1344

4:30PM Kulicke & Soffa CEO Scott Kulicke plans to retire in 2011 (KLIC) 5.16 +0.00 : Co announces that Scott Kulicke plans to retire as Chairman and CEO of the Company in June of 2011. The company's Board of Directors will promptly begin a search for a new CEO, and expects to include both internal and external candidates.

9:01AM Suntech Power signs long-term supply agreements for up to 490MW in Europe (STP) 16.93 : Co announces it has signed three long-term supply agreements for up to 490MW of high performance solar modules to be delivered over the next three years. Three of Suntech's strategic long-term partners in Europe including a value-added reseller, an EPC (engineering, procurement and construction) company, and a project developer, signed the agreements to secure access to Suntech's market leading solar modules and to develop closer collaboration on market information, shipment planning, and new product roll-outs.

8:34AM Diodes raises Q4 rev guidance due to continued strength in Asian markets (DIOD) 20.11 : Co raises revenue guidance for Q4 (Dec), sees Q4 (Dec) revs of $128-131 mln vs. $128.31 mln First Call consensus, up from $126-130 previously. The co is maintaining its fourth quarter 2009 gross margin guidance of 31-33% vs the 32.1% consensus and continues to expect operating expenses to be comparable to those of the third quarter 2009 on a percent of revenue basis. In addition, the Company now expects a tax benefit of approximately $2.5-3.5 million in the fourth quarter of 2009. For 2010, the Company estimates its tax rate to range between 13-23% versus its previous guidance of between 15-25%.

8:00AM Corning sees continued strength in LCD mkt (GLW) 17.89 : Co will announce that continued strength in worldwide LCD television sales has led to an increase in the company's fourth-quarter glass substrate volume expectations, and an improved outlook on 2010 glass market growth. These improved estimates will be provided in remarks to be delivered at the Barclays Capital Global Technology Conference in San Francisco. Corning now anticipates the worldwide glass market will be closer to 2.4 billion square feet this year, an improvement from earlier estimates of 2.3 billion square feet. The co also believes global LCD TV sales will exceed 132 million, up from the previous expectation of 129 million sets.

The Irvine Unified School District Board of Education approved a plan to enter into an agreement with SunEdison, a subsidiary of MEMC Electronic materials (WFR), and SPG Solar to establish energy-generating solar photovoltaic power systems at twenty-one sites throughout the district. It will be the largest solar deployment for a public school system in the state of California...

icon url

ReturntoSender

12/10/09 11:02 PM

#8774 RE: ReturntoSender #6755

From Briefing.com: 4:20 pm : Stocks spent the session in a sideways chop, but managed to settle with solid gains. The advance came in the face of modest strength in the U.S. dollar, weakness among financial issues, and a mixed weekly jobless claims report. Participation lacked for most of the session, though.

Trade was choppy for the entire session, but that didn't take stocks out of a relatively narrow range, nor did it derail a broad-based advance. There was a flurry of selling late in the session that caused stocks to surrender some of their gains, but the broader market was able to garner support as the S&P 500 came in contact with the 1100 mark.

In the end, advancing issues outnumbered decliners by more than 2-to-1. As broad as the advance was, it was even more impressive since it came despite a stronger dollar. Gains by the greenback have most often led to selling in the stock market, due to the drag of a stronger dollar on commodity prices and repatriated profits from multinationals, but stocks were able to hold their gains as the Dollar Index worked its way to a 0.1% gain.

Though the broader market showed resolve, financials lagged for the entire session. The sector settled with a 0.2% loss as ongoing chatter about a potential equity raise by Citigroup (C 3.87, +0.01) to repay its TARP funds failed to attract support for the sector. Citi has yet to unveil an official plan.

On a related note, Treasury Secretary Geithner appeared before the Congressional Oversight Panel to make a case for extending the $700 billion TARP plan. Geithner expressed that TARP will help the U.S. maintain the capacity to address potential threats to its financial system and decrease the need for future intervention.

Some market watchers consider it unclear why Treasury wants to extend TARP, but has reportedly let some financial outfits entertain the prospect of TARP repayment.

Initial jobless claims for the week ending Dec. 5 totaled 474,000, which is worse than the 455,000 initial claims that had been widely expected and is up from the previous week's tally of 457,000 initial claims. However, continuing claims made a sharp move down to 5.16 million from 5.46 million. The consensus had called for 5.45 million continuing claims.

The trade deficit for October totaled $32.9 billion, which is less than the $36.8 billion deficit that had been widely expected. It is also an improvement from the upwardly revised $35.7 billion deficit that was registered in September. Meanwhile, the November Treasury Budget was expected to show a shortfall of $131.6 billion, but it was less steep at $120.3 billion.

An auction of 30-year Bonds attracted a bid-to-cover ratio of 2.45, which is largely in-line with the recent average of 2.41. A lot of commentary focused on the fact that yield had to reach 4.52% to spur interest, but half the bidders were willing to take a yield below 4.42%. Still, Treasuries turned lower in the wake of the announcement. The benchmark 10-year Note finished roughly 14 ticks lower, but the 30-year Bond dropped more than one full point. Their yields stand at 3.49% and 4.49%, respectively.

Stocks came under a bit of pressure following the midday announcement, but the move was contained as buyers continued to provide support.

Shares of retailers (+1.5%) were among the best performers; that helped the consumer discretionary sector post a 1.4% gain, which was the best of any major sector.

Health care stocks were close behind with an impressive 1.2% gain, which came even though Eli Lilly (LLY 35.02, -1.54) showed considerable weakness after it reaffirmed downside guidance for fiscal 2009 and in-line guidance for fiscal 2010.

Participation had lacked for most of the session, but a late surge in trading volume sent the number of shares exchanged on the NYSE above 1 billion. Still, that level is well below the 50-day moving average of 1.2 billion.

Advancing Sectors: Consumer Discretionary (+1.4%), Health Care (+1.2%), Utilities (+1.2%), Energy (+0.9%), Telecom (+0.7%), Consumer Staples (+0.5%), Industrials (+0.4%), Tech (+0.4%)
Declining Sectors: Materials (-0.3%), Financials (-0.2%)DJ30 +68.78 NASDAQ +7.13 NQ100 +0.5% R2K -0.4% SP400 +0.6% SP500 +6.40 NASDAQ Adv/Vol/Dec 1040/1.96 bln/1640 NYSE Adv/Vol/Dec 1832/1.06 bln/1197

4:11PM National Semi beats by $0.06, beats on revs; issues upside Q3 rev guidance (NSM) 15.28 -0.22 : Reports Q2 (Nov) earnings of $0.20 per share, $0.06 better than the First Call consensus of $0.14; revenues fell 18.2% year/year to $345 mln vs the $336.7 mln consensus. Reports Q2 gross margins 65.3% vs consensus of 62.9%. Co sees Q3 revs flat sequentially vs. $345 mln in Q2, compared to $331.18 mln First Call consensus.

7:12AM Akeena Solar's Andalay AC solar panels now available at Lowe's Home Improvement Stores (AKNS) 0.99 :

7:05AM Methode Electronics beats by $0.12, beats on revs (MEI) 7.95 : Reports Q2 (Oct) earnings of $0.10 per share, excluding non-recurring items, $0.12 better than the First Call consensus of ($0.02); revenues fell 18.8% year/year to $98.5 mln vs the $84.7 mln consensus. Consolidated gross margins as a percentage of sales increased to 22.1% in the fiscal 2010 second quarter from 20.2% in the comparable period of fiscal 2009 despite an 18.8% drop in sales, largely due to the restructuring actions previously taken to reduce the cost structure, in part as a result of the sustained change in the global economic environment. Excluding the $0.7 mln Delphi asset write-down and the $1.7 million reversal of one-time pricing contingencies included in net sales, consolidated gross margins as a percentage of sales was 21.5% for 2Q10.

7:04AM Ciena misses by $0.05, beats on revs; sees 1Q10 rev increase of up to 5% (CIEN) 13.23 : Reports Q4 (Oct) loss of $0.12 per share, excluding non-recurring items, $0.05 worse than the First Call consensus of ($0.07); revenues fell 1.9% year/year to $176.3 mln vs the $167.7 mln consensus. "We're excited about the prospect of our combination with the Nortel MEN business, and also about the market entry of significant new products like our CoreDirector FS and 5400 family. We believe the combined company will be well positioned to capture additional market share with a product portfolio and vision that is aligned with market direction." Until the Nortel transaction has closed, any guidance provided by Ciena will be specific to Ciena as a standalone entity and will not include pro-forma estimates for combined company expectations. "While cautious customer spending seems likely to continue as we enter 2010, our fourth quarter order flow gives us confidence in our ability to deliver sequential revenue growth in our fiscal first quarter 2010. We currently expect a sequential increase in our fiscal first quarter revenue of up to 5%." (consensus calls for a 2.4% QoQ sales increase).

6:40AM General Electric receives $1.4 bln contract to supply turbines for largest wind farm ever built in the US (GE) : Co announces that it has received a $1.4 bln contract from independent power producer Caithness Energy to supply wind turbines and provide services for an 845-megawatt wind farm project to be located in Oregon. The wind farm, called Shepherds Flat, has received the majority of the necessary government permits to operate and is ready to be built. When completed it will be larger than any wind farm currently in operation around the globe.

6:07AM Lattice Semi raises Q4 rev guidance (LSCC) 2.66 : Co announces Q4 revenue is now expected to increase by approx 10% to 13% sequentially. This upward revision compares to previous guidance that Q4 revenue would be up 6% to 10% sequentially. This calculates to ~$54.01-55.483 mln vs. $53.13 mln First Call consensus. The revision is based on stronger than expected turns business across most of our products. Co says "As the final planned step of our previously announced efforts to transition certain of our distributors from sell-in to a sell-through distribution model, in December 2009 we commenced the termination of two additional sell-in distributors in Asia. We estimate that this process will reduce revenue in the fourth quarter of 2009 by approximately an additional $1.0 mln. This is in addition to the previously announced approximate $1.0 mln revenue impact from the conversion of two other distributors from sell-in to sell-through. The guidance announced today includes the anticipated effect of these conversions. Gross margin percentage is expected to be approx 53% to 55% of revenue, unchanged from prior guidance. Total operating expenses are now expected to be approx $26.9 mln. The increase compared to prior guidance of $26.0 mln is due to $0.9 mln of restructuring charges related to our previously- announced July 2009 headcount reductions, the move of our warehouse to Singapore and the planned opening of an operations center in Singapore. Pursuant to a public tender offer, we have tendered $14.0 million par value of corporate bonds subject to credit default risk auction rate securities. The fair value of these securities as of the end of the third quarter 2009 was approx $6.6 mln. Should all of the tendered securities be accepted, we would realize a gain of approx $2.8 mln. However, we cannot guarantee that all or any of the securities will be accepted under the tender offer. We continue to expect to return to profitability for the fourth quarter of 2009..."

icon url

ReturntoSender

12/12/09 6:53 PM

#8775 RE: ReturntoSender #6755

From Briefing.com: Weekly Recap - Week ending 11-Dec-09What volatility there was this week really boiled down to two moves, a sharply lower open on Tuesday and a higher open on Thursday. And with one big down move followed by one big up move, U.S. equity markets ended the week flat. That makes four consecutive weeks now that the market has basically moved sideways, trading in a consolidation pattern.

Looking at the ten sectors that make up the S&P 500, they also closed the week mixed. Utilities (+3.6%) led the four gainers, while Financials (-1.6%) led the six decliners.

Tuesday's dip came after ratings agency Moody's said the U.S. and U.K. must prove they can whittle down their ballooning deficits to avoid threats to their triple-A credit ratings. The ratings agency set the two countries apart from other top-rated sovereign borrowers, calling them "resilient" rather than "resistant."

Specifically for the U.S., it would lose its top rating in 2013 if economic growth proves anemic, interest rates rise and the government fails to dent the deficit or recover most of its assistance to the Financial sector. However, a situation of moderate growth and deficit reduction -- the path Moody's considers most likely -- while unfavorable in the near term, does not currently threaten the rating.

Thursday's morning advance could have been carryover from a modest afternoon rally the previous session, otherwise there was not one specific catalyst to explain the move. The Claims data that morning was mixed, though the Trade Deficit for October came in better than expected, and the dollar showed little direction against the other major currencies.

The week's other economic data failed to provide support, despite coming in better than expected. The bulk of it was released on Friday, including Retail Sales for November and Michigan Sentiment for December, but they gave a larger boost to the dollar than to the equity market.

Following last Friday's strong session, the greenback continued its rebound this week, at the same time capping any gains in the equity market.

Looking ahead to next week, the focus will be on the FOMC policy statement on Wednesday. Investors will once again be looking for a change in the language, specifically if the Fed will continue to expect rates to stay at exceptionally low levels for "an extended period." A change could help continue the recent rebound in the dollar, but once again that could limit any potential equity market gains.

Besides the FOMC, the economic calendar is crowded on Tuesday and Wednesday next week, with PPI and Industrial Production the first day followed by CPI and Housing Starts/Building Permits the next. The earnings calendar will also pick up, with retailer Best Buy (BBY) reporting on Tuesday and tech companies Oracle (ORCL) and Research In Motion (RIMM) on Thursday.
 
Index Started Week Ended Week Change % Change YTD %
DJIA 10388.90 10471.50 82.60 0.8 19.3
Nasdaq 2194.35 2190.31 -4.04 -0.2 38.9
S&P 500 1105.98 1106.41 0.43 0.0 22.5
Russell 2000 602.79 600.37 -2.42 -0.4 20.2

3:21PM Broadcom shares continue to display very notable relative weakness vs. the NDX 100 and the semi space (SMH, IGW) (BRCM) 30.12 -1.27 : The daily chart looks as if yesterday's daily candlestick formation is leading to a strong, high volume reversal on today's daily price bar. Price is trading to new lows on the week on the strongest volume of the month as shares are down nearly 4% versus .75% for the SMH ETF. The rising 20 day EMA may be in play just beneath the 30.00 level. LoD now @ 30.0

icon url

ReturntoSender

12/13/09 7:10 PM

#8777 RE: ReturntoSender #6755

InvestmentHouse Weekend Market Summary 12/11/09

http://www.investmenthouse.com/weekendmarketsummary.htm

- Rotation and stocks rising with a rising dollar: two new themes.
- Retail sales post second month of gains.
- Import prices are rising.
- Jobs are growing . . . in the federal government (along with salaries).
- Commodities dipping, small and mid-caps under accumulation.
- Maybe no rally to year end, but small caps look to be setting up for a good January effect.

Market actually starting to act like a market anticipating economic growth.

This week epitomized the changes taking place in the market, even though they may have just solidified this week. It behooves us as investors to take note of what is happening in the stock market and the markets surrounding it. One of the main changes I discussed on Thursday was rotation. There has been a move out of commodities. Gold had a rough week ($1,115.10, -10.00) after hitting $1,226 just over a week ago. There is a current rotation out of gold, but we have a play on the GLD because it could be trying to bottom and could make a knifepoint turn.

Oil was down sharply ($69.66, -0.88). It may be in a position to bounce as it is reaching important EMAs, but the rotation has been out of these and into medical, business services, and semiconductors. A lot of these are in small cap areas, and the small caps have been consolidating with perhaps some accumulation ready to break them higher for the January effect.

There is a second change in the market that started showing itself on Friday: the dollar is rising. It was just consolidating on Thursday along the 50 day EMA, and now it has broken sharply higher. At the same time, the stock market rose slightly and the small caps gained a bit of ground. The Dow industrials gained ground, and SP500 gained as well. There were no breakouts of the range, but the dollar was up, stocks were up, and bonds were down. The 10 year treasury was strong (3.55%). It surged back up and broke through a key level at 3.5%. Whether it will hold the move remains to be seen, but stocks and the dollar are higher, and the bonds are lower. They are acting as they "should" act if the economy is trying to improve.

The market was mixed overall at the close with NASDAQ down and the NYSE up. Stocks mostly moved higher, however, and moved higher in the small cap area. That is important because they are a growth area, and if the economy were improving, one would expect to see it move higher. SP600 rose 0.95%. Those are key points with respect to the market. There is rotation and it is acting as if there will be economic improvement. You would expect to see improvement in small caps and other growth areas such as semiconductors. Semiconductors had an excellent move over the past two weeks. There is a growth trade and now more of a positive economic trade.

Looking at the SP futures in the morning, there was a huge pop on the retail sales data (1.3% for October, 0.6% expected). October was revised a bit lower (1.1% from 1.4%), but November was quite solid. If you take out autos, it was not much worse (1.2% versus 0.4%). October was revised a bit lower again to flat from 0.2%. There is some downside revision, but not bad overall. Two months of positive retail sales growth had people excited. The futures jumped up, but they did not stay there. They came back and closed the gap. By the time the market got underway, they closed, bounced, and then were back down. It took an afternoon recovery to get SP500 back up to speed.

We tend to import more of what makes our economy go (such as petroleum), so import prices are important. They were supposedly tame at 0.4%, and that matched the prior month. That leads some to say there is no inflation there is not massive inflation, but there is inflation underway. Some financial stations were arguing that if you take out petroleum, then things are better because petroleum is falling in price. They will be better, and they are falling just in time to give consumers a Christmas present that may hold over into the New Year. Oil prices are falling, but they look to be reaching a support level now. It bounced to $80, and now it has gone down to $70. That is the range oil tends to trade in, so it could bounce back up. If you look at the ex-petroleum numbers for import prices, they are up 1.4% on the month and up 3.6% year-over-year. That is inflation. We are not as much of an export nation as we would like to think (although the Obama administration wants to make us an export nation). Imports are still important because we import more when US consumers do well. The problem is that prices are rising, and there is that pesky oil. However, even if you strip out oil, prices are still rising above what the Fed would consider its speed limit. There is inflation out there, and it is not helped by the dollar. If the dollar rallies, it will be better in December, just as oil falling will be better for us in December. That will help things out, but thus far it has not changed the trend, and the import prices were somewhat looked past.

NSM beat the street on the top and bottom, and UTX substantially raised its guidance and shot higher. There is good news with the forecast for 2010, and it benefited the market. Initial job claims come out on Thursday and then they reverberate through Friday. As you know, they were higher on Thursday (474K versus 455K expected), but it was still below 500K. Continuing claims fell (5.1M versus 5.46M the week prior). Everyone thinks things are great, but there are problems with jobs when you look beyond the headline numbers. There is a category posted called emergency continuing claims, and they rose 430K for the week. They are six times where they were this time last year. Continuing claims are not getting any better; people are just falling off the rolls of standard claims and going elsewhere. Every time Congress extends unemployment benefits, they have to go back to the small businesses and ask them for more money. It is a double whammy: Not only do they not have money to hire people, but they also have to pay for the people they have already laid off. They would probably love to hire them back, but if there is no work, that is not going to happen.

Congress does not have an issue because there are plenty of jobs there. USA Today reported that the fastest growing segment of jobs in the country is in the federal government. They are adding 10K jobs per month during a recession. The average public sector job earner makes $40,331 per year, while the average federal government employee makes $71,206. It is a rapidly growing area, and they are paying top dollar. The Department of Transportation had one employee making more than $170K before the stimulus package was passed; after the stimulus package was passed, there are 1,690 transportation department employees making more than $170K. The FAA chief got a $100K + raise thanks to the stimulus package. That money is not being used to create jobs; it is being used to pad the pockets of federal workers. When the FAA chief got 100K + raise, how many other federal government employees got such raises? 1,700. In the middle of a recession when millions of people are losing their jobs, federal employees are not only getting more jobs, but they are getting massive pay raises. This should be bothering people. It certainly bothers me as a taxpayer.

There is a proposal with the healthcare bill to cut the Medicare age requirement down to 55. How can they cut $500B + from Medicare, then lower it to the age of 55 and add approximately 30M people onto the Medicare rolls? It does not seem like the plan is to make it work at all. The new Senate bill has been measured by a non-partisan group, and they found it will cost a lot more and is going to put more people out of coverage than in it. With that kind of logic going on in Washington, it is hard to believe the economy will turn around. The economy tries to do what it wants without Washington it can help or hurt, and Washington has not helped. The economy will try to make a recovery out of it anyway, although it is going to be a slow, pathetic recovery by past standards. It will try to pull it together for 2010 and at least get it going through the summer. After that, there may be a double dip, but that is in the future, and lord knows our Senators and Congressmen cannot look that far into the future.

Gold was down, the dollar was up, and bonds were down. Things are at least looking right in the world of the stock market.

TECHNICAL

INTERNALS

The internals were not much to crow about for the session. The small caps tend to represent what the advance/decline line is going to be. NASDAQ 1.4:1 advancers, NYSE 1.9:1 advancers. Those are the small caps helping kick in with their nearly 1% gain on the session. Looking at SP500 and the representation of the NYSE volume, you see it was a week of declining volume. It was the same story with NASDAQ. There was an upside day on Thursday, but it was still in a very low range of below-average volume. Again, they are range trading, and that is the kind of volume to expect in a range trade. It is not necessarily a bad thing.

CHARTS

The SP500 had an up and down week. It was down at the beginning, held the bottom of the range, bounced back up, and was trading in the top half of the range to end the week. No relative change. There have been five weeks now of trading laterally. Some of the SP500 stocks are being sold, and some other stocks in the NYSE are being accumulated.

NASDAQ is an interesting play because it gapped higher on the session up toward the top of the range and then reversed. It closed off its lows and closed basically flat. It is still trading in the top half of the range, but it is trying to make that higher low and is not able to get the breakout of the ascending triangle it has formed. It has been banging around in a narrowing range, and the breakout will occur over the next week or two. It is going to be interesting because it will be a catalyst coming for the rest of the market. It is a growth area --- semiconductors and small caps have been performing better. If there is growth coming, it should break out to the upside. The market is going to tell what the economy will do, and we are seeing some of this in the small caps. I think they are under accumulation because when looking at leadership, there are many small caps in good shape. I think they are under accumulation and, if you look at the SOX, you see it had a super two weeks. It leveled out this week and is consolidating, but it is holding over the peaks that it broke through, looking very strong.

NASDAQ has its ascending triangle, the SOX is breaking to a new high, and there are the small caps consolidating laterally and trying to set up a move. We will see many good small caps positions when we look at leadership. There are the mid-caps, similar to NASDAQ, setting up an ascending triangle. The SP400 is setting up an ascending triangle and trying to make a higher low right now. Those are growth areas, and they are improving. If the economy is going to pick up, these indices are going to break out ahead of that.

LEADERSHIP

The USO is lower and oil fell. During the week, some of the energy stocks that had rebounded after falling were showing signs of heading back over. HAL rebounded up to the resistance point at 28 and is struggling. It is showing a doji at resistance on a light-volume rebound after heavy-volume selling. It will roll back over. You can see the same thing in general in the OIH. It sold off early in the week, rebound Wednesday and Thursday, and a hangman doji at resistance on Friday it looks like it will head lower as well. BTU is showing some wear and tear, but it has not broken down completely. It did recover at the end of the week, but it was a low-volume recovery and it could head back lower. As it made a high in November, MACD was unable to make a high, rolling over at a lower level. That shows a weakness, and there was a selloff. We will see how this bounces. It has tried to come up to the 78% Fibonacci, and if it comes back up there again and stalls, it is definitely a downside play.

They say economic recoveries have a copper roof to them. FCX is somewhat of the bellwether of copper, and it is rolling over. Similar to other stocks, there was a high with MACD, there was a new high, and MACD failed to make a new high. There was a crash lower on volume, an attempt to hold near the 50 day EMA and some support, but the downside volume was stronger. It looks like it is ready to roll over and make a serious drop, possibly down to the 65 range. We will be looking at that as a short play for the weekend. It is the same story if you look at PCU. There is a double top --- I would have loved for this to hold down at the 78% Fibonacci, but it did not. It does not matter because the weakening MACD gapped lower on volume, there was a weak test, and it is ready to roll over as well.

Steel is still looking solid, and even AA had a good day because it upped its guidance. You would think that commodities would be moving higher given a better economic outlook for the US, but some are and some are not. Some have had great runs and are victims of their own success and of the strengthening dollar. Bear in mind that they do not necessarily cut against the idea that the economy will be improving in 2010.

GS bounced up Wednesday and Thursday, and it looks like it will try to roll back over. Some of the banks that were down Thursday tried to rebound. WFC gapped lower and recovered a bit of ground, and BAC recovered some ground as well. The financials are trying to bounce back. LM had two very difficult days on Wednesday and Thursday, but it recovered a bit of ground on Friday. Somewhat of a snap back in the financials, but they still are not great-looking patterns.

DOX has had a great run and is coming back and testing. It looks like that could be a play. It traded below the breakout point on the low Thursday and snapped back. Buyers picked it back up and it held up on Friday. It could give a buy. FALC has a trend reversal ongoing, and it is trying to set up and make a break. INFA is trying to make a breakout of an ascending triangle. SNIC had a nice breakout, and now it is testing and holding over very orderly pullback. A lot of these are in the business software area, and they cater to small businesses and increasing productivity. LFT is performing well, had a nice break higher, and has a nice flag in progress. I am looking for ABCD patterns this week and for flag pullbacks on the small caps. I am also looking for rollovers from some of the big caps and the sectors in energy and metals that rallied back a bit after breaking lower but are not able to consummate the recovery through resistance. That is going to give us some excellent opportunity.

FLOW had a break higher and a nice pullback a great flag. We have seen a lot of this catalog and retail stuff (such as VVTV) doing well. XING has a nice base, a break higher, and it is testing. It is volatile but just an example of what is going on. There is rotation. Money is coming into these and you can see the volume moving up.

There is ongoing accumulation as the overall market moves laterally. Big volume is coming in, and there are nice, long, low-lying consolidations where you see they have been buying all along. Then there is big volume moving in as they make the break. There is a lot of money flowing into small caps, and that is what happens in rotation. That is why the growth areas are moving higher.

THE MARKET

MARKET SENTIMENT

VIX: 21.59; -0.73
VXN: 22.38; -0.75
VXO: 20.53; -0.44

Put/Call Ratio (CBOE): 0.9; -0.01

Bulls versus Bears:

This is a reading of the number of bullish investment advisors versus bearish advisors. The reason you look at this is that it gives you an idea of how bullish investors are. If they are too bullish then everyone is in the market and it is heading for a top: if everyone wants to be in the market then all the money is in and there is no more new cash to drive it higher. On the other side of the spectrum if there are a lot of bears then there is a lot of cash on the sideline, and as the market rallies it drags that cash in as the bears give in. That cash provides the market the fuel to move higher. If bears are low it is the same as a lot of bulls: everyone is in and the market doesn't have the cash to drive it higher.

Bulls: 50.6% Up from 44.4%. Moving to a high on this last run, matching the levels from September and October. Hitting highs again just as SP500 bumps prior peaks yet again. Believers may have waned but the liquidity did not. Still well over the 35% level that is the threshold for what is considered a bullish climate. It does not mean things are necessarily bearish; that takes a reading in the 60% range. Hit a high of 47.7% mid-June on the run from the March lows. Again, to be seriously bearish it needs to get up to the 60% to 65% level. Dramatic rise from 21.3% in November 2008, the bottom on this leg. This last leg down showed us the largest single week drop we have ever seen, falling from 33.7% to 25.3%. Hit 40.7% on the high during the rally off the July 2008 lows. 30.9% was the March low. In March the indicator did its job with the dive below 35% and the crossover with the bears. A move into the lower 40's is a decline of significance. A move to 35% is a bullish indicator.

Bears: 17.6%. Bears are leaving the building the past three weeks, falling sharply from 26.7%. This is the lowest level of the entire rally and is at a bearish level. Just in time for the SP500 testing the prior peak. Peaked near 28% on this round, falling short of the 35.6% hit in July 2009. For reference, cracking above the 35% threshold considered bullish. Hit a high on this run at 47.2%. For reference, bearishness hit a 5 year high at 54.4% the last week of October 2008. The move over 50 took bearish sentiment to its highest level since 1995. Extreme negative sentiment. Prior levels for comparison: Bearishness peaked at 37.4% in September 2007. It topped the June 2006 peak (36%) on that run. That June peak eclipsed the March 2006 high (33%) and well above the 2005 highs that spawned new rallies (30% in May 2005, 29.2% in October 2005). That was a huge turn, unlike any seen in recent history.

NASDAQ

Stats: -0.55 points (-0.03%) to close at 2190.31
Volume: 1.698B (-10.44%)

Up Volume: 901.543M (-134.906M)
Down Volume: 841.681M (-41.915M)

A/D and Hi/Lo: Advancers led 1.43 to 1
Previous Session: Decliners led 1.57 to 1

New Highs: 59 (-36)
New Lows: 24 (+2)

NASDAQ CHART: Click to view the chart

NASDAQ 100 CHART: Click to view the chart

SOX CHART: Click to view the chart

SP500/NYSE

Stats: +4.06 points (+0.37%) to close at 1106.41
NYSE Volume: 1.003B (-4.7%)

Up Volume: 677.677M (+24.696M)
Down Volume: 319.151M (-63.611M)

A/D and Hi/Lo: Advancers led 1.89 to 1
Previous Session: Advancers led 1.55 to 1

New Highs: 290 (+53)
New Lows: 42 (+9)

SP500 CHART: Click to view the chart

SP600 Chart: Click to view the chart

DJ30

Stats: +65.67 points (+0.63%) to close at 10471.5
Volume DJ30: 189M shares Friday versus 195M shares Thursday.

DJ30 CHART: Click to view the chart

MONDAY

It is another week closer to Christmas without a sign of real movement in the indices. Whether you are talking about the SP500 or SP600, they have been moving laterally for five weeks. There are two forces at work, particularly in the big cap areas: the managers wanting the market to go upward to the end of the year, and those that want to keep the status quo and are being defensive and selling into rallies. They are canceling each other out right now, and we are moving laterally in the range. Then there is the rotation into other areas. Commodities are heading lower and many industrials are struggling. Areas that led the market higher are struggling as the dollar strengthens, but they had a healthy run. Money is rotating and moving into many of the smaller areas. The small caps and mid caps are harbingers of economic growth, so we are setting up for the January effect and a run higher by the small caps. In January, mutual fund managers traditionally buy the smaller caps where they have more chance of big gains through the year. You can get better percentage gains on stocks that are smaller in price. Smaller cap can move versus a lot of the big names that have run higher and move slowly when they do make moves because their growth is not as big as the small caps. Their percentages cannot be the same, so we can see bigger multiples built into the small caps. They can make big runs, and then they are sold off after they make those runs and fund managers look elsewhere for the rest of the year. They try to get their growth stocks bought in December and January, then let them run higher and then sell them off by the summertime. That is the way it typically works, and then they look for consumer stocks at that point. This is the rotation that fund managers go through.

Things are playing by the standard rulebook right now. That shows NASDAQ setting up with an ascending triangle that could make the breakout because it is a growth area. The mid-caps are setting up an ascending triangle because it is a growth area. The SOX already broke into a new high out of a ragged, ugly pattern because it is a growth area, and now we are waiting for the small caps to do the same and confirm what is going on. It may take until early January when they start moving, but they are definitely under accumulation, and we have definitely been putting them on the report and will continue to do so. We will also continue to take advantage of the stocks that have rallied but have run out of buyers (e.g., in commodities and some of the metals).

We are taking what the market gives. Right now, it is going to give upside on small cap and growth plays, and it will give downside on the plays that have run hard and are rolling over near term. It is going to give us plays like on PCU or FCX that have made their runs and are ready to make a fall. That is how we take what the market gives and make some more Christmas money ahead. Have an excellent weekend, and we will try to do the same.

Support and Resistance

NASDAQ: Closed at 2190.31
Resistance:
2191 is the October 2009 peak
2205 is the November 2009 peak
2210 (from September 2008) to 2212 (the July 2009 closing low)
2275 - 2278 from the February 2008 and April 2008 lows

Support:
2177 is a low from March 2008
2169 is the March 2008 closing low (double bottom)
2168 is the September 2009, intraday peak
2167 from the July 2008 intraday low
2155 is the March 2008 intraday low
2143 is the October 2009 range low
The 50 day EMA at 2139
2099 is the mid-September 2008 closing low
2070 is the September 2008 intraday low
2060 is the August peak
2048 is the early October 2009 closing low
2016 is the early August peak
1984 from late September
1962 is the bottom of the August 2009 range.
1947 is the October gap down point
1897 is the October post gap intraday high.
The 200 day SM A at 1884
1880 is the June peak
1862 is the July peak

S&P 500: Closed at 1106.41
Resistance:
1106 is the September 2008 low
1114 is the November 2009 peak
The March/July up trendline at 1128
1133 from a September 2008 intraday low
1185 from late September 2008
1200 from the July 2008 low

Support:
1101 is the October high
The 18 day EMA at 1098
1085 is the 2007 down trendline
1080 is the September 2009 peak
The 50 day EMA at 1081
1078 is the October range low
1070 is the late September 2009 peak
1044 is the October 2008 intraday high
The August peak at 1040
The early October 2009 closing low at 1025
The early August intraday peak at 1018
The November 2008 peak at 1006 closing 1007.53 intraday
992 is the August 2009 consolidation low
The 200 day SMA at 959
956 is the June intraday peak

Dow: Closed at 10,471.50
Resistance:
10,496 is the November 2009 high
10,609 from the Mid-September 2008 interim low
10,963 is the July 2008 low

Support:
10,365 is the late September 2008 low
The 50 day EMA at 10,122
10,120 is the October 2009 peak
9918 is the September 2008 peak
9855 is the early September peak in its lateral range
9835 is the late September 2009 peak
9654 is the November 2008 high
9625 is the October 2008 closing high
9620 is the August 2009 peak
9430 is the early October low
9387 is the mid-October peak
9116 is the August low
9088 is the January 2009 peak
8985 is the closing low in the mid-2003 consolidation
The 200 day SMA at 8946
8934 is the December closing high
8878 is the June peak
8829 is the late November 2008 peak

Economic Calendar

These are consensus expectations. Our expectations will vary and are discussed in the 'Economy' section.

December 15 - Tuesday
- Core PPI, November (08:30): 0.2% expected, -0.6% prior
- PPI, November (08:30): 0.8% expected, 0.3% prior
- Empire Manufacturing, December (08:30): 24.00 expected, 23.51 prior
- Net Long-term TIC Fl, October (09:00): $42.3B expected, $40.7B prior
- Capacity Utilization, November (09:15): 71.1% expected, 70.7% prior
- Industrial Production, November (09:15): 0.5% expected, 0.1% prior

December 16 - Wednesday
- Building Permits, November (08:30): 570K expected, 552K prior
- Housing Starts, November (08:30): 578K expected, 529K prior
- CPI, November (08:30): 0.4% expected, 0.2% prior
- Core CPI, November (08:30): 0.1% expected, 0.3% prior
- Crude Inventories, 12/11 (10:30): -3.82M prior
- FOMC Rate Decision, December 16 (14:15): 0.25% expected, 0.25% prior

December 17 - Thursday
- Initial Claims, 12/12 (08:30): 465K expected, 474K prior
- Continuing Claims, 12/5 (08:30): 5170K expected, 5157K prior
- Leading Indicators, November (10:00): 0.7% expected, 0.3% prior
- Philadelphia Fed, December (10:00): 16.0 expected, 16.7 prior

Don't miss our Market Summary each evening. It is part of "The Daily" which is available at InvestmentHouse.com. The Daily focuses on enhancing returns through strategic investing using various tools including stock options. The Daily is a must for anyone with an IRA or anyone that enjoys investing in individual stocks.
icon url

ReturntoSender

12/14/09 10:08 PM

#8779 RE: ReturntoSender #6755

From Briefing.com: 4:30 pm : Stocks sported solid gains for the entire session as a batch of positive news items brought buyers into action. However, afternoon trade became rather subdued as the stock market entered a familiar sideways drift.

Global indices got an overnight lift from news that Abu Dhabi has supplied Dubai's corporate flagship, Dubai World, with $10 billion. Several weeks ago Dubai World had requested to freeze its debt payments amid a lack of liquidity. By doing so, Dubai World had rekindled concern about the security of global credit markets.

On a related note, Standard & Poor's lowered its foreign currency sovereign credit rating and local-currency credit rating on Mexico. The announcement follows several other downgrades and cautionary comments made by ratings agencies in the last two weeks.

Speculation of a pick up in merger and acquisition activity helped win support for stocks this session. That was caused by a move by ExxonMobil (XOM 69.69, -3.14) to acquire XTO Energy (XTO 47.86, +6.37) in an all-stock transaction valued at $41 billion. Since that values XTO at $51.69 per share, a premium of roughly 25% over its closing price this past Friday, several related plays in the oil and gas exploration industry (+6.4%) garnered support. Integrated oil and gas stocks (-2.1%) fell out of favor, though, and hampered the broader energy sector (+0.2%).

Financials lagged in the early going, but managed to attract buyers as the session progressed and finished with a 0.6% gain. The sector's slow start stemmed from concerns of shareholder dilution at Citigroup (C 3.70, -0.25), which announced it will repay its $20 billion in TARP securities and terminate its loss-sharing agreement with the government with an issue of $17.0 billion of common stock, with an over-allotment option of $2.55 billion, and $3.5 billion of tangible equity units made up of prepaid common stock purchase contracts and subordinated notes. Meanwhile, the Treasury will unwind its approximate 34% stake in the company.

Citigroup's announcement has given rise to speculation that other TARP recipients like Wells Fargo (WFC 25.49, +0.08) and PNC Financial (PNC 53.36, +0.61) may soon announce repayment plans.

Renewed selling pressure against the U.S. dollar took the Dollar Index down 0.3% and provided broad support for stocks. However, the dollar's decline was particularly beneficial to materials stocks, which climbed 1.5% as commodities prices fell to a 1.0% loss, according to the CRB Commodity Index.

Gains were broad for the entire session, but action was a bit choppy in the early going. Things steadied in the afternoon so that stocks could make a solid close, though. Telecom was the only major sector in the S&P 500 to finish with a loss; it declined just 0.1%.

Advancing Sectors: Materials (+1.5%), Industrials (+1.2%), Consumer Discretionary (+0.9%), Health Care (+0.9%), Tech (+0.9%), Financials (+0.6%), Utilities (+0.4%), Consumer Staples (+0.3%), Energy (+0.2%)
Declining Sectors: Telecom (-0.1%)DJ30 +29.55 NASDAQ +21.79 NQ100 +1.0% R2K +1.6% SP400 +1.5% SP500 +7.70 NASDAQ Adv/Vol/Dec 1838/1.86 bln/883 NYSE Adv/Vol/Dec 2268/1.07 bln/780

4:05PM Rambus acquires patented innovations and technology from Global Lighting Technologies for $26 mln (RMBS) 21.53 +0.02 : Co announces that announced it has acquired technology and a portfolio of advanced lighting and optoelectronics patents from Global Lighting Technologies Inc. (GLT). These patented innovations, which include MicroLens light distribution technology, broaden Rambus' solutions for computing and consumer electronics. As part of this agreement, Rambus will pay GLT $26 mln. In addition, it is expected that twelve people will join Rambus from GLT including Jeff Parker, GLT's co-founder, former chief executive officer and principal inventor. Most of those joining from GLT will form a new Lighting Technology Division led by Mr. Parker.

4:05PM JA Solar expects Q4 2009 shipments to exceed prior guidance; issues FY10 shipment guidance (JASO) 5.30 +0.73 : Co announces that based on current customer orders and product deliveries, it expects Q4 shipments to exceed the high-end of its prior guidance given on Nov 10, 2009. Co is raising its guidance for FY09, and issuing shipment guidance for the FY10. Based on strong customer demand for JA Solar's products, co currently expects shipments for Q4 to exceed 210MW, compared with prior guidance in the range 170MW to 200MW. For the full year 2009, the company expects shipments to exceed 488MW, compared with prior guidance in the range of 448MW to 478MW. For the FY10, co currently expects shipments to be in the range of 750MW to 800MW. "We continue to make progress in our global customer development, and are seeing strong demand for our high quality solar products from all major markets, including Germany, China, U.S., Italy, South Korea, Spain and France. We also expect strong growth from our newer markets, such as the Czech Republic and Japan," said Baofang Jin.

8:00AM California Micro to be acquired by ON Semiconductor for $4.70/share in all cash tender offer (CAMD) 3.05 : ON Semiconductor (ONNN) and CAMD announced the signing of a definitive merger agreement pursuant to which ONNN will acquire CAMD through a cash tender offer of $4.70 per share. With net cash, cash equivalents and short-term investments of approximately $45 million at the end of November 2009, the transaction value of CAMD represents an enterprise value of approximately $63 million and an equity value of approximately $108 million, based on common stock outstanding and issued. The proposed transaction and related merger agreement have been approved by each company's board of directors... ONNN will finance the acquisition using existing cash resources and the closing of the transaction is not contingent on the receipt of financing. The companies expect the transaction to close in the first quarter of 2010. Upon closing, ON Semiconductor may record a one-time charge for purchased in-process research and development expenses and other deal related costs. The amount of that charge, if any, has not yet been determined. "Given the significant synergies we expect to realize from this combination, we anticipate that the acquisition will be accretive to earnings per share within the first year post the transaction close." (stock is halted)

3:16AM LDK Solar signs contract to supply solar modules to Belgium-based Enfinity; co will deliver approx 50 MW of solar modules to Enfinity in 2010 (LDK) 8.56 :

icon url

ReturntoSender

12/17/09 12:00 AM

#8780 RE: ReturntoSender #6755

From Briefing.com: 4:10 pm : A weaker dollar helped put stocks in higher ground in the early going, but broader market support faded in the wake of the latest statement from the Federal Open Market Committee (FOMC).

Early gains were broad based as the dollar dipped as much as 0.4% against a basket of foreign currencies in the early going. The Nasdaq was even able to log a fresh 52-week high.

However, support for stocks started to fade ahead of the latest FOMC directive and then buckled in the report's wake.

The FOMC stated that economic activity has continued to pick up and that deterioration in the labor market is abating. The FOMC also expressed that conditions in the financial markets are improving, so some of the Fed's special liquidity facilities will soon end as planned.

More notably, the FOMC indicated that the target range for the federal funds rate will remain at 0.00% to 0.25% and that economic conditions, including low rates of resource utilization, subdued inflation trends, and stable inflation expectations, are likely to warrant exceptionally low levels of the federal funds rate for an extended period. The overall language in the statement is consistent with previous statements, so it helped calm concerns that the Fed may look to raise interest rates sooner than later.

Despite that, the greenback advanced against competing currencies and gave the Dollar Index a momentary gain. The Dollar Index settled with a fractional loss.

Though the dollar was able to improve its position, support for commodities remained strong. That gave the CRB Commodity Index a 1.6% gain, its best by percent in three weeks, and helped the materials sector outperform. Materials stocks advanced 1.0%, led by diversified metals and miners (+1.7).

Energy stocks also looked strong. They advanced 0.5% as oil prices closed 2.8% higher at $72.68 per barrel. Early weakness in the dollar and a larger-than-expected weekly inventory draw of 3.69 million barrels underpinned oil's strength.

Financials also showed strength in the face of the broader market's afternoon downturn. The sector settled with a 0.7% gain, though regional banks (-0.6%) traded with continued weakness.

Homebuilders were among this session's best performers. They climbed 5.0% amid data that indicated housing starts for November hit an annualized rate of 574,000 units, which matched the consensus and marked an increase from the rate registered the previous month. Building permits for November hit an annualized rate of 584,000, which bested the rate of 570,000 that had been widely forecast. It also topped the rate of 551,000 that was registered in October.

The November Consumer Price Index increased 0.4% month-over-month, which matches the consensus estimate. Excluding food and energy, consumer prices were flat for the month, but they had been expected to rise 0.1%. Since the CPI data generally matched expectations, it didn't cause any meaningful stir in the broader market.

Advancing Sectors: Materials (+1.0%), Financials (+0.7%), Energy (+0.5%), Tech (+0.4%), Consumer Discretionary (+0.2%)
Declining Sectors: Utilities (-0.4%), Consumer Staples (-0.4%), Health Care (-0.4%) Telecom (-0.3%), Industrials (-0.3%)DJ30 -10.88 NASDAQ +5.86 NQ100 +0.2% R2K +0.8% SP400 +0.5% SP500 +1.25 NASDAQ Adv/Vol/Dec 1568/2.02 bln/1128 NYSE Adv/Vol/Dec 1967/1.16 bln/1058

4:42PM Newport retires $20.2 million of its convertible subordinated notes (NEWP) 8.39 +0.17 : Co reported that it has used $18.7 million of cash to retire $20.2 million of its convertible subordinated notes. As a result of this transaction, the company's results for the fourth quarter of 2009 will be positively impacted by a total of $0.5 million due to the gain on extinguishment of debt and the lower interest expense for the period. In addition, due to the reduction in the company's total debt, it expects to incur lower interest expense in 2010 and beyond. Newport estimates that this reduction will result in approximately $0.03 of incremental earnings per diluted share in 2010.

4:15PM LDK Solar partners with GPR-SBTFC for developing and constructing 100 MW of PV plants in Europe in 2010 (LDK) 9.20 +0.08 : Co has signed an agreement with Global Power Resources to develop and construct PV plants totalling 100 megawatts in 2010. LDK Solar will provide engineering, procurement, construction services and supply the solar modules. GPR will acquire the final ownership of the PV plants. The targeted 100MW of PV plants is expected to be completed by the end of 2010. The project pipeline, which will be carried out by LDK Solar, will involve all the European countries currently participating in national feed-in tariff subsidies, such as France, Germany, Italy and Spain.

4:05PM UTStarcom appoints Kenneth Luk Chief Financial Officer, effective immediately (UTSI) 2.03 +0.13 :

4:01PM Nanometrics announces it intends to offer shares of common stock (NANO) 12.44 +0.05 :

3:09PM SEMI reports third quarter 2009 worldwide semiconductor equipment figures, billings of us $4.54 bln : SEMI today reported that worldwide semiconductor manufacturing equipment billings reached $4.54 billion in the third quarter of 2009. The billings figure is 69% percent higher than the second quarter of 2009 and 31% less than the same quarter a year ago. SEMI and the Semiconductor Equipment Association of Japan (SEAJ) jointly collect the data from 110 global equipment companies that provide input on a monthly basis. Worldwide semiconductor equipment bookings were US$5.83 billion in the third quarter of 2009. The figure is 4% more than the same quarter a year ago and 98% greater than the bookings figure for the second quarter of 2009.

9:15AM Intel: FTC confirms suit against Intel (INTC) 19.80 : The Federal Trade Commission today sued INTC charging that the company has illegally used its dominant market position for a decade to stifle competition and strengthen its monopoly. In its complaint, the FTC alleges that Intel has waged a systematic campaign to shut out rivals' competing microchips by cutting off their access to the marketplace. In the process, Intel deprived consumers of choice and innovation in the microchips that comprise the computers' central processing unit, or CPU. These chips are critical components that often are referred to as the "brains" of a computer. According to the FTC complaint, Intel's anticompetitive tactics were designed to put the brakes on superior competitive products that threatened its monopoly in the CPU microchip market. Over the last decade, this strategy has succeeded in maintaining the Intel monopoly at the expense of consumers, who have been denied access to potentially superior, non-Intel CPU chips and lower prices, the complaint states... The FTC's administrative complaint charges that Intel carried out its anticompetitive campaign using threats and rewards aimed at the world's largest computer manufacturers, including Dell, Hewlett-Packard, and IBM, to coerce them not to buy rival computer CPU chips. Intel also used this practice, known as exclusive or restrictive dealing, to prevent computer makers from marketing any machines with non-Intel computer chips. In addition, allegedly, Intel secretly redesigned key software, known as a compiler, in a way that deliberately stunted the performance of competitors' CPU chips. Intel told its customers and the public that software performed better on Intel CPUs than on competitors'

8:57AM Seagate Tech initiated with a Outperform at Wedbush Morgan; tgt $22 (STX) 16.41 : Wedbush Morgan initiates STX with a Outperform and price target of $22 based on expectations for continued favorable supply-demand conditions, share gains in the 2.5" drive segment and expanding margins. The firm believes that 2010 should be a very good year for HDD vendors as demand is likely to be very strong, driven by a tech refresh in businesses and an improved consumer spending environment. In addition, the industry has consolidated and the companies are now focusing on profitability rather than market share gains. The firm understands that a lot of the forward optimism is priced into the stock. Still the firm believe that there is plenty of room for upside to the Street's forward estimates and to the stock price. The firm believes that HDD stocks will still trade below their peers in the storage systems and IT hardware segment and thus they believe that a multiple of 9x is justified, which is significantly below their peers in IT hardware.

8:53AM Western Digital initiated with a Outperform at Wedbush Morgan; tgt $49 (WDC) 39.56 : Wedbush Morgan initiates WDC with a Outperform and price target of $49 based on expectations for continued favorable supply-demand conditions, share gains in the enterprise drive segment and expanding margins. The firm believes that 2010 should be a very good year for HDD vendors as demand is likely to be very strong driven by a tech refresh in businesses and an improved consumer spending environment. In addition, the industry has consolidated and the companies are now focusing on profitability rather than market share gains.

8:32AM Mattson received multiple orders for the its Suprema photoresist strip system (MTSN) 2.91 : Co announced it received multiple orders for the its Suprema photoresist strip system. The Company noted that the Suprema systems would be used for all dry strip applications including the high dose implant strip (HDIS), which is the most difficult dry strip process. The tool shipments will start in the current quarter and continue into the first half of 2010.

7:31AM KVH Industries receives $6.4 mln order for fiber optic gyro-based inertial measurement units (KVHI) 13.26 :

7:14AM Kulicke & Soffa corrects financial results for its Q4 2009 (KLIC) 5.30 : Co issued a release announcing its financial results for its Q4 2009. Subsequent to the issuance of its press release, the Company identified an error in calculating income tax expense included in net income for the Company's fourth fiscal quarter. The correction of the error reduced income tax expense by $750,000, which resulted in an increase to net income after tax of $750,000, and increased other assets by $750,000. On a non-GAAP basis for the fourth fiscal quarter of 2009, the Company's corrected income from continuing operations of $10.9 million, or $0.16 per diluted share, resulted in an increase of $0.02 per share. Net revenue from continuing operations of $110.5 million is unchanged.

3:18AM LDK Solar and Uni Land S.p.A. to construct PV plants totaling 20 MW in 2010 and 2011 (LDK) 9.12 : Co announces that it has signed an agreement with Uni Land S.p.A. to develop and construct PV plants totaling 20 MW in 2010 and 2011.

icon url

ReturntoSender

12/17/09 10:15 AM

#8781 RE: ReturntoSender #6755

C MT/LT bought 10,000 shares@3.19 - I'm thinking today's offering puts a floor on the stock.

shares of financial behemoth Citigroup (C) are down nearly 8% to $3.18 per share after the company priced its previously announced share offering at $3.15 per share, which marks a near 9% discount to the stock's closing price for the previous session.

icon url

ReturntoSender

12/17/09 10:57 PM

#8782 RE: ReturntoSender #6755

From Briefing.com: 4:30 pm : Stiff selling on heavy volume came as the greenback spiked against foreign currencies and financials faltered. Stocks now head into Friday with a week-to-date loss of nearly 1%.

The dollar made its way to a 1.1% gain against competing currencies after Standard & Poor's downgraded Greece's debt rating. It was the second reduction of its kind this week. Support for the greenback had the Dollar Index up as much as 1.4%, which put it at a new three-month high.

That proved to be a headwind for both stocks and commodities, which put materials stocks under the most pressure this session. The materials sector settled with a loss of 2.3%.

However, it was weakness in the financial sector that hampered the broader market. Financials, which make up 14% of the stock market's weight, fell 1.8%.

Pressure against financials followed several headlines, which began with news that Citigroup (C 3.20, -0.25) priced shares in its previously announced common stock offering at $3.15 each, a near 9% discount to the previous session's closing price. The low price tag even kept the Treasury from unloading its $5 billion of shares in the company.

Shares of investment banks and brokerages were sent to a 2.8% loss after highly regarded analyst Meredith Whitney lowered her earnings estimates for Morgan Stanley (MS 29.12, -1.22) and Goldman Sachs (GS 160.93, -4.06).

Meanwhile, consumer finance stocks dropped 3.3% in the wake of the latest quarterly report from Discover Financial (DFS 14.92, -1.50). The company posted earnings of $0.63 per share, including certain items, but saw an increase in its managed net charge off rate to 8.43%. It failed to win support, though, when it stated during its conference call that it feels much more confident that its TARP repayment will be sooner than later and implied that a capital raise would not be necessary.

FedEx (FDX 84.47, -5.48) also failed to inspire with its latest quarterly results. The global shipment company brought in earnings of $1.10 per share, which matched its preannouncement, but topped the consensus of $1.06 per share. However, FedEx expects third quarter earnings to range from $0.50 to $0.70 per share, which is shy of the current consensus of $0.84 per share. It also stated it expects earnings for fiscal 2010 to range from $3.45 to $3.75 per share, which brackets the current consensus of $3.46 per share.

Initial jobless claims for the week ending December 12 totaled 480,000, which is up 7,000 from the previous week and more than the 465,000 initial claims that had been widely expected. Continuing claims climbed 5,000 from the previous week to roughly 5.19 million, which is more than the 5.17 million that had been forecast by economists.

Selling pressure took a temporary reprieve with the midmorning release of the November Philadelphia Fed Index, which hit 20.4. The consensus had called for a reading of 16.0.

Leading indicators for November increased 0.9%, which is stronger than the 0.7% increase that had been expected.

By eclipsing 1.7 billion shares, trading volume on the NYSE hit its highest level in nearly three months this session. The heavy volume suggests that there was conviction behind this session's selling effort, though it comes one day ahead of tomorrow's quadruple witching options expiration. Nonetheless, selling culminated with stocks near their session lows and declining issues outnumbering advancers by more than 4-to-1.

Advancing Sectors: (None)
Declining Sectors: Materials (-2.3%), Financials (-1.8%), Consumer Staples (-1.3%), Consumer Discretionary (-1.3%), Tech (-1.2%), Industrials (-1.0%), Health Care (-0.9%), Telecom (-0.8%), Energy (-0.7%), Utilities (-0.6%)DJ30 -132.86 NASDAQ -26.86 NQ100 -1.3% R2K -1.1% SP400 -1.1% SP500 -13.10 NASDAQ Adv/Vol/Dec 717/1.93 bln/1966 NYSE Adv/Vol/Dec 845/1.72 bln/2203

4:11PM Oracle beats by $0.03, beats on revs (ORCL) 23.98 : Reports Q2 (Nov) earnings of $0.39 per share, $0.03 better than the First Call consensus of $0.36; revenues rose 3% year/year to $5.87 bln vs the $5.69 bln consensus. "We delivered results which were substantially better than we expected on both the top and bottom line, growing non-GAAP operating margins by 280 basis points to 49%, the highest Q2 non-GAAP operating margin in our history... Our solid top line growth, coupled with disciplined expense management, was key in generating $8.4 billion of free cash flow over the last twelve months... For the fourth consecutive quarter, Oracle took market share from SAP in every region around the world... In constant currency, our applications business grew 1% in the Americas and 2% in Asia Pacific versus a negative 35% and negative 34% respectively for SAP."

4:11PM Palm misses by $0.05, beats on revs (PALM) 11.72 +0.11 : Reports Q2 (Nov) loss of $0.37 per share, $0.05 worse than the First Call consensus of ($0.32); revenues rose 57.6% year/year to $302 mln vs the $266.2 mln consensus. Gross margin was 25.6% vs. 20.1% year ago. The company shipped a total of 783,000 smartphone units during the quarter, representing a 5 percent decrease from the first quarter of fiscal year 2010 and a year-over-year increase of 41 percent compared to the second quarter of fiscal year 2009. Smartphone sell-through for the second quarter was 573,000 units, down 29 percent from the first quarter of fiscal year 2010 and down 4 percent year-over-year.

4:10PM Research In Motion beats by $0.06, beats on revs; guides Q4 EPS above consensus, revs above consensus (RIMM) 63.46 -1.21 : Reports Q3 (Nov) earnings of $1.10 per share, $0.06 better than the First Call consensus of $1.04; revenues rose 11.2% year/year to $3.92 bln vs the $3.78 bln consensus. Q3 Net Subscribers 4.4 mln, Guidance 4.0-4.3 mln. Q3 Device Shipments 10.1 10 mln, Guidance 9.2-9.9 mln. Q3 Gross Margins 42.7%, Guidance 43%. The revenue breakdown for the quarter was approximately 82% for devices, 14% for service, 2% for software and 2% for other revenue. Co issues upside guidance for Q4, sees EPS of $1.23-1.31 vs. $1.12 consensus; sees Q4 revs of $4.2-4.4 bln vs. $4.11 bln consensus. Gross margin for Q4 is expected to be approximately 43.5%. Net subscriber account additions in the fourth quarter are expected to be in the range of 4.4-4.7 million. "RIM is experiencing a great start to the holiday buying season and the strong Q3 results and Q4 outlook clearly reflect the strength of our diversified product portfolio as well as the success of our efforts to expand into broader customer segments and new geographies while maintaining our strong position in North America."

9:17AM LDK Solar announces signing of an indicative term sheet for a minority stake in its polysilicon production plants (LDK) 9.20 : Co announces it signed an indicative term sheet with VMS Investment Group and its affiliates pursuant to which the Investors have agreed to subscribe between $50-$80 mln aggregate amount of redeemable and convertible preference shares of the Cayman Islands subsidiary, which is to be created to hold and operate LDK Solar's polysilicon business, valuing the entity at $1.30-$1.65 bln. The transaction will require a reorganization of LDK Solar's polysilicon business through which the assets and liabilities relating to the polysilicon business would be assumed by the newly created subsidiary, which will be wholly owned by LDK Solar. The terms of the securities have a two year maturity and are convertible at the option of the holders at a conversion ratio that includes an investment internal rate of return. The investment is expected to close by the end of March 2010.

9:16AM Nanometrics prices a 2.025 mln share common stock offering at $11/share (NANO) 12.44 : The co's founder is also selling 675,000 shares of common stock at a public offering price of $11.00 per share as part of the same offering.

11:17 am Philadelphia Fed Index Details Manufacturing Expansion

The Philadelphia Fed Business Outlook rose to 20.4 in December from 16.7 in November. The median economic forecast predicted the index would increase to 17.5.

The index has remained positive for five consecutive months and signals continued growth in the manufacturing sector.

The increase in the index came in spite of a slowdown in new orders. The new orders index, while still showing positive growth, fell from 14.8 to 6.5. Shipment growth remained stable.

The biggest surprise from the details came from the labor sector.

For the first time since the end of 2007, the number of employees index broke through the zero threshold as the index settled at 6.3. While growth prospects in manufacturing labor look anemic (77.3% of companies reported no change in their labor demand), it is very encouraging to see more firms reporting an increase in hiring than firms reporting layoffs.

Further, the growth rate in the employee workweek is on the rise as the index increased from 2.0 to 6.4.

In other good news, the inventory situation is getting better.

While the index is still below zero, the index rose from -17.3 to -7.4. We expect inventories to begin posting positive growth within the next three months.

The situation for prices remains potentially problematic.

The prices paid index increased from 14.9 to 33.8 as 38.7% of firms reported higher prices for their supplies.

Unfortunately, consumer demand remains muted and firms are unable to pass on the higher supply costs. The prices received index fell from -1.5 to -1.8 in November.

Until the relationship reverses for prices, firms will have difficulties maintaining profits.

Please note: the Philly Fed Business Outlook does not provide a strong gauge of national manufacturing activity. In general, all Federal Reserve surveys only provide microeconomic information regarding the region in which the bank is located.

Correlations between regions in close proximity are also low. For example, the New York Fed's Empire State Manufacturing Survey dropped from 23.51 in November to 2.55 in December, which obviously did not play a role in boosting manufacturing in Philadelphia.

icon url

ReturntoSender

12/19/09 8:33 PM

#8783 RE: ReturntoSender #6755

From Briefing.com: 4:30 pm : Despite a strong start on the back of a better-than-expected batch of earnings, stocks finished with varied gains. Trading volume was exceptionally high, but not very telling of the broader market's mood.

Oracle (ORCL 24.34, +1.46) and Research In Motion (RIMM 69.99, +6.53) both announced last evening earnings results that exceeded analysts' expectations for the latest quarter. The positive surprises helped bring buyers back into the action after they had stepped to the sidelines in the previous session's sell-off.

Accenture (ACN 41.37, -0.29) and Nike (NKE 64.42, +1.17) helped keep a positive vibe with better-than-expected earnings of their own, but it was financials that assisted tech stocks in providing leadership to the broader market.

Both tech stocks and financial stocks had been beaten down during the previous session, but rebounded to respective gains of 1.6% and 1.4% this session. Tech helped the Nasdaq outperform its counterparts, but the two sectors teamed up to provide leadership to the broader market --the two sectors were the best two performing sectors and combine to make up nearly 35% of the total weight in the S&P 500.

This session's action wasn't all positive, though. Stocks came under pressure midsession as the dollar made its way to a fresh three-month high against competing currencies. The greenback's gain caused the stock market to temporarily retreat into negative territory.

Stocks recovered to finish at afternoon highs as the dollar's advance proved unsustainable. The greenback finished flat for the session.

Despite the modest gain by the broader market, it wasn't enough to keep stocks from a weekly loss of 0.6%, which makes for the stock market's worst weekly performance in seven weeks. Meanwhile, stocks have shed 0.7% in the past month.

Trading volume on the NYSE hit its highest level of the year by eclipsing 3 billion shares, but that was largely the result of this year's last quadruple witching options expiration. The S&P 500 is also due to be rebalanced. Ordinarily high trading volume suggests heavy participation and a sense of conviction among participants, but since the surge in volume this session was fueled by traders concerned with squaring their positions the general mood of the market isn't so easily discerned.

Advancing Sectors: Tech (+1.6%), Financials (+1.4%), Consumer Discretionary (+0.5%), Utilities (+0.5%), Energy (+0.3%), Health Care (+0.3%), Telecom (+0.2%), Materials (+0.1%)
Declining Sectors: Consumer Staples (-0.3%), Industrials (-0.2%)DJ30 +20.63 NASDAQ +31.64 NQ100 +1.6% R2K +1.1% SP400 +0.5% SP500 +6.39 NASDAQ Adv/Vol/Dec 1663/2.86 bln/1094 NYSE Adv/Vol/Dec 1774/3.16 bln/1242

10:28AM LDK Solar confirms pricing of follow-on public offering of 16.52 mln american depositary shares at $7/ADS (LDK) 6.96 -0.86 : Co expects to use approximately $90.0 million of its net proceeds to pay down short-term debt and the remaining proceeds to fund the polysilicon production plant and the expansion of the solar module business, and for general corporate purposes.

9:00AM North American semiconductor equipment industry posts November 2009 book-to-bill ratio of 1.06 : North America-based manufacturers of semiconductor equipment posted $790.5 million in orders in November 2009 (three-month average basis) and a book-to-bill ratio of 1.06, according to the November 2009 Book-to-Bill Report published today by SEMI. The three-month average of worldwide bookings in November 2009 was $790.5 million. The bookings figure is up 4.5 percent from the final October 2009 level of $756.3 million, and nearly 1 percent higher than the $783.8 million in orders posted in November 2008. The three-month average of worldwide billings in November 2009 was $743.7 million. The billings figure is 7.1 percent greater than the final October 2009 level of $694.1 million, and nearly 8 percent less than the November 2008 billings level of $806.8 million. "After a slight flattening of bookings in October 2009, both bookings and billings growth remained relatively slow but steady into November," said Stanley T. Myers, president and CEO of SEMI. "This trend reinforces our view of an improving spending forecast as the industry heads into 2010."

Micron Technology (MU) announces that it will voluntarily transfer its stock exchange listing from The NYSE to the NASDAQ Global Select Market, effective Dec. 30, 2009...

09:18 am Oracle (ORCL)

Oracle (ORCL 22.88) reported better-than-expected fiscal second quarter results, news that has shares of the company more than 4.5% higher in Friday's premarket trading.

Reports Q2 (Nov) earnings of $0.39 per share, $0.03 better than the First Call consensus of $0.36;

Revenues rose 3% year-over-year to $5.87 billion vs. the $5.69 billion consensus.

"We delivered results which were substantially better than we expected on both the top and bottom line, growing non-GAAP operating margins by 280 basis points to 49%, the highest Q2 non-GAAP operating margin in our history," said CFO Jeff Epstein.

08:31 am Research In Motion (RIMM)

Research In Motion (RIMM 63.46) reported better-than-expected third quarter earnings and issued upside guidance for the fourth quarter, news that pleased investors and sent shares of the company more than 10% higher in after-hours trading Thursday.

Research In Motion reported earnings of $1.10 per share, $0.06 better than the First Call consensus of $1.04.

Revenues rose 11.2% year-over-year to $3.92 billion vs. the $3.78 billion consensus.

The BlackBerry maker said it added 4.4 million net subscribers at the end of the quarter, better than the 4.0 million to 4.3 million that Wall Street analysts expected.

Research In Motion issued upside earnings guidance for the fourth quarter, saying it expects earnings of $1.23 to $1.31 per share, well ahead of the current consensus estimate of $1.12. The company projects revenues to range from $4.2 billion to $4.4 billion; the consensus estimate stands at $4.11 billion.
icon url

ReturntoSender

12/20/09 4:31 PM

#8785 RE: ReturntoSender #6755

InvestmentHouse Weekend Market Summary 12/18/09

http://www.investmenthouse.com/weekendmarketsummary.htm

- Expiration, S&P rebalance drive volume, but overall market themes remain.
- Dollar, oil close out a strong week.
- Indices bumping at breakouts, but to this juncture unable to close the deal.
- Growth continues to lead as market looks for a Santa Claus rally.

Lots of movement but all markets continue their trends.

It is difficult to get a read on a session that contains both quadruple expiration and an S&P Index rebalance. There will be the normal issues associated with expiration, particularly at year-end following a solid rally. Positions and options will be rolled out, some will be canceled and closed. On top of that, there is an S&P rebalance where all the S&P indices are reconfigured to move some stocks in and some out. Therefore, the index funds have to reshuffle their lineup, which leads to a lot of buying and selling, so the volume or breadth cannot be trusted. In other words, the internals mean nothing and that casts doubt on whether the entire session meant anything. Something that you can always look for is whether the underlying themes behind the market remain. It is easy to say in this case that they did. Not only the stock market, but the other markets (the dollar, gold, commodities, etc.) all maintained their relative trends as well. There was no real impact overall on the market. It is just a session that is hard to read, and we will take it for what it was.

Oil initially spiked higher on news that Iran made an incursion into Iraq and surrounded an oil well or an oil field (the reports were varied and many). Iran is coveting some of Iraq's oil fields, and it is concerned that Iraq may be able to put more oil onto the line soon, to 1M+ barrels a day. That could affect world price, and Iran wants to keep prices higher because it needs to fund its terrorist activities and fight off the insurgency in its own country that the youth are posing to it. That news raised oil, spiking it up well over $1.00 as oil continued its run. It could not hold onto the gains to the close though; indeed, it was just up a few cents ($73.02, +0.37). Nonetheless, this was a best week for oil in about a year. It made a tremendous move, up 4% on the week.

The ORCL and RIMM earnings out Thursday evening drove a lot of the action with techs. There was strong action with those two stocks, and they set the pace for NASDAQ. RIMM gapped higher and NASDAQ was clearly in the lead, and ORCL gapped to a new rally high as well. They lead techs higher, but it did not change anything in the market. It maintained the trends, but it did not cause any serious breaks (NASDAQ is threatening, however).

Late in the day, there was a Copenhagen climate agreement. They heralded this as a great accomplishment as some of the developing countries of the world were involved, but no one had to sign anything as they did with Kyoto. They pushed off a meeting in Mexico next year where they were supposed to sign a formal agreement to instead discuss in another meeting what they should do in 2016. This great accomplishment that put untold millions of tons of carbon pollutants into the air the very thing they are worried about accomplished nothing. That is good for the United States because we would otherwise be sending our money away to countries that are our competitors and are rising faster than we are in manufacturing. It is a plus for the United States that we got out of there with an agreement that was just another paper tiger.

The dollar was up fractionally (1.4336 Euros versus 1.4342 Thursday), but the action on the chart was equivocal. It finished strong and ran higher, and now there is a doji on the session. With all the expirations, that probably does not mean anything. There have been interim dojis along the way that were just that: continuation dojis. The DXY0 has now moved into a key range of resistance, from 77.25 up to 78, and it bumped there on Thursday and faded back. It broke over it on Friday and faded back. You would expect it to sidestep laterally before it tries to continue higher, as it did at 76 when it ran into the September low as well as two consolidation ranges in October. This is a key level. This is the 78-79 range with a descending 200 day EMA on top of it that will start exerting some influence on the index. It could run out of gas. I still view this as a relief bounce. This has been a sharp move, but when a market or stock becomes deeply oversold, it tends to have very sharp snapback rallies. When a stock market is in a recession or bear market, it tends to have sharp snapback rallies that are vicious because they are short covering. The snowball starts rolling, more and more people have to cover, it shoots higher, but then it burns itself out and comes back down. This is going to be a key area over the next two weeks as the dollar tries to move higher. We will see if it does. I think it is an oversold bounce on the dollar. There is no real substance here because the Fed has okayed the continuation of free money to the banks and the printing of trillions of dollars. That has not changed the picture overall economically other than some belief that there is going to be an economic recovery. This is a short squeeze, and I anticipate it will end and come back down. It could very well end up in the 79 range after a lateral move and another attempt to break higher. This has been a great move for the dollar. It needed to come back, and now it has made a sizable bounce and will have to prove if it has the mettle to continue the rally.

Gold was up modestly ($113, +5.60) and has been very volatile the last few sessions. There was a sharp selloff, and that happens after strong moves. We moved in after the sharp selloff, and it gapped higher looking solid. It gapped lower on Thursday as the dollar exploded higher, but it came back on Friday and it is holding this range. It may try to hold or it may come back. We will buy into more positions as it hits support levels and makes higher lows. Gold had a tough week. It will likely struggle a bit more based on the Thursday action, but there are still buyers out there and it will find its way back up. I am still looking for gold to go to $1,500 over the next six to nine months.

Bonds faded somewhat (10 year closing 3.54% versus 3.48% Thursday). There are some big swings in bond yields, and they are still moving higher after the selloff. We will have to see how bonds end up performing. Remember bonds were flashing a very solid "Economic Trouble Ahead" sign earlier in the year, and then they had a selloff as some of the economic data became better and the dollar started to rebound. Everything rallies and tests. The dollar became oversold and it is bouncing. Gold became overbought and it is selling and correcting. Bonds were a bit too strong and negative on the economy, and they have been correcting. No matter what you are trading, every market will have these sharp corrections in an overall trend when too many people crowd into the trade. Overall, the trends have not changed whether you look at the stock market, the bond market, the dollar, gold, or commodities. They have only gone through a correction to each of their trends of late, and Friday did nothing to change that.

TECHNICAL

INTERNALS

The internals did not mean a thing. Volume exploded, up 25% on the NYSE to 2.1B, and up 48% on NASDAQ to 2.7B. That is impressive volume, but it is all related to rebalances, triple, and quadruple witching.

CHARTS

NASDAQ was able to match its prior closing high, and that keeps it in the upper echelon of its ascending triangle and still trying to make the break higher. The interesting thing is that it has been unable to do that. It has had the reasons to make the break: the Fed keeping the money supply free and easy, ORCL and RIMM producing great earnings, and generally improving views with respect to technology. It has a great pattern and one would presume it will make the break, but it just has not done it yet. That will be key moving ahead. There is the Santa Claus rally next week, and it should break out and rally up into the end of the year. The question is whether it will make the move and if it can hold it.

We gave the NASDAQ top billing because it truly was the leader with its 1% + gain on Friday. That knocked SP500 off its perch, but it was no slouch. It is back up mid-range in its range. There was big volume due to expiration on Thursday, and then expiration and the SP rebalance on Friday. It makes sense that there was a lot of volume and horse trading going on with respect to this index. It is in the mid-range and it is somewhat struggling. It is up and down, could not make the break, and it sold off. This is with energy having a very good week. The oil services ETF had a great two-week run, but SP500 was still lackluster and stuck in the middle of its range. Financials were down. The XLF has trended lower since December. The financials were not helping SP500 any (it is heavily weighted with financials), but even with a positive energy sector and other areas that were improving, SP500 still could not make a significant move. That leaves us asking the same question we did with NASDAQ: Can SP500 make the breakout? It has every reason to do so, but it cannot make the move. There is rotation out of some of these stocks, and that is hamstringing the SP500 somewhat. That makes it a less interesting case than NASDAQ, which has every reason to rally. Nonetheless, if SP500 moves, its weight is on the rest of the market as well.

The real star of the week was SP600. It broke over its November peak, tested and held it (even on Thursday), bouncing off the low. Friday it moved up and put in a new closing high over the November peak. That puts it right at a September peak, another key resistance level; indeed, it is just entering a new range of resistance, from the September peak up to the October peak. The small caps are looking very strong. There is money moving into those stocks as it moves out of some of the commodities, financials, and industrials over the past two weeks. They are showing good buying, they still have good patterns, but they also have an issue trying to make the breakout. No one wants to be the rabbit to run for the rest of the market and drag everyone else with them after making the breakout. That is part of what I was discussing earlier with some fund managers happy with where things are and wanting to sit on their gains. Then, as more than one reader has suggested, there are others that want to keep the status quo and take some gains after the year is over. They will take some gains on rallies, and that has been undermining attempts to make breakouts. Others would like to run it higher and put more gains on the books for their year-end prospectus.

The mid-cap SP400 is another rebalance index and is in a great position, similar to NASDAQ. It is holding up beautifully. It is in the upper quarter of its range, holding over the November peak, ascending triangle, and ready to make the breakout. There is money rotating into smaller stocks and setting up a nice move.

The SOX was the leader in December. It broke out and continued to move higher, and it lost many of its spectacular attributes late in the move. It is nonetheless putting in new closing highs and continuing higher as the growth area of semiconductors is improving. ORCL and RIMM are moving higher. They make devices and have the software to run devices that technology produces, so the entire technology sector is performing pretty well. The charts are still in great shape.

There were some hiccups toward the end of the week, but that has a lot to do with quadruple expiration causing volatility. At the end of the session on Friday, there was classic volatility after a selloff. There was a rally back and then the surge late on the SPYders as many of the SP stocks were shuffled. After the close, they were trying to sort out all of the market on close orders as the indices and ETFs put in their orders to sell and buy the various SP stocks. There are so many SP indices that had to be reshuffled; it will take until Monday to figure out what happened.

LEADERSHIP

One of the maligned areas this week was financials. We took gain on GS. It is trying to bottom and we will see what happens here. It looks like it could be doing that because other financial stocks look the same way. JPM has come down to a support line just over 40 and is trying to put in a bounce. It looks like it could do that. MS is also the same it had the snot knocked out of it over the past month, but it has come down and showed a hammer doji that happened on the 200 day EMA on the low. It is holding right at support at 29, and we could get a bounce out of MS. We could get a bounce out of many of these. If you like bounce plays, these are setting up to do that, but whether they will have a lot of strength behind them is the another question. You might be able to make a play up to 32 off 29 on MS. That is not a huge move, but it is very solid on a bounce play.

AAPL is still holding the triangle it is trying to form up, and it is not bad. It recovered from the Thursday dump. There are many other good stocks in technology that are holding up well. QCOM is one that could be a bounce play. It was trying to set up something of an ABCD pattern, but it carried on and lost a lot of that luster. Overall, it has formed something of a triangle. If it could make a break higher, it could be interesting. It is not on the top of my list, but I am looking at it. I like is QLGC, but this is a dangerous pattern even though it does not look dangerous. This is not necessarily a bad thing in a bull market, but you should watch for these if there is a transition going on (I am not saying there is one, other than NASDAQ has been unable to make the breakout from a good pattern). They can run out of gas. It is trying to set up a triangle, but then it gets extended and cannot figure out what to do. If MACD is running out, it has lost momentum. Be careful of these. It can make the break higher but could just as easily make the break lower. Know your market and where you are in the life cycle. That tells you a lot about whether you want to step into a pattern.

The chips still look good. We have a position in CY. It has made a nice rally and come back to a nice test. It is in an excellent position to run higher, and you see this a lot in semiconductors. KLAC has an interesting pattern, and it could make the break higher. MACD is rising note how in QLGC it was heading lower. We have rising MACD, so this could be an interesting play. A similar play in CYMI: a double bottom, bounce, handle, rising MACD, and showing good upside volume. It showed a doji on Friday. I do not know if this volume means anything since it was expiration and SP rebalancing, but it has that same look. I like this one a bit better than KLAC. MFLX is another I have been looking at. It has the pullback, kind of a handle, a break higher. Nice rally into it and trying to form something of an ABCD, but there are a bit too many letters in the alphabet here as well. It fell apart, but there is something of a cup with handle, and it is trying to make the break higher with rising MACD. There are some positives there.

Energy had a better week. APA is always a good one to watch. It had a nice rally, is moving laterally, and it set up another one of the cup with handle patterns. APC rallied back and is testing the 50 day EMA. It is not the same clear, nice pattern, but it could make a bounce up as well. It is not in great shape or in terrible shape. HAL rallied all week, gapped higher, and reversed on Friday. I do not know what that means because of the expiration, but it had a great recovery. It is not a great pattern at all. There is the double top and lower MACD, but it did rally and had volume as it came back up. Energy is mixed, but it had a good week overall. There are some good setups there.

FCX, in metals, is trying to hold. It started to sell hard on Thursday, was trying to hold on Friday, and I still think it is coming lower. BHP is the same type of scenario, but it has more support. Metals, like commodities, are varied. Some are performing better than others.

Healthcare still looks good, and money is still moving in. CNMD has been setting up and trying to make the break. It IS making the break as a matter of fact, we bought some of this on Friday. BABY is one I like, and it is very interesting. It could give a neat run from the 14 range up to 17, the prior high. It is a cool pattern. It is not perfect, but even a perfect pattern can fall apart on you.

Retail had a good day. PZZA had nice volume, a break higher, a nice test, and then a new break back up over the downtrend. I like those kinds of patterns. DBRN had a test and is moving back up and getting some volume. It is not all candy and roses, however. BBY is all of a sudden having a hard time. You thought it might want to hold up after it gapped down and touched a support level, but it is giving it up and going down big time. That is not good. It had decent earnings, but apparently, they were not good enough. This is a concern about the holiday season, but more about what comes after the holidays. It seems like investors feel that retailers may be using up their bullets on this holiday season similar to how the Fed has used up all of its bullets. If a major upheaval comes along, the Fed has no bullets left, and you get that sense looking at the way some of the retailers are acting. That is not all of retail, and a lot of them performing just fine.

Leadership is fine, and there is still a rotation ongoing. Medical is improving, retail stocks are decent, and there is the business software and business services starting to perform. On top of that, the semiconductors are moving higher, and technology is looking solid. There is plenty of leadership even though there are prior leaders being recycled right now. They are going down and being sold off, but then they will base and set back up. As the dollar dies out on its rally, then we could see these stocks make a comeback. Again, the next two weeks on the dollar will be important as it hits the 78-79.50 level. There is resistance there after a good corrective snapback rally. That will be one of the main drivers in the week ahead.

THE MARKET

MARKET SENTIMENT

VIX: 21.68; -0.83
VXN: 21.78; -1.06
VXO: 20.53; -1.31

Put/Call Ratio (CBOE): 0.98; +0.07

Bulls versus Bears:

This is a reading of the number of bullish investment advisors versus bearish advisors. The reason you look at this is that it gives you an idea of how bullish investors are. If they are too bullish then everyone is in the market and it is heading for a top: if everyone wants to be in the market then all the money is in and there is no more new cash to drive it higher. On the other side of the spectrum if there are a lot of bears then there is a lot of cash on the sideline, and as the market rallies it drags that cash in as the bears give in. That cash provides the market the fuel to move higher. If bears are low it is the same as a lot of bulls: everyone is in and the market doesn't have the cash to drive it higher.

Bulls: 52.2%. Rising again after a slight dip the prior week. This is the highest level on this run. Still well over the 35% level that is the threshold for what is considered a bullish climate. It does not mean things are necessarily bearish; that takes a reading in the 60% range. Hit a high of 47.7% mid-June on the run from the March lows. Again, to be seriously bearish it needs to get up to the 60% to 65% level. Dramatic rise from 21.3% in November 2008, the bottom on this leg. This last leg down showed us the largest single week drop we have ever seen, falling from 33.7% to 25.3%. Hit 40.7% on the high during the rally off the July 2008 lows. 30.9% was the March low. In March the indicator did its job with the dive below 35% and the crossover with the bears. A move into the lower 40's is a decline of significance. A move to 35% is a bullish indicator.

Bears: 16.7%. Holding basically steady for the past three weeks, down from a 17.6% reading. Bears are down but still skeptical as the lateral slide indicates. This is the lowest level of the entire rally and is at a bearish level. Peaked near 28% on this round, falling short of the 35.6% hit in July 2009. For reference, cracking above the 35% threshold considered bullish. Hit a high on this run at 47.2%. For reference, bearishness hit a 5 year high at 54.4% the last week of October 2008. The move over 50 took bearish sentiment to its highest level since 1995. Extreme negative sentiment. Prior levels for comparison: Bearishness peaked at 37.4% in September 2007. It topped the June 2006 peak (36%) on that run. That June peak eclipsed the March 2006 high (33%) and well above the 2005 highs that spawned new rallies (30% in May 2005, 29.2% in October 2005). That was a huge turn, unlike any seen in recent history.

NASDAQ

Stats: +31.64 points (+1.45%) to close at 2211.69
Volume: 2.755B (+48.96%)

Up Volume: 2.174B (+1.76B)
Down Volume: 664.846M (-804.493M)

A/D and Hi/Lo: Advancers led 1.5 to 1
Previous Session: Decliners led 2.73 to 1

New Highs: 115 (+45)
New Lows: 42 (+1)

NASDAQ CHART: Click to view the chart

NASDAQ 100 CHART: Click to view the chart

SOX CHART: Click to view the chart

SP500/NYSE

Stats: +6.39 points (+0.58%) to close at 1102.47
NYSE Volume: 2.147B (+25.26%)

Up Volume: 1.833B (+1.644B)
Down Volume: 800.856M (-701.04M)

A/D and Hi/Lo: Advancers led 1.37 to 1
Previous Session: Decliners led 2.63 to 1

New Highs: 225 (+65)
New Lows: 36 (-3)

SP500 CHART: Click to view the chart

SP600 Chart: Click to view the chart

DJ30

Stats: +20.63 points (+0.2%) to close at 10328.89
Volume DJ30: 480M shares Friday versus 198M shares Thursday.

DJ30 CHART: Click to view the chart

MONDAY

It is a short week with Christmas on Friday, which means the market will close early on Thursday. The indices are well positioned to make a Santa Claus rally. Even NASDAQ is in a great pattern and should make a nice Santa Claus rally. It is perfectly positioned to lead higher, and it can move along with SP600 and SP400 and plow into new rally ground into Christmas. The question is if it will do it. I think it might, and it could have a holdover toward January. This time of year tends to move with the trend, and the trend is solidly in place and solidly higher. You would expect it to continue higher. What we want to do is let our positions ride and move in toward the end of the year and see just how much they move up. We can consider whether to take gains or not and wait until January, but if I have a gain in hand and it looks as if it could be topping out on that move, I am not going to wait a few days until the next year. The options could dry up some if the move dissipates, and then if it starts to turn against you and go back down, you are losing all the money you would have made. I would rather have the money in hand and pay some taxes on it then have a good play go back down and not make as much money. I still have to pay tax on it, it is just whether I pay it this year or the next. A 50-70% gain on an option play now is much better than a 30% gain taken early next year. The tax considerations are not going to have as much of an impact on my trading scheme as they would in hedge funds or in the mutual funds that are managing billions of dollars those managers have to watch out for their clients.

We will let our positions run. If we get one that is topping out or hits a target and we want to take some gain, we are going to act as usual. We will take partial gain and let the rest of it run. On the other hand, if it has made a tremendous move and we do not think it will go any further, then we can take the whole thing off the table. We will continue to look for upside because I still think one of the themes, even going into early 2010, is going to be the small and mid-caps still rising and having a good January effect move. I do not think there will be a lot of selling to start the year that will send every sector tumbling down. There may be selling in those that moved up in the SP that are struggling now. We may see that rotation continue, but that would not affect the stocks that we are moving into versus those that have made their run and are selling back. We will basically keep the same strategy because we see the same events unfolding where we can take advantage of the smaller caps rising. It may be a different story after January, but we will watch and see how it plays out. Right now, I am seeing good stocks making good moves and giving the "buy me" signal, so that is what we are doing.

Have an excellent weekend. We will play the shortened holiday weekend for what it gives us, but not get too wrapped up in it because there are other things more important this time of year.

Support and Resistance

NASDAQ: Closed at 2211.69
Resistance:
2210 (from September 2008) to 2212 (the July 2009 closing low)
2218 is the August 2005 peak
2245 from July 2008 through 2260 from late 2005.
2275 - 2278 from the February 2008 and April 2008 lows

Support:
2205 is the November 2009 peak
2191 is the October 2009 peak
The 18 day EMA at 2185
2177 is a low from March 2008
2169 is the March 2008 closing low (double bottom)
2168 is the September 2009, intraday peak
2167 from the July 2008 intraday low
2155 is the March 2008 intraday low
The 50 day EMA at 2150
2143 is the October 2009 range low
2099 is the mid-September 2008 closing low
2070 is the September 2008 intraday low
2060 is the August peak
2048 is the early October 2009 closing low
2016 is the early August peak
1984 from late September
1962 is the bottom of the August 2009 range.
1947 is the October gap down point
The 200 day SM A at 1906
1897 is the October post gap intraday high.
1880 is the June peak
1862 is the July peak

S&P 500: Closed at 1102.47
Resistance:
1101 is the October high
The 18 day EMA at 1103
1106 is the September 2008 low
1114 is the November 2009 peak
The March/July up trendline at 1137
1133 from a September 2008 intraday low
1185 from late September 2008
1200 from the July 2008 low

Support:
The 50 day EMA at 1085
1083 is the 2007 down trendline
1080 is the September 2009 peak
1078 is the October range low
1070 is the late September 2009 peak
1044 is the October 2008 intraday high
The August peak at 1040
The early October 2009 closing low at 1025
The early August intraday peak at 1018
The November 2008 peak at 1006 closing 1007.53 intraday
992 is the August 2009 consolidation low
The 200 day SMA at 969
956 is the June intraday peak

Dow: Closed at 10,328.98
Resistance:
10,365 is the late September 2008 low
10,496 is the November 2009 high
10,609 from the Mid-September 2008 interim low
10,963 is the July 2008 low

Support:
The 50 day EMA at 10,173
10,120 is the October 2009 peak
9918 is the September 2008 peak
9855 is the early September peak in its lateral range
9835 is the late September 2009 peak
9654 is the November 2008 high
9625 is the October 2008 closing high
9620 is the August 2009 peak
9430 is the early October low
9387 is the mid-October peak
9116 is the August low
9088 is the January 2009 peak
The 200 day SMA at 9038
8985 is the closing low in the mid-2003 consolidation
8934 is the December closing high
8878 is the June peak
8829 is the late November 2008 peak

Economic Calendar

These are consensus expectations. Our expectations will vary and are discussed in the 'Economy' section.

December 22 - Tuesday
- GDP - Third Estimate, Q3 (08:30): 2.8% expected, 2.8% prior
- GDP Prices - Third E, Q3 (08:30): 0.5% expected, 0.5% prior
- Existing Home Sales, November (10:00): 6.25M expected, 6.10M prior

December 23 - Wednesday
- Personal Income, November (08:30): 0.5% expected, 0.2% prior
- Personal Spending, November (08:30): 0.7% expected, 0.7% prior
- PCE Prices, November (08:30): 1.6% expected, 0.2% prior
- PCE Prices - Core, November (08:30): 0.1% expected, 0.2% prior
- Michigan Sentiment-Rev, December (09:55): 73.7 expected, 73.4 prior
- New Home Sales, November (10:00): 439K expected, 430K prior
- Crude Inventories, 12/18 (10:30): -3.69M prior

December 24 - Thursday
- Initial Claims, 12/19 (08:30): 470K expected, 480K prior
- Continuing Claims, 12/12 (08:30): 5175K expected, 5186K prior
- Durable Goods Orders, November (08:30): 0.5% expected, -0.6% prior
- Durable Goods Orders, November (08:30): 1.0% expected, -1.3% prior
icon url

ReturntoSender

12/21/09 7:25 PM

#8786 RE: ReturntoSender #6755

From Briefing.com: 4:30 pm : Early buying spurred strong, broad-based gains among stocks, but action quickly steadied so that the broader market spent the session moving sideways in a narrow range. Though that didn't make for much excitement, the advance was interesting in that it held firm despite a strong bounce by the U.S. dollar.

Moderate weakness in the greenback drove the Dollar Index to an early loss of 0.3%, which helped win support for stocks and keep all 10 major sectors in positive territory for the entire session.

The greenback gradually turned its loss into a 0.4% gain, though. That marked the fifth straight advance for the Dollar Index. The move undercut commodities considerably, sending the CRB Commodity Index from a 0.6% gain to a 0.5% loss, but it didn't disrupt the gains made by stocks.

Even with commodity prices pressured, materials stocks still booked a gain of 1.2%. Diversified metals and mining players (+2.0%) were a primary source of strength amid an upgrade of Alcoa (AA 15.73, +1.15) by analysts at Morgan Stanley.

Financials concluded the session as the best performing sector. They advanced 1.5% as diversified banks booked a 2.3% gain after Barron's published an article that portrayed major U.S. banks in positive light.

Meanwhile, continued support for large-cap tech drove the Nasdaq Composite to a fresh 52-week high. Intel (INTC 20.09, +0.46) was a primary leader in that move; it also hit its own 52-week high, thanks partly to an upgrade from analysts at Barclays.

Health care had been one of the better performing sectors in the early going, but scaled back its advance a bit. It still finished 1.1% for the better as participants responded favorably to news that Senate Democrats have come closer to moving past Republican objections to health care reform.

Global pharmaceutical Sanofi-Aventis (SNY 39.07, -0.04) made news this morning with the announcement that it will pay $93.50 in cash for each outstanding share of Chattem (CHTT 93.14, +23.16).

Chattem, which makes over-the-counter personal care products, won some support for smaller consumer staples plays as participants speculated over which companies could also become takeover candidates, but larger consumer staples stocks weighed on the sector. Consumer staples stocks, as a group, still settled with a 0.8% gain.

Walgreens (WAG 36.61, -0.03) was a primary laggard among consumer staples stocks. Though the company announced this morning better-than-expected adjusted earnings of $0.52 per share for the latest quarter, it wasn't enough to please its investors.

ConAgra (CAG 22.03, -0.13) had a similar struggle. It also brought in better-than-expected adjusted earnings of $0.52 per share for the latest quarter, but even went on to increase its expected earnings for fiscal 2010 to $1.73 per share, up from $1.70 per share. That still wasn't enough to win it favor, though.

Despite the relative weakness of a few consumer staples stocks, the broader market booked a solid gain. Nearly 90% of its components were able to stage an advance. Such support for stocks drove Treasuries sharply out of favor. In turn, the benchmark 10-year Note dropped more than one point to send its yield to a four-month high. It settled with its yield near 3.68%.

Advancing Sectors: Financials (+1.5%), Consumer Discretionary (+1.3%), Materials (+1.2%), Energy (+1.1%), Tech (+1.1%), Health Care (+1.1%), Telecom (+0.9%), Consumer Staples (+0.8%), Industrials (+0.7%), Utilities (+0.4%)
Declining Sectors: (None)DJ30 +85.25 NASDAQ +25.97 NQ100 +1.2% R2K +1.3% SP400 +1.4% SP500 +11.58 NASDAQ Adv/Vol/Dec 1814/1.84 bln/914 NYSE Adv/Vol/Dec 2193/1.01 bln/844

4:03PM Jabil Circuit beats by $0.03, reports revs in-line; guides Q2 EPS above consensus, revs above consensus (JBL) 15.02 +0.22 : Reports Q1 (Nov) earnings of $0.32 per share, excluding non-recurring items, $0.03 better than the First Call consensus of $0.29; revenues fell 8.7% year/year to $3.09 bln vs the $3.11 bln consensus. Co issues upside guidance for Q2, sees EPS of $0.20-0.32, excluding non-recurring items, vs. $0.19 consensus; sees Q2 revs of $2.90-3.10 bln vs. $2.88 bln consensus. "We believe that we have a good pipeline of new business, a stable to improving end-market environment and a keen focus on cost, quality and delivery for our valuable customers. We also think that we have established positive momentum toward a much improved fiscal 2010 and we expect to provide further evidence of this in our second fiscal quarter."

8:34AM Vishay raises Q4 rev guidance driven by higher than anticipated demand for both discrete semiconductors and passive components (VSH) 7.54 : Co issues upside guidance for Q4 (Dec), sees Q4 (Dec) revs of $580-600 mln vs. $557.87 mln First Call consensus, up from $530-570 mln previously. The strong revenue recovery in the current quarter was driven by higher than anticipated demand for both discrete semiconductors and passive components. Vishay is still capacity constrained, especially in some of its semiconductor lines.

8:09AM On The Wires : UTStarcom (UTSI) announces the signing of of a definitive agreement to sell its facility in Hangzhou, China for RMB 950 mln to the Zhongnan Group of Companies. The transaction is subject to customary closing conditions and is expected to close before the end of first quarter of 2010. Net of taxes, the payment to UTStarcom will be RMB 900 mln. UTStarcom expects to record an impairment charge in its fourth quarter 2009 financial statements as a result of the agreement to sell the asset...

MEMC Electronic Materials (WFR) announces that it has taken an ownership interest in Eversol Corporation, a solar wafer manufacturer in Taiwan...

7:25AM On The Wires : Intel (INTC) announced new Intel Atom processors today that feature integrated graphics built directly into the CPU, enabling improved performance and smaller, more energy-efficient designs in a new generation of netbooks and Atom-based entry level desktop PCs...

7:24AM Nokia: Fitch downgrades Nokia to 'A-'; outlook stable (NOK) 12.45 : Fitch Ratings has today downgraded Nokia's Long-term Issuer Default Rating (IDR) and senior unsecured rating to 'A-' from 'A' respectively. The Short-term IDR has been downgraded to 'F2' from 'F1'. The Outlook on the Long-term IDR is Stable. The downgrade follows the update to the company's strategy and revised financial guidance provided at Nokia's Capital Markets Day ('CMD') on 2 December, which continue to signal margins in the core Devices & Services division are unlikely to quickly regain the levels formerly reported by the company's handsets business. Coupled with what is potentially now a rebasing of the devices business, to lower albeit good levels of profitability, the company's network infrastructure JV with Seimens, 'NSN,' continues to face significant challenges. The JV lost market share in 2009 and is now expected to generate considerably weaker earnings than projected at the time of the merger in 2007. With a non-IFRS operating profit target of between breakeven and 2% in 2010, and with earnings in this business currently still negative,, NSN is taking longer to integrate and generate the scale synergies that were expected at the time it was formed. (Margin guidance at the 2007 CMD, was for the operating margin to grow to 10% by the end of 2009).

7:16AM Palm upgraded to Hold at Morgan Joseph based on valuation (PALM) 10.17 : Morgan Joseph upgrades PALM to Hold from Sell based on valuation. The firm continue to believe that management's guidance of $1.6-1.8bn is overly optimistic, however, since management offered this guidance, the stock has dropped more than 33%. With shares having penetrated their former $10 price target intraday on Friday, to as low as $9.60, the firm believes that the Street is more than discounting management's ability to meet that guidance. The firm also anticipates that the Street is once again questioning whether or not Palm is a viable company given the expectations for $80 mln in expected cash burn for F3Q10 even with the additional $360 mln in net proceeds raised back in September, as high marketing spend may keep cash burn at high levels. Even though Pre numbers were disappointing in F2Q10, Palm shares are currently trading at 1.5x the firm's estimates, which are low on the Street, compared to RIM's 2.2x CY2010 EV/Sales. The firm nows feel that Palm is fairly valued and that the risk reward is no longer on the side of the shorts.

7:01AM First Solar and EDF Energies Nouvelles in exclusive talks with Blanquefort (FSLR) 135.67 : First Solar and EDF Energies Nouvelles announce that they are in the final stages of exclusive negotiations with the town of Blanquefort, near the city of Bordeaux, to locate a new solar panel manufacturing plant. The plant, co-financed by First Solar and EDF Energies Nouvelles, will be operated by First Solar and sell its entire production of innovative, thin-film photovoltaic panels to EDF EN for its first 10 years of operation. Construction is expected to begin in the second half of 2010 and a full production capacity of more than 100 megawatts a year is to be reached in early 2012. The plant is expected to create up to 400 jobs in the region of Aquitaine and represent a total investment of approximately EUR100 million. The decision to focus on Blanquefort for the manufacturing plant follows an extensive review of potential sites throughout the country. First Solar and EDF EN expect to finalize all remaining agreements in the coming weeks. First Solar and EDF EN believe that France will become a major market for solar electricity in Europe thanks in large part to forward-looking French solar policies.

icon url

ReturntoSender

12/22/09 10:52 PM

#8787 RE: ReturntoSender #6755

From Briefing.com: 4:15 pm : More broad-based buying sent stocks to fresh 52-week highs in the face of a surprise downward revision to third quarter GDP and a gain by the greenback.

An extension of the previous session's buying effort positioned stocks for a strong start this morning, but the mood was tempered by news that third quarter GDP was determined to have increased at a slower-than-expected annualized rate of 2.2%, according to the third and final estimate. The consensus prediction called for no revisions to the 2.8% increase that had been posted in the previous estimate.

However, buyers weren't dissuaded by the data. Their case was strengthened by existing home sales figures for November. The data showed that existing home sales climbed at a stronger-than-expected clip of 7.4% month-over-month. That lifted the annualized rate to 6.54 million units, which exceeded the average prediction that sales would climb to a rate of 6.25 million units.

Shortly after the release of the home sales figures, the S&P 500 set a fresh 52-week high. It wasn't led by any individual name or sector; rather, its source of support was broad. Such broad-based buying helped the Nasdaq Composite and the Amex Airline Index (XAL 34.17, +1.49) put in fresh 52-week highs of their own. The Nasdaq actually closed near those highs.

The broader stock market wasn't able to close at its session highs, but it did successfully work through some moderate midsession selling pressure that stemmed from a bounce by the greenback. The dollar had a mixed start, but it firmed up and climbed against competing currencies to take the Dollar Index to a fresh three-month high. It finished off of that mark with a gain of 0.2%.

This session's trading volume wasn't very high; fewer than 1 billion shares exchanged hands on the NYSE. Such low trading volume often enables stocks to move more than they ordinarily would during a day with more typical levels of trading volume. Perhaps more importantly, low share volume often suggests a lack of conviction behind the market's move.

Nonetheless, the buying effort pushed volatility lower for the second straight session. In turn, the Volatility Index stands at a new 52-week low.

Treasuries continued to tumble, too. The benchmark 10-year Note shed 18 ticks and saw its yield rise to 3.75% for the first time since August.

Advancing Sectors: Telecom (+1.0%), Materials (+0.7%), Tech (+0.6%), Energy (+0.5%), Consumer Staples (+0.4%), Health Care (+0.4%), Financials (+0.3%), Consumer Discretionary (+0.2%), Industrials (+0.1%)
Declining Sectors: Utilities (-0.7%)DJ30 +50.79 NASDAQ +15.01 SP500 +3.97 NASDAQ Adv/Vol/Dec 1585/1.72 bln/1098 NYSE Adv/Vol/Dec 1900/955 mln/1114

4:11PM Micron lifts ~4% in afterhours following Q1 results (MU) 9.41 +0.10 :

4:07PM Micron beats by $0.16, beats on revs (MU) 9.36 +0.05 : Reports Q1 (Nov) earnings of $0.23 per share, $0.16 better than the First Call consensus of $0.07; revenues rose 24.1% year/year to $1.74 bln vs the $1.6 bln consensus. Revenue from sales of DRAM products increased 50% in Q1 compared to Q4 due to a 25% increase in sales volume and a 21% increase in average selling prices. Revenue from sales of NAND Flash products increased 21% in Q1 compared to Q4 due to a 16% increase in sales volume and a 5% increase in average selling prices. The co's gross margin on sales of memory products improved from 12% in Q4 of FY09 to 27% in Q1 of FY10 due primarily to the increases in average selling prices.

4:01PM Motorola: LifeSync purchases wireless patent portfolio from Motorola (MOT) 8.10 -0.29 : LifeSync Holdings is pleased to announce that it has purchased the Besson Patent Portfolio and other wireless vital sign patents from Motorola. The Besson Patents describe the use of wireless, two-way, digital communication between patient-electrodes or sensors and an evaluator station for monitoring a patient. The acquired patent portfolio includes additional wireless improvements including a wireless system telemetry protocol and programmable wireless electrode systems for medical monitoring. "We are excited about the opportunities for growth in our licensing program that these key assets will provide," said Shelley Hartman, President and CEO of LifeSync. Terms were not disclosed.

2:24PM Microsoft: i4i confirms it won appeal by Microsoft (MSFT) 30.75 +0.23 : Today, in the United States Federal Circuit Court of Appeals, in Washington D.C., a panel of three judges returned their ruling on the appeal of i4i v. Microsoft and upheld jury's verdict and all the findings of the August 11, 2009 Final Judgment that ruled in favor of i4i and found that Microsoft had willfully infringed i4i's U.S. Patent # 5,787,449, issued in 1998.

9:20AM Evergreen Solar panels chosen to power Patriot Place (ESLR) 1.51 : Co announces that its String Ribbon solar panels have been chosen for a 525-kilowatt installation at Patriot Place, a 1.3-million-square-foot shopping, dining and entertainment complex.

09:25 am Jabil Circuit (JBL)

Jabil Circuit (15.02) reported fiscal first quarter earnings that topped the consensus estimate and issued upside guidance for its second quarter

The company reported fiscal first quarter earnings of $0.32 per share, excluding nonrecurring items, $0.03 better than the First Call consensus of $0.29;

Revenues fell 8.7% year-over-year to $3.09 billion vs. the $3.11 billion consensus.

Jabil issued upside guidance for Q2, sees EPS of $0.20-0.32, excluding nonrecurring items, vs. $0.19 consensus. The company expects revenues to range from $2.90 billion to $3.10 billion; the consensus expects $2.88 billion.

"We believe that we have a good pipeline of new business, a stable to improving end-market environment and a keen focus on cost, quality and delivery for our valuable customers," said CEO Timothy L. Main. "We also think that we have established positive momentum toward a much improved fiscal 2010 and we expect to provide further evidence of this in our second fiscal quarter."

icon url

ReturntoSender

12/23/09 7:35 PM

#8788 RE: ReturntoSender #6755

From Briefing.com: 4:15 pm : Disappointing new home sales numbers caused stocks to surrender opening gains, but a weaker dollar helped drive stocks back into the green. However, the rebound was resisted at session highs and left gains to chop their way into the close.

The major indices started the session in higher ground amid continued broad-based buying that was helped along by solid gains throughout Europe and Asia. A pullback by the greenback also provided support; it concluded the session with a 0.5% loss against competing currencies after it had hit a three-month high in the previous session.

Initial gains came despite a smaller-than-expected increase in both personal income and spending in November. They were up 0.4% and 0.5%, respectively. Meanwhile, core personal consumption expenditures for November were flat. They had been expected to rise a modest 0.1%.

Stocks weren't able to shrug off the November new home sales numbers, however. New home sales for the month fell 11.3% from October to an annualized rate of 355,000 units, which is well below the rate of 438,000 units that had been widely expected.

The news caused the broader market to slide in a hurry. Shares of homebuilders had been up nearly 2% ahead of the report, but saw that gain nearly vanish entirely. They were able to reclaim some of the gains and finish 0.7% for the better.

Materials stocks and energy stocks helped lead a broader market recovery, but they were unable to push the broader market past the session high that was set in the early going. That high, which marked a new 52-week high for the S&P 500, created a line of resistance in afternoon action. Still, the two sectors logged gains of 1.5% and 0.5%, respectively.

Support for the sectors came amid higher commodity prices and energy prices. While a retreat by the dollar helped both groups, oil got an added benefit from a larger-than-expected weekly inventory draw of 4.84 million barrels. Oil prices settled 2.9% higher at $76.59 per barrel.

With only a few days left in the holiday shopping season, Internet retailers were also in favor. They teamed with large-cap tech to drive the Nasdaq Composite to another new 52-week intraday high and closing high.

Financials fell out of favor this session. The sector settled with a 0.4% loss as diversified banks stocks (-1.5%) and diversified financial services plays (-1.0%), like Citigroup (C 3.29, -0.05), faltered.

Citigroup saw some of the most trading volume this session, but that's not saying much given the lack of overall participation. Fewer than 800 million shares exchanged hands on the NYSE this session. The 50-day average stands just above 1.2 billion shares. The lack of participation should not come as a surprise ahead of the Christmas holiday, but market watchers should note that lack of trading volume is often tantamount to a lack of conviction among the investing community, so swings by stocks on light volume shouldn't necessarily be considered telling signs of market direction. DJ30 +1.51 NASDAQ +16.97 NQ100 +0.7% R2K +1.2% SP400 +0.7% SP500 +2.57 NASDAQ Adv/Vol/Dec 1835/1.59 bln/855 NYSE Adv/Vol/Dec 2161/786 mln/847

5:17PM Conexant retires remaining senior secured debt, Establishes New Credit Facility (CNXT) 2.38 -0.10 : Co announced that it completed the previously announced planned redemption of the remaining $61.4 mln of outstanding aggregate principal amount of its floating rate senior secured notes due in November 2010. The co also announced that its special purpose entity, Conexant CF, LLC, established a new accounts receivable credit facility with Silicon Valley Bank for $15 mln through November 30, 2010.

1:15PM MEMC Elec and Xcel Energy strike deal for 50MW (AC) / 55MW (DC) of solar PV Energy in New Mexico (WFR) 13.25 +0.12 : SunEdison, North America's largest solar energy services provider, a subsidiary of MEMC Electronic Materials (WFR), and Xcel Energy's (XEL) regional operating company, Southwestern Public Service Company, today announced a deal for five photovoltaic solar installations in New Mexico that will total 50 megawatts (MW) in generation capacity.

9:17AM ASM Intl NV target raised to $30 from $25 at GC Research (ASMI) 25.57 :

9:17AM Applied Materials target raised to $22 from $19 at GC Research (AMAT) 13.94 :

9:16AM Cymer downgraded to Neutral from Overweight at GC Research; tgt $45 (CYMI) 39.05 :

08:42 am Micron Technology (MU)

Micron Technology (MU 9.41) reported fiscal first quarter earnings that easily beat expectations as sales rebounded from depressed levels.

Micron reported fiscal first quarter earnings of $0.23 per share, $0.16 better than the First Call consensus of $0.07.

Revenues rose 24.1% yer-over-year to $1.74 billion, topping the $1.6 billion consensus.

Revenue from sales of DRAM products increased 50% in Q1 compared to Q4 due to a 25% increase in sales volume and a 21% increase in average selling prices. Revenue from sales of NAND Flash products increased 21% in Q1 compared to Q4 due to a 16% increase in sales volume and a 5% increase in average selling prices.

Micron's gross margin on sales of memory products improved from 12% in Q4 of FY09 to 27% in Q1 of FY10 due primarily to the increases in average selling prices.

Shares of MU are about 3.4% higher an hour ahead of Wednesday's opening bell.
icon url

ReturntoSender

12/26/09 5:41 PM

#8789 RE: ReturntoSender #6755

From Briefing.com: 2:00 pm Weekly Wrap

Limited economic reports and corporate data didn't prevent the market from logging solid gains and hitting a fresh 52-week high during the holiday-shortened week. Volume was low as many market participants took an extended holiday, with the stock market closing early on Thursday and closing for the whole day on Friday in recognition of Christmas.

The market averaged around 800 million shares on the NYSE, well below the 52-week average of 1.4 billion.

Buying interest was broad-based despite the light volume, with all 10 sectors advancing for the week.

Cyclical stocks outperformed as investors continue to show an increased appetite for risk. Materials climbed 2.3%, tech advanced 1.9% and energy gained 1.7%. Conversely, the utilities sector underperformed, settling near the unchanged mark.

In the end, all of the major indices hit fresh 52-week highs, as can be seen in the graphic below. (graphic only available to Briefing In Play subscribers).

There was not much in terms of corporate news this week. Walgreen (WAG) posted slightly better-than-expected quarterly earnings ($0.49 vs. consensus of $0.48), as did ConAgra Foods (CAG), which posted $0.52 vs. the consensus estimate of $0.47.

Economic data were mixed.

Existing home sales rose by a stronger-than-expected rate of 7.4% month-over-month to an annualized rate of 6.54 million units. That exceeded economists' median estimate of 6.25 million units. The news helped lift the stock market.

But later in the week, November new home sales disappointed with an 11.3% month-over-month drop to an annualized rate of 355,000, well below the median forecast of 438,000. Still, the data had a limited impact on the market, as this report can be very volatile month to month.

Third quarter GDP did not grow as strongly as originally thought, the Bureau of Economic Analysis third revision showed. GDP grew at a 2.2% annual rate, down from the second revision figure of 2.8% and missing the consensus of 2.8%. The lower reading was due to revisions to personal consumption expenditures, gross private domestic investment, change in private inventories, imports and government spending.

On a positive note, weekly initial jobless claims dropped by a larger-than-expected amount to 450,000 from 480,000 in the prior week. This beat the consensus estimate of 470,000 and was the lowest level since fall 2008. While the labor market remains weak, the trend in jobless claims has been heading in the right direction.

In fixed income, Treasuries saw pressure across the yield curve. The 10-year note started the week with a yield of 3.54% before settling at 3.78%. The 30-year bond started the week at 4.46% and ended the week at 4.64%.

Separately, the Senate passed its health care bill, although the news had a limited impact on the stock market. The Senate and House are expected to reconcile their bills in January.

The stock market has had its worst decade since the 1930s, but as the table below shows, it is on pace for a solid year of gains.
 
Index Started Week Ended Week Change % Change YTD
DJIA 10328.89 10520.10 191.21 1.9 % 19.9 %
Nasdaq 2211.69 2285.69 74.00 3.3 % 44.9 %
S&P 500 1102.47 1126.48 24.01 2.2 % 24.7 %
Russell 2000 610.57 634.07 23.50 3.8 % 27.0 %

1:00PM Qualcomm announced that Len Lauer, chief operating officer, has resigned and accepted a CEO role at another company (QCOM) 46.10 +0.15 :

icon url

ReturntoSender

12/28/09 8:16 PM

#8792 RE: ReturntoSender #6755

From Briefing.com: 4:15 pm : Modest gains in the early going turned into modest losses during afternoon action, but some late support helped the stock market settle higher for the sixth straight session. There weren't many catalysts to account for this session's trade; instead, stocks were largely left to move on their own.

Amid a lack of news flow, early participants took their cues from overseas markets, which made solid gains on the back of better-than-expected economic data in Japan and word that stimulus policies in China will remain intact. A modest pullback by the greenback also provided early support to stocks. The Dollar Index settled with a 0.1% loss.

However, stocks came under pressure in afternoon trade. Financials proved to be a particular drag on action and fell 0.3% as bank stocks sank to a 0.7% loss, based on the KBW Bank Index. That slide came even though the Federal Reserve proposed amendments that would offer interest-bearing term deposits to eligible institutions.

Though financials faltered, the broader market was able to reclaim its gains into the close. Telecom and health care settled 0.6% and 0.4% higher, respectively, and were the best performing sectors.

Retailers looked relatively strong for the entire session amid news from MasterCard Advisors' SpendingPulse that U.S. retail holiday sales increased an estimated 3.6% year-over-year. Internet retailers contributed meaningfully to the increase so Amazon.com (AMZN 139.29, +0.82) garnered support, but its strength faded. Still, it was able to provide support to the Nasdaq 100, which outperformed the headline indices by booking a 0.5% gain.

Commodities performed well for the entire session. That helped the CRB Commodity Index climb 1.3% to trade at a fresh two-month high, even though weakness in the dollar was relatively tame.

Treasuries tripped again. That took the benchmark 10-year Note down nine ticks and its yield to 3.84%, which puts it near four-month highs. Treasuries temporarily pared their losses amid news that results from an auction of two-year Notes produced a bid-to-cover that was in-line with this year's average of 2.9. The two-year Note fell four ticks, which put its yield at 1.04%.

Only some 700 million shares exchanged hands on the NYSE this session. Though Christmas holiday has passed, light action is likely to persist until after the new year.

Advancing Sectors: Telecom (+0.6%), Health Care (+0.4%), Energy (+0.3%), Tech (+0.2%), Utilities (+0.2%), Materials (+0.2%), Consumer Staples (+0.1%)
Declining Sectors: Financials (-0.3%), Industrials (-0.1%)
Unchanged: Consumer DiscretionaryDJ30 +26.98 NASDAQ +5.39 NQ100 +0.5% R2K +0.0% SP400 +0.0% SP500 +1.30 NASDAQ Adv/Vol/Dec 1215/1.23 bln/1482 NYSE Adv/Vol/Dec 1555/705 mln/1482

4:36PM Fairchild Semi and Infineon reach patent settlement, cross-license (FCS) 10.15 -0.15 : Co announced it has settled patent lawsuits with Infineon Technologies (IFNNY). Co also announced it had entered into a broad cross-license with Infineon related to semiconductor technology, the terms and conditions of which were not disclosed. The two companies filed patent infringement lawsuits against each other in Maine and Delaware courts in November, 2008. Fairchild said it will record a $6 million charge in the fourth quarter related to the settlement and cross-license.

4:03PM Cascade Microtech announces appointment of interim Executive Vice President; reaffirms Q4 revs guidance of $14-16 mln vs $15.05 two analyst estimate (CSCD) 4.75 +0.15 : Co announces Mr. Steve Harris, Vice President of Engineering, has been given the additional appointment as interim Executive Vice President effective December 21, 2009, for the transition period until a new CEO is appointed.

icon url

ReturntoSender

12/29/09 10:58 PM

#8793 RE: ReturntoSender #6755

From Briefing.com: 4:30 pm : Stocks started the session in higher ground, but stumbled as a lack of leadership kept the broader market from countering a rebound by the dollar. In turn, the S&P 500 saw its recent streak of gains come to an end.

Participants returned to Tuesday's trade willing to extend the previous session's modest advance. That enabled the S&P 500 to open at its 52-week high with broad-based gains. This session's lack of leadership caught up with stocks, though. As the Dollar Index swung from a morning loss of roughly 0.5% to a gain of 0.3%, the broader equity market slipped into negative territory, unable to rally behind a leader.

While the greenback eased back a bit to settle with a 0.2% gain against a basket of foreign currencies, stocks were unable to garner enough support to push higher. The stock market's loss this session was slight, but it still finished on a weak note near session lows. The downward move ended the stock market's streak of gains at six.

Consumer discretionary stocks (+0.2%), industrial stocks (+0.2%), and consumer staples stocks (+0.1%) were the only major sectors to net a gain this session. Energy stocks had the weakest showing and fell to a 0.7% loss. The sector's weakness came even though oil prices managed to muster a fractional gain and close pit trade at $78.02 per barrel.

Little attention was paid to news that the S&P/Case-Shiller Home Price Index for October came in at 146.6, which is in step with the consensus of 147.0. The Composite 20-city Home Price Index for October fell 7.3% year-over-year, which is on par with the consensus 7.2% year-over-year decline. That's the slowest rate of decline in two years.

The Consumer Confidence Index for December also did little to move the market this session. It came in at 52.9, which is in-line with the 53.0 that had been widely forecast.

Results from a $42 billion auction of five-year Treasuries caused little stir among both stocks and Treasuries. The auction was met with a bid-to-cover ratio of 2.6, which is above this year's average ratio of 2.3, but below the previous auction's ratio of 2.8. The benchmark 10-year Note was able to make its way higher into the close and finish with a gain of nine ticks, though. That put its yield back near 3.80%.

Advancing Sectors: Consumer Discretionary (+0.2%), Industrials (+0.2%), Consumer Staples (+0.1%)
Declining Sectors: Energy (-0.7%), Financials (-0.4%), Health Care (-0.2%), Materials (-0.1%), Utilities (-0.1%), Tech (-0.1%)
Unchanged: Telecom DJ30 -1.67 NASDAQ -2.68 NQ100 -0.3% R2K -0.1% SP400 -0.2% SP500 -1.58 NASDAQ Adv/Vol/Dec 1315/1.19 bln/1358 NYSE Adv/Vol/Dec 1482/638 mln/1525

4:05PM Broadcom reaches settlement in stock options class action lawsuit; co will pay $160.5 mln (BRCM) 31.35 -0.27 : Co announced that it has agreed in principle to settle the securities class action litigation pending against the co and certain of its current and former officers and directors. The class action, relating to the co's historical stock option accounting practices, was brought on behalf of persons and entities who bought or acquired shares of BRCM's common stock between July 21, 2005 and July 13, 2006. Under the proposed settlement, the claims against BRCM and its officers and directors will be dismissed with prejudice and released in exchange for a $160.5 mln cash payment by BRCM. The co expects to record the settlement amount as a one-time charge in its statement of operations for Q4 of 2009.

icon url

ReturntoSender

01/02/10 12:36 PM

#8794 RE: ReturntoSender #6755

From Briefing.com: 09:08 am Weekly Wrap
The market looked set to end a quiet, holiday-shortened week flat, but an aggressive end-of-day sell-off Thursday left the major U.S. averages in the red.

It was a very slow week. With a number of foreign markets closed on Monday and Thursday, the calendar thin on catalysts and many traders off their desks, volume was well below average. In fact, Tuesday and Thursday were the two lightest volume days of the year at the NYSE; even less than the day after Thanksgiving when the market only traded for a half day.

But it's because of the light volume that Thursday's late-session move was possible. It wasn't news-related. Instead it was most likely funds squaring up positions before the year-end, with the decline exaggerated by the light volume.

There could be some element of nervousness ahead of the New Year's celebrations, given the attempted terrorist attack on Christmas Day. But once again it's most likely longs exiting some of their positions while the 2009 tax year is still in effect.

A trend we've been watching recently is the weakness in the Treasury market. The yield on the 10-year Note increased approximately 65 bps this month to 3.85%. The strength in stocks that has been seen alongside rising Treasury yields can be explained easily as an asset reallocation trade that is predicated on lower levels of risk aversion.

But the yield on the 10-year Note only increased modestly this week. It had spiked to a multi-month high of 3.910% Thursday morning following better-than-expected Claims data -- Initial 432,000 vs. the 460,000 consensus; Continuing 4.981 million vs. the 5.100 million consensus -- but gave up those gains before closing early for the holiday.

Yields were held in check this week due to three Treasury Note auctions -- $44 billion in 2-years Monday; $42 billion in 5-years on Tuesday; $32 billion in 7-years on Wednesday. Considering the number of participants that were absent from the market this week, the results from a demand perspective were not bad.

Looking ahead to next week, the economic calendar will be in focus, particularly the employment sector as the change in Nonfarm Payrolls and the Unemployment Rate for December will be released on Friday.
 
Index Started Week Ended Week Change % Change YTD
DJIA 10520.1 10428.05 -92.05 -0.9 % 18.8 %
Nasdaq 2285.69 2269.15 -16.54 -0.7 % 43.9 %
S&P 500 1126.48 1115.1 -11.38 -1.0 % 23.5 %
Russell 2000 634.07 625.39 -8.68 -1.4 % 25.2 %

4:25 pm : Light news flow and a poor turnout left stocks to trade in lackluster fashion for most of the session, but some late pressure caused stocks to close at session lows and conclude the year on a weak note. Still, stocks settled only slightly below their 52-week highs with strong gains for the year.

As has been the case all week, participants had few cues for trade this session. Of the few headlines there were, little reaction was made.

The latest dose of data featured initial jobless claims for the week ending December 26. Initial claims fell 22,000 to 432,000, which is less than the 460,000 initial claims that had been expected. It also marked the lowest tally in more than 15 months. However, the dip did come during the week of Christmas.

Meanwhile, continuing claims came in at 4.98 million. That was lower than expected and below 5.00 million for the first time since February.

Participants shrugged off the better-than-expected jobless claims numbers, but gave focus to the dollar, which had offered early support for stocks with a 0.6% overnight loss against competing currencies, but later weighed on stocks as it recovered to finish with a 0.1% gain. The Dollar Index closed the month with a 4.1% gain, but finished the year with a 4.1% loss.

The dollar's doldrums this year helped prop up commodities prices and gave the CRB Commodity Index a 23.5% annual gain. The CRB closed this session with a 0.1% loss, though.

Still, the reflation trade that followed the global economic slowdown earlier this year helped make materials stocks some of this year's best performers -- the materials sector booked a gain of 45.2% this year, although it shed 1.3% this session.

Of the major sectors, tech was the best performer in 2009. Though it quietly shed 1.1% in its latest outing, it still finished the year with a 59.9% gain. Large-cap tech issues helped the Nasdaq Composite advance 43.9% this year to outperform its counterparts with relative ease; the S&P 500 finished the year with a 23.5% gain, while the Dow finished 2009 18.8% higher.

Financials showed strength for most of this session, but buckled when the broader market took a dive in the final hour of trade. They fell 0.4% this session, but were up 14.8% for the year. Though its yearly gain wasn't as impressive as what was accomplished by other sectors, financials finished the year up approximately 250% from their March low.

That spike is attributable to bank stocks, which rallied after liquidity fears faded. Many widely-held bank stocks had fallen below $1 per share during the depths that the stock market saw, but they have since climbed exponentially.

With many market participants looking to lock in such gains, trading volume has been light for the past couple of weeks. End of year holidays have also led to light volume as many trading desks have become lightly staffed.

Since the stock market is closed tomorrow, January 1, to observe New Year's Day, such was also the case this session. Fewer than 700 million shares traded hands on the NYSE this session. That's less than half of this year's average single-session trading volume, which stands close to 1.4 billion shares.

Advancing Sectors: (None)
Declining Sectors: Utilities (-1.5%), Industrials (-1.3%), Materials (-1.3%), Health Care (-1.2%), Consumer Staples (-1.1%), Tech (-1.1%), Telecom (-1.0%), Consumer Discretionary (-1.0%), Energy (-0.9%), Financials (-0.4%)DJ30 -120.46 NASDAQ -22.13 NQ100 -1.0% R2K -1.3% SP400 -1.3% SP500 -11.32 NASDAQ Adv/Vol/Dec 1026/1.25 bln/1730 NYSE Adv/Vol/Dec 994/680 mln/2018
icon url

ReturntoSender

01/05/10 10:59 PM

#8798 RE: ReturntoSender #6755

From Briefing.com: 4:30 pm : For the most part, the stock market lacked direction this session, but it still managed to put together a late advance that helped it settle near its session high. That helped stocks book a modest gain and close near fresh 52-week highs.

Financials were a primary source of support this session. The sector spiked 1.7% as diversified banks climbed 2.6%. European banking giant Barclays (BCS 19.34, +1.01) was especially strong after analysts at Deutsche Bank picked the name as one of its top choices for European bank stocks.

Leadership from financials helped pull stocks up from negative territory a few times this session. Technical support also helped provide a base from which stocks could rebound.

The S&P 500 set its session low amid a knee-jerk reaction to the midmorning release of some disappointing November pending home sales numbers. Pending home sales for November decreased 16.0% month-over-month, which was a far steeper slide than the 2.0% decline that many had forecast. The disappointing data overshadowed news that factory orders for November were up a stronger-than-expected 1.1% (consensus called for a 0.5% increase).

There were only a few corporate headlines this session. Among them, Kraft (KFT 28.77, +1.34) announced that it has opted to sell its North American pizza business to Nestle in order to offer cash as part of its bid for Cadbury (CBY 49.73, -1.92). Meanwhile, Kraft's proposal to issue stock to help it acquire Cadbury received criticism from Berkshire Hathaway's Warren Buffett, who suggested that Kraft's shares constitute an expensive currency. Berkshire reportedly owns some 9% of Kraft's outstanding shares.

Automaker Ford (F 10.96, +0.68) had a strong session, thanks to news that its sales for December surged approximately 33%, which is far better than the 13% increase that many on the Street had expected.

Though stocks were able to put together a strong finish, a rebound by the dollar weighed on things a bit. The greenback had been down modestly ahead of the opening bell, but rallied to finish with a 0.2% gain against a basket of foreign currencies.

The dollar's move also dampened investor appetite for commodities. Still, the CRB Commodity Index had been on its way toward a late session gain of its own, but finished flat instead.

Support for Treasuries took the benchmark 10-year Note up 15 ticks and its yield back below 3.8%. The Note's yield now stands near 3.75%, which is its lowest level in more than one week.

Advancing Sectors: Financials (+1.7%), Energy (+0.8%), Materials (+0.5%), Consumer Discretionary (+0.5%), Industrials (+0.4%), Telecom (+0.2%)
Declining Sectors: Utilities (-1.2%), Health Care (-0.6%), Consumer Staples (-0.1%)
Unchanged: Tech DJ30 -11.94 NASDAQ +0.29 NQ100 +0.1% R2K -0.3% SP400 +0.3% SP500 +3.53 NASDAQ Adv/Vol/Dec 1197/2.84 bln/1505 NYSE Adv/Vol/Dec 1845/1.19 bln/1198

4:27PM Silicon Image appoints Camillo Martino Chief Executive Officer (SIMG) 2.76 +0.06 : Martino comes to Silicon Image from SAI Technology, Inc. SAI is a leading supplier of 4G and security technology solutions to the mobile communications industry. During Martino's two year tenure as a board member, chief operating officer (COO) and Angel investor, SAI experienced rapid growth and built a strong and innovative business. Martino will remain a member of the SAI Board of Directors after joining Silicon Image.

1:00PM Integrated Device's PureTouchTM capacitive touch controller selected by Gionee Communication, a China handset provider, for use in its slider-style mobile phone (IDTI) 6.58 -0.02 :

9:10AM On The Wires : Maxim Integrated Products (MXIM) and Celeno Communications announce their collaboration to provide whole-home wireless HD solutions. The companies are now offering a joint reference design that can be embedded into HDTVs, gaming consoles, digital video recorders, laptops, Blu-ray players, set-top boxes, and home gateways... LTX-Credence Corporation (LTXC) announces a new multi-channel, VI instrument for the ASL test system. The XVI greatly enhances multi-site capability for the ASL1000 and ASL 3000 test systems with 14 channels per board...

CopperGate, a wholly-owned subsidiary of Sigma Designs (SIGM) and Gigafast jointly announce that Gigafast is developing HomePlug AV bridges based upon the high performance CopperGate CG2110 Chipset...

icon url

ReturntoSender

01/07/10 11:05 PM

#8800 RE: ReturntoSender #6755

From Briefing.com: 4:40 pm : A bounce by the buck weighed down stocks during the early going, but strength among financial issues helped carry the broader stock market to its fourth straight gain.

The dollar traded with strength for the entire session and finished with a 0.6% gain against a basket of foreign currencies. Though that gain weighed on the broader market, it was particularly burdensome for raw materials stocks, which had outperformed during the previous session. Materials stocks pared their losses, though; they finished with a 0.5% loss.

Early weakness also came amid losses in Asia, where some considered a rate hike for Chinese short-term debt to be a hint toward tighter monetary policy. Action was mixed in Europe, where the Bank of England kept its benchmark interest rate at 0.5% and its $200 billion pound asset purchase plan in place.

News that the U.S. issued a warning that banks should guard against the risk of rising interest rates caused a momentary pull back from a slow, afternoon ascent that was led by the financial sector. Financials found renewed support and finished with a 2.1% gain, though. Banks saw some of the best gains as shares of regional lenders spiked 5.7% and diversified banks bounded to a 3.3% gain.

The move contrasted the relatively lackluster performance of the financial sector during the fourth quarter. Some market pundits believe that participants are rotating back into the financial sector and that has forced short-sellers to cover their positions, which were taken amid negative analyst commentary during December.

Industrials made up the next best performing sector. They advanced 1.3%, thanks to strength in General Electric (GE 16.25, +0.80) and Texas Industries (TXI 38.40, +1.26), which posted a smaller-than-expected loss for its latest quarter.

Bed Bath & Beyond (BBBY 41.94, +2.71) posted a positive earnings surprise and upside guidance. Its report complemented a batch of generally upbeat monthly same-store sales results. Support for the space faded as the session progressed, but retailers were still able to finish with a 0.8% gain.

Initial jobless claims for the week that ended January 2 didn't cause much of a stir. Initial claims totaled 434,000, up 1,000 from the prior week. The latest tally was slightly less than the 439,000 claims that had been expected. Continuing claims came in at 4.80 million, which is a smaller total than the 4.98 million continuing claims that many had come to expect. Continuing claims for the previous week were unchanged at 4.98 million.

Advancing Sectors: Financials (+2.1%), Industrials (+1.3%), Consumer Discretionary (+0.8%), Health Care (+0.4%)
Declining Sectors: Telecom (-0.9%), Utilities (-0.5%), Materials (-0.5%), Tech (-0.4%), Energy (-0.2%)
Unchanged: Consumer StaplesDJ30 +33.18 NASDAQ -1.04 NQ100 -0.1% R2K +0.6% SP400 +0.5% SP500 +4.55 NASDAQ Adv/Vol/Dec 1576/2.30 bln/1129 NYSE Adv/Vol/Dec 1874/1.19 bln/1184

3:01PM Palm and Verizon Wireless announced availability of Palm Pre Plus and Palm Pixi Plus (PALM) 11.01 -0.21 : Verizon Wireless (VZ) and Palm announced the Jan. 25 availability of Palm Pre Plus and Palm Pixi Plus, bringing the Palm webOS experience to customers on the nation's largest and most reliable wireless 3G network. Palm Pre Plus has a large touch screen; high-performance processor; and slide-out keyboard. Pre Plus also comes with the Palm Touchstone Back Cover, making the phone compatible with the inductive Touchstone Charging Dock. Verizon Wireless Pre Plus customers will also get 16 GB of storage (approximately 15 GB user available) for applications and media.

2:55PM Palm announces Palm webOS developer program is now open (PALM) 11.20 -0.04 : The Palm webOS developer program is now open. Any developer can now go to the Palm Developer Center and start developing and distributing applications for webOS devices. Palm announced a $1 million developer Hot Apps bonus program for the rapidly growing Palm webOS developer community.

icon url

ReturntoSender

01/09/10 9:17 PM

#8801 RE: ReturntoSender #6755

Amateur Investors Weekend Stock Market Analysis (1/9/10)

http://www.amateur-investor.net/Weekend_Market_Analysis_Jan_9_10.htm

I thought this weekend I would go back an revisit historical PE Ratios versus the Inflation Adjusted S&P 500 Composite as derived by Robert Shiller's data. The first thing I would like to point out is that, based on Shiller's data, previous Secular Bear Market bottoms using an Inflation Adjusted S&P Composite Chart haven't occurred until the PE Ratio has dropped to 7 or below which happened in 1982 (point A), 1932 (point B) and way back in 1921 (point C). So far, since the current Secular Bear Market began in 2000, the lowest PE Ratio has been around 13 which occurred with the March 2009 low (point D). Thus from a historically perspective so far the PE Ratio hasn't reached a low enough level for a Secular Bear Market Low to occur using Inflation Adjusted Charts so we shall see if history ends up repeating itself in the long run.


Meanwhile another thing to notice is that the current Inflation Adjusted S&P Composite chart is acting similar to previous Secular Bear Markets that occurred from the mid 1960's through the early 1980's and further back from from 1906 through 1921 (defined by the purple rectangles). On the other hand the Secular Bear Market that occurred in the 1930's and 1940's was characterized by a steep sell off over a short period of time which developed into a longer term "ABCDE" Triangle pattern. As you can see it doesn't appear this type of pattern is developing.


Next as you can see since the mid 1890's there have been a series of Secular Bear and Bull Markets. No doubt once the current Secular Bear Market does end this will be followed by another Secular Bull Market at some point later this decade into the 2020's if the pattern continues like it has for the last 113 years. Furthermore if the current Secular Bear Market acts similar in time to the previous ones from 1966 through 1982 and 1906 to 1921 then we would remain in this current Bearish Cycle for possibly another 5 to 7 years.


Of course when you compare the Inflation Adjusted Chart to a Non Inflation Adjusted Chart things appear to look better than they are as shown below. After the last sell off from 2000 through 2002 (points F to G) the S&P 500 rallied over the next 5 years and made a slightly higher high by late 2007 (points G to H) on a Non Inflation Adjusted Chart. However the Inflation Adjusted Chart never got even close to the previous high made in 2000 (point I) which was then followed by another massive sell off from late 2007 into early 2009 with a lower low being made in both charts (points J).

Finally many people are probably wondering why the S&P made a low in March of 2009. Notice the previous high made in 1968 (point K) corresponded to the low made in March of 2009 when using Inflation Adjusted values. Personally I don't think this bounce off of the 1968 high happened by accident.


icon url

ReturntoSender

01/10/10 3:39 PM

#8802 RE: ReturntoSender #6755

InvestmentHouse Weekend Market Summary 1/8/10

http://www.investmenthouse.com/weekendmarketsummary.htm

- Market absorbs the jobs report, rallies as it focuses on earnings, liquidity.
- Unemployment figures are much worse than the headline and will get worse even if non-farm jobs turn positive.
- Bottom line: layoffs may be over, but jobs are not in the offing.
- M3 money supply starting to contract in the US as it starts to follow the EU.
- Stocks already moving higher into earnings, and there are still some earnings runs setting up.
- What to hold into earnings: managing your money.

No upside surprise to send the market higher on the open, but it shakes off the news and recovers nonetheless.

Despite the cold weather, the market is staying hot. We are enjoying continued gains and taking more positions as stocks continue their run into earnings season. This was the first Friday of the month, which means the jobs report was released. It looked like there might be a positive read because President Obama scheduled an afternoon press conference on Thursday night, but that was not the case. November was positive, turning in a 4K jobs gain, but that was offset by revisions to October. There was the wet blanket of the 85K jobs lost in December, a month that usually sees hiring in retail. There was no bailout for the jobs (so to speak), although the trend continued to improve and the unemployment rate remained at 10%. That is a loaded headline, however.

The Obama press conference dealing with the economy turned out to be the announcement of tax credits for green products such as solar panels etc. I love tax credits, but the problem is that these are so limited. Not many businesses particularly small businesses will be able to take advantage of it. It will not help the group that is struggling the most and the group that creates the most jobs in the United States. This administration has a very difficult time understanding how the economy works. They have some brilliant people, but they subscribe to the Phillips curve economic theory. Other than roughly six years in the history of mankind, that theory has not worked.

The jobs were negative, but that was not enough to seriously impact futures. They were modestly lower after the numbers, but they did not reverse much. I did not think it could keep a good market down, and it did not. Stocks started lower, but they recovered all session. NASDAQ led, but it eventually brought the others with it. A late, last-half-hour bid came into the market and pushed all of the indices positive, closing NASDAQ at about 0.73% and SP500 and the Dow with a modest gain.

The jobs report did impact the dollar, and it was up. It had a nice move higher on Thursday, and when the numbers came out, the dollar turned down (1.4414 Euros versus 1.4316 Thursday). Gold was not a huge mover on the session, but that reversal did turn it from negative to positive. It was somewhat positive ($1,137, +3.30), but it closed upside, and this is a great pattern in gold. If it eases out a day or two laterally, we will pick up more positions on the GLD and play the run up to the prior high.

Bonds were interesting because the 10 year stayed the same. It did not have a lot of movement (3.82% versus 3.83% Thursday). Bonds did rally and drive the yield down to 3.78% early, but then the 10 year faded back. The 2 year maintained its gains, moving 10BP. This is because the Fed will keep its stranglehold on the short end since it does not want rates to rise. It will do whatever it can to keep the short end down, so yields on the 2 year turned sharply lower. A 10BP move any day in bonds is a sharp move. Once again, the yield curve is getting very steep and the spread between the short and long end is getting very wide. That is not good because they can become detached from each other, and that means serious inflation issues. That is why I think gold is getting ready to make another run higher.

The industrials and techs were leaders. It is ironic that the industrials were leading because SP500 was lagging a bit. The dollar going down helped them along, as did UPS raising its guidance in an earnings preannouncement that was much better than expected. That pushed a lot of shippers and transports up higher and helped the SP industrials move up. It was a market weary of the jobs report, but the trends held. There was nothing to upset the market, and all of the indices turned and recovered after their slow start. It was not a bad day overall, and not a bad week either. The indices were up most of the week, and that is not a bad way to start the year. I always hear that the first three days in January tell how the month will go, and then how that month goes will tell how the year will go. It could be another very good year according to that old adage, although it is not always accurate. The market will forecast what the economy will do, but right now, it is forecasting the amount of liquidity that will remain in the system and not necessarily what the economy is going to do. The Fed is going to keep liquidity in the system as this job number shows.

TECHNICAL

INTERNALS

NASDAQ was the volume leader all week, and every day except Monday was above-average trade. Even though it was lower on Friday as the index moved higher, it was still a solid session. The volume stayed high as it moved laterally, and that was something of a concern. It showed a bit of churn, but you have to realize there was no volume and this is the start of a new year. Money is being put to work and positions are being shuffled, so the volume picks up. There are more players in the market doing more things. It held up and started to break higher. Overall, that is a good volume week for the NASDAQ. It is nice because it resolved the pullback with an upside break.

The SP500 was below average, only spending two days above average on the week. That is better than what it was, but is still not a lot of participation. That is important because the SP600 and SP400, the small and mid-caps, drive a lot of the volume as well. If they are not moving, then there is a worry about what the rest of the market will do. They were up however, so while this is a concern, it was not as big a deal. At least there were a couple of days above average.

Advancers led 1.7:1 on NASDAQ and 1.7:1 on the NYSE as well. The day before it was 1.45:1 on the NYSE and 1.4:1 on NASDAQ. They are matching their moves, but notice how the breadth has been tame of late versus in the fall when it was not uncommon to have days where breadth was 3:1, 4:1, or 5:1. The volatility has calmed down a bit. There is rotation in the market, and this is typical of the first of the year and this kind of action. Different sectors are getting money as it comes out of other sectors. There are not huge moves to the upside or huge breadth reads because money is just being moved around.

CHARTS

NASDAQ had the big volume and a better day being in leadership. There was a breakout from the ascending triangle. It was a nice breakout and a test to the 10 day EMA. That was right before the end of the year, so there was some selling ahead of the year. Then there was a break higher and a nice test starting back up on Friday.

The NASDAQ 100 had a nice day as well. It was leading the tech market at 0.85% gain. It helped that GOOG turned around, and AAPL looks good as well. There was general strength in the NASDAQ 100 helping to bring things higher. I like the pattern here, and it mirrors the NASDAQ. That is very healthy action that is building toward the future, and the future looks upside right now.

The SP500 had a jumbled pattern. It was moving higher, it narrowed into a tight trading range, but it made a breakout as well. It was not as neat and clean a pattern as the NASDAQ, but it did make a breakout. It rallied up, sold and then it bounced up this week led by the industrials and energy. They were moving higher every day of the week while NASDAQ struggled a bit on the way up. Note it was the same theme: a breakout, test, and another breakout. We will probably get some kind of test after this move. It could also still go up a few days. We will let it run, and I have no issues with that. That is important because it shows the stair-stepping pattern that you like to see as the indices move up. These are not huge moves as the market gets ready for earnings season, but it is still healthy action.

The small caps were not as neat and pretty, but they were breaking to a new high as well. They broke out of a sloppy range, tested, came up, and then tested again. They are now breaking higher once more. It is the same idea, just not as clean as NASDAQ. The semiconductor sector looks the same, stair stepping its way higher.

LEADERSHIP

TEX did not have a huge move after the nice Thursday run, but it continues its move higher. You have to like that break. BUCY is going to the moon. There is the same action breakout, test, rally and there is a lot of momentum there. ITW has not been moving as fast as the others have, but it looks like it might start to. MACD is turning up, there is an upside volume day as it broke up off a lateral consolidation above the 50 day EMA. ITW might be a play for us. You have to see how far it can move on these runs.

CSX was running because of the UPS news. It had a triangle and breakout, and it got moving on this news today. UPS you cannot play that. It looks like it just made it over a resistance point, so you want to see it move laterally and hold the gap. If it does hold the gap and does not fill it, you can buy it on the move higher. We will be watching UPS.

JBHT had a strong day upside, although the pattern is not showing anything we want to buy into. FDX could be a trade for us; it has volume and it is testing the 50 day EMA.

Energy took a pause and later it did not. APC paused, moving laterally. BTU has been moving well and is now taking some sideways action, but HAL is blasting off to the moon.

AAPL is setting up nicely. It had a breakout and has come back to test. It reaches down and bounces back each day. AAPL likes to run ahead of earnings, and we might get another squeeze play for a decent trade. We made great money with GOOG on a downside play. Today it sold down and started to reverse in the midst of this consolidation range. Buys are starting to come back in, so we took the rest of the gain of our downside play off the table. That was a sweet play, taking advantage that the stock was overbought and was ready for a correction.

Financials have been important all week and have been taking a pause. GS paused after a nice resumption of the move on Thursday. The entire section had its outlook lowered by an analyst who said they would not make as much trading this year, and that impacted the session on the day. This is not a bad move for GS. It can move laterally for a couple more days, and if it holds and starts to bounce, we can add a few more positions. It is the same with JPM: it just paused on the day. WFC had a nice rally and is taking a pause on lower volume.

The semiconductors have some interesting action going on. They broke higher, and some of them are testing while others are not. MCHP is coming down and testing, and it is holding over some old peaks. We will watch as it may develop into a play for us. CY bolted higher on the news of possible tax credits for solar panels. MXIM had a breakout, but then it reached down and turned back up in an ABCD pattern. The problem is that you have to see how much movement you get out of this. It had a lot of work to do to move 10%. You can trade it, but it will not give a huge amount of return.

CELG is in a six-month trading range, but note that it made a higher low at the 50 day EMA. It looks like it could break out, and that could make an interesting play because there will be some room to run. There is some resistance at 60-65, and that would give a nice trade if it can rally to that level.

THE ECONOMY

Non-Farm jobs ready to turn positive, but not employment. Only in government figures could that be.

The jobs report came in at -85K. That was worse than the -25K to 0 that was expected, but November was revised up to 4K from -11K. There was a net loss of 1K jobs between the revisions to October and November because October was written down heavily. The workweek held steady at 33.2 hours. Unemployment rate held steady at 10%. That seems like things are not too negative. First of all, you typically see the workweek rise before you see job creation. If employees are not working more, there is no need to hire anyone new.

The real key to the jobs number is the unemployment rate. The non-farms' payrolls could very well turn positive next month again if not then, definitely by the end of the first quarter in March. That does not show that the economy is improving, however. Despite what Greenspan used to say, the unemployment report is the one that tells the true story when the economy is coming out of recession. The non-farm payrolls are just the big companies. It does not pick up the small businesses that were lost. It does not pick up any of the people who are no longer in the workforce. Only the unemployment report does that. It asks if people are working, if they are looking or have given up. They ask those questions, and that is how to figure out what the unemployment rate really is. That is where a lot of the small businesses are. There has not been the surge in S corporations, limited liability corporations, or limited partnerships that came out of the 2000-2001 recession. We know that small businesses are not doing much, and when you look deeper in the numbers, you can really see they are not doing much.

That 10% hides the truth because 1K people left the jobs pool and are not looking anymore. We just leave them out, but that is not correct. If we factor in all the people who want to work but cannot get work, then the rate ticks up close to 11%. Then there is the other category called disgruntled workers who are unemployed or underemployed. They want a job but cannot get one. There were 929K of them in December, and if you add them back in, the unemployment rate spikes up to 17%. We are only utilizing 64.6% of our workforce now, the lowest since 1985. 25M Americans are out of work and 929K disgruntled workers is a record. The unemployment rate (even the inaccurate number reported by the government) will rise. People will try to seek jobs again when they think the economy is improving, but there are never enough jobs to absorb them all. The government's number will rise to at least 10.5%, and the overall unemployment rate will be 20%. That is the highest since the Great Depression.

Is UPS a good sign? It raised its guidance, but it also announced it was cutting 1800 jobs. One of the things you can conclude from the jobs report is that the layoffs may be over but there are no jobs being created. UPS is laying off 1800, and then other companies announced they would be laying people off as well. That is one of the reasons that UPS cited it would be able to increase its earnings expectations because it will not have 1800 management salaries to pay. That is not the kind of top line revenue growth we are looking for; that is bottom line growth. We saw a lot of that in 2008 and 2009. In 2009, the earnings rallied mainly because of that. It is not necessarily a great sign that UPS raised its guidance. We need to see the other companies saying they are growing their top line and are anticipating hiring people, but the jobs report indicates that is not the case. We have to produce 3K jobs a month for over a year to replace everyone that lost a job during this depression. The big companies will not do that. You can give GE all the green contracts you want, and it will still lay people off or not hire anyone because it will use automation and build these products with as few people as possible. They are not expanding; they are just trying to keep their cash flow going. Small businesses expand and hire people. Remember MSFT, AAPL, and CSCO. They started as 3-5 people and then grew to create all the jobs in the 80's and 90's.

Money Supply Following the EU?

There was also news on our money supply. The M3 includes everything, even non-bank deposits such as savings and loan and longer-term deposits. That is starting to contract, and that is a bad sign. That means consumers have less money. In Europe, it is negative for the first time in history. That is a concerning scenario because that indicates things will slow again and we might get the double dip that everyone discounts because the stock market is up. They are erroneously assuming that the stock market is rising because it is predicting a rising economy, but it is rising because of all the money in the system not being put to work. The jobs report shows that. Small businesses are nowhere to be found. They cannot get loans. Banks are saying they are lending, but the big banks are not they are investing money overseas. They are lending it to somebody overseas, getting paid interest for it, and getting free money. Over here, the regional banks are getting clocked because they are not getting any money. They are the ones who often lend to small businesses. The jobs market is down as a result and does not look like it will recover any time soon.

THE MARKET

MARKET SENTIMENT

VIX: 18.13; -0.93
VXN: 18.92; -1.07
VXO: 17.01; -0.88

Put/Call Ratio (CBOE): 0.65; -0.07

Bulls versus Bears:

This is a reading of the number of bullish investment advisors versus bearish advisors. The reason you look at this is that it gives you an idea of how bullish investors are. If they are too bullish then everyone is in the market and it is heading for a top: if everyone wants to be in the market then all the money is in and there is no more new cash to drive it higher. On the other side of the spectrum if there are a lot of bears then there is a lot of cash on the sideline, and as the market rallies it drags that cash in as the bears give in. That cash provides the market the fuel to move higher. If bears are low it is the same as a lot of bulls: everyone is in and the market doesn't have the cash to drive it higher.

Bulls: 52.2%. Rising again after a slight dip the prior week. This is the highest level on this run. Still well over the 35% level that is the threshold for what is considered a bullish climate. It does not mean things are necessarily bearish; that takes a reading in the 60% range. Hit a high of 47.7% mid-June on the run from the March lows. Again, to be seriously bearish it needs to get up to the 60% to 65% level. Dramatic rise from 21.3% in November 2008, the bottom on this leg. This last leg down showed us the largest single week drop we have ever seen, falling from 33.7% to 25.3%. Hit 40.7% on the high during the rally off the July 2008 lows. 30.9% was the March low. In March the indicator did its job with the dive below 35% and the crossover with the bears. A move into the lower 40's is a decline of significance. A move to 35% is a bullish indicator.

Bears: 16.7%. Holding basically steady for the past three weeks, down from a 17.6% reading. Bears are down but still skeptical as the lateral slide indicates. This is the lowest level of the entire rally and is at a bearish level. Peaked near 28% on this round, falling short of the 35.6% hit in July 2009. For reference, cracking above the 35% threshold considered bullish. Hit a high on this run at 47.2%. For reference, bearishness hit a 5 year high at 54.4% the last week of October 2008. The move over 50 took bearish sentiment to its highest level since 1995. Extreme negative sentiment. Prior levels for comparison: Bearishness peaked at 37.4% in September 2007. It topped the June 2006 peak (36%) on that run. That June peak eclipsed the March 2006 high (33%) and well above the 2005 highs that spawned new rallies (30% in May 2005, 29.2% in October 2005). That was a huge turn, unlike any seen in recent history.

NASDAQ

Stats: +17.12 points (+0.74%) to close at 2317.17
Volume: 2.085B (-5.34%)

Up Volume: 1.531B (+241.028M)
Down Volume: 560.308M (-476.511M)

A/D and Hi/Lo: Advancers led 1.69 to 1
Previous Session: Advancers led 1.4 to 1

New Highs: 179 (+52)
New Lows: 10 (+4)

NASDAQ CHART: Click to view the chart

NASDAQ 100 CHART: Click to view the chart

SOX CHART: Click to view the chart

SP500/NYSE

Stats: +3.29 points (+0.29%) to close at 1144.98
NYSE Volume: 994.866M (-16.67%)

Up Volume: 511.975M (-299.971M)
Down Volume: 474.638M (+99.303M)

A/D and Hi/Lo: Advancers led 1.68 to 1
Previous Session: Advancers led 1.45 to 1

New Highs: 520 (+60)
New Lows: 71 (+13)

SP500 CHART: Click to view the chart

SP600 Chart: Click to view the chart

DJ30

Stats: +11.33 points (+0.11%) to close at 10618.19
Volume DJ30: 172M shares Friday versus 217M shares Thursday.

DJ30 CHART: Click to view the chart

MONDAY

The market is preparing for earnings, and there will be preannouncements. They are already coming in with UPS, and there has been nothing bad thus far. Very few negative announcements are a good thing. Very few announcements at all are good because they will come out and be in line or better. The market has been anticipating this and is up along with a January effect move. It can still run into earnings. There are stocks that like to run into earnings like GS and AAPL. Others like to pop when earnings come out such as RIMM. We will look at the plays that like to run into earnings. If GS moves laterally a couple more days, we might take more positions in it. I have no problem focusing assets in great stocks that are ready to make a run higher. AAPL looks like it wants to make a run into earnings, and we are going to play those that like to make those moves. The moves will not be as big on these, but they are still very lucrative. The prices on GS and AAPL are not chicken feed, and these stocks can move. We can play options on those, run them into earnings, and make a lot of money. If you get a good run, you take the gain. If you want to, if it is in your character, you can let part of it run into earnings. If you get a good run into earnings, you better take some money off the table. You like to go into earnings a bit light. We still have a lot of positions, but we have taken a lot of gain off the table and so those positions are smaller. As they move up and move toward earnings, our positions in them and our exposure gets lower while our bank accounts are growing. We may miss out on some big moves, but if a stock has run into earnings, what are the odds that it will give up some of that after the earnings are reported, unless it is just stupendous numbers? We have seen stupendous numbers, do not get me wrong. BBBY was great, but it did not run into earnings it based ahead of earnings and gapped. If you are playing a pre-earnings run and you have the gain, then take it. When we do let them run, it is because our exposure is low at that point.

We have taken a lot of gain and anticipate getting more of a run higher toward earnings. We will use it to take more off the table. We are down to a third or quarter position on a lot of stocks because we have taken gain on some of them twice. Others we have taken one time and will take some more (or all) of it as we move toward earnings. The decision is yours, whether you like to hold them through earnings or fold them and take the money ahead of time. It is a matter of your risk tolerance, your money management, and how much money you have in the play. Our plan is take it off as it goes up so exposure is minimized by the time earnings come out. We will miss huge moves at times, but we will participant in it because we still have some options in play.

Upside surprises are always possible, but the market looks to be building in a potential surprise ahead of time. Look at your stocks to see if they are moving higher or not into earnings. That will tell you whether you want to chance holding some through the earnings report.

It was a nice week, it was good upside for the bulls, and we still anticipate more coming with the earnings run and a January effect move. After that, who knows what will happen. The liquidity is staying in the market. That is positive, but the market will see the writing on the wall at some point, start to take some gains, and then it will come back. We will take what the market gives us regardless of what we think will happen. We are not smarter than the market. When the market says to buy, we buy. If it shows us reason to sell, we sell. We stick to what the market gives and stick by good money management moves. We make a lot of money that way. 2009 was a great year, and 2010 is starting out great as well. Have a good weekend and stay warm.

Support and Resistance

NASDAQ: Closed at 2317.17
Resistance:
2324-2370 is a range of resistance from early 2008
2382-2395 from 2008
2412-2415 represents a series of peaks and lows in 2007, 2008
2453 is the August 2008 peak

Support:
2292 is a low from January 2008
The 10 day EMA at 2290
2275 - 2278 from the February 2008 and April 2008 lows
The 18 day EMA at 2268
2245 from July 2008 through 2260 from late 2005.
2218 is the August 2005 peak
2210 (from September 2008) to 2212 (the July 2009 closing low)
The 50 day EMA at 2207
2205 is the November 2009 peak
2191 is the October 2009 peak
2177 is a low from March 2008
2169 is the March 2008 closing low (double bottom)
2168 is the September 2009, intraday peak
2167 from the July 2008 intraday low
2155 is the March 2008 intraday low
2143 is the October 2009 range low
2099 is the mid-September 2008 closing low
2070 is the September 2008 intraday low
2060 is the August peak
2048 is the early October 2009 closing low
2016 is the early August peak
1984 from late September
1962 is the bottom of the August 2009 range.
The 200 day SM A at 19561
1947 is the October gap down point

S&P 500: Closed at 1144.98
Resistance:
1185 from late September 2008
1200 from the July 2008 low

Support:
1133 from a September 2008 intraday low
The 18 day EMA at 1125
1119 is the early December intraday high
1114 is the November 2009 peak
1106 is the September 2008 low
The 50 day EMA at 1103
1101 is the October high
1080 is the September 2009 peak
1078 is the October range low
1070 is the late September 2009 peak
1044 is the October 2008 intraday high
The August peak at 1040
The early October 2009 closing low at 1025
The early August intraday peak at 1018
The November 2008 peak at 1006 closing 1007.53 intraday
The 200 day SMA at 993
992 is the August 2009 consolidation low

Dow: Closed at 10,618.19
Resistance:
10,609 from the Mid-September 2008 interim low is being tested.
10,963 is the July 2008 low

Support:
The 18 day EMA at 10,508
10,496 is the November 2009 high
10,365 is the late September 2008 low
The 50 day EMA at 10,321
10,120 is the October 2009 peak
9918 is the September 2008 peak
9855 is the early September peak in its lateral range
9835 is the late September 2009 peak
9654 is the November 2008 high
9625 is the October 2008 closing high
9620 is the August 2009 peak
9430 is the early October low
9387 is the mid-October peak
The 200 day SMA at 9249

Economic Calendar

These are consensus expectations. Our expectations will vary and are discussed in the 'Economy' section.

January 08 - Friday
- Average Workweek, December (08:30): 33.2 actual versus 33.2 expected, 33.2 prior (no revisions)
- Hourly Earnings, December (08:30): 0.2% actual versus 0.2% expected, 0.1% prior (no revisions)
- Nonfarm Payrolls, December (08:30): -85K actual versus 0K expected, 4K prior (revised from -11K)
- Unemployment Rate, December (08:30): 10.0% actual versus 10.0% expected, 10.0% prior (no revisions)
- Wholesale Inventorie, November (10:00): 1.5% actual versus -0.3% expected, 0.6% prior (revised from 0.3%)
- Consumer Credit, November (15:00): -$17.5B actual versus -$5.0B expected, -$4.2B prior (revised from -$3.5B)

January 12 - Tuesday
- Trade Balance, November (08:30): -$34.5B expected, -$32.9B prior

January 13 - Wednesday
- Crude Inventories, 1/08 (10:30): 1.33M prior
- Treasury Budget, December (14:00): -$92.0B expected, -$120.3B prior

January 14 - Thursday
- Initial Claims, 01/09 (08:30): 433K expected, 434K prior
- Continuing Claims, 1/2 (08:30): 4800K expected, 4802K prior
- Retail Sales, December (08:30): 0.5% expected, 1.3% prior
- Retail Sales ex-auto, December (08:30): 0.3% expected, 1.2% prior
- Export Prices ex-ag., December (08:30): 0.7% prior
- Import Prices ex-oil, December (08:30): 0.4% prior
- Business Inventories, November (10:00): 0.2% expected, 0.2% prior

January 15 - Friday
- Core CPI, December (08:30): 0.1% expected, 0.0% prior
- CPI, December (08:30): 0.2% expected, 0.4% prior
- Empire Manufacturing, January (08:30): 11.25 expected, 2.55 prior
- Capacity Utilization, December (09:15): 71.8% expected, 71.3% prior
- Industrial Production, December (09:15): 0.6% expected, 0.8% prior
- Michigan Sentiment, January (09:55): 73.8 expected, 72.5 prior

icon url

ReturntoSender

01/11/10 5:38 PM

#8803 RE: ReturntoSender #6755

Long term look at NASDAQ. Calling a bottom or a top is hard but everything is clear in retrospect. Fear is rampant at market bottoms. It can be completely ignored by the masses at market tops even though volatility sometimes begins to rise in advance of the final market top.

But what can be said for sure is that once the market finds a cyclical bottom even after a failed bottom like that in 2001 the ultimate bottom will lead a cyclical advance that typically lasts around 17 months. It might be more. It might be less. It might be that even after profit taking hits in one sector that other areas of the market will rally for an extended period of time.

Note that the semiconductor index hit its high far in advance of the overall Nasdaq after the bottom in 2002.

icon url

ReturntoSender

01/12/10 10:44 PM

#8805 RE: ReturntoSender #6755

From Briefing.com: 4:30 pm : Dampened sentiment that stemmed from an earnings miss at Alcoa led to broad-based weakness that culminated in the stock market's first loss of the new year.

Alcoa (AA 15.52, -1.93) announced last evening earnings results that fell short of the consensus estimate. Though the miss doesn't necessarily carry implications for the broader economy, it did undermine the positive tone of trade that had taken stocks higher in each of the past six sessions.

Commodities were also broadly weak this session. Specifically, the CRB Commodity Index dropped 1.7%, which was its worst single session percentage loss in more than one month.

Softer commodity prices and weakness among Alcoa and other diversified metals plays (-3.8%) dragged the materials sector to a 1.9% loss, which was the worst of the major indices.

Diversified financial services stocks (-2.9%) and diversified bank shares (-1.8%) slumped amid news that the government wants to impose fees on banks to help recoup TARP funds. The weakness that emanated from bank stocks even undercut multiline insurers, which had traded with strength after Hartford Financial (HIG 27.12, +0.95) issued a strong earnings update. Multiline insurers finished fractionally lower, while the broader financial sector fell to a 1.6% loss.

Large-cap tech remained weak. Its losses caused the Nasdaq Composite to lag for the second straight session.

The Dow managed to limit its move to the downside, though. That was largely the result of Procter & Gamble (PG 60.89, +0.69), which was upgraded by analysts at Bank of America's Merrill Lynch. DJ30 -36.73 NASDAQ -30.10 NQ100 -1.3% R2K -1.3% SP400 -1.3% SP500 -10.76 NASDAQ Adv/Vol/Dec 755/2.39 bln/1923 NYSE Adv/Vol/Dec 852/1.10 bln/2187

6:18PM Linear Tech beats by $0.04, beats on revs; guides Q3 revs above consensus (LLTC) 30.23 -0.41 : Reports Q2 (Dec) earnings of $0.35 per share, excluding non-recurring items, $0.04 better than the First Call consensus of $0.31; revenues rose 2.9% year/year to $256.4 mln vs the $247.1 mln consensus. Co issues upside guidance for Q3, sees sequentialy Q3 revs growth of 7-10%, which equates to ~$274.3-282.0 mln vs. $257.55 mln consensus. Co said, "Our factories continue to execute well, enabling us to maintain low lead times which allows our customers to place orders on us close to their demand requirements. Strong second quarter bookings and a related positive book-to-bill ratio that was higher than we have experienced in the past several quarters, leads us to be optimistic as we enter our Q3."

4:31PM QLogic guides Q3 above consensus (QLGC) 20.66 +1.76 : Co expects to report net revenue in the range of $147-149 million for3Q10 (First Call consensus $138 mln), which represents a sequential increase of approximately 12-13% q/q. The updated expected net revenue exceeds the previously forecasted third quarter net revenue range of $134 million to $140 million. "Our revenue performance was driven by strong sequential growth for our Host Products compared to the second quarter of fiscal 2010." Co anticipates reporting GAAP net income per diluted share for the third quarter of fiscal 2010 in the range of $0.23 to $0.24. On a non-GAAP basis, the Company expects to report net income per diluted share of $0.29 to $0.30, compared to the previously forecasted range of $0.22 to $0.24 per diluted share, First Call consensus $0.24. The non-GAAP net income per diluted share amounts exclude stock-based compensation, acquisition-related charges, and the related income tax effects.

9:06AM FormFactor lowers Q4 rev outlook; issues 1Q10 rev outlook below consensus (FORM) 20.58 : Co issues downside guidance for Q4 (Dec), sees Q4 (Dec) revs of $32-33 mln vs. $39.54 mln First Call consensus, from $38-39 mln previously. The lower than expected fourth quarter revenue results are due primarily to a delay in the timing of customer technology transitions, tooling cycles and volume plans. Co issues downside guidance for Q1 (Mar), sees Q1 (Mar) revs in the $40 mln+ range vs. the $45.82 mln consensus. The co continues to expect strong growth in 2010 fueled by design proliferation and volume ramps resulting in approximately 60% year over year revenue growth, plus or minus 10%. The company currently expects revenues in the first quarter of 2010 to be in the range of $40 million plus or minus 10%.

9:01AM Tegal received a repeat order for a 981ACS plasma etch system (TGAL) 1.27 : Co announced that it has received a repeat order for a 981ACS plasma etch system from a leading hard disk drive manufacturer to support a critical capacity expansion for magnetic data storage device fabrication. The new Tegal 981ACS unit adds to the customer's extensive installed base of Tegal 900 Series plasma etch systems already being used for precision photoresist descum applications in high volume manufacturing.

9:01AM Benchmark Elec says expects to exceed guidance for fourth quarter 2009 (BHE) 19.45 : Co announces that it expects sales and EPS to exceed the high end of guidance for Q4. On October 27, 2009, the co had provided Q4 guidance for sales between $520-$560 mln (vs $543 mln consensus) and diluted EPX, excluding restructuring charges, between $0.22-$0.26 (vs $0.24 consensus).

8:36AM RF Micro Device announces it has hit its financial goals for 3Q10; sees 15% non-GAAP operating margin for FY10 and FY11; will be net cash positive by end of FY11 (RFMD) 4.77 : Co at a conference today said RFMD had achieved its financial targets for its fiscal 2010 third quarter, ending January 2, 2010, related to revenue, non-GAAP gross margin, non-GAAP earnings per share and free cash flow. RFMD's CFO and vice president of administration, said that, based upon RFMD's December 2009 quarterly performance and current projections for the March 2010 quarter, RFMD believes its non-GAAP operating margin will converge on 15% for its fiscal 2010, ending April 3, 2010. Regarding future periods, RFMD indicated order and shipment momentum had extended into the March 2010 quarter. RFMD also reiterated previous guidance indicating it plans to achieve 15% non-GAAP operating margin for its fiscal 2011 and it expects to be net cash positive by the end of its fiscal 2011.

8:03AM Cray sees FY09 revs of ~$284 mln vs $284.90 mln First Call consensus; expects rev growth and profitability in 2010 (CRAY) 6.47 : The co says based on preliminary results, total revenue for 2009 is now expected to be about $284 million and earnings are expected to be in the range of about break-even to a small loss from operations. Cash and short-term investments as of December 31, 2009 are expected to be above $110 million. Cray retired all remaining convertible notes during the fourth quarter of 2009. During the fourth quarter, a contract modification was not finalized and consequently a milestone was delayed in the agreement covering Phase III of the Defense Advanced Research Projects Agency's High Productivity Computing Systems program. This contract delay will have an approximately $7 million negative impact to net research and development expenses in the fourth quarter of 2009. Substantive talks regarding this contract are ongoing and the company expects to complete a contract modification and milestone in the first quarter of 2010. After the anticipated contract modification, the remaining amount of the contract is expected to be reduced by $60 million, to $92.5 million... "While a wide range of results remains possible, we expect revenue growth and profitability for 2010... Many variables may impact this outlook, but one significant item is the timing of the availability and release of our next generation supercomputer, code named "Baker," including the completion of development and testing of the Baker interconnect chipset, known as "Gemini," and associated system software. We currently expect Baker development to be completed in the third quarter 2010. As a result, we expect a significant majority of 2010 revenue to be recognized in the fourth quarter."

icon url

ReturntoSender

01/13/10 8:48 PM

#8806 RE: ReturntoSender #6755

From Briefing.com: 4:35 pm : In a moderately bullish sign, broad-based buying brought back stocks from sizable losses that were logged in the previous session. The move put the stock market back near its 52-week high.

Despite this session's strong finish, stocks actually stumbled in the early going. Large-cap tech was particularly weak amid continued profit taking, which was supported by news that Google (GOOG 587.09, -3.39) may pull out of China. The headline prompted participants to drop shares of GOOG below their 50-day moving average for the first time since July. Though the stock pared its losses and settled at the key technical line, it still failed to share in the broader tech sector's 1.0% gain.

Renewed support for financial stocks drove the sector from a 0.6% loss to a 1.2% gain this session. The move was primarily underpinned by banks, which booked a 1.8% gain. Shares of banks showed no reaction to the testimonies of financial executives about the financial crisis at Capitol Hill today.

Financials were a primary leader for most of the session, but health care stocks logged the best gain. They advanced 1.3%.

Telecom was the only sector that failed to find positive ground. It shed 0.4% amid weakness in integrated telecom stocks, which fell 0.7%. The telecom sector, which boasts a dividend yield in excess of 5.5% at current stock prices, failed to find support amid chatter that current tax rates, including the dividend tax, may be extended.

Energy stocks had traded with weakness as oil prices extended their sell-off from the previous session amid a larger-than-expected weekly inventory build. Energy stocks recovered to finish with a 0.4% gain, but oil prices stayed lower to close below $80 per barrel for the first time this year.

Support for stocks led to selling among Treasuries. Treasuries extended their losses after a $21 billion auction of 10-year Notes drew a yield of 3.75% and a bid-to-cover of 3.0, which is well above the 2009 average of 2.6. The benchmark 10-year Note fell 19 ticks, which pushed its yield back up toward 3.8%.

The Treasury's budget for December showed a deficit of $91.9 billion, which is in-line with the $92.0 billion that had been expected, on average, by economists. The deficit for November was $51.8 billion.

The Fed's latest Beige Book stated that economic activity is still low, but improving. It also stated that credit quality is still worsening, though.

Stocks may have fully recovered from profit-taking in the previous session, but the lack of trading volume suggests that there wasn't much conviction behind this session's move. Fewer than 1 billion shares traded hands on the NYSE; recent averages stand closer to 1.1 billion shares.

Advancing Sectors: Health Care (+1.3%), Financials (+1.2%), Tech (+1.0%), Consumer Discretionary (+0.9%), Utilities (+0.9%), Materials (+0.9%), Consumer Staples (+0.7%), Industrials (+0.5%), Energy (+0.4%)
Declining Sectors: Telecom (-0.4%)DJ30 +53.51 NASDAQ +25.59 NQ100 +1.3% R2K +1.3% SP400 +1.3% SP500 +9.46 NASDAQ Adv/Vol/Dec 1832/2.37 bln/871 NYSE Adv/Vol/Dec 2246/970 mln/800

8:04AM TriQuint Semi raises Q4 rev and EPS guidance; sees seasonal Q1 rev decline (TQNT) 5.82 : Co issues upside guidance for Q4 (Dec), sees EPS of $0.12-0.13, excluding non-recurring items, vs. $0.11 First Call consensus, up from $0.10-0.12 previously; sees Q4 (Dec) revs of ~$190 mln vs. $180.87 mln consensus, up from $175-185 mln previously. Expectations for the first quarter of 2010 are for a normal seasonal decline in revenue of 10% to 15%. TriQuint reiterates expectations for solid revenue growth in 2010.

7:02AM Tessera Tech Licenses SHELLCASE MVP Technology to JCAP (TSRA) 19.80 : Co announces that China-based Jiangyin Changjiang Advanced Packaging Corporation has licensed Tessera's SHELLCASE MVP image sensor packaging technology. JCAP will use the SHELLCASE MVP technology in its production line for image sensor wafer-level packaging designed for portable products such as mobile phones, notebook and netbook computers, as well as camera products in consumer electronics. Tessera recorded an initial fee from JCAP under this license agreement in the third quarter of 2009. Because SHELLCASE MVP is 'infrastructure' intellectual property the timing between signing a SHELLCASE MVP license agreement and Tessera's receipt of initial royalty payments under the agreement is approximately 15-30 months.

6:30AM Amtech Systems announces $59 mln in total orders for the December quarter (ASYS) 10.53 :

icon url

ReturntoSender

01/14/10 5:19 PM

#8807 RE: ReturntoSender #6755

Intel Q4 Crushes Wall Street Expectations

Revenue and earnings come well above projections, and 2010 is off to a decent start as well.

http://www.internetnews.com/bus-news/article.php/3858726/Intel+Q4+Crushes+Wall+Street+Expectations.htm

January 14, 2010
By Andy Patrizio: More stories by this author:

It's been 12 months since the disastrous fourth quarter of 2008, where Intel saw its revenue fall by 20 percent and the company nearly reported a loss as the economy imploded and buying came to a screeching halt. One year later, the chip giant is now leading the way to recovery with revenues and profits that exceeded projections.

Intel (NASDAQ: INTC) today reported fourth-quarter revenue of $10.6 billion and net income of $2.3 billion, or earnings per share of $0.40. That's a 28 percent improvement in revenue income and 875 percent improvement in net income from the fourth quarter of 2008.

Even more remarkably, that net profit comes after a $1.25 billion payment from Intel's settlement with AMD (NYSE: AMD).

Analysts surveyed by Thomson Reuters expect Intel to post earnings of $1.9 billion, or $0.30 per share on sales of $10.2 billion for the quarter. In Q4 2008, Intel posted revenue of $8.2 billion and income of $234,000.

For fiscal 2009, Intel posted a net income of $4.4 billion, or 77 cents per share, on revenue of $35.1 billion. That's a 7 percent drop in revenue and 17 percent drop in net income versus 2008 -- but it's also comparing three strong quarter of 2008 and one bad one (the fourth) versus a 2009 that started terribly and slowly rebuilt over the year.

"Intel's strong 2009 results reflect our investment in industry-leading manufacturing and product innovation," Intel President and CEO Paul Otellini said in a statement. "This strategy has enabled us to generate unprecedented operating efficiencies while growing our traditional businesses and creating exciting new market opportunities, even in difficult economic times."

Revenue was up across the board in the fourth quarter, with PC client sales up 10 percent, datacenter sales up 21 percent, other Intel Architecture up 22 percent, and Intel Atom and chipset revenue up six percent, all sequentially from Q3.

For the first quarter of 2010, Intel projects revenue $9.7 billion, plus or minus $400 million, with gross margin of 61 percent, plus or minus 2 percentage points.

Intel will host a conference call with analysts later today to discuss the earnings.

The conference call will be real important. We are at the point in the cycle where a lot of companies should blow away estimates. So far after hours not that much of a move for INTC but it's a stock with a lot of shares outstanding.

RtS
icon url

ReturntoSender

01/15/10 12:42 PM

#8809 RE: ReturntoSender #6755

Chart of the Day - Typical Rally?

http://www.chartoftheday.com/20100115.htm?A%3ECLICK

The Dow made another rally high Thursday. To provide some perspective to the current Dow rally that began back in March, all major market rallies of the last 110 years are plotted on today's chart. Each dot represents a major stock market rally as measured by the Dow. As today's chart illustrates, the Dow has begun a major rally 27 times over the past 110 years which equates to an average of one rally every four years. Also, most major rallies (73%) resulted in a gain of between 30% and 150% and lasted between 200 and 800 trading days -- highlighted in today's chart with a light blue shaded box. As it stands right now, the current Dow rally (hollow blue dot labeled you are here) has entered the low range of a "typical" rally and would currently be classified as both short in duration and below average in magnitude.

icon url

ReturntoSender

01/16/10 4:57 PM

#8810 RE: ReturntoSender #6755

Amateur Investors Weekend Market Analysis (1/16/10)

http://www.amateur-investor.net/Weekend_Market_Analysis_Jan_16_10.htm

As I have mentioned before the two periods of time that most resemble the current action in the market are from the mid 1970's and further back in the late 1930's. Taking a closer look at the mid 1970's the Dow lost 47% from early 1973 through late 1974 which was then followed by a 56% gain before stalling out near its 61.8% Retracement Level (point A) calculated from the early 1973 high to the late 1974 low. This was then followed by a 15% pullback over the next few months before the Dow rallied an additional 31% through the middle part of 1976. Thus from late 1974 through the middle part of 1976 the Dow gained a total of 80% from the late 1974 low.


After the Dow peaked in 1976 this was followed by a very choppy consolidation period for the next 6 years as support came in at or above its 61.8% Retracmenent Level (point B) calculated from the 1974 low to the 1976 high. Eventually by 1983 the Dow was finally able to break out of its choppy consolidation pattern which was followed by a Secular Bull Market from 1983 through 1999.


Meanwhile taking a look at the current chart of the Dow so far it has gained 66% since the March 2009 low however it hasn't reached its longer term 61.8% Retracement Level just above 11230 (point C) calculated from the October 2007 high to the March 2009 low. Of course the question is if the Dow were to follow a similar pattern to the mid 1970's will it reach its 61.8% Retracement Level or not before undergoing a more substantial pullback?


Meanwhile the other time period that looks similar to the current action in the Dow is from the late 1930's. During that period of time the Dow went through a 5 Wave pattern to the downside in which it lost 50% of its value in basically one year. This was then followed by an impressive 63% rally over a period of 8 months in which the Dow stalled out at its 61.8% Retracement Level (point D) in late 1938. After stalling out at its 61.8% Retracement Level the Dow then pulled back 24% over the next 5 months which was then followed by a rally back to near the 61.8% Retrace (point E) which stalled out just below the late 1938 peak. After stalling out for a second time the Dow then steadily declined over the next 3 years and eventually retested its prior 1938 low by early 1942 (point F) with a drop of 42%.


When you look at the current chart of the Dow you can see a similar 5 Wave pattern to the downside that began with the October 2007 high and ended with the March 2009 low. Now if the Dow were to repeat the late 1930's pattern then it could still rise up to the 61.8% Retracement Level just above 11230 before a more significant pullback occurs.


Meanwhile let's say the period from the late 1930's through the early 1940's ends up repeating itself which evolved into an ABC type corrective pattern. The longer term upward trend line (black line) connecting the 1932 low with the 1982 low could eventually come into play around 6000 if the C Wave becomes an elongated affair.


Finally since the March 2009 low the Dow has been holding support on a weekly basis at or above its 10 Week EMA (blue line). I expect at some point we will see another test of the 10 Week EMA which is now nearing the 10400 level. If the 10 Week EMA were to be broken to the downside then a more substantial correction would likely occur with a potential drop possibly back to the 40 Week EMA (green line). Also notice the 23.6% Retracement Level from the March low to the most recent high also comes into play at the 40 Week EMA as well.

icon url

ReturntoSender

01/17/10 9:46 PM

#8811 RE: ReturntoSender #6755

InvestmentHouse Weekend Market Summary 1/15/10

http://www.investmenthouse.com/weekendmarketsummary.htm

- News is not bad, earnings are good, but market responds negatively.
- SP500 rallies 8 out of 10 sessions and the financial stations act as if it was down 8 out of 10 sessions.
- Despite the chop on NASDAQ and being down two of three sessions, bigger picture the indices hold near support.
- Economic data in line and improving, but it is not that great an improvement.
- With indices at next resistance market needs a bit of consolidation or a big catalyst to break them higher. Thus far earnings have not done the trick.
- Time to be patient and let the good stocks test and set up entry points.

Intel earnings, decent economic data cannot drive stocks ahead of long weekend, earnings.

We have DIVIDED the video into component parts: Market Overview, Technical Summary, Economy, and the Next Session. This allows you to choose the segments you are interested in without having to find the spot in a longer video. Click on the link to the portion you wish to view.

MARKET OVERVIEW

TO VIEW THE MARKET OVERVIEW CLICK THE FOLLOWING LINK:
Market Overview Video

TO VIEW THE TECHNICAL SUMMARY VIDEO CLICK THE FOLLOWING LINK:
Technical Summary Video

TO VIEW THE ECONOMY VIDEO CLICK ON THE FOLLOWING LINK:
Economy Summary Video

TO VIEW THE NEXT SESSION VIDEO CLICK THE FOLLOWING LINK:
Next Session Video

I did not feel the market would make a breakout on Friday, and it definitely did not. It is not that the news was bad. CPI was a bit better on the headline than expected, and the core was right in line at the 0.1% gain. Industrial production was in line at 0.6. Capacity was actually ahead at 72 versus 7 1.8 expected, and the New York PMI came in at a solid 15.92. That beat the 12 expected, and was much better than the 2.55 originally reported in December. Even that was revised up to 4.5.

It was just the fact that the market, SP500 namely, was up eight out of nine days moving into this session. It is also expiration, and there will be position shuffling. To top it off, the market is almost at the heart of earnings season. There is a lot coming out. Even with INTC's earnings on Thursday night - where it beat on both the bottom and top line and said it will expand operations - the market was not very pleased with it. You would think that would be good for all of the semiconductors (particularly the chip equipment makers), but they were down as well. The market was not ready to break higher. It is notable that it could not move on such good news with INTC.

The market has been up eight out of nine days on the SP500. The NASDAQ was still holding its gains, but had become a bit choppy. That may be telling more of the story. SP500 with its dollar-related or overseas-related stocks is moving higher, while some of the NASDAQ got up ahead of itself. Looking at the SOX chart, the small caps - particularly semiconductors - were ready to come back.

The indices may look heavy and are definitely getting choppier with the semiconductors and NASDAQ, but we have to look at the bigger picture. Do not get too tied up in the day-to-day, up and down movements. After all, on Friday, all the journalism majors that tried to pass themselves off as financial news anchors were very glum about the action. The market has gone down two out of the last three days, regardless of the fact that it broke out in late December and rallied up through mid-January. That did not matter; it was what happened Friday. A bunch of long faces, and many questions from the analysts: Is this going to be the start of a selloff? Is this the end of the run? Well, it may be, but I seriously doubt it. The liquidity is still out there pumping things up. Markets will still correct and test no matter what the uptrend is, and maybe that is what we are due for right now. It certainly looks as if the SOX is making a correction near term. The question is whether it will be a leader or just typically more volatile than the rest of the indices as it always is.

When you look at the macro picture, you have to note that NASDAQ tapped at the 18 day EMA once more and it held, despite all the chop and its loss of over 1% on the session. The SP500 also tapped at the 18 day EMA and held. The SP600 held at the 18 day EMA on the low and bounced back. It was not a total selloff it was not the kind of gutting you would imagine if you'd just stepped in from being gone a month or two and listened to the journalism majors on the financial channels.

The indices did lose over 1% across the board. That is except for the Dow, but it lost 0.94% itself, so it was not far away. Nonetheless, they are holding their trends. It was a tough day, but it was also the end of expiration. The market has rallied almost straight up for two weeks on SP500, and there is a long weekend ahead. There will be some profit taking after such a run. There will be positions shuffled thanks to expiration, and some people will want to take cash off the table with earnings coming up. I think we saw a bit of all of that on Friday.

OTHER MARKETS

The dollar was up on the day. It continues in a flag pattern it has formed after it reversed its trend and rallied off the late-November low. It has sold back all the way to the 50 day EMA. There is a bit of support there, and it is trying to bounce again but has not made it yet. It got some traction on Friday and managed to close higher (1.4378 Euros versus 1.4499 Thursday), and that colored the other markets.

Click to view the Dollar Index chart

Oil traded lower again. It broke through the 18 day EMA it was trying to hold, and now it is down at the 50 day EMA in the meat of the consolidation from mid-October through November. Oil bounced up, hit the top of its range, and it is selling back. It did not help on Friday that the IEA lowered its 2010 expected oil demand. The IEA apparently does not think the world economies will recover as much as the other pundits out there do. That may have had an effect on oil, but oil is in a technical move right now, bouncing down from its prior peak. If it holds and can bounce up, that will be of real interest. It will then likely break through and out of the top of its range. If oil breaks out over $85.00 and rallies again, that would be a game-changer for many of the forecasts for 2010. That would be serious for the world economies.

Click to view the Oil Index chart

With the dollar up, gold struggled again. It was up two days, Wednesday and Thursday, and it gave it back on Friday. We are still in the move higher. There was a higher low, and then it has come back and is testing right now. It is still making a higher low overall, so the pattern is still positive. It is much more sluggish than it has been in the past. It had a big run and is digesting the gains, but it is edging out something of a cup with handle. We will see if it can make the breakout and run up to the prior peak.

Click to view the Gold Index chart

Bonds have been rallying, and interest rates are going down. If the economy is getting better as many people think it will, why are bonds rallying again? They had good demand on the auctions this week, but then again, that means bonds are rallying and people are concerned about being in stocks. That may be the case. Economic data was a bit worrisome, and it all started with AA. That got things off on the wrong foot with earnings season, and the market has been gun shy ever since. Bonds have been rallying and interest rates have been falling. The 10 year closed lower (3.68% versus 3.73% the prior session.) Even the short end at the 2 year was down (0.87% versus 0.92% Thursday). It was at 1% just over a week ago. Bonds are definitely rallying, and that often means discontent with respect to the economic future. I do not want to worry too much about that right now. I would just like to see bonds stabilize and avoid any sudden spikes in the 10 year that might indicate there is inflation. It is somewhat doing that with this move. As investors moved out of stocks a bit, they moved toward Treasuries, and that is normal.

Click to view the Bonds chart

TECHNICAL

INTERNALS

The breadth is getting more volatile (as it was before the past few weeks). There has been +1.4:1 or -1.4:1; that seems to be the comfort zone for the indices. The breadth is now starting to expand on days that are decidedly stronger or decidedly weaker. On Friday breadth was - 2.75:1 on NASDAQ and -2.3:1 on NYSE. The last time there was breadth that strong was on Wednesday when the market was up. There is still capability to have strong breadth both ways, but it is something that has not happened in awhile. Does this mean volatility is moving back into the market? We are seeing some day-to-day. Looking at the NASDAQ chart, it has been bouncing around in this range, and it is not a tight range. It is very volatile. There are big moves up, gaps down, and then moves back up and down. There is volatility returning to the market, and that means breadth expands.

Volume surged. It was well above average on NASDAQ the strongest of the year. The NYSE volume was up as well. It moved back above average and had the strongest volume of the year. It is only the third time it has been above average in 2010, but that does not mean anything because it is expiration Friday. I will not attribute anything to this volume. Volume has been elevated on NASDAQ the entire year while it has not been on the NYSE. NASDAQ is considered more of a growth area with its technology, medical stocks, and smaller stocks (it is not just limited to the SP600). That makes the higher volume interesting because that indicates that investors are interested in growth stocks to start the new year. The index is still trending higher despite being choppy this year. You have to view that as a positive overall, but also take it with a grain of salt because there is a lot of volatility day-to-day coupled with a lot of volume on NASDAQ. That is typically not a great scenario when there has been a long run. Keep that in mind as earnings unfold and we see how stocks react. The earnings reaction to INTC was not great on Friday. It blew it out on the top and bottom line and had nothing but good things to say. Margins were at a record, yet it was down on the session; indeed, most of the chips and techs were down. With all of this chop and volatility coupled with above average volume on every session but one in 2010, that warrants being careful as we move forward in earnings season.

CHARTS

On Thursday, I talked about how the main indices have bumped into a resistance level, and that is still in play at this point. Selling back from that level is obviously a sign of weakness of a certain degree. NASDAQ is at its September 2008 peak that jumped up there in the middle of the month. The SP500 is at the mid-month low from September 2008. It has not quite made that level, but it is bouncing back. There is choppier trade on NASDAQ, and there is more volatile and choppy trade on SP500. There is some chop coming back into the market as they hit resistance. The sellers are there and the buyers are there, and they are fighting it out. Overall, however, the large indices held their 18 day EMAs. They have also held this near-term trendline. This is not a bad one because there are three points on it on NASDAQ. This is a solid trendline at 2255.

SP500 still has a trendline it is holding, and it tapped it on Friday. We have three points on this as well; if it holds, there will be a fourth point, and that would make a solid trendline. It is trying to hold this level, and that would be a good point for it to do so and continue on this breakout of rally and testing. It would be due to rally now, but it has to have a catalyst. SOX is already in correction mode. Will it be followed by NASDAQ and the other indices, or is it just being its usual volatile self and coming down to test? There is a potential for an ABCD pattern, but it is ragged. You want them to be clean and neat to be their most powerful. The question is whether it is leading the market into a deeper correction or just getting it out of its system first.

LEADERSHIP

Most of leadership is in modest pullbacks. The industrials, commodities, and materials are all in pullbacks. This all started on Tuesday when China said that it was going to raise the reserve limits for its banks. That typically leads to this kind of selling. It does not last that long, but it gets investors nervous about their positions in industrials, energy, and metals and they succumb to profit taking.

CMI was back. There was a big breakout, and then Tuesday knocked it back. It is still testing, and it is in a great pullback. BUCY gapped down on Tuesday and is now testing. We might get a nice play out of it in a few days. TEX was not affected. It had a nice break higher and a nice test. It could be ready for a new buy. CAT is struggling. It had a great pullback but a bad Friday, and it gapped down and then sold off. It is at the bottom of its range marked by the November and December peaks. It can find support there, continue higher, and salvage itself. Most of them are in pullbacks, but that is after good runs as well.

Oil was down, but energy stocks held their ground. SLB is moving laterally at its peak. APA is also moving laterally and consolidating its gains. BTU had a nice pullback, and we might get a buy out of that. CVX is not bad either. VLO is showing great volume as it breaks higher. It is still a sloppy pattern, so it is hard to get into that one. There are some good stocks holding their own even though oil is falling.

The chips are struggling. INTC had great earnings, it was hammered, but of course, it rose from $20 to all of $21.50 over the prior four weeks and got knocked back. It is not like the old days, back in the 80's and 90's, is it? It was knocked back 3% on high volume. They were not impressed with the earnings, but it did not destroy the pattern. AAPL took a hit as well. It has been trying to set up nicely over the October-November peaks, and it came back. It is trying to hold the lower part of the range right now. QCOM has been having a good run, and it just took it in stride. It is in an easy pullback and is still in good shape, but it will be hard to make money on QCOM. It has to move a long way, and it is not that big of a mover anymore. It went up for three weeks straight, and it was only a 10% move. QLGC has a nice pullback under way. Low volume, gapped higher. It is filling the gap. That is a very interesting play setting up.

The financials are having trouble right now. JPM came out with earnings and it just plain missed. It was having problems on its revenues with losses in mortgages and commercial loans. It had to increase its loan-loss reserve, and it just went down. The good thing about JPM is that it did not go down that much --- only 2.25%. It is still in consolidation, and we might get an ABCD pattern out of it and watch it head upside. Do not ever give up on them just because they do not do something you want them to do on one day. GS is having its issues, but an ABCD pattern had set up. It is at support at 165. Are we looking to bail? If it does not perform, yes. However, with an ABCD pattern, it could get back up to the November peak at 180 fairly easily, and that would make a great play to the upside. Going from 165 up to 180 --- playing some options, I would take that any day. MS is very similar. It sold off, but it is not bad. WFC sold back, but it is also holding in its recent range and could set up an ABCD pattern if it steps down a bit lower.

There are stocks that are pulling back, but they are not destroying themselves, and that is always a positive. You like to see stocks pull back, give you opportunities to move in, and then actually bounce. Then you can enjoy the ride back up. I really like it when the pundits on the financial stations are so negative. They are going to get a chance to buy these stocks at a better price and they are just so glum about it. I like when they get negative when there is a two-day pullback after an eight-day run. I will take that any day.

THE ECONOMY

Please see the ECONOMY video at the following link: Economy Video

THE MARKET

MARKET SENTIMENT

VIX: 17.91; +0.28
VXN: 18.73; +0.53
VXO: 17.11; +0.53

Put/Call Ratio (CBOE): 0.82; +0.06

Bulls versus Bears:

This is a reading of the number of bullish investment advisors versus bearish advisors. The reason you look at this is that it gives you an idea of how bullish investors are. If they are too bullish then everyone is in the market and it is heading for a top: if everyone wants to be in the market then all the money is in and there is no more new cash to drive it higher. On the other side of the spectrum if there are a lot of bears then there is a lot of cash on the sideline, and as the market rallies it drags that cash in as the bears give in. That cash provides the market the fuel to move higher. If bears are low it is the same as a lot of bulls: everyone is in and the market doesn't have the cash to drive it higher.

Bulls: 48.3%. Once again bulls have peaked out near the 50% level. Bulls have bumped at 50ish since late August 2009, falling to 45ish and then rebounding. Thus for now this is more of the same as bulls get a bit pessimistic as the indices rise again and VIX falls. Hit 52.2% three weeks back, the highest level on this run. Still well over the 35% level that is the threshold for what is considered a bullish climate. It does not mean things are necessarily bearish; that takes a reading in the 60% range. Hit a high of 47.7% mid-June on the run from the March lows. Again, to be seriously bearish it needs to get up to the 60% to 65% level. Dramatic rise from 21.3% in November 2008, the bottom on this leg. This last leg down showed us the largest single week drop we have ever seen, falling from 33.7% to 25.3%. Hit 40.7% on the high during the rally off the July 2008 lows. 30.9% was the March low. In March the indicator did its job with the dive below 35% and the crossover with the bears. A move into the lower 40's is a decline of significance. A move to 35% is a bullish indicator.

Bears: 16.9%. Virtually in a flat line the past 6 weeks, down from 28% in mid-November. No sign of real worry based on this reading. This is the lowest level of the entire rally and is at a bearish level. Peaked near 28% on this round, falling short of the 35.6% hit in July 2009. For reference, cracking above the 35% threshold considered bullish. Hit a high on this run at 47.2%. For reference, bearishness hit a 5 year high at 54.4% the last week of October 2008. The move over 50 took bearish sentiment to its highest level since 1995. Extreme negative sentiment. Prior levels for comparison: Bearishness peaked at 37.4% in September 2007. It topped the June 2006 peak (36%) on that run. That June peak eclipsed the March 2006 high (33%) and well above the 2005 highs that spawned new rallies (30% in May 2005, 29.2% in October 2005). That was a huge turn, unlike any seen in recent history.

NASDAQ

Stats: -28.75 points (-1.24%) to close at 2287.99
Volume: 2.556B (+16.49%)

Up Volume: 569.157M (-743.322M)
Down Volume: 2.07B (+1.123B)

A/D and Hi/Lo: Decliners led 2.75 to 1
Previous Session: Advancers led 1.42 to 1

New Highs: 106 (-49)
New Lows: 8 (+6)

NASDAQ CHART: Click to view the chart

NASDAQ 100 CHART: Click to view the chart

SOX CHART: Click to view the chart

SP500/NYSE

Stats: -12.43 points (-1.08%) to close at 1136.03
NYSE Volume: 1.408B (+58.49%)

Up Volume: 246.422M (-239.793M)
Down Volume: 1.154B (+763.827M)

A/D and Hi/Lo: Decliners led 2.32 to 1
Previous Session: Advancers led 1.43 to 1

New Highs: 236 (-167)
New Lows: 34 (-12)

SP500 CHART: Click to view the chart

SP600 Chart: Click to view the chart

DJ30

Stats: -100.9 points (-0.94%) to close at 10609.65
Volume DJ30: 362M shares Friday versus 201M shares Thursday. Expiration trade in full gear.

DJ30 CHART: Click to view the chart

TUESDAY

Monday is a holiday. Maybe things will finally get back to "normal" after that. There will not be any expiration, after all it will just be earnings season kicking off in full swing. The market is bumping up against that resistance. The September low at about 1152 is the next resistance. It is up there and having a bit of trouble. The same thing on NASDAQ: it is having problems at its resistance from that September peak as well. The small caps are having issues from way back in 2008 when there were 1,2, 3 lows. It is at that point now and bumping its head. The market needs a catalyst to get it to move through this resistance. It is acting tired. NASDAQ is volatile and choppy, moving laterally. INTC gave a good earnings report and went down. We will have to see what the other earnings are and how the companies are treated after they report. If it is similar treatment, you know that the market is tired and will need consolidation or a big catalyst to send it higher.

Our game plan is to look for more testing. There will be more chop and testing by stocks. Some of these are in excellent shape to move back up, and they may be early leaders. It may take a couple more days of moving laterally at support before the market is ready to let them go, but we will be ready when they do. Be patient and watch the test. We want to look for good stocks in good pullbacks that we can take advantage of. We will get good positions just as other people are wringing their hands worrying about them. Do not get overly excited when you see a stock dip and bounce. Let us make sure we can get a close to the upside that looks strong and that the rest of the market is gelling as well.

Do not feel bad about closing some positions now. We are in earnings season, and there has been a good run higher. We have taken a lot of gain and continued to take gain on Friday, but do not feel bad if you want to close a position. Do not feel bad about closing it, raising some cash, and being patient and picking new opportunities. If you can get out without too bad of a loss and you see others, such as CMI, setting up well for a break higher, then close one out and put it to work where you think it will make you some money. If CMI makes a break higher off this pullback, maybe you will go in, make some green, and feel good about the recovery after the first pullback of the new year.

There is nothing showing there will be a major correction. There is a lot more chop, but we have to mind our current positions. We have taken a lot of gain already. Remember that earnings are out there, and do not feel like you have to buy stocks just because earnings are coming. Indeed, it is a good time to wait and let stocks gap up or down, and then set up for much higher percentage plays. We are taking positions out that have earnings in February so we do not have to make squeeze plays on them. That is also why we are foregoing some if they do not show us exactly what we want to see. We can be patient, and we have the luxury to do that after a good gain after a good rally. We are going to pick our shots when they are available, then move in and feel good about it. We will get good entry points. If they turn against us, we will just close them out and will not have lost much of anything. If we hit them right, we let them run and we make great gains. Have a wonderful weekend.

Support and Resistance

NASDAQ: Closed at 2287.99
Resistance:
2292 is a low from January 2008
2319 from the September 2008 peak
2326.28 is the January high
2324-2370 is a range of resistance from early 2008
2382-2395 from 2008
2412-2415 represents a series of peaks and lows in 2007, 2008
2453 is the August 2008 peak

Support:
The 18 day EMA at 2282
2275 - 2278 from the February 2008 and April 2008 lows
2245 from July 2008 through 2260 from late 2005.
The 50 day EMA at 2224
2218 is the August 2005 peak
2210 (from September 2008) to 2212 (the July 2009 closing low)
2205 is the November 2009 peak
2191 is the October 2009 peak
2177 is a low from March 2008
2169 is the March 2008 closing low (double bottom)
2168 is the September 2009, intraday peak
2167 from the July 2008 intraday low
2155 is the March 2008 intraday low
2143 is the October 2009 range low
2099 is the mid-September 2008 closing low
2070 is the September 2008 intraday low
2060 is the August peak
2048 is the early October 2009 closing low
2016 is the early August peak
1984 from late September
The 200 day SM A at 1980
1962 is the bottom of the August 2009 range.
1947 is the October gap down point

S&P 500: Closed at 1136.03
Resistance:
1150 is the January 2010 peak
1156 is the Sept 2008 low
1185 from late September 2008
1200 from the July 2008 low

Support:
1133 from a September 2008 intraday low
The 18 day EMA at 1132
1119 is the early December intraday high
1114 is the November 2009 peak
The 50 day EMA at 1110
1106 is the September 2008 low
1101 is the October high
1080 is the September 2009 peak
1078 is the October range low
1070 is the late September 2009 peak
1044 is the October 2008 intraday high
The August peak at 1040
The early October 2009 closing low at 1025
The early August intraday peak at 1018
The November 2008 peak at 1006 closing 1007.53 intraday
The 200 day SMA at 1001
992 is the August 2009 consolidation low

Dow: Closed at 10,609.65
Resistance:
10,963 is the July 2008 low

Support:
10,609 from the Mid-September 2008 interim low
The 18 day EMA at 10,571
10,496 is the November 2009 high
The 50 day EMA at 10,382
10,365 is the late September 2008 low
10,120 is the October 2009 peak
9918 is the September 2008 peak
9855 is the early September peak in its lateral range
9835 is the late September 2009 peak
9654 is the November 2008 high
9625 is the October 2008 closing high
9620 is the August 2009 peak
9430 is the early October low
9387 is the mid-October peak
The 200 day SMA at 9322

Economic Calendar

These are consensus expectations. Our expectations will vary and are discussed in the 'Economy' section.

January 15 - Friday
- Core CPI, December (08:30): 0.1% actual versus 0.1% expected, 0.0% prior
- CPI, December (08:30): 0.1% actual versus 0.2% expected, 0.4% prior
- Empire Manufacturing, January (08:30): 15.92 actual versus 12.00 expected, 4.50 prior (revised from 2.55)
- Capacity Utilization, December (09:15): 72.0% actual versus 71.8% expected, 71.5% prior (revised from 71.3%)
- Industrial Production, December (09:15): 0.6% actual versus 0.6% expected, 0.6% prior (revised from 0.8%)
- Michigan Sentiment, January (09:55): 72.8 actual versus 74.0 expected, 72.5 prior

January 19 - Tuesday
- Net Long-Term TIC Fl, November (09:00): $27.5B expected, $20.7B prior

January 20 - Wednesday
- Building Permits, December (08:30): 580K expected, 584K prior
- Housing Starts, December (08:30): 575K expected, 574K prior
- Core PPI, December (08:30): 0.1% expected, 0.5% prior
- PPI, December (08:30): 0.0% expected, 1.8% prior

January 21 - Thursday
- Initial Claims, 1/16 (08:30): 440K expected, 444K prior
- Continuing Claims, 1/09 (08:30): 4600K expected, 4596K prior
- Leading Indicators, December (10:00): 0.7% expected, 0.9% prior
- Philadelphia Fed, January (10:00): 18.8 expected, 20.4 prior
- Crude Inventories, 1/15 (11:00): 3.70M prior

icon url

ReturntoSender

01/19/10 10:57 PM

#8812 RE: ReturntoSender #6755

From Briefing.com: 4:30 pm : There weren't many truly positive catalysts this session, but participants showed support for stocks as they stepped in to buy the many names that were sent lower in the previous session. Their efforts drove stocks to a fresh 52-week closing high.

Stocks started the session in mixed fashion, but a steady stream of buyers helped stocks fully recover from their 1.1% loss this past Friday. Though technical resistance at 52-week intraday highs contained the move, the advance remained broad based and strong into the close.

The buying effort showed that participants remain willing to keep the stock market's pullbacks short and shallow as they try to take a position for future gains. Earnings represent a primary caveat to future gains, though.

Citigroup (C 3.54, +0.12) was the latest financial giant to post its latest quarterly results. The company booked a loss of $0.33 per share, but that was in-line with Wall Street's expectations. Shares of C were initially pressured by the report, but they were able to snap back and book a gain. The broader financial sector settled with a 1.1% gain.

Health care fared the best this session. It advanced 2.0% amid speculation that a Republican election to the vacant Massachusetts Senate seat could stall or stymie health care reform.

Tech was another strong source of support for the stock market. The sector climbed 1.6% as IBM (IBM 134.14, +2.36) hit a fresh 52-week high ahead of its quarterly announcement. IBM was one of more than 50 companies in the S&P 500 to book a fresh 52-week high and one of seven Dow components to hit a new yearly high.

Kraft (KFT 29.41, -0.17) was one of just a handful of Dow components to finish lower. It was weighed down by news that Cadbury (CBY 54.83, +2.93) has consented to a takeover by the food giant. Kraft will have to pay $19.44 billion in cash and stock for the confectioner, though.

Though smaller, an acquisition was announced by Tyco International (TYC 38.19, +0.65), which will pay $2.0 billion for Brink's Home Security Holdings (CFL 41.54, +10.12). Tyco went on to forecast fiscal first quarter adjusted earnings from $0.63 to $0.65 per share, which exceeds the current consensus of $0.50 per share and the range of $0.48 to $0.50 per share that the company had previously forecast. The company maintained its in-line guidance for fiscal 2010, though.

Roughly 90% of the stocks in the S&P 500 booked gains this session. Though that helped the broader market put together one of its better sessions since the start of the year, more impressive is that the advance came in the face of a firmer dollar -- the greenback actually gained a healthy 0.5% against a basket of foreign currencies.

Advancing Sectors: Health Care (+2.0%), Tech (+1.6%), Materials (+1.6%), Telecom (+1.5%), Utilities (+1.2%), Consumer Discretionary (+1.2%), Financial (+1.1%), Industrials (+0.9%), Energy (+0.9%), Consumer Staples (+0.6%)
Declining Sectors: (None).DJ30 +115.78 NASDAQ +32.41 NQ100 +1.7% R2K +1.8% SP400 +1.3% SP500 +14.20 NASDAQ Adv/Vol/Dec 1893/2.06 bln/825 NYSE Adv/Vol/Dec 2389/1.04 bln/686

5:01PM Rambus and Samsung sign comprehensive agreement; Samsung to invest $200 mln (RMBS) 21.13 +0.36 : Samsung Electronics and Rambus (RMBS) announce that they have reached agreement settling all claims between them and licensing Rambus' patent portfolio covering all Samsung semiconductor products including a perpetual fully paid-up license to certain current DRAM products. As part of the overall agreement, Samsung will invest $200 mln in Rambus stock. Other consideration to Rambus includes an initial payment of $200 mln and a quarterly payment of about $25 mlnor the next five years. In addition, Samsung and Rambus have signed a memorandum of understanding relating to a new generation of memory technologies which brings together Samsung's leadership in memory technologies with Rambus' innovations in high performance memory interfaces. The two companies will initially focus on graphics and mobile memory solutions and will further review a potential collaboration on server and high-speed NAND Flash memories. Stock is halted.

4:30PM First Solar, PNM sign contract for 22 megawatts of utility scale power for New Mexico (FSLR) 123.94 : New Mexico's largest electric utility has signed a contract with FSLR to construct 22 megawatts AC of utility scale photovoltaic solar power plants in New Mexico.

4:11PM IBM beats by $0.12, reports revs above consensus; guides FY10 EPS to high end of prior range, above consensus (IBM) 134.14 +2.36 : Reports Q4 (Dec) earnings of $3.59 per share, $0.12 better than the First Call consensus of $3.47; revenues rose 0.7% year/year to $27.2 bln vs the $26.96 bln consensus. Reports Q4 gross margins of 48.3% vs Street est of 48.4%. Co issues upside guidance for FY10, sees EPS of at least $11.00 vs. $10.88 consensus. In the Q3 report (10/15), the company reaffirmed its 2010 EPS guidance, stating that it was well ahead of pace for its 2010 roadmap of $10 to $11 per share... Global Business Services segment revenues decreased 3 percent to $4.6 billion; Revenues from the Systems and Technology segment totaled $5.2 billion for the quarter, down 4 percent; Revenues from the Software segment were $6.6 billion, an increase of 2 percent; Signings in Consulting and Systems Integration and in Integrated Technology Services were $7.4 billion, an increase of 1 percent... "IBM continued to benefit from our strategic transformation, offerings that our clients value in this economy, and our commitment to developing countries around the world.... In 2009, we invested in opportunities such as Smarter Planet solutions, cloud computing and advanced analytics. These new capabilities position IBM to grow as the economy recovers. The increased operational leverage we have established by creating a globally integrated enterprise will enable us to drive greater profits as revenue growth returns. We are confident about 2010 and our ability to achieve the high end of our long-term roadmap." The balance sheet remains strong, and the company is well positioned to take advantage of opportunities.

4:07PM Cree beats by $0.08, beats on revs; guides Q3 EPS and revs well above consensus (CREE) 54.21 +0.20 : Reports Q2 (Dec) earnings of $0.38 per share, excluding non-recurring items, $0.08 better than the First Call consensus of $0.30; revenues rose 35.1% year/year to $199.5 mln vs the $186.8 mln consensus. Co issues upside guidance for Q3 (Mar), sees EPS of $0.41-0.44, excluding non-recurring items, vs. $0.28 consensus; sees Q3 revs of $215-225 mln vs. $189.21 mln consensus. Q2 non-GAAP gross margin was 47.5% vs 43.9% consensus; it was 44.1% in SepQ and 38.9% in the year ago period; Cree's target is 40% plus or minus. Co says LED lighting adoption continues to gain momentum and its near term focus is on factory execution and capacity expansion.

4:04PM Cree trading almost 4 points higher following earnings (CREE) 54.21 : $57, $59, and $60 are technical levels to watch. Stock was down sharply on Friday ahead of earnings

1:41PM Semiconductors Hldrs Trust back vacillating near early high (SMH) 27.32 +0.39 : The Semi sector (SMH) was a laggard last week with it dropping more than 3% on Friday and as much as 6.3% off Monday's high. It held at support at its Oct high and 50 day ema and stabilized Friday with the early run today reaching 27.34 which has been retested in recent trade. For the near term as long as the 27.15/27.05 support area is not taken out, it will be in position for follow through upticks. Key short term resistances to work through to neutralize the recent weak pattern are at 27.60 and the 27.80/27.86 area (Click for chart) -- SNDK +6.3%, ADI +1.6%, ALTR +1.7%, AMAT +1.7%, AMD +2.2%, AMKR +1.8%, ATML +2%, LSI +1.7%, TER +1.8%, XLNX +1.6%.

8:03AM Chipmos Technology says revs for Dec 2009 were $39.9 mln, up 8.9% from Nov 2009 and up 63.9% YoY (IMOS) 0.80 : Co announces that revs for the month of December 2009 was NT$1,274.7 million or US$39.9 million, an increase of 8.9% from the month of November 2009 and an increase of 63.9% from the same period in 2008. On a quarterly basis, revenues for the fourth quarter of 2009 was NT$3,589.7 million or US$112.4 million, an increase of 7.2% from the third quarter of 2009 and an increase of 17.6% from the same period in 2008. This is above prior expectations that fourth quarter 2009 revenue would be flat to having growth in the single digit percentage, as compared to the third quarter 2009. The Company also announced upwardly revised gross margin guidance for the fourth quarter 2009, primarily due to better than expected revenue. The Company now expects gross margin will be in the range of negative 13% to negative 17%, compared to prior guidance of negative 18% to negative 25%.

icon url

ReturntoSender

01/20/10 9:49 PM

#8813 RE: ReturntoSender #6755

From Briefing.com: 4:30 pm : Disregard for a large batch of better-than-expected earnings reports gave way to a stiff bout of selling pressure that put stocks on track for their worst loss in more than two months. However, financials were able to garner support into the close and help the broader market trim its losses.

Stocks set fractionally improved 52-week highs in the previous session, but momentum failed to carry over as global participants reacted negatively to news that China's authorities reportedly ordered some banks to curb lending in a move suggestive of tighter monetary policy. The order precedes the release of China's fourth quarter GDP numbers, so many have inferred that the report will feature a strong upside reading.

Concern about a forced slowdown of China's economy led some to consider the implications for the global economy's recovery. That weighed on both stocks and commodities and even led some to seek safety in the U.S. dollar. Support for the dollar helped the greenback gain 1.1% against a basket of foreign currencies, but it only exacerbated the burden on stocks and commodities.

Broad-based weakness pushed the stock market down as much as 1.8% and momentarily below its July to January trendline even though there were plenty of positive earnings surprises. IBM (IBM 130.25, -3.89), Coach (COH 35.35, -2.10), Wells Fargo (WFC 27.82, -0.46), U.S. Bancorp (USB 25.01, +0.52) and State Street (STT 46.28, +3.08) were among the more widely-held companies to top expectations. However, Morgan Stanley (MS 30.63, -0.53) came short of the consensus earnings estimate and Bank of America (BAC 16.49, +0.17) had a deeper-than-expected loss. Bank of America redeemed itself with news of more stable credit costs, particularly at the consumer level.

Amid the many earnings reports from financial players, several banking issues were able to garner support. Diversified banks buckled and gave up an early gain to finish with a 0.7% loss, but regional banks gained 1.7%. Their strength helped the broader financial sector climb from a 1.2% loss to finish the session just 0.1% to the downside.

Despite relative leadership from the financial sector, weakness remained widespread. As such, eight of the 10 sectors logged losses of 1% or more.

Health care held up relatively well. It finished the session just 0.5% lower. It had been up in early action amid continued support from those that speculate that health care reform could be stalled or stymied with the election of a Republican to the Massachusetts Senate seat.

Energy stocks suffered the most this session. They dropped 1.7% as a group. The sector's weakness was worsened by softer oil prices. February crude oil contracts, which expired at the close of pit trade, settled with oil quoted 1.8% lower at $77.62 per barrel, while March contracts closed with oil priced 2.2% lower at $77.55 per barrel.

Economic data was mixed overall and didn't do anything for market participants this session. More specifically, the December Producer Price Index increased 0.2% month-over-month, which was higher than the consensus call for a flat reading. Monthly producer prices had spiked 1.8% in November. Excluding food and energy, producer prices for December were flat from the previous month. An increase of 0.1% had been widely forecast following the 0.5% monthly increase that was posted in November.

Housing starts for December hit an annualized rate of 557,000, which is a slower clip than the expected rate of 572,000 units. It also marked a pullback from the annualized rate of 580,000 that was registered in November.

However, building permits hit an annualized rate of 653,000 in December. That was far higher than the annualized rate of 580,000 permits that the consensus had predicted and up from the previous month's annualized rate of 589,000 permits.

Advancing Sectors: (None)
Declining Sectors: Energy (-1.7%), Materials (-1.5%), Tech (-1.5%), Telecom (-1.4%), Industrials (-1.3%), Consumer Discretionary (-1.2%), Utilities (-1.1%), Consumer Staples (-1.0%), Health Care (-0.5%), Financials (-0.1%)DJ30 -122.28 NASDAQ -29.15 NQ100 -1.5% R2K -1.5% SP400 -0.8% SP500 -12.19 NASDAQ Adv/Vol/Dec 729/2.38 bln/1968 NYSE Adv/Vol/Dec 787/1.05 bln/2249

4:33PM Skyworks beats by $0.02, beats on revs; guides Q2 EPS above consensus, revs above consensus (SWKS) 14.71 -0.15 : Reports Q1 (Dec) earnings of $0.27 per share, $0.02 better than the First Call consensus of $0.25; revenues rose 16.6% year/year to $245.1 mln vs the $240.9 mln consensus. Co issues upside guidance for Q2, sees EPS of $0.21 vs. $0.19 consensus; sees Q2 revs of $225 mln vs. $214.56 mln consensus. Co states, "Skyworks' strong performance is being driven by several key trends including the exploding demand for mobile Internet applications, increasingly diversified linear products and the rapid adoption of smart grid technologies. More importantly, as our improving gross and operating margins demonstrate, our innovative solutions are allowing us to further differentiate Skyworks, positioning us to create even greater competitive advantages and shareholder."

4:26PM Xilinx beats by $0.05, beats on revs; guides Q4 revs above consensus (XLNX) 23.94 +0.06 : Reports Q3 (Dec) earnings of $0.40 per share, excluding $0.02 in non-recurring items, $0.05 better than the First Call consensus of $0.35; revenues rose 12.0% year/year to $513.3 mln vs the $491.7 mln consensus. Co issues upside guidance for Q4, sees Q4 revs of down 1% sequentially to up 3% sequentially, which equates to ~$508-528.7 mln vs. $492.79 mln consensus. XLNX sees Mar qtr gross margin of 64-65%, vs. 63.3% consensus.

4:09PM F5 Networks beats by $0.03, beats on revs; guides Q2 EPS above consensus, revs above consensus (FFIV) 52.92 +0.59 : Reports Q1 (Dec) earnings of $0.52 per share, excluding non-recurring items, $0.03 better than the First Call consensus of $0.49; revenues rose 15.5% year/year to $191.2 mln vs the $185.7 mln consensus. Co issues upside guidance for Q2, sees EPS of $0.52-0.54, excluding non-recurring items, vs. $0.48 consensus; sees Q2 revs of $195-200 vs. $186.81 mln consensus. Co says, "While seasonal factors typically make Q2 our most challenging quarter, customer buying patterns continue to stabilize and our near-term business outlook remains strong."

4:08PM Plexus beats by $0.02, beats on revs; guides Q2 EPS above consensus, revs above consensus (PLXS) 28.98 +0.25 : Reports Q1 (Dec) earnings of $0.36 per share, excluding non-recurring items, $0.02 better than the First Call consensus of $0.34; revenues fell 5.6% year/year to $430.4 mln vs the $422.3 mln consensus. Co issues upside guidance for Q2, sees EPS of $0.42-0.52 vs. $0.31 consensus; sees Q2 revs of $470-495 mln vs. $423.90 mln consensus.

California Micro Devices (CAMD) announces it and the other named defendants in the three purported class action lawsuits that were filed in connection with the proposed acquisition of California Micro Devices by ON Semiconductor (ONNN) have entered into a memorandum of understanding with counsel for the plaintiffs. Under the terms of the memorandum of understanding, the parties have agreed to settle the lawsuits, subject to court approval.

1:17AM ASML Holding beats by EUR 0.02, beats on revs; issues downside Q110 revenue guidance and upside Q210 revenue guidance (ASML) 32.75 : Reports Q4 (Dec) earnings of EUR 0.12 per share, EUR 0.02 better than the First Call consensus of EUR 0.10; revenues rose 17.6% year/year to EUR 581 mln vs the EUR 573.7 mln consensus. Q4 2009 net bookings were valued at EUR 956 mln with 40 systems including 35 new and 5 used systems, leading to an order backlog valued at EUR 1.853 bln as of December 31, 2009. ASML's backlog as of September 27, 2009 was valued at EUR 1.353 bln, totaling 54 systems with an average selling price of EUR 25.1 mln. Q409 gross margin was 38.0%. This margin is the result of an improvement of co's cost structure and stronger service and field option sales and compares with the Q309 gross margin of 34.4%. "We booked EUR 956 million of systems in the fourth quarter of 2009 and expect bookings of the same order of magnitude for the first quarter of 2010, confirming an upturn of the semiconductor industry," CEO Eric Meurice said. Co issues downside guidance for Q110; sees revenue of approx EUR 700 mln vs EUR 770 mln First Call consensus. Co issues upside guidance for Q210; sees revenue of approx EUR 950 mln vs EUR 815.38 mln. Co expects gross margin of approx 40% in Q110, in line with 40% consensus. CEO comments that first quarter will be "somewhat restricted, due to standard - long - equipment industry production lead times and new product introduction challenges, followed by a much higher second quarter."

08:35 am IBM (IBM)

IBM (IBM 134.14) reported fourth quarter earnings that topped the consensus estimate, capping off what CEO Samuel J. Palmisano called "a strong year with a solid performance in the fourth quarter in which we again delivered growth in margins, profit and earnings."

IBM reported fourth quarter earnings of $3.59 per share, $0.12 better than the First Call consensus of $3.47. Net income of $4.8 billion was up 9%.

Revenues rose 0.7% year-over-year to $27.2 billion; the consensus estimate stood at $26.96 billion. Gross margins came in at 48.3%; the consensus estimate called for 48.4%.

IBM said that it expects fiscal 2010 earnings of at least $11.00 per share, ahead of the current consensus estimate of $10.88.

Shares of IBM are about 1.5% lower an hour ahead of Wednesday's opening bell but are about 2.5% higher year-to-date.
icon url

ReturntoSender

01/21/10 9:53 PM

#8814 RE: ReturntoSender #6755

From Briefing.com: 4:40 pm : Threats of tighter monetary policy in China and increased bank regulation combined with a sell-the-news mentality to drop the stock market for its worst single-session percentage loss in nearly 12 weeks.

Stocks had already tumbled significantly in the previous session, but sellers were back at it after China reported stronger-than-expected fourth quarter GDP growth and a sharper-than-expected spike in inflation, which renewed concern that tighter monetary policy may be in the offing. Tighter policy in China would presumably crimp the country's growth and slow the global economic rebound.

Such a consideration has weighed on both stocks and commodities for two straight sessions. That has had a doubly negative impact on materials stocks, which sank to a 4.3% loss in their latest showing.

Meanwhile, energy stocks dropped 2.0% as oil prices were pushed to a near one-month low of $75.66 per barrel before they finished pit trade with a 2.1% loss at $76.08 per barrel. Price erosion came in the face of a surprise inventory draw of 4.7 million barrels during the week that ended Jan. 15.

Financials were forced a sharp 3.0% lower. President Obama stirred concern for financials with the announcement that plans are being put together to ensure that no bank will own, invest in or sponsor a hedge fund or a private equity fund, or proprietary trading operations unrelated to serving customers for its own profit. Further, the proposal will place broader limits on the excessive growth of the market share of liabilities at the largest financial firms. Though details of any such plan will change as it moves through the legislative process, the idea behind such a plan is a negative for big financial institutions.

The announcement seemed to exacerbate weakness in Goldman Sachs (GS 160.87, -6.92), which had already succumbed to profit-taking by participants who believed that its better-than-expected earnings of $8.20 per share had already been priced into the stock. The company's in-line revenue results also dulled the glimmer of its upside earnings surprise.

However, regional banks were able to garner support and put together a 0.8% gain. They were actually up nearly 3% at their session high as investors acted on knowledge that regional lenders won't be as restricted by Obama's regulatory proposals as their larger competitors. Regional banks were generally an exception to the recent sell-the-news trend and, as a result, were helped by a handful of better-than-expected quarterly reports.

Another exception to the recent sell-the-news trend was eBay (EBAY 24.13, +1.90). Its upside earnings surprise helped it net its best single session advance by percent in six months. That was even more impressive given the scope of losses in the broader market this session.

Volatility surged amid this session's slide. The Volatility Index closed some 19% higher in its sharpest move in two months.

Trading volume topped 1.5 billion shares on the NYSE this session. That's well above recent averages and suggestive of strong underlying conviction.

As an aside, initial weekly payrolls continue to come in at elevated levels. Initial claims for the week ended Jan. 16 totaled 482,000, which was more than the 440,000 initial claims that had been expected. It was also up from the prior week's 446,000 initial claims tally.

Meanwhile, continuing claims came in at 4.60 million, which matched the consensus forecast. Continuing claims for the prior week were revised modestly higher to 4.62 million. DJ30 -213.37 NASDAQ -25.55 NQ100 -0.9% R2K -1.8% SP400 -1.3% SP500 -21.56 NASDAQ Adv/Vol/Dec 676/2.90 bln/2015 NYSE Adv/Vol/Dec 649/1.50 bln/2401

4:35PM Veeco Instruments awarded $4 mln R&D Matching Fund from DoE Solid State Lighting Manufacturing Grant (VECO) 35.43 -1.00 : Co announced that it has been awarded $4 million in R&D matching funds from the American Recovery and Reinvestment Act by the U.S. Department of Energy to support high-efficiency solid state lighting projects. Solid state lighting, which uses light emitting diodes (LEDs) and organic LEDs (OLEDs) has the potential to be ten times more energy-efficient than traditional incandescent light bulbs. The overall objective of this two year program is to develop high-volume MOCVD systems that provide a 4X reduction in the cost of epitaxial growth for LED devices, with the ultimate goal of a 10X reduction in LED costs. Veeco will partner with Sandia National Laboratories on this project. In total the Department of Energy awarded more than $37 million in funding for solid state lighting programs. Veeco's proposal was one of eight selected as part of U.S. Manufacturing

4:33PM Conexant reports Q1 EPS of $0.17 vs $0.11 consensus, revs rose 10% YoY to $61.8 mln vs $60.1 mln two analyst est (CNXT) 2.85 -0.05 : Conexant expects revenues for the second quarter of fiscal 2010 to be $60 to $61 mln vs $54.9 two analyst est. Core gross margins are expected to be about 61% of revenues. The company anticipates that core operating expenses will be approximately $25 million. As a result, the company expects that second fiscal quarter core operating income will range between $11.6 and $12.5 mln, with core net income of $0.13 to $0.14 per share vs $0.08 consensus.

4:21PM Advanced Micro beats by $0.13, beats on revs; sees seasonal Q1 rev decline (AMD) 8.99 +0.12 : Reports Q4 (Dec) loss of $0.05 per share, excluding a $1.57 per share favorable impact from a legal settlement with INTC, $0.13 better than the First Call consensus of ($0.18); revenues rose 41.7% year/year to $1.65 bln vs the $1.49 bln consensus. Advanced Micro sees Q1 revs down sequentially, consensus calls for a ~16% sequential decline. Fourth quarter 2009 AMD gross margin was 45% vs the 42.4% consensus, compared to 42% in the prior quarter. "AMD's quarter marks another milestone in our transformation and underscores our growing momentum. We enter 2010 having completed the transition to a fabless business model, reached a historic antitrust settlement, and made significant progress strengthening our balance sheet. Our innovative strategy for designing the world's most vivid digital experiences continues to generate demand."

4:18PM Western Digital beats by $0.49, beats on revs (WDC) 45.29 +1.03 : Reports Q2 (Dec) earnings of $1.85 per share, $0.49 better than the First Call consensus of $1.36; revenues rose 43.7% year/year to $2.62 bln vs the $2.35 bln consensus. Hard drive shipments up 39% yr/yr. "For the third consecutive quarter, we increased output in a supply constrained environment, providing strong support of our customers' growth opportunities, primarily in the consumer segment but, notably, with some emerging strength in the commercial sector...A moderate pricing environment, combined with our passionate focus on cost and efficiency, enabled gross margins of 26.2% -- well above the high end of our model range."

4:17PM Emulex beats by $0.02, beats on revs; guides Q3 EPS above consensus, revs in-line (ELX) 12.60 -0.01 : Reports Q2 (Dec) earnings of $0.18 per share, excluding non-recurring items, $0.02 better than the First Call consensus of $0.16; revenues fell 0.3% year/year to $108.3 mln vs the $104.1 mln consensus. Co issues mixed guidance for Q3, sees EPS of $0.16-0.18, excluding non-recurring items, vs. $0.14 consensus; sees Q3 revs of $100-103 mln vs. $100.32 mln consensus.

4:11PM Google stabilizing above the $550 level, down about $30 after earnings (GOOG) 582.98 : $551.50 was gap support from 11/06. If it gets through $550, the next big level isn't until the $530 area. Last trade at $552.70

4:05PM Google beats by $0.29, reports revs in-line (GOOG) 582.98 +2.57 : Reports Q4 (Dec) earnings of $6.79 per share, $0.29 better than the First Call consensus of $6.50; revenues rose 17.3% year/year to $4.95 bln vs the $4.92 bln consensus. Aggregate paid clicks, which include clicks related to ads served on Google sites and the sites of its AdSense partners, increased approximately 13% over 4Q08 and increased approximately 9% over 3Q09. Average cost-per-click, which includes clicks related to ads served on Google sites and the sites of our AdSense partners, increased approximately 5% over 4Q08 and increased approximately 2% over 3Q09. Revenues from outside of the United States totaled $3.52 bln, representing 53% of total revenues in the 4Q09, compared to 53% in 3Q09and 50% in 4Q08. Non-GAAP operating income in the fourth quarter of 2009 was $2.76 bln, or 41% of revenues. This compares to non-GAAP operating income of $2.15 billion, or 38% of revenues, in 4Q08.

4:05PM Microsemi reports EPS in-line, revs in-line; guides Q2 EPS in-line, revs above consensus (MSCC) 17.18 +0.05 : Reports Q1 (Dec) earnings of $0.26 per share, in-line with the First Call consensus of $0.26; revenues fell 13.6% year/year to $112.8 mln vs the $112.4 mln consensus. Co issues mixed guidance for Q2, sees EPS of $0.26-0.27 vs. $0.27 consensus; sees Q2 revs up 2-4% q/q (~$115-117 mln) vs. $114.82 mln consensus.

4:08PM Advanced Energy signs strategic PV solar service agreement for Colorado State University's new, 2 MW solar plant (AEIS) 15.62 +0.00 : Co announces that AMEC, the international engineering and project management company, has engaged Advanced Energy for a multi-year agreement to provide SiteGuard services for Colorado State University's new, two megawatt photovoltaic solar power plant located in Fort Collins, Colorado. The new solar facility started producing power in early December and is expected to be fully commissioned in early 2010.

12:36PM Motorola confirms store for Android applications in China (MOT) 7.42 -0.06 : Motorola confirms that in China introduced SHOP4APPS, Motorola's store for Android applications. SHOP4APPS will be available on new Motorola smartphones in China starting in time for Chinese New Year. Motorola additionally announced a new feature on their Android handsets enabling users to customize their Android devices by selecting their own search provider. Users will be able to select their search experience from a number of providers including Baidu (BIDU) and others, with whom Motorola has signed strategic agreements.

Cree (CREE) announces a distribution agreement with Arrow Electronics for Cree SiC power products...

Sanmina-SCI Corp (SANM), announces that it has selected SandForce high performance processors for its solid state drive products...

8:38AM LightPath gives Q2 guidance; says strength due to Asian markets (LPTH) 2.30 : The co gives Q2 guidance: backlog scheduled to ship within the next 12 months is $4.0 million, an increase of $900,000 or 29% as compared to the backlog of $3.1 million on December 31, 2008 and an increase of $1.7 million or 74% as compared to the backlog on June 30, 2009; cash on hand as of December 31, 2009 was $906,000 as compared to $524,000 on December 31, 2008 and $580,000 on June 30, 2009; revenue for the second quarter of fiscal 2010 was $2.2 million compared to $1.9 million for the same period in fiscal 2009 and up $600,000 or 38% from the previous quarter. Jim Gaynor, President and Chief Executive Officer of LightPath, commented, "During the second quarter of fiscal 2010 we saw for the second consecutive quarter a significant increase in our backlog. We also experienced revenue growth of 38% over the previous quarter. The order strength continues to come from our work in the Asian markets in industrial laser tools and telecom applications." (Note, there are no estimates for LPTH)

8:30AM Applied Materials and Advanced Micro-Fabrication Equipment settle litigation and resolve all outstanding disputes (AMAT) 13.80 : The co and Advanced Micro-Fabrication Equipment, Inc. (AMEC) today jointly announced that they have settled all litigation between the respective companies and that all outstanding disputes have been resolved. Among other things, there was a dispute over the ownership of certain patent families filed by AMEC. In the settlement the parties agreed that those patent families will be jointly owned. AMEC also made a payment to Applied Materials of an undisclosed amount, and in light of that, the parties agreed to collaborate on projects in the future.

7:33AM Fairchild Semi beats by $0.06, beats on revs; guides Q1 revs above consensus (FCS) 9.26 : Reports Q4 (Dec) earnings of $0.23 per share, $0.06 better than the First Call consensus of $0.17; revenues rose 10.5% year/year to $354.5 mln vs the $340.9 mln consensus. Co issues upside guidance for Q1, sees Q1 revs of roughly $370 mln vs. $335.78 mln consensus. Adjusted gross margin was 30.3 percent, up 340 basis points sequentially and 380 basis points higher than in the fourth quarter of 2008. Adjusted gross margin excludes accelerated depreciation and inventory write-offs/reserve releases related to fab closures. "Our scheduled backlog for first quarter shipments is currently about $369 million which is roughly $33 million higher than this point a quarter ago. Included in this amount is approximately $20 million of backlog that we booked in the first three and a half weeks of this quarter. We expect that both distributor sell through and OEM demand will continue to track above seasonal levels in Q1. Given the solid order rates this quarter and our starting backlog position, we expect first quarter sales to be roughly $370 million while further improvements in product mix help drive adjusted gross margin to a range of 31 to 32 percent. We expect R&D and SG&A spending to be approximately $78 million in Q1. Interest expense for the first quarter is expected to be roughly $3 million while our adjusted tax rate should be in the range of 15 to 20 percent. We remain disciplined in our capital investment plans with spending forecast to be between 6 to 7 percent of sales in 2010. We anticipate recording approximately $2 million in charges and $2 million of accelerated depreciation in the first quarter associated with previously announced fab closure actions. As with last quarter, we are not assuming any obligation to update this information, although we may choose to do so before we announce first quarter results."

F5 Networks (FFIV) announces that it has joined the NetApp (NTAP) Alliance Partner Program as an Advantage Alliance Partner. F5 is collaborating with NetApp to provide customers with unified application and data delivery solutions to enable more agile and dynamic data centers...

7:01AM Trina Solar commences module supply to Australia's largest distributor, RFI (TSL) 24.01 -0.97 : Co announced it has made initial shipments to RF Industries Pty Ltd ("RFI"), Australia's leading renewable energy distributor in January 2010. This is in conjunction with the Company's intention to finalize with RFI a national distribution agreement to supply up to 10 MW of PV modules in 2010.

09:38 am Advanced Micro upgraded to Buy at Broadpoint AmTech Research; tgt raised to $10: . Broadpoint AmTech Research upgrades AMD to Buy from Neutral and raises their tgt to $10 from $5.80 as the recent positive events (Analyst Day/INTC settlement/capital structure) lead the firm to believe that AMD's risk/reward is now compelling. The firm notes that AMD's capital structure improved as a result of INTC's $1.25 bln settlement and yesterday's announcement of debt restructuring actions. The firm believes that AMD's debt of ~$3.7 bln will be reduced by ~25%, while also lowering interest expense slightly less, ~20%. Should Global Foundries and ATIC's chartered purchase be consolidated, the firm believes that they could see deconsolidation in the following 3-6 months. Furthermore, the firm feels that revenue growth in the coming quarters will prove to be stronger than the Street is modeling, driven by: a healthy Win7 cycle; leadership in the Evergreen GPU platform; more focused marketing; and possible tailwind from INTC settlement headlines entering the selling season.

icon url

ReturntoSender

01/23/10 5:51 PM

#8815 RE: ReturntoSender #6755

Amateur Investors Weekend Stock Market Analysis (1/23/10)

http://www.amateur-investor.net/Weekend_Market_Analysis_Jan_23_10.htm

The market finally came under some selling pressure this week as investors had become very complacent over the past month. The 5 Day Average of the Put to Call Ratio dropped to a 3 year low right (point A) before the sell off began. Meanwhile also notice since the March 2009 low each time a pullback has occurred it ended as the 5 Day Average of the Put to Call Ratio rose back to the 1.0 level (points B). Currently the 5 Day Average of the Put to Call Ratio is still well below the 1.0 level so the market could still go even lower as a correction occurs.


Meanwhile since July the Dow has been holding support at or above its 10 Week EMA (blue line) as it has been trending higher however that support area was broken solidly to the downside this week. It's possible we will see an oversold bounce develop next week as the Dow may find initial support at its 20 Week EMA (green line) near 10090.


Of course the question is has the Dow completed an ABC corrective rally and put in a significant top? At this point nobody knows the answer to that question. If the Dow were to drop below its 20 Week EMA then the next support level to watch appears to be around 9735 which is along the 40 Week EMA (blue line) and aligns with the 23.6% Retrace calculated from the March 2009 low to the most recent high.


Finally as I mentioned last weekend the longer term upward trend line (black line) in the Dow connecting the 1932 low with the 1982 low would eventually come into play near the 6000 level if the C Wave ends up being an elongated affair much like occurred from the late 1930's through the early 1940's.

icon url

ReturntoSender

01/23/10 6:17 PM

#8816 RE: ReturntoSender #6755

CPC 60 Day SMA versus the SOX - Frankly a longer term moving average is necessary to clearly show a trend when you are talking what is truly low or not. That said even a 5 day sma shows basically the same thing but it is just too busy.

Bottom line is that the CPC was no where near where it was at the top in 2000. In addition it has been lower at many times prior to an actual market top.


Bottom line for me is that there is nothing yet showing up in the market volume to indicate the market has made a real top. I own 10,000 share of Citigroup and I can tell you, even I think, the downgrade of semi-equip stocks was pure BS.

RtS
icon url

ReturntoSender

01/24/10 5:45 PM

#8817 RE: ReturntoSender #6755

InvestmentHouse Weekend Market Summary

http://www.investmenthouse.com/weekendmarketsummary.htm

- Another sharp downside day as the uncertainty remains, and indeed even grows.
- Triumvirate of uncertainties sends market reeling again.
- Suddenly the indices are at key support after a sudden drop.
- Leadership takes a pounding across the board though there are, as usual, pockets of interest.
- Incongruous policies, rhetoric threaten an already lackluster recovery here and elsewhere.
- Strong downside Friday close warrants caution to start the next week.
- Earnings can turn things around . . . if investors can get a handle on the uncertainties.

Uncertainty remains, leaving a void the sellers fill.

We have DIVIDED the video into component parts: Market Overview, Technical Summary, Economy, and the Next Session. This allows you to choose the segments you are interested in without having to find the spot in a longer video. Click on the link to the portion you wish to view.

MARKET OVERVIEW

TO VIEW THE MARKET OVERVIEW CLICK THE FOLLOWING LINK:
Market Overview Video

TO VIEW THE TECHNICAL SUMMARY VIDEO CLICK THE FOLLOWING LINK:
Technical Summary Video

TO VIEW THE ECONOMY VIDEO CLICK ON THE FOLLOWING LINK:
Economy Summary Video

TO VIEW THE NEXT SESSION VIDEO CLICK THE FOLLOWING LINK:
Next Session Video

Friday was another down day on the heels of Thursday's tumble. This was brought about by increased and threatened regulation in China and the US. The week started with China threatening to cut off banks from lending for the rest of January and perhaps into February. It was not specific as to which banks would be targeted. Obviously, the banks that were unable to meet the new loan reserve requirements were on the list, but the chair in charge indicated that it could be other banks as well. That undermined a lot of the "over there" stock trades, the Chinese stock market, and markets around the world.

On top of that, the President of the United States attacked financial institutions on Thursday. He said if they got too big, they would break them up along with prohibiting and/or taxing the proprietary trading. With these shocks to the market, they continued to sell and sold big on Friday. The large cap indices all fell by 2% or more. It was an old-fashioned butt kicking as stocks large and small fell across the board. Uncertainty, the attacks on the financial institutions, and the talk of not reappointing Bernanke as Fed Chairman all led to the confusion. Friday culminated into this major selloff. It was piqued by the fact that many senators said they would not vote to reaffirm Bernanke. I have issues with him, but it is mostly issues with the Fed in general; indeed, that is what those senators are saying. They were upset with the Fed and reacting to Tuesday's election. They see a populist uprising and anger about the Fed keeping quiet about deals being cut behind closed doors. Those senators are playing a political ticket to take shots at Bernanke. Like him or not, he has performed as any Fed Chairman would in these times. He could be put on the chopping block as the sacrificial lamb. He may get it, and maybe he deserves it, but it is not a great time for this to occur. Thus, the markets were selling. This confusion is anathema to investors and, thus, the stock market. Therefore, you see the rush to the door and a high-volume stampede at that.

The market opened lower. The SP500 SPYders started lower. It tried to bounce and looked like it might make a recovery; indeed, it was bouncing and trying to hold through mid-morning. Then the sellers took over, the bounce failed over lunch, and then the selling was on in the afternoon. It became a massive rush to the exits as the session wore on. One thing that was disconcerting, other than the overall selling, was that the SOX failed to hold up at all. It tried to make a stand at the 50 day EMA. Recall that it was the first one to go down. The market followed it, and it looked like it might hold. When the selling reared its ugly head, the SOX bravely turned its tail and fled (as they say in Monty Python). It gapped, it went through the 50 day EMA, went through support in December, and now it is down. It even undercut the peaks in September and October. When that went down, almost everything went down. There are always pockets of strength, and some of those were on the report. There are stocks holding up nicely despite the rest of the market falling down. The result was that the indices are already at the support levels that I talked about on Wednesday and Thursday. There was no orderly pullback or orderly selling. Rather, it was a lemming rush to the exits, and it picked up speed as the bell approached to end the week. Investors do not like uncertainty and especially do not like it over the weekend. Nine times out of ten when there is populist rhetoric going on, the Sunday talk shows or the bully pulpit of the President will be used on the weekend to discuss further details and other areas they want to regulate. That has investors scared. That has small and large businessmen and the entire world financial markets scared as well.

OTHER MARKETS

The dollar had a banner week. It broke higher out of a consolidation, but it struggled on Thursday and Friday. It rallied up to the 200 day EMA on Thursday, and then it could not make headway on Friday. That does not mean it will collapse back down. It has broken over a key level from the August lows, and it dates all the way to 2008 where it held and surged at the December low. The dollar is at a key level. It has broken through it and is testing. It looks like the dollar is taking a pause after another good surge to break out of the flag consolidation. I think it will still go higher. The move does not look like it is over yet, particularly if there is worry in the world. Despite our $12.2T debt, people still run to the US when there is trouble in the world because it is still more stable than other places on earth. This is what happened in bonds.

Click to view the Dollar Index chart

The bonds did not move much on the session, but they did move a lot during the week. The 10 year rallied (3.59% versus 3.6% Thursday), but that is well off levels that it was earlier in the week. Bonds are not surging as much to the upside as other markets are tumbling to the downside, but there is a run to safety in them. That is exactly what one would expect. Worries about the economies in Europe and China, and new regulations in the US (just when the banks are trying to get on their feet) have investors worried about the economic future. They turn to bonds due to that situation as well.

Click to view the Bonds chart

Gold did not provide much of a haven, but it was not down by much ($1,093.50, -9.70). It is trying to double bottom. It tested off the low on Thursday, and then it gapped on Friday and tested. It held the December lows in the third week of the month and snapped back. Gold was down, no doubt, but it is in a position to bounce. We may get a play on the GLD again after it treated us like a cheap date earlier this week.

Click to view the Gold Index chart

Oil is not having a good time. The world economies could be in trouble due to excess regulation and tinkering. If China goes too far (as is usually the case when the government meddles in economies), there will be less demand for products, so less need for production, and, finally, less need for oil. It is tumbling. It tried to hold the 50 day EMA and has broken through decisively after testing the top of the range to start 2010. It looks like it is heading down to $72.50 - 70.00. There is a range of support from the August - September peaks, and then down at 70.00 is the December low and another level of support. Support is a range rather than one specific point, and it looks like oil is going down to that level.

Click to view the Oil Index chart

Summary: Earnings were not necessarily stupendous, but there were not a lot of terrible misses. There were good beats on the top line and bottom line, but that was no salve with respect to what the future holds. Earnings are about looking in the rearview mirror. When there are worries about a double dip in Europe, worries about China overreacting, and then the US overreacting to an election that went against the party in power, then that creates a lot of worry and fear. You can hear it time after time on the financial and news stations. Very intelligent economists and market analysts said what the administration is doing is extremely dangerous. It took a loss, it cannot handle the loss, and it is afraid of losing its agenda. It is now pandering to populism where people are upset that the banks made a lot of money. I am upset that banks made a lot of money as well: they are getting free money and able to turn it into 4-5% gains in overseas investments. That bugs me as a taxpayer. I am never going to see that money come back, but I will not let that cloud my judgment and say we should regulate them out of business. We are trying to help them recover, so the regulations make no sense. The incongruous actions being taken will lead to serious problems.

TECHNICAL

INTERNALS

The VIX surged 23% on Friday, and this is a massive move. A one-week move from the 17 level up to 28 is huge. That does not mean that volatility is a problem, and it does not mean the market is oversold. When you get in the 40 and 50 range, it is majorly oversold. This was an aberration because the world financial systems almost collapsed. I was getting calls late at night to put all my money in a safe deposit box and these were smart, sane arbitrage players telling me this. You understand how difficult and crazy it was back then and why volatility was so high. This is a high level, and we are at 28. 28 used to be considered high in the range from 20-30; that was normal. I hate to use the term "new normal," but that is what this essentially is. The new normal is not 20-30. The new normal is anywhere from 15-50. Seriously, you can have low readings of volatility for a long time and not be in trouble. It does not necessarily mean anything other than it could be due for a selloff. You can have volatility decreasing down to 11 or 10 levels and still have the market in long-term rallies. The thing to worry about is when volatility spikes as the market rallies. That is when a serious market rollover is coming.

The breadth was again quite negative at -2.7:1 on NASDAQ versus -2.9:1 on Wednesday. There was not much improvement. Note that I said breadth was starting to show big swings over the last week and a half. That was a precursor. It was showing its own internal volatility, and now volatility picks up in a number and it does not matter what it is. It does not have to be the VIX it can be in any kind of measure. Then you can anticipate trouble ahead or a change coming. On the NYSE, it was massively negative at -4.2:1 after -3.5:1 on Thursday. Really negative action.

The volume shows that there was another serious selloff. This is the second day of very high volume on the NYSE. After very low volume in late December and most of January when NASDAQ volume was spiking, the NYSE finally took off to the downside. Indeed, the three big spikes were on the downside. There was similar action with the NASDAQ. There was higher volume, but the big downside was related to the big volume spikes. There were four out of five days with big volume to the downside. That means lots of distribution, and that tells you they are simply dumping stocks. Distribution begets more selling or it has selling, maybe a pause, and more selling afterwards.

CHARTS

All the large cap indices are already at or below the next important support level I talked about on Wednesday and Thursday. SP500 is already inside in November-December range. It blew through the tops of that level, and now we are looking at the bottom of that range and the September peak around 1085-1080. That is the range of key support. You could extend that down to 1075 if you wanted to because that is the closing point. It is in a range of support. It could sell a day or two more and find the bottom. The move down has been so sharp, and the question is what it will do when it gets there.

NASDAQ has had high-volume selling, and it is right at its level of support at roughly 2015-2000. It has an entire range it could sell off to down to 2165. It will try too hold at the top of this range or at least it touched it and bounced back a bit on Friday. I do not know if it will try to hold yet, but it is at a level. We could see some slowing in selling over the next couple of sessions if it is going to try to hold. It is a key level, and you would expect it to show a bounce attempt. It may try to undercut it and then reverse; it comes in many forms. Sometimes they bounce off the level, and sometimes they undercut it and reverse. We will have to see how it plays out. We can expect some kind of bounce in this range, whether from the Friday close or a bit deeper into the range.

As noted earlier, the SOX was a horrible disappointment. It turned tail and fled, and it has crashed all the way down to the bottom range of the next support level. SOX and semiconductors go into everything we make these days, and if the economies of the world will struggle, the chips are out the door quickly. The interesting indices were the small and mid caps. They sold, but they are holding the 50 day EMA. That is the start of a range of support down to 325 from the September peak. It also held in mid-December. They look decent because they are not selling as hard, although that is a dubious honor given the size of the selloff.

The SP400 had similar action. It is holding the 50 day EMA and is above the October peak. It is an awfully sharp fall, and it is not planing out at all. They can turn on a dime as we saw on the trendline in November. We will have to see how it plays out. They are holding up, but are not that strong. I am not yet convinced that they can turn on a dime.

There were very sharp drops, and there is no sign of slowing yet. We will have to wait and see whether they can make a sharp turn at the support levels (such as on NASDAQ), or if they need to plane out a bit more or test and make smaller drops before making the turn. This is almost too fast of a decline to get a real feel for when exactly they will turn. We will talk more about what we can expect come Monday, and what we will be looking for in order to get that turn.

LEADERSHIP

BUCY gapped down and held similar to a small cap. There is interest there. TEX had the same type of action, showing a hammer doji at the 50 day EMA. There are possibilities there, especially when you juxtapose them with others such as JOYG or DE that look as if they are in freefall. Energy had a rough session, and these two tough days cast them down. They looked like they were trying to hold. APA was down hard. HAL is at its 50 day, but it was selling hard.

Metals were mostly down. FCX had a very tough week and gapped below support on Friday, but it did manage to hold. MTL showed a hammer doji at support, so not everything was down and out. I am trying to point out some positives in a market that was down overall.

Techs were a virtual wasteland on Friday. The selling got ugly on stocks such as AAPL, CSCO, INTC, and MSFT. Those are sharp selloffs and the very definition of trouble patterns. Biotechs are stable right now. DNDN came off the 50 day EMA with above-average volume. It could not hold the move, but it shows it was not selling. CELG was also trying to hold its end up and still make a new breakout.

Airlines were surprisingly strong. CAL was not up, but it held up well. LUV was not up on the session either, but it held up very well. TKC, a foreign telecom we sometimes look at, is not selling off sharply. It is holding above the prior peak in October. It is not all doom and gloom, but there are not a lot of pretty pictures out there right now. Nearly all sectors were lower. There were pockets of strength, but most sectors were beaten up severely because investors are uncertain about the future.

THE MARKET

MARKET SENTIMENT

VIX: 27.31; +5.04
VXN: 28.37; +5.18
VXO: 26.05; +4.86

Put/Call Ratio (CBOE): 1.07; +0.14

Bulls versus Bears:

This is a reading of the number of bullish investment advisors versus bearish advisors. The reason you look at this is that it gives you an idea of how bullish investors are. If they are too bullish then everyone is in the market and it is heading for a top: if everyone wants to be in the market then all the money is in and there is no more new cash to drive it higher. On the other side of the spectrum if there are a lot of bears then there is a lot of cash on the sideline, and as the market rallies it drags that cash in as the bears give in. That cash provides the market the fuel to move higher. If bears are low it is the same as a lot of bulls: everyone is in and the market doesn't have the cash to drive it higher.

Bulls: 48.3%. Once again bulls have peaked out near the 50% level. Bulls have bumped at 50ish since late August 2009, falling to 45ish and then rebounding. Thus for now this is more of the same as bulls get a bit pessimistic as the indices rise again and VIX falls. Hit 52.2% three weeks back, the highest level on this run. Still well over the 35% level that is the threshold for what is considered a bullish climate. It does not mean things are necessarily bearish; that takes a reading in the 60% range. Hit a high of 47.7% mid-June on the run from the March lows. Again, to be seriously bearish it needs to get up to the 60% to 65% level. Dramatic rise from 21.3% in November 2008, the bottom on this leg. This last leg down showed us the largest single week drop we have ever seen, falling from 33.7% to 25.3%. Hit 40.7% on the high during the rally off the July 2008 lows. 30.9% was the March low. In March the indicator did its job with the dive below 35% and the crossover with the bears. A move into the lower 40's is a decline of significance. A move to 35% is a bullish indicator.

Bears: 16.9%. Virtually in a flat line the past 6 weeks, down from 28% in mid-November. No sign of real worry based on this reading. This is the lowest level of the entire rally and is at a bearish level. Peaked near 28% on this round, falling short of the 35.6% hit in July 2009. For reference, cracking above the 35% threshold considered bullish. Hit a high on this run at 47.2%. For reference, bearishness hit a 5 year high at 54.4% the last week of October 2008. The move over 50 took bearish sentiment to its highest level since 1995. Extreme negative sentiment. Prior levels for comparison: Bearishness peaked at 37.4% in September 2007. It topped the June 2006 peak (36%) on that run. That June peak eclipsed the March 2006 high (33%) and well above the 2005 highs that spawned new rallies (30% in May 2005, 29.2% in October 2005). That was a huge turn, unlike any seen in recent history.

NASDAQ

Stats: -60.41 points (-2.67%) to close at 2205.29
Volume: 2.764B (-3.06%)

Up Volume: 448.265M (-479.888M)
Down Volume: 2.367B (+411.212M)

A/D and Hi/Lo: Decliners led 2.7 to 1
Previous Session: Decliners led 2.89 to 1

New Highs: 44 (+44)
New Lows: 16 (+14)

NASDAQ CHART: Click to view the chart

NASDAQ 100 CHART: Click to view the chart

SOX CHART: Click to view the chart

SP500/NYSE

Stats: -24.72 points (-2.21%) to close at 1091.76
NYSE Volume: 1.472B (-1.91%)

Up Volume: 161.408M (-33.84M)
Down Volume: 1.299B (-80K)

A/D and Hi/Lo: Decliners led 4.19 to 1
Previous Session: Decliners led 3.49 to 1

New Highs: 115 (-79)
New Lows: 47 (+4)

SP500 CHART: Click to view the chart

SP600 Chart: Click to view the chart

DJ30

Stats: -216.9 points (-2.09%) to close at 10172.98
Volume DJ30: 323M shares Friday versus 304M shares Thursday.

DJ30 CHART: Click to view the chart

MONDAY

The market should not have sold as hard as it did based on the earnings and economic data, but there is the regulation fear and uncertainty driving the selling. With such a hard selloff into the close on Friday, Monday can be ugly. Tuesday can be ugly after that. Historically, a very negative Friday close during serious selling can bleed over into Monday and Tuesday. With that in mind, we were closing positions late in the day even though there is a chance for a bounce. The ones we closed had given up support and were not coming back. We did not want to see them get in any worse shape if the selling continued on Monday. That is why we took a lot of gains off the table on the way into earnings. We typically do that, but in all honesty, I did not anticipate such a violent pullback, primarily because we did not anticipate the government coming in and re-upping more regulation. That took the market down in a spiral lower.

I am concerned about the two hard days of selling, as well as the potential for more hard selling on Monday and possibly Tuesday. As a result we are not in a hurry to buy any upside positions, but that does not mean we will not be looking. There are good stocks holding up quite well in leadership areas they are out of step with the rest of the market and are showing the kind of strength you like to see. We will be looking at those and seeing if they can hold. The selling, too, may end sooner than later, and they would be good purchases as they would be in excellent shape to rebound.

We are in the middle of earnings season, and one would hope earnings would have more of an impact. Generally, if stocks are up ahead of earnings, they typically sell off when earnings first come out. If they are down when going into earnings, they tend to rally as earnings start. Then, a couple of weeks into earnings when everyone knows the gist of the story line, the earnings start running out of their mojo and the market quits rising on every result. Then the selloff starts.

Since stocks are down at the start of this earnings season, you would expect the good results could catch up eventually and send stocks higher. Maybe that will be the case with earnings providing the catalyst to turn things back up. That is often the pattern, but investors are going to have to resolve and digest the eco-political news that is upsetting the market for now. Maybe Barney Frank will speak out again to help calm things down after the President ruffled everyone's feathers. On the other hand, maybe something worse will come out the state of the union address is ahead this week and stocks continue lower.

Regardless, the market will probably sell more and further test the support. These are serious times and some new serious issues have arisen. This is, however, the market we have to work with right now. We will be patient and pick up positions when they present themselves, but I do not want to jump in on the first show of a turn because it likely will not be the case.

As I said in the Friday post-market alert, I am going to go in the cellar this weekend to find a nice bottle of wine. I am going to open it up, let it breathe, and I am going to sip it a lot. These kinds of days are why we took a lot of gain off the table on the way up. You cannot stop playing the game. You just close out positions when you get in trouble, and that is what we were doing. While the market can sell at any time, this type of selloff was rather unanticipated as the new war against financial institutions was more than anticipated as well. This too shall pass, however, and we will recover. Then we will have more opportunities. For now, we should stay in the bunker for a bit and see how the market reacts to the sharp Thursday and Friday decline. If a bounce higher that fails, we will play some downside off that. If there is a real turn that shows some buying, and the earnings are good and supporting the move, we can pick up some upside as well. Make moves in increments, not loading the boat all at once; we can always add more when the move tests and confirms itself.

Support and Resistance

NASDAQ: Closed at 2205.29
Resistance:
2210 (from September 2008) to 2212 (the July 2009 closing low)
2218 is the August 2005 peak
The 50 day EMA at 2276
2245 from July 2008 through 2260 from late 2005.
The July/November/December 2009 up trendline at 2274
2275 - 2278 from the February 2008 and April 2008 lows
2292 is a low from January 2008
2319 from the September 2008 peak
2326.28 is the January high
2324-2370 is a range of resistance from early 2008
2382-2395 from 2008
2412-2415 represents a series of peaks and lows in 2007, 2008
2453 is the August 2008 peak

Support:
2205 is the November 2009 peak
2191 is the October 2009 peak
2177 is a low from March 2008
2169 is the March 2008 closing low (double bottom)
2168 is the September 2009, intraday peak
2167 from the July 2008 intraday low
2155 is the March 2008 intraday low
2143 is the October 2009 range low
2099 is the mid-September 2008 closing low
2070 is the September 2008 intraday low
2060 is the August peak
2048 is the early October 2009 closing low

S&P 500: Closed at 1091.76
Resistance:
1101 is the October high
1106 is the September 2008 low
The 50 day EMA at 1112
1114 is the November 2009 peak
The July/November/December 2009 up trendline at 1116
1119 is the early December intraday high
1133 from a September 2008 intraday low
1150 is the January 2010 peak
1156 is the Sept 2008 low
1185 from late September 2008
1200 from the July 2008 low

Support:
1080 is the September 2009 peak
1078 is the October range low
1070 is the late September 2009 peak
1044 is the October 2008 intraday high
The August peak at 1040
The early October 2009 closing low at 1025
The early August intraday peak at 1018
The November 2008 peak at 1006 closing 1007.53 intraday
The 200 day SMA at 1007
992 is the August 2009 consolidation low

Dow: Closed at 10,172.98
Resistance:
10,365 is the late September 2008 low
The 50 day EMA at 10,394
10,496 is the November 2009 high
10,609 from the Mid-September 2008 interim low
10,963 is the July 2008 low

Support:
10,120 is the October 2009 peak
9918 is the September 2008 peak
9855 is the early September peak in its lateral range
9835 is the late September 2009 peak
9654 is the November 2008 high
9625 is the October 2008 closing high
9620 is the August 2009 peak
9430 is the early October low
9387 is the mid-October peak
The 200 day SMA at 9373

Economic Calendar

These are consensus expectations. Our expectations will vary and are discussed in the 'Economy' section.

January 25 - Monday
- Existing Home Sales, December (10:00): 5.90M expected, 6.54M prior

January 26 - Tuesday
- Case-Shiller 20-city, November (09:00): -5.00% expected, -7.28% prior
- Consumer Confidence, January (10:00): 53.5 expected, 53.3 prior
- FHFA Home Price Index, November (10:00): 0.1% expected, 0.6% prior

January 27 - Wednesday
- New Home Sales, December (10:00): 370K expected, 355K prior
- Crude Inventories, 1/22 (10:30): -0.471M prior
- FOMC Rate Decision, 1/27 (14:15): 0.25% expected, 0.25% prior

January 28 - Thursday
- Initial Claims, 01/23 (08:30): 450K expected, 482K prior
- Continuing Claims, 01/16 (08:30): 4600K expected, 4599K prior
- Durable Orders, December (08:30): 2.0% expected, 0.2% prior

January 29 - Friday
- GDP-Adv., Q4 (08:30): 4.6% expected, 2.2% prior
- Chain Deflator-Adv., Q4 (08:30): 1.3% expected, 0.4% prior
- Employment Cost Index, Q4 (08:30): 0.4% expected, 0.4% prior
- Chicago PMI, January (09:45): 57.4 expected, 58.7 prior
- University of Michigan, January (09:55): 73.0 expected, 72.8 prior
icon url

ReturntoSender

01/24/10 9:38 PM

#8818 RE: ReturntoSender #6755

The buying opportunity may already be here. We have not even broke the uptrend. The VIX is way above it's 10 day sma. We are still early in a typical cyclical rally.


In addition the CPC is spiking too. It does not take long for a lot of puts to get in play.


I doubt that any of us here trust analysts at all.

RtS


icon url

ReturntoSender

01/25/10 7:58 PM

#8820 RE: ReturntoSender #6755

From Briefing.com: 4:30 pm : Late pressure left stocks to finish the session on a rather weak note, but the major indices were still able to settle in positive territory.

Gains were varied for the entire session as choppy trade made it difficult for stocks to put together any sort of sustainable relief rally in the wake of the stock market's three consecutive slides. Disappointing December existing home sales numbers didn't help either.

Existing home sales for December fell 16.7% month-over-month to an annualized rate of 5.45 million units, which is a slower pace than the annualized rate of 5.90 million units that had been expected.

The announcement caused a bit of a broad-based slip, but homebuilders saw the worst of it as their near 2% gain turned into a loss. The group recovered to finish with a 0.4% gain, though.

Materials stocks had been strong performers for most of the session. They were helped along by AK Steel (AKS 21.27, +1.08), which posted better-than-expected earnings for its latest quarter. However, the lack of market weight in the materials sector made it difficult to lead a broader recovery.

Telecom, which also lacks weight in the broader market, finished with the best gains of any major sector. AT&T (T 25.58, +0.19) and Verizon (VZ 30.68, +0.34) helped the sector put together a 1.1% gain. The two integrated telecom giants are due to report their latest quarterly results later this week.

Though their loss was fractional, health care was the only major sector to finish in the red. Managed care providers (-0.5%) proved to be a drag on the sector.

Volatility made a considerable pullback after it had surged in the previous week. Specifically, the Volatility Index, or VIX, fell 7.0% this session.

Trading volume was moderate as hardly 1 billion shares exchanged hands on the NYSE this session. Given the scope of last week's losses, many participants are waiting to see what stocks will do amid a larger batch of earnings releases and economic data.

Advancing Sectors: Telecom (+1.1%), Materials (+0.8%), Tech (+0.7%), Utilities (+0.6%), Energy (+0.6%), Financials (+0.5%), Industrials (+0.5%), Consumer Discretionary (+0.3%), Consumer Staples (+0.2%)
Declining Sectors: (None)
Unchanged: Health CareDJ30 +23.88 NASDAQ +5.51 NQ100 +0.4% R2K +0.2% SP400 +0.2% SP500 +5.02 NASDAQ Adv/Vol/Dec 1312/2.14 bln/1379 NYSE Adv/Vol/Dec 1755/1.05 bln/1289

5:02PM Silicon Labs asserts intellectual property rights (SLAB) 44.30 +0.22 : The co announces the filing of a patent infringement lawsuit against Quintic Corporation, a California semiconductor company, and its Chinese affiliate, in the U.S. Federal District Court in Austin, TX. The lawsuit alleges that the two defendants have infringed five patents relating to mixed-signal integrated circuits, specifically United States Patent No. 6,226,506, No. 7,035,607, No. 7,200,364, No. 7,199,650, and No. 7,355,476. The broad nature of the alleged infringement, spanning various aspects of their IC architecture, represents a significant misappropriation of Silicon Labs' market leading mixed-signal technology. Silicon Labs innovative radio technology is a result of years of R&D investment and is now in its fourth generation. The company's ICs have been adopted in consumer products worldwide including handsets, portable media players and consumer radios.

4:40PM Volterra Semi beats by $0.13, beats on revs (VLTR) 17.81 +0.34 : Reports Q4 (Dec) earnings of $0.34 per share, excluding non-recurring items, $0.13 better than the First Call consensus of $0.21; revenues rose 56.2% year/year to $34.2 mln vs the $32.2 mln consensus.

4:36PM Texas Instruments beats by $0.03, reports revs in-line; guides Q1 EPS and revs above consensus (TXN) 23.69 : Reports Q4 (Dec) earnings of $0.52 per share, $0.03 better than the First Call consensus of $0.49; revenues rose 20.6% year/year to $3 bln vs the $2.98 bln consensus. TXN reports Q4 gross margins of 52.8% vs Street Expectations 52.6%, Q3 was 51.42%. Co issues upside guidance for Q1, sees EPS of $0.44-0.52 vs. $0.43 consensus; sees Q1 revs of $2.95-3.19 vs. $2.83 bln consensus. Orders were $3.26 billion, up 75 percent from a year ago and up 5 percent from the prior quarter. Inventory was $1.20 billion at the end of the quarter, down $173 million from a year ago and up $86 million from the prior quarter. "TI's growth and improving performance reflect our focus on Analog and Embedded Processing. These are large, diverse businesses that give us access to the world's fastest-growing electronics markets. In the fourth quarter, demand was strong across end markets without the usual holiday slowdown. Throughout, we believe customer and channel inventories have been lean. With demand continuing to be solid and inventories well below historical levels, our outlook for the first quarter reflects the likelihood of sequential growth instead of the typical seasonal decline."

4:33PM Apple beats handily on top and bottom line; guides Q2 EPS above consensus, revs above consensus (AAPL) 203.07 : Reports Q1 (Dec) earnings of $3.67 per share, $1.60 better than the First Call consensus of $2.07; revenues rose 32.0% year/year to $15.68 bln vs the $12.06 bln consensus. Apple reports Q1 sales of 3.36 mln Macs vs Street at ~3 mln, 21 mln iPods vs Street at ~22 mln, and 8.7 mln iPhones vs Street at ~9 mln. Co issues upside guidance for Q2, sees EPS of $2.06-2.18 vs. $1.77 consensus; sees Q2 revs of $11.0-11.4 bln vs. $10.37 bln consensus. Sees Q2 gross margin of 39% vs. 36.8% consensus. "The Company expects its gross margin percentage to decrease in future periods compared to levels achieved during 2009 and the first quarter of 2010, and anticipates gross margin levels of about 39% in the second quarter of 2010. This expected decline is due largely to flat or reduced average selling prices on new and innovative products that have higher cost structures that deliver greater value to customers and both expected and potential future cost increases for key components"... If you annualize our quarterly revenue, it's surprising that Apple is now a $50+ billion company," said Steve Jobs, Apple's CEO. "The new products we are planning to release this year are very strong, starting this week with a major new product that we're really excited about." *On September 23, 2009, the Financial Accounting Standards Board ratified Emerging Issues Task Force (EITF) Issue 08-1 and EITF Issue 09-3, resulting in the issuance of accounting standard updates ASU 2009-13 and ASU 2009-14. The new accounting principles result in the Company's recognition of substantially all of the revenue and product cost for iPhone and Apple TV when those products are delivered to customers. (Stock is halted)

4:11PM Zoran beats by $0.04, reports revs in-line; guides Q1 EPS above consensus, revs above consensus (ZRAN) 11.76 +0.27 : Reports Q4 (Dec) earnings of $0.01 per share, $0.04 better than the First Call consensus of ($0.03); revenues rose 24.9% year/year to $93.3 mln vs the $94 mln consensus. Co issues upside guidance for Q1, sees EPS of $(0.02)-(0.05), excluding acquisition-related amortization costs and stock-based compensation expenses vs. ($0.09) consensus; sees Q1 revs of $90 mln-$94 mln vs. $88.91 mln consensus.

4:05PM JA Solar announces Dr. Peng Fang as Chief Executive Officer (JASO) 4.91 +0.34 : Co announces the appointment of Dr. Peng Fang as chief executive officer, effective immediately. Mr. Baofang Jin will remain in his role as executive chairman and will work closely with Dr. Fang.

4:02PM PLX Tech beats by $0.08, beats on revs; guides Q1 revs above consensus (PLXT) 3.98 +0.19 : Reports Q4 (Dec) earnings of $0.09 per share, excluding non-recurring items, $0.08 better than the First Call consensus of $0.01; revenues rose 87.3% year/year to $26.6 mln vs the $23.8 mln consensus. Co issues upside guidance for Q1, sees Q1 revs of $27-29 mln vs. $23.61 mln consensus.

9:04AM MIPS Techs appoints Sandeep Vij to CEO (MIPS) 4.10 : Co announces that the MIPS Technologies Board of Directors has appointed Sandeep Vij as president, chief executive officer and director. Mr. Vij succeeds Interim CEO Anthony B. Holbrook, who will continue to serve as chairman of MIPS Technologies' Board of Directors. Mr. Vij brings to MIPS Technologies more than 20 years of senior-level management and marketing experience in the semiconductor industry.

1:37AM MEMC Electronic Materials and Conergy settle litigation; amend supply agreement (WFR) 13.19 : Co and German solar developer Conergy AG have reached an out of court settlement of a lawsuit related to a solar wafer supply contract between Conergy and MEMC Singapore Pte. Ltd. The terms of the amended contract include a significant reduction in the minimum quantity of wafers that Conergy must purchase over the remaining 8+ years of the contract, as well as a minimum market share commitment should Conergy's demand exceed the reduced quantities. The amendment also modifies the pricing terms to be based on market rates similar to other MEMC long-term solar wafer supply agreements. The settlement includes a payment to MEMC of an undisclosed amount.
icon url

ReturntoSender

01/27/10 12:02 AM

#8821 RE: ReturntoSender #6755

From Briefing.com: 4:30 pm : Stocks were able to overcome a weak start, but their advance ran into resistance and rolled over late in the session. However, the slide was stopped short as support was secured at the lows set last week.

Premarket selling pressure made for a lower start to the session as participants showed a moderately negative reaction to steep losses in Asia, where China's regulators followed through with plans to raise reserve requirements at select banks and Japan's sovereign debt was put on a negative outlook from Standard & Poor's. A subsequent flight to quality boosted the buck, which didn't help the early tone of trade either.

However, stocks were able to garner some midmorning support with the release of the latest Consumer Confidence Index, which climbed to 55.9 in January from 53.6 in December. Not only did the January reading exceed the 53.5 that had been widely expected, but it also marked the highest reading in more than one year.

Though there is no empirical evidence that connects consumer confidence with higher spending and, in turn, higher profits for retailers, retailers steadily outperformed the broader market and finished with a 0.6% gain.

Tech emerged to trade with considerable strength for most of the session, thanks to Apple (AAPL 205.94, +2.87), which posted upside earnings and a strong forecast. Support for the stock had been constrained initially as it was learned that accounting changes played a part in Apple's numbers, but the stock was able to brush that aside.

Apple's leadership helped take the Nasdaq Composite and the Nasdaq 100 markedly higher, but the two averages ran into resistance at their 50-day moving averages, which were violated during last week's retreats. Meanwhile, the broad-based S&P 500 struggled to make much of a move past the psychologically-significant 1100 line. Failure to extend gains inevitably gave way to selling.

The late afternoon slide took tech back to the neutral line after it had been up as much as 1.3%. Texas Instruments (TXN 23.35, -0.34) was among the sector's primary laggards; participants sold news of the company's positive earnings surprise after the shares had spiked 2.5% in the session before the announcement.

Dow components Johnson & Johnson (JNJ 62.79, -0.43) and Verizon (VZ 30.17, -0.51) were also sold despite better-than-expected earnings of their own.

Fellow Dow component Travelers (TRV 50.23, +1.34) managed to garner support amid its upside surprise, but it couldn't keep the financial sector from falling in afternoon action. Weakness among specialized finance companies (-4.4%) dragged the sector to a 1.7% loss after it had been up as much as 1.0%.

Advancing Sectors: Utilities (+0.4%), Consumer Discretionary (+0.1%)
Declining Sectors: Financial (-1.7%), Telecom (-1.2%), Materials (-1.1%), Energy (-0.5%), Health Care (-0.4%), Industrials (-0.1%)
Unchanged: Consumer Staples, TechDJ30 -2.57 NASDAQ -7.07 NQ100 +0.1% R2K -1.0% SP400 -0.4% SP500 -4.61 NASDAQ Adv/Vol/Dec 869/2.39 bln/1797 NYSE Adv/Vol/Dec 1092/1.12 bln/1943

5:41PM STMicroelectronics beats by $0.02, reports revs in-line; guides Q1 revs above consensus (STM) 8.50 +0.05 : Reports Q4 (Dec) earnings of $0.04 per share, $0.02 better than the First Call consensus of $0.02; revenues rose 13.5% year/year to $2.58 bln vs the $2.56 bln consensus. Co issues upside guidance for Q1, sees Q1 revs down 7-13%, which equates to ~$2.24-2.39 bln vs. $2.23 bln consensus.

4:35PM QLogic beats by $0.02, beats on revs (QLGC) 18.89 -0.43 : Reports Q3 (Dec) earnings of $0.31 per share, excluding non-recurring items, $0.02 better than the First Call consensus of $0.29; revenues fell 8.9% year/year to $149.1 mln vs the $147.3 mln consensus.

4:24PM Altera trading almost a point higher after earnings on decent volume, testing the recent highs at $22.25 (ALTR) 21.19 : Last trade at $22.06

4:21PM Altera beats by $0.05, beats on revs; guides Q1 revs above consensus (ALTR) 21.19 -0.14 : Reports Q4 (Dec) earnings of $0.34 per share, $0.05 better than the First Call consensus of $0.29; revenues rose 16.1% year/year to $365 mln vs the $334.9 mln consensus. Co issues upside guidance for Q1, sees Q1 sequential revs growth of 5-10%, which equates to ~$383.3-401.50 mln vs. $338.54 mln consensus. Co said, "The Q4 produced extraordinary growth driven by customer program ramps and better end demand across all of our markets. Our new products were the growth leaders in a quarter that saw sequential improvements across all product and market segment categories. We believe that in 2010 our 40-nm product leadership will create an additional growth driver for the co as customers shift from the prototype stage to production-based demand."

4:15PM Concurrent beats by $0.14, beats on revs (CCUR) 3.89 0.00 : Reports Q2 (Dec) earnings of $0.01 per share, $0.14 better than the First Call consensus of ($0.13); revenues fell 17.1% year/year to $15 mln vs the $12.5 mln consensus. Gross margins for the second quarter of fiscal year 2010 were 62%, compared to 59% in the prior year's second quarter.

4:12PM Sanmina-SCI beats by $0.10, beats on revs; guides Q2 EPS above consensus, revs above consensus (SANM) 12.30 +0.65 : Reports Q1 (Dec) earnings of $0.23 per share, $0.10 better than the First Call consensus of $0.13; revenues rose 9.2% year/year to $1.48 bln vs the $1.4 bln consensus. Co issues upside guidance for Q2, sees EPS of $0.22-$0.27, excluding non-recurring items, vs. $0.09 consensus; sees Q2 revs of $1.45 bln-$1.55 bln vs. $1.36 bln consensus.

4:07PM RF Micro Device beats by $0.02, reports revs in-line (RFMD) 4.27 +0.06 : Reports Q3 (Dec) earnings of $0.14 per share, excluding non-recurring items, $0.02 better than the First Call consensus of $0.12; revenues rose 23.9% year/year to $250.3 mln vs the $251.6 mln consensus. Non-GAAP gross margin increased sequentially from 38.1% to 38.4%. RFMD is enjoying strength in CPG, supported by strong calendar 2010 handset unit forecasts, expanded participation across customer programs and increasing adoption of connected devices, including smart phones and 3G devices. In the diversified markets served by MPG, RFMD continues to see positive demand trends supported by increasing customer order activity. Co sees CPG quarterly revenue is expected to be better than normal seasonality in the March quarter. In MPG, quarterly revenue is expected to be flat to up sequentially in the March quarter. Non-GAAP operating margin for the fiscal 2010 full-year period is expected to approach RFMD's annual target of 15%. RFMD expects strong free cash flow, in-line with recent quarterly performances. "For fiscal 2011, we expect a contribution margin of approximately 60% on each incremental dollar of revenue, and we believe we're on track to deliver continued revenue and earnings growth in fiscal 2011 and beyond."

4:03PM Integrated Device beats by $0.01, beats on revs (IDTI) 6.45 +0.00 : Reports Q3 (Dec) earnings of $0.10 per share, excluding non-recurring items, $0.01 better than the First Call consensus of $0.09; revenues fell 14.7% year/year but rose 2.1% sequentially to $142.5 mln vs the $140.5 mln consensus.

4:02PM Molex beats by $0.02, beats on revs; guides Q3 EPS above consensus, revs above consensus (MOLX) 20.89 +0.07 : Reports Q2 (Dec) earnings of $0.24 per share, excluding non-recurring items, $0.02 better than the First Call consensus of $0.22; revenues rose 9.4% year/year to $729.6 mln vs the $709.2 mln consensus. Co issues upside guidance for Q3, sees EPS of $0.22-0.26, excluding non-recurring items, vs. $0.19 consensus; sees Q3 revs of $715-735 mln vs. $691.38 mln consensus.

Microsemi Corporation (MSCC) announces that it has partnered with specialty foundry provider MagnaChip Semiconductor LLC to develop advanced mixed-signal process technology that is optimized for products in Microsemi's key commercial growth markets...

8:02AM Chipmos Technology unit entered into a definitive Transfer Of Claim Agreement to sell to Citigroup Financial Products (IMOS) 0.75 : Co announced that ChipMOS TECHNOLOGIES, a wholly owned subsidiary of ChipMOS, has entered into a definitive Transfer Of Claim Agreement to sell to Citigroup Financial Products the general unsecured claim reflected in the proof of claim against Spansion, Spansion Technology, Spansion, Spansion International and Cerium Laboratories filed by ChipMOS Taiwan in United States Bankruptcy Court. The claim that is the subject of the Agreement includes accounts receivable for testing and assembly services provided to Spansion in the amount of approximately US$66 million to US$70 million (the "Undisputed Claim"). The purchase price for the Undisputed Claim is approximately US$33 million.

7:30AM Am Superconductor: China's XJ Group orders initial 100 sets of wind turbine core electrical components from AMSC (AMSC) 37.17 : Co announces that it has received an initial order for 100 sets of wind turbine core electrical components from China's XJ Group. The components will be deployed in 2 megawatt doubly fed induction wind turbines that were co-developed with AMSC Windtec, a wholly owned subsidiary of AMSC.

6:58AM Corning beats by $0.02, beats on revs (GLW) 18.72 : Reports Q4 (Dec) earnings of $0.44 per share, excluding non-recurring items, $0.02 better than the First Call consensus of $0.42; revenues rose 41.3% year/year to $1.53 bln vs the $1.45 bln consensus. Co said, "Our economic assumptions for 2010 include a mild recovery in the developed world economies and continued growth in China. Clearly we don't have a crystal ball that can guarantee this outlook will come true, so we will be cautious on spending and prepared to be nimble if we see changes... We expect the overall display glass market to be up in the first quarter versus our original expectation of lower seasonal demand... and we believe the supply chain will need to continue to expand to support another year of good retail growth for LCD products."

09:34 am Texas Instruments (TXN)

Texas Instruments (TXN 23.69) reported better-than-expected fourth quarter earnings and issued upside guidance for the first quarter, saying that demand continues to be solid.

Texas Instruments reported fourth quarter earnings of $0.52 per share, $0.03 better than the First Call consensus of $0.49.

Revenues rose 20.6% year-over-year to $3 billion, in-line with the $2.98 billion consensus.

"In the fourth quarter, demand was strong across end markets without the usual holiday slowdown. Throughout, we believe customer and channel inventories have been lean," said CEO Rich Templeton. "With demand continuing to be solid and inventories well below historical levels, our outlook for the first quarter reflects the likelihood of sequential growth instead of the typical seasonal decline."

Texas Instruments issued upside guidance for its first quarter, saying it expects earnings of $0.44 to $0.52 per share, ahead of the current consensus estimate that calls for $0.43. The company expects revenues to range from $2.95 billion to $3.19 billion, also ahead of the current consensus estimate of $2.83 billion.

08:36 am Apple (AAPL)

Apple (AAPL 203.07) reported fiscal first quarter earnings and revenues that easily beat expectations on strong Mac sales. The company also issued upside guidance for the second quarter.

Apple reported fiscal first quarter earnings of $3.67 per share, $1.60 better than the First Call consensus estimate of $2.07.

Revenues rose 32.0% year-over-year to $15.68 billion, easily topping the $12.06 billion consensus estimate.

Apple reported sales of 3.36 million Macs during the quarter, better than the Wall Street estimate of 3 million. Apple sold 21 million iPods (vs. Street estimate 22 million) and 8.7 million iPhones (vs. Street estimate of 9 million).

Apple said that during the quarter it elected retrospective adoption of the Financial Accounting Standards Board's amended accounting standards related to certain revenue recognition. Adoption of the new accounting standards significantly changes how the company accounts for certain items, particularly sales of iPhone and Apple TV.

The new accounting principles result in the company's recognition of substantially all of the revenue and product cost for iPhone and Apple TV when those products are delivered to customers. Under historical accounting principles, the company was required to account for sales of both iPhone and Apple TV using subscription accounting.

Looking ahead to its fiscal second quarter, Apple said it expects earnings of $2.06 to $2.18 per share, well ahead of the current consensus estimate of $1.77. Apple expects Q2 revenues to range from $11.0 billion to $11.4 billion; the consensus estimate calls for $10.37 billion.

Shares of AAPL are down just over 4% an hour ahead of Tuesday's opening bell.
icon url

ReturntoSender

01/27/10 11:13 AM

#8822 RE: ReturntoSender #6755

SMH ST bot 1000 shares@25.89

icon url

ReturntoSender

01/27/10 8:10 PM

#8823 RE: ReturntoSender #6755

From Briefing.com: 4:30 pm : Stocks spent most of the session mired in moderate weakness, but were able to push higher in the wake of the latest statement from the Federal Open Market Committee (FOMC).

The first FOMC policy statement of the new year came on the eve of a vote to put Ben Bernanke back into the seat of Fed Chairman. To little surprise the statement indicated that economic activity continues to strengthen and that the deterioration in the labor market is abating. The FOMC also opted to keep the federal funds rate at 0.00% to 0.25% and will maintain exceptionally low levels for an extended period of time. Kansas City Fed President Hoenig was the only FOMC member to dissent.

A knee-jerk reaction to the statement caused stocks to whipsaw before they eventually pushed into positive territory. Financials, which had steadily outperformed since the opening bell, were a primary leader in the late advance. The sector managed to make its way to a 2.3% gain. Regional bank stocks (+3.7%) and diversified banks (+4.1%) were leaders in the sector. Their strength came amid news that Barney Frank, Chairman of the House Financial Services Committee, stated that proposals to clamp down on risky activities at banks could be put into law within months. Such measures would likely have more of an adverse impact on larger, diversified financial services companies, but even they were able to climb 2.4% this session.

While financials provided leadership to the broader market, Apple (AAPL 207.88, +1.94) helped the Nasdaq Composite outperform its counterparts. Apple's advance came amid a favorable reaction to the company's newly launched iPad, as well as pricing for the product. News that Apple will rely on the network of AT&T (T 25.62, +0.29) provided support for the integrated telecom giant.

There were several earnings announcements for participants to chew on this session, but the results were largely overshadowed by anticipation for the FOMC statement. Still, earnings continue to generally exceed expectations -- Caterpillar (CAT 53.44, -2.41), United Technologies (UTX 67.61, -1.57), Boeing (BA 61.93, +4.22), Illinois Tool Works (ITW 43.99, -1.20), Abbott Labs (ABT 53.90, -0.58), and ConocoPhillips (COP 49.81, -0.62) were part of the latest bunch. However, some of the reports were of lesser quality and featured mixed guidance.

Despite another underwhelming response to earnings, the stock market was still able to book a gain this session. However, all three major indices remain below their 50-day moving averages.

Commodities were wrought with weakness this session. Not even a surprise draw in weekly crude oil inventories could deter sellers from dragging down oil prices to close pit trade with a 1.4% loss at $73.64 per barrel. Oil had been as low as $72.65 per barrel, which marked a one-month low.

Collective weakness among commodities gave the CRB Commodity Index a 1.9% loss. That marks its worst single-session percentage slide in two months and leaves the CRB down 2.5% week-to-date.

The latest batch of new home sales numbers were displeasing. According to the report, annualized new home sales for December made a 7.6% monthly decline, which contrasted negatively with the consensus call for a 3.0% month-over-month increase.

Advancing Sectors: Financials (+2.3%), Tech (+0.6%), Health Care (+0.6%), Consumer Discretionary (+0.4%), Telecom (+0.4%), Industrials (+0.2%), Consumer Staples (+0.1%)
Declining Sectors: Materials (-0.8%), Energy (-0.6%), Utilities (-0.5%)DJ30 +41.87 NASDAQ +17.68 NQ100 +0.8% R2K +1.0% SP400 +0.2% SP500 +5.33 NASDAQ Adv/Vol/Dec 1577/2.48 bln/1076 NYSE Adv/Vol/Dec 1517/1.30 bln/1515

6:29PM Teradyne beats by $0.02, reports revs in-line; guides Q1 EPS above consensus, revs above consensus (TER) 10.26 +0.14 : Reports Q4 (Dec) earnings of $0.17 per share, excluding non-recurring items, $0.02 better than the First Call consensus of $0.15; revenues rose 37.3% year/year to $267.4 mln vs the $266.9 mln consensus. Co issues upside guidance for Q1, sees EPS of $0.20-0.26, excluding non-recurring items, vs. $0.13 consensus; sees Q1 revs of $290-310 mln vs. $268.67 mln consensus.

4:43PM Lam Research beats by $0.07, beats on revs (LRCX) 35.54 +0.54 : Reports Q2 (Dec) earnings of $0.47 per share, $0.07 better than the First Call consensus of $0.40; revenues rose 71.8% year/year to $487 mln vs the $453.6 mln consensus. LRCX reports gross margins of 44.8% vs 44.4% consensus. "In the December 2009 quarter we saw significant growth in shipments, revenue and earnings for Lam Research. As we move into 2010 we will continue to focus on delivering market share gains in our etch and clean businesses to expand revenues, earnings per share and cash generation from cycle to cycle."

4:17PM Qualcomm beats by $0.06, reports revs in-line; guides Q2 below consensus; guides FY10 EPS in-line, lowers revs in-line (QCOM) 47.20 +0.31 : Reports Q1 (Dec) earnings of $0.62 per share, excluding non-recurring items, $0.06 better than the First Call consensus of $0.56. Co issues downside guidance for Q2, sees EPS of $0.49-0.53, excluding non-recurring items, vs. $0.57 consensus; sees Q2 revs of $2.4-2.6 bln vs. $2.75 bln consensus. Co issues in-line guidance for FY10, sees EPS of $2.10-2.30, excluding non-recurring items, vs. $2.26 consensus; sees FY10 revs of $10.4-11.0 bln vs. $11.06 bln consensus, down from $10.5-11.3 bln. Co guides Q2 MSM shipments at approx. 89-92 mln; CDMA/WCDMA devices shipped of approx. 144-149 mln, and CDMA/WCDMA device wholesale average selling price of approx. $179.

4:13PM Intersil beats by $0.02, beats on revs; guides Q1 EPS above consensus, revs above consensus (ISIL) 14.23 +0.36 : Reports Q4 (Dec) earnings of $0.18 per share, $0.02 better than the First Call consensus of $0.16; revenues rose 35.5% year/year to $177.7 mln vs the $175.1 mln consensus. Co issues upside guidance for Q1, sees EPS of $0.18-$0.20 vs. $0.15 consensus; sees Q1 revs of $180-$187 mln vs. $167.91 mln consensus. Gross margin for the fourth quarter was 55.2%, compared with gross margin of 33.7% in the same quarter last year, and 54.5% in the third quarter of 2009. Co states, "The fourth quarter was stronger than expected due to recovery of the industrial and communications end markets, and growing traction from new product introductions. Inventories reached historically low levels and we believe we are positioned for continued growth throughout our businesses in 2010."

4:12PM Celestica beats by $0.03, reports revs in-line; guides Q1 EPS above consensus, revs above consensus (CLS) 9.91 +0.10 : Reports Q4 (Dec) earnings of $0.21 per share, excluding non-recurring items, $0.03 better than the First Call consensus of $0.18; revenues fell 14.0% year/year to $1.66 bln vs the $1.65 bln consensus. Co issues upside guidance for Q1, sees EPS of $0.15-0.21 vs. $0.15 consensus; sees Q1 revs of $1.45-1.60 bln vs. $1.43 bln consensus.

4:06PM Flextronics beats by $0.02, beats on revs; guides Q4 EPS above consensus, revs in-line (FLEX) 7.10 +0.53 : Reports Q3 (Dec) earnings of $0.17 per share, $0.02 better than the First Call consensus of $0.15; revenues fell 19.6% year/year to $6.56 bln vs the $6.29 bln consensus. Co issues mixed guidance for Q4, sees EPS of $0.13-0.16 vs. $0.13 consensus; sees Q4 revs of $5.8-6.2 bln vs. $5.85 bln consensus.

4:06PM LSI Logic beats by $0.07, beats on revs; guides Q1 EPS in-line, revs above consensus (LSI) 6.00 +0.26 : Reports Q4 (Dec) earnings of $0.18 per share, excluding non-recurring items, $0.07 better than the First Call consensus of $0.11; revenues rose 4.6% year/year to $637.8 mln vs the $631.5 mln consensus. For Q1, co sees EPS of $0.04-0.10, excluding non-recurring items, vs. $0.06 consensus; sees Q1 revs of $590-620 mln vs. $580.1 mln consensus.

2:22PM Apple confirms iPad (AAPL) 208.00 +2.60 : Co confirms the new iPad, a device for browsing the web, reading and sending email, enjoying photos, watching videos, listening to music, playing games, and reading e-books. iPad includes 12 new apps designed especially for the iPad, and will run almost all of the over 140,000 apps in the App Store. iPad will be available in late March starting at the price of just $499.

9:30AM Tegal received an order for a Tegal 200 SE DRIE tool (TGAL) 1.26 +0.08 : Co announced it has received an order for a Tegal 200 SE DRIE tool, equipped with the Tegal ProNovaTM ICP source, from a leading manufacturer of precision timing devices. Tegal was awarded the 200 SE DRIE tool order after a thorough competitive evaluation by the customer, who will use the silicon DRIE tool to develop MEMS-based precision timing devices.

EMCORE (EMKR) announces that it has been awarded a contract by ATK Space Systems of Goleta, California to manufacture, test, and deliver solar panels for ATK's UltraFlex solar arrays. The period of performance for this contract for the first two vehicles runs through 2013 and is valued in the range of $9-$11 mln... Conolog Corporation (CNLG) announces that it has completed field testing and started production/marketing of its "GlowWorm" fiber optic detector that may be used in any fiber optic line or network without the need to cut the cable...

8:31AM Emcore awarded solar panel manufacturing contract from ATK Space Systems; valued in a range of $9-$11 mln (EMKR) 1.00 : Co announces that it has been awarded a contract by ATK Space Systems to manufacture, test, and deliver solar panels for ATK's UltraFlex solar arrays. These solar arrays will be used to power the Orion spacecraft being developed by Lockheed Martin Space Systems Company for NASA. The period of performance for this contract for the first two vehicles runs through 2013 and is valued in the range of $9-$11 mln. The flight solar array system is expendable for each Orion mission and continuous production is expected to run through 2020 and beyond.

MoSys (MOSY) announces that ROHM has signed a major technology license agreement for MoSys' 1T-SRAM embedded memory technology. The technology license agreement will enable ROHM to design and manufacture ICs utilizing 1T-SRAM in ROHM's fabrication facilities...

8:07AM UTStarcom selected Sanmina-SCI Corporation as its new outsourced electronics manufacturing service provider (UTSI) 2.39 : UTStarcom, Inc. (UTSI) selected Sanmina-SCI Corporation (SANM) as its new outsourced electronics manufacturing service provider (EMS), a move that aligns with UTStarcom's announced restructuring initiatives and expands the company's cost savings efforts. Under the terms of the agreement, Sanmina-SCI will provide full electronics manufacturing services for UTStarcom's system products currently being built in UTStarcom's Hangzhou facility. These services include new product introduction (NPI) support, material sourcing and procurement, printed circuit board assembly, system integration and testing, final pack-out and delivery. Increasing UTStarcom's ability to manage demand swings, the flexible cost structure of this outsourcing agreement matches UTStarcom's volume of orders and allows for a faster cash flow cycle and lower working capital usage.

7:09AM DSP Group beats by $0.07, beats on revs (DSPG) 6.46 : Reports Q4 (Dec) earnings of $0.12 per share, ex-items, $0.07 better than the First Call consensus of $0.05; revenues fell 23.5% year/year to $54.7 mln vs the $53.9 mln consensus. Co states, "As we look to 2010, we expect conditions in our major end markets, including Europe and the U.S., to improve. We project revenue growth of 10% for 2010 over 2009 (which equates to approximately $233.4 mln vs. $233.97 mln consensus) reflecting a sharp recovery during the first quarter, as compared to the first quarter of 2009, and revenue generation from our new product categories throughout the year."

3:50AM LDK Solar signs module supply contract with COU/Oneworld (LDK) 6.96 : Co announces that it has signed a contract to supply solar modules to Canada based COU Solar, a subsidiary of Oneworld Energy. Under terms of the agreement, LDK Solar will deliver approx 30 megawatts of solar modules to COU/Oneworld in 2010.

icon url

ReturntoSender

01/31/10 10:39 AM

#8825 RE: ReturntoSender #6755

From Briefing.com: 4:30 pm : A better-than-expected GDP report couldn't keep stocks from selling off and logging their third straight weekly loss, which has left the stock market down nearly 4% since the start of the new year.

Stocks started the session in positive territory and even made their way to a gain of more than 1%. The move was underpinned by an advance fourth quarter GDP reading that showed annualized quarter-over-quarter growth of 5.7%, which was considerably stronger than the 4.7% rate of expansion that had been widely forecast. Core personal consumption expenditures (PCE) increased at an annualized quarter-over-quarter rate of 1.4%, which is slightly stronger than the 1.3% increase that had been expected.

Though Fed member Kohn indicated in a speech that interest rates are likely to stay near zero for an extended period if the economy follows the trajectory expected by the Fed, signs of strong economic growth brought back speculation that interest rates will be hiked sooner than later. That notion drove the dollar 0.7% higher against competing currencies and put the Dollar Index at a fresh five-month high.

The notion of a stronger economy also looked like it would reheat the reflation trade as commodities and natural resource stocks climbed sharply. The energy sector climbed to a 1.7% gain, while the materials sector made its way to a 2.1% gain. However, both commodities and natural resource stocks rolled over, which culminated in a 1.4% loss for both energy stocks and materials stocks. The two sectors had been the best performers in the early going, but ended the session among the worst performers.

Tech dropped 2.1% to finish the session with the steepest loss, though. Microsoft (MSFT 28.18, -0.98) led other large-cap tech lower as participants reacted in a sell-the-news manner to the computer giant's better-than-expected earnings report. Given that tech carries more market weight than any other sector, its weakness in recent sessions has caused a considerable drag on the broader market. During the course of the past 10 sessions tech stocks have dropped more than 9%, leaving the S&P 500 to lose 6.5% over the same period.

The drag of tech on the broader market was also seen in shares of Amazon.com (AMZN 125.41, -0.62), which tested three-week highs after the company posted an upside earnings surprise and issued upside guidance. But the stock rolled over to log a loss.

In a sign of conviction, trading volume on the NYSE surpassed 1.5 billion shares. That was the most action in one month.

Advancing Sectors: (None)
Declining Sectors: Tech (-2.1%), Energy (-1.4%), Materials (-1.4%), Industrials (-1.0%), Financials (-0.7%), Consumer Discretionary (-0.6%), Utilities (-0.6%), Health Care (-0.5%), Telecom (-0.4%), Consumer Staples (-0.2%)DJ30 -53.13 NASDAQ -31.65 NQ100 -1.7% R2K -1.0% SP400 -1.4% SP500 -10.66 NASDAQ Adv/Vol/Dec 929/3.10 bln/1729 NYSE Adv/Vol/Dec 955/1.58 bln/2065

4:01PM Atmel: Court preliminarily approves partial settlement of 'in re atmel corporation derivative litigation' (ATML) 4.64 -0.12 : The co announces that the United States District Court for the Northern District of California has preliminarily approved a settlement agreement (the "Agreement") to settle previously disclosed litigation related to Atmel's historical practices regarding the timing of stock option grants. The Agreement provides, on behalf of all current Atmel shareholders, for the full settlement and release of all claims against all of the defendants, except Atmel's former general counsel, James Michael Ross, related to the allegations and/or matters set forth in three consolidated shareholder derivative actions and two actions to compel production of company books and records, currently pending in the U.S. District Court for the Northern District of California, the Superior Court of the State of California, County of Santa Clara, and the Court of Chancery of the State of Delaware... The terms of the Agreement provide for: (i) a direct financial benefit to Atmel of $9.65 million; (ii) the adoption and/or implementation of a variety of corporate governance enhancements, particularly in the way Atmel grants and documents grants of employee stock option awards; (iii) the payment by Atmel of plaintiffs' counsels' attorneys' fees, costs, and expenses in the amount of $4.94 million; and (iv) the dismissal with prejudice of all claims by and between the settling parties and releases of all claims against the settling defendants.

9:01AM Atmel will continue to explore the potential sale of the Company's Smart Card business (ATML) 4.76 : Co announced that following a comprehensive review of alternatives for its ASIC business, it will continue to explore the potential sale of the Company's Smart Card (SMS) business located in Rousset, France and East Kilbride, UK and that it intends to discontinue potential sale discussions for its Customer Specific Products (CSP) and Aerospace businesses. As previously announced, Atmel has entered into an exclusivity agreement with LFoundry GmbH for the potential sale of this fab business. Atmel has been pursuing strategic alternatives for the ASIC business and related manufacturing assets as part of its transformation plan, which is aimed at focusing on the Company's high-growth and high-margin businesses.

08:46 am Microsoft (MSFT)

Microsoft (MSFT 28.93) reported solid profit growth driven by cost cutting measures and strong demand for Windows 7.

Microsoft reported fiscal second quarter earnings of $0.60 per share. The reported figure excludes a $0.14 per share positive impact from the recognition of $1.71 billion of deferred revenue relating to the Windows 7 Upgrade Option Program and presales of Windows 7 to OEMs and retailers before general availability.

Operating income of $8.51 billion and net income of $6.66 billion represented year-over-year increases of 43% and 60%, respectively.

Revenues rose 14.4% year-over-year to $19.02 billion (including the $1.71 billion deferred revenue); the consensus called for $17.84 billion.

"Exceptional demand for Windows 7 led to the positive top-line growth for the company," said Peter Klein, chief financial officer at Microsoft. "Our continuing commitment to managing costs allowed us to drive earnings performance ahead of the revenue growth."

Microsoft said it sold over 60 million Windows 7 licenses, making it the fastest selling operating system in history.

Shares of MSFT are about 2.8% higher ahead of Friday's opening bell.

icon url

ReturntoSender

02/01/10 10:59 PM

#8828 RE: ReturntoSender #6755

From Briefing.com: 4:30 pm : Strength among natural resource plays helped the stock market put together a low-volume advance that concluded at session highs with all 10 major sectors in positive ground.

Materials stocks spiked 3.7% as participants pushed back into precious metals and metals stocks. After recording sizable losses in recent weeks, gold prices closed pit trade 1.9% higher at $1105 per ounce, while silver prices settled 2.9% higher at $16.66 per ounce. That helped Freeport McMoRan (FCX 71.59, +4.90) to put together its best single-session percentage advance in approximately six months. The stock was also helped by the notion that it had been oversold after it fell in seven of the eight previous sessions, which cost the stock one-fifth of its market cap.

Diversified metals and miners settled the session with a 7.3% gain, while gold stocks gained 6.3%, and steel stocks were sent 5.3% higher.

All 39 components in the S&P 500 energy sector finished the session in higher ground to give the sector a 3.0% gain. Integrated energy giant Exxon Mobil (XOM 66.18, +1.75) was a primary leader in the group, due to its better-than-expected earnings and a 2.1% rise in crude oil prices, which settled the session at $74.13 per barrel.

The Philadelphia Semiconductor Index put together a 3.1% gain after it had dropped 6.3% during the course of the two previous sessions. Support for the space was helped by news from the Semiconductor Industry Association that global chip sales in December surged 29% year-over-year.

Health care stocks finished with a solid 0.5% gain, but they struggled to keep up with the broader market this session. That was largely due to relative weakness in managed care names in the wake of in-line earnings and a tepid 2010 forecast from Humana (HUM 48.71, +0.09).

This morning's economic data was generally mixed. The ISM Manufacturing Index for January hit a five-year high of 58.4, which topped the consensus call of 55.5, but enthusiasm for the report was tempered by news that construction spending during December made a month-over-month 1.2% decline, which is worse than the 0.5% decline that many had forecast.

Personal income during December climbed 0.4%, which is a slightly sharper increase than the 0.3% increase that had been expected. Spending during December increased 0.2%, which was softer than the 0.3% increase that was widely forecast. Core personal consumption expenditures increased a tepid 0.1% month-over-month, but that was in-line with the consensus.

Advancing Sectors: Materials (+3.7%), Energy (+3.0%), Financials (+1.6%), Tech (+1.5%), Industrials (+1.5%), Consumer Discretionary (+1.1%), Consumer Staples (+0.8%), Utilities (+0.7%), Health Care (+0.5%), Telecom (+0.4%)
Declining Sectors: (None)DJ30 +118.20 NASDAQ +23.85 NQ100 +1.1% R2K +1.2% SP400 +1.5% SP500 +15.32 NASDAQ Adv/Vol/Dec 1709/2.22 bln/972 NYSE Adv/Vol/Dec 2411/1.04 bln/642

6:08PM Silicon Motion misses by $0.26, misses on revs; guides Q1 revs in-line (SIMO) 3.20 +0.04 : Reports Q4 (Dec) loss of $0.28 per share, excluding excluding stock-based compensation, acquisition-related charges, foreign exchange gain, and other items, $0.26 worse than the First Call consensus of ($0.02); revenues fell 29.3% year/year to $22.8 mln vs the $24.8 mln consensus. Co issues in-line guidance for Q1, sees Q1 revs of down 5% to up 5% sequentially, which equates to ~$21.7-23.9 mln vs. $22.38 mln consensus. Co says, "Although we are entering the seasonally slow part of the year especially relating to our mobile storage business, we are seeing continued signs of improvement in our business and design pipeline and are confident that our business will improve as the year progresses."

4:44PM Rudolph Tech misses by $0.13, beats on revs; co announced record bookings (RTEC) 6.77 +0.50 : Reports Q4 (Dec) loss of $0.20 per share, which includes includes the restructuring charge, litigation, and stock-based compensation, $0.13 worse than the First Call consensus of ($0.07); revenues rose 76.8% year/year to $29 mln vs the $26.6 mln consensus. Co reported record book-to-bill ratio of 2.6 exceeded industry averages by more than 2X.

4:17PM TranSwitch announces a workforce reduction and other cost savings initiatives (TXCC) 1.82 +0.27 : Co announces it recently effected a restructuring to be implemented and concluded during the first quarter of 2010. This workforce reduction primarily affects personnel based in Fremont, California, New Delhi and Bangalore, India and Shelton, Connecticut. TranSwitch expects that these restructuring actions and other cost reduction initiatives will result in annual savings of approx $4.0 mln, and that these savings will begin to be recognized in first quarter of 2010. Of this amount, TranSwitch expects annual savings of approximately $2.4 mln in reduced employee related costs including base salary reductions and $1.6 mln from other cost savings initiatives. In connection with the restructuring, TranSwitch expects to incur pre-tax restructuring charges of approx $1.4 mln which will be cash expenditures primarily for employee related costs. The Company expects these charges to be recorded in the first quarter of 2010.

Mattson Technology (MTSN) announces that it has received multiple orders for the company's Suprema photoresist strip system and the Helios XP rapid thermal processing system from one of the leading memory customers based in Asia...

7:30AM Am Superconductor receives $70 mln order for wind turbine electrical control systems from China's Shenyang blower works (AMSC) 38.02 : Co announces that it has received an initial order for full wind turbine electrical control systems from China's Shenyang Blower Works that is worth approximately $70 mln. The systems will be deployed in the 2 megawatt doubly fed induction wind turbines that were co-developed with AMSC Windtec, a wholly owned subsidiary of AMSC. This is the largest initial electrical control system order that AMSC has received to date from any wind turbine customer.

7:19AM SIA says global chip sales decline in 2009 : The Semiconductor Industry Association (SIA) reports that worldwide semiconductor sales in 2009 were $226.3 billion, a decline of 9 percent from 2008 when sales were $248.6 billion. Total sales for 2009 surpassed the SIA forecast of $219.7 billion. December sales were $22.4 billion, an increase of 29 percent from December 2008, when sales were $17.4 billion. December sales declined by 1.2 percent from November when sales were $22.7 billion. All monthly sales numbers represent a three-month moving average. "2009 turned out to be a better year for the global semiconductor industry than expected," said SIA President George Scalise. "A strong focus on inventories throughout the supply chain mitigated the impact of the worldwide economic downturn and positioned the industry for growth as the global economy recovers. "Sales in the final quarter of 2009 were supported by healthy demand in a variety of end markets including PCs, cell phones, and consumer electronics. In 2010, unit sales of personal computers and cell phones - which account for approximately 60 percent of total semiconductor consumption - will grow in the low-to-mid teens, providing a solid platform for chip sales. Consumer electronics are expected to grow in the mid-single digits," Scalise continued. "We are also seeing the effects of recovery in the enterprise sector and we believe this trend will continue," Scalise noted. SIA expects a return to normal seasonal patterns, which suggests a modest slowdown in the first quarter.

6:14AM UTStarcom announces it has entered into agreements for a strategic relationship with Beijing E-town International Investment and Development (UTSI) 2.16 : Co announces it has entered into agreements for a strategic relationship with Beijing E-town International Investment and Development, an investment company established by the Beijing Municipality which includes an investment of $48.5 mln by BEIID and two unrelated investment funds, Ram Max Group Limited and Shah Capital Management. The three investment parties are advised by Yellowstone Capital. As part of the investment, UTStarcom will issue approx 22 mln shares of common stock at a price of $2.20 per share, with BEIID investing $25 mln, Ram Max Group Limited investing $12.5 mln and Shah Capital investing $11 mln. In connection with the transaction and in furtherance of UTStarcom's strategic goals in China, Mr. Jack Lu has been appointed the new Chief Executive Officer and President of the Company effective the later date of three months after the closing of the investment or June 30, 2010. From the closing of the transaction until he assumes the CEO position, he will be the Company's Chief Operations Officer. Mr. Peter Blackmore will retire as CEO and President of UTStarcom upon Mr. Lu's assumption of the CEO position.

icon url

ReturntoSender

02/02/10 10:46 PM

#8829 RE: ReturntoSender #6755

From Briefing.com: 4:35 pm : Despite a sluggish start and a lack of concerted leadership, the stock market made its way back above 1100 as buyers offered broad-based support for the second straight session.

For fear that the previous session's low-volume rally was anything more than a reflex bounce that followed last week's losses, participants showed reservation in the early going. That made for listless, choppy trade.

However, buyers stepped back in after a couple of early dips failed to gain momentum. Broad buying ensued, but stocks paused to consolidate their gains at a couple of near-term resistance levels in the S&P 500 -- last week's closing highs and the psychologically-significant 1100.

Though the S&P 500 was able to make its way back above 1100, it remains 4% below its January high. Nonetheless, all 10 major sectors finished the latest session in higher ground; seven of them gained in excess of 1%.

Materials stocks consistently lagged. The sector still gained 0.4%, but Dow Chemical (DOW 27.57, -1.06) proved to be a drag as participants dismissed its better-than-expected earnings.

Some materials stocks sported strong gains, though. Particularly, an upgrade of Alcoa (AA 13.67, +0.31) and Freeport McMoRan (FCX 72.51, +0.92) by analysts at Citigroup won support for aluminum and diversified metals plays, while an upgrade of Schnitzer Steel (SCHN 45.51, +3.09) by analysts at UBS helped steel stocks.

Higher commodity prices also offered support to the sector. With a 1.9% gain, the CRB Commodity Index made its best single-session percentage gain in nearly one month.

A modest 0.2% decline by the Dollar Index played a minor role in the CRB's move, but oil prices were a primary underpinning of the gain. Pit trade closed with crude oil priced 3.7% higher at $77.17 per barrel. That played a part in the energy sector's 1.4% bounce. Of the 39 components listed in the S&P 500 Energy Sector, only Baker Hughes (BHI 47.26, -0.07) failed to log a gain.

Energy names topped this session's list of most actively traded stocks by volume. Overall volume was slightly above average as almost 1.2 billion shares exchanged hands on the NSYE this session.

Still, participants don't seem to be reacting much to earnings. UPS (UPS 58.62, +0.23) posted an upside surprise that helped its shares climb, but the broader market was generally unfazed. Whirlpool (WHR 82.23, +6.17) missed Wall Street's consensus, but its strong outlook won it favor.

There wasn't much reaction to the latest economic data or economic commentary as an in-line 1.0% month-over-month increase in December pending home sales was generally dismissed by market participants.

Treasury Secretary Geithner's testimony about the government's fiscal 2011 budget was also generally disregarded, while former Fed Chairman and current Chair of the President's Economic Recovery Advisory Board Paul Volcker gave a testimony on reining in risk taking at commercial banks that offered little additional detail.

Advancing Sectors: Health Care (+1.9%), Industrials (+1.9%), Consumer Discretionary (+1.5%), Energy (+1.4%), Telecom (+1.3%), Consumer Staples (+1.3%), Financials (+1.1%), Tech (+0.8%), Utilities (+0.8%), Materials (+0.4%)
Declining Sectors: (None)DJ30 +111.32 NASDAQ +18.86 NQ100 +0.9% R2K +0.8% SP400 +1.4% SP500 +14.13 NASDAQ Adv/Vol/Dec 1479/2.50 bln/1164 NYSE Adv/Vol/Dec 2341/1.18 bln/695

4:50PM TTM Tech provides update on regulatory status of proposed acquisition (TTMI) 10.65 +0.19 : Co announced that the Committee on Foreign Investment in the United States ("CFIUS") has completed its review of the proposed acquisition by TTM Hong Kong, a subsidiary of the Company, of certain indirect wholly owned subsidiaries of Meadville Holdings that are engaged in PCB operations. CFIUS has informed the Company that there are no unresolved national security concerns for this acquisition. The Company and Meadville had previously voluntarily filed a notice for CFIUS's review.... Co received a letter from the U.S. Federal Trade Commission in January 2010 indicating that its request for early termination of the Hart-Scott-Rodino review process had been granted. The Company's application previously submitted to antitrust regulators in the People's Republic of China is currently under review.

4:17PM GT Solar beats by $0.10, beats on revs; guides FY10 EPS above consensus, revs above consensus (SOLR) 6.00 +0.22 : Reports Q3 (Dec) earnings of $0.25 per share, $0.10 better than the First Call consensus of $0.15; revenues rose 66.6% year/year to $173.6 mln vs the $145.4 mln consensus. Co issues upside guidance for FY10, sees EPS of $0.52-$0.60 vs. $0.49 consensus; sees FY10 revs of $500-$550 mln vs. $502.12 mln consensus. The company reiterated its gross margin guidance for the fiscal year of approximately 39%. Co states, "We have seen an increase in business activity over the last four months from our key customers in Asia, indicating that their utilization rates are climbing and, as a result, the supply environment for low cost, high quality wafers is expected to tighten. We believe recent orders, including some from new customers, provide further evidence that GT Solar remains the technology leader in the market and that our systems continue to be the choice of leading PV manufacturers."

4:07PM JDS Uniphase beats by $0.03, beats on revs; guides Q3 revs above consensus (JDSU) 8.37 +0.21 : Reports Q2 (Dec) earnings of $0.12 per share, $0.03 better than the First Call consensus of $0.09; revenues rose 15.1% year/year to $343.8 mln vs the $334.2 mln consensus. Non-GAAP gross margin was 44.6% compared to 44.0% in the prior quarter and 43.5% in second quarter of fiscal 2009. Co issues upside guidance for Q3, sees Q3 revs of $325-$350 mln vs. $322.68 mln consensus.

10:45AM Motorola announced an investment in Scanbuy; terms of the investment were not disclosed (MOT) 6.34 +0.01 : Co announced an investment in Scanbuy. Motorola acted as lead investor and was joined by Masthead Venture Partners, Hudson Ventures and select private investors. Financial terms of the investment were not disclosed.

8:47AM Tower Semicon and Soitec sign agreement to offer backside illumination platform for high-end image sensors (TSEM) 1.15 : The co and Soitec Group (Euronext Paris) announce that they have signed an agreement that will enable a turn-key solution for high-end backside illuminated (BSI) CMOS image sensors (CIS) for industrial, medical and automotive applications. "The market for BSI CMOS image sensors replacing current Front Side Illumination (FSI) technology is expected to reach $800M in 2013," according to Jerome Baron, principal analyst at Yole Developpement. "The BSI image sensor market will be mainly driven by digital cameras and cell-phone applications, but high performance imaging applications such as medical, industrial and automotive vision sensors are also an important segment. We estimate the market for high-end BSI image sensors to reach $120M in the same time frame."

7:38AM Am Superconductor beats by $0.06, beats on revs; guides FY10 EPS above consensus, revs above consensus (AMSC) 39.75 : Reports Q3 (Dec) earnings of $0.20 per share, $0.06 better than the First Call consensus of $0.14; revenues rose 95.4% year/year to $80.7 mln vs the $76.7 mln consensus. Co issues upside guidance for FY10, sees EPS of $0.65-$0.67 vs. $0.58 consensus; sees FY10 revs of $312-$315 mln vs. $306.90 mln consensus. Co also states, We delivered better-than-expected financial results for the third fiscal quarter as wind-related revenues continued to grow and our cost management initiatives provided additional bottom-line benefits. With several wind turbine manufacturing customers in volume production, many others set to begin production over the next 12 months and new power grid orders continuing to be closed, the foundation has been set for further growth in fiscal 2010 and beyond..." As co detailed at its Analysts' Day in Nov 2009, co expects growth to continue in FY11. Co expects revenue to exceed $400 mln (vs consensus of $419.5 mln) and non-GAAP net income to exceed $54 mln, or $1.15 per diluted share (vs consensus of $1.15) for FY11.

2:23AM ARM Holdings reports 4Q09 results (ARMH) : Reports Q4 (Dec) earnings of 1.79 pence/share vs 1.94 pence/share in 4Q08; revenue declined 6% year/year to $140.0 mln vs $130.85 mln consensus. Co expects group dollar revenues for the full-year to be at least in line with current market expectations.

icon url

ReturntoSender

02/03/10 10:18 PM

#8830 RE: ReturntoSender #6755

From Briefing.com: 4:30 pm : Support for large-cap tech helped the Nasdaq Composite recover from the red to finish flat, but weakness in the broader market left the S&P 500 to chop along in negative territory as participants looked past several positive headlines and strong gains by China's markets.

China's Shanghai Composite and Hong Kong's Hang Seng both booked gains in excess of 2% in their latest session as a couple of banks tightened lending in order to head off government mandates. However, neither those gains nor news that the ADP Employment Report showed a smaller-than-expected loss of 22,000 private sector jobs in January aroused support. An in-line reading of 50.5 for the January ISM Services Index was also dismissed.

Given the stock market's strong gains in the two previous sessions, buyers opted to take a break from this session's action. That's not to say that sellers reclaimed control, though; overall losses were contained.

Large-cap tech traded with strength and helped the tech sector net a 0.3% gain and the Nasdaq 100 finish the session 0.4% higher. The Nasdaq Composite finished flat as weakness among its other issues undermined its performance. Cisco (CSCO 23.07, +0.05) saw mixed interest ahead of its latest quarterly report. Still, that was an improvement from the 0.6% loss that it displayed at its session low.

Financials were particularly weak. They logged a loss of 1.4%, unable to rally around better-than-expected earnings from insurers Aflac (AFL 50.94, +1.24) and MetLife (MET 34.80, -1.57). Aflac was able to win itself support with an upside forecast, though.

Dow component Pfizer (PFE 18.62, -0.44) fell short of Wall Street's consensus earnings estimate. That encouraged pressure against other pharmaceutical stocks, which lost a collective 1.4%. The broader health care sector shed 1.1%.

Advancing Sectors: Tech (+0.3%), Consumer Discretionary (+0.2%)
Declining Sectors: Financials (-1.4%), Health Care (-1.1%), Materials (-1.0%), Telecom (-0.8%), Energy (-0.8%), Utilities (-0.8%), Consumer Staples (-0.5%), Industrials (-0.4%)DJ30 -26.30 NASDAQ +0.85 NQ100 +0.4% R2K -0.6% SP400 -0.7% SP500 -6.04 NASDAQ Adv/Vol/Dec 1077/2.32 bln/1526 NYSE Adv/Vol/Dec 1162/1.06 bln/1856

4:32PM Broadcom announces dividend policy; declares the first quarterly cash dividend of $0.08 per share (BRCM) 27.89 -0.14 : Co announced that its Board of Directors has adopted a dividend policy pursuant to which the Company intends to pay quarterly cash dividends on its common stock. The Board declared the first quarterly cash dividend of $0.08 per share payable to holders of the Company's common stock. The dividend was declared by the Board of Directors on January 27, 2010 and will be paid on March 8, 2010 to holders of the Company's Class A and Class B common stock of record at the close of business on February 19, 2010. (Briefing.com note: Annualizing the $0.08 quarterly dividend gives BRCM a ~1.2% annual dividend yield)

4:12PM Novellus beats by $0.06, beats on revs (NVLS) 22.05 +0.29 : Reports Q4 (Dec) earnings of $0.39 per share, $0.06 better than the First Call consensus of $0.33; revenues rose 29.5% year/year to $244.2 mln vs the $237.1 mln consensus. Co says "We believe the continued momentum behind the recovery in our industry is sustainable, as it is based on the return of fundamental end market demand drivers similar to the ones we saw a decade ago. While the future is never certain, we expect to see continued growth in semiconductor demand, which ultimately drives our business. This demand is being fueled by a worldwide acceleration of information technology infrastructure expansion, including the adoption of Windows 7, massive government spending worldwide to enhance security around the globe, and the rise of the Chinese consumer (who is forecasted to spend nearly four times as much on electronics as the U.S. or European consumer over the next five years). Technology has consistently been a key driver for improvement in the quality of life around the globe, and we believe there is no end in sight to the application of semiconductors to help achieve this goal."

4:12PM ON Semiconductor beats by $0.05, beats on revs; guides Q1 revs above consensus (ONNN) 7.86 +0.05 : Reports Q4 (Dec) earnings of $0.19 per share, $0.05 better than the First Call consensus of $0.14; revenues rose 1.7% year/year to $497.1 mln vs the $491 mln consensus. ONNN reports Q4 gross margins of 39.9% vs 39.2% consensus. On a mix-adjusted basis, average selling prices in the fourth quarter of 2009 were down less than 1% when compared to the third quarter of 2009. Co issues upside guidance for Q1, sees Q1 revs of $515-525 mln vs. $479.26 mln consensus. Co sees 1Q10 gross margin of 40-41%, operating expenses of $132-$136 mln, and fully diluted share count of 445 mln.

4:11PM FEI Company misses by $0.05, beats on revs; guides Q1 revs in-line (FEIC) 21.18 -0.07 : Reports Q4 (Dec) earnings of $0.17 per share, $0.05 worse than the First Call consensus of $0.22; revenues rose 1.8% year/year to $154.5 mln vs the $149.9 mln consensus. Co issues guidance for Q1, sees GAAP EPS of $0.15 - $0.20, including estimated restructuring charges of $0.02 to $0.03 per share, may not be comparable to $0.28 consensus; sees Q1 revs of $150 mln - $156 mln vs. $154.33 mln consensus. Bookings are expected to be at least $145 mln.

4:11PM Broadcom reports Q4 (Dec) results, beats on revs (BRCM) 27.89 -0.14 : Reports Q4 (Dec) earnings of $0.11 per share, may not be comparable to the First Call consensus of $0.44; revenues rose 19.2% year/year to $1.34 bln vs the $1.32 bln consensus. BRCM reports total gross margins of 53.1 % vs 52.3% consensus. Color on items included in EPS: As previously disclosed, in the fourth quarter of 2009, Broadcom announced that it had agreed in principle to settle the securities class action litigation pending against the company and certain of its current and former officers and directors relating to the company's historical stock option accounting practices. Under the proposed settlement, the claims against Broadcom and its officers and directors will be dismissed with prejudice and released in exchange for a $160.5 million cash payment by Broadcom. The company recorded the settlement amount as a one-time charge. The proposed settlement remains subject to the satisfaction of various conditions, including negotiation and execution of a final stipulation of settlement and approval by the U.S. District Court for the Central District of California following notice to members of the class. This charge reduced net income by $0.31 per share (diluted) in the fourth quarter and year ended 2009. In addition, we received $63.2 million from our directors' and officers' insurance carriers, which the company recorded as a reduction of selling, general and administrative expense. This increased net income by $0.12 per share (diluted) in the fourth quarter and year ended December 31, 2009.

4:10PM Cisco Systems beats by $0.05, beats on revs (CSCO) 23.07 +0.05 : Reports Q2 (Jan) earnings of $0.40 per share, $0.05 better than the First Call consensus of $0.35; revenues rose 8.0% year/year to $9.81 bln vs the $9.41 bln consensus. Reports Q2 gross margins of 64.5% vs Street at 64.8%... Days sales outstanding in accounts receivable (DSO) at the end of the second quarter of fiscal 2010 were 39 days, compared with 32 days at the end of the first quarter of fiscal 2010, and compared with 29 days at the end of the second quarter of fiscal 2009. Inventory turns on a GAAP basis were 12.1 in the second quarter of fiscal 2010, compared with 11.6 in both the first quarter of fiscal 2010 and the second quarter of fiscal 2009. Non-GAAP inventory turns were 11.7 in the second quarter of fiscal 2010, compared with 11.3 in both the first quarter of fiscal 2010 and the second quarter of fiscal 2009. "From a financial standpoint, Q2 was an outstanding quarter. Our performance with an eight percent year-over-year increase in Q2 revenue represents our third sequential quarter of positive growth and was well above the strong guidance we outlined during our first quarter conference call... We delivered strong gross margins and added $2.5 billion in cash from operations during our second quarter, bringing our total of cash and investments to $39.6 billion. We believe that these results demonstrate the strong foundation from which we can continue to focus on growing and capturing market transitions in our industry."

4:08PM Pericom Semi beats by $0.01, beats on revs; guides Q3 revs above consensus (PSEM) 9.11 -0.28 : Reports Q2 (Dec) earnings of $0.10 per share, $0.01 better than the First Call consensus of $0.09; revenues rose 16.6% year/year to $35.8 mln vs the $35 mln consensus. Co issues upside guidance for Q3, sees Q3 revs of $34-36 mln vs. $33.00 mln consensus. Gross margins are expected to be in the 33% to 35% range. Co said, "We look forward to resuming our revenue growth and delivering better operating results in 2010."

9:46AM Emcore enters into an agreement to sell a majority interest in its fiber optics business resulting in the completion of its restructuring (EMKR) 1.05 +0.03 : Co entered into a share purchase agreement to create a joint venture with Tangshan Caofeidian Investment. Caofeidian Industry Zone is a fast developing area in the strategic Bohai Rim Economical Region with a total investment of $26.4 billion, and hosts a large number of corporations and enterprises, including China Capital Steel, Sinopec, and others. The agreement provides for TCIC to purchase 60% interest in EMCORE's Fiber Optics business (excluding its satellite communications and specialty photonics fiber optics product lines), which will be operated as a joint venture once the transaction is closed. The new joint venture entity will be named EMCORE Fiber Optics, Limited (EFO), and registered in Hong Kong. The agreement provides for TCIC to pay EMCORE ~$27.8 million in cash and provide an additional funding of $27 million to EFO after the closing. The Fiber Optics businesses included in this transaction are EMCORE's telecom, enterprise, cable TV, fiber-to-the-premises, and video transport product lines. EMCORE will retain the satellite communications and specialty photonics fiber optics product lines as well as the satellite and terrestrial solar businesses.

8:13AM On The Wires : TriQuint Semiconductor (TQNT) announces that the Compensation Committee of its Board of Directors approved a stock option award for an aggregate of 160,000 shares of TriQuint's common stock under the Company's 2008 Inducement Award Program to one new employee who will serve as the Company's Vice President of Texas Operations...

8:04AM Silicon Labs beats by $0.22, reports revs in-line; guides Q1 revs above consensus (SLAB) 44.35 : Reports Q4 (Dec) earnings of $0.84 per share, $0.22 better than the First Call consensus of $0.62; revenues rose 28.1% year/year to $127.2 mln vs the $127.4 mln consensus. Non-GAAP gross margin for the quarter was up again to 65.7%. Non-GAAP gross margin for the year was 63.8%, an industry-leading result when paired with the company's revenue growth. Co issues upside guidance for Q1, sees Q1 revs of $120-$125 mln vs. $118.69 mln consensus.

7:01AM Silicon Storage to be acquired by MCHP for $2.85 per share in cash (SSTI) 2.69 : Microchip Technology Incorporated (MCHP) announces it has signed a definitive agreement to acquire Silicon Storage Technology (SSTI) for $2.85 per share in cash. As separately announced today by SST, SST has terminated its previously announced merger agreement prior to entering into the definitive agreement with Microchip. The acquisition has been approved by the Boards of Directors of each company and is expected to close in the second quarter of calendar 2010, subject to approval by SST's stockholders and other customary closing conditions. "This acquisition enables Microchip to gain earlier access to SST's advanced technologies, as well as the ability to customize technology variants that can give us an advantage over competing technologies." "We believe this is an attractive transaction for SST's stockholders, as it presents a significant premium to the prior transaction and requires no external financing," continued Mr. Sanghi. "We look forward to completing this transaction early in the second calendar quarter of 2010."

6:58AM ATMI beats by $0.02, beats on revs (ATMI) 16.50 : Reports Q4 (Dec) earnings of $0.22 per share, $0.02 better than the First Call consensus of $0.20; revenues rose 20.9% year/year to $84.6 mln vs the $76.8 mln consensus. Co says given the opportunities available in the advanced technology generations, for 2010 they are planning for an $8 - $10 million increase in R&D spend. Co also says "... For ATMI, differentiated growth should come from the high-end, very high-performing devices where our customers need the advanced materials and process integration expertise that ATMI offers, and which is the focus of our High Productivity Development investments. 2010 should be a year of growth, with many forecasters predicting healthy wafer start increases that should help strengthen our base business. We expect to see the pace of new technology adoption accelerate as we move through 2010."

icon url

ReturntoSender

02/04/10 9:39 PM

#8831 RE: ReturntoSender #6755

From Briefing.com: 4:35 pm : Woes over the fiscal health of select European nations and some disappointing jobless claims numbers fueled a selling frenzy that culminated in the market's worst single-session percentage loss since April.

Concerns for the fiscal health of Portugal, Greece, and Spain in the wake of some tepid bond auction results stirred early selling interest, which intensified with news that initial jobless claims for the week ended Jan. 30 increased more than expected week-over-week to 480,000. Continuing claims remained steady week-over-week at 4.60 million, but that was still higher than the consensus call for 4.58 million continuing claims.

Disappointment over the headlines led global participants to seek safety in the dollar, which spiked 0.7% to a new six-month high.

Participants wanted little to do with equities, though. In turn, 97% of the issues listed in the S&P 500 logged a loss, which drove the broad-market measure to its lowest close in nearly three months. Meanwhile, the Dow Jones Industrial Average dipped below 10,000 for the first time since early November, but settled just above that psychologically significant line. Cisco (CSCO 23.16, +0.09) was the only Dow component to book a gain, thanks to its better-than-expected earnings and strong guidance.

Visa (V 83.05, -0.47) also exceeded earnings expectations and reaffirmed its outlook for growth, but its shares rolled over from a strong gain in the early going to join peer MasterCard (MA 222.11, -25.47) in the red. MasterCard missed Wall Street's consensus earnings estimate for the latest quarter. The stock was one of the weakest names in the financial sector, which fell 4.2%, worse than any other major sector.

Natural resource plays had been among the poorest performers for most of the session. Their losses were linked to broader market weakness and sharp losses in the commodity complex, which dragged down the CRB Commodity Index to a new three-month low and a 2.6% loss for the session.

Weakness among commodities was broad based as oil prices plummeted 5.0% to $73.14 per barrel. Prices haven't fallen by such a sharp percentage since summer. Meanwhile, gold prices were pushed 4.3% lower to $1064 per ounce -- December marked the last time that gold fell by more than 4%.

Volatility spiked amid this session's sell-off. That resulted in a near 21% rise in the Volatility Index, which is often dubbed the VIX, or more ominously the Fear Index.

Retailers mostly made up the handful of names to book gains in the broader market. That was largely the result of several upbeat same-store sales reports for January. Still, retailers fell a collective 2.3%.

As if the breadth of this session's slide wasn't telling enough of conviction, trading volume on the NYSE came close to 1.5 billion shares, which is well above its 50-day and 200-day moving average.

While this session's sell-off will weaken sentiment in the broader market, participants still have yet to see the latest nonfarm payrolls report, which often brings volatility all on its own. The nonfarm payrolls report for January is scheduled to be released Friday morning at 8:30 ET.

Advancing Sectors: (None)
Declining Sectors: Financials (-4.2%), Energy (-3.9%), Materials (-3.8%), Industrials (-3.1%), Tech (-2.9%), Consumer Discretionary (-2.9%), Utilities (-2.6%), Health Care (-2.6%), Telecom (-2.4%), Consumer Staples (-2.3%)DJ30 -268.37 NASDAQ -65.48 NQ100 -2.9% R2K -3.4% SP400 -3.2% SP500 -34.17 NASDAQ Adv/Vol/Dec 366/2.78 bln/2319 NYSE Adv/Vol/Dec 272/1.48 bln/2842

6:29PM Silicon Storage reports Q4 EPS of $0.02 vs. ($0.38) in the prior year; revs grew 2.2% to $72.9 mln (SSTI) 2.84 -0.01 :

4:41PM Advanced Analogic Tech reports EPS in-line, revs in-line; guides Q1 revs above consensus (AATI) 3.49 +0.01 : Reports Q4 (Dec) loss of $0.05 per share, in-line with the First Call consensus of ($0.05); revenues rose 11.8% year/year to $20.8 mln vs the $20.7 mln consensus. Co reported gross margins of 47.6% for the fourth quarter of 2009, compared to 38.0% for the fourth quarter of 2008 and 51.2% for the third quarter of 2009. Non-GAAP gross margin was 48.1% for the fourth quarter of 2009, compared to 43.3% for the fourth quarter of 2008 and 51.7% for the third quarter of 2009. The Company ended the fourth quarter of 2009 with $102.0 mln in cash, cash equivalents, and short-term investments. Co issues guidance for Q1, sees EPS of ($0.12) - ($0.10), may not be comparable to ($0.07) consensus; sees Q1 revs of $21 mln-$23 mln vs. $19.67 mln consensus. The first quarter 2010 estimates include pre-tax quarterly share-based compensation expense in the range of $1.4 to $1.6 mln

4:34PM Harmonic beats by $0.02, beats on revs; guides 1H10 above consensus; announces retirement of CFO (HLIT) 5.90 -0.17 : Reports Q4 (Dec) earnings of $0.07 per share, excluding non-recurring items, $0.02 better than the First Call consensus of $0.05; revenues fell 10.5% year/year to $86.7 mln vs the $83.9 mln consensus. Co issues upside 1H10 guidance, anticipates that net sales for the first half of 2010 will be in a range of $170.0-180.0 million vs the $166.5 mln consensus. Non-GAAP gross margins and operating expenses for the first half of 2010, which exclude charges for stock-based compensation and the amortization of intangibles, are anticipated to be in a range of 48% to 49% and $66.5 to $68.5 million, respectively. Total bookings in the fourth quarter of 2009 were $107.6 million, up from $79.9 million in the third quarter. For the full year 2009, net sales were $319.6 million, compared to $365.0 million in 2008. International sales represented 50% of net sales for the fourth quarter and 49% for the full year of 2009, up from 47% and 44%, respectively, for the same periods in 2008. In 2009, the co's 10 largest customers contributed 47% of net sales, compared to 58% in 2008. CFO Dickson announces plans to retire, the search for a new CFO has begun.

4:17PM KLA-Tencor declares quarterly dividend of $0.15/share and resumes stock buyback program under which 9.8 mln shares are available for repurchase (KLAC) 28.31 -0.98 :

4:16PM MTS Systems misses by $0.03, misses on revs (MTSC) 3.17 -0.51 : Reports Q1 (Dec) earnings of $0.23 per share, $0.03 worse than the First Call consensus of $0.26; revenues fell 23.7% year/year to $89 mln vs the $91.5 mln consensus. "As we look forward, there are several aspects of our business and the market that support our cautious sense of optimism. First, overall market conditions remained relatively unchanged during the quarter and this sense of ongoing stability is reassuring. Second, the expense-reduction and efficiency initiatives implemented over the past several quarters successfully aligned our cost structure with this environment. Third, we are encouraged that our shorter-cycle Sensors segment, which was more immediately impacted by the economic downturn at its onset, is achieving margin results similar to pre-recession levels."

4:10PM Powerwave misses by $0.02, misses on revs (PWAV) 1.35 -0.06 : Reports Q4 (Dec) earnings of $0.01 per share, $0.02 worse than the First Call consensus of $0.03; revenues fell 20.9% year/year to $142.6 mln vs the $148.3 mln consensus.

4:10PM Monolithic Power beats by $0.01, beats on revs; guides Q1 revs above consensus (MPWR) 18.98 -0.89 : Reports Q4 (Dec) earnings of $0.20 per share, $0.01 better than the First Call consensus of $0.19; revenues rose 34.0% year/year to $46.5 mln vs the $45.2 mln consensus. Co issues upside guidance for Q1, sees Q1 revs of $45-$49 vs. $41.86 mln consensus. Co also sees gross margin flat to slightly down from 4Q09; Research and development and selling, general and administrative expenses between $19.2 mln and $20.6 mln; and Non-GAAP research and development and selling, general and administrative expenses between $16.0 mln and $17.0 mln. This excludes an estimate of stock-based compensation expense in the range of $3.2 mln to $3.6 mln.

4:07PM TTM Tech misses by $0.03, beats on revs; guides Q1 EPS below consensus, revs below consensus (TTMI) 9.77 -0.38 : Reports Q4 (Dec) earnings of $0.14 per share, excluding charges related to previously announced plant closures and the Meadville Holdings transaction, $0.03 worse than the First Call consensus of $0.17; revenues fell 9.1% year/year to $149.9 mln vs the $145.4 mln consensus. Co issues downside guidance for Q1, sees EPS of $0.06-0.11 vs. $0.18 consensus; sees Q1 revs of $132-140 mln vs. $145.05 mln consensus.

12:52PM Semiconductors Hldrs Trust range trade near support, 200 day follows (SMH) 24.47 -1.03 : Noted support at 24.45 in The Technical Take and have seen the SMH stabilize near this level over the last hour (session low 24.44). Intraday needs to sustain a push through 24.55 and 24.70 to begin to improve the bias. Next support on a failure is at its 200 day sma at 24.29.

8:30AM On The Wires : Ultratech (UTEK) announces that it has received a follow-on, multiple-system order for its laser spike anneal tools from a major foundry in Asia. Ultratech's LSA100A systems will be used to support high-volume production for advanced logic devices in 2010...

8:13AM On The Wires (OPNEX) : Ultratech (UTEK) announces that it has received a follow-on, multiple-system order for its laser spike anneal tools from a major foundry in Asia. Ultratech's LSA100A systems will be used to support high-volume production for advanced logic devices in 2010...

8:03AM Power Integrations beats by $0.01, beats on revs (POWI) 32.07 : Reports Q4 (Dec) earnings of $0.42 per share, $0.01 better than the First Call consensus of $0.41; revenues rose 10.2% year/year to $66.1 mln vs the $64.6 mln consensus.

8:00AM Trina Solar announces sales agreement with AE Photonics in Germany (TSL) 24.22 : Co announces it has entered into an agreement with AE Photonics of Germany for 40 MW of PV modules to be delivered during 2010. Under the terms of the agreement a total of 20 MW will be shipped during the first half of 2010 with agreed prices for the first quarter. Initial shipments commenced in January 2010.

7:16AM Benchmark Elec beats by $0.03, beats on revs; guides Q1 EPS and revs above consensus (BHE) 18.76 : Reports Q4 (Dec) earnings of $0.29 per share, excluding non-recurring items, $0.03 better than the First Call consensus of $0.26; revenues rose 3.1% year/year to $600 mln vs the $552.4 mln consensus. Co issues upside guidance for Q1, sees EPS of $0.28-0.32, excluding non-recurring items, vs. $0.24 consensus; sees Q1 revs of $580-620 mln vs. $537.11 mln consensus. Operating margin for the fourth quarter was 3.5%, excluding restructuring charges. "I am pleased with the solid performance of our team in the fourth quarter. The strong demand from our existing customers as well as the progress of our new program ramps contributed to an 18% sequential increase in revenues over the third quarter. Our fourth quarter revenue and operating margin improvements were achieved in the face of numerous challenges, including the inefficiencies caused by component lead time constraints. We have gained significant momentum in new business bookings and program ramps and are well positioned to continue to gain share in our key markets."

icon url

ReturntoSender

02/06/10 8:25 PM

#8832 RE: ReturntoSender #6755

From Briefing.com: 4:30 pm : Volatility returned to the market this week, with a sharp 3% drop in the S&P 500 on Thursday and big swings in the major averages today. However, looking at the end result the picture is less dramatic, as S&P 500 declined just -0.7% on the week. The increased volatility has stemmed from sovereign debt concerns centered around the more fiscally troubled European nations such as Portugal, Spain and Greece. This uncertainty pressured overseas markets over the past two days, and resulted in strength in the dollar.

The dollar has played a key role in the market action of the past two days, with dollar-denominated assets exhibiting a strong inverse relationship with the currency. This was very evident in this afternoon's strong rebound, as a pullback from 6-month highs in the dollar index coincided with a sharp short-covering rally that erased triple-digit losses in stocks. Technical levels have also played a role in the end-of-week action, with the S&P 500 managing to hold its 200-day exponential moving average after slicing through key support levels yesterday.

Looking at today's action more closely, stocks attempted to trade higher ahead of the opening bell, despite the worse-than-expected January Employment Report. The report showed that 20,000 nonfarm jobs were lost in January, worse than the consensus expectation for a gain of 15,000 jobs. However, a pullback in the headline unemployment rate to 9.7% from 10.0% proved a silver lining for some. While buyers temporarily had control as the dollar eased off morning highs, strength in stocks was short-lived. After declining as much as 1.8% during the first half of the day, the market was able to erase triple-digit losses (the DJIA rebounded over 170 pts) in a late-day short-covering spike that coincided with a pullback in the dollar.

Looking out to next week, earnings season continues but there are fewer major names scheduled to report, with only two Dow components (DIS & KO) due out during the week. Volatility could remain elevated as the market continues to digest macro factors and growing uncertainty. DJ30 +10 NASDAQ +16 NQ100 +0.8% R2K +0.6% SP400 +0.2% SP500 +3 NASDAQ Adv/Vol/Dec 1433/1822059383/1214 NYSE Adv/Vol/Dec 1326/1562194266/1740

5:14AM Brooks Automation misses by $0.02, beats on revs (BRKS) 8.52 : Reports Q1 (Dec) loss of $0.02 per share, excluding non-recurring items, $0.02 worse than the First Call consensus of ($0.00); revenues rose 44.7% year/year to $106.2 mln vs the $94.1 mln consensus.

3:35AM Silicon Image misses by $0.01, reports revs in-line; guides Q1 revs below consensus (SIMG) 2.29 : Reports Q4 (Dec) loss of $0.07 per share, excluding non-recurring items, $0.01 worse than the First Call consensus of ($0.06); revenues fell 4.2% year/year to $35.6 mln vs the $35.5 mln consensus. Co issues downside guidance for Q1, sees Q1 revs of $30.0-32.0 mln vs. $34.47 mln consensus. Co sees gross margin of 54.0-55.0%.

icon url

ReturntoSender

02/07/10 4:53 PM

#8834 RE: ReturntoSender #6755

InvestmentHouse Weekend Market Summary 2/5/10

http://www.investmenthouse.com/weekendmarketsummary.htm

- Market responds as expected with an afternoon rally on the heels of further selling.
- Jobs data pulls the old switch-a-roo as payrolls fail to post a gain but unemployment falls.
- European PIIGS threaten a 2008-like slump as leverage questions breed fear.
- Friday rebound eases worries, but has to prove it was a character change.

Market sells again but rebounds in the last hour.

We have DIVIDED the video into component parts: Market Overview, Technical Summary, Economy, and the Next Session. This allows you to choose the segments you are interested in without having to find the spot in a longer video. Click on the link to the portion you wish to view.

MARKET OVERVIEW

TO VIEW THE MARKET OVERVIEW CLICK THE FOLLOWING LINK:
Market Overview Video

TO VIEW THE TECHNICAL SUMMARY VIDEO CLICK THE FOLLOWING LINK:
Technical Summary Video

TO VIEW THE ECONOMY VIDEO CLICK ON THE FOLLOWING LINK:
Economy Summary Video

TO VIEW THE NEXT SESSION VIDEO CLICK THE FOLLOWING LINK:
Next Session Video

The Friday jobs report was somewhat preempted by the PIIGS running through the European Union on Thursday and its deleterious effect upon the stock market. Nonetheless, jobs did have their impact on Friday. The futures were negative beforehand, but bounced positive after the jobs report. There was a dichotomy in the report, and it was not as expected. There were 20K non-farm payroll jobs lost, but the unemployment number fell (9.7% versus 10% the prior month, 10% expected). The latter was able to boost the market higher despite massive revisions in the true number of jobs lost during the recession. That is rearview mirror information, so the market did not pay it much mind. The market opened a bit lower and tried a bounce, but then sold negative. We used that failed bounce to take some downside gain off the table. Then we would sit back and wait for the market to bounce. We were anticipating some short covering and wanted to get in on some other downside positions. We still thought the character of the market had not changed. The market bounced and sold, and it held the same low it held on two prior occasions during the day. It bounced higher, made a lower high, and it bounced and started to roll over after lunch. We took some positions there, but they came back to bite us somewhat as the market rebounded late and gave us the expected short covering to end the week. We did not panic, but we took a few more positions in the stocks that were still good plays to the downside. We did not get into many of the others from the report on Thursday because they sold early and did not rebound enough to make them good plays. We would be playing the edges, and that is more difficult. I thought we should wait and see if they rebounded more next week. There was a big reversal at the end of the day that sent many stocks back up even to positive; it even sent the indices positive by the end of the day. The question is whether this was just a short-covering rally or if there was a reversal. You cannot tell on the first day, particularly since the index patterns are atrocious. We will have to see how the market plays out in the first part of next week. It is important to note that the move itself did not change the downside character of the market.

The main issue facing the market was when the PIIGS started running through Europe on Thursday. Portugal, Italy, Ireland, Greece, and Spain are all in trouble. They have huge deficits, and the problem is the cost of insuring their debt through credit default swaps. You may remember those from the fall of 2008 - everyone had to learn what they were very quickly because their spreads were rapidly widening, and the cost of these insurance policies in some cases went up 1000% overnight. The credit default swap spreads are exploding in Europe. They are getting much wider, and wide equals risk. If a spread is wide on an option, then it is either thinly traded or there is a lot of risk associated with it (or both). This is happening with the credit default swaps in these countries. It is becoming an increasingly expensive proposition for the countries that have been buying the debt of Greece. This is a dangerous time, and the ramifications are huge if Greece goes under. If Greece has to default, that is a serious issue that will ripple across the globe. Even the US 5 year credit default swap spreads widened by 30-40BP on Thursday alone. This is not just a European issue, and you can see that when you look at gold. One would think that gold would be surging during all this uncertainty, but it had a very tough week. It rebounded on Friday from its lows to close positive, but the fact that it is not rising when there is great uncertainty in the world indicates there is a worry of deflation rather than inflation.

OTHER MARKETS

Dollar. After a slight pause to start the week, the dollar surged higher Wednesday through Friday. It was fueled by the fear in the rest of the world, and particularly world currencies such as the Euro that dove down versus the dollar. Even the yen was lower against the dollar. Some are saying this was just because of an unwinding of the carry trade that is where you borrow against one currency and invest elsewhere and pocket the difference. With the dollar rising, they say it had to be unwound because it was being used as a carry currency to some extent. That was probably part of what caused the spike higher, but it was also a safe-haven play. One cannot ignore that the EU is in trouble, and it boggles the mind to see some people on TV treat this episode just as they treated the summer of 2008. Things were going down rapidly, but they refused to acknowledge that fact. The Euro had been moving up steadily against the dollar, and it is now being squashed because of the worries in the EU with the PIIGS nations. The dollar is rallying because people want to put their money in a safe currency. Even with all of our debt, we are still considered safe. The question is, if we keep spending as we are now, will we be in the same place Greece is five years down the road? Our credit worthiness could be questioned by the credit-rating mechanisms and, more importantly, the investors around the world. They are the ones with the final say. The dollar enjoyed a solid week, but it was at the expense of other currencies and at the expense of many stocks as well.

Gold. Gold tried to bounce and make a double bottom off the December low, but it was unable to do so. It peaked on Wednesday and then was massively crushed on Thursday. It sold again on Friday. It broke through support, but managed to rebound and close positive ($1,065.38, +.38).

Oil. Oil had another tough week of its own. It did bounce as well, but it was shoved lower. It was unable to recapture all of the losses it felt during the day and closed down ($71.85, 1.29). When it was posting $4.00 losses intraday, then -$1.29 was not a bad session. It also held at the key support from December where it bottomed. It is right at the average of the trading range from August through September. Everything was on the recovery trail at the end of the session. That leads me to question whether it was just short covering (which I believe it was), versus some renewed buying just because it was time to buy. That is possible; maybe the economic data in the US is good enough. We will have to see how that plays out next week.

Bonds. Bonds were up all week, but they were back and forth. At the end of the day on Friday, the 10 year closed at 3.57%. That yield was down from the 3.60% posted on Thursday. Bond were rallying and pushing the yields lower once more. It was not too long ago that bond yields were up at 3.8%, and they are now down at 3.57%. There are worries out there, and the bonds have rallied accordingly.

TECHNICAL

INTERNALS

The internals were hardly impressive. Advancers did move positive on the NASDAQ as it recovered, and it lead the recovery at 1.2:1. That was pale compared to the -6:1 on Thursday, but you have to take into account that it was a reversal session, so they do not swing that quickly. Interestingly, decliners on the NYSE led -1.4:1. That shows that there were still plenty of stocks downside, even though the indices recovered to positive. Narrow rebounds indicate short covering.

Volume moved up on NASDAQ to 2.7B and on the NYSE to 1.5B. You can argue that that is a reversal: the markets came back, rallied off lows, and closed positive on rising gain. There has definitely been a sharp selloff for the past three weeks and a good reversal off a support level. It could be a reversal, and maybe they will move up from here. The momentum could keep things going on Monday or Tuesday. We will see, but again, I view this as something of a short-covering move. The selling is not over yet. There are issues out there bigger than the economic data from the US, and that is a major overhang for the market as it trades over the next few weeks. In other words, investors will have to see what happens with these credit default swaps, what their spreads do, and how the rest of the world reacts to the debts in the EU PIIGS.

CHARTS

SP500. The SP500 reversed off support and did so on volume. This does not tell us whether or not the selling is over. It could be good for a short-term bounce since it held a support point and bounced. There was a significant selloff. It was 1100 down to 1050. 50 points in a couple of days is a lot of selling in a short period of time, and a bounce-back is normal. We could see a bounce back up to 1075 (the prior low from late January). There is other resistance there from the September peak. We will have to see how high it bounces, but I do not feel this changed the character of the move. The bias is still downwards, although the buyers might have put in a statement on Friday.

NASDAQ. NASDAQ showed the same action. There was higher volume (higher than already high volume on the Thursday selling), a selloff down to some support at 2100, and then a reversal to positive. Once again, you had the move back up after a selloff. Will that lead to more upside? It very well could. 2150 is a barrier, but the big barrier is at 2200-2205. NASDAQ will have to show us. If there is a big reversal like that, it could definitely be a sea change in the market. However, looking at the selloffs over the prior three weeks, it was due for a short-covering rally this time around. That is what we got, and now the question is whether a short-covering rally can turn into a full-fledged bull rally (in other words, the longer-term buyers come back in and buy). There has been significant damage done, and there is significant resistance to overcome. It is hard for an index to sell off like this and then find the kind of support it needs to break out and run again. It could be that this reversal leads to a rebound that comes higher than these prior levels. It may slingshot it back up to test the bottom of this range. There are many possibilities, but you also have to look at probabilities. I think this was short covering after a big selloff. We have been putting our money on it finding resistance and continuing down. Unless it proves otherwise, that is what we will continue to do.

SP600. The small caps showed the same action. They came down to an important support level where we figured they would come to. 310 was one of the levels that showed a lot of support. It could fall to 300 as well, but it decided to reverse off that level. It had a nice recovery to positive, and we will see how far it bounces to start the week. It has serious resistance of its own, but we will have so see how it works.

SOX. SOX was never down as much. It was down, but it reversed and was sold off harder than the other indices. It tested close to the bottom of its support range and reversed, basically following the rest of the market.

The indices reversed, they did so on high volume, but the internals were rather weak as far as breadth. There are many patterns that have the same look they did before Thursday. They bounce, but they still have that downside bias to them. If the buyers come back in flush with money and ready to buy, nothing is going to stop them. There has been a lot of technical damage, however, and it has hard for those kinds of moves to hold up. It will probably sell off again and have more downside before this is resolved. That makes sense because that is the way stocks typically act. They shoot up, they have big gains, and then they come back and start selling (and sell a bit harder than before). The downside is a bit stronger than it has been on any of the other moves. When that happens, there is technical damage done and they tend to move laterally and base out before they take back off to the upside. When you have this kind of selloff, "V" or knifepoint turns are not as common.

LEADERSHIP

Technology. It is interesting to note that technology performed better. There is hardly a pattern of strength for AAPL, but it bottomed, bounced, and it bottomed again. It is still holding support at 190. It could very well bounce higher and come back to test the prior peaks. It is not a pattern of strength, but there is a double bottom set, and techs were showing more money flowing their way. GOOG was the same story. It did not break down further as the rest of the market sold off to end the week. It held tight at 525 and is showing some strength. INTC held at this steady and constant support level at 19. MCHP also did not sell off; it held tight at 26. This pattern repeated over and over again.

Industrials. Industrials came back. BUCY was in free fall, breaking below a key level at 50, but it reversed to close above that level and showed a hammer doji. After a selloff, that can mean a break higher, but it can also just be continuation doji. This has not been a huge selloff it has been a one-day event, so it is less likely to be a meaningful rebound. JOYG may be in position for a bounce. It has come down to support at the August peak, and it coincides with the 200 day EMA. It is showing a hammer doji as well. It is at a more significant selloff and may be ready for a bounce. That would be all because this is what you would call a damaged pattern that has to base out. DE did not break down, either. It hit the intraday low, but it reversed to hold the range it has been trading in for just over a week.

Metals. The metals are showing some of the same type of action. FCX has been in the doghouse for a while, but it has made a double bottom at the 200 day EMA as well as other important price points at 65. MTL reversed off this trendline. If it holds, that makes it a good trendline because that would be a third test of it. It is not a pretty pattern, but it looks like it wants to bounce. They do not all look great, but there is enough life in some of these. They are holding support and could put in a bounce to start next week.

Energy. APA sold down to a support level and rebounded off the intraday low. This is a common theme. SLB came down to our target, tapped above the 200 day EMA as well, and reversed. It made us nice gain and bounced. This is not a good pattern, but it is one where it could bounce higher as it trades in this range. We will have to see how much strength there is next week. DO recovered too, and it recovered off a support level. This is damaged goods, however. It could have a knifepoint turn, but the odds are not great for that.

Retail. Retail continues to be one of the stronger areas. ANN had nice same store sales, and it had a nice doji test on the gap. It could be ready to move back up. COH was a downside play. It bounced, but this is not what you would call a strong pattern. BWLD is another stock that, while it was down on the week, it did not really sell off. It is just moving in a range, holding the short term EMAs.

Overall, the indices are still showing a downside bias. There is also leadership that is showing a downside bias, but there are pockets (tech, retail, and some metals) that show they could post a near term rally or bounce off of the selloffs because they held a prior low and are trying to put in small double bottoms.

THE ECONOMY

'Backwards' jobs report leaves pundits puzzled.

The jobs report on Friday was the main news after Thursday rattled the entire world's financial markets with the issues arising out of the EU countries. Non-farm payrolls fell 20K, and that was almost the mirror image of the expected gain. That was not helpful, but the unemployment rate fell to 9.7%, versus the 10% reported prior and expected. An important aspect was that the workweek moved up to 33.3 hours versus 33.2. It has been stagnant for quite some time at that level, and any rise is a positive. Although, that is a very low number of hours worked for the week, and it has to get closer to 36 before it makes a difference. Nonetheless, this market will grasp at anything, and you have to start turning before you can get to good levels.

The non-farm payrolls were down 20K, but that was not the worst of it. Revisions were terrible. December was -150K versus -80K originally reported. November was written up to 64K versus the 4K reported. In October, it was written way down to -224K versus the -127K originally shown. Overall, the revisions were based upon a change in the benchmarks to more accurately reflect what happened during the year. The revisions showed 1.2M additional jobs lost. In other words, since the recession started, there were -8.4M jobs lost versus the -7.2M previously reported. That is fairly staggering. That leaves 14M people unemployed. The tough aspect of this recession is that the unemployed typically stay unemployed for a period of two months. During this recession, the average period of unemployment has been seven months. As the weekly new jobless claims show, they continue to add onto the unemployed payrolls. That is a great burden on the economy and society. The unemployment rate did fall to 9.7%, and that is a positive. This usually means that, as the country comes out of recession, the entrepreneurs cannot find a job so they start their own businesses out of desperation and the inability to find a "normal" job. The interesting thing is that the household survey showed that 541K more people were working in January. That is the largest jump in 5 years. That is a positive because jobs recover ahead of the non-farm payrolls number. That topped the 430K that were unemployed or lost their jobs in the household survey, and that gave the net jump higher to jobs. Further, the job pool fell by around 250K. That always makes the unemployment rate look better simply because people are leaving the workforce. You have a mixed showing. There are actual positives where, in the months before, there were no positives at all. There is improvement in the household survey. Even the disgruntled workers came in at 16.5%, down almost 1 point from the 17.4% in December. There is improvement even on that level.

Temporaries rose 52K. That is four months in a row temporary hiring has improved. That is important because companies typically hire people on a temporary basis before they make permanent offers. On a temporary basis, an employer does not have to provide healthcare and that type of thing. You can hire them, see if they work out, and then make a full time offer. It starts in baby steps, and there were good forward steps taken in January. Without the revisions and adjustments, there is still a 10.6% unemployment rate. That shows where the problem is because many of the other numbers are just numbers games. The actual number of people is what we should be measuring, and that puts it at about 10.6%. That is as the government does it as most people would measure it, it would be around 16%. There are still discouraged workers that have given up, and there is a 50% increase since President Obama took the office. He has the unfortunate position of being the president at the time a recession hit. George Bush had the same issues, and other presidents did as well. There is improvement, but the question is whether it is sustainable. That depends on whether the economic bounce we see is sustainable as well. It would be nice to see some of the stimulus money given back to people to invest in businesses versus trying to prime the pump with credits for hiring employees. It is somewhat heartening to hear that many people on the financial stations and other places are saying a jobs credit will not do anything. It is interesting to note that when George Bush was dealing with his recession, the idea was floated by some to have a credit for hiring people just like we are doing now. The irony is that there were many Democrats who came out against it saying they tried it in the past and it had no impact on net jobs. They were absolutely right; it does not. It is interesting how the focus and logic shifts depending on who is in the White House or who is in charge of Congress.

THE MARKET

MARKET SENTIMENT

The VIX surged to a new rally high on Friday as the market sold off early. Remember, the market did sell off through the middle of the day, but then it recovered. As it recovered, of course, the volatility fell. There was a higher low and a huge surge on Thursday. It was running well on Friday before it came back. Once the VIX makes a big move, it can really run. It will hold tight for a long time, but then it breaks the ice and can easily slide higher or lower. Thus, what happened on Friday may not mean much. There is a big gravestone doji, and that could mean it is going to turn down. However, you have to think that it has broken through the ice. It may shoot back up if the market was just subject to short covering on Friday ahead of a weekend and after a big selloff. Although volatility faded back, that does not say to me that there was a major problem with respect to a reversal to the upside in the market.

VIX: 26.11; +0.03
VXN: 25.96; -0.03
VXO: 25.28; -1.25

Put/Call Ratio (CBOE): 1.21; +0.15

Bulls versus Bears:

This is a reading of the number of bullish investment advisors versus bearish advisors. The reason you look at this is that it gives you an idea of how bullish investors are. If they are too bullish then everyone is in the market and it is heading for a top: if everyone wants to be in the market then all the money is in and there is no more new cash to drive it higher. On the other side of the spectrum if there are a lot of bears then there is a lot of cash on the sideline, and as the market rallies it drags that cash in as the bears give in. That cash provides the market the fuel to move higher. If bears are low it is the same as a lot of bulls: everyone is in and the market doesn't have the cash to drive it higher.

Bulls: 38.9%. The selling took further toll on bulls, dropping them from 40.0%. After peaking at 53 on this move the bulls continue to run, falling to a new low post- July 2009. Once again bulls peaked out near the 50% level. Bulls have bumped at 50ish since late August 2009, falling to 45ish and then rebounding. Getting close to the 35% level that is the threshold for what is considered a bullish climate. Hit a high of 47.7% mid-June on the run from the March lows. Again, to be seriously bearish it needs to get up to the 60% to 65% level. Dramatic rise from 21.3% in November 2008, the bottom on this leg. This last leg down showed us the largest single week drop we have ever seen, falling from 33.7% to 25.3%. Hit 40.7% on the high during the rally off the July 2008 lows. 30.9% was the March low. In March the indicator did its job with the dive below 35% and the crossover with the bears. A move into the lower 40's is a decline of significance. A move to 35% is a bullish indicator.

Bears: 22.2%. Surprisingly bears fell for the week, down from 23.3% after a brisk rise up from 16%ish on the lows this leg where it held for several weeks. Peaked near 28% in November, falling short of the 35.6% hit in July 2009. For reference, cracking above the 35% threshold considered bullish. Hit a high on this run at 47.2%. For reference, bearishness hit a 5 year high at 54.4% the last week of October 2008. The move over 50 took bearish sentiment to its highest level since 1995. Extreme negative sentiment. Prior levels for comparison: Bearishness peaked at 37.4% in September 2007. It topped the June 2006 peak (36%) on that run. That June peak eclipsed the March 2006 high (33%) and well above the 2005 highs that spawned new rallies (30% in May 2005, 29.2% in October 2005). That was a huge turn, unlike any seen in recent history.

NASDAQ

Stats: +15.69 points (+0.74%) to close at 2141.12
Volume: 2.751B (+0.41%)

Up Volume: 1.907B (+1.61B)
Down Volume: 866.637M (-1.666B)

A/D and Hi/Lo: Advancers led 1.19 to 1
Previous Session: Decliners led 6.03 to 1

New Highs: 16 (-4)
New Lows: 52 (-1)

NASDAQ CHART: Click to view the chart

NASDAQ 100 CHART: Click to view the chart

SOX CHART: Click to view the chart

SP500/NYSE

Stats: +3.07 points (+0.29%) to close at 1066.18
NYSE Volume: 1.563B (+5.33%)

Up Volume: 832.375M (+792.031M)
Down Volume: 712.345M (-727.385M)

A/D and Hi/Lo: Decliners led 1.42 to 1
Previous Session: Decliners led 7.64 to 1

New Highs: 63 (-15)
New Lows: 89 (+25)

SP500 CHART: Click to view the chart

SP600 Chart: Click to view the chart

DJ30

Stats: +10.05 points (+0.1%) to close at 10012.23
Volume DJ30: 308m shares Friday versus 304M shares Thursday.

DJ30 CHART: Click to view the chart

MONDAY

The dollar will play a role in what happens in the stock market. It may not be the leading cause, but it may be a symptom of what is going on. Whether the dollar continues to rise or not could tell what will happen with the rest of the stock market. The dollar is gaining strength because of worries overseas. Maybe that is what it was telling us when it reversed its downtrend and started this rally the rally that is becoming stronger as the world economic picture grows weaker. People move to US currency even though we have unreal amounts of debt. It is just not as unreal as some of the places in Europe and other parts of the world. People are putting their money into US currency, and that is a symptom of what may happen next week. One of the things we need to consider is the reversal on Friday. I consider that short covering while others consider it a reversal signal. We will find out in the first couple of days in the week.

The earnings season is winding down, and there will be more economic data. Retail sales are a big component, but that is out late in the week. There is not a lot in the beginning of the week to drive things, so we will get to see what the market will do. The bias is down right now. We will have to see if liquidity comes back in to stir it back to the upside. Many Fed members, including Bernanke, are going to be speaking next week to Congress with respect to how and when they will remove all of the stimulus. That is something the market has factored in and will be listening to next week. There are still a lot of negatives out there, but it is when everything gets negative that things can turn positive again. I just do not think the selling is over yet. There are still unresolved issues. As long as serious issues remain unresolved and are incalculable (such as how bad the credit default swap will be in the EU), the market views that as uncertainty and does not like to move higher. No one wants to buy in that kind of uncertainty. When things get as bad as they can get, that is typically when the uncertainty is resolved (because it cannot get any worse than it is) and the market rallies. We are not at that stage right now.

We have downside positions we took on Friday and that we have had over the course of the last few weeks. We will keep those on. We will see how the stocks bounce early in the week. We can play upside bounces on stocks that can move well. There are stocks that can race higher if things go well. FCX is capable of doing that. There are other stocks that have sold off but held support and have set up a double bottom pattern. We can make a play off those. As for the others, we will be watching for them to rebound in their downtrends, hit resistance, and set up new downside. We have played others to the upside while they rebound and set up to the downside. Then we take our gains, flip out of the upside, and look at the downside plays. This is a market you have to trade right now because many patterns are broken and have to go through a healing process. There has been a deeper selloff than on any of the prior moves to the upside, so you have to do some work to get your house back in order. Then you can set up another run like the one we see in FCX spanning July through November. We will employ the same theory right now, which is to take what the market gives. That means we play good movers as the market bounces, and as it stalls out, we switch into plays that are set up to fall and can let our current plays fall again. Have a great weekend, and enjoy the Super Bowl.

Support and Resistance

NASDAQ: Closed at 2141.12
Resistance:
2143 is the October 2009 range low
2155 is the March 2008 intraday low
2167 from the July 2008 intraday low
2168 is the September 2009, intraday peak
2169 is the March 2008 closing low (double bottom)
2177 is a low from March 2008
2191 is the October 2009 peak
2205 is the November 2009 peak
2210 (from September 2008) to 2212 (the July 2009 closing low)
The 50 day EMA at 2212
2218 is the August 2005 peak
2245 from July 2008 through 2260 from late 2005.
2275 - 2278 from the February 2008 and April 2008 lows
2292 is a low from January 2008
2319 from the September 2008 peak
2326.28 is the January high
2324-2370 is a range of resistance from early 2008
2382-2395 from 2008
2412-2415 represents a series of peaks and lows in 2007, 2008
2453 is the August 2008 peak

Support:
2099 is the mid-September 2008 closing low
2070 is the September 2008 intraday low
2060 is the August peak
2048 is the early October 2009 closing low
The 200 day SMA at 2020
2015 from an early August 2008 peak

S&P 500: Closed at 1066.19
Resistance:
1070 is the late September 2009 peak
1078 is the October range low
1084 to 1080 (September 2009 peak)
1101 is the October 2009 high
The 50 day EMA at 1104
1106 is the September 2008 low
1114 is the November 2009 peak
1119 is the early December intraday high
1133 from a September 2008 intraday low
1150 is the January 2010 peak
1156 is the Sept 2008 low
1185 from late September 2008
1200 from the July 2008 low

Support:
1044 is the October 2008 intraday high
The August peak at 1040
The early October 2009 closing low at 1025
The early August intraday peak at 1018
The 200 day SMA at 1019
The November 2008 peak at 1006 closing 1007.53 intraday
992 is the August 2009 consolidation low

Dow: Closed at 10,012.23
Resistance:
10,120 is the October 2009 peak
10,285 is the late December consolidation peak
The 50 day EMA at 10,314
10,365 is the late September 2008 low
10,496 is the November 2009 high
10,609 from the Mid-September 2008 interim low
10,963 is the July 2008 low

Support:
9829 is the September 2008 closing high
9918 is the September 2008 peak
9855 is the early September peak in its lateral range
9835 is the late September 2009 peak
9654 is the November 2008 high
9625 is the October 2008 closing high
9620 is the August 2009 peak
The 200 day SMA at 9481
9430 is the early October low
9387 is the mid-October peak

Economic Calendar

These are consensus expectations. Our expectations will vary and are discussed in the 'Economy' section.

February 05 - Friday
- Nonfarm Payrolls, January (08:30): -20K actual versus 15K expected, -150K prior (revised from -85K)
- Unemployment Rate, January (08:30): 9.7% actual versus 10.0% expected, 10.0% prior
- Average Workweek, January (08:30): 33.3 actual versus 33.2 expected, 33.2 prior
- Hourly Earnings, January (08:30): 0.3% actual versus 0.2% expected, 0.2% prior
- Consumer Credit, December (15:00): -$1.7B actual versus -$10.0B expected, -$21.8B prior (revised from -$17.5B)

February 09 - Tuesday
- Wholesale Inventories, December (10:00): 0.6% expected, 1.5% prior

February 10 - Wednesday
- Trade Balance, December (08:30): -$35.0B expected, -$36.4B prior
- Crude Inventories, 2/5 (10:30): 2.32M prior
- Treasury Budget, January (14:00): -$60.0B expected, -$91.9B prior

February 11 - Thursday
- Initial Claims, 02/06 (08:30)
- Continuing Claims, 02/06 (08:30)
- Retail Sales, January (08:30): 0.4% expected, -0.3% prior
- Retail Sales ex-auto, January (08:30): 0.4% expected, -0.2% prior
- Business Inventories, December (10:00): 0.4% expected, 0.4% prior

February 12 - Friday
- Michigan Sentiment, February (09:55): 74.8 expected, 74.4 prior
icon url

ReturntoSender

02/08/10 10:36 PM

#8835 RE: ReturntoSender #6755

From Briefing.com: 4:30 pm : Weakness among financial issues took the broader market through a near-term technical support level to settle at a session low, and left the Dow to close below 10,000 for the first time in three months.

Financial stocks dropped 2.2% as participants pressured the sector after it had rallied this past Friday for a 1.2% gain. Financials traded as laggards for the entire session, but didn't drag down the broader market until late in the session.

Bank of America (BAC 14.48, -0.52) was one of the weakest performers within the financial sector. It was also a primary laggard among blue chips and helped drag down the Dow. Though the Dow has made intraday dips below the psychologically significant 10,000 level in recent sessions, this session marked the first time since early November that it actually closed below the mark.

Technical support had provided early support for the broader S&P 500 near the 1059 line in the early going and briefly into the close. However, sellers redoubled their efforts in the waning minutes of the session and caused stocks to close at session lows.

Broader market weakness inevitably dragged down shares of retailers from a 1.3% gain to a 0.2% loss. The group had found strength in better-than-expected earnings from CVS Caremark (CVS 32.72, +1.65) and Morgan Stanley's upgrade of Home Depot (HD 28.59, +0.61).

The dollar's move off of its session lows also weighed on stocks. The Dollar Index had been down 0.4% at its session low, but cut that to a 0.1% loss.

Despite that move, commodities were still able to book strong gains. As such, the CRB Commodity Index advanced to a 1.2% gain.

Advancing Sectors: (None)
Declining Sectors: Financials (-2.2%), Materials (-1.5%), Industrials (-1.1%), Utilities (-1.1%), Energy (-0.9%), Telecom (-0.8%), Tech (-0.5%), Consumer Discretionary (-0.4%), Health Care (-0.4%), Consumer Staples (-0.3%)DJ30 -103.84 NASDAQ -15.07 NQ100 -0.6% R2K -1.1% SP400 -0.7% SP500 -9.45 NASDAQ Adv/Vol/Dec 922/2.05 bln/1708 NYSE Adv/Vol/Dec 1077/1.08 bln/1957

4:18PM Trident Microsystems reports Q2 results (TRID) 1.81 +0.11 : Trident Microsystems reports Q2 earnings of ($0.22), which includes the impact of a $2.8 mln write-off of pre-production inventory, vs ($0.18) First Call consensus; revs increased 66% year/year to $31.9 mln vs $32.75 mln First Call consensus. As previously announced, Trident has changed its fiscal year end to December 31. For its new fiscal first quarter ending Mar. 31, 2010, which will include approximately eight weeks of operating results for the newly acquired product lines, Trident is providing the following outlook. Co sees Q1 revs of $85 mln to $90 mln, which may not be comparable to the $33.4 mln First Call consensus. Co also issues Q2 revenue guidance of $140 mln to $160 mln, which may not be comparable to $35 mln First Call consensus.

4:07PM Nuance Communications beats by $0.02, beats on revs (NUAN) 14.91 +0.23 : Reports Q1 (Dec) earnings of $0.29 per share, $0.02 better than the First Call consensus of $0.27. "Nuance achieved increased revenue growth in the quarter, enabled by stronger performance across all of its business lines. In the quarter, operating margins improved year over year, even as we increased investments in R&D, advertising and sales personnel" said Paul Ricci, chairman and CEO of Nuance. "Our first quarter performance, on-going investments in sales, channels and products, and our leadership position in key markets position Nuance for sustained growth for the balance of fiscal 2010."

4:02PM Veeco Instruments beats by $0.07, beats on revs; guides Q1 EPS above consensus, revs above consensus (VECO) 31.05 +0.63 : Reports Q4 (Dec) earnings of $0.41 per share, $0.07 better than the First Call consensus of $0.34; revenues rose 32.7% year/year to $146.4 mln vs the $129.8 mln consensus. Co issues upside guidance for Q1, sees EPS of $0.41-$0.50 vs. $0.37 consensus; sees Q1 revs of $150-165 mln vs. $142.23 mln consensus. "With record backlog of $402 million at the end of December, Veeco begins 2010 with unprecedented momentum. Business patterns in LED remain very strong in the first quarter, similar to what we experienced in the latter half of 2009, with multi-tool system orders being quoted to a large number of customers. Leading global LED manufacturers are showing strong interest in our newly introduced TurboDisc K465i(TM) GaN MOCVD System, which we believe is the best product on the market today. We are increasing manufacturing capacity to satisfy customer demand, with a current plan to ramp capacity to 45 or more tools this quarter and approximately 70 by the second quarter. We believe our Data Storage business, with its dramatically lowered breakeven structure and backlog of $60 million ending 2009, is in excellent position starting 2010. We remain well-aligned with our key customers and plan to introduce new technologies to continue to advance areal densities for thin film magnetic heads. In Metrology, our new product pipeline is the best it's been in years, and the business returned to profitability in both Q3 and Q4 2009. We currently expect all three Veeco businesses to grow revenues and profits in 2010."

4:01PM Atmel beats by $0.04, beats on revs (ATML) 4.80 -0.01 : Reports Q4 (Dec) earnings of $0.04 per share, $0.04 better than the First Call consensus of ($0.00); revenues rose 2.7% year/year to $343.6 mln vs the $338 mln consensus. "We are pleased to have delivered revenue growth and gross profit expansion that exceeded the upper end of our guidance range this quarter, as demand strengthened and factory utilizations improved," said Steve Laub, Atmel's President and Chief Executive Officer. "Microcontroller sales of 8- and 32-bit products, as well as our capacitive touch solutions, grew strongly as we continued to outperform the market. Based on our solid design win momentum and booking activity we are excited about the outlook for 2010, particularly for our microcontroller and touch products."

Cree (CREE) announces that the city of Valdez has joined the Cree LED City initiative; Valdez is in the process of converting all 343 street lights to LED technology...

Tessera Technologies (TSRA) announces that Samsung Electronics has integrated Tessera's OptiML Focus solution for extended depth of focus capabilities, and OptiML UFL solution for improved low-light performance, into Samsung's new 2.0 megapixel, full HD CMOS image sensor for notebook computer cameras and other applications...

icon url

ReturntoSender

02/10/10 8:23 PM

#8837 RE: ReturntoSender #6755

From Briefing.com: 4:30 pm : Continued speculation about loan guarantees for Greece and Fed Chairman Bernanke's hint at a rate hike kept the dollar in focus this session. Its advance took stocks lower, save financials.

The Dollar Index spent the entire session in positive territory as newswires were filled with conflicting reports about whether Germany will lead a bailout for Greece and other European countries currently in need. Its strength grew as Fed Chairman Bernanke's prepared remarks about how the Fed may opt to raise the discount rate before long made the rounds. The greenback had been up as much as 0.7% against competing currencies, but eased back a bit to settle with a 0.4% gain.

The midsession pullback by the greenback helped the stock market recover from a loss of more than 1%. Financials also provided support -- the sector steadily outperformed for the entire session, such that it finished with a 0.8% gain. It was the only major sector to finish in higher ground, though.

Strength in the financial sector was broad as multiline insurers (+2.2%), diversified banks (+1.5%), and diversified financial services players (+1.2%) all logged handsome gains.

Despite leadership from financials, the broader market couldn't push through the headwind that stemmed from a stronger dollar. In turn, the stock market failed to extend the previous session's 1.3% gain. However, stocks are still up 0.2% week-to-date. Though that's relatively unimpressive, stocks haven't booked a weekly gain since the first week of January.

Hardly 1 billion shares exchanged hands this session on the NYSE, making for rather light volume. Many participants may continue to wait on the sidelines until something of substance comes out of the Greece debt dilemma.

Despite broader market weakness, Treasuries failed to find support as the benchmark 10-year Note shed roughly 11 ticks. Its yield pushed above 3.7% at its session low. Disappointing results for an auction of 10-year Notes were the primary cause. They featured a yield of 3.69%, an indirect bid of 33%, and a bid-to-cover ratio of 2.67.

Looking ahead, participants will continue to focus on the dollar and any headlines regarding a bailout for Greece. Weekly jobless claims numbers, which are due tomorrow morning, also remain a point of interest for participants. Results for an auction of 30-year Bonds could also come into play.

Advancing Sectors: Financials (0.8%)
Declining Sectors: Materials (-0.7%), Utilities (-0.6%), Health Care (-0.6%), Energy (-0.5%), Consumer Discretionary (-0.5%), Telecom (-0.4%), Tech (-0.3%), Industrials (-0.3%), Consumer Staples (-0.2%)DJ30 -20.26 NASDAQ -3.00 NQ100 -0.2% R2K +0.1% SP400 -0.1% SP500 -2.39 NASDAQ Adv/Vol/Dec 1281/2.03 bln/1310 NYSE Adv/Vol/Dec 1500/1.01 bln/1497

4:50PM Sierra Wireless misses by $0.09, reports revs in-line; guides Q1 EPS below consensus, revs above consensus (SWIR) 11.76 +0.01 : Reports Q4 (Dec) earnings of $0.09 per share, excluding non-recurring items, $0.09 worse than the First Call consensus of $0.18; revenues rose 8.4% year/year to $144 mln vs the $144.7 mln consensus. Co issues mixed guidance for Q1, sees EPS of $0.11, excluding non-recurring items, vs. $0.15 consensus; sees Q1 revs of $150 mln vs. $140.89 mln consensus. "In January of 2010, we achieved another world first in launching the first ever 3G/4G mobile hot spot with Sprint. Achievements like this underscore our commitment to developing new, differentiated AirCard products supporting leading edge air interface technologies for our key operator partners. Looking forward, we have good visibility to Q1 revenue growth and believe we are uniquely positioned in our target markets with the industry's broadest product line, strongest global presence and unmatched innovation capability. Furthermore, we believe that our target markets of M2M and mobile computing present compelling growth opportunities and we are investing to bolster our leadership position."

4:09PM Bell Micro reports the SEC completed investigation and that no enforcement action has been recommended (BELM) 4.61 +0.07 : Co announced that it received notice from the Securities and Exchange Commission that the investigation concerning the company's accounting and financial reporting matters has been completed and that no enforcement action has been recommended.

8:04AM Trina Solar achieved "breakthrough" in its development of monocrystalline cell technology (TSL) 23.13 : Co announced it achieved a breakthrough in its development of monocrystalline cell technology. As part of the Company's ongoing research and development strategy, Trina Solar has developed a square monocrystalline cell with enhanced power output using its proprietary improved cell manufacturing process. Using specially designed metallization and passivation techniques, the advanced cell structure is expected to significantly boost cell conversion efficiency, achieving up to 18.8% efficiency in test laboratory production. In addition, this technology is expected to improve module output due to increased light absorbing surface area of the square shaped cell.

1:06AM Micron announces agreement to acquire Numonyx in all-stock transaction (MU) 9.08 : Co and Numonyx Holdings B.V. announce that the companies have signed a definitive agreement under which Micron has agreed to acquire privately held Numonyx in an all-stock transaction valuing Numonyx at approx $1.27 bln. Under the terms of the agreement, Micron will issue 140 mln Micron common shares to Numonyx shareholders, Intel (INTC), STMicroelectronics, N.V. (STM) and Francisco Partners. Up to 10 mln additional Micron common shares will be issued ratably to Numonyx shareholders to the extent the volume weighted average price of Micron shares for the 20 trading days, ending two days prior to the close of the transaction, ranges between $7.00 and $9.00 per share.

09:38 am Advanced Micro upgraded to Buy at Broadpoint AmTech Research; tgt raised to $10: . Broadpoint AmTech Research upgrades AMD to Buy from Neutral and raises their tgt to $10 from $5.80 as the recent positive events (Analyst Day/INTC settlement/capital structure) lead the firm to believe that AMD's risk/reward is now compelling. The firm notes that AMD's capital structure improved as a result of INTC's $1.25 bln settlement and yesterday's announcement of debt restructuring actions. The firm believes that AMD's debt of ~$3.7 bln will be reduced by ~25%, while also lowering interest expense slightly less, ~20%. Should Global Foundries and ATIC's chartered purchase be consolidated, the firm believes that they could see deconsolidation in the following 3-6 months. Furthermore, the firm feels that revenue growth in the coming quarters will prove to be stronger than the Street is modeling, driven by: a healthy Win7 cycle; leadership in the Evergreen GPU platform; more focused marketing; and possible tailwind from INTC settlement headlines entering the selling season.
icon url

ReturntoSender

02/14/10 9:04 PM

#8839 RE: ReturntoSender #6755

Amateur Investors Weekend Stock Market Analysis (2/13/10)

http://www.amateur-investor.net/Weekend_Market_Analysis_Feb_13_10.htm

Since the mid July low each time the S&P 500 has pulled back it was followed by a sharp upside reversal (points A to B). However the most recent correction hasn't been followed by a sharp upside reversal like the previous times.


Meanwhile so far the S&P 500 has held support right at its 40 Week EMA (blue line) and just above its 23.6% Retrace from the March low to the January high. If the 40 Week EMA and 23.6% Retrace were to be broken then the next major support area would be at 965 which is the 38.2% Retrace calculated from the March low to the January high.


As for the Dow so far it has held support above its 40 Week EMA (blue line) at 9780 which pretty much coincides with its 23.6% Retrace from the March low to the January high. Thus that will be a key support level to watch in the weeks ahead. If that level is broken then the next major support area would be near 9100 which is the 38.2% Retrace.


The Nasdaq also has been holding support above its 40 Week EMA (blue line) which coincides with its 23.6% Retrace as well near 2070. Thus this level will be a key support level in the weeks ahead as the next major support level below 2170 would probably be at the 38.2% Retrace near 1920.


Meanwhile on a daily chart the Nasdaq could be developing a potential Head and Shoulders Top pattern. If the Nasdaq fails to rally above its 50 Day EMA (blue line) just above 2200 then that would allow for the development of the 2nd Shoulder.


The last Head and Shoulders Top pattern that actually worked out on a daily timeframe was back in late 2008 into early 2009 which was eventually followed by a significant bottom in early March.


Finally the action in the US Dollar will likely have the final say in how the market acts in the days ahead. There has been an almost perfect inverse relationship between the US Dollar (blue line) and the S&P Futures (purple line) the last several days. Dollar Up (points C to D)...Futures down (points E to F), Dollar down (points D to C), Futures Up (points F to E).

icon url

ReturntoSender

02/15/10 3:00 PM

#8841 RE: ReturntoSender #6755

Leavitt Brothers Market Breadth Indicator Update:

http://leavittbrothers.com/blog/?p=2679
icon url

ReturntoSender

02/16/10 9:08 AM

#8843 RE: ReturntoSender #6755

One of the first things I ever noticed while charting is that both oversold of RSI (14) nearing 30 and overbought RSI (14) nearing 70 generally lead to corrections. Overlay charts that show that along with contrarian indicators like the CPC or VIX and you can anticipate both rallies and sell offs.


I posted these charts because the market is in a position to rally here. The recent selling was harder on the NYSE and S&P 500 than the SOX and NASDAQ so I look for tech stocks to lead if they will. Of course rallies do end at some point but as we have already discussed now would be a historically fast end to a cyclical rally after a recession.

RtS
icon url

ReturntoSender

02/16/10 10:55 PM

#8844 RE: ReturntoSender #6755

From Briefing.com: 4:30 pm : Stocks finished at session highs in their best single-session percentage advance in three months as buyers returned from an extended weekend to offer stocks broad-based support.

Nearly 95% of the names in the S&P 500 booked gains this session, but the strongest moves were made by energy plays, which advanced a collective 2.7%. The move was helped by a 3.9% spike in crude oil prices, which settled pit trade at $77.01 per barrel.

Oil helped the CRB Commodity Index extend its gains from last week by another 2.6%, which marks the CRB's best single-session gain by percent since mid-November, to a two-week high, such that it now stands just below its 50-day moving average.

The bid for commodities was supported by weakness in the U.S. dollar, which retreated a sharp 0.9% against a basket of foreign currencies. The move marked the dollar's worst drop since late November and a weak follow through from the gains that posted last week, when the Dollar Index hit a multimonth high as global participants sought safety amid uncertainty surrounding Greece's fiscal health. Neither a specific plan nor a concrete development regarding the matter has been unveiled.

In corporate news, better-than-expected earnings from British banking giant Barclays (BCS 19.03, +2.35) helped win support for shares of lenders and diversified banks. In turn, all 24 members of the KBW Bank Index advanced and gave the KBW a 2.9% gain -- its best single-session percentage move in more than one month.

Shared strength among banking issues helped JPMorgan Chase (JPM 40.07, +1.12) overcome early weakness, which followed news that it will pay nearly $1.7 billion for the Asian and European operations of the RBS-Sempra commodities joint venture. The company later announced that its net credit losses for January spiked to 10.91% from 7.11% in December, but its shares still finished with a near 3% gain at their session high.

Though strength was broad based this session, Dow component Kraft (KFT 28.97, -0.12) was unable to find support. Though it posted a solid quarterly report, it was one of only two Dow components to log a loss this session.

Pfizer (PFE 17.72, -0.08) was the other Dow component to book a loss. It failed to attract support from fellow pharmaceutical giant Merck (MRK 37.66, +0.74), which offered investors in-line earnings results for its latest quarter. Though MRK booked a gain, it wasn't enough to help the health care sector keep up with the broader market. Health care, as a group, advanced 0.9%, which is about half of what the broader market gained. DJ30 +169.67 NASDAQ +30.66 NQ100 +1.3% R2K +1.7% SP400 +1.6% SP500 +19.36 NASDAQ Adv/Vol/Dec 1923/2.03 bln/755 NYSE Adv/Vol/Dec 2526/1.08 bln/511

4:54PM Photronics beats by $0.05 (PLAB) 4.41 +0.32 : Reports Q1 (Dec) earnings of $0.01 per share, excluding non-recurring items, $0.05 better than the First Call consensus of ($0.04); revenues rose 12.0% year/year to $98.2 mln vs the $94.7 mln dual-analyst est.

4:10PM Cray beats by $0.01, reports revs in-line; guides FY10 revs in-line (CRAY) 5.25 +0.07 : Reports Q4 (Dec) earnings of $0.08 per share, $0.01 better than the First Call consensus of $0.07; revenues fell 43.2% year/year to $88.2 mln vs the $88.7 mln consensus. Co issues in-line guidance for FY10, sees FY10 revs of $305-325 mln vs. $310.83 mln consensus. Co said, a wide range of results remains possible for 2010. Many variables may impact our results, but one significant item is the timing of the availability and release of our next generation supercomputer, code-named "Baker," including its new interconnect chipset, known as "Gemini," and associated system software." Separately, the co said, "As a result of the timing of the Baker system release, we expect a significant majority of 2010 revenue to be recognized in Q4. Service revenue is expected to be in the range of $110 mln for 2010, driven by strong growth in our custom engineering initiative. Gross margins for 2010 are expected to be in the mid-30 percent range."

4:04PM Flextronics executes mandatory call option on its 6 1/2 % senior subordinated notes due 2013 (FLEX) 6.91 +0.12 :

TowerJazz, a subsidary of Tower Semiconductors (TSEM) announces that it has accelerated plans for additional capacity expansion to meet customer demand, which is exceeding current capacity. In the company's Fab2 located in Israel, capacity will increase by approximately 30,000 wafers per year in order to meet the greatly expanding needs of customers for its wide range of specialty process technologies. In the company's manufacturing facility located in Newport Beach, CA, capacity will be increased by 36,000 wafers per year to enable the fab to accommodate the substantial increase in demand necessitating more than 100% utilization...

7:30AM Photronics enters into new credit facility and repays its previously existing credit facility and term loan (PLAB) 4.09 : Co announced today that it has entered into a new three-year revolving credit facility in the amount of $50 million, with an expansion capability to $65 million. In connection therewith, Photronics repaid all outstanding amounts of its previously existing credit facility and term loan which was due to mature on January 31, 2011. The new credit agreement provides for reduced interest rates and covenant amendments, collectively, to the benefit of Photronics.

7:24AM Intel and Nokia will create a unified Linux-based platform (INTC) 20.43 : Intel Corporation and Nokia are merging their Moblin and Maemo software platforms. This will create a unified Linux-based platform that will run on multiple hardware platforms across a wide range of computing devices. Called MeeGo, the open software platform will accelerate industry innovation and time-to-market for a wealth of new Internet-based applications and services and exciting user experiences. MeeGo-based devices from Nokia and other manufacturers are expected to be launched later this year.

7:23AM Microsoft unveiled the next generation of Windows Phones (MSFT) 27.93 : Microsoft Corp. CEO Steve Ballmer unveiled the next generation of Windows Phones, Windows Phone 7 Series. For the first time ever, Microsoft will bring together Xbox LIVE games and the Zune music and video experience on a mobile phone, exclusively on Windows Phone 7 Series.

Ultra Clean Holdings (UCTT) announces that it has entered into an agreement with Orbotech (ORBK) under which Ultra Clean will provide manufacturing services to Orbotech at one of Ultra Clean's two facilities in Shanghai. Ultra Clean Microelectronics Equipment, a subsidiary of UCTT, will assemble products from Orbotech's Supervision range of high-speed automated optical inspection systems for applications in the manufacture of flat panel display products.

7:12AM Advanced Energy beats by $0.13, beats on revs; guides Q1 EPS above consensus, revs above consensus (AEIS) 14.25 : Reports Q4 (Dec) earnings of $0.04 per share, $0.13 better than the First Call consensus of ($0.09); revenues fell 1.6% year/year to $66.4 mln vs the $59.3 mln consensus. Gross margin improved significantly to 36.8% in the fourth quarter, up from 30.1% in the third quarter of 2009 and 27.2% for the fourth quarter of 2008. The sequential improvement was driven largely by leverage against our fixed costs from the increase in revenues. Co issues upside guidance for Q1, sees EPS of $0.13-$0.17 vs. ($0.03) consensus; sees Q1 revs of $77-$83 mln vs. $66.85 mln consensus.

6:04AM Rudolph Tech receives $5 mln in capacity orders for metrology production tools from tier one memory manufacturer (RTEC) 8.11 :

icon url

ReturntoSender

02/17/10 8:06 PM

#8845 RE: ReturntoSender #6755

From Briefing.com: 4:30 pm : Action this session was choppy and trade was both listless and thin, but stocks still put together a broad-based gain in the face of a strong rebound by the dollar.

The greenback bounced back from its 0.9% loss in the previous session to book a 1.0% gain against competing currencies this session. It had traded with strength for the entire session, but its gains were extended after the latest FOMC meeting minutes indicated that the Fed raised its 2010 GDP forecast to 3.2% from 3.0%. Despite the improved forecast, officials continue to believe that economic conditions warrant exceptionally low interest rates.

Despite the greenback's gain, stocks were able to add to their advance from the previous session. The follow-through was helped by strong overseas gains and kept intact by better-than-expected housing start numbers for January and in-line building permit numbers. Industrial production for January increased at a stronger-than-expected clip, while capacity utilization was in step with the consensus call.

Though earnings have generally been a nonfactor for determining the stock market's movements during recent weeks, strong results and an upbeat forecast from Deere & Co. (DE 56.48, +2.70) helped keep the mood among participants positive. As for the stock itself, it made its best single-session percentage gain in six months.

While DE's move was enviable, the stock lacked the leadership to attract a flood of market participants. In turn, trading volume this session barely broke 1 billion shares on the NYSE. Nonetheless, broad-market investors are likely pleased that stocks were able to advance in broad-based fashion for the second straight session.

Advancing Sectors: Health Care (+0.8%), Consumer Discretionary (+0.8%), Consumer Staples (+0.7%), Industrials (+0.6%), Tech (+0.4%), Financial (+0.4%), Telecom (+0.3%), Materials (+0.1%)
Declining Sectors: Energy (-0.4%), Utilities (-0.3%)DJ30 +40.43 NASDAQ +12.10 NQ100 +0.5% R2K +0.6% SP400 +0.6% SP500 +4.64 NASDAQ Adv/Vol/Dec 1565/2.06 bln/1063 NYSE Adv/Vol/Dec 2049/1.02 bln/978

4:30PM O2Micro issued patent for voltage reference circuit (OIIM) 5.77 -0.11 :

4:30PM GT Solar and Jiangxi announces new order totalling $20 mln (SOLR) 5.75 -0.12 : Co industry, and Jiangxi Sornid Hi-Tech Co., Ltd. today jointly announced that they signed a new contract totaling more than $20 million for GT Solar's market-leading GT-DSS450(TM) ingot growth furnaces and ancillary equipment and services. The order was booked in GT Solar's current fourth fiscal quarter and revenue is expected to be recognized in subsequent periods. "We are seeing an increase in bookings for our GT-DSS450 furnaces in China as customers begin to add new production capacity to position themselves for the next phase of growth in the worldwide solar industry," said Tom Gutierrez, GT Solar's president and chief executive officer.

4:29PM NVIDIA beats by $0.03, beats on revs; guides Q1 revs above consensus (NVDA) 17.84 +0.17 : Reports Q4 (Jan) earnings of $0.23 per share, $0.03 better than the First Call consensus of $0.20; revenues rose 104.2% year/year to $982.5 mln vs the $957.2 mln consensus. NVDA reports Q4 gross margins of 44.7% vs 41.7% consensus. Co issues upside guidance for Q1, sees Q1 revs flat vs. Q4, or $982.5 mln vs. $931.19 mln consensus. NVIDIA sees Q1 GAAP gross margin of 44-45%, may not compare to the non-GAAP gross margin consensus of 41.4%. Co states, "While the yield of chips made using the latest 40nm process has improved significantly, demand continues to exceed our constrained supply. Looking ahead this year, we are excited to raise the bar again with our next-generation Fermi GPU architecture; our Tegra mobile processor will enable a new class of amazing mobile devices like tablets; and our 3D Vision glasses and accompanying technology will bring a whole new dimension to personal computing."

4:14PM Applied Materials reports EPS in-line, beats on revs; guides Q2 EPS and revs above consensus; guides FY10 revs above consensus (AMAT) 12.99 +0.04 : Reports Q1 (Jan) earnings of $0.13 per share, in-line with the First Call consensus of $0.13; revenues rose 39.1% year/year to $1.85 bln vs the $1.75 bln consensus. AMAT reports Q1 gross margins of 38.5% vs 38.4% consensus. Co issues upside guidance for Q2, sees EPS of $0.17-0.22 vs. $0.15 consensus; sees Q2 revs up 15-25, or roughly $2.13-2.31 vs. $1.78 bln consensus. Co issues upside guidance for FY10, sees FY10 revs up greater than 50%, which calculates out to greater than $7.52 bln, vs. $7.33 bln consensus -- this is up from prior outlook of more than 30% rev growth. "Applied posted solid first quarter results led by robust sales in our semiconductor equipment business... With global demand improving in our customers' end markets, we are raising our full-year revenue target to reflect higher anticipated demand in our semiconductor, LCD display and crystalline silicon solar businesses... Applied enters its second quarter with considerable momentum, and we are off to an excellent start for the year."

4:12PM Analog Devices beats by $0.05, beats on revs; guides Q2 EPS above consensus, revs above consensus (ADI) 28.38 -0.22 : Reports Q1 (Jan) earnings of $0.43 per share, excluding non-recurring items, $0.05 better than the First Call consensus of $0.38; revenues rose 5.5% year/year to $603 mln vs the $575.5 mln consensus. Co issues upside guidance for Q2, sees EPS of $0.48-0.51, excluding non-recurring items, vs. $0.41 consensus; sees Q2 revs of $635-650 mln vs. $596.63 mln consensus. Gross margin was 61.1% of revenue, compared to 56.3% of revenue in the immediately prior quarter, and 56.4% of revenue in the year-ago period. Gross margin improvements were primarily due to lower manufacturing costs, increased factory utilization, and strong sales of products sold to industrial and communications infrastructure customers. "Order rates from end customers were strong throughout the first quarter of fiscal 2010, increasing 8% sequentially. As a result, the opening backlog for shipment in the second quarter increased substantially. Based on order rates and customer feedback, we expect revenue from industrial and communications infrastructure customers to grow in the second quarter, and revenue from consumer customers to be approximately flat."

4:08PM Axcelis Tech reports Q4 revs of $38.7 mln vs. $42.0 mln a year ago; EPS of ($0.10) vs. ($0.24) a year ago (ACLS) 1.78 +0.06 : "During the downturn we made positive strides in improving our business model and we are now seeing the rewards. In particular we are pleased that we generated cash in the quarter. While we expect this positive trend to continue and we believe we will be cash flow positive in 2010, quarterly cash flows may vary due to timing of shipments, customer buying patterns and investments in working capital. We are experiencing a significant increase in recent order flow and are forecasting sales to be up across all product lines and service programs. These contributions strengthen our foundation for the future, and we look forward to capitalizing on the significant opportunities that lie ahead."

4:08PM Hewlett-Packard beats by $0.04, beats on revs; guides Q2 EPS midpoint above consensus, revs above consensus; raises FY10 guidance (HPQ) 50.12 +0.68 : Reports Q1 (Jan) earnings of $1.10 per share, excluding non-recurring items, $0.04 better than the First Call consensus of $1.06; revenues rose 8.2% year/year to $31.18 bln vs the $30.01 bln consensus. Imaging and Printing Group (IPG) revenue increased 4% to $6.2 billion. Personal Systems Group (PSG) posted a 26% increase in unit shipments and maintained the leading market share position in PCs worldwide. Enterprise Storage and Servers (ESS) reported total revenue of $4.4 billion, up 11%. Services revenue decreased 1% to $8.7 billion. Guidance: Co issues upside guidance for Q2, sees EPS of $1.03-1.05 vs. $1.03 consensus; sees Q2 revs of $29.4-29.7 bln vs. $29.03 bln consensus. Co raises guidance for FY10, sees EPS of $4.37-4.44 vs. $4.37 consensus; sees FY10 revs of $121.5-122.5 bln vs. $120.03 bln consensus. FY10 guidance is up from prior guidance for EPS and revs of $4.25-4.3 and $118-119 bln... "Solid performance across the business and disciplined execution on our cost initiatives contributed to strong growth in cash flow and EPS," said Cathie Lesjak, HP executive vice president and chief financial officer. "We will continue to invest for growth and leverage our scale and global position to take advantage of an improving demand environment."

Axcelis Technologies (ACLS) announces that a major foundry has selected the IntegraTM dry strip system for its most advanced production facility...

Juniper Networks (JNPR) announces that its SRX Series Services Gateway has been selected by Verizon Wireless to provide added network protection for mobile data users on the Verizon Wireless network... Semtech (SMTC) announces the Defense Supply Center Columbus has qualified Semtech's transient voltage suppressor platform as meeting performance specification sheet MIL-PRF- 19500/516, Revision D to JANS level. This qualifies the parts for use in aerospace and satellite applications... Cypress Semiconductor (CY) announces that Fujitsu Limited has selected the TrueTouch solution from Cypress to implement the water-resistant touchscreen in NTT DOCOMO's new handset... Suntech Power Holdings (STP) recently supplied solar panels for 19 remote schools in Lebanon working with local partner and Lebanese integrator Asaco General Trade & Contracting...

Netlist (NLST) announces that a major OEM has commenced volume consumption of NetVault-NV, a flash memory based non-volatile cache memory subsystem targeting RAID storage applications...

icon url

ReturntoSender

02/18/10 8:21 PM

#8846 RE: ReturntoSender #6755

4:30PM Fed raises discount rate to 0.75% from 0.50%-- Bloomberg (ECONX) :

6:25PM Futures are lower after hours with S&P 500 futures 8.95 points below fair value of 1105.05 and Nasdaq 100 futures 14.827 points below value of 1822.82 :

4:35PM Fed Releases Statement on Discount Window (ECONX) : The Federal Reserve Board on Thursday announced that in light of continued improvement in financial market conditions it had unanimously approved several modifications to the terms of its discount window lending programs. Like the closure of a number of extraordinary credit programs earlier this month, these changes are intended as a further normalization of the Federal Reserve's lending facilities. The modifications are not expected to lead to tighter financial conditions for households and businesses and do not signal any change in the outlook for the economy or for monetary policy, which remains about as it was at the January meeting of the Federal Open Market Committee (FOMC). At that meeting, the Committee left its target range for the federal funds rate at 0 to 1/4 percent and said it anticipates that economic conditions are likely to warrant exceptionally low levels of the federal funds rate for an extended period. The changes to the discount window facilities include Board approval of requests by the boards of directors of the 12 Federal Reserve Banks to increase the primary credit rate (generally referred to as the discount rate) from 1/2 percent to 3/4 percent. This action is effective on February 19. In addition, the Board announced that, effective on March 18, the typical maximum maturity for primary credit loans will be shortened to overnight. Primary credit is provided by Reserve Banks on a fully secured basis to depository institutions that are in generally sound condition as a backup source of funds. Finally, the Board announced that it had raised the minimum bid rate for the Term Auction Facility (TAF) by 1/4 percentage point to 1/2 percent. The final TAF auction will be on March 8, 2010. Easing the terms of primary credit was one of the Federal Reserve's first responses to the financial crisis. The increase in the discount rate announced Thursday widens the spread between the primary credit rate and the top of the FOMC's 0 to 1/4 percent target range for the federal funds rate to 1/2 percentage point. The increase in the spread and reduction in maximum maturity will encourage depository institutions to rely on private funding markets for short-term credit and to use the Federal Reserve's primary credit facility only as a backup source of funds. The Federal Reserve will assess over time whether further increases in the spread are appropriate in view of experience with the 1/2 percentage point spread.

4:19PM Ixia beats by $0.01, beats on revs (XXIA) 8.41 +0.17 : Reports Q4 (Dec) earnings of $0.06 per share, $0.01 better than the First Call consensus of $0.05; revenues rose 36.8% year/year to $56.1 mln vs the $53.2 mln consensus.

4:09PM Dell beats by $0.01, beats on revs (DELL) 14.43 +0.32 : Reports Q4 (Jan) earnings of $0.28 per share, $0.01 better than the First Call consensus of $0.27; revenues rose 11.0% year/year to $14.9 bln vs the $13.85 bln consensus. Dell reports Q4 gross margins of 16.5% vs 18.0% consensus. Michael Dell: "Our solutions portfolio is expanding rapidly, driven by our strong capabilities, ongoing innovation and smart acquisitions. We continue to listen to and engage closely with customers through millions of conversations and interactions each day, enabling Dell to provide more relevant, value-oriented solutions to help meet their unique needs." Dell saw demand in the important commercial business continuing to return during the fourth quarter and is cautiously optimistic that this trend will continue into fiscal-year 2011. The company is confident in its ability to deliver the right technology to commercial customers and believes its extensive and ongoing cost actions position it well for this environment of increased demand. Longer term, the company is confident it can generate growth in revenue, operating-income margin and cash flow from operations.

4:08PM First Solar beats by $0.13, beats on revs; guides FY10 EPS in-line, revs in-line (FSLR) 126.29 +2.07 : Reports Q4 (Dec) earnings of $1.65 per share, $0.13 better than the First Call consensus of $1.52; revenues rose 47.9% year/year to $641.3 mln vs the $581.4 mln consensus. Co issues in-line guidance for FY10, sees EPS of $6.05-6.85, excluding non-recurring items, vs. $6.37 consensus; sees FY10 revs of $2.7-2.9 bln vs. $2.73 bln consensus. Total capital spending is projected to range from $500 to $550 million, including the Malaysian expansion. As a result, the Company expects to generate $730 to $790 million of operating cash flow and $180 to $290 million of free cash flow. T

4:07PM Nanometrics misses by $0.02, misses on revs (NANO) 10.50 +0.40 : Reports Q4 (Dec) earnings of $0.01 per share, $0.02 worse than the First Call consensus of $0.03; revenues rose 28.3% year/year to $26.3 mln vs the $27.8 mln consensus. Co says, "In the near term, we expect the favorable environment for semiconductor capital spending to continue, and we anticipate that our results for the first quarter of 2010 will show significant revenue growth."

4:03PM Anadigics beats by $0.04, beats on revs; guides Q1 EPS above consensus, revs above consensus (ANAD) 4.41 +0.08 : Reports Q4 (Dec) loss of $0.05 per share, $0.04 better than the First Call consensus of ($0.09); revenues fell 7.5% year/year to $41.8 mln vs the $39.6 mln consensus. Co issues upside guidance for Q1, sees EPS of ($0.05)-($0.06) vs. ($0.10) consensus; sees Q1 revs of inline with $41.8 mln reported in Q4 vs. $36.84 mln consensus. Co says "In contrast to normal seasonality, we are seeing very strong growth in our Wireless bookings in the first quarter of 2010. As such, we expect Wireless net sales to increase approximately 20% sequentially. This strength is expected to offset the previously anticipated weakness in WLAN..."

4:30 pm : Broad-based buying helped both the Dow and the Nasdaq Composite close above their 50-day moving averages for the first time in almost one month, but the S&P 500 was met with resistance as it encountered the technical hurdle. Nonetheless, stocks still booked their third straight gain.

Stocks chopped along in a tight trading range for the first part of the session as participants tried to take their cues from fluctuations in the dollar. Relative to a basket of foreign currencies, the greenback oscillated between a gain of 0.4% and a loss of 0.2% before it settled with a fractional loss.

Though the dollar's final pullback brought buyers into the market, there didn't appear to be much conviction behind the move. In fact, fewer than 1 billion shares traded hands on the NYSE this session. It marked the most thinly traded session in one month.

Still, stocks were able to make to make a broad-based advance that saw advancing issues outnumber decliners by 3-to-1 in the S&P 500. Despite such positive market breadth, the S&P 500 couldn't push through its 50-day moving average, which stands at 1108. The line also marks an approximate 60% retracement of the stock market's slide from its January high to its February low. The line will almost certainly come back into play tomorrow.

Materials stocks (+1.2%) were the best performers of the session as gold stocks (+2.5%) bounced on better-than-expected earnings from Barrick Gold (ABX 39.23, +1.37) and Kinross Gold (KGC 18.86, +0.36). Steel stocks (+2.7%) were helped by an upgrade of Nucor (NUE 43.62, +1.18) by analysts at Bank of America's Merrill Lynch.

Hewlett-Packard (HPQ 50.81, +0.69) helped the tech sector make its way to a 0.8% gain, thanks to better-than-expected earnings and upside guidance, but it wasn't much of a leader for the broader market.

Wal-Mart (WMT 53.47, -0.59) also failed to inspire. The retail giant posted better-than-expected earnings for the latest quarter and issued in-line guidance, but its fourth quarter U.S. comparable store sales fell more than expected.

Despite listless action among stocks and lack of conviction among participants, the stock market was still able to shrug off a flurry of disappointing data.

Specifically, weekly jobless claims for the week ended Feb. 13 totaled 473,000. That was up 31,000 from the previous week and worse than the 438,000 claims that had been widely forecast. Continuing claims came in at 4.56 million, which is unchanged from the previous week, but a bit worse than the 4.50 million continuing claims that many had come to expect.

The Producer Price Index for January spiked 1.4% month-over-month, which is sharper than the 0.8% increase that had been expected. Excluding food and energy, producer prices increased 0.3% month-over-month, which is a more rapid clip than the 0.1% monthly increase that had been expected after the core measure of producer prices was flat in the prior month.

Meanwhile, leading indicators increased 0.3% in January, but the pickup wasn't as strong as the 0.5% increase that was expected. It also marked a sharp pullback from the 1.2% increase that was posted in the prior month.

The Philadelphia Fed Index for February was the only economic report that exceeded expectations. It came in at 17.6, which topped the 17.0 that had been expected. It also marked an improvement from the 15.2 that was posted in January.

Amid the disappointing data and the stock market's advance, Treasuries had a tough session, which sent the yield on the benchmark 10-year Note up to 3.80% for the first time in more than one month.

In other trade, commodities had a generally solid session as the CRB Commodity Index advanced 0.8% to a fresh three-week high. It closed at its 50-day moving average.

Crude oil was a primary source of support for the CRB's gain. Prices settled pit trade 2.2% higher at $79.06 per barrel, even though the latest batch of weekly inventory data showed a larger-than-expected build of 3.085 million barrels. DJ30 +83.66 NASDAQ +15.42 NQ100 +0.7% R2K +0.7% SP400 +0.6% SP500 +7.24 NASDAQ Adv/Vol/Dec 1543/2.05 bln/1074 NYSE Adv/Vol/Dec 2107/960 mln/929

7:02AM SMSC announces acquisition of Kleer semiconductor (SMSC) 20.48 : Co announced that it has acquired substantially all the assets and certain liabilities of Kleer Semiconductor Corporation, a designer of high quality, interoperable wireless audio technology addressing headphones and earphones, home audio/theater systems and speakers, portable audio/media players and automotive sound systems. Under terms of the asset purchase agreement, SMSC paid approximately $5.5 mln in cash and additional cash payments of up to $2.0 mln may occur upon achievement of certain performance goals. The acquisition closed on February 16, 2010.

icon url

ReturntoSender

02/21/10 12:41 PM

#8849 RE: ReturntoSender #6755

From Briefing.com: 4:30 pm : The Fed's decision to hike the discount rate after the prior session's close stirred market participants to dump stocks in pursuit of the dollar, but the dollar inevitably drifted lower and stocks managed to recover and finish the week with their fourth straight gain.

Given that the Fed's decision to lift the discount rate to 0.75% from 0.50% marked the first rate hike in one year, participants panicked a bit and made a knee-jerk decision to sell stocks. The announcement shouldn't have come as a complete surprise, though. After all, Fed Chairman gave market participants a clue during his recent testimony before the House Financial Services Committee that a modest increase in the spread between the discount rate and the target federal funds rate was expected before long.

Still, to help quell concern about what may be in store, the Fed expressed that its decision was not a signal for any change in the economy or monetary policy. Several Fed officials made similar, separate comments of their own about how to interpret the move, but many seemed to ignore the notion that the increased discount rate was a tacit sign that the financial system is back on firmer footing.

In conjunction with the announcement the dollar was pushed higher, such that the Dollar Index climbed as much as 0.5% to new multimonth highs and even broke through a key technical resistance level that restrained its gain in the previous session. However, the greenback eventually rolled over and finished at a session low with a 0.5% loss against a basket of foreign currencies.

A softer-than-expected inflationary reading played a hand in the dollar's downturn. The Consumer Price Index (CPI) for January made a 0.2% monthly gain, which was slightly below the 0.3% increase that had been widely expected. Excluding food and energy, consumer prices for January actually slipped 0.1% month-over-month, instead of the 0.1% monthly increase that economists had forecast.

As the dollar surrendered its gain, stocks were able to regroup and make a broad-based bounce to positive territory. The move took the S&P 500 above its 50-day moving average to a one-month high, but buyers didn't step in at the higher price points to help stocks extend the move into something more meaningful. As a result, stocks traded with choppy action into the close and left the stock market to settle with a modest gain, in-line with its 50-day moving average. Still, that was enough to give the stock market its fourth straight advance and a weekly gain of more than 3% -- its best weekly performance in three months.

Advancing Sectors: Utilities (+1.4%), Financials (+0.6%), Industrials (+0.5%), Materials (+0.5%), Consumer Discretionary (+0.4%), Energy (+0.2%), Consumer Staples (+0.1%)
Declining Sectors: Telecom (-0.3%), Health Care (-0.2%), Tech (-0.1%)DJ30 +9.45 NASDAQ +2.16 NQ100 0.00% R2K +0.4% SP400 +0.5% SP500 +2.42 NASDAQ Adv/Vol/Dec 1385/2.13 bln/1230 NYSE Adv/Vol/Dec 1793/1.12 bln/1227

Taiwan Semiconductor Manufacturing Company (TSM) and MAPPER Lithography revealed that a pre-alpha MAPPER tool located on TSMC's Fab 12 GigaFab is repeatedly printing features previously unachievable using current immersion lithography technology...

08:26 am Dell (DELL)

Dell (DELL 14.43) reported earnings and revenue Thursday night that beat consensus estimates and said that it saw demand continuing to return in the fourth quarter, but the news wasn't enough to stop shares of DELL from sinking in Friday's premarket trade.

Dell reported fourth quarter earnings of $0.28 per share, $0.01 better than the First Call consensus of $0.27.

Revenues rose 11.0% year-over-year to $14.9 billion, topping the $13.85 billion consensus.

Gross margins of 16.5% underperformed the 18.0% consensus. The company said margins were pressured by seasonal strength in consumer demand, which has lower margins.

Dell said it saw demand in the important commercial business continuing to return during the fourth quarter and is cautiously optimistic that this trend will continue into fiscal-year 2011.

Shares of DELL have gained 0.5% year-to-date but are indicated to open Friday trade about 5% lower.
icon url

ReturntoSender

02/22/10 8:11 PM

#8853 RE: ReturntoSender #6755

From Briefing.com: 4:40 pm : Stocks rolled over in the final few minutes of trade to log their first loss in five sessions. The downturn came after the stock market failed to extend a move that took it from a modest loss back to its opening high.

Financials were integral in the afternoon advance. The sector was a steady outperformer for the entire session and finished with a 1.1% loss, despite a lack of clear catalysts within the sector. While the broader market inevitably failed to follow the financial sector to a gain, its strength helped limit losses.

Technical support at the S&P 500's 50-day moving average also provided support. The line acted as a floor for trade during the entire session. It even held firm as stocks extended their opening slide into negative territory amid news that President Obama has proposed to broaden the Medicare Hospital Insurance tax base in his latest health care reform plan. Despite the negative reaction to the news item, health care stocks finished fractionally lower.

Energy stocks were the worst performers. They shed 1.3%. Schlumberger (SLB 61.57, -2.33) was a primary laggard following news that it has agreed to a stock-for-stock merger with Smith International (SII 41.03, +3.33).

In other merger and acquisition news, Thermo Fisher Scientific (TMO 48.10, -1.12) has made a $6 billion bid for Millipore (MIL 87.35, +16.01).

Treasuries traded in quiet fashion this session. Results from an $8 billion auction of 30-year TIPS did little to stimulate interest in the space. As such, the benchmark 10-year Note finished just a few ticks lower.

The dollar also traded quietly along the flat line. Its movements had little overall effect on the broader market.

Trading volume was paltry once again as fewer than 1 billion shares traded hands on the NYSE. DJ30 -18.97 NASDAQ -1.84 NQ100 -0.3% R2K +0.1% SP400 +0.0% SP500 -1.16 NASDAQ Adv/Vol/Dec 1413/1.94 bln/1267 NYSE Adv/Vol/Dec 1511/944 mln/1540

11:12AM Agilent wins HPLC columns trade secrets case against Advanced Materials Technology (A) 30.97 -0.23 : Co announced a favorable decision in its trade secrets and breach of contract case against Advanced Materials Technology and three of its employees in the Delaware Court of Chancery. Agilent filed the lawsuit in January 2008 to protect confidential and proprietary information relating to its high-performance liquid chromatography (HPLC) technology. The decision in favor of Agilent found that the individual defendants, members of AMAT's senior management team, breached their employment contracts with Agilent by removing Agilent property without permission, and used Agilent confidential information to benefit AMAT. In particular, the court ruled that AMAT illegally used Agilent trade secrets and confidential information in developing its Halo HPLC columns.

8:01AM Chipmos Technology received the initial payment of approximately $33 million from escrow agent for the sale of accounts receivable (IMOS) 0.68 : The co announces that it has received the initial payment of approximately $33 million from escrow agent for the sale of accounts receivable for testing and assembly services provided to Spansion in the amount of approximately $66 million to $70 million.

Amkor Technology (AMKR) announced that the International Trade Commission has reversed a finding by the Administrative Law Judge on the issue of whether a certain invention constitutes prior art to Amkor's asserted patents in its patent infringement case against Carsem. The Commission remanded the investigation to the ALJ to make further findings in light of the Commission's ruling by March 22, 2010, and extended the target date for completion of the investigation to July 20, 2010...

ASML Holding NV (ASML) announces its new FlexRay programmable illumination system is finding strong acceptance by providing chip makers with virtually unlimited illumination source tuning....

icon url

ReturntoSender

02/23/10 10:57 PM

#8854 RE: ReturntoSender #6755

From Briefing.com: 4:30 pm : Stocks closed near session lows in their worst single-session percentage loss in more than two weeks as sellers were stirred to action by a disappointing consumer confidence reading and a stronger dollar.

A relatively weak start quickly turned to something more ugly with the midmorning release of the February Consumer Confidence Index, which came in below expectations at a 10-month low of 46.0. Broad-based pressure immediately followed to take each of the three major indices back below its 50-day moving average after the technical line acted as a supportive floor in the previous session.

Losses among stocks worsened as the greenback gained ground against competing currencies. The dollar settled the session 0.5% higher after it extended a moderate gain from the early going.

The confluence of broad market weakness and a stronger dollar dragged down the materials sector to a 1.7%. Steel was one of the worst performing groups in the sector after it had been a leader during recent sessions. Steel stocks shed a collective 4.0%.

In addition to weakness among basic materials, commodities had a poor session. As such, the CRB Commodity Index dropped 1.6%. The fall takes the CRB back below its 50-day moving average after it had hit a one-month high in the previous session.

Financials were officially the worst performing sector of the session, though they had actually traded with relative strength in the early going. They finished with a 1.8% loss, which undid the sector's outsized gains from Monday.

While the broader market was mired in weakness, retailers were able to limit losses. Retailers in the S&P 500 finished with a collective loss of 0.5%, but that was mostly owed to strength in Home Depot (HD 30.75, +0.43), which actually hit a fresh 52-week high after it announced better-than-expected earnings, issued an upside guidance, and increased its quarterly dividend.

Macy's (M 18.67, +0.20) was also able to finish higher after it reported better-than-expected results of its own. The company's earnings outlook was in-line with what Wall Street has surmised.

Not every retailer was able to fare so well, though. Both Target (TGT 50.06, -0.58) and Sears Holdings (SHLD 93.80, -1.86) exceeded earnings expectations, but failed to book gains.

Treasuries had a strong session, which saw the benchmark 10-year Note climb nearly one full point. That trimmed its yield nearly 10 basis points to 3.69%. Treasuries were partly helped by results from a $44 billion auction of 2-year Notes that attracted a yield of nearly 0.90% with an above-average bid-to-cover of 3.3 and a strong indirect bid of 53.6%.

Advancing Sectors: (None)
Declining Sectors: Financial (-1.8%), Materials (-1.7%), Tech (-1.4%), Energy (-1.5%), Industrials (-1.2%), Health Care (-1.1%), Telecom (-1.0%), Utilities (-0.8%), Consumer Discretionary (-0.6%), Consumer Staples (-0.6%)DJ30 -100.97 NASDAQ -28.59 NQ100 -1.3% R2K -1.1% SP400 -1.3% SP500 -13.41 NASDAQ Adv/Vol/Dec 875/2.27 bln/1759 NYSE Adv/Vol/Dec 939/1.08 bln/2113

4:30PM Ultratech receives order from Taiwan's largest LED (UTEK) 13.19 +0.07 : Co announced that it has received an order from Taiwan's largest light-emitting diode (LED) chip manufacturer for an LED lithography system, which is specifically designed and optimized for high-brightness LED (HBLED) manufacturing. In addition, this customer has provided a conditional commitment to purchase several additional Sapphire 100 systems to meet its ramp requirements over the next few quarters. The Sapphire 100 tool is scheduled to be available for volume shipments in the second half of 2010.

4:10PM Verigy beats by $0.01, misses on revs; guides AprQ below consensus (VRGY) 10.84 -0.44 : Reports Q1 (Jan) loss of $0.03 per share, excluding non-recurring items, $0.01 better than the First Call consensus of ($0.04); revenues rose 55.9% year/year and 9% sequentially to $106.0 mln vs the $111.2 mln consensus. Co issues downside guidance for Q2 (Apr), sees EPS of $(0.08)-0.01, excluding non-recurring items, vs. $0.02 consensus; sees Q2 revs of $107-117 mln vs. $119.8 mln consensus.

8:02AM RF Micro Device secures U.S. Department of Defense contract awards related to GaN Microelectronics (RFMD) 4.38 : The co announces that it has been awarded $3.2 million in R&D contracts by the United States Department of Defense related to GaN microelectronics, including materials, device fabrication and high power circuits. The $3.2 million in R&D contracts extends RFMD's contract backlog for calendar 2010 to approximately $5 million. Since calendar 2004, RFMD has been awarded approximately $13 million in R&D contracts by the U.S. Government.

6:05AM Silicon Storage: Microchip Technology announces amendment to definitive agreement for acquisition of Silicon Storage Technology (SSTI) 2.89 : Microchip Technology (MCHP) announces it entered into an amendment to its February 2, 2010 definitive agreement to acquire Silicon Storage Technology (SSTI). Under the revised terms, SST shareholders would be entitled to receive $3.00 per share in cash compared to $2.85 per share prior to the amendment. This amendment was in response to an offer made by another party to SST's Strategic Committee on February 19, 2010.
icon url

ReturntoSender

02/24/10 8:59 PM

#8855 RE: ReturntoSender #6755

From Briefing.com: 4:35 pm : Despite an early slip, both stocks and commodities were able to rebound from their losses in the prior session.

Coming off of its worst single-session percentage drop in more than two weeks, the stock market bounced back in a strong move that finished with stocks near their session highs. The gains didn't come easy, though; stocks were pressured in the early going by disappointing new home sales for January and a negative knee-jerk response to prepared remarks from Fed Chairman Bernanke.

New home sales for January fell 11.2% month-over-month in their worst monthly downturn since January 2009. The drop took new home sales to an annualized rate of 309,000 units, which is below the pace of 354,000 units that had been expected.

In a prepared statement for his semiannual testimony on monetary policy, Fed Chairman Bernanke indicated that the FOMC continues to anticipate a moderate pace of economic recovery and that inflation is expected to remain subdued, but at some point the Fed will need to begin to tighten monetary conditions to prevent inflationary pressures.

With the outlook for economic growth and inflation unchanged, the dollar came under pressure and fell to a loss of 0.7% against competing currencies. That pullback spurred a broad-based bid in the stock market, but financials provided the most support. The sector netted a 1.7% gain, more than any other major sector.

Retailers also had a strong session. The sector outperformed for the second straight session with a 2.0% gain.

Stocks started to drift lower from their session highs as the greenback rallied in afternoon action to close with a loss of just 0.1%. However, the S&P 500 found technical support at the 1100 line. It worked its way back toward session highs to close in its resistance zone.

Though the broader market was able to shrug off the dollar's rally, materials stocks still came under pressure. The sector's 0.1% loss made it the only sector that failed to log a gain.

While materials stocks struggled, commodities managed to move higher in the face of the dollar's upturn. That gave the CRB Commodity Index a 0.9% gain.

Oil was especially strong. It finished 1.3% higher at $79.93 per barrel, despite a larger-than-expected build in weekly crude oil inventories.

Treasuries had a lackluster session as a $42 billion auction of 5-year Notes drew a yield of 2.395% and attracted a bid-to-cover ratio of 2.75 and an indirect bidder participation of 40.3%.

Advancing Sector(s): Financials (+1.7%), Consumer Discretionary (+1.3%), Tech (+1.1%), Industrials (+0.9%), Energy (+0.8%), Health Care (+0.8%), Consumer Staples (+0.7%), Telecom (+0.4%), Utilities (+0.1%)
Declining Sector(s): Materials (-0.1%)DJ30 +91.75 NASDAQ +22.46 NQ100 +1.0% R2K +0.9% SP400 +0.9% SP500 +10.64 NASDAQ Adv/Vol/Dec 1649/2.13 bln/991 NYSE Adv/Vol/Dec 2223/1.01 bln/817

6:29PM ASM Intl NV reports Q4 loss of EUR 0.23 vs loss of EUR 0.31 in the prior year's quarter, revs grew 12% to EUR 201.9 mln (ASMI) 22.14 +0.10 :

4:08PM TriQuint Semi beats by $0.01, beats on revs; guides Q1 EPS above consensus, revs above consensus; guides FY10 revs above consensus (TQNT) 6.75 +0.20 : Reports Q4 (Dec) earnings of $0.14 per share, $0.01 better than the First Call consensus of $0.13; revenues rose 11.7% year/year to $193.3 mln vs the $188.3 mln consensus. Co issues upside guidance for Q1, sees EPS of $0.08-$0.10 vs. $0.07 consensus; sees Q1 revs of $170-$175 vs. $168.56 mln consensus. For the full year co sees revs growth of about 20%, which calculates to roughly $785.2 mln (vs $746.1 mln).

icon url

ReturntoSender

02/25/10 8:17 PM

#8856 RE: ReturntoSender #6755

From Briefing.com: 4:30 pm : The S&P 500 gapped down in the early going and traded with a 1.7% loss at its session low, but a downturn by the dollar caused stocks to rally into the afternoon. The major indices were able to reverse nearly all of their losses and finish near session highs.

Stocks looked like they were headed for a dismal session as all 10 of the major sectors in the S&P 500 dropped to losses in excess of 1% in the early going. Pessimism among participants was rooted in a disappointing batch of economic data and moderate strength in the dollar.

According to the latest weekly jobless claims figures, initial claims climbed for the week ended Feb. 20 totaled 496,000, up 22,000 week-over-week. Not only was that worse than expected, it was the highest initial claims count since November. Continuing claims were worse than expected; they totaled 4.62 million.

Durable goods orders failed to temper the negative reaction to the jobless claims numbers. Specifically, durable goods orders increased a stronger-than-expected 3.0% in January, but orders less transportation made a surprise 0.6% decline.

Housing prices for December made a 1.6% monthly decline. They had been expected to increase 0.4%.

Fed Chairman Bernanke testified on monetary policy and economy conditions before the Senate Banking Committee this morning, but his comments reflected those that he offered to the House Financial Services Committee yesterday. In turn, the testimony was generally a non-factor.

In addition to a disappointing lot of data, participants had to grapple with gains by the greenback. The dollar garnered support amid news that Moody's believes ratings on Greece hinge on the country's fiscal reform follow through. Though that comment didn't offer anything new, it had substance in the sense that Moody's is the last ratings agency to have an 'A' rating on Greek sovereign debt. An 'A' rating is required of a country to exchange its bonds with the European Central Bank as collateral for loans under rules that will go into effect at the end of this year. Failure to maintain such a rating could prove problematic as Greece attempts to remedy its fiscal woes.

Despite such consideration, the euro eventually bounced back and pressured the dollar, which finished the session with a 0.1% loss against a basket of foreign currencies. The dollar's reversal helped the stock market break free from range-bound trade near session lows.

Materials stocks were among the primary beneficiaries. The sector had been down more than 2% at its session low, but settled with a modest 0.2% loss. Newmont Mining (NEM 49.02, +2.54) was a primary leader, thanks to better-than-expected earnings for its latest quarter.

Better-than-expected earnings from Limited Brands (LTD 22.15, +0.61) and Kohls (KSS 54.08, +2.49) helped retailers outperform the broader market for the third straight session. Retailers finished with a 0.4% gain, collectively, which helped the consumer discretionary sector settle with a fractional loss. That made it the best performing sector in the broader market.

One of the session's strongest gains was made by Coca-Cola Enterprises (CCE 25.48, +6.30), which surged amid news that its North American bottling business will be acquired by Coca-Cola (KO 53.12, -2.04).

Though the stock market was able to rally amid the greenback's pullback, commodities had a mixed response as the CRB Commodity Index stayed stuck near its session low. It finished with a 1.4% loss. Oil prices gradually made their way off of session lows, but still settled pit trade with a 2.3% loss at $78.17 per barrel. Meanwhile, gold closed with a 1.0% gain at $1108.50 per ounce.

Treasuries traded with moderate strength. They were partly supported by strong results from an at-record $32 billion auction of 7-year Notes. The auction attracted a yield of 3.08%, which was a bit below what had been expected, and a bid-to-cover ratio of 2.98, which was above the recent average of 2.75. However, the indirect bid hit 40.3%, which was below the recent average of 54.4%.

Advancing Sectors: (None)
Declining Sectors: Telecom (-0.4%), Utilities (-0.3%), Financials (-0.3%), Industrials (-0.3%), Tech (-0.2%), Materials (-0.2%), Energy (-0.2%), Consumer Staples (-0.1%), Health Care (-0.1%), Consumer Discretionary (-0.1%)DJ30 -53.13 NASDAQ -1.68 NQ100 +0.00% R2K +0.1% SP400 +0.0% SP500 -2.30 NASDAQ Adv/Vol/Dec 1121/2.27 bln/1500 NYSE Adv/Vol/Dec 1512/1.15 bln/1504

5:56PM Rambus announced that its board of directors approved a new share repurchase program authorizing the repurchase of up to 12.5 mln shares (RMBS) 21.48 -0.09 :

4:22PM OmniVision beats by $0.01, beats on revs; guides Q4 EPS in-line, revs in-line (OVTI) 14.22 +0.08 : Reports Q3 (Jan) earnings of $0.20 per share, excluding non-recurring items, $0.01 better than the First Call consensus of $0.19; revenues fell 14.4% year/year to $156.9 mln vs the $154.8 mln consensus. Co issues in-line guidance for Q4, sees EPS of $0.11-0.21, excluding non-recurring items, vs. $0.16 consensus; sees Q4 revs of $145-160 mln vs. $157.61 mln consensus. Gross margin for the third quarter of fiscal 2010 was 24.6% as compared to 24.0% for the second quarter of fiscal 2010 and 22.4% for the third quarter of fiscal 2009. The sequential increase in gross margin reflected a slightly improved product mix and a reduced inventory valuation exposure due to the improving business outlook.

4:18PM Kopin reports Q4 results; issues in-line guidance for FY10 (KOPN) 4.03 -0.02 : Kopin reports Q4 earnings of $0.08 vs $0.03 First Call consensus; revs increased 14% year/year to $33 mln vs $27.50 mln First Call consensus. Co issues guidance, sees FY10 revs of $120 mln to $130 mln vs $130 mln First Call consensus. "Anchored by a strong balance sheet, manufacturing know-how and technology expertise, we are well positioned to generate sustained growth,"..."Innovation is an integral part of our history and strategy. While other companies have struggled during the economic downturn, we have capitalized on the opportunity by expanding our technology and product portfolios. We have continued to enhance our manufacturing capabilities and capacity, add new management and scientific talents, patent new technologies and develop the advanced new display systems and III-V structures that we believe will become growth engines for the Company in the coming years."

4:13PM Novatel Wireless reports Q4 (Dec) results, misses on revs; guides Q1 below consensus (NVTL) 7.35 +0.23 : Reports Q4 (Dec) earnings of $0.03 per share, may not be comparable to the First Call consensus of $0.07; revenues rose 36.1% year/year to $88.6 mln vs the $91 mln consensus. Co issues downside guidance for Q1, sees EPS of ($0.14) vs. $0.05 consensus; sees Q1 revs of $70 mln vs. $83.76 mln consensus. The Company currently expects first quarter 2010 revenues to be approximately flat compared to the year ago period and lower than the fourth quarter of 2009, with decreased revenues attributed to core products due to lower average selling prices (ASP) and lower seasonal sales volumes. The Company currently expects sales in the first quarter of 2010 from its MiFi Intelligent Mobile Hotspot products to increase compared to the fourth quarter of 2009, despite the impact of a $3 million reduction in revenues related to MiFi marketing and promotional campaigns with certain operator customers. "While revenues decreased from the third quarter, they increased 36% year-over-year due to steady demand for our core USB modems and revolutionary MiFi Intelligent Mobile Hotspot products, which have now launched commercially with 17 operators around the globe... Fourth quarter revenues hit the mid-point of our guidance and GAAP and non-GAAP gross margins of 26.2% and 26.4%, respectively, were impacted by product mix."

11:00AM Microsoft enters intellectual property licensing agreement with Panasonic (MSFT) 28.15 -0.48 : Co has entered into an intellectual property licensing agreement with Panasonic (PC) to provide it with access to Microsoft's Extended File Allocation Table (exFAT) technology, the latest generation of Microsoft's file system. Panasonic is one of the latest companies to adopt exFAT technology through Microsoft's new licensing program, enabling it to deliver a rich, integrated media experience for its customers.

9:10AM LTX-Credence beats by $0.02, beats on revs; guides Q3 EPS and revs above consensus (LTXC) 2.72 : Reports Q2 (Jan) earnings of $0.03 per share, excluding non-recurring items, $0.02 better than the First Call consensus of $0.01; revenues rose 57.9% year/year to $48 mln vs the $47.3 mln consensus. Co issues upside guidance for Q3, sees EPS of $0.04-0.05, excluding non-recurring items, vs. $0.03 consensus; sees Q3 revs of $53-55 mln vs. $52.54 mln consensus. "We returned to profitability and generated positive net cash in the second fiscal quarter, two important milestones for the Company. The business model is performing as expected, and our focus continues to be about growing top line revenue. We saw strong growth in several key market areas, indicating to us that the aggressive growth strategies we have in place are starting to pay off. Since hitting the industry trough last year, our product revenues have recovered faster than the competition resulting in market share gains."

RFMD (RFMD) announces the extension of their collaboration to develop high frequency GaAs MMIC solutions focused on SELEX Galileo's next generation of electronically-scanned phased array radar systems...

Magma Design Automation (LAVA) announces the recent opening of a joint IC design lab. The lab will provide local designers with access to Magma's advanced analog and digital IC design software and comprehensive training programs...

7:46AM GT Solar announces new DSS orders totaling ~$200 mln (SOLR) 5.60 : Co announced it has signed new contracts totaling ~$200 mln for its DSS450 ingot growth furnaces and ancillary equipment and services. This includes a $137 mln follow-on order from a large Chinese customer, as well as orders from Tianwei New Energy Holdings, Phoenix Photovoltaic Technology, Yingli Green Energy Holding, JA Solar Holding, Taiwan-based Sino-American Silicon Products (SAS), and one other customer. The orders were booked in GT Solar's current fourth fiscal quarter and revenue for these orders is expected to be recognized in periods subsequent to the current fiscal year.

icon url

ReturntoSender

02/26/10 9:09 PM

#8857 RE: ReturntoSender #6755

From Briefing.com: 4:20 pm : All the whipsaw action earlier this week left participants subdued for most of the week's final session. That left stocks to spend most of the session trading listlessly in a tight range.

Participants were generally unmoved by the revised fourth quarter GDP numbers. The headline growth rate was upwardly revised to reflect 5.9% annualized growth rate, which exceeded expectations, but the personal consumption component increased at a softer-than-expected clip of 1.7%. Core personal consumption expenditures increased at a faster-than-expected quarter-over-quarter clip of 1.6%, though.

The rest of the morning's economic data also failed to lift the mood of market participants. Specifically, existing home sales for January made a surprise 7.2% month-over-month drop to an annualized rate of 5.05 million units. Meanwhile, the final February Consumer Sentiment Survey from University of Michigan was little changed at 73.6 and in-line with expectations.

During recent months weakness in the dollar has been cause for stock market gains, but participants shrugged off the dollar's latest dip. The greenback had gyrated in the early going as the euro garnered support as news that United Kingdom GDP was upwardly revised overshadowed the latest batch of headlines regarding Greece's fiscal woes. The greenback eventually rolled over to finish with a 0.5% loss against competing currencies.

Financials attempted to provide the stock market with a late lift, but the move lost momentum into the close. Still, JPMorgan Chase (JPM 41.97, +1.33) led the financial sector to a 0.7% gain, which was better than that of any other major sector. Though there was no specific news item to account for strength in JPM, it was still able to put together its best single-session percentage gain in more than three months.

AIG (AIG 24.77, -2.74) was a laggard in the financial sector. The booked its worst single-session loss by percent in nearly three months after its latest quarterly results proved disappointing.

In other earnings news, a better-than-expected bottom line from Gap (GPS 21.50, +1.11) helped shares of the retailer put together their best single-session percentage gain since September.

Though the broader market was able to eke out a gain, it wasn't enough to turn stocks positive for the week. Instead, the S&P 500 settled with a weekly loss of 0.4%. Despite that slip, the stock market finished February with a 2.8% monthly gain.

Trading volume on the NYSE exceeded both its 50-day moving average and its 200-day moving average as more than 1.5 billion shares exchanged hands on the big board.

Commodities finished the month on a strong note. As such, the CRB Commodity Index finished the session with a 1.2% gain, which helped drive a 3.5% monthly gain.

Treasuries had a relatively quiet session. Though the benchmark 10-year Note settled off of its high, it still netted a few ticks to push its yield back toward 3.60%.

Advancing Sectors: Financials (+0.7%), Industrials (+0.4%), Consumer Discretionary (+0.2%), Energy (+0.2%), Telecom (+0.2%), Health Care (+0.1%), Tech (+0.1%)
Declining Sectors: Utilities (-0.7%), Consumer Staples (-0.5%)
Unchanged: MaterialsDJ30 +4.23 NASDAQ +4.04 NQ100 +0.3% R2K -0.3% SP400 +0.1% SP500 +1.55 NASDAQ Adv/Vol/Dec 1231/2.26 bln/1420 NYSE Adv/Vol/Dec 1804/1.25 bln/1219

4:19PM LDK Solar acquires Best Solar's crystalline module manufacturing plant at cash consideration of $21.5 mln (LDK) 6.19 +0.02 : Co announced that it has entered into an agreement to acquire the crystalline module manufacturing plant of Best Solar Co., Ltd. ("Best Solar"). Under the terms of the transaction LDK will acquire Best Solar's crystalline module manufacturing plant at cash consideration of $21.5 mln, representing the fair value of the assets acquired determined on an arms-length basis.

ChipMOS TECHNOLOGIES (IMOS) entered into a share purchase agreement with Siliconware Precision Industries (SPIL) to sell to SPIL Company's holding of 133,000,000 common shares of its wholly owned subsidiary, ChipMOS TECHNOLOGIES, with a consideration of approximately ~$51 mln. The purchased shares represent ~15.8% of the total number of ChipMOS Taiwan's outstanding shares. Under the terms and conditions of the Share Purchase Agreement, SPIL will pay the purchase price in four installments to the Company with the final installment scheduled to be paid on or about March 31, 2011.

8:01AM Broadcom authorized a new evergreen share repurchase program (BRCM) 31.40 : Co authorized a new evergreen share repurchase program under which it may repurchase shares of Broadcom's Class A common stock. Repurchases under this program are intended to reduce or eliminate the dilution associated with stock incentive plans. Repurchases under the new program will be made in open market or privately negotiated transactions. Broadcom expects to use cash on hand to fund the repurchases. The Board has not established an end date for the new repurchase program. The plan does not obligate Broadcom to acquire any particular amount of common stock, and it may be suspended at any time at the company's discretion. The evergreen share repurchase program may be complemented with an additional share repurchase program in the future.

icon url

ReturntoSender

02/27/10 12:42 PM

#8858 RE: ReturntoSender #6755

Amateur Investors Weekend Stock Market Analysis (2/27/10)

http://www.amateur-investor.net/Weekend_Market_Analysis_Feb_27_10.htm

For those that don't believe the Federal Reserve has any affect on the market the chart below shows how they can influence it by adjusting the Fed Funds Rate. Each time the market has gone through a correction of varying degrees the Fed Policy has been to lower the Fed Fund Rates by a substantial amount (points A to B) which has always been followed by a decent rally (points C to D). Also notice from the early 1980's through the mid 1990's that the long term trend in the Fed Funds Rate was to the downside which had a positive impact on the market as a Secular Bull Market evolved. However keep in mind the Fed Funds Rate was over 18% in the early 1980's so the Federal Reserve had a lot of room to allow for the rates to drop through the 1990's. Right now the Fed Funds Rate is basically near "0" so there is no room to cut the rates like what we saw back in the early 1980's when rates were at all time highs.


With the Feds Fund Rate at historical lows two outcomes are likely. Either they will stay at extremely low levels for an extended period of time like Japan has done the last several years or the rates will begin to rise.

As you can see keeping the rates low over a long period of time hasn't helped Japan's Market as it has remained in a Secular Bear Market for the past 20 years and lost over 80% of its value. If Japan is lucky it may be finally developing a longer term Double Bottom pattern although the one in the early to mid 1990's failed to follow through.


Meanwhile if the Fed Funds Rate begins to rise over a long period of time that may have a negative impact on the market like occurred from the mid 1960's through the early 1980's as the Dow got stuck in an extended trading range.


Meanwhile another observation involves the amount of Cash Mutual Funds actually have on hand as reported by ICI.org on a monthly basis. This data has been tracked since the mid 1950's. The average amount of cash held by Mutual Funds has been around 6.9%. Prior to the beginning of the last Secular Bull Market from the mid 1980's through the late 1990's Mutual Funds had a lot of excess cash on hand on a % basis and by 1991 (point E) they had nearly double the long term average.

Meanwhile notice over the past 10 years the amount of Cash on Hand has been below the longer term average (white line). Furthermore notice how fast Mutual Funds have burned up their Cash (points F to G) in the past year as the Dow has rallied with the Cash Levels dropping from 6% to 3.6% in just under 12 months as the previous all time low made in 2007 (point I) is getting closer. Keep in mind it took nearly 7 years for the % of Mutual Fund Cash to drop from 6.5% to 3.5% from 2001 through 2007 (points H to I) prior to the late 2007 top and 10 years to go from a high of 12% in 1991 to the low of 4% in 2000 (points J to K) as the Dow peaked in late 1999. Furthermore going even further back to the early to mid 1970's Mutual Funds went through a lot of there Cash in a short period of time as well (points L to M) right before a significant market top occurred. Thus the big question is will the Mutual Funds have to rebuild their Cash Levels before another Secular Bull Market can develop and will a longer term trading range occur like we saw from the mid 1960's through the early 1980's?

icon url

ReturntoSender

02/27/10 8:46 PM

#8859 RE: ReturntoSender #6755

I have been holding a number of long term positions bought too quickly after the market began to sell off in 2007.

I'm actually above water now overall but I don't expect smooth sailing going into the future.

The DOW and S&P 500 managed new highs a few years ago if we overlook the effects of inflation however low the rate may appear now. But we who have posted here for most if not all of the 47,000+ posts know that the NASDAQ and SOX were not anywhere near new highs in 2007.


How can anyone who is capable of making a dispassionate look at the market including all fundamental data think that our stock market must eventually reset by seeing the kinds of P/E's that were paid for stocks prior to the excesses of the bull market that reached unbelievable bubble highs in 2000?

There is money to be made in this any any time of stock market but until we reset at those lows on P/E's we cannot expect another long term bull market to start. Since 1900, the average P/E ratio for the S&P 500 index has ranged from 4.78 in Dec 1920 to 44.20 ...

http://www.tradersnarrative.com/sp-500-price-earnings-ratio-long-term-chart-2330.html

http://www.investorsfriend.com/S%20and%20P%20500%20index%20valuation.htm

Until we reach those kinds of lows on the P/E ratio of the S&P 500 then I will continue to play shorter term trends. Days, weeks and even years can bring profitable trades even in a bear market like we have seen the last ten years.

Election years cycles, contrarian sentiment analysis, technical analysis and fundamental analysis are all useful.

But fear and greed both rule at times. Greed in the 90's in the stock market. But for the NASDAQ and SOX it has been fear ruling now for ten solid years with no chance of new highs.

We are a lot closer to new lows than new highs and waiting for a P/E of say 10 on the S&P 500 before expecting to make money off the next 20 year long term bull seems logical to me.

By the time we see those former long term market low P/E's for the S&P 500 most people will be entirely sick of the stock market.

Many here already are. It's true that programming trading is responsible for the majority of the trades going on today but we have more predictive data available to us as small investors than ever before if we just use it.

It's still possible to make money. It just is not possible to do it the way it was done from 1980 to 2000 by long term investing....

YET

RtS
icon url

ReturntoSender

02/28/10 12:56 PM

#8860 RE: ReturntoSender #6755

Short Term to Intermediate Indicators. It's best to be cover shorts and enter long positions on cross overs of green lines. Best to go short on cross overs of the red lines and or exit long positions.

The first set of charts for market timing the SMH are based on using the NASDAQ New Highs and similar indexes are shown here. To go long: First wait for the NASDAQ New Highs to set a new low and reverse itself from an approach of the lower Bollinger Band. To go short: Wait for the NASDAQ new highs and other similar new high indices to set a new high print at, near, or above the upper Bollinger Band. I am also now using the NASDAQ McClellan Oscillator (Ratio Adjusted) $NAMO) to confirm the above - Overbought above 25 - Oversold below -25. These charts do not fully update until after market close.


Short Term Indicators vs. the SMH; any index can be used - The first set of short term indicators I use are based on the put to call ratio. To go long it is best to wait for the put to call ratio to close over 1.0. On the chart below the put to call ratio now updates intraday but it is not always accurate! Intraday reading of the put to call ratio can be found here updated every half hour after the open:

http://www.cboe.com/data/IntraDayVol.aspx

The more days in a row the put to call ratio prints over 1.0 this the more likely the bottom will be a strong one. The link above shows intraday readings of the P/C ratio.

Also closes on the put to call ratio below 0.50 and sometimes a bit above are indicative of a short term top. Watch the simple moving averages as well because periods of too much buying of puts or calls will almost certainly bring about market bottoms and tops respectively. On the CPC/VIX ratio; this is largely a longer term indicator where investors are likely to make more money on the long side once the short-term 21 day sma has crossed above the 200 day sma. The reverse is true as well. An investor will likely make more money on the short side when the 21 day sma crosses below the 200 day sma:


Next I use the VIX, VXO and VXN (Fear Indices) because they can help to refine decision making on tops and bottoms upon reverses from upper or lower Bollinger Bands especially when the index stretches more than 10% above or below its 10 day simple moving average. When a volatility index stretches more than 10% above or below its 10 day sma it will generally reverse direction as will the market in general in the opposite direction.


S&P 500 versus CPC - Spikes in the CPC correlate with market bottoms.


I selected a 3 day SMA here to smooth out the advance decline lines of the NYSE and NASDAQ. Look for positive or negative divergences to help see market turns. As always the red horizontal lines should advise caution to bullish investors. The green ones should indicate it's time to be watching for a buy entry. Same thing with New Highs.


icon url

ReturntoSender

03/02/10 11:07 PM

#8864 RE: ReturntoSender #6755

From Briefing.com: 4:30 pm : Stocks finished in weak fashion as solid, broad-based gains faded into the close and the major indices settled near session lows. However, the stock market still managed to eke out a slight gain, which puts it in positive territory for the year.

The mood among participants this session had generally been upbeat since the opening bell. The positive tone helped stocks extend the prior session's advance, such that the major indices hit new one-month highs.

Natural resource plays were leaders in the market's move. As such, energy stocks and materials stocks booked the best gains. Both sectors settled with a 0.8% gain, as measured by their Exchange Traded Funds (XLE 57.13, +0.47) and (XLB 32.25, +0.27).

Strong gains among commodities underpinned the strength in the energy and materials sectors. Specifically, oil prices advanced 1.2% to close at $79.68 per barrel after they had been as high as $80.95 per barrel, which marked a one-month high. A 3.6% spike to $17.06 per ounce gave silver one of its best single-session percentage moves in months. Meanwhile, gold prices settled pit trade with a 1.7% gain at $1137.40 per ounce after easing back from one-month highs around $1138 per ounce.

Financials had been a primary source of support for the broader market, but they lost their momentum as the session progressed. The sector's primary ETF, (XLF 14.77, +0.05), had been up roughly 1% at its session high, but it finished with a modest 0.3% gain.

Tech stocks also tumbled. That left the tech select SPDR (XLK 21.94, -0.03) to finish in negative territory.

A trip by tech stocks and financial stocks left the broader market without two of its primary leadership sources. That made it difficult for the broader market to sustain gains when it had already been without any legitimate catalysts.

Despite the absence of positive drivers, the S&P 500 managed to hold on to a modest gain, which put it back in positive territory for the year. Though its year-to-date gain is fractional, the benchmark index had struggled to accomplish that feat during the prior session.

Participation remains on the light side, however; barely 1 billion shares traded hands on the NYSE this session.

Advancing Sectors: Materials (+1.0%), Energy (+0.8%), Utilities (+0.5%), Health Care (+0.4%), Consumer Staples (+0.4%), Financials (+0.3%), Industrials (+0.3%)
Declining Sectors: Telecom (-0.1%), Tech (-0.2%), Consumer Discretionary (-0.3%)DJ30 +2.19 NASDAQ +7.22 NQ100 +0.3% R2K +0.9% SP400 +0.8% SP500 +2.60 NASDAQ Adv/Vol/Dec 1769/2.78 bln/892 NYSE Adv/Vol/Dec 2127/1.07 bln/895

3:41PM EMC Corp authorized a stock purchase program to purchase VMware Class A common stock (EMC) 17. -0.05 : Co announced that its Board of Directors has authorized a stock purchase program to allow the company to make open market purchases of VMware (VMW) Class A common stock in order to maintain EMC's ~80% majority ownership at its current level over the long term.

9:33AM Fairchild Semi files patent lawsuit against Power Integrations in China (FCS) 10.74 +0.01 : Co filed a patent infringement lawsuit against Power Integrations in the People's Republic of China. Fairchild is seeking a permanent injunction preventing the sale, manufacture or use in China, or the importation into China, of Power Integrations products alleged to infringe four Chinese patents, including products in the TinySwitch II, TinySwitch III, LinkSwitch II, LinkSwitch XT and TOPSwitch GX product families. The company is also seeking monetary damages. The lawsuit was filed in Suzhou Intermediate Court. Fairchild Semiconductor and its subsidiaries hold more than 2,200 patents on the company's inventions worldwide.

9:27AM Apple sues HTC for patent infringement (AAPL) 208.99 : Co filed a lawsuit against HTC for infringing on 20 Apple patents related to the iPhone's user interface, underlying architecture and hardware. The lawsuit was filed concurrently with the U.S. International Trade Commission and in U.S. District Court in Delaware.

Trina Solar Limited (TSL) announces the establishment of its European regional headquarters in Zurich, Switzerland, which commenced initial operations as of January 2010...

STEC (STEC) announces at Embedded World 2010 that it is currently sampling SlimSATA and SATA-CF SSDs, STEC's newest line of solid-state drives for the embedded markets...

TowerJazz (TSEM) announces an agreement with Korea's IC Design Education Center to accelerate the country's specialty IC design expertise. Under the terms of the agreement, IDEC will provide Korean universities with access to a broad range of specialty process technologies from TowerJazz's MH fab through discounted multi-project wafer shuttles.

6:30AM Amtech Systems announces $8.5 mln in new solar orders (ASYS) 8.68 : Co announces that its solar subsidiary, Tempress Systems, has received approx $8.5 mln in solar orders for its diffusion processing systems from two new customers in Asia and one new customer in Europe. Including these most recent orders, Amtech's solar orders in the current quarter that ends March 31, 2010 total $27 mln and total solar orders to-date in fiscal 2010 have surpassed $80 mln. Amtech's fiscal 2010 began October 1, 2009.

6:04AM Ascent Solar and FTL Solar sign multi-million dollar strategic alliance supply agreement (ASTI) 4.02 : Co announces that it has signed a strategic supply agreement with FTL Solar, LLC, a provider of lightweight solar structures and products headquartered in Austin, TX. The agreement includes a minimum purchase commitment of $6.5 mln over a three year period.

09:35 am Qualcomm Announces Dividend Hike & Repurchase Plan

Following a 24% drop in its stock since late January due to weak second quarter (March) guidance, Qualcomm (QCOM 35.56) has announced that its Board of Directors approved a 12% increase in its quarterly dividend and a new $3 billion stock repurchase program to replace a $2 billion stock repurchase program, which was recently completed with $1.7 billion of repurchase activity.

The quarterly dividend will increase from $0.17 to $0.19 per share, which computes to a 2.1% annual yield. The new stock repurchase program has no expiration date.

icon url

ReturntoSender

03/03/10 11:00 PM

#8865 RE: ReturntoSender #6755

From Briefing.com: 4:30 pm : Greece's long-awaited austerity plan wasn't enough for participants to forget about the fiscal troubles that still face the likes of Spain and Portugal. That left the stock market unable to sustain solid, broad-based gains.

Led by the materials sector, stocks made their way to fresh one-month highs. The materials sector had been up as much as 2.0% before it saw that gain cut in half. Still, materials saw the best gain of any major sector as a combination of momentum and a weaker dollar provided it with support.

Weakness in the greenback came as the euro and British pound rebounded from recent losses, which were frequently attributed to the fiscal woes that face the likes of Greece, Portugal, and Spain.

Greece attempted to quell concern over its fiscal health with the release of a new austerity plan that includes civil service salary cuts and a sales tax increase. Despite such plans, problems persist for Portugal and Spain. That reality caused Europe's major bourses to show little initial reaction to Greece's plans, but the continent's major averages gradually pushed higher to log strong gains.

U.S. equities were unable to mimic the move. The Dow, Nasdaq Composite, and S&P 500 each added modestly to the previous session's gains, but eventually rolled over. That left the stock market to finish flat after three straight advances.

The afternoon slide left the S&P 500 below the 1125 line, which many traders believe could act as a springboard for further gains if the stock market closes above it.

Economic data received little attention this session. That's essentially because participants remain cautious ahead of the official nonfarm payrolls number on Friday. Cautious trade also led to light trading volume, which failed to surpass 1 billion shares on the NYSE.

A glimpse into the payrolls report was given with the February ADP Employment Change Report, which indicated that 20,000 private payrolls were shed last month. The number was in-line with expectations and the smallest decline in one year.

Meanwhile, the ISM Services Index for February came in at 53.0, which was above the reading of 51.0 that had been widely expected and marked the highest reading since October 2007.

The Fed's Beige Book, which is largely full of anecdotal economic news, came with little surprise. It indicated that nine of the 12 Fed districts reported modest improvement in economic activity during February, while consumer spending improved slightly in many districts.

Commodities had a strong session that pushed the CRB Commodity Index back above its 50-day moving average. Oil futures prices closed 1.5% higher at $80.87 per barrel, despite a larger-than-expected weekly inventory build of 4.03 million barrels. Silver had another strong session and closed with a 1.6% gain at $17.33 per ounce.

Advancing Sectors: Materials (+1.0%), Energy (+0.2%), Industrials (+0.2%), Consumer Staples (+0.1%), Tech (+0.1%), Financials (+0.1%) Declining Sectors: Health Care (-0.5%), Telecom (-0.2%), Utilities (-0.1%) Unchanged: Consumer DiscretionaryDJ30 -9.22 NASDAQ -0.11 NQ100 +0.00% R2K +0.2% SP400 +0.2% SP500 +0.48 NASDAQ Adv/Vol/Dec 1412/2.54 bln/1245 NYSE Adv/Vol/Dec 1641/936 mln/1368

4:20PM Altera raises bottom end of Q1 revs guidance, in-line with consensus (ALTR) 24.64 -0.16 : Co raises bottom end of Q1 revs guidance to 7-10% of sequential growth, up from prior 5-10% of sequential growth, which equates to ~$390.6-401.5 mln vs. $393.9 mln consensus, up from $383.3-401.5 mln prior guidance. The co expects solid growth from new products in Q1. All four vertical market segments are likely to report sequential improvements. Growth continues in the telecom and wireless market segment as communications equipment manufacturers respond to ongoing Asian demand.

4:06PM Sigma Designs beats by $0.27, beats on revs (SIGM) 12.17 -0.49 : Reports Q4 (Jan) earnings of $0.37 per share, $0.27 better than the First Call consensus of $0.10; revenues rose 44.0% year/year to $68.1 mln vs the $52.7 mln consensus. "We are pleased to report a substantial increase in revenue for the fourth quarter, nearly doubling that of our third quarter, and reflecting the underlying strength of the markets we serve. Our IPTV market sales were up sharply and we believe that the market is moving into a new growth phase evidenced by the many telco accounts that achieved their highest ever net subscriber additions in the fourth quarter. Our connected media player sales were also up, reflecting increased sell-through rates for consumer products such as network players that enable Internet access for playback of over-the-top content. Finally, our connected home market sales increased significantly as a result of added revenues from the recently acquired CopperGate operation, whose revenues accrue from their leadership position in home audio/video network solutions such as HomePNA. Moving forward, we are continuing to pursue major design wins in the hybrid IP Cable set-top box industry and increased adoption of Z-Wave based home control solutions.

4:02PM Finisar beats by $0.01, beats on revs; guides Q4 revs above consensus (FNSR) 12.93 +0.05 : Reports Q3 (Jan) earnings of $0.17 per share, $0.01 better than the First Call consensus of $0.16; revs rose 32% YoY to $166.9 mln vs $164.80 mln First Call consensus. Co issues upside guidance for Q4, sees Q4 revs of $175-185 mln vs. $167.22 mln consensus. Additional non-cash and infrequently occurring charges excluded in calculating non-GAAP operating income are expected to total approximately $6 to $8 million. As a result, on a non-GAAP basis, gross margin is also expected to be approximately the same as the third quarter with non-GAAP operating margin in the range of 8.5% to 10%.

Optelecon (OPTC) announces the award of a $503,000 traffic management equipment contract from Temple, a regional systems distributor based in Decatur, Alabama, USA...

7:45AM Conexant announces comprehensive refinancing plan (CNXT) 4.89 : Co announced a comprehensive refinancing plan designed to improve its balance sheet and address its liquidity needs. The co expects that this refinancing plan will provide sufficient financial flexibility to tender for its outstanding 4% convertible subordinated notes due 2026 and to realize the benefits associated with its business and growth opportunities. Conexant has priced $175 mln of new 11.25% senior secured notes due 2015, and is launching an offering of ~14 mln shares of its common stock. The senior secured notes have already been placed with institutional investors, and the co expects to complete the equity offering in the next several days. The proceeds from these offerings, together with available cash, will be used by the co to tender for any and all of its outstanding $232 mln convertible subordinated notes, which are "puttable" in March 2011.

6:30AM Lattice Semi raises guidance for Q1 on robust growth (LSCC) 3.08 : Co says Q1 revenue is now expected to increase by approximately 21% to 25%, sequentially. This upward revision compares to previous guidance that first quarter revenue would be up 8% to 12%, sequentially (This calculates to ~$66.67-68.87 mln vs $60.53 mln consensus). The revision is based on robust growth across all product lines and continued strength in the Company's order bookings throughout the quarter. Gross margin percentage is expected to be approximately 55% to 57% of revenue, upwardly revised from our prior guidance of approximately 54% to 56%. Total operating expenses are now expected to be approximately $30.0 million. The increase compared to prior guidance of $29.0 million is primarily due to costs related to the acceleration of certain R&D activities, and an increase in sales related expenses. Lattice reiterates its expectation for continued profitability in the first quarter of 2010.

4:47AM LDK Solar resolves class action lawsuit (LDK) 6.43 : Co announces that it has reached an agreement to settle the securities class action lawsuit pending in the U.S. District Court of Northern Calif. After submitting the proposed settlement agreement to the court on February 16, 2010, the court granted preliminary approval of the settlement on February 17, 2010. The settlement is not final until the class receives notice of the settlement and the court grants final approval of the settlement terms. Under the terms of the agreement, all of the claims in the securities class action lawsuit will be dismissed with prejudice. As part of the settlement terms, LDK Solar and its insurance carrier will pay a total of $16 mln (approx 5% of the alleged damages) to compensate the class members and to cover all legal and administrative expenses.


icon url

ReturntoSender

03/08/10 11:09 PM

#8870 RE: ReturntoSender #6755

From Briefing.com: 4:30 pm : Listless and lackluster action kept participants on the sidelines as stocks consolidated their recent gains. A lack of market-moving headlines and other trading catalysts also made for minimal participation.

Investors and traders showed little willingness to step back into the stock market after it advanced more than 3% last week. In turn, hardly 900 million shares exchanged hands on the NYSE in what was this year's second-smallest level of volume.

In addition to the light trade, action was also rather quiet and stocks spent most of the session stuck in a narrow range. There were neither economic data nor corporate news items to act as movers.

However, Hewlett-Packard (HPQ 51.73, -0.30) did disappoint with its downward revision of first quarter earnings to $1.07 per share.

Despite the generally positive influence of merger and acquisition activity on the broader market, news that AIG (AIG 29.10, +1.02) offloaded its American Life Insurance Company to MetLife (MET 40.90, +1.98) in a $15.5 billion deal only seemed to help shares of insurers. Still, that kept the financial sector in positive territory for the entire session. Financials finished with a tepid 0.2% gain.

A bounce by the dollar also kept a cap on trade. The greenback had been down roughly 0.4% at its session low, but recovered to finish flat.

Despite the bland action in the broader market, the Nasdaq Composite was able to garner enough support to hit a fresh 52-week high. Research In Motion (RIMM 73.39, +3.89) was a primary leader after it was upgraded on Wall Street.

Advancing Sectors: Telecom (+1.1%), Consumer Discretionary (+0.4%), Tech (+0.3%), Financials (+0.2%)
Declining Sectors: Industrials (-0.5%), Health Care (-0.4%), Consumer Staples (-0.4%), Energy (-0.2%), Materials (-0.1%), Utilities (-0.1%)DJ30 -13.68 NASDAQ +5.86 NQ100 +0.1% R2K +0.2% SP400 +0.2% SP500 -0.20 NASDAQ Adv/Vol/Dec 1443/2.19 bln/1246 NYSE Adv/Vol/Dec 1792/905 mln/1249

7:15PM Diodes Incorporated raises Q1 2010 guidance (DIOD) 22.40 +0.28 : Co raises Q1 revs guidance to $134-138 mln vs. $134.6 mln consensus, up from $131-137 mln. The co is also raising its Q1 2010 gross margin guidance to 32.5-33.1% from its prior guidance of 32-33%. The co is raising revenue guidance due to continued strength in its global markets.

4:33PM Texas Instruments raises lower end of Q1 EPS and revs, in-line with consensus (TXN) 24.69 -0.28 : Co raises lower end of Q1 EPS to $0.48-0.52 vs. $0.49 First Call consensus, from $0.44-0.52; raises lower end of Q1 revs to $3.07-3.19 bln vs $3.08 bln consensus, from $2.95-3.19 bln prior guidance.

8:30AM Applied Materials announces increased cash dividend to $0.07 from $0.06 and $2 bln share repurchase authorization (AMAT) 12.29 : Co announces that its Board of Directors has approved a 17% increase in the quarterly cash dividend to $0.07 per share, payable on June 16, 2010 to stockholders of record as of May 26, 2010. Previously, the quarterly cash dividend was $0.06 per share. Applied's Board also approved a new stock repurchase program authorizing up to $2 billion in repurchases over the next three years ending in March 2013.

Altera (ALTR) announces that its Stratix IV FPGAs passed the Interlaken Alliance's device interoperability testing...

8:02AM Silicon Storage shareholders to receive $3.05/share in cash under newly amended merger agreement with Microchip (SSTI) 3.25 : Co announces that it entered into a second amendment to its Feb. 2, 2010 definitive agreement to acquire Silicon Storage Technology (SSTI). Under the revised terms, SSTI shareholders would be entitled to receive $3.05/share in cash compared to $3.00/share prior to the second amendment. This second amendment was in response to an offer made by another party to SSTI's Strategic Committee on March 2, 2010. Additionally, in connection with the amendment, MCHP is today purchasing directly from SSTI newly issued shares in an amount equal to 19.9% of the current issued and outstanding shares of the common stock of SST at $3.05/share in cash. In the event that MCHP's acquisition of SSTI is not consummated, MCHP has agreed that as a general matter, it will not use its voting rights to block a transaction that constitutes a superior proposal and the profits on its sales in such transaction will be limited. Furthermore, MCHP will have an option to sell its shares back to SSTI at $3.05 per share.

8:01AM RF Micro Device sees Q4 EPS of $0.11-0.12 vs $0.10 First Call consensus; revs $240-245 mln vs $231.79 mln First Call consensus (RFMD) 4.82 : The co now expects to generate quarterly revenue of approximately $240 million to $245 million (First Call Consensus $232 mln), which represents approximately 41% year-over-year growth at the midpoint of this updated outlook. As a result of the anticipated increase in revenue, RFMD expects to achieve non-GAAP quarterly earnings per share of approximately $0.11 to $0.12 (First Call Consensus $0.10). RFMD is experiencing broad-based strength in its core business this quarter, with current customer demand significantly outpacing original expectations in both the cellular products group and multi-market products group. RFMD is seeing particular strength in China and Korea and expects continued market share gains across leading cellular baseband providers and handset manufacturers this calendar year.

8:01AM Ciena announces proposed private sale of $250 mln in convertible senior notes due 2015 (CIEN) 16.01 :

3:37AM Advanced Semiconductor Engineering announces February 2010 unaudited consolidated net revenues increased 202% year/year to NT$ 12.98 bln; sequential change was +48.8% (ASX) 4.23 :

icon url

ReturntoSender

03/09/10 11:02 PM

#8871 RE: ReturntoSender #6755

From Briefing.com: 4:35 pm : Stocks made their way to solid gains after a soft start, but pressure picked up after stocks failed to extend the advance in afternoon trade. Still, the major indices finished the session modestly higher.

A lack of upbeat headlines and a stronger dollar left buyers with little reason to get back into the action. The tepid tone was reflective of broader sentiment, which has some in fear that the stock market may be overextended after its rally in the past year -- the S&P 500 is up nearly 70% since its multiyear closing low reached exactly one year ago. While no one wants to be in a vulnerable position if a correction takes place, few want to risk missing out on further gains.

Stocks are also just 1% off of their 52-week highs, which were reached in mid-January. A stronger dollar has been a hurdle for stocks to return to that mark, though. The buck advanced a mere 0.1% this session, but that was only after it pared its gain. Initially, the greenback garnered support as the euro and British pound were pressured by news that analysts at Fitch kept a Negative outlook in place for Portugal's AA rating and that Britain's plan to halve its deficit in four years was determined to be too slow.

There were a few corporate news items, but none of them caused any major swings in the stock market. Among the headlines, Texas Instruments (TXN 24.19, -0.50) announced an improved its earnings outlook, which remains in in-line with that of Wall Street. Still, the semiconductor company's shares slipped.

Meanwhile, Cisco (CSCO 26.13, +0.00) unveiled plans for its new router, which is expected to improve the flow of content and, in turn, inspire further content development. That helped AT&T (T 25.56, +0.28) and wireless service plays (+2.8%) prop up the telecom sector, which finished 1.2% higher. Apple (AAPL 223.02, +3.94) was also helped; it gave the Nasdaq a lead over its counterparts for the second straight session.

Northrop Grumman (NOC 64.00, -0.16) announced in-line guidance for fiscal 2010, but the bigger headline was the company's decision to take itself out of contention for a contract to build next generation refueling planes. The latter item buoyed Boeing (BA 67.79, +0.55).

Treasuries came into focus with news that a $40 billion auction of 3-year Notes attracted a bid-to-cover ratio of 3.1, which is above the recent average of 2.9, and an indirect bid of 51.8%, which is on par with the recent average of 52%.

There wasn't any economic data today, but tomorrow brings monthly wholesale inventory data and the Treasury's monthly budget statement.

Advancing Sectors: Telecom (+1.2%), Industrials (+0.8%), Tech (+0.4%), Financials (+0.3%), Energy (+0.1%)
Declining Sectors: Materials (-0.5%), Utilities (-0.3%), Consumer Staples (-0.2%), Health Care (-0.1%), Consumer Discretionary (-0.1%)DJ30 +11.86 NASDAQ +8.47 NQ100 +0.6% R2K +0.4% SP400 +0.1% SP500 +1.95 NASDAQ Adv/Vol/Dec 1483/2.56 bln/1176 NYSE Adv/Vol/Dec 1735/1.12 bln/1314

8:30AM First Solar signs contract with PG&E for 300 MW photovoltaic solar power project (FSLR) 108.64 : Co announces a power purchase agreement to supply Pacific Gas and Electric Company with renewable electricity from a 300 megawatt utility-scale photovoltaic solar power facility that First Solar is developing in Southern California. The Desert Sunlight project, to be located near Desert Center in eastern Riverside County, CA, will have a total capacity of 550 megawatts, enough to power approximately 160,000 area homes - or about 480,000 residents. The other 250 MW portion of the project is already under contract to Southern California Edison. First Solar's power purchase agreements with PG&E and SCE are subject to the approval of the California Public Utilities Commission.

CalAmp (CAMP) and and Kepware Technologies introduce the Air Traffic Controller, a distributed communications processor that optimizes bandwidth over wireless networks... Ixia (XXIA) announces that its "K2" 100 Gigabit Ethernet test solution was implemented in AT&T's (T) testing of a standard-ready, single-flow, 100 GE field trial...

Semtech (SMTC) announces that as an inducement to enter into employment with Semtech, it has made awards effective March 2, 2010 of restricted stock units to three recently hired employees under the Semtech 2009 Long-Term Equity Incentive Inducement Plan...

3:11AM United Microelectronics reports unaudited net sales for February 2010 increased 174.66% year/year to NT$8.63 bln; month/month sales increased 0.4% (UMC) 3.57 :

09:30 am Texas Instruments (TXN)

After the close yesterday, Texas Instruments (TXN 24.69) raised the lower end of its first quarter guidance, which remained in-line with Wall Street estimates.

The company raised the bottom end of its first quarter earnings guidance, putting its forecast to $0.48 to $0.52 per share versus the $0.49 First Call consensus, up from its prior guidance of $0.44 to $0.52. TXN raised the bottom end of its revenue guidance, which moved its current forecast to $3.07 billion to $3.19 billion versus the $3.08 billion consensus, up from prior guidance of $2.95 billion to $3.19 billion.

Shortly after issuing guidance, TXN held a conference call to discuss its new outlook. During the call, the company said, "in general we expect all of our segments to grow sequentially this quarter with the exception of wireless where in wireless base band revenue will decline what would be a seasonally typical amount. Analog and embedded processing are both strong, and even selected areas inside of our other revenue are doing well."

With respect to lead times, the company said it has been able to reduce lead times for some products this quarter although the company still has many products that continue to have extended lead times. This is the result of capacity increases at TXN, especially in the assembly and test areas. The reduced lead times are not due to any softening demand.

So far the company has seen both revenue, as well as orders, quarter-to-date remain strong, and they have remained strong even as the company has begun to reduce the lead times. Regarding inventory, TXN expects to be able to build some inventory this quarter, and in fact the company could see an increase of a few days from the 76 days of inventory that it held at the end of last quarter.

Regarding visibility, the company said it is not significantly different. The company said it still plans on holding utilization rates at about the same level as in the first quarter. TXN also said it thinks its meeting the deliveries to those extended lead times, so in terms of its delinquencies, the company is holding well, but those extended lead times are longer than what it and its customers want from TXN. Separately, cancelations have not trended up this quarter.
icon url

ReturntoSender

03/10/10 7:20 PM

#8873 RE: ReturntoSender #6755

From Briefing.com: 4:30 pm : In the absence of any broader market catalysts, financials and tech issues led the major indices to varied gains in the face of choppy trade.

This morning's mood was generally subdued, but stocks were able to stage an early advance as financials garnered support in the face of news that some Senate Democrats will propose to expand the Volker Rule with new limits on proprietary trading by banks and nonbank financial firms.

Citigroup (C 3.96, +0.14) was a strong performer amid news that it has issued a $2 billion trust preferred offering. Renowned analyst Dick Bove also issued positive comments on the stock. Meanwhile, widely-followed financial analyst Meredith Whitney gave positive grades to Visa (V 91.52, +1.37) and MasterCard (MA 249.60).

Banks were among the best overall performers in the sector as regional banks scored a 2.9% gain and diversified banks climbed 1.8%. The KBW Bank Index closed 2.2% higher.

Tech stocks also displayed relative strength, which helped take the Nasdaq Composite to a fresh 52-week high. The Nasdaq has advanced in eight of the past nine sessions, outperforming its counterparts in each of the past three sessions.

The S&P 500 has also advanced in eight of its last sessions, but it ran into resistance when it came within striking distance of its 52-week high, which was set in mid-January. Failure to push through resistance left stocks to roll over and surrender gains.

Buyers stepped in to help stocks recover from their slide, but the broad-based S&P 500 remains roughly five points shy of its high.

In the week's first dose of data, wholesale inventories for January slipped 0.2% when a 0.2% increase had been expected. Though the decline can undermine GDP, some suggested that it could be indicative of stronger-than-expected demand.

The Treasury's budget statement for February showed a deficit of $220.9 billion, which was essentially in step with the $222.0 billion consensus, but deeper than the $193.9 billion deficit that was recorded in February 2009.

Neither the Treasury statement nor the wholesale inventory data did anything for stocks.

In a widely-watched $21 billion auction of 10-year Notes, bidders showed up in strong numbers, such that the bid -to-cover ratio was just shy of 3.5, which is well above recent averages. The indirect bid was relatively modest, though; it came in at 35.1%. The benchmark 10-year Note settled slightly lower, but that kept its yield a few basis points above 3.70%.

A mixed finish for commodities gave the CRB Commodity Index a fractional loss. Gold was a primary source of weakness -- it settled 1.3% lower at $1108.20 per ounce. Oil prices gained 0.7% to close pit trade at $82.09 per barrel. Oil prices had traded around $83 per barrel, which marked a multiweek high, in the wake of a smaller-than-expected inventory build of 1.43 billion barrels.

Trading volume on the NYSE hit its highest level in nearly two weeks by totaling 1.14 billion shares. That also put it above its 50-day moving average of 1.09 billion shares.

Advancing Sectors: Financials (+1.1%), Tech (+0.8%), Energy (+0.6%), Industrials (+0.4%), Consumer Discretionary (+0.3%), Health Care (+0.1%), Utilities (+0.1%)
Declining Sectors: Consumer Staples (-0.2%), Telecom (-0.1%), Materials (-0.1%)DJ30 +2.95 NASDAQ +18.27 NQ100 +0.8% R2K +0.8% SP400 +0.8% SP500 +5.16 NASDAQ Adv/Vol/Dec 1724/2.49 bln/957 NYSE Adv/Vol/Dec 2040/1.14 bln/985

4:34PM Semtech beats by $0.08, beats on revs; guides Q1 EPS above consensus, revs above consensus (SMTC) 17.35 +0.16 : Reports Q4 (Jan) earnings of $0.30 per share, excluding non-recurring items, $0.08 better than the First Call consensus of $0.22; revenues rose 35.6% year/year to $85 mln vs the $77 mln consensus. Co issues upside guidance for Q1 (Apr), sees EPS of $0.27-0.30, excluding non-recurring items, vs. $0.21 consensus; sees Q1 revs up 7-13% sequentially, which computes to $91-96 mln vs. $79.5 mln consensus.

F5 Networks (FFIV 63.07 +1.41) showed strength after it was rumored that Hewlett Packard (HPQ 51.70 -0.18) could be interested in the co.

8:00AM Trina Solar signs sales agreement with U.S. wholesale distributor Essco (TSL) 22.77 : Co announces that its subsidiary, Changzhou Trina Solar Energy, has signed a sales agreement with Essco Wholesale Electric. Under the terms of the agreement, Trina Solar is expected to supply Essco with approximately 25 MW of PV modules and an additional 4 MW at the option of Essco, to be delivered during 2010. With the signing of this sales agreement, the Company has now secured a total of approximately 40 MW of PV modules from customers in the United States during 2010, all with agreed prices.

7:06AM On The Wires : CalAmp (CAMP) announces that it has entered into an agreement with Space Data Radio, LLC to lease a 100 KHz portion of licensed 900 MHz radio frequency spectrum across the entire United States, subject to execution of a definitive agreement and FCC filings...

09:38 am Advanced Micro upgraded to Buy at Broadpoint AmTech Research; tgt raised to $10: . Broadpoint AmTech Research upgrades AMD to Buy from Neutral and raises their tgt to $10 from $5.80 as the recent positive events (Analyst Day/INTC settlement/capital structure) lead the firm to believe that AMD's risk/reward is now compelling. The firm notes that AMD's capital structure improved as a result of INTC's $1.25 bln settlement and yesterday's announcement of debt restructuring actions. The firm believes that AMD's debt of ~$3.7 bln will be reduced by ~25%, while also lowering interest expense slightly less, ~20%. Should Global Foundries and ATIC's chartered purchase be consolidated, the firm believes that they could see deconsolidation in the following 3-6 months. Furthermore, the firm feels that revenue growth in the coming quarters will prove to be stronger than the Street is modeling, driven by: a healthy Win7 cycle; leadership in the Evergreen GPU platform; more focused marketing; and possible tailwind from INTC settlement headlines entering the selling season.
icon url

ReturntoSender

03/12/10 12:36 PM

#8875 RE: ReturntoSender #6755

Chart of the Day - COTD - Historical PE Ratio of the S&P 500

http://www.chartoftheday.com/20100312.htm?T

Today's chart illustrates how the recent rise in earnings has impacted the current valuation of the stock market as measured by the price to earnings ratio (PE ratio). Generally speaking, when the PE ratio is high, stocks are considered to be expensive. When the PE ratio is low, stocks are considered to be inexpensive. From 1936 into the early 1990s, the PE ratio tended to peak in the low 20s (red line) and trough somewhere around seven (green line). The price investors were willing to pay for a dollar of earnings increased during the dot-com boom (late 1990s), surged even higher during the dot-com bust (early 2000s), and spiked to nosebleed levels during the financial crisis (late 2000s). Currently, with 99% of US corporations having reported for Q4 2009, the PE ratio stands at 22 which is at the high end of a range that existed from the mid-1930s up until the early 1990s.

icon url

ReturntoSender

03/13/10 12:17 PM

#8877 RE: ReturntoSender #6755

Amateur Investors Weekend Stock Market Analysis (3/12/10)

http://www.amateur-investor.net/Weekend_Market_Analysis_Mar_13_10.htm

The SPY ETF has been up "11" consecutive days in a row beginning in late February. Meanwhile the all time record since the SPY began trading in 1993 is "12" days in a row back in 1995.


The chart below is a daily chart of the SPY back in the Fall of 1995. After completing its 12th Day in a row to the upside this was followed by a rather choppy period from mid September through late October before it resumed its move higher in November. Thus the odds don't favor the market moving much higher from current levels in the near term.


Meanwhile another interesting feature has been the overall volume the past several months especially since last Fall. Those who have followed the market for a long time know generally it's bullish when volume is below normal on pullbacks and higher with the rallies. However since the Fall the exact opposite has been happening as the pullbacks have been accompanied by higher volume while the rallies have been occurring with below normal volume. (In the chart below I'm using a 20 Day Moving Average (MA) for volume with the daily difference plotted above or below the 20 Day MA (denoted by black line)). Notice the volume with the last pullback was very high while the latest rally's volume has been very low.


Meanwhile if we go back to 2007 the same type of pattern occurred right before the October 2007 top as a lot of volume occurred with the sell off from late July through August while volume was far less as the SPY made a slightly higher high by early October (point A). Now keep in mind this doesn't mean the market is going to go through a large sell off in the months ahead however the overall volume pattern in the market right now is somewhat concerning.


Finally after going through some data from the Flow of Funds which has released by the Federal Reserve on a Quarterly basis since 1952 there has been a strong correlation between Mutual Fund Selling and market bottoms. The chart below is what I call the Mutual Fund Panic Indicator which measures the amount of money being taken out of stocks by Mutual Funds. Like everyone else Mutual Fund Managers tend to panic near market bottoms as well. As shown below when Mutual Funds have decreased there assets in stocks by -20% or more (points B) since 1952 significant market bottoms have occurred ( Fall of 1962, Fall of 1970, Fall of 1974, Fall of 1987, Fall of 2002 and Spring of 2009). Also as you can see significant oversold rallies over a rather short period of time have also occurred which follows Newton's Third law of Motion "For every action there is an equal and opposite reaction".


Previous oversold rallies have ranged from 70% to as high as 97% after the Mutual Fund Panic Index has reached a value of -20 or below. Currently the Dow is up nearly 65% from its March 2009 low so this snapback rally is nothing unusual based on previous signals. Also just because the Dow could eventually rally 70% or more that doesn't mean the next great Secular Bull Market has begun. From the mid 1960's through the early 1980's there were two 70% or more rallies however the Dow basically went sideways for a period of 17 years.

icon url

ReturntoSender

03/13/10 3:38 PM

#8878 RE: ReturntoSender #6755

SPY overbought on daily chart. Showing a Doji with an RSI over 70 usually means it is time for a short term market turn lower. The VIX is low but the put to call ratio is not as low as what is usually seen at a major market top. So I agree we should probably see some selling in the market but this does not look like a major market top yet at all.


The weekly chart shows what Amateur Investors is worried about here. The volume on down weeks has been higher than up weeks lately. That is not a good thing but as the monthly chart below will show all is far from lost:


Volume on the SPY still looks good for further gains on the Monthy Chart to me:


Unfortunately the semiconductors have not been outperforming lately. This calls into question if they are going to lead or simply fallow even if we get any additional rally from here? No new highs lately for the SMH!


RtS

icon url

ReturntoSender

03/14/10 12:31 PM

#8879 RE: ReturntoSender #6755

The new highs and new lows on the Nasdaq show that we are overbought but in a very healthy position in this market for now. The chart also shows that the overall Nasdaq has also outperformed the SOX for years. Proving that while semiconductors may be in everything they are not in everyone's portfolio!


Think about buying when indicators reach green horizontal lines and positive divergences are present. Think about selling when indicators reach red horizontal lines and negative divergences are present.

Bottom line is that we are due for something of a pullback perhaps but are not yet in any real danger in the overall market forming a long term top in my humble opinion.

RtS


icon url

ReturntoSender

03/14/10 9:53 PM

#8881 RE: ReturntoSender #6755

What we have now is a Bull Rally within a secular bear for the SOX and Nasdaq.


That does not mean there has not been money to be made.

Eventually I expect that the SOX will reach new highs but first I think the S&P 500 returns to historical lows on its PE ratio.

In the meantime I am not convinced that the SOX and market itself cannot continue higher for a while.

http://en.wikipedia.org/wiki/Market_trend

RtS


icon url

ReturntoSender

03/15/10 11:33 AM

#8884 RE: ReturntoSender #6755

I think the resistance at 1150 is going to be the most important thing here for a little while. That said I did give your chart a recommendation. Thanks for sharing it here! Here's my take. I don't have any projection for downside ahead. I just think some profit taking is in order. When the CPC and VIX and other indicators rise into buy zones I will be reloading on some positions.


RtS
icon url

ReturntoSender

03/15/10 10:42 PM

#8888 RE: ReturntoSender #6755

From Briefing.com: 4:30 pm : There were plenty of headlines today, but participants were focused on the upcoming FOMC policy statement. Uncertainty ahead of the directive left stocks to trade listlessly for most of the session, but a late rally helped stocks finish near session highs.

Though it closed near its best level, the stock market finished flat for the session as the S&P 500 got hung up on the 1150 line in the final few minutes of trade. The line, which marks a 52-week closing high for the S&P 500, also acted as a source of resistance in the early going.

A stronger dollar had hampered stocks for the better part of the session, too. However, the greenback's 0.5% gain did little to dissuade participants from offering support in the final few minutes of trade.

The stock market's late move came amid a spike in share volume, but trading volume for the session as a whole was weak. The lack of overall participation precedes the latest policy statement from the Federal Open Market Committee (FOMC), which will issue its directive prior to tomorrow's opening bell. Most participants thought it prudent to remain on the sidelines for fear of being out of position when the FOMC offers its latest assessment of economic conditions and its outlook for monetary policy.

On a similar note, Japan reportedly upgraded its assessment of its economy for the first time in eight months, but the upgrade had been expected. Meanwhile, concerns persist that China may have to tighten monetary policy in order to cool conditions.

The latest U.S. data did little to stir action ahead of tomorrow's FOMC policy statement. Industrial production for February increased 0.1%, which is slightly better than the the flat reading that had been expected, while at 72.7% capacity utilization for the month was in-line with expectations. The Empire Manufacturing Index for March hit 22.9, which is a bit better than the 22.0 that was widely forecast, but not quite as strong as the 24.9 that had been posted for February.

Senator Dodd gave bank stocks a bit of a spook with his proposal for financial reform this afternoon. Dodd dashed hopes for a diluted reform proposal with his call for stringent policies to limit risk imposed on the financial system by major institutions. Bank stocks bounced back, though; the KBW Bank Index finished with a modest 0.2% gain. That was enough to trim the broader financial sector's loss to just 0.1% after it had been down more than 1%.

Health care stocks also made a strong move into the close. The sector finished with a 0.5% gain, though Boston Scientific (BSX 6.80, -0.98) continued to lag. The company confirmed reports that it stopped shipment of certain products amid a pending FDA documentation review linked to paperwork error for manufacturing processes.

The best gains came from the consumer staples sector. It finished 0.8% higher. It was helped by PepsiCo (PEP 66.15, +1.05), which hiked its dividend and issued a share repurchase plan, and Wal-Mart (WMT 55.42, +1.52), which was upgraded by analysts at Citigroup.

Advancing Sectors: Consumer Staples (+0.8%), Telecom (+0.5%), Health Care (+0.5%), Utilities (+0.5%), Industrials (+0.2%), Consumer Discretionary (+0.1%)
Declining Sectors: Energy (-1.0%), Tech (-0.3%), Materials (-0.3%), Financials (-0.1%) DJ30 +17.46 NASDAQ -5.45 NQ100 -0.2% R2K -0.3% SP400 -0.2% SP500 +0.52 NASDAQ Adv/Vol/Dec 1103/1.91 bln/1560 NYSE Adv/Vol/Dec 1263/926 mln/1733

RF Micro Devices (RFMD) announces that it has successfully manufactured the industry's first photovoltaic cell using high-volume six-inch gallium arsenide machinery... American Science and Engineering (ASEI) announces that the Transportation Security Administration has added the Company's Gemini 6040, Gemini 7555, and Gemini 100100 X-ray inspection systems to its Air Cargo Screening Qualified Technology List...

8:01AM Chipmos Technology reports revenue for the month of February 2010 was NT$1,131.2 million or US$35.2 million, (IMOS) 0.74 : Co announces that revenue for the month of February 2010 was NT$1,131.2 mln or US$35.2 mln, a decrease of 9.1% from the month of January 2010 and an increase of 44.8% from the same period in 2009.

icon url

ReturntoSender

03/17/10 8:56 PM

#8890 RE: ReturntoSender #6755

From Briefing.com: 4:30 pm : The stock market moved higher for the third straight session; a fresh 52-week high was set along the way. Though the latest advance was broad based, the stock market surrendered part of its gain after an encounter with near-term technical resistance.

Momentum from recent advances carried over into early action and positioned stocks to extend their gains. The upward trend only seems to have begotten more buying.

A positive bias among broader market participants has taken volatility down considerably. As such, the Volatility Index dropped to a 22-month low. It closed down 5.0%.

The upbeat tone in the broader market lifted advancing issues at a rate of more than 2-to-1 in the S&P 500. Financials and natural resource plays were steady leaders during the session.

Financials finished 1.1% higher. The sector's strength was underpinned by banks, especially regional banks, which tacked on 2.4% to extend their year-to-date gain to 29.8%.

Meanwhile, oil and gas equipment stocks advanced 1.7% to help the energy sector secure a 1.1% gain. A 1.5% rise in oil prices to $82.93 per barrel helped. Oil's climb came in the face of a smaller-than-expected inventory build of 1.01 million barrels for the week ended Mar. 12. In other oil-related news, OPEC opted to keep output unchanged at its latest meeting, as had been expected.

Metal mining giant Alcoa (AA 14.46, +0.66) helped the materials sector stage a 0.7% gain. Reuters reported that the Italian parliament has approved a decree that offers favorable conditions to some industrial consumers after Alcoa had recently threatened to idle smelters in the country.

While buyers kept stocks in positive territory for the entire session, they couldn't propel the S&P 500 past near-term resistance at the 1170 line. Stocks tried twice to overtake the technical line, but they rolled over after they failed on both attempts. Still, stocks were able to close the session with solid gains.

Overseas markets, including those in both Europe and Asia, also made strong gains in their latest showing. Their advances followed better-than-expected employment data out of Britain and minutes from a recent Bank of England meeting that showed committee members voted unanimously to keep interest rate targets unchanged. Japan's central bank voted in its latest meeting to keep its own interest rates low and doubled the amount available under its short-term lending program to 20 trillion yen.

Current Fed Chairman Bernanke and former Fed Chairman Volcker testified about banking regulation to the House Committee on Financial Services this afternoon, but neither made any stark comments.

U.S. data did little for participants this session. Producer prices for February fell 0.6%, which was a sharper drop than expected, but core prices climbed a tame 0.1%, as expected.

Advancing Sectors: Financials (+1.1%), Energy (+1.1%), Materials (+0.7%), Telecom (+0.6%), Consumer Discretionary (+0.5%), Consumer Staples (+0.5%), Tech (+0.4%), Utilities (+0.4%), Industrials (+0.4%), Health Care (+0.1%)
Declining Sectors: (None) DJ30 +47.69 NASDAQ +11.08 NQ100 +0.2% R2K +0.7% SP400 +0.7% SP500 +6.75 NASDAQ Adv/Vol/Dec 1577/2.22 bln/1093 NYSE Adv/Vol/Dec 2161/1.02 bln/886

5:25PM TSL drops 3.7% to $22.24 following news on follow-on public offering of 7,900,000 American Depositary Shares :

5:23PM Trina Solar announces follow-on public offering of 7,900,000 American Depositary Shares (TSL) 23.08 +0.19 : Co announced that it intends to offer, subject to market and other conditions, 7,900,000 American depositary shares ("ADSs"), each representing 50 ordinary shares of the Company. Trina Solar intends to grant the underwriters an option to purchase up to additional 1,185,000 ADSs. Trina Solar plans to use the net proceeds of the offering to expand manufacturing facilities for the production of PV cells and modules, for research and development purposes, including the expansion of its research and development center, and for downstream projects and general corporate purposes. The Company's management will retain broad discretion over the use of proceeds, and the Co may ultimately use the proceeds for different purposes than what it currently intends.

5:00PM Sunpower to build 1-megawatt solar power system for Yolo County (SPWRA) 21.90 +0.66 : Co announces that SunPower will design and construct a 1-megawatt solar power system at the Yolo County Justice Center in Woodland, Calif. Yolo County, which will own the system and associated renewable energy credits, is financing the purchase using multiple funding sources, including clean renewable energy bonds and qualified energy conservation bonds available through the American Recovery and Reinvestment Act of 2009. "With the funding we secured as a result of the federal stimulus bill and the California Energy Commission loan, Yolo County has no out-of-pocket expenses to build the project, and will be net cash flow positive from the first day of the system's operation, expected to be later this year," said Yolo County General Services Director Ray Groom. "We estimate that savings over the next 25 years will be about $8.8 million, directly benefiting Yolo County residents and businesses. State and federal funding has helped make solar power an easy, affordable means to reduce county operational costs as well as our dependence on fossil fuels."

9:01AM NVIDIA announces extension of its stock repurchase program (NVDA) 17.75 : Co announced an extension of its existing stock repurchase program, under which it may purchase up to $2.7 billion of its common stock through May 2013. Prior to this three-year extension, the program had been set to expire in May 2010. Since initially authorizing its stock repurchase program in August 2004, NVIDIA has spent $1.46 billion to repurchase 90.9 million shares of its common stock.

7:03AM Aehr Test Systems receives order for its new advanced burn-in and test system (AEHR) 2.38 : Co announces it has received an order for its new Advanced Burn-in and Test System from a leading Japanese semiconductor integrated device manufacturer. The system is configured for burning-in and testing advanced logic devices. The system is expected to ship during the second half of calendar 2010.

6:38AM Actel sees Q1 revs up sequentially four percent to eight percent; up from two percent to six percent previously (ACTL) 13.90 : Co announces first quarter 2010 revenues are expected to be up sequentially four percent to eight percent. The previous guidance was up two percent to six percent. (This calculates to ~$51.68- $53.68 mln vs $51.7 mln single analyst est) Gross margin is expected to be at the previous guidance of 62%. Operating expenses are anticipated to come in at approx $27.5 mln, which excludes an estimated $2.1 mln of stock-based compensation expense and $0.6 mln associated with the acquisition of Pigeon Point Systems. The previous guidance was approx $27.0 mln. Other income is expected to be about $0.5 mln, which is unchanged from previous guidance. The non-GAAP tax rate for the quarter is expected to be about 30%, which is unchanged from the previous guidance.

icon url

ReturntoSender

03/21/10 11:51 AM

#8892 RE: ReturntoSender #6755

Chart of the Day - COTD - Typical Rally? So Far this Rally has been both Shorter and Below Average in Duration!

http://www.chartoftheday.com/20100319.htm?T

The Dow continues to make new rally highs. To provide some perspective to the current Dow rally that began just over one year ago, all major market rallies of the last 110 years are plotted on today's chart. Each dot represents a major stock market rally as measured by the Dow. As today's chart illustrates, the Dow has begun a major rally 27 times over the past 110 years which equates to an average of one rally every four years. Also, most major rallies (73%) resulted in a gain of between 30% and 150% and lasted between 200 and 800 trading days -- highlighted in today's chart with a light blue shaded box. As it stands right now, the current Dow rally (hollow blue dot labeled you are here) has entered the low range of a "typical" rally and would currently be classified as both short in duration and below average in magnitude.


My Comments - RtS

The rally so far has lasted a little over a year. We are overbought now and due for a pullback but an average rally would last at least twice as long with another 40 to 50% gain if I am reading the chart right. Of course not all sectors would normally continue to benefit equally in any further advance.


icon url

ReturntoSender

03/22/10 10:39 PM

#8896 RE: ReturntoSender #6755

From Briefing.com: 4:35 pm : The stock market finished the day with solid gains as the Nasdaq provided clear leadership throughout the session, bolstered by strength in semiconductor stocks. The stock market didn't get off to a great start, however, beginning the session with moderate losses. Before the market opened, investors and traders had two major news events to take in -- one domestic, and one overseas. On the home-front, the House of Representatives passed healthcare reform last night by a vote of 219-212. The news lifted a long standing overhang on healthcare stocks, which were strong all day. In particular, hospital stocks like Community Health Systems (CYH 40.51 +2.35) and Tenet Healthcare (THC 6.27 +0.52) put in impressive gains. Internationally, German Chancellor, Angela Merkel, made waves by saying that Greece doesn't need financial support, and that European Union leaders shouldn't make the question of aid for Greece the focus of their summit later in the week. She believes that Greece should solve its own debt problems despite other European policy makers urging Germany to back support for Greece. These comments underscored the latest signs of divisions within the euro-zone countries on how best to provide help to Greece. The major European markets, including Great Britain's FTSE, Germany's DAX, and France's CAC, all closed lower today... After the lower open, the major averages quickly rallied higher into positive territory. Also, in early morning action, the dollar was showing considerable strength while commodities like crude oil and natural gas languished with losses. News flow tapered off as the morning progressed, although financial stocks whip-sawed around as Secretary of the Treasury Timothy Geithner stated that he would not accept a financial reform bill that fails to provide strong protection for consumers. Furthermore, he stated that a reform bill must put strong constraints on risk-taking by large financial institutions, protect economy, taxpayers from future crises. Technology stocks also received a jolt when Google (GOOG 557.50 -2.50) announced that Google.CN site will now be redirected to Google.com.HK. The stock initially spiked higher on that news -- while BIDU sold off -- but the gains were short-lived as GOOG finished the day in the red... In the afternoon, commodities reversed course and erased their earlier losses. Crude oil finished higher by $0.68 to $81.65/barrel and gold finished down $8.10 per ounce to $1,099.50, still well off the lows of the day. The turnaround in commodities coincided with a pull-back in the U.S. dollar. Stocks meanwhile, were able to extend their gains a bit, although there wasn't a clear catalyst for the late afternoon uptick. The economic calendar was empty and corporate earnings were very light, with only two companies (PVH, DXPE) scheduled to report after the bell... Looking ahead, existing home sales data will be released at 10:00 ET tomorrow morning with consensus at 5.0 mln units. Before the open tomorrow, there are four companies expected to report earnings, including Walgreens (WAG 35.33 +0.80), KB Home (KBH 17.44 +0.11), and Carnival (CCL 37.91 +0.29). DJ30 +43.91 NASDAQ +20.99 SP500 +5.91 NASDAQ Adv/Vol/Dec 1732/2321.8 mln/970 NYSE Adv/Vol/Dec 2005/953.9 mln/1015

4:18PM Integrated Silicon raises Q2 EPS and revs guidance, above current consensus (ISSI) 7.49 +0.19 : Co raises Q2 EPS guidance to $0.20-0.24 vs. $0.11 consensus, up from $0.08-0.12; raises revs guidance to $54-56 mln vs. $50.7 mln consensus, up from $48-52 mln. Co said, "During the March quarter to date, the Co has experienced better than expected end market demand and pricing, primarily for its DRAM products. As a result, the co is increasing its revenue and margin guidance for the quarter. In addition, due to higher than expected new product mask costs and non-executive employee compensation, the Co now expects its operating expenses to be higher than previously expected. The Co also expects its net income and EPS to be higher than its prior guidance... Demand in all of our markets has further strengthened in the March quarter exceeding our original expectations as the DRAM market continues to experience increasing demand while DRAM supplies remain constrained. Pricing for DRAM also improved helping to increase our gross margins and net income." (Stock is halted)

10:33AM Techwell: Intersil to acquire Techwell for $18.50/share (TWLL) 12.44 : Intersil Corporation (ISIL) and Techwell (TWLL) have entered into a definitive agreement for Intersil to acquire Techwell through a cash tender offer at $18.50 per share. Net of Techwell's cash and equivalents, the transaction values Techwell at ~$370 million. "The addition of Techwell's mixed signal video products will help our customers build solutions that improve performance, reduce overall cost and shorten time-to-market. In addition, the acquisition will significantly increase our overall industrial business, which will become our largest end market at approximately 31% of revenue." The acquisition is expected to be accretive to Intersil's 2010 earnings, excluding one-time costs and other acquisition-related charges. (both ISIL and TWLL are halted)

9:04AM Tegal Sells Thin Film Etch and PVD Assets to OEM Group (TGAL) 1.28 : Co announced that it has sold its legacy thin film etch and physical vapor deposition (PVD) product lines to OEM Group, Inc. for aggregate consideration of up to $3 million, of which a maximum of $1 million is subject to OEM Group's achievement of certain target sales levels.

Trident Microsystems (TRID) announces that its CX24500 series of high-definition set-top box chipsets have been designed into Shenzhen Coship Electronics' next generation audio/video STB units...

8:07AM Trident Microsystems unveiled its China strategy and outlined how it plans to help Chinese manufacturers compete (TRID) 1.72 : Co unveiled its China strategy and outlined how it plans to help Chinese manufacturers compete in the global market as well as in the aggressive and high-volume local China market. With more than 400 million TV households, China represents the fastest-growing TV and set-top box market in the world and Trident is uniquely positioned to serve that market as a top-three industry player in both market segments. There are two major government-funded initiatives currently taking place in China that are aimed at delivering digital TV and triple play services (voice, video, data) to households across the country. Trident's current product roadmaps and core expertise deliver the enabling technologies to address both of these markets today and in the future. Trident is the only IC supplier in the world that holds top three positions in the TV and STB markets and this technology strength and synergy can help Chinese customers win the high-volume designs.

7:30AM Am Superconductor receives order from Sinovel for initial 5 megawatt wind turbine electrical control systems (AMSC) 25.44 : Co announces that it has received an initial order for full wind turbine electrical control systems from China's largest wind turbine manufacturer, Beijing-based Sinovel Wind Group Co. The systems will be deployed in Sinovel's first 5 megawatt doubly fed induction wind turbines. AMSC expects to deliver the electrical control systems to Sinovel in the second half of calendar year 2010.

Ascent Solar Technologies (ASTI) announces that it has signed a Strategic Alliance Agreement with Kirloskar Integrated Technologies Limited, India (Kirloskar); under the terms of the multi-phase agreement the two companies will commence integration, marketing and distribution of Ascent Solar's flexible CIGS photovoltaic modules into products designed to address multiple market opportunities in India...

icon url

ReturntoSender

03/27/10 10:40 PM

#8900 RE: ReturntoSender #6755

Amateur Investors Weekend Stock Market Analysis (3/27/10)

http://www.amateur-investor.net/Weekend_Market_Analysis_Mar_27_10.htm

The Wave pattern from the March 2009 lows could be a Triple Zig Zag pattern similar to what occurred in the late 1930's. From 1937 through early 1938 the Dow had 5 distinct waves to the downside. This was then followed by a Triple Zig Zag pattern which peaked in late 1938 at the 61.8% Retrace calculated from the early 1937 high to the early 1938 low. Once the peak occurred in late 1938 this was followed by a choppy correction over the next 3 1/2 years before a bottom occurred in early 1942 as the Dow dropped slightly below the early 1938 low.


As you can see a Triple Zig Zag pattern can look awfully similar to a 5 Wave pattern which is likely confusing those who follow Wave Analysis like Prechter for example who a few months back thought the rally had ended with the mid January highs. Meanwhile others are confident another Secular Bull Market has begun because they think the move off the March 2009 lows is a 5 Wave pattern. Right now I favor a Triple Zig Zag pattern as shown below. Of course the question is will the Dow rally back to its 61.8% Retrace just above 11240 before the Z Wave peaks like occurred back in late 1938?


Finally as I showed a few weeks ago each time the Mutual Fund Panic Index has dropped to -20 or below (points A) the Dow has rallied at least 70% from the bottom. Right now the Dow has rallied just over 69% from the March 2009 low. If it rallies up to 11000 that would be a 70% rally from the March 2009 low and if it gets up to the 61.8% Retrace near 11240 that would be a 74% rally.

icon url

ReturntoSender

03/28/10 7:18 PM

#8901 RE: ReturntoSender #6755

InvestmentHouse Weekend Market Summary

http://www.investmenthouse.com/weekendmarketsummary.htm

- Dollar is lower Friday, but stocks don't benefit.
- Another intraday reversal Friday leaves stocks flat, but no further damage done.
- EU has a plan: punt to the IMF.
- Social Security already in the red.
- Weaker bond auctions just a sign of things to come and our debt to rise.
- More healthcare surprises.
- Taxes to inevitably rise.
- This week will tell the ramifications of the Thursday intraday reversal.
- Jobs report on Friday, but the market will be closed.

Stocks reverse early gains again, but no further damage.

Compared to Thursday, Friday was a piker. The point swings were much less, volume was lower, and the market started higher on the day. The dollar was even lower because the EU has a plan. More accurately, it has a play borrowed by football: It is going to punt to the IMF. The plan states that the IMF is to be on standby, ready to lend Greece money if needed. The other countries in the EU will focus on shoring up the Euro because they do not want it to collapse. How they will do that is not clear, but at least they have a plan. As weak as that plan may appear, it did seem to work on Friday as the dollar was lower and stocks started higher in the morning. As on Thursday, however, the rally faded into the afternoon. That was not because the dollar rallied - it did not. In the premarket alert, I suspected that there might have been an afternoon decline simply because of the action on Thursday and the immediate response to the upside with the gaps higher on Friday. Despite a decent GDP number it was lower but still solid and a better Michigan Sentiment indication, the market, could not support the gains into the afternoon. It slid down, and by the afternoon had turned the indices negative. There was a bounce in the back half of the afternoon, and that closed the indices basically flat but mostly mixed. The large cap NYSE indices were up, but the growth areas were slightly lower. The end result was another rally that ultimately failed just as it did on Thursday, although not nearly as spectacularly.

OTHER MARKETS

Dollar. The dollar had a spectacular week with huge gains on Wednesday and another surge Thursday that clearly broke it out of its consolidation and took it to a new rally high. Perhaps it had too much success during the week because it did sell back against the Euro and other currencies ahead of the weekend. It probably had something to do with the great European plan that was put in place, but the dollar was a bit overbought in the near term (1.3413 Euro versus 1.382 Thursday). This was a week that saw the dollar trade solidly below the key 1.35 Euro level. It was trying to hold 1.34-1.35 and was smashed, but the other currencies did recover some to end the week (again, just likely due to the dollar's success). Nothing indicates this with change anytime soon. The EU put in a punting play, but that is not really a plan. It is just ready to move in case Greece cannot get its own house in order. There are still the other PIIGS to worry about, including the UK. This is definitely not the end of the dollar's strength against the Euro. This is a giveback on Friday ahead of the weekend after a strong week.
Click to view the chart

Oil. Oil struggled a bit. It closed slightly lower ($80.12, -0.41). It is still holding in the top half of its range just as it has done on each of the last dips over the past three to four weeks. A good consolidation in November and in late February is propping it up. It is finding support despite a big build in inventories and despite issues in Europe. Oil is holding its gains, and thus gasoline holding up as well. It is keeping a high average per gallon in the US closing in on $3.00 and it is not even the end of March. Oil still looks like it could break out. Even though it is stalling at the top of its range, it is not breaking lower and smashing through this key level. It could hold the 50 day EMA or above 78 next week and try a breakout. It could be next week or the week after, but it looks like it will make a try unless very bad news comes out with respect to growth overseas.
Click to view the chart

Gold. Gold had an up day after a down week. It finished strong, moving back over the 1100 level that so many are watching ($1,108.80, +14.70). This made a new low for March, but that still kept it inside its overall base that started in early December. There is still a reverse head and shoulder trying to form, and it can still do that. The left shoulder dropped all the way to 1075, so it could still make that level and hold the pattern. It is not in position yet to make the buy. We will be watching it, but gold is still working through its base. It has reasons to rally ultimately, given the 0% interest rate policy with the US Fed and many other central banks. In fact, they are still printing a lot of money in order to pay for programs and bailouts. The US is going to be printing even more money. We have more programs that will require more money and will be in deficit despite claims to the contrary even as the healthcare bill was passed. Right after that, they will have to pass the so-called "doctor fix" for Medicare. That will immediately use any savings as elusory as they are and go into deficit to pay the doctors enough that they will continue to accept Medicare.
Click to view the chart

Bonds. Bonds did recover some on the session with the 10 year closing down (3.85% versus 3.88% Thursday). There was a big move during the week as bonds rallied, with the 10 year moving up from the 3.869% level close to 3.9%. There was a big move on Wednesday, and you can tie this into many things. The healthcare bill was passed. There will have to be more money printed. There was a bad 7 year auction on Thursday that had to offer a higher yield in order for investors to take the paper. That is symptomatic of the problems with a huge debt and deficit that is only going to get larger. Bonds are selling and interest rates are rising because of the amount of money required to be printed. That is inflationary, so interest rates will rise. Also, there is improvement in the US, and rates tend to rise when there is improvement in the economy. The Fed will also have to raise interest rates at some point. There is a triumvirate of issues pushing yields higher and driving bonds lower as a result. I do not expect that to change any time soon unless there is a major problem overseas to impact the price of oil and bonds, making US bonds look more attractive as a safe haven. Right now, it does not look like anything along those lines will appear, especially given that the EU now has a plan. With that, everything is coming up roses, no doubt.
Click to view the chart

TECHNICAL PICTURE

INTERNALS

Breadth. Breadth was basically flat on the NASDAQ as it closed lower by just a fraction of a percentage point. Breadth was flat on the NYSE as well with a slight gain of advancers over decliners. The session was basically flat and held no surprises and no big moves. Breadth never had major swings.

Volume. Volume was down. It fell to 2.2B on NASDAQ, and that took it back below average after a strong Thursday reversal that saw volume shoot above average on that exchange. NYSE volume fell as well, dropping to 1B shares, or 11%. After it traded up to average on the Thursday intraday reversal, it once again fell back below average where it has resided for most of the last three weeks. Not too much excitement with the internals on Friday, but again, most of that excitement was on Thursday with higher volume and a big reversal that saw good breadth turn into negative breadth as stocks sold off on higher volume.

CHARTS

SP500. The big move for SP500 was on Thursday with that new high on the rally followed by a reversal to negative on rising volume. There is a little more dramatic picture on NASDAQ, but it was very quiet on Friday, even though it did trade in a range and close in the middle. It tapped the 10 day EMA on the low and volume tapered off below average. There were no fireworks on Friday, and if the SP500 can hold above the January peak at 1151, all will be forgiven and it can continue to move higher. The tread is still in place and is not in any danger. Thursday was a reversal day, where it was higher and lower than a prior session (indeed the prior two sessions), and the ramifications of that would not show up on Friday. The ramifications will show up early next week, and Monday and Tuesday (particularly Tuesday) are days to watch after this kind of reversal. Again, the volatility day-to-day has been exaggerated. The market goes down and bounces right back up. It goes down the next day and then reverses intraday. Volume goes up and down. This is the kind of choppy action you see when a bottom or a top is trying to be put in. There was the same effect back in January when the market topped near term. Then when it bottomed in February, there was a sharp selloff, reversals, and a sell back down immediately followed by a bounce higher that sold off the high. Very choppy action and big volume as it was doing it that is characteristic of a turn in the market. It may not turn. It may hold support at 1151 with just a modest pullback. If that is the case, again, everything is forgiven and it can continue to move higher. It can sell back to 1150-1125 or even the top of the November and December range and not be in serious danger. It has had a great run off the February low with a pause, and it has had almost a month of straight runs to the upside. It is due for a rest or test, and it is going through the initial stages of that now.

NASDAQ. NASDAQ shows a similar picture the big rise on Thursday and then the reversal to negative on a spike oaf above-average volume. Friday it tested the 10 day EMA on the low, just as the SP500 did, and bounced off of that for a very modest loss. It is showing the same day-to-day chop. Big volume and low volume. It could easily come back and test 2350-2355, or go down to the January peak. It is very strong, plenty of momentum still. The uptrend is in place, so I am not looking for a major rollover or selloff, but it is showing indications that it wants to consolidate more and take a breather. In this instance, you should let it. The need to be patient still applies heading into next week.

SP600. SP600 is more of the same: Choppy after a great run. Up one, down one, reversing one. It is showing that it also wants to take a breather. It has support around 353; that is a key level it broke through. I would not be surprised if the selling takes it to that point to test. That would be absolutely normal after such a great move and strong leadership by the small caps.

SOX. The semiconductors posted a new closing high on Tuesday, and then immediately gave it back on Wednesday and Thursday. It finished lower on Friday, but it did hold the 10 day EMA on the close. It looks like a fairly orderly pullback. Big break, test, and holding over that mid-March peak. It does not look bad here at all. I cannot say you should run away from this, but it is not excellent. You could make the case for a double top with MACD making a lower peak even as the index broke to a new closing high. You have to watch for that because there are indications of trouble. Overall, however, it has been a laggard on the move up, and it is being dragged higher by the other indices that are much stronger and testing from a position of strength. We need to let the volatility work its way out and see what happens on Monday and Tuesday. That will tell more of the tale as to the significance and impact of the Thursday high-volume reversal after the indices struck gold and hit new rally highs.

LEADERSHIP

Financial. JPM has thrown a pair of tombstone doji on the last two sessions just as it broke to a new rally high off the February low, crossing over the January peak. That did not put it at a new high on this rally that is still over in October. The financials had a great run. They are a little winded and are showing indications that, along with the indices, they may want to test somewhat. No danger here from the look of it, but I will keep an eye on them to see if we can get a decent setup from these stocks. GS is one I am looking at already. It tried to make the move on Thursday, but reversed and Friday and tapped the 18 day EMA on the low, selling further. To me, this sets the play up a bit better. It, too, is having trouble with the January high, which is actually an interim recovery high. But, MACD is still in very good shape. Momentum has built for the stock, and I am looking for it to hold in the area of the 18 day EMA or the support at 170. It is pretty well delineated there. If there is a move down to 170 and get any kind of bounce, we will be all over that. We are looking at the play right now, but we need to see how far it will come back and keep adjusting our buy point until it can show us the move higher. WFC is also showing a pair of doji at the prior high. It did clear the January peak, but now it is up at the October. MACD is solid. It had a great run, and it just needs to take a breather.

Retail. Retail had another great week. There is more good news coming out and more upgrades during the week. Good news keeps flowing with respect to the retailers. ANN showed a good consolidation during the week and then broke higher again on Friday on rising average volume. Strength building upon strength. JWN is showing no signs of slowing. It continues to move higher after breaking to a new rally high early in the month. At the other end of the spectrum with respect to target clientele, WMT is performing well also. It broke higher and is putting in a nice flag test. It could make a break to the upside further. The thing is, how much upside can you get? Maybe it will run up to the prior high, and that would be a decent play. WMT just kind of plods along; it is not a great trading stock.

Healthcare. With the healthcare bill passing, this is a bifurcated sector. Some of the medical device stocks had a delayed effect to the healthcare bill. They will have a 3.8% tax placed on every device produced. HOLX had one of the delayed reactions. It sold ahead of it, bounced a bit when the news came out, but then it rolled over toward the end of the week. ZOLL is a defibrillator manufacturer. It sees serious trouble for itself with the healthcare costs for its company as well as the tax on each of its devices. It was rolling over on higher volume on Friday. HUM is in the Medicare Advantage and is being boxed around, but it sold on light volume to end the week. There was not an effort to dump the stock. Others are benefitting, such as hospitals. LPNT had a great rally ahead of the bill passage, and then it broke higher earlier in the week. It is testing in a nice flag. There are winners and losers based upon this bill.

Industrial. DE is setting up nicely. It broke higher, very nice test in progress, and it showed a doji on Friday. CAT says it will take $100M in charges related to the healthcare bill. Indeed, DE will take around $100M in charges with respect to healthcare costs. BUCY broke higher on Tuesday with a nice fade back to test. That is an interesting stock, too. DE, BUCY, and GS all look interesting. Maybe some of the hospitals will be able to give us some buys or trades higher off of the flags they are forming.

Technology. AAPL had an up session after selling off on Thursday, reversing from a new high. It actually hit a new closing high on Friday. It had its price target raised to $300 by one of the firms covering it; AAPL still seems to be attracting more money its way.

THE ECONOMY

TO VIEW THE ECONOMY VIDEO CLICK THE FOLLOWING LINK:
Economy Summary Video

Healthcare passed just in time . . . to see Social Security go into the red.

Weak bond auctions becoming commonplace.

1) Worsening credit position.
2) Credit rating could be cut from AAA
3) Cost of servicing debt rising for US, pushing the price tag of our individual debt higher and higher.

More Surprises in healthcare.

Not Armageddon, at least not this week.

3.8% tax and other taxes not indexed to inflation: another AMT.

Taxes, taxes as far as the eye can see.

In 10 years, perhaps earlier, tax rates will have to explode higher.

THE MARKET

MARKET SENTIMENT

The VIX is undercutting the lows from January, and that is an indication that the market is somewhat overbought in the near term. That showed up in the action last week with the day-to-day volatility, although it did not show up in the VIX itself. This is that day-to-day volatility where the market chops back and forth in a big range, but there are not the surges in volatility overall. This could mean an interim pullback, but it is not suggesting a major top of any kind in place.

VIX: 17.77; -0.63
VXN: 18.67; -0.15
VXO: 16.91; -0.73

Put/Call Ratio (CBOE): 0.92; +0.05

Bulls versus Bears:

This is a reading of the number of bullish investment advisors versus bearish advisors. The reason you look at this is that it gives you an idea of how bullish investors are. If they are too bullish then everyone is in the market and it is heading for a top: if everyone wants to be in the market then all the money is in and there is no more new cash to drive it higher. On the other side of the spectrum if there are a lot of bears then there is a lot of cash on the sideline, and as the market rallies it drags that cash in as the bears give in. That cash provides the market the fuel to move higher. If bears are low it is the same as a lot of bulls: everyone is in and the market doesn't have the cash to drive it higher.

Bulls: 48.9%. Up from 46.1%, continuing the steady rise since a low of 35.6% in February, the lowest it has been since July 2009. Over the 35% threshold level below which suggests bullishness. After peaking at 53 on this move the bulls lost some nerve, falling to a new low post- July 2009. Once again bulls peaked out near the 50% level. Bulls have bumped at 50ish since late August 2009, falling to 45ish and then rebounding. Hit a high of 47.7% mid-June on the run from the March lows. Again, to be seriously bearish it needs to get up to the 60% to 65% level.

Bears: 20.5%. After bouncing up and down, heading lower steadily, down from 21.3% last week, down sharply falling from 27.8%. Over 35% is considered bullish for the market, so still a ways off even though bulls are falling to a bullish level. Continuing the rise from 16%ish on the lows this leg where it held for several weeks. Peaked near 28% in November, falling short of the 35.6% hit in July 2009. For reference, cracking above the 35% threshold considered bullish. Hit a high on this run at 47.2%. For reference, bearishness hit a 5 year high at 54.4% the last week of October 2008. The move over 50 took bearish sentiment to its highest level since 1995. Extreme negative sentiment. Prior levels for comparison: Bearishness peaked at 37.4% in September 2007. It topped the June 2006 peak (36%) on that run. That June peak eclipsed the March 2006 high (33%) and well above the 2005 highs that spawned new rallies (30% in May 2005, 29.2% in October 2005). That was a huge turn, unlike any seen in recent history.

NASDAQ

Stats: -2.28 points (-0.1%) to close at 2395.13
Volume: 2.204B (-12.66%)

Up Volume: 1.111B (+150.074M)
Down Volume: 1.112B (-453.139M)

A/D and Hi/Lo: Decliners led 1.04 to 1
Previous Session: Decliners led 1.65 to 1

New Highs: 78 (-132)
New Lows: 16 (+5)

NASDAQ CHART: Click to view the chart

NASDAQ 100 CHART: Click to view the chart

SOX CHART: Click to view the chart

SP500/NYSE

Stats: +0.86 points (+0.07%) to close at 1166.59
NYSE Volume: 1.03B (-10.86%)

Up Volume: 599.59M (+117.313M)
Down Volume: 406.768M (-238.995M)

A/D and Hi/Lo: Advancers led 1.1 to 1
Previous Session: Decliners led 1.44 to 1

New Highs: 221 (-322)
New Lows: 25 (-44)

SP500 CHART: Click to view the chart

SP600 Chart: Click to view the chart

DJ30

Stats: +9.15 points (+0.08%) to close at 10850.36
Volume DJ30: 175M shares Friday versus 200M shares Thursday.

DJ30 CHART: Click to view the chart

MONDAY

Personal income and spending will come out on Monday, and Tuesday will be the Case-Shiller Home Index. That will be important. It is the week of the jobs report, so there is the ADP Employment Report. We also have regional factory news for factory orders and the Chicago PMI. There will also be the weekly jobless claims always important and the ISM index. Manufacturing has been one of the strong points in the recovery. On Friday, there are the non-farm payrolls. It is all a warm up for that. There are expectations that range up to 300K jobs being added for the month. How did they get to those? 100K added because of the census. 100K coming back in because of the weather in other words, the weather got better, so people are being rehired. Then another 100K for good measure, perhaps because of the manufacturing improvement. The official expectations are for 190K, but up to 300K is possible. It will be interesting to see. 200K of those, of course, could be related to the government or just a rebound from no one working in the prior months because of bad weather.

Friday, the payroll report comes out, but the market will not be open for Good Friday. There will be a three-day weekend for the stock market, and that always has some play with respect to stocks as traders in some of the big funds want to get squared away before a long weekend. With news of all the programs that are still being pushed, anything could happen. Of course, you cannot forget that the EU has a plan. As long as they have that plan out there, things should be okay, right? Because nothing can go wrong with this great plan. After all, the IMF is involved and it is such a stalwart of support and calm. Earnings will also affect things next week. They are just two weeks away. We could see some warnings or some positive guidance. Most of what we have seen thus far has been positive guidance, and the market has moved up nicely into the preliminaries of earnings season. It would be very appropriate and helpful to get some sort of consolidation moving into earnings. Otherwise, we are setting ourselves up for a weaker market. There may be good news early that pops it up, but then the market is already high. It would really take something to drive it higher. That leaves it more subject to upset if things are not as great or investors get their fill of good news. The big thing we are looking at, is how the Thursday intraday reversal on high volume plays out this coming week. There are several factors involved. There was the reversal that was the culmination of all the volatility of the prior two weeks. There was a break higher and an attempted test that looked successful because the market broke higher on Monday and Tuesday, but then the volatility came back in. As soon as the market hit a new closing high, it sold off the next session. It rallied sharply to a new high the next day on Thursday, and then it gave it all back and reversed negative on rising volume. There was a lot of day-to-day volatility and big surges intraday.

How will this play out? As noted on Thursday, you have to look and see to the next week; Mondays and Tuesdays are often days where you see the result of a sharp reversal or turn the prior week. We will be looking at those days to see how the market reacts. It may be that nothing transpires during those two days. It may take more of the week to ascertain what is going to happen (and it may be nothing). It may be that as the markets did on Friday they just brush it off, consolidate a bit more, continue the uptrend and start back to the upside. We will see what happens. Since we do not know what the outcome of that Thursday reversal will be, it is time to be patient. If the pullback is going to happen, let it take place. It will not hurt because it will give better buy points on stocks we are looking at. Some great stocks will be pulling back. We protect our positions to the upside, of course, as we have been doing all week. If they get in a bit of trouble near support, we can take some gain off the table. There is no point in taking great risks here because there was a great run to the upside. We have banked a lot of money on a lot of these positions already, and we do not want to see them get turned over on us. If there is a pullback, we will be able to buy back in and make new trades to the upside and make more money off of them. If we get good plays to the downside, we might want to take advantage of those as well. The market has punished the downside plays, but that does not mean it will be the case all the time. When you see setups occurring off highly volatile action, you often get good downside plays you can take advantage of. Look what happened in January. There was a highly volatile action again, and there was the selloff. It was not the end of the rally, but it was a pretty severe selloff. We do not have to get a selloff nearly this steep. There could be one down to the 1151 area and still make great money on downside plays. You could play the SPYders themselves if you wanted down to that level, and pick up some scratch along the way. There are several ways to play this from an index point of view, as well as some of the weak sectors we have seen that have not been able to take out their January peaks or prior peaks and have been struggling. They might pull back and continue to base, and that pullback can give us several points of gain. When you are playing with put options, that gives you plenty of bang for the buck to put into the bank.

Again, we do not have to get fancy. We just have to see the volatility and realize there is a potential change in the market. We need to be patient, we need to be cautious with our upside positions that could be thrown back at us. The market has rallied upside, and this type of volatility would typically presage some downside. Always take advantage of what the market is giving you. If it gives us downside play, we will go that way. We picked up a little PBR late in the session as it rebounded off the lows. We are anticipating more of a selloff off of this head and shoulders pattern. Maybe we get it, and maybe we do not, but it was well worth the risk/reward for it. We will look for other plays that give good risk/reward. If it works, we get a great reward. If it does not work, we do not risk much. At the same time, we look for those upside plays on those great stocks, watching them set up to give us new plays to the upside. We can turn what many would see as a disadvantage into our own advantage, and as always take what the market gives. Have an excellent weekend.

Support and Resistance

NASDAQ: Closed at 2395.13
Resistance:
2412-2415 represents a series of peaks and lows in 2007, 2008
2453 is the August 2008 peak

Support:
2382-2395 from 2008
The 10 day EMA at 2385
2324-2370 is a range of resistance from early 2008
2320 to 2326.28 is the January high
2319 from the September 2008 peak
2292 is a low from January 2008
The 50 day EMA at 2296
2273 to 2282 marks bottom of January 2010 lateral peak
2275 - 2278 from the February 2008 and April 2008 lows
2245 from July 2008 through 2260 from late 2005.
2210 (from September 2008) to 2212 (the July 2009 closing low)
2205 is the November 2009 peak
2191 is the October 2009 peak
2177 is a low from March 2008
2169 is the March 2008 closing low (double bottom)
2168 is the September 2009, intraday peak
2167 from the July 2008 intraday low
2155 is the March 2008 intraday low
2143 is the October 2009 range low
The 200 day SMA at 2113

S&P 500: Closed at 1166.59
Resistance:
1170 is the prior March 2010 high
1185 from late September 2008
1200 from the July 2008 low

Support:
The 10 day EMA at 1162
1156 is the Sept 2008 low
1151 is the January 2010 peak
1133 from a September 2008 intraday low
Bottom of the January 2010 consolidation 1131 to 1136
The 50 day EMA at 1129
1119 is the early December intraday high
1114 is the November 2009 peak is breaking
1106 is the September 2008 low
1101 is the October 2009 high
1084 to 1080 (September 2009 peak)
1078 is the October range low
1070 is the late September 2009 peak
The 200 day SMA at 1056
1044 is the October 2008 intraday high
The August peak at 1040
The early October 2009 closing low at 1025
The early August intraday peak at 1018
The November 2008 peak at 1006 closing 1007.53 intraday
992 is the August 2009 consolidation low

Dow: Closed at 10,850.36
Resistance:
10,963 is the July 2008 low

Support:
10,730 is the January 2010 peak
10,609 from the Mid-September 2008 interim low
The 50 day EMA at 10,505
10,496 is the November 2009 high
10,365 is the late September 2008 low
10,285 is the late December consolidation peak
10,120 is the October 2009 peak
9829 is the September 2008 closing high
9918 is the September 2008 peak
9855 is the early September peak in its lateral range
9835 is the late September 2009 peak
The 200 day SMA at 9831
9654 is the November 2008 high
9625 is the October 2008 closing high
9620 is the August 2009 peak
9430 is the early October low
9387 is the mid-October peak

Economic Calendar

These are consensus expectations. Our expectations will vary and are discussed in the 'Economy' section.

March 26 - Friday
- GDP - Third Estimate, Q4 (08:30): 5.6% actual versus 5.9% expected, 5.9% prior
- GDP Deflator - Third, Q4 (08:30): 0.5% actual versus 0.4% expected, 0.4% prior
- Michigan Sentiment -, March (09:55): 73.6 actual versus 73.0 expected, 72.5 prior

March 29 - Monday
- Personal Income, February (08:30): 0.1% expected, 0.1% prior
- Personal Spending, February (08:30): 0.3% expected, 0.5% prior
- PCE Prices - Core, February (08:30): 0.1% expected, 0.0% prior

March 30 - Tuesday
- Case-Shiller 20-city, January (09:00): -0.6% expected, -3.1% prior
- Consumer Confidence, March (10:00): 50.0 expected, 46.0 prior

March 31 - Wednesday
- ADP Employment Chang, March (08:15): 40K expected, -20K prior
- Chicago PMI, March (09:45): 61.0 expected, 62.6 prior
icon url

ReturntoSender

03/28/10 9:19 PM

#8902 RE: ReturntoSender #6755

High VIX Market Bottom? Low Vix Market Top?

That would be too easy. In theory it is possible. In truth like any indicator it's best to look for divergences before thinking you might catch an actual bottom or top.

That is to say look for lower highs on the VIX even while the market is making new lows before expecting a true long term bottom. Conversely look for higher lows on the VIX before expecting an actual market top.

Even when an actual bottom or top is put in it is only really known in the rear view mirror.


RtS
icon url

ReturntoSender

03/29/10 10:42 PM

#8903 RE: ReturntoSender #6755

From Briefing.com: 4:15 pm : In contrast to the past couple of sessions, stocks managed to maintain solid gains into the close on Monday. The advance was broad based, but financials lagged from the start.

A dip by the dollar helped bring buyers into the stock market and keep the bullish trend intact. The greenback fell 0.4% against competing currencies; it was never able to muster an actual gain against the basket.

The dollar's decline proved particularly beneficial for energy stocks, which led for the entire session and settled with a 1.8% gain. Higher oil prices helped the energy space; contracts closed pit trade with crude oil priced 2.7% higher at $82.16 per barrel. Though no specific price was given, an OPEC chief stated that oil prices will not be allowed to rise too high, according to The Wall Street Journal.

Oil wasn't the only commodity to attract buyers, though. Broad-based interest for natural resources spurred the CRB Commodity Index to a 2.1% gain, which was its best single-session percentage advance in more than one month.

Strength among commodities and basic materials helped diversified metals and mining stocks spike a collective 4.7% higher. That sort of support helped the broader materials sector outperform, though it eased back a bit to finish with a 0.9% gain, which was even with what health care and industrials scored.

Though the stock market traded with relatively steady gains for most of the session, financials oscillated between positive and negative territory, lagging all the while. Still, the sector managed to finish with a 0.2% gain as it struggled to hold near the 52-week high that it set last week. Many market pundits have long pointed to the financial sector as a necessary source of support for continued gains in the broader market.

Economic data is also a key catalyst for trade, but the latest dose did little for participants. According to figures, consumption expenditures in February increased 0.3%, as expected, while core personal consumption expenditures were flat, which was not too much of a surprise since the consensus had called for a tepid 0.1% increase. Total and disposable income posted no growth in February -- a 0.1% increase had been expected.

The lack of market-moving data and the absence of any major corporate news items made for moderate participation, such that trading volume on the NYSE failed to eclipse 1 billion shares. DJ30 +45.50 NASDAQ +9.23 NQ100 +0.4% R2K +0.4% SP400 +0.8% SP500 +6.63 NASDAQ Adv/Vol/Dec 1539/1.88 bln/1115 NYSE Adv/Vol/Dec 2097/944 mln/944

11:43AM Cisco Systems receives antitrust approvals from European Commission and US Department of Justice for pending acquisition of TANDBERG (CSCO) 26.61 +0.15 : Co announced that it has received approval from the European Commission for its proposed acquisition of TANDBERG and that the Antitrust Division of the United States Department of Justice (DOJ) has announced that it will not challenge the proposed acquisition in light of the commitments Cisco has made to the European Commission. The transaction remains subject to ongoing regulatory review in Brazil; however, the antitrust approvals from the European Commission and Justice Department represent the final regulatory approvals required before the transaction can close. Cisco and TANDBERG anticipate closing in the coming weeks.

11:34AM First Solar system integrator Assyce Fotovoltaica is constructing the largest First Solar photovoltaic power plant in Spain (FSLR) 120.07 +3.57 : First Solar's Spanish system integrator, Assyce Fotovoltaica, is constructing the largest First Solar free-field solar power plant in Extremadura, with a capacity of more than 26 MWp. The power plant with a land area of 69 hectares should be completed by the end of the year and will generate more than 42 mln kilowatt-hours of electricity per year. The construction of the free-field solar power plant began at the end of January.

MIPS Technologies (MIPS) and Virage Logic (VIRL) announce that they are teaming to offer optimized embedded memory IP for joint customers..

Sanmina-SCI Corporation (SANM) announces the formal inauguration of its state-of-the-art technology manufacturing campus in the Oragadam Hi-Tech Special Economic Zone near Chennai in the state of Tamil Nadu...

SunPower (SPWRA, SPWRB) announces that it has completed its acquisition of SunRay Renewable Energy, a leading European solar power plant developer with offices in Europe and the Middle East. As a result, SunPower has expanded its project pipeline to include more than 1,200 megawatts of solar photovoltaic projects in various stages of development in Italy, France, Israel, Spain, the United Kingdom and Greece.

7:30AM Bell Microproducts to be acquired by Avnet for $7.00 per share; raises lower end of Q1 rev guidance (BELM) 5.38 : Bell Microproducts to be acquired by Avnet (AVT) in an all cash merger for $7.00 per share, which equates to an equity value of approximately $252 mln and a transaction value of approximately $594 million assuming a net debt position for Bell of $342 million at face value as of December 31, 2009. The acquisition has been approved by the Boards of Directors of both companies and is subject to the approval of Bell's shareholders as well as customary regulatory approvals. The transaction is expected to close in 60 to 120 days, deliver at least 12.5% ROCE for Avnet post integration and should be immediately accretive to earnings excluding integration and transaction costs. Co also raises Q1 revs guidance to $795-815 mln vs $809.00 mln Thomson Reuters consensus, from previous guidance of $780-815 mln. Further, management is anticipating a first quarter shift in product mix. Distribution sales are expected to be relatively strong and approximately flat with Q4 sales levels, representing an estimated increase of 17% to 20% from the first quarter of 2009. ProSys, the Company's reseller division, is expected to generate lower than previously anticipated sales volumes, primarily due to seasonally lower purchases by a few large customers. Due to this product mix shift from higher margin single-tier sales and in part due to seasonality, the co anticipates generating first quarter gross margins of between 8.5% and 9.0%, a decline from 9.4% in the fourth quarter of 2009.

icon url

ReturntoSender

03/30/10 10:53 PM

#8904 RE: ReturntoSender #6755

From Briefing.com: 4:30 pm : Large-cap tech issues gave a modest lift to the Nasdaq, but the broader market finished flat after interest in a better-than-expected consumer confidence report dissipated.

A stronger-than-expected improvement in the May Consumer Confidence Index to 52.5 further improved what was already a generally positive tone in the early going. Though gains were modest, the morning advance was broad based.

However, the mood among market participants deteriorated as the dollar made a move up from negative territory to finish with a 0.3% gain against competing currencies. The greenback's gain was somewhat restricted by strength in the British pound, which garnered support amid news that Britain's fourth quarter GDP was upwardly revised to reflect a 0.4% increase.

Still, credit analysts at S&P remain concerned about Britain's fiscal deficit. Such concern offers another reminder that even historically stable global economies face sovereign debt challenges. To its credit, though, France's AAA rating was affirmed by Fitch analysts, who also said the outlook for France's grade is stable.

Strength in the dollar dragged down the broader market, but tech stocks showed resilience. That gave the sector a 0.5% gain and helped the Nasdaq edge out its counterparts.

Apple (AAPL 235.83, +3.44) was a primary leader in its space after reports indicated that the company is developing a network that will enable its highly coveted iPhone to team with more companies than just AT&T (T 25.95, -0.56). The news dropped shares of T, but Verizon (VZ 31.23, +0.78) staged a strong gain.

Financials were part of the reason that the broader market struggled to post a gain. The sector, which is second to tech by market weight, finished with a 0.7% loss. That made it the worst performing sector in the S&P 500. Diversified financial services stocks (-1.3%) were the weakest performers in the sector; they were also among the most actively traded names by volume in the entire market.

Overall trading volume was underwhelming once again as fewer than 1 billion shares traded hands on the NYSE. The low-volume trade has been consistent in recent weeks as participants continue to take a cautious stance, wary of jumping in or out of the market for fear of a correction or missing further gains.

Advancing Sectors: Tech (+0.5%), Materials (+0.2%), Industrials (+0.2%), Health Care (+0.1%), Consumer Staples (+0.1%)
Declining Sectors: Financials (-0.7%), Telecom (-0.4%), Utilities (-0.2%)
Unchanged: Energy, Consumer Discretionary DJ30 +11.56 NASDAQ +6.33 NQ100 +0.3%% R2K +0.3% SP400 +0.1% SP500 +0.05 NASDAQ Adv/Vol/Dec 1446/2.07 bln/1246 NYSE Adv/Vol/Dec 1552/907 mln/1462

5:00PM FEI files suit to collect ~$2.4 mln of receivables owed by Cambridge Global Systems (FEIC) 23.12 +0.33 : Co announced that it has filed suit in the United States District Court for the Eastern District of Virginia to collect approximately $2.4 mln of receivables owed to FEIC by Cambridge Global Systems of Chantilly, VA. Cambridge Global Systems, a subsidiary of Cambridge Systems, purchased three systems from FEIC on behalf of a U.S. Federal agency and a prime contractor through a set-aside program. FEIC has delivered the systems to its end-user customers. The government agency and its contractors have paid Cambridge Global Systems, but Cambridge has not paid FEIC. FEIC expects to increase its reserve for uncollectible receivables for the full amount of the Cambridge receivable in its first quarter, which ends on April 4, 2010.

4:31PM O2Micro announces that is has adopted a program to repurchase up to $10 mln worth of ADSs (OIIM) 6.89 +0.26 :

3:25PM Applied Materials details plans for growth at analyst meeting, expects FY10 net sales more than 60% higher than FY09 (AMAT) 13.37 +0.06 : Co today held an analyst meeting to outline its plans for growing revenue and profitability over the next several years. Applied's executive team shared the company's goals of capitalizing on an expected multi-year expansion in the semiconductor industry, increasing market share across its businesses, and driving operational improvements. Applied is seeing growth in demand across a number of its businesses, and the company now expects fiscal 2010 net sales to be more than 60% higher than in fiscal 2009 - compared to its previous forecast of up more than 50%. Sees revs growth of more than 60% (calc to $8.02 bln vs $8.29 bln Thomson Reuters consensus)

6:32AM White Elec Designs to be acquired by Microsemi Corporation for $7/share (WEDC) 5.46 : Microsemi Corporation (MSCC) announces it has entered into a definitive agreement to acquire White Electronic Designs (WEDC) through a cash tender offer at $7.00 per share for a net transaction value of approx $100 million, net of White Electronic's projected cash balance at closing. Microsemi will finance the acquisition using its cash on hand and there will be no acquisition debt incurred in connection with the transaction. Microsemi expects that there will be significant cost synergies from the transaction and that Microsemi can drive gross profit levels to its own corporate target as Microsemi exits lower margin business, drives a richer product mix, and realizes operational and other cost synergies by Microsemi's fourth fiscal quarter, ended October 3, 2010. Based on current assumptions, Microsemi further expects the acquisition to be $0.08 to $0.12 accretive in its full fiscal year 2011.

Avago Technologies (AVGO) announces that on March 15, 2010 Avago filed a patent infringement lawsuit in the U.S. District Court for the Eastern District of Texas against STMicroelectronics (STM). Avago alleges that certain STMicroelectronics products infringe four of Avago's patents covering optical navigation technology and is seeks cash compensation and an order preventing further infringement of the technology...

1:40AM Amkor announces initial determination in ITC patent infringement case against Carsem (AMKR) 7.11 : Co announces that the Administrative Law Judge in Amkor's patent infringement case against Carsem in the International Trade Commission has issued a Supplemental Initial Determination. Although the ALJ's ruling did not disturb the prior finding that Carsem Dual and Quad Flat No-Lead Packages infringe some of Amkor's patent claims relating to MicroLeadFrame technology, the ALJ found that some of Amkor's patent claims are invalid and, as a result, the ALJ did not find a statutory violation of the Tariff Act.

09:48 am LDK Q4 Earnings Fall Short of Expectations

LDK Solar (LDK 6.47, -0.58) reported fourth quarter earnings this morning, which fell short of Wall Street expectations. In addition, the company provided its revenue outlook for the first quarter, which is in-line with consensus.

The company reported fourth quarter earnings of $0.03 per share, excluding non-recurring items, $0.09 worse than the Thomson Reuters consensus of $0.12. Revenues fell 28.6% year-over-year to $304.6 million, slightly higher than the $301.9 million consensus.

For the first quarter, the company expects to earn revenue of $310 million to $330 million, in-line with the $321.03 million Thomson Reuters consensus, with wafer shipments between 370 MW to 400 MW and module shipments between 25 MW to 30 MW.

During the fourth quarter, the company shipped 340.4 MW of wafers, up 33.8% year-over-year. Gross margin for the fourth quarter of fiscal 2009 was 9.9%, compared to 20.1% in the third quarter of fiscal 2009 and negative 49.6% in the fourth quarter of fiscal 2008. Operating margin for the fourth quarter of fiscal 2009 was negative 1.1% compared to 13.2% in the third quarter of fiscal 2009 and negative 59.0% in the fourth quarter of fiscal 2008.

The company said, "We continue to make progress in ramping polysilicon production. Our 1,000 MT plant is producing near capacity. We continued ramping up operations for the first 5,000 MT train of our 15,000 MT plant during the quarter and increasing output on a monthly basis. We made significant progress in diversifying and integrating our business. We are now able to serve our global customer base with a new line of solar module products via the acquisition of the module assembly assets from Best Solar. We are encouraged that we will be able to expand our sales throughout Europe, North America and Asia. We continue to be excited by the long-term growth opportunities in the solar industry."

09:31 am AAPL Plans Production of New iPhone This Year - WSJ

The Wall Street Journal reported that Apple (AAPL 232.39) plans to begin producing this year a new iPhone that could allow U.S. phone carriers other than AT&T (T) to sell the iconic gadget, said people briefed by the company.

The Journal said the new iPhone would work on a type of wireless network called CDMA, these people said. CDMA is used by Verizon Wireless (VZ), AT&T's main competitor, as well as Sprint Nextel (S) and a handful of cellular operators in countries including South Korea and Japan. The vast majority of carriers world-wide, including AT&T, use another technology called GSM.

Separately, the Journal reported that Apple plans to release a new version of its current iPhone this summer, continuing its practice of annual upgrades at about the same time of year, said people briefed on the matter.
icon url

ReturntoSender

03/31/10 9:04 PM

#8905 RE: ReturntoSender #6755

From Briefing.com: 4:30 pm : Disappointment over the latest ADP Employment Report hampered stocks for the entire session, which concluded on a relatively weak note.

Another 23,000 private payrolls were cut in March, according to the most recent ADP Employment Report. Though that was the smallest decline in two years, the news prompted participants to pressure stocks since the addition of 40,000 jobs had been expected.

The surprise drop in payrolls has called into question projections for the official nonfarm payrolls report, which is due Friday and is expected by many to show an increase of 185,000 jobs. Unlike the ADP figure, the government's tally is subject to a weather-related rebound and will include 2010 census workers.

The mood among market participants dwindled further with the midmorning release of the Chicago PMI for March. It came in at 58.8, but the consensus had called for 61.0 after a reading of 62.6 in February.

Though generally disregarded, factory orders figures offered a positive surprise to participants. Orders for February increased 0.6%, which was slightly more than the expected 0.5% increase, while orders for January were revised higher to reflect a 2.5% increase.

Despite that small dose of positive data, participants remained fixated on the ADP numbers. Given that jobs data is a key consideration in the Fed's monetary policy decisions, the slower-than-expected improvement in the jobs picture put added pressure on the dollar, which fell 0.5% against a basket of foreign currencies. Still, the dollar's decline didn't do anything for the broader market this session.

Energy stocks outperformed the broader for the entire session, but couldn't compel the rest of the stock market to follow it. Energy advanced 0.4% amid news that the Obama administration will propose allowing offshore oil and natural gas exploration in part of the Gulf of Mexico. The news drove drillers to a 2.6% gain.

Higher crude oil prices also helped. The price of oil climbed 1.7% to close pit trade at $83.76 per barrel. Contracts had actually encountered some midmorning pressure amid news of a larger-than-expected build of 2.93 million barrels, but it didn't take long before sellers backed off.

Financials made up the only other sector to finish in positive territory. They netted a collective 0.2% gain amid strength in regional banks (+1.4%) and multiline insurers (+1.5%).

Trading volume was rather unimpressive, given that this session marked the the quarter's end. Some expected that a degree of portfolio rebalancing would lead to an increase in share volume at the major exchanges. Instead, volume on the NYSE was in-line with recent averages.

The Fed's planned purchases of up to $1.25 trillion of agency mortgage-backed securities also came to an end today. The plan's expiration makes for an inflection point in the capital markets.

Advancing Sectors: Energy (+0.4%), Financials (+0.2%)
Declining Sectors: Consumer Discretionary (-0.8%), Tech (-0.6%), Industrials (-0.6%), Consumer Staples (-0.5%), Materials (-0.5%), Telecom (-0.5%), Utilities (-0.3%), Health Care (-0.3%) DJ30 -50.79 NASDAQ -12.73 NQ100 -0.5% R2K -0.8% SP400 -0.5% SP500 -3.84 NASDAQ Adv/Vol/Dec 1008/2.37 bln/1668 NYSE Adv/Vol/Dec 1211/1.15 bln/1815

4:30PM Advanced Micro renews patent license agreement with Rambus (AMD) 9.27 unch : RMBS announces AMD has renewed its patent license agreement. The original term of AMD's agreement runs through the end of September this year. The renewal extends the patent license through the third quarter of 2015. Under the agreement, Rambus granted AMD a patent license for its integrated circuit and circuit board products. Under the agreement, AMD will continue to pay Rambus a license fee that will be determined at the end of 2010. This license fee is payable each year in quarterly installments.

4:25PM Research In Motion trades as low as 66.00 in after-hours in reaction to earnings/guidance before bouncing... currently trading -7% at 68.68 (RIMM) 73.97 -0.94 :

4:22PM Research In Motion misses by $0.01, misses on revs; guides Q1 EPS above consensus, revs in-line (RIMM) 73.97 -0.94 : Reports Q4 (Feb) earnings of $1.27 per share, $0.01 worse than the Thomson Reuters consensus of $1.28; revenues rose 17.9% year/year to $4.08 bln vs the $4.31 bln consensus. Gross margin for the fourth quarter was 45.7% compared to 42.7% in the prior quarter. Reports Q4 net subscriber account additions of 4.9 mln vs guidance of 4.4-4.7 mln; ships 10.5 mln units in Q4 vs guidance of 10.6-11.2 mln and Street est of ~11 mln... Guidance: Co issues upside EPS guidance for Q1, in-line rev guidance. Sees Q1 EPS of $1.31-1.38 vs. $1.22 Thomson Reuters consensus; sees Q1 revs of $4.25-4.45 bln vs. $4.33 bln Thomson Reuters consensus. RIMM Q1 gross margins is expected to be approx 44.5% compared to Thomson Reuters consensus of 42.9%. Net subscriber account additions in the first quarter are expected to be between 4.9-5.2 million... The revenue breakdown for the quarter was approximately 80% for devices, 16% for service, 2% for software and 2% for other revenue. At the end of the quarter, the total BlackBerry subscriber account base was over 41 million. "RIMM has completed another outstanding fiscal year with record revenue, earnings and subscriber results... We are off to a great start in fiscal 2011 and expect strong shipments, revenue, subscriber and earnings growth in Q1. We are also very excited about our portfolio of products and services for the coming year and we continue to see exceptional opportunity for sustained growth."

4:11PM Micron beats by $0.15, beats on revs (MU) 10.45 -0.34 : Reports Q2 (Feb) earnings of $0.39 per share, $0.15 better than the Thomson Reuters consensus of $0.24; revenues rose 97.5% year/year to $1.96 bln vs the $1.82 bln consensus. Revenue from sales of DRAM products increased 24% in Q2 of fiscal 2010 compared to Q1 of FY10 due to a 17 % increase in unit sales volume and a 7% increase in average selling prices. Revenue from sales of NAND Flash products were down slightly in Q2 compared to Q1 due to a slight decrease in average selling prices. The co's gross margin on sales of memory products improved from 27 % in Q1 to 35% in Q2 due to both an overall increase in average selling prices as well as decreases in manufacturing costs.

4:02PM Aehr Test Systems receives order for its MAX Burn-in and test system with individual temperature control (AEHR) 2.68 -0.12 :

Brightpoint (CELL) and Research In Motion (RIMM) announce plans to expand the distribution of BlackBerry smartphones in Indonesia. Brightpoint will provide logistics and supply chain expertise, assisting RIM to expand the national distribution of BlackBerry smartphones through Brighpoint's relationships with local distributors...

7:30AM Sunpower and Sol.In.Build Srl announced an agreement to build seven solar photovoltaic (PV) power plants (SPWRA) 19.23 : The co and Sol.In.Build Srl, a majority owned subsidiary of Veronagest SpA, announced an agreement to build seven solar photovoltaic (PV) power plants totaling 16.5 megawatts in the Sicily region of Italy. Located on a combined total of 63 hectares, the seven plants will range in size from one to 3.5 megawatts, and will be complete by September 2010. Up to 50 jobs are expected to be created during construction. The construction will be financed by a pool of leading Italian and international banks including Societe Generale, Unicredit Medio Credito Centrale and Dexia.

3:23AM On The Wires : AU Optronics (AUO) announces that AUO has signed an MOU with Toshiba Mobile Display Co., Ltd. to purchase 100% shares of AFPD Pte., Ltd. a subsidiary of TMD in Singapore and a manufacturer of LCD panels based on low temperature polysilicon technology... SunPower (SPWRA/SPWRB) and Sol.In.Build Srl, a majority owned subsidiary of Veronagest SpA, announce an agreement to build seven solar photovoltaic power plants totaling 16.5 megawatts in the Sicily region of Italy.

10:04 am FSII Guides Q3 Revenue Above Consensus

FSI International (FSII 3.95, +0.26) reported fiscal second quarter earnings this morning, which beat expectations.

The company reported second quarter earnings of $0.05 per share, excluding $0.03 in stock compensation, $0.02 better than the two estimate average of $0.03.

Revenues rose 119.8% year-over-year to $18.9 million, slightly above the $18.6 million two estimate average.

For the third quarter, the company is expecting revenues of $23 million to $25 million, above the currently $20.79 million two estimate average on orders of $25.0 million to $27.0 million.

Based upon the anticipated gross profit margin and the operating expense run rate, the co expects net income of $2.5 million to $3.0 million versus the $1.3 million two estimate average, for the third quarter of fiscal 2010. The company expects to use $2.0 million-3.0 million of net cash in operating activities in the third quarter, as it manages accounts receivable and inventory levels and supports the higher expected third quarter order and revenue levels.

icon url

ReturntoSender

04/02/10 11:10 PM

#8906 RE: ReturntoSender #6755

From Briefing.com: 10:33 am Weekly Wrap

The Dow and S&P 500 posted solid gains in relatively subdued and low volume trading during the holiday-shortened week.

The Nasdaq, however, settled with a modest gain as some large-cap technology issues underperformed. Research In Motion (RIMM) was a main laggard, shedding 8.8%, after posting earnings that missed Wall Street's expectations.

Eight of the ten sectors gained, led by energy (+3.8%), materials (+2.4%) and utilities (+2.0%). The two lagging sectors were consumer discretionary (unchanged) and technology (unchanged).

But Apple (AAPL) had a solid showing for the week, climbing 2.2%, amid reports it is working on a new iPhone that may be available on carriers other than AT&T (T).

The gains within the energy sector were aided by a strong advance in crude oil prices (6.3%) and word that President Obama is proposing to allow some new offshore drilling. Commodities as a whole rose 3.4% as the dollar fell 1.3%.

Separately, the Federal Reserve completed its $1.25 trln in MBS purchases. Though there was some volatility, rates saw relatively limited movement as this was known well in advance. In addition, the Fed currently has a "buy-and-hold" stance, meaning it will continue to own roughly 25% of the agency MBS market.

Economic news had a relatively limited impact on trade.

Consumption expenditures in February increased 0.3%, as expected, while core personal consumption expenditures were flat, which was not too much of a surprise since the consensus had called for a tepid 0.1% increase. Total and disposable income posted no growth in February -- a 0.1% increase had been expected.

March Consumer Confidence rebounded to 52.5 from 46.4, topping the 51.0 consensus. Part of the gain is likely due to the solid 6.1% gain in the S&P 500 during March.

The ISM Manufacturing Index for March came in at 59.6, which exceeded expectations (57.0) and marked the best reading in more than five years.

The labor market was in focus. Weekly initial jobless claims met expectations at 440,000. The ADP private payroll report on Wednesday showed an unexpected decline, shedding 23,000 versus the consensus that called for a gain of 40,000. Though the drop is a negative for the labor market outlook, this report has not always correlated with the official government report.

The stock market was closed Friday in recognition of Good Friday. The March employment report, however, was still released at 8:30ET.

On the bright side, nonfarm payrolls increased by 162,000 positions (consensus 184,000) in March. The prior two months saw upward revisions. January was revised from -26,000 to +14,000 while February was revised from -36,000 to -14,000. Temporary help services increased 40,000 in March.

Temporary employment, which is seen as a leading indicator, has increased by 313,000 since September.

The average workweek for all employees on private nonfarm payrolls picked up to 34.0 hours (consensus 33.9) from an upwardly revised 33.9 hours in February. In turn, the manufacturing workweek increased 0.2 to 39.9 hours and factory overtime was up 0.1 hour over the month to 2.9 hours.

The uptick in the average workweek will also be held out as another marker that suggests hiring activity should pick up in coming months.

The unemployment rate held steady at 9.7% (consensus 9.7%). On the not-so-bright-side, average hourly earnings declined -0.1% (consensus +0.2%) in March after a 0.2% increase in February, which was revised up from an originally reported increase of 0.1%.

On a year-over-year basis, average hourly earnings have risen 1.8%, which means they are actually up only 0.5% on a real basis using core CPI, which was up 1.3% year-over-year in February, as the deflator. The limited income growth will continue to act as a restraint on consumer spending.

Another very bothersome number is the number of long-term unemployed. That number stretched to 6.5 mln in March from 6.1 mln in February. The translation is that 44.1% of all workers officially counted as unemployed have been out of work 27 weeks or longer. That compares to 24.6% a year ago.

The so-called "real" unemployment rate, which counts the total unemployed plus all marginally attached workers and the total employed part-time for economic reasons, edged up to 16.9% from 16.8%. Essentially, this means one out of every six workers over the age of 16 is still either unemployed or underemployed.

The futures market moved up after the data, but we wouldn't put a lot of stock in the futures indication given the thin conditions.

In any event, the stock market has been inclined to look at the silver lining with most reports these days. Come Monday we will see if that remains the case.

The March employment report had some silver linings, but it is still hard not to notice the dark clouds of meager earnings growth and the inability to find full-time work.
 
Index Started Week Ended Week Change % Change YTD
DJIA 10850.36 10927.07 76.71 0.7 % 4.8 %
Nasdaq 2395.13 2402.58 7.45 0.3 % 5.9 %
S&P 500 1166.59 1178.1 11.51 1.0 % 5.6 %
Russell 2000 678.97 683.98 5.01 0.7 % 9.4 %

4:35 pm : Early support sent the stock market to a fractionally improved 52-week high, but as buyers backed away and sellers squared their positions ahead of tomorrow's official jobs report stocks succumbed to pressure. Stocks bounced in the final hour to close the session on a strong note, though.

News of a pleasing eurozone PMI and a restated commitment by China to loose monetary policy was cited as a reason for the positive mood among market participants in the early going. A less obvious cause for the early gains is that fund money was put to work with the start of the second quarter.

The best ISM Manufacturing Index reading in five years gave reason to push stocks even higher. At 59.6, the index also exceeded expectations of many economists.

Other economic data had less of an affect on the morning mood. News that construction spending for February a sharper-than-expected 1.3% received little mention, while an initial jobless claims count of 439,000 for the week ended Mar. 27 was shrugged off since it was in-line with the consensus forecast.

The weekly jobless claims count precedes the government's official payrolls report, which is due tomorrow morning. The report's release always makes for a widely-watched event, but the stock market will be closed in observance of Good Friday.

Given that the stock market will be closed tomorrow and the jobs report possesses a degree of uncertainty, many market participants were compelled to square their bets. That gave way to some selling and, in turn, an afternoon slide, which was likely exacerbated by the light trading volume ahead of the holiday weekend.

Of the major indices, the Nasdaq made the sharpest slide as it fell from a 1% gain all the way into negative territory. Research In Motion (RIMM 68.52, -5.45) was a primary source of weakness after disappointment over its earnings led to a downgrade by analysts at Goldman Sachs.

A late flurry of buying helped stocks rebound into the close. Though the stock market was unable to return to the fractionally improved 52-week highs that it set in the early going, it still finished the week on a strong note with broad-based gains.

As such, all 10 major sectors finished in positive ground. Materials gained the most made as they ascended 1.8%. Support for the sector was helped by a 0.5% loss in the Dollar Index.

The dollar's decline also lifted commodity prices, which hiked the CRB Commodity Index to a 1.1% gain. Natural gas was the biggest gainer among commodities; contract prices had been down roughly 1% in the morning, but news of a smaller-than-expected inventory build sent prices up 5.7% to $4.09 per MMBtu.

Advancing Sectors: Materials (+1.8%), Energy (+1.6%), Utilities (+1.3%), Telecom (+1.0%), Financials (+0.9%), Consumer Discretionary (+0.7%), Industrials (+0.6%), Health Care (+0.6%), Consumer Staples (+0.5%), Tech (+0.1%)
Declining Sectors: (None) DJ30 +70.44 NASDAQ +4.62 NQ100 +0.1% R2K +0.8% SP400 +0.9% SP500 +8.67 NASDAQ Adv/Vol/Dec 1512/2.28 bln/1146 NYSE Adv/Vol/Dec 2270/914 mln/769

4:05PM Cray awarded $45 mln supercomputer contract from the National Nuclear Security Administration (CRAY) 5.99 +0.04 : Co announced that it has signed a sub-contract with Los Alamos National Security, LLC to provide the National Nuclear Security Administration with a next-generation Cray supercomputer. Currently valued at more than $45 mln, the multi-year, multi-phase contract can be expanded if the NNSA exercises an option for a future upgrade. The new system will create a new supercomputing platform, named Cielo, for the Advanced Simulation and Computing program at the NNSA.

Research in Motion (RIMM 73.97 -0.95) reported Q4 (Feb) earnings of $1.27 per share, $0.01 worse than the Thomson Reuters consensus of $1.28; revenues rose 17.9% year/year to $4.08 bln vs the $4.31 bln consensus. Gross margin for the fourth quarter was 45.7% compared to 42.7% in the prior quarter. Reports Q4 net subscriber account additions of 4.9 mln vs guidance of 4.4-4.7 mln; ships 10.5 mln units in Q4 vs guidance of 10.6-11.2 mln and Street est of ~11 mln. Company issued upside EPS guidance for Q1, in-line rev guidance. Sees Q1 EPS of $1.31-1.38 vs. $1.22 Thomson Reuters consensus; sees Q1 revs of $4.25-4.45 bln vs. $4.33 bln Thomson Reuters consensus.

XYRATEX (XRTX 16.93 +0.27) reported Q1 (Feb) earnings of $0.96 per share, $0.18 better than the Thomson Reuters consensus of $0.78; revenues rose 73.5% year/year to $319 mln vs the $309.7 mln consensus. Company issued upside guidance for Q2, sees EPS of $1.10-$1.63 vs. $0.76 Thomson Reuters consensus; sees Q2 revs of $400-$460 mln vs. $329.85 mln Thomson Reuters consensus.

Wall Street Journal reported with a new version of the iPhone in the works, the clock is ticking for AT&T (T 25.84 -0.11) to get its much-criticized network ready for the looming battle. The carrier has taken a beating from consumers who have complained about poor coverage in major cities including New York and San Francisco. Now, AT&T is racing to reduce its dropped calls and speed up Web-surfing before Apple (AAPL 235.00 -0.85) releases a new version of the iPhone that could run on Verizon Wireless's (VZ 31.02 -0.21) network.

Kaufman noted that at a press and analyst event yesterday, Intel (INTC 22.29 -0.05) launched the Xeon 7500 Nehalem-EX processor (also Xeon 6500), which supports up to 8 cores. Firm believes this announcement caps a string of product releases that represents a significant strengthening of the company's server processor product family. While INTC's existing Nehalem server products have driven strong upgrade momentum in the 2-way mainstream processor market, the company believes that as many as 1 million servers have had a delayed refresh cycle due to the economic downturn.

Associated Press reported that LM Ericsson (ERIC 10.44 +0.21) said it has received a deal worth $1.3 billion from India's largest telecommunications operator, Bharti Airtel, to expand and upgrade its networks. Ericsson says the expansion will help Airtel to put a converged network into place and expand its coverage in rural India. The contract covers Airtel networks in 15 of 22 telecom circles and will result in better voice quality and faster data access for users.

icon url

ReturntoSender

04/04/10 3:20 PM

#8909 RE: ReturntoSender #6755

Leavitt Brothers Update on Market Breadth Indicators:

http://leavittbrothers.com/blog/?p=2877
icon url

ReturntoSender

04/04/10 9:57 PM

#8910 RE: ReturntoSender #6755

Actually I follow all the same kind of indicators myself with my own charts. The market is still at risk of a sell off but we are in the sweet spot of an economic recovery.

According to my indicators and what Leavitt Brothers follows the market especially was at risk a couple weeks back. Even before the Leavitt Brothers e-mail came saying it was time to be careful I sold some of my positions thinking we might get some selling.

While some stocks have seen some profit taking while the market has continued to rise with fewer new highs and more new lows along the way.

You can see that here on these charts:


But looking on a longer term chart you can see why market breadth indicators can only give you a feel for when the market is overbought or oversold.


The BPNDX which we all follow here has been overbought for a very long time. But although that tells us the market could decline it does not mean it has to decline.


Ultimately it should be understood that economic cycles trump market breadth and market sentiment indicators. Right now the FED is still very much doing all it can to stimulate the economy. I'm very skeptical about how much of a recovery we are going to get ultimately but a market top now would be very atypical and premature. We should be seeing less participation as the rally matures but an ultimate high for the market on this cyclical recovery may be as much as 1 to 3 years (who knows really!) in the future:


RtS
icon url

ReturntoSender

04/05/10 10:41 PM

#8911 RE: ReturntoSender #6755

From Briefing.com: 4:30 pm : Broad-based buying on the back of upbeat data boosted the major indices to fresh 52-week highs, but the widely watched Dow couldn't quite make its way to the psychologically significant 11,000 mark.

The stock market was closed in observance of Good Friday when the latest nonfarm payrolls report was released last week, so many market participants treated the jobs numbers like new. Though the numbers were mixed, including a smaller-than-expected increase of 162,000 in total jobs during March and a steady unemployment rate of 9.7%, a deeper dig into the data revealed that there was a larger-than-expected increase in private sector payrolls.

A generally positive reaction to the jobs numbers helped give the major equity averages a positive start to the session. Stocks added to their gains shortly after it was learned that the ISM Service Index for March exceeded expectations to hit a multiyear high of 55.4 and that pending home sales for February made a surprise 8.2% month-over-month increase.

Though strong data spurred a solid buying effort, there wasn't much volume behind the move. Stocks spent the entire afternoon in a tight range, unable to further build on their gains. For the S&P 500 that meant that it would spend the afternoon bumping up against the 1187 to 1188 zone, while the Dow Jones Industrial Average couldn't quite close the gap on 11,000 -- both levels were last seen in September 2008.

Buyers favored energy stocks the most this session. That helped the sector ascend to a 1.6% gain. Higher oil prices helped. Contract prices for crude oil hit an 18-month high just shy of $87 per barrel before it settled with a 2.1% gain at $86.62 per barrel.

The reflation trade also helped materials stocks, which tacked on 1.2% this session. Steel plays (+3.8%) provided the most support to the sector, but metal and mining giant Alcoa (AA 14.73, +0.03) lagged after it was downgraded by analysts at JPMorgan. The downgrade precedes Alcoa's quarterly earnings announcement next week.

Tech stocks (+1.1%) were also strong this session. Apple (AAPL 238.49, +2.52), one of the sector's frequent leaders, lagged a bit in the early going amid suggestions that initial sales of its latest gadget, the iPad, have been underwhelming. Analysts at JPMorgan increased their target on the stock, however.

Health care stocks (-0.3%) and consumer staples stocks (-0.1%), often considered defensive plays, trailed the broader market for the entire session. Their decline suggested that broader market participants remain more interested in riskier plays.

On that note, small-caps and mid-caps outperformed with ease. Specifically, the Russell 2000 Small-Cap Index climbed 2.0%, while the S&P 400 Mid-Cap Index added 1.6%.

Meanwhile, Treasuries fell out of favor. As a result, the yield on the benchmark 10-year Note eked past 4.00% for the first time since this past summer. Results from a reopened auction of $8 billion in 10-year TIPS did little to alleviate pressure. The auction drew a yield of 1.71% with a bid-to-cover ratio of 3.4. The indirect bid came in at 37.5%.

The dollar had a quiet session and closed with a 0.1% loss against a basket of competing currencies. Over the weekend the U.S. Treasury decided to delay a report to Congress on the currency policies of China, among other major trading partners.

Many major foreign markets were closed Monday for holiday observance.

Advancing Sectors: Energy (+1.6%), Materials (+1.2%), Consumer Discretionary (+1.2%), Tech (+1.1%), Financial (+1.0%), Industrials (+0.8%), Telecom (+0.7%), Utilities (+0.6%)
Declining Sectors: Health Care (-0.3%), Consumer Staples (-0.1%) DJ30 +46.48 NASDAQ +26.95 NQ100 +0.9% R2K +2.0% SP400 +1.6% SP500 +9.34 NASDAQ Adv/Vol/Dec 2028/2.04 bln/688 NYSE Adv/Vol/Dec 2298/900 mln/765

10:00AM Apple: EMG Technology accuses Apple's New iPad of patent infringement (AAPL) 236.44 +0.46 : EMG Technology announced that it will move to include the newly released Apple iPad (media player, personal TV & eBook reader) as an additional accused product in EMG's previously filed patent infringement lawsuit against, which is pending in the U.S. District Court for the Eastern District of Texas. "EMG will take steps to add Apple's newly released iPad to the range of Apple products already accused of patent infringement in the case, including the iTunes Store, iPhone, iPod Touch and Apple TV. The trial date is set for September 12, 2011," explained Shawn Hansen, an attorney with the Palo Alto, California office of Manatt, Phelps & Phillips, who is representing EMG in the case.

8:53AM Semiconductor Industry Association reports February chip sales : The Semiconductor Industry Association (SIA) reported that worldwide semiconductor sales in February were $22.0 billion, a decrease of 1.3% from January when sales were $22.3 billion. February sales grew by 56.2% from February 2009 when sales were $14.1 billion. All monthly sales numbers represent a three-month moving average. "The February sales numbers reflect continued recovery of sales of semiconductors, with demand principally driven by growth in sales of electronic products in emerging economies," said SIA President George Scalise. "Unit sales of the two leading demand drivers for semiconductors - personal computers and cell phones - are now projected to grow in the low- to mid-teens in 2010. While the 56 percent year-on-year growth reflected in the February sales number is encouraging, it is important to note that January and February of 2009 marked the low point for the semiconductor industry during the worldwide economic downturn. "There are encouraging signs that the global economic recovery will continue, and we remain cautiously optimistic that there is upside potential for growth beyond our November forecast for 2010," Scalise concluded.

8:30AM Apple sells over 300,000 iPads first day (AAPL) 235.97 : The co announces that it sold over 300,000 iPads in the US as of midnight Saturday, April 3. These sales included deliveries of pre-ordered iPads to customers, deliveries to channel partners and sales at Apple Retail Stores. Apple also announced that iPad users downloaded over one million apps from Apple's App Store and over 250,000 ebooks from its iBookstore during the first day. "It feels great to have the iPad launched into the world -- it's going to be a game changer," said Steve Jobs, Apple's CEO. "iPad users, on average, downloaded more than three apps and close to one book within hours of unpacking their new iPad."

7:00AM CalAmp announces $15.2 million in new contracts for its wireless networks business (CAMP) 2.76 : Co announced that its Wireless Networks business has entered into three new supply contracts with an aggregate value of $15.2 million, increasing the backlog of this business to a record level. The three contracts are with customers in the Rail Transportation, Public Safety and Utility Smart Grid sectors. Work on each contract is expected to begin immediately with the majority of the revenues expected to be recognized in the current and next fiscal year.

icon url

ReturntoSender

04/06/10 11:00 PM

#8912 RE: ReturntoSender #6755

From Briefing.com: 4:30 pm : A pullback by the buck and strength among financials combined to help the broader market make its way up to a new 52-week high after stocks had traded with a modest loss in the early going. Gains faded a bit into the close, but overall price action remained positive.

Participants pressured stocks in the early going as the greenback gained ground against competing currencies. It was up nearly 0.7% at its session high, but that gain was cut shortly after the midafternoon release of minutes from the latest FOMC meeting. According to those minutes, the Fed's language regarding low interest rates for an extended period of time does not preclude the Fed from promptly tightening policy. Still, the Fed added that the extended period language could last longer if economy worsens or inflation declines. To the latter point, the FOMC members indicated that consumer spending in the first quarter still seemed constrained and that data has shown a greater-than-expected decline in inflation. Given those observations the Dollar Index dipped to close with a gain of 0.3%.

The dollar's moderation helped the broader market break free from an afternoon of range-bound trade, which was largely the result of resistance at the neutral line.

Leadership from the financial sector had helped to initially lift the broader market up from its opening low. Buyers sought bank stocks, so the KBW Bank Index tacked on 2.4%. That sent the broader financial sector 1.1% higher.

Retailers were also strong on a relative basis. The group gained 0.6%. Discount retailer Dollar General (DG 27.01) was especially strong after it was upgraded by analysts at Wells Fargo. The analysts initiated Family Dollar (FDO 37.79, +0.30) with a strong ranking ahead of the retailers earnings report tomorrow morning.

Also on the earnings calendar, Schnitzer Steel (SCHN 54.66, -0.56) is scheduled to announce its latest quarterly results Wednesday evening. Its shares failed to sustain the gains that were sported by larger competitors AK Steel (AKS 25.00, +0.80) and US Steel (X 69.71, +0.75).

Though the stock market failed to finish the session at its high and its overall move was modest, it still booked its third straight gain or its sixth advance in seven sessions (including a couple of fractional gains).

Treasuries made a modest bounce after pressure in the prior session drove the yield on the benchmark 10-year Note above 4.00%. Gains in the 10-year Note remained steady after a $40 billion auction of 3-year Notes drew a higher-than-expected yield of nearly 1.78%. The auction's bid-to-cover ratio came in at 3.10, which was in step with that of the prior auction, but up from the 10-auction average of 2.94. Indirect bidders accounted for 52.2%, up from 51.8% in the prior auction, but below the 10-auction average of 53.4%.

Advancing Sectors: Financials (+1.1%), Utilities (+0.9%), Materials (+0.2%), Consumer Discretionary (+0.2%)
Declining Sectors: Telecom (-0.4%), Consumer Staples (-0.3%), Health Care (-0.2%)
Unchanged: Tech, Energy, Industrials DJ30 -3.56 NASDAQ +7.28 NQ100 +0.2% R2K +0.6% SP400 +0.5% SP500 +2.00 NASDAQ Adv/Vol/Dec 1498/2.12 bln/1151 NYSE Adv/Vol/Dec 1705/933 mln/1306

3:35 pm : Natural gas fell 4.2% this session after rising 12% since last Thursday's 6 month low. The May contract hit a session low at $4.07 per MMBtu in the afternoon; it closed at $1.40 per MMBtu.

The front month crude oil futures hit a new 18 month high at $87.09 per barrel this session. May crude oil finished 0.3% higher at $86.84 per barrel.

Gold futures pared early losses to finish with a very modest gain. June gold futures closed 0.2% higher at $1136.50 per ounce.

Sellers were in control of silver futures, though. May silver closed 0.9% lower at $17.96 per ounce after trading in negative territory for the entire session.

Wheat futures were notably higher this session. July wheat futures closed with a 2.2% gain at $4.70 per bushel on a covering of short positions. DJ30 -4.46 NASDAQ +7.96 SP500 +1.80 NASDAQ Adv/Vol/Dec 1453/1.76 bln/1192 NYSE Adv/Vol/Dec 1672/681 mln/1323

7:30AM Am Superconductor receives $20 mln order for wind turbine electrical control systems from India's Ghodawat Energy (AMSC) 28.82 : Co announces that it has received an initial order for full wind turbine electrical control systems worth more than US$20 million from Ghodawat Energy. Under the terms of the contract, AMSC will begin shipping the electrical control systems to Ghodawat in the middle of calendar 2010 and will complete all shipments by the end of calendar 2013 at the latest.

7:00AM CalAmp announces promotion of Michael Burdiek to President and Chief Operating Officer (CAMP) 3.16 :

icon url

ReturntoSender

04/07/10 10:41 PM

#8913 RE: ReturntoSender #6755

From Briefing.com: 4:30 pm : Moderate weakness mired stocks for most of the session, but a failed attempt to push into positive prompted sellers to intensify their efforts and hand the stock market its worst loss in more than one month.

A lack of positive catalysts in the early going left market participants without reason to chase stocks to new highs, which have become increasingly difficult register in recent sessions.

A stronger dollar also stymied buying. In the early going the Dollar Index climbed to a gain of 0.4% before it pulled back to settle with a gain of 0.2%. Most of the dollar's strength was owed to the euro, which weakened in the wake of news that eurozone economic activity stagnated in the fourth quarter.

Precious metals were unfazed by the dollar, though. Gold prices climbed 1.5% to $1137 per ounce, while silver prices settled 1.5% higher at $18.20 per ounce. Such strength won favor for Barrick Gold (ABX 40.70, +1.28), Goldcorp (GG 39.87, +1.59), and IAMGOLD (IAG 15.60, +0.71).

Strength among precious metals plays helped offset the weakness of Monsanto (MON 68.09, -1.45) within the materials sector, which fell 0.7%. Monsanto posted an earnings miss and confirmed a tepid forecast.

All 10 major sectors fell, but losses were worst among telecom stocks. The sector tumbled 2.3%.

Financials fell 0.5% despite early attempts to provide leadership to the broader market. The sector was sacked by a late flurry of selling that came about after stocks failed to find their way into higher ground. The S&P 500 actually flirted with a gain after a $21 billion auction of 10-year Treasuries drew a lower-than-expected yield of 3.90% and a record bid-to-cover ratio of 3.7, but the stock market's failure to overcome resistance at the neutral line set the stage for a more concerted selling effort.

Sellers intensified their efforts after it was learned that consumer credit in February fell by $11.5 billion. It was expected to contract by just $0.7 billion. Consumer credit for the prior month was revised upward to a $10.6 billion increase from a $5.0 billion increase.

While a bounce up from session lows in the final hour of trade helped moderate the extent of this session's slide, it still wasn't enough to prevent the stock market's worst loss since February.

Advancing Sectors: (None)
Declining Sectors: Telecom (-2.3%), Energy (-1.0%), Utilities (-0.9%), Materials (-0.7%), Industrials (-0.6%), Financials (-0.5%), Consumer Discretionary (-0.5%), Consumer Staples (-0.5%), Health Care (-0.4%), Tech (-0.2%) DJ30 -72.47 NASDAQ -5.65 NQ100 -0.2% R2K -0.3% SP400 -0.7% SP500 -6.99 NASDAQ Adv/Vol/Dec 1230/2.87 bln/1469 NYSE Adv/Vol/Dec 1109/1.15 bln/1924

4:03PM SMSC beats by $0.06, beats on revs; guides Q1 EPS above consensus, revs above consensus (SMSC) 24.15 +0.16 : Reports Q4 (Feb) earnings of $0.18 per share, $0.06 better than the Thomson Reuters consensus of $0.12; revenues rose 62.1% year/year to $83 mln vs the $79.9 mln consensus. Co issues upside guidance for Q1, sees EPS of $0.23-0.28 vs. $0.18 Thomson Reuters consensus; sees Q1 revs of $90-94 mln vs. $83.09 mln Thomson Reuters consensus. "The environment for semiconductor spending is accelerating. We are seeing strong orders across all of the markets we serve, including a resumption in enterprise PC spending. We anticipate growth in each of our product lines and geographies in the first quarter of fiscal 2011, which leads us to believe that revenue will increase by 8 to 13 percent sequentially."

Palm (PALM 4.29 +0.44) shares spiked on renewed takeover chatter. Palm calls are seeing interest following the chatter with 13.2K calls trading vs 3.2K puts. As mentioned before, while many rumors circulate during the day, and the validity of the source of these rumors can be questionable, the speculation may increase volatility in the near term.

8:30AM O2Micro announces battery protection patent granted (OIIM) 7.01 : Co was issued 10 claims under United States patent number 7,646,169 for its Trickle Discharge for Battery Pack Protection invention. This invention employs a controlled trickle discharge to protect the battery pack from a large current fault condition, like a short circuit. Any electronic device with a rechargeable battery, such as notebook computers, PDAs, cell phones, power tools, benefit from this circuitry and method.

8:01AM Cirrus Logic pre-reports MarQ revenue above consensus (CRUS) 9.37 : Co expects to report Q4 (Mar) revenue of $62.6 mln, an increase from the previous guidance of $55-59 mln and vs $56.8 mln consensus. Co will report full results on April 27. Co estimates gross margin to be 56-57%. Co says Q4 results set the stage for what it expects will be another strong year.

4:10AM Advanced Semiconductor Engineering announces monthly net revenues (ASX) 4.75 : Co announces unaudited consolidated net revenues for March increased 188% year/year to NT$ 15,847 mln; sequentlial change was +22.0%. Co announces Q110 net revenues increased 180.3% year/year to NT$ 37,555 mln.

icon url

ReturntoSender

04/13/10 11:19 PM

#8920 RE: ReturntoSender #6755

From Briefing.com: 4:25 pm : Market participants were initially uninspired by mixed results from Alcoa, but interest in tech plays ahead of Intel's latest report helped the broader market muster a fractional gain. A slight dip by the dollar helped, too.

First quarter results from Dow component Alcoa (AA 14.34, -0.23) unofficially marked the start earnings season last evening. Alcoa posted adjusted earnings of $0.10 per share, which was in-line with the consensus estimate, but earnings quality was questioned due to smaller-than-expected revenue.

Fellow Dow component JPMorgan Chase (JPM 45.87, -0.27) is scheduled to report its latest quarterly results tomorrow morning, ahead of the opening bell. The stock closed at a session low, however.

Regional bank stocks were especially weak. The group fell 2.0% following the decision by analysts at UBS to downgrade KeyCorp (KEY 8.14, -0.20), Huntington Banc (HBAN 5.69, -0.34), and Regions Financial (RF 8.34, -0.40).

Meanwhile, analysts at Credit Suisse won favor for educational services plays with an upgrade of DeVry (DV 71.73, +6.67) and ITT Educational (ESI 119.20, +10.42). Shares of the pair set fresh 52-week highs.

Participants chased Intel (INTC 22.76, +0.22) to a fresh 52-week high ahead of its post-close earnings announcement. Shares of the semiconductor giant helped give the Philadelphia Semiconductor Index a 0.6% gain and helped the Nasdaq Composite find a fractionally improved 52-week high.

The broader S&P 500 had its gains capped as it continues to encounter resistance at 1200. Still, the benchmark index was able to rebound from a midmorning loss that briefly took it below near-term support at 1190. That slide came as the Dollar Index turned a modest loss into a slight gain, but stocks recovered as the buck's bounce proved unsustainable.

Volatility ramped up this session. Specifically, the Volatility Index spiked nearly 8% before it finished the session 3.5% higher. The rebound followed a 30-month low in the prior session.

Treasuries had a quiet, but relatively solid session as the benchmark 10-year Note continued its gradual climb. The yield on the Note now stands slightly above 3.80% after it had been just above 4.00% last week.

Advancing Sectors: Consumer Discretionary (+0.6%), Tech (+0.3%), Industrials (+0.3%)
Declining Sectors: Energy (-0.5%), Utilities (-0.4%), Materials (-0.3%), Telecom (-0.2%)
Unchanged: Health Care, Financials, Consumer Staples DJ30 +13.45 NASDAQ +8.12 NQ100 +0.4% R2K +0.3% SP400 +0.4% SP500 +0.82 NASDAQ Adv/Vol/Dec 1375/2.53 bln/1295 NYSE Adv/Vol/Dec 1549/1.05 bln/1481

5:07PM Linear Tech beats by $0.13, beats on revs (LLTC) 29.65 +0.31 : Reports Q3 (Mar) adjusted earnings of $0.52 per share, $0.13 better than the Thomson Reuters consensus of $0.39; revenues rose 21.4% year/year to $311.3 mln vs the $279.1 mln consensus. "Bookings remained strong throughout the quarter and our book-to-bill ratio for the quarter was once again firmly positive. Though it is likely that certain customers may have begun to restock inventory from unsustainably low levels, or have reacted to longer lead times within the industry, we believe that new programs at both new and existing customers as well as expanding end-customer demand at continuing programs have been the primary catalyst for our current growth. Inventories in the distribution channel are still relatively lean and inventory turns remain higher than normal. Looking ahead we remain upbeat about our growth prospects and currently believe we can continue to keep our lead times at modest levels of 4 to 6 weeks and grow revenues another 7-10% in our fiscal fourth quarter."

5:01PM Kulicke & Soffa announces Q2 revs of ~$153 mln vs. $146.4 mln Thomson Reuters consensus; guides Q3 revs of $205 mln vs. $143.1 mln consensus (KLIC) 7.86 -0.26 : Co said, "We are able to give revenue guidance for the June quarter a few weeks earlier than normal because of unprecedented demand for both ball bonders and wedge bonders. Based on booked orders, we expect June quarter revenue of ~$205 mln. This same strength in demand gives us visibility into the beginning of the September quarter and while it is too early to give guidance for that quarter, so far we are seeing a continuation of current customer demand patterns."

4:20PM Intel beats by $0.05, beats on revs; guides Q2 revs, margins above consensus (INTC) 22.76 +0.23 : Reports Q1 (Mar) earnings of $0.43 per share, $0.05 better than the Thomson Reuters consensus of $0.38; revenues rose 44.2% year/year to $10.3 bln vs the $9.83 bln consensus. Intel reports Q1 gross margins of 63% vs 61.3%. The average selling price (ASP) for microprocessors was slightly up. Co issues upside guidance for Q2, sees Q2 revs of $9.8-10.6 bln vs. $9.69 bln Thomson Reuters consensus. Co guides Q2 gross margins of 64%, plus or minus a couple percentage points, vs 60.4% consensus. Co guides FY10 gross margins to 64%, plus or minus a couple percentage pts, vs 61.6% consensus, up from 61%, plus or minus 3% pts... Spending (R&D plus MG&A) was $12.4 billion, plus or minus $100 million. The company's prior expectation was $11.8 billion, plus or minus $100 million. R&D spending was approximately $6.4 billion. Tax rate was approximately 31% for the second, third and fourth quarters. Depreciation was approximately $4.4 billion, plus or minus $100 million. Capital spending is expected to be $4.8 billion, plus or minus $100 million. "The investments we're making in leading edge technology are delivering the most compelling product line-up in our history... These leadership products combined with growing worldwide demand and continued outstanding execution resulted in Intel's best first quarter ever. Looking forward, we're optimistic about our business as Intel products are designed into a variety of new and exciting segments."

4:16PM Silicon Graphics announced a strategic partnership with Nimbis Services (SGI) 10.25 -0.14 : Co announced a strategic partnership with Nimbis Services, which will provide easy access to SGI Cyclone, the first large-scale, on-demand cloud computing service specifically dedicated to technical applications. Cyclone's HPC cloud services will be available May 2010 for small and mid-sized U.S. companies via Nimbis Services' ecommerce portal.

8:38AM Apple confirms updated MacBook Pro line (AAPL) 242.29 : Co confirms updated MacBook Pro line with faster processors, powerful next-generation NVIDIA (NVDA) graphics and even longer battery life. The 13-inch MacBook Pro features the new NVIDIA GeForce 320M graphics processor for up to 80% faster graphics and a 10-hour built-in battery. The new 15-inch and 17-inch MacBook Pro models feature Intel (INTC) Core i5 and i7 processors and Apple's new automatic graphics switching technology that toggles between NVIDIA GeForce GT 330M and Intel HD Graphics processors.

8:13AM On The Wires : Infosys (INFY) announces that it will manage internal IT services for Microsoft (MSFT) worldwide. As part of this managed services agreement, Infosys will streamline implementation processes, simplify support and service, while at the same time lowering the enterprise costs through the use of the latest Microsoft solutions such as Windows 7. Rorke Data, wholly owned subsidiary of Bell Microproducts (BELM), announced at NAB that it has partnered with FalconStor Software (FALC) for a high-performance shared storage solution-HyperDrive... Cadence Design Systems (CDNS) announces that LSI (LSI) signed a multi-year agreement for Cadence mixed-signal technology...

Applied Materials (AMAT) opened its new Singapore Operations Center, Applied's first facility in Asia for manufacturing its advanced semiconductor equipment...

7:02AM Canadian Solar awarded contract offers for 176 MW (AC) of distributed solar power projects by Ontario Power Authority via Feed-in Tariff Program (CSIQ) 24.24 : Co announces it has been awarded Contract Offers for 176 megawatts (MW) of open field photovoltaic power generation projects under the new Feed-in Tariff (FIT) program that is part of the landmark Green Energy and Green Economy Act. Once final approval is obtained, these projects are expected to be completed in 2011 and 2012. The projects were developed, in partnership, with several leading renewable energy developers in the Ontario market, including 3G Energy Corp., Axio Power Inc., Saturn Power and UC Solar. Canadian Solar expects that it will establish a state-of-art module manufacturing facility in Ontario by Q1 2011, which is expected to employ approximately 500 people. Further, the company will continue to supply installed solutions that meet Ontario FIT program content requirements for 2010 and 2011. Once final approval is obtained, the Ontario Power Authority will buy 100 percent of the power and renewable energy credits from the Canadian Solar projects under the FIT program.

icon url

ReturntoSender

04/15/10 8:59 PM

#8922 RE: ReturntoSender #6755

From Briefing.com: 4:30 pm : The stock market stretched its streak of gains to six even though interest among buyers cooled amid a mixed batch of headlines.

Better-than-expected earnings and an upside forecast from UPS (UPS 68.89, +3.44) after the prior session's close seemed to set the stage for continued gains in the early going. The report propelled UPS to its best single-session percentage gain in more than one year and pushed the Dow Jones Transportation Index up 1.7% to a new 52-week high. CSX (CSX 55.25, -0.21) lagged even though analysts at Deutsche Bank raised their target on the rail carrier.

The broader market had a hard time trading in a clear direction as bounces fleeted and retreats ran into technical support. Still, the stock market was able to eke out another gain, which made for the best streak of gains by the S&P 500 in one month.

Action was also a bit choppy in the Nasdaq Composite, but the tech rich index resisted efforts to retreat into the red. Its relative strength was rooted in continued interest in large-cap tech ahead of the latest results from Google (GOOG 595.30, +6.30).

The dollar acted as an occasional headwind this session. It settled nearly 0.4% higher against a basket of foreign currencies as the euro was pressured amid rekindled concerns about the ability of Greece to service its debt and word that the country has lowered expectations for the amount it hopes to raise from a global dollar bond at the end of this month.

Rather than cheer China's torrid 11.9% increase in first quarter GDP, many market watchers in Asia grew increasingly concerned about the prospect of tighter monetary policy in the country, regardless of some cooler-than-expected inflationary data.

Stateside data proved mixed. Weekly initial jobless claims were up more than expected to 484,000, while continuing claims climbed to a worse-than-expected 4.64 million.

Industrial production during March increased a much smaller-than-expected 0.1%, while at 73.2% capacity utilization was generally in-line with what had been expected.

The Empire State Manufacturing Survey hit a five-month high of 31.9 and the Philadelphia Fed Survey for April came in at 20.2 to beat the consensus estimate.

Trading volume was strong this session. In fact, with nearly 1.2 billion shares traded on the NYSE this session, volume on the big board surpassed its 200-day moving average for the first time since a quadruple witching options session nearly one month ago. Monthly options are set to expire tomorrow, so trading volume could see another spike in the week's final session.

Participants can also look forward to results from Bank of America (BAC 19.48, +0.08) and the latest housing start figures and building permit numbers Friday. The preliminary reading on consumer sentiment for April from the University of Michigan is also due tomorrow.

Advancing Sectors: Industrials (+0.9%), Tech (+0.5%), Consumer Discretionary (+0.4%)
Declining Sectors: Financials (-0.5%), Consumer Staples (-0.3%), Health Care (-0.3%), Telecom (-0.2%), Utilities (-0.2%)
Unchanged: Materials, Energy DJ30 +21.46 NASDAQ +10.83 NQ100 +0.5% R2K +0.3% SP400 -0.1% SP500 +1.02 NASDAQ Adv/Vol/Dec 1537/2.76 bln/1145 NYSE Adv/Vol/Dec 1449/1.20 bln/1549

1:25PM Power-One announces its digital power technology patent license agreement and dismissal of legal proceedings (PWER) 4.87 +0.42 : Co announced that it, and Emerson's (EMR) wholly owned subsidiaries Artesyn Technologies, Inc. and Astec America Inc., have entered into a non-exclusive, worldwide, Field of Use agreement for certain of Power-One's digital power technology patents. The parties further agreed to jointly dismiss with prejudice all pending lawsuits. The non-exclusive license agreement allows Emerson to offer non-isolated DC/DC conversion devices designed for board-mounting that: include a serial communications bus interface designed and adapted to receive control commands and send monitoring information; are designed and adapted to be used in an array of non-isolated DC/DC power conversion devices linked to a common serial communications bus; and are designed and adapted to be used to power one or more devices.

9:05AM Novellus raises Q1 EPS guidance due to lower-than-expected tax rate (NVLS) 26.92 : Co raises guidance for Q1 (Mar), sees EPS of $0.47, excluding non-recurring items, vs. $0.40 Thomson Reuters consensus. The company had previously forecasted its fiscal 2010 effective tax rate to be within a range of 25% to 30%. Due to an analysis of the impact of a recent U.S. Tax Court opinion on its tax expense related to foreign operations, the company is revising its fiscal 2010 effective tax rate guidance to a range of 15% to 20%.

7:32AM Fairchild Semi beats by $0.01, beats on revs; guides Q2 revs above consensus (FCS) 12.41 : Reports Q1 (Mar) earnings of $0.25 per share, excluding non-recurring items, $0.01 better than the Thomson Reuters consensus of $0.24; revenues rose 6.6% year/year to $378 mln vs the $371.6 mln consensus. Co issues upside guidance for Q2, sees Q2 revs of $395-400 mln vs. $380.47 mln Thomson Reuters consensus. "Our current scheduled backlog is sufficient to achieve the low end of this range. We still have availability for certain packages in the current quarter and we are working on numerous approaches to optimize supply which combined could support sales at the high end of the range or better. We expect to increase gross margin to 33 to 34 percent due primarily to a richer product mix as a number of new designs ramp into production." Fairchild reported first quarter adjusted gross margin of 32.5 percent, up 220 basis points sequentially and 17 percentage points higher than in the first quarter of 2009. "Demand remained robust throughout the quarter including better-than-seasonal order rates during the Asian holidays. Demand strength is broad based with the greatest growth for our products targeted to the computing, power supply, industrial and automotive end markets. We are effectively managing our supply through capacity reservations in our advanced order management system to support our top tier customers, which represent roughly 75 percent of our sales. Our sales growth was evenly balanced between OEM and distribution channels. Distributor sell through increased 5 percent sequentially which is significantly better than normal seasonality. The upside in sell through drove a channel inventory reduction of about 2 percent from the prior quarter, resulting in a record low 7.8 weeks of inventory. This is the fourth consecutive quarter of sell through growth and fifth quarter of channel inventory reduction. If we add this channel inventory reduction to our sales, we estimate actual consumption demand was approximately $381 million for the first quarter."

icon url

ReturntoSender

04/16/10 10:47 AM

#8923 RE: ReturntoSender #6755

Chart of the Day - COTD - Rallies after Massive Bear Market Declines:

http://www.chartoftheday.com/20100416.htm?T

Today's chart illustrates rallies that followed massive bear markets. For today's chart, a 'massive' bear market is defined as a decline of greater than 50%. Since the Dow's inception in 1896, there have been only three bear markets whereby the Dow declined more than 50% (early 1930s, late 1930s until early 1940s, and during the very recent financial crisis). Today's chart also adds the rally that followed the dot-com bust during which the Nasdaq declined 78%. One point of interest is that the current Dow rally has followed a path that is fairly similar to that of the Nasdaq rally that began in late 2002. It is also worth noting that each rally lasted from about 300 to 370 trading days and then moved into a trading range/choppy phase that lasted for a year or more. In the end, the current post-massive bear market rally is by no means atypical.


icon url

ReturntoSender

04/16/10 9:54 PM

#8924 RE: ReturntoSender #6755

From Briefing.com: 4:30 pm : The stock market's six-session streak of gains ended in dramatic fashion as the S&P 500 suffered its worst percentage loss in two months following news that the Securities Exchange Commission (SEC) has levied a charge against Goldman Sachs.

Moderate weakness in the early going became something much worse with midmorning news that the SEC has charged Goldman Sachs (GS 160.70, -23.57) and one of the company's vice presidents with fraud related to subprime securities. Goldman Sachs saw some $12 billion, or 13%, of its market cap evaporate. Concern that other investment banks and brokerages may be implicated led the group to a 9.4% loss. That undercut the broader financial sector, which fell 3.8% in its worst slide since February.

While selling was the worst among financials, more than 90% of the stocks in the S&P 500 retreated into the red. Most market participants wanted to lock in profits after they had watched the S&P 500 climb nearly 4% over the course of the previous 10 sessions, 7 of which marked improved 52-week highs.

Not even better-than-expected earnings from blue chips Google (GOOG 550.15, -45.15), Bank of America (BAC 18.41, -1.07), and General Electric (GE 18.97, -0.53) could keep sellers at bay this session. Participants initially responded to reports from the trio with mixed interest as many believed plenty good news had already been built in to the share prices. Some wanted more in the way of improved outlooks.

Economic data was split between positive and negative. Housing starts for March hit an annualized rate of 626,000, which was more than the rate of 610,000 that had been expected and the highest rate in more than one year. Building permits for March came in at an annualized rate of 685,000, which was above the rate of 625,000 that had been expected and was also the highest rate in more than one year.

On the other side of things, the preliminary Consumer Sentiment Survey for April from the University of Michigan came in at 69.5, which was not only below the 75.0 that had been widely expected, but it was also the worst reading since November.

The drastically soured tone turned some to Treasuries. In turn, the benchmark 10-year Note saw its yield slip to 3.76%, which is roughly 25 basis points below where it sat about two weeks ago.

Volatility also spiked in response to this session's selling. The Volatility Index, often euphemistically dubbed the Fear Index, spiked approximately 15%. Amid such action, many have come to question whether the stage has been set for a larger correction or if money will start to move in from the sidelines.

Trading volume surged to its highest level in nearly one month, but it is unclear how much of that is owed to this session's negative headlines since this was an options expiration session.

Advancing Sectors: (None)
Declining Sectors: Financials (-3.8%), Materials (-1.8%), Industrials (-1.6%), Energy (-1.5%), Consumer Discretionary (-1.4%), Tech (-1.4%), Utilities (-1.1%), Telecom (-0.8%), Health Care (-0.6%), Consumer Staples (-0.3%) DJ30 -125.91 NASDAQ -34.43 NQ100 -1.3% R2K -1.3% SP400 -1.2% SP500 -19.54 NASDAQ Adv/Vol/Dec 726/2.85 bln/1962 NYSE Adv/Vol/Dec 571/1.75 bln/2465

10:17 am BAC Beats Wall Street's Q1 Expectations

Bank of America (BAC 19.20, -0.28) reported its first quarter earnings and revenue results earlier this morning, which were better than Wall Street expectations.

The company reported first quarter earnings of $0.28 per share, $0.19 better than the Thomson Reuters consensus of $0.09. Revenues fell 10.6% year-over-year to $31.97 billion, but were higher than the $27.97 billion consensus.

Revenue declines were driven by the absence of year-earlier credit-related gains on Merrill Lynch structured notes, the sale of an equity investment and lower mortgage banking volume and income. Revenue declines were driven by the absence of year-earlier credit-related gains on Merrill Lynch structured notes, the sale of an equity investment and lower mortgage banking volume and income. Credit quality continued to improve during the quarter, with net losses declining in most consumer portfolios.

Credit costs, however, remain high amid relatively weak global economic conditions. Credit quality across most commercial portfolios showed signs of improvement with criticized and nonperforming loans decreasing from the prior quarter. Net charge-offs in the commercial portfolios declined across a broad range of borrowers and industries. Net charge-offs in the first quarter of $10.8 billion, or 4.44%, which reflect the new accounting guidance, are comparable with managed net losses of $11.3 billion, or 4.54%, in the prior quarter.

Nonperforming loans, leases and foreclosed properties were $35.9 billion, compared with $35.7 billion at December 31, 2009. The provision for credit losses was $9.8 billion, $305 million lower than the fourth quarter of 2009 ($992 million lower ex-acctg changes) and $3.6 billion lower than the same period a year earlier.

Looking at the company's balance sheet, BAC reported a tier 1 capital ratio of 10.23% versus 10.4% in the fourth quarter and 10.09% in its first quarter of 2009. The company's tangible common equity ratio was reported as 5.24% versus 5.57% in the fourth quarter and 3.13% in its first quarter of 2009.

In its global card services segment, net income was reported at $952 million as credit costs declined, reflecting continued improvement in the U.S. economy. Net revenue declined 9% to $6.8 billion due to lower net interest income from the decline in average loans and lower fee income resulting from the implementation of the CARD Act. Provision for credit losses decreased $4.7 billion to $3.5 billion from a year ago as lower delinquencies and lower expected losses from the improved economic outlook drove reserve reductions during the quarter.

Global Banking and Markets net income increased $709 million to $3.2 billion, driven by record performance in sales and trading. Revenue increased by $795 million as market conditions improved and the impact of writedowns on legacy assets decreased from a year earlier. Fixed Income, Currency and Commodities revenue of $5.8 billion was primarily driven by sales and trading revenues. Revenue rose on improved market conditions, increased liquidity, tighter credit spreads and the reduced impact of writedowns on legacy assets.

10:03 am GE Beats Q1 Expectations by $0.05

General Electric (GE 18.89, -0.61) reported first quarter earnings this morning, which were better than Wall Street expectations.

The company reported first quarter earnings of $0.21 per share, excluding $0.05 in non-recurring items, $0.05 better than the Thomson Reuters consensus of $0.16. Revenues fell 4.8% year-over-year to $36.6 billion versus the $37.1 billion consensus.

GE Capital Services' (GECS) revenues fell 9% versus the first quarter of last year to $13.2 billion. Industrial sales were $23.5 billion, down 2% from the first quarter of 2009. Segment profit fell 16% compared with the first quarter of 2009, as 12% growth at Energy Infrastructure was more than offset by earnings declines of 41% at GE Capital, 18% at Technology Infrastructure and 49% at NBC Universal. Total company orders were $17.1 billion, or down 8%, while total backlog was stable at $174 billion.

The company said, "GE's environment continued to improve in the first quarter of 2010. We saw encouraging economic signs, including increases in airline passenger miles and freight loadings, declines in receivables delinquencies, and growth in local advertising markets. Total co backlog of equipment and services held steady from the prior quarter at $174 billion. Our Healthcare and Oil & Gas businesses experienced solid orders growth and our equipment and services backlog remains strong. We are seeing solid signs of stabilization. Losses, delinquencies and non-earning assets (ex-FAS 167) declined in the quarter. At the same time, reserve coverage increased. We are originating new business at attractive margins and our funding costs have declined. GE Capital losses seem to have peaked. Commercial real estate continues to be challenging, but the risks are understood and we expect them to be manageable. We have strengthened the GE Capital franchise and are on track for solid earnings growth."

09:49 am GOOG Tops Q1 Expectations

Google (GOOG 563.19, -32.11) reported first quarter results after the close yesterday, which beat expectations.

The company reported fiscal first quarter earnings of $6.76 per share, $0.16 better than the Thomson Reuters consensus of $6.60. Revenues ex-TAC rose 24% year-over-year to $5.06 billion versus the $4.95 billion consensus.

Google-owned sites generated revenues of $4.44 billion, or 66% of total revenues, in the first quarter of 2010. This represents a 20% increase over first quarter 2009 revenues of $3.69 billion. Google's partner sites generated revenues, through AdSense programs, of $2.04 billion, or 30% of total revenues, in the first quarter of 2010. This represents a 24% increase from first quarter 2009 network revenues of $1.64 billion.

Aggregate paid clicks, which include clicks related to ads served on Google sites and the sites of our AdSense partners, increased approximately 15% over the first quarter of 2009 and increased approximately 5% over the fourth quarter of 2009. Operating expenses, other than cost of revenues, were $1.84 billion in the first quarter of 2010, or 27% of revenues, compared to $1.52 billion in the first quarter of 2009, or 28% of revenues.

Non-GAAP operating income in the first quarter of 2010 was $2.78 billion, or 41% of revenues. This compares to non-GAAP operating income of $2.16 billion, or 39% of revenues, in the first quarter of 2009. Net cash provided by operating activities in the first quarter of 2010 totaled $2.58 billion, compared to $2.25 billion in the first quarter of 2009. The company said, "We expect to continue to make significant capital expenditures."

09:42 am AMD Beats Q1 Expectations

AMD (AMD 9.81, -0.35) reported fiscal first quarter results after the close yesterday, which easily topped Wall Street expectations.

The company reported first quarter Non-GAAP earnings of $0.09 per share, excluding non-recurring items, $0.16 better than the Thomson Reuters consensus of ($0.07).

Revenues rose 33.7% year-over-year to $1.57 billion versus the $1.54 billion consensus. Non-GAAP gross margin was 43%, a sequential increase of two percentage points.

For the second quarter, the company said it sees revenues "down seasonally" versus $1.52 billion Thomson Reuters consensus.

Computing Solutions segment revenue decreased 5% sequentially and increased 23% year-over-year. The sequential decrease was driven by lower microprocessor unit shipments, partially offset by an increase in microprocessor average selling price (ASP). The year-over-year increase was driven by an increase in microprocessor unit shipments.

Graphics segment revenue decreased 3% sequentially and increased 88% year-over-year. The sequential decrease was driven primarily by a seasonal decline in royalties received in connection with the sale of game console systems, largely offset by an increase in graphics processor unit (GPU) revenue. The year-over-year increase was driven primarily by an increase in GPU shipments.

09:32 am Housing Starts Show Marked Improvement

Residential construction expenditures received a nice boost as February's housing starts level was revised up to 616,000 from 575,000. March's level rose to an even greater height of 626,000 and outperformed expectations by 16,000.

This was the best housing report since October 2008.

After languishing roughly at or below 500,000 since October 2008, single-family starts have finally moved upward. They rose to 536,000 in the revised February data and held at that level in March.

Multifamily units remained below 100,000 for the sixth time in the last seven months.

Building permits increased by 48,000 to 685,000 in March. They are at their highest level since October 2008.

icon url

ReturntoSender

04/17/10 11:53 PM

#8925 RE: ReturntoSender #6755

Amateur Investors Weekend Market Analysis (4/17/10)

http://www.amateur-investor.net/Weekend_Market_Analysis_April_17_10.htm

As I mentioned last weekend investors were becoming very complacent in the market as the CBOE Equity Put to Call Ratio had dropped back to a rather low level. A chart of the Equity Put to Call Ratio using a 10 Day Average going back to 1997 is shown below. As you can see this week the 10 Day Average reached a level not seen since 2000. Also notice from 1997 through 2000 the 10 Day Average dropped back to or below the .40 level (black line) on several occasions (points A). However the S&P 500 was still able to move higher although there were some decent corrections (points B to C). Meanwhile from 2001 through 2009 the 10 Day Average generally stayed at or above the 0.50 level (brown line).


Finally for those that follow Wave Theory the move down from the October 2007 high to the March 2009 low was clearly a 5 Wave pattern which could be an "A" Wave of a larger "ABC" type corrective pattern. Meanwhile the rally from the March 2009 low has been an impressive corrective "B" Wave which is taking the shape of a possible Triple Zig Zag pattern as the final Z Wave up is occurring. In a triple Zig Zag pattern the W, X and Z Waves are supposed to be a Zig Zag pattern which would look like an "abc" type affair. Also remember a "B" Wave typically can retrace retrace 50%-61.8% of the A Wave so the S&P 500 has reached the upper end of this range as the 61.8% Retrace is at 1229.


Furthermore in this type of pattern once the B Wave completes then the final C Wave to the downside would follow which could become an elongated affair. An example of a similar pattern occurred from the late 1930's through the early 1940's.

icon url

ReturntoSender

04/19/10 10:42 PM

#8927 RE: ReturntoSender #6755

From Briefing.com: 4:30 pm : Financial stocks were whipsawed to a strong gain that helped the broader market recover from a modest loss to make a strong finish.

Early gains were quickly challenged as participants reapplied pressure to financial shares. That sent the financial sector from a gain of more than 1% down to a loss of nearly 1% at its session low. However, the sector was able to stage a rebound amid news that an SEC decision to press on with charges of fraud against Goldman Sachs (GS 163.32, +2.62) was only secured with a 3-to-2 vote, which suggested that the case might not be so strong. Shares of GS finished near their session high, while the broader financial sector settled with a 1.1% gain.

Citigroup (C 4.88, +0.32) recouped all of its losses from the prior session with a 7.0% surge. The move followed better-than-expected earnings.

While renewed strength in the financial sector provided a necessary lift to the broader market, technicals played a part, too. As such, support surfaced for the S&P 500 around 1186 and the Dow brought in buyers when it breached 11,000.

Most of the better performing blue chips in the Dow were buoyed by anticipation for their earnings. IBM (IBM 132.23, +1.60), Coca-Cola (KO 55.32, +0.35), and Johnson & Johnson (JNJ 66.03, +1.01) were atop the list.

A pullback by the greenback boosted the afternoon bid. The buck settled with a gain of less than 0.2% against competing currencies.

Despite the dollar's diminished strength, commodities succumbed to selling. That left the CRB Commodity Index to fall 1.1%. Oil prices were pushed 2.2% lower to close pit trade at $81.45 per barrel. That marked the third straight loss for crude oil prices.

Trading volume was strong this session. In fact, with nearly 1.3 billion shares trading hands on the NYSE this session, it was one of the most actively traded non-options expiration sessions this year.

Advancing Sectors: Financials (+1.1%), Telecom (+1.1%), Health Care (+0.8%), Consumer Staples (+0.4%), Consumer Discretionary (+0.3%), Materials (0.2%), Tech (+0.2%), Utilities (+0.2%), Energy (+0.2%)
Declining Sectors: (None)
Unchanged: Industrials DJ30 +73.39 NASDAQ -1.15 NQ100 +0.00% R2K -0.5% SP400 -0.3% SP500 +5.39 NASDAQ Adv/Vol/Dec 1009/2.15 bln/1672 NYSE Adv/Vol/Dec 1324/1.26 bln/1681

4:48PM Evergreen Solar sees Q1 revs of $78.5 mln vs $73.60 mln Thomson Reuters consensus (ESLR) 1.18 +0.06 : The co announces preliminary unaudited selected financial results for the first quarter of 2010, ended April 3, 2010. Shipments for the first quarter of 2010 increased to a new Company record of approximately 35.4 megawatts. Revenues for the quarter were approximately $78.5 million vs $73.60 mln Thomson Reuters consensus and average selling price was approximately $2.20 per watt. Manufacturing costs were approximately $2.05 per watt, which is consistent with the fourth quarter of 2009. Richard M. Feldt, Chairman, CEO and President stated, "Operationally, our Devens facility is performing very well, and as a result, we expect production and sales to increase to between 37 to 38 megawatts for the second quarter of 2010. Overall, demand for our product in the first quarter was strong and our selling prices decreased modestly by approximately 4% from the fourth quarter of 2009, mostly due to the stronger US dollar. Furthermore, our ongoing dialog with customers indicates that overall demand for our products in 2010 is expected to be consistent with the initial forecast of 175 megawatts we provided in February." Mr. Feldt added, "Our progress in Wuhan, China is on schedule and we expect to begin production in mid 2010. I am particularly pleased to report that we produced our first wafers from Quad furnaces initially being used for training purposes, which were installed in Wuhan in mid-March."

4:15PM IBM beats by $0.04, reports revs slightly above consensus; raises FY10 EPS guidance above consensus (IBM) 132.23 +1.60 : Reports Q1 (Mar) earnings of $1.97 per share, $0.04 better than the Thomson Reuters consensus of $1.93; revenues rose 5.3% year/year to $22.86 bln vs the $22.75 bln consensus. IBM reports Q1 gross margins of 43.6% vs Street est of 44.3%. Co raises guidance for FY10, sees EPS of at least $11.20 vs the $11.12 consensus; up from guidance for at least $11 previously. The company also said it expects constant-currency revenue growth for IBM and for its total services, software and hardware businesses in the second quarter. "Looking ahead, we are confident in our ability to grow revenue, and given our mix of higher-value business and productivity we will expand margins, grow profit, cash and EPS, and increase returns to shareholders"... Segment info: Total Global Services revenues increased 4% (down 2%, adjusting for currency). Global Technology Services segment revenues increased 6% (flat, adjusting for currency) to $9.3 bln. Global Business Services segment revenues were flat (down 5%, adjusting for currency) at $4.4 bln. Consulting services signings were up 18%, with 25% of signings related to Smarter Planet and Business Analytics... IBM ended the first-quarter 2010 with $14.0 billion of cash on hand and generated free cash flow of $1.4 billion, up approximately $400 million year over year.

4:05PM Atheros Communications beats by $0.06, beats on revs (ATHR) 39.76 -0.50 : Reports Q1 (Mar) earnings of $0.57 per share, excluding non-recurring items, $0.06 better than the Thomson Reuters consensus of $0.51; revenues rose 144.3% year/year to $214.7 mln vs the $201.2 mln consensus. "We experienced broad-based strength across our PC OEM and Networking channels, including strong momentum for our newly acquired PLC business..."

11:12AM Semiconductor Hldrs displays relative weakness but holding near initial supports (SMH) 29.60 -0.42 : The SMH generally underperformed the S&P in the wake of its early Jan advance but it provided leadership last week following its technical breakout. It has displayed relative weakness today as the pullback has been extended as low as 29.64 in recent trade but there is room for a pause without any technical damage. The 38% retracement of the advance off the early month reaction low of 27.95 is at 29.54 has been probed in recent trade (session low 29.57) with the 50% level at 29.24 (Click for daily chart).

8:04AM Silicon Labs and Arrow Electronics establish global franchise agreement (SLAB) 52.05 : Arrow Electronics (ARW) and SLAB announced a distribution agreement for Silicon Labs' broad portfolio of mixed-signal products.

2:50AM STMicroelectronics Board to propose increase annual dividend to $0.28/share from $0.12/share (STM) 10.25 :

09:38 am Advanced Micro upgraded to Buy at Broadpoint AmTech Research; tgt raised to $10: . Broadpoint AmTech Research upgrades AMD to Buy from Neutral and raises their tgt to $10 from $5.80 as the recent positive events (Analyst Day/INTC settlement/capital structure) lead the firm to believe that AMD's risk/reward is now compelling. The firm notes that AMD's capital structure improved as a result of INTC's $1.25 bln settlement and yesterday's announcement of debt restructuring actions. The firm believes that AMD's debt of ~$3.7 bln will be reduced by ~25%, while also lowering interest expense slightly less, ~20%. Should Global Foundries and ATIC's chartered purchase be consolidated, the firm believes that they could see deconsolidation in the following 3-6 months. Furthermore, the firm feels that revenue growth in the coming quarters will prove to be stronger than the Street is modeling, driven by: a healthy Win7 cycle; leadership in the Evergreen GPU platform; more focused marketing; and possible tailwind from INTC settlement headlines entering the selling season.

icon url

ReturntoSender

04/20/10 8:34 PM

#8928 RE: ReturntoSender #6755

From Briefing.com: 4:35 pm : Blue chips managed modest gains amid a bevy of better-than-expected earnings, but the results acted as a positive catalyst for the broader market, which settled with a strong gain.

The S&P 500 extended its rebound from the prior session so that it is now less than 1% below the 52-week high that it tumbled from late last week. Its strength in the latest session was broad based with all 10 major sectors booking gains.

Broader market strength coupled with a 0.9% increase in crude oil prices to $83.91 per barrel to take energy stocks to a 1.9% gain. That was the best of the major indices.

Financials were next in line. The sector settled 1.3% higher with regional banks up 3.5% following better-than-expected bottom line results from Marshal & Isley (MI 9.31, +0.90), Regions Financial (RF 8.80, +0.47), and Zions Bank (ZION 27.42, +1.99).

Goldman Sachs (GS 159.98, -3.34) reported an upside earnings surprise of its own on the heels of fraud charges by the SEC. As for the latter matter, Britain's financial regulator started a formal enforcement investigation into the firm.

IBM (IBM 129.69, -2.54) and Johnson & Johnson (JNJ 65.99, -0.04) also bested Wall Street's expectations for the latest quarter, but a lowered forecast from Johnson & Johnson and dissatisfaction with IBM's margins dampened enthusiasm over the reports.

Market participants also showed little interest in upbeat earnings from Coca-Cola (KO 54.47, -0.85) and a dividend hike from Procter & Gamble (PG 63.19, -0.03). Their subsequent weakness hampered the consumer staples sector, which closed just 0.1% for the better.

Still, buying in the broader market was impressive as stocks climbed for the eighth time in nine sessions and the Volatility Index dropped by 9.3%. The VIX is now just 3% above the multiyear low that it hit last week.

Advancing Sectors: Energy (+1.9%), Financials (+1.3%), Utilities (+1.1%), Consumer Discretionary (+1.1%), Industrials (+0.7%), Telecom (+0.7%), Tech (+0.4%), Health Care (+0.3%), Materials (+0.2%), Consumer Staples (+0.1%)
Declining Sectors: (None) DJ30 +25.01 NASDAQ +20.20 NQ100 +0.5% R2K +1.4% SP400 +1.3% SP500 +9.65 NASDAQ Adv/Vol/Dec 2045/2.08 bln/651 NYSE Adv/Vol/Dec 2499/1.13 bln/556

4:36PM Apple beats by $0.88, beats on revs; guides Q3 EPS below consensus, revs above consensus (AAPL) 244.59 -2.48 : Reports Q2 (Mar) earnings of $3.33 per share, $0.88 better than the Thomson Reuters consensus of $2.45; revenues rose 48.7% year/year to $13.5 bln vs the $12.04 bln consensus. Co reports Q2 gross margins of 41.7% vs Street est of 40.1%, up from 39.9% in the year-ago quarter. Co reports 10.89 mln iPods sold in Q2 vs Street est of ~9.7 mln, 8.75 mln iPhones sold in Q2 vs Street est of ~7.3 mln, and 2.94 mln Macs sold in Q2 vs Street est of ~2.9 mln. Co issues mixed guidance for Q3, sees EPS of $2.28-2.39 vs. $2.70 Thomson Reuters consensus; sees Q3 revs of $13.0-13.4 bln vs. $12.97 bln Thomson Reuters consensus. International sales accounted for 58% of the quarter's revenue. "We're thrilled to report our best non-holiday quarter ever, with revenues up 49 percent and profits up 90 percent," said Steve Jobs, Apple's CEO. "We've launched our revolutionary new iPad and users are loving it, and we have several more extraordinary products in the pipeline for this year." Stock is halted.

4:21PM Altera beats by $0.10, beats on revs; guides Q2 revs above consensus (ALTR) 26.75 +0.68 : Reports Q1 (Mar) earnings of $0.50 per share, $0.10 better than the Thomson Reuters consensus of $0.40; revenues rose 52.0% year/year to $402.3 mln vs the $396.7 mln consensus. Co issues upside guidance for Q2, sees Q2 sequential revs growth of 8-12%, which calculates to ~$434.5-450.6 mln vs. $400.80 mln Thomson Reuters consensus.

4:08PM Juniper Networks beats by $0.01, reports revs in-line (JNPR) 31.45 +0.27 : Reports Q1 (Mar) earnings of $0.27 per share, excluding non-recurring items, $0.01 better than the Thomson Reuters consensus of $0.26; revenues rose 19.4% year/year to $912.6 mln vs the $906.1 mln consensus. JNPR's operating margin for the first quarter of 2010 increased to 17.6% on a GAAP basis from 10.6% in the same quarter a year ago. Non-GAAP operating margin for the first quarter of 2010 increased to 23.2% from 16.4% in the same quarter a year ago.

4:05PM Cree beats by $0.03, beats on revs; guides JunQ above consensus (CREE) 82.17 +2.10 : Reports Q3 (Mar) earnings of $0.47 per share, excluding non-recurring items, $0.03 better than the Thomson Reuters consensus of $0.44; revenues rose 78.5% year/year to $234.1 mln vs the $223.5 mln consensus. CREE reports non-GAAP gross margin of 48.1% vs the 47.1% consensus. Co issues upside guidance for Q4 (Jun), sees EPS of $0.48-0.51, excluding non-recurring items, vs. $0.47 Thomson Reuters consensus; sees Q4 revs of $255-265 mln vs. $241.8 mln Thomson Reuters consensus.

4:02PM Plexus beats by $0.02, reports revs in-line; guides Q3 EPS in-line, revs above consensus (PLXS) 39.66 +2.229 : Reports Q2 (Mar) earnings of $0.51 per share, $0.02 better than the Thomson Reuters consensus of $0.49; revenues rose 26.3% year/year to $491 mln vs the $486.4 mln consensus. Co issues mixed guidance for Q3, sees EPS of $0.54-0.60 vs. $0.54 Thomson Reuters consensus; sees Q3 revs of $520-545 mln vs. $506.81 mln Thomson Reuters consensus. "Our pace of new business wins continued at a strong level. During the second fiscal quarter we won 18 new manufacturing programs that we currently anticipate will generate approximately $137 million in annualized revenue when fully ramped into production over the coming quarters. Our engineering services business continued to build a healthy backlog, winning approximately $16 million of new programs during the second fiscal quarter. All new business is subject to risks around the timing and ultimate realization of the anticipated revenues."

4:01PM Evergreen Solar Announces Proposed $165 Million Convertible Senior Secured Notes Offering (ESLR) 1.22 +0.04 : Co announced its intention to offer $165 million aggregate principal amount of convertible senior secured notes due 2015, subject to market conditions and other factors. Evergreen Solar will use the net proceeds from this offering for the purchase of a portion of its outstanding 4% Convertible Senior Notes due 2013 concurrent with the closing of this offering, and intends to use the remainder of the net proceeds for general corporate purposes, working capital and capital expenditures for further expansion of its manufacturing facility in Wuhan, China.

4:00PM Canadian Solar expects PV module shipments in the first quarter of 2010 to be approximately 189 MW to 191 MW, with gross margins at 13% to 13.5%. (CSIQ) 21.33 +0.40 : Co announced that based on selected unaudited financial results, it now expects PV module shipments in the first quarter of 2010 to be approximately 189 MW to 191 MW, with gross margins at 13% to 13.5%. This compares to prior expectations for shipments of approximately 180 MW to 190 MW and gross margin in the mid-teens. The Company expects to incur a material net foreign exchange loss for the quarter, estimated at US $18 million to US $20 million pre-tax, due to the significant depreciation of the Euro against the U.S. dollar during the quarter. "Demand for our products was very strong in Q1 and we were able to maintain our raw materials prices as well as our processing costs within the expected range for the quarter. The Euro depreciated dramatically during the quarter and we did not have adequate currency hedging to cover our Euro exposure. We have since taken actions to significantly increase our currency hedging, with approximately 85% of our expected Euro exposure for the second quarter of 2010 now protected."

Integral Systems (ISYS) has entered into an agreement with Aleut Communications Services to relocate the operational satellite ground system equipment. Under the terms of the FSOF Relocation contract, Integral Systems will provide the engineering services and expertise to plan and execute moving all of the equipment to NOAA's new, modernized facility, without disrupting operations... Clare, a wholly owned subsidiary of IXYS Corporation (IXYS), announced the immediate availability of the CPC9909 High-Voltage HB LED driver...

8:04AM Trina Solar to Supply Power for Belgian-European Pavilion at Shanghai World Expo (TSL) 25.20 : Co announces that its subsidiary, Changzhou Trina Solar Energy, has partnered with one of the largest and most experienced global renewable energy developers, Enfinity, to cover the roofs of the Belgian-European Pavilion and the Theme Pavilion at the 2010 Shanghai World Expo with the Company's modules.

2:03AM O2Micro receives ruling in ITC case (OIIM) 7.40 : Co announces that the Administrative Law Judge for the U.S. International Trade Commission issued an Initial Determination regarding respondents Monolithic Power Systems (MPWR), Microsemi (MSCC), and ASUSTek. The ALJ determined that none of the Respondents in the investigation violated Section 337 (19 U.S.C. 1337). The ALJ's ruling is an Initial Determination on the Respondents' activities as they relate to a single O2Micro patent. If the Commission grants a petition for review, it may affirm, modify, reverse, set aside, or remand all or part of the ALJ's decision in developing the full final determination.

icon url

ReturntoSender

04/21/10 10:38 PM

#8929 RE: ReturntoSender #6755

From Briefing.com: 4:30 pm : Action was generally lackluster in the broader market this session, but there were a few pockets of strength as participants digested the latest round of earnings results.

Choppy trade took the S&P 500 from a modest gain in the early going down below the psychologically significant 1200 line, but the broad market measure was able to recover into the close to settle with a slight loss.

Industrials were a steady source of strength this session. The sector finished 0.9% higher amid strength in Dow components United Technologies (UTX 76.93, +2.73) and Boeing (BA 74.21, +2.80), along with Lockheed Martin (LMT 86.25, +1.28). Each posted a positive earnings surprise for the latest quarter.

Huntington Bancshares (HBAN 6.59, +0.76) led regional banks 1.7% higher, even as Wells Fargo (WFC 33.01, -0.68) faltered amid disappointment over the lender's top line results.

In a similar vein, Morgan Stanley (MS 31.68, +1.23) moved investment banks markedly higher with its earnings, but Goldman Sachs (GS 158.93, -1.05) failed to follow. Shares of GS were grounded despite a CNBC report that the SEC has a testimony that appears to contradict the fraud charges aimed against Goldman Sachs.

Financials finished with a 0.5% loss, but had been down in excess of 1% at their session low.

Health care stocks were the weakest overall with a 1.8% loss. That slide came even though Stryker (SYK 57.93, -0.52) and St Jude Medical (STJ 41.75, +0.75) posted positive reports. Abbott Labs (ABT 51.78, -1.28) also beat expectations, but led pharmaceutical plays lower. Gilead Sciences (GILD 40.76, -4.31) bested earnings expectations, too, but was hit with an analyst downgrade that imbued the broader biotech space.

Weakness among biotechs undermined the Nasdaq Composite, such that it was unable to finish with more than a modest gain despite a record high for Apple (AAPL 259.22, +14.63). Apple boasted blowout numbers in its latest quarterly report.

Though the Nasdaq Composite was hampered a bit, the Nasdaq 100 was able to outperform with a 0.5% gain. Amazon.com (AMZN 146.43, +2.23) was an additional source of support ahead of its earnings announcement Thursday night.

The S&P 400 Mid-Cap Index managed a 0.4% gain, thanks to help from Tupperware Brand (TUP 53.92, +5.56), which not only posted upside earnings results, but also issued an upside forecast.

Small-caps in the Russell 2000 settled 0.6% higher amid leadership from Cybersource (CYBS 25.72, +6.28), which will be acquired by Visa (V 93.13, -0.92) for $26 per share -- a premium of nearly 34% above its prior session close.

Commodities closed with a collective gain of 0.4%, as measured by the CRB Commodity Index. Its strength was primarily underpinned by gold's 0.8% gain to $1148.80 per ounce and silver's 1.4% climb to $18.08 per ounce in the face of the dollar's 0.2% increase against a basket of foreign currencies.

Oil prices failed to sustain a rebound that followed a selloff induced by a surprise build in weekly oil inventories. It settled with a 0.2% loss at $83.68 per barrel. Natural gas gave up a gain of more than 1% to close 0.5% lower at $3.96 per MMBtu.

Treasuries garnered strong support this session. In turn, the benchmark 10-year Note made its way 15 ticks higher, which took its yield down to 3.75%.

Advancing Sectors: Industrials (+0.9%), Consumer Discretionary (+0.6%), Tech (+0.4%), Utilities (+0.2%), Consumer Staples (+0.1%)
Declining Sectors: Health Care (-1.8%), Telecom (-0.9%), Financial (-0.5%), Energy (-0.2%), Materials (-0.1%) DJ30 +7.86 NASDAQ +4.30 SP500 -1.23 NASDAQ Adv/Vol/Dec 1418/2.63 bln/1265 NYSE Adv/Vol/Dec 1741/1.21 bln/1300

6:32PM Teradyne beats by $0.10, beats on revs; guides Q2 EPS above consensus, revs above consensus (TER) 12.18 +0.04 : Reports Q1 (Mar) earnings of $0.33 per share, excluding non-recurring items, $0.10 better than the Thomson Reuters consensus of $0.23; revenues rose 173.3% year/year to $329.6 mln vs the $302.7 mln consensus. Co issues upside guidance for Q2, sees EPS of $0.45-0.52 vs. $0.24 Thomson Reuters consensus; sees Q2 revs of $390-420 mln vs. $314.98 mln Thomson Reuters consensus.

5:03PM Mattson reports 1Q10 net loss of ($0.22) vs. ($0.22) Thomson Reuters consensus; revenue increased 350% y/y to $25.2 mln vs. $23.6 mln consensus (MTSN) 5.32 +0.07 :

4:22PM Lam Research beats by $0.12, beats on revs (LRCX) 39.99 -0.42 : Reports Q3 (Mar) earnings of $0.94 per share, excluding non-recurring items, $0.12 better than the Thomson Reuters consensus of $0.82; revenues rose 29.9% year/year to $632.8 mln vs the $623.8 mln consensus. quarter. Ongoing gross margin for the March 2010 quarter was $292.9 million or 46.3%, compared to ongoing gross margin of $218.5 million, or 44.8%, for the December 2009 quarter. The sequential increase in gross margin was primarily due to improved factory utilization as a result of increased business volume and a more favorable product mix. Ongoing operating expenses for the March 2010 quarter remained essentially flat compared with the December 2009 quarter. "Shipments for the March 2010 quarter represented an all-time high for Lam Research reflecting market share gains in both our etch and clean businesses, supported by strong operational performance of the factory and supply chain".

4:22PM Intersil beats by $0.02, beats on revs; guides Q2 EPS above consensus, revs above consensus (ISIL) 16.75 +0.01 : Reports Q1 (Mar) earnings of $0.22 per share, $0.02 better than the Thomson Reuters consensus of $0.20; revenues rose 60.2% year/year to $189.4 mln vs the $185 mln consensus. Co issues upside guidance for Q2, sees EPS of $0.23-0.26 vs. $0.22 Thomson Reuters consensus; sees Q2 revs of $200-208 mln vs. $191.43 mln Thomson Reuters consensus. "The industrial and communications end markets continued their strong recoveries, while our computing end market performed better than anticipated due to strength in the worldwide PC business," said Dave Bell, Intersil's President and Chief Executive Officer. "Inventories remain stable at historically low levels and our manufacturing capacity has kept lead times much lower than many of our competitors."

4:04PM Intersil donates 100,000 square-foot wafer fabrication facility to the University of Central Florida (ISIL) 16.74 +0.01 : Co announced that it will donate a high-technology semiconductor wafer fabrication facility and the land it occupies to the University of Central Florida. The gift consists of 100,494 square feet (9,336 square meters) of office space, manufacturing and cleanroom facilities, plus a 5 acre (2 hectare) property. In addition, Intersil will provide utilities and assist with operating expenses during the first three years of UCF's ownership, enabling a turnkey solution for the university. The entire donation is valued at approximately $13 million.

4:17PM Novellus beats by $0.05, beats on revs (NVLS) 26.65 +0.05 : Reports Q1 (Mar) earnings of $0.47 per share, excluding non-recurring items, $0.05 better than the Thomson Reuters consensus of $0.42; revenues rose 179.3% year/year to $276.2 mln vs the $265.5 mln consensus. Co said, "There continues to be strong demand for personal computers from both the consumer and corporate sectors. This bodes well for continued capacity expansion in the semiconductor industry. We are very pleased with our strong operating performance this quarter and believe we can continue to improve on all key financial metrics. Looking forward, we expect our business prospects to continue to be good."

4:09PM F5 Networks beats by $0.02, beats on revs; guides Q3 EPS above consensus, revs above consensus (FFIV) 66.96 +1.00 : Reports Q2 (Mar) earnings of $0.56 per share, $0.02 better than the Thomson Reuters consensus of $0.54; revenues rose 33.7% year/year to $206.1 mln vs the $199.6 mln consensus. Co issues upside guidance for Q3, sees EPS of $0.57-0.59 vs. $0.56 Thomson Reuters consensus; sees Q3 revs of $214-219 mln vs. $206.93 mln Thomson Reuters consensus. Reflecting both the high number of service maintenance contracts generated by new product sales and the high renewal rate on existing maintenance contracts, deferred revenue increased to $226.5 million, up 7% from the prior quarter and 41 percent from the second quarter a year ago.

4:06PM Qualcomm beats by $0.02, beats on revs; guides Q3 EPS in-line, revs in-line; guides FY10 EPS in-line, revs in-line (QCOM) 42.63 -0.66 : Reports Q2 (Mar) earnings of $0.59 per share, $0.02 better than the Thomson Reuters consensus of $0.57; revenues rose 8.1% year/year to $2.66 bln vs the $2.63 bln consensus. Co issues in-line guidance for Q3, sees EPS of $0.51-0.55 vs. $0.55 Thomson Reuters consensus; sees Q3 revs of $2.5-2.7 bln vs. $2.66 bln Thomson Reuters consensus. Co issues in-line guidance for FY10, sees EPS of $2.21-2.32 vs. $2.31 Thomson Reuters consensus; sees FY10 revs of $10.4-11.0 bln vs. $10.77 bln Thomson Reuters consensus. Co guides FY10 CDMA-based device average selling price range to approx. $182 - $188. "We delivered strong financial results this quarter, driven by healthy 3G device shipments and greater than expected demand for our chipsets. 3G subscribers have now surpassed 1 billion worldwide and with the 3G auction process underway in India, the 3G footprint continues to expand globally... Calendar year 2010 3G device shipments are progressing in line with our expectations, and although we're continuing to operate in a competitive chipset pricing environment, we're positioned to continue to grow share through new partner engagements and our broad, industry-leading 3G chipset roadmap. Our business is executing well and we are pleased to be raising our earnings guidance for the fiscal year."

8:31AM Evergreen Solar announces the pricing of $165 million of its 13% convertible senior secured notes due 2015 (ESLR) 1.25 : The notes will mature on April 15, 2015 unless earlier converted, repurchased or redeemed. Interest will be payable semi-annually at a rate of 13% per annum on each April 15 and October 15, beginning on October 15, 2010.

(TSM) announced that it has shipped nearly 600,000 8-inch 0.25-micron AEC-Q100 grade 1 qualified embedded flash wafers targeted at a wide variety of automotive applications, accounting for over 720 mln microcontrollers...

American Superconductor Corporation (AMSC) announced that it has received another follow-on order for 30 sets of wind turbine power electronic components from Ulsan, South Korea-based Hyundai Heavy Industries. AMSC expects to complete shipments under this new order by June 30, 2010.

7:09AM EMC beats by $0.02, beats on revs; guides FY10 EPS above consensus, revs above consensus (EMC) 19.41 : Reports Q1 (Mar) earnings of $0.26 per share, $0.02 better than the Thomson Reuters consensus of $0.24; revenues rose 23.5% year/year to $3.89 bln vs the $3.71 bln consensus. Co issues upside guidance for FY10, sees EPS of $1.18 vs. $1.14 Thomson Reuters consensus; sees FY10 revs of $16.5 bln vs. $16.04 bln Thomson Reuters consensus. "During the first quarter, we saw customers move forward with increased confidence, focusing not only on cost cutting initiatives, but beginning new innovative projects in their traditional and virtual data center infrastructures. This helped us clearly achieve the 'triple play' we projected last quarter by gaining market share while investing for the future and increasing profitability. Looking ahead, we remain confident that we'll continue to execute on all three of these areas."

7:01AM ATMI beats by $0.05, beats on revs (ATMI) 20.99 : Reports Q1 (Mar) earnings of $0.25 per share, excluding one time tax benefit, $0.05 better than the Thomson Reuters consensus of $0.20; revenues rose 128.1% year/year to $85.3 mln vs the $82.2 mln consensus. Co says "We believe our revenues during the quarter grew at a rate greater than the overall market, due to strength in our life sciences products and evidence of some localized SDS(R) inventory stocking, Volume, favorable product mix and continued cost control resulted in an increase in gross margin to 48.9%. We generated $19.5 million in cash from operations. Our business model and strong balance sheet provide us financial and strategic flexibility to take advantage of opportunities in the marketplace. As previously announced, increased research and development investment related to our high productivity development platform will cause quarterly R&D spending to increase by approximately $3 million for the remaining quarters of 2010."
icon url

ReturntoSender

04/22/10 9:26 PM

#8930 RE: ReturntoSender #6755

There are a lot of stocks selling off on earnings that beat even. The market has come a long way. Some individual stocks have had huge runs off the bottom so profit taking is absolutely necessary.

Where I get a bit concerned is trying to short stocks in the face of a bull market that very likely is not over. I would be afraid to short most positions for very long at all.

Let me explain why using a chart. Lets look at the market as a whole using the NASDAQ Composite as an example but you could substitute virtually any major market average. Look at the RSI. What you will see is that while the market could sell off at any point in time that we have not yet hit one of the hallmarks of previous true market tops an RSI(14) over 70 on the monthly charts:


RtS

icon url

ReturntoSender

04/24/10 10:38 PM

#8932 RE: ReturntoSender #6755

From Briefing.com: 4:30 pm : The Dow closed on its highs for the year, and finished higher for its eighth consecutive week, closing on its 200-week moving average. U.S. equities initially took their cue from Europe as investors responded positively to Greece seeking aid from the IMF and European Union.

News that Greece requested $55 billion from the EU and IMF helped improve the mood of investors following last night's after-hours session, when it had appeared several companies would be weaker this morning. Traders sold the news of better-than expected earnings from market heavyweights Microsoft (MSFT 30.96, -0.43) and Amazon (AMZN 143.63, -6.46), investors gained confidence as the selling stayed contained, and stocks started rallying around midday to close at both session highs and 19-month highs.

Energy shares were the best performers, gaining 2.3%. Schlumberger (SLB 72.68, +4.50) led the sector showing gains of almost 7%. Higher oil prices helped as crude closed near $85.10 in electronic trading.

Meanwhile, telecom shares continued to lag the broader market and closed down 0.2%. A downgrade of Verizon (VZ 29.05, -0.23) put pressure on shares in the telecom space.

Volume on the NYSE closed above its 200-day average for the third straight session.

Economic data released today had little sustainable impact on the direction of the market in early trading. A surprise spike in new home sales for March of 26.9% month-over-month to an annualized rate of 411,000 units led to a short rally in stocks, but they later pulled back.

Durable goods orders for March also had little influence on the market's initial direction. Total orders fell 1.3%, which is a negative surprise since the consensus had called for a 0.2% increase. Excluding transportation, durable goods orders for March spiked 2.8%, which was considerably stronger than the 0.7% increase that had been widely forecast. Orders less transportation for February were revised higher to reflect a 1.7% increase.

Advancing Sectors: Energy (+2.3%), Materials (+1.3%), Health Care (+1.1%), Utilities (+0.8%), Industrials (+0.7%), Consumer Discretionary (+0.5%), Tech (+0.5%), Financials (+0.4%)
Declining Sectors: Telecom (-0.2%), Consumer Staples (-0.1%) DJ30 +69.99 NASDAQ +11.08 NQ100 +0.5% R2K +1.0% SP400 +1.0% SP500 +8.61 NASDAQ Adv/Vol/Dec 1702/2.43 bln/991 NYSE Adv/Vol/Dec 2161/1.21 bln/869

icon url

ReturntoSender

04/25/10 12:24 PM

#8934 RE: ReturntoSender #6755

InvestmentHouse Weekend Market Summary 4/23/10

http://www.investmenthouse.com/weekendmarketsummary.htm

-Sellers try to sell early but have no stomach for it and the buyers push the indices to new rally highs.
- Greece knuckles under, calls in the IMF (meaning you and me).
- FOMC members feel it is time to start selling over $1T of mortgage securities.
- March Durable Goods Orders weighed down by lack of airplane sales.
- March new home buyers take advantage of expiring credit, spiking sales 27%.
- HHS report pegs national healthcare at hundreds of billions more than expected with millions losing their insurance, and hospitals closing.
- SEC or SEX? Your tax dollars viewing porn.
- Volume finally shows up, but after two months of gains it is not necessarily the good thing some suggest.
- Leadership continues to find a way as money continues to find its way into the market.

Sellers tried their hand again this week but were beaten back with new rally highs.

There was way too much information in the market on Friday, and not all of it had to do with the market. There were the usual issues with Greece, the economy, the Fed, and earnings; but there was other news that was frankly disturbing. The Medicare actuary said that the newly-passed healthcare bill will cost hundreds of billions of dollars more than anticipated. There will be hospital closures because they won't be able to make the bottom line with their expenses and the cost structures that are laid out. Then there was news from FCC, those guardians of our dollars who go after the Bernie Madoffs and corrupt bankers. In the midst of trying to pass a 1600-page bank regulation bill, we find out they are spending their time and taxpayer dollars watching porno sites and spending eight hours a day doing this. One fellow visited the sites 1800 times in two weeks. That is your money at work. We put our trust in the government to do the right thing and be the watchdogs for us. We concede our liberties to them and trust they will take care of us, and we need to rethink that position because it never works. That is why we set up the kind of country we did with checks and balances (that we are giving away). Of course, I digress.

The market was somewhat in trouble until the morning. It was not in dire straits but was just ready to open lower. It bounced around through the morning. Then the dollar started to fall back, and that gave stocks a boost. They rallied up to the close with all of the indices closing positive and pushing to new rally highs. They were led once again by the best rallying sector of all: The small caps. An incredible uptrend, never got in trouble. It didn't stall out as did many of the large cap stocks. It just kept trucking. SP500 hit a new rally high as well, pushing through the high of just over a week ago. It was an important move for the SP500 because it had undergone a week of some churn, as had the other large cap indices. High volume and an inability to move further at the top of the run is a warning sign. It was good to see it push through, and now we will see if it holds the move into next week and keeps things going. The stock market ended the week on a very positive note and looks to be in good shape once again.

OTHER MARKETS.

Dollar. The dollar started the day strong, but it was not able to hold that gain at least against the basket of currencies on the DXY0. It did finish lower against the Euro after starting stronger on the day (1.3369 Euros versus 1.3291 Thursday). As the dollar reversed, the stock market seemed to pick up momentum toward the end of the day. It was also stronger Friday morning before it reversed. The dollar is still in good shape because it rallied back. It was in trouble over the last three weeks, but it has broken back up and looks solid. It had a boost of last week because of the issues in Greece. On Friday there was a reason that the dollar reversed after starting stronger: Greece finally gave in and asked the IMF to bail them out because the austerity programs were not being well-received by the market. Of course they are not. Every time the Greek government announced a modest (at best) austerity package, the pension holders and workers had strikes and rioted in the street. The market was not too sanguine about what Greece was trying to do, because it knew it would not fly with the workers. After Greece initially said it wanted IMF help and the dollar surged, things calmed down and the dollar faded. It is still in decent shape, but it sold back on the session.
Click to view the chart

Bonds. Bonds in the US finished weaker; in other words, they sold and pushed yields higher (US 10 year 3.82% versus 3.77% Thursday.) Bonds surged in the US off this low based upon the weakness building in Greece. It came out this week when the Greek bond market imploded and yields surged and their bond curve inverted. That means the short end including the 2 year note held a higher yield than the long end. In other words, money had no value down the road in Greece because they thought things would get worse. That inversion is a sign of economic recession at the least.

The government came to its senses and thought it better get money now before things get out of hand. That helped ease some of the pressure on the US dollar because everyone said at least the IMF is in there now and will help. We will see. Our bond market tells us the story is not over because bonds rallied off their lows on Friday. We know there are still skeptics in the bonds market, and you can see that when looking at the pattern. Bonds were also hit because at least half of the FOMC members think it is time for the Fed to start selling its $1.25T in mortgage-related assets. It is time to start clearing the books. It may not be the same thing as tightening, but it has that effect as it tends to drive rates higher because it makes what they are holding worth less. Bonds struggled and sold and yields rallied in the US on Friday for those two reasons: the IMF going into Greece, and more indication that the US Fed will embark on a tighter money policy. That has to happen, and it is one of the reasons bonds have been trending lower since December. The rally over the last few weeks was due almost directly to worries of failure in Greece. We will see if that changes now that the IMF is in. It also didn't hurt that Russia had a successful bonds auction for the first time in about ten years. Iceland had its credit rating increased by Moody's. Iceland was one of the first banking systems to collapsed, and the raised credit rating may help. You cannot help but think that maybe Moody's was feeling sorry for Iceland due to the volcano. It was raised, but no one takes much stock in credit rating agencies right now.
Click to view the chart

Oil. Oil is bouncing back nicely. It sold off at the first of the week and the end of the prior week. It broke back down in its trading range, but that was short lived. It bounced back up and had a big day on Friday. ($85.10, +1.40). It is back out of the trading range. It had a test, something of an ABCD pattern, and has taken back off. There is the impulse move, the ABCD, and just when it looked like it would dive, it reversed and moved back up. That is what the ABCD pattern does for you. Oil is moving to the upside, it is back out of its range, and is looking like it will continue higher into the summer. We will have the 3.00 a gallon gas prices, don't worry, folks. I know you are all relieved to hear that.
Click to view the chart

Gold. Gold rallied on Friday as well ($1,156.40, +13.50). It has been basing. It sold back a little over a week ago, it has recovered, and it has cleared this important peak in March making a higher high. Gold has also set up something of an ABCD pattern. There is the impulse move, ABCD, and now it is moving back up. Gold looks good. There is a lot of inflation out there you cannot have this kind of money out there without inflation. That is why the Fed says it will have to start tightening the old belt again. Even as the Fed spoke, gold still rallied. You think people are not exactly believing that the IMF is going to handle Greece and that the US is going to be able to prevent inflation? There are doubts, and I am sure you are shocked to hear that.

The other markets have been impacted all week by what has been transpiring here as well as overseas. It has been a fascinating week with respect to what China said on slowing its economy, what the Fed is talking about with tightening its belt, the Greece situation, and the other countries that are as close as Greece to having serious financial issues. This is as close right now as we were in the second half of 2008 to having a selloff. We are not out of the woods by any stretch. You have to be careful and keep an eye on what is ahead. When the stock market continues to move higher with all the money in it, being careful means keeping your money at work right now.
Click to view the chart

TECHNICAL PICTURE

INTERNALS

Breadth. Breadth was bland just as it was on Thursday with a 1.7:1 advancers over decliners on the NASDAQ. With the SP600 in the lead on the NYSE, there was a 2.5:1 ratio. Very solid advance on the NYSE with the small caps leading the way and punching out new highs once more.

Volume. Volume fell off 10% on NASDAQ, but it was still solid at 2.35B. Volume fell on the NYSE as well, but it was at 1.2B. Still very respectable by all accounts. A lot of folks on the financial stations said it was nice to see the volume come in this week, and that is nice if things are moving up. They did move up but, over the past couple of weeks, the volume has been up but the market has not moved anywhere. That is the churn I was talking about where it is unable to make the new highs and unable to continue to the upside. You have to worry about that. High volume when the market cannot move higher after a strong run (as we have seen since the start of February) means stocks are trading hands a lot. It makes sense because the market is not going up, but there is a lot of volume. That means a lot of trading is going on, but the buyers and sellers are just trading hands no one is taking charge. The buyers have led all the way up because the market has rallied. There were more buyers than sellers. Now over the last week or two they were equal. One day the buyers would win, then the next the sellers would win and vice versa. That is a change from just the solid upside where the buyers were clearly in control. Since the volume was higher, that shows the sellers were more active; indeed, we saw them come into play on Wednesday and Thursday. They sold the market off on Thursday, but the market turned back up and the buyers won the day. And the buyers actually won the week because all of the indices broke to new rally highs on Friday and they did so on solid volume. Not increased volume, but still solid. That is a positive, and there is no writing around that. Despite the chop, the market finished to the upside with new rally highs. You cannot complain about that.

CHARTS

SP500. SP500 broke to a new rally high after nearly two weeks of lateral movement on high volume. There was some churn and distribution but also some buying. The buyers came back on Thursday and pushed the market higher, and then they broke it to a new rally high on Friday. Clearly the buyers were in a bit of trouble and the sellers exerted themselves somewhat. They tried to take control, but they were rebuffed and the buyers won the day on the SP500. They won the day and the week on NASDAQ as well.

NASDAQ. NASDAQ broke to a new rally high itself. Volume was no great shakes on Friday, but it was still above average. When you look at the Thursday reversal where it started lower, tested the 18 day EMA, and then reversed to positive, there was very strong volume. There was a very strong move and it is continuing on NASDAQ with the break to the new high. Everyone wants to look for the market to sell. We had "just in case" downside plays because it looked like the market was getting ragged. But every time the market gets ragged, the buyers come in because there is so much liquidity in the market. The Fed has not pulled it out yet. Until the Fed does pull it out or is talking about it on a daily basis, the market is still going to try to overcome the sellers and continue higher.

SP600. Stellar performance. All week there were new highs. It started with a bit of trouble but reversed intraday on Monday. Then it was higher Tuesday, Wednesday, Thursday and Friday. Impressive, impressive and did I say impressive? The small caps are leading, and that is a good barometer for the economy. There is no arguing about that as well. You can complain about it all you want, you can say this recovery is not a good recovery or as strong as others in the past. And you will be right. But things were so bad at the bottom that they could only improve. Any improvement from zero is a positive. For now, the momentum is up. We have seen earnings reports continue to come in strong with 70% of those reporting having beaten on the revenue side. In other words, there were increased sales. 85% have beaten on the bottom line, and that means earnings. That is much higher than historic norms. The momentum is there for profits with low employment levels in other words, high productivity and feeling the need to higher. The market thinks that the companies will be able to maintain those high profit levels for the next few quarters. Thus the small cap index continues to rally higher.

SOX. The semiconductors were somewhat of a laggard on Friday. They were up, but it was not quite 0.4%, and not the strong move you saw in most of the other indices. I am not overly worried about that. There was the gap higher a week and a half ago on the INTC earnings that was filled. It has moved up since then, and there are a lot of great-looking stocks in the SOX (and we own some of them). I feel decent about those and the prospects of this index. It is not overbought, and a lot of the stocks are in excellent position to move higher.

In sum, the sellers did try to influence the market. They put their cards on the table Wednesday and Thursday, and they did it the Friday before. Each time, however, the buyers were able to snatch victory from the jaws of defeat. The sellers were bluffed, they folded, and the buyers won and the market rallied. Even though volume was higher and there was churn, the buyers still outnumber the sellers. They are pushing the indices higher based upon the outlook now for the future that they still view as positive.

LEADERSHIP

Semiconductors. Semiconductors had a great week. LRCX broke higher on its earnings and continued the move on Friday. Very solid action. NVLS had a solid week, too; a modest gain on Friday, but a very good week. It broke higher already. There were a couple of strong moves, and it had good earnings. It was treated favorably on its earnings as well. The chips are strong, they are not overbought, and they still have plenty of room to run.

Retail. Retail was solid as Sears remember that old commercial? SHLD is exploding higher. We are letting those positions run. It doesn't report earnings until mid-May, so I want to just let them go. Impressive across the board in retail. ANN broke higher again on Thursday and gapped up higher on Friday. The strong get stronger. BBBY broke higher again last week and at the end of the week as well. Really all week long it was up, Tuesday through Friday, hitting new highs as it goes. Impressive strength in retail across the board. FAST is breaking higher as well. It is not a consumer retailer, but it is a retailer to the industrial and construction sectors.

Metals. Metals are still struggling. Copper is not looking good, and that is what I refer to as an ugly pattern. Steel is not looking good either. MT is not strong. The industrial metals are changing up a bit. TIE was able to rally back at the end of the week. It had a double top and looked like it could be trouble, but it might be trying to salvage itself.

Financials. Banks had a tough week, but JPM is not out of the picture. Maybe there is an ABCD pattern setting up. It is holding at the 50 day EMA and tapping there. GS is still struggling. It bounced some and is heading back down to end the week. Regional banks are decent and still holding up well in their uptrend. FITB is holding its gains, just not really strong now. It has been a tough week for banks. I would be happy being able to make it through with the uptrend in good shape.

Industrials. Industrials are mixed but looking good. CAT pulled in a new rally high. CMI had a new rally high. BUCY didn't have a new rally high, but is not in terrible shape even though it had a rough week. TEX had a nice week, and I am glad to have some of that on board. Very solid breakout, nice test, and rallying back up. Even those that have lagged are firming up a bit and helping out with other areas that have been powering higher.

Technology. AAPL surged higher on earnings Wednesday, it surged higher on Thursday, and it put in a more modest 1.5% gain on Friday. As AAPL put in that new high, it surpassed MSFT in market cap not in all the shares, but in publicly traded shares. MSFT has a lot of shares that it holds in reserve just for its owners, and it has a lot of treasury stock that is not publicly traded. Nonetheless, on publicly-traded shares, AAPL is now the market-cap king. It is kind of ironic. Years back AAPL was on the verge of going under and MSFT invested 100M dollars to keep it going because the Macintosh was not doing well. There was no iPod, there was no iPhone. When the iMac came out, it was a game-changer for AAPL. The Pirates of Silicon Valley is a fun movie to watch. It would be interesting to see a sequel to that as Steve Jobs has finally learned his lesson and is not so trusting of guys like Bill Gates. You can say he stabbed him in the back or just took advantage of poorly-worded contracts and too much trust from AAPL. For AAPL followers, they are happy to see it because they always felt AAPL was better. And they do make better products. I digress, but that is an interesting story. AAPL is flying to the moon. You have to be careful when a stock starts a ballistic move because it may be peaking out. That happened back in March. It went ballistic gapping and running higher as it is doing now, and all it did is consolidate laterally and then take off to the upside again. If AAPL continues higher, we will probably take more of our option plays off the table because there is huge gain in that. Then we will let it consolidate and see if it continues back to the upside.

THE ECONOMY

Please view the Economy Video at the following link:
Economy Summary Video

THE MARKET

MARKET SENTIMENT

Once again the VIX has found support at the support line it hit back in 2008 (and that acted as resistance well back into 2005-2007). It has held that level and it might bounce here. There is that possibility, but it is not in any nefarious mood. There are no higher lows higher lows as the market rallies means danger. The VIX hit a level that has, in the past, resulted in market pullbacks or corrections, but not a major collapse or rollover. There could be a correction here, a consolidation after a nice run, and breaks to new highs on the indices. It is not necessarily the case because we are not seeing the higher lows, and the market action continues to be very strong. VIX gives an idea what is going on, but does not trump market action.

VIX: 16.62; +0.15
VXN: 16.6; -0.23
VXO: 15.54; +0.09

Put/Call Ratio (CBOE): 0.71; -0.05

Bulls versus Bears:

This is a reading of the number of bullish investment advisors versus bearish advisors. The reason you look at this is that it gives you an idea of how bullish investors are. If they are too bullish then everyone is in the market and it is heading for a top: if everyone wants to be in the market then all the money is in and there is no more new cash to drive it higher. On the other side of the spectrum if there are a lot of bears then there is a lot of cash on the sideline, and as the market rallies it drags that cash in as the bears give in. That cash provides the market the fuel to move higher. If bears are low it is the same as a lot of bulls: everyone is in and the market doesn't have the cash to drive it higher.

Bulls: 53.3%. The bulls are still running, up from 51.1%. Even with this move in the market, however, bulls are still off the 60% to 65% considered bearish. Many more bulls than in February, but they are not running away with the market and thus the market continues to rally. Not that this is a 'Green Zone' of safety; it is a level that can still spark a selloff as seen early this year. This move started at a low of 35.6% in February, the lowest it has been since July 2009. Over the 35% threshold level below suggesting bullishness. After peaking at 53 on this move the bulls lost some nerve, falling to a new low post- July 2009. Once again bulls peaked out near the 50% level. Bulls have bumped at 50ish since late August 2009, falling to 45ish and then rebounding. Hit a high of 47.7% mid-June on the run from the March lows. Again, to be seriously bearish it needs to get up to the 60% to 65% level.

Bears: 17.4%. Pretty precipitous decline in bear sightings, down from 18.9% last week. Well off the 27.8% level on the high of this leg in February and heading toward the 15% level that is bearish for the market. Over 35% is considered bullish for the market; definitely at the lower end of the scale. Heading back toward the 16%ish on the lows of the leg where it held for several weeks. Peaked near 28% in November, falling short of the 35.6% hit in July 2009. For reference, cracking above the 35% threshold considered bullish. Hit a high on this run at 47.2%. For reference, bearishness hit a 5 year high at 54.4% the last week of October 2008. The move over 50 took bearish sentiment to its highest level since 1995. Extreme negative sentiment. Prior levels for comparison: Bearishness peaked at 37.4% in September 2007. It topped the June 2006 peak (36%) on that run. That June peak eclipsed the March 2006 high (33%) and well above the 2005 highs that spawned new rallies (30% in May 2005, 29.2% in October 2005). That was a huge turn, unlike any seen in recent history.

NASDAQ

Stats: +11.08 points (+0.44%) to close at 2530.15
Volume: 2.349B (-10.12%)

Up Volume: 1.605B (-212.005M)
Down Volume: 770.876M (-159.056M)

A/D and Hi/Lo: Advancers led 1.69 to 1
Previous Session: Advancers led 1.65 to 1

New Highs: 363 (+48)
New Lows: 6 (-4)

NASDAQ CHART: Click to view the chart

NASDAQ 100 CHART: Click to view the chart

SOX CHART: Click to view the chart

SP500/NYSE

Stats: +8.61 points (+0.71%) to close at 1217.28
NYSE Volume: 1.207B (-6.52%)

Up Volume: 791.935M (+31.133M)
Down Volume: 399.558M (-119.42M)

A/D and Hi/Lo: Advancers led 2.47 to 1
Previous Session: Advancers led 1.73 to 1

New Highs: 783 (+227)
New Lows: 59 (+14)

SP500 CHART: Click to view the chart

SP600 Chart: Click to view the chart

DJ30

Stats: +69.99 points (+0.63%) to close at 11204.28
Volume DJ30: 207M shares Friday versus 215M shares Thursday.

DJ30 CHART: Click to view the chart

MONDAY

There are a lot more earnings out next week, and a lot more economic data. We will have to keep looking at the Greece story to see what happens, and there a possibility that more news will come out over the weekend. The IMF is going to step in and put in almost $61B by May 19th. That calmed everyone down as evidenced by the market, and it should help in the week ahead as the market focuses on other things such as the economic data here in the US. What will the Federal Reserve say on Wednesday with respect to its rates? With this be the time that it removes the extended-period language? Likely. And we have to see what happens with respect to the initial jobless claims and whether the manufacturing reports from the various regions continue to improve. With the market breaking to new rally highs on Friday, we will have to see if they are able to hold on Monday. A lot of times a surge into the Friday close turns back and reverses some on Monday. There is no problem with that. Doesn't mean it will sell off; it just means we might get a test that allows us to pick up positions.

There are still stocks that are not overbought and are coming into leadership position or have rallied well and are just testing. We can deal with that. A healthy market shows rotation as money moves from one area to another. Right now the metals are in trouble. The money has moved out of them and is moving into other areas. We continue to see that happen. We just find where the money is going, looking for places that have pulled back or that are just now coming in to join the party. You always get concerned when laggards finally join the party because things could be getting overdone at that point. Again, with this much liquidity out there, and with the Fed still having its foot on the accelerator, so to speak, we will have the ability to move the market higher. Next week could be key if it does take out the substantial or exceptional-period language. Then the market could give back some of these gains as it girds itself for the Fed starting to raise interest rates. It will have to sell a bunch of the assets that it owns right now, and that will have the effect of raising interest rates. The Fed doesn't actually have to raise rates themselves it can influence rates simply by selling the over $1T of mortgage-based securities it purchased during the crisis. There will be intrigue next week, without a doubt, and it will have a lot to do with US interest rates and the money supply.

Has anything changed? Not really. It may change depending on how strong the Fed's wording is. For now, nothing has changed, and therefore our game plan has not changed. We will continue to do the same thing we have been doing. If a stock is in good position and shows a buy, we will buy it. If it runs higher and hits a target, we will take some profits. If it doesn't hold up we will get rid of it. It may reverse and run back up after a pullback, but we are not going to take that chance right now. The market is pretty extended. It keeps running and it always tends to run further than you think it will. When they turn they turn fast. We saw that last week. The sellers threw their hat into the ring, but it just got thrown right back at them after the buyers stomped on it.

At some point the sellers will be able to wrest control from the buyers. The higher-volume churn over the past week and a half showed there was some weakening in the buyers' position. Friday they tried to put an exclamation point after the gain saying they are still here and in control. That will last for awhile, and as long as it does, we will play it. But we will be ready in case it doesn't. That is why whenever there is trouble or we see something that looks improbable, we put some of those "just in case" downside plays on the report. If there is a reversal, it can happen very quickly and we want to be able to get in and make quick gains if it does. A lot of times that first move is a vicious one. It has to set up further downside as it clears out a lot of players. We will took for opportunity to the upside, we will take gain when we have it in hand, and we will protect the downside by not letting plays get out of hand. Even with the market moving up, money does tend to rotate. Some good sectors and stocks that were performing well may become the focus of sellers and profit taking and then undergo a correction. We can hang onto stocks that we have a lot of gain built up in, after we take some off the table. You do not want to do that with options. I hate to say it, but we are going to stay the course. As soon as I say that, the course may change. We will keep looking for plays that can make us money to the upside, and if things turn, we will play that. We will continue to take what the market gives. For now, it is giving to the upside as the path of least resistance. Have a great weekend and enjoy the spring weather.

Support and Resistance

NASDAQ: Closed at 2530.15
Resistance:
2546 from July 2007

Support:
The 18 day EMA at 2469
2453 is the August 2008 peak
2412-2415 represents a series of peaks and lows in 2007, 2008
2382-2395 from 2008
The 50 day EMA at 2389
2324-2370 is a range of resistance from early 2008
2320 to 2326.28 is the January high
2319 from the September 2008 peak
2292 is a low from January 2008
2273 to 2282 marks bottom of January 2010 lateral peak
2275 - 2278 from the February 2008 and April 2008 lows
2245 from July 2008 through 2260 from late 2005.
2210 (from September 2008) to 2212 (the July 2009 closing low)
2205 is the November 2009 peak
2191 is the October 2009 peak
2177 is a low from March 2008
The 200 day SMA at 2176
2169 is the March 2008 closing low (double bottom)
2168 is the September 2009, intraday peak
2167 from the July 2008 intraday low
2155 is the March 2008 intraday low

S&P 500: Closed at 1217.28
Resistance:
1240 is the key July 2008 interim low.
1293 from a March 2008 low
1298 is the November 2008 rebound high that made a lower high. Also part of the Q1 2008 double bottom.

Support:
1200 from the July 2008 low
The 18 day EMA at 1195
1185 from late September 2008
1170 is the prior March 2010 high
The 50 day EMA at 1165
1156 is the Sept 2008 low
1151 is the January 2010 peak
1133 from a September 2008 intraday low
Bottom of the January 2010 consolidation 1131 to 1136
1119 is the early December intraday high
1114 is the November 2009 peak is breaking
1106 is the September 2008 low
1101 is the October 2009 high
1084 to 1080 (September 2009 peak)
The 200 day SMA at 1083
1078 is the October range low
1070 is the late September 2009 peak
1044 is the October 2008 intraday high
The August peak at 1040
The early October 2009 closing low at 1025
The early August intraday peak at 1018

Dow: Closed at 11,204.28
Resistance:
11,734 from 11-98 peak

Support:
11,100 from the 7-08 low
The 18 day EMA at 11,024
10,963 is the July 2008 low
The 50 day EMA at 10,789
10,730 is the January 2010 peak
10,609 from the Mid-September 2008 interim low
10,496 is the November 2009 high
10,365 is the late September 2008 low
10,285 is the late December consolidation peak
10,120 is the October 2009 peak
The 200 day SMA at 10,075
9829 is the September 2008 closing high
9918 is the September 2008 peak
9855 is the early September peak in its lateral range
9835 is the late September 2009 peak

Economic Calendar

These are consensus expectations. Our expectations will vary and are discussed in the 'Economy' section.

April 19 - Monday
- Leading Indicators, March (10:00): 1.4% actual versus 1.1% expected, 0.4% prior (revised from 0.1%)

April 21 - Wednesday
- Crude Inventories, 04/17 (10:30): 1.89M actual versus -2.20M prior

April 22 - Thursday
- Initial Claims, 04/17 (08:30): 456K actual versus 450K expected, 480K prior
- Continuing Claims, 04/10 (08:30): 4646K actual versus 4600K expected, 4686K prior
- PPI, March (08:30): 0.7% actual versus 0.5% expected, -0.6% prior
- Core PPI, March (08:30): 0.1% actual versus 0.1% expected, 0.1% prior
- Existing Home Sales, March (10:00): 5.35M actual versus 5.29M expected, 5.01M prior (revised from 5.02M)
- FHFA Home Price Index, February (10:00): -0.2% actual versus -0.2% expected, -0.8% prior (revised from -0.6%)

April 23 - Friday
- Durable Orders, March (08:30): -1.3% actual versus 0.1% expected, 1.1% prior (revised from 0.9%)
- Durable Orders ex tr, March (08:30): 2.8% actual versus 0.7% expected, 1.7% prior (revised from 1.4%)
- New Home Sales, March (10:00): 411K actual versus 330K expected, 324K prior (revised from 308K)

April 27 - Tuesday
- Case-Shiller 20-city, February (09:00): 1.1% expected, -0.7% prior
- Consumer Confidence, April (10:00): 53.7 expected, 52.5 prior

April 28 - Wednesday
- Crude Inventories, 04/24 (10:30): 1.89M prior
- FOMC Rate Decision, 4/28 (14:15): 0.25% expected, 0.25% prior

April 29 - Thursday
- Continuing Claims, 04/17 (08:30): 4625K expected, 4646K prior
- Initial Claims, 04/24 (08:30): 440K expected, 456K prior

April 30 - Friday
- GDP-Adv., Q1 (08:30): 3.2% expected, 5.6% prior
- Chain Deflator-Adv., Q1 (08:30): 0.9% expected, 0.5% prior
- Employment Cost Index, Q1 (08:30): 0.5% expected, 0.5% prior
- Chicago PMI, April (09:45): 59.8 expected, 58.8 prior
- Michigan Sentiment, April (09:55): 71.5 expected, 69.5 prior
icon url

ReturntoSender

04/26/10 11:04 PM

#8935 RE: ReturntoSender #6755

From Briefing.com: 4:30 pm : Stocks chopped along in mixed fashion for the entire session. Though that made for rather lackluster action, it allowed recent gains to consolidate.

Overall buying interest cooled among market participants this session. In turn, the major market averages lacked leadership and were confined to a relatively narrow trading range until a late slip led to a weak finish.

Financials hampered the broader market for the entire session. The sector dropped 1.7% as its declining issues outnumbered its advancers. Citigroup (C 4.61, -0.25), regularly one of the most actively traded names by volume, fell 5% after it disclosed that the Treasury will sell up to some 7 billion its shares.

Shares of BlackRock (BLK 192.95, -18.07) dropped more than 8% in their worst single-session percentage loss in more than one year after the company announced earnings that came short of the consensus.

Given that the broader market has come to expect both strong earnings and strong guidance from reporting companies, Dow component Caterpillar (CAT 71.65, +2.87) climbed to a fresh 52-week high after it had posted earnings that exceeded the consensus estimate and raised its outlook.

Whirlpool (WHR 112.42, +10.20) did the same and saw its stock hit an all-time high.

Humana (HUM 43.56, -1.97) also cleared the heightened hurdle with an upside earnings surprise and upside guidance, but its stock succumbed to the efforts of sellers. Its weakness bled into shares of other managed care companies, which dropped to a collective loss of 3.1%. Health care stocks, as a whole, shed 1.1%.

Weakness among financials and health care, two of the largest sectors in the broader market, kept stocks were mired for most of the session, but the dollar was able to garner modest support as the euro retreated amid persistent concerns regarding the deployment of funds for Greece from the European Union and International Monetary Fund. The greenback gave up some of its gain, but it still finished slightly higher for the session.

Treasuries had a quiet session. The at-record $11 billion 5-yr TIPS auction was met with a bid-to-cover ratio of 3.2, which is slightly above that of the prior auction, and an indirect bidder participation rate of 23.1%, which is below the rate of 47.8% from the prior average. Results from an auction of 2-year Notes will be released tomorrow at 1:00 PM ET.

Trading volume was strong once again. In fact, for the first time this year volume on the NYSE has exceeded the 200-day moving average for four straight sessions.

Advancing Sectors: Consumer Discretionary (+0.6%), Industrials (+0.2%), Materials (+0.1%)
Declining Sectors: Financials (-1.7%), Health Care (-1.1%), Utilities (-0.4%), Telecom (-0.3%), Tech (-0.2%), Energy (-0.2%), Consumer Staples (-0.2%) DJ30 +0.75 NASDAQ -7.20 NQ100 -0.3% R2K -0.4% SP400 -0.4% SP500 -5.23 NASDAQ Adv/Vol/Dec 1306/2.38 bln/1420 NYSE Adv/Vol/Dec 1429/1.22 bln/1616

4:18PM Nanometrics announces follow-on shipments and qualification of UniFire for high volume production (NANO) 10.51 0.00 : Co announced that additional UniFire 7900 metrology systems have been delivered and qualified by an existing customer, and are currently in production for high volume manufacturing process control of advanced wafer-level packaging processes.

4:16PM Anadigics beats by $0.01, beats on revs; guides Q2 EPS above consensus, revs above consensus (ANAD) 5.34 +0.16 : Reports Q1 (Mar) loss of $0.04 per share, excluding non-recurring items, $0.01 better than the Thomson Reuters consensus of ($0.05); revenues rose 42.9% year/year to $43.5 mln vs the $42.5 mln consensus. Co issues upside guidance for Q2, sees EPS of $0.01 vs. ($0.03) Thomson Reuters consensus; sees Q2 revs of $48.7 mln vs. $45.27 mln Thomson Reuters consensus.

4:15PM Emulex beats by $0.14, reports revs in-line; guides Q4 EPS in-line, revs below consensus (ELX) 13.66 +0.35 : Reports Q3 (Mar) earnings of $0.30 per share, $0.14 better than the Thomson Reuters consensus of $0.16; revenues rose 33.4% year/year to $102.2 mln vs the $102.5 mln consensus. Co issues mixed guidance for Q4, sees EPS of $0.16-0.18 vs. $0.18 Thomson Reuters consensus; sees Q4 revs of $100-103 mln vs. $106.68 mln Thomson Reuters consensus.

4:10PM Extreme Networks beats by $0.02, reports revs in-line; guides Q4 EPS midpoint above consensus, revs above consensus (EXTR) 3.52 : Reports Q3 (Mar) earnings of $0.06 per share, $0.02 better than the Thomson Reuters consensus of $0.04; revenues rose 1.3% year/year to $78.2 mln vs the $78 mln consensus. Co issues upside guidance for Q4, sees EPS of $0.05-0.07 vs. $0.05 Thomson Reuters consensus; sees Q4 revs of $82-85 mln vs. $81.50 mln Thomson Reuters consensus. "Third quarter revenue reflected solid performance in North America, where product revenue increased 30% from the second quarter, reversing a historic pattern of sequential revenue declines as we executed to our target for the quarter... We also posted positive net income and grew revenue-per-employee to the highest level since the fourth quarter of fiscal 2008."

4:09PM Veeco Instruments beats by $0.01, reports revs in-line; guides Q2 EPS above consensus, revs above consensus (VECO) 51.06 -0.55 : Reports Q1 (Mar) earnings of $0.49 per share, excluding non-recurring items, $0.01 better than the Thomson Reuters consensus of $0.48; revenues rose 159.9% year/year to $163.2 mln vs the $163.9 mln consensus. Co issues upside guidance for Q2, sees EPS of $0.78-0.90, excluding non-recurring items, vs. $0.59 Thomson Reuters consensus; sees Q2 revs of $220-240 mln vs. $195.88 mln Thomson Reuters consensus. Co said, "We continue to see strong momentum in our LED business. We believe our TurboDisc K465i MOCVD System has hit the market at the right time, offering high productivity and best-in-class yields. As a result, Veeco has been gaining share and winning business at many of the world's top LED manufacturers. To date, second quarter business patterns remain extremely strong, with multi-tool system orders being quoted at a large number of customers. In fact, several key Asian customers have already booked sizeable orders in April"

4:08PM Volterra Semi beats by $0.08, beats on revs (VLTR) 28.19 +0.55 : Reports Q1 (Mar) earnings of $0.35 per share, $0.08 better than the Thomson Reuters consensus of $0.27; revenues rose 98.4% year/year to $36.3 mln vs the $35.1 mln consensus.

4:05PM PLX Tech beats by $0.03, beats on revs; guides Q2 revs in-line (PLXT) 6.35 +0.44 : Reports Q1 (Mar) earnings of $0.07 per share, excluding non-recurring items, $0.03 better than the Thomson Reuters consensus of $0.04; revenues rose 74.5% year/year to $28.8 mln vs the $28 mln consensus. Co issues in-line guidance for Q2, sees Q2 revs of $28-31 mln vs. $28.95 mln Thomson Reuters consensus.

4:04PM Sanmina-SCI beats by $0.04, beats on revs; guides Q3 EPS above consensus, revs above consensus (SANM) 19.22 +0.25 : Reports Q2 (Mar) earnings of $0.29 per share, excluding non-recurring items, $0.04 better than the Thomson Reuters consensus of $0.25; revenues rose 27.5% year/year to $1.53 bln vs the $1.51 bln consensus. Co issues upside guidance for Q3, sees EPS of $0.30-0.36 vs. $0.29 Thomson Reuters consensus; sees Q3 revs of $1.55-1.65 vs. $1.55 bln Thomson Reuters consensus. Operating margin for the second quarter was 3.7 percent, up 40 basis points, compared to 3.3 percent in the prior quarter and a 270 basis point improvement compared to 1 percent in the second quarter fiscal 2009.

10:30AM MEMC Elec unit SunEdison to develop solar PV Program for Remington in Ontario (WFR) 16.24 +0.42 : Co's unit SunEdison announced that it will be developing and constructing up to fourteen roof-top solar photovoltaic projects with capacity totaling up to 3 Megawatts for The Remington Group, one of the leading real estate developers in Ontario. Under the agreement, SunEdison will finance, build, own, operate, monitor and maintain photovoltaic solar energy systems hosted at Remington facilities, and the Ontario Power Authority will purchase the energy produced under the terms of Ontario's Feed-in Tariff Program.

MIPS Technologies, Inc. (MIPS) and Imagination Technologies have formed a strategic alliance to ensure the optimum system solution and support for customers combining IP from both companies...

O2Micro International Limited (OIIM) was issued 16 claims under United States patent number 7,668,643 for its Automatic Automotive Exhaust Emission data processing system...

7:01AM Celestica CEO enters automatic securities disposition plan (CLS) 10.91 : Co announced that Craig Muhlhauser, President & Chief Executive Officer, has entered into an automatic securities disposition plan for the sale of up to 1,496,147 Subordinate Voting Shares between May 10, 2010 and April 29, 2011. The shares represent approximately thirty-five per cent of Mr. Muhlhauser's total vested and unvested equity at target performance levels.

icon url

ReturntoSender

04/29/10 12:37 AM

#8937 RE: ReturntoSender #6755

From Briefing.com: 4:30 pm : Strength among financials helped the broader market fend off the challenge of another midsession sovereign debt downgrade and a late flurry of selling. The latest FOMC policy statement had no real effect on trade.

Early trade was rather choppy, but the action was generally positive as stocks sported broad-based gains. Buying came largely as a reflex to the outsized losses that dropped stocks in the prior session.

Another big batch of upbeat earnings and a moderately weaker dollar helped support the improved mood. However, the broader market quickly reversed into the red when news was released that analysts at Standard & Poor's downgraded Spain's credit rating to AA from AA+. Though Spain's debt is still investment grade, a knee-jerk selling effort still followed the announcement, which came just one day after Standard & Poor's cut its rating for Portugal and Greece.

Volatility also spiked and sent many participants back to the dollar, which swung from a modest loss to a 0.4% gain. The greenback gradually gave up its gain and with a 0.2% loss, while volatility cooled and the Volatility Index closed down 7.5%.

Financials were a primary source of strength in the broader market's rebound. The sector also offered leadership as sellers redoubled their efforts in the final hour of trade. Financials settled with a 1.3% gain, which was the best of any major sector.

Relative weakness among large-cap tech issues hampered the Nasdaq, however. It lagged for the entire session and closed flat.

The latest policy statement from the Federal Open Market Committee proved to be a nonevent. The FOMC indicated that the fed funds target rate remains unchanged at the range 0.00% to 0.25%, as expected, and that rates will stay exceptionally low for extended period.

With the policy statement out of the way, many participants turn their focus to the weekly jobless claims count tomorrow and then the first quarter GDP reading on Friday.

Advancing Sectors: Financials (+1.3%), Energy (+1.1%), Materials (+1.0%), Utilities (+0.9%), Industrials (+0.8%), Health Care (+0.7%), Consumer Staples (+0.6%), Telecom (+0.5%), Tech (+0.2%)
Declining Sectors: Consumer Discretionary (-0.3%) DJ30 +53.28 NASDAQ -0.26 NQ100 +0.1% R2K +0.2% SP400 +0.2% SP500 +7.65 NASDAQ Adv/Vol/Dec 1412/2.66 bln/1284 NYSE Adv/Vol/Dec 1809/1.44 bln/1222

6:36PM Palm trades ~27% higher after hours following news that HPQ will acquire the co (PALM) 4.63 -0.02 : See 16:05 comment

5:33PM Interdigital Comm misses by $0.12, reports revs in-line (IDCC) 28.35 -0.13 : Reports Q1 (Mar) earnings of $1.09 per share, $0.12 worse than the Thomson Reuters consensus of $1.21; revenues rose 64.6% year/year to $116.2 mln vs the $116.8 mln consensus. Co states, "Regarding the sequential increase in operating expenses from fourth quarter 2009, approximately $6 million of that increase relates to increases in arbitration and litigation expenses, an adjustment to the company's long-term compensation accrual and seasonal increases in the first part of the year. For second quarter 2010, a portion of the seasonal increases in expenses will recur. Given the opportunity to further generate near term revenues from our SlimChip modem core platform, we expect to see a moderate increase in development expense in second quarter 2010, but this increase will be offset by associated revenues. Expenses for arbitration and litigation will be driven by the level of activity in those areas."

4:19PM AXT Inc beats by $0.04, beats on revs (AXTI) 4.09 +0.38 : Reports Q1 (Mar) earnings of $0.08 per share, $0.04 better than the Thomson Reuters consensus of $0.04; revenues rose 141.6% year/year to $18.6 mln vs the $16.7 mln consensus. "This was another very good quarter for AXT," said Morris Young, chief executive officer. "We have continued to experience solid demand for our products across all of our primary markets, driven by significant and extended market trends, such as the rapid expansion of wireless devices and subscribers, the increasing momentum in the adoption of LED technology and the growing interest in solar energy. Further, our own execution has been strong throughout our engineering, manufacturing, sales and administrative functions. We have had tremendous success in continuing to develop our valuable, long-term customer relationships as well as penetrating new customers and new opportunities to drive our growth and diversify our base. In addition, our efforts to restructure and refocus our organization over the past nine months are resulting in tangible benefits in our efficiency, productivity and profitability - creating a solid foundation for our success in quarters to come."

4:15PM TriQuint Semi beats by $0.01, beats on revs; guides Q2 EPS above consensus, revs above consensus (TQNT) 7.95 +0.03 : Reports Q1 (Mar) earnings of $0.12 per share, $0.01 better than the Thomson Reuters consensus of $0.11; revenues rose 52.1% year/year to $180.8 mln vs the $175 mln consensus. Co issues upside guidance for Q2, sees EPS of $0.15 vs. $0.13 Thomson Reuters consensus; sees Q2 revs of $200-$210 mln vs. $188.99 mln Thomson Reuters consensus. The company expects continued solid demand in our networks market and strong factory utilization will lead to a non GAAP gross margin of about 40%. Non GAAP operating expenses are expected to grow to between $57-$58 mln. As of today, the company is 92% booked to the midpoint of our revenue guidance.

4:12PM First Solar beats by $0.37, beats on revs; guides FY10 EPS above consensus, revs below consensus (FSLR) 128.13 -0.23 : Reports Q1 (Mar) earnings of $2.00 per share, $0.37 better than the Thomson Reuters consensus of $1.63; revenues rose 35.8% year/year to $568 mln vs the $540.6 mln consensus. Co issues mixed guidance for FY10, sees EPS of $6.80-7.30 vs. $6.15 Thomson Reuters consensus; sees FY10 revs of $2.6-2.7 bln vs. $2.74 bln Thomson Reuters consensus. Total capital spending is projected to be $625 to $650 million. The company expects to generate $725 to $775 million of operating cash flow.

4:10PM LSI Logic beats by $0.05, beats on revs; guides Q2 EPS in-line, revs in-line (LSI) 6.39 +0.13 : Reports Q1 (Mar) earnings of $0.14 per share, excluding non-recurring items, $0.05 better than the Thomson Reuters consensus of $0.09; revenues fell 0.1% year/year to $637.2 mln vs the $629.8 mln consensus. Co issues in-line guidance for Q2, sees EPS of $0.08-0.14, excluding non-recurring items, vs. $0.10 Thomson Reuters consensus; sees Q2 revs of $635-665 mln vs. $642.83 mln Thomson Reuters consensus.

4:10PM Newport beats by $0.02, beats on revs (NEWP) 13.92 +0.33 : Reports Q1 (Mar) earnings of $0.14 per share, $0.02 better than the Thomson Reuters consensus of $0.12; revenues rose 19.8% year/year to $107.2 mln vs the $101.2 mln consensus. They expect sales in the second quarter of 2010 to be similar to the strong first quarter level (consensus is $102.9 mln). In addition, they expect their earnings per diluted share in the second quarter of 2010 to be approximately equal to the first quarter level, and then increase sequentially in the third and fourth quarters of 2010.

4:10PM Power Integrations misses by $0.02, misses on revs; guides Q2 revs above consensus (POWI) 42.75 +0.52 : Reports Q1 (Mar) earnings of $0.49 per share, $0.02 worse than the Thomson Reuters consensus of $0.51; revenues rose 77.4% year/year to $71.5 mln vs the $72.5 mln consensus. Gross margin for the first quarter was 50.2 percent; operating margin was 20.8 percent. Co issues upside guidance for Q2, sees Q2 revs of $74-78 mln vs. $72.44 mln Thomson Reuters consensus. GAAP gross margin is expected to be between 50 percent and 51 percent, including an impact of approximately half a percentage point from stock-based compensation. "We achieved record revenues for the third straight quarter, surpassing $70 million in quarterly revenues for the first time ever, and we expanded our non-GAAP operating margin for the fifth straight quarter. Bookings increased dramatically during the quarter and have remained strong in April. While the strength in orders and resulting expansion of our backlog is partly attributable to extended lead times, we believe our revenue growth is being driven mainly by end-market demand as well as greater penetration of our products into the power-supply market."

4:09PM Cadence Design beats by $0.01, beats on revs; guides Q2 EPS in-line, revs in-line; guides FY10 EPS in-line, revs in-line (CDNS) 7.15 -0.01 : Reports Q1 (Mar) earnings of $0.02 per share, $0.01 better than the Thomson Reuters consensus of $0.01; revenues rose 7.8% year/year to $222 mln vs the $214.9 mln consensus. Co issues in-line guidance for Q2, sees EPS of $0.02-0.04 vs. $0.03 Thomson Reuters consensus; sees Q2 revs of $215-225 mln vs. $218.58 mln Thomson Reuters consensus. Co issues in-line guidance for FY10, sees EPS of $0.05-0.15 vs. $0.14 Thomson Reuters consensus; sees FY10 revs of $865-900 mln vs. $888.37 mln Thomson Reuters consensus. "Cadence is off to a good start in 2010. The team executed across the board and our focus on customer engagement continues to yield success," said Lip-Bu Tan, president and chief executive officer. "Business improved in all geographies with strength in Asia and North America, and in all platform areas, especially verification, custom and digital design."

4:05PM Palm: HPQ to acquire Palm for $1.2 bln or $5.70 per share in cash (PALM) 4.63 -0.02 : HPQ announced that they have entered into a definitive agreement under which HPQ will purchase Palm (PALM) at a price of $5.70 per share of Palm common stock in cash or an enterprise value of approximately $1.2 bln. The transaction has been approved by HPQ and Palm boards of directors. "The combination of HP's global scale and financial strength with Palm's unparalleled webOS platform will enhance HP's ability to participate more aggressively in the fast-growing, highly profitable smartphone and connected mobile device markets. Palm's unique webOS will allow HP to take advantage of features such as true multitasking and always up-to-date information sharing across applications... Palm's innovative operating system provides an ideal platform to expand HP's mobility strategy and create a unique HP experience spanning multiple mobile connected devices."

Integral Systems (ISYS) announced that it has acquired privately held Sophia Wireless for $2.5 million in an all cash transaction. The acquisition will be financed using the Company's existing cash available...

8:02AM First Solar agrees to acquire NextLight Renewable Power; total consideration for the transaction is approx $285 mln (FSLR) 128.36 : Co and NextLight Renewable Power, LLC announce they have entered into a definitive agreement for First Solar to acquire NextLight, a developer of utility-scale solar projects in the southwestern United States. The acquisition includes a 1,100 megawatt solar project pipeline. First Solar will acquire NextLight in an all-cash transaction that is expected to be completed in the third quarter of 2010, pending the satisfaction of certain closing conditions specified in the merger agreement. Total consideration for the transaction is approx $285 million, subject to certain closing adjustments as provided in the merger agreement.

8:01AM Silicon Labs acquires Silicon Clocks and CMEMS technology (SLAB) 50.71 : The co announces the acquisition of Silicon Valley-based Silicon Clocks, an early stage company creating innovative microelectromechanical system (MEMS) technology. Silicon Clocks' CMEMS(TM) (CMOS+MEMS) technology is aligned with Silicon Labs' efforts to leverage its CMOS-based timing products into high-volume applications such as consumer electronics.

7:17AM Owens Corning beats by $0.27, beats on revs; FY10 EPS could be as high at $2.00 vs the $.54 consensus (OC) 29.80 : Reports Q1 (Mar) earnings of $0.42 per share, excluding non-recurring items, $0.27 better than the Thomson Reuters consensus of $0.15; revenues rose 17.8% year/year to $1.26 bln vs the $1.03 bln consensus. The Composites segment increased profits in the first quarter, demonstrating strong operating leverage. In the Roofing business, the strong momentum continued into the first quarter of 2010 with an increase in earnings before interest and taxes (EBIT) of nearly one-third over the same period a year ago. The Insulation business performed as expected, narrowing its losses despite continued weakness in the U.S. housing market. Based on continued strong margins in the Roofing business and improved results for the Composites segment, OC expects that the co's 2010 adjusted EBIT could be as high as $450 million, which equates to an adjusted earnings per share of about $2.00 (consensus is $1.54). In the Composites segment, the co believes that overall demand will continue to trend upward as global industrial activity improves. The rate of market recovery remains uncertain. The co expects to increase production to meet improved market demand, which will result in higher capacity utilization during the year as compared to 2009. Additionally, the Composites segment will continue to realize the benefit of various cost-reduction actions and prior price increases. The co expects strong momentum to continue in the Roofing business, as actions taken to increase margins in 2008 and 2009 will drive profitability in 2010. Owens Corning believes that margins in excess of 20 percent will be achieved in 2010. The co estimates that the Insulation business will narrow its losses in 2010, despite continued U.S. residential construction market weakness.

7:03AM Corning beats by $0.10, beats on revs; raises expectations for annual growth of LCD market (GLW) 20.12 : Reports Q1 (Mar) earnings of $0.52 per share, $0.10 better than the Thomson Reuters consensus of $0.42; revenues rose 57.0% year/year to $1.55 bln vs the $1.52 bln consensus. Flaws said higher-than-expected retail demand for LCD televisions, laptops, and desktop computers in quarter one, along with an improved outlook for these consumer electronic products through the remainder of the year, "have led us to increase our expectations for the annual growth of the LCD glass market. We now forecast a range of 2.9 billion square feet to 3.1 billion square feet of glass this year, up from our original expectation of 2.8 billion to 3.0 billion square feet." This represents a year-over-year growth rate of 18% to 27%. In its Display Technologies segment, Corning expects second-quarter volume will increase in the mid-single digits for both its wholly owned business and SCP. Glass price declines in the quarter should be similar to the first quarter. The co said it plans on running all available capacity by the end of quarter two to meet panel maker demand. "Our first quarter was outstanding, driven by excellent results across nearly all of our major business units. We were particularly pleased with the performance in Display Technologies where we were essentially sold out. We are also encouraged by the growing market demand for Corning Gorilla glass for handheld and other electronic devices." Gross margin improved significantly to 47% from 42% in the previous quarter, and over last year's first quarter of 27%.

7:06AM DSP Group beats by $0.05, beats on revs (DSPG) 78.75 : Reports Q1 (Mar) earnings of $0.11 per share, $0.05 better than the Thomson Reuters consensus of $0.06; revenues rose 40.6% year/year to $56.1 mln vs the $54.1 mln consensus. "We continue to improve our financial performance, and feel optimistic about our business outlook. Our first quarter financial results exceeded the higher end of our guidance range as better than expected revenues and lower non-GAAP operating expenses contributed to higher non-GAAP operating income. On the product side, we passed another milestone event by commencing commercial shipments of our XpandR multimedia platform, and anticipate the launch of additional XpandR-based products this year by leading consumer electronic brands."

11:36 am BRCM Beats Q1 EPS Expectations

Broadcom (BRCM 6.58, +0.29) released its fiscal first quarter results after the close yesterday, which beat expectations.

The company reported first quarter GAAP earnings of $0.40 per share, $0.11 better than the Thomson Reuters consensus of $0.29. Revenues rose 9.0% year-over-year to $1.46 billion, modestly better than the $1.38 billion consensus. In the quarter, the company reported gross margins of 52.5% versus the 52.6% Thomson Reuters consensus.

For the second quarter, the company is forecasting revenues to be in the range of $1.535 billion to $1.635 billion (+5-12% sequentially), above the current $1.42 billion Thomson Reuters consensus. The company also forecasted gross margins, which it expects to be flat with the first quarter, in-line with consensus.

The company said, "Our focus to increase expenses more slowly than revenue produced solid operating margins and record earnings per share. Demand for current products, coupled with new product introductions, should enable us to deliver strong sequential growth into the second quarter. Our products for the Home, Hand, and Infrastructure are extremely well positioned to deliver sustained profitable growth and will benefit from both improved global demand and the increasing role of communications in a connected world."

10:00 am FLEX Guides Q1 In-line

Flextronics International (FLEX 7.89, -0.05) released its fiscal fourth quarter earnings yesterday after the close, which were slightly ahead of consensus. Also, the company guided first quarter earnings and revenues in-line with consensus.

The company reported earnings of $0.16 per share, excluding non-recurring items, $0.01 better than the Thomson Reuters consensus of $0.15. Revenues rose 6.4% year-over-year to $5.94 billion, missing the $6.04 billion consensus.

For the first quarter, the company said it expects earnings to be in the range of $0.16 to $0.19 per share, excluding non-recurring items, in-line with the $0.16 Thomson Reuters consensus. On the top line, the company sees revenues falling in the range of $6.1 billion to $6.6 billion, in-line with the $6.33 billion Thomson Reuters consensus.

09:53 am RFMD Tops Q4 Expectations

RF Micro Devices (RFMD 5.92, +0.43) reported fourth quarter earnings after the close yesterday, which were better than Wall Street expectations.

The company reported fourth quarter earnings of $0.16 per share, which were $0.05 better than the Thomson Reuters consensus of $0.11. Revenues rose 51.4% year-over-year to $260.8 million, higher than the $240.2 million consensus.

For fiscal year 2011, the company noted in its press release that it sees expects revenue and non-GAAP EPS to increase over fiscal 2010 results (current consensus is for FY11 of $0.52/$1.037 billion).

RFMD stated in its earnings release that they are currently fully booked for sequential revenue growth in the June quarter and currently expects June quarterly gross margin to be consistent with March quarterly results. (first quarter revenue estimate is $247.86 million).

RFMD currently expects transceiver revenue to increase sequentially in the June quarter and to begin a ramp-down in the September quarter. Fiscal 2011 free cash flow to be consistent with fiscal 2010 levels and to become net cash positive during fiscal 2011, as noted in the company's press release.

The company also said it expects moderate year-over-year operating expense growth in fiscal 2011 and cash taxes of approximately $6 million to $7 million per quarter, reflecting the Company's improved outlook for revenue and profitability.

icon url

ReturntoSender

05/02/10 12:36 AM

#8940 RE: ReturntoSender #6755

Amateur Investors Weekend Stock Market Analysis (5/1/10)

http://www.amateur-investor.net/Weekend_Market_Analysis_May_1_10.htm

The main thing to watch next week will be if the bearish looking Head and Shoulders Top pattern follows through or not to the downside. The Neckline is sloping downward towards the 1180 level so that will be a key level to watch early in the week.


Furthermore also notice the 23.6% Retrace (red line) from the early February low to the April high resides near 1180 as well. If the S&P 500 drops below the 1180 support level then the next area of support would be in the 1170 to 1153 range. 1170 is at the 50 Day EMA (green line) while 1153 is the 38.2% Retrace (blue line) from the early February low to the April high. In addition notice 1153 is close to the previous high made in mid January (point A) and also is near the longer term upward trend line (black line) connecting the March 2009 low with the early February 2010 low.

icon url

ReturntoSender

05/02/10 11:04 AM

#8942 RE: ReturntoSender #6755

SOX ready to roll over? Not likely just yet:

icon url

ReturntoSender

05/03/10 10:46 PM

#8944 RE: ReturntoSender #6755

From Briefing.com: 4:30 pm : Unable to push past 1205, the S&P 500 settled just a few points shy of its session high with broad-based gains.

Stocks were dropped for a 1.7% loss this past Friday, but buyers showed a willingness to step right back into the action. Their efforts took more than six out of every seven stocks in the S&P 500 higher. Such broad-based buying dragged volatility down, such that the Volatility Index fell nearly 9%.

Materials stocks made up the only major sector that failed to stage a gain. Instead, they finished flat as diversified metals and mining plays fell to a 2.3% loss.

Some might be quick to point to the dollar's 0.6% advance as a cause for the relative weakness of the materials sector, but the greenback's gain did nothing to derail the broader market from staging a strong advance. For virtually the entire session both the dollar and the stock market with strong gains and both finished near their session highs.

Most of the buck's upturn came against the yen and the euro. The euro's slide followed news that the European Union and International Monetary Fund agreed to provide Greece with 110 billion euros in financial aid. Though that sum exceeds the 45 billion euros that had originally been proposed, some still wonder whether it would be enough to truly stem systemic risk in the region, especially as the fiscal health of Portugal, Italy, Ireland, and Spain remain rather dubious. What's more, Germany remains hesitant to commit to the recently proposed rescue plan.

Some of the strongest gains this session were had by small-cap stocks. Collectively, they climbed 2.3%, led by a surge in Jackson Hewitt (JTX 2.12, +0.44), which announced a change to its credit agreement.

In other corporate news, Continental (CAL 22.86, +0.51) and United (UAUA 22.11, +0.51) agreed to a definitive merger that will give 1.05 shares of UAUA common stock for each CAL share. The announcement stoked takeover chatter, which helped lift the Amex Airline Index 2.2%.

Meanwhile, auto makers were out with their latest monthly sales numbers. Toyota Motor (TM 77.69, +0.60) said that its U.S. sales for April increased 24% year-over-year, while Honda Motor (HMC 33.68, -0.11) posted for April an annual increase of almost 13% in U.S. sales. Ford Motor (F 13.30, +0.28) reported that its sales for April were up 25% from the year before.

Economic data was generally without surprise, but that was mostly because economists had already seen official first quarter GDP data. Personal income and personal spending for March increased 0.3% and 0.6%, respectively -- both were in-line with expectations. However, core personal consumption expenditures were expected to be flat, but they eked out a 0.1% increase.

Construction spending for March made a surprise increase of 0.2%. It had been expected to fall by 0.5%.

The ISM Manufacturing Index for April came in at 60.4, which was essentially on par with the 60.0 that had been widely expected.

Advancing Sectors: Consumer Discretionary (+2.1%), Industrials (+2.1%), Financials (+1.8%), Tech (+1.4%), Utilities (+1.3%), Telecom (+1.1%), Energy (+1.0%), Health Care (+0.6%), Consumer Staples (+0.6%)
Declining Sectors: (None)
Unchanged: Materials DJ30 +143.22 NASDAQ +37.55 NQ100 +1.6% R2K +2.3%% SP400 +1.6% SP500 +15.57 NASDAQ Adv/Vol/Dec 1978/2.33 bln/747 NYSE Adv/Vol/Dec 2360/1.18 bln/696

5:02PM Entegris announced it has entered into discussions to reduce its revolving credit facility from $121.7 mln to $60 mln (ENTG) 6.75 +0.57 :

4:56PM Conexant retires $106.7 mln of 4% convertible subordinated notes due 2026 (CNXT) 3.13 +0.07 :

4:07PM Pericom Semi beats by $0.02, beats on revs; guides Q4 revs above consensus (PSEM) 11.99 0.31 : Reports Q3 (Mar) earnings of $0.12 per share, $0.02 better than the Thomson Reuters consensus of $0.10; revenues rose 2.5% year/year to $36.7 mln vs the $35 mln consensus. Co issues upside guidance for Q4, sees Q4 revs of $40-$42 mln vs. $36.00 mln Thomson Reuters consensus. Gross margin for Q4 is expected to be in the 35-36% range, operating expenses in the $11.2-$11.7 mln range, and net income from unconsolidated affiliates PTI and JCP is expected to be approximately $0.6 mln.

icon url

ReturntoSender

05/04/10 10:13 AM

#8945 RE: ReturntoSender #6755

JBL bot 1000 shares@14.99 - Oversold, but it could get more so.

icon url

ReturntoSender

05/05/10 7:50 PM

#8947 RE: ReturntoSender #6755

From Briefing.com: 4:30 pm : Another round of highly volatile trade brought broad-based losses, but this session's slide wasn't as bad as the prior session's selloff. Still, many market participants seem to have grown increasingly skittish.

The prior session's 2.4% slide was the worst single-session percentage loss since February, but stocks failed to quickly snap back as they had so many other times. Instead, sellers stepped right back in to drop the S&P 500 another 1% in the early going. The pressure pushed the benchmark index well below its 50-day moving average, which hadn't been broken for two months.

Early weakness was partly owed to persistent concerns about the fiscal health of Greece and the rest of the PIIGS contingent, which includes Portugal, Ireland, Italy, and Spain. Moody's reminded investors of their risk with news that Portugal's debt has been placed on review for possible downgrade.

Lost support for the euro and an interest in safety drove the U.S. dollar sharply higher once again. The greenback set a new 11-month high against a collection of competing currencies before it eased back. Still, it closed with a 1.0% gain and is now up 8.0% year-to-date.

With many global participants turning away from riskier assets and riskier markets the Dow Jones World Index fell 1.3%. The World Index dropped 1.7% when excluding the U.S., given that U.S. stocks were able to trim losses.

The S&P 500 had been down as much as 1.3% at its session low, but support from a technical trend line through 1158 triggered a rebound that took stocks all the way to positive territory. The gain proved unsustainable and stocks drifted lower into the close, though.

Of the major sectors, consumer staples (+0.3%) and health care (+0.2%) were the only two that managed to stage gains. Telecom limited its loss to just 0.1%.

Some of the worst losses were found in the energy sector, which was weighed down by broader market weakness and another sharp drop in oil prices. Crude oil prices had dropped 4% in the prior session and then surrendered 3.3% this session. Oil prices now stand at $79.97 per barrel, below the $80 per barrel mark for the first time in more than one month. The latest bout of selling was exacerbated by a larger-than-expected build in weekly oil inventories.

Financials had offered some midsession support to the broader market by making a swing from a near 2% loss to a near 1% gain. However, the sector succumbed to pressure as sellers redoubled their efforts; it finished with a 0.5% loss.

Volatility spiked once again. Amid early selling the Volatility Index spiked roughly 14% to a new three-month high, but it pulled back to settle nearly 5% higher.

Treasuries garnered support amid the highly volatile action. In fact, strong gains in the benchmark 10-year Note dropped its yield below 3.50% for the first time this year. The gain moderated so that the Note's yield climbed to 3.55% into the close.

Heightened participation helped trading volume on the NYSE hit 1.5 billion shares for the second straight session. That's the first time this year that volume has hit 1.5 billion shares on back-to-back sessions.

Economic data has done little for trade for the second straight session, but that's mostly due to a lack of surprise as the April ISM Service Index came in at 55.4, which was just below the 56.0 that had been widely forecast. The ADP Employment Report for April showed a slightly greater-than-expected 32,000 private payroll additions.

Advancing Sectors: Consumer Staples (+0.3%), Health Care (+0.2%)
Declining Sectors: Energy (-1.5%), Industrials (-1.5%), Consumer Discretionary (-1.4%), Materials (-0.8%), Utilities (-0.7%), Tech (-0.6%), Financials (-0.5%), Telecom (-0.1%) DJ30 -59.94 NASDAQ -21.96 NQ100 -0.5% R2K -1.6% SP400 -1.1% SP500 -7.73 NASDAQ Adv/Vol/Dec 675/2.94 bln/2039 NYSE Adv/Vol/Dec 625/1.50 bln/2461

5:29PM Kulicke & Soffa misses by $0.02, reports revs in-line (KLIC) 7.99 -0.23 : Reports Q2 (Mar) GAAP earnings of $0.28 per share, $0.02 worse than the Thomson Reuters consensus of $0.30; revenues rose 510.3% year/year to $153.8 mln vs the $152.9 mln consensus.

5:07PM Methode Electronics announces investment in Eetrex (MEI) 11.00 -0.03 : Co announced it has become an investor in Eetrex, a developer and manufacturer of chargers, inverters, and battery systems for hybrid and plug-in hybrid electric vehicles. Co has acquired 15% of Eetrex's stock, and pursuant to the investment, co will appoint two board members.

4:34PM Microchip beats by $0.03, beats on revs; guides Q1 EPS above consensus, revs above consensus; raised quarterly dividend to a record $0.342 (MCHP) 28.99 +0.16 : Reports Q4 (Mar) GAAP earnings of $0.40 per share, $0.03 better than the Thomson Reuters consensus of $0.37; revenues rose 60.4% year/year to $278 mln vs the $269.9 mln consensus. Co issues upside guidance for Q1, sees GAAP EPS of $0.43 vs. $0.39 Thomson Reuters consensus; sees Q1 revs of $300 mln vs. $279.28 mln Thomson Reuters consensus.

4:34PM Maxim Integrated reaches agreement in principle to settle class action stock option litigation (MXIM) 18.70 -0.32 : Co announced that it has entered into a memorandum of understanding reflecting an agreement in principle to settle all claims asserted against all defendants in the putative class action concerning the co's stock option accounting practices. The agreement in principle provides for the payment of $173 mln by the co. The after-tax cash impact is estimated to be $110 mln.

4:06PM ON Semiconductor beats by $0.02, beats on revs; guides Q2 revs above consensus (ONNN) 7.75 -0.20 : Reports Q1 (Mar) earnings of $0.19 per share, excluding non-recurring items, $0.02 better than the Thomson Reuters consensus of $0.17; revenues rose 10.7% year/year to $550.2 mln vs the $520.9 mln consensus. Co issues upside guidance for Q2, sees Q2 revs of $565-580 mln vs. $534.16 mln Thomson Reuters consensus.

4:01PM Virage Logic beats by $0.02, beats on revs; guides Q3 EPS in-line, revs in-line (VIRL) 9.27 -0.04 : Reports Q2 (Mar) earnings of $0.08 per share, $0.02 better than the Thomson Reuters consensus of $0.06; revenues rose 111.8% year/year to $25.2 mln vs the $24.9 mln consensus. Co issues in-line guidance for Q3, sees EPS of $0.10-0.13 vs. $0.12 Thomson Reuters consensus; sees Q3 revs of $26.0-27.0 mln vs. $26.55 mln Thomson Reuters consensus.

8:02AM EMS Tech misses by $0.02, misses on revs; reaffirms FY10 EPS guidance (ELMG) 25.90 : Reports Q1 (Mar) earnings of $0.07 per share, $0.02 worse than the Thomson Reuters consensus of $0.09; revenues fell 10.2% year/year to $82.9 mln vs the $84.9 mln consensus. Co reaffirms guidance for FY10, sees EPS of $0.75-0.90 vs. $0.81 Thomson Reuters consensus.

8:02AM Vishay beats by $0.02, misses on revs; guides Q2 revs in-line (VSH) 10.18 : Reports Q1 (Mar) earnings of $0.24 per share, $0.02 better than the Thomson Reuters consensus of $0.22; revenues rose 42.5% year/year to $640.5 mln vs the $657.2 mln consensus. Co issues in-line guidance for Q2, sees Q2 revs of $660-700 mln vs. $676.93 mln Thomson Reuters consensus.

Applied Materials (AMAT) announced that its Esatto Technology is expected to be used in more than 2 gigawatts of annual cell manufacturing capacity in the next few months at customer sites in China, Taiwan and Europe...

7:35AM O2Micro beats by $0.08, beats on revs (OIIM) 7.06 : Reports Q1 (Mar) GAAP earnings of $0.11 per share, $0.08 better than the Thomson Reuters consensus of $0.03; revenues rose 50.8% year/year to $34.9 mln vs the $33.6 mln consensus. GAAP gross margin was 61.6% in Q110 vs 60.6% in 4Q09 and 55.5% in 1Q09.

icon url

ReturntoSender

05/06/10 3:34 PM

#8948 RE: ReturntoSender #6755

I tried to get some buy orders in but the market moved back up again so quickly that the lows of the day that all I got was a few shares.

I'm thinking maybe put in some low bids for tomorrow and see if this is more than a one day event.

Certainly one must worry that the recent rise in volatility is an indication that the uptrend of the market is in real danger but even if that is true the market rarely goes up or down all at once.

1987 does come to mind however. Today was nothing compared to that day on a percentage basis:

http://en.wikipedia.org/wiki/Black_Monday_%281987%29

Black Monday refers to Monday, October 19, 1987, when stock markets around the world crashed, shedding a huge value in a very short time. The crash began in Hong Kong, spread west through international time zones to Europe, hitting the United States after other markets had already declined by a significant margin. The Dow Jones Industrial Average (DJIA) dropped by 508 points to 1738.74 (22.61%).
icon url

ReturntoSender

05/07/10 10:27 PM

#8953 RE: ReturntoSender #6755

From Briefing.com: 4:35 pm : The best monthly jobs report in four years couldn't keep sellers from sending stocks to their fourth straight loss, which contributed to the stock market's worst weekly performance in one year.

Despite persistent weakness overseas amid continued contagion concerns, stocks managed to attract some modest support as some speculated that a rebound may be in order after the stock market sank some 6% during the course of the three previous sessions. The worst of that loss came Thursday, when the Dow's intraday drop of almost 1000 points was blamed on the failure of computerized trades and electronic networks. In response, both the NYSE and Nasdaq cancelled trades from a 20 minute time block that saw prices greater than or less than 60% away from the consolidated last print price.

However, stocks were unable to sustain the early bid. News that nonfarm payrolls for April surged 290,000, the largest increase since March 2006, couldn't even secure support for stocks.

As an aside, the headline unemployment rate climbed to 9.9% from 9.7% as a result of workers re-entering the workforce.

With sellers reaffirming control, stocks were unable to make anything more than a few upward charges, each of which proved fruitless in the face of resistance.

Heavy volume to the downside made for widespread weakness. As such, nearly 90% of the names in the S&P 500 logged losses and declining share volume on represented 85% of the NYSE's total trading volume, which surpassed 2 billion shares for the second straight session. Volume on the NYSE has not broken 2 billion shares in back-to-back sessions in more than one year. What's more, neither of those two sessions have been options expirations sessions.

Such steep losses amid such heavy volume has caused volatility to spike to its highest level in more than a year. The Volatility Index settled this session roughly 25% higher.

The heightened volatility has given support to gold, which closed this session at $1213 per ounce, up 1.3% for the session. Gold prices actually set a new 2010 high of almost $1215 per ounce earlier in the session.

Treasuries failed to secure support, though. The benchmark 10-year Note fell several ticks, such that its yield moved back above 3.40%.

Meanwhile, the stock market booked its worst closed in two months. That contributed to a weekly loss of more than 6%, which makes for the stock market's worst weekly slide in one year.

Advancing Sectors: (None)
Declining Sectors: Tech (-2.3), Industrials (-2.1%), Consumer Discretionary (-1.9%), Energy (-1.5%), Health Care (-1.4%), Materials (-1.3%), Financials (-1.2%), Telecom (-0.6%), , Utilities (-0.6%), Consumer Staples (-0.5%) DJ30 -139.89 NASDAQ -54.00 NQ100 -2.3% R2K -2.9% SP400 -2.5% SP500 -17.27 NASDAQ Adv/Vol/Dec 577/4.11 bln/2115 NYSE Adv/Vol/Dec 887/2.41 bln/2229

10:22AM Apple: Nokia sues Apple in Wisconsin for infringement of Nokia patents (AAPL) 237.67 -8.62 : Nokia (NOK) filed a complaint against Apple alleging that Apple iPhone and iPad 3G products infringe five important Nokia patents. The patents in question relate to technologies for enhanced speech and data transmission, using positioning data in applications and innovations in antenna configurations that improve performance and save space.

2:55AM On The Wires : United Microelectronics (UMC) reports unaudited net sales for April 2010 increased 35.51% year/year to NT9.32 bln; month/month sales declined 1.69%... AU Optronics (AUO) reports preliminary consolidated April 2010 revenue increased 68.9% year/year to NT$41,154 mln; revenue increased 1.2% from March 2010... Advanced Semiconductor Engineering (ASX) reports unaudited consolidated net revenues for April 2010 increased 139.8% year/year to NT$14.67 bln; sequential change was -7.5%.

icon url

ReturntoSender

05/10/10 10:06 PM

#8956 RE: ReturntoSender #6755

From Briefing.com: 4:35 pm : Efforts to prevent contagion in Europe helped the stock market stage its best single-session rally in more than one year. And even though the move was both broad and strong and accompanied by high volume trade, some question its sustainability.

A positive mood permeated global trade for the entire session, thanks to a decision by leaders of the European Union (EU) and International Monetary Fund (IMF) to pledge financial support to eurozone countries. In turn, Greece and other countries on tenuous financial footing will be able to tap a pool of 500 billion euros from the EU, while the IMF stands ready with another 250 billion euros. In addition to those measures, the European Central Bank announced that it will make eurozone bond purchases via the secondary market. Such a move should help facilitate credit markets by providing a deep pocketed buyer. Meanwhile, the U.S. Federal Reserve has reopened swap lines with foreign institutions.

That series of efforts helped tighten credit default swap spreads for the likes of Greece and Portugal, and also sent the euro up sharply. The euro gave ground against bounce by the greenback, though; in turn, the dollar settled trade with a loss of little more than 0.2% after it had been down as much as 1.8% against a basket of competing currencies.

Stocks traded with strong gains for the entire session, especially those in Europe, where all 30 names in Germany's DAX advanced and all 40 components of France's CAC climbed. French banks booked some of the best gains as the bailout news helped relieve concerns related to their loan exposure to Greece.

Many market pundits questioned whether this session's surge was anything more than a relief rally for the broader market, especially after the S&P 500 fell almost 8% during the course of the four previous sessions.

Bets on further moves to the downside caused some to cover their positions this session. That sort of short covering only squeezed stocks higher and ushered in higher trading volume.

With some 1.8 billion shares exchanging hands on the NYSE this session, trading volume surpassed its 200-day moving average for the fifth time in a row.

Though some may discount the conviction behind this session's move and attribute it to relief buying and short covering, nearly 98% of the names in the S&P 500 advanced to take the stock market to its best percentage gain in more than 52-weeks. Such broad-based strength sent the Volatility Index, or "fear gauge," to a 30% drop.

Advancing Sectors: Industrials (+5.7%), Financials (+5.6%), Consumer Discretionary (+5.3%), Tech (+5.0%), Materials (+4.8%), Energy (+4.0%), Utilities (+3.0%), Consumer Staples (+2.8%), Health Care (+2.7%), Telecom (+2.4%)
Declining Sectors: (None) DJ30 +404.71 NASDAQ +109.03 NQ100 +5.0% R2K +5.6% SP400 +5.2% SP500 +48.85 NASDAQ Adv/Vol/Dec 2209/2.78 bln/327 NYSE Adv/Vol/Dec 2988/1.86 bln/157

4:14PM LDK Solar beats by $0.05, beats on revs; guides Q2 revs above consensus; guides FY10 revs above consensus (LDK) 6.96 +0.78 : Reports Q1 (Mar) earnings of $0.06 per share, $0.05 better than the Thomson Reuters consensus of $0.01; revenues rose 14.1% year/year to $347.6 mln vs the $325.9 mln consensus. Co issues upside guidance for Q2, sees Q2 revs of $460-490 mln (with wafer shipments between 460 MW and 480 MW, and module shipments between 60 MW and 70 MW) vs. $382.30 mln Thomson Reuters consensus. Co issues upside guidance for FY10, sees FY10 revs of $1.6-1.7 bln (with wafer shipments between 1.7 GW and 1.8 GW and module shipment between 200 MW and 300 MW) vs. $1.39 bln Thomson Reuters consensus.

4:04PM Nuance Communications beats by $0.01, beats on revs (NUAN) 17.38 +0.96 : Reports Q2 (Mar) earnings of $0.28 per share, excluding non-recurring items, $0.01 better than the Thomson Reuters consensus of $0.27; non-GAAP revenues rose 22.6% year/year to $292.8 mln vs the $282.9 mln consensus.

7:31AM Adaptec announces $34 mln sale of RAID Storage business to PMC-Sierra Inc. (ADPT) 2.94 : Co announced the signing of a definitive agreemnt to sell certain assets to PMC-Sierra for ~$34 mln in cash. Following the sale, the co will retain its Aristos ASIC technology business, certain real estate assets, more than 200 patents, and approximately $400 million in cash and marketable securities.

6:33AM Amtech Systems announces $15 mln in new solar orders, reports fiscal YTD solar orders reach $98 mln (ASYS) 8.60 :

icon url

ReturntoSender

05/12/10 11:43 PM

#8958 RE: ReturntoSender #6755

From Briefing.com: 4:30 pm : Broad-based buying boosted stocks to their best levels of the week, but the S&P 500 now now faces a key technical line.

Stocks gradually chopped their way higher for the entire session. Initial gains were largely underpinned by the strength of Europe's major bourses, which were led by a 2.4% spike in Germany's DAX after the country reported stronger-than-expected first quarter GDP growth of 0.2%.

Gains began to mount as the session progressed. The S&P 500 had a bit of trouble near the 1170 line, but the broad market measure inevitably pushed past the point of resistance. Though the stock market was able to hold that level and close above it, the 50-day moving average represents a more formidable challenge at 1173.

Tech stocks, which collectively represent the heaviest sector by market weight, provided a key source of leadership this session. The sector catapulted to a 2.2% gain, which swung it back into positive territory for the year. Tech stocks are now up 2.1% year-to-date.

Retailers overcame an early fit of weakness to finish with a gain of 1.4%, collectively. Macy's (M 24.70, +0.80) was a leader in the group after it posted better-than-expected earnings. It reaffirmed an outlook that remains below Wall Street's consensus forecast, but stated that it would be premature to raise guidance due to macro uncertainty.

Natural resource plays garnered strong support after they had traded as laggards during the prior session.

Unfazed by a 0.9% drop in oil prices to $75.65 per barrel following a larger-than-expected build in weekly inventories, energy stocks staged a 1.3% gain. The sector was led by refiners, which surged 4.6%.

The materials sector climbed 1.9% as diversified metals and mining stocks spiked 4.0%. Gold stocks settled with a less impressive 0.9% gain, even though individual gold prices hit new record highs. The yellow metal closed pit trade with a 1.9% gain at $1243.10 per ounce, but extended their run into electronic trade as they eclipsed $1249 per ounce.

Treasuries were weak for the entire session. The benchmark 10-year Note shed roughly 12 ticks after an auction of 10-year Notes drew a lower-than-expected yield of almost 3.55% and a bid-to-cover ratio of 2.96.

The Treasury also unveiled its April budget, which showed a $82.7 billion deficit. That was much more than expected and was also the largest deficit ever recorded for April.

Advancing Sectors: Tech (+2.2%), Industrials (+2.0%), Materials (+1.9%), Consumer Discretionary (+1.4%), Energy (+1.3%), Financials (+1.1%), Telecom (+1.0%), Utilities (+0.9%), Health Care (+0.7%), Consumer Staples (+0.6%)
Declining Sectors: (None) DJ30 +148.65 NASDAQ +49.71 NQ100 +1.8% R2K +3.0% SP400 +2.2% SP500 +15.88 NASDAQ Adv/Vol/Dec 2221/2.30 bln/494 NYSE Adv/Vol/Dec 2661 /1.27 bln/437

4:08PM Cisco Systems beats by $0.03, beats on revs, with in-line gross margin (CSCO) 26.74 +0.78 : Reports Q3 (Apr) earnings of $0.42 per share, excluding non-recurring items, $0.03 better than the Thomson Reuters consensus of $0.39; revenues rose 27.0% year/year to $10.37 bln vs the $10.24 bln consensus. Co reports Q3 gross margins of 64% vs co guidance of 64-65%. "We witnessed a return to strong balanced growth across geographies, products and customer segments that we haven't seen since before the global economic challenges began."

1:49AM On The Wires : Suntech Power Holdings (STP), the University of New South Wales and Silex Solar will together research advanced technology to further improve the power conversion efficiencies of crystalline silicon solar cells through a 3-year collaborative research project...

icon url

ReturntoSender

05/16/10 12:00 PM

#8959 RE: ReturntoSender #6755

Monday Morning Outlook: DJIA Chalks Up a Weekly Win
Expiration week could provide tailwind if ... big if ... euro is stabilized

by Todd Salamone 5/15/2010 9:45 AM

http://www.schaeffersresearch.com/commentary/observations.aspx?ID=99891

It was a volatile week that ended with the Dow Jones Industrial Average (DJIA) scoring a healthy TKO -- thanks largely to Monday's 400-point relief rally. The CBOE Market Volatility Index (VIX) reflected that volatility. Although it settled down from its readings in the low 40s the previous week, the VIX still ended the week at an elevated 31.24. Looking ahead, Todd Salamone, Senior Vice President of Research, remains worried about the weakness in the euro, but he's heartened by several technical indicators. Todd also shares some thoughts from the Las Vegas Money Show, where he and Bernie Schaeffer made presentations last week. Next, Senior Quantitative Analyst Rocky White takes a look at the weekly Investors Intelligence poll, a survey we regularly monitor. Not surprisingly, investors were shaken by the May 6 "flash crash." Rocky explains why he's encouraged by the desertion of these fair-weather bulls. Finally, we wrap up with a look at some key economic and earnings reports slated for release this week.

Recap of the Previous Week: Dow Bounces Back From "Flash Crash"
By Joseph Hargett, Senior Equities Analyst


You'd be forgiven for thinking Wall Street might be shell-shocked coming into the week, given the bruising it had just suffered, wiping out all of the year's gains. In fact, the exact cause of the brief, but terrifying 1,000-point plunge in the Dow Jones Industrial Average (DJIA) on May 6 remained uncertain, although regulators told Congress they were zeroing in on the activity of a single futures trader.

But traders were cheered when the European Union (EU) and the International Monetary Fund (IMF) agreed on a near $1 trillion rescue package to aid debt-riddled nations across the euro zone. Even before the market opened on Monday, futures were suggesting a 400-point rally, and sure enough, the bulls rode back into town on a 404-point wave. The Dow high-fived its way to a 3.9% gain, while the S&P 500 Index (SPX) and the Nasdaq Composite (COMP) did even better, advancing 4.4% and 4.1% respectively.

The bulls spent Tuesday digesting their gains. Worries persisted about the European bailout package, but traders in the U.S. were encouraged by an upbeat earnings forecast from Dow component Intel Corp. (INTC) and growing private-sector hiring. Nonetheless, the Dow slipped 0.3% for the day.

The bulls resumed their climb on Wednesday. The government reported that the U.S. trade deficit widened in March, but it also said U.S. exports increased by 3.2%, the highest level since late 2008, pointing to health in the manufacturing sector. The Dow ended the day with a sprightly 1.4% gain.

Nonetheless, the European debt issue haunted the week, with worries that tough new austerity measures in southern Europe will dampen economic growth. The U.S. financial sector was also under fire all week, as Congress turned its full attention to financial reform, tightening rules on everything from bank practices to credit cards to ratings agencies. As if the increased oversight wasn't unnerving enough, The Wall Street Journal reported on Wednesday that federal investigators are looking into the marketing of mortgage derivative products by Morgan Stanley (MS), while The New York Times reported Thursday that State Attorney General Andrew Cuomo wants to know if MS and seven other leading banks intentionally misled ratings agencies in order to inflate the ratings on their mortgage products. By the end of Thursday, the Dow surrendered more than 100 points, or 1.1%.

Traders heard more good economic news Friday. Sales continued to rise at American retail stores in April, while other reports -- on industrial production, manufacturing and consumer confidence -- also indicated that the economic recovery is progressing. But Wall Street still couldn't shake those euro zone blues, and the Dow spent much of the session trading down 200 points or more. When the dust settled Friday, the Dow had bounced back from its session lows, but still retreated nearly 163 points.

Despite logging back-to-back triple-digit losses, the Dow held on to Monday's gains. For the week, the DJIA added 2.3%, marking its first weekly gain since mid-April. Elsewhere, the SPX rose 2.2% for the week, and the Nasdaq led the pack with a weekly gain of 3.6%.

What the Trader Is Expecting in the Coming Week: All Eyes on Europe
By Todd Salamone, Senior Vice President of Research

In last week's Monday Morning Outlook, the following observation was made:

"The pullback has caused technical damage, with the SPX closing below its January highs in the 1,150 area, and its 160-day moving average. The 160-day trendline contained the SPX's early February lows, when fears about Greece's debt issues first emerged... The good news is that the SPX heads into next week trading above 1,050, the site of its February lows. The index also remains above its 200-day moving average... For what it is worth, the 200-day trendline supported the SPX in 1997, after 'Asian Contagion' worries spread and pushed stocks into a corrective mode."

Mirroring the price action of the 1997 "Asian Contagion," the S&P 500 Index (SPX) rallied powerfully from its 200-day moving average early last week, in response to a loan package from the European Union and the International Monetary Fund to the euro zone's most heavily indebted nations. The rally pushed the SPX back above its 160-day moving average, situated at 1,120, and the January highs in the 1,150 area. But after an unsuccessful attempt to overtake its 50-day moving average in the 1,175 area, the SPX retreated 3.1% on Thursday and Friday. The SPX closed the week at 1,135 - below its January highs, but above the 160-day moving average, in a slight technical improvement relative to last week.


As Bernie summarized in his keynote presentation last week at the Las Vegas Money Show, levels of importance on the SPX include the round 1,100 level, which is not only the SPX's 200-day moving average, but also represents about a 10% correction from the recent highs. Bernie also mentioned that we are keeping a close eye on the 1,167 level, as this is the site of the 160-month moving average, a trendline that acted as support at the bear-market bottom in 2002-2003. Moreover, when this moving average was breached in October 2008, it was a major sell signal. A month-end close above this level would support the notion that the SPX is in bull mode.

With the euro hitting fresh lows on Friday, it is evident that European worries continue to weigh negatively on investors in the U.S. market. The sell-off that began late Thursday and through Friday indicates there is a lot of fear about negative financial developments over the weekend. But a possibility this weekend would be government officials looking to implement a plan specifically designed to stabilize the euro, and this would be most effective if they can get U.S. cooperation. It is our belief that such cooperation is very plausible, as we don't think Washington wants to see the dollar get overly strong from here.

Last week's rescue package did nothing to stabilize the euro, and such stabilization is of very high priority over the short term. If in fact officials do something over the weekend to prop up the euro, we could see a huge equity rally on Monday. In the absence of such a plan, there could be follow-through selling.

Another potential catalyst this week is the expiration of May options. There is massive out-of-the-money put open interest on various indexes and exchange-traded funds that is getting set to expire. Should the market find any type of stability, whether technical or news-based, the unwinding of short positions related to the expiration of the out-of-the-money puts could create a tailwind for the stock market.

I'll conclude with a message that I've made in this forum on several occasions, and a message I found myself repeating at the Las Vegas Money Show last week, during presentations or in casual conversation with the many visitors to our booth. That is, ensure your long positions are hedged, and engage in strategies that reduce risk and give you profit opportunity on unexpected events. This may take on even more importance now, with the technical backdrop questionable and volatility on the rise – the CBOE Market Volatility Index (VIX – 31.24) has experienced nine consecutive closes above its 200-day moving average.

Prepare for the investing week ahead. Every week, Bernie Schaeffer and his staff provide you with their insight about what has happened and, more importantly, what will happen in the market. We dig deep and show you what's happening behind the scenes, and tell you which indicators are predicting major market moves. If you enjoyed this week's edition of Monday Morning Outlook, sign up here for free weekly delivery straight to your inbox.

Indicator of the Week: Investors Intelligence Survey
By Rocky White, Senior Quantitative Analyst

Foreword: Every week Investors Intelligence releases a sentiment survey that we monitor closely. The poll tracks the percentage of investors who are bullish, bearish, and those who foresee a correction. As contrarians, we tend to regard high levels of optimism as a bearish indicator going forward, and we see high levels of pessimism as bullish. The poll released last week was especially interesting, because it was taken during the turmoil of a couple of weeks ago.

Below is a chart of the bullish responses minus the bearish responses along with the S&P 500 Index. The higher this figure, the more optimism there is among investors. We consider optimism to be at an extreme when the difference in the bulls and bears gets to around 40%. With the strength of the market over the last year or so, it is not all that surprising that we had optimism nearing that level. It was encouraging when optimism decreased so significantly in the most recent survey, as the bulls minus bears line fell below 25%.


II bull-bear percentage versus the SPX since January 2005


Interpreting the Current Survey: As I mentioned earlier, it was not that surprising that optimism was at such a high level prior to the release of the last sentiment survey. Then after the tumultuous week a couple of weeks ago, you would suspect that optimism would come down some.

A key question is: How much did optimism fall? A large drop in optimism would signal that bullish respondents were bullish simply due to the strong market price action. It would reveal that they really believe the market is on shaky ground, since it took only a couple of days of losses and some volatility to change their minds.

We would be encouraged by that exposed fear. It would be worrisome if optimism did not fall much (or even increased). This would show stubbornness among investors, if not even price action against their convictions would sway them from that bullish stance. This situation would be dangerous because investors already in the market reduce the potential upside, and a further fall would force them to capitulate and drive the market lower. The more stubborn the bulls, the steeper the next pullback will be.

So, how much did optimism fall? Below is a table showing the bulls dropped from 56% to 47% and the bears increased from 19% to 25%. Therefore, the bulls minus bears line went from 37% before the market correction to 23% in the most recent survey.


SPX levels versus skew between II bull and bear percentages

To gauge how big of a drop this is, I went back to 1972 and found all the times there was a significant amount of optimism (bulls above 50%) and found how the survey reacted to a one-week market pullback of at least 3%. There have been 30 similar situations. Measuring optimism in terms of the difference in bulls minus the bears, it is the fifth biggest drop in optimism that we have seen. It's encouraging from the standpoint that it signals nervousness among investors.

Historical Results: You'll recall that the bulls minus bears number fell from 37% to 23% in the most recent survey -- a 14-point difference. Out of the 30 cases we found above, there were 12 times when it fell by more than seven points. The first chart below is a summary of S&P 500 returns following those 12 instance times is below. The second table below shows the 18 other times that the bulls/bears difference was less than seven points.

Note the top table is much more bullish in the shorter term, with that bullishness fading the farther out you go. The historical results below back up our conjecture that you want to see optimism fall significantly during a market pullback, rather than just a moderate fall in optimism.


Returns following drops in II bullish readings and returns following spikes in bullish readings


Implications:You can see that in the short run especially we are glad to see such a significant decrease in optimism as determined by the Investors Intelligence sentiment survey. In such a bullish environment, it is hard to get an accurate measure of sentiment because it's natural for people to be in the bullish camp when things are going so good. The market's recent pullback and volatility has exposed the anxiety of investors to be quite high. That's good news, as we believe that fear is crucial in sustaining a market uptrend.

This Week's Key Events: Inflationary Data on Tap
By Joseph Hargett, Senior Equities Analyst

Here is a brief list of some of the key events for the upcoming week. All earnings dates listed below are tentative and subject to change. Please check with each company's respective website for official reporting dates.

Monday
* Monday is devoid of economic reports, while Lowe's Companies Inc. (LOW), Agilent Technologies Inc. (A), and SINA Corp. (SINA) are on tap to present their quarterly earnings figures.

Tuesday
* April's building permits, producer price index (PPI), core PPI, and housing starts will arrive on Tuesday. On the earnings front, Abercrombie & Fitch Co. (ANF), Ambac Financial Group Inc. (ABK), The Home Depot Inc. (HD), Wal-Mart Stores Inc. (WMT), Analog Devices Inc. (ADI), and Hewlett-Packard Co. (HPQ) are scheduled to release their quarterly reports.

Wednesday
* Wednesday brings the weekly report on U.S. petroleum supplies, as well as the April consumer price index (CPI) and core CPI. Taking their turn in the earnings confessional are BJ's Wholesale Club Inc. (BJ), Deere & Co. (DE), Applied Materials Inc. (AMAT), Hot Topic Inc. (HOTT), and Limited Brands Inc. (LTD).

Thursday
* Weekly initial jobless claims hit the Street on Thursday, followed by April's leading economic indicators and May's Philadelphia Fed manufacturing index. Dollar Tree Inc. (DLTR), GameStop Corp. (GME), Ross Stores Inc. (ROST), Staples Inc. (SPLS), Tidewater Inc. (TDW), Aeropostale Inc. (ARO), Brocade Communications Systems Inc. (BRCD), Dell Inc. (DELL), salesforce.com inc. (CRM), and Marvell Technology Group Ltd. (MRVL) are scheduled to report earnings.

Friday
* Friday closes the week with a whimper, as there are no economic reports on the docket. AnnTaylor Stores Corp. (ANN) and Frontline Ltd. (FRO) round out the week's earnings reports.

And now a few sectors of note...

Dissecting The Sectors
Sector
Real Estate
Bullish

Outlook: The iShares Dow Jones U.S. Real Estate Index Fund (IYR) came roaring back with the rest of the market last week. What's more, the fund reclaimed its 10-week moving average, rose above round-number support at the 50 level, and finished perched on its rising 50-day moving average. Furthermore, the fund continues to show strong performance relative to the S&P 500 Index. On the sentiment front, IYR's International Securities Exchange (ISE) and Chicago Board Options Exchange (CBOE) 50-day buy (to open) put/call volume ratio continues to turn higher from low levels. This may be indicative of hedged money accumulating stocks in this group. Elsewhere, bearish sentiment continues to pile up on the commercial real estate sector. Recently, in a story titled "Lenders Open to Real-Estate Pain," The Wall Street Journal offered up the following gem in reference to commercial real estate: "A slow motion train wreck is still a train wreck." There is also plenty of negativity outside of the financial media. Specifically, fewer than 32% of the 1,035 analysts covering the sector have doled out "buys." Any upgrades could provide lift for the sector.
Sector
Financials
Neutral

Outlook: The Financial Select Sector SPDR (XLF) also rebounded alongside the broader market last week, as shares bounced off support at their 200-day moving average. This trendline contained the exchange-traded fund's February 2010 lows, and continues to provide a floor for the XLF. What's more, the shares reclaimed long-term support/resistance in the 15 area. Meanwhile, there is room for sentiment to improve toward the group. Specifically, roughly half of the 515 analysts following financial-sector stocks rate them a "hold" or worse. Any upgrades from this bunch could provide an additional tailwind. However, the XLF's International Securities Exchange (ISE) and Chicago Board Options Exchange (CBOE) 50-day buy-to-open put/call ratio recently peaked, suggesting that hedged buyers are no longer in accumulation mode. This development could become a bigger concern if the XLF breaches support at its 200-day moving average.
Sector
Consumer Discretionary
Bullish

Outlook: Economic data remained strong for retailers last week, as the Commerce Department reported that sales rose for the seventh straight month in April, climbing by a better-than-expected 0.4%. Adding to the upside surprise, sales in February and March were each revised higher by two-tenths of a percentage point. Technically speaking, the S&P Retail SPDR (XRT) rebounded from support at its 80-day moving average last week, reclaiming round-number support at the 40 level in the process. With many retailers releasing their quarterly reports, we recommend shifting your focus to under-loved names that are reacting favorably to earnings. For example, Whole Foods Market Inc. (WFMI) looks promising after rallying 5.6% in reaction to its quarterly report. The stock also sports only five "buys" out of 19 total rankings. By comparison, Kohl's Corp. (KSS) fell 5.8% in the wake of its earnings report, despite attracting 24 "buys" out of 31 ratings. Given this data, we would favor WFMI over KSS, as WFMI has more upgrade potential and stronger tailwinds related to the positive earnings surprise. Speaking of ratings, only about 50% of the analyst ratings on retail stocks are "buys," leaving plenty of room for potential upgrades. As analysts and investors digest the improving economic and technical outlook for the sector, we should see added buying pressure push these stocks steadily higher.
icon url

ReturntoSender

05/16/10 12:08 PM

#8960 RE: ReturntoSender #6755

Leavitt Brothers - The State of the Market:

http://leavittbrothers.com/blog/?p=3032
icon url

ReturntoSender

05/17/10 11:09 PM

#8962 RE: ReturntoSender #6755

From Briefing.com: 4:30 pm : The stock market drifted from a modest gain in the early going to a loss of more than 1%, but market participants gradually bid stocks higher in the second half of the session. In the end, the three major indices settled with slight gains.

Sellers showed strength for the first part of the session. Their efforts had taken more than 80% of the names in the S&P 500 into negative territory. Cyclical stocks seemed to be their primary target as materials, industrials, and financials all fell to a loss of more than 1%. Energy stocks saw some of the worst price action as they dropped more than 2% -- the energy sector's slide was exacerbated by continued weakness in oil prices, which fell to a three-month low and closed pit trade with a 2.1% loss at $70.08 per barrel.

However, buyers started to step back in and helped energy stocks cut their losses. The sector still finished with a 1.0% loss, but that was less than half the loss that the sector had seen at its session low.

Meanwhile, materials stocks settled with just a 0.2% loss. Industrials closed 0.3% lower and financials finished flat. Financials were helped by strength among consumer finance plays, a few of which reported improvements in their monthly delinquency metrics. A few big banks also saw some improvement in their monthly credit card metrics.

Shares of home improvement retailers had been down almost 4%. They were hurt by broader market weakness and what was deemed a lackluster latest quarterly report Lowe's (LOW 25.08, -0.99). The company posted better-than-expected quarterly earnings, but its guidance was uninspiring. However, shares home improvement retailers were able to finish with a modest 0.4% loss.

While support for cyclical plays eventually surfaced, buyers still favored defensive-oriented telecom (+1.2%) and consumer staples (+0.9%).

The afternoon recovery came as the greenback gave up nearly all of its gain for the session. It had set a fresh 52-week high in overnight trade, but it finished with only a fractional gain. Its pullback was partly owed to the euro's rally from a multiyear low of 1.2235 per dollar to a 0.3% gain against the dollar at 1.2397 per dollar.

Advancing Sectors: Telecom (+1.2%), Consumer Staples (+0.9%), Consumer Discretionary (+0.6%), Tech (+0.2%), Utilities (+0.1%), Health Care (+0.1%)
Declining Sectors: Energy (-1.0%), Industrials (-0.3%), Materials (-0.2%)
Unchanged: Financials DJ30 +5.67 NASDAQ +7.38 NQ100 +0.4% R2K +0.3% SP400 +0.2% SP500 +1.26 NASDAQ Adv/Vol/Dec 1303/2.40 bln/1403 NYSE Adv/Vol/Dec 1254/1.44 bln/1820

4:10PM Agilent beats by $0.02, beats on revs; guides Q3 EPS above consensus, revs above consensus; guides FY10 EPS in-line, revs above consensus (A) 34.19 +0.33 : Reports Q2 (Apr) earnings of $0.43 per share, $0.02 better than the Thomson Reuters consensus of $0.41; revenues rose 16.5% year/year to $1.27 bln vs the $1.24 bln consensus. Co issues upside guidance for Q3, sees EPS of $0.43-0.45 vs. $0.42 Thomson Reuters consensus; sees Q3 revs up 16-19% y/y to ~$1.23-1.26 bln vs. $1.2 bln Thomson Reuters consensus. Co issues mixed guidance for FY10, sees EPS of $1.70-1.75 vs. $1.70 Thomson Reuters consensus; sees FY10 revs up 12% y/y to ~$5.02 vs. $4.93 bln Thomson Reuters consensus.

3:13PM Semiconductor Hldrs ETF works back near morning high at 27.84 (SMH) 27.80 +0.36 : Sector has displayed relative strength today with the afternoon recovery recently reaching its morning peak -- XLNX +3.1%, ALTR +2.3%, LLTC +1.4%, KLAC +1.2%, LRCX +1%.

12:01PM Ascent solar modules installed at ProLogis (PLD) rooftop Photovoltaic test site in Denver (ASTI) 3.35 -0.23 : Co announced that its BIPV class of laminates have been installed at the ProLogis (PLD) Rooftop Photovoltaic Test Site located in Denver, Colorado. The Test Site totals 11 kWp DC of power generation capacity from 99 modules and eight different module manufacturers: Ascent Solar (ASTI), First Solar (FSLR), GS-Solar, MiaSole, Solyndra, Suniva, United Solar Ovonic (ENER) and Xunlight. Already generating power, the initial configuration provides side-by-side comparisons of several module technologies, including monocrystalline, glass-on-glass thin film and membrane-applied thin film modules.

7:42AM Vitesse Semi will complete a 1 for 20 reverse stock split of its common stock, to take effect on June 30, 2010 (VTSS) 0.37 :

6:08AM Netlist settles lawsuit with Texas Instruments (NLST) 2.74 : Co announces that it has reached a settlement in the misappropriation of trade secrets and breach of contract lawsuit against Texas Instruments (TXN). The settlement resolves a dispute between the two companies concerning the use of proprietary memory modules and other related technology.

icon url

ReturntoSender

05/18/10 10:09 PM

#8963 RE: ReturntoSender #6755

From Briefing.com: 4:30 pm : An early bid gave the major equity averages a solid start, but the tone of trade soon turned negative as the dollar rallied against the euro. Stocks settled with sharp losses near session lows.

News that the European Union handed Greece some 14.5 billion euros to keep the country out of default helped usher in buying among overseas markets. The accompanying gains helped provide support for domestic stocks to extend their rebound from the prior session.

The mood among global participants was further supported by signs of renewed strength in the euro. However, the euro soon resumed its backslide. Its downturn steepened following news that Germany will ban naked short selling of certain financial stocks, credit default swaps, and government bonds. The euro dropped a sharp 1.5% to a fresh four-year low that was just above 1.2200 per dollar, which helped the Dollar Index spike 1.1% to a fractionally improved 52-week high.

The euro's retreat and the dollar's rally put in motion a gradual, broad-based selling effort, which lasted for most of the session. Stocks attempted to steady their descent in the final hour, but still chopped into the close to settle near their worst levels of the day.

Banking issues were among the most out of favor. In turn, the KBW Bank Index dropped 3.7% to log its lowest closing level in about two months. Weakness among bank stocks dragged down the financial sector to a 2.8% loss, which was the worst of any major sector.

Materials stocks saw one of the most dramatic turnarounds. The sector had been up more than 2% at its session high, but closed with a 1.5% loss.

With a 0.7% loss, energy stocks limited their decline to half of what the broader market incurred. The sector had been up some 2% at its session high, but broader market weakness coupled with a retreat in oil prices undermined its strength -- oil prices closed pit trade with a 1.0% loss at $69.41 per barrel after they had been up as high as $72.52 per barrel.

A batch of better-than-expected earnings reports from a raft of retailers couldn't keep the group from a collective loss of 2.5%. Shares of Dow components Home Depot (HD 34.73, -0.86) and Wal-Mart (WMT 53.71, +0.98) diverged -- HD was weak despite upside guidance; both posted an upside earnings surprise.

Weakness among stocks helped win support for Treasuries. As such, the benchmark 10-year Note climbed more than one point so that its yield fell near 3.35%.

In the latest dose of data, the April Producer Price Index decreased 0.1%, which contrasts with the 0.1% decline that many had come to expect. Excluding food and energy, producer prices increased 0.2% month-over-month, but a softer increase of 0.1% had been expected.

Housing starts for April climbed 5.8% to an annualized rate of 672,000, which is stronger than the expected rate of 650,000. However, building permits for April dropped 11.5% month-over-month to an annualized rate of 606,000, which is lower than the expected rate of 680,000.

Advancing Sectors: (None)
Declining Sectors: Financials (-2.8%), Consumer Discretionary (-1.8%), Tech (-1.6%), Materials (-1.5%), Industrials (-1.4%), Utilities (-1.0%), Health Care (-0.8%), Energy (-0.7%), Telecom (-0.5%), Consumer Staples (-0.5%) DJ30 -114.88 NASDAQ -36.97 NQ100 -1.5% R2K -1.9% SP400 -1.5% SP500 -16.14 NASDAQ Adv/Vol/Dec 682/2.42 bln/2026 NYSE Adv/Vol/Dec 703/1.52 bln/2362

4:33PM Photronics beats by $0.05 (PLAB) 4.91 -0.30 : Reports Q1 (Mar) earnings of $0.09 per share, $0.05 better than the First Call consensus of $0.04; revenues rose 26% year/year to $105.1 mln vs the $102.3 mln consensus.

4:17PM Hewlett-Packard beats by $0.04, beats on revs; guides Q3 in-line; raises FY10 guidance above consensus (HPQ) 46.79 -0.73 : Reports Q2 (Apr) earnings of $1.09 per share, $0.04 better than the Thomson Reuters consensus of $1.05; revenues rose 12.4% year/year to $30.8 bln vs the $29.82 bln consensus. Co issues in-line guidance for Q3, sees EPS of $1.05-1.07 vs. $1.07 Thomson Reuters consensus; sees Q3 revs of $29.7-30.0 bln vs. $29.72 bln Thomson Reuters consensus. Co issues upside guidance for FY10, sees EPS, ex-charges, of $4.45-4.50 vs. $4.45 Thomson Reuters consensus, up from $4.37-4.44 previously; sees FY10 revs of $123.7-124.9 bln vs. $123.04 bln Thomson Reuters consensus, up from $121.5-122.5 bln previously. Personal Systems Group posted a 20% increase in unit shipments. Industry Standard Server revenue increased 54%, while Storage revenue increased 16%.

4:08PM Analog Devices beats by $0.05, beats on revs; guides Q3 EPS above consensus, revs above consensus (ADI) 27.66 -0.69 : Reports Q2 (Apr) earnings of $0.55 per share, $0.05 better than the Thomson Reuters consensus of $0.50; revenues rose 40.8% year/year to $668.2 mln vs the $644.1 mln consensus. Co issues upside guidance for Q3, sees EPS of $0.59-0.61 vs. $0.52 Thomson Reuters consensus; sees Q3 revs of $695-715 mln vs. $658.31 mln Thomson Reuters consensus. Analog Devices announced The Board of Directors increased its quarterly dividend by 10% to $0.22. Co said, "We are planning for gross margins to be in the range of 65% to 66%. We expect that operating expenses will grow, but well below revenue growth. As a result, we anticipate that operating margins will expand to 33% to 34%."

Cisco (CSCO) announced its intent to acquire privately held MOTO Development Group, a design consulting firm that develops products and product strategies for the consumer industry.

9:02AM Tegal has received an order for a Tegal 110 S/DE DRIE tool from Uppsala University (TGAL) 1.18 :

12:23AM On The Wires : Akeena Solar (AKNS) enters into an exclusive worldwide agreement to manufacture, distribute, market and install its solar panels under the Westinghouse name; as part of the Westinghouse transition, Akeena's wholly-owned subsidiary Andalay Solar will be renamed Westinghouse...

icon url

ReturntoSender

05/20/10 12:39 AM

#8964 RE: ReturntoSender #6755

From Briefing.com: 4:30 pm : A rally by the euro against the dollar did little to motivate buyers, but stocks still slashed their losses after the S&P 500 dropped more than 1% to breach its 200-day moving average.

Overnight pressure against the euro took the currency down to a fractionally extended four-year low against the dollar. Its weakness remains underpinned by persistent uncertainty surrounding the fiscal health of the various European Union members. However, the euro started to attract some support in the minutes ahead of the opening bell and was eventually squeezed higher to a gain of little more than 1.5% versus the dollar.

Though the euro's move made for its best single-session gain against the greenback in nearly one year, the lack of any new developments in Europe led many to believe that the bounce was little more than a relief rally that squeezed short sellers. In turn, stocks showed little sustained reaction to the euro's climb.

With sellers still in control the S&P 500 gradually descended for the first half of trade. It even broke below its 200-day moving average of 1102 for a brief moment. However, support quickly surfaced as the benchmark index ran into the psychologically significant 1100 line. Stocks were able to cut their losses by more than half during afternoon action.

Financials proved to be a key source of support, even though the sector saw some rather volatile action -- the sector swung from a 1.0% gain to a 2.0% loss, then grinded its way higher to close with 0.2% gain. Still, financials made up the only sector to finish in higher ground.

Industrial stocks saw the most selling. The sector shed 1.3%, despite better-than-expected earnings and upside guidance from Deere & Co. (DE 58.87, +1.71).

Hewlett-Packard (HPQ 47.00, +0.21) was also out with better-than-expected earnings and upside guidance. Its shares had little overall influence on the tech sector, which fell to a 0.7% loss.

An upside earnings surprise from Target (TGT 54.03, -0.19) couldn't take the pressure off of retailers. With a 0.5% decline, shares of retailers logged their fourth loss in five sessions, during which time the group has fallen nearly 7%.

The Federal Open Market Committee (FOMC) acknowledged that there is increased investor anxiety about uncertainty over Europe. Concern over the continent's troubles left many to shrug off an increase in the FOMC's average 2010 GDP estimate to 3.5% from 3.2%, according to minutes from the latest FOMC meeting. As an aside, the FOMC has made no decisions about long term asset sale strategy.

In terms of actual data, the Consumer Price Index for April declined 0.1% month-over-month when a 0.1% monthly increase had been expected. Consumer prices less food and energy were flat for the second straight month, but a 0.1% monthly increase had been expected.

Advancing Sectors: Financials (+0.2%)
Declining Sectors: Industrials (-1.3%), Utilities (-1.0%), Energy (-1.0%), Consumer Discretionary (-0.8%), Tech (-0.7%), Materials (-0.4%), Telecom (-0.2%), Consumer Staples (-0.2%), Health Care (-0.1%) DJ30 -66.58 NASDAQ -18.89 SP500 -5.75 NASDAQ Adv/Vol/Dec 642/2.58 bln/2083 NYSE Adv/Vol/Dec 660/1.63 bln/2424

4:20PM GT Solar beats by $0.04, beats on revs; guides FY11 EPS in-line, raises revs in-line (SOLR) 5.31 -0.13 : Reports Q4 (Mar) earnings of $0.23 per share, $0.04 better than the Thomson Reuters consensus of $0.19; revenues rose 40.6% year/year to $194.7 mln vs the $183 mln consensus. Co issues in-line guidance for FY11, sees EPS of $0.55-0.65 vs. $0.60 Thomson Reuters consensus; raises FY11 revs to the upper end of its previous range with revenue of $550-600 mln vs. $578.10 mln Thomson Reuters consensus.

4:05PM Applied Materials beats by $0.01, beats on revs; guides Q3 EPS, revs above consensus (AMAT) 13.02 +0.08 : Reports Q2 (Apr) earnings of $0.22 per share, $0.01 better than the Thomson Reuters consensus of $0.21; revenues rose 24.3% year/year to $2.3 bln vs the $2.24 bln consensus. Co issues upside guidance for Q3, sees EPS of $0.22-0.26 vs. $0.21 Thomson Reuters consensus; sees Q3 revs of $2.254-2.415 bln vs. $2.21 bln Thomson Reuters consensus.

4:03PM SMTC Corp amends debt agreements (SMTX) 3.74 +0.08 : Co announced it has signed amended loan agreements with Wells Fargo Capital Finance Corporation and Export Development Canada to refinance the co'sshort and long term debt. Under the new lending arrangements, the term and principal repayment schedule have been extended to 2013 and virtually all principal payments eliminated in 2010. With the performance and prospects for the Company continuing to improve, interest rates have been reduced and covenants either eliminated or modified. Interest rates on the revolving line of credit are now at prime rate plus 1%, currently representing an aggregate rate of 3.25% in Canada and 4.25% in the US; reducing to prime rate as performance improves. Interest rates on the term loan will also vary depending upon financial performance in the range of LIBOR plus 2.5% to 3.5%.

2:22PM TranSwitch received pre-production orders from a Chinese Telecom OEM (TXCC) 2.31 +0.10 : Co received pre-production orders from a Chinese Telecom OEM for its Atlanta 80 processor for use in its WiMAX VoIP terminal equipment. The first widespread deployments of the Atlanta based WiMax Fixed Wireless Terminals will be in Asia and Europe in Q3 2010.

Palm (PALM) announced that the Palm Pre Plus and Palm Pixi Plus phones will be available in the UK on O2 from May 28...

8:01AM Trina Solar enters strategic partnership with TUV Rheinland, UL and CGC (TSL) 16.46 : Co announces its subsidiary, Changzhou Trina Solar Energy, has signed a strategic partnership agreement with TUV Rheinland Group

icon url

ReturntoSender

05/23/10 2:35 PM

#8966 RE: ReturntoSender #6755

Monday Morning Outlook: Have We Seen This Movie Before? DJIA Trying to Protect 10,000
Expiration week pressures may have contributed to Thursday's plunge
by Todd Salamone 5/22/2010 12:40 PM


http://www.schaeffersresearch.com/commentary/observations.aspx?ID=100039

The Dow Jones Industrial Average gave up a whopping 4% last week, and dipped below the psychologically important 10,000 level on an intraday basis on Friday. The Dow is now about 9% below its 2010 high, set in late April. Unsurprisingly, the CBOE Market Volatility Index is at an elevated 40, although it's down from Friday morning's freshly tapped annual high. Looking ahead, Todd Salamone, Senior Vice President of Research, is obviously concerned about a deteriorating technical picture, but warns against a knee-jerk panic reaction. Todd thinks that expiration-week pressures may have played as much of a role in Thursday's action as concerns about Europe. Next, Senior Quantitative Analyst Rocky White takes a look at how different market sectors performed during and following the market pullbacks of June-July 2009 and January-February 2010. Rocky compares that performance to the current correction. Finally, we wrap up with a look at some key economic and earnings reports slated for release this week.

Recap of the Previous Week: From 'Flash Crash' to Slow Motion Crash
By Joseph Hargett, Senior Equities Analyst

First, there was the "flash crash" of May 6. That may have just been a harbinger of the slow motion crash to come. From Tuesday through Thursday of last week, the Dow Jones Industrial Average (DJIA) plunged more than 550 points, to 10,068, marking a more than 10% decline from the late April highs just north of 11,200. Wall Street was clearly worried that the European debt crisis would spread and threaten the economic recovery in the U.S.

It's hard to remember now after that hair-raising midweek dive, but even though the DJIA spent most of Monday deeply in the red, it actually ended up in positive territory, although by a scant 0.05%. The Dow required a big-time eleventh-hour rebound to overcome an intraday 180-point deficit.

Despite Monday's comeback, Wall Street just couldn't shake the specter of European financial woes. The currency markets helped bring the issue back to the forefront on Tuesday, as the euro tagged a four-year low versus the U.S. dollar, prompting speculation that the 16-nation European currency was on its way out the door. Meanwhile, Germany contributed to the backlash by banning "naked" short selling, which many analysts opined would limit banks' ability to hedge market exposure. Investors in the U.S. expressed their displeasure by sending the Dow more than 1% lower on the day.

Anxiety about the declining euro spilled over into Wednesday's trading, as analysts fretted that the declining European currency may impact U.S. corporations' overseas profits. And if Wall Street wasn't getting enough flack from overseas, economic data on the home front came in weaker than expected, with the Mortgage Bankers Association noting that the number of homes in foreclosure climbed to 4.63% during the first quarter. Still, an upwardly revised outlook on the U.S. economy by the Federal Reserve provided a late-session lift, guiding the DJIA to a milder loss of 0.63% on the day.

Then came Thursday -- what is it about Thursdays? Fears continued to spread that countries like Greece, Spain and Portugal would be unable to pay their debts, despite the massive bailout package put in place by the European Union, and perhaps bring on a repeat of the 2008 financial crisis. Economic reports dampened the already bad mood. Weekly jobless claims came in worse than expected, while the Conference Board reported an unexpected monthly drop in April's leading economic indicators. Stocks were hammered from the outset. When the smoke lifted, all the major indexes had plunged more than 3.6%, with the Dow recording a daily loss of 376 points. The CBOE Market Volatility Index (VIX) spiked 29.6% to 45.79.


The U.S. Senate approved financial reform legislation Thursday, and despite the many complaints on Wall Street about the particulars of the bill, the small note of certainty appeared to encourage traders on Friday. Still, trading crossed the breakeven line several times during the course of the session, sending the VIX up to a new annual peak of 48.20 in early trading. It was only a last-minute push that allowed the Dow to score a 1.25% gain for the day, but that was obviously not enough to mitigate the dismal week. On a weekly basis, the Dow shed 4%, the S&P 500 Index gave up 4.2%, while the Nasdaq Composite tumbled more than 5%.

What the Trader Is Expecting in the Coming Week: Bulls Should Not Panic
By Todd Salamone, Senior Vice President of Research

"... levels of importance on the SPX include the round 1,100 level, which is not only the SPX's 200-day moving average, but also represents about a 10% correction from the recent highs... If in fact officials do something over the weekend to prop up the euro, we could see a huge equity rally on Monday. In the absence of such a plan, there could be follow-through selling... Another potential catalyst this week is the expiration of May options. There is massive out-of-the-money put open interest on various indexes and exchange-traded funds that is getting set to expire... ensure your long positions are hedged, and engage in strategies that reduce risk and give you profit opportunity on unexpected events. This may take on even more importance now, with the technical backdrop questionable and volatility on the rise – the CBOE Market Volatility Index (VIX – 31.24) has experienced nine consecutive closes above its 200-day moving average."
--Monday Morning Outlook, May 15, 2010

Last week brought about further deterioration in the technical backdrop of the market. The knee-jerk reaction might be, "Since the 1,100 level has been breached, should I sell everything?" Before doing so, it might be helpful to consider what may have inspired Thursday's disastrous price action, which violently pushed the S&P 500 Index (SPX) below its 200-day moving average. Was it really worries about Europe that generated this selling activity? Perhaps, but one might cry "nonsense!" since the decline occurred within the context of a euro rally.

Another explanation could be directed toward options expiration. After the broad indexes fell below strikes with heavy put open interest, put sellers at these strikes may have been actively shorting futures to hedge their positions, a concept known as delta hedging. Without getting into the complex details of delta hedging, be assured that this activity can create a snowball effect, much like we saw in Thursday's trading. In fact, it might be more than just coincidence that the intraday lows on Friday were similar to the "flash crash" lows of May 6. As long-time readers of Monday Morning Outlook know, while expiration week tends to be bullish, when we do have a decline, it is typically quite painful.


In another interesting development in Friday's trading, the VIX finally hit a level that matched its highs during the 1997 "Asian Contagion" and the 1998 "Russian Ruble Crisis." In addition, Friday's peak matched the two VIX crests during the first bear market of the new millennium. If the "European Contagion" does not have the negative systemic risk brought on by the Lehman Brothers bankruptcy and our own credit crisis in late 2008 and early 2009, the bulls may find the VIX high on Friday as an extremely encouraging development.


Moreover, on Friday, the VIX's peak was above the high of the previous day, and both its intraday low and weekly close were below Thursday's low. To market technicians, this chart formation is known as a bearish "outside" day, which usually signals lower prices ahead. Or, in this instance, it could signal lower volatility in the days ahead, which would likely coincide with a rally in stocks.

We observed previous instances when the VIX experienced a bearish "outside" day with a huge range, defined by the high being at least 20% above the VIX close. As defined by these parameters, a signal of this sort has occurred eight times since 1995. Per the table below, days one through 10 following these signals have had historical bullish implications. The returns 21 days following the signals have also had bullish implications, but note that the percent positive is less than the at-any-time returns since 1995.


Above being said, proceed with some caution, as the SPX did close below the key 1,100 level. Another concern is that the most recent American Association of Individual Investors' survey, released on Thursday, showed increasing optimism among those surveyed. This is somewhat disturbing, since those polled have proven to be an outstanding contrarian indicator during the past several months. Throw in the fact that this increasing optimism is within the context of a pullback and it becomes even more disturbing.

Potential support for the SPX is Friday's low around 1,055. If this level breaks, another important level would be 1,045, site of the lows in February. Resistance is in the 1,100-1,120 area. You already know the importance of 1,100, as described above. The 1,115 level, which marked the SPX's level at the end of 2009, could also be significant. Finally, 1,120 is yet another potential resistance area, as it's the site of the 160-day moving average and chart resistance in November and December 2009.

Continue to hedge your long positions during this volatile market environment. If you owned May put options as a hedging strategy, remember to buy more protection to replace the expired options.

Prepare for the investing week ahead. Every week, Bernie Schaeffer and his staff provide you with their insight about what has happened and, more importantly, what will happen in the market. We dig deep and show you what's happening behind the scenes, and tell you which indicators are predicting major market moves. If you enjoyed this week's edition of Monday Morning Outlook, sign up here for free weekly delivery straight to your inbox.

Indicator of the Week: Market Corrections and Sectors
By Rocky White, Senior Quantitative Analyst

Foreword: The S&P 500 Index (SPX) closed at 1,072 last Thursday, translating to a drop of 12% from its closing high on April 23. Many commentators are making a big deal of this, because this is the market's first 10% correction since the March 2009 bottom. That's true, but 10% is an arbitrary figure; we have had significant corrections in the last year that were less than that. Below is a chart of the SPX since March 2009. I circled the significant corrections that I'm talking about. In June-July 2009 the market fell more than 7% on a closing basis, and then in January-February 2010 the market had a correction of 8%. Finally, I circled the current correction.

This week I'm taking a look back at those corrections on a sector basis. I examine what sectors were hit the hardest and what that meant going forward. We'll see if this recent correction resembles those prior cases. It may give us insight on where we can go from here and how to profit from it.


Daily chart of the SPX since March 2009 with highlighted periods of correction


Returns by Sector: I track the returns of the various sectors by using a list of 31 different exchange-traded funds (ETFs). Below is a table that shows returns for many of those ETFs. The top of the table shows the 10 worst-performing ETFs. Then I show the SPY, representing the S&P 500. Finally, the 10 sectors below the SPY are top-performing sectors during the current correction. The last two columns in the table show where the sector ranked during the prior market pullbacks. The best-performing ETF during the corresponding correction has a rank of 1. The worst-performing ETF has a rank of 31.

What I gather from the table is that the three market corrections are quite similar. Commodities/metals get hit especially hard during the pullbacks. Bonds and the dollar do relatively well. Gold outperformed the SPX in the prior two corrections, but this time it is doing especially well, as it is the third best-performing sector among the 31 ETFs that I track. The next two best-performing ETFs after gold are gold miners and silver. Those sectors are currently negative, but they have held up better than the SPX. That's different from the prior two corrections, in which they underperformed the SPX.


Following the Correction: Hopefully I'm not jinxing anything, but let's assume Thursday's close marked the bottom for a while and we get a decent bounce over the next few weeks. Below are a couple of tables which show the best and worst five sectors of the prior corrections, and how they performed over the next two weeks and one month after the market hit its low.

What you will notice, and something we've observed time and time again, is that the sectors that get hit the hardest during a correction generally bounce back the most. Looking at the table showing the June 2009 correction, we see all five of the sectors that performed the worst during the correction outperformed the S&P 500 over the next two weeks and one month. Also note that four of the five best-performing sectors underperformed the S&P 500 in the following month. A similar pattern is shown in the table with data from the January 2010 correction.


Implications: The hard part going forward is predicting whether the market is going to bounce back in the next few weeks or remain weak and keep falling. Unfortunately, the analysis above doesn't help with that. But it does tell us that if you think Thursday was the low and you see us bouncing back, then commodities is the way to go. If we continue to fall then avoid those and get some exposure to bonds, the dollar and/or maybe even gold.

This Week's Key Events: Home Sales, GDP and Consumer Sentiment
By Joseph Hargett, Senior Equities Analyst

Here is a brief list of some of the key events for the upcoming week. All earnings dates listed below are tentative and subject to change. Please check with each company's respective website for official reporting dates.

Monday

*

Monday offers up April's existing home sales, while Campbell Soup Company (CPB), Yingli Green Energy Hold. Co. Ltd. (YGE), and Phillips-Van Heusen Corp. (PVH) are on tap to present their quarterly earnings figures.

Tuesday

*

May's consumer confidence figures will arrive on Tuesday. On the earnings front, AutoZone Inc. (AZO), Cracker Barrel Old Country Store Inc. (CBRL), Medtronic Inc. (MDT), Trina Solar Limited (TSL), and TiVo Inc. (TIVO) are scheduled to release their quarterly reports.

Wednesday

*

Wednesday brings the weekly report on U.S. petroleum supplies, as well as April's durable goods and April's new home sales. Taking their turn in the earnings confessional are American Eagle Outfitters (AEO), Diana Shipping Inc. (DSX), Solarfun Power Holdings Co. Ltd. (SOLF), Toll Brothers Inc. (TOL), Hoku Corp. (HOKU), Jo-Ann Stores Inc. (JAS), NetApp Inc. (NTAP), and Take-Two Interactive Software Inc. (TTWO).

Thursday

*

Weekly initial jobless claims hit the Street on Thursday, followed by a second look at first-quarter gross domestic product (GDP). Big Lots Inc. (BIG), Costco Wholesale Corp. (COST), H.J. Heinz Company (HNZ), Tiffany & Co. (TIF), Guess?, Inc. (GES), J. Crew Group Inc. (JCG), Novell Inc. (NOVL), and OmniVision Technologies Inc. (OVTI) are scheduled to report earnings.

Friday

*

Friday closes the week with April's personal income and spending reports, the PCE core index for April, the Chicago Business Barometer for May, and the University of Michigan's consumer sentiment index for May. There are currently no earnings reports scheduled for release on Friday.

And now a few sectors of note...

Dissecting The Sectors
Sector
Real Estate
Bullish

Outlook: It was another rough week on Wall Street, but the iShares Dow Jones U.S. Real Estate Index Fund (IYR) held up admirably well. In fact, IYR closed above its 20-week moving average and the 47.50 level. This area also marks a half-high of the fund's February 2007 peak near $95 per share. Furthermore, the 47.50 level provided stiff overhead resistance in December 2009, and should provide a springboard of support for IYR. On the sentiment front, IYR's International Securities Exchange (ISE) and Chicago Board Options Exchange (CBOE) 50-day buy (to open) put/call volume ratio continues to turn higher from low levels. This may be indicative of hedged money accumulating stocks in this group. Elsewhere, bearish sentiment continues to pile up on the commercial real estate sector. Recently, in a story titled "Lenders Open to Real-Estate Pain," The Wall Street Journal offered up the following gem in reference to commercial real estate: "A slow motion train wreck is still a train wreck." There is also plenty of negativity outside of the financial media. Specifically, fewer than 35% of the 1,055 analysts covering the sector have doled out "buys." Any upgrades could provide lift for the sector.
Sector
Financials
Neutral

Outlook: The Financial Select Sector SPDR (XLF) struggled alongside the broader market last week, and failed to hold support at its 200-day moving average. This trendline contained the trust's February 2010 lows, and could create a bit of turmoil for the fund. However, the shares held above intermediate-term support in the 14 region. Meanwhile, there is room for sentiment to improve toward the group. Specifically, roughly half of the 513 analysts following financial-sector stocks rate them a "hold" or worse. Any upgrades from this bunch could provide an additional tailwind. However, the XLF's International Securities Exchange (ISE) and Chicago Board Options Exchange (CBOE) 50-day buy-to-open put/call ratio recently peaked, suggesting that hedged buyers are no longer in accumulation mode. We view this as an even greater concern at the moment with the XLF trading below its 200-day moving average.
Sector
Consumer Discretionary
Bullish

Outlook: Economic data has been strong for retailers lately, as retail sales rose for the seventh straight month in April, climbing by a better-than-expected 0.4%. Adding to the upside surprise, sales in February and March were each revised higher by two-tenths of a percentage point. Technically speaking, the S&P Retail SPDR (XRT) rebounded from support at its 120-day moving average last week. With many retailers releasing their quarterly reports, we recommend shifting your focus to under-loved names that are reacting favorably to earnings. For example, Whole Foods Market Inc. (WFMI) looks promising after rallying more than 40% on a year-to-date basis and issuing a strong quarterly report. The stock also sports only four "buys" out of 18 total rankings. By comparison, Kohl's Corp. (KSS) fell 5.8% in the wake of its earnings report, despite attracting 18 "buys" out of 22 ratings. Given this data, we would favor WFMI over KSS, as WFMI has more upgrade potential and stronger tailwinds related to the positive earnings surprise. Speaking of ratings, only about 50% of the analyst ratings on retail stocks are "buys," leaving plenty of room for potential upgrades. As analysts and investors digest the improving economic and technical outlook for the sector, we should see added buying pressure push these stocks steadily higher.

icon url

ReturntoSender

05/24/10 10:36 PM

#8968 RE: ReturntoSender #6755

From Briefing.com: 4:25 pm : Trade was muddled for most of the session, but weakness among financial stocks and other cyclical plays undercut the broader market for a sizable loss.

Stocks got off to a relatively weak start after news that Spain's central bank took control of regional savings outfit CajaSur served as a very real reminder of the financial uncertainty in Europe. The headline also stirred selling against the euro, which fell 1.6% to 1.2373 per dollar.

While the euro was weak for the entire day, Europe's major bourses were able to stage a rebound. Their upturn helped ease some of the early pressure against domestic stocks, but persistently listless trade limited the broader market's upward moves. As a consequence, the S&P 500 was unable to push past the session highs of this past Friday.

The mixed tape was eventually imbued by financial stocks, which fell to a 2.9% loss -- the worst of any major sector in the S&P 500. Diversified bank stocks (-4.0%) and regional bank stocks (-4.2%) were among the worst performing groups, but Janus Capital (JNS 10.51, -0.85) saw one of the sharpest slides after analysts at Goldman Sachs downgraded asset managers.

Energy stocks (-2.2%), materials stocks (-1.7%), and industrial stocks (-1.6%) also came under a stiff bout of selling pressure as market participants turned against cyclical stocks.

Large-cap tech stocks had displayed strength for most of the session, but the group succumbed to selling in the final stretch of trade. The Nasdaq 100 had been up as much as 1.0%, but it finished with a 0.4% loss as it closed at its session low along with the other major averages. Yahoo! (YHOO 15.54, +0.07) was able to hold on to a modest gain, though. Its strength followed news that it will form a strategic alliance with Nokia (NOK 10.02, -0.05).

There weren't any other major news items of note and economic data was limited to April existing home sales, which spiked 7.6% month-over-month to an annualized rate of 5.77 million units. A rate of 5.62 million units had been expected.

The economic calendar for Tuesday features a consumer confidence reading from the Conference Board and housing price data from the Federal Housing Finance Agency.

Advancing Sectors: (None)
Declining Sectors: Financials (-2.9%), Energy (-2.2%), Materials (-1.7%), Industrials (-1.6%), Telecom (-1.0%), Utilities (-0.9%), Consumer Discretionary (-0.8%), Consumer Staples (-0.8%), Tech (-0.6%), Health Care (-0.2%) DJ30 -126.82 NASDAQ -15.49 NQ100 -0.4% R2K -1.2% SP400 -1.0% SP500 -14.04 NASDAQ Adv/Vol/Dec 935/2.08 bln/1756 NYSE Adv/Vol/Dec 1187/1.31 bln/1912

6:26PM Motorola announces cash tender offers for up to $400 mln of certain of its outstanding debt securities (MOT) 6.73 -0.11 :

5:43PM Rambus: ITC extends target date of final determination in Rambus matter regarding NVIDIA (NVDA) products (RMBS) 24.14 -0.06 :

4:11PM Microchip: Greenliant Systems acquires NANDrive, NAND controller and specialty flash memory assets from Microchip Technology (MCHP) 26.85 -0.51 : Greenliant Systems announces that it has acquired the NANDrive, NAND Controller and Specialty Flash Memory assets of Microchip Technology. The three product lines will form the core of Greenliant's solid-state storage product portfolio for the embedded system, data center and mobile Internet markets.

10:17AM Yahoo! and Nokia (NOK) announce partnership for web services (YHOO) 15.57 +0.10 : Co's announced strategic alliance. As part of the alliance: Nokia will be global provider of Yahoo!'s maps and navigation services, integrating Ovi Maps across Yahoo! properties, branded as "powered by Ovi." Yahoo! will become global provider of Nokia's Ovi Mail and Ovi Chat services branded as "Ovi Mail / Ovi Chat powered by Yahoo!" Nokia and Yahoo! plan to work on ID federation between their services. Select, co-branded service offerings are expected to become available from the second half of 2010, with global availability expected in 2011.

8:32AM MEMC Elec to acquire Solaicx; to be accretive to earnings in 2011 (WFR) 11.01 : Co announces it has reached a definitive agreement to acquire privately held Solaicx. MEMC will pay to the existing securityholders of Solaicx at closing cash in the amount of $66 million, plus an additional amount in cash equal to amounts which have been recently invested in, or which may be invested prior to closing in Solaicx by its existing securityholders. Co expects acquisition to be accretive to EPS in 2011.

1:26AM On The Wires : TriQuint Semiconductor (TQNT) announces that it has been awarded a contract by the US Air Force Research Laboratories to develop new Gallium Nitride modules for unmanned aerial vehicles. TriQuint's new GaN devices will extend the range and capabilities of UAVs that are used for reconnaissance missions over Afghanistan, Iraq and other regions...

icon url

ReturntoSender

05/25/10 9:40 PM

#8969 RE: ReturntoSender #6755

From Briefing.com: 4:30 pm : The S&P 500 rallied from a loss of more than 3% to an incremental gain on Tuesday. The move began with a technical bounce, gained momentum on the back of an upbeat consumer confidence figure, then extended the push into the final leg of trade amid leadership from financials.

Persistent concerns about the fiscal conditions of Europe and renewed geopolitical tensions between North Korea and South Korea caused global equity markets to fall sharply as investors shunned risk and sought safety. With stocks sharply out of favor roughly 95% of the components in the S&P 500 fell to a loss and the benchmark index dropped to a six-month low.

However, technical support at the 1040 line brought about a bounce from the morning low. The rebound gained upward momentum in the minutes that followed the midmorning release of the May Consumer Confidence Index, which topped expectations by coming in at a two-year high of 63.3.

Other data -- including a 0.1% monthly decline by the March S&P/CaseShiller 20-City Composite and a 0.3% increase in the FHFA's Home Price Index for March -- had no real effect on trade. Stocks looked like they were about to stagnate midsession as the S&P 500 ran into resistance at the 1060 line. That proved to be less of a hurdle once financial stocks started to provide leadership.

Financials found support after CNBC reported that Representative Frank stated that the financial reform bill's language regarding derivatives goes too far. The prospect that the proposed rules on derivatives may be diluted or thrown out helped the financial sector swing to a gain of 0.8%. It had been down more than 3% at its session low.

Materials stocks made one of the most dramatic turnarounds. The sector had been down more than 3% at its session low, but it rallied to finish with a 1.6% gain.

Retailers outperformed for virtually the entire session to finish with a 1.4% gain. Autozone (AZO 194.57, +10.32) was a leader after it posted quarterly earnings that exceeded Wall Street's consensus estimate with ease.

While a few pockets of strength helped the broader market stage a rally, the headline indices struggled at the neutral line in the final minutes of trade. However, a final flurry of buying pushed the broad-based S&P 500 into the green in the waning moments of trade. Though the Dow and Nasdaq couldn't make it into higher ground, they still settled near session highs.

The afternoon sprint knocked Treasuries back a bit. The benchmark 10-year Note saw its yield fall to a near one-year low of almost 3.10% in the early going, but its yield stood closer to 3.15% at the close. Meanwhile, the 2-year Note finished slightly lower amid disappointing auction results, which featured a bid-to-cover ratio of 2.9 and indirect bidder participation of 36.2%. Results from an auction of 5-year Notes will be released Wednesday afternoon.

Advancing Sectors: Materials (+1.6%), Financials (+0.8%), Consumer Discretionary (+0.8%), Telecom (+0.2%)
Declining Sectors: Consumer Staples (-1.0%), Utilities (-0.7%), Health Care (-0.7%), Tech (-0.2%), Energy (-0.1%) DJ30 -22.82 NASDAQ -2.60 NQ100 +0.00% R2K -0.2% SP400 -0.1% SP500 +0.38 NASDAQ Adv/Vol/Dec 888/2.89 bln/1767 NYSE Adv/Vol/Dec 1118/1.88 bln/1964

4:33PM Ixys beats by $0.05; guides Q1 revs well above consensus (IXYS) 8.47 : Reports Q4 (Mar) earnings of $0.13 per share, $0.05 better than the First Call consensus of $0.08; revenues rose 31.4% year/year to $76.6 mln vs the $67.2 mln consensus. Co issues upside guidance; co sees Q1 revs of $79-81 mln vs. the $71.5 mln consensus.

4:07PM UTStarcom plans to sell IP messaging and US PDSN Assets to NewNet Communication Technologies; transaction expected to close in June 2010 (UTSI) 1.98 -0.04 : Co is selling its IP Messaging and US PDSN Assets to NewNet Communication Technologies who will also become a reseller of the UTStarcom core IP-based product portfolio in the North America and Latin American regions. Terms of the agreement were not disclosed. The transaction is expected to close in June of 2010.

American Superconductor (AMSC) and Sinovel Wind Group announced that they have expanded their strategic partnership to include additional wind turbine designs for both the onshore and offshore markets...

6:36AM On The Wires : Zoran (ZRAN) announces it has licensed the stereoscopic RealD Format and will incorporate support for 3D content delivery and display technology into its TV, set-top box and Blu-ray products. Zoran's TV reference design with integrated RealD 3D support is available now....

6:17AM Trina Solar beats by $0.05, beats on revs (TSL) 17.66 : Reports Q1 (Mar) earnings of $0.66 per share, $0.05 better than the Thomson Reuters consensus of $0.61; revenues rose 155.0% year/year to $336.8 mln vs the $329.8 mln consensus. Gross margin was 30.9%, above the co's guidance of 26% to 28%, compared to 32.6% in the fourth quarter of 2009 and 17.2% in the first quarter of 2009. Total shipments were 192.6 MW, compared to the co's previous guidance of 180 MW to 190 MW, vs 163.7 MW in 4Q09 and 48.8 MW in 1Q09. For 2Q10, the co expects to ship between 200 MW to 205 MW of PV modules. TSL believes its gross margin for the second quarter will be in the high 20s in percentage terms. For FY10, the co reiterates its guidance for total PV module shipments between 750 MW to 800 MW, representing an increase of 88% to 100% from 2009. Co expects to increase its shipment volumes on a quarter to quarter basis through the end of 2010. Additionally, the co expects to increase its percentage of global shipments to the U.S. in 2H10.

icon url

ReturntoSender

06/01/10 9:57 PM

#8972 RE: ReturntoSender #6755

From Briefing.com: 4:30 pm : Sloppy, listless trade gave way to a broad-based selling effort, which intensified into the close and culminated in another round of sharp losses.

Market participants returned from the extended holiday weekend to several of the same problematic themes of recent weeks. For starters, worries about the state of finances in Europe continue to linger, but news that the European Central Bank (ECB) said that eurozone banks face further writedowns over the next 18 months added to concern. Europe's major bourses buckled and the euro fell to a new four-year low of $1.211 in response.

Meanwhile, concerns about global growth came back into play in the wake of weaker-than-expected monthly manufacturing data from China.

In the face of the market's growth concerns, the Bank of Canada announced that it added 25 basis points to its benchmark interest rate, which now stands at 0.50%. The hike makes Canada the first G-7 country to raise rates.

U.S. data showed that the ISM Manufacturing Index for May hit 59.7, which is a bit better than the 59.4 that had been widely expected. Moreover, construction spending for April surged 2.7%, which easily surpassed the 0.1% monthly increase had been widely anticipated, to make for the best monthly increase since 1998.

Those announcements helped stocks swing from an early loss of more than 1% to a solid gain.

A pullback by the greenback also helped stocks, but the dollar was later able to stage a modest rebound so that it finished with a 0.3% gain against a basket of competing currencies.

Though stocks looked like they were on course for an impressive turnaround, trade quickly turned muddled. That left the broader market to chop along in lackluster action.

The lack of positive leadership left stocks susceptible to a late selloff, which focused on cyclical plays like materials stocks and energy stocks. The materials sector fell to a 3.1% loss as steel stocks dropped 5.9%. Meanwhile, energy fell 4.3%, collectively, as oil and gas equipment plays are imbued by BP (BP 36.52, -6.43), which continues to grapple with the consequences of its oil spill in the Gulf of Mexico.

Weakness among energy stocks was exacerbated by a pullback in oil prices, which finished pit trade with a 1.8% loss at $72.58 per barrel.

Gold prices closed with a 0.9% gain at $1226.90 per ounce, however. July silver also shared in the safety trade; it finished up 0.5% at $18.55 per ounce.

Advancing Sectors: (None)
Declining Sectors: Energy (-4.3%), Materials (-3.1%), Utilities (-2.3%), Financials (-2.1%), Industrials (-2.1%), Consumer Discretionary (-1.6%), Health Care (-1.0%), Tech (-0.9%), Telecom (-0.8%), Consumer Staples (-0.2%) DJ30 -112.61 NASDAQ -34.71 NQ100 -0.9% R2K -3.1% SP400 -2.7% SP500 -18.70 NASDAQ Adv/Vol/Dec 455/2.13 bln/2224 NYSE Adv/Vol/Dec 642/1.43 bln/2403

Trina Solar (TSL) announced its research agreement with the Solar Energy Research Institute of Singapore to develop an all-back-contact high-efficiency silicon wafer solar cell using Trina Solar's monocrystalline wafers...

ChipMOS TECHNOLOGIES (IMOS) announced that ChipMOS TECHNOLOGIES, a 95.5% owned subsidiary of ChipMOS, would receive $12.6 mln from ProMOS Technologies as payment in full of an outstanding accounts receivable balance owed to ChipMOS Taiwan. Under an amendment to an existing service agreement, ProMOS paid ChipMOS Taiwan $6.3 mln on May 28, 2010...

The Victoria-Suntech Advanced Solar Facility was officially launched. The facility, a collaborative venture between Swinburne University of Technology and Suntech Power Holdings (STP) has been partially funded by a AUD3 mln grant under the Victorian Science Agenda Investment Fund...

Flextronics (FLEX) formally announced plans to develop a Power manufacturing and service facility in Ganzhou, Jiangxi.

7:31AM Hewlett-Packard to invest $1 billion to launch new era of enterprise services (HPQ) 46.01 : To fund this investment, HP will take a charge of approximately $1 billion over a multiyear period that will be included in its GAAP financial results. Once completed, this transformation is expected to generate annualized gross savings of approximately $1 billion and net savings after reinvestment in a range between $500 million and $700 million.
icon url

ReturntoSender

06/05/10 1:31 PM

#8974 RE: ReturntoSender #6755

From Briefing.com: 4:15 pm : Sellers reclaimed control of the stock market after it had put together solid back-to-back gains. The change in tone came amid renewed concerns about contagion in Europe and disappointing nonfarm payrolls data.

Stocks entered Friday with a weekly gain of more than 1%, but that was dashed with this session's rout, which saw the S&P 500 drop more than 3%. That gave the stock market a weekly loss of more than 2% -- its fourth weekly loss of more than 1% in six weeks.

Market participants sold stocks en masse upon learning that officials from Hungary stated that economic conditions in their country are grave and that talk of default is not an exaggeration. What's more, the country does not plan to put austerity measures in place, leading many wonder whether the European Union (EU) will have to provide a bailout.

Though Hungary uses the forint instead of the euro as its currency, the country's troubles make for a manifestation of the fears spawned by the tenuous fiscal and financial conditions throughout Europe. In turn, the euro dropped a precipitous 1.7% to set a new four-year low of $1.1956.

Trade was also hurt by news that nonfarm payrolls for May increased by 431,000, which is well below the 500,000 that many had expected. Even higher numbers had been whispered in some circles, making disappointment over the number all the more significant. Ultimately, the smaller-than-expected increase in payrolls overshadowed news that the unemployment rate made a surprise move to 9.7% from 9.8%.

There really weren't any other headlines to act as catalysts for trade. In turn, market participants were focused on the negative. Of the 500 components in the S&P 500, only one -- Cephalon (CEPH 59.11, +0.33) -- managed to muster a gain. Weakness in the rest of the market led the benchmark index to one of its worst performances this year and its lowest close since February.

Such sharp selling pressure caused the Volatility Index, often euphemistically dubbed the "Fear Gauge," to surge more than 20%. It closed at its highest level of the week.

There was plenty participation behind this session's selloff. Specifically, trading volume on the NYSE surpassed 1.6 billion shares, which is comfortably above the 50-day average of roughly 1.4 billion shares. This session's declining volume outnumbered advancing volume by more than 130-to-1.

Amid this session's carnage, Treasuries fared extremely well. As such, the benchmark 10-year Note spiked more than one point to drop its yield is below 3.20%.

Gold was also a beneficiary of a flight to safety. It closed pit trade with a 0.6% gain at $1217.20 per ounce.

Gold wasn't the only commodity to find favor, though. Natural gas prices climbed 2.3% to settle pit trade at $4.82 per MMBtu as the energy component extended its surge from the prior session.

Advancing Sectors: (None)
Declining Sectors: Industrials (-4.6%), Financials (-4.0%), Materials (-3.9%), Consumer Discretionary (-3.8%), Energy (-3.5%), Tech (-3.2%), Utilities (-3.0%), Health Care (-3.0%), Consumer Staples (-2.6%), Telecom (-2.3%) DJ30 -324.06 NASDAQ -83.86 NQ100 -3.4% R2K -5.0% SP400 -4.1% SP500 -37.95 NASDAQ Adv/Vol/Dec 300/2.30 bln/2372 NYSE Adv/Vol/Dec 289/1.63 bln/2790

Xilinix (XLNX) prices $520 mln of 2.625% convertible senior notes due in June 2017.

icon url

ReturntoSender

06/05/10 10:37 PM

#8975 RE: ReturntoSender #6755

Amateur Investors Weekend Stock Market Analysis (6/5/10)

http://www.amateur-investor.net/Weekend_Market_Analysis_June_5_10.htm

Obviously the S&P 500 has a key support area at 1041 (black line) which was the late May low. If it breaks below 1041 then the next support area would be at 1009 (red line) which is the 38.2% Retrace from the March 2009 low of 667 to the April 2010 high of 1220. Meanwhile a drop below 1009 would likely lead to a deeper correction back to the 50% Retrace of 944 (blue line).


If the market is going to have any additional weakness it will likely be from now through the Fall. Historically the year before a Presidential Election Year has been favorable for the market going back to 1942 especially in the November through August time period as shown in the table below.

The Average Return has been 20.5% for the last 17 occurrences going back to 1942. The smallest Return was 5.7% in 1947 while the largest Return was 41.8% in 1987 which by the way preceded the October 1987 crash.
  
Dow Performance prior to a Presidential Election Year since 1942
Holding Period (October Close to August Close)
Date Monthly Closing Date Monthly Closing % Return
Price Price
Oct-1942 114.10 Aug-1943 136.60 19.7
Oct-1946 169.20 Aug-1947 178.90 5.7
Oct-1950 225.00 Aug-1951 270.30 20.1
Oct-1954 352.10 Aug-1955 468.20 33.0
Oct-1958 543.20 Aug-1959 664.60 22.3
Oct-1962 589.90 Aug-1963 729.30 23.6
Oct-1966 807.10 Aug-1967 901.30 11.7
Oct-1970 755.60 Aug-1971 898.10 18.9
Oct-1974 665.50 Aug-1975 835.30 25.5
Oct-1978 792.50 Aug-1979 887.60 12.0
Oct-1982 991.70 Aug-1983 1216.20 22.6
Oct-1986 1,877.70 Aug-1987 2663.00 41.8
Oct-1990 2,442.30 Aug-1991 3043.60 24.6
Oct-1994 3,908.10 Aug-1995 4610.60 18.0
Oct-1998 8,592.10 Aug-1999 10829.30 26.0
Oct-2002 8,397.03 Aug-2003 9415.82 12.1
Oct-2006 12,080.73 Aug-2007 13357.74 10.6
Oct-2010 ? Aug-2011 ? ?
Avg Return 20.5
,/pre>

icon url

ReturntoSender

06/06/10 5:06 PM

#8976 RE: ReturntoSender #6755

InvestmentHouse Weekend Market Summary

http://www.investmenthouse.com/weekendmarketsummary.htm

- No three straight as stocks sell sharply to end the week.
- New sources of worry in Europe, overly high jobs expectations too much for stocks to handle.
- Obama administration learns a lesson in expectations management.
- Jobless wait hits a record high as private sector creates a measly 41K new jobs. Laughable if not so tragic.
- Euro sinks to a new low since 2006.
- Stocks thoroughly thrashed, but growth indices still remain in the recent lateral range: don't assume failure.
- Reverting to the down on Friday, up on Monday pattern? The bulls can only hope.

It comes down to jobs quality, not quantity, for investors.

There was not a third consecutive upside session for the indices after the back-to-back gain (the first since late April) occurred on Thursday. Instead they turned and sold sharply to end the week. NASDAQ -83 points at 3.6%; the Dow -300 points at -3%; SP500 -38 points at -3.4%; SOX -4.4%, SP600 -4.8%, and NASDAQ 100 -3.3%. NASDAQ 100 almost came in as one of the relative strength leaders.

There were new sources of worry coming out of Europe. Even though Hungary does not trade the Euro as its primary currency, it reported that its economy was in a "very grave situation." Then the French bank Societe Generale was rumored to have some serious derivative losses. With the focus turning away from Portugal, Greece, and Spain into new areas, that was hard to overcome. In the US we had some overly high expectations for the jobs report. There were statements made by the head of the administration about how this would be a great number. Apparently they saw the 9.7% unemployment rate as good. It is, but the problem is that no one is coming into the job market; people are leaving the job market, and that is why the unemployment rate fell. There were a few jobs created thanks to the census, so there is a lower unemployment rate, but it is not a pretty picture.

The indices were thrashed. They started low and then moved even lower as the session progressed. There has a modest upside bounce mid-morning after the gap lower, but it never came close to scaring up anything near positive. Then the market rolled over and slid down to close at sessions lows. It was a very strong downtrend for the day in that it stayed below the 10 day EMA the entire time after the mid-morning bump, excepting a short, 20-minute period midday. It was a sharply negative day on the session. On SP500, it broke below the recent lows in its lateral trading range after undercutting the February low and coming off the new low in the selloff. For the other indices such as NASDAQ, it was not as bad. NASDAQ did break below the recent lows, but it is still more or less in that lateral consolidation after bouncing up off the May low. There is some hope there. There is something of substance still in the bounce, though it got a severe setback on Friday. It may just have been due to bad news and the jobs report being overly hyped. It could also be reverting to the more typical trend in recent months: Down on Friday on fears of what might happen over the weekend, and then bouncing back up on Monday if no major disaster hits.

OTHER MARKETS.

Dollar. The fear trade was back on, but with a bit of a twist. The dollar surged. The Euro got body slammed down with the first close below 1.20 since 2006 (1.1967 versus 1.2159 Thursday). That was one of the lows of the entire move. You can see from the DXY0 that the dollar was stronger against all other stocks. I talked about the pennant setting up that was a consolidation for a new break higher. Friday we got the new break higher, and it was a hum dinger. That is a big breakout of a nice consolidation. The dollar recovery I talked about for so long being an oversold bounce really continues to pour on the coals to the upside. Looking at the weekly chart, it balked three weeks back when it approached the late 2008 and early 2009 twin peaks. Now it is pouring on the gas and is rallying up through the late 2008 peak and is now taking aim at the 2009 closing high (not the intraday yet, but it will be there soon enough). Very strong break to the upside by the dollar. It goes to show the fear trade is alive and people are running to safety. After all, why not the US? Our debt-to-GDP ratio is a mere 90%; that is better than Greece and other European countries, so we must be a hell of a bargain. That is the good thing about having a nice track record over the last 50 or 60 years: People still instinctively turn to our currency and debt instruments in times of trouble. The question is when they will stop doing that. At what point will our debt-to-GDP ratio become so high that it overcomes our history as being the main flight-to-safety currency and debt market?
Click to view the chart

Bonds. After pulling back over the past week indeed, gapping sharply lower on Thursday there was a sharp gap higher on Friday. Very strong move to the upside. You can see something of an ABCD pattern, and there is the gap to the upside. As noted, it was strong. Looking at the weekly chart on the 20 year, you can see something of a double bottom. There is the selloff, the double bottom, the rally, and now a pennant has formed right at the hump in the double bottom. That is where you would expect it to encounter resistance. If the handle forms and keeps in an orderly, narrow formation moving laterally, then the odds of a breakout increase tremendously. We could see another breakout in US bonds, believe it or not. They are already defying logic with this move, and if Europe continues to deteriorate, bonds will continue to grow stronger until we reach the point in the US where our credit worthiness becomes suspect. If the rest of the world goes down, we will have been unable to sell the $1.25T in junk assets that the Fed bought during the crisis. We still have interest rates at 0%. Where are the bullets? What can the US do if Europe falls and we are left standing, having to fund the world, and then we start to stumble? The ammunition will be spent. It would be hand to hand combat, and I am afraid it would not be in the currency markets. By the close, the 10 year US treasury had rallied (3.20% yield versus 3.37% Thursday). Like the dollar, it made a blistering move.
Click to view the chart

Gold. Gold had a nice day. Even though the fear trade was on, gold still rallied. There is a fear out there, and something is driving gold beyond just inflation. It broke sharply higher, and moved back over the 2009 peak ($1,221.60, +11.60). A very solid move to the upside, and this is basically a consolidation that we have been looking at over the past few weeks. Looking at the weekly pattern, gold is simply consolidating just above the prior all-time high hit in late 2009. We have the same kind of action we are seeing in bonds, just with a different pattern. A breakout, a pennant over a few weeks, and now it is ready to make the break to the upside.
Click to view the chart

Oil. You would expect that oil would be clubbed from the fear trade, and it was pretty much beaten to death on Friday ($70.85, -3.76). There was a rather sharp turn in the rebound off the bottom of the trading range. Nice rally, a test, and it looked like it was making the break to the upside. Then it knocked below the recent low on the test with strong volume. Looks like there could be trouble for oil yet again. It is just one of the problems facing the commodity right now. Looking on a weekly chart, it is still at the bottom of its range. It has not broken down, and it still looks healthy on a weekly pattern. That means it could find support down at the prior lows or at the recent lows for that matter and then make a renewed move to the upside in the trading range. For now, this is a very sharp and very negative turn down near term.
Click to view the chart

Overall the other markets showed the fear trade once again. The twist I talked about earlier was that gold made a solid upside move despite the fear of deflation spreading throughout Europe. Remember, it was not just the PIIGS. There was an important French bank rumored to have major losses with respect to derivatives. We hear that Hungary's economy is in a very grave situation. How many more of these news stories are out there, and how much pressure will that put on the stronger countries in Europe? The bigger question one that impacted the US and its double dip possibilities later on this year is what is the contagion effect for the rest of the world? On the upside, I can say that CSCO said it was accelerating its global hiring. Perhaps trying to offset the news of the jobs report on the day, CSCO and John Chambers tried to take the bull by the horns and say they would be hiring so all is not lost. I doubt CSCO can turn the tide by itself, however.

TECHNICAL PICTURE

INTERNALS

Breadth. Breadth was massively lower. After a meager 1.6:1 advancers over decliners on Thursday on NASDAQ, the decliners led 7.5:1 on Friday. On the NYSE after a meager 1.6:1 to the upside, it was -7:1 on Friday. Sellers swamped the market and pushed most stocks lower.

Volume. Volume bounced up to 2.2B on NASDAQ. That is still right at or below average. On NYSE there was a big 34% jump to 1.6B, and that did manage to push volume back above average on that index. It was a significant move above average as it sold and broke through the lower part of the range. That is important selling. There was distribution; they were dumping stocks in the SP500.

CHARTS

SP500. After bumping the 200 day EMA twice the last being on Thursday at the high the SP500 gapped lower and then sold very hard. It did undercut the recent lateral range, and I am measuring it from the low after the initial bounce. It undercut it on Friday and did so on volume. There was some dumping of NYSE shares. It was a sharp turn lower, and I am looking at the closing low in February once again for a test. We will see if it can make something of a double bottom off that level. It tried to make a double bottom at the higher point, and now we will see if it can make one at the lower point. SP500 is one of the weaker-looking indices of the group.

NASDAQ. The NASDAQ was no beauty as it, too, was gutted. It gapped lower, was selling below its 200 day EMA, and undercutting this low on Tuesday. It is not a good move for it, but volume was still below average even though it was elevated. There were not a lot of sellers ready to take this index down. It looked as if it wanted to emerge as a leader to the upside on this bounce, taking over for SP500. The growth indices looked like they were starting to move. I am not writing off NASDAQ based on this move. The volume has been low, and it has been consolidating laterally in this range on lower, below-average volume. Ever since it sold off on higher trade, it is moved laterally on lower volume after that bounce. It bounced on higher volume, and then continued to move up. We will see how this next week plays out. It is still good enough to make the bounce higher given the low volume, it could do that. Continue this move, continue to consolidate, and then try to make the next break to the upside. From at the way it is acting and the volume associated with the move lower, NASDAQ is not dead yet.

SP600. The small caps were one of the other growth indices that looked good. It has some issues. It made a closing low on the Friday move on this pullback. It has now broken down into the January range at that peak and is coming to a critical level at the 200 day EMA. That is also coincident with the bottom of that January consolidation as well as a late-February lateral shelf consolidation. There are three points lining up. The 200 day EMA, the February flat shelf consolidation, and the bottom of the January peak. This is an important point for the SP600 as it is one of the indices that was holding up better than the rest and trying to lead higher. Nice that it was a growth index as well.

SOX. The SOX turned back as well. It made it up to the bottom of its January peak and actually cracked into that range on Thursday. Looking strong, looking like it wanted to do something, and then it gapped lower. It is still in the range as of Friday; it did not make a lower low. There is still a double bottom in place, and this could still be viewed as a handle. We will have to see how the chips play out next week. Just as we will have to see how all the other indices react to the Friday selling that took them down to or just below the recent lows in the lateral consolidation. Remember, one of the patterns that were in place most weeks was a selloff on Friday on fear, and then a rebound on Monday when the worst-imagined fears did not come to fruition over the weekend. That would bring the buyers or short coverers back on Monday, and we would have an upside Monday. With the indices still in this lateral consolidation, there is a very good chance that if nothing major happens over the weekend we get the bounce back up in the range. That could be more consolidation, and also it would be overcoming some really bad news. Let us face it, the news out there is not good. If the market continues to consolidate and finds footing at this higher level, that is a positive. It keeps getting hit with bad news. It was down on that day, but if it does not break the range, that shows there are buyers supporting the indices at support at the lower part of that range. If they see the news as not any worse than they anticipate, that is how you set up at least interim bottoms for bounces higher.

LEADERSHIP

Retail. The retailers have been the strongest in the market. Some have moved well of late that were maybe pulling back on Friday in the selling. ARO gapped sharply higher on Thursday on good results and was filling that gap on Friday. Note that the volume was quite low on that move. Great volume the prior three sessions as it bottomed and started back up, and volume was quite tame as it sold off on Friday. That is called opportunity. A lot of people do not want to step in when the market looks like chopped liver left in the sun, but when you see good setups from good stocks, you should watch and see how they hold. If they hold and the market can hold in this range, it has a very good chance of bouncing nicely. Same thing with ROST. It is a stock that posted a very solid Thursday on good results. It was testing back on Friday and filling this little gap; no big deal. Volume was lower again. There is a little double bottom and you can see almost a head and shoulders. There was a break higher, and now it is filling the gap and coming back to test. That could be opportunity for more positions on ROST. PNRA is the same thing. A good break on Wednesday, coming back, and testing toward the 10 day EMA and this March peak. It could provide opportunity for those looking for good stocks that have held up very well in a pullback mode. Contrast that with AEO. The eagle looks like it has been shot. ANF sold off. It tried to make the move Thursday through the 200 day EMA to the gap, but then it gapped lower on Friday. It is not looking too healthy.

Internet. AKAM has been a solid performer. It was down on Friday after a big gap higher on Thursday that broke it to a new high in the move. It closed at a closing high over the prior peaks. It was not really burned on Friday; it just came back and gave back part of what it gained on Thursday. GOOG is looking quite decent. It sold back on Friday, but it was only 1.3% after a strong break to the upside. If it can hold in this range, maybe come back to the 10 day and maybe take off from there, that is an interesting trade to the upside. It has some issues which makes you want to get a quick-hit move. The lows from February and early March are at roughly 525, and it is at 498 right now. You have to see the move and get in to get a decent trade using options.

Semiconductors. SNDK was back on Friday, but it was not gutted. Volume was up, but it is still holding at the 10 day EMA and holding over these twin peaks. We might get a decent entry point for even more positions out of this. NVLS got a pullback to the 10 day EMA on lower, below-average volume. It could hold in this range, move laterally, and kick back up. That would be a great entry point. Usually you do not want to chase the bus. You wait for the bus to come back to you and get on at your leisure.

Metals. There was a little inverse head and shoulders they were trying to set up, but that did not happen on a lot of these. They gapped lower on Friday and are threatening the bottom of the range. We will have to see if they get a false break where it goes below and moves back up. Notice how MACD is at a higher level. If it holds it will make a divergent bottom, and that would be very interesting for a move back up. It is being sticky in the 63 range. It is trying to hold at the lower key support, and I will give it the benefit of the doubt and watch what it does next week. AKS is one of those inverse head and shoulders. It gapped lower on Friday on volume, taking it back down to these lows. We will see what happens when it gets to the lows. Will it undercut and then rebound, showing some kind of false bottom? We will have to be patient and let it show us the move. Remember, we are down at the prior lows. The indices are still above those prior lows and we do not want to assume failure at this point. Everything is negative without a doubt, but do not assume failure. Things are so negative, the indicators are at extremes, and that is when you often see changes. Even though it looks like it may have failed, that may just be the head fake. We will have to see.

Financial. JPM has come back down to a prior support level at the bottom of its range, gapping and selling off all session. Volume was up, but when a stock comes down to a support level, is not a bad thing. Upside volume shows that someone is still stepping in to hold it up. If it does bounce at this level (or sells under it) and reverses to close early in the week and the high volume remains, that shows you that someone is there picking it up and wanting to hold it up at this support range again. GS is another key financial. It was down 1.25% on Friday, but notice it is holding its lateral move. This is what I am talking about with respect to the indices. Holding that lateral move, down at the lows it does not look pretty. Everything looks bad and nothing sounds right on any of the financial and news stations. That is when you have to watch out. When things look like they will never get better, they have a weird way of turning around.

It is hard to call it leadership since a lot of these stocks and sectors are getting their tails kicked. Nonetheless, there are stocks still holding at support. There are also stocks still moving higher this week that just got knocked back some on Friday. We will have to see how that plays out.

THE ECONOMY

Headline jobs numbers are not good once you look behind them just a bit.

Expectations raised by the administration had no hope of being met.

It was all quantity versus expectations

Trucking upswing versus a double bottom.

TO VIEW THE ECONOMY VIDEO USE THE FOLLOWING LINK:
Economy Summary Video

THE MARKET

MARKET SENTIMENT

VIX. It looked as if it had bounced but was rolling back over as the market put together the back-to-back gains. Then the news hit out of Europe and the US, and on Friday the VIX gapped higher. It has tried to make a higher high over the Tuesday peak, but it was unable to do that and faded. It still held a 20% gain on the session and still has higher lows put in. Maybe it is not done at this point, and maybe it is still factoring in issues that are facing the rest of the world. Remember, the market had sold back enough to bounce, but they have been piling additional problems on top of those we already know about. There were new issues dealing with a French bank and Hungary. If unexpected news hits the market, it will trump technical action. That is basically what was seen on Friday. The news was unexpected; it hit the market and blasted VIX to the upside. VIX is still much lower than the prior peaks. If things calm down, the market can still hold its lateral range and VIX would start to head back down as it bounces. This does not necessarily indicate there is more selling based on what happened Friday; it depends on what happens next week. If there is more selling that spikes it higher, then we have more issues. For now, the big high was made almost two weeks back, and it is normal to take a few weeks after that initial big spike is hit for the market to rally seriously. When we look at the charts, we will see that the bounce in the lateral move is not quite dead yet.

VIX: 35.48; +6.02
VXN: 34.16; +4.78
VXO: 34.38; +5.6

Put/Call Ratio (CBOE): 0.97; -0.11

Bulls versus Bears:

This is a reading of the number of bullish investment advisors versus bearish advisors. The reason you look at this is that it gives you an idea of how bullish investors are. If they are too bullish then everyone is in the market and it is heading for a top: if everyone wants to be in the market then all the money is in and there is no more new cash to drive it higher. On the other side of the spectrum if there are a lot of bears then there is a lot of cash on the sideline, and as the market rallies it drags that cash in as the bears give in. That cash provides the market the fuel to move higher. If bears are low it is the same as a lot of bulls: everyone is in and the market doesn't have the cash to drive it higher.

Bulls: 39.8% versus 39.3. Holding rather flat after some substantial drops from 43.8%, 47.2%, and 56.0% before that. This move started at a low of 35.6% in February, the lowest it has been since July 2009. 35% is the threshold level suggesting bullishness. After peaking at 53 on this move the bulls lost some nerve, falling to a new low post- July 2009. Once again bulls peaked out near the 50% level. Bulls have bumped at 50ish since late August 2009, falling to 45ish and then rebounding. Hit a high of 47.7% mid-June on the run from the March lows. Again, to be seriously bearish it needs to get up to the 60% to 65% level.

Bears: 28.4% versus 29.2%. Surprising drop, but given the market's attempt to move higher, understandable. Still a big move up from 24.7% the week before where it held for a couple of weeks. Fell to 18.7% on the low. Hit a high of 27.8% level on the prior leg in February. Over 35% is considered bullish for the market; definitely at the lower end of the scale. Peaked near 28% in November, falling short of the 35.6% hit in July 2009. For reference, cracking above the 35% threshold considered bullish. Hit a high on this run at 47.2%. For reference, bearishness hit a 5 year high at 54.4% the last week of October 2008. The move over 50 took bearish sentiment to its highest level since 1995. Extreme negative sentiment. Prior levels for comparison: Bearishness peaked at 37.4% in September 2007. It topped the June 2006 peak (36%) on that run. That June peak eclipsed the March 2006 high (33%) and well above the 2005 highs that spawned new rallies (30% in May 2005, 29.2% in October 2005). That was a huge turn, unlike any seen in recent history.

NASDAQ

Stats: -83.86 points (-3.64%) to close at 2219.17
Volume: 2.263B (+5.81%)

Up Volume: 93.379M (-1.583B)
Down Volume: 2.241B (+1.754B)

A/D and Hi/Lo: Decliners led 7.47 to 1
Previous Session: Advancers led 1.64 to 1

New Highs: 18 (-36)
New Lows: 98 (+71)

NASDAQ CHART: Click to view the chart

NASDAQ 100 CHART: Click to view the chart

SOX CHART: Click to view the chart

SP500/NYSE

Stats: -37.95 points (-3.44%) to close at 1064.88
NYSE Volume: 1.634B (+33.91%)

Up Volume: 12.448M (-749.225M)
Down Volume: 1.621B (+1.176B)

A/D and Hi/Lo: Decliners led 6.97 to 1
Previous Session: Advancers led 1.63 to 1

New Highs: 77 (-24)
New Lows: 81 (+40)

SP500 CHART: Click to view the chart

SP600 Chart: Click to view the chart

DJ30

Stats: -323.31 points (-3.15%) to close at 9931.97
Volume DJ30: 256M shares Friday versus 177M shares Thursday.

DJ30 CHART: Click to view the chart

MONDAY

There are some interesting economic reports coming as well as technical action. We will have wholesale inventories on Wednesday, and on Friday there will be business inventories. I just talked about truckers and inventories, and it will be interesting to see if they continue to build or not. The data is back from April, so it is not the freshest, but it will be curious to see if they continue on the uptrend. There will also be the important initial claims and retail sales. We got a look at same store sales, and they were mixed to lackluster. We will see what kind of sales we were able to generate in May.

I talked earlier about how there was a pattern (before last week) of down Fridays and up Mondays. We went back to the down Friday in a big way, and we will see if it generates an upside Monday. It is not a total breakdown yet. It was definitely not a good day, but there is that stickiness at this point that I was talking about with respect to leadership stocks. They are down, they are coming back to test this level, but do not assume a rollover. They have been trading in this range and have shown a lot of stickiness at this level. We will see if they can continue to move higher. It is not a slam dunk or an assured fact they will break below that support level. SP500 does not look great. NASDAQ does not look that bad. It is not a raving beauty of a pattern, but there are support levels that it is still well above. It is still above this long-term support level. It stretches back over a decade, although it did not hold up through the 2008 crash. Of course not. It did not hold, but it has recovered and is trying to hold it now. We will see if it can continue to do that.

It is a battle right now. Will there be growth or will there be blood? Will the economy be able to hold up with the problems in Europe and maybe with problems here in the US? We will have to see how this test of these February lows play out this time. They have shown a lot of stickiness. There are still stocks in good leadership position. I am not ready to write it off. On the other hand, I am not saying it is a sure thing that it will move higher. Nothing is a sure thing right now. There is a lot of thrashing about here; a lot of going down one day and then up the next. Very volatile. They are fighting each over at key levels trying to determine where the market will go.

What do you do in a situation like that? You do not take every trade. We have not been doing much with trades we pick up a position here and there. Be patient, take opportunity as it presents itself, and you put a bit of money to work. The payoffs here can be big. If it breaks to the upside, you have plenty of upside. If it breaks downside and you are playing a move to the upside, you have a good stop point. If it breaks to the downside, we also have a good stop loss point and a good potential gain to the downside. Either way, this is an important point. Pick your shots, and look for good plays upside and downside. Put some money to work and see which way it breaks. We can still make money both ways. We can make money at the upside and downside as it thrashes about. Some of the good stocks continue to move higher overall despite the back and forth motion of the market. On the other hand, some of the weak stocks continue to move down overall despite the back and forth action. You can play that to your advantage, taking what the market gives. It is a bit hairier and quicker, but it can be done. Overall be patient and do not take too much of a position. Look for the really good setups. If the market moves in that direction, they will be the ones that play out the best. Have an excellent weekend.

Support and Resistance

NASDAQ: Closed at 2219.17

Resistance:
The 200 day SMA at 2234
2245 from July 2008 through 2260 from late 2005.
2275 - 2278 from the February 2008 and April 2008 lows
2273 to 2282 marks bottom of January 2010 lateral peak
2292 is a low from January 2008
2319 from the September 2008 peak
2320 to 2326.28 is the January 2010 high
2324-2370 is a range of resistance from early 2008
The 50 day EMA at 2336
2382-2395 from 2008
2412-2415 represents a series of peaks and lows in 2007, 2008
2434 is the May 2010 high
2453 is the August 2008 peak

Support:
2210 (from September 2008) to 2212 (the July 2009 closing low)
2205 is the November 2009 peak
2185 to 2195 represent support points for years: December 2004 peak, July to October 2005 consolidation, January, March and July 2008 lows, and October 2009 peak.
2177 is a low from March 2008
2169 is the March 2008 closing low (double bottom)
2168 is the September 2009, intraday peak
2167 from the July 2008 intraday low
2155 is the March 2008 intraday low
2100 is the February 2010 low

S&P 500: Closed at 1064.88
Resistance:
1070 is the late September 2009 peak
1078 is the October range low
1084 to 1080 (September 2009 peak)
1101 is the October 2009 high
1106 is the September 2008 low
The 200 day SMA at 1107
1114 is the November 2009 peak
1119 is the early December intraday high
Bottom of the January 2010 consolidation 1131 to 1136
1133 from a September 2008 intraday low
The 50 day EMA at 1133
1151 is the January 2010 peak
1156 is the Sept 2008 low
1170 is the prior March 2010 high
1174 is the May 2010 high
1181 is the April selloff low
1185 from late September 2008

Support:
1044 is the October 2008 intraday high AND the February 2010 low
1040 is the May 2010 low
1020 is the bottom of the late summer 2009 consolidation
946 from June 2009

Dow: Closed at 9931.97
Resistance:
10,120 is the October 2009 peak
10,285 is the late December consolidation peak
The 200 day SMA at 10,299
10,365 is the late September 2008 low
10,496 is the November 2009 high
The 50 day EMA at 10,543
10,609 from the Mid-September 2008 interim low
10,730 is the January 2010 peak
10,920 is the recent May high
10,963 is the July 2008 low
11,100 from the 7-08 low
11,205 is the April closing high
11,734 from 11-98 peak

Support:
9829 is the September 2008 closing high
9918 is the September 2008 peak
9855 is the early September peak in its lateral range
9835 is the late September 2009 peak AND the February 2010 low
9774 is the May 2010 intraday low

Economic Calendar

These are consensus expectations. Our expectations will vary and are discussed in the 'Economy' section.

June 01 - Tuesday
- Construction Spending, April (10:00): 2.7% actual versus 0.1% expected, 0.4% prior (revised from 0.2%)
- ISM Index, May (10:00): 59.7 actual versus 59.4 expected, 60.4 prior (no revisions)

June 02 - Wednesday
- Challenger Job Cuts, May (07:30): -65.1% actual versus -71.1% prior
- Pending Home Sales, April (10:00): 6.0% actual versus 4.3% expected, 7.1% prior (revised from 5.3%)
- Auto Sales, May (14:00): 4.1M expected, 3.9M prior
- Truck Sales, May (14:00): 4.8M expected, 4.9M prior

June 03 - Thursday
- ADP Employment Change, May (08:15): 55K actual versus 60K expected, 65K prior (revised from 32K)
- Productivity-Rev., Q1 (08:30): 2.8% actual versus 3.3% expected, 3.6% prior
- Unit Labor Costs, Q1 (08:30): -1.3% actual versus -1.6% expected, -1.6% prior
- Initial Claims, 05/29 (08:30): 453K actual versus 455K expected, 463K prior (revised from 460K)
- Continuing Claims, 05/22 (08:30): 4666K actual versus 4600K expected, 4635K prior (revised from 4607K)
- Factory Orders, April (10:00): 1.2% actual versus 1.7% expected, 1.7% prior (revised from 1.3%)
- ISM Services, May (10:00): 55.4 actual versus 55.6 expected, 55.4 prior
- Crude Inventories, 05/29 (11:00): -1.90M actual versus 2.46M prior

June 04 - Friday
- Nonfarm Payrolls, May (08:30): 431K actual versus 500K expected, 290K prior
- Unemployment Rate, May (08:30): 9.7% actual versus 9.8% expected, 9.9% prior
- Hourly Earnings, May (08:30): 0.3% actual versus 0.1% expected, 0.0% prior
- Average Workweek, May (08:30): 34.2 actual versus 34.2 expected, 34.1 prior

June 07 - Monday
- Consumer Credit, April (15:00): -$2.0B expected, $2.0B prior

June 09 - Wednesday
- Wholesale Inventories, April (10:00): 0.5% expected, 0.4% prior
- Crude Inventories, 06/05 (10:30): -1.90M prior

June 10 - Thursday
- Initial Claims, 06/05 (08:30): 450K expected, 453K prior
- Continuing Claims, 06/29 (08:30): 4600K expected, 4666K prior
- Trade Balance, April (08:30): -$41.2B expected, -$40.4B prior
- Treasury Budget, May (14:00): $154.0B expected, $189.6B prior

June 11 - Friday
- Retail Sales, May (08:30): 0.3% expected, 0.4% prior
- Retail Sales ex-auto, May (08:30): 0.1% expected, 0.4% prior
- Michigan Sentiment, June (09:55): 74.8 expected, 73.6 prior
- Business Inventories, April (10:00): 0.5% expected, 0.4% prior
icon url

ReturntoSender

06/07/10 10:43 PM

#8977 RE: ReturntoSender #6755

From Briefing.com: 4:30 pm : A lack of news flow left stocks to spend the session shadowing the euro, which remains under the control of sellers. In turn, the major equity averages booked another round of broad-based losses.

The euro retreated overnight to a fresh four-year low of roughly $1.188, but it managed to fully recover from that loss by the time the stock market opened for trade. The euro's upward swing helped give the major indices a higher start, but stocks soon lost their direction as the euro fell under renewed selling pressure. The euro was quoted 0.4% lower at $1.192 at the close of trade.

The Dow and S&P 500 spent most of the session oscillating between positive and negative territory amid listless trade. Such a lack of direction and an absence of leadership eventually gave way to a steady, broad-based slide that saw the S&P 500 settle at session lows around the 1050 level, which has been identified as a key level by many traders.

Losses were sharp, especially among industrials plays, which fell 2.6% as all 57 names in the sector settled in the red.

Tech stocks tumbled 1.9% loss. Their weakness weighed heavily on the Nasdaq and caused it to underperform the other headline indices for the entire session.

Utilities made up the only major sector to finish with a gain. They advanced 0.5%.

Other defensive-oriented stocks also attracted support; health care finished with a fractional loss and telecom closed with a tepid 0.1% loss.

Gold and silver stocks garnered considerable support as precious metals prices were spurred higher by a flight to safety. Specifically, Newmont Mining (NEM 55.16, +1.44), Yamana Gold (AUY 10.81, +0.31), and Barrick Gold (ABX 43.12, +1.70) were among the best performers as gold gained 2% to close pit trade at $1240.80 per ounce and silver settled 5% higher at $18.16 per ounce.

Bristol-Myers (BMY 23.86, +1.42) and Celgene (CELG 53.82, +2.27) were the best overall performers by percent gained this session. Their advances in the face of broader market weakness were underpinned by positive drug study results.

Economic data was limited to a monthly consumer credit report. It showed that consumer credit increased by $1.0 billion in April. That made for a sharp upturn from the downwardly revised $5.4 billion decline in consumer credit for the prior month. However, the report was generally a non-factor for trade.

Advancing Sectors: Utilities (+0.5%)
Declining Sectors: Industrials (-2.6%), Financials (-2.0%), Tech (-1.9%), Consumer Discretionary (-1.8%), Materials (-1.7%), Energy (-0.8%), Consumer Staples (-0.7%), Telecom (-0.1%)
Unchanged: Health Care DJ30 -115.48 NASDAQ -45.27 NQ100 -1.9% R2K -2.4% SP400 -2.0% SP500 -14.41 NASDAQ Adv/Vol/Dec 453/2.21 bln/2235 NYSE Adv/Vol/Dec 815/1.42 bln/2221

4:15PM Altera expects Q2 revenue to be at the high end of previous guidance (ALTR) 23.26 -0.39 : Altera sees Q2 revs of ~$442.5-450.6 mln vs $443.51 mln Thomson Reuters consensus. Co announced that Q2 revenue is now expected to be at the high end of previous guidance, growing 10-12% sequentially. The company's prior guidance was for sequential growth of 8-12%. Once again, new products will be the quarter's growth drivers as 65-nm FPGAs and particularly 40-nm FPGAs are producing strong growth. As previously anticipated, revenues in all four vertical market segments are likely to be up sequentially.

3:36PM Cree sinks to fresh lows as it closes in on a test of its May range/3-mth low near $59.50-60.00 (CREE) 60.46 -4.04 : Would note that the 200-day ema is below at $58.38 and it has not been tested since Mar of 2009.

icon url

ReturntoSender

06/10/10 10:55 PM

#8979 RE: ReturntoSender #6755

From Briefing.com: 4:25 pm : Better-than-expected economic data from China and Australia combined with a successful Spanish bond auction and in-line to slightly better-than-expected weekly jobs data in the U.S. were good enough reasons for U.S. equity investors buy beaten down shares.

The Dow Jones Industrial Average surged 273 points, with the S&P 500 up 31, and the Nasdaq higher by 60.

Stocks opened the day sharply higher, and drifted sideways for much of the session before extending their gains in the final hour of trading to finish at session highs. The energy sector was particularly strong with BP Plc closing up 12.7% (BP 32.92, +3.72).

Shares of Goldman Sachs (GS 133.71, -3.09) failed to participate in the rally following a FT report regarding an additional SEC inquiry into a mortgage backed security. The stock closed lower by 2.3%.

The euro continued its recent climb, regaining the 1.2100 level for the first time in a week after trading as low as 1.1877 on Monday. The pound also extended its recent gains, climbing above 1.4700 after spend some of today's session near 1.4500.

Commodities were mostly higher today led by strength in energy, with crude oil closing at 75.48 +1.10, its highest close since May 11th.

Gold grinded lower throughout the day and found support near 1118. The yellow metal continues to hover near 1120.

Advancing Sectors: Industrials (+3.5%), Financials (+3.3%), Materials (+3.5%), Consumer Discretionary (+3.2%), Energy (+4.9%), Tech (+2.5%), Utilities (+2.7%), Health Care (+2.0%), Consumer Staples (+1.5%), Telecom (+2.1%)

Declining Sectors: None DJ30 +273.28 NASDAQ +59.86 SP500 +31.15 NASDAQ Adv/Vol/Dec 2256/2.14 bln/417 NYSE Adv/Vol/Dec 2690/1.34 bln/380

4:04PM National Semi beats by $0.05, beats on revs; guides Q1 revs above consensus (NSM) 13.50 +0.39 : Reports Q4 (May) GAAP earnings of $0.33 per share, $0.05 better than the Thomson Reuters consensus of $0.28; revenues rose 10.1% year/year to $398.5 mln vs the $384.1 mln consensus. Co issues upside guidance for Q1, sees Q1 revs of $410-418 mln vs. $390.78 mln Thomson Reuters consensus.

4:02PM Finisar beats by $0.02, beats on revs; guides Q1 revs above consensus (FNSR) 14.22 +0.68 : Reports Q4 (Apr) earnings of $0.22 per share, $0.02 better than the Thomson Reuters consensus of $0.20; revenues rose 75.3% year/year to $188.5 mln vs the $183 mln consensus. Co issues upside guidance for Q1, sees Q1 revs of $190-205 mln vs. $186.09 mln Thomson Reuters consensus.

8:16AM Virage Logic to be acquired by Synopsys (SNPS) for $12.00 share (VIRL) 9.37 : Synopsys and Virage Logic Corporation announced they have signed a definitive agreement for Synopsys to acquire Virage Logic. Under the terms of the agreement, Synopsys will pay $12.00 cash per Virage Logic share, resulting in a transaction value of ~$315 mln, or ~$289 mln net of cash acquired. The transaction is subject to regulatory and Virage Logic shareholder approval, as well as other customary closing conditions.

icon url

ReturntoSender

06/12/10 1:23 PM

#8980 RE: ReturntoSender #6755

From Briefing.com: 4:30 pm : Stocks finished the week on a strong note after a disappointing monthly retail sales report had initially dampened hope for an extension to the prior session's surge.

The S&P 500 rallied 3% on Thursday, but action in the early going suggested that participants were interested in pocketing some of that gain. The worst Advance Retail Sales Report in months provided the excuse. Many had expected a modest increase in May retail sales, but they got a 1.2% drop instead. Sales less autos had also been expected to make a slight increase, but they fell 1.1% in their worst drop in over one year.

Stocks got some relief from the preliminary Consumer Confidence Survey for from University of Michigan. The survey exceeded expectations for a reading of 74.5 by improving to a two-year high of 75.5.

Business inventory data for April had little impact on trade. As had generally been expected, inventories increased 0.4% for the month.

Given the lack of corporate news flow, market participants were left to take their cues from the economic data. However, the conflicting nature of those reports left stocks to trade in a relatively tight range in lackluster fashion for most of the session.

The major averages were pushed higher in the final few minutes to settle at session highs, though. The move was likely helped by the light volume, which often makes for more exaggerated swings among stocks.

Nonetheless, the Nasdaq netted a gain of more than 1%. That helped it secure weekly gain of just over 1%. For comparison, the S&P 500 tacked on a 2.5% weekly gain and the Dow added a 2.8% weekly gain, even though their gains were moderate this session.

Underlying gains were varied. Microsoft (MSFT 25.66, +0.66) was a steady source of strength for the Nasdaq, while better-than-expected earnings and upbeat guidance made National Semiconductor (NSM 14.21, +0.68) a leader in the broader S&P 500. Strength in MSFT and NSM helped drive the overall tech sector to a 1.1% gain, which was second only to the materials sector's 1.2% advance.

Health care stocks also saw strong support. They advanced 0.8% as pharmaceutical plays found favor following Citigroup's upgrade of Bristol-Myers Squibb (BMY 25.08, +0.44). The stock was also named a top pick among pharmaceutical plays by Barclays.

Airline stocks saw some of the best gains. As such, the Amex Airline Index ascended to a 2.5% gain. The index is now up more than 16% year-to-date, while the S&P 500 is down more than 2% since the start of 2010.

Consumer staples stocks lagged for the entire session. They closed with a 0.8% loss. Tobacco stocks (-1.3%), household products (-1.1%), and soft drinks (-0.9%) were among the sector's worst performing plays.

Advancing Sectors: Materials (+1.2%), Tech (+1.1%), Health Care (+0.8%), Industrials (+0.5%), Energy (+0.4%), Financials (+0.4%), Telecom (+0.2%), Consumer Discretionary (+0.2%)
Declining Sectors: Consumer Staples (-0.8%)
Unchanged: Utilities DJ30 +38.54 NASDAQ +24.89 NQ100 +0.9% R2K +1.4% SP400 +1.1% SP500 +4.76 NASDAQ Adv/Vol/Dec 1888/1.81 bln/752 NYSE Adv/Vol/Dec 2212/1.04 bln/805

8:00AM Motorola and Research In Motion (RIMM) announce settlement and license agreement (MOT) 6.84 : The cos entered into a Settlement and License Agreement which ends all outstanding worldwide litigation. Under the Agreement, Motorola and RIM will benefit from a long-term, intellectual property cross-licensing arrangement involving the parties receiving cross-licenses of various patent rights, including patent rights relating to certain industry standards and certain technologies, such as 2G, 3G, 4G, 802.11 and wireless email . In addition, the parties will transfer certain patents to each other. The financial terms of the Agreement include an up-front payment and ongoing royalties to Motorola. Further terms and conditions of the Agreement are confidential.

Maxim Integrated Products (MXIM) announces that it has priced a public offering of senior notes due 2013 in an aggregate principal amount of $300.0 mln with a coupon interest rate of 3.45%...

icon url

ReturntoSender

06/13/10 12:30 PM

#8981 RE: ReturntoSender #6755

InvestmentHouse Weekend Market Summary

http://www.investmenthouse.com/weekendmarketsummary.htm

- Another back to back gain, but it is no follow through.
- No strong surge, but the probabilities of a more sustained bounce are stacking up.
- Some quality stocks step up to leadership roles, but their ranks are still thin.
- Retail sales disappoint greatly, but it is likely just a slow month for the economy.
- EU is still the wild card for the US economy and prospects of a double dip recession.
- Bearish and bullish sentiment indicators show a rare crossover.
- Looking for a move up to the January high and watching for good stocks and good entry points for that move.

Another back to back gain, the second in 1.5 weeks, indicates a more sustained bounce.

Here in the office we are dubbing the Thursday and Friday market gains the "oversold bounce part two." There was a second attempt at a bounce off the February lows on the SP500. There was the original selling in May that took the SP500 below its February low and then the bounce. It looked like that bounce may try to make a move up to the January peaks, but it ran out of gas at the 200 day EMA twice. It then fell back down to the prior low, but then came part two. Starting this week there was an intraday reversal on Tuesday and a surge on Wednesday that could not quite hold. On Thursday the case of Viagra showed up, and the market surged and was able to hold the move. Friday things looked grim early on as some of the economic reports were not as good as hoped. The market gapped lower but then reversed and rallied into the close for a third gain out of four sessions. The market has not had that kind of batting average in quite some time. This was not the follow-through I was talking about earlier in the week, however.

Volume was extremely light on Friday. That is typical of a Friday in the summer, and the percentage gains were not strong. NASDAQ scored +1.1%, but the Dow only scored +0.38%. SP500 +0.44%, SOX +1.4%, SP600 +1.3%, and NASDAQ 100 +0.93%. Those gains are not what it takes for a follow-through session. You like to see powerful moves of +2% or better, particularly considering how this market has shown back and forth crazy moves as it has consolidated at the February lows. Huge moves back and forth, so you would expect a follow-through to be an impressive percentage move as well with high volume. That was not the case on Friday, so it was nothing doing for the first chance at a follow-through. We simply had a continuation of the rally higher.

Nonetheless, it was a decent reaction on Friday. There was bad economic news with weak retail sales for May coming in at -1.2% on the headline versus the 0.2% gain. Futures that were in decent shape before the number gap sharply lower, and the market gapped lower as well. The market did recover, however. It overcame that data and, after chopping around most of the session, it did rally into the close for gains across the board. That shows strength it has not had. Moreover, it overcame a stronger dollar that moved up as the session wore on. That one-two punch bad economic data and a strengthening dollar has typically taken this market lower, but Friday the oversold bounce continued for back-to-back gains on SP500 and the other indices as well.

This move does not have the credentials to suggest that a new rally is underway right now. There was no follow-through as of yet, and leadership remains rather sparse. There are some good quality stocks that are leading higher and that can make this a decent bounce such as AKAM and BIDU. We took positions on BIDU on Friday just to be ready in case it makes a good surge to start next week. FFIV is another strong stock ready to move as well. There are many others that look strong enough to perhaps take SP500 and NASDAQ back to the January peak.

It is hard to say that the weak volume, relatively modest bounce on a Friday in the summer is pointing toward a significant rally. When you put together all of the action that has occurred over the past month, however, there may be enough traction for stocks to make that bounce after failing spectacularly during May and early June.

OTHER MARKETS.

Dollar. The dollar did see an advance, though it closed off its high on the session compared to other currencies (1.2098 Euros versus 1.2124 Thursday). The dollar is off its highs which saw it break below 1.2 Euros. I doubt we have seen the last of a sub-1.2 dollar on this move, however. The DXY0 pulled back modestly after bumping into the late 2008/early 2009 peaks, holding the 18 day EMA on the low and starting to bounce on Friday. Likely this is just another normal pullback to near support and its move higher. It is measuring the move to break out above that prior high.
Click to view the chart

Bonds. Bonds rallied back as well (US 10 year yield 3.24% versus 3.32% Thursday). The bond market took a sizable hit during the week because pundits statesmen all came out of various countries saying there would be no trouble in the Euro zone. Interestingly, some of the people saying that were from the Euro zone and of course have a vested interest in seeing that the entire system does not collapse (namely the CEO of BNP Paribas). US bonds did pull back during the week, but this looks like a normal consolidation. Nothing here is overly nefarious. They are bumping into prior highs and testing somewhat.

The TIPS show similar action. There has been a pullback over the past month to support where they look like they are trying to hold and start to bounce. Thursday was an aberration day. It broke below the 50 day EMA on the close but immediately turned back up and held above that area. I do not think that bonds are going to start to sell off right now because Europe is not safe. I will discuss more of Europe's issues later and why that is impacting bonds and in the US and overseas bonds.
Click to view the chart

Gold. Gold has not been rocketing straight to the upside, but it has also not been breaking down ($1,228.20, +6.00). It was rather modest compared to some of the other moves, but gold has broken to an all-time high. It fell back below it, and then broke out above that again on Monday and rallied more Tuesday. It spent the rest of the week testing. Note that it came back down to the prior high and bounced on Friday. Gold is not in trouble, and there are several reasons. Number one, it is still an inflation trade despite the fear in Europe that there will be deflation caused by the EU countries going under or defaulting. This is all despite what the CEO of BNP Paribas says as well as Trichet and the EU President.

Gold is also showing that there is a fear trade still built in with the unknown. A lot of money is moving out of Europe in fear, and that is what supported the US bonds market for the past several months (when it should be heading the other way in the Fed will start raising rates). You cannot put all of your money in US Treasuries, however. The Fed's (and the ECB's) hands are tied thanks to the trouble in Europe, and it cannot start raising rates anytime soon. Therefore there will be cheap money, inflation, and fear. People cannot put everything into US Treasuries, so they have to find some other mechanism to store their wealth and provide some upside. Gold is once again offering a haven for people looking to diversify out of US Treasuries as their only safety hedge. Gold looks as if it is just testing the break of the all-time high and still has room to the upside.
Click to view the chart

Oil. Oil had a rougher day Friday, losing ground ($74.21, -1.27) and it showed a bounce downward from a test of the 200 day EMA on Thursday. Oil is still moving higher in its range. It is building higher lows and higher highs off the bottom of its seven-month range. I do not think oil will flip over and dive back down. The 200 day EMA could represent some resistance as it matches up with a consolidation range from late 2009 and some interim peaks and valleys in February and March of 2010. There could even be resistance in early May where it bumped up, tried to recover through that level on the selling, but was not able to do so before it sold off to the bottom of its trading range. I do not think again that oil will tank. It could continue higher, and we are basically looking for a move up into the range from March. Very important range, and topped by the January peak. It is summer, so there will be more demand for oil from driving. That should help bolster oil somewhat, though it will not break it out of that range unless there are extraneous events such as major hurricanes that plow through the Gulf and disrupt production. That would be unfortunate, spreading all the oil coming out of the BP rig. They are now saying it is twice as much as estimated during the major part of the spill when it was uncapped and gushing into the Gulf of Mexico.
Click to view the chart

TECHNICAL PICTURE

INTERNALS

Volume. Trade fell 15% on NASDAQ down to 1.78B shares, well below average for the NASDAQ exchange. Over the past several weeks, volume has traded virtually below average on all but a handful of days. Thus there has not been much strength in the selling or the upside with respect to the NASDAQ. It is hitting its summertime doldrums and riding along on light trade. The NYSE saw a 22% decline in volume down to 1.04B. Well below average and no real drive on the move upside. That is what low volume tells you. In other words, there just were not as many players in the market pushing stocks higher. The move does not mean that much, and it lends credence to the idea that this is simply part two of the oversold bounce.

Breadth. Breadth was decent, but nowhere near what we have seen in recent rounds. It was 2.5:1 on NASDAQ and 2.6:1 on the NYSE. In the old days that would have been great breadth, but now when we are seeing 4:1-7:1 on these back and forth sessions over the past few weeks as the buyers and sellers fight it out. Breadth in the 2.5:1 range is not providing much interest, but it does show it has been matching the moves in the market. Today's move was so-so, and there was so-so breadth. Yesterday there was tremendous breadth as the market moved higher, and that is exactly what you would expect. It is definitely matching to moves; there is no divergence. We are not seeing the market move down sharply and negative breadth or vice versa. What you see is what you get, and there is nothing to surprise us. The internals show an oversold bounce.

CHARTS

SP500. The SP500 gapped lower on the session when the retail sales came in lower than expected, but there was a recovery and a move back to positive. That in itself was a positive because the market was able to overcome bad news and a rallying dollar. Those have been teamed up as a one-two punch to keep the market at bay, but we have a second back-to-back move. Aside from last week, that is something not seen since late April when the market peaked. That is strange. The market peaked with the last back-to-back upside gain in SP500 in late April, and it immediately turned and sold off through the end of May. It has been trying to come back starting to January, although it just sold down to the prior low. We have another double bottom created here, and a back-to-back upside gain and then a selloff. A rally and then another back-to-back upside gain two of them in roughly a week. That is something we had not seen during the entire selloff, and now we have two of them. That is another indication that the market is finding a bit of footing and will be able to put in a better bounce this time than in the first attempt. It was a good try the first time. It rallied, sold off a bit and came back up, but the 200 EMA proved to be too much. I think with this double bottom and showing more strength that we can actually challenge the January high. Whether it is the bottom or the top of the range all the way up to 1150. 1125-1150 is the band of resistance. That is what we are trying to play with the nice positions we picked up this week once the market got the selling out of its system and the stronger stocks showed themselves and started to move back up.

NASDAQ. NASDAQ is a similar picture. There was a selloff to a new low. It undercut those early May lows but still held above the February lows. We have a double bottom. There was the initial bounce that failed, a double bottom, and now there is a back-to-back upside gain on NASDAQ. There are not the three out of four days upside this week just the last two. Two out of four over the same period, but there was the reversal that SP500 showed on Tuesday as well, and it has built off of that. Volume has been terrible but it did cross over the 200 day EMA. I think there is enough mojo, as with SP500, to take it up to the January peak. 2325 is roughly where you are looking for it to move. The 50 day EMA is still lower than that, roughly coincident at 2310. NASDAQ, as with SP500, looks like it has the juice to make it back up to this peak. Then you have to worried if there is a head and shoulders forming with the move from late May into June. We will see. Those often set up and rarely consummate.

SP600. SP600 posted a nice 1% gain on the session. It, too, put together a back-to-back gain but, unlike SP500, it did not have the three out of four days upside; it was more like NASDAQ. Nonetheless, it held at a key level at the bottom of the January peak and the February consolidation shelf. It bounced at that point off of that reversal an Tuesday. It has room to run up to its next important resistance level: the March consolidation. It actually got close to that on the last move. Could it possibly rally up to the early April peak? We will have to let it make its play. Right now the move is not saying much other than it has a firmer foundation as with the other large cap indices, and it wants to make a higher move at this juncture.

SOX. The semiconductors have shown the same action, but something of a triple bottom. They are holding at this long term support line. This is a critical line right below the 200 day EMA. This is a long term (about 10-12 year) line that has held. Now it looks like it has traction and is trying to move upside toward the January peak just as NASDAQ and SP500 are doing.

In sum, we have the market failing one attempt at an oversold bounce, coming back to the same level of support, and then putting in a second bottom and bouncing. It has more traction because it is showing the second back-to-back upside pairing of the past week and a half. It has not done that since the market peaked in late April. Thus, given the other indications over the last week the extremes in the VIX, extremes in breadth, and the extremes in the put/call ratio it looks as if the groundwork is set for a bounce to the upside. That is the missing link as to why this rally will likely fail. It probably needs to fail for the leadership of the market to continue to base and set up good patterns to lead the market higher.

LEADERSHIP

This past week I have discussed leadership and the dearth of quality leaders, at least in any quantity. I do not want to imply, however, that there is no leadership. There are sectors and stocks leading higher, but it is the number of leaders that is worrisome. The ranks are thin and will have to be bolstered and fleshed out in order for the market to hold serious gains. That is just common sense. You have to have more stocks moving to the upside and in position to overcome the overhead supply that tends to push them down when sellers move in and dump stocks as they get back to their old highs. A lot of stocks need to be on the move upside to show the overall big money players mutual funds, insurance companies, hedge funds are actually in the mood to buy for the long term versus just some short term short covering.

Healthcare. Healthcare was one of the leading groups on Friday, and it has been setting up to be in a leadership roll over the past few weeks. We have been taking positions along the way. LNCR had an excellent Thursday and Friday, breaking to a new rally high. Of course we bought in already, and it is very solid as it makes the rally to the upside. It is not alone. ILMN posted a new rally high on Friday on rising, above-average volume. It has had very good above-average volume on the upside of late, and that is helping propel it to new highs. HNT is breaking to a new rally high and posted good volume on Friday as it made that move. CI is breaking higher. It is not showing huge volume, but it is set up to make the move higher. It had some lower highs, but it is starting to put in higher lows. It is using the 200 day EMA as support and starting to make the break upside. Healthcare is trying to lead, but it is a defensive area. People turn there when they feel times will not be as strong ahead. The good thing about healthcare is that it has the moves of a growth sector. We can take positions in some of these stocks and enjoy very nice gains even though it is a defensive play. You would not typically associate it with strong gains.

Industrials. Industrials started to show new life this week after some rocky times over the past month and a half. CMI made a break above the triangle it formed, and we started moving in on positions Friday. Would have liked to have done it Thursday, but we got an entry point on Friday as well as it gapped back and rallied to the upside. There is life out there, and you can see it also in DE. It is not yet running like a deer, but it made the triple bottoms above the 200 day EMA and is breaking higher. It is not in a great buy position now, but it may give one if it comes back and tests and makes a higher low along this trendline and starts to break higher. That would be a nice entry point. Industrials have some life and they can help lead. They helped lead the market higher from 2007 into the crash and then in the recovery in 2009.

Technology. FFIV is starting to move again after setting up in something of an ascending triangle that is consolidating a nice run higher through April. Good volume on the break to the upside, nice tests showing volume reversal in the early week. It then broke off the 50 day EMA that it held yet again on Friday, and we picked up positions as it made that move. AAPL was up again on Friday, putting in a back-to-back upside day, but its volume was lower each session. AAPL has made the double top at the 78% Fibonacci retracement level of the selloff in May, and that is a classic sell signal. It managed to bounce off of the gap up point from April on Thursday and Friday. Again it was low volume, and I expect it to turn back down and sell some more. AAPL makes its own wake, however; it may just continue to run to the upside. We will have to see because it is always a strong run.

Internet. Internet. AKAM continues to perform, and was up again on Friday to a new rally high. We took some of the gain of our second position off the table, over 16% on the stock and 100% on the options. It is doing very well. It has trended higher and higher even through all of the selling. Cannot complain about that.

Retail. Some of the retailers are going down while new areas are rising. UA made the break higher on Friday on some very solid volume, clearing this downtrend line and what is basically a double bottom with handle that broke out. You may want to call it an ABCD pattern that broke, tested, and is moving up again. The point is that it is a solid upside pattern and is starting to break to the upside as well. We did not catch all those that we wanted and typically do look at and catch on the moves. XKS set up nicely with the triangle. I looked at it, and then it made the break and gapped and ran away from us on good volume at the end of the week.

DECK is another position we wanted to get into, but it is elusive, staying a jump ahead of you, always seeming to gap away just as you want to move in. You almost have to hold your nose and jump in no matter where it is. We had a chance to get into it on Wednesday, then on Thursday it gapped and ran. Friday it came back and I was looking at it because I had talked about it in the morning alert. It did not open down that much. I thought we might get a little pullback, but the next thing you know the buyers hit the pedal and it roared higher to a new rally higher on strong volume. Sometimes you have to hold your nose and jump, but the way this market has been, it is not the kind to hold your nose and jump too many times. As volatile as things are, you may find there is no water in the bottom of the pool. As you can see, there has been a reemergence of leadership, but it is still very thin.

Energy still remains very weak. You can go sector by sector of weak, downtrodden sectors. Financials, energy, and many industrials while some have improved are really beaten up and have terrible patterns. It takes time to rebuild leadership across the market where there are waves of stocks breaking out of the upside off of solid bases. That typically does not work when you have a month or two of hard selling in the market and then try to bolt back up off the lows. There is so much damage done to patterns that they cannot just turn on a dime and move back to the upside. They have to work through the overhead supply, set new bases, and then make good upside rallies. If we get that, that is great. If it cannot do it, then it will take time. The market makes these rallies like it looks like it will make now, and that is part of the basing process. It is not the end of the selling; it is just part of the process that the market goes through. It bases, works the sellers out of the system, and getting the committed holders holding the stocks. Then there is the breakout.

At this juncture that looks like it could take a while. We have a bounce we are playing to the upside, but I do not think that bounce will hold. I think that stocks will come back down and do more basing. I hate to say it, but we could spend a good chunk of the summer in the basing process. That does not mean you cannot make money. We have stocks right now that are breaking to the upside nicely and have plenty of room to run, particularly if SP500 makes it up to the January consolidation (even more so the January peak). That will give excellent gains on the great stocks we have been buying positions on over the latter part of this week. There are other stocks we already have positions on. AKAM continues to bolster gains and is getting tremendous gains on our earlier position we took several weeks back.

With that in mind, we do not want to get ahead of ourselves. This is still likely a bounce with the potential to be something more. Over the next few weeks, there could be improvement in the quality of leadership as stocks continue to base out. Maybe this was the bottom, but we do not have to guess on that. We can play good stocks as they move higher and, if it was the bottom, we will smell like roses as stocks continue to move higher and build profits for us as more and more money comes back to the market. If that is the case, we will see more and more stocks join the rally. Leadership comes in and joins and it moves up in waves. That will give more and more buying opportunities if there is a recovery. If not, we can live with that, too. It is all part of the basing process, and we will take advantage of what the market gives us.

THE MARKET

MARKET SENTIMENT

VIX. Volatility on Friday thumped hard to the downside, coming down to the 50 day EMA and undercutting the lows over the past three weeks. What we saw in the original selling was the spiking higher of volatility almost to 48 before it started to peel back. Rallies tend to start a few weeks after volatility hits its peaks, and it looks like volatility has hit its peak. We had one high, a higher low, a new higher high, and then another higher low. Now it is rolling over and getting a lower high and a lower low. Some people who have been watching awhile may ask if that is an ABCD pattern forming. That could be the case, but typically volatility does not follow that pattern as stocks do. Nonetheless, I will be watching to see if it bounces higher. As I will discuss later, it looks as if the market is trying to make for more of a rally here. We have broken the string of higher highs and higher lows in the VIX, and this allows the oversold bounce to have a bit more traction.

VIX: 28.79; -1.78
VXN: 28.8; -2.5
VXO: 27.9; -1.78

Put/Call Ratio (CBOE): 1.08; +0.08. Still above 1.0 on the rise, indicating there is still plenty of skepticism about any upside move. That skepticism plays into the somewhat extreme negative views.

Bulls versus Bears:

This past week the bearish number of investment advisors topped bullish advisors. That is a rare event and thus very noteworthy. It falls into our theme that the sentiment indicators have hit extremes and are at levels sufficient for at least a more sustained bounce in the indices.

This is a reading of the number of bullish investment advisors versus bearish advisors. The reason you look at this is that it gives you an idea of how bullish investors are. If they are too bullish then everyone is in the market and it is heading for a top: if everyone wants to be in the market then all the money is in and there is no more new cash to drive it higher. On the other side of the spectrum if there are a lot of bears then there is a lot of cash on the sideline, and as the market rallies it drags that cash in as the bears give in. That cash provides the market the fuel to move higher. If bears are low it is the same as a lot of bulls: everyone is in and the market doesn't have the cash to drive it higher.

Bulls: 38.5%. Falling as the last rally attempt failed, down from 39.8% the prior week. Down substantially from 43.8%, 47.2%, and 56.0% before that. This move started at a low of 35.6% in February, the lowest it has been since July 2009. 35% is the threshold level suggesting bullishness. After peaking at 53 on this move the bulls lost some nerve, falling to a new low post- July 2009. Once again bulls peaked out near the 50% level. Bulls have bumped at 50ish since late August 2009, falling to 45ish and then rebounding. Hit a high of 47.7% mid-June on the run from the March lows. Again, to be seriously bearish it needs to get up to the 60% to 65% level.

Bears: 39.9%. Huge spike from 28.4% shows a rare crossover as bears top bulls. It continues a sharp rise from 24.7% the week before where it held for a couple of weeks. Fell to 18.7% on the low. Hit a high of 27.8% level on the prior leg in February. Over 35% is considered bullish for the market; definitely at the lower end of the scale. Peaked near 28% in November, falling short of the 35.6% hit in July 2009. For reference, cracking above the 35% threshold considered bullish. Hit a high on this run at 47.2%. For reference, bearishness hit a 5 year high at 54.4% the last week of October 2008. The move over 50 took bearish sentiment to its highest level since 1995. Extreme negative sentiment. Prior levels for comparison: Bearishness peaked at 37.4% in September 2007. It topped the June 2006 peak (36%) on that run. That June peak eclipsed the March 2006 high (33%) and well above the 2005 highs that spawned new rallies (30% in May 2005, 29.2% in October 2005). That was a huge turn, unlike any seen in recent history.

NASDAQ

Stats: +24.89 points (+1.12%) to close at 2243.6
Volume: 1.78B (-14.89%)

Up Volume: 1.539B (-375.872M)
Down Volume: 221.307M (-9.262M)

A/D and Hi/Lo: Advancers led 2.53 to 1
Previous Session: Advancers led 5.28 to 1

New Highs: 41 (+21)
New Lows: 38 (-39)

NASDAQ CHART: Click to view the chart

NASDAQ 100 CHART: Click to view the chart

SOX CHART: Click to view the chart

SP500/NYSE

Stats: +4.76 points (+0.44%) to close at 1091.6
NYSE Volume: 1.042B (-22%)

Up Volume: 695.551M (-608.401M)
Down Volume: 334.608M (+305.056M)

A/D and Hi/Lo: Advancers led 2.66 to 1
Previous Session: Advancers led 5.54 to 1

New Highs: 84 (+4)
New Lows: 39 (+1)

SP500 CHART: Click to view the chart

SP600 Chart: Click to view the chart

DJ30

Stats: +38.54 points (+0.38%) to close at 10211.07
Volume DJ30: 188M shares Friday versus 222M shares Thursday.

DJ30 CHART: Click to view the chart

MONDAY

There is a lot of economic data coming our way. There are a lot of regional manufacturing reports starting with New York on Monday, and then industrial production and capacity on Wednesday. Housing starts, building permits, initial claims, and then CPI on Thursday. That is followed by leading indicators and we close out with the Philly Fed on Thursday morning. Plenty of economic indicators. The regional manufacturing report will be for June already, and we will see if there is that uptick I was talking about when discussing trucking.. We have some more economic data, and we have potential bad news coming out of Europe every day. We could see another country emerge as a problem that was heretofore not considered a problem. That is an ever-present issue for the market, but there is nothing you can do about it. On Friday it did not undermine the market. Stocks were able to recover and post the second gain in a back-to-back gain for the end of the week.

I am looking for this bounce to continue, but it may not continue every day. Remember, we have only had three back-to-back upside sessions since late April, but two of them have been in the past week and a half. That is a sign of strength to the upside. We may get an off Monday, but I still think we have the momentum to continue up to the January peak. With respect to leadership, we are seeing more good stocks break to the upside that can propel the market higher. That is exactly what I am looking for them to do as the market continues to the upside. It is not too late to buy into some of these stocks. Some these have set up. Early leaders were out in front on Thursday and Friday, but others are there still in position to buy. If there is a nice pullback on Monday (a setback as some would view it), I think it would be an opportunity to move into some of these positions. Friday was an opportunity for a few positions, although the pullback was not enough on some of the stocks we were looking at given the strength of the move they made on Thursday.

I think the rally is going to continue, so I am looking for openings for good plays that we can use as vehicles to the upside. If we get a pullback on Monday on stocks we are looking to get in, we can use that to our advantage. Then as the market recovers, that pushes us up in better profit position as it moves toward the January peak. That is our initial target on any bounce. We have some great positions in play, and we will look to pick up more as the rally gives us opportunity. Have an excellent weekend.

Support and Resistance

NASDAQ: Closed at 2243.60

Resistance:
2245 from July 2008 through 2260 from late 2005.
2275 - 2278 from the February 2008 and April 2008 lows
2273 to 2282 marks bottom of January 2010 lateral peak
2292 is a low from January 2008
The 50 day EMA at 2311
2319 from the September 2008 peak
2320 to 2326.28 is the January 2010 high
2324-2370 is a range of resistance from early 2008
2382-2395 from 2008
2412-2415 represents a series of peaks and lows in 2007, 2008
2434 is the May 2010 high
2453 is the August 2008 peak

Support:
The 200 day SMA at 2239
2205 is the November 2009 peak 2210 (from September 2008) to 2212 (the July 2009 closing low)
2185 to 2195 represent support points for years: December 2004 peak, July to October 2005 consolidation, January, March and July 2008 lows, and October 2009 peak.
2177 is a low from March 2008
2169 is the March 2008 closing low (double bottom)
2168 is the September 2009, intraday peak
2167 from the July 2008 intraday low
2155 is the March 2008 intraday low
2100 is the February 2010 low

S&P 500: Closed at 1091.60
Resistance:
1101 is the October 2009 high
1106 is the September 2008 low
The 200 day SMA at 1108
1114 is the November 2009 peak
1119 is the early December intraday high
The 50 day EMA at 1121
Bottom of the January 2010 consolidation 1131 to 1136
1133 from a September 2008 intraday low
1151 is the January 2010 peak
1156 is the Sept 2008 low
1170 is the prior March 2010 high
1174 is the May 2010 high
1181 is the April selloff low
1185 from late September 2008

Support:
1084 to 1080 (September 2009 peak)
1078 is the October range low
1070 is the late September 2009 peak
1044 is the October 2008 intraday high AND the February 2010 low
1040 is the May 2010 low
1020 is the bottom of the late summer 2009 consolidation
946 from June 2009

Dow: Closed at 10,211.07
Resistance:
10,285 is the late December consolidation peak
The 200 day SMA at 10,313
10,365 is the late September 2008 low
The 50 day EMA at 10,447
10,496 is the November 2009 high
10,609 from the Mid-September 2008 interim low
10,730 is the January 2010 peak
10,920 is the recent May high
10,963 is the July 2008 low
11,100 from the 7-08 low
11,205 is the April closing high
11,734 from 11-98 peak

Support:
10,120 is the October 2009 peak
9829 is the September 2008 closing high
9918 is the September 2008 peak
9855 is the early September peak in its lateral range
9835 is the late September 2009 peak AND the February 2010 low
9774 is the May 2010 intraday low

Economic Calendar

These are consensus expectations. Our expectations will vary and are discussed in the 'Economy' section.

June 07 - Monday
- Consumer Credit, April (15:00): $1.0B actual versus -$2.0B expected, -$5.4B prior (revised from $2.0B)

June 09 - Wednesday
- Wholesale Inventories, April (10:00): 0.4% actual versus 0.5% expected, 0.7% prior (revised from 0.4%)
- Crude Inventories, 06/05 (10:30): -1.83M actual versus -1.90M prior

June 10 - Thursday
- Initial Claims, 06/05 (08:30): 456K actual versus 450K expected, 459K prior (revised from 453K)
- Continuing Claims, 05/29 (08:30): 4462K actual versus 4600K expected, 4717K prior (revised from 4666K)
- Trade Balance, April (08:30): -$40.3B actual versus -$41.3B expected, -$40.0B prior (revised from -$40.4B)
- Treasury Budget, May (14:00): $135.9B actual versus $142.0B expected, $189.6B prior

June 11 - Friday
- Retail Sales, May (08:30): -1.2% actual versus 0.2% expected, 0.6% prior (revised from 0.4%)
- Retail Sales ex-auto, May (08:30): -1.1% actual versus 0.1% expected, 0.6% prior (revised from 0.4%)
- Michigan Sentiment, June (09:55): 75.5 actual versus 74.5 expected, 73.6 prior
- Business Inventories, April (10:00): 0.4% actual versus 0.5% expected, 0.7% prior (revised from 0.4%)

June 15 - Tuesday
- Export Prices ex-ag., May (08:30): 1.4% prior
- Import Prices ex-oil, May (08:30): 0.5% prior
- Empire Manufacturing, June (08:30): 20.0 expected, 19.11 prior
- Net Long-Term TIC Fl, Aprilil (09:00): $140.5B prior

June 16 - Wednesday
- Housing Starts, May (08:30): 653K expected, 672K prior
- Building Permits, May (08:30): 631K expected, 610K prior
- PPI, May (08:30): -0.5% expected, -0.1% prior
- Core PPI, May (08:30): 0.1% expected, 0.2% prior
- Capacity Utilization, May (09:15): 74.4% expected, 73.7% prior
- Industrial Productio, May (09:15): 0.8% expected, 0.8% prior
- Crude Inventories, 06/12 (10:30): -1.83M prior

June 17 - Thursday
- Initial Claims, 06/12 (08:30): 450K expected, 452K prior
- Continuing Claims, 06/5 (08:30): 4475K expected, 4462K prior
- CPI, May (08:30): -0.2% expected, -0.1% prior
- Core CPI, May (08:30): 0.1% expected, 0.0% prior
- Current Account Bala, Q1 (08:30): -$123.0B expected, -$115.6B prior
- Leading Indicators, May (10:00): 0.4% expected, -0.1% prior
- Philadelphia Fed, June (10:00): 18.8 expected, 21.4 prior
icon url

ReturntoSender

06/15/10 8:45 AM

#8984 RE: ReturntoSender #6755

From last night Briefing.com: 4:30 pm : The stock market failed to sustain strong gains on Monday as buyers backed down upon running into resistance near a key technical hurdle.

Trade started on a positive note as the major market averages shadowed the advances made by overseas markets. Continued strength in the euro also helped give a lift to stocks. The euro had been up more than 1.5% against the dollar at its session high, but it finished with a 1.0% gain near $1.223.

The euro encountered some midsession selling amid news that analysts at Moody's downgraded Greece's debt to Ba1 from A3. The news had little lasting effect on the euro since the downgrade made for little surprise, given the popular belief that fiscal conditions in Greece remain tenuous. Amid such tenuous conditions, Greece's Prime Minister Papandreou said ahead of this past weekend that his government decided against leaving the euro and pledged to pay its dues and return to growth.

The Greece headline proved to be a modest downtick in the stock market's gradual, afternoon descent. In the first half of trade stocks had made a steady march higher so that the S&P 500 was up more than 1% at its session high, but the broad-based strength began to fade once the stock market lost momentum near its 200-day moving average. The technical line remains a formidable point of resistance against the stock market's attempts at near-term gains.

Market participants put some of the most pressure on natural resource plays. In turn, the materials sector swung to a 1.0% loss after it had been up more than 1% at its session high. Chemicals stocks dropped more than 2% as a group; so did gold stocks.

Energy stocks had also been up more than 1%, but they settled with a 0.5% loss. BP Plc (BP 30.67, -3.30) was one of the worst performers in the sector. The company announced that its cost of response to the Gulf oil spill now stands at $1.6 billion, while political rhetoric against the company persists. Analysts also continue to express concern for the company's dividend.

Financials were a laggard for most of the session; even in the early going, when strength was broad. The sector fell to a 0.7% loss as weakness among diversified banks (-1.6%) and investment banks (-2.0%) faltered.

Only a few pockets of strength remained into the close. Defensive-oriented utilities (+0.4%), consumer staples (+0.4%), and health care stocks (+0.2%) finished in positive territory. Consumer discretionary plays (+0.2%) advanced with help from retailers (+0.5%).

Advancing Sectors: Utilities (+0.4%); Consumer Staples (+0.4%); Health Care (+0.2%); Consumer Discretionary (+0.2%)
Declining Sectors: Materials (-1.0%), Financials (-0.7%), Energy (-0.5%), Tech (-0.3%), Telecom (-0.3%), Industrials (-0.2%) DJ30 -20.18 NASDAQ +0.36 NQ100 -0.1% R2K +0.5% SP400 +0.4% SP500 -1.97 NASDAQ Adv/Vol/Dec 1484/1.89 bln/1168 NYSE Adv/Vol/Dec 1888/1.14 bln/1165

4:15PM TranSwitch announces the termination of its agreement to issue additional shares (TXCC) 2.36 +0.11 :

4:00PM SMSC announces acquisition of STS (SMSC) 23.01 -0.04 : Co announced that it has acquired Wireless Audio IP B.V. ("STS"). SMSC expects Kleer and STS to contribute ~$15 mln in revenue in fiscal 2011 and the acquisitions are expected to be neutral to slightly accretive during SMSC's current fiscal year 2011. Under terms of the share purchase agreement, SMSC paid $22 mln in cash and additional cash payments of up to $3 million may occur upon achievement of certain performance goals. The acquisition closed on June 14, 2010.

Lattice Semi (LSCC) extends distribution agreement with MSC Vertriebs GmbH to include Benelux and Italy.

icon url

ReturntoSender

06/15/10 8:08 PM

#8985 RE: ReturntoSender #6755

From Briefing.com: 4:30 pm : Stocks had run into resistance at their 200-day moving average during the prior session, but this time the broader market staged a strong, steady climb past that key technical line to settle at a three-week high.

The tone to trade was positive for the entire session. Initial strength was underpinned by continued support for the euro, which was sent another 0.9% higher to $1.234 following a successful debt offering from Spain and Ireland. The success of that offering suggested that even in the face of continued concerns about tenuous fiscal conditions in Europe there is still an appetite for risk. A positive reaction among Europe's major bourses also helped perpetuate a positive tone among market participants.

Broad-based buying helped stocks build upon their strong start. In fact, all 10 major sectors garnered support; each finished with a gain in excess of 1%.

Industrial stocks saw the strongest move. As a group they swung to a 3.0% gain as all 57 members of the industrial sector settled in positive territory. Illinois Tool (ITW 46.78, +1.13) was among them. The company reaffirmed an in-line earnings forecast for fiscal 2010.

Tech provided some of the most leadership, though. The sector, which is the largest by market weight, advanced 2.9%. Semiconductor and semiconductor equipment stocks collectively surged 5.5%, according to the Philadelphia Semiconductor Index.

Energy stocks ascended to a 2.7% gain. Even BP Plc (BP 31.40, +0.73) found favor in the face of negative political rhetoric and continued questions about its dividend. The company also had its debt downgraded by analysts at Fitch.

Only a handful of stocks failed to make gains this session. Best Buy (BBY 38.56, -2.49) and GameStop (GME 20.71, -1.17) were among the losers. Best Buy's weakness was rooted in an earnings miss for the latest quarter, but the company gave details of a plan to exchange gift cards for video game trade ins. The game exchange plan is what pressured shares of GameStop.

Overall, some 98% of stocks in the S&P 500 staged a gain. Such extensive strength sent the S&P 500 to its best level in three weeks and up through its 200-day moving average, which had stood around 1108. On a few separate occasions during recent weeks the stock market had only encountered resistance at its 200-day moving average.

There wasn't a whole lot of trading volume behind this session's move, though. Specifically, trading volume on the NYSE this session was 1.16 billion shares, which is below the 50-session average of 1.45 billion shares.

Advancing Sectors: Industrials (+3.0%), Tech (+2.9%), Energy (+2.7%), Financials (+2.6%), Materials (+2.6%), Consumer Discretionary (+2.4%), Utilities (+2.0%), Health Care (+1.7%), Telecom (+1.6%), Consumer Staples (+1.1%)
Declining Sectors: (None) DJ30 +213.88 NASDAQ +61.92 NQ100 +2.8% R2K +2.5% SP400 +2.4% SP500 +25.60 NASDAQ Adv/Vol/Dec 2151/2.25 bln/532 NYSE Adv/Vol/Dec 2622/1.16 bln/442

4:12PM Bell Micro: RiskMetrics Group and Glass Lewis recommend Shareholders vote for proposed acquisition by Avnet (AVT) (BELM) 6.97 +0.02 :

9:03AM Ingram Micro President resigns to become CEO of a non-technology industrial company in Asia (IM) 17.29 : Co announced that Alain Monie, president and chief operating officer, has resigned, effective August 22, 2010, to accept a chief executive officer position at a multi-national industrial company based in Asia.

From last night Briefing.com: 4:30 pm : The stock market failed to sustain strong gains on Monday as buyers backed down upon running into resistance near a key technical hurdle.

Trade started on a positive note as the major market averages shadowed the advances made by overseas markets. Continued strength in the euro also helped give a lift to stocks. The euro had been up more than 1.5% against the dollar at its session high, but it finished with a 1.0% gain near $1.223.

The euro encountered some midsession selling amid news that analysts at Moody's downgraded Greece's debt to Ba1 from A3. The news had little lasting effect on the euro since the downgrade made for little surprise, given the popular belief that fiscal conditions in Greece remain tenuous. Amid such tenuous conditions, Greece's Prime Minister Papandreou said ahead of this past weekend that his government decided against leaving the euro and pledged to pay its dues and return to growth.

The Greece headline proved to be a modest downtick in the stock market's gradual, afternoon descent. In the first half of trade stocks had made a steady march higher so that the S&P 500 was up more than 1% at its session high, but the broad-based strength began to fade once the stock market lost momentum near its 200-day moving average. The technical line remains a formidable point of resistance against the stock market's attempts at near-term gains.

Market participants put some of the most pressure on natural resource plays. In turn, the materials sector swung to a 1.0% loss after it had been up more than 1% at its session high. Chemicals stocks dropped more than 2% as a group; so did gold stocks.

Energy stocks had also been up more than 1%, but they settled with a 0.5% loss. BP Plc (BP 30.67, -3.30) was one of the worst performers in the sector. The company announced that its cost of response to the Gulf oil spill now stands at $1.6 billion, while political rhetoric against the company persists. Analysts also continue to express concern for the company's dividend.

Financials were a laggard for most of the session; even in the early going, when strength was broad. The sector fell to a 0.7% loss as weakness among diversified banks (-1.6%) and investment banks (-2.0%) faltered.

Only a few pockets of strength remained into the close. Defensive-oriented utilities (+0.4%), consumer staples (+0.4%), and health care stocks (+0.2%) finished in positive territory. Consumer discretionary plays (+0.2%) advanced with help from retailers (+0.5%).

Advancing Sectors: Utilities (+0.4%); Consumer Staples (+0.4%); Health Care (+0.2%); Consumer Discretionary (+0.2%)
Declining Sectors: Materials (-1.0%), Financials (-0.7%), Energy (-0.5%), Tech (-0.3%), Telecom (-0.3%), Industrials (-0.2%) DJ30 -20.18 NASDAQ +0.36 NQ100 -0.1% R2K +0.5% SP400 +0.4% SP500 -1.97 NASDAQ Adv/Vol/Dec 1484/1.89 bln/1168 NYSE Adv/Vol/Dec 1888/1.14 bln/1165

4:15PM TranSwitch announces the termination of its agreement to issue additional shares (TXCC) 2.36 +0.11 :

4:00PM SMSC announces acquisition of STS (SMSC) 23.01 -0.04 : Co announced that it has acquired Wireless Audio IP B.V. ("STS"). SMSC expects Kleer and STS to contribute ~$15 mln in revenue in fiscal 2011 and the acquisitions are expected to be neutral to slightly accretive during SMSC's current fiscal year 2011. Under terms of the share purchase agreement, SMSC paid $22 mln in cash and additional cash payments of up to $3 million may occur upon achievement of certain performance goals. The acquisition closed on June 14, 2010.

Lattice Semi (LSCC) extends distribution agreement with MSC Vertriebs GmbH to include Benelux and Italy.
icon url

ReturntoSender

06/16/10 10:17 PM

#8986 RE: ReturntoSender #6755

From Briefing.com: 4:30 pm : Stocks spent the session chopping along listlessly as market participants monitored the euro and digested a large batch of BP headlines and a the latest dose of economic data.

Trade was initially guided by action in the euro, which had come under pressure after yield spreads widened on Portugal and Spain's debt. With Spain scheduled to meet with authorities from the European Union and International Monetary Fund there was increased speculation that the country is in need of financial aid. The euro was down as much as 0.6% against the greenback and temporarily reversed that loss, but it still finished with a 0.2% loss at $1.23.

A clear leader never emerged from this session's action. Only the stodgy utilities sector traded with a steady gain. It settled 0.6% higher.

Market participants were hit with a barrage of headlines regarding BP (BP 31.85, +0.45) that stirred volatility in the stock. Shares of BP had been backed down to trade near their lows, but support near those lows resulted in a squeeze higher. The stock saw further support following its decision to suspend its dividend for the rest of this year and also to establish a $20 billion escrow fund for claims that stem from the Gulf oil spill. Those decisions seemed to remove some uncertainty about the company's compliance with government requests as a remedy for the spill is sought. Moreover, reports that bond guru Bill Gross purchased a bundle of BP debt provided a vote of confidence in the company.

In other corporate news, FedEx (FDX 78.07, -4.94) posted better-than-expected earnings of $1.33 per share for the latest quarter, but that was overshadowed by a forecast that called for fiscal 2011 earnings that would range from $4.40 to $5.00 per share, which is below Wall Street's current consensus forecast for earnings of $5.05 per share. The stock suffered its worst single-session slide in six months.

Shares of Nokia (NOK 8.77, -1.05) also slid sharply following a disappointing outlook. The stock dropped more than 10% after the company stated that it expects second quarter net sales for devices and services to be at the lower end or slightly below the previously stated range of 6.7 billion to 7.2 billion euros. The company is suspected of feeling competitive pressures from Apple (AAPL 267.56, +7.56) in the handset market; shares of AAPL outperformed and helped lead the Nasdaq 100 to a 0.4% gain, though the Nasdaq Composite closed flat.

Economic data for the day consisted of the May Producer Price Index, which fell 0.3% month-over-month when a 0.5% monthly decline had been widely expected. Excluding food and energy, producer prices made a 0.2% monthly increase, which is essentially in step with the 0.1% monthly increase that had been expected.

Housing starts and building permits disappointed. Specifically, housing starts for May dropped 10% month-over-month to an annualized rate of 593,000 units, which is well below the rate of 655,000 units that had been widely expected. Building permits for May dropped 5.9% month-over-month to an annualized rate of 574,000, which is well below the expected rate of 631,000.

Industrial production for May increased 1.2%, which bested the 0.9% increase that had been anticipated. Capacity utilization hit 74.7, which is in-line with the 74.5% that was widely forecast.

Advancing Sectors: Utilities (+0.6%), Health Care (+0.3%), Tech (+0.2%)
Declining Sectors: Consumer Discretionary (-0.6%), Consumer Staples (-0.5%), Industrials (-0.2%), Energy (-0.2%), Materials (-0.1%)
Unchanged: Financials, Telecom DJ30 +4.69 NASDAQ +0.05 NQ100 +0.4% R2K -0.4% SP400 -0.4% SP500 -0.62 NASDAQ Adv/Vol/Dec 1063/1.94 bln/1563 NYSE Adv/Vol/Dec 1245/1.17 bln/1796

5:00PM Kulicke & Soffa CEO establishes rule 10b5-1 stock trading plans (KLIC) 8.14 : Co announced that C. Scott Kulicke, Chief Executive Officer, has modified an existing stock trading plan to sell K&S common stock and established a new trading plan to sell certain shares granted to him as equity compensation that are scheduled to vest in October 2010. Mr. Kulicke entered into these plans in connection with his scheduled retirement and as part of his personal long-term strategy for asset diversification.

11:43AM Apple statement on iPhone 4 pre-orders (AAPL) 264.90 +5.25 : Co stated that its carrier partners took pre-orders for more than 600,000 of Apple's new iPhone 4. It was the largest number of pre-orders Apple has ever taken in a single day.

9:02AM Mattson receives multiple Suprema system orders from leading foundry in Asia (MTSN) 4.00 : Co announced that a semiconductor foundry based in Asia has placed multiple orders for its Suprema photoresist strip system. The co noted that the orders come from multiple production fabs from its long standing customer, and the systems would be used for all photoresist strip processes on both front-end-of-line and back-end-of-line applications. The tool shipments will start in the current quarter and continue into 2011.

9:01AM FormFactor announces cost reduction measures (FORM) 11.84 : Co announces cost reduction measures targeted to lower the company's operating expenses. As part of this effort, the company will reduce its total workforce by approximately 8%. FormFactor expects to incur approximately $5 million in restructuring charges related to the plan, which will be recorded in the second quarter of fiscal 2010.

8:03AM Vishay declares spin-off dividend of VPG shares (VSH) 9.03 : Co board of directors has declared a pro rata dividend of the outstanding shares of VPG capital stock owned by co that will result in the complete separation of the two companies. The targeted distribution date will be July 6, 2010, subject to the satisfaction of all conditions to the spin-off, including declaration of effectiveness of VPG's registration statement filed with the Securities and Exchange Commission relating to the spin-off. If the conditions are not satisfied in time for a July 6, 2010 distribution, the distribution date will be scheduled to occur on or before August 24, 2010, and would be expected to be August 2, 2010. On the distribution date, co common stockholders of record as of 5:00 p.m. on June 25, 2010, the record date for the distribution, will receive 1 share of VPG common stock for every 14 shares of co common stock they hold, and co Class B common stockholders of record as of 5:00 p.m. on June 25, 2010 will receive 1 share of VPG Class B common stock for every 14 shares of co Class B common stock they hold. Fractional shares of VPG common stock and VPG Class B common stock will not be distributed to co stockholders. Instead, the fractional shares of VPG common stock will be aggregated and sold in the open market, with the net proceeds distributed pro rata in the form of cash payments to co stockholders who would otherwise be entitled to receive a fractional share of VPG common stock. Holders of co Class B common stock will be compensated by VPG for fractional shares of VPG Class B common stock they were entitled to receive based upon the same price used to cash out the fractional shares of VPG common stock.

8:02AM Nokia lowers devices & services Q2 outlook and updates the FY10 outlook (NOK) 9.82 : Co now expects Q2 Devices & Services net sales to be at the lower end or slightly below previously expected range of EUR 6.7-7.2 bln primarily due to lower than previously expected average selling prices and mobile device volumes. Co now expects Q2 Devices & Services non-IFRS operating margin to be at the lower end or slightly below previously expected range of 9% to 12% primarily due to a lower than previously expected gross margin. Co continues to expect industry mobile device volumes to be up approximately 10% in 2010, compared to 2009 (based on its revised definition of the industry mobile device market applicable beginning in 2010). Co continues to target its mobile device volume market share to be flat in 2010, compared to 2009. Co now expects Devices & Services non-IFRS operating margin to be at the lower end of, or below, its previously targeted range of 11% to 13% for the full year 2010. Co also expects its mobile device value market share to be slightly lower in 2010 primarily due to the competitive situation at the high-end of the market and shifts in product mix.

8:02AM MEMC Elec: SunEdison acquires two solar PV projects from TransAlta (WFR) 11.69 : The co, a division of WFR, announces its purchase of two ground-mount solar photovoltaic (PV) development projects in Ontario from TransAlta, Canada's largest publicly traded generator and marketer of electricity and renewable power. This acquisition is part of SunEdison's ongoing activities to accelerate the development of solar PV projects in Ontario. Under the terms of the sale, SunEdison acquired more than 300 acres of land across two sites near Sandhurst, Ontario (south of Napanee). The first site will be used to develop and construct a 10-MW Renewable Energy Standard Offer Program (RESOP) project. The second site will be developed for Ontario's Feed-in-Tariff (FIT) program.

icon url

ReturntoSender

06/20/10 11:16 PM

#8987 RE: ReturntoSender #6755

Amateur Investors Weekend Stock Market Analysis (6/19/10)

http://www.amateur-investor.net/Weekend_Market_Analysis_June_18_10.htm

Right now we have two potential longer term chart patterns in play for the Dow. The bearish chart would be a large Head and Shoulders Top pattern that began with the high made a decade ago which is acting as the 1st Shoulder. Meanwhile the Head would be the peak reached in late 2007. Furthermore the recent move from the March 2009 low to the high made in late April would be the early stages of the 2nd Shoulder. Finally the Neckline (black line) is severely sloped to the downside. If the Dow were to form a 2nd Shoulder and then breakdown a retest of the Neckline would certainly be possibly in the longer term. Also notice the Neckline would eventually intersect the 61.8% Retracement Level calculated from the late 1974 low to the April 2010 high if it turns out to be an elongated affair.


Meanwhile for the bullish crowd the Dow also could be exhibiting a potential Broadening Top pattern. An example of a Broadening Top pattern is shown below which takes the shape of a Megaphone. Also as you can see once the final 5th Wave ends it's followed by a sharp downside reversal as the previous Wave 4 low is taken out.


If a Broadening Top pattern is developing it appears the Dow is beginning the final 5th Wave to the upside which should rise above the previous high made in late 2007 which was near 14200. Meanwhile once the final 5th Wave completes then a sharp downside reversal would follow as the previous March 2009 Wave 4 low is eventually be taken out.


For those that don't think this pattern has ever happened before the S&P 500 exhibited a similar pattern from the mid 1960's through the early 1970's which was followed by a 48% correction once the pattern completed.


Finally keep in mind both of the patterns mentioned above would likely take another 3 to 5 years to play out if they occur.
icon url

ReturntoSender

06/24/10 12:27 AM

#8991 RE: ReturntoSender #6755

From Briefing.com: 4:30 pm : Mostly muddled trade ended in a modest loss for the S&P 500 as the worst new home sales figures on record acted as a drag on trade and the FOMC failed to deliver any positive news to market participants.

Stocks set their session lows in the early going as it was reported that new home sales for May fell almost 33% month-over-month to an annualized rate of 300,000 units. Not only was that far below the rate of 430,000 units that had been expected by economists polled by Briefing.com, but it was the lowest rate since records began more than 45 years ago.

Though the stock market was able to trim its losses, it didn't make its way into higher ground until the afternoon release of the latest policy statement from the Federal Open Market Committee (FOMC). The FOMC maintained the target range for the federal funds rate at 0.00% to 0.25%, as expected. It also stated that exceptionally low levels of the federal funds rate are expected for an extended period.

Once again, Thomas Hoenig voted against the decision to keep the interest rate target unchanged. He also argued against the language about keeping exceptionally low interest rates.

Though the FOMC included in its statement the observation that economic recovery is proceeding, it also stated that financial conditions have become less supportive of economic growth on balance.

The stock market's upward push during the minutes that followed the FOMC statement proved short lived, mostly because it lacked any sort of real leadership. In turn, stocks spent the rest of the session stuck in choppy trade with moderate losses.

Energy stocks represented some of the session's weakest performers. The sector shed 1.0%. A 1.6% drop in crude oil prices to $76.57 per barrel didn't help the sector -- an unexpected build in weekly oil inventories helped keep oil prices in the red for the entire session.

Telecom was a solid performer, though. The sector settled with a 0.6% gain.

Treasuries had a strong session. As such, the yield on the benchmark 10-year Note fell below 3.10% for its first time in almost one month before it ticked higher in afternoon trade. Treasuries encountered some selling after results from an auction of 5-year Notes showed that dollar demand fell below $100 billion for the first time in nine months and the auction's bid-to-cover came in below 2.6, which is less than the average ratio for the past eight sessions.

The euro had a quiet start to the session, but it managed to make its way to a 0.3% gain against the greenback. The British pound was an even better performer as it spiked 0.9% versus the dollar. The pound was helped by positive comments about the U.K. budget plan from various credit analysts and a tacit vote of confidence in the U.K. economy by a member of the recent Bank of England who wanted an increase in the bank's interest rate.

Advancing Sectors: Telecom (+0.6%), Consumer Staples (+0.3%), Materials (+0.1%)
Declining Sectors: Utilities (-1.1%), Energy (-1.0%), Tech (-0.5%), Industrials (-0.4%), Financials (-0.3%), Health Care (-0.3%)
Unchanged: Consumer Discretionary DJ30 +4.92 NASDAQ -7.57 NQ100 -0.3% R2K -0.3% SP400 -0.2% SP500 -3.27 NASDAQ Adv/Vol/Dec 1187/1.88 bln/1412 NYSE Adv/Vol/Dec 1422/1.13 bln/1601

5:00PM Monolithic Power: ITC confirms MPS patent victory against O2 Micro (MPWR) 18.72 -0.27 : Co announced the U.S. International Trade Commission issued a final determination finding no violation of Section 337 by MPS or its customers in an action brought by O2 Micro International, Ltd. in 2008. An ITC administrative law judge had previously issued an initial determination in April that also found no violation. The ITC's final determination concludes that none of MPS' accused products infringe O2 Micro's U.S. Patent No. 7,417,382 (the '382 patent).

4:30PM Dell updates FY11 guidance; sees FY11 revs of ~$60.3-62.95 bln vs $61.55 bln Thomson Reuters consensus (DELL) 13.82 +0.01 : Co expects solid growth for the year driven by the refresh of PCs in commercial and public segments coupled with the company's expanding abilities. Co expects revenue for Fiscal 2011 will increase 14 to 19% (which calc to $60.3-62.95 bln vs $61.55 bln Thomson Reuters consensus). Co also said it expects that non-GAAP operating income will increase by 18 to 23% and cash flow from operations will be greater than net income for the current year.

4:17PM Advanced Micro announces commencement of exchange offer of up to $500 mln for its 8.125% senior notes due 2017 (AMD) 8.56 -0.02 :

4:05PM LDK Solar signs module supply contract with Gestamp Solar (LDK) 5.75 +0.05 : Co announced today that it has signed a contract to supply solar modules to Spain-based Gestamp Asetym Solar, a subsidiary of Gestamp Corporation. Under terms of the agreement, LDK Solar will deliver 15.8 megawatts of solar modules to Gestamp Solar during the third quarter.

3:31PM Cisco Systems provides details of $1 bln multi year investment in Russia (CSCO) 22.88 -0.09 : Co today made commitment to invest $1 bln in Russian initiative to drive technological innovation within the country. Cisco has identified a five phase collaborative approach over this next decade through which this $1B investment will be staged. 1) Co will seek venture capital partners 2) Co announced its commitment to establish a dedicated physical presence in Skolkovo. 3) Co will attempt to build a model for partnering with existing businesses, venture capital and technology companies in Russia. 4) Co will focus on collaboration in the areas of go-to-market models for the creation and success of start-ups in partnership with the Russian venture capital community. 5) Create a second Emerging Technologies group HQ in Skolkovo.

icon url

ReturntoSender

06/24/10 11:24 PM

#8992 RE: ReturntoSender #6755

From Briefing.com: 4:30 pm : Four straight losses have the stock market down nearly 4% week-to-date. The most recent slide came amid some rather uninspiring data and some mixed earnings reports.

Market participants initially had a somewhat positive reaction to premarket data that showed durable goods orders for May fell 1.1%, which was softer than the expected 1.3% decline, and orders less transportation increased 0.9%, which was a slower clip than the 1.3% increase that had been anticipated.

The durable goods orders figures were released at the same time as the initial jobless claims count for the week ended June 19. The latest lot of claims declined 19,000 week-over-week to 457,000, which was largely in-line with the 460,000 initial claims that had been widely expected. Continuing claims fell 45,000 week-over-week to 4.55 million, which was also on par with what had been expected.

Though the data wasn't inspiring, it didn't disappoint either. In turn, there was a sense of relief among many market participants, given the salience of yesterday's worst new home sales report on record and the disappointing jobless claims report from the prior week. Still, the stock market started the session in the red and quickly fell under a sharp, broad-based selling effort.

Earnings didn't do anything to offer support. Nike (NKE 69.63, -2.89) posted in-line earnings and Bed Bath & Beyond (BBBY 39.12, -2.34) brought in better-than-expected earnings, but that was overshadowed by the company's weak forecast. Best Buy (BBY 35.74, -0.89) treated investors to a 7% increase in its dividend, but that was largely ignored by the broader market. Shares of retailers were dropped for a collective loss of 2.7%.

All 10 major sectors settled in the red after an afternoon attempt to lessen losses failed. Instead, the broader market finished near its session low in its worst performance of the week. Even utilities logged a 0.3% loss after it had spent the first several hours in higher ground.

Volatility spiked as result of the stock market's selloff. That sent the Volatility Index more than 10% higher. It has been nearly three weeks since it moved so sharply.

Despite the increase in volatility and the widespread weakness among stocks, Treasuries were unable to sustain gains. Early support for the benchmark 10-year Note caused its yield to set a new 52-week low near 3.07%, but the Note fell to a fractional loss after a 7-year Note auction produced a bid-to-cover of 3.0 and dollar demand of $90.3 billion.

Currencies oscillated for most of the session before the U.S. dollar made a flat finish. The euro managed to make a modest gain of 0.2% against the greenback after it had been in the red during early action.

Precious metals found support. They had actually been weak in the early going, but were able to attract buyers as the stock market succumbed to broad-based selling. Gold prices closed pit trade at $1245.80 per ounce, up 0.9%, and silver settled at $18.71 per ounce, up 1.3%.

Advancing Sectors: (None)
Declining Sectors: Consumer Discretionary (-2.5%), Materials (-2.4%), Financials (-2.1%), Energy (-2.1%), Tech (-1.8%), Industrials (-1.8%), Telecom (-1.5%), Consumer Staples (-0.9%), Health Care (-0.8%), Utilities (-0.3%) DJ30 -145.64 NASDAQ -36.81 NQ100 -1.6% R2K -1.7% SP400 -1.8% SP500 -18.35 NASDAQ Adv/Vol/Dec 637/2.05 bln/1998 NYSE Adv/Vol/Dec 690/1.26 bln/2336

4:22PM Research In Motion beats by $0.04, misses on revs; guides Q2 EPS above consensus, revs in-line (RIMM) 58.59 -1.04 : Reports Q1 (May) earnings of $1.38 per share, $0.04 better than the Thomson Reuters consensus of $1.34; revenues rose 23.7% year/year to $4.24 bln vs the $4.35 bln consensus. Co issues mixed guidance for Q2, sees EPS of $1.33-1.40 vs. $1.31 Thomson Reuters consensus; sees Q2 revs of $4.4-4.6 bln vs. $4.5 bln Thomson Reuters consensus. Co authorized a share repurchase program to purchase for cancellation up to approximately 31 mln common shares. Co reports Q1 gross margins of 45.4% vs 44.5% company guidance. Co reports Q1 units shipped of 11.2 mln vs 11.2-11.8 mln guidance. Co reports Q1 net subscriber adds of 4.9 mln vs 4.9-5.2 mln guidance

4:06PM Oracle beats by $0.06, beats on revs (ORCL) 22.22 -0.46 : Reports Q4 (May) earnings of $0.60 per share, excluding non-recurring items, $0.06 better than the Thomson Reuters consensus of $0.54; revenues rose 39.9% year/year to $9.6 bln vs the $9496.7 mln consensus. ORCL reports Q4 non-GAAP operating margin of 46.0% vs 42.2% consensus; co reported 45% last qtr and 51.1% prior Q4. Non-GAAP software license updates and product support revenues were up 13% to $3.5 billion. "We estimate that Sun contributed over $400 million to non-GAAP operating income in our Q4," said Oracle President, Safra Catz. "This compares with a loss in Sun's quarter ending June of last year, when Sun was an independent company. Now that Sun is profitable, we have increased confidence that we will meet or exceed our goal of Sun contributing $1.5 billion to non-GAAP operating income in FY2011, and $2.0 billion in FY2012."

4:03PM FSI Intl beats by $0.02, beats on revs; guides AugQ revs in-line (FSII) 4.58 -0.07 : Reports Q3 (May) earnings of $0.18 per share, $0.02 better than the Thomson Reuters consensus of $0.16; revenues rose 85.8% year/year to $28.7 mln vs the $28.1 mln consensus. Co issues in-line guidance for Q4 (Aug), sees Q4 revs of $27-30 mln vs. $29.4 mln Thomson Reuters consensus.

8:13AM On The Wires : IBM (IBM), Samsung Electronics, GLOBALFOUNDRIES and STMicroelectronics (STM) said that the four companies are collaborating to synchronize semiconductor manufacturing facilities for the production of advanced chips based on 28nm process jointly developed by IBM Technology Alliance...

8:10AM On The Wires : Advanced Energy Industries (AEIS) announced that it has expanded its service facility and installed a new manufacturing line for its RF generator products, located in Sungnam City, South Korea. The company began shipping its first Korean-manufactured product, earlier this month...

icon url

ReturntoSender

06/27/10 2:42 PM

#8993 RE: ReturntoSender #6755

From Briefing.com: 4:30 pm : A finalized financial reform bill drove banks and a bevy of other financial services firms sharply higher Friday, but the broader market had to fight for even a modest gain.

The House and Senate reached an agreement on financial regulation this morning. The bill, which is expected to be passed in coming weeks, will prohibit banks from making risky bets with their own money, but some will still be able to participate in hedge funds and private equity funds. Though there are still some uncertainties related to the bill's implications, its finalization removes an overhang from the financial sector. Diversified financial services spiked 3.4%, investment banks and brokerages bounced 3.1%, and specialized finance stocks climbed 3.0%. The overall financial sector settled with a 2.8% gain, which was twice the 1.4% gain of the next best performing sector -- materials.

The materials sector was led by strength in gold and silver stocks like Newmont Mining (NEM 61.67, +2.72) and diversified metals plays like Freeport McMoRan (FCX 66.57, +3.13). Their gains came partly in response to a pullback by the greenback, which fell to a 0.5% loss against competing currencies.

The dollar's decline and the euro's resulting climb also coincided with an afternoon advance by the broader market, but the move proved difficult to sustain as stocks chopped lower into the close. Still, stocks were able to settle with a modest gain that snapped their recent losing streak at four sessions.

While the broader market saw mixed interest, small caps in the Russell 2000 spiked 1.9% ahead of the annual reconstitution of the Russell indices. The rebalancing occurs after the close, but preparation for the change stoked trading volume.

The latest in economic data and corporate headlines seemed to have little lasting impact on the overall mood of market participants this session.

The final GDP reading for the first quarter showed that the overall economy grew at a slower-than-expected rate of 2.7% from January through March. Meanwhile, personal consumption growth increased at a softer-than-expected rate of 3.0% and core personal consumption expenditures made a 0.7% increase, which is slightly stronger than many had anticipated.

Traders also got their hands on the final Consumer Sentiment Survey for June from the University of Michigan. It improved slightly to 76.0, which represents the best reading since January 2008.

Oracle (ORCL 22.60, +0.38) was one of the more widely held companies to recently report quarterly results. The company's earnings topped what Wall Street had expected. The company also issued solid guidance.

Research In Motion (RIMM 53.26, -5.32) also brought in a better-than-expected bottom line, but that was overshadowed by a relatively mixed forecast. Shares of RIMM plummeted to a fresh 52-week low in their worst single-session percentage drop in roughly nine months.

Advancing Sectors: Financials (+2.8%), Materials (+1.4%), Industrials (+0.6%), Utilities (+0.3%), Health Care (+0.2%), Consumer Discretionary (+0.1%)
Declining Sectors: Consumer Staples (-1.5%), Telecom (-1.2%), Tech (-0.6%), Energy (-0.1%) DJ30 -8.99 NASDAQ +6.06 NQ100 -0.3% R2K +1.9% SP400 +1.1% SP500 +3.07 NASDAQ Adv/Vol/Dec 1800/3.65 bln/827 NYSE Adv/Vol/Dec 2212/2.55 bln/810

11:36AM Power Integrations names Sandeep Nayyar CFO (POWI) 31.91 +0.13 : Co announced that Sandeep Nayyar has been appointed vice president and chief financial officer, effective today.

8:46AM On The Wires : Trina Solar Limited (TSL) announced that it is expected to supply PV modules to the University of Queensland St Lucia campus in Brisbane, Australia, to be used for a 1.2 MW solar system which will be installed on the rooftops of four university buildings...

icon url

ReturntoSender

07/13/10 8:58 AM

#8999 RE: ReturntoSender #6755

From Briefing.com: Broadcom (BRCM) announced its subsidiary, Broadcom International, has declared the Offer for Innovision Research & Technology, wholly unconditional as all of the Conditions to the Offer have been satisfied or waived... Mattson Technology (MTSN) announced that leading semiconductor foundries based in Asia have placed multiple orders for the Company's dry strip systems, Suprema and Aspen 3 Strip... Applied Materials (AMAT) announced that it has signed a five-year contract to service all Applied Materials chip production equipment at NXP Semiconductor's facility in Nijmegen, Holland..

7:01AM Research In Motion announces TSX approval for common share repurchase program (RIMM) 53.79 : Co announces that the TSX has approved the share repurchase program announced by RIMM on June 24, 2010. Under its share repurchase program, RIMM may, during the twelve-month period from July 15, 2010 to July 14, 2011, purchase up to 22,457,566 of its common shares through the facilities of the TSX and the Nasdaq Stock Market

From Briefing.com Last Night: 4:30 pm : Stocks spent the final few hours of the session stuck in choppy trade to essentially finish flat for the day. The lackluster action came despite strength in the tech sector.

The major averages showed little clear direction on Monday. Large-cap tech issues provided early leadership and traded with steady strength throughout the session. In turn, the tech sector, which accounts for almost one-fifth of the total weight of the S&P 500, settled 0.7% higher. The broader market failed to follow, though. Instead, it remained range bound into the close and finished only fractionally higher.

Materials were mired in weakness for almost all of the session. The sector sank to a 1.1% loss as steel stocks (-3.7%) and diversified metals and miners plays (-4.1%) were dropped ahead of the latest quarterly report from Dow component Alcoa (AA 10.87, -0.07). Though Alcoa's announcement marks an unofficial start to earnings season, reporting doesn't get going in earnest until next week. As has been the case in recent quarters, most participants will place plenty of significance on corporate forecasts since such outlooks help diminish the uncertainty of coming quarters.

Such uncertainty seemed to keep many on the sidelines. In turn, this session's trading volume was paltry in that hardly 850 million shares were traded on the NYSE. That's the lowest total this year.

Those that did trade didn't have any real cues ahead of Alcoa's announcement. The only item of wide interest was news that Aon (AON 35.62, -2.72) will pay a mix of cash and stock to acquire Hewitt Associates (HEW 46.79, +11.39) for $50.00 per share, which marks a premium of roughly 40% over HEW's closing price last week. The news sent shares of HEW to a fresh 52-week high, but dropped shares of AON to a new 52-week low.

The latest Treasury auction had no real impact on stocks. However, Treasuries gradually gave up their gains after the release of the auction's results. The $35 billion auction of 3-year Notes drew a yield of 1.06% and a bid-to-cover ratio of 3.2, which is above the 12-auction average of 3.0. Indirect bidders accounted for about 41%, but that is below averages of recent auctions.

Advancing Sectors: Tech (+0.7%), Utilities (+0.3%), Consumer Staples (+0.3%), Consumer Discretionary (+0.2%)
Declining Sectors: Materials (-1.1%), Industrials (-0.5%), Health Care (-0.2%), Energy (-0.1%), Telecom (-0.1%)
Unchanged: Financials DJ30 +18.24 NASDAQ +1.91 NQ100 +0.3% R2K -1.2% SP400 -0.5% SP500 +0.79 NASDAQ Adv/Vol/Dec 808/1.78 bln/1865 NYSE Adv/Vol/Dec 1072/854 mln/1896

5:31PM Brooks Automation raised Q3 EPS and revs above consensus (BRKS) 8.02 -0.15 : Co raised Q3 EPS to $0.22-0.24 vs. $0.19 Thomson Reuters consensus; co also raised Q3 revs to $156-157 mln vs. $152.7 mln consensus. Co said, "The company further noted that based on current backlog and new order booking trends it also expects sequential revenue gain, margin expansion and earnings growth in the fourth fiscal quarter ending September 30, 2010.

4:14PM Alcoa beats by $0.01, beats on revs; raises aluminum consumption estimate (AA) 10.87 -0.07 : Reports Q2 (Jun) earnings of $0.13 per share, $0.01 better than the Thomson Reuters consensus of $0.12; revenues rose 22.2% year/year to $5.19 bln vs the $5.05 bln consensus. "The top and bottom line growth was driven by higher volumes from stronger end markets and continued gains from our productivity programs. Based on this improved end-market demand, we are raising our projection for aluminum consumption from 10 percent to 12 percent this year."

4:07PM Novellus beats by $0.06, beats on revs (NVLS) 26.68 +0.19 : Reports Q2 (Jun) earnings of $0.66 per share, $0.06 better than the Thomson Reuters consensus of $0.60; revenues rose 169.6% year/year to $321.4 mln vs the $312 mln consensus.

9:54AM Apple: Expect strong Jun-qtr with big iPad and iPhone cycles driving 2H upside - Caris (AAPL) 260.87 +1.25 : Caris notes that AAPL reports Q3 results July 20 and given they already raised their ests in early June, they make just minor tweaks, including iPads +200K to 3.2 mln, iPhones -300K to 8.4 mln on new product cycling and Macs still 3.25 mln (+25%Y/Y) blnut ASP now blnarely down, keeping their revs/EPS ests effectively unchanged at $15.0 bln/$3.15 from $15.0 bln/$3.12 (vs. consensus $14.3 bln/$3.03), though with further hikes to Sep/Dec iPhones and iPads increasing their CY10 revs/EPS to $68.0 bln/$15.60 from $66.6 bln/$15.23, and CY11 to $78.3bln/$17.53. AAPL remains their top pick and they continue to see a powerful succession of product cycle catalysts driving the next 3 qtrs.

9:32AM Dell expands Cloud Strategy and Services with Microsoft (MSFT) Windows Azure Platform Appliance (DELL) 12.83 -0.03 : Cos announced a strategic partnership in which Dell intends to use the Windows Azure platform appliance, introduced by Microsoft today, as a part of its Dell Services Cloud to develop and deliver next-generation cloud services. The Windows Azure platform appliance will allow Dell to deliver private and public cloud services for Dell and its enterprise, public, small and medium-sized business customers. Dell will also work with Microsoft to develop a Dell-powered Windows Azure platform appliance for enterprise organizations to run in their data centers.

9:31AM eBay and Microsoft announce cloud computing agreement (EBAY) 20.23 -0.06 : Microsoft (MSFT) and eBay announced that eBay will be one of the first customers of Microsoft's new Windows Azure platform appliance for cloud computing.

Mattson Technology (MTSN) announced that a semiconductor memory customer based in Asia has placed multiple orders for the Helios XP rapid thermal processing system. The systems will be delivered to the customer by the end of the current third quarter and will be used for all critical RTP steps in the customer's memory production lines

Rudolph Technologies (RTEC) announced that the Fraunhofer Institute for Silicon Technology has placed an order for an NSX Series Macro Inspection System.

icon url

ReturntoSender

07/14/10 12:38 AM

#9000 RE: ReturntoSender #6755

From Briefing.com: 4:30 pm : A positive start to earnings season and a surge by the euro sent stocks to their sixth straight gain, but the broader market couldn't quite close above its 50-day moving average.

Stocks traded with strength for the entire session. Market participants responded positively to the latest quarterly report from Dow component Alcoa (AA 11.00, +0.13), which unofficially started earnings season on a strong note with better-than-expected earnings and revenue. Fellow Dow component Chevron (CVX 72.23, +1.38) complemented the report with a statement that it expects sequential earnings growth, which is tantamount to upside guidance given what analysts had already forecast.

Though all 10 major sectors staged gains, financials finished with the best gains. The sector settled 2.6% as bank stocks and diversified financial services shares surged. As such, the KBW Bank Index advanced 3.0%.

Meanwhile, the euro gained 1.0% against the greenback to find a fractionally improved two-month high. The had actually been behind the dollar overnight, but it began a steady climb after Greece held a successful debt auction. Little was made of news that Moody's downgraded Portugal's debt since Moody's had the highest rating on the country ahead of the decision.

While stocks spent the entire session with impressive gains, they couldn't quite muster enough momentum to sustain their first push past the S&P 500's 50-day moving average since early May - the 50-day average currently stands at 1096.

Participation was moderate this session. Specifically, 1.1 billion shares exchanged hands on the NYSE. The 50-day average for trading volume is closer to 1.5 billion shares.

The stock market's strength kept steady pressure on Treasuries this session. They weren't helped by the latest 10-year Note auction, which was met with a bid-to-cover ratio of 3.1, dollar demand of almost $65 billion, and an indirect bidder participation rate of 42%. The prior auction produced a bid-to-cover of 3.2, dollar demand of $68.0 billion, and indirect bidder participation of 40%.

The only items on the economic calendar included a June Treasury budget that showed a $68.4 billion deficit, which is not quite as steep as the $70.0 billion deficit that had been expected, on average, by a sample of economists polled by Briefing.com. There was also a Trade Balance for May that showed a $42.3 billion deficit when a $39.4 billion deficit had been expected, on average, by a sample of economists.

Advancing Sectors: Financials (+2.6%), Consumer Discretionary (+2.5%), Materials (+2.2%), Industrials (+1.9%), Tech (+1.4%), Energy (+1.2%), Telecom (+0.9%), Consumer Staples (+0.8%), Health Care (+0.7%), Utilities (+0.3%)
Declining Sectors: (None) DJ30 +146.75 NASDAQ +43.67 NQ100 +1.3% R2K +3.4% SP400 +2.4% SP500 +16.59 NASDAQ Adv/Vol/Dec 2244/2.31 bln/442 NYSE Adv/Vol/Dec 2644/1.13 bln/387

4:21PM Intel beats by $0.08, beats on revs; guides Q3 revs and margins above consensus; raises FY10 margins and capital spending forecast (INTC) 21.01 : Reports Q2 (Jun) earnings of $0.51 per share, $0.08 better than the Thomson Reuters consensus of $0.43; revenues rose 34.6% year/year to $10.8 bln vs the $10.25 bln consensus. Reports Q2 gross margins of 67% vs the 64.0% Thomson Reuters consensus. Co issues upside guidance for Q3, sees Q3 revs of $11.2-12.0 bln vs. $10.92 bln Thomson Reuters consensus. Sees Q3 gross margin of 67% plus or minus a couple % pts vs. the 64.4% consensus. Intel guides FY10 gross margins to 66%, + or - a couple pts, up from previous guidance of 64% + or - a couple pts, vs the 64.2% Thomson Reuters consensus. INTC sees FY10 Capital Spending in the range of $5.0 bln to $5.4 bln; previous guidance $4.7-4.9 bln. "Strong demand from corporate customers for our most advanced microprocessors helped Intel achieve the best quarter in the company's 42-year history... Our process technology lead plus compelling architectural designs increasingly differentiate Intel-based products in the marketplace. The PC and server segments are healthy and the demand for leading-edge technology will continue to increase for the foreseeable future."

12:03PM General Electric announces smart grid-compatible electric vehicle charger (GE) 15.26 +0.33 : Co introduced the GE WattStation, an electic vehicle (EV) charger. GE WattStation significantly decreases time needed for vehicle charging and, using smart grid technology, allows utility companies to manage the impact of electric vehicles on the local and regional grids. Combining functionality with consumer friendly form from renowned industrial designer Yves Behar, the GE WattStation on average decreases electric vehicle charging time from 12-18 hours to as little as 4-8 hours compared to standard charging "level 1", assuming a full-cycle charge for a 24 kWh battery.

9:02AM Suntech Power appoints Amy Yi Zhang to spearhead strategic project finance initiatives (STP) 10.57 : Co announces that Ms. Amy Yi Zhang will assume a new role as Vice President in charge of Suntech's strategic project finance initiatives. In her new role, Ms. Zhang will focus on strategic initiatives including building stronger relationships with key project finance partners and developing value-added solutions to support sales growth

icon url

ReturntoSender

07/14/10 11:48 PM

#9001 RE: ReturntoSender #6755

From Briefing.com: 4:30 pm : Better-than-expected earnings and upside guidance from tech bellwether Intel drove the Dow and Nasdaq higher for the seventh straight session, but the S&P 500 settled fractionally below the neutral line for an anticlimactic end to its recent streak of gains.

A stellar report from Dow component Intel (INTC 21.36, +0.35) provided investors with a picture of an improved business environment and sent tech stocks to a 0.8% gain, collectively. The tech sector couldn't quite extend its gain above its 200-day moving average, though.

Meanwhile, the tech-rich Nasdaq outperformed the broader market for almost all of the session as the S&P 500 was mired in choppy, mixed trade. Broader market participants failed to rally around Intel's announcement. Their lack of interest was partly owed to the notion that the stock market had become overbought after it had advanced in six straight sessions for a cumulative gain of more than 7%.

Financials weighed on the broader market for the entire session. As a group they fell to a 0.9% loss as bank stocks showed weakness ahead of a quarterly report from Dow component and banking bellwether JPMorgan (JPM 40.35, -0.13) Thursday morning. The KBW Bank Index dropped 1.6%.

Economic data did little to help extend the recent buying effort. After all, the latest FOMC meeting minutes indicated that real GDP for 2010 is now expected to range from 3.0% to 3.5%, which is down from the previous range of 3.2% to 3.7%, while the projection for 2011 GDP ranges from 3.5% to 4.2% after it had previously ranged from 3.4% to 4.5%.

As for unemployment, the 2010 projection rate ranges from 9.2% to 9.5% after it had ranged from 9.1% to 9.5%. The expected unemployment rate for 2011 ranges from 8.3% to 8.7% after it had ranged from 8.0% to 8.5% before.

FOMC members agreed that it would be appropriate to keep the target federal funds rate at a range of 0.00% to 0.25%.

Advance Retail Sales for June fell a sharper-than-expected 0.5% and sales less autos slipped 0.1% when no change had been expected.

Import prices for June fell 1.3% month-over-month after a 0.5% monthly decline in May.

Business inventory data for May increased by 0.1%, which is slightly softer than the 0.2% increase that had been widely expected.

Results from the latest 30-year Treasury Bond auction saw strong dollar demand of $37.6 billion and a bid-to-cover ratio of 2.9. Indirect bidder participation was 37%. The prior auction saw dollar demand of $37.3 billion and a bid-to-cover of 2.9 and indirect bidder participation of 36%.

Treasuries didn't make much of an immediate response to the numbers, but they were able to settle with strong gains, such that the yield on the benchmark 10-year Note moved below 3.05% and the yield on the 30-year Bond moved closer to 4.00%.

The euro managed to swing from a loss to fractionally improved two-month high against the greenback, but it eased back a bit to settle the session with a 0.1% gain.

Participation was underwhelming as hardly 1 billion shares traded hands on the NYSE. The 50-day moving average stands between 1.4 billion and 1.5 billion shares per session.

Advancing Sectors: Tech (+0.8%), Industrials (+0.2%), Consumer Staples (+0.2%), Health Care (+0.1%), Materials (+0.1%), Telecom (+0.1%), Utilities (+0.1%)
Declining Sectors: Financials (-0.9%), Consumer Discretionary (-0.5%), Energy (-0.3%) DJ30 +3.70 NASDAQ +7.81 NQ100 +0.5% R2K -0.4% SP400 -0.2% SP500 -0.17 NASDAQ Adv/Vol/Dec 1092/2.16 bln/1505 NYSE Adv/Vol/Dec 1331/1.06 bln/1629

8:01AM National Semi declared a cash dividend of $0.10 per outstanding share of common stock, up from $0.08 per common share (NSM) 14.54 :

7:03AM Microsemi receives $22 million production order for products used in GPS defense systems (MSCC) 16.05 : Co announces that it has received a production order of approximately $22 million for customized GPS modules that utilize the proprietary anti-tamper process technology Microsemi added with its acquisition of White Electronic Designs Corporation in May.

2:19AM Cabot Micro estimates 3Q10 revenue of $101.7 mln vs $102.48 mln consensus; reports higher 3Q10 operating expenses due to litigation costs (CCMP) 36.65 : Co issues downside guidance for Q3 (Jun), sees Q3 (Jun) revs of $101.7 mln vs. $102.48 mln Thomson Reuters consensus. Operating expenses increased significantly in the third fiscal quarter, ended June 30, 2010, due to higher litigation costs. The co expects to report operating expenses of approx $34.5 mln in the third fiscal quarter, or $2.4 mln higher than the $32.1 mln reported in the previous quarter. The increase from the prior period was primarily driven by higher expenses related to the co's ongoing patent enforcement litigation with DuPont Air Products NanoMaterials, LLC during the third fiscal quarter. Following completion of the jury trial on July 8, in which the co's patents at issue were upheld, the co expects litigation costs to decrease significantly. Given the increase in operating expenses in the third fiscal quarter, the co now expects to exceed its previous guidance range for full year operating expenses of $120.0-125.0 mln for FY10. In addition, the co expects to report a gross profit margin of approx 49.0% of revenue in the third fiscal quarter.

1:52AM Toshiba starts construction of Fab 5 for NAND flash memory at Yokkaichi; Toshiba and SanDisk sign joint venture agreement (SNDK) 45.71 : Toshiba announces that it has started construction of a state-of-the-art fabrication facility, Fab 5, at Yokkaichi Operations, its memory production facility in Mie Prefecture, with construction work scheduled for completion in Spring 2011. Toshiba and SanDisk announce that they have signed primary agreements for a new joint venture to operate in the Fab 5 facility.

1:45AM ASML Holding beats by EUR 0.08, beats on revs (ASML) 31.27 : Reports Q2 (Jun) earnings of EUR 0.54 per share, EUR 0.08 better than the Thomson Reuters consensus of EUR 0.46; revenues rose 286.4% year/year to EUR 1.07 bln vs the EUR 0.99 bln consensus. 2Q10 gross margin was 43.0% compared with the 1Q10 gross margin of 40.3%. Co anticipates bookings levels of around EUR 1.3 bln in the third quarter; co expects FY10 sales to grow 10-15% above historical peak sales of EUR 3.8 bln.

09:39 am INTC Guides Q3 Revs and Margins Above Consensus (INTC)

Intel (INTC 22.05 +1.04) reported second quarter earnings after the close yesterday of $0.51 per share, $0.08 better than the Thomson Reuters consensus of $0.43.

On the top line, revenues rose 34.6% year-over-year to $10.8 billion, above the $10.25 billion consensus. The company reported second quarter gross margins of 67% versus the 64.0% Thomson Reuters consensus.

For its third quarter, the company expects to see revenue in the range of $11.2 billion to $12.0 billion, above the current $10.92 Thomson Reuters consensus and gross margins of 67% plus or minus a couple % pts versus the 64.4% consensus.

Intel guided fiscal year 2010 gross margins to 66%, + or - a couple pts, up from previous guidance of 64% + or - a couple pts, versus the 64.2% Thomson Reuters consensus. Intel sees fiscal year 2010 capital spending in the range of $5.0 billion to $5.4 billion; previous guidance $4.7 billion to $4.9 billion.

The company said, "Strong demand from corporate customers for our most advanced microprocessors helped Intel achieve the best quarter in the company's 42-year history... Our process technology lead plus compelling architectural designs increasingly differentiate Intel-based products in the marketplace. The PC and server segments are healthy and the demand for leading-edge technology will continue to increase for the foreseeable future."
icon url

ReturntoSender

07/17/10 11:42 AM

#9003 RE: ReturntoSender #6755

Amateur Investors Weekend Stock Market Analysis (7/17/10)

http://www.amateur-investor.net/Weekend_Market_Analysis_July_17_10.htm

The S&P 500 found support on July 1st near its 38.2% Retrace of 1009 (blue line) which was calculated from the March 2009 low of 667 to the April 2010 high of 1220. Meanwhile despite the impressive 9% bounce from the 1011 low in the S&P 500 over a 2 week period it's still exhibiting a potential Head and Shoulders Top pattern. If the 1009 level were to be taken out at some point in the future then that would eventually lead to a larger correction with the next area of longer term support either at the 50% Retrace of 944 (red line) or the 61.8% Retrace at 878 (brown line)


Meanwhile for this bearish pattern to be broken which is starting to evolve into a series of lower Highs (H) and lower Lows (L) the S&P 500 would have to rise back above the 1131 level in the weeks ahead.


Keep in mind for the longer term health of the market we don't want to see a repeat of the 2000 through 2002 time period in which the S&P 500 made a series of lower Highs (H) and lower Lows (L) after peaking in early 2000. The pattern was finally broken in early 2003 after the S&P 500 lost 50% of its value. Also notice from 2000 through 2002 there were some impressive sharp oversold rallies as well ranging from 10% to 24% even though the longer term trend continued downward.

icon url

ReturntoSender

07/19/10 10:10 PM

#9005 RE: ReturntoSender #6755

[BRIEFING.COM] Stocks finished the session off their best levels, but still modestly higher with the Dow closing up close to 55 points. Markets opened higher following a stronger-than-expected earnings report from Halliburton (HAL 29.17, +1.66) that sparked buying in the energy space.

Earnings reports from Hasbro (HAS 39.35, -0.15) and Delta Airlines (DAL 11.36, -0.36) beat analysts' earnings per share estimates, but missed on revenues.

After a brief pop on the open, stocks pulled back to the flat line following the National Homebuilders Association Index that came in at a 14 reading, below the expected 16 mark. Shares in Pulte (PHM 7.93, -0.12), DR Horton (DHI 9.97, -0.13), and Lennar (LEN 13.80, -0.21) traded lower on the news.

Bank of America (BAC 13.58, -0.40) shares traded to the downside after Goldman Sachs (GS 145.71, -0.46) announced they had removed the stock from their conviction list, but kept its buy rating.

There are 17 companies scheduled to report results tonight, with key reports from International Business Machines (IBM 129.88, +1.85), Texas Instruments (TXN 25.55, +0.78) and Steel Dynamics (STLD 13.99, -0.22) due out after the bell.

The volatility index (-2.4%) closed lower for the first time in five sessions to finish at 25.63.

Trading volume was underwhelming as only 952 million shares traded at the New York Stock Exchange.

Advancing Sectors: Consumer Discretionary (+0.9%), Energy (0.4%), Healthcare (+0.5%), Materials (+0.2%), Industrials (+0.6%), Telecommunications (+0.6%), Utilities (+1.5%), Information Technology (+1.0%), Financials (unch), Consumer Staples (unch)

Declining Sectors: None

From Briefing.com: 4:34PM Texas Instruments reports EPS, revs in-line with consensus/guidance; guides Q3 EPS above consensus, revs in-line; raises FY10 cap-ex (TXN) 25.55 +0.78 : Reports Q2 (Jun) earnings of $0.62 per share, in-line with the Thomson Reuters consensus of $0.62 and guidance of $0.60-0.64; revenues rose 42.3% year/year to $3.5 bln vs the $3.52 bln consensus and guidance of $3.45-3.59 bln. Co issues guidance for Q3, sees EPS of $0.64-0.74 vs. $0.64 Thomson Reuters consensus; sees Q3 revs of $3.55-3.85 bln vs. $3.59 bln Thomson Reuters consensus. Q2 Gross Margin of 54.17% vs 53.5% consensus; capital expenditures: $1.2 billion, up from the prior expectation of $0.9 billion "Our Analog and Embedded Processing businesses turned in double-digit sequential growth, outpacing their respective markets and again confirming their ability to positively impact the financial performance of TI... Orders were strong in the quarter, backlog increased and we expect to grow revenue again in the third quarter."

4:13PM IBM beats by $0.03, misses on revs; raises FY10 guidance (IBM) 129.79 +1.76 : Reports Q2 (Jun) earnings of $2.61 per share, $0.03 better than the Thomson Reuters consensus of $2.58; revenues rose 2.0% year/year to $23.72 bln vs the $24.17 bln consensus. Reports Q2 gross profit margin of 45.6% vs Thomson Reuters consensus of 45.8%. IBM sees FY10 EPS of "at least $11.25," up from prior guidance of "at least $11.20", and vs. the $11.27 consensus. IBM signed services contracts totaling $12.3 bln, decrease of 12%. "In the second quarter we again delivered double-digit earnings-per-share growth, increased margins, as well as improving constant-currency revenue performance in our ongoing software, services and hardware businesses, and in all geographies."

4:02PM Atheros Communications to acquire Opulan Technologies Corp (ATHR) 30.46 +1.19 : Atheros will pay Opulan shareholders ~$72 mln in cash, and may pay additional cash to Opulan shareholders subject to the attainment of earn-out objectives applicable to the acquired business during a 12-month period following the closing date. The transaction is expected to close in Q3 2010. The acquisition has been approved by the board of directors of each company, and a majority of Opulan's shareholders have agreed to approve the transaction
icon url

ReturntoSender

07/21/10 9:48 PM

#9008 RE: ReturntoSender #6755

From Briefing.com: 4:30 pm : A negative response to comments from Fed Chairman Bernanke sent the stock market to a sharp, broad-based loss after most of the session had been spent in choppy, sideways trade.

Stocks opened with solid gains as market participants initially showed a more positive response to the latest round of earnings than they had in recent sessions. Strength was broad in the early going, but some of the best gains came from financials, which were up as much as 1.5% on the back of better-than-expected results from Morgan Stanley (MS 26.80, +1.58), Wells Fargo (WFC 26.06, +0.15), and US Bancorp (USB 23.07, -0.08) ahead of the adoption of new financial regulation into law. Despite the sector's early strength, it succumbed to broader market pressure and settled with a 1.8% loss. That put it among the worst performing sectors of the session.

The broader market spent the middle of the session chopping along the neutral line, but then made a sharp pullback in response to comments from Fed Chairman Bernanke, who made his semiannual monetary policy report to the Senate Banking Committee this afternoon. Bernanke spoke of continued uncertainty in the economy and made note of the Fed's preparations to take more policy actions as needed. The comments generally reflected the downgraded economic outlook that was communicated in the FOMC Minutes, but the stock market's negative response seemed to reflect its relatively nervous state, which was further underscored by the drop in the yield of the 10-year Treasury Note below 2.90% to its lowest level since April 2009.

Industrial stocks managed to limit their losses. Specifically, the sector settled just 0.4% into the red. Textron (TXT 19.65, +1.57) and Eaton (ETN 73.14, +4.08) provided support after both companies posted better-than-expected earnings and issued upside guidance. Eaton complemented its report with a dividend increase, while shares of TXT were upgraded.

United Technologies (UTX 67.03, -0.51) became a drag on the industrial sector when the Dow component succumbed to selling as participants shrugged off the outfit's better-than-expected bottom line.

Fellow Dow component Coca Cola (KO 54.08, +0.84) also bested earnings expectations, but it shares were able to hold their gain into the close.

The Nasdaq has lagged the other headline indices for most of the session. It was undercut by losses among large-cap tech plays after Yahoo! (YHOO 13.91, -1.29) reported a rather unimpressive revenue figure that overshadowed its upside earnings surprise. Better-than-expected earnings from Apple (AAPL 254.24, +2.35) provided some support, though.

In commodities trade, oil prices opened pit trade more than 1% higher, but settled at $76.56 per barrel with a 1.3% loss. Pressure was largely underpinned by the latest weekly inventory data, which showed a surprise build of 360,000 barrels of crude oil when a draw of 1.2 million barrels had been expected.

Gold prices finished flat at $1192 per ounce after a rather lackluster session of sideways trade. Silver prices settle 0.6% higher at $17.80 per ounce. However, both precious metals were pressured in electronic trade after pit trade closed because the dollar worked its way higher in response to the comments from Bernanke.

Advancing Sectors: (None)
Declining Sectors: Financials (-1.8%), Consumer Discretionary (-1.8%), Health Care (-1.5%), Utilities (-1.4%), Tech (-1.4%), Energy (-1.4%), Consumer Staples (-1.0%), Industrials (-0.4%), Materials (-0.4%), Telecom (-0.2%) DJ30 -109.43 NASDAQ -35.16 NQ100 -1.3% R2K -1.9% SP400 -1.5% SP500 -13.89 NASDAQ Adv/Vol/Dec 668/2.23 bln/1959 NYSE Adv/Vol/Dec 992/1.20 bln/2018

4:28PM Xilinx beats by $0.05, beats on revs; sees Q2 sales up 3%-7% sequentially (XLNX) 27.83 -0.62 : Reports Q1 (Jun) earnings of $0.58 per share, $0.05 better than the Thomson Reuters consensus of $0.53; revenues rose 58.1% year/year to $594.7 mln vs the $568.6 mln consensus. XLNX Q2 margin is expected to be approximately 65% plus or minus one percentage point. Co sees Q2 sales up 3%-7% sequentially, which calculates to roughly $612.5-$636.3 mln (vs. $565.43 mln Thomson Reuters consensus).

4:18PM Corning Announces New Capacity Investments of $800 mln (GLW) 16.80 +0.14 : The company will invest approximately $800 mln to construct a new LCD glass substrate facility in the People's Republic of China. With the support of the Beijing municipal government, co will locate the new facility in the Beijing Digital TV Industry Park within the Beijing Economic Technological Development Area. The manufacturing plant will have up to Generation 8.5 glass-melting and finishing capabilities. Groundbreaking is planned for September of this year, with production slated to begin in the first half of 2012.

4:13PM Amkor: ITC issues notice of final determination finding no violation in Amkor MLF patent case against Carsem (AMKR) 5.37 -0.15 :

4:13PM F5 Networks beats by $0.07, beats on revs; guides Q4 EPS above consensus, revs above consensus (FFIV) 73.11 -3.69 : Reports Q3 (Jun) earnings of $0.66 per share, $0.07 better than the Thomson Reuters consensus of $0.59; revenues rose 45.7% year/year to $230.5 mln vs the $218.4 mln consensus. F5 Networks reports Q3 gross margin 80.7% vs. 80.4% consensus. Co issues upside guidance for Q4, sees EPS of $0.69-0.71 vs. $0.62 Thomson Reuters consensus; sees Q4 revs of $242-247 mln vs. $230.22 mln Thomson Reuters consensus.

4:05PM Qualcomm beats by $0.03, beats on revs; guides Q4 EPS in-line, revs in-line (QCOM) : Reports Q3 (Jun) earnings of $0.57 per share, $0.03 better than the Thomson Reuters consensus of $0.54; revenues fell 1.7% year/year to $2.71 bln vs the $2.63 bln consensus. Co issues in-line guidance for Q4, sees EPS of $0.55-0.59 vs. $0.57 Thomson Reuters consensus; sees Q4 revs of $2.67-2.93 bln vs. $2.77 bln Thomson Reuters consensus. Qualcomm guides FY10 CDMA-based device average selling price range to $184-188 vs previous guidance of approx. $182-188.

4:04PM Plexus beats by $0.02, beats on revs; guides Q4 EPS in-line, revs in-line (PLXS) 28.89 -0.95 : Reports Q3 (Jun) earnings of $0.59 per share, $0.02 better than the Thomson Reuters consensus of $0.57; revenues rose 41.7% year/year to $536.4 mln vs the $529.7 mln consensus. Co issues in-line guidance for Q4, sees EPS of $0.58-$0.63 vs. $0.63 Thomson Reuters consensus; sees Q4 revs of $530-$555 mln vs. $555.51 mln Thomson Reuters consensus.

4:01PM Corning to expand clean-air auto product manufacturing in China (GLW) 16.80 +0.14 : Co announced that its board of directors has approved a capital expenditure plan to increase manufacturing capacity in the company's Environmental Technologies and Life Sciences segments in the People's Republic of China. Corning will invest ~$125 mln to expand its Corning Shanghai Company Limited automotive substrate facility and ~$40 mln to build a new manufacturing and distribution facility for Corning Life Sciences in the Yangtze River Delta. Final site selection for the life sciences facility is now underway. These investments will be part of Corning's 2011 capital expenditures.

8:51AM Applied Materials follow up on Energy and Environmental Solutions segment restructuring; co's revised earnings tgt at high end of prior tgt (AMAT) 12.34 : Co announced plans to restructure its Energy and Environmental Solutions segment to put a primary emphasis on opportunities in crystalline silicon (c-Si) solar and advanced energy, including light emitting diode (LED) technology. Upon completion of the restructuring plan, annual operating expenses are expected to decrease by at least $100 million on an annualized basis. The restructuring plan is intended to make EES a profitable segment in fiscal year 2011. The cost of implementing the EES restructuring plan is expected to be in the range of approximately $375 million to $425 million, or $0.18 to $0.21 per share, which will be reported as cost of products sold and restructuring and asset impairments in the company's consolidated statements of operations for the third quarter of fiscal 2010. In May, the company announced its target for non-GAAP EPS for the third quarter of fiscal 2010 of between $0.22 and $0.26 per share, which did not include any potential restructuring charges. The revised target is for non-GAAP earnings of $0.10 to $0.14 per share, which would have been at the high end of the previous target after taking into account the approximately $0.14 per share impact of the inventory charges and other obligations related to today's actions. (Briefing.com note: Prior consensus was for $0.24)

8:13AM Axcelis Tech announced a multiple system, follow-on order for Optima HDx from semiconductor manufacturer in Asia (ACLS) 1.76 :

7:07AM EMC beats by $0.01, reports revs in-line; expected to exceed previous FY10 EPS, revs guidance (EMC) 20.24 : Reports Q2 (Jun) earnings of $0.28 per share, excluding non-recurring items, $0.01 better than the Thomson Reuters consensus of $0.27; revenues rose 23.5% year/year to $4.02 bln vs the $3.98 bln consensus. Co guidance for FY10, sees EPS exceeding previous outlook of $1.18, excluding non-recurring items, vs. $1.20 Thomson Reuters consensus; sees FY10 revs exceeding previous outlook of $16.5 bln vs. $16.64 bln Thomson Reuters consensus. "For the second consecutive quarter, EMC once again turned a 'triple play' by gaining market share while investing for the future and increasing profitability. With this, we also expanded gross and operating margins and generated all-time record year-to-date operating and free cash."

7:00AM ATMI beats by $0.02, reports revs in-line (ATMI) 14.88 : Reports Q2 (Jun) earnings of $0.24 per share, $0.02 better than the Thomson Reuters consensus of $0.22; revenues rose 51.4% year/year to $91 mln vs the $90.6 mln consensus.

07:23 am Solarfun Power target raised to $13 at Auriga U.S.A: . Auriga U.S.A raises their SOLF tgt to $13 from $9 saying consistent with their industry research suggesting robust demand in 2010, they find that SOLF is faced with allocating modules through the remainder of this year. They also believe the company is opportunistically buying cells on the open-market in order to appease customer requests for additional module supplies. Their findings appear to be corroborated by the July 19 press release where the company announced plans to increase cell capacity as well as convert 160MW of existing capacity to its high-efficiency selective emitter technology.
icon url

ReturntoSender

07/23/10 11:20 AM

#9009 RE: ReturntoSender #6755

From Briefing.com: 8:32AM Advanced Micro announces extension of exchange offer of its 8.125% senior notes due 2017 for registered notes (AMD) 7.61 :

8:31AM Apple says white models of of its new iPhone 4 have continued to be more challenging to manufacture than they originally expected (AAPL) 259.27 : As a result, co says that they will not be available until later this year. The availability of the "more popular" iPhone 4 black models is not affected.

8:21AM ARM Holdings: Microsoft (MSFT) licenses ARM Architecture (ARMH) 14.39 : The cos announced that they have signed a new licensing agreement for the ARM(R) architecture. The agreement extends the collaborative relationship between the two companies. Since 1997 Microsoft and ARM have worked together on software and devices across the embedded, consumer and mobile spaces, enabling many companies to deliver user experiences on a broad portfolio of ARM-based products.

7:05AM Celestica reports EPS in-line, beats on revs; guides Q3 EPS in-line, revs in-line (CLS) 9.07 : Reports Q2 (Jun) earnings of $0.21 per share, in-line with the Thomson Reuters consensus of $0.21; revenues rose 13.1% year/year to $1.59 bln vs the $1.57 bln consensus. Co issues in-line guidance for Q3, sees EPS of $0.20-$0.24 vs. $0.24 Thomson Reuters consensus; sees Q3 revs of $1.55-$1.65 bln vs. $1.69 bln Thomson Reuters consensus.

7:02AM Celestica to expand healthcare capabilities through acquisition of Allied Panels; terms not disclosed (CLS) 9.06 +0.34 : Co announced it has signed a definitive agreement to acquire Allied Panels Entwicklungs-und Produktions GmbH. The acquisition of will significantly expand co's capabilities in the healthcare diagnostics and imaging market.

From Briefing.com yesterday: 4:30 pm : A sharp rebound sent the S&P 500 back above its 50-day moving average, but the benchmark index couldn't quite make it to 1100, which marks a formidable point of resistance.

Stocks booked steep losses in the prior session as uncertainty undermined trade, but a rebound began to take shape in early morning futures trade as Europe's major bourses rallied amid a stronger-than-expected eurozone PMI reading and retail spending numbers for the United Kingdom. The euro also responded positively; it retraced its prior session slide to settle 1.1% higher against the greenback on Thursday.

In contrast to recent sessions, market participants appeared to cheer the latest round of earnings results, which featured more than 100 reports and were generally better-than-expected.

Some of the strongest gains were made by industrial plays, like Union Pacific (UNP 72.40, +3.28) and UPS (UPS 63.15, +3.14). Both bested expectations for the bottom line, but UPS complemented its report with an increased outlook.

Fellow industrial issues and Dow components 3M (MMM 84.75, +2.45) and Caterpillar (CAT 68.00, +1.13) also reported better-than-expected bottom line results. 3M also issued upside guidance, while CAT raised its forecast so that it is in step with what Wall Street has forecast.

Among other blue chips, AT&T (T 25.51, +0.59) posted an upside surprise and raised its outlook, but and Travelers (TRV 49.29, -0.58) came short of the consensus earnings estimate and even cut its forecast.

A battery of regional banks was also out with earnings. SunTrust Banks (STI 24.58, +2.16), Fifth Third (FITB 12.43, +1.15), KeyCorp (KEY 7.95, +0.41), PNC Bank (PNC 59.78, +1.24), and Huntington Banc (HBAN 5.85, +0.18) each beat, but BB&T Corp (BBT 25.34, -0.57) was a let down.

Banks will likely remain in close focus tomorrow, when results from a series of stress tests on European banks will be released.

Health care stocks generally lagged throughout the session, even though both Eli Lilly (LLY 35.15, +0.20) and Bristol-Myers Squibb (BMY 24.93, +0.18) beat earnings expectations.

Nonetheless, all 10 major sectors advanced. Most had heady gains. That helped the S&P 500 sprint past its 50-day moving average, but stocks struggled to push the move to within reach of the 1100 line.

Once again, trading volume wasn't very impressive. It came short of 1.2 billion shares on the NYSE, which has averaged almost 1.4 billion shares per session during the past 50 trading days.

Fed Chairman Bernanke triggered selling in the prior session, when he spoke of unusual uncertainty in the economy before the Senate Banking Committee, but his comments to the House Financial Services Committee today had no real impact on trade since they were consistent with what he had already stated. Interestingly enough, his comments generally reflected what had already been indicated by the minutes from the latest FOMC meeting.

Keeping a focus on the economy, the latest initial jobless claims count climbed 37,000 week-over-week to 464,000, which is more than the 445,000 initial claims that had been widely expected. Continuing claims dropped 223,000 week-over-week to just below 4.49 million, but that is likely due to the expiration of jobless benefits. To help support unemployed workers, the House approved today a bill to extend jobless benefits.

As for housing, existing home sales for June fell 5.1% month-over-month to an annualized rate of 5.37 million units. That is a better rate than the 5.09 million units that had been widely expected. News that total months supply climbed to 8.9 from 8.3 was disregarded.

Leading indicators for June got little attention. They reportedly slipped 0.2%, which is slightly less severe than the 0.4% decline that had been widely expected.

Advancing Sectors: Financials (+3.1%), Industrials (+3.1%), Consumer Discretionary (+3.1%), Tech (+2.7%), Materials (+2.3%), Energy (+2.2%), Telecom (+2.0%), Utilities (+1.6%), Consumer Staples (+0.9%), Health Care (+0.5%)
Declining Sectors: (None) DJ30 +201.77 NASDAQ +58.56 NQ100 +2.5% R2K +3.7% SP400 +2.9% SP500 +24.08 NASDAQ Adv/Vol/Dec 2206/2.27 bln/432 NYSE Adv/Vol/Dec 2673/1.18 bln/396

4:34PM Skyworks beats by $0.02, beats on revs; guides Q4 EPS above consensus, revs above consensus (SWKS) 18.05 +0.84 : Reports Q3 (Jun) earnings of $0.32 per share, excluding non-recurring items, $0.02 better than the Thomson Reuters consensus of $0.30; revenues rose 44.0% year/year to $275.4 mln vs the $269.4 mln consensus. Co issues upside guidance for Q4, sees EPS of $0.37, excluding non-recurring items, vs. $0.34 Thomson Reuters consensus; sees Q4 revs of $300 mln vs. $287.49 mln Thomson Reuters consensus.

4:32PM Cymer beats by $0.17, beats on revs; guides Q3 revs in-line (CYMI) 33.76 +1.51 : Reports Q2 (Jun) earnings of $0.70 per share, $0.17 better than the Thomson Reuters consensus of $0.53; revenues rose 111.4% year/year to $131.9 mln vs the $117.9 mln consensus. Co reports gross margins of 53%. Co issues in-line guidance for Q3, sees Q3 revs of $132-$138 mln vs. $132.45 mln Thomson Reuters consensus. Co sees Q3 gross margins of 51%.

4:30PM Microsemi beats by $0.01, beats on revs; guides Q4 EPS in-line, revs above consensus (MSCC) 15.36 +0.27 : Reports Q3 (Jun) earnings of $0.30 per share, $0.01 better than the Thomson Reuters consensus of $0.29; revenues rose 27.1% year/year to $136 mln vs the $130.3 mln consensus. Co issues mixed guidance for Q4, sees EPS of $0.33-$0.35 vs. $0.33 Thomson Reuters consensus; sees Q4 revs growing 7-9% sequentially, which equates to approx $145.5-148.2 mln vs. $139.98 mln Thomson Reuters consensus.

4:21PM Microsoft beats by $0.05, beats on revs (MSFT) 25.84 +0.75 : Reports Q4 (Jun) earnings of $0.51 per share, $0.05 better than the Thomson Reuters consensus of $0.46; revenues rose 22.5% year/year to $16.04 bln vs the $15.27 bln consensus. Co reported Q4 Gross Margins of 80.23% vs 80.55% Consensus, Co says "We saw strong sales execution across all of our businesses, particularly in the enterprise with Windows 7 and Office 2010." The co updated their operating expense guidance of $26.9 billion to $27.3 billion for the full year ending June 30, 2011 vs the previous guidance of $26.1-26.3 bln.

4:17PM QLogic beats by $0.01, misses on revs (QLGC) : Reports Q1 (Jun) earnings of $0.30 per share, excluding non-recurring items, $0.01 better than the Thomson Reuters consensus of $0.29; revenues rose 16.1% year/year to $142.6 mln vs the $144.1 mln consensus.

4:11PM SanDisk beats by $0.18, beats on revs; announces retirement of CEO (SNDK) 43.10 +0.98 : Reports Q2 (Jun) earnings of $1.08 per share, $0.18 better than the Thomson Reuters consensus of $0.90; revenues rose 61.5% year/year to $1.18 bln vs the $1.16 bln consensus. Sandisk reports Q2 gross margin of 47% vs. the 43.6% Thomson Reuters consensus. Average price per gigabyte sold declined 18% on a year-over-year basis and declined 8% sequentially. Separately today, SanDisk announced that Dr. Eli Harari, Founder, Chairman and Chief Executive Officer, will retire from his current positions on December 31, 2010. As part of the succession planning process, the Board of Directors appointed Sanjay Mehrotra, currently SanDisk's President and Chief Operating Officer, as the new Chief Executive Officer of the company, effective January 1, 2011. Mr. Mehrotra was appointed to the Company's Board of Directors effective July 21, 2010. The Board also appointed Michael Marks, a member of the SanDisk Board since 2003, to the role of Chairman effective January 1, 2011.

4:11PM Rambus misses by $0.04, reports revs in-line (RMBS) 18.99 +0.69 : Reports Q2 (Jun) loss of $0.11 per share, $0.04 worse than the Thomson Reuters consensus of ($0.07); revenues rose 57.2% year/year to $38.9 mln vs the $39.1 mln consensus.

4:06PM PMC-Sierra beats by $0.01, reports revs in-line (PMCS) : Reports Q2 (Jun) earnings of $0.20 per share, excluding non-recurring items, $0.01 better than the Thomson Reuters consensus of $0.19; revenues rose 30.4% year/year to $160.7 mln vs the $159.4 mln consensus.

4:05PM Ixia beats by $0.01, beats on revs (XXIA) 10.48 +0.61 : Reports Q2 (Jun) earnings of $0.10 per share, $0.01 better than the Thomson Reuters consensus of $0.09; revenues rose 72.1% year/year to $66.1 mln vs the $64 mln consensus

4:03PM Flextronics beats by $0.01, beats on revs; guides Q2 EPS in-line, revs above consensus (FLEX) 6.56 +0.37 : Reports Q1 (Jun) earnings of $0.19 per share, $0.01 better than the Thomson Reuters consensus of $0.18; revenues rose 13.5% year/year to $6.57 bln vs the $6.39 bln consensus. Co issues mixed guidance for Q2, sees EPS of $0.19-0.21 vs. $0.20 Thomson Reuters consensus; sees Q2 revs of $6.8-7.2 bln vs. $6.75 bln Thomson Reuters consensus.

8:03AM Cypress Semi beats by $0.04, beats on revs (CY) 10.65 : Reports Q2 (Jun) earnings of $0.24 per share, $0.04 better than the Thomson Reuters consensus of $0.20; revenues rose 43.1% year/year to $223 mln vs the $218.6 mln consensus. "Our customers are continuing to provide increased booking visibility into Q3 and Q4...Our book-to-bill at the end of Q2 remained very strong at 1.30, led by our Consumer and Computation Division. All divisions had a book-to-bill above 1.10."

6:46AM Semi Manufacturing and Virage Logic extend partnership to 40 NM ll process technology (SMI) 3.23 : Virage Logic (VIRL), and Semiconductor Manufacturing International (SMI) announces the extension of their longstanding partnership to the 40-nanometer low-leakage process technology. Building on the successful partnership that was initially established on the 130nm process technology, Virage Logic and SMIC have collaborated to provide mutual customers with highly differentiated IP on a broad range of SMIC's process technologies including 90nm and 65nm. Under the terms of the new agreement, System-on-Chip designers will have access to Virage Logic's SiWare Memory compilers, SiWare Logic libraries, SiPro MIPI and Intelli DDR IP on SMIC's advanced 40nm LL process.

6:16AM Cabot Micro misses by $0.04, reports revs in-line (CCMP) 32.78 : Reports Q3 (Jun) earnings of $0.43 per share, $0.04 worse than the Thomson Reuters consensus of $0.47; revenues rose 17.7% year/year to $101.7 mln vs the $101.4 mln consensus.

09:49 am MSFT Tops Q4 Expectations (MSFT)

Microsoft (MSFT 25.61 -0.23) reported fourth quarter earnings of $0.51 per share after hours yesterday, $0.05 better than the Thomson Reuters consensus of $0.46.

Revenues rose 22.5% year-over-year to $16.04 billion, above the $15.27 billion consensus. The company reported fourth quarter gross margins of 80.23% versus the 80.55% Consensus.

The company said, "We saw strong sales execution across all of our businesses, particularly in the enterprise with Windows 7 and Office 2010."

MSFT updated their operating expense guidance of $26.9 billion to $27.3 billion for the full year ending June 30, 2011 versus the previous guidance of $26.1 billion to $26.3 billion.

07:53 am Microsoft upgraded to Hold at The Benchmark Company: . The Benchmark Company upgrades MSFT to Hold from Sell and sets target price at $32 in the wake of a good quarter with balanced results, partly driven by Windows 7 and partly by a strong Server and Tools division showing, capturing some of the recovering corporate IT spending other companies have seen. Firm says their upgrade is driven mainly by the stock's low valuation, close to multi-year lows on P/E and EV/Revenue, because they continue to worry that long-term strategic issues remain unanswered.

07:46 am Nokia upgraded to Buy at Wunderlich: . Wunderlich upgrades NOK to Buy from Hold following earnings and based on better-than-expected margins and less time risk with the Symbian 3 cycle starting in less than three months. Firm says the 3Q could be worse than expected if the bottom falls completely out of Nokia's smartphone market; they believe this is unlikely as Nokia is already pricing very aggressively and is not competing squarely against the BlackBerry, the fashion of the iPhone, or the Android domain of consumer electronics mavens.

07:44 am QLogic downgraded to Hold at ThinkEquity: . ThinkEquity downgraded QLGC to Hold from Buy following earnings. The firm says a comparison of sequential revenue growth trends of INTC's data center group (proxy for server chips) with QLGC's Host business for the first three quarters of CY10, suggests that the server upgrade cycle may have more of a muted effect on the Fibre Channel Host Adaptor business than they previously anticipated. Considering QLGC may not have a near-term strong demand catalyst that may materially lift numbers beyond their estimates and that at current levels, shares, reflect the company's market leadership, robust financial model, and strong FCF.
icon url

ReturntoSender

07/25/10 2:03 PM

#9011 RE: ReturntoSender #6755

Monday Morning Outlook: Earnings, European Bank Tests Propel SPX Above 1,100
Bernanke casts a shadow with his 'unusually uncertain' outlook
by Ryan Detrick 7/24/2010 11:07 AM


Generally strong earnings reports and increasing evidence of recovery in the euro zone helped propel the S&P 500 Index (SPX) above the 1,100 level last week. The Dow Jones Industrial Average (DJIA) likewise surpassed 10,400. However, the major market indexes remain slightly off their June highs (to say nothing of April). Looking ahead, Senior Technical Strategist Ryan Detrick is sitting in again for Todd Salamone this week. Ryan covers a wide swath of territory today, including the health of the euro, the SPX's break above its 50-day moving average, "death crosses," and the CBOE Market Volatility Index (VIX). It's a mixed picture, but Ryan concludes, "I'd say it is wise to side with the bulls." Next, Senior Quantitative Analyst Rocky White takes a look at market performance during midterm election years. Finally, we wrap up with a look at some key economic and earnings reports slated for release this week.

Recap of the Previous Week: SPX 1,100 a Reason to Cheer
By Joseph Hargett, Senior Equities Analyst

The Dow Jones Industrial Average (DJIA) fought back from the previous week's 1% loss, gaining a solid 3.2%. The bulls proved their resilience, despite a 100-point drop on Wednesday in reaction to less-than-cheerful comments by Federal Reserve Chairman Ben Bernanke. Earnings season thus far has given the bulls more reason to cheer than not, and the S&P 500 Index (SPX), for one, proved its mettle by muscling above the 1,100 mark.

The news Monday was mixed. Overseas, Moody's Investors Service downgraded Ireland's credit rating. Here in the U.S., the National Association of Home Builders said its confidence index plunged to 14 in July – the lowest level since March 2009. However, Halliburton's (HAL) earnings cheered traders. The Dow settled on a respectable 0.56% gain on the day.

Traders were disappointed on Tuesday by earnings reports from big-cap behemoths Goldman Sachs (GS), IBM (IBM) and Texas Instruments Inc. (TXN), as well as a gloomy outlook from blue chip Johnson & Johnson (JNJ), and the Dow initially sank more than 100 points. But the bulls stood their ground, and buyers returned later in the day. The Dow gained another 0.74%.

Apple (AAPL) and Morgan Stanley (MS), among others, reported strong earnings on Wednesday, but traders didn't show their cards until the Fed's Bernanke testified before the Senate Banking Committee. They didn't much like what they heard. Bernanke said the economic outlook is "unusually uncertain," and that "financial conditions ... have become less supportive of economic growth in recent months." Although the Fed chairman said central bankers are "prepared to take further policy actions as needed," he made it clear the Fed was unlikely provide any more stimulus to the shaky recovery. Traders ran for the exits and the Dow sank 109 points, or 1.07%.

What a difference a day makes. Upbeat earnings reports Thursday from high-profile Dow components such as Caterpillar Inc. (CAT), 3M Company (MMM), and AT&T Inc. (T) boosted spirits into the party zone. Meanwhile, industrial orders in Europe rose by 3.8%, while the Markit euro-zone composite purchasing managers' index unexpectedly rose to 56.7 in July. Furthermore, May retail sales in the U.K. were also better than forecast. The Dow soared 202 points, or nearly 2%.

Only seven of the 91 banks tested "failed" the highly anticipated European bank stress tests on Friday, with Spain accounting for five of the casualties. Although doubts about the strictness of those tests emerged later, the bulls kept their party hats on through the closing bell. The Dow climbed another 102 points, or 1%. For the week, the blue-chip barometer was even more impressive, adding 3.2%. The SPX rallied 3.5% for the week, while the Nasdaq Composite tacked on a very healthy 4.2%.

What the Trader Is Expecting in the Coming Week: SPX Breaks Above 50-Day Moving Average
Ryan Detrick, Senior Technical Strategist

I think Federal Reserve Chairman Ben Bernanke summed it up on Wednesday when he called the economic outlook "unusually uncertain." On Tuesday we rallied on "weak" earnings, and on Wednesday we sold off on big volume after "good" earnings. What else can you say, other than uncertainty rules? Nonetheless, earnings for the most part have come in better than expected and the market is showing some signs of life.

Don't get me wrong, there are probably more reasons to be very concerned out there than reasons to be bullish. We have worries over some poor, high-profile bank earning reactions, weak housing numbers, jobs, European debt, future dividend and capital gains tax increases, and lastly record lows for the two-year yields - suggesting the bond market isn't buying into the economic recovery. Nonetheless, if everyone else is worried about these same things – you have to wonder how much of this bad news is already baked in.

What I do find encouraging is the fact that the S&P 500 Index (SPX) was able to substantially break above its 50-day moving average, along with breaking a three-month downtrend line. Again, we have some major concerns regarding the world economy – but price action is what matters, and this is a step in the right direction for the bulls.


Again, although I see some positives, by no means is this an all-clear buy signal. Last year at this time we were very bullish on the overall market and rode it up into the April peak. Unfortunately, things aren't quite that clear today, and for this reason we recommend shortening your timeframes or making sure you have hedges in place.

With that said, the action in the financials is one area that has us concerned. Numerous names have had poor reactions to earnings and the price action on the XLF is rather weak.


Meanwhile, the 50-day buy-to-open (BTO) put/call ratio on the XLF has peaked and rolled over sharply. This rollover looks quite bearish, especially when you consider the rally in 2009 was accompanied by a rising put/call ratio. Additionally, we see huge August puts relative to calls in at-the-money options. With heavy put open interest, there is always the risk of a major delta hedge-based decline from that put open interest.


What is there to like? Well, for starters, the price action in the euro is very encouraging. Will the euro exist in 15 years? I don't know, but a lot of people seem to think there's a chance it won't. Nonetheless, for today's market, strength in the European currency is a great sign that some of the recent European sovereign debt issues could be subsiding. Additionally, we continue to see extreme skepticism toward the currency. As Todd has mentioned in the past, this is a very nice-looking contrarian play.


As we've mentioned several weeks in a row now, the CBOE Market Volatility Index (VIX) is down near support from its 200-day moving average. This level continues to act as strong support. A break beneath this level could signal volatility is subsiding and a nice summer rally is ready to take off. Keep your eyes on this one.


Another potentially major positive is that overall sentiment continues to be very negative. Should we see a string of good news, this could be very powerful. Sentiment polls still show investors are near past levels of bearishness consistent with major market bottoms. Last week, I noted how last July saw a well-publicized head-and-shoulders topping pattern that was dead wrong, and coincidentally marked a huge end-of-year rally, and how we were seeing the exact same thing this July. One other similarity between last July and this July is the Investors Intelligence poll, which has the same number of bears and bulls. Last year, after such a configuration, the Dow rallied almost 1,800 points in two and a half months.


On the technical front, this week the PowerShares QQQ Trust (QQQQ) completed a "death cross." This is when the 50-day moving average crosses beneath its longer-term 200-day moving average. As the name would suggest, this is viewed as a very bearish indicator. The SPX completed its death cross a few weeks ago, and this brought out a good deal of bears claiming that no major bear market has occurred without a death cross. Although on the surface this is correct, as Rocky White mentioned in Monday Morning Outlook recently, since 1972, on the one-, three-, and six- month timeframes, a death cross is actually more bullish than the typical returns on the SPX. Not so bearish after all, huh?

What does a death cross on the QQQQ tell us? Well, going back to 2000, death crosses are indeed bearish.


The only problem I have with this is the results are extremely skewed due to the massive drop in 2000. Not that we should discount this, but let's take a look at all the death crosses since 2003. In fact, we get a much different result. In fact, death crosses on the QQQQ are actually more bullish in all time frames going out a year – confirming that a death cross by itself isn't reason alone to put on the bear suit.


Todd is back next week and I'll leave you with this chart. Although we see reasons to be concerned and reasons to be bullish, as long as the SPX stays above its upward trending 80-week moving average, I'd say it is wise to side with the bulls. Remember, this trendline served as support during the last bull market and was supportive on the recent pullback. So far, so good.

Good luck trading.


Prepare for the investing week ahead. Every week, Bernie Schaeffer and his staff provide you with their insight about what has happened and, more importantly, what will happen in the market. We dig deep and show you what's happening behind the scenes, and tell you which indicators are predicting major market moves. If you enjoyed this week's edition of Monday Morning Outlook, sign up here for free weekly delivery straight to your inbox.

Indicator of the Week: Presidential Cycles
By Rocky White, Senior Quantitative Analyst

Foreword: We're a few months away from the midterm elections. In the last couple of years there have been some major pieces of legislation passed (TARP, health care reform, financial regulation) and there are a few more things some Democrats would like to take care of (energy/climate change legislation). Will legislation before the midterms be good for the market? I'm not one to get into a political debate, so I'll leave that for others to discuss. But I do have the numbers on how the market has performed depending on which party holds the presidency and which year it is of the presidential cycle.

Dow Returns by Party: In 1949, Harry Truman became the first president to be inaugurated to his first term on Jan. 20 (prior to Franklin Roosevelt's third term, presidents were inaugurated in March). So I went back to 1949 and looked at how the Dow Jones Industrial Average performed depending on whether a Democrat or Republican held office. The table below shows that the Dow has performed better with a Democrat in office as opposed to a Republican. The second-half returns would be most relevant to now. With a Democrat in office, the Dow has an average return of about 7% for the last six months of the year. Also, there has been a positive return an impressive 84% of the time.


Second Half of Year Broken Down: The table below breaks down the Dow performance for the second half of the year. The second year of a presidential cycle is the year of the midterm elections. You can see that it happens to be the worst time for the Dow when a Democrat is in office. During that half-year the Dow averages a 4.28% return and is positive 67% of the time. The Republicans on the other hand have seen the Dow perform well during the midterm year when they hold the presidency. During those years the market is still positive only 67% of the time, but the market returns an average of 7.26%.


Finally, below is a table showing you the second half of the individual midterm election years where a Democrat was president. The first half of this year was not a good one for the Dow, but that has been typical according to the table below. Five of the seven results in the table below are negative, averaging a loss of 3.88%. The second half of the year has usually been pretty bullish, averaging a return of 4.28%. That is no thanks to the third quarter, though. We see in the table that the third quarter has a very slightly negative average return. Four of the six results are pretty good, but there are two returns that are negative by double digits.


This Week's Key Events: Earnings, and Several Reports on Consumer Sentiment
By Joseph Hargett, Senior Equities Analyst

We're right in the thick of earnings season. Here is a brief list of some of the key events for the upcoming week. All earnings dates listed below are tentative and subject to change. Please check with each company's respective website for official reporting dates.

Monday
* We'll get several more glimpses into the minds of consumers this week, beginning with new homes sales for June on Monday. Sohu.com Inc. (SOHU), Lorillard Inc. (LO), SL Green Realty Corp. (SLG), Albemarle Corp. (ALB), and Universal Health Services Inc. (UHS) will release their quarterly earnings reports.

Tuesday
* On Tuesday, we'll get the Case-Shiller 20-city home price index for May, but more importantly, the Conference Board's Consumer Confidence Index for July. If you recall, this index slumped badly in June. AK Steel Holding Corp. (AKS), BP plc ( BP), CIT Group Inc. (CIT), Cummins Inc. (CMI), Domino's Pizza Inc. (DPZ), DuPont (DD), L-3 Communications Holdings Inc. (LLL), LCA-Vision Inc. (LCAV), Lexmark International Inc. (LXK), Office Depot Inc. (ODP), Lockheed Martin Corp. (LMT), United States Steel Corp. (X), Teva Pharmaceutical Industries Ltd. (TEVA), Under Armour Inc. (UA), Valero Energy Corp. (VLO), Aetna Inc. (AET), AFLAC Inc. (AFL), Broadcom Corp. (BRCM), Buffalo Wild Wings (BWLD), CB Richard Ellis Group Inc. (CBG) Cephalon Inc. (CEPH), DreamWorks Animation SKG Inc. (DWA), Fiserv Inc. (FISV), Massey Energy Co. ( MEE) and Panera Bread Co. (PNRA) are scheduled to report earnings.

Wednesday
* The market will be graced with the weekly report on U.S. petroleum supplies on Wednesday, while ArcelorMittal (MT), The Boeing Company (BA), Coca-Cola Enterprises Inc. (CCE), Comcast Corp. (CMCSA), ConocoPhillips (COP), Constellation Energy Group Inc. (CEG), International Paper Company (IP), M/I Homes Inc. (MHO), Martha Stewart Living Omnimedia Inc. (MSO), P.F. Chang's China Bistro (PFCB), Sprint Nextel Corp. (S), Akamai Technologies Inc. (AKAM), Cincinnati Financial Corp. (CINF), Cliffs Natural Resources Inc. (CLF), Goldcorp Inc. (GG), Green Mountain Coffee Roasters Inc. (GMCR), NetLogic Microsystems Inc. (NETL), Skechers USA Inc. (SKX), and Sturm, Ruger & Co. (RGR) will post their quarterly results.

Thursday
* Weekly initial jobless claims will be joined by the Fed's Beige Book on Thursday. Avon Products Inc. (AVP), Barrick Gold Corp. (ABX), Celgene Corp. (CELG), Colgate-Palmolive Co. (CL), Exxon Mobil Corp. (XOM), Motorola Inc. (MOT), Northrop Grumman Corp. (NOC), Sony Corp. (SNE), Strayer Education Inc. (STRA), Wynn Resorts Limited (WYNN), Chiquita Brands International Inc. (CQB), Coinstar Inc. (CSTR), Expedia Inc. (EXPE), First Solar Inc. (FSLR), McAfee Inc. (MFE), and MetLife Inc. (MET) will report earnings.

Friday
* On Friday, we'll get the latest numbers on second-quarter gross domestic product, along with the Chicago Purchasing Managers' Index for July, and a final look at July consumer confidence as measured by Reuters and the University of Michigan. Joining the earnings parade will be Arch Coal Inc. (ACI), Chevron Corp. (CVX), ITT Corp. (ITT), and Merck & Co. Inc. (MRK).
icon url

ReturntoSender

07/25/10 2:24 PM

#9012 RE: ReturntoSender #6755

InvestmentHouse Weekend Market Summary

http://www.investmenthouse.com/weekendmarketsummary.htm

- Market a bit hung over, but stumbles along and then rallies in the afternoon on EU stress tests.
- Indices post a higher high, starting the breakout from their inverted head and shoulders.
- EU economic data improves, bolsters US rally despite some weaker earnings reports on Friday.
- Leaders keep setting up and breaking higher, providing the upside impetus.
- Looking for a move to the January peaks and then an important test.

Stocks stumble around after Thursday rally, but then focus after EU stress tests.

The US stock market was a bit hungover on Friday after posting very nice 2%+ gains on Thursday. There is often a little softness in the morning after nice gains, and it was aided by earnings reports that were less than spectacular. AMZN missed by $0.09. MCD beat expectations, but its sales were not as anticipated. MCD suffers the fate of a very successful company that for many quarters has easily topped expectations, growing sales all around the globe. When it was unable to do that this quarter, the market did not treat it kindly. Welcome to the world of NFLX. That is what happened to it on Thursday after several quarters of stomping expectations. It could not stomp them as hard, and it was taken to the cleaners.

It is not that the news was bad; there was actual good news out of Europe. German business confidence was higher than expected indeed, it hit a three-year high. The UK GDP came in at 1.1%. That is not much, but when the expectations were for crap, two times crap is pretty good. This was double its expectations and, consequently, European markets were up. They were up but then started to stumble right before the close. The European stress tests came out after the market closed, and there was a bit of trepidation ahead of the weekend as to what these might show.

US stock futures were down, and they opened the market lower. Looking at the intraday chart, there was a gap lower on the SP500, and it just chopped around. It did manage to move back up to the positive level, but by lunch time, stocks on the SP500 were flat, NASDAQ was lower, and the US markets were generally mixed. They were chopping around, and the question was whether it would be another Captain Ron session where the markets stumble into good fortune, or if it would be more of the up and down trade we have seen for the last couple of months while the US market is basing.

As it turns out, we got Captain Ron once more. He showed up just after lunch when the EU stress tests came out. Out of 91 banks, only 7 of them failed the test. Not many people believed this was an accurate read of the strength and health of the EU banks. Many feel it was a preordained outcome. They threw some of the banks to the dogs one even from Germany but overall they passed when things were not considered that good. After all, we were close to another financial meltdown just a few short months ago.

Whether preordained or not, the market was ready to believe. It wants to believe, and that has been the theme of the market over the past few weeks. It wants to believe things are better, and thus there was the improbable rally that stocks enjoyed after breaking to new 2010 lows. They reversed on what was a false breakdown and rallied. They tested and now have made a higher low and are breaking to a higher high. That is the first step in recovery. It is a long process, but it is the first step. The next step will be taking out the last high before the lower low. That will be much more interesting because that puts the SP500 back up to the January 2010 range. I am getting a bit ahead of myself.

There was a definite Captain-Ron atmosphere in the market, and stocks surged higher into the afternoon, and then they started to chop back and forth. They even tried to sell off in the last hour, but rebounded in the last 15 minutes to close near session highs. NASDAQ +1%, the Dow +1%, SP500 +0.82, SOX +0.5, SP600 +2.1%, NASDAQ 100 +0.66%. NASDAQ 100 had to carry the likes of NFLX and AMZN on its back. When they were down, that is not an easy thing to do. They all finished positive as the Captain Ron, happy-go-lucky stock market continued to move higher. Granted it got the help from earnings most of the week. IBM disappointed, but almost everyone else came through in the clutch. There were outstanding results. Even with a couple of disappointments from some stalwarts of late (namely SNDK, NFLX, and IBM) stock are overall reporting outstanding earnings and, more importantly, excellent guidance. They have plenty of money, but they are just not spending any of it except amongst themselves. I guess that will have to do for now. It is definitely enough to keep the stock market going as it tries to fight its way back up through all of this resistance. So far there was a higher low, a higher high, and still on track to continue to the upside.

OTHER MARKETS.

The other markets more or less continued their recent trends.

Dollar. The dollar was stumbling around once more (1.2914 Euros versus 1.27887 Thursday). Of course it was lower: US earnings were not great to start with, and the EU had good news with the UK and German business confidence. The dollar was lower, although not cataclysmically. The problem with the dollar is that it broke the 2009 trendline, kissed it, and it is falling back. It is in jeopardy of coming back down to the February and March-through-mid-April consolidation. It very easily could drop there. I am not expecting the dollar to rise anytime soon, although I am not expecting any kind of cataclysmic decline.
Click to view the chart

Bonds. Bonds took a hit for the second day in a row. Wednesday they were in breakout mode. The stock market was down, and bonds were surging to a new closing high for 2010. That did not last very long; they reversed and started to sell (10 year US Treasury 2.99% versus 2.93% yield Thursday). It was not too long ago they were even higher, so this is still decent and low pricing, but there appears to be an attempt to sell bonds now. That would make sense. With the European economy looking stronger, there is not much need to run to the safety of US bonds. If that means more success for the US economy, then that means there are less US investors putting money in bonds as well. There is a bit of a double top over the past four weeks. We will have so see how far that pushes bonds. The important level is marked by the white horizontal line that runs roughly through the July low. There are some price peaks and closes you can see several of them. Tests along the way. The line goes way back in time, and it is an important one. We will see how it holds. That is the next important test for bonds, and it is being bolstered by a rising 50 day EMA. If it breaks this level with all of these support points, it will be a significant and important move in that bonds are heading lower.
Click to view the chart

Gold. Gold has been under pressure, and it continued under pressure. It rallied all the way to the 50 day EMA on the Friday high and reversed to close down ($1,188.50, -7.10). It is starting what looks to be a continuing downtrend towards the 200 day EMA. That just so happens to be at the January 2010 and the March 2010 peaks as well. There are important price highs and lows, and now the 200 day EMA there. That looks to be the next test level. It could pull up around 1155. It is going down to this range from the looks of it. That is why I am still looking for a GLD play to the downside after this test. We would get it and have a nice gain as it drops.
Click to view the chart

Oil. There is a storm ready to come across Florida and head into the Gulf. It looks like oil has hit an important level itself, rising up to the June twin peaks. Looking back to March, this is a level where oil tested and held as it rallied to highs in its range. Now it is back at this midpoint in this range, and it is testing this area. There was a big burst on Thursday when the storm formed, and now we will see if it pushes on through. If it does not, this will be significant with the storm out there. Granted it is not a huge storm and is not expected to get very strong. Nonetheless, if it does not move up with the storm, that does not say much for oil's prospects of going much higher or at least breaking out of its longer-term range.
Click to view the chart

TECHNICAL PICTURE

INTERNALS

Volume. Volume was not bad at all, rising almost 2.4B shares on NASDAQ. That moved it a bit further above average. Thursday was a rising volume day and so was Friday. Not bad action. NYSE volume continues to languish well below average. It struggled to get just over 1B shares, but it did do it for what that is worth. It is still quite weak, so you cannot put a lot of credence into this move. Techs do look a bit better. Some of that tech volume was downside volume. There were issues with some tech stocks, and that pushed volume higher as they sold. Do not take too much solace in the fact that volume was up on Friday.

Breadth. Breadth was not bad at 3.4:1 on NASDAQ and 3.7:1 on the NYSE. Very solid with the small caps leading the move. You would expect breadth to be broad and it was. There is still the same pattern: On days when the market moves, the breadth is either strongly positive or strongly negative while volume remains equivocal at best.

CHARTS

SP500. The SP500 broke to a higher high on this move, although it really needs to get through the June peak. It is coincident with other areas of support and resistance. I am looking back to the February dip, back to the gap point from May, and then some peaks in June as well. It is in an area where there is resistance, but there will be resistance on the entire move upside because the whole area represents overhead supply. The key area is going to be the January peak range, again marked by these two white lines. That will be where we watch the next test the 200 day EMA. Then there is this range of resistance at 1,115 followed by the important January peak range.

NASDAQ. NASDAQ also made a higher high on this move after the higher low. It cleared the 200 day EMA already. Not a bad move. It, too, has to deal with the January high. It is shooting down each higher resistance as it comes up to it. It still has the major work to do where it also rallied into mid June and bumped its head hard and stumbled to a new 2010 low. With that in mind, we have to keep a close eye as NASDAQ makes the move to that point. As with the SP500, there is that reverse head and shoulders working, and it looks to be trying to break out now. Remember, there was the six month head and shoulders on both NASDAQ and the SP500 that was consummated (some said) with this breakdown in July to new 2010 lows. Then it reversed, and now the market is rallying again. How many times have you seen that happen? The moral of that story is not to put too much faith in head and shoulders patterns. Inverted head and shoulders patterns can be cool; I like them when they form after a long selloff, and that is what we are seeing now.

SP600. You can see it on SP600 as well. It broke through the 50 day EMA and through its recent peak. Similarly to the other indices, it has made a higher low and a higher high. It also still has the lion's share of its work ahead of it, as it has to deal with the March consolidation. That is also roughly where it bounced up in late May, early June, and mid June. That will be the critical level for the small caps, but they are roaring back right now, reversing a trend and rallying higher. They never did hit a lower low for 2010 in the July selloff.

SOX. Semiconductors have been a leader the entire way. The SOX is still performing well, although it was a bit disappointing on Friday. There were issues with SNDK. It was one of the market leaders to the upside that just did not produce good earnings and was being sold off. That hampered the semiconductors. Still, they have made a higher low at the 200 day EMA. They just have not made a higher high yet over the earlier July peak. There is a serious level coming up for the semiconductors as well. There is a band resistance, and it just crossed into it on Friday.

LEADERSHIP

Financial. JPM is trying to set up and break higher as well. A nice rally and a gap. It filled the gap after earnings, and it is now rallying back to the upside. Not a lot of volume yet, but it is still not bad. It put in a higher high, a higher low, and now it is trying to break to the upside. The 50 day EMA will be the next resistance. There is a bit of price resistance there, but it has plenty of room to the upside. GS is interesting; it pulled back to end the week. There were questions about the settlement it had with the SEC, but note how it tapped the 10 day EMA, and it also tapped the high from early June. It bounced up on Friday, and it is an excellent pullback. It looks primed to make a rally back up to this next resistance point which is right now coincident with the 200 day EMA. That will be serious resistance, but it is also a very nice run to that point.

Technology. AAPL was up modestly after gapping lower on Friday. It is having problems issuing the white iPhone. Apparently it yellows and needs to get the kinks worked out, but AAPL is still banging around in its range. It has not sold off, but it is just doing a range trade after a strong run, trading up and down. That is not necessarily a bad thing. If it can consolidate in a trading range while holding these gains and makes a higher low, it may break out to the upside of the range. Always watch for the higher lows at a key support level it can lead to a breakout. FFIV reported great earnings, screaming to the upside with another 4.5% gain. Even GOOG is getting in on the mix. It is trying to set up its own inverted head and shoulders and trying to break to the upside as well. AKAM looked like its goose may have been cooked, but it managed to make a higher low. Now it is making a higher high and trying to return to the upside; indeed, it broke into its uptrend line. It is back in its channel, and we will see if it can continue on in this channel as the strong get stronger. EMC had a great surge and broke out to a higher rally high. It tested that, and came right back to sit on top of that mid-June peak and then bounced higher. It does not pay in the market to take photographs.

Semiconductors. ALTR broke to a new rally closing high on Friday and is looking great. Very nice test, surging back up. XLNX was the same action. It broke to a new rally high, tested it over a week, and then Thursday and Friday it was off to the races once more. SWKS blasted off to a new rally high on excellent volume. Outstanding action.

Industrial. CAT continues to move higher, almost a 2% gain. Industrials are looking solid. CMI broke out of its triangle and is moving to a new rally high. JOYG is exploding higher. It made not only a higher low, but a higher high as well. Excellent action from industrial stocks.

Metals. Metals are also enjoying gains. AKS cleared the 50 day EMA on Thursday. It continued higher on Friday on rising average volume, putting in an almost 3.25% move. FCX is doing the same: Surging higher, making a higher high. Although volume did trail off, it is still solid trade.

Retail. GES cracked its 50 day EMA on Thursday and exploded through it on higher volume on Friday. Excellent reversal. Here is the selloff, and here is the inverted head and shoulders. The left shoulder in June, the head to start July, and the right shoulder over the past week and a half. Exploding higher Thursday and Friday. BBBY made a higher high as well off this double bottom. I do not know if I am ready to get into this one. It has a lot of gaps, and there is serious resistance from February. I would like to see it form a handle here, fade back slightly, and then start to surge. That is when I would want to move in on this one. LOW had a nice move on the week. It has a double bottom set up on its own. It is at the hump now at the double bottom. I want to see what happens. I would like to see it fade back a bit, hold right on top of the peaks in the first bottom and then make the break to the upside. That would be your buy point. TJX looks to be setting up again after looking pretty ugly a week ago. It has now double bottomed at the 200 day EMA and it is starting back to the upside. I would like to see more volume here and see how that plays out. It might turn into an interesting play.

As you can see, there are many stocks that have sold off, and there are many stocks that have formed rounded bottoms, double bottoms, or inverted head and shoulders patterns. They are starting to make the move higher as money flows back into them. A lot of these were retail stocks, metal stocks, and industrial stocks that sold off after leading the market higher. Now they have based out. They have put in those patterns and are breaking to the upside.

We have been picking them up as they have been moving. We are doing the best we can you cannot catch them all. Some of them gapped away from us, and you have to wait until they come back. That is all you can do. You can only buy so many, but you can try to get as many of the good ones as possible. We have been and enjoying the fruits of those, and actually taking gains this week on stocks we bought as they started to come out of off their lows. As the market continues higher as it looks like this Captain Ron, happy-go-lucky stumble higher is going to do we will continue to take more gain off the table.

The market indices are approaching the next resistance point. Once they get out of this range and it looks as if they are doing that right now they are going to move back up toward the January peak range. That will be the important point where it will test. If they stall there, we will be happy anyway because we will have logged great gain and will be banking it. If they stall, we will bank the gain and see what happens. If they do not, that is great. We will let our positions run and look for more upside just as we have been doing all along.

Remember, breaks higher come in waves. When stocks have time to base and move higher in this choppy manner, that gives them time to work on their patterns, develop some strength, and then break higher. We see them come out in waves, and leaders are breaking out in waves. That is why we are able to buy well into the move. We buy with caution, of course, because the move had not proved itself. It could still turn over on us, but it is making higher lows and higher highs. It keeps finding a way to move upside, even when there was bad news as there was this week. The market reacted very positively to some bad news. Of course it did get good news that gave it a good kick in the pants to the upside anyway. The fact that it was able to move on good news and then hold the line on bad news and continue higher is very positive.

THE MARKET

MARKET SENTIMENT

VIX. There were a series of lower highs from the VIX after it spiked in May during the flash crash and subsequent test lower. In June and early July, I noted that when the market made the new low in the new 2010 lows, VIX did not make new highs. I suggested at the time and I felt strongly about it that that indicated the market would have an oversold bounce and we would have to see how it performed from there. Now volatility is back down to the 200 day EMA. It held there and then bounced when the market sold off on the first test of its oversold bounce, but it rebounded. After a rebound it sold back to the 200 day EMA after this last run. Now it has not broken down even though the market has broken to a higher high.

Looking at the SP500, the high in this selloff is where volatility bounced back up. Now the market is breaking back through that high, but the volatility is still holding at the 200 day EMA. Looking back to mid June, that is when volatility hit the 200 day EMA. There was a higher high in June, and there is a lower high now. Is that suggesting this move is over? After all, there was a higher high at this same level, and here we have a lower high. Actually, I think this suggests that volatility is going to break lower and the market is going to run higher.

VIX: 23.47; -1.16
VXN: 24.16; -1.06
VXO: 23.33; -0.94

Put/Call Ratio (CBOE): 0.84; +0.02

Bulls versus Bears:

After a crossover, a tie. Two weeks back the bulls/bears reading showed a rare crossover, typically a bullish indication. The market continues to perform decently to the upside. This past week they were tied, still a bullish indication.

This is a reading of the number of bullish investment advisors versus bearish advisors. The reason you look at this is that it gives you an idea of how bullish investors are. If they are too bullish then everyone is in the market and it is heading for a top: if everyone wants to be in the market then all the money is in and there is no more new cash to drive it higher. On the other side of the spectrum if there are a lot of bears then there is a lot of cash on the sideline, and as the market rallies it drags that cash in as the bears give in. That cash provides the market the fuel to move higher. If bears are low it is the same as a lot of bulls: everyone is in and the market doesn't have the cash to drive it higher.

Bulls: 35.6%. Up from 32.6% that was a reading below the bears for that same week. Still tied with the bears and that is still a bullish indication. Down from 56.0% on this leg's high. This move started at a low of 35.6% in February, the lowest it has been since July 2009. 35% is the threshold level suggesting bullishness. After peaking at 53 on this move the bulls lost some nerve, falling to a new low post- July 2009. Once again bulls peaked out near the 50% level. Bulls have bumped at 50ish since late August 2009, falling to 45ish and then rebounding. Hit a high of 47.7% mid-June on the run from the March lows. Again, to be seriously bearish it needs to get up to the 60% to 65% level.

Bears: 35.6%. Up from 34.8% where it stayed for two weeks and for a crossover with the bulls. Solid rise from the mid to upper 20's. Fell to 18.7% on the low. Hit a high of 27.8% level on the prior leg in February. Over 35% is considered bullish for the market; definitely at the lower end of the scale. Peaked near 28% in November, falling short of the 35.6% hit in July 2009. For reference, cracking above the 35% threshold considered bullish. Hit a high on this run at 47.2%. For reference, bearishness hit a 5 year high at 54.4% the last week of October 2008. The move over 50 took bearish sentiment to its highest level since 1995. Extreme negative sentiment. Prior levels for comparison: Bearishness peaked at 37.4% in September 2007. It topped the June 2006 peak (36%) on that run. That June peak eclipsed the March 2006 high (33%) and well above the 2005 highs that spawned new rallies (30% in May 2005, 29.2% in October 2005). That was a huge turn, unlike any seen in recent history.

NASDAQ

Stats: +23.58 points (+1.05%) to close at 2269.47
Volume: 2.37B (+10.01%)

Up Volume: 1.667B (-317.642M)
Down Volume: 719.61M (+435.348M)

A/D and Hi/Lo: Advancers led 3.41 to 1
Previous Session: Advancers led 4.93 to 1

New Highs: 78 (+39)
New Lows: 40 (+1)

NASDAQ CHART: Click to view the chart

NASDAQ 100 CHART: Click to view the chart

SOX CHART: Click to view the chart

SP500/NYSE

Stats: +8.99 points (+0.82%) to close at 1102.66
NYSE Volume: 1.15B (-2.26%)

Up Volume: 911.087M (-155.763M)
Down Volume: 229.759M (+122.374M)

A/D and Hi/Lo: Advancers led 3.71 to 1
Previous Session: Advancers led 5.71 to 1

New Highs: 220 (-12)
New Lows: 38 (-5)

SP500 CHART: Click to view the chart

SP600 Chart: Click to view the chart

DJ30

Stats: +102.32 points (+0.99%) to close at 10424.62
Volume DJ30: 200M shares Friday versus 171M Thursday.

DJ30 CHART: Click to view the chart

MONDAY

There is a full week of action ahead. We will have the new home sales following the rather disappointing existing home sales. They were better than expected, so the market reacted positively, but they are still atrocious and not getting any better. There is the Case-Shiller 20-city index. It will tell us about how bad prices are. Then there will be some consumer confidence and ending out the week with Michigan Sentiment. They are at recession levels, and I do not expect them to get much better. Durable goods orders are always interesting because businesses have more money than the individuals they are just not spending it. Initial jobless claims are expected to be crappy again. GDP advance for Q2, etc. We are going to have a full slate of data in addition to more earnings.

The market is looking solid. It is making higher lows and higher highs, moving to the upside. We are also well into earnings season. We are over halfway there, and we have seen a lot of results. There have been mostly good results and some bad. The market is reacting positively to the upside. Often the stock market will react one way as earnings start, and then it has a problem after that in keeping the same move going (particularly if it is to the upside). We are having a summer rally. It does not look like it after the selloff ahead of this bounce, but we are having a rally. That typically means it will rally into August. Notice that techs do well at this time of year, but then everything slumps in September into October. I still expect to get more upside. I do not think we will necessarily have that turn back down after we get midway through earnings. There was a huge selloff moving into earnings, and now we are seeing things are not nearly as bad as the selloff would have indicated. Stocks are recovering and moving well.

Leadership is setting up and continues to move to the upside. It is coming in waves, and we have been buying those. I expect to market to continue higher. It does not mean it is clear sailing not at all. There will be choppy action. It is still in a base, going up and down. Huge moves downside, big moves upside. The result is it has not gone much of anywhere over the past two months, but that is part of the basing process.

What I expect is a rally up to this January peak (or somewhere in the range of January). Then I expect more basing activity. That would break it out of this inverted head and shoulders, it would rally, and then it would most likely test that breakout. That is normal. People will freak out at that point, but we will take gain at that point as it hits that level and stalls out. That is our plan. There are initial targets that we will keep and honor as the stock market moves higher. We bank money along the way, and we are never crushed when it turns or starts to head back down. I expect it to test after it gets to this level, and we will have to reevaluate at that point. Has the data changed? Are there any warnings? What is going on generally in the world? If it comes back and tests normally, a pullback to the 200 day EMA would make a lot of sense. It bounces up to this level in January, sells back to the 200 day EMA, makes another higher low after a higher high, and then it breaks out over a key level. That is what I anticipate will happen. That is, if we continue to get the same kind of news out of the EU and get decent economic data in the US.

There is a belief now that China may be able to engineer something of a soft landing. I will believe it when I see it. India is still strong and Brazil remains strong. There are the other companies of the BRIC that are able to keep things moving. Thus we are seeing those stocks such as CAT and its industrial brethren doing better. The commodities stocks metals, lumber, etc. that you need to build things, they are moving up again. They were the leaders in 2007-2009, and they had a hard time after the world came tumbling down. They were the ones moving up crazily, and now they have come crashing down. They have had their test and are moving back up now that things appear to be recovering and are not as bad as many had feared. LIBOR has turned down to 0.49%. It was up to 0.55%, and it has been steadily ticking down over the past couple of weeks.

There is a much better outlook of things to come, thus I anticipate the market will continue to try to build back to the upside. But it is never a straight line. After this rally to a new higher high, we may get softness to start the week. That is okay because there are positions that we were unable to get into that I would like a shot at. If they pull back a bit, we can get into them. I will be looking for others as well while they make the move to the upside and towards this January peak. That will be the next critical point. If we get there, we will have bank made and we will be banking a lot of gain on the positions we have been taking ever since the market made this reversal off of the lower low for 2010. That is the old false breakdown. We were ready for it, and we started moving in as it made the move up and have been reaping some nice reward on the way back up. We will continue to do that as it moves up toward the January peak. Have an excellent weekend.

Support and Resistance

NASDAQ: Closed at 2,245.89

Resistance:
2245 from July 2008 through 2260 from late 2005.
The 200 day SMA at 2259
2275 - 2278 from the February 2008 and April 2008 lows
2273 to 2282 marks bottom of January 2010 lateral peak
2292 is a low from January 2008
2319 from the September 2008 peak
2320 to 2326.28 is the January 2010 high
2324-2370 is a range of resistance from early 2008
2382-2395 from 2008

Support:
The 50 day EMA at 2242
2221 is the gap down upside point from June.
2205 is the November 2009 peak 2210 (from September 2008) to 2212 (the July 2009 closing low)
2185 to 2195 represent support points for years: December 2004 peak, July to October 2005 consolidation, January, March and July 2008 lows, and October 2009 peak.
2184 is the June gap bottom side.
2177 is a low from March 2008
2169 is the March 2008 closing low (double bottom)
2168 is the September 2009, intraday peak
2167 from the July 2008 intraday low
2155 is the March 2008 intraday low
2100 is the February 2010 low
2024 from November 2009
2020 to 2005 from the Q4 2009 peaks

S&P 500: Closed at 1102.66
Resistance:
1106 is the September 2008 low
The 200 day SMA at 1113
1114 is the November 2009 peak
1119 is the early December intraday high
Bottom of the January 2010 consolidation 1131 to 1136
1133 from a September 2008 intraday low
1151 is the January 2010 peak
1156 is the Sept 2008 low
1170 is the prior March 2010 high
1174 is the May 2010 high
1181 is the April selloff low
1185 from late September 2008

Support:
1101 is the October 2009 high and the recent May and June 2010 interim peaks
The 50 day EMA at 1091
1084 to 1080 (September 2009 peak)
1078 is the October range low
1070 is the late September 2009 peak as well as several other peaks and valleys even in 2010
1044 is the October 2008 intraday high AND the February 2010 low
1040 is the May 2010 low
1020 is the bottom of the late summer 2009 consolidation
946 from June 2009

Dow: Closed at 10,424.64
Resistance:
10,365 is the late September 2008 low
The 200 day SMA at 10,395
10,496 is the November 2009 high
10,594 is the June 2010 peak
10,609 from the Mid-September 2008 interim low
10,730 is the January 2010 peak
10,920 is the recent May high
10,963 is the July 2008 low
11,100 from the 7-08 low
11,205 is the April closing high
11,734 from 11-98 peak

Support:
10,285 is the late December consolidation peak
The 50 day EMA at 10,262
10,260 from the May and June 2010 interim peaks
10,120 is the October 2009 peak
9829 is the September 2008 closing high
9918 is the September 2008 peak
9855 is the early September peak in its lateral range
9835 is the late September 2009 peak AND the February 2010 low
9774 is the May 2010 intraday low
9325 is a late 2008 interim peak
9034 from early 2009 peaks

Economic Calendar

These are consensus expectations. Our expectations will vary and are discussed in the 'Economy' section.

July 19 - Monday
- National Homebuilder, July (10:00): 14 actual versus 16 prior (revised from 17)

July 20 - Tuesday
- Building Permits, June (08:30): 586K actual versus 572K expected, 574K prior
- Housing Starts, June (08:30): 549K actual versus 575K expected, 578K prior (revised from 593K)

July 21 - Wednesday
- Crude Inventories, 07/17 (10:30): 0.360M actual versus -5.06M prior

July 22 - Thursday
- Initial Claims, 07/17 (08:30): 464K actual versus 445K expected, 427K prior (revised from 429K)
- Continuing Claims, 07/10 (08:30): 4487K actual versus 4600K expected, 4710K prior (revised from 4681K)
- Existing Home Sales, June (10:00): 5.37M actual versus 5.09M expected, 5.66M prior
- Leading Indicators, June (10:00): -0.4% expected, 0.4% prior

July 26 - Monday
- New Home Sales, June (10:00): 310K expected, 300K prior

July 27 - Tuesday
- Case-Shiller 20-city, May (09:00): 4.0% expected, 3.81% prior
- Consumer Confidence, July (10:00): 51.0 expected, 52.9 prior

July 28 - Wednesday
- Durable Orders, June (08:30): 1.0% expected, -0.6% prior
- Durable Orders ex Tr, June (08:30): 0.5% expected, 1.6% prior
- Crude Inventories, 07/24 (10:30): 0.360M prior

July 29 - Thursday
- Initial Claims, 07/24 (08:30): 464K expected, 464K prior
- Continuing Claims, 07/17 (08:30): 4550K expected, 4487K prior

July 30 - Friday
- GDP-Adv., Q2 (08:30): 2.5% expected, 2.7% prior
- Chain Deflator-Adv., Q2 (08:30): 1.1% expected, 1.1% prior
- Employment Cost Index, Q2 (08:30): 0.5% expected, 0.6% prior
- Chicago PMI, July (09:45): 56.5 expected, 59.1 prior
- University Michigan Sentiment, July (09:55): 67.5 expected, 66.5 prior
icon url

ReturntoSender

07/27/10 12:16 AM

#9013 RE: ReturntoSender #6755

From Briefing.com: 4:15 pm : The S&P 500 settled just above its 200-day moving average after FedEx raised its forecast and new home sales figures for June proved better than expected. Trading volume was light, though.

FedEx (FDX 83.39, +4.43) helped improve the mood of market participants this morning when it added $0.20 to its first quarter earnings per share outlook. The global shipment company now believes that profits for its first fiscal quarter will range from $1.05 to $1.25 per share, which exceeds the consensus call of $1.01 per share. While the broader market showed a positive response to the announcement, gains were much more pronounced among industrial plays (+1.7%) and in the Dow Jones Transportation Index (+2.6%).

A near 24% month-over-month surge in new home sales increased interest in stocks. The stronger-than-expected spike in sales took the annualized rate to 330,000 for June. New home sales had been expected to hit a more modest annualized rate of 310,000 units after they recorded record lows in May. That helped the S&P homebuilder ETF (XHB 15.82, +0.40) outperform.

The positive headlines helped drive stocks higher, but resistance at the S&P 500's 200-day moving average kept a cap on gains until another round of buying helped the broad market measure settle above the key hurdle for the first time in one month.

Some market watchers will no doubt be quick to point out that participation was modest and that light volume can exaggerate the stock market's moves - hardly 1 billion shares trading hands on the NYSE. The lack of volume suggests that many investors prefer to remain on the sidelines amid uncertainty over whether stocks will hold recent gains or if the global economy's recovery effort is strong enough to warrant those gains in the first place.

There weren't any major earnings announcements for traders to digest this morning, but Genzyme (GENZ 67.38, +4.86) continues to find itself in the center of ongoing takeover chatter.

In other news, Tony Hayward, current CEO of embattled BP (BP 38.65, +1.79), will resign his position as company head in October. Speculation on the matter had started to intensify during the weekend.

The euro had a strong session. Specifically, the currency climbed 0.7% against the greenback to settle near $1.30, which puts it within striking distance of its two-month high. Conversely, the Dollar Index dropped 0.5% to set its lowest level since early May.

Advancing Sectors: Industrials (+1.7%), Financials (+1.6%), Telecom (+1.5%), Consumer Discretionary (+1.5%), Health Care (+1.4%), Energy (+1.1%), Utilities (+0.7%), Tech (+0.6%), Materials (+0.5%), Consumer Staples (+0.4%)
Declining Sectors: (None) DJ30 +100.81 NASDAQ +26.96 NQ100 +0.8% R2K +2.2% SP400 +1.8% SP500 +12.35 NASDAQ Adv/Vol/Dec 2044/2.17 bln/639 NYSE Adv/Vol/Dec 2442/1.02 bln/579

4:31PM Advanced Micro announces pricing of private offering of $500 mln of senior notes (AMD) 8.07 +0.25 : Co announced that it has agreed to sell $500 mln aggregate principal amount of its 7.75% Senior Notes due 2020 in a private offering. AMD intends to close the transaction on or around August 4, 2010. AMD estimates that the net proceeds from the issuance and sale of the senior notes will be ~$489.8 mln after deducting the initial purchasers' discounts and estimated transactions expenses. AMD intends to use the net proceeds, along with existing cash, to purchase its 6.00% Convertible Senior Notes due 2015 validly tendered pursuant to the co's tender offer for such notes, which was previously announced. Net proceeds not used in the tender offer, if any, will be used for general corporate purposes.

6:42PM Rambus confirms ITC issues notice of final determination in Rambus matter regarding NVIDIA products (RMBS) 19.59 +0.60 : Co confirmed that the International Trade Commission (ITC) issued its notice of final determination in the action brought by Rambus against NVIDIA Corporation and other Respondents. In its notice, the ITC has affirmed the findings of the Administrative Law Judge (ALJ), with certain modifications. The final determination, including such modifications, has yet to be released.

4:18PM Integrated Device beats by $0.03, beats on revs (IDTI) 5.63 +0.17 : Reports Q1 (Jun) earnings of $0.14 per share, excluding non-recurring items, $0.03 better than the Thomson Reuters consensus of $0.11; revenues rose 36.5% year/year to $158.3 mln vs the $151.6 mln consensus.

4:08PM Sanmina-SCI misses by $0.02, beats on revs; guides Q4 EPS in-line, revs in-line (SANM) 15.74 +0.58 : Reports Q3 (Jun) earnings of $0.32 per share, $0.02 worse than the Thomson Reuters consensus of $0.34; revenues rose 34.4% year/year to $1.63 bln vs the $1.6 bln consensus. Co issues in-line guidance for Q4, sees EPS of $0.35-0.41 vs. $0.38 Thomson Reuters consensus; sees Q4 revs of $1.65-1.70 bln vs. $1.65 bln Thomson Reuters consensus.

4:07PM Volterra Semi beats by $0.03, reports revs in-line (VLTR) 27.64 +0.64 : Reports Q2 (Jun) earnings of $0.40 per share, $0.03 better than the Thomson Reuters consensus of $0.37; revenues rose 76.3% year/year to $40.2 mln vs the $40.1 mln consensus.

4:05PM Veeco Instruments beats by $0.18, beats on revs; guides Q3 EPS above consensus, revs above consensus (VECO) 44.66 +1.93 : Reports Q2 (Jun) earnings of $1.01 per share, $0.18 better than the Thomson Reuters consensus of $0.83; revenues rose 251.4% year/year to $253 mln vs the $232 mln consensus. Co issues upside guidance for Q3, sees EPS of $1.23-$1.43 vs. $1.05 Thomson Reuters consensus; sees Q3 revs of $290-$315 mln vs. $282.60 mln Thomson Reuters consensus. VECO says that based on its strong backlog and current order visibility, co is currently forecasting that 2010 revenues will be over $1 billion, with strong YoY growth from 2009 in revenue and profitability in all three business segments.

4:01PM PLX Tech reports EPS in-line, revs in-line; guides Q3 revs in-line (PLXT) 4.57 +0.15 : Reports Q2 (Jun) earnings of $0.07 per share, in-line with the Thomson Reuters consensus of $0.07; revenues rose 63.2% year/year to $29.7 mln vs the $29.9 mln consensus. Co issues in-line guidance for Q3, sees Q3 revs of $30-32 mln vs. $31.30 mln Thomson Reuters consensus.

6:38AM Fairchild Semi confirms court's decision that it willfully infringed Power Integrations patents (FCS) 10.28 : Co said it expects to appeal a federal court's decision Friday that the company willfully infringed Power Integrations (POWI) patents. The ruling has no impact on Fairchild's business. The company voluntarily stopped U.S. sales of affected products in 2007, replacing them with products that Power Integrations agrees do not infringe the asserted patents. Meanwhile, the two companies continue to fight three other lawsuits... Fairchild maintains that its products do not violate Power Integrations patents and that it respects the intellectual property rights of its competitors.


icon url

ReturntoSender

07/28/10 12:30 AM

#9014 RE: ReturntoSender #6755

From Briefing.com: 4:15 pm : The stock chopped its way to a flat finish after struggling to find direction during the first half of the session. Yet despite a sense of uncertainty among stocks, neither Treasuries nor precious metals found favor.

Stocks put together a strong start on the back of better-than-expected earnings from diversified financial services outfit UBS (UBS 16.50, +1.35) and an increase in income at Deutsche Bank (DB 68.06, +1.88). News that the Basel Committee on Banking Supervision will allow less strict capital and liquidity requirements for banks added to the positive backdrop surrounding financials in the early going.

Dow component DuPont (DD 40.38, +1.39) added to the positive tone by turning in an upside earnings surprise.

Meanwhile, embattled energy giant BP (BP 38.00, -0.65) reported a steep second quarter loss that was the result of expenses related to the oil spill in the Gulf. The oil outfit also announced plans to sell some $30 billion in assets during the next 18 months and confirmed that CEO Tony Hayward will be replaced by Robert Dudley in October.

Not all reports were strong. An earnings miss by U.S. Steel (X 45.76, -3.13) sent its shares to their worst loss in more than a month. The slide was exacerbated by profit taking, given that the stock had climbed more than 30% from its July low to the prior session's close. Peer AK Steel (AKS 14.49, -0.71) actually exceeded expectations for the quarter, but that couldn't keep profit takers away.

Retailers traded with outsized losses for almost the entire session. The group dropped 1.9%. Though there is no empirical evidence linking spending with consumer confidence, some suggested that the Conference Board's latest Consumer Confidence Index played a part in the weakness of the retail space. The Consumer Confidence Index for July came in at 50.4, which is down from the upwardly revised 54.3 that had been recorded for the prior month and slightly below the 61.0 that had been widely expected.

The broader market actually made a solid bounce shortly after the release of the report, but they were quick to give up that gain. Stocks then struggled to find their direction for the rest of the session.

The choppy, sideways slog that characterized afternoon trade came after stocks cleared their 200-day moving average in the prior session and settled at one-month highs. What's more, with stocks up more than 9% since their July low some wonder if the market is overbought in the near-term.

Such a prospect seemed to boost utilities stocks, which outperformed with a 1.6% gain. The sector remains in focus tomorrow with the release of earnings from Dominion (D 43.27, +0.67) and Southern Co. (SO 36.73, +0.65).

However, Treasuries, traditional safe havens, were weak for the entire session. Results from a $38 billion auction of 2-year Notes didn't do anything to lift demand. The auction attracted a bid-to-cover of 3.3, an indirect bidder participation rate of 33%, and dollar demand of $126.5 billion, each of which was down from the prior auction.

Precious metals had to grapple with stiff selling. In the process the price of gold dropped to its lowest level since May and settled with a 1.9% loss at $1158 per ounce. Silver prices settled 3.0% lower at $17.63 per ounce.

Advancing Sectors: Utilities (+1.6%), Consumer Staples (+0.4%), Telecom (+0.4%), Financials (+0.1%), Tech (+0.1%)
Declining Sectors: Consumer Discretionary (-1.2%), Industrials (-0.8%), Materials (-0.6%), Energy (-0.4%)
Unchanged: Health Care DJ30 +12.26 NASDAQ -8.18 NQ100 -0.1% R2K -0.5% SP400 -0.7% SP500 -1.17 NASDAQ Adv/Vol/Dec 1104/2.07 bln/1493 NYSE Adv/Vol/Dec 1332/1.11 bln/1686

4:30PM Juniper Networks to acquire SMobile for $70 mln in cash (JNPR) 28.08 -0.77 :

4:16PM Integrated Silicon beats by $0.07, beats on revs, Q4 revs in-line (ISSI) 9.54 -0.15 : Co reports Q3 EPS of $0.57, $0.07 better than the $0.50 Thomson Reuters consensus; revs rose 25% year/year to $71.2 mln vs $68.44 mln Thomson Reuters consensus. The co currently expects its revenue for the September quarter to be between $74-80 mln, vs $74.30 mln Thomson Reuters consensus, and its gross margin to be between 34-37%.

4:15PM Silicon Image beats by $0.06, beats on revs; guides Q3 revs above consensus (SIMG) 3.36 -0.11 : Reports Q2 (Jun) earnings of $0.03 per share, $0.06 better than the Thomson Reuters consensus of ($0.03); revenues rose 30.0% year/year to $44.6 mln vs the $38 mln consensus. Co issues upside guidance for Q3, sees Q3 revs of $48-50 mln vs. $43.45 mln Thomson Reuters consensus.

4:04PM RF Micro Device beats by $0.01, beats on revs; guides Q2 in line with Q1 (RFMD) 4.30 -0.05 : Reports Q1 (Jun) earnings of $0.16 per share, $0.01 better than the Thomson Reuters consensus of $0.15; revenues rose 28.8% year/year to $273.8 mln vs the $263.9 mln consensus. Co issues in-line guidance for Q2, sees Q2 results in line with Q1; $0.16 in Q1 vs $0.16 Q2 consensus; Q1 revs were $273.8 mln vs $274.65 mln Q2 consensus. RFMD currently expects revenue growth to accelerate in fiscal 2012 as major programs at new and existing customers ramp into volume production.

4:01PM Qualcomm and ECOtality (ECTY) to enable electric vehicle charging stations with cellular connectivity (QCOM) 39.22 -0.02 : Co and ECOtality Incorporated (ECTY) have entered into an agreement to implement cellular connectivity into charging stations. The solution will allow ECOtality to use a commercial cellular network to manage its Blink brand charging station operations, transfer usage data, download firmware updates and publish availability to electric vehicle drivers in real time.
icon url

ReturntoSender

07/28/10 7:13 PM

#9015 RE: ReturntoSender #6755

From Briefing.com: 4:10 pm : Briefing.com covered more than 150 earnings reports between the prior session's close and this morning's open. The vast majority of those announcements featured upside earnings surprises, but market participants were generally unimpressed, such that stocks ultimately succumbed to a broad selling effort that left the major averages to settle lower between 0.4% and 1.0%.

Managed care providers Aetna (AET 27.56, -0.80) and WellPoint (WLP 50.82, -1.98) both produced better-than-expected earnings for the latest quarter and even increased their forecasts, but the pair was dropped markedly, such that shares of managed care stocks sank a collective 2.5%.

Such weakness weighed on the overall health care sector for the entire session. As a result, health care stocks shed 1.4% this session. That made them the worst performing sector of the day.

Telecom traded with relative strength for the entire session and settled with a 0.4% gain. That made it the only sector to stage a gain this session. Wireless services provider Sprint Nextel (S 4.84, +0.01) was a primary leader after it posted an upside earnings surprise. However, integrated giant AT&T (T 26.20, +0.05) lagged after it was placed on Standard & Poor's ratings watch list.

Boeing (BA 67.32, -1.30) was one of the worst performing blue chips this session. Investors ignored the company's better-than-expected bottom line since it came amid a light revenue figure and failed to lead to an increased forecast.

In other earnings news, Las Vegas Sands (LVS 26.69, +1.41), Comcast (CMCSA 19.56, +0.23), Broadcom (BRCM 37.47, -0.06), and Aflac (AFL 49.52, -1.19) each exceeded earnings expectations for the latest quarter. CVS (CVS 31.54, +0.94) had in-line results, but Newmont Mining (NEM 55.40, -0.38) missed.

Data did nothing to inspire traders this session. That was largely because durable goods orders for June made a surprise 1.0% decline when a 1.0% increase had been anticipated. Orders less transportation fell 0.6%, which contrasted with the 0.6% increase that had been widely expected. Both total orders and orders less transportation for the prior moth were revised downward to reflect a 0.8% decline a 1.2% increase, respectively.

The Fed's latest Beige Book saw a muted response since it failed to provide any new insight into economic conditions. In step with recent comments from Fed Chairman Bernanke at his semiannual testimonies to the Senate and House, the Beige Book stated that the economic recovery has slowed in some areas.

Treasuries were flat for most of the session, but a bid surfaced in the afternoon to take the yield on the benchmark 10-year Note back below 3.0%. The move came as stocks encountered increased selling and market participants digested results from an auction of 5-year Notes. The auction produced a bid-to-cover ratio of almost 3.1 and had an indirect bidder participation rate of 47.3%. Dollar demand for the auction totaled $113.2 billion. Each measure was above that of the prior session.

In the commodity pits, oil prices settled with a 0.7% loss at $76.99 per barrel after they had been as low as $75.90 per barrel amid news that oil inventories for the week ended July 23 had increased by 7.31 million barrels, which was far more bearish than the draw of 1.73 million barrels that had been expected.

In contrast, natural gas prices staged a 1.4% gain to settle at $4.71 per MMBtu.

Precious metals prices diverged as gold gained 0.2% to close pit trade at $1160.40 per ounce and silver prices extended their slide from the prior session to settle with a 1.0% loss at $17.44 per ounce. DJ30 -39.81 NASDAQ -23.69 SP500 -7.72 NASDAQ Adv/Vol/Dec 762/1.84 bln/1841 NYSE Adv/Vol/Dec 995/1.00 bln/2013

6:41PM Teradyne beats by $0.22, beats on revs; guides Q3 EPS above consensus, revs above consensus (TER) 10.21 -0.29 : Reports Q2 (Jun) earnings of $0.69 per share, excluding non-recurring items, $0.22 better than the Thomson Reuters consensus of $0.47; revenues rose 168.2% year/year to $454.8 mln vs the $408.3 mln consensus. Co issues upside guidance for Q3, sees EPS of $0.75-0.83 vs. $0.45 Thomson Reuters consensus; sees Q3 revs of $490-520 mln vs. $416.80 mln Thomson Reuters consensus.

4:41PM Monolithic Power beats by $0.02, reports revs in-line; guides Q3 revs above consensus (MPWR) 19.17 -0.52 : Reports Q2 (Jun) earnings of $0.31 per share, $0.02 better than the Thomson Reuters consensus of $0.29; revenues rose 35.2% year/year to $55.7 mln vs the $55.6 mln consensus. Co issues upside guidance for Q3, sees Q3 revs of $66-70 mln vs. $59.65 mln Thomson Reuters consensus.

4:41PM Newport beats by $0.08, beats on revs; guides FY10 EPS above consensus, revs above consensus (NEWP) 10.83 -0.08 : Reports Q2 (Jun) earnings of $0.22 per share, $0.08 better than the Thomson Reuters consensus of $0.14; revenues rose 31.0% year/year to $114.6 mln vs the $108.5 mln consensus. Co issues upside guidance for FY10, sees EPS of $0.80-0.90 vs. $0.64 Thomson Reuters consensus; sees FY10 revs of $460-470 mln vs. $441.44 mln Thomson Reuters consensus.

4:37PM Cadence Design beats by $0.04, beats on revs; guides Q3 EPS below consensus, revs in-line; guides FY10 EPS in-line, revs above consensus (CDNS) 6.45 -0.17 : Reports Q2 (Jun) earnings of $0.07 per share, $0.04 better than the Thomson Reuters consensus of $0.03; revenues rose 8.1% year/year to $227 mln vs the $220.9 mln consensus. Co issues mixed guidance for Q3, sees EPS of $0.01-0.03 vs. $0.05 Thomson Reuters consensus; sees Q3 revs of $225-235 mln vs. $225.52 mln Thomson Reuters consensus. Co issues mixed guidance for FY10, sees EPS of $0.12-0.16 vs. $0.15 Thomson Reuters consensus; sees FY10 revs of $900-925 mln vs. $897.13 mln Thomson Reuters consensus.

4:29PM TriQuint Semi beats by $0.05, reports revs in-line; guides Q3 EPS above consensus, revs in-line (TQNT) 7.33 +0.02 : Reports Q2 (Jun) earnings of $0.20 per share, $0.05 better than the Thomson Reuters consensus of $0.15; revenues rose 14.8% year/year to $207.5 mln vs the $205.9 mln consensus. Co issues mixed guidance for Q3, sees EPS of $0.20 vs. $0.18 Thomson Reuters consensus; sees Q3 revs of $215-225 mln vs. $216.88 mln Thomson Reuters consensus. Co expects strong growth in their mobile devices market will lead to a non-GAAP gross margin between 40% and 41%.

4:23PM NVIDIA guides well below consensus (NVDA) 10.13 -0.33 : Co now sees Q2 revs $800-820 mln vs $955.03 mln Thomson Reuters consensus; down from $950-970 mln prior guidance. The revenue shortfall occurred primarily in the consumer GPU business, resulting from increased memory costs and economic weakness in Europe and China. The increased solution cost of discrete GPUs led to a greater-than-expected shift to lower-priced GPUs and PCs with integrated graphics. No conference call will be held in conjunction with this business update.

4:13PM LSI Logic reports EPS in-line, misses on revs; guides Q3 EPS in-line, revs below consensus (LSI) 4.74 -0.23 : Reports Q2 (Jun) earnings of $0.11 per share, excluding non-recurring items, in-line with the Thomson Reuters consensus of $0.11; revenues rose 0.3% year/year to $639.4 mln vs the $654.4 mln consensus. Co issues guidance for Q3, sees EPS of $0.08-0.14, excluding non-recurring items, vs. $0.13 Thomson Reuters consensus; sees Q3 revs of $625-655 mln vs. $694.97 mln Thomson Reuters consensus.

4:08PM Monolithic Power announces $50 million stock repurchase program (MPWR) 19.50 -0.19 :

4:02PM Lam Research beats by $0.20, beats on revs (LRCX) 41.66 -0.98 : Reports Q4 (Jun) earnings of $1.17 per share, $0.20 better than the Thomson Reuters consensus of $0.97; revenues rose 219.2% year/year to $695.3 mln vs the $656.5 mln consensus. Q4 operating margin of 22.4% vs consensus of 23.9%

8:04AM Silicon Labs beats by $0.08, reports revs in-line (SLAB) 42.78 : Reports Q2 (Jun) earnings of $0.72 per share, $0.08 better than the Thomson Reuters consensus of $0.64; revenues rose 29.1% year/year to $134.6 mln vs the $133.8 mln consensus.

07:20 am RF Micro Device downgraded to Mkt Perform at Charter Equity: . Charter Equity downgrades RFMD to Mkt Perform from Buy saying while they are increasing estimates to reflect an improved margin profile, they are reducing their rating to reflect the more difficult environment for equities in general and semiconductors in particular.
icon url

ReturntoSender

07/31/10 7:05 PM

#9016 RE: ReturntoSender #6755

Amateur Investors Weekend Market Analysis 7/31/2010

http://www.amateur-investor.net/Weekend_Market_Analysis_July_31_10.htm

This week let's revisit work done by Robert Shiller which compares the historical PE Ratio (blue line) versus the Inflation Adjusted S&P Composite (red line) going back to 1899. The long term historical average PE Ratio based on Shiller's work is 16.3 going back to 1899 as denoted by the black line in the chart below. As you can see back in early 2009 the PE Ratio dropped below the long term historical average (point A) which was followed by an 83% rally in the S&P Composite. Thus it appears the Institutional Money thought it was undervalued enough to justify buying it just below the PE Ratio's long term average.

Meanwhile since 1900 based on Inflation Adjusted values major market bottoms haven't occurred until the PE Ratio has dropped back to at least the 7.0 level (points B) as denoted by the purple line. These occurred in the early 1980's, early 1930's and further back in the early 1920's. Thus the question is will Shiller's PE Ratio have to drop back to the 7.0 level at some point in the future before the next major bottom occurs for this current cycle?


Finally the last thing I would like to point out is that there is a defined upward channel (green lines) going back to the late 1920's and early 1930's. Thus the second question is will the bottom of this channel eventually be tested at some point in the future?

icon url

ReturntoSender

08/01/10 12:00 PM

#9018 RE: ReturntoSender #6755

Monday Morning Outlook: Seven Percent July Gain was DJIA's Best Advance in a Year
The 1,115 level could pose a technical challenge for the SPX
by Todd Salamone 7/31/2010 11:02 AM

http://www.schaeffersresearch.com/commentary/observations.aspx?ID=101398

The Dow Jones Industrial Average (DJIA) was flat for the week, but gained 7.1% during the month of July -- its biggest monthly advance in a year. Meanwhile, the S&P 500 Index (SPX) and the Nasdaq Composite (COMP) also skyrocketed to 6.9% monthly gains. Looking ahead, Todd Salamone, Senior Vice President of Research, is seeing more put buying on major exchange-traded funds, which we interpret as hedge funds buying protection when they are in accumulation mode. However, Todd is also worried about intermediate-term turbulence amid midterm elections and a regulatory environment that is anything but business-friendly. Later, Senior Quantitative Analyst Rocky White finds that the 1,115 level has been smackdown territory for the SPX several times this year. In fact, 1,115 is the approximate level at which the SPX kicked off the year, and Rocky wonders whether the index's level at the beginning of the year functions as resistance in tough markets (and vice versa, acting as support in uptrending markets). You'll be interested in his findings. Finally, we wrap up with a look at some key economic and earnings reports slated for release this week.

Recap of the Previous Week: A Flat Week, But a Great Month
By Joseph Hargett, Senior Equities Analyst

The week was mostly a wash, with the Dow Jones Industrial Average adding about 40 points. But what a month! All three major market indexes sprinted to healthy gains of approximately 7% in July. With earnings season in full swing, bulls found a lot to like in a parade of mostly positive reports. Even so, bulls were chastened by increasing evidence that the road to economic recovery could be slow and painful, and the final week of the month was mostly flat.

Stocks picked up on Monday where they left off the previous Friday, and the Dow skipped ahead another 100 points, or nearly 1%. Traders were encouraged by an upbeat outlook from business bellwether FedEx (FDX), and a 23.6% increase in new home sales for June.

After three straight days of 100-point gains, the bulls took a breather on Tuesday, with the DJIA eking out a 0.12% gain. DuPont (DD) reported solid second-quarter earnings and lifted its full-year forecast, and the S&P/Case-Shiller home price index rose in May, echoing Monday's upbeat housing stats. However, the U.S. consumer remained wary; the Conference Board reported that its Consumer Confidence Index fell to a five-month low of 50.4 in July.

Boeing (BA) set a gloomy tone for Wednesday with a second-quarter earnings miss; the aerospace giant also disappointed with its outlook for the full year. Moreover, traders heard yet another confirmation that the economic recovery remains weak when the Commerce Department reported that U.S. durable goods orders fell 1% in June. The Fed whistled the same tune with the afternoon release of the Beige Book, in which most of the 12 Federal Reserve districts reported stagnant or slowing economic progress. The Dow backpedaled all day long, finally settling on a loss of 0.38%.

Slightly disappointing outlooks from the likes of Exxon Mobil (XOM) and Colgate-Palmolive (CL) were offset by slightly better-than-expected numbers on jobless claims on Thursday. However, St. Louis Fed President James Bullard shook things up by raising the specter of "Japan-style" deflation if the Fed keeps interest rates too low for too long. "With a little bit weaker numbers on the economy and inflation a little bit low," Bullard said, "people are starting to talk about the possibility of a Japanese-style outcome for the U.S." The Dow fought a battle with the breakeven line for most of the day, but swooned into the close, losing 0.29%.

Second-quarter gross domestic product (GDP) data was released first thing Friday morning, revealing slower-than-anticipated economic growth. The Dow tumbled more than 100 points in the first 15 minutes. But the bulls fought back, aided partly by a report showing robust manufacturing activity in the Midwest, with the Dow finishing the session with a tiny loss of 0.01%. For the week, the DJIA was flat, adding 0.4% For the month, though, the index added a very healthy 7.1%, marking its biggest monthly gain in a year. Meanwhile, the SPX gave back 0.1% last week, but tacked on 6.9% for the month, while the COMP surrendered 0.7% for the week, but added 6.9% in July.

What the Trader Is Expecting in the Coming Week: Watching the Hedge Funds for Clues
Todd Salamone, Senior Vice President of Research

"Investors more than halved their equity overweight positions this month and boosted bond holdings as their expectations for global economic growth collapsed, a survey from BofA Merrill Lynch showed on Tuesday [July 13] ... Hedge funds' net exposure to equity markets - measured as long minus short as a percentage of capital — fell to 18 percent, the lowest level since March 2009, from 29 percent in June ... Investors' overweight in U.S. equities tumbled to 7 percent this month from 20 percent."
Reuters News, July 13, 2010

"The 1.65 trillion hedge-fund industry, after posting its worst second-quarter performance in a decade, is taking less risk, using less debt and making fewer trades, according to data from securities exchanges and brokers including Credit-Suisse AG and JPMorgan Chase & Co. Hedge-fund clients of Zurich-based Credit Suisse held 24 percent of their assets in cash in June, compared with 19 percent three months earlier."
Bloomberg News, July 30, 2010

If you believe that hedge funds are the predominant force in the current market environment, as we do, the trends reported by articles such as these are extremely relevant. These stories were produced for public consumption during the past couple of weeks, but our daily analysis of option activity on major exchange-traded funds (ETF) has indicated for weeks now what has been revealed in these articles.

Below is a chart of the combined 20-day buy (to open) put/call volume ratio on three major ETFs - the SPDR S&P 500 ETF Trust (SPY), the PowerShares QQQ Trust (QQQQ), and the iShares Russell 2000 Index Fund (IWM). Hedge funds are heavy users of these products, and will often buy puts on these exchange-traded funds when they are accumulating individual stocks.

A rising buy (to open) put/call volume ratio is often indicative that the hedge fund world is in accumulation mode, as they buy ETF puts to hedge long positions. However, a decreasing ratio of put volume to call volume can point to less put protection being purchased, which is often a sign that hedge fund managers have had their fill, resulting in a loss of bullish market momentum or leaving the market vulnerable to a corrective phase. As you can see, the ratio moved sharply lower in late April/early May, an indication that hedge fund managers were no longer in buying mode.


With retail investors pulling money from equity funds for three-plus years, this leaves little room for traditional fund managers to accumulate stocks. It is the hedge funds and high-frequency traders who are dominating market action at present. Therefore, when hedge fund managers are not actively bidding stocks higher, there is little chance the stock market will make any significant headway. Worse yet, if hedge fund managers are in distribution mode, corrections occur. Finally, if hedge funds are neither aggressively buying nor selling shares, it is the mean-reverting actions of high-frequency traders that influence the market, often resulting in painful trading-range action.

Referring back again to the chart above, it is encouraging if you are a market bull to see the 20-day buy (to open) put/call volume ratio turn higher from relatively low levels earlier this month, as it suggests that hedge fund managers with heavier-than-normal cash positions are in accumulation phase once again. The big question is whether or not they'll remain in buying mode for a sustained period, as in 2009.

This relates to a comment that I made on CNBC this past Thursday about the firepower that exists at present for a strong bullish move in equities. The statement was qualified with the uncertainty related to the timing of such a move, as investors continue to fret over the slowdown in economic growth amid a regulatory environment that is far from "business friendly," and tax reform that may not be "investor friendly" in the year ahead. Throw in the upcoming midterm elections in November, and such uncertainty could drive hesitancy among potential investors.

Turning to the technical backdrop, the SPX comes into the new week trading not far below stiff resistance in the 1,115-1,120 region. For long-time readers of Monday Morning Outlook, you might remember the significance of this area, which served as resistance for several weeks in late 2009, as traders focused on the 1,121 level being a 61.8% Fibonacci retracement of the 2007 high and 2009 low.

Presently, in addition to the Fibonacci significance of the 1,120 area, there are important trendlines converging in the 1,115-1,120 zone -- specifically, the 80-day, 160-day and 200-day moving averages could continue their role as resistance in the near term. Moreover, 1,117 is the site of the SPX's June closing high, and 1,115.10 is the site of 2009's close. (For more on the potential importance of year-end closes as support/resistance levels, be sure to read Rocky White's "Indicator of the Week" segment on page 2.)

With the SPX still below 1,120, the bears are still in the driver's seat. A short-term swing lower could push the SPX back to the 1,040-1,050 area. But, if hedge fund managers are indeed in accumulation mode -- which current option activity on major ETFs suggests -- look for 1,120 to be penetrated to the upside.


Given the firepower on the sidelines, our advice is to retain long exposure, but continue to hedge so that you can stay whole during periods of market turbulence.

Finally, I'll leave you with seasonality statistics as we move into the month of August. During the past 30 years, the month of August has ushered the SPX higher 63% of the time, for an average gain of 0.40%. The average percentage gain ranks ninth out of the 12 months. However, the month of August has been even better for investors since the turn of the century. During the past 10 years, the SPX has finished higher eight times during August, and the average monthly return of 0.90% ranks it third out of the 12 months.

Prepare for the investing week ahead. Every week, Bernie Schaeffer and his staff provide you with their insight about what has happened and, more importantly, what will happen in the market. We dig deep and show you what's happening behind the scenes, and tell you which indicators are predicting major market moves. If you enjoyed this week's edition of Monday Morning Outlook, sign up here for free weekly delivery straight to your inbox.

Indicator of the Week: S&P 500 Resistance at 1,115
By Rocky White, Senior Quantitative Analyst

Foreword: Bernie Schaeffer pointed out in an e-mail that the S&P 500 Index (SPX) got smacked down this past week just as it was about to move into positive territory for the year. The same thing happened in June. Is this by accident? Perhaps, but it also may be that 1,115 (about where the SPX began the year) is acting as some sort of resistance level. Are traders psychologically anchoring the index to where it stood at the beginning of the year?

As the index approaches this level from below, traders seem to view prices as becoming high- and therefore begin selling. Or maybe big-money players have an interest in whether the market finishes up or down for the year. If so, then the SPX's trek toward the 1,115 region might prompt a bunch of hedging and/or speculative activity, which should ultimately send the index in one direction or the other, depending on whether the bulls or bears win out.


Look at 2009 in the chart below. The S&P 500 began the year in a freefall, bottoming out in March. From early March until the end of the year, the market steadily climbed 67% higher. In fact, the only time the market struggled for any length of time was from May through July, just as the index was moving into positive territory for the year.


More Historical Results: These few observations made me curious, so I went back to 1972 on the S&P 500. I determined where the index began the year and called it the 0% YTD line. Finally, I calculated the returns for the market depending on whether the SPX approached this 0% YTD line from below or from above. If the barometer approached it from below, then I called it a resistance line; a summary of the results is in the top table (red). If the index approached it from above, I called it a support line, as reflected in the green table below.

The returns are pretty interesting. The findings support the theory that the index's level at the beginning of the year can act as support or resistance for the market. Focusing on the one-month returns when the SPX has approached this level from below, we find the indez has a tendency to get knocked down. It's positive in the next month only 35% of the time, and averages a loss of nearly 1%. On the other hand, when the market is positive and the SPX approached this level from above, the month was positive 64% of the time, averaging a return of 3.84%.

S&P 500 YTD returns 0% YTD line as support and resistance


This Week's Key Events: More Earnings, and Jobless Numbers on Friday
By Joseph Hargett, Senior Equities Analyst

Earnings season continues at a busy clip. Here is a brief list of some of the key events for the upcoming week. All earnings dates listed below are tentative and subject to change. Please check with each company's respective website for official reporting dates.

Monday
* The Commerce Department will release its construction spending report for June on Monday. We'll also get a look at the Institute for Supply Management (ISM) Index for June. Humana Inc. (HUM), Loews Corp. (L), MannKind Corp. (MNKD), Aflac Inc. (AFL), Evergreen Solar Inc. (ESLR), General Cable Corp. (BGC), SBA Communications Corp. (SBAC), and Verisign Inc. (VRSN) will release their quarterly earnings reports.

Tuesday
* The Commerce Department will weigh in again on Tuesday morning with reports on personal income, personal spending and factory orders for June. We'll learn about July auto sales in the afternoon. Archer Daniels Midland Co. (ADM), ArvinMeritor Inc. (ARM), Coach Inc. (COH), D.R. Horton Inc. (DHI), Duke Energy Corp. (DUK), The Dow Chemical Co. (DOW), Marathon Oil Corp. (MRO), MasterCard Inc. (MA), MGM Resorts International (MGM), Molson Coors Brewing Co. (TAP), OfficeMax Inc. (OMX), Pfizer Inc. (PFE), The Procter & Gamble Co. (PG), Rowan Companies Inc. (RDC), Solarfun Power Holdings Co. Ltd. (SOLF), Tenet Healthcare Corp. (THC), Anadarko Petroleum Corp. (APC), AvalonBay Communities Inc. (AVB), CBS Corp. (CBS), Force Protection Inc. (FRPT), Leap Wireless International Inc. (LEAP), Novatel Wireless Inc. (NVTL), priceline.com Inc. (PCLN), STEC Inc. (STEC), True Religion Apparel Inc. (TRLG), and Whole Foods Market Inc. (WFMI) are scheduled to report earnings.

Wednesday
* The market will be graced with the weekly report on U.S. petroleum supplies on Wednesday, along with the ISM services index, but the Street will likely pay the most attention to the ADP report on private sector employment, the first of three days worth of employment data. Agrium Inc. (AGU), AOL Inc. (AOL), Garmin Ltd. (GRMN), IntercontinentalExchange Inc. (ICE ), Polo Ralph Lauren Corp. (RL), Qwest Communications International Inc. (Q), Sirius XM Radio Inc. (SIRI), Time Warner Inc. (TWX), TRS Automotive Holdings Corp. (TRW), Transocean Ltd. (RIG), and Yamana Gold Inc. (AUY) will post their quarterly results.

Thursday
* The weekly report on initial jobless claims will be released on Thursday. Beazer Homes USA Inc. (BZH), Diana Shipping Inc. (DSX), DIRECTV (DTV), Fuel Systems Solutions Inc. (FSYS), Hyatt Hotels Corp. (H), Liz Claiborne Inc. (LIZ), Playboy Enterprises Inc. (PLA), Time Warner Cable Inc. (TWC), Activision Blizzard Inc. (ATVI) and Kraft Foods Inc. (KFT) will report earnings.

Friday
* On Friday, the Labor Department will release the month's highly anticipated nonfarm payrolls and unemployment reports. Joining the earnings parade will be China Sunergy Co. Ltd. (CSUN) and Dynegy Inc. (DYN).
icon url

ReturntoSender

08/04/10 7:02 PM

#9022 RE: ReturntoSender #6755

From Briefing.com: 4:30 pm : A better-than-expected ADP Employment reading and a stronger-than-expected ISM Service Index gave stocks a lift, but caution ahead of other pivotal jobs data limited gains until an afternoon bid lifted the major averages out of their trading ranges to a solid finish.

The July ADP Employment Change showed that 42,000 jobs were added to private payrolls last month. Given that the increase was greater than the 25,000 additions that had been widely expected, some hope that the official nonfarm payrolls figures will be stronger than currently forecast when they are released Friday morning. Before that, participants must digest the latest weekly initial jobless claims count, which is due tomorrow morning.

While the ADP data gave stocks a positive start this session, gains grew when the July ISM Service Index came in at 54.3, which bested the 53.0 that had been expected.

However, gains were dashed when stocks ran into resistance near the stock market's weekly high and rumors surfaced that China's regulators have requested stress tests of their banks. The alleged tests would consider a 60% decline in residential property prices. That prompted some concern about how the possibility of plummeting property prices in China would hurt the global recovery.

Though there was no real leadership to speak of, stocks fought off efforts to take them into the red. They then chopped along with modest gains before gradually climbing into the close.

Retailers outperformed with a 2.2% gain. The space was spurred higher by better-than-expected earnings and upside guidance Priceline (PCLN 281.30, +50.63) and news that Barnes & Noble (BKS 15.31, +2.47) will pursue strategic alternatives. The near 20% surge in shares of BKS helped lead both the Russell 2000 and the S&P 400 to a 1.1% gain.

For the most part, other corporate announcements had little influence on overall trade, but Goldman Sachs (GS 156.41, +3.22) garnered support for itself amid word from CNBC that the firm might spin out its prop trading arm. Some see the move as one that would promote earnings growth. As for the broader financial sector, it lagged for most of the session and finished just 0.3% higher.

Defensive-oriented plays in the utilities and telecom sectors were also laggards. Utilities eked out a 0.1% gain, while telecom fell 0.1% to finish as the only major sector to log a loss.

Lacking participation kept trading volume on the NYSE below 1 billion shares. That's well below the 50-day average of 1.28 billion shares that are usually exchanged on the Big Board.

Advancing Sectors: Consumer Discretionary (+1.5%), Health Care (+0.9%), Materials (+0.8%), Industrials (+0.7%), Tech (+0.6%), Energy (+0.5%), Consumer Staples (+0.3%), Utilities (+0.1%)
Declining Sectors: Telecom (-0.1%) DJ30 +44.05 NASDAQ +20.05 NQ100 +0.9% R2K +1.1% SP400 +1.1% SP500 +6.78 NASDAQ Adv/Vol/Dec 1744/2.04 bln/868 NYSE Adv/Vol/Dec 2248/975 mln/777

5:53PM Kulicke & Soffa beats by $0.12, beats on revs; guides Q4 revs in-line (KLIC) 7.20 +0.30 : Reports Q3 (Jun) earnings of $0.65 per share, $0.12 better than the Thomson Reuters consensus of $0.53; revenues rose 324.8% year/year to $221.3 mln vs the $205.3 mln consensus. Co issues in-line guidance for Q4, sees Q4 revs of $250-260 mln vs. $226.88 mln Thomson Reuters consensus. "while it is too early to provide December quarter guidance, we can say that we expect that quarter's revenue to be about comparable to September."

4:30PM Atmel beats by $0.05, beats on revs (ATML) 5.19 +0.05 : Reports Q2 (Jun) earnings of $0.11 per share, excluding non-recurring items, $0.05 better than the Thomson Reuters consensus of $0.06; revenues rose 38.2% year/year to $393.4 mln vs the $374.2 mln consensus.

4:26PM ON Semiconductor beats by $0.02, beats on revs; guides Q3 revs in-line (ONNN) 6.95 +0.16 : Reports Q2 (Jun) earnings of $0.24 per share, $0.02 better than the Thomson Reuters consensus of $0.22; revenues rose 38.9% year/year to $583.3 mln vs the $573.8 mln consensus. Co issues in-line guidance for Q3, sees Q3 revs of $585-$610 mln vs. $593.90 mln Thomson Reuters consensus. Sees Q3 gross margins of 42.5%-43%. "Backlog levels at the beginning of the third quarter of 2010 were up from backlog levels at the beginning of the second quarter of 2010 and represent over 90 percent of our anticipated third quarter 2010 revenues. We expect that average selling prices for the third quarter of 2010 will be approximately flat when compared to the second quarter of 2010."

11:21AM Research In Motion: Brightstar expands distribution relationship with Research In Motion in Hong Kong (RIMM) 53.74 -1.80 : Brightstar, has expanded its existing global distribution relationship with Research In Motion to Hong Kong. Brightstar will distribute BlackBerry smartphones to multiple retail channels in Hong Kong. Supported smartphone models include BlackBerry Bold(TM) 9700 in black and white and BlackBerry Curve 8520.

10:13AM Intel confirms U.S. Federal Trade Commission reach tentative settlement (INTC) 20.56 -0.15 : Co stated "Intel and the Federal Trade Commission (FTC) have reached a tentative settlement in the antitrust suit filed by the Commission December 16. The FTC sued Intel alleging Intel had violated Section 5 of the FTC Act. The settlement agreement expressly states that Intel does not admit either any violation of law or that the facts alleged in the complaint are true."

8:50AM Fairchild Semi reduces debt by another $122 mln (FCS) 8.82 : Co announces that on 7/30/2010 it voluntarily prepaid its B-1 incremental term loan of $121.6 million. The incremental B-1 loan, under its existing senior credit facility, had an interest rate of Libor + 2.50 percent. At current interest rates, this reduction in debt saves approximately $3.2 million annually in net interest expense.

6:33AM Sunpower completes largest solar power trackign system in Australia (SPWRA) 12.78 : Co announces it has completed a 505-kilowatt solar power installation for Horizon Power, a government-owned utility providing power to remote and regional communities and resource operations in Western Australia.

6:21AM United Micro beats by $0.01, reports revs in-line (UMC) 3.14 : Reports Q2 (Jun) earnings of $0.07 per share, $0.01 better than the Thomson Reuters consensus of $0.06; revenues rose 34.3% year/year to $927 mln vs the $919.4 mln consensus.

08:52 am Advanced Micro initiated with a Neutral at Sterne Agee: . Sterne Agee initiates AMD with a Neutral, saying servers continue to be strong but AMD's new platform launch should be incrementally positive in late 4Q10. While near-term PC sentiment has been overall negative with U.S.-Europe and China being weaker and July shipments down M/M, firm believes August shipments will see a 10%-20% M/M rebound. Firm says OEMs still appear to prefer sea shipments to offset component costs. But key to AMD and PC market near-term will be Back to School sales and retail picking up in Europe, with near-term retail sales sentiment negative in U.S. & Europe.

10:04 am STEC Guides Q3 EPS Well Above Consensus (STEC)

STEC (STEC 15.94 +0.29) reported second quarter earnings of $0.09 per share, excluding non-recurring items, $0.09 better than the Thomson Reuters consensus of ($0.00).

Revenues fell 29.1% year-over-year to $61.3 million, better than the $50.1 million consensus.

For the third quarter, the company expects to see earnings of $0.18 to $0.20 per share, excluding non-recurring items, well above the $0.13 Thomson Reuters consensus. Revenues are expected to be $78 million to $80 million, also well above consensus, which is $68.28 million.

09:59 am IOSP Reports Q2 EPS Well Above Last Year's Q2 (IOSP)

Innospec (IOSP 12.53 +0.77) reported diluted EPS of $0.66 for its second quarter, which is well above last year's EPS of $0.32.

On the top line, net sales grew 23% year-over-year to $168.4 million.
icon url

ReturntoSender

08/06/10 12:26 AM

#9023 RE: ReturntoSender #6755

From Briefing.com: 4:30 pm : A bleak weekly jobless claims count caused consternation ahead of tomorrow's pivotal nonfarm payrolls report. Stocks responded by plodding along with modest losses for the entire session.

Initial jobless claims for the week ended July 31 to a three-month high of 479,000, which was worse than the expected initial claims count of 455,000. Continuing claims came down 34,000 from the prior week, but they remain at uncomfortably high levels above 4.5 million.

Even though the weekly claims figures will not play a part in the calculation of the July payrolls report, which is due tomorrow, the data stirred concern that the report might not show the improvement that some had hoped for following a better-than-expected ADP Employment Change reading yesterday.

Uncertainty ahead of the payrolls report kept many on the sidelines. In turn, trading volume on the NYSE totaled a pathetic 875 million shares.

A lack of interest in stocks left stocks to trade listlessly for the entire session, though the major indices were able to trim their losses into the close.

Financials and tech stocks weighed on trade. The two sectors, which are the two largest by market cap and combine for 35% of the stock market's weight, both fell 0.4%. Weakness in the tech sector was partly owed to semiconductor stocks (-0.6%), while financials fell amid losses in consumer finance plays (-1.6%).

Insurers showed relative strength, though. Prudential Financial (PRU 58.00, +1.29) and Cigna (CI 33.96, +1.81) both bested earnings expectations. However, Hartford Financial (HIG 22.68, -1.16) lowered its profit outlook even though it had an upside earnings surprise of its own.

Retailers settled near session highs with a 0.6% gain, collectively. The group was led by Abercrombie & Fitch (ANF 39.53, +0.73), which posted stronger-than-expected same-store sales for July and greater-than-expected revenue figure for the latest quarter, and Macy's (M 19.78, +0.34), which also had stronger-than-expected same-store sales results, but went on to issue upside guidance.

Currencies lacked influence over the broader market as the dollar dipped 0.2%. Most of its weakness was owed to strength in the yen, which closed near its best levels of the year, and a bounce by the euro following the European Central Bank's decision to leave its benchmark rate unchanged at 1.00% and the Bank of England's choice to keep its target rate at 0.50% and maintain its bond repurchase program. ECB President Trichet followed up the decision with bullish comments about Europe's economy. That seemed to complement positive comments from other regional officials regarding fiscal progress in Greece.

Advancing Sectors: Materials (+0.3%), Telecom (+0.3%), Consumer Discretionary (+0.2%), Industrials (+0.1%), Energy (+0.1%)
Declining Sectors: Consumer Staples (-0.4%), Financials (-0.4%), Tech (-0.4%), Health Care (-0.1%)
Unchanged: Utilities DJ30 -5.45 NASDAQ -10.51 NQ100 -0.2% R2K -1.2% SP400 -0.5% SP500 -1.43 NASDAQ Adv/Vol/Dec 871/1.78 bln/1740 NYSE Adv/Vol/Dec 1273/875 mln/1733

3:30 pm : Commodities concluded pit trade for Thursday with mixed results, but the CRB Commodity Index still shed 0.5%.

Natural gas was one of the worst performers. It had been as high above $4.80 per MMBtu in the early going, but sellers stepped in once it was learned that weekly inventories had a build of 29 bcf, which is actually less than the 33 bcf that had been widely expected. Contract prices for the commodity closed 2.8% lower at $4.61 per MMBtu.

Oil prices never garnered any real support. In turn, contracts for crude closed with a 0.6% loss at $82.01 per barrel.

Precious metals made modest gains. Specifically, gold tacked on 0.3% to finish at $1199.30 per ounce and silver settled 0.2% higher at $18.32 per ounce.

In the soft commodities space, wheat prices continued their ascent. The grain gained 7.3% to close at $8.11 per bushel amid reports that Russia, which produces some 8% of the world's wheat, will ban exports of grains in August. DJ30 -11.28 NASDAQ -7.43 SP500 -1.50 NASDAQ Adv/Vol/Dec 957/1.44 bln/1620 NYSE Adv/Vol/Dec 1311/624 mln/1646

4:38PM Aehr Test Systems announces follow-on WaferPak contactor orders of ~$2 mln scheduled to ship during the next 4 months (AEHR) 1.36 -0.03 :

4:33PM Multi-Fineline beats by $0.04, reports revs in-line; guides Q4 revs in-line (MFLX) 24.42 -0.38 : Reports Q3 (Jun) earnings of $0.23 per share, ex-items, $0.04 better than the Thomson Reuters consensus of $0.19; revenues rose 3.7% year/year to $181 mln vs the $181 mln consensus. Co issues in-line guidance for Q4, sees Q4 revs of $220-$240 mln vs. $227.50 mln Thomson Reuters consensus.

4:30PM Diodes beats by $0.02, reports revs in-line; guides Q3 revs above consensus (DIOD) : Reports Q2 (Jun) earnings of $0.41 per share, excluding non-recurring items, $0.02 better than the Thomson Reuters consensus of $0.39; revenues rose 43.6% year/year to $149.2 mln vs the $148.2 mln consensus. Co issues upside guidance for Q3, sees Q3 revs of $158-164 mln vs. $153.79 mln Thomson Reuters consensus.

4:29PM Microchip misses by $0.04, reports revs in-line; guides Q2 EPS in-line, revs above consensus (MCHP) 30.76 +0.33 : Reports Q1 (Jun) earnings of $0.47 per share, $0.04 worse than the Thomson Reuters consensus of $0.51; revenues rose 66.3% year/year to $320.8 mln vs the $319.3 mln consensus. Co issues guidance for Q2, sees EPS of approx $0.52 vs. $0.52 Thomson Reuters consensus; sees Q2 revs of $340-$343 mln vs. $329.02 mln Thomson Reuters consensus. Sees Q2 gross margins of 62.7%.

4:10PM Brooks Automation beats by $0.05, reports revs in-line (BRKS) 8.16 +0.06 : Reports Q3 (Jun) earnings of $0.26 per share, excluding non-recurring items, $0.05 better than the Thomson Reuters consensus of $0.21; revenues rose 257.2% year/year to $156.8 mln vs the $156.5 mln consensus. "All current indications from our global customer base are for continued strong performance. We anticipate continued revenue growth and expanding operating margins in the near term and have high expectations for our business opportunities in targeted new market segments next year and beyond."

4:06PM TTM Tech beats by $0.05, beats on revs; guides Q3 EPS in-line, revs above consensus (TTMI) 10.13 -0.25 : Reports Q2 (Jun) earnings of $0.26 per share, $0.05 better than the Thomson Reuters consensus of $0.21; revenues rose 114.7% year/year to $310.2 mln vs the $301.6 mln consensus. Co issues mixed guidance for Q3, sees EPS of $0.26-$0.33 vs. $0.27 Thomson Reuters consensus; sees Q3 revs of $341-$357 mln vs. $325.77 mln Thomson Reuters consensus.

10:23AM MEMC Elec and DRI Energy sign channel partner agreement for the deployment of solar power installations of over 19 MW of solar capacity (WFR) 9.49 -0.05 :

icon url

ReturntoSender

08/07/10 7:42 PM

#9024 RE: ReturntoSender #6755

From Briefing.com: Weekly Recap - Week ending 06-Aug-10

Fannie Mae (FNMA/OTC) reported a net loss of $1.2 billion in the second quarter of 2010, compared to a net loss of $11.5 billion in the first quarter of the year. Net revenue was $4.5 billion in the second quarter of 2010, up 49 percent from $3.0 billion in the first quarter of 2010, due primarily to an increase in net interest income. Credit-related expenses, which are the total provision for credit losses plus foreclosed property expense, were $4.9 billion, down from $11.9 billion in the first quarter of 2010. The company expects its financial results will continue to be negatively affected by losses primarily on a subset of loans it acquired between 2005 and 2008.

The company expects that its credit-related expenses will remain high in 2010. However, the company expects that, if current trends continue, its credit-related expenses will be lower in 2010 than in 2009. Net fair value gains were $303 million in the second quarter, compared to losses of $1.7 billion in the first quarter of 2010, due primarily to lower fair value losses on the company's derivatives, which were partially offset by lower fair value gains on its trading securities. During the quarter, loans from Fannie Mae's 2009- 2010 book of business continued to perform solidly while credit-related expenses on the overall book of business decreased by more than $7 billion. Beginning in 2008, Fannie Mae raised its underwriting standards and sharply reduced its acquisitions of higher-risk loans to support sustainable homeownership. The impact of these changes is shown in the 2009 and 2010 vintages of Fannie Mae's single-family loans, which have the lowest early serious delinquency rates of any loans the company has acquired in the last 10 years. The company currently anticipates that these loans will be profitable.

Credit Losses: Almost all of the company's realized credit losses in 2009 and 2010 on single-family loans are attributable to single-family loans that it purchased or guaranteed from 2005 through 2008. While these loans will give rise to additional credit losses that it has not yet realized, the company estimates that it has reserved for the substantial majority of these losses... Housing Forecast: The company expects home prices to decline slightly for the balance of 2010 and into 2011 before stabilizing, and that home sales will be basically flat for all of 2010. Residential mortgage debt outstanding is expected to decline for the third year in a row.

Providing Liquidity: During the first half of 2010, the company purchased or guaranteed an estimated $423 billion in loans, which includes approximately $170 billion in delinquent loans the company purchased from its single-family mortgage-backed securities trusts. Fannie Mae remained the largest single issuer of mortgage-related securities in the secondary market during the second quarter, with an estimated market share of new single-family mortgage-related securities of 39.1 percent, compared with 40.7 percent in the first quarter of 2010.

4:16PM Kulicke & Soffa's CEO Will Retire on 9/30/2010; Bruno Guilmart is appointed New President and CEO (KLIC) 6.79 -0.82 :

4:14PM Hewlett-Packard issues preliminary Q3 EPS above prior guidance; sees Q4 EPS, revs in-line; raises FY10 EPS and rev guidance above consensus (HPQ) 46.30 -0.05 : Co issues upside guidance for Q3 (Jul), sees EPS of ~$1.08 vs. $1.07 Thomson Reuters consensus and guidance of $1.05-1.07. Co issues in-line guidance for Q4 (Oct), sees EPS of $1.25-1.27 vs. $1.26 Thomson Reuters consensus; sees Q4 (Oct) revs of $32.5-32.7 bln vs. $32.63 bln Thomson Reuters consensus. Co raises guidance for FY10 (Oct), sees EPS of $4.49-4.51 vs. $4.49 Thomson Reuters consensus, up from $4.45-4.50 previously; sees FY10 (Oct) revs of $125.3-125.5 bln vs. $124.52 bln Thomson Reuters consensus, up from $123.7-124.9 bln previously.

4:08PM Lattice Semi announces resignation of CEO effective September 4; appoints Christopher Fanning as Interim CEO (LSCC) 5.43 +0.09 : Co announces that Bruno Guilmart has resigned as President and CEO effective September 4, 2010 to pursue other opportunities. Mr. Guilmart is also resigning as a director and tendered his resignation on August 5, 2010. The Board has appointed Christopher M. Fanning as interim Chief Executive Officer, also effective September 4, 2010. Mr. Fanning currently serves as Lattice's Corporate Vice President and General Manager, Low Density & Mixed Signal Solutions.

4:06PM Hewlett-Packard CEO Mark Hurd resigns; CFO Cathie Lesjak appointed interim CEO (HPQ) 45.50 -0.86 : Co announced that Chairman, Chief Executive Officer and President Mark Hurd has decided with the Board of Directors to resign his positions effective immediately. The Board has appointed CFO Cathie Lesjak, 51, as CEO on an interim basis. Lesjak is a 24-year veteran of the company who has served as HP's CFO and as a member of the company's Executive Council since January 2007. She oversees all company financial matters and will retain her CFO responsibilities during the interim period. Hurd's decision was made following an investigation by outside legal counsel and the General Counsel's Office, overseen by the Board, of the facts and circumstances surrounding a claim of sexual harassment against Hurd and HP by a former contractor to HP. The investigation determined there was no violation of HP's sexual harassment policy, but did find violations of HP's Standards of Business Conduct. Lesjak has taken herself out of consideration as the permanent CEO but will serve as interim CEO until the selection process is complete. The selection of a new chairman will occur in conjunction with the CEO decision. (Stock is halted)

7:47AM Microchip earnings correction: Beats by $0.04; guides Q2 rev and EPS above consensus (MCHP) 30.76 : Last night we compared MCHP's Q1 GAAP results to the non-GAAP consensus. The co reported Q2 non-GAAP EPS of $0.55, $0.04 better then the $0.51 consensus. Co also isssued upside Q2 guidance; co sees Q2 non-GAAP EPS of ~$0.58 vs the $0.52 consensus, with rev of $340-343 mln vs the $329 mln consensus... the prior comment has been removed.

7:22AM Advanced Micro's ATI Radeon Graphics Solutions to power Apple's (AAPL) new iMac and Mac Pro (AMD) 7.50 :

icon url

ReturntoSender

08/09/10 9:08 PM

#9025 RE: ReturntoSender #6755

From Briefing.com: 4:25 pm : There weren't any catalysts for trade this session, but stocks still made their way solidly higher. Participation was paltry ahead of the FOMC rate decision, though.

Stocks spent the session in the green, but there was never really a leader among them. Instead, gains were broad and varied.

Telecom made the best move. It finished 1.1% higher, though the sector's lack of market weight meant that its strength had little influence on overall trade.

Tech stocks, which is the largest sector by market weight, struggled in the early going, but eventually caught up with the broader market. The sector settled with a 0.5% gain, but computer giant Hewlett-Packard (HPQ 42.60, -3.70) remained near 52-week lows following news that the company's CEO will step down amid sexual harassment claims. The ignominy of situation completely overshadowed the company's upside guidance.

Stocks encountered some choppy price action into the close, such that the major indices finished shy of their session highs. Despite that, stocks were still able to book their best closing levels of the past month. The improvement was fractional, though.

Trade also lacked conviction. That was made evident by the paltry 790 million shares that exchanged hands on the NYSE today. It was the lowest share count all year.

Many point to tomorrow's FOMC decision as a primary reason that traders opted to stay on the sidelines. The consensus is that the FOMC will keep its target interest rate in a range of 0.00% to 0.25%, but many are concerned that the Fed might change the verbiage in its directive.

The greenback gained 0.3% against a basket of foreign currencies ahead of the FOMC decision. Most of that move came at the euro's expense, which directly dropped 0.4% against the dollar.

Advancing Sectors: Telecom (+1.1%), Consumer Discretionary (+0.9%), Energy (+0.6%), Financials (+0.6%), Industrials (+0.6%), Tech (+0.5%), Consumer Staples (+0.5%), Utilities (+0.4%), Materials (+0.4%), Health Care (+0.3%)
Declining Sectors: (None)DJ30 +45.19 NASDAQ +17.22 NQ100 +0.7% R2K +1.4% SP400 +1.0% SP500 +6.15 NASDAQ Adv/Vol/Dec 1763/1.62 bln/880 NYSE Adv/Vol/Dec 2199/789 mln/830

6:30PM Zoltek beats by $0.03, beats on revs (ZOLT) 10.28 : Reports Q3 (Jun) loss of $0.01 per share, $0.03 better than the Thomson Reuters consensus of ($0.04); revenues rose 39.9% year/year to $42.4 mln vs the $34.2 mln consensus.

6:28PM Plexus confirms fire in Oradea, Romania facility (PLXS) 29.61 +0.19 : Co announced that a fire broke out in one of its two manufacturing buildings in Oradea, Romania. The fire occurred after production hours while the building was unoccupied. Although the fire was limited to a portion of non-production space, operations within this building will suspend until at least Thursday morning (local time) to provide sufficient time to complete a full assessment of the damage.

Marvell (MRVL) and HARMAN (HAR) announced they are enabling automakers to offer integrated Wi-Fi connectivity via award-winning Marvell Mobile Hotspot technology.

8:05AM RF Monolithics announces modification of ViewPoint Bank credit facility (RFMI) 1.32 : Co announced it has entered into a modification of the existing loan agreement to extend the deadline for raising $700,000 in new capital until September 30, 2010. In the modification, RFM confirmed that it is currently in compliance with the loan agreement. Co indicated that it expects to comply with the new capital requirement before the new deadline.

6:25AM Sunpower signs euro 48 mln definitive sale agreement for Italian power plants (SPWRA) 12.82 : Co announces that Etrion Corporation has signed a euro 48 mln definitive sale and purchase agreement to acquire the equity in the first two phases of the Montalto di Castro solar photovoltaic (PV) power park, the largest in Italy. The acquisition of the 20-megawatt (MW) first phase of the project for euro 36 million has been completed. The acquisition of the 8 MW second phase for euro 12 million remains subject to standard closing conditions and is expected to close by the end of the third quarter, 2010.

6:15AM Solarfun Power announces expansion of its marketing and customer support team to bolster business growth in the United States (SOLF) 10.66 :

09:39 am HPQ CEO Resigns Following Sexual Harrassment Charge (HPQ)

Hewlett-Packard (HPQ 43.51 -2.79) announced that Chairman, Chief Executive Officer and President Mark Hurd has decided with the Board of Directors to resign his positions effective immediately.

The Board has appointed CFO Cathie Lesjak, 51, as CEO on an interim basis. Lesjak is a 24-year veteran of the company who has served as HP's CFO and as a member of the company's Executive Council since January 2007. She oversees all company financial matters and will retain her CFO responsibilities during the interim period. Hurd's decision was made following an investigation by outside legal counsel and the General Counsel's Office, overseen by the Board, of the facts and circumstances surrounding a claim of sexual harassment against Hurd and HP by a former contractor to HP.

The investigation determined there was no violation of HP's sexual harassment policy, but did find violations of HP's Standards of Business Conduct. Lesjak has taken herself out of consideration as the permanent CEO but will serve as interim CEO until the selection process is complete. The selection of a new chairman will occur in conjunction with the CEO decision.

Also, the company raised its earnings guidance for its third quarter to approx. $1.08 per share versus the $1.07 Thomson Reuters consensus, up from $1.05 to $1.07. For its fourth quarter, the company issues earnings guidance of $1.25 to $1.27, in-line with the $1.26 Thomson Reuters consensus. On the top line, the company sees revenue falling in the range of $32.5 billion to $32.7 billion versus $32.63 billion Thomson Reuters consensus.

For its fiscal year 2010, the company raised earnings guidance to $4.49 to $4.51 per share, in-line with the $4.49 Thomson Reuters consensus, up from $4.45 to $4.50 previously. The company expects revenues to be $125.3 billion to $125.5 billion, above the $124.52 billion Thomson Reuters consensus, up from $123.7 billion to $124.9 billion previously.
icon url

ReturntoSender

08/10/10 11:50 PM

#9026 RE: ReturntoSender #6755

From Briefing.com: 4:30 pm : A positive response to the latest FOMC policy statement brought a bid to the broader market, but stocks still finished with varied losses.

Weakness was widespread in the early going. Participants took their cues from overseas markets, which moved lower in response to disappointing trade data from China overnight. The morning mood was further undermined by news that second quarter nonfarm productivity made a surprise 0.9% decline. News that wholesale inventories had a weaker-than-expected 0.1% increase had no real impact on action.

Uncertainty ahead of the latest FOMC policy statement also prompted participants to pare their positions, but once the announcement hit newswires buyers stepped into the fold.

The FOMC voted to keep the target federal funds rate at 0.00% to 0.25%, as expected. It also repeated recent statements by noting that conditions are likely to warrant exceptionally low levels of the federal funds rate for an extended period.

However, the Fed surprised many with its plans to keep constant its securities holdings by reinvesting principal payments from agency debt and agency mortgage-backed securities in Treasuries. That pronouncement drove the benchmark 10-year Note sharply higher, such that its yield dropped to a 14-month low of less than 2.75%.

Given that the Fed will hold its balance sheet constant, the decision to purchase Treasuries is not a means of quantitative easing, but it will likely keep the market thinking the Fed is moving closer to implementing new quantitative easing measures as it looks to support economic growth and price stability.

The dollar was dropped in response to the announcement. It had been up almost 1% at its session high, but finished with just a 0.2% gain.

The market's mood may have improved in the wake of the FOMC statement, but the S&P 500 and Dow both failed to find positive ground. Instead, they chopped into the close to finish with varied losses after each was down more than 1%.

Though the broader market was mired in the red, defensive-oriented stocks were able to muster gains. As such, telecom (+0.4%), utilities (+0.4%), consumer staples (+0.3%), and health care (+0.2%) were the only sectors to settle higher.

Trading volume remained unimpressive in that fewer than 1 billion shares were exchanged on the NYSE this session. That makes for a lackluster follow up to the prior session's paltry count, which came in at its lowest level of the year.

Advancing Sectors: Telecom (+0.4%), Utilities (+0.4%), Consumer Staples (+0.3%), and Health Care (+0.2%)
Declining Sectors: Tech (-1.2%), Materials (-1.0%), Financials (-1.0%), Industrials (-0.8%), Consumer Discretionary (-0.8%), Energy (-0.8%)DJ30 -54.50 NASDAQ -28.52 NQ100 -0.8% R2K -2.0% SP400 -1.3% SP500 -6.73 NASDAQ Adv/Vol/Dec 556/2.05 bln/2088 NYSE Adv/Vol/Dec 814/980 mln/2218

4:24PM Sunpower beats by $0.05, misses on revs; guides Q3 EPS in-line, revs in-line; guides FY10 EPS in-line, revs in-line (SPWRA) 12.93 -0.55 : Reports Q2 (Jun) earnings of $0.15 per share, $0.05 better than the Thomson Reuters consensus of $0.10; revenues rose 28.4% year/year to $384.2 mln vs the $401.2 mln consensus. Co issues in-line guidance for Q3, sees EPS of $0.08-0.15 vs. $0.13 Thomson Reuters consensus; sees Q3 revs of $450-490 mln vs. $458.12 mln Thomson Reuters consensus. Co issues upside guidance for FY10, sees EPS of $1.35-1.65 vs. $1.28 Thomson Reuters consensus; sees FY10 revs of $2.0-2.25 bln vs. $2.1 bln Thomson Reuters consensus.

4:07PM LDK Solar beats by $0.14, beats on revs; guides Q3 revs above consensus; guides FY10 revs above consensus (LDK) : Reports Q2 (Jun) earnings of $0.36 per share, $0.14 better than the Thomson Reuters consensus of $0.22; revenues rose 62.6% year/year to $565.3 mln vs the $458.4 mln consensus. Gross margin for the second quarter of fiscal 2010 was 18.0%, compared to 15.7% in the first quarter of fiscal 2010 and negative 90.0% in the second quarter of fiscal 2009. Co issues upside guidance for Q3, sees Q3 revs of $570-600 mln vs. $422.04 mln Thomson Reuters consensus; wafer shipments between 520 MW and 550 MW, and module shipments between 75 MW and 85 MW. Co issues upside guidance for FY10, sees FY10 revs of $1.95-2.0 bln vs. $1.59 bln Thomson Reuters consensus; wafer shipments between 1.95 GW and 2.0 GW and module shipments between 250 MW and 300 MW.

4:02PM Cree beats by $0.04, reports revs in-line; guides Q1 EPS above consensus, revs below consensus (CREE) 68.96 -2.63 : Reports Q4 (Jun) earnings of $0.55 per share, $0.04 better than the Thomson Reuters consensus of $0.51; revenues rose 78.7% year/year to $264.6 mln vs the $264 mln consensus. Co issues mixed guidance for Q1, sees EPS of $0.56-0.59 vs. $0.54 Thomson Reuters consensus; sees Q1 revs of $270-280 mln vs. $283.96 mln Thomson Reuters consensus.

9:01AM IBM acquires Datacap; Financial terms were not disclosed (IBM) 132 : Co announced the acquisition of Datacap, a privately-held company based in Tarrytown, NY. Datacap is a leading provider of software that enables organizations to transform the way they capture, manage and automate the flow of business information to improve business processes, reduce paper costs or manual errors and meet compliance mandates. Financial terms were not disclosed.

icon url

ReturntoSender

08/12/10 12:06 AM

#9027 RE: ReturntoSender #6755

From Briefing.com: 4:30 pm : A loss of confidence in the economic recovery led to a deep, broad-based selloff that sent stocks reeling. Though the broader market suffered its worst loss of the past few weeks, it was able to secure support just above a key technical line.

Market participants turned pessimistic after China reported some weaker-than-expected retail sales figures and a slight dip in industrial production during July. Japan's lackluster machinery orders report and moderate economic outlook didn't help.

The Bank of England also failed to counter waning confidence in a steady global recovery with its statement that risks to growth are still to the downside.

Those announcements come after the Fed stated again yesterday that the economic recovery is likely to be more modest in the near term.

Coupling the underwhelming announcements with the stock market's inability to build on the gains of recent weeks, investors took the opportunity to rotate out of stocks. The selling effort was largely indiscriminate as 495 of the 500 members of the S&P 500 fell to a loss - Macy's (M 20.52, +1.14) was one of the few to stage a gain after it reported better-than-expected quarterly earnings and raised its outlook.

Such widespread weakness caused the S&P 500 to slice through its 200-day simple average, but it held steady just above its 50-day average of 1088.

Treasuries ticked higher as participants sought safety. In turn, the benchmark 10-year Note dropped to a 14-month low and ended the day around 2.68%.

Treasuries showed a muted response to results from a $24 billion auction of 10-year Notes. Dollar demand for the auction was a solid $73 billion, up from the prior auction and above recent averages, but the bid-to-cover came in at 3.0, which is below the prior auction and recent averages. The yield on the auction came in at 2.73%.

The dollar also found favor among investors. After the close the Dollar Index continued to sport a 1.9% gain, its best performance of the past year. Most of that move came against the euro, which plummeted 2.4%. In contrast, the yen set a fresh 15-year high versus the dollar early this morning, but it eased back above the widely watched level of 85 yen per dollar in afternoon trade. DJ30 -265.42 NASDAQ -68.54 NQ100 -2.8% R2K -4.0% SP400 -3.4% SP500 -31.59 NASDAQ Adv/Vol/Dec 283/2.26 bln/2348 NYSE Adv/Vol/Dec 442/1.16 bln/2622

6:48PM Futures sharply lower after hours with S&P 500 futures 10.35 points below fair value of 1087.25 and Nasdaq 100 futures 25.76 points below fair value of 1844.51 :

5:30PM Cisco Systems trading over 8% lower in after hours trading at $21.80 following earnings results (CSCO) 23.73 -0.58 :

5:00PM Advanced Energy announces resignation of Chief Financial Officer Lawrence Firestone (AEIS) 15.96 -1.23 : John McMahon, Vice President and Corporate Controller, will handle financial reporting, accounting and finance responsibilities until a replacement for Mr. Firestone can be named.

4:08PM Cisco Systems beats by $0.01, reports revs in-line (CSCO) 23.73 -0.58 : Reports Q4 (Jul) earnings of $0.43 per share, $0.01 better than the Thomson Reuters consensus of $0.42; revenues rose 27.1% year/year to $10.8 bln vs the $10.88 bln consensus. "This was yet another very strong quarter with a number of record financial results for Cisco, closing the fiscal year in a tremendous position of strength -- a compelling financial model, a well-tuned innovation engine and solid execution on our growth strategy... Whether the global economy continues to show mixed signals or not -- the strength of our financial model and profit generation serves us well... During fiscal 2010 we generated more than $10 billion in cash from operations and saw growth in our deferred revenue, working capital, backlog, and cash and investments. We will continue to use this strong financial position to expand our portfolio and deliver a compelling value proposition for our investors, partners, customers and employees."

9:42AM Hewlett-Packard signs multiyear application services agreement to develop dealer business system for Nissan North America (NSANY) (HPQ) 42.33 :

08:41 am Sunpower upgraded to Accumulate at Ardour Capital: . Ardour Capital upgrades SPWRA to Accumulate from Hold and raises their tgt to $17 from $16 on strong 2011 outlook and expected cost improvements. Firm's main concern about SPWRA is high manufacturing costs versus its Chinese peers. The Co indicated financing is very healthy with leading banks and equity investors showing new interest.

10:51 am SPWRA Guides Q3 EPS In-line (SPWRA)

Sunpower (SPWRA 12.98 +0.05) reported second quarter earnings of $0.15 per share, $0.05 better than the Thomson Reuters consensus of $0.10.

Revenues rose 28.4% year-over-year to $384.2 million, worse than the $401.2 million consensus.

For the third quarter, the company expects to see earnings in the range of $0.08 to $0.15 per share, in-line with the $0.13 Thomson Reuters consensus. On the top line, the company expects revenues of $450 million to $490 million in-line with the $458.12 million Thomson Reuters consensus.

For the fiscal year 2010, the company expects earnings to fall in the range of $1.35 to $1.65 per share, above the $1.28 Thomson Reuters consensus. Revenue expectations are $2.0 billion to $2.25 billion versus the $2.1 billion Thomson Reuters consensus.

10:07 am CREE Guides Q1 EPS Above Consensus, Revs Below (CREE)

Cree (CREE 61.35 -7.61) reported fourth quarter earnings of $0.55 per share, $0.04 better than the Thomson Reuters consensus of $0.51.

Revenues rose 78.7% year-over-year to $264.6 million versus the $264 million consensus.

For the first quarter, the company issued earnings guidance of $0.56 to $0.59 per share, above the $0.54 Thomson Reuters consensus. On the top line, the company expects revenues to be in the range of $270 million to $280 million, below the $283.96 million Thomson Reuters consensus.
icon url

ReturntoSender

08/16/10 11:55 PM

#9033 RE: ReturntoSender #6755

From Briefing.com: 4:30 pm : Last week's near 4% loss made for a bit of a hangover Monday morning as stocks opened with a loss. An early bounce helped the broader market improve its position, but it still finished flat.

Early participants were dealt few trading cues. Among the more notable headlines, there was lower-than-expected annualized second quarter GDP of 0.4% in Japan, renewed selling in Europe, a slightly smaller-than-expected rise in the August Empire Manufacturing Index to 7.1, and an earnings miss from home improvement retailer Lowe's (LOW 19.70, +0.11).

Despite the lackluster headlines, the S&P 500 bounced up from its opening low in the 1070 area to make its way back to its two-day consolidation range highs in the 1080 to 1085 zone. Resistance in that zone confined the broader market to a narrow range that resulted in a finish flat.

The Nasdaq had a better finish. Its relative strength stemmed from tech issues, which outperformed for the entire session. The overall tech sector settled with a 0.4% gain, though it had been up roughly 1% at its session high.

Small-caps in the Russell 2000 outperformed. 3Par (PAR 18.00, +8.35) was a primary leader following news that Dell (DELL 11.96, -0.05) will purchase the company for $18 per share, which is an 87% premium over the stock's closing price last week.

In other merger news, airline plays TAM S.A. (TAM 20.78 +4.09) and LAN Airlines (LFL 27.79, +0.59) will combine their holdings under a single parent entity. That helped drive the Amex Airline Index 2.4% higher.

For-profit education plays were pressured amid reports regarding poor loan repayment rates at Strayer Education (STRA 163.26, -36.75). Adding to the weight was a downgrade of Corinthian Colleges (COCO 5.22, -1.44) by analysts at Deutsche Bank.

Trading volume was pathetic again. Specifically, share volume on the NYSE didn't even break 800 million shares. That makes for one of the most thinly traded session's all year.

Though the dollar dropped to a 0.5% loss, safe havens like Treasuries and gold garnered support.

Broad support for fixed income dropped the yield on the 2-year Note to a new record low of less than 0.49%. The benchmark 10-year Note saw its yield drop to a 15-month low just under 2.57%, while the yield on the 30-year Bond fell to 3.71% for the first time since April 2009.

Gold prices closed 0.9% higher at $1226.20 per ounce, which marks a one-month closing high.

Advancing Sectors: Materials (+0.5%), Tech (+0.4%), Utilities (+0.1%), Energy (+0.1%)
Declining Sectors: Health Care (-0.4%), Telecom (-0.3%), Financials (-0.2%)
Unchanged: Consumer Discretionary, Consumer Staples, IndustrialsDJ30 -1.14 NASDAQ +8.39 NQ100 +0.2% R2K +0.9% SP400 +0.2% SP500 +0.13 NASDAQ Adv/Vol/Dec 1624/1.63 bln/1008 NYSE Adv/Vol/Dec 1880/787 mln/1090

5:26PM Emcore sees Q4 revs of $54-56 mln with increases in both the photovoltaics and fiber optics segments (No consensus) (EMKR) 0.93 : In last year's Q4, co reported revs fo $40.5 mln.

4:09PM Agilent beats by $0.06, misses on revs; guides Q4 EPS above consensus, revs above consensus (A) 27.16 -0.19 : Reports Q3 (Jul) earnings of $0.54 per share, excluding non-recurring items, $0.06 better than the Thomson Reuters consensus of $0.48; revenues rose 30.9% year/year to $1.38 bln vs the $1.4 bln consensus. Co issues upside guidance for Q4, sees EPS of $0.58-0.59, excluding non-recurring items, vs. $0.54 Thomson Reuters consensus; sees Q4 revs of $1.52 bln vs. $1.5 bln Thomson Reuters consensus.

4:00PM CalAmp awarded $1.1 mln contract to supply National Oceanic and Atmospheric Administration with wireless modems (CAMP) 2.48 +0.07 :

9:05AM Texas Instruments: Intel (INTC) to acquire Texas Instruments' cable modem unit; terms not disclosed (TXN) 24.28 :

8:33AM Advanced Energy appoints new CFO (AEIS) 15.39 : Co announces appointment of new CFO Danny C. Herron. His most recent position was CFO for Sundrop Fuels.

8:00AM Veeco Instruments announces sale of Metrology Business to Bruker Corporation (BRKR) (VECO) 31.29 : Co announces that it has agreed to sell its Metrology business to Bruker Corporation (BRKR) for $229 mln in cash. The transaction has been approved by the Board of Directors of both companies and is expected to close in the fourth quarter of 2010, pending regulatory review and subject to customary closing conditions. The sale will transfer Veeco's worldwide Metrology business to Bruker, including Veeco's Atomic Force Microscope business in Santa Barbara, CA and its Optical Industrial Metrology business in Tucson, AZ, as well as Veeco's associated global AFM/OIM field sales and support organization. Bruker intends to combine Veeco Metrology with its global Bruker Nano instruments business, which currently sells a broad range of systems and analytical solutions for materials and nanotechnology research. Veeco currently expects cash proceeds from the transaction to be approximately $160 mln net of estimated applicable taxes and transaction fees. Additional terms of the transaction were not disclosed. Veeco will account for the Metrology business segment as a "discontinued operation" effective August 15, 2010. Veeco is therefore updating guidance for third quarter 2010 revenue from continuing operations to be in the range of $255-280 mln, with GAAP earnings per share between $1.45 and $1.72 and non-GAAP EPS between $1.13 and $1.33 (Current Q3 consensus is $1.34). Without Metrology, Veeco's updated guidance is that 2010 revenues from continuing operations will be approx $1 bln, with about 90% from the LED & Solar business segment. (Current 2010 rev consensus is $1.058 bln)

6:18AM LDK Solar to invest RMB 2.5 bln in new solar cell and module facility. (LDK) 7.27 :

icon url

ReturntoSender

08/22/10 9:44 PM

#9036 RE: ReturntoSender #6755

InvestmentHouse Weekend Market Update:

http://www.investmenthouse.com/weekendmarketsummary.htm

- A quiet expiration Friday overcomes a very weak start as SP500 recovers to hold 1070, and importantly, stay inside the range.
- Initial bias was lower with the Friday news vacuum, but once again stocks recover. More than end of the week short covering?
- Bonds surging again, dollar ready to rally further, but LIBOR is falling quickly. If not the US, then what country in Europe?
- Plenty of gloom, but think with your head, not your guts: look at leadership and the patterns. They are still bullish.

Lots of gloom, surging bonds, rallying dollar, economic weakness, but stocks hold the line at support.

It is going to be a bit different tonight. I will pull from many different areas to give a picture of what is happening with the markets in the world right now. I want to show how they dovetail together and foreshadow what is coming down the road. It may not be what you expect, and it is definitely not what the mainstream is reporting with respect to the world economies and markets.

I will start by just going over the basics. Today was a quiet Friday expiration. A very weak start, but then a recovery as SP500 held the 1070 level. Stocks started weak and sold into mid-morning bottoming right before lunch once again. SP500 undercut the 1070 level. Indeed, it tested it as it tried to bounce in the morning but failed twice. It held 1064 and then started to work its way back up with something of an intraday inverted head and shoulders. It broke through 1070 and managed to hold on into the close by the skin of its teeth at 1071-1072. NASDAQ turned slightly positive. The Dow came back to a -0.5% loss after impressive triple-digit losses earlier. SP500 closed negative, but with only a -0.37% decline, it was not nearly as bad as it had been. SOX finished positive with almost a +0.5% gain. The small caps were basically flat. It was a mixed market. Growth was in the lead versus the SP500, which really has the best-looking pattern of the group right now. Even after Friday when it was lagging, it still has positives to it. It reached down intraday, but it again found buyers and rallied back to hold 1070. That was important, but it is extremely important that it is still holding in its trading range.

There has been a lot of bad news in the last couple of weeks. The market has sold off on that news, but it has not broken down. There was significantly bad news (like the Philly Fed on Thursday) that could have broken the market's back, but it did not break through intermediate support at 1070. It is still well off the bottom of the range, including the February low as well as the May and June lows and not to mention the July selloff that was a false breakdown and reversed the SP500 and the rest of the market.

The other indices are showing the same kind of fortitude, although they may not be in as good a position as SP500. Nonetheless, they are holding within their range. Again, that is significant given all of the negatives impacting the market over the past few weeks. Even with all the negatives that hit, we did have the rally on earnings that brought stocks back into the top of the range. Now they are having their downside move on a bout of some bad news, but it did not sink the market.

I am making a big deal out of the SP500 rallying back to hold 1070 on Friday. You may ask if that was just short covering after a week that saw a bloody Thursday. No doubt there was some short covering. No doubt some of the people who sold on Thursday and saw their positions slide further on Friday morning banked some profit. That helped drive things back up as they bought stocks to cover their short positions, but that is not the end of the story. I will go into this more when I discuss leadership. For now, remember that SP500 did hold 1070 on the day, but that it is within an overall larger trading range. Indeed, it is well off the bottom of its trading range.

OTHER MARKETS

Dollar. There has been the selloff, a hold at support a very logical level for it to hold and an oversold bounce. There has been a pullback this week to test that bounce. It held the near term support at the 10 day EMA and 18 day EMA, showing doji on both Wednesday and Thursday. Friday there was sharp break to the upside, and the dollar traded below 1.27 Euro at one point. It was down to 1.269 (and less) on the session. By the close, it could not hold off all of the gain (1.2711 Euro versus 1.2819 Thursday). Off its peak, but it closed above the 50 day EMA. It had a very solid bounce after this short flag pattern that consolidated the initial break off the February and March support level and it came back to test that.

Dollars are acting as a safe haven again. We last saw that in April and May when Europe was falling off the table. The dollar then sold June to mid August when it was decided that the European woes were overblown. Indeed, Germany is showing good GDP growth. You would think those fear were overblown and the dollar was artificially inflated by those fears. Now the dollar is moving back up. Could it be on some the weaker US data? It could, but why would people buy US dollars if they thought the problem was with the US economy? If the US economy goes downhill, the Fed will do everything it can to keep the money supply plentiful and growing and that works adversely to the value of the dollar. The dollar should be going down if we are worried about the US economy, but it is going back up. Indeed, it started to break higher out of its own inverted head and shoulders pattern after the selloff.

How many times have we seen this pattern in plays in this market? We have many plays on the report with this pattern, and now the dollar is showing it. AMZN formed an inverted head and shoulders and broke higher. Now it is testing and ready to move again. BEN had a selloff, an inverted head and shoulders, and now a break to the upside. GMCR is not as clear, but you can see the selloff, the formation of the head and shoulders, and the break higher. JOYG: Shoulder, head, shoulders, and the break higher. NTGR shows a very clear inverted head and shoulders, a breakout, and now it is testing. SCHN has the inverted head and shoulders, a break to the upside, and you could even say it is forming a new shoulder now. WEBMD: inverted head and shoulders, test, and then a break to the upside.

There are more than this, but I am just giving an idea what is out there. You cannot swing a dead cat without hitting a stock that is in either an inverted head and shoulders pattern or, more recently, forming ABCD consolidations. There are also flag consolidations, double bottoms, double bottoms with handles, cup with handles, and there have been trading ranges. These are not selloff patterns; they are accumulation patterns. They are not topping patterns. There are buyers slowly working into stocks, and they are working into them when there is a lot of gloom in the market.
Click to view the chart

Bonds. Bonds have been on fire. There was a gap higher this week, clearing this consolidation range, and surging to the upside. The 10 year was off on Friday after a tremendous run (2.61% off from the 2.57% on Thursday), but it was trading at 2.55% premarket. We made a lot of money off the TLT as it surged to the upside.
Click to view the chart

Gold. Gold rallied off of the low that was hit as Europe recovered. Higher through May, and then it turned over when it looked like Europe would recover. It has been rallying back up over the past three weeks. If the economies are better than we thought, then there is a concern about inflation. There was also a play on gold we saw during the May issues with the EU it was a safe haven out of fear. Even though gold tends to rise when there are worries of inflation and will fall with worries of deflation, it was nonetheless rising. People are flat-out scared, and they are buying gold, US bonds, and US dollars even though the US economic data has been poor and people are suggesting a double dip recession.
Click to view the chart

Oil. Oil has been falling, and that is expected if the US economy is falling. It had a sharp plunge and was down again on Friday ($73.46, -0.97). This has been quite a tumble from over $82 almost 10 points in two weeks. It hit resistance and fell. That made some sense, but now it is just tumbling further. Is it just the US, or is there something more out there?
Click to view the chart

TECHNICAL SUMMARY

INTERNALS

Volume. Volume was lower at 1.9B shares on the NASDAQ. Volume was up to 1.1B on SP500. A little expiration volume came in on the NYSE.

Breadth. The A/D was flat on NASDAQ, and they held a slight 1.5:1 lead on the NYSE. Nothing major here.

CHARTS

SP500. SP500 undercut the 1070 on the low and recovered it on the close. It is maintaining its range. Volume was elevated again, but this is expiration week, so you would expect volume to be a bit higher. It was still below average. Some sellers were taking advantage, but you could say the opposite on Friday as the market bounced back on elevated volume. The buyers stepped in to support it.

NASDAQ. Similar action on the NASDAQ. It sold off but rallied back, turning slightly positive. It, too, held an interim level in its trading range, holding over the May and June lows. Not the prettiest picture, but it remains inside of its trading range with something of an inverted head and shoulders. It is the same as the SP500.

SP600. Not pretty either. It sold, undercut the recent low, and reversed. It did not quite make it positive, but it closed flat. It is trying to hold these prior lows from July and June. Small caps are struggling. Economic data has not been kind to the small caps because their bread and butter is the US economy, and it is not doing that well. Nonetheless, they are still above the February low. They never touched it on the last selling, and they remain inside their trading range.

SOX. The SOX was up on the day almost 0.5%. It is still below its trading range. It is in the lower reaches where it was testing intraday and recovering in May through July. It is not out of the woods, but looking at the SMH (the ETF for the semiconductors a broader group) it is still inside of its range. It did not get much of the bounce, but it is trying to move up again. As with all of the indices, they holding inside their four-month trading range, and that is important.

LEADERSHIP

Tonight I will look at leadership a bit differently, and I want to examine certain patterns to demonstrate a point. BEN sold off and formed the inverted head and shoulders and broke out. It is now consolidating that move with an ABCD pattern that is a consolidation pattern. What is the import of this? There is the strong move to the upside as there was in July. These are not perfect because there is this hitch in late July before the peak, but it is still the same type of move. A strong move up to the "A" point, and then it sells off and makes a lower low. There is a lower high, a lower low, and then people get worried and say the momentum is gone. The gloom rises and things do not look good. Sound familiar? That is what is happening now.

What about other stocks? BIDU was in a trading range. It broke out and surged on the news in July on the earnings runs, and then it pulled back. It pulled back, made a lower high, and it is in the process of making a lower low. Things do not look good as BIDU, one of the market leaders, falls to the wayside. Everything else looks strong. You have to recognize that this is a type of ABCD pattern. BWLD has not surged to a high like the others yet it is in the process of recovering. It did make a solid surge off the July low, and now it is making an ABCD pattern. Indeed, it broke upside and is now testing back after that initial move. It could make a break up into the gap point.

CNMD has not rallied yet either. It has made its selloff, and it is working on an inverted head and shoulders. As it is doing this, it is setting up an ABCD pattern. It is a consolidation of the July to August move, and that is setting up the shoulder for a break to the upside. Do you want more? CTSH made a nice breakout, a gap, and formed the X-to-A point. The ABCD pattern is not huge, but there it is. It started to break higher off of that this week. Now it is testing, making a higher low, and looks ready to move up as well. RIG is setting up an ABCD pattern off the breakout of this consolidation. It is not a huge runner like some of them. NTGR has a nice, inverted head and shoulders, a nice breakout, and now it is setting up an ABCD pattern. It broke higher, tested, and looks like it will be ready to make a run again. There are many of these. SID broke higher, showing an ABCD pattern.

These are consolidations. They do not mean it is an automatic run to the upside, but when you see so many of these forming, that can sit in the back of your mind. When you compile it with all the gloom in the market and the fact that the indices are holding their trading ranges (and are up inside of their trading ranges), you start to wonder what is going on. SP500 is not a perfect example, but it had its little inverted head and shoulders and a break higher. Now there is an ABCD setting up. Note where this is setting up: right at support, and right at the 50% Fibonacci retracement of this July to August move. Indeed, it has a little double bottom that looks to be forming at this level. I love to see those double bottoms. Note that each time it has touched it the buyers have popped it back up.

Don't Forget the Sentiment.

Another piece of data to look at is the put/call ratio in the 'Market Sentiment' section. It moved back over 1. That is showing there are more puts being bought than calls. That is not definitive in and of itself, but when leaned up with all the other indications, it suggests the gloom level is high and could be getting to the point of a turn. The market had not sold off that hard it is still in the middle of its range. The SP500 is trying to hold in the lower third of its range, and it keeps finding support at 1070. High gloom. Leaders are in accumulation patterns, and SP500 is in an accumulation pattern with a reverse head and shoulders plus the ABCD pattern.

Investors are negative on the market even when stocks are showing relatively bullish accumulation patterns. Many leaders are holding very nice gains. There are others in the industrial sector CAT, JOYG, CMI trading well up into the tops of their ranges, but they are not showing any weakness. They are not ready to roll over; indeed, they are forming the ABCD patterns I have been talking about. That is a good consolidation. It is not a lock, but when so many of these are forming and you couple that with the gloom and the indices not wanting to break down in their range, you get the idea that the stock market does not want to fall. Why does it not want to fall given the bad economic news out there?

Pulling It All Together.

This is where I try to pull it all together. US stocks are not that worried about what is going on in the US. The economic news has been worsening the entire time, and the fact that the stocks are maintaining a trading range and holding support is indicative that the market as factored in this bad news for the most part. It will knock the market around for the day of the release, but overall it has not taken the market down to new lows. With the bullish patterns you see on many of the leadership stocks, that would make you more inclined to believe that stocks may be ready to rally despite the gloom (or BECAUSE of a lot of the gloom). They may not rally from where they are right now they may test lower in the range. SP500 may come down to the May and June lows and then bounce back up. There are a lot of patterns that look about ready to go however, so it may not get much lower before it tries to rally back.

The US stock market may not break out of its base, but it wants to rally back up. It is continuing to consolidate even in the face of bad news. Given that, what is going on with bonds? Bonds are surging higher, and the dollar is rallying. What is driving people to those markets? A lot of investors were burned on stocks and do not want to go back into stocks. At the first sign of trouble, they are running into bonds. Surely some of the buying has to do with US investors being a bit jaded with the US stock market and seeking a safe place in bonds. That is great. The stock market may not be the best market. Bonds are the best market to determine the future, but the stock market is not selling off it had its selling and is trying to recover.

What else could be driving bonds? We do not know what the yield curve is because the Fed has been keeping that tamped down on the low end for a long time. It has not had a chance to invert because the Fed has already been in the game for so long, holding the short end down. It has been selling more at the short end of late, but the long end is selling more quickly. That is leading to the flatter curve, but it is not leading to an inverted curve right now. If it inverts, the US economy looks like it would be heading toward another recession, or maybe a depression this time. But it is not doing that. US bonds are rallying, and the dollar is rallying as well.

What does all this mean? It does not necessarily mean great things for the US economy, but not horrible things either. It does not mean we are going to surge higher, but it could mean the worst is over for now (although I hate to go out on THAT limb). Everyone is predicting a double dip, except the stock market is not diving lower even on bad news. With the US stock market holding in its range despite bad news, and with plenty of leadership in the market forming accumulation patterns, why are bonds rallying? Why is the dollar rallying and setting up for an even bigger rally? Looking at the chart of the TLT, back in 2008 there was a massive surge with the financial crisis. Then there was the fall off as things cooled off, and now we are seeing another rally. Indeed, we gapped through a serious resistance point this week on strong volume, and bonds were running higher. This is troubling to say the least. At the same time, LIBOR rates fell to a new low for this cycle at 0.33%. They have been dropping steadily all week about a click a day, and they are well off the peak. During this period, the LIBOR ratings were not measured in points at all. They were hugely inflated. The cost of insuring credit default swaps exploded higher to unheard-of levels, and LIBOR surged over 4% as well. A tremendous surge. This time, LIBOR is heading lower as bonds are moving higher.

That means this time it is not a financial issue. It is not a problem with banks not trusting one another and not lending. Those links in the chain have been repaired. Something else is going on here. I could be wrong, but I believe the problem lies back in Europe. I think the market in the US is probably anticipating some kind of change in the fall elections that would help combat some of what the market feels are anti-business and thus anti-US economy policies. Thus the market is consolidating but not breaking down on the economic news. As for Europe, even though Germany is strong, I think a sovereign debt issue is still ready to explode. Germany may be in great shape, but it has done things that other EU countries have not done. It has gone through its austerity program it had to absorb East Germany, after all, and get its house in order. It has done so and is doing fabulously, but Germany is not Europe. I think there is a country or two on the verge of imploding, and it will be a sovereign debt issue. It could be Spain, Italy, or Greece. Greece and Spain are considered real problems. Is there a dark horse in Portugal? The UK could flip back over as well.

I do not know which one it could be, but something a story is being told in the currency markets. The dollar is rallying again when it should be falling against the Euro. If the EU is so strong and the US is heading to a double dip, then the dollar should be falling. But it has a good bullish pattern going. I could be totally wrong, but it looks like there is a sovereign debt issue being factored in that could hit the markets by surprise given the belief Europe is in the clear. You can bet that will affect the US market. If that kind of news comes out, it is not good, but it is hard to plan on when it will come. We will have to watch the bond market and the currency markets and see how rapidly they accelerate. If they accelerate too rapidly, that is a concern and you prepare by lightening up and hedging.

With respect to the US currency, it also could mean that it has factored in all the bad news and feels like we will not have the double dip. It may feel there is a change coming in the fall with the elections that will rectify a lot of these issues. When you look at the action in US stocks you can see that it could be factoring that in and the two dovetail. That could explain the currency rally, but it still does not explain the bonds issue. We have to be cautious moving ahead. I will keep my eye on currency and bonds rates. If there is too big of a spike, we have to be cautious with our stock plays.

THE MARKET

MARKET SENTIMENT

VIX: 25.49; -0.95
VXN: 25.76; -1.14
VXO: 25.45; -0.65

VIX. The VIX has been moving in a range, more or less holding at the 200 day EMA that is coincident with the January and February peaks. There is enough gloom in the market to keep it at a slightly elevated level. It rallied even as the market put in a bit of a gain. There are worries about just how valid any market move is. When you listen to the financial stations, you can feel the gloom out there; it is very depressing. Everyone seems convinced that the market is in trouble and we are headed for a double dip. Yet the market is holding in its range. Volatility is holding at a semi-elevated level, but there are no cracks in either.

Put/Call Ratio (CBOE): 1.04; +0.07

Bulls versus Bears:

Back to more bulls than bears, the 'normal' state of affairs for the market. This after a crossover and then a tie. A rare crossover a month back and it was, as s typical, a bullish scenario.

This is a reading of the number of bullish investment advisors versus bearish advisors. The reason you look at this is that it gives you an idea of how bullish investors are. If they are too bullish then everyone is in the market and it is heading for a top: if everyone wants to be in the market then all the money is in and there is no more new cash to drive it higher. On the other side of the spectrum if there are a lot of bears then there is a lot of cash on the sideline, and as the market rallies it drags that cash in as the bears give in. That cash provides the market the fuel to move higher. If bears are low it is the same as a lot of bulls: everyone is in and the market does not have the cash to drive it higher.

Bulls: 36.7% versus 41.7%. Tumbling back down toward the 35% range, moving closer to the 35.6% hit a month back when the bulls and bears crossed over. They are starting to merge again, a good sign. The high on the last leg was 56.0% after starting at 35.6% on the low in February, the lowest it has been since July 2009 . . . until this last leg. 35% is the threshold level suggesting bullishness. After peaking at 53 on this move the bulls lost some nerve, falling to a new low post- July 2009. Once again bulls peaked out near the 50% level. Bulls have bumped at 50ish since late August 2009, falling to 45ish and then rebounding. Hit a high of 47.7% mid-June on the run from the March lows. Again, to be seriously bearish it needs to get up to the 60% to 65% level.

Bears: 31.1% versus 27.5%. A nice jump as the bears head for the bulls once more, no longer endangered. Moving back toward the 35.6% level hit just a few weeks before. Hit 18.7% on the low. Hit a high of 27.8% level on the prior leg in February. For reference, cracking above the 35% threshold considered bullish. Hit a high on the prior run at 47.2%. For more reference, bearishness hit a 5 year high at 54.4% the last week of October 2008. The move over 50 took bearish sentiment to its highest level since 1995. Extreme negative sentiment. Prior levels for comparison: Bearishness peaked at 37.4% in September 2007. It topped the June 2006 peak (36%) on that run. That June peak eclipsed the March 2006 high (33%) and well above the 2005 highs that spawned new rallies (30% in May 2005, 29.2% in October 2005). That was a huge turn, unlike any seen in recent history.

NASDAQ

Stats: +0.81 points (+0.04%) to close at 2179.76
Volume: 1.936B (-3.45%)

Up Volume: 1.032B (+682.334M)
Down Volume: 837.629M (-915.863M)

A/D and Hi/Lo: Decliners led 1.02 to 1
Previous Session: Decliners led 4.14 to 1

New Highs: 24 (+1)
New Lows: 143 (+9)

NASDAQ CHART: Click to view the chart

NASDAQ 100 CHART: Click to view the chart

SOX CHART: Click to view the chart

SP500/NYSE

Stats: -3.94 points (-0.37%) to close at 1071.69
NYSE Volume: 1.123B (+4.71%)

Up Volume: 320.382M (+238.177M)
Down Volume: 789.028M (-191.786M)

A/D and Hi/Lo: Decliners led 1.5 to 1
Previous Session: Decliners led 3.72 to 1

New Highs: 199 (-50)
New Lows: 123 (+31)

SP500 CHART: Click to view the chart

SP600 Chart: Click to view the chart

DJ30

Stats: -57.59 points (-0.56%) to close at 10213.62
Volume DJ30: 251M shares on expiration Friday versus 227M shares Thursday.

DJ30 CHART: Click to view the chart

MONDAY

There will be some important economic data with existing home sales coming out and new home sales on Wednesday. Durable goods are always important and, as always, the initial jobless claims come out on Thursday. Then we will get the second look at the GDP for Q2. It is expected to drop down to 1.4% as things have softened in the US. That is what is expected, but what can we expect from stocks? You may know where I am going with this because I have already discussed a lot of good leaders in accumulation patterns (not distribution patterns). I will be watching for the market to hold. I think the SP500 could make a stand where it is now and continue higher given its pattern as well as the pattern shown by many of the strong stocks that are not breaking down. Indeed, they are setting up accumulation of their own.

The gloom is very high. Many people think we are going into another recession, or maybe even a depression and we may. Who knows? It can happen if the shocks are bad enough. The stocks are telling us that things are not as gloomy as the financial stations would lead you to believe, however. Think with your head and not with your guts. With this market, if you always thought with our guts, you would spend a lot of time puking. You have to step back and recognize leadership patterns. You have to recognize the trading ranges, the ABCD patterns, the inverted head and shoulders, the cup with handles, and the flag patterns that have formed after good surges to the upside. These are not selloff patterns these are profit taking and accumulation patterns. They are still bullish. I will try to think with my head even though my guts may be asking if I am sure about all this. Play the percentages and good risk/reward levels. These patterns are providing that. You have good risk/reward levels in these patterns if we move in at the right time. As they set up, we want to be ready to make the moves. We have been playing these, and some of them that we are playing now have pulled back in these accumulation/consolidation patterns. We will be looking to pick up more of these leaders.

It is a wild market out there. All the markets are going in different directions, and it is leading people astray. They get overwhelmed when thinking with their guts and not their heads. Trust in the patterns that you are seeing, and trust in the fact that the market has not broken down despite bad news. We have to be cautious with respect to what bonds are doing. Maybe not as much as currency, but we need to watch it. There are issues out there we have to be cautious about. They may come from overseas surprise, surprise and not the US where everyone expects it to come from given our weakening economic data. Again, we have seen the bad data. The market has been hit with lackluster guidance, worse-than-expected leading indicators, regional manufacturing falling down, housing sales still in the toilet, and jobless claims rising to 500K on a weekly basis. This is bad, bad news, but the market is holding inside of its range. Not only that, but it is up off the bottom of the range.

That means we will continue to look for bullish patterns. We will look for opportunity to move in, and we will not forget the downside you have to be ready in case things implode. We have to go with our heads and use what we know about the market versus what our guts are telling us. Go with what you know rather than listening to the opinions of people on the financial stations who are only messing with your head. Think about it, have a great weekend, and I will see you on Monday.

Support and Resistance

NASDAQ: Closed at 2179.76

Resistance:
2184 is the June gap bottom side.
2185 to 2195 represent support points for years: December 2004 peak, July to October 2005 consolidation, January, March and July 2008 lows, and October 2009 peak.
2205 is the November 2009 peak 2210 (from September 2008) to 2212 (the July 2009 closing low)
2221 is the gap down upside point from June.
The 50 day EMA at 2240
2245 from July 2008 through 2260 from late 2005.
The 200 day SMA at 2271
2275 - 2278 from the February 2008 and April 2008 lows
2273 to 2282 marks bottom of January 2010 lateral peak
2292 is a low from January 2008
2319 from the September 2008 peak
2320 to 2326.28 is the January 2010 high
2341 is the June 2010 peak
2324-2370 is a range of resistance from early 2008
2382-2395 from 2008

Support:
2177 is a low from March 2008
2169 is the March 2008 closing low (double bottom)
2168 is the September 2009, intraday peak
2167 from the July 2008 intraday low
2155 is the August 2010 low and the March 2008 intraday low
2140 from the May and June 2010 lows
2100 is the February 2010 low
2061 is the July 2010 low
2024 from November 2009
2020 to 2005 from the Q4 2009 peaks

S&P 500: Closed at 1071.69
Resistance:
1078 is the October range low
1084 to 1080 (September 2009 peak)
The 50 day EMA at 1096
1101 is the October 2009 high and the recent May and June 2010 interim peaks
1106 is the September 2008 low
1114 is the November 2009 peak
The 200 day SMA at 1116
1119 is the early December intraday high
1131 is the June 2010 peak
Bottom of the January 2010 consolidation 1131 to 1136
1133 from a September 2008 intraday low
1151 is the January 2010 peak
1156 is the Sept 2008 low
1170 is the prior March 2010 high
1174 is the May 2010 high
1181 is the April selloff low
1185 from late September 2008

Support:
1070 is the late September 2009 peak as well as several other peaks and valleys even in 2010. Important level.
1065 is the May flash crash intraday low.
1044 is the October 2008 intraday high AND the February 2010 low
1040 is the May and June 2010 low
1020 is the bottom of the late summer 2009 consolidation
946 from June 2009

Dow: Closed at 10,213.62
Resistance:
10,260 from the May and June 2010 interim peaks
10,285 is the late December consolidation peak
10,365 is the late September 2008 low
The 50 day EMA at 10,374
The 200 day SMA at 10,453
10,496 is the November 2009 high
10,594 is the June 2010 peak
10,609 from the Mid-September 2008 interim low
10,730 is the January 2010 peak
10,920 is the recent May high
10,963 is the July 2008 low
11,100 from the 7-08 low
11,205 is the April closing high
11,734 from 11-98 peak

Support:
10,209 is recent August 2010 low
10,120 is the October 2009 peak
9829 is the September 2008 closing high
9918 is the September 2008 peak
9855 is the early September peak in its lateral range
9835 is the late September 2009 peak AND the February 2010 low
9774 is the May 2010 intraday low
9325 is a late 2008 interim peak
9034 from early 2009 peaks

Economic Calendar

These are consensus expectations. Our expectations will vary and are discussed in the 'Economy' section.

August 24 - Tuesday
- Existing Home Sales, July (10:00): 4.75M expected, 5.37M prior

August 25 - Wednesday
- Durable Orders, July (08:30): 3.1% expected, -1.2% prior
- Durable Goods -ex Transportation, July (08:30): 0.5% expected, -0.9% prior
- New Home Sales, July (10:00): 330K expected, 330K prior
- Crude Inventories, 08/21 (10:30): -0.818M prior

August 26 - Thursday
- Initial Claims, 08/21 (08:30): 485K expected, 500K prior
- Continuing Claims, 08/14 (08:30): 4515K expected, 4478K prior

August 27 - Friday
- GDP - Second Estimate, Q2 (08:30): 1.4% expected, 2.4% prior
- GDP Deflator - Second iteration, Q2 (08:30): 1.8% expected, 1.8% prior
- University of Michigan Consumer Sentiment, August (09:55): 69.4 expected, 69.6 prior

August 16 - Monday
- NY Fed - Empire Manufacturing PMI, August (08:30): 7.10 actual versus 7.5 expected, 5.08 prior
- Net Long-Term TIC Fl, June (09:00): $44.4B actual versus $35.3B prior (revised from $35.4B)
- NAHB Housing Market Sentiment, August (10:00): 13 actual versus 14 expected, 14 prior

August 17 - Tuesday
- Housing Starts, July (08:30): 546K actual versus 555K expected, 537K prior (revised from 549K)
- Building Permits, July (08:30): 565K actual versus 573K expected, 583K prior (revised from 586K)
- PPI, July (08:30): 0.2% actual versus 0.2% expected, -0.5% prior
- Core PPI, July (08:30): 0.3% actual versus 0.1% expected, 0.1% prior
- Industrial Production, July (09:15): 1.0% actual versus 0.6% expected, -0.1% prior (revised from 0.1%)
- Capacity Utilization, July (09:15): 74.8% actual versus 74.5% expected, 74.1% prior

August 18 - Wednesday
- Crude Inventories, 08/14 (10:30): -0.818M actual versus -2.99M prior

August 19 - Thursday
- Initial Claims, 08/14 (08:30): 500K actual versus 475K expected, 488K prior (revised from 484K)
- Continuing Claims, 08/07 (08:30): 4478K actual versus 4500K expected, 4491K prior (revised from 4452K)
- Leading Indicators, July (10:00): 0.1% actual versus 0.2% expected, -0.3% prior (revised from -0.2%)
- Philadelphia Fed, August (10:00): -7.7 actual versus 7.5 expected, 5.10 prior
icon url

ReturntoSender

08/24/10 11:57 PM

#9037 RE: ReturntoSender #6755

From Briefing.com: 4:30 pm : Economic uncertainty has led stocks lower in four straight sessions for a cumulative loss of 3.9%. Paltry existing home sales figures for July only added ambiguity to the economic outlook.

The major equity averages opened trade with losses of about 1%. The opening slide reflected the weak action of markets overseas, where Germany's DAX dropped below its 200-day moving average for the first time in more than one month and Japan's Nikkei entered bear market territory. The Shanghai Composite mustered a modest gain, but it also near bear market territory.

Sellers intensified their efforts with the release of existing home sales figures for July. Sales plummeted 27% month-over-month to an annualized rate of 3.8 million units. Not only is that far below the 4.7 million units that had been expected, but the rate of decline and the actual sales level were the worst since records began in 1999.

Hope for a revival in housing was further dashed with news that the total supply of homes now stands at 12.5 months. That said, some believe a double dip in housing is likely.

Such pessimistic headlines sent the three major indices set fresh one-month intraday lows - the Dow even briefly dropped below 10,000 - but some near-term support helped stocks stem their losses.

Only defensive-oriented telecom stocks and utilities stocks staged gains. Both sectors advanced 0.3%.

The dollar had been strong in the early going, but concerns about the health of the U.S. economy undercut the currency. It was up 0.5% at its high and retreated into the red before finishing flat. Amid the dollar's downturn, the Japanese yen set a fresh 15-year high of 83.6 yen per dollar.

The dollar's drop and an interest in safety squeezed gold prices higher. The precious metal had been down more than 1% in early pit trade, but it settled with a 0.3% gain at $1233.40 per ounce.

In contrast, oil prices on October contracts fell 2.0% to close at $71.63 per barrel. In relation to the continuous contract, that's the lowest close since early June.

A strong bid for Treasuries drove yields to new annual lows, but Treasuries pulled back after stocks started to stem their losses.

Results from an auction of 2-year Notes did little to alter the preferences of participants. Both the auction's bid-to-cover ratio of 3.1 and its dollar demand of $115.4 billion were below averages of recent sessions.

Advancing Sectors: Utilities (+0.3%), Telecom (+0.3%)
Declining Sectors: Materials (-2.3%), Health Care (-2.0%), Industrials (-2.0%), Consumer Discretionary (-1.7%), Financials (-1.7%), Tech (-1.6%), Energy (-1.4%), Consumer Staples (-0.3%)DJ30 -133.73 NASDAQ -35.87 NQ100 -1.8% R2K -1.2% SP400 -1.6% SP500 -15.49 NASDAQ Adv/Vol/Dec 670/2.17 bln/1965 NYSE Adv/Vol/Dec 730/1.17 bln/2286

5:01PM Veeco announced that its Board of Directors has authorized the repurchase of up to $200 mln of the Co's common stock over the next year (VECO) 31.02 -0.09 :

.Intel (INTC) and Nokia (NOK) create Joint Innovation Center with the University of Oulu. One of the first objectives of the new lab is to create new and compelling mobile user experiences that leverage the rapidly increasing capabilities of mobile devices. The lab is the latest member of Intel Labs Europe - Intel's European Research Network.

6:22AM Trina Solar beats by $0.03, beats on revs; raises FY10 shipment forecast; raises capacity expansion (TSL) 22.41 : Reports Q2 (Jun) earnings of $0.52 per share, $0.03 better than the Thomson Reuters consensus of $0.49; revenues rose 147.2% year/year to $370.8 mln vs the $338.7 mln consensus. Co sees Q3 shipments between 250 MW to 260 MW of PV modules. For the full year of 2010, the co expects total PV module shipments to be between 900-930 MW, compared to its earlier guidance of between 750-800 MW, representing an increase of 126% to 133% from 2009; the co expects to increase its shipment volume in the second half of 2010 compared to the first half. Additionally, the co expects to increase its percentage of global shipments to the United States in the second half of 2010; co also increases its capacity expansion.

07:54 am Plexus downgraded to Neutral at Ticonderoga: . Ticonderoga downgrades PLXS to Neutral from Buy saying they believe the acceleration in weakening demand trends that they expect across the tech landscape (i.e., networking/wireless and industrial for Plexus), will eventually catch up with the company.
icon url

ReturntoSender

08/25/10 11:33 PM

#9038 RE: ReturntoSender #6755

From Briefing.com: 4:30 pm : Market participants were dealt another dose of disappointing data, but stocks worked their way higher and eventually benefited from a late-session squeeze that helped them book their first gain in five sessions.

Stocks fell almost 4% during the course of the four previous sessions, but the early tone among traders suggested that they would continue to trend lower. The interest to sell stemmed partly from renewed weakness overseas. Europe's bourses initially overcame news that Ireland's sovereign debt rating was reduced to AA- from AA at Standard & Poor's, but they eventually rolled over. The Shanghai Composite dropped 2.0% and Japan's Nikkei sank deeper into bear market territory, even though the yen eased off of the 15-year best that it booked in the prior session. Recent export data added to concerns about the implications of the yen's strength. Amid those concerns, it was reported that Japan's Ministry of Finance might consider unilateral yen-selling intervention.

Disappointment over the latest durable goods orders data added to the negative tone of premarket trade. Overall durable goods orders for July increased just 0.3%, which is far less than the 3.0% increase that had been widely expected. Excluding transportation, durable goods orders dropped 3.8%, which contrasts sharply with the 0.5% increase that many had forecasted. The prior month's orders were revised upward to reflect a 0.1% decline in total orders and a 0.2% increase in orders less transportation.

Sellers intensified their efforts when new home sales numbers for July were released shortly after the open. New home sales dropped 12.4% month-over-month to an annualized rate of 276,000 units, which is well below the rate of 334,000 units that had been widely expected.

Near-term support levels were violated and stocks set fresh monthly lows amid the knee-jerk selling that ensued, but the major indices were quick to rebound. That bounce spurred some short covering, which squeezed stocks even higher.

Shares of home improvement retailers and homebuilders saw some of the sharpest moves. They swung to gains of 2.1% and 3.8%, respectively, as big bets against the space ahead of the dour housing data had to be covered.

While the broader market's gain was rather modest, the Nasdaq staged a strong advance. It was led by large-cap tech plays like Apple (AAPL 242.89, +2.96) and Google (GOOG 454.62, +3.23).

Biotech also provided support to the Nasdaq. Biotech stocks advanced 1.5%, but managed care providers were the strongest performers within the health care sector. Managed care stocks climbed 2.5%.

Treasuries were strong in the early going, such that yields on dropped to new annual lows. However, Treasuries retreated as the stock market climbed. Results from an auction of 5-year Notes didn't help. The auction drew a bid-to-cover of 2.8 and dollar demand of $101.9 billion. Both measures were down from the prior auction.

Advancing Sectors: Consumer Discretionary (+1.0%), Health Care (+1.0%), Telecom (+0.6%), Tech (+0.5%), Materials (+0.3%), Financials (+0.3%), Consumer Staples (+0.1%)
Declining Sectors: Energy (-0.3%), Utilities (-0.3%), Industrials (-0.2%)DJ30 +19.61 NASDAQ +17.78 NQ100 +0.9% R2K +1.6% SP400 +0.8% SP500 +3.46 NASDAQ Adv/Vol/Dec 1676/2.02 bln/977 NYSE Adv/Vol/Dec 1832/1.11 bln/1167

4:33PM Semtech beats by $0.03, beats on revs; guides Q3 EPS above consensus, revs above consensus (SMTC) 16.91 +0.06 : Reports Q2 (Jul) earnings of $0.42 per share, excluding non-recurring items, $0.03 better than the Thomson Reuters consensus of $0.39; revenues rose 70.7% year/year to $113.2 mln vs the $110.8 mln consensus. Co issues upside guidance for Q3, sees EPS of $0.45-0.47, excluding non-recurring items, vs. $0.41 Thomson Reuters consensus; sees Q3 revs growth of ~6-10% sequentially, which calculates to ~$120.0-124.5 mln vs. $116.18 mln Thomson Reuters consensus.

4:09PM JDS Uniphase beats by $0.01, reports revs in-line; guides Q1 revs in-line (JDSU) 10.23 +0.16 : Reports Q4 (Jun) non-GAAP earnings of $0.15 per share, $0.01 better than the Thomson Reuters consensus of $0.14; non-GAAP revenues rose 19.6% year/year to $398.1 mln vs the $398 mln consensus. Co issues in-line guidance for Q1, sees Q1 non-GAAP revs of $410-425 mln vs. $415.90 mln Thomson Reuters consensus. "We enter fiscal 2011 with order momentum and an industry-leading product portfolio."

07:48 am Corning upgraded to Outperform at Oppenheimer: . Oppenheimer upgrades GLW to Outperform from Perform and sets target price at $20 saying their upgrade doesn't mean that they think the inventory correction rattling through the LCD supply chain is over. The most likely scenario is that it will endure another one to three months. Still, firm says if prior inventory corrections are any indicator, this is the time to turn positive on GLW's shares, when fear of downward revisions is peaking and when potential upside scenarios--Gorilla Glass, an accelerated TV replacement cycle, solar, etc.--lie forgotten in the weeds.

07:46 am Trina Solar target raised to $41 at Auriga U.S.A: . Auriga U.S.A raises their TSL tgt to $41 from $24 following earnings. The firm says mgmt did not disappoint investors with a strong beat and raise scenario on the Q2 conference. However, after raising estimates ahead of the call last week, they are increasing both estimates and price target again. Firm fully expected management to raise 2010 shipment guidance, which they did, but the surprise to their model came on the guidance of capacity reaching 1500MW in 2011 vs prior estimate of 1300MW. The firm says the stock was inexpensive heading into the call, and now appears more undervalued at just 8.2x 2011E EPS after the call.
icon url

ReturntoSender

08/27/10 11:30 AM

#9040 RE: ReturntoSender #6755

Chart of the Day - Average Performance on a Monthly Basis Since 1950:

http://www.chartoftheday.com/20100827.htm?T

Except for a brief counter-trend rally in July, the stock market has struggled since peaking in late April. Investors are concerned. For some perspective, today's chart presents the Dow's average performance for each calendar month since 1950. As today's chart illustrates, it is not unusual for the stock market to underperform during the May to October time frame with a brief counter-trend rally occurring in July. It is worth noting that the worst calendar month for stock market performance (i.e. September) is fast approaching.

icon url

ReturntoSender

08/29/10 11:00 PM

#9042 RE: ReturntoSender #6755

InvestmentHouse Weekend Market Summary 8/27/10

http://www.investmenthouse.com/weekendmarketsummary.htm

- Stocks get some good and some bad, trade all over the map, but then post strong rallies.
- Q2 GDP not as bad as expected: when worse is better.
- Michigan sentiment disappoints along with Bernanke as he fails to provide any concrete action.
- Stocks again swallow bad news, hold at support, rally.
- Stocks set for a bounce in the range. How far depends upon whether laggard sectors play a bit of catch up.
- A passel more economic data to come, capped by the jobs report. Can the market handle the truth again, i.e. the economy is not that great right now?

Stocks overcome the news, hold support and rally.

It took a while on Friday, but the market got its feet underneath it and was able to rally. It posted strong gains across the board, but it was not easy. The GLD numbers came in before the open, and they were a bit better than expected at 1.6%. That was better than the 1.4% anticipated, but well off the 2.4% in the first iteration of the Q2 number. Futures were up in a bizarre case of "lower is better" since it was not as bad as thought. The market opened higher, but then it sold off. It started back up, but then two things happened: Michigan Sentiment and Ben Bernanke's speech.

Michigan Sentiment came out almost a half hour into the open, and it showed a 68.9 reading versus the 70 expected. That was even below the 69.6 originally reported, and that sent the market into a tail spin. It sold off from gains to negative. Then Ben Bernanke's speech at the Jackson Hole Conference was put on top of that. He did not offer anything concrete. He said the Fed stood ready to do whatever it took in the event that it was needed. Investors thought it was needed now. That coupled with the Michigan Sentiment pushed stocks sharply lower.

It was a zigzag all morning, but the important thing was SP500 held 1040. That is coincident with the May and June lows. It held that level for the fourth time this week, and this time there was a sharp upside break. Short covering ahead of the weekend? Perhaps, but there was volume behind the move as well. The stock market has been showing the ability to hold support despite bad news. Friday was another day without very good news. There was a continuing M&A battle over IPAR between HP and DELL. That has some people excited, but overall the theme is that the economies of US and Europe are simply not that strong. That was weighing down the market.

US came out with relatively weak data all week, but that did not sink the indices below support; they are still in their range. When it was apparent that was not going to happen on Friday, they shot to the upside, and there was good leadership along the way with some of the stocks I talked about (such as the China stocks). Others were picking up nicely as well. Those leaders we were looking at to pull some weight actually started to do so. Not all of them, however. The financials need to come to the show, but the market has been able to rally without them at least trade in the range. If it is going to break out of the range, it will need their support along with the semiconductors. They have been a drag on the technology side of the equation.

On Friday the big news was a very choppy morning, back and forth trade. It looked like another selloff was in progress, only to hold support and reverse nicely. When I say nicely, I am talking about very solid gains. NASDAQ +1.6%, Dow +1.6%, SP500 +1.6%, SOX +2%, SP600 +2.66% that was huge. NASDAQ 100 was only up 1.3% versus 1.6% on the overall NASDAQ; that shows that the small caps were in the lead. What have I said about small caps and how important they are for determining what will happen with the future of the economy? We are seeing a bit of it. They were relative strength leaders all week. On the downside days they were not down as far, and on the upside days they posted better gains. That is a good sign.

The market is swallowing bad news and staying in its range. The market is a discounter of future corporate earnings, and earnings are tied to the economy. Small caps are very much tied to the US economy. If they start to break sharply higher and lead the market even, dare I say, break out later on that bodes well for the US economy. For now, we got the bounce we were looking for, and I am happy to take it. We already have great positions in place, and we will be looking to take more next week.

OTHER MARKETS

Dollar. The upside move and the ability to hold support over the past several sessions had stymied the moves we had seen in the fear sectors. The DXY0 was struggling on Thursday, and it struggled a bit more on Friday. There was no selloff (1.2734 Euro versus 1.2720 Thursday). It was peeling back to test. It is not the trouble, but it just made a good reversal from its downtrend. It tested that reversal, rallied again, and now it is putting in another flag pattern at the 50 day EMA. There is still plenty of room for it to run up to the key resistance level just below 85 on the DXY0. It has not changed anything; there was just no need to rush into the dollar on Thursday and Friday. That was particularly true on Friday because stocks were performing better and the fear level died down as the session went on. Perhaps investors thought helicopter Ben would not do anything to stop the Fed stimulus. He stands ready to do something no one knows exactly what in the event things worsen in the US economy.
Click to view the chart

Bonds. The strongest indicator of all on Friday was the bond market. Wednesday I noted the gap and reversal, and we took a big chunk of our TLT gain off the table (somewhere around 250% on the options). Thursday it tried to move up again on a little fear, but on Friday there was no fear. The bond market sold off sharply (US 10 year 2.64% versus 2.48% Thursday). We took the rest of our TLT (what little we had) off the table, banking that gain. Bonds as a fear play suddenly lost the fear aspect. That is a key piece of the puzzle I am looking at. The stock market is holding the bottom of its trading range, and bonds have been shooting higher as the stock market sold off into the bottom of its range.

On the SP500, it is selling in August while the TLT has been rising in August. Then, suddenly, a massive reversal. Bonds all of a sudden do not look so great. They will fill the gap from mid August, but the question is whether they break below the June and July peaks. We sold out. Bonds are not having the fear money put into them. Remember, the bonds market is a very good indicator of the economic future. They have been racing higher, and that had me very concerned about what was going on. That was mitigated somewhat by what the stock market was doing. If bonds sell off and interest rates rise, even if the Fed says it will help out, you can read that to mean bond traders are perhaps seeing improving economics. It could also be seeing more inflation down the road.
Click to view the chart

Gold. It was not a banner day for gold either. Gold gapped higher Thursday and sold off. It rallied again to just below the Thursday peak, and faded back to close just slightly higher on the session ($1,239.80, +2.00). Whichever market you look at, it was not a big day for gold. It has bounced up to this prior peak, but it is stalling below that level. Indeed, take a look at the GLD and its Fibonacci retracement of the selloff from June into early August. It has bounced up to the 78% Fibonacci retracement, and that is where the bulk of the last trade has been. It is having a hard time moving through that level. This shows that the recovery for that high means there is not that much downside momentum. When there is a recovery to the 78%, start looking for a roll back over if it cannot break through. If it forms a double top here, that is almost a sure sign that gold will be heading lower.

The interesting feature about the action on Friday was that gold was not rising higher on fears of inflation. Remember, bonds could have been selling because of a fear of inflation if the Fed was going to be very loose with money. They weren't they were just selling from what it looks like, and that may be on economic improvement. Gold is not spiking through the moon; it is struggling at the 78% Fibonacci retracement. It bears watching, and indeed we have a GLD play to the downside because it is at the 78% Fibonacci retracement. We could get a nice fall down to these lows from July and August, and then maybe a bounce higher before a double top at the 78% retracement sends it lower toward the July low. We will have to see how it develops, but this looks like a top at least an interim top.
Click to view the chart

Oil. If the stock market was doing better because it is factoring in positives with respect to the economy, you would expect oil to be up. That is precisely what happened. After a very nasty three-week selloff, oil was churning back to the upside ($75.17, +1.81). That is almost a 2.5% move on the session. It held this interim support this week and bounced. Again, if there is a belief that the economy is going to improve, one would expect oil to improve and it is. Fill up your gas tanks before oil rallies back up over $80 and they jack the price back up.
Click to view the chart

TECHNICAL SUMMARY

INTERNALS

Volume. Volume was up 20% on NASDAQ to 2.1B. Not a blowout session at all, but it was good to see volume rise on an upside day. At 1.1B, volume on the NYSE was not a barn burner, but it made it up to average. I will not complain about that. A 4% rise is a 4% rise on a summer Friday. Think about how many Fridays have been deathly quiet in the market.

Breadth. Breadth was relatively outstanding, but that is how it has been. It is big either way the market goes. 4.5:1 on the NASDAQ, and 6.6:1 on the NYSE. The small caps were exploding into the lead and they were doing the same on NASDAQ. Big upside volume, big outsized breadth to the upside. That is exactly what you want to see if you are worried about the economy, i.e., the small caps leading the charge to the upside.

CHARTS

SP500. The key was the hold at 1040. It was a very volatile morning; it whipsawed back and forth. You had a hang tough and watch the leaders. We were watching the leaders early and looking at stocks such as NTES those kind of stocks that have been holding up well during the selling. They were holding the line and moving higher in the morning. By the end of the day, SP500 posted a solid break, finally, off of the May and June lows. After four days of testing, it broke sharply higher. It did not quite fill the gap down from Tuesday, and next week it will be interesting when SP500 gets up to the May 6th flash crash low at 1065. It is sitting right below it at 1064. I think we have the momentum on our side up to these interim peaks at a minimum. It may make it back up to the bottom of the January peak and the June peak as well. Now it would be the July/August peak from the last time SP500 visited that level.

NASDAQ. Same kind of action on the NASDAQ. It undercut the February low again, touched down where it touched bottom on Wednesday and rallied back up for a gain. It, too, has not filled the gap. It has much fun to come, but we are seeing good action in MACD. There is a higher high when price was below the June peak, and that is a positive divergence. There is a little bit of momentum; maybe it will make it up there. It may not get that far and it only get to the 200 day EMA, but I still anticipate a good move here based upon the indices swallowing a lot of bad news and hanging onto support.

SP600. SP600 held the July low. Remember, it never broke its February low. It has held the July low, and it still has the head and shoulders look to it, but it was a big move. Lots of small caps moving well a 2.6% move is nothing to sneeze at but it has a lot of resistance. It has the May 6th flash crash, it has the June low (it is just at that point), and then it has the January peak to deal with. Not to mention the March, June, July, and August peaks. It is never easy digging out of a hole, and that is what has to happen when stocks or indices sell off. It happened in July. It was not a straight shot, and it never is. Now we see what kind of guts the small caps have as they move higher. Is it a harbinger of better economic times to come, or is it just a technical bounce in the range? I will be more than happy with a technical bounce in the range because that is what I have been looking for all week.

SOX. SOX broke to a new low on this selloff intraday, and then reversed to close positive. It did not scare anyone with this move. The most interesting thing is it held the February low and reversed off of that after toying with it all week. Still have to get above the Tuesday gap, and it has to get back up to this gap point from mid August. There is a lot of resistance overhead. When it gets to that gap point, it will struggle a bit. What the SOX does at the August gap down point will tell us a lot from the tech side of the equation whether the bounce will have any stamina. If it blows through there, that is a very good indication that the bounce for NASDAQ and SP500 is going to go into the upper reaches of the trading range. If it stalls there, this may be a short-lived bounce. They might just make it up to mid range and then roll back over. It will be a key index to watch in order to determine just how strong the other indices are.

LEADERSHIP

Financial. Financials have not participated in the rally. They are not giving the kind of leadership that is going to take the NYSE indices higher or lower; they are tagging along. We will see how they respond as the market bounces. JPM was up on Friday on good volume, perhaps putting in a double bottom attempt here. At least that will give it a foot higher, and maybe it can break through that February low and move up toward the June and July peaks. We will see. GS was still lagging. It was lagging on Friday. Even though the market was up, it was down. We sold out of our positions and it just continued lower on Friday. It is a good thing we got out, but I am watching it. It has a ragged ABCD pattern, and we will see where (and if) it finds bottom and can rally once more. There are not a lot of good moves in financials. WFC was up, but it is in an atrocious pattern. We will have to see how this plays out. Financials will have to participate, or the bounce will never make it out of the trading range.

Semiconductors. AMAT is trying to mass for a bounce, but it is in a continuing downtrend that the 10 day EMA is holding in check. It does not look like it will be contributing much to the upside anytime soon. XLNX is not in much better shape. It is trying to put in a low at the prior bottom in August, but it still does not look very good itself. XLNX is not in any position to post a strong rally, although it could bounce. I guess any stock could bounce. Many other semiconductors show the same kind of patterns: The sharp selloff and not in a good pattern. NVLS has a trading range at least, and it is holding at support. It had that big selloff Friday and reversal on volume, so buyers stepped in again as they did back in May and June. We will see if it can bounce it back up. Some semiconductors look better than others, of course. BRCM held its support and bounced off the bottom of the support range on strong volume. Support is typically a range, remember. There are lows, and then a second set of lows. It has used both of them, and now it looks like it will try to bounce back up in its trading range. Semiconductors are very mixed, but overall are still very negative in their patterns.

Industrials. Industrials improved on the day, but they had a rough week. CAT gapped lower on Tuesday, but it was not able to recover much of that move. Still struggling. JOYG sold to the 200 day EMA, undercut it on Thursday, but then it managed to reverse on Friday. Still not a great pattern. There is a double top below the April peak, so it is not a picture of strength, although it looks like it will try to bounce. DE held a key level at the March and April peaks, and it reversed and managed to bounce on Friday.

China. BIDU started to bounce back up on a bit better volume on Friday. NTES gapped higher, tested, and continued upside. No volume, but it is in a nice pattern. CAGC started to move up. Low volume, and it looks like it might be ready to bounce this coming week.

Technology. AAPL did not participate sharply in the move, but it did sell off to a new low on the selling and reversed to hold the base. Perhaps we see a trade higher. An important stock for NASDAQ to continue higher. AKAM is trading near the top of its range and is still in decent shape. FFIV is all right, but it is looking toppy.

Retail. Retail is widely mixed, with some stocks sporting decent action such as NTES but that is not the rule. There has been improvement over the week, however, such as in COST. There was a big volume move to the upside, and now a nice test. It may make an interesting entry point, although there is not a tremendous amount of upside if you look at these prices and the scale of it. There is some retail improving. If you have improvement in some technology, improvement in some retail, and then the industrials can pick back up, then there is a decent move under way. It does not hurt that the China stocks are moving as well. We might be able to get some momentum in the upside on this rally. Again, I am not anticipating a breakout unless is there a lot more improvement in leadership, financials, and semiconductors. Right now we are looking for a trade up in the range versus a breakout. If it comes, that is great. If not, we will make money on the move to the upside.

THE MARKET

MARKET SENTIMENT

VIX. The VIX dove 10% on Friday. A big, strong move by the stock market, but it was really a volatile session. It spiked early and reversed as the market rallied. What does this mean? Remember, look how the VIX did not ramp up during the selling. It basically held the prior peaks, and that tells you there is not the kind of fear in the market that will lead to a major selloff. Some would say that means there will not be any upside movement, but that is incorrect. The VIX can go low for a long time, yet the market rallies and rallies. Now the VIX is trading in a trading range just as the index has been trading in a trading range. This is a big move. It is a move that could mean we have a break in volatility, but we have to watch when it gets down to the levels from July and August. If the stock market stalls at that level, we will start watching to see if the stock market stalls when volatility gets down to that level. That is exactly where it stalled before, and the markets are in a trading range until they prove otherwise. That is what volatility is telling us right now.

VIX: 24.45; -2.92
VXN: 26.31; -2.57
VXO: 24.91; -2.47

Put/Call Ratio (CBOE): 0.8; -0.08

Bulls versus Bears:

Bulls still outnumber bears, but they are merging again for another possible crossover. With the market set to bounce higher in its range, however, it looks as if a second crossover this year is not going to happen, at least not yet.

This is a reading of the number of bullish investment advisors versus bearish advisors. The reason you look at this is that it gives you an idea of how bullish investors are. If they are too bullish then everyone is in the market and it is heading for a top: if everyone wants to be in the market then all the money is in and there is no more new cash to drive it higher. On the other side of the spectrum if there are a lot of bears then there is a lot of cash on the sideline, and as the market rallies it drags that cash in as the bears give in. That cash provides the market the fuel to move higher. If bears are low it is the same as a lot of bulls: everyone is in and the market does not have the cash to drive it higher.

Bulls: 33.3% versus 36.7%. Continuing the decline and indeed falling below the 35% considered a bullish indicator. This bolsters the upside run in the range. Bulls and bears are starting to merge again though no crossover yet. The high on the last leg was 56.0% after starting at 35.6% on the low in February, the lowest it has been since July 2009 . . until this last leg. 35% is the threshold level suggesting bullishness. After peaking at 53 on this move the bulls lost some nerve, falling to a new low post- July 2009. Once again bulls peaked out near the 50% level. Bulls have bumped at 50ish since late August 2009, falling to 45ish and then rebounding. Hit a high of 47.7% mid-June on the run from the March lows. Again, to be seriously bearish it needs to get up to the 60% to 65% level.

Bears: 31.2% versus 31.1%. Barely budged after the big move from 27% the prior week. Sure would have liked more bears rising to meet the falling bulls for another crossover; that would be powerful, but we will take this. Hit 18.7% on the low in April. Hit a high of 27.8% level on the prior leg in February. For reference, cracking above the 35% threshold considered bullish. Hit a high on the prior run at 47.2%. For more reference, bearishness hit a 5 year high at 54.4% the last week of October 2008. The move over 50 took bearish sentiment to its highest level since 1995. Extreme negative sentiment. Prior levels for comparison: Bearishness peaked at 37.4% in September 2007. It topped the June 2006 peak (36%) on that run. That June peak eclipsed the March 2006 high (33%) and well above the 2005 highs that spawned new rallies (30% in May 2005, 29.2% in October 2005). That was a huge turn, unlike any seen in recent history.

NASDAQ

Stats: +34.94 points (+1.65%) to close at 2153.63
Volume: 2.126B (+20.21%)

Up Volume: 1.978B (+1.703B)
Down Volume: 174.925M (-1.345B)

A/D and Hi/Lo: Advancers led 4.55 to 1
Previous Session: Decliners led 2.03 to 1

New Highs: 24 (+7)
New Lows: 88 (-10)

NASDAQ CHART: Click to view the chart

NASDAQ 100 CHART: Click to view the chart

SOX CHART: Click to view the chart

SP500/NYSE

Stats: +17.37 points (+1.66%) to close at 1064.59
NYSE Volume: 1.09B (+4.33%)

Up Volume: 1.005B (+769.248M)
Down Volume: 79.472M (-713.58M)

A/D and Hi/Lo: Advancers led 6.61 to 1. The Breadth suggests more than just short covering taking place.
Previous Session: Decliners led 1.86 to 1

New Highs: 219 (+29)
New Lows: 73 (+38)

SP500 CHART: Click to view the chart

SP600 Chart: Click to view the chart

DJ30

Stats: +164.84 points (+1.65%) to close at 10150.65
Volume DJ30: 208M shares Friday versus 176M shares Thursday. Some good upside volume moving in here as well.

DJ30 CHART: Click to view the chart

MONDAY

The coming week is chock full of economic data. We got through some important pieces of data this week that were not good: Existing home sales, new home sales, GLD, and Sentiment. They were not that good, but the market managed to swallow the bad news and rally. It will have another chance to do that this week. There is personal income and spending on Monday. Case-Shiller and the Chicago PMI come in on Tuesday, along with the Conference Board Consumer Confidence Index. Then we will also get the minutes of the last FOMC meeting.

That is a hell of a start to the week, but it does not slow down. Wednesday we have ADP because it is the first week of September , and that means the jobs report will be on Friday. But it doesn't stop with ADP or the ISM index. There are initial jobless claims on Thursday. There is productivity, factory orders, pending home sales, and then Friday that is all a lead-in to the non-farm payrolls. Non-farm payrolls are expected to come in at -118K. A bit better than the prior month, but that is still pathetic.

With all this data, what is the market going to do? It depends on how it takes it but, technically, I like what I see with respect to the stock market particularly the SP500 and the SP600. Maybe Friday was some short covering; we will see. This market showed a lot of tenacity at this important level, whether it was SP500, NASDAQ, or SP600. I think we could get a decent bounce. It is a matter of gradation. I would love to see it make it back up to the June and August peaks. Maybe it will only make it to the interim peak, but we will just watch it. We have some great positions in place, and we will let them bounce. If it runs out of gas, we will take some money off the table.

When it gets mid-range, we will have pretty good coin built into some of our positions. It will not be my favorite target, but if it stalls out, we can take some gain off the table and then see if it continues to break higher toward the top of the range. That is what happened in past bounces. It will stall, test, and then it just works its way back to the upside. If we get a good, sharp move early in the week that carries us to that interim level, and then we anticipate it testing and moving higher. If it struggles to get up to that midpoint, then it may not make it beyond that. If we get better economic data, Katie bar the door, because we may get a serious move to the upside that has serious strength behind it.

We are going to keep looking for upside plays. We took good positions on Friday, and we will be looking for more next week. Maybe things will change; maybe it will break. This could be a false hold, but I do not think so. We will be ready with downside plays for bounces. As the week progresses, and the market moves up, there will be some stocks ripe for a bounce some that maybe broke below their ranges and have sold off and are coming back up to test. Maybe some semiconductors since the SOX and the SMH are below their ranges. If the stocks rally back up to those ranges and stall, then they could be ripe for the downside. That could coincide with the SP500 moving to the mid range or the next interim level of resistance and stalling. Then we would get downside. We have to be ready for that because we are range trading. Sometimes the market goes all the way to the top of the range and sometimes it does not.

Some confirmation would be nice early next week, but what makes me believe it will go higher is the tenacity at that prior low the ability to overcome bad news and still hold support and then to start to rally. That is why we will look for more upside plays from stocks that have made pullbacks and are still in position to move CAGC, for instance, is in good position to move higher. We will look for other stocks similarly situated to rally upside and make us money, and nice, strong patterns and support levels to bounce them up into the tops of their range. Have an excellent weekend. Remember next week is the employment week, and then we have a three-day weekend for Labor Day after that. Start factoring that in to your trading equation.

Support and Resistance

NASDAQ: Closed at 2118.69

Resistance:
2140 from the May and June 2010 lows
2151 is the Tuesday gap down point
2155 is the August 2010 low and the March 2008 intraday low
The 10 day EMA at 2167
2168 is the September 2009, intraday peak
2169 is the March 2008 closing low (double bottom)
2177 is a low from March 2008
2184 is the June gap bottom side.
2185 to 2195 represent support points for years: December 2004 peak, July to October 2005 consolidation, January, March and July 2008 lows, and October 2009 peak.
2205 is the November 2009 peak 2210 (from September 2008) to 2212 (the July 2009 closing low)
2221 is the gap down upside point from June.
The 50 day EMA at 2225
2245 from July 2008 through 2260 from late 2005.
The 200 day SMA at 2272
2275 - 2278 from the February 2008 and April 2008 lows
2273 to 2282 marks bottom of January 2010 lateral peak
2292 is a low from January 2008
2319 from the September 2008 peak
2320 to 2326.28 is the January 2010 high
2341 is the June 2010 peak
2324-2370 is a range of resistance from early 2008
2382-2395 from 2008

Support:
2100 is the February 2010 low
2061 is the July 2010 low
2024 from November 2009
2020 to 2005 from the Q4 2009 peaks

S&P 500: Closed at 1047.22
Resistance:
1065 is the May flash crash intraday low.
1070 is the late September 2009 peak as well as several other peaks and valleys even in 2010. Important level.
The 10 day EMA at 1070
1078 is the October range low
1084 to 1080 (September 2009 peak)
The 50 day EMA at 1090
1101 is the October 2009 high and the recent May and June 2010 interim peaks
1106 is the September 2008 low
1114 is the November 2009 peak
The 200 day SMA at 1116
1119 is the early December intraday high
1131 is the June 2010 peak
Bottom of the January 2010 consolidation 1131 to 1136
1133 from a September 2008 intraday low
1151 is the January 2010 peak
1156 is the Sept 2008 low
1170 is the prior March 2010 high
1174 is the May 2010 high
1181 is the April selloff low
1185 from late September 2008

Support:
1044 is the October 2008 intraday high AND the February 2010 low
1040 is the May and June 2010 low
1020 is the bottom of the late summer 2009 consolidation
946 from June 2009

Dow: Closed at 9985.21
Resistance:
10,120 is the October 2009 peak
10,209 is recent August 2010 low
10,260 from the May and June 2010 interim peaks
10,285 is the late December consolidation peak
The 50 day EMA at 10,328
10,365 is the late September 2008 low
The 200 day SMA at 10,454
10,496 is the November 2009 high
10,594 is the June 2010 peak
10,609 from the Mid-September 2008 interim low
10,730 is the January 2010 peak
10,920 is the recent May high
10,963 is the July 2008 low
11,100 from the 7-08 low
11,205 is the April closing high
11,734 from 11-98 peak

Support:
9829 is the September 2008 closing high
9918 is the September 2008 peak
9855 is the early September peak in its lateral range
9835 is the late September 2009 peak AND the February 2010 low
9774 is the May 2010 intraday low
9325 is a late 2008 interim peak
9034 from early 2009 peaks

Economic Calendar

These are consensus expectations. Our expectations will vary and are discussed in the 'Economy' section.

August 30 - Monday
- Personal Income, July (08:30): 0.2% expected, 0.0% prior
- Personal Spending, July (08:30): 0.3% expected, 0.1% prior
- PCE Prices - Core, July (08:30): 0.1% expected, 0.0% prior

August 31 - Tuesday
- Case-Shiller 20-city Home Price Survey, June (09:00): 3.5% expected, 4.61% prior
- Chicago PMI, August (09:45): 57.5 expected, 62.3 prior
- Consumer Confidence, August (10:00): 50.0 expected, 50.40 prior
- Minutes of FOMC Meeting, 08/10 (14:00)

September 01 - Wednesday
- ADP Employment Change, August (08:15): 13K expected, 42K prior
- Construction Spending, July (10:00): -0.7% expected, 0.1% prior
- ISM Index, August (10:00): 53.0 expected, 55.5 prior
- Crude Inventories, 08/28 (10:30): 4.11M prior
- Auto Sales, August (14:00): 3.9M expected, 3.8M prior
- Truck Sales, August (14:00): 5.1M expected, 5.14M prior

September 02 - Thursday
- Initial Jobless Claims, 08/28 (08:30): 475K expected, 473K prior
- Continuing Claims, 08/21 (08:30): 4435K expected, 4456K prior
- Productivity-Rev., Q2 (08:30): -1.6% expected, -0.9% prior
- Unit Labor Costs, Q2 (08:30): 1.1% expected, 0.2% prior
- Factory Orders, July (10:00): 0.3% expected, -1.2% prior
- Pending Home Sales, July (10:00): 0.0% expected, -2.6% prior

September 03 - Friday
- Nonfarm Payrolls, August (08:30): -118K expected, -131K prior
- Nonfarm Payrolls - Private, August (08:30): 42K expected, 71K prior
- Unemployment Rate, August (08:30): 9.6% expected, 9.5% prior
- Hourly Earnings, August (08:30): 0.1% expected, 0.2% prior
- Average Workweek, August (08:30): 34.2 expected, 34.2 prior
- ISM Services, August (10:00): 53.2 expected, 54.3 prior

August 24 - Tuesday
- Existing Home Sales, July (10:00): 3.83M actual versus 4.72M expected, 5.26M prior (revised from 5.37M)

August 25 - Wednesday
- Durable Orders, July (08:30): 0.3% actual versus 3.0% expected, -0.1% prior (revised from -1.2%)
- Durable Goods -ex Transportation, July (08:30): -3.8% actual versus 0.5% expected, 0.2% prior (revised from -0.9%)
- New Home Sales, July (10:00): 276K actual versus 334K expected, 315K prior (revised from 330K)
- Crude Inventories, 08/21 (10:30): 4.11M actual versus -0.818M prior

August 26 - Thursday
- Initial Claims, 08/21 (08:30): 473K actual versus 485K expected, 504K prior (revised from 500K)
- Continuing Claims, 08/14 (08:30): 4456K actual versus 4515K expected, 4518K prior (revised from 4478K)

August 27 - Friday
- GDP - Second Estimate, Q2 (08:30): 1.6% actual versus 1.4% expected, 2.4% prior
- GDP Deflator - Second iteration, Q2 (08:30): 1.9% actual versus 1.8% expected, 1.8% prior
- University of Michigan Consumer Sentiment, August (09:55): 68.9 actual versus 70.0 expected, 69.6 prior
icon url

ReturntoSender

08/31/10 10:57 PM

#9046 RE: ReturntoSender #6755

From Briefing.com: 4:35 pm : August finished on a flat note after a bit of end-of-month buying fizzled into the close. The lackluster finish left stocks to lock in another marked monthly loss.

Technical support at the 1040 line helped the S&P 500 bounce back from an opening slide. The rebound initially paused near the neutral line, but stocks then pushed into positive territory with the release of the Conference Board's Consumer Confidence Index for August. The Index climbed to 53.5 from 51.0. It was widely expected to slip to 50.0.

The broader market gave more weight to the consumer confidence reading than the generally anecdotal and entirely regional Chicago PMI, which came in at 56.7 for August. Not only did that figure fall short of the consensus of 57.0, but it was also the lowest since November 2009.

There was little reaction among market participants to the minutes from the August 10 FOMC meeting. As expressed in Fed Chairman Bernanke's speech last week, the minutes indicated that the pace of the economic recovery slowed in recent months. However, many policymakers judged that downside risks to the U.S. recovery had become somewhat larger.

Interest among buyers has been unsustainable in recent weeks, but there was some modest end-of-month buying, which helped drive some midsession gains and took trading volume above recent averages. However, many participants remain unwilling to jump back into stocks ahead of the monthly payrolls report. A glimpse into the official figures (due Friday) will come with the ADP Employment Change tomorrow morning. Caution ahead of the report left stocks to crawl to a flat finish.

Weakness of the past couple of weeks culminated with a 4.7% loss for the S&P 500 during August. That poor performance marks the stock market's third monthly loss in four months.

Amid such weakness the yield on the 10-year Note fell more than 40 basis points to close out August near 2.47%. It registered its 19-month low of 2.42% just last week.

Though stocks have been weak in recent weeks and there is a growing concern about the tenuous footing of the economy, merger and acquisition activity continues on. Most recently, Exelon (EXC 40.72, +0.20) announced it will acquire the renewable energy unit of Deere & Co. (DE 63.27, +0.29) in a deal valued at some $900 million.

Dow component 3M (MMM 78.55, -1.10) will pay an investor group $230 million to acquire Attenti Holdings S.A. That announcement came after 3M agreed to acquire Cogent (COGT 11.00, -0.09) just yesterday.

In other corporate news, Monsanto (MON 52.65, -3.25) issued a tepid revenue forecast, which caused it to fall sharply out of favor. Shares of MON were among this session's worst performing issues.

Advancing Sectors: Telecom (+1.1%), Financials (+0.9%), Utilities (+0.4%), Materials (+0.3%), Consumer Staples (+0.2%), Consumer Discretionary (+0.1%)
Declining Sectors: Tech (-0.6%), Health Care (-0.4%), Industrials (-0.3%), Energy (-0.2%)DJ30 +4.99 NASDAQ -5.94 NQ100 -0.3% R2K +0.1% SP400 +0.00% SP500 +0.41 NASDAQ Adv/Vol/Dec 1264/2.12 bln/1320 NYSE Adv/Vol/Dec 1654/1.40 bln/1332

4:07PM STEC Inc announces rule 10b5-1 trading plan (STEC) 11.16 -0.02

4:02PM Concurrent beats by $0.08, beats on revs (CCUR) 5.00 +0.05 : Reports Q4 (Jun) earnings of $0.11 per share, $0.08 better than the Thomson Reuters consensus of $0.03; revenues rose 20.1% year/year to $19.1 mln vs the $12.5 mln consensus.

2:38PM Semiconductor Hldrs ETF drops to new session/nine month low of 24.27 (SMH) 24.28 -0.36 : The SMH slipped under its Feb and last week's lows (24.42/24.38) in opening trade but quickly rebounded. A slow but steady slide this afternoon has recently taken out the early lows. Weighing on the SMH are: ADI -1.8%, AMD -2.7%, AMKR -1.7%, BRCM -5.8%, INTC -1.4%, LSI -2.6%, MU -2%, SNDK -2.5%, TER -3.1%.

8:09AM Trident Microsystems plans to pursue license agreements with TV OEMs and consumer electronics semiconductor providers; has not disclosed financial details of its licensing program (TRID) 1.43 :

icon url

ReturntoSender

09/02/10 12:13 AM

#9047 RE: ReturntoSender #6755

From Briefing.com: 4:35 pm : A drastically improved tone among participants caused stocks to climb quickly and sharply early on, but the S&P 500 spent the rest of the session trending alongside its 50-day moving average.

Strong overseas gains and pleasing data from abroad inspired buyers to return to the fold after an extended absence in recent weeks. Their bids even persisted in the face of the August ADP Employment Change report, which indicated that private payrolls fell by 10,000 last month, when an increase of 13,000 had been widely expected.

Stocks extended their advance with help from the August ISM Manufacturing Index, which came in at 56.3. Its increase from 55.5 from July flew in the face of calls for a decline to 52.9.

While this session's surge was underpinned by an improved mood among market participants, short covering augmented the move as many scrambled to cover bets they had made against the market ahead of the official nonfarm payrolls report on Friday. That report will likely play a pivotal part in this week's remaining sessions, given that it offers insight into the health of U.S. companies and it carries implications for the broader economy. Concerns about the pace and sustainability of the economic recovery have led to cautious trade in recent sessions.

Still, it was a bullish sign that more than 98% of the names in the S&P 500 staged gains. Some of the biggest moves were made by financials and industrial stocks. Coming off of monthly losses of approximately 7% and 8%, respectively, both sectors climbed 3.9%.

Despite such strength, the S&P 500 could not push past its 50-day moving average, which is in the 1080 zone. Still, the broad market measure made its best gain in nearly two months. That gain and those booked by overseas markets helped the Dow Jones World Index spike 2.7% in its best single-session move in three months.

With participants showing a willingness to hold riskier issues, the dollar dropped to a 0.9% loss, its worst single-session slide in a month. Treasuries also toppled to drive yields markedly higher. Meanwhile, the CRB Commodity Index rallied to a 1.6% gain, its best single-session move in more than a month, most of which was owed to a spike in oil prices.

Oil prices spiked 2.8% to $73.91 per barrel. The energy component had been as high as $74.48 per barrel.

Precious metals failed to find sustainable support this session. As such, gold prices climbed to a new two-month high of about $1255.30 per ounce, but inevitably slipped to a 0.2% loss at $1248.10 per ounce. In similar fashion, silver prices climbed to about $19.50 per ounce, a three-month high, before slipping to $19.39 per ounce to log a 0.2% loss.

Advancing Sectors: Industrials (+3.9%), Financials (+3.9%), Energy (+3.6%), Consumer Discretionary (+3.4%), Materials (+2.9%), Tech (+2.7%), Health Care (+2.3%), Utilities (+2.2%), Consumer Staples (+1.7%), Telecom (+1.6%)
Declining Sectors: (None)DJ30 +254.75 NASDAQ +62.81 NQ100 +3.0% R2K +3.8% SP400 +3.4% SP500 +30.96 NASDAQ Adv/Vol/Dec 2186/2.16 bln/475 NYSE Adv/Vol/Dec 2649/1.19 bln/422

4:00PM Maxim Integrated Signs Russian Distribution Agreement With the Symmetron Group (MXIM) 16.36 +0.49 : Co announced that it has added the Symmetron Group as a new franchised distributor in Russia, Ukraine, and Belarus, effective September 1, 2010. This agreement bolsters Maxim's presence in these markets, making it easier for system designers to benefit from Maxim's high-performance engineering solutions. Maxim's solutions address a wide range of consumer, computing, communications, industrial, medical, and automotive applications.

7:07AM LTX-Credence beats by $0.01, beats on revs; guides Q1 EPS in-line, revs in-line (LTXC) 2.15 : Reports Q4 (Jul) earnings of $0.11 per share, excluding non-recurring items, $0.01 better than the Thomson Reuters consensus of $0.10; revenues rose 108.0% year/year to $73.2 mln vs the $71.9 mln consensus. Co issues in-line guidance for Q1, sees EPS of $0.11-0.13, excluding non-recurring items, vs. $0.13 Thomson Reuters consensus; sees Q1 revs of $75-80 mln vs. $77.69 mln Thomson Reuters consensus. "We shipped a record number of Diamond systems in the quarter and expect to ship another record number of units in the current quarter."

07:21 am Cree resumed with a Hold at Kaufman Bros; tgt $58: . Kaufman Bros resumed coverage of CREE with a Hold and sets target price at $58 saying as a technology leader in the space and a pure-play on the growth in the LED market, they believe CREE deserves a premium multiple; however, they do not feel comfortable increasing the multiple to the high end of the range and would look to see earnings acceleration above their forecasts to become more constructive on the name.

07:19 am FormFactor target lowered to $12 at Oppenheimer following lowered guidance: . Oppenheimer noted, after the close Tuesday, FORM lowered Q3 (Sept.) rev guidance to $46-$48 mln from the mid-$50 mln range issued on 7/27. The co cited: 1) longer customer qualifying times for its Matrix products, 2) refusal to take on low-margin business, and 3) longer lead times. Though the process may be painful-cash burn is still high in Q3/Q4-mgmt is taking the necessary steps on the way to profitability, in its view. Though its 2010 ests aren't moving drastically, Opco is lowering its tgt to $12 from $22 as cash flow is becoming the focus due to forward investing in Matrix, stretching DSOs due to extended qualifications and lengthening lead times/lower inventory turns.

icon url

ReturntoSender

09/02/10 9:30 PM

#9048 RE: ReturntoSender #6755

From Briefing.com: 4:30 pm : Another broad-based buying effort sent stocks through resistance to book their second straight gain ahead of the monthly nonfarm payrolls report.

Trade started on a flat note as market participants let the prior session's surge settle a bit. Major market averages in Asia advanced to catch up with Wall Street, but action was also lackluster in Europe, where it was announced that eurozone GDP increased 1.0% in the second quarter and that the European Central Bank (ECB) will keep its benchmark lending rate at 1.00%. ECB President Trichet stated that eurozone GDP for 2010 is now expected to grow in a range from 1.4% to 1.8%, up from the range 0.7% to 1.3%. For 2011, growth is now expected to range from 0.5% to 2.3%, up from 0.2% to 2.2%.

Early participants had little reason to alter their mood since the initial jobless claims count for the week ended August 28 came in at 472,000, which is in on par with the 475,000 initial claims that had been widely expected. The latest tally was also little changed from the prior week total of 478,000. Continuing claims saw a more substantial slip as they fell to 4.46 million from 4.48 million.

Final nonfarm productivity readings for the second quarter also offered little surprise. Productivity in the quarter fell 1.8%, which is in stride with the 1.7% decline that had been widely forecasted. Unit labor costs for the quarter increased 1.1%, as expected.

Pending home sales for July provided participants with a positive surprise. They posted a 5.2% monthly increase, which contrasts with the call for no change from economists polled by Briefing.com. That data overshadowed news that factory orders for July increased 0.1% instead of 0.3% as had been widely expected.

Stocks were able to garner support, but the S&P 500 struggled in the 1085 zone. That area provided resistance for most of the morning and afternoon, but buyers stepped up their efforts in the afternoon so that stocks settled at session highs.

The advance has the S&P 500 up nearly 4% in the first two days of September. That is almost enough to offset what was lost in August, but many market watchers want to see how stocks react to tomorrow's official nonfarm payrolls report before a call is made on whether market sentiment has improved, especially given the market's fickleness.

Trading volume was rather light this session. With fewer than 1 billion shares trading hands on the NYSE, it seems many investors are also cautious ahead of the payrolls report.

Of the trades that were made, volume was heaviest among large-cap tech and large-cap financials. Financials had lagged in the early going, but bounded in the afternoon so that the tech sector settled with a 1.0% gain. As for tech, it advanced 0.9% as semiconductor stocks spiked a collective 2.1%.

Retailers also had a strong session. As a group, they climbed 2.2%. Most of that move was owed to a large batch of better-than-expected same-store sales results for August.

Advancing Sectors: Consumer Discretionary (+1.8%), Industrials (+1.3%), Materials (+1.1%), Financials (+1.0%), Tech (+0.9%), Energy (+0.9%), Consumer Staples (+0.6%), Health Care (+0.6%), Telecom (+0.2%)
Declining Sectors: Utilities (-0.2%)DJ30 +50.63 NASDAQ +23.17 NQ100 +1.1% R2K +1.2% SP400 +1.3% SP500 +9.81 NASDAQ Adv/Vol/Dec 1639/1.69 bln/952 NYSE Adv/Vol/Dec 2102/960 mln/880

Broadcom Corporation (BRCM) announced that the Broadcom BCM7400 satellite set-top box system-on-a-chip solution has been chosen by leading digital media equipment company EchoStar Technologies L.L.C., a subsidiary of EchoStar Corporation (SATS), for its SlingLoaded 922 high definition digital video recorder.

icon url

ReturntoSender

09/07/10 11:39 PM

#9053 RE: ReturntoSender #6755

From Briefing.com: 4:15 pm : Stocks staged gains in the first few sessions of September, but market participants returned from Labor Day ready to sell. Their efforts were focused on financials and other cyclical plays.

In the four sessions leading up to Labor Day weekend the S&P 500 gained more than 5%. In the wake of such a heady move came rekindled concerns about the health of European banks. That invoked stiff selling among bank stocks. In turn, the KBW Bank Index fell 3.2%, which cut into the 8.5% gain that it had made over the four previous sessions.

Weakness among large-cap banking issues undermined the broader financial sector. As such, financials fell to a collective loss of 2.4% and closed at session lows.

Profit taking also undercut other cyclical plays, like consumer discretionary stocks and energy stocks. Both of those sectors fell 1.6%.

In contrast, defensive-oriented issues were the only ones to limit losses. Specifically, consumer staples stocks and telecom stocks both slipped just 0.3%, while both utilities and health care stocks ended 0.6% lower.

Still, such widespread weakness stoked volatility. That sent the Volatility Index (VIX) up almost 12% from the four-month low that it set late last week.

Amid the stock market's slide and the increase in volatility Treasuries attracted strong support - the benchmark 10-year Note climbed almost a full point and the 30-year Bond tacked on two full points.

Results from an auction of 3-year Notes were largely lackluster. The auction drew a bid-to-cover of 3.2, dollar demand of $105.9 billion and an indirect bidder participation rate of 42.4%. The four previous auctions held an average bid-to-cover of almost 3.3, dollar demand of about $116.3 billion, and an average indirect bidder participation rate of 44.6%.

The greenback made a big gain by climbing 0.9% against a basket of competing currencies. Most of the move was against the euro, which dropped 1.4% in its steepest single-session slide in nearly four weeks.

Favor for safety also sparked buying in the yen, which set a fractionally improved 15-year high of 83.5 yen per dollar. Japan's central bank brought little surprise with its decision to keep its benchmark lending rate at 0.1%.

News flow was light all session, though former Hewlett-Packard (HPQ 39.92, -0.43) head Mark Hurd is now co-President of Oracle (ORCL 24.27, -1.34). CNBC later reported that Hewlett-Packard has filed a lawsuit against Hurd for violating confidentiality agreements.

Advancing Sectors: (None)
Declining Sectors: Financials (-2.4%), Energy (-1.6%), Consumer Discretionary (-1.6%), Tech (-0.9%), Industrials (-0.9%), Materials (-0.8%), Health Care (-0.6%), Utilities (-0.6%), Telecom (-0.3%), Consumer Staples (-0.3%)DJ30 -107.24 NASDAQ -24.86 NQ100 -0.7% R2K -2.2% SP400 -1.5% SP500 -12.67 NASDAQ Adv/Vol/Dec 590/1.69 bln/2060 NYSE Adv/Vol/Dec 799/829 mln/2203

3:30 pm : Soft commodities were the largest advancing sector today, rallying for 1.7% -lead by a 4.1% move in March sugar futures.

Oct crude oil settled lower by 0.7% to $74.09 per barrel. It traded well lower this morning on weakness on concerns about the economy, but was able to recoup most of its losses to end the session with only modest losses. Oct natural ended lower by 1.6% to $3.86 per MMBtu in what was an uneventful session.

Dec gold finished higher by 0.6% to $1259.30 per ounce. A flight to safety, spurred by concerns about the economy, supported gold prices today. Dec silver shed 0.2% to end at $19.91 per ounce. Silver did manage to trade above the $20 level, putting in highs at $20.045 -its best levels since mid-March of 2008.DJ30 -105.58 NASDAQ -25.38 SP500 -12.51 NASDAQ Adv/Vol/Dec 596/1.4 bln/2044 NYSE Adv/Vol/Dec 766/561.8 mln/2225

4:15PM Altera raises Q3 revs guidance above consensus (ALTR) 26.60 -0.23 : Co raises Q3 revenue guidance to 10-14% growth above Q2 levels, which calculates to ~$516.2-535.0 mln vs. $497.8 mln Thomson Reuters consensus, up from prior guidance for sequential growth of 4-8%, which calculates to $488.1-506.8 mln. Co said, "Growth continues to be broad. It is likely that all four of the co's vertical markets will show sequential growth. The telecom and wireless vertical market is on track to be the fastest growing portion of the business, driven in large part by 3G wireless deployments and needs for additional wireless backhaul capacity."

6:51AM GT Solar announces a secondary offering of 10 mln shares of its common stock by GT Solar Holdings; concurrently, GT Solar Holdings enters into agreement to sell up to 15 mln additional shares to UBS Securities and an affiliate (SOLR) 8.78 : Co announces a secondary offering of 10 mln shares of its common stock by one selling stockholder, GT Solar Holdings, pursuant to a shelf registration statement filed with the SEC. Concurrently with this offering, the selling stockholder has entered into agreements to sell up to 15 mln additional shares of co's common stock to UBS Securities and one of its affiliates in connection with an offering by UBS AG of its Mandatorily Exchangeable Notes due 2013. Co will not receive any proceeds from either transaction but will pay the expenses of the selling stockholder.

3:23AM United Micro reports Aug revs increased 20.13% YoY to NT$10.89 bln (UMC) 2.76 :

1:21AM Applied Materials reports significant advances in PV Technologies at PVSEC (AMAT) 10.98 : Co announces significant advances in PV Technologies at PVSEC. Some highlights are 18.4% cell efficiency achieved in back-contacted crystalline silicon cells. Less than 10% conversion efficiency in thin film silicon modules for utility scale applications. Also, factory automation systems boosting solar manufacturing productivity.

icon url

ReturntoSender

09/09/10 10:59 PM

#9055 RE: ReturntoSender #6755

From Briefing.com: 4:30 pm : Solid gains overseas and a smaller-than-expected weekly jobless claims count helped stocks start the session on a strong note, but sellers applied pressure in early afternoon action. Near-term technical support provided a springboard so stocks could reclaim some of their gains, but the rebound faded into the close.

Initial strength stemmed from strong gains overseas, excluding the Shanghai Composite (-1.4%). Japan's Nikkei advanced 0.8% and Hong Kong's Hang Seng climbed 0.4%, while Germany's DAX advanced 0.9%, France's CAC climbed 1.2%, and Britain's FTSE finished with a 1.2% gain. Little was made of news that the Bank of England kept its target interest rate at 0.5%, as expected, but news that the trade deficit for the United Kingdom grew to record levels in July put pressure on the British pound. The pound pared its loss to finish just 0.2% below the greenback, though.

Initial jobless claims for the week ended September 4 totaled 451,000, which is down 27,000 week-over-week and less than the 470,000 claims that had been expected, on average, among economists polled by Briefing.com. Continuing claims came in at 4.48 million, but that was a greater tally than the 4.45 million that had been widely expected. Continuing claims were essentially unchanged week-over-week.

As for other data, the U.S. trade deficit for July improved to $42.8 billion from $49.8 billion. It was widely expected to come in at $47.3 billion.

The generally positive data and the strength of overseas markets motivated morning participants to send stocks to a gain of little more than 1%, but the S&P 500 was unable to push past the 1110 line.

Stocks spent a couple of hours drifting along session highs, before news that Deutsche Bank (DB 59.99, -1.97) may issue stock to raise capital induced selling. The S&P 500 saw its gain more than halved, but near-term support at the 1102 line kept the stock market from extending its slide. Support there helped stocks rebound, but the bounce lost momentum shortly ahead of the close.

Though the Deustche Bank headline should not come as a surprise, given lingering concerns about the health of European banks and that new regulatory requirements are expected with the release of Basel III, it was enough to cut into the financial sector. Financial stocks saw a 2% gain more than halved before they settled with a 1.2% gain.

Part of the sector's resilience is owed to positive momentum among domestic bank stocks. Their strength in recent sessions has the KBW Bank Index up about 9% since setting a 2010 intraday low just seven sessions ago.

In contrast to continued gains among bank stocks, the winning streak among steel stocks was snapped with a 1.6% loss. Prior to this session's slide, steel stocks in the S&P 500 had climbed in six straight sessions for a cumulative gain of nearly 12%. Weakness among steel stocks this session undercut the materials sector, which finished with a 0.3% loss. It was the only major sector that failed to stage a gain.

Though the broader market lost some of its direction into the close, it still held on for its sixth gain in seven sessions. Participation in that time has been paltry, however. In fact, trading volume on the NYSE has failed to break 1 billion shares in each of the past five sessions.

Strength among stocks continues to weigh on Treasuries. Lackluster results from an auction of 30-year Bonds could not change that. The auction drew a bid-to-cover of 2.7 and dollar demand of $35.5 billion. The indirect bidder participation rate was 36.1%. An average of the past six auctions produced a bid-to-cover of 2.8, dollar demand of $39.0 billion, and indirect bidder participation of 35.4%.

Advancing Sectors: Financials (+1.2%), Telecom (+1.2%), Health Care (+1.2%), Utilities (+0.7%), Consumer Staples (+0.3%), Tech (+0.2%), Energy (+0.2%), Industrials (+0.1%), Consumer Discretionary (+0.1%)
Declining Sectors: Materials (-0.3%)DJ30 +28.23 NASDAQ +7.33 NQ100 +0.3% R2K +0.1% SP400 +0.2% SP500 +5.31 NASDAQ Adv/Vol/Dec 1385/1.17 bln/1182 NYSE Adv/Vol/Dec 1862/837 mln/1133

4:30PM Texas Instruments narrows Q3 EPS to the range of $0.66-0.72 vs. $0.69 Thomson Reuters consensus, narrows revenues to the range of $3.62-3.78 bln vs. $3.69 bln consensus (TXN) 23.84 +0.16 : Original outlook for Q3 was EPS in the range of $0.64-0.74 and revenues between $3.55-3.85 bln. Thomson Reuters consensus EPS $0.69 and revenues $3.689 bln.

4:03PM National Semi beats by $0.02, reports revs in-line; guides Q2 revs below consensus (NSM) 12.90 +0.01 : Reports Q1 (Aug) earnings of $0.36 per share, $0.02 better than the Thomson Reuters consensus of $0.34; revenues rose 31.0% year/year to $412 mln vs the $415.4 mln consensus. Co issues downside guidance for Q2, sees Q2 revs of $390-415 mln vs. $420.62 mln Thomson Reuters consensus. Q1 sales increased sequentially due primarily to demand from wireless handset and industrial markets, the two largest markets served by National. Q1 gross margin of 70.9 percent set a new record for the co, driven by improved manufacturing cost efficiencies from higher capacity utilization and benefits from manufacturing consolidation completed in the fourth quarter of fiscal 2010. "Our business model is working well with another quarter of revenue growth, 70 percent gross margins and over 36 percent operating margins. However, in the near term, slower growth in our end markets and distribution channel, along with some likely inventory reduction, will mute the seasonal growth that we would normally see in our business during this time of the year."

4:00PM Lattice Semi reiterates guidance for Q3; Q3 revenue is expected to be flat to up 5% on a sequential basis vs consensus of growth of 3% (LSCC) 4.66 -0.06 : Gross margin percentage is expected to be ~59-61% of revenue. Total operating expenses are expected to be approximately $31.0 million.

8:00AM ARM Holdings introduced the Cortex-A15 MPCore processor (ARMH) 18.09 : Co introduced the Cortex-A15 MPCore processor that delivers a 5x performance improvement over advanced smartphone processors, within a comparable energy footprint. In advanced infrastructure applications the Cortex-A15 processor running at up to 2.5GHz will enable scalable solutions within constantly shrinking energy, thermal and cost budgets.

icon url

ReturntoSender

09/11/10 12:28 PM

#9056 RE: ReturntoSender #6755

From Briefing.com: Weekly Recap - Week ending 10-Sep-10The major indices settled with modest gains following a holiday-shortened week of light corporate news and economic reports. The economic reports that were released, however, helped quiet fears of a double dip recession.

The S&P 500 settled with a gain of 0.5% after advances in the last three sessions offset a loss of 1.2% on Tuesday. Seven of the ten sectors advanced, led by healthcare (+2.0%) and industrials (+1.6%). The utilities sector (-0.7%) underperformed as PG&E (PCG) slipped 7.4% after a natural gas pipeline it owned exploded and started a fire. Overall trading volume was once again light, in part due to the Rosh Hashanah holiday.

Banks were in focus throughout the week. The WSJ issued a report that questioned the European stress test results, which sparked selling early in the week. Meanwhile, the Basel III capital guidelines are expected to be announced Sunday, which fueled speculation regarding how much standards will be tightened. According to reports, Deutsche Bank (DB) is already planning on raising $9 bln euros and is expected to be the first as many European banks that will need to shore up capital to meet the new Basel requirements. The financial sector slipped 0.5% for the week.

In other corporate news, Oracle was a top gainer this week surging 9.3% on word that it hired former Hewlett-Packard (HPQ) CEO Mark Hurd as co-president. In response, HP filed a lawsuit against Hurd over breach of contract.

Texas Instruments (TXN) shed 2.6% for the week after the company narrowed its third quarter outlook, which remains in-line with the Thomson Reuters average analyst estimate.

Economic data were on the light side, though the weekly new unemployment claims reading did spark some buying interest. Initial jobless claims for the week ended September 4 totaled 451,000, which is down 27,000 week-over-week and less than the 470,000 claims that had been expected, on average, among economists polled by Briefing.com. Continuing claims came in at 4.48 million, but that was a greater tally than the 4.45 million that had been widely expected. Continuing claims were essentially unchanged week-over-week.

In other economic news, July consumer credit data showed that credit fell another $3.6 billion. Consumer credit has tightened for six straight months and in 17 of the last 18 months.

Treasury trading was volatile, with yields falling sharply on Tuesday and then gaining following several auctions. The yield on the 10-year note started the week at 2.70%, hit an intraweek low of 2.59% on Tuesday and then rebounded to settle at 2.79%.
 
Index Started Week Ended Week Change % Change YTD %
DJIA 10447.93 10462.77 14.84 0.1 0.3
Nasdaq 2233.75 2242.48 8.73 0.4 -1.2
S&P 500 1104.51 1109.55 5.04 0.5 -0.5
Russell 2000 643.36 636.46 -6.90 -1.1 1.8

8:31AM MEMC Elec signs memorandum of understanding for 400MW of solar projects with provincial government in Korea (WFR) 10.69 :

7:15AM Actel confirms Q3 Guidance (ACTL) 15.40 : Co reaffirms Q3 revs of +3-7% sequentially (vs 5.1% consensus) and gross margin of ~65%

07:39 am Sigma Designs initiated with a Hold at The Benchmark Company: . The Benchmark Company initiates SIGM with a Hold saying despite a compelling valuation, they choose a Hold due to looming competition from Broadcom (BRCM) and uncertainty relating to AT&T's next generation home networking choice.


icon url

ReturntoSender

09/12/10 12:28 PM

#9058 RE: ReturntoSender #6755

Leavitt Brothers State of the Market Video:

http://leavittbrothers.com/blog/?p=3474
icon url

ReturntoSender

09/12/10 7:31 PM

#9060 RE: ReturntoSender #6755

Monday Morning Outlook: Can DJIA Maintain Perch Above 200-Day Moving Average?
Sorting out the myths and facts of expiration week

by Todd Salamone 9/11/2010 11:13 AM

http://www.schaeffersresearch.com/commentary/content/monday+morning+outlook+can+djia+maintain+perch+above+200-day+moving+average/observations.aspx?ID=102233#102233

The September rally continued into a second week, although just barely. In fact, even though the Dow Jones Industrial Average has advanced in seven of the last eight sessions, it eked out a tiny gain of only 0.1% last week, settling at 10,462.77. Looking ahead, Todd Salamone, Senior Vice President of Research, wonders if there's any rally fuel left in the tank following the last two weeks, and considers the possibility of mean reversion. Next, Senior Quantitative Analyst Rocky White reports that next week is triple-witching expiration week (aka quadruple-expiration week, but Rocky is Old School.) Triple-witching week may have a scary reputation, but Rocky finds that triple-witching weeks are positive 72% of the time. Finally, we wrap up with a look at some key economic and earnings reports slated for release this week.

Recap of the Previous Week: Running in Place
By Joseph Hargett, Senior Equities Analyst

The fall political campaigns officially kicked off on Labor Day, but unless you're a political junkie, the holiday-shortened week didn't offer much in the way of drama. News was light, as was trading volume. Nonetheless, traders were encouraged by the faintest glimmers of economic recovery, as fears of a double-dip recession began to fade.

The market stumbled to begin the week on Tuesday after the Wall Street Journal reported that recent stress tests did not completely reveal the levels of risky debt held by European banks. That was enough to slow the September mini-rally. The Dow Jones Industrial Average gave up 107 points, or 1.03%.

The smelling salts came out Wednesday, after a successful auction of Portuguese debt eased concerns about Europe's fiscal health. Traders remained cautious, however, especially after the Federal Reserve's Beige Book report confirmed that the economic recovery remains weak. The Dow added 0.45% for the day.

The Labor Department revealed early Thursday that initial jobless claims fell more than expected. That's all the bulls needed to hear to stoke a morning rally. However, fears about Europe's fiscal health were revived in the afternoon when it was reported Deutsche Bank (DB) might have to raise up to $11.4 billion in capital. The bulls still managed a slight win on the day, with the Dow advancing 0.27%.

Friday's action was a microcosm of the previous several weeks: better-than-expected economic data, in this case on wholesale inventories, amid lingering concerns about the economy. President Obama got into the act by reminding a press conference that the recovery has been "painfully slow." The Dow notched a 0.5% gain for the day, and it needed every bit of that to record a W for the week, advancing a measly 0.1%. Nonetheless, technicians cheered two developments: the Dow finished above resistance at its 200-day moving average, and it managed a second weekly close above its 20-week moving average. Meanwhile, the S&P 500 Index added 0.5% for the week, finishing at 1,109.55, and the Nasdaq Composite recorded a weekly gain of 0.4%, settling at 2,242.48.

What the Trader Is Expecting in the Coming Week: Mean Reversion a Possibility
By Todd Salamone, Senior Vice President of Research

"From a shorter-term perspective, there is a tremendous amount of put open interest just below current levels on major exchange-traded funds that we follow. If the market stabilizes during the next few days, short covering related to expiring put open interest in the next few weeks could support a rally from SPX 1,040, the lower boundary of the current trading range..."
- Monday Morning Outlook, Aug. 28, 2010

In a nutshell, not a lot has changed from last week, with the market recovering from Tuesday's sell-off to close slightly higher on the week. Triple-witching expiration week is upon us, and Rocky White provides some interesting statistics for you to chew on in the section below.

If indeed the rally from S&P 500 Index (SPX) 1,040 to the high of 1,110 last week can be attributed to short covering, one might come into the week wondering, "What is left in the tank?" This is a fair question for several reasons.

After all, now that key indexes come into this week sitting significantly above the biggest put open interest strikes in the September series, and considering that there is only one week left until expiration, you can assume the short covering related to that put open interest is a thing of the past.

Plus, if you are playing the mean-reversion game, you will note that the SPX comes into the week:

1. Trading higher in seven of the last eight trading days

2. Sitting near the top of a long trading range

3. Trading just below the convergence of its 160-day and 200-day moving averages

Could we be putting too much emphasis on the current winning streak? There have been four other occasions in 2010 in which the SPX rallied in seven of eight trading days. The first eight trading days of the year began this way, and there were similar streaks in March, April, and July. The January and July streaks ended with giant thuds within one to five days. But the March and April "signals" did not end with a mean-reverting decline in the immediate term, although mean reversion began taking shape in a major way one week after the April signal.


With the SPX at 1,050 two weeks ago, we noted that retail investors had become very gloomy, as was evident by the weekly American Association of Individual Investors' survey. At the time, only 20% of those surveyed had a bullish outlook on the equity market, which we viewed as a potential contrarian bull signal. At present, 40% of those surveyed are bullish, which doubles the reading of only two weeks ago. Given the poor track record of this group during the past several months, a contrarian's antennae might perk up: this sudden movement into the bullish camp is a risk worth noting following the 5% advance since the end of August.

Setting the tone for next week could be weekend news flow from China, which moved up the release date of various economic indicators to Saturday from Monday. For example, monthly figures on industrial production, fixed-asset investment, wholesale inflation and consumer inflation data will be reported on Saturday. This has led some to speculate that China's central bank could be planning an interest rate increase before the markets open on Monday, in response to inflationary pressures.

With the CBOE Market Volatility Index (VIX) trading around its lowest level since the "flash crash" of early May, and implied volatility on many equity options trading near multi-week lows, now is a good time to buy put protection for long positions you are interested in protecting. Should the market break out from this range, we think a breakout will be to the upside. But sharp, quick pullbacks are still a possibility amid signs that deep-pocketed institutional players, including hedge funds, are not in an accumulation phase.

Another way to hedge long positions against a short-term equity market decline is to take advantage of the pullback in the bond market by going long the iShares Trust Barclays 20+ Year Treasury Bond (TLT). Bonds have been among the strongest assets in 2010 amid cries of a "bubble," but they have been mired in a pullback since late August. Last week's pullback to the 102 area looks appealing, as the 102 strike is the site of peak put open interest in the September series, which could serve as options-related support. Additionally, the 102 area is the site of the TLT's 50-day moving average and a former resistance level in July 2010. Hedge funds have been scooping up bonds in 2010, and a risk to this play is that these players suddenly liquidate long positions.


If you enjoy Monday Morning Outlook...

...we also offer a free Market Recap after the close every day. Did the Dow go up 100 points? Or down? We'll tell you why. We'll also tell you who the big winners and losers were, and we'll share some highlights from our daily articles and blog postings. Market Recap is a quick, but insightful read. Sign up here to have Market Recap delivered straight to your inbox every evening shortly after the close.

Prepare for the investing week ahead. Every week, Bernie Schaeffer and his staff provide you with their insight about what has happened and, more importantly, what will happen in the market. We dig deep and show you what's happening behind the scenes, and tell you which indicators are predicting major market moves. If you enjoyed this week's edition of Monday Morning Outlook, sign up here for free weekly delivery straight to your inbox.

Indicator of the Week: Triple-Witching Expiration
By Rocky White, Senior Quantitative Analyst

Foreword: The upcoming week is a triple-witching expiration week. Not only are equity options expiring, but so are stock index futures and stock market index options. Additionally, single stock futures expire, so triple-witching expiration is also commonly referred to as quadruple-witching expiration. This week I'll take a look at how the market has performed during these special expiration weeks. Also, with all the activity going on (closing expiring contracts and opening up new ones to replace them), pundits often suggest preparing for increased volatility. We'll take a look at the numbers to see just how volatile we can expect this week to be.

Triple-Witching Week: Below is a table comparing triple-witching expiration weeks since 2006 to other expiration weeks and to nonexpiration weeks. The 18 triple-witching expirations have vastly outperformed other weeks. Typical nonexpiration weeks average a slight loss, and are positive only half the time. Ordinary expiration weeks average a slightly bigger loss, and are positive 55% of the time. Triple-witching weeks, though, are positive 72% of the time, averaging a gain of 0.82%.


Low Volatility? One of the more noteworthy numbers in the table above is the standard deviation of returns. Triple-witching expirations have a reputation for being volatile, but the numbers show far less volatility during these weeks than other weeks.

Is volatility actually that depressed during these weeks? Not necessarily. Look at the table below. Here I summarize the data the same as above but on a daily basis rather than on a weekly basis. The daily volatility during triple-witching expiration week is 1.60%, which is about the same as nonexpiration weeks, and a bit less than other expirations. So on a daily basis, you can expect typical market volatility, but on a weekly basis the market barely moves. This leads to the conclusion that mean reversion is typical during these weeks. If the market goes up early in the week, then it's likely to go down later in the week, and vice versa. This could be the result of the various market players defending key strike prices throughout the week.


Freaky Friday: Finally, I wanted to mention what many call "Freaky Friday." That's the day all those contracts mentioned above expire. Despite its scary name, the last day during triple-witching week strongly outperforms the last day of other weeks. Again, you may hear from the talking heads or elsewhere that you need to prepare for elevated volatility, but the numbers just don't back this claim up.


This Week's Key Events: Consumer Price Index Due on Friday
By Joseph Hargett, Senior Equities Analyst

Here is a brief list of some of the key events for the upcoming week. All earnings dates listed below are tentative and subject to change. Please check with each company's respective website for official reporting dates.

Monday
* U.S. budget figures for August are due from the Treasury Department on Monday. K12 Inc. (LRN) will report earnings.

Tuesday
* The Commerce Department will report on August retail sales and July business inventories. Best Buy Co. Inc. (BBY), Cracker Barrel Old Country Store Inc. (CBRL), The Kroger Co. (KR), and Pall Corp. (PLL) are scheduled to report earnings.

Wednesday
* The New York Fed will report on September manufacturing activity in the New York region on Wednesday. Back in Washington, the Fed will report on industrial production in August, and we'll also get the usual weekly report on U.S. petroleum supplies. CLARCOR Inc. (CLC) and The Dress Barn Inc. (DBRN) will post their quarterly results.

Thursday
* We'll get the weekly report on new jobless claims, the producer price index for August, and the Philadelphia Fed's report on manufacturing activity in that region. FedEx Corp. (FDX), Pier 1 Imports Inc. (PIR), Oracle Corp. (ORCL), and Research In Motion Limited (RIMM) will report earnings.

Friday
* The Labor Department will deliver the August consumer price index, while the University of Michigan will give its first peek at consumer sentiment in September. There are no earnings reports scheduled for Friday.
icon url

ReturntoSender

09/14/10 12:22 AM

#9061 RE: ReturntoSender #6755

From Briefing.com: 4:30 pm : Broad-based buying on the back of Basel III boosted stocks to their fourth straight gain, or seventh advance in eight sessions. Still, participation remained unimpressive.

Basel III was released overnight. The international regulatory code dictates that required common equity will increase to 4.5% from 2.0% and that a capital conservation buffer of 2.5% is necessary. The stricter requirements will be phased in over a nine year span.

Since there had been concerns about capital levels among Europe's banks, the absence of negative surprises in Basel III helped European bank stocks bounce in overnight trade. That, coupled with news that the European Commission now expects eurozone GDP to increase 1.7% instead of 0.9% in 2010, drove Europe's major bourses to big gains. Meanwhile, the euro rallied 1.5% against the greenback.

Asia's major equity averages also advanced handsomely. They were helped by news that August industrial production in China grew a stronger-than-expected 13.9% year-over-year and that China's August retail sales grew a stronger-than-expected 18.2% year-over-year. Consumer prices in China increased 3.5% in August, as had been widely expected.

An agreeable Basel III and strong overseas action set the stage for the S&P 500 to make a heady move of its own. It ran into some mild selling pressure midsession, but recovered to book a 1% gain and settle at a one-month closing high. It also broke above its 200-day moving average for the first time in one month.

Banks were among the biggest beneficiaries of this session's bounce. The KBW Bank Index advanced 3.0%, which puts it up 11% from the 2010 low that it set only nine sessions ago.

Semiconductor stocks were also strong. As such, the Philadelphia Semiconductor Index spiked 3.4%.

Of the 10 major sectors, only the consumer staples settled with a loss. They shed 0.1%.

Trading volume failed to break 1 billion shares on the NYSE as many investors continue to sit on the sidelines, skeptical of whether the stock market can sustain its bullish streak now that it is already up about 7% since the start of September.

Commodities pits benefited from the positive tone among traders this session. Specifically, the CRB Commodity Index advanced 0.9% to a new one-month high as oil prices advanced 0.9% to $77.19 per barrel. Their session high of $78.04 per barrel marked a one-month best. Meanwhile, silver settled 1.4% higher at $20.15 per ounce after it traded to a fresh 29-month high.

Merger and acquisition activity were at the center of corporate activity. ArcSight (ARST 43.91, +8.81) will be acquired by Hewlett-Packard (HPQ 38.28, +0.08) for $43.50 per share, Hertz (HTZ 10.84, +0.79) will pay $50 for each outstanding share of Dollar Thrifty (DTG 50.58, +2.57) and 3M (MMM 84.86, +0.92) has offered $10.50 for each outstanding share of Cogent (COGT 10.86, -0.07).

Advancing Sectors: Financials (+2.3%), Tech (+2.1%), Materials (+1.6%), Consumer Discretionary (+1.1%), Industrials (+1.1%), Energy (+0.6%), Telecom (+0.4%), Utilities (+0.4%), Health Care (+0.1%)
Declining Sectors: Consumer Staples (-0.1%)DJ30 +81.36 NASDAQ +43.23 NQ100 +1.6% R2K +2.5% SP400 +1.8% SP500 +12.35 NASDAQ Adv/Vol/Dec 2098/1.97 bln/547 NYSE Adv/Vol/Dec 2297/934 mln/725

4:23PM Advanced Energy wins Stage 3 Solar Energy Grid Integration System contract (AEIS) 14.59 : Co announced that PV Powered, an Advanced Energy co, has been selected to continue development work funded by the U.S. Department of Energy Solar Energy Technologies Program and administered by Sandia National Laboratories. The effort is focused on lowering the barriers to adoption of solar energy on the utility grids of North America. Stage 3 represents the final stage of the competitive portion of the SEGIS program and is focused on commercialization of the technologies developed under previous stages.

1:25AM Lam Research announces $250 mln share repurchase program (LRCX) 36.24 :

icon url

ReturntoSender

09/14/10 10:51 PM

#9062 RE: ReturntoSender #6755

From Briefing.com: 4:30 pm : Stocks attempted to stage another gain in the latest round of trade, but some late selling pressure left the major indices to finish in mixed fashion.

Cautious trade in the early going left stocks to start the session in the red. Participants were generally uninspired by Advance Retail Sales for August. The report indicated that retail sales in August increased 0.4%, which is slightly stronger than the 0.3% increase that had been expected, on average, among economists surveyed by Briefing.com. Excluding autos, August sales increased 0.6%, which is double the 0.3% increase that had been widely expected. Enthusiasm over August sales was partly tempered by downward revisions to sales for the prior month.

In other data, business inventories for July increased 1.0%, which is more than the 0.7% increase that had been widely expected. The greater-than-expected increase in business inventories ought to bode well for third quarter GDP.

Stocks overcame initial weakness to stage a steady climb, but the advance failed to take the S&P 500 through 1128, which marks the "flash crash" close and the top of the summer trading range. The major averages lacked direction after being rebuffed by the resistance line.

Shares of retailers still fared well, though. As a group they settled with a 1.2% gain. Best Buy (BBY 36.73, +2.08) was a primary leader in the group after it posted better-than-expected earnings and an increased profit outlook. The stock made its biggest bounce by percent in four months to book a two-month closing high.

Tech stocks were strong, too, although their gains were more than halved to 0.5%. Cisco (CSCO 21.46, +0.20) was a leader in the bunch after hinting at a potential dividend in 2011 during a presentation today.

JPMorgan (JPM 40.72, -0.40) resumed the discussion on its dividend during a conference as well by saying that it plans to restore its dividend payout ratio to a range of 30% to 40%. That did little to get bank stocks out of their funk, though some banks briefly benefited from news that embattled SunTrust Bank (STI 25.91, +0.60) believes it will post a third quarter profit, rather than log a loss as many have forecasted.

Trading volume on the NYSE failed to break 1 billion shares for the eighth straight session. Participation could pick up as monthly options come closer to their expiration at the end of the week.

Gold prices under the continuous contract set a new all-time high of $1274.60 per ounce, well above the previous all time high of $1266.50 per ounce. Silver prices continued their ascent as well. Specifically, the December contract for the precious metal hit $20.55 per ounce.

Meanwhile, the greenback dropped sharply against competing currencies. Specifically, the euro rallied 0.9% against the dollar and the yen climbed 0.7% and, in doing so, booked a fresh 15-year high against the dollar.

Though stocks settled with mixed results and volatility was muted, Treasuries caught a strong bid this session. In turn, the yield on the benchmark 10-year Note pulled back below 3.70% after it broke above its 50-day moving average in the prior session.

Advancing Sectors: Tech (+0.5%), Health Care (+0.4%), Telecom (+0.1%), Consumer Staples (+0.1%), Consumer Discretionary (+0.1%)
Declining Sectors: Financials (-1.0%), Industrials (-0.3%), Energy (-0.3%), Utilities (-0.2%), Materials (-0.1%)DJ30 -17.64 NASDAQ +4.06 NQ100 +0.4% R2K -0.5% SP400 +0.1% SP500 -0.80 NASDAQ Adv/Vol/Dec 1108/2.10 bln/1486 NYSE Adv/Vol/Dec 1369/922 mln/1581

5:42PM MEMC Elec: SunEdison awarded solar service contract to deploy a 14.5MW solar power plant for Davis-Monthan Air Force Base (WFR) 11.04 +0.13 : SunEdison, a worldwide solar energy services provider and subsidiary of MEMC Electronic Materials (WFR), was awarded a ground-mounted 14.5 megawatt solar service contract with Davis-Monthan Air Force Base in Tucson, Arizona.

8:18AM FormFactor appoints Tom St. Dennis as CEO (FORM) 7.52 : Co announces the appointment of Tom St. Dennis as its CEO, and as a member of the Board of Directors. Both appointments effective 9/13/10. Most recently he was a SVP at Applied Materials where he was General Manager of the Silicon Systems Group.

Intel Capital, Intel Corporation's (INTC) global investment organization, continued its strong commitment to fostering entrepreneurship in the United States with the announcement of four investments totaling over $30 million. The deals include Moab unified automation intelligence technology provider Adaptive Computing; analog IC physical design software developer Ciranova; cloud computing infrastructure and services provider Joyent; and energy software and services provider Nexant. Cabela's Incorporated (CAB) announced it renewed its $350 mln commitment under an outstanding series of variable funding notes issued by Cabela's Credit Card Master Note Trust. The commitment is for one year. iGo (IGOI) awarded two additional United States Patents relating to its novel approach to reducing wasted standby power, commonly referred to as "vampire power." A fifth patent related to iGo Green Technology is expected to issue on September 21, 2010. Orange and Nokia (NOK) announced a new integrated Ovi service that gives Orange customers using Nokia handsets easier access to more content. Nokia's Ovi Store with Orange will be accessible by Orange customers in the UK and France in 2011.

Nokia (NOK) announced family of smartphones powered by the all new Symbian platform. Highlights include: Three new smartphones, Nokia E7, Nokia C7 and Nokia C6, which join the previously announced Nokia N8.

Microsemi Corporation (MSCC) announced that it has acquired all of the assets of VT Silicon...

6:25AM Chipmos Technology reports Aug revs increased 2.0% from June; reduces commodity dram exposure (IMOS) 0.92 : Co announces revs for the month of August 2010 was NT$1,621.0 mln or $50.6 mln, an increase of 2.0% from the month of July 2010 and an increase of 45.7% from the same period in 2009. Co also announced recent efforts to reduce its commodity DRAM exposure and refinement of its niche/mobile DRAM strategic focus, under which the co reorganized its DRAM final test production line. Co also also plans to return seven high-speed DRAM testers at the end of leases saving ~$550K in monthly leasing fees.

5:13AM Finisar and Source Photonics settle patent dispute (FNSR) 16.17 : Co announces it had entered into a Settlement and Cross License Agreement with Source Photonics. Under the terms of the Settlement Agreement, Source Photonics will pay a license fee to co in the amount of $14.5 mln for a fully paid-up license to the Finisar digital diagnostics and transceiver module patents through December 31, 2015. Payment in full is to be made by September 30, 2010.

09:49 am Advanced Micro target lowered to $5 at Auriga U.S.A: . Auriga U.S.A lowers their AMD tgt to $5 from $6 saying despite the stock being down 36% YTD and valuation now under 1.0x EV/sales on their CY11 estimates, their sense is that AMD will continue to underperform competitors Intel (INTC) and NVidia (NVDA) on a fundamental as well as a share price basis over the course of the next year. Firm says it's clearly more difficult for investors to initiate new short positions at current levels, and realistically with GlobalFoundries off the books it's tough to see AMD burning much cash over the next two years. However, the firm has lower estimates to reflect continuing weakness in the PC sector (both CPU and GPU) -- consensus probably has a long way to go to catch up on the necessary cuts, particularly as weak pricing in CPU and GPU takes hold.
icon url

ReturntoSender

09/16/10 12:01 AM

#9063 RE: ReturntoSender #6755

From Briefing.com: 4:30 pm : Stocks spent most of the session plodding along the neutral line until a late lift helped them settle with solid gains. However, the late climb couldn't quite build enough momentum to make a move past key resistance levels.

Moderate weakness at the open led to a lower start, but the broader market was able to attract support as the 1115 line held for the S&P 500. The 1115 line not only marks the stock market's 200-day moving average, but it is also the dividing point between year-to-date gains and losses.

Technical support helped participants shrug off a disappointing September Empire Manufacturing Index, which slipped to 4.1 from 7.1. It had been expected that it would come in at 6.4.

Import prices heated up in August with a 0.6% monthly increase. They had increased just 0.1% in the prior month.

Industrial production increased 0.2% in August, but the consensus called for a slightly stronger hike of 0.3% after a 0.6% increase in the prior month. Capacity utilization in August was 74.7%, not too different than the 75.0% that was widely forecasted.

Market participants were hardly surprised by the decision of Japan's government to curtail the yen's strength by intervening in currency markets since there had been plenty speculation about such a measure in recent weeks. Still, Japan's Nikkei Index spiked more than 2% overnight as exporters found favor amid a 3% drop in the yen. Though Japan's currency remains near its 15-year high, a cheaper yen makes U.S. exports more expensive to Japan.

Stocks spent latter part of the morning and most of the afternoon confined to a relatively narrow range. There was no headline or clear catalyst responsible for the bounce, but stocks broke free in the final hour to finish near session highs. However, the S&P 500 could not attract enough support to take it back to the prior session's high, which are in line with the top of the summer trading range and the "flash crash" close.

Participation was unimpressive once again as trading volume on the NYSE failed to break above 1 billion shares.

Despite the apparent lack of conviction, the only thing investors care about at the end of the day is whether their holdings advanced. That said, health care stocks had the best performance. The sector swung to a 0.8% gain. Savient Pharmaceuticals (SVNT 19.98, +5.22) was a standout after the FDA approved a gout drug from the firm.

Tech stocks were relatively strong for the second straight session, though their collective 0.6% gain came without help from semiconductor stocks (-0.3%).

Financials (+0.4%) had a relatively quiet session as bank stocks were mixed following their pullback in the prior session. However, MasterCard (MA 210.18, +10.43) outperformed after it announced the approval of a $1.0 billion share repurchase plan and stated it expects earnings per share to achieve a compound annual growth rate of 20% or more until fiscal 2013.

Energy stocks lagged for the entire session, but the sector managed to limit its loss to 0.2%. A 1.0% decline in oil prices to $76.02 per barrel weighed on the sector. Oil prices had been down more than 2% ahead of an in-line inventory report, though.

Advancing Sectors: Health Care (+0.8%), Consumer Staples (+0.7%), Tech (+0.6%), Telecom (+0.5%), Financials (+0.4%), Consumer Discretionary (+0.2%), Industrials (+0.1%)
Declining Sectors: Utilities (-0.5%), Energy (-0.2%), Materials (-0.1%)DJ30 +46.24 NASDAQ +11.55 NQ100 +0.6% R2K +0.5% SP400 +0.4% SP500 +3.97 NASDAQ Adv/Vol/Dec 1480/2.08 bln/1109 NYSE Adv/Vol/Dec 1591/900 mln/1406

4:04PM Micrel increases share repurchase amount to $30 mln from previous $15 mln (MCRL) 9.76 -0.09 :

12:27PM Apple announces AirPrint wireless printing for iPad, iPhone & iPod touch coming to users in November; available first on HPQ (AAPL) 269.79 +1.73 : Co announced that it is releasing a beta version of its AirPrint wireless printing for iPad, iPhone and iPod touch to members of Apple's iOS developer program today, and that AirPrint will be included in the free iOS 4.2 software update in November. AirPrint automatically finds printers on local networks and can print text, photos and graphics to them wirelessly over Wi-Fi without the need to install drivers or download software. HP'Qs existing and upcoming ePrint enabled printers will be the first to support printing direct from iOS devices.

8:07AM UTStarcom wins contract from Sichuan Radio and TV and Jinan, Shandong province (UTSI) 1.93 : Co announces contracts for Sichuan Radio and TV's Integrated IPTV Broadcasting Control Platform Project and for Jinan Radio & TV Network Center's Equipment Purchase Project to become the Center's exclusive broadband solution provider.

Microsemi (MSCC) announced that it has acquired privately held Arxan Defense Systems. Terms not disclosed.

6:38AM Monolithic Power sees Q3 revs at lower end of previously announced guidance (MPWR) 17.56 : Co issues downside guidance for Q3 (Sep), sees Q3 (Sep) revs at the lower end of its previously announced guidance of $66-70 mln vs. $67.97 mln Thomson Reuters consensus.

09:39 am Skyworks tgt raised to $25 at Oppenheimer on higher ests: . Oppenheimer is raising their tgt to $25 from $23 and their ests ahead of consensus, based on checks. The strength reflects a mix of a strong handset market, market share gains, and strong execution. They would be buyers of the shares ahead of the co's upcoming Sept. 21st analyst day. They expect mgmt to expand on Skyworks' growing TAM (total available market) and more importantly set a new mid-term operating target.

icon url

ReturntoSender

09/17/10 12:42 PM

#9065 RE: ReturntoSender #6755

Chart of the Day - COTD - Rallies Post-Massive Bear Markets

Today's chart illustrates rallies that followed massive bear markets. For today's chart, a 'massive' bear market is defined as a decline of greater than 50%. Since the Dow's inception in 1896, there have been only three bear markets whereby the Dow declined more than 50% (early 1930s, late 1930s until early 1940s, and during the very recent financial crisis). Today's chart also adds the rally that followed the dot-com bust during which the Nasdaq declined 78%. The current Dow rally has followed a path that is fairly similar to that of post-massive bear market rallies. The initial surge of the current rally lasted nearly 300 trading days and has been trading flat/choppy ever since. If the current rally were to continue to follow the post-massive bear market rally pattern, the current choppy phase would continue for another 200+ trading days.


http://www.chartoftheday.com/20100917.htm?T
icon url

ReturntoSender

09/19/10 7:02 PM

#9068 RE: ReturntoSender #6755

InvestmentHouse Weekend Market Summary

http://www.investmenthouse.com/weekendmarketsummary.htm

- Still in the trading range but with an interesting twist on SP500 and NASDAQ .
- NASDAQ, SP500 tap resistance, show doji at the top of the range.
- CPI flat on the core, leaving one to wonder what the Fed will do at its Tuesday meeting.
- Michigan Sentiment misses expectations and falls to a one year low.
- Leadership has improved, but enough for a breakout?
- The doji may suggest another pullback, but at this stage in the trading range be watching for a higher low at key support as a portent to a range breakout.

We have seen this action before, but this time it is later in the trading range.

It was another day in the trading range for the indices, but it was not an insignificant day. It was expiration Friday so volume was up marginally, but that was not the real story. The story was that both SP500 and NASDAQ bounced up and tested a key resistance level. SP500 bounced up to the 1131 resistance, which is the bottom of its January trading range. Back in December and January, there was a lateral move where the SP500 peaked. Since its selloff that started in April, it has been unable to break above that level again. NASDAQ is showing some of the same action. It has rallied up to its January peak which is roughly matching the August and June peaks. The interesting feature was that both gapped higher, tapped that resistance level, and could not go any further. The NASDAQ showing something of a hangman or hammer doji at that level, while the SP500 is showing something of an evening star doji at that level.

Is that dispositive? Not in and of itself. In the past there have been doji at resistance that did not lead to anything. As you look in August, the last of the lateral move led to the selloff to the bottom of the range. In June there was the big reach higher and a doji that led to the selloff all the way down to the July low. These are symbols that you have to watch at the top and bottom of a range. After the selloff, there is a doji and a bounce, then another doji and a bounce. Coming into the August low, there is one doji, and then back and forth sessions, and then another that led to the move to the upside. The point is that the indices did not break out of their ranges. They did finish positive on the day. The chart shows that they were up across the board NASDAQ 0.5% , SP500 flat, Dow 0.1%, SP600 0.5%, SOX flat, NASDAQ 100 0.4%. The indices were up on the session, but they tapped important resistance and showed a candlestick pattern that suggests they could roll back over. That is not dispositive, but it was interesting enough for us to start some SSO put positions. In other words, looking to play the move down.

It may not do it. There is still plenty of leadership that could break the market to the upside. Industrials had a very good day. Financials were down, but they did not have a terrible day. Technology continues to look solid. They could bounce right up from here. They could test, and then bounce after making a higher low at the 18 day EMA or the 50 day EMA. Or they could roll over and sell all the way to the bottom of the range again. They have not answered the question, but Friday was interesting with this candlestick pattern as noted. Maybe it was just an expiration Friday thing, but it is something that you have to note and be ready for in the event it is signaling a selloff. We have been taking gain off the table over the last several sessions as the indices rallied higher and then started to move laterally at that resistance. That was the game plan. We have banked a lot of gain. We have taken some new positions to the upside as well as the downside as we wait for the market to show us its next move. We are well positioned. If it continues higher, we have great positions in place and more to take. If it turns over, we have already banked a lot of gain and we can quickly get out of other positions and play the downside. We are still in the range. Nothing was decided this week, but it is getting more interesting.

Stocks were ready to start the day to the upside thanks to the ORCL and RIMM earnings released Thursday after the bell. It also got the boost from TXN that increased its dividend as well as its buyback. It is interesting to note that TXN's buyback plans, with this additional buyback announced, is roughly equal to the float of the stock. That tells you that buybacks really are not that meaningful as to whether the company will make the buybacks. It is meaningful as to the perception of the stock. We saw buyback announcements all week that helped boost stocks higher. It is like splits do at times. When they get the announcement, it may not mean a lot in terms of what will happen to the shares themselves, but the perception is a bullish one and it helps stock prices.

This helped offset some less-than-spectacular economic data. The CPI came in with a 0.3% gain, topping the 0.2% expected and matching the 0.3% gain in July. The core, however, was flat versus an anticipated 0.1% gain that would match the July 0.1% gain. Food and energy were to the upside. Michigan Sentiment was a disappointment. It came in at 66.6 for September versus 70 expected. That was expected to rise from 68.9 in August. Lower gasoline prices and better hourly earnings did not do the trick for those in Michigan as it did for the Conference Board's consumer confidence indication released earlier in the week.

Stocks initially started higher, but they rolled over immediately as the session got underway. Indeed, they turned to negative and bounced on the sentiment news. Apparently there were fears it would be worse than it actually was. Stocks recovered to positive, moved laterally into the close and hanging on for that modest gain to end the week. Of course this action on SP500 resulted in a doji on the candlestick chart as it bumped 1131 and was never able to get back to that level on the day. NASDAQ started out at its high as well. It sold off and made a series of higher lows through the remainder of the session, forming something of an ascending triangle. It ran out of time for a breakout, although it looked like it would give us one with an hour and a half in the session. That rolled over and it trailed off with very modest gains.

OTHER MARKETS

Dollar. The dollar managed to recover some ground, though it was sharply lower for the week. A quick selloff early in the week, then moving laterally at a support level at the top of the February and March range. It was holding that and trying to put in a higher low for a new bounce (1.3042 Euro versus 1.3078 Thursday). It was a week where the dollar struggled against the Euro and other currencies, even though the Japanese government intervened in its currency market, selling Yen in order to drive the price of the Yen lower. The dollar did not have a good week, but now we will see if it can hold after coming back and testing the support I anticipated it would test.
Click to view the chart

Bonds. Bonds finished a bit stronger on the session (10 year 2.74% versus 2.76% Thursday), but they were down for the week. We have had a dramatic run higher, a selloff, and an important gap lower on Thursday. Then a modest rally on Friday that did not alter the break of this important support level. I still anticipate bonds to roll over and fall further next week toward the support level marked by the July and August lows (not to mention the May and June peaks).
Click to view the chart

Gold. Gold had a big week. It appears to be pricing in some inflation, and it had a strong surge early in the week that it maintained through the end of the week. It was not a strong push to close out the action, however. A doji on Friday, but it was still to the upside ($1,278, +4.20). Still an all-time high for the yellow metal, and that indicates inflation anticipated despite an unchanged reading in the core CPI for August. Gold is anticipating inflation. It doesn't rise with inflation; just as any market, it anticipates what is coming and moves in advance. Even though the US inflation indicators are minimal and many fear deflation, with all of the money printing, there could be a quick spike in inflation.
Click to view the chart

Oil. The world cannot work without oil, but it was having a hard week. Are world economies recovering? Maybe, maybe not. In Ireland there was a big worry on Friday as its credit default swaps hit all-time highs in pricing. That means the prices are soaring for insuring the debt in Ireland. They exploded higher in the US and generally around the world in September of 2008 as the financial/credit crisis expanded. Credit default swap premiums jumped over thousands of percent in just a matter of days, indicating the rapidly accelerating fears with respect to defaults by sovereign entities (and many of the larger financial institutions). Ireland is showing record default swaps now, and this is after the 2008 crisis. Something does not smell right in the EU. I had said that something was wrong, and it was probably something in Europe that would result most likely in some form of sovereign debt default from one of the PIIGS. It looks like Ireland is the poster child for that, although it could come from any of the PIIGS. In any event, oil is sniffing that way as well. It finished lower once more ($73.66, -0.84).
Click to view the chart

TECHNICAL SUMMARY

INTERNALS

Volume. Volume ramped up 35% to 0.3B on NASDAQ, and that was thanks to expiration Friday no doubt. Volume also increased on the NYSE, exploding higher to 1.8B shares, up over 100%. Again, that is thanks to expiration Friday. There were few fireworks during the week, so they all showed up on Friday. Since it was quadruple witching expiration, the added volume is understandable.

Breadth. Breadth was a 1.4:1 NASDAQ and 1.4:1 on the NYSE. Given that the indices are basically flat, you can say that was a positive and things were better. Indeed, the SP600 posted a gain versus losses -- relatively stronger than the other indices, for that matter -- and that helped push that breadth higher. It really does not tell us anything given the other indications in the market.

CHARTS

SP500. It tapped at 1131, which is the bottom of the January peak range. That is a kind of consolidation peak. There is a broad top, and the SP500 is back at the bottom of this level. The significance is that it stopped it in June, and it stopped it again in August. Now it is back at that level, tapping at it on Friday and showing a candlestick doji. This is where volatility has bottomed when the market has peaked. It is in prime position to roll over, but don't anticipate that it will happen. I think is there a good probability it could happen, but it is not definite because there are some good leaders out there.

NASDAQ. NASDAQ is the same situation. It gapped to the upside and rallied up to the top of the January peak. It stalled there, and it is showing a hammer doji -- a gap to a doji at resistance. Still in the overall bearish pattern, but in a trading range. There is a possibility it could fall back from here as well. It gapped higher to resistance, and volume spiked. Maybe that volume was related only to expiration, but it was helped by others -- ORCL and RIMM had big volume on the session. It was positive volume, but it nonetheless touched resistance and volume spiked. Just as you watch for volume to rise when an index touches a support level and recovers, when you see the same thing on the top of a range, that indicates sellers are stepping in to sell a market off. The doji and the higher volume coupled with the resistance is waving a caution flag in our faces. We will have to see how it plays out.

SP600. SP600 had a better day, up 0.5%. It is still holding at the 200 day EMA, mid-range in its trading range. It is trying to establish a shelf to bounce higher. Unlike the other indices, it is in decent shape because it is not bumping its head against resistance and looking as if it will roll over. Instead it is moving laterally and consolidating, and that is a silver lining for the rest of the market, i.e., SP500 and NASDAQ, as they may come back to test a bit. That would be just about time the SP600 is ready to move back to the upside.

SOX. The semiconductors had a much better week. They rallied nicely all week. There was the inverted head and shoulders, trying to break higher, but they have banged into the bottom of the May-August range and stalled. It does not mean they are out for the count, but that is something to consider with the other indices at resistance. Are the semiconductors going to change their stripes and rally hard from here, or are they just going to stall out and fade? Of course a lot depends on what the SP500 and NASDAQ do. This is still not told us the answer, although it got interesting with the gaps to resistance showing doji on rising volume.

LEADERSHIP

Financial. Financials were down on the session. JPM dropped down to the 10 day EMA on a big volume spike. It was expiration, so I do not want to read too much into it, but it was a pretty hard plop down after moving up to the late July peak, matching it at the 200 day EMA and then falling back down. It will be important to see how it and other financials perform early next week after that drop. MS was down as well on rising volume, although it is still above a support point. It also banged into the early August peak and the 200 day EMA and rolled back down this week. Not all are showing that same action. WFC is moving laterally after hitting the 50 day EMA. Of course it didn't rise up to the prior highs. It was not as strong as the others. You can say a stock that is not as strong does not look as bad, but that is like saying a pig is cute just because it is not as ugly as a rat. If the financials continue to fall, that will be an impetus for SP500 to fall back from its doji at resistance.

Industrial. The industrials performed very well on the day, rising on big volume. CAT broke out of its series of higher lows to a new rally high, and it did so on strong volume. DE did the same thing. Strong volume breakout and nice surge. CMI did not quite have as strong a move, so I held off given the doji on the SP500. Nonetheless, they are clear leaders that are moving higher. They go into the plus category for a continued rally.

Technology. AAPL could not keep that move up. It gapped to the upside and rolled over a bit on Friday. Nothing serious as far as any impending selloff -- it was just a huge move on Thursday, and it was a little backfilling on Friday. ORCL gapped higher and rallied. It would be one to watch after this breakaway gap. It cleared resistance on the gap, and now you look for a lateral move for a few days. When it starts to break upside, you move in. Obviously we will have ORCL on the watch list and ready for that move.

RIMM gapped higher and rolled over. Is it at a bottom? It is hard to say that would be the case right now. It is continuing lower in a trend lower. It did undercut this prior low, and it is interesting because even though the price is at a lower low than it was in July, MACD is making a higher low. There is a divergent bottom there. This would be a false breakdown from RIMM. You would look for a buy as it moved through this low and was able to hold. It was unable to do that on Friday, but we will see if it holds at the 10 day EMA or above the 18 day EMA as it did on Friday and can reverse back to the upside. That is a chance to play the stock. You also have to watch out -- there was a strong selloff, a bounce, a higher low, and a higher high. Now if it breaks lower, you have a downside ABCD pattern. Not much room to the A point, so you may not want to make that play. You would not get good enough return. Instead I would be watching to see if it reverses off of the 10 or 18 day EMA to the upside. You would play a reversal up to perhaps this gap point from June or the July/August peak.

ADTN is another tech that has been performing well. It started to bounce higher on some volume Friday. It once more looks like it is ready to break higher. We could have picked up more positions but decided to wait until Monday given the action on NASDAQ and SP500. Others are still setting up. RAX pulled back a bit more, holding right at the prior peak. Volume jumped up as it held that level. That shows some buyers stepping in even though it was down on the session. There are some positives continuing in the tech sector.

Metals. FCX gapped higher early in the week and moved laterally to finish. Still in solid shape. No issues with copper. MTL had some good news out on the day, but it was not able to make hay of it. It closed at the 18 day EMA, but had a nice pullback holding over prior peaks and something of a cup with handle. It could be ready to make a solid break higher.

Retail. EAT gapped lower and sold off on high volume. Not a total breakdown, but I did not like the look of it at all. BWLD sold again after a tough Thursday. It gapped higher but could not hold it, and it closed a bit lower. DRI sold back to the 10 day EMA on stronger volume, but it is holding there. No issues. It could continue to bounce to the upside.

There are some areas that are showing leadership, and others are coming around. There are not big blocks of stocks in sectors that are showing great leadership and ready to move in and power the market higher. That is what keeps me somewhat skeptical that the market will be able to break out of this trading range. It could do it. It could break out with what leadership there is, and then the others could build into the role over the next several weeks. That has been known to happen. There is not a swell of stocks moving to the upside that gives me confidence that there will be a breakout. Maybe the semiconductors continue to improve and help drive the action. That would help, no doubt. If the financials trim their losses from the end of the week and reverse and start to rally again, they would add to the impetus for the breakout as well.

There are enough stocks to make the breakout if they start performing again after this pullback. It is normal to run up to resistance and move laterally, set up a shelf, and then try to make the breakout. There is the issue with the test of resistance, a doji, and a fade back from there. In the past, that has been the problem for the stocks in the trading range. They have turned right back down and sold. We are later in the trading range now, and maybe it will not be an issue. Maybe it has run its course, has done all of the consolidating and factoring into the future it needs to, and it is ready to move. It will have to show it, that's for sure. We are back to the Missouri state: Show me.

THE MARKET

MARKET SENTIMENT

VIX. For the past two weeks, the VIX has been holding at levels it hit back in August. What happened in August? SP500 was at the top of its trading range. Then fast forward a few weeks into late August. The VIX was down here as SP500 was at the top of the range. Now fast forward to today. It is back at the levels from late July and early August that saw SP500 at a peak. We have volatility at that same level. Take another look at SP500. Volatility is down and SP500 is up. SP500 is showing doji on the candlestick chart. That is an interesting development. Will it fall down? It is not necessarily the case. It is not written in stone, but it is quite interesting and worth taking some downside positions on the SSO.

VIX: 22.01; +0.29
VXN: 22.26; +0.45
VXO: 20.7; -0.26

Put/Call Ratio (CBOE): 0.89; +0.07

Bulls versus Bears:

The CROSSOVER from the prior week reverted, but the bulls and bears are still close together. That crossover is a bullish indicator, and the market has rallied off of it. Question is, did it generate the momentum for a range breakout?

This is a reading of the number of bullish investment advisors versus bearish advisors. The reason you look at this is that it gives you an idea of how bullish investors are. If they are too bullish then everyone is in the market and it is heading for a top: if everyone wants to be in the market then all the money is in and there is no more new cash to drive it higher. On the other side of the spectrum if there are a lot of bears then there is a lot of cash on the sideline, and as the market rallies it drags that cash in as the bears give in. That cash provides the market the fuel to move higher. If bears are low it is the same as a lot of bulls: everyone is in and the market does not have the cash to drive it higher.

Bulls: 36.7% versus 33.3%. Another sizeable jump from 29.4% the week before. Back above the 35% threshold, below which is considered a bullish indicator. This dulls some of the recent upside, bullish bias. The high on the last leg was 56.0% after starting at 35.6% on the low in February, the lowest it has been since July 2009 . . . until this last leg. 35% is the threshold level suggesting bullishness. After peaking at 53 on this move the bulls lost some nerve, falling to a new low post- July 2009. Once again bulls peaked out near the 50% level. Bulls have bumped at 50ish since late August 2009, falling to 45ish and then rebounding. Hit a high of 47.7% mid-June on the run from the March lows. Again, to be seriously bearish it needs to get up to the 60% to 65% level.

Bears: 31.1%. A modest slip from 32.2% versus the big drop from 37.7% the week before that. Back below the 35% level, above which is considered bullish. Hit 18.7% on the low in April. Hit a high of 27.8% level on the prior leg in February. For reference, cracking above the 35% threshold considered bullish. Hit a high on the prior run at 47.2%. For more reference, bearishness hit a 5 year high at 54.4% the last week of October 2008. The move over 50 took bearish sentiment to its highest level since 1995. Extreme negative sentiment. Prior levels for comparison: Bearishness peaked at 37.4% in September 2007. It topped the June 2006 peak (36%) on that run. That June peak eclipsed the March 2006 high (33%) and well above the 2005 highs that spawned new rallies (30% in May 2005, 29.2% in October 2005). That was a huge turn, unlike any seen in recent history.

NASDAQ

Stats: +12.36 points (+0.54%) to close at 2315.61
Volume: 2.359B (+35.19%)

Up Volume: 1.422B (+448.009M)
Down Volume: 1.148B (+315.218M)

A/D and Hi/Lo: Advancers led 1.37 to 1
Previous Session: Decliners led 1.67 to 1

New Highs: 105 (+29)
New Lows: 45 (+16)

NASDAQ CHART: Click to view the chart

NASDAQ 100 CHART: Click to view the chart

SOX CHART: Click to view the chart

SP500/NYSE

Stats: +0.93 points (+0.08%) to close at 1125.59
NYSE Volume: 1.857B (+105.16%)

Up Volume: 804.445M (+387.278M)
Down Volume: 1.028B (+553.441M)

A/D and Hi/Lo: Advancers led 1.44 to 1
Previous Session: Decliners led 1.39 to 1

New Highs: 313 (+81)
New Lows: 16 (+3)

SP500 CHART: Click to view the chart

SP600 Chart: Click to view the chart

DJ30

Stats: +13.02 points (+0.12%) to close at 10607.85
Volume DJ30: 367M shares Friday versus 170.3M shares Thursday.

DJ30 CHART: Click to view the chart

MONDAY

Monday is still going to be a "show me state" day, no doubt about that. There is a lot of economic data coming out. There is the NAHB housing report on Monday. There are housing starts for August on Tuesday, and the FOMC makes a rate decision. Some say it may go to quantitative easing part deux, given that the inflation readings remain low and the economy remains weak. Initial jobless claims come out on Thursday, as well as existing home sales. Leading economic indicators, durable goods, and new homes end the week. There is plenty of economic activity no doubt, but it is not earth moving. Homes will be important because it is the largest investment most people have. The jobless claims will be the headliners.

That does not tell us a whole lot. They will impact the market near term, but the market looks several months down the road in making decisions about where it will go over the next several weeks versus just the next day. There is a doji on Friday at resistance. That is an interesting point, and we took some puts on the SSO. We may take some puts on other areas or make other downside plays. The indices are still in their trading range and have not made a decision. They are showing indications that led to breaks lower in the past. We are just playing decent probabilities with the downside plays because we have a clear point for the stop/loss and a very good risk/reward.

We are still at an inflection point. We still do not have an answer. There are some tantalizing pieces of information based on the action from Friday (really the entire week), but it is inconclusive because it was expiration Friday. I sure like the look of the high volume and the doji at resistance indicating the sellers piling in. You have to mitigate that somewhat with the expiration Friday volume ramp up.

Moving into next week, we will look into some downside positions and be ready for that. If the market breaks lower, we will also be ready to close out some upside. Maybe it will just test back to a support range. If so, we still want to lock in gain before then. If it tests at a lower level and holds, we can always make the move in as it breaks back to the upside. It would be making a higher low at an important support level, such as the 50 day EMA, inside a trading range. That often presages the breakout of the range. If that happens, then we start looking to the upside and button down the downside.

That is the nature of a trading range. You have to be ready to recognize the issues that can confront you as it trades back and forth. It is not automatic, particularly when there are this many rotations under the belt inside the range. This is when you start looking for change, not status quo. We also have financials performing better, industrials breaking to new highs, semiconductors trying to improve, and techs coming to life late in the week. Those are other reasons to beware of a test lower that may hold a key support level. If it does, we then look for a renewed attempt at a breakout. With a higher low at the 50 day EMA, I would anticipate a breakout.

For now, I do not anticipate that early in the week. We just have to let it develop, and we will continue to do what we have done. If gain is presented and the indices cannot make the breakout, we will take gain off the table. If we see good potential moves to the upside and the market is not breaking down, we can pick up some positions in those. If we see the rollover, however, we will protect our upside positions and the gain we have in them. We will play the downside, being weary of a possible higher low at a key support level that could trigger a breakout. Have a great weekend.

Support and Resistance

NASDAQ: Closed at 2315.61
Resistance:
2319 from the September 2008 peak
2320 to 2326.28 is the January 2010 high
2341 is the June 2010 peak
2324-2370 is a range of resistance from early 2008
2382-2395 from 2008

Support:
2310 is the August 2010 peak
2292 is a low from January 2008
2273 to 2282 marks bottom of January 2010 lateral peak
2275 - 2278 from the February 2008 and April 2008 lows. Key lows.
The 200 day SMA at 2276
2245 from July 2008 through 2260 from late 2005.
2236 is the first August gap point.
A series of interim peaks at 2230ish from the May to August trading range
The 50 day EMA at 2230
2221 is the gap down upside point from June.
2205 is the November 2009 peak 2210 (from September 2008) to 2212 (the July 2009 closing low)
2185 to 2195 represent support points for years: December 2004 peak, July to October 2005 consolidation, January, March and July 2008 lows, and October 2009 peak.
2184 is the June gap bottom side.
2177 is a low from March 2008
2169 is the March 2008 closing low (double bottom)
2168 is the September 2009, intraday peak
2155 is the August 2010 low and the March 2008 intraday low
2151 is the Tuesday gap down point
2140 from the May and June 2010 lows
2100 is the February 2010 low
2099 is the recent August intraday low
2061 is the July 2010 low
2024 from November 2009
2020 to 2005 from the Q4 2009 peaks

S&P 500: Closed at 1125.59
Resistance:
1129 to 1131 is the June and August 2010 peaks
Bottom of the January 2010 consolidation 1131 to 1136
1133 from a September 2008 intraday low
1151 is the January 2010 peak
1156 is the Sept 2008 low
1170 is the prior March 2010 high
1174 is the May 2010 high
1181 is the April selloff low
1185 from late September 2008

Support:
1119 is the early December intraday high
The 200 day SMA at 1116
1114 is the November 2009 peak
1106 is the September 2008 low
1101 is the October 2009 high and the recent May and June 2010 interim peaks
The 50 day EMA at 1095
1084 to 1080 (September 2009 peak)
1078 is the October range low
1070 is the late September 2009 peak as well as several other peaks and valleys even in 2010. Important level.
1065 is the May flash crash intraday low.
1044 is the October 2008 intraday high AND the February 2010 low
1039 to 1040 are the May, June, and August 2010 lows
1020 is the bottom of the late summer 2009 consolidation
946 from June 2009

Dow: Closed at 10,607.85
Resistance:
10,609 from the Mid-September 2008 interim low
10,730 is the January 2010 peak
10,920 is the recent May high
10,963 is the July 2008 low
11,100 from the 7-08 low
11,205 is the April closing high
11,734 from 11-98 peak

Support:
10,594 is the June 2010 peak
10,496 is the November 2009 high
The 200 day SMA at 10,456
10,365 is the late September 2008 low
The 50 day EMA at 10,364
10,285 is the late December consolidation peak
10,260 from the May and June 2010 interim peaks are breaking
10,209 is recent August 2010 low
10,120 is the October 2009 peak
9938 is the August 2010 low
9918 is the September 2008 peak
9855 is the early September peak in its lateral range
9835 is the late September 2009 peak AND the February 2010 low
9829 is the September 2008 closing high
9774 is the May 2010 intraday low
9325 is a late 2008 interim peak
9034 from early 2009 peaks

Economic Calendar

These are consensus expectations. Our expectations will vary and are discussed in the 'Economy' section.

September 20 - Monday
-NAHB Market Index, September (10:00): 14 expected, 13 prior

September 21 - Tuesday
-Housing Starts, August (08:30): 550K expected, 546K prior
-Building Permits, August (08:30): 560K expected, 559K prior
-FOMC Rate Decision, 9/21 (14:15): 0.25% expected, 0.25% prior

September 22 - Wednesday
-Crude Inventories, 09/18 (10:30): -2.49M prior

September 23 - Thursday
-Initial Claims, 09/18 (08:30): 450K expected, 450K prior
-Continuing Claims, 09/11 (08:30): 4450K expected, 4485K prior
-Existing Home Sales, August (10:00): 4.04M expected, 3.83M prior
-Leading Indicators, August (10:00): 0.1% expected, 0.1% prior

September 24 - Friday
-Durable Orders, August (08:30): -1.3% expected, 0.4% prior
-Durable Orders -ex T, August (08:30): 0.7% expected, -3.7% prior
-New Home Sales, August (10:00): 290K expected, 276K prior

September 13 - Monday
-Treasury Budget, August (14:00): -$90.5B actual versus -$95.0B expected, -$103.6B prior

September 14 - Tuesday
-Retail Sales, August (08:30): 0.4% actual versus 0.3% expected, 0.3% prior (revised from 0.4%)
-Retail Sales ex-auto, August (08:30): 0.6% actual versus 0.3% expected, 0.1% prior (revised from 0.2%)
-Business Inventories, July (10:00): 1.0% actual versus 0.7% expected, 0.5% prior (revised from 0.3%)

September 15 - Wednesday
-NY Fed - Empire PMI, September (08:30): 4.10 actual versus 6.4 expected, 7.1 prior
-Export Prices ex-ag., August (08:30): 0.5% actual versus -0.2% prior
-Import Prices ex-oil, August (08:30): 0.3% actual versus -0.2% prior (revised from -0.3%)
-Industrial Production, August (09:15): 0.2% actual versus 0.3% expected, 0.6% prior (revised from 1.0%)
-Capacity Utilization, August (09:15): 74.7% actual versus 75.0% expected, 74.6% prior (revised from 74.8%)
-Crude Inventories, 09/11 (10:30): -2.49M actual versus -1.85M prior

September 16 - Thursday
-Initial Claims, 09/11 (08:30): 450K actual versus 460K expected, 453K prior (revised from 451K)
-Continuing Claims, 09/4 (08:30): 4485K actual versus 4450K expected, 4569K prior (revised from 4478K)
-PPI, August (08:30): 0.4% actual versus 0.3% expected, 0.2% prior
-Core PPI, August (08:30): 0.1% actual versus 0.1% expected, 0.3% prior
-Current Account, Q2 (08:30): -$123.3B actual versus -$125.0 expected, -$109.2B prior (revised from -$109.0B)
-Net Long-Term TIC Fl, June (09:00): $61.2B actual versus $44.4B prior
-Philadelphia Fed, September (10:00): -0.7 actual versus 2.0 expected, -7.7 prior

September 17 - Friday
-CPI, August (08:30): 0.3% actual versus 0.2% expected, 0.3% prior
-Core CPI, August (08:30): 0.0% actual versus 0.1% expected, 0.1% prior
-Michigan Sentiment, September (09:55): 66.6 actual versus 70.0 expected, 68.9 prior
icon url

ReturntoSender

09/19/10 8:58 PM

#9069 RE: ReturntoSender #6755

Leavitt Brothers Video Market Overview:

http://leavittbrothers.com/blog/?p=3501
icon url

ReturntoSender

09/20/10 8:51 PM

#9070 RE: ReturntoSender #6755

From Briefing.com: 5:05PM HP and Oracle reaffirmed their long-term strategic partnership and the resolution of litigation regarding Mark V. Hurd's employment at ORCL (HPQ) 39.39 +0.25 : Co announced while the terms of the settlement are confidential, Mr. Hurd will adhere to his obligations to protect HP's confidential information while fulfilling his responsibilities at ORCL. The agreement also reaffirms HP and Oracle's commitment to delivering the best products and solutions to their more than 140,000 shared customers.

4:49AM Oracle unveils new products at conference (ORCL) 27.48 : Co introduces 4 major products including: Exalogix, Unbreakable Enterprise Kernel (co's preferred Linux platform) Exadata OLTP machine, and Fusion Applications (available in a controlled release in 1Q11).

3:26AM LDK Solar signs memorandum of understanding with national renewable energy laboratory (LDK) 8.02 : Co announces the signing of a memorandum of understanding with the DOE's National Renewable Energy Laboratory for collaborative research and development activities related to silicon materials and photovoltaic devices.

2:49AM Finisar acquires Broadway Networks (FNSR) 17.53 : Co announces it it has acquired Broadway Networks for an undisclosed sum in an all-cash transaction. Co indicated that the acquisition is not expected to have a significant impact on revenue or earnings in the near term.

Lattice Semi (LSCC) announces low cost programmable SPI-4.2 solution...

4:30 pm : The S&P 500 pushed through technical resistance to set a fresh four-month high on Monday. There were no catalysts or headlines to account for the climb. Only a bullish bias among market participants underpinned the move.

Stocks made only modest gains in the early going. Most traders took their cues from Europe, where the major bourses staged strong gains as concerns about sovereign debt subsided. Early action was generally consistent with the relatively cautious trade that typically precedes an FOMC announcement, the latest of which will be released tomorrow afternoon.

Though no rate actions are expected tomorrow, many will look for changes in the verbiage of the actual the FOMC statement to give clues about where policy might be headed. The looming announcement comes after the National Bureau of Economic Research announced this morning that the recession that began in December 2007 ended in June 2009. Such a stretch made it the longest recession of any since World War II.

Amid an absence of market-moving headlines and uncertainty about the pace of the economic recovery and plans to support it, stocks still attracted enough support to push the S&P 500 through key resistance levels. The broad market index barely paused as it crossed through the top end of its summer trading range to reach its highest level since May. Momentum was helped by some short covering among those that thought resistance would hold.

Support was broad based with all 10 major sectors staging gains, but a 2.0% gain made financials the best performers of the day. Discover Financial (DFS 16.16, +0.59) was a leader in the sector after it posted better-than-expected earnings.

Lennar (LEN 15.14, +1.15) reported better-than-expected earnings of its own to help homebuilders rally ahead of September housing starts data, which is scheduled for release tomorrow morning. A 5.6% gain among homebuilders helped lift the consumer discretionary sector 1.9%.

The tech sector advanced 1.4% amid continued merger and acquisition activity, which includes news that IBM (IBM 131.79, +1.60) will acquire Netezza (NZ 28.27, +3.67) for $27.00 per share and L-1 Identity Solutions (ID 11.64, +1.94) will be acquired by Safran for $12.00 per share.

The tone of trade was decidedly positive this session, but the persistent lack of trading volume suggests that retail investors still are not completely on board.

Advancing Sectors: Financials (+2.0%), Consumer Discretionary (+1.9%), Energy (+1.7%), Telecom (+1.6%), Industrials (+1.5%), Tech (+1.4%), Health Care (+1.4%), Utilities (+1.3%), Consumer Staples (+1.0%), Industrials (+0.6%)
Declining Sectors: (None)DJ30 +145.77 NASDAQ +40.22 NQ100 +1.7% R2K +2.9% SP400 +1.7% SP500 +17.12 NASDAQ Adv/Vol/Dec 2151/2.00 bln/564 NYSE Adv/Vol/Dec 2490/956 mln/560
icon url

ReturntoSender

09/21/10 8:54 PM

#9071 RE: ReturntoSender #6755

From Briefing.com: 4:10PM PMC-Sierra lowers Q3 guidance below consensus (PMCS) 7.78 +0.01 : Co expects its net revenues in Q3 ending September 26, 2010, to be in the range of $161-163 mln vs consensus of $173.36 mln. Co's previous outlook for third quarter net revenues announced during the July 22, 2010 earnings conference call was a revenue range of $169-177 mln. Co expects its gross margins in Q3 of 2010 to be at the lower end of the outlook range provided of 67.5-68.5% vs consensus of 68%. Operating expenses in Q3 of 2010 are expected to be in the range of $64-65 mln, down from the prior outlook range of $66-67 mln.

4:07PM Adobe Systems beats by $0.05, reports revs in-line; guides Q4 EPS in-line, revs below consensus (ADBE) 32.94 -0.16 : Reports Q3 (Aug) earnings of $0.54 per share, $0.05 better than the Thomson Reuters consensus of $0.49; revenues rose 42.0% year/year to $990.3 mln vs the $985 mln consensus. Co issues mixed guidance for Q4, sees EPS of $0.48-0.54 vs. $0.53 Thomson Reuters consensus; sees Q4 revs of $0.950-1.000 bln vs. $1.03 bln Thomson Reuters consensus.

5:40PM Adobe Systems is trading 15.8% to $27.73 following its earnings/guidance results (ADBE) 32.94 -0.17 :

4:05PM Tessera Tech announces Fujitsu renews technology licensing agreement with Tessera (TSRA) 16.97 +0.02 : Under the agreement, which was renewed in accordance with its original terms, Fujitsu is licensed to Tessera's semiconductor packaging technology covering a broad range of chip scale and multi chip package types.

4:30 pm : Stocks shook off a listless start to extend their four-month highs, but they failed to sustain gains in the face of resistance. Not even a pledge of support from the FOMC and better-than-expected housing start and building permit data could prop up the major averages.

Trade started on a rather dull note as the major averages made a modest slip in the opening minutes. Losses were generally contained as the S&P 500 was supported at the 1136 to 1138 zone.

Action was also constricted by caution ahead of the latest FOMC policy statement, but the major averages made some sharp swings with the release of the statement. To no surprise, the target interest rate was left unchanged at the range 0.00% to 0.25%. Consistent with past statements, the Fed stated that economic conditions, including low rates of resource utilization, subdued inflation trends, and stable inflation expectations, are likely to warrant exceptionally low levels for the federal funds rate for an extended period. However, the statement went on to indicate that the Fed is prepared to provide additional accommodation if needed.

Though no specific measures were stated, the Fed's expression of support attracted enough buyers to drive the S&P 500 to its best level since May. However, buyers backed away as the benchmark index lost momentum near the 1150 line.

Treasuries also swung higher with the release of the policy statement, but they maintained their gains into the close. The benchmark 10-year Note netted a full point and saw its yield drop back below the 2.60% level for the first time in about 10 days.

The dollar was dropped for a 1.0% loss. It had already been down before the FOMC made its announcement because of a stronger euro following a series of successful sovereign debt offerings from Ireland, Greece and Spain.

Better-than-expected housing starts and building permits during August were overshadowed by the FOMC announcement, though construction materials plays (+3.1%) benefited from the data. Housing starts climbed 10.5% month-over-month to an annualized rate of 598,000, and building permits increased 1.8% month-over-month to an annualized rate of 569,000.

Financials comprised the worst performing sector of the session. The sector's 1.0% loss ate into its 2.0% gain from the prior session.

In contrast, airline stocks were strong. An increased profitability forecast for 2010 from The International Air Transport Association sent the Amex Airline Index up 1.9% to its best level in almost three years.

Advancing Sectors: Telecom (+0.3%), Industrials (+0.2%), Health Care (+0.1%)
Declining Sectors: Financials (-1.0%), Utilities (-0.5%), Consumer Discretionary (-0.4%), Materials (-0.4%), Energy (-0.1%), Tech (-0.1%), Consumer Staples (-0.1%)DJ30 +7.41 NASDAQ -6.48 NQ100 +0.00% R2K -0.8% SP400 -0.6% SP500 -2.93 NASDAQ Adv/Vol/Dec 983/2.14 bln/1636 NYSE Adv/Vol/Dec 1063/1.05 bln/1900

09:54 am SWKS Guides Q4 Above Consensus (SWKS)

Skyworks (SWKS 19.61 -0.18) guides its fourth quarter earnings at $0.40 per share, better than the $0.37 Thomson Reuters consensus.

On the top line, the company guided revenues at $310 million, above the $301.26 million Thomson Reuters consensus.

07:45 am Kopin upgraded to Buy at Wunderlich; tgt raised to $4.50: . Wunderlich upgrades KOPN to Buy from Hold and raises their tgt to $4.50 from $4 based on higher expectations for market share in the III-V segment as capacity enhancements come online in late 2011 and beyond.

07:28 am SanDisk downgraded to Neutral at Sterne Agee: . Sterne Agee downgrades SNDK to Neutral from Buy saying they believe peaking consumer builds into October and slowing share gains with improving NAND supply could cap NAND upside.
icon url

ReturntoSender

09/27/10 7:32 PM

#9076 RE: ReturntoSender #6755

From Briefing.com: 4:30 pm : Stocks had looked like they might muster a slight gain in the final hour of trade, but a late-session selloff led stocks to finish at their lows with broad losses.

Financials led the slide into the close. The sector shed 1.2%, which makes for the worst loss of any major sector. Regional banks were under some of the most pressure; they dropped 2.2%.

In contrast, telecom stocks held on to their gains. In turn, the sector made it out with a 0.9% gain. The sector's lack of market weight left it unable to provide legitimate leadership to the broader market, though.

Airline shares also outperformed. Their strength helped the Amex Airline hit its highest level in almost three years. Its 1.8% gain was underpinned by news that Southwest Air (LUV 13.35, +1.07) will acquire Air Tran Holdings (AAI 7.34, +2.79) for $7.69 per share, a 69% premium over AAI's closing price from Friday.

Alberto-Culver (ACV 37.64, +6.16) also made merger and acquisition news with word that it will be acquired by Unilever for $37 per share, which represents a premium of about 17% over ACV's closing price from last week.

A lack of data, market moving headlines, and the absence of a consensus regarding the direction of the stock market kept participants on the sidelines. That depressed share volume, such that trading volume on the NYSE failed to break 1 billion shares again. Since the start of September trading volume on the Big Board has only broken above 1 billion shares on four occasions.

Treasuries had a strong session that saw the yield on the 10-year Note slide to 2.52%. The yield on the 2-year Note eased to just below 0.42% following an auction of 2-year Treasuries that drew a bid-to-cover ratio of 3.78, dollar demand of $136.1 billion, and indirect bidder participation of 39.0%. For comparison, the prior auction had a bid-to-cover of 3.12, dollar demand of $115.4 billion, and indirect bidder participation of 29.2%.

Advancing Sectors: Telecom (+0.9%), Utilities (+0.1%)
Declining Sectors: Financials (-1.2%), Industrials (-0.8%), Health Care (-0.8%), Materials (-0.7%), Consumer Discretionary (-0.6%), Consumer Staples (-0.5%), Energy (-0.4%), Tech (-0.2%)DJ30 -48.22 NASDAQ -11.45 NQ100 -0.6% R2K -0.4% SP400 -0.2% SP500 -6.51 NASDAQ Adv/Vol/Dec 1036/1.89 bln/1614 NYSE Adv/Vol/Dec 1260/919 mln/1706

5:28PM Jabil Circuit beats by $0.03, reports revs in-line; guides Q1 EPS in-line, revs in-line (JBL) 13.89 +0.32 : Reports Q4 (Aug) earnings of $0.52 per share, excluding non-recurring items, $0.03 better than the Thomson Reuters consensus of $0.49; revenues rose 37.9% year/year to $3.86 bln vs the $3.89 bln consensus. Co issues in-line guidance for Q1, sees EPS of $0.53-0.57, excluding non-recurring items, vs. $0.53 Thomson Reuters consensus; sees Q1 revs of $3.9-4.0 bln vs. $4.09 bln Thomson Reuters consensus.

4:38PM Research In Motion unveils the BlackBerry PlayBook; new professional-grade tablet (RIMM) 48.36 : In the release, co states "Perfect for either large organizations or an "army of one", the BlackBerry PlayBook is designed to give users what they want, including uncompromised web browsing, true multitasking and high performance multimedia, while also providing advanced security features, out-of-the-box enterprise support and a breakthrough development platform for IT departments and developers... Measuring less than half an inch thick and weighing less than a pound, the BlackBerry PlayBook features a vivid 7" high resolution display... jointly fueled by a 1 GHz dual-core processor and the new BlackBerry Tablet OS... with support for Adobe (ADBE) Flash Player " RIMM is trading up to $49.12 in after hours.

4:32PM Research In Motion announces BBM social platform; to integrate BlackBerry Messenger with apps (RIMM) 48.36 -0.51 : Co announced the BBM (BlackBerry(R) Messenger) Social Platform, giving developers the tools to build applications that take advantage of the social aspects of the popular BBM service. Developers will be able to integrate various functions of the BBM service into their applications including chat capabilities, content sharing, and invitations. Also, co launched its advertising service for the BlackBerry Application Platform. The BlackBerry Advertising Service helps developers integrate advertising in their BlackBerry smartphone applications quickly and easily, while also allowing advertisers, agencies and brands to work with a broad selection of advertising networks.

1:33AM Hewlett-Packard recommends rejection of below-market mini-tender offer for HP Shares by TRC Capital (HPQ) 40.98 : Co announces it has received notice of an unsolicited mini-tender offer by TRC Capital to purchase from HPQ stockholders up to 3 mln shares of HPQ, representing ~0.1% of HPQ's outstanding shares, at a price of $36.70/share in cash. HPQ recommends that stockholders do not tender their shares in response to TRC Capital's offer because the offer is at a price below the current market price for HPQ shares and subject to numerous conditions

icon url

ReturntoSender

09/28/10 10:49 PM

#9077 RE: ReturntoSender #6755

From Briefing.com: 4:30 pm : Despite an early slide, stocks were able to settle with solid, broad gains Tuesday.

The major averages opened with narrow gains after a member of the Bank of England made the case for further monetary stimulus. The comments, along with speculation that European central banks will purchase troubled debt, helped relieve worries about sovereign debt.

However, sellers were quick to step into the action. Their efforts intensified with the September Consumer Confidence Index, which made a surprise drop to a seven-month low of 48.5.

The stock market attracted support as it came within close contact of its summer trading range top. Technical support provided a floor from which stocks could rebound, but a lack of actual leadership left stocks to spend most of the afternoon hugging the neutral line until a late spurt of buying helped stocks finish near their session highs.

Thanks to better-than-expected earnings, Walgreen (WAG 33.81, +3.46) was the best performer of the day. Its spike made for its best single-session performance in more than a year.

In contrast, Monsanto (MON 48.75, -4.32) was the worst performer of the day. Its dive came amid cautious comments about the company's seeds products and some negative numbers from an Australian agricultural chemical company. The stock weighed on the broader materials sector, which had lagged for most of the session and only mustered a fractional gain in the moments ahead of the close.

Though the broader market's overall gain was a bit restricted, advancing issues outnumbered decliners by 4-to-1. More upbeat were small-cap stocks, which helped the Russell 2000 advance 1.1%.

Treasuries had a strong session as the 30-year Bond climbed a full point, the 10-year Note tacked on 16 ticks, and the 5-year Note gained about eight ticks. Results from the latest 5-year Note auction drew a bid-to-cover ratio of 2.96, dollar demand of $103.6 billion, and an indirect bidder participation rate of 50.1%. Though the latest auction saw slightly better demand than the sale did in August, dollar demand still was not that strong since it was the third lowest of the last twelve auctions.

The dollar dropped to a new seven-month low as the euro rallied 1.0% against the greenback. From its session low to its session high the euro swung 1.6% to end the day near $1.36.

Advancing Sectors: Health Care (+0.9%), Consumer Staples (+0.8%), Consumer Discretionary (+0.8%), Energy (+0.8%), Industrials (+0.5%), Financials (+0.3%), Utilities (+0.2%), Tech (+0.1%), Telecom (+0.1%)
Declining Sectors: (None)
Unchanged: MaterialsDJ30 +46.10 NASDAQ +9.82 NQ100 +0.1% R2K +1.1% SP400 +0.8% SP500 +5.54 NASDAQ Adv/Vol/Dec 1760/2.14 bln/853 NYSE Adv/Vol/Dec 2114/1.03 bln/870

4:03PM SMSC beats by $0.10, beats on revs; guides Q3 EPS below consensus, revs below consensus (SMSC) 22.48 +0.79 : Reports Q2 (Aug) earnings of $0.51 per share, excluding non-recurring items, $0.10 better than the Thomson Reuters consensus of $0.41; revenues rose 38.6% year/year to $104.1 mln vs the $102.2 mln consensus. Co issues downside guidance for Q3, sees EPS of $0.42-0.43, excluding non-recurring items, vs. $0.47 Thomson Reuters consensus; sees Q3 revs of $104-107 vs. $107.29 mln Thomson Reuters consensus.

11:02AM Fairchild Semi entered into a memorandum of understanding with Sichuan Changhong Electric (FCS) 9.12 -0.05 : The strategic partnership enables the companies to collaborate further on product development. Changhong has committed to fulfilling purchasing target plans for Fairchild's leading-edge power and mobile components through December 2015. Fairchild's devices are designed into a broad range of Changhong products including LED TVs, PDP TVs, LCD TVs, CRT TVs, set-top boxes, refrigerators and air conditioners.

MIPS Technologies (MIPS) announced that long-time MIPS customer PMC-Sierra (PMCS) is licensing a broad range of MIPS32 processor cores...

08:58 am First Solar target raised to $180 at Argus: . Argus raises their FSLR tgt to $180 from $155 as co is emerging as a beneficiary of the increased push by U.S. utilities toward alternative fuels. Partly as a result of decisions by utility boards and state-mandated targets, North American utilities are increasingly investing in alternative electricity-generation sources such as wind power and solar photovoltaic. Despite the recent surge in FSLR shares, firm believes that they remain deeply undervalued based on the co's earnings prospects.

10:46 am OIIM Lowers Q3 Guidance (OIIM)

O2Micro (OIIM 5.76 +0.02) revised its financial expectations for the third quarter of fiscal 2010, ending September 30, 2010.

The third quarter revenue is expected to be below previous estimates due to inventory adjustments in the supply chain.

The company currently expects revenue to be down 10% to 15% from second quarter levels versus -7%.

The gross margin is expected to be ~60%.

09:45 am JBL Guides Q1 EPS In-line (JBL)

Jabil Circuit (JBL 13.35 -0.54) reported fourth quarter earnings of $0.52 per share, excluding non-recurring items, $0.03 better than the Thomson Reuters consensus of $0.49.

Revenues rose 37.9% year-over-year to $3.86 billion versus the $3.89 billion consensus.

For the first quarter, the company guided earnings in the range of $0.53 to $0.57 per share, excluding non-recurring items, versus $0.53 Thomson Reuters consensus. On the top line, the company expects to see revenue at $3.9 billion to $4.0 billion versus the $4.09 billion Thomson Reuters consensus.
icon url

ReturntoSender

09/29/10 10:56 PM

#9078 RE: ReturntoSender #6755

From Briefing.com: 4:30 pm : The major averages slipped modestly on Wednesday as the broader market followed the financial sector.

Financial stocks completely reversed a 1% loss in the going only to give up the move and finish with a 0.8% loss, which was largely the result of weakness in bank stocks.

Bank stocks had also undermined action in Europe, where Germany's DAX dropped 0.5%, France's CAC fell 0.7%, and Britain's FTSE finished 0.2% lower.

With the financial sector unable to fight off sellers, the broader market faltered with the arrival of the final hour.

Resistance along the top end of recent trading ranges didn't help the case for stocks. Even at their best levels of the day the major averages were hung up near the neutral line.

Energy stocks booked relatively big gains, however. The sector's 0.7% advance was broad in that 35 of the 39 sector members advanced. Only Exxon Mobil (XOM 61.59, -0.47), Murphy Oil (MUR 61.26, -0.28), and Spectra Energy (SE 22.50, -0.01) logged losses. BP Plc (BP 40.00, +0.71) was among the better performers in the sector, despite contradicting reports regarding settlement talks related to the company's recent oil spill.

Only a fractional gain was made by the tech sector, despite strong guidance from Hewlett-Packard (HPQ 42.53, +0.91) and strength among semiconductor stocks (+0.7%). Xerox (XRX 10.29, -0.26) and Electronic Arts (ERTS 16.23, -0.32) ended up dragging down the sector.

There were no major economic releases today, but tomorrow brings the third reading on second quarter GDP. No changes to the economy's 1.6% annualized second quarter growth rate are expected.

Ahead of the data, Philadelphia Fed President Plosser stated that he does not favor additional asset purchases at this time. Those comments sent bonds lower in afternoon action. The benchmark 10-year Note ended with a loss of about eight ticks. Treasuries had trimmed some of their midday losses amid results from an auction of 7-year Notes. The auction drew a yield of 1.89%, a bid-to-cover ratio of 3.04, and had indirect bidder participation of 50.2%. The bid-to-cover was the best in more than a year.

The dollar dropped to a new eight month-low this session and finished with a 0.3% against a basket of competing currencies. Most of its weakness was owed to a bounce by the euro and a gain by the yen.

A lack of direction over the past few sessions has stocks flat for the week. Should that theme hold into tomorrow it will mark a rather anticlimactic close to the third quarter. Despite such a finish, the S&P 500 is on track for a third quarter gain of almost 10%. Most of that is the result of a 9% by the S&P 500 so far this month. The strong month-to-date move has the stock market on pace for its best monthly gain since April 2009.

Advancing Sectors: Energy (+0.7%)
Declining Sectors: Materials (-0.9%), Financials (-0.8%), Consumer Discretionary (-0.7%), Telecom (-0.5%), Utilities (-0.4%), Consumer Staples (-0.4%), Health Care (-0.3%)
Unchanged: Industrials, TechDJ30 -22.86 NASDAQ -3.03 NQ100 -0.2% R2K +0.3% SP400 +0.00% SP500 -2.97 NASDAQ Adv/Vol/Dec 1378/2.09 bln/1215 NYSE Adv/Vol/Dec 1650/1.01 bln/1317

1:47AM O2Micro wins patent infringement case versus BiTEK and receives injunction (OIIM) 5.95 : Co annouces that the Court for the Eastern District of Texas issued a permanent injunction and final judgment affirming that products using accused Beyond Innovation Technology ("BiTEK") DC/AC converters infringe on claims of certain O2Micro patents and that BiTEK induced such infringement. As a result of BiTEK's acts, the Court ordered to prevent BiTEK, and its customers who receive notice of the injunction, from manufacturing, using, selling, offering to sell or importing into the US any inverter controllers or modules that infringe the asserted claims of these co's patents.

07:28 am Hewlett-Packard target raised to $53 at Kaufman Bros: . Kaufman Bros raises their HPQ tgt to $53 from $51 after upbeat analyst day. It notes enterprise hardware seems most promising driven by storage and networking. The co is focused on beefing up its sales coverage which is consistent with its supply chain checks. Firm has higher conviction in name though CEO transition could continue to weigh on shares.
icon url

ReturntoSender

10/03/10 5:12 PM

#9080 RE: ReturntoSender #6755

From Briefing.com: Weekly Recap - Week ending 01-Oct-10The major indices settled with slight losses after a week of relatively range-bound trade. Corporate news was light and economic data came in mixed, with an upside surprise to consumer spending and disappointing consumer sentiment reading.

Seven of the 10 sectors settled in the red, but a strong 2.4% gain in energy as oil prices rallied 6.7% helped offset the weakness. Financials underperformed with a loss of 0.8%.

The stock market may have ended September in lackluster fashion, but the month's overall return was anything but. The S&P 500 gained 8.8%, marking the best month since April 2009 and the best September since the 1930s.

In M&A news, Southwest Airlines (LUV) will acquire Air Tran Holdings (AAI 7.) for $7.69 per share, a 69% premium over AAI's closing price from Friday.

Alberto-Culver (ACV) also made merger and acquisition news with word that it will be acquired by Unilever (UL) for $37 per share, which represents a premium of about 17% over ACV's closing price from the previous week.

In other corporate news, Walgreen (WAG) outperformed after it reported better-than-expected earnings on strong prescription drug sales. The company rallied 10.9% for the week, making it the top S&P 500 performer.

Monsanto (MON) plunged 12.9%, making it the worst S&P 500 performer. The agriculture and chemical company slumped amid reports that its SmartStax seed products are not performing as well as expected, with less expensive seeds providing higher yields.

Hewlett-Packard (HPQ) was unable to hold on to a weekly gain after sliding on news that the company has hired Leo Apotheker, former head of SAP, as its new CEO and President.

In economic news, September Consumer Confidence Index made a surprise drop to a seven-month low of 48.5, falling well short of the Briefing.com consensus of 54.0..
On the upside, initial jobless claims for the week ended September 25 totaled 453,000, which is slightly less than the 457,000 initial claims that had been forecasted by economists polled by Briefing.com. The latest tally is down 16,000 week-over-week. Continuing claims fell 83,000 week-over-week to 4.46 million.

Personal income and spending during August increased 0.5% and 0.4%, respectively. Both were better than expected. Core personal consumption expenditures increased 0.1% month-over-month, as expected.
The Treasury market posted solid gains this week on the long end of the curve, pushing yields lower thanks to some strong auction results. The 10-year is currently yielding 2.51%, down from 2.55%.

At the same time, the dollar took a hit as the euro and other currencies rallied. The dollar index shed 1.7% for the week.
  
Index Started Week Ended Week Change % Change YTD %
DJIA 10860.26 10829.68 -30.58 -0.3 3.9
Nasdaq 2381.22 2370.75 -10.47 -0.4 4.5
S&P 500 1148.67 1146.24 -2.43 -0.2 2.8
Russell 2000 671.01 679.29 8.28 1.2 8.6

Teradyne (TER) entered into a distribution agreement with Accelonix in the United Kingdom and Ireland to satisfy increasing demand for test solutions in those areas... With the number of active Nokia (NOK) service users now reaching 140 million worldwide, the company today announced that more than 200,000 people are currently signing up daily to Ovi, and that Ovi Store has reached the milestone of 2.3 million downloads per day...

09:15 am JA Solar downgraded to Hold at Auriga U.S.A: . Auriga U.S.A downgrades JASO to Hold from Buy based on valuation. The firm says long-term investors may still find further upside to the shares as they assign a below-average P/E of just 8x, given JASO's lack of vertical integration within the solar supply chain, while short-term investors should find the current price level attractive to recognize profits.

icon url

ReturntoSender

10/04/10 9:42 PM

#9082 RE: ReturntoSender #6755

From Briefing.com: 4:30 pm : Broad-based selling dropped stocks for sizable losses Monday. The slide found support at last week's lows, though.

Action was a bit choppy in the early going, but with neither concerted nor clear leadership sellers were able to claim control. Materials stocks were hit with the worst - they dropped 1.4% as steel stocks sank 2.4% and shares of diversified metals and miners dropped 2.1%.

Tech stocks were among the heaviest drags, though, given that the tech is the heaviest by market weight. Its 1.1% loss was largely due to weakness in semiconductor stocks (-1.6%) and semiconductor equipment stocks (-1.9%).

Financials had shown early strength, but faltered as the broader market began to roll over. It ended the day 0.7% lower with considerable weakness in shares of American Express (AXP 39.09, -2.73), which will challenge an antitrust lawsuit by the government. Shares of AXP endured their worst single-session slide since January to settle at their lowest level in three months. Visa (V 73.24, -0.08) and MasterCard (MA 222.64, -2.14) both plan to settle, but each saw its shares settle lower.

The rest of the day's headlines revolved around merger and acquisition activity, which included news that Sanofi-Aventis (SNY 32.87, -0.25) offered to acquire Genzyme (GENZ 71.01, +0.13) for $69 per share, Microsemi (MSCC 18.30, +1.19) will pay $20.88 for each share of Actel (ACTL 20.95, +4.93), and Dynamex (DDMX 21.05, +5.74) will be acquired by Greenbriar Equity for $21.25 per share. Sara Lee (SLE 14.40, +0.97) allegedly rejected a takeover bid from KKR.

There was only a light dose of data today. It didn't do much for traders.

Factory orders for August fell 0.5%, which is a bit steeper than the 0.4% decline that had been expected. Orders for the prior month were revised higher to reflect a 0.5% increase.

Pending home sales increased a stronger-than-expected 4.3% month-over-month. The consensus among economists polled by Briefing.com had called for just a 1.0% increase. Data for the prior month was revised downward to reflect a 4.5% increase, though.

Despite weakness in the stock market, Treasuries really didn't get much support. The benchmark 10-year Note finished up just nine ticks and the 30-year Bond edged just four ticks higher. Their yields now stand just below 2.48% and 3.71%, respectively.

Lackluster trading volume resumed as fewer than a billion shares were traded on the NYSE. The lack of participation suggests that their may not have been much belief in the stock market's mover lower. To be fair, though, share volume was anemic all the way up to the stock market's multi-month highs, which were set just last week.

Advancing Sectors: (None)
Declining Sectors: Materials (-1.4%), Energy (-1.1%), Tech (-1.1%), Industrials (-1.1%), Health Care (-1.0%), Financials (-0.7%), Consumer Staples (-0.4%), Utilities (-0.3%), Consumer Discretionary (-0.2%)
Unchanged: Telecom DJ30 -78.41 NASDAQ -26.23 SP500 -9.21 NASDAQ Adv/Vol/Dec 696/1.92 bln/1936 NYSE Adv/Vol/Dec 821/943 mln/2160

4:04PM MEMC Elec subsidiary SunEdison sells solar power plant to First Reserve (WFR) 11.76 -0.20 : Co announces sale of a 70 megawatt photovoltaic power plant located in Northeast Italy, near the town of Rovigo. SunEdison and Banco Santander jointly developed and co-owned the Rovigo plant prior to this sale. The total price for the sale is expected to be ~276 mln Euro. As part of the project acquisition, First Reserve has made an initial payment of 46 mln Euro to SunEdison, with the balance to be paid upon interconnection of the plant, which is expected to occur by the end of the fourth quarter of 2010. First Reserve expects to close the long-term project debt financing for the project in the fourth quarter of 2010.

4:01PM MaxLinear lowers Q3 rev guidance below consensus; sees Q3 gross margin modestly higher than originally forecast (MXL) 11.36 +0.16 : Co lowers Q3 rev guidance to $18.4-18.6 mln from $20.0-20.5 mln vs. the $20.34 mln Thomson Reuters consensus. Co also announced that it expects Q3 gross margin percentage to be modestly higher than originally forecast. "Although we experienced quarter-over-quarter revenue growth, revenues in each of our consumer, cable, automotive, and mobile segments fell short of our beginning of the quarter estimates and our purchase order backlog at mid-quarter. As the quarter concluded, customers either reduced the amount of purchase orders within lead time or requested rescheduling of shipments. We believe that these shortfalls are related to the uncertainty in the current semiconductor market, leading us to revise our revenue guidance."

8:38AM Chipmos Technology unit entered into a settlement agreement with Spansion (IMOS) 1.28 : ChipMOS TECHNOLOGIES (Bermuda) entered into a settlement agreement with Spansion (SPSNQ) for its general unsecured claim on breach of contract and liquidated damages rights... Under the Agreement, the total amount of recognized damage on breach of contract and liquidated damages rights was US$135 million. Based on the Company's earlier disclosed information about this transaction on its January 14 and 26, 2010 press releases, ChipMOS Taiwan will be receiving approximately US$68 million from the above arrangement.

8:32AM Silicom Limited receives add on order from existing cumstomer; annual sales to this customer are expected to grow to $1.5 mln (SILC) 13.98 :

8:03AM Advanced Energy announces expansion of operations in Ontario, Canada (AEIS) 13.05 : Co announces a strategic expansion of its operations in Ontario, Canada. The expansion includes the creation of a new legal entity in Ontario, Canada to provide local support to its customers in the region

Micron Technology (MU) announced that Hitachi-LG Data Storage has selected co's 25-nanometer NAND as the flash memory solution for its new hybrid optical disk drive.

icon url

ReturntoSender

10/05/10 9:09 PM

#9083 RE: ReturntoSender #6755

From Briefing.com: 4:30 pm : Stocks set fresh four-month highs as buyers provided broad support amid a steep drop by the dollar, which was sunk by speculation of further quantitative easing.

Participants first appeared uninspired by news that Australia's reserve bank left its cash rate unchanged at 4.5% after a series of rate hikes and that Japan's central bank cut its key interest rate to near zero. However, Japan's plans for a 5 trillion yen fund to purchase bonds and other asset backed securities forged the idea that the U.S. may also have in place plans for further quantitative easing.

Such a prospect weighed heavily on the dollar, which dropped 0.8% to a new eight-month low, but spurred higher almost 98% of the names in the S&P 500. The broad index settled at its best level since May.

The stock market's move to that mark was gradual. It had hesitated near key resistance levels, but got some additional support after the release of the September ISM Service Index. The Index came in at 53.2, up from the prior month and above the 51.8 that had been widely expected among economists polled by Briefing.com.

The materials sector benefited the most from this session's buying. It rallied 2.8% for its best single session advance in one month. Support for natural resource plays and basic materials stocks was augmented by a jump in commodities, which sent the CRB Commodity Index up 1.6%. Precious metals outshined as the continuous gold contract climbed close to 2% to set a new all-time high of $1340.60 per ounce and the continuous silver contract spiked more than 3% to a fresh 30-year high at $22.92 per ounce.

Adding to the impressiveness of this session's strength was robust share volume. More than 1.2 billion shares traded hands this session. That's close to what was traded during the portfolio rebalancing and window dressing at the end of the third quarter.

Advancing Sectors: Materials (+2.8%), Industrials (+2.7%), Financials (+2.4%), Tech (+2.3%), Energy (+2.3%), Consumer Discretionary (+2.1%), Health Care (+1.8%), Telecom (+1.7%), Utilities (+1.1%), Consumer Staples (+1.1%)
Declining Sectors: (None)DJ30 +193.45 NASDAQ +55.31 NQ100 +2.5% R2K +3.0% SP400 +2.1% SP500 +23.72 NASDAQ Adv/Vol/Dec 2146/2.24 bln/491 NYSE Adv/Vol/Dec 2448/1.24 bln/561

3:39PM Qualcomm is seeing strong interest in using the FLO TV network or spectrum (QCOM) 44.35 +0.46 : Co issues statement on FLO TV. Co says as previously indicated it has been examining strategic opportunities for FLO TV. Co has been engaging in conversations with a wide range of partners for both the network and the spectrum. Co is seeing strong interest in using the FLO TV network or spectrum to capitalize on the growing imbalance between mobile data supply and demand, the growth of tablets, and consumer demand for high quality video and print content, and a richer user experience. While this process continues, co is suspending direct to consumer sales of new devices. "We anticipate we will maintain the network so that current direct to consumer subscribers will continue to receive FLO programming into Spring 2011. Service provided to handsets purchased through wireless operators is unaffected at this time. In the event of a discontinuance of service, FLO TV will make appropriate refunds, the details of which will be communicated prior to discontinuation. While we are working to redeploy impacted employees, we anticipate that there will be some layoffs."

11:55AM Emcore concludes accounting review and announces unaudited results for its third quarter and nine-month period ended June 30, 2010 (EMKR) 0.83 +0.05 : During Q3, mgmt determined that ~$2.5 mln of excess and obsolete inventory reserves related to Fiber Optics segment should have been recorded in the quarter ended September 30, 2009. Accordingly, balance sheet was corrected to reduce inventory by ~$2.5 mln with a corresponding increase to accumulated deficit. The impact resulted in the reduction of cost of revenue of ~$1.2 mln and $0.3 mln in the quarters ended December 31, 2009 and March 31, 2010, respectively which improved profitability in these reporting periods. Co also recorded a $0.2 mln compensation-related adjustment in the quarter and year ended September 30, 2009. These corrections had no impact to net cash used in operating activities as reported on the statements of cash flows. The effect of these corrections was not considered material to any previously reported financial statement and these corrections will be made to applicable prior period financial information in future filings with the SEC.

Sierra Wireless (SWIR) and TELUS (TU) announced a multi-year strategic agreement for Sierra Wireless to provide M2M Services Management for TELUS..

8:00AM National Semi and Suntech (STP) collaborate to develop 'smart panel' technology (NSM) 12.60 : Co announces that it is collaborating with Suntech Power, to develop "smart panel" technology, incorporating National Semiconductor's award-winning SolarMagic power optimizer chipset into Suntech solar panels to improve the power output of solar systems.

Taiwan Semi (TSM) expanded its IP Alliance to incorporate a soft IP program that will improve soft IP readiness for advanced technology nodes and drive earlier time-to-market.

icon url

ReturntoSender

10/06/10 10:49 PM

#9084 RE: ReturntoSender #6755

From Briefing.com: 4:30 pm : The Dow and S&P 500 essentially followed up a choppy, lackluster session with a flat finish, but the Nasdaq underperformed as large-cap tech issues acted as a drag.

Broader market trade lacked direction in the early going. Stocks were unable to build on the prior session's big bounce mostly because of disappointment over the September ADP Employment Change. The report indicated that private payrolls fell by 39,000 last month, but economists polled by Briefing.com had expected, on average, an increase of 18,000. On a positive note, data for the prior month was revised upward to reflect an addition of 10,000 payrolls. Still, the downside surprise of September adds to the uncertainty of the official nonfarm payrolls report due Friday.

Selling pressure picked up midsession, but both the Dow and S&P 500 were able to retrace the slide. For a time the Dow fractionally extended its five-month high, but the S&P 500 could not confirm the move. Blue chips were led by integrated energy giants Exxon Mobil (XOM 63.94, +0.68) and Chevron (CVX 83.89, +0.50) while the broader market was led by Massey Energy (MEE 33.82, +1.94) and Constellation Brands (STZ 18.52, +0.76), which posted better-than-expected bottom line and reaffirmed its earnings outlook for fiscal 2011.

Monsanto (MON 48.65, +0.13) was also out with its latest quarterly results. The company came short of earnings expectations and even issued downside guidance, but still advanced as materials stocks attracted broad support. Materials stocks settled with a 0.8% gain, which was matched only by the energy sector.

Tech stocks sagged all session, though. The sector's 0.6% slide came as semiconductor stocks fell 1.6% and the likes of Amazon.com (AMZN 155.40, -5.47) and Citrix Systems (CTXS 60.15, -9.85) fell out of favor. Weakness among large-cap tech issues weighed heavily on the Nasdaq, which lagged its counterparts for the entire afternoon.

Treasuries traded with strength all session. So strong were their gains that yields on Notes with 2-year, 3-year, 5-year, and 7-year maturities set record lows. The benchmark 10-year Note saw its yield settle below 2.40% after it had been as low as 2.36%, its lowest level since January 2009. The yield on the 30-year Bond fell to 3.67% after it was as low as 3.63%. During the session the yield curve hit its flattest level in about five weeks.

The dollar's doldrums continued as it dropped another 0.5% against competing currencies. That put it at a new eight-month low. Most of the move lower is owed to strength in the euro, which gained 0.7% against the greenback even though analysts at Fitch downgraded Ireland's debt.

On deck for tomorrow are the latest weekly jobless claims count and consumer credit figures for August. Earnings season gets its unofficial start after the close when Dow component Alcoa (AA 12.37, +0.23) reports its latest quarterly results.

Advancing Sectors: Materials (+0.8%), Energy (+0.8%), Industrials (+0.6%), Consumer Staples (+0.4%)
Declining Sectors: Telecom (-1.6%), Tech (-0.6%), Consumer Discretionary (-0.5%), Utilities (-0.4%), Health Care (-0.4%)
Unchanged: FinancialsDJ30 +22.93 NASDAQ -19.17 NQ100 -0.9% R2K -0.6% SP400 -0.8% SP500 -0.78 NASDAQ Adv/Vol/Dec 1083/2.13 bln/1535 NYSE Adv/Vol/Dec 1399/979 mln/1574

5:52PM MEMC Elec: JPMorgan to finance an estimated $60 mln for SunEdison solar projects across the U.S. (WFR) 12.33 -0.01 : SunEdison, a subsidiary of MEMC Electronic Materials (WFR), announced an agreement with JPMorgan Capital Corp to fund an estimated $60 mln in project financing for SunEdison deployments across key markets in the United States.

4:05PM JA Solar announces supply agreement for 13mw of mono-crystalline solar cells with a leading U.S. solar manufacturer; delivery begins in Q3 and will continue through remainder of 2010 (JASO) 8.95 +0.65 :

2:03PM Apple: Motorola Mobility (MOT) sues Apple for patent infringement (AAPL) 288.97 +0.30 : Motorola announces that it's subsidiary, Motorola Mobility, has filed a complaint with the U.S. International Trade Commission alleging that Apple's iPhone, iPad, iTouch and certain Mac computers infringe Motorola patents. Motorola Mobility also filed patent infringement complaints against Apple in the Northern District of Illinois and the Southern District of Florida. Overall, Motorola Mobility's three complaints include 18 patents, which relate to early-stage innovations developed by Motorola in key technology areas found on many of Apple's core products and associated services, including MobileMe and the App Store. The Motorola patents include wireless communication technologies, such as WCDMA (3G), GPRS, 802.11 and antenna design, and key smartphone technologies including wireless email, proximity sensing, software application management, location-based services and multi-device synchronization.

8:07AM JA Solar announces supply agreements with BP Solar for more than 185 MW (JASO) 8.30 : Co announces it has signed strategic supply agreements with BP Solar to provide a total of more than 185 MWs of mono-crystalline and multi-crystalline solar cells in 2010 and through 2011. Under the terms of the agreements, co will supply BP Solar with more than 100 MW in 2011, beginning in the Q1. In a separate agreement, which began earlier this year, co committed to provide more than 85 MW, a significant portion of which has already been delivered, with the remainder continuing through 4Q10.

6:30AM Mattson wins orders for multiple suprema photoresist strip systems from new Asian customer (MTSN) 2.76 : Co announces that it has received orders for multiple Suprema photoresist strip systems from a new Asian customer. The Supremas will be used in both front-end-of-line and back-end-of-line applications for advanced logic device production. The systems are scheduled to ship in the fourth quarter of 2010.

5:04AM Advanced Semi reports Sep revs increased 97.2% to NT$17.37 bln (ASX) 4.20

Verizon (VZ) and Motorola (MOT) unveiled Motorola CITRUS powered by Android 2.1...Advanced Micro (AMD) extends AMD Fusion Partner Program to distributors. The expanded program will provide distributor partners access to all of the benefits within the AMD Fusion Partner Program to help accelerate sales of AMD-based solutions. AMD is also unveiling the AMD Rewards Program, which creates added sales-based incentives for partners to drive channel sales growth...

icon url

ReturntoSender

10/07/10 10:41 PM

#9085 RE: ReturntoSender #6755

From Briefing.com: 4:30 pm : Strong same-store sales results and an in-line weekly jobless claims count were offset by the dollar's recovery. In turn, the stock market booked another flat finish ahead of the always-pivotal nonfarm payrolls report.

Stocks started the session in higher ground, but they were quickly cut down as the dollar started to rebound off of an eight-month low. The dollar was down as much as 0.6% and climbed to a 0.4% gain before it settled with a 0.1% gain. Amid the dollar's doldrums the euro set an eight-month high and the yen hit a 15-year high. The dollar's turnaround led many to look past the latest lot of weekly jobless claims.

Initial claims for the week ended October 2 totaled 445,000, which is slightly below the 455,000 claims that had been expected among economists polled by Briefing.com and down 11,000 week-over-week. Continuing claims declined 48,000 week-over-week to 4.46 million, which is a bit more than the 4.45 million claims that had been widely anticipated.

September same-store sales were also shrugged off by the broader market, though a 13% increase in same-store sales by Abercrombie & Fitch (ANF 42.03, +3.44) made its shares one of this session's best performers by percent gained. Of the 25 retailers covered by Briefing.com, 19 posted better-than-expected results. As a group, retailers gained 0.4%.

Retailers helped lift the consumer discretionary sector to a 0.3% gain. That tied tech for the best performing sector of the session. Tech's strength came in contrast to the prior session, when its weakness caused the Nasdaq to underperform.

Telecom was at the weak end of things for the second straight session. It tumbled 1.2% today.

Earnings announcements were light ahead of the latest from Dow component Alcoa (AA 12.20, -0.17), which unofficially begins earnings season with its announcement. PepsiCo (PEP 66.10, -2.01) and Immucor (BLUD 16.72, -3.72) both posted in-line earning, but PepsiCo trimmed the top end of its growth outlook and Immucor issued downside guidance. Marriott (MAR 35.67, -2.19) reported a miss, but issued an in-line forecast.

Despite the flurry of announcements, many participants spent the session looking ahead to the official September nonfarm payrolls report, which will be released tomorrow morning ahead of the open. There is an element of uncertainty around the report, especially after the ADP Employment Change for September surprised to the negative side.

Advancing Sectors: Consumer Discretionary (+0.3%), Tech (+0.3%), Utilities (+0.1%), Health Care (+0.1%)
Declining Sectors: Telecom (-1.2%), Materials (-0.9%), Consumer Staples (-0.5%), Financials (-0.4%), Energy (-0.4%), Industrials (-0.1%)DJ30 -19.07 NASDAQ +3.01 NQ100 +0.3% R2K -0.2% SP400 -0.1% SP500 -1.91 NASDAQ Adv/Vol/Dec 1153/1.86 bln/1463 NYSE Adv/Vol/Dec 1357/915 mln/1596

4:08PM Kulicke & Soffa follow up -- co says Dec qtr revs to be significantly below September qtr revs... consensus is for a ~2% sequential drop (KLIC) 6.49 : "The combination of industry growth and market share gains have driven what will be an all-time record for quarterly revenue from continuing operations, but we have recently seen softness in forecasted demand. In our June quarter earnings release, we stated that although it was too early to provide December quarter guidance, we expected December quarter revenue to be about comparable to the September quarter. Given softening industry conditions, it now appears that December quarter revenue will be significantly below the September level." (Consensus calls for a ~2% sequential decline)... The Company will provide additional guidance when it announces its full fiscal fourth quarter results... As mentioned at 16:05, co sees Q4 (September qtr) revs at upper end of $250-260 mln range, vs $255.78 mln Thomson Reuters consensus. (Stock is halted)

4:05PM Kulicke & Soffa sees Q4 revs at upper end of $250-260 mln range, vs $255.78 mln Thomson Reuters consensus (KLIC) 6.49 +0.16 :

4:06PM Micron misses by $0.06, misses on revs (MU) 7.11 +0.16 : Reports Q4 (Aug) earnings of $0.32 per share, $0.06 worse than the Thomson Reuters consensus of $0.38; revenues rose 91.5% year/year to $2.49 bln vs the $2.65 bln consensus. MU reports gross margins of 31.3% vs Thomson Reuters consensus of 30.9%

4:06PM Alcoa beats by $0.04, beats on revs; increases 2010 global aluminum consumption forecast (AA) 12.20 -0.17 : Reports Q3 (Sep) earnings of $0.09 per share, excluding $0.03 in non-recurring items, $0.04 better than the Thomson Reuters consensus of $0.05; revenues rose 14.6% year/year to $5.29 bln vs the $4.95 bln consensus. The QoQ increase was the result of a 3% increase in aluminum shipment volumes and a 7% increase in alumina shipments, offset by lower realized third-party prices for alumina (-5%) and aluminum (-2%). Strong end-market rev performance in the quarter was achieved in Packaging (+11%), Commercial Transportation (+10%), Building & Construction (+10%), and Aerospace (+3%). Quarterly results were impacted by lower London Metal Exchange prices and negative currency impacts. These were partially offset by higher volumes in Alumina, Flat-Rolled Products, and Engineered Products and Solutions and the continued benefits from Alcoa's Cash Sustainability Program. "We see markets strengthening and have increased our 2010 global aluminum consumption forecast to 13% from 12%. In countries such as China, Brazil, India, and Russia, more and more people are moving into the middle class, driving demand in building and construction, transportation, and packaging. This trend favors aluminum as it is light, strong, and infinitely recyclable."

7:40AM LightSquared announced that Qualcomm (QCOM) is integrating L-Band LTE technology; also Nokia Siemens to deploy LightSquared nationwide network : LightSquared announced that Qualcomm (QCOM) is integrating L-Band LTE technology in its mainstream chipset roadmap. Qualcomm has also developed an advanced satellite air interface technology called EGAL (Enhanced Geostationary Air Link), which enables the satellite mode of operation in mobile devices... Initial Device Manufacturers LightSquared also announced that Nokia (NOK) will provide branded, data-centric products for LightSquared customers in support of Nokia Siemens Networks' infrastructure build-out for LightSquared's network. Additionally, LightSquared disclosed that both the Nokia Siemens Networks and LightSquared boards of directors recently approved the 8-year, $7 billion agreement for Nokia Siemens Networks to deploy, install, operate and maintain the LightSquared nationwide network. The agreement, the largest of its kind for the U.S. wireless industry, was first announced on July 20 of this year.

icon url

ReturntoSender

10/10/10 12:21 PM

#9088 RE: ReturntoSender #6755

Monday Morning Outlook: DJIA Enjoys the View from Above 11,000
Bulls see a silver lining in disappointing jobs report
by Ryan Detrick 10/9/2010 9:56 AM

http://www.schaeffersresearch.com/commentary/content/monday+morning+outlook+djia+enjoys+the+view+from+above+11000/observations.aspx?ID=102798#102798

The bulls resumed what now appears to be a fall rally last week, and the Dow Jones Industrial Average settled above the 11,000 level for the first time since May 3. Looking ahead, Ryan Detrick, Senior Technical Strategist, is sitting in for Todd Salamone. If you recall, Ryan has been stubbornly bullish, even during the worst of the summer doldrums. Ryan takes a victory lap this week -- he's not a bit modest about it -- and foresees more of the same. Next, Senior Quantitative Analyst Rocky White reports that traders of futures on the CBOE Market Volatility Index (VIX) are forecasting VIX readings significantly above current levels in the coming months. Rocky finds this expectation worrisome. Finally, we wrap up with a look at some key economic and earnings reports slated for release this week.

Recap of the Previous Week: Traders Put Their Faith in the Fed
Schaeffer's Editorial Staff

The 11,000 level on the Dow Jones Industrial Average loomed in view all week, but it wasn't until Friday's dismal job figures arrived that the blue chip barometer managed to topple the millennial milestone. Say what? Traders concluded that the weak jobs picture would force the Federal Reserve into action to prop up the recovery. Somewhat tentatively, the bulls tiptoed up to 11,000 on Friday and the Dow closed the week perched just above this mark.

Euro zone worries once again troubled the market on Monday. Irish officials said it might cost 50 billion euros to rescue the nation's troubled banking system, and they also recommended huge budget cuts to prove to financial markets they're serious about dealing with their massive deficit. Here at home, factory orders dropped more than expected. The Dow shed 0.72%.

Overseas news also set the tone on Tuesday, when the Bank of Japan surprised the world by cutting interest rates virtually to zero. That no doubt reminded traders that our own central bank has been broadly hinting at another round of asset purchases. Meanwhile, the Institute for Supply Management's (ISM) nonmanufacturing index jumped to 53.2 in September, surpassing economists' forecast for a rise to 52, a strong indication the employment picture is finally beginning to revive. The bulls took the reins and drove the Dow to a gain of nearly 200 points, or 1.80%. The Dow, at 10,944.72, was within hailing distance of 11,000 for the first time since May.

In the first of three days of employment reports on Wednesday, payroll processor ADP reported that private sector employment fell by 39,000 in September; analysts had expected an improvement. Meanwhile, a pall was cast over the tech sector after Equinix Inc. (EQIX) lowered its revenue guidance for the third quarter and the year. The Dow traded in a tight 60-point range throughout the day, and finally settled on a small gain of 0.21%. While the Dow managed to close above breakeven, the Nasdaq Composite (COMP) slumped 0.80%.

New jobless claims finally dipped beneath the 450,000 mark on Thursday, and retailers reported that the aisles were full during the back-to-school shopping season. Nordstrom (JWN), Macy's (M), J.C. Penney Company (JCP), Abercrombie & Fitch (ANF), American Eagle Outfitters (AEO), and Limited Brands (LTD) all recorded healthy upticks in September same-store sales, giving merchants new hope for the Christmas shopping season. Analysts were pleasantly surprised by both the jobless numbers and the sales figures, but the bulls held their fire in advance of Friday's nonfarm payrolls and unemployment reports. The Dow traded on both sides of the breakeven line through the course of the session, but eventually slipped 0.17%.

Although private payrolls gained 64,000 jobs in September, the economy as a whole shed 95,000 nonfarm jobs, the Labor Department reported before the open on Friday. Economists were expecting a much smaller decline. A better unemployment report might have emboldened a full-scale assault on the Dow 11,000 mark, but the weak numbers seemed sufficient to ensure that the Fed will step in again to support the economy. Meanwhile, Alcoa (AA) kicked off earnings season with an upbeat report and guidance. The Dow snuck up to the 11,000 mark throughout the morning, crossed above about midday, and then managed to hold on for dear life through a skittish afternoon. The Dow gained 0.53% for the day and settled at 11,006.48, its first appearance above 11,000 since before the early May "flash crash." The Dow recorded a respectable 1.6% advance for the week, while the S&P 500 Index (SPX) climbed 1.7% and the COMP brought up the rear, gaining 1.3%.

What the Trading Desk Is Expecting: Earnings Should Continue to Drive Market
By Ryan Detrick, Senior Technical Strategist

"It's hip to be conservative."

That is a recent quote I ran across, and I think it really hammers home the overall mentality of market participants today. With more than 20 straight weeks of equity mutual fund outflows, the fact is that very few people believe in the strength of this rally. When a recent two-year bond auction saw the highest demand in years, it really said something about what market participants want to own. It said investors would rather own something with no yield than buy "risky" stocks.

Yet, if you've followed what we've been saying at Schaeffer's since the middle of last year, then you know that we think all of this negativity could be very bullish for the stock market. Our overall stance hasn't changed. Price action remains strong, fundamentals are improving, and sentiment is negative. All of that is a recipe for higher prices.

Let's talk some about fundamentals. If next year's S&P 500 Index (SPX) earnings are expected to come in at $95, and the SPX is trading around 1,160, this equals a forward price/earnings ratio of 12. Not too overvalued, if you ask me. What about earnings? Earnings have come in much better than expected for three straight quarters. In the end, earnings are a major driver of equity prices. In our opinion, expectations are simply still too low for this recovery, and that should lead to higher equity prices down the road.

The September monthly jobs number came in weak on Friday, but a good deal of that was due to jobs lost at the state and local government levels. The good news is, private payrolls remain strong. Also, the weekly initial claims finally dipped beneath 450,000 for the first time this year. Should this number continue to creep lower, it will be a major plus. Manufacturing and housing data continue to improve, as well. Things aren't great, but remember -- once they are, that is probably the time to sell.

What about the credit market? If we've learned anything over the past few years, it is that the credit market is probably the best indicator we have for how the economy is really doing. When it shut down in 2008, the economy followed. Well, in the third quarter we just had the busiest quarter of merger and acquisition activity since the financial crisis. August was the best August in more than 10 years. In fact, according to Thomson Reuters, total worldwide M&A volume is up to $1.68 trillion for the first nine months of 2010.

Not to be outdone, stock buybacks are extremely strong as well -- another positive fundamental driver. Think about this: There were more stock buybacks in the first two months of this year than in all of 2009. Buybacks and M&A are two very positive fundamental reasons to remain bullish. Lastly, junk bonds continue to be very strong. If we were truly headed for a double dip, I think the junk bond market would be more worried. Bottom line, the credit market is working just fine and this should lead to an improving economy and higher stock prices.

On the sentiment front, here's one chart I came across this week that stood out as really summing up how investors feel. It's a study by the Investment Company Institute that looks at mutual fund shareholders' overall willingness to take on investment risk. As you might have expected, it hasn't rebounded since the financial crisis. In fact, about 30% are willing to take on above-average risk, the exact same as this time last year. In contrast, in May 2008, 37% were willing to take on such risk. Given some of the impressive gains we've seen since the March 2009 lows, this is a great contrarian bullish sign.


One of my favorite sentiment indicators is the Investors Intelligence poll. Although bullish sentiment has been increasing, it is still nowhere near past major peaks. Given the recent strong price action, this is another sign of potentially higher prices. As you can see here, the difference between bulls and bears is less than 20%. Past major peaks have occurred up near 40%. Nothing wrong with this picture.

SPX versus Bulls-Bears from II


Turning to the technical backdrop, you have to like the head-and-shoulders breakout we have going on here. The recent consolidation above 1,130 before this week's surge was picture perfect. A move back up to the April highs could be very possible.

SPX with inverse head and shoulders pattern


On a longer-term basis, something happened recently that is very significant -- we had a golden cross on the Dow. This occurs when the 50-day moving average crosses above the 200-day moving average. This formation can have very bullish implications from a longer-term perspective. What I find very encouraging is the fact that nearly no one is talking about this bullish development. Compare that with what happened when we had a death cross in early July. Nearly everyone was talking about the death cross as a sign of the end of the bull market, amid predictions we'd drop to new lows very soon. I think this hammers home the mentality of market participants. Bad news is amplified and good news isn't noticed. The good news for us? As long as this continues, I think we continue to climb that wall of worry.

And if you remember, back in July I showed that a death cross by itself wasn't any reason to expect a market plunge, and cited numerous reasons to remain bullish. Well, fortunately the bears were dead wrong, as we've had a nice rally since then.


We know the market has been strong, but when is it due for a pullback? One indicator I like to use to determine this is how many stocks are trading above their 50-day moving average. This number currently checks in at 86%, a number consistent with two peaks this calendar year and subsequent corrections.

NYSE percent of stocks above 50-day moving average


On the surface, this is a concern for a pending correction. But it's important to remember that this number got up to current levels several times in 2009, and it didn't do much to slow down the bull then. So what will it be this time?

My best guess is that we keep trending higher. If you look at data going back several years, being extremely overbought is actually very bullish. Also, check out how many stocks are over their 200-day moving average. This is only 71% currently, so it has plenty of room to move higher before being "overbought." Speaking of overbought, last year this figure made it up to 90% and stayed there for several months before the overbought status became a problem.

NYSE percent of stocks above 200-day moving average


Earnings season officially kicked off last week with some impressive results from aluminum giant Alcoa (AA). Here's a study that we do every quarter -- and although on the surface you could argue it is random, it has a very solid track record. Whatever way AA goes the day after reporting earnings, it is a very good indicator for how the market will perform in the near term. Given AA was up nearly 6% on Friday, this is a very good sign for the bulls.

SPX returns following AA earnings reports


Looking at this week, the International Monetary Fund and Group of 7 are holding meetings this weekend. Currency matters will be in focus. That, coupled with the effects of options expiration, should add to potential volatility. But in the end, earnings could be the next major driver for the stock market here.

Todd is back next week, so I'll leave you with probably the most important chart I know, which is one you should continue to watch. It is the SPX's 80-week moving average. This trendline marked great buying opportunities during the last bull market, and so far this year has twice held as support. In the end, price action is what matters -- and as long as the SPX stays above its 80-week moving average, side with the bulls.

SPX with 80-week moving average


Good luck trading.

If you enjoy Monday Morning Outlook...

...we also offer a free Market Recap after the close every day. Did the Dow go up 100 points? Or down? We'll tell you why. We'll also tell you who the big winners and losers were, and we'll share some highlights from our daily articles and blog postings. Market Recap is a quick, but insightful read. Sign up here to have Market Recap delivered straight to your inbox every evening shortly after the close.

Prepare for the investing week ahead. Every week, Bernie Schaeffer and his staff provide you with their insight about what has happened and, more importantly, what will happen in the market. We dig deep and show you what's happening behind the scenes, and tell you which indicators are predicting major market moves. If you enjoyed this week's edition of Monday Morning Outlook, sign up here for free weekly delivery straight to your inbox.

Indicator of the Week: VIX Term Structure
By Rocky White, Senior Quantitative Analyst

Foreword: Most options traders are familiar with the CBOE Market Volatility Index, which is popularly known as the VIX. It's calculated using prices of S&P 500 Index (SPX) options and basically gives the market's expectation of volatility in the next month of trading. Using futures prices on the VIX, we can construct a term structure that tells us where traders expect the VIX to be heading. The term structure is the relationship between short-dated VIX futures and longer-dated VIX futures. Keep in mind that the VIX generally moves in the opposite direction as the market. Thus, if traders expect a higher VIX, then it's a pretty good assumption that they expect a lower market.

Current Term Structure: Hopefully the chart below will give you a good feel on what the term structure looks like now compared to other times. Each line represents a certain point in time. The black line with the yellow diamonds shows the current term structure. Moving left to right, you see first where the VIX was trading, and then where one-month futures were trading, the two-month futures and so on.

Note that the term structure -- the difference between what short-term traders are expecting and what longer-term traders are expecting -- is very steep right now. The VIX is just above 20, but futures traders expect it be near 30 in four months. This is quite high, given that the average VIX reading this year is between 23 and 24. The green line shows the term structure two months ago. Despite the VIX being lower now than then, futures traders are expecting a higher VIX in four months than they expected then. In short, a steep term structure became even steeper.

The purple line is interesting as it shows the VIX term structure just after the May "flash crash." The VIX spiked up near the mid 30s. The expectations were that the VIX would remain elevated, as the line is pretty flat. The red line shows the term structure in April when the market was in a strong uptrend. The VIX was at one of the lowest points of the year, and VIX futures traders were expecting it to ascend to a more "typical" level.

VIX term structure


Are Futures Traders Right? The steepness of the current term structure is at an exceptionally high level. VIX futures traders are expecting significantly more volatility going forward, which would most likely mean a lower market. To measure the steepness of the term structure, I show the 10-day average of the futures slope, which I defined as the difference between the four-month VIX futures contract and the one-month contract. I calculate the difference as a percentage of the VIX.

The chart shows we are currently at one of the highest levels of the year. The high levels have had a tendency to be warning signs. I circled three previous peaks this year, occurring in January, April and August. Those three spikes preceded significant market declines. Though there have been a couple of false signals, and even early signals, this indicator might be a cause for concern.

SPX daily and 10-day VIX futures slope


This Week's Key Events: Intel, GE, Google in the Earnings Spotlight
Schaeffer's Editorial Staff

Earnings season is under way, and we'll see a handful of big names this week, but the deluge won't begin in earnest until the following week. Here is a brief list of some of the key events this week. All earnings dates listed below are tentative and subject to change. Please check with each company's respective website for official reporting dates.

Monday
* There are no major economic reports scheduled for Monday. Global Payments Inc. (GPN) will report earnings.

Tuesday
* The Federal Open Market Committee will release the minutes of its most recent meeting on Tuesday. Fed officials have been offering broad hints about more quantitative easing, likely by increasing purchases of U.S. Treasury bonds. Traders will examine the entrails of the minutes for more clues. Fastenal Company (FAST), CSX Corp. (CSX), Intel Corp. (INTC) and Linear Technology Corp. (LLTC) are scheduled to issue their quarterly reports.

Wednesday
* We'll get the usual weekly report on U.S. petroleum supplies, along with September import and export data and the Treasury's budget numbers for September. Scheduled to report earnings are ASML Holding N.V. (ASML), JPMorgan Chase & Co. (JPM), and Apollo Group Inc. (APOL).

Thursday
* The Labor Department will release the weekly jobless claims figures, along with the September producer price index. The Commerce Department will report on the August trade balance. In the earnings spotlight will be Safeway Inc. (SWY), Advanced Micro Devices Inc. (AMD), Google Inc. (GOOG), J.B. Hunt Transport Service Inc. (JBHT), and The Progressive Corp. (PGR).

Friday
* Friday will be busy again, with September data available on the consumer price index and retail sales. The New York Fed will report on manufacturing in the region for October, while the University of Michigan will offer up its first reading on consumer sentiment in October. Gannett Co. Inc. (GCI), General Electric Co. (GE), Infosys Technologies Limited (INFY) and Mattel Inc. (MAT) will report earnings.
icon url

ReturntoSender

10/10/10 2:28 PM

#9089 RE: ReturntoSender #6755

InvestmentHouse Weekend Market Summary

http://www.investmenthouse.com/weekendmarketsummary.htm

- Stocks respond surprisingly well to another pathetic jobs report.
- 95K jobs lost. Private sector creates jobs but at 64K, even less than expected.
- Stock market adds to its breakout to close the week, and volume rises as a nice bonus.
- Some new areas are starting to step up. Can they keep it up?

A good day of gains to close the week despite the lack of jobs report.

Friday was supposed to be all about jobs. The jobs number on the headline was not that positive with -95K versus expectations that it would be 0 to -10K jobs. Even with that bad number the market, though choppy at first, did rally with SP500 posting a 7 point gain. Futures actually moved up after the number though it was a volatile premarket session after the jobs report, no doubt, but there was a theme of the futures moving higher toward the open. Stocks sold off after the initial rise, but then slow, steady gains all the way to the close. A dip at the bell, but that had more to do with it being a Friday and investors thought they better take profits given the rally, just to make things balance out.

It was a decent upside day. NASDAQ +0.77%, SP500 +0.6%, Dow +0.5%, SP600 +1.3%, SOX +1%, NASDAQ 100 +0.77%. Gains across the board on a terrible jobs number. But, maybe it was not as terrible as the headline indicated. After all, government jobs were down -159K, and that has to make any free enterprise, capitalist, republic-loving investor happier. The government finally shrinks after exploding in growth over the past two years; a positive, but in the bigger picture, hardly a dent. The private sector jobs did rise 64K, but that was less than the 75K expected. 65K jobs is nothing; it takes 150-200K just to keep up with population growth. Despite the recession, people are still trying to come to the US to get jobs, although the word needs to go out that there are not many out there. Indeed, that is why illegal immigration is somewhat down across our southern borders.

Friday I heard financial station guests talking about how great it is that 850K jobs have been created over the last year and a half to two years. While it is nice to see people actually getting some jobs, jobs are not moving higher and sustaining a drop in the unemployment rate. Or maybe it did. After all, the unemployment rate held at 9.6% when it was expected to rise to 9.7%. Maybe happy times are here! Not. We all know there are fewer and fewer people in the jobs pool looking for work. Crowing about 65K private sector jobs is not enough to get the unemployed excited and coming back into the market and looking for jobs. Once they do feel things are better, they will come back in and then we will see that unemployment rate likely hop over 10%. You can spin this any way you want to, and you can get a little traction out of it. You can talk about the decrease in government jobs and the increase in private sector jobs, but that is about all you can get out of it. It is not any kind of great increase at all. Manufacturing lost 6K jobs and construction lost 21K. Retail managed to add 6K, and services were the bright spot with an 86K gain. There were solid indications in some sectors, but it was hit or miss. Very spotty but mostly negative or flat growth, just like the overall number.

Telling once more was the chronically unemployed -- those looking for work and not finding it for more than 6 months. Those are at 6.1M people, and that is way too many in a country such as ours. Despite that rather gloomy look, the market managed to rally. It put on a good show of it at that. It did not matter that MU missed its earnings or that Deutsche Bank downgraded the entire semiconductors equipment manufacturing sector. It did not seem to hurt stocks that had a mind to move higher. After breaking out earlier, we can see why. There was a solid move on Tuesday that cleared the resistance on SP500. Now it is free to try to run up toward the 78% Fibonacci at 1175, just another 10 points away. That is exactly what we are looking for, and the market is continuing to show an upside bias despite gloomy news in the economy.

Perhaps it is looking down the road (as it is supposed to be doing) and sees something better. Whatever the reason, it is trying to move higher right now. Could it possibly be a flood of liquidity coming from the Fed again? You never want to fight the Fed. History shows that stocks do perform better when it goes on a liquidity binge, at least while the liquidity is being added to the system. The problem comes after going on such a massive spending spree. Other markets are telling us that there is a problem out there. If we keep going on the path of devaluing our dollar and trying to jumpstart the economy by making everything worth less by devaluing our currency, eventually it leads to spiking inflation.

OTHER MARKETS

Dollar. The dollar was down. It tried to buck up and move higher on Thursday, and indeed it did, and it was trying to extend that gain on Friday. It was positive premarket as well as in the first half of the day, but as the session wore on it faded (1.3927 Euro versus 1.3918 Thursday). The dollar is getting ripped by the belief that there will be quantitative easing on the table again. When that happens, you devalue your currency. That is the way it works, pure and simple. The Fed has no problem doing it because Bernanke fears another Great Depression, and the administration likes it because it wants to inflate its way out of the massive debt it has saddled on the America public. It is not just this administration; it was the one before it as well. There is plenty of blame to spread on everyone. Some called themselves conservatives and free-market people and they were not. Others are adamantly not free-market people. The irony is that the policies in both administrations are so confused that all they have done is grow the government and grow the debt.
Click to view the chart

Bonds. Bonds overall lost a little ground in an amalgam of all the issues, but the 10 year Note held fairly steady. As a matter of fact, it was flat at 2.39%. It was stronger during the day with the yield at 2.36%, but it could not hold it into the close. Nonetheless, it remains elevated. Gold and other markets are running higher or are in anticipation of more buying of bonds and printing of money. The interesting thing is that bonds are not spiking higher. That is something I am watching and pondering. We will continue to look at them and see how they perform. Bonds should be running higher right now but they are not. Maybe they are telling us something is better down the road.
Click to view the chart

Gold. Gold has been up all week, and after a really wild reversal session on Thursday, it was right back into the game ($1,345.50, +10.50). I am looking for a pullback, and I would hate to think that is all it will give us. It has been strong, and there is reason for it to be strong. Those reasons have not changed. While it does need to have some sort of consolidation, it does not seem to want to give up any ground.
Click to view the chart

Oil. Oil had a very good week, and it ended on a good note as well ($82.63, +0.93). It rallied up to one of its resistance levels in its range, and fell back Thursday. It tested even lower on Friday but reversed off the 10 day EMA for that gain. As the dollar falls, it takes more dollars to buy a barrel of oil. That is why oil is running higher. Maybe you can make the correlation between bonds not moving higher and oil running higher. If bonds are not rallying, then perhaps the economy is going to do better instead of worse. Bonds tend to rally when the idea is that stocks are not going to do well because the economy will be poor. Maybe it is just the fact that bonds have rallied too far right now and they are running out of the ability to move higher. It could take more to get them to move than just the same old story about the Fed coming in and buying more assets.

It was clear that oil was running higher most likely because the dollar was running lower. Gold was running sharply higher because the US is bound and determined to stick with the easy money, asset-buying binge they have been on for the past three years. That holds true for all the other central banks, as we saw this week with Australia, Europe, Japan, etc.
Click to view the chart

TECHNICAL SUMMARY

Volume. Volume rose on the NASDAQ as well as on the NYSE. For a Friday that is a good sign, particularly when the market started soft and closed high. That is your good high-to-low price action coupled with rising volume. That is what you call good price/volume action.

Breadth. The advance/decline line was not bad at 2.5:1 on NASDAQ, and 3:1 on the NYSE. Everything was solid all week. There were not any sudden changes in price/volume volume action or in breadth that would make you think that something was lurking below the surface.

CHARTS

SP500. SP500 did post a gain. It has moved through the 1151 January peak this week. It held the move, tested it Thursday, and then it bounced. It posted a nice gain on Friday. It is coming up to the 78% Fibonacci retracement at 1175, just a mere 10 points away. It is looking solid, and it will rally likely to this level at the May peak. It may stall some and then try to make the move up to the April peak. It has been showing good momentum and getting support from other areas. It may make that move despite a lot of misgivings as to how the market could perform in the Q4.

Note that some fund managers might be trying to play catch up since they missed a lot of this run off of the August low (some even off the July low). Thus there would be more money coming in and pushing the market higher and higher. You have to juxtapose this with the earnings season coming out, so it might get up to the 78% Fibonacci retracement level and then stall out. It is never a straight shot one way or the other. There are road signs -- and sometimes car wrecks -- along the way as a stock or index moves higher.

NASDAQ. NASDAQ showed similar action, breaking higher this week again. Testing and then moving up to the new rally high on the Friday close. Volume was up, so there was good buying as it made the move. It, too, is closing in on its Fibonacci extension. Here you see the May peak. Looking at the Fibonacci chart, the 78% retracement at 2434 matches the May high. NASDAQ was just about 33 points away from that level. It is just a good day's work before it makes that resistance level. How it reacts at that point, as with the SP500, tells a little what will happen down the road. It looks like these stocks are in good shape to move higher; that is, if some of these that have pulled back can consolidate. If SP500 gets a little help from the financials, that would not hurt anything. And then it could get help from some other areas as well. We are seeing that happen with some of them.

SP600. SP600 was up 1.3% and also moved to a rally high. A straight shot moving up, testing 1-2-3, moving up, testing, and moving up. Just a nice building of these small pyramids one on top of the other, showing a healthy upside move. There will be resistance near term as well. It has this gap point from April, and it will hit that at the same time NASDAQ and SP500 hit their 78% retracement marks. Indeed, looking at the SP600 78% retracement level, it is just above that gap up point. It is going to be bumping into its resistance just about the time that the other indices do the same.

SOX. Semiconductors were up almost 1%, but they have not done anything on the week. Maybe holding steady is a win for this sector. It overcame the downgrade of the chip equipments sector as well as MU's missed earnings. All it could do was bump the 200 day EMA on the high and back off modestly to the close. It is trying to make the break through. It is not turning tail and running, but it is still following the other indices. Indeed they are probably dragging the semiconductor index higher whether it wants to or not.

LEADERSHIP

Financial. Once again, as the market moves higher, financials did not. JPM was down, but it is on the 50 day EMA. It has an interesting pattern, and maybe something comes of it. Maybe. GS bounced up to the 200 day EMA, posting a 1% gain. Interesting, but it is just at the top of its range right now. I guess you could call this a triangle. I have been watching these patterns form up in the financials, but they are not as pretty a pattern as I would want to see. There is something here, but I do not think they are quite ready. Looks like there could be more rotations here before they break higher. On a positive note, they are setting up, and we will continue to watch them. WFC looks a lot like JPM. It rallied up, it has pulled back a couple of days, and it is holding at the 50 day EMA. It is trying to set up for another bounce. That would be very helpful for the SP500 and the other indices. Note that a lot of those financials start reporting their earnings next week, and that will be important news for the market overall. Financials still make up a big percentage of the SP500 despite being gutted and trampled over the last three years.

Metals. Metals had a great week. AA beat its earnings and had a great day, bouncing over the 200 day EMA. FCX continued its unbelievable gold-like run higher. Steel is better, but STLD is still mired in a range. AKS is also mired in a range.

Technology. AAPL made a new closing high on this rally and bounced back nicely. It did not give up, and it did not have the issues a lot of other stocks have. Really nice boost for NASDAQ. GOOG had a good day as well. It is moving laterally, forming a flag on top of a flag. No complaints on how it is moving, but I would like to see more action. EMC has been an interesting stock for the market over the last several months. It is not performing as well, and that is something to keep an eye on. FFIV continued to sell, but it also rallied off of its low. Note that that was off at the last consolidation level. We will see if anything develops there. AKAM is very negative. A little head and shoulders and a break lower. It tried to hold an important level, it slumped through it on Wednesday, and it is making a low-volume recovery to that level. You call this a downside play.

Agriculture. There was data about the corn crop being pathetic, and that blasted them higher. AGU surged to the upside, and MOS gapped as well. It was a banner day for those stocks once we found out that we need more food produced and the crops will not be that great.

Retail. Retail had a good week as well. Good comeback with the same store sales. It was better than expected overall, with some saying the back-to-school season was really great. ANF gapped higher and continued to move to the upside on Friday. ZUMZ continued higher as well after it gapped up Thursday on its same store sales. There are many stocks in retail performing well and coming back to life. It is a huge sector, and not all of them move at once. You can never say all of retail is doing better. It is easy to say that, but in reality it is divided into many sectors. Overall, however, retail is performing quite nicely.

The question is how many new groups will come up and help us out. There is some movement in chemicals. There is movement in the retail stocks, although they have been volatile of late. Metals continue to move well, and some of the small industrials are starting to move. There were some coal stocks heading higher. There are stocks out there stepping up. They are coming in off very low prices, but not because they are in the trash heap. They have been working on their bases while the rest of the market rallied. Some of them have started to move up as some of the market pulls back on profit taking. That is, if it can continue and we see more of them move up, that is a sign of rotation. That the very healthy for the market. There is still not a lot surging higher to fill the shoes of those that moved ahead of it, but more and more are getting money thrown their way. Maybe we will see the tide turning before too long.

THE MARKET

MARKET SENTIMENT

VIX. Volatility has broken below its lows from late spring 2010. As the market broke higher, volatility broke lower. It did not produce a selloff as it had in July and as we thought it might have done in September. Looked like it might do it, but no. It is going to break down. This is not necessarily a bad thing. It likely just tells us that the correlation that set up during this period is now broken because the market is moving to a new range in itself. Volatility can fall to very low levels for extended periods, and it does not mean that the market is going to start selling again. You have to watch for the correlations when they set up. They did for awhile, but now it looks like that is not the case. The market the breaking higher, volatility is falling, and that is exactly what I would expect it to do.

VIX: 20.71; -0.85
VXN: 21.98; -1.08
VXO: 19.74; -0.86

Put/Call Ratio (CBOE): 0.85; -0.22

Bulls versus Bears:

The CROSSOVER from August is long gone but it did its job.

This is a reading of the number of bullish investment advisors versus bearish advisors. The reason you look at this is that it gives you an idea of how bullish investors are. If they are too bullish then everyone is in the market and it is heading for a top: if everyone wants to be in the market then all the money is in and there is no more new cash to drive it higher. On the other side of the spectrum if there are a lot of bears then there is a lot of cash on the sideline, and as the market rallies it drags that cash in as the bears give in. That cash provides the market the fuel to move higher. If bears are low it is the same as a lot of bulls: everyone is in and the market does not have the cash to drive it higher.

Bulls: 45.6% versus 43.3%. The crossover level at 29% bulls is long gone, but it did its job. Again, investors play catch-up with the market. The high on the last leg was 56.0% after starting at 35.6% on the low in February, the lowest it has been since July 2009 . . . until this last leg. 35% is the threshold level suggesting bullishness. After peaking at 53 on this move the bulls lost some nerve, falling to a new low post- July 2009. Once again bulls peaked out near the 50% level. Bulls have bumped at 50ish since late August 2009, falling to 45ish and then rebounding. Hit a high of 47.7% mid-June on the run from the March lows. Again, to be seriously bearish it needs to get up to the 60% to 65% level.

Bears: 28.3% versus 27.8%. The 37.7% peak at the height of the crossover is well in the rearview mirror but bears remain well below the 35% level considered bearish for the market overall. Hit 18.7% on the low in April. Hit a high of 27.8% level on the prior leg in February. For reference, cracking above the 35% threshold considered bullish. Hit a high on the prior run at 47.2%. For more reference, bearishness hit a 5 year high at 54.4% the last week of October 2008. The move over 50 took bearish sentiment to its highest level since 1995. Extreme negative sentiment. Prior levels for comparison: Bearishness peaked at 37.4% in September 2007. It topped the June 2006 peak (36%) on that run. That June peak eclipsed the March 2006 high (33%) and well above the 2005 highs that spawned new rallies (30% in May 2005, 29.2% in October 2005). That was a huge turn, unlike any seen in recent history.

NASDAQ

NASDAQ enjoyed the 'golden cross' this past week, a positive indication as it shows near term momentum swinging.

Stats: +18.24 points (+0.77%) to close at 2401.91
Volume: 1.944B (+7.67%)

Up Volume: 1.285B (+117.75M)
Down Volume: 646.807M (-8.287M)

A/D and Hi/Lo: Advancers led 2.54 to 1
Previous Session: Decliners led 1.27 to 1

New Highs: 137 (+24)
New Lows: 25 (0)

NASDAQ CHART: Click to view the chart

NASDAQ 100 CHART: Click to view the chart

SOX CHART: Click to view the chart

SP500/NYSE

Almost, basically a gnat's butt, from the golden cross.

Stats: +7.09 points (+0.61%) to close at 1165.15
NYSE Volume: 945.135M (+3.25%)

Up Volume: 704.545M (+333.787M)
Down Volume: 232.256M (-290.175M)

A/D and Hi/Lo: Advancers led 3.03 to 1
Previous Session: Decliners led 1.17 to 1

New Highs: 330 (+20)
New Lows: 7 (-2)

SP500 CHART: Click to view the chart

SP600 Chart: Click to view the chart

DJ30

Stats: +57.9 points (+0.53%) to close at 11006.48
Volume DJ30: 152M shares Friday versus 142M shares Thursday.

DJ30 CHART: Click to view the chart

MONDAY

Next week there is more data, but the jobs report is out of the way. Everyone lets their breath out after that. The minutes of the Fed come out on Tuesday. Continuing claims and initial claims are on Thursday, and then there is more interesting data on Friday with retail sales for September as well as Michigan Sentiment and the New York Fed. There will also be the business inventories number. It will be interesting to see whether it is falling or rising and whether that is due to sales are falling or rising. That will give a barometer of where this recovery is.

What will be the real driver next week? There are two things occurring. Number one is the technical move that we are seeing with NASDAQ and the SP500 wanting to move up toward their 78% Fibonacci retracement. That will be a key level because it shows just how much strength the move has. If it turns tail and dives lower, that is a problem. Often they come back and test again, however. If that fails, it typically means a rollover. That is a long way off before seeing what is going to happen along those lines. I am anticipating a move up to that 78% level. Then this run we are currently on will need to take a breather, and it will then come back and test. It will either sell off or continue on, making the break and heading toward a full retracement of the April to July selloff. Things right now are looking solid. More leadership will have to show up and start pulling its own weight.

The other aspect, of course, will be earnings. They really take off next week, and they could help give us a bump and run up to that 78% Fibonacci retracement level. The market is moving as if it wants to go there, and some decent early earnings, such as AA, could give the market the impetus to run up to that level sooner than later. As we have seen in many earnings cycles, there is an initial reaction that is either positive or negative, and then the back half of the season trades in the opposite direction. That is often the case when you have stocks rallying into earnings, getting a good boost initially. We rallied into them because we thought they would be better, and they are better. So they rally some more, but then they run out of juice and sell back on the back half of the season.

The only thing that means to us is that we have to be more cautious around the 78% retracement level. Indeed, we will look to take some gain off of the table when the indices get there. Of course, that is always our game plan. We have good runs to the upside; we take gain of we have a good, sustained move; and then we let it make its test and set up all over again. The 78% is a little more important simply because it is the 78% level. It is a long retracement, and it is hard to keep the momentum up much longer past that unless it is very, very solid. The 78% Fibonacci level will tell us a whole lot about this market. It could make it all the way up there, it could make it there and stall. It could blow past it and come back and test, or it could test and then break down.

There are always many options that can happen as the market moves, but right now there is good volume to the upside, breaking through resistance. There is enough leadership to get the job done. I would like to see more coming in from new areas, and maybe that was starting last week. Financials look like they are in position to move. They have pulled back ahead of their earnings, albeit modestly, and some of their patterns are building. They are not what you would tell your mother to invest in, but they are getting to that point. If we got good earnings, they may try to make a move. That would really help SP500. The question is how much we want to buy moving towards the 78% retracement given that it is very close on NASDAQ and SP500. We will never turn down a good set up. A lot of these stocks have not become extended because they did not participate in much of that rally that started off the July and August lows. They are not that extended, and they could have room to run even if the overall market bumps into those levels and stalls out. If we get that run up to the 78% range, we will be taking some gain off the table.

I will still be looking for the plays that are obvious -- the stuff that looks good and still has plenty of room to run. They may run even further beyond the indices even if the indices stall at the 78% level. I do not know if the indices will do that. I could try to start guessing where the tops and bottoms are, and I do always make educated guesses as to where they might peak or might bottom, but no one knows for sure. Many a good trader has not scored the profits he should have scored on trades by cutting it off too early because he figured this is the top or the bottom. I stand here guilty as charged; I have done it before and I still do it on trades instead of letting them all run. That is why I often take partial profits and let the trades continue to run. We all do it here in the office because we are not smarter than the market. We play the probabilities as best we can, and then you have to let the probabilities work for you. When they do, you just let them run and let them make you money.

I have seen that over and over again in the last several months with these plays that continue to run higher. Eventually they run out of juice, such as FFIV, but it sure does make you a lot of must be in the interim. You just continue to let those positions run for as long as they will, and that is how you make your money. Pick high-probability plays, and then you let the probabilities work for you. It is like playing blackjack -- not that I want to compare this to gambling. The only one who can get away with it is James Bond. If you play the probabilities, however, you increase your chances of winning. If you play and let your stocks run for you, you increase your chances of winning and winning big.

Enough of my lesson on probabilities, although it is one of the hardest to learn. Out of 10 trades, you may only have four that work, but you will still make good money in the stock market if you manage your trades and the probabilities. With that, I will see you on Monday with some more plays in our pockets and ways to make money as the market continues on toward the 78% Fibonacci retracement.

Support and Resistance

NASDAQ: Closed at 2401.91
Resistance:
2425 is an interim peak from May 2010
2434 is the May interim peak and the 78% Fibonacci retracement of the April selloff.
2530 is the April 2010 peak (2535.28 intraday)

Support:
2382-2395 from 2008
2324-2370 is a range of resistance from early 2008
2341 is the June 2010 peak
2320 to 2326.28 is the January 2010 high
2319 from the September 2008 peak
2310 is the August 2010 peak
The 50 day EMA at 2294
2292 is a low from January 2008
The 200 day SMA at 2289
2273 to 2282 marks bottom of January 2010 lateral peak
2275 - 2278 from the February 2008 and April 2008 lows. Key lows.
2245 from July 2008 through 2260 from late 2005.
2236 is the first August gap point.
A series of interim peaks at 2230ish from the May to August trading range
2221 is the gap down upside point from June.
2205 is the November 2009 peak 2210 (from September 2008) to 2212 (the July 2009 closing low)
2185 to 2195 represent support points for years: December 2004 peak, July to October 2005 consolidation, January, March and July 2008 lows, and October 2009 peak.
2184 is the June gap bottom side.
2177 is a low from March 2008
2169 is the March 2008 closing low (double bottom)
2168 is the September 2009, intraday peak
2155 is the August 2010 low and the March 2008 intraday low
2151 is the Tuesday gap down point
2140 from the May and June 2010 lows
2100 is the February 2010 low
2099 is the recent August intraday low

S&P 500: Closed at 1165.15
Resistance:
1170 is the prior March 2010 high
1174 is the May 2010 high, 78% Fibonacci retracement of April peak
1181 is the April selloff low
1185 from late September 2008

Support:
1156 is the Sept 2008 low
1151 is the January 2010 peak
1133 from a September 2008 intraday low
Bottom of the January 2010 consolidation 1131 to 1136
1129 to 1131 is the June and August 2010 peaks
1119 is the early December intraday high
The 200 day SMA at 1119
The 50 day EMA at 1118
1114 is the November 2009 peak
1106 is the September 2008 low
1101 is the October 2009 high and the recent May and June 2010 interim peaks
1084 to 1080 (September 2009 peak)
1078 is the October range low
1070 is the late September 2009 peak as well as several other peaks and valleys even in 2010. Important level.
1065 is the May flash crash intraday low.
1044 is the October 2008 intraday high AND the February 2010 low
1039 to 1040 are the May, June, and August 2010 lows

Dow: Closed at 11,006.48
Resistance:
11,100 from the 7-08 low
11,205 is the April closing high
11258 is the April 2010 peak
11,734 from 11-98 peak

Support:
10,963 is the July 2008 low
10,920 is the recent May high
10,730 is the January 2010 peak
10,609 from the Mid-September 2008 interim low
10,594 is the June 2010 peak
The 50 day EMA at 10,582
10,496 is the November 2009 high
The 200 day SMA at 10,488
10,365 is the late September 2008 low
10,285 is the late December consolidation peak
10,260 from the May and June 2010 interim peaks are breaking
10,209 is recent August 2010 low
10,120 is the October 2009 peak
9938 is the August 2010 low
9918 is the September 2008 peak
9855 is the early September peak in its lateral range
9835 is the late September 2009 peak AND the February 2010 low
9829 is the September 2008 closing high
9774 is the May 2010 intraday low

Economic Calendar

These are consensus expectations. Our expectations will vary and are discussed in the 'Economy' section.

October 08 - Friday
- Nonfarm Payrolls, September (08:30): -94K actual versus 0K expected, -57K prior (revised from -54K)
- Nonfarm Private Payrolls, September (08:30): 64K actual versus 74K expected, 93K prior (revised from 67K)
- Unemployment Rate, September (08:30): 9.6% actual versus 9.7% expected, 9.6% prior
- Hourly Earnings, September (08:30): 0.0% actual versus 0.2% expected, 0.3% prior
- Average Workweek, September (08:30): 34.2 actual versus 34.2 expected, 34.2 prior
- Wholesale Inventories, August (10:00): 0.8% actual versus 0.4% expected, 1.5% prior (revised from 1.3%)

October 12 - Tuesday
- Minutes of FOMC Meeting, 9/21 (2:00)

October 13 - Wednesday
- MBA Weekly Mortgage Applications, 10/08 (07:00): -0.2% prior
- Export Prices ex-ag., September (08:30): 0.5% prior
- Import Prices ex-oil, September (08:30): 0.3% prior
- Crude Inventories, 10/09 (10:30): 3.09M prior
- Treasury Budget, September (14:00): -$32.0B expected, -$46.6B prior

October 14 - Thursday
- Initial Claims, 10/09 (08:30): 449K expected, 445K prior
- Continuing Claims, 10/02 (08:30): 4450K expected, 4462K prior
- PPI, September (08:30): 0.2% expected, 0.4% prior
- Core PPI, September (08:30): 0.1% expected, 0.1% prior
- Trade Balance, August (08:30): -$44.5B expected, -$42.8B prior

October 15 - Friday
- CPI, September (08:30): 0.2% expected, 0.3% prior
- Core CPI, September (08:30): 0.1% expected, 0.1% prior
- Retail Sales, September (08:30): 0.4% expected, 0.4% prior
- Retail Sales ex-auto, September (08:30): 0.4% expected, 0.6% prior
- NY Fed - Empire Manu, October (08:30): 6.0 expected, 4.10 prior
- Michigan Sentiment, October (09:55): 68.6 expected, 68.2 prior
- Business Inventories, August (10:00): 0.5% expected, 1.0%
icon url

ReturntoSender

10/11/10 9:09 PM

#9090 RE: ReturntoSender #6755

From Briefing.com: 4:30 pm : Stocks spent most of the session chopping along listlessly with modest gains until a flurry of late selling led to a flat finish.

A lack of headlines left stocks with few drivers this morning, but a modest bid helped keep the major averages in positive territory. Still, conviction appeared lacking as there was little support when stocks were tested with resistance near last week's highs. Stocks were also backed down by the greenback's gains -- the dollar advanced 0.4% against competing currencies after the yen set another new 15-year high against it overnight.

Natural resource plays showed some strength in the first few minutes of trade, but that proved fleeting when the dollar was bid higher. Energy stocks settled with a 0.1% gain and materials stocks finished with a 0.2% loss.

Tech stocks had looked strong in afternoon trade. The sector was propped up by a mix of large-cap tech plays and semiconductor stocks. Broadcom (BRCM 36.38, +0.64) was a leader in the bunch after analysts at Goldman Sachs added the name to its Conviction Buy List. The overall tech sector still finished with a fractional gain, though.

Trade was quiet for most of the session. For some stretches it even became rather boring -- for more than three hours the S&P 500 was confined to a two-point range.

Despite that, the Volatility Index (VIX) dropped more than 8% to its lowest level since late April. However, that was mostly because of a mechanical shift in the options used to calculate the VIX, rather than a calming among market participants.

The VIX was virtually unmoved by some late selling that undercut the major averages and actually took the Dow back below 11,000. A very modest bid in the final minutes helped blue chips reclaim the psychologically significant mark and made for an overall flat finish.

Trading volume on the NYSE dropped to its lowest level in one month as barely 800 million shares exchanged hands this session. That is likely owed to the combination of few trading catalysts and some traders leaving their desks for Columbus Day -- The U.S. Treasury market was closed for its observance.

Advancing Sectors: Telecom (+0.3%), Energy (+0.2%), Tech (+0.1%), Consumer Discretionary (+0.1%), Consumer Staples (+0.1%)
Declining Sectors: Industrials (-0.3%), Materials (-0.2%), Financials (-0.1%)
Unchanged: Health Care, UtilitiesDJ30 +3.63 NASDAQ +0.42 SP500 +0.15 NASDAQ Adv/Vol/Dec 1233/1.55 bln/1416 NYSE Adv/Vol/Dec 1638/824 mln/1317

9:31AM Microsoft and partners discuss Windows Phone 7 portfolio (MSFT) 24.69 +0.12 : Co stated "Microsoft joined its partners in discussed nine new Windows Phone 7 handsets that will be available this holiday season from leading mobile operators in Europe, North America and Asia Pacific.... Windows Phone 7 will be available in a variety of sleek form factors from device-makers such as Dell (DELL), HTC Corp., LG and Samsung, and from mobile operators including America Movil, AT&T (T), Deutsche Telekom AG, Movistar, O2, Orange, SFR, SingTel, Telstra, TELUS (TU), T-Mobile USA and Vodafone (VOD). All Windows Phone 7 phones will include the high-performance Snapdragon processor from Qualcomm (QCOM). A broad selection of phones will begin shipping in holiday 2010 with more arriving in 2011, including phones from Sprint (S) and Verizon Wireless (VZ). In addition, select models will be available at Microsoft Store locations and from Amazon (AMZN)."

7:40AM On The Wires (WIRES) : ARM (ARMH) and Semiconductor Manufacturing International Corporation (SMI) to collaborate on the development of ARM leading physical IP library platform for SMIC 65nmLL and 40nm LL technology process nodes. This agreement will provide free access on the ARM DesignStart online IP access portal to library suites of 9-track and 12-track multi-Vt logic libraries, power management kits, ECO kits and ARM high density optimized memory compilers...

Tower Semicon (TSEM) and Crocus Technology announced the successful completion of the first stage of integration of Crocus' Thermally Assisted Switching-based MRAM technology into TowerJazz's 0.13-micron CMOS process. As a result of the collaboration, a special low temperature back-end process technology was developed that enables TAS MRAM memory arrays to be manufactured in co's core 0.13um copper back-end process flow...

3:33AM LDK Solar raises Q3 revenue guidance above consensus (LDK) 9.80 : Co issues upside guidance for Q3 (Sep), sees Q3 (Sep) revs of $610-640 mln vs. $580.62 mln Thomson Reuters consensus and above previously stated $570-600 mln. At the end of Sept 2010, co's manufacturing capacity reached, as previously planned, 11,000 MT in polysilicon, 2.6 GW in wafers, 120 MW in cells, and 760 MW in modules. As of the end of Q3, cash balances, including pledged bank deposits, were ~$800 mln.

icon url

ReturntoSender

10/12/10 8:33 PM

#9091 RE: ReturntoSender #6755

From Briefing.com: 4:30 pm : Though stocks were quick to recover from an early slide, the broader market stagnated near the neutral line until word of possible quantitative easing pushed stocks into positive ground for a solid finish.

Moderate, yet widespread weakness had dropped the stock market for a loss in the early going. Near-term support provided a floor for a rebound, but the S&P 500 struggled to turn positive with the dollar holding out in positive territory.

The dollar finally dipped into the red following the release of the minutes from the FOMC's meeting on September 21. According to the minutes, members are prepared to provide additional accommodation, if needed, to support the economic recovery and to return inflation, over time, to levels consistent with the FOMC mandate. While such accommodation may be appropriate before long, members made clear that any decisions would depend upon future information about the economic situation and outlook.

Relative to competing currencies, the dollar ended the day with a 0.1% loss after it had been up as much as 0.6% in overnight trade.

The dollar's decline helped induce enough buying to lift the broader market into positive ground. Financials made the biggest move, such that the sector settled with a 1.3% gain. Shares of JPMorgan Chase (JPM 40.40, +0.67) showed leadership ahead of its quarterly report tomorrow morning.

Tech stocks were also strong ahead of the latest from chip bellwether Intel (INTC 19.77, +0.21). Shares of INTC were atop the list of most actively traded names by volume this session, though overall volume on the NYSE was generally unimpressive again.

There were only a few headlines ahead of the latest round of earnings. Among them, Pfizer (PFE 17.48, +0.10) will acquire King Pharmaceuticals (KG 14.14, +3.99) for $14.25 per share, which makes for a 40% premium to the stock's prior session closing price.

Disappointing guidance from global steelmaker Posco (PKX 114.47, -5.03) weighed on domestic steel plays (-0.9%).

Among other commodity-backed plays, oil and gas drillers had been down 1.4% at their session low, but were able to book a 1.1% gain following news that the government lifted the moratorium on deepwater drilling after imposing stricter safety and operating requirements.

The U.S. Treasury market reopened from a Columbus Day holiday to solid support, which dropped the yield on the 2-year Note to a new record low. Early gains were eventually given back, though. It didn't help that dollar demand at the latest auction of 3-year Notes was the lowest since mid-2009. The $32 billion auction produced a bid-to-cover of just 2.95 on dollar demand of $94.4 billion and an indirect bidder participation rate of 29.0%.

Advancing Sectors: Financials (+1.3%), Tech (+0.7%), Consumer Staples (+0.3%), Materials (+0.3%), Consumer Discretionary (+0.2%), Health Care (+0.2%)
Declining Sectors: Utilities (-0.3%), Energy (-0.1%), Industrials (-0.1%)
Unchanged: TelecomDJ30 +10.06 NASDAQ +15.59 NQ100 +0.7% R2K +0.4% SP400 +0.4% SP500 +4.45 NASDAQ Adv/Vol/Dec 1521/1.98 bln/1085 NYSE Adv/Vol/Dec 1659/922 mln/1293

5:05PM Linear Tech misses by $0.01, beats on revs; guides Q2 revs in-line (LLTC) 31.56 +0.32 : Reports Q1 (Sep) earnings of $0.61 per share, excluding $0.02 in non-recurring items, $0.01 worse than the Thomson Reuters consensus of $0.62; revenues rose 64.6% year/year to $388.6 mln vs the $383.8 mln consensus. Co issues in-line guidance for Q2, sees Q2 revs flat to down 4% sequentially, which calculates to ~$373.1-388.6 vs. $384.14 mln Thomson Reuters consensus. Co reports 1Q11 operating margin of 52.6% vs. 51.8% Thomson Reuters consensus.

4:20PM Intel beats by $0.02, reports revs and margins in-line; guides Q4 revs in-line, margins above consensus (INTC) 19.77 +0.21 : Reports Q3 (Sep) earnings of $0.52 per share, $0.02 better than the Thomson Reuters consensus of $0.50; revenues rose 18.2% year/year to $11.1 bln vs the $10.99 bln consensus (guidance was for $10.8-11.2 bln in revs). Intel reports Q3 gross margins of 66% vs 66.1% consensus and guidance of 65-67%. Q3 PC Client Group revenue was up 3% sequentially and Q3 Data Center Group revenue was up 3% sequentially... Co issues in-line rev guidance for Q4, sees Q4 revs of $11.0-11.8 bln vs. $11.32 bln Thomson Reuters consensus. Intel guides Q4 gross margins to 67%, plus or minus a couple percentage points, vs 65.6% consensus. "Intel's third-quarter results set all-time records for revenue and operating income... These results were driven by solid demand from corporate customers, sales of our leadership products and continued growth in emerging markets. Looking forward, we continue to see healthy worldwide demand for computing products of all types and are particularly excited about our next-generation processor, codenamed Sandy Bridge, and the many new designs around our Intel Atom processors in everything from the new Google TV products to a wide array of tablets based on Windows, Android* and MeeGo operating systems."

12:20PM Semiconductor Hldrs edges above morning recovery to set minor new session high of 28.65 (SMH) 28.64 +0.15 : The new high in midday trade leaves it slightly under its five week high from yesterday is at 28.71. The next area of note at its July and June peaks at 28.90 -- ALTR +1.4%, AMAT +1.1%, AMD +1.2%, KLAC +1%, LLTC +1.4%, LSI +1.5%, MU +2%, NVLS +1.3%, XLNX +1%.

12:01PM SMTC announces manufacturing partnership with Vocera Communications (SMTX) 3.32 +0.02 : Co announces the commencement of a manufacturing relationship with Vocera Communications, Inc. SMTC began manufacturing the Vocera communications badge at their Chihuahua, Mexico facility in the third quarter and expects to achieve full production volumes during the first quarter of 2011.

8:30AM Emcore appointes Mark Weinswig, as CFO, effective October 11, 2010 (EMKR) 0.95 : Co names Mark Weinswig as CFO effective October 11, 2010. Prior to joining co, he held various leadership positions as Controller, EVP of Business Development, and Interim CFO with technology companies including Coherent and Avanex.

8:16AM On The Wires (WIRES) : SunPower Corp. (SPWRA, SPWRB) announced that construction is underway on a 3.5-megawatt SunPower solar power system at Macy's, Inc. online fulfillment center in Goodyear, Ariz. The system will deliver the equivalent of 70 percent of the 600,000-square-foot building's electricity demand, and is expected to be the largest solar system on a single rooftop in the U.S. when it is completed in March of 2011... TCF National Bank, a subsidiary of TCF Financial Corporation (TCB), announced that today it is filing a lawsuit challenging the constitutionality of the Durbin Amendment. Congress included this Amendment, without hearings, in the Wall Street Reform and Consumer Financial Protection Act of 2010, also known as the Dodd-Frank Act.

8:10AM Silicon Labs acquires ChipSensors, maker of single-chip CMOS Sensors (SLAB) 36.54 : Co announced the acquisition of Ireland-based ChipSensors Limited, an early stage technology company creating single-chip CMOS sensors designed to detect temperature, humidity and gases. ChipSensors' technology complements Silicon Labs' touch, proximity sensing and recently acquired MEMS technology, expanding the company's capabilities in CMOS-based sensors.

8:02AM TriQuint Semi sees Q3 non-GAAP EPS and rev above consensus (TQNT) 9.09 : Co sees Q3 EPS of $0.27, ex-items, vs $0.20 Thomson Reuters consensus; revs $238 mln vs $221.17 mln Thomson Reuters consensus "strong demand combined with outstanding execution in operations led to revenues well above our earlier expectations. I'm very pleased with our third quarter earnings and sequential revenue growth of ~15%." Co expects solid Q4 sequential rev growth (consensus +5.4% QoQ growth).

6:25AM Solarfun Power completes capacity expansion plan and further expansion plans (SOLF) 12.19 : Co announces that it has already reached its 2010 year-end target of 360 MW in ingot manufacturing capacity, 400 MW in wire saw capacity, 500 MW of cell capacity and 900 MW in module capacity. This represents increases of 100 MW in cell capacity and 200 MW in module capacity compared to the end of the 2Q10. The co expects to ramp production of the new cell, wire saw and ingot lines in the 2Q11 and complete the expansion by 3Q11. The total capital expenditures required for this expansion, including the construction of new buildings and related infrastructure, are ~$130 mln.

6:21AM Lattice Semi appoints Darin Billerbeck President and CEO (LSCC) 4.92 : Co announces its Board has appointed Darin Billerbeck as President and CEO, effective November 8, 2010. He most recently served as the CEO of Zilog, which was acquired by IXYS.

GT Solar (SOLR) opened its new Asia operations headquarters in Hong Kong. The Hong Kong headquarters better serves the needs of its customers throughout the Asia Pacific region...Osaka Securities Exchange, operator of the JASDAQ market, and The NASDAQ (NDAQ) today announced a strategic alliance for OSE to be the first Asian exchange marketing partner of GlobeNewswire and the NASDAQ OMX suite of products. OSE and NASDAQ OMX will further explore adding additional services to this mutually beneficial partnership...
icon url

ReturntoSender

10/13/10 11:14 PM

#9092 RE: ReturntoSender #6755

From Briefing.com: 4:30 pm : Strong earnings and a slide in the dollar sent stocks to fresh five-month highs this session. Some of the gains were surrendered into the close, though.

Buying was initially stirred by better-than-expected earnings from bellwethers Intel (INTC 19.24, -0.53) and JPMorgan Chase (JPM 39.84, -0.56). Though neither name actually advanced, their announcements were enough to add to the stock market's recent momentum, which has seen the S&P 500 close higher for four straight sessions.

JPM wasn't the only name that was rejected among banks. Their general weakness left the financial sector to finish flat.

Tech (+0.9%) was actually led by Apple (AAPL 300.14, +1.60), which broke above the $300 mark to set a record high.

Rail carrier CSX Corp (CSX 59.66, +2.40) was one of the session's best performers, thanks to an upside earnings surprise of its own. The stock's strength helped the industrials sector advance 1.5%, but materials stocks advanced 1.7% to book the biggest gain of any sector.

Basic materials stocks, as well as the broader market, were helped by renewed weakness in the dollar. The dollar dipped 0.4% to test its eight-month lows.

Weakness in the dollar and a broadly positive mood among traders sent the CRB Commodity Index to a new two-year high. The CRB finished with a 0.6% gain, about half of what it had sported at its session high.

Positive market breadth had taken the Volatility Index (VIX) down to its lowest level since April, but the VIX rebounded as stocks drifted lower into the close.

Though stocks finished off of their session highs, advancing issues still outnumbered advancers by 4-to-1 in the S&P 500. Share volume was also strong, in that nearly 1.3 billion shares were traded on the NYSE today. Outside of the final session of the third quarter, today's total is the greatest of the past month.

Treasuries retraced their slide as stocks eased lower into the close. In turn, the benchmark 10-year Note finished a few ticks for the better even though dollar demand at a $21 billion auction of 10-year Notes was the lowest since December 2009.

Advancing Sectors: Materials (+1.7%), Industrials (+1.5%), Energy (+1.1%), Tech (+0.9%), Consumer Staples (+0.8%), Health Care (+0.7%), Utilities (+0.3%), Consumer Discretionary (+0.2%)
Declining Sectors: Telecom (-0.1%)
Unchanged: FinancialsDJ30 +75.68 NASDAQ +23.31 SP500 +8.33 NASDAQ Adv/Vol/Dec 1946/2.31 bln/707 NYSE Adv/Vol/Dec 2289/1.27 bln/712

4:04PM Universal Display announces "significant advances" in solution-processible phosphorescent OLED material systems for potential low-cost OLED manufacturing (PANL) 25.50 +0.79 : Co announced significant advances in the performance of its UniversalP2OLED solution-processible, phosphorescent OLED material systems for use with solution-based manufacturing processes. In a paper delivered today, Dr. Kwang Ohk Cheon, Senior Research Scientist at Universal Display, reported that the performance of Universal Display's solution-processible P2OLED technology and materials have advanced significantly through the continued development of enhanced materials and device structures using its proprietary solution-processed, small-molecular emitter systems. These systems are now approaching the performance of PHOLEDs made by vacuum-evaporated techniques.

3:01PM Intel has lagged since its firmer open, testing support zone (INTC) 19.26 -0.51 : A steady slide has followed the firmer start with it pulling back to a support zone marked by its 20 ema and 38% retrace of the Aug-Oct run at 19.22/19.11 (session low 19.16). Initially need to see sustained action above 19.30/19.35 to begin to begin to improve the negative pattern.

8:03AM Broadcom has signed a definitive agreement to acquire Beceem Communications; expects the acquisition of Beceem to be neutral to earnings in 2011 (BRCM) 36.73 : Co announces it has signed a definitive agreement to acquire Beceem Communications. Co expects to pay ~$316 mln to acquire all of the outstanding shares of capital stock and other equity rights of Beceem. The purchase price will be paid in cash, except that portion attributable to unvested employee stock options will be paid in stock options exercisable for shares of co's common stock. Co expects the acquisition of Beceem to be neutral to earnings in 2011. The transaction is expected to close in co's 4Q10 or by the end of co's 1Q11.
icon url

ReturntoSender

10/14/10 11:33 PM

#9093 RE: ReturntoSender #6755

From Briefing.com: 4:10 pm : Stocks logged their first loss in five sessions as weakness among bank stocks imbued broader market trade and the dollar pared its loss. Data was of little consequence this session.

A lack of direction in the early going left stocks vulnerable to a broader slide that was led by bank stocks. Banks succumbed to a concerted selling effort related to concern regarding banks' handling of foreclosures and representation of mortgage loan pools for use in mortgage backed securities.

Given the uncertainty surrounding the situation, participants opted to dump a broad range of banks in high volume. That dropped the KBW Bank Index below its 50-day moving average for a 2.6% loss, its worst in more than one month.

Materials stocks were also hit relatively hard after the sector entered into today's trade with a month-to-date gain of more than 6%. Profit taking sent the sector 0.9% lower.

Telecom outperformed for almost the entire session. The sector's 0.3% advance was led by Dow component Verizon (VZ 32.44, +0.23), which confirmed that it will soon begin to offer the iPad from Apple (AAPL 302.31, +2.17).

The broader market was able to improve its position into the close to finish with a more mild loss. Still, the Volatility Index closed about 8% higher in its sharpest percentage increase since early September.

The dollar also improved its position since dropping to a new 2010 low overnight. Global investors had continued their push against the dollar due to the notion that further quantitative easing could result in a greater number of dollars in circulation. The greenback was able to retrace some of its slide to settle with a 0.6% loss against competing currencies.

Data had little influence on trade. Among the items released, initial jobless claims for the week ended October 9 totaled 462,000, which is more than the 450,000 claims that had been expected, on average, among economists polled by Briefing.com. The latest initial claims figure made for a week-over-week increase of 13,000. Continuing claims fell 112,000 week-over-week to 4.40 million.

The Producer Price Index for September increased 0.4%, just as it did in August. The increase for September exceeds the 0.2% monthly increase that had been widely forecast. Excluding food and energy, producer prices increased a more tepid 0.1% for the second straight month, as expected.

Trade during August resulted in a deficit of $46.3 billion, which is up from the $42.6 billion deficit recorded for the prior month. It was also worse than the $44.5 billion deficit that had been generally expected among economists polled by Briefing.com.

Despite losses among stocks and an increase in volatility, Treasuries fell this session. Most of that was due to another disappointing Treasury auction. Demand for 30-year Bonds was the lowest since December 2009. The Bond dropped about 1.5 points so that its yield climbed to 3.90%.

Advancing Sectors: Telecom (+0.3%), Tech (+0.1%)
Declining Sectors: Financials (-1.8%), Materials (-0.9%), Industrials (-0.4%), Utilities (-0.2%), Consumer Discretionary (-0.2%), Health Care (-0.2%), Energy (-0.1%)
Unchanged: Consumer StaplesDJ30 -1.51 NASDAQ -5.85 NQ100 -0.1% R2K -0.3% SP400 -0.5% SP500 -4.29 NASDAQ Adv/Vol/Dec 1202/2.01 bln/1423 NYSE Adv/Vol/Dec 1203/1.11 bln/1773

5:00PM Veeco Announces Asia Expansion Plan; Hangzhou Silan Azure Selects Veeco's MOCVD Tools to Ramp LED Manufacturing (VECO) 40.85 -0.18 : Co announced a significant expansion of Veeco's Asia presence in order to better support the rapid growth of the LED industry and the needs of its customers. VECO announced in a separate release, that Hangzhou Silan Azure Co. Ltd., one of the largest LED manufacturers in China, has placed a multi-tool order for Veeco's TurboDisc K465iTM Metal Organic Chemical Vapor Deposition Systems. The equipment will be placed at Silan Azure's facility in Hangzhou for its high brightness light emitting diode manufacturing ramp.

4:57PM Seagate Technology announces preliminary interest regarding a going private transaction (STX) 12.69 -0.06 : Co received a preliminary indication of interest regarding a going private transaction. Co is in discussions with the party from whom it received the indication of interest, and its board of directors is evaluating the indication of interest and other strategic alternatives. The company has retained Morgan Stanley and Perella Weinberg Partners to provide financial advice and Wilson Sonsini Goodrich & Rosati and Arthur Cox as legal counsel. There is no assurance that the company will receive a formal offer or that any transaction will take place. Neither the company nor its representatives will be providing any additional comments regarding the preliminary indication of interest. (Stock is halted)

4:19PM Advanced Micro beats by $0.09, reports revs in-line (AMD) 7.13 -0.08 : Reports Q3 (Sep) earnings of $0.15 per share, $0.09 better than the Thomson Reuters consensus of $0.06; revenues rose 15.7% year/year to $1.62 bln vs the $1.61 bln consensus. Gross margin was 46.0% against 44.0% consensus. AMD expects revenue to be approximately flat sequentially for the fourth quarter of 2010 (approx $1.62 bln vs $1.66 bln consensus)

4:06PM Google beats by $0.96, beats on revs (GOOG) 540.93 -2.37 : Reports Q3 (Sep) earnings of $7.64 per share, excluding non-recurring items, $0.96 better than the Thomson Reuters consensus of $6.68; revenues rose 25.0% year/year to $5.48 bln vs the $5.27 bln consensus. Q3 paid clicks (PPC) +~16% YoY vs. ests in the low to mid teens (+15% YoY in Q2), +4% QoQ; cost per click (CPC) +~3% YoY vs. ests in the mid single digits (+4% YoY in Q2), +2% QoQ. Q3 op-ex 30% of revs vs. 29% in Q2. Q3 non-GAAP operating income was $2.93 bln, or 40% of revenues. This compares to non-GAAP operating income of $2.39 bln, or 40% of revenues, in 3Q09. Headcount +7.0% QoQ. TAC 26% of rev vs 27% in 3Q09.

12:28PM MEMC Elec: Sharp to supply thin film solar panels for an 18.5 megawatt DC solar deployment, jointly developed by co, in Ontario, Canada (WFR) 13.50 -0.09 :

8:32AM First Solar Announces Plans for Two New Manufacturing Facilities (FSLR) 136.93 : Co announced plans to build two new four-line manufacturing plants that will boost the company's annual manufacturing capacity by nearly 500 MW to help meet strong demand for its advanced thin-film photovoltaic modules. The plants are expected to be built in the United States and Vietnam and completed in 2012. Each new plant will create approximately 600 green jobs and will be designed to accommodate additional production capacity. Negotiations and site assessments are ongoing in both countries and will be finalized and announced at a later date. The new plants announced today, combined with these previously announced expansions, will nearly double production capacity from 1.4 GW in 2010 to more than 2.7 GW in 2012.

Naval Warfare Systems Command to provide technology updates and new concepts to detect and track submarines. This contract extension is valued at $24 million... WD (WDC) will begin hard drive manufacturing operations in Brazil, positioning the company to more effectively meet customer demand in this rapidly growing market and adding a key element to WD's global supply chain infrastructure...

8:06AM Sunpower JV successfully manufactured the first 100 solar cells (SPWRA) 14.24 : Co announced that AUO SunPower Sdn. Bhd., its joint venture solar cell fabrication facility (Fab 3) in Malaysia with AU Optronics (AUO), has successfully manufactured the first 100 solar cells, yielding a minimum conversion efficiency of 22.2 percent. Construction and ramp of manufacturing in Fab 3 will continue through 2013 and, when complete, will generate more than 1,400 megawatts per year of high-efficiency solar cells. The company anticipates commercial production to ramp up later this year.

Flextronics (FLEX) held a ceremony to celebrate the launch of its newest Flextronics Computing facility located in Wuzhong, China. This new computing-focused campus is strategically aligned with co's other computing sites in Beijing, Shanghai and Wujiang and provides complete design and manufacturing services for desktop, all-in-one computers, notebook products, and tablets...

icon url

ReturntoSender

10/16/10 6:13 PM

#9094 RE: ReturntoSender #6755

From Briefing.com: Weekly Recap - Week ending 15-Oct-10Third quarter earnings reporting season began in earnest this week. While the strong start played a role in the market's advance, particularly in the tech-heavy Nasdaq indices, investors remained focused on the prospects for further quantitative easing from the Federal Reserve.

U.S. equity markets rallied late Tuesday following the release of the FOMC Minutes from the Sept. 21 meeting, which reassured investors that "QE2" seemed to be the likely default scenario for Fed officials.

Then on Friday, Fed Chairman Ben Bernanke seemed to confirm that view, saying at a conference that "there would appear -- all else being equal -- to be a case for further action."

Most of the move this week occurred Tuesday afternoon and Wednesday morning (with the exception, again, of the tech-heavy Nasdaq indices). Foreign markets rallied overnight following the FOMC Minutes, then gains were extended Wednesday, aided by a strong start to earnings season.

Notably, tech bellwethers Intel (INTC) and Google (GOOG) pleased investors. Intel beat by $0.02 and issued gross margin guidance above consensus while Google crushed bottom-line expectations. Those results, along with M&A activity, helped the NASDAQ Comp. outperform the other major averages this week. The NASDAQ 100 also hit a new 52-week high.

Staying along those lines, eight of the 10 S&P 500 sectors advanced this week, easily led by a 3.9% surge in IT. Financials underperformed after JPMorgan Chase (JPM) and GE Capital reported weak top-line figures.

This week's economic calendar was back-loaded. The interesting point here is the market may have preferred bad news, because bad news increases the likelihood of QE2. That may be the reason the major averages ended mixed on Friday -- tech rallied following Google's results -- despite much better-than-expected Retail Sales data. The advance figure for September came in at 0.6% (Briefing.com consensus 0.4%) while both the headline figure and Sales ex. autos were revised higher in August.

Looking ahead to next week, investors can expect a flood of third quarter results, but the focus may once again be on the economy. The economic calendar is a little thin, though it does include Industrial Production, Housing Starts and Building Permits, and the FOMC's regional Beige Book economic survey.
 
Index Started Week Ended Week Change % Change YTD %
DJIA 11006.48 11062.78 56.30 0.5 6.1
Nasdaq 2401.91 2468.77 66.86 2.8 8.8
S&P 500 1165.15 1176.19 11.04 0.9 5.5
Russell 2000 693.82 703.16 9.34 1.3 12.4

2:31PM Technology Select Sector back flirting with its opening high at 24.03, its 52-wk close high from April is at 23.08 (XLK) 23.02 +0.33 : Note that its 52-wk intraday peak from April is at 24.16 -- GOOG +10.8%, CSCO +1%, HPQ +1.6%, AAPL +2.7%, ORCL +1.8%, MSFT +0.8%.

9:15AM Motorola and Nokia (NOK) announce 4G licensing agreement (MOT) 7.96 : Co and Nokia jointly announce that the companies have entered into a 4G license agreement. Under the terms of the agreement, Motorola and Nokia have extended the companies' existing intellectual property licensing agreement to include 4G cellular technologies, such as LTE, WiMAX and LTE-Advanced. The terms of the agreement are confidential

8:06AM Chipmos Technology plans 1:4 reverse stock split; also confirmed payment from Spansion (IMOS) 1.47 : Co announced that it will hold a special meeting of shareholders on January 21, 2011 to seek approval for a reverse stock split of ChipMOS's common stock with a ratio of 1-for-every-4 shares.... Co also confirmed that its subsidiary, ChipMOS TECHNOLOGIES, INC., a 91% owned subsidiary of ChipMOS, has received the payment of approximately US$67.8 million for the sale of recognized damage on breach of contract and liquidated damages rights against Spansion LLC as disclosed in the Company's January 14, 26 and October 4, 2010 press releases.

6:35AM General Electric beats by $0.02, misses on revs; sees industrial revs flat YoY, with growth QoQ (GE) 17.16 : Reports Q3 (Sep) earnings of $0.29 per share, excluding non-recurring items, $0.02 better than the Thomson Reuters consensus of $0.27; revenues fell 5.1% year/year to $35.89 bln vs the $37.54 bln consensus. GE Capital Services' revenues fell 2% vs last year to $12.5 bln. Industrial sales were $23.6 bln, down 6% from 3Q09. Revs were impacted by lower equipment sales and reduced GE Capital assets. GE expects Q4 2010 Industrial revs to grow QoQ from Q3 and to be about flat with the year-ago period. "For the first time in eight quarters, we saw growth in both equipment and service orders. Equipment orders increased 9%, including 33% growth in Technology Infrastructure... Third-quarter 2010 results should give investors confidence that a renewed GE should grow earnings and dividends in 2011 and beyond... GE Capital is well positioned with respect to Basel III capital requirements and we expect earnings growth in our financial services business to continue."

Texas Instruments (TXN) announced its first wafer fabrication facility in China. This important milestone puts manufacturing close to the co's growing customer base there.

08:59 am Apple ests raised at RBC Capital Mkts ahead of Q4 report Monday: . RBC Capital notes, on 5 mln iPads, 13.5 mln iPhones, it expects $20.3 bln rev and $4.48 EPS (prior $19.7/$4.15), above Street ($18.8/$4.06) and guidance; GMs expected at 38.0%, above 35% guidance. On strong holiday iPhone, iPad sales and distribution expansion, Q1 guidance expected at $23.0-23.5 bln rev (50% Y/Y), above Street ($22.1). On conservative GM outlook (est. 35-36%), EPS guidance expected at $4.57-$4.85 (Street $5.01). iPhone/iPad supply chain checks indicate strong 2H/CY10 build; it is raising its F10 ests to $65.2 bln rev, $15.00 EPS (prior $64.6/$14.67; $63.7/$14.56) and F11 to $86.2 bln/$19.27 (prior $84.3/$19.00; $81.0/18.03 consensus).

10:58 am AMD Sees Q4 Revs Flat Sequentially (AMD)

Advanced Micro (AMD 21.04 -0.75) reported third quarter earnings of $0.15 per share, $0.09 better than the Thomson Reuters consensus of $0.06.

Revenues rose 15.7% year-over-year to $1.62 billion versus the $1.61 billion consensus.

Gross margin was 46.0% against 44.0% consensus.

AMD expects revenue to be approximately flat sequentially for the fourth quarter of 2010 (approx $1.62 billion versus the $1.66 bln consensus).

10:16 am GOOG Easily Tops Q3 EPS Expectations (GOOG)

Google (GOOG 593.90 +52.97) reported third quarter earnings of $7.64 per share, excluding non-recurring items, $0.96 better than the Thomson Reuters consensus of $6.68.

Revenues rose 25.0% year-over-year to $5.48 billion versus the $5.27 billion consensus.

Third quarter paid clicks (PPC) rose approx.16% year-over-year versus estimates in the low to mid teens (up 15% year-over-year in the second quarter), rose 4% quarter-over-quarter; cost per click (CPC) rose approx. 3% year-over-year versus estimates in the mid single digits (up 4% year-over-year in the second quarter), up 2% quarter-over-quarter op-ex 30% of revenues versus 29% in the second quarter.

Third quarter non-GAAP operating income was $2.93 billion, or 40% of revenues.

This compares to non-GAAP operating income of $2.39 billion, or 40% of revenues, in 3Q09. Headcount +7.0% quarter-over-quarter. TAC was 26% of revenues versus 27% in the third quarter of 2009.

09:48 am GE Q3 Revs Fall Short of Expectations (GE)

General Electric (GE 16.42 -0.74) reported third quarter earnings of $0.29 per share, excluding non-recurring items, $0.02 better than the Thomson Reuters consensus of $0.27.

Revenues fell 5.1% year-over-year to $35.89 billion, worse than the $37.54 billion consensus.

GE Capital Services' revenues fell 2% versus last year to $12.5 billion. Industrial sales were $23.6 billion, down 6% from the third quarter in 2009.

Revenues were impacted by lower equipment sales and reduced GE Capital assets. GE expects fourth quarter 2010 Industrial revs to grow quarter-over-quarter from the third quarter and to be about flat with the year-ago period.

The company said, "For the first time in eight quarters, we saw growth in both equipment and service orders. Equipment orders increased 9%, including 33% growth in Technology Infrastructure... Third-quarter 2010 results should give investors confidence that a renewed GE should grow earnings and dividends in 2011 and beyond... GE Capital is well positioned with respect to Basel III capital requirements and we expect earnings growth in our financial services business to continue."

09:42 am Inflation Remains Subdued as PPI Growth Fails to Pass Through to CPI

Consumer price growth slowed in September as prices increased only 0.1% after rising 0.3% in August. The Briefing.com consensus expected prices to increase 0.2%.

The lack of price growth was a little surprising considering the September PPI data.

Producer prices rose 0.4% as food prices increased 1.2%. Producer food prices generally pass through into the CPI with minimal depreciation, but that did not occur in September. Food prices were up only 0.3%. That is the highest increase since October 2008, but a far cry from the 1.2% increase in the PPI. It seems that even food manufacturers and grocery stores, which sell the most inelastic products consumers can buy, cannot escape the deflationary pressures brought on by high unemployment and low income growth.

Excluding food and energy, core CPI remained unchanged for the second consecutive month. The consensus expected core prices to increase 0.1%.

Year-over-year core growth fell to 0.8% in September. This is the lowest growth rate since 1961 and well below the 2.0% - 2.5% Fed target level.

09:39 am Consumers Show No Signs of Slowing Down as Retail Sales Remain Strong

Last month we stated that back-to-school spending was not the main motivator for strong retail sales in August. Instead, we pointed toward unexpected income growth as the driver in goods demand in August. These ideas were confirmed with the latest data as retail sales remained strong in September.

Retail sales rose 0.6% in September after an upwardly revised 0.7% increase in August. The Briefing.com consensus called for sales to increase by 0.4%.

If back-to-school spending was the main driver for the growth in August, we would have expected a substantial payback period to develop in September in school-related areas. That did not happen.

Sales growth was widespread with only clothing (-0.2%) and department stores (-0.1%) revealing monthly declines.

Even more impressive, the sales growth came after the employment report revealed a lack of growth in weekly earnings along with some of the worst consumer sentiment/confidence levels seen since the end of the recession. It seems that consumers are not worried that income will fall in the near future.

Core retail sales, which exclude the highly volatile motor vehicle dealers, buildings material and supply stores, and gasoline stations, grew 0.4% in September after increasing 1.0% in August. This level is consistent with expectations of steady spending over the next few months.
icon url

ReturntoSender

10/18/10 8:11 PM

#9097 RE: ReturntoSender #6755

From Briefing.com: 4:50PM Apple drops ~24 pts to $294 in after-hours upon resumption of trading... call to begin in 10 minutes at 17:00 ET (AAPL) 318.00 +3.26 :

4:48PM Microsoft dips ~0.50 on 16:45 headline regarding departure of Chief Software architect, now at 25.20 in after-hours (MSFT) 25.82 +0.28 :

4:35PM Apple beats by $0.56, beats on revs; guides Q1 EPS below consensus, revs above consensus (AAPL) 318.0 +3.26 : Reports Q4 (Sep) earnings of $4.64 per share, $0.56 better than the Thomson Reuters consensus of $4.08; revenues rose 66.6% year/year to $20.34 bln vs the $18.9 bln consensus. AAPL reports Q4 gross margins of 36.9% vs Street est of 38.1%. Apple reports 4.19 mln iPads sold in Q4 vs Street est of ~4.7 mln; 9.05 mln iPods sold in Q4 vs Street est of ~9.5 mln; 14.1 mln iPhones sold in Q4 vs Street est of ~11.4 mln; 3.89 mln Macs sold in Q4 vs Street est of ~3.8 mln... Co issues mixed guidance for Q1, sees EPS of $4.80 vs. $5.06 Thomson Reuters consensus; sees Q1 revs of $23.0 bln vs. $22.34 bln Thomson Reuters consensus... "iPhone sales of 14.1 million were up 91 percent year-over-year, handily beating the 12.1 million phones RIMM sold in their most recent quarter. We still have a few surprises left for the remainder of this calendar year... We're thrilled with the performance and strength of our business, generating almost $5.7 billion in cash flow from operations during the quarter. (Stock is halted; resumption time set for 16:50)

4:11PM IBM beats by $0.07, reports revs in-line; guides FY10 EPS above consensus (IBM) 142.83 +1.77 : Reports Q3 (Sep) earnings of $2.82 per share, $0.07 better than the Thomson Reuters consensus of $2.75; revenues rose 3.0% year/year to $24.27 bln vs the $24.13 bln consensus. Co reported Q3 gross margin of 45.3% vs 46.0% Thomson Reuters consensus. Co issues upside guidance for FY10, sees EPS of at least $11.40 vs. $11.30 Thomson Reuters consensus; up from prior guidance of "at least $11.25." "In the third quarter we grew revenue in our hardware, software and services businesses, expanded margins and again increased earnings per share at double digits... We achieved excellent performance in our growth markets unit, reflecting sustained investments through the downturn and the continued strength of the infrastructure build-out in these countries... Looking ahead, we are uniquely positioned in the enterprise, investing in high value segments like business analytics, advanced systems and smarter planet solutions. As a result, we are confident we can deliver strong business performance to grow profit, return value to our shareholders and to achieve full-year 2010 diluted earnings per share of at least $11.40." IBM ended the third-quarter 2010 with $11.1 billion of cash on hand and generated free cash flow of $3.2 billion, down approximately $200 million year over year.

9:02AM First Solar Increases Revolving Credit Facility to $600 million (FSLR) 144.56 : Co announced that it has amended its existing senior secured revolving credit facility, increasing it from $300 million to $600 million. The term of the facility, which was oversubscribed, has been extended from three to five years and will mature in 2015. First Solar intends to use the facility for general corporate purposes, including the issuance of letters of credit.

09:37 am C Q3 Earnings Beat Expectations (C)

Citigroup (C 4.01 +0.06) reports third quarter earnings of $0.07 per share, $0.01 better than the Thomson Reuters consensus of $0.06.

Revenues fell 5.7% year-over-year to $20.74 billion versus the $21.15 billion consensus.

Citigroup income from continuing operations, which excludes an $800 million pre-tax ($435 million after-tax) loss on the previously-announced sale of The Student Loan Corporation, was $2.6 billion. Net income was down $529 million, or 20%, from the second quarter 2010, mainly driven by the loss on the previously-announced sale of SLC, as well as Securities and Banking, which declined 17%. Revenues were primarily driven by Local Consumer Lending and Securities and Banking.

Citicorp Latin America and Asia revenues were up 7% and 1%, respectively, from the prior quarter, while North America and EMEA revenues declined 6% and 2%, respectively. Provisions for credit losses and for benefits and claims declined $746 million sequentially to $5.9 billion, the lowest level since the second quarter of 2007. Expenses of $11.5 billion decreased $346 million, or 3%, from the prior quarter.

Citi's maintained a Tier 1 Common ratio of 10.3% at the end of the third quarter 2010. Citigroup net credit losses declined $303 million, or 4%, sequentially to $7.7 billion, reflecting continued improvement across most consumer portfolios. Citigroup's allowance for consumer loan losses was $37.6 billion, down $2.0 billion from the prior quarter. The net release of allowance for loan losses and unfunded commitments was $2.0 billion, compared to $1.5 billion in the quarter. The net reserve release in the current quarter was $1.4 billion for consumer loans and $575 million for corporate lo unfunded lending commitments.

4:15 pm : A big rebound by bank stocks on the back of an upbeat report from Citigroup helped drive the broader market markedly higher Monday.

Citigroup (C 4.17, +0.22) not only posted bigger-than-expected bottom line results, but also reported reduced credit provisions. That, along with a good conference call, helped overshadow a light revenue figure. The stock rallied for its best single-session percentage gain since a 7% surge in April on the strongest volume of any other stock in the S&P 500.

Strength in C helped drive buying among bank stocks, such that the KBW Bank Index bounced to a 3.0% gain after it booked a 4.5% loss last week.

Strength among bank stocks boosted the broader financial sector to a 2.3% gain, which was the best gain of any major sector.

Energy stocks handed back some of their gains just ahead of the close as Halliburton (HAL 34.09, -1.73) was hammered amid disappointment over its third quarter earnings report. However, BP (BP 41.49, +0.87) provided leadership amid news that it has agreed to sell its upstream businesses and associated interests in Venezuela and Vietnam to TNK-BP for $1.8 billion. A 2.3% spike in crude oil prices, which settled a bit above $83.00 per barrel, also helped the sector. Energy stocks collectively advanced 0.8%.

While the broader market was able to book a strong gain and settle near its session high, retailers failed to rally. They settled the day with a collective loss of 0.5% as JC Penney (JCP 33.30, -0.57) dropped in response to a short-term stockholder rights plan that is likely intended to fight off institutional control.

Semiconductor stocks also slumped in the face of broader market strength. They shed 0.7% on the session, and hampered the Nasdaq in the process.

Treasuries also put in a strong session, but they pulled back a bit into the close. Still, the benchmark 10-year Note settled about 15 ticks higher with its yield quoted at 2.51%.

The dollar had less of an impact on trade than it has had in recent weeks. It was up 0.8% at its overnight high, but finished with a 0.1% loss. The reversal was never met with much of a response by market participants.

Data also had a little role in this session's trade. Participants were generally unmoved in news that September industrial production unexpectedly fell 0.2% and capacity utilization remained just shy of 75%. Separately, net Long-term Treasury International Capital Flow for August doubled month-over-month to $128.7 billion.

Trading volume was unimpressive again as fewer than 1 billion shares were exchanged on the NYSE. That comes after Friday's total hit 1.42 billion shares, the second highest sum since mid-July.

Advancing Sectors: Financials (+2.3%), Health Care (+0.9%), Utilities (+0.9%), Energy (+0.8%), Telecom (+0.7%), Tech (+0.5%), Consumer Staples (+0.3%), Materials (+0.3%), Industrials (+0.1%)
Declining Sectors: Consumer Discretionary (-0.2%)DJ30 +80.91 NASDAQ +11.89 NQ100 +0.3% R2K +1.0% SP400 +0.6% SP500 +8.52 NASDAQ Adv/Vol/Dec 1727/1.74 bln/893 NYSE Adv/Vol/Dec 1995/995 mln/1021

icon url

ReturntoSender

10/19/10 8:51 PM

#9098 RE: ReturntoSender #6755

From Briefing.com: 4:27PM FSI Intl to resume trading at 16:30 ET (FSII) 3.08 +0.05 :

4:15PM FSI Intl receives multiple antares orders from leading worldwide logic device manufacturer; dual process chamber ANTARES systems range in price from $1.8-2.3 mln (FSII) 3.08 : Co announces that a leading Asia-based logic device producer has placed additional orders for multiple ANTARES CryoKinetic cleaning systems. The logic chip provider currently uses the ANTARES system for various BEOL particle removal processes and with this order, is adding capacity in the 45nm technology generation at their U.S. fab. The systems are expected to ship in the second quarter of fiscal 2011. The dual process chamber ANTARES systems range in price from $1.8 to $2.3 million, depending on configuration. (stock is halted)

4:05PM FSI Intl beats by $0.02, misses on revs; guides Q1 revs below consensus (FSII) 3.08 +0.05 : Reports Q4 (Aug) earnings of $0.17 per share, $0.02 better than the Thomson Reuters consensus of $0.15; revenues rose 102.8% year/year to $28.8 mln vs the $29.4 mln consensus. Co issues downside guidance for Q1, sees Q1 revs of $10-12 mln vs. $26.62 mln Thomson Reuters consensus. 2010; rate, the company expects a net loss of $3.5 to $4.0 million for the first quarter of fiscal 2011. The sequential decline can be attributed to the timing of requested shipments by several of the company's major customers. A portion of the expected revenue is subject to either receiving purchase orders or obtaining timely acceptance from customers.* Given expected first quarter orders and evaluation tool acceptances, the fiscal 2011 second quarter revenue level is expected to exceed the second half fiscal 2010 quarterly run rate The company expects first quarter fiscal 2011 orders to increase sequentially, as compared to $29.3 million in the fourth quarter of fiscal 2010.

4:17PM Altera beats by $0.04, reports revs in-line; guides Q4 revs above consensus (ALTR) 29.50 -0.14 : Reports Q3 (Sep) earnings of $0.69 per share, $0.04 better than the Thomson Reuters consensus of $0.65; revenues rose 84.1% year/year to $527.5 mln vs the $526 mln consensus. Co issues upside sequential revs guidance for Q4, sees Q4 revs growing 3-6% from Q3, which calculates to ~$543.3-559.2 mln vs. $511.89 mln Thomson Reuters consensus.

4:03PM Cree beats by $0.02, misses on revs; guides Q2 EPS below consensus, revs below consensus (CREE) 53.00 -2.56 : Reports Q1 (Sep) earnings of $0.60 per share, $0.02 better than the Thomson Reuters consensus of $0.58; revenues rose 58.7% year/year to $268.4 mln vs the $277.7 mln consensus. Cree reports Q1 gross margins of 48.6% vs Street est of 48.4%. Co issues downside guidance for Q2, sees EPS of $0.56-0.60 vs. $0.60 Thomson Reuters consensus; sees Q2 revs of $270-280 mln vs. $297.04 mln Thomson Reuters consensus. "Q1 was another record quarter for Cree as revenue grew in lighting, LED components and power products... Although total revenue was on the low end of our target range of $270-280 million due to a decline in LED chips, LED lighting adoption continues to gain momentum and the growth drivers for the company remain on track."

4:30 pm : The stock market suffered its worst single-session drop in two months as market participants shrugged off a big batch of better-than-expected earnings and the dollar surged.

Apple (AAPL 309.50, -8.50) reported last evening earnings that exceeded the consensus estimate, but expectations for a robust bottom line had been largely built in already as the stock had climbed in 10 straight sessions for a cumulative gain of about 14% ahead of its announcement. Thinner margins and an all-too-typical tepid outlook only offered fodder for the case to take profits.

Despite its own better-than-expected earnings and increased forecast, Dow component IBM (IBM 138.03, -4.80) dropped more than 3% in its worst single-session slide in five months. The stock had set a fresh 52-week high in the prior session.

Fellow Dow component Coca-Cola (KO 60.34, +0.34) was also out with better-than-expected earnings, as were UnitedHealth (UNH 35.30, -0.95) and Johnson & Johnson (JNJ 63.29, -0.57), both of which complemented their reports with raised earnings guidance.

Goldman Sachs (GS 156.72, +3.02) surpassed the consensus earnings estimate with ease by bringing in $2.98 per share, $0.70 above what Wall Street had expected, even though it saw a decline in trading and principal investment revenue.

Capital One Financial (COF 38.76, +1.53) announced ahead of schedule a big upside earnings surprise of its own. The announcement helped shares of COF rally up from an eight-month low in the face of broader market weakness.

Leadership from GS and COF had helped the financial sector stage a modest gain while the broader market was mired in the red, but the sector reversed to finish with a 1.4% loss, which is close to what the broader market suffered. The downturn came in response to headlines that PIMCO and the New York Fed want Bank of America (BAC 11.80, -0.54) to repurchase mortgages. Traders were not at all interested in the bank's better-than-expected bottom line.

The dollar's 1.7% gain -- its best move in two months -- exacerbated weakness among stocks. Strength in the greenback followed supportive comments from Treasury Secretary Geithner and China's decision to hike its interest rates by 25 basis points.

With the dollar up sharply and the broader market inclined to sell, commodities slumped, such that the CRB Commodity Index tumbled 1.9% for its worst loss since late June.

Oil was one of the worst performing commodities. Its price dropped 4.3% to $79.49 per barrel. February was the last time oil suffered such a steep loss.

Sharply lower oil prices and stiff selling in the broader market made energy stocks the worst performing sector. As a group energy stocks tumbled 2.4%. Not even stronger-than-expected earnings from Occidental Petroleum (OXY 81.20, -4.25) could stem the sector's loss.

Advancing Sectors: (None)
Declining Sectors: Energy (-2.4%), Materials (-2.3%), Health Care (-1.8%), Tech (-1.7%), Industrials (-1.5%), Consumer Discretionary (-1.5%), Financials (-1.4%), Telecom (-1.3%), Consumer Staples (-1.0%), Utilities (-0.6%)DJ30 -165.07 NASDAQ -43.71 NQ100 -1.6% R2K -2.3% SP400 -1.8% SP500 -18.81 NASDAQ Adv/Vol/Dec 438/2.26 bln/2225 NYSE Adv/Vol/Dec 520/1.27 bln/2484

4:30PM Suntech and Calisolar extend strategic partnership - ink letter of intent for new Ontario manufacturing facility and long term purchase agreement (STP) 8.85 -0.59 : Co and Calisolar Inc., a privately held, vertically integrated manufacturer of solar silicon, wafers and cells, announced that the companies have signed a Letter of Intent to construct a solar silicon manufacturing facility in Ontario Canada.

4:27PM FSI Intl to resume trading at 16:30 ET (FSII) 3.08 +0.05 :

4:15PM FSI Intl receives multiple antares orders from leading worldwide logic device manufacturer; dual process chamber ANTARES systems range in price from $1.8-2.3 mln (FSII) 3.08 : Co announces that a leading Asia-based logic device producer has placed additional orders for multiple ANTARES CryoKinetic cleaning systems. The logic chip provider currently uses the ANTARES system for various BEOL particle removal processes and with this order, is adding capacity in the 45nm technology generation at their U.S. fab. The systems are expected to ship in the second quarter of fiscal 2011. The dual process chamber ANTARES systems range in price from $1.8 to $2.3 million, depending on configuration. (stock is halted)

4:05PM FSI Intl beats by $0.02, misses on revs; guides Q1 revs below consensus (FSII) 3.08 +0.05 : Reports Q4 (Aug) earnings of $0.17 per share, $0.02 better than the Thomson Reuters consensus of $0.15; revenues rose 102.8% year/year to $28.8 mln vs the $29.4 mln consensus. Co issues downside guidance for Q1, sees Q1 revs of $10-12 mln vs. $26.62 mln Thomson Reuters consensus. 2010; rate, the company expects a net loss of $3.5 to $4.0 million for the first quarter of fiscal 2011. The sequential decline can be attributed to the timing of requested shipments by several of the company's major customers. A portion of the expected revenue is subject to either receiving purchase orders or obtaining timely acceptance from customers.* Given expected first quarter orders and evaluation tool acceptances, the fiscal 2011 second quarter revenue level is expected to exceed the second half fiscal 2010 quarterly run rate The company expects first quarter fiscal 2011 orders to increase sequentially, as compared to $29.3 million in the fourth quarter of fiscal 2010.

4:17PM Altera beats by $0.04, reports revs in-line; guides Q4 revs above consensus (ALTR) 29.50 -0.14 : Reports Q3 (Sep) earnings of $0.69 per share, $0.04 better than the Thomson Reuters consensus of $0.65; revenues rose 84.1% year/year to $527.5 mln vs the $526 mln consensus. Co issues upside sequential revs guidance for Q4, sees Q4 revs growing 3-6% from Q3, which calculates to ~$543.3-559.2 mln vs. $511.89 mln Thomson Reuters consensus.

4:03PM Cree beats by $0.02, misses on revs; guides Q2 EPS below consensus, revs below consensus (CREE) 53.00 -2.56 : Reports Q1 (Sep) earnings of $0.60 per share, $0.02 better than the Thomson Reuters consensus of $0.58; revenues rose 58.7% year/year to $268.4 mln vs the $277.7 mln consensus. Cree reports Q1 gross margins of 48.6% vs Street est of 48.4%. Co issues downside guidance for Q2, sees EPS of $0.56-0.60 vs. $0.60 Thomson Reuters consensus; sees Q2 revs of $270-280 mln vs. $297.04 mln Thomson Reuters consensus. "Q1 was another record quarter for Cree as revenue grew in lighting, LED components and power products... Although total revenue was on the low end of our target range of $270-280 million due to a decline in LED chips, LED lighting adoption continues to gain momentum and the growth drivers for the company remain on track."

9:45AM Intel announces $6-8 bln investment in next-generation manufacturing in U.S. (INTC) 19.00 -0.19 : Co announces that co will invest between $6-8 billion on future generations of manufacturing technology in its American facilities. The action will fund deployment of Intel's next-generation 22-nanometer manufacturing process across several existing U.S. factories, along with construction of a new development fabrication plant in Oregon. The projects will support 6,000 to 8,000 construction jobs and result in 800 to 1,000 new permanent high-tech jobs.

8:20AM Axcelis Tech lands multiple system order from major chip manufacturer for integra plasma dry strip systems (ACLS) 2.07 : Co announced that it has received a significant, multiple system order from one of the world's largest chipmakers. The chipmaker will use the Company's Integra RSTM photoresist dry strip cleaning system at fabs in both Asia and the U.S. for high volume production of its most advanced products.

7:05AM EMC reports EPS in-line, beats on revs; raises FY10 EPS, rev guidance above consensus (EMC) 20.80 : Reports Q3 (Sep) earnings of $0.30 per share, excluding non-recurring items, in-line with the Thomson Reuters consensus of $0.30; revenues rose 19.7% year/year to $4.21 bln vs the $4.15 bln consensus. Co raises guidance for FY10, sees EPS of $1.25, excluding non-recurring items, vs. $1.21 Thomson Reuters consensus and 'exceed $1.18' previosuly; sees FY10 revs of $16.9 bln vs. $16.7 bln Thomson Reuters consensus and 'exceed previous $16.5 bln' previously. Third-quarter highlights included strong customer demand and double-digit revenue growth for the company's market-leading high-end EMC Symmetrix storage product portfolio, which increased 23% compared with the year-ago quarter, and EMC's mid-tier storage product portfolio, which grew revenue 22% year over year. "For the third consecutive quarter EMC achieved our 'triple play' - we gained market share, invested aggressively to capitalize on the shift to cloud computing, and increased profitability. Cloud computing is driving a fundamental change in the way IT is designed and managed, represents a massive opportunity, and is happening now in various phases across the globe."

09:22 am IBM target raised to $165 at Argus: . Argus raises their IBM tgt to $165 from $148 after the co delivered a strong quarter, led as always by its high margined software business. Also as expected, IBM's three server families, all of which are in the midst of or have recently completed meaningful product upgrades, delivered a very strong quarter for IBM's hardware business.

10:56 am IBM Issues Upside FY10 EPS Guidance (IBM)

IBM (IBM 138.22 -4.61) reported third quarter earnings of $2.82 per share, $0.07 better than the Thomson Reuters consensus of $2.75.

Revenues rose 3.0% year-over-year to $24.27 billion versus the $24.13 billion consensus. The company reported third quarter gross margin of 45.3% vs 46.0% Thomson Reuters consensus.

For its fiscal year 2011, the company expects to earn at least $11.40 per share, above the $11.30 Thomson Reuters consensus; up from prior guidance of "at least $11.25."

IBM said "In the third quarter we grew revenue in our hardware, software and services businesses, expanded margins and again increased earnings per share at double digits... We achieved excellent performance in our growth markets unit, reflecting sustained investments through the downturn and the continued strength of the infrastructure build-out in these countries... Looking ahead, we are uniquely positioned in the enterprise, investing in high value segments like business analytics, advanced systems and smarter planet solutions. As a result, we are confident we can deliver strong business performance to grow profit, return value to our shareholders and to achieve full-year 2010 diluted earnings per share of at least $11.40."

IBM ended the third-quarter 2010 with $11.1 billion of cash on hand and generated free cash flow of $3.2 billion, down approximately $200 million year over year.

10:12 am AAPL Sees Q1 Earnings Below Expectations (AAPL)

Apple (AAPL 309.37 -8.36) reported fourth quarter earnings of $4.64 per share, $0.56 better than the Thomson Reuters consensus of $4.08.

Revenues rose 66.6% year-over-year to $20.34 billion, well above the $18.9 billion consensus. AAPL reports fourth quarter gross margins of 36.9% versus Street estimates of 38.1%.

Apple reports 4.19 million iPads sold in the fourth quarter versus Street estimates of approx. 4.7 million; 9.05 mln iPods sold in fourth quarter versus Street estimates of approx. 9.5 million; 14.1 million iPhones sold in the fourth quarter versus Street estimates of approx. 11.4 million; 3.89 million Macs sold in the fourth quarter versus Street estimates of approx. 3.8 mln.

For its first quarter, the company issued mixed guidance. The company expects to see earnings of $4.80 per share, below the $5.06 Thomson Reuters consensus. On the top line, Apple, expects to sees revenues of $23.0 billion versus the $22.34 billion Thomson Reuters consensus...

The company said, "iPhone sales of 14.1 million were up 91% year-over-year, handily beating the 12.1 million phones RIMM sold in their most recent quarter. We still have a few surprises left for the remainder of this calendar year."
icon url

ReturntoSender

10/20/10 10:55 PM

#9099 RE: ReturntoSender #6755

From Briefing.com: 4:30 pm : A drop by the dollar and another big batch of better-than-expected earnings announcements helped stocks recover from the prior session's slide, though some of the stock market's gain faded into the close.

The dollar surged 1.7% in the prior session, but was dumped this session for a 1.3% loss in what appeared to be a diminished sense of risk aversion.

That said, support for commodity-backed stocks and basic materials plays drove the materials sector to a 2.0% gain, which was the best of any major sector. All 31 members in the materials sector advanced.

Shares of airlines staged some of the biggest gains. As such, AMR Corp (AMR 7.36, +0.84), US Airways (LCC 10.84, +0.75), and Delta Air Lines (DAL 12.97, +1.27) helped drive the Amex Airline Index to a 5.3% gain and its highest level in almost three years. All three air carriers reported better-than-expected earnings.

Internet search outfit Yahoo! (YHOO 15.80, +0.31) also reported an upside earnings surprise, but it issued a rather weak forecast. Dow components United Technologies (UTX 73.92, +0.31) and Boeing (BA 71.36, +2.31) both posted upside earnings surprises. Each improved its earnings outlook, too.

Financials finished with a 1.1% gain after being down as much as 0.7% amid an earnings miss from regional lender Comerica (CMA 35.94, -2.45) and a messy report from Morgan Stanley (MS 25.38, -0.01). Shares of MS successfully recovered from their loss, but could not quite finish in higher ground. Meanwhile, US Bancorp (USB 22.83, +0.02) finished flat and Wells Fargo (WFC 25.60, +1.05) spiked. Both of bested bottom line expectations. BlackRock (BLK 169.51, -5.12) also posted better-than-expected earnings, but its shares fell for the fourth time in five sessions.

Amid an improved tone of trade and the dollar's downturn, commodities recovered from their selloff in the prior session. More specifically, the CRB Commodity Index dropped 1.9% in the prior session for its worst loss since June, but rebounded to a 2.1% gain today. The move was largely led by oil prices, which bounced 2.9% to $82.52 per barrel. A smaller-than-expected build in weekly oil inventories helped.

Little was made of the Fed's latest Beige Book, which was the only item on today's economic calendar. According to data from the twelve Fed Districts, national economic activity continued to rise, albeit at a modest pace, from September to early October.

Advancing Sectors: Materials (+2.0%), Energy (+1.4%), Telecom (+1.4%), Industrials (+1.3%), Consumer Discretionary (+1.2%), Financials (+1.1%), Tech (+0.8%), Utilities (+0.8%), Health Care (+0.8%), Consumer Staples (+0.6%)
Declining Sectors: (None)DJ30 +129.35 NASDAQ +20.44 NQ100 +0.8% R2K +1.2% SP400 +1.3% SP500 +12.27 NASDAQ Adv/Vol/Dec 1867/2.04 bln/770 NYSE Adv/Vol/Dec 2283/1.10 bln/716

4:47PM Mattson reports 3Q10 net loss per share of ($0.13) vs. ($0.11) Thomson Reuters consensus; revenue increased 255% y/y to $39.8 mln vs $39.1 mln consensus (MTSN) 2.84 -0.03 :

4:40PM Mattson shipped the paradigmE etch system to semiconductor manufacturer; co expects production revenues to begin in 2H of 2011 (MTSN) 2.84 -0.03 :

4:26PM Xilinx reports EPS in-line, misses on revs; guides Q3 revs below consensus (XLNX) 26.01 -0.32 : Reports Q2 (Sep) earnings of $0.65 per share, in-line with the Thomson Reuters consensus of $0.65; revenues rose 49.3% year/year to $619.7 mln vs the $626.3 mln consensus. Reports 2Q11 gross margin of 65.6% vs. the 65.0% consensus and 64-66% guidance. Co issues downside guidance for Q3, sees Q3 rev flat to -4% QoQ, which equates to $594.9-619.7 mln vs. $622.62 mln Thomson Reuters consensus. Sees gross margin of ~64-66% vs. the 65.0% consensus.

4:08PM Intersil beats by $0.07, misses on revs; guides Q4 EPS in-line, revs below consensus (ISIL) 11.85 +0.16 : Reports Q3 (Sep) earnings of $0.28 per share, ex-items, $0.07 better than the Thomson Reuters consensus of $0.21; revenues rose 30.2% year/year to $219.1 mln vs the $231 mln consensus. Gross margin for the third quarter increased to a record 58.9%, compared with gross margin of 54.6% in the same quarter last year, and 58.3% in the second quarter of 2010. Co issues mixed guidance for Q4, sees EPS of $0.21-$0.24, ex-items, vs. $0.23 Thomson Reuters consensus; sees Q4 revs of $202-$214 mln vs. $230.67 mln Thomson Reuters consensus.

4:06PM Seagate Tech misses by $0.08, reports revs in-line; will not provide guidance due to preliminary indication of interest on going private transaction (STX) 15.21 : Reports Q1 (Sep) earnings of $0.37 per share, $0.08 worse than the Thomson Reuters consensus of $0.45; revenues rose 1.3% year/year to $2.7 bln vs the $2.72 bln consensus. Due to regulatory requirements the company will not at this time be providing any additional information concerning the preliminary indication of interest regarding a going private transaction that was disclosed on October 14, 2010, and the company will not provide, discuss or answer questions regarding the outlook for the December quarter or any future fiscal periods.

7:02AM ATMI beats by $0.01, beats on revs (ATMI) 15.75 : Reports Q3 (Sep) earnings of $0.25 per share, excluding a $0.05 gain, $0.01 better than the Thomson Reuters consensus of $0.24; revenues rose 30.8% year/year to $95 mln vs the $92.9 mln consensus.

09:50 am CREE Guides Q2 Revs Below Consensus (CREE)

Cree (CREE 48.74 -4.26) reported first quarter earnings of $0.60 per share, $0.02 better than the Thomson Reuters consensus of $0.58.

Revenues rose 58.7% year-over-year to $268.4 million, below the $277.7 million consensus.

Cree reports first quarter gross margins of 48.6% versus Street estimates of 48.4%.

The company second quarter issued earnings guidance of $0.56 to $0.60 per share versus $0.60 Thomson Reuters consensus. On the top line, the company issued revenue guidance of $270 million to $280 million versus $297.04 million Thomson Reuters consensus.

The company said, "Q1 was another record quarter for Cree as revenue grew in lighting, LED components and power products... Although total revenue was on the low end of our target range of $270 million to $280 million due to a decline in LED chips, LED lighting adoption continues to gain momentum and the growth drivers for the company remain on track."
icon url

ReturntoSender

10/23/10 10:49 PM

#9101 RE: ReturntoSender #6755

Amateur Investors Weekend Stock Market Analysis (10/23/10)

http://www.amateur-investor.net/Weekend_Market_Analysis_Oct_23_10.htm

From late 2007 through early 2009 the Dow had a sharp 5 Wave pattern to the downside in which it lost 54% of its value. This was then followed by a sharp 74% rally over a 13 month period.


Going back over the past 110 years there are two similar looking 5 Wave patterns that were followed by parabolic oversold rallies. The first one occurred from 1973 through 1974 in which the Dow lost 46% of its value. This was then followed by a sharp 80% "abc" type rally over an 18 month period in which the Dow peaked just below its early 1973 high. Meanwhile once the Dow peaked in the middle part of 1976 this was then followed by an extended choppy consolidation pattern which last nearly 7 years before the Dow finally rallied strongly again beginning in 1983.


Meanwhile the other similar 5 Wave pattern occurred from early 1937 through early 1938 in which the Dow lost 50% of its value. This was then followed by a sharp 64% rally that took the shape of a Triple Zig Zag pattern as the Dow peaked at its 61.8% Retrace. After peaking in late 1938 there was a 23% correction which was then followed by a minor "abc" rally which saw the Dow rally back to near its previous peak. Meanwhile after peaking in late 1938 the Dow then trended lower over the next 2 1/2 years as it eventually retested its prior low by early 1942 after losing 42% of its value. Thus the entire structure from the early 1937 high to the early 1942 low ended up being a large "ABC" type corrective pattern.


Once again looking at the current chart of the Dow either pattern mentioned above is still possible. If the Dow is exhibiting a similar pattern to that of the mid 1970's then the latest rally from the July low is the final "c" wave of an "abc" type pattern. If "c" ends up having a length that is 61.8% of "a" then that would yield a value around 12573 which is very close to the 78.6% Retrace. Meanwhile once the "abc" pattern completes then we would see a choppy consolidation pattern develop during the next several years which could easily last through 2017 or 2018.


Meanwhile if the Dow is exhibiting a pattern similar to the late 1930's then Wave B peaked at 11258 back in late April at its 61.8% Retrace. Furthermore the recent rally from the early July low is just a minor "abc" type rally which will peak just below the previous high of 11258. This would then be followed by a gradual downward trend for Wave C in which the Dow would eventually retest the low made in March of 2009 at some point in 2013 or 2014.


With the Dow currently near its late April high of 11258 it appears we will find out rather soon which potential pattern mentioned above may evolve in the longer term.

icon url

ReturntoSender

10/24/10 4:09 PM

#9102 RE: ReturntoSender #6755

InvestmentHouse Weekend Market Update:

http://www.investmenthouse.com/weekendmarketsummary.htm

- Stocks finish out the week as it moved the entire week: upside bias but modest gains.
- Earnings continue to turn in solid guidance . . . for the most part.
- Housing prices head lower for the second month, raising worries of a double dip.
- Indices struggling to move higher, but many stocks sport solid moves Friday, presaging a move to the April highs.

THE MARKET

MARKET SENTIMENT

VIX: 18.78; -0.49
VXN: 20.42; -0.76
VXO: 18.53; -0.49

Put/Call Ratio (CBOE): 0.87; -0.09

Bulls versus Bears:

The CROSSOVER from August is long gone but it did its job.

This is a reading of the number of bullish investment advisors versus bearish advisors. The reason you look at this is that it gives you an idea of how bullish investors are. If they are too bullish then everyone is in the market and it is heading for a top: if everyone wants to be in the market, then all the money is in and there is no more new cash to drive it higher. On the other side of the spectrum if there are a lot of bears then there is a lot of cash on the sideline, and as the market rallies it drags that cash in as the bears give in. That cash provides the market the fuel to move higher. If bears are low it is the same as a lot of bulls: everyone is in and the market does not have the cash to drive it higher.

Bulls: 45.1% versus 47.2%. First week to slip in more than a month though holding at an elevated level. Was 45.6% three weeks back. Steady rise since hitting 29% where bears overtook bulls back in early September. Still below the 65% level considered as bearish, above the 35% level below which is considered bullish. Where you would expect for a rally such as this one. The crossover level at 29% bulls is long gone, but it did its job. The high on the last leg was 56.0% after starting at 35.6% on the low in February, the lowest it has been since July 2009 . . . until this last leg. 35% is the threshold level suggesting bullishness. After peaking at 53 on this move the bulls lost some nerve, falling to a new low post- July 2009. Once again bulls peaked out near the 50% level. Bulls have bumped at 50ish since late August 2009, falling to 45ish and then rebounding. Hit a high of 47.7% mid-June on the run from the March lows. Again, to be seriously bearish it needs to get up to the 60% to 65% level.

Bears: 22.0% versus 24.7%. Unlike bulls, bears continued to soften, meaning more bullishness. Down from 28.3% three weeks back. The 37.7% peak at the height of the crossover is well in the rearview mirror but bears remain well below the 35% level considered bearish for the market overall. Hit 18.7% on the low in April. Hit a high of 27.8% level on the prior leg in February. For reference, cracking above the 35% threshold considered bullish. Hit a high on the prior run at 47.2%. For more reference, bearishness hit a 5 year high at 54.4% the last week of October 2008. The move over 50 took bearish sentiment to its highest level since 1995. Extreme negative sentiment. Prior levels for comparison: Bearishness peaked at 37.4% in September 2007. It topped the June 2006 peak (36%) on that run. That June peak eclipsed the March 2006 high (33%) and well above the 2005 highs that spawned new rallies (30% in May 2005, 29.2% in October 2005). That was a huge turn, unlike any seen in recent history.

NASDAQ

Stats: +19.72 points (+0.8%) to close at 2479.39
Volume: 1.587B (-25.99%)

Up Volume: 1.234B (+155.683M)
Down Volume: 405.424M (-648.659M)

A/D and Hi/Lo: Advancers led 1.75 to 1
Previous Session: Decliners led 1.59 to 1

New Highs: 101 (-26)
New Lows: 31 (-1)

NASDAQ CHART: Click to view the chart

NASDAQ 100 CHART: Click to view the chart

SOX CHART: Click to view the chart

SP500/NYSE

Stats: +2.82 points (+0.24%) to close at 1183.08
NYSE Volume: 772.155M (-26.75%)

Up Volume: 451.726M (-16.457M)
Down Volume: 300.613M (-267.473M)

A/D and Hi/Lo: Advancers led 1.53 to 1
Previous Session: Decliners led 1.11 to 1

New Highs: 236 (-158)
New Lows: 12 (-33)

SP500 CHART: Click to view the chart

SP600 Chart: Click to view the chart

DJ30

Stats: -14.01 points (-0.13%) to close at 11132.56
Volume DJ30: 104M shares Friday versus 178M shares Thursday.

DJ30 CHART: Click to view the chart

Support and Resistance

NASDAQ: Closed at 2479.39
Resistance:
2482 is the recent October peak
2518 is interim peak from April 2010
2530 is the April 2010 peak (2535.28 intraday)

Support:
2434 is the May interim peak and the 78% Fibonacci retracement of the April selloff.
2425 is an interim peak from May 2010
The 18 day EMA at 2419
2382-2395 from 2008
2324-2370 is a range of resistance from early 2008
2341 is the June 2010 peak
The 50 day EMA at 2345
2320 to 2326.28 is the January 2010 high
2319 from the September 2008 peak
2310 is the August 2010 peak
The 200 day SMA at 2297
2273 to 2282 marks bottom of January 2010 lateral peak
2275 - 2278 from the February 2008 and April 2008 lows. Key lows.
2245 from July 2008 through 2260 from late 2005.
2236 is the first August gap point.
A series of interim peaks at 2230ish from the May to August trading range
2221 is the gap down upside point from June.
2205 is the November 2009 peak 2210 (from September 2008) to 2212 (the July 2009 closing low)
2185 to 2195 represent support points for years: December 2004 peak, July to October 2005 consolidation, January, March and July 2008 lows, and October 2009 peak.
2184 is the June gap bottom side.
2169 is the March 2008 closing low (double bottom)
2155 is the August 2010 low and the March 2008 intraday low
2140 from the May and June 2010 lows
2100 is the February 2010 low
2099 is the August 2010intraday low

S&P 500: Closed at 1183.08
Resistance:
1185 from late September 2008
1220 is the April 2010, post-bear market peak

Support:
1174 is the May 2010 high, 78% Fibonacci retracement of April peak
1170 is the prior March 2010 high
The 18 day EMA at 1165
1156 is the Sept 2008 low
1151 is the January 2010 peak
1133 from a September 2008 intraday low
The 50 day EMA at 1138
Bottom of the January 2010 consolidation 1131 to 1136
1129 to 1131 is the June and August 2010 peaks
The 200 day SMA at 1121
1119 is the early December intraday high
1114 is the November 2009 peak
1106 is the September 2008 low
1101 is the October 2009 high and the recent May and June 2010 interim peaks
1084 to 1080 (September 2009 peak)
1078 is the October range low
1070 is the late September 2009 peak as well as several other peaks and valleys even in 2010. Important level.
1065 is the May flash crash intraday low.
1044 is the October 2008 intraday high AND the February 2010 low
1039 to 1040 are the May, June, and August 2010 lows

Dow: Closed at 11,132.56
Resistance:
11,205 is the April closing high
11258 is the April 2010 peak
11,734 from 11-98 peak

Support:
11,100 from the 7-08 low
The 18 day EMA at 10,990
10,963 is the July 2008 low
10,920 is the recent May high
The 50 day EMA at 10,747
10,730 is the January 2010 peak
10,609 from the Mid-September 2008 interim low
10,594 is the June 2010 peak
The 200 day SMA at 10,515
10,496 is the November 2009 high
10,365 is the late September 2008 low
10,285 is the late December consolidation peak
10,260 from the May and June 2010 interim peaks are breaking
10,209 is recent August 2010 low
10,120 is the October 2009 peak
9938 is the August 2010 low
9918 is the September 2008 peak
9855 is the early September peak in its lateral range
9835 is the late September 2009 peak AND the February 2010 low
9829 is the September 2008 closing high
9774 is the May 2010 intraday low

Economic Calendar

These are consensus expectations. Our expectations will vary and are discussed in the 'Economy' section.

November 01 - Monday
-Personal Income, September (08:30): 0.3% expected, 0.5% prior
-Personal Spending, September (08:30): 0.4% expected, 0.4% prior
-PCE Prices - Core, September (08:30): 0.1% expected, 0.1% prior
-ISM Index, October (10:00): 53.6 expected, 54.4 prior
-Construction Spending, September (10:00): -0.5% expected, 0.4% prior

November 03 - Wednesday
-MBA Mortgage Applica, 10/29 (07:00)
-Challenger Job Cuts , October (07:30): -44.1% prior
-ADP Employment Change, October (08:15): 25K expected, -39K prior
-ISM Services, October (10:00): 53.6 expected, 53.2 prior
-Factory Orders, September (10:00): 0.6% expected, -0.5% prior
-Crude Inventories, 10/30 (10:30)
-Auto Sales, October (14:00): 3.75M prior
-Truck Sales, October (14:00): 5.07M prior
-FOMC Rate Decision, November 3 (14:15): 0.25% expected, 0.25% prior

November 04 - Thursday
-Initial Claims, 10/30 (08:30)
-Continuing Claims, 10/30 (08:30)
-Productivity-Prel, Q3 (08:30): 0.6% expected, -1.8% prior
-Unit Labor Costs, Q3 (08:30): 1.9% expected, 1.1% prior

November 05 - Friday
-Nonfarm Payrolls, October (08:30): 45K expected, -95K prior
-Nonfarm Payrolls - Private, October (08:30): 60K expected, 64K prior
-Unemployment Rate, October (08:30): 9.6% expected, 9.6% prior
-Hourly Earnings, October (08:30): 0.1% expected, 0.0% prior
-Average Workweek, October (08:30): 34.2 expected, 34.2 prior
-Pending Home Sales, September (10:00): 0.5% expected, 4.3% prior
-Consumer Credit, September (15:00): -3.8B expected, -$3.3B prior
icon url

ReturntoSender

10/25/10 10:21 PM

#9104 RE: ReturntoSender #6755

From Briefing.com: 4:34PM Texas Instruments beats by $0.02, beats on revs, both in-line with narrowed guidance; guides Q4 EPS in-line, revs in-line (TXN) 28.98 +0.32 : Reports Q3 (Sep) earnings of $0.71 per share, $0.02 better than the Thomson Reuters consensus of $0.69; revenues rose 29.9% year/year to $3.74 bln vs the $3.69 bln consensus. Q3 operating margin 32.8% vs 32.8% consensus Co issues in-line guidance for Q4, sees EPS of $0.59-0.67 vs. $0.63 Thomson Reuters consensus; sees Q4 revs of $3.36-3.64 bln vs. $3.51 bln Thomson Reuters consensus. Co sees FY10 R&D expense: $1.6 bln, up from the prior expectation of $1.5 bln; capital expenditures: $1.2 bln; depreciation: $0.9 bln. "Demand from industrial markets was especially strong, while consumer demand cooled, impacting markets such as computing and televisions. Across a wide array of markets, our Analog and Embedded Processing products and Wireless smartphone chips continued to gain share... As we move into the fourth quarter, we expect sequentially lower revenue reflecting a combination of seasonal patterns, continued soft demand in computing and consumer markets, and slowing growth in the industrial market."

4:25PM MIPS Tech beats by $0.07, beats on revs (MIPS) 10.65 +0.25 : Reports Q1 (Sep) earnings of $0.17 per share, $0.07 better than the Thomson Reuters consensus of $0.10; revenues rose 50.0% year/year to $22.5 mln vs the $19.7 mln consensus. "Our financial performance in the first quarter continues to demonstrate our momentum across all of our target markets. This momentum includes the addition of new licensees in the quarter that are developing chips for mobile solutions. Both our royalty revenue and our license revenue exceeded our expectations during the quarter."

4:12PM Zoran beats by $0.03, reports revs in-line; guides Q4 well below consensus (ZRAN) 7.56 -0.15 : Reports Q3 (Sep) loss of $0.02 per share, $0.03 better than the Thomson Reuters consensus of ($0.05); revenues fell 14.0% year/year to $99.3 mln vs the $99.8 mln consensus. Co issues downside guidance for Q4, sees EPS of ($0.39)-($0.43) vs. ($0.06) Thomson Reuters consensus; sees Q4 revs of $60-65 vs. $95.17 mln Thomson Reuters consensus. "DTV was impacted by share loss by our customers to tier-1 brands combined with severe price erosion in the segments they serve. We were also impacted by one of our customers' decision to add a second source supplier, causing additional share loss for Zoran. In addition, we are seeing rising channel inventory and softening consumer demand. DVD is also showing signs of weakening demand, causing a modest inventory build of red-laser products.... As a result of these developments, we are reducing our outlook for the remainder of 2010 and are carefully evaluating our current strategies against existing and potential growth opportunities. We are also in the process of working on restructuring alternatives with an emphasis on operating expenses to right size the business. Management remains committed to returning Zoran to a growing and profitable business with a sound financial model, and we are working to take whatever steps are necessary to achieve this objective."

4:09PM Veeco Instruments beats by $0.20, reports revs in-line; guides Q4 EPS in-line, revs in-line (VECO) 39.94 +0.86 : Reports Q3 (Sep) earnings of $1.46 per share, $0.20 better than the Thomson Reuters consensus of $1.26; revenues rose 271.0% year/year to $277.1 mln vs the $275.2 mln consensus. Co shipped 'over 100' MOCVD systems, guidance was for 100; Q3 bookings were $278 mln and end backlog was $569 mln (prior quarter was $347 mln and $597 mln, respectively which included Metrology business). Co issues in-line guidance for Q4, sees EPS of $1.46-1.74 vs. $1.47 Thomson Reuters consensus; sees Q4 revs of $285-320 mln vs. $310.50 mln Thomson Reuters consensus. Co state Q4 bookings will be equal to or better than Q3.

4:07PM Volterra Semi expands share repurchase plan by $15 mln (VLTR) :

4:06PM Veeco Instruments: Epistar of Taiwan places multi-tool order for Veeco MOCVD systems (VECO) 39.94 +0.86 : Co announces that Epistar Corporation, headquartered in Taiwan, placed a multi-tool order for Veeco's TurboDisc K465i gallium nitride Metal Organic Chemical Vapor Deposition (MOCVD) Systems for high volume light emitting diode production.

4:02PM Integrated Device beats by $0.03, reports revs in-line (IDTI) 5.95 -0.04 : Reports Q2 (Sep) earnings of $0.19 per share, excluding non-recurring items, $0.03 better than the Thomson Reuters consensus of $0.16; revenues rose 19.6% year/year to $166.9 mln vs the $166 mln consensus.

4:30 pm : An overnight drop in the dollar and some strong existing home sales data sent stocks to five-month highs, but technical resistance and a slide by financials caused the broader market to surrender a good deal of that gain.

The dollar dropped 1.0% overnight so that it traded at a 15-year low against the yen. Its weakness was widely attributed to the inability of the G-20 to devise a specific plan supportive of the greenback in global trade.

The decline by the dollar drove buyers to action in the early going. Their efforts were emboldened with the release of existing home sales for September. Sales reportedly surged at an unprecedented pace of 10% to an annualized rate of 4.53 million units, which is greater than the annualized rate of 4.25 million units that had been widely expected among economists polled by Briefing.com.

Buyers took the S&P 500 to its highest level since May, but it lost momentum as it approached the psychologically significant 1200 line. Resistance in that region caused some to sell.

An upturn in the dollar, which settled with a 0.5% loss, led stocks to surrender even more of their gains.

Financials failed to provide any sustainable support to the broader market. The sector was actually up almost 1% in the opening minutes, but finished with a 0.4% loss as bank stocks were backed down. Financials have been largely absent from the stock market's recent advances.

Utilities make up the only other sector to slide to a loss. They finished the day 0.3% lower.

Positive breadth helped keep the major equity averages in positive ground all session. Fading support left the stock market to finish at its session low, though. The rather underwhelming finish caused the Volatility Index to climb about 6% at the close.

Despite the broader market's downward drift, materials stocks still booked big gains. They advanced 1.7% as participants poured money into diversified metals (+2.2%) and fertilizer and agricultural chemicals (+2.2%). While basic materials stocks were strong, commodities were too. Commodities collectively gained 1.0%, according to the CRB Commodity Index.

Treasuries had been up nicely in the early going, but pulled back. Their slide steepened following results from a $10 billion auction of 5-year TIPS. The auction drew a yield of -0.55%, which is the first negative yield on record. It was widely expected, though.

Advancing Sectors: Materials (+1.7%), Consumer Discretionary (+0.6%), Health Care (+0.5%), Telecom (+0.4%), Tech (+0.3%), Consumer Staples (+0.2%), Industrials (+0.2%), Energy (+0.1%)
Declining Sectors: Financials (-0.4%), Utilities (-0.3%)DJ30 +31.49 NASDAQ +11.46 NQ100 +0.4% R2K +0.6% SP400 +0.5% SP500 +2.54 NASDAQ Adv/Vol/Dec 1599/1.76 bln/1043 NYSE Adv/Vol/Dec 1793/1.01 bln/1181

4:57PM PLX Tech misses by $0.01, misses on revs; guides Q4 revs below consensus (PLXT) 4.26 +0.02 : Reports Q3 (Sep) earnings of $0.07 per share, $0.01 worse than the Thomson Reuters consensus of $0.08; revenues rose 39.8% year/year to $30.2 mln vs the $31.3 mln consensus. Co issues downside guidance for Q4, sees Q4 revs of $28-31 mln vs. $32.53 mln Thomson Reuters consensus. Gross margins are expected to be approximately 57% vs. 56% consensus.

1:23PM Flextronics expands operations in Europe and India to support customer demand (FLEX) 6.30 +0.07 : Flextronics Global Services opened two new facilities in Milan, Italy and Delhi, India to better support increased market demand for existing OEM customers. The 240,000 square feet Milan facility is the first operation for forward logistics and value added services in this region, while the newly opened 20,000 square feet Delhi facility offers fulfillment and managed logistics support for OEMs expanding their operations in Northern India.

7:04AM General Electric wins contracts over $750 mln for 2,400-Megawatt Samalkot power plant expansion in India (GE) 16.05

3:26AM LDK Solar signs polysilicon agreement with BYD (LDK) 10.74 : Co announces that it has signed a two-year polysilicon sales agreement valued at ~$300 mln with BYD which is a China-based co that is 10% owned by Berkshire Hathaway (BRK.A). Under terms of the agreement, co will supply polysilicon with monthly shipments expected to commence in January 2011 and extend through the end of 2012. A deposit for this two-year contract has already been received.

ANADIGICS (ANAD) announced an upgrade to its ACA2604 RF amplifier supporting operation to 1 GHz. The improved ACA2604 enables cable MSOs and telco service providers to increase data rates as well as the number of channels available to consumers. Additionally, co introduced its latest upstream path RF amplifier optimized for use in DOCSIS-compliant cable modems, CATV set-top boxes (STBs), residential gateways and Embedded-Multimedia Terminal Adapter (E-MTA) applications...
icon url

ReturntoSender

10/26/10 9:23 PM

#9105 RE: ReturntoSender #6755

From Briefing.com: 4:30 pm : Strength in the dollar overshadowed another batch of better-than-expected earnings this morning. While that left stocks to start the session in the red, the broader market was able to recover to the neutral line, where it was mired amid resistance.

The dollar rebounded solidly from its loss in the prior session, such that the Dollar Index settled 0.7% higher today. That move came in the face of a stronger British pound, which was helped by news that the United Kingdom's economic output for the third quarter hit a stronger-than-expected clip of 0.8%. Moreover, Standard & Poor's affirmed the UK's AAA credit rating.

With the dollar a primary catalyst for trade, the broader market was uninspired by the latest round of quarterly reports. The most recent lot included upside earnings surprises from Amgen (AMGN 57.26, -0.69), Biogen Idec (BIIB 59.99, +0.09), Bristol-Myers Squibb (BMY 26.86, -0.30), Johnson Controls (JCI 34.49, -0.25), and Texas Instruments (TXN 28.88, -0.10). Coach (COH 49.78, +5.30), National-Oilwell Varco (NOV 52.03, +4.06), and Ford Motor (F 14.36, +0.21) each posted better-than-expected earnings, too, but their shares set fresh 52-week highs.

IBM (IBM 140.67, +0.83) already reported its results for the latest quarter, but managed to attract support with its announcement that its board has authorized $10.0 billion for share repurchases.

Though moderate, a broadly positive response followed the midmorning release of the Consumer Confidence Index for October. It improved to 50.2 from 48.5, but had only been expected to improve to 49.0, according to economists polled by Briefing.com.

Despite positive data and generally upbeat corporate reports, the stock market never successfully staged an advance. Sellers kept the S&P 500 out of positive territory by standing ready at the neutral line.

Treasuries also had an unimpressive session. The benchmark 10-year Note fell 21 ticks so that its yield climbed to 2.64%. The 30-year Bond fell more than a full point so that its yield returned to the 4.00% mark.

Similar to the prior session, Treasuries extended their losses in the wake of the latest Note auction. Today's auction featured $35 billion of 2-year Notes that drew a bid-to-cover ratio of 3.43 on dollar demand of $120.1 billion and an indirect bidder participation rate of 40.0%. The 2-year Note ended the day down a couple of ticks so that its yield was last quoted at 0.39%.

Advancing Sectors: Consumer Discretionary (+0.4%), Energy (+0.3%), Tech (+0.1%), Telecom (+0.1%), Financials (+0.1%),
Declining Sectors: Consumer Staples (-0.4%), Health Care (-0.3%), Industrials (-0.3%), Materials (-0.2%), Utilities (-0.2%)DJ30 +5.41 NASDAQ +6.44 NQ100 +0.3% R2K -0.1% SP400 -0.2% SP500 +0.02 NASDAQ Adv/Vol/Dec 1298/1.94 bln/1335 NYSE Adv/Vol/Dec 1360/962 mln/1614

5:57PM STMicroelectronics announces appointment of new Chief Operating Officer (STM) 8.14 -0.13 : Co announced the appointment of a new Chief Operating Officer. Alain Dutheil, who has held the position of ST's COO since 2005, has decided to retire following 27 years with the Company. Replacing Dutheil as ST's new COO is Didier Lamouche, who has been a member of the Supervisory Board of STM from April 2006, before stepping down on October 26, 2010, in view of his appointment as COO of STM.

5:31PM STMicroelectronics beats by $0.01, reports revs in-line (STM) 8.14 -0.13 : Reports Q3 (Sep) earnings of $0.22 per share, $0.01 better than the Thomson Reuters consensus of $0.21; revenues rose 17.1% year/year to $2.66 bln vs the $2.64 bln consensus. Mr. Bozotti stated, "Even though in the third quarter the level of bookings in certain market applications softened from the very high levels in prior periods, we are encouraged by the level of our backlog in the fourth quarter. As a result, we expect sequential net revenue growth of between 2% and 7%. We also expect the fourth quarter to show a further improvement in our gross margin to about 39.5%, plus or minus 1.0 percentage point' revenue approx $2.71-2.84 bln. THomson Reuters consensus $2.72 bln.

4:33PM Broadcom Corporation to offer approximately $600 mln of senior notes (BRCM) 37.22 -0.29 :

4:32PM Ixys beats by $0.01, beats on revs (IXYS) 10.88 +0.15 : Reports Q2 (Sep) earnings of $0.22 per share, $0.01 better than the Thomson Reuters consensus of $0.21; revenues rose 67.4% year/year to $89.9 mln vs the $85.8 mln consensus. Backlog was $160.0 million at September 30, 2010, as compared to $78.7 million at September 30, 2009. Bookings were $85.1 million for the quarter ended September 30, 2010, as compared to $55.3 million for the comparable quarter of the prior year.

4:17PM LDK Solar: Helios to pay LDK Solar an amount of ~$31 million as arbitration award plus interest, costs of arbitration, and lawyers' fees (LDK) 11.29 +0.03 : Co announces that the International Court of Arbitration stated that the wafer supply contract entered into in October 2008 between LDK Solar and the Italy-based Helios Technology S.p.A is valid and effective throughout its duration and at terms and conditions related to quantities and prices set forth therein. The International Court of Arbitration also stated that by virtue of the arbitration proceedings Helios shall pay to LDK Solar an amount of approximately $31 million. To this amount interest of 8% shall be added from the date of the award until the effective payment as well as costs for the arbitration proceedings and lawyers' fees.

4:11PM F5 Networks beats by $0.07, beats on revs; guides Q1 EPS above consensus, revs above consensus; announces $200 mln share repurchase program (FFIV) 102.54 +1.71 : Reports Q4 (Sep) earnings of $0.79 per share, excluding non-recurring items, $0.07 better than the Thomson Reuters consensus of $0.72; revenues rose 47.8% year/year to $254.3 mln vs the $249 mln consensus. Co issues upside guidance for Q1, sees EPS of $0.80-0.82, excluding non-recurring items, vs. $0.73 Thomson Reuters consensus; sees Q1 revs of $265-270 mln vs. $259.76 mln Thomson Reuters consensus. The company also announced today that its board of directors approved a new program to repurchase up to $200 million of the company's outstanding common stock. "As enterprises and other large organizations confront the new realities of today's global economy, they are turning increasingly to technologies that enable them to operate more efficiently and compete more successfully by giving them flexible, on-demand access to more resources while reducing overall costs. This shift is reflected broadly in the trend towards data center consolidation and the widespread adoption of server virtualization and new infrastructure models such as cloud computing... Within the past year, these trends have accelerated, and our products have been increasingly deployed as strategic points of control in new data center architectures, integrating disparate resources and managing the flow of traffic within and between data centers. In addition, we have continued to see growing demand for our products among service providers grappling with the proliferation of mobile devices, the explosion of mobile applications and the corresponding increase in mobile data traffic. As a result, our product revenues grew 12 percent sequentially in Q4 and 38 percent during fiscal 2010,"

4:10PM Broadcom beats by $0.05, beats on revs; guides Q4 revs above consensus (BRCM) 37.22 : Reports Q3 (Sep) earnings of $0.60 per share, $0.05 better than the Thomson Reuters consensus of $0.55; revenues rose 44.0% year/year to $1.81 bln vs the $1.75 bln consensus. Co issues upside guidance for Q4, sees Q4 revs of $1.8-1.9 bln vs. $1.75 bln Thomson Reuters consensus. Sees product gross margin flat from Q3. "Looking ahead, we believe that consumer demand for connectivity will continue to drive demand for our communication semiconductors, which should enable Broadcom to deliver solid revenue growth and sustained profitability in the fourth quarter."

4:10PM Novellus beats by $0.04, beats on revs (NVLS) 27.38 -0.43 : Reports Q3 (Sep) earnings of $0.88 per share, $0.04 better than the Thomson Reuters consensus of $0.84; revenues rose 107.6% year/year to $367.2 mln vs the $355.7 mln consensus. Bookings in the third quarter of 2010 were $406.9 mln, up $22.0 mln or 5.7 percent from second quarter bookings of $384.9 mln. Third quarter shipments of $363.3 mln were up by $31.2 mln or 9.4 percent from $332.1 mln in the second quarter. Deferred revenue as of the end of the quarter was $47.4 mln, an increase of $3.0 mln or 6.8 percent from $44.4 mln at the end of the second quarter. Deferred revenue in the second and third quarters included $30.6 mln and $32.4 mln, respectively, related to system sales.

4:09PM Advanced Analogic Tech reports EPS in-line, beats on revs; guides Q4 revs in-line (AATI) 3.75 -0.09 : Reports Q3 (Sep) loss of $0.06 per share, excluding non-recurring items, in-line with the Thomson Reuters consensus of ($0.06); revenues fell 4.4% year/year to $25 mln vs the $24.4 mln consensus. Co issues in-line guidance for Q4, sees Q4 revs of $23-25 mln vs. $24.98 mln Thomson Reuters consensus; sees GAAP EPS of ($0.09)-($0.07).

4:08PM FormFactor beats by $0.01, reports revs in-line, authorizes $50 mln share buyback (FORM) 8.37 -0.55 :

Reports Q3 (Sep) loss of $0.55 per share, ex-items, $0.01 better than the Thomson Reuters consensus of ($0.56); revenues rose 8.0% year/year to $47.3 mln vs the $47.2 mln consensus. The company also announces it has authorized the repurchase of up to $50 mln in common stock.

4:07PM RF Micro Device beats by $0.03, beats on revs; sees next quarter in line with this quarter (RFMD) 6.37 -0.24 : Reports Q2 (Sep) earnings of $0.19 per share, $0.03 better than the Thomson Reuters consensus of $0.16; revenues rose 4.4% year/year to $285.8 mln vs the $275.9 mln consensus. Reports Q2 non-GAAP gross margin of 39.8% vs. the 39.4% consensus. RFMD expects December quarterly results will be approximately in line with September quarterly results (consensus calls for EPS of $0.17 and revs of 281.8 mln). RFMD now expects to achieve record free cash flow in fiscal 2011 in the range of $180-$200 million.

4:07PM F5 Networks announces new share repurchase program up to $200 million (FFIV) :

4:07PM FormFactor beats by $0.01, reports revs in-line; announces $50 mln buyback (FORM) 8.36 -0.56 : Reports Q3 (Sep) loss of $0.55 per share, excluding non-recurring items, $0.01 better than the Thomson Reuters consensus of ($0.56); revenues rose 8.2% year/year to $47.3 mln vs the $47.2 mln consensus. In other matters, the Board of Directors has authorized the repurchase of up to $50 million dollars worth of common stock. Under the authorized stock repurchase program, the company may repurchase shares from time to time on the open market; the pace of repurchase activity will depend on levels of cash generation, current stock price, and other factors. The stock repurchase authorization expires in 12 months and the program may be modified or discontinued at any time.

4:06PM Broadcom to acquire Percello for ~$86 mln (BRCM) 37.22 -0.29 : Co announces that it has signed a definitive agreement to acquire Percello. The acquisition of Percello is expected to enable co to lower overall bill of material cost and accelerate the time to market for best-in-class and energy-efficient femtocell technology. In connection with the acquisition, Broadcom expects to pay approximately $86 million, net of cash assumed from Percello, to acquire all of the outstanding shares of capital stock and other rights of Percello. The purchase price will be paid in cash, except that a portion of such purchase price attributable to unvested employee stock options will be paid in Broadcom restricted stock units. Additional consideration of up to $12 million in cash will be reserved for future payment to the former holders of Percello capital stock and other rights upon satisfaction of certain performance goals.

4:06PM F5 Networks -- Earnings Mover (FFIV) 102.54 +1.71 : Stock sees some initial weakness following the report, dropping roughly 5 pts as it dips down into the $98.00 area. Support is in this vicinity near $97.00-97.50, followed by $95.00, then $90.00.

4:02PM Molex beats by $0.01, beats on revs; guides Q2 EPS below consensus, revs in-line; co increases dividend 14.8% to $0.175 (MOLX) 22.55 +0.28 : Reports Q1 (Sep) earnings of $0.45 per share, excluding non-recurring items, $0.01 better than the Thomson Reuters consensus of $0.44; revenues rose 33.2% year/year to $897.7 mln vs the $867.4 mln consensus. Co issues mixed guidance for Q2, sees EPS of $0.38-0.44 vs. $0.45 Thomson Reuters consensus; sees Q2 revs of $850-890 mln vs. $872.67 mln Thomson Reuters consensus.

8:00AM JA Solar raises Q3 shipment guidance (JASO) 8.45 : Based on strong customer orders and higher than anticipated production and shipments during the third quarter, JA Solar expects its third quarter 2010 shipments to exceed 410 MW, above its previous shipment guidance of 375MW given on Aug. 10, 2010. The new guidance represents approximately 31.8 percent higher shipment compared with second quarter 2010 shipment of 311MW, and approximately 131.6 percent growth over third quarter 2009 shipment of 177MW.

7:10AM Benchmark Elec beats by $0.03, beats on revs; guides Q4 EPS in-line, revs below consensus (BHE) 16.97 : Reports Q3 (Sep) earnings of $0.38 per share, excluding items, $0.03 better than the Thomson Reuters consensus of $0.35; revenues rose 23.8% year/year to $631.9 mln vs the $610.6 mln consensus. Co issues mixed guidance for Q4, sees EPS of $0.33-$0.37, excluding items, vs. $0.37 Thomson Reuters consensus; sees Q4 revs of $590-$630 mln vs. $642.16 mln Thomson Reuters consensus.

Applied Materials (AMAT) announced that Hareon Solar has selected Applied's SmartFactory manufacturing automation software to improve productivity across Hareon's solar photovoltaic cell manufacturing operations in China...LSI Corp (LSI) announced it has collaborated with IP Infusion to develop an advanced carrier-grade solution for mobile backhaul and carrier Ethernet...

08:28 am Texas Instruments target raised to $34 at Stifel Nicolaus: . Stifel Nicolaus raises their TXN tgt to $34 from $29 following earnings. Firm believes TI continues to execute on its path to becoming a more stable and profitable company. Firm says while business is also poised to slow down near-term, they do not believe the company is about to embark on a multi-quarter correction. Given what they view as strong business execution, coupled with attractive valuation, firm reits their Buy.

icon url

ReturntoSender

10/27/10 11:15 PM

#9106 RE: ReturntoSender #6755

From Briefing.com: 4:25 pm : The broader market was dropped for a loss of more than 1% amid another bounce by the dollar, but some late session support helped stocks stage a strong swing higher into the close.

Speculation that any future measures of quantitative easing might be applied gradually or be smaller in scope than had been hoped propped up the dollar today. Its strength over competing currencies sent the Dollar Index up 0.5%, so that it is now up almost 3% from the 2010 low that it set less than two weeks ago.

Strength in the dollar overshadowed the latest round of earnings announcements, which were generally upbeat. In turn, participants actually drove the stock market down to a loss of more than 1% before an afternoon rally slashed losses and actually gave the Nasdaq a gain.

Strength in the Nasdaq was mostly owed to semiconductor stocks following better-than-expected earnings and strong guidance from Broadcom (BRCM 41.56, +4.34), which hit a new 52-week high and helped drive the Philadelphia Semiconductor Index 3.1% higher.

Comcast (CMCSA 20.27, +0.63) also provided leadership to the Nasdaq after it announced an upside earnings surprise of its own, but the broader market's reaction to other reports was less consistent.

Both Whirlpool (WHR 81.04, -3.48) and ConocoPhillips (COP 60.08, -0.74) posted upside earnings surprises, but each stock sold off while a bottom line beat by Northrop Grumman (NOC 61.38, +0.03) was met with indifference. Dow component Procter & Gamble (PG 63.08, +0.22) also beat on the bottom line, but it only attracted sustainable support into the close.

A positive earnings surprise from Aflac (AFL 56.39, +1.20) took shares of the insurer to a new 52-week high and provided leadership to financials, which mustered a 0.1% gain. It was the second best performing sector behind technology, which climbed 0.4%.

Of the sectors that logged losses, materials were hit the hardest. As a group they fell 0.9%, most of which was the result of a 2.7% loss among diversified metals and miners.

Data did little for stocks this session. Durable goods orders for September increased 3.3%, which is much better than the 1.8% increase that had been expected among economists polled by Briefing.com, but after excluding transportation, orders actually fell 0.8%, which contrasts with the consensus call for a 0.2% increase.

New home sales for September increased 6.6% month-over-month to an annualized rate of 307,000 units, which is greater than the rate of 299,000 units that had been expected among economists polled by Briefing.com.

Widespread weakness had the Volatility Index up more than 10% to trade near its 50-day moving average for the first time in about three weeks, but the stock market's late session run caused volatility to cool. In turn, the Volatility Index was up about 4% at the close of trade.

Even in the face of higher volatility and sizable losses among stocks, Treasuries never found support. In fact, pressure was so stiff in that space that the yield on the 10-year Note climbed to a one-month high of 2.72%, which is about where the Note closed.

For the second straight session Treasuries failed to find support in the wake of an auction of Notes. This time $35 billion in 5-year Notes were up for grabs. The auction drew a yield of 1.33% on a bid-to-cover ratio of 2.8 and an indirect participation rate of 39.5%.

6:36PM Teradyne beats by $0.03, misses on revs; guides Q4 EPS below consensus, revs below consensus (TER) 11.89 +0.14 : Reports Q3 (Sep) earnings of $0.82 per share, $0.03 better than the Thomson Reuters consensus of $0.79; revenues rose 91.5% year/year to $502.1 mln vs the $508 mln consensus. Co issues downside guidance for Q4, sees EPS of $0.21-0.28 vs. $0.59 Thomson Reuters consensus; sees Q4 revs of $300-325 mln vs. $447.40 mln Thomson Reuters consensus.

5:27PM Broadcom prices $300 mln aggregate principal amount of 1.5% senior notes due 2013 and $400 mln aggregate principal amount of 2.375% senior notes due 2015 (BRCM) 41.56 +4.34 : Co announces that it increased the size of its previously announced private offering of senior notes. Co priced $300 million aggregate principal amount of 1.5% senior notes due 2013 and $400 mln aggregate principal amount of 2.375% senior notes due 2015. The senior notes were offered to qualified institutional buyers. The sale of the senior notes is expected to close on or about November 1, 2010.

4:24PM Power Integrations beats by $0.04, beats on revs; guides Q4 revs in-line (POWI) 33.89 +0.71 : Reports Q3 (Sep) earnings of $0.53 per share, excluding non-recurring items, $0.04 better than the Thomson Reuters consensus of $0.49; revenues rose 25.8% year/year to $75.5 mln vs the $74.1 mln consensus. Co issues in-line guidance for Q4, sees Q4 revs of $67-73 mln vs. $73.53 mln Thomson Reuters consensus.

4:14PM Integrated Silicon misses by $0.06, misses on revs; guides Q1 EPS below consensus, revs below consensus; co authorizes additional $20 mln stock buyback program (ISSI) 9.25 +0.23 : Reports Q4 (Sep) earnings of $0.43 per share, $0.06 worse than the Thomson Reuters consensus of $0.49; revenues rose 58.6% year/year to $73.6 mln vs the $77.4 mln consensus. Co issues downside guidance for Q1, sees EPS of $0.30-0.36 vs. $0.45 Thomson Reuters consensus; sees Q1 revs of $68-72 mln vs. $76.80 mln Thomson Reuters consensus.

4:12PM TriQuint Semi beats by $0.01, reports revs in-line; guides Q4 EPS in-line, revs in-line (TQNT) 10.30 +0.47 : Reports Q3 (Sep) earnings of $0.27 per share, $0.01 better than the Thomson Reuters consensus of $0.26; revenues rose 37.0% year/year to $237 mln vs the $236.1 mln consensus. Co issues in-line guidance for Q4, sees EPS of $0.26-$0.28 vs. $0.26 Thomson Reuters consensus; sees Q4 revs of $245-$255 mln vs. $243.29 mln Thomson Reuters consensus. The company is 91% booked to the midpoint of rev guidance. For Q4, the co expects that strong growth in the mobile devices market will lead to a non-GAAP gross margin between 41% and 42%. Looking to 2011, the co believes continued robust growth in demand should lead to revenue growth of about 20%

4:10PM Newport beats by $0.09, beats on revs; guides FY10 EPS above consensus, revs above consensus (NEWP) 13.29 +0.72 : Reports Q3 (Sep) earnings of $0.34 per share, $0.09 better than the Thomson Reuters consensus of $0.25; revenues rose 41.8% year/year to $125.2 mln vs the $119.1 mln consensus. Co issues upside guidance for FY10, sees EPS to exceed $1.00 vs. $0.91 Thomson Reuters consensus; sees FY10 revs of ~$475 mln vs. $466.86 mln Thomson Reuters consensus. Co said, "we are confident that we are well positioned to achieve continued revenue and earnings growth in 2011."

4:09PM LSI Logic beats by $0.02, misses on revs; guides Q4 EPS in-line, revs below consensus (LSI) 4.74 : Reports Q3 (Sep) earnings of $0.13 per share, $0.02 better than the Thomson Reuters consensus of $0.11; revenues rose 8.8% year/year to $629 mln vs the $640.3 mln consensus. Co issues mixed guidance for Q4, sees EPS of $0.10-0.16 vs. $0.13 Thomson Reuters consensus; sees Q4 revs of $635-665 vs. $675.30 mln Thomson Reuters consensus.

4:04PM Plexus beats by $0.05, beats on revs; guides Q1 EPS in-line, revs in-line (PLXS) 33.59 +0.34 : Reports Q4 (Sep) earnings of $0.65 per share, $0.05 better than the Thomson Reuters consensus of $0.60; revenues rose 41.4% year/year to $555.6 mln vs the $545.4 mln consensus. Co issues in-line guidance for Q1, sees EPS of $0.56-0.62, excluding non-recurring items, vs. $0.61 Thomson Reuters consensus; sees Q1 revs of $550-580 mln vs. $566.33 mln Thomson Reuters consensus.

4:02PM Flextronics beats by $0.03, beats on revs; guides Q3 EPS above consensus, revs above consensus (FLEX) 6.40 +0.03 : Reports Q2 (Sep) earnings of $0.23 per share, excluding non-recurring items, $0.03 better than the Thomson Reuters consensus of $0.20; revenues rose 27.3% year/year to $7.42 bln vs the $7.01 bln consensus. Co issues upside guidance for Q3, sees EPS of $0.23-0.25 vs. $0.22 Thomson Reuters consensus; sees Q3 revs of $7.5-7.7 bln vs. $7.44 bln Thomson Reuters consensus.

2:58PM NASDAQ 100 (NDX) strength & weakness- Semis (BRCM, MRVL, LRCX) continue to lead the index, now trading in positive territory on the heels of strong earnings & guidance from BRCM (BRCM) :

9:52AM Semiconductor Hldrs continues to outperform, provides leadership for Nasdaq 100 +0.6, Nasdaq Comp -0.4 (SMH) 28.86 +0.18 : The SMH has reached a new session high of 28.89 leaving it just under Monday's peak and the top end of the broad multi-month range at 28.94/29.04 -- BRCM +7.7%, ALTR +0.7%, ADI +0.6%, AMAT +0.3%, KLAC +0.6%, LLTC +0.2%, SNDK +0.4%, XLNX +0.8%.

8:06AM Silicon Labs beats by $0.01, reports revs in-line; guides Q4 revs below consensus (SLAB) 39.02 : Reports Q3 (Sep) earnings of $0.53 per share, $0.01 better than the Thomson Reuters consensus of $0.52; revenues fell 4.5% year/year to $120.2 mln vs the $120.4 mln consensus. Co issues downside guidance for Q4, sees Q4 revs of $105-110 vs. $121.64 mln Thomson Reuters consensus. "While this retreat in revenue is uncharacteristic, we believe the fourth quarter represents a trough, and the composition of the business that will emerge in 2011 will be even more growth oriented... We're very optimistic about progress in our emerging video product line and continue to view our Broad-based business as a strategic growth engine in 2011 and beyond."

Mattson Technology (MTSN) announced that its Millios system has been selected for joint projects with CNT's leading IC partners for the development of advanced millisecond anneal applications at the 3X nanometer technology nodes and below.

Broadcom (BRCM) announced the availability of its BCM6818 Gigabit Passive Optical Network based residential gateway system-on-a-chip solution...

07:25 am JinkoSolar Holding upgraded to Buy at Auriga U.S.A; tgt raised to $37: . Auriga U.S.A upgrades JKS to Buy from Hold and raises their tgt to $37 from $32 noting last night the company announced a follow-on offering of 2 million shares that is just less than 10% dilutive to current shareholders. Given the increased capital, management will be ramping capacity to 1 GW by the end of 2011, which increases shipments, revenue, and EPS substantially.
icon url

ReturntoSender

10/29/10 12:01 AM

#9107 RE: ReturntoSender #6755

From Briefing.com: 4:35 pm : Stocks settled mixed with the major equity averages near the neutral line. The lack of direction came despite encouraging data and a sharp drop by the dollar, but preceded the advance GDP report for the third quarter.

The S&P 500 was up about 0.6% at its session high and down about 0.5% at its session low before it muddled its way to a flat finish. Early gains were helped by a positive reaction to initial jobless claims for the week ending October 23. They totaled 434,000, which is well below the 458,000 initial claims that had been expected, on average, among economists polled by Briefing.com. The tally was also the smallest since July. More impressive is that continuing claims fell to 4.36 million, which is a near two-year low.

It took little time before the stock market's early gain was dashed, even though the dollar was under stiff pressure. The dollar, which has had an inverse relationship with stocks for several months, dropped to a 1.1% loss.

While the greenback was less of a factor than in recent sessions, stocks worked their way out of the red to finish slightly above the neutral line.

Actual leadership was limited, but health care managed to book a 0.5% gain, one of the better performances. That came amid strength in Cardinal Health (CAH 34.33, +0.92) and Celgene (CELG 61.20, +1.80). Both had upbeat earnings reports.

Industrials were at the other end of the scope as 3M (MMM 85.07, -5.30) dropped precipitously despite an upside earnings surprise. However, the sector pared losses into the close to finish just 0.3% into the red.

Market participants had varied reactions to earnings Akamai (AKAM 51.11, +0.72), Visa (V 76.45, -3.47), Colgate-Palmolive (CL 74.92, -0.58), Norfolk Southern (NSC 60.79, -0.56), Las Vegas Sands (LVS 44.63, +3.57), Noble Energy (NE 34.32, -0.11), Zimmer Holdings (ZMH 49.41, -2.48), Motorola (MOT 8.13, +0.04), and Dow Chemical (DOW 30.86, -0.35), all of which had better-than-expected earnings. To be fair, though, revenue results remain less impressive.

Outside of earnings, Halliburton (HAL 31.68, -2.74) ran into stiff selling on heavy volume following reports regarding the stability of the cement mixture foundation of the Deepwater Horizon well.

Treasuries finally caught a bid after slumping earlier this week. They were helped by strong results from a $29 billion auction of 7-year Notes. Yields settled a bit above session lows.

Tomorrow brings the advance GDP report for the third quarter. It will be released ahead of the market's open and is likely to be a major trading event. The consensus among economists polled by Briefing.com pegs growth at 2.0%.

Advancing Sectors: Health Care (+0.5%), Consumer Discretionary (+0.4%), Consumer Staples (+0.3%), Telecom (+0.3%), Utilities (+0.2%), Tech (+0.1%)
Declining Sectors: Industrials (-0.3%), Materials (-0.1%), Financials (-0.1)
Unchanged: EnergyDJ30 -12.33 NASDAQ +4.11 NQ100 +0.2% R2K -0.5% SP400 -0.1% SP500 +1.33 NASDAQ Adv/Vol/Dec 1088/2.02 bln/1504 NYSE Adv/Vol/Dec 1498/1.01 bln/1442

4:53PM AXT Inc reports EPS in-line, beats on revs; guides Q4 EPS above consensus, revs above consensus (AXTI) 7.04 -0.03 : Reports Q3 (Sep) earnings of $0.13 per share, ex-items, in-line with the two analyst estimate of $0.13; revenues rose 15.5% year/year to $26.8 mln vs the $25.5 mln consensus. Co issues upside guidance for Q4, sees EPS of $0.15-$0.17 vs. $0.14 two analyst estimate; sees Q4 revs of $28-$29 mln vs. $26.69 mln two analyst estimate.

4:25PM Tessera Tech beats by $0.04, beats on revs (TSRA) 19.40 -0.04 : Reports Q3 (Sep) GAAP earnings of $0.38 per share, $0.04 better than the GAAP Thomson Reuters consensus of $0.34; revenues rose 24.2% year/year to $82.1 mln vs the $80.9 mln consensus.

4:24PM Varian Semi beats by $0.05, reports revs in-line; guides Q1 EPS above consensus, revs in-line (VSEA) 30.22 -0.59 : Reports Q4 (Sep) earnings of $0.79 per share, $0.05 better than the Thomson Reuters consensus of $0.74; revenues rose 120.3% year/year to $258.8 mln vs the $256.9 mln consensus. Co issues guidance for Q1, sees EPS of $0.84-0.89 vs. $0.83 Thomson Reuters consensus; sees Q1 revs of $270-280 mln vs. $279.74 mln Thomson Reuters consensus. "With the introduction of Trident, our new high current tool and Solion, our solar ion implant tool, we expect to strengthen our current market position and develop new markets in fiscal year 2011."

4:23PM Oracle issues statement regarding SAP (ORCL) 29.36 +0.66 : "SAP management has insisted for three and a half years of litigation that it knew nothing about SAP's own massive theft of Oracle's intellectual property. Today, SAP has finally confessed it knew about the theft all along. The evidence at trial will show that the SAP Board of Directors valued Oracle's copyrighted software so highly, they were willing to steal it rather than compete fairly."

4:23PM SolarWinds beats by $0.03, beats on revs; guides Q4 EPS in-line, revs in-line (SWI) 17.98 +0.38 : Reports Q3 (Sep) earnings of $0.21 per share, excluding non-recurring items, $0.03 better than the Thomson Reuters consensus of $0.18; revenues rose 27.4% year/year to $41.2 mln vs the $38 mln consensus. Co issues in-line guidance for Q4, sees EPS of $0.18-0.19 vs. $0.19 Thomson Reuters consensus; sees Q4 revs of $39.0-41.5 mln vs. $40.84 mln Thomson Reuters consensus.

4:18PM KLA-Tencor beats by $0.13, beats on revs (KLAC) : Reports Q1 (Sep) earnings of $0.99 per share, excluding non-recurring items, $0.13 better than the Thomson Reuters consensus of $0.86; revenues rose 98.8% year/year to $682 mln vs the $647.3 mln consensus. "... Orders were strong, backlog increased and we delivered outstanding gross and operating margins in the quarter."

4:18PM TranSwitch misses by $0.04, reports revs in-line (TXCC) 2.45 -0.05 : Reports Q3 (Sep) loss of $0.04 per share, $0.04 worse than the Thomson Reuters consensus of ($0.00); revenues fell 9.2% year/year to $12.8 mln vs the $12.8 mln two analyst consensus.

4:17PM Power-One beats by $0.17, beats on revs; guides Q4 revs above consensus (PWER) 11.13 0.00 : Reports Q3 (Sep) earnings of $0.40 per share, $0.17 better than the Thomson Reuters consensus of $0.23; revenues rose 213.6% year/year to $314 mln vs the $264.7 mln consensus. Co issues upside guidance for Q4, sees Q4 revs of $340-360 mln vs. $297.94 mln Thomson Reuters consensus.

4:13PM Microsoft beats by $0.07, beats on revs (MSFT) 26.28 +0.23 : Reports Q1 (Sep) earnings of $0.62 per share, $0.07 better than the Thomson Reuters consensus of $0.55; revenues rose 25.3% year/year to $16.2 bln vs the $15.8 bln consensus. Co reports Q1 operating margins of 44.0% vs 39.8% Thomson Reuters consensus. Co reaffirms operating expense guidance of $26.9 bln reaffirms operating expense guidance of $26.9 billion to $27.3 billion for FY11.

4:05PM First Solar beats by $0.26, beats on revs; guides FY10 EPS above consensus, revs above consensus (FSLR) 151.15 +0.85 : Reports Q3 (Sep) earnings of $2.21 per share, excluding non-recurring items, $0.26 better than the Thomson Reuters consensus of $1.95; The third quarter net income excludes a one-time tax expense of $14.7 million, or $0.17 per fully diluted share, relating to the Company's decision to repatriate $300 million of earnings from certain of its foreign subsidiaries revenues rose 65.9% year/year to $797.7 mln vs the $778.5 mln consensus. Co issues upside guidance for FY10, sees EPS of $7.50-7.65 vs. $7.46 Thomson Reuters consensus; sees FY10 revs of $2.58-2.61 bln vs. $2.58 bln Thomson Reuters consensus.

4:04PM Maxim Integrated beats by $0.06, beats on revs; guides Q2 EPS above consensus, revs in-line (MXIM) 19.66 -0.02 : Reports Q1 (Sep) earnings of $0.43 per share, $0.06 better than the Thomson Reuters consensus of $0.37; revenues rose 39.4% year/year to $626.1 mln vs the $614 mln consensus. Co issues mixed guidance for Q2, sees EPS of $0.39-0.44 vs. $0.35 Thomson Reuters consensus; sees Q2 revs of $595-625 mln vs. $603.76 mln Thomson Reuters consensus.

MIPS Technologies (MIPS) announced that long-time MIPS licensee Cavium Networks has reaffirmed its commitment to the MIPS architecture by renewing its license of the high-performance MIPS64 architecture...

8:10AM Celestica misses by $0.02, misses on revs (CLS) 8.84 : Reports Q3 (Sep) earnings of $0.20 per share, excluding non-recurring items, $0.02 worse than the Thomson Reuters consensus of $0.22; revenues fell 0.6% year/year to $1.55 bln vs the $1.6 bln consensus. "Our fourth quarter outlook reflects strong sequential revenue growth of approximately 15% at the midpoint of our guidance, fueled primarily by recent program wins in our server and consumer end markets and a stable demand forecast for the balance of our customer portfolio." 15% sequential increase equates to $1.78 bln as the midpoint, Thomson Reuters consensus $1.754 bln.

8:10AM Sunpower and Iberdrola Renewables sign contract to build 30 MW solar power plant in Colorado (SPWRA) 13.77 : Co announces an agreement with Iberdrola Renewables to design and build a 30-megawatt photovoltaic solar power plant, the San Luis Valley Solar Ranch, on 216 acres of private, former agricultural land in Colorado's Alamosa County. Expected to be fully operational by the end of 2011, construction will begin this year and create approximately 100 jobs.

8:03AM MIPS Tech: Cavium Networks extends MIPS architecture license (MIPS) 14.34 : MIPS announces that long-time licensee Cavium Networks (CAVM) has renewed its license of the high-performance MIPS64 architecture. Cavium's OCTEON multi-core processor family is based on the MIPS64 architecture. These processors have been widely adopted in routers, switches, storage networking equipment, security appliances, data-center equipment, and a broad range of 3G, WiMAX and LTE infrastructure equipment.

7:54AM Jabil Circuit intends to offer $300 mln of Senior Notes (JBL) 14.31 : Co announces its intention to offer $300 mln of senior unsecured notes due 2020. Co expects to use the net proceeds from the Offering to fund the repayment of a portion of its borrowings under the term loan portion of its senior credit facility.

Xilinx (XLNX) announced the Spartan-6Q family and Virtex-6Q family, its newest generation of field programmable gate arrays qualified for meeting the rigorous requirements of the aerospace and defense market... KVH Industries (KVHI) announced a new distribution agreement with Furuno Electric for KVH's mini-VSAT BroadbandSM service. Under the terms of this arrangement, Furuno will begin marketing and selling mini-VSAT Broadband airtime service and supporting equipment along with a compatible 1-meter antenna system on a global basis through its established distributor and dealer channels...

09:27 am Seagate Tech downgraded to Hold at Stifel Nicolaus: . Stifel Nicolaus downgrades STX to Hold from Buy given the risk/reward profile associated with the ongoing negotiations of a potential private equity takeout. Firm continues to believe that there is a high probability that a deal does get done. From a valuation perspective, they maintain our prior takeout EV/EBITDA multiple assumption of 5-6x EV/EBITDA C2011 estimates as a fair takeout valuation range (mid-point of historical 4-7x), leading to their expectation of a go-private consideration of $17/sh.

10:07 am MOT Guides Q4 In-line (MOT)

Motorola (MOT 8.64 +0.54) reports third quarter earnings of $0.16 per share, excluding non-recurring items, $0.05 better than the Thomson Reuters consensus of $0.11.

Revenues rose 6.4% year/year to $5.8 billion versus the $5.66 billion consensus.

For the fourth quarter, the company guided earnings in the range of $0.14 to $0.16 per share, excluding non-recurring items, versus the $0.15 Thomson Reuters consensus.

Shipped 3.8 million smartphones with a total of 22 smartphones introduced during 2010.
icon url

ReturntoSender

10/30/10 11:01 PM

#9110 RE: ReturntoSender #6755

Market top coming? Bob, don't go raining on our parade here and get too bullish... again... I mean still... LOL

Honestly we are getting very close to the end of earnings season. CSCO earnings come out on Nov 10. If the market can keep churning higher until then we should get some selling after.

The $NASI and $NYSI and number of stocks above their 50 day moving averages is beginning to roll over:


The dollar is trying to find a bottom even as the volatility indexes are attempting the same.


The NASDAQ is in danger of forming a double top:


The good news is COTD says we are entering a typically strong period of time for the market which we know is from the typical October bottom until the end of April when the typical sell in May and go away maxim takes over. Of course the market can and does act atypically whenever it feels like it. But here is the data since 1950:

http://www.chartoftheday.com/20101029.htm?T

The stock market is now entering what has historically been the strongest half of the year. Today's chart illustrates that investing in the S&P 500 from the last trading day in October (therefore referred to as the Halloween indicator) through the end of April accounted for the vast majority of S&P 500 gains since 1950. While there are some noteworthy periods during which the Halloween indicator didn't produce (e.g. during the oil embargo of 1973-74, the dot-com bust of 2000-01, and the financial meltdown of 2007-2009), the overall out performance is compelling.


RtS
icon url

ReturntoSender

11/01/10 10:30 PM

#9113 RE: ReturntoSender #6755

From Briefing.com: 4:30 pm : Strength in the early going had the stock market up 1% to trade near its five-month high, but the mix of a stronger dollar, technical resistance, and uncertainty ahead of this week's major events left stocks to slide and nearly finish with a loss.

Trade ended on a flat note last week, but buyers were brought back into the mix by data. Manufacturing data out of China was impressive as the country's PMI improved to a six-month high of 54.7. That was complemented by domestic data that showed an October ISM Manufacturing Index of 56.9, which marked also marked a six-month high and exceeded the 54.0 that had been widely expected.

U.S. construction spending for September was also strong. It increased 0.5% when a 0.7% decline had been expected to follow a downwardly revised 0.2% decline in the prior month.

Income and spending data was rather disappointing, but participants shrugged it off anyway. September personal income slipped 0.1% and spending increased a tepid 0.2% -- the consensus had called for a 0.2% increase in income and a 0.4% increase in spending. Core personal consumption expenditures for September were flat, as expected, though.

The collective body of data helped drive the S&P 500 to within less than one point of its best level since May, but the move was unable to push through resistance in that zone.

At the same time stocks ran into resistance they had to grapple with a bounce by the greenback, which was also spurred higher by today's data since it could help make the case for smaller steps toward further quantitative easing.

It is widely expected that the FOMC will announce some sort of plan to augment monetary policy on Wednesday, but the size and scope of the plan remains a mystery. Participants are also brooding over the implications of midterm elections and the latest monthly payrolls report on Friday.

Uncertainty about what will unfold this week also kept many investors on the sidelines. In turn, trading volume on the NYSE did not even break 1 billion shares.

Those that did trade left to surrender all of their gains and then some as the stock market actually fell to a modest loss in late trade. Though it recovered, the stock market's fractional gain paled in comparison to what it had sported in the early going.

Energy stocks had been early leaders with a 1.5% gain at their session high, but they settled just 0.3% for the better. Baker Hughes (BHI 48.37, +1.95) was one of the best performers in the group, thanks to an upside earnings surprise.

Though defensive oriented, utilities underperformed by a wide margin. The sector's 0.9% slide was also its worst loss in more than a month.

Advancing Sectors: Tech (+0.4%), Telecom (+0.4%), Energy (+0.3%), Health Care (+0.2%), Industrials (+0.1%)
Declining Sectors: Utilities (-0.9%), Consumer Staples (-0.1%)
Unchanged: Consumer Discretionary, Materials, FinancialsDJ30 +6.13 NASDAQ -2.57 NQ100 +0.2% R2K -0.7% SP400 -0.2% SP500 +1.12 NASDAQ Adv/Vol/Dec 971/1.92 bln/1684 NYSE Adv/Vol/Dec 1556/958 mln/1405

4:22PM Rudolph Tech beats by $0.08, misses on revs (RTEC) 7.59 +0.18 : Reports Q3 (Sep) earnings of $0.34 per share, ex-items, $0.08 better than the Thomson Reuters consensus of $0.26; revenues rose 124.5% year/year to $52.3 mln vs the $52.9 mln consensus. Third quarter gross margin rose to 56%, compared to 41% in 3Q09. The increase in gross margin was due to higher revenues, including an increase in software sales, higher average selling prices and lower reserves due to better inventory utilization.

4:18PM Concurrent misses by $0.17, beats on revs (CCUR) 6.90 +0.56 : Reports Q1 (Sep) loss of $0.14 per share, $0.17 worse than the Thomson Reuters consensus of $0.03; revenues rose 21.1% year/year to $15.5 mln vs the $12.5 mln consensus.

4:07PM Sanmina-SCI beats by $0.08, reports revs in-line; guides Q1 EPS in-line, revs below consensus (SANM) 12.98 -0.21 : Reports Q4 (Sep) earnings of $0.46 per share, excluding non-recurring items, $0.08 better than the Thomson Reuters consensus of $0.38; revenues rose 24.7% year/year to $1.69 bln vs the $1.68 bln consensus. Co issues mixed guidance for Q1, sees EPS of $0.40-0.44, excluding non-recurring items, vs. $0.43 Thomson Reuters consensus; sees Q1 revs of $1.63-1.68 bln vs. $1.71 bln Thomson Reuters consensus.

Flextronics (FLEX) announced that Flextronics Medical will open a dedicated, 180,000 square foot facility in Senai, Johor, Malaysia. This expansion will support a significant rise in demand from medical OEMs, while providing additional low-cost geographic diversity to meet our customers' needs.

7:04AM Corning misses by $0.01, reports revs in-line; lowers FY10 cap-ex to $1.0 bln from $1.2 bln. (GLW) 18.28 : Reports Q3 (Sep) earnings of $0.51 per share, $0.01 worse than the Thomson Reuters consensus of $0.52; revenues rose 8.3% year/year to $1.6 bln vs the $1.61 bln consensus. Sales in the Display Technologies segment were $645 million, declining 23% sequentially and 5% YoY. Volume at the co's wholly owned business declined about 25% sequentially and 5% year over year. Display Technologies' performance benefited from a favorable Japanese yen-to-U.S. dollar exchange rate in the quarter. Glass price declines in the third quarter were comparable to the second quarter. "We have seen a modest increase in utilization rates at the Taiwanese panel makers in October. We believe this is in response to lower panel inventory levels and expectations for good worldwide retail demand during the upcoming holiday season. Our glass demand forecast is based on the assumption panel maker utilization rates will remain modestly higher the remainder of the fourth quarter in comparison to a much weaker September. However, panel maker utilization rates this quarter may not rebound to the level they were prior to the inventory correction. As a result, we anticipate worldwide glass market demand could be flat to down slightly quarter to quarter. The co expects the movement in combined glass volume at both its wholly owned business and SCP to be in line with the market in the fourth quarter. We expect glass pricing at both our wholly owned business and SCP to decline in the mid-single digit range in the fourth quarter. This decline would be more than previous quarters and reflects pricing pressure caused by the current imbalance of glass supply and demand." Co lowers FY10 cap-ex to $1.0 bln from $1.2 bln.

7:01AM Anadigics beats by $0.02, beats on revs (ANAD) 6.79 : Reports Q3 (Sep) earnings of $0.06 per share, $0.02 better than the Thomson Reuters consensus of $0.04; revenues rose 66.9% year/year to $61.3 mln vs the $57.6 mln consensus.

07:40 am Cisco Systems ests raised at Oppenheimer; FY1Q11 sales tracking ahead of expectations: . Oppenheimer notes, based on its checks, it believes Cisco's FY1Q11 (October) sales are tracking ahead of expectations. The channel's FY2Q11 outlook is also positive (US and Europe) and Opco is raising its estimates given the strength in near-term demand. With that said, its cautious stance on Cisco's core switching and routing businesses remains unchanged. The channel noted tough competition from HPQ and JNPR and believes switching is the area the vendors are making the strongest inroads against Cisco. 2011 EPS est to $1.73 from $1.70; 2012 est to $1.85 from $1.80 ($1.73/$1.98 consensus).

09:57 am JKS Guides Q4 Revs Well Above Consensus (JKS)

JinkoSolar Holding (JKS 34.57 +4.42) reports third quarter earnings of $1.75 per share, $0.79 better than the Thomson Reuters consensus of $0.96.

Revenues rose 260% year-over-year to $215 mln, notably higher than the $153.3 mln Thomson Reuters consensus.

For its fourth quarter, the company issued revenues guidance of $210 million to $220 million, well above the $162.44 million Thomson Reuters consensus.

Also, for the fourth quarter of 2010, JinkoSolar expects total solar product shipments to be in the range of 130 MW to 140 MW with module shipments expected to be between 100 MW to 110 MW.

Based on the current operating conditions, the Company raises its full year 2010 total solar product shipments guidance to an estimated range of 448 MW to 458 MW, from its earlier guidance of 395 MW to 415 MW, with module shipments expected to be in an estimated range of 257 MW to 267 MW for the full year 2010, as compared to its earlier guidance of 195 MW to 205 MW.

09:44 am GLW Q3 Earnings Miss Mark (GLW)

Corning (GLW 18.56 +0.28) reports Q3 (Sep) earnings of $0.51 per share, $0.01 worse than the Thomson Reuters consensus of $0.52.

Revenues rose 8.3% year-over-year to $1.6 billion, in-line with the $1.61 billion consensus.

Sales in the Display Technologies segment were $645 million, declining 23% sequentially and 5% year-over-year. Volume at the co's wholly owned business declined about 25% sequentially and 5% year over year. Display Technologies' performance benefited from a favorable Japanese yen-to-U.S. dollar exchange rate in the quarter. Glass price declines in the third quarter were comparable to the second quarter.

The company said, "We have seen a modest increase in utilization rates at the Taiwanese panel makers in October. We believe this is in response to lower panel inventory levels and expectations for good worldwide retail demand during the upcoming holiday season. Our glass demand forecast is based on the assumption panel maker utilization rates will remain modestly higher the remainder of the fourth quarter in comparison to a much weaker September. However, panel maker utilization rates this quarter may not rebound to the level they were prior to the inventory correction. As a result, we anticipate worldwide glass market demand could be flat to down slightly quarter to quarter. The co expects the movement in combined glass volume at both its wholly owned business and SCP to be in line with the market in the fourth quarter. We expect glass pricing at both our wholly owned business and SCP to decline in the mid-single digit range in the fourth quarter. This decline would be more than previous quarters and reflects pricing pressure caused by the current imbalance of glass supply and demand."

The company lowered its fiscal year 2010 CapEx to $1.0 billion from $1.2 billion.
icon url

ReturntoSender

11/02/10 9:15 PM

#9114 RE: ReturntoSender #6755

From Briefing.com: 4:30 pm : Steady support gave stocks strong gains Tuesday, but resistance capped the climb.

The dollar was the primary driver of today's action. It slid to a 0.7% loss as the euro rallied in the wake of some strong eurozone PMI manufacturing data that overshadowed wider yield spreads on riskier debt of countries like Greece.

There was no domestic data posted today, but a barrage of reports begins tomorrow. Tomorrow also brings the latest FOMC policy statement, which is widely expected to include plans for further quantitative easing. Though the size and scope of any such plan are not known, the market's reaction to the announcement will be telling of whether there is confidence in the Fed's efforts to keep away a double dip.

With the dollar down markedly ahead of tomorrow's events, stocks were able to attract a broad bid that propped up all 10 major sectors. What is more, the buying effort drove the S&P 500 back to within one point of its five-month high before it encountered formidable resistance in the 1195 to 1196 zone. Though the stock market failed to set a new multi-month intraday high, it did book its best close since early May.

Of the major sectors, defensive-oriented utilities actually settled with the strongest gain. The sector's 1.2% gain came after it had underperformed in the prior session.

With a 1.1% gain energy stocks were not far behind. The sector was led by oil and gas explorers (+1.5%) and oil and gas equipment plays (+1.4) amid a 1.2% rise in oil prices to $83.90 per barrel. BP Plc (BP 41.42, +0.65) outperformed after it posted an upside earnings surprise.

Dow component Pfizer (PFE 17.45, -0.17) posted better-than-expected earnings of its own and issued in-line guidance, but were out of favor for all but the first few minutes of the session.

Financials managed only a modest 0.3% gain. The sector was partly hampered by weakness among bank stocks, which collectively fell to a 0.2% loss after analysts at Moody's downgraded U.S. regional banks' supported ratings. Participation was unimpressive once again.

Fewer than 1 billion shares changed hands on the NYSE this session. That made it clear that many investors would rather wait on the sidelines to see the midterm election results, hear the Fed's latest take on and plans for the economy, and assess jobs data at the end of the week.

Advancing Sectors: Utilities (+1.2%), Consumer Discretionary (+1.1%), Energy (+1.1%), Telecom (+0.9%), Materials (+0.9%), Tech (+0.9%), Health Care (+0.8%), Industrials (+0.8%), Consumer Staples (+0.4%), Financials (+0.3%)
Declining Sectors: (None)DJ30 +64.10 NASDAQ +28.68 NQ100 +1.1% R2K +2.1% SP400 +1.1% SP500 +9.19 NASDAQ Adv/Vol/Dec 1948/1.93 bln/702 NYSE Adv/Vol/Dec 2209/913 mln/772

4:37PM Universal Display and Acuity Brands (AYI) announce $2 million U.S. Department of Energy SBIR Phase III contract to demonstrate prototype phosphorescent OLED lighting system for commercial application (PANL) 26.49 +0.74 :

4:11PM STEC Inc beats by $0.11, beats on revs; guides Q4 EPS above consensus, revs in-line (STEC) 15.32 : Reports Q3 (Sep) earnings of $0.31 per share, $0.11 better than the Thomson Reuters consensus of $0.20; revenues fell 12.4% year/year to $86.1 mln vs the $79.4 mln consensus. Non-GAAP gross profit margin was 46.5% for the third quarter of 2010, vs 43.9% consensus, compared to 49.8% for the third quarter of 2009 and 42.7% for the second quarter of 2010. Co issues guidance for Q4, sees EPS of $0.31-0.33 vs. $0.25 Thomson Reuters consensus; sees Q4 revs of $88-90 mln vs. $88.48 mln Thomson Reuters consensus. "As evidence of our progress, we have made significant strides towards qualifying our ZeusIOPS SSDs with a SAS interface at two of our large OEM customers. In line with the storage industry's trend towards SAS interface technology, we are seeing an increase in orders of SAS interface SSDs. As a result, we now believe that sales of our SAS based ZeusIOPS SSDs could approach 40% of STEC's total ZeusIOPS revenue for the fourth quarter of 2010."

4:04PM FEI beats by $0.06, reports revs in-line; guides Q4 EPS above consensus, revs above consensus (FEIC) 21.84 +0.45 : Reports Q3 (Sep) earnings of $0.31 per share, ex-items, $0.06 better than the Thomson Reuters consensus of $0.25; revenues rose 4.8% year/year to $153 mln vs the $153.8 mln consensus. Co issues upside guidance for Q4, sees EPS of $0.36-$0.41, ex-restructuring items, vs. $0.31 Thomson Reuters consensus; sees Q4 revs of $167-$175 mln vs. $162.96 mln Thomson Reuters consensus.

4:03PM Nanometrics reports EPS in-line, revs in-line (NANO) 14.18 +1.02 : Reports Q3 (Sep) earnings of $0.53 per share, in-line with the Thomson Reuters consensus of $0.53; revenues rose 6.1% year/year to $53.9 mln vs the $53.7 mln consensus.

icon url

ReturntoSender

11/05/10 12:59 AM

#9116 RE: ReturntoSender #6755

From Briefing.com: 4:30 pm : Strong, broad-based buying one day after the Fed unveiled plans for further quantitative easing sent stocks sharply higher, such that the three major equity averages set fresh 2-year highs.

Yesterday's unveiling of the Fed's plan to purchase another $600 billion of longer-term Treasuries reflected its accommodative stance. That helped spur overseas markets higher and drove down the dollar, which fell to a new 2010 low before it was quoted with a 0.5% loss at the close of trade.

Such supportive themes for stock prices helped the S&P 500 and Nasdaq Composite make their biggest spike in about four weeks. The Dow booked its best gain in two months.

Commodity and resource-linked stocks led for most of the session. Strength in that space helped the energy sector climb 3.0% and the materials sector ascend 3.3%.

Their strength was shared in the commodity pits, where December contracts for silver surged 6.2% to settle at $26.04 per ounce. Prior to that silver set a fresh 30-year high at $26.10 per ounce. December contracts for gold rallied 3.4% to close at $1383.10 per ounce. It set a new all time high of $1384.80 per ounce. Such strength helped the CRB Commodity Index hit a new two-year high with a 2.4% spike. That was its third biggest spike by percent this year.

Financials boasted the biggest gains of the session, however. The sector surged 3.4% as bank stocks bounded in response to broader market support and headlines that the Fed will give stronger, better capitalized banks the ability to raise dividends, even though many already have the ability to raise dividends.

Many investors were also pleased to hear that President Obama is open to discussing an extension of former President Bush's tax cuts for all incomes. There was not a dramatic reaction among stocks, though, since stocks had already moved sharply higher by the time the headline crossed newswires.

Earnings had no real influence over broader market action this session, mostly because there were no bellwethers or stalwarts in the bunch. That will likely be the case again tomorrow.

Economic data was generally disregarded, too. Initial jobless claims for the week ended October 30 totaled 457,000, which is greater than the 445,000 initial claims that had been expected, on average, among economists polled by Briefing.com. The latest tally marked a week-over-week increase of 20,000. As for continuing claims, they fell to 4.34 million from 4.38 million in the prior week. The weekly data precedes tomorrow's official nonfarm payrolls report for October.

Nonfarm productivity in the third quarter increased by 1.9%, which is better than the 0.9% increase that had been widely expected. Third quarter unit labor costs actually fell 0.1% when they were expected to increase 1.0%.

Trading volume on the NYSE hit its highest level in two weeks as money moved in from the sidelines. However, it is still too early to tell whether this session's surge was enough to attract retail investors back to action.

The positive tone to trade caused the Volatility Index (VIX) to drop for the third straight session for a cumulative loss of 15%. That has the VIX back near the six-month low that it set just a couple of weeks ago.

The benchmark 10-year Note had another strong session, thanks to momentum from news yesterday that the Fed's plan to purchase Treasuries will include those with maturities that range from two years to 10 years. The yield on the 10-year Note is now down to 2.48% after it had been almost as high as 2.73% just last week.

Advancing Sectors: Financials (+3.4%), Materials (+3.3%), Energy (+3.0%), Industrials (+2.2%), Tech (+1.6%), Consumer Discretionary (+1.6), Telecom (+1.4%), Consumer Staples (+1.2%), Utilities (+1.0%), Health Care (+0.4%)
Declining Sectors: (None)DJ30 +219.71 NASDAQ +37.07 NQ100 +1.4% R2K +2.6% SP400 +1.9% SP500 +23.10 NASDAQ Adv/Vol/Dec 2002/2.53 bln/662 NYSE Adv/Vol/Dec 2515/1.38 bln/492

5:09PM Microchip declares record quarterly cash dividend; increases dividend to 34.4 cents per share; accelerates dividend for the following quarter (MCHP) 33.95 +1.08 : Co announces that its Board of Directors has declared a quarterly cash dividend on its common stock of 34.4 cents per share. The dividend is payable on December 2, 2010, to stockholders of record on November 18, 2010. Microchip will accelerate its dividend payment from March 2011 into late December 2010. The Board of Directors has declared this cash dividend on its common stock of 34.5 cents per share. This dividend is payable on December 27, 2010, to shareholders of record on December 13, 2010. After this payment, Microchip's next dividend payment is expected to be in June 2011.

4:29PM Microchip reports Q3 results (MCHP) 33.95 +1.08 : Reports Q2 (Sep) earnings of $0.63 per share, $0.05 better than the Thomson Reuters consensus of $0.58; revenues rose 68.6% year/year to $382.3 mln vs the $341.9 mln consensus. Co issues guidance for Q3, sees EPS of $0.55-0.59 vs. $0.59 Thomson Reuters consensus; sees Q3 revs of $351.7-374.6 mln vs. $347.31 mln Thomson Reuters consensus.

5:09PM Skyworks beats by $0.03, beats on revs; guides DecQ EPS above consensus, revs above consensus (SWKS) 23.68 +0.93 : Reports Q4 (Sep) earnings of $0.43 per share, excluding non-recurring items, $0.03 better than the Thomson Reuters consensus of $0.40; revenues rose 37.3% year/year to $313.3 mln vs the $309.7 mln consensus. Co issues upside guidance for Q1 (Dec), sees EPS of $0.44, excluding non-recurring items, vs. $0.42 Thomson Reuters consensus; sees Q1 revs of $330-335 mln vs. $326.9 mln Thomson Reuters consensus.

4:25PM Atmel beats by $0.06, beats on revs (ATML) 8.93 +0.08 : Reports Q3 (Sep) earnings of $0.18 per share, excluding non-recurring items, $0.06 better than the Thomson Reuters consensus of $0.12; revenues rose 39.8% year/year and 13% sequentially to $444.3 mln vs the $427.6 mln consensus.

4:17PM ON Semiconductor to Further Expand Facility in Pocatello, Idaho; $15.7 million expansion further increasing capacity and production at the eight-inch wafer fab (ONNN) 8.00 +0.15 : Co announces plans to install another $15.7 million worth of production equipment in its eight-inch Pocatello, Idaho, wafer manufacturing facility during the next six months. This investment is in addition to the company's announcement in June of an $11 million equipment expansion.

4:10PM Coherent beats by $0.05, reports revs in-line (COHR) 44.46 +0.12 : Reports Q4 (Sep) earnings of $0.69 per share, excluding non-recurring items, $0.05 better than the Thomson Reuters consensus of $0.64; revenues rose 54.6% year/year to $166.4 mln vs the $168 mln consensus.

4:08PM TTM Tech beats by $0.15, beats on revs; guides Q4 EPS above consensus, revs in-line (TTMI) 11.40 +0.52 : Reports Q3 (Sep) earnings of $0.43 per share, $0.15 better than the Thomson Reuters consensus of $0.28; revenues rose 15.3% year/year to $357.8 mln vs the $350.2 mln consensus. Co issues mixed guidance for Q4, sees EPS of $0.35-0.42 vs. $0.31 Thomson Reuters consensus; sees Q4 revs of $351-367 mln vs. $362.38 mln Thomson Reuters consensus.

4:02PM Rubicon Tech beats by $0.04, reports revs in-line; guides Q4 EPS above consensus, revs in-line (RBCN) 25.31 +0.92 : Reports Q3 (Sep) earnings of $0.35 per share, $0.04 better than the Thomson Reuters consensus of $0.31; revenues rose 259.6% year/year to $20.5 mln vs the $20.7 mln consensus. Co issues mixed guidance for Q4, sees EPS of $0.47-0.49 vs. $0.39 Thomson Reuters consensus; sees Q4 revs of $25-27 mln vs. $24.98 mln Thomson Reuters consensus.

8:09AM Vishay prices of its offering of $275 million principal amount of 2.25% convertible senior debentures due 2040 (VSH) : Co announces the pricing of its offering of $275 mln principal amount of 2.25% convertible senior debentures due 2040. The sale is expected to close Nov. 9, 2010. Interest will be payable on the debentures semi-annually at a rate of 2.25% per annum. In addition to ordinary interest, beginning on Nov. 15, 2020, contingent interest will accrue in certain circumstances relating to the trading price of the debentures and under certain other circumstances. The debentures will be initially convertible, subject to certain conditions, into cash, shares of VSH's common stock or a combination thereof, at VSH's option, at an initial conversion rate of 72.0331 shares of common stock per $1,000 principal amount of debentures. This represents an initial effective conversion price of approx $13.88/share. This initial conversion price represents a premium of 12.5% to the closing price of VSH's common stock on Nov 3, which was $12.34/share.

09:36 am Apple initiated with a Outperform at Robert W. Baird; tgt $410: . Apple was initiated with a Outperform at Robert W. Baird; tgt $410. Firm notes co has established itself as the unabashed premium provider in the burgeoning smartphone market. It expects the co to further expand its market position, while also capitalizing on a number of newer growth initiatives, including the iPad, which is opening another huge market. It views co as having an attractive valuation, despite the strong stock move.

09:34 am Qualcomm upgraded to Neutral at MKM Partners; tgt raised to $55: . MKM Partners upgrades QCOM to Neutral from Sell and raises their tgt to $55 from $30 based on 4QFY10 results and strong guidance for 1QFY11 and FY11. Firm says they clearly underestimated QCOM's ability to shrug off LG's and Sony Ericsson's volume weakness and overestimated the impact of Samsung's baseband orders from Infineon.

09:49 am QCOM Guides FY11 Above Consensus (QCOM)

Qualcomm (QCOM 49.03 +3.34) reported fourth quarter earnings of $0.68 per share, excluding non-recurring items, $0.09 better than the Thomson Reuters consensus of $0.59.

Revenues rose 9.7% year-over-year to $2.95 billion versus the $2.85 billion consensus.

For the first quarter, the company guides earnings in the range of $0.70 to $0.74 per share, excluding non-recurring items, versus $0.64 Thomson Reuters consensus. On the top line, the company expects to earn revenues of $3.05 billion to $3.35 billion versus the $2.99 billion Thomson Reuters consensus.

For fiscal year 2011, the company expects earnings to fall between $2.63 to $2.77, excluding non-recurring items, above the $2.59 Thomson Reuters consensus, while revenues are expected to be $12.4 billion to $13.0 billion versus the $12.1 billion Thomson Reuters consensus.
icon url

ReturntoSender

11/07/10 6:03 PM

#9118 RE: ReturntoSender #6755

Monday Morning Outlook: DJIA, SPX, Nasdaq at Two-Year Highs
Traders applaud election results, new Fed stimulus

by Todd Salamone 11/6/2010 10:30 AM

http://www.schaeffersresearch.com/commentary/observations.aspx?ID=103332

"Don't Fight the Fed," read the headline on Page 1 of The Wall Street Journal on Friday. The bulls agreed and the Dow Jones Industrial Average powered ahead 2.9% last week, finishing above 11,400. All three of the major market indexes are at year-to-date highs and at levels not seen since September 2008. Looking ahead, Todd Salamone, Senior Vice President of Research, observes that "for now, bulls are in control," but warns "anything can happen anytime," and advises keeping hedges in place. Next, Senior Quantitative Analyst Rocky White wonders whether money managers try to "catch up" in the last two months of the year by chasing stocks that have done well in the first 10 months. If so, the added buying pressure could provide yet another boost for these outperformers. But Rocky's survey finds a mixed bag of results. Finally, we wrap up with a look at some key economic and earnings reports slated for release this week.

Recap of the Previous Week: Fed Lights the Fuse
Schaeffer's Editorial Staff

The elections set the table, and the Fed lit the fuse, to mix a metaphor.

After treading water in the early part of the week while waiting for the Fed and election results, the Dow Jones Industrial Average soared more than 200 points on Thursday, with traders evidently approving both the Fed's restart of the money machine and the prospects of legislative gridlock in Washington, D.C. Thursday's bull rush put the Dow well above the April highs, and also reclaimed territory not explored since the fall of Lehman Brothers in September 2008.

Traders hit the "pause" button ahead of the news. Although the market was encouraged by manufacturing data out of China and the U.S. on Monday, and the Dow traded in a 182-point range throughout the day, it settled barely in the black, with a gain of 0.06%. The bulls proved a little more resilient on Tuesday, and the Dow climbed 0.58%.

The cavalry arrived Wednesday, as the midterm results became clear. Republicans repainted the electoral map red, easily taking control of the House of Representatives, and putting a dent in the Democrats' lead in the Senate. President Obama himself pronounced it a "shellacking." Then the Fed weighed in early in the afternoon with its plan for another round of monetary stimulus. The initial reaction was muted: Despite a brief spike and an equally brief slump immediately following the Fed announcement, the Dow meandered to a modest advance of 0.24%. Even so, both the Dow and the Nasdaq Composite (COMP) settled at two-year highs.

After a night to sleep on the meaning of it all, traders apparently decided Wednesday's news was pretty darn good. The Dow rocketed nearly 200 points right out of the gate on Thursday, and traders were unfazed even by an increase in new jobless claims. Retail sales reports also boosted sentiment, with consumers apparently more willing to loosen the purse-strings. By the close, the Dow recorded a 220-point advance, or 1.96%. The S&P 500 Index (SPX) and the COMP also settled at pre-Lehman levels, with the SPX boasting its first finish above 1,200 since May 2010.

And on the fifth day, we rested, or so it seemed. The Labor Department reported a much better-than-expected jobs growth figure on Friday, although not enough to reduce the unemployment rate. But the bulls had put away their party hats for the week. Still, the Dow inched ahead 0.08% for the day, and climbed a very respectable 2.9% for the week. The SPX, meanwhile, did even better, adding 3.6% for the week, while the COMP motored ahead 2.9%.

What the Trading Desk Is Expecting: Sideline Cash Could Extend Rally
By Todd Salamone, Senior Vice President of Research

"The lower expectations with respect to QE2, and a growing consensus that there is little post-event upside for stocks, could have bullish implications, to the extent that traders have acted on this perception by moving to the sidelines. Such actions coincidentally put a cap on the market, which we have witnessed during the past couple of weeks. But the actions might also generate a lower probability of a 'buy the rumor, sell the news' scenario developing and, in turn, increase the chances of a 'buy the news' situation if the expected outcomes come to fruition... the cautious tone among some investors may set up a year-end rally in the absence of a major disappointment next week."
Monday Morning Outlook, Oct. 30, 2010

Traders and investors braced for a "sell the news" reaction in the stock market, but much to their surprise, the news -- Republicans gained control of the House and the Fed announced $600 billion in Treasury purchases (QE2) -- sparked a major rally in U.S. indexes last week. In fact, the S&P 500 Index (SPX) pushed above potential resistance from its 80-month moving average for the first time since September 2008. Moreover, the index closed the week above its April 2010 high of 1,219.80.

Skepticism still prevails, particularly as it relates to Fed policy and the impact it will have on the economy. Technicians continue to preach caution, with worries about the high percentage of stocks trading above their 50-day moving average, thin volume, low realized volatility and a steep CBOE Market Volatility Index futures curve, although our research suggests the futures curve has a sketchy track record in predicting declines.

For now, bulls are in control, and there is a plethora of sideline cash from those who moved to the sidelines, anticipating a "sell the news" reaction to last week's events. Now, fund investors and under-invested long/short hedge funds stand ready to buy pullbacks, perhaps feeling the urge to play "catch up" as the year-end clock is only weeks away. Moreover, after 26 consecutive weeks now of outflows from domestic equity funds, one has to wonder if the retail investor will finally get bold enough to support the advance?

It appears many have missed out on the advance, as the majority of the SPX's move, from 1,125 in mid-September to the present 1,225, occurred over only about seven trading days, those unshaded in the graph below. Emotions of feeling "left out" could lay the foundation for a year-end rally.


Short covering related to expiring index and exchange-traded fund (ETF) put positions, which act as portfolio protection, could also work in favor of the bulls. With expiration of these options only two weeks away and a few major calendar events behind us, this short covering could be an additional market driver in the weeks ahead. As mentioned last week, the iShares Russell 2000 Index (RUT) experienced a major buildup of put open interest in the last few weeks, as a cautious tone hovered over the market. The strikes with heavy put open interest could also work against the bulls, if unforeseen negative news hits the market, as such strikes tend to act like magnets when sellers predominate. At present, however, the open interest configurations on major indexes and ETFs is bullish.


Working in favor of the bears is our "VIX Premium" indicator, which compares the level of the CBOE Market Volatility Index (VIX) to actual 20-day SPX historical volatility. Last week, the VIX traded at more than a 140% premium to the SPX's 20-day realized volatility. The difference in the two has since narrowed, but since early 2009, when the difference narrows from extreme levels, a market pullback soon followed. One difference from the past is that the VIX premium most recently exploded higher during a two-week trading range, whereas previously, it exploded higher during a rally.

As always, we are open to the fact that "anything can happen anytime." Therefore, continue to emphasize your long exposure, and keep your portfolio protection in place.


If you enjoy Monday Morning Outlook...

...why not check out Opening View, our daily preview of market activity? Each morning, we analyze the prior day, review the overnight markets, and monitor the morning wires to give you our special Schaeffer's take on the action, before the opening bell. Sign up here to have Opening View delivered straight to your inbox every morning.

Prepare for the investing week ahead. Every week, Bernie Schaeffer and his staff provide you with their insight about what has happened and, more importantly, what will happen in the market. We dig deep and show you what's happening behind the scenes, and tell you which indicators are predicting major market moves. If you enjoyed this week's edition of Monday Morning Outlook, sign up here for free weekly delivery straight to your inbox.

Indicator of the Week: Outperformers in the Last Two Months of the Year
By Rocky White, Senior Quantitative Analyst

Foreword: The S&P 500 Index (SPX) is up almost 10% this year, so money managers will be expected to post very impressive gains for 2010. The index is a popular yardstick by which funds are judged. It does not look good for a fund to underperform this benchmark. To avoid such embarrassment, you may have a lot of funds scrambling to catch up in the last two months of this year. How will they do that? One possibility is that they'll throw money at the high-flying stocks in hopes they'll keep flying right through the end of the year. That could mean those outperformers will continue to outperform in the next couple of months. In today's article, I test this theory by looking back over the last several years.

Valid Theory?: The theory is that money managers trying to "catch up" to a hot market, i.e., one that has performed well during the first 10 months of the year, will pump money into the high flyers in the final two months. To test this, I focused on years where the S&P 500 was up significantly through October. After applying some liquidity criteria, I broke down all the stocks into five brackets, depending on their return from January through October. Bracket No.1 includes those stocks with the lowest returns January through October. Bracket No. 2 includes the next worst performers -- and so on, until you get to bracket No. 5, which includes the stocks that performed the best.

Below is a table showing the data for 2009. The top performers, January through October, are in bracket No. 5 at the bottom of the table. Just as our theory would predict, those stocks did in fact perform the best over the last two months of the year. They averaged a return of about 15% (median of 13.4%). This was better than any of the other four brackets. The worst grouping of stocks was in the second bracket.

SPX 2009 returns for November through December


I didn't include 2008 because the market tanked all year, so a key criteria for our study, a strong performing benchmark, wasn't met. Below is the data for 2007. The market was up over 9% through October, which is about the time the market began to weaken before the 2008 crash. The S&P 500 was down about 5.2% for the remainder of the year, so no bracket shielded an investor from losses. However, if you had to have money in the market, those January-October outperformers were the best place to be. The fourth bracket was the only one that outperformed the S&P 500 (down 4.2% vs. the SPX down 5.2%). The bracket of best-performing stocks through October (bracket No. 5) was the next best bracket to be in.

SPX 2007 returns for November through December


The year 2006 again supports our theory. Bracket No. 5 was the top-performing bracket from November through December of that year.

SPX 2006 returns for November through December


I skipped 2004 and 2005 because the SPX was down or up only moderately those years through October. But in 2003 the index gained almost 20% through the first 10 months. However, this year our theory does not hold up. Not even close. The worst stocks through October were the best stocks for the rest of that year. The fifth bracket was awful at the end of 2003. All other brackets saw an average stock gain of at least 5%, but the fifth bracket had an average return that was negative.

SPX 2003 returns for November through December


Implications:– The last few times that the SPX was up significantly through October, we saw the stocks that performed well up to that point had a tendency to outperform other stocks in the last two months as well. Fund managers buying these stocks trying to catch up with the market may have contributed to this effect. However, it doesn't seem to be an infallible green light to dump money into big returning stocks this year. We would suggest taking the approach of our Expectational Analysis. However, below are the 25 S&P 500 stocks that have had the best return year-to-date. This list could be a good place to start.


This Week's Key Events:
Schaeffer's Editorial Staff

Here is a brief list of some of the key events this week. All earnings dates listed below are tentative and subject to change. Please check with each company's respective website for official reporting dates.

Monday
* There are no major economic reports scheduled for Monday. Frontier Communications Corp. (FTR), Sysco Corp. (SYY), Warner Chilcott Plc (WCRX ), Clean Energy Fuels Corp. (CLNE), Clear Channel Outdoor Holdings Inc. (CCO), Convergys Corp. (CVG), Eagle Bulk Shipping Inc. (EGLE), LSK Solar Co. Ltd. (LDK), priceline.com Incorporated (PCLN), Silver Wheaton Corp. (SLW) and The Warnaco Group Inc. (WRC) will report earnings.

Tuesday
* The Commerce Department will report on September wholesale inventories. Ebix Inc. (EBIX), Fossil Inc. (FOSL), hhgregg Inc. (HGG), JA Solar Holdings Co. Ltd. (JASO), K12 Inc. (LRN), Solarfun Power Holdings Co. Ltd. (SOLF), Tyco International Ltd. (TYC), Starwood Property Trust Inc. (STWD), and URS Corp. (URS) are scheduled to issue their quarterly reports.

Wednesday
* We'll get the usual weekly report on crude inventories, along with the September trade balance figures. Scheduled to report earnings are Maidenform Brands Inc. (MFB), Macy's Inc. (M), Polo Ralph Lauren Corp. (RL), Sara Lee Corp. (SLE), and Cisco Systems Inc. (CSCO)

Thursday
* The weekly initial jobless claims report comes out on Thursday. Kohl's Corp. (KSS), Tim Hortons Inc. (THI), NVIDIA Corp (NVDA), SunPower Corporation (SPWRA) and The Walt Disney Company (DIS) will report earnings.

Friday
* The University of Michigan will deliver its first reading on consumer sentiment during November. Agilent Technologies Inc. (A), D.R. Horton Inc. (DHI), J.C. Penney Company Inc. (JCP) and Wendy's Arby's Group Inc. (WEN) will report earnings.
icon url

ReturntoSender

11/08/10 8:28 PM

#9121 RE: ReturntoSender #6755

From Briefing.com: 4:25 pm : A stronger dollar restrained buying so that the stock market spent the session chopping along in the red without any clear form of leadership.

Global sales growth of 6.5% in October for McDonald's (MCD 79.31, +0.01) and more delivery delays from Boeing (BA 70.21, -1.06) represented two of the more meaningful announcements ahead of this session, but neither had any impact on broader market action.

Given the slow news flow from the corporate space and the absence of data today, participants took their cues from the dollar. The greenback sported steady gains for most of the session and was up 0.6% at the close of trade. The dollar's advance today marked an extension of the 0.9% gain that it had logged last Friday, when it bounced off of an 11-month low.

Despite the greenback's gain, commodities were able to make varied gains. That helped push the CRB Commodity Index up another 0.5% so that it extended its two-year high.

Strength in the commodities complex helped natural resource stocks of the materials sector and energy sector advance 0.2% and 0.3%, respectively.

Tech made up the only other major sector to muster a gain as Cisco (CSCO 24.39, +0.13) attracted support ahead of its quarterly announcement on Wednesday. As a group tech stocks settled just 0.1% higher. Still, that was enough for the Nasdaq Composite to eke out a fractional gain. The tech-rich index has now advanced for five straight sessions and for 20 of the past 23 sessions.

Financials fell under renewed selling pressure after the sector had outperformed in each of the three previous sessions. Coming off of a near 7% weekly gain, financials fell to a 0.8% loss today. Insurers weighed most heavily on the sector.

Treasuries had a lackluster session that saw the benchmark 10-year Note slip a few ticks and the 30-year Bond pick up a few ticks. Their yields settled at about 2.55% and 4.11%, respectively. Results from an auction of 3-year Notes featured a bid-to-cover ratio of 3.26, dollar demand of $104.3 billion, and an indirect bidder participation rate of 35.0%.

Advancing Sectors: Energy (+0.3%), Materials (+0.2%), Tech (+0.1%)
Declining Sectors: Financials (-0.8%), Utilities (-0.6%), Consumer Staples (-0.3%), Telecom (-0.3%), Health Care (-0.3%), Industrials (-0.3%), Consumer Discretionary (-0.1%)DJ30 -37.24 NASDAQ +1.07 NQ100 +0.1% R2K +0.0% SP400 -0.1% SP500 -2.60 NASDAQ Adv/Vol/Dec 1279/1.80 bln/1375 NYSE Adv/Vol/Dec 1354/908 mln/1609

4:31PM JA Solar Announces Additional 600MW of Solar Product Supply Agreements for 2011 Delivery (JASO) 9.41 -0.02 : Co announced that it has signed several additional supply agreements with multiple customers to provide more than 600MW of solar power products for 2011 delivery. To date, total signed supply agreements for delivery in 2011 exceeds 1.2GW. In addition, JA Solar has received prepayments associated with these customer orders. "Business momentum continues to be strong, with robust demand from existing and new customers across multiple geographies," said Dr. Peng Fang, CEO of JA Solar. "Visibility of customer demand remains high and major client indications give us increased confidence in the prospect for 2011... Note: Co reports earnings tomorrow morning before the open.

4:19PM Diodes beats by $0.02, reports revs in-line; guides Q4 revs in-line (DIOD) 23.22 -0.08 : Reports Q3 (Sep) earnings of $0.51 per share, $0.02 better than the Thomson Reuters consensus of $0.49; revenues rose 33.6% year/year to $163.1 mln vs the $162.8 mln consensus. Co issues in-line guidance for Q4, sees Q4 revs of $160-168 mln vs. $162.46 mln Thomson Reuters consensus. Co also sees Q4 gross margin to be comparable to the third quarter level and operating expenses are anticipated to be comparable to third quarter levels on a percent of revenue basis. They expect income tax rate for the fourth quarter to range between 17 and 23 percent. Shares used to calculate GAAP EPS for the fourth quarter are anticipated to be approximately 46.3 million.

4:10PM LDK Solar beats by $0.29, beats on revs; guides Q4 revs above consensus; guides FY11 revs above consensus (LDK) 13.49 +0.31 : Reports Q3 (Sep) earnings of $0.72 per share, $0.29 better than the Thomson Reuters consensus of $0.43; revenues rose 19.5% year/year to $675.6 mln vs the $628.1 mln consensus. Gross margins increased to 22% from 18%. Co issues upside guidance for Q4, sees Q4 revs of $710-750 mln vs. $593.54 mln Thomson Reuters consensus. wafer shipments between 580 MW and 600 MW, and module shipments between 120 MW and 130 MW, in-house polysilicon production between 1,700 MT and 1,900 MT, in-house cell production between 20 MW and 23 MW and gross margin between 24% and 26%. For fiscal 2011, LDK Solar expects its revenue to be in the range of $2.9 billion to $3.3 billion, Briefing.com consensus $2.16 bln with wafer shipments between 2.5 GW and 2.8 GW and module shipments between 700 MW and 800 MW, in-house polysilicon production between 9,000 MT and 10,000 MT, in-house cell production between 400 MW and 500 MW and gross margin between 22% and 28%.

8:01AM Suntech Power will supply 9.43MW of solar panels and technical support for the second phase of a 44MW solar power plant in Thailand (STP) 9.30 : Co will supply 9.43MW of solar panels and technical support for the second phase of a 44MW solar power plant (38MW AC output) in Thailand. Owned by Bangchak Petroleum Public Co., Ltd., and integrated by Solartron Public Co., Ltd., the landmark solar power plant will be one of the largest in Thailand and Southeast Asia. The 9.43MW contract comes after Suntech was chosen to provide 34.5MW of solar panels and technical support for the project's first phase, announced in August 2010. With groundwork construction underway, the complete 44MW capacity solar power plant remains on schedule to be grid-connected by late-2011.

Marvell (MRVL) announced the co will unveil its quad-core processing, enterprise-class cloud computing platform, Marvell ARMADA XP. The ARMADA XP is the fastest ARM processor available on the market today for enterprise class applications... Acacia Research Corporation (ACTG) announced that a subsidiary has acquired rights to patents for power management technology within integrated circuits....

6:02AM GT Solar to repurchase and retire 26.5 million shares from private equity investors at ~$7.66 per share (SOLR) 8.84 : Co announces that the company has entered into a definitive agreement to repurchase shares of common stock from GT Solar Holdings, LLC whose members include all of the Company's private equity investors. Under the terms of this agreement, co has agreed to purchase 26.5 million shares of its common stock at a price of approximately $7.66 per share for a total purchase price of approximately $203 million. The share repurchase is expected to close on or before November 12, 2010. As a result of the repurchase, the company's shares outstanding are expected to be reduced from approximately 151 million to approximately 124 million. The company will use its available cash to initially fund the transaction. Following the repurchase of these shares, the company expects to have over $110 million in cash and cash equivalents and short-term investments. In connection with the repurchase, the company obtained a commitment from Credit Suisse for a senior secured credit facility of up to $200 million.

3:02AM Advanced Semi announces Oct consolidated net revenues +89.7% YoY to NT$16,908 mln (ASX) 4.67 :

2:06AM United Micro net sales for October +15.09% YoY to NT$10,700,048 (UMC) 3.17 :

09:39 am SOLR Raises FY11 Guidance (SOLR)

GT Solar (SOLR 9.46 +0.62) reported second quarter earnings of $0.28 per share, $0.04 better than the Thomson Reuters consensus of $0.24.

Revenues rose 120% year-over-year to $244.6 million, well above the $199.2 million consensus.

For its fiscal year 2011, the company raised guidance its earnings guidance to $1.00 to $1.10 per share, above the $0.93 Thomson Reuters consensus, up from $0.90 to $1.00.

On the top line, the company sees revenues falling in the range of $775 million to $850 million, above the $753.02 million Thomson Reuters consensus, up from $700 million to $775 million.

Operating margin for the quarter was 29.9 percent of revenue, compared to 20.0 percent of revenue in the first fiscal quarter and 14.8 percent in the second quarter of fiscal 2010.

In a separate release, the company announced it will repurchase and retire 26.5 million shares from private equity investors at approximately $7.66 per share.

icon url

ReturntoSender

11/09/10 10:26 PM

#9122 RE: ReturntoSender #6755

From Briefing.com: 4:30 pm : Stocks fell to a marked loss as the dollar reversed an early loss to stage its third straight advance.

For the first time since August the greenback has gained ground against competing currencies in three straight days of trade. The latest advance, which netted the greenback a 0.9% gain after it had been down as much as 0.4%, has the dollar up 2.8% from the 2010 low that it set just last week.

There were no market moving announcements from any widely-held companies and data for today was of little consequence, so action among stocks remained tethered to that of the dollar. Keeping with their inverse relationship, the stock market moved lower as the dollar extended its climb into the close.

Financials were hit the hardest. The sector dove to a 2.2% loss. Of the sector's 81 members, only Marshal & Isley (MI 5.59, +0.05) and People's United (PBCT 12.56, +0.04) booked gains. Property plays were particularly weak.

Meanwhile, bond insurer Ambac Financial (ABK 0.24, -0.28) saw its share price slashed in half following news that it has filed for bankruptcy.

Materials stocks made up the next worst performing sector. The sector had actually been up as much as 0.9% as it traded with relative strength in the first half of the session, but it settled with a 1.6% loss.

Early buying among basic materials stocks was partly helped by continued strength among commodities. Precious metals were particularly strong as gold gained 0.4% to settle pit trade at $1410.10 per ounce and silver rallied 5.3% to settle at $28.91 per ounce. Prior to the close of pit trade gold hit a new all time high of $1424.30 per ounce and silver set a fresh 30-year high of $29.34 per ounce. Both rolled over in electronic trade, though.

Though precious metals prices were pushed lower after the close of pit trade and the dollar staged a strong rally, the CRB Commodity Index continued its climb with a 1.2% gain to a new two-year high. The CRB has booked nine consecutive gains.

Treasuries failed to attract any support today. In fact, they encountered increased pressure after results from an auction of 10-year Notes were released. The auction drew a bid-to-cover ratio of 2.80 on dollar demand of $67.2 billion and an indirect bidder participation rate of 56.6%. The benchmark 10-year Note fell close to a point while the 30-year Bond dropped two full points. Their yields were last quoted near 2.66% and 4.25%, respectively.

Advancing Sectors: (None)
Declining Sectors: Financials (-2.2%), Materials (-1.6%), Industrials (-0.9%), Consumer Discretionary (-0.9%), Utilities (-0.6%), Health Care (-0.5%), Consumer Staples (-0.4%), Tech (-0.3%), Energy (-0.3%), Telecom (-0.1%)DJ30 -60.09 NASDAQ -17.07 NQ100 -0.6% R2K -1.5% SP400 -1.1% SP500 -9.85 NASDAQ Adv/Vol/Dec 743/2.19 bln/1904 NYSE Adv/Vol/Dec 809/1.11 bln/2194

8:34AM Solarfun Power announces $67,843,658 follow-on public offering of ADS (SOLF) 11.47 : Co announces that it intends to offer up to an aggregate sale price of US$67,843,658 of American depositary shares, each representing five ordinary shares of the Company. Solarfun plans to use the net proceeds from the offering for capital expenditures and general working capital purposes.

7:19AM JA Solar beats by $0.13, beats on revs; riases FY10 shipment guidance (JASO) 9.41 : Reports Q3 (Sep) earnings of $0.47 per share, $0.13 better than the Thomson Reuters consensus of $0.34; revenues rose 179.9% year/year to $541 mln vs the $453.8 mln consensus. Gross margin percentage in the third quarter was 22.5 percent, exceeding our previous guidance of 20 percent. Compared with second quarter gross margin of 23.1 percent, the slight decrease in gross margin was primarily due to increase in wafer cost which was partially offset by an increase in the average selling price, as well as a change in product mix. Based on strong demand for JA Solar's products, the co is raising its outlook for FY10. The co currently expects shipments to exceed 1.45GW in 2010, compared with prior guidance of 1.35GW. Shipments in the fourth quarter of 2010 are expected to be ~450MW.

Micrel (MCRL) announced the release of SM802xxx, the first products from co's ClockWorks Flex family, the next generation of high performance programmable Clock Synthesizers...The Institute for Medical Microbiology of the University Medical Center Goettingen selects Bruker's (BRKR) MALDI Biotyper for bacterial and fungal identification...Micron Technology (MU) announced a high-density Axcell NOR flash memory device for automotive applications, strengthening its already broad portfolio of leading products and technologies for the automotive market...

09:50 am SOLF Q3 Revs Top Expectations (SOLF)

Solarfun (SOFL 10.65 -0.82) reported third quarter earnings of $0.69 per share, which may not be comparable to the Thomson Reuters consensus of $0.49.

Revenues rose 126.0% year-over-year to $326.7 million versus the $287.3 million consensus.

The company said, "ASP excluding PV module processing services to increase slightly from 3Q10. For the full year 2010, the co will also raise the shipment guidance from 750 MW to ~785 MW. For the fourth quarter of 2010, the co expects a slight decline in module shipments compared with the previous quarter. This does not reflect the strength of market demand nor the co's competitive position."

icon url

ReturntoSender

11/10/10 10:48 PM

#9123 RE: ReturntoSender #6755

From Briefing.com: 4:30 pm : Despite the dollar's longest and strongest streak of gains in months, stocks were able to recover from sizable losses to settle with varied gains. The first real dose of data in several days did little to move the market.

Amid rekindled concerns about eurozone sovereign debt the dollar climbed as much as 0.9% before it was backed down to a 0.3% gain at the close of trade. Even though that made for a rather marked retreat, the dollar still booked its fourth consecutive advance for the first time since August. Moreover, the 2.3% gained by the greenback in the past four sessions has made for the dollar's strongest four-session performance since August.

The stock market had been down about 0.8% before the dollar's downturn from its session high attracted buyers back into the market. Some short squeezing in the wake of the prior session's wobbliness aided the move.

Participants showed particular favor for financials after they had dropped more than 2% in the prior session. The sector rebounded to a 1.4% gain this session. Diversified services were especially strong as they advanced 2.3%.

Energy stocks weren't far behind. They climbed 1.3% with help from higher oil prices, which finished pit trade with a 1.3% gain at $87.81 per barrel, its highest close of the year. Though oil's advance was helped by a surprise draw down in weekly inventories, it still flew in the face of a broader pullback among commodities, including a 7.1% drop in the price of silver to $26.89 per ounce after it set a 30-year high of $29.34 per ounce in the prior session.

Research In Motion (RIMM 58.44, +3.44) helped the Nasdaq Composite modestly outperform its counterparts after it unveiled plans for its tablet. Cisco (CSCO 24.49, +0.14) was slow to attract support ahead of its quarterly report, but it still booked a gain.

Small-cap stocks registered some of the strongest gains. Collectively they climbed 1.2%, according to the Russell 2000. Its advancing issues outnumbered decliners by more than 3-to-1.

Treasuries attracted mixed interest this session. They initially sold off following the release of results from a $16 billion auction of 30-year Bonds. The auction drew a bid-to-cover of 2.31 on dollar demand of $37.0 billion and an indirect bidder participation rate of 38.4%. The relatively low bid-to-cover was related more to the increased size of auction than overall investor appetite. After the results were more fully digested Treasuries rallied such that the yield on the benchmark 10-year Note was up as much as 2.77% and down as much as 2.64%, which is about where it was when trade closed. The 30-year Bond yield was up as high as 4.33% before it closed near 4.24%.

Data for the day featured an initial jobless claims count for the week ended November 6. The report was moved a day up on the calendar due to the observance of Veterans Day tomorrow (U.S. equity markets will remain open, but U.S. bond markets will be closed). It featured new initial claims of 435,000, which is down 24,000 week-over-week and less than the 450,000 that had been generally expected among economists polled by Briefing.com. Continuing claims were also down from the prior week. They came in at 4.30 million, down from 4.39 million.

The trade deficit for September totaled $44.0 billion, which is not quite as deep as the $44.8 billion deficit that had been expected, on average, among economists polled by Briefing.com. The September deficit was down a bit from the $46.5 billion deficit recorded for August. The deficits come in stark contrast with the $27 billion surplus recently reported by China for its trade in October -- something that will likely draw discussion during the G-20 meeting that begins tomorrow.

Meanwhile, the Treasury budget for October featured a deficit of $140.4 billion, which is essentially on par with the $140.0 billion budget deficit that had been expected among economists that were polled by Briefing.com.

Advancing Sectors: Financials (+1.4%), Energy (+1.3%), Consumer Discretionary (+0.8%), Materials (+0.5%), Tech (+0.2%)
Declining Sectors: Utilities (-0.6%), Consumer Staples (-0.3%), Industrials (-0.2%), Telecom (-0.1%)
Unchanged: Health CareDJ30 +10.29 NASDAQ +15.80 NQ100 +0.5% R2K +1.2% SP400 +0.9% SP500 +5.31 NASDAQ Adv/Vol/Dec 1780/2.02 bln/867 NYSE Adv/Vol/Dec 1855/1.12 bln/1138

7:05PM SMSC announces mobile embedded controller IP license agreement with Fintek (SMSC) 26.79 +0.68 : Co entered into an agreement to license certain of its 8 bit MEC1300 mobile embedded controller intellectual property to Feature Integration Technology Inc. (Fintek), a privately held company based in Hsinchu, Taiwan. Fintek intends to utilize the technology as part of its mobile embedded controller line of products targeting notebook, netbook, smartbook and tablet platforms. As part of the agreement, SMSC will receive an undisclosed royalty associated with Fintek device sales.

4:07PM Cisco Systems beats by $0.02, reports revs in-line (CSCO) 24.49 +0.14 : Reports Q1 (Oct) earnings of $0.42 per share, $0.02 better than the Thomson Reuters consensus of $0.40; revenues rose 19.2% year/year to $10.75 bln vs the $10.74 bln consensus. Cash and cash equivalents and investments were $38.9 billion at the end of the first quarter of fiscal 2011, compared with $39.9 billion at the end of fiscal 2010; During the first quarter of fiscal 2011, Cisco repurchased 113 million shares of common stock under the stock repurchase program at an average price of $22.14 per share for an aggregate purchase; Days sales outstanding in accounts receivable (DSO) at the end of the first quarter of fiscal 2011 were 38 days, compared with 41 days at the end of the fourth quarter of fiscal 2010; Inventory turns on a GAAP basis were 11.2 in the first quarter of fiscal 2011, compared with 12.6 in the fourth quarter of fiscal 2010. "Cisco delivered solid financial results, during a challenging economic environment. While we have seen capital spending moderate in some areas of our business, our execution in the areas we can control and influence speak to the success and relevance of the company's strategy."

4:02PM Brooks Automation beats by $0.05, beats on revs (BRKS) 7.41 +0.14 : Reports Q4 (Sep) earnings of $0.38 per share, excluding non-recurring items, $0.05 better than the Thomson Reuters consensus of $0.33; revenues rose 183.3% year/year to $181.6 mln vs the $176.6 mln consensus. "Although we are starting to see moderation from the high growth levels attained during fiscal 2010, we believe that our principal served markets will remain healthy as the global economy continues to recover. Additionally, our successes with design-in wins, particularly in markets adjacent to semiconductor, will drive revenue and earnings growth for fiscal 2011."

09:39 am JA Solar target raised to $10 at Auriga U.S.A: . Auriga U.S.A raises their JASO tgt to $10 from $8 saying the co's strong 3Q report underscores its industry leading position, but near-term uncertainty surrounding 1Q seasonality will keep its multiple range-bound.
icon url

ReturntoSender

11/13/10 10:55 PM

#9124 RE: ReturntoSender #6755

From Briefing.com: Weekly Recap - Week ending 12-Nov-10The S&P 500 shed -2.2% this week, coming under pressure on increasing European sovereign debt concern, a sharp drop in Chinese shares and a profit warning from tech bellwether Cisco (CSCO). The decline breaks a five week winning streak.

Only the energy sector posted a weekly gain, up 1.0%. The other nine sectors all posted declines of at least 1.3%, with financials shedding 4.1% and tech falling 3.2%.

Shares of Cisco plunged -17.0%, acting as the main drag this week. The company posted better-than-expected fiscal first quarter earnings per share, but issued downside guidance for the second quarter and fiscal year. Cisco expects second quarter revenues to be up 3-5% and fiscal year revenues to be up 9-12%. Those forecasts are below current Thomson Reuters consensus estimates that call for growth of 12.8% and 13.1%, respectively. The company is keeping a conservative outlook due to slow public sector spending.

Fellow Dow component Disney (DIS +1.5%) reported earnings that came up just short of expectations. Reassuring comments from the company mitigated some of the initial disappointment from the earnings report.

In other corporate news, Intel (INTC +1.4%) increased its dividend by 15%. Chevron (CVX +0.5%) offered to acquire Atlas Energy (ATLS +43.7%) for $4.3 bln, a hefty 37% premium.

Shares of Boeing (BA -11.5%) fell on news that its Dreamliner 787 delivery date will be delayed once again.

In economic news, the initial claims data should provide a boost to consumer confidence. Granted the initial claims level is still high, yet the latest reading is the first reading below 440,000 since the recession began that didn't have any statistical or seasonal biases behind it. This is an encouraging report on the heels of the October employment report that could prompt more discouraged workers to begin looking for work again.

Continuing claims continued their downward trend, falling to 4.301 mln (Briefing.com consensus 4.350 mln) from 4.387 mln for the week ending October 30. Although that downtrend has been driven by the expiration of benefits more so than a pickup in hiring activity, the drop in initial claims is an encouraging marker that hiring activity could pick up soon.

Separately, the trade deficit narrowed in September to $44.0 bln (Briefing.com consensus -$44.8 bln) from $46.5 bln in August.

In overseas news, European sovereign debt worries were back at the forefront, with notable concern regarding Ireland. Speculation that the country's bailout of its financial sector will prove too expensive and require an EU bailout of Ireland sent the spread between the 10-year Ireland and German notes to all time highs.

Meanwhile, China's Shanghai Composite plunged more than 5% Friday on speculation that China will raise interest rates. The news spurred selling interest in commodities.

The CRB Index plunged 3.2% as the dollar index climbed 2.0%.
Index Started Week Ended Week Change % Change YTD %
DJIA 11444.08 11192.58 -251.50 -2.2 7.3
Nasdaq 2578.98 2518.21 -60.77 -2.4 11.0
S&P 500 1225.85 1199.21 -26.64 -2.2 7.5
Russell 2000 736.59 719.27 -17.32 -2.4 15.0
4:42PM Methode Electronics awarded integrated center stack program from General Motors; expected to represent over $100 mln in revenue per year starting in FY14 (MEI) 9.64 -0.27 : Co has been awarded a next generation integrated center stack program for multiple General Motors vehicle platforms. The center stacks will be featured on certain vehicles starting in model year 2013, and are expected to have a five-year program life. Center stack production will begin during Methode's fiscal year 2013 and is expected to represent over $100 mln in revenue per year starting in fiscal year 2014. Actual revenue will depend on a number of factors, including consumer demand for General Motors' vehicles. Briefing.com note: MEI's FY10 revs were $377.6 mln).

11:08AM Intel lowers prices on solid-state drives (INTC) 21.51 +0.30 : Co has lowered prices and introduced a new model of its award-winning Intel Solid-State Drive product line. SSDs can replace hard disk drives in a PC and provide a substantial performance boost for a notebook or desktop PC, making SSDs one of the hottest new waves in personal computing.

9:01AM Intel announces 15% increase to quarterly cash dividend to $0.18; remains on track to have our best year ever (INTC) 21.21 : Intel announced that its board of directors has approved a 15% increase in the quarterly cash dividend to $0.18 ($0.72 per share on an annual basis), beginning with the dividend that will be declared in the first quarter of 2011 (prior dividend rate was $0.1575 per quarter). "Intel remains on track to have our best year ever and we continue to generate strong cash flows," said Paul Otellini, Intel president and CEO. "Our ongoing operational performance and confidence in our business going forward provide the ability to return more cash to shareholders."

11:05AM Solarfun Power announces increase in size and pricing of follow-on public offering of 9.2 mln ADSs at $9.00 per ADS (SOLF) 9.23 -0.06 : Co announced that its follow-on public offering of 8 mln American depositary shares each representing five ordinary shares of the Company, was priced at $9.00 per ADS, and that the underwriters have exercised their option to purchase 1,200,000 additional ADSs. Co plans to use the total proceeds of ~$165.6 million, including $82.8 million from the public offering and ~$82.8 million from the private placement, for capital expenditures and general working capital purposes. Morgan Stanley and UBS Investment Bank acted as joint bookrunners for the public offering.

8:04AM Agilent beats by $0.05, beats on revs; guides Q1 EPS, revs above consensus; guides FY11 EPS in-line, revs above consensus (A) 35.73 : Reports Q4 (Oct) earnings of $0.65 per share, excluding non-recurring items, $0.05 better than the Thomson Reuters consensus of $0.60; revenues rose 35.0% year/year to $1.58 bln vs the $1.52 bln consensus, orders +32% YoY to $1.69 bln. Co issues upside guidance for Q1, sees EPS of $0.55-0.57, excluding non-recurring items, vs. $0.53 Thomson Reuters consensus; sees Q1 revs of $1.53-1.55 bln vs. $1.47 bln Thomson Reuters consensus. Co issues guidance for FY11, sees EPS of $2.30-2.50, excluding non-recurring items, vs. $2.37 Thomson Reuters consensus; sees FY11 revs of $6.1-6.3 bln vs. $6.1 bln Thomson Reuters consensus.

08:29 am Microsemi target raised to $30 at FBR Capital: . FBR Capital raises their MSCC tgt to $30 from $26. Firm notes co took a major step forward in becoming a larger, more technically adept systems provider into its core defense and space markets with the purchase of Actel. With the closing mid quarter, both December- and March-quarter financial results are affected by stub quarter and other acquisition impacts. That said, it notes earnings power now looks much higher by early 2011, a large positive. Finally, firm notes co's business model has many attractive elements, including robust operating margins, sole-source supplier status into growing markets, barriers to entry, and management's track record of execution.

08:28 am LDK Solar upgraded to Buy at Argus; tgt $17: . Argus upgrades LDK to Buy from Hold and sets target price at $17 based on solid evidence of demand strength as well as increasing efficiency across the company's integrated solar PV production model.

10:00 am SPWRA Raised Lower End of FY10 EPS Guidance (SPWRA)

Sunpower (SPWRA 14.83 +0.72) reported third quarter earnings of $0.26 per share, excluding non-recurring items, $0.13 better than the Thomson Reuters consensus of $0.13.

Revenues rose 18.3% year-over-year to $550.6 million, well above the $471.7 million consensus.

Non-GAAP gross margin 22.3% better than the 21.3% expected.

For the fourth quarter, the company guided earnings in the range of $0.95 to $1.15 per share, excluding non-recurring items, in-line with the $1.10 Thomson Reuters consensus. On the top line, revenues are expected to be $870 million to $970 million, in-line with the $935.56 million Thomson Reuters consensus.

For the fiscal year 2010, the company increased the low end of earnings guidance to $1.45 to $1.65, better than the $1.43 Thomson Reuters consensus. Revenues are expected to be in the range of $2.15 billion to $2.25 billion, in-line with the $2.15 billion Thomson Reuters consensus. The company also raised gross margin guidance to 22% to 23% from 20% to 22%.

09:46 am NVDA Guides Q4 Revs Above Consensus (NVDA)

NVIDIA (NVDA 13.59 +0.98) reported third quarter earnings of $0.15 per share, $0.01 better than the Thomson Reuters consensus of $0.14.

Revenues fell 6.6% year-over-year to $843.9 million versus the $844 million consensus.

Third quarter non-GAAP gross margins were reported at 46.5% versus the 46.8% consensus.

For the fourth quarter, the company sees revenues of +3% to 5% quarter-over-quarter, which calculates to $869.2 million to $886.1 million, above the $866.06 million Thomson Reuters consensus.
icon url

ReturntoSender

11/14/10 2:33 PM

#9125 RE: ReturntoSender #6755

Amateur Investors Weekend Market Analysis (11/13/10)

http://www.amateur-investor.net/Weekend_Market_Analysis_Nov_13_10.htm

For those that follow Wave Analysis the S&P 500 appears to be exhibiting a large ABC type rally from the March 2009 low. Wave A went from 667 to 1220 while Wave B dropped back to 1011. Meanwhile the recent rally from the early July low of 1011 appears to be Wave C. Keep in mind C Waves are supposed to be composed of 5 separate Waves so it appears Wave 3 of 5 of C peaked at 1227. Also notice 1227 is only 2 points away from the 61.8% Retrace calculated from the October 2007 high of 1576 to the March 2009 low of 667.


Meanwhile the current pullback from the 1227 high would be Wave 4 of 5 of C. The first area of support would be at 1183 which is the 23.6% Retrace calculated from the bottom of Wave 2 (1040) to the peak of Wave 3 (1227) while the second level of support would be around 1170 which is along the 10 Week EMA (blue line). So I would expect Wave 4 of 5 of C would hold support somewhere in the 1183 to 1170 range. Meanwhile once Wave 4 of 5 of C finishes then Wave 5 of 5 of C would occur. Typically the length of Wave 5 will be similar to the length of Wave 1. Since Wave 1 of 5 had a length of 118 points then adding that number to the bottom of Wave 4 of 5 would lead to an initial target near 1300.


Finally as I mentioned a few weeks ago the overall pattern looks very similar to that of the mid 1970's in which a sharp 5 Wave sell off was immediately followed by a sharp "ABC" type oversold rally. However after the "ABC" pattern completed the Dow then traded in a choppy sideways pattern for the next 7 years before finally breaking out in 1983. Furthermore also notice there were two other "ABC" type moves preceding the mid 1970's one in the early 1970's and further back in the mid to late 1960's. Both of those patterns were followed by substantial sell offs (points C to D).


icon url

ReturntoSender

11/14/10 8:20 PM

#9126 RE: ReturntoSender #6755

InvestmentHouse Weekend Market Summary

http://www.investmenthouse.com/weekendmarketsummary.htm

- Thursday's dark clouds start raining and blowing on China concerns: market seeking a reason to pull back.
- China's rising inflation ignites speculation of rate hikes and slower growth even as the rest of the world cuts rates and hopes China keeps growing.
- Expectations are now for an Irish default.
- Michigan sentiment rises, but no one cares.
- Market is in correction mode and the question is now how far.
- Still looking for new buying opportunities after the selling as fund managers still want to chase performance to year end.

Cisco didn't sink the market, but Cisco is no China.

Thursday I was impressed by how the market did not collapse when bellwether CSCO was surprised by an unexpected slowdown in the last 30 days of the quarter. CSCO is very important to the business community and the public sector (i.e., the governments that buy CSCO's products), but it is not China. CSCO is big; China is bigger, particularly in the current world market where China's economy and stock market are growing. The stock markets in the US and Europe are rallying, but they are moving higher on liquidity. Massive amounts of liquidity are being injected into financial markets, driving them higher. The Fed is relying on the old adage (and not a proven one) that if people feel wealthier they spend more. They are trying to inflate financial instruments such as stocks to make people feel better about their future and thus spend more money. They think we will then somehow spend our way out of the crisis. That is about all the Fed has to work with given the atrocious fiscal policies in the United States. You have to give chairman Bernanke and his henchmen credit; creativity is definitely a hallmark of this Federal Reserve. Success is another story, however, and there is much concern as to whether the US will be successful. A lot of that concern was voiced in the G20 economic summit this week. The US was beaten about the head and shoulders by the other countries for our profligate ways and for wanting to inflate our way out of any problem facing us.

While the market weathered the CSCO storm on Thursday, it did not have as much luck on Friday due to news out of China. It reported that inflation rose at the fastest pace in 25 months. China did not say anything specific about that, but it sparked speculation that China will be forced to increase its interest rates in an attempt to slow its economy down and stave off inflation. The US and EU are trying to jumpstart their economies by printing massive amounts of money, and the PIIGS particularly Ireland and Portugal are on the verge of default. The pundits out today and markets that trade in these probabilities suggest that Ireland is more likely to default than not. Given that these other countries are trying to inflate their way out of their problems, this is a real issue. They are hoping and praying that China continues to grow while we conduct these massive liquidity experiments. Although they are not really experiments since other countries have tried to do this in the past and failed miserably. While we conduct these liquefying programs, we have to hope that China will continue to grow and drag us and the other western countries out of the quicksand that our fiscal policies have placed us in.

Not a savory position, and the US and other world stock markets sold off accordingly. It was not just stock markets. Indeed, nearly every other market in the world sold back. Stocks started lower on the session but then immediately moved to the upside. Stocks bounced immediately from the start. This also happened Thursday; stocks immediately started to the upside and continued to recover throughout the session. That was an impressive day given the negatives. It looked as if the market may be doing the same on Friday; in other words, that big fund managers would be chasing performance to the end of the year and were using another dip as an opportunity to buy. The problem is that the indices never made it back to the flatline and started to sell. They sold and sold often. An afternoon recovery helped things, but it did not take them out of the realm of ugly.

NASDAQ, -1.5%; SP500, -1.2%; Dow, -0.8%; SP600, -1.5%; SOX, +0.3%; NASDAQ 100, -1.6%. It was an ugly session, but it was not necessarily a breakdown session. The SP500 held at the 18 day EMA on the low, managing to bounce up off the intraday doldrums. The NASDAQ also recovered off its low, but it was not able to hold the 18 day EMA. At this stage of the game, they were in the pullback mode. The question is just how far we will have to pull back. Was the pullback due to China's speculation about interest rate hikes? Not likely. After all, there was some decent news on the day as well.

There were good earnings out of retail. DDS spiked higher, and NVDA did just fine on its earnings and spiked higher as well. There was also the final Michigan Sentiment report for the month. It showed a slightly higher level of consumer sentiment at 69.3 versus 69 expected and 67.7 in October. Michigan is feeling a bit better, but it did not have much of an impact on the market because the market was ready to sell. It has been one heck of a run from August through early November, and there was a gap higher over the April peaks. Right now, that looks like an exhaustion gap at this point because the indices are coming back to test. They were primed to pull back, and they started to test to the downside on the first news that was worthy of a pullback.

Markets will find the silver lining in any kind of news when they want to rally. Then when they are extended, they will find things that are wrong with any picture, whether it is good or bad news. When China sneezes in public, the market has a history of faltering. It did so in late September when China said it would have to tighten lending standards for some banks. The news came out in threes, and it was a troubling time for the market. When China came out with a problem today, it was more of a reason to pull back. It gave investors a solid reason to take a bit of profit off the table when they were already looking to do so. Some will say the market pulled back off the China news, but it just gave the market a reason to pull back. It did that with a little more vigor after the news was released and the speculation started about raising interest rates.

NASDAQ has broken back below the April peak, and it could drop down to the 50 day EMA. SP500 is still in good shape. It is at the 18 day EMA and could fade back to the lateral October consolidation and not miss a beat. Now it is a question of how far the selling will go. Given that the market is in pullback mode now, that question was on every trader's lips as of the close on Friday.

OTHER MARKETS

Dollar. The dollar has been on fire this week, and with good reason. There is the trouble in the EU with suggestions that Ireland and other countries would default on their debt. That is based on solid evidence of the massively wide spreads and credit default swaps for Ireland, Portugal, and Spain, versus Germany. Even the Fed promising to flood the market with liquidity was not enough to keep the dollar down from a technical bounce against the Euro (1.3693 versus 1.3658 Thursday). After a good move to the upside, the dollar is struggling at the 50 day EMA. It just cleared the twin peaks from October, but it is in good shape. It has a double bottom and it bounced through. It could slide laterally for a few days and then make a new break to the upside and challenge the August low. I do not think the dollar will be a strong world-leader currency because we are trying to devalue it. It only went up last week because it sold hard into a support level, and then the EU suddenly looked a lot crappier than everyone had imagined.

The issues in Europe caused the dollar to spike. We will see if those issues remain and the dollar can consolidate laterally and break to the upside. If it does, that could be something very disturbing with respect to Europe. The dollar is being intentionally devalued. If it still rises against the Euro even as we are purposefully flooding the market with liquidity to keep it down, that shows you how precarious things are in the EU.
Click to view the chart

Bonds. Bonds were clubbed, particularly in the US. They were closed on Thursday for Veteran's Day, and it took some of us in the office awhile to figure out why the 10 year was not moving. It was just one of those days. The 10 year bond was slammed in the US (2.78% versus 2.64%). A holiday can sometimes distort the move because it does not trade and the pressures build up. When the market does reopen, things change immediately. For example, the 10 year was trading at 2.70% premarket. Still up sharply. As the day progressed, bonds sold even more here in the United States. Of course, they are matching what is happening in Europe with the same type of fiscal policies, where the bonds are selling and exploding to new highs along with spreads.
Click to view the chart

Gold. Gold took it on the chin this week, and it really had a rough day on Friday. It was slaughtered ($1,365.50, -37.70). Gold is a bit volatile now. After a long, steady run where there was no volatility, there was a nice test and it started right back up. Fantastic. Now it is being slammed around a bit. There was some volatility at the peak, and it could not put a new high in on MACD. Is there a little momentum loss here, and things just got out of hand on Friday. That happened in many stocks and many markets around the world. Things got carried away, but I do not think it is indicative of what will happen. In other words, I do not think gold is breaking down and tumbling back down to the May or July peaks.
Click to view the chart

Oil. Oil had a rough day as well. The dollar was off slightly, but oil was down sharply ($84.88, -2.93). A good thumping right back down below the April/May peaks, and it managed to hold above these recent highs. That is a positive. As far as the technical situation, it has not broken its uptrend. It was caught in a sharp down draft on Friday, however, as commodities were roughed up because of the worries with China's inflation. They are worried that demand for products, whether it be oil or other commodities, will dissipate and they all took it on the chin. An overreaction in the near term, no doubt. We may get buying opportunities out of this, so I am not that concerned about it unless it takes a more pernicious long-term pattern. It has not shown that yet.
Click to view the chart

All of the world markets got roughed up. Again, it was probably overdone in the near term due to worries about China. That has a distorting effect on the rest of the currencies, commodities, and hard assets around the globe.

TECHNICAL SUMMARY

INTERNALS

Volume. Volume backed off considerably on NASDAQ to 2.1B shares. Why was that? Look what happened with CSCO. Volume dropped to 235M shares versus the 550M shares on Thursday. Volume backed off on CSCO, and that had the same effect on NASDAQ and the other indices as volume trailed off. Down 11.4% to 2.1B shares. On the NYSE, volume rose 6% to 1B shares. Volume was lower Thursday on the NYSE. Once again we have mixed volume, but this time flipped. It is not that bad of news because it sold off below the 18 day EMA, and it then reversed to hold that level on the close. Seeing volume pick up when it tests the near support level or a decently important support level is not a bad thing. It shows buyers stepping in. We did not get negative news as for as volume, it was just the flip of Thursday and it did not give a definitive picture. Overall, it was not a bad volume session.

Breadth. 4:1 to the downside on NASDAQ and 4.7:1 on the NYSE. We have not seen these kinds of numbers in awhile. Earlier in the year before this run started, the breadth was massive day-to-day in different directions. Depending on which way the market went, breadth was massively backing that move, so it meant very little. Buyers and sellers were fighting it out on a day-to-day basis. One day the buyers would capitulate, and the next day the sellers would capitulate. That caused wide spreads in breadth. On Friday it was just China fever. Everyone was a bit panicked and they all sold. I do not think it is anything long term at all.

CHARTS

SP500. SP500 sold below the 18 day EMA, managed to rebound to cover that area on the close. Volume moved up just above average. Yes, it is below the April peak now. Not devastating at all. The important thing is that MACD bump up on the last move, and that shows decent action. There is not a ton of momentum here, but it is not a divergent top that would show momentum is falling down and we have a likelihood of a deeper test. Right now, it is definitely heading lower from the looks of it. If it does, you are looking square at that October trading range as a support level. Indeed, it started to tap and feel toward it on Friday, and it bounced up off that level. It may not even get down to the bottom of this range at roughly 1170. It closed at 1200, so it still has plenty of room. It could dip a bit further and still be in excellent shape for its uptrend. Note that it is still above the 18 EMA. That is something it has not broken through on this entire run after it started moving higher in late August.

NASDAQ. The NASDAQ is having a little bit more of an issue. It broke below its 18 day EMA. That is the first time it has done that on this run, but it was not a complete sell off. It did bounce off its lows. It did break the trendline that is straight to the upside, but I did not expect it would hold that anyway. It is just below the April peaks but holding decently. There is not a lot of support until it gets down to 2433, where the 50 day EMA is. There are also some price points here. NASDAQ gapped up to that level in early October, and it was the interim peak from May. This is an important level for NASDAQ, and if it breaks through this 18 day EMA, it could find its way toward that level before it gets the selling out of its system and is ready to move back to the upside. Again, that is not a huge move to the downside. It causes near-term pain, but overall it is good for the market. We will stick to our stops. For the most part, as long as a stock is holding support, we do not want to sell into support. If it cannot bounce and starts to break, you want to get out and look for your next opportunity.

SP600. SP600 was down 1.5% on the session. Very normal test. It did not take out the April peak, coming back to test down toward the 18 day EMA. Still above it, and not a bad session at all. It is going to set itself up with a higher low, and a ramp to try to take out that April peak.

SOX. SOX was up. Semiconductors gave back more of the gain. They were excited because INTC announced an increase in its dividend. That always excites investors, and they start looking around for others that may be doing the same and buying those stocks. After all, there is still a lot of concern about the economy, and dividend-paying stocks are a neat thing to have. Not a bad session. Similar to the SP600, it was unable to take out the April peak. It is testing back, trying to make a higher low and give itself a ramp for a run at a new breakout over that level.

LEADERSHIP

Financial. GS looks excellent. It showed a nice, tight doji at the 10 day EMA on Friday, oblivious to what was going on in the rest of the market. Hard to complain about that. WFC was unable to hold the 200 day EMA and the pullback. Not a total collapse, but a little disappointing that it was unable to continue to the upside. EWBC was showed a nice tight doji at the 10 day EMA on Thursday but not on Friday. It broke down to the 18 day EMA and closed just below the twin June peaks. It is not dead at all. MACD is still at a higher high. That is what you want to see, but it needs to prove something to us right now.

Industrial. CAT had a nice doji at the 18 day EMA. No issues. BUCY was not bad. Lower high, but it is holding its 50 day EMA. It is not great, but it is hanging in there. No implosion on a day that it very well could have with the China news.

Metals. FCX was down a bit, but hardly hurting. AA was solid. Looking quite nice.

Retail. JWN is holding at the 10 day EMA. It was somewhat down but ignoring the other news. DDS had a big gap to the upside, very strong. Thank you for the gain. JCP did not have a great session, but it reported decent earnings. It could not hold the move upside, but it still in decent shape. SKS had a nice pullback, holding the 18 day EMA. Not in any trouble at all. M was up on the session. It bounced off the 18 day EMA on the Thursday low, and continued upside on Friday.

Technology. AAPL is showing a little trouble. High volume, selling down. It managed to bounce off the lows, but it is showing a bit of an issue. GOOG sold sharply down 2.25%. It is coming down to the gap up point. The key is whether it will hold the gap. If it does, it is likely to continue to move upside. There were big names having problems on Friday big names that have not had problems to this point, and that actually carried the water for most of the market. If they go, can the others step up in their place? I still see many good stocks doing so, but remember that the NASDAQ 100 was down 1.6% while NASDAQ was down under 1.5%. There is some trouble in those large cap tech names that are weighing it down.

Miscellaneous Leaders. AMZN broke below the 18 day EMA on the close for the first time since late August. There is a bit of an issue there. It is not dead by any means, but there are some problems with some household names that have helped the stock market move higher to this point. Now more than ever, it is up to the quality stocks that have not made the move yet to step up and help out. The leaders that have moved the market to this point are struggling.

Many stocks continue to be in good shape despite the selling. That is promising for the market. As it pulls back on this test, those will hold up and will be ready to move higher and lead out to the upside as the market recovers. That is why we keep an eye on those. Several that I am looking at could give us buys off of this test. There are many of them on the reports. DECK continues to set up, and it is in a nice flag pattern. Even though it has rallied quite a bit, we can get a nice trade out of it. We need to be thinking about that near term. Longer term, you look for the patterns that are not extended at all and can give nice moves to the upside that are sustained. We have been enjoying some of those for a long time with the likes of PCLN and NFLX. They just ignore the market action on the session and do their own thing.

THE MARKET

MARKET SENTIMENT

VIX. VIX had a good spike on Friday, rising 10.5%, and it came off the lows where it gapped down to the prior week. Some would say volatility was at a point where the market needed to correct. It is not really the issue right now. The correlation between volatility and market moves is not as it was, although it obviously rallied as the market sold off this past week. I am not going to get too wrapped up in volatility right now. Maybe it will set up a new correlation, but that usually happens when the market is not trending, but moving laterally. When it starts trending, that changes the whole relationship, and we have had a trending market of late.

VIX: 20.61; +1.97
VXN: 22.55; +3.18
VXO: 20.35; +2.67

Put/Call Ratio (CBOE): 1.03; +0.26

Bulls versus Bears:

The CROSSOVER from August is long gone but it did its job.

This is a reading of the number of bullish investment advisors versus bearish advisors. The reason you look at this is that it gives you an idea of how bullish investors are. If they are too bullish then everyone is in the market and it is heading for a top: if everyone wants to be in the market, then all the money is in and there is no more new cash to drive it higher. On the other side of the spectrum if there are a lot of bears then there is a lot of cash on the sideline, and as the market rallies it drags that cash in as the bears give in. That cash provides the market the fuel to move higher. If bears are low it is the same as a lot of bulls: everyone is in and the market does not have the cash to drive it higher.

Bulls: 48.4% versus 46.7%. Still on the rise (45.6%, 45.1% versus 47.2% prior). Steady rise since hitting 29% where bears overtook bulls back in early September, but now somewhat indecisive with SP500 moving laterally. Still below the 65% level considered as bearish, above the 35% level below which is considered bullish. Where you would expect for a rally such as this one. The crossover level at 29% bulls is long gone, but it did its job. The high on the last leg was 56.0% after starting at 35.6% on the low in February, the lowest it has been since July 2009 . . . until this last leg. 35% is the threshold level suggesting bullishness. After peaking at 53 on this move the bulls lost some nerve, falling to a new low post- July 2009. Once again bulls peaked out near the 50% level. Bulls have bumped at 50ish since late August 2009, falling to 45ish and then rebounding. Hit a high of 47.7% mid-June on the run from the March lows. Again, to be seriously bearish it needs to get up to the 60% to 65% level.

Bears: 23.1% versus 24.4%. Slipping after holding steady at 24.4% for two weeks, up from 22.0% that at the time was a blip sandwiched between 24.7% the prior week). Down from 28.3% in September. The 37.7% peak at the height of the crossover is well in the rearview mirror but bears remain well below the 35% level considered bearish for the market overall. Hit 18.7% on the low in April. Hit a high of 27.8% level on the prior leg in February. For reference, cracking above the 35% threshold considered bullish. Hit a high on the prior run at 47.2%. For more reference, bearishness hit a 5 year high at 54.4% the last week of October 2008. The move over 50 took bearish sentiment to its highest level since 1995. Extreme negative sentiment. Prior levels for comparison: Bearishness peaked at 37.4% in September 2007. It topped the June 2006 peak (36%) on that run. That June peak eclipsed the March 2006 high (33%) and well above the 2005 highs that spawned new rallies (30% in May 2005, 29.2% in October 2005). That was a huge turn, unlike any seen in recent history.

NASDAQ

Stats: -37.31 points (-1.46%) to close at 2518.21
Volume: 2.143B (-11.39%)

Up Volume: 388.516M (-405.794M)
Down Volume: 1.789B (+131.193M)

A/D and Hi/Lo: Decliners led 4.01 to 1
Previous Session: Decliners led 1.92 to 1

New Highs: 54 (-53)
New Lows: 39 (+3)

NASDAQ CHART: Click to view the chart

NASDAQ 100 CHART: Click to view the chart

SOX CHART: Click to view the chart

SP500/NYSE

Stats: -14.33 points (-1.18%) to close at 1199.21
NYSE Volume: 1.012B (+6.34%)

Up Volume: 104.388M (-251.116M)
Down Volume: 901.033M (+323.024M)

A/D and Hi/Lo: Decliners led 4.68 to 1
Previous Session: Decliners led 1.89 to 1

New Highs: 155 (-85)
New Lows: 23 (-9)

SP500 CHART: Click to view the chart

SP600 Chart: Click to view the chart

DJ30

Stats: -90.52 points (-0.8%) to close at 11192.58
Volume DJ30: 218M shares Friday versus 297M shares Thursday.

DJ30 CHART: Click to view the chart

MONDAY

Monday is heavy on the economic data, of course. There will still be earnings coming out, but they will start to taper off. The week will start off with a bang with retail sales and the Empire Manufacturing Report on Monday. We will get to take a look all business inventories. Remember, they spiked up in wholesale inventories over the past two months. Tuesday comes industrial production and capacity utilization. Very important. There is the PPI, and I will be watching that. The Fed says there is no inflation, so it is something to keep an eye on. On Thursday, we have the CPI. We all know there is no inflation out there, so there is nothing to be worried about. Right?

Housing starts are very important. Of course, the weekly jobless claims come in on Thursday along with leading economic indicators and the Philly Fed. There is a lot of economic activity, so we will take another pulse reading on the US economy. I am not expecting it to be doing hand springs, but apparently there is this idea that we are improving. We will see if we get improving data. There are some serious issues, and we are not doing badly given everything that is going on. We will never break free and really roar ahead with all of the crappy fiscal policies we have, however. The monetary policy is just trying to do anything it can based upon the fiscal policies.

The market is in pullback mode. The SP500 could hold right at the 18 day EMA and bounce right back up. Very nice, orderly test by the large caps. The question is whether NASDAQ is going to be able to hold the line or if it will tumble down toward the May interim peak that is coincident with the 50 day EMA. It is rising up below prices. There are some big names in the index and they are not all tech names that are sagging notably. They are very heavy after strong runs, and they could break lower. If they do, they will take NASDAQ down with them because it is a market-cap weighted index. The big market cap stocks cause the majority of each move. We have to watch that, and it could definitely slide back further.

There is nothing nefarious at this point. Consider the bigger picture of what is going on. The year-end run with the large mutual funds and other fund managers chasing gains and the massive amounts of liquidity the Fed has pumped into the market. The idea is that it will continue to the upside before the year is over. The question is when and how far this pullback will be. NASDAQ could hold anywhere in the range from where it closed on Friday, as it is in the top of this April peak consolidation, or it could all fade all the way down to the 50 day EMA. That would be a little painful. It closed at 2518, and the 50 day EMA is down at 2433. That is almost 90 points to the downside. While that would be a normal correction that would set up new buys, it is painful in the near term. I expect more of a pullback. I am not sure how much we will get, but I expect more. We have reasonable stops. As long as our stocks are holding key support levels, we will let them run. We do not want to sell into support, particularly with the idea that the market is just testing back and will bounce again. By the same token, if things get a little out of hand, we do not want to let good positions that we have made a lot of money on steal some of that money we will use for the holiday season.

We will mind our stops and be reasonable about them, watching where support is. Do not sell into support, but then do not let good gains get out of hand to the downside. I still think we will get good pullbacks out of this. This weekend I will be looking at stocks that are already in position to move. They may not do it if the market will pull back for another few days or a week. They will have to retrench and come back a little more, but in all likelihood, that only gives us better setups to play out of. As they bounce, we get the trigger and we can make the moves. We may also see money rotate out of some areas that have performed very well. AAPL and GOOG could start losing their backing at this point and need to consolidate. The money rotates out and looks to new areas and starting sending them higher. We will get those kinds of buys. That is what a healthy market does. Keep your eyes open and see where the money is flowing, and then you move in those directions. Healthcare has been getting money of late, and we have picked up a few of those positions.

We will keep our eyes open, we will look for any sector rotation that is ongoing, and we are ready to put our money to work when given the opportunity. I anticipate some more pullback here. That is why we were taking gain on the way up. We banked a tremendous amount of profits on the way up during this rally, so when we do get a pullback we are not just panicking and wantonly selling. We can sell with a cool, calm head. If we see a stock that we have a big gain built up in and it is holding support, why would we want to dump it? There is no reason to do that at all.

There is a lot of data moving into next week. We are in the midst of a pullback, and some people are already starting to get worried about it. That is good. I like to see the concern ramp up. As everyone gets bent out of shape, it has the tendency to end quicker. We will be looking for opportunity in new stocks, and we will be protecting our positions. As long as they hold support, I am sanguine about the outlook ahead. Not too sanguine, however. As soon as you get that way, you will get one in your ear. We will be ready and we will watch. We will not get one in the ear, and we will make some more money before the end of the year is over. I am excited about this pullback because we will get more opportunity to get great stocks as they recover. Have an excellent weekend.

Support and Resistance

NASDAQ: Closed at 2518.21
Resistance:
The 18 day EMA at 2521
2530 is the April 2010 closing peak
2535.28 is the April 2010 intraday peak
2540 is the gap up point from early November
2550 from May and June 2008 peaks
2569 is the November gap up point through the April 2010 peak
2725 from July 2007 interim peak
2735 from late 2007 interim peak
2862 is the 2007 peak

Support:
2518 is interim peak from April 2010
2511 is the lower range of the November gap up point
2482 is the recent October peak
2434 is the May interim peak and the 78% Fibonacci retracement of the April selloff.
The 50 day EMA at 2433
2425 is an interim peak from May 2010
2382-2395 from 2008
2324-2370 is a range of resistance from early 2008
2341 is the June 2010 peak
2320 to 2326.28 is the January 2010 high
2319 from the September 2008 peak
The 200 day SMA at 2317
2310 is the August 2010 peak

S&P 500: Closed at 1199.21
Resistance:
1220 is the April 2010, post-bear market peak is breaking
1313 from the August 2008 interim peak

Support:
The 18 day EMA at 1198
1185 from late September 2008
1174 is the May 2010 high, 78% Fibonacci retracement of April peak
1170 is the prior March 2010 high
The 50 day EMA at 1167
1156 is the Sept 2008 low
1151 is the January 2010 peak
1133 from a September 2008 intraday low
Bottom of the January 2010 consolidation 1131 to 1136
1129 to 1131 is the June and August 2010 peaks
The 200 day SMA at 1127
1119 is the early December intraday high
1114 is the November 2009 peak
1106 is the September 2008 low
1101 is the October 2009 high and the recent May and June 2010 interim peaks
1084 to 1080 (September 2009 peak)
1078 is the October range low
1070 is the late September 2009 peak as well as several other peaks and valleys even in 2010. Important level.
1065 is the May flash crash intraday low.
1044 is the October 2008 intraday high AND the February 2010 low
1039 to 1040 are the May, June, and August 2010 lows

Dow: Closed at 11,192.53
Resistance:
11,205 is the April closing high
The 18 day EMA at 11,221
11258 is the April 2010 peak
11,734 from 11-98 peak

Support:
11,100 from the 7-08 low
The 50 day EMA at 10,978
10,963 is the July 2008 low
10,920 is the recent May high
10,730 is the January 2010 peak
10,609 from the Mid-September 2008 interim low
10,594 is the June 2010 peak
The 200 day SMA at 10,576
10,496 is the November 2009 high
10,365 is the late September 2008 low
10,285 is the late December consolidation peak
10,260 from the May and June 2010 interim peaks are breaking
10,209 is recent August 2010 low
10,120 is the October 2009 peak
9938 is the August 2010 low
9918 is the September 2008 peak
9855 is the early September peak in its lateral range
9835 is the late September 2009 peak AND the February 2010 low
9829 is the September 2008 closing high
9774 is the May 2010 intraday low

Economic Calendar

These are consensus expectations. Our expectations will vary and are discussed in the 'Economy' section.

November 12 - Friday
- Michigan Sentiment, November (09:55): 69.3 actual versus 69.0 expected, 67.7 prior

November 15 - Monday
- Retail Sales, October (08:30): 0.7% expected, 0.6% prior
- Retail Sales ex-auto, October (08:30): 0.4% expected, 0.4% prior
- Empire Manufacturing, November (08:30): 11.7 expected, 15.73 prior
- Business Inventories, September (10:00): 0.9% expected, 0.6% prior

November 16 - Tuesday
- PPI, October (08:30): 0.8% expected, 0.4% prior
- Core PPI, October (08:30): 0.1% expected, 0.1% prior
- Net Long-Term TIC Fl, August (09:00): $38.9B prior
- Industrial Production, October (09:15): 0.3% expected, -0.2% prior
- Capacity Utilization, October (09:15): 74.9% expected, 74.7% prior
- NAHB Market Housing, November (10:00): 15.0 expected, 16.0 prior

November 17 - Wednesday
- MBA Mortgage Application, 11/12 (07:00): +5.8% prior
- CPI, October (08:30): 0.3% expected, 0.1% prior
- Core CPI, October (08:30): 0.1% expected, 0.0% prior
- Housing Starts, October (08:30): 600K expected, 610K prior
- Building Permits, October (08:30): 565K expected, 539K prior
- Crude Inventories, 11/13 (10:30): -3.27M prior

November 18 - Thursday
- Initial Claims, 11/13 (08:30): 442K expected, 435K prior
- Continuing Claims, 11/06 (08:30): 4300K expected, 4301K prior
- Leading Indicators, October (10:00): 0.6% expected, 0.3% prior
- Philadelphia Fed, November (10:00): 4.5 expected, 1.0 prior
icon url

ReturntoSender

11/15/10 9:46 PM

#9127 RE: ReturntoSender #6755

From Briefing.com: 4:30 pm : Stocks faltered in the final hour of trade to finish the day with a fractional loss. The slide came in the face of leadership from financials and some upbeat retail sales data.

Financials spent the entire session out in front of the broader market. At its best level the sector was up 1.6% as banks caught a bid and consumer finance plays attracted support following the release of their latest monthly card metrics. Financials failed to hold their gains, though, as sellers reclaimed control of broader market action in late trade.

Support from the financial sector had helped lift the broader market as much as 0.7% in the face of a stronger dollar, but the dollar eventually broke out of its trading range so that it was up 0.8% at the close of trade. The dollar's move and the S&P 500's inability to extend its intraday high beyond the 1207 line in afternoon action left stocks susceptible to the efforts of sellers. The major averages finished mixed near session lows as a result.

Deal making during the weekend helped drive some early buying. Isilon Systems (ISLN 33.77, +7.48) will be acquired for $33.85 per share by EMC Corp (EMC 21.45, -0.27), while Mediacom Communications (MCCC 8.37, +1.51) will be acquired for $8.75 per share by Rocco Commisso and an entity created by Commisso. The biggest deal was Caterpillar's (CAT 81.82, +0.78) purchase of Bucyrus (BUCY 89.80, +20.18) for $92 per share. Each acquisition came at a premium of close to 30% over where the takeover targets settled trade last week.

Outside of the merger and acquisition activity, Lowe's (LOW 21.46, -0.23) reported an upside earnings surprise. Its shares initially tested a one-month high, but they rolled over to finish with a sizable loss.

The rest of the retail space was not much better off as it collectively fell 1.0%. Not even news that retail sales for October increased at a stronger-than-expected clip of 1.2% could help. Sales less autos saw a more mild and in-line increase of 0.4%. The consensus among economists polled by Briefing.com had called for a 0.7% increase in overall sales and a 0.4% increase in sales less autos.

The Empire Manufacturing Survey was more disappointing. Following a reading of 15.7 last month, it was expected to come in at 11.7 for November. Instead, it came in at -11.1. Some disappointment was tempered by the fact that the report is not underpinned by any actual data, but is survey on sentiment among regional manufacturers.

Treasuries fell under a stiff bout of pressure that drove the yield on the benchmark 10-year Note up to 2.95% at the close of trade. That makes for the Note's highest yield since August.

Advancing Sectors: Financials (+0.4%), Telecom (+0.3%), Utilities (+0.3%), Industrials (+0.2%)
Declining Sectors: Materials (-0.9%), Energy (-0.5%), Tech (-0.4%), Consumer Discretionary (-0.3%), Health Care (-0.2%), Consumer Staples (-0.1%)DJ30 +9.39 NASDAQ -4.39 NQ100 -0.3% R2K +0.1% SP400 +0.2% SP500 -1.46 NASDAQ Adv/Vol/Dec 1420/1.86 bln/1195 NYSE Adv/Vol/Dec 1386/877 mln/1577

5:44PM Microsoft: Kinect for Xbox 360 hits mln mark in just 10 days (MSFT) 26.20 -0.07 : Co announced it has sold 1 million Kinect for Xbox 360 units worldwide in 10 days and is on pace to hit 5 million by the end of the year.

AMD (AMD) announced it has joined The Linux Foundation's MeeGo open source Linux project, and will provide engineering expertise intended to help establish the technical foundations for next-generation mobile platforms and embedded devices.

7:02AM SMSC acquires Symwav co had previously made a $5.2 million equity investment in Symwave, resulting in a total equity stake of 14% (SMSC) 26.72 : Co announces that it has acquired Symwave. SMSC had previously made a $5.2 million equity investment in Symwave, resulting in a total equity stake of 14 percent, and recently provided $3.1 million in bridge financing to Symwave. Under terms of the agreement, SMSC also agreed to make cash payments to Symwave shareholders as part of an earnout provision upon achievement of certain financial goals during calendar year 2011.

6:39AM Amtech Systems beats by $0.24, beats on revs; guides Q1 revs above consensus; guides FY11 revs above consensus (ASYS) 17.28 : Reports Q4 (Sep) earnings of $0.58 per share, $0.24 better than the Thomson Reuters consensus of $0.34; revenues rose 288.0% year/year to $45.4 mln vs the $38.6 mln consensus. Co issues upside guidance for Q2, sees Q2 revs of $44-46 mln vs. $32.70 mln Thomson Reuters consensus. Co issues upside guidance for FY11, sees FY11 revs "surpassing $200 mln" vs. $148.50 mln Thomson Reuters consensus. Total orders in Q4 were $49.6 million ($41.3 million solar), up 11% compared to total orders of $44.7 million ($37.3 million solar) in the preceding quarter. Gross margin increased to 39%, compared to 37% sequentially and 26% in 4Q09, primarily due to more efficient capacity utilization from higher shipment volumes.

icon url

ReturntoSender

11/16/10 7:24 PM

#9128 RE: ReturntoSender #6755

From Briefing.com: 4:35 pm : More than 95% of the names in the S&P 500 logged losses today. Their weakness was underpinned by renewed concerns about a rate hike in China, the state of finances in Ireland, and Greece's ability to tighten its fiscal practices.

Stocks opened trade in the red as the prior session's late slide extended into premarket trade with help from a 4% plunge by China's Shanghai Composite. Selling there was stoked by speculation that a rate hike may be in the offing since Korea raised its target rate. Many are fearful that tighter monetary policy in China would not only soften demand in the country, but also stymie global growth.

Also in the backdrop was worry about the financial health of Ireland and its banks. The country's prime minister stated in a CNBC report that the country's banks are meeting European Central Bank funding requirements and that the country has not had to ask for aid.

The tone of trade further weakened with word that Austria has opted to withhold bailout funds for Greece because it may miss its deficit reduction target.

The dollar was helped by that headline. Buying in the currency was strong enough to take the greenback more than 1% higher to its best level since September before it eased back to end the trading day with a gain of about 0.9%. However, the greenback's gain only exacerbated weakness among stocks.

Selling was so sharp that the S&P 500 was pushed through initial support levels to the 1173 line, which was last touched in October. Even though it finished off of its low, the S&P 500 still suffered its worst single-session percentage loss since August.

The Dow had dropped more than 200 points to violate the 11,000 line before it attempted to pare its loss. Among its 30-members, only WalMart (WMT 54.26, +0.31) and Home Depot (HD 31.71, +0.32) booked gains. Home Depot satisfied investors with an upside earnings surprise and a strong outlook.

WalMart's latest quarter was not too inspiring, but the company did issue a strong forecast. Strength in the pair, along with solid results from a handful of smaller retailers, helped limit losses among retailers to 0.6%, collectively.

In addition to stocks, traders also cut down commodities. That left the CRB Commodity Index to lose 3.2% after it lost 3.6% this past Friday. The CRB is now down 7.6% from the two-year high that it set last week.

Treasuries attracted support after they fell under a concerted midday selling effort. Their slide coincided with the dollar's initial bounce. In the end, though, the benchmark 10-year Note gained a full point to take its yield down to 2.84% after it hit 2.9%, its highest level since August, in the prior session. The 30-year Bond pushed up more than two points so that its yield slid to 4.27% after it was at a six-month high of about 4.42% just yesterday.

Data for today did nothing to offer support to stocks. The October Producer Price Index increased 0.4%, which is more tepid than the 0.8% increase that had been expected among economists polled by Briefing.com. Core prices actually fell 0.6%, which contrasts with the consensus call for a 0.1% increase.

Additionally, industrial production was unchanged in October. It had been expected to increase 0.3% after a 0.2% decline in the prior month. Capacity utilization remained steady at 74.8%, as generally expected.

Headlines of the day brought plenty of participants into the fold. In turn, trading volume on the NYSE totaled more than 1.3 billion shares. That is far more than the paltry tally of 880 million shares that exchanged hands on the Big Board in the prior session.

Advancing Sectors: (None)
Declining Sectors: Materials (-2.2%), Energy (-2.1%), Tech (-1.9%), Financials (-1.8%), Telecom (-1.6%), Industrials (-1.6%), Health Care (-1.3%), Consumer Discretionary (-1.3%), Utilities (-1.2%), Consumer Staples (-1.1%)DJ30 -178.47 NASDAQ -43.98 NQ100 -1.8% R2K -2.0% SP400 -1.8% SP500 -19.41 NASDAQ Adv/Vol/Dec 548/2.25 bln/2103 NYSE Adv/Vol/Dec 405/1.35 bln/2642

12:21PM Semiconductor Hldrs hovering slightly under its morning bounce high at 30.08 (SMH) 30.03 +0.29 : The SMH has displayed relative strength vs. the S&P for much of the session. And as noted, while the Dow, XLB, XLF, KRE all reached back to their 50 day averages, the SMH has thus far been able to hold near its 20 day ema and above last week's low at 29.86/29.74 (session low 29.82).

09:26 am JinkoSolar Holding target raised to $43 at Collins Stewart: . Collins Stewart raises their JKS tgt to $43 from $34 saying they recently had been restricted on JKS since before it reported 3Q10 results. This note updates their forecast to reflect the impact of those results, which were well above their prior forecast, its recent secondary offering, and its accelerated capacity expansion plan. JKS now expects to have 600MW of vertically integrated capacity online by December 2010, up from prior outlook for 500MW. Firm says their CY11 forecast is now based on JKS shipping 615MW, up from 470MW in prior forecast.

icon url

ReturntoSender

11/17/10 11:40 PM

#9129 RE: ReturntoSender #6755

From Briefing.com: 4:30 pm : Listless trade left stocks to spend the afternoon stuck in a tight range before a late fit of selling threatened to undercut the major averages. Stocks settled mixed.

Yesterday the stock market dove 1.6% for its fourth straight loss and worst decline in three months. But participants were slow to wade back into the waters of the equity market, especially amid lingering concerns about tighter monetary policy in China and the tenuous state of Ireland's finances. Though China's State Council announced price control guidelines to reassure consumers facing rising inflation and Ireland's Finance Minister will meet with officials from the European Union, European Central Bank, and International Monetary Fund, participants showed restraint.

Broader market advances were limited so that the S&P 500 was kept within a three-point trading range for almost the entire afternoon. An absence of legitimate leadership helped sustain the range bound trade.

Of the major sectors, consumer discretionary fared the best. Its 0.7% advance was underpinned by strength among retailers. Target (TGT 55.62, +2.08) was a standout in its space as participants responded positively to its latest quarterly report. The stock booked its best percentage gain in about five months.

The discretionary sector was also helped by strength in automakers ahead of the initial public offering pricing of General Motors.

Financials were out of favor for the entire session. Their 0.6% loss made for the worst sector performance of the session. Diversified financial services (-1.5%) and regional banks (-1.7%) were the worst offenders in the sector.

Aware of the mixed underlying action and the broader market's inability to break free from the day's trading range, sellers attempted to apply some late pressure. Part of it came after a weaker-than-expected outlook from NetApp (NTAP 49.25, -3.44) was leaked ahead of its scheduled report. However, support surfaced to keep stocks from rolling over.

For the second straight day data had little meaningful impact on trade. Among the most recent reports, the Consumer Price Index for October increased 0.2% after a 0.1% increase in the prior month. It had been expected to increase 0.3% month-over-month. Core consumer prices for were flat for the second month in a row. The Briefing.com consensus called for a 0.1% increase for October.

Housing starts for October fell 11.7% month-over-month to an annualized rate of 519,000, which is less than the rate of 600,000 starts that had been expected among economists polled by Briefing.com. Building permits edged 0.5% higher to an annualized rate of 550,000, which is also less than the rate of 570,000 permits that had been expected.

Trading volume retreated from the robust amounts seen in the prior session. Today's tally on the NYSE did not even break 1 billion shares.

Advancing Sectors: Consumer Discretionary (+0.7%), Energy (+0.4%), Health Care (+0.1%)
Declining Sectors: Financials (-0.6%), Telecom (-0.2%), Utilities (-0.1%), Tech (-0.1%), Materials (-0.1%), Industrials (-0.1%)
Unchanged: Consumer StaplesDJ30 -15.62 NASDAQ +6.17 NQ100 +0.3% R2K +0.3% SP400 +0.6% SP500 +0.25 NASDAQ Adv/Vol/Dec 1374/1.83 bln/1245 NYSE Adv/Vol/Dec 1807/953 mln/1182

4:10PM Applied Materials beats by $0.05, beats on revs; guides Q1 EPS in-line, revs in-line (AMAT) 12.38 -0.08 : Reports Q4 (Oct) earnings of $0.36 per share, excluding non-recurring items, $0.05 better than the Thomson Reuters consensus of $0.31; revenues rose 88.9% year/year to $2.89 bln vs the $2.59 bln consensus. Co issues in-line guidance for Q1, sees EPS of $0.30-0.34, excluding non-recurring items, vs. $0.32 Thomson Reuters consensus; expects net sales to be down in the range of 8 percent to 15 percent quarter over quarter, equates to ~$2.46-2.66 bln vs. $2.62 bln Thomson Reuters consensus. "We are seeing strong momentum in our business as we enter 2011, fueled by accelerated innovation and market share gains... In 2010, Applied generated $1.7 billion in cash from operations after investing more than $1.1 billion in research and development."

3:38PM NetApp beats by $0.03, beats on revs; guides Q3 EPS below consensus, revs in-line (stock is still halted -- no resumption time yet) (NTAP) 49.25 -3.44 : Reports Q2 (Oct) earnings of $0.52 per share, excluding non-recurring items, $0.03 better than the Thomson Reuters consensus of $0.49; revenues rose 32.6% year/year to $1.21 bln vs the $1.19 bln consensus. Co issues guidance for Q3, sees EPS of $0.48-0.50, excluding non-recurring items, vs. $0.51 Thomson Reuters consensus; sees Q3 revs of $1.24-1.29 bln vs. $1.26 bln Thomson Reuters consensus. "NetApp produced 49% year over year growth in product revenue and our highest non-GAAP operating margin in over a decade, while simultaneously investing aggressively in our future."

9:14AM Emcore receives announces new $35 mln credit facility with Wells Fargo (EMKR) 1.25 : Co announces the establishment of a revolving credit facility with Wells Fargo (WFC). The asset-based credit facility provides for borrowings up to $35 mln for working capital requirements, letters of credit and other general corporate purposes.

6:32AM Suntech Power to acquire 375MV of wafer manufacturing capacity for ~$127 mln cash (STP) 8.34 : Co announces that it is in the process of acquiring 375MW of ingot and wafer slicing capacity in China. The wafer manufacturing capacity is being spun off from a subsidiary of Glory Silicon Technology Investments Limited, in which Suntech holds an equity investment. Suntech will acquire the remaining 70% shares of the capacity for a total cash consideration of ~$127 million, which is the total consideration after an offset of ~$80 million of liabilities owed to Suntech. Post the acquisition, Suntech will own 100% of the 375MW of wafer manufacturing capacity in China. Suntech will take operational control in the fourth quarter of 2010 and it is expected to be immediately accretive to earnings.

09:54 am STP Sees Q4 Shipments +10% QoQ (STP)

Suntech Power (STP 7.54 -0.80) reported third quarter earnings of $0.18 per share, $0.05 worse than the Thomson Reuters consensus of $0.23.

Revenues rose 57.2% year-over-year to $743.7 million, above the $714 million consensus.

Consolidated gross margin 16.4% (cons: 17.6%). In 4Q10, STP expects at least 10% sequential growth in shipments.

Suntech targets to ship more than 1.5GW of solar products in 2010, representing year-over-year growth of at least 113%. Consolidated gross margin in the fourth quarter is expected to be approx. 17% (cons: 17.9%), which is based on an assumed exchange rate of 1.35USD to the Euro. GSF is in the process of constructing a further 140MW of projects, of which at least 80MW are expected to be completed in the fourth quarter 2010.

icon url

ReturntoSender

11/19/10 12:13 AM

#9130 RE: ReturntoSender #6755

From Briefing.com: 4:30 pm : Strong, broad-based buying amid hope that Ireland will accept financial aid boosted stocks today, but failure to push through resistance caused stocks to stagger a little bit into the close.

Despite the tenuous state of finances in Ireland, the country's officials have insisted in recent days that they do not need aid. However, reports have suggested that representatives have taken on a more open tone ahead of scheduled talks with the European Union, European Central Bank, and International Monetary Fund. The indication that Ireland is open to funding has helped calm contagion concerns, though troubles linger for the rest of the PIGS contingent.

With global participants feeling more secure and accepting of risk, Europe's bourses bounced big. That helped perpetuate a positive tone set overnight by Asia's major averages, which got some relief from the steep slides endured amid speculation about actions to stem inflation in recent sessions.

The rotation back into stocks left the dollar to drop about 0.5% and boost some 90% of the issues in the S&P 500 to a gain. Natural resource plays like energy (+2.2%) and materials (+1.9%) attracted the most support. Stocks still failed to generate the momentum necessary to take the S&P 500 back above 1200, however. The benchmark index spent most of the session hugging the psychologically significant line before wavering a bit into the close. Stocks still finished with their best gain in two weeks, though.

Trading volume was heaviest in shares of General Motors (GM 34.24, +1.24), which returned to the NYSE for the first time in more than a year following its post-restructuring initial public offering. GM garnered an IPO price of $33 per share, but the stock opened trade at about $35 per share before it pulled back.

Action surrounding shares of GM helped bolster broader market share volume, such that 1.21 billion shares traded hands on the NYSE today. Average volume for the past 50 sessions stands at 1.04 billion shares.

There were a few doses of data today, but the latest Philly Fed Index was the only item to actually induce a positive response among participants. The Philadelphia Fed Index for November improved to 22.5 from 1.0 in October. Economists polled by Briefing.com had expected the reading to improve to just 5.0.

Leading Economic Indicators for October increased 0.5%, which is a bit less than the 0.6% increase that had been widely expected after a 0.5% increase in the prior month.

Initial jobless claims for the week ended November 13 totaled 439,000, down 2,000 week-over-week. That is not a surprise since 442,000 initial claims had been expected, on average, among economists surveyed by Briefing.com. Meanwhile, continuing claims fell to a near two-year low just below 4.30 million, which is down from the 4.34 million recorded for the prior week.

Advancing Sectors: Energy (+2.2%), Materials (+1.9%), Industrials (+1.8%), Tech (+1.8%), Telecom (+1.5%), Financials (+1.4%), Health Care (+1.3%), Consumer Staples (+1.3%), Consumer Discretionary (+0.9%), Utilities (+0.6%)
Declining Sectors: (None)DJ30 +173.35 NASDAQ +38.39 NQ100 +1.7% R2K +1.9% SP400 +1.4% SP500 +18.10 NASDAQ Adv/Vol/Dec 1979/2.06 bln/662 NYSE Adv/Vol/Dec 2448/1.21 bln/568

4:31PM Semtech reports grants of inducement awards (SMTC) 22.99 +0.51 : Co announces that as an inducement to enter into employment with Semtech, it has made awards effective November 17, 2010 of restricted stock units to eight recently hired employees under the Semtech 2009 Long-Term Equity Incentive Inducement Plan. An aggregate of 58,000 restricted stock units have been awarded for these Inducement Awards. Pursuant to the terms of Inducement Awards, each of the Inducement Awards is subject to time-based vesting and will vest annually over a four-year period.

4:30PM Conexant names New President and Chief Operating Officer (CNXT) 1.37 +0.02 : Co announced that Sailesh Chittipeddi has been named president and chief operating officer. Chittipeddi joined CNXTin 2006 and served most recently as co-president, with responsibility for global engineering, operations, quality, IT, and associated infrastructure activities. He continues to report to Scott Mercer, Conexant's chairman and chief executive officer.

4:15PM Dell beats by $0.12, misses on revs; raises FY11 operating income guidance above consensus; reaffirms FY11 rev guidance at midpoint (DELL) 13.66 +0.31 : Reports Q3 (Oct) earnings of $0.45 per share, excluding non-recurring items, $0.12 better than the Thomson Reuters consensus of $0.33; revenues rose 19.4% year/year to $15.39 bln vs the $15.76 bln consensus. Co raises operating income guidance and reaffirms rev guidance at mid-point for FY11, sees operating income +23-28% to ~$3.66-3.81 bln vs. the $3.53 bln consensus, up from +18-23% previously, sees FY11 revs at mid-point of +14-19% to ~$60.31-62.95 bln vs. $62.38 bln Thomson Reuters consensus. Large Enterprise rev was $4.3 bln, up 27% YoY. Public revenue was $4.4 bln, a 20% increase (including Perot); small and medium biz rev +24% to $3.7 bln; consumer rev +4% to $3 bln. Commercial and enterprise sectors continue to be solid. Q3 gross margin 19.5% vs. the 17.5% consensus. "With solid demand in our commercial segments, we executed well and that led to record profitability for the co and especially in our important enterprise solutions and services business."

4:10PM Nanometrics CFO informed co of his intention to retire (NANO) 11.82 +0.48 : Co announced today that James P. Moniz, chief financial officer, has informed the company of his intention to retire on April 1, 2011. The company has retained an executive search firm to identify an appropriate successor and Mr. Moniz will remain in his role to ensure a seamless transition of the CFO role next year.

4:09PM Marvell beats by $0.02, reports revs in-line (MRVL) 18.94 +0.20 : Reports Q3 (Oct) earnings of $0.45 per share, $0.02 better than the Thomson Reuters consensus of $0.43; revenues rose 19.4% year/year to $959 mln vs the $949.9 mln consensus.

8:02AM Sunpower issued in-line FY11 EPS guidance and revs guidance slightly below consensus (SPWRA) 13.31 : Co sees FY11 EPS of $1.75-2.05 vs $1.86 Thomson Reuters consensus; sees revs $2.65-2.85 bln vs $2.87 bln Thomson Reuters consensus and non-GAAP gross margin of 20-22%. SunPower also announced that Allianz Renewable Energy Partners signed a definitive sale and purchase agreement to acquire 100% of the equity in SunPower's wholly owned subsidiary, Orsa Maggiore PV Srl, which owns the 15-megawatt (MWp) Solare Roma photovoltaic power plant. The power plant is located in the municipality of Anguillara, Province of Rome, Lazio region, Italy. The transaction is expected to be completed by the end of 2010, subject to the fulfillment of standard closing conditions. SunPower designed and is building the power plant and will provide ongoing operations and maintenance services for the new owner.

Juniper Networks (JNPR) announced it has acquired the intellectual property assets of Blackwave, an innovator in Internet video storage and delivery infrastructure, further enhancing the company's solutions for delivering Internet video content with exceptional scale, performance and efficiency. Financial terms of the transaction were not disclosed...

3:22AM LDK Solar arbitration award upheld in Venice court of appeal (LDK) 10.97 : The Venice Court of Appeal upholds that the "take or pay" clause in the wafer supply contract entered into in October 2008 between co and Helios is valid and effective throughout its duration and at terms and conditions related to quantities and prices set forth therein. The arbitration award orders Helios to pay to LDK Solar an amount of ~$31 mln plus interest, costs for the arbitration proceedings and lawyers' fees.

3:17AM Verigy merges with LTC Credence (LTXC); authorizes increase in share repurchase program (VRGY) 8.91 : Co announces that it and LTC Credence (LTXC) have entered into a definitive merger agreement that would create a semiconductor test co with the scale and presence to provide comprehensive solutions to customers across most major semiconductor market segments. The transaction will either be effected through a reorganization where co and LTXC would be wholly owned subsidiaries of Holdco, a newly created subsidiary, or through a merger where LTXC would become a wholly owned subsidiary of co. LTXC shareholders will receive a fixed exchange ratio of 0.96 shares of co stock or Holdco stock for each share of LTXC stock. Upon closing, co or Holdco, as applicable, will issue ~49 mln shares on a fully diluted basis to complete the transaction. At that time, co and LTXC shareholders will own ~56% and 44%, respectively, of the combined co. The combined co also expects to realize substantial synergies within one year of the close of the deal, with annual cost savings expected to reach at least $25 mln, primarily from increased efficiencies in manufacturing and reduced operating expenses. Co also announced its board has authorized an odd lot program that will result in the purchase of ~2.3 million shares, or 4% of co's current outstanding shares, from shareholders holding less than 100 shares of the combined company following the transaction. In addition, co's board has authorized an annual stock repurchase program of up to 10% of the co's current outstanding shares, effective for ~12 months following the transaction.

1:11AM Oracle policies anticompetitive asserts SIA in appeal filed with the US department of justice (ORCL) 27.91 : The Service Industry Association has filed an appeal to the U.S. Department of Justice about what it considers as Oracle's anticompetitive policies pertaining to hardware maintenance of Oracle's Sun Microsystems products. The SIA contends the new policies are directed at the $2.4 bln dollars of Sun hardware maintenance business currently contracted to Independent Service Organizations. SIA believes co's new hardware maintenance policies are the most onerous of all within the IT service and maintenance industry and are created solely to monopolize the Sun hardware maintenance business.

10:07 am AMAT Guides Q4 In-line (AMAT)

Applied Materials (AMAT 12.59 +0.21) reported fourth quarter earnings of $0.36 per share, excluding non-recurring items, $0.05 better than the Thomson Reuters consensus of $0.31.

Revenues rose 88.9% year-over-year to $2.89 billion, above the $2.59 bln consensus.

For its first quarter, the company expects to see earnings in the range of $0.30 to $0.34 per share, excluding non-recurring items, in-line with the $0.32 Thomson Reuters consensus; expects net sales to be down in the range of 8% to 15% quarter over quarter, equates to approx. $2.46 billion to $2.66 billion, in-line with the $2.62 billion Thomson Reuters consensus.

The company said, "We are seeing strong momentum in our business as we enter 2011, fueled by accelerated innovation and market share gains... In 2010, Applied generated $1.7 billion in cash from operations after investing more than $1.1 billion in research and development."

09:42 am NTAP Guides Q3 EPS Below Consensus (NTAP)

NetApp (NTAP 52.61 +3.37) reported second quarter earnings of $0.52 per share, excluding non-recurring items, $0.03 better than the Thomson Reuters consensus of $0.49.

Revenues rose 32.6% year-over-year to $1.21 billion versus the $1.19 billion consensus.

For the third quarter, the company guided third quarter earnings in the range of $0.48 to $0.50 per share, excluding non-recurring items, below the $0.51 Thomson Reuters consensus. Revenues are expected to be $1.24 billion to $1.29 billion, in-line with the $1.26 billion Thomson Reuters consensus.

The company said, "NetApp produced 49% year over year growth in product revenue and our highest non-GAAP operating margin in over a decade, while simultaneously investing aggressively in our future."

08:28 am Motorola initiated with a Buy at Stifel Nicolaus; tgt $11: . Stifel Nicolaus initiates MOT with a Buy and price target of $11 based on improving competitive position in the high-growth smartphone market is not reflected in valuation. They expect the Mobile Devices business (42% of 3Q10 revenue) to support a CY10-12 revenue CAGR of 25% in the company's continuing operations, driving average EPS growth of more than 50% over that period as operating margin improves from 7.1% to 11.8% following recent cost rationalization.
icon url

ReturntoSender

11/21/10 8:53 PM

#9132 RE: ReturntoSender #6755

InvestmentHouse Weekend Market Summary

http://www.investmenthouse.com/weekendmarketsummary.htm

- Stocks shake off early hangover, but can only post modest gains.
- China rattles the market again, but stocks, commodities recover.
- Bernanke takes on China, challenges Congress and Administration to get into the game.
- Sentiment a bit frothy, but liquidity still dominates the picture.
- New leaders emerging in time for the holidays.
- Thanksgiving week problematical, but from turkey to Santa the market looks good.

Modest gains to end the week still leave indices with room to recover.

Stocks faced another crisis on Friday morning. China increased its bank reserve requirements, and Hong Kong increased taxes on properties sold that were owned for less than two years. There was a capital gains change, and that rattled the markets. That always happens when China does something attempting to slow its economy. It has not been able to do it yet. It did have a recession a year ago, but it had a V-shaped recovery because it promoted the right policies and got back on track. It is actually growing its economy and stock market. In our country, we have the wrong policies and we did not get any growth generated, but we have had our stock market go up because of massive liquidity. We have pumped a lot of money into the stock market just as we did in late 1999, and the stock market shot higher with all the Y2K money that was not used and put into financial markets.

Right now, trillions of dollars are not going anywhere because small businesses are not doing any business. With a 2% GDP growth rate, it is mediocre, and it is all funny money being purchased into the system. We are seeing all of the markets not just stock markets shoot higher. Of course, we will see inflation. The CPI said there was no inflation this week, but we know that is not the case. Cotton hit an all-time high this week, and several other commodities have hit or are pushing all-time highs. WMT said the rise in cotton prices was "freaky." We are ignoring some serious problems out there.

The market on Friday was able to shake off the Chinese problems. Looking at the SPX, early on it started lower, reversed, and moved through that flat line and posted a gain on the session. NASDAQ, +0.15%; SP500, +0.25%; Dow, +0.2%; SP600, +0.3%; SOX, +1.6%; NASDAQ 100, flat. Some of the key large cap techs that led the market higher are tired. That does not mean the rally is over. There are many new stocks coming up and taking a leadership role while the stalwarts of the market (AAPL, GOOG) take a pause. That is normal and perfectly good action. It is called rotation, and that is what we are seeing right now. Still, Friday was less than impressive with its moves.

There were great earnings out. DELL and MRVL posted good earnings and strong outlooks. ANN stores and the FL both posted strong earnings. Retail had a great day. It shows there is some traction in the market, but it is not much. We are sowing the seed of inflation and other issues that will overrun the modest gains in some areas of the economy. We have a 1970's-like economy going because we have bad policy decisions fiscal and monetary and we have the same kind of issues now that we were having then. Monetary issues, fiscal policy issues, and we also have overregulations. There are tons of new regulations coming into the market. There is healthcare, and we will see cap and trade come into the market. It is not through Congress but through the EPA. We will have a boatload of new regulations and a lot of uncertainty at the same time because we do not know what our tax rates will be. They will probably be higher. We do not know what our healthcare policy will be because no one read the bill or really knows what the effects are. With that background, it will be difficult to make any headway, but near term we have massive amounts of liquidity coming into the stock market. It is still being put into stocks and all kinds of commodities around the world, and thus we have inflation. Our CPI is just not showing it yet.

Bernanke was out talking to the rest of the world, and he had two targets. One was China and he was saying not to be so hard on us. He said they need to get their currency right and let it rise. He also had words for the administration and Congress. Bernanke says they are doing all they can with monetary policy, and they need the executive and legislative branches to take some responsibility. They need to stop this spending. He said we need better fiscal order in our house to help us with our monetary policy. It is going to create inflation if we do not stop this ridiculous spending. We are creating ridiculous demand without investing in the country to create supply. If you do not have supply but you have a lot of excess money pumping up false demand, then you get explosive inflation.

I grew up in the 1970's, and it was a terrible time. A lot of inflation, a lot of regulations and uncertainty about the future. There was a horrible malaise in the country, and I never thought we would see that again. We are reliving the 1970's, and the parallels are striking. From Nixon to Ford to Carter, we now have Bush to Bush to Obama. The muddled policies of all of them are leading to the same outcomes. That is one of the problems that come from not recognizing our history: We are repeating it in just a few generations. Amazing. Of course, I digress as usual.

There was no standard economic news, but other news was out. We had Bernanke and the China story, and the market still managed to recover and post a gain. It was not an outstanding move. Stocks surged on Thursday, and they had a little hangover on Friday. It was expiration, and you would expect a little volatility. We got some, but not much at all. We got a quiet day, and it sold off and rallied back. The market tested logical support during the week. SP500 is coming back to its October consolidation range, and it bounced. Thanksgiving week is coming up, and that is a problematic week. Sometimes it has up and sometimes it is down during the week. Often stocks do not perform too well ahead of Thanksgiving, but then we have Turkey Day to Christmas where there is a rise in the market. That is your Santa Claus rally, and often it is a stealth rally. Stocks do not race upside; they just melt higher, and then stocks are suddenly up. They are up nicely, but it is not a huge move on an individual day. Typically, after a couple of weeks, the talking heads on the financial stations say, "I guess that was our Santa Claus rally." Next week there may not be a lot happening, but then you look for the upside bias to continue for the rest of the holiday season. With the indices having pulled back to support and in position to move back up, they have a nice setup to do just that.

OTHER MARKETS

Dollar. The dollar is on a bit of a pullback. This is a flag pattern after a double bottom. You can see where it broke below a support level and then reversed. A little false bottom there. It has rallied up through these prior peaks, made a higher high, and now it is testing back after bumping into some resistance. Looks like it is ready to move back to the upside (1.3689 Euro versus 1.3639 Thursday). It lost a little ground, but the pattern suggests it will move right back up after this test.

The dollar suffered a little at the end of the week because the EU situation improved. Ireland was talking about a bailout, and that calmed the markets down. The Euro was able to stabilize some, and it drove the dollar lower as it did so.
Click to view the chart

Bonds. Bonds were relatively unimpressive on the week. They bounced, and they are in a selloff. They have bounced in relief, and they added a little more to the upside on Friday (10 year yield 2.87% versus 2.90% Thursday).
Click to view the chart

Gold. Gold had a rough week itself actually a rough two weeks. It managed to rebound late in the week, bouncing as the dollar sold back. Not a convincing bounce. It was unable to recover the trendline from the July low. The dollar looks as if it is in a modest pullback and a flag that will bounce back to the upside, and gold has to prove that it can move back to the upside itself. It has bounced, but can it sustain? It is at the trendline, showing a hangman doji. It needs to be careful. Gold was basically flat on the session ($1,353.40, -0.15).
Click to view the chart

Oil. As the dollar pulled back to end the week, oil manage to rebound. It was a tough week for oil. It sold off sharply early in the week with the worries about Europe and China. It did rally some on Friday, but it was unable to hold the move ($81.65, -0.20). It has bounced back up to resistance, and it is finding resistance. It gapped lower, and it is having trouble with that gap point. This is a key level that it tapped on the high Friday. It is that all-important January level it had such a hard time getting through that back in October.
Click to view the chart

TECHNICAL SUMMARY

INTERNALS

Volume. Volume fell 10% on NASDAQ to 1.8B shares. It fell 9% on the NYSE to 1.1B. It was a little better showing overall on the NYSE. Keeping it closer to average volume.

Breadth. Breadth was not committal. Advancers led 1.2:1 on the NASDAQ, and they led 1.5:1 on the NYSE. Nothing earth shattering there given the quiet, calm session.

CHARTS

SP500. SP500 was not very exciting with its 0.25% gain. It put in another inside day after selling off for the prior week and a half. It bounced sharply on Thursday off a key support level the rising 50 day EMA, October consolidation, and just above the 78% Fibonacci retracement of the April selloff. It has held and bounced the market, and that is a logical move. Does it go higher from here? I anticipate it may move laterally again and then make the next move upside after Thanksgiving. That is from general historical moves; it does not mean they will follow every year. The important thing is we have an upside bias that should continue if new leadership continues to develop and take the place of some of the winded names of leadership.

NASDAQ. NASDAQ showed similar action. It sold back into the gap a bit. It managed to recover for a gain, but it was very noncommittal action. It is still in no man's land. It never made it back down to the 50 day EMA or the Fibonacci retracement level. It is below the April peak, and it has several gaps. It could stand to move laterally a little and make the move. It is having some issues because some of the big names such as AAPL, GOOG, MSFT, and CSCO are having troubles of their own.

SP600. The small caps advanced 0.3%. They are showing the same action, moving a little higher. An inside day, unable to advance the ball after this pullback. They are in good shape to run up toward the April peak, but they need to get it together and have the right catalyst to do so. Still shaping up, decent, looking at that April peak.

SOX. SOX had a very good session. A nice, strong move, taking it back up to a key level. Still below the April peak, but the semiconductors continue to show improvement across the board. They were the strongest move in October. They were testing with a double bottom and look to be trying to take point on the lead again in a move back up through Thanksgiving into Christmas. They still have to deal with that April peak. They never made it through, but semiconductors have been doing well. They are breaking back into this trading range that they fell out of in August and have been on the rally ever since. Looks like they have their ears pinned back and are making their upside move.

LEADERSHIP

Leaders in distress. Some of the NASDAQ leaders have come upon hard times. It is not that they are selling off radically, but they are just unable to advance the move. They have had strong runs, lead the market to the upside, and they are now working through bases. AAPL is working in a trading range. Looking back, it did the same thing from April into late August before it broke out and made its next rally. Now it is moving up and down just as it did back then. It does not mean it is done with its run. It just means it is tired and the market needs to find someone else to come along and help. GOOG has had its issues. It had a great earnings report, but now it sold off into its gap zone, it has rallied back, and it looks like it might be ready to turn over. Some of these leaders have had issues and are no longer helping NASDAQ. CSCO is having the same issues. It gapped lower on earnings, and it moved to a lower low. Not helping NASDAQ along. These are holding it back, but there are other stocks helping move NASDAQ and is other indices along or at least keeping them to the upside for now.

Financial. JPM is still in its pullback. Not able to break out of the top of its range. GS is looking good. It is trying to get ready to move higher, but it was not able to do it on Friday.

Industrial. CAT had a nice day to the upside. Not a lot of volume, but it broke to a new rally high. DE posted a bit more of a gain after a good break off its 50 day EMA. There is a little trouble with MACD. It is not showing a same strength it had in recent times, but it has been a consistent rally off the 50 day EMA. Some of these industrial stocks are still in quite good shape.

Energy. I have been talking about some of the leaders having to go into rotation. They are taking their time out while others appear and come to the upside. PCX has been struggling a bit, but it has found its feet. It has volume to the upside, and it is breaking back upside. Energy is showing strength. HAL had a new high on the rally this week, and SLB new high on the rally this week. Not all energy is moving higher, but these areas are stirring and making their moves. That has been missing for quite some time.

Semiconductors. Semiconductors had a great day. BRCM had a new rally high on volume. MRVL had a strong surge off a test of the 200 day EMA and a Fibonacci retracement as well. NVDA keeps winning for us, moving higher. New rally high after breaking through the 200 day EMA. Semiconductors took a big chunk of the lead back in the rally up through early November. A quick test and they are at it again right now.

Retail. There are problems with the economy, but there are still retail leaders knocking the cover off the ball. DECK is exploding higher this week, and LULU is exploding higher on volume. NFLX pulled back, tested, and it is starting back up after holding its trendline. That is a positive. NKE is exploding to the upside to a new rally high on tremendous volume Friday. UA is exploding to a new high as well. Very strong moves.

Miscellaneous. Certain sectors in energy, semiconductors, and retail are taking the leadership by the horns and rallying nicely. There are other areas showing leadership as well, like some internet stocks that you have never heard of before. ACOM is exploding higher as well out of a little triangle. TROW is breaking higher after a nice pullback. A little flag to the 18 day EMA. VIT gapped higher over another flag that tested the 50 day EMA. It was not a huge move on Friday, but it looks ready to move. There are many stocks that are great, quality stocks that you may not have heard of very much. They are performing very well and are ready to move up.

Leadership may be changing somewhat. Some of the early leaders are turning weary, but money is rotating into other areas. This makes perfect sense. Am I planning on the economy booming down the road? No, but some people are wearing rose-colored glasses about what may happen. I guess 3% growth would be very good given what we have had. I do know that there are hundreds of billions of dollars that will be pushed into the financial markets whether the stock markets, currency markets, bond market, or the commodities markets and that will cause them to rise. There is not enough economic activity to soak up all of those funds, so they will go quickly into the financial system and push stocks higher.

That is why I am anticipating more of a move upside through the end of the year as some big hedge funds, mutual funds, and pension funds chase performance. All that money will be shoved into the market. It is a great racket for the banks and financial institutions that get the money at virtually 0% borrowing it from our Fed and then turn around and either buy bonds and collect the yield for easy money, or they push it into the commodities markets or the stock market and try to get really big gains. That happened in 1999, and it has happened other times in history when we have massive liquifications of the market by the Fed. That is why the old adage exists that says, "You do not fight the Fed." When it starts to push massive amounts of money in, it will make markets higher whether there is economic growth or not. While there will be ups and downs just as we saw this past week with the SP500 and other indices pulling back, they cannot withstand the tidal wave of money that continues to come to the market.

THE MARKET

MARKET SENTIMENT

VIX. The VIX tumbled lower to end the week as stocks tried to rebound off of their early selling. Tuesday volatility gapped to the upside, and then gapped right back down. It is now trading at the October and early November levels where the market encountered a bit of trouble. There is a little correlation setting up now between volatility and market action. That correlation breaks down, it solidifies again, and then it breaks down. Repeat the process. There may be a correlation developing now, and I would anticipate that the market runs into a bit of trouble here. That makes sense with Thanksgiving week and stocks often having trouble finding traction before they start moving up between Thanksgiving and Christmas. We may see a little giveback next week based upon the VIX, but it is not a strong correlation at this point.

VIX: 18.04; -0.71
VXN: 19.78; -0.48
VXO: 17.44; -1.05

Put/Call Ratio (CBOE): 0.66; -0.17

Bulls versus Bears:

The CROSSOVER from August is long gone but it did its job.

This is a reading of the number of bullish investment advisors versus bearish advisors. The reason you look at this is that it gives you an idea of how bullish investors are. If they are too bullish then everyone is in the market and it is heading for a top: if everyone wants to be in the market, then all the money is in and there is no more new cash to drive it higher. On the other side of the spectrum if there are a lot of bears then there is a lot of cash on the sideline, and as the market rallies it drags that cash in as the bears give in. That cash provides the market the fuel to move higher. If bears are low it is the same as a lot of bulls: everyone is in and the market does not have the cash to drive it higher.

Bulls: 56.2 versus 48.4%. The strongest move upside since May, indeed topping that level and getting closer to the 5 year high at 62.0. Moving toward the level considered bearish, i.e. where so many are in the market and believe it is going up that the ammunition to send it higher runs low. This is where you start to be careful and watch for breakdowns, but there is also a lot of liquidity being pushed into the market and that can continue the move despite excess bullishness. The crossover level at 29% bulls is long gone, but it did its job. The high on the last leg was 56.0% after starting at 35.6% on the low in February, the lowest it has been since July 2009 . . . until this last leg. 35% is the threshold level suggesting bullishness. Again, to be seriously bearish it needs to get up to the 60% to 65% level.

Bears: 20.2% versus 23.1%. Continuing the slide after holding steady at 24.4% for two weeks. Down from 28.3% in September. The 37.7% peak at the height of the crossover is well in the rearview mirror but bears remain well below the 35% level, above which is considered bullish for the market overall. Hit 18.7% on the low in April. Hit a high of 27.8% level on the prior leg in February. For reference, cracking above the 35% threshold considered bullish. Hit a high on the prior run at 47.2%. For more reference, bearishness hit a 5 year high at 54.4% the last week of October 2008. The move over 50 took bearish sentiment to its highest level since 1995. Extreme negative sentiment. Prior levels for comparison: Bearishness peaked at 37.4% in September 2007. It topped the June 2006 peak (36%) on that run. That June peak eclipsed the March 2006 high (33%) and well above the 2005 highs that spawned new rallies (30% in May 2005, 29.2% in October 2005). That was a huge turn, unlike any seen in recent history.

NASDAQ

Stats: +3.72 points (+0.15%) to close at 2518.12
Volume: 1.796B (-9.96%)

Up Volume: 1.018B (-602.285M)
Down Volume: 735.769M (+308.692M)

A/D and Hi/Lo: Advancers led 1.23 to 1
Previous Session: Advancers led 2.99 to 1

New Highs: 95 (+6)
New Lows: 50 (+7)

NASDAQ CHART: Click to view the chart

NASDAQ 100 CHART: Click to view the chart

SOX CHART: Click to view the chart

SP500/NYSE

Stats: +3.04 points (+0.25%) to close at 1199.73
NYSE Volume: 1.104B (-8.9%)

Up Volume: 635.459M (-410.663M)
Down Volume: 444.027M (+301.843M)

A/D and Hi/Lo: Advancers led 1.46 to 1
Previous Session: Advancers led 4.11 to 1

New Highs: 184 (-26)
New Lows: 17 (+2)

SP500 CHART: Click to view the chart

SP600 Chart: Click to view the chart

DJ30

Stats: +22.32 points (+0.2%) to close at 11203.55
Volume DJ30: 219M shares Friday versus 172M shares Thursday.

DJ30 CHART: Click to view the chart

MONDAY

It is Thanksgiving. It is a fun week, but it means a lot of the economic data will be jumbled up around the day. Tuesday and Wednesday, we will have a lot of information. The second rendition of the GDP is out Tuesday morning. 2.4% expected versus 2%. Then there will be existing home sales, and that will catch the attention of the market. We need to know how many sales are out there and what those inventory levels are. Wednesday is a lot more data. Income and spending, core PCE, durable goods orders, initial jobless claims, Michigan Sentiment, and new home sales just to name a few. A full week crammed in ahead of the holiday. It will be a short week. The market will not be open on Thursday, and it is a half day on Friday. They should close it on Friday, but the old theory is that the market cannot be closed for four days straight.

Thanksgiving week in the market is usually problematic. It goes up, it goes down, and it is not a clear directional week. The bias is upside. Near term, it has been back to the downside, so we may muddle around a little more as the indices test back. NASDAQ is still in no man's land, so it may find difficulty moving higher. It probably wanted to test lower and never got opportunity to do so. Maybe this week it will just bang around laterally a bit, tighten its range, and then it would be ready for a move higher after Thanksgiving. When the market has an upside bias and tons of money is coming into the market on a good year that a lot of hedge funds and mutual funds missed, they will want to chase that performance to the end of the year. Then they can show their investors that they were actually doing something and making some money. That money is being purchased into the financial system and will find its way into the markets. I anticipate these stocks to move higher.

Some of these old leaders that we have been following and still have positions in are not breaking down. They are just moving laterally. I want to let them base out because there is no reason to sell AAPL when it is up 100% or so for us. We can just let it move. Other stocks, however, are coming out with new leaders that you may not know that well, but are excellent companies. They will get money, and they will race to the upside. We have been buying them when things were not so great, but they were showing upside because they are leaders. By definition, leaders take off first. You can see a stock like DECK exploding to the upside while the indices are still below their November peaks. The leaders are already taking off to the upside, and we got good buys on them earlier in the week. We will continue to look for those. We will have some plays for next week, and we will see if we get buys on them. We may get some better entry points if the pre-Thanksgiving sessions are a little bit weaker. A little more consolidation would not hurt at all. We can be ready for some plays to start the next week.

To recap, we have some good entry points and we took advantage of them this week. Next week, we may get some more decent entry points if the markets do not rally to the upside. We will have to see what happens. Again, the days before Thanksgiving are problematic, and they can be up or down. Recently, they have been down over the years, but not dramatically so. We could get a little more pullback, a perfect position for more of the new emerging leaders to start higher with that money that will come in and push stocks higher, I believe, toward the end of the year as big funds chase performance.

Liquefying the markets and pushing them higher, making people have to get out of cash because they are earning zero this wealth-effect attempt will likely not end up with the best results. As chairman Bernanke said on Friday, we need different fiscal programs to help the monetary side of the equation. Raising taxes and spending like there is no tomorrow are not the fiscal solutions to help solve the problem. If we do that, it would be better for chairman Bernanke to raise interest rates. It would also be a great move if we would just get rid of the income tax and replace it with a national sales tax. We would get more real savings going there, if we raised interest rates, we would get more real savings going on. We could be smart about Social Security and parcel it up. For those that are too old to save for their future right now, we keep the promises we made for them. For the younger group anywhere from 40's, 50's and below we would start changing that to a privatized system and unleash all kinds of capital in the US.

We could really put some smart fiscal policies in place to take advantage of the monetary policies and create growth in the US. We could have China holding our debt, but not because it has to. We would make the US once again a great place for people to invest in because they would see real growth emerging from these kinds of policies. We should pull back from the policies of big government and regulating all parts of our lives. We should let the individuals use their ingenuity and entrepreneurial spirit to create new businesses and new ways of doing things that only individuals can come up with. If we would do that, we would create the climate where other countries want to invest in the US for growth reasons versus just having to hold our debt and pray that we do not totally screw up with our monetary and fiscal policies.

A bit of me on the soap box to wrap it up, but it is getting toward the end of the year. I always need to start prognosticating about what is coming. With cotton hitting an all-time high and other commodities right at that level as well, it is worrisome about what we are promulgating out of Washington. We need to get our eye back on the ball, or we will see a lot of inflation exploding. If we think we have had bad times to this point, just wait and see what happens if that inflation comes. People are not paying back debts or borrowing money right now because there is inflation. When inflation comes, that is when you want to pay back your debts. You want to pay back your debts with cheaper dollars. If there is a lot of inflation to come, which people are anticipating, there is no reason to start paying back debts or take on big projects because they would rather do it with funny money later.

Have a great weekend. All that funny money means the market probably continues to the upside after this pullback, and we have some great positions this week to take advantage of it. I think there will be more coming our way as we ride this wave of liquidity higher.

Support and Resistance

NASDAQ: Closed at 2518.12
Resistance:
2518 is interim peak from April 2010
2530 is the April 2010 closing peak
2535.28 is the April 2010 intraday peak
2540 is the gap up point from early November
2550 from May and June 2008 peaks
2569 is the November gap up point through the April 2010 peak
2593 is the November 2010 high
2725 from July 2007 interim peak
2735 from late 2007 interim peak
2862 is the 2007 peak

Support:
2511 is the lower range of the November gap up point
2482 is the recent October peak
The 50 day EMA at 2445
2434 is the May interim peak and the 78% Fibonacci retracement of the April selloff.
2425 is an interim peak from May 2010
2382-2395 from 2008
2324-2370 is a range of resistance from early 2008
2341 is the June 2010 peak
2320 to 2326.28 is the January 2010 high
The 200 day SMA at 2326
2319 from the September 2008 peak
2310 is the August 2010 peak

S&P 500: Closed at 1199.73
Resistance:
1220 is the April 2010 peak
1227 is the November 2010 peak
1313 from the August 2008 interim peak

Support:
1185 from late September 2008
1174 is the May 2010 high, 78% Fibonacci retracement of April peak
The 50 day EMA at 1171
1170 is the prior March 2010 high
1156 is the Sept 2008 low
1151 is the January 2010 peak
1133 from a September 2008 intraday low
Bottom of the January 2010 consolidation 1131 to 1136
1129 to 1131 is the June and August 2010 peaks
The 200 day SM A at 1130
1119 is the early December intraday high
1114 is the November 2009 peak
1106 is the September 2008 low
1101 is the October 2009 high and the recent May and June 2010 interim peaks
1084 to 1080 (September 2009 peak)
1078 is the October range low
1070 is the late September 2009 peak as well as several other peaks and valleys even in 2010.
1065 is the May flash crash intraday low.
1044 is the October 2008 intraday high AND the February 2010 low
1039 to 1040 are the May, June, and August 2010 lows

Dow: Closed at 11,203.55
Resistance:
11,205 is the April closing high
11,258 is the April 2010 peak
11,452 is the November 2010 peak
11,734 from 11-98 peak

Support:
11,100 from the 7-08 low
The 50 day EMA at 11,004
10,963 is the July 2008 low
10,920 is the recent May high
10,730 is the January 2010 peak
10,609 from the Mid-September 2008 interim low
The 200 day SMA at 10,599
10,594 is the June 2010 peak
10,496 is the November 2009 high
10,365 is the late September 2008 low
10,285 is the late December consolidation peak
10,260 from the May and June 2010 interim peaks are breaking
10,209 is recent August 2010 low
10,120 is the October 2009 peak
9938 is the August 2010 low
9918 is the September 2008 peak
9855 is the early September peak in its lateral range
9835 is the late September 2009 peak AND the February 2010 low
9829 is the September 2008 closing high
9774 is the May 2010 intraday low

Economic Calendar

These are consensus expectations. Our expectations will vary and are discussed in the 'Economy' section.

November 23 - Tuesday
- GDP - Second Estimate, Q3 (08:30): 2.4% expected, 2.0% prior
- GDP Deflator - Second estimate, Q3 (08:30): 2.3% expected, 2.3% prior
- Existing Home Sales, October (10:00): 4.42M expected, 4.53M prior
- Minutes of FOMC Meet, November 3 (14:00)

November 24 - Wednesday
- MBA Mortgage Application, 11/19 (07:00): -14.4% prior
- Personal Income, October (08:30): 0.4% expected, -0.1% prior
- Personal Spending, October (08:30): 0.5% expected, 0.2% prior
- PCE Prices - Core, October (08:30): 0.1% expected, 0.0% prior
- Durable Orders, October (08:30): -0.3% expected, 3.3% prior
- Durable Orders -ex t, October (08:30): 0.4% expected, -0.8% prior
- Initial Claims, 11/20 (08:30): 442K expected, 440K prior
- Continuing Claims, 11/13 (08:30): 4280K expected, 4295K prior
- Michigan Sentiment, November (09:55): 69.4 expected, 69.3 prior
- New Home Sales, October (10:00): 312K expected, 307 prior
- FHFA Home Price Index, Q3 (10:00): 0.9% prior
- Crude Inventories, 11/20 (10:30): -7.29M prior
icon url

ReturntoSender

11/22/10 8:14 PM

#9134 RE: ReturntoSender #6755

From Briefing.com: 4:15 pm : A loss of excitement for Ireland's financial aid request left the stock market to drop more than 1%, but technical support provided a base for a rebound that helped the broader market slash its loss and the Nasdaq Composite stage a nice gain.

Officials from Ireland announced during the weekend a request for financial aid from the European Union as part of an effort to sturdy its tenuous financial state. Nothing official has been put forth, but most estimates point toward a plan that will feature something on the order of 100 billion euros.

Global participants initially reacted to the announcement by boosting the euro and giving European bourses a strong start to the week, but attention was quickly diverted to the persisting problems of Portugal and Spain. That left Europe's equities to roll over and the euro to drop against the dollar.

At its overnight low the dollar was down 0.7%, but it swung to a gain of about 0.4% at its session high. It gave up part of that gain so that at the close of trade it was only up 0.2% against a basket of competing currencies. The dollar's rebound from its overnight low and the recognition that ineffective fiscal practices continue to trouble countries in the EU periphery caused stocks to come under a broad wave of selling. The effort took both the Dow and the S&P 500 down more than 1%.

Just as was the case in Europe, financials were the weakest performers and undermined broader market action. At its low the financial sector was down more than 2%, but it finished with a 1.4% loss. Goldman Sachs (GS 161.05, -5.62) was one of the hardest hit, no thanks to news of trading probes at a couple of hedge funds.

The financial sector was helped by a broader market rebound that began after support for the S&P 500 held in the 1184 to 1186 area.

Tech, the largest sector in the S&P 500 by market weight, provided a helping hand in the move. The sector showed leadership as it worked its way to a 0.6% gain. Most of that move was owed to strength in semiconductor stocks like SanDisk (SNDK 42.57, +2.59), which set a three-month high after an analyst upgrade, and Broadcom (BRCM 44.17, +0.95), which hit a four-year high after it announced a definitive agreement to acquire Gigle Networks for approximately $75 million.

The afternoon climb helped volatility cool, such that the Volatility Index was up just 3% at the close after it was up more than 10% during the day.

Trading volume was lackluster on the NYSE. Though some key economic releases in coming days will likely attract some participation, overall share volume in coming days will likely lack due to the holiday shortened week -- U.S. markets will be closed Thursday in observance of Thanksgiving and Friday will be a half day.

Treasuries saw some seesaw action as well today. The benchmark 10-year Note ran into some pressure after results from an auction of 2-year Notes showed a bid-to-cover ratio of 3.70, dollar demand of $129.5 billion, and an indirect bidder participation rate of 38.3%. For comparison, the average for the past three auctions holds a bid-to-cover ratio of 3.44, dollar demand of $123.9 billion, and indirect bidder participation of 36.1%.

Advancing Sectors: Tech (+0.6%), Consumer Discretionary (+0.3%), Utilities (+0.2%), Materials (+0.2%)
Declining Sectors: Financials (-1.4%), Energy (-0.4%), Telecom (-0.3%), Industrials (-0.3%), Consumer Staples (-0.1%)
Unchanged: Health CareDJ30 -24.82 NASDAQ +13.90 NQ100 +0.7% R2K +0.4% SP400 +0.7% SP500 -1.88 NASDAQ Adv/Vol/Dec 1336/1.85 bln/1303 NYSE Adv/Vol/Dec 1520/917 mln/1453

4:10PM Hewlett-Packard beats by $0.06, beats on revs; guides Q1 EPS above consensus, revs above consensus; guides FY11 EPS above consensus, revs in-line (HPQ) 43.25 +0.76 : Reports Q4 (Oct) earnings of $1.33 per share, $0.06 better than the Thomson Reuters consensus of $1.27; revenues rose 8.1% year/year to $33.28 bln vs the $32.75 bln consensus. HPQ reports Q4 operating margins of 12.0%, in-line with Thomson Reuters consensus of 12.0%. Co issues upside guidance for Q1, sees EPS of $1.28-1.30 vs. $1.22 Thomson Reuters consensus; sees Q1 revs of $32.8-33.0 bln vs. $32.74 bln Thomson Reuters consensus. Co raises guidance for FY11, sees EPS of $5.16-5.26 vs. $5.11 Thomson Reuters consensus; sees FY11 revs of $132.0-133.5 bln vs. $132.41 bln Thomson Reuters consensus (prior guidance was for FY11 EPS of $5.05-5.15; revs of $131.5-133.5 bln). Co cites "Broad-based year-over-year growth in the commercial segment driven by ESS growth of 25% and growth in commercial PC Clients and Printers of 20% and 22%, respectively, in the fourth quarter."

4:05PM Analog Devices also authorized the repurchase of an additional $1 billion of common stock (ADI) 35.96 +0.78 :

4:04PM Analog Devices beats by $0.03, beats on revs; guides Q1 EPS above consensus, revs in-line; authorizes additional $1 bln stock repurchase (ADI) 35.96 +0.78 : Reports Q4 (Oct) earnings of $0.73 per share, $0.03 better than the Thomson Reuters consensus of $0.70; revenues rose 34.7% year/year to $770 mln vs the $755.8 mln consensus. Q4 gross margin of 67.0% vs. the 66.6% consensus. Co issues guidance for Q1, sees EPS of $0.63-0.67 vs. $0.63 Thomson Reuters consensus; sees Q1 revs of $715-740 mln vs. $728.36 mln Thomson Reuters consensus. "Our book-to-bill ratio for the fourth quarter, as measured by end customer bookings, was below one as customers began to lower their inventories in response to shortened industry lead-times. During the fourth quarter, order patterns at ADI weakened in late August and September, but substantially recovered in October. Overall, customer feedback indicates that end demand remains strong in most end markets. In this environment, we would expect to operate with less backlog and higher turns during the first quarter." The Board of Directors authorized the repurchase of an additional $1 bln of common stock under ADI's existing share repurchase program.

4:00PM RF Monolithics announces two-year extension of ViewPoint Bank Credit Facility for $5 mln senior secured credit facility (RFMI) 1.19 -0.05 :

8:02AM Broadcom to Acquire Gigle Networks; expects the acquisition to be dilutive by ~$0.01 per share in 2011 (BRCM) 43.22 : Co announces it has signed a definitive agreement to acquire Gigle Networks. In connection with the acquisition, Broadcom expects to pay approximately $75 million to acquire all of the outstanding shares of capital stock and other rights of Gigle Networks. Additional consideration of up to $8 million in cash will be reserved for future payment to the former holders of Gigle Networks capital stock and other rights upon satisfaction of certain performance goals. Excluding any purchase accounting related adjustments or fair value measurements that are not estimable at this time, Broadcom expects the acquisition of Gigle Networks to be dilutive by approximately $0.01 per share in 2011.

icon url

ReturntoSender

11/23/10 8:54 PM

#9135 RE: ReturntoSender #6755

From Briefing.com: 4:30 pm : Participants kept stiff and steady pressure on stocks all session. Their efforts came amid news that military tension has intensified between North Korea and South Korea, and ongoing contagion concerns for Europe.

Each of the major equity averages tumbled more than 1% today. Downside momentum took the Dow below the 11,000 before it settled on its 50-day moving average and the S&P 500 moved below 1180 before it recovered to that point. Sell-offs of a similar degree were made abroad. Collective weakness left the Dow Jones World Index to drop 1.9% in its worst single-session slide since August.

The push to dump stocks came in response to news that artillery fire was exchanged overnight between North Korea and South Korea. Though tension between the two nations has been persistent, the latest episode marks a dramatic escalation of the tone between them.

That development added to the distress of market participants, who have long held concern for the fragile state of finances among countries in the European Union periphery. Even Ireland remains a point of worry as it has yet to completely structure a bailout package and implement austerity measures.

Distress and uncertainty moved many into the relative safety of the dollar, which was up 1.3% against competing currencies at the close of trade. The advance marked its biggest one-day bounce in a month and put the currency at its best level in almost two months.

Only a few pockets of strength were seen this session. Hewlett-Packard (HPQ 44.19, +0.94) was the only blue chip in the Dow to post a gain. Its strength was owed to better-than-expected earnings and upside guidance.

J.Crew (JCG 43.99, +6.34) registered a big gain in response to news that it will be taken private for $43.50 per share, a premium of about 15% relative to the prior session's closing price. It helped limit pressure against other retailers, but the group still booked a 0.8% loss.

Upward revisions to third quarter GDP failed to provide fodder for buyers. The data indicated that GDP grew 2.5% from July through September. Advance data had initially indicated that GDP had increased 2.0% in that time. Economists polled by Briefing.com had expected the revised data to reflect growth of 2.4%.

Reflective of the GDP data, minutes from the most recent FOMC meeting generally indicated that the economic recovery has proceeded at a modest rate in recent months. However, there has been only a gradual improvement in labor market conditions. Also, inflation remains low.

Among meeting members, most saw the risks to growth as broadly balanced, but some saw the risks as tilted to the downside. A majority saw the risks to inflation as balanced, but some saw downside risks. Members also differed in their assessments of the likely benefits and costs associated with the latest program of quantitative easing.

Treasuries displayed strength in the early going as participants sought their relative safety, but they gave up a chunk of their gains following results from an auction of 5-year Notes. The auction attracted a bid-to-cover ratio of 2.65, dollar demand of $92.8 billion, and an indirect bidder participation rate of 31.5%.

Advancing Sectors: (None)
Declining Sectors: Energy (-1.9%), Materials (-1.7%), Financials (-1.6%), Tech (-1.5%), Consumer Discretionary (-1.4%), Industrials (-1.3%), Health Care (-1.3%), Utilities (-1.1%), Consumer Staples (-1.1%), Telecom (-0.9%)DJ30 -142.21 NASDAQ -37.07 NQ100 -1.6% R2K -1.0% SP400 -1.1% SP500 -17.11 NASDAQ Adv/Vol/Dec 662/1.90 bln/1994 NYSE Adv/Vol/Dec 671/1.02 bln/2356

4:08PM Verigy beats by $0.01, misses on revs; guides Q1 EPS below consensus, revs below consensus (VRGY) 8.45 +0.27 : Reports Q4 (Oct) earnings of $0.29 per share, excluding non-recurring items, $0.01 better than the Thomson Reuters consensus of $0.28; revenues rose 63.9% year/year to $159 mln vs the $164.3 mln consensus. Co issues downside guidance for Q1, sees EPS of $(0.03)-0.02, excluding non-recurring items, vs. $0.17 Thomson Reuters consensus; sees Q1 revs of $115-120 mln vs. $144.83 mln Thomson Reuters consensus.

4:07PM Verigy initially falls ~8% to $7.78 following weak Q1 guidance in earnings report (VRGY) 8.45 +0.27 :

6:57AM LTX-Credence beats by $0.05, misses on revs; guides Q2 EPS below consensus, revs below consensus (LTXC) 7.65 : Reports Q1 (Oct) earnings of $0.42 per share, excluding non-recurring items, $0.05 better than the Thomson Reuters consensus of $0.37; revenues rose 80.4% year/year to $75.6 mln vs the $77.3 mln consensus. Co issues downside guidance for Q2, sees EPS of $0.11-0.16, excluding non-recurring items, vs. $0.26 Thomson Reuters consensus; sees Q2 revs of $53-58 mln vs. $67.42 mln Thomson Reuters consensus.

Acacia Research Corporation (ACTG) announced that its subsidiary Microprocessor Enhancement Corporation has entered into a settlement and license agreement with ARM Holdings Plc (ARMH). This agreement resolves patent litigation pending review by the Court of Appeals for the Federal Circuit. This patented technology generally relates to an architecture employed in advanced pipeline microprocessors...

Mattson Technology (MTSN) announced that it received a repeat order for the Alpine etch system from a leading semiconductor manufacturer. The system, which is scheduled to ship in November 2010, will be used in the customer's leading-edge 300 millimeter (mm) packaging facility in Asia for advanced wafer-level packaging.

SunEdison, a subsidiary of MEMC Electronic Materials (WFR), has successfully interconnected a 70 megawatt photovoltaic power plant in Northeast Italy, near the town of Rovigo.

07:57 am Ixia ests and target raised to $19 at Wunderlich: . Wunderlich believes most of the upside of Ixia's recent results and guidance represents the early stage of a demand cycle that will be lengthier and larger than what the company has experienced in the past. This is because demand for data has multiplied since the 3G test equipment spending cycle and is expanding to emerging markets. On the enterprise side, the integration of computing and network functions combined with implementation of Ethernet for storage networks is bringing opportunities with new customers. Firm is raising its forecast and increasing its target to $19.00 from $15.50.

09:44 am HPQ Raises FY11 Guidance (HPQ)

Hewlett-Packard (HPQ 44.19 +0.94) reports fourth quarter earnings of $1.33 per share, $0.06 better than the Thomson Reuters consensus of $1.27.

Revenues rose 8.1% year-over-year to $33.28 billion versus the $32.75 billion1 consensus.

HPQ reports fourth quarter operating margins of 12.0%, in-line with Thomson Reuters consensus of 12.0%.

For the first quarter, the company guided first quarter earnings in the range of $1.28 to $1.30, above the $1.22 Thomson Reuters consensus. Revenues expectations are between $32.8 billion to $33.0 billion versus the $32.74 billion Thomson Reuters consensus.

For the fiscal year 2011, the company sees earnings guidance in the range of $5.16 to $5.26, above the $5.11 Thomson Reuters consensus. On the top line, the company is guiding revenues to be between $132.0 billion to $133.5 billion versus the $132.41 billion Thomson Reuters consensus (prior guidance was for fiscal year 2011 EPS of $5.05-5.15; revenues of $131.5 billion to $133.5 billion).

The company cites "Broad-based year-over-year growth in the commercial segment driven by ESS growth of 25% and growth in commercial PC Clients and Printers of 20% and 22%, respectively, in the fourth quarter.
icon url

ReturntoSender

11/27/10 7:58 PM

#9137 RE: ReturntoSender #6755

Amateur Investors Weekend Market Analysis (11/27/10)

http://www.amateur-investor.net/Weekend_Market_Analysis_Nov_27_10.htm

Overall nothing has changed regarding the overall wave structure from the March 2009 low as it appears the S&P 500 is exhibiting Wave C of a larger "ABC" corrective pattern. Also notice how the S&P 500 recently stalled out near its 61.8% Retrace calculated from the October 2007 high to the March 2009 low for Wave 3 of 5 of C.


Meanwhile for the past 3 weeks the S&P 500 has been in a choppy consolidation pattern which appears to be Wave 4 of 5 of C. So far it looks like Wave 4 of 5 is evolving into some type of "abcde" Triangle pattern as the S&P 500 has been holding support above its 50 Day EMA (green line). If we are seeing a Triangle pattern develop then we are missing "e" to complete the pattern possibly around the 1180 level.


Meanwhile once Wave 4 of 5 ends then the final 5th Wave up would occur to complete the larger "ABC" pattern possibly around 1291. 1291 was calculated by taking the length of Wave 1 which was 118 points and adding that to the potential Wave 4 low of 1173.


Finally keep a close eye on the Banking sector as the Banking Index (BKX) hasn't been confirming the move higher in the S&P 500 since the July low. Keep in mind we saw a similar divergence in 2007 as the BKX began to breakdown (points F to G) while the S&P 500 continued higher (points H to I). Eventually the S&P 500 peaked and caught up with the weakness in the BKX. Furthermore also notice the BKX has been developing a potential Head and Shoulders Top pattern the past several months with the key support area along the Neckline near the 43 level. If the BKX were to break solidly below its Neckline in the coming months that would eventually spell trouble for the broader market.


icon url

ReturntoSender

11/28/10 10:55 PM

#9138 RE: ReturntoSender #6755

Monday Morning Outlook: Market Stuck in Neutral; DJIA Slips Below 11,100
SPX, Nasdaq are still looking at gains for month of November

by Todd Salamone 11/27/2010 10:37 AM

http://www.schaeffersresearch.com/commentary/observations.aspx?ID=103703

The Dow Jones Industrial Average's post-election slump continued, with the blue chip barometer slipping below 11,100 at the end of the holiday-shortened week. Looking ahead, Todd Salamone, Senior Vice President of Research, compares the trading range behavior we've seen recently to the action at this time last year. Next, Senior Quantitative Analyst Rocky White finds that the market's performance in the week following Black Friday, the kickoff to the shopping season, can be an indicator for performance the rest of the year, and indeed, even the next quarter. Finally, we wrap up with a look at some key economic and earnings reports slated for release this week.

Recap of the Previous Week: Thanksgiving Week Pullback
Schaeffer's Editorial Staff

Rocky White called it, just like Babe Ruth's called shot in the 1932 World Series. Last week in this space, our Senior Quantitative Analyst analyzed the market's historical performance during Thanksgiving week and found that the week tends to perform countertrend to the year to date. That is, if the market is up, as it is this year, Thanksgiving week tends to see a pullback. Sure enough, the Dow Jones Industrial Average retreated 1% last week. Of course, Mr. White had a little help from renewed worries over euro zone debt, hostilities between the Koreas, FBI raids on major hedge funds and the kickoff to the holiday shopping season, but still: Our hat's off to Rocky.

The holiday week got off to a decidedly downbeat start Monday with FBI raids on several major hedge funds in connection with a major insider trading investigation. Goldman Sachs (GS) is among the targets of the investigation, according to The Wall Street Journal, which broke the story online the previous Friday night and in print on Saturday. The probe "could eclipse the impact on the financial industry of any previous such investigation," according to the Journal. Traders also watched developments in Ireland, which agreed to accept an aid package tied to budgetary constraints. The Dow shed 0.22% for the day.

The more than 60-year-old conflict between the two Koreas heated up again Tuesday when North Korea shelled a South Korean island and the South returned fire. There's nothing like a shooting war between Cold War proxies to take the starch out of Wall Street. The geopolitical tensions overshadowed an upbeat gross domestic product report, which showed the economy grew 2.5% during the third quarter, up from the initial estimate of 2%. The minutes from the early-November Federal Open Market Committee meeting also weighed on traders. Fed officials lowered their expectations for economic growth and warned that a return to normal unemployment levels could be years away. The Dow sank 1.27%.

First-time jobless claims came in at 407,000 early Wednesday, far lower than expected and the lowest level in more than two years, and the bulls were off to the races. The University of Michigan reported that its consumer sentiment index was 71.6, another better-than-expected reading as the holiday approached. The Dow soared 150 points, or 1.37%, erasing Tuesday's losses.

Wall Street took Thanksgiving Day off, of course, but returned from the feasting in a sour mood. Renewed worries about sovereign debt in Portugal and Spain were not assuaged by those countries' tough new budgetary measures. In a shortened post-holiday session that ended at 1 p.m., the Dow fell 0.85%. For the week, the Dow fell about 1% and the S&P 500 Index slipped 0.8%. The Nasdaq Composite, meanwhile was in positive territory last week, gaining 0.6%. Furthermore, although the Dow is down for the month to date, the SPX and Nasdaq are still on track for gains in November.

What the Trading Desk Is Expecting: Trading Range Reminiscent of Late 2009
By Todd Salamone, Senior Vice President of Research

"The 3.8% decline from the S&P 500 Index's (SPX) 1,225 closing high earlier this month pushed the SPX down to its 40-day moving average, which coincides with a former area of congestion from mid-to-late October. As we move into a holiday-shortened week, this area is potentially supportive if another pullback occurs... Longer-term resistance levels still reside just above last week's SPX close, which could continue to put a lid on the market. Specifically, the round-number 1,200 level – an area of congestion in 2005 – the 80-month moving average at 1,206, and the 1,230 area, site of the 61.8% Fibonacci retracement of the 2007 high and 2009 trough, could collaborate to cap the market's progress... With retail investors pulling cash out of domestic equity funds for 28 consecutive weeks, it is the under-invested hedge funds that have the capability to drive significant rallies. Without more support from this crowd, the market is exposed to the mean-reversion games of the high-frequency traders, especially with the defined areas of support and resistance as discussed above in play."

--Monday Morning Outlook, Nov. 20, 2010

Last week's holiday-shortened week was dominated by overseas headlines ranging from escalating tensions between North and South Korea, anticipation that Portugal and Spain could be the next to seek bailouts and, albeit on a smaller scale, continued speculation that a Chinese rate hike is imminent. Amid the negative headlines, mean-reversion best defines the resultant price action on the S&P 500 Index (SPX) last week, as the index found itself strangled between 1,180 and 1,200 during the week, with sharp moves to these levels driven by overnight news that created significant movement at the opening bell. At the end of the week, the SPX found itself exactly between support at 1,180 and resistance at 1,200.


As discussed a few weeks ago, it is looking more and more like the price action of the broader market is vulnerable to the trading range behavior that occurred between mid-November and mid-December 2009, when longer-term resistance levels also capped market rallies. In fact, except for the brief breakout above 1,200 immediately following QE2 and the midterm elections, the SPX has experienced little net movement since mid-October.


The sideways price action, while frustrating for anyone with a time frame beyond a few weeks, might be considered a win for market bulls, considering that:

1. News stories from overseas (China, Europe, North and South Korea) have not been positive drivers.

2. Yields on the 10-year Treasury note have surged 50 basis points since mid-October, from 2.40% to last week's highs around 2.90%.

3. We are seeing evidence that hedge funds are no longer in accumulation mode.

4. There is no support from retail investors, who continue to pull money out of domestic stock mutual funds (they pulled $2.8 billion from domestic equity funds in the latest week, according to the Investment Company Institute).

Above being said, a lesson learned in early May is that when the high-frequency players are the only game in town -- as they appear to be now -- things can get quite ugly if "surprises" emerge and these players abruptly depart the playing field.

It is for this reason that we continue to be strong advocates of using cheap put premiums to protect your long positions, especially in instances where implied volatility on individual stock options has plummeted after a company announces earnings. We have noticed that option premiums have reached multi-month lows on some stocks.

Or, another strategy is to buy call options in lieu of purchasing shares of a stock that you expect to make an upside move. Given that options give you control over a specified number of shares at a fraction of the cost to own the shares outright, you can position yourself to profit handsomely if the underlying moves in your expected direction, while simultaneously putting less capital at risk during these tenuous times.

A sector that will gather much attention during the next several weeks will be the consumer discretionary group, particularly retailers. (Senior Quantitative Analyst Rocky White discusses this in more depth in the next section.) Despite concerns about the health of the consumer, retail stocks, as measured by the SPDR S&P Retail Trust (XRT – 47.33), are among the strongest performers year to date. The exchange-traded fund, in fact, was positive while the broader market traded lower on Friday. Several earnings reports in the group are due in December, while holiday sales will be carefully monitored by investors. How this group does relative to expectations will dictate near-term price action in this group and could even influence broad market sentiment.

According to a Bloomberg article on Friday, "estimates for holiday sales vary from little changed to increases of as much as 4.5 percent. The retail federation predicts a gain of 2.3 percent to $447.1 billion after an uptick of 0.4 percent last year and a 3.9 percent drop in 2008... Same-store sales for November and December may advance as much as 3.5 percent, the largest increase since 2006, according to the International Council of Shopping Centers."

We have seen put buying on XRT amid strong price action in recent weeks, a sign that hedged buyers may be accumulating these equities, which we tend to view as bullish. Moreover, buy-to-open option volume has increased on XRT in recent weeks, and such activity has tended to foreshadow rallies in the sector dating back to April 2009. We continue to favor the consumer discretionary group, which includes some retail and restaurant stocks.

If you want to hedge long stock exposure to this group, XRT options are cheap. The January 46 put, for example, is trading at a 27.5% implied volatility, and protects you on downside movement below 46 through December expiration. Implied volatility on XRT options is slightly above April 2010's low of 20%, which was a three-year low. For perspective, XRT options were trading at 30% at this time last year, and 37% at the end of June.


If you enjoy Monday Morning Outlook...

...we also offer a free Market Recap after the close every day. Did the Dow go up 100 points? Or down? We'll tell you why. We'll also tell you who the big winners and losers were, and we'll share some highlights from our daily articles and blog postings. Market Recap is a quick, but insightful read. Sign up here to have Market Recap delivered straight to your inbox every evening shortly after the close.

Prepare for the investing week ahead. Every week, Bernie Schaeffer and his staff provide you with their insight about what has happened and, more importantly, what will happen in the market. We dig deep and show you what's happening behind the scenes, and tell you which indicators are predicting major market moves. If you enjoyed this week's edition of Monday Morning Outlook, sign up here for free weekly delivery straight to your inbox.

Indicator of the Week: Black Friday Reactions
By Rocky White, Senior Quantitative Analyst

Foreword: Friday, the day after Thanksgiving, was Black Friday, the beginning of the holiday shopping season. There will be plenty of media attention this week as Black Friday sales data is disclosed. Economists will be analyzing the data and suggesting what it reveals about the condition of the economy. Since Black Friday is considered to be so significant, it might be useful to keep a close eye on the market's reaction this week. In the analysis below, I went back 20 years to see if the market's one-week reaction to Black Friday told us anything about what to expect from the stock market going forward.

Analysis: I looked at the performance of the S&P 500 Index (SPX) in the week after Black Friday. Then I recorded the returns for the rest of the year following that week, and broke down those returns depending on whether the week after Black Friday was positive or negative. The table shows the reaction to Black Friday has been a pretty good indicator for the rest of the year. In the last 20 years, the week after Black Friday has been positive 12 times. In those years the rest of the year has averaged a pretty impressive return of 2.01%. Furthermore, 10 out of 12 times (83%) the return for the rest of the year was positive. In the eight years that the week after was negative, the average return was only 0.69%.

SPX rest of year returns following Black Friday


The difference is even more prominent when you look farther out. Rather than looking at returns until the end of the year (approximately one month), the table below looks at returns over the next three months. When the market is up in the week following Black Friday, the SPX was up on average more than 4% in the next three months. If the week after Black Friday is down, then the market goes down on average by 1.86%.

SPX 3-month returns following Black Friday


Implications: The consumer 's willingness to spend money is considered vital to this market. Sales data from last week will be highly scrutinized, and there will be plenty of articles on what the data tells us about economy. It might be a good idea to note the market's reaction. The analysis above shows it could be a good indication of what's in store going forward.

This Week's Key Events: November Jobless Data on Tap Friday
Schaeffer's Editorial Staff

Here is a brief list of some of the key events this week. All earnings dates listed below are tentative and subject to change. Please check with each company's respective website for official reporting dates.

Monday
* There are no major economic reports scheduled for Monday. Inergy, L.P. will report earnings.

Tuesday
* The Case-Shiller 20-city index for September will be released, along with the Chicago purchasing managers' index for November. The Conference Board, meanwhile, will publish its survey on consumer confidence in November. Barnes & Noble Inc. (BKS), Trina Solar Limited (TSL), and OmniVision Technologies Ltd. (OVTI) are scheduled to issue their quarterly reports.

Wednesday
* Wednesday will be busy. ADP and Challenger, Gray & Christmas will kick off three successive days of jobs data, with the former reporting on private sector growth in November, and the latter releasing data on layoffs. The Institute for Supply Management (ISM) will publish its November manufacturing index, and the Commerce Department will report on construction spending in October and auto sales in November. The Fed will issue its Beige Book for December, and we'll get the usual weekly report on crude inventories. Scheduled to report earnings are Charming Shoppes Inc. (CHRS), Aeropostale Inc. (ARO), Collective Brands Inc. (PSS), Jo-Ann Stores Inc. (JAS), Krispy Kreme Doughnuts (KKD) and Zumiez Inc. (ZUMZ).

Thursday
* The Labor Department will give us its weekly look at jobless claims. Del Monte Foods Company (DLM), The Kroger Co. (KR) Toll Brothers Inc. (TOL), Coldwater Creek Inc. (CWTR), Novell Inc. (NOVL) and VeriFone Systems Inc. (PAY) plan to report earnings.

Friday
* The Labor Department will report on nonfarm payrolls and the unemployment rate for November, while the Commerce Department will unveil its findings on October factory orders. The ISM, meanwhile, will release its services index for November. Big Lots Inc. (BIG) will report earnings.
icon url

ReturntoSender

11/29/10 10:44 PM

#9139 RE: ReturntoSender #6755

From Briefing.com: 4:15 pm : Stocks staged a late session rally as strength in financials, energy, and materials propelled the major indices to minimal losses (Nasdaq -0.4%, S&P 500 -0.1%) after seeing heavy selling this morning on European debt fears, and growing tensions on the Korean Peninsula. Stocks moved off their session lows following the completion of the second Permanent Open Market Operation of the day. Today's operations allowed dealers to rid their books of $9 billion worth of Treasuries, and possibly put that money to work in equities.

The major European indices all closed down at least 2% after the $113 billion bailout of Ireland was announced. Bond yields in some of the more troubled European nations ticked higher as contagion fears continue to spread. After seeing a session low of 1.3064, the euro clawed its way back to the 1.3125 area.

Rising tensions on the Korean Peninsula did little to quell fears after South Korea said it was pushing forward on a joint naval exercise with the U.S., and told China it would not take place in six-party talks to diffuse the situation. The major Asian indices closed mixed.

Financials (+0.5%) were among the best performing stocks all session long as the regional banks helped the sector to a solid gain. Huntington Bancshares (HBAN 5.79, +0.24), Regions Financial (RF 5.38, +0.13), and Wells Fargo (WFC 27.20, +0.55) led the way for financials as 55 out of 81 stocks in the S&P 500 Financials Index closed in positive territory.

After being the worst performing sector at the start of trading, the materials sector ended the day as one of the top performers. Freeport-McMoran (FCX 101.25, +3.33), Vulcan Materials (VMC 39.45, +0.69), and US Steel (X 47.90, +0.56) all registered solid gains.

Retailers were in focus as the holiday shopping season kicked off over the weekend, and initial feedback was generally encouraging. Online retailers saw a mixed session with today marking Cyber Monday, the start of the online holiday shopping season. Amazon.com (AMZN 179.23, +2.03) saw strong gains, but eBay (EBAY 30.22, -0.93) closed lower.

Treasuries closed off their best levels of the session, but still saw a higher day. Buying in the complex pushed the 10-yr yield down 4 basis points to 2.826%. DJ30 -39.51 NASDAQ -9.34 SP500 -1.64 NASDAQ Adv/Vol 1453/1189 NYSE Adv/Vol/Dec 1248/923.5 mln /1711

5:22PM Microsoft: Xbox 360 surpasses 2.5 mln Kinect sensors sold (MSFT) 25.31 +0.06 : Co announced that strong demand over the Black Friday weekend has propelled retail sales of Kinect for Xbox 360 to more than 2.5 mln units worldwide since it launched just 25 days ago.

4:05PM Nanometrics announces $10 mln share repurchase program (NANO) 11.48 -0.21 :

#
# Power Integrations (POWI) announced on October 22, 2010, a $30 million strategic investment in SemiSouth Laboratories.

8:00AM Marvell confirms jury ruled in its favor, rejecting misappropriation of trade secrets allegations brought on behalf of Jasmine Networks (MRVL) 19.58 : Co announced that a Santa Clara Superior Court Jury in California found in its favor, rejecting misappropriation of trade secrets allegations brought on behalf of Jasmine Networks, Inc. The jury unanimously found that Marvell did not use or acquire any Jasmine trade secrets and did not violate any nondisclosure agreements.

icon url

ReturntoSender

11/30/10 9:32 PM

#9140 RE: ReturntoSender #6755

From Briefing.com: 4:30 pm : For the second straight session the stock market was down sharply before it slashed losses. This time, though, stocks failed to finish near their highs for the day.

Continued concern that the financial troubles of less fiscally responsible countries in the eurozone periphery could spill into the broader global financial system caused yield spreads on the debt of Spain, Portugal, and their ilk to widen. To little surprise, analysts at S&P announced late that they have put Portugal's ratings on Credit Watch with Negative implications.

In order to trim risk market participants dumped stocks in favor of traditional safe havens like the dollar and U.S. Treasuries. The dollar settled with a 0.6% gain against competing currencies, but Treasuries ultimately surrendered most of their gains.

The early push against stocks sent the S&P 500 down more than 1%. Prior session lows were probed near the 1174 line, but support at that point held so as to provide stocks with a floor for a rebound.

Losses were cut further following the latest Consumer Confidence Index, which improved in November to a five-month high of 54.1 from 49.9 in October. The Index had been widely expected to improve to a more moderate 52.0.

Stocks set their highs for the day after President Obama expressed that the White House is currently involved in efforts to extend unemployment benefits. Efforts to extend the Bush tax cuts are also broadly believed to be underway.

Still, the S&P 500 never did manage to push into positive territory. That failure invited some late selling.

Tech stocks had the most adverse impact on trade. The sector, which is the largest by market weight, suffered the worst loss of any sector with a 1.4% drop. Weakness in the tech space proved especially damaging to the Nasdaq, which trailed its counterparts for the entire day.

Tech was also one of the poorest performing sectors of November. For the month it fell 1.8%, which was enough to drag down the broad-based S&P 500 to a 0.2% loss for November after it had set a two-year high earlier in the month.

Telecom was the only major sector to muster a gain. It advanced just 0.1%. It still logged a 1.4% monthly loss.

Worth mention, though, is that the materials sector completely erased an early loss of more than 1% to finish flat today. That was helped by precious metals plays after gold prices finished pit trade up 1.3% at $1386.10 per ounce and silver settled gained 3.2% higher at $28.21 per ounce. Materials stocks collectively gained 0.9% in November.

End-of-the-month trade brought about an increase in trading volume, such that more than 1.5 billion shares were traded on the NYSE today. That makes for the biggest one-day total in two months.

Advancing Sectors: Telecom (+0.1)
Declining Sectors: Tech (-1.4%), Health Care (-0.8%), Financials (-0.7%), Consumer Staples (-0.5%), Consumer Discretionary (-0.3%), Energy (-0.3%), Industrials (-0.3%), Utilities (-0.1%)
Unchanged: MaterialsDJ30 -46.47 NASDAQ -26.99 NQ100 -1.3% R2K -0.7% SP400 -0.6% SP500 -7.21 NASDAQ Adv/Vol/Dec 857/2.32 bln/1784 NYSE Adv/Vol/Dec 994/1.53 bln/1948

4:21PM OmniVision beats by $0.05, beats on revs; guides Q3 EPS above consensus, revs above consensus (OVTI) 28.29 0.83 : Reports Q2 (Oct) earnings of $0.58 per share, excluding non-recurring items, $0.05 better than the Thomson Reuters consensus of $0.53; revenues rose 30.7% year/year to $239.5 mln vs the $232.3 mln consensus. Co issues upside guidance for Q3, sees EPS of $0.50-0.63, excluding non-recurring items, vs. $0.41 Thomson Reuters consensus; sees Q3 revs of $230-250 mln vs. $209.64 mln Thomson Reuters consensus.

4:20PM OmniVision initially pops 6% to $30.00 following Q2 earnings results and upside Q3 EPS and revs guidance; now at $29.62 (OVTI) 28.29 -0.83 :

4:16PM Motorola board of directors has approved the separation of Motorola Mobility Holdings from Motorola, Inc. through a tax-free dividend (MOT) 7.66 -0.11 : Co announces that its board of directors has approved the separation of Motorola Mobility Holdings from Motorola, Inc. through a tax-free dividend involving the distribution of all Motorola Mobility common stock held by Motorola to Motorola stockholders and has also approved a reverse stock split of shares of Motorola common stock following the distribution. On Jan. 4, 2011, Motorola, Inc. will change its name to Motorola Solutions, Inc. and will begin trading on the New York Stock Exchange under the ticker symbol MSI, and Motorola Mobility Holdings will begin trading on the NYSE under the ticker symbol MMI.

Rudolph Technologies (RTEC) is partnering with a semiconductor assembly and test services manufacturer to provide its inspection and metrology capability in the development of stacked packaging processes.

Applied Materials (AMAT) announced that it has entered into a settlement agreement with Samsung Electronics Co. The Agreement resolves potential civil claims and removes the risk of civil litigation between the parties relating to the alleged acquisition, misappropriation and misuse of Samsung confidential semiconductor information in Korea. It also establishes a broad framework of incentives to Samsung for the future relationship between the two companies.

6:40AM Trina Solar beats by $0.21, beats on revs; raises FY10 shipment guidance (TSL) 23.89 : Reports Q3 (Sep) earnings of $1.08 per share, $0.21 better than the Thomson Reuters consensus of $0.87; revenues rose 103.5% year/year to $508.3 mln vs the $420.6 mln consensus. For Q4, the co expects to ship ~300 MW of PV modules. For FY10, the co raises its guidance for total PV module shipments to be ~1 GW, compared to its earlier guidance of between 900 MW to 930 MW, representing an increase of ~151% from the annual PV module shipments in 2009. As a result of strong demand for its module products in both European and non-European markets, including the United States, the co expects to increase its shipment volume in the fourth quarter of 2010 compared to the third quarter of 2010. The co expects its Euro denominated Q4 ASP to increase QoQ. The co expects that the actual manufacturing yield of its PV cell and module production may reach up to 1.1 GW of annualized capacity during the fourth quarter of 2010. In 2H11, the co expects to raise its annualized in-house production capacity of ingot and wafer as well as PV cell and module production capacity to reach approximately 1.2 GW and 1.7 GW, respectively, based on actual manufacturing yield.

6:30AM Sunpower and NRG (NRG) Solar agreed to build 250-megawatt California Valley solar ranch (SPWRA) 11.95 : NRG Solar, a subsidiary of NRG Energy, and SunPower Corp. announced agreements to begin construction next year of the 250-megawatt (MW) California Valley Solar Ranch in San Luis Obispo County. The solar power plant is expected to create approximately 350 jobs during construction, will power about 100,000 homes and will be one of the largest photovoltaic solar power plants in the world, when complete. NRG Solar plans to invest up to $450 million of equity in the project over the next four years.

icon url

ReturntoSender

12/01/10 11:01 AM

#9141 RE: ReturntoSender #6755

COCO Short Term Trade Bought 10,000 shares@3.92

icon url

ReturntoSender

12/01/10 10:55 PM

#9142 RE: ReturntoSender #6755

From Briefing.com: 4:15 pm : The stock market surged more than 2% to its best single-session gain in three months on solid volume as market participants shrugged off risk and engaged in a concerted buying effort.

The S&P 500 gapped up to the 1200 line in the opening minutes of trade as market participants responded to big gains by Europe's major bourses, which were helped by solid manufacturing data from both Europe and China, along with comments from European Central Bank President Trichet about support for the eurozone financial system. Trichet also made hints of increased bond purchases.

Although the report was later contradicted in the financial media, a midday story that the U.S. was willing to participate in a rescue fund for Europe helped the major equity averages move another leg higher. They spent most of the session consolidating gains along session highs that are near the upper end of a near-term resistance zone.

The strongest collective move was made by the energy sector, which swung to a 2.9% gain. In addition to broader market support, the sector was helped by crude oil's 3.1% spike to $86.75 per barrel.

Not to be ignored, the materials sector and industrials sector posted gains of 2.8% and 2.6%, respectively. Metals issues were among the biggest drivers of the materials sector's gain while building products plays provided leadership to the industrial space. Deere & Co. (DE 76.14, +1.44) was a laggard in the industrial sector, despite news of its dividend hike to $0.35 from $0.30 per share.

Not only were this session's gains rich, they were also broad as about 96% of the stocks in the S&P 500 advanced. Perhaps more impressive is that such a broad-based surge came on solid share volume as some 1.1 billion shares were traded on the NYSE.

With contagion concerns cooled and stocks in such strong shape, market participants dumped safe havens like the dollar and Treasuries. At the close of trade the dollar was down about 0.8% against competing currencies and the benchmark 10-year Note was off by more than a full point. The yield on the Note never broke above 3.00%, but it did set a four-month high of almost 2.99%.

Volatility cooled considerably. As such, the Volatility Index was down about 10% at the close.

The latest lot of data proved solid and, as such, only seemed to support this session's return to risk. A precursor to the official monthly nonfarm payrolls report on Friday, the latest ADP Employment Change data indicated that private payrolls expanded by 93,000 in November. Not only is that total greater than the 58,000 additions that had been expected, on average, among economists polled by Briefing.com, but it also marks the best ADP reading in three years.

The ISM Manufacturing Index for November eased to 56.6 after a reading of 56.9 in the prior month, but that was still in stride with the expected reading of 56.5.

Construction spending in October increased 0.7%, just as it did the month before. The consensus among economists polled by Briefing.com called for a 0.5% decline.

Nonfarm productivity for the third quarter increased 2.3%, which is up from the 1.9% increase recorded in the preliminary reading, but still not quite as strong as the 2.4% increase that had been widely expected.

No real response was made to the Fed's latest Beige Book since it was without surprise. It indicates that the economy continued to improve, on balance, that lending activity is stable, and that credit quality has been steady to improving.

Advancing Sectors: Energy (+2.9%), Materials (+2.8%), Industrials (+2.6%), Tech (+2.2%), Consumer Discretionary (+2.1%), Financials (+2.1%), Health Care (+1.9%), Consumer Staples (+1.6%), Telecom (+1.5%), Utilities (+1.1%)
Declining Sectors: (None)DJ30 +249.76 NASDAQ +51.20 NQ100 +2.2% R2K +2.2% SP400 +2.1% SP500 +25.52 NASDAQ Adv/Vol/Dec 1926/2.11 bln/751 NYSE Adv/Vol/Dec 2353/1.11 bln/682

6:14PM Finisar beats by $0.06, beats on revs; guides Q3 EPS above consensus, revs above consensus (FNSR) 19.77 +0.68 : Reports Q2 (Oct) earnings of $0.44 per share, excluding non-recurring items, $0.06 better than the Thomson Reuters consensus of $0.38; revenues rose 65.3% year/year to $240.9 mln vs the $229.7 mln consensus. Co issues upside guidance for Q3, sees EPS of $0.45-0.47, excluding non-recurring items, vs. $0.41 Thomson Reuters consensus; sees Q3 revs of $247-262 mln vs. $240.46 mln Thomson Reuters consensus.

4:32PM Semtech beats by $0.02, reports revs in-line; guides Q4 EPS in-line, revs below consensus (SMTC) 24.03 +0.64 : Reports Q3 (Oct) earnings of $0.48 per share, excluding non-recurring items, $0.02 better than the Thomson Reuters consensus of $0.46; revenues rose 63.9% year/year to $123.1 mln vs the $122.1 mln consensus. Co issues mixed guidance for Q4, sees EPS of $0.39-0.43, excluding non-recurring items, vs. $0.42 Thomson Reuters consensus; sees Q4 revs of $110-116 mln vs. $116.66 mln Thomson Reuters consensus.

4:04PM Sigma Designs beats by $0.04, beats on revs (SIGM) 12.12 +0.12 : Reports Q3 (Oct) earnings of $0.41 per share, excluding non-recurring items, $0.04 better than the Thomson Reuters consensus of $0.37; revenues rose 119.2% year/year to $77.8 mln vs the $73.6 mln consensus.

11:27AM Semiconductor Hldrs continues to outperform, notches new session/52-wk high of 32.02 (SMH) 32.00 +0.95 : Initial resistance from here is in the 32.10/32.20 zone. Semi related names helping pace the way are: LRCX +4.8%, KLAC +4.7%, ALTR +4.6%, NVDA +4.2%, MRVL +3.7%, BRCM +3.1%, AMAT +3.1%, MCHP +2.9%, XLNX +2.9%, LLTC +2.4%.

7:25AM Ixia announces proposed offering of $125 million of convertible senior notes due 2015 (XXIA) 15.86 : Co announces that it intends to sell $125 million principal amount of Convertible Senior Notes due 2015. The Notes are being offered only to qualified institutional buyers pursuant. The Notes will be convertible into Ixia's common stock.

10:10 am OVTI Guides Q3 Above Consensus (OVTI)

OmniVision (OVTI 30.83 +2.54) reported second quarter earnings of $0.58 per share, excluding non-recurring items, $0.05 better than the Thomson Reuters consensus of $0.53.

Revenues rose 30.7% year-over-year to $239.5 million versus the $232.3 million consensus.

For the third quarter, the company expects earnings to be in the range of $0.50 to $0.63, excluding non-recurring items, better than the $0.41 Thomson Reuters consensus. On the top line, the company expects revenues to be $230 million to $250 million, well above the $209.64 million Thomson Reuters consensus.
icon url

ReturntoSender

12/03/10 12:09 AM

#9143 RE: ReturntoSender #6755

From Briefing.com: 4:15 pm : Stocks staged big gains for the second straight session as market participants continued to display an appetite for risk.

Today the S&P 500 gained more than 1%, which came on top of the prior session's surge of more than 2%. The combination of gains made for the stock market's best back-to-back performance in three months. The latest buying effort came even though market participants were initially disappointed by the failure of the European Central Bank to expand its bond purchasing program. To no surprise, though, the ECB did leave its target interest rate unchanged at 1.00%.

The euro made some sudden swings during a press conference from ECB President Trichet, but it eventually rallied against the dollar. The Dollar Index ended the day down about 0.7%, which made for its second straight loss since setting a two-month high.

Market participants were somewhat dismissive of news that initial jobless claims for the week ended November 27 totaled 436,000, which is up 26,000 from the prior week and greater than the 422,000 initial claims that had been expected among economists polled by Briefing.com.

However, the latest pending home sales figures provoked strong buying, especially among shares of homebuilders, which surged 4.7%. Pending home sales for October had been widely expected to remain flat, but instead spiked 10.4% month-over-month for their best move since record keeping began about 10 years ago. Pending sales were less impressive year-over-year as they tumbled 22.4%, but that was because of home buyer tax credits last year.

Financials attracted the strongest support of any sector this session. They spiked 2.6% as a group, but the biggest moves in that space were made by banking issues. As such, the KBW Bank Index bounced 3.9% higher. Before the start of December, the KBW fell more than 3% during a two-month span. During that same time the S&P 500 had advanced more than 3%. Many banks have been hampered in recent months by concerns about their exposure to the sovereign debt of Europe.

Retailers recorded a collective gain of 1.8%. In addition to broader market support the group was helped by a raft of stronger-than-expected same-store sales reports, which included Black Friday transactions. It is still too early to see how much returned purchases will eat into those sales, however.

Though market participants displayed an increased willingness to take on risk, small-cap stocks and mid-cap stocks didn't perform any better than the broader market. They advanced 1.1% and 1.3%, respectively.

Airline stocks sat out of this session's advance. As a result, the Amex Airline Index shed 0.5%. Despite its lagging performance today, airline shares are still collectively up 46% for the year.

Treasuries oscillated for most of the session before ultimately logging a loss. Amid its swings the benchmark 10-year Note's yield moved above 3.00% for the first time since July.

Tomorrow should be an interesting day for stocks. Given the heady gains of the past two sessions, market participants are likely wondering how the market will fare with the release of the latest monthly payrolls report. The latest factor orders figures and ISM Service Index are also scheduled for release tomorrow.

Advancing Sectors: Financials (+2.6%), Materials (+1.5%), Industrials (+1.5%), Consumer Discretionary (+1.3%), Tech (+1.3%), Energy (+1.3%), Telecom (+1.1%), Health Care (+0.7%), Utilities (+0.3%), Consumer Staples (+0.1%)
Declining Sectors: (None)DJ30 +106.63 NASDAQ +29.92 NQ100 +1.0% R2K +1.1% SP400 +1.3% SP500 +15.46 NASDAQ Adv/Vol/Dec 1685/2.02 bln/960 NYSE Adv/Vol/Dec 2125/1.12 bln/869

4:03PM Magma Design beats by $0.01, beats on revs; guides Q3 EPS in-line, revs above consensus (LAVA) 4.43 +0.01 : Reports Q2 (Oct) earnings of $0.07 per share, excluding non-recurring items, $0.01 better than the Thomson Reuters consensus of $0.06; revenues rose 14.4% year/year to $33.9 mln vs the $33.3 mln consensus. For Q3 (Jan), co sees EPS of $0.06-0.07, excluding non-recurring items, vs. $0.07 Thomson Reuters consensus; sees Q3 revs of $34.0-34.5 mln vs. $33.9 mln Thomson Reuters consensus.

JA Solar Holdings (JASO) announced that it has entered into a long-term supplemental wafer and polysilicon supply agreement with GCL-Poly Energy Holdings Limited and its subsidiaries. GCL-Poly will supply JA Solar with an aggregate of approximately 10GW of high quality polycrystalline wafers and polysilicon products for a five year period, from January 2011 to December 2015, at pre-determined shipment volume. The agreement also contains a clause for a price adjustment mechanism.

SunPower (SPWRA, SPWRB) and E.ON Climate and Renewables Italia Solar Srl announced a contract for SunPower to design and build a 3.4-megawatt ground-mounted solar power plant in Italy's Lazio region. Construction on the plant will start this year and is expected to be completed in April 2011.

Advinus Therapeutics and Corning Incorporated (GLW) announced a collaboration to bring Corning Epic label-free detection technology to India. The collaboration between Advinus and Corning enables Advinus to leverage the Corning Epic technology to enhance its own drug discovery capabilities and to provide assay development and screening services to companies both in India and abroad.

2:24AM On The Wires (WIRES) :

* Rambus (RMBS) announced it has filed a complaint with the United States International Trade Commission requesting the commencement of an investigation pertaining to products from Broadcom (BRCM), Freescale Semiconductor (FSL), LSI (LSI), MediaTek, NVIDIA (NVDA) and STMicroelectronics (STM) that infringe on patents.

* Accenture (ACN) and NHN Corp have signed an agreement to collaborate in the development of applications for smartphones in South Korea. Micron Technology (MU) introduced a portfolio of high-capacity flash memory products that will lengthen the life of NAND for years to come.

SAFC Hitech, a member of the Sigma-Aldrich (SIAL), reinforced its commitment to the Asia-Pacific electronics markets by announcing plans to build a new, dedicated facility in Kaohsiung, Taiwan for transfilling, technical service and production of LED and silicon semiconductor precursors. The new facility is expected to be operational by late 2011.

1:53AM Ixia increases aggregate amount and prices $175 mln of Convertible Senior Notes due 2015 (XXIA) 14.97 : Co announces the pricing of $175 mln aggregate principal amount of its 3.00% Convertible Senior Notes due 2015. The aggregate principal amount was increased from $125 mln to $175 mln from the previously announced offering. The Notes will bear interest at a fixed rate of 3.00% per year, payable semiannually in arrears on June 15 and December 15 of each year, beginning on June 15, 2011. The Notes will be convertible into co's common stock at an initial conversion rate of 51.4536 shares per $1,000 principal amount of Notes, which is equivalent to an initial conversion price of ~$19.43 per share. Co intends to use the net proceeds from the sale of the Notes for general corporate purposes, potential future acquisitions and strategic transactions.

10:02 am Suntech Power upgraded to Buy at Auriga U.S.A; tgt raised to $11: . Auriga U.S.A upgrades STP to Buy from Hold and raises their tgt to $11 from $9 ahead of the Dec 6 Analyst Day and after the Glory Silicon acquisition announcement, they adjust their model only for the expected margin increase from in-house wafering -- and find potential to reach ~22% gross margin in 2011 vs. 4Q guidance of 17% and 2011 Consensus of ~18%. Firm says gross margin of ~20% is also the norm around which STP operated in years past. They model 25% internal wafering capabilities in 2011 to discount recent missteps in execution.
icon url

ReturntoSender

12/05/10 1:23 PM

#9146 RE: ReturntoSender #6755

InvestmentHouse Weekend Stock Market Summary

http://www.investmenthouse.com/weekendmarketsummary.htm

- Stocks have reason to sell and the sellers take their shot, but they fall short and stocks turn positive.
- Renewed upside bias shows itself Friday as NASDAQ joins the other growth industries with a new 2010 closing high.
- Market finding solid leadership from many areas, but SP500 could use some financial help to get through the November high.
- Job creation 1/3 of expectations, unemployment rises to 9.8%. Should anyone be surprised? Economic data has improved, but it is not THAT strong.
- VIX drops to its October-November lows again as SP500 tries the November peak.
- Key test for SP500 after a solid bounce already: can it follow the growth indices?

Stocks overcome a weak jobs report, showing the renewed upside bias.

Two strong days on Wednesday and Thursday and in the Thursday night report I talked about possibly getting an opportunity in the morning to buy some positions a bit cheaper after the jobs report. I did not have any inside news on what the report, but I expected it might be a little bit disappointing because everyone was getting ginned up with the economic data. There has been a definite improvement in US economic data in manufacturing and retail. Same store sales came in very well for November, and people got a little overexcited with their expectations. Jobs lagged, and the economic data is simply not strong enough for a long enough time to generate the job growth people were hoping for.

Expectations were only 130K, so that was not any massive leap in jobs. In fact, it was lower than what was reported in October. When jobs came in at 39K versus the expectations of 130K, however, that was a bit hard for the market to swallow. The non-farm payrolls were bumped up for October to 172K from 151K but the actual numbers were disappointing at 1/3 of expectations. Significant to the headline factor, the unemployment rate ticked up to 9.8% from 9.6%. That is always a problem. More people entered the work force because of that optimism seen in the Michigan Sentiment report, consumer confidence, and retail sales. The unemployment rate went up because more entered the market than there were jobs to absorb. That was a disappointment as was the average workweek holding steady at 34.3 hours. Average hourly earnings were also unchanged versus a modest gain that was expected, and that was on top of a decent 0.3% gain in October. It was a letdown all the way around.

Looking at the SPY before the jobs report, there were nice gains in the futures. After the jobs report, we hit the bottom just before 8:00 o'clock central time. The market came back and performed fairly decently. It was down at the open, but on the upswing from the opening bell. Indeed, the market put in a jagged performance through lunch and early afternoon, and then it started higher. The market showed its renewed upside bias. Remember, it just went through a good correction and lateral consolidation over the prior three weeks. It showed a lot of buy support, particularly in the SP500, and it made a nice break to the upside. There was a good pullback, a nice lateral consolidation, and a strong upside break.

During this rise from August into early November, the market seemed to continue to find an upside bias. It disappeared during this correction, of course. That is what happens. Now that upside bias is returning. There was every reason for the market not to recover on Friday. The jobs report was highly anticipated to be better and turned out worse than expected, yet stocks rebounded as investors used the dip to buy back in. That tells us that buyers are still here. The upside bias asserted itself in the afternoon, and stocks rallied nicely to the close. There was a broad lateral move during the session into early afternoon, and then stocks caught a bid into the weekend.

I thought we would not have much to buy given the solid two upside days Wednesday and Thursday, but it turned out that we actually had the opportunity to buy some stocks on Friday. I was looking at GS, and it had rallied nicely the day before. I thought we could get a pullback after the jobs number. It did have problems early on in the session. It was higher premarket, but as the session opened it traded lower and we were able to pick it up at a lower price. Then the stock churned upside the rest of the day. Indeed, there were some great stocks and really classic patterns that we looked at on the Thursday report that performed very well on Friday. They were moving up nicely, and I was not going to second guess the pattern and second guess what the market was showing. We bought positions, and more than I anticipated we would. That is the way the market is.

We do not rule the market; the market tells us what to do. You just have to be smart enough to see what is happening and follow it. I was not going to say that I do not like the buy on Friday and stick to that plan even though stocks in great patterns were showing great action. That is the way you miss out on moves. Sometimes you get in a little early on a Friday. We could have a test on Monday -- after all, SP500 still has to deal with its November peak. The growth indices are moving very well, however. A lot of these stocks were growth-type stocks. You just do not want to turn a blind eye to good moves, and we did not. We stepped into those positions.

There were gains across the board. NASDAQ, +1%; SP500, +0.25%; Dow, +0.2%; SP600, +0.7%; SOX, +0.5%. The NASDAQ 100 stocks are not doing as well as the smaller cap NASDAQ stocks. That is no surprise right now because a lot of the large-cap techs led the initial move upside, and stocks such as AAPL and GOOG are struggling right now. It is no problem; other stocks are coming in and leading from other areas. Energy and industrial stocks are performing well, material stocks are starting to pick up the pace. Semiconductors are performing well, and of course retail is looking great -- particularly stocks like DECK. SP500 will need help from the financials, and they were not able to continue the rally on Friday. They looked good Thursday, and some of them are moving up, but SP500 will probably need some help if it is going to break through that November peak and continue following the growth areas. The financial stocks are coming to life. We will see if they can continue higher next week after taking a pause on Friday.

OTHER MARKETS

Dollar. The dollar took it on the chin on Friday. On Wednesday and Thursday, it pulled back after a strong seven-day rally. The pullback was normal, but the move Friday was not that normal. It was a hefty loss at 1.3%. Versus the Euro, the dollar completely tanked (1.3416 Euro versus 1.3224 Thursday). That does not tell the story, however. The dollar broke below 1.3 Euro early in the week, and what a reversal it has shown. It has almost given up the entire move higher on the second leg off of that low. Is it in jeopardy now? Yes and no. It is down to its 50 day EMA, and that is a support level. It is holding near that prior peak on the first run off the low, so it can find support here and continue to the upside. It is the size of these losses that are worrisome. These are big daily losses, and they ramped up on Friday. We will see if the dollar can hold.

Why did the dollar have trouble? Worries about the EU were somewhat mitigated this week given the Irish bailout, and that immediately firmed up the Euro and dropped the dollar. We had good economic data, and that would tend to firm up the dollar because the Fed would be less inclined to continue with as much Quantitative Easing. When the jobs report was a disappointment and the jobless claims on Thursday were disappointing, that helped weaken the dollar further to close out the week.
Click to view the chart

Bonds. Bonds were rather flat on Friday after taking a thumping during the week (10 year 3.01% versus 3.00% Thursday). It was not long ago that the 10 year treasury was trading between 2.7 and 2.8%. It has been a fairly quick turn for the bond, but as the economic data improved, bond traders became concerned that the Fed would not need to use as much Quantitative Easing and buy as many debt instruments. Therefore, there is not as much demand for them, and bonds to sell while yields start to rise.
Click to view the chart

Gold. Gold had an excellent day and a strong week. It took the day off Wednesday and Thursday, but it had a big Tuesday and a big Friday ($1,408.00, +18.70). There was a lot of activity late in the day, and gold continued to run up. It was a very strong day for gold, and it was a strong finish on the day as well. In November, gold closed at a high of $1,410.10, and it hit a high of $1,424.00. It is not at that old high, but it posted a new closing high. I will not toot the horn too much because we are not there yet, but back in March I said gold would hit $1,500 this year. It does not look like it will make it, but it has had a heck of a run. It has been a heck of a run just in the last 5 months. It is strong, and now they are saying it will go to $2,000. I am not sure about that, but I do know $1,500 is still reachable and it will probably get there.

Gold is looking stronger, and it has taken out the October interim peak. It has taken out the closing high from November, and we will see if it can continue the momentum. It is definitely looking stronger because it is shooting down the resistance points in front of it.
Click to view the chart

Oil. Oil had an outstanding week, and it was up again on Friday. Lo and behold, it hit a new high -- closing and intraday -- over the November peak as it topped them quite easily ($89.22, +1.22). A strong session for oil, and as you can see, it has topped the April and May peaks. Looking at a weekly chart, it is not an all-time high, but it has cleared just about everything else outside of this sprint higher in 2008. This could be a bit of tarnish on the holiday season. The average gasoline price is already jumping higher. I believe it was quoted at almost $2.90 nationwide. Can you believe in the winter we have gasoline prices approaching and topping $3.00 a gallon? I even want to think about next summer, but we will be doing that not too long after the first of the year. They saying oil is rising because of the perceived recovery in the world economy -- that would mean the US joining the fight with India and China. If that is the case, that means more oil being used and more demand on the black gold.
Click to view the chart

INTERNALS

Volume. Volume declined 11% on NASDAQ to 1.75B shares, and it declined almost 19% on the NYSE to 907M. It was not a big volume day, and that is okay. The indices were either at new 2000 highs or bumping up against old resistance, and they were under some pressure. They were not doing too well on the day, so I do not mind seeing some lighter volume. There was no churning at these highs; they just drifted higher in the face of some bad news. I do not have an issue with that, and you probably should not either.

Breadth. Breadth was tame. 1.5:1 on NASDAQ and 1.8:1 advancers over decliners on the NYSE. Those small caps helping to push the NYSE breadth higher.

CHARTS

SP500. After spending two weeks down at that key level and bouncing up each day, SP500 finally made the break this week. Big moves on Wednesday and Thursday. On Friday it was not able to take out that November peak, but it has taken out the April peak and that is good news. It has not taken out the November peak yet, and MACD has not moved up. I cannot say there is a divergent top here yet, but I am watching that. You have to keep an eye on leadership as well, and I will talk about that soon. MACD is not going to rule the roost versus having good leadership and rotation in the market.

NASDAQ. NASDAQ broke through the April peak earlier in the week. On Friday it broke through to a new November closing high. That would be a new closing high for 2010 as well. Volume was not great. MACD is making a bit of a lower high here. It is something to watch, but it does not tell the entire story. One of the reasons we have trouble with MACD is that the momentum from the large cap stocks are not helping NASDAQ that much. On SP500, the financials are trying to help but are not doing a banner job.

SP600. SP600 was an excellent performer, up almost 0.7%. It, too, cleared its April and November peaks. Note that its November peak never did top April, so this was a significant move for the small caps. They have taken the bull by the horns and taken leadership by the horns as well.

SOX. SOX is doing well. It broke through its April and November peaks this week. It did so Thursday for the April peak, and it added to the gains on Friday after a gap lower. Growth is showing excellent strength. There is some good news. There was a higher high with MACD as it made its move, so it is looking somewhat positive, leading the rest of the market to the upside.

LEADERSHIP

Financial. GS dipped on the open. It still lost some ground on the day, but it was modest and we used that to move in. I still think it has a little ABCD pattern we can make some money off of. Some of the other financials contributed nicely. WFC posted another gain, almost 1% on the session. Hard to complain about the action. It is approaching the November peak, and it is going to have something to prove. That is important because SP500 is approaching that November peak and will need help from the financials. The financials have to deal with that themselves. That will make this a very important challenge for the market this coming week. JPM added to the gains as well, up 0.75% on the session. It is rolling back up in its rolling pattern. There is hope from the financials that they can help SP500 break through that November peak next week.

Industrials. Industrials were strong as well. They had a great week, and it was epitomized by CAT moving up for four strong sessions after a Monday doji at the 18 day EMA. Good volume on the initial move higher, and coasted up to close higher on the week. Very solid move. CMI closed a little bit down on the session Friday, but it had a great week. It gapped higher Wednesday, clear some resistance and came off of a little flag pattern. Very strong, nice action from many of the industrials.

Semiconductors. XLNX had a strong week, moving up to its summertime peak. It will have a little challenge because there is not a lot of volume here, but it is just moving nicely to the upside. NVLS is breaking to the upside, getting some open field to run in. It had a nice rally that broke through a resistance level, it came back and formed a flag pattern, and then it has broken higher and is working very nicely to the upside. NVDA had a strong move, continued higher and beat the odds. It has filled this gap from way back in May with a big base. It came back, nice handle, a gap to the upside, and it has the power this time. It is challenging and breaking through that gap point.

JASO has an ABCD pattern. It held right at a key support level, and note that gap point in the prior highs. It put in a good high-volume break to the upside on Friday, and it looks like it is pulling away from its D point. TSL may have a similar pattern, something of an ABCD. It is a little more wobbly than JASO, but I am going to watch TSL. It may be worth taking a deeper look.

Technology. The big techs continue to struggle. AAPL is at the top of its trading range. There is a bit of a divergent top, but it formed a big trading range as well during the summer and it broke higher off that. I am not going to get in a snit over that. GOOG is trying. It has gapped sharply lower this week. It tried to rebound late in the week, and it did, but it is more of a bear flag. More aggressive. You would try to play it down to the gap point, and we could do that. It closed at $573 and, the gap point is at $541. That gives a significant area to play to the downside. You could play a downside move. Then we would look to catch a rebound after the gap fill and see if we could ride it back up to the prior high. That would be a pair of good moves just taking what the mark gives you -- whether downside or upside.

Energy. Energy had a great week. HAL went straight up, showing excellent strength. PBR continued a great roll up higher in its trading range on the week. I like that and am letting it move. I like the fact that it broke through the 50 day EMA. It has a gap point here, but it is a gappy stock. You do not worry about gaps as much with a stock that gaps as much as PBR. It is making the steady move upside as I want it to. APC did not have a great session, but it came to life this week. It is primarily known as a gas producer, although it has a lot of oil production. It was good to see some of the gas companies starting to rally to end last week.

Retail. Every time it looks like DECK will have trouble, it continues higher. Here it gapped up to a hangman doji a week ago, and that did not stop it. It gapped up higher the next two sessions. Volume has taken off. It is getting ballistic -- you might start thinking, "This is getting frothy; is it a blow off top or not?" Then it tested on Thursday. It could have been coming back, but then on Friday there was more volume to the upside in a huge 6.5% move. Now the volume is big and the stock has run tremendously. You could start thinking it is a blow off top here, but I am going to let it run. If it gets to $100 on this move and volume crescendos even more, then we will definitely take some money off the table. You would be a fool not to. Right now, we will see how this runs. We all know that a stock and the market can run much further than anyone would rationally think it could. We will let it work until it tells us it is not going to work anymore. DECK was not the only one, although it was one of the more spectacular stocks. SKS did not have great same store sales, but it held in there and put in a flag after a great run to the upside. On Friday it broke through the topside of that flag. It continues to show strength even though you may not think it could do it. PNRA had an excellent week and an excellent month. It gapped higher on Wednesday and to the gains on Thursday.

Select areas are doing much better in retail. I will throw in ANF because it moved well on its same store sales the other day. Very nice, but some of them are getting crushed. They still have to perform, and ARO was not able to do that. ZUMZ was up 20% with its same store sales, topping expectations, but it got hit on the move. Now it is holding support, so we will see if it can hold and continue to the upside. There are some cracks in the armor. They have had big runs, no doubt. From $14.00 up to over $32.00 -- is a big run in any book. With a lot of good expectations already being built in for the Christmas season, some people are taking money out.

Summary. Overall, leadership is very solid. It would help if the financials came around, but money is pushed into the other areas. This week it went into materials, and we were already into some VMC. It went more into energy, and we have already gotten into several energy stocks as well. It is going into some of the housing stocks, although I am still not wild about them. Of course, a lot of the small caps are moving higher and the semiconductors are starting to break back to the upside after a consolidation. Money continues to flow into the market, and it continues to move around in the market. That is a healthy indication. That leads me to believe that, after this nice correction that the market showed these past three weeks, that it is going to give us a nice run toward the end of the year.

Will it make it to December 31st? I don't know. Who does? There is Quantitative Easing coming in, there are fund managers chasing performance to the year end, and that is producing a lot of good leaders with a lot of great patterns to play. When that happens, you tend to get continued runs to the upside. Now we have had a nice correction and consolidation, so the table is set to continue the move upside. Indeed, the market started eating at that table this week. Of course we were there, too. We took the market's invitation.

THE MARKET

MARKET SENTIMENT

VIX. The VIX had a tough week. It gapped lower Wednesday, falling Thursday, and again Friday with big chunks. It landed down near its October and November lows. There is a lot of speculation that that means the market is going to sell. It might and it might not. It was lower back in March and April of this year as well. What does this mean? When looking at volatility, many people say if it gets too low it means the market is set up to sell. That is really not the case. Looking at historical charts, volatility can be low for a long, long time and the market still rallies. After a long rally, you should worry when volatility rises as the market rises. Back in 2007 right before the financial crisis, the market was rising. Then volatility started to rise with the market in that last part of the run. That is not a good thing to see. Looking back to 2000, you can see volatility spiking, starting to rise as the market was ready to peak out. Not a great thing to see. Right now, we do not necessarily have that. The market is rising, yet volatility is falling.

What I see in the near term with these pictures is a small correlation set up. As the market or volatility goes up and down and they move inversely, you get a rise in volatility indicating a drop in the stock market price. Then when it falls, you see the market bounce back. When the volatility rises, the market falls. Does this look like much of a correlation? Right now, it is a modest one at best. Volatility was rising and the market was trending slightly lower, and then as volatility fell, the market spurted higher this week. That is the inverse relationship. It is down to levels that the market hit on other occasions in October and November. Now the question is if it will mean a pullback in the stock market. The SP500 is at a key level, but NASDAQ, SP600, and the SOX are all moving through their April and November peaks. They could come back to test in a pullback, and that would bounce volatility up somewhat. That would be fine, but it probably will not be anything major. It will probably be more like what we have seen right here.

VIX: 18.01; -1.38
VXN: 19.77; -1.65
VXO: 17.19; -1.72

Put/Call Ratio (CBOE): 0.79; +0.09

Bulls versus Bears:

This is a reading of the number of bullish investment advisors versus bearish advisors. The reason you look at this is that it gives you an idea of how bullish investors are. If they are too bullish then everyone is in the market and it is heading for a top: if everyone wants to be in the market, then all the money is in and there is no more new cash to drive it higher. On the other side of the spectrum if there are a lot of bears then there is a lot of cash on the sideline, and as the market rallies it drags that cash in as the bears give in. That cash provides the market the fuel to move higher. If bears are low it is the same as a lot of bulls: everyone is in and the market does not have the cash to drive it higher.

Bulls: 55.4% versus 55.7%. A second week of fading even as the market continued its gains, falling from 56.2. Strong surge from 48.4% just a month back, the strongest move upside since May, indeed topping that level and getting closer to the 5 year high at 62.0. Moving toward the level considered bearish, i.e. where so many are in the market and believe it is going up that the ammunition to send it higher runs low. This is where you start to be careful and watch for breakdowns, but there is also a lot of liquidity being pushed into the market and that can continue the move despite excess bullishness. The crossover level at 29% bulls is long gone, but it did its job. The high on the last leg was 56.0% after starting at 35.6% on the low in February, the lowest it has been since July 2009 . . . until this last leg. 35% is the threshold level suggesting bullishness. Again, to be seriously bearish it needs to get up to the 60% to 65% level.

Bears: 21.8% versus 21.6%. A modest gain, rebounding from 20.2%. Fell from 23.1% a month back. Pausing the slide after holding steady at 24.4% for two weeks. Down from 28.3% in September. The 37.7% peak at the height of the crossover is well in the rearview mirror but bears remain well below the 35% level, above which is considered bullish for the market overall. Hit 18.7% on the low in April. Hit a high of 27.8% level on the prior leg in February. For reference, cracking above the 35% threshold considered bullish. Hit a high on the prior run at 47.2%. For more reference, bearishness hit a 5 year high at 54.4% the last week of October 2008. The move over 50 took bearish sentiment to its highest level since 1995. Extreme negative sentiment. Prior levels for comparison: Bearishness peaked at 37.4% in September 2007. It topped the June 2006 peak (36%) on that run. That June peak eclipsed the March 2006 high (33%) and well above the 2005 highs that spawned new rallies (30% in May 2005, 29.2% in October 2005). That was a huge turn, unlike any seen in recent history.

NASDAQ

Stats: +12.11 points (+0.47%) to close at 2591.46
Volume: 1.751B (-11.24%)

Up Volume: 1.191B (-299.292M)
Down Volume: 626.839M (+113.189M)

A/D and Hi/Lo: Advancers led 1.55 to 1
Previous Session: Advancers led 1.76 to 1

New Highs: 230 (+8)
New Lows: 27 (-9)

NASDAQ CHART: Click to view the chart

NASDAQ 100 CHART: Click to view the chart

SOX CHART: Click to view the chart

SP500/NYSE

Stats: +3.18 points (+0.26%) to close at 1224.71
NYSE Volume: 907.531M (-18.81%)

Up Volume: 631.905M (-319.301M)
Down Volume: 259.157M (+97.081M)

A/D and Hi/Lo: Advancers led 1.8 to 1
Previous Session: Advancers led 2.51 to 1

New Highs: 475 (+13)
New Lows: 60 (+2)

SP500 CHART: Click to view the chart

SP600 Chart: Click to view the chart

DJ30

Stats: +19.68 points (+0.17%) to close at 11382.09
Volume DJ30: 149M shares Friday versus 212M shares Thursday.

DJ30 CHART: Click to view the chart

MONDAY

There is more economic data next week, but the bulk of the important data was released this week. There will be crude inventories, initial claims, and some wholesale inventories. Then there will be the import/export prices. It will be interesting to see just how much inflation we are importing or not. It will be good to see if Michigan Sentiment clicks up higher and continues its improvement. The consumer has been fairly ebullient of late and has been buying and helping send stock prices higher.

Maybe it is a chicken-or-the-egg scenario. Bernanke wanted people to feel wealthier, so he is pumped a lot of money into the economy. He knew it would not be used for economic activity, but that it would be put into the financial markets. Thus, the financial markets would rise and people's stocks would be worth more. Even though the prices for their houses are in the toilet, at least they would feel better because their stock portfolios are up. Maybe they would go out and spend some money. Good grief, was he correct? After all, look at those retail sales and same store sales. Hard to argue with that. There is a lot of money out there, and there is a lot of pent-up demand after a couple of really crappy Christmases. The stage is set, and stocks are making the most of it thus far.

I will keep looking around for leaders in the market. I will see if I can find more that are in good position or some new leaders trying to step up. Financials might prove interesting given that the SP500 is at its November peak and a lot of the financials have to break through that level as well. Maybe we will get some action from them, and that should really energize the large cap index and help it follow along with the growth indices. I did not think I would see many plays after the great run on Wednesday and Thursday, but looking around, there were several. There were a lot of those ABCD patterns that I talk about quite a bit. JASO had its ABCD pattern set up. All of a sudden there bunch of triangles forming. In the summertime, it was an inverted head and shoulders. Then the break out from that, and then a lot of stocks formed a triangle. JASO formed an ABCD pattern. There are all these consolidation patterns that formed. The triangles are breaking higher, and now the ABCD patterns are breaking higher. I will continue to look for new opportunities.

We have quite a few positions in the market, but that is the way it is. When the market runs and money is flowing into different sectors, different sectors perk up, set up, and break higher. You just have to play it when the market is there. In certain times of the year, fish run. Whether it is spawning season or the fall when they are fattening up, you need to be out there fishing for them when they are on the move. That is what you do with the market because there are going to be slow times ahead. There are these kinds of runs now into the end of the year. At some point after the first of the year, there will be a pullback; there always is.

We will keep playing this rally because that is what the market is giving us. Whatever I think about the future does not amount to a hill of beans. We will take what the market gives, watch what it shows us and tells us, and then we will respond accordingly. I will continue to look for good setups as money moves around the market into new areas. I will try to find some quality stocks in quality positions that we can take advantage of and make more money this year. We have had a great year, and it looks like this Christmas rally is going to turn a great year into an outstanding one. That means you need to stay on your toes, however. When it looks good and everyone thinks we will get the run to the end of the year, it may come up short. We may start checking up before Christmas. If that is the case, we will just bank some great gains.

Have an excellent weekend!

Support and Resistance

NASDAQ: Closed at 2591.46
Resistance:
2593 is the November 2010 high
2725 from July 2007 interim peak
2735 from late 2007 interim peak
2862 is the 2007 peak

Support:
2569 is the November gap up point through the April 2010 peak
2550 from May and June 2008 peaks
2540 is the gap up point from early November
2535.28 is the April 2010 intraday peak
2530 is the April 2010 closing peak
2518 is interim peak from April 2010
2511 is the lower range of the November gap up point
2482 is the recent October peak
The 50 day EMA at 2474
2460 is the November 2010 low.
2434 is the May interim peak and the 78% Fibonacci retracement of the April selloff.
2425 is an interim peak from May 2010
2382-2395 from 2008
2324-2370 is a range of resistance from early 2008
The 200 day SMA at 2342
2341 is the June 2010 peak
2320 to 2326.28 is the January 2010 high
2319 from the September 2008 peak
2310 is the August 2010 peak

S&P 500: Closed at 1224.71
Resistance:
1227 is the November 2010 peak
1313 from the August 2008 interim peak

Support:
1220 is the April 2010 peak
1185 from late September 2008
The 50 day EMA at 1180
1174 is the May 2010 high, 78% Fibonacci retracement of April peak
1173 is the November 2010 low
1170 is the prior March 2010 high
1156 is the Sept 2008 low
1151 is the January 2010 peak
1133 from a September 2008 intraday low
Bottom of the January 2010 consolidation 1131 to 1136
The 200 day SM A at 1135
1129 to 1131 is the June and August 2010 peaks
1119 is the early December intraday high
1114 is the November 2009 peak
1106 is the September 2008 low
1101 is the October 2009 high and the recent May and June 2010 interim peaks
1084 to 1080 (September 2009 peak)
1078 is the October range low
1070 is the late September 2009 peak as well as several other peaks and valleys even in 2010.
1065 is the May flash crash intraday low.
1044 is the October 2008 intraday high AND the February 2010 low
1039 to 1040 are the May, June, and August 2010 lows

Dow: Closed at 11,382.09
Resistance:
11,452 is the November 2010 peak
11,734 from 11-98 peak

Support:
11,258 is the April 2010 peak
11,205 is the April closing high
11,100 from the 7-08 low
The 50 day EMA at 11,058
10,963 is the July 2008 low
10,920 is the recent May high
10,730 is the January 2010 peak
The 200 day SMA at 10,644
10,609 from the Mid-September 2008 interim low
10,594 is the June 2010 peak
10,496 is the November 2009 high
10,365 is the late September 2008 low
10,285 is the late December consolidation peak
10,260 from the May and June 2010 interim peaks are breaking
10,209 is recent August 2010 low
10,120 is the October 2009 peak
9938 is the August 2010 low
9918 is the September 2008 peak
9855 is the early September peak in its lateral range
9835 is the late September 2009 peak AND the February 2010 low
9829 is the September 2008 closing high
9774 is the May 2010 intraday low

Economic Calendar

These are consensus expectations. Our expectations will vary and are discussed in the 'Economy' section.

December 07 - Tuesday
- Consumer Credit, October (15:00): -$2.3B expected, $2.1B prior

December 08 - Wednesday
- MBA Mortgage Applications, 12/03 (07:00): -16.5% prior
- Crude Inventories, 12/04 (10:30): 1.07M prior

December 09 - Thursday
- Initial Claims, 12/04 (08:30): 430K expected, 436K prior
- Continuing Claims, 11/27 (08:30): 4250K expected, 4270K prior
- Wholesale Inventories, October (10:00): 0.8% expected, 1.5% prior

December 10 - Friday
- Trade Balance, October (08:30): -$44.4B expected, -$44.0B prior
- Export Prices ex-ag., November (08:30): 0.7% prior
- Import Prices ex-oil, November (08:30): 0.3% prior
- Michigan Sentiment, December (09:55): 72.5 expected, 71.6 prior
- Treasury Budget, November (14:00): -$134.0B expected, -$120.3B prior

December 02 - Thursday
- Initial Claims, 11/27 (08:30): 436K actual versus 422K expected, 410K prior (revised from 407K)
- Continuing Claims, 11/20 (08:30): 4270K actual versus 4200K expected, 4217K prior (revised from 4182K)
- Pending Home Sales, October (10:00): 10.4% actual versus 0.0% expected, -1.8% prior

December 03 - Friday
- Nonfarm Payrolls, November (08:30): 39K actual versus 130K expected, 172K prior (revised from 151K)
- Nonfarm Private Payrolls, November (08:30): 50K actual versus 140K expected, 160K prior (revised from 159K)
- Unemployment Rate, November (08:30): 9.8% actual versus 9.6% expected, 9.6% prior
- Hourly Earnings, November (08:30): 0.0% actual versus 0.1% expected, 0.3% prior (revised from 0.2%)
- Average Workweek, November (08:30): 34.3 actual versus 34.3 expected, 34.3 prior
- Factory Orders, October (10:00): -0.9% actual versus -1.3% expected, 3.0% prior (revised from 2.1%)
- ISM Services, November (10:00): 55.0 actual versus 54.5 expected, 54.3 prior
icon url

ReturntoSender

12/06/10 8:22 PM

#9148 RE: ReturntoSender #6755

From Briefing.com: 4:15 pm : Stocks fought their way to a fractional gain late in the day as the dollar pulled back, but the effort failed to attract enough support to prevent a flurry of selling in the final few minutes of trade.

Stocks spent most of the session trying to push through moderate selling pressure, which came as some market participants opted to take profits following last week's 3.0% gain by the S&P 500.

Added pressure came in response to the dollar's first advance in four sessions. The greenback was up as much as 0.7% against a basket of competing currencies after Fed Chairman Bernanke stated in a weekend interview that the Fed could provide further stimulus to the economy, if necessary. The dollar was also driven higher as the euro dropped in response to reports of division among European leaders on the matter of increasing Europe's recently announced bailout plan. The euro was also implicated in a downgrade of Hungary's credit rating by analysts at Moody's to Baa3 from Baa1. Hungary's principal currency, the forint, had been down almost 3% before it recovered to a 1.5% loss by the end of the trading day.

As the dollar pared its gain to end the day just 0.3% higher, buyers returned to the stock market so that the S&P 500 finally turned positive. The market's move proved unsustainable, though, as it fell to its first loss in four sessions. The Nasdaq Composite was able to extend its streak of gains to four, though.

Health care stocks made up the worst performing sector of the session. They fell 0.7% as a group, even though Pfizer (PFE 16.80, +0.08) showed strength after its surprise announcement that its CEO will soon retire.

Borders (BGP 1.39, +0.31) led small-cap stocks of the Russell 2000 to a 0.6% gain after Pershing Square stated that it would be prepared to finance, on mutually acceptable terms, an offer by Borders Group to purchase all of the equity securities of Barnes & Noble (BKS 14.69, +1.41) in an all-cash transaction valued at $16 per share.

In other corporate news, MetLife (MET 40.75, +0.61) issued a strong outlook that helped its shares move higher. Still, that was too little to offset weakness in shares of regional banks (-0.4%) and diversified bank (-0.9%). The financial sector still finished with a 0.2% loss.

Energy stocks were the best performers of the session, but the sector's gain was clipped to 0.3% by the close. The sector's relative strength came even though crude oil prices finished higher by just 0.2% at $89.38 per barrel after the commodity had been down for most of the morning and early afternoon. Natural gas had a much stronger session that saw contract prices climb 3.3% to $4.49 per MMBtu.

Outside of the energy complex, silver prices set a new 30-year record at $30.12 per ounce before easing back to $29.74 per ounce for a 1.5% gain. Gold prices were up in pit trade to $1422.40 per ounce before they settled with a 0.6% gain at $1416.10 per ounce. The yellow metal later spiked in electronic trade to a new record high above $1428 per ounce.

Advancing Sectors: Energy (+0.3%), Tech (+0.1%)
Declining Sectors: Health Care (-0.7%), Utilities (-0.5%), Consumer Staples (-0.3%), Financials (-0.2%), Industrials (-0.2%)
Unchanged: Consumer Discretionary, Telecom, MaterialsDJ30 -19.90 NASDAQ +3.46 NQ100 -0.1% R2K +0.7% SP400 +0.0% SP500 -1.59 NASDAQ Adv/Vol/Dec 1522/1.61 bln/1122 NYSE Adv/Vol/Dec 1464/803 mln/1502

8:22AM Zoran: Ramius seeks shareholder support to reconstitute Zoran's Board of Directors (ZRAN) 7.69 : Ramius Value and Opportunity Advisors announced that it delivered a letter to ZRAN. In the letter, Ramius stated it believes that Zoran's shares are deeply undervalued and that such valuation discrepancy is primarily due to long-term fundamental underperformance and repeated missed expectations for revenue growth and profitability.Ramius also announced today that in order to immediately address these serious concerns it has filed a preliminary consent solicitation with the SEC seeking shareholder support to remove and replace six members of the current Board with highly qualified director candidates.

Rambus (RMBS) announced that it has renewed their patent license agreement with Elpida Memory. This agreement covers Elpida's range of memory products including SDR, DDR, DDR2, DDR3, LPDDR, LPDDR2, GDDR3 and GDDR5 DRAM.

SunEdison, a subsidiary of MEMC Electronic Materials (WFR), announced that its affiliate, MEMC Singapore, is partnering with Flextronics (FLEX) to produce solar photovoltaic panels at Flextronics' facility in Newmarket, Ontario.

7:02AM Verigy receives unsolicited proposal from Advantest for $12.15/share (VRGY) 9.14 : Co announces it has received an unsolicited proposal from Advantest (ATE) to acquire all of the outstanding Verigy ordinary shares for $12.15 per share in cash. The Verigy Board has reviewed the Advantest proposal and determined that it is not superior to Verigy's pending transaction with LTX-Credence (LTXC). However, the Verigy Board believes the Advantest proposal might lead to a superior transaction so it has determined to engage in discussions with Advantest.

Ultratech, (UTEK) opened an advanced manufacturing facility in Singapore. Ultratech plans to spend more than $125 mln dollars over the next several years in support of its Singapore International Operations.

3:29AM Advanced Semi report Nov net revenues (ASX) 5.29 : Co announces montly net revenues of rose 93.7% YoY to NT$16,822 mln, down 0.5% sequentially
icon url

ReturntoSender

12/07/10 11:34 PM

#9150 RE: ReturntoSender #6755

From Briefing.com: 4:15 pm : News of extended tax cuts helped send the stock market to a new two-year high in the first few minutes of trade, but gains were eventually slashed so that stocks settled flat.

Last evening the White House made preliminary agreements with congressional officials to extend income and dividend tax cuts, as well as payroll taxes and unemployment benefits. Although the legislative process still has to play out, the reaction among market participants this morning was decidedly positive. Improved confidence on the part of investors rekindled the risk trade.

Support for stocks sent both the S&P 500 and the Nasdaq to new two-year highs, but the Dow stalled just a point below its November peak. Natural resource plays made some of the biggest bounces this morning; both the materials sector and the energy sector were up as much as 1.4%. Buying therein was further bolstered by strength among commodities.

The CRB Commodity Index was up more than 1% to a new two-year high during early trade, but it didn't take long for traders to take profits and send the Index to a 0.5% loss. Gold prices ended the day down 0.5% to $1409.00 per ounce after the continuous gold contract hit a new all time high of $1431.10 per ounce. Silver prices settled with a 0.5% gain at $29.78 per ounce after they had been at a 30-year high of $30.75 per ounce. Oil prices were clipped from a two-year high of $90.76 per barrel to settle pit trade with a 0.8% loss at $88.69 per barrel.

Stocks also fought sellers through the morning, but pressure didn't really intensify until the final hour of trade. A near eight-point drop in the S&P 500 during the course of about 40 minutes coincided with the dollar's push to a session high, or gain of 0.3%, which is right about where it was at the close. The greenback had been down 0.6% at its session low.

The stock market's afternoon slide began just before the release of consumer credit data for October. Total consumer credit climbed $3.4 billion, which is a surprise since the consensus among economists surveyed by Briefing.com had called for a $2.5 billion decline. Consumer credit for September was revised downward to reflect a $1.2 billion increase.

Though support for stocks waned late in the session, Treasuries were spurned for the entire day. So severe was the selling effort that the yield on the benchmark 10-year Note surged more than 25 basis points before it eased back a bit to 3.13%, which makes for its highest closing level since July.

There were no corporate announcements of broad consequence today, although it is worth mention that NICOR (GAS 48.79, +2.03) and AGL Resources (AGL 34.98, -2.15) will merge in an $8.6 billion transaction. Meanwhile, auto parts retailers AutoZone (AZO 260.15, -1.76) and Pep Boys (PBY 13.57, +0.61) posted pleasing quarterly results, though their shares finished mixed.

Share volume was robust this session. In fact, more than 1.6 billion shares traded hands on the NYSE. That's the greatest tally since September and more than 50% greater than the 50-day moving average on the Big Board.

Advancing Sectors: Industrials (+0.5%), Consumer Staples (+0.4%), Telecom (+0.4%), Materials (+0.1%)
Declining Sectors: Utilities (-0.5%), Energy (-0.3%)
Unchanged: Tech, Health Care, Consumer Discretionary, FinancialDJ30 -3.03 NASDAQ +3.57 NQ100 +0.0% R2K +1.1% SP400 +0.1% SP500 +0.63 NASDAQ Adv/Vol/Dec 1485/1.91 bln/1162 NYSE Adv/Vol/Dec 1496/1.63 bln/1485

4:34PM Lam Research announced Stephen Newberry, CEO, will take on the responsibility of vice chairman of board of directors; co also promoted Martin Anstice to the position of president, effective immediately (LRCX) 49.72 +0.23 :

4:30PM Texas Instruments narrows guidance (TXN) 33.41 +0.46 : Sees Q4 EPS of $0.61-0.65 vs $0.63 Thomson Reuters consensus, prior guidance of $0.59-0.67; sees revs $3.43-3.57 bln vs $3.50 bln Thomson Reuters consensus, prior guidance of $3.36-3.64 bln. Co will hold a call at 5:00 ET.

9:26AM MoSys prices $20 mln registered direct offering at $4/share (MOSY) 4.38 : Co announces a registered direct equity financing of $20.0 mln by issuing common stock from its existing shelf registration statement. The company has entered into purchase agreements with a small number of investors to buy 4,450,000 shares of common stock at a price of $4.00 per share. In addition, Leonard Perham, the Company's chief executive officer and a director, and Carl Berg, a director, have entered into agreements with the company to purchase 275,000 and 230,000 shares of common stock, respectively, at the closing market price on December 6, 2010 of $4.38 per share. The company conducted the financing without the services of a placement agent or underwriter. Net proceeds of the transaction (after expenses of the offering) to the company are expected to be ~$19.9 mln.

A Seagate Company (STX) announced that The Jewish Federation of Greater Los Angeles has selected EVault for Microsoft System Center Data Protection Manager for their online backup needs.

8:26AM Emcore enters into agreement to establish its Suncore joint venture in Huainan, China (EMKR) 1.57 : Co announces that it has entered into an investment and cooperation agreement with San'an Optoelectronics Company and Huainan municipal government. The Agreement calls for EMCORE and San'an to register and operate their previously announced joint venture, Suncore Photovoltaics Co, in Huainan City to develop and manufacture high-concentration photovoltaic components and systems for terrestrial solar power applications. Suncore received land grant of 263 acres and various other incentives, was awarded a $75 million cash grant to fund manufacturing equipment purchases, and will receive a $0.21 rebate for every watt of the first 1,000 MW of CPV products.

07:26 am Suntech Power: Confirmation of wafering effect; tgt raised to $12 at Auriga: . Auriga notes that in-line with their Analyst Day preview, Suntech (STP) introduced 2011 gross margin guidance of 20-22% from cost gains associated with new in-house wafering. They again refine their valuation methodology by making the equity contribution of Global Solar Fund (GSF) zero in the "after tax" line, as they see the potential for volatility masking true underlying results. They increase their FY11 ests to $3.55 bln from $3.05 bln and EPS to $1.48 from $1.42 (cons: $3.02 bln, $0.88); their tgt goes to $12 from $11; Buy.
icon url

ReturntoSender

12/08/10 10:51 PM

#9151 RE: ReturntoSender #6755

From Briefing.com: 4:20 pm : The stock market lacked direction during the first half of the trading day, but the financial sector ultimately helped lead the broader market to a modest gain.

Stocks started the day in positive territory, but they retreated into the red as the dollar fought off selling efforts to secure support at the neutral line. The dollar oscillated thereafter and finished the day with fractional gain.

Buyers were slow to respond to the stock market's morning slide, but their gradual move back into the market helped stocks muster gains. Financials attracted the most support. The sector swung to a 1.8% gain. Banks were some of the best performers in the space as the KBW Bank Index climbed 2.9%. Banks have had a strong start to December; the KBW is already up 10.0% in the first six sessions of this month. For comparison, the S&P 500 is up 4.0% in that same time span.

Two IPO's out of China accounted for some of today's best individual performances. Dangdang (DANG 29.91, +13.91), labeled by many as China's Amazon.com (AMZN 176.29, -0.48), almost doubled in price. Youku.com (YOKU 33.44, +20.64), which is conceptually similar to YouTube, more than doubled in price.

Home Depot (HD 34.08, +0.53) had a strong session of its own, but it couldn't keep the Dow from trailing its counterparts. The stock challenged six-month highs after it issued an improved outlook.

Fellow Dow component McDonald's (MCD 78.74, -1.60) reported this morning global comparable sales growth of 4.8% for November, but that could not help the stock from extending its record high. MCD was the worst performing stock in the Dow.

Treasury prices continued to turn lower, such that the yield on the 10-year Note hit a six-month high of almost 3.33% before it eased back to 3.24% around the close of trade. A $21 billion reopening of 10-year Notes attracted a yield 3.34% and produced a bid-to-cover ratio of 2.92. Dollar demand was the weakest in a year; it came in at $61.3 billion.

The sell-off in precious metals continued as silver prices plummeted 5.1% to settle at $28.25 per ounce and gold dropped 1.9% to $1383.20 per ounce. In contrast, natural gas prices climbed 4.5% to $4.60 per MMBtu, a four-month closing high. Weekly natural gas inventory data are due tomorrow morning. Today's larger-than-expected draw of 3.82 million barrels of crude oil initially pressured oil prices, but the commodity pared its loss to settle the day down 0.5% at $88.28 per barrel.

Advancing Sectors: Financials (+1.8%), Tech (+0.9%), Consumer Staples (+0.3%), Health Care (+0.1%)
Declining Sectors: Materials (-0.9%), Utilities (-0.5%), Energy (-0.3%), Industrials (-0.3%), Consumer Discretionary (-0.1%)
Unchanged: TelecomDJ30 +13.32 NASDAQ +10.67 NQ100 +0.5% R2K -0.1% SP400 -0.1% SP500 +4.53 NASDAQ Adv/Vol/Dec 1316/1.77 bln/1321 NYSE Adv/Vol/Dec 1160/1.11 bln/1844

4:43PM Seagate Tech has increased the size of its previously announced offering of $500 million aggregate principal amount of senior notes due 2018 to $750 mln (STX) 15.07 -0.09 : Co announces that it has increased the size of its previously announced offering of $500 million aggregate principal amount of senior notes due 2018 (the "Notes") to $750 million. The Notes were priced at 100% of the aggregate principal amount and will bear interest at a rate of 7.75% per annum.

4:37PM Semtech enters agreement in principle to settle class action securities litigation (SMTC) 24.06 +0.16 : Co entered into an agreement in principle to settle all claims asserted against all defendants in the putative class action concerning the Company's stock option accounting practices captioned In re Semtech Corporation Securities Litigation. The agreement in principle provides for the payment of $20 million by the Company. The agreement in principle contemplates the negotiation and execution of a final settlement agreement. The proposed settlement would fully resolve all claims against the Company, all current officers and directors of the Company named in the lawsuit, and certain former officers and directors of the Company named in the lawsuit. No parties admit any wrongdoing as part of the proposed settlement. The settlement also is subject to preliminary approval by the Court, notice to the putative class and subsequent final approval by the Court.

# Semtech (SMTC) is working with IBM Corp (IBM) and its 3D through-silicon via technology to develop a platform that has applications in fiber optic telecommunications, RF sampling and filtering, test equipment and instrumentation, and sub-array processing for phased array radar systems.
# The Motorola Solutions business of Motorola (MOT) and Janam Technologies announced that Motorola - together with its subsidiary, Symbol Technologies - and Janam have reached an agreement that settles all outstanding intellectual property disputes between the two companies.
# Voltaire (VOLT) signed an agreement with Atlantik Systeme to distribute its products in Germany. Atlantik Systeme has also joined Voltaire's adVantage Partner Program.

3:28AM LDK Solar signs multi-year wafer and polysilicon supply contract with Lu'an Group (LDK) 10.08 : Co announces it has entered into a multi-year wafer and polysilicon supply contract with Shanxi Lu'an Photovoltaic Technology, a subsidiary of Lu'an Group. Under terms of the contract, co will provide 120 MW of solar wafers commencing in January 2011 through December 2012 and 2,000 metric tons of polysilicon commencing in January 2011 through February 2013. No financial terms were disclosed.

09:18 am Novellus tgt raised to $36 at RBC following guidance: . RBC is raising their tgt to $36 from $34 (Top Pick) following last night's guidance; mgmt raised the lower end of 4Q10 order guidance from -14% to -5% while maintaining the upper end at +10%, implying one of the two uncertain orders discussed during 3Q10 earnings call have come in. Co raised Q4 EPS guidance to $0.88-1.00 from $0.85-1.00 and reaffirmed sales of $367-385 mln (cons: $0.92, $377.8 mln). The call was in-line with an incrementally bullish tone compared to the 3Q10 earnings call. They are raising their FY10 and FY11 EPS slightly.

08:52 am Apple FY11 ests and tgt raised to $390 at Stifel Nicolaus: . Stifel Nicolaus is raising its FY11 EPS estimate from $18.84 to an above-Street $19.23 and increasing its target price from $360 to $390. The increase in its FY11 EPS estimate reflects higher iPad, iPhone and mac units assumptions and slightly lower assumptions iPod estimates, as well as a slight increase in its gross margin assumption for FY11 (from 37.2% to 37.3%). On increased confidence of an iPhone launch on VZ in mid F2Q11 (i.e. mid-Feb. vs its prior est of March) it's raising its iPhone units estimates for FY11 from 57.9mn to 58.8mn. Firm is also raising its FY11 ASP assumptions for iPhone from $571 to $580 based on its assumption that Apple will secure higher ASPs following a VZ deal made with semi-exclusivity in the U.S. (i.e. no T-Mobile (DT)).

09:49 am TXN Narrows Guidance (TXN)

Texas Instruments (TXN 33.36 -0.05) expects to see fourth quarter earnings of $0.61 to $0.65, in-line with the $0.63 Thomson Reuters consensus, compared to prior guidance of $0.59 to $0.67.

Revenues are now expected to be $3.43 billion to $3.57 billion, in-line with the $3.50 billion Thomson Reuters consensus, prior guidance of $3.36 billion to $3.64 billion.
icon url

ReturntoSender

12/10/10 12:07 AM

#9153 RE: ReturntoSender #6755

From Briefing.com: 4:15 pm : Financials put on another strong performance, but the broader market was slow to follow. Even after a late lift, the S&P 500 finished the day with only a modest gain.

The broader market moved higher in the early going with help from news that initial jobless claims for the week ended December 4 fell to 421,000, which is less than the 429,000 claims that had been predicted by economists polled by Briefing.com, and that continuing claims declined to a two-year low of 4.09 million.

However, early buying lacked the conviction necessary to extend the S&P 500 past its two-year high of 1235, which was set earlier this week. The loss of momentum near that point coincided with a bounce by the dollar. That ultimately fed into a flurry of selling.

Sellers tried to send the S&P 500 into the red a couple of times, but support limited both the depth and duration of those declines. Though the benchmark index was able to move back into positive territory, most of the afternoon was spent session chopping along with a narrow gain. The Nasdaq did the same, but the Dow spent most of the day down with a slight loss.

Financials displayed leadership for the second straight session, but the broader market refused to rally around it. Financials finished the day with a 1.3% gain, which puts it on pace for a weekly gain of 2.9%.

Banks have backed most of the financial sector's recent gains. The KBW Bank Index added to the prior session's 2.9% spike by booking a 2.2% gain today. It is up 4.8% week-to-date.

Although gains by the greenback acted as a headwind in the early going, the dollar's strength dwindled into the close. At the end of the day the dollar was only up fractionally against a basket of competing currencies. Waning support for the greenback came at the same time that Bloomberg TV reported that PIMCO raised its estimate for U.S. growth based on the Fed's second quantitative easing effort. Stocks responded positively, but the S&P 500 stalled near its session high. The Dow finished at the flat line.

Treasuries caught a bid after two straight sell-offs. They set their highs following the release of results from a $13 billion auction of 30-year Bonds. The auction's results generally indicated that there is a market for Treasuries at current interest rates.

Advancing Sectors: Financials (+1.3%), Telecom (+1.1%), Consumer Staples (+0.4%), Materials (+0.4%), Utilities (+0.3%), Energy (+0.3%), Industrials (+0.2%), Health Care (+0.2%)
Declining Sectors: (None)
Unchanged: Consumer Discretionary, TechDJ30 -2.42 NASDAQ +7.51 NQ100 +0.0% R2K +0.5% SP400 +0.4% SP500 +4.72 NASDAQ Adv/Vol/Dec 1528/1.92 bln/1069 NYSE Adv/Vol/Dec 1673/1.01 bln/1336

4:04PM National Semi beats by $0.02, misses on revs; guides Q3 revs below consensus (NSM) 14.97 +0.23 : Reports Q2 (Nov) earnings of $0.34 per share, $0.02 better than the Thomson Reuters consensus of $0.32; revenues rose 13.3% year/year to $390.4 mln vs the $399.5 mln consensus. Co issues downside guidance for Q3, sees Q3 revs of $344-359 mln vs. $382.34 mln Thomson Reuters consensus. NSM's total co bookings decreased 24 percent sequentially in the second quarter of fiscal 2011. Distributors reduced their order rates as lead times across the industry have generally declined, and product availability has improved. Bookings were also down from wireless handset customers as they adjusted their backlog coverage to reflect lower build activity following the holiday season. During the second quarter of fiscal 2011, billings exceeded bookings. Gross margin of 68.9 percent decreased from 70.9 percent in 1Q11, which had set a record for the co. National reported gross margin of 65.3 percent in the second quarter of fiscal 2010. "Revenues in our Q2 were impacted by two factors. First, although distributor resales of our products were about flat sequentially, we shipped ~$25 mln less to them than in the preceding quarter. Secondly, we saw, in aggregate, slower demand from mobile phone customers than we typically see in this seasonally strong, pre-holiday season quarter. As this inventory correction by our customers and distributors works its way through our business this quarter, we will continue to invest in our rev growth initiatives. This should position us to show amplified revenue growth as we emerge from what we see as a temporary supply chain adjustment."

4:02PM Plexus announces expansion and SFDA certification in Xiamen, China (PLXS) 28.54 +0.21 : Co announces that it has entered into an agreement to purchase land for the construction of a new manufacturing facility in the Xiamen Xiangyu Free Trade Zone, adjacent to its current facility. This new facility will operate under the existing management team and will add approximately 180,000 square feet of manufacturing capacity. Construction is expected to begin in March 2011 with production to commence in the second half of calendar 2012. In addition, Plexus' current Xiamen, China manufacturing facility has received State Food and Drug Administration, P.R. China (SFDA) certification to support customers in the Medical industries. This certification allows Plexus to manufacture finished Class I and II medical devices for our customers that sell into China end-markets.

4:02PM Diodes reiterates revenue and gross margin guidance; lowers operating expense expectations (DIOD) 27.05 : The Company is maintaining its revenue and gross margin guidance for the fourth quarter of 2010 as it anticipates revenue to range between $160 million and $168 million (Thomson Reuters consensus $164 mln), or between a decrease of 2% and an increase of 3% sequentially, and gross margin is expected to be comparable to the third quarter of 2010 level of 37.4 percent. In addition, the Company is revising its guidance for operating expenses and tax rate. The Company now expects operating expenses as a percent of revenue to decrease 50 to 100 basis points from third quarter 2010 level versus its previous guidance of comparable to third quarter 2010. Also, the Company now projects its fourth quarter tax rate to be approximately 20 to 24 percent due to an operating expense improvement in higher tax rate jurisdictions versus its previous guidance of 17 to 23 percent. Shares used to calculate GAAP EPS for the fourth quarter are anticipated to be approximately 46.3 million, the same as the prior guidance.

4:01PM Kopin authorizes the repurchase of up to $15 million of common stock (KOPN) 4.16 +0.08 :

Amonix announced that it has selected Flextronics (FLEX) as a manufacturing partner for its industry-leading CPV utility-scale solar systems.

AgigA Tech, a subsidiary of Cypress Semiconductor (CY), announced multiple safety and compliance certifications have been granted for their family of intelligent battery-free energy modules. Among the approvals received are compliance to UL 60950-1, CSA C22.2 No. 60950-01-07, and CB Certification to IEC 60950-01 and/or EN 609050-1.

Symmetricom (SYMM) announced that its SCi 2000 Embedded Software Clock has been selected by Broadcom (BRCM) for integration into its 1588-enabled processor, switch and PHY system platforms. The combined product offerings are intended for service providers, carriers and enterprises that require a high-performance, precise timing solution with significant cost and integration efficiencies.

7:07AM Ciena misses by $0.03, beats on revs; guides Q1 revs in-line (CIEN) 15.92 : Reports Q4 (Oct) loss of $0.18 per share, excluding non-recurring items, $0.03 worse than the Thomson Reuters consensus of ($0.15); revenues rose 136.9% year/year to $417.6 mln vs the $405.3 mln consensus. Co issues in-line guidance for Q1, sees Q1 revs of $410-430 mln vs. $414.42 mln Thomson Reuters consensus. Q4 performance includes $255.6 mln in rev from the acquired assets of the Metro Ethernet Networks business of Nortel, reflecting the second full quarter of combined operations since the close of the transaction on March 19, 2010. "While current macroeconomic conditions are still causing some caution in customer spending, the continuing strength in the fundamental demand drivers of our business and progress on our integration gives us confidence in our ability to achieve our operating targets. We expect fiscal first quarter 2011 revenue to be in the range of $410 million to $430 million and adjusted gross margin to be in the low 40s range."

6:57AM SemiLEDs prices 5.25 mln share IPO at $17 per share, above the $14.50-16.50 expected range (LEDS) :

6:06AM Lattice Semi reiterates Q4 rev guidance, inline with consensus (LSCC) 5.46 : Co issues in-line guidance for Q4 (Dec), sees Q4 (Dec) revs of down 2-7% to ~$71.7-75.6 mln vs. $73.59 mln Thomson Reuters consensus. Co sees Gross margin percentage is expected to be ~58-60% of revenue; total operating expenses are expected to be ~$34.0 mln. The majority of the sequential increase is related to new product launch expenses and associated mask costs. Also co reiterates its expectation for continued profitability in the fourth quarter of 2010.

Cadence Design Systems (CDNS) ,announced that Semiconductor Manufacturing International (SMI) has adopted Cadence Silicon Realization products for the design-for-manufacturing and low-power technology at the core of SMIC's 65-nanometer Reference Flow 4.1. Using Cadence Encounter Digital Implementation System as the foundation, the companies collaborated to provide an integrated end-to-end Silicon Realization flow for 65-nanometer system-on-chip designs.

2:07AM ASML Holding increases Q4 2010 bookings guidance; sees Q4 bookings to be above EUR2 bln (ASML) 35.17 : Co sees sees stronger than expected demand for lithography equipment, coming from most semiconductor market segments; while DRAM lithography demand is weakening less than originally planned, NAND Flash memory investments for the high volume ramp of new technologies and Foundry/Logic commitments for new strategic fab projects are driving brisk lithography demand for 2011. As a result of this demand, co is increasing the expectation for fourth quarter system order intak and now expects Q4 bookings to be above EUR 2 billion, and above its previous forecast that Q4 bookings to exceed the Q3 level of EUR 1.3 billion worth of systems.

10:15 am CIEN Guides Q1 Revs In-line (CIEN)

Ciena (CIEN 17.80 +1.88) reported fourth quarter ($0.18) per share, excluding non-recurring items, $0.03 worse than the Thomson Reuters consensus of ($0.15).

Revenues rose 136.9% year-over-year to $417.6 million versus the $405.3 million consensus.

For the first quarter, the company guided revenues in the range of $410 million to $430 million, in-line with the $414.42 million Thomson Reuters consensus.

Fourth quarter performance includes $255.6 million in revenues from the acquired assets of the Metro Ethernet Networks business of Nortel, reflecting the second full quarter of combined operations since the close of the transaction on March 19, 2010.

The company said, "While current macroeconomic conditions are still causing some caution in customer spending, the continuing strength in the fundamental demand drivers of our business and progress on our integration gives us confidence in our ability to achieve our operating targets. We expect fiscal first quarter 2011 revenue to be in the range of $410 million to $430 million and adjusted gross margin to be in the low 40s range."
icon url

ReturntoSender

12/11/10 10:16 PM

#9154 RE: ReturntoSender #6755

From Briefing.com: Weekly Recap - Week ending 10-Dec-10

The yield on the 10-year Treasury note settled at 2.92% on Monday. When the stock market closed on Friday, the yield on the 10-year note rested (and we use that word loosely) at 3.32%. If one had been told before the week started that there would be a 40 basis point spike in the 10-year yield, it would have been understandable if they thought volatility would also spike and that the stock market would have a bad week.

As it turned out, volatility, measured by the VIX Index, dropped 2.2%, while the S&P 500 gained 1.3% this week. In fact, the S&P 500 broke out to a new 52-week high and is now sitting at its best level since September 2008.

Various theories abounded for the sudden reversal of fortune in the Treasury market, which hit the back end of the yield curve particularly hard. Some suggested it was a reflection of growing concerns about inflation. Others indicated it was a statement of concern about the U.S. budget deficit that was exacerbated this week by a tax compromise plan announced by President Obama (more on this in a bit).

Our sense of things is that the bond market is working its way through an adjustment phase, not so much because it is overly fearful at this time of rising inflation and a higher deficit, but because it understands a reflation of the U.S. economy is under way and that an extraction of the safe-haven/recession premium is in order.

If the "old normal" of double-dip recession fears supported yields closer to 2.50%, the "new normal" of economic recovery trends probably supports something closer to 3.00% to 3.50%.

It is easy of course to get caught in the echo chamber of negativity on this matter. To wit, things have been good in the bond market for so long that there is a magnetic resonance to claims that this is the initial popping of the bond bubble, or that it is a clear indication that bond vigilantes are starting to circle the wagons, or that it is a harbinger of scary inflation numbers coming our way.

There is a bit of panic selling going on we think as some holders are daunted by the thought of seeing nice-sized profits being quickly eroded in emotional sell offs. In any event, added volatility in the Treasury market is probably something we will have to get used to seeing in the months ahead.

The coming week should be another week of active trading in the Treasury market. Participants will return Monday armed with the latest inflation reading out of China. They will also contend with a bunch of important economic data released throughout the week in the U.S., including the PPI, CPI, Retail Sales, Industrial Production, and Housing Starts reports. Not to be outdone, there is an FOMC meeting on Tuesday that will certainly hold the market's utmost attention.

So, the week ahead will bring no rest for the weary.

Getting back to the week that was, it was underpinned in our estimation by a recovery theme. That is, there were several happenings that were consistent with the ongoing recovery from the great financial crisis.

The government sold its remaining stake in Citigroup (C); AIG (AIG) said it would pay back all amounts owed under its credit agreement with the Federal Reserve Bank of New York, which total approximately $20 bln; General Electric (GE) said it will increase its quarterly dividend by 17%; and volatility dropped sharply.

2011 GDP forecasts, meanwhile, were revised upward with economists factoring for the effects of a tax compromise plan the president reached with Republican leaders that included the following provisions:

--Every American family will keep their lower tax rates for the next two years
--A 2% employee payroll tax cut for workers next year
--The top rate of 15% for capital gains and dividends remains in place for another two years
--A maximum 35% estate tax with an exemption up to $5 mln

These provisions were agreed to by the president, contingent on the extension of some other tax cuts and a 13-month extension of unemployment benefits.

Democratic leaders have expressed their disappointment in the compromise plan, although it was generally accepted by the market that a bill would be passed before January 1 that would ensure the lower tax rates remain intact for all taxpayers. An inability to pass such a bill is a near-term risk then for the market, which has shown little fear of late.

To the latter point, the stock market's ability to move higher this week in the face of rising long-term rates is a telling sign that a belief in the recovery trade, which should lead to higher rates, was stronger than the fear of a rising deficit and/or uncontrollable inflation.

Fittingly, the financial sector (+3.8%), which benefits from a steepening yield curve, powered this week's advance and was followed by the telecom services (+2.0%), technology (+1.4%) and industrials (+1.3%) sectors.
 
Index Started Week Ended Week Change % Change YTD %
DJIA 11382.09 11410.32 28.23 0.2 9.4
Nasdaq 2591.46 2637.54 46.08 1.8 16.2
S&P 500 1224.71 1240.40 15.69 1.3 11.2
Russell 2000 756.42 776.83 20.41 2.7 24.2

09:15 am OmniVision target raised to $40 at Oppenheimer following checks in Asia: . Oppenheimer's recent channel checks in Asia leave us incrementally positive on OmniVision. It believes the co's main challenge today is keeping up with demand, which is running well ahead of capacity. While capacity expansion will be limited through early 2011, Opco believes revenue momentum will re-accelerate mid-2011 as incremental BSI-2 capacity is added. Design and supply chain activity around OmniVision's 8MP BSI-2 sensor appears to be intense, which is suggestive of a steep ramp in the summer of 2011. Tgt to $40 from $32.

09:14 am Intel tgt raised to $26 at Auriga: . Auriga is raising its INTC tgt to $26 from $22 partly because its sees less risk to numbers here than elsewhere (CY11 EPS estimate to just under consensus), and partly to recognize the multiple expansion that is now evident throughout the semiconductor space. Investors seem to be focused on a potential slowdown on the client PC side due to cannibalization from tablets, but firm's work suggests that this ignores the increased data center requirements that such relatively under-powered mobile devices will drive over the next several years. Firm's sense is that it's less than halfway through a multi-year server cycle in which INTC has a distinct advantage over its main competitor, AMD.

10:34AM GT Solar receives $47.3 mln order for its current generation SDR400 CVD reactors (SOLR) 8.88 -0.16 : Co announced that it has received a $47.3 mln order from South Korea-based polysilicon producer OCI Company, for its newest SDR400 CVD reactors. This is OCI's third order for GT Solar's SDR400 CVD reactors. The new systems will be installed as the first phase of OCI's new polysilicon capacity expansion plan, which OCI announced on December 8, 2010. The order will be included in GT Solar's backlog for its current Q3 FY11, which ends on January 1, 2011.

SunPower (SPWRA, SPWRB) announced that the company has received a $2.5 million investment from the Texas Enterprise Fund and a $900,000 grant from the City of Austin to expand operations with a major new corporate operations center in Austin, Tex. SunPower will create 450 jobs in the region over the next four years, beginning with 115 jobs created in 2011.

6:24AM JinkoSolar Holding Achieves 600 MW Integrated Capacity and 546 MW 2011 Supply Contract Backlog (JKS) 21.26 : Co announces it has increased its in-house annual solar cell and solar module production capacities to ~600 MW each, ahead of schedule in order to meet the demand for co's products. To date, the co has secured solar module supply contracts, including downpayments, totaling 546 MW for 2011, mainly from leading global solar companies.

3:39AM LDK Solar increases cash consideration for exchange offer (LDK) 10.60 : Co announces it has amended its previously announced offer to exchange up to $300 mln in aggregate principal amount of its currently outstanding 4.75% Convertible Senior Notes due 2013.

icon url

ReturntoSender

12/12/10 10:44 PM

#9155 RE: ReturntoSender #6755

Leavitt Brothers - Trades and state of the market:

http://leavittbrothers.com/blog/?p=3798
icon url

ReturntoSender

12/13/10 8:28 PM

#9158 RE: ReturntoSender #6755

From Briefing.com: 4:20 pm : Stocks started off on a positive note after China refrained from hiking it benchmark interest rate despite a hotter-than-expected CPI number, and instead insisted they would continue to observe a strong growth policy despite the uptick in prices. Stocks strengthened throughout much of the session, but began giving back their gains in the final hour of trading. The Dow was able to eek out a small gain of 0.2%, while the S&P 500 closed flat, and the Nasdaq slipped into negative territory and closed down 0.5%. Today's late day selloff prevented the Dow from closing at a 2-yr high after it was trading above its November 5th close of 11444.08 within the final 10 minutes of the session.

Weakness in the greenback was prevalent all session long after Moody's said the passage of the tax cuts would have ramifications, and may lead to the U.S. being placed on negative outlook down the road. The soft dollar pushed the euro to 1.3400, while the pound saw a session high just shy of 1.5900. Dollar/yen once again failed above 84.00, a level where it has had trouble for the past three weeks.

Energy stocks outperformed all session long, gaining 0.8%, as the weak dollar sent buyers into commodity related stocks. Cabot Oil & Gas (COG 36.99, +1.63), National Oilwell Varco (NOV 63.99, +1.33), and Baker Hughes (BHI 55.06, +1.14) were among the best performing stocks in the sector.

Materials stocks saw solid gains thanks to the weaker dollar as AK Steel (AKS 14.95, +0.37), Vulcan Materials (VMC 44.66, +1.38), Freeport-McMoran (FCX 115.56, +2.69), and Cliffs Natural (CLF 75.56, +1.23) led the advance.

Health care stocks eased off their best levels of the session after a Virginia judge ruled President Obama's health care law was unconstitutional, and ended the day with a gain of 0.1%. Thermo Fisher (TMO 55.56, +2.52) was the best performer in the space after the company announced it was acquiring Dionex (DNEX 117.86, +19.69) for approximately $2.1 billion, or $118.50 per share in cash, representing a 21% premium to Dionex's close on Friday.

Treasuries posted solid gains today as buyers moved into the market following the Fed's Permanent Open Market Operations in which they purchased $7.79 bln worth of 2016/2017 maturities. After touching 3.391%, its highest yield since June, the 10-yr yield ended the day near 3.29%. The belly of the curve will end the day a little steeper with the 2-10-yr spread running 269.2.

Volume was light with less than one billion shares trading on the floor of the New York Stock Exchange.

Tomorrow should provide an interesting session with the Senate expected to vote on the tax cut, as well as releases of PPI, core PPI, retail sales, retail sales ex-auto, business inventories, and the FOMC rate decision.DJ30 +18.24 NASDAQ -12.63 SP500 +0.06 NASDAQ Adv/Vol/Dec 1054/1.84 bln/1587 NYSE Adv/Vol/Dec 1435/962.2 mln/1582

5:33PM FormFactor reaffirms Q4 revs of $40 to $45 million vs. $43.1 mln Thomson Reuters consensus (FORM) 10.20 -0.12 :

6:30AM Mattson receives multiple orders from leading semiconductor manufacturer for paradigmE Etch System for volume production of advanced NAND flash devices (MTSN) 3.19 : Co announces it has received multiple orders from a leading semiconductor manufacturer for its paradigmE etch system. The systems, some of which have already shipped, will be used in an extended set of etch applications for the volume production of advanced NAND flash devices. Total financial terms were not immediately disclosed.

6:05AM Canadian Solar and SkyPower announce 18.5MW Engineering, Procurement and Construction agreement for solar projects in Ontario, Canada (CSIQ) 13.37 : Co announces that it and SkyPower announced they have signed an engineering, procurement and construction agreement. As part of the agreement, Canadian Solar Solutions, through SkyPower's power purchase agreements, will commission two solar parks with a nameplate capacity of 18.5 MW in Ontario. The construction of both projects is expected to reach completion by mid-2011.

# ARM (ARMH) announced the availability of Version 2.0 of the ARM Cortex Microcontroller Software Interface Standard.
# PMC-Sierra (PMCS), announced the Adaptec by PMC family of Series 6 RAID controllers designed to excel in high I/O transaction and high bandwidth processing applications.

09:29 am Research In Motion: Rodman and Renshaw expectations into the qtr: . Rodman and Renshaw expects RIMM to report unit sales (80% of mix) at the upper end of guidance range of 13.8-14.4 mln. Firm says sales of Curve, Torch and aggressive promotions were contributors to the recovery. Firm says growth in the international markets was offset by share loss to Apple (AAPL) and Android in North America. ASPs were likely at the lower end of guidance of $310-315 albeit an improvement from $301 in the prior quarter. Firm says gross margins should be modestly above guidance of 42%, but a drop from 44.5% in the prior quarter, as a benefit of new product cycle. Net/net, earnings are likely to be towards the high end of outlook of $1.62-1.70.

07:14 am Broadcom resumed with a Buy at Auriga U.S.A; tgt $55: . Auriga U.S.A downgrades CAVM to Hold from Buy and raises their tgt to $42 from $37 saying they continue to view CAVM as a secular growth story with strong long-term potential. However, with the stock up 34% QTD despite a weak report from top customer Cisco (CSCO), they see risk/reward more evenly balanced, and would wait for a better entry point to put new money to work. Firm says for investors looking for exposure to comm. IC growth, they prefer EZChip (EZCH) in small cap and newly-initiated upon Broadcom (BRCM) in large cap.

icon url

ReturntoSender

12/14/10 7:44 PM

#9159 RE: ReturntoSender #6755

From Briefing.com: 4:15 pm : The FOMC statement made for a volatile afternoon as stocks sold off, treasuries sold off, and the dollar rallied. The Dow had been trading up as much as 85 points following the FOMC statement, but sold off as traders digested the news, and closed with a gain of 48 points. Today's gains in the Dow allowed the index to close at its best level since September 2008. The S&P 500 and Nasdaq each finished with gains of 0.1%.

Telecom (+1.6%), health care (+1.1%), and utilities (+0.3%) were among the best performing sectors for a second consecutive session as traders seem to be rotating out of more economically sensitive stocks, and into some of the recent laggards. Those investors seeking yield will be happy to know that today's leading sectors sport healthy dividend yields.

Health care was one of the top performing sectors buoyed by a strong gain in Amgen (AMGN 56.78, +2.67) after the company announced its bone drug Xgeva allows prostate cancer patients to live longer without the disease spreading to their bones. Other stocks in the sector to see solid gains included C.R. Bard (BCR 89.55, +3.50), and Mylan (MYL 20.68, +0.85).

Shares of Best Buy (BBY 35.49, -6.21) were hit hard today after reporting weaker-than-expected results before the opening bell. The company announced earnings of $0.54 per share when the Thomson Reuters consensus was looking for earnings of $0.61 per share. The company also missed analysts' expectations by posting revenues of $11.89 billion which represented a 1.1% drop in year/year. The poor earnings hit other electronics retailers with Radioshack (RSH 18.63, -0.58) and Gamestop (GME 21.76, -0.16) also seeing losses.

Financials (-0.9%) closed lower today as weakness in the regional banks were a drag. Huntington Bancshares (HBAN 6.29, -0.37), Regions Financial (RF 6.21, -0.34), and First Horizon National (FHN 10.46, -0.46) finished the day among the worst performing stocks in the S&P 500 Financials Index. Within the index, 63 of 81 members ended the session in negative territory.

Treasury yields were higher all session long, and spiked to new highs following the FOMC statement. Selling in the 10-yr pushed its yield up to a session high of 3.490%, a level it had not seen since mid-May. As traders more aggressively sold the longer dated maturities, the 2-10-yr spread steepened to a session high 285. The spread now trades within striking distance of its all-time steepest level of 293.9.

The dollar strengthened post FOMC statement, and will end the day near its best level of the session. As the dollar moved higher, the euro fell back below the 1.3400 level, and the pound retreated further from 1.5800. After trading flat near 83.35 for much of the afternoon, dollar/yen will finish near its session high of 83.78.

Economic data was mixed with better-than-expected November retail sales, and a bigger-than-expected rise in producer prices. Business inventories saw a gain, but failed to meet expectations.

Volume was light yet again with less than one billion shares trading on the floor of the New York Stock Exchange. DJ30 +47.98 NASDAQ +2.81 SP500 +1.13 NASDAQ Adv/Vol/Dec 1327/1.85 bln/1297 NYSE Adv/Vol/Dec 1334/956.9 mln/1694

11:05AM FSI Intl receives order for Orion single wafer cleaning system from major Asian semiconductor manufacturer (FSII) 4.23 +0.04 : Co announces the receipt of an order for its FSI ORION single wafer cleaning platform from a major Asian semiconductor manufacturer. The order represents acceptance of the evaluation tool shipped in late 2009 for front-end-of-line (FEOL) development programs. This system is now qualified in ashless all-wet photoresist strip and silicon etch for the production of 28nm logic devices. Revenues for the four-chamber evaluation system and four-chamber expansion model is expected to be recognized in the second quarter of fiscal 2011

Skyworks Solutions (SWKS) is powering multiple smart phones from HTC including the EVO, Desire HD and Z with Skyworks' highly integrated power amplifier modules as well as the company's industry leading switch technology. Taiwan-based HTC is one of the fastest growing companies in the mobile sector.

LSI Corporation (LSI) announced that its Link Layer Processor and Advanced PayloadPlus processors have achieved compliance with three Metro Ethernet Forum specifications.

8:06AM Best Buy misses by $0.07, misses on revs; lowers FY11 EPS guidance below consensus (BBY) 41.70 : Reports Q3 (Nov) earnings of $0.54 per share, $0.07 worse than the Thomson Reuters consensus of $0.61; revenues fell 1.1% year/year to $11.89 bln vs the $12.45 bln consensus. Co lowers guidance for FY11, sees EPS of $3.20-3.40 vs. $3.55-3.70 previously and the $3.59 Thomson Reuters consensus. The co noted that this new guidance range includes the favorable impact of share repurchases made year-to-date through the end of the fiscal third quarter which approximates $0.12 ($0.10 previously). "Fiscal third quarter domestic sales were softer than we expected, but we were very pleased with the continued strong gross margin performance and actions to lower variable expenses." The co noted that the Domestic segment's rev declined more than expected, driven primarily by larger than expected industry declines in key U.S. consumer electronics categories for the three months ended October 31, 2010, as well as a decline in the co's estimated domestic market share for such period. The co estimates that its domestic market share declined 110 bps versus the comparable period last year for the three months ended October 31, 2010. The decline was driven primarily by declines in TVs, mobile computing and gaming software. Based on fiscal year-to-date trends, the co now estimates that its domestic market share will decline for the full fiscal year as compared to the prior fiscal year.

8:06AM Altera Acquires Avalon Microelectronics, Extending Its Communication System IP for FPGA and ASIC Product Portfolio (ALTR) 36.91 : Co announced it has acquired Avalon Microelectronics Inc., an industry leader in flexible Optical Transport Network (OTN) IP, for use in its FPGA and ASIC products. With the acquisition of Avalon, Altera expands its portfolio of customizable IP solutions for OTN applications, supporting data rates at 1.2G, 2.5G and 10G, as well as 40G and 100G. Terms have not been disclosed on the acquisition, which is not a material financial matter for Altera.

8:05AM Conexant to sell property in Newport Beach for $23.5 mln (CNXT) 1.68 : Co signed an agreement with Uptown Newport LP to sell property adjacent to its Newport Beach headquarters for $23.5 million. Under the terms of the agreement, Conexant will retain an equity investment in the land in the form of a limited partnership interest of up to $2.2 million. Uptown Newport LP is a joint venture consisting of a fund controlled by New York-based DRA Advisors LLC and an affiliate of The Shopoff Group. The transaction is subject to customary closing conditions, and expected to be completed by the end of December.

7:24AM SEMI reports 3Q10 worldwide semiconductor equipment figures; billings +22% sequentially to $11.12 bln (SMH) 32.58 : SEMI reports that worldwide semiconductor manufacturing equipment billings reached $11.12 billion in the 3Q10. The billings figure is 22% higher than 2Q10 and 148% higher YoY. Worldwide semiconductor equipment bookings were $12.39 billion in the 3Q10. The figure is 113% more than the same quarter a year ago and 6% greater than the bookings figure for the 2Q10.

# F5 Networks (FFIV) announced enhanced support for organizations that run Citrix and other virtual desktop applications. Using the BIG-IP Access Policy Manager or BIG-IP Edge Gateway solution, customers can consolidate and centralize authentication and access control for simpler and more predictable access management across all virtual desktop environments, including Citrix, Microsoft, and VMware based deployments.

# CEVA (CEVA) announced that PMC-Sierra (PMCS) has licensed its CEVA-VoP voice-over-IP platform for use in PMC-Sierra's next generation system-on-chip devices for Fiber-To-The-Home applications.

An RFID device from STMicroelectronics (STM) now allows technical equipment to 'talk back,' providing detailed information, such as a full maintenance history, to speed up servicing and simplify record keeping for OEMs and equipment operators.

09:48 am BBY Lowers FY11 EPS Guidance (BBY)

Best Buy (BBY 35.76 -5.94) reported third quarter earnings of $0.54 per share, $0.07 worse than the Thomson Reuters consensus of $0.61.

Revenues fell 1.1% year-over-year to $11.89 billion versus the $12.45 billion consensus.

For the fiscal year 2011, the company lowered its earnings guidance to $3.20 to $3.40 versus $3.55 to $3.70 previously and the $3.59 Thomson Reuters consensus.

The company noted that this new guidance range includes the favorable impact of share repurchases made year-to-date through the end of the fiscal third quarter which approximates to $0.12 ($0.10 previously)."

Fiscal third quarter domestic sales were softer than we expected, but we were very pleased with the continued strong gross margin performance and actions to lower variable expenses." The co noted that the Domestic segment's rev declined more than expected, driven primarily by larger than expected industry declines in key U.S. consumer electronics categories for the three months ended October 31, 2010, as well as a decline in the co's estimated domestic market share for such period.

The company estimates that its domestic market share declined 110 bps versus the comparable period last year for the three months ended October 31, 2010. The decline was driven primarily by declines in TVs, mobile computing and gaming software. Based on fiscal year-to-date trends, the co now estimates that its domestic market share will decline for the full fiscal year as compared to the prior fiscal year.
icon url

ReturntoSender

12/15/10 9:52 AM

#9160 RE: ReturntoSender #6755

Current State of the $SOX:


Hey, I have been buying stuff like it's 1999 myself. Of course financially I'm in much better shape than then. I'm not buying anything indiscriminately. Prices in this area will continue to fall even if we get real inflation in basic materials. Unfortunately that is a very real possibility.

RtS
icon url

ReturntoSender

12/15/10 11:01 PM

#9161 RE: ReturntoSender #6755

From Briefing.com: 4:10 pm : Stocks hit their highest levels of the session in the first hour of trading, and saw a gradual selloff throughout the course of the day. Stocks closed near their worst levels of the session with the S&P 500 seeing losses of 0.5%.

Equity futures were under pressure in pre-market trading after Moody's announced it was reviewing Spain for a negative outlook, Portugal held a weaker-than-expected 3-month bill auctionl, and Japan's Tankan survey indicated large manufacturers' confidence was at it lowest point in almost two years.

Joy Global (JOYG 85.79, +5.58) was one of the top performers all session long after the company announced stronger-than-expected results for its fourth quarter. The company released earnings of $1.39 per share versus the Thomson Reuters consensus of $1.16 per share. Revenues topped expectations as well, coming in at $1.05 billion versus the Thomson Reuters consensus estimate of $0.92 billion. The company raised its guidance for full year 2011. Caterpillar (CAT 93.14, +1.05) saw a positive reaction to the results.

Shares of Boston Beer (SAM 94.99, +10.24) surged after the company raised its forecast for its 2010 profit to $3.30 to $3.60 per share after forecasting a profit of $2.85 to $3.15 per share on November 4th. Molson Coors (TAP 50.35, +0.61) rode its coattails for a nice gain.

Shares of BP (BP 43.85, -0.59) slipped on the news that the U.S. government was suing them for the Gulf of Mexico oil spill. Anadarko Petroleum (APC 67.42, -1.55) and Transocean (RIG 71.90, -0.90) were also named in the suit.

The Treasury complex was under pressure for most of the session as prices started to fall and yields began to rise following the Fed's Permanent Open Market Operations. The yield on the 10-yr climbed from 3.40% when the POMO results were released to a session high of 3.558%. The move in the 10-yr yield pushed it to its highest level since mid-May. Steepening continued in the 2-10-yr spread with the curve seeing 288.6, its widest since late February. A breach of 293.9 would be a record high.

The dollar index ran to a session high just short of 80.30 from its 8 AM ET low of 79.46. A number of things weighed on the euro today with its selloff intensifying as Ireland's Parliament passed a vote that approved the European Union/International Monetary Fund bailout. The single currency will end the day down close to 150 pips at 1.3220. A weak jobs report weighed on the pound, and an easing of inflationary pressures has some thinking more stimulus may be necessary. Sterling closed off 230 pips to 1.5540. Dollar/yen added 0.60 to finish the session near 84.25 as it looks to breakout above current resistance levels.

Tomorrow's data is heavy with initial and continuing claims, housing starts and building permits, and current account balance all at 8:30 AM ET, followed by the Philly Fed at 10 AM ET.

Volume was light with just more than one billion shares changing hands on the floor of the New York Stock Exchange.DJ30 -19.07 NASDAQ -10.50 SP500 -6.36 NASDAQ Adv/Vol/Dec 1048/1.86 bln/1598 NYSE Adv/Vol/Dec 1034/1.10 bln/1960

4:03PM TriQuint Semi announces that SAMSUNG selects its complete RF front-end solution for its Galaxy Tab and Galaxy S Series (TQNT) 11.89 -0.17 : Co announces that SAMSUNG selected TriQuint for its complete 3G RF front-end for its new Samsung Galaxy Tab. This is in addition to Samsung choosing TriQuint's total 3G RF front-end solution for its smartphone series, Galaxy S.

6:10AM MEMC Elec appoints Mark Murphy as CFO (WFR) 11.72 : Co announces that effective January 10, 2011, it will transition the CFO role to Mark Murphy from the current CFO, Tim Oliver. Murphy was most recently VP and Controller of Praxair. Oliver is leaving the co to pursue other opportunities.

09:54 am BRCM Guides Q4 Revs Above Consensus (BRCM)

Broadcom (BRCM 42.95 -1.98) expects to see fourth quarter revenues in the range of approx. $1.9 billion versus the $1.85 bln Thomson Reuters consensus.

Co sees GAAP product gross margin down slightly sequentially due to warranty and excess & obsolete charges, excluding impact of GAAP valuation related charges related to Q4 acquisitions that are not available at this time.

The company sees GAAP R&D plus SG&A expenses estimated to be up $20 million to $30 million sequentially, excluding approx. $25 million of acquisition and employee stock plan charges.

The company stated "Our increased revenue guidance reflects stronger than expected demand for products in our Mobile and Wireless markets versus our initial expectations entering the quarter."

09:48 am FSLR Guides FY11 Above Consensus (FSLR)

First Solar (FSLR 139.06 +2.02) guided net sales in the range of $3.7 billion to $3.9 billion, up about 46% year-over-year compared to the midpoint of 2010 guidance provided on October 28, 2010.

The net sales forecast is comprised of $2.8 to $2.9 billion of module sales and $0.9 to $1.0 billion of EPC/project development sales. EPS is forecasted to grow to between $8.75 to $9.50 per fully diluted share and consolidated operating income is $875 to $975 million.

These forecasts include $80 - $85 million of manufacturing start-up expenses and $15-20 million of factory ramp costs associated with plant expansions. The Company plans to invest $1.0 to $1.1 billion of capital to nearly double production capacity by year-end 2012, to maintain existing capacity and to add infrastructure to support growth. First Solar expects to generate $1.0 - $1.1 billion of operating cash flow during 2011.

icon url

ReturntoSender

12/17/10 10:43 AM

#9162 RE: ReturntoSender #6755

From Briefing.com Today: 10:00 am RIMM Guides Q4 EPS Above Consensus

Research In Motion (RIMM 60.11 +0.88) reported third quarter earnings of $1.74 per share, above the consensus of $1.65.

Revenues rose 18.9% year-over-year to $5.5 billion above the $5.4 billion consensus.

Management reported third quarter net subscriber addition of 5.1 million in-line with its 5.0-5.4 million company guidance and approximate 5.2 million Street estimate.

The company reported third quarter gross margin of 43.6% above the 42.1% consensus and 42% company guidance.

The company also reported third quarter units shipped of 14.2 million in-line with the 13.8-14.4 million company guidance and above the approximate 14.2 million Street estimate.

The company issued upside guidance for the fourth quarter, seeing earnings per share of $1.74-1.80 above the $1.61 consensus. The company also issued fourth quarter revenue guidance of $5.5-5.7 billion above the $5.46 billion consensus. The company sees gross margin percentage for Q4 to be similar to third quarter levels of 43.6%, above the consensus of 42.0%.

09:57 am TTWO Easily Tops Q4 EPS Expectations (TTWO)

Take-Two (TTWO $12.82 +0.88) reported fourth quarter earnings of $0.67 per share, $0.36 better than the Thomson Reuters consensus of $0.31.

Revenues rose 32.3% year-over-year to $373.7 million, well above the $325.2 million consensus.

The strongest contributors to net revenue and profitability in the three month period ended October 31, 2010 were new titles, including NBA 2K11, Mafia II, Red Dead Redemption, Sid Meier's Civilization V, Grand Theft Auto IV: Complete and New Carnival Games. In connection with the change to its fiscal year-end, Take-Two is providing guidance for the three months ending December 31, 2010 and the fiscal fourth quarter and full year ending March 31, 2011.

For the three month period ending 12/31/2010, co sees revs of $295 million to $315 million and EPS of $0.25 to $0.35. For the 3 months ending 3/31/2011, co sees revs of $100 million to $150 million and EPS of ($0.60) to ($0.50). For the year ending 3/31/2011, co sees EPS of 3/31/2011, co sees revs of $1.0 to $1.1 bln and EPS of $0.50 to $0.65. Given the change in fiscal year, estimates don't compare to the consensus.

09:50 am ORCL Guides Q3 EPS Above Consensus (ORCL)

Oracle (ORCL 32.00 +1.73) reports second quarter earnings of $0.51 per share, excluding non-recurring items, $0.05 better than the Thomson Reuters consensus of $0.46.

Revenues rose 46.5% year-over-year to $8.58 billion versus the $8.34 billion consensus.

Both GAAP and non-GAAP new software license revenues were up 21% to $2.0 bln. non-GAAP software license updates and product support revenues were up 12% to $3.7 bln. Both GAAP and non-GAAP hardware systems products revenues were $1.1 billion. Non-GAAP operating margin was 44%.

On the conference call, the company guided third quarter earnings at $0.48 to $0.50, above the $0.46 consensus. On the top line, the company expects revenue growth on a non-GAAP basis to range from 31-35% at current exchange rates and 30-34% in constant currency.

The company said, "Our new license growth of 21% demonstrates the strength of the company-specific momentum we are seeing. And our Sun business continues to improve with hardware gross margins increasing to 53%. Since joining Oracle I've met with and visited many customers that have expressed a high level of enthusiasm around our strategy of engineering hardware and software that works together. That enthusiasm translates into an Exadata pipeline that has now grown to nearly $2 billion. That number is a good leading indicator that customers are planning to increase their investment in Oracle technology."

SunEdison, a subsidiary of MEMC Electronic Materials Inc. (WFR), and Arizona Public Service Co. announced construction of a utility-scale photovoltaic solar power plant located two miles north of the Prescott Regional Airport. SunEdison will own and operate the plant with APS purchasing the entire output. APS estimates the 10-megawatt facility can provide enough power to meet the annual energy needs of 2,500 Arizona customers.

From Yesterday: 4:15 pm : Stocks started the day in the red following mixed jobs and housing data, but quickly turned positive after the Philadelphia Fed number topped expectations. From then on the major market averages didn't look back as they closed near their best levels of the session. The Nasdaq led the advance with a gain of 0.8%, while the S&P 500 and Dow lagged with respective gains of 0.6% and 0.4%. The S&P 500 and Dow saw their best closes since September 2008.

FedEx (FDX 94.26, +1.87) saw strong gains today after the company reported weaker than expected earnings, but gave strong guidance of $5.00-$5.30 per share for full year 2011. The Thomson Reuters consensus is looking for full year earnings per share of $5.21. Rival United Parcel Service (UPS 73.77, +1.52) also gained on the forecast.

Bank of America (BAC 12.55, +0.26) shares were higher by as much as 4.0%, but sold off following the Fed's proposed rules for debit card interchange rate regulation. The stock had been trading higher after reports surfaced that the company may be close to reaching settlement with mortgage investors.

Shares of Visa (V 66.96, -9.98) and Mastercard (MA 223.99, -25.23) tumbled following the proposed debit card interchange rate regulation. At their worst levels of the session the stocks were down in excess of 13%.

Athenahealth (ATHN 39.83, -2.42) saw a sharp drop midday after the company released updated guidance for full year 2011. The company is calling for $0.68-$0.78 earnings per share while the Thomson Reuters consensus was looking for $0.85 per share.

An afternoon rally in Treasuries allowed maturities across the curve to close at their best levels of the session. The 10-yr yield crossed 3.56% before the noon hour, but by the end of the session was below 3.45% as buyers came out of the woodwork. The 2-10-yr spread saw some flattening, ending the day near 280 after seeing a session high of 288. The 293.9 mark represents record steepness of the spread.

The greenback saw a relatively quiet session, closing modestly lower near 80.10. A small drop in the dollar made for a gain of close to 20 pips in the euro, as the single currency will end the day near 1.3230. The pound will end the session just off its 1.5632 high, while dollar/yen will close lower by 0.20 near the 84.00 level.

Tomorrow's lone data point is leading indicators which will be released at 10 AM ET. DJ30 +41.78 NASDAQ +20.09 SP500 +7.64 NASDAQ Adv/Vol/Dec 1810/1.74 bln/824 NYSE Adv/Vol/Dec 2053/1.01 bln/971

4:13PM Research In Motion beats by $0.09, beats on revs; guides Q4 EPS above consensus, revs above consensus (RIMM) 59.24 +0.06 : Reports Q3 (Nov) earnings of $1.74 per share, $0.09 better than the Thomson Reuters consensus of $1.65; revenues rose 18.9% year/year to $5.5 bln vs the $5.4 bln consensus. Research In Motion reports Q3 net subscriber adds of 5.1 mln vs 5.0-5.4 mln company guidance and ~5.2 mln Street est. Research In Motion reports Q3 gross margin of 43.6% vs 42.1% Thomson Reuters consensus and 42% company guidance. Research In Motion reports Q3 units shipped of 14.2 mln vs 13.8-14.4 mln company guidance and ~14.2 mln Street est . Co issues upside guidance for Q4, sees EPS of $1.74-1.80 vs. $1.61 Thomson Reuters consensus; sees Q4 revs of $5.5-5.7 bln vs. $5.46 bln Thomson Reuters consensus. Gross margin percentage for Q4 is expected to be similar to third quarter levels, Thomson Retuers consensus is 42.0%.

4:04PM Oracle beats by $0.05, beats on revs (ORCL) 30.27 -0.22 : Reports Q2 (Nov) earnings of $0.51 per share, excluding non-recurring items, $0.05 better than the Thomson Reuters consensus of $0.46; revenues rose 46.5% year/year to $8.58 bln vs the $8.34 bln consensus. Both GAAP and non-GAAP new software license revenues were up 21% to $2.0 bln. non-GAAP software license updates and product support revenues were up 12% to $3.7 bln. Both GAAP and non-GAAP hardware systems products revenues were $1.1 bln. Non-GAAP operating margin was 44%. "Our new license growth of 21% demonstrates the strength of the company-specific momentum we are seeing. And our Sun business continues to improve with hardware gross margins increasing to 53%. Since joining Oracle I've met with and visited many customers that have expressed a high level of enthusiasm around our strategy of engineering hardware and software that works together," said Hurd. "That enthusiasm translates into an Exadata pipeline that has now grown to nearly $2 bln. That number is a good leading indicator that customers are planning to increase their investment in Oracle technology."

4:02PM Aehr Test Systems announces follow-on WaferPak contactor orders (AEHR) 1.16 -0.10 : Co received ~$3 million in follow-on orders for multiple FOX-1 WaferPak contactors from a leading manufacturer of semiconductor memory devices. Shipments began in the second fiscal quarter of 2011 and are scheduled to complete during the current fiscal year.

11:13AM Microchip enters into a wireless design partnership agreement with Taoglas (MCHP) 34.63 +0.26 : Taoglas Limited announces a Wireless Design Partnership agreement with Microchip Technology. Surface-mount technology antennas such as Taoglas' PA.25 Cellular (2G/3G/3.5G) and SGP.25D GPS patch are just two of the antennas chosen. Microchip also selected Taoglas' automotive-approved "Titan" AA.105 Active External GPS IP67 antenna, for customers looking for an external antenna solution.

8:34AM Nanometrics received order for UniFire 7900 metrology system for advanced 3D wafer-scale packaging process control (NANO) 11.89 : This initial system will be delivered in the fourth quarter of 2010 to enable the foundry's transition from development to high volume manufacturing in 2011.

Axcelis Technologies (ACLS) announced that its IntegraTM ES plasma dry strip system has been selected as the process tool of record by one of the world's largest semiconductor manufacturers. The co has received the first in a series of orders for the system to support the customer's 32nm and 28nm technology manufacturing capacity expansion. The orders will begin shipping in December 2010.

FedEx (FDX 94.38 +1.99) reported second quarter earnings of $1.16 per share, excluding non-recurring items, $0.15 worse than the Thomson Reuters consensus of $1.31.

Revenues rose 12.1% year-over-year to $9.63 billion versus the $9.7 billion consensus.

For the third quarter, the company issued earnings guidance of $0.95 to $1.15, excluding non-recurring items, in-line with the $1.10 Thomson Reuters consensus.

For the fiscal year 2011, the company raised its earnings guidance to $5.00 to $5.30, excluding non-recurring items, in-line with the $5.21 Thomson Reuters consensus and $4.80 to $5.25 previously.

Operating margin -170 bps year-over-year to 4.9%.

The company said, "Our operating performance in the quarter was impacted by strong compensation and benefits headwinds as we reinstated programs curtailed during the recession. During the quarter, we also realized more normalized growth in FedEx International Priority shipments and higher fuel prices than our earnings guidance had assumed. Yield improvement and cost management remain our focus. We expect margins to improve in the second half of fiscal 2011 and in fiscal 2012, as we continue to benefit from solid global demand for our differentiated services and as certain cost headwinds subside next fiscal year."
icon url

ReturntoSender

12/17/10 12:49 PM

#9163 RE: ReturntoSender #6755

Chart of the Day - Post Massive Bear Market Rallies.

http://www.chartoftheday.com/20101217.htm?T

Today's chart illustrates rallies that followed massive bear markets. For today's chart, a 'massive' bear market is defined as a decline of greater than 50%. Since the Dow's inception in 1896, there have been only three bear markets whereby the Dow declined more than 50% (early 1930s, late 1930s until early 1940s, and during the very recent financial crisis). Today's chart also adds the rally that followed the dot-com bust during which the Nasdaq declined 78%. The current Dow rally has followed a path that is fairly similar to that of post-massive bear market rallies. The initial surge of the current rally lasted nearly 300 trading days and has been trading flat/choppy ever since. It is worth noting that the current rally just made new rally highs. However, both the 1932 Dow rally and the 2002 Nasdaq rally briefly made new highs during their flat/choppy phases. If the current rally were to continue to follow the post-massive bear market rally pattern, the current choppy phase would continue for another 150+ trading days (i.e. 7+ months).


icon url

ReturntoSender

12/18/10 7:12 PM

#9164 RE: ReturntoSender #6755

From Briefing.com: Weekly Recap - Week ending 17-Dec-10Following a volatile, headline-driven week, U.S. equity markets ended up basically where they began, eking out a small gain.

Seven of the 10 S&P sectors rose, led by Materials (+1.7%), Consumer Staples (+1.6%) and Health Care (+1.5%). Financials (-1.4%) led the underperformers.

The most notable move of the week occurred in the Treasury market. Yields extended their recent, aggressive run, with the 10-year peaking at 3.56%, approximately 115 basis points above the October low and 99 basis points above the closing level on November 3, when the Federal Reserve announced a second round of quantitative easing. The sell-off in Treasuries ran out of steam on Thursday and Friday, however, with the 10-year falling back to 3.32%.

In equities, the major averages began the week by failing to hold their gains on Monday and Tuesday, falling back near unchanged in late-afternoon trade.

Tuesday was a busy session. Markets rallied as better-than-expected November retail sales data more than offset disappointing earnings and guidance from Best Buy (BBY). The retail sales report not only exceeded consensus estimates, but flew in the face of weak wage growth reported in the November employment report. However, the major averages saw a delayed sell-off following the FOMC policy directive, which did not acknowledge the backup in long-term rates that has occurred despite the Fed's bond purchase program.

That negative sentiment carried over into Wednesday. The major averages opened higher despite trading lower premarket after Moody's place Spain's long-term debt rating on review for a possible downgrade. But the opening levels did not hold and markets saw a gradual sell-off throughout the course of the day as Treasuries sold off and the dollar rallied.

A rally Thursday brought the major averages back to even on the week. Negative earnings from FedEx (FDX) initially sent the stock down 4%, but the company also increased its guidance, helping shares rebound to close up 2% on the session. The aforementioned pullback in Treasury yields also aided the rebound.

With the three-day Christmas weekend next week, the calendar is full in the middle of the week. Walgreens (WAG) is the only earnings report of note, out Wednesday before the open. The economic calendar is full, with existing home sales and the third estimate for third quarter GDP on Wednesday -- though the latter is not typically revised to any great extent -- as well as durable orders, personal income/spending and new home sales on Thursday.
 
Index Started Week Ended Week Change % Change YTD %
DJIA 11410.32 11491.91 81.59 0.7 10.2
Nasdaq 2637.54 2642.97 5.43 0.2 16.5
S&P 500 1240.40 1243.91 3.51 0.3 11.6
Russell 2000 776.83 779.52 2.69 0.3 24.6

icon url

ReturntoSender

12/19/10 1:23 PM

#9167 RE: ReturntoSender #6755

InvestmentHouse Weekend Market Summary

http://www.investmenthouse.com/weekendmarketsummary.htm

- Quiet expiration as stocks drift higher but many stocks look ready to move next week.
- Tax compromise passage sets the stage, but the market just drifts.
- Leading economic indicators round out the week of data.
- Indices have tested the break over the November high. Now can they drift higher to year end, riding promised liquidity?

Blah expiration, but some good stocks look good.

It certainly was not much of an expiration Friday. It was "quadruple witching," as they call it, but it did not lead to many fireworks. Most of the action usually takes place earlier in the week. Wednesday was down, Thursday was up, and Friday was a wash like Monday and Tuesday. From the perspective of the indices, Friday was quite boring. Early on, it looked like a big open to the downside. The scale on the SPY is at 124.90, and the opening was down at roughly 124.80. Not a huge move. It started lower, drifted higher, and looks like that old low-to-high move. Everything looked fine, but the indices lost their mojo in the back half of the afternoon. They gave up a chunk of gain, and the Dow finished lower on a session of rather unspectacular gain. NASDAQ, +0.2%; SP500, < +0.1%; Dow, -0.6%; SP600, +0.6%; SOX, +0.67%; NASDAQ 100, +0.25.

There were no dramatic fireworks, but that does not mean there was no drama. Some stocks moved quite well. DECK broke out of its pennant with a nice, big break to the upside on solid volume. ANF had a nice move to the upside on volume. Sometimes volume will be accelerated on expiration, but not on all stocks. It is true for the big stocks, but small stocks are not part of the equation. Some moved but could not quite hold all the gain. RS had nice volume, and it had already been picking up as it broke out of its pennant pattern.

There were others stocks scattered around the market that are not brand name, but they are quality stocks nonetheless. EBIX made a nice break to the upside on rising volume. TIBX posting a break upside on nice volume. Some stocks are set up to move quite well if the market continues its move to the upside. The indices did not do much on the session (or on the week), but there were interesting moves by leadership stocks nonetheless. Some are breaking down, and many are still breaking to the upside.

It was a quiet week. There is the drift higher after breaking the November peak, a lateral move, and then the test down to the 10 day EMA (lo and behold, that was right above the November peak), and then the bounce higher on Thursday off of that test. A break, a test, and the start to the move higher is pretty classic action in an upward-trending market. Perhaps next week we will get a continuation of this drift to the upside into Christmas and even to the end of the year. That sets the stage for what can or cannot happen in January. You never know when you have a rally up to the end of the year.

We still have a Federal Reserve worried about unemployment. Even though there is improvement in other economic areas, the Fed is focused like a laser on the unemployment rate. Until it sees unemployment improving, it will not get off the accelerator with respect to liquidity. We are promised liquidly through Q1 or the first half of next year, and possibly longer. Bill Gross of PIMCO says it could be another year before rates rise. We will see. For now, the Fed is bound and determined to bring unemployment down, and it will keep the money flowing. Now it is getting some help from the fiscal side of the equation as well.

There was not a lot of excitement in the market movement on Friday, and there was not a lot of excitement elsewhere. The tax compromise was passed, and the President signed it into law later in the session. The market did not budge on the news. I suppose it was factored in that the compromise would get the seal of approval given the elections and the dire state of the economy. Of course, this will be stimulative now even though it was not stimulative through the Bush years. At the end of two years, it will then cease to be stimulative. Is that an advanced economic equation? No. It is called the political-cycle equation. They are doing what is expedient now, and they will revisit it in two years and see whether it is expedient to extend or shut them down at that time.

In any event, they passed and there will be a bit more relief and some payroll taxes heading lower. It would be nice if they would throw in a bit of corporate tax relief. We have the worst corporate tax structure in the world. If we would reduce our rates down to, say, zero, we might actually see a boom in the US. They would never do that, however, because we believe and even the Tea Partiers believe that if you cut taxes you increase spending. Ronald Reagan disproved that. John F. Kennedy disproved that. They cut tax rates and revenue boomed. Indeed, when Bush cut tax rates the revenues boomed. Bill Clinton cut tax rates. People say he raised rates. He did, and that caused damage to the economy ultimately. However, he and his advisers were also smart enough to reduce capital gains taxes, and that offset the hiked marginal rate. It kept the economy going because it kept money flowing in. Revenues have gone up with every tax cut we have had. It is not a cost. We are not spending money. It does not increase the deficit to give a tax cut; it lowers the deficit because revenues rise more than they were when taxes were higher.

As noted, that was not exciting the market on Friday. There was not much exciting the market. There was a little M & A activity. The bank of Montreal was buying Marshall & Isley, but it did not excite the market that much. There were good earnings. ORCL and RIMM both beat the street. TTWO beat and performed quite well, gapping to the upside and moving nicely. It was joined by the larger cap brethren that did quite well on their own. Outside of their own numbers, that did not excite the market that much either.

Leading economic indicators were solid at 1.1% when 1.2% was expected. That was almost three times what was reported in October. Not bad news, but it was ho-hum. Boeing said it was going to add 4-5K jobs in 2011, and that still didn't get things that excited. It was just a day where the market had tested and was drifting higher. It was expiration, positions were being moved, and the indices were dull. Some stocks are in good position. They either moved well or put themselves in very good position to move well next week. That had me interested. We normally do not do a lot of buying on Friday, but we did our share. We picked up some shares in ANF. It had a nice move. We picked up some RS, and it is doing just fine. FCX bounced nicely. It has better volume and looks like it might be starting its pre-split move. SLB was up a bit, but it was not that much. I am looking for positioning for next week, and I have seen some good positioning.

Add that on top of a week that showed very good economic data. Retail sales were up 0.8%. A lot of that was gasoline sales, but there was buying ongoing nonetheless. New York Empire Manufacturing came in at 10.5 versus 3 expected, and a -11 in November. Industrial production rose 0.4% versus a -0.2% in October. Capacity hit 75.2 versus 74.9 in October. The Philly Fed came in very nicely at 24.3 versus 13 expected and 22.5 in November. There were some good moves the Philly Fed, for instance. The average workweek hit a five or six year high. There was outstanding news. It was not able to excite the stock market to big gains on the week, but we did get that bounce off of the test of the break over the November peak. That is important. It was not a huge move, but stocks are well-positioned to continue a drift higher into Christmas.

OTHER MARKETS

Dollar. The dollar posted a gain on the session, but it was down early on. It sold off and tapped near the 50 day EMA, but then it reversed for a gain (1.3186 Euro versus 1.3234 Thursday). It has been chopping around in a range since pulling back after its great run off of its low. It is trying to regroup and set a new rally. It could very well do that.
Click to view the chart

Bonds. Bonds continued their recovery on Friday. They were slaughtered over the past four weeks, but they bounced on Thursday and Friday they were running strong (10 year 3.33%, versus 3.43% Thursday). Bonds look like they are in a bounce. Obviously, you will get bounces in a downtrend, even in horrific downtrends. That is what bonds are showing at this point.
Click to view the chart

Gold. Gold had a tough week. It sold off sharply, but it is trying to catch itself at the 50 day EMA. It has caught itself there before when it broke its trend in mid-November. It looked like it was cooked and rallied back. It has done the same thing here, and it is trying to bounce off the 50 day EMA. It is looking heavy, but it did manage to post a gain on the session ($1,379.80, +8.80).

With the economy somewhat in recovery mode, there is a view that this will alleviate some inflation pressures. Really and truly, growth does alleviate inflation because there is supply; we avoid the supply/demand tightness that leads to inflation. Ultimately, there is a tremendous amount of liquidity out there that will cause inflation. While there may be a near term bluster in gold, it will move higher in the long term. There is a tremendous run from July into October, straight up. Since then, it has become choppier but has not broken down by any stretch of the imagination. It is still making higher lows. As long as it is making higher lows, it is hard to make the argument that it will fall. It looks choppy, and it takes a long time for a trend that is this strong to turn. It may do that. For now, it is holding the 50 day EMA and we will see what happens moving down the road.
Click to view the chart

Oil. Oil has been holding up well all week, and it was able to add some on Friday ($88.52, +0.82). It has been moving laterally all week after breaking to a high. It has not been able to get on track. One of the reasons is the dollar has been bouncing back and forth, trying to firm up. That had an impact on the price of oil, of course. As the dollar declines, oil prices rise because it costs more dollars to buy every barrel of oil. As the dollar rises, it takes fewer dollars. Oil prices do not have the rise just because the dollar is weaker.
Click to view the chart

TECHNICAL SUMMARY

INTERNALS

Volume. It was a bland day. Volume was up 40% on the NASDAQ to 2.34B shares. It was up 100% on the NYSE to 2B shares. That is all expiration volume. It does not really mean a thing.

Breadth. Advancers were very flat, matching the session. They led 1.1:1 on the NASDAQ and 1.3:1 on the NYSE.

CHARTS

SP500. Taking a bigger view, there is the April peak, the selloff into the summer, the rally back into November that cleared the April peak. Then the market sold back, made a good test, and then rallied through November. As noted, it has come back slightly. It rallied up, flattened out as it got to the November peak, and then broke through. It has come back slowly and quietly, testing that move and holding at the 10 day EMA. It started to bounce on Thursday, and it added a bit on Friday. Nothing big on Friday, but it made a test that opens the door for it to drift higher maybe even to rally higher into the end of the year. That is the way it should work, although it has been quiet and hard to see. It makes a lot of sense.

NASDAQ. The NASDAQ made the break. It flattened out after it broke. It tested the 10 day EMA, held above the November peak, and it started to move back up. Nothing spectacular. Kind of quiet and hard to see, but that is what it looks to be doing.

SP600. SP600 was a bit more dramatic. They took the lead late in the year. They rallied through that November peak and really made the break through it. It flattened out more at the April peak, but then it broke through, tested, and now it is moving up. It added the 0.6% gain on Friday and is looking good compared to the large-cap indices.

SOX. SOX posted a 0.7% gain. It is the same kind of action. A break through, nice test to the 18 day EMA, and moving back up. That is what you would expect to see.

SP400. The SP400 does not look as pronounced at the SP600, but it did make a solid break over that November peak. It has been moving laterally. There is the test of the 10 day EMA, and now it is trying to move higher.

I do not see stocks in a position where they will roar ahead. It is the holidays, and there is a lot of liquidity in the system. They have run a good ways, but it has also tested recently. Let's drift higher and see where we can go into the end of the year. There are plenty of stocks looking good, so that makes sense.

LEADERSHIP

Financial. JPM is still pulling back into its trading range. Maybe it does not hold and make the break, but this is where you watch. There is a well-defined trading range. It is coming back to test. If it holds at the 50 day EMA, a lot of times you get the breakout of the trading range at that point. It has made several rotations in it. After that, look for a higher low to make the breakout. It is usually at a level like the 50 day EMA. It has never been able to hold at that level as it has come back. If it does, this is the first time it will have held there, and that will be in the upper half of the range and position to make the break to the upside. Always watch for that when you are looking at a pattern or a trading range that has been ongoing for quite some time; that higher low is often your ticket to a breakout.

GS had a pullback off of its recent highs. We will see if it can hold and make the next break to the upside. WFC had a nice test back to the 10 day EMA, catching up with it. That may send it back to the upside.

Industrials. Industrials have been enjoying very nice moves. Not so great on Friday, but they have had a good week and are testing back. CAT came back 0.5% on the session. No major damage done at all. JOYG announced great earnings on the week, and it gapped to the upside. It is not giving in on its gap. Whenever you have a gap, you look for the lateral move if it is a breakaway gap. Then as it makes the move higher, you can move into the upside. I will keep an eye on that one. CMI had a good week. A nice move higher, testing back slightly as the week ended.

Energy. Energy was chopping around the entire week, but SLB looks good and ready to move back up. HAL looks solid with a pullback. BTU looks solid. Look at that pennant that has formed on top of the other one. That could be gravy on a new break higher. I love the tight range, quieting down, and sitting right on top of the other consolidation. That is always a good indication.

Retail. Retail is still doing well. Some consolidation, some breaks higher. DECK consolidated and then made the break on Friday. LULU continued to move higher. It had a nice gap to the upside, tested, and it is taking off to the upside once more. Some retail is doing quite well. EAT is moving higher off of a test after a nice run to the upside. YUM is trying to stretch out and make a new move to the upside.

Semiconductors. Semiconductors had a pullback on the week, but that may present opportunity. LRCX pulled back one day, and then it is bouncing again. Not a lot of weakness there. NVLS is similar. It is working its way higher at the 10 day EMA, showing good strength. TQNT has a nice test, an ABCD pattern. We will see if it can make the break to the upside. It is not all wonderful. BRCM is struggling. It broke below the 18 day EMA on Wednesday, and it is having a hard time recovering

Technology. A lot of small names are doing better, particularly in the software area. EBIX started to bounce higher on stronger volume after a nice test of a break the lows. EPIC has a nice pattern and looks like it could make a further break upside. ADVS announced a split, and it looks like it may be ready to put in a pre-split run. The cloud computing was all the rage, with the FFIV and others moving higher earlier in the year. AKAM needed to consolidate, and it is doing that in this ranging ascending triangle. The neat thing about this pattern is AKAM made a big advance. It did give back some ground with a gap lower in late July, but it immediately recovered. Instead of giving ground, it is consolidating in a big triangle laterally. When it goes, it could go big. Today was a day the aggressive players could get in, coming off of this bounce. We will look to see if it makes the breakout above the upper trendline. Some old names are coming back, and some new names are starting to perform well and take the lead.

Steel. Metals have been an important player all week. FCX made a nice 1-2-3 pullback. A nice doji on Thursday, and it bounced higher on Friday on volume. That was our cue to move in. STLD made a very solid break higher. RS made a breakout upside. It did not hold all of it, but it is breaking out of its pennant. MTL has a nice bounce off of a 10 day EMA test.

There are stocks well-poised to move higher in a continued upside drift in the stock market.

THE MARKET

MARKET SENTIMENT

VIX. Volatility broke down sharply this week. Friday was a very sharp break. It was probably influenced by expiration, so I do not want to read too much into it. It is worth noting that the last time it was this low was back in March and April of this year. When it got this low, the market rolled over and went into some serious selling. Looking at the SP500 chart, it peaked in late April and fell into the base that walked through the summer, and then it broke higher to begin the fall. At this level, volatility can be an issue. We will see what happens. There is a lot of complacency. People are not buying much protection out there because they assume the market will go up. That is part of the problem. When everyone who will be in the market gets in and they think nothing can go wrong, most of the money is put to work. At that point, that is when you can have pullbacks in the market.

Many people are more bullish right now. The bulls rose to 56.8% of investment advisers versus 56.2% the prior week. It has been on a steady rise, and it is getting to the point of being a little more bearish. That is typically reserved for the 60-65% bulls range. At that point, most of the ammunition is used up. The bears continue to slide. They are at 20.5%, down from 21.3% the prior week. That is a significant drop. It has been hanging around at the 21% area for quite some time, and it is down from 28% in September. Bears are not looking too bearish at this point. You get around 15%, and that is really bearish. We are just running out of steam; it is not a sign that the locomotive is stopping and going to fall back on you.

VIX: 16.11; -1.28
VXN: 17.31; -0.94
VXO: 15.52; -1.74

Put/Call Ratio (CBOE): 0.78; -0.09

Bulls versus Bears:

This is a reading of the number of bullish investment advisors versus bearish advisors. The reason you look at this is that it gives you an idea of how bullish investors are. If they are too bullish then everyone is in the market and it is heading for a top: if everyone wants to be in the market, then all the money is in and there is no more new cash to drive it higher. On the other side of the spectrum if there are a lot of bears then there is a lot of cash on the sideline, and as the market rallies it drags that cash in as the bears give in. That cash provides the market the fuel to move higher. If bears are low it is the same as a lot of bulls: everyone is in and the market does not have the cash to drive it higher.

Bulls: 56.8 versus 56.2%. Moving up from a small dip the prior 2 weeks (from 55.7% and 56.2%), advisors returned to their bullishness, matching the peak on this move. Strong surge from 48.4% just a month back, the strongest move upside since May, indeed topping that level and getting closer to the 5 year high at 62.0. Moving toward the level considered bearish, i.e. where so many are in the market and believe it is going up that the ammunition to send it higher runs low. This is where you start to be careful and watch for breakdowns, but there is also a lot of liquidity being pushed into the market and that can continue the move despite excess bullishness. The crossover level at 29% bulls is long gone, but it did its job. The high on the last leg was 56.0% after starting at 35.6% on the low in February, the lowest it has been since July 2009 . . . until this last leg. 35% is the threshold level suggesting bullishness. Again, to be seriously bearish it needs to get up to the 60% to 65% level.

Bears: 20.5% versus 21.3%. Back on the decline after bumping modestly higher as the market flattened out. Down from 28.3% in September. The 37.7% peak at the height of the crossover is well in the rearview mirror but bears remain well below the 35% level, above which is considered bullish for the market overall. Hit 18.7% on the low in April. Hit a high of 27.8% level on the prior leg in February. For reference, cracking above the 35% threshold considered bullish. Hit a high on the prior run at 47.2%. For more reference, bearishness hit a 5 year high at 54.4% the last week of October 2008. The move over 50 took bearish sentiment to its highest level since 1995. Extreme negative sentiment. Prior levels for comparison: Bearishness peaked at 37.4% in September 2007. It topped the June 2006 peak (36%) on that run. That June peak eclipsed the March 2006 high (33%) and well above the 2005 highs that spawned new rallies (30% in May 2005, 29.2% in October 2005). That was a huge turn, unlike any seen in recent history.

NASDAQ

Stats: +5.66 points (+0.21%) to close at 2642.97
Volume: 2.347B (+41.15%)

Up Volume: 1.526B (+212.39M)
Down Volume: 1.163B (+750.68M)

A/D and Hi/Lo: Advancers led 1.1 to 1
Previous Session: Advancers led 2.17 to 1

New Highs: 217 (+41)
New Lows: 38 (+13)

NASDAQ CHART: Click to view the chart

NASDAQ 100 CHART: Click to view the chart

SOX CHART: Click to view the chart

SP500/NYSE

Stats: +1.04 points (+0.08%) to close at 1243.91
NYSE Volume: 2.025B (+100.17%)

Up Volume: 1.204B (+460.848M)
Down Volume: 790.98M (+531.401M)

A/D and Hi/Lo: Advancers led 1.33 to 1
Previous Session: Advancers led 2.02 to 1

New Highs: 309 (+63)
New Lows: 37 (+6)

SP500 CHART: Click to view the chart

SP600 Chart: Click to view the chart

DJ30

Stats: -7.34 points (-0.06%) to close at 11491.91
Volume DJ30: 358M shares Friday versus 163M shares Thursday. Expiration trade.

DJ30 CHART: Click to view the chart

MONDAY

The market will be closed for Christmas Eve on Friday, so we have a short week. We also have a market that is not moving very strongly, but it has not lost its upside bias either. It tested midweek, and it started to bounce toward the end of the week. That shows the upside bias is still there after testing the breakout. There is a bit of economic data starting on Wednesday with the usual applications for the week. We have the third estimate of GDP for Q3, and it is expected to come in a bit stronger. There is some data that has come in better with inventories and that sort of thing. That is a positive, I suppose. Existing home sales will come in, and we saw new sales this week. Thursday brings personal income and spending, durable goods orders, initial claims, Michigan Sentiment, and new home sales. Talk about packing it all in before the end of the week and Christmas.

We will have a lot to deal with, and the question whether the market will just ignore it and drift higher as it did on Friday. As noted in the leadership section, there are many stocks in great position. They are moving up well or in position to move up well, whether it is a drift or a solid upside break. We do not like to buy that much on a Friday, but when good stocks are in position and look ready to move up and start the move, you want to get a good entry point. Then you have a nice exit point if it does turn against you. That said, I still think we will get upside because it looks positive moving into next week.

The market has an upside bias, it has the tax bill passed, and it has the Fed on its side. Europe continues to struggle, but China looks better, India looks better, and Brazil looks better. That is solid despite the drag of Europe and the US; indeed, even the US looked better. The manufacturing reports last week showed that things were picking up, as did other reports such as production and capacity. Despite all of the negatives, the economy is trying to move up and support what the stock market has shown for the past several months. The question is whether the stock market continues to move higher. There is the flood of liquidity, and there is the administration and Congress providing fiscal support by extending the tax cuts and lowering payroll taxes. That might provide more impetus for the economy to move up. If that is the case, stocks should move up a bit ahead of that, and that is exactly what they are doing.

Again, the break over the November peak, the test, and now just drifting back up. I would love to see a drift higher into Christmas and the New Year and bank some more solid gain. After all, we still have all that liquidity out there, and it could be a good 2011 as well. No predictions, though. We always take what the market gives. You cannot go too far out on a limb because it will always break underneath you. You need to follow what the market is doing, and you can anticipate a bit. You look ahead to find good patterns and good sectors. As they start to make the move, you move in. That is exactly what we were doing this week, and that is what we will continue to do. Enjoy your shopping and enjoy a great weekend. We will have a short week next week, but we will see if we can make some more money to help pay those Christmas bills.

Have a great evening!

Support and Resistance

NASDAQ: Closed at 2642.97
Resistance:
2725 from July 2007 interim peak
2729 is the 127% Fibonacci extension of the August 2010 run
2735 from late 2007 interim peak
2862 is the 2007 peak

Support:
2593 is the November 2010 high
The 18 day EMA at 2594
2580 is the November 2010 closing high
2569 is the November gap up point through the April 2010 peak
2550 from May and June 2008 peaks
2540 is the gap up point from early November
2535.28 is the April 2010 intraday peak
2530 is the April 2010 closing peak
The 50 day EMA at 2523
2518 is interim peak from April 2010
2511 is the lower range of the November gap up point
2482 is the recent October peak
2460 is the November 2010 low.
2434 is the May interim peak and the 78% Fibonacci retracement of the April selloff.
2425 is an interim peak from May 2010
2382-2395 from 2008
2324-2370 is a range of resistance from early 2008
The 200 day SMA at 236-0
2341 is the June 2010 peak
2320 to 2326.28 is the January 2010 high
2319 from the September 2008 peak
2310 is the August 2010 peak

S&P 500: Closed at 1242.87
Resistance:
1278 is the 127% Fibonacci extension of the August 2010 run
1313 from the August 2008 interim peak

Support:
1227 is the November 2010 peak
The 18 day EMA at 1222
1220 is the April 2010 peak
The 50 day EMA at 1197
1185 from late September 2008
1174 is the May 2010 high, 78% Fibonacci retracement of April peak
1173 is the November 2010 low
1170 is the prior March 2010 high
1156 is the Sept 2008 low
1151 is the January 2010 peak
The 200 day SM A at 1141
1133 from a September 2008 intraday low
Bottom of the January 2010 consolidation 1131 to 1136
1129 to 1131 is the June and August 2010 peaks
1119 is the early December intraday high
1114 is the November 2009 peak
1106 is the September 2008 low
1101 is the October 2009 high and the recent May and June 2010 interim peaks
1084 to 1080 (September 2009 peak)
1078 is the October range low
1070 is the late September 2009 peak as well as several other peaks and valleys even in 2010.
1065 is the May flash crash intraday low.
1044 is the October 2008 intraday high AND the February 2010 low
1039 to 1040 are the May, June, and August 2010 lows

Dow: Closed at 11,499.25
Resistance:
11,734 from 11-98 peak

Support:
11,452 is the November 2010 peak
The 18 day EMA at 11,342
11,258 is the April 2010 peak
11,205 is the April closing high
The 50 day EMA at 11,167
11,100 from the 7-08 low
10,963 is the July 2008 low
10,920 is the recent May high
10,730 is the January 2010 peak
The 200 day SMA at 10,691
10,609 from the Mid-September 2008 interim low
10,594 is the June 2010 peak
10,496 is the November 2009 high
10,365 is the late September 2008 low
10,285 is the late December consolidation peak
10,260 from the May and June 2010 interim peaks are breaking
10,209 is recent August 2010 low
10,120 is the October 2009 peak
9938 is the August 2010 low
9918 is the September 2008 peak
9855 is the early September peak in its lateral range
9835 is the late September 2009 peak AND the February 2010 low
9829 is the September 2008 closing high
9774 is the May 2010 intraday low

Economic Calendar

These are consensus expectations. Our expectations will vary and are discussed in the 'Economy' section.

December 17 - Friday
- Leading Indicators, November (10:00): 1.1% actual versus 1.2% expected, 0.4% prior (revised from 0.5%)

December 22 - Wednesday
- MBA Mortgage Applications, 12/17 (07:00): -2.3% prior
- GDP - Third Estimate, Q3 (08:30): 2.7% expected, 2.5% prior
- GDP Deflator - Third, Q3 (08:30): 2.3% expected, 2.3% prior
- Existing Home Sales, November (10:00): 4.65M expected, 4.43M prior
- FHFA Home Price Index, October (10:00): -0.7% prior
- Crude Inventories, 12/18 (10:30): -9.85M prior

December 23 - Thursday
- Personal Income, November (08:30): 0.2% expected, 0.5% prior
- Personal Spending, November (08:30): 0.5% expected, 0.4% prior
- PCE Prices - Core, November (08:30): 0.1% expected, 0.0% prior
- Durable Orders, November (08:30): -1.0% expected, -3.3% prior
- Durable Goods Orders, November (08:30): 1.0% expected, -2.7% prior
- Initial Claims, 12/18 (08:30): 424K expected, 420K prior
- Continuing Claims, 12/11 (08:30): 4075K expected, 4135K prior
- University of Michigan, December (09:55): 75.0 expected, 74.2 prior
- New Home Sales, November (10:00): 303K expected, 283K prior
icon url

ReturntoSender

12/20/10 12:02 PM

#9169 RE: ReturntoSender #6755

Beware the Hindenburg Omen!

I thought it might be fun to put together a few charts of my own to follow the Hindenburg Omen.

Here are the Charts for tracking the Hindenburg Omen. Look for NYSE New Highs and New Lows to be 84 or higher at the same time as we get a NYSE that is higher than 50 days back. Also the McClellan Oscillator is negative on the same day:


More from Wikipedia:

http://en.wikipedia.org/wiki/Hindenburg_Omen

Criteria

1. The daily number of NYSE new 52 week highs and the daily number of new 52 week lows are both greater than or equal to 2.8 percent (typically, 84) of the sum of NYSE issues that advance or decline that day (typically, around 3000)[3]. An older version of the indicator used a threshold of 2.5 percent of total issues traded (approximately 80 of 3200 in today's market).
2. The NYSE index is greater in value than it was 50 trading days ago. Originally, this was expressed as a rising 10 week moving average, but the new rule is more relevant to the daily data used to look at new highs and lows.
3. The McClellan Oscillator is negative on the same day.
4. New 52 week highs cannot be more than twice the new 52 week lows (though new 52 week lows may be more than double new highs).

The traditional definition requires each condition to occur on the same day. Once the signal has occurred, it is valid for 30 days, and any additional signals given during the 30-day period should be ignored. During the 30 days, the signal is activated whenever the McClellan Oscillator is negative, but deactivated whenever it is positive.[4]

Possible weaknesses

To eliminate false positives some technical analysts have imposed the condition that the Hindenburg Omen

* must be triggered three times in a row within a month from the first triggering event for said initial trigger signal to be considered to be valid (i.e. requires double confirmation)
* is only valid when "all tightly coupled triggerings are within a fortnight"
* will indicate a possible future downturn or correction, depending on the magnitude of any "one off" triggering

[edit] Conclusions

From historical data, the probability of a move greater than 5% to the downside after a confirmed Hindenburg Omen was 77% [The Wall Street Journal 8/23/2010 article cited below states that accuracy is 25%, looking at period from 1985], and usually takes place within the next forty days. The probability of a panic sellout was 41% and the probability of a major stock market crash was 24%. Though the Omen does not have a 100% success rate, every NYSE crash since 1985 has been preceded by a Hindenburg Omen. Of the previous 25 confirmed signals only two (8%) have failed to predict at least mild (2.0% to 4.9%) declines.

Because of the specific and seemingly random nature of the Hindenburg Omen criteria, the phenomenon may be simply a case of overfitting. That is, by backtesting through a large data set with many different variables, correlations can be found that do not really have predictive significance. The Omen is at best an imperfect technical indicator that is a work in progress.
[edit] Recent occurrences

* August 12, 2010: The Omen's creator, Jim Miekka, considered the Omen officially triggered on this date with 92 and 81 new 52-week highs and lows, respectively. The McClellan Oscillator was a negative -120.03 and the 10-week NYSE moving average was rising; the market closed above its open of 50 days prior (May 27). [5]. In the ensuing week, the Omen narrowly missed confirmation twice (August 13 and 19).

* August 20, 2010: According to the Wall Street Journal, the omen was confirmed on Friday, with 83 new 52-week highs and 95 new 52-week lows on the NYSE. The McClellan Oscillator was a negative -106.46 and the 10-week NYSE moving average was rising; the market closed above its open of 50 days prior (June 11). [6]

* August 24, 2010: 166 New Lows, 87 new Highs, McClellan Oscillator was negative, but the 10 week average began to fall. (Non-Confirmation.) (Although the 12 week average is still positive.)

* August 25, 2010: 150 New Lows, 90 new Highs, McClellan Oscillator was negative, but again the 10 week average was falling (Non-Confirmation.) (Although the 12 week average is still positive.)

* August 31, 2010: 86 New Lows, 164 new Highs, McClellan Oscillator was negative, and the 10 week moving average was up slightly 8.86 (0.13%) but falling (non-confirmation)

* December 14, 2010: 113 New Lows, 179 New Highs, 3063 Advancers+Decliners, McClellan Oscillator was negative (-5.36), NYSE Composite Index closed at 7855.22 vs 7272.53 50 trading days prior (October 4, 2010), and the 10 week moving average was rising.

* December 15, 2010: 89 New Lows, 156 New Highs, 3044 Advancers+Decliners, McClellan Oscillator was negative (-22.59), NYSE Composite Index closed at 7798.78 vs 7434.18 50 trading days prior (October 5, 2010), and the 10 week moving average was rising. This represents a single confirmation.


icon url

ReturntoSender

12/21/10 9:25 PM

#9171 RE: ReturntoSender #6755

From Briefing.com: 4:20 pm : The stock market advanced for the tenth time in 11 sessions to set a new two-year high as financials provided leadership in the face of a narrow gain by the greenback. However, action was generally anemic again as share volume dwindled.

The major stock indices of both Europe and Asia moved markedly higher overnight. Their gains helped inspire buying at home, such that domestic averages gapped higher in the early going.

Financials were quick to provide leadership to the broader market as the sector settled with a 1.6% gain. Bank stocks were especially strong. Diversified banks ripped to a 2.2% gain while regional banks advanced 1.9%. Toronto-Dominion Bank (TD 71.95, +2.44) was a standout after the outfit confirmed its plan to take over Chrysler Financial. The $6.3 billion acquisition comes as part of the firm's expansionary effort.

Strength in the financial sector helped push the S&P 500 through near-term resistance around the 1250 zone. A couple of hours was spent consolidating those gains along the 1254 line before some late buying took the stock market to its best level since September 2008. The late move lost momentum, though, and the stock market settled in the 1254 to 1255 zone.

It is impressive that the stock market's advance came after the dollar turned an early loss into a narrow gain. Early weakness in the greenback came as the euro advanced after China's Vice Premier expressed that his country supports efforts by the European Union and International Monetary Fund to stem sovereign debt problems of the eurozone and countries in its periphery. Gains by the euro were partly clipped by early morning news that analysts at Moody's put Portugal's credit rating on review for possible downgrade, but were later completely dashed shortly after analysts at Fitch issued cautious commentary on Greece's credit rating.

Earnings news was limited. Both Jabil Circuit (JBL 19.55, +1.89) and Adobe Systems (ADBE 30.93, +1.75) posted better-than-expected earnings then went on to issue upside guidance.

No economic data was issued today. That certainly didn't help share volume, which has already been hampered by the thinning of trading desks ahead of year-end holidays. A lack of participation this session resulted in share volume of barely 800 million shares on the NYSE.

Advancing Sectors: Financials (+1.6%), Materials (+1.0%), Energy (+0.9%), Industrials (+0.7%), Tech (+0.6%), Consumer Discretionary (+0.5%), Telecom (+0.2%)
Declining Sectors: Consumer Staples (-0.4%), Health Care (-0.2%), Utilities (-0.1%)DJ30 +55.03 NASDAQ +18.05 NQ100 +0.5% R2K +1.1% SP400 +0.7% SP500 +7.52 NASDAQ Adv/Vol/Dec 1928/1.65 bln/730 NYSE Adv/Vol/Dec 2079/809 mln/945

4:25PM Xilinx falls ~7.4% to $26.30 after lowering Q3 revs guidance; npw at $26.55 (XLNX) 28.39 +0.28 :

4:24PM Xilinx lowers Q3 revs guidance below consensus (XLNX) 28.39 +0.28 : Co lowers Q3 revs guidance to down ~7-9% sequentially, which equates to ~$563.9-576.3 mln vs. $604.7 mln consensus, down from ~flat to down 4%, which equates to ~$594.9-619.7 mln. The decreased sales guidance is primarily related to weaker than anticipated sales to a few large communications customers, specifically in the wireless segment. The Co expects sales growth to return to the communications segment in the March quarter based on current backlog and forecasts from its large customers. -- Gross margin is expected to be approximately 65%, in line with previous guidance. Additional commentary pertaining to the March quarter will be provided when the company reports its third quarter financial results on January 19, 2011. No conference call will be held in conjunction with this guidance revision.

4:04PM FSI Intl beats by $0.03, reports revs in-line; issues mixed Q2 guidance (FSII) 4.24 -0.11 : Reports Q1 (Nov) loss of $0.06 per share, $0.03 better than the Thomson Reuters consensus of ($0.09); revenues fell 25.3% year/year to $10.9 mln vs the $10.9 mln consensus. Co issues mixed guidance for Q2, sees Q2 revs exceeding $30 mln vs. $30.10 mln Thomson Reuters consensus, with net income of $3.5-4.5 mln vs the $5.0 mln consensus. Orders for 1Q11 increased 10 percent to $32.3 mln, as compared to $29.3 mln in the fourth quarter of fiscal 2010 and increased 73% from the $18.7 mln first quarter fiscal 2010 level.

Ultratech (UTEK) introduced the LSA100L, a new dual-beam laser spike anneal system for logic devices. With multiple beta systems in the field, the production version of Ultratech's LSA100L will be available in the first quarter of 2011.

09:52 am JBL Beats Q1 EPS Expectations (JBL)

Jabil Circuit (JBL 18.95 +1.29) reported first quarter earnings of $0.61 per share above the consensus of $0.54.

Revenues rose 32.2% year-over-year to $4.08 billion above the $3.96 billion consensus.

The company issued upside guidance for the second quarter, seeing earnings per share of $0.49-0.53, above the $0.44 consensus. The company sees second quarter revenues of $3.85-3.95 billion above the $3.7 billion consensus.

09:44 am ADBE Guides Q1 Above Consensus (ADBE)

Adobe (ADBE $31.00 +1.82) reported fourth quarter earnings of $0.56 per share, excluding non-recurring items, $0.04 better than the Thomson Reuters consensus of $0.52.

Revenues rose 33.2% year-over-year to $1.01 billion versus the $0.99 billion consensus.

For the first quarter, the company expects to see earnings of $0.54-0.59, excluding non-recurring items, versus $0.51 Thomson Reuters consensus. On the top line, the company see revenues falling in the range of $1.0 billion to $1.05 billion versus the $992.19 million Thomson Reuters consensus.

The company said, "We posted our first billion dollar quarter and record annual revenue in 2010, driven by outstanding performance across all of our major businesses."
icon url

ReturntoSender

12/22/10 9:03 AM

#9172 RE: ReturntoSender #6755

Chart of the Day - Today's Secular Bear vs the Great Depression's:

http://www.chartoftheday.com/20101222.htm?T

Today's chart compares the inflation-adjusted S&P 500 performance during the current secular bear market (the inflation-adjusted S&P 500 peaked in 2000) to the inflation-adjusted S&P 500 performance following the peak of 1929 (i.e. during the Great Depression). For today's chart, both the 2000 to present S&P 500 (blue line) and the 1929-1949 S&P 500 (gray line) having been normalized to where each of their peaks begin in year zero and at the $100 level. What is of interest is not that both of these markets had declines and rallies of equal magnitude -- they did not. What is of interest is that both bear markets have tended to head in the same direction for approximately the same amount of time. For example, both bear markets suffered through a major decline during the first 2 1/2 years and then rallied sharply into year seven. Both markets then formed a major peak in year seven and declined sharply in the middle of the eighth year. Both bear markets have continued to follow a similar path following the eighth year trough. However, if this similarity in direction were to continue, the current stock market rally would need to close out in fairly short order.


icon url

ReturntoSender

12/22/10 11:35 PM

#9174 RE: ReturntoSender #6755

From Briefing.com: 4:15 pm : Financials finished off of their session highs, but still successfully led the broader market to another gain, which made for new two-year closing high.

The financial sector continued its December advance with a 1.1% gain today. It had been up 1.4% at its session high. Nonetheless, the sector is now up 10.9% month to date, while the S&P 500 is up a more muted 6.6% so far this month. However, for the year the financial sector is up 11.1% while the S&P 500 is up 12.9% to its best level since Lehman Brothers collapsed in 2008.

Once again banks were behind the financial sector's ascent. Shares of diversified banks advanced 1.5% while shares of regional lenders tacked on 2.1% this session.

Buyers continued their foray into banking issues despite a dearth of news from the space. Among the more noteworthy headlines, Berkshire Hills (BHLB 21.00, -0.28) will acquire Legacy Bancorp (LEGC 12.65, +4.05) for about $13.00 per share, which represents a premium of approximately 50% over the prior session's closing price.

Data did little to move stocks. The third and final estimate for third quarter GDP indicated that the economy expanded at a 2.6% annual clip from July through September. The consensus among economists polled by Briefing.com had called for 2.7% growth after the previous estimate had indicated that third quarter growth totaled 2.5%.

As for personal consumption during the third quarter, it increased 2.4%. That is down from the 2.8% increase that had been reported previously.

November existing home sales increased 5.6% month over month to an annualized rate of 4.68 million units, which is on par with the 4.65 million units that had been expected, on average, among economists polled by Briefing.com. Though the broader market shrugged off that particular piece of data, shares of homebuilders were helped to a 3.1% gain after they had been down as much as 1.5%.

Walgreens (WAG 38.85, +2.02) was a top individual performer today. Better-than-expected earnings helped the stock book its best percentage gain in almost three months so that it set a fresh 52-week high.

Nike (NKE 86.95, -5.35) was also out with its latest quarterly results. The company posted an upside earnings surprise, but that was overshadowed by disappointment related to the athletic apparel maker's futures orders figure.

Outside of equities, the dollar had a quiet day. It was down only fractionally at the close.

Commodities saw mixed interest, but the CRB Commodity Index still mustered a 0.4% gain, which marked its fourth straight advance and took the CRB to its best level since 2008.

Advancing Sectors: Financials (+1.1%), Utilities (+0.5%), Energy (+0.4%), Consumer Staples (+0.4%), Industrials (+0.3%), Telecom (+0.2%), Health Care (+0.2%), Consumer Discretionary (+0.1%)
Declining Sectors: (None)
Unchanged: Materials, TechDJ30 +26.33 NASDAQ +3.87 NQ100 +0.1% R2K +0.00% SP400 +0.3% SP500 +4.24 NASDAQ Adv/Vol/Dec 1391/1.62 bln/1254 NYSE Adv/Vol/Dec 1838/783 mln/1163

4:13PM Micron misses by $0.13, misses on revs (MU) 8.28 +0.14 : Reports Q1 (Nov) earnings of $0.15 per share, $0.13 worse than the Thomson Reuters consensus of $0.28; revenues rose 32.2% year/year to $2.3 bln vs the $2.37 bln consensus.

12:00PM Broadcom receives favorable claim construction ruling in patent infringement case against Emulex (ELX) (BRCM) 43.88 -0.24 : "The ruling reinforces our infringement case against Emulex's OneConnect, and the components used in Emulex's OneConnect, HBAs, and Fibre Channel switch products". Broadcom, which has accused Emulex of infringing nine Broadcom patents, is seeking damages and an injunction against Emulex. U.S. District Court Judge James V. Selna issued his final ruling on December 17, 2010 following an earlier Markman hearing. Broadcom has asserted that Emulex's products infringe at least twenty claims of nine Broadcom patents.

10:01AM Dell to acquire InSite One (DELL) 13.80 -0.04 : Co announces its intent to acquire cloud-based medical archiving leader InSite One, to help healthcare organizations simplify retention of healthcare data. The InSite One solution helps customers reduce costs associated with long-term data storage and migration and eliminates one of the biggest shortcomings in healthcare today--the lack of sharing of images between medical professionals in the diagnosis and treatment of disease. Terms of the transaction, which is subject to customary closing conditions, were not disclosed.

Motorola (MOT) announced that Motorola Mobility has acquired Zecter, a leading start-up with synchronization and streaming technologies for on-demand digital media consumption; terms of the transaction were not disclosed

8:31AM Advanced Energy announces creation of strategic business units (AEIS) 13.90 : Co announces the creation of two focused business units within the company effective January 1, 2011. The two business units, Thin Films and Renewables, will enable improved execution and a strategic focus on two distinct markets.

8:01AM Trina Solar signs 20 MW solar project with CECEP Solar Sheyang Power Corp (TSL) 23.32 : Under the terms of the agreement, Trina Solar has been supplying PV modules for the construction of a ground mounted solar project of approximately 20 MW located in Sheyang, Jiangsu Province, China. Additionally, together with local partners, the Company has been designing and managing the construction and development of the project. The project is expected to be completed by the end of December 2010. The solar power station is believed to be one of the largest solar projects being built in China in 2010.

09:38 am Micron downgraded to Neutral at Avian: . Avian Securities downgrades MU to Neutral from Positive, saying strength in NAND was not enough to offset the weakness in DDR3 DRAM pricing. While the company will remain in the black when report FQ1, the firm believes they will miss street estimates. They move to a Neutral as they expect EPS to break even in FQ2; sirm sees 30%+ DRAM declines throughout the qtr and don't believe better NAND conditions will be able to offset weakness in DRAM.

09:49 am XLNX Lowers Q3 Guidance (XLNX)

Xilinx (XLNX 27.13 -1.26) lowered third quarter revs guidance to down approx. 7% to 9% sequentially, which equates to approx. $563.9 million to $576.3 million, below the $604.7 million consensus, down from ~flat to down 4%, which equates to approx. $594.9 million to $619.7 million.

The decreased sales guidance is primarily related to weaker than anticipated sales to a few large communications customers, specifically in the wireless segment. The Co expects sales growth to return to the communications segment in the March quarter based on current backlog and forecasts from its large customers.

Gross margin is expected to be approximately 65%, in line with previous guidance. Additional commentary pertaining to the March quarter will be provided when the company reports its third quarter financial results on January 19, 2011. No conference call will be held in conjunction with this guidance revision.
icon url

ReturntoSender

12/26/10 4:28 PM

#9176 RE: ReturntoSender #6755

Amateur Investors Weekend Market Analysis

http://www.amateur-investor.net/Weekend_Market_Analysis_Dec_25_10.htm

Here is what I see as being the three most likely outcomes for the Dow in the years ahead. The most bearish scenario is that the entire move from the October 2007 Top 2009 low is evolving into a corrective "ABC" type Zig Zag affair. Wave A bottomed at 6470 in March of 2009 which was composed of 5 Waves. Meanwhile the rally from the March 2009 low is Wave B which would then be followed by an elongated Wave C. Wave C would likely drop slightly below the March 2009 low while finding support along the trend line (black line) connecting the October 2002 and March 2009 lows near the 6000 level at some point by 2014 or 2015. Keep in mind this would likely be the worst case scenario.


Meanwhile an alternative bearish scenario would be the Dow is forming a Head and Shoulders Top pattern much like occurred in the 1970's. However notice back in the late 1970's after forming the Head and Shoulders Top pattern the Dow never retested its Neckline and held support at its 61.8% Retracement Level (point D). Furthermore also notice the Dow traded in a choppy consolidation pattern after forming the 2nd Shoulder for nearly 7 years before breaking out in 1983.


Here is a current chart of the Dow with the potential Head and Shoulders Top pattern. Now if the Dow were to follow the 1970's pattern and peak around 11700 then a 61.8% Retracement from the March 2009 low of 6470 to 11700 would be around 8500. Also we would see a choppy consolidation pattern for the next 7 years between 11700 and 8500 which would take us through 2017.


Meanwhile a bullish scenario would be the Dow is developing a Broadening Top/Megaphone pattern like occurred in the S&P 500 from the mid 1960's through the mid 1970's. Also notice the 5th Wave up was an "abc" affair and once completed after rallying 74% was followed by a 48% sell off.


If the Dow is developing this pattern then it's about half way through its final 5th Wave which would probably complete around 2013 as the final Wave peaks around 15000 as a possible "abc" Zig Zag pattern much like we saw in the early to mid 1970's with the S&P 500. Keep in mind once the final 5th Wave completes this would then be followed by a large sell off and a likely test of the lower trend line below 6000 by 2015 (point F).


Finally the key to which of the above mentioned patterns is developing will depend on the next correction in the Dow. Right now the rally from the July low of 9614 certainly looks like a 5 Wave pattern which is nearing completion. Thus it looks like the Dow is due for a correction as we move into 2011 of at least 10%.

If we are seeing pattern 1 or 2 then the Dow will eventually drop below the July low of 9614. Meanwhile if pattern 3 is going to occur then the Dow really shouldn't drop below the 10400 area which would be at the 61.8% Retracement Level if the Dow peaks just below the 11700 next week.

icon url

ReturntoSender

12/27/10 8:48 PM

#9178 RE: ReturntoSender #6755

From Briefing.com: 4:15 pm : Though the Dow never made it out of the red, the S&P 500 and the Nasdaq Composite turned modest losses into fractional gains after participants initially reacted negatively to news of a rate hike in China.

During the weekend China's central bank tacked on another 25 basis points to its target lending rate and deposit rate. The decision, which is intended to stave off inflation, rekindled concern about slower growth in China and, in turn, a more sluggish global economic recovery. China's Shanghai Composite tumbled nearly 2% and Germany's DAX and France's CAC closed lower by 1% or more (Hong Kong's Hang Seng and Britain's FTSE were both closed for holiday observance).

Concern about slower growth coupled with losses abroad undermined domestic trade in the early going, but financials were quick to provide support. Consistent with the past couple of weeks, financials jumped out to an early lead and held their gains for the duration of the day. The sector settled with a 1.0% gain.

Though financials were initial leaders, it was only after tech stocks reversed their losses that the S&P 500 was able to find higher ground and settle a couple of points below the two-year high that it had set last week. As for the tech sector, it finished with a 0.2% gain even as large-cap issues like Microsoft (MSFT 28.07, -0.23) and Yahoo! (YHOO 16.48, -0.24) logged losses.

With so many trading desks thinly staffed around the holidays and amid severe winter storms, share volume was extraordinarily light this session -- fewer than a half billion shares traded on the NYSE. Today's tally made for one of the most lightly traded sessions of the year.

Treasuries had a quiet start to the day, but garnered some buying in the wake of a $35 billion auction of 2-year Notes. The auction drew a bid-to-cover ratio of 3.71, dollar demand of $129.9 billion, and an indirect bidder participation rate of 22.6%. For comparison, the prior auction produced a bid-to-cover ratio of 3.70, dollar demand of $129.5 billion, and an indirect bidder participation rate of 38.3%. As of the close, the 2-year Note was unchanged with its yield just below 0.65%, the benchmark 10-year Note closed about 15 ticks higher with its yield at 3.34%, and the 30-year Bond tacked on a full point so that its yield was lowered to just below 4.41%.

The dollar had a lackluster day that was spent in the red with a loss that ranged from about 0.1% to 0.2% relative to a basket of competing currencies.

Advancing Sectors: Financials (+1.0%), Telecom (+0.3%), Tech (+0.2%), Industrials (+0.2%)
Declining Sectors: Energy (-0.4%), Consumer Staples (-0.4%), Consumer Discretionary (-0.3%), Health Care (-0.3%)
Unchanged: Utilities; MaterialsDJ30 -18.46 NASDAQ +1.67 NQ100 +0.00% R2K +0.4% SP400 +0.1% SP500 +0.78 NASDAQ Adv/Vol/Dec 1536/1.10 bln/1105 NYSE Adv/Vol/Dec 1636/467 mln/1306

5:02PM MEMC Elec subsidiary SunEdison receives final milestone payment of 230 mln Euros for Rovigo solar power plant (WFR) 10.96 -0.02 :

4:48PM Hoku enters into $10 mln credit agreement (HOKU) 2.43 +0.03 : In an 8-K, co announces on December 20, 2010, Hoku entered into a Credit Agreement with China Merchants Bank. The Credit Agreement provides for one or more term loans in an aggregate principal amount not to exceed $10 million, which must be borrowed within 30 days of the effective date of the Credit Agreement.

Rambus (RMBS) announced it has renewed its patent license agreement with Renesas Electronics Corporation. This agreement covers the use of Rambus patented innovations in a broad range of logic integrated circuit products offered by Renesas Electronics. Specific terms of the agreement are confidential.

8:01AM Trina Solar announces three-year $800 mln investment in Changzhou Trina PV Park (TSL) 23.60 : The investments in Changzhou Trina PV Park from 2011 to 2013 will be made for the purposes of expanding the co's manufacturing capacity and research and development facilities. Co also announced that its wholly owned subsidiary Changzhou Trina Solar Energy surpassed the revenue milestone of 10 bln Renminbi for the calendar year 2010. This figure does not represent the consolidated revenue of Trina Solar Limited in 2010.

7:03AM Research In Motion CFO adopted automatic securities disposition plan (RIMM) 58.65 : Co announced that Brian Bidulka, RIM's Chief Financial Officer, has adopted a new automatic securities disposition plan in accordance with the Securities and Exchange Commission's Rule 10b5-1. The objective of Bidulka's ASDP is to facilitate the donation of 2,500 RIM shares to a registered charitable foundation and the sale of 66,500 RIM shares by Bidulka over the two-year term of the ASDP. The RIM shares to be donated and sold by Mr. Bidulka are issuable upon the exercise and vesting of stock options and restricted share units granted to Mr. Bidulka and include 25,000 shares underlying stock options that are expiring during the term of the ASDP and 20,000 shares underlying RSUs that are vesting during the term of the ASDP.

6:24AM Amkor to redeem all $100 million of its 6.25% convertible subordinated notes due 2013 (AMKR) 7.39 : Co announced that it will call for redemption all of the $100,000,000 aggregate principal amount outstanding of its 6.25% Convertible Subordinated Notes due 2013. The redemption date of the Notes will be January 26, 2011.

07:47 am Google target raised to $690 at Kaufman Bros: . Kaufman Bros raises their GOOG tgt to $690 from $650 saying U.S. holiday online sales were strong, even at the tail end of the season. Firm says continued strength was a surprise, especially as retailers had front-loaded offers, now the upside is certain. Firm says eCommerce spend accelerated to 12% Y/Y growth season-to-date per comScore; MasterCard estimate is 15% Y/Y and Google should benefit from eCommerce strength.

icon url

ReturntoSender

12/29/10 10:48 PM

#9185 RE: ReturntoSender #6755

From Briefing.com: 4:15 pm : Late selling pressured stocks, but the major averages still made out with another modest gain. Treasuries ticked higher, too. Little attention was paid to the dollar, which dropped markedly.

Though buying during the session remained reserved, broad support helped take the stock market to a new two-year high today. Sellers knocked stocks off of that perch in the last leg of trade, but the session ended before the ticker tape could print red. The S&P 500 has managed to settle out of the red on all but three occasions this month. The benchmark index is now on pace for an annual gain of about 13% with only two sessions remaining in 2010.

As an overall group energy stocks boasted some of the biggest gains of the day. They were only up narrowly in the early going, but ended the day 0.8% higher. The sector was largely led by drillers and equipment plays, which settled with gains of 1.8% and 2.0%, respectively.

Fertilizer and agricultural plays also found favor among participants. That helped Potash (POT 152.07, +7.40), Mosaic (MOS 74.80, +3.36), and Agrium (AGU 90.16, +3.90) surge to new two-year highs. Their strength also helped prop up the basic materials sector so that it settled with a 0.4% gain, which was second only to energy.

Financials and utilities lagged all session; both ended the day with a 0.3% loss. Financials, which had been leaders earlier this month, were weighed down by investment banks and brokerages like Morgan Stanley (MS 27.28, -0.38). Utilities were undercut by losses in electric utilities like Exelon (EXC 41.57, -0.39).

Just as a rally by the dollar was shrugged off in the prior session, nothing was really made of its 0.8% drop today. Relative to a basket of foreign currencies the dollar is still up 2.4% for the year.

Treasuries attempted to recover the losses sustained during the prior session with a strong rally today. The benchmark 10-year Note gained more than a point so that its yield was at 3.34% by the end of the day. Buying came in response to results from an auction of 7-year Notes. The auction attracted dollar demand of $82.9 billion while the bid-to-cover ratio came in at 2.86. The indirect bidder participation rate hit 64.2%. All were improved from the prior session.

Share volume was anemic once again as barely a half billion shares traded hands on the NYSE. That's only half of the NYSE's 50-day moving average of 1.00 billion shares. However, trading volume surpassed Monday's paltry total of 467 million shares, which made for the second lowest tally of the entire year.

Advancing Sectors: Energy (+0.8%), Materials (+0.4%), Consumer Discretionary (+0.2%), Health Care (+0.1%), Tech (+0.1%), Telecom (+0.1%)
Declining Sectors: Financials (-0.3%), Utilities (-0.3%), Industrials (-0.1%)
Unchanged: Consumer StaplesDJ30 +9.84 NASDAQ +4.05 NQ100 +0.2% R2K +0.1% SP400 +0.3% SP500 +1.27 NASDAQ Adv/Vol/Dec 1441/1.13 bln/1194 NYSE Adv/Vol/Dec 1922/518 mln/1091

7:16 am ON Semiconductor target raised to $13 at FBR Capital: . FBR Capital raises their ONNN tgt to $13 from $12 1Q EPS saying recent checks suggest 4Q revenues are tracking toward the upper end of guidance, with EPS likely one or two pennies better than consensus. For 1Q, they think ON's organic revenues can decline less than seasonally typical, likely by 2%-4% QOQ, but with EPS possibly better than the Street expects. Firm says while some investors have fretted about the Sanyo acquisition, they expect this deal to close in the next week or so, and think earnings can ramp faster than previously expected given the "operational support" that Sanyo Electric is providing to ON Semi.

icon url

ReturntoSender

12/30/10 10:47 PM

#9187 RE: ReturntoSender #6755

From Briefing,com: 4:30 pm : The S&P 500 settled lower for only the fourth time this month as a late recovery effort stalled at the neutral line.

Stocks spent the entire session confined to a relatively narrow range. The listless, lackluster action ended with only energy (+0.1%) and telecom (+0.1%) in higher ground, but losses in the other sectors were slight.

Participants, who were limited in number, were generally unmotivated today. As such, no real responses were made to the latest dose of data, which featured some positive surprises.

Initial jobless claims for the week ended December 25 totaled 388,000, which is the lowest sum in more than two years. Economists polled by Briefing.com had expected, on average, that initial claims would come in at 416,000.

The Chicago PMI for December was posted shortly after the open. It improved to a 22-year high of 68.6.

Pending home sales for November increased 3.5% month over month. That compares favorably with the Briefing.com consensus call for a 3.0% decline.

The dollar spent the day in the red and finished with a 0.3% loss against a basket of competing currencies as it extended its slide from the prior session. That didn't really do anything to drive buying, however. The breakdown in the dollar-stock market dynamic in recent days is mostly owed to increased apathy as investors take extended vacations around year-end holidays, or opt to take their gains and losses.

Amid the lack of participation, barely a half billion shares were traded today on the NYSE. The 50-day average stands closer to 1 billion.

Advancing Sectors: Telecom (+0.1%), Energy (+0.1%)
Declining Sectors: Financials (-0.4%), Health Care (-0.3%), Industrials (-0.2%), Tech (-0.2%), Utilities (-0.2%), Consumer Discretionary (-0.1%), Consumer Staples (-0.1%)
Unchanged: MaterialsDJ30 -15.67 NASDAQ -3.95 NQ100 -0.3% R2K -0.1% SP400 +0.1% SP500 -1.90 NASDAQ Adv/Vol/Dec 1217/1.09 bln/1394 NYSE Adv/Vol/Dec 1492/507 mln/1447

8:01AM Chipmos Technology receives approval for extension of repayment schedule on its short-term bank loans from Taiwan Bank Creditors (IMOS) 1.49 : Co announces that the its 88.96% subsidiary ChipMOS TECHNOLOGIES has reached agreement with and received approval from its bank creditors for an extension of its repayment schedule on its short-term loans. Co states its goal is to continue to pay down debt in 2011 and subsequently on a repayment schedule anticipated to reduce total debt to less than $300 mln by the end of 2011.

1:25AM Emcore announces delay in 10-K filing (EMKR) 1.15 : Co announces that it would be delaying its filing of its Form 10-K filing. In March 2010, the co announced that it had changed auditors from Deloitte & Touche to KPMG. On December 28, 2010, the co was informed by the prior auditor, Deloitte & Touche that they have not completed their procedures to re-issue their opinion with respect to the co's financial statements for 2008 and 2009. Deloitte is specifically reviewing their audit procedures performed on the co's goodwill and intangible assets accounts. As a result, the co is unable to file the 2010 Form 10-K at this time. The co intends to file the 2010 Form 10-K as promptly as practicable once Deloitte is able to re-issue its opinion with respect to the prior fiscal years.
icon url

ReturntoSender

01/01/11 6:09 PM

#9188 RE: ReturntoSender #6755

From Briefing.com: Weekly Recap - Week ending 31-Dec-10

Year In Perspective 2010--Strong Finish to a Bumpy Ride:

2010 turned out to be a good year for the major averages, with the S&P finishing up 13% YTD. This is a smaller increase than the +25% gain in 2009, which represented an impressive rebound off the post-crisis lows, but 2010 was still another year of improvement after the 39% plunge in 2008. Additionally, this year's return is more than three times the average return of +4% over the past 7 years, although we'll be the first to admit that the average annual return can't come close to describing the action of the past seven years. As we exit 2010, the S&P is now +87% from the March 2009 lows, but still 20% below the 2007 peak of 1576. Below we'll recap the events that shaped the year, take a look ahead at the most important themes for 2011, and give a summary of the performance of various aspects of the world markets.

2010 represented the second year of the financial markets' rebound, which took place amid continued economic recovery for the world. There weren't nearly as many critical events in 2010 as there were in 2009 or 2008, but there were still several noteworthy items/themes that shaped the year. This played out through an early-spring rally, a pre-summer selloff and then a fall rally to finish the year at two-year highs. Notably, December was especially strong, with a monthly gain of +6.5% and only four down days during the month.

Looking back at the year, among the many noteworthy factors shaping 2010, the key events included the following:

* The European Debt Crisis -- We discussed this at the end of 2009 as one of the "Key Themes" for 2010, and it will again be a major item of interest in 2011. Intensifying concerns about Greece and contagion effects weighed on global markets during the first few months of 2010. Although the eventual Greece bailout was announced in February, concern quickly shifted to other weak areas, such as the peripheral EU nations of Ireland, Portugal, Spain and Italy. Although Ireland just recently caved and accepted a bailout this fall, contagion concerns remain evident around Europe, and these continue to impact the euro on a daily basis. As mentioned above, this remains an area of great focus in 2011.
* Continued monetary stimulus from major central banks around the world, as other emerging countries tighten -- The continued monetary stimulus has been most evident in Europe, Japan and the U.S., while other (primarily Asia and some Latin American regions) governments are tightening to slow down growth/inflation. The U.S.'s recent Quantitative Easing Part II (aka QE2) initiative in November demonstrated the need for continued support domestically. The latest U.S. measures follow the EU's sweeping bailout package in the spring, and Japan's "Comprehensive Monetary Easing" plan announced in early October. Shortly after the U.S.'s QE2 plan came to fruition, the EU bailed out Ireland. It is still not clear if the U.S. and Europe will need further monetary stimulus in 2011 as the current programs run out. At the same time, the emerging growth regions of China, India, Thailand, Chile and Brazil are tightening rates in order to slow down growth and rising prices.
* The 2010 "Flash Crash" -- On May 6 intensifying European jitters and the persistent risk-on/risk-off trade culminated in the sharpest intraday market plunge since 1987, which was instantly coined "The Flash Crash." The Dow lost as much as 1000 points intraday, before rebounding sharply to close down ~350 pts. The exact cause of the flash crash is still unknown, but an influx of computerized sell orders amid a lack of bids in a very nervous market seems to be the biggest contributing factor. This sparked a broad regulatory review of the allowance of high-frequency trading programs and their influence on the broader market.
* BP's oil spill -- After this summer, video images of oil spewing from the ruptured BP Macondo oil well in the Gulf of Mexico are burned into the brains of any market/news watcher. Late on April 20, the Macondo Well exploded, causing catastrophic damage to the well and catching fire to the Deepwater Horizon rig. The well itself is 65% owned by BP, 25% by Anadarko (APC) and 10% by Mitsui, while the Deepwater Horizon is owned by Transocean (RIG). The explosion took 11 lives and sent an untold amount of crude oil in the Gulf of Mexico over the following 4 months. As a result BP announced plans to divest up to $30 billion in assets to help pay for the disaster (to date the co has sold close to $22 billion in assets). The static kill on the well was completed on Aug. 4 and the well was declared dead on Sept. 19.
* Foreclosure issues surface -- In October, bank stocks experienced heightened volatility on growing concerns about their foreclosure processes, as several companies had halted related activities after the government began investigating documentation and processes around certain foreclosures. Some of the related issues (such as the extent of mortgage putbacks, mortgage holder recourse) remain, although for now the market has focused on other more positive factors for the financial sector.
* Tighter regulation of many areas of the financial markets -- Broad financial regulatory measures were outlined in the Dodd & Frank Bill, which includes the Volcker rule, limitations on size/scope of banks, etc. The Durbin bill proposed caps on debit interchange fees. The CFTC has stepped up regulation of commodities trading, and the SEC has cracked down on various aspects of the markets, including the April case against Goldman (GS) and their current insider trading probe concerning expert networks. Most recently, the FCC's Net Neutrality vote is the first attempt at regulating the broadband market.
* Political shift in the U.S. Congress -- The November elections resulted in a major shift in power in Congress, with Republicans gaining a net of 6 Senate seats and 63 House seats, winning control of the House back. This shift in power could change the implementation health care and financial regulatory changes in place.
* Korean tensions remain elevated this year -- While Korean tensions remain a constant, there were two major spats that surprised the markets this year. In March, North Korea sunk a South Korean naval ship with a torpedo, and more recently in November, North Korea fired artillery shells into Yeonpyeong Island off the west coast of South Korea, killing two South Korean marines and wounding several others. Although Korean tensions are nothing new, the more aggressive nature of the latest move by North Korea adds ongoing uncertainty to the geopolitical picture.

While these were the major events of the year, there are several broader areas of interest as well.

M&A Recovers: First increase in M&A volume since 2007; High cash balances and low rates to fuel M&A in coming years

2010 represented the first increase in global M&A since 2007, with a 19% year-over-year increase in dollar volume to $2.08 trillion worth of deals during the year. The United States made up 35% of the volume, or $728 billion of global M&A activity, representing an increase of ~13% YoY. While it is a healthy improvement, the 2010 global figure is well below the $4 trillion in deals that took place in 2007, with analysts seeing the next few years as a hot period for M&A activity, fueled by low interest rates and extremely high cash levels on corporate balance sheets.

Some of the bigger U.S. deals announced this year include Quest's (Q) proposed acquisition of Century Link (CTL) for $22.2 billion, and Sanofi's (SNY) hostile $18.2 billion bid for Genzyme (GENZ). The largest deal to close in 2010 globally was MetLife's (MET) acquisition of Alico from American Intl Group (AIG) for $12.6 billion. Another notable deal involving AIG was the failed Prudential bid for AIG's Asian multi-line insurance arm AIA Group for $35.5 billion in cash. Resource grabs were also a theme of 2010, with 3 out of the top 4 proposed deals in 2010 involving scarce materials. The top proposed deal of 2010 was the failed $42.9 billion bid for Potash by BHP Billiton. The second largest global deal still pending is Petrobras's proposed $42.5 billion acquisition of Offshore Brazil Oil Properties from Federative Republic of Brazil. The fourth largest global deal of 2010, which is still pending, was the U.K's International Power GBP 16.3 billion bid for Belgium's GDF Suez Energy. Hewlett Packard (HPQ) and Dell (DELL) provided some excitement this fall, with their bidding war for 3par (PAR). HPQ finally won with its offer of $2.1 billion or $33/share for PAR stock representing a 242% premium from the initial $18 bid from DELL on 8/16. Caterpillar's (CAT) pending acquisition of Bucyrus (BUCY) was also notable at $8.6 billion, or $92/share in cash, which came in at the 10th largest US deal, and 22nd largest global deal. The most active M&A participant in 2010 was The Carlyle Group, with 37 deals and $16.1 billion in total volume.

Looking ahead, it is expected that 2011 will be another big year for M&A, fueled by record cash balances and low interest rates.

IPO Market Bounces Back: Busiest year for new issues since 2007; Chinese IPO volume spikes

After a couple of years in the doldrums, the IPO market had a strong, bounce-back year in 2010. Not only was there a sharp increase in the sheer quantity of new deals hitting the market, but the number of prominent, large IPOs also picked up -- most notably, General Motors' (GM) record setting $23.1 billion deal. To put this resurgence into better context, with 154 new deals, 2010 shapes up to be the busiest year for public stock offerings since 2007 when there were 214 new issues. Of course, driving this sharp turnaround was a surge of IPOs flowing out of China. In 2010, there were 40 Chinese IPOs to list on the U.S. market, accounting for more than a quarter of the total number of IPOs. Furthermore, China-based IPOs trading here in the U.S. raised a total of $3.5 billion in financing, which is three times more than last year. Reminiscent of the dot.com era, several of these IPOs skyrocketed higher immediately upon hitting the open market, including recent names like Youku.com (YOKU), China DangDang (DANG), and Noah Holdings (NOAH). Fueling the strong demand for these new deals was the strong economic growth outlook for China which has bolstered corporate profits and growth rates in that country.

Looking ahead to 2011, many analysts are expecting the IPO market to be strong once again with more deals expected than in 2010. Once again, activity is expected to remain at a fevered pick in the Asia-Pacific region with an estimated 60% of new IPOs originating there. In the U.S., an economy showing increasing signs of life, clarity on the business tax rates, and the Fed's QE2 policies are a few elements that are anticipated to drive solid IPO volumes. A few well-known, highly-regarded companies that may test the IPO market next year include Facebook, Groupon, Toys 'R Us, HCA, and Skype.

Valuation/Earnings Growth: Slower earnings growth ahead off a higher base; Valuation is reasonable for stocks

Looking at the broad market performance, like 2009, the second half of 2010 was much better than the first half. The 2010 low in the S&P occurred exactly in the middle of the year, at 1010 on July 1. That represented a 9% decline from the start of the year. The S&P has since gained 23% from the July 1 low, fueled by attractive valuations and easy monetary policy.

We closed out 2009 with the S&P 500 trading at 15x forward four quarters' earnings. At its current level, the S&P 500 is trading at ~13.5x forward four quarters' earnings. Following the very strong earnings growth of ~40% in 2010 (helped by easy comparisons vs. 2009 in first three quarters of the year), earnings growth is expected to slow to 13% in 2011. Although this is still strong earnings growth, it represents a notable slowdown from this year, which in combination with continued recovery uncertainty, may justify the lower market multiple.

Looking at the earnings yield (the inverse of the P/E ratio), it currently stands at ~7.4%. This compares quite favorably to the 3.3% yield in the 10-year treasury.

Please See Briefing.com's 2011 Market Outlook report for detailed analysis of current market valuation.

Conclusion: Outlook is relatively bullish, but 2011 could be another bumpy year

With low interest rates, improving economic data and healthy projected earnings growth, the outlook for 2011 is relatively bullish. Although broad market valuation remains reasonable, with stocks at 2-year highs, sentiment near a bullish extreme and several macro risks still in the picture, it may be a bumpy ride again in 2011. We'd also note that correlations are very low, meaning picking the right stock will be important. Also, with volatility at the low end of the three-year range, insurance in the form of puts is relatively cheap given the extremely bullish sentiment. This may be a good hedge against some of the headline risk that remains, as there continue to be real problems the market needs to deal with.

As we enter the New Year, the key factors we'll be watching most closely in 2011 include the following:

* Geopolitical tensions -- North Korea, Iran and the possibility for flare ups in internal political tensions around some of the emerging markets regions that have been in front of the global recovery.
* Pace of economic recovery -- Although a double-dip is out of the majority of economist's forecasts, the sustainability of improving economic conditions is a key area of interest -- critical areas include unemployment (currently at 9.8% vs. 10% when we exited 2009), housing market data.
* Pace and direction of monetary policy -- Along the same lines, the level and direction of monetary policy, and the economy's ability to grow on its own, is a major question. Once this is confirmed, the exit strategy will be in focus.
* Slower earnings growth -- More difficult earnings comparisons, diminished impact of cost-cutting initiatives enacted amid the recession, lack of top-line growth.
* State fiscal problems -- Fiscal problems at the state level are expected to intensify during 2011, and there is much debate about the extent of these issues and how the Federal government will handle them as they spread to the municipal level.
* Changing environment for financial sector -- The financial sector will be working through looming mortgage foreclosure and potential putback issues, increased regulation, persistent unemployment, European problems and upcoming enactment of Basel III. On the other hand, the ability for banks to reinstate dividends would be a positive for those individual names, and may be seen as a signal of strength from the higher quality institutions.
* Political gridlock -- The recent shift in power could change the implementation health care and financial regulatory changes in place.
* Valuations of market leaders -- This year's leaders are trading at egregious valuations (read NFLX, APKT, FFIV, etc), so it will be interesting to see if these correct as people become more concerned with valuations of the cleaner growth stories.
* Record cash balances -- Corporate balance sheets are holding record amounts of cash, and it is likely that at least a portion of this cash will be deployed over the coming year with possible uses including M&A, dividends and buybacks.

For an in-depth review of the fundamental outlook for the market, please see Briefing.com's 2011 Market Outlook report.

As always, in 2011 the team of analysts at Briefing.com will continue to work tirelessly to bring you the most important market intelligence that influences the financial markets and your portfolio every day.

Wishing you the best in 2011,

http://finance.yahoo.com/marketupdate/update

3:28PM Events and conferences of interest for next week : Events and conferences of interest for next week, January 3 - 7, are listed below. For a complete list of next week's events, please see the events calendar.

Monday

* $29 bln 3-month and $28 bln 6-month Treasury Bills Auctions

Tuesday

* December FOMC Minutes
* S, VZ, LBTYA at Citi Entertainment, Media & Telecommunications Conference

Wednesday

* Fed's Hoenig
* AOL, EXPE, CMCSA at Citi Entertainment, Media & Telecommunications Conference

Thursday

* BMY, MRK, CELG at Goldman Sachs Healthcare CEO's Conference
* MSFT, XLNX at JPMorgan Tech Forum@CES

Friday

* Bernanke Testifies Before Senate Budget Panel
* Fed's Evans

icon url

ReturntoSender

01/07/11 12:25 AM

#9197 RE: ReturntoSender #6755

From Briefing.com: 4:30 pm : Stocks lacked direction for the entire session and, appropriately, finished in mixed fashion.

Overseas gains had offered mild support to stock prices this morning, but buying failed to generate any meaningful momentum before the open. Support waned with an uninspiring initial jobless claims count for the week ended January 1. Initial claims totaled 409,000, which is on par with the 405,000 initial claims that had been expected, on average, among economists polled by Briefing.com. Initial claims were up 18,000 from the prior week while continuing claims were down 50,000 from the prior week to 4.10 million.

December same-store sales disatisfied as only a few firms met or exceeded expectations. That left the lot of retailers to slide to a 1.6% loss. Target (TGT 54.93, -4.01) was among the worst performing retailers after it reported that its same-store sales increased by less than 1% during December. The stock found support at its 200-day average, which was last touched two months ago, but it still settled with its worst single-session loss in more than a year.

Telecom stocks were also shunned. In turn, the telecom sector lost 2.8%, which made it the worst performing sector of the session.

At the other end of the spectrum, tech scored a 0.9% gain, which made for the sector's fourth straight advance and puts it on pace for a 2.9% weekly gain. Semiconductor plays underpinned the sector's most recent advance. Semiconductor stocks collectively advanced 1.8%. Such strength also helped prop up the Nasdaq.

Though the negative correlation between the dollar and the stock market has diminished in recent days, the broader market ran into some late morning selling that coincided with a bounce by the greenback against the euro. The euro violated its 200-day moving average to set a one-month low after the release of a report that offered a framework for future eurozone bank failures in the eurozone. No report was issued on sovereign debt in the eurozone.

A stronger dollar certainly didn't help the case for commodities, which were clipped for further losses today. In broad terms, the CRB Commodity Index fell 1.3%. Crude oil prices tumbled 2.1% to settle at $88.38 per barrel. Natural gas prices logged a 1.1% loss at $4.43 per MMBtu after they had swung to a gain of more than 2% following news of a greater-than-expected draw of 135 bcf.

Advancing Sectors: Tech (+0.9%), Health Care (+0.4%)
Declining Sectors: Telecom (-2.8%), Consumer Discretionary (-0.7%), Energy (-0.7%), Financials (-0.6%), Materials (-0.4%), Consumer Staples (-0.4%), Industrials (-0.2%)
Unchanged: UtilitiesDJ30 -25.58 NASDAQ +7.69 SP500 -2.71 NASDAQ Adv/Vol/Dec 1148/2.11 bln/1469 NYSE Adv/Vol/Dec 1165/1.09 bln/1821

4:36PM Verizon and Vodafone PLC (VOD) jv confirm release of 4G LTE smartphones, tablets, a MiFi, hotspot and notebooks (VZ) 36.23 -0.95 : Verizon Wireless announced a suite of 10 forthcoming 4G LTE devices - including smartphones from HTC, LG, Motorola (MOT) and Samsung; tablets from Motorola and Samsung; a MiFi from Novatel Wireless (NVTL) and a mobile hotspot from Samsung; and two notebooks from HP (HPQ). Verizon expects these consumer-oriented devices to be available by mid-2011, with some available as early as March 2011.

4:22PM Tessera Tech licenses patents to Olympus Imaging (TSRA) 21.79 -0.10 : Co announces that Olympus Imaging Corporation signed a worldwide licensing agreement with a Tessera subsidiary under which Olympus is licensed to Tessera's patents for red-eye detection and removal technology.

4:08PM Aehr Test Systems received over $1 mln additional orders for multiple FOX-15 WaferPak cartridges (AEHR) 1.20 +0.03 : Co received over $1 million in additional orders for multiple FOX-15 WaferPak cartridges from automotive semiconductor manufacturer. The WaferPak cartridges are scheduled to start shipping during calendar year 2011.

4:07PM Volterra Semi issues downside guidance (VLTR) 23.48 -0.08 : Co issues downside guidance for Q4 (Dec), sees EPS of $0.20-0.22 vs. $0.28 Thomson Reuters consensus; sees Q4 (Dec) revs of 35.4-35.6 vs. $38.41 mln Thomson Reuters consensus. "The customer inventory correction we experienced in the fourth quarter with our major customers in communications, server and storage markets was deeper than originally expected," said Jeff Staszak, Volterra's President and CEO. "Recent order activity indicates normal seasonality in the first quarter of 2011 with the exception of our notebook business which will be up sequentially. Going forward Volterra remains well-positioned with excellent visibility on continued market share gains as notebook and server platforms launch."

# Maxim Integrated Products (MXIM) showcased its Plugged into Skype video camera solutions in Maxim booth.
# Intersil Corporation (ISIL) will conclude its distribution relationship with Arrow Electronics (ARW) effective April 7, 2011. Arrow will continue to provide shipments of Intersil products through April 7, 2011. Intersil has taken this action to increase focus within its distribution channel to provide the best customer support in the industry.

# Qualcomm Incorporated (QCOM) and Powermat announced the signing of a non-binding Letter of Intent to explore the possibilities of developing cutting-edge wireless power solutions.

# Trident Microsystems (TRID) announced that they have entered into a patent license agreement relating to a part of Trident's motion estimation and motion compensation patent portfolio.

# Broadcom Corporation (BRCM) announced that its Bluetooth technology is being adopted for active shutter 3D glasses by RealD (RLD).

Cavium Networks (CAVM) and ARM (ARMH) announced that Cavium's next-generation products will be powered by ARM's Cortex-A family of processor cores.

8:08AM Trident Microsystems partners with Yahoo! to deliver the first connected Cinema TV into the home (TRID) 1.63 : Co announces that it has ported a cinema version of the Yahoo! (YHOO) Connected TV experience onto the Trident DTV platform that will be powering top-brand Cinema TVs scheduled to begin shipping in early 2011

Research In Motion (RIMM) and Sprint (S) announced plans to launch a new BlackBerry PlayBook tablet model featuring connectivity to the Sprint 4G network.

3:16AM LDK Solar agrees to acquire 70% of Solar Power for $33 mln (LDK) 10.35 : Co announces it has agreed to acquire a 70% interest in Solar Power (SOPW.OB) for ~$33 mln. The transaction significantly strengthens SPI's balance sheet, which will enable the acceleration of the development of its project pipeline, which primarily consists of utility-scale power plants and commercial/industrial distributed generation systems.

3:00AM Advanced Semi reports Dec and Q4 net revenues; Q4 consolidated revs beats consensus (ASX) 5.55 : Co reports Dec 2010 consolidated net revenues +124.8% YoY to NT$19,553; Q4 revs +102.7% YoY to NT$53,283.0 vs NT$46,566.4 Thomson Reuters consensus.

SanDisk Corporation (SNDK) announced that its 32 gigabyte 1 and 64GB SanDisk P4 modular solid state drives were selected by ASUS as the SSDs of choice for its new Eee Slate EP121 tablet computers.
icon url

ReturntoSender

01/08/11 5:08 PM

#9200 RE: ReturntoSender #6755

Chart of the Day - Job Growth - Not so much

http://www.chartoftheday.com/20110107.htm?T

Today, the Labor Department reported that nonfarm payrolls (jobs) increased by 103,000 in December. For some perspective, today's chart illustrates the percent increase in the number of jobs for every decade since the 1940s (the data goes back to 1939). Today's chart illustrates that up until this millennium, the number of jobs at the end of a decade has always been at least 20% greater than 10 years prior. During the last decade, not only was that 20% plus growth not achieved, the decade actually ended with less jobs than when it began. This negative job growth is particularly noteworthy due to the fact that the US population had increased by 10% in addition to a significant increase in global wealth during the same time frame. With one year down in the current decade (see gray column), today's chart illustrates that job growth is positive albeit only slightly so. If job growth during the current decade were to increase at the same pace as what occurred during the first year of this decade, the decade would end with an 8.7% gain in jobs (see gray dot). This is certainly better than the decade just passed, however, it is well off the 20% plus pace of decades past.


icon url

ReturntoSender

01/09/11 2:31 PM

#9205 RE: ReturntoSender #6755

InvestmentHouse Weekend Market Update:

http://www.investmenthouse.com/weekendmarketsummary.htm

- Strangely mixed jobs report taken as a glass half full, half empty by the market.
- Non-farm payrolls miss, but unemployment rate plunges: which do you trust?
- After all the analysis, jobs remain crappy, private small business creation is improving thanks to US entrepreneurship, and the Fed remains with its foot on the gas.
- Choppy but upside week avoids a correction overall, but some sectors are in private corrections.
- Trend remains in place, but the rally into earnings and the lagging small caps remain the worries for a market that is a bit overbought.

MARKET OVERVIEW

Market takes some solace from the unemployment rate, but not enough to rally.

Investors were scratching their heads on Friday morning. With more government data, you can understand why people would be confused, but there was even more reason for confusion this time around. Nonfarm payrolls for December came in well below expectations at 103K versus 150K expected officially. The whisper number was up to 200K or more not even close. Revisions to October and November did help bring the December number closer to expectations. There were 70K more jobs. Adding that back to the 103K, that put it easily over 150K and more in the line with the 175-200K whisper number on the street.

That was not bad, but futures tumbled on the news. They were able to rebound because of the unemployment rate. It was expected to come in at 9.7% after 9.8% in November, but it tumbled to 9.4%. Hallelujah, we are in nirvana. We had the largest, most rapid decline in the unemployment rate since April of 1998. Certainly President Obama was pleased about it, but does it really mean what they say it means? Numbers can be deceiving and they typically are. The workforce contracted, falling by 260K. Those are people who just gave up. If jobs are so plentiful, why could they not find work? When you have a drop in the size of the workforce, the unemployment rate goes down even without any more jobs.

That is part of the equation, but the 260K does not account for such a large decline. Former Fed officials on the financial stations said the nonfarm payroll number is the one that makes the difference. They were saying that back in the recession of 2000-2001. The household survey was improving, but the Fed said not to look at that. Greenspan was even in front of Congress saying you cannot look at that. He kept saying the nonfarms is the key, but the economy was recovering. Jobs were being created even when the nonfarm payroll and the supposedly jobless recovery raged on. That is the old entrepreneurial American spirit. If you cannot find a job after a while, you make your own damn job. People are starting their own businesses. They cannot find work at those companies that laid them off, especially the big corporations that are still net job losers.

Enough people told the BLS that they were finding jobs to help bring the unemployment rate to the downside. If you are working at your own business, you are working at a job. The government may not seem to think that, but that is the case. The nonfarm payrolls data failed to pick that up. They do not pick up on new jobs and new businesses being created. It is not the greatest environment for business creation. The tax levels are not favorable, although they were extended and that may have helped. We still do not have a good economic environment to start a small business, although they say a recession is a great time to start a small business. We may have some good, powerful companies coming up in the works. Maybe some more AAPL or CSCO who knows? It could be very interesting several years down the road.

The combination of factors lowered the unemployment rate. Number one, the jobs pool fell so the unemployment rate fell as well. Fewer people seeking jobs makes it look better than it really is. Number two, there are businesses where people are going to work. They are not the ones that the government lavished the stimulus funds on. These are people who are just fed up with waiting around while the government keeps picking at their wallets; they are going out to make money. As Ronald Reagan said, the best thing you can do for yourself is make a lot of money, keep as much of it as you can, and not send it to the government. That is what they are try trying to do, and that is about as American as you can get. That is part of the reason for improvement in the unemployment rate while the nonfarm payroll number still reeks.

It is interesting to note that the average workweek held steady at 34.3. After clicking up a couple of tenths over the past six months, it is stalled out again. That is an indication that the big companies the government looks to for providing jobs growth (although we know they do not) are going nowhere in a hurry. When the average hourly workweek does not improve, the companies are not in position to hire. They have to start working the current workers very hard before they will hire new people. The workweek tells us that is simply not happening.

The market was somewhat confused. Looking at the SPY, the futures were up moving into the jobs report, though not up very much. They then tumbled to negative, recovered to positive, and then bounced up and down through a choppy morning and sold off through the early afternoon. They did post a decent recovery to end the week, and that left the market in decent position overall. The indices were up for the week. It was not a massive move, but they did a good job. This was the week that everyone came back to work, and the market had rallied from the late-November test. It put in a strong move. That is its second good move off of the August low, and it was due a correction.

I thought there could be some profit taking, and the market managed to shake it off. There was profit taking, no doubt. Some of the sectors that led the move higher some commodities, energy, and retail all suffered at the hands of sellers last week. They were not total collapses, but there are sharp pullbacks in these areas. At the same time, other groups were moving higher. Tech and semiconductors got new life. Healthcare and medical got new life with money flowing their way on volume. The market saw rotation. It was not able to rally sharply. It did move higher, but it was not rallying because there were leadership sectors struggling and fading back. At the same time, it did not collapse; it consolidated its moves in place. There is a transition going on. Money is moving around the market, but it is moving around rapidly enough and in enough key areas to keep the indices higher.

There are questions heading into next week. There is the start of earnings and what the market will do given the good rally into earnings, and the SP600 is lagging. It did not collapse, but it was flat on the week. It was not able to post that rally or make the early-week surge stick as the small caps lag. That is not good news for the economy because the recovery is still very early, very tender, and has a long way to go. It is too early for the small caps to give up the leadership mantle unless this is a really pathetic economic recovery that will not last long. If it is a short one, maybe the small caps should start to peel back. I do not think that is the case, however. Looking at the SP500, it was in a big base, and it broke out and tested. It should have a lot more upside. I am somewhat concerned if the market can continue to rally moving into the next two to three weeks. There are good reasons for it to have issues. It has rallied into earnings and the small caps continue to lag.

OTHER MARKETS

Dollar: The dollar found a lot of strength this week, and it broke over the last December peak with another decent move (1.2907 versus 1.3014 Thursday). A very strong week for the greenback as the economic data improved and the likelihood of the Fed continuing to print money decreased. That naturally bolsters the currency. It now has to deal with the late-November peak, and that will be important. This range from the August low up to the November peak is a resistance level. There are areas of consolidation that it has to punch through. It may not make it in one continuing move to the upside. It may stop, pause, regroup, and then try to make the break. It looks like the dollar has turned over a new leaf. After rallying, it looked like it was topping out and ready to fall, but it found a lot of strength courtesy of improving economic data.
Click to view the chart

Bonds: Bonds managed to gain some strength (10 year 3.32% versus 3.41% Thursday). Bonds were kicked around early in the week. On Friday they held support and were trying to bounce again. This is the same support they held last week. It looked like they would bounce and did, but they could not keep it moving. They are trying to resume the upside, however, once again holding. It looks like they may pull it off. It is a market in transition now, and there are some trends being tested, bumped, and maybe even broken. Again, you have to look at the small caps. All of this is on the doorstep of earnings season.
Click to view the chart

Gold: Gold was down on the day, but it recovered nicely off its lows ($1,368.70, -3.00). Gold had rallied up to its prior peaks and was looking good, but then it was body slammed this week. It started on Tuesday with a real hammering, and it was off to the downside again on Friday. It was looking really weak but managed to reverse. There is a bit of buying ongoing, but gold suddenly looks shaky. It has to prove something. Dare I say it? It has to show its mettle.
Click to view the chart

Oil: Oil had a great run. It ran well from early November into late December, and then it just had to come back. It did this week, but it was not a total breakdown. There were some impressive daily losses no doubt, but it did give up the ghost. It happened at the 50 day EMA on Friday, reversed and bounced, and it was looking decent. It closed lower, and after hours it moved higher ($88.03, -0.60). There was no damage done. It consolidated a good move to the upside and held a logical support level, i.e., the 50 day EMA, the early December consolidation, and the mid-November peak. It held a logical place to find support, and now I bet we will see it bounce higher from here. Oh, joy. That will certainly make all other petroleum-based products rise in price yet again because the move is sustained. It is not one of those that jacked right up and then turned over and fell back down. It is showing it can hold its moves and hold its gain. Prices of all petroleum-based products are being increased even as we speak.
Click to view the chart

TECHNICAL SUMMARY

INTERNALS

Volume. Volume was lower, down 7% on NASDAQ to 1.9B. Volume on the NYSE fell 0.5%, basically flat at 1.08B.

Breadth. Breadth was negative at -1.7:1 on the NASDAQ and -1.4:1 on the NYSE. The small caps lagged. It is interesting to see that breadth was not atrocious again on the NYSE even though there was trouble in the small caps. The internals were not that negative. There was good volume on the week, and there was positive volume with upside days on upside volume. There was some distribution as well with downside days on rising volume.

CHARTS

SP500. SP500 is flat to end the week. It rallied Monday-Wednesday and then tapered off Thursday and Friday. Note it is holding its near support easily. It rallied back from the lows on Friday. The buyers stepped right back in and bought it up when it looked like it might be the trouble. Remember, this is a big base that started in late April. The market rallied up, tried to break out of it, and just cracked it in early November. It faded back, formed a handle, and then broke out. This is really the first breakout move for SP500. It has put in two good moves off the August low now, but this is only the first breakout low.

I expect a test. Not that this recent run is as long as the August-November run. It does not necessarily have to be because this is a breakout move. The small caps are lagging and earnings are right around the corner after a nice run. Often you get the news built in, and comparisons will be tougher this year than last year. There is room for disappointment. The market is hemming and hawing but holding its gain. It is consolidating in place as some of the energy stocks struggle and lose money while others in tech land gain money. The trend is staying in place, but I am cautious given the proximity to earnings and the move thus far.

NASDAQ. NASDAQ is the same story, although it put in a bit more upside. It had a nice week, gapping higher on Monday and then moving higher through Friday. It did lose some ground, however. As with the SP500, it tested near support and recovered nicely into the close, holding its trend above near support. NASDAQ had a nice breakout, rallied from the August lows, and had its test. It has rallied nicely, moving up ahead of earnings. That leaves it vulnerable if earnings are not super. Even if earnings are super, sometimes it is not enough to support the stock or index further as the news is built in.

SP600. SP600 is the worry. There is a nice run here as well, but there is not the gain on the week. There is a big struggle. There was the engulfing pattern on Tuesday, and there was the inside day on Wednesday that did not change anything. Thursday and Friday did not alter the pattern at all. There is still an engulfing pattern more or less in control near term, and it is trying to direct the SP600 lower. The overall trendline remains in effect, but SP600 is showing signs of wear and tear. We will see if it has the ability to hold and continue to the upside next week.

SOX. The semiconductors were the only index up on the session, rising a powerful 0.23%. After three weeks of a lateral move over the 18 day EMA, they showed power on Thursday with a great move. I expect the semiconductors to show additional power in the future. They have set up a good pattern and are not really overextended. They have consolidated for three weeks, and they are ready to move if they get good results from some semiconductors companies. It did not happen on Friday as NVLS was downgraded. That set the tone, but it did not take the sector down. That is important, of course.

LEADERSHIP

Financial. Financials had a good week. They got a bit choppy on Friday with JPM reaching lower, but what a nice comeback intraday. GS had a tap at the 18 day EMA and a nice comeback as well. EWBC was up on the day, gave it up, and it finished down slightly. It is still in excellent shape as it continues to the upside. SP500 still has the support of the financials, and they helped it move. In the summer, we were waiting and waiting for the financials to move. They finally got a fire lit under them and are moving for a change. No complaints.

Energy. HAL thumped lower on Thursday. It held the 50 day EMA on Friday, and maybe it can bounce. BTU sold off hard on Thursday and bounced a bit on Friday. Volume was better. We will see. It is not a rollover, selloff, and massive plunge by these stocks; it is more like a needed correction. These engulfing patterns came in and started taking the stocks lower.

Semiconductors. Semiconductors had a good week, finally making the break on Thursday. NVDA was a leader, surging to the upside. It looked like it was getting weak on the day and may be running out on its move, so we took the rest of the January options off the table (for a 350% gain in this case). It turned out we probably could have squeezed a bit more out of them, but I said we would move out and take the rest off when it started to fall. It did not collapse but still shows it is moving well, and semiconductors are moving well in general. ALTR did not finish that well, but overall I liked the pattern. The semiconductors are getting money thrown their way, and of course we will be more than happy to participate as they do.

Healthcare/Drugs. Healthcare had a good week. ZOLL made us great money, surging higher and continuing to the upside on Friday. UTHR is still moving to the upside. It showed great volume this week. It is really starting to move out of a six-week, lateral, very tight consolidation. We took gain on it, following our plan as it hit this target. Not huge. Almost 12% on the stock and 70% or so on the options. That is not bad for an initial target. Things are moving somewhat decently to the upside.

Technology. Technology gained some ground. AAPL was a nice leader on the week, moving up quite well. FFIV broke higher. It could not finish strong, but we may get a pre-earnings run out of it. If not we will bag it, but there is money moving into semiconductors and techs in general. Software stocks seem to do pretty well. BCSI is a case in point, putting in a nice move on the week. We had January options in it as well. We were trying to get more out of it and were able to take 200% on some positions and 150% on other options. We banked a little more gain on stock positions 46% on one and almost 30% on another. A nice mover getting new life once more.

Industrial. Industrials were a leader on the way up, but they took the week off. CAT has been moving laterally for a couple of weeks. CMI is moving laterally. It tried to make the break higher, but it was thrust back down. CAT has rallied nicely. It may be a little overbought, but it is not coming back. It could be setting up for a new move. I say that because there was another flat consolidation in September and October, and it made the break to the upside and produced another good run. We ought to be looking for that now even though a lot of people say the market is overvalued and the stocks are way too high. They may be, but we do not know for sure; they could always break higher.

One man's high is another man's low, and both of them could be rich. One guy could have ridden the stock from lower, thought it was too high, and was ready to sell out. The other could have bought into it on this pattern and then it rallies again. They would both make money. People get too critical of other opinions in the market. If there was only one way to make money in the market, then your opinion might mean something. There are so many ways to make money in the market and so many different strategies and methodologies. One person's high could very well be another person's low.

In summary, there was some rotation this week. There were stocks getting beat up badly in the market. A lot of that had to do with the energy sector. They were getting knocked around, and the retail sectors were getting knocked around. Both of them were decent leaders on the way up. If they are not going to get the money, it has to go somewhere. It was moving into software, technology, semiconductors, and healthcare and medical. It will likely move into other areas shortly. We will have to keep our eyes open and see where it heads. That is the beauty of a market that has a lot of liquidity: It continues to move higher, but sometimes it will change horses and pick a new lead team to move the market to the upside.

THE MARKET

MARKET SENTIMENT

VIX. The VIX is basically going nowhere. This has been the fear for many television pundits over the past couple of months. They are concerned that the VIX is at historically low levels and that can cause trouble. Well, the earth can open up and swallow us all tomorrow as well. No, that is not really a problem for us. Looking back, the VIX can stay at very low levels for very long periods of time while the market is moving higher. During 2004-2007 the market moved up. You have a problem when the volatility rises while the market rises. That happened in 2007. That is when you have a correction coming, and that is not the case here. Volatility can stay low for a long, long time while the market rallies, and it is not even down to those levels now. It is not showing a correlation of up and down with the market. It does sometimes, but it is not doing it now. I am not going to get bent out of shape about it.

VIX: 17.14; -0.26
VXN: 18.72; +0.31
VXO: 16.05; -0.17

Put/Call Ratio (CBOE): 0.91; +0.16

Bulls versus Bears:

This is a reading of the number of bullish investment advisors versus bearish advisors. The reason you look at this is that it gives you an idea of how bullish investors are. If they are too bullish then everyone is in the market and it is heading for a top: if everyone wants to be in the market, then all the money is in and there is no more new cash to drive it higher. On the other side of the spectrum if there are a lot of bears then there is a lot of cash on the sideline, and as the market rallies it drags that cash in as the bears give in. That cash provides the market the fuel to move higher. If bears are low it is the same as a lot of bulls: everyone is in and the market does not have the cash to drive it higher.

Bulls: 54.5% versus 55.6%. Second week of fade after hitting 58.8% on this run's high (thus far). Dipped at year end as many anticipate a first of the year correction. Again you have to as if this is self-fulfilling given the market is still trending higher. Still high in a string of high readings but below the 5 year high at 62.0. Still bearish enough. Closing in on the level considered bearish, i.e. where so many are in the market and believe it is going up that the ammunition to send it higher runs low. This is where you start to be careful and watch for breakdowns, but there is also a lot of liquidity being pushed into the market and that can continue the move despite excess bullishness. The crossover level at 29% bulls is long gone, but it did its job. The high on the last leg was 56.0% after starting at 35.6% on the low in February, the lowest it has been since July 2009 . . . until this last leg. 35% is the threshold level suggesting bullishness. Again, to be seriously bearish it needs to get up to the 60% to 65% level.

Bears: 20.5% versus 20.0%. Hanging around in the 20% range as the bears are not growing as the bulls weaken slightly. That suggests overall that investors believe the market will continue to advance after a pullback. Down from 28.3% in September. The 37.7% peak at the height of the crossover is well in the rearview mirror but bears remain well below the 35% level, above which is considered bullish for the market overall. Hit 18.7% on the low in April. Hit a high of 27.8% level on the prior leg in February. For reference, cracking above the 35% threshold considered bullish. Hit a high on the prior run at 47.2%. For more reference, bearishness hit a 5 year high at 54.4% the last week of October 2008. The move over 50 took bearish sentiment to its highest level since 1995. Extreme negative sentiment. Prior levels for comparison: Bearishness peaked at 37.4% in September 2007. It topped the June 2006 peak (36%) on that run. That June peak eclipsed the March 2006 high (33%) and well above the 2005 highs that spawned new rallies (30% in May 2005, 29.2% in October 2005). That was a huge turn, unlike any seen in recent history.

NASDAQ

Stats: -6.72 points (-0.25%) to close at 2703.17
Volume: 1.925B (-7.29%)

Up Volume: 775.296M (-443.34M)
Down Volume: 1.193B (+337.784M)

A/D and Hi/Lo: Decliners led 1.69 to 1
Previous Session: Decliners led 1.28 to 1

New Highs: 150 (-39)
New Lows: 7 (-1)

NASDAQ CHART: Click to view the chart

NASDAQ 100 CHART: Click to view the chart

SOX CHART: Click to view the chart

SP500/NYSE

Stats: -2.35 points (-0.18%) to close at 1271.5
NYSE Volume: 1.086B (-0.57%)

Up Volume: 433.68M (+79.698M)
Down Volume: 639.055M (-83.862M)

A/D and Hi/Lo: Decliners led 1.37 to 1
Previous Session: Decliners led 1.64 to 1

New Highs: 256 (-102)
New Lows: 18 (-11)

SP500 CHART: Click to view the chart

SP600 Chart: Click to view the chart

DJ30

Stats: -22.55 points (-0.19%) to close at 11674.76
Volume DJ30: 189M shares Friday versus 193M shares Thursday.

DJ30 CHART: Click to view the chart

MONDAY

Inventories, PPI, CPI, retail sales, industrial production, Michigan Sentiment there is a lot of data coming. It is somewhat anticlimactic after the jobs report, but given the mixed picture in the jobs report, it makes it all the more important. We have to keep an eye on that. Earnings are coming up. As seen on Friday, there are already warnings out there. VLTR warned about the quarter, and it was all over the map. It finished up, but I did not have enough Pepto-Bismol to get into that on Friday. LIZ was having trouble, too. They joined stocks from the Thursday same store sales that were not great, and they got slaughtered.

We are still going to look for more plays to the upside. We have had a great run to this point. We are into earnings, and even if earnings are blowout we have seen stocks pull back. MOS reported some super earnings this week, but look what happened. It tried to move up a bit, but it had all of its move on the triangle break. It is having a hard time getting up and going again.

That is instructive. We have a lot of stocks that are up, moving into their earnings. They may be a little overripe and ready to be picked or fall to the ground. That does not mean they will collapse, but look what happens if you warn. LIZ has already pulled back for a week and a half going into its earnings. When it pre-announced some bad news, it gapped below the 200 day EMA. My friends, this is what you call a breakaway gap to the downside. It is worth trying to play this.

Breakaway gaps tend to continue in the direction of the gap. The only problem is that it is a $6.00 stock and it will probably be difficult to make a lot of money on the downside. It does not mean you cannot, but there is a lot of support around the $5.00 level and it is already at $6.00. It is tougher to make money on, but look for things like this. If you get the right stock, you can make money off of it.

We have a mixed jobs report, and earnings could be a problem as well. You still have the Fed coming in with a lot of liquidity and there is an improving economy. The comps on the earnings might be more difficult. The market has moved up for a few weeks, and we could be ripe for some selling on stocks. We do not just pick any stock, however. There are stocks out there showing those engulfing patterns; they move higher one day and then are swallowed up the next day with a big downside move.

We have a test of those late in the week. They could provide downside opportunity, particularly going into a market that has rallied up into earnings. We could have some downside there, but we do not want to just pick the best stocks and say it has gone up a long way and short it. That is a suicide pact. It is like stepping in front of a train hoping it will derail. Strong stocks can come back in selling, but it is a tough game to play, particularly with the liquidity still in the market. As soon as it breaks lower one day, it turns around and bounces back in your face. We saw this with so many stocks today. They were selling and then reversed and finished well off their lows. We want to pick stocks that are weakening anyway. We will look at those engulfing patterns.

We will also look at the upside. There are stocks that will not report until the end of February. They could be very strong. The market is trending higher overall. If they have a great pattern and good set up, we will not ignore those even though we are in earnings and the market is a bit overbought. It could turn around and hit us on the head with a hammer. I am willing to take a couple of lumps on the head, but not a lot of them. We will be careful with what we buy as always. We will pick up stocks that say "buy me," and are in position and have the great risk/reward. If they go against us, they are not going to hurt that much, but we have potential for plenty of upside.

There is money rotating through the market. If it continues rotating, that means it will find new places to go. If earnings cause a pullback, they could still pull back. If the money is moving into those in anticipation of earnings, there is less likelihood that they fall significantly. We will start putting money to work slowly. Not the whole position a piece at a time when we get the opportunity. We may lose out on some big moves, but it is worth it to be cautious at this point. The market has run well and we are going into earnings. Warnings are not being treated very kindly, and even some good earnings results are not being treated well. The risk/reward there is not as great, so we will not put as much money at risk on new positions. It does not mean we will not take them. If they say "buy me," We will buy them.

I do not want to be accused of being a raging bull, throwing caution to the wind, and ignoring the possibilities that there could be a fall. I am acknowledging that all the way. I am also acknowledging, however, that the liquidity is staying in the market for now (thanks to Ben Bernanke and Co.) and the economic data continues to improve. With that combination, I am still willing to play the upside when the opportunity presents itself.

As always, we will take what the market gives. We are heading into earnings with a nice gain under the belt, and earnings are not necessarily being treated well. If we see stocks that are weakening, they make good setups for the downside plays. I will be more than happy to take advantage of those. At the same time, take care of your other positions. The money is rotating, and once it starts to leave, it can get a bit hairy for those stocks. Continue to take care of positions and button them up if they get in trouble. That is how we keep our gains from last year and the early part of this year. We will keep them flowing with the new positions.

Have a great weekend!

Support and Resistance

NASDAQ: Closed at 2703.17
Resistance:
2725 from July 2007 interim peak
2729 is the 127% Fibonacci extension of the August 2010 run
2735 from late 2007 interim peak
2862 is the 2007 peak

Support:
The 10 day EMA at 2683
The 18 day EMA at 2664
2593 is the November 2010 high
The 50 day EMA at 2589
2580 is the November 2010 closing high
2569 is the November gap up point through the April 2010 peak
2550 from May and June 2008 peaks
2540 is the gap up point from early November
2535.28 is the April 2010 intraday peak
2530 is the April 2010 closing peak
2518 is interim peak from April 2010
2511 is the lower range of the November gap up point
2482 is the recent October peak
2460 is the November 2010 low.
2434 is the May interim peak and the 78% Fibonacci retracement of the April selloff.
2425 is an interim peak from May 2010
2382-2395 from 2008
The 200 day SMA at 2381

S&P 500: Closed at 1271.50
Resistance:
1278 is the 127% Fibonacci extension of the August 2010 run
1313 from the August 2008 interim peak

Support:
The 10 day EMA at 1266
The 18 day EMA at 1257
1227 is the November 2010 peak
The 50 day EMA at 1226
1220 is the April 2010 peak
1185 from late September 2008
1174 is the May 2010 high, 78% Fibonacci retracement of April peak
1173 is the November 2010 low
1170 is the prior March 2010 high
1156 is the Sept 2008 low
1151 is the January 2010 peak
The 200 day SM A at 1149
1133 from a September 2008 intraday low
Bottom of the January 2010 consolidation 1131 to 1136
1129 to 1131 is the June and August 2010 peaks

Dow: Closed at 11,674.76
Resistance:
11,734 from 11-98 peak
11,867 from the August 2009 high and peak on that bounce in the selling.
11,893, from March 2008 closing low
12,110 from the March 2007 closing low
13,058 from the May 2008 peak on that bounce in the selling

Support:
The 18 day EMA at 11,574
11,452 is the November 2010 peak
The 50 day EMA at 11,367
11,258 is the April 2010 peak
11,205 is the April closing high
11,100 from the 7-08 low
10,963 is the July 2008 low
10,920 is the recent May high
The 200 day SMA at 10,759
10,730 is the January 2010 peak

Economic Calendar

These are consensus expectations. Our expectations will vary and are discussed in the 'Economy' section.

January 07 - Friday
- Nonfarm Payrolls, December (08:30): 103 actual versus 150K expected, 71K prior (revised from 39K)
- Nonfarm Private Payrolls, December (08:30): 113K actual versus 162K expected, 79K prior (revised from 50K)
- Unemployment Rate, December (08:30): 9.4 actual versus 9.7% expected, 9.8 prior (no revisions)
- Hourly Earnings, December (08:30): 0.1% actual versus 0.1% expected, 0.0% prior (no revisions)
- Average Workweek, December (08:30): 34.3 actual versus 34.3 expected, 34.3 prior (no revisions)
- Consumer Credit, November (15:00): $1.3B actual versus -$2.5B expected, $7.0B prior (revised from $3.4B)

January 11 - Tuesday
- Wholesale Inventories, November (10:00): 1.3 expected, 1.9% prior

January 12 - Wednesday
- MBA Mortgage Purchas, 01/07 (07:00): +2.3% prior
- Export Prices ex-ag., December (08:30): 0.8% prior
- Import Prices ex-oil, December (08:30): 0.8% prior
- Crude Inventories, 01/08 (10:30): -4.16M prior
- Treasury Budget, December (14:00): -$91.4B prior

January 13 - Thursday
- Initial Claims, 01/08 (08:30): 420K expected, 409K prior
- Continuing Claims, 01/01 (08:30): 4070K expected, 4103K prior
- PPI, December (08:30): 0.7% expected, 0.8% prior
- Core PPI, December (08:30): 0.2% expected, 0.3% prior
- Trade Balance, November (08:30): -$40.6B expected, -$38.7B prior

January 14 - Friday
- CPI, December (08:30): 0.4% expected, 0.1% prior
- Core CPI, December (08:30): 0.1% expected, 0.1% prior
- Retail Sales, December (08:30): 0.7% expected, 0.8% prior
- Retail Sales ex-auto, December (08:30): 0.6% expected, 1.2% prior
- Industrial Production, December (09:15): 0.4% expected, 0.4% prior
- Capacity Utilization, December (09:15): 75.5% expected, 75.2% prior
- Michigan Sentiment, January (09:55): 75.0 expected, 74.5 prior
- Business Inventories, November (10:00): 0.7% expected, 0.7% prior
icon url

ReturntoSender

01/15/11 9:25 PM

#9213 RE: ReturntoSender #6755

Amateur Investors Weekend Stock Market Analysis (1/15/11)

http://www.amateur-investor.net/Weekend_Market_Analysis_Jan_15_11.htm

Last weekend I mentioned significant bottoms have occurred since 1900 when the 18 Period RSI smoothed with a 5 Month Moving Average has dropped below the 35 level (green line) and then risen back above it. I have enhanced this study by using a 3 Month Moving Average (red line) instead which led to one additional occurrence in the early 1900's for a total of 6 Signals. Also notice all were followed by rallies of 80% or more as well.


Of course the big question is can we use this data to figure out market tops? If we look at the unsmoothed RSI values (green line) and take the difference between the lowest RSI value and highest RSI value for each signal then we get the numbers in the chart below which have ranged from 32 to 48. Notice in 3 out of the previous 5 cases the total difference was in the lower to mid 30's while the other two were in the mid to upper 40s. Currently the RSI difference between the low and high is now at 36 so we are definitely in the alert zone for a potential nearing top based on previous occurrences.


Now when you look at all of the Signals since 1900 the two that most resemble the current move up from the March 2009 low are in the mid 1970's and the early 1900's (1915-1917). As I have talked about before the mid 1970's rally was accompanied by a sharp "ABC" type rally off of the late 1974 low. "A" was a 56% rise while "B" was a 12% pullback which was then followed by a 31% rise for "C" that led to a total gain of 80%. This was then followed by a 28% correction in which the Dow found support at its 61.8% Retracement Level (blue line). However as you can see the Dow basically got stuck in an extended trading range from 1976 through 1982 as it traded between its 1976 high and the 61.8% Retracement Level before finally breaking out in 1983.


Meanwhile if we look at the period from 1915 through 1917 you can see a similar sharp "ABC" type rally from the early 1915 low. "A" was an 86% rise while "B" was a 13% pullback which was then followed by a 22% rise for "C" for a total gain of 98%. This was then followed by a 40% correction during the next 14 months as the Dow held support at its 78.6% Retracement Level (red line) by late 1917. After the sharp 40% correction then an impressive 82% rally occurred during the next 2 years which was then followed by a 47% sell off which bottomed in late 1921. If we are going to go through a period like this in the coming years then expect more extreme volatility. Suffice to say it would be far better to see a pattern like occurred from the mid 1970s through the early 1980's which was less volatile versus the one below.


Finally if we look at a current chart of the Dow you can certainly see a similar "ABC" type rally from the March 2009 low much like occurred in the mid 1970's and way back in the 1915-1917 time period. "A" was a 74% rise while "B" was a 15% pullback which has been followed by a 23% rise so far for "C". Meanwhile a 61.8% Retrace (red line) from the Dow's current high would be around 8500 which would be a 28% correction while a 78.6% Retrace (blue line) would be around 7600 and a 35% correction.


icon url

ReturntoSender

01/16/11 12:22 PM

#9214 RE: ReturntoSender #6755

InvestmentHouse Weekend Market Update:

http://www.investmenthouse.com/weekendmarketsummary.htm

- China clouds once again form over the market, but buyers use the dip to buy on volume.
- Economic data not as good as hoped, better than thought on Friday, but the movement still points to improvement.
- Michigan Preliminary Sentiment disappoints but Capacity and Production are solid.
- Leadership across the market jumps with chips leading the way.
- Market shows every intention to continue to rally to next resistance. Perfect. Just be skeptical.

MARKET OVERVIEW

Friday provides plenty of follow through to the new SP500 resistance break.

The stock market had a sluggish start. It was sluggish well into the night primarily because China raised its bank reserve lending requirements by 50BP. That is the fourth time in the last two months. Every time China takes a step to slow down its economy, it has deleterious effects on the rest of the markets in the world because of China's voracious growth appetite. It wants commodities, industrial equipment, and everything it can get its hands on.

Governments are typically not that successful in their ability to manage a slowdown. When they try, it worries investors and prices come out of the market. Even with the sluggishness, US futures were improving in the wee hours toward the open. This even though there were some not-too-great numbers with respect to retail sales and the CPI. That did not slow the market down; it continued its improvement into the open.

It tested down initially but then continued the rally unabated, although there was a hitch in the get-along half an hour into the session. The Michigan Sentiment preliminary for January came in at 72.7, well off the 75.5 anticipated. Note how the market sold back just as it hit the closing price from Thursday, at a technical resistance point. There was reason to stall with the news, but it overcame it. It rallied higher throughout the session. Nice action, indeed. Looking at the SP500 shows the sprint up to the close a bit clearer. Not bad action at all. No inclination to sell, and investors bought the entire day. NASDAQ, +0.75%; SP500, +0.75%; Dow, +0.5%; SP600, +1%; SOX, +2.7%; NASDAQ 100, +0.78%.

This was a fairly important move for the indices. The SP500 bumped up against the 127% Fibonacci extension and moved laterally for a week, but it did not stall out or roll back over. A lot of pundits thought it might do that. We kept an open mind about it. It was a perfect opportunity for a correction, but it didn't do it. It broke higher Wednesday, stalled a little on Thursday, and then continued to the upside on Friday. That has all the feel of a breakout, particularly when you look at the percentage gains as well as the increasing volume.

There were a lot of positive attributes to this move, and there is still room to the upside before SP500 hits the resistance from 2006, 2007, and 2008. There are peaks and valleys waiting for SP500 to hit them but they are still waiting. That gives SP500 extra room to move higher into earnings just as it is doing now. It may not last. It may not make the move stick, but it is having a great run. It is enjoying the first rounds of earnings and even overcoming some selling on Friday.

There was news contributing to the early depression in the market other than the Chinese data. The CPI for December came out hotter than expected. It rose 0.5% versus the 0.4% expected. The core was right in line at 0.1%. Food and energy is where most of the price increases are coming from, but we are told not to worry about that because they are stripped out and not part of the core. The problem is that the core consists of things that are not food and energy, such as flat-panel TVs and personal computers. These types of things declining in price, but we do not need to purchase them every day to survive. We do have to eat, and we do need gasoline and heating oil. We have to make it to work and heat our homes particularly given the weather of late.

We need to buy those things every day, but we are told by the economists in the government not to worry about it. They say we need to worry about PCs and flat panel TVs and whether those prices are going down. They don't put it exactly that way, but that is the sum total of it. Do you trust the economists and the government, or do you trust the numbers? I am not going to make any judgment calls, but I think you know what hits and really hurts in this struggling economy. Right now, it is food and energy, but it will bleed into other items. It takes energy to create steel and other items that go into the products we consume. Cotton is hitting all-time highs. Corn is surging. The clothes we wear, food we eat, and the petroleum we burn are all going up in price. There is no inflation, mind you.

The market was not buying into that, which is why there was some sluggishness on the day. Michigan Sentiment was also a problem. Industrial production was much better than expected at 0.8%, doubling the 0.4% anticipated. Capacity rose to 76%, up from 75.5%. That put it at its highest level since August of 2008. Remember, August of 2008 was right before it hit the fan. The SP500 was trading around 1260 on the first of August, before everything hit. Now we are closing at 1293. There are at least some parallels with the same SP500 price. It is the highest level on the capacity utilization since the market finally fell off in that big tumble right before all of the "stuff" hit the fan with the financial crisis. It was an ugly downdraft. It is nice to see things are coming back, but they are not coming back that fast. Hardly an inspiring recovery.

Business inventories turned out to be quite interesting at 0.2% when 0.8% were expected. Very similar to wholesale inventories. Companies are not excited to build up inventory, but sales are good. Sales are depleting inventory, and in theory that means there will ultimately be production to refill the coffers. We still have to go through an ugly 2011, most likely. The housing crisis slide that began in the summer of 2005 will probably crescendo in 2011 with foreclosures at the worst they have been. As is often the case, when the negatives hit their peaks (or what appear to be horrible numbers that will not get better), that is when the bottoms are put in. There is anticipation of a bottom in houses in 2011. That may just be a forecast where it cannot get any worse, so it is about time a bottom is hit. Sometimes those can be your most accurate forecasts.

OTHER MARKETS

Dollar: 1.3378 versus 1.3350 euro. The dollar appears to have set up a new short range from 79 to 81-82. Friday it looked ready to hold and turn back up once more.
Click to view the chart

Bonds: 3.32% versus 3.29% 10 year. Down on the session but still working laterally the past month, putting in a floor to rally from. That is in line with what gold is suggesting, that it is going to sell. Lower gold means lower interest rates (no inflation) and if bonds rally that means lower rates as well. That is the opposite of what Bernanke is saying about rising rates because of a rising economy. Bonds have not broken out yet, but they certainly look to be ready to do so.
Click to view the chart

Gold: 1359.00, -28.00. Doesn't look like any bounce for gold as it broke below its recent lows. Triple topped, tried to make a higher low once more, but failed. Better economic data may be read as requiring less government money printing, but with the fake Euro bond offerings that seems unlikely. Nonetheless, the markets typically do not lie.
Click to view the chart

Oil: 91.53, +0.13. Still very strong after another good week, and it held even with the China story.
Click to view the chart

TECHNICAL SUMMARY

INTERNALS

Volume. Volume rose 3.5% on NASDAQ to slightly over 2B shares. Volume rose on a solid upside session. It was up 14% on the NYSE to 1.05B. Excellent volume trade.

Breadth. The advance/decline line was lackluster. The NASDAQ 100 topped the NASDAQ overall and shows up in the advance/declines at 1.75:1. The NYSE is not any better at 1.4:1. Even though the small caps are in the lead, it was not an overall broad move. That is worrisome, but a lot of financials were moving upside along with some big energy stocks, if it does not fan out a little more next week, it could be an issue, but I would not worry much about it now.

CHARTS

SP500. I am looking at the inverted head and shoulders of the summer. The rally from August into November, the consolidation through November, the new breakout and rally up through now. It is still moving higher and showing the right kind of action. Higher volume on the upside day. It broke out, it tested, and it rallied again. SP500 moved through the November peak and then came back and tested it. Then it rallied slowly, made it to the 127% extension. It moved laterally, broke higher, tested, and is continuing to the upside.

There is still room to the upside right now. It can go into the 1300's easily, and that carries it into the meat of earnings season. That would be normal. It may hit resistance at that point and then back off in the last half of earnings season. That is typical action I almost hate to talk about it because it seems too pat. It does look that way, however. Then again, the market can go further than you think. While we anticipate that might happen, we will just go with what the market tells us. We are ready for everything that could happen. We have many avenues, and we take it the way the market goes.

NASDAQ. NASDAQ is the same story. It stalled out, broke over the November peak, and tested. Then it stalled out below the 127% Fibonacci extension, gapped through it, and was up running again on Friday on rising volume. Great volume here, all that accumulation is now popping it to the upside as well.

SP600. SP600 rose to a new closing high on the rally. That was good to see as it gained almost a whole percent. It continues rallying up this trendline. Nice to see the small caps making that new high in the rally and following the large-cap indices.

SOX. SOX has been the true leader of late, and it added another 2.7% on Friday. It is surging to the upside. INTC's earnings did not help INTC that much, but it sure helped the chip equipment companies such as AMAT and NVLS. NVLS was moving really well and we banked some gain on it. The semiconductors are performing very well.

Indeed, all of the indices are doing well right now. They entered this new leg a little tentatively, but now they have made up their mind. They are really moving after breaking the 127% Fibonacci range. There will still be some resistance ahead, no doubt. It cannot be avoided, but it has been able to shoot down all resistance to this point. NASDAQ has broken through the two shoulders of its 2007-2008 head and shoulders pattern. Now it is taking aim at the head. Very strong action. It does not mean it will take that out, but it means it has a good run to it.

If we get to that level, we will probably have some more resistance. It would be a good point to take some gain off the table, or at least be a little lighter when you got there, having taken gain on the way. There will be a pullback before too long. We want to be light going into it, and we have been taking positions all the way up. With earnings, we may get to a point where we run out of good will to the upside.

LEADERSHIP

Financial. JPM announced its earnings on the day and shot higher, but it could not hold all the gain. It was a nice move. It closed off the high oh, well. GS was up on the day. Very nice move. If you look at GS longer term, you can see an inverted head and shoulders that runs from mid-2009 to present. It looks like it will make a break from there, and that could propel it higher. If you go further back, you can see a bigger type of inverted head and shoulders. It is askew, but you can see the pattern. It looks very good for GS, and I am happy we are in it. We picked up some new positions this week. There are good things happening in financials. When good things happen in financials, good things happen to the SP500.

Energy. SP500 and energy go hand in hand. HAL was bouncing up off the 50 day EMA. We can handle that. XEC is moving up well yet again. What a week for that company. We have some XOM, too, and it is rallying on volume. It is hard to complain about the moves of these big guys.

Retail. PNRA is trying to make a bounce to the upside. It looked interesting, but it did not make the move. SKX is coming off of a long sell off. It looks decent for a rally to the upside. DECK looks like it may turn the tide and actually go to the upside. LULU has reported great earnings this week. It gapped to the upside, but it is at that December peak. It will be interesting to see what it can do at that level.

Industrial. Industrials are interesting. CAT has been moving four weeks in a lateral, flat range. Maybe this is just a good consolidation like it put together in September and October and rallied higher off of that. Sometimes after long runs these can be bearish. Just before the rollover in 2000-2001, a lot of stocks had rallied well, formed this pattern, and then rolled over. The market was done at that point, however, and it was ready to come back. I am not saying that is the case here. It should be an expanding market given the improving economy. Therefore, I will view CAT as maybe taking a breather for a new break higher. TERX had a nice break to the upside. A good week for it, but we missed it. Sometimes that happens.

Technology. AAPL had a big week. It was up, leading the large cap indices higher. AAPL has earnings next week, I believe on Tuesday after the close. We got a nice rally into earnings. If it continues higher, I think a lot of the VZ news will be built in. You might want to take more gain off the table if you have any options out there. You have good gain in them after the last two weeks. BMC started higher on Friday. It is looking pretty tasty. As noted yesterday, SNIC is also moving up quite well. There are several business software stocks making the move to the upside.

Semiconductors. Semiconductors are moving well. NVLS was screaming to the upside thanks to INTC and its anticipated expansion. It will need more chip equipment. TQNT is breaking to the upside as well. Very solid. AMAT was up almost 8% on the day. It was a very strong day for the semiconductors. No wonder SOX the rallying sharply to the upside.

Miscellaneous. EZPW surged to the upside on volume. It is still going strong in an economy that is supposed to be improving. These do improve as the economy starts to improve, however. Believe it or not, pawnshops are not the bad places they are made out to be. They handle a lot of business in neighborhoods and are performing quite well.

Along that line, look at the pattern in URI. It shows that people may not be buying a lot of equipment, but they are renting it for a job here and there. They may not want to invest in that big piece of equipment right now, but in 2011 they will be able to take credits on a lot of these purchases. It is not just expensing them, but taking credits; that is a big difference.

A credit is almost as good as money because it comes off the bottom line of your tax return. If you owe $10,000 in taxes and can buy something that costs $3000, you can get a credit for the entire amount. You will have saved almost a third of your tax bill for buying a piece of equipment. Then you actually have something. You are not giving the money to the government and getting nothing back. Let's face it: with our debt, it ain't coming back to you.

A credit allows you to take that money, reduce your tax bill by the very amount, and you get something that you need. Hard to argue with that. I love credits use them if you have them. Things like URI are going up now, but we may see actual buying thanks to programs that can help people buy what they need.

I have to go to the black-and-blue bottom stock of the week: CMG. We looked at it when it had no follow-through on the reversal, and it came back up. Then it reversed back into its support range and looked great, but then it faded down. Once again, it showed no follow-through to the downside and bounced higher on Thursday, so we did it again. Sometimes you just have to forget it and just do it. Sometimes it takes two or three times to get it right and get in, or at least have the patience to get in and stay in.

We jumped in CMG early on Friday, and it is starting to pay off. We got it at $2.30, so we have a little gain going in. This is a classic case of just having to stick with it. It does not matter how many times you try and do not succeed on something as long as you keep your losses small. When the opportunity comes back, be ready to make the move. Hopefully we will see some great returns from CMG on this run.

THE MARKET

MARKET SENTIMENT

VIX. The VIX has dropped back down to the start of the Q2 2010 lows. That matches up with the lows of summer 2008 before the financial crisis sent volatility exploding higher. It is back to these levels, and that has people calling for corrections. When it is was down to this level before the summer of 2010 and that selloff, it led to a big spurt higher. It can lead to selling. The market is at a point where it has rallied nicely for two strong legs in a row. It is approaching next resistance. The problem is, it is not showing any signs that it wants to slow down right now. Volatility indicates that there could be a correction in an ongoing rally. It is not indicating there is a long-term major turn to the downside in the market. If volatility was rising higher as the stock market rallied higher, that would be a danger sign. I do not see danger now; I see a level that could indicate an interim correction coming. There is still room for SP500 to run to the upside before it hits next resistance.

VIX: 15.46; -0.93
VXN: 16.49; -0.96
VXO: 14.36; -1.11

Put/Call Ratio (CBOE): 0.57; -0.15

Bulls versus Bears:

This is a reading of the number of bullish investment advisors versus bearish advisors. The reason you look at this is that it gives you an idea of how bullish investors are. If they are too bullish then everyone is in the market and it is heading for a top: if everyone wants to be in the market, then all the money is in and there is no more new cash to drive it higher. On the other side of the spectrum if there are a lot of bears then there is a lot of cash on the sideline, and as the market rallies it drags that cash in as the bears give in. That cash provides the market the fuel to move higher. If bears are low it is the same as a lot of bulls: everyone is in and the market does not have the cash to drive it higher.

Bulls: 57.3% versus 54.5%. Back on the upside after a couple weeks of fade, but still below the 58.8% high on this leg. Dipped at year end as many anticipate a first of the year correction. Again you have to as if this is self-fulfilling given the market is still trending higher. Still high in a string of high readings but below the 5 year high at 62.0. Still bearish enough. Closing in on the level considered bearish, i.e. where so many are in the market and believe it is going up that the ammunition to send it higher runs low. This is where you start to be careful and watch for breakdowns, but there is also a lot of liquidity being pushed into the market and that can continue the move despite excess bullishness. The crossover level at 29% bulls is long gone, but it did its job. The high on the last leg was 56.0% after starting at 35.6% on the low in February, the lowest it has been since July 2009 . . . until this last leg. 35% is the threshold level suggesting bullishness. Again, to be seriously bearish it needs to get up to the 60% to 65% level.

Bears: 19.1% versus 20.5%. Breaking lower after hanging around in the 20% for a few weeks. Down from 28.3% in September. The 37.7% peak at the height of the crossover is well in the rearview mirror but bears remain well below the 35% level, above which is considered bullish for the market overall. Hit 18.7% on the low in April. Hit a high of 27.8% level on the prior leg in February. For reference, cracking above the 35% threshold considered bullish. Hit a high on the prior run at 47.2%. For more reference, bearishness hit a 5 year high at 54.4% the last week of October 2008. The move over 50 took bearish sentiment to its highest level since 1995. Extreme negative sentiment. Prior levels for comparison: Bearishness peaked at 37.4% in September 2007. It topped the June 2006 peak (36%) on that run. That June peak eclipsed the March 2006 high (33%) and well above the 2005 highs that spawned new rallies (30% in May 2005, 29.2% in October 2005). That was a huge turn, unlike any seen in recent history.

NASDAQ

Stats: +20.01 points (+0.73%) to close at 2755.3
Volume: 1.952B (+3.58%)

Up Volume: 1.363B (+384.366M)
Down Volume: 656.207M (-287.003M)

A/D and Hi/Lo: Advancers led 1.76 to 1
Previous Session: Decliners led 1.27 to 1

New Highs: 233 (+26)
New Lows: 11 (0)

NASDAQ CHART: Click to view the chart

NASDAQ 100 CHART: Click to view the chart

SOX CHART: Click to view the chart

SP500/NYSE

Stats: +9.48 points (+0.74%) to close at 1293.24
NYSE Volume: 1.058B (+13.98%)

Up Volume: 759.955M (+399.018M)
Down Volume: 288.564M (-268.368M)

A/D and Hi/Lo: Advancers led 1.43 to 1
Previous Session: Decliners led 1.17 to 1

New Highs: 487 (+4)
New Lows: 211 (+52)

SP500 CHART: Click to view the chart

SP600 Chart: Click to view the chart

DJ30

Stats: +55.48 points (+0.47%) to close at 11787.38
Volume DJ30: 200M shares Friday versus 162M shares Thursday.

DJ30 CHART: Click to view the chart

TUESDAY

The market is closed on Monday for the Martin Luther King holiday. Tuesday will open with the Empire Manufacturing Index out of New York. We will have some housing market sentiment. On Wednesday we will see the usual stories about mortgage purchases, but then it will kick into building permits and housing starts. While they are important, they really do not mean anything at this stage.

We do not want to see them higher right now. They have been volatile, and volatility is a sign of change. We will have to see. We do not want the builders building a lot of new homes. If they get that confidence, that is always worrisome. If they are confident enough to build right now, however, more power to them. I guess I have to say that simply because someone has to be doing something in this economy.

People I know are trying to get loans for their small businesses, and it is incredible. You can get the loans if you can put up collateral such as money, but if you had the money maybe you would not be seeking a loan. I will not get caught up in that, but small businesses are still having a hell of a time out there getting the funding to move forward. Credits will help, but still you still need the money to buy something.

On Thursday we go back to the usual initial claims, but there are also existing home sales, leading indicators, and the Philly Fed. Remember, that was just revised to 20.8 from 24.3. The expectations have dropped considerably.

That is the news that will hit, but there could be other stories out of China. Remember, it always comes in threes. There is definitely more economic data ahead, some possible news out of China and other growth areas, and we have more earnings. The flood gates will open, as they say on the financial stations. Thus far, the reception has been favorable overall. It has helped break SP500 out of this consolidation below the 127% Fibonacci extension. It is picking up steam. The indices and the market are gathering momentum overall as they make the break. Volume is up, pricing is strong, and leadership is breaking to the upside.

Many believe that a correction is imminent. This even as the SP600 hits a new rally high and as the SOX blasts off, leading the market upside. We may get a sudden reversal that takes the gains out of the system, but it typically does not happen that way. It can if there are bad things out there and there could be. Europe could be a problem, and it was this week. There could be implosions that the market does not see coming. That is always detrimental. It can take a quick 5% out of the market if something unexpected hits. Right now, nothing nefarious seems to be in the weeds.

The market is running higher and we have been taking positions on the upside. We have also been taking gain as stocks rally higher. At some point there is a turn in earnings. The good news (if it is a good-news season) saturates the market and individual stocks. They get all the gains they can handle and just cannot go any higher. What goes up starts to slide back down even on good news. We are very impressed with this move without a doubt. We are in the group anticipating a top. The thing is, while we anticipate it, we cannot call exactly where it is. There are areas where it looks like it may occur. With SP500 it could have been at the 127% extension, but it was not.

What you can do is prepare. The market has the final say, but we have to prepare for what may happen. We have some downside plays and some upside plays. We take gains partial or whole were necessary. We do not go in blind. We do not try to pick the tops and bottoms, but we have to be ready. You have to prepare for whatever comes your way.

The market remains strong. It is continuing its rally on volume, defying a lot of the pundits. As I said in the market close alert, I am more than fine with that. Our positions continue to increase in value, making us very good money. It is a very good start to 2011, adding onto an outstanding 2010. Again, we are in that area where we see another strong run to the upside and the indices are approaching resistance. 1313 is SP500, and that gives another 20 points to the upside. The next is 1325 to 1327. That gives even more possibility to the upside, and we will be more than happy to let our positions run toward those resistance levels.

Do not get too excited, however. Do not think it can only go up. The indices look strong. There is no reason to believe they will roll over anytime soon based on the technical action: Higher volume, strong price moves, breakouts, and leadership. Although General Patton said that there was no reason to assume the Germans would launch a major winter offensive, and therefore he expected that is exactly what Germany would do. We cannot let down our guard and believe everything is going to continue to rally.

Expect the unexpected. More than that, be ready for the unexpected. Stay skeptical. Be critical with respect to the market and your plays. As soon as you think you have it licked, that is when you get licked. For now, the market and stocks are acting right and looking good. All is right in the world, but do not forget that this is earnings season. There has been a rally into earnings season. They are just getting cranked up, and the initial response has been favorable. A lot of euphoria on the early earnings announcements often leads to the back half of the season getting profits taken. The saturation point is hit, as noted earlier, and the good news simply cannot drive stocks further. That does not mean a crash, but it means a pullback.

We will do what we have been doing. As stocks rally and they hit initial targets in logical places (127% extension, 161% extension), you take gain. Not all of it. You take partial profits because you will let some run, and they do keep running. As we get closer and you have good gains built up into stock positions, take some money off the table. NKE was running well into earnings. We took some money off the table, and then it gapped and was never was able to recover. We had to take the rest of them off. We did not lose much because we had a huge gain built into it.

We will be taking some more gain. A lot of our positions do not have earnings reported until late January or early February. I know we can get more out of this run. We do not want to get greedy and try to squeeze the last nickel out of it, though, because we might get the squeeze put on us. If you have good gains in a position going into earnings, take some profit. We have already taken profits on AAPL, but it has had a great run this week. We can look at taking some more.

Have a great long weekend!

Support and Resistance

NASDAQ: Closed at 2755.30
Resistance:
2825 is the 2007 closing peak.
2862 is the 2007 peak

Support:
2735 from late 2007 interim peak
2729 is the 127% Fibonacci extension of the August 2010 run
2725 from July 2007 interim peak
The 10 day EMA at 2716
The 18 day EMA at 2693
The 50 day EMA at 2615
2593 is the November 2010 high
2580 is the November 2010 closing high
2569 is the November gap up point through the April 2010 peak
2550 from May and June 2008 peaks
2540 is the gap up point from early November
2535.28 is the April 2010 intraday peak
2530 is the April 2010 closing peak
2518 is interim peak from April 2010
2511 is the lower range of the November gap up point
2482 is the recent October peak
2460 is the November 2010 low.
2434 is the May interim peak and the 78% Fibonacci retracement of the April selloff.
2425 is an interim peak from May 2010
2382-2395 from 2008
The 200 day SMA at 2388

S&P 500: Closed at 1293.24
Resistance:
1313 from the August 2008 interim peak
1325-27 is the March 2008 closing low and the May 2006 peak
1364 is the March 2007 low
1370 is the August 2007 low

Support:
1278 is the 127% Fibonacci extension of the August 2010 run
The 10 day EMA at 1277
The 18 day EMA at 1268
The 50 day EMA at 1236
1227 is the November 2010 peak
1220 is the April 2010 peak
1185 from late September 2008
1174 is the May 2010 high, 78% Fibonacci retracement of April peak
1173 is the November 2010 low
1170 is the prior March 2010 high
1156 is the Sept 2008 low
The 200 day SM A at 1152
1151 is the January 2010 peak
1133 from a September 2008 intraday low
Bottom of the January 2010 consolidation 1131 to 1136
1129 to 1131 is the June and August 2010 peaks

Dow: Closed at 11,787.38
Resistance:
11,867 from the August 2009 high and peak on that bounce in the selling.
11,893, from March 2008 closing low
12,110 from the March 2007 closing low
13,058 from the May 2008 peak on that bounce in the selling

Support:
11,734 from 11-98 peak
The 18 day EMA at 11,638
11,452 is the November 2010 peak
The 50 day EMA at 11,430
11,258 is the April 2010 peak
11,205 is the April closing high
11,100 from the 7-08 low
10,963 is the July 2008 low
10,920 is the recent May high
The 200 day SMA at 10,780
10,730 is the January 2010 peak

Economic Calendar

These are consensus expectations. Our expectations will vary and are discussed in the 'Economy' section.

January 14 - Friday
- CPI, December (08:30): 0.5% actual versus 0.4% expected, 0.1% prior
- Core CPI, December (08:30): 0.1% actual versus 0.1% expected, 0.1% prior
- Retail Sales, December (08:30): 0.6% actual versus 0.7% expected, 0.8% prior
- Retail Sales ex-auto, December (08:30): 0.5% actual versus 0.6% expected, 1.0% prior (revised from 1.2%)
- Industrial Production, December (09:15): 0.8% actual versus 0.4% expected, 0.3% prior (revised from 0.4%)
- Capacity Utilization, December (09:15): 76.0% actual versus 75.5% expected, 75.4% prior (revised from 75.2%)
- Michigan Sentiment, January (09:55): 72.7 actual versus 75.5 expected, 74.5 prior
- Business Inventories, November (10:00): 0.2% actual versus 0.8% expected, 0.7% prior

January 18 - Tuesday
- Empire Manufacturing, January (08:30): 12.0 expected, 10.57 prior
- Net Long-Term TIC Fl, November (09:00): $27.6B prior
- NAHB Housing Market Sentiment, January (10:00): 16 expected, 16 prior

January 19 - Wednesday
- MBA Mortgage Purchases, 01/14 (07:00): +2.2% prior
- Housing Starts, December (08:30): 550K expected, 555K prior
- Building Permits, December (08:30): 560K expected, 530K prior

January 20 - Thursday
- Initial Claims, 01/15 (08:30): 425K expected, 445K prior
- Continuing Claims, 01/08 (08:30): 3900K expected, 3879K prior
- Existing Home Sales, December (10:00): 4.80M expected, 4.68M prior
- Leading Indicators, December (10:00): 0.6% expected, 1.1% prior
- Philadelphia Fed, January (10:00): 20.5 expected, 20.8 prior (revised from 24.3)
- Crude Inventories, 01/15 (11:00): -2.15M prior
icon url

ReturntoSender

01/18/11 11:31 PM

#9216 RE: ReturntoSender #6755

From Briefing.com: 4:30 pm : A push against Citigroup and Apple mired the major equity averages for most of the session, but stocks managed to settle higher with varied gains that were good enough to make for fresh two-year closing highs.

The latest quarterly report from Citigroup (C 4.80, -0.33) came short of expectations on both the top and bottom line. Disappointment sent shares of the diversified financial giant to their steepest loss in more than six months.

Regional bank Comerica (CMA 37.84, -3.51) posted an impressive upside earnings surprise, but its shares were rejected in response to news that it will acquire Sterling Bank (SBIB 8.93, +1.23) for $10 per share, a 30% premium over its closing price last week.

Some support was provided to the financial sector by consumer finance plays following the publication of monthly card metrics from American Express (AXP 46.37, +0.12) and Discover Financial (DFS 20.74, +0.36). Results from the two companies were generally in line with what had been expected.

Ahead of its own quarterly report, Apple (AAPL 340.65, -7.83) shares were shunned in response to news that company Chief Executive Steve Jobs will take another medical leave of absence. The stock opened more than 6% lower, but losses were pared during the day. Shares of AAPL experienced some of the heaviest trading volume that they have seen in almost one year.

Leadership was lacking all session, but stocks still managed to grind to modest gains. In the end, advancing issues edged out decliners by 3-to-2 in the S&P 500.

Data wasn't very inspirational. The Empire State Manufacturing Survey improved to 11.9 for January. The consensus call among economists polled by Briefing.com was pegged at 12.0.

Net Long-Term Treasury International Capital Flows spiked in November to $85.1 billion from $28.9 billion in the prior month, but the data indicated that China's holdings of U.S. debt were lowered by little more than 1%.

Overseas data, another successful debt offering from Spain, and supportive comments about funding for the European recovery from Russia's finance minister all helped spur the euro and British pound higher against the greenback. The Dollar Index ended the trading day down by about 0.6%, which makes for its sixth loss in seven sessions.

Advancing Sectors: Energy (+0.7%), Materials (+0.6%), Industrials (+0.6%), Health Care (+0.4%), Tech (+0.3%), Consumer Discretionary (+0.3%), Utilities (+0.2%)
Unchanged: Consumer Staples
Declining Sectors: Financials (-0.8%), Telecom (-1.3%)DJ30 +50.55 NASDAQ +10.55 NQ100 +0.2% R2K +0.00% SP400 +0.9% SP500 +1.78 NASDAQ Adv/Vol/Dec 1278/2.04 bln/1369 NYSE Adv/Vol/Dec 1626/1.22 bln/1374

5:07PM Linear Tech beats by $0.04, beats on revs; guides Q3 revs below consensus (LLTC) 36.13 +0.26 : Reports Q2 (Dec) earnings of $0.62 per share, $0.04 better than the Thomson Reuters consensus of $0.58. Linear Tech sees Q3 revenue and earnings declining 6% to 10% sequentially. Co issues downside guidance for Q3, sees Q3 revs declining 6-10%, which calculates to ~$345.2-360.6 mln vs. $373.09 mln Thomson Reuters consensus.

4:33PM Apple beats by $1.04, beats on revs; guides Q2 EPS above consensus, revs above consensus (AAPL) 340.65 -7.83 : Reports Q1 (Dec) earnings of $6.43 per share, $1.04 better than the Thomson Reuters consensus of $5.39; revenues rose 70.5% year/year to $26.74 bln vs the $24.42 bln consensus. AAPL reports Q1 iPod sales of 19.45 mln compared to street expectations of ~17.7 mln. AAPL reports Q1 iPad sales of 7.33 mln compared to street expectations of ~6.3 mln. AAPL reports Q1 iPhone sales of 16.24 mln compared to street expectations of ~15.6 mln. AAPL reports Q1 Mac sales of 4.13 mln compared to street expectations of ~4.25 mln... Co issues upside guidance for Q2, sees EPS of $4.90 vs. $4.46 Thomson Reuters consensus; sees Q2 revs of $22 bln vs. $20.71 bln Thomson Reuters consensus. "We had a phenomenal holiday quarter with record Mac, iPhone and iPad sales... We are firing on all cylinders and we've got some exciting things in the pipeline for this year including iPhone 4 on Verizon which customers can't wait to get their hands on." AAPL shares are currently halted (no resumption time given yet).

4:17PM Western Digital beats by $0.38, beats on revs (WDC) 33.94 +0.50 : Reports Q2 (Dec) earnings of $0.96 per share, $0.38 better than the Thomson Reuters consensus of $0.58; revenues fell 5.5% year/year to $2.48 bln vs the $2.35 bln consensus. The co generated $505 million in cash from operations during the December quarter, ending with total cash and cash equivalents of $3.1 billion. "We are pleased to deliver better-than-expected revenues, profitability and gross margin in the December quarter, reflecting solid execution and an improvement in hard drive industry conditions compared with the prior two quarters."

4:15PM IBM beats by $0.10, beats on revs; guides FY11 EPS in-line with 2015 road map (IBM) 150.65 +0.65 : Reports Q4 (Dec) earnings of $4.18 per share, $0.10 better than the Thomson Reuters consensus of $4.08; revenues rose 6.6% year/year to $29.02 bln vs the $28.26 bln consensus. Co issues in-line guidance for FY11, sees GAAP EPS of at least $12.56 vs. $12.58 Thomson Reuters consensus. IBM said that it expects to deliver full-year 2011 GAAP earnings per share of "at least $12.56; and operating (non-GAAP) earnings per share of at least $13.00, which puts the company on track for the 2015 road map of at least $20 of operating (non-GAAP) earnings per share." The 2011 operating (non-GAAP) earnings exclude $0.44 per share for the amortization of purchased intangible assets, other acquisition-related charges and certain retirement-related costs that the company has defined as non-operating. IBM's tax rate was 24.4%, down 0.2 points year over year. Net income margin increased 0.4 points to 18.1 percent. The Americas' fourth-quarter revenues were $12.2 billion, an increas 9 percent (9 percent, adjusting for currency) from the 2009 period. Revenues from Europe/Middle East/Africa were $9.5 billion, down 2 percent (up 4 percent, adjusting for currency). Asia-Pacific revenues increased 14 percent (7 percent, adjusting for currency) to $6.6 billion. OEM revenues were $784 million, up 21 percent compared with the 2009 fourth quarter.

4:03PM Cree misses by $0.03, misses on revs; guides Q3 EPS below consensus, revs below consensus (CREE) 62.71 -1.06 : Reports Q2 (Dec) earnings of $0.55 per share, $0.03 worse than the Thomson Reuters consensus of $0.58; revenues rose 28.8% year/year to $257 mln vs the $276.6 mln consensus. CREE reports Q2 operating margins 26.5% vs 27.3% Thomson Reuters consensus; Q1 31.3%. CREE reports Q2 gross margins of 47.1% vs 47.8% Thomson Reuters consensus; Q1 49.0%. Co issues downside guidance for Q3, sees EPS of $0.38-0.45 vs. $0.58 Thomson Reuters consensus; sees Q3 revs of $245-265 vs. $288.33 mln Thomson Reuters consensus. "Q2 results reflected continued growth in our LED lighting product line, but revenue and earnings were lower than our targets due primarily to lower sales to our LED component distributors in Asia... We are managing through an inventory correction in Asia in the near term, but the opportunity in LED lighting has not changed. Quarterly revenue increased 29% year-over-year and based on the market trends we are seeing, and the success of our own LED lighting business, we are more confident that we will see continued adoption of LED lighting over the next several years."

MIPS Technologies (MIPS) announced Realtek Semiconductor Corp., reaffirmed its long-time commitment to the MIPS architecture by licensing a broad range of MIPS32 processor cores.

8:18AM Citigroup misses by $0.04, misses on revs (C) 5.13 : Reports Q4 (Dec) earnings of $0.04 per share, $0.04 worse than the Thomson Reuters consensus of $0.08; revenues rose 133.1% year/year to $18.37 bln vs the $20.4 bln consensus. Fourth Quarter Included Negative CVA of $1.1 Billion Pre-Tax Due to Citi Spreads Tightening continued to wind down Citi Holdings in an economically rational manner, reducing assets by $128 billion in 2010 alone. Holdings' total assets have declined by more than half from their peak in 2008 to $359 billion and now stand at less than 20% of balance sheet. Tier 1 Common of $105 Billion, Tier 1 Common Ratio of 10.7%. Allowance for Loan Losses of $40.7 Billion. Net credit losses were $6.8 bln compared to $7.65 bln in the prior quarter. Net build was $2.2 bln compared to $1.9 bln in prior quarter. The net release of allowance for loan losses and unfunded lending commitments was $2.3 billion, compared to $2.0 billion in the prior quarter. The net reserve release in the current quarter consisted of $1.3 billion for consumer loans and $920 million for corporate loans and unfunded lending commitments. Expenses rose to $12.4 bgln compared to $11.5 bln in Q3. Citigroup expenses increased $951 million, or 8%, sequentially to $12.5 billion, reflecting the impact of foreign exchange3, higher legal and related expenses, severance, higher volumes in certain businesses, and continued investments in Citicorp businesses. Book value per share stands at $5.61 and tangible book value per share is $4.45. Citigroup's net interest margin was 2.97%, down from 3.09% in the third quarter 2010, mainly reflecting the impact of a reserve build related to Japan Consumer Finance, lower investment yields as Citi's substantial liquidity position was maintained, as well as a decline in loans in Citi Holdings. Citicorp revenues were $14.3 billion, down $2.0 billion, or 12%, from the third quarter 2010. Growth in Latin America and Asia revenues, up 5% and 2%, respectively, was offset by declines in EMEA and North America, down 30% and 21%, respectively.

8:04AM Chipmos Technology announces December and Q4 revenue (no ests) (IMOS) 1.77 : Co reports December rev +9% QoQ and 19% YoY to $52.2 mln. On a quarterly basis, revenue for the fourth quarter of 2010 was NT$4,322.6 million or US$148.3 million, a decrease of 8.4% from the third quarter of 2010 and an increase of 20.4% from the same period in 2009. Fourth quarter revenue is consistent with overall semiconductor market trends and inline with prior guidance provided on November 15, 2010 for 4Q10 revenue indicating a decline by approximately 6% to 12% compared to 3Q10.

Rudolph Technologies (RTEC) announced that it will collaborate with a leading process tool supplier and an IC device manufacturer in the development of 3D advanced semiconductor packaging applications.

* Micrel (MCRL) launched the KSZ8895/8875/8864 series. The devices are low-power, highly integrated, 4/5-port Layer-2 switch-on-a-chip ICs.

icon url

ReturntoSender

01/20/11 9:19 PM

#9218 RE: ReturntoSender #6755

From Briefing.com: 4:30 pm : Stocks tried to rally back from another stiff selling effort, but the broader market's inability to extend beyond the neutral line led stocks to waver into the close.

Sellers attempted to take control of trade right away. Their efforts were motivated by worries that China might have to tighten monetary policy to contain inflation after the country reported that its economy expanded at a torrid clip of 9.8% in the fourth quarter. Some stepped in with a bid that took the S&P 500 and the Dow back to the neutral line, but resistance there encouraged sellers to redouble their efforts.

For the second straight session the Nasdaq was hit the hardest. At its session low, the tech-rich Index was down 1.4%. The S&P 500 was down 0.8% and the Dow was down 0.7% at their worst levels of the day. Selling pressure began to ease midsession, though there wasn't any headline to account for the shift in sentiment. Amid the improved tone stocks staged a gradual climb in afternoon action, but neither the Dow nor the S&P 500 could do more than briefly poke into positive territory before drifting into the close.

eBay (EBAY 30.78, +1.68) was one of the few strong performers in the Nasdaq today. Its near 6% surge followed better-than-expected earnings and strong guidance. Fell Nasdaq component Google (GOOG 626.77, -4.98) was weak ahead of its latest report.

Morgan Stanley (MS 29.02, +1.27) was a standout in the broader market, thanks to an upside earnings surprise. It led the financial sector to a 0.5% gain, even though regional lenders like FifthThird (FITB 14.22, -0.39) and PNC Financial (PNC 61.00, -0.81) lagged following strong results of their own.

Freeport McMoRan (FCX 110.90, -4.26) also tumbled after it reported better-than-expected earnings. It was caught up in a push against basic materials stocks, which collectively fell to a 1.5% loss.

There was a substantial dose of data to digest this morning. It included news that initial jobless claims for the week ended January 15 came in at 404,000, which is below the 425,000 initial claims that had been widely expected. The week-over-week decline took the four-week moving average down to 411,750. As for continuing claims, they fell to 3.86 million from 3.89 million.

Existing home sales for December spiked 12.3% to an annualized rate of 5.28 million units. Not only is that better than the rate of 4.80 million units that had been widely expected, but it was also the highest rate since Spring.

Leading indicators for December increased by 1.0%. That bested the 0.6% increase that was widely expected, but it remained on level with what had been recorded for the prior month.

The Philadelphia Fed Index for January was a bit disappointing. It came in at 19.3, which is both shy of the 20.0 that had been anticipated and below the downwardly revised reading of 20.8 for the prior month.

The dollar scored only its second gain in nine sessions with a 0.2% advance against a basket of major foreign currencies. Most of that move came against the yen, which was down 1.2% to 83.0 yen per dollar at the closing bell.

Treasuries turned sharply lower in the face of a weaker equity market. They had already been under pressure, but their slide steepened with the release of results from a $13 billion auction of 10-year TIPS. Weak demand at the auction caused the benchmark 10-year Note to drop to a loss of about a full point. It settled off of that low so that its yield was just shy of 3.45%.

Tomorrow's economic calendar is empty so most of the market's attention will be on the latest from Dow components General Electric (GE 18.43, +0.10) and Bank of America (BAC 14.54, +0.17).

Advancing Sectors: Utilities (+0.6%), Financials (+0.5%), Consumer Staples (+0.4%), Consumer Discretionary (+0.2%), Health Care (+0.2%)
Declining Sectors: Telecom (-0.2%), Industrials (-0.4%), Tech (-0.7%), Energy (-0.7%), Materials (-1.5%)DJ30 -2.49 NASDAQ -21.07 NQ100 -0.8% R2K -1.1% SP400 -0.8% SP500 -1.66 NASDAQ Adv/Vol/Dec 731/2.33 bln/1908 NYSE Adv/Vol/Dec 1124/1.19 bln/1845

4:36PM Advanced Micro beats by $0.03, beats on revs; sees Q1 revenue flat to slightly down QoQ vs -5.4% consensus (AMD) 8.02 +0.09 : Reports Q4 (Dec) earnings of $0.14 per share, excluding non-recurring items, $0.03 better than the Thomson Reuters consensus of $0.11; revenues rose 0.2% year/year to $1.65 bln vs the $1.63 bln consensus. Co sees Q1 revenue to be flat to slightly down QoQ vs -5.4% consensus. Reports gross margin of 45%, in-line iwth preannouncement

4:32PM Skyworks beats by $0.01, reports revs in-line; guides Q2 EPS above consensus, revs above consensus (SWKS) 30.03 -1.88 : Reports Q1 (Dec) earnings of $0.45 per share, excluding non-recurring items, $0.01 better than the Thomson Reuters consensus of $0.44; revenues rose 36.7% year/year to $335.1 mln vs the $334 mln consensus. Co issues upside guidance for Q2, sees EPS of 0.38-0.40, excluding non-recurring items, vs. $0.37 Thomson Reuters consensus; sees Q2 revs of 310-320 vs. $306.48 mln Thomson Reuters consensus.

4:23PM Emulex beats by $0.02, reports revs in-line; guides Q3 EPS in-line, revs in-line (ELX) 11.75 -0.43 : Reports Q2 (Dec) earnings of $0.15 per share, excluding non-recurring items, $0.02 better than the Thomson Reuters consensus of $0.13; revenues rose 5.3% year/year to $114 mln vs the $113.4 mln consensus. Co issues in-line guidance for Q3, sees EPS of $0.08-0.11, excluding non-recurring items, vs. $0.11 Thomson Reuters consensus; sees Q3 revs of $108-112 vs. $110.52 mln Thomson Reuters consensus.

4:11PM Hewlett-Packard announces Shumeet Banerji, Gary Reiner, Patricia Russo, and Meg Whitman as new Board members (HPQ) 46.78 +0.46 : Co announces that its board of directors has appointed five new members, effective Jan. 21, bringing the total number of board members to 13. The new directors are Shumeet Banerji, chief executive officer of Booz & Company; Gary Reiner, former chief information officer of General Electric Company and a current special advisor to private equity firm General Atlantic; Patricia Russo, former chief executive officer of Alcatel-Lucent; Dominique Senequier, chief executive officer of AXA Private Equity; and Meg Whitman, former president and chief executive officer of eBay Inc. The five new directors also will stand for re-election at HP's next Annual Meeting of Stockholders in March. In addition, HP announced that incumbent directors Joel Hyatt, John Joyce, Robert Ryan and Lucille Salhany are not standing for re-election at the company's Annual Meeting of Stockholders.

4:09PM Google beats by $0.66, beats on revs; announces mgmt changes, Larry Page succeeds Schmidt as CEO (GOOG) 626.77 -4.98 : Reports Q4 (Dec) earnings of $8.75 per share, excluding non-recurring items, $0.66 better than the Thomson Reuters consensus of $8.09; revenues rose 28.6% year/year to $6.37 bln vs the $6.06 bln consensus. GOOG reports Q3 Paid Clicks increased 18% y/y, 11% q (Y/Y expectations ~15%); Costs Per Click increased 5% y/y, 4% q/q (Y/Y expectations ~5%). Intn' rev +52% YoY. Q3 Paid Clicks increased 18% y/y, 11% q (Y/Y expectations ~15%). GOOG also announces mgmt changes: Starting from April 4, Larry Page, Google Co-Founder, will take charge of Google's day-to-day operations as Chief Executive Officer. Sergey Brin, Google Co-Founder, will devote his energy to strategic projects, in particular working on new products. Eric Schmidt will assume the role of Executive Chairman, focusing externally on deals, partnerships, customers and broader business relationships, govt outreach and technology thought leadership--all of which are increasingly important given Google's global reach. Internally, he will continue to act as an advisor to Larry and Sergey.

4:07PM Google discloses info on Schmidt stock trading plan (GOOG) 627.77 -4.98 : On December 9, 2010, Eric [Schmidt] adopted a stock trading plan in accordance with guidelines specified under Rule 10b5-1 of the Exchange Act, and Google's Policy Against Insider Trading. In the future, he will begin selling a portion of his Google stock pursuant to this trading plan. The pre-arranged trading plan was adopted in order to allow Eric to sell a portion of his Google stock as part of his long-term strategy for individual asset diversification and liquidity. The stock transactions pursuant to this trading plan will be disclosed publicly through Form 4 and Form 144 filings with the SEC. Using this trading plan, Eric can diversify his investment portfolio and can spread stock trades out over a period of one year to reduce market impact. Because this trading plan was established well in advance of a trade, it also helps avoid concerns about whether Eric had material, non-public information when he made a decision to sell his stock. As of Dec 31, 2010, Eric held approx 9.2 mln shares of Class A and Class B common stock, which represented approx 2.9% of Google's outstanding capital stock and approx 9.6% of the voting power of Google's outstanding capital stock. Under the terms of the trading plan, Eric intends to sell approx 534,000 shares of Class A common stock. If Eric completes all the planned sales under this trading plan, he would continue to own approx 8.7 million shares...

4:06PM Flextronics beats by $0.01, beats on revs; guides MarQ above consensus (FLEX) 8.22 -0.14 : Reports Q3 (Dec) earnings of $0.25 per share, excluding non-recurring items, $0.01 better than the Thomson Reuters consensus of $0.24; revenues rose 19.5% year/year to $7.83 bln vs the $7.61 bln consensus. Co issues upside guidance for Q4 (Mar), sees EPS of $0.21-0.23, excluding non-recurring items, vs. $0.21 Thomson Reuters consensus; sees Q4 revs of $7.1-7.4 bln vs. $6.96 bln Thomson Reuters consensus.

4:04PM Maxim Integrated beats by $0.03, reports revs in-line; guides Q3 revs above consensus (MXIM) 25.60 -0.33 : Reports Q2 (Dec) earnings of $0.44 per share, excluding non-recurring items, $0.03 better than the Thomson Reuters consensus of $0.41; revenues fell 2.1% year/year to $612.9 mln vs the $607.7 mln consensus. Co issues upside guidance for Q3, sees Q3 revs of $590-620 vs. $585.02 mln Thomson Reuters consensus.

2:51PM Power Integrations confirms it was awarded double damages in patent-infringement case against Fairchild Semiconductor (FCS) (POWI) 38.21 -1.12 : (See prior 7:44 comment)

11:35AM Semiconductor Hldrs ETF slides to new session low of 33.36 (SMH) 33.40 -0.74 : Semi/Disk Drive weakness have helped push the Nasdaq Comp to a minor new session low of 2686. The next support of note for the SMH is at its Dec peak at 33.26. The weakest performers in the SMH include: ALTR -4.2%, AMAT -3.3%, AMKR -2.3%, ATML -5.8%, BRCM -4.4%, (testing its 50 sma), LSI -2.3% (testing its 50 ema), MXIM -2.3%, NSM -2.4%, NVLS -2.7%, SNDK -4.7%, TER -3.8%,

9:03AM Tegal and se2quel Partners form new company in solar utility development (TGAL) 0.63 : Co announced that it has formed, along with se2quel Partners LLC, a new company dedicated to the development and operation of large scale photovoltaic (PV)-based solar utilities in the United States, Latin America, the Middle East and Africa.

7:34AM Fairchild Semi beats by $0.06, reports revs in-line; guides Q1 revs above consensus; court ruling doubles patent damage award to POWI to ~$12.1 mln (FCS) 16.73 : Reports Q4 (Dec) earnings of $0.45 per share, excluding non-recurring items, $0.06 better than the Thomson Reuters consensus of $0.39; revenues rose 12.2% year/year to $397.7 mln vs the $399.6 mln consensus. Co issues upside guidance for Q1, sees Q1 revs of $405-420 mln vs. $388.60 mln Thomson Reuters consensus. "Our current scheduled backlog is sufficient to achieve this range. We expect gross margin to be flat to down 100 bps QoQ due primarily to the impact of lower utilization in the fourth quarter as well as modest seasonal increases in costs." Separately, the co announced a recent court ruling in its six-year-old patent litigation with Power Integrations (POWI). The court denied Power Integrations' request for attorneys' fees and triple damages, and instead doubled the damage award from ~$6.1 mln to ~$12.2 mln. The amount is fully reserved and the decision will have no effect on Fairchild's business operations.

6:09AM Tyco Electronics beats by $0.05, beats on revs; guides Q2 EPS below consensus, revs in-line; guides FY11 EPS, revs in-line (TEL) 36.03 : Reports Q1 (Dec) earnings of $0.73 per share, excluding non-recurring items, $0.05 better than the Thomson Reuters consensus of $0.68; revenues rose 10.7% year/year to $3.2 bln vs the $3.16 bln consensus. Total co orders were $3.2 billion, an increase of 7 percent compared to the prior year and up 7 percent sequentially. The book-to-bill ratio was 0.99 overall and 1.03, excluding the SubCom business. Sales grew 11 percent compared to the prior-year quarter and 2 percent sequentially. Organically, sales increased 11 percent compared to the prior year and were down 2 percent sequentially. The adjusted operating margin was 14.5 percent in the quarter, up 300 basis points versus the prior year and up 30 basis points sequentially. Co issues mixed guidance for Q2, sees EPS of $0.70-0.74, excluding non-recurring items, vs. $0.75 Thomson Reuters consensus; sees Q2 revs of $3.45-3.55 bln vs. $3.48 bln Thomson Reuters consensus. Co issues in-line guidance for FY11, sees EPS of $3.05-3.20, excluding non-recurring items, vs. $3.07 Thomson Reuters consensus; sees FY11 revs of $13.9-14.3 bln vs. $14.03 bln Thomson Reuters consensus.

NXP Semiconductors (NXPI) announced that Comba Telecom Systems Holdings has selected NXP high speed converters for use in its digital repeater products.

HP Enterprise Services today announced FCC, a Spain-based multinational public services company, has signed a seven-year technology services agreement with Hewlett-Packard Servicios Espana. The agreement is intended to transform FCC's technology infrastructure to advance the company's ability to compete internationally; it is valued in excess of $300 mln in revenue for HP (HPQ).

1:45AM Baldor Electric: ABB Ltd announces second extension to tender offer for Baldor Electric (BEZ) common stock (BEZ) 63.39 : ABB and BEZ announce that ABB's subsidiary Brock Acquisition Corp has extended for a second time the expiration date for its tender offer for all of the outstanding shares of common stock of BEZ at a price of $63.50 per share net to the holder in cash, without interest and less any required withholding taxes, until 5:00 p.m., New York City time, on Tuesday, January 25, 2011. The offer had previously been scheduled to expire on January 19, 2011.

1:40AM Trident Microsystems CEO resigns to pursue other opportunities; appoints interim CEO; President also resigns (TRID) 1.61 : Co announces that Sylvia Summers Couder has resigned as CEO and as a director to pursue other opportunities. The co also announced that Mr. Philippe Geyres has been appointed as Interim CEO effective immediately and that the co has initiated a search for a CEO following this transition. Geyres is a candidate for the permanent CEO position. Geyres joined Trident's board in February 2010 following the co's acquisition of certain assets of NXP. The co also announced that Christos Lagomichos has announced his departure from co and resignation as its President effective Feb. 9, 2011.

09:42 am FFIV Guides Q2 Revs Below Consensus (FFIV)

F5 Networks (FFIV $113.35 -25.43) reported first quarter earnings of $0.88 per share, excluding non-recurring items, $0.05 better than the Thomson Reuters consensus of $0.83.

Revenues rose 40.6% year-over-year to $268.9 million versus the $270.6 million consensus.

For the second quarter, the company sees earnings in the range of $0.84 to $0.86, excluding non-recurring items, versus $0.85 Thomson Reuters consensus. On the top line, revenues are expected to be $275 million to $280 million versus the $281.13 million Thomson Reuters consensus.

First quarter GAAP gross margin 81.8% versus 81% to 82% prior guidance.

The company said, "Product revenue was up nearly 44 percent from the first quarter of fiscal 2010, and service revenue grew more than 35 percent during the same period. On a regional basis, all geographies delivered sequential and year-over-year gains, led by Asia Pacific where revenue was up 11 percent from the prior quarter and 62 percent from the first quarter a year ago. Underpinning the continued strength in our service business, deferred revenue grew 10.9 percent to $287.8 million from the previous quarter."

08:26 am ZOOM Technologies initiated with a Buy at Ladenburg Thalmann; tgt $7: . Ladenburg Thalmann initiates ZOOM with a Buy and price target of $7 saying they believe that Zoom Technologies is fully taking advantage of the rapidly evolving feature phone/ smartphone trend in the world's largest mobile phone market and is on path to become a leading mobile phone OEM in China.
icon url

ReturntoSender

01/25/11 11:02 PM

#9224 RE: ReturntoSender #6755

From Briefing.com: 4:30 pm : Listless action left stocks to slide on a couple of occasions during the day, but buyers eventually bought the dip to take stocks back to the neutral line for a flat finish.

Stocks started the session on weak footing following mixed action overseas. Asia's major averages were split as China's Shanghai Composite and Hong Kong's Hang Seng slipped, but Japan's Nikkei climbed sharply amid news that the Bank of Japan increased its GDP forecast to 3.3% from 2.1% and left its key rate at 0.1%. Europe's bourses moved lower after it was learned that United Kingdom fourth quarter GDP fell 0.5%. There was also concern about the capital health of Spain's banks.

Earnings were generally solid, but they did nothing to drive the broader market. That's mostly because the market has come to expect strong results following its ascent in recent months -- the Dow remains near its best level in two years, but the S&P 500 and the Nasdaq Composite both set their two-year highs last week.

The Consumer Confidence Index for January offered some support to stocks in early trade. It came in at an eight-month high of 60.6, which was much better than the 53.5 Briefing.com consensus. Excitement over the consumer confidence reading helped the broad market recover from an opening slip, but stocks were unable turn positive. Failure to find higher ground invited selling pressure, which kept stocks in the red almost all afternoon and the S&P 500 down as much as 0.8%.

Buyers finally surfaced in the final hour. The bid they placed was broad and strong enough for the major averages to push back to the flat line. Energy stocks and financial stocks had been heavy drags on the broader market for most of the afternoon. Both sectors were down in excess of 1% at their session lows, but each made a nice move into the close.

Energy settled a tame 0.3% lower for the session. Baker Hughes (BHI 62.32, +2.95) was one of its best performers, thanks to an upside earnings surprise for its latest quarter. Many other sector members were hurt by concerns related to another drop in oil prices, which recorded their lowest close in a month by dropping 1.9% to $86.19 per barrel.

Financials ended the day down just 0.2%. Dow component American Express (AXP 44.80, -0.99) was a drag after its in-line results failed to inspire investors. Fellow Dow component Travelers (TRV 56.23, +0.61) displayed individual strength following news of an upside earnings surprise.

Telecom ended the day as the best performing sector. It advanced 1.0% amid strength in Dow component Verizon (VZ 35.79, +0.55), which actually came short of the consensus earnings estimate.

Better-than-expected earnings from fellow blue chips Johnson & Johnson (JNJ 61.08, -1.02) and 3M (MMM 88.50, -1.82) were overshadowed by forecasts that were either outright disappointing or essentially lackluster.

Treasuries caught a nice bid. Most of their bounce followed an auction of 2-year Treasury Notes. The auction drew a bid-to-cover of 3.47, dollar demand of $121.5 billion, and an indirect bidder participation rate of 27.0%. For comparison, the average of the three previous auctions gives a bid-to-cover of 3.61, dollar demand of $126.5 billion, and an indirect bidder participation of 33.6%. The 2-year Note saw its yield move below 0.58% and the benchmark 10-year Note saw its yield slide just under 3.33%.

Advancing Sectors: Telecom (+1.0%), Tech (+0.4%), Consumer Staples (+0.2%), Materials (+0.1%)
Declining Sectors: Energy (-0.3%), Financials (-0.2%), Industrials (-0.2%), Utilities (-0.1%), Health Care (-0.1%)DJ30 -3.33 NASDAQ +1.70 NQ100 +0.2% R2K +0.1% SP400 +0.2% SP500 +0.34 NASDAQ Adv/Vol/Dec 1212/1.95 bln/1430 NYSE Adv/Vol/Dec 1603/1.04 bln/1379

4:24PM MIPS Tech beats by $0.02, misses on revs (MIPS) 15.13 +0.24 : Reports Q2 (Dec) earnings of $0.14 per share, $0.02 better than the Thomson Reuters consensus of $0.12; revenues rose 43.9% year/year to $21.9 mln vs the $22.2 mln consensus. "Both our royalty revenue and earnings exceeded our expectations during the quarter."

4:21PM Super Micro Computer beats by $0.05, beats on revs; guides Q3 EPS in-line, revs above consensus (SMCI) 13.03 +0.11 : Reports Q2 (Dec) earnings of $0.31 per share, excluding non-recurring items, $0.05 better than the Thomson Reuters consensus of $0.26; revenues rose 32.3% year/year to $240.8 mln vs the $224.1 mln consensus. Co issues mixed guidance for Q3, sees EPS of $0.25-0.29, excluding non-recurring items, vs. $0.26 Thomson Reuters consensus; sees Q3 revs of $235-245 mln vs. $225.80 mln Thomson Reuters consensus. Non-GAAP gross margin for the second quarter was 16.8% compared to 16.7% in the same period a year ago. Non-GAAP gross margin was 16.0% for 1Q11.

4:19PM Altera beats by $0.01, beats on revs; guides Q1 revs above consensus (ALTR) 37.91 -0.37 : Reports Q4 (Dec) earnings of $0.72 per share, $0.01 better than the Thomson Reuters consensus of $0.71; revenues rose 52.2% year/year to $555.4 mln vs the $547.6 mln consensus. Co issues upside guidance for Q1, sees Q1 revs declining 1-5% sequentially, which calculates to ~$527.6-549.8 mln vs. $524.92 mln Thomson Reuters consensus. Altera reports Q4 gross margins of 70.9% vs. the 70.4% consensus.

4:16PM Juniper Networks beats by $0.02, beats on revs; issues Q1 guidance (JNPR) 34.82 -0.06 : Reports Q4 (Dec) earnings of $0.39 per share, excluding approximately $0.03 per share favorable impact due to the extension of R&D tax credit, $0.02 better than the Thomson Reuters consensus of $0.37; revenues rose 26.4% year/year to $1.19 bln vs the $1.12 bln consensus. Co issues guidance for Q1, sees EPS of $0.30-0.33 vs. $0.34 Thomson Reuters consensus; sees Q1 revs of $1.06-1.11 bln vs. $1.09 bln Thomson Reuters consensus. Juniper estimates that its non-GAAP gross margin will remain in its targeted range of between 66% and 68% in the first quarter. The Q1 non-GAAP EPS guidance includes the impact of recent acquisitions of approximately $0.02 per share.

4:05PM RF Micro Device beats by $0.01, misses on revs (RFMD) 7.30 -0.60 : Reports Q3 (Dec) earnings of $0.19 per share, $0.01 better than the Thomson Reuters consensus of $0.18; revenues fell 2.4% year/year to $278.8 mln vs the $285.8 mln consensus. Co reported Q3 gross margin 38.7% vs. the 39.5% consensus.

4:03PM Molex beats by $0.04, beats on revs; guides Q3 EPS in-line, revs above consensus (MOLX) 25.34 +0.07 : Reports Q2 (Dec) earnings of $0.46 per share, ex-items, $0.04 better than the Thomson Reuters consensus of $0.42; revenues rose 23.6% year/year to $901.5 mln vs the $872.5 mln consensus. Co issues mixed guidance for Q3, sees EPS of $0.39-$0.43 vs. $0.40 Thomson Reuters consensus; sees Q3 revs of $850-$890 mln vs. $848.51 mln Thomson Reuters consensus.

Ciena Corporation (CIEN) announced it was selected by Saudi Arabia's telecoms operator Mobily to build a highly resilient, adaptable and scalable nationwide network to effectively address dramatic traffic growth and support the roll out of new services while reducing overall operational costs.

JDSU (JDSU) announced new micro lithography or patterning processes for JDSU optical coatings that contribute to improved light sensing intelligence in a wide variety of consumer electronic products.

# Cymer (CYMI) announced that TCZ, its wholly owned subsidiary, has received a volume order for the TCZ-900B crystallization system from a leading Taiwanese flat panel display manufacturer.
# Advanced Micro-Fabrication Equipment announced that it has prevailed for the second time in a patent infringement lawsuit filed against AMEC subsidiaries by Lam Research Corporation (LRCX) in the Intellectual Property Court of Taiwan.

8:05AM Zoran issues letter to shareholders, urges all Zoran stockholders to reject Ramius' efforts to take control of the Board of Directors and the co (ZRAN) 9.32 :

7:15AM Corning misses by $0.01, beats on revs (GLW) 19.64 : Reports Q4 (Dec) earnings of $0.46 per share, $0.01 worse than the Thomson Reuters consensus of $0.47; revenues rose 15.2% year/year to $1.76 bln vs the $1.61 bln consensus. "Corning anticipates that equity earnings from Dow Corning Corporation will improve sequentially. Overall equity earnings are expected to be down 5%, excluding the impact of the one-time gains in last year's fourth quarter."

7:03AM EMC beats by $0.01, beats on revs; guides FY11 EPS above consensus, revs above consensus (EMC) 23.83 : Reports Q4 (Dec) earnings of $0.42 per share, $0.01 better than the Thomson Reuters consensus of $0.41; revenues rose 19.2% year/year to $4.89 bln vs the $4.79 bln consensus. Co issues upside guidance for FY11, sees EPS of $1.46 vs. $1.45 Thomson Reuters consensus; sees FY11 revs of $19.6 bln vs. $18.96 bln Thomson Reuters consensus. EMC expects to repurchase $1.5 billion of the company's stock in 2011.

Cabot Microelectronics (CCMP) announced the launch of its NovusTM A7000 series Aluminum CMP slurry intended to enable its customers' advanced High-K and Metal Gate device integration schemes.

07:27 am Xilinx upgraded to Buy at Auriga U.S.A; tgt raised to $37: . Auriga U.S.A upgrades XLNX to Buy from Hold and raises their tgt to $37 from $35 as they tweak their estimates and multiple higher. Firm says it now appears that, even though Altera (ALTR) seems to have the upper hand in high-end FPGA at 28nm, particularly for the communications segment, XLNX will have a timing advantage with its low/mid-range product families.

07:25 am General Electric tgt raised to $23 at Oppenheimer following earnings Friday: . Oppenheimer is rasing their tgt to $23 from $21 following earnings, which they note benefited by ~2c from reserve release. With improving metrics at GE Capital continuing apace, and attention having trended to signs of industrial recovery, the shares reacted positively on 1/24 to 6% organic industrial rev growth and 12% orders growth. They are maintaining '11E EPS of $1.35 (cons: $1.31), but note increased conviction that their est is well within reach.
icon url

ReturntoSender

01/26/11 11:00 PM

#9225 RE: ReturntoSender #6755

From Briefing.com: 4:20 pm : Stocks finished the session with modest gains, but the Dow failed to hold the 12,000 level, and the S&P never reached 1300. The FOMC interest rate decision and statement was pretty much a non-event. The lone question of how many dissenters there would be on the statement was answered when none of the members voted against the decision.

The major market averages opened mixed, but were soon solidly in positive territory after the better-than-expected New home sales data. New home sales for December increased 17.5% month-over-month to an annualized rate of 329,000 units, a bit above the rate of 300,000 units that had been expected, on average, among economists polled by Briefing.com. Nonetheless, the 17.5% increase comes following the 5.5% gain that occurred in November.

Energy shares were the leaders all session long as the S&P 500 Energy Index closed higher by 2.1%. Halliburton (HAL 43.40, +3.20) and Baker Hughes (BHI 65.99, +3.67) led the advance as 39 of 41 stocks in the index finished higher. Occidental Petroleum (OXY 96.94, -0.21) lagged following the company's mixed earnings report. The company topped EPS expectations by $0.03 per chare, but missed on revenues.

Two IPOs began trading today, and both ended the day with solid gains. Nielsen (NLSN 25.00, +2.00) priced its 71.4 million share IPO at $23, above the $20-22 expected range, while Demand Media (DMD 22.61, +5.61) priced an 8.9 million share IPO at $17, vs. expectations for 7.5 million shares at $14-16.

Shares of Boeing (BA 70.02, -2.22) were under pressure following the company's weaker-than-expected full year 2011 forecast. The company guided earnings of $3.80-$4.00 per share, which is weaker than the consensus estimate of $4.55 per share. The company announced earnings of $1.56 per share (which may not compare) versus the Thomson Reuters consensus of $1.12. Revenues came in soft at $16.55 billion versus the consensus estimate of $17.02 billion. Shares of competitors Lockheed Martin (LMT 78.39, -0.68) and Northrop Grumman (NOC 68.81, -0.70) were weaker on the results.

Shares of Netflix (NFLX 183.03, -3.71) closed lower ahead of the company's Q4 earnings after the closing bell. The Thomson Reuters consensus is calling for earnings per share of $0.71 and revenues of $597.49 million. Analysts will be focusing on subscriber growth, which arguably the most important metric. The company has previously guided for Q4 total subscriptions to be in the range of 19.0-19.7 million.

Treasuries ended the day near their worst levels of the session despite a solid $35 billion 5-yr note auction. The results of the auction caused yields to ease off their highest levels of the session, but buying was short-lived as sellers piled on ahead of the FOMC interest rate decision. After some initial buying following the release of the statement, the selling pressure was too great, and yields moved to their highest levels of the day. The 10-yr ended the day higher by nine basis points at 3.419%. The yield curve ended the day steeper, with the 2-10-yr spread running 279.2.

The dollar index saw some immediate weakness following the FOMC statement, but losses quickly turned to gains before easing back towards the flat line. The pound was the best performing currency all session long, and ended U.S. trading up 85 pips to 1.5900.DJ30 +8.25 NASDAQ +20.25 SP500 +5.45 NASDAQ Adv/Vol/Dec 1995/2.04 bln/649 NYSE Adv/Vol/Dec 2089/1.12 bln/920

6:34PM Teradyne soars 11% to $16.25 after beating Q4 earnings expectations and guiding Q1 well above consensus (See 18:33 comment) (TER) 14.63 +0.49 :

6:33PM Teradyne beats by $0.12, beats on revs; guides Q1 EPS above consensus, revs above consensus (TER) 14.63 +0.49 : Reports Q4 (Dec) earnings of $0.37 per share, excluding non-recurring items, $0.12 better than the Thomson Reuters consensus of $0.25; revenues rose 20.6% year/year to $322.2 mln vs the $316.3 mln consensus. Co issues upside guidance for Q1, sees EPS of $0.33-0.39, excluding non-recurring items, vs. $0.19 Thomson Reuters consensus; sees Q1 revs of $350-375 mln vs. $295.44 mln Thomson Reuters consensus.

4:14PM Lam Research beats by $0.17, beats on revs (LRCX) 54.05 +1.35 : Reports Q2 (Dec) earnings of $1.74 per share, excluding non-recurring items, $0.17 better than the Thomson Reuters consensus of $1.57; revenues rose 78.7% year/year to $870.7 mln vs the $828.7 mln consensus.

4:12PM Integrated Silicon misses by $0.02, reports revs in-line; guides Q2 EPS in-line, revs above consensus (ISSI) 9.92 +0.26 : Reports Q1 (Dec) earnings of $0.26 per share, $0.02 worse than the Thomson Reuters consensus of $0.28; revenues rose 30.6% year/year to $66.1 mln vs the $66.2 mln consensus. Co issues guidance for Q2, sees EPS of $0.22-0.29 vs. $0.22 Thomson Reuters consensus; sees Q2 revs of $59-64.0 mln vs. $58.50 mln Thomson Reuters consensus.

4:11PM Cohu beats by $0.08, beats on revs (COHU) 16.66 +0.53 : Reports Q4 (Dec) earnings of $0.48 per share, excluding non-recurring items, $0.08 better than the Thomson Reuters consensus of $0.40; revenues rose 85.6% year/year to $96.9 mln vs the $95 mln consensus.

4:03PM LSI Logic beats by $0.01, beats on revs; guides Q1 EPS in-line, revs in-line (LSI) 5.86 -0.05 : Reports Q4 (Dec) earnings of $0.14 per share, excluding non-recurring items, $0.01 better than the Thomson Reuters consensus of $0.13; revenues rose 4.1% year/year to $664 mln vs the $649.4 mln consensus. Co issues in-line guidance for Q1, sees EPS of $0.07-0.13, excluding non-recurring items, vs. $0.10 Thomson Reuters consensus; sees Q1 revs of $605-635 mln vs. $615.88 mln Thomson Reuters consensus.

4:02PM Qualcomm beats by $0.10, beats on revs; guides Q2 EPS above consensus, revs above consensus; guides FY11 EPS above consensus, revs above consensus (QCOM) 51.86 +0.34 : Reports Q1 (Dec) earnings of $0.82 per share, $0.10 better than the Thomson Reuters consensus of $0.72; revs rose 25% YoY to $3.35 bln vs $3.20 bln Thomson Reuters consensus. Co issues upside guidance for Q2, sees EPS of $0.77-0.81 vs. $0.68 Thomson Reuters consensus; sees Q2 revs of $3.45-3.75 bln vs. $3.12 bln Thomson Reuters consensus. Co issues upside guidance for FY11, sees EPS of $2.91-3.05 vs. $2.78 Thomson Reuters consensus; sees FY11 revs of $13.6-14.2 bln vs. $12.78 bln Thomson Reuters consensus. "We are very pleased to report record revenues, earnings per share and MSM chipset shipments this quarter driven by increased demand for smartphones and data-centric devices across an expanding number of regions and price points... In addition, we have resolved one of our previously disclosed licensee disputes, which will be reflected beginning with the second fiscal quarter results. We continue to execute on our strategic objectives as our partners leverage our technologies and solutions to offer leading wireless products and services to consumers around the globe. We believe we are uniquely positioned to benefit from these industry trends and are substantially raising our revenue and earnings guidance for the fiscal year."

Silicon Laboratories (SLAB) announced the acquisition of Silicon Valley-based SpectraLinear. Silicon Labs acquired the talented SpectraLinear team and a complementary portfolio of programmable clock ICs for ~$40 million.

Silicom (SILC) announced that a Tier 1 server manufacturer will begin offering appliances which integrate Silicom's SETAC Server To Appliance Converter with one of the popular models of its standard servers.

JA Solar Holdings (JASO) announced that the Company has signed a module supply contract with a leading Italian renewable energy company, which belongs to a large utility group in Europe. Under the terms of this agreement, JA Solar will supply this customer with a total of 29 megawatts of photovoltaic modules during 2011.

8:08AM Silicon Labs beats by $0.09, beats on revs; guides Q1 revs above consensus (SLAB) 47.62 : Reports Q4 (Dec) earnings of $0.46 per share, $0.09 better than the Thomson Reuters consensus of $0.37; revenues fell 12.0% year/year to $111.9 mln vs the $108 mln consensus. Co issues upside guidance for Q1, sees Q1 revs of $116-122 mln vs. $111.34 mln Thomson Reuters consensus. The co anticipates 2011 will be another growth year, with strong contributions from both the broadcast and broad-based businesses. Specifically, the company expects its video business to ramp and triple in size, while the timing business is expected to deliver high double-digit growth again in 2011.

8:01AM Cisco Systems announces intent to acquire Pari Networks (CSCO) 21.57 : Co announced its intent to acquire privately-held Pari Networks, a provider of network configuration and change management (NCCM) and compliance management solutions that will complement Cisco's smart service capabilities. Based in Milpitas, Calif., with part of its employee base in Hyderabad, India, Pari Networks' technology will integrate into Cisco's smart services and help accelerate the ability of Cisco and its partners to manage the health and stability of customer networks.

4:06AM United Micro beats by $0.01, reports revs in-line (UMC) 3.26 : Reports Q4 (Dec) earnings of $0.09 per share, $0.01 better than the Thomson Reuters consensus of $0.08; revenues rose 24.4% year/year to $1.08 bln vs the $1.07 bln consensus. "After experiencing growth momentum for over a year and a half at UMC, we anticipate revenue for the first quarter of 2011 to decline slightly due to appreciation of NT dollar, certain customers undergoing product and technology-node transitions, and other seasonal adjustments. UMC is optimistic about demand for high-end chips this year, with revenue contribution from 40nm growing quarterly in 2011 to become a main revenue driver."

Advanced Energy Industries (AEIS), a leader in power conversion solutions, announced that it will showcase its innovative new products, the Paramount Series of power generators, and the Navigator II matching network at SEMICON Korea 2011.

Thailand's second largest operator, DTAC, with 20 mln subscribers, has signed its first contract with Ericsson (ERIC) to modernize its nationwide 2G, GSM/EDGE network, and prepare for mobile-broadband services based on WCDMA/HSPA and LTE/4G.

08:20 am JA Solar downgraded to Hold at Collins Stewart; tgt $7: . Collins Stewart downgrades JASO to Hold from Buy and sets target price at $7 due to concerns that its business of selling solar cells to independent module makers will come under significant pressure in 2H11 as the current demand strength subsides. Firm says recent statistics from Italy's renewable energy regulator, the GSE, imply a pace of solar installations in CY10 in that country that is 2-3x higher than previously believed. They believe that strength in Italy helped sustain an unnaturally strong level of demand in 2H10.

10:58 am MIPS Q2 EPS Tops Expectations (MIPS)

MIPS Tech (MIPS $13.65 -1.48) reported fourth quarter earnings of $0.14 per share, $0.02 better than the Thomson Reuters consensus of $0.12.

Revenues rose 43.9% year-over-year to $21.9 million versus the $22.2 million consensus.

The company said, "Both our royalty revenue and earnings exceeded our expectations during the quarter."
icon url

ReturntoSender

01/28/11 10:42 AM

#9226 RE: ReturntoSender #6755

From Briefing.com last night: 4:30 pm : The Dow and S&P 500 had a lackluster finish that came after they had wavered near key technical levels, but the Nasdaq managed to score a solid gain following a couple of exceptional quarterly announcements.

Netflix (NFLX 210.87, +27.84) and Qualcomm (QCOM 54.90, +3.04) helped the Nasdaq Composite lock in a nice lead over its counterparts for the entire session. The two stocks were distinguished by their bottom line beats and upside forecasts. Shortly before the closing bell Microsoft (MSFT 28.87, +0.09) posted an upside earnings surprise that pushed the Nasdaq to a session high, but the move was sold into the final minutes of the session.

The surprise announcement from MSFT also helped the S&P 500 clear 1300 and the Dow eclipse 12,000, but neither could hold the move. Both settled slightly below their psychologically significant lines.

Broad market participants were generally uninspired by stronger-than-expected earnings from Dow components Caterpillar (CAT 96.63, +0.88), AT&T (T 28.13, -0.60), and Procter & Gamble (PG 64.18, -1.93), as well as upside surprises from the likes of Eli Lilly (LLY 35.47, +0.52) and Colgate-Palmolive (CL 77.39, -2.61). The primary reason is that simply beating the consensus earnings estimate has become expected, especially in light of the stock market's climb in the past couple of months to two-year highs.

Murphy Oil (MUR 65.74, -7.49) failed to meet the consensus earnings estimate. Bristol-Myers Squibb (BMY 26.35, +0.42) also came short of the call, but compounded the offense with downside guidance. Starbucks (SBUX 33.03, -0.04) beat expectations, but issued downside guidance.

Data today was mixed. Durable goods orders for December dropped 2.5% in an ugly follow up to the 0.1% decline that was recorded in the prior month. The sharp decline in December came as a surprise considering that the Briefing.com consensus called for a 1.5% increase. Excluding transportation, durable goods orders increased 0.5%, but that still is not as strong as the 0.6% increase that had been expected among economists polled by Briefing.com or the 4.5% spike that had been recorded for the prior month.

The latest initial jobless claims tally for the week ended January 22 came in at a three-month high of 454,000, which is well above the 410,000 claims that had been widely expected. Continuing claims came in at 3.99 million, up from 3.90 million.

Pending home sales proved to be a much more positive surprise. They climbed 2.0% when a 0.5% decline had been expected.

The Dollar Index was down fractionally at the end of the trading day. Most of its slip was due to a narrow gain by the euro, although the yen fell a sharp 0.9% to 82.90 yen per dollar after S&P's downgrade of Japan's debt to AA- from AA.

Treasuries had a quiet session that ended with muted gains. An auction of 7-year Notes attracted a bid-to-cover of 2.85, dollar demand of $82.7 billion, and an indirect bidder participation rate of 52.1%.

Advancing Sectors: Financials (+0.9%), Consumer Discretionary (+0.8%), Tech (+0.5%), Industrials (+0.5%), Utilities (+0.4%), Health Care (+0.3%)
Declining Sectors: Energy (-0.5%), Materials (-0.7%), Consumer Staples (-0.9%), Telecom (-0.9%)DJ30 +4.39 NASDAQ +15.78 NQ100 +0.7% R2K +0.2% SP400 +0.5% SP500 +2.91 NASDAQ Adv/Vol/Dec 1348/2.04 bln/1284 NYSE Adv/Vol/Dec 1675/987 mln/1311

4:30PM Microchip beats by $0.01, beats on revs; guides Q4 EPS in-line, revs above consensus (MCHP) 37.89 : Reports Q3 (Dec) earnings of $0.58 per share, excluding non-recurring items, $0.01 better than the Thomson Reuters consensus of $0.57; revenues rose 47.1% year/year to $367.8 mln vs the $361.8 mln consensus. Co issues guidance for Q4, sees EPS of $0.56-0.58, excluding non-recurring items, vs. $0.57 Thomson Reuters consensus; sees Q4 revs of $367.8-378.9 mln vs. $362.00 mln Thomson Reuters consensus.

4:25PM Varian Semi beats by $0.08, beats on revs; guides Q2 EPS above consensus, revs above consensus (VSEA) 43.54 +1.38 : Reports Q1 (Dec) earnings of $0.95 per share, $0.08 better than the Thomson Reuters consensus of $0.87; revenues rose 100.0% year/year to $282.6 mln vs the $276.2 mln consensus. Co issues upside guidance for Q2, sees EPS of $1.02-1.07 vs. $0.81 Thomson Reuters consensus; sees Q2 revs of $315-325 mln vs. $274.73 mln Thomson Reuters consensus.

4:24PM Micros Systems beats by $0.04, reports revs in-line; guides FY11 revs in-line, increases FY11 net income guidance (MCRS) 45.25 -0.24 : Reports Q2 (Dec) earnings of $0.45 per share, $0.04 better than the Thomson Reuters consensus of $0.41; revenues rose 9.5% year/year to $247.1 mln vs the $245.6 mln consensus. Co issues in-line guidance for FY11, sees FY11 revs of $1-1.005 bln vs. $1.01 bln Thomson Reuters consensus. Co also guides for FY11 net income of $145-$147 million, up from its prior guidance of $140-$142 mln. Using its current weighted-average number of shares outstanding, on a diluted basis, this would equate to EPS of $1.75-$1.77. Thomson Reuters consensus for FY11 EPS is $1.76.

4:17PM KLA-Tencor beats by $0.04, beats on revs (KLAC) 44.68 +0.15 : Reports Q2 (Dec) earnings of $1.10 per share, $0.04 better than the Thomson Reuters consensus of $1.06; revenues rose 74.1% year/year to $766 mln vs the $717.9 mln consensus.

4:16PM QLogic beats by $0.06, reports revs in-line (QLGC) 17.93 +0.24 : Reports Q3 (Dec) earnings of $0.53 per share, $0.06 better than the Thomson Reuters consensus of $0.47; revenues rose 4.5% year/year to $155.8 mln vs the $155.6 mln consensus.

4:15PM Rambus and Panasonic (PC) sign patent license agreement (RMBS) 20.95 +0.32 : This five year agreement covers Panasonic's products with DRAM memory controllers for SDR, DDR, DDR2, DDR3, and other DRAM devices. Rambus will receive royalty payments based on the shipment of these memory controllers.

4:14PM Applied Micro beats by $0.01, beats on revs (AMCC) 10.64 +0.24 : Reports Q3 (Dec) earnings of $0.10 per share, $0.01 better than the Thomson Reuters consensus of $0.09; revenues rose 16.2% year/year to $62.4 mln vs the $61.3 mln consensus.

4:09PM SanDisk beats by $0.19, beats on revs (SNDK) 51.32 +1.35 : Reports Q4 (Dec) earnings of $1.27 per share, $0.19 better than the Thomson Reuters consensus of $1.08; revenues rose 6.9% year/year to $1.33 bln vs the $1.3 bln consensus. Reports gross margins of 43.4% compared to 45.2% street expectations

4:09PM Rambus misses by $0.01, beats on revs (RMBS) 20.95 +0.32 : Reports Q4 (Dec) earnings of $0.29 per share, $0.01 worse than the Thomson Reuters consensus of $0.30; revenues rose 195.1% year/year to $90.9 mln vs the $89.3 mln consensus.

4:04PM Microsemi reports EPS in-line, revs in-line; guides Q2 EPS in-line, revs in-line (MSCC) 23.68 -0.60 : Reports Q1 (Dec) earnings of $0.37 per share, in-line with the Thomson Reuters consensus of $0.37; revenues rose 63.5% year/year to $184.4 mln vs the $183.8 mln consensus. Co issues in-line guidance for Q2, sees EPS of $0.44-$0.46 vs. $0.44 Thomson Reuters consensus; sees Q2 revs growing 10-13% sequentially, which equates to approx $202.84-208.37 mln vs. $203.56 mln Thomson Reuters consensus.

4:03PM Lattice Semi beats by $0.03, reports revs in-line; guides Q1 revs above consensus (LSCC) 5.94 +0.13 : Reports Q4 (Dec) earnings of $0.11 per share, $0.03 better than the Thomson Reuters consensus of $0.08; revenues rose 32.7% year/year to $73.1 mln vs the $73.6 mln consensus. Co issues upside guidance for Q1, sees Q1 revs of +2-7% QoQ to ~$74.6-78.2 mln vs. $73.07 mln Thomson Reuters consensus. Gross margin of 62.7%, compared to 59.1% in 3Q10 and 55.3% in 4Q09.

4:03PM Coherent beats by $0.16, beats on revs; guides FY11 revs above consensus (COHR) 47.47 -0.37 : Reports Q1 (Dec) earnings of $0.85 per share, $0.16 better than the Thomson Reuters consensus of $0.69; revenues rose 49.1% year/year to $183.1 mln vs the $176.8 mln consensus. Co says due to the combined impact of record orders, record backlog and the completion of the Hypertronics transaction, it sees FY11 revs of revs of $760-780 mln vs. $715.96 mln Thomson Reuters consensus.

3:50PM Microsoft beats by $0.09, beats on revs (MSFT) 29.33 +0.56 : Reports Q2 (Dec) earnings of $0.77 per share, $0.09 better than the Thomson Reuters consensus of $0.68; revenues rose 4.7% year/year to $19.9 bln vs the $19.15 bln consensus. Co reaffirms operating expense guidance of $26.9-27.3 bln

11:40AM Concurrent has been awarded patent for technology that is foundational for network DVR services (CCUR) 5.63 +0.43 : The patented technology solves the challenges of resource-allocation and management for the storage and distribution of content from a centralized, network-based system. Using factors such as demand, consumption level and timeliness of content, Concurrent's technology enables automatic prioritization of resources for the ingest and delivery of content.

9:15AM Cabot Micro correction - beats by $0.09, revs above consensus (CCMP) 45.57 : Reports Q1 (Dec) earnings of $0.71 per share, $0.09 better than the Thomson Reuters consensus of $0.62; revenues rose 16.9% year/year to $114.2 mln vs the $109 mln consensus. Earlier we incorrectly compared the yr/yr revs. We have deleted the original story.

9:04AM Cirrus Logic beats by $0.01, beats on revs; guides Q4 revs above consensus (CRUS) 17.92 : Reports Q3 (Dec) earnings of $0.34 per share, $0.01 better than the Thomson Reuters consensus of $0.33; revenues rose 46.6% year/year to $95.6 mln vs the $91.7 mln consensus. Co issues upside guidance for Q4, sees Q4 revs of $88-94 mln vs. $85.61 mln Thomson Reuters consensus. Co sees FY11 gross margin to be between 54-56% vs 55.8% consensus.

9:01AM Dell selected by FBI to provide IT Supply and Support; the FBI IT Triple S vehicle has a ceiling value of $30 bln over a period of up to eight years. (DELL) 13.77 : The FBI has selected co's wholly-owned subsidiary, Perot Systems Government Services, a unit of Dell Services, as one of the 46 prime service and solutions providers for the agency's indefinite delivery, indefinite quantity Federal Bureau of Investigation Information Technology Supplies and Support Services contract. A prime services designation provides Dell Services with the opportunity to compete for a range of IT supply and support services at the FBI. The FBI IT Triple S vehicle has a ceiling value of $30 bln over a period of up to eight years.

8:48AM LDK Solar prices a follow-on offering of 12 mln ADS, each representing one ordinary share, at a price to the public of $12.40 per ADS (LDK) 13.02 :

TriQuint Semiconductor (TQNT) and Circuits Multi-Projects announce CMP has chosen TriQuint's TQP15 for its Gallium Arsenide foundry process technology offering for universities and small company customers.

7:31AM Cypress Semi to sell CMOS Image Sensor business unit to ON Semi (ONNN) fo r~$31.4 mln (CY) 20.41 : ON Semiconductor (ONNN) and co announce that a definitive agreement has been signed for ONNN to acquire the CMOS Image Sensor Business Unit from CY in an all cash transaction for ~$31.4 mln. The transaction is expected to close by the end of the first quarter of 2011. Upon the closing, ONNN may record one-time charges related to the transaction. The amounts of such charges, if any, have not yet been determined.

icon url

ReturntoSender

01/30/11 1:00 PM

#9227 RE: ReturntoSender #6755

From Briefing.com: Weekly Recap - Week ending 28-Jan-11The major indices were poised to gain for the eighth out of nine week, but sharp selling Friday resulted in modest losses. Earnings reports acted as the primary drivers of equities. Economic data continued to paint of picture of recovery as annualized real GDP in the fourth quarter rose 3.2%.

The S&P 500 declined -0.5%. Seven of the 10 of the sectors settled in the red, though selling interest was mixed with only 51% of S&P 500 stocks trading lower. Consumer discretionary, consumer staples and health care were the worst performing sectors.

Energy (+1.2%) and materials (+0.9%) outperformed thanks to better-than-expected results from the likes of Halliburton (HAL, +12.0%) and AK Steel (AKS, +10.5%).

The flood of earnings reports this week included 14 Dow components. Results for the latest quarter were generally ahead of estimates, with 11 Dow companies posting better-than-expected EPS. But several companies missed on revenue and issued tepid guidance.

Cyclical names DuPont (DD, +4.0%) and Caterpillar (CAT, +3.2%) outperformed on the heels of strong earnings reports as revenue surged 15% and 68%, y/y, respectively.

On the downside, American Express (AXP, -4.7%) fell after missing EPS expectations. Boeing (BA, -3.4%) was also a laggard after coming up short on revenue as the company's new flagship airliner remains muddled in delays.

Outside of the Dow, high flyer Netflix (NFLX, +19.7%) rallied after reporting strong results and issuing upside guidance. Netflix is now worth a whopping $11.3 bln and trades at a forward price-to-earnings multiple of 50x.

Fellow high flyer Amazon (AMZN, -3.5%) failed to meet the market's lofty expectations. The company topped estimates for the current quarter, but a moderate earnings forecast was met with selling pressure.

Ford Motor (F, -9.4%) shares plunged following a disappointing earnings report. Revenue declined by a smaller-than-expected 6.6%, though earnings came well short of expectations as costs increased and European operations posted a loss.

In economic news, Real GDP increased 3.2% from the previous quarter on a seasonally adjusted rate. Although this figure was slightly below the consensus, the data are extremely strong after stripping out the inventory impact-real final sales skyrocketed 7.1%, the fastest quarterly increase since Q2 1984. Impressively, widespread growth drove the expansion.

New home sales for December increased 17.5% month-over-month and existing home sales climbed 12.3, both ahead of expectations. The uptick in sales reflect why housing starts were on an upward path in the second half of 2010.

Durable goods orders for December dropped 2.5% in an ugly follow up to the 0.1% decline that was recorded in the prior month. The sharp decline in December was well below the Briefing.com consensus that called for a 1.5% increase. Nondefense aircraft orders declined an unheard of 99.5% during the month from $5.085 bln to $24 mln. When we look at the nonseasonally adjust data, we say that aircraft orders actually increased from $5.7 bln to $10.6 bln. The drastic difference between the seasonally and nonseasonally adjusted figures suggest there will be a upward revision.

Importantly, business investment remained strong as orders for nondefense capital goods excluding aircraft increased 1.4% in December as we saw in the GDP report.

The latest initial jobless claims tally for the week ended January 22 came in at a three-month high of 454,000, which is worse than the 410,000 claims that the consensus called for. Continuing claims came in at 3.99 million, up from 3.90 million.

Separately, the latest FOMC statement didn't contain any major surprises. The FOMC left rates unchanged at 0.00-0.25% and maintained the expansion of its asset purchase program, with a continued intention to purchase $600 bln of longer-term Treasury securities by the end of Q2 2011.

In overseas news, Standard & Poor's lowered its sovereign debt rating on Japan by one notch to from AA to AA-. That matches Fitche's rating, but is one ahead of Moody's current rating. Meanwhile, massive protests in Egypt continue to draw attention.

The coming week brings more earnings releases and the January employment report.
 
Index Started Week Ended Week Change % Change YTD %
DJIA 11871.84 11823.70 -48.14 -0.4 2.1
Nasdaq 2689.54 2686.89 -2.65 -0.1 1.3
S&P 500 1283.35 1276.34 -7.01 -0.5 1.5
Russell 2000 773.18 775.40 2.22 0.3 -1.1

9:02AM Motorola Solutions: Telit Wireless Solutions to purchase MSI's M2M modules line of products; financial terms not disclosed (MSI) 38.58 :

09:27 am General Electric upgraded to Buy at Argus; tgt $26: . Argus upgrades GE to Buy from Hold and sets target price at $26 saying GE's industrial businesses have reported higher equipment orders over the past three quarters, and they expect this trend to continue due to growing demand for healthcare imaging products and increased commercial air traffic. In addition, the firm expects a reduction in loan losses at GE Capital based on recent performance and prospects for further improvement in the financial markets.
icon url

ReturntoSender

02/02/11 11:09 PM

#9232 RE: ReturntoSender #6755

From Briefing.com: 4:30 pm : The major equity averages chopped along listlessly all session as big gains from the prior session were allowed to consolidate.

Stocks lacked direction from the start of trade. Many opted to take a breather after the S&P 500 surged 1.8% in the prior session to settle comfortably above key psychological levels that had not been seen since mid-2008. The lack of participation made for sluggish action and low share volume, which failed to surpass 1 billion shares on the NYSE.

Only a muted response was made to the latest ADP Employment Change, which indicated that 187,000 private payrolls were added in January. The consensus among economists polled by Briefing.com had called for 145,000 private payroll additions. Data for the prior month was revised downward to reflect 247,000 private payroll additions, which is the greatest increase since 2006.

The latest round of earnings was generally shrugged off by the broader market, but Electronic Arts (ERTS 18.09, +2.47) attracted attention with its bottom line beat and share repurchase plan. The stock soared to an eight-month high and helped lift the tech sector to a 0.3% gain; tech was the only sector to stage a gain.

Semiconductor stocks also offered support to the tech sector. Their collective 0.5% gain came despite disappointment over the latest results from Broadcom (BRCM 43.79, -2.60).

As for other announcements, Whirlpool (WHR 83.60, -1.82) and AFLAC (AFL 57.10, -1.43) missed consensus earnings calls, but Boston Scientific (BSX 6.85, -0.28) and Time Warner (TWX 35.10, +2.79) both exceeded expectations. Time Warner also announced an 11% dividend increase.

Financials fell to a 0.9% loss. They were the worst performing sector after they had staged one of the strongest moves in the prior session. Multi-line insurers were particularly weak today. Hartford Financial (HIG 27.93, -0.82) fell hard ahead of its quarterly report.

Outside of equities, the dollar caught a slight bid after it had set a two-month low in the prior session. It was up just 0.1% against a collection of competing currencies at the end of the trading day.

Treasuries failed to attract sustainable support. They had been up a bit in the early going, but inevitably fell. The retreat resulted in a 3.50% yield on the benchmark 10-year Note for the first time since December and a 30-year Bond yield of 4.65%, which is its highest level since April. Selling among Treasuries accelerated after it was learned that dealers had wanted to sell more than six times the amount of issues that the Fed was willing to buy back. Pressure eased into the close, though.

Advancing Sectors: Tech (+0.3%)
Unchanged: Energy
Declining Sectors: Financials (-0.9%), Utilities (-0.5%), Telecom (-0.5%), Consumer Staples (-0.4%), Health Care (-0.4%), Materials (-0.3%), Industrials (-0.3%), Consumer Discretionary (-0.2%) DJ30 +1.81 NASDAQ -1.63 NQ100 -0.2% R2K -0.3% SP400 -0.2% SP500 -3.56 NASDAQ Adv/Vol/Dec 1142/2.03 bln/1462 NYSE Adv/Vol/Dec 1391/934 mln/1571

6:06PM Adobe recommends rejection of below-market mini-tender offer by TRC Capital Corp (ADBE) 33.43 -0.08 : Adobe Systems Incorporated (Nasdaq:ADBE) has been notified of an unsolicited "mini-tender" offer by TRC Capital Corp to purchase up to 3 million shares, or less than 0.58 percent, of outstanding Adobe common stock at a price of $32.00 per share in cash. TRC's offer price is approximately 4.53 percent less than the $33.52 closing price of Adobe common stock on Jan. 26, 2011, the day before the offer commenced.

4:31PM Cymer beats by $0.40, beats on revs; guides Q1 revs above consensus (CYMI) 50.01 +0.54 : Reports Q4 (Dec) earnings of $1.08 per share, $0.40 better than the Thomson Reuters consensus of $0.68; revenues rose 52.4% year/year to $146.9 mln vs the $143.6 mln consensus. Co issues upside guidance for Q1, sees Q1 revs of $150 mln vs. $148.14 mln Thomson Reuters consensus.

4:27PM Mattson misses by $0.06 (MTSN) 2.40 : Reports Q4 (Dec) ($0.16), $0.05 worse than the Thomson Reuters consensus of ($0.11); revenues fell 11.3% year/year to $41.3 mln vs the $40.9 mln consensus.

4:26PM Cadence Design beats by $0.03, beats on revs; guides Q1 EPS above consensus, revs in-line; guides FY11 EPS in-line, revs above consensus (CDNS) 8.83 +0.06 : Reports Q4 (Dec) earnings of $0.07 per share, $0.03 better than the Thomson Reuters consensus of $0.04; revenues rose 13.2% year/year to $249 mln vs the $237.9 mln consensus. Co issues mixed guidance for Q1, sees EPS of $0.06-0.08 vs. $0.06 Thomson Reuters consensus; sees Q1 revs of $225-265 mln vs. $241.63 mln Thomson Reuters consensus. Co issues mixed guidance for FY11, sees EPS of $0.30-0.40 vs. $0.35 Thomson Reuters consensus; sees FY11 revs of $1.03-1.07 bln vs. $1.02 bln Thomson Reuters consensus.

4:14PM Newport beats by $0.05, beats on revs; guides Q1 EPS in-line, revs in-line (NEWP) 18.84 +0.40 : Reports Q4 (Dec) earnings of $0.40 per share, $0.05 better than the Thomson Reuters consensus of $0.35; revenues rose 30.9% year/year to $132.9 mln vs the $130.5 mln consensus. Co issues in-line guidance for Q1, sees EPS of approx $0.28 vs. $0.29 Thomson Reuters consensus; sees Q1 revs of approx $123 mln vs. $123.18 mln Thomson Reuters consensus.

08:53 am BRCM Guides Q1 Revs In-line (BRCM)

Broadcom (BRCM $46.39) reported fourth quarter earnings of $0.58 per share, ex-$0.11 in non-recurring items, which may not be comparable to the Thomson Reuters consensus of $0.74; GAAP EPS of $0.47 versus GAAP consensus of $0.57.

Revenues rose 44.9% year-over-year to $1.95 billion versus the $1.9 billion consensus.

For the first quarter, the company expects to see revenues in the range of $1.75 billion to $1.85 billion versus the $1.8 billion Thomson Reuters consensus; with GAAP product gross margin flat from 49.4%, net of increased amortization of ~60 bps.

The company said, "Our record results, powerful balance sheet and strong operating cash flow enable us to increase our dividend by 12.5% and accelerate share repurchases, reflecting our continued commitment to returning capital to our shareholders. Looking ahead, we will focus on continuing to grow revenue faster than our peers and to gain share in our core markets, while maintaining financial discipline."
icon url

ReturntoSender

02/07/11 11:12 PM

#9239 RE: ReturntoSender #6755

From Briefing.com: 4:25 pm : Another round of broad buying drove stocks to new two-year highs. Share volume was unimpressive, though.

Stocks made a quick move higher in the early going. Strong gains by Europe's bourses had helped to provide a positive backdrop in the absence of any domestic data. Merger and acquisition activity also acted as a boon as many thought it an encouraging sign that deals are being made even as stocks trade at their best levels in more than two years.

Pride International (PDE 39.80, +5.41) will be purchased with a mix of cash and stock for $41.60 per share, a premium of about 21% over its closing price last week, by Ensco (ESV 52.13, -2.28). That announcement helped stoke buying in other offshore drillers and exploratory plays.

Beckman Coulter (BEC 82.65, +7.48) will be acquired with cash by Danaher (DHR 49.03, +1.05) for $83.50 per share, a premium of about 11% over its closing price last week.

AOL (AOL 21.19, -0.75) announced it will acquire Huffington Post for $315 million in a mostly cash transaction. The deal comes after AOL had announced better-than-expected earnings last week.

Financials were this session's best performers; they climbed 1.5%. The move was largely led by multi-line insurers like Loews Corp (L 43.27, +1.87), which posted an upside earnings surprise for its latest quarter.

Humana (HUM 58.74, -1.80) was also out with earnings, but its results came short of the consensus forecast. An improved outlook from the firm failed to offset the offense.

While buying lifted the broader market to its best level since mid-2008, there wasn't a lot of share volume behind the move. In fact, share volume on the NYSE failed to break 900 million.

Today's only piece of data was released late in the afternoon. It indicated that consumer credit during December increased by $6.09 billion, which is far more than the $2.50 billion increase that had been expected, on average, among economists polled by Briefing.com. Consumer credit for November had increased by $2.02 billion.

An appetite for risk had initially helped to renew pressure against Treasuries so that yields climbed to levels not seen since May, but they were able to rebound. The benchmark 10-year Note still finished with a fractional loss, but the 30-year Bond scored its first gain in a week.

The dollar finished flat after it had staged gains in the previous three sessions. It had been on pace for another gain, but fell in afternoon trade.

Advancing Sectors: Financial (+1.5%), Industrials (+1.0%), Utilities (+0.7%), Tech (+0.6%), Energy (+0.6%), Consumer Discretionary (+0.5%), Materials (+0.5%), Consumer Staples (+0.1%)
Declining Sectors: Health Care (-0.2%), Telecom (-0.2%) DJ30 +69.48 NASDAQ +14.69 NQ100 +0.5% R2K +1.0% SP400 +0.9% SP500 +8.18 NASDAQ Adv/Vol/Dec 1803/1.77 bln/863 NYSE Adv/Vol/Dec 2073/88 mln/917

4:37PM SMSC issues statement in response to announcement by CNXT of receipt of unsolicited proposal from Golden Gate Private Equity (SMSC) 24.56 +0.17 : "We continue to believe that the combination of Conexant (CNXT) and SMSC provides for a highly complementary merger of talent and technology that is in the interests of Conexant stockholders, customers and employees... We believe that SMSC and Conexant together have the opportunity to take advantage of economies of scale and drive profitable growth, and that our proposal would provide Conexant stockholders with the opportunity to participate in the future success of the combined company." Under the terms of the merger agreement, SMSC will have an opportunity to propose changes to the agreement in the event that Conexant determines that another proposal is superior to the SMSC transaction.

4:31PM Intel is resuming shipments of the Intel 6 Series Chipset for use only in PC system configurations that are not impacted by the design issue; no change to updated outlook (INTC) 21.69 : Co announces that it is resuming shipments of the Intel(R) 6 Series Chipset for use only in PC system configurations that are not impacted by the design issue. Only computer makers who have committed to shipping the Intel(R) 6 Series Chipset in PC system configurations that are not impacted by the design issue will be receiving these shipments. This resumption of shipments of the Intel 6 Series Chipset is not changing the company's updated first quarter 2011 and full-year financial Outlook published on January 31st. In parallel, Intel has started manufacturing on a new version of this support chip. Intel now expects to begin shipping the new parts in mid February.

4:30PM Conexant receives an unsolicited, written proposal from a private equity firm, Golden Gate Private Equity, to acquire co at a price in the range of $2.35 to $2.45 per share in cash (CNXT) 2.10 +0.02 : As previously announced, co entered into a definitive merger agreement on January 9, 2011 with Standard Microsystems Corporation (SMSC) and a wholly owned subsidiary of SMSC pursuant to which co stockholders would receive for each share of co common stock $1.125 in cash and a fraction of a share of SMSC common stock equal to $1.125 divided by the volume weighted average price of SMSC common stock for the 20 trading days ending on the second trading day prior to closing, but in no event more than 0.04264 nor less than 0.03489 shares of SMSC common stock.

4:11PM Veeco Instruments beats by $0.01, reports revs in-line; guides Q1 EPS below consensus, revs below consensus; guides FY11 EPS above consensus, revs in-line (VECO) 45.14 +0.57 : Reports Q4 (Dec) earnings of $1.62 per share, $0.01 better than the Thomson Reuters consensus of $1.61; revenues rose 151.9% year/year to $300 mln vs the $302.2 mln consensus. Reports Q4 gross margins of 50.2% vs 50.3% consensus. Co issues downside guidance for Q1, sees EPS of $1.02-1.39 vs. $1.45 Thomson Reuters consensus; sees Q1 revs of $215-265 mln vs. $292.56 mln Thomson Reuters consensus. Co issues mixed guidance for FY11, sees EPS of greater than $5.00 vs. $4.96 Thomson Reuters consensus; sees FY11 revs of greater than $1 bln vs. $1.09 bln Thomson Reuters consensus. "Q1 2011 revenues will be lower than Q4 2010 because we are planning to ship 12-20 MOCVD reactors in the new MaxBright "cluster" format, and will not be recording any revenue on these systems in the first quarter. Timing of revenue is also being impacted by the longer order-to-revenue cycle times associated with the high percentage of business currently coming from China, primarily due to customer facility readiness. The average time to convert orders to revenue is currently several months longer in China than in other regions."

3:33PM Semiconductor lagging, holds thus far at first level support (SMH) 35.69 -0.12 : The sector has underperformed as the market slipped back modestly off early highs this afternoon but it has thus far held at first level support noted in The Technical Take at 35.63/35.55 (session low 35.58). A sustained push back through 35.85/35.95 is needed over the short term in order to neutralize the weaker price action off the early high.

11:02AM Flextronics & eSolar announce partnership for design services (FLEX) 7.97 +0.01 : eSolar announced that it has entered into an agreement with Flextronics for design services relating to next generation heliostats and solar collector systems. Flextronics plans to provide electromechanical design services from its location in Plano, Texas to support the future requirements of eSolar.

8:32AM Verizon confirms iPhone 4 availability this Thursday (VZ) 36.31 : Co announces beginning at 7 a.m. EST on Thursday, Feb. 10, iPhone 4 will be available at more than 2,000 Verizon Wireless Communications Stores nationwide and Apple's retail stores. iPhone 4 is available for a suggested retail price of $199.99 for the 16 GB model and $299.99 for the 32 GB model with a new two-year customer agreement. Customers can subscribe to a Nationwide Talk plan (beginning at $39.99 for 450 minutes) or a Nationwide Talk and Text plan (beginning at $59.99 for 450 minutes and includes unlimited text, picture and video messaging), as well as an unlimited Email and Web data plan for $29.99 per month.

Rudolph Technologies (RTEC) announced that it has received multiple system orders from a major Asian foundry and an IDM with fabrication facilities in the U.S. for its latest MetaPULSE-G opaque metrology tool.

Lattice Semiconductor (LSCC) announced the immediate availability of five new comprehensive Intellectual Property Suites to accelerate the design of electronic systems in a variety of industries using the award winning LatticeECP3 FPGA family.

07:22 am Cisco Systems target raised to $24 from $22 at Wunderlich: . Wunderlich is raising their tgt to $24 from $22 as firm believes inventory conditions in commercial channels improved and demand remains firm with enterprise accounts. With respect to their intrinsic value calculation (present value of future earnings), this reflects upward fine-tuning of ests and passage of time. In terms of relative value, their new target reflects multiple expansion to that of the S&P 500 multiple.

icon url

ReturntoSender

02/15/11 11:25 PM

#9246 RE: ReturntoSender #6755

From Briefing.com: 4:30 pm : A deluge of data failed to inspire buyers to build on the prior session's two-year closing high. Instead, the major equity averages fell modestly.

Stocks stretched in the prior session so that the S&P 500 came within reach of the 100% gain level from its 2009 low, but participants were generally inclined to sell today. As such, energy and materials plays, which had been leaders in the prior session, succumbed to profit taking. Both sectors logged losses of 1.1%.

Overall pressure was more mild, but utilities (+0.3%) and consumer discretionary stocks (+0.1%) were the only two sectors to score gains. The discretionary space was helped by Marriott (MAR 41.46, +0.46), which reported a better-than-expected bottom line, but issued a mixed outlook.

In other corporate news, Marsh & McLennan (MMC 30.23, +1.36) posted an upside surprise of its own. That helped its shares surge. FedEx (FDX 95.98, +1.99) trimmed its forecast. That was widely forgiven because the revision stemmed from the impact of weather, although higher fuel prices also played a part.

In the latest merger news, NYSE Euronext (NYX 38.12, -1.33) and Deutsche Boerse confirmed that they will combine.

Despite those announcements, data was the theme of the day. Among the more widely watched reports, advance retail sales and sales less autos both increased by 0.3% in January. Economists polled by Briefing.com had expected, on average, increases of 0.5% and 0.6%, respectively. The retail sales picture was further imbued by news that figures for the prior month were revised downward.

The Empire Manufacturing Survey for February came in at 15.4. That was up from the 11.9 posted for the prior month, but in line with the 15.5 consensus call published by Briefing.com.

Import prices for January increased 1.5% month over month, Net Treasury International Capital Flows increased to $48.2 billion in December from $35.6 billion in the prior month, and business inventories for December increased 0.8%. Those reports were assigned secondary status, though.

As for overseas data, China's CPI increased by 4.9% in January. Though that marked an acceleration from the 4.6% increase in December, it wasn't as bad as what had been widely feared. Still, China's PPI for January spiked an even sharper 6.6% after a 5.9% increase in the prior month. Japan reported that its industrial production increased 3.3% during December. The country's central bank also upgraded its economic outlook, but made no change to its key interest rate.

In Europe, France and Germany both reported that their fourth quarter GDP grew 0.4%, but eurozone GDP expanded at a slower 0.3% in the fourth quarter. The eurozone ZEW Survey for February improved to 29.5 from 25.4 in January, but Germany's February ZEW made a more modest improvement to 15.7 from 15.4 from the prior month. Consumer prices heated up even further in the United Kingdom with a 4.0% increase in January after a 3.7% increase in December. That report helped drive the British pound higher against the greenback.

Although the pound gained ground against the dollar, the Dollar Index managed to finish the trading session flat as the dollar advanced against the yen. The Dollar Index just set a three-week high in the prior session.

Advancing Sectors: Utilities (+0.3%), Consumer Discretionary (+0.1%)
Unchanged: Consumer Staples
Declining Sectors: Health Care (-0.1%), Financials (-0.2%), Telecom (-0.3%), Industrials (-0.3%), Tech (-0.5%), Energy (-1.1%), Materials (-1.1%)DJ30 -41.55 NASDAQ -12.83 NQ100 -0.2% R2K -0.7% SP400 -0.5% SP500 -4.31 NASDAQ Adv/Vol/Dec 1007/2.01 bln/1627 NYSE Adv/Vol/Dec 1131/927 mln/1828

5:22PM MEMC Elec reported that Samsung Fine Chemicals and the co sign polysilicon joint venture agreement (WFR) 14.14 -0.21 : Samsung Fine Chemicals (SFC) and MEMC Electronic Materials (WFR) announced a joint venture agreement between SFC and MEMC's affiliate, MEMC Singapore, to produce high purity polysilicon in Ulsan, Korea. Through a 50/50 capital investment, the joint venture will build and operate a new facility on an existing SFC property in Ulsan. The facility, which is expected to begin production in 2013, will have an initial capacity of 10,000 metric tons of polysilicon annually, and have the potential to expand to satisfy rapidly growing demand over time.

4:07PM Dell beats by $0.16, reports revs in-line; guides FY12 revs above consensus (DELL) 13.91 -0.18 : Reports Q4 (Jan) earnings of $0.53 per share, $0.16 better than the Thomson Reuters consensus of $0.37; revenues rose 5.3% year/year to $15.69 bln vs the $15.71 bln consensus. Reports Q4 non-GAAP operating margins of 6.5% vs 6.3% Thomson Reuters consensus. Dell sees FY12 rev +5-9% vs. +4.7% consensus (equates to ~$64.6-67.0 bln vs. $64.43 bln Thomson Reuters consensus). Dell sees FY12 non-GAAP operating income growth of 6-12%, may not compare to +5.6% consensus... For its fiscal-year 2012, Dell expects revenue growth of 5 to 9 percent, non-GAAP operating income growth of 6 to 12 percent, and continued strong execution on cash flow with cash flow from operations exceeding net income. In its first quarter of fiscal-year 2012, Dell expects normal seasonal declines in its consumer and public businesses and, as such, a slight sequential decline in revenue (consensus calls for -1.5% QoQ). Stock is halted.

4:06PM Analog Devices beats by $0.05, reports revs in-line; guides Q2 EPS above consensus, revs in-line (ADI) 41.00 +0.01 : Reports Q1 (Jan) earnings of $0.70 per share, includes $0.04 of one-time tax benefit items, $0.05 better than the Thomson Reuters consensus of $0.65; revenues rose 20.8% year/year to $728.5 mln vs the $728.2 mln consensus. Co issues mixed guidance for Q2, sees EPS of $0.65-0.69 vs. $0.64 Thomson Reuters consensus; sees Q2 revs of $730-760 mln vs. $730.27 mln Thomson Reuters consensus. For the balance of the year, co is planning for expenses to grow slower than revenues.

10:02AM SMTC Corp receives commendation from the City of San Jose (SMTX) 3.50 -0.06 : Co received a Letter of Commendation from the City of San Jose in recognition of the company's presence and operations in Silicon Valley and for its efforts in growing the regional economy. A brief ceremony was held at City Hall and hosted by San Jose Mayor Chuck Reed.

Suniva announced that it is working with Varian Semiconductor Equipment Associates (VSEA) to use ion implantation of boron in the manufacture of solar cells.

SMSC (SMSC) announced that Qualcomm Incorporated (QCOM) has licensed SMSC's patented Inter-Chip Connectivity technology.

Broadcom (BRCM) and ARM (ARMH) announced the signing of a broad reaching license agreement, enabling Broadcom to access the entire range of ARM processors, from the smallest, lowest-power ARM CortexTM-M0 processor, through to the newly introduced, high-performance Cortex-A15 application processor and beyond.

RF Micro Devices (RFMD) announced that Samsung has selected RFMD's PowerSmart power platforms and WiFi components to enable a broad portfolio of next-generation 3G/4G devices, Galaxy S 2 and Galaxy Tab 10.1. Additionally, co announced the addition of four new products to its expanding portfolio of front end modules for 3G/4G switch and signal conditioning applications.

# Skyworks Solutions (SWKS) introduced a new family of antenna switch modules for dual and triple-mode smart phones, tablets and datacards. and power efficiency of the SPARC T3 to the communications market.

# Ericsson (ERIC) and Polycom (PLCM) announced collaboration around an integrated end-to-end solution for hosted telepresence services that will enable telecom operators to deliver affordable, high-definition visual communications services to businesses and consumers.

Powerwave Technologies (PWAV) introduced its new lineup of mobile broadband site solutions that are optimized for operators to quickly and cost-effectively deploy 4G services over existing 2G/3G infrastructure.

Sierra Wireless (SWIR) announced that NetComm has selected Sierra Wireless AirPrime MC7750 and MC7710 intelligent embedded modules to provide 4G cellular network connectivity for its new NetComm Liberty Series LTE WiFi Router. Additionally, co announced that LANCOM has selected Sierra Wireless AirPrime intelligent embedded modules to provide wireless network connectivity for its new line of 4G cellular broadband VPN routers.

icon url

ReturntoSender

02/16/11 11:08 PM

#9247 RE: ReturntoSender #6755

From Briefing.com: 4:30 pm : Natural resource plays led the broader market to another session of strong gains. Data had little sway with traders, though.

Buying abroad overnight and this morning helped bring buyers back into action after the prior session's slip. The stock market's ability to bounce right back from that loss was also indicative that a buy-the-dip mentality continues to permeate trade.

Positive responses to the latest quarterly results from Comcast (CMCSA 25.13, +0.97), Dell (DELL 15.56, +1.65), and Deere (DE 95.86, +2.24) also helped perpetuate an upbeat tone.

Other corporate news included word that Genzyme (GENZ 75.10, +0.80) has agreed to be purchased by Sanofi-Aventis (SNY 34.95, +0.46) for $74 per share plus a Contingent Value Right. That announcement overshadowed disappointing results from GENZ.

Shares of discount retailers benefited from a strong bid after Trian Group issued a proposal to acquire Family Dollar (FDO 53.54, +9.58) for a price in the range of $55 to $60 per share in cash. The specified range represents a premium of at least 25% over FDO's prior session closing price.

Energy stocks and materials stocks made up the two strongest performing sectors. They both snapped back from sizable losses in the prior session to record gains of 1.3% and 1.2%, respectively. Both sectors steadily outperformed for virtually all of the session.

At its session high, the S&P 500 was up 0.7%, but some mid-session selling slashed that gain to less than 0.2%. Pressure intensified around the same time that Reuters reported the planned presence of two Iranian warships in the Suez Canal. Concern about potential geopolitical implications of such a move were pushed aside, at least for now, so that stocks could gradually recoup most of their gains and settle at new two-year closing highs.

Market participants had a relatively muted response to minutes from the latest FOMC meeting, even though the record indicated that the Fed has raised its economic forecast and noted that risks to GDP growth have diminished.

As for data, producer prices for January increased by 0.8%, which is slightly greater than the 0.7% increase that had been generally expected among economists surveyed by Brieifng.com. Producer prices had increased 1.1% in the prior month. As for core producer prices, they increased a more tepid 0.5% month over month, but that is still sharper than the 0.2% increase that had been widely expected after a 0.2% increase in the prior month.

Housing starts for January had been expected, on average, among economists polled by Briefing.com to hit an annualized rate of 540,000, but instead they spiked 14.6% month over month to an annualized rate of 596,000. The surge makes for a sharp rebound from the downwardly revised 5.1% decline that was reported for the prior month.

Building permits for January dropped 10.4% from the prior month to an annualized rate of 562,000. After a 15.3% jump in the prior month, January building permits had been widely expected to come in at 575,000.

Industrial production for January was just posted. It fell 0.1%, which contrasts with the Briefing.com consensus call for a 0.6% increase.

Advancing Sectors: Energy (+1.3%), Materials (+1.2%), Consumer Discretionary (+0.8%), Tech (+0.8%), Financial (+0.6%), Health Care (+0.5%), Industrials (+0.4%), Consumer Staples (+0.2%)
Declining Sectors: Telecom (-0.3%), Utilities (-0.3%)DJ30 +61.53 NASDAQ +21.21 NQ100 +0.7% R2K +1.0% SP400 +0.7% SP500 +8.31 NASDAQ Adv/Vol/Dec 1745/2.28 bln/904 NYSE Adv/Vol/Dec 2256/926 mln/745

5:02PM Teradyne reached an agreement to sell its Automotive Diagnostic Solutions unit to SPX Corporation (SPW) (TER) 18.92 +1.05 : Co has reached an agreement to sell its Automotive Diagnostic Solutions unit to SPX Corporation. Diagnostic Solutions, which serves transportation OEMs, tier-one suppliers and independent service providers is based in Manchester, England and has other major operations in Munich and Detroit. The terms of the sale were not disclosed. Completion of the transaction is expected no later than the second quarter 2011.

4:11PM Rubicon Tech beats by $0.14, beats on revs; guides Q1 EPS upside, revs in-line (RBCN) 21.11 +0.71 : Reports Q4 (Dec) earnings of $0.64 per share, $0.14 better than the Thomson Reuters consensus of $0.50; revenues rose 247.1% year/year to $29.5 mln vs the $26.8 mln consensus. Co issues upside guidance for Q1, sees EPS of $0.62-0.65 vs. $0.52 Thomson Reuters consensus; sees Q1 revs of $34-36 mln vs. $31.30 mln Thomson Reuters consensus.

4:07PM NetApp beats by $0.02, reports revs in-line; guides Q4 EPS below consensus, revs in-line (NTAP) 58.54 +0.10 : Reports Q3 (Jan) earnings of $0.52 per share, excluding non-recurring items, $0.02 better than the Thomson Reuters consensus of $0.50; revenues rose 25.3% year/year to $1.27 bln vs the $1.28 bln consensus. Co issues guidance for Q4, sees EPS of $0.49-0.53, excluding non-recurring items, vs. $0.54 Thomson Reuters consensus; sees Q4 revs +15-20% YoY to $1.36-1.41 bln vs. $1.38 bln Thomson Reuters consensus.

4:02PM Cray beats by $0.19, beats on revs; guides Q1 revs above consensus; guides FY11 revs below consensus (CRAY) .26 +0.15 : Reports Q4 (Dec) earnings of $1.46 per share, $0.19 better than the Thomson Reuters consensus of $1.27; revenues rose 148.8% year/year to $219.4 mln vs the $213.3 mln consensus. Co issues upside guidance for Q1, sees Q1 revs of $35-40 mln vs. $35.00 mln Thomson Reuters consensus. Co issues downside guidance for FY11, sees FY11 revs of $320-340 mln vs. $340.34 mln Thomson Reuters consensus. For the year, gross margins are expected to be in the range of 2010 levels and operating expenses are expected to be higher than 2010, driven primarily by lower anticipated R&D co-funding credits. Based on this outlook, the co expects to be profitable for 2011. Cash balances are expected to increase significantly from fourth quarter levels by the end of the first quarter of 2011.

9:51AM F5 Networks slips back into the red after slightly firmer start (FFIV) 125.10 -1.27 : Stock surged more than 26% off its Jan to to test its 50 sma yesterday off the open. It pulled back and finished in the red Tuesday and this morning it has slipped after a limited push higher off the open. Its 50 ema at 124.50 has provided a support thus far today with its 20 day ema at 123.40.

# STMicroelectronics (STM) and LifeNexus , announced that STMicroelectronics will produce the iChip microprocessor for the LifeNexus Personal Health Card.

# Texas Instruments (TXN) introduced a serial-controlled, 16-channel constant-current sink LED driver with four-channel grouped delay.

# Maxim (MXIM) introduced sampling of the MAX2550-MAX2552, a family of multiband transceivers specifically designed for a new range of dongle, module, and stand-alone femto base stations.

# Agilent (A) announced that they have entered into a licensing agreement with Qualcomm (QCOM) for factory test technology.

08:41 am Dell tgt raised to $18 at Stifel following earnings: . Stifel is raising their tgt to $18 from $16 on higher ests following earnings last night. With a setup where they viewed investor sentiment to largely reflect limited/no directional expectations, they believe Dell's Q4 results and FY12 outlook should result in a healthy share reaction and potential reengagement among value investors. While investors will be left to gauge the impact of decelerating favorable component cost dynamics on the co's GM% story thru FY12 (expect favorable trends to continue thru 1H12), they believe Dell's operational/supply-chain realignment, solutions mix shift, and increased comfort in pricing discipline are viewed as positives.

08:27 am Hewlett-Packard target raised to $55 at Wedbush: . Wedbush raises their HPQ tgt to $55 from $50 saying they that HPQ should be able to modestly beat the January quarter top line Street estimate of $32.96B and materially beat the bottom line Street estimate of $1.29. Firm says the corporate refresh cycle is still going strong and they expect HP to benefit from strength in the enterprise as well as commercial refresh cycles. For the January quarter, they expect material upside to gross margin estimates primarily due to lower component costs and increasing revenue contribution from higher margin businesses such as networking and storage.

10:57 am DELL Guides FY12 Revs Above Consensus (DELL)

Dell (DELL $15.22 +1.31) reported fourth quarter earnings of $0.53 per share, $0.16 better than the Thomson Reuters consensus of $0.37.

Revenues rose 5.3% year-over-year to $15.69 billion versus the $15.71 billion consensus.

Reports fourth quarter non-GAAP operating margins of 6.5% versus 6.3% Thomson Reuters consensus. Dell sees FY12 rev +5% to +9% versus +4.7% consensus (equates to approx. $64.6 billion to $67.0 billion versus $64.43 billion Thomson Reuters consensus).

Dell sees FY12 non-GAAP operating income growth of 6-12%, may not compare to +5.6% consensus.

For its fiscal-year 2012, Dell expects revenue growth of 5 to 9 percent, non-GAAP operating income growth of 6% to 12%, and continued strong execution on cash flow with cash flow from operations exceeding net income.

In its first quarter of fiscal-year 2012, Dell expects normal seasonal declines in its consumer and public businesses and, as such, a slight sequential decline in revenue (consensus calls for -1.5% quarter-over-quarter).

icon url

ReturntoSender

02/17/11 9:38 PM

#9248 RE: ReturntoSender #6755

From Briefing.com: 4:30 pm : After digesting the latest dose of data the major equity averages brushed aside some fainthearted selling to extend their climb to new two-year highs. Natural resource plays led the move for the second straight session.

There was little surprise to the initial jobless claims tally for the week ended February 12. Initial claims increased from 385,000 in the prior week to 410,000, which is in stride with the 408,000 initial claims that had been expected, on average, among economists polled by Briefing.com. Continuing claims were essentially unchanged at 3.91 million.

Consumer prices for January featured a 0.4% increase in the headline number and a 0.2% increase in the core number. The consensus among economists polled by Briefing.com had called for a 0.3% increase in total CPI and a 0.1% increase in core CPI. Prior month increases were 0.4% and 0.1%, respectively, for total and core consumer prices.

The Philadelphia Fed Survey for February surged to a seven-year high of 35.9. Economists had generally expected a reading of only 21.0 after it came in at 19.3 in the prior month.

Leading Indicators for January increased by just 0.1%, which is shy of the 0.3% increase that had been widely anticipated. Indicators for December were downwardly revised to reflect a 0.8% increase.

Data did little to provide direction to morning participants, who were initially inclined to sell. It became clear, though, that there was little conviction behind the selling as stocks gradually turned modest losses into modest gains. The move reflected the broad market's bullish bias, which has helped stocks gain 10 times in the 13 sessions traded so far this month.

Materials stocks (+0.9%) and energy stocks (+0.8%) were leaders in the latest move. The two sectors also outperformed in the prior session and are now up 2.0% and 3.1% week to date, respectively.

There wasn't much news out of the materials sector, but energy plays Apache (APA 120.62, +0.11) and Pride International (PDE 40.55, +0.02) settled near the neutral line after the pair had posted quarterly results this morning. Williams Companies (WMB 30.08, +2.32) was a standout in the space after it announced better-than-expected earnings, an increased dividend, and plans to separate into two stand-alone publicly traded companies.

Semiconductors also made strong gains. NVIDIA (NVDA 25.68, +2.30) led the Philadelphia Semiconductor Index to a 1.4% gain following its latest quarterly report and forecast.

Financials failed to follow the broader market's lead this session. Instead, the sector fell to a 0.1% loss after it failed to push into positive territory on only on a few occasions. Regional banks (-1.3%) and diversified banks (-1.1%) weighed on the sector.

Advancing Sectors: Materials (+0.9%), Energy (+0.8%), Consumer Staples (+0.7%), Telecom (+0.3%), Utilities (+0.3%), Health Care (+0.3%), Tech (+0.2%), Industrials (+0.2%), Consumer Discretionary (+0.1%)
Declining Sectors: Financial (-0.1%)DJ30 +29.97 NASDAQ +6.02 SP500 +4.11 NASDAQ Adv/Vol/Dec 1575/1.94 bln/1053 NYSE Adv/Vol/Dec 1868/881 mln/1126

4:11PM Sunpower beats by $0.31, reports revs in-line; guides Q1 EPS in-line, revs in-line; guides FY11 EPS and revs above consensus (SPWRA) 17.43 +0.29 : Reports Q4 (Dec) earnings of $1.36 per share, excluding non-recurring items, $0.31 better than the Thomson Reuters consensus of $1.05; revenues rose 71.0% year/year to $937.1 mln vs the $931.4 mln consensus. Co issues in-line guidance for Q1, sees EPS of $0.15-0.21, excluding non-recurring items, vs. $0.16 Thomson Reuters consensus; sees Q1 revs of $475-525 mln vs. $488.61 mln Thomson Reuters consensus. Co issues upside guidance for FY11, sees EPS of $2.00-2.20, excluding non-recurring items, vs. $1.87 Thomson Reuters consensus; sees FY11 revs of $2.8-2.95 bln vs. $2.78 bln Thomson Reuters consensus.

JA Solar Holdings (JASO) announced that it has developed a new high-power multi-crystalline solar cell with a conversion efficiency of 18.2%, representing a significant breakthrough in multi-crystalline silicon solar cell technology.

7:05AM Anadigics beats by $0.01, beats on revs; guides Q1 EPS below consensus (ANAD) 6.53 : Reports Q4 (Dec) earnings of $0.07 per share, $0.01 better than the Thomson Reuters consensus of $0.06; revenues rose 44.0% year/year to $60.2 mln vs the $58 mln consensus. Co issues downside guidance for Q1, sees EPS of ($0.07)-(0.08), excluding non-recurring items, vs. $0.04 Thomson Reuters consensus. "We are seeing indications of greater than normal seasonality in the first quarter of 2011 primarily due to softness in China and through our distribution channels relating to excess inventories, coupled with a continued market correction expected to further impact our Cable and WiMax revenue."

7:04AM Plexus authorizes to repurchase up to $200 mln of its common stock (PLXS) 29.27 : Co announces its Board has approved a new stock repurchase program under which the co is authorized to repurchase up to $200 mln of its common stock. The Board has also authorized the co to fund the stock repurchase program with existing cash and new long-term debt of up to $200 mln. This borrowing transaction is expected to close by the end of the co's fiscal third quarter.

10:49 am NVDA Guides Q1 Revs Above Consensus (NVDA)

NVIDIA (NVDA $24.24 +0.86) reported fourth quarter GAAP earnings of $0.29 per share, including a $37.1 million after tax legal settlement from INTC, vs. the GAAP Thomson Reuters consensus of $0.22; revenues fell 9.8% year/year to $886.4 million vs the $892.2 million consensus.

For the first quarter, the company expects revenues to grow 6% to 8% year-over-year to approx. $939.6 million to $957.3 million versus $888.52 million Thomson Reuters consensus, with GAAP GM of 48.5% to 49.5%.

GAAP gross margin was a record 48.1% compared with 46.5% in the previous quarter and 44.7 percent in the same period a year earlier. "Tegra is positioned center stage in the revolution in super phones and tablets, while Tesla is becoming an essential processor for supercomputing. I have never been more excited about NVIDIA's prospects."

09:59 am NTAP Guides Q4 Below Consensus (NTAP)

NetApp (NTAP $53.13 -5.40) reports third quarter earnings of $0.52 per share, excluding non-recurring items, $0.02 better than the Thomson Reuters consensus of $0.50.

Revenues rose 25.3% year-over-year to $1.27 billion versus the $1.28 billion consensus.

For the fourth quarter, the company guided earnings in the range of $0.49 to $0.53, excluding non-recurring items, versus $0.54 Thomson Reuters consensus. Revenues are expected to grow +15-20% year-over-year to $1.36 billion to $1.41 billion versus $1.38 billion Thomson Reuters consensus.

09:54 am RBCN Guides Q1 Above Consensus (RBCN)

Rubicon Tech (RBCN $24.03 +2.92) reports fourth quarter earnings of $0.64 per share, $0.14 better than the Thomson Reuters consensus of $0.50.

Revenues rose 247.1% year-over-year to $29.5 million versus the $26.8 million consensus.

For the first quarter, the company guided earnings in the range of $0.62 to $0.65, above the $0.52 Thomson Reuters consensus. On the top line, revenues are expected to be $34 million to $36 million versus $31.30 million Thomson Reuters consensus.

icon url

ReturntoSender

02/22/11 11:51 PM

#9253 RE: ReturntoSender #6755

From Briefing.com: 4:30 pm : Intense selling sent the S&P 500 to its worst single-session loss in six months as participants pared risk amid rising social and political tension in the Middle East and Northern Africa.

Ongoing protests and social unrest in Libya prompted the country's leader, Gaddafi, to threaten suspension of oil supplies from his country, which boasts the biggest oil reserve in Africa. Gaddafi was also defiant in the face of calls for him to step down as dictator.

Asia's major averages led an overnight sell-off that saw the Shanghai Composite drop 2.6%, the Hang Seng slide 2.1%, and the Nikkei tumble 1.8%. News that Moody's lowered its outlook on Japan to Negative darkened the tone of trade.

The overnight slide combined with concern about volatility related to rising geopolitical risk abroad stirred U.S. participants to slash their stock holdings. At first, their efforts took stocks down about 1%, but as has been the case in previous sessions some stepped in to provide support and bid up the dip. A February Consumer Confidence Index reading of 70.4, which exceeded the Briefing.com consensus of 67.0 to set a near three-year high, aided the effort.

However, in contrast to previous sessions, sellers redoubled their efforts after stocks failed to extend their morning rebound. Persistent pressure took the S&P 500 to its first 2% loss since last August.

More than 90% of the stocks in the S&P 500 ended the day in the red. The bleeding brought in plenty of participants, who sent share volume well above 1 billion on the NYSE. Among the major sectors, materials were hit the hardest. As a group, materials stocks dove to a 3.1% loss. Energy had been resilient in the early going, but weakness inevitably bled into the space as the broad market buckled. Energy stocks had been up as much as 1.5%, but ended the day with a 0.7% loss.

Early strength in the energy sector was predominately underpinned by a spike in oil prices. April crude oil finished 6% higher at $95.32 per barrel. Elsewhere in the commodity space, safety seekers sent April gold up 0.9% to $1401.10 per ounce and silver 2% higher to $32.86 per ounce. Silver prices had actually set a new 30-year high above $34 per ounce in the early morning.

Treasuries also benefited from an interest in safety, despite lackluster results from an auction of 2-Year Notes. The auction drew a bid-to-cover of 3.03 for dollar demand of $106.1 billion, and an indirect bidder participation rate of 31.2%.

The dollar did little today. It had been flat in morning trade, but mustered a gain of merely 0.2% by the end of the day.

Corporate news had no real impact on overall trade. The spike in volatility -- the Volatility Index was up about 30% at its high -- caused many to shrug off earnings from Dow components Home Depot (HD 38.09, -0.39) and Wal-Mart (WMT 53.67, -1.71). Both bested what Wall Street had expected for the bottom line, but HD complemented its report with increased guidance and an increased dividend.

Advancing Sectors: (None)
Declining Sectors: Materials (-3.2%), Financial (-3.1%), Industrials (-2.9%), Tech (-2.6%), Consumer Discretionary (-2.4%), Telecom (-1.7%), Health Care (-1.5%), Energy (-0.7%), Consumer Staples (-0.7%), Utilities (-0.3%)DJ30 -178.46 NASDAQ -77.53 NQ100 -2.9% R2K -2.6% SP400 -2.4% SP500 -27.57 NASDAQ Adv/Vol/Dec 374/2.12 bln/2306 NYSE Adv/Vol/Dec 359/1.11 bln/2701

4:12PM Hewlett-Packard beats by $0.07, misses on revs; guides Q2 EPS, revs below consensus; raises FY11 EPS in-line, lowers revs below consensus (HPQ) 48.23 -0.44 : Reports Q1 (Jan) earnings of $1.36 per share, excluding non-recurring items, $0.07 better than the Thomson Reuters consensus of $1.29; revenues rose 936.3% year/year to $32.3 bln vs the $32.95 bln consensus. Co issues downside guidance for Q2, sees EPS of $1.19-1.21, excluding non-recurring items, vs. $1.25 Thomson Reuters consensus; sees Q2 revs of $31.4-31.6 bln vs. $32.59 bln Thomson Reuters consensus. Co issues mixed guidance for FY11, raises EPS to $5.20-5.28, excluding non-recurring items, from $5.16-5.26 vs. $5.24 Thomson Reuters consensus; lowers FY11 rev to $130-131.5 bln from $132-133.5 bln vs. $132.95 bln Thomson Reuters consensus. Q1 non-GAAP operating margin of 12.4% vs 11.7% Thomson Reuters consensus. HP saw balanced growth in the first quarter across all regions in local currency, with accelerated growth in BRIC countries. Results were largely driven by momentum in the commercial sector as businesses continued to spend on technology. HP experienced uneven consumer performance across its geographies and product categories during the quarter. First quarter revenue was up 6% in the Americas to $14.4 billion. Revenue was flat in Europe, the Middle East and Africa and up 7% in Asia Pacific to $12.1 billion and $5.8 billion, respectively. When adjusted for the effects of currency, revenue was up 5% in the Americas, up 4% in Europe, the Middle East and Africa and up 2% in Asia Pacific. Revenue from outside of the United States in the first quarter accounted for 65% of total HP revenue, with revenue in the BRIC countries increasing 11% while accounting for 11% of total HP revenue.

11:12AM Cisco Systems promotes Gary Moore to COO, a new position within the co, effective immediately (CSCO) 18.66 -0.19

11:01AM Benchmark Elec announces that it has acquired facilities and certain other assets to expand its precision technologies capabilities in Penang, Malaysia; financial terms not disclosed (BHE) 19.58 -0.28 : +

Verizon Wireless (VZ) and Motorola Mobility (MMI) announced the Feb. 24, 2011 availability of the innovative new Motorola XOOM tablet. The first device to run Google's new Android 3.0 Honeycomb operating system, the Motorola XOOM will be available for purchase from Verizon Wireless for $599.99 with a new two-year customer agreement or $799.99 without a contract. Wireless 3G data service for the Motorola XOOM will begin at $20 monthly access for 1GB.

8:25AM Zoran discloses that it has entered a merger agreement with CSR for an equity value of ~$679 mln; ZRAN shareholders will receive ~$13.03 per share in CSR shares (ZRAN) 9.32 : Zoran shareholders will receive ADSs representing the equivalent of 1.85 ordinary shares of CSR for each share of Zoran common stock held, which, as at close on 18 February 2011 represents a value of US$13.03 per share of Zoran common stock. In addition, CSR announces that it intends to return up to US$240 million to shareholders via an on-market share buyback programme. The Share Buyback is intended to achieve an overall financial impact on CSR broadly equivalent to a transaction structured with ~65% stock and 35% cash. The Share Buyback, which will replace the US$50 million programme announced on 13 September 2010, of which approximately US$37 million has been expended, is expected to commence as soon as practicable following this announcement.

8:07AM Chipmos Technology reports Jan revs +24.5% YoY to $53.4 mln; up 1.9% sequentially (IMOS) 7.39 : Revenue for the month of January 2011 was NT$1,548.8 million or US$53.4 million, an increase of 1.9% from the month of December 2010 and an increase of 24.5% from the same period in 2010.

6:26AM Trina Solar beats by $0.78, beats on revs; sees Q1 shipment volume higher QoQ (TSL) 29.41 : Reports Q4 (Dec) earnings of $1.87 per share, $0.78 better than the Thomson Reuters consensus of $1.09; revenues rose 104.9% year/year to $641.8 mln vs the $525.3 mln consensus. Gross margin was 31.4% in the fourth quarter of 2010, compared to the co's previous guidance of ~30%, and was primarily due to higher than targeted ASP. The fourth quarter gross margin compares to 31.4% in the third quarter of 2010 and 32.6% in the fourth quarter of 2009. Gross margin relating to the co's in-house wafer production to module production was 36.5% in the fourth quarter of 2010, compared to its previous guidance of mid 30s in percentage terms, and 37.6% in the third quarter of 2010. For the first quarter of 2011, the co expects its shipment volume for PV modules to be slightly higher than that for the fourth quarter of 2010. The co expects its gross margin relating to its in-house wafer production to module production to be ~30% during the first quarter of 2011. The co believes its overall gross margin, taking into account wafer and cell requirements outsourced to third party suppliers to meet demand in excess of its internal capacity, for the first quarter will be in the mid to high 20s in percentage terms. To meet expected demand for its PV solar modules, the co expects to raise its annualized in-house ingot and wafer production capacity, as well as PV cell and module production capacity to reach approximately 1.2 GW and 1.9 GW, respectively, in the second half of 2011, based on actual manufacturing yield.

1:48AM Jabil Circuit acquires 3 of its former divested operations; expects one time charge to GAPP earnings of $25-40 mln (JBL) 22.57 : Co announces it has acquired three of its former operations in France and Italy, which were divested in July of 2010. Co currently expects, based on existing information, to take a one-time charge of $25-40 mln to U.S. GAAP earnings in its second fiscal quarter of 2011. This charge is principally the write-off of working capital loans for the operations and other expenses associated with the transaction. Co comments: "Although the transgressions of the purchaser that led to this action were beyond our control, we could not stand-by and allow the circumstances to deteriorate further, risking more serious consequences to our stakeholders."

Cree (CREE) announced commercial availability of the LBR-30 LED lamp, aimed at replacing energy-wasting incandescent lamps commonly used in tracks, commercial and residential recessed downlights. Panasonic Solutions Company, a unit of Panasonic (PC) announced it will offer a new high definition, 32", hospital-grade, patient room display later this year.

Dell (DELL) and Microsoft (MSFT) will collaborate to deliver an analytics, informatics, Business Intelligence and performance improvement solution designed specifically to meet the needs of community hospitals through an affordable, subscription-based model.

GT Solar (SOLR) announced its next generation silicon tetrachloride converter for polysilicon production plants using direct chlorination for hydrogenating STC.

icon url

ReturntoSender

02/28/11 10:54 PM

#9258 RE: ReturntoSender #6755

From Briefing.com: 4:30 pm : Stocks overcame some afternoon selling to settle in positive ground with varied gains. That helped secure the sixth straight monthly gain for both the S&P 500 and the Nasdaq, and the third straight monthly gain for the Dow.

Trade started on a strong note with buyers encouraged by solid gains among most major markets abroad, although disappointing earnings from global banking giant HSBC (HBC 55.09, -2.18) hampered Britain's FTSE. The positive tone to early trade was also helped by a pullback in oil prices following word that Saudi Arabia will make up for any supply disruption that stems from the tenuous circumstances in Libya. April crude oil ended lower by 0.9% to $96.97 per barrel.

Amid the action in oil prices, energy stocks faltered after a strong start, but recovered to settle with a 0.6% gain that is on par with what the broader market ultimately scored. Weakness in semiconductor stocks (-1.1%) weighed on the Nasdaq, which lagged its counterparts for virtually the entire session after it had outperformed late last week.

Amazon.com (AMZN 173.29, -3.95) exacerbated the Nasdaq's problems as participants dropped the stock to a three-week low following news that analysts at UBS downgraded shares of AMZN. Apple (AAPL 353.21, +5.05) offered support as it advanced to its fourth straight gain following three consecutive losses.

Although the Nasdaq had a rather underwhelming performance this session, it locked in a 3.5% gain February. The S&P 500 scored a 4.0% monthly gain while the Dow advanced 3.4% for the month.

Fanfare for the latest dose of data was minimal, despite few blemishes.

January personal income increased by 1.0%, which is stronger than the 0.3% increase that had been expected, on average, among economists polled by Briefing.com. However, January personal spending increased just 0.2%, which is less than the widely anticipated increase of 0.4%. Core personal consumption expenditures for January increased just 0.1% month over month, but that had been broadly expected.

The Chicago PMI for February climbed to a 20-year high of 71.2. It had only ben expected to come in at 67.5 after a 68.8 reading in January.

Pending home sales for January fell 2.8% month over month, but that is still better than the 3.2% decline that had been expected, on average, among economists surveyed by Briefing.com. The January decline is also softer than the 3.2% slide reported for the prior month.

Advancing Sectors: Telecom (+1.5%), Utilities (+1.0%), Materials (+1.0%), Health Care (+0.9%), Energy (+0.6%), Consumer Discretionary (+0.6%), Industrials (+0.6%), Financials (+0.5%), Consumer Staples (+0.4%), Tech (+0.2%)
Declining Sectors: (None)DJ30 +95.89 NASDAQ +1.22 NQ100 +0.2% R2K +0.2% SP400 +0.3% SP500 +7.34 NASDAQ Adv/Vol/Dec 1328/2.03 bln/1336 NYSE Adv/Vol/Dec 2040/1.25 bln/966

4:05PM Agilent acquires Lab901 to expand electrophoresis portfolio for molecular biology applications, terms not disclosed (A) 42.08 -0.28 :

4:01PM SMSC announces that NVIDIA Corporation (NVDA) has licensed co's patented Inter-Chip Connectivity technology (SMSC) 26.33 +0.63 : ICC enables the USB 2.0 protocol to be delivered over short distances consuming a fraction of the power of a traditional USB 2.0 analog interface while retaining 100 percent software compatibility with an analog USB 2.0 connection.

9:03AM EMC and IBM Corp (IBM) announced the extension of a technology licensing agreement that enables customers to install and utilize EMC and IBM products in heterogeneous IBM zEnterprise mainframe server environments (EMC) 26.91 :

Veeco Instruments (VECO) announced that Samsung Advanced Institute of Technology in Korea has selected Veeco's TurboDisc K465i Gallium Nitride Metal Organic Chemical Vapor Deposition System for advanced GaN on Si research for power electronics.

8:02AM Vitesse Semi announces that its common shares have been approved for listing on the NASDAQ Global Market; co to trade under ticker "VTSS" (VTSS) : Co announces that its common shares have been approved for listing on the NASDAQ Global Market. The company expects that its common stock will commence trading on NASDAQ on March 2, 2011 under the symbol "VTSS." Until then, its shares will continue to be quoted on Pink Sheets under the symbol "VTSS.PK.

# Finisar (FNSR) announced that its EPON Stick is available as the first Multi-Source Agreement Small Form-factor Pluggable ONU that interoperates with other EPON equipment based on CableLabs DOCSIS Provisioning of EPON specifications.

# Fujitsu Semiconductor and ARM (ARMH) announced that they have signed a comprehensive license agreement for ARM IP products. Additionally, NXP Semiconductors (NXPI) and ARMH announced that they have expanded their strategic relationship with a long-term subscription licensing agreement around the ARM Cortex-M series processors for microcontrollers.

6:17AM JinkoSolar Holding beats by $0.80, beats on revs; guides Q1 revs above consensus; guides FY11 revs above consensus (JKS) 29.24 : Reports Q4 (Dec) earnings of $2.36 per share, $0.80 better than the Thomson Reuters consensus of $1.56; revenues rose 148.3% year/year to $267.7 mln vs the $228.3 mln consensus. Co issues upside guidance for Q1, sees Q1 revs of $280-290 mln vs. $231.65 mln Thomson Reuters consensus. Co issues upside guidance for FY11, sees FY11 revs of $1.4-1.5 bln vs. $978.93 mln Thomson Reuters consensus. The co expects to increase its in-house annual silicon wafer, solar cell and solar module production capacities to ~900 MW each by the end of the first quarter of 2011. For the full year 2011, total solar module shipments are expected to be in the range of 950-1,000 MW. The Company expects to increase its in-house annual silicon wafer, solar cell and solar module production capacities to ~1,500 MW each, as compared to its original guidance of 1,000 MW each by the end of 2011.

icon url

ReturntoSender

03/01/11 11:21 PM

#9259 RE: ReturntoSender #6755

From Briefing.com: 4:30 pm : A spike in oil prices amid percolating geopolitical tension in the Middle East prompted participants to pare their positions. Their steady selling effort left stocks to settle at session lows with sharp losses.

The tone of trade in the early going was actually positive, but buyers began to lose interest as Europe's major bourses drifted lower, even though Germany, France, the United Kingdom, and the broader eurozone all posted solid PMI Manufacturing data. A jump in oil prices before the open of pit trade also undermined early strength.

Oil prices rallied 2.7% to settle at $99.63 per barrel, a two-year closing high. Even after the close oil prices flirted with $100 per barrel in electronic trade. Oil's strength started with morning reports that Saudi Arabia sent tanks into neighboring Bahrain, where social unrest continues to be of concern in a region largely responsible for the world's oil supply. Indicative of the tensions surrounding the region, Saudi Arabia's stock market slumped 7%.

As oil prices pushed higher, participants pressed stocks lower, eventually spurring a broad-based sell-off that left more than 90% of the S&P 500 in the red. That took the Volatility Index up close to 15%.

Precious metals rallied as many sought safety. Silver settled with a 2.0% gain at $34.41 per ounce and gold gained 1.4% to close at $1431.20 per ounce. Silver extended its climb after the close of pit trade so that the continuous contract hit a new 30-year high above $34.60 per ounce. Gold prices hit a record high above $1434 per ounce after pit trade ended.

Although precious metals were strong, materials stocks dropped 2.3% for the worst loss of any major sector. Financials weren't far behind; they dropped 2.2%. Fifth Third (FITB 13.95, -0.65) was one of the financial sector's weakest performers following news that the SEC has subpoenaed the regional bank in connection with certain commercial loans.

The SEC also sent a subpoena to Las Vegas Sands (LVS 43.70, -2.94) in regard to compliance with the Foreign Corrupt Practices Act. CNBC reported that the SEC has filed suit against former Goldman Sachs (GS 161.31, -2.47) Board Member Rajat Gupta regarding allegations of insider trading. Gupta reportedly will step down from the Board of Procter & Gamble (PG 62.74, -0.31).

Economic data did nothing to stymie selling efforts today. The ISM Manufacturing Index for February hit a multi-year high of 61.4 to exceed the Briefing.com consensus of 60.5. However, construction spending for January fell 0.7%, which is a bit steeper than the 0.6% decline that had been broadly anticipated.

Fed Chairman Bernanke delivered his semi-annual monetary policy report to the Senate Banking Committee this morning. He was optimistic of the economic outlook, but made no new revelations.

Advancing Sectors: (None)
Declining Sectors: Materials (-2.3%), Industrials (-2.2%), Financial (-2.2%), Consumer Discretionary (-1.8%), Tech (-1.7%), Telecom (-1.7%), Energy (-1.5%), Utilities (-1.0%), Health Care (-0.7%), Consumer Staples (-0.5%)DJ30 -168.32 NASDAQ -44.86 NQ100 -1.5% R2K -2.0% SP400 -1.7% SP500 -20.89 NASDAQ Adv/Vol/Dec 618/2.22 bln/2032 NYSE Adv/Vol/Dec 724/1.18 bln/2298

4:16PM Altera reaffirms Q1 revs guidance, sequentially down 1-5%, in-line with consensus (ALTR) 41.23 -0.63 : Co reaffirms Q1 revs of a sequential decline of 1-5%, which calculates to ~$533.2-549.8 mln vs. $537.2 mln Thomson Reuters consensus. The company continues to believe that the Industrial Automation, Military & Automotive vertical market will be up sequentially in the first quarter, while sales in the company's other vertical markets will be flat to down.

FIRST announced that, in cooperation with PTC (PMTC), it has expanded the international rollout of the FIRST Tech Challenge program to India, China and Eastern Europe.

9:01AM Zoran issues open letter to shareholders; says proposed merger with CSR offers stockholders significant premium and upside potential (ZRAN) 11.21 : Co issued a letter to shareholders urging support to "prevent Ramius from jeopardizing the value creation potential of the proposed merger of Zoran and CSR. As we recently announced, Zoran is proposing to merge with CSR in an all stock transaction which offers Zoran stockholders a significant premium -- the implied price per share being offered by CSR represents a premium of approximately 39.9% to the closing price of Zoran and a premium of approximately 89% to the enterprise value of Zoran net of cash as of February 18, 2011, the last business day before the merger announcement."

1:32AM Juniper Networks prices $1 bln Senior Notes offering (JNPR) 44.00 : Co announce the the pricing of $300 mln aggregate principal amount of its 3.100% Senior Notes due 2016, $300 mln aggregate principal amount of its 4.600% Senior Notes due 2021 and $400 mln aggregate principal amount of its 5.950% Senior Notes due 2041. Co intends to use the net proceeds from this offering for general corporate purposes, which may include working capital, capital expenditures, other corporate expenses, share repurchases and acquisitions of products, technologies or businesses.


icon url

ReturntoSender

03/05/11 5:37 PM

#9262 RE: ReturntoSender #6755

From Briefing.com: Weekly Recap - Week ending 04-Mar-11The S&P 500 ended the week flat after a sharp fall Tuesday was offset by a sharp increase Thursday. Oil prices hit two year highs on the continued turmoil in Libya and the Middle East, while gold hit a record high. U.S. economic data continues to paint a picture of recovery as private employers hired more than 200,000 people in February.

Most of the sectors settled in a tight range near the unchanged mark. Health care was the top gainer, up 2.4%, while financials acted as the main drag with a loss of 1.6%.

In corporate news, heavyweight Apple (AAPL) rose 3.0% as the company unveiled its new iPad.

In economic news, the employment situation continues to slowly improve. Private employers added 222,000 jobs in February, topping expectations and more than enough to offset a decline in public payrolls, with overall payrolls increasing 190,000. The unemployment rate unexpectedly ticked down to 8.9% from 9.0%.

In economic news, the ISM Service index rose to 59.7, the highest level since 2005. On a related note, the ISM manufacturing Index hit a multi-year high of 61.4, exceeding the Briefing.com consensus of 60.5.

Fed Chairman Bernanke delivered his semi-annual policy report to lawmakers. He was optimistic about the economic outlook but made no real revelations.

Meanwhile, unrest in the Middle East continues to stir up the commodity market. Oil prices rallied 7.3% hitting a multi-year high of $105.17 per barrel. Gold increased 1.6% to an all-time nominal high of $1441 per ounce.

The Treasury market and the dollar also saw volatility but essentially ended the week flat. The dollar saw some weakness after ECB President Trichet said that the ECB may raise interest rates as soon as next month to quell inflation. Note that the ECB has a single mandate of inflation targeting so the move is not necessarily going to be followed by the Fed.
 
Index Started Week Ended Week Change % Change YTD %
DJIA 12130.45 12169.88 39.43 0.3 5.1
Nasdaq 2781.05 2784.67 3.62 0.1 5.0
S&P 500 1319.88 1321.15 1.27 0.1 5.0
Russell 2000 821.95 824.99 3.04 0.4 5.3

Cree, Inc. (CREE) announced a two-year extension of the strategic agreement signed with Zumtobel Lighting GmbH in 2008. The companies continue to work together to bring industry-leading LED lighting to Europe.

China Intelligent Lighting and Electronics (CIL) announced that its LED street lamps have passed the International Commission on Illumination's 127-1997 Standard Test, conducted by National Lighting Test Center. China Intelligent's LED street lamps have already passed tests conducted by Bureau of Quality and Technology Supervision of Dongguan City, Guangdong Province.

Amtech Systems (ASYS) announced that its solar subsidiary, Tempress Systems, has increased its share of the solar diffusion market to ~40% and has been ranked number one in revenue in calendar 2010 for process tools used in c-Si cell diffusion for the solar market, based on analysis contained within Solarbuzz's PV Equipment Quarterly of trended quarterly tool revenue.

1:28AM MEMC Elec prices private offering of $550 mln of 7.750% Senior Notes due 2019 (WFR) 13.07 : The co plans to use the net proceeds of the offering for general corporate purposes, including working capital, capital expenditures, the construction of solar power projects, and acquisitions, investments, strategic transactions and joint ventures.

07:58 am Juniper Networks: Auriga remains buyers at these levels: . Auriga maintains their Buy and $54 target for Juniper (JNPR), as the company laid out its disruptive, innovation-driven growth strategy in its Analyst Day and also introduced its new packet transport switch for the "super" core of service provider networks. Firm notes JNPR also re-iterated its operating targets of 20%+ top-line growth and 25%+ operating margins. Combined with the growth potential of new QFabric (Stratus) data center product and MobileNext (Falcon) EPC solution, they continue to see JNPR as well positioned to grow at 20%+ rates with significant operating leverage over the next 4-5 years.

10:34 am MRVL Guides Q1 Below Consensus (MRVL)

Marvell (MRVL 16.58 -1.64) reported fourth quarter earnings of $0.40 per share, worse than the consensus of $0.42.

Revenues rose 6.9% year-over-year to $900.5 million, below the $923.9 million consensus.

On the conference call management issued guidance seeing first quarter revenues of $800-850 million, below the $887.71 million consensus. Also on the conference call Marvell issued Q1 EPS guidance of roughly $0.30, below the $0.36 consensus.

The company reported a fourth quarter non-GAAP gross margin of 59.4% vs. the 59.4% consensus.

The company's Board of Directors also authorized the company to repurchase up to an additional $500 million, for a total of $1 billion, of its outstanding common shares. As of February 28, 2011, Marvell reported it has purchased roughly $150 million under the existing repurchase authorization bringing the total available under the repurchase program up to approximately $850 million.
icon url

ReturntoSender

03/06/11 9:55 PM

#9263 RE: ReturntoSender #6755

Monday Morning Outlook: Rising Anxiety as Bull Market Turns Two
Stocks finished a choppy week more or less unchanged

by Todd Salamone 3/5/2011 12:58 PM

http://www.schaeffersresearch.com/commentary/observations.aspx?ID=105373&trackback=mmoezine

The major market indexes went on a roller-coaster ride last week, as soaring oil prices incited inflationary concerns. By the time the dust settled, though, stocks finished five drama-filled days more or less where they started. As we look ahead to a new week, Todd Salamone believes the bulls may still have the edge -- but highlights a few critical technical levels to watch amid continuing global turmoil.

Meanwhile, Rocky White celebrates the bull market's two-year anniversary by looking back at previous winning streaks for the Dow industrials, and uncovers the best-performing sectors during the market's latest bust-and-boom cycle. Finally, we wrap up with updates on a few sectors of note, along with a preview of the week ahead.

What the Trading Desk Is Expecting: Choppy Action as Indexes Test Key Levels
By Todd Salamone, Senior Vice President of Research

"With all the talk about the SPX doubling a couple of weeks ago, it appears some hedge fund managers may have taken this as a cue to become less aggressive in accumulating equities. Our analysis of option activity on the iShares Russell 2000 Index (IWM), PowerShares QQQ Trust (QQQQ), and SPDR S&P 500 ETF (SPY) shows the combined buy-to-open put/call ratio on these funds rolling over, suggesting that the purchase of portfolio protection that usually occurs with equity accumulation has slowed. Previous such rollovers in the ratio have preceded range-bound periods or declines.

The bright side is that with retail cash still flowing into domestic equity funds -- and in the early innings of doing so, as discussed last week -- the market still has a source of demand that it did not have during previous instances in which hedge funds managers had their fill... But the negative is that retail players are less apt to hedge their portfolios, and more prone to panic-sell on negative headlines."
-- Monday Morning Outlook, Feb. 26, 2011

If last week is any indication of what lies ahead in the immediate future, a period of choppy trading may be in store as geopolitical tensions drive oil prices higher on supply-side concerns. For example, at its trough and peak on Wednesday and Thursday, the S&P 500 Index (SPX) traded 20 points below and 12 points above the prior week's close, before ending the week at 1,321.15 -- just 1.27 points above the previous Friday's close. In fact, it took a rally in the last half-hour of Friday's session to put the SPX into positive territory for the week. Daily declines of 1.6% and 0.73% sandwiched a 1.7% advance on Thursday.


The key SPX levels of 1,300 and 1,333 came into play once again, with the 1,300 area marking the lows on Wednesday afternoon. Meanwhile, the 1,333 area was the site of the SPX's peak late Thursday afternoon, before rumors of political unrest spreading to Saudi Arabia once again sent crude oil higher and stocks lower. Remember, the 1,333 level marks a double of the SPX's March 2009 low, and since rallying above this level in mid-February, the index has traded slightly lower.

The CBOE Market Volatility Index (VIX --19.06) comes into this week trading at a critical juncture. Last week, we discussed the late-February pop in the "fear index" that was capped at the VIX's 200-day moving average, which is currently situated at 22.31. This week, we'll take an even longer-term look at the VIX, using its 80-week moving average -- which is currently sitting at 22.34, within just 0.03 point of its 200-day moving average. Like its 200-day counterpart, the 80-week trendline has had historical significance. Bulls would prefer to see the VIX remain below these long-term moving averages, while caution should be exercised if the index were to move above them.


Moreover, we have mentioned the historical importance of the 20 area for the VIX in previous commentaries. The VIX, in fact, traded above 20 for most of the day Friday, but managed to close back below this level for the second consecutive week. This action in the VIX favors the bulls as we enter this week's trading.


Clearly, news flow from the Middle East and North Africa is driving the dramatic day-to-day action in equities, as the SPX's double lows are challenged. At the same time, the round-number 1,300 level on the SPX has provided firm support in a market that has so far proven to be relatively resilient amid a 31% surge in oil prices during the past two-and-a-half weeks. The technical and sentiment backdrops continue to favor the bulls, but the uncertainty related to overseas developments warrants the use of portfolio protection in the event of a continued spike in oil driven by supply-side concerns.

Indicator of the Week: The Bull Market's Two-Year Anniversary
By Rocky White, Senior Quantitative Analyst

Foreword: Wednesday of this upcoming week will mark exactly two years since the Dow bottomed in 2009. Since then, the Dow is up about 85%. This week, I'll look back at other such high-flying rallies over a two-year period. Also, I'll look at some specific sectors to see which groups have and have not participated in the rally.

Dow Rallies: An 85% rally over two years is quite rare for the Dow. The table below shows each time the Dow has accomplished this feat over a two-year period, going all the way back to 1900. This is only the ninth occurrence. The table also shows how the Dow fared over the next three months, six months, one year and two years after hitting this technical milestone. The returns are summarized in the second table below.


Summary of Returns


After hitting a two-year bull market anniversary, the Dow has tended to continue its rally during the next six months. However, the returns are bearish in the longer term. One year after this event, the Dow averages a loss of 2.7%. Two years later, the Dow was higher only 25% of the time averaging a significant 6.3% loss.

Sector Performance: I looked at some popular exchange-traded funds (ETFs) over the last few years to compare how individual sectors performing during the 2008 crash, and since the market bottom.

Below is a table showing the best ETF returns since the March 9, 2009 bottom. Precious metals are very popular right now, so it's not a huge surprise that SPDR S&P Metals and Mining ETF (XME) and iShares Silver Trust (SLV) are on this list. SLV has been especially impressive, as it has gained about 150% -- even including the 2008 market crash.

The financial and real estate sectors have really performed well, but remember: Those sectors got crushed during the crash. I think the appearance of the SPDR S&P Retail ETF (XRT) on this list will come as quite a surprise for many people. Even if you bought at the 2007 market top, this ETF has returned a respectable 22% over the last three years.


This next table shows the worst-performing sectors during the rally. Of the sector ETFs that I considered -- about 30 of them -- only PowerShares DB US Dollar Index Bullish Fund (UUP) and iShares Barclays 20+ Year Treasury Bond Fund (TLT) were down. Both of those assets were actually up during the crash. These are considered "safe havens," and money has started leaving these funds and flowing into riskier assets like stocks and commodities.

Thanks to overseas turmoil, the U.S. Oil Fund (USO) has been up over the last few weeks -- but over the last two years, the fund's returns are pretty modest compared to other assets. The Health Care Select Sector SPDR Fund (XLV) and the PowerShares DB Agriculture Fund (DBA) are also up modestly during the rally.


Below are some broader-based ETFs that I thought might be interesting to look at. Focusing on the major indexes, it's not a surprise that iShares Russell 2000 Index Fund (IWM) has performed the best during the rally -- small-cap names are typically more volatile than big-cap stocks. What's interesting, though, is that during the crash, the IWM's return was very similar to the returns of the larger-cap SPDR S&P 500 ETF (SPY) and SPDR Dow Jones Industrial Average ETF Trust (DIA) funds. The big caps, evidently, were not much of a "safe" play during the crash. The performance of iShares MSCI Emerging Markets Index Fund (EEM) is pretty similar to the U.S. index fund returns.

Last but not least, I've also included the returns of SPDR Gold Trust (GLD). Of all the ETFs I considered, GLD was the only one that showed positive returns during the 2008 crash and during the rally of the last two years.


This Week's Key Events: Fed Presidents Bookend a Light Week
Schaeffer's Editorial Staff

Here is a brief list of some of the key events this week. All earnings dates listed below are tentative and subject to change. Please check with each company's respective website for official reporting dates.

Monday
* The economic calendar kicks off Monday with updates on consumer credit and employment trends, as well as comments from Fed Presidents Dennis Lockhart and Richard Fisher. On the earnings front, Ciena (CIEN), Urban Outfitters (URBN), Perfect World (PWRD), and Casey's General Stores (CASY) will release their quarterly reports.

Tuesday
* On Tuesday, we'll hear the latest report on chain-store sales from ICSC-Goldman Sachs. Notable earnings reports include Suntech Power (STP), Dick's Sporting Goods (DKS), AeroVironment (AVAV), and Korn/Ferry (KFY).

Wednesday
* Wednesday brings us word on wholesale inventories for January, the latest MBA mortgage applications survey, and the regularly scheduled update on domestic petroleum supplies from the Energy Information Administration (EIA). Meanwhile, the day's earnings docket includes H&R Block (HRB), American Eagle Outfitters (AEO), Hercules Offshore (HERO), and Molycorp (MCP).

Thursday
* The weekly report on jobless claims hits the Street on Thursday, along with import/export data for January. Canadian Solar (CSIQ), National Semiconductor (NSM), Clean Energy Fuels (CLNE), and Smith & Wesson (SWHC) share the earnings stage.

Friday
* We wrap up the week with the preliminary Thomson Reuters/University of Michigan consumer sentiment survey for March, along with comments from New York Fed President William Dudley. Retail issues AnnTaylor Stores (ANN) and Citi Trends (CTRN) round out the week's roster of earnings reports.
icon url

ReturntoSender

03/06/11 11:20 PM

#9264 RE: ReturntoSender #6755

This BPNDX Chart will continue to update:


This market can still advance but it is getting more mature. Fear the negative divergences of lower numbers of stocks above their 200 day simple moving averages along with lower highs in the BP Indexes even as the market makes new highs.

RtS
icon url

ReturntoSender

03/07/11 10:02 PM

#9265 RE: ReturntoSender #6755

From Briefing.com: 4:30 pm : The Nasdaq Composite led its counterparts lower as participants dumped semiconductor stocks and other tech related issues. However, the ability of the S&P 500 to hold steady above last week's lows helped pull the Nasdaq back above its 50-day moving average.

The major U.S. averages logged losses last Friday, but they all made a strong upward push in the final minutes of that session. That and a pullback by oil prices from a two-year high of almost $107 per barrel at the start of pit trade helped stocks start the new week on a positive note. It didn't take long for sellers to step in, though.

At first, sellers were focused on tech stocks. Their effort took the Nasdaq down to a 2.0% loss so that it traded below its 50-day moving average once again. As selling spread, the broader S&P 500 flirted with last week's low, but its ability to hold steady above that mark caused selling pressure to ease a bit so that it could slowly pare its loss. That helped lift the tech-rich Nasdaq back above the key trend line.

Semiconductor stocks still finished with a collective loss of 2.7%, but Ciena (CIEN 25.98, -2.83) suffered a near 10% loss after it issued disappointing guidance. Its upside earnings surprise for the latest quarter was completely ignored.

Consumer credit data made up the only item on the economic calendar, but the figures were of little consequence to the broader market. Consumer credit for January increased by $5.0 billion, which is greater than the $3.3 billion increase that had been expected among economists surveyed by Briefing.com. December's consumer credit was revised downward to reflect an increase of about $4.1 billion.

Advancing Sectors: Utilities (+0.4%)
Declining Sectors: Materials (-1.8%), Tech (-1.4%), Consumer Discretionary (-1.0%), Health Care (-0.9%), Industrials (-0.8%), Financial (-0.7%), Energy (-0.7%), Consumer Staples (-0.3%), Telecom (-0.1%)DJ30 -79.85 NASDAQ -39.04 NQ100 -1.4% R2K -1.5% SP400 -1.3% SP500 -11.02 NASDAQ Adv/Vol/Dec 610/2.19 bln/2050 NYSE Adv/Vol/Dec 702/1.04 bln/2315

3:15PM Semtech reports grants of inducement awards (SMTC) 23.64 -0.52 : Co announced that as an inducement to enter into employment with Semtech, it has made awards effective March 1, 2011 of restricted stock units ("Inducement Awards") to two recently hired employees under the Semtech 2009 Long-Term Equity Incentive.

11:35AM Semi continues to be a drag on underperforming Nasdaq, XSD, XLK and Nasdaq Comp near their 50 day averages (TECHX) : The Semi sector has been a drag throughout the session with the XSD slipping under its 50 day ema/sma for the first time since last Sep (held on intraday basis in late Feb). The SMH is off 3.1% but is holding above last week's low at 35.16 (session low 35.26). The Semi declines also leaves the XLK back near its 50 sma/ema at 26.16/26.09 (session low 26.08). As noted earlier the Nasdaq Comp -38 is just above its 50 day sma at 2750.

8:30AM O2Micro confirms Patent for EEFL Protection System Granted to O2Micro (OIIM) 8.26 : Co announces it was issued 20 claims under United States patent number 7,888,889 for its External Electrode Fluorescent Lamp System Protection architecture; a continuation of the invention issued June 2009 under United States patent number 7,554,273.

7:06AM Hitachi: Western Digital (WDC) to acquire Hitachi Global Storage Technologies in transaction valued at ~$4.3 bln (HIT) 61.24 : Western Digital and Hitachi entered into a definitive agreement whereby Western Digital will acquire Hitachi Global Storage Technologies in a cash and stock transaction valued at ~$4.3 billion. Under the terms of the agreement, WD will acquire Hitachi GST for $3.5 billion in cash and 25 million WD common shares valued at $750 million, based on a WD closing stock price of $30.01 as of March 4, 2011. Hitachi will own ~10% of Western Digital shares outstanding after issuance of the shares and two representatives of Hitachi will be added to the WD board of directors at closing. The transaction has been approved by the board of directors of each company and is expected to close during the third calendar quarter of 2011, subject to customary closing conditions, including regulatory approvals. WD plans to fund the transaction with a combination of existing cash and total debt of approximately $2.5 billion. Western Digital expects the transaction to be immediately accretive to its earnings per share on a non-GAAP basis, excluding acquisition-related expenses, restructuring charges and amortization of intangibles.

7:04AM GT Solar settle two putative securities class-action lawsuits related to co's IPO for $10.5 Million (SOLR) 10.97 : Co anounces announced that it has reached an agreement in principle to settle two putative securities class-action lawsuits related to the Company's initial public offering on July 24, 2008. The terms of the proposed settlement, which includes no admission of liability or wrongdoing by the co or by any other defendant, provide for a full and complete release of all claims that were or could have been brought against all defendants in both the federal and state securities actions. The Company will pay $10.5 million into a settlement fund. Of this amount, the co will contribute $1 million and the co's liability insurers will contribute the remaining $9.5 million. The co's contribution represents its contractual indemnification obligation to its underwriters. Both the terms of the proposed settlement and the plan of distribution for the settlement fund are subject to further documentation and Court approval.

7:03AM Ciena beats by $0.02, beats on revs; guides Q2 revs below consensus (CIEN) 28.81 : Reports Q1 (Jan) loss of $0.14 per share, excluding non-recurring items, $0.02 better than the Thomson Reuters consensus of ($0.16); revenues rose 146.3% year/year to $433.3 mln vs the $421.9 mln consensus. Co issues downside guidance for Q2, sees Q2 revs of $415-435 mln vs. $438.54 mln Thomson Reuters consensus, with an adj. gross margin on the low 40s ragne. "We continue to be encouraged by strong end user demand and recent customer awards that validate our technology and solutions and leave us well positioned for growth. In the short term, however, we are mindful of the effects of our back office integration activity, which -- while extremely well-executed -- resulted in some revenue acceleration into the first quarter and minor ERP-related supply chain constraints at the beginning of our second quarter."

PMC-Sierra (PMCS) announced 10G-EPON OLT devices with industry-leading traffic management, packet processing, on-chip redundancy and the industry's most advanced optical diagnostic technologies.

2:54AM NXP Semi issues $500 mln covenant light term loan transaction (NXPI) 30.75 : Co announces that its subsidiary, NXP B.V., together with NXP Funding, has concluded a new $500 mln Senior Secured Term Loan Facility due in 2017. The transaction is scheduled to close within a month. The new loan has a margin of 3.25% above LIBOR, combined with a LIBOR floor of 1.25%, and was priced at 99.5%. Co separately announced that it intends to issue redemption notices for all $362 mln outstanding of its 7.875% Senior Secured Notes due 2014, together with $100 mln of its US dollar-denominated Floating Rate Notes due 2013 and $200 mln of its Euro-denominated Floating Rate Notes due 2013.

07:37 am OmniVision tgt raised to $50 at Oppenheimer: . Oppenheimer is raising their tgt to $50 from $40 as they note channel checks indicate that recent chatter about competitive share losses and BSI2 yield problems are a lot of hooey. It's true (as they've previously reported) that a surge in demand has left OVTI capacity constrained, and that this has made it difficult to fully support lower priority customers and markets. But according to our checks OVTI is winning the business it wants to win and retaining the customers that have been the cornerstone of its success in recent years. They're increasingly confident that the strong underlying growth trends and design win momentum will translate into another step-function rev increase in late 1Q12, as incremental capacity (all BSI2) ramps.

09:56 am JASO & WFR Announce Joint Venture

JA Solar (JASO 7.05 +0.05) and MEMC (WFR 12.84 -0.11) announced a joint venture agreement between JA Solar and MEMC's affiliate, MEMC Singapore, to build and operate a solar cell production facility in China.

The companies reported that in Phase One of the project, the joint venture will build a production facility with a capacity of 250 megawatts of photovoltaic cells. The companies also reported that the phase one production facility will be located at JA Solar's Yangzhou site, and is expected to begin commercial production in the second half of 2011. In later phases, total production capacity may be expanded up to 1GW.

The joint venture will be a 50/50 partnership between JA Solar and MEMC Singapore.

09:29 am CIEN Reports Q1 Results Above Expectations (CIEN)

Ciena (CIEN 28.81) reported a first quarter loss of $0.14 per share, $0.02 better than the consensus of ($0.16).

Revenues rose 146.3% year-over-year to $433.3 million, above the $421.9 million consensus.

The company issued downside guidance for the second quarter, sees second quarter revenues of $415-435 million, below the $438.54 million consensus.

The company stated "We continue to be encouraged by strong end user demand and recent customer awards that validate our technology and solutions and leave us well positioned for growth. In the short term, however, we are mindful of the effects of our back office integration activity, which -- while extremely well-executed -- resulted in some revenue acceleration into the first quarter and minor ERP-related supply chain constraints at the beginning of our second quarter."
icon url

ReturntoSender

03/08/11 11:35 PM

#9266 RE: ReturntoSender #6755

From Briefing.com: 4:30 pm : The major equity averages scored strong gains as oil prices failed to fight off selling efforts and financials offered leadership.

Stocks stumbled in the early going as oil prices rallied back from overnight selling pressure. Oil had been hit by news reports that OPEC would increase production. Although later reports indicated that the organization has no plans for an extraordinary meeting, oil still failed to sustain its move and spent the rest of the day oscillating in negative territory. It closed with a 0.4% loss near $105 per barrel.

Financials showed strength from the onset of trade. Even as the broader market made an early dip into negative territory the sector traded higher. Once oil proved unable to sustain a push into positive territory financials attracted additional buying interest. Support for a wide range of financial issues helped drive the sector to a 2.2% gain. Specialized finance (-0.5%) failed to fined favor, though.

Even more impressive, airline stocks soared to a 4.8% gain. That made for the strongest single-session move by the Amex Airline Index in more than four months. The Airline Index is still down almost 6% year to date though.

Of the major sectors, only energy finished in the red. The sector's 0.6% loss was largely the result of weakness in oil and gas refiners, which dropped 2.4%.

There were no economic releases today and earnings announcements were without any real broad market concern. That may have kept some on the sidelines, but total share volume was still close to 1 billion on the NYSE.

The decidedly positive bias among afternoon traders helped the S&P 500 and the Dow undo yesterday's loss. However, relatively lackluster performances by a few large-cap tech issues hampered the Nasdaq today, so it is still down a bit for the week.

While Wall Street had a strong session, action abroad was a bit mixed. Germany's DAX and Britain's FTSE both finished flat, but France's CAC climbed to a 0.6% gain. The Bank of France kept its first quarter GDP forecast unchanged at 0.8% growth. In Asia, Japan's Nikkei and China's Shanghai Composite closed with minor gains, but Hong Kong's Hang Seng surged 1.7% as buyers there were encouraged by news that some banks will have their reserve requirements eased.

Advancing Sectors: Financials (+2.2%), Telecom (+1.6%), Industrials (+1.5%), Utilities (+1.0%), Materials (+1.0%), Consumer Staples (+0.8%), Consumer Discretionary (+0.7%), Health Care (+0.7%), Tech (+0.6%)
Declining Sectors: Energy (-0.6%)DJ30 +124.35 NASDAQ +20.14 NQ100 +0.4% R2K +1.5% SP400 +1.2% SP500 +11.69 NASDAQ Adv/Vol/Dec 1898/1.85 bln/745 NYSE Adv/Vol/Dec 2243/987 mln/717

4:39PM Suntech Power reports Q4 (Dec) results, beats on revs; guides FY11 revs above consensus (STP) 9.00 -0.15 : Reports Q4 (Dec) earnings of $2.02 per share, which includes acquisitions and is not be comparable to the Thomson Reuters consensus of $0.29; revenues rose 61.9% year/year to $945.1 mln vs the $843.7 mln consensus. Co issues upside guidance for FY11, sees FY11 revs of $3.4-3.6 bln vs. $3.36 bln Thomson Reuters consensus. For the fourth quarter of 2010, consolidated gross profit was $153.4 million and gross margin was 16.2% compared to consolidated gross profit of $122.0 million and gross margin of 16.4% in the third quarter of 2010. In the first quarter of 2011, Suntech expects PV shipments to be relatively flat compared with the fourth quarter of 2010. Due to the integration of wafer manufacturing capacity, consolidated gross margin in the first quarter of 2011 is expected to increase to approximately 20%. For the fiscal year ending December 31, 2011, Suntech expects to ship at least 2.2GW of solar products and generate revenues of $3.4 billion to $3.6 billion, subject to changes in foreign exchange rates. Consolidated gross margin for the full year 2011 is expected to be approximately 20% to 22%. Suntech expects to achieve 2.4GW of installed cell and module production capacity by the end of 2011. Suntech expects to achieve 1.2GW of installed wafer capacity by the end of 2011. Full year 2011 capital expenditures are expected to be in the range of $250 million to $270 million.

4:31PM Texas Instruments narrows Q4 guidance; EPS to $0.56-0.60 vs. $0.59 consensus; rev $3.34-3.48 bln vs. $3.41 bln consensus (TXN) 35.86 +0.38 : Previous Q4 guidance: EPS of $0.54-0.62; rev: $3.27-3.55 bln.

4:29PM Finisar reports EPS in-line, beats on revs; guides Q4 EPS, revs below consensus (FNSR) 40.04 : Reports Q3 (Jan) earnings of $0.47 per share, excluding non-recurring items, in-line with the Thomson Reuters consensus of $0.47; revenues rose 57.6% year/year to $263 mln vs the $257.9 mln consensus. Non-GAAP gross margin decreased to 34.7% of revenues from 35.5% in the preceding quarter but increased from 32.2% in the third quarter of the prior year. Co issues downside guidance for Q4, sees EPS of $0.31-0.35, excluding non-recurring items, vs. $0.48 Thomson Reuters consensus; sees Q4 revs of $235-250 mln vs. $268.55 mln Thomson Reuters consensus. During Q4, the co will be impacted by the full three months of the annual price negotiations with telecom customers that typically take effect on January 1, the 10-day long shutdown at certain customers for Chinese New Year in February, the adjustment of inventory levels at some telecom customers, particularly for products which had previously been on allocation and long lead times, including WSS and ROADM line cards, and a slowdown in business in China overall.

1:02PM Applied Materials approved an increase in the quarterly cash dividend from $0.07 per share to $0.08 per share (AMAT) 15.87 -0.09 :

Flextronics (FLEX) announced that Eastman Kodak Company (EK) has signed an agreement for the expansion and renewal of the business relationship that the two companies formed in 2007.

7:31AM Qualcomm announces cash dividend will increase to $0.215 per share from $0.19 effective for quarterly dividends payable after March 25, 2011 (QCOM) 57.58 :

National Semiconductor (NSM) announced that its award-winning WEBENCH Designer tools are now available in the Traditional Chinese language.

AMD (AMD) announced the launch of the fastest graphics card in the world, the AMD Radeon HD 6990. AMD Radeon HD 6990 graphics cards are available immediately from retailers worldwide, with select models starting at $699 MSRP.

1:42AM United Micro reports sales for February 2011 increased 4.3% YoY, down 5.4% sequentially (UMC) 2.86 : Co reports unaudited net sales for the month of February 2011 of NT$9,007,512 an increase of 4.32% YoY, down 5.43% MoM.

1:38AM Zoran comments on results of Ramius consent solicitation (ZRAN) 1064 : Co confirms that Ramius Value and Opportunity Master Fund, a stockholder, has delivered the requisite consents to elect three new independent directors to co's Board in substitution for three of co's current independent Board members. "We welcome the new directors to the Zoran Board and look forward to working together on behalf of our stockholders. We would also like to thank our three departing board members for their many years of service and contribution to Zoran's success."

07:22 am LDK Solar downgraded to Sell at Collins Stewart; tgt lowered to $9.50: . Collins Stewart downgrades LDK to Sell from Hold and lowers their tgt to $9.50 from $12 given their concerns that LDK is poorly position for a downturn and out belief that spot market wafer demand will slow dramatically in the months ahead.

07:22 am MIPS Tech upgraded to Buy at The Benchmark Company: . The Benchmark Company upgrades MIPS to Buy from Hold based on the likelihood of MIPS increasing its mobile market share. Firm says the wireless industry's transition to 4G air interfaces such as LTE should at least allow MIPS to gain share in broadband cellular modems. Also, some key license agreements with Chinese baseband chip companies should allow MIPS to gain a toehold in the TD-SCDMA (and future TD-LTE) baseband market.
icon url

ReturntoSender

03/13/11 11:24 AM

#9270 RE: ReturntoSender #6755

InvestmentHouse Weekend Market Update:

http://www.investmenthouse.com/weekendmarketsummary.htm

- Despite quake, tsunami, EU bond yield surge, weaker sentiment, and morning pundit predictions the market would selloff, it didn't.
- January retail sales rise in line at 1%, but driven so to speak by gasoline price increases.
- Michigan sentiment takes a hit on gasoline prices. Inflation expectations jump.
- Business sales hit a 12 month high at 2%.
- SP500 looks just like November and SP600 as well. NASDAQ and SOX, however, have to make a comeback.

MARKET SUMMARY

You hate to ask what more can happen, yet the market is holding up for now.

It was another day loaded with news. Unfortunately there was some tragic news with the earthquake and tsunami in Japan. Our thoughts and prayers go out to the victims of that natural disaster, as well as those rushing to their aid. The US Navy and many other branches of the service are rushing to give supplies and equipment to Japan to help the relief effort.

In addition to that terrible news, there were other worries out. There was an EU bond yield surge. We cannot forget the debt crisis (with the US included) that still has to be dealt with. Bond yields were surging, and there was weaker sentiment in the US. There were a lot of predictions by the pundits that the market would sell off as the day wore on. You would expect that looking at the futures early on, but that is not what happened. Indeed, we were looking at the futures and the charts. We put out a premarket alert saying that the market would bounce. It was merely a technical bounce; there was no solid foundation or reason for it to do it other than a technical situation. Sure enough, that is exactly what happened on the day.

The futures were down but, almost to the minute that the bell rang, the market turned positive and rallied throughout the session. It came back a bit late in the day, but overall quite solid. NASDAQ, +0.5%; SP500, +0.75%; Dow, +0.5%; SP600; +20%; SOX +1%. It has a long way to come back. It has been beaten up this week, but it managed to post a gain even though it looks to be a relief gain at best.

It was not a huge day to the upside, but it was not a day to complain. It was a relief bounce on some of the indices and individual sectors. SP500 still looks quite solid. The slight undercut of the 50 day EMA on Thursday and a recovery on Friday sure makes it look like November. Of course looks can be deceiving, so we cannot bank everything on the fact that February and March look like November of 2010.

You do have to take what the market gives you, and it was bouncing nicely. There were great stocks moving very well on Friday. It was not just a relief move. Retailers were moving quite nicely. Old standbys such as CHS were rallying nicely. BONT tested and looks to be ready to bounce back up after breaking from a triangle. This was common. There were energy stocks moving back up well, particularly the refineries such as FTO. Some technology stocks were performing well. A had a nice reach lower and reverse. These are solid stocks in solid patterns performing nicely even as some sectors show wear and tear. We will discuss more of those in the leadership section.

OTHER MARKETS

Dollar: 1.3911 Euro versus 1.3790. You might wonder why the dollar would sell off with an earthquake and tsunami in Japan. The reason is that the yen really surged. It surged against everything because insurance claims in Japan will have to be paid in yen. They would be buying yen and selling other assets to acquire more yen. Insurance companies would be doing this to make their payments. Therefore you would see a stronger yen even though there was a devastating natural disaster on the Japanese economy.

The dollar has rallied back from a support level. It was a setback on Friday given the extraneous circumstance, and we will see if it can bounce from here and continue the move up to test this range of resistance from November into January.
Click to view the chart

Bonds: 10 year 3.40% yield versus 3.36%. Bonds sold on the session. There are two interesting side notes with respect to the bond action. The first is that bond yields are surging in Europe. That is the part of inflation you get when you have a weak debt picture. When your balance sheet is very weak, it requires those buying your debt to demand more return. In other words, they demand more yield for the bonds they are buying. Then the bonds drop in price and the yield goes up. Then you have a point where no one wants them and the yields spiral out of control.

Another interesting thing was that CNBC had the CEO of WFC on today. Mr. John Stumpf said WFC was really into the game as far as lending. He said it was a "myth" that WFC and other banks were not lending. He even went onto say that they were really pushing those loans, but the small business demand was not there. They started a campaign of a "second look" where they would look at loans that they had fallen short before, and then would do whatever they could to make those loans.

Wow, that sounds almost like they are really trying. I bank with WFC and know a lot of small businesses do as well, and they could not get money out of them if they wanted to. Several of them I talked to said when they went to WFC, they would not even grant them a sit down. They immediately said they would stick them into the small business plan without even looking at them. They did not get a first look much less the second look. I talked to many of them today, and they said they were not getting any calls from their bankers and loan officers saying they were getting a second look.

It is a bunch of crapola. I'm sorry, but that is the way it is. I have contacts inside this bank way up, and they say they are not catering to small business at all. They are going for people with extremely high net worth X hundreds of millions in net worth. That is who they are making loans to and catering to. I am not just picking on WFC, but they are a big bank in our neck of the woods, so everyone knows them. When the CEO says this kind of nonsensical drivel on CNBC, it is almost fraud. It is incredible. I would love to put him under oath and have him say that to Congress because he would be committing perjury. I guess you have to know if you are committing perjury X pure stupidity does not cover it. In any event, I do not want to pick on just them, but what the hell.

Bonds are trying to rally here in the US, and that is not a necessarily a great thing. There has been a lot of unrest in the world overall, so you would think bonds would rally in a flight to safety in the US. That is what we are seeing. There is no major turn. Inflation will be a big issue. The fear factor right now has helping push bonds higher and yields somewhat lower, although on Friday yields did bounce up.
Click to view the chart

Gold: $1,421.00, +8.50. Gold was not in play today, but it did bounce to the upside. It is still holding its gains over the trio of highs in late 2010. It is testing and looks like it could still make the move back to the upside.
Click to view the chart

Oil: $101.13, -1.57. Oil is the big story X how everything will be impacted by moves in oil and how disasters such as in Japan impact oil. Japan is the world's third largest oil importer. You would expect oil to be weak if Japan was hit with a big natural disaster since that would quell demand. Oil did decline rather sharply intraday. It reached almost all the way down to the 20 day EMA and this pennant consolidation (the first consolidation after breaking to a new high on this rally). It recovered from trading below $100 during the session, however.

Oil was also weakened by Sheikh Alwaleed bin Talal in Saudi Arabia. He likes to play the market and speak on CNBC. He used to be a big share holder in Citibank X maybe he still is. There were a lot of questions bandied back and forth, and one was whether oil is justified at $100 a barrel. He said it is not. He said it was all being driven by fear right now, and that if things quiet down oil prices will decline. That is the point: "If things calm down." Everywhere you look, something bad has happened. You cannot swing a dead cat without hitting a problem. Natural disasters, political unrest, protests, violence, churches being burned X you name it. It is not that great out there.

I hope no one gets mad because I said "swing a dead cat." That is a colloquialism in the southern United States from Tom Sawyer times. Indeed, it was from Huckleberry Finn. I am just throwing out a bit of Americana, but every time I say something like that I get emails from people getting upset. Please, cat lovers, I am just trying to liven it up and getting a little colloquial with my terminology.

In any event, looking at the pattern on oil, there is nothing that suggests it is about to sell off. Indeed, it is coming back and making a very nice test. It may snug up a bit more near the $100 range. I bet that is where it holds and tries to bounce back to the upside.
Click to view the chart

THE ECONOMY

Retail sales up but gasoline prices are the cause: burning dollars in the tank.

Michigan Sentiment tumbles on rising gasoline prices and expectations of inflation.

To view the Economy Video follow the link below:
Economy Summary Video

TECHNICAL SUMMARY

INTERNALS

Internals were not that strong considering the upside moves. That suggests it was a relief bounce from the Thursday selloff. Frankly, that is what we were expecting.

Volume. Volume declined 18% to 1.88B on the NASDAQ. It fell 20% on the NYSE to a mere 921M, falling just below average.

Breadth. Breadth was a yawner. Advancers lead 1.1:1 on the NASDAQ and a bit better at 1.8:1 on the NYSE. One reason is the rebound in energy. Also the small caps are performing better. They have not broken their 50 day EMA, and that makes it more interesting.

CHARTS

SP500. SP500 did bounce on that lower volume, but it retook the 50 day EMA. It is not a carbon copy of November, but it is close. We had a strong initial selloff on the current test. It was slower in November, but it did make this double bottom that ultimately led to the bounce. Notice how the second bottom was right on the 50 day EMA. The difference is it snapped off that level each session that it tapped it. It did not close near it.

On Thursday it closed just below the 50 day EMA. There is a bit of difference, but not as strong. That has people worried, of course, and it is always something to watch. Overall the pattern is still solid, however. One concern is that MACD is really hitting the toilet. Not only is it not high as it has been X not that bad because the SP500 has not rebounded up to those highs X but it is really hitting the skids and heading lower. It did do the same thing in November. Do not get too wrapped up in that. Look more for comparisons of price highs versus MACD highs. When it made this last high, SP500 and MACD both put in a high. Here it is putting in an overall higher high, and that is a relatively good indication. SP500 continues to look just fine, all things considered.

NASDAQ. NASDAQ is struggling, on the other hand. It gapped below the 50 day EMA on Thursday. It recovered on Friday after gapping lower at the open and immediately reversing. It did post a gain, but the problem is it tapped at the 50 day EMA on the high and tapped at these prior resistance levels. These were the February lows and the gapping lateral range from January. It tapped them and it faded to the close. It still managed to hold a gain, but the close off of that key level shows it had no guts to take it on. Therefore, I do not know if it will have the guts to continue. Can it be dragged back up by SP500, or will it drag SP500 lower as SOX dragged the NASDAQ lower?

SP600. SP600 still looks good. It has yet to break its 50 day EMA. It did it pretty much on the Friday open, but it bounced right back up and closed over that level. Very solid action. Again, will it survive the gravitational tugs from NASDAQ and the SOX as they head lower? We will have to see if those indices do head lower. They do not look that healthy. SP500 has gotten the snot knocked out of it this week. It was trying to put a decent consolidation together, but it broke lower and gapped sharply lower on Thursday. It gapped and came back up on Friday. You could almost say this is an engulfing day, but volume was not that great overall. It did not quite take out that peak on Thursday.

You could say maybe that it's an ABCD, but it is a really jagged pattern. If this was just a clean sweep up from this level without the big dip, that would be much more meaningful. Right now it has on the ropes and it has to prove itself.

SOX. Even though it may bounce near term, it looks like the path of least resistance will be more selling right now. I hate to be a pessimist, but that surely is the way it looks.

LEADERSHIP

Financial. JPM barely missed a beat on the Friday action. It sold Thursday, but held up its pattern very well over the 50 day EMA. Still looking solid. EWBC looks good, continuing its trend higher. It is below the 20 day EMA, but it also broke below the 20 day EMA in late February and continued to the upside. GS is holding support, doggedly so. It will not give it up.

I am not necessarily ready to dive into it. I am not totally comfortable with it. It has something of a triangle trying to set up, but it is not hitting enough points. That is always a concern. STT is struggling. It is slowly winding its way lower. Not all financials are strong, but they are looking solid overall.

Retail. Retail continues to look good. HIBB had a nice surge on earnings. It could not quite hold it, but it is a great pattern. ZUMZ announced its earnings as well. It gapped down but rallied back. It will likely not collapse here. I am going out on a limb there, but it looks solid despite the action on Friday.

RL had very nice action. JCP is looking okay. It had a doji on Friday, but it has had a great week, surging to the upside. AMZN might be ready to roll back to the upside. Do not forget the strong ones like LULU. It looks very appealing as it sets up a very nice pattern.

Energy. A lot of energy stocks held at the 50 day EMA and were bouncing back on Friday, although they started lower (such as HAL). FTO did very well with a nice break to the upside on volume. XOM held the 50 day EMA and is trying to bounce. That was pretty much the story of the sector.

Technology. Tech has been lagging, but AAPL held the 50 day EMA and bounced. Cannot complain about that kind of action from AAPL. It has held the 50 day EMA many times on this run. FFIV, similar to AMZN, may be trying to roll back up with a nice bounce. We will have to see if it can play out. SOHU is finally starting to make the move we anticipated X a great break to the upside on Friday. Strong volume as it made that move.

NTES may be able to break higher to the upside out of this pennant it is forming. BIDU is starting to break to the upside. Interesting action. We have a nice rally and then it sold off. No ABCD because it kept making higher lows. It put in a bit of a triangle and started the break to the upside. That makes BIDU quite interesting for us. I hate that it is up almost 3.5% on the day. Maybe we will get a pullback Monday. We will see if we can get something out of that.

Metals. Metals are suddenly improving. STLD had a nice break to the upside. It looked like it was selling off, but it is not out of the woods. These are worth considering and keeping an eye on. We have been watching SCHN, and it did not hold as we wanted it to. It gapped lower, but it is trying to come back. We will see what happens. AKS is the same situation as STLD. It sold off, but now it is making a comeback. Very interesting indeed. FCX is trying to bounce after that sharp selloff that made us some very good money to the downside.

Industrial. CAT held the 50 day EMA and bounced back, and maybe it has an ABCD pattern. It looks negative. There is the lower high and lower low, but you have the ABCD. There is a nice rally here, and it is holding at a logical point. It has not given back off of the move because it is holding above this consolidation range. That makes it quite interesting. JOYG has similar action, although it is getting close to the bottom. It did not take it out. There is an ABCD pattern.

I wanted it to hold at the 50 day EMA and make the bounce higher. That would have been cool, but we do not have a problem with a further shakeout either. If it can make the move, then it makes the move. We do not care necessarily what it looks like as long as the pattern is true. There were stocks under stress, but there are also stocks in very good position to move higher. They are still getting money and looking solid. They could lead the market right back up.

Semiconductors. Semiconductors are not necessarily bouncing right back up. XLNX sold off hard. It is trying to bounce, but it stalled out on the way back up at the 50 day EMA. LRCX is trying to bounce, but it is not showing that power to the upside that you would like to see. ONNN has bounced modestly, but it does not look all that strong. It has a broad top here and it rolled over. It has to come up and attack that 50 day EMA and see what it can do at that level. There are leaders in trouble, and leaders that have more to do. They may even want to sell more. At the same time, there are other sectors doing well. Strange as it may seem, retail continues to look as if it wants to move to the upside.

THE MARKET

MARKET SENTIMENT

VIX: 20.08; -1.8
VXN: 22.49; -1.78
VXO: 20.62; -1.3

Put/Call Ratio (CBOE): 1.07; +0.02

Bulls versus Bears:

This is a reading of the number of bullish investment advisors versus bearish advisors. The reason you look at this is that it gives you an idea of how bullish investors are. If they are too bullish then everyone is in the market and it is heading for a top: if everyone wants to be in the market, then all the money is in and there is no more new cash to drive it higher. On the other side of the spectrum if there are a lot of bears then there is a lot of cash on the sideline, and as the market rallies it drags that cash in as the bears give in. That cash provides the market the fuel to move higher. If bears are low it is the same as a lot of bulls: everyone is in and the market does not have the cash to drive it higher.

Bulls: 52.2% versus 50.6%. Bouncing right back up despite the market chop, moving toward the 53.3% three weeks back. Below the 55.1% hit in January and the 58.8% high on this leg. Still at a high level in a string of high readings but below the 5 year high at 62.0. Fading back from the level considered bearish, i.e. where so many are in the market and believe it is going up that the ammunition to send it higher runs low. This is where you start to be careful and watch for breakdowns, but there is also a lot of liquidity being pushed into the market and that can continue the move despite excess bullishness. The crossover level at 29% bulls is long gone, but it did its job. The high on the last leg was 56.0% after starting at 35.6% on the low in February, the lowest it has been since July 2009 . . . until this last leg. 35% is the threshold level suggesting bullishness. Again, to be seriously bearish it needs to get up to the 60% to 65% level.

Bears: 21.1% versus 19.5%. Bears remain skeptical and grew in number even as bulls grew in number as well. Still below the 23.3% hit 5 weeks back and below the 28.3% in September. The 37.7% peak at the height of the crossover is well in the rearview mirror but bears remain well below the 35% level, above which is considered bullish for the market overall. Hit 18.7% on the low in April. Hit a high of 27.8% level on the prior leg in February. For reference, cracking above the 35% threshold considered bullish. Hit a high on the prior run at 47.2%. For more reference, bearishness hit a 5 year high at 54.4% the last week of October 2008. The move over 50 took bearish sentiment to its highest level since 1995. Extreme negative sentiment. Prior levels for comparison: Bearishness peaked at 37.4% in September 2007. It topped the June 2006 peak (36%) on that run. That June peak eclipsed the March 2006 high (33%) and well above the 2005 highs that spawned new rallies (30% in May 2005, 29.2% in October 2005). That was a huge turn, unlike any seen in recent history.

NASDAQ

Stats: +14.59 points (+0.54%) to close at 2715.61
Volume: 1.882B (-18.12%)

Up Volume: 1.27B (+904.93M)
Down Volume: 563.59M (-1.436B)

A/D and Hi/Lo: Advancers led 1.12 to 1
Previous Session: Decliners led 5.79 to 1

New Highs: 33 (-1)
New Lows: 73 (+6)

NASDAQ CHART: Click to view the chart

NASDAQ 100 CHART: Click to view the chart

SOX CHART: Click to view the chart

SP500/NYSE

Stats: +9.17 points (+0.71%) to close at 1304.28
NYSE Volume: 921.06M (-19.91%)

Up Volume: 722.66M (+609.16M)
Down Volume: 184.04M (-845.96M)

A/D and Hi/Lo: Advancers led 1.84 to 1
Previous Session: Decliners led 4.71 to 1

New Highs: 54 (+9)
New Lows: 21 (-10)

SP500 CHART: Click to view the chart

SP600 Chart: Click to view the chart

DJ30

Stats: +59.79 points (+0.5%) to close at 12044.4
Volume DJ30: 143M shares Friday versus 181M shares Thursday.

DJ30 CHART: Click to view the chart

MONDAY

Next week brings a plethora of economic news starting with a lot of regional manufacturing reports. New York comes in on Tuesday. We will have the rate decision by the Fed on Tuesday as well. It probably will not give us any kind of change of plan, although we need to start looking for the pullback. Even though there was Quantitative Easing II, it will run out by the summer. The Fed will have to start telling us what it will do after that X whether it will go to Quantitative Easing III, as some are suggesting, or if it will do a complete pullback. If it starts talking pullback, that is when the market will start to panic and drop. Some are saying that is why it is doing it right now; it is starting to factor in the Fed eventually backing off from this massive liquidity pump.

There are also housing starts and building permits. There is the PPI, the CPI, and the Philly Fed on Thursday. There is nothing scheduled on Friday. We have plenty of data to keep the market occupied X as if it needs it. We also have the bond issues in Europe and the riots there. We have the protests, riots, and church burnings, etc. in North Africa and the Middle East. There is continuing turmoil in Libya. It is an unbelievable denial what the Libyan government says versus what is showing up on film. That is always the way when dealing with a totalitarian society. Sometimes it does not even have to be totalitarian, as we know.

There are also the natural disasters. Then we have our own issues in the US with the state capitals and the disagreements between those wanting collective bargaining in the public sphere and those wanting to take away some of the luxurious punch bowl that has been doled out and cannot continue. That is an interesting story itself. All of this will have to work its way out.

It is one of the most interesting years we have had in quite some time. Of course I keep saying that about every other year. That just shows you how the world has to adjust to get along with each other better in a time where the global economy is truly becoming global. There is also a fight to maintain elements of sovereignty that you have to in any country. There are some ways that we do not want to be like other countries. They do not necessarily want to be like us. It is a good thing we keep our identity, but we have to figure out how to work together as we do it. We are having some growing pains with respect to that.

In any event, there is a lot of activity, and that is all an overlay to the technical picture. We have talked a lot about the SP500 and the SP600 looking fine in their patterns. You can even throw the DJ30 in as well. I liked the DJ20 a few weeks ago, but as soon as they hit that new high they were sold off. There is an issue there as well. Nonetheless, we had these consolidations, and we will see if the SP500, SP600 and the Dow can offset the likes of the SOX. It is in a lot of trouble at this point, and NASDAQ is below the 50 day EMA and not looking like a spring chicken either.

Friday we got a bounce we were looking for. Come Monday, I hope we are not kicking ourselves in the behind for not closing more upside positions with this bounce. We will see how that plays out. Again, there are many good upside stocks. There are good sectors doing well and stocks within those sectors performing well. That keeps us heartened that money is still moving into these areas and others in the market. Some leaders like the semiconductors and energy, however, need some air let out of them. They have had tremendous runs, but it looks as if oil will continue higher. If it does, that should help prop up a bunch of the energy stocks that pulled back to their 50 day EMA.

BHI had a very solid day. It bounced sharply off of its 50 day EMA. It is not a lost cause by any means. There are some chips that even still look good, although they are getting few and far between. It is getting difficult to find a lot of good stocks even in the technology sector. They are out there, but it is harder to find some of them so you look in other areas.

We have been mining some of the retail areas. They have looked good. Even some of the technology stocks have come around and started to look better after they have consolidated. We will continue to look for the upside plays because we have some key indices that are still in their uptrends and still look as if they want to hold them.

We will also be looking at some of the downside. They made us good money this past week with X, FCX, etc. But it has been a tough go making money to the downside because the bid under the market bounces it right back up. We may get some improvement again in the metals. They are trying to come around. It will still be a market where we look for the upside plays. We will look for downside plays in sectors that are corroding and starting to crumble. We can play it both ways, almost having our cake and eating it, too. It is a bit choppier and tougher to do, no doubt.

We will keep our play sizes down for now. Do not try to be a hero. There is no point to that in these kinds of transition stages. Even if it does not change the trend, it just rotates and becomes very choppy for awhile before resuming the move. We have made money doing it, sure. We have been banking gain now and then with three or four plays here and there. It is not the steady four or five plays a day. It shows you there is chop going on. You should not take as big of trades, and you should not overweigh your portfolio with any one of these plays in particular. Take even trades and take smaller ones. Do not be greedy, and just let the plays work.

If they do, that is great. If they do not, you can get out of them and move on. You are not going to win the game in this kind of market, but this kind of market can help you lose the game if you are not careful. You do not want to take big risks at a time when it doesn't warrant you taking big risks. Narrow the size, narrow the goal. Be happy with smaller gains and do not let losses get out of hand.

Enjoy the weekend. We will hope and pray for the people in Japan and other places affected by the tsunami. We hope that everyone in the world can settle down and see the big picture. Then maybe some of this hostility will end. I know it is pollyanna, but there is power in positive thought. If you get enough people thinking positive thoughts X like in Kelly's Heroes, "Stop with the negative waves, Moriarty!" Let us start having some positive vibes, and you would be surprised how things happen.

If you do not think it will happen around the world, at least do it for your portfolio. Have confidence in your trade, because that makes a huge amount of difference. Be confident and positive, and you will act quickly and decisively. You will get out of trouble faster, and you will let other plays run that are working for you if you are confident and bold in your actions.

Enough of my pep talk. Have a great weekend!

Support and Resistance

NASDAQ: Closed at 2715.61
Resistance:
The 50 day EMA at 2730
2729 is the 127% Fibonacci extension of the August 2010 run
2735 from late 2007 interim peak
2762 is the February low
2796 is the February gap down point
2825 is the 2007 closing peak.
2841 is the February 2011 peak
2862 is the 2007 peak

Support:
2705 is the February 2011 and consolidation low
2686 is the recent January 2011 closing low
2676 is the January 2010 low
2645-2650ish from December 2010 consolidation
2593 is the November 2010 high
2580 is the November 2010 closing high
2569 is the November gap up point through the April 2010 peak
2550 from May and June 2008 peaks
2540 is the gap up point from early November
2535.28 is the April 2010 intraday peak
2530 is the April 2010 closing peak
2518 is interim peak from April 2010
2511 is the lower range of the November gap up point
2482 is the recent October peak
2460 is the November 2010 low.
The 200 day SMA at 2456

S&P 500: Closed at 1304.28
Resistance:
1313 from the August 2008 interim peak
1325-27 is the March 2008 closing low and the May 2006 peak
1344 is the February 2011 peak
1364 is the March 2007 low
1370 is the August 2007 low

Support:
The 50 day EMA at 1297
1294 is the February 2011 and the consolidation low
1278 is the 127% Fibonacci extension of the August 2010 run
1275 is the January 2010 low, early January 2011 peak
1227 is the November 2010 peak
1220 is the April 2010 peak
1185 from late September 2008
The 200 day SMA at 1179
1174 is the May 2010 high, 78% Fibonacci retracement of April peak
1173 is the November 2010 low
1170 is the prior March 2010 high
1156 is the Sept 2008 low
1151 is the January 2010 peak
1133 from a September 2008 intraday low
Bottom of the January 2010 consolidation 1131 to 1136
1129 to 1131 is the June and August 2010 peaks

Dow: Closed at 12,044.40
Resistance:
12,110 from the March 2007 closing low
12,391 is the February 2011 peak
13,058 from the May 2008 peak on that bounce in the selling

Support:
The 50 day EMA at 11,974
11,893, from March 2008 closing low
11,867 from the August 2009 high and peak on that bounce in the selling.
11,734 from 11-98 peak
11,452 is the November 2010 peak
11,258 is the April 2010 peak
11,205 is the April closing high
11,100 from the 7-08 low
The 200 day SMA at 11,025
10,963 is the July 2008 low
10,920 is the recent May high
10,730 is the January 2010 peak

Economic Calendar

These are consensus expectations. Our expectations will vary and are discussed in the Economy section.

March 11 - Friday
- Retail Sales, February (08:30): 1.0% actual versus 1.0% expected, 0.7% prior (revised from 0.3%)
- Retail Sales ex-auto, February (08:30): 0.7% actual versus 0.6% expected, 0.6% prior (revised from 0.3%)
- Michigan Sentiment, March (09:55): 68.2 actual versus 76.5 expected, 77.5 prior
- Business Inventories, January (10:00): 0.9% actual versus 0.8% expected, 1.1% prior (revised from 0.8%)

March 15 - Tuesday
- Empire Manufacturing, March (08:30): 17.0 expected, 15.43 prior
- Export Prices ex-ag., February (08:30): 0.9% prior
- Import Prices ex-oil, February (08:30): 0.8% prior
- Net Long-Term TIC Fl, January (09:00): $65.9B prior
- NAHB Housing Market , March (10:00): 17 expected, 16 prior
- FOMC Rate Decision, March (14:15): 0.25% expected, 0.25% prior

March 16 - Wednesday
- MBA Mortgage Index, 03/11 (07:00): +15.5% prior
- Housing Starts, February (08:30): 570K expected, 596K prior
- Building Permits, February (08:30): 573K expected, 562K prior
- PPI, February (08:30): 0.6% expected, 0.8% prior
- Core PPI, February (08:30): 0.2% expected, 0.5% prior
- Current Account Balance, Q4 (08:30): -$110.0B expected, -$127.2B prior
- Crude Inventories, 03/12 (10:30): 2.52M prior

March 17 - Thursday
- Initial Claims, 03/12 (08:30): 387K expected, 397K prior
- Continuing Claims, 03/05 (08:30): 3750K expected, 3771K prior
- CPI, February (08:30): 0.4% expected, 0.4% prior
- Core CPI, February (08:30): 0.1% expected, 0.2% prior
- Industrial Production, February (09:15): 0.6% expected, -0.1% prior
- Capacity Utilization, February (09:15): 76.5% expected, 76.10% prior
- Leading Indicators, February (10:00): 0.9% expected, 0.1% prior
- Philadelphia Fed, March (10:00): 28.0 expected, 35.9 prior
icon url

ReturntoSender

03/16/11 6:52 PM

#9278 RE: ReturntoSender #6755

I have nothing against shorting. I have done it many times in the past. I will say that one needs to be much more nimble shorting than buying long.

After all you actually own nothing but a borrowed stock, sold short, loaned to you, on margin from a brokerage that can and will change their margin loan rules arbitrarily.

I know this because it has happened to me.

Being long I am more concerned about oil over $100.00 than the Japanese problems being long now. Let me share a couple of charts on oil and remind everyone that this recent selling began before the earthquake in Japan:


Longer term chart on oil versus the S&P 500. Note that when the price of oil runs over $100.00 that the market has sold off in the past as well as now:


As it concerns the SOX and semiconductor related stocks look for a rebound soon in the market even if oil prices don't take off back above $100.00 per barrel. Why because virtually every chart of a major market index will bounce once an RSI of 30 is reached on a six month daily chart unless we are in a bear market:


I look for a bounce very soon in the market overall. How sustainable will it be?

Oil prices and the price of gasoline itself will make all the difference:


One of the gals who works for me has forced her son to take the bus to school due to the high cost of gas. My brother in law is not going to take a vacation in their motor home because of the same thing.

The high cost of gasoline can and will kill this market rally if it stays above $100.00 a barrel for any real length of time.

RtS
icon url

ReturntoSender

03/20/11 1:49 PM

#9282 RE: ReturntoSender #6755

Monday Morning Outlook: Two Major Risk Factors for the Bulls
Option activity indicates that hedge funds may still be on the sidelines

by Todd Salamone 3/19/2011 3:04 PM

http://www.schaeffersresearch.com/commentary/observations.aspx?ID=105587&trackback=mmoezine

It was a wild ride in the equities market last week. Stocks spiraled relentlessly lower through Wednesday, as the nuclear crisis in disaster-stricken Japan rattled markets across the globe. Then, the major indexes spent the last two days of the week charging higher, bouncing back from their year-to-date breakeven levels. In the wake of this five-day roller-coaster ride, Todd Salamone pinpoints key technical areas to watch going forward -- as well as two serious points of concern for the bulls. Meanwhile, Rocky White explains why small-cap stocks were relatively unruffled by last week's bout of volatility.

What the Trading Desk Is Expecting: Days of Technical Reckoning Ahead
By Todd Salamone, Senior Vice President of Research

"Anything can happen during expiration week -- from delta-hedge selling related to the enormous put open interest below current levels, to a short-covering rally related to the expiration of the put open interest. Probabilities favor the short-covering rally, but watch out below if delta-hedge selling occurs...

"Bulls would prefer that the VIX remain below its 200-day moving average, at 21.85, and its 80-week moving average, currently situated at 22.27...

"Admittedly, there is a lot to digest this week. In our view, the long-term outlook remains bullish, but the short-term outlook still suggests choppy action between 1,300 and 1,333 for the SPX. If 1,300 breaks decisively, look for the 1,270 area to be the next level of support, as it's the site of the SPX's 80-day moving average."

Monday Morning Outlook, March 12, 2011

A brewing nuclear crisis in Japan was the catalyst for "watch out below!" expiration-week volatility this past week, with the S&P 500 Index (SPX – 1279.20) closing down 25 points, or 1.9%. In reviewing the price action driven by the Japan catalyst, one has to wonder: How much of the selling was related to expiration-week delta hedging? Delta hedging is a process in which sellers of index and exchange-traded fund (ETF) puts short S&P futures in order to maintain a neutral position, and heavy put strikes below act as magnets due to their increasing sensitivity to the decline in the underlying index or ETF.

We found it interesting, for example, that the SPDR S&P 500 ETF (SPY) was driven down to the 125 strike at Wednesday's lows, as this was the site of the last significant put open interest in the expiring March series. Even as headline news remained bleak, the ETF managed to bounce strongly -- perhaps due to the major delta-hedge selling being exhausted. As you can see in the chart below, the put open interest at the 123 and 124 strikes was minimal compared to the put open interest at the 125 through 128 strikes.


To the extent that some of last week's selling was driven by hedging activity related to the huge put open interest on expiring index and ETF options, it would favor the bulls, as investor anxiety climbed amid the selling. For example, the latest survey from the American Association of Individual Investors (AAII) revealed only 28% of those surveyed were bullish -- the lowest percentage of bulls since late August 2010, which was a buying opportunity.

Despite the rising fears, the SPX managed to close the week above its 80-day moving average, which we identified as a potential support area in the event of a decisive break below 1,300. The rising 80-day moving average enters this week's trading at 1,277.60. Coincidentally, this area marks a 50% retracement of the prior week's close and last week's low.

Moreover, we found it interesting that the SPX, Dow Jones Industrial Average (DJIA – 11,858.52) and Russell 2000 Index (RUT – 794.66) pulled back to their respective breakevens for the year, and closed the week in positive territory after rallying from these year-to-date breakeven numbers -- which are 1,257.64, 11,577.51 and 783.65, respectively. The Nasdaq Composite (COMP – 2,643.67), however, closed the week barely in negative year-to-date territory, below its Dec. 31, 2010 close at 2,652.87.

These "year-to-date" breakeven numbers can be viewed as potential support for the upcoming week. Meanwhile, potential resistance levels would be the familiar round-number areas, such as 12,000 on the Dow, 1,300 on the SPX and 800 on the RUT.


The two major risk factors working against the bulls in the short term are:

1. Volatility, as measured by the CBOE Market Volatility Index (VIX – 24.44), is rising. We noted in prior weeks that bulls should be encouraged by the fact that the VIX was getting capped at long-term trendlines, such as its 200-day and 80-week moving averages, which are situated at 21.69 and 22.26, respectively. While the VIX peaked in the 30 area around mid-week, we won't have confirmation that a top has been reached until we see a decline below these long-term trendlines and the 20 level. Finally, it is interesting that the VIX's peak at 31.28 last week is approximately double the lows that have been in place since mid-December.

2. Another concern is that our analysis of activity in the options market indicates that hedge funds are still not showing interest in accumulating equities. And if retail investors continue to bail, as they have done during the past couple of weeks, this absence of institutional and retail interest could create a challenge for equities in the near term.

One alternative you could consider amid the global uncertainty is a stock-replacement strategy, where you sell stocks that you like and buy in-the-money or longer-dated call options on those same equities. We noticed equity implied volatilities did not experience the pop that index implied volatilities experienced last week. Therefore, many equity options remain reasonably priced.

Options allow you to put less dollars at risk, but offer you returns that are a multiple of the comparable return on the underlying equity. This strategy allows you to participate in a rally if volatility has peaked, while simultaneously exposing fewer dollars to the market. If you are looking for equity put plays, we recommend hunting in the large-cap technology space, as hedge funds appear to be bailing on these equities.

Indicator of the Week: Measuring Investor Reactions to Japan's Disaster
By Rocky White, Senior Quantitative Analyst

Foreword: Stock markets were jolted last week, as a nuclear crisis unfolded in the wake of an earthquake and tsunami in Japan the previous Friday. U.S. markets fell especially hard on Tuesday and Wednesday, before paring their losses in the last few days of the week. In the analysis below, I show how investors have reacted to the disaster by looking at returns of some major exchange-traded funds (ETFs). We'll also consider what implications these reactions might have going forward.

Prior Bull Markets: Below is a list of ETFs I thought would be interesting to consider. The table displays their returns through Wednesday of last week, which is the day the Dow fell 240 points and bottomed. Then you'll see the returns following Wednesday, when the market gained back a significant number of points.

Obviously, the ETF most affected was the iShares MSCI Japan Index Fund (EWJ), which tracks Japanese stocks. It fell over 10% through Wednesday of last week, before gaining back over 7% over the next two days. Japan's currency action was a surprise to some people, as the yen actually moved significantly higher immediately after the disaster. This was on speculation that Japanese money will be repatriated as they rebuild.

Also interesting was the behavior of major U.S. indexes. The small-cap stocks are typically the most volatile. They fall the most in bad times, and rise the most in good times. However, the iShares Russell 2000 Index (IWM), which tracks smaller companies, fell the least when the markets tumbled. This is probably because the big-cap stocks generate more revenue from overseas, and are therefore more affected by a fall in demand from Japan.

The other ETFs listed show that oil and gold fell after the disaster, but gained most of it back when markets rebounded. Bonds increased significantly, as investors looked for safe places to put their money.

Post-Japan ETF performance


Option Activity: Another effect of the disaster which may be supportive of the market is that it spooked a lot of investors to put hedges in place. Look at the chart below, which shows April-dated put open interest for the SPDR S&P 500 ETF (SPY). I show the open interest prior to last week (as of March 11), as well as open interest at the end of last week. For the strikes immediately below the price of the SPY (strikes 123-127), the amount of put open interest nearly doubled from the beginning of the week until the end of the week. These added puts support the market, because if portfolios are hedged, then losses aren't as severe when the market declines -- making the portfolio managers less likely to panic sell, which can drive the markets even lower. These put options were possibly purchased as investors prepared for the worst. And the contrarian in us knows that the market rarely does what the crowd is most prepared for.


This Week's Key Events: Housing Stats and Fourth-Quarter GDP on Tap
Schaeffer's Editorial Staff

Here is a brief list of some of the key events this week. All earnings dates listed below are tentative and subject to change. Please check with each company's respective website for official reporting dates.

Monday
* We kick off the week with February's existing home sales, along with quarterly earnings from Tiffany & Co. (TIF) and Feihe International (ADY).

Tuesday
* Weekly chain store sales are on the economic calendar, as well as the Richmond Fed manufacturing survey for February. On the earnings front, we'll hear from Carnival (CCL), Dollar General (DG), and Walgreen Company (WAG).

Wednesday
* New home sales for December will hit the Street on Wednesday, as will the regularly scheduled update on domestic petroleum supplies. The earnings calendar brings us the latest quarterly results from General Mills (GIS), Paychex (PAYX), and Red Hat (RHT).

Thursday
* Durable goods orders for February and weekly jobless claims are due out Thursday. A few heavy hitters are scheduled to step up to the earnings plate, including Best Buy (BBY), ConAgra (CAG), Oracle (ORCL), and Research In Motion Limited (RIMM).

Friday
* The week wraps up with the final estimate on fourth-quarter gross domestic product (GDP), as well as the late-March Reuters/University of Michigan consumer sentiment report. There are no major earnings reports on the docket.
icon url

ReturntoSender

03/22/11 11:29 PM

#9287 RE: ReturntoSender #6755

From Briefing.com: 4:30 pm : The S&P 500 faltered in the face of resistance near the 1300 zone during the early going. That left it to muddle along with a modest loss for the rest of the session as buyers sat on their gains from the prior session.

Although there is still headline risk related to the military action in Libya and the status of damaged nuclear facilities in Japan, the lack of deterioration of relative conditions in those countries has made them less threatening, for the time being, to market participants. That theme helped the major equity averages advance more than 1% yesterday. However, there wasn't any follow through this morning. The lack of early buying interest left stocks to slip into the red, which is where they spent the rest of the session.

Overall selling pressure was rather mild today. Declining share volume outpaced advancing volume by just 3-to-2 -- total share volume on the NYSE barely broke 800 million.

Corporate headlines drove action in a few individual names, but did little for the overall market. Walgreen (WAG 39.21, -2.76) slumped to one of its worst single-session losses in about nine months following in-line earnings results. Meanwhile, Express (EXPR 18.42, +1.02) hit a one-month high following news of its upside earnings surprise. Bristol Myers Squibb (BMY 26.29, +0.29) initially bounced to a one-month high in response to news that one of its drugs met a primary endpoint in a Phase III study, but the stock gradually gave back a chunk of its gain.

Renewed pressure against the greenback dropped the Dollar Index to a new 52-week intraday low, but the buck battled back for a flat finish.

No economic data of consequence was out today. Tomorrow brings the latest monthly new home sales figures, though. Also on tomorrow's agenda are weekly crude oil inventories and a speech from Fed Chairman Bernanke. DJ30 -17.90 NASDAQ -8.22 NQ100 -0.2% R2K -0.5% SP400 -0.7% SP500 -4.61 NASDAQ Adv/Vol/Dec 1051/1.65 bln/1540 NYSE Adv/Vol/Dec 1262/822 mln/1703

4:13PM Jabil Circuit also reports update related to Japan operations; may have an impact on the supply of components (JBL) 18.93 -0.58 : "Our employees and site in Gotemba, Japan were not directly impacted by the natural disaster. However, many of our employees as well as suppliers were impacted. We extend our heartfelt condolences to those who have suffered losses as a result of this tragedy." Revenue from Jabil's Gotemba site is not material to overall results. The natural disaster in Japan may have an impact on the supply of components to Jabil's global manufacturing operations. However, the extent of this impact is not known at this time. Therefore, Jabil is expressing expectations regarding its third quarter results excluding the impact of potential supply disruptions on these results. These expectations include the recently acquired sites in Italy and France on a fully consolidated basis.

4:08PM Adobe Systems beats by $0.01, reports revs in-line; guides Q2 EPS below consensus, revs below consensus (ADBE) 32.88 +0.54 : Reports Q1 (Feb) earnings of $0.58 per share, excluding non-recurring items, $0.01 better than the Thomson Reuters consensus of $0.57; revenues rose 19.7% year/year to $1.03 bln vs the $1.03 bln consensus. Q1 non-GAAP operating margin of 38.9% vs. the 37.6% consensus and 37-38% guidance. Co issues downside guidance for Q2, sees EPS of $0.47-0.54, excluding non-recurring items, vs. $0.56 Thomson Reuters consensus; sees Q2 revs of $970 mln-$1.02 bln vs. $1.03 bln Thomson Reuters consensus. "Although Adobe has a very diversified business, Japan is our second largest country from a revenue perspective and March is typically our biggest revenue month of the year there due to fiscal year-end spending. Given the uncertain business environment in Japan, we are being prudent and have reduced our revenue expectation for our second quarter by $50 mln -- or roughly one-third of our original Q2 revenue expectation for Japan."

4:06PM Sunpower and Hawaiian Electric sign solar power agreement (SPWRA) 15.71 -0.40 : Hawaiian Electric (HE) and SunPower (SPWRA) announced an agreement for SunPower to sell solar photovoltaic power to the utility under a fixed price contract for 20 years. The power will be generated from a five-megawatt solar farm that SunPower will design, build and operate at Kalaeloa in West Oahu. The purchase power agreement is before the Hawaii Public Utilities Commission for approval.

4:05PM Jabil Circuit beats by $0.03, reports revs in-line; guides Q3 EPS above consensus, revs above consensus (JBL) 18.93 -0.58 : Reports Q2 (Feb) earnings of $0.54 per share, excluding non-recurring items, $0.03 better than the Thomson Reuters consensus of $0.51; revenues rose 30.8% year/year to $3.93 bln vs the $3.91 bln consensus. Co issues upside guidance for Q3, sees EPS of $0.55-0.59, excluding non-recurring items, vs. $0.53 Thomson Reuters consensus; sees Q3 revs of $4.1-4.2 bln vs. $4.03 bln Thomson Reuters consensus. Jabil Circuit reports Q2 core operating margin of 4.3% vs. the 4.2% consensus

8:31AM Apple announces iPad 2 will go on sale in 25 additional countries this Friday, March 25 (AAPL) 339.30 : Co announced that the iPad 2, will go on sale in 25 additional countries this Friday, March 25. iPad 2 will be available at Apple retail stores and select Apple Authorized Resellers at 5 p.m. local time, and online through the Apple Store beginning at 1 a.m. Apple also announced that all models of iPad 2 will be available in Hong Kong, Korea, Singapore and additional countries in April.

Sierra Wireless (SWIR) announced that NETGEAR (NTGR) has selected Sierra Wireless AirPrime embedded wireless modules to provide high-speed connectivity for a new series of mobile broadband routers that are specifically designed to take advantage of 4G LTE and Dual-Carrier HSPA+ networks

Research In Motion (RIMM) announced plans to make the highly-anticipated BlackBerry PlayBook tablet available in more than 20,000 retail outlets in the U.S. and Canada.

icon url

ReturntoSender

03/24/11 10:07 PM

#9291 RE: ReturntoSender #6755

From Briefing.com: 4:30 pm : There wasn't really room for positive spin on today's headlines, but stocks still scored strong gains as market participants showed renewed interest in risk.

The tone of trade today was positive from the start. Participants initially took their cues from Europe's major bourses, which all advanced around 1% or more in the face of a decision by Moody's to downgrade about 30 banks in Spain, the likelihood for a bailout of Portugal following the failure of its Parliament to pass austerity measures, and a mixed batch of economic data.

There wasn't much to boast about at home either. Data featured a 0.9% drop in overall durable goods orders for February and a 0.6% fall in orders less less transportation. The consensus among economists polled by Briefing.com had called for increases of 1.1% and 1.8%, respectively.

The latest weekly initial jobless claims count came in at 382,000, which is on par with the 384,000 initial claims that had been broadly expected.

Consumer electronics and home office supplies retailer Best Buy (BBY 30.13, -1.72) issued cautious commentary during its quarterly conference call that overshadowed the company's upside earnings surprise. The stock dropped to a two-year low after it had opened in positive territory.

Even amid lackluster headlines stocks still attracted strong buying interest. The effort even took the S&P 500 past the 1300 zone through secondary resistance above that point to a 10-day high.

Tech stocks, which collectively represent the largest sector by market weight, were a primary source of leadership. The sector climbed 1.6%. Large-cap tech issues like Research In Motion (RIMM 64.09, +1.97), which spiked above its 50-day simple moving average ahead of its earnings report, helped the Nasdaq Composite outperform its counterparts.

Financials lagged for the second straight session. Bank of America (BAC 13.48, -0.17) deepened its one-month low in the wake of yesterday's news that the Fed refused the bank's proposal to distribute capital to shareholders in the second half of 2011. Capital One Financial (COF 51.86, +0.45) was dealt the same decision, but its shares actually staged an impressive rebound. As a group, financials advanced just 0.5%.

Energy stocks were today's weakest performers. They gained just 0.3% after oil prices failed to sustain a move above $106 per barrel to settle essentially unchanged at $105.60 per barrel.

Precious metals came under pressure after pushing higher. Gold prices closed with a 3.1% loss at $1434.90 per ounce after the continuous gold contract traded to a new all-time high at $1448.60 per ounce. May silver ended settled with a 0.6% gain at $37.37 per ounce after it hit $38.18 per ounce, which is its highest level in more than 30 years.

For the third straight session share volume was unimpressive. That should pick up in coming sessions as money managers reposition their portfolios for quarter's end.

Advancing Sectors: Tech (+1.6%), Consumer Discretionary (+1.5%), Health Care (+1.2%), Industrials (+1.0%), Telecom (+0.9%), Consumer Staples (+0.8%), Finance (+0.5%), Materials (+0.4%), Utilities (+0.4%), Energy (+0.3%)
Declining Sectors: (None)DJ30 +84.54 NASDAQ +38.12 NQ100 +1.8% R2K +0.7% SP400 +1.0% SP500 +12.12 NASDAQ Adv/Vol/Dec 1674/1.99 bln/926 NYSE Adv/Vol/Dec 1947/868 mln/1013

4:28PM Research In Motion beats by $0.02, misses on revs; guides Q1 EPS below consensus, revs below consensus; guides FY12 EPS above consensus (RIMM) 64.09 +1.96 : Reports Q4 (Feb) earnings of $1.78 per share, $0.02 better than the Thomson Reuters consensus of $1.76; revenues rose 36.2% year/year to $5.56 bln vs the $5.64 bln consensus. RIMM reports Q4 gross margins of 44.2% vs 43.5% consensus; guidance was for GM to 'be similar to Q3' which was 43.6%. Reports Q4 shipments of 14.9 mln units vs. the 14.5-15.0 mln unit guidance... Co issues downside guidance for Q1, sees EPS of $1.47-1.55 vs. $1.65 Thomson Reuters consensus; sees Q1 revs of $5.2-5.6 bln vs. $5.64 bln Thomson Reuters consensus. Gross margin percentage for the first quarter is expected to be approximately 41.5%, vs. 42.7% consensus... Co issues upside guidance for FY12, sees EPS of $7.50- vs. $6.81 Thomson Reuters consensus... This guidance range reflects a mix shift in handset towards lower ASP products in the first quarter and an increased level of investment in Research and Development and Sales and Marketing related to our tablet and platform initiatives. The guidance range is slightly wider than normal to reflect the risk of potential disruption in RIMM's supply chain as a result of the recent earthquake in Japan. "As we enter fiscal 2012, RIMM is in an excellent position to benefit from the continuing convergence of the mobile communications and mobile computing markets. We are laying a strong foundation for RIMM's expanding market opportunity through focused investments and we are extremely excited about our smartphone, tablet and platform roadmaps."

4:05PM Oracle beats by $0.04, beats on revs; raises quarterly dividend 20% to $0.06 (ORCL) 32.14 +0.73 : Reports Q3 (Feb) earnings of $0.54 per share, excluding non-recurring items, $0.04 better than the Thomson Reuters consensus of $0.50; revenues rose 36.9% year/year to $8.76 bln vs the $8.67 bln consensus. Both GAAP and non-GAAP new software license revenues were up 29% to $2.2 billion. Non-GAAP software license updates and product support revenues were up 13% to $3.8 billion. Both GAAP and non-GAAP hardware systems products revenues were $1.0 billion. Non-GAAP operating income was up 35% to $3.9 billion, and non-GAAP operating margin was 44%. "Our hardware product gross margins increased to 55% in the quarter so we are now completely confident that we will exceed the $1.5 billion profit goal we set for the overall Sun business for the current fiscal year. Q3 performance was broad based with all geographies reporting revenue growth of 30% or higher... The sequential rev growth for Exadata and Exalogic was up over 50%. And we expect to see an even higher growth rate for these two game changing technologies in Q4... In Q3 we signed several large hardware and software deals with some of the biggest names in cloud computing... For example, Salesforce.com's new multi-year contract enables them to continue building virtually all of their cloud services on top of the Oracle database and Oracle middleware." In addition, Oracle also announced that its raised its quarterly cash dividend to $0.06 per share from $0.05 per share.

Trident Microsystems (TRID)announced that its HiDTV Pro-SA1 system-on-a-chip has been designed into Hisense's newest line of affordable and feature rich Connected TVs for the Japanese market.

8:10AM Best Buy beats by $0.01, reports revs in-line; guides FY12 EPS below consensus, revs in-line (BBY) 31.85 : Reports Q4 (Feb) earnings of $1.86 per share, excluding $0.36 in restructuring charges and a $0.12 benfit from lower taxes, $0.01 better than the Thomson Reuters consensus of $1.85; revenues fell 1.8% year/year to $16.26 bln vs the $16.3 bln consensus. The decrease reflected a 4.6 percent decline in comparable store sales, partially offset by the impact of net new stores in the past 12 months. The co's gross profit rate for the fiscal fourth quarter was 24.3 percent of revenue (24.4 percent on an adjusted basis), an increase of 40 basis points on an adjusted basis when compared to the fourth quarter of fiscal 2010. During the fourth quarter of fiscal 2011, the company repurchased ~$70 million, or 2 million shares of its common stock at an average price of $35.66 per share. During fiscal 2011, the co repurchased ~$1.2 billion, or 33 million shares of its common stock at an average price of $36.62 per share. The co also noted that it has ~$1.3 billion remaining capacity under its existing share repurchase authorization as of the end of the fiscal fourth quarter. Co issues guidance for FY12, sees EPS of $3.30-3.55, excluding non-recurring items, vs. $3.56 Thomson Reuters consensus; sees FY12 revs of $51.0-52.5 bln (+1-4%) vs. $52.13 bln Thomson Reuters consensus, with comps flat to down 3%.

NXP Semiconductors (NXPI) announced new additions to its Ultra High Frequency and FM broadcast product portfolio, including the BLF888B transistor. Configured as a Doherty power amplifier, the BLF888B achieves breakthrough 50% DVB-T efficiency, offering significant reductions in the power consumption of UHF broadcast systems.

08:41 am Cree target lowered to $65 at Morgan Joseph: . Morgan Joseph lowers their CREE tgt to $65 from $75 following lowered guidance. The firm says gross margins of approx 43%, compared to initial estimate of 46%, were also guided lower for the March quarter due largely to pricing pressure in the LED chip product line. They also note that margin pressure is anticipated given that sales were expected to be back-end loaded in F3Q11, and are now likely to occur in F4Q11, leading to an increase in inventories in the March quarter, and negatively impacting utilization rates. Longer term, their expectation for gross margins in the mid-to-high 40s is unchanged.
icon url

ReturntoSender

03/27/11 11:19 AM

#9293 RE: ReturntoSender #6755

InvestmentHouse Weekend Market Summary

http://www.investmenthouse.com/weekendmarketsummary.htm

- Market makes it 6 out of 7, holding a gain despite some afternoon profit taking.
- Older economic news (GDP) is fine, but the newer information is not as fine.
- Second Fed member talks about inflation. Market may be assuming QE 3 but the Fed has started dropping bread crumbs.
- A solid week, a bit extended, but more tape painting provides a path for gains up to . . . the Jobs Report.

MARKET SUMMARY

A bit of profit taking late in the session but nothing to change the week.

The stock market performed as expected on Friday with a continuing recovery rally. It lasted at least through lunch, and then it made the pullback that we anticipated into the afternoon and the close. There was a bit of profit taking, but it was not anything spectacularly negative. It was just a little fade ahead of the weekend following a good six out of seven upside sessions. NASDAQ, +0.25%; SP500, +0.3%; Dow, +0.4%; SP600, +0.84%; SOX, -0.25%; NASDAQ 100, +0.2%.

Nothing negative at all about the action. It was just a day where the momentum continued until the afternoon when some profit taking occurred. We felt that was going to happen, and we were part of the profit taking. We bagged a few nice gains here and there on another run to the upside. With the market being this choppy over the past few weeks, having a nice run and banking some gain is a very good outcome. Moving into next week, the question is whether the tape painting ahead of the end of the quarter will continue, and will it continue into the Friday jobs report? Friday will wrap up the quarter, and it will be interesting to see if the market moves right up to the quarter or if there is an anticipatory pullback.

New money has been coming into the market on new months (excepting this month). Overall we have had good upside moves to start each month and each quarter as fresh money is put to work. There is no doubt that new money is coming into the market, but there are some issues ahead we have to examine before we can conclude that the market can continue to the upside after this end-of-quarter rally.

OTHER MARKETS

Dollar: 1.4078 Euro versus 1.4171. The dollar scored a nice gain. It undercut the November low, and now it has reversed and recovered that level. We may get that familiar false breakdown. A stock X or currency in this case X will break lower only to reverse just as people think it has broken a significant support level and is heading lower. Often we have seen a stock or currency reverse after that and make a good move to the upside. We will see if it is a good move. The dollar is in a three-month downtrend. It is just now approaching that downtrend line, and the 20 day EMA acted as resistance on the last bounce. It is coming to an important area, and we will see how it is handled. The reversal may be worthwhile. The Fed was out again on Friday saying that we have to consider the removal of the liquidity and start focusing on inflation. With that, we have two of them speaking that way. There may be some credence to it given that there is more than one shooting from the hip. Thus the dollar was warranted a rise, particularly after other currencies have had a good run against it. Maybe this is nothing more than a bit of giveback. We will see.
Click to view the chart

Bonds: 3.44% versus 3.41% 10 year Treasury. Bonds lost a little ground. A good rally up off the lows, a higher low and a higher high. Now they are coming back to test the 50 day EMA, the gap, and the late-February peak. Also sitting right on top of the December-January consolidation. A great place to hold and bounce if it will do that, but why would bonds be moving up if the economy is improving and everything is fine in the world? Well, everything is not fine in the world, thus I believe that is one reason that bonds in the US are acting somewhat as a safe haven again. Money is working its way regardless of the gains in the stock market because there is a bit of a fear trade in bonds. That is helping push bonds higher and yields lower, although they there are still elevated yields from where they were just a few months back.
Click to view the chart

Gold: $1,426.30, -10.10. Gold had a tougher day. It did not make the surge it has in the past. There are various closes of gold, but the point is it has had a good rally. It bounced up against the early-March peak and it is having a struggle at this point. We did not like the action in one of our silver plays, so we took the gain off the table. It could be that these precious metals are double topping here. I do not think it would be any kind of major pullback X more of a modest pullback to test these prior peaks or just below them before moving back up.

It does not appear that gold is in a lot of trouble, although there are those out there saying it is ready to crash. Others are saying it is going to $5,000. I am not in either camp, although I do think it will go up.
Click to view the chart

Oil: $105.39, -0.03. Note how this pattern is very similar to gold, at least in the double-top aspects. It is holding steady on the session after mirroring what happened on Thursday when it tapped that prior high and showed a doji, unable to continue the move. We have calls out of JPM that oil is going to explode higher up to $130 average in Q2. That would not be good for the American consumer or businesses, of course, but it looks rather suspiciously double-toppish right here. It may pull back before it moves higher.
Click to view the chart

THE ECONOMY

TO VIEW THE ECONOMY CLICK THE FOLLOWING LINK:
Economy Summary Video

TECHNICAL SUMMARY

INTERNALS.

Volume. The internals were relatively lackluster on the day. The market moved higher, but volume fell 6% on the NASDAQ to 1.8B. That was below average. It fell 5% on the NYSE to 824M, and that was below average as well.

Breadth. Breadth was a modest 1.4:1 on the NASDAQ. It was a bit better at 1.7:1 on the NYSE thanks to the small caps outperforming the rest of the market. Not much excitement from the internals.

CHARTS

SP500. Six days out of seven to the upside on the SP500, and it rallied higher intraday. It never made it to the March peak and, of course, that means it did not make it to the February rally high. It showed an evening star doji. It gapped to the upside and showed a doji with that high candle. We will now see if it gaps to the downside. This is not necessarily death. If it hit the high, that could have been a real concern. It did not happen here, but it has had a good rally back to the upside. You always have to have a bit of concern when you see a good recovery rally that falls short of prior peaks and does not seem to have a lot of momentum. Yes, it moved up six out of seven days, no doubt, but the volume is pathetic. There is no trade. It has been below average for the last four days as the market moved higher.

You do not necessarily want to bet against this. The end of quarter is coming and the tape painting has been excellent. There would be more of that next week, which will see the last week of March and Q1 take place. It ends on Friday. Technically there is a lack of real push with strength at this point, but if money continues to flow, we will not get in front of it. I would anticipate another rise, maybe up to the early-March peak if it cannot make the February peak. There is still room to the upside, but I am not anticipating the market will break to a new rally high. If it does, I'll be pleasantly surprised.

NASDAQ. NASDAQ did not have a stellar day, but it had very similar action to the SP500. A gap higher, a rally, and then a giveback. It sold to give back most of the move. Still below the March peak and February peak, and right at the mid-January level. We have some problems here. There is a lack of momentum at an important area. It has been a good recovery. It has been a long-winded recovery, but technically we are concerned. We might get some more followthrough toward the end of the month and end of quarter. After that we have to watch. We have to be a bit careful; there may be some impetus to sell even if there is also a first-of-the-month or new-quarter push to the upside as some new money gets dumped into the market.

SP600. I do not want to say the small caps were more frightening than the others, but they have had more success and have rallied to key levels faster than the large-cap indices. On Friday SP600 moved through the March peak. It still left it below February, but it made an important break and it got thrown back in its face. Yes, it still gained almost 1%, but it lost a lot of ground as it came off of its high. We have a doji here, and it is at that March peak X it caught my eye. It is a bit disquieting, but then again, it is just a warning or an indicator. It is not anything carved in stone. It just says it got to that level and the sellers pushed it back.

There are reasons for that on SP600 as well as NASDAQ and SP500. A good run to the upside, a good recovery move, and then a weekend when there is a lot of geopolitical turmoil ongoing. After a good run to the upside with two days where the market will not be open, it is not surprising that investors were taking some money off of the table. That does not mean the move is over. It just means there was a bit of profit taking on Friday, and that was exhibited on the SP600 as well.

SOX. SOX was down on the session. It again tried to put some distance on its 50 day EMA and failed to do so. It is still ragged and still well below its March and February peak. It is actually struggling at some prior lows (the late-February low and a consolidation range from late-January). Semiconductors have a little issue here, a potential head and shoulders. It could be apexing right now. We will have to watch and see what happens.

LEADERSHIP

Retail. Retail had a decent day. FOSL had a very solid upside day on strong volume. PCLN resumed its move this week with a great surge off the 50 day EMA, putting together three very strong upside days. BC has a very nice day, breaking higher out of its pennant pattern as it does from time to time. Tremendous volume on this move. Nice action.

WFMI continues to the upside. It gapped with that breakaway move. It took its time, moving laterally over a month, but now it is making nice, steady gains once again. Retail is looking good in some areas. Some are not as hot, but it is showing consumers coming in again, and that is interesting. We had the positive Q4 GDP with respect to consumer spending, but we have had sentiment indicators that are not as positive. That is often the case; people say they will not spend as much, but they end up doing it anyway.

Energy. Energy had a decent day, although it was mixed. RPC had a great day on volume, moving higher. A great week as it really kicked in the continuation of its breakout move. NBL had a great week and it has resumed the move on Friday, kicking nicely higher. FTO is doing very well. Nice breakout from that flag pattern. Good action there. Volume could have been better, but we will not quibble over that. On the other hand, there are stocks that ran well but could not keep it together on Friday. LUFK posted a gain, but it showed a doji after a very nice two-week run. A little pullback would be normal.

Transportation. Transports continue to perform decently. TK posted a nice break on volume Friday. It started on Thursday, and it continued with a nice, strong move on Friday. CSX did not a lot, but it was a positive two weeks as it posted a new rally high, continuing its solid move. It is getting to a point now where it tends to come back and test the 20 day EMA. In the past when has moved up with these rather accelerated gains, it comes back to test that level. We may see it head back for some testing after that doji it showed on the Friday candlestick chart.

Industrials. CAT tested and it resumed the move upside with some nice volume. DE had a good day as well, bouncing to the upside.

Financial. Financials were not helping out at all on Friday (or Thursday, for that matter). JPM barely moved. GS actually declined on Friday on rising volume. WFC made a move higher, but it stalled at the 50 day EMA. Not that exciting.

Technology. AAPL had a nice day, gapping to the upside. It keeps getting prices raised. ORCL announced earnings after the Thursday close. It gapped to the upside, but notice that it gave back a lot of it. Good news, but ORCL trades like this on its earnings; sometimes it gaps and holds, and sometimes it gaps and gives back. This is just one of those 50/50s, and it gave back on this session. There are others out there. CRM made a nice bounce, gapping higher on Thursday. Now it is testing. That may give the entry point we are looking for. We did see some technology start to come back from selling, and we may get some buys out of it moving to next week.

Overall leadership perked up as you would have expected after this kind of move. Some of it is extended. Some energy stocks are quite extended, and some in retail have made a good move thus far. Of course CSX in the rails is way up. DE and CAT had a little pullback, but they have had a good bounce to the upside. Not necessarily where you would want to buy. The problem is finding stocks in position to move. Some have pulled back. Maybe now money will flow more readily back into technology after it has been beaten up over the past several weeks.

THE MARKET

VIX. The VIX has given back the move from the first part of March that ratcheted volatility up over 30 as the market sold back. As soon as the market rallied, it has dropped right back down, but not to the lows that started the move. Why? The indices have not made the highs they were at before the move. This is acting just as you would expect it to. In other words, volatility was not rising as the stock market rose. It only started to move up when the stock market turned volatile and choppy and started to sell off. Volatility, typically being the inverse of the stock market move, shot higher at the time. It would have been a problem if volatility was moving up as the stock market was moving up similarly. That was not the case. If it does happen, that is pretty reliable indication that you have a major correction coming. We did not have that X not yet. We had a substantial pullback as we had in August and November, but no major selloff. The market is rebounding and it still has work to do. We will see what happens. VIX was not flashing any very dangerous signs.

VIX: 17.91; -0.09
VXN: 20.78; +0.19
VXO: 17.66; -0.12

Put/Call Ratio (CBOE): 0.84; -0.05

Bulls versus Bears:

This is a reading of the number of bullish investment advisors versus bearish advisors. The reason you look at this is that it gives you an idea of how bullish investors are. If they are too bullish then everyone is in the market and it is heading for a top: if everyone wants to be in the market, then all the money is in and there is no more new cash to drive it higher. On the other side of the spectrum if there are a lot of bears then there is a lot of cash on the sideline, and as the market rallies it drags that cash in as the bears give in. That cash provides the market the fuel to move higher. If bears are low it is the same as a lot of bulls: everyone is in and the market does not have the cash to drive it higher.

Bulls: 50.6% versus 52.2%. Even as the market pushed higher investors were a bit more skeptical. Good to see. Bulls peaked in late December on this upside leg and have made lower highs since. Still high overall but not necessarily bearish. Hit 55.1% in January and 58.8% on the December high on this leg. Still at a high level in a string of high readings but below the 5 year high at 62.0. Fading back from the level considered bearish, i.e. where so many are in the market and believe it is going up that the ammunition to send it higher runs low. This is where you start to be careful and watch for breakdowns, but there is also a lot of liquidity being pushed into the market and that can continue the move despite excess bullishness. The crossover level at 29% bulls is long gone, but it did its job. The high on the last leg was 56.0% after starting at 35.6% on the low in February, the lowest it has been since July 2009 . . . until this last leg. 35% is the threshold level suggesting bullishness. Again, to be seriously bearish it needs to get up to the 60% to 65% level.

Bears: 22.4% versus 22.3%. Bears increased before bulls started to decrease but now the bulls are moving a bit faster. Up from 19.5% to start March. Moving back up toward 23.3% hit mid-February, still well below the 28.3% in September 2010. The 37.7% peak at the height of the crossover is well in the rearview mirror but bears remain well below the 35% level, above which is considered bullish for the market overall. Hit 18.7% on the low in April. Hit a high of 27.8% level on the prior leg in February. For reference, cracking above the 35% threshold considered bullish. Hit a high on the prior run at 47.2%. For more reference, bearishness hit a 5 year high at 54.4% the last week of October 2008. The move over 50 took bearish sentiment to its highest level since 1995. Extreme negative sentiment. Prior levels for comparison: Bearishness peaked at 37.4% in September 2007. It topped the June 2006 peak (36%) on that run. That June peak eclipsed the March 2006 high (33%) and well above the 2005 highs that spawned new rallies (30% in May 2005, 29.2% in October 2005). That was a huge turn, unlike any seen in recent history.

NASDAQ

Stats: +6.64 points (+0.24%) to close at 2743.06
Volume: 1.806B (-6.21%)

Up Volume: 1.05B (-560M)
Down Volume: 742.81M (+401.67M)

A/D and Hi/Lo: Advancers led 1.37 to 1
Previous Session: Advancers led 1.8 to 1

New Highs: 141 (+29)
New Lows: 20 (-4)

NASDAQ CHART: Click to view the chart

NASDAQ 100 CHART: Click to view the chart

SOX CHART: Click to view the chart

SP500/NYSE

Stats: +4.14 points (+0.32%) to close at 1313.8
NYSE Volume: 823.97M (-5.15%)

Up Volume: 528.83M (-143.95M)
Down Volume: 284.48M (+95.79M)

A/D and Hi/Lo: Advancers led 1.69 to 1
Previous Session: Advancers led 2.09 to 1

New Highs: 242 (+68)
New Lows: 23 (+7)

SP500 CHART: Click to view the chart

SP600 Chart: Click to view the chart

DJ30

Stats: +50.03 points (+0.41%) to close at 12220.59
Volume DJ30: 130M shares Friday versus 131M shares Thursday.

DJ30 CHART: Click to view the chart

MONDAY

As if the rest of the issues in the world were not enough, the data parade renews itself next week with a torrent of economic reports culminating Friday with the March jobs report. There may be more news over the weekend as problems arise in Syria now, and more stirring in Saudi Arabia. I do not want too be dramatic here, but the spread of this unrest is getting to be quite dramatic. Bear with me while I digress a bit.

I am sure a lot of people want to throw off the yoke of oppression they have endured for decades, and no one other than the yoke owners have issue with that. The problem is that some people are using the uprisings in North Africa and the Middle East to score politically here in the US. They are trying to piggyback on the uprisings, but the themes are not the same at all. We do not know all of the motives of those overseas, but we can assume there are many who just want freedom. That is natural. We wanted it and it is an innate desire in everyone. Of course they do not necessarily know how they would govern themselves, and it quite possibly would not be a democracy, but they just want freedom from what is imprisoning them now. They know they are not going to get anything if they continue to acquiesce, so we are seeing uprisings.

Over here it is not the same thing. We have relative freedom, although it is being stripped away piece by piece over the years. But we do have freedom. Some of these groups using the uprisings overseas as a comparison to their actions are simply trying to perpetuate some bad decisions made in the past. Both sides have legitimate arguments. If you have a contract and you set up your life in reliance upon that contract, it is very difficult later in life to have that reneged upon and have to renegotiate the terms. It may, however, be a situation where there is absolutely no alternative because the money is not there. There has to be a compromise made at some point because too much was promised, with good intentions, but it is more than we can deliver.

The question is how we are going to make up that promise. Do you put it all on the other members of society who are not a part of these pension contracts and other retirement deals that were made? Do they have to shoulder the shortfalls all themselves because the governments may have been too profligate or they just overpromised? Some of the contracts were just unreasonable and unrealistic; there was no way they could be fulfilled but it was done for votes, expediency, etc. Nonetheless, they were promises made and reliance has occurred. Or is it fair to put it all on the taxpayers and tax more from them to pay for others unrealistic contracts? Maybe it would be fair to work at it from both ends? Perhaps some of the benefits should be cut back and then maybe some more revenue brought in from elsewhere or redirected. These are issues we will have to deal with, but it is not the same as what people are experiencing overseas.

Educate yourselves on it, and you will see what the truths are. Do not be led to believe anything X not by what I say or what anyone else says. Just read, listen to everyone, and then make rational decisions. Wouldn't we all be better off if we did that? What novel thoughts.

Back to the market.

Whether we want to face it or not, those are the realities that the market has to deal with every day as an overlay to what it normally factors into the equation, e.g. be income and spending, profits and losses, manufacturing, orders, confidence, etc. And we have a week full of those factors. Personal income and spending is on Monday along with pending home sales. Case/Shiller on Tuesday along with consumer confidence, and then Challenger and ADP on Wednesday. Then we have initial claims, Chicago PMI and factory orders on Thursday. This all leads up to the granddaddy of them all: Nonfarm payrolls on Friday. That is expected to fall back a bit to 185K, which is still a pathetic number.

The Unemployment rate is expected to stay at 8.9% after dropping unexpectedly to that level the prior month. Will it bounce up or not? The way they count unemployment now, it is hard to tell. It is no longer if you are working or not. It is whether you are working or trying to or out of the market, et cetera. In any event, it is still bad, but it may be improving as the weekly jobless claims are showing.

We will get a lot of data next week, no doubt. What has happened this past week when we have gotten a lot of data? The market went up, even though a lot of the news was negative from overseas and with the US economic numbers. The market said, what the heck, we are going higher. That led everyone to believe it is painting the tape or anticipating some further Quantitative Easing in the form of QE III.

We have been playing the devil's advocate on all of the theories we have put out lately, whether it is tape painting (likely some of that) or the anticipation of Quantitative Easing III from all of the bad data and bad news in the world. We have come back and poked holes in all of that. It could be pretty much any game at this point. Why? The government is involved so deeply in businesses, monetary and fiscal policy, and in our lives and how we run our businesses. They are making sure GE pays no income taxes whatsoever from the stimulus money it received and all the other loopholes it can find. There are many things the government has to be involved in order to make everything work the way it wants to. It is a tough job indeed.

In the technical picture, we see a market that has rallied six out of seven days. We also see a rally that has a bunch of big-money players that may have missed out on some of the move and want to get in and drive the market higher. Not just to drive it higher, but to get in these stocks they want to have in their quarterly reports. They only have a few days to accomplish that, and as they pile in, they push the market to the upside.

Friday was not a particularly strong day, but for reasons discussed earlier, it was not that weak either. We do not want to put too much into the two doji on the candlestick chart the indices showed in the week. What we anticipate is a further move to the upside. That means some stocks that are already extended will get more extended. That will not make them good buys. There will be stocks out there still in good shape we can try to pick up. We have to realize we may only get three to five more days of upside before more profit taking hits at the end of the quarter or right at the beginning of next quarter. That would get us through Friday, April 1st X watch out for April Fool's Day. Early the following week we may see some pullback.

The question is how much? For now, all you can say is there is likely some more profit taking. We just have to play this buy ear because, technically, it has made a good move back up but has not been that powerful with the low volume. We do not want to chase too many positions here. I know some do not want to hear me say that, but we have picked up a lot of good positions over the past few weeks and started taking some gain off the table. We will use a further rally to primarily take more gain off the table versus initiating a bunch of new positions.

It is all about the risk/reward. We need good entry points where we have a close and logical stop point at hand. We need something that, upside, gives us enough return if we are right to warrant the risk. We do not want to go into 1:1 plays where we are risking a dollar to make a dollar. Those are not odds to continually win. We will have to look for very good risk/reward plays, and those are simply harder to find right now. They are out there. I see them right now when looking through the market, but they are just not as prevalent as they were two weeks ago. The market was sold off then and stocks were falling back towards support and that 50 day EMA that so many of them were hitting and holding.

We have to just throttle back on new positions, let continuing positions run, and take gain as we have to opportunity. If we get a few good plays to the upside that we can buy into, so be it. We can hopefully get some that run decently for us in a week or a week-and-a-half and that give us a nice return.

I do not want to get you discouraged in thinking we will have a slow week ahead in terms of bias. We may. Things may turn around and all of a sudden money may flood into the market. Then we could buy more and ride the wave higher and just keep our stops close at hand. We will play it by ear. We will find some plays and, if we need to, we will make those plays. The intention will be to make money. You do not want to trade either just to trade or in the hope you will make money. We want to know going in that the odds are in our favor and that we expect to make money on the plays. If we do not have that feeling about it, we might as well not be entering that particular trade.

Keep abreast of what is going on. We will let our positions run and look for opportunity. The market always gives us opportunity no matter what. While we may not be taking ten or twelve positions next week, we may be taking two, three, or four. They can make us nice money nonetheless. I will see you on Monday at the start of a week full of data.

Have a great weekend!

Support and Resistance

NASDAQ: Closed at 2743.06
Resistance:
2762 is the February low
2796 is the February gap down point
2802 is the early March peak
2825 is the 2007 closing peak.
2841 is the February 2011 peak
2862 is the 2007 peak

Support:
2729 is the 127% Fibonacci extension of the August 2010 run
The 50 day EMA at 2715
2705 is the February 2011 and consolidation low
2686 is the recent January 2011 closing low
2676 is the January 2010 low
2645-2650ish from December 2010 consolidation
2580 is the November 2010 closing high
2569 is the November gap up point through the April 2010 peak
2550 from May and June 2008 peaks
2540 is the gap up point from early November
2535.28 is the April 2010 intraday peak
2530 is the April 2010 closing peak
2518 is interim peak from April 2010
The 200 day SMA at 2479
The November 2010 low at 2460

S&P 500: Closed at 1313.80
Resistance:
1313 from the August 2008 interim peak
1325-27 is the March 2008 closing low and the May 2006 peak
1332 is the early March peak
1344 is the February 2011 peak
1364 is the March 2007 low
1370 is the August 2007 low

Support:
The 50 day EMA at 1295
1294 is the February 2011 and the consolidation low
1275 is the January 2010 low, early January 2011 peak
1255 is the late December 2010 consolidation range
1249 is the March 2011 low
1235 is the mid-December 2010 consolidation low
1227 is the November 2010 peak
1220 is the April 2010 peak
The 200 day SMA at 1190
1185 from late September 2008
1174 is the May 2010 high, 78% Fibonacci retracement of April peak
1173 is the November 2010 low
1170 is the prior March 2010 high
1156 is the Sept 2008 low
1151 is the January 2010 peak
1133 from a September 2008 intraday low
Bottom of the January 2010 consolidation 1131 to 1136
1129 to 1131 is the June and August 2010 peaks

Dow: Closed at 12,220.59
Resistance:
12,283 is the March 2011 peak
12,391 is the February 2011 peak
13,058 from the May 2008 peak on that bounce in the selling

Support:
12,110 from the March 2007 closing low
The 50 day EMA at 11,976
11,893 from March 2008 closing low
11,867 from the August 2009 high and peak on that bounce in the selling.
11,734 from 11-98 peak
11,555 is the March low
11,452 is the November 2010 peak
11,258 is the April 2010 peak
11,205 is the April closing high
The 200 day SMA at 11,119
11,100 from the 7-08 low
10,963 is the July 2008 low
10,920 is the recent May high
10,730 is the January 2010 peak

Economic Calendar

March 25 - Friday
- GDP - Third Estimate, Q4 (08:30): 3.1% actual versus 2.9% expected, 2.8% prior
- GDP Deflator - Third, Q4 (08:30): 0.4% actual versus 0.4% expected, 0.4% prior
- Michigan Sentiment - Preliminary, March (09:55): 67.5 actual versus 68.0 expected, 68.2 prior

March 28 - Monday
- Personal Income, February (08:30): 0.3% expected, 1.0% prior
- Personal Spending, February (08:30): 0.5% expected, 0.2% prior
- PCE Prices - Core, February (08:30): 0.2% expected, 0.1% prior
- Pending Home Sales, January (10:00): 0.3% expected, -2.8% prior

March 29 - Tuesday
- Case-Shiller 20-city, January (09:00): -3.3% expected, -2.38% prior
- Consumer Confidence, March (10:00): 65.0 expected, 70.4 prior

March 30 - Wednesday
- MBA Mortgage Index, 03/25 (07:00): +2.7% prior
- Challenger Job Cuts, March (07:30): 20% prior
- ADP Employment Change, March (08:15): 210K expected, 217K prior
- Crude Inventories, 03/26 (10:30): 2.131M prior

March 31 - Thursday
- Initial Claims, 03/26 (08:30): 383K expected, 382K prior
- Continuing Claims, 03/19 (08:30): 3700K expected, 3721K prior
- Chicago PMI, March (09:45): 69.5 expected, 71.2 prior
- Factory Orders, February (10:00): 0.4% expected, 3.1% prior

April 01 - Friday
- Nonfarm Payrolls, March (08:30): 185K expected, 192K prior
- Nonfarm Private Payrolls, March (08:30): 203K expected, 222K prior
- Unemployment Rate, March (08:30): 8.9% expected, 8.9% prior
- Hourly Earnings, March (08:30): 0.2% expected, 0.0% prior
- Average Workweek, March (08:30): 34.3 expected, 34.2 prior
- ISM Index, March (10:00): 61.4 expected, 61.4 prior
- Construction Spending, February (10:00): -0.7% expected, -0.7% prior
- Auto Sales, April (15:00): 4.61M prior
- Truck Sales, April (15:00): 5.61M prior
icon url

ReturntoSender

03/30/11 10:51 PM

#9296 RE: ReturntoSender #6755

From Briefing.com: 4:30 pm : Renewed buying interest has the stock market on pace for its best first quarter performance since 1998.

Robust gains abroad provided a spark that helped stocks extend their prior session advance. No real reaction was made to the latest ADP Employment Change, which indicated that private payrolls increased by 201,000 in March. The Briefing.com consensus had called for an increase of 210,000.

Support continues to be broad based, but telecom has consistently been a top performer during the course of the past few sessions. In fact, the sector is up about 5% week to date. Integrated plays AT&T (T 30.71, +0.66) and Verizon (VZ 38.46, +0.17) have hit new 52-week highs in the process.

Strength in both shares of T and VZ helped the Dow climb to within about 20 points of the two-year high that it set little more than a month ago. Meanwhile, strength among small-cap stocks took the Russell 2000 to its highest level since 2008. The broad-based S&P 500 is back near its one-month high, which has it on pace for a quarterly gain of more than 5%. It encountered some resistance in the 1330 zone, though.

Energy stocks experienced some volatility with President Obama's outline of the U.S. energy policy. Energy stocks had been up about 1%, but gave up all of that gain in the minutes leading up to the speech. A lack of surprises enabled the sector to rebound to a 0.8% gain.

Tech stocks traded with relative weakness all session. Although the sector settled in positive territory, its 0.2% gain paled in comparison with what the broad market scored. Despite that, the tech-rich Nasdaq actually edged out its counterparts. Biotech play Cephalon (CEPH 75.44, +16.69) was a top performer after Valeant Pharma (VRX 50.08, +5.69) announced an all cash takeover offer of $73 per share for the company. Both stocks set 52-week highs.

Even though the end of the first quarter is close at hand, participation remains unimpressive in that share volume failed to break 1 billion on the NYSE again. Part of the reluctance among portfolio managers to rearrange their holdings is owed to caution ahead of the official nonfarm payrolls report, which is due this Friday.

Treasuries settled the day with solid gains. Their advance came in the face of a stronger stock market and lackluster results from an auction of 7-year Notes. The auction drew a bid-to-cover of 2.79, dollar demand of $80.9 billion, and an indirect bidder participation rate of 49.4%.

Advancing Sectors: Telecom (+1.4%), Materials (+1.2%), Consumer Discretionary (+1.1%), Materials (+1.0%), Energy (+0.8%), Financials (+0.7%), Health Care (+0.7%), Consumer Staples (+0.6%), Industrials (+0.4%), Tech (+0.2%)
Declining Sectors: (None)DJ30 +71.60 NASDAQ +19.90 NQ100 +0.5% R2K +1.3% SP400 +1.0% SP500 +8.82 NASDAQ Adv/Vol/Dec 1826/1.81 bln/779 NYSE Adv/Vol/Dec 2191/918 mln/811

4:30PM Photronics acquires $30.4 mln aggregate principal amount of its outstanding 5.5% convertible notes (PLAB) 8.91 +0.32 : Co announced that it acquired $30.4 mln aggregate principal amount of its 5.5% convertible senior notes due in October 2014. The convertible notes were acquired in individually negotiated transactions, by delivering ~$19.7 mln in cash and approximately 4.5 mln shares of its common stock with an approx. value of $39.2 mln. As a result, the Company expects to record an after-tax charge in the range of $30 mln to $31 mln, of which ~67% is expected to be noncash. As a result of the after-tax charge and the issuance of common stock, the Company's equity will increase by ~$9 mln.

4:01PM Analog Devices priced an offering of $375 million aggregate principal amount of 3.00% senior unsecured notes due April 15, 2016 (ADI) 39.51 +0.01 :

10:01AM ATMI announces a global distribution agreement with Finesse Solutions (ATMI) 18.43 -0.03 : Co announces a global distribution agreement with Finesse Solutions, LLC, of San Jose, CA, a manufacturer of measurement and control solutions for bioprocess applications. The deal gives co the right to sell Finesse T700 control systems with the ATMI single-use Integrity PadReactor system. The combined turnkey system will provide the single-use market with a best-in-class, ready-to-use bioreactor platform.

9:04AM Interdigital Comm announces pricing of private offering of $200 million of 2.50% senior convertible notes (IDCC) 43.51 : Co announces the pricing of its private offering of $200 million aggregate principal amount of 2.50% Senior Convertible Notes due 2016, which was upsized from the previously announced $150 million offering, to be sold to qualified institutional buyers. The notes will be convertible at an initial conversion rate of 17.3458 shares of InterDigital common stock per $1,000 principal amount of the notes, which is equivalent to an initial conversion price of ~$57.65, which represents a 32.5% conversion premium to the closing sale price of $43.51 per share of InterDigital common stock on the NASDAQ Global Select Market on March 29, 2011.

O2Micro International Limited (OIIM) was issued 21 claims under United States patent number 7,898,218 for its Power Supply Topology

Sierra Wireless (SWIR) announced that Fujitsu has selected Sierra Wireless to provide 3G mobile broadband for several new models in its LIFEBOOK series of notebooks and tablets.

icon url

ReturntoSender

03/31/11 11:14 PM

#9297 RE: ReturntoSender #6755

From Briefing.com: 4:30 pm : Stocks finished the first quarter in lackluster fashion, but still scored their best first quarter performance since 1998.

Buying in recent sessions helped the S&P 500 work its way to a quarterly gain of more than 5%. However, momentum was lost today as participants digested some relatively uninspiring data and showed caution ahead of tomorrow's pivotal payrolls report.

Initial jobless claims for the week ended March 26 totaled 388,000, which is down from the prior week, but slightly greater than the 383,000 initial claims that had been expected, on average, among economists polled by Briefing.com.

The Chicago PMI for March came in at 70.6, which is slightly stronger than the 69.5 that had been widely anticipated, but less than the prior month's figure of 71.2.

Factory orders figures for February fell 0.1% in the face of the Briefing.com consensus call for a 0.4% increase.

Late comments from Minneapolis Fed President Kocherlakota, an FOMC voting member, indicated that the Fed funds rate may need to increase by 75 basis points in late 2011. Stocks wavered a bit in response, but their movement only looked meaningful because of the session's narrow trading range.

Stocks lacked leadership all session long. Energy stocks displayed strength in the early going, but retreated to a 0.3% loss, even though oil prices pushed past $106 per barrel to a new two-year high. Oil prices in the continuous contract gained almost 17% in the first quarter.

Materials stocks and industrial stocks scored a 0.4% gains, collectively, but neither has the weight to provide a broader lift.

Financials fell 0.4% in one of the poorest sector performances. Berkshire Hathaway (BRK.B 83.63, -1.83) was a key source of weakness after the company announced the resignation of David Sokol, who many had considered to be a possible successor for Warren Buffett.

Mosaic (MOS 78.75, -1.70) and CarMax (KMX 32.10, -2.49) both battled selling pressure, too. Both posted better-than-expected earnings.

Although participants exercised restraint ahead of the tomorrow's jobs report, the end of the quarter brought about a slight increase in share volume as investors moved to reposition portfolios. In turn, trading volume on the NYSE exceeded 1 billion shares for the first time in over a week.

Advancing Sectors: Industrials (+0.4%), Materials (+0.4%)
Unchanged: Telecom, Health Care
Declining Sectors: Consumer Staples (-0.3%), Energy (-0.3%), Utilties (-0.3%), Tech (-0.3%), Financials (-0.4%), Consumer Discretionary (-0.4%)DJ30 -30.88 NASDAQ +4.28 NQ100 +0.1% R2K +0.4% SP400 +0.4% SP500 -2.43 NASDAQ Adv/Vol/Dec 1494/1.91 bln/1117 NYSE Adv/Vol/Dec 1746/1.08 bln/1241

4:03PM Aehr Test Systems has received an order for a FOX-15 WaferPak cartridge from a communication equipment manufacturer (AEHR) 2.10 -0.94 : This is the first WaferPak cartridge ordered by this customer and it is scheduled to ship during calendar year 2011.

8:09AM Chipmos Technology provides notice of early redemption to holders of 3.375% Convertible Senior Notes due 2011 (IMOS) 8.76 : Co announces it provided notice to the holders of its outstanding $2.26 mln of 3.375% Convertible Senior Notes due 2011 of the co's election to redeem all of the Holders' Notes with effect as of May 3, 2011.

07:24 am Intel ests and tgt cut to $25 at FBR Capital Mkts following PC checks: . FBR notes checks with the top six notebook ODMs have deteriorated of late, with 1Q notebook builds downticking slightly from -10.5% QOQ to -11% QOQ, and with 2Q builds downticking from an optimistic +15% QOQ (which FBR said was likely to be reduced) to +7% QOQ, worse than expected. For Intel, FBR is cutting its financial estimates slightly due to its inclusion of McAfee-related amortization of intangible expenses, and as firm shaves another point from its Intel 2011 unit growth forecast, which now stands at +7% YOY (excluding Intel's 14th week in 1Q11). FBR thinks INTC can trade in a range of $19-$24 in 2011. 2011 GAAP EPS estimate from $2.10 to $2.05, its 2012 estimate from $2.20 to $2.15 ($2.04/$2.20), and its target from $27 to $25, an 11x P/E multiple, low but reflective of PC unit growth challenges.
icon url

ReturntoSender

04/03/11 3:09 PM

#9299 RE: ReturntoSender #6755

InvestmentHouse Weekend Market Summary:

http://www.investmenthouse.com/weekendmarketsummary.htm

- Jobs report or not, stocks perform as expected, providing us opportunity to work our plan and take some more gain.
- China PMI, M&A activity set the stage for a better, partially that is, jobs report.
- My how the jobs picture has changed as our country has embraced socialism.
- US PMI remains solid though misses its expectations.
- SP500, DJ30 bumping February highs, unable to punch through even on the jobs data.
- Running out of room at the prior highs or will the Fed liquidity continue to overcome world events and buoy stocks?

MARKET SUMMARY

Stocks stick to our plan.

It did not matter whether the jobs report was there or not. Stocks performed per our plan, allowing us to catch more upside and bank some more gain. I always love it when a plan comes together. The stock market got a decent jobs report that showed over 200K jobs in the nonfarm payroll sector, and the private sector put in 230K jobs. The unemployment rate fell to 8.8%. While that is dubious, it was still good enough news for the market. It gapped higher as we were looking for it to do. It rallied through mid-morning and allowed us to bank a lot of gain on the session.

There was some selling as we expected. There was profit taking late in the day. Traders who had moved with the market on this nice run to the upside decided it was time to bank some gain. SP500 got through the March peak and ran out of steam as it approached the February peak. It sold way off of its high on the session.

Some late buying in the last hour helped push all the indices back up and keep them positive except for the semiconductor index; it closed down -1%. It is looking a bit winded, but they all closed positive and allowed us the opportunity to take that extra gain. I will talk about their patterns in a bit. Some of them are questionable, but the market did what we wanted on Friday, so I have no complaints.

NASDAQ, +0.3%; SP500, +0.5%; Dow, +0.46%; SP600, +0.3%; SOX, -1%; NASDAQ 100, +0.2%

OTHER MARKETS

Dollar: 1.4224 Euro versus 1.4162. The dollar was down. It had been surging premarket at 1.4106 Euro. Very solid. It surged on the good economic news; if the US economy is recovering, the dollar will, of course, be worth more. The other factor is the Fed. It would not be as necessary for the Fed to continue with Quantitative Easing beyond this second round, the QE II. But the dollar was unable to hold those moves, and it reversed.

There is a resistance line drawn there. I did not draw that in after today's action. That was drawn in long ago, looking at the October closing low back in 2010. It closed at that level, danced off of it some other times (including in February), and it touched it and rolled back down. That is not a sign of strength. Of course I do not have to tell you that. The dollar is having its troubles. Maybe investors did not believe that the jobs report was as good as the first-blush rally would have suggested. Maybe not. The dollar has a lot of reasons to be concerned about the future.
Click to view the chart

Bonds: 3.44% versus 3.46% 10 year US Treasury. You would expect bonds to have sold off aggressively given the stronger economic news, and they did sell off. They gapped lower, but they did not take out the recent lows and they recovered. The 10 year was stronger on the session with good economic data. That tells us there is still something bugging the bond market. What everyone heralded as good news X well, almost everyone X was not enough to keep bonds down.
Click to view the chart

Gold: $1,428.10, -11.90. Gold closed significantly lower. Gold was down fairly aggressively on the day. It still, however, remains in this consolidation and sitting on top of the three prior peaks. Gold does not look like it is about to roll over. With stronger US data, you would think gold would be under pressure because there would be less need for the Fed to continue Quantitative Easing. That would help overall stocks and other equities while diminishing gold. Gold is somewhat of an inflation play, and if the Fed can eliminate or limit its inflationary actions, gold would suffer.
Click to view the chart

Oil: $107.94, +1.24. Oil closed higher. Very solid. It topped at $108 during the day. These charts show it was higher than $108, but that is after the fact. It was a good session for oil, no doubt, as it breaks to a new high. It did not look like it would roll over. It had this double top where it came back and tested, but it just did not test as far as we thought it would. We thought it might come back to the 20 day. Instead it bounced off the 10 day EMA and made a new high. Oil continues to surge. It will be a long, high-priced summer in terms of gasoline. I am afraid, as Walmart told us on Thursday, a lot of other things will be higher in price as well. Walmart is seeing inflation really take hold and start to gin up consumer prices.

Coming from Walmart, that is interesting. Anyone who has dealt with them knows that the company is very persnickety with its suppliers. It is constantly urging them X well, I put that too nicely. It harasses them to lower their prices. If Walmart finally says prices are going up, you know its suppliers have said they cannot cut prices anymore. They will have to raise them.
Click to view the chart

TECHNICAL SUMMARY

INTERNALS.

Volume. Volume was mixed. It rose to 2.1B on NASDAQ, up almost 10%. It fell to 910M, down 15% on the NYSE.

Breadth. Breadth was rather anemic as it has been all week. 1.2:1 on the NASDAQ, and 2.4:1 on the NYSE. As those small and mid caps helped bolster the exchange breadth all week long.

CHARTS

SP500. I am looking at a volatility chart versus the orange SP500. As volatility spiked back in late February, the SP500 started to get rocky. Volatility was basically low during the rise, and then it spiked up just as the market cracked lower. That is exactly the action you would expect to see. As SP500 fell to its low on that pullback, volatility hit its peak. Then as the SP500 righted itself and rallied back up toward that prior peak, volatility has fallen off. It has not gotten to the lows of December, January, and February, but it is holding right above them. It is in spitting distance.

Looking at SP500 all by its lonesome, you can see that it did move over the early-March peak. It did not take out the February peak, and then it closed off of its high. A significant close off of the high, showing something of a doji on the candlestick chart.

There is not much instruction from MACD because it was unable to make a new high. You can maybe surmise that as it moved just past the early-March peak it was a lower MACD, but that is a tough read. We do have an ABCD pattern that is rallying, getting back up near the A point. What do you expect in those? When it gets near the A point, it will have a bit of struggle. We may see, after this good two-and-a-half to three-week run, we may see that the SP500 is going to struggle. Maybe it will come back and test early next week before it continues. Makes perfect sense. It has had a good run to the end of the quarter on tape painting. It would be normal for it to pull back and kiss the rising 10 or 20 day EMA.

NASDAQ. NASDAQ showed similar action. It was unable to move through the March peak. It gapped higher and reversed off a lot of its gain on the day. It closed positive, but showed something of a loose doji. Same three week run, roughly the same test of the March and February resistance. It would be normal for it to fall back, regroup a little after the tape painting, and see if it can make the next move higher. It is missing some help from key areas.

SP600. SP600 gapped to a new high, showing something of an evening star doji on the candlestick pattern. That is where it gaps to the upside, rallies, and falls back. It did not close negative, and it does not have to. Now we see, if it gaps lower, it has some near term weakens. Is that frightening? Shocking? No. It moved to a new high. It gapped and rallied over the old peaks. Coming back to test them would be quite normal indeed. If it holds that test and continues upside, that is fantastic. That is a great indication for the US economy. If it crashes and burns, rolling over and plunging to its death, that is obviously not a good thing. It is all about where it holds. If it can hold this old high or even the March peak and bounce from there, it is in great shape. We will have to see how it plays out. Small caps have been a very pleasant surprise along with their mid-cap brethren of late. Hard to complain about them.

SOX. The SOX looks a little decrepit. It rallied, yes, but it barely got through the 50 day EMA before it started to struggle. It never even scared the March peak, and forget about February. It did not even make the January peak. That could be part of a head and shoulders, but it would be a hunchback head and shoulders. In any event, it broke back below the 50 day EMA, and there was a bit of volume there. Perhaps we have something of a downside ABCD pattern in the works. That is just the opposite where you make a higher low and a higher high versus that lower high and lower low. There is selloff, it bounced, tested, and it bounced again. That is all inside of this early-March selloff. Maybe it will sell down. If it does, the first target is down near the March low.

In sum, the indices are a bit overdone right now. Even the small caps that have been the best performer over the past three weeks. They broke to a new high, but they are extended. A test is normal. NASDAQ and SP500 have some very interesting tests to make because they never made the new high. We will see how they perform and whether they roll over hard or just have a normal pullback.

LEADERSHIP

Technology. SSYS had a very strong session. What a solid week. It broke above the prior trading range and had very solid action. Love that high-volume break. RAX has a good week as well. Not necessarily surging on Friday, but it had a very good week and a half, breaking to a new rally high. Not all of the moves in technology were so stellar. AAPL broke back down to the 50 day EMA on Friday. It is not breaking down, but definitely not looking all that strong. GOOG had rallied on the latter part of the week. Not bad at all. It bounced off of an old support level. It tested, filling part of that gap, and it held it. It just broke below it, and it looks like it filled most of the gap now that I look at it again. It filled a lot of it, and then it rallied higher.

We will see if it continues higher. Volume sure was low. There is a sharp selloff, a bounce, a higher low and a higher high. A gap to the 50 day EMA, rallied through it, and then fell back to close below that level. ABCD. We will be watching that potential downside play on GOOG. Would that be one where we are expecting a massive rollover? Not necessarily. A play down to the 200 day EMA looks about right. It is bumping up against some serious resistance. Just thought I would throw that out there and let you chew it over. The ABCDs work both ways.

Financial. GS was trying to bounce back up, and it ran into some resistance. It hit the 50 day EMA on the high, fell back. Still an upside day; it held some of the gap. Questionable. WFC is another questionable bank. Not for its pattern, but for what it is doing here. It looks decent from the pattern. Its practices are not that great, and what is questionable is its CEO saying they are giving all lenders a "second look." I know many small businesses that bank at WFC and have gone there looking for money. They did not get even the first sit down let alone a second look. But I digress. It is a nice pattern at the 50 day EMA, flattening out. Maybe it will provide a bounce (finally).

Industrial. CAT continues its strong move, up another 1.6% on Friday. You cannot keep that stock down. DE is still running as well. It is trying to run with the cats and was showing excellent volume Thursday and Friday, gapping to the upside and rallying quite nicely.

Energy. Energy had a great time the past two weeks. We took a little off the table on Friday. HAL gapped higher and sold lower. Classic near-term, profit-taking move. FTO is holding its own and still looking solid in the refining area. CHK cannot seem to get off of its own feet. It is just sitting at the 20 day EMA, working laterally the past three weeks.

Retail. Retail has been solid. BWLD is making a nice higher low at the 10 day EMA. It might be worth positions if you are not in it yet. It might be worth more positions if you are in it as it sets up something of a triangle. Not bad at all. LULU announced a stock split on the week. It rallied to the upside and moved laterally Wednesday, Thursday, and Friday. Still looks very good here. We took a little bit of interim gain off the table just in case Monday does not prove so kind to it and other stocks that have performed well. SHLD had a good move Wednesday, and then it faded Thursday and Friday. Perfect. Back down to the 20 day EMA, and in great shape to move higher.

What does all of this tell us? It tells us there are still stocks in good position to move higher. It also shows there are stocks such as CAT and its ilk that are still running higher but are not exactly in good buy positions. Overall the market indices look as if they are bumping into resistance, but some great leadership refuses to say down. It continues to move to the upside, and that is a continued bullish indication for the market overall. Not to mention it is great action in the small caps as well. Maybe near term they need a pullback, but the leadership (and a lot of it is the same leadership) still looks very solid.

THE ECONOMY

To view the Economy Video use the following link:
Economy Summary Video

THE MARKET

VIX. The VIX fell sharply this week after the early-week issues. It gapped lower on Friday, recovered, but was still down on the session. It is back down in this range where the market peaked out a bit and started to fall. That drove the VIX back up. We will see if it has the same effect. As we look at the charts, you will note they are approaching those early-March peaks. Look where the VIX was when it was there. Very interesting.

VIX: 17.4; -0.34
VXN: 19.41; -0.33
VXO: 15.95; -0.5

Put/Call Ratio (CBOE): 0.89; +0.02

Bulls versus Bears:

This is a reading of the number of bullish investment advisors versus bearish advisors. The reason you look at this is that it gives you an idea of how bullish investors are. If they are too bullish then everyone is in the market and it is heading for a top: if everyone wants to be in the market, then all the money is in and there is no more new cash to drive it higher. On the other side of the spectrum if there are a lot of bears then there is a lot of cash on the sideline, and as the market rallies it drags that cash in as the bears give in. That cash provides the market the fuel to move higher. If bears are low it is the same as a lot of bulls: everyone is in and the market does not have the cash to drive it higher.

Bulls: 51.6% versus 50.6%. Recovering but below the recent high at 52.2%. Investors remain a bit skeptical as SP500 tests the February highs with sentiment lower than it was during that month. Bulls peaked in late December on this upside leg and have made lower highs since. Still high overall but not necessarily bearish. Hit 55.1% in January and 58.8% on the December high on this leg. Still at a high level in a string of high readings but below the 5 year high at 62.0. Fading back from the level considered bearish, i.e. where so many are in the market and believe it is going up that the ammunition to send it higher runs low. This is where you start to be careful and watch for breakdowns, but there is also a lot of liquidity being pushed into the market and that can continue the move despite excess bullishness. The crossover level at 29% bulls is long gone, but it did its job. The high on the last leg was 56.0% after starting at 35.6% on the low in February, the lowest it has been since July 2009 . . . until this last leg. 35% is the threshold level suggesting bullishness. Again, to be seriously bearish it needs to get up to the 60% to 65% level.

Bears: 23.1% versus 22.4%. Despite the three week rise, some investors are more skeptical about a further move though they are not running away with worry. Up from 19.5% to start March. Moving back up toward 23.3% hit mid-February, still well below the 28.3% in September 2010. The 37.7% peak at the height of the crossover is well in the rearview mirror but bears remain well below the 35% level, above which is considered bullish for the market overall. Hit 18.7% on the low in April. Hit a high of 27.8% level on the prior leg in February. For reference, cracking above the 35% threshold considered bullish. Hit a high on the prior run at 47.2%. For more reference, bearishness hit a 5 year high at 54.4% the last week of October 2008. The move over 50 took bearish sentiment to its highest level since 1995. Extreme negative sentiment. Prior levels for comparison: Bearishness peaked at 37.4% in September 2007. It topped the June 2006 peak (36%) on that run. That June peak eclipsed the March 2006 high (33%) and well above the 2005 highs that spawned new rallies (30% in May 2005, 29.2% in October 2005). That was a huge turn, unlike any seen in recent history.

NASDAQ

Stats: +8.53 points (+0.31%) to close at 2789.6
Volume: 2.134B (+9.7%)

Up Volume: 1.05B (+159.77M)
Down Volume: 1.01B (-10M)

A/D and Hi/Lo: Advancers led 1.25 to 1
Previous Session: Advancers led 1.34 to 1

New Highs: 252 (+56)
New Lows: 28 (-8)

NASDAQ CHART: Click to view the chart

NASDAQ 100 CHART: Click to view the chart

SOX CHART: Click to view the chart

SP500/NYSE

Stats: +6.58 points (+0.5%) to close at 1332.41
NYSE Volume: 910.49M (-15.7%)

Up Volume: 659.08M (+220.19M)
Down Volume: 227.56M (-396.02M)

A/D and Hi/Lo: Advancers led 2.39 to 1
Previous Session: Advancers led 1.41 to 1

New Highs: 579 (+215)
New Lows: 60 (+9)

SP500 CHART: Click to view the chart

SP600 Chart: Click to view the chart

DJ30

Stats: +56.99 points (+0.46%) to close at 12376.72
Volume DJ30: 148M shares Friday versus 186M shares Thursday.

DJ30 CHART: Click to view the chart

MONDAY

Next week the market starts off looking at a little bit of economic data. It does not begin until Tuesday with the ISM services and the Fed minutes. We will see just how many people on the Fed are looking to lay off after QE II ends. There is not a lot of data on Wednesday X crude inventories, the mortgage index. Initial jobless claims come in on Thursday. There are some consumer credit and wholesale inventories on Friday. A very light week in terms of economic data. More importantly, earnings are about to start. It is already April 4th come Monday. That means we have to start thinking about AA and its traditional kick off to earnings season.

What will stocks do? On Friday they had a good session, so to speak. They closed well off the high. The Dow 30 and the SP500 are butting heads up against the February highs, and thus far they have been unable to punch through. The jobs data was pretty good. Everyone was giving it a big cheer, but it was unable to hold the indices at their session highs, and it was unable to take out important resistance. Maybe they have run out of gas here. Maybe they put in all the effort on the three-week rally that recovered back up to the jobs number.

What drives stocks from here? There are earnings. Stocks could give back some ahead of that, and SP500 and the Dow may be indicating that they want to do that. We might get some good buy positions if that happens. We may get pullbacks to the 50 day EMA that allow stocks to move. Remember, there are still a lot of good stocks out. They are showing good patterns that are not necessarily overextended or that can rally to the upside. We can use those as vehicles on a continuing move.

We would really like to see some kind of giveback first, particularly heading into earnings. Otherwise you have the market hanging out up at the old highs on some low-volume moves to that level. If they get some data that is not great, they may get sold back aggressively. Further, if they get some data that is good right off the bat, they can rally further but then sell aggressively given they have had no giveback after this move. We will have to see how it plays out.

The first part of this week will tell some of the story for the near term action. The sellers kind of showed their hand on Friday. They came down and pushed the market around some, but they were not able to win the session out. Indeed, buyers came right back in late on Friday. You might wonder why they were coming in, but there is money still to be put into the market.

Oh, yes. The money. That is the Fed liquidity, and it is still there. QE II is winding down, and there have been four Fed officials saying they need to reconsider whether to continue with QE II and definitely any Quantitative Easing after that. Some suggest not only ending that program but raising interest rates by 75BP in the near term.

There are the hawks out there that say we have to throttle back on all of this liquidity. How does that impact the market? Obviously, to this point, investors have not been buying into the fact that liquidity will be withdrawn. It will be, and everyone knows that; the question is when. The sixty-four billion dollar question is what effect that has on the market in the interim as the knowledge becomes more accepted that the Fed is getting ready to end Quantitative Easing. That is where it really gets interesting, and we will just have to see. Thus far the market has brushed it off. At some point it will have to deal with it because the Fed will eventually remove that liquidity.

This is a good point to start watching. We have SP500 and the Dow coming up to these prior peaks in February. They have not broken through yet, and a little pullback is good. Where do they go from there? Can the SP500 break through the A point and continue on with the pattern having beaten the odds with an ABCD? It could, no doubt about it. If the economy continues to improve, if it picks up faster, then it could overcome some of the liquidity drain when the Fed ends its Quantitative Easing programs.

Right now, I simply do not think the economy is strong enough to do that. But we still have that SP600 that has moved to a new high, and decisively so. Perhaps it is forecasting that the economy will be strong enough to offset the start of the withdrawal of liquidity by the Fed. The Fed is not going to remove it all at once. It will not pull a Greenspan from back in March of 2000 when it called back all of its money overnight. That sent the market into vapor lock and the economy afterward. It will withdraw gradually, but it also has to withdraw at a reasonable pace given the worries about inflation. Bernanke is not worried about it, but Walmart is. Who deals with more costs on a daily basis and has a better figure on the actual, real-world inflation picture? You make the call. Walmart is pretty much on the ball with respect to pricing.

In any event, things start to get a bit more interesting now. The plan worked just fine. Stocks ran up to the end of the quarter, and we were able to bank some nice gain. We still have some excellent positions that show no fear. In other words, they show no sign that they are weakening. We will see how they fare after a pullback early this week. A pullback is likely coming. How the market weathers it will tell the story about the next moves in this market X this market that has thus far defied the odds, defied the geopolitical turmoil, and even five calls by Fed officials to start withdrawing the liquidity. Someday it will have to face that music, and we will see whether it has the character to continue higher. Of course, in this instance, character equates with economic strength. I will see you on Monday to see how this puzzle plays out.

Have a great weekend!

Support and Resistance

NASDAQ: Closed at 2789.60
Resistance:
2796 is the February gap down point
2802 is the early March peak
2825 is the 2007 closing peak.
2841 is the February 2011 peak
2862 is the 2007 peak

Support:
2762 is the February low
2729 is the 127% Fibonacci extension of the August 2010 run
The 50 day EMA at 2724
2705 is the February 2011 and consolidation low
2686 is the recent January 2011 closing low
2676 is the January 2010 low
2645-2650ish from December 2010 consolidation
2603 is the March 2011 low
2580 is the November 2010 closing high
2569 is the November gap up point through the April 2010 peak
2550 from May and June 2008 peaks
2540 is the gap up point from early November
2535.28 is the April 2010 intraday peak
2530 is the April 2010 closing peak
2518 is interim peak from April 2010
The 200 day SMA at 2491
The November 2010 low at 2460

S&P 500: Closed at 1332.41
Resistance:
1332 is the early March peak
1344 is the February 2011 peak
1364 is the March 2007 low
1370 is the August 2007 low

Support:
1325-27 is the March 2008 closing low and the May 2006 peak. Bending.
1313 from the August 2008 interim peak
The 50 day EMA at 1300
1294 is the February 2011 and the consolidation low
1275 is the January 2010 low, early January 2011 peak
1255 is the late December 2010 consolidation range
1249 is the March 2011 low
1235 is the mid-December 2010 consolidation low
1227 is the November 2010 peak
1220 is the April 2010 peak
The 200 day SMA at 1195
1185 from late September 2008
1174 is the May 2010 high, 78% Fibonacci retracement of April peak
1173 is the November 2010 low
1170 is the prior March 2010 high
1156 is the Sept 2008 low
1151 is the January 2010 peak
1133 from a September 2008 intraday low
Bottom of the January 2010 consolidation 1131 to 1136
1129 to 1131 is the June and August 2010 peaks

Dow: Closed at 12,376.72
Resistance:
12,391 is the February 2011 peak
13,058 from the May 2008 peak on that bounce in the selling

Support:
12,283 is the March 2011 peak
12,110 from the March 2007 closing low
The 50 day EMA at 12,036
11,893 from March 2008 closing low
11,867 from the August 2009 high and peak on that bounce in the selling.
11,734 from 11-98 peak
11,555 is the March low
11,452 is the November 2010 peak
11,258 is the April 2010 peak
11,205 is the April closing high
The 200 day SMA at 11,169
11,100 from the 7-08 low
10,963 is the July 2008 low
10,920 is the recent May high
10,730 is the January 2010 peak

Economic Calendar

March 28 - Monday
- Personal Income, February (08:30): 0.3% actual versus 0.3% expected, 1.2% prior (revised from 1.0%)
- Personal Spending, February (08:30): 0.7% actual versus 0.5% expected, 0.3% prior (revised from 0.2%)
- PCE Prices - Core, February (08:30): 0.2% actual versus 0.2% expected, 0.1% prior
- Pending Home Sales, February (10:00): 2.1% actual versus 0.3% expected, -2.8% prior

March 29 - Tuesday
- Case-Shiller 20-city, January (09:00): -3.06% actual versus -3.3% expected, -2.43% prior (revised from -2.38%)
- Consumer Confidence, March (10:00): 63.4 actual versus 65.0 expected, 72.0 prior (revised from 70.4)

March 30 - Wednesday
- MBA Mortgage Index, 03/25 (07:00): -7.5% actual versus +2.7% prior
- Challenger Job Cuts, March (07:30): -38.6% actual versus 20% prior
- ADP Employment Change, March (08:15): 201K actual versus 210K expected, 208K prior (revised from 217K)
- Crude Inventories, 03/26 (10:30): 2.945M actual versus 2.131M prior

March 31 - Thursday
- Initial Claims, 03/26 (08:30): 388K actual versus 383K expected, 394K prior (revised from 382K)
- Continuing Claims, 03/19 (08:30): 3714K actual versus 3700K expected, 3765K prior (revised from 3721K)
- Chicago PMI, March (09:45): 70.6 actual versus 69.5 expected, 71.2 prior
- Factory Orders, February (10:00): -0.1% actual versus 0.4% expected, 3.3% prior (revised from 3.1%)

April 01 - Friday
- Nonfarm Payrolls, March (08:30): 216K actual versus 185K expected, 194K prior (revised from 192K)
- Nonfarm Private Payrolls, March (08:30): 230K actual versus 203K expected, 240K prior (revised from 222K)
- Unemployment Rate, March (08:30): 8.8% actual versus 8.9% expected, 8.9% prior
- Hourly Earnings, March (08:30): 0.0% actual versus 0.2% expected, 0.0% prior
- Average Workweek, March (08:30): 34.3 actual versus 34.3 expected, 34.3 prior (revised from 34.2)
- ISM Index, March (10:00): 61.2 actual versus 61.4 expected, 61.4 prior
- Construction Spending, February (10:00): -1.4% actual versus -0.7% expected, -1.8% prior (revised from -0.7%)
- Auto Sales, April (15:00): 4.61M prior
- Truck Sales, April (15:00): 5.61M prior

April 05 - Tuesday
- ISM Services, March (10:00): 59.5 expected, 59.7 prior
- Fed Minutes, March 15 (14:00)

April 06 - Wednesday
- MBA Mortgage Index, 04/01 (07:00): -7.5% prior
- Crude Inventories, 04/02 (10:30): 2.945M prior

April 07 - Thursday
- Initial Claims, 04/02 (08:30): 388K expected, 388K prior
- Continuing Claims, 03/26 (08:30): 3700K expected, 3714K prior
- Consumer Credit, February (15:00): $3.6B expected, $5.0B prior

April 08 - Friday
- Wholesale Inventories, February (10:00): 1.0% expected, 1.1% prior
icon url

ReturntoSender

04/03/11 3:42 PM

#9300 RE: ReturntoSender #6755

Monday Morning Outlook: When Technical Resistance and Bullish Seasonality Collide...
The DJIA, SPX, MID, and RUT are docked just below technical sticking points

by Todd Salamone 4/2/2011 2:00 PM

http://www.schaeffersresearch.com/commentary/observations.aspx?ID=105767&trackback=mmoezine

Traders breathed a sigh of relief last week, after an endless gauntlet of employment data came in better than expected. The major market indexes wrapped up their best first quarter in more than a decade, and closed the week comfortably higher -- all in all, more than making up for a flattish month of March. However, it was impossible to ignore the fact that stocks finished Friday on a rather timid note, with bulls tapping the brakes just shy of key technical hurdles.

With the second quarter off to an impressive start, Todd Salamone highlights the critical technical levels to watch for the next five days -- including a first-ever run at quadruple-digit territory for the S&P 400 MidCap Index (MID). Meanwhile, Rocky White takes a look at bullish April seasonality, and discovers the potential implications of a solidly positive first quarter. Finally, we wrap up with a look at the week ahead, as well as a few sectors of note.

Notes from the Trading Desk: Key Technical Tests for the Major Market Indexes
By Todd Salamone, Senior Vice President of Research

"A few indicators caught our attention this past week which could align nicely for the bulls. For instance, evidence in the options market suggests some hedge funds may be in the early stages of accumulation again.... fear among equity option players hit a six-month high... the VIX is trading at a very small premium relative to SPX historical volatility... when the VIX reading and SPX historical volatility converge following a period of weakness, such situations usually mark bottoms and precede a period of bullish price action."

Monday Morning Outlook, March 26, 2011

Investors last week opted to ignore overseas uncertainty and instead focused on positive domestic news, bidding equities sharply higher for the second consecutive week. Stronger-than-expected employment numbers, a Fed survey indicating easing credit conditions for hedge funds, pension funds and private equity firms; plus continued merger-and-acquisition activity and impressive March auto sales all acted as catalysts to close out March in an impressive fashion and begin the seasonally strong month of April on a positive note.

But by Friday afternoon, equities ran out of steam, as technical-related selling appeared to cap an initially promising day. For example, we have discussed the importance of the 1,333 level on the S&P 500 Index (SPX - 1,332.41), which marks double the March 2009 low. After trading above this level on Friday morning, the index retreated back below it by later that afternoon.


Moreover, the SPX wasn't the only index contending with a major resistance area. The Russell 2000 Index (RUT - 846.77) climbed to its June-July 2007 peak in the 850 area on Friday morning -- but sellers quickly emerged, dampening hopes for this index to log a new all-time high. As a side note, the 850 area is about 150% above the March 2009 low.


Finally, the Dow Jones Industrial Average (DJIA - 12,376.72) had a battle of its own to fight, as it attempted to break through its 2011 closing high at 12,391, made on Feb. 18. The DJIA actually climbed above 12,400 in late-morning trading on Friday, but quickly retreated back below 12,400 and its 2011 closing high by the close. A move to Dow 13,000 would double the 2009 low.


One major index that did rise to new all-time highs is the S&P 400 MidCap Index (MID - 996.43). Whereas double lows or previous resistance areas made themselves known to the SPX, RUT and DJIA, it was an important round-number level on the MID that came into play last week, as the index made its first-ever run at 1,000 on Friday.


Looking back in history, are there any particular technical implications attached to 1,000 -- beyond its round-number significance? In 1995, the Nasdaq Composite (COMP - 2,789.60) was able to burst through 1,000 relatively quickly, but endured several pullbacks to this millennium mark for about a six-month period.

For the DJIA, it was a completely different story. Its first-ever attempt to climb above 1,000 in 1966 was rejected violently, and there were multiple runs at 1,000 in the years following that ended badly. It wasn't until November 1982 that the DJIA finally cleared 1,000 and never looked back. Gold futures, meanwhile, made their first run at $1,000 per ounce in March 2008, but it wasn't until October 2009 that gold finally rallied above $1,000 in an impressive, powerful breakout.

For the Dow and other major market indexes, important resistance levels lie just overhead that could impact short-term trading patterns. The good news for bulls -- as we have discussed in previous weeks -- is that the sentiment backdrop is one that suggests there is still firepower on the sidelines to drive equities through these critical overhead levels, as selling power may not be as great in reality as it looks in theory on a chart.

Indicator of the Week: April and Second-Quarter Seasonality
By Rocky White, Senior Quantitative Analyst

Foreword: Last Thursday was the final day of March, which ended the first quarter. In March, the S&P 500 Index (SPX) was down more than 5% halfway through month, just after the Japan disaster. Then it rallied strongly during the second half of the month to finish about even. To see if this recent bout of strength can continue, below I look at some historical data for the upcoming month and quarter.

April Returns: Looking at the SPX over the last five- or 20-year periods, there is no better month than April. Below are tables showing the average returns per month, as well as the percentage of positive monthly returns. As it turns out, April has the highest average return over both time frames. Also, note that it's the only month that has been positive in each of the last five years.


Quarterly Returns: April is also the start of the second quarter. Below is a table showing quarterly returns over the last 20 years. The second quarter is not nearly as bullish as the fourth quarter, but it's better than the first and third. One bearish point is that the second quarter has been negative more than any of the other quarters.


If you read the headlines -- which seem to be fairly glum on this market -- you may not realize it, but the SPX just had the best first quarter in over 10 years. The index was up 5.4% through the first three months of 2011, despite March being flat. The table below lists each year since 1975 that the market was up 5% or more in the first quarter. There's nothing too noteworthy about April's average return of 1.55%, because -- as we saw earlier -- April tends to show pretty good returns, anyway.

However, look at the SPX's returns for the rest of the year following a 5% first-quarter gain. They are very bullish. The last four times this occurred, the market saw double-digit percent gains the rest of the year. In the 11 previous occurrences when the first quarter was up 5% or more, there was only one time the market lost ground over the rest of the year. That year, of course, was 1987, in which the market crashed by over 20% in a single day.


This Week's Key Events: Bernanke Speech, Fed Minutes on the Docket
Schaeffer's Editorial Staff

Here is a brief list of some of the key events this week. All earnings dates listed below are tentative and subject to change. Please check with each company's respective website for official reporting dates.

Monday

*

Federal Reserve Chairman Ben Bernanke is scheduled to deliver a speech at the Atlanta Fed conference today. Schnitzer Steel (SCHN) will headline a relatively quiet day of earnings reports.

Tuesday

*

The economic calendar includes the Institute for Supply Management's (ISM) non-manufacturing index for March, as well as the minutes from the latest meeting of the Federal Open Market Committee (FOMC). KB Home (KBH), Layne Christensen (LAYN), and AngioDynamics (ANGO) are expected to report earnings.

Wednesday

*

Mid-week brings us the usual update on crude inventories, as well as the Chicago Fed's manufacturing index for February. On the earnings front, we'll hear from Monsanto (MON), Immucor (BLUD), and Ruby Tuesday (RT).

Thursday

*

The day's economic docket includes weekly jobless claims and February's consumer credit report. Quarterly earnings are due out from Constellation Brands (STZ), Pier 1 Imports (PIR), and Rite Aid (RAD).

Friday

*

The sole economic announcement of note is the government's wholesale inventories report for February, and Blyth Industries (BTH) is the only company on the earnings calendar.

And now a few sectors of note...

Dissecting The Sectors
Sector
Automotive
Bullish

Outlook: The earthquake and tsunami in Japan have cast doubts over automakers and auto parts issues, as supply disruptions and shortages are now points of concern. By now, we feel these concerns have been factored into the shares. In fact, pullbacks can be viewed as buying opportunities for select stocks. BorgWarner (BWA) continues to impress, with the stock finding its way to a new all-time high of $81.84 on Friday. With more than 12% of BWA's float sold short, there's plenty of cash left on the sidelines to fuel future gains. Meanwhile, Navistar International (NAV) is also holding up well, rising to a multi-year peak of $70.82 last week. However, we remain skeptical of domestic manufacturers such as General Motors (GM) and Ford (F). Both stocks rallied Friday after reporting solid March sales data, but ended the week just beneath familiar technical resistance levels.
Sector
Leisure
Bullish

Outlook: A recent Fortune article claimed the "U.S. consumer is under attack," even as the Commerce Department reported that retail sales rose to a four-month high in February. And during the past three months, investors have withdrawn cash from the Fidelity Leisure fund, despite a strong one-year return. This continuing skepticism in the face of solid fundamentals creates appealing contrarian opportunities for select leisure stocks. Within the group, we continue to find Wynn Resorts (WYNN), Netflix (NFLX), and Chipotle Mexican Grill (CMG) particularly appealing. All three stocks combine positive price action with healthy short-to-float ratios and skeptically skewed analyst ratings, suggesting that there's still plenty of cash that could still flow into these outperforming equities. In fact, WYNN rose to its highest price since November 2007 on Friday, thanks to record-high gambling revenues in Macau. CMG, meanwhile, wrapped up the week by finding a fresh peak on the charts, while NFLX is hovering within striking distance of an all-time best.
Sector
Coal & Natural Gas
Bullish

Outlook: We continue to favor coal, particularly as investors rediscover the sector in the wake of Japan's nuclear crisis. The Market Vectors Coal (KOL) exchange-traded fund (ETF) made a decisive breakout beyond short-term pressure in the $50 region last week, notching a Friday close above this round-number level for the first time since July 2008. Within the group, we still favor International Coal (ICO). The stock is stair-stepping steadily higher, hitting a new high of $11.62 as recently as Friday -- yet nearly 10% of ICO's float is sold short, raising the possibility of short-covering support. Patriot Coal (PCX) is another stock to watch in the sector, after collecting its highest weekly close since September 2008. Going forward, upgrades could help the stock extend its rebound. Currently, Zacks reports just five "buys" out of 16 total analyst ratings. Meanwhile, despite an 18% increase in the Fidelity Natural Gas fund in the three months ending February, investors have withdrawn cash. Moreover, the $989 million in total assets pales in comparison to the $2.6 billion in total assets this fund achieved in mid-2008. Strong price action and a lack of euphoria about the natural gas sector make it a compelling long play, particularly in the wake of President Obama's vow to reduce the country's dependence on foreign oil imports. EOG Resources (EOG) has established a solid foothold above former resistance at $115, with the stock up nearly 30% year-to-date. However, there are only 14 "buy" ratings among the 34 analysts following the shares -- leaving plenty of room for upgrades.
icon url

ReturntoSender

04/03/11 4:00 PM

#9301 RE: ReturntoSender #6755

Chart of the Day - COTD - Jobs Recovery?

http://www.chartoftheday.com/20110401.htm?A%3ECLICK

Today, the Labor Department reported that nonfarm payrolls (jobs) increased by 216,000 in March. Today's chart puts the latest data into perspective by comparing nonfarm payrolls following the the end of the latest economic recession (i.e. the Great Recession -- solid red line) to that of the prior recession (i.e. 2001 recession -- dashed gold line) to that of the average post-recession from 1954-2000 (dashed blue line). As today's chart illustrates, the current jobs recovery is much weaker than the average jobs recovery that follows the end of a recession. Today's chart also illustrates that the current jobs recovery is slightly stronger than what occurred following the recession of 2001 and that the trend is up.


icon url

ReturntoSender

04/07/11 12:01 AM

#9307 RE: ReturntoSender #6755

From Briefing.com: 4:30 pm : The major equity averages surrendered early gains to trade flat in early afternoon action, but leadership from the financial sector helped the broader market settle in positive territory.

Early support was helped by gains abroad, where participants in China took yesterday's news of another 25-basis point rate hike in stride upon their return from holiday. News of a successful debt offering by Portugal also helped perpetuate a positive tone. Much later in the day Portugal announced plans to request foreign financial aid.

The generally positive tone to morning trade benefited both blue chips and riskier small-cap stocks. In fact, the Dow extended its two-year high with help from Cisco (CSCO 18.07, +0.85), which scored its best single-session gain in nearly nine months. Meanwhile, the Russell 2000 Small-Cap Index achieved a record high with help from La-Z-Boy (LZB 10.92, +1.08) following an analyst upgrade, but fellow small-cap issue American Superconductor (AMSC 14.47, -10.41) plummeted more than 40% after the company cut guidance and announced that a key customer refused product delivery from the firm.

However, broad market buying interest wasn't strong enough to take the S&P 500 back through resistance at the 1340 line. That left stocks to drift lower before securing support near the neutral line.

Financials proved pivotal in lifting the broader market up from the flat line in afternoon trade. The sector achieved a 1.1% gain. NYSE Euronext (NYX 39.81, +0.83) was a top performer in the sector after it was reported that the firm has no interest a counter bid for Nasdaq OMX Group (NDAQ 28.83, +0.83), but gains among diversified financial plays had the most impact, due to their collective weight.

Even amid leadership from the highly influential financial sector, the overall market still achieved only a modest gain for the session. As a result, action this week continues to be largely range bound.

Despite the broader market's drift, Treasuries continue to come under pressure. In turn, the yield on the benchmark 10-year Note is nearly at a one-month high of 3.55%.

Advancing Sectors: Financials (+1.1%), Utilities (+0.8%), Tech (+0.7%), Consumer Staples (+0.4%), Health Care (+0.2%), Industrials (+0.2%)
Declining Sectors: Consumer Discretionary (-0.2%), Telecom (-0.6%), Materials (-0.8%), Energy (-0.9%)DJ30 +32.85 NASDAQ +8.63 NQ100 +0.2% R2K +0.1% SP400 +0.0% SP500 +2.91 NASDAQ Adv/Vol/Dec 1520/2.00 bln/1094 NYSE Adv/Vol/Dec 1690/884 mln/1270

5:03PM Advanced Analogic Tech CFO resigns (AATI) 3.80 : Co announced that Brian McDonald has resigned from his position as Vice President of Worldwide Finance, Chief Financial Officer, and Secretary to pursue other interests. Ashok Chandran, who has been with the co for more than six years, most recently as Vice President and Chief Accounting Officer, will become interim Chief Financial Officer, effective immediately.

5:01PM Power-One lowers Q1 revs guidance, below consensus (PWER) 8.29 -0.30 : Co lowers Q1 revs to $240-245 mln vs. $275.5 mln Thomson Reuters consensus, below its previously announced range of $260-290 mln, due to market conditions and near-term feed-in-tariff uncertainty in Italy and Germany. Co said, "Although we expect to post a nearly 60% increase in revenue in Q1 of 2011 compared to 2010, we've revised our guidance for the quarter due to recent adverse conditions in the European solar market. Based on current developments, we still anticipate European countries such as Italy and Germany will continue to support solar adoption to reduce reliance on non-renewable sources of power. Further, for the remainder of 2011 and 2012, we believe we are better positioned to handle similar regional anomalies due to our expanded product line and focus on developing new markets, including the United States, China and India."

4:05PM Tessera Tech announces strategic reorganization initiatives; exploring a possible separation of its Imaging & Optics business (TSRA) 18.20 +0.50 : Co has formed new group charged with developing, acquiring and monetizing semiconductor technologies beyond packaging. The group, which will be responsible for an initial portfolio of ~280 patents and patent applications, will consist of ~40 current employees. Their focus will be on circuitry design, memory modules, 3-D architecture, and advanced interconnect technologies, among other areas. Tessera also announced that it is exploring a possible separation of its Imaging & Optics business. As part of this initiative, Tessera has retained GCA Savvian Advisors as its financial advisor to assist in the evaluation of multiple alternatives, including, among others, a spin-off transaction. Tessera has not set a definitive timetable for completing its exploration of alternatives for the Imaging & Optics business and there can be no assurance that the process will result in any transaction. Co does not expect to make further public comment regarding these matters unless a definitive agreement or other commitment for any transaction is reached.

9:01AM Cypress Semi announces that it will vigorously defend itself in a patent lawsuit filed by Avago Technologies (AVGO) (CY) 19.21 : Co announces that it will vigorously defend itself in a patent lawsuit filed by Avago Technologies (AVGO). The lawsuit, filed on January 21 in the Federal District Court of Delaware, alleges that CY's well-received OvationONS optical navigation technology infringes on Avago's intellectual property. "Cypress will show at trial that its technology is fundamentally different than the technology covered in Avago's patents. In fact, Cypress's solution is based on an entirely distinct method of tracking. Avago's patents are based on image correlation techniques where a series of images are taken and compared to detect movement. Cypress instead uses its own, patented OptiCheck technology, which the company has invested tens of millions of dollars to develop. OptiCheck is a proprietary, speckle-based two-dimensional comb array technology."

Building on its plans to accelerate its software strategy, HP (HPQ) announced that it has signed a leasing agreement for Moffett Towers in Sunnyvale, Calif., to create a state-of-the-art software innovation cent

10:59 am AMSC Sees Q4 EPS, Revs Well Below Consensus (AMSC)

Am Superconductor (AMSC $13.25 -11.63) sees fourth quarter non-GAAP net loss versus $0.33 Thomson Reuters consensus; revs less than $42 million versus the $119.13 million Thomson Reuters consensus.

On March 31, 2011, Sinovel refused to accept contracted shipments of 1.5 megawatt (MW) and 3 MW wind turbine core electrical components and spare parts that AMSC was prepared to deliver. AMSC believes that Sinovel intends to reduce its level of inventory before accepting further shipments. AMSC estimates that its balance of cash, cash equivalents, marketable securities and restricted cash as of March 31, 2011 was ~$240 million.

This is down from $260.5 mln as of December 31, 2010. AMSC's cash balance was negatively impacted by an increased inventory level related to the refusal of shipments by Sinovel, and Sinovel's failure to pay AMSC for certain contracted shipments made in fiscal year 2010. As a result of both accumulated aged accounts receivable due to payment delays and Sinovel's recent refusal to accept March deliveries, AMSC is reviewing the appropriateness of the timing of its rev recognition on ~$56 million of unpaid shipments in Q2, Q3 and Q4.

AMSC continues to have active discussions with Sinovel to determine when Sinovel will accept further shipments and when it will pay for past shipments. In the meantime, AMSC has taken certain actions to reduce expenses, and the co is in the process of implementing plans to better align spending with near-term revs while continuing to maintain a high level of service and support for its global Wind and Grid customers.

09:48 am Am Superconductor downgraded to Hold at Ardour Capital; tgt lowered to $22.50: . Ardour Capital downgrades AMSC to Hold from Buy and lowers their tgt to $22.50 from $50 noting the co's principal customer Sinovel, refuses to accept new shipments of core electrical components in March and the co lowered guidance. Firm says as they combed though Sinovel's 2010 annual report that was released today, they found that this largest turbine producer in China was able to sell every turbine it made in 2H10. Even though Sinovel's overall inventory level increased during 2H10, the work in progress/finished products portion only increased to RMB7,398m from RMB7,391m at the end of 1H10. They est this level of WIP corresponding to about 2.4GW finished turbines. Moreover, Sinovel had a backlog of 14.4GW and RMB5.7b cash on hand at the end of 2010. Firm says it did not report any payables older than a year with AMSC. They therefore determine that the Sinovel's explanation for the rejection of shipment to be unreasonable.
icon url

ReturntoSender

04/08/11 12:39 PM

#9309 RE: ReturntoSender #6755

Chart of the Day - COTD - S&P 500 Earning near all time high!

http://www.chartoftheday.com/20110408.htm?T

With first-quarter earnings season set to officially kick-off on Monday when Alcoa reports first-quarter earnings, today's chart provides some long-term perspective to the current earnings environment by focusing on 12-month, as reported S&P 500 earnings. Today's chart illustrates how earnings declined over 92% from its Q3 2007 peak to Q1 2009 low which brought inflation-adjusted earnings to near Great Depression lows. Since its Q1 2009 low, S&P 500 earnings have surged (up an inflation-adjusted 994%) and currently come in at a level that is greater than what occurred at the peak of the dot-com bubble and not far from its credit bubble peak. It is interesting to note that the original run up in real earnings from Great Depression lows to dot-com highs took over 67 years. The current spike has taken 20 months.

icon url

ReturntoSender

04/09/11 10:39 PM

#9310 RE: ReturntoSender #6755

From Briefing.com: Weekly Recap - Week ending 08-Apr-11The S&P 500 shed 0.3%, in relatively subdued trade. The modest decline follows a steep 4.2% gain in the previous two weeks.

Seven of the 10 sectors fell, with industrials shedding 1.4%. Consumer staples posted the largest gain, up 1.1%.

Commodity prices rallied, with silver spiking 8.5%, crude advancing 4.8% and gold gaining 3.3%. Meanwhile, the dollar index fell 1.3%, with the dollar hitting a fresh 52-week low against the euro.

In corporate news, Texas Instruments (TXN) is going to buy National Semiconductor (NSM) for $6.5 bln, an 80% premium.

NSM spiked 68% and was the top gainer. Retailers also were among the week's best performing stocks on upside reports.

On the downside, oil sensitive stocks took a hit. Southwest Airlines (LUV) shed 7.8%.

In overseas news, the ECB raised its benchmark lending rate by 25 bps to 1.25%, as expected. Portugal requested aid from EU officials, also as expected.

Back in the U.S., the looming threat of a government shutdown had a limited impact on stock trading.

The coming week marks the unofficial start to first quarter earnings season with Alcoa (AA) reporting on Monday after the close.
 
Index Started Week Ended Week Change % Change YTD %
DJIA 12376.72 12380.00 3.28 0.0 6.9
Nasdaq 2789.60 2780.42 -9.18 -0.3 4.8
S&P 500 1332.41 1328.17 -4.24 -0.3 5.6
Russell 2000 846.77 840.89 -5.88 -0.7 7.3

4:05PM QuickLogic lowers Q1 revs guidance below consensus (QUIK) 4.87 -0.13 : QuickLogic lowers Q1 revs guidance to $5.5 mln vs. $6.8 mln Thomson Reuters two-analyst est, down from ~$6.8 mln., plus or minus 10%, which calculates to ~$6.1-7.5 mln. New product revenue is expected to be ~$1.2 mln while mature product revenue is expected to be ~$4.3 mln as compared to previously announced guidance of ~$2.2 mln and $4.6 mln plus or minus 10%, respectively. Approximately 60% of the shortfall in new product revenue was in the company's broadband data card segment and the majority of the remaining shortfall was in the company's secure access data card segment. The co reported that the primary reasons for the lower new product revenue include: 1) Broadband Data Card Segment: For the second half of Q1, sell through and shipment forecasts for the co's two largest Tier 1 OEMs did not achieve the forecasts provided by these OEMs and validated by our baseband modem partner in early Feb. 2) Secure Access Datacard Segment: --Business Solution: The co's customer delayed this product rollout. The customer's original intent was to launch this product with CSSPs based on the co's existing platforms and then transition to the new ArticLink CX II platform, but the customer decided to delay this product rollout until the CX platform was available. --Banking Solution: The company's customer discovered an issue in the printed circuit board (PCB) design that was unrelated to QuickLogic's CSSP. Although the co received a first quarter shipment commitment from this customer, the PCB issue has delayed the shipment of the co's CSSP.

4:01PM QuickLogic lowers Q1 revs guidance to $5.5 mln vs. $6.8 mln Thomson Reuters consensus, down from $6.8 mln (QUIK) 4.87 -0.13 :

8:33AM Corning to maintain production levels at its Shizuoka and Sakai City LCD glass facilities during Sharp Corporation's temporary production curtailment of LCD panels (GLW) 20.20 : "The decision by Sharp has no impact on our Corning Gorilla Glass operations in Japan. Demand for Gorilla Glass continues to be very strong."

LDK Solar (LDK) announced a business investment of ~$40 mln to establish a new manufacturing plant in Nanchang City, Jiangxi Province.

3:24AM United Micro reports March sales of NT$9,585,283; +1.11% YoY; +6.41 sequentially (UMC) 2.84 :

09:37 am STX Guides Q3 Above Consensus

Seagate Tech (STX $15.75 +1.06) issues third quarter revenue guidance of approx. $2.7 billion versus the $2.62 billion Thomson Reuters consensus, unit shipments of 49 million and gross margin as a percent of revenue near or slightly above the high-end of the original outlook range of 18% to 19%.

Cash, cash equivalents and short-term investments at the end of the fiscal third quarter totaled ~$2.5 billion. Inventory in the distribution channel of Seagate 3.5" SATA hard disk drives is below the targeted range of 4-6 weeks on hand.
icon url

ReturntoSender

04/12/11 11:49 PM

#9315 RE: ReturntoSender #6755

From Briefing.com: 4:30 pm : For the first time in quite a while buyers failed to provide near-term support in the face of selling pressure. That left the S&P 500 to suffer its worst single-session slide in almost a month and close below its 50-day moving average for the first time in three weeks.

The tone of trade was initially weakened by a concerted selling effort among the major foreign averages, most of which suffered losses of at least 1%. Japan's Nikkei was one of the worst performers; it tumbled 1.7% following news that officials have increased Japan's nuclear crisis rating to the maximum level of 7.

Dow component Alcoa (AA 16.70, -1.07) gave market participants their first glimpse into earnings season, but apparently they didn't like the view. Even though Alcoa announced its fourth consecutive upside earnings surprise, a light revenue figure suggested softer demand than what Wall Street had wanted. Shares of AA recouped some of their losses, but still settled about 6% lower for one of their worst losses of the past year.

In contrast to the action of recent weeks, market participants refused to provide support to the broad market's early drop. Not even another drop in oil prices could stir support for stocks. Oil prices closed pit trade with a 3.3% loss at $106.25 per barrel. Selling against oil accelerated with news that analysts at Goldman Sachs predict that oil prices will see a substantial pullback in coming months. Just yesterday morning oil prices were above $113 per barrel to mark their highest level in more than two years.

The combination of sharply lower oil prices and broad market weakness led energy stocks to collectively lose 3.0%, which was the sector's worst single-session slide in one month.

Financials attracted buyers in the face of widespread weakness before they were backed down in the final hour of trade. The sector actually turned a loss of about 1% into a fractional gain, but settled with a 0.4% loss.

Treasuries were spurred higher amid the stock market's slide. Buying interest in that space was supported by a solid auction of 3-year Notes. The auction drew a bid-to-cover of 3.25, dollar demand of $104.0 billion, and an indirect bidder participation rate of 33.7%.

The dollar's doldrums continued today. In turn, the euro set a new one-year high of about $1.45. It was quoted with a 0.4% gain just below that level at session's end.

Even though action today was more exciting than it has been in recent weeks, participation remains at unimpressive levels. More specifically, share volume on the NYSE failed to break 1 billion again.

Advancing Sectors: Consumer Staples (+0.3%)
Declining Sectors: Health Care (-0.1%), Utilities (-0.2%), Consumer Discretionary (-0.2%), Financials (-0.4%), Telecom (-0.6%), Industrials (-0.8%), Tech (-0.9%), Materials (-1.4%), Energy (-3.0%)DJ30 -117.53 NASDAQ -26.72 NQ100 -0.7% R2K -1.4% SP400 -1.% SP500 -10.30 NASDAQ Adv/Vol/Dec 638/1.82 bln/1989 NYSE Adv/Vol/Dec 756/946 mln/2225

5:54PM F5 Networks is rallying after hours, up ~3.2% to $96.80 in sympathy to RVBD's upside guidance (see 17:40, 17:50 comment) (FFIV) 93.77 -0.73 :

5:50PM Riverbed Technology rallies ~10% to $34.00/share after hours following upside Q1 guidance (RVBD) 30.92 -2.15 :

5:45PM Atmel response to Infineon patent lawsuit (ATML) 12.44 -0.67 : Co announced that Infineon Technologies A.G. and Infineon Technologies North America Corporation filed a patent infringement lawsuit against Atmel in the United States District Court for the District of Delaware. The company has not yet reviewed the complaint in detail. Atmel intends to vigorously defend these allegations and believes that the allegations are entirely without merit. Infineon asserts that Atmel is infringing 11 Infineon patents.

5:40PM Riverbed Technology sees Q1 revs of $163-164 mln vs $160.1 mln Thomson Reuters consensus, sees Non-GAAP EPS of $0.19-0.20 vs $0.18 consensus (RVBD) 30.92 -2.15 : Co guides Q1 above expectations... Co said, "With a strong start to 2011, Riverbed exceeded revenue and earnings expectations in the first quarter. We executed well, achieving 45% year-over-year revenue growth, and non-GAAP operating profits doubled compared to the first quarter last year. Sales increased on an annual basis across all major geographies as spending on WAN optimization remains a priority."

2:06PM Sunpower confirms DoE offered $1.187 bln conditional commitment for loan guarantee supporting the 250-Megawatt California Valley Solar Ranch (SPWRA) 16.03 -0.36 : Co announced the project has been offered support via a conditional commitment for a loan guarantee of up to $1.187 billion from the DoE. NRG Solar, a subsidiary of NRG Energy, Inc. (NRG) will assume all ownership and financing responsibilities for the project, subject to certain conditions. SunPower will design, build, and initially operate and maintain the solar power plant. Construction is expected to start in the second half of 2011, contingent on permitting and financing, with a portion of the project expected to begin operations by the end of 2011 and the balance coming on line in 2012 and 2013.

1:46PM Juniper Networks confirms prodcuts protect customers from new Microsoft (MSFT) vulnerabilities disclosed today (JNPR) 38.10 -0.48 : Co has confirmed its Intrusion Detection and Preventionsecurity systems and Integrated Security Gateway firewall/virtual private network (VPN) systems with IDP offer protection for new Microsoft vulnerabilities announced today.

8:36AM Marvell founders file lawsuit against Goldman Sachs (GS); claims GS 'put firms interests in front of clients'; claims defrauded executives of more than $100 mln (MRVL) 16.05 : The founders of MRVL, Sehat Sutardja and Weili Dai, filed a lawsuit in San Francisco Superior Court against Goldman Sachs (GS) and two account executives, alleging GS manipulated the 2008 financial crisis to defraud the two Silicon Valley executives of more than $100 mln. The suit alleges Goldman Sachs issued a margin call for the two executives' investment accounts, which were managed, under false pretenses, wrongly claiming an SEC Rule mandated the margin call when no such rule existed. It is alleged the margin call was a result of Goldman Sachs' need to repair its balance sheet and insulate itself from the extreme market turmoil of the financial crisis in 2008. Further, the complaint alleges that Goldman Sachs' wholly improper margin call reflects the Goldman Sachs' willingness to put its own interests ahead of its clients.

8:01AM MEMC Elec resumes wafer production in Japan (WFR) 12.16 : Co announces that it has resumed production of 300mm wafers at its facility in Utsunomiya, Japan following the earthquake that occurred on March 11. The facility has been shipping unaffected product and has resumed production on qualified process tools, while continuing to inspect, qualify, and ramp additional equipment. Production yield on operating tools has been comparable to pre-earthquake levels, raw material availability has been good, and power availability has improved. Full 300mm production is targeted to be achieved by the middle of May. The facility's small volume of 200mm wafer capacity, previously scheduled to be moved to the company's Ipoh, Malaysia site during the third quarter of 2011, is now in the process of being moved ahead of the original schedule.

Nokia (NOK) announced the Nokia E6 and the Nokia X7, two new smartphones aimed at business people and entertainment enthusiasts respectively. The two devices are the first Nokia smartphones to contain the updated Symbian software, with new icons and usability enhancements such as improved text input, a faster browser and refreshed Ovi Maps.

11:10 am Western Digital ests raised at Wedbush on improving pricing environment: . Wedbush is raising its June quarter estimates for WDC to $2.25B/$0.70 from $2.23B/$0.66 ($2.24/$0.65 consensus). Firm is raising its gross margin assumptions for WDC due to the improving pricing environment. It is likely that 3.5 SATA and 2.5 notebook drive ASPs (average selling price) are flat-to-up q/q in the June quarter. It is likely that the WDC stock outperforms the Nasdaq in the next couple of quarters as the pricing environment for HDDs improves in the next quarter or two

11:01 am MCRL Lowers Q1 Guidance (MCRL)

Micrel (MCRL $13.18 -1.22) lowers first quarter earnings to $0.13 to $0.14 from $0.17 to $0.19 versus the $0.18 Thomson Reuters consensus. The company also sees revenues down 10% to 11% quarter-over-quarter to approx. $67.3 million to $68.0 million versus the $72.6 million consensus, versus the -2 to -6% previously.

The shortfall in rev is primarily a result of lower than expected sales to a device manufacturer in Korea that makes wireless handsets and other consumer electronic devices. This customer moderated product deliveries during the quarter to control inventory levels. In addition, Micrel also experienced a reduction in overall demand in March related to disruptions in the worldwide electronics supply chain due to the earthquake and tsunami in Japan.

The company also had a further inventory reduction by its sell-in (POP) channel partners as a result of the inventory over-build that took place in the last half of 2010. Based upon current demand estimates, the co expects second quarter 2011 revs to grow sequentially over first quarter 2011 revenues (cons: $76.3 mln).

11:10 am Western Digital ests raised at Wedbush on improving pricing environment: . Wedbush is raising its June quarter estimates for WDC to $2.25B/$0.70 from $2.23B/$0.66 ($2.24/$0.65 consensus). Firm is raising its gross margin assumptions for WDC due to the improving pricing environment. It is likely that 3.5 SATA and 2.5 notebook drive ASPs (average selling price) are flat-to-up q/q in the June quarter. It is likely that the WDC stock outperforms the Nasdaq in the next couple of quarters as the pricing environment for HDDs improves in the next quarter or two

icon url

ReturntoSender

04/13/11 11:05 PM

#9316 RE: ReturntoSender #6755

From Briefing.com: 4:30 pm : Broad buying in the early going gave stocks an opening gain, but the market's failure to extend the move beyond near-term resistance brought sellers back into the fold. Stocks eventually battled back for a mixed finish, though.

Strong gains among the major foreign market averages established a positive tone to early trade. Banking bellwether JPMorgan Chase (JPM 46.25, -0.39) further bolstered the positive bias by announcing better-than-expected quarterly results for both its top and bottom line.

Early enthusiasm began to fade as the S&P 500 struggled in the face of resistance in the 1321 to 1322 area. The struggle tempted sellers, whose efforts threatened to give the stock market its fifth straight loss.

The Nasdaq managed to remain out of the red for the entire session. Its relative strength stemmed from an enviable performance by tech stocks. Tech stocks, which represent the largest sector by market weight, settled the session with a 0.7% gain. The sector's relative size and strength inevitably helped lift the broader market to the neutral line for a flat finish.

Energy stocks suffered a 3% drop yesterday, but the sector managed to muster a 0.3% gain today. Part of that is owed to a 0.8% gain by crude oil prices to $107.11 per barrel in the face of a greater-than-expected weekly inventory build of 1.63 million barrels.

Financials were the worst performers overall. Their 0.8% drop made for a discouraging follow-up to a failed rally attempt in the prior session. The sector now sits at a three-week low.

Treasuries started the session in the red, but staged a rebound that helped extend recent gains. The effort was sustained in the wake of the latest 10-year auction, which drew a bid-to-cover of 3.13, dollar demand of $65.7 billion, and an indirect bidder participation rate of 42.4%.

Moderate support for the greenback helped the Dollar Index inch its way up from the 52-week low that it set yesterday. The move was mostly owed to weakness in the euro.

Participants didn't show much of a reaction to President Obama's plan to slash the federal deficit by $4 trillion in 12 years or less. Economic data also had little impact on trade.

Retail sales for March increased by 0.4% while sales less autos increased by 0.8%. The consensus among economists polled by Briefing.com had called for respective increases of 0.5% and 0.7%. Both total sales and sales less autos for the prior month were revised upward to reflect increases of 1.1%.

The Fed's latest Beige Book didn't contain any kind of surprise. Generally, it indicated that economic activity continued to improve since the last report.

Advancing Sectors: Tech (+0.7%), Energy (+0.3%), Consumer Discretionary (+0.3%), Utilities (+0.3%), Consumer Staples (+0.1%)
Declining Sectors: Health Care (-0.1%), Industrials (-0.2%), Telecom (-0.3%), Materials (-0.6%), Financials (-0.8%)DJ30 +7.41 NASDAQ +16.73 NQ100 +0.8% R2K +0.2% SP400 +0.3% SP500 +0.25 NASDAQ Adv/Vol/Dec 1317/1.75 bln/1251 NYSE Adv/Vol/Dec 1535/900 mln/1374

5:00PM Intel changes financial reporting structure to reflect recent acquisitions (INTC) 19.78 +0.02 : Co reportes that beginning with the publication of Intel's first-quarter earnings report on Tuesday, April 19, the co will revise the presentation of its financial results to reflect the recently closed acquisitions of Infineon Wireless Solutions and McAfee, Inc. Infineon Wireless Solutions will now operate as Intel Mobile Communications. The co is providing this detail now in order to give visibility into the new reporting model.

4:14PM Lam Research announced that Christine Heckart has joined its board of directors (LRCX) 51.23 -0.71 : Heckart is currently serving as chief marketing officer at NetApp (NTAP). Her previous executive leadership positions were at Microsoft (MSFT) and Juniper Networks (JNPR).

6:31AM Amtech Systems issues preliminary Q2 rev above consensus (ASYS) 22.31 : Co sees Q2 revs of ~$60 mln ($52 mln in solar) vs $58.61 mln Thomson Reuters consensus (+12% QoQ, +273% YoY); bookings ~$70 mln ($60 mln solar). The co's total order backlog at March 31, 2011 was a record $193 mln, compared to $173 mln at December 31, 2010. The co expects to report final fiscal 2011 second quarter results on or about May 9, 2011. "Our strong preliminary revenue for the second quarter further demonstrates our technology leadership in high efficiency solar diffusion and our operational capability to manage and service this high-end growth market. With our continued success in expanding our solar market share with an increasing number of upper tier solar customers, our marketing pipeline continues to be healthy, and we continue to ramp up operations to support our record-breaking backlog and profitably manage our rapid growth."

09:42 am RVBD Guides Q1 Above Consensus (RVBD)

Riverbed Technology (RVBD $34.94 +4.02) expects sees first revs of $163 million to $164 million versus the $160.1 million Thomson Reuters consensus. On the bottom line RVBD expects to see Non-GAAP earnings of $0.19 to $0.20 per share, better than the $0.18 consensus.

The company said, "With a strong start to 2011, Riverbed exceeded revenue and earnings expectations in the first quarter. We executed well, achieving 45% year-over-year revenue growth, and non-GAAP operating profits doubled compared to the first quarter last year. Sales increased on an annual basis across all major geographies as spending on WAN optimization remains a priority."
icon url

ReturntoSender

04/17/11 10:07 PM

#9320 RE: ReturntoSender #6755

Monday Morning Outlook: Putting a 'Cheap' VIX in Historical Context
Despite near-term hurdles, bulls still have the upper hand

by Todd Salamone 4/16/2011 1:20 PM

http://www.schaeffersresearch.com/commentary/observations.aspx?ID=105939&trackback=mmoezine

Stocks continued to inch away from key technical resistance levels last week, but options-related support helped keep downside to a minimum. Now, the beginning of a five-week expiration cycle raises the prospect of additional short-term headwinds, as a two-month low in the VIX could entice anxious investors to scoop up portfolio protection. However, Todd Salamone argues that bulls still have the edge in this endlessly churning market -- and, as a matter of fact, the VIX might not be so "low," after all.

Meanwhile, Rocky White offers some historical perspective on the breakout rally in gold and silver, now that the latter metal's unstoppable momentum has sparked a divergence from the duo's historical relationship. Finally, we wrap up with a look at the week ahead -- which promises an all-out onslaught of corporate earnings -- as well as a few sectors of note.

Notes from the Trading Desk: Five-Week Expiration Cycle Could Create Headwinds
By Todd Salamone, Senior Vice President of Research

"... it's quite clear that overhead technical levels are having a stifling impact at present, as the Dow and other indexes contend with everything from 'double-top' to 'double-low' to 'round-number' resistance areas simultaneously... Look for 1,300 on the SPX to act as potential support on a decline. There is major put open interest getting set to expire at the 1,300 strike on SPX options, and at the 130 strike on SPDR S&P 500 ETF (SPY) options, which could be supportive."

- Monday Morning Outlook, April 9, 2011

April expiration week was dominated by a lot of domestic and overseas headlines, including Japan upgrading the severity of its nuclear crisis; a two-notch downgrade of Ireland's debt by Moody's; continued federal budget debate in the U.S.; economic data that included disappointing jobless claims numbers; and negative earnings reactions for Alcoa (AA), Bank of America (BAC), JPMorgan Chase (JPM), and tech giant Google (GOOG).

The S&P 500 Index (SPX - 1,319.68) got out of the gate higher on Monday morning, but the 1,333 area (double its March 2009 low) quickly came into play once again as a resistance area. From that point, it was a steady dose of selling into Thursday morning -- at which point the SPX rocketed higher from put-related support at the round-number 1,300 area. This also happens to be the site of its 80-day moving average, a trendline that has marked many peaks and troughs since 2008. In the end, the SPX closed slightly lower for the week, as it remains range-bound between 1,300 and 1,333.

In fact, since the SPX burst above the round 1,300 level on the first trading day of February, nearly 80% of the daily closes since that time have been between 1,300 and 1,333, and these remain support and resistance levels in the near term. If these levels are taken out, the next areas of support and resistance are 1,280 and 1,340, respectively.


A bear might conclude that the market's loss of momentum from the late 2010 advance is a sign of impending weakness. But a bull's perspective is that the market continues to hold up pretty well amid negative headlines, even as the major market indexes entered last week trading just below major resistance areas.

In our view, the bulls still hold the upper hand in this ongoing, never-ending debate. The technical backdrop remains solid, yet there are plenty of skeptics -- driven in part by a hyper-focus on the conclusion of the Fed's "QE2" program, which some think will mark the end of the party.

While equities haven't made any headway since mid-February, silver and gold notched new all-time highs. Silver's move last week was especially notable, as it traded above its early 1980 record peak. For more on silver and gold, see Rocky White's commentary on the next page.


With April expiration now behind us, the CBOE Market Volatility Index (VIX - 15.32) enters the week trading in the 15 area again, which has been a floor since December. Evidently, those seeking protection against a downturn view portfolio insurance as "cheap" when the VIX ventures down into its present area. And with many protective puts expiring this past week, it wouldn't be a major surprise to see index put buyers active in the days ahead. Such activity can be a headwind for equities, as sellers of portfolio insurance hedge by shorting futures.

But the VIX is not as "low" as it appears on the surface. For example, in late December and early February, the SPX's 20-day historical volatility was registering readings of 11.0 and 11.3 when the VIX was trading in the 15-16 area. Right now, SPX 20-day historical volatility is just over 8.4, which would suggest the VIX is relatively high, even as it trades at chart support and may be considered relatively low by most portfolio managers. The bottom line is: Based on SPX historical volatility, the VIX has room to move lower.


On a related note, since April expiration came unusually early, the upcoming week marks the first of a five-week expiration cycle. Our research indicates that during the past five years, the first week of a five-week expiration cycle has had a negative bias.


Our theory as to why this particular week has a negative bias is related to those looking to add portfolio insurance via the purchase of options on indexes and exchange-traded funds. The put options that are purchased at the start of a five-week cycle are more sensitive to changes in the underlying than options that expire in four weeks. Therefore, sellers of the portfolio protection that typically hedge will sell more SPX futures in the first week of a five-week expiration cycle relative to the first week of a four-week expiration cycle.

The spring 2011 issue of SENTIMENT magazine is now available here.

Indicator of the Week: Gold vs. Silver
By Rocky White, Senior Quantitative Analyst

Foreword: The run-up in precious metals is becoming quite unprecedented. One amazing statistic is that gold has been up every single year since 2001! To understand how remarkable that is, when we consider all 3,000+ stocks in our database of optionable securities, only one can make that same claim -- thinly traded Wabtec (WAB). Furthermore, the first quarter of 2011 marked 10 straight positive quarters for gold. It's only the third time that has happened.

Below is a table showing the previous occasions in which gold closed ten straight positive quarters. The first time was in 1972, not long after the country went completely off the gold standard. That marked the beginning of a 10-year bull market in the yellow metal. The second time was at the end of 1979. This was the beginning of a losing streak in which gold lost 21% of its value over the next 10 years. You can see in both prior instances that the next quarter was lower. So, if this quarter closes positive, it will be the longest streak ever.

Gold - 10 straight positive quarters


Silver: Any talk of precious metals right now has to include silver, which has skyrocketed suddenly. Below is a chart showing the return for gold, silver and the S&P 500 Index (SPX) over the last 10 years. Gold and silver moved in lockstep right up until about August of last year, when silver exploded. Stocks, as you can see, have pretty much been flat.

Decade returns for gold, silver, and SPX


Another way to compare gold and silver is to look at an exchange rate between the two. Below is a graph since 1970 showing how many ounces of silver you could purchase for one ounce of gold. You can see this number plummet over the last several months, as the price of silver has significantly outpaced gold. Currently, one ounce of gold will get you less than 40 ounces of silver. This is the lowest reading since 1983. Historically, since 1970, the average reading was 55 ounces of silver per ounce of gold, and we are now well below that.

silver vs. gold since 1970


Going Forward: Momentum has a tendency to last longer than many people expect, so it would not surprise me to see precious metals -- and silver, especially -- to continue higher. We'll of course be keeping a close eye on sentiment. Bullish sentiment is expected when price action is so strong.

However, one thing to make note of is the table below, which shows option data on the gold and silver exchange-traded funds (ETFs) -- the SPDR Gold Trust (GLD) and iShares Silver Trust (SLV), respectively. I looked at the expiration months February through May, and found the number of calls and puts bought to open (BTO) in the two months leading into each of those expirations. I focused on short-term BTO data because I feel it's a good representation of speculative money. Look at how option traders are recognizing the SLV rally. In February there were more puts purchased on SLV than calls. But so far in the May expiration series, there have been twice as many calls bought as puts. Contrast that to GLD, which has seen calls only slightly outnumber puts.

BTO p/c ratio for GLD and SLV


We'll be keeping an eye on this data and more for evidence of exhaustive buying, at which point it may be wise to temper your exposure to silver. Or, if you want to be in precious metals, you might look at playing gold.

This Week's Key Events: The Earnings Onslaught Begins in Earnest
Schaeffer's Editorial Staff

Here is a brief list of some of the key events this week. All earnings dates listed below are tentative and subject to change. Please check with each company's respective website for official reporting dates.

Monday
* The economic calendar kicks off with the National Association of Home Builders' housing market index for April. A busy week of earnings begins with the latest quarterly reports from Citigroup (C), Halliburton (HAL), Texas Instruments (TXN), and KeyCorp (KEY).

Tuesday
* Tuesday brings us more housing data, with home starts and building permits for March. On the earnings front, reports are due out from blue chips Johnson & Johnson (JNJ), IBM (IBM), and Intel (INTC), as well as banking issues Goldman Sachs (GS), US Bancorp (USB), and State Street (STT).

Wednesday
* The week's onslaught of housing data wraps up with existing home sales for March. Taking the earnings stage are Apple (AAPL), AT&T (T), American Express (AXP), United Technologies (UTX), and Freeport-McMoRan Copper & Gold (FCX).

Thursday
* The holiday-shortened week concludes with weekly jobless claims, the Conference Board's leading economic indicators for March, and the Philadelphia Fed business index for April. Dow components General Electric (GE) and Travelers (TRV) are scheduled to report earnings, along with Honeywell (HON), Morgan Stanley (MS), and Capital One Financial (COF).

Friday
*The equities market will be closed in observance of Good Friday.
icon url

ReturntoSender

04/18/11 10:23 PM

#9322 RE: ReturntoSender #6755

From Briefing.com: 4:30 pm : The major equity averages worked their way up from session lows, but still settled with losses on the order of 1%. Negativity was initially the result of weakness among Europe's bourses, but it was then exacerbated by news that S&P lowered its outlook on U.S. debt to negative.

Stocks opened trade sharply lower. The initial sell-off came as a culmination of concerns stemming from speculation about debt restructuring for less fiscally responsible eurozone nations like Greece, Ireland, and Portugal and news that analysts at S&P lowered their outlook on U.S. debt to Negative. The AAA rating currently held by the U.S. was affirmed, though.

Those headlines completely overshadowed the latest round of earnings results, which included upside earnings surprises from Citigroup (C 4.42, +0.00), Halliburton (HAL 47.14, +0.32), and Eli Lilly (LLY 35.62, -0.39). As has been the case since the start of earnings season one week ago, strong announcements didn't necessarily translate to gains, especially in the face of broad market selling interest.

At the depths of this session's slide, the Dow was down more than 200 points and the S&P 500 was down more than 20 points so that it traded below the 1300 line at 1295.

Stocks gradually worked their way higher in afternoon trade. There wasn't a single sector that made its way back to the flat line, but tech stocks and consumer staples stocks did the best job of limiting losses. Each sector finished with a loss of 0.7%. Tech's relative strength came even though only three stocks in the sector -- Akamai Tech (AKAM 39.73, +1.64), Apple (AAPL 331.85, +4.39), and Qualcomm (QCOM 53.29, +0.15) -- managed to make gains. Meanwhile, grocers propped up consumer staples stocks after Supervalu (SVU 10.67, +0.05) issued upside guidance.

News of the change to the U.S. debt outlook caused knee-jerk selling among Treasuries this morning, but their ability to rebound to solid gains suggested that the news was largely priced in.

The dollar was also dropped in morning trade, but it quickly reclaimed gains and then some. In turn, the Dollar Index climbed to a 0.9% gain. Most of the advance came against the euro, which was quoted 1.3% lower at $1.423 as of the close of today's trade.

Despite the dollar's advance, precious metals were able to put together strong performances amid this session's volatility. Gold settled with a 0.5% gain at $1492.90 per ounce after it set a record high of $1498.60 per ounce. Silver settled 0.9% higher at $42.98 per ounce after it hit $43.56 per ounce, which is its highest level in more than 30 years.

Advancing Sectors: (None)
Declining Sectors: Consumer Staples (-0.7%), Tech (-0.7%), Utilities (-0.9%), Consumer Discretionary (-0.9%), Health Care (-1.2%), Telecom (-1.3%), Materials (-1.3%), Industrials (-1.3%), Financials (-1.4%), Energy (-1.5%)DJ30 -140.24 NASDAQ -29.27 NQ100 -0.7% R2K -1.6% SP400 -1.7% SP500 -14.54 NASDAQ Adv/Vol/Dec 531/1.80 bln/2089 NYSE Adv/Vol/Dec 577/1.04 bln/2445

4:45PM FSI International receives multiple ANTARES system orders (FSII) 3.86 -0.09 : Co announced that it received orders for multiple ANTARES Cryokinetic cleaning systems. The logic and foundry chip providers that placed these orders currently use the ANTARES system for various BEOL particle removal processes including particle removal after in-line wafer testing and other high defectivity steps to focus on improving overall device yield. Unlike aqueous technologies, Cryokinetic cleaning technology is uniquely qualified for these applications because of its all-dry defect removal method. FSI has over 150 ANTARES process modules in production at foundry and logic device producers worldwide. The systems are expected to ship in the second half of fiscal 2011.

4:33PM Texas Instruments misses by $0.03, reports revs in-line; guides Q2 revs in-line, Q2 EPS Expected to see Negative 5 Cent Impact from Japan Earthquake (TXN) 34.79 -0.20 : Reports Q1 (Mar) earnings of $0.55 per share, $0.03 worse than the Thomson Reuters consensus of $0.58; revenues rose 5.8% year/year to $3.39 bln vs the $3.4 bln consensus. TXN reports Q1 Gross Margin of 50.9 % vs 52.8% Street Expectations. Co issues guidance for Q2, sees EPS of $0.52-0.60, which includes a $0.05 negative impact from the impact of the Japanese earthquake and aftermath, may not be comparable to $0.63 Thomson Reuters consensus; sees Q2 revs of $3.41-3.69 bln vs. $3.53 bln Thomson Reuters consensus.

4:16PM Silicon Graphics announces that Japan's Semiconductor Energy Laboratory has purchased a high performance computing solution consisting of an SGI Altix ICE 8400 to accelerate the research and development of semiconductor technology (SGI) 17.50 -1.17 :

4:15PM Hewlett-Packard announced that Thomas E. Hogan, executive vice president, Enterprise Business Sales and Marketing, has decided to leave the company (HPQ) 39.75 -0.51 :

8:01AM Trident Microsystems has divested five patents to Innovus Prime; financial terms of the agreement were not disclosed (TRID) 1.02 :

Microsemi Corporation (MSCC) has been granted Class H & K certifications as prescribed by the MIL PRF 38534 specification, defined by the Defense Logistics Agency.

Lattice Semiconductor (LSCC) announced the immediate availability of the new LatticeECP3 Versa Development Kit, which is ideal for developing leading edge applications in a variety of markets such as industrial networking, industrial automation, computing, medical equipment, defense and consumer electronics.

3:16AM LDK Solar repurchases its 4.75% convertible senior notes due 2013 at an aggregate principal amount of $351,775,000 (LDK) 11.21 :

09:49 am C Tops Q1 EPS Expectations by $0.01 (C)

Citigroup (C $4.47 +0.05) reported first quarter earnings of $0.10 per share, $0.01 better than the Thomson Reuters consensus of $0.09; Citigroup net income was $3.0 billion, compared to $1.3 billion in the fourth quarter and $4.4 billion in the first quarter 2010.

Revenues rose 7.4% year/year to $19.73 billion versus the $20.55 billion consensus. Revenues were down 22% q/q; The year over year decline was mainly driven by lower revenues in Fixed Income Markets and North America Regional Consumer Banking, as well as negative CVA. Citicorp revs of $16.5 billion were up 16% sequentially, driven by a 70% increase in Securities and Banking. Citi Holdings revs of $3.3 billion declined 17% sequentially, driven primarily by the impact of the asset transfer in Special Asset.

Citicorp generated 62% of its revenues and 72% of its net income from its international operations in the first quarter. Citicorp end of period loans grew 10% year-over-year, with 6% growth in consumer loans and 16% growth in corporate loans.

In the first quarter 2011, Citigroup transferred $12.7 billion of assets in the Special Asset Pool in Citi Holdings from HTM to trading. This transfer permits the sale of those assets, which have disproportionately higher risk-weightings under Basel III. The transfer resulted in a net $709 million pre-tax charge to revenues, from the recognition of $1.7 billion in pre-tax losses ($1.0 after-tax) which were previously reflected in accumulated other comprehensive income (AOCI), partially offset by $946 million of mark-to-market and realized gains on those assets.

Credit continued to improve during the quarter, as Citigroup net credit losses declined for the seventh consecutive quarter to $6.3 billion. In addition, the current quarter included a net $3.3 billion release of allowance for loan losses and unfunded lending commitments. Citigroup expenses of $12.3 billion were down 1% sequentially. Expenses increased 7% year over year reflecting higher legal and related costs, the impact of foreign exchange2, continued investment spending and increased business volumes, partially offset by productivity saves and a decline in Citi Holdings. Citigroup provisions for credit losses and for benefits and claims improved by $5.4 billion, or 63%, year over year to $3.2 billion. Consumer net credit losses declined 32% from the prior year period. Citi continued to improve its capital strength, with a Tier 1 Common ratio of 11.3%, book value per share of $5.85 and tangible book value per share of $4.69, each as of the end of the first quarter 2011.
icon url

ReturntoSender

04/22/11 11:00 AM

#9326 RE: ReturntoSender #6755

Investors Intelligence at Schaeffers:

http://www.schaeffersresearch.com/streetools/market_tools/investors_intelligence.aspx
 
Date Published Percent Bullish Percent Bearish
04/20 54.2 19.2
04/13 55.4 16.3

icon url

ReturntoSender

04/24/11 1:27 PM

#9327 RE: ReturntoSender #6755

InvestmentHouse Weekend Market Summary

http://www.investmenthouse.com/weekendmarketsummary.htm

- Stocks continue their rally, giving us the moves we want but still below the February peaks.
- Strong earnings and guidance offset another week of 400K jobless claims and a tumbling Philly Fed manufacturing report.
- Leadership is across the board but financials are holding SP500 back at a critical point.
- Can earnings and a decent technical pattern push stocks through to the other side?

MARKET SUMMARY

Good earnings overcome so-so economic data and rally stocks as per the plan.

Stocks did what we wanted them to do to close out the week ahead of the three-day weekend. We were looking for a move up toward the February peak, and they more or less did that. SP500 gapped higher and rallied to the March peak. It could not go beyond that. NASDAQ gapped just past its March peak and into the gap zone from the downfall off of its February peak. We hoped to get this high and cannot complain. It got close enough. We were taking some profits on the day because we got what we wanted. It would have been the height of foolishness not to after we got what we wanted and said we would take profits.

The interesting thing is that the market did not take profits overall. There were a couple of points were it looked like it might sell off. It gapped open and then sold off a bit. Then it tried to sell a couple of times in the afternoon session. The sellers simply were not strong enough. Volume was a bit lighter, but not pathetically light. Stocks managed to rally in the last half hour to close right at session highs whether it was on the SP500, NASDAQ or what have you. It was a good two-day rally to end the week. NASDAQ, +0.6%; SP500, +0.5%; Dow, +0.4%; SP600, +0.7%; SOX fell 0.05%; NASDAQ 100, +0.8%. NASDAQ 100 was leading the way higher with AAPL's earnings and many other big-name techs performing well on their earnings results.

It may have seemed fairly easy with some of the big-name large caps leading the way. AAPL gapped higher on its earnings. We took some gain off of our more recent position in it. BIDU did not move up. It has been moving higher, and we decided to bank some gain there. We had a big option trade and we took a little off the table. BWLD was not necessarily racing to the upside, and we took nice gain there. We just were picking and choosing throughout the market. We took gain on LULU as well in one of our late positions. PLXS was up big on its earnings results. SCSS bolted to the upside with a huge 30% gain on the session. Now we have something like 90% gain built into our stock position on that play. Cannot complain there.

We even took some gain on TITN because it had a great week. Then it did the old gap-higher-and-reverse routine. Did not quite hit our target, but it was ripe. We took some 18% stock gain and 90%+ option gain on that. Even though it did not hit our target, it showed indications that it might try to pull back near term. We banked a little gain and took some interim gain on other positions as well. It was that kind of day for us, although the market overall held onto its gains rather well.

It was not a given that it would do that. Before the bell opened, we had initial jobless claims come in at 403K, cracking over 400K for the second straight week when only 390K was expected. Moreover, the prior week was revised higher to 416K from the original 412K reported. We see a tick higher in jobless claims, and it is worrisome when you see two weeks back to back. We will see what the rubber match does next week, but you have to be a little concerned, particularly when some companies are taking about trouble.

Other companies are talking in glowing reports. GE and DD beat estimates and boosted their guidance. That has been commonplace. Remember, coming into this earnings season I was talking about the very few warnings or upside warnings, for that matter. That meant I felt that either stocks would be in line or they would be beaten. For the most part, they have been beating the lights out of their expectations, such as AAPL, SCSS, PLXS, QCOM, DD and GE. GE actual grew. It is ironic that the CNBC people are no longer there, always talking about the mother ship. As soon as GE dumps them, earnings start really coming in. Makes you think. I hope I did not give CNBC a complex.

Even though the jobless claims were worse than expected, they did not hamper the move at all. The Philadelphia Fed came out at 10:00 o'clock. It tumbled after an 18-year high at 43 in March. I think that is an appropriate use of the word. It tumbled to 18.5 when 33 were expected. That is almost half of expectations. What is going on in Philly? What kind of slowdown is this? This flies in the face of what we are hearing everywhere else. Could it be one reason the bond market is a little worried? I doubt it. There are probably other things worrying the bond market other than what is going on in the Philly region in manufacturing. If it is endemic to other manufacturing areas, it could be a problem. As we all know, manufacturing is what led the economy out of the black hole following the financial mess.

Leading Economic Indicators are better than expected, doubling up to 0.4% gain, although that was much less than the 1% recorded in February. That was revised higher from 0.8%. We had some decent data outside of a tumble down in the Philly Fed and a second consecutive week of 400K jobless claims. What is the focus right now? Is it Libya? No. Is it the budget deficit? It should be, but it is not. Is it the dollar diving lower? It does not seem to be. Is it the bonds mysteriously holding gains when they should be selling? No. It is earnings, baby. And earnings have been quite good. We have done better hanging onto stocks through earnings than we have selling before them.

Look at IBM. Its earnings were perhaps considered a disappointment on the initial run through, but look what happened on Thursday. It is up 2%, breaking out of its little inverted head and shoulders pattern. Stocks are reporting good results. Companies are doing well, and they are saying things look good. Most of them are big companies instead of smaller ones. That could be a problem, but there is also the small cap index that does not look like chopped liver right now. Overall, that is a positive for the market.

OTHER MARKETS

Dollar: 1.4554 versus 1.4516 Euro. The dollar was down again. The dollar is below any recent support level, and it is having fun with the November 2010 lows. It is right below that level. That puts it in jeopardy of coming all the way back down to the 2008 lows. That is a long way to go, but it could make it there without too much trouble. That is disconcerting to say the least.

The dollar continues to get slammed because the Federal Reserve has no interest in raising interest rates and our government feels that the best way to get out of this mess is to inflate our dollar. That devalues it. That is not a great thing for all of us hard-working citizens who own dollars and have to buy gasoline every day to power our vehicles. Not a good situation for us little pawns in this game of Life. Maybe you know what movie I took that from.
Click to view the chart

Bonds: 3.40% versus 3.40% 10 year US Treasury. Bonds were flat. From a longer-term perspective, there is this big selloff from August into February. Now you have a recovery. We had the Egypt and Tunisia issues, and those seem to be quelled. We had Japan. It bounced up, but then fell off after Japan. Now it is back up again. It is trying to put in a higher over the 50 day EMA, other prior peaks, and a gap point. There is a lot of support here. It could move higher.
Click to view the chart

Gold: $1,504.00, +4.50. Gold managed a bit of a gain, and it is in a steady run higher. It is a little toppy right now. It is a bit extended in the near term, but there is nothing to indicate that gold will not continue higher. It is over $1,500. That is what I said it would get to. It took a little longer than anticipated, but it is there. I do not think it will not take too long to get to $1,700.
Click to view the chart

Oil: $112.29, +0.89. There looked to be a little selloff that would give us an opportunity to get some cheaper gas prices, but it is not working. Looks like oil is right back near its high. This will be an important move for oil. Can it break through that prior peak, or will it act as a double top and come back down? The Gulf CEO said that oil will trade below $100 by July. We will have to see. I am not 100% sure that will happen when looking at the charts. Then again, there is a lot of oil out there.

As Ben Stein said, we have not one teacup less than we had last year at this time, and we had lower gasoline prices. Perhaps we will get to lower prices. Then again, if we do not have a teacup less and gasoline prices are still higher, than something else is causing the problems. Probably those darn speculators. All of you speculators out there who are just trying to make a little extra money in your life because the government is devaluing the dollar as fast as it can. You are somehow a terrible person because you are using your wits to make some extra money in addition to the 9-5. The government thinks that is a bad thing. I guess you are supposed to stand there and take it while the government chops off 20% of the dollar over the last 6-9 months. Thank you very much, Federal Government and Ben Bernanke.
Click to view the chart

TECHNICAL SUMMARY

INTERNALS.

Volume. Volume was down. We expected it to be down heading into a three-day weekend. It fell to 1.8B shares on the NASDAQ and down to 811M shares on the NYSE.

Breadth. Breadth was decent on the NYSE at 2:1. It was so-so at 1.5:1 on the NASDAQ. I guess the small caps helped out the NYSE and its performance. We had so-so internals, but we did not expect more on the day. We got our move to the upside, so we did not have much to complain about.

CHARTS

SP500. SP500 gapped up to its March peaks. It could not go beyond that. It closed at the session high, but it is also right at those peaks and below the February high at 1344. You have just under seven points for SP500 to get there. It could do that on the open next Monday if the market is so inclined.

At this point, what do you watch for? You have an inverted head and shoulders trying to break out. That could be gravy for the SP500. It will need help from the financials, which it has not been getting. The energy stocks are recovering and are helping out along with the industrials. It could make the break higher even without the financials, although it would not be a very powerful move. We have to watch out for a possible bounce down and inability to make the break. It has already rallied up to the February peak. It failed, came back down, and made a higher low. Now it has to make the break through. If it does not at this point, it morphs the pattern into slightly more bearish than the somewhat bullish inverted head and shoulders it has shown.

Remember, stocks pulled back nicely ahead of earnings, and they have a nice catalyst with some better-than-expected results in guidance. That has bounced them right back up. Now they have to make the move through that prior resistance; otherwise, it is just a bounce to the prior high. It is one that we were looking to play and have played. All we are doing is looking at the technical picture. Down the road, it will have to do something with that February peak if the SP500 will make further progress to the upside.

NASDAQ. NASDAQ is the same picture. It gapped up above its March peaks, showing a doji. It was unable to move through the February peak. It is in this gap zone where it gapped lower after that high. Very similar to SP500. It needs to do something with this move now. There is the pullback into earnings. You have the catalyst we wanted to. TXN, AAPL you name it are blasting the index higher. Now it has to do something with it. It has given us the move we wanted short term, and we have profited from that. Now it has to do something other than sit and stare at those prior highs with its thumb in its ear or other parts of its anatomy that I will not mention.

SP600. The small caps had a nice 0.7% move. Gapped to the upside. Not a whole lot of action. They moved through the old high, holding up at that level. Still could make a move higher. The small caps have been performing well. We will see if their earnings can be as stellar as the large caps and thus move to a new high as well. You have a nice rally here. There is a double bottom, a rally, and a nice Fibonacci double bottom at the 50% retracement level and the 50 day EMA. It broke higher off of that. I would like to see it take out the prior peak. That will be the important move, not only for the small caps but for the market as well since the small caps represent such a large part of the US domestic economy.

SOX. Semiconductors had their big day on Wednesday. They gapped higher, but they were not able to hold the move. They were tired. A huge gap on Wednesday, but it could not take out the early-April peak. Technically nothing has changed. It had a big day on Wednesday, and that is all it has had. It did not break any resistance or alter the pattern. It helped, but it did not turn it into a near-term positive necessarily. The semiconductors and the SOX are still something to watch as the market proceeds into next week.

LEADERSHIP

I will just run through some names and ask whether any particular group stands out or if it was just a broad move. Judging from a lot of the stocks, it was a rather broad move. XTX is independent energy. Look at this nice bolt higher, 4% to the upside. TZOO, after a two-and-a-half week lateral move, I thought it may form an ABCD pattern. It did not even want to wait. Maybe it only knows ABC. It blasted off for a 27% move on Friday. Did we take anymore gain? No. With that kind of move, I want to let it run. Who knows what is driving this thing. Earnings are growing, China is growing. We will just let it run as far as it will.

PLXS had big earnings and blasted higher. SCSS surged to the upside. AAPL blasted off. MTZ had a strong 5.5% move. HAL posted a 1.6% move. It is looking pretty broad, wouldn't you say? SSYS was not a huge mover up almost 3% but it has had great volume as it took off to the upside. A lot of stocks were moving quite well.

Financial. I mentioned they would have to help the SP500, but they are not. JPM put in something of a bear flag. It sold off, gapped lower. It tried to bounce off of this March low and put in a bear flag. It may roll over. WFC had a disastrous two weeks. It gapped lower on Wednesday and then fell below the 200 day EMA on Thursday. It is not feeling the love. SP500 has been able to move up without them. The question is whether it can continue to do so and move through that February peak if the financials continue their refusal to play along with the rest of the market.

Industrial. CAT gapped to the upside for its second gap in a row. JOYG also gapped to the upside for its second gap in a row. In short, industrials were performing quite well.

Retail. Retailers have also been performing well. BWLD has been moving well, although maybe it did not have its best day on Thursday. LULU put in a nice 2.5% move on Thursday as it continued to climb.

There continues to be a lot of leadership in the market. The question for this coming week is whether that leadership is overextended near term. Many stocks have had a great week to the upside as earnings bolted them higher, but a lot of leaders were already high to begin with, and may be near-term extended. With the market looking at those February highs on NASDAQ and SP500, and with the financials being an anchor chain on the SP500, you have to take note that there may be a bit of profit taking once earnings run their course and the news is no longer big news.

THE MARKET

VIX: 14.69; -0.38
VXN: 15.85; -0.64
VXO: 13.45; -0.82

Put/Call Ratio (CBOE): 0.93; -0.04

Bulls versus Bears:

This is a reading of the number of bullish investment advisors versus bearish advisors. The reason you look at this is that it gives you an idea of how bullish investors are. If they are too bullish then everyone is in the market and it is heading for a top: if everyone wants to be in the market, then all the money is in and there is no more new cash to drive it higher. On the other side of the spectrum if there are a lot of bears then there is a lot of cash on the sideline, and as the market rallies it drags that cash in as the bears give in. That cash provides the market the fuel to move higher. If bears are low it is the same as a lot of bulls: everyone is in and the market does not have the cash to drive it higher.

Bulls: 54.2% versus 55.4%. Still backsliding a bit but holding the 6 point surge three weeks back (57.3%). Lower again but still close to that 60+ level that indicates some trouble for a bull run. Hit 55.1% in January and 58.8% on the December high on this leg. It is matching those readings in a string of high readings but below the 5 year high at 62.0. Fading back from the level considered bearish, i.e. where so many are in the market and believe it is going up that the ammunition to send it higher runs low. This is where you start to be careful and watch for breakdowns, but there is also a lot of liquidity being pushed into the market and that can continue the move despite excess bullishness. The crossover level at 29% bulls is long gone, but it did its job. The high on the last leg was 56.0% after starting at 35.6% on the low in February, the lowest it has been since July 2009 . . . until this last leg. 35% is the threshold level suggesting bullishness. Again, to be seriously bearish it needs to get up to the 60% to 65% level.

Bears: 19.2% versus 16.3%. Bearish sentiment is growing despite the indices trading near highs. The pullback from the February peak unnerved some investors as likely did the surge in gasoline, oil, and gold. Down from 23.1% to start April, but making their way back. Fell like a stone on that decline, moving below the April 2010 low. 28.3% in September 2010. The 37.7% peak at the height of the crossover is well in the rearview mirror but bears remain well below the 35% level, above which is considered bullish for the market overall. Hit 18.7% on the low in April. Hit a high of 27.8% level on the prior leg in February. For reference, cracking above the 35% threshold considered bullish. Hit a high on the prior run at 47.2%. For more reference, bearishness hit a 5 year high at 54.4% the last week of October 2008. The move over 50 took bearish sentiment to its highest level since 1995. Extreme negative sentiment. Prior levels for comparison: Bearishness peaked at 37.4% in September 2007. It topped the June 2006 peak (36%) on that run. That June peak eclipsed the March 2006 high (33%) and well above the 2005 highs that spawned new rallies (30% in May 2005, 29.2% in October 2005). That was a huge turn, unlike any seen in recent history.

NASDAQ

Stats: +17.65 points (+0.63%) to close at 2820.16
Volume: 1.882B (-12%)

Up Volume: 1.24B (-550M)
Down Volume: 581.81M (+250.3M)

A/D and Hi/Lo: Advancers led 1.48 to 1
Previous Session: Advancers led 3.13 to 1

New Highs: 143 (+8)
New Lows: 25 (-11)

NASDAQ CHART: Click to view the chart

NASDAQ 100 CHART: Click to view the chart

SOX CHART: Click to view the chart

SP500/NYSE

Stats: +7.02 points (+0.53%) to close at 1337.38
NYSE Volume: 811.29M (-16.01%)

Up Volume: 513.42M (-224.69M)
Down Volume: 286.16M (+65.23M)

A/D and Hi/Lo: Advancers led 2.15 to 1
Previous Session: Advancers led 4.54 to 1

New Highs: 394 (+84)
New Lows: 44 (+2)

SP500 CHART: Click to view the chart

SP600 Chart: Click to view the chart

DJ30

Stats: +52.45 points (+0.42%) to close at 12505.99
Volume DJ30: 167M shares Thursday versus 204M shares Wednesday.

DJ30 CHART: Click to view the chart

MONDAY

Next week is a big data week. There will be a lot of earnings still coming out. It is already the 25th on Monday, but earnings will run well into May.

New home sales will follow up on last week's existing home sales. There is Case/Shiller which will give us a backward-looking view, but it has not been doing well. It will be interesting whether it can perk up. Will Consumer Confidence perk back up as expected? There are durable goods orders as well as the FOMC rate decision. Mr. Bernanke will come out afterward with the first-ever Federal Reserve Press Conference. They are coming out after the Fed makes its decisions so the Fed head can talk to the world and calm them down if necessary.

It also gives Bernanke the first shot out of the box. It will dilute any dissent to nothing because Bernanke will get to answer all of the dissents before they have a chance to say anything. Instead of them sniping around Bernanke and him having to stoically take it, he will be able to come out on the offensive with the new transparency of the Federal Reserve.

Of course the Fed will not tell us who they loan the money to or where all the money is sitting. That would be too much transparency. After all, it is only our money as tax-paying citizens of the United States of America. That would be just too much for us to know in a government of, for, and by the people. In any event, it will be interesting to see how Bernanke handles it and how the market perceives it.

Q1 GDP is coming out. It is expected to drop, and I think it could go below 1%. Some of the recent data suggests it may not fall that far, but it could go below 1%. Initial claims will be interesting to see. Then we have personal spending and income to close out the week along with the Chicago PMI and Michigan Sentiment.

That is tons of data with the stock market sitting right at prior peaks after a nice earnings run. This was a great move to the upside. We saw a two-week pullback with a bit of concern with all that was going on in the market. The Congress could not agree on any kind of meaningful budget cuts. Then we had great earnings and that pushed everything to the back burner and investors embraced stocks. They bought and were loving life.

We were, too, because we had bought a lot of stocks along the way. All that enthusiasm pushed them right back up for us. We loved the gains. As noted, we were taking them on Thursday. Now we have to deal with that prior high. Earnings seasons tend to run the opposite direction after that set that initial course based on the news coming out. If there is good news and an earnings session starts off well with good response, then you get some profit taking at some point. The key is "at some point" we do not know when that will be.

We do know that we are at the prior peak yet again. We have to deal with that so soon. NASDAQ and SP500 do have a good inverted head and shoulders pattern. Perhaps they can continue to the upside. Earnings are great and guidance has been great. If that continues (and a lot of the SP and NASDAQ companies continue to say they expect results to be better than anticipated) why wouldn't they move higher? The market rallies in anticipation of good news and earnings. It is not necessarily on the news, although it tends to knee-jerk around near term.

We have something of a loggerhead. We have the old high. We have a rally up to that level on great news. Can the news continue in its good fashion? Will that be enough to push it through those prior peaks? As you know, I am not 100% certain about that, and that is why we were taking gains on Thursday. If we had good gains locked in or new positions where we had not taken any before, we were taking some of those profits off the table. Why not? We got the move we wanted.

We may get a move higher on Monday, and we have to watch out. If there is a gap at the open, we have to watch for a reversal. If it gaps up and SP500 taps at that February peak and it cannot hold, we will probably take some of our SPY options off the table as well. We will see how it plays out. We banked some nice gain. We still have more that we could bank, but we are letting the market take us out of a lot of these positions at this point (other than our option positions.) May is coming up, and we have quite a few stocks with May options. We will look at taking more of those off the table on any further rally at this point.

We have to be a cautious. We will look at plays to the upside because of the patterns that NASDAQ and SP500 are showing us and because of the good guidance that we are hearing from these companies. It is not just paltry guidance. They are almost ebullient about the future. In some cases they are not, so we want to have other plays in hand. The thing is, we will have to look for them, because a lot of stocks ran very well this week. Many of them are extended near term, and you do not want to play chase on these. You typically get another shot. With the resistance just overhead, we may get that pullback to start. If the good stocks pull back and hold position and near support, then everything is still fine and they can continue to rally. We would move in as they break back to the upside.

We will look for the best upside we can find the good stuff, not the scrubs. We may not be able to have as much as we normally do because of the good move into earnings. We will probably have to look at some downside in case these things fail. Like the Boy Scouts, we like to always be prepared. Have a joyous Easter weekend. Whatever your beliefs are, I hope you are with good friends and family. I will see you on Monday as we try to make more of the money we enjoy spending this weekend.

Support and Resistance

NASDAQ: Closed at 2820.16
Resistance:
2825 is the 2007 closing peak.
2841 is the February 2011 peak
2862 is the 2007 peak

Support:
2816 is the early April peak
2802 is the early March intraday peak
2796 is the February gap down point
2762 is the February low
The 50 day EMA at 2746
2729 is the 127% Fibonacci extension of the August 2010 run
2705 is the February 2011 and consolidation low
2686 is the recent January 2011 closing low
2676 is the January 2010 low
2645-2650ish from December 2010 consolidation
2603 is the March 2011 low
2580 is the November 2010 closing high
2569 is the November gap up point through the April 2010 peak
2550 from May and June 2008 peaks
2540 is the gap up point from early November
2535.28 is the April 2010 intraday peak
2530 is the April 2010 closing peak
The 200 day SMA at 2532

S&P 500: Closed at 1337.38
Resistance:
1340 is the early April 2011 peak
1344 is the February 2011 peak
1364 is the March 2007 low
1370 is the August 2007 low

Support:
1332 is the early March peak
1325-27 is the March 2008 closing low and the May 2006 peak.
1313 from the August 2008 interim peak
The 50 day EMA at 1310
1294 is the February 2011 and the consolidation low
1275 is the January 2010 low, early January 2011 peak
1255 is the late December 2010 consolidation range
1249 is the March 2011 low
1235 is the mid-December 2010 consolidation low
1227 is the November 2010 peak
1220 is the April 2010 peak
The 200 day SMA at 1213

Dow: Closed at 12,505.99
Resistance:
13,058 from the May 2008 peak on that bounce in the selling

Support:
12,391 is the February 2011 peak
12,283 is the March 2011 peak is bending
The 50 day EMA at 12,173
12,110 from the March 2007 closing low
11,893 from March 2008 closing low
11,867 from the August 2009 high and peak on that bounce in the selling.
11,734 from 11-98 peak
11,555 is the March low
11,452 is the November 2010 peak
The 200 day SMA at 11,329

Economic Calendar

April 21 - Thursday
- Initial Claims, 04/16 (08:30): 403K actual versus 390K expected, 416K prior (revised from 412K)
- Continuing Claims, 04/09 (08:30): 3695K actual versus 3650K expected, 3702K prior (revised from 3680K)
- Philadelphia Fed, April (10:00): 18.5 actual versus 33.0 expected, 43.4 prior
- Leading Indicators, March (10:00): 0.4% actual versus 0.2% expected, 1.0% prior (revised from 0.8%)
- FHFA Housing Price I, February (10:00): -1.6% actual versus -1.0% prior (revised from -0.3%)

April 25 - Monday
- New Home Sales, March (10:00): 280K expected, 250K prior

April 26 - Tuesday
- Case-Shiller 20-city, February (09:00): -3.2% expected, -3.06% prior
- Consumer Confidence, April (10:00): 64.4 expected, 63.4 prior

April 27 - Wednesday
- MBA Mortgage Index, 04/22 (07:00): +5.3% prior
- Durable Orders, March (08:30): 1.9% expected, -0.6% prior (revised from -0.7%)
- Durable Orders -ex T, March (08:30): 1.6% expected, -0.3% prior
- Crude Inventories, 04/23 (10:30): -2.322M prior
- FOMC Rate Decision, April (12:30): 0.25% expected, 0.25% prior

April 28 - Thursday
- GDP-Adv., Q1 (08:30): 1.7% expected, 3.1% prior
- GDP Deflator, Q1 (08:30): 2.3% expected, 0.4% prior
- Initial Claims, 04/23 (08:30): 390K expected, 403K prior
- Continuing Claims, 04/16 (08:30): 3700K expected, 3695K prior
- Pending Home Sales, March (10:00): 1.5% expected, 2.1% prior

April 29 - Friday
- Personal Income, March (08:30): 0.4% expected, 0.3% prior
- Personal Spending, March (08:30): 0.5% expected, 0.7% prior
- PCE Prices - Core, March (08:30): 0.1% expected, 0.2% prior
- Employment Cost Inde, Q1 (08:30): 0.5% expected, 0.4% prior
- Chicago PMI, April (09:45): 67.1 expected, 70.6 prior
- Michigan Sentiment -, April (09:55): 69.6 expected, 69.6 prior
icon url

ReturntoSender

04/24/11 2:00 PM

#9328 RE: ReturntoSender #6755

Monday Morning Outlook: Bullish Chart Pattern May Be Forming Under the Radar
Can the SPX take out its looming year-to-date highs?

by Todd Salamone 4/23/2011 1:19 PM

http://www.schaeffersresearch.com/commentary/observations.aspx?ID=106013&trackback=mmoezine

There was no shortage of market action during the holiday-shortened week, thanks to a jam-packed schedule of corporate earnings. Building on the momentum of upside surprises from the likes of Intel (INTC), Apple (AAPL), and even underdog Johnson & Johnson (JNJ), the major indexes won key victories by Thursday's closing bell. The Dow settled its first week above 12,500 in nearly three years, while the S&P 500 Index closed just north of 1,333 -- a double of its March 2009 low.

Which is not to suggest that there isn't noteworthy resistance still lingering overhead, as Todd Salamone observes. On the plus side, recent option activity points to evidence of big-money players at work, and the charts reveal a potentially bullish technical pattern in the making. Beware that first trading day after the long weekend, though -- as Rocky White discovers, Easter seasonality promises some significant highs, and some very bumpy lows.

Notes from the Trading Desk: Still Bullish, but Buying Cheap Portfolio Protection
By Todd Salamone, Senior Vice President of Research

"...since the SPX burst above the round 1,300 level on the first trading day of February, nearly 80% of the daily closes since that time have been between 1,300 and 1,333, and these remain support and resistance levels in the near term. If these levels are taken out, the next areas of support and resistance are 1,280 and 1,340, respectively...the CBOE Market Volatility Index (VIX) enters the week trading in the 15 area again, which has been a floor since December. Evidently, those seeking protection against a downturn view portfolio insurance as 'cheap' when the VIX ventures down into its present area. And with many protective puts expiring this past week, it wouldn't be a major surprise to see index put buyers active in the days ahead... But the VIX is not as 'low' as it appears on the surface...Based on SPX historical volatility, the VIX has room to move lower."

- Monday Morning Outlook, April 16, 2011

The 15 level on the CBOE Market Volatility (VIX - 14.69) indeed acted as a floor, albeit briefly. The VIX popped to a high of 19.07 Monday morning, as the S&P 500 Index (SPX - 1,337.38) quickly retreated to support in the 1,300 region, site of its 80-day moving average. But the Monday morning selling quickly abated, as the remainder of the week saw equities head north while the VIX headed south. The SPX defied the odds and closed higher for the week, even though the first leg of a five-week expiration cycle has an historical tendency for stocks to trade lower.

Moreover, the VIX experienced its first close below the 15 level since July 6, 2007. In July 2007, the index was ascending from a sub-10 level in November 2006. The close below 15 this past week confirms our thesis that the VIX has room to move lower.


Two weeks ago in this space, we said, "The good news for bulls as we enter earnings season is that expectations appear to be low." And it was earnings reports, particularly in the tech sector, that drove stocks higher. Low expectations set the table for positive reactions, and we saw plenty of those last week.

Moreover, as we discussed last month, there is evidence that hedge fund managers are tip-toeing back into U.S. stocks. This is critical as the major equity indexes make another assault on resistance levels.

Hedge fund accumulation is evident in our option activity analysis, as the ratio of combined buy-to-open puts versus buy-to-open calls on the PowerShares QQQ Trust (QQQ), iShares Russell 2000 Index (IWM), and SPDR S&P 500 ETF (SPY) continues to climb higher from recent lows. Hedge fund managers will usually buy exchange-traded fund (ETF) puts as they accumulate certain equities, thereby creating a bias toward put buying on these ETFs. This is encouraging for bulls -- as it will take buying from this group to push the major indexes through resistance levels, since retail investors have again disappeared during the past month.


Technicians might take interest in the potential for a bullish "ascending triangle" breakout on the SPX, if the index were to move above resistance in the 1,340-1,345 area, as this would set up a target in the 1,430-1,435 region. This potentially bullish technical development is not being discussed in a lot of trading circles, which we find of particular interest, as this is indicative of a crowd that remains cautious and skeptical.

In other words, it is the bearish technical patterns that seem to garner the most attention. One example is the bearish "head & shoulders" (H&S) pattern in July 2010 that got a lot of play in the media and various other social outlets, with many technicians building the case for a bloodbath. The "bearish" pattern proved to be a crowded short trade that presented a golden buying opportunity instead.

The sentiment at present is somewhat similar to that which existed around the time of the SPX's bullish "inverse H&S" breakout above 1,125-1,130 in September 2010 that had a target of 1,220. The bullish technical pattern received a small fraction of the attention of the July 2010 "bearish" development. However, the bullish pattern played out on cue and the SPX reached its target in November, as this was a much less crowded trade when the signal was triggered.


We enter the week with the bulls in control, as the SPX has made a strong advance from support at 1,300, which is the site of its 80-day moving average. Plus, the VIX is trending lower, with the close below 15 last week. But resistance still lies overhead, with the 1,340-1,345 calendar-year highs lingering just overhead on the SPX, and the S&P 400 Midcap (MID - 995.16) and Russell 2000 Index (RUT -845.64) sitting below their respective resistance levels at 1,000 and 850.

We remain bullish. At the same time, this appears to be a decent time to buy portfolio insurance to hedge against the unexpected, as the VIX is lower and SPX actual volatility is slightly higher relative to last week. This implies you are getting a slightly better deal on portfolio protection -- just as we're entering the heart of earnings season, and with an important Fed decision on the calendar next week.


The spring 2011 issue of SENTIMENT magazine is now available here.

Indicator of the Week: Easter Seasonality
By Rocky White, Senior Quantitative Analyst

Foreword: Easter is upon us. According to the table below, the fact that the S&P 500 Index (SPX) is positive on the year should make us quite optimistic for the rest of 2011. Since 1975, when the SPX was positive through the Easter holiday, it continued higher for the rest of the year an incredible 20 out of 21 times, or 95%. The only time the SPX declined after being positive through Easter was in 1987 -- the year of the Black Monday stock market crash. Also impressive is the fact that the market averages a 10% return for the rest of the year. This is a much better performance compared to when the SPX is trading lower year-to-date at Easter.


Shorter Time Frame: Still looking at the SPX since 1975, below is a table that shows market returns in the next day, week and month after the Easter holiday. For comparison, I also have a table showing typical, "anytime" returns for those time frames.

Judging by this data, it looks like buyers take an extra day of Easter vacation and don't show up to the office at all on Monday. The day after Easter is positive only 39% of the time, and averages a significantly negative return. Despite Monday's dismal performance, the week and month after Easter tend to be slightly bullish. According to this historical pattern, if you want to buy this market after the Easter holiday, then you'll want to wait until Tuesday to get in.

SPX Returns Since 1975


This Week's Key Events: FOMC Debuts Post-Meeting Press Briefing
Schaeffer's Editorial Staff

Here is a brief list of some of the key events this week. All earnings dates listed below are tentative and subject to change. Please check with each company's respective website for official reporting dates.

Monday
* The week begins with the Commerce Department's new home sales report for March. On the earnings front, we'll hear from Netflix (NFLX), Kimberly Clark (KMB), RadioShack (RSH), and Sohu.com (SOHU).

Tuesday
* Tuesday brings the release of the S&P/Case-Shiller home-price index for February, as well as April's consumer confidence report from the Conference Board. Meanwhile, the day's earnings docket promises plenty of major reports -- including 3M Company (MMM), Coca-Cola Co. (KO), Delta Air Lines (DAL), Ford Motor (F), Amazon.com (AMZN), and Valero Energy (VLO).

Wednesday
* The key economic news on Wednesday will be the Federal Open Market Committee's (FOMC) interest rate decision, followed by a press briefing with Fed Chairman Ben Bernanke. Also on tap are durable goods orders and the Chicago Fed manufacturing index for March, along with earnings reports from Boeing (BA), eBay (EBAY), Baidu (BIDU), Starbucks (SBUX), and Aflac (AFL).

Thursday
* The Commerce Department's advance report on first-quarter gross domestic product (GDP) is due out on Thursday, and we'll also hear about pending home sales for March. The earnings schedule includes quarterly results from Exxon Mobil (XOM), Microsoft (MSFT), International Paper (IP), Colgate Palmolive (CL), and PepsiCo (PEP).

Friday
* The economic calendar wraps up with the Chicago purchasing managers index (PMI) and the final Reuters/University of Michigan consumer sentiment index for April. Caterpillar (CAT), Chevron (CVX), Merck (MRK), and American Axle (AXL) are scheduled to report earnings.
icon url

ReturntoSender

04/26/11 11:22 PM

#9331 RE: ReturntoSender #6755

From Briefing.com: 4:20 pm : Broad-based buying on the back of better-than-expected earnings took both the Dow and S&P 500 to their best level in almost three years. The Nasdaq actually extended its three-year high.

Although there is some uncertainty about what might be said in tomorrow's FOMC policy statement, market participants were in the mood to buy today. In turn, stocks were up more than 1% at session highs and advancing share volume was more than double declining share volume. Overall trading volume, about 900 million shares on the NYSE, still wasn't very impressive, though.

Buying interest was generally broad, but industrial stocks put together some of the best gains. The sector's 1.8% surge was led by Illinois Tool Works (ITW 57.73, +3.32), which posted an upside earnings surprise then complemented the report by issuing a strong revenue forecast. The stock surged to a new three-year high in response. In a similar vein, 3M (MMM 95.94, +1.82) shares recorded a new all-time high following its quarterly results and increased forecast.

Strong guidance, the implementation of a $0.25 cash dividend, and the designation of $1 billion for share repurchases made Humana (HUM 76.69, +4.01) a top performer. Its leadership spread to other managed care providers and propped up the overall health care sector, which achieved a 1.1% gain.

UPS (UPS 74.30, +0.66) benefited from a nice bid on the back of its latest quarterly report and forecast. Ford (F 15.66, +0.12) also found favor following its latest quarterly announcement. Ford's Japanese competitors Honda (HMC 37.61, -0.22), Toyota (TM 78.66, -0.85), and Nissan (NSANY 18.76, +0.31) received less favorable treatement amid news that their rating outlooks were lowered by analysts at S&P due to the impact of the massive earthquakes in Japan last month.

Airline stocks were some of today's top performers. Higher oil prices have weighed on the space in recent weeks, but the space ascended sharply with news that earnings from both Delta Air Lines (DAL 9.99, +0.99) and US Airways (LCC 8.80, +0.52) exceeded what had been expected on Wall Street.

Not every quarterly announcement was treated positively. Blue chip IBM (IBM 168.49, +0.82) mustered a modest gain, but actually lagged the overall market after it announced a 15% hike to its dividend and the designation of $8 billion for share repurchases. Fellow Dow component Coca-Cola (KO 66.93, -0.81) fell after its earnings came short of the consensus estimate.

Netflix (NFLX 228.91, -22.76) dropped precipitously in high volume to probe monthly lows as participants shunned the stock because of its disappointing forecast, which overshadowed an upside earnings surprise. Under Armour (UA 69.64, -8.83) also took a dramatic dive, even though the company reported richer-than-expected earnings and issued strong sales guidance.

Treasuries attracted buying interest in the face of the stock market's strength and a relatively unimpressive auction of 2-year Notes. The auction drew a bid-to-cover of 3.06, dollar demand of $107.1 billion, and an indirect bidder participation rate of 37.9%.

As for the dollar, it continues to descend against a basket of major foreign currencies. In turn, it logged a new 52-week low and was quoted with a 0.3% loss at the close of today's trade.

Commodities failed to benefit from the dollar's downturn. More specifically, oil prices settled with a 0.1% loss at $112.11 per barrel. Gold prices closed with a fractional loss at $1501.40 per ounce and silver settled with a 0.8% loss at $44.70 per ounce.

Advancing Sectors: Industrials (+1.8%), Telecom (+1.5%), Energy (+1.2%), Health Care (+1.1%), Materials (+1.0%), Utilities (+0.9%), Tech (+0.8%), Financials (+0.6%), Consumer Staples (+0.6%), Consumer Discretionary (+0.3%)
Declining Sectors: (None)DJ30 +115.49 NASDAQ +21.66 NQ100 +0.5% R2K +1.0% SP400 +1.0% SP500 +11.99 NASDAQ Adv/Vol/Dec 1648/2.06 bln/941 NYSE Adv/Vol/Dec 2188/906 mln/837

5:25PM STMicroelectronics misses by $0.01, reports revs in-line; guides Q2 revs in-line (STM) 12.43 +0.28 : Reports Q1 (Mar) earnings of $0.19 per share, $0.01 worse than the Thomson Reuters consensus of $0.20; revenues rose 9.0% year/year to $2.54 bln vs the $2.55 bln consensus. Co issues in-line guidance for Q2, sees Q2 revs of -2% to +5%, which calculates to ~$2.48-2.66 bln vs. $2.66 bln Thomson Reuters consensus. "Following the March 11th earthquake in northern Japan, ST quickly moved to ensure the safety of its employees and their families and to help its customers and partners. While the impacts to date have been manageable from ST's perspective, we remain vigilant and prepared to adjust to and support any shifts in demand or changes to the semiconductor supply-chain in the near-term." The co expects Q2 2011 revenues to evolve sequentially in the range of about -2% to +5% after taking into account ST-Ericsson's anticipated sequential net sales decline. As a result, gross margin in Q2 is expected to be about 38.7%, plus or minus 1 percentage point.

4:26PM Altera beats by $0.03, reports revs in-line; guides Q2 revs above consensus (ALTR) 46.59 +0.85 : Reports Q1 (Mar) earnings of $0.68 per share, $0.03 better than the Thomson Reuters consensus of $0.65; revenues rose 33.2% year/year to $535.8 mln vs the $536.5 mln consensus. ALTR reports Q1 gross margin of 72.5% vs. the 71.5% consensus. Co issues upside guidance for Q2, sees Q2 revs growth of flat to up 5%, which calculates to ~$535.8-562.6 vs. $532.43 mln Thomson Reuters consensus.

4:21PM MIPS Tech misses by $0.01, misses on revs (MIPS) 10.68 +0.05 : Reports Q3 (Mar) earnings of $0.09 per share, $0.01 worse than the Thomson Reuters consensus of $0.10; revenues rose 14.3% year/year to $20 mln vs the $21.7 mln consensus.

4:18PM LDK Solar lowers Q1 guidance; reaffirms FY11 rev guidance (LDK) 11.42 +0.36 : Co provided an updated outlook for the first quarter 2011 and reiterated its guidance for the full year 2011. For the first quarter of 2011, LDK Solar expects to report revenue in the range of $745 to $755 mln down from $800-850 mln consensus vs $819.15 mln consensus, wafer shipments of 625 to 635 megawatts (MW), module shipments of 109 MW to 114 MW, in-house polysilicon production of 2,450 MT to 2,470 MT, in-house cell production between 44 MW and 46 MW, and gross margin between 30.0% and 31.0%. The Company's prior guidance for the first quarter was wafer shipments of 610 MW to 660 MW, and module shipments of 120 to 140 MW, in-house polysilicon production between 2,300 MT and 2,400 MT, in-house cell production between 45 MW and 50 MW, and gross margin between 27.0% and 29.0%. Co also reiterates its 2011 guidance of revenue in the range of $3.5 to $3.7 bln vs. $3.29 bln consensus, gross margins between 24% and 29%, wafer shipments to be between 2.7 and 2.9 GW, module shipments to be between 800 and 900 MW, polysilicon production to be between 10,000 and 11,000 MT, and in-house cell production to be between 500 and 600 MW.

4:12PM Broadcom beats GAAP ests by $0.05, reports revs in-line; guides Q2 revs below consensus (BRCM) 40.41 +0.25 : Reports Q1 (Mar) earnings of $0.40 per share, $0.05 better than the Thomson Reuters consensus of $0.35; revenues rose 24.2% year/year to $1.82 bln vs the $1.81 bln consensus. Co issues downside guidance for Q2, sees Q2 revs of $1.75-1.85 bln vs. $1.9 bln Thomson Reuters consensus, with product gross margin up ~50 bps QoQ from 48.9%. non-GAAP operating margin of 22.6% vs. the 21.3% consensus; gross margin: 50.7% product gross margin: 48.9%. "In addition, momentum continues to build around our innovative solutions. Following a record year in 2010, we had record design wins in the first quarter, which speaks to the continued underlying strength of our integrated solutions for the Home, Hand and Infrastructure markets."

4:07PM FormFactor beats by $0.10, beats on revs (FORM) 10.70 +0.78 : Reports Q1 (Mar) loss of $0.32 per share, ex-items, $0.10 better than the Thomson Reuters consensus of ($0.42); revenues fell 8.0% year/year to $40.4 mln vs the $36.9 mln consensus.

4:03PM Emcore enters into $9.6 mln common stock private placement (EMKR) 2.46 +0.04 : Co announced that it entered into a Stock Purchase Agreement to sell an aggregate of 4,407,603 shares of its common stock to Shanghai Di Feng Investment Co. Ltd. in a private placement. The transaction, which represents 4.9% of the total number of shares outstanding, is expected to raise a total of approximately $9.6 million. The purchase price per share for the shares sold in such private placement will be $2.19, representing a discount of approximately 5.3% based on a 15-day volume-weighted average price as of April 25, 2011. EMCORE did not issue any warrants or pay any broker fees or commissions in connection with the transaction. The closing of the private placement is subject to the completion of customary closing conditions for transactions of this type, including approval of applicable Chinese government agencies.

10:20AM IBM approves 15% increase in quarterly cash dividend to $0.75; authorizes $8.0 bln for stock repurchase (IBM) 168.80 1.18 : Co declared a regular quarterly cash dividend of $0.75 per common share, payable June 10, 2011 to stockholders of record May 10, 2011. Today's dividend declaration represents an increase of $0.10, or 15% higher than the prior quarterly dividend of $0.65 per common share. The board also authorized $8 bln in additional funds for use in the company's stock repurchase program. This amount is in addition to ~$4.7 bln remaining at the end of March from a prior authorization.

8:57AM Sanmina-SCI intends to offer $500 mln of senior notes due 2019 (SANM) 11.45 : Co intends to use the net proceeds of this offering, together with cash on hand, to fund the tender offer for any and all of its outstanding 6 3/4% Senior Subordinated Notes due 2013 and to fund the tender offer for up to $200 mln aggregate principal amount of its 8.125% Senior Subordinated Notes due 2016.

Trina Solar (TSL) announced that its subsidiary has signed a sales agreement to supply solar modules to US-based FRV AE Solar, a subsidiary of Fotowatio Renewable Ventures, in which co is expected to supply FRV with ~35 MW of the co's powerful utility-scale solar modules during 2011, at predetermined prices. Delivery is expected to commence in the second quarter of 2011 for one of the largest solar PV systems located just outside of Austin, Texas.

ARM (ARMH) announced a new licensing agreement with LG Electronics that provides access to the high performance, low-power ARM Cortex processor and ARM Mali GPU families.

09:47 am O2Micro initiated with a Buy at Brigantine; tgt $10: . Brigantine initiates OIIM with a Buy and price target of $10 saying they believe O2Mirco is well positioned to benefit from the near-term LED backlighting adoption trend and emerging solid state lighting (SSL) market. Outside of lighting, the firm believes that the power management segment is expanding with design wins from consumer products such as camcorders and power tools and developing activity with electric transportation (e-bikes and HEV/EV), as well as potential revenue upside from the adoption of USB 3.0, where OIIM is the Intel reference standard.
icon url

ReturntoSender

04/27/11 9:32 PM

#9332 RE: ReturntoSender #6755

From Briefing.com: 4:25 pm : The major equity averages hugged the flat line in early trade as participants prepared for commentary from the Fed and its Chairman, Ben Bernanke. Stocks eventually broke free from their narrow range to extend their recent highs.

Although the stock market has been on an upward trend in recent sessions, traders were apprehensive to chase stocks higher this morning. Their pause preceded the latest FOMC policy statement, which indicated that the Fed expects to keep the Fed Funds Rate -- still at 0.00% to 0.25% -- at exceptionally low rate levels for an extended period. The Fed also noted that the economic recovery is proceeding at a moderate pace, instead of the firmer pace that it had noted in its previous statement.

Fed Chairman Bernanke later indicated in a press conference that the Fed has lowered its GDP forecast for 2011 to the range 3.1% to 3.3%, from 3.4% to 3.9%. The Fed also trimmed the top end of GDP estimates for 2012 and 2013, but narrowed their long-run growth estimate so that it ranges from 2.5% to 2.8%, instead of 2.4% to 3.0%.

Although GDP growth is expected to moderate, Bernanke announced that the Fed expects unemployment in 2011 to be between 8.4% and 8.7%, which is down from the range of 8.8% to 9.0% that had been previously estimated.

The revisions to economic growth and unemployment come ahead of tomorrow's report on first quarter GDP, which is widely expected to show growth of 1.7%. It was learned early this morning that the United Kingdom economy expanded at a 0.5% rate in the first quarter.

Following today's Fedspeak, gold and silver prices made sharp gains into electronic trade. Gold actually set a new record high of roughly $1530 per ounce while silver extended its 30-year high to more than $48 per ounce.

Earnings were generally of secondary interest to the overall market today, but there were some dramatic swings at the individual level.

Amazon.com (AMZN 196.63, +14.33) ascended almost 8% to a record high following its latest quarterly report. Boeing (BA 76.12, +0.57) and WellPoint (WLP 75.54, +2.57) also benefited from a positive response to their quarterly reports; both set fresh 52-week highs.

ConocoPhillips (COP 79.83, -1.38) came short of the consensus earnings estimate. That initially imbued Exxon Mobil (XOM 87.78, +0.36) ahead of its quarterly report tomorrow morning. Although COP couldn't fully recover, shares of XOM rebounded to close within one dollar of their 52-week high. International integrated plays BP Plc (BP 46.53, +0.21) and CNOOC (CEO 250.71, -2.55) finished in mixed fashion, though.

The overall energy sector managed to fully erase a loss of more than 1%. Hess (HES 82.74, +2.07) and Baker Hughes (BHI 77.28, +3.22 were leaders, thanks to stronger-than-expected earnings. Shares of BHI actually hit a 52-week high.

Broadcom (BRCM 35.45, -4.96) also had an upside earnings surprise for the latest quarter, but that mattered little in light of the company's disappointing forecast. In turn, the stock dropped to a six-month low.

Advancing Sectors: Telecom (+1.3%), Health Care (+1.2%), Consumer Discretionary (+1.1%), Utilities (+0.8%), Financials (+0.6%), Industrials (+0.6%), Tech (+0.5%), Consumer Staples (+0.5%), Materials (+0.2%)
Unchanged: Energy
Declining Sectors: (None)DJ30 +95.59 NASDAQ +22.34 NQ100 +0.7% R2K +0.6% SP400 +0.6% SP500 +8.42 NASDAQ Adv/Vol/Dec 1618/2.08 bln/956 NYSE Adv/Vol/Dec 1932/959 mln/1041

6:10PM Teradyne beats by $0.02, beats on revs; guides Q2 EPS in-line, revs below consensus (TER) 18.29 +0.07 : Reports Q1 (Mar) earnings of $0.39 per share, excluding non-recurring items, $0.02 better than the Thomson Reuters consensus of $0.37; revenues rose 18.1% year/year to $377.2 mln vs the $366.3 mln consensus. Co issues mixed guidance for Q2, sees EPS of $0.38-0.44, excluding non-recurring items, vs. $0.44 Thomson Reuters consensus; sees Q2 revs of $375-400 mln vs. $401.80 mln Thomson Reuters consensus.

5:49PM Parametric beats by $0.01, reports revs in-line; guides Q3 EPS in-line, revs in-line; guides FY11 EPS in-line, revs in-line (PMTC) 24.26 +0.33 : Reports Q2 (Mar) earnings of $0.26 per share, excluding non-recurring items, $0.01 better than the Thomson Reuters consensus of $0.25; revenues rose 11.9% year/year to $269.2 mln vs the $266.7 mln consensus. Co issues in-line guidance for Q3, sees EPS of $0.28-0.32, excluding non-recurring items, vs. $0.30 Thomson Reuters consensus; sees Q3 revs of $275-285 mln vs. $276.49 mln Thomson Reuters consensus. Co issues in-line guidance for FY11, sees EPS of $1.20-1.25, excluding non-recurring items, vs. $1.22 Thomson Reuters consensus; sees FY11 revs of $1.12-1.13 bln vs. $1.12 bln Thomson Reuters consensus.

4:42PM Evergreen Solar says near term liquidity has been negatively impacted and may require us to secure additional sources of cash sooner than expected (ESLR) 2.08 -0.07 : Co announced shipments for the first quarter of 2011 were approximately 18 megawatts at an average selling price of $1.86 per watt, compared to fourth quarter 2010 shipments of approximately 47 megawatts at an average selling price of $1.90. Through April 26, the Company has shipped an additional 6 MW at an average selling price of $1.86 per watt. Cash and cash equivalents, including restricted cash, as of April 2, 2011 were approximately $38.5 million and were approximately $33 million at April 26, after making the Company's scheduled interest payment of $10.75 million on April 15 to holders of the Company's 13% Senior Secured Convertible Notes due 2015. "Uncertainties regarding feed-in-tariffs and other subsidy programs have substantially slowed the demand for solar panels in 2011. While the first quarter has historically been slow for the industry, the sluggish demand has unexpectedly continued early into the second quarter... As a result of our low year to date sales volume and potentially slower sales for the remainder of this year as the industry balances inventory levels, along with significantly increased pricing pressure, the cash that we had previously expected to realize through the reduction in accounts receivable and inventory from our recently closed Devens facility will be less than expected and will take longer than expected to realize. Therefore, our near term liquidity has been negatively impacted and may require us to secure additional sources of cash sooner than expected. Accordingly, we will continue to aggressively pursue opportunities to address our capital structure in the near term, including restructuring our existing debt, in order to significantly deleverage and better position ourselves to secure additional financing and execute our strategy of developing and supplying the lowest cost industry standard sized wafers to the world's leading solar module manufacturers."

4:34PM Mattson reports EPS in-line, beats on revs (MTSN) 2.42 +0.07 : Reports Q1 (Mar) loss of $0.12 per share, in-line with the Thomson Reuters consensus of ($0.12); revenues rose 13.8% year/year to $47 mln vs the $41.2 mln consensus.

4:32PM MagnaChip reports Q1 non-GAAP EPS of $0.40 vs $0.52 a year ago; revs rose 4.7% Yoy to $187.9 mln, no ests yet for this recent IPO (MX) 13.98 -0.05 : Co expects Q2 revenue to rise 5-9% sequentially which computes to $197-205 mln, no estimates.

4:28PM Flextronics misses by $0.01, misses on revs; guides Q1 EPS below consensus, revs below consensus (FLEX) 7.51 +0.04 : Reports Q4 (Mar) adjusted earnings of $0.21 per share, $0.01 worse than the Thomson Reuters consensus of $0.22; revenues rose 15.5% year/year to $6.86 bln vs the $7.28 bln consensus. Co issues downside guidance for Q1, sees EPS of $0.20-$0.23 vs. $0.23 Thomson Reuters consensus; sees Q1 revs of $7.10-7.60 bln vs. $7.61 bln Thomson Reuters consensus.

4:24PM Xilinx beats by $0.07, beats on revs; sees Q1 sales above consensus (XLNX) 32.86 +0.36 : Reports Q4 (Mar) earnings of $0.59 per share, $0.07 better than the Thomson Reuters consensus of $0.52; revenues rose 11.1% year/year to $587.9 mln vs the $579.7 mln consensus. Co sees Q1 sales flat to +4% QoQ from $587.9 mlnvs. consensus call for +1% from $579.7 mln, with gross margin of ~64-65% vs. 65.0% consensus.

4:24PM LSI Logic reports EPS in-line, beats on revs; guides Q2 EPS in-line (LSI) 6.90 -0.03 : Reports Q1 (Mar) earnings of $0.10 per share, excluding non-recurring items, in-line with the Thomson Reuters consensus of $0.10; revenues, including discontinued operations, fell 1.3% year/year to $629 mln vs the $622.7 mln consensus. Co issues guidance for Q2, sees EPS of $0.07-0.13 vs. $0.11 Thomson Reuters consensus; sees Q2 revs of $465-495 mln, may not be comparable to $635.59 mln Thomson Reuters consensus.

4:20PM Intersil reports EPS in-line, revs in-line; guides Q2 EPS above consensus, revs in-line (ISIL) : Reports Q1 (Mar) GAAP earnings of $0.11 per share, in-line with the Thomson Reuters consensus of $0.11; revenues rose 5.0% year/year to $198.9 mln vs the $197.1 mln consensus. Co sees Q2 GAAP EPS of $0.15-0.18 vs. $0.15 Thomson Reuters consensus; sees Q2 revs of $204-212 mln vs. $208.68 mln Thomson Reuters consensus.

4:17PM Cadence Design beats by $0.01, beats on revs; guides Q2 EPS above consensus, revs above consensus; guides FY11 EPS above consensus, revs above consensus (CDNS) 9.78 +0.38 : Reports Q1 (Mar) earnings of $0.09 per share, $0.01 better than the Thomson Reuters consensus of $0.08; revenues rose 19.9% year/year to $266.1 mln vs the $260 mln consensus. Co issues upside guidance for Q2, sees EPS of $0.09-$0.11 vs. $0.09 Thomson Reuters consensus; sees Q2 revs of $270-280 mln vs. $260.35 mln Thomson Reuters consensus. Co issues upside guidance for FY11, sees EPS of $0.36-$0.44 vs. $0.36 Thomson Reuters consensus; sees FY11 revs of $1.075-1.115 bln vs. $1.06 bln Thomson Reuters consensus.

4:15PM TriQuint Semi reports EPS in-line, beats on revs; guides Q2 EPS below consensus, revs below consensus (TQNT) 13.48 +0.08 : Reports Q1 (Mar) earnings of $0.15 per share, excluding non-recurring items, in-line with the Thomson Reuters consensus of $0.15; revenues rose 24.1% year/year to $224.3 mln vs the $220.5 mln consensus. On a non-GAAP basis, gross margin for the first quarter was 40.0%, up from 39.0% in the first quarter of 2010 and flat sequentially. Co issues downside guidance for Q2, sees EPS of $0.16-0.18 vs. $0.21 Thomson Reuters consensus; sees Q2 revs of $230-240 mln vs. $241.28 mln Thomson Reuters consensus.

4:08PM Novellus beats by $0.01, reports revs in-line (NVLS) 34.68 -0.17 : Reports Q1 (Mar) earnings of $1.04 per share, $0.01 better than the Thomson Reuters consensus of $1.03; revenues rose 49.6% year/year to $413.2 mln vs the $410.1 mln consensus.

10:06AM GT Solar receives $218.9 million order for advanced sapphire crystallization furnaces from Guizhou Haotian Optoelectronics Technology Co. LTD (SOLR) 10.17 +0.30 :

9:09AM ARM Holdings beat Q1 ests overnight (ARMH) 30.74 : Reports Q1 EPS of GBP 2.73 vs. the GBP 2.58 consensus; rev +26% YoY to GBP 116.2 mln vs., the GBP 111.0 mln consensus. "ARM has made an encouraging start to 2011 with more leading cos choosing to deploy ARM technology in their products. Looking forward, we anticipate normal seasonality for royalty revenues in the second quarter and, notwithstanding the current uncertainty as to the economic impact of the Japanese earthquake on the semiconductor industry supply chain and end-product markets, we expect that group dollar revenues for the full-year 2011 will be at least in line with current market expectations."

Apple (AAPL) announced that iPad 2, the second-generation of its breakthrough post-PC device, will arrive in Japan on Thursday, April 28 and Hong Kong, Korea, Singapore and eight additional countries on Friday, April 29. iPad 2 will be available at Apple retail stores at 9 a.m. local time, select Apple Authorized Resellers, and online through the Apple Store beginning at 1 a.m. Additionally, iPad 2 with Wi-Fi will be available in China beginning Friday, May 6.

8:33AM Apple responds inquiries of location gathering of its devices; co has never tracked location of iPhone, does not plan to (AAPL) 350.42 : Co would like to respond to the questions we have recently received about the gathering and use of location information by its devices. 1. Why is Apple tracking the location of my iPhone?Apple is not tracking the location of your iPhone. Apple has never done so and has no plans to ever do so.... 3. Why is my iPhone logging my location?The iPhone is not logging your location. Rather, it's maintaining a database of Wi-Fi hotspots and cell towers around your current location, some of which may be located more than one hundred miles away from your iPhone, to help your iPhone rapidly and accurately calculate its location when requested. Calculating a phone's location using just GPS satellite data can take up to several minutes. iPhone can reduce this time to just a few seconds by using Wi-Fi hotspot and cell tower data to quickly find GPS satellites, and even triangulate its location using just Wi-Fi hotspot and cell tower data when GPS is not available (such as indoors or in basements).

8:31AM Apple announced that white iPhone 4 will be available tomorrow (AAPL) 350.42 : Co announced that the white iPhone 4 will be available beginning tomorrow. White iPhone 4 models will be available from Apple's online store (www.apple.com), at Apple's retail stores, AT&T and Verizon Wireless stores and select Apple Authorized Resellers.

8:04AM Silicon Labs beats by $0.05, reports revs in-line; guides Q2 revs in-line (SLAB) 43.81 : Reports Q1 (Mar) earnings of $0.40 per share, $0.05 better than the Thomson Reuters consensus of $0.35; revenues fell 5.6% year/year to $119.6 mln vs the $118.9 mln consensus. Co issues in-line guidance for Q2, sees Q2 revs of $124-130 mln vs. $128.58 mln Thomson Reuters consensus.

7:14AM Corning beats by $0.03, beats on revs; sees equity earnings +10% QoQ (GLW) 20.60 : Reports Q1 (Mar) earnings of $0.47 per share, $0.03 better than the Thomson Reuters consensus of $0.44; revenues rose 9.0% year/year to $1.92 bln vs the $1.83 bln consensus. Display Technologies wholly owned business glass volume increased by upper-single digits sequentially, while volume at Samsung Corning Precision Materials, improved slightly. The co's total glass volume, which includes its wholly owned business and SCP, increased 5% sequentially. Telecommunications sales increased 7% sequentially and 30% year over year. Specialty Materials sales jumped 29% sequentially and 165% YoY, driven primarily by Corning Gorilla Glass. Environmental Technologies sales improved 12% sequentially and 35% YoY. Outlook: In the display segment, Corning expects combined glass volume in the second quarter to be consistent with the first quarter. Glass volume for the company's wholly owned business is anticipated to decline in the low- to mid-teen range sequentially, primarily the result of lower utilization rates at several customers. At Samsung Corning Precision, volume is expected to increase in the low- to mid-teen range for the quarter. Glass price declines are expected to continue to moderate. "We have reviewed the display component supply chain in Japan. It is our opinion that a potential component shortage that could cause a significant disruption is unlikely. With regard to Sharp's decision to reduce production, we see this as a temporary situation that will not last beyond the second quarter." As a result, the co expects a significant increase in LCD glass demand in the third quarter with Sharp resuming production and the global supply chain preparing for the seasonally strong fourth quarter. Telecommunications segment second-quarter sales are expected to increase around 20% sequentially and be up nearly 30% YoY. Environmental Technologies segment second-quarter sales are expected to decline slightly sequentially compared to a record first quarter. Year-over-year quarterly sales increases should be about 35%. Specialty Materials sequential sales in the second quarter are expected to grow about 20%, the result of continued strong Gorilla Glass performance. Corning anticipates that equity earnings will be up about 10% sequentially [10% QoQ growth on earnings of $748 mln or $0.47 for Q1 equates to $823 mln or ~$0.52, may not compare to $756 mln consensus, $0.47].

AMD (AMD) announced a new collaboration with MulticoreWare to deliver an advanced set of tools for OpenCL optimization.

Trina Solar (TSL) announced through its subsidiary, Changzhou Trina Solar Energy, the extension of its national distribution agreement with Australia's leading renewable energy distributor, RF Industries.

5:18AM United Micro reports EPS in-line, misses on revs (UMC) 2.77 : Reports Q1 (Mar) earnings of $0.06 per share, in-line with the Thomson Reuters consensus of $0.06; revenues rose 13.6% year/year to $956.1 mln vs the $1014.8 mln consensus. For Q2, co sees wafer shipments and ASP flat; capacity utilization in mid 80% range; Gross margins in Low to mid 20% range. Additionally, co sees Consumer and computer segments will outpace the communication sector.

4:39AM Nokia plans to transfer Symbian software activities to Accenture (ACN); ACN to provide future smartphone ecosystem services to co; (NOK) 8.86 : Co and Accenture (ACN) announce plans for a strategic collaboration in which NOK would outsource its Symbian software activities and transition about 3,000 employees to ACN. At the same time, ACN would provide mobility software services to NOK for future smartphones. This collaboration also includes plans for Accenture to provide mobility software, business and operational services around the Windows Phone platform to NOK and other ecosystem participants. ACN would become a preferred partner for NOK's smartphone development activities, as well as a preferred provider of services. Additionally, co announced plans to align its global workforce and consolidate site operations. These measures are part of NOK"s target to reduce its Devices & Services non-IFRS operating expenses by EUR1 bln for the full year 2013 in comparison to the full year 2010.

icon url

ReturntoSender

04/30/11 12:31 AM

#9333 RE: ReturntoSender #6755

Chart of the Day - Gasoline Prices

http://www.chartoftheday.com/20110429.htm?T

As a result of ongoing geopolitical tensions as well and increasing global demand, the price of crude oil continues to trend higher. Over the past eight months, the cost of one barrel of crude oil has increased by over $40. With oil prices trending higher, it is not all that surprising to find that gasoline prices are following suit. Since the financial crisis lows at the end of 2008, the average US price for a gallon of unleaded has risen $2.18 per gallon. The only time when gasoline prices were higher than today was during a brief three-month period in mid-2007, just prior to the Great Recession.

icon url

ReturntoSender

05/03/11 11:22 PM

#9337 RE: ReturntoSender #6755

From Briefing.com: 4:30 pm : A slump among energy stocks dragged down the broad market, but afternoon support helped the major equity averages recover into the close.

Trade was generally unimpressive for the first half of the day. Selling eventually intensified to take the Nasdaq down to a loss of more than 1%. Akamai Tech (AKAM 33.46, -0.77) and Amazon.com (AMZN 198.45, -2.74) were among its heaviest drags. Nasdaq component Foster Wheeler (FWLT 34.20, -1.05) was also a heavy drag following news that the oil services company's earnings came short of the consensus estimate.

Energy stocks were weak across the board. Even Anadarko Petroleum (APC 78.51, -1.84) dropped sharply, despite a much stronger-than-expected earnings report. Overall, energy stocks fell to a 2.4% loss. A 2.2% drop in oil prices to $111.05 per barrel didn't bode well for the energy sector. Oil prices haven't been that low in more than two weeks.

The broad market did a decent job of limiting selling pressure, especially since today's leaders were utilities stocks (+0.7%) and telecom stocks (+1.5%) -- neither has much sway with the market, given their lack of weight.

Blue chip Pfizer (PFE 20.44, -0.58) fell sharply, even though the pharmaceutical play posted an upside earnings surprise. Its weakness in the Dow was offset by Intel (INTC 23.23, +0.32) and Bank of America (BAC 12.60, +0.26).

A big earnings beat by MasterCard (MA 282.38, +7.09) helped make the stock a top performer; shares set a near three-year high.

Even though today's action wasn't very exciting, and there weren't many catalysts to bring in traders from the sidelines, share volume on the NYSE hit 1 billion shares for the first time in about a month.

Advancing Sectors: Telecom (+1.5%), Utilities (+0.7%), Financials (+0.4%), Consumer Staples (+0.3%)
Declining Sectors: Tech (-0.2%), Industrials (-0.3%), Health Care (-0.3%), Consumer Discretionary (-0.5%), Materials (-1.0%), Energy (-2.4%)DJ30 +0.15 NASDAQ -22.46 NQ100 -0.5% R2K -1.3% SP400 -1.1% SP500 -4.60 NASDAQ Adv/Vol/Dec 782/2.23 bln/1824 NYSE Adv/Vol/Dec 1042/1.00 bln/1949

4:26PM Nanometrics announced that Korean memory manufacturer has accepted its UniFire 7900 metrology system for process control of advanced packaging of DRAM devices (NANO) 15.63 -0.21 :

4:17PM AXT Inc beats by $0.01, reports revs in-line; guides Q2 EPS in-line, revs in-line (AXTI) 7.19 +0.52 : Reports Q1 (Mar) GAAP earnings of $0.13 per share, $0.01 better than the Thomson Reuters consensus of $0.12; revenues rose 31.8% year/year to $24.6 mln vs the $24.5 mln consensus. Co issues in-line guidance for Q2, sees EPS of $0.13-0.16 vs. $0.13 Thomson Reuters consensus; sees Q2 revs of $26.5-27.5 mln vs. $25.83 mln Thomson Reuters consensus.

4:11PM First Solar beats by $0.17, beats on revs; reaffirms FY11 EPS guidance, revs guidance (FSLR) 134.66 -2.87 : Reports Q1 (Mar) earnings of $1.33 per share, $0.17 better than the Thomson Reuters consensus of $1.16; revenues were unchanged from the year-ago period at $567 mln. Quarter over quarter, the net income decrease was primarily driven by lower net sales and gross margin. Year over year, the net income decrease was primarily driven by reduced average selling prices and higher expenses, partially offset by increased module production and lower module cost per watt. Gross margins 45.6% compared to 49.7% in prior year. Co reaffirms guidance for FY11, sees EPS of $9.25-9.75 vs. $9.52 Thomson Reuters consensus; sees FY11 revs of $3.7-3.8 bln vs. $3.79 bln Thomson Reuters consensus.

4:05PM QuickLogic beats by $0.01, reports revs in-line (QUIK) 3.65 -0.13 : Reports Q1 (Mar) loss of $0.01 per share, $0.01 better than the Thomson Reuters consensus of ($0.02); revenues rose 2.2% year/year to $5.6 mln vs the $5.5 mln consensus. "As previously announced, we had a revenue shortfall in the first quarter. While I'm disappointed in our short term results, I am not discouraged about our future success in light of our continued positive progress in the smartphone and tablet markets," said Andy Pease, QuickLogic's President and CEO. "We continue on track toward a mid-year launch of a previously discussed VEE/DPO-enabled smartphone and we continue to make progress on several new VEE/DPO-enabled tablet designs."

4:03PM Coherent beats by $0.05, beats on revs; guides FY11 revs above consensus (COHR) 60.20 -1.76 : Reports Q2 (Mar) earnings of $0.83 per share, ex-items, $0.05 better than the Thomson Reuters consensus of $0.78; revenues rose 34.7% year/year to $200.9 mln vs the $192.7 mln consensus. Co issues upside guidance for FY11, sees FY11 revs of $790-$805 mln vs. $777.96 mln Thomson Reuters consensus. Co states, "Our record-setting bookings and revenue in the second quarter underscore the continuing strength in our commercial markets, especially in the microelectronics business. Demand for lasers used in the packaging of smartphones and the production of flat panel displays remains very high. We are expanding capacity and adding inventory to fulfill these orders for the balance of fiscal 2011 and into fiscal 2012."

4:02PM Molex reports Q3 (Mar) results, revs in-line; guides Q4 EPS in-line, revs in-line; increases dividend (MOLX) 26.60 +0.12 : Reports Q3 (Mar) earnings of $0.22 per share, may not be comparable to the Thomson Reuters consensus of $0.42; revenues rose 15.6% year/year to $874.5 mln vs the $872 mln consensus. Co issues in-line guidance for Q4, sees EPS of $0.42-0.48 vs. $0.48 Thomson Reuters consensus; sees Q4 revs of $900-930 mln vs. $907.57 mln Thomson Reuters consensus. The Board of Directors has approved an increase in the quarterly cash dividend to $0.20 per share, an increase of 14.3% from the previous cash dividend of $0.175 per share.

8:40AM Apple announces new iMac with next generation quad-core processors, Graphics & Thunderbolt I/O technology (AAPL) 346.28 : The new iMac features quad-core Intel (INTC) Core i5 processors. iMac is the first desktop computer on the market to include Thunderbolt I/O technology.

GT Solar International (SOLR) announced that it has signed an agreement with leading Taiwanese LED wafer manufacturer, Tera Xtal Technology Corporation, to supply Tera Xtal sapphire cores for increasing their production of epitaxial-ready LED wafers.

8:02AM Vishay reports EPS in-line, revs in-line; guides Q2 revs in-line (VSH) 19.06 : Reports Q1 (Mar) earnings of $0.49 per share,ex-items, in-line with the Thomson Reuters consensus of $0.49; revenues rose 8.5% year/year to $695.2 mln vs the $699.4 mln consensus. Co issues in-line guidance for Q2, sees Q2 revs of $695-$735 mln vs. $716.63 mln Thomson Reuters consensus.

7:37AM IPG Photonics beats by $0.04, beats on revs; guides Q2 EPS above consensus, revs above consensus (IPGP) 69.40 : Reports Q1 (Mar) earnings of $0.47 per share, $0.04 better than the Thomson Reuters consensus of $0.43; revenues rose 95.2% year/year to $100 mln vs the $95 mln consensus. Co issues upside guidance for Q2, sees EPS of $0.50-0.59 vs. $0.46 Thomson Reuters consensus; sees Q2 revs of $102-110 mln vs. $101.53 mln Thomson Reuters consensus. "IPG's order flow remains strong... It has become clear that our fiber lasers are now well accepted in many applications, especially in materials processing, as potential customers recognize our brand and the value our products provide. In addition, we are seeing customers, especially OEMs, order products in significantly greater quantities. Given the leverage in our business model, our sales performance should result in impressive profitability for the year."

7:02AM Anadigics reports EPS in-line, revs in-line; guides Q2 EPS below consensus, revs below consensus (ANAD) 3.69 : Reports Q1 (Mar) loss of $0.07 per share, in-line with the Thomson Reuters consensus of ($0.07); revenues fell 0.2% year/year to $43.5 mln vs the $43.1 mln consensus. Co issues downside guidance for Q2, sees EPS of ($0.16)-(0.17) vs. ($0.01) Thomson Reuters consensus; sees Q2 revs of $35-37 mln vs. $50.08 mln Thomson Reuters consensus. Shipments to our largest North American wireless customer will decrease during the second quarter resulting in an expected sequential decrease in Wireless net sales of approximately 25% to 30%. While Broadband net sales are expected to increase sequentially by approximately 35%, it will not be sufficient to offset the decline in Wireless sales.

6:14AM Kulicke & Soffa beats by $0.18, beats on revs; guides Q3 revs above consensus (KLIC) 9.03 : Reports Q2 (Mar) earnings of $0.54 per share, $0.18 better than the Thomson Reuters consensus of $0.36; revenues rose 34.4% year/year to $206.7 mln vs the $188.3 mln consensus. Co issues upside guidance for Q3, sees Q3 revs of $255-275 mln vs. $201.30 mln Thomson Reuters consensus; backlog +64% YoY. "Our results exceeded the high-end of prior guidance, with revenue increasing ~39% compared to the prior quarter led by our OSAT customers. We continue to benefit from strong demand from both our ball and wedge bonder equipment lines from a wide range of customers. Momentum continued in the gold to copper transition, with ~71% of our ball bonder shipments in the most recent quarter sold as copper capable bonders. We also continue to benefit from ongoing replacement demand for our latest generation of gold only ball bonders. We have also seen an increased demand for large area bondable options, which enable our customers to gain added efficiencies and reduce the cost of packaging."

Lattice Semiconductor (LSCC) and Oregano Systems announced the immediate availability of three comprehensive versions of the IEEE-1588 Timing Node System IP core for the LatticeECP3 and LatticeECP2M FPGA families.

icon url

ReturntoSender

05/04/11 10:16 PM

#9338 RE: ReturntoSender #6755

From Briefing.com: 4:30 pm : Aggressive selling threatened to take the major equity averages sharply lower, but for the second straight session losses were pared as pressure eased in afternoon action.

Little hullabaloo was made over news that Portugal has been offered a bailout worth about 78 billion euros, and no real reaction was made to a disappointing ADP Employment Change report for April. The Change report suggested that last month's private payrolls increased by 179,000, which is less than the 200,000 private payrolls that had been expected, on average, among economists polled by Briefing.com.

Stocks began to sell-off in the minutes that followed the ISM Non-Manufacturing Index for April. It fell to 52.8 from 57.3, but was widely expected to remain near 57.4.

Energy stocks and materials stocks were the hardest hit. Both sectors were down in excess of 2% before paring losses in afternoon trade to finish the day down 1.6% and 1.7%, respectively. Their weakness was exacerbated by renewed pressure against commodities. Commodities collectively tumbled 1.8%, as measured by the CRB Commodity Index, even though the Dollar Index probed its two-year low before finishing flat.

At session lows the three major equity averages were down more than 1% in relatively heavy volume, but for no apparent reason pressure began to ease shortly after midday. The afternoon ascent actually took the Nasdaq to within striking distance of the neutral line, but resistance there ultimately caused the major averages to retreat back into the red.

Corporate news continues to have little impact on overall trade, given the dwindling number of blue chips and bellwethers making quarterly reports. CBS (CBS 27.21, +1.97), Time Warner (TWX 36.49, -1.24), Comcast (CMCSA 25.96, -0.65), and Las Vegas Sands (LVS 42.53, -3.34) were among the more widely held names to recently issue reports. Only LVS came short of the consensus earnings estimate.

Consumer staples stocks ConAgra (CAG 25.51, +0.76) and Ralcorp (RAH 87.39, +4.06) were able to put together strong gains in the face of broad weakness. Their strength followed an offer by CAG to acquire RAH for $86 per share, or a premium of more than 20% above the levels that RAH had traded at prior rumors of the offer last week.

For the second straight session, share volume on the NYSE broke 1 billion. That hasn't happened in more than a month.

Advancing Sectors: (None)
Declining Sectors: Materials (-1.7%), Energy (-1.6%), Industrials (-1.4%), Financials (-0.9%), Consumer Discretionary (-0.4%), Telecom (-0.3%), Tech (-0.3%), Utilities (-0.3%), Health Care (-0.1%), Consumer Staples (-0.1%)DJ30 -83.93 NASDAQ -13.39 NQ100 -0.2% R2K -1.3% SP400 -0.9% SP500 -9.30 NASDAQ Adv/Vol/Dec 698/2.24 bln/1872 NYSE Adv/Vol/Dec 940/1.10 bln/2059

4:12PM Atmel beats by $0.01, beats on revs (ATML) 14.75 +0.05 : Reports Q1 (Mar) earnings of $0.16 per share, $0.01 better than the Thomson Reuters consensus of $0.15; revenues rose 0.8% year/year to $461.4 mln vs the $453.2 mln consensus.

4:00PM Atmel announces additional $300 mln to stock repurchase program (ATML) 14.75 +0.05 : 6:21AM

4:09PM JDS Uniphase beats by $0.02, beats on revs; guides Q4 revs in-line (JDSU) : Reports Q3 (Mar) earnings of $0.22 per share, $0.02 better than the Thomson Reuters consensus of $0.20; revenues fell 4.6% year/year to $455.4 mln vs the $448 mln consensus. Co issues in-line guidance for Q4, sees Q4 revs of $455-475 mln vs. $469.82 mln Thomson Reuters consensus.

4:09PM SolarWinds beats by $0.02, beats on revs; guides Q2 EPS in-line, revs in-line; guides FY11 EPS in-line, revs in-line (SWI) 23.70 +0.49 : Reports Q1 (Mar) earnings of $0.21 per share, $0.02 better than the Thomson Reuters consensus of $0.19; revenues rose 25.3% year/year to $43 mln vs the $42.1 mln consensus. Co issues in-line guidance for Q2, sees EPS of $0.19-0.20 vs. $0.20 Thomson Reuters consensus; sees Q2 revs of $43.2-44.7 mln vs. $44.51 mln Thomson Reuters consensus. Co issues in-line guidance for FY11, sees EPS of $0.83-0.89 vs. $0.86 Thomson Reuters consensus; sees FY11 revs of $185.5-191.5 mln vs. $187.41 mln Thomson Reuters consensus.

4:05PM Pericom Semi beats by $0.02, reports revs in-line; guides Q4 revs above consensus (PSEM) 8.88 -0.04 : Reports Q3 (Mar) earnings of $0.10 per share, $0.02 better than the Thomson Reuters consensus of $0.08; revenues rose 7.9% year/year to $39.6 mln vs the $39.5 mln consensus. Co issues upside guidance for Q4, sees Q4 revs of $41.5-43.5 mln vs. $40.57 mln Thomson Reuters consensus. Q4 GAAP gross margins are expected to be between 33.3% and 35.3%, and adjusting for share-based compensation, amortization of intangibles, fair value adjustments, and compensation accruals that are expected to total approximately 1.2%, non-GAAP gross margins are expected to be in the 34.5% to 36.5% range... The sequential revenue decline primarily resulted from lower volume associated with customer inventory adjustments to align with end user demand, an adjustment period that we believe has now been completed. The second and third quarters of fiscal 2011 included a full three months of Pericom Technology, Inc. ("PTI") operations, acquired on August 31, 2010.

Varian Semi: Applied Materials (AMAT) to acquire Varian Semiconductor Equipment Associates for $63 per share in cash (VSEA) 40.55 : The cos announced the signing of a definitive merger agreement under which Applied will acquire Varian for $63 per share in cash for a total price of ~$4.9 billion on a fully-diluted basis. The transaction is expected to be accretive to Applied's earnings on a non-GAAP basis in the first year. The merger received unanimous approval by the Boards of Directors of both companies. Applied expects to fund the transaction with a combination of existing cash balances and debt. Applied has secured a commitment for a $2 billion, one-year senior bridge loan facility and plans to arrange for long-term debt financing. Applied also has in place an existing, undrawn $1 billion revolving credit facility. Additional financing arrangements are expected to include replacement of the existing credit facility with a new four-year, $1.5 billion revolving credit facility. Applied remains committed to a strong investment grade capital structure.

07:49 am First Solar downgraded to Hold at Collins Stewart: . Collins Stewart downgrades FSLR to Hold from Buy following earnings. The firm says given that the DoE process is an unknown to investors, they expect FSLR's P/E multiple to contract while the risk of additional delays is present. Given growing risks associated with a poor solar demand environment, the increasingly back-end loaded nature of FSLR's guidance and uncertainty regarding the timing of its most critical large project, the firm is lowering their rating.

07:48 am Apple resumed with a Outperform at Oppenheimer; tgt lowered to $450: . Oppenheimer resumes coverage of AAPL with a Outperform and lowers their tgt to $450 from $465 saying they view Apple as a core holding in any technology or growth portfolio and are bullish on its outlook. The iPhone has ample room to expand domestically with Verizon/other US carriers and internationally, especially when a lower priced, mini-iPhone is added. Firm notes the iPad is earlier in its ramp and represents a catalyst for Apple in both consumer and enterprise.

icon url

ReturntoSender

05/06/11 1:19 AM

#9339 RE: ReturntoSender #6755

From Briefing.com:4:30 pm : The stock market attempted to fight off early selling interest, but it ultimately rolled over to log another loss.

The mood among market participants continues to sour. As such, the stock market fell for the fourth time in as many sessions. Prior to that losing streak, the stock market had advanced in seven out of eight sessions.

The inclination to sell increased with news that initial jobless claims for the week ended April 30 spiked to 474,000, which is the highest level in the series since August 2010. The spike in initial claims proved much sharper than what had been expected, given that the Briefing.com consensus had called for an initial claims count closer to 400,000. Additionally, the underestimated increases in jobless claims during the past few weeks, coupled with a disappointing ADP Employment Change report for April, has caused some concern about what tomorrow morning's official jobs report might look like.

Little attention was paid to news that first quarter productivity increased by 1.6%, which is better than the 1.0% gain that had been broadly expected. That was helped by a a 1.0% decline in unit labor costs, which had been expected to increase by 0.8%.

Stocks started to fight back after a few hours of selling. Semiconductor issues and other assorted tech plays helped the Nasdaq find higher ground. Electronic Arts (ERTS 21.68, +1.76) actually hit a 52-week high after it posted an upside earnings surprise for the latest quarter.

The S&P 500 couldn't quite follow its tech-rich counterpart into positive territory, though. Its failure to attract enough buying interest to sustain a rally allowed sellers to redouble their efforts in afternoon action. Aggressive selling took the stock market down to its lowest level in two weeks.

Retailers helped the consumer discretionary sector limit its loss to only 0.2%. The group's performance followed a round of stronger-than-expected same-store sales reports for April. Hott Topic (HOTT 7.30, +0.78) surged 12% so that it is now narrowly below its 52-week high. Automaker General Motors (GM 32.02, -1.02) posted a better-than-expected earnings report, but its shares were shunned.

Energy stocks continued to feel the brunt of sellers' efforts. Today the sector dropped another 2.3%, which leaves it down almost 7% week to date. Transocean (RIG 68.77, +0.31) was one of the few energy issues that managed to put together a gain; its performance came in the wake of an upside earnings surprise.

Outsized losses among energy stocks have come amid considerable weakness in oil prices, which dove 8.6% to settle at $99.80 per barrel. That marked their first close below $100 per barrel since mid-March.

Silver suffered another dramatic drop. Its 7.9% dive to $36.30 per ounce has left the precious metal more than 20% below the near 31-year high that was recorded at the end of last week's trade. Silver's slide has been exacerbated by several margin increases.

General weakness among commodities dropped the CRB Commodity Index for a 4.9% loss.

Sudden buying in the greenback certainly didn't help the commodities complex. The dollar's 1.4% advance against a basket of major foreign currencies was owed to a combination of short covering and disappointment over comments from European Central Bank President Trichet regarding plans to watch prices for the next few periods before making any monetary policy changes.

Treasuries were spurred higher, too. Buying interest in the traditional safe haven took the yield on the benchmark 10-year Note down to a 2011 low at 3.15%.

Advancing Sectors: (None)
Declining Sectors: Energy (-2.3%), Telecom (-1.3%), Materials (-1.2%), Financials (-1.1%), Consumer Staples (-0.8%), Utilities (-0.7%), Industrials (-0.6%), Tech (-0.5%), Health Care (-0.6%), Consumer Discretionary (-0.2%)DJ30 -139.41 NASDAQ -13.51 NQ100 -0.5% R2K -0.4% SP400 -0.4% SP500 -12.22 NASDAQ Adv/Vol/Dec 989/2.24 bln/1567 NYSE Adv/Vol/Dec 1133/1.12 bln/1859

5:09PM SMTC Corp reports Q1 revenue of $56.3 mln, down 8% y/y, single analyst estimate $72.3 mln; net income $0.05 per share, single analyst estimate $0.08 (SMTX) 2.52 -0.08 :

4:35PM QLogic beats by $0.03, reports revs in-line (QLGC) 18.00 +0.44 : Reports Q4 (Mar) earnings of $0.37 per share, $0.03 better than the Thomson Reuters consensus of $0.34; revenues rose 4.5% year/year to $152.3 mln vs the $150.8 mln consensus.

4:34PM Multi-Fineline misses by $0.02, misses on revs; guides Q3 revs below consensus (MFLX) 23.37 -0.33 : Reports Q2 (Mar) GAAP earnings of $0.48 per share, $0.02 worse than the Thomson Reuters consensus of $0.50; revenues rose 34.4% year/year to $207.1 mln vs the $223 mln consensus. Co issues downside guidance for Q3, sees Q3 revs of $200-220 mln vs. $231.14 mln Thomson Reuters consensus.

4:18PM Microchip beats by $0.02, beats on revs; guides Q1 EPS in-line, revs in-line (MCHP) 40.54 -0.11 : Reports Q4 (Mar) earnings of $0.59 per share, excluding non-recurring items, $0.02 better than the Thomson Reuters consensus of $0.57; revenues rose 36.7% year/year to $380 mln vs the $373.7 mln consensus. Co issues in-line guidance for Q1, sees EPS of $0.58-0.62, excluding non-recurring items, vs. $0.60 Thomson Reuters consensus; sees Q1 revs of $383.8-402.8 mln vs. $385.88 mln Thomson Reuters consensus.

4:17PM Microchip increases dividend to $0.346 per share from $0.345 per share (MCHP) 40.54 -0.11 :

4:10PM TTM Tech beats by $0.01, misses on revs; guides Q2 EPS in-line, revs in-line (TTMI) 17.71 +0.21 : Reports Q1 (Mar) earnings of $0.40 per share, $0.01 better than the Thomson Reuters consensus of $0.39; revenues fell 8.2% year/year to $342.8 mln vs the $350.5 mln consensus. Co issues in-line guidance for Q2, sees EPS of $0.36-0.45 vs. $0.42 Thomson Reuters consensus; sees Q2 revs of $350-370 mln vs. $365.13 mln Thomson Reuters consensus.

4:10PM Vitesse Semi announces retirement of Chief Financial Officer Rich Yonker (VTSS) 5.06 +0.04 : Mr. Yonker will remain as CFO until his successor is appointed and an orderly transition is completed. Co has initiated a search to fill this position.

4:03PM Rubicon Tech beats by $0.14, beats on revs (RBCN) : Reports Q1 (Mar) earnings of $0.80 per share, $0.14 better than the Thomson Reuters consensus of $0.66.

4:02PM Emcore enters into a long-term supply agreement With Space Systems/Loral, terms not disclosed (EMKR) 2.48 -0.01 :

8:31AM Cisco Systems announces significant changes to its business structure and operations (CSCO) 17.47 : The company will streamline its sales, services and engineering organizations as it focuses on the five areas driving the growth of networks and the Internet: core -- routing, switching, and services; collaboration; data center virtualization and cloud; video; and architectures for business transformation. The changes announced today include: -- Worldwide Field Operations will now be organized into three geographic regions, to drive faster decision making with greater accountability and alignment. These regions include the Americas -- Cisco Engineering will organize functionally to drive technology innovation, accountability and alignment across all five company priority areas. Senior vice president Pankaj Patel and senior vic -- Cisco will refine its cross-functional Council structure to three councils that reinforce consistent and globally-aligned customer focus and speed to market across major areas of the business.

7:14AM Lam Research announces intention to offer $700 million of convertible notes (LRCX) 47.37 : Co intends to use a portion of the net proceeds of the offering to repurchase, depending on interest, a minimum of 1,000,000 shares of its common stock and may repurchase up to 3,000,000 shares of its common stock from purchasers of notes in privately negotiated transactions effected through one of the initial purchasers.

2:55AM ON Semiconductor beats by $0.07, beats on revs; guides Q2 revs above consensus (ONNN) 10.28 : Reports Q1 (Mar) earnings of $0.27 per share, $0.07 better than the Thomson Reuters consensus of $0.20; revenues rose 50.3% year/year to $870.6 mln vs the $830.1 mln consensus. Co issues upside guidance for Q2, sees Q2 revs of $860-900 mln vs. $850.12 mln Thomson Reuters consensus. Co states: "Backlog levels for the second quarter of 2011 represent over 90% of our anticipated second quarter 2011 revenues. We expect that average selling prices for the second quarter of 2011 will be flat to down ~1% when compared to the first quarter of 2011.

2:23AM Novellus prices $600 mln 2.625% Senior Convertible Notes due 2041 (NVLS) 32.92 : CO intends to use ~$350 mln of the net proceeds of this offering to repurchase shares of co's common stock from purchasers of notes in this offering in privately negotiated transactions effected through one of the initial purchasers as co's agent.
icon url

ReturntoSender

05/10/11 6:35 PM

#9345 RE: ReturntoSender #6755

From Briefing.com: 4:30 pm : After falling for four straight sessions, the stock market has put together a string of three straight gains. The climb has been underpinned by the buy-the-dip mentality that traders have followed for the past couple of years.

Despite uncertainty about the future of monetary policy, the fiscal health of the eurozone states, growth and interest rates in China, and geopolitical tensions at various points across the globe, the tone of trade has turned decidedly upbeat during the course of the past few sessions. Participants have been confident that buying stocks following a series of losses will ultimately lead to gains, given that the market's resilience has made it quick to recover from any short-term setbacks ever since it bottomed in early 2009.

Strong earnings have been a source of fundamental support for the stock market's climb up from its bear market low, although it can be conceded that reports in recent weeks have had less of an influence over broad market action, given the lack of blue chips and bellwethers in the reporting lineup.

Microsoft (MSFT 25.67, -0.16) came out today to announced that it will pay $8.5 billion to acquire Skype. However, the stock failed to find favor. Evidently investors would have preferred different use of the firm's cash hoard, which included $7 billion in cash and equivalents and another $43 billion in short term investments at the end of the first quarter.

In other corporate news, Boston Scientific (BSX 7.02, -0.69) President and CEO, Ray Elliott, will retire at the end of this year. That announcement dropped the stock to a new one-month low.

Treasuries managed to limit their losses in the face of a stronger equity market. Their recovery came after session lows were set following solid auction results for $32 billion in 3-year Notes. The auction drew a bid-to-cover of 3.29, dollar demand of $105.3 billion, and an indirect bidder participation rate of 34.4%.

After advancing solidly this last Thursday Friday, the dollar has ended lower in each of the past two trading days. Today's loss was only about 0.2%.

Advancing Sectors: Consumer Discretionary (+1.3%), Utilities (+1.3%), Telecom (+1.1%), Financials (+0.9%), Tech (+0.9%), Industrials (+0.8%), Materials (+0.7%), Consumer Staples (+0.6%), Health Care (+0.6%)
Declining Sectors: (None)DJ30 +75.68 NASDAQ +28.64 NQ100 +0.9% R2K +1.6% SP400 +1.1% SP500 +10.87 NASDAQ Adv/Vol/Dec 1910/2.02 bln/648 NYSE Adv/Vol/Dec 2448/831 mln/563

5:03PM JinkoSolar Holding announces $30 mln share repurchase program; announces proposed offering of $125 mln convertible senior notes (JKS) 27.19 +0.75 : Co announced that its board of directors approved a share repurchase program on May 6, 2011, which authorizes the Company to repurchase up to $30 million of its ordinary shares represented by American depositary shares within 12 months. Co announced its plans to issue, subject to market and other conditions, US$125 million in aggregate principal amount of convertible senior notes due 2016. The terms and timing of the offering have not been finalized. The Company will use a portion of the proceeds of the offering to pay for the capped call and associated expenses described below. The Company intends to use the remaining net proceeds from the offering for expansion of its silicon wafer, solar cell and solar module production capacity.

4:24PM Mattson announces proposed public offering of common stock (MTSN) 2.22 +0.02 : Needham & Company, LLC is acting as sole book running manager and Rodman & Renshaw, LLC and Roth Capital Partners are acting as co-managers for the offering. Co intends to use the net proceeds from this offering for general corporate purposes, which may include working capital, capital expenditures, other corporate expenses, and acquisitions of complementary products, technologies or businesses.

4:23PM Sanmina-SCI announces early settlement for its previously announced tender offers and consent solicitation (SANM) 12.01 +0.45 : Co announces that, as of 5:00 p.m., New York City time, on May 9, 2011, it had received tenders and consents from holders of $279,340,000 in aggregate principal amount of its 6 3/4% Senior Subordinated Notes due 2013, representing ~73.51% of the outstanding 2013 Notes, and tenders from holders of $257,484,000 in aggregate principal amount of its 8.125% Senior Subordinated Notes due 2016, representing ~42.91% of the outstanding 2016 Notes, in connection with the Company's previously announced cash tender offer and consent solicitation for any and all of the 2013 Notes and cash tender offer for up to $200.0 million aggregate principal amount of the 2016 Notes.

4:10PM Amtech Systems beats by $0.26, beats on revs; guides Q3 revs above consensus; guides FY11 revs above consensus (ASYS) 21.07 +0.81 : Reports Q2 (Mar) earnings of $0.77 per share, $0.26 better than the Thomson Reuters consensus of $0.51; revenues rose 280.7% year/year to $61.3 mln vs the $59 mln consensus. Co issues upside guidance for Q3, sees Q3 revs of $63-66 mln vs. $60.27 mln Thomson Reuters consensus. Co updates guidnace for FY11, now sees FY11 revs surpassing $240 mln (vs. $235.19 mln Thomson Reuters consensus), prior the co had guided for revenue to surpass $230 mln.

4:09PM STEC Inc drops almost 13% to $17.50 after hours following Q1 results and downside Q2 EPS and revs guidance (see 16:08 comment) (STEC) 20.07 +0.09 :

4:08PM STEC Inc reports EPS in-line, beats on revs; guides Q2 EPS below consensus, revs below consensus (STEC) 20.07 +0.09 : Reports Q1 (Mar) earnings of $0.32 per share, excluding non-recurring items, in-line with the Thomson Reuters consensus of $0.32; revenues rose 144.6% year/year to $94.9 mln vs the $91.6 mln consensus. Co issues downside guidance for Q2, sees EPS of $0.21-0.30, excluding non-recurring items, vs. $0.31 Thomson Reuters consensus; sees Q2 revs of $80-90 mln vs. $93.74 mln Thomson Reuters consensus.

2:01PM GT Solar commences lawsuit against ARC Energy for misappropriation of trade secrets (SOLR) 11.30 +0.31 : Co announces that its subsidiaries, GT Crystal Systems, LLC and GT Solar Hong Kong, Limited have filed a lawsuit in the Hillsborough County Superior Court in New Hampshire against Advanced RenewableEnergy Company, Kedar Gupta, its Chief Executive Officer and Chandra Khattak, an ARC employee, for the misappropriation of trade secrets relating to sapphire crystallization processes and equipment. The complaint alleges that ARC and the named individuals misappropriated trade secrets relating to GT Crystal Systems' technology for manufacturing sapphire crystals, as a means of entering the sapphire crystallization equipment business. The complaint further alleges civil conspiracy, unfair competition, breach of contract and interference with contractual relations.

9:38AM GT Solar receives $91 million in orders from customers in Asia for its advanced sapphire furnaces (SOLR) 11.00 +0.01 :

8:09AM Trina Solar expects its solar module shipments in Q1 to be in the range of 320-322 MW, compared to previous guidance of slightly higher than the ~351 MW shipped 4Q10 (TSL) 26.78 : Co announces the following updates to its previous guidance made for the quarter ended March 31, 2011. Due to impacts to module demand and order flow linked to Italy's solar regulatory revisions, the Company expects its solar module shipments in the first quarter to be in the range of 320 MW to 322 MW, compared to the Company's previous guidance of slightly higher than the approximately 351 MW shipped in the fourth quarter of 2010.For the full year 2011, the Company reiterates its expectation for total PV module shipments of between 1.75 GW to 1.80 GW, representing an increase of 65.6% to 70.3% from 2010.

8:03AM Microsoft confirms it has entered into an agreement to purchase Skype for $8.5 bln in cash (MSFT) 25.83 : Skype will support Microsoft devices like Xbox and Kinect, Windows Phone and a wide array of Windows devices, and Microsoft will connect Skype users with Lync, Outlook, Xbox Live and other communities. Microsoft will continue to invest in and support Skype clients on non-Microsoft platforms. The acquisition is subject to regulatory approvals and other customary closing conditions. The parties hope to obtain all required regulatory clearances during the course of this calendar year... conference call at 11am ET.

7:42AM Taiwan Semi says net sales for April 2011 were approximately NT$36.23 billion, a decrease of 0.4% YoY (TSM) 13.69 : Co announced its net sales for April 2011: On an unconsolidated basis, net sales were approximately NT$36.23 bln, a decrease of 0.4% over March 2011 and an increase of 10.9% over April 2010. Revenues for January through April 2011 totaled NT$138.78 bln, an increase of 13.9% compared to the same period in 2010. On a consolidated basis, net sales for April 2011 were approximately NT$ 37.13 bln, a decrease of 0.5% over March 2011 and an increase of 9.8% over April 2010. Revenues for January through April 2011 totaled NT$142.5 bln, an increase of 13.1% compared to the same period in 2010.

* First Solar (FSLR) and China Power International New Energy Holding Limited signed a strategic cooperation framework agreement to collaborate on solar photovoltaic projects in China, the United States and other international markets.

6:10AM JA Solar beats by $0.09, reports revs in-line (JASO) 6.10 : Reports Q1 (Mar) earnings of $0.41 per share, $0.09 better than the Thomson Reuters consensus of $0.32; revenues fell 5.5% year/year to $556.4 mln vs the $552.1 mln consensus. Total shipments in the first quarter of 2011 were 451MW, compared with shipments of 463MW in the fourth quarter of 2010, representing a sequential decrease of 2.6%. Compared with the same period last year, shipments grew 65.8% from 272MW. With regard to co's outlook, co states: "Due to changes in the market environment as result of the recent solar policy changes in Italy, solar cell and module shipments in the second quarter are expected to exceed 400MW. The co's current estimate for total cell and module shipments for full year 2011 remains unchanged at 2.2GW."

1:22AM Vishay prices $150 mln of 2.25% Convertible Senior Debentures due 2041 (VSH) 16.91 : Co announces Vishay intends to use the net proceeds from this offering, together with cash on hand, to repurchase shares of its common stock for an aggregate purchase price of $150 mln as follows: 1) Approximately $100 mln to repurchase shares of co's common stock from institutional investors in negotiated transactions and 2) Approximately $50 mln to repurchase additional shares of co's common stock through an agreement with an affiliate of the initial purchaser concurrently with the pricing of this offering.

icon url

ReturntoSender

05/11/11 11:11 PM

#9346 RE: ReturntoSender #6755

From Briefing.com: 4:30 pm : Stocks saw a string of strong performances come to an end as participants applied pressure amid a strong jump by the dollar. Commodities also succumbed to concerted selling interest.

Over the course of the past three sessions the stock market displayed impressive resilience as it generated enough momentum to climb more than 1%. However, concerns about higher interest rates and the fiscal state of Greece tested the conviction of recent market participants. Suspicion that higher interest rates may be forthcoming were underpinned by news that China saw a 5.3% increase in consumer prices and that the Bank of England expects consumer prices to climb above its targeted 2.0% rate and remain there through 2012.

The dollar still won support, though. Its strength came amid concern about what may be needed to prevent a default by Greece. The greenback was able to build on its gain against the euro so that the Dollar Index ended the trading day with a 1.0% gain.

Neither stocks nor commodities could attract meaningful support. In turn, the major equity averages all fell close to 1% while the CRB Commodity Index dropped to a 3.0% loss.

The combination of broad market weakness and lower commodity prices led the energy sector to suffer a 2.9% loss while the materials sector fell 2.7%.

Consumer staples stocks did a good job fending off sellers, though. The sector settled just 0.1% lower. At the individual level, Teva Pharma (TEVA 48.65, +1.51) and Macy's (M 28.36, +2.03) outperformed. Both company's posted upside earnings surprises for the latest quarter, but Macy's complemented its report with an improved forecast word that it has doubled its dividend to $0.10 per share.

Treasuries were able to attract buying interest today. They were helped by results from an results from a 10-year Note auction, which drew a bid-to-cover of 3.00, dollar demand of $72.0 billion, and an indirect bidder participation rate of 42.7%. The benchmark 10-year Note gained about a half point.

Advancing Sectors: (None)
Declining Sectors: Energy (-2.9%), Materials (-2.7%), Financials (-1.3%), Industrials (-1.1%), Telecom (-0.9%), Tech (-0.9%), Consumer Discretionary (-0.8%), Health Care (-0.3%), Utilities (-0.2%), Consumer Staples (-0.1%)DJ30 -130.33 NASDAQ -26.83 NQ100 -0.8% R2K -1.8% SP400 -1.1% SP500 -15.08 NASDAQ Adv/Vol/Dec 614/2.27 bln/2021 NYSE Adv/Vol/Dec 476/977 mln/2599

4:36PM Mattson and Mesocoat announce exclusive supply agreement (MTSN) 1.87 -0.35 : The co and MesoCoat announced that the two companies have agreed to an Exclusive Supply Agreement that grants MesoCoat access to Mattson's ultra-high-intensity Vortek arc lamp system. MesoCoat will use the lamps, which generate an extremely high intensity of focused light, in the production of its high-performance nanocomposite cladding solutions for an estimated $3.8 billion worldwide metal cladding market.

4:18PM Tessera Tech announced the co's Board of Directors appointed Robert A. Young, Ph.D., as president and chief executive officer; Robert Boehlke will become Chairman (TSRA) 18.91 -0.35 : Mr. Young is currently a member co's Board of Directors. Henry Nothhaft resigned today as the co's president and chief executive officer to pursue his advocacy of smart innovation policies in Washington, as presented in his recently-released book Great Again - Revitalizing America's Entrepreneurial Leadership (Harvard Business Press). Mr. Nothhaft will continue to serve as chairman of the board of directors until May 20, 2011, shortly before the company's upcoming 2011 annual meeting of stockholders, and will remain in a non-executive advisory role to assist co with various endeavors thereafter. Robert Boehlke will succeed Nothhaft as chairman. Boehlke is currently a member of co's Board of Directors. Mr. Young has served as a member of co's board of directors since its inception in 1991. He has had a broad career including 17 years at IBM Corporation, where he held various executive positions. Subsequently, Mr. Young served as the managing partner of Dillon, Read & Co., Inc.'s venture capital operation before serving as Dillon, Read & Co.'s head of Technology Banking.

4:10PM Flextronics and MEMC expand partnership to produce solar panels for SunEdison (FLEX) 7.00 -0.07 : FLEX and MEMC Electronic Materials (WFR) announced the expansion of an agreement between Flextronics and MEMC's affiliate, MEMC Singapore, to produce solar panels for MEMC's SunEdison subsidiary. This partnership expansion includes the production of solar panels from Flextronics' Clean Tech Supersite in Port of Tanjung Pelepas, Malaysia. The MEMC-branded solar panels will be used by SunEdison for its solar photovoltaic projects. This announcement follows an earlier agreement between the two companies signed in December 2010 under the terms of which Flextronics will manufacture solar PV panels for MEMC from its Newmarket, Ontario facility. Through the expansion announced today, Flextronics expects to build approximately 270 megawatts of solar panels annually for SunEdison in Malaysia.

4:09PM Cisco Systems beats by $0.05, reports revs in-line (CSCO) 17.78 -0.01 : Reports Q3 (Apr) earnings of $0.42 per share, excluding non-recurring items, $0.05 better than the Thomson Reuters consensus of $0.37; revenues rose 4.8% year/year to $10.87 bln vs the $10.86 bln consensus; non-GAAP gross margin of 63.9% vs. the 62.0% consensus. Cash flows from operations were $3.0 billion for the third quarter of fiscal 2011, compared with $2.6 billion for the second quarter of fiscal 2011, and compared with $3.0 billion for the third quarter of fiscal 2010. Cash and cash equivalents and investments were $43.4 billion at the end of the third quarter. Cisco repurchased 54 million shares of common stock under the stock repurchase program at an average price of $18.39 per share for an aggregate purchase price of $1.0 billion in Q3. "This quarter played out as we expected. We have acknowledged our challenges. We know what we have to do. We have a clear game plan, and we are a company with a track record of market-shaping innovation. We thank our shareholders, employees, customers and partners as we transition to the next phase of Cisco."

4:08PM Canadian Solar misses by $0.28, beats on revs (CSIQ) 9.80 -0.46 : Reports Q1 (Mar) earnings of $0.13 per share, $0.28 worse than the Thomson Reuters consensus of $0.41; revenues rose 31.6% year/year to $443.4 mln vs the $423.5 mln consensus; Gross margin was 14.7%, compared to 17% in Q4 and 12.4% in 1Q10. Solar module shipments for the first quarter of 2011 totaled 244 MW, compared to shipments of 185 MW for the first quarter of 2010. Sales to European markets in the first quarter of 2011 accounted for 75.7% of revenue, while sales to North America represented 12.2% and to Asia and others regions represented 12.2% of revenue, compared to 88.5%, 5.7% and 5.8%, respectively, in the first quarter of 2010. Accounts receivable balance at the end of the first quarter 2011 was $306.7 million, up from $169.7 million at the end of the fourth quarter of 2010 and $224.3 million at the end of the first quarter of 2010. For the second quarter of 2011, shipments are expected to be in the range of approximately 245 MW to 255 MW, with gross margin expected to be between 13% and 15%. The Company remains on track to expand its annualized capacity for solar cells to 1.3GW, and annualized capacity for modules to 2 GW, both by mid-2011. The new module capacity includes 200MW in Guelph, Canada, to provide Ontario-content qualified solar modules to the Company's downstream solar projects and customers in Ontario. For the full year 2011, the Company reiterates its previous guidance of shipments of approximately 1.2 GW to 1.3 GW. continued: "We have seen significant declines in raw materials costs so far in Q2, including lower costs for polysilicon, wafer and cells, which we expect to help lessen the impact of expected declines in module ASP.

9:05AM Mattson prices its 6.8 mln share common stock offering at $1.80 per share (MTSN) 2.21 :

9:01AM Intel announces 16 percent increase in quarterly cash dividend (INTC) 23.03 : Co announces that its board of directors has approved a 16 percent increase in the quarterly cash dividend to 21 cents per share (84 cents per share on an annual basis), beginning with the dividend that will be declared in the third quarter of 2011.

8:33AM Sanmina-SCI calls for full redemption of 6-3/4% senior subordinated notes due 2013 (SANM) 12.01 :

Silicom Ltd. (SILC) announced that it has achieved two important Design Wins for Networking Modules, a product line that Silicom developed as a part of its SETAC Server-to-Appliance Converter strategy. Silicom expects that its sales of such products to the two customers will total ~$3 million per year.

# Advanced Energy Industries, Inc. (AEIS), announced that its 500kW Solaron PV inverters have achieved a 98 percent efficiency rating from the California Energy Commission, a record breaking efficiency rating for any inverter in this power class.

# microchipDIRECT, the direct source of products from Microchip Technology Inc. (MCHP) and Microchip third parties, announced that it has expanded inventory to further support its customers in these uncertain times. Inventory for microchipDIRECT customers has increased 300% during the last nine months, in its e-commerce warehouse.

Sierra Wireless (SWIR)announced that EDMI has selected the Sierra Wireless AirPrimeSL6087 embedded wireless module to provide cellular connectivity for EDMI's new plug-and-play modular pod-based system that is integrated into the Mk7B smart single-phase electronic revenue meter.

AMD (AMD) announced a collaboration with Acceleware whereby the companies will deliver professional training programs to help developers learn how to create applications that comply with OpenCL standards.

icon url

ReturntoSender

05/16/11 10:51 PM

#9350 RE: ReturntoSender #6755

From Briefing.com: 4:30 pm : Stocks were mixed for most of the morning, but an upturn by the dollar and weakness among tech stocks encouraged selling. Pressure was most pronounced against the Nasdaq, which dropped to its lowest level in almost one month.

The tone of early trade was lackluster. Losses abroad and news that IMF managing director Strauss-Kahn was arrested ahead of an important meeting undermined sentiment. A downturn in the dollar stirred up some buying interest, but the greenback eventually bounced back so that it ended the day with a tepid loss of 0.2%.

The dollar started to pare losses at about the same time that the Nasdaq failed to push into positive territory. The broader market endured a more gradual decline, but the Nasdaq suffered a sharper slide that left it with a loss that was more than double that of the S&P 500 and about four times that of the Dow.

Large-cap tech stocks weighed most heavily on the Nasdaq, which closed just above its 50-day moving average.

Consumer discretionary stocks also came under sharp pressure. The sector's 1.4% decline came as Lowe's Companies (LOW 24.84, -0.92) dropped to a three-month low following a disappointing quarterly report, which featured an earnings miss and disappointing forecast. Retailer JC Penney (JCP 37.21, -1.23) gapped up to a two-year high following an upside earnings surprise and strong outlook, but the stock quickly rolled over.

Financials had lagged last week, but traded with relative strength for most of this session. The sector's slide was limited to a fractional loss amid support from consumer finance stocks following the release of several monthly card metric reports.

Advancing Sectors: Health Care (+0.1%)
Unchanged: Utilities, Consumer Staples
Declining Sectors: Tech (-1.5%), Consumer Discretionary (-1.4%), Telecom (-0.8%), Energy (-0.8%), Industrials (-0.4%), Materials (-0.4%), Financials (-0.1%)DJ30 -47.38 NASDAQ -46.16 NQ100 -1.7% R2K -1.5% SP400 -0.9% SP500 -8.30 NASDAQ Adv/Vol/Dec 528/2.08 bln/2085 NYSE Adv/Vol/Dec 957/904 mln/2033

7:40PM Hewlett-Packard announces that it will now report Q2 earnings results tomorrow morning (May 17) at 7:30am EST instead of May 18 after the close (HPQ) 39.80 -0.61 :

6:22PM Texas Instruments prices $3.5 bln of investment grade notes (TXN) 34.91 -0.27 : Co announced the pricing of four series of senior unsecured notes for an aggregate principal amount of $3.5 bln. The notes consist of the following: $500 mln of 0.875% notes due May 15, 2013, $1.0 bln of floating rate notes due May 15, 2013, $1.0 bln of 1.375% notes due May 15, 2014, $1.0 bln of 2.375% notes due May 16, 2016 TI intends to use the net proceeds from the sale of the notes primarily to fund the merger with National Semiconductor Corp and to use the excess, if any, for general corporate purposes. The offering is expected to close May 23, 2011. Morgan Stanley & Co. Incorporated; J.P. Morgan Securities LLC; Merrill Lynch, Pierce, Fenner & Smith Incorporated; and Citigroup Global Markets Inc. are serving as joint book-running managers for the offering.

4:31PM TranSwitch announced a common stock offering for an indeterminate amount (TXCC) 3.30 -0.14 : Needham & Co is acting as sole book running manager, and Northland Capital Markets and Signal Hill are acting as co-managers for the offering. TranSwitch intends to use the net proceeds from the offering for general corporate purposes, including working capital.

9:01AM SanDisk agrees to acquire Pliant Tech for ~$327 mln; expects the transaction to be dilutive to its non-GAAP earnings by 2-3% in fiscal year 2011;accretive to non-GAAP earnings in fiscal year 2012 (SNDK) 46.49 : Co announces a definitive agreement to acquire Pliant Technology. Co will pay ~$327 mln in cash and provide certain equity-based incentives. Co expects the transaction to be dilutive to its non-GAAP earnings by 2-3% in fiscal year 2011 and accretive to non-GAAP earnings in fiscal year 2012. Co states: "The Enterprise SSD market is poised for considerable growth, with revenue projected to reach $4.2 bln in 2015, up from $994 mln in 2010."

Marvell (MRVL) announced the world's first dual-string smart LED controller chip, the 88EM8801, which uses the co's unique power technology to enable superior lighting performance.

8:04AM GT Solar announces multiple new orders totaling $84.3 million for DSS crystallization growth furnaces (SOLR) 11.36 : Co announced that it has signed new contracts for its DSS multicrystalline growth furnaces from both new and existing customers totaling $84.3 million. The new customers include Nantong Zongyi New Material Co., Ltd. and Inner Mongolia Zhong Huan Solar Material Co., Ltd. The orders will be included in GT's backlog for the quarter ending June 2, 2011.

Microsemi (MSCC) announced a line of intelligent half bridge Insulated Gate Bipolar Transistor standard power modules, including five products that simplify system design and are each available in the co's proprietary low-profile LP8 package.

6:29AM Canadian Solar announces 81 MW sales agreement with Saferay (CSIQ) 9.68 : Co announces it has signed an agreement to sell 81 MW of solar modules to Saferay GmbH at a fixed price for projects in Germany. Canadian Solar is expected to deliver the full 81 MW before the end of the third quarter 2011. Delivery has already commenced. Berlin-based Saferay was founded in early 2010, as a spin-off from one of Germany's leading solar cell manufacturers, and is a developer, owner and operator of large scale PV power plants.

NextOp Software announced it is partnering with Altera (ALTR) signing a multi-year, multi-license agreement to expand its deployment of NextOp's BugScope Assertion Synthesis product.

Lattice Semiconductor (LSCC) and System General announced that both automated and manual programming systems now fully support the first member of the MachXO2 PLD family, the 1200 LUT LCMXO2-1200.

07:46 am STEC Inc upgraded to Buy at The Benchmark Company; tgt $21: . The Benchmark Company upgrades STEC to Buy from Hold and sets target price at $21 saying STEC should benefit from the rapidly growing enterprise-class SSD market. They also believe investors should not underestimate STEC's key points of differentiation within the SSD market: a heavy software focus, proprietary ASIC-based controller capability, a high level of vertical integration, and a strong patent portfolio. Given the recent 25%-plus sell-off in STEC's share price, they believe the risk-reward profile justifies a long position in STEC shares.
icon url

ReturntoSender

05/18/11 12:27 AM

#9351 RE: ReturntoSender #6755

From Briefing.com: 4:15 pm : Participants pared risk for the first part of the session, but a downturn by the dollar and strength among financials gradually boosted the broader market. Stocks were snared at the neutral line, though.

Selling pressure took stocks down markedly at midday. The drop actually put all three major equity averages at lowest level in almost a month. That stirred interest in Treasuries, such that the yield on the benchmark 10-year Note fell to a 2011 low around 3.10%.

Tech stocks were hit with some of the hardest selling interest. The sector slid to a loss of more than 1% as shares of Hewlett-Packard (HPQ 36.85, -2.94) dropped precipitously to a new 52-week low following a disappointing forecast, which completely overshadowed the company's upside earnings surprise for the latest quarter. The tech sector later cut its loss in afternoon trade; it finished just 0.2% lower for the day.

HP shares also took a heavy toll on the Dow, which lagged its counterparts for just about the entire day. Wal-Mart (WMT 55.54, -0.52) also weighed to the Blue Chip Index, although the company reported better-than-expected earnings for the latest quarter.

Data didn't do anything to motivate buying interest. April Industrial production was just posted. It was flat in the face of calls for a 0.5% increase. Capacity Utilization came in at 76.9%, which is less than the 77.7% that had been expected, on average, among economists surveyed by Briefing.com.

Housing starts for April hit an annualized rate of 523,000, but that is less than the rate of 563,000 units that had been expected, on average, among economists polled by Briefing.com. The April rate is also down from the prior month's rate of 585,000 units. Building permits fell to an annualized rate of 551,000 from 574,000 permits, but economists polled by Briefing.com had expected a rate closer to 590,000 permits.

The news hurt shares of homebuilders, which collectively fell to a 1.3% loss, according to the PHLX Housing Sector Index. However, home improvement retailer Home Depot (HD 37.40, +0.42) put together a strong gain following its latest quarterly report, which featured a better-than-expected bottom line.

Stocks gradually worked their way higher in afternoon action. The advance was helped along by a downturn the dollar, which fell to a 0.3% loss against a basket of major foreign currencies.

Financials were a source of leadership late in the day. The sector's 0.7% gain was largely owed to a bounce by bank stocks, which lifted the KBW Bank Index a 1.5% gain. Strength among financials comes after the sector had lagged last week.

Even though financials offered to lead the market higher and the dollar ended the day at its session low, buying lost momentum once the Nasdaq and S&P 500 came in contact with the neutral line. That left the two averages to trade sideways for the final hour of the day.

Advancing Sectors: Financials (+0.7%), Utilities (+0.7%), Consumer Staples (+0.3%), Telecom (+0.3%), Consumer Discretionary (+0.1%)
Unchanged: Health Care
Declining Sectors: Energy (-0.2%), Tech (-0.2%), Materials (-1.1%), Industrials (-1.3%)DJ30 -68.79 NASDAQ +0.90 NQ100 +0.2% R2K -0.3% SP400 -0.7% SP500 -0.49 NASDAQ Adv/Vol/Dec 1063/2.20 bln/1538 NYSE Adv/Vol/Dec 1306/930 mln/1772

4:31PM Skyworks to acquire SiGe Semiconductor for $210 million in cash, plus an additional $65 million if certain performance targets are met over next 12 months (SWKS) 26.64 -0.62 : Co announces it will acquire SiGe Semiconductor for $210 million in cash, plus an additional $65 million if certain performance targets are met over next 12 months. transaction has been approved by Skyworks' and SiGe's boards of directors and is anticipated to close in June, subject to customary closing conditions, including the receipt of domestic and foreign regulatory approvals. Excluding any non-recurring acquisition related charges and amortization of acquired intangibles, Skyworks expects the acquisition to be immediately accretive to non-GAAP earnings and will finalize estimates of the transaction's financial impact, as well as the accounting for the transaction, upon deal close.

4:09PM Dell beats by $0.11, misses on revs; reaffirms FY12 revs guidance, raises FY12 operating income guidance; sees mid-single digit Q2 revs growth -- DELL will resume trading at 16:20 (DELL) 15.90 -0.10 : Reports Q1 (Apr) earnings of $0.55 per share, ex-items, $0.11 better than the Thomson Reuters consensus of $0.44; revenues rose 1.0% year/year to $15.02 bln vs the $15.41 bln consensus; non-GAAP operating margin of 9.2% vs. the 7.5% consensus. The strong first quarter results also reflect Dell's improved profitability in end-user-computing, particularly Dell's client desktop and laptop offerings. This improved performance is the result of a higher-value product portfolio, good cost management, better sales execution and a significantly improved supply chain. Co reaffirms rev guidance for FY12, sees FY12 revs of +5-9% YoY to ~$64.56-67.0 bln vs. $64.56 bln Thomson Reuters consensus, co raises non-GAAP operating income growth guidance to 12-18% from +6-12% previously, vs. the +9.3% consensus. DELL expects mid-single digit revenue growth in Q2, which is slightly above its normal, sequential seasonal growth of 2-3% vs. consensus of 6.5%.

4:03PM Analog Devices beats by $0.07, beats on revs; guides Q3 EPS above consensus, revs above consensus (ADI) 40.23 -0.32 : Reports Q2 (Apr) earnings of $0.75 per share, excluding non-recurring items, $0.07 better than the Thomson Reuters consensus of $0.68; revenues rose 8.6% year/year to $791 mln vs the $746.2 mln consensus; 2Q11 gross margin increased to a record 67.6% of revenue Co issues upside guidance for Q3, sees EPS of $0.70-0.75 vs. $0.69 Thomson Reuters consensus; sees Q3 revs of $765-795 mln vs. $758.94 mln Thomson Reuters consensus; Gross margin: 67.0% to 68.0% of sales.

9:16AM TranSwitch priced a 5.4 mln share common stock offeirng at $2.80/share (TXCC) 3.30

Analog Devices (ADI) introduced the ADM2682E and ADM2687E, the industry's first single-chip 5-kVrms signal- and power-isolated RS-485 data transceivers that meet the safety isolation requirements of high voltage systems in motor, power and energy control systems.

8:05AM Amkor to offer $400 million aggregate principal amount of senior notes; announces tender offer for its 9.25% senior notes due 2016 (AMKR) 6.74

7:38AM Hewlett-Packard beats by $0.03, reports revs in-line; guides Q3 EPS, revs below consensus; lowers FY11 EPS, revs below consensus (HPQ) 39.80 : Reports Q2 (Apr) earnings of $1.24 per share, excluding non-recurring items, $0.03 better than the Thomson Reuters consensus of $1.21; revenues rose 2.5% year/year to $31.63 bln vs the $31.53 bln consensus. Co issues downside guidance for Q3, sees EPS of ~$1.08, excluding non-recurring items, vs. $1.23 Thomson Reuters consensus; sees Q3 revs of $31.1-31.3 bln vs. $31.78 bln Thomson Reuters consensus. Co lowers guidance for FY11, sees EPS of at least $5.00, excluding non-recurring items, vs. $5.24 Thomson Reuters consensus, down from $5.20-5.28; sees FY11 revs of $129-130 bln vs. $130.22 bln Thomson Reuters consensus, down from $130-131.5 bln, reflecting an expected near-term impact from the Japan earthquake and related events, continued softness in sales of consumer PCs, and reduced operating profit expectations for Services. Results were largely driven by performance in the commercial sector as businesses continued to spend on technology. HP experienced uneven consumer performance across its product categories during the quarter with continued softness in consumer PCs across all geographies. Co cites continued strength in commercial businesses resulted in commercial revenue increasing 8% year over year, with Enterprise Servers, Storage and Networking revenue up 15%, Software revenue up 17%, and commercial PC Clients and Printers revenue up 13% and 7%, respectively.

7:10AM Trina Solar misses by $0.41, misses on revs (TSL) 24.79 : Reports Q1 (Mar) earnings of $0.63 per share, $0.41 worse than the Thomson Reuters consensus of $1.04, FX had a ($0.30) impact; revenues rose 63.6% year/year to $550.9 mln vs the $579.4 mln consensus. Gross margin was 27.5%, compared to the co's previous guidance of mid to high 20s in percentage terms, compared to 31.4% in the fourth quarter of 2010 and 30.9% in the first quarter of 2010 As of April 30, 2011, the co's annualized in-house ingot and wafer production capacity was ~750 MW and its PV cell and module production capacities was ~1.6 GW. To meet expected demand for its PV solar modules, the co expects to raise its annualized in-house ingot and wafer production capacity and PV cell and module production capacity to ~1.2 GW and 1.9 GW, respectively, in the second half of 2011, based on actual manufacturing yield. "Amidst a challenging macro environment and winter season conditions, we maintained relatively strong shipment volumes in the first quarter. Despite decreased sequential demand linked to Italy's solar regulatory revisions, we realized notable market share gains in Germany, the rest of Europe and on a global basis."

Veeco Instruments Inc. (VECO) announced that Elec-Tech International has placed a multi-unit order for Veeco's recently released TurboDisc MaxBright MOCVD System for production of high-brightness light-emitting diodes at their facility in Wuhu, China.

# Trina Solar Limited (TSL) announced through its subsidiary, Trina Solar GmbH, that it has signed a sales agreement with Mohring Energie GmbH, a well-established German-based project developer and engineering, procurement and construction services company.

# Xilinx (XLNX) announced its acquisition of Sarance Technologies, completing its industry-leading technology portfolio for addressing next generation line card applications by adding premier connectivity communications capabilities. No terms were disclosed.

6:22AM Tower Semicon misses by $0.02, misses on revs (TSEM) 1.20 : Reports Q1 (Mar) GAAP EPS, loss of $0.02 per share, $0.02 worse than the Thomson Reuters consensus of ($0.00); revenues rose 6.0% year/year to $120.6 mln vs the $123.7 mln consensus.

# Power Integrations (POWI) introduced two new members of its LinkZero-AX product family, along with a PI University introductory video course that explains how designers can achieve 0.00 watts of standby energy consumption.

08:22 am PMC-Sierra resumed with a Hold at Auriga U.S.A; tgt $8: . Auriga U.S.A resumes coverage of PMCS with a Hold and sets target price at $8 saying they expect strong sequential growth over the course of this year due to strength in storage, the Wintegra contribution, and recovering transport segment. However, firm says their ests are lower than consensus for 2012 as they do not expect OTN to become meaningful before 2013, and their analysis also shows that growth in Wintegra and SAS in 2012 could be partially offset by declining Fiber Channel, SONET, T/E and Processor businesses.

09:53 am HPW Guides Q3 Below Consensus, Lowers FY11 Guidance (HPQ)

Hewlett-Packard (HPQ $37.28 -2.52) reported second quarter earnings of $1.24 per share, excluding non-recurring items, $0.03 better than the Thomson Reuters consensus of $1.21.

Revenues rose 2.5% year/year to $31.63 billion versus the $31.53 billion consensus.

For the third quarter, the company expects to see earnings of ~$1.08, excluding non-recurring items, well below the $1.23 Thomson Reuters consensus and sees revenues of $31.1 billion to $31.3 billion versus the $31.78 billion Thomson Reuters consensus.

For its fiscal year 2011, the company lowered its earnings to at least $5.00, excluding non-recurring items, versus $5.24 Thomson Reuters consensus, down from $5.20 to $5.28 and sees revenues of $129 billion to $130 billion versus the $130.22 billion Thomson Reuters consensus, down from $130 billion to $131.5 billion, reflecting an expected near-term impact from the Japan earthquake and related events, continued softness in sales of consumer PCs, and reduced operating profit expectations for Services.

Results were largely driven by performance in the commercial sector as businesses continued to spend on technology. HP experienced uneven consumer performance across its product categories during the quarter with continued softness in consumer PCs across all geographies. Co cites continued strength in commercial businesses resulted in commercial revenue increasing 8% year over year, with Enterprise Servers, Storage and Networking revenue up 15%, Software revenue up 17%, and commercial PC Clients and Printers revenue up 13% and 7%, respectively.
icon url

ReturntoSender

05/18/11 8:40 PM

#9352 RE: ReturntoSender #6755

Global Slowdown to Hit by Summer, Even for U.S., Says Achuthan
By Stacy Curtin

http://finance.yahoo.com/blogs/daily-ticker/global-slowdown-hit-summer-even-u-says-achuthan-130920838.html
[EDIT: A 5 minute video interview is at the link.]

The world is headed for an economic slowdown, according to the Economic Cycle Research Institute's (ECRI) Long Leading Index of global industrial growth.

"It is not country specific, but imagine if you could add up all the activity in factories around the world and see if it was accelerating or decelerating, that is what this indicator is focused on," says Lakshman Achuthan founder and managing director of the research center. "And it has been telling us very clearly, unambiguously, that we have a peak in global industrial growth this summer."

Take a look at the institute's chart here. The downturn follows in lock-step the fall in short-term indicators like ISM survey and the ECRI's Industrial Commodity Inflation index.

Also of note in ECRI's recent data is its future inflation gauge, which excludes commodities. This index had been inching up since last year until last month, says Achuthan, when the index dropped two points, or a little less than two percent.

Why does this matter?

"There is a linkage in cycles of inflation and cycles in growth," he tells Aaron in the interview above. "Basically, one quarter of the time you can have a downturn in the inflation cycle ahead of a downturn in economic growth."

As Aaron points out in the interview, Bernanke might have been right in calling inflation "transitory" and those who have been betting on higher rates and inflation should be rethinking those bets.

The Good And The Bad

The good news as the slowdown quickly approaches is that Achuthan does not believe another recession is headed our way.

The bad news is he says "the U.S. economy will not escape" the downturn, but will "participate in it…and in one way, shape or form, it is going to impact this recovery."

So far, he's got a pretty good track record in predicting these sorts of things.

Last September he sat down with The Daily Ticker (nee Tech Ticker) to offer his opinion after a number of the ECRI's indicators plummeted and in turn put investors on edge. Achuthan put the chance of a double-dip at more than 50%, but also said there was a very good possibility that the economy would have a "soft landing," which turns out it did.
icon url

ReturntoSender

05/18/11 9:23 PM

#9353 RE: ReturntoSender #6755

From Briefing.com: 4:45 pm : Stocks fought threw sluggish trade in the early going to stage impressive gains and settle at session highs. The move was led by natural resource plays.

In the prior session, stocks rebounded back to the lower end of their recent trading range, but struggled to generate enough momentum to make a gain. Stocks were mired near the neutral line again this morning while participants monitored overseas trade and a modest upturn by the dollar. However, the market's unwillingness to turn lower garnered additional support, which eventually led to a gradual climb.

Commodities were especially strong, suggesting a willingness among participants to return to risk, for now at least. Oil prices spiked more than 3% to close pit trade above $100 per barrel. It was partially helped by a bullish inventory report. Overall, the CRB Commodity Index climbed 2.3%.

Strength among commodities helped materials stocks and energy stocks outperform. Both sectors advanced on the order of 2%.

Dell (DELL 16.75, +0.85) was one of today's top performers. The stock's spike to a 52-week followed a strong earnings report and forecast.

Deere & Co. (DE 86.50, -0.46) also posted a strong quarterly report and forecast, but its shares dropped at the open. The stock eventually improved its position, but still settled with a modest loss.

Shares of Target (TGT 49.96, -0.82) also had to fight through selling interest in the wake of an upside earnings surprise, but Abercrombie & Fitch (ANF 75.69, +2.52) rallied to a new 52-week high following its better-than-expected earnings report.

Advancing Sectors: Materials (+2.1%), Energy (+2.0%), Consumer Discretionary (+1.2%), Industrials (+1.1%), Tech (+0.8%), Health Care (+0.8%), Financials (+0.5%), Telecom (+0.3%), Consumer Staples (+0.2%)
Declining Sectors: Utilities (-0.3%)DJ30 +80.60 NASDAQ +31.79 NQ100 +0.8% R2K +1.6% SP400 +1.5% SP500 +11.70 NASDAQ Adv/Vol/Dec 1914/1.88 bln/667 NYSE Adv/Vol/Dec 2351/882 mln/658

4:32PM Cisco Systems: MOSAID files complaint against Cisco at International Trade Commission (CSCO) 16.64 +0.01 : MOSAID Technologies initiated legal action against CSCO by filing a complaint for patent infringement with the United States International Trade Commission in Washington, D.C. MOSAID's complaint asserts that six of MOSAID's patents are infringed by certain Cisco products, including Power over Ethernet switches and routers, Digital Subscriber Line (DSL) wireless access points, cable modem wireless access points, PoE Internet Protocol phones, and cable modems with Voice over IP. MOSAID is requesting that the ITC halt the unlawful importation and sale of these and certain other Cisco products in the United States.

OmniVision Technologies (OVTI) introduced the OV5690, the first 5-megapixel image sensor to use OmniVision's proprietary OmniBSI-2 pixel architecture. The new 1.4-micron backside illumination pixel allows for a full five megapixels in a 1/4-inch optical format, and combines best-in-class image quality with a 20 percent reduction in camera module height, making it an effective solution for slimmer mobile handsets, smart phones and tablet computers.

7:30AM GT Solar receives $228 million order for polysilicon production equipment and technology from South Korean Polysilicon Producer OCI Company, Ltd. (SOLR) 11.48 : Co announces that it has received its largest order to date for polysilicon production equipment and technology totaling $228 million from South Korea-based polysilicon producer OCI Company, Ltd. The production equipment will be incorporated into OCI's new Phase 4 production facility. The order will be included in GT Solar's backlog for its current Q1 FY12, which ends on July 2, 2011.

1:51AM Amkor prices $400 mln 6.625% Senior Notes due 2021 (AMKR) 6.63 : The net proceeds from the offering will be used to fund the co's tender offer for the ~$264.3 mln aggregate principal amount of its outstanding 9.25% Senior Notes due 2016 and for general corporate purposes, including the redemption of any 2016 Notes not tendered in the tender offer and the refinancing of the co's 2.50% Convertible Senior Subordinated Notes due May 2011.

11:41 am ADI Guides Q3 Above Consensus (ADI)

Analog Devices (ADI $42.73 +2.50) reported second quarter earnings of $0.75 per share, excluding non-recurring items, $0.07 better than the Thomson Reuters consensus of $0.68.

Revenues rose 8.6% year/year to $791 million versus the $746.2 million consensus; second quarter gross margin increased to a record 67.6% of revenue

For the third quarter, the company expects to see earnings of $0.70 to $0.75 versus the $0.69 Thomson Reuters consensus and expects to see revenues at $765 million to $795 million versus the $758.94 million Thomson Reuters consensus; Gross margin: 67.0% to 68.0% of sales.

09:50 am DELL Raises FY12 Operating Income Guidance (DELL)

Dell (DELL $16.86 +0.96) reported first quarter earnings of $0.55 per share, ex-items, $0.11 better than the Thomson Reuters consensus of $0.44.

Revenues rose 1.0% year/year to $15.02 billion versus the $15.41 billion consensus; non-GAAP operating margin of 9.2% vs. the 7.5% consensus.

The strong first quarter results also reflect Dell's improved profitability in end-user-computing, particularly Dell's client desktop and laptop offerings. This improved performance is the result of a higher-value product portfolio, good cost management, better sales execution and a significantly improved supply chain.

The company reaffirmed revenue guidance for fiscal year 2012 at 5-9% growth, which calculates to approx. $64.56 billion to $67.0 billion versus the $64.56 billion Thomson Reuters consensus. The company raised non-GAAP operating income growth guidance to 12% to 18% from +6% to 12% previously, versus the +9.3% consensus. DELL expects mid-single digit revenue growth in second quarter, which is slightly above its normal, sequential seasonal growth of 2% to 3% versus consensus of 6.5%.
icon url

ReturntoSender

05/20/11 12:47 AM

#9354 RE: ReturntoSender #6755

From Briefing.com: 4:30 pm : Stocks managed to muster a second day of gains in the face of some disappointing economic data. Leadership was also lacking.

News that initial jobless claims for the week ended May 14 fell from 438,000 to 409,000, which is less than the 420,000 that had been widely expected, helped support a positive tone among morning participants. However, a dose of disappointing data shortly after the open caused the tone of trade to sour.

The Philadelphia Fed Index for May came in at 3.9, which is well below the 18.0 that had been widely expected. The May reading is also down sharply from the 18.5 that had been posted in April.

Leading Indicators for April fell by 0.3%. The consensus among economists surveyed by Briefing.com had called for no change.

Existing home sales fell to an annualized rate of 5.05 million in April. They had been expected to come in at a pace of 5.23 million units following the prior month's rate of 5.09 million units.

A negative response to the data caused stocks to retreat into the red for a while, but a downturn by the dollar helped renew support for the equity market. Although the dollar remained near its session low and closed with a loss of about 0.4%, stocks were unable to make anything more than a modest gain.

Industrial stocks staged the strongest advance, but their lack of weight in the overall market limited their ability to lead. Nonetheless, the industrial sector put together a 0.7% gain.

Social media play LinkedIn (LNKD 94.25, +49.25) was a top performer in its debut session. The stock achieved a gain of more than 100%, even though it settled more than 20% off of its session high.

Retailers had a rough session. Sears Holding (SHLD 73.86, -1.99), Limited (LTD 40.81, -1.64), Buckle (BKE 41.19, -6.71), Hott Topic (HOTT 7.25, -0.41), and Advance Auto Parts (AAP 63.49, -7.17) all tumbled in the wake of their latest quarterly reports. Discount retailer Dollar Tree (DLTR 63.11, +1.78) was one of the few names that moved higher, thanks mostly to an upside earnings surprise.

Advancing Sectors: Industrials +0.7%, Telecom +0.6%, Consumer Staples +0.5%, Consumer Discretionary +0.3%, Utilities +0.2%, Financial +0.1%, Tech +0.1%, Materials +0.1%, Energy +0.1%
Declining Sectors: Health Care -0.2%DJ30 +45.14 NASDAQ +8.31 NQ100 +0.3% R2K +0.2% SP400 +0.2% SP500 +2.92 NASDAQ Adv/Vol/Dec 1308/1.76 bln/1294 NYSE Adv/Vol/Dec 1764/871 mln/1210

4:15PM LDK Solar announces postponement of proposed offering of senior notes (LDK) 8.21 -0.38 : Co announced the postponement of its proposed offering of U.S. dollar-denominated senior notes due to recent market conditions. LDK Solar originally planned to use the funds to pay down its short-term debts, but the recent increase in interest rates exceeded its original expectations. "Despite the postponement of this bond offering, we still expect to generate sufficient operating cash flow to support our business plan."

4:06PM Brocade beats by $0.03, reports revs in-line (BRCD) 6.26 +0.08 : Reports Q2 (Apr) earnings of $0.13 per share, excluding non-recurring items, $0.03 better than the Thomson Reuters consensus of $0.10; revenues rose 9.8% year/year to $550 mln vs the $550 mln consensus.

4:03PM Aehr Test Systems received over $2 mln in additional orders for FOX-1 WaferPak contactors and support services (AEHR) 1.60 +0.03

07:26 am Suntech Power downgraded to Neutral at Collins Stewart; tgt lowered to $8: . Collins Stewart downgrades STP to Neutral from Buy and lowers their tgt to $8 from $10 due to a combination of poor solar demand, falling prices and STP's relatively average cost structure by China standards.

2:36 pm S&P 500 Tech Sector; Goldman Downgrades Semi Equip Sector

The tech sector is trading higher today, along with gains in the broader market. Semiconductors are also showing relative weakness in the tech space, however, with the Philly Semi Index trading 0.8% lower. Among chips in the index, KLAC (-3.8%) is a notable laggard. Among other major indices, the S&P 500 is trading 0.2% higher while the NASDAQ and the QQQ are trading 0.4% higher. Among tech bellwethers, ORCL (-1.3%) is showing relative strength while INTC (-1.5%) is under pressure.

In earnings last night, SNPS (-3.0%) reported an inline Q2 and guidance. This morning, NTES (+1.6%) reported an EPS beat and inline revenues.

In news last night, it was reported that BIDU (+3.0%) has been targeted in lawsuit for its censorship. This morning, LNKD (+139.4%) opened up at $83, well above its already increased IPO pricing of $45.

In rumors, we are hearing CSCO (-0.2%) could consider the sale of Linksys, AAPL's (+0.4%) upcoming iCloud offering will use LLNW (+1.6%), SCON (+17.9%) takeover chatter, and CSCO (-0.2%) for APKT (+1.3%) making the rounds.

Among the more notable analyst upgrades this morning, LRCX (-1.1%) was upgraded to Buy at Goldman. In downgrades this morning, Goldman downgraded the Semi Equipment sector to Cautious.

In addition the firm downgraded INTC (-1.5%) and KLAC (-3.9%) to Sell, and AMAT (-1.5%) to Neutral. Elsewhere, SMT (-27.1%) was downgraded at Piper Jaffray and Cowen and NETL (-4.5%) was downgraded to Underweight at Morgan Stanley.

CRM (+1.2%), BRCD (+1.5%), ADSK (+1.0%) and INTU (+1.9%) are the notable tech names set to report results today after the close.
icon url

ReturntoSender

05/20/11 2:55 PM

#9355 RE: ReturntoSender #6755

Cruel Summer? Data Signal Global Industrial Slowdown
By SCOTT STODDARD , INVESTOR'S BUSINESS DAILY

Posted 05/19/2011 11:41 AM ET


A global summer slowdown looms as a leading indicator of factory activity has turned down, according to a well-respected independent research firm.

The Economic Cycle Research Institute's long leading indicator of global industrial growth peaked at 0.7 in August 2010, predicting a cyclical peak for industrial activity this summer. The index stood at 0.1 in March, near the lowest level since January 1980.

"There's a downturn in global industrial growth in clear sight," said ECRI managing director Lakshman Achuthan.

Output has already started to decelerate in the U.S., Europe and key emerging market countries such as China that have driven the global economic recovery. Yet Achuthan said he sees no sign of a renewed recession.

Update: On Thursday, the Philadelphia Federal Reserve reported that its manufacturing index fell sharply in May to 3.9 from 18.5 in April. While still above the neutral 50 level, the reading has crashed from March's long-time high of 43.4 and is the lowest since last October. The new orders index also showed a rapid deceleration to 5.4 from April's 18.8 and March's 40.3. Unfilled orders turned negative. But prices pressures eased and the jobs subindex rose.

ECRI has a good track record of predicting turns in the business cycle. It spotted the last two U.S. recessions and surprised financial markets in April 2009 when it predicted the latest downturn would end that summer. The National Bureau of Economic Research, the official arbiter of U.S. business cycles, ultimately confirmed that.

The long leading global industrial growth index is comprised of about 60 components that Achuthan said represent diverse long-term drivers of global industrial cycles in some 20 countries, including China and India.

"We've found that, collectively, they paint a picture showing clear patterns that highlight the earliest antecedents of global industrial cycles," he said.

Output in the 17-member euro zone unexpectedly fell in March, suggesting that Q1 economic growth may have been weaker than expected.

Production plunged in Japan following the March 11 earthquake and tsunami.

China's industrial pace has slowed more than expected amid government efforts to cool inflation.

In the U.S., industrial output was flat in April after rising 0.7% in March, as parts shortages due to Japan's earthquake hurt auto production. Manufacturing production fell 0.5%.

Factories have been a bright spot in a lackluster U.S. recovery, struggling with a still-weak housing market, tight credit and looming government budget cuts.

The Federal Reserve and the National Association for Business Economics have cut their U.S. growth forecasts this year. Achuthan said about half of all slowdowns in overall U.S. economic growth lead to recessions, though he and other economists said that a renewed downturn was unlikely.

Reduced factory activity has had the benefit of bringing down the price of industrial commodities such as oil, copper and lumber. The growth rate of ECRI's industrial commodity inflation index plunged to a seven-month low of 18.2% in May from 31.2% in April.

"Commodity price inflation is rolling over," Achuthan said. "This is a classic sequence, and people need to start thinking about the scenario where global industrial growth once again starts to throttle back."

Crude oil futures rose back above $100 a barrel on Wednesday — up 3% to $100.10 — but well off their recent peak of $114.83. Copper also rallied, but is down about 8% in 2011.

Analysts worry that some central banks may be tightening credit too quickly.

The European Central Bank raised interest rates last month and is widely expected to do so again in July, as inflation runs well above its target despite turmoil in smaller, debt-ridden nations such as Greece, Portugal and Ireland.

The ECB is "too far ahead," said Joe Gagnon, a senior fellow at the Peterson Institute for International Economics. He added that the central bank responds to oil prices, which have fallen sharply from their peak amid signs of slower economic growth.

Achuthan said the People's Bank of China has likewise gotten ahead of itself, tightening too sharply even though the economy has started to slow noticeably.

"China is stepping on the brakes, but a slowdown is baked in the cake," he said. "The risk is they go too far in fighting inflation."

A day after reporting weaker industrial, retail and lending growth, the central bank ordered banks to set aside more cash for the fifth time this year.

Monetary policy has a long lag. So recent policy moves, designed to battle inflation, won't affect economic activity until late this year or early 2012.

On the other hand, the U.S. Federal Reserve has kept rates low and maintained loose policies, viewing the recent run-up in commodity prices as temporary, despite the qualms of a few policymakers. The Bank of England has also kept the monetary spigot open as fears about government austerity measures have so far trumped concerns about soaring inflation.

http://www.investors.com/NewsAndAnalysis/Article.aspx?id=572555
icon url

ReturntoSender

05/20/11 3:45 PM

#9356 RE: ReturntoSender #6755

Chart of the Day - COTD - Home Values

The US real estate market continues to struggle. For some perspective, today's top chart illustrates the US median price (adjusted for inflation) of a single-family home over the past 41 years while today's bottom chart presents the annual percent change in home prices (also adjusted for inflation). Today's chart illustrates that, prior to the financial crisis, the inflation-adjusted median home price rarely declined more than 5% in one year (gray shading). It is also very important to note that due to a large number of distressed properties, a high unemployment rate and stagnant wages, the inflation-adjusted median home price has declined 7.9% over the past year -- an annual decline larger than any that occurred during the 35 years prior to the financial crisis.

icon url

ReturntoSender

05/22/11 3:04 PM

#9360 RE: ReturntoSender #6755

Monday Morning Outlook: Choppy Trading Ahead as Bulls and Bears Battle It Out
The VIX breached a treacherous technical level last Thursday
by Todd Salamone 5/21/2011 11:45 AM

http://www.schaeffersresearch.com/commentary/observations.aspx?ID=106397&trackback=recapezine

Now that the major market indexes have trudged their way to a third straight weekly loss, it's becoming more and more difficult to argue the point that seasonality is destiny. Indeed, it would seem the bulls have given up hope almost entirely in May, with one closely watched investor sentiment survey falling to a nine-month low in the latest week. But can it really be that bad out there?

Well... yes and no, according to Todd Salamone. We head into the week with stocks still pinned between key support and resistance levels, creating opportunities for both bulls and bears in the weeks ahead. That being said, Rocky White warns that traders may want to brace for more short-term losses in the immediate future, as the days leading up to the unofficial start of summer tend to be trying for the market. In fact, as Bernie Schaeffer observes, the VIX last week ventured into potentially dangerous territory, if recent history is any guide.

Finally, we wrap up with a look at the key events scheduled for this week -- including the Commerce Department's first-quarter GDP revision -- as well as a few sectors of note.

Notes from the Trading Desk: Stocks Still Churning Around Familiar Technical Levels
By Todd Salamone, Senior VP of Research

"...bulls would like to see the MID and RUT quickly rally back above resistance at 1,000 and 850, respectively, as it is important that small- and mid-cap stocks regain their leadership role. But with some investor polls showing optimism as these indexes struggle to overtake important technical levels, it isn't a slam-dunk that these sectors regain their leadership... The broad market is vulnerable to trading in a range during the next few weeks."
-- Monday Morning Outlook, May 7, 2011

After the S&P 500 Index (SPX - 1,333.27) rallied 5% from its mid-April lows into May, we have indeed entered a period of choppiness, as the first-quarter earnings season winds down and worries about European sovereign debt and Fed policy take center stage. Since we mentioned the heightened possibility of a trading range two weeks ago, the SPX quickly hit a calendar-year high, retreated, and has since bounced around key support and resistance areas. The index is down a grand total of seven points during this stretch of time.


Throughout this range-bound period, the SPX has found support at its 80-day moving average, which is currently situated at 1,320. This trendline marked a low in mid-April, and once again earlier this week. Moreover, the March 2009 "double-low" in the 1,333 area has proven to be supportive on various occasions during the past couple of weeks, and this is exactly where the SPX is situated ahead of next week's trading.

Disturbing for bulls is the series of lower highs put in during this month, as a trendline drawn through various peaks rests in the 1,340 area -- which is also the site of the February peak that preceded a month-long, 6%-plus correction earlier this year. Also, the inverse "head and shoulders" breakout that occurred last month has so far failed to produce meaningful follow-through gains, and it is quite possible that some of the weaker hands who may have jumped into the market on this bullish technical pattern will have to be flushed out before stocks can gain traction again.

The bears, meanwhile, are fighting a series of higher lows in place since mid-March. In order for this pattern to continue, the SPX must hold support in the 1,320 area. If we see a fourth straight week of declines this week, a failure at 1,320 could set the table for a quick move down to the March calendar-year lows in the 1,250 area.


As we mentioned a couple of weeks ago and discussed as far back as late March, small-cap equities, as represented by the Russell 2000 Index (RUT - 829.06), and mid-cap stocks, as measured by the S&P 400 MidCap Index (MID - 986.83), are encountering extremely important resistance levels. Therefore, it's not a huge surprise that the broader market has struggled to make meaningful headway as these key indexes continue to negotiate significant technical resistance.

The RUT, for example, has experienced a few closes north of its 2007 all-time high in the 850 area, but has been unable to sustain a meaningful move above this milestone. Simultaneously, the MID has struggled to overtake the 1,000 millennium mark, after first testing this level in early April.


Speaking of noteworthy technical areas, Bernie Schaeffer points out that the CBOE Market Volatility Index (VIX - 17.43) closed last Thursday at 15.52 -- just south of the 16 level. "It is pretty safe to say that nothing much good has come in the period immediately after a close by the VIX below 16," he cautions. "There were a cluster of such occurrences ahead of the May 2010 flash crash," as well as the market corrections in March and May 2011.

While the long-term technical backdrop is still firmly bullish, the short-term technical backdrop is more ambiguous at the moment. It certainly appears that something's got to give in the weeks ahead. Seasonal factors favor the bears, as Rocky notes in his commentary on the next page, but the sentiment backdrop indicates that investors are beginning to get discouraged, which oftentimes signals the beginning of a rally after extremes are met.

For example: There was another week of outflows from domestic equity funds, and the percentage of bulls in the most recent American Association of Individual Investors (AAII) weekly sentiment survey dropped to 26.7% -- the lowest reading since Aug. 26, 2010, when stocks put in a significant bottom. Moreover, equity put buying relative to call buying on the major options exchanges is at its highest level since July 6, 2010, which marked another short-term low.

Hedge funds, as far as we can tell through our analysis of put option activity on the broad-based exchange-traded funds, are showing a willingness to step up and buy on declines. However, these deep-pocketed players also seem hesitant to feed rallies once the aforementioned technical resistance levels are approached.

More choppiness could be in store, but we would keep an eye out for opportunities on both the bull and bear side. The recent pullback in gold and silver appears attractive for potential long plays, while the big banking stocks, far from living up to heightened investor expectations heading into 2011, look to be attractive shorts.

Indicator of the Week: Memorial Day Seasonality
By Rocky White, Senior Quantitative Analyst

Foreword: We're heading toward the end of May, and that means Memorial Day is approaching. We can look forward to honoring our troops, cookouts, and summertime -- but can we look forward to what the market has in store for us? Let's take a closer look at Memorial Day seasonality to see what traders can expect in the coming weeks.

Weeks Surrounding Memorial Day: Below is a table showing how the S&P 500 Index (SPX) has performed around Memorial Day since 2000 -- and the index hasn't fared too well in the week leading up to the holiday. The week prior to Memorial Day has typically been negative, averaging a loss of 0.49%. The week following Memorial Day, however, has done a decent job of bringing the market back. The holiday-shortened four-day week has been very strong in recent history, netting a gain 64% of the time with an average return of 1.15%. In fact, Memorial Day weeks are significantly stronger than typical weeks.

Week Before and After Memorial Day


So we know this upcoming week tends to be bearish, but below is a table that breaks down exactly how the week before Memorial Day progresses, day by day. Apparently, the only session we can look forward to is Thursday, which has been the strongest day out of the pre-holiday week. All other days have averaged negative returns since 2000, including Monday -- despite it being positive more often than not. Tuesday has seen the fewest positive returns (27%), while Friday has averaged the steepest loss (-0.37%).

Week Before Memorial Day Breakdown


Another Bearish Aspect: Another factor weighing on the next five days is that we're entering the first week of a new options expiration cycle, which tend to be bearish. One theory maintains that those buying portfolio insurance tend to purchase a lot of puts early in the cycle, which creates a headwind for the market. The table below goes back to 2006, and it shows the first week in the cycle has been positive only 45% of the time.

SPX Start of Expiration Cycle Returns


In short, the historical data above would suggest some weakness coming up this week. While the next week -- Memorial Day week -- has been quite bullish, it also marks the beginning of June. Over the past 10 years, June has been the worst-performing month for the SPX.

This Week's Key Events: First-Quarter GDP Revision Set to Hit the Street
Schaeffer's Editorial Staff

Here is a brief list of some of the key events this week. All earnings dates listed below are tentative and subject to change. Please check with each company's respective website for official reporting dates.

Monday
* The economic calendar is bare on Monday. On the earnings front, we'll hear from Campbell Soup Co. (CPB), GT Solar (SOLR), Perfect World (PWRD), and Verigy Ltd. (VRGY).

Tuesday
* Tuesday brings us the Commerce Department's report on new home sales for April, as well as the Richmond Fed's manufacturing index for May. Earnings reports are due out from Applied Materials (AMAT), AutoZone (AZO), Medtronic (MDT), Take-Two Interactive Software (TTWO), and TiVo (TIVO).

Wednesday
* As usual, we'll hear the weekly update on domestic petroleum inventories on Wednesday. The day's docket also features durable goods orders for April and the Federal Housing Finance Agency's home price index for March. Meanwhile, American Eagle Outfitters (AEO), Costco Wholesale (COST), Hormel Foods (HRL), NetApp (NTAP), and Toll Brothers (TOL) are expected to report earnings.

Thursday
* On Thursday, the Commerce Department will issue its first-quarter gross domestic product (GDP) revision, while the Labor Department will release the latest data on weekly jobless claims. Also on tap is the Kansas City Fed's manufacturing index for May. The earnings calendar brings us the latest quarterly results from Big Lots (BIG), H.J. Heinz (HNZ), Marvell Technology (MRVL), OmniVision Technologies (OVTI), and Tiffany & Co. (TIF).

Friday
* The economic calendar wraps up on Friday with reports on personal incomes and spending, pending home sales for April, and the final Reuters/University of Michigan consumer sentiment index for May. Mentor Graphics (MENT) and SeaDrill Limited (SDRL) round out the week's slate of earnings reports.


[NOTE: I am adding this this week because it is a tech comment.]
Sector
Mid-Cap Tech
Bullish

Outlook: The tech sector came on strong during first-quarter earnings season, with companies both big and small showing surprising resilience, given the rampant anxiety about potential Japan-related supply disruptions. The PowerShares QQQ Trust (QQQ) now sports a year-to-date gain of 6.9%, besting the 6.0% rise collected by the S&P 500 Index (SPX) during the same time frame. Plus, the 50-day buy-to-open put/call volume ratio for QQQ is on the upswing, implying that hedged players are actively buying tech shares. However, we would advise against playing the outsized, over-loved names within the group, such as Microsoft (MSFT), Cisco Systems (CSCO), or Research In Motion Limited (RIMM). Instead, we recommend seeking out mid-cap stocks that combine positive price action with a skeptically slanted sentiment backdrop. One such example is Ciena Corp. (CIEN), which has gained about 24.5% for the year -- but a lofty 29% of its float is sold short. Likewise, Red Hat (RHT) has outperformed the SPX by 9.3 percentage points over the past 60 sessions, yet the shares have been targeted by speculative put buyers at an accelerated pace in recent weeks. From a contrarian perspective, this lingering negative sentiment represents pent-up buying pressure, which could unwind to propel these stocks higher as the technical strength continues.
icon url

ReturntoSender

05/25/11 12:16 AM

#9362 RE: ReturntoSender #6755

From Briefing.com: 4:30 pm : Stocks ended the day with modest losses after a half-hearted attempt to rebound from the prior session's drop failed in the early going. The decline keeps stocks at monthly lows.

Traders showed some buying interest this morning as markets abroad steadied and the dollar drifted lower. However, their lack of conviction quickly became apparent when they failed to defend early gains as stocks began to lose direction and then drift lower.

Most of the major sectors muddled along in mixed fashion, but weakness among tech stocks (-0.4%) weighed on the Nasdaq, which consistently underperformed its counterparts.

In contrast, energy stocks sported strong gains for the entire session. As a group, they settled with a 1.3% gain. Part of the sector's strength was owed to a near 2% gain by crude oil prices, which closed pit trade just a penny shy of $99.60 per barrel. Oil's gain came amid bullish analyst calls for the price of oil.

Corporate news flow was lacking and economic data was limited to April new home sales, which improved to an annualized rate of 323,000 units from a pace of 301,000 units in the prior month. On average, economists polled by Briefing.com had expected the rate to remain near the March pace. Homebuilders initially had a positive reaction to the data, but ultimately retreated. That left the SPDR S&P Homebuilders ETF (XHB 18.12, -0.08) to settle with a loss.

Advancing Sectors: Energy (+1.3%), Materials (+0.5%), Telecom (+0.5%)
Declining Sectors: Consumer Staples (-0.1%), Financials (-0.2%), Utilities (-0.2%), Health Care (-0.3%), Tech (-0.4%), Consumer Discretionary (-0.5%), Industrials (-0.6%)DJ30 -25.05 NASDAQ -12.74 NQ100 -0.6% R2K -0.5% SP400 -0.3% SP500 -1.09 NASDAQ Adv/Vol/Dec 1014/1.88 bln/1565 NYSE Adv/Vol/Dec 1381/865 mln/1604

5:08PM HEICO beats by $0.03, beats on revs (HEI) 49.77 0.69 : Reports Q2 (Apr) earnings of $0.40 per share, $0.03 better than the Thomson Reuters consensus of $0.37; revenues rose 20.0% year/year to $184.5 mln vs the $176 mln consensus. Co expects FY11 cash flow provided by operating activities to remain at a high level and to ~$95-100 mln. Capital expenditures in fiscal 2011 are anticipated to ~$10-12 mln.

4:32PM KEMET announced the public secondary offering of 7.0 million shares of its common stock by selling shareholders (KEM) 15.05 -0.88 : The shares to be offered are subject to issuance upon exercise of a currently outstanding and exercisable warrant held by the selling securityholder, a portion of which will be sold to and exercised by Deutsche Bank Securities, the underwriter in connection with its sale of the underlying shares.

4:11PM Applied Materials beats by $0.01, beats on revs; guides Q3 EPS in-line, revs below consensus (AMAT) 13.71 -0.08 : Reports Q2 (Apr) earnings of $0.38 per share, excluding non-recurring items, $0.01 better than the Thomson Reuters consensus of $0.37; revenues rose 24.7% year/year to $2.86 bln vs the $2.77 bln consensus. Co issues guidance for Q3, sees EPS of $0.31-0.37, excluding non-recurring items, vs. $0.37 Thomson Reuters consensus; sees Q3 revs falling 3-10% sequentially, which calculates to ~$2.57-2.78 vs. $2.79 bln Thomson Reuters consensus.

4:09PM Sanmina-SCI announces the final results for its previously announced tender offer and consent solicitation (SANM) 10.33 -0.18 : As previously announced, on May 10, 2011, the Company accepted for payment $279,340,000 in aggregate principal amount of its 2013 Notes validly tendered as of the Early Tender and Consent Deadline and made payment to The Depository Trust Company therefor. On May 11, 2011, the Company called the remainder of the outstanding 2013 Notes for redemption on June 10, 2011.

10:06AM Microsoft previews next release of Windows Phone (MSFT) 24.13 -0.04 : The co has previewed the next major release of Windows Phone "Mango" which will deliver more than 500 new features. The "Mango" release will be available for free to Windows Phone 7 customers and is scheduled to ship on new phones beginning this fall.

QLogic (QLGC) announced that its 8200 Series 10GbE converged network adapters are now offered within a broad range of Dell PowerEdge blade servers.

AMD (AMD) introduced the newest generation of professional graphics cards, the AMD FirePro V5900 and AMD FirePro V7900, more than doubling performance of competitive offerings in key professional market applications.

09:40 am SOLR Guides FY12 Above Consensus (SOLR)

GT Solar (SOLR $12.90 +01.28) reported fourth quarter earnings of $0.41 per share, $0.07 better than the Thomson Reuters consensus of $0.34.

Revenues rose 39.2% year/year to $271 million versus the $223.7 million consensus.

Operating margin for the fourth quarter of fiscal 2011 was 30.5 percent of revenue, compared to 36.1 percent of revenue in the third quarter of fiscal 2011 and 28.4 percent in the fourth quarter of fiscal 2010. Operating margin for fiscal 2011 was 30.4 percent, compared with 26.5 percent in fiscal 2010.

For its fiscal year 2012, the company issued earnings guidance of $1.55 to $1.85 versus the $1.45 Thomson Reuters consensus and expects revenues of $1.0 billion to $1.1 billion versus the $966.41 million Thomson Reuters consensus.

"GT's overall business outlook remains strong. We booked over $230 million of new business in the fourth quarter, bringing total net bookings for the year to over $1.1 billion and our backlog as of April 2nd to approximately $1.2 billion. The healthy pace of business has continued into the new fiscal year with an additional $722 million of orders booked so far in the first quarter of fiscal year 2012. "The strength of our balance sheet enables us to significantly increase our investment in a continued flow of new products and additional strategic opportunities. Combined with our strong backlog and continued bookings momentum, this positions GT very well for the foreseeable future."
icon url

ReturntoSender

05/26/11 11:38 PM

#9364 RE: ReturntoSender #6755

From Briefing.com: 4:30 pm : Performances among the major equity averages varied today. Data were generally disappointing.

Stocks traded near the neutral line in the early going. The tepid tone came amid mixed action abroad and news that the second estimate of first quarter GDP showed growth of 1.8%, which is unchanged from the advance reading, but less than the 2.0% growth rate that had been expected among economists surveyed by Briefing.com.

Initial jobless claims for the week ended May 21 totaled 424,000. Not only is that up by 10,000 from the prior week, but it exceeds the 400,000 initial claims that had been widely expected.

The dollar was down markedly this morning, but that didn't seem to matter too much to traders in the wake of the data. The greenback pared its loss as the session progressed, but it was still down 0.5% against a basket of competing currencies at the close of trade.

After struggling to find direction for the first couple of hours, stocks began a gradual climb higher. Microsoft (MSFT 24.67, +0.48) and NetApp (NTAP 55.31, +3.58) led the tech-rich Nasdaq. Shares of MSFT were helped by favorable comments about the stock from hedge fund manager David Einhorn while NTAP was aided by a satisfactory quarterly report.

The S&P 500 managed to make a modest advance with help from consumer discretionary stocks (+0.8%) after Tiffany & Co. (TIF 76.04, +6.00) and Guess? (GES 44.57, +4.47) reported impressive quarterly results. Other retailers shared in their strength, such that the SPDR S&P Retail ETF (XRT 53.23, +0.87) ascended to a weekly high.

The Dow ended the day at the unchanged mark. Despite strength in MSFT shares, other blue chips traded in mixed fashion.

Small-cap stocks outperformed again. For the second straight session their strength has sent the Russell 2000 to a gain in excess of 1%.

Share volume remains sluggish. The anemic pace will most likely continue tomorrow since many traders will take off early to get a jump on the long, Memorial Day weekend.

Treasuries attracted strong support and closed near session highs. The climb sent the yield on the benchmark 10-year Note down to 3.06%, which makes for a new 2011 low. Gains were helped along in the wake of an auction of 7-year Notes that drew a bid-to-cover of 3.20, dollar demand of $94.0 billion -- the highest since early 2010 -- and an indirect bidder participation rate of 47.6%.

Advancing Sectors: Consumer Discretionary (+0.8%), Tech (+0.6%), Telecom (+0.6%), Energy (+0.5%), Financials (+0.5%), Industrials (+0.4%), Materials (+0.2%), Consumer Staples (+0.2%)
Declining Sectors: Health Care (-0.1%), Utilities (-0.1%)DJ30 +8.10 NASDAQ +21.54 NQ100 +0.7% R2K +1.2% SP400 +0.9% SP500 +5.22 NASDAQ Adv/Vol/Dec 1830/1.92 bln/712 NYSE Adv/Vol/Dec 2154/861 mln/846

4:40PM Advanced Analogic Tech to be bought by Skyworks (SWKS) for a nominal price of $6.13 per share (AATI) 3.90 +0.06 : Skyworks Solutions (SWKS) signed a definitive agreement to purchase Advanced Analogic Technologies Incorporated (AATI). This acquisition expands Skyworks' portfolio with highly complementary analog semiconductor products including battery chargers, DC/DC converters, voltage regulators and LED drivers. The analog power management market is expected to grow to $12.1 billion in 2014, up from $9.9 billion in 2010 according to Gartner market. Skyworks has entered into a definitive agreement to acquire Advanced Analogic Technologies for a nominal price of $6.13 per share, representing a 52 percent premium to AATI's 30-day trailing average. The $6.13 nominal share price consists of $3.68 per share in cash and .08725 of a share of Skyworks common stock for each outstanding share of Advanced Analogic Technologies common stock

4:24PM OmniVision beats by $0.01, beats on revs; guides Q1 (Jul) EPS in-line, revs in-line (OVTI) 36.42 +0.22 : Reports Q4 (Apr) earnings of $0.66 per share, $0.01 better than the Thomson Reuters consensus of $0.65. Co issues in-line guidance for Q1 (Jul), sees EPS of 0.64-0.77 vs. $0.69 Thomson Reuters consensus; sees Q1 (Jul) revs of 265-285 vs. $277.22 mln Thomson Reuters consensus.

4:15PM LDK Solar signed a module supply contract with a leading Italy-based solar systems integrator (LDK) 6.58 +0.40 : Co announced that it has signed a module supply contract with a leading Italy-based solar systems integrator. Under the terms of the agreement, LDK Solar will provide 45 megawatts (MW) of solar modules with monthly shipping expected to commence in June 2011.

4:05PM Marvell misses by $0.01, misses on revs (MRVL) 14.58 +0.41 : Reports Q1 (Apr) earnings of $0.29 per share, $0.01 worse than the Thomson Reuters consensus of $0.30; revenues fell 6.3% year/year to $802 mln vs the $825.6 mln consensus. Co reports Q1 non-GAAP gross margins of 58.5% vs 59% consensus. "The results for our first quarter reflected the typical seasonality of our consumer centric end markets... Even at this low point in the revenue cycle, we were an industry leader in profitability for both operating and cash flow margins, demonstrating the strength of our long-term business model. We remain confident that the investments we are making such as in TD-SCDMA and SSD will result in improved results throughout the year."

1:06PM Suntech Power announced strategic partnership for supply of up to 190MW of solar panels to solarhybrid in 2011 (STP) 7.65 +0.24 : Under the terms outlined in the agreement, Suntech will become solarhybrid's partner and will supply solar panels for the majority of solarhybrid's German project pipeline in 2011. Five solar power plants, which solarhybrid is developing in Germany, will be equipped with 172MW of Suntech solar panels. Two additional projects that solarhybrid is currently developing in Italy (10MW) and Slovakia (6MW) will also be powered by Suntech solar panels.

Broadcom (BRCM) announced in an 8K that as previously disclosed, the remaining defendants in the federal consolidated derivative action captioned In Re Broadcom Corporation Derivative Litigation, Case No. CV-06-3252-R entered into a settlement. On May 23, 2011, the United States District Court for the Central District of California entered an order granting final approval of the settlement.

Micron Technology (MU) announced that early engineering samples are available for its third-generation reduced latency DRAM.

TSMC (TSM) announced that 28nm support within the Open Innovation Platform design infrastructure is fully delivered, as demonstrated by 89 new 28nm designs scheduled to tapeout.

11:49 am NTAP Guides Q1 Above Consensus (NTAP)

NetApp (NTAP $55.54 +3.81) reported fourth quarter earnings of $0.59 per share, excluding non-recurring items, $0.06 better than the Thomson Reuters consensus of $0.53.

Revenues rose 21.8% year/year to $1.43 billion versus the $1.39 billion consensus.

For the first quarter, the company Co issues upside guidance for Q1, sees EPS of $0.52-0.57, excluding non-recurring items, versus $0.50 Thomson Reuters consensus; sees first quarter revenue of +26-34% year/year, which calculates to approx. $1.43 billion to $1.52 billion versus $1.4 billion Thomson Reuters consensus.

"NetApp delivered 30% revenue growth, 38% growth in cash from operations and over $1B in non-GAAP operating profit during fiscal 2011. We achieved the largest market share gains in our history and closed a record number of million dollar deals, demonstrating our momentum in the market as enterprise customers increasingly choose NetApp as their vendor of choice for storage virtualization and cloud deployments."
icon url

ReturntoSender

05/31/11 11:27 PM

#9367 RE: ReturntoSender #6755

From Briefing.com: 4:10 pm : The major market averages ended with solid gains, finishing at their best levels of the session. Early strength was attributed to news of Germany leading a second bailout for Greece. Overseas strength continued into the U.S. session with markets opening higher by more than 1.0%. Shares were knocked off their opening levels after disappointing Chicago PMI, and Consumer Confidence numbers were released, but rallied to their best levels in the final 30 minutes of trading.

Energy stocks were among the early leaders, but struggled over the course of the session before rallying into the close. As a whole, the S&P 500 Energy Index gained 1.0% to finish on pace with the broader market. Massey Energy (MEE 65.98, +1.96) was one of the best performing stocks in the space all session long.

Financials also saw a quick start, and finished on par with the S&P 500. Franklin Resources (BEN 129.60, +2.84) outperformed the sector after receiving a broker upgrade. Goldman Sachs (GS 140.66, +2.07) was one of the best performing stocks in the sector early on after receiving a buy recommendation, but faded as the day wore on. Shares of American International Group (AIG 28.50, -0.38) continue to underperform following last week's re-IPO.

Conglomerate Siemens (SI 133.85, +5.66) added 4.4% after Germany announced it would cease the use of all nuclear energy by 2022. The company saw gains because the news was beneficial to its wind turbine business. Alternative energy names such as First Solar (FSLR 124.25, +2.88) also traded higher.

Industrials were among the best performing sectors today thanks in part to a 4.2% gain by General Dynamics (GD 74.24, +2.98). The stock saw gains in pre-market trade after receiving a broker upgrade, and then moved to its best levels of the day after the company announced it had won a $744 mln contract to build landing strips for the U.S. Navy. An option can increase the contract value to $1.3 billion.

Treasuries spent the overnight session holding small losses, but turned positive following the disappointing S&P/Case Shiller 20-city Index reading, and continued moving higher after poor Chicago PMI and Consumer Confidence numbers. Buying pushed the 10-yr yield to 3.04%, its lowest level since early December while the 2-10-yr spread tightened to almost 258.

The dollar index spent the entire session in negative territory, trading in a tight range between 74.60 and 74.70 for most of the day. After hitting a session high of 1.4424 the euro will end the day with a gain of close to 100 pips at 1.4390. Dollar/yen saw some heavy selling off this morning's highs, but regained most of the sell off, ending higher by 55 pips near 81.50.

Economic data is heavy tomorrow with the MBA Mortgage Index (7 a.m. ET), Challenger Job Cuts (7:30 a.m. ET), ADP Employment Change (8:15 a.m. ET), ISM Index (10 a.m. ET), Construction Spending (10 a.m. ET), and Auto/Truck Sales (3 p.m. ET).DJ30 +128.21 NASDAQ +38.44 SP500 +14.10 NASDAQ Adv/Vol/Dec 1817/1.79 bln/785 NYSE Adv/Vol/Dec 2269/698.7 mln/755

O2Micro International (OIIM) was issued 12 claims under United States patent number 7,936,151 for its Battery State Monitoring circuitry; a continuation of the invention issued July 2010 under United States patent number 7,683,577.

* Veeco Instruments (VECO) announced that Taiwan based Genesis Photonics Inc. has placed a multi-unit order for Veeco's recently released TurboDisc MaxBright Multi-reactor MOCVD System.

8:13AM Nokia lowers Devices & Services second quarter 2011 outlook and updates full year 2011 outlook (NOK) 8.20 : Co now expects Devices & Services net sales to be substantially below its previously expected range of EUR 6.1-6.6 billion for the second quarter 2011. This update is primarily due to lower than previously expected average selling prices and mobile device volumes. Co now expects Devices & Services non-IFRS operating margin to be substantially below its previously expected range of 6% to 9% for the second quarter 2011. This update is primarily due to lower than previously expected net sales. While visibility is very limited, Nokia's current view is that second quarter 2011 Devices & Services non-IFRS operating margin could be around breakeven... Given the unexpected change in our outlook for the second quarter, Nokia believes it is no longer appropriate to provide annual targets for 2011. However, Nokia expects to continue to provide short-term quarterly forecasts in its interim reports as well as annual targets when circumstances allow it to do so... Nokia remains pleased with its progress on its Windows Phone strategy, and has increased confidence that the first Nokia product with Windows Phone will ship in the fourth quarter 2011.

NVIDIA (NVDA) announced a new addition to the NVIDIA 3D Vision product family: NVIDIA 3D Vision wired glasses. GAZ Group, part of Oleg Deripaska's Basic Element, and Terex (TEX) announced they have entered into an agreement to form a joint venture company for the manufacture of construction and roadbuilding equipment in Russia.

Western Digital (WDC) said it was informed by the European Commission that the EC would enter a Phase II review of WD's previously announced acquisition of Hitachi Global Storage Technologies' holding company, Viviti Technologies, a wholly owned subsidiary of Hitachi (HIT). The company is co-operating fully with the EC in the Phase II review.

# The first device in Freescale Semiconductor's (FSL) MC1323x family optimized for consumer applications using ZigBee RF4CE technology is now available in production quantities.

# Silicon Image (SIMG) announced its upcoming third-generation WirelessHD 60GHz chipsets, the SiI6300 family consisting of the SiI6320 HRTX Network Processor, SiI6321 HRRX Network Processor and SiI6310 HRTR RF Transceiver.

1:05AM Nam Tai Electronics provides Further Update on the Impact From Natural Disasters in Japan on co's Business; expects minimal impact on Q2 or FY reusults (NTE) 5.93 : Co updates its assessment of the impact on the Company's business from the Tohoku earthquake and tsunami. Mgmt has recently again reviewed the situation and announces that various actions taken by suppliers, customers, and the co appear to have successfully mitigated the effects of any supply chain interruptions or component shortages resulting from the earthquake. Therefore, at this time mgmt anticipates minimal unfavorable impact on second quarter financial performance and no significant impact on year 2011.

07:17 am NVIDIA resumed with a Buy at Auriga; tgt raised to $24: . Auriga resumes coverage of NVDA with a Buy from Hold and raises their tgt to $24 from $19 saying they see potential for strong growth in Tegra, which may more than offset its flattish GPU business. Firm says their analysis leads them to conclude that Tegra remains at an early phase of growth and could reach $3 bln per year by 2016 by leveraging sharp growth in Android/Windows tablets and also by increasing its market share in mid- to high-end smart phones.

11:39 am S&P 500 Tech Sector +0.7%; BRCM, NVDA, NVTL, TZOO Upgraded

The tech sector is trading up +0.70% today, slightly under performing the S&P 500 +0.6%. Semiconductors are showing relative strength in the tech space, +1% so far. A few solar names FSLR +1.9% and WFR +3.5% are up today following Germany's annoucement they will discontinue using all nuclear energy by 2022.

In earnings Kingston Wirelessinfo (KONE) -33% following lowered guidance, Nokia (NOK) -17% lowered their outlook for their Devices and Services segment, RADA -3.3% after reporting Q1 results. ELTK is up 35% following Q1 earnings.

In news, Agilysys (AGYS) +33.3% after announcing sale of Tech solutions group to OnX Enterprise solutions, MAGS +8% following announced $35.5 mln contract, Funtalk China (FTLK) +13% being acquired for $7.20/share, Nam Tai (NTE) +3.2% expects minimal impact on Q2 and FY results from Japan's natural disaster, GIB +2% following announced $45 mln contract award, PWRD -2.7% after announcing it would acquire Cryptic Studios for EUR35 mln, AVGO -4% after announcing sale of 25 mln shares by selling shareholders.

Among the more notable analyst upgrades this morning, BRCM -2.2% upgraded at BMO Capital, EBAY +1.5% upgraded at ThinkEquity, NVDA +1.4% resumed with a Buy at Auriga, FIRE +5.3% initiated with a Buy at Citigroup, NVTL +5.6% upgraded at JP Morgan, TZOO +10.2% upgraded at Morgan Keegan.

09:52 am NOK Lowers Devices and Services Outlook for Q2 (NOK)

Nokia (NOK $7.10 -1.10) now expects Devices & Services net sales to be substantially below its previously expected range of EUR 6.1 billion to EUR6.6 billion for the second quarter 2011.

This update is primarily due to lower than previously expected average selling prices and mobile device volumes. Co now expects Devices & Services non-IFRS operating margin to be substantially below its previously expected range of 6% to 9% for the second quarter 2011. This update is primarily due to lower than previously expected net sales.

While visibility is very limited, Nokia's current view is that second quarter 2011 Devices & Services non-IFRS operating margin could be around breakeven... Given the unexpected change in our outlook for the second quarter, Nokia believes it is no longer appropriate to provide annual targets for 2011. However, Nokia expects to continue to provide short-term quarterly forecasts in its interim reports as well as annual targets when circumstances allow it to do so.

Nokia remains pleased with its progress on its Windows Phone strategy, and has increased confidence that the first Nokia product with Windows Phone will ship in the fourth quarter 2011.
icon url

ReturntoSender

06/01/11 9:27 PM

#9368 RE: ReturntoSender #6755

From Briefing.com: 4:15 pm : The major market averages finished near their worst levels of the session, with all three losing close to 2.3%. Equities were knocked lower following this morning's disappointing data as both the ADP Employment report and ISM Index fell short of expectations. Selling continued over the course of the session with stocks moving to their worst levels of the day following a late downgrade of Greek debt by Moody's. The rating agency announced it was dropping the rating of Greek debt to Caa1 from B1, and assigned a negative outlook.

The euro slipped to its worst levels of the day following the Greek downgrade, and ended the U.S. session down 70 pips to near 1.4325.

Treasuries were a favorite among market players as buying across the complex ran maturities to their best levels since early December. Today's rally dropped the 10-yr yield below 3.00% for the first time since December 6, and when it was all said and done the benchmark yield ended at 2.966%. As traders moved more aggressively into the longer dated paper the 2-10-yr spread flattened to 251.1.

Financial shares lagged the broader market, and were the worst performing sector within the S&P 500. As a whole the group lost 3.5% with heavyweights Wells Fargo (WFC 26.94, -1.43) and Bank of America (BAC 11.24, -0.50) under pressure all session long. Regional banks Sun Trust Banks (STI 26.32, -1.81) and Regions Financial (RF 6.54, -0.52) also saw heavy losses.

Microsoft (MSFT 24.43, -0.58) was back in the headlines today on reports that the company was set to purchase the phone business of Nokia (NOK 6.69, -0.33) for $19 billion. The report by technology blog Boy Genius was later denied by a Nokia spokesperson who said it was "100% baseless." Nonetheless, both stocks saw heavy volume on the session.

Gold miners were among the best performing stocks for most of the session as the yellow metal climbed above $1550 per ounce earlier this morning. A sell off in precious metals following the pit close pushed most of the miners into negative territory. Large miners like Barrick Gold (ABX 47.28, -0.48) and Newmont Mining (NEM 55.67, -0.90) underperformed some of the smaller ones like Agnico-Eagle Mines (AEM 64.32, -0.38) and Kinross Gold (KGC 15.75, +0.03).

Utilities outperformed the broader market, posting a loss of 1.1% for the day. None of the stocks in the S&P 500 Utilities Index closed in positive territory. Other "defensive" sectors outperformed with health care and telecom each losing 1.4%.

Data scheduled for an 8:30 a.m. ET release tomorrow includes initial and continuing claims, productivity, and unit labor costs while factory orders will be released at 10 a.m. ET.DJ30 -279.65 NASDAQ -66.11 SP500 -30.65 NASDAQ Adv/Vol/Dec 420/2.03 bln/2205 NYSE Adv/Vol/Dec 547/916.3 mln/2486

9:01AM Anadigics Announces Production Volume Shipments of New Multi-Band Power Amplifier to Qualcomm (ANAD) 3.27 : Co announces that it is shipping production volumes of its AWT6521 multi-mode power amplifier for the Qualcomm Gobi3000 module.

Qualcomm (QCOM) announced its 800MHz MSM7x27 mobile processor will be the first to enable Flash Player for the mass market segment of smartphones. In addition, Qualcomm will enable high-definition video playback of Flash-based content on mid-tier and higher end Snapdragon-powered smartphones and tablets.

# AMD (AMD) launched its 9-Series chipset line-up, helping PC builders to develop next generation high performance desktop platforms. The co also unveiled its 2011 HD Tablet Platform, based on the AMD Z-Series Accelerated Processing Unit, enabling vivid media display and content creation capabilities for the fast-growing market of Microsoft Windows-based tablets.

# HP (HPQ) unveiled a new suite of software to operationalize, measure and improve IT performance across the industry's broadest set of technology investments and asset classes.

1:21AM Micrel increases quarterly dividend by 14.3% to $0.04 per share; authorizes $30 mln share repurchase plan (MCRL) 11.77 :

11:20 am S&P 500 Tech Sector -0.8%; Top News Incl. AMSC, YHOO

The tech sector is trading lower today, but ahead of larger losses in the broader market. Semiconductors are showing relative weakness in the tech space, however, with the Philly Semi Index trading 1.1% lower. Among chips in the index, MU (-3.4%) is a notable laggard. Among other major indices, the S&P 500 is trading 1.1% lower while the NASDAQ is trading 0.8% lower. The QQQ, meanwhile, is trading 0.8% lower. Among tech bellwethers, AAPL (+0.3%) is showing continued strength, while HPQ (-1.6%) is under pressure.

In earnings last night, GAME (+4.6%) reported Q1 EPS in-line, but beat on revs. Also, NVLS (+1.0%) reaffirmed and narrowed EPS guidance at its mid qtr update.

In news last night, AMSC (-18.2%) announced that it would delay reporting Q4 and fiscal year end financial results and cut 10% of its workforce. This morning, YHOO (-2.8%) and Alibaba reached agreement.

Among the more notable analyst upgrades this morning, Hudson Square Research upgraded T (-0.5%) to Buy. In downgrades this morning, NOK (-0.3%) was downgraded at Goldman, WestLB, Bernstein, and Canaccord, SQNS (-9.4%) was downgraded to Hold at Needham, and VZ (-1.3%) was downgraded to Sell at Hudson Square.

No notable tech names are set to report results today after the close.

icon url

ReturntoSender

06/04/11 10:00 PM

#9369 RE: ReturntoSender #6755

From Briefing.com: Weekly Recap - Week ending 03-Jun-11The stock market tumbled 2.3% during the holiday-shortened week following weaker-than-expected job growth in the U.S. and continued concerns over Greece. Treasury yields tumbled and the dollar index declined.

All 10 sectors fell at least 1.0%. Cyclical sectors consumer discretionary (-3.2%), materials (-3.2%) and industrials (-3.1%) saw the biggest declines. The materials sector is now in negative territory for the year, joining the financial sector.

The bulk of this week's decline occurred Wednesday as stocks dropped 2.2%. Risky assets came under pressure following a disappointing private employment reading and a weaker-than-expected ISM manufacturing reading. While the overall ISM number is still indicative of expansion, the pace of change proved to be the upsetting factor.

Negative news regarding Greece pushed stocks even lower late in the day.

Moody's. Rating Service cut the rating of Greek debt to Caa1 from B1, and assigned a negative outlook, noting a high probability of default. Historically, sovereign debt that is downgraded to Caa1 or below typically defaults around 20% of the time within one year and 35% of the time within three years.

The May employment report marked the big economic item of the week. Total nonfarm payrolls rose just 54,000 (Briefing.com consensus +169,000) while private sector payrolls rose 83,000 (Briefing.com consensus +180,000). Both numbers were well below averages for the prior three months, which were 220,000 and 244,000 respectively.

The unemployment rate ticked up to 9.1% from 9.0% (Briefing.com consensus 9.0%); the average workweek held steady at 34.4 hours (Briefing.com consensus 34.3); and average hourly earnings increased 0.3% (Briefing.com consensus +0.2%). The latter was the most welcome surprise, yet the enthusiasm for the result is mitigated by the understanding that average hourly earnings over the last 12 months are up 1.8%, meaning they are negative on an inflation-adjusted basis.

The long-term unemployed (i.e., those workers unemployed 27 weeks or more) now account for 45.1% of the unemployed versus 43.1% in April.

Payroll gains in May were confined mostly to professional and business services and health care. Government shed 29,000 workers, most at the local level and concentrated in the education sector.

The positive is that there is still job growth, yet the prevailing negative today is that the job growth isn't strong enough to bring down the unemployment rate and it isn't strong enough to lift consumer confidence and consumer spending by a meaningful degree. Ironically, the latter understanding is a key reason why businesses are reluctant to hire in aggressive fashion.

The defensive posturing was evident in Treasuries, which were a favorite among market players as buying across the complex ran maturities to their best levels since early December. The 10-year yield dropped below 3.00% for the first time since December 6, and when it was all said and done the benchmark yield ended at 2.99%.
 
Index Started Week Ended Week Change % Change YTD %
DJIA 12441.58 12151.20 -290.38 -2.3 5.0
Nasdaq 2796.86 2732.78 -64.08 -2.3 3.0
S&P 500 1331.10 1300.16 -30.94 -2.3 3.4
Russell 2000 836.26 808.13 -28.13 -3.4 3.1

STMicroelectronics (STM) introduced the first member of a family of power transistors that are fully qualified for use in electronic subsystems on board satellites and launchers.

1:32 pm S&P 500 Tech Sector -0.8%; CSCO for RIMM Rumors Circulate

The tech sector is trading lower today along with losses in the broader market. Semiconductors are showing in-line weakness in the tech space with the Philly Semi Index trading 0.7% lower. Among chips in the index, Advanced Micro Devices (AMD -1.9%) is a notable laggard. Among other major indices, the S&P 500 is trading 0.5% lower while the NASDAQ is trading 0.7% lower. The QQQ, meanwhile, is trading 0.8% lower. Among tech bellwethers, T (-0.9%) and VZ (-0.9%) are under pressure.

In earnings last night, VeriFone Systems (PAY -1.6%) reported a Q2 beat and a Q3 raise with in-line FY11 guidance. Also last night, Altera Corp (ALTR -1.5%) reaffirmed Q2 sales guidance.

In news, American Tower (AMT -4.7%) received a subpoena from the SEC requesting certain documents from 2007 through the present, including in particular documents related to the company's tax accounting and reporting.

In rumors, we are hearing Cisco Systems (CSCO -0.8%) for Research in Motion (RIMM -1.2%) takeover chatter making the rounds.

Among the more notable analyst upgrades this morning, Sterne Agee upgraded Avago Technologies (AVGO +0.9%) to Buy, Netgear (NTGR +0.8%) was upgraded to Buy at Lazard, and Aruba Networks (ARUN +2.5%) was upgraded to Overweight at Barclays. In downgrades this morning, Shanda Interactive Entertainment (SNDA -0.9%) was downgraded to Underweight at HSBC Securities, Sterne Agee downgraded Skyworks (SWKS -4.9%) to Neutral, and Kenexa (KNXA -6.7%) was downgraded to Neutral at Longbow.
icon url

ReturntoSender

06/07/11 11:25 PM

#9374 RE: ReturntoSender #6755

From Briefing.com: 4:10 pm : Stocks finished on their session lows as Fed Chairman Bernanke's late day speech on his U.S. economic outlook pushed stocks to their worst levels of the day. In his speech, Mr. Bernanke restated the need for accommodative monetary policy. The Dow led today's decline, sliding 0.2% while the S&P shed 0.1%, and the Nasdaq finished with fractional losses.

Shares of International Paper (IP 29.78, +0.13) and Temple-Inland (TIN 29.49, +8.48) made headlines today after International Paper made a $30.60 per share bid for Temple-Inland following yesterday's close on Wall Street. The unsolicited bid was quickly rejected with Temple-Inland saying it "grossly undervalues" the company despite being a 46% premium to Monday's closing price. Other packaging/paper stocks such as Boise (BZ 7.89, +0.42) and Packaging Corp. of America (PKG 28.49, +1.66) saw a positive response to the news.

Materials finished as the best performing sector in the S&P 500, adding 0.3% for the day. Precious metals rebounded from their worst levels of the session and finished mixed at the close of pit trade with gold down $3.40 to $1543.80 and silver up $0.29 at $37.08. Gold miner Newmont Mining (NEM 52.94, -0.50) and silver miner Silver Wheaton (SLW 33.70, +0.05) finished down 0.9% and up 0.2% respectively.

Sprint (S 5.49, -0.11) was among today's biggest decliners early, but pared a good portion of its losses after being downgraded to sell from hold at Stifel Nicolaus. The reason for the downgrade is being attributed to Sprint's Network Vision and 4G strategy being more complicated, and potentially taking a lot more time and money than investors are currently anticipating. The stock closed lower by 2.0% on the news.

Despite a plethora of positive comments regarding yesterday's announcement of the iCloud, shares of Apple (AAPL 332.04, -6.00) finished among the worst performers in the technology space as they ended down close to 1.8%. The stock has been stuck in a range between $330 and $360 throughout most of 2011 and today's weakness brings the price within a couple dollars of the year's lower bound.

Treasuries finished the day at their best levels of the U.S. session as the solid $32 billion 3-yr note auction lifted maturities across the complex off their worst levels of the day. The 10-yr yield ended the U.S. session at 3.011% and eased just below 3.00% following Mr. Bernanke's speech.

The dollar index ended the day on its worst levels of the session, but was able to hold the 73.50 level. Traders remain focused on Thursday's Bank of England and European Central Bank interest rate decisions.

Tomorrow will see the release of the highly volatile MBA Mortgage Index at 7 a.m. ET, and the Fed's Beige Book at 2 p.m. ET. Watch for Treasury to issue $21 bln 10-yr notes in a reopening.DJ30 -19.15 NASDAQ -1.00 SP500 -1.23 NASDAQ Adv/Vol/Dec 1522/1.67 bln/1027 NYSE Adv/Vol/Dec 1803/741.8 mln/1159

3:30 pm : July crude oil settled a few cents above the unchanged mark at $99.09 per barrel, erasing all of its earlier losses. Reports earlier this morning indicated that Saudi Arabia would raise its production output by 500K regardless of the outcome of tomorrow's OPEC meeting. A separate report indicated that OPEC would hike production by as much as 1.5 mln bpd. Those reports caused prices to drop. Despite those reports, crude oil was able to recoup most of its losses to end right around unchanged. It was a quiet session for July natural gas, which closed flat on the day at $4.83 per MMBtu.

August gold ended lower by 0.2% to $1543.80 per ounce, while July silver ended up 0.8% to $37.08. Both metals sold off to their respective lows in morning trade. They spent the remainder of the session attempting to rebound off of those lows, with gold ending just shy of the flat line, while silver was able to close back in positive territory. DJ30 +47.00 NASDAQ +10.54 SP500 +5.79 NASDAQ Adv/Vol/Dec 1747/1.4 bln/818 NYSE Adv/Vol/Dec 2048/609.8 mln/905

5:30PM Freescale announces pricing of senior notes offering (FSL) 18.12 -0.12 : Co announced that Freescale Semiconductor, its wholly owned indirect subsidiary, priced its offering of $750 million aggregate principal amount of 8.05% senior unsecured notes due 2020 (the "Notes") at a discount to par of 98% in connection with its previously announced private offering. The closing of the private offering is expected to occur on June 10, 2011, subject to customary closing conditions.

5:07PM Sunpower on Conference Call (SPWRA) 20.95 +0.11 : Seeing 'substantial global' ASP pressure; expect this to remain in place for 2011; sees Q2 gross margins in the range of 15-17%, 17-19% for full year... evaluating additional moves to improve cost structure and take advantage of the roof top market... accelerating investment into residential; taking away from UPP business... believe supply has caught up to demand in solar industry; earlier ramp ups will provide co with an advantage... in discussions about monetize equipment currently in Italy; not able to provide timing but notes expectations are priced into the guidance... says in their downstream not seeing large 'chunks of inventory' but says that it is out there in the industry... says inventories have continued to decline; will improve inventory turns in Q3...

4:20PM LDK Solar beats by $0.09, reports revs in-line; guides Q2 revs below consensus (LDK) 7.10 +0.43 : Reports Q1 (Mar) earnings of $0.95 per share, $0.09 better than the Thomson Reuters consensus of $0.86; revenues fell 91.7% year/year to $766.3 mln vs the $769.5 mln consensus. Co issues downside guidance for Q2, sees Q2 revs of $710-760 mln vs. $771.68 mln Thomson Reuters consensus. wafer shipments between 500 MW and 550 MW, and module shipments between 200 MW and 220 MW, in-house polysilicon production between 2,650 MT and 2,750 MT, in-house cell production between 120 MW and 130 MW and gross margin between 22% and 26%.

4:16PM KLA-Tencor announced shipment of the first LMS IPRO5 reticle pattern placement metrology system (KLAC) 41.12 +0.56 :

4:16PM Trident Microsystems names Dr. Bami Bastani as CEO and President (TRID) 0.92 -0.01 : Co announced that Dr. Bami Bastani has been appointed Chief Executive Officer and President and has been elected to the Board of Directors. Bastani has more than 20 years of experience as a CEO and senior executive in the semiconductor industry. His appointment is effective immediately. Philippe Geyres, who has served as the company's interim CEO since January 2011, will continue in his role as a member of the Board of Directors.

4:11PM Sunpower issues mixed guidance; citing Italian solar policy this year have had a significant impact on the global solar market (SPWRA) 20.95 +0.11 : Co issues mixed guidance for Q2 (Jun), sees EPS of ($0.05)-0.10 vs. $0.23 Thomson Reuters consensus; sees Q2 (Jun) revs of $550-600 mln vs. $541.98 mln Thomson Reuters consensus. Co issues mixed guidance for FY11 (Dec), sees EPS of $1.20-1.70 vs. $1.79 Thomson Reuters consensus; sees FY11 (Dec) revs of $2.80-2.95 bln vs. $2.69 bln Thomson Reuters consensus. "The changes to Italian solar policy this year have had a significant impact on the global solar market... In response, we rebalanced our product allocation in Italy away from power plants and toward our European residential and commercial (R&C) business where demand remains strong. The ability to reallocate our product in the face of market changes is a key feature of SunPower's vertically integrated, geographically diversified model. However, systems sold through our R&C channel yield less profit per watt than systems deployed in self-developed power plant projects, as reflected in our Q2 outlook. In addition, we expect the current global pricing pressure to persist through 2011 and, as a result, we are planning full-year 2011 non-GAAP gross margins to be in the range of 17% to 19%... To align with the reallocation of product, we are rebalancing resources to support the growth of our residential and commercial rooftop businesses... We're taking aggressive steps to actively manage our manufacturing and operating expenses, including working with suppliers to modify contracts to reflect current market conditions. In addition, our 2011 outlook incorporates the efficient management of our balance sheet through production optimization and demand-driven inventory levels. These steps, along with the $1 billion credit support agreement with Total, position SunPower to gain market share profitably." SPWRA and Total (TOT) also confirmed Total's cash tender offer to acquire approximately 60 percent of the outstanding shares of Class A common stock and approximately 60 percent of the outstanding shares of Class B common stock of SunPower for $23.25 per share respectively, as scheduled on June 14, 2011.

* Analog Devices (ADI) released for general availability today the ADIS16407 iSensor IMU magnetometer and a pressure sensor into a single package.

# Sierra Wireless (SWIR) announced that GeaCom has selected a Sierra Wireless AirPrime embedded wireless module to provide the 3G wireless connection for GeaCom's handheld multilingual medical communication system.

# RF Monolithics (RFMI) introduced two additions to the co's RFM2M brand of M2M Wireless Sensor Network Platform building block products - the battery-powered SN2430R420 sensor modem and LG2430E gateway.

8:01AM TriQuint Semi demonstrates gallium nitride leadership by achieving key development milestones (TQNT) 11.89 : Co announced several milestones related to its industry leading Gallium Nitride (GaN) developments. Together with customers and various US Government agencies, TriQuint is working to define the future of RF, where it believes GaN will play a key role. Together with researchers from the University of Notre Dame, TriQuint put its GaN NEXT Process, which is being developed with funds from DARPA and not yet commercially available, through stringent performance tests. The results of the testing demonstrated performance twice that of recently-claimed 'best' performance by University of California Santa Barbara.

8:01AM Skyworks reaffirms Q3, annualized outlook ahead of Investor Meetings (SWKS) 23.28 : Co is affirming its outlook for above market growth, excluding its recently announced acquisitions. In April 2011, Skyworks guided to ~$345 million in revenue with non-GAAP diluted earnings per share of $0.46 for the current quarter, consensus $345.3 mln and $0.46. Further, during the earnings conference call, the co indicated it was on a path to approach a $1.5 bln rev run rate with $2.00 in annualized non-GAAP diluted earnings per share in the Sept quarter. This growth outlook is being driven by the co's broad customer base, diversification into new markets and increasing share gains. "Skyworks' core business continues to outperform our addressed markets and we believe this will be clearly reflected in our performance and guidance."

Open-Silicon and Micron Technology (MU) announced that the cos have entered into an agreement that will enable them to explore opportunities around Micron's recently announced Hybrid Memory Cube products.

# ON Semiconductor (ONNN) has opened its new Singapore hub for global distribution. The new $3.5 mln state-of-the-art facility was built and implemented in partnership with DHL.

# AMD (AMD) reintroduced the FX brand for PC processors and platforms.
icon url

ReturntoSender

06/10/11 12:46 AM

#9375 RE: ReturntoSender #6755

From Briefing.com: 4:30 pm : The stock market settled shy of its session high, but it still managed to score a gain, which successfully snapped a six-session losing streak.

There weren't really any inspiring headlines this morning, but the growing belief that stocks are near-term oversold drove some relief buying. In turn, participants shrugged off news that initial jobless claims for the week ended June 4 totaled 427,000, which is greater than the 423,000 initial claims that had been expected among economists polled by Briefing.com. The latest tally was little changed from the prior week's count.

Although U.S. exports increased by just 1.3% in April after they had climbed by 4.9% in March, the U.S. trade deficit for April totaled $43.7 billion, which isn't quite as deep as the $48.7 billion deficit that had been broadly expected. The latest deficit is also less than the downwardly revised March deficit of $46.8 billion.

There was little corporate news to trade today, but Texas Instruments (TXN 32.91, +0.24) came into focus for cutting its guidance then clarifying that the revision was due to softer demand from a single wireless customer. Fellow semiconductor play National Semiconductor (NSM 24.58, -0.01) failed to see much action ahead of its quarterly report as participants generally ignored the rest of the tech space. A general lack of interest among tech plays left the sector to muster a gain of merely 0.1%. Listlessness in the space also hampered the Nasdaq, which ended the day with only a modest gain.

A bullish USDA report bolstered strength in shares of agricultural chemical and product companies. That helped the broader materials sector climb more than 2% before it drifted into the close to settle with a 1.6% gain.

Financials finally made a strong move higher after falling to a 2011 low in the prior session. The sector's 1.2% gain came in response to strength among both banking issues and insurance plays.

The improved tone among market participants this session took both the Dow and S&P 500 to gains of little more than 1%. The pair spent most of the afternoon stuck in a narrow trading range before slowly surrendering some of their gains into the close.

The stock market's late slip helped relieve Treasuries from some selling. Treasuries had set session lows shortly after the early afternoon release of results from an auction of 30-year Bonds. The auction drew a bid-to-cover ratio of 2.63, dollar demand of $34.2 billion, and an indirect bidder participation rate of 38.4%.

Market participants spent most of the session giving little consideration to a stronger dollar, which was helped by weakness in the euro after European Central Bank President Trichet stated the need to remain vigilant in an environment of upward inflation pressure and economic uncertainty. The ECB opted to keep its target interest rate unchanged at 1.25%.

Advancing Sectors: Materials (+1.6%), Energy (+1.2%), Financials (+1.2%), Health Care (+1.0%), Consumer Discretionary (+0.8%), Industrials (+0.7%), Consumer Staples (+0.5%), Tech (+0.1%), Utilities (+0.1%)
Declining Sectors: Telecom (-0.1%)DJ30 +75.42 NASDAQ +9.49 NQ100 +0.2% R2K +0.6% SP400 +0.5% SP500 +9.44 NASDAQ Adv/Vol/Dec 1599/1.71 bln/1002 NYSE Adv/Vol/Dec 1904/908 mln/1076

4:04PM National Semi misses by $0.01, beats on revs (NSM) 24.58 -0.01 : Reports Q4 (May) earnings of $0.26 per share, $0.01 worse than the Capital IQ Consensus Estimate of $0.27; revenues fell 6.1% year/year to $374.1 mln vs the $365.1 mln consensus. Gross margin was 66.5 percent in the fourth quarter of fiscal 2011 - flat with Q3 and down from the fourth quarter of fiscal 2010. Although revenue increased sequentially, factory utilization dropped slightly in order to reduce days of inventory by 13 in the fourth quarter from 109 days to 96. National reported gross margin of 66.5 percent in the third quarter of fiscal 2011 and 68.8 percent in the fourth quarter of fiscal 2010. "Business conditions were a little better than we expected in the quarter. With bookings up 21%, the first increase for three quarters, we were able to get back to meaningful quarterly revenue growth." National will hold a special meeting of stockholders on June 21, 2011 to seek stockholder approval of the merger with TXN.

AMD (AMD) announced an investment in ViVu, a desktop videoconferencing solutions co. The AMD Fusion Fund program makes strategic investments in companies that are developing unique, digital consumer and professional experiences that take advantage of the power of the innovative AMD Fusion Accelerated Processing Unit products.

10:03 am TXN Lowers Q2 Guidance (TXN)

Texas Instrument (TXN $33.19 +0.52) lowered second quarter earnings guidance to $0.51 to $0.55 versus $0.58 Capital IQ Consensus Estimate, from $0.52 to $0.60.

The company also lowered revenue guidance to $3.36 billion to $3.50 billion versus the $3.55 billion Capital IQ Consensus Estimate, from $3.41 billion to $3.69 billion.
icon url

ReturntoSender

06/12/11 7:03 PM

#9377 RE: ReturntoSender #6755

From Briefing.com: Weekly Recap - Week ending 10-Jun-11The stock market suffered wide-spread selling, pushing the Nasdaq and Russell 2000 in negative territory for the year. As stocks stumbled, market participant sought the relative safety of Treasuries and the dollar.

All 10 of the S&P 500 sectors fell. Defensive investments outperformed on a relative basis with utilities down just 0.5%. On the downside, financials (-3.9%) and tech (-3.1%) got hit the hardest. Selling was broad-based with only 57 companies trading higher in the S&P 500.
Heavyweight Apple (AAPL, -5.0%) weighed on the market. The company faced selling after it revealed its iCloud service and new mobile operating system.

Texas Instruments (TXN, -4.2%) issued a second quarter earnings warning, though losses from the announcement were limited on word the weakness is due to Nokia (NOK).

The major financials all saw selling pressure. Bank of America (BAC) fell 7.6% and Citigroup (C) shed 7.5%.

Fed Chairman Bernanke issued an economic outlook that failed to lift stocks because he didn't say anything all that surprising to alter a negative mood, and a trend, that has been prevailing for the last five weeks or so.

The Fed Chairman began his remarks with an acknowledgment that U.S. economic growth has been slower than expected so far this year, but that wasn't anything the market didn't already know. On balance, he kept to the party line that (a) commodity-based inflation pressures are transitory (b) the economy should regain momentum in the second half of the year and (c) economic conditions are likely to warrant exceptionally low levels for the federal funds rate for an extended period.

There was no hint of QE3, but anyone truly expecting him to go down that road with this speech was way ahead of themselves.

In economic developments, economic releases were mixed. The not-so-good news is that initial claims remained above 400,000 for the week ending June 4 while the good news is that the U.S. trade deficit narrowed to $43.7 bln in April from $46.8 bln in March, which was revised from an originally reported deficit of $48.2 bln, which will factor positively for GDP growth.

Briefly, initial claims rose 1,000 from the prior week to 427,000 and were slightly weaker than the Briefing.com consensus estimate of 423,000. A level above 400,000 is not typically consistent with strong labor growth. Although the latest reading doesn't cover the survey period for the June household survey on employment, it will nonetheless feed ongoing concerns about the frustratingly slow pace of recovery in the labor market.
 
Index Started Week Ended Week Change % Change YTD %
DJIA 12151.20 11951.90 -199.30 -1.6 3.2
Nasdaq 2732.78 2643.73 -89.05 -3.3 -0.3
S&P 500 1300.16 1270.98 -29.18 -2.2 1.1
Russell 2000 808.13 779.54 -28.59 -3.5 -0.5

09:23 am MEMC Elec downgraded to Hold at Stifel Nicolaus: . Stifel Nicolaus downgrades WFR to Hold from Buy given the rapidly deteriorating environment in the solar wafer industry. While their Sum-of-the-Parts analysis points to brighter prospects for the stock, they view near-term risk/reward as balanced, and they do not see investors warming up to the name over the next 6-9 months in face of acute reductions in solar pricing and significant estimate revisions downward.

7:30AM Qualcomm to acquire the assets of semiconductor design co Rapid Bridge (QCOM) 55.87 : Co has agreed to acquire substantially all of the assets of Rapid Bridge LLC, a San Diego-based inventor of advanced techniques for the design and development of semi products. The co's technology reduces complexity in integrated circuit (IC) development at advanced technology nodes to enable greater design flexibility and optimized die size and power consumption. Rapid Bridge's San Diego design team and San Diego/Bangalore engineering services operations will be integrated into Qualcomm CDMA Technologies. The asset acquisition, which is subject to regulatory approval and fulfillment of certain terms and conditions, is expected to close by the end of FY11.

# Research In Motion (RIMM) announced plans to launch the BlackBerry PlayBook tablet in an additional 16 markets around the world over the next 30 days

icon url

ReturntoSender

06/13/11 10:56 PM

#9381 RE: ReturntoSender #6755

From Briefing.com: 4:30 pm : Mixed action among energy, financial, and tech stocks, which are frequent drivers of broad market action, left the major equity averages to settle the trading day in underwhelming fashion after some early buying gave stocks a solid start to the session.

On the heels of their sixth straight weekly loss, stocks attracted some relief buying this morning. The bid came even though varied performances abroad made for a muddled backdrop. No domestic data were released and corporate news was mostly made up of merger and acquisition activity, which featured the purchase of Timberland (TBL 43.20, +13.21) by VF Corp (VFC 101.01, +9.21) for $43 per share, the $33 per share bid for EMS Tech (ELMG 32.80, +8.00) by Honeywell (HON 55.71, +0.18), and the joining of Gerber Scientific (GRB 10.99, +2.87) and Vector Capital in a deal that will give GRB stockholders $11 per share.

Early trade saw energy stocks move higher and financials falter, but the two sectors eventually saw their fortunes reverse. In turn, financials rallied out of the red to finish the with a 1.0% gain while energy stocks ended the day with a 1.4% loss. Energy stocks were hurt by a drop in oil prices, which were quoted 2.0% lower at $97.30 per barrel at the end of pit trade.

Tech stocks, which represent the largest sector by market weight, were quiet for the entire session. As a group, they closed unchanged for the session.

A lack of collective direction left the stock market to drift to a loss, which was stemmed only after a new three-month intraday low was set.

The dollar spent the entire day in the red, but that failed to convert participants into full-fledged buyers. In fact, the dollar's weakness seemed to be of little overall concern to the market. Even after S&P took Greece's debt rating deeper into junk territory by reducing it to CCC, the greenback was unable to overcome the euro. At the end of the trading day, the euro was quoted at $1.441, up 0.5%. More impressive is the 0.9% gain sported by the sterling pound, which was quoted at $1.637 at days end.

The mixture of slow summer trading with so few catalysts may have kept trading volume on the NYSE below 1 billion shares, but overall participation wasn't by any means paltry. In fact, participation on the Big Board took share volume above 900 million shares.

Advancing Sectors: Financials (+1.0%), Telecom (+0.7%), Utilities (+0.4%), Health Care (+0.4%), Consumer Staples (+0.3%), Industrials (+0.1%)
Unchanged: Tech
Declining Issues: Consumer Discretionary (-0.2%), Materials (-0.6%), Energy (-1.4%)DJ30 +1.06 NASDAQ -4.04 NQ100 +0.1% R2K -0.3% SP400 -0.3% SP500 +0.85 NASDAQ Adv/Vol/Dec 940/1.86 bln/1673 NYSE Adv/Vol/Dec 1373/908 mln/1706

5:40PM GT Solar raises Q1 earnings and revs guidance; reiterates FY12 guidance and raises backlog expectations for FY12 (SOLR) 12.19 -0.21 : Co raises Q1 EPS guidance to ~$0.30 vs. $0.14 Capital IQ Consensus Estimate up from prior $0.08-0.11; co raises revs guidance to $225 mln vs. $154.7 mln Capital IQ Consensus Estimate, up from prior guidance of $140-150 mln. Co reiterated FY12 guidance provided on May 24, 2011 of EPS at $1.55-1.85 vs. $ 1.76 consensus, sees revs at $1-1.1 bln vs. $899 mln consensus. In addition, given the significant number of orders it has received thus far in the first quarter of fiscal 2012, the company now expects its backlog at the end of fiscal 2012 to be at least $1.6 billion. Previously, it had estimated its backlog would be above $1 billion at the end of fiscal 2012.

4:15PM Hewlett-Packard announced organizational changes; co will eliminate CAO role (HPQ) 34.65 -0.45 : Co announced organizational changes that will more closely align its corporate structure with the strategy it announced in March. Ann Livermore has been elected to the HP board... As part of the realignment to improve the company's focus on customer-facing businesses, HP will streamline its administrative operations. HP will eliminate the chief administration officer role and broaden the role of its chief information officer. As a result, Pete Bocian, executive vice president and chief administrative officer, is leaving HP, effective immediately. The functions that make up that organization will be subsumed within other parts of HP. In addition, Randy Mott, executive vice president and chief information officer, is leaving HP effective immediately. Co will conduct a search for a successor. The company thanks Pete and Randy for their efforts and wishes them the best in their next endeavors.

8:39AM GT Solar announces multi-year sapphire material contract with Exotic Electro-Optics (SOLR) 12.41 : Co announces that its subsidiary, GT Crystal Systems, has signed a multi-year contract valued at $3.75 million with Exotic Electro-Optics, a subsidiary of II-VI (IIVI). Under the terms of the contract, GT Crystal Systems will provide large sapphire blanks to EEO for a US-based defense program.

Veeco Instruments (VECO) announced that it has been awarded $4 mln in R&D Matching Funds by the U.S. Department of Energy to support high-efficiency solid state lighting projects.

Integrated Device Technology (IDTI) announced that it has delivered the industry's first single-chip enterprise-class flash controller with native PCIe(R). The controller was co-developed with Micron Technology (MU) for exclusive use in Micron's recently announced P320h PCIe solid-state storage system.

6:02AM Tower Semicon sees Q2 revs above consensus (TSEM) 1.04 : Co issues upside guidance for Q2 (Jun), sees Q2 (Jun) revs of $136-142 mln vs. $133.06 mln Capital IQ Consensus Estimate. The mid-range of the current guidance is a record high since inception and represents a 15% increase from previous quarter revenues of $120.6 mln and an 11% increase YoY.

Lattice Semiconductor (LSCC) and Flexibilis Oy announced the immediate availability of the Flexibilis Ethernet Switch IP cores.

AMD (AMD) announced a new set of software development tools and solutions to enable developers to optimize their applications for OpenCL standards.

SANYO Semiconductor,an ON Semiconductor (ONNN) company, announced the introduction of LC823425, an audio processing solution for portable devices such as IC recorders.

1:18AM Rambus Chairman steps down due to increased demands of his responsibilities at Benchmark Capital and its portfolio cos; director Thomas Bentley has been elected by the Board to succeed Bruce Dunlevie as chairman (RMBS) 13.58 :

07:18 am TTM Tech upgraded to Strong Buy at Needham: . Needham upgrades TTMI to Strong Buy from Buy as the co remains one of the best run companies in their universe, and boasts an impressive customer list with some of the leading players in tech, all while operating at the vanguard of a highly consolidated space. The firm says, any opportunity to pick up such a high-quality company at such a discount should be seized upon. TTMI On Sale. Firm says in in recent weeks as TTMI has been slammed under a litany of thinly validated derivative calls, including Apple production, the company's only 10% customer, networking concerns (34% of revenue) after negative comments from Ciena (believe not even a customer), and Juniper, as well as general macro-economic concerns both here and abroad. Firm says at $13.37 TTMI is trading just 2x tangible book, less than 8x this year's earnings, and is down over 40% from its 52-week high.
icon url

ReturntoSender

06/26/11 8:33 PM

#9385 RE: ReturntoSender #6755

From Briefing.com: Market Update

Weekly Recap - Week ending 24-Jun-11

What a long, strange trip it has been -- and we're only talking about the last five days for the equity market. Once again, things were volatile, only this week it wasn't due entirely to Greece.

Greece was certainly a big part of the trading equation, but if you'll allow us some acronymic license, the FOMC, the IEA, and the GOP also played prominent roles as well.

To begin, the week started on an upbeat note. The major averages advanced Monday and Tuesday on light volume in an anticipation trade rooted in the belief that (a) the Greek prime minister and his new cabinet would survive a no confidence vote at midnight on Tuesday and (b) the FOMC's policy directive and subsequent remarks from Fed Chairman Bernanke at the press conference would have a calming effect in an angst-ridden environment.

Participants got it half right. The Greek prime minister and his cabinet survived in a party-line vote, yet the FOMC and the Fed chairman in particular failed in their supporting role.

The Fed's failings were as much about what it said as what it didn't say. In truth, the policy directive read almost exactly as conventional wisdom said it would.

There was an acknowledgment that the economic recovery was unfolding more slowly than previously expected, but that the slowdown reflected in part factors that are likely to be temporary. Commodity-based inflation pressures are expected to dissipate; QE2 will be complete at the end of June; and economic conditions are likely to warrant exceptionally low levels for the federal funds rate for an extended period.

The added wrinkle for the market is that Mr. Bernanke acknowledged at the press conference that the Fed does not have a precise read on why the slow pace of economic growth is persisting. Furthermore, the Fed's central tendency projections for real GDP growth in 2011 and 2012 were lowered from their April projections, yet the Fed chairman downplayed the likelihood of QE3 coming to fruition anytime soon.

Mr. Bernanke said the Fed is in a position of waiting and watching the incoming data to determine its next move (or non move). That is a fair and defensible position, but the market nonetheless would rather think the Fed is in a position of being ahead of the curve, particularly at this sensitive time for the employment picture and the Greek debt crisis. The sense that it isn't created some nervousness that the Fed isn't waiting and watching as much as it is waiting and wishing for the data to confirm its temporary slowdown views.

The market had been little changed for most of Wednesday, but it rolled over after the press conference and closed at its lows for the day. We suspect the late sell-off, which carried over into a 200+ point decline in the Dow early Thursday, emanated also from the unsatisfying thought that the market is going to be handcuffed by the economic calendar here and abroad for an extended period of time.

Sure enough, weaker-than-expected readings for purchasing manager indexes in China and the eurozone on Thursday, along with another disappointing initial claims report in the U.S., helped grease the wheels of Wednesday's closing slide.

At its low on Thursday, the S&P 500 was down 1.9% as the weight of the Fed's debatable outlook and the aforementioned data flattened investor sentiment. It didn't help matters either that press reports indicated GOP leaders walked out of budget deficit negotiations with Vice President Biden, saying talks had reached an impasse. That may just be political gamesmanship, but in this uncertain period, it can also be labeled poor timing.

The market needs closure on the issue of the debt ceiling being raised by August 2 and the current deficit attention disorder that is afflicting both parties is clouding the prospect of the debt ceiling being raised in time. Undoubtedly, the ratings agencies aren't too keen on the latest developments.

Still, it would be remiss not to add that the Treasury market barely batted an eye, even if the equity market did, at word of the impasse. That is because it continues to be fueled by safety trades related to Greece and signs of an economic slowdown, while at the same time persisting in the belief that a debt ceiling compromise will be achieved before it's too late. The yield on the 10-year note fell seven basis points this week to 2.87%.

Another big storyline from Thursday was the news that the IEA is releasing 60 mln barrels from strategic petroleum reserves (30 mln from the U.S.). That decision, it was said, flowed from worries about longer-lasting supply disruptions in Libya, although it was interpreted by many to be a tactical strike against speculators who are long the oil market. Oil prices, which were already down sharply in response to the data, remained under pressure in the wake of the announcement.

Crude oil futures for August delivery, which sat above $114 per barrel at the start of May, settled the week just under $91 per barrel.

Attention will now be paid to whether the IEA intervention, and the threat of more to come, can keep prices from rising sharply from current levels. That will be a tall order if incoming economic data show improvement or further uprisings in the Middle East develop.

For now, though, the drop in oil prices has to be considered a positive change at the margin insomuch as it is helping to bring down gas prices and helping to quell inflation expectations.

But, wait, there was still more when it came to Thursday's action. We said earlier the S&P 500 was down as much as 1.9%, yet it ultimately ended the day down just 0.3%. The reported catalyst for the recovery bid was news that Greece reached an agreement with the EU and IMF on a new five-year austerity plan.

We're not sure why it would react so strongly to the Greece headline. We guess it was the type of thing that sounded just good enough for a market that tested key technical support at the 200-day moving average to force weak-handed short sellers to cover their positions. It beat the alternative, we suppose, of hearing on a day like Thursday that they failed to reach an agreement.

The fact of the matter is that the Greek parliament still hasn't passed the plan. That vote comes next week and the outcome is as up in the clouds right now as the Greek gods. In brief, nothing got settled Thursday, but the idea that things didn't get any worse with respect to Greece held sway in the rebound effort.

The recovery vibes didn't last long though. Despite an upward revision to Q1 GDP (to 1.9% from 1.8%) and a durable orders report showing renewed growth in orders for nearly every sector in May, the market struggled on Friday. Basically, it gave back most of the ground it made up in Thursday's late rally, which is consistent with our thought that we were not quite sure why the market rallied like it did on the Greece headline on Thursday.

Friday's selling led to a 1.2% decline in the S&P 500 that left it down 0.2% for the week. The Dow Jones Industrial Average slipped 0.6% for the week, but the Nasdaq, S&P 400 Midcap Index, and Russell 2000 rose 1.4%, 1.4% and 2.1%, respectively.

Notwithstanding the concerns about Greece and an economic slowdown, risk aversion was not the default trade in the equity market.

Cyclical sectors outperformed noncyclical sectors by and large and growth stocks outperformed value stocks. The sustainability of those trends in the coming week will likely hinge on Greece's austerity vote and the economic data that the Fed and everyone else are watching day-by-volatile day.

--Patrick J. O'Hare, Briefing.com
 
Index Started Week Ended Week Change % Change YTD %
DJIA 12004.30 11934.58 -69.72 -0.6 3.1
Nasdaq 2616.48 2652.89 36.41 1.4 0.0
S&P 500 1271.50 1268.44 -3.06 -0.2 0.9
Russell 2000 781.75 797.79 16.04 2.1 1.8

3:16PM Semi/Technology SMH/XLK continue to lag, Nasdaq Comp -37 sets new low -- Dow -107, S&P -14 just above their lows (QQQ) :

Diodes (DIOD) announced an agreement to invest in Eris Technology. has announced that it will offer to its shareholders and employees up to 10 mln shares of common stock at NT$39 per share to raise NT$390 mln (~$14 mln). Diodes has agreed to purchase any shares not purchased by Eris' shareholders and employees and Eris' founders have agreed to sell Diodes any shares necessary to ensure that Diodes will obtain a minimum of 8 mln shares, which represents an ~ 24% ownership in Eris after the capital increase.

UTStarcom (UTSI) and UTStarcom Holdings announced the proposed merger to reorganize the co as a Cayman Islands company was approved by the stockholders of UTStarcom at the annual meeting.

1:05 pm Tech Sector Over One Percent Lower; Comcast added to Goldman's Conviction Buy List (CMCSA)

The tech sector is trading lower today, trailing losses in the broader market. Semiconductors are showing relative weakness in the tech space with the Philly Semi Index trading 1.7% lower. Among chips in the index, MU (-12.9%) is the notable laggard. Among other major indices, the S&P 500 is trading 0.8% lower while the NASDAQ is trading 0.9% lower. The QQQ, meanwhile, is trading 1.3% lower. Among tech bellwethers, ORCL (-3.9%) and CSCO (-2.0%) are under pressure.

In earnings, ORCL (-3.9%) reported a slightly better-than-expected quarter and issued inline guidance. Elsewhere, MU (-12.9%) posted a miss and TIBX (+0.5%) reported a beat and upside guidance.

In news, COOL (+4.2%) will be added to the Russell Microcap Index. In M&A, there was a report from the WSJ that BBBB (+5.8%) may be acquired by buyout firm.

Among the more notable analyst ratings changes this morning, CMCSA (0.0%) was added to the Conviction Buy list at Goldman and CTCT (+1.7%) was upgraded to Neutral at Dougherty.

There are no notable tech names set to report results today after the close.

09:55 am MU Results Fall Short of Expectations (MU)

Micron (MU $7.44 -0.99) reported third quarter earnings of $0.07 per share, $0.10 worse than the Capital IQ Consensus Estimate of $0.17.

Revenues fell 6.5% year/year to $2.14 billion versus the $2.37 billion consensus.

The company's consolidated gross margin improved to 22 percent for the third quarter of fiscal 2011 from 19 percent for the second quarter of fiscal 2011 due primarily to decreases in manufacturing costs. Revenue from sales of DRAM products was 7 percent lower in the third quarter of fiscal 2011 compared to the second quarter of fiscal 2011 due to a decrease in sales volume.

09:52 am ORCL Guides Q1 EPS In-line (ORCL)

Oracle (ORCL $31.26 -1.20) reported fourth quarter earnings of $0.75 per share, excluding non-recurring items, $0.04 better than the Capital IQ Consensus Estimate of $0.71.

Revenues rose 11.9% year/year to $10.78 billion versus the $10.74 bln consensus.

Both GAAP and non-GAAP new software license revenues were up 19% to $3.7 bln. Both GAAP and non-GAAP software license updates and product support revenues were up 15% to $4.0 bln. Both GAAP and non-GAAP hardware systems products revenues were down 6% to $1.2 bln. Non-GAAP operating income was up 19% to $5.2 bln, and non-GAAP operating margin was 48%.

"In Q4, we achieved a 19% new software license growth rate with almost no help from acquisitions. This strong organic growth combined with continuously improving operational efficiencies enabled us to deliver a 48% operating margin in the quarter. As our results reflect, we clearly exceeded even our own high expectations for Sun's business. In addition to record setting software sales, our Exadata and Exalogic systems also made a strong contribution to our growth in Q4. Today there are more than 1,000 Exadata machines installed worldwide. Our goal is to triple that number in FY12. In FY11 Oracle's database business experienced its fastest growth in a decade. Over the past few years we added features to the Oracle database for both cloud computing and in-memory databases that led to increased database sales this past year. Lately we've been focused on the big business opportunity presented by Big Data."

On the conference call after hours yesterday, the company guided its first quarter earnings in the range of $0.45 to $0.48 versus the Capital IQ Consensus Estimate of $0.46; sees revs growth of +9% to 12%.
icon url

ReturntoSender

06/27/11 9:02 AM

#9387 RE: ReturntoSender #6755

Schaeffers Monday Morning Outlook: Why Bulls Should Keep an Eye on SPX 1,260 Amid rising uncertainty, the S&P 500 Index is hovering near a key technical level
by Ryan Detrick 6/25/2011 12:29 PM

http://www.schaeffersresearch.com/commentary/observations.aspx?ID=106889&trackback=recapezine

After stringing together four straight days of gains, stocks started to come unglued Wednesday afternoon -- right around the time Fed Chairman Ben Bernanke was trying to explain to reporters what the central bank means by "an extended period of time." Despite a rather haphazard weekly performance by the major market indexes, key technical support levels remain intact as we head into the historically bullish month of July. In fact, Senior Technical Strategist Ryan Detrick wonders whether sentiment isn't tipped a little too far toward the "full-tilt panic" end of the spectrum, given the relatively modest pullback in the market. Meanwhile, as key indexes test their respective 200-day moving averages, Senior Quantitative Analyst Rocky White takes a closer look at the significance of this oft-cited trendline. Finally, we wrap up with a preview of the week ahead, as well as a few sectors of note.

Notes from the Trading Desk: Flashing Back to Summer 2010
By Ryan Detrick, Senior Technical Strategist

Are we having fun yet? After a brief four-day winning streak, we sold off the final three days of the week, as troubling news out of the euro zone dominated global trading. One day things are looking better in Greece -- then they aren't. Wait a day, and then the issue is with Italian banks. The market hates uncertainty, and with all the debt drama happening in Europe, there's more than enough uncertainty to go around.

Todd Salamone is out on vacation this week, so I'm stepping in to share my thoughts on the market. The last time I wrote Monday Morning Outlook, back in mid-May, I noted a few areas of technical resistance, as well as the potential for weakness in June. That scenario has played out, but all is not lost for the bulls here. In fact, taking a big-picture look at the market, you have to be rather impressed with the resiliency.

The S&P 500 Index (SPX - 1,268.45) has pulled back only about 8% from its early May peak. When you consider that this retreat comes on the heels of a more than 100% advance since March 2009, that pullback seems pretty acceptable. And when you reflect on just how poor the U.S. economic data has been over the past two months, along with the ongoing euro-zone debt issues -- the resilient price action is that much more impressive.

Technically speaking, the SPX is trading near strong support from its uptrending 200-day moving average, as well as its March 2011 lows.
Daily Chart of SPX since May 2010 With 200-Day Moving Average


Speaking of those March lows... that area also coincides with the SPX's year-to-date breakeven level, as Todd has noted in recent weeks. Add it all up, and the 1,260 region is a critical area to watch as near-term support.

On the sentiment front, numerous indicators are displaying the kind of heavy-handed pessimism that has coincided with previous buying opportunities. Now, this doesn't count for much until the overall price action improves -- but it does suggest we have some wood for the fire should we start to bounce.

For starters, investors continue to take money out of domestic mutual funds at a near-record pace. According to the Investment Company Institute (ICI), there are now net outflows of nearly $4 billion from domestic mutual funds for the year. In fact, more than $12 billion has been yanked out during the past two weeks alone! This level of panic is consistent with recent market bottoms.

Remember, we'd already seen three straight years of equity mutual fund outflows before 2011 even started. Four straight years would be unheard of, especially when you consider some of the amazing gains we've seen during this same time frame. The sad truth is, there have been two constants during this bull market: One, higher prices; and two, the retail crowd has missed out on most of the rally. With retail-level investors bailing on stocks once again, do you really expect the rally to stop now?

Elsewhere, the Investors Intelligence poll is nearing levels of skepticism consistent with past bottoms. The difference between bulls and bears is currently less than 10%. As you can see below, this is nearing the critical 0% area that has marked previous buying opportunities.

II Bulls & Bears with OEX


Our analysis of the options markets suggests that negative sentiment continues to dominate, as evidenced by the 20-day buy-to-open put/call volume ratio for the SPDR S&P 500 ETF (SPY), PowerShares QQQ Trust (QQQ), and iShares Russell 2000 Index Fund (IWM). As Todd has often noted, this ratio tends to move higher when fund managers are accumulating equities, as they purchase puts on broad-focused exchange-traded funds (ETFs) to hedge their long stock positions. This indicator has correctly nailed the recent weakness in the market, and it's currently docked at its lowest level since July 2009. This rock-bottom reading suggests there is plenty of cash on the sidelines to push the market higher very quickly, once these deep-pocketed players return to accumulation mode.
20-Day BTO P/C Ratio for SPY, QQQ, IWM


Finally, check out the strong historical performance of the SPX during the month of July in recent years. Sure, a good deal of this bullish price action is probably a direct result of how bad June has been, but it's reassuring nevertheless as we head into a new month.
SPX Performance by Month


All in all, I see some definite similarities between the current market situation and the summer of 2010. Think back to a year ago: We were in the midst of an 18% correction that took nearly three months to fully form. During that time, we were greeted with a brief economic slowdown at home in the U.S., while euro-zone debt issues continued to fester -- sparking concerns about the long-term life expectancy of the common currency. Not that much different than now, is it?

The only difference is, we have seen much more technical resilience this time around, and I think this is a sign that Mr. Market wants to continue higher. Don't follow the rest of the retail crowd by panicking in the face of bearish headlines. Overall, the price action remains strong, and sentiment continues to be downright dire. This doesn't mean we'll go straight up from here, but it does suggest that the overall uptrend is still alive and well.

Best of luck in your trading.

Indicator of the Week: The 200-Day Moving Average
By Rocky White, Senior Quantitative Analyst

Foreword: The S&P 500 Index (SPX) was pretty much flat again for the second straight week, after declining for six consecutive weeks before that. Now, the index is sitting right on top of its 200-day moving average -- which will hopefully act as support, so this market can regain some traction and move higher once again. With the benchmark index perched squarely atop this closely watched trendline, it's not too surprising to find that roughly half of all stocks in our database are above their respective 200-day moving averages, and roughly half are below. The data is pretty interesting, though, when you look at the results by sector, and then throw some sentiment stats into the equation.
SPX with 200-Day Moving Average


200-Day Moving Averages: Below is a chart of the SPX, along with the percentage of all stocks in our database that are above their 200-day moving average. Over the last several weeks, the percentage has fallen from above 80% to right around 50%. It's intriguing to look at this chart and realize that, at the market's 2007 peak, the percentage of stocks never rose above 80%. Also, that number started plummeting even before the market crash. In fact, the percentage of stocks above their 200-day trendline was falling below 50% just as the market was peaking. At the beginning of 2008 -- after the peak, but before the violent crash -- less than 40% of stocks were above their 200-day moving average.

The last time this indicator fell below 50% was soon after the May 2010 "flash crash." The market quickly found a bottom at that point, and rallied strongly for the next several months.
SPX with Percent of Stocks Above 200-Day MA


By Sector: While 50% of all stocks are above their 200-day moving average, this parity is not consistent across all sectors. The percentage of equities above this trendline are broken down by sector in the table below. The sectors with the most stocks above their 200-day moving average are at the top of the table, and those with the least are at the bottom. I also show the percent of analyst "buy" rankings on each group. It's worthwhile to note where there's a dichotomy between the price action and the analyst rankings -- such as stocks which have held up well during the downtrend, but still have a small number of "buy" ratings from analysts (and vice versa).

Notice the top three sectors in terms of price action (restaurants, food/beverages/soaps, and utilities) each have less than 50% "buy" recommendations. The other sector that sticks out at the top of the table is real estate, with 70% of those stocks above their 200-day moving averages, but only 40% "buy" ratings from analysts. At the bottom of the table, the clear outlier is precious metals. Only about one-quarter of sector components currently sit above their 200-day moving averages, yet 63% of analysts give those stocks a "buy" rating.

Remember, our Expectational Analysis® methodology looks for situations where the price action is positive, but the sentiment is pessimistic -- or, on the flip side, the price action is negative while sentiment is optimistic. If these current price trends continue, it leaves a lot of room for multiple upgrades in the outperforming sectors, and multiple downgrades in the underperforming sectors. That could translate into big moves for those stocks, and big profits for investors anticipating those moves.
Breakdown by Sector


This Week's Key Events: Consumer Sentiment in the Spotlight
Schaeffer's Editorial Staff

Here is a brief list of some of the key events this week. All earnings dates listed below are tentative and subject to change. Please check with each company's respective website for official reporting dates.

Monday

*

The economic calendar kicks off with the Chicago Fed's manufacturing index, as well as the Census Bureau's report on personal incomes and spending for May. Nike (NKE) and Standard Microsystems (SMSC) are expected to report earnings.

Tuesday

*

The S&P/Case-Shiller home price index for April will hit the Street on Tuesday, accompanied by the Conference Board's consumer confidence index and the Richmond Fed's manufacturing index for June. Quarterly earnings are due out from Progress Software (PRGS), Sealy Corp. (ZZ), and Shaw Group (SHAW).

Wednesday

*

Wednesday features the regularly scheduled report on domestic petroleum inventories, along with a double dose of housing data: May's pending home sales and the weekly MBA mortgage applications index. The earnings calendar heats up with reports from Acuity Brands (AYI), Family Dollar Stores (FDO), General Mills (GIS), KB Home (KBH), Lindsay Corp. (LNN), and Monsanto Co. (MON).

Thursday

*

Weekly jobless claims are on the day's docket, and traders will also eye the Chicago purchasing managers index (PMI) for June. Apollo Group (APOL), Constellation Brands (STZ), Darden Restaurants (DRI), Schnitzer Steel Industries (SCHN), Smith & Wesson (SWHC), and Xyratex Ltd. (XRTX) will share the earnings spotlight.

Friday

*

The week wraps up with the ISM manufacturing index, the final Reuters/University of Michigan consumer sentiment index for June, May's construction spending report, and auto and truck sales for June. Rada Electronic Industries (RADA) is slated to report earnings.

And now a few sectors of note...

Dissecting The Sectors
Sector
Leisure/Retail
Bullish

Outlook: Following a string of disappointing employment reports early in the month, consumer discretionary stocks received a much-needed shot in the arm in mid-June after the Commerce Department revealed a smaller-than-expected decline in May retail sales. From a technical standpoint, the SPDR S&P Retail ETF (XRT) remains in a longer-term uptrend. The major market indexes are hovering near breakeven on a year-to-date basis, but XRT is up 7.4% since the start of 2011. The fund recently bounced from support in the $50 region -- near the site of its rising 160-day moving average -- and managed to gain 2.7% amid last week's lackluster broad-market action. One concern would be a recent roll-over in the fund's 50-day buy-to-open put/call volume ratio, as put buying has been consistent with technical strength in the sector. As a result, exposure to the group should be limited to a few choice outperformers. A couple of equities we favor include AutoZone (AZO) and Green Mountain Coffee Roasters (GMCR), both of which are trading above familiar technical support levels. Despite the positive price action, GMCR has been targeted by speculative put buyers and short sellers, while AZO's analyst ratings are skewed toward the bearish end of the spectrum. Another strong contrarian candidate is Bed Bath & Beyond (BBBY), which gapped higher after reporting surprisingly strong earnings this past week. As these equities continue to outperform, a shift in sentiment toward the bullish camp could contribute to additional upside.
Sector
Gold
Bullish

Outlook: It was a bumpy ride lower for gold during the first several weeks of May, thanks to a widespread commodities sell-off and news of a high-profile investor unloading his stake in the popular "safe haven" investment. However, a recent report revealed that investment demand for gold in China surged to 90.9 metric tons during the first quarter, establishing the emerging market as the world's top buyer of the precious metal. Amid constantly simmering inflationary concerns, ongoing sovereign debt drama in Europe, and economic reports signaling a rough patch in the U.S. recovery, it seems that the fundamental backdrop still supports a bullish case for gold. In fact, the SPDR Gold Trust (GLD) has held up remarkably well in the face of a resurgent dollar. The shares broke below support at their 40-day moving average last week, but GLD found a floor near $146. The July 146 strike is home to heavy put open interest of 24,567 contracts, with another accumulation of 48,080 contracts located at the July 145 put. Going forward, these out-of-the-money puts could create a layer of options-related support for the fund. Plus, GLD's 50-day buy-to-open put/call ratio continues to turn higher from its near-term lows. In recent years, similar rebounds in this ratio have coincided with periods of bullish price action for the ETF.
Sector
Large-Cap Tech
Bearish

Outlook: Big-cap tech continues to suffer, thanks in part to a string of weak earnings reports from the likes of Research In Motion Limited (RIMM), Oracle (ORCL), and Micron Technology (MU). Within the group, Dow component Cisco Systems (CSCO) is one of the most high-profile underperformers. Many Wall Street pundits cited the stock as a "bargain" following a bearish gap in February -- but the stock has since tumbled to a string of new multi-year lows. With only 1.1% of CSCO's float sold short, and 12 analysts still doling out a "buy" or better rating on the shares, the tech giant could be vulnerable to a capitulation by the remaining bulls. Likewise, fellow Dow member Microsoft (MSFT) is sitting on a hefty year-to-date loss of 11.8%, yet 66% of brokerage firms maintain an optimistic rating on the stock -- opening the door for potential downgrades in the event of continued technical weakness. Even more compelling, the PowerShares QQQ Trust (QQQ) recently broke below its 200-day moving average, and this trendline is now threatening to switch roles to act as resistance. Plus, the fund's 50-day buy-to-open put/call volume ratio has rolled over from its recent peak, which could be a sign that big-money players are no longer accumulating shares.
Sector
Financials
Bearish

Outlook: In the current environment of declining interest rates and free-falling home prices, there's just not much to like about financial stocks at the moment -- particularly with sector stalwarts such as Goldman Sachs (GS) and Morgan Stanley (MS) still facing regulatory probes and legal battles dating back to the 2008 market crash. Elsewhere within the sector, Bank of America (BAC), Citigroup (C), and Wells Fargo (WFC) were hit with a downgrade warning from Moody's earlier this month, due in part to lingering uncertainty over the potential ramifications of increased regulation and oversight by the Fed. Nevertheless, there's been a flurry of bullish media coverage on the banking sector during the past several weeks, with the general consensus being that major financial firms are alluringly "cheap" at the moment. Indeed, many of the best-known names within the group, including B of A, Citigroup, Goldman, and Wells Fargo, are sitting on double-digit percentage losses for 2011. JPMorgan Chase (JPM) has also dropped into negative territory for the year, extending a months-long swoon on the charts. Checking out the sentiment backdrop, the 50-day buy-to-open call/put volume ratio for the Financial Select Sector SPDR (XLF) has turned higher lately, which has had bearish implications for the group in the past. Plus, data from Zacks indicates that 58% of analyst ratings on finance stocks are of the "buy" or better variety, despite the dismal price action. Going forward, these underperforming bank stocks look vulnerable to additional downside as this remaining optimism is shaken out.
icon url

ReturntoSender

06/27/11 10:25 PM

#9388 RE: ReturntoSender #6755

From Briefing.com: 4:30 pm : Broad-based buying in thin volume helped stocks score strong gains this session. The action precedes a pivotal vote by Greece's parliament tomorrow.

There weren't many headlines to act as cues for traders this morning. Participants even dismissed the day's only data, which featured news that personal income for May increased by 0.3%, but spending was flat. The consensus among economists polled by Briefing.com had called for a 0.4% increase in income and a 0.1% increase in spending. However, core personal consumption expenditures for the month increased by 0.3%, which is greater than the 0.2% increase that had been broadly anticipated.

After hovering near the neutral line for the first few minutes of trade, stocks began to stage a strong climb. Financials led the early effort with a quick sprint up to a gain of more than 1%. The sector spent the rest of the session sporting that gain.

Tech stocks eventually rallied to replace financials as the top performing sector. Tech, which is also the largest sector by market weight, settled with a 1.4% gain. Tech's strength helped give the Nasdaq an added lift.

Gains weren't limited to cyclical plays, though. Instead, all 10 major sectors ended the day in positive territory. Half of them had gains of nearly 1% or more.

The breadth and size of the move was partly made possible by the lack of share volume, which gave each trade greater relative weight than it would have had during a day of even average share volume. At just 835 million shares on the NYSE, total volume today was among the lightest of the year. Such paltry participation will likely persist ahead of the long, holiday weekend (U.S. markets will be closed next Monday for the observance of Independence Day).

Even though vacation plans are expected to pull many off of their trading in coming days, plenty of attention will be paid to Greece's progress in putting its fiscal house in order. Another step comes tomorrow, when the country's parliament votes on whether or not to accept the austerity plan that country officials agreed upon last week with the European Union and International Monetary Fund.

Advancing Sectors: Tech (+1.4%), Consumer Discretionary (+1.2%), Financials (+1.1%), Telecom (+1.1%), Industrials (+0.9%), Utilities (+0.8%), Energy (+0.7%), Health Care (+0.6%), Consumer Staples (+0.4%), Materials (+0.2%)
Declining Sectors: (None)DJ30 +137.48 NASDAQ +36.45 NQ100 +1.8% R2K +0.4% SP400 +0.6% SP500 +13.35 NASDAQ Adv/Vol/Dec 1613/1.72 bln/973 NYSE Adv/Vol/Dec 2089/835 mln/914

4:07PM SMSC beats by $0.18, beats on revs; guides Q2 EPS in-line, revs above consensus (SMSC) 24.01 +0.58 : Reports Q1 (May) earnings of $0.47 per share, excluding non-recurring items, $0.18 better than the Capital IQ Consensus Estimate of $0.29; revenues rose 6.5% year/year to $103.5 mln vs the $101.3 mln consensus. Co issues in-line EPS guidance for Q2, sees EPS of $0.36-0.38, excluding non-recurring items, vs. $0.38 Capital IQ Consensus Estimate; sees upside Q2 revs of $112-114 mln vs. $108.17 mln Capital IQ Consensus Estimate. "We do not expect any further material impact as a result of the Japanese crisis and expect further growth in our automotive and consumer revenue."

6:25AM LDK Solar approved a share buyback program that authorizes LDK Solar to repurchase up to US$110 million of its American Depository Shares (LDK) 6.81 :

09:26 am Molex downgraded to Sell at Ticonderoga; tgt $20: . Ticonderoga downgrades MOLX to Sell from Neutral and sets target price at $20, in light of slowing tech trends, high EMS inventories and a rich valuation relative to tech. Given the relative outperformance of the stock this year and healthy valuation versus tech, they believe now is the time to take profits. For FY12, they are reducing their pro forma EPS estimate to $2.00 from $2.05 (cons: $2.04), however, they believe more downside is possible.

icon url

ReturntoSender

06/29/11 12:15 AM

#9389 RE: ReturntoSender #6755

From Briefing.com: 4:30 pm : For the second straight session broad-based buying on light share volume took stocks sharply higher. Greece's vote on new austerity measures remains on the horizon, however.

Word that Germany backs France's proposal to involve the private sector in Greece's efforts to restore its finances turned the tepid tone of premarket trade into something decidedly more optimistic. Participants' positive response was attributable to the appearance of a unified front in attacking the problems plaguing fiscally woeful Greece. In turn, traders were more dismissive of the uncertainty regarding Greece's vote on a set of austerity measures established by country officials, the EU, and the IMF.

Once trade opened, stocks set out on a steady ascent that took the three major equity averages to gains in excess of 1%. A 2.7% aggregate gain made energy stocks the biggest drivers of the advance. However, Nike (NKE 89.90, +8.28) surged 10% to book one of the best percentage gains for an individual issue following its upside earnings surprise.

Financials failed to find any meaningful support. The sector settled with a gain of just 0.4%. What's more, that modest move came after the sector had spent some time in negative territory.

Participation was paltry once again. In turn, share volume dwindled, which made it easier for stocks to score outsized gains. Thin trading volume is expected to be an ongoing theme this week, given that many traders are taking vacation ahead of the holiday weekend.

4:17PM Dell gives update on growth goals ahead of tomorrow's Analyst Day; co has repurchased $1.6 bln in stock FYTD (DELL) 16.01 +0.07 : Brian Gladden, Dell CFO, outlined the key priorities underway to allow the co to deliver on its long-term value creation framework of 5-7% rev growth, GAAP operating income of more than 7 percent and cash flow from operations exceeding net income. Those priorities include accelerated enterprise growth, disciplined cost management and operational improvements, and continued profitable growth in laptop and desktop products. Over the past four quarters, Dell's revenue has exceeded the long-term growth goal, GAAP operating income has been 6.7% and cash flow has been $4.2 billion, which was 1.3 times net income. Mr. Gladden also reported that, fiscal year-to-date, Dell has repurchased $1.6 billion in stock and expects to repurchase more than $2 billion in stock during the current fiscal year.

11:04AM Micron selected to help Alcatel-Lucent (ALU) accelerate information sharing across global broadband networks (MU) 7.32 -0.02 : Cos announced that Alcatel-Lucent has chosen Micron's third-generation reduced latency DRAM to drive Alcatel-Lucent's next generation of network offerings. Alcatel-Lucent plans to rely on Micron's RLDRAM 3 memory to support the industry's first 400-gigabit capable chipset.

8:02AM Axcelis Tech selected the Integra ES plasma dry strip system to support high-volume device manufacturing facilities (ACLS) 1.70 : The systems have started shipping this month to multiple fabs worldwide.

STMicroelectronics (STM) introduced a new memory with a fast recording feature for storing important data during unexpected events.

09:09 am JA Solar downgraded to Sell at Brean Murray; tgt $4: . Brean Murray downgrades JASO to Sell from Hold and sets target price at $4. Firm notes downgraded is based on material pricing pressure in conjunction with higher raw material costs associated with inventory write-downs from Q1 and limited benefit from lower costs across the value chain, particularly around polysilicon as it remains committed to long-term contracts to its major supplier. Firm highlights this suggests less of a prospect for the co to experience similar 2H/11 rebound in margins associated with the recent and dramatic decline in silicon prices that are helping to drive some margin expansion for its peers in the Q3/Q4 time frame.

09:08 am OmniVision upgraded to Buy at Canaccord Genuity; tgt raised to $38: . Canaccord Genuity upgrades OVTI to Buy from Hold and raises their tgt to $38 from $33 following positive supply chain checks that show a strong manufacturing ramp for image sensors in CQ3, and general health for Apple-weighted component suppliers. Firm says while initial yields for BSI-2 may constrain gross margin expansion in H2/11, they believe ramping smartphone demand for 8MP, weak feature phone trends, and strength for Entertainment should drive revenue and EPS upside at solid ASPs.

icon url

ReturntoSender

07/03/11 10:43 PM

#9390 RE: ReturntoSender #6755

From Briefing.com: Weekly Recap - Week ending 01-Jul-11The stock market rallied the most in two years ahead of the holiday shortened week. The major indices advanced ahead of and after the Greek parliament successfully voted on austerity measures that are needed in order to get a bailout and avoid default. As stocks rallied, the dollar fell, commodities gained and yields on Treasuries bounced higher.

Buying interest was broad-based - only seven stocks within the S&P 500 posted a loss. The 10 sectors gained at least 2.9%. Tech led the way, rallying 6.9%, followed by a 6.4% gain in industrials. Defensive sectors underperformed on a relative basis with Consumer staples up 2.9% and utilities gaining 3.4%.

The rally this week leaves only financials in the red for the year (-2.0%). The healthcare sector is still the top gainer (+14.1%) despite underperforming this week.

In corporate items, news that Bank of America (BAC) agreed to an $8.5 bln mortgage settlement with a bevy of influential investors. Shares rose 5.4%.

Credit/debit card companies rallied the most this week after the interchange fee cap was lowered by a lower-than-expected amount. MasterCard (MA) gained 15.4% and Visa (V) climbed 19.8%.

The market had a relatively limited reaction to economic data this week, though an upside surprise on ISM helped extend gains Friday.

Initial claims have levitated above 400,000 for many weeks now without any special factors to account for the uptick. The latest report didn't show anything different, as claims for the week ending June 25 were 428,000 (Briefing.com consensus 420,000), down a mere 1,000 from the week before. The 4-week moving average rose slightly to 426,750.

Although this initial claims report will not factor into the upcoming employment report for June, the persistent levitation above 400,000 will keep expectations for strong, nonfarm payroll growth in check. Payroll gains in excess of 100,000 are needed to support normal labor force growth and a stable unemployment rate.

As a reminder, the stock market is closed Monday in observance of the Fourth of July holiday.
 
Index Started Week Ended Week Change % Change YTD %
DJIA 11934.58 12582.70 648.12 5.4 8.7
Nasdaq 2652.89 2816.03 163.14 6.1 6.2
S&P 500 1268.44 1339.6 71.23 5.6 6.5
Russell 2000 797.79 840.04 42.25 5.3 7.2

7:59AM MEMC Elec announces termination of Suntech Power (STP) Wafer supply agreement (WFR) 8.53 : Co announces that its unit and and Suntech Power (STP) have agreed to terminate their long-term solar wafer supply agreement. Under the terms of the supply agreement, which was originally signed in July 2006, WFR was to supply solar wafers to Suntech over a 10-year period, with pre-determined pricing, on a take or pay basis beginning in January 2007. As part of the original supply agreement, STP advanced funds to WFR in the form of a loan/security deposit and WFR received a warrant to purchase up to a 4.99% equity stake in STP. Issues with respect to Suntech's price and volume purchase obligations under the supply agreement have created challenges to finding a mutually beneficial arrangement between the parties. After two formal contract amendments, in order to resolve these ongoing challenges, the co's have now agreed to terminate the supply agreement. In exchange for WFR's agreement to terminate the supply agreement, STP has agreed to pay WFR $120 mln, through the retention by WFR of $53 mln of cash deposited previously by Suntech under the supply agreement and currently held by WFR, and a $67 mln irrevocable letter of credit established by STP for the benefit of WFR, to be drawn upon in four equal installments on July 8, 2011, October 1, 2011, January 1, 2012 and April 1, 2012. WFR is assessing the financial impact on its second quarter and full year 2011 earnings of the Suntech termination, related contract termination charges, and other restructuring actions.

7:00AM JA Solar to acquire wafer producer Solar Silicon Valley (JASO) 5.55 : Co announced that it has entered into a definitive agreement to acquire 100% ownership interest in Silver Age Holdings Limited, a British Virgin Islands company that owns 100% of Solar Silicon Valley Electronic Science and Technology, in a transaction that values Solar Silicon Valley at ~$180 mln. At the time of closing JA Solar will issue 30.901 million ordinary shares as consideration at a price of $5.825 per share. Each ADS of JA Solar represents one ordinary share. The consideration for the acquisition represents ~2.6 times the audited net income of Solar Silicon Valley for 2010. Upon completion of the transaction, JA Solar's internal wafer capacity will be increased to approximately 785MW, ensuring a stable supply of low-cost wafers. The acquisition is subject to customary closing conditions and Chinese regulatory approvals, and is expected to close in the third quarter of 2011.


icon url

ReturntoSender

07/06/11 12:48 AM

#9393 RE: ReturntoSender #6755

From Briefing.com: 4:30 pm : Participants opted to sit on last week's gains, so the major equity averages spent the entire session chopping along before booking a mixed finish.

Even though the observance of Independence Day yesterday allowed stocks an extra 24 hours to rest after last week's climb -- the strongest in about two years -- the broad market moved sideways today. Underlying action was consistently without leadership.

The major averages saw some selling interest stem from news that analysts at Moody's downgraded Portugal's debt. Moody's has also been reviewing banks in China because audits may have understated the amount of money that the banks doled out to local governments.

Domestic bank stocks were out of favor all session. Their weakness weighed on the overall financial sector, which fell to a 0.6% loss.

Energy stocks were the best performers, as a group. The group was helped by the spike in oil prices during pit trade. Forward contracts saw oil prices push up by 2.1% to almost $96.90 per barrel. Ameron International (AMN 85.08, +18.81) surged in response to a takeover offer from National Oilwell Varco (NOV 80.02, +1.71). Exxon Mobil (XOM 81.60, -0.41) suffered a slight loss, even though reports suggested that a swelling Yellowstone River could complicate the company's efforts to clean it up after an oil leak was discovered recently.

Immucor (BLUD 26.99, +6.26), which will be required by TPG Capital, was another top performer, but the health care sector remained stuck in the red. The group settled with a 0.3% loss.

The dollar caught a nice bid on the back of Portugal's downgrade. At the close of trade, the greenback had advanced 0.6% against a collection of competing currencies, namely the euro, which dropped 0.9% to $1.442.

The only piece of domestic data on today's calendar was a 0.8% increase in factor orders for May. Orders had been expected to increase by 1.0%, though. Foreign data featured underwhelming PMI Services readings. The flow of data will remain slow for the rest of the week, but participants get their hands on a highly anticipated jobs report this coming Friday. The current consensus calls for the headline unemployment rate to remain at 9.1%.

Advancing Sectors: Energy +0.5%, Consumer Discretionary +0.4%, Tech +0.2%, Materials +0.1%
Declining Sectors: Consumer Staples -0.1%, Telecom -0.2%, Health Care -0.3%, Industrials -0.6%, Utilities -0.6%, Financials -0.8%DJ30 -12.90 NASDAQ +9.74 NQ100 +0.4% R2K +0.2% SP400 +0.1% SP500 -1.79 NASDAQ Adv/Vol/Dec 1296/1.56 bln/1266 NYSE Adv/Vol/Dec 1462/907 mln/1546

1:29PM American Electric unit to partner with Turning Point Solar on the development of the Turning Point Solar generating facility in Noble County (AEP) 37.76 -0.42 : AEP Ohio entered into a participation agreement with Turning Point Solar, a joint venture of Agile Energy and New Harvest Ventures, to cooperate on the development of one of the largest solar generating facility east of the Mississippi River. Construction and commercial operation of the facility will be phased in over three years with construction expected to begin in the summer of 2012 and finishing in 2015.

12:49PM GT Solar receives $81.7 mln in new orders for polysilicon production equipment and technology (SOLR) 16.80 +0.62 : The recent orders include GT's hydrochlorination equipment used for the production of TCS as well as other polysilicon production equipment. The orders will be included in GT Solar's backlog for its first quarter of FY12, which ended on July 2, 2011.

Microsoft (MSFT) and Wistron have executed a patent agreement that provides broad coverage under Microsoft's patent portfolio for Wistron's tablets, mobile phones, e-readers and other consumer devices running the Android or Chrome platform. Although the contents of the agreement have not been disclosed, the parties indicate that Microsoft will receive royalties from Wistron under the agreement.

8:32AM Marvell increases share repurchase program by $500 million to $1.5 billion (MRVL) 15.11 : "We continue to be confident in our growth prospects and our ability to generate significant cash flows. Combined with our strong balance sheet, we believe this increase in the share repurchase is consistent with our plan to return value to our shareholders." The repurchases, which are expected to be funded from Marvell's current cash and short-term investments position that stood at approximately $2.3 billion as of April 30, 2011, may occur in open market, privately negotiated or block transactions.

Marvell (MRVL) announced that four of the six smartphones selected by China Mobile (CHL) in its first round of smartphone purchasing are powered by the Marvell PXA920 single-chip solution.

8:31AM Advanced Energy lowers Q2 rev guidance below consensus; sees EPS at the low end of, or slightly lower than previous range (AEIS) 15.02 : Co lowers Q2 guidance; lowers Q2 rev guidance to $137-140 mln from $148-160 mln vs $153.35 mln Capital IQ Consensus Estimate; with earnings at the low end of, or slightly lower than $0.36-0.44 vs. the $0.42 consensus. "The performance of our renewables business drove our lower than expected second quarter rev, while our thin film business performed in-line with our expectations. Our results were primarily impacted by changing solar market conditions driven by panel price declines, short lead-times for components, and permitting and financing delays. These trends are causing some customers to push-out purchases until panel prices stabilize, leading to the postponement of construction of their projects. Additionally, changing incentive programs in certain regions, coupled with increasing competition, affected the quarter and continue to be ongoing industry dynamics. While we are disappointed in our renewables results this quarter, our recently-announced large project wins reinforce our confidence in our strategy of selling based on LCOE (levelized cost of energy), which we believe will continue to differentiate us from our competitors."

Xilinx (XLNX) announced that Logicview Electronic Technology has selected Virtex-6 FPGAs for the co's next-generation prototyping system and hardware emulation platform slated for introduction in early 2012.

# Lattice Semiconductor (LSCC) announced that its LatticeECP3 FPGA family is compliant with the PCI Express 2.0 specification at 2.5Gbps.

Wi-LAN (WILN) announced that the co and Texas Instruments (TXN) reached an agreement to end litigation regarding Bluetooth in the U.S. District Court for the Eastern District of Texas. Terms of the agreement, including financial amounts to be paid to WiLAN, are confidential.

08:58 am Riverbed Technology downgraded to Perform at Oppenheimer: . Oppenheimer downgrades RVBD to Perform from Outperform. While they are not calling the top on shares and remain constructive on the co's long-term fundamentals, they feel the recent price run-up limits near-term upside potential. They believe co is poised to deliver a strong second quarter based on their channel checks, and feels that the co is well positioned to benefit long-term from its leadership in the WOC market. That said, with valuation less appealing at current levels and a 2012 catalyst not yet established, OPCO feels it would be appropriate for investors to take profits.

08:57 am Freescale Semi initiated with a Outperform at Oppenheimer; tgt $24: . Oppenheimer initiates FSL with a Outperform and price target of $24. Following five years of transformation as a private co, FSL went public May 25. FSL's core embedded processor, microcontroller, and RF/analog/sensor products target the automotive, communications, industrial and consumer markets. Turnaround efforts appear to have taken root and FSL is back in growth/share gain mode, with particular traction/upside in its largest end-market, automotive. Additionally, deleveraging and continued consolidation efforts appear poised to push material margin expansion into 2013-a rare thing in semis at this point in the cycle.

icon url

ReturntoSender

07/09/11 3:42 PM

#9395 RE: ReturntoSender #6755

From Briefing.com: Weekly Recap - Week ending 08-Jul-11The stock market managed to squeeze out a modest gain during the holiday-shortened week despite disappointing employment figures.

Trade was mixed with five of the 10 sectors within S&P 500 posting a gain. Cyclical sectors energy (+0.8%), tech (+1.6%) and materials (+1.3%) all outperformed. Telecom (-1.3%) and financials (-1.1%), underperformed as they have year-to-date (telecom is up 4.4% and financials are down 3.1% for the year).

Retailers outperformed following solid same-store sales reports. Target (TGT) advanced 6.6%, Kohl's (KSS) climbed 6.5% and Abercrombie (ANF) gained 6.3%.

The main item this week was the employment report for July, which disappointed on every front.

Nonfarm payrolls rose a meager 18,000 (Briefing.com consensus +80,000); nonfarm private payrolls increased 57,000 (Briefing.com consensus +110,000); the unemployment rate rose to 9.2% (Briefing.com consensus 9.1%); the average workweek dipped 0.1 to 34.3 hours (Briefing.com consensus 34.4); and hourly earnings were flat (Briefing.com consensus +0.2%).

Separately, nonfarm payrolls for April and May were revised lower, with the former month going from 232,000 to 217,000 and the latter month going from 54,000 to 25,000.

The "real" unemployment rate, which factors for the total unemployed plus marginally attached workers and persons working part-time for economic reasons, jumped from 15.8% in May to 16.2% in June. That is tantamount to saying one in six workers over the age of 16 is either unemployed or underemployed.

In overseas news, Moody's downgraded Portugal's debt to junk status and the People's Bank of China again raised its one year lending rate Asian markets ended the week higher while European shares posted modest losses.
In commodity action, gold prices rallied 4.1% as the CRB Index gained 2.0%. The dollar also advanced--climbing 1.8% against the euro and 1.1% against a basket of currencies.
 
Index Started Week Ended Week Change % Change YTD %
DJIA 12582.70 12657.20 74.50 0.6 9.3
Nasdaq 2816.03 2859.81 43.78 1.6 7.8
S&P 500 1339.67 1343.80 4.13 0.3 6.9
Russell 2000 840.04 852.57 12.53 1.5 8.8

STMicroelectronics (STM) announced a new highly integrated SoC family with unique integration of comprehensive video and audio inputs, advanced video quality and expanded functionality.

3:24AM United Micro reports June sales of NT$9.186 bln; down 11.1% YoY; down 2.3% sequentially (UMC) 2.55 :

1:56AM Newport enters into agreement to acquire Ophir Optronics (OPHRF) for $8.43 per share; ~$230 mln (NEWP) 18.91 : Co announces it has signed a definitive agreement to acquire Ophir Optronics. The consideration to be paid by Newport is $8.43 per share, or a total of ~$230 mln in cash. The transaction is expected to close in the fourth quarter of 2011. Co expects the transaction to be immediately accretive to its earnings following the closing.

10:07 am Multi-Fineline Lowers Third Quarter Revenue Guidance (MFLX)

Multi-Fineline (MFLX $20.35 -1.38) lowered its third quarter revenue guidance to approx. $191 million, versus the previous guidance of $200 million to $220 million and consensus of $209.95 million.

The company expects gross margin to be approx. 12%, down from prior guidance of 12% to 13%.

The company said, "Primarily due to a reduction in demand from one key customer in the latter part of June, net sales for the third quarter were lower than expected. Although forecasting in the near term is difficult, we believe we have significant market share with our major customers and we expect net sales to increase on a sequential quarter basis in the fourth quarter due to higher seasonal demand."

09:59 am Ixia Lowers Second Quarter Guidance (XXIA)

Ixia (XXIA $9.87 -3.14) lowers second quarter earnings guidance to $0.07 to $0.08, down from $0.14 to $0.17 previously, versus the $0.16 Capital IQ Consensus Estimate. On the top line, the company expects revenues to fall in the range of $67 million to $69 million, down from $78 million to $82 million previously versus $80.16 million Capital IQ Consensus Estimate.

The company said, "We are disappointed with our revenue performance this quarter, which was impacted by several factors, including delays and reductions in spending by certain large network equipment makers, a large wireless order received too late in the quarter to ship and soft sales in the Asia Pacific region, while we expected revenue from Japan to decline sequentially from the record first quarter, we experienced unexpected weakness in other parts of Asia Pacific, such as China and India. It is important to note that second quarter sales to our largest customer, Cisco, were strong at approximately $10 million. Additionally, we did see some encouraging trends in the quarter, including an overall book-to-bill ratio in excess of one, and we secured our highest booking quarter to date for our IxCatapult wireless solutions, some of which will be recognized as revenue in future quarters. These indicators give us confidence that we will return to sequential growth in the third quarter although we remain cautious about the overall spending environment."

09:54 am SemiLEDs Misses Third Quarter Expectations; Sees Fourth Quarter Guidance Below Consensus (LEDS)

SemiLEDs (LEDS $5.69 -0.51) reported third quarter GAAP ($0.19) per share, $0.12 worse than the Capital IQ Consensus Estimate of ($0.07).

Revenues fell 43.4% year/year to $5.6 million versus the $6.3 million consensus.

GAAP gross margin for the third quarter of fiscal 2011 was 9%, compared with 51% in the third quarter of fiscal 2010. Operating margin for the third quarter of fiscal 2011 was negative 70%, compared with 36% in the third quarter of fiscal 2010.

Margins were negatively impacted by a charge of $1.1 million for the write-downs of inventory.

For the fourth quarter, the company expects to see GAAP EPS of ($0.25)-(0.23) vs. ($0.03) Capital IQ Consensus Estimate; sees fourth quarter revenues in the range of $5.5 million to $6.5 million versus the $9.03 million Capital IQ Consensus Estimate; with a negative GAAP gross margin.
icon url

ReturntoSender

07/10/11 6:20 PM

#9397 RE: ReturntoSender #6755

InvestmentHouse Weekend Market Summary

http://www.investmenthouse.com/weekendmarketsummary.htm

- Weak, very weak, jobs data disappoints investors.
- Stocks sell, but they do good work in minimizing the damage.
- Unemployment rate rises even as jobs pool falls, underscoring the weakness in jobs market.
- More testing is likely but market shows surprising strength in the face of bad news, suggesting a test versus a selloff.

MARKET SUMMARY

Woeful jobs data hurts stocks, but investors move in on the dip.

Weak jobs data on Friday disappointed investors and knocked the market back for some significant losses. Investors were not overly disappointed, however, because they used the selling to step back in and push stocks back to the upside as you can see from the chart of the SP500. They did not finish positive on the day, but there were very good recovery moves. NASDAQ was down 1.4% on its low, but it rebounded to close with just a 0.4% decline. The NYSE sold down 1.5% on its low, but it managed to recover almost half of that, closing at just 0.8%. There was downside, but it was not overly negative.

Volume fell significantly on both the NYSE and the NASDAQ. Volume on the NASDAQ fell 14%, and it was down almost 11% on the NYSE. Lower volume and the recovery off of the session lows hit early on both indicate that sellers are not just dumping stocks. The fear on the day was that investors would come in with all the good news they could possibly have and then get a bad number on the jobs report and really sell the market. It looked like they might do that early, but they did manage to find support and rally back not turning positive but nicely cutting the losses. That would suggest that our scenario is in place of a pullback to test versus a rollover.

I always thought this was a relief bounce, but I was open to change as it continued higher. It certainly has not made the breakout to a new rally high, but it exhibited good strength to the upside. Now it has had very bad news after eight days of upside and about all the good news any market could possibly have. It sold off on that bad news, but only modestly; that is another indication that this is a positive for the upside longer term. Once this pullback runs its course, it will be ready to move higher once again.

What news on the day made the difference? Of course it was the jobs report after the ADP report on Thursday came in much stronger than expected, more doubling expectations. The nonfarm payroll came in horribly weak at 18K jobs versus 80K expected. Some people already said 175K was expected on the nonfarm payrolls, and it did not come close. Moreover, May was revised to 25K from 54K, more than halving the prior iteration. Private payrolls were nowhere near the expectations of most pundits, coming in at 57K versus 110K.

The unemployment rate was interesting. It rose to 9.2% versus 9.1% before and a repeat of that number as expected. Often the unemployment rate will rise as the economy starts to improve. More people start looking for work, there are not enough jobs to absorb them all, and that equals a higher unemployment rate. This time the jobs pool fell by 270K. There were not more people looking for jobs and inflating the jobless claims numbers. Job creation is so anemic that the unemployment rate rose even with a 270K reduction in the work force. That is an indication of just how pernicious this downturn is and what trouble people have in finding work. Employers simply do not want to spend the money to hire new people.

Another important element of the report is the average workweek. It came in at 34.3 when 34.4 was expected, and 34.4 was hit the month before. There had been an increase, but it did not continue. Overall hours worked are still rather low, so there is not much pressure on companies to hire more employees.

Wholesale inventories for May rose 1.8%, doubling the 0.9% expected. The revisions were up to 1.1% from 0.8% in April. This may seem like a good thing. Companies are producing more goods, but it is not a good thing if they cannot sell them. Inventories are not stacking up because companies are making more goods; the regional PMI reports show that some areas are even contracting. There is not a big ramp up in manufacturing, and a lot of companies in the manufacturing business are cutting back or slowing down their runs. This tells us it is only a lack of sales pushing inventories higher. Retailers are not out buying as much from the wholesalers.

This economic data was more than enough to dampen the enthusiasm seen earlier in the week from the solid Chicago manufacturing number, the ISM manufacturing that was stronger than expected, and the ADP report out on Thursday. Stocks sold back and closed lower, although it was good to see them manage to recover off of the lows into the close.

OTHER MARKETS

Dollar: 1.4265 Euro versus 1.4352.
Click to view the chart

Bonds: 3.03% versus 3.15% versus 3.10% 10 year US Treasury. Surging on the weaker economic data as you would expect.
Click to view the chart

Gold: $1541.90, +11.30. Fear over the US outlook sent investors to the gold pits.
Click to view the chart

Oil: $96.20, -2.47. Weak economic data meant weaker oil prices, this after spiking close to $100 yet again.
Click to view the chart

TECHNICAL SUMMARY

INTERNALS.

Volume. The internals were not that great, but they did not do any damage. Volume was lower, down 14% on NASDAQ to 1.61B. It was lower by 10% on the NYSE to 712M. Lower volume on the selling shows that investors were not dumping their stocks. The fact that they bounced back later in the session shows that to be the case.

Breadth. Decliners were a bit worse. -2:1 on NASDAQ, decliners over advancers. -2.3:1 on the NYSE. Bad but not atrocious.

CHARTS

SP500. There is the initial selloff, but it held at the early-July low. SP500 managed to rebound and close right at that February closing high at 1343. SP500 closed at 1343.8, so it was able to hold above that level. Still an important area. It is right below the April and May peak, and it has not been able to recover yet. We still have to watch for a downtrend. Again, you have to like the way it managed to fight its way back off of those lows. That leaves it in position to test a bit more and then take on those highs and try for the breakout once again.

NASDAQ. NASDAQ lost almost 0.5%. It gapped lower. Indeed, on the low it pretty much filled the gap higher Thursday that occurred on that ADP report. It reversed off of its lows, and, while it did not close positive, it did manage to push back up into the range from Thursday. It was down and having its issues, but it also held and reversed. It is still in position to make a run at the late-April peak. Very interesting.

SP600. SP600 lost 0.7% but also sold off, undercutting the Thursday low and reversing. While it was still down on the day, it shows a good reversal. It could test some more over the next few days and deliver a new and sustained break to the upside.

SOX. All things considered, SOX performed rather admirably. It dropped 1.6%, but it tapped the 10 and 20 day EMA on the low and bounced nicely off of that level. Semiconductors will be very important in the market moving ahead, and they are trying to hang onto this rally off of the double bottom from the third and fourth week of June. They are trying to do what they need to do. As long as they manage to recover off of the lows as we saw, that is a good indication. If we can get the semiconductors to lead higher, that would be a good indication overall for the market moving higher as well.

LEADERSHIP

Leadership had a common thread, and that was it managed to hold relatively important near-term support and rebounded off of the opening lows. ININ is an indication of that. It is one I felt was good to move into on the day because it held the 50 day EMA and bounced. We just took a partial position for now. We are nibbling away at positions as they show the ability to recover. That is exactly what we wanted to see.

Other stocks are doing the same thing. After gapping higher on Thursday, DANG gapped lower but held the 20 day EMA on the low and managed to hold key support. That was worth a few partial positions as well. NTES tested nicely, tapping the 10 day EMA for the second session in a row. It recovered nicely to the close. It was also worth buying some positions.

The real leaders of the market are holding up very well. They came back to test, but they have just been using this as a reason to pull back, consolidate, and set up the next move to the upside. We are seeing this in other areas and will continue to look for stocks in position to move higher. Even after the market sold on a weak jobs report, it managed to rebound off of those lows. A lot of these leaders did the same thing, and we were ready to move in and pick up a few as they made that recovery. Nice tests, and they now look to be bouncing. Definitely worth putting your money into.

THE MARKET

SENTIMENT INDICATORS

VIX. The VIX gapped higher, but it closed virtually flat when the market recovered. Volatility is simply not exploding higher, and it shows that this selling was not that virulent. That is, of course, a good thing for the upside.

VIX: 15.95; 0
VXN: 17.45; -0.26
VXO: 15.65; +0.16

Put/Call Ratio (CBOE): 1.02; +0.17

Bulls versus Bears:

This is a reading of the number of bullish investment advisors versus bearish advisors. The reason you look at this is that it gives you an idea of how bullish investors are. If they are too bullish then everyone is in the market and it is heading for a top: if everyone wants to be in the market, then all the money is in and there is no more new cash to drive it higher. On the other side of the spectrum if there are a lot of bears then there is a lot of cash on the sideline, and as the market rallies it drags that cash in as the bears give in. That cash provides the market the fuel to move higher. If bears are low it is the same as a lot of bulls: everyone is in and the market does not have the cash to drive it higher.

Bulls: 40.9% versus 39.8%. Rallying for a second week after that strong rebound rally. Down from 45.2% over the past month, but trying to turn back up after holding just over 35%, below which is considered bullish. Well below the 5 year high at 62.0. Fading back from the level considered bearish, i.e. where so many are in the market and believe it is going up that the ammunition to send it higher runs low. The crossover level at 29% bulls from July 2010 is long gone. 35% is the threshold level suggesting bullishness. To be seriously bearish it needs to get up to the 60% to 65% level.

Bears: 24.7% versus 26.9%. Falling for a second week after a rise. Big upside burst a month back from 22.6%. Passed the 23.1% hit to start April and putting the moves on 28.3% from September 2010, just as the market pulled out of that base. The 35% level is considered bullish for the market overall. For more reference, bearishness hit a 5 year high at 54.4% the last week of October 2008. The move over 50 took bearish sentiment to its highest level since 1995. Extreme negative sentiment. Prior levels for comparison: Bearishness peaked at 37.4% in September 2007. It topped the June 2006 peak (36%) on that run. That June peak eclipsed the March 2006 high (33%) and well above the 2005 highs that spawned new rallies (30% in May 2005, 29.2% in October 2005). That was a huge turn, unlike any seen in recent history.

NASDAQ

Stats: -12.85 points (-0.45%) to close at 2859.81
Volume: 1.617B (-14.35%)

Up Volume: 503.64M (-1.076B)
Down Volume: 1.11B (+830.79M)

A/D and Hi/Lo: Decliners led 2.02 to 1
Previous Session: Advancers led 3.24 to 1

New Highs: 77 (-151)
New Lows: 30 (+7)

NASDAQ CHART: Click to view the chart

NASDAQ 100 CHART: Click to view the chart

SOX CHART: Click to view the chart

SP500/NYSE

Stats: -9.42 points (-0.7%) to close at 1343.8
NYSE Volume: 712M (-10.44%)

Up Volume: 362.55M (-1.467B)
Down Volume: 1.89B (+1.571B)

A/D and Hi/Lo: Decliners led 2.35 to 1
Previous Session: Advancers led 3.56 to 1

New Highs: 114 (-326)
New Lows: 103 (-33)

SP500 CHART: Click to view the chart

SP600 Chart: Click to view the chart

DJ30

Stats: -62.29 points (-0.49%) to close at 12657.2
Volume DJ30: 131M shares Friday versus 153M shares Thursday.

DJ30 CHART: Click to view the chart

MONDAY

There is a slew of important data next week. Export and import prices are important on the 13th. We also have FOMC minutes. It is always interesting to see how the Fed is shaping up so we can figure out what will happen at the next meeting. Continuing claims on Thursday, as always. Retail Sales for June are out, and that is an important read. There is the core PPI along with the PPI. On Friday we have the CPI and core CPI along with the New York Empire Manufacturing that fell almost 8 points in June. Very important indeed.

You have to take a lot of this in light of the economic data up to this point. It does not indicate any strong recovery. On Thursday I said there was no reason to expect the jobs number to be as strong as expected unless the administration or government was playing around with the numbers. One would assume they had not done so given the weak result. There will be scrutiny on this week's economic data, though it will be hard to top the disappointment of the Friday jobs report for June.

That said, what I discussed earlier is still the relevant view of the near future. The indices sold on the news, but they were able to pare their losses nicely. That means I expect that the relief rally and the stripes it was showing are changing somewhat. It is not just a relief rally; it is trying to actually set up a test and make a new break to the upside. It can do that. It has, after all, changed somewhat. You have to be open to change in the market. We never thought it would bounce this high, and thus the plays we were making to the upside performed better than we thought as well. We have very good gain in hand. Now the question is just what I talked about last night and this morning: Will this be a pullback, a rollover, or a break higher from here?

It does not look like it has finished testing yet. Based on the action it has shown, I do not think there is necessarily a rollover in place. After all, we saw good recoveries on Friday. Very interesting, indeed. I am looking more for a test of this move. That does not mean a single day; I am looking for two, three, or maybe four or five days of a test before a move back up that could realistically have a chance of breaking through the prior highs. That did not mean we were not active. We did pick up shares of stocks such as ININ, DANG, and NTES. Those were very nice pullbacks that tapped support and looked to be ready to move back to the upside. We are already using this pullback to enter some positions. We are just taking partials right now, but if things improve with the test, we could take larger positions overall.

That is the mindset I have heading into this week. We could still get a rollover. There is no doubt that the market could just turn over and dive if the economic data continues on the heels of the Friday jobs report and shows that slowing overcomes the ADP as well as the other reports last week that suggested there was improvement taking place in the economic data. In other words, more bad news may trump the good feelings engendered during the week that helped drive the market to the upside.

More likely, given what we have seen in the action of the leaders, we will get a pullback. Somewhere back down near this 1330 range. If it can hold along that range on a three, four, or five day pullback, that puts it in excellent shape to make a new break to the upside and try to take out the prior high. That is pretty cool. We will let it do that, obviously, and enjoy the ride all the way up with our continuing upside plays. That would be a marked change from what we were expecting to happen on this move. Then again, you have to be able to adjust to the market and play accordingly.

As I said last night, I would never have been involved in this market if I would have merely trusted gut instincts. It was saying one thing, but then I saw certain stocks saying it was time to buy. I did not think I knew better than the market, so I just bought in and made money. We will do that again. We will be patient. We will probably see leaders pull back and hold, and we can do what we did on Friday and take some partial positions on those along the way. Then we have good exposure when the market starts to break back to the upside. We can start buying even more when it does that.

The jobs report was not total carnage (even though it was an ugly report) because the market is still showing resilience. If it can show that same resilience on Friday in the face of such bad news, it is likely just ready to test a bit and then make another run or take another shot at that April and May peak. After all, earnings are coming. What better way to celebrate a good earnings season than to have a bit of pullback just before it and then break to a new rally high.

Have a great weekend!

Support and Resistance

NASDAQ: Closed at 2859.81
Resistance:
2862 is the 2007 peak
2888 is the May 2011 peak
2956 from November 2000
3026 from October 2000 low
3042 is the May 2000 low

Support:
2841 is the February 2011 peak
2825 is the 2007 closing peak.
2816 is the early April peak. Key.
2796 is the February gap down point
2762 is the February low
2759 is the May low
The 50 day EMA at 2751
2723 to 2705 is the range of support at the bottom of the January to May trading range
2706 to 2705 is the April 2011 low and the February 2011 and consolidation low (bottom of the trading range)
2686 is the January 2011 closing low
2676 is the January 2010 low
The 200 day SMA at 2674
2645-2650ish from December 2010 consolidation
2603 is the March 2011 intraday low (post-Japan low)
2580 is the November 2010 closing high
2569 is the November gap up point through the April 2010 peak

S&P 500: Closed at 1343.80
Resistance:
1344 is the February 2011 peak is being challenged again
1364 is the March 2007 low
1370 is the August 2007 low
1371 is the recent May 2011 peak

Support:
1340 is the early April 2011 peak
1332 is the early March peak
1325-27 is the March 2008 closing low and the May 2006 peak.
1318.51 is the May low
1313 from the August 2008 interim peak
The 50 day EMA at 1311
1295 to 1294 is the April 2011 low and the February 2011 consolidation low (bottom of the trading range)
1275 is the January 2010 low, early January 2011 peak
The 200 day SMA at 1272
1255 is the late December 2010 consolidation range
1249 is the March 2011 low (post-Japan)
1235 is the mid-December 2010 consolidation low
1227 is the November 2010 peak
1220 is the April 2010 peak

Dow: Closed at 12,657.20
Resistance:
12,876 is the May high
13,058 from the May 2008 peak on that bounce in the selling

Support:
12,605 is the mid-May 2011 high
12,391 is the February 2011 peak
The 50 day EMA at 12,310
12,283 is the March 2011 peak
12,110 from the March 2007 closing low
12,094 is the April 2011 low
11,893 from March 2008 closing low
11,867 from the August 2009 high and peak on that bounce in the selling.
The 200 day SMA at 11,859
11,734 from 11-98 peak
11,555 is the March low
11,452 is the November 2010 peak

Economic Calendar

July 05 - Tuesday
- Factory Orders, May (10:00): 0.8% actual versus 1.0% expected, -0.9% prior (revised from -1.2%)

July 06 - Wednesday
- MBA Mortgage Index, 07/02 (07:00): -5.2% actual, -2.7% prior
- Challenger Job Cuts, June (07:30): +5.3% actual, -4.3% prior
- ISM Services, June (10:00): 53.3 actual versus 54.0 expected, 54.6 prior

July 07 - Thursday
- ADP Employment Change, June (08:15): 157K actual versus 60K expected, 36K prior (revised from 38K)
- Initial jobless claims (8:30): 418K actual versus 425K expected, 432K prior (revised from 428K)
- Crude oil inventories (11:00): -888K actual versus -4.375M prior

July 08 - Friday
- Non-Farm Payrolls, June (8:30): 18K actual versus 80K expected, 25K prior (revised from 54K)
- Private Payrolls, June (8:30): 57K actual versus 110K expected, 57K prior (revised from 83K)
- Unemployment Rate, June (8:30): 9.2% actual versus 9.1% expected, 9.1% prior
- Average workweek: 34.3 actual versus 34.4 expected, 34.4 prior (up from 34.3 the prior month)
- Hourly earnings: 0.0% actual versus 0.2% expected, 0.3% prior
- Wholesale Inventories, May (10:00): 1.8% versus 0.9% expected, 1.1% prior (revised from 0.8%)
- Consumer Credit, May (3:00): $5.1B actual versus $3.5B expected, $6.5B prior

July 12 - Tuesday
- Trade Balance, May (08:30): -$44.0B expected, -$43.7B prior

July 13 - Wednesday
- MBA Mortgage Index, 07/09 (07:00): -5.2% prior
- Export Prices ex-ag., June (08:30): 0.5% prior
- Import Prices ex-oil, June (08:30): 0.4% prior
- Crude Inventories, 07/09 (10:30): -0.889M prior

July 14 - Thursday
- Initial Jobless claims (8:30): 425K expected, 418K prior
- Retail Sales, June (8:30): -0.2% expected, -0.2% prior
- Retail Sales ex-Autos (8:30): 0.0% expected versus 0.3% prior
- PPI, June (8:30): -0.3% expected, 0.2% prior
- PPI Core (8:30): 0.2% expected, 0.2% prior
- Business Inventories, May (10:00): 0.9% expected, 0.8% prior

July 15 - Friday
- CPI, June (8:30): -0.1% expected, 0.2% prior
- Core CPI (8:30): 0.2% expected, 0.3% prior
- Empire Manufacturing, July (8:30): 0.8 expected, -7.8 prior
- Industrial Production, June (9:15): 0.2% expected, 0.1% prior
- Capacity Utilization, June (9:15): 76.8% expected, 76.7% prior
- Michigan Sentiment, July (9:55): 71.3 expected, 71.5 prior
icon url

ReturntoSender

07/11/11 8:09 PM

#9399 RE: ReturntoSender #6755

From Briefing.com: 4:30 pm : 4:16PM Microchip lowers Q1 EPS guidance below cosnensus, citing multiple reasons for broad-based weakness; sees Q2 rev down QoQ (Halted -- will resume trading at 16:35) (MCHP) 37.48 -0.39 : Co lowers Q1 non-GAAP EPS guidance to $0.53-0.55 from $0.58-0.62 vs $0.60 Capital IQ Consensus Estimate. "Our net sales activity in the June quarter did not progress as we originally expected. We are seeing broad-based weakness in our business due to a number of factors. In the June quarter, our automotive business was down significantly from the March 2011 quarter due to lower automotive production activities including supply issues from other manufacturers associated with the earthquake in Japan. We also believe that some of the revenue upside that we saw in the March 2011 quarter was the result of customers being cautious and accelerating purchasing activities to minimize supply chain disruptions. Therefore, we believe we were also impacted by the correction of that inventory in the June 2011 quarter. Additionally, our consumer business was soft due to poorer global economic conditions including high unemployment, high oil prices and the resulting low consumer confidence. The computing portion of our business was also lower than our expectations as we saw reduced purchases by multiple large customers in this sector... We are cautiously modeling our September quarter rev to be QoQ down by low to mid single digits [consensus calls for +3% QoQ off higher Q2 base]... At the end of the June and September quarters, our inventory is expected to be in the 120 to 130 day range, which is acceptable to us and will enable us to keep our lead times short and help us be more competitive in our markets."

4:08PM Novellus beats by $0.02, reports revs in-line (NVLS) 35.77 -0.20 : Reports Q2 (Jun) earnings of $0.79 per share, $0.02 better than the Capital IQ Consensus Estimate of $0.77; revenues rose 9.0% year/year to $350.2 mln vs the $352.1 mln consensus. Bookings in Q2 of 2011 were $311.6 million, down $103.5 million or 24.9% from Q1 2011 bookings of $415.1 million. Second quarter shipments of $359.3 million were down $17.6 million or 4.7% from $376.9 million in Q1 2011.

4:08PM Alcoa misses by $0.01, beats on revs; reaffirms global aluminum demand projections (AA) 15.91 -0.47 : Reports Q2 (Jun) earnings of $0.32 per share, $0.01 worse than the Capital IQ Consensus Estimate of $0.33; revenues rose 27.0% year/year to $6.59 bln vs the $6.34 bln consensus. The sequential increase in income from continuing operations was driven by higher quarterly revenue (up 11%), higher alumina shipments (up 8%), and higher realized pricing for both alumina (up 7%) and aluminum (up 6%), along with improved productivity and continued strong growth in major markets served by mid- and down-stream businesses. This was somewhat offset by a weaker U.S. dollar, along with higher energy and materials costs. Looking ahead, Alcoa projects continued growth in all major end markets on a global basis, including aerospace (7%), automotive (4-8%), commercial transportation (7-12%), packaging (2-3%), building and construction (1-3%), and industrial gas turbines (5-10%). For the year, Alcoa projects aluminum demand to grow 12% on top of the 13% growth seen in 2010. Alcoa projects that, from a 2010 baseline, aluminum demand will double by 2020 on 6.5% annual growth. "Although the economic recovery is uneven, the overall outlook for Alcoa - and for aluminum - remains positive. Demand for aluminum continues to rise and so does growth in our major markets. These factors support our projection that aluminum demand will grow 12% this year and will double by 2020."

Market Close Recap: The near 2% drop suffered by the stock market this session was its worst single-day decline in more than a month. The aggressive sell-off came in response to concerns that the European Union is struggling to help countries in its periphery restore their financial health.

An emergency meeting during the weekend stirred speculation that European Union officials may be considering including Italy in any new bailout packages. Concerns about Italy's financial health began to intensify last week, as evidenced by the spike in yields there.

Worry that the EU remains so far from resolving the threats of countries in the region's periphery sank many of Europe's major bourses. Both France's CAC and Germany's DAX dropped more than 2% in their latest round of trade. Italy's FTSE fell 4%.

Such weakness imbued domestic stocks and prompted participants to sell any gains that they had scored during the course of the past couple of weeks. In turn, the broad-based S&P 500 dropped precipitously. It didn't really secure any support until it came into close contact with its 50-day simple moving average just below the 1320 line.

Financials fell the hardest. The sector's near 3% tumble came amid weakness in banks, insurers, and diversified financial services alike. Only a handful of stocks in the sector were able to limit their losses to less than 1%.

All 30 Dow components settled in the red. Alcoa (AA 15.92, -0.46) was one of the poorest performers ahead of its quarterly report, which marks the unofficial start to earnings season. A few other blue chips will report quarterly results later this week, but announcements won't begin in earnest for several more days.

The Dollar Index hit its best level since March as traders dumped the euro in pursuit of the relative safety offered by the greenback. At the end of the day the dollar was quoted with a 1.2% gain against a basket of competing currencies.

Gold had attracted strong buying interest in the early going, but the precious metal had to fight to settle with a gain. After gold prices had been up by about 1%, they retreated to the neutral line. The precious metal was able to rebound to $1549 per ounce for a 0.5% gain on the day.

Advancing Sectors: (None)
Declining Sectors: Financials -2.8%, Materials -2.1%, Energy -2.0%, Consumer Discretionary -2.0%, Industrials -1.8%, Tech -1.8%, Health Care -1.4%, Telecom -1.1%, Utilities -1.1%, Consumer Staples -0.7%DJ30 -151.44 NASDAQ -57.19 NQ100 -1.8% R2K -2.2% SP400 -2.2% SP500 -24.31 NASDAQ Adv/Vol/Dec 456/1.79 bln/2178 NYSE Adv/Vol/Dec 427/829 mln/2594

Novellus Systems (NVLS) announced the VECTOR CFD family of films for the company's VECTOR Express, VECTOR Extreme and VECTOR Excel plasma-enhanced chemical vapor deposition systems.

PMC-Sierra (PMCS) announced the industry's first true hardware 6Gb/s SATA/SAS RAID controllers with on-board DRAM cache for the entry-level market segment.

Sino IC Technology selected the Teradyne (TER) UltraFLEX to test RF, baseband and broadband devices.

j2 Global Communications (JCOM) announced that it has acquired Data Haven and the virtual PBX business of Buzz Networks. Terms of the acquisitions were not disclosed and the financial impact to j2 Global is not expected to be material. Solid State Supplies has extended its UK and Ireland distribution agreement with Microsemi (MSCC) to include the co's low-power and mixed-signal FPGAs.

09:33 am Aeroflex downgraded to Perform at Oppenheimer following last night's guidance cut: . Oppenheimer downgrades ARX to Perform from Outperform following yesterday's negative pre-announcement. Aeroflex shares have performed well since the November 2010 IPO, up 38% vs. the SOX 9%, and with shares nearing their prior $20 target, they are stepping to the side. Updated F4Q guidance of $198-200 mln vs. prior $220-228 mln was negatively impacted by approval delays for a multi-million dollar US govt radio contract. Following two consecutive quarters of light revenues, they anticipate this miss to weigh on ARX shares at the open and keep them range-bound for at least the immediate future.
icon url

ReturntoSender

07/13/11 10:44 PM

#9400 RE: ReturntoSender #6755

From Briefing.com: 4:25 pm : Buying interest on the back of strong GDP data from China and comments from Fed Chairman Bernanke had the major equity averages up more than 1% today, but that gain was slashed as stocks gradually descended in afternoon trade.

The mood among market participants this morning was much improved from the negativity that permeated trade during the three prior sessions. Participants were partly encouraged by news that China reported second quarter GDP growth of 9.5% over the same period one year ago. The torrid clip proved greater than expected, and suggested that China remains a primary driver of the global economic rebound.

Concerns about the fiscal health of countries in the eurozone's periphery cooled, at least for today, to help the euro rally against the dollar. The dollar dropped another leg lower amid comments from Fed Chairman Bernanke.

During his semiannual testimony on monetary policy to the House Financial Services Committee, Bernanke stated that the Fed remains prepared to adjust monetary policy in the event that economic developments warrant such a move. Bernanke also noted that the Fed has reached a consensus on the steps involved in an exit strategy from current policy. As we expressed yesterday, it is only natural, and should even be expected, that the Fed prudently discuss such scenarios.

Buying interest picked up after participants digested Bernanke's prepared remarks. The stock market's climb was broad based, but natural resource plays staged the strongest gains. In fact, energy stocks were up 2%, as a group. Materials stocks weren't far behind.

The two sectors got an added boost because of a bounce by many underlying commodities. Oil prices had pushed up to a gain of more than 1% on the back of a surprisingly large draw down in weekly oil inventories before an afternoon pullback left it to settle pit trade with a 0.6% gain at $98.05 per barrel. Meanwhile, gold prices rallied to a record high of almost $1589 per ounce before it settled with a 1.5% gain at $1585.30 per ounce.

However, stocks struggled to sustain their gains as action advanced into the afternoon. The loss of support left the major equity averages to drift lower. Only a brief bit of buying interest in the final few minutes kept the stock market from settling at its session low.

Defensive-oriented stocks, which had already lagged all session, suffered the only losses. Specifically, utilities fell 0.2% while telecom closed with a 0.1% loss. Consumer staples stocks collectively closed at the unchanged mark.

A traditional safe haven, the benchmark 10-year Note traded with weakness in the early going, but was able to rebound amid the stock market's afternoon drift. It also got a boost from strong auction results. The 10-year Note sale drew a bid-to-cover of 3.18, dollar demand of $66.7 billion, and an indirect bidder participation rate of 42.0%. For comparison, an average of the past six auctions gives a bid-to-cover of 3.20, dollar demand of $70.4 billion, and an indirect bidder rate of 52.3%.

Advancing Sectors: Materials +0.8%, Energy +0.7%, Consumer Discretionary +0.5%, Industrials +0.4%, Tech +0.3%, Health Care +0.3%, Financials +0.2%
Unchanged: Consumer Staples
Declining Sectors: Telecom -0.1%, Utilities -0.2%DJ30 +44.73 NASDAQ +15.01 NQ100 +0.4% R2K +0.9% SP400 +0.3% SP500 +4.08 NASDAQ Adv/Vol/Dec 1821/1.90 bln/761 NYSE Adv/Vol/Dec 2015/883 mln/987

9:33AM LTX-Credence announces selection of X-Series by ELMOS Semiconductor AG for testing automotive ASICs and ASSPs (LTXC) 8.35 +0.11 :

9:05AM Newport enters into agreement to acquire High Q Technologies (NEWP) 17.87 : Terms of the transaction, which is anticipated to close before the end of the third quarter, were not disclosed. High Q, headquartered in Rankweil, Austria, expects 2011 revenues of approximately $20 million, with three-fourths of its sales to customers in Europe. The company is profitable, and Newport expects the acquisition to be accretive to its earnings immediately after closing.

IXYS Corporation (IXYS) announced the introduction of the PCM-7510 by its IXYSRF division located in Colorado. The PCM-7510 module is an air-cooled, high power pulsed-current source designed to drive diode lasers, bars and arrays in permanent and semi-permanent installations.

Microsemi Corporation (MSCC) announced a new multichip memory product that provides a drop-in replacement for the discontinued Micron memory package used in Texas Instruments (TI) processors.

1:53AM ASML Holding beats by $0.06, beats on revs; guides Q3 revs in-line; reaffirms sales expectations (ex-EUV) (ASML) 34.88 : Reports Q2 (Jun) earnings of $1.00 per share, $0.06 better than the Capital IQ Consensus Estimate of $0.94; revenues rose 5.3% year/year to $1.53 bln vs the $1.51 bln consensus. Co issues in-line guidance for Q3, sees Q3 revs of ~EUR1.4 bln vs. $1.41 bln Capital IQ Consensus Estimate. Co anticipates third quarter orders likely not to exceed EUR500 mln. Co states its 2012 business will be supported by the continuation of the ramp of 2x nm nodes in Logic, 2x nm nodes in NAND memory and 3x nm in DRAM memory, the aggressive and litho-intensive development efforts of sub-20 nm technologies, as well as the introduction of the first EUV volume production systems NXE:3300. Co reiterates sales expectation for all of 2011, to hit a record level clearly above EUR5 bln, not including EUV (no est ex-EUV). Systems backlog, excluding EUV at the end of Q2 was EUR2,756 mln.
icon url

ReturntoSender

07/16/11 8:05 PM

#9401 RE: ReturntoSender #6755

From Briefing.com: Weekly Recap - Week ending 15-Jul-11Stocks tumbled more than 2% as Europe debt concerns and the inability of U.S. lawmakers to reach a debt ceiling agreement weighed on sentiment.

The major indices suffered broad-based losses, with less than 50 stocks within the S&P 500 advancing. Nine of the 10 sectors fell more than 1%. Financials (-4.1%) and industrials (-3.6%) faced the most selling pressure. The energy sector outperformed on a relative basis after settling unchanged.

Fed Chairman Bernanke gave his semi-annual testimony to lawmakers. Bernanke stated that the Fed remains prepared to adjust monetary policy in the event that economic developments warrant such a move. Bernanke also noted that the Fed has reached a consensus on the steps involved in an exit strategy from current policy.

European sovereign debt concerns continues to weigh on stocks. An emergency EU meeting prompted speculation that the EU may be considering including Italy in any new bailout packages. Meanwhile, Moody's downgraded Ireland's debt to junk.

While the U.S. has extremely low borrowing rates currently, the country has debt concerns of its own. Major rating agencies Moody's and S&P 500 both put the U.S. on review for a possible downgrade as uncertainty regarding the debt ceiling persists. S&P gave it a 50% chance that it will lower its long-term U.S. rating within the next 90 days.

In corporate news, second quarter earnings reporting season unofficially started this week with Alcoa's (AA) report after the close Monday. A total of 13 S&P 500 companies reported earnings. Although 10 of them topped earnings expectations, only two of the reporting stocks posted a weekly share price advance.

Alcoa missed EPS estimates by a penny, but posted better-than-expected revenue and offered a reassuring outlook. Shares fell 5.8% for the week.

Banking giants JPMorgan Chase (JPM -2.0%) and Citigroup (C -8.7%) both saw their share prices decline despite posting upside EPS results.

Shares of Google (GOOG 12.7%) rallied after the company handily topped EPS expectations. Revenue increased 24% y/y and EPS gained 36%.

Earnings reporting season speeds up in the coming week. Operating earnings are projected to increase 14% y/y. Given the current uncertainty in the capital markets, guidance will be a key factor.
 
Index Started Week Ended Week Change % Change YTD %
DJIA 12657.20 12479.70 -177.50 -1.4 7.8
Nasdaq 2859.81 2789.80 -70.01 -2.4 5.2
S&P 500 1343.80 1316.14 -27.66 -2.1 4.7
Russell 2000 852.57 828.78 -23.79 -2.8 5.8

11:07 am Citigroup Beats Second Quarter Earnings Expectations (C)

Citigroup (C $39.34 +0.32) reported second quarter earnings of $1.09 per share, $0.13 better than the Capital IQ Consensus Estimate of $0.96.

Revenues rose 4.5% year/year to $20.62 bln versus the $19.76 bln consensus.

"We expect to begin returning capital to shareholders next year and end that year with an 8%-9% Tier 1 Common Capital Ratio under Basel III. During the first half of 2011, we added an estimated $9 billion in Basel III regulatory capital through the 'multiplier effect' created by the combined impact of earnings and the utilization of our deferred tax assets. In addition, at the end of 2012, we currently expect Citigroup's risk weighted assets under Basel III to be in the range of 135% of what they would be under Basel I and, more importantly, Citicorp's risk weighted assets to be approximately 120% of what they would be under Basel I."

Citicorp revenues of $16.3 billion in the second quarter 2011 decreased less than 1% from the prior year period. Citi Holdings revenues declined 18% from the prior year period to $4.0 billion. Citigroup's quarterly net income increased 24%, compared to the second quarter 2010, to $3.3 billion as a significant improvement in the cost of credit was partially offset by higher operating costs. Total cost of credit in the second quarter fell 49% to $3.4 billion. The improvement in credit costs was driven by a 35% decline in net credit losses to $5.1 billion and a $2.0 billion release of credit reserves, reflecting a lower level of inherent losses remaining in the portfolio. Operating expenses grew 9% from the prior year period to $12.9 billion, reflecting the impact of foreign exchange translation, volume-related expenses in Citicorp, legal and related expenses and ongoing investment spending, which were partially offset by ongoing reengineering benefits and lower expenses in Citi Holdings.

Citigroup's total allowance for loan losses was $34.4 billion at quarter end, or 5.4% of total loans. The $2.0 billion net release of credit reserves was 37% higher than the prior year period as credit quality continued to improve during the second quarter. More than half of the net credit reserve release was attributable to Citi Holdings.

Book value per share was $60.34 and tangible book value per share was $48.75, 13% and 16% increases, respectively, versus the prior year period. Citigroup's Tier 1 Capital Ratio was 13.6% and its Tier 1 Common Ratio was 11.6%, an increase of 161 bps and 189 bps, respectively, from the second quarter 2010.
icon url

ReturntoSender

07/18/11 9:50 PM

#9404 RE: ReturntoSender #6755

From Briefing.com: 4:20 pm : Stocks were slapped by sellers again this session. The subsequent slide sent stocks to a new low for July.

The three major equity averages sank steadily in the first couple of hours. All three were down in excess of 1% before pressure started to ease. The market's push up from its session low came after the S&P 500 had managed to resist extending its slide much below the 1300 line. June was the last time the S&P 500 traded below that line. The

broad market never really managed to make any kind of meaningful run higher, however. That left the major equity averages to settle with marked losses.

Tech stocks and energy stocks did a good job of staving off sellers. The two sectors logged losses of 0.3% and 0.4%, respectively. Tech was helped by Apple (AAPL 373.80, +8.88), which printed a record high. Halliburton (HAL 53.12, +0.04) helped oil and gas services stocks after it posted an upside earnings report.

Financials were down more than 2% at their session low, but managed to lessen that to a 1.4% loss. The sector was bogged down by weakness among banks and diversified financial services names like Bank of America (BAC 9.72, -0.28), which is scheduled to report its latest results tomorrow morning.

European bank stocks were especially weak amid lingering concern regarding fiscal conditions and sovereign debt in their home continent. Stress tests throughout the region late last week failed to quell concerns over the state of finances there. Threats of the matter imbued the broader market.

Financial media also focused on the lack of progress in raising the U.S. debt ceiling. The deadline for a decision is still a few weeks away.

Safe havens like gold and the greenback were on the short list of strong performers this session. Gold prices set a record high of almost $1608 per ounce in the face of a stronger dollar, which was up 0.4% at the end of the trading day. However, the dollar had been up close to 1% at its session high.

Advancing Sectors: (None)
Declining Sectors: Tech -0.3%, Energy -0.4%, Consumer Staples -0.6%, Telecom -0.8%, Health Care -0.8%, Utilities -0.9%, Consumer Discretionary -1.1%, Industrials -1.1%, Materials -1.2%, Financials -1.4%DJ30 -94.57 NASDAQ -10.70 NQ100 -0.5% R2K -1.5% SP400 -1.3% SP500 -24.69 NASDAQ Adv/Vol/Dec 537/1.76 bln/2039 NYSE Adv/Vol/Dec 455/874 mln/2604

4:13PM IBM beats by $0.07, beats on revs; guides FY11 EPS above consensus (IBM) 175.28 -0.26 : Reports Q2 (Jun) earnings of $3.09 per share, $0.07 better than the Capital IQ Consensus Estimate of $3.02; revenues rose 12.4% year/year to $26.67 bln vs the $25.32 bln consensus. IBM reported Q2 gross margin of 46.8% vs 46.0% street expectations. Co issues upside guidance for FY11, sees EPS of at least $13.25 vs. $13.19 Capital IQ Consensus Estimate, up from prior guidance for "at least $13.15"... The estimated services backlog at June 30 was $144 billion, up $15 billion year over year at actual rates ($2 billion, adjusting for currency). Services revenue was up 10%, 2% adjusting for currency. Growth markets revenue was up 23%, 13­justing for currency. Business analytics revenue was up more than 20% in the first half. Cloud revenue are on track to double in 2011.

4:12PM Cisco Systems announces additional details on comprehensive action plan; will reduce global workforce by ~6500 employees (CSCO) 15.43 -0.16 : Cisco will reduce its global workforce across all functions by ~6,500 employees, which includes ~2,100 employees who elected to participate in a voluntary early retirement program. In connection with this plan, Cisco estimates that it will recognize total pre-tax restructuring charges to its GAAP financial results in an amount not expected to exceed $1.3 bln over several quarters, consisting of severance and other one-time termination benefits. Substantially all of these charges are cash-based. Cisco expects that ~$750 mln of these charges will be recognized during the fourth quarter of fiscal 2011, including ~$500 mln relating to the voluntary early retirement program. The remaining balance of the charges is expected to be recognized during fiscal 2012.

4:07PM Cisco Systems announces transfer of Juarez, Mexico manufacturing operation to Foxconn (CSCO) 15.43 -0.16 : The agreement brings Cisco's video equipment manufacturing in line with the company's overall strategy of partnering with world-class contract manufacturers to deliver the highest-quality products to customers. The agreement also positions the companies to further expand their strategic partnership in North America.

3:48PM MEMC Elec and its SunEdison subsidiary join Flextronics (FLEX) to to create ~ 400 new jobs supporting solar module production (WFR) 7.41 -0.22 : Co announced the creation of ~400 jobs to ramp production of MEMC solar panels being manufactured at Flextronics' facility in Newmarket, Ontario.

10:00AM Intersil announced opening of new enhanced low dose rate sensitivity testing facility (ISIL) 11.85 -0.33 : Co announced its continued commitment to the global space community by introducing its new Palm Bay, Florida ELDRS testing facility. The facility will perform low dose rate total ionizing dose acceptance testing for all Intersil radiation hardened products regardless of process technology on a wafer by wafer basis.

Texas Instruments (TXN) introduced the industry's first fully integrated battery protection and cell-balancing solution for Li-Ion and lithium iron phosphate battery packs.

Seagate (STX) announced it has began distribution channel shipments of the Pulsar XT.2 solid state drive that combines outstanding and consistent performance with the data integrity and drive endurance needed for the most demanding enterprise environments, and is on track to commence channel shipments of the Pulsar.2 SSD, the first Multi-Level Cell Flash-enabled SSD from an enterprise hard drive maker.

8:06AM Chipmos Technology reports Q2 $162.2 million (no ests), an increase of 4.5% from Q1 and an increase of 3.8% YoY (IMOS) 8.13 : Co reports June 2011 revenue of $53.0 mln, a decrease of 6.5% from May 2011 and a decrease of 3.2% YoY.

Maxim Integrated Products (MXIM) announced it has acquired SensorDynamics, a privately held semiconductor company that develops proprietary sensor and microelectromechanical solutions.

7:18AM Semi Manufacturing appoints Zhang Wenyi as Chairman, Executive Director, and acting CEO (SMI) 3.92 : Co announces that Zhang Wenyi has been appointed as co's Chairman, Executive Director, and acting CEO with effect from July 15th. The co will continue its search for a suitable candidate to fill the CEO position. Zhang previously served as the Chairman of the Board of Shanghai Hua Hong.

Lattice Semiconductor (LSCC) announced release 6.1 of its PAC-Designer mixed signal design software, with updated support for Lattice's Platform Manager, Power Manager II and ispClock devices.

10:42 am Sunpower downgraded to Sell at Collins Stewart; tgt $15: . Collins Stewart downgrades SPWRA to Sell from Neutral; tgt $15. Sunpower's A shares have rallied 14.5% last week, possibly due to technical factors related to the short position in the A shares and limited float. The float in SPWRA's shares was reduced by ~60% due to Total's June 14 tender. Conditions in the solar market have deteriorated in recent weeks, with module prices falling faster than expected. While Sunpower has a unique product and efficiency advantages, its modules are still priced in reference to the price of traditional modules. Due to the decline, they view SPWRA's earnings as vulnerable in the quarters ahead. They have lowered ests below consensus.
icon url

ReturntoSender

07/20/11 12:27 AM

#9405 RE: ReturntoSender #6755

From Briefing.com: 4:30 pm : Stocks rallied sharply in response to a strong batch of earnings reports, pleasing economic data, and presumed progress in talks about raising the U.S. debt ceiling.

A positive tone permeated trade for the entire session. It was first spurred by renewed buying interest among Europe's major bourses after they had suffered another slide in the prior session. Earnings also stoked early buying interest, given that the vast majority of reports exceeded what had been expected.

Dow components Johnson & Johnson (JNJ 66.72, -0.37), Coca-Cola (KO 69.32, +2.20), and IBM (IBM 185.21, +9.93) all posted upside surprises. Shares of JNJ and KO actually climbed to record highs.

Bank of America (BAC 9.57, -0.15) also beat, but the stock had a different reaction -- it extended its descent to a fresh two-year low. Fellow financial giant Goldman Sachs (GS 128.49, -0.84) also dropped to a two-year low after it broke character to post earnings that failed to come anywhere close to the consensus estimate.

Of all things, housing data also offered encouragement to early traders. Housing starts for June reportedly hit an annualized rate of 629,000 units, which is greater than the clip of 570,000 units that had been anticipated, on average, among economists polled by Briefing.com. The annualized clip posted for June was the most robust rate recorded since January. As for building permits, they improved to a rate of 624,000 from 609,000 in the prior month. The consensus had called for permits to remain at a rate of 609,000.

The stock market traded with an impressive gain for most of the session, but the S&P 500 was restricted to a range between near-term support around 1315 and near-term resistance around 1320 until President Obama provided a mid-afternoon update on the debt ceiling dealings. Obama indicated a bipartisan group of Senators has agreed to a plan that features tough spending cuts and a revenue component.

The stock market responded by extending its advance beyond the upper boundary of its morning range. Buying was broad, but tech stocks offered the most leadership. The sector ascended to a 2.7% gain. Apple (AAPL 376.85, +3.05) was actually a relative laggard ahead of its quarterly report.

Treasuries also responded positively to Obama's update. In turn, the yield on the benchmark 10-year Note dropped back below 2.90%.

As for the dollar, it ended the day with a 0.3% loss against competing currencies. That's about half of what it had endured during the early going.

Advancing Sectors: Tech +2.7%, Consumer Discretionary +2.0%, Energy +1.7%, Consumer Staples +1.5%, Financials +1.4%, Materials +1.4%, Industrials +1.3%, Health Care +0.9%, Telecom +0.8%, Utilities +0.8%
Declining Sectors: (None)DJ30 +202.26 NASDAQ +61.41 NQ100 +2.3% R2K +2.3% SP400 +2.0% SP500 +21.29 NASDAQ Adv/Vol/Dec 2036/1.90 bln/548 NYSE Adv/Vol/Dec 2417/870 mln/632

5:03PM Apple component suppliers Cirrus Logic (CRUS), OmniVision (OVTI ), and Skyworks (SWKS) trading higher in after hours following another blow out qtr from AAPL (AAPL) 376.85 +3.05 :

4:36PM Apple beats by $1.95, beats on revs; guides Q4 conservatively (AAPL) 376.85 +3.05 : Reports Q3 (Jun) earnings of $7.79 per share, $1.95 better than the Capital IQ Consensus Estimate of $5.84; revenues rose 82.0% year/year to $28.57 bln vs the $24.98 bln consensus. Apple reports Q3 gross margins of 41.7% vs Street est of 39.2% and 38.0% guidance. Apple reports 3.95 mln Macs sold in Q3 vs Street est of ~4.2 mln. Apple reports 20.34 mln iPhones sold in Q3 vs Street est of ~16.8 mln. Apple reports 9.25 mln iPads sold in Q3 vs Street est of ~7.9 mln... Co issues guidance for Q4 (Sep), sees EPS of $5.50 vs. $6.44 Capital IQ Consensus Estimate; sees Q4 (Sep) revs of $25 bln vs. $27.65 bln Capital IQ Consensus Estimate... "We're thrilled to deliver our best quarter ever, with revenue up 82 percent and profits up 125 percent," said Steve Jobs, Apple's CEO. "Right now, we're very focused and excited about bringing iOS 5 and iCloud to our users this fall... We are extremely pleased with our performance which drove quarterly cash flow from operations of $11.1 billion, an increase of 131 percent year-over-year." (Briefing.com note: AAPL is known for giving conservative guidance)

4:19PM Altera beats by $0.01, reports revs in-line; guides Q3 revs above consensus; raises qrtrly dividend 33% to $0.08 (ALTR) 43.56 +1.01 : Reports Q2 (Jun) earnings of $0.65 per share, $0.01 better than the Capital IQ Consensus Estimate of $0.64; revenues rose 16.9% year/year to $548.4 mln vs the $549.1 mln consensus. Co issues upside guidance for Q3, sees Q3 revs +2-6% QoQ to ~$559.4-581.3 vs. $549.06 mln Capital IQ Consensus Estimate. Co raises quarterly dividend 33% to $0.08. "This quarter marks a return to sequential growth following the mild correction we experienced in the first quarter. We expect more sales gains in the third quarter," said John Daane, president, chief executive officer, and chairman of the board. "Early in the quarter we began shipping our Stratix V FPGA family, the industry's first high-end 28-nm FPGA. Our 28-nm FPGA families combine a tailored architecture, an optimal manufacturing process, and specific product features to give us continuing technology leadership that builds on the technology leadership and strong competitive position we established at 40 nm."

4:15PM LDK Solar signed a 15 Megawatt supply contract with juwi Solar in Germany (LDK) 6.45 : Under the terms of the agreement, LDK Solar will provide 15 MW of polycrystalline PV modules from August 2011 to November 2011, with an option to deliver an additional 15 MW immediately, until the end of the year

4:09PM Riverbed Technology reports EPS in-line, misses on revs (RVBD) 41.40 +2.63 : Reports Q2 (Jun) earnings of $0.21 per share, in-line with the Capital IQ Consensus Estimate consensus of $0.21; revenues rose 34.9% year/year to $170.3 mln vs the $172.7 mln consensus. "Overall it was a solid second quarter, with sales in the U.S. increasing 50% over the prior year... We experienced softness in the EMEA region, which we attribute to both the regional economy and our own execution. Looking ahead, we have confidence in our ability to improve our execution in this region with new EMEA sales leadership announced last week. Our top-line growth was led by a 38% year-over-year increase in product sales. Non-GAAP product gross margin reached an all-time high of 81.5%, and we achieved a record non-GAAP operating margin of 29.6%. Our competitive position is stronger than ever, our product portfolio is even more robust with the acquisitions announced today, and our market opportunity is growing. We expect a strong second half of 2011." Separately, Riverbed announced today the acquisition of two companies, Zeus Technology and Aptimize. See 16:05 comment for details.

11:00AM Intel to acquire Fulcrum Microsystems, privately held fabless semiconductor company (INTC) 22.74 +0.46 : Additional terms of the transaction were not disclosed. It is expected to close in the third quarter of 2011.

9:03AM Rudolph Tech announced it intends to offer $50 million in aggregate principal amount of convertible senior notes due 2016 (RTEC) : Co announced it intends to offer, subject to market and other conditions, $50 mln in aggregate principal amount of convertible senior notes due 2016. The notes will be sold only to qualified institutional buyers pursuant to Rule 144A under the Securities Act of 1933, as amended. The co also intends to grant to the initial purchaser of the notes an option to purchase up to an additional $10 mln aggregate principal amount of the notes.

RF Micro Devices (RFMD) announced its Foundry Services business unit has expanded its portfolio of process technologies to include two additional GaAs process technologies - RFMD's FD25 low noise pHEMT process and RFMD's FET1H switching pHEMT process.

ARM (ARMH) selected for its low power credentials and comprehensive ARM Partner ecosystem to address low- and high-end applications, such as smartphones, tablets and smart TV's.

7:01AM Microsemi acquires the technology and related assets from Brijot Imaging Systems (MSCC) 19.17 : The acqusition strengthens Microsemi's millimeterwave technology offering in the 70-100GHz range.

10:42 am Sunpower downgraded to Sell at Collins Stewart; tgt $15: . Collins Stewart downgrades SPWRA to Sell from Neutral; tgt $15. Sunpower's A shares have rallied 14.5% last week, possibly due to technical factors related to the short position in the A shares and limited float. The float in SPWRA's shares was reduced by ~60% due to Total's June 14 tender. Conditions in the solar market have deteriorated in recent weeks, with module prices falling faster than expected. While Sunpower has a unique product and efficiency advantages, its modules are still priced in reference to the price of traditional modules. Due to the decline, they view SPWRA's earnings as vulnerable in the quarters ahead. They have lowered ests below consensus.

icon url

ReturntoSender

07/20/11 11:06 PM

#9406 RE: ReturntoSender #6755

From Briefing.com: 4:25 pm : Financials traded with strength all session, but the broader market failed to follow it higher. In turn, the major averages ended the day mixed.

The mood among participants was positive ahead of the open, but once trade began stocks slid and spent the rest of the session chopping along. Financials, which climbed to a 1.1% gain, failed to stir broader buying interest.

E*Trade (ETFC 14.72, +1.77) was a top performer among financial issues following news that Citadel, which has a near 10% stake in the company, urged it to call a special meeting to maximize value. Better-than-expected earnings from US Bancorp (USB 26.14, +1.11) made the stock a leader among banking plays.

Apple (AAPL 386.90, +10.05) took center stage in the earnings show, though. The company's blowout quarter sent the up to a record high. Yahoo! (YHOO 13.48, -1.11) was at the opposite end of the spectrum; disappointment over the firm's financial forecast overshadowed its in-line earnings results to send the stock to a new 2011 low. Still, Riverbed Tech (RVBD 32.05, -9.35) and Fortinet (FTNT 21.61, -5.17) were the Nasdaq's worst performers in the wake of their quarterly reports. Although the pair lacks weight, the steepness of their losses hampered the Nasdaq, which lagged its counterparts just about all session.

Economic data remained light. Today's only release was the June existing home sales tally, which showed that an annualized sales rate of 4.77 million units. The consensus among economists polled by Briefing.com had called for annualized sales of 4.93 million units. That comes a day after housing starts were reported to have hit their highest rate since January.

With sovereign debt concerns of Europe cooled in the wake of a successful debt auction by Portugal, the dollar drifted lower again today. Its 0.4% loss this session has also left it down 0.4% for the week.

Advancing Sectors: Financials +1.1%, Utilities +0.6%, Industrials +0.2%
Unchanged: Telecom, Materials
Declining Sectors: Energy -0.3%, Health Care -0.4%, Consumer Staples -0.4%, Tech -0.4%, Consumer Discretionary -0.6%DJ30 -15.51 NASDAQ -12.29 NQ100 -0.4% R2K -0.3% SP400 -0.2% SP500 -0.89 NASDAQ Adv/Vol/Dec 1042/1.88 bln/1543 NYSE Adv/Vol/Dec 1662/796 mln/1326

5:19PM Seagate Tech on call issues downside EPS guidance, rev guidance slightly ahead of consensus (STX) 16.99 +0.06 : Co issues downside guidance for Q1 (Sep), sees EPS of $0.29-0.33, excluding non-recurring items, vs. $0.45 Capital IQ Consensus Estimate; sees Q1 (Sep) revs of $2.9 bln vs. $2.87 bln Capital IQ Consensus Estimate.

4:32PM MKS Instruments beats by $0.09, beats on revs; guides Q3 EPS below consensus, revs below consensus (MKSI) 25.08 -0.48 : Reports Q2 (Jun) earnings of $0.73 per share, $0.09 better than the Capital IQ Consensus Estimate of $0.64; revenues rose 1.8% year/year to $224.5 mln vs the $220.5 mln consensus. Co issues downside guidance for Q3, sees EPS of $0.40-$0.60 vs. $0.65 Capital IQ Consensus Estimate; sees Q3 revs of $180-$210 mln vs. $220.61 mln Capital IQ Consensus Estimate.

4:29PM Intel beats by $0.08, beats on revs; guides Q3 revs above consensus (INTC) 22.99 -0.07 : Reports Q2 (Jun) earnings of $0.59 per share, $0.08 better than the Capital IQ Consensus Estimate of $0.51; revenues rose 21.7% year/year to $13.1 bln vs the $12.82 bln consensus. Gross margin was 61 percent, consistent with the company's expectation. The co sees FY11 non-GAAP gross margins of 64% +/- a couple of percentage points. Co issues upside guidance for Q3, sees Q3 revs of $13.6-14.6 bln vs. $13.45 bln Capital IQ Consensus Estimate. Co says "Strong corporate demand for our most advanced technology, the surge of mobile devices and Internet traffic fueling data center growth, and the rapid rise of computing in emerging markets drove record results. Intel's 23 percent revenue growth in the first half and our increasing confidence in the second half of 2011 position us to grow annual revenue in the mid-20 percent range."

4:24PM Xilinx beats by $0.03, beats on revs; guides Q2 revs in-line (XLNX) 33.18 -0.51 : Reports Q1 (Jun) earnings of $0.56 per share, $0.03 better than the Capital IQ Consensus Estimate of $0.53; revenues rose 3.5% year/year to $615.5 mln vs the $599.7 mln consensus. Co issues in-line guidance for Q2, sees Q2 revs -3% to +1% QoQ, which equates to ~$597.0-621.7 vs. $602.79 mln Capital IQ Consensus Estimate.

4:11PM Qualcomm beats by $0.02, beats on revs; guides Q4 EPS in-line, revs in-line (QCOM) 57.30 +0.32 : Reports Q3 (Jun) earnings of $0.73 per share, excluding non-recurring items, $0.02 better than the Capital IQ Consensus Estimate of $0.71; revenues rose 34.2% year/year to $3.62 bln vs the $3.55 bln consensus. Co issues in-line guidance for Q4, sees EPS of $0.75-0.80, excluding non-recurring items, vs. $0.76 Capital IQ Consensus Estimate; sees Q4 revs of $3.86-4.16 bln vs. $3.9 bln Capital IQ Consensus Estimate. CDMA-based Mobile Station Modem MSM shipments: 120 million units, up 17 percent y-o-y and 2 percent sequentially. March quarter total reported device sales: ~$36.4 billion, up 44 percent y-o-y and down 9% QoQ. March quarter estimated CDMA-based device shipments: ~170 to 174 mln units, at an estimated average selling price of ~$209 to $215 per unit. "Looking forward, we continue to see healthy growth in CDMA-based device shipments of ~18% in calendar year 2011, and we are pleased to be raising our revenue and Non-GAAP earnings guidance for the fiscal year, driven primarily by strong global smartphone adoption and the addition of Atheros."

4:10PM F5 Networks beats by $0.06, reports revs in-line; guides Q4 EPS in-line, revs in-line (FFIV) 111.44 : Reports Q3 (Jun) earnings of $0.97 per share, $0.06 better than the Capital IQ Consensus Estimate of $0.91; revenues rose 26.1% year/year to $290.7 mln vs the $290.7 mln consensus. Co issues in-line guidance for Q4, sees EPS of $0.97-0.99 vs. $0.98 Capital IQ Consensus Estimate; sees Q4 revs of $307-312 mln vs. $309.62 mln Capital IQ Consensus Estimate. "Strong sales in APAC and Japan, in particular of our high-end products, accounted for most of the revenue growth during the quarter... EMEA revenue was down from the prior quarter, and Americas revenue was up only slightly, due in part to a slowdown in U.S. Federal sales... With the rollout of these new products and a number of others over the coming year, we continue to believe that our competitive position in the traditional ADC market has never been stronger, and that the opportunity to expand our footprint in adjacent markets has never been greater. As a result, we remain confident in our ability to sustain top-line growth and profitability by continuing to expand our reach into new and existing markets and by hiring and retaining the best people."

4:07PM Cohu beats by $0.07, beats on revs (COHU) 13.47 -0.13 : Reports Q2 (Jun) earnings of $0.28 per share, $0.07 better than the Capital IQ Consensus Estimate of $0.21; revenues rose 8.1% year/year to $80.9 mln vs the $80 mln consensus.

4:06PM Plexus beats by $0.03, misses on revs; guides Q4 EPS below consensus, revs below consensus (PLXS) 33.38 +0.17 : Reports Q3 (Jun) earnings of $0.58 per share, $0.03 better than the Capital IQ Consensus Estimate of $0.55; revenues rose 4.3% year/year to $559 mln vs the $569.6 mln consensus. Co issues downside guidance for Q4, sees EPS of $0.50-0.55, excluding non-recurring items, vs. $0.60 Capital IQ Consensus Estimate; sees Q4 revs of $530-560 mln vs. $582.75 mln Capital IQ Consensus Estimate.

4:06PM Seagate Tech beats by $0.03, beats on revs (STX) 16.99 +0.06 : Reports Q4 (Jun) earnings of $0.28 per share, $0.03 better than the Capital IQ Consensus Estimate of $0.25; revenues rose 7.6% year/year to $2.86 bln vs the $2.71 bln consensus. "Seagate and the industry are benefitting from the significant demand for storage related to new applications and architectures associated with mobile and connected devices... Because hard disk drive storage is a fundamental technology for cloud service providers, data centers and all other network-based content providers, total industry demand grew almost 40% in fiscal year 2011 to 330 million terabytes. For the June quarter, Seagate's average capacity per drive shipped grew to approximately 590GB, an increase of 39% year-over-year. As more online content and services become available to billions of connected mobile devices, we expect demand for storage capacity to continue to grow and Seagate to benefit from this growth."

9:21AM Rudolph Tech prices offering of $50 mln of 3.75% convertible senior notes due 2016; warrent transaction will have a dilutive effect on the co's EPS to the extent that the price of its common stock exceeds the strike price of the warrant, which is ~ $17/share (RTEC) 9.59 : Co announced the pricing of its offering of $50 mln aggregate principal amount of 3.75% convertible senior notes due 2016. The Company also granted the initial purchaser of the notes an option to purchase up to an additional $10 mln aggregate principal amount of the notes. The notes will pay interest semi-annually on January 15 and July 15 at an annual rate of 3.75%, and will mature on July 15, 2016, unless earlier converted or repurchased. In connection with the offering of the notes, the co has entered into a convertible note hedge and a warrant transaction with an affiliate of the initial purchaser. The convertible note hedge transaction is intended to reduce potential dilution to the Company's common stock upon conversion of the notes.

KEMET (KEM) introduced its first-to-market F5D Series metallized polyester film capacitors with integrated ceramic capacitors. These multicomponent capacitors eliminate the need for two devices by filtering both low and high frequency noise in automotive motors and other suppression applications.

LSI Corporation (LSI) announced the availability of a family of network accelerator cards that offload functions and reducing time to market. The accelerator cards allow OEMs to use existing software investments and reducing development costs.

8:17AM Micron announces a $600 mln convertible sr notes offering (MU) 7.52 : Micron intends to use a portion of the net proceeds from these offerings to pay the cost of the capped call transactions entered into in connection with the offering of the Notes. A portion of the net proceeds will be used to repurchase shares of Micron's common stock pursuant to a Board authorized $150.0 million stock repurchase program including purchases in negotiated transactions with institutional investors in the offering through one of the initial purchasers, as Micron's agent, subject to availability, in other privately negotiated or market transactions following the offering and the remainder will be used for general corporate purposes, including working capital, capital expenditures, and potential acquisitions and strategic transactions.

7:00AM EMC beats by $0.01, beats on revs; raises FY11 EPS, revs in-line (EMC) 27.38 : Reports Q2 (Jun) earnings of $0.35 per share, excluding non-recurring items, $0.01 better than the Capital IQ Consensus Estimate of $0.34; revenues rose 20.4% year/year to $4.85 bln vs the $4.73 bln consensus. Co issues in-line guidance for FY11, raises EPS to exceed $1.48 from $1.46 vs. $1.49 Capital IQ Consensus Estimate; raises FY11 revs to exceed $19.8 bln from $19.6 bln vs. $19.83 bln Capital IQ Consensus Estimate. Second-quarter highlights included double-digit revenue growth for EMC Information Storage business, which increased 19% year over year. EMC's high-end EMC Symmetrix storage product portfolio, which includes the EMC Symmetrix VMAX, increased rev 15% YoY, and EMC's portfolio of mid-tier storage products3 grew revenue 27% YoY. Revenue from VMware (VMW), which is majority-owned by EMC, increased 37% and revenue from EMC's RSA Information Security business grew 13% YoY. Additional second-quarter highlights included strong revenue growth for the EMC VNX unified storage and the co's backup and recovery solutions. EMC saw increasing customer demand for its Big Data technologies -- product revenue from EMC Isilon, EMC Atmos and EMC Greenplum each doubled year over year. VCE's year-to-date revenue for 2011 has already exceeded its full-year 2010 revenue amount. EMC's consolidated second-quarter revenue from the United States reached $2.5 bln, an increase of 17% year over year, representing 52% of consolidated second-quarter revenue. Revenue from EMC's business operations outside of the United States hit an all-time record $2.3 bln, an increase of 25% year over year, representing 48% of consolidated second-quarter revenue. Within this, revenue increased 20%, 34% and 43% year over year, respectively, in EMC's Europe, Middle East and Africa; Asia Pacific and Japan; and Latin America regions.

6:03AM Microsemi announces proposal to acquire Zarlink Semiconductor $548.7 mln; expected to be immediately accretive to co's earnings; net sales are expected to be at the high end of Microsemi's revenue guidance (MSCC) 19.94 +0.77 : Co announced today that it has made a proposal to the board of directors of Zarlink Semiconductor to acquire all of the outstanding shares of the Company for CAD $3.35/share in cash. The proposed transaction has a total equity value of $548.7 mln based on a fully diluted share count and represents a 40 percent premium to Zarlink's share price as of July 19, 2011, and a 43 percent premium to Zarlink's trailing 30 day average share price. The CAD $3.35 proposal exceeds every Zarlink closing share price over the last five years. Co sees Q3 (Jun) revs of at the high end of prev range $213.7-217.9 mln vs. $215.82 mln Capital IQ Consensus Estimate.

Zoran (ZRAN) announced that it has licensed its IPS print language software, including page description language interpreters for PCL 5 and PostScript for use in the recently launched HP Officejet Pro 8000 Enterprise Printer.

10:46 am Riverbed Technology Reports In-line Second Quarter Earnings Results (RVBD)

Riverbed Technology (RVBD $32.18 -9.22) reported second quarter earnings of $0.21 per share, in-line with the Capital IQ Consensus Estimate consensus of $0.21.

Revenues rose 34.9% year/year to $170.3 million versus the $172.7 million consensus.

The company said, "Overall it was a solid second quarter, with sales in the U.S. increasing 50% over the prior year... We experienced softness in the EMEA region, which we attribute to both the regional economy and our own execution. Looking ahead, we have confidence in our ability to improve our execution in this region with new EMEA sales leadership announced last week. Our top-line growth was led by a 38% year-over-year increase in product sales. Non-GAAP product gross margin reached an all-time high of 81.5%, and we achieved a record non-GAAP operating margin of 29.6%. Our competitive position is stronger than ever, our product portfolio is even more robust with the acquisitions announced today, and our market opportunity is growing. We expect a strong second half of 2011."

Separately, Riverbed announced today the acquisition of two companies, Zeus Technology and Aptimize.
icon url

ReturntoSender

07/23/11 9:22 PM

#9407 RE: ReturntoSender #6755

From Briefing.com: Weekly Recap - Week ending 22-Jul-11Stocks rallied more than 2% as European leaders reached an agreement to bail out Greece. The main thrust (and surprise) of the headlines was not so much that a solution had been worked out for Greece, but that leaders were focused on controlling contagion risk by enhancing the flexibility of the European Financial Stability Facility (EFSF).

While details of Greece's new bailout package continue to emerge, reports indicate EU leaders agreed to allow the EFSF to intervene in the secondary markets and provide liquidity, thereby aiding the European Central Bank and helping countries like Greece. In addition, the terms on the EFSF loans will be doubled from 7.5 years to 15 years and decrease interest rates from 5-6% to 3.5%. Private sector holders of Greek debt have agreed to take a 21% haircut on their bond holdings, equivalent to 37 bln euros.

The news gave a boost to stocks as nine of 10 sectors advanced. Tech, energy and financials outperformed. Defensive sectors underperformed, with telecom down 0.1%.

Among other investable assets, crude gained 2.6%, the dollar fell 1.2% and Treasury yields increased from 2.90% to 2.98%.

U.S. lawmakers are still trying to reach agreement on a deal to raise the debt ceiling. Current indications from prediction market Intrade suggest there is lower probability that a deal will be reached compared to one week ago.

In corporate news, it was a busy week on the earnings front with roughly 20% of S&P 500 companies reporting. Results were generally better than expected with about 75% of companies topping EPS estimates.

Widely-held names Apple (AAPL), IBM (IBM), Johnson & Johnson (JNJ), AT&T (T), Coca-Cola (KO) and Microsoft (MSFT) all topped EPS estimates. Apple was especially a standout, gaining 7.8% after blowing by estimates in its best quarter ever and on trailing basis surpassing Microsoft (MSFT) net income for the first time.

Investment banking giants Goldman Sacs (GS) missed estimates but its shares still rose 4.2% for the week.

The coming week brings another bevy of earnings reports, advance second quarter GDP, new home sales and consumer confidence.
 
Index Started Week Ended Week Change % Change YTD %
DJIA 12479.70 12681.10 201.40 1.6 9.5
Nasdaq 2789.80 2858.83 69.03 2.5 7.8
S&P 500 1316.14 1345.02 28.88 2.2 6.9
Russell 2000 828.78 841.82 13.04 1.6 7.4

7:49AM Celestica beats by $0.04, beats on revs; guides Q3 EPS in-line, revs in-line (CLS) 8.52 : Reports Q2 (Jun) earnings of $0.27 per share, $0.04 better than the Capital IQ Consensus Estimate of $0.23; revenues rose 15.4% year/year to $1.83 bln vs the $1.81 bln consensus. Co issues in-line guidance for Q3, sees EPS of $0.23-0.29, excluding non-recurring items, vs. $0.25 Capital IQ Consensus Estimate; sees Q3 revs of $1.725-1.875 bln vs. $1.85 bln Capital IQ Consensus Estimate. "Celestica had strong financial results in the second quarter as we delivered robust margin expansion and we achieved 15% year-over-year revenue growth... Despite this environment, Celestica remains focused on providing industry-leading flexibility and operational performance to support our customers' success and delivering on our 2011 revenue growth, operating margin and ROIC targets."

Microsemi Corporation (MSCC) announced its award-winning SmartFusion customizable system-on-chip devices are now supported by FreeRTOSTM, a scale-able real time kernel designed specifically for small embedded systems, and can be used in any type of application.

6:37AM General Electric beats by $0.02, beats on revs (GE) 19.16 : Reports Q2 (Jun) earnings of $0.34 per share, $0.02 better than the Capital IQ Consensus Estimate of $0.32; revenues fell 3.5% year/year to $35.63 bln vs the $34.7 bln consensus. primarily driven by the absence of NBCU revenues after the sale of GE's majority position to Comcast. Excluding this impact, revs were up 7%. GE Capital Services' (GECS) revs decreased 1% from last year to $12.4 bln. Industrial sales of $23.0 bln decreased 6% YoY. Segment profit increased 18% YoY, as increases of more than 100% at GE Capital, more than 500% at Transportation, 9% at Aviation and 8% at Healthcare more than offset earnings decreases of 19% at Energy Infrastructure and 26% at Home & Business Solutions. GE's backlog grew to a record high of $189 bln. Total infrastructure orders were up 24%, reflecting robust strength in equipment orders, up 33%, and service orders up 16%. "International revenues from Industrial (ex NBCU) were $13.4 bln, up 23% representing 59% of total Industrial revenues. GE revenue for the Industrial segments accelerated in growth regions, including double-digit increases in India, China, Southeast Asia, Africa, Russia, Australia, Canada, and Latin America. GE Capital's portfolio transformation is ahead of schedule. Consumer and Commercial Lending and Leasing led with earnings growth of 57% and more than 100%, respectively. We continue to see strong demand for credit with CLL new volume originations at $10.8 bln for the quarter, up 33% from prior year... As previously communicated, Energy earnings and margins were down primarily as a result of pressure in the renewable sector. In addition, margins were impacted by the integration of Energy acquisitions. Indicators are pointing to a stronger second half in 2011 for Energy when we expect ~17% unit volume growth YoY. Integration of strategic Energy acquisitions is ahead of plan, further positioning Energy Infrastructure for growth in the second half of this year. Overall, Industrial earnings should improve in 2H11 and the cycle is expected to accelerate in 2012." Cash generated from Industrial operating activities totaled $4.4 bln in the first half of 2011, on track for full-year plan of $12-13 bln. At quarter-end, GE had $91 bln of consolidated cash. Year-to-date, the co has executed on $1 bln of stock buybacks and $2.7 billion of stock buybacks since restarting the program in 3Q10. The co plans to retire the preferred stock issued to Berkshire Hathaway (BRK.B) in October 2011.

12:57 pm Advanced Micro Guides Third Quarter Revenue Below the Mid-point of Consensus (AMD)

Advanced Micro (AMD $7.60 +1.10) reported second quarter earnings of $0.09 per share, excluding non-recurring items, $0.01 better than the Capital IQ Consensus Estimate of $0.08.

Revenues fell 4.8% year/year to $1.57 billion versus the $1.58 bln consensus. Gross margin was 46%.

For the third quarter, the company expects to see revenue growth of 8% to 12% quarter/quarter to approx. $1.70 billion to $1.76 billion versus the $1.70 billion Capital IQ
icon url

ReturntoSender

07/24/11 12:08 PM

#9409 RE: ReturntoSender #6755

Monday Morning Outlook: The Two SPX Levels You Really Need to Know
Don't buy the hype about bearish technical patterns

by Ryan Detrick 7/23/2011 10:30 AM

http://www.schaeffersresearch.com/commentary/observations.aspx?ID=107261&trackback=recapezine

It was another week of partisan gridlock on the federal budget debate, even as euro-zone leaders hammered out a plan meant to prevent a Greek domino effect. However, traders shook off lingering uncertainty over the looming U.S. debt ceiling, with an onslaught of corporate earnings reports ultimately driving the action. The major market indexes netted healthy gains by Friday's close, but -- as Ryan Detrick points out -- stocks are still just drifting between all-too-familiar support and resistance levels. The range-bound action could continue over the short term, but Ryan sees plenty of reasons to believe a breakout to the upside is in the market's future. Fortunately, Rocky White has already crunched the numbers to come up with a list of contrarian-friendly stocks to consider for the second half of 2011. Finally, we wrap up with a few sectors of note, as well as a preview of the week ahead.

Notes from the Trading Desk: Bearish Technical Patterns Spark Media Buzz
By Ryan Detrick, Senior Technical Strategist

Todd Salamone is out on vacation this week, so I'll be filling in with my take on the market action. First of all, what a difference a week makes! At this time last week, rising concerns over sovereign debt crises in Europe and the U.S. had pressured stocks to one of their worst weeks of the year. Fast-forward seven days, and the S&P 500 Index (SPX - 1,345.02) is just a few solid sessions away from another multi-year high.

So, what exactly changed? Well, there's been significant progress on the Greek bailout, even as the debt debate here in the U.S. has been inching along -- but the big market mover has been earnings. On the whole, second-quarter earnings have been very strong so far. In fact, all that talk of a double-dip recession last month is looking more and more like investors just continuing to scare themselves out of an ongoing, powerful bull market. But this is nothing new, as investors have been finding reasons to doubt this market for nearly 28 months now.

Just take a look at the following chart of the SPX. From late August to the early May peak, the index gained more than 30%. But, bigger-picture, the SPX has simply been trading in a 100-point range from about 1,260 to 1,360 since January.

Weekly Chart of SPX since September 2010


Back in late June, when all the talk was about how we were going to break down to new lows, I noted the significance of support at 1,260, as well as the extreme degree of negative sentiment:

Don't follow the rest of the retail crowd by panicking in the face of bearish headlines. Overall, the price action remains strong, and sentiment continues to be downright dire.

As of this writing, not much has changed. The market is still technically strong, yet no one seems to believe in the uptrend.

Speaking of technicals, we've noticed the media picking up on some bearish chart formations. Few contrarian indicators are more powerful than this. As we've noted time and time again, once the media starts talking about bearish technical analysis patterns, it could be time to get long, or vice versa. For example, back in late April, the media was buzzing about a bullish "inverse head-and-shoulders" pattern, which -- as contrarians -- we would have preferred to see slip under the radar. Sure enough, the market peaked for the calendar year shortly thereafter.

However, this past week, we saw dire warnings about bearish head-and-shoulders patterns, as well as "island reversals," being thrown around in the media. If the past two years have taught us anything, it would be to get ready for a rally soon.

Turning from technicals to fundamentals, earnings are coming in solid for yet another quarter, but I'm more impressed with the strong merger-and-acquisition activity we've seen. Just last week, Carl Icahn upped his bid to acquire Clorox (CLX), while Express Scripts (ESRX) bought Medco Health Solutions (MHS) for more than $29 billion. Continued M&A activity is very bullish for the overall market.

I'm not a huge valuation guy, but let's take a second to look at just how reasonable valuations really are. We are looking at record SPX earnings of about $100 per share this year. This translates to a price/earnings ratio of 13.5. When you consider inflation is less than 2%, and 10-year yields are less than 3%, this confirms just how low valuations really are. Historically, with inflation and yields that low, you'd expect a P/E ratio closer to the low 20s. In other words, stocks are potentially trading at a 30% discount, simply due to all of the well-known fears out there.

With that in mind, just imagine if the European issues are resolved without any more major snags. Yes, the situation could get much worse -- but so much of the bad news is already priced in at this point, I think the bigger concern for investors would be missing out on a huge second-half rally -- potentially to new highs, as Bernie Schaeffer noted recently.

Turning to the sentiment backdrop, we continue to see money flow out of equity mutual funds, as there have now been 12 straight weeks of equity mutual fund outflows -- bringing the year-to-date outflows to $18 billion. Incredibly, we've seen $22 billion flow out during just the past five weeks. With the SPX less than 3% from a new multi-year high, the bullish implications are very clear: There's still a lot of money on the sidelines that could push us much higher.

I read this week that as of the second quarter, hedge funds have more than $2 trillion in assets -- a new record. As Todd has mentioned over the last few weeks, we're seeing signs that hedge-fund managers are accumulating equities, as they often purchase puts on broad-focused exchange-traded funds (ETFs) to hedge their long stock positions. The 20-day buy-to-open put/call volume ratio for the SPDR S&P 500 ETF (SPY), PowerShares QQQ Trust (QQQ), and iShares Russell 2000 Index Fund (IWM) continues to move higher, which is a good sign that big-money players are scooping up equities. Even better, the ratio has more room to run before reaching a level that has coincided with previous peaks.

20-day BTO put/call volume ratio for SPY, QQQ, IWM


Elsewhere, the Investors Intelligence poll is showing a little bullishness entering the picture, but we are nowhere near past major peaks. The current difference between bulls and bears is 25%, while the 40% area has caused some trouble in the past. Again, this would suggest we have room to run higher from current levels.

II bulls-bears with OEX


Overall, the powerful combination of low expectations, solid earnings, modest valuations, and strong price action remains firmly in place. For the time being, we could very well continue to trade in that aforementioned 100-point range on the SPX -- but longer-term, the odds highly favor an eventual breakout and a strong year-end rally. Best of luck in your trading.

Finally, my thoughts go out to all those affected by the senseless violence that took place in Norway on Friday.

Indicator of the Week: Positive Price Action, Negative Sentiment, and Stocks to Watch in the Second Half
By Rocky White, Senior Quantitative Analyst

Foreword: This week, I'll be using a couple of basic technical and sentiment analysis metrics to create a list of stocks to watch for the rest of the year. For those not familiar with our philosophy here at Schaeffer's, we are contrarian investors. That means we look for situations where the prevailing sentiment on Wall Street runs counter to a stock's technical and fundamental performance.

When an uptrending stock is surrounded by negative sentiment, this can be bullish for a couple of reasons. First of all, investors are clearly expecting bad things for the stock -- perhaps an earnings miss, or some other kind of negative development. If the investing crowd is expecting bad news, then it's surely already priced in. So, if something bad does happen, the resulting sell-off is typically muted, as the majority of investors have already exited their positions or hedged in preparation. However, if the expected downturn doesn't come to pass, the prevailing negative sentiment can lead to a fast and furious rally in the stock, as all that sideline money suddenly rushes in to buy.

Timing the Rush: So, how do we know when all that sideline money is going to rush into the stock? Well, we don't know exactly when it will happen (if only it were that easy!), but we do know investors can only watch a stock go higher and higher for so long before they finally capitulate and buy into the rally. That's why we keep an eye on solidly uptrending stocks that are surrounded by bearish sentiment from investors and analysts.

Using a couple of very simple metrics, I put together a study that highlights our contrarian philosophy. Going back to the year 2000, and looking at all equities that met some minimum liquidity criteria, I put the stocks into four groups based on their price returns during the first half of the year. Group 1 had the worst returns, and Group 4 had the best returns. To quantify sentiment, I looked at the percentage of "buy" recommendations from Wall Street analysts. Group 1 is stocks that were looked at favorably on Wall Street, and Group 4 are stocks that the analysts hated.

Below is a table showing the average first-half returns and the average percentage of "buy" ratings for the different groups. (Note that Group 1 for the average return is not the same subset of stocks for Group 1 of average percent "buys.") However, do you see what we're looking for in the second half of the year? If we focus on the stocks that arrived in Group 4 for both metrics, we'll have found a combination of positive price action and negative sentiment. According to our theory, these stocks will have a tendency to outperform.

First-Half Returns and Analyst Ratings by Group


Study Results: The table below shows the average returns for all of these stocks during the second half of the year. Looking at the groupings on the left side of the table, those in Group 4 boasted the highest first-half returns overall. Scanning across the top of the table, the stocks with the best first half-returns and the least "buy" ratings from analysts (Group 4 price and Group 4 analyst ratings) collected the best average return out of all the subsets, up 8.7%.

It's interesting to note, though, that the worst subset of second-half returns also originated from the generally outperforming Group 4. However, the underperformers were the stocks that were actually the most loved on Wall Street (Group 4 price, Group 1 analyst ratings -- up just 1.1% for the second half).

First-Half Performance with Analyst Rating Breakdown


In other words, after looking at the high-flyers from the first half of the year, how do we know which rallies will continue through the end of the year, and which are starting to run out of gas? We suggest you look at what Wall Street thinks of those stocks. When equities are enthusiastically loved by analysts, there's a greater possibility that buying pressure has been exhausted and the uptrend is near its end. But if Wall Street hates the stock, it's evidence that there's still sideline money that could flow into the stock and support future gains.

Stocks to Watch: Following the analysis above, the natural thing to do is list some stocks that are in Group 4 of both metrics through the first half of 2011. Below is a list of the 20 most liquid stocks that have racked up a substantial gain so far this year, yet get no love from Wall Street. Be forewarned, though: We don't advocate blindly playing the stocks on the list. Gaining an edge in stock/option trading requires a lot of legwork, but this list should serve as a solid starting point to research potential bullish plays for the rest of the year.

Second-Half Stocks to Watch


This Week's Key Events: Second-Quarter GDP Punctuates a Busy Week
Schaeffer's Editorial Staff

Here is a brief list of some of the key events this week. All earnings dates listed below are tentative and subject to change. Please check with each company's respective website for official reporting dates.

Monday

*

No major economic reports are scheduled for Monday. Earnings are due out from Baidu (BIDU), Broadcom (BRCM), Netflix (NFLX), RadioShack (RSH), Texas Instruments (TXN), BE Aerospace (BEAV), and Lorillard (LO).

Tuesday

*

The economic calendar kicks off Tuesday with new home sales for June, the S&P/Case Shiller 20-city home price index for May, and the Conference Board's consumer confidence index for July. On the earnings front, we'll hear from 3M Company (MMM), Amazon.com (AMZN), Ford Motor (F), GlaxoSmithKline (GSK), AK Steel (AKS), U.S. Steel (X), ARM Holdings (ARMH), JetBlue Airways (JBLU), Juniper Networks (JNPR), Regions Financial (RF), and Under Armour (UA).

Wednesday

*

Wednesday features the Federal Reserve's Beige Book, along with June's durable goods orders and the regularly scheduled weekly report on petroleum inventories. Boeing (BA), ConocoPhillips (COP), Delta Air Lines (DAL), Visa (V), Corning (GLW), Akamai Technologies (AKAM), Level 3 Communications (LVLT), Green Mountain Coffee Roasters (GMCR), Whole Foods Market (WFM), and Ryland Group (RYL) are expected to report earnings.

Thursday

*

On Thursday, we'll hear the usual update on weekly jobless claims, as well as pending home sales for May. Sharing the earnings spotlight will be Exxon Mobil (XOM), Chesapeake Energy (CHK), Starbucks (SBUX), Sprint Nextel (S), Automatic Data Processing (ADP), Bristol Myers Squibb (BMY), Boston Scientific (BSX), DR Horton (DHI), and M/I Homes (MHO).

Friday

*

The week's marquee economic report -- the advance estimate of second-quarter gross domestic product (GDP) -- hits the Street on Friday. Also on the day's docket are the Chicago PMI and the final Reuters/University of Michigan consumer sentiment index for July. Rounding out the week's slate of earnings reports are Amgen (AMGN), Meritage Homes (MTH), Newmont Mining (NEM), American Axle (AXL), Arch Coal (ACI), and Weyerhaeuser (WY).

And now a few sectors of note...

Dissecting The Sectors
Sector
Leisure/Retail
Bullish

Outlook: Despite ongoing concerns about consumer spending habits, headline retail sales edged higher in June, defying expectations for a modest decline. On the charts, the SPDR S&P Retail ETF (XRT) remains in a longer-term uptrend. The fund is up 13.6% since the start of 2011 -- easily outperforming the major market indexes -- and XRT found a new all-time high of $56.44 earlier this month. Plus, XRT's 50-day buy-to-open put/call volume ratio is turning higher, which has previously been consistent with periods of technical strength. Nevertheless, plenty of pessimism is still levied against the consumer discretionary group. Our data reveals that restaurants boast the largest percentage of stocks above their 200-day moving average, yet less than half of the cumulative analyst ratings are "buys." With so much negativity surrounding this outperforming sector, it seems there's plenty of cash still on the sidelines that could flow in to support additional upside. A few retail/leisure stocks we favor include Chipotle Mexican Grill (CMG), Crocs (CROX), and Green Mountain Coffee Roasters (GMCR), all of which have excelled on the charts in 2011. Despite the positive price action, all three equities are heavily shorted -- raising the possibility of short-covering support amid continued technical strength. Among Internet-based discretionary stocks, both Amazon.com (AMZN) and Netflix (NFLX) are appealing. This duo has been exploring all-time highs in 2011, yet we still see evidence of lingering skepticism. As these equities continue to outperform, a shift in sentiment toward the bullish camp could contribute to future gains.
Sector
Real Estate
Bullish

Outlook: Real estate is Wall Street's perennial underdog, but the robust price action in this sector demands a second look from contrarians. The iShares Dow Jones U.S. Real Estate Index Fund (IYR) is up more than 12% this year, comfortably surpassing the major market indexes. In fact, 80% of stocks in the real estate sector are trading above their benchmark 200-day moving averages -- the fifth-highest percentage among the sectors we track. Despite this broad-based technical strength, only 41% of analyst ratings on real estate stocks are of the "buy" variety -- which happens to be the third-lowest percentage among the more than 40 industry groups we follow. As IYR continues to climb the charts, a round of upgrades could help to attract some buying interest to this underappreciated sector.
Sector
Large-Cap Tech
Bearish

Outlook: Big-cap tech continues to underwhelm, despite enthusiasm over stronger-than-forecast earnings reports from sector stalwarts such as Google (GOOG), Intel (INTC), and IBM (IBM). Within the group, Dow component Cisco Systems (CSCO) is one of the most high-profile underperformers. Many Wall Street pundits cited the stock as a "bargain" following a bearish gap in February -- but the stock has since tumbled to a string of new multi-year lows. CSCO has regained some ground after bottoming just south of the $15 level in mid-June, but the stock's longer-term downtrend remains firmly intact. Meanwhile, fellow Dow member Microsoft (MSFT) received a warm welcome for its fiscal fourth-quarter earnings report on Friday, but is now trading just below all-too-familiar resistance in the $28-$30 area. Nevertheless, MSFT's average 12-month price target stands at an ambitious $32.64, in territory the shares haven't explored in more than three years -- opening the door for potential price-target cuts in the event of continued stagnation on the charts.
Sector
Financials
Bearish

Outlook: A troubling trend has emerged in the big-cap financial sector this earnings season, with a number of banking heavyweights failing to capitalize on "well-received" quarterly reports. Stocks such as Citigroup (C) and JPMorgan Chase (JPM) have seen their post-earnings gains evaporate all too quickly, leaving the shares locked in their respective year-to-date downtrends. Even Morgan Stanley (MS), which gapped dramatically higher after its Thursday report, backpedaled to end the week south of resistance at $24. In fact, the Financial Select Sector SPDR (XLF) is down 4% year-to-date, having missed out entirely on the broad market's advance. Checking out the sentiment backdrop, the 50-day buy-to-open put/call volume ratio for the XLF remains depressed, suggesting that big-money players are still on the sidelines. Plus, data from Zacks indicates that 59% of analyst ratings on finance stocks are of the "buy" or better variety, despite the dismal price action. Going forward, these underperforming bank stocks look vulnerable to additional downside as this remaining optimism is shaken out.
icon url

ReturntoSender

07/25/11 8:02 PM

#9411 RE: ReturntoSender #6755

From Briefing.com: 4:10 pm : Stocks closed in the middle of today's range as the strength found after the opening plunge waned in afternoon trade. The Dow saw the biggest decline, falling 0.7% while the S&P and Nasadq both lost 0.6%.

Oil & gas equipment & services co Baker Hughes (BHI 79.95, +0.05) beat on both the top and bottom lines and closed up 0.1% after it was able to shrug off a $0.16 per share loss on operations in Libya.

Pepsico (PEP 64.37, -1.39) saw more selling pressure today after being downgraded and removed from Goldman Sachs' Conviction Buy List. Weaker than expected demand in developed countries and rising commodity costs were highlights from the most recent quarter.

Apple (AAPL 398.50) touched $400 in early afternoon trade as momentum carried over from last week's blowout earnings. In just the past week the company has seen China Mobile (CHL 49.20, -0.16) and China Unicom (CHA 65.76, -0.98) announce plans to sell the iPhone 5 by the end of 2011.

Industrial stocks outperformed after Eaton Corp. (ETN 52.59, +1.43) and Roper Industries (ROP 87.13, +2.67) both topped estimates. Eaton announced EPS of $0.95 per share which topped the Capital IQ Consensus Estimate of $0.93 per share. Roper Industries saw solid gains on the back of strong earnings. The stock ended up 3.2% after announcing record sales of $708 million for the quarter, and raising its full year 2011 guidance to $4.20-4.30 per share, up from the $3.97-4.12 per share.

E*TRADE Financial (ETFC 16.52, +0.88) finished up 5.6% after the company's board of directors responded to a Citadel letter by saying it has retained Morgan Stanley to conduct a review of its strategic alternatives. Speculation has rival Ameritrade (AMTD 19.96, +0.35) making a bid for the company.

The dollar index ended with a modest loss, but was able to hold the 74.00 level for a third consecutive session. The euro eked out a small gain, but was unable to close above 1.44 resistance in quiet trade. Safe haven buying in the Swiss franc pushed it to a record .8020 per dollar.

The 10-yr yield ended the day slightly elevated as light selling ran it back up to 3.00% by the close of trade in the U.S. DJ30 -88.36 NASDAQ -16.03 SP500 -7.59 NASDAQ Adv/Vol/Dec 605/1.57 bln/2006 NYSE Adv/Vol/Dec 577/760.9 mln/2470

5:19PM Advanced Energy misses by $0.05, reports revs in-line; guides Q3 EPS below consensus, revs in-line (AEIS) 12.11 -0.33 : Reports Q2 (Jun) earnings of $0.31 per share, $0.05 worse than the Capital IQ Consensus Estimate of $0.36; revenues rose 38.1% year/year to $138.2 mln vs the $138.4 mln consensus. Co issues mixed guidance for Q3, sees EPS of $0.20-0.30, excluding non-recurring items, vs. $0.35 Capital IQ Consensus Estimate; sees Q3 revs of $130-140 mln vs. $138.88 mln Capital IQ Consensus Estimate.

4:34PM Texas Instruments beats by $0.02, reports revs in-line; guides Q3 EPS, revs in-line (TXN) 31.47 -0.31 : Reports Q2 (Jun) earnings of $0.56 per share, $0.02 better than the Capital IQ Consensus Estimate of $0.54; revenues fell 1.1% year/year to $3.46 bln vs the $3.43 bln consensus. Co issues in-line guidance for Q3, sees EPS of $0.55-0.65 vs. $0.63 Capital IQ Consensus Estimate; sees Q3 revs of $3.4-3.7 bln vs. $3.62 bln Capital IQ Consensus Estimate. TI's operating profit was negatively impacted by about $50 mln due to costs associated with the March earthquake in Japan. Orders were $3.60 billion, down 3 percent from the year-ago quarter and about even with the prior quarter. Inventory was $1.76 billion at the end of the quarter, up $413 mln from a year ago and up $84 million from the prior quarter. The increase in both comparisons was primarily due to the company building inventory for higher customer service levels, which included the ramp-up of new manufacturing capacity. Gross margin 30.7%. "We are pleased with the continued success of the TI portfolio in Analog and Embedded Processing. Sequential revenue growth was driven by Embedded Processing up 12% and Analog up 3%, and we believe we again gained market share in both segments."

4:34PM Sunpower lowers EPS guidance, narrows revenue guidance (SPWRA) 20.88 -1.44 : Co issues mixed guidance for Q2 (Jun), sees EPS of ($0.20) - ($0.19) down from ($0.05) - $0.10 vs. ($0.01) Capital IQ Consensus Estimate; sees Q2 (Jun) revs of $590-595 mln narrowed from $550-600 mln vs. $569.51 mln Capital IQ Consensus Estimate. The company now expects its second-quarter non-GAAP gross margin to be in the range of approximately 12 percent to 13 percent, compared to its previously announced outlook of 15 percent to 17 percent. Firm says "While we met our revenue goals for the second quarter, our gross margin and bottom line performance was impacted by market conditions in Germany and Italy, despite these challenges, we successfully reduced inventory quarter over quarter and have begun the process of cancelling above-market third-party cell contracts. In addition, we continue to execute on our accelerated cost reduction roadmap and are ahead of our original plan. With the closure of the Total transaction, we commenced negotiations with banks to effectively utilize our $1 billion credit support agreement and expect to enter into new and more flexible credit facilities shortly. With continued strong demand for our high-efficiency systems and our partnership with Total, we are poised to gain share profitably." (stock is halted)

4:13PM Sanmina-SCI beats by $0.08, beats on revs; guides Q4 EPS above consensus, revs above consensus (SANM) 9.22 -0.35 : Reports Q3 (Jun) earnings of $0.42 per share, excluding non-recurring items, $0.08 better than the Capital IQ Consensus Estimate of $0.34; revenues rose 2.5% year/year to $1.67 bln vs the $1.65 bln consensus. Co issues upside guidance for Q4, sees EPS of $0.40-0.44, excluding non-recurring items, vs. $0.34 Capital IQ Consensus Estimate; sees Q4 revs of $1.65-1.70 bln vs. $1.65 bln Capital IQ Consensus Estimate.

4:09PM Volterra Semi beats by $0.06, beats on revs (VLTR) 22.99 -0.63 : Reports Q2 (Jun) earnings of $0.28 per share, excluding non-recurring items, $0.06 better than the Capital IQ Consensus Estimate of $0.22; revenues rose 3.7% year/year to $41.7 mln vs the $38.5 mln consensus.

4:08PM Broadcom beats by $0.09, reports revs in-line (BRCM) 34.91 -0.56 : Reports Q2 (Jun) earnings of $0.72 per share, $0.09 better than the Capital IQ Consensus Estimate of $0.63; revenues rose 12.5% year/year to $1.8 bln vs the $1.8 bln consensus. Product gross margin was 51.1%. Co states, "Looking forward, we see strong demand for our communications solutions, reinforcing that innovation is driving customer demand. We expect solid growth in revenue and profitability in Q3."

4:05PM PLX Tech beats by $0.01, beats on revs; guides Q3 revs in-line (PLXT) 3.31 -0.05 : Reports Q2 (Jun) loss of $0.06 per share, excluding non-recurring items, $0.01 better than the Capital IQ Consensus Estimate of ($0.07); revenues rose 9.3% year/year to $30.7 mln vs the $29 mln consensus. Co issues in-line guidance for Q3, sees Q3 revs of $31-33 mln vs. $32.08 mln Capital IQ Consensus Estimate.

4:01PM Brooks Automation announces purchase of Nexus Biosystems for $79 mln (BRKS) 10.59 -0.19 : Co announced today that it had completed the acquisition of Nexus Biosystems. The net cash purchase price was $79 mln. Additionally, the co paid ~$6.7 mln for the value of the unrestricted cash held by Nexus at closing. For the trailing twelve months ended June 30, 2011, Nexus generated revenues of $36 mln.

Micrel (MCRL) rolled out the MAQ3203, an AEC-Q100 version of the MIC3203. This new step-down High Brightness LED driver IC reduces the complexity and cost of high current LED driver solutions in automotive lighting applications.

8:02AM Silicon Labs beats by $0.03, misses on revs (SLAB) 41.73 : Reports Q2 (Jun) earnings of $0.48 per share, $0.03 better than the Capital IQ Consensus Estimate of $0.45; revenues fell 6.2% year/year to $126.2 mln vs the $127.5 mln consensus.

icon url

ReturntoSender

07/27/11 12:19 AM

#9412 RE: ReturntoSender #6755

4:25 pm : The major market averages closed just off their worst levels of the session, unable to hold their midday gains. The Dow (-0.7%) paced today's decline with the S&P (-0.4%) and Nasdaq (-0.1%) faring a little better.

Netflix (NFLX 266.91, -14.62) closed lower by 5.2% after beating by $0.14 in the second quarter, but on slightly weaker-than-expected revenues of $788.6 million (Capital IQ Consensus Estimate of $791.2 million). The co issued downside third quarter guidance, seeing earnings per share of $0.72-1.07 (consensus $1.08), revenues of $799.5-828.5 million (Capital IQ Consensus Estimate of $845.6 million) and domestic operating margin of 13.6%. The weak guidance was attributed to the negative price impact of the its decision to separate DVD by mail and streaming.

Steelmaker AK Steel (AKS 12.81, -2.71) ended down 17.5% after posting disappointing third quarter results. The company missed the Capital IQ Consensus Estimate of $0.49 per share by $0.17 and saw revenues climb 12.3% YoY to $1.79 billion. However, that number was short of the Capital IQ Consensus Estimate of $1.81 billion. As for the third quarter, the company expects shipments to be between 1.4-1.45 million tons with an average per-ton selling price lower by about 1.0%. It also expects raw material costs to tick higher from the previous quarter. Shares of competitor United States Steel Corp. (X 40.62, -3.67) lost 8.3%.

Broadcom (BRCM 38.20, +3.29) gained 9.4% after posting earnings per share of $0.72 which topped the Capital IQ Consensus Estimate of $0.63. Revenues jumped 12.5% YoY to $1.8 billion which was in-line with forecasts. Product gross margin was 51.1%. Looking ahead to the third quarter the company sees revenues climbing to a range of $1.90-2.0 billion with the Capital IQ Consensus Estimate at $1.93 billion. Several firms came out today and upgraded the stock after yesterday's results.

Food Retailer SuperValu (SVU 9.11, +0.59) added 6.9% today after reporting earnings per share of $0.35 which were better than the Capital IQ Consensus Estimate of $0.33. Revenues posted a slight miss, falling 3.7% YoY to $11.11 billion (Capital IQ Consensus Estimate of $11.16 billion). The company reaffirmed its full year 2012 forecast in which it sees revenues of $37 billion versus the Capital IQ Consensus Estimate of $36.04 billion.

Shares of Simon Property Group (SPG 122.39, +1.92) hit their best level since February 2007, and are just off their all-time highs after announcing earnings of $1.65 per share which was better than the Capital IQ Consensus Estimate of $1.58 per share. Revenues rose 11.5% YoY to $1.04 billion to slightly better the $1 billion consensus. The property group issued in-line guidance for full year 2011 saying it expects earnings per share of $6.65-6.73 versus the Capital IQ Consensus Estimate of $6.71 per share.

Treasuries finished at their best levels of the session after the $35 billion 2-yr note auction saw solid but not spectacular results. The auction drew 0.417% and saw a 3.14x bid/cover (3.37x 12-auction average) as indirect bidders took down just 27.7% of the offering. Direct bidders showed up in force, taking down 20.0% of the auction (14.6% 12-auction average). The 10-yr yield ended the day near 2.95% after seeing an overnight high of 3.04%.

The dollar index ended the day near its worst levels of the session, hammered lower by the little progress that has been made in the debt ceiling talks. A gain of 140 pips pushed the euro through the 1.45 level and to its best close since July 4. The Swiss franc punctured the .8000 level for the first time ever as it remains the currency of choice among participants. Other notable movers included the yen which strengthened to better than 78 per dollar and the Canadian dollar which hit a 3.5-yr high against the greenback.DJ30 -91.50 NASDAQ -2.84 SP500 -5.49 NASDAQ Adv/Vol/Dec 889/1.69 bln/1683 NYSE Adv/Vol/Dec 1035/837.4

4:28PM Zoran beats by $0.09, reports revs in-line; guides Q3 EPS above consensus, revs in-line (ZRAN) 8.44 -0.02 : Reports Q2 (Jun) loss of $0.36 per share, $0.09 better than the Capital IQ Consensus Estimate of ($0.45); revenues fell 11.2% year/year to $82.9 mln vs the $82.6 mln consensus. Co issues guidance for Q3, sees EPS of ($0.12)-($0.07) vs. ($0.15) Capital IQ Consensus Estimate; sees Q3 revs of $100-105 mln vs. $102.01 mln Capital IQ Consensus Estimate.

4:20PM FormFactor beats by $0.13, beats on revs (FORM) 9.63 +0.04 : Reports Q2 (Jun) loss of $0.16 per share, $0.13 better than the Capital IQ Consensus Estimate of ($0.29); revenues fell 19.1% year/year to $46.6 mln vs the $45.9 mln consensus.

4:13PM Juniper Networks misses by $0.02, misses on revs; guides Q3 EPS, revs below consensus (JNPR) 31.17 +0.50 : Reports Q2 (Jun) earnings of $0.31 per share, excluding non-recurring items, $0.02 worse than the Capital IQ Consensus Estimate of $0.33; revenues rose 14.6% year/year to $1.12 bln vs the $1.15 bln consensus. Co issues downside guidance for Q3, sees EPS of $0.26-0.30, excluding non-recurring items, vs. $0.38 Capital IQ Consensus Estimate; sees Q3 revs of $1.07-1.12 bln vs. $1.22 bln Capital IQ Consensus Estimate. Non-GAAP gross margin of 65.6% vs. guidance range of 66-68%; operating margin for the second quarter of 2011 decreased to 21.6% from 22.3% in the first quarter of 2011 and from 23.9% in the prior year second quarter. Days sales outstanding in accounts receivable ("DSO") was 39 days in the second quarter of 2011, compared to 38 days in the prior quarter and 36 days in the same quarter of the prior year. Juniper repurchased ~3.9 million shares in the second quarter of 2011, at an average price of $38.94 per share, or ~$150 million dollars.

4:03PM RF Micro Device beats by $0.01, beats on revs; guides Q2 revs in-line (RFMD) 6.45 +0.11 : Reports Q1 (Jun) earnings of $0.08 per share, excluding non-recurring items, $0.01 better than the Capital IQ Consensus Estimate of $0.07; revenues fell 21.8% year/year to $214.2 mln vs the $207.4 mln consensus. Co issues in-line guidance for Q2, sees Q2 revs of +65% QoQ to ~$227.1 mln vs. $226.58 mln Capital IQ Consensus Estimate. RFMD expects non-GAAP gross margin to increase ~50 basis points and non-GAAP operating expenses to be ~flat to up $1 million QoQ

1:00PM QuickLogic receives first high volume production order from Pantech for tablet phone (QUIK) 3.53 -0.06 : Co announcd the receipt of the first volume production order for VEE and DPO technologies for the new Pantech Tablet Phone dual-core Snapdragon smartphone which has been released this month in South Korea.

Microchip Technology (MCHP) announced its first high-accuracy, stand-alone six-channel analog front end for three-phase energy metering. NTT America, a wholly owned U.S. subsidiary of NTT Communications announced the release of Global Virtual Link, the next evolution of its Ethernet solution that offers customers such as content providers and Internet service providers direct connectivity among their multiple locations.

8:14AM Axcelis Tech major design win for Optima HDx High current implanter from major foundry (ACLS) 1.80 : Co announced that a major foundry has selected the Optima HDx high current implanter for their new, flagship manufacturing facility. The system is expected to ship in September, where it will be used in 28nm logic manufacturing.

7:45AM STEC Inc disclosed that the SEC is conducting a formal investigation involving trading in the co's securities (STEC) 17.71 : Co disclosed that the SEC is conducting a formal investigation involving trading in the co's securities. The co and certain of the co's officers and employees, including its CEO and President, have received subpoenas in connection with the SEC's investigation. The Company is fully cooperating with the SEC in regards to this matter. On July 19, 2011, the Staff of the SEC notified the Company, its CEO and President that they are considering recommending that the SEC initiate a civil injunction action against the Company, its CEO and President, charging them with violations of the antifraud and reporting provisions of the federal securities laws.

SMSC (SMSC) announced it is breaking new ground in USB port power charging with the industry's first programmable USB power controller.

7:08AM DSP Group reports EPS in-line, revs in-line; guides FY11 revs below consensus (DSPG) 8.31 : Reports Q2 (Jun) earnings of $0.08 per share, in-line with the Capital IQ Consensus Estimate consensus of $0.08; revenues fell 3.8% year/year to $58.5 mln vs the $58.1 mln consensus. Co issues downside guidance for FY11, sees FY11 revs of $200-207 mln vs. $236.00 mln Capital IQ Consensus Estimate, down from prior guidance for $227-245 mln. In the past few weeks we have experienced a slowdown in bookings, due to what appears to be a near-term softening of the consumer electronics market, resulting in weaker demand for cordless telephony products. As a result of these macro-economic conditions, we are experiencing a decrease in customer projections... "Despite our lower revenue guidance for the year as a result of this near-term, temporary market slowdown, we are seeing strong evidence that our past R&D investments in new product areas are gaining significant market traction and delivering revenue growth that we expect to accelerate over the long-term. For 2011, we expect new products revenue of approximately $25 million, representing a 56% increase over 2010." The Company's Board has unanimously authorized a 1 million share increase in the number of shares of Common Stock the Corporation is authorized to repurchase pursuant to its stock repurchase plan, bringing the total authorization to 2.6 million shares.

09:15 am NVIDIA downgraded to Sell at Needham: . Needham downgrades NVDA to Sell from Hold and they see downside for the shares in the $9-11 range. Firm says their downgrade is not based primarily on near term trends, which are soft, but rather on the following long term concerns: secular challenges in core graphics as integrated graphic offerings from Intel's Sandybridge and AMD's Llano fully ramp in the mainstream desktop/notebooks; reductions in their Tegra forecast owing to near term overbuild from Non-Apple tablets, intensifying competition in 2012 from TI and QCOM, and shrinking addressable smartphone TAM; and decline in core gross margins (ex-Intel) due to pricing pressure in GPUs and Tegra GM trending below 50%.

09:15 am Sunpower downgraded to Sell at Stifel Nicolaus: . Stifel Nicolaus downgrades SPWRA to Sell from Hold following lowered guidance. The firm says the co's cost structure has always been higher than the competition; however, the margin squeeze that many have feared has finally arrived given the preannounced results last night. While downgrading after a negative preannouncement is difficult, they were surprised by the magnitude of the gross margin miss versus their expectations, and don't see any near term fixes for SunPower this year as they scramble to reallocate modules from Europe to the United States and other markets.

1:35 pm S&P 500 Tech Sector Shows Modest Gains; FFIV Upgraded, NVDA Downgraded (FFIV)

The tech sector is trading modestly higher today, ahead of losses in the broader market. Semiconductors are showing relative strength in the tech space with the Philly Semi Index trading 1.2% higher. Among chips in the index, BRCM (+9.7%) is the notable leader, while STM (-9.7%) is underperforming. Among other major indices, the S&P 500 is trading lower (-0.4%), while the NASDAQ is trading 0.2% lower. The QQQ, meanwhile, is trading up around 0.2%. Among tech bellwethers, AAPL (+1.3%) is again showing relative strength, while ORCL (-0.1%) is under pressure.

In earnings last night, TXN (+0.9%) reported a slightly better-than-expected qtr with inline guidance, BRCM (+9.7%) and SANM (+22.2%) posted a beats with upside guidance, and STM (-9.7%) missed and guided lower. This morning, ARMH (-1.9%) reported a slight beat and issued inline guidance and LXK (+17.4%) and ACIW (+3.6%) posted a beat with inline guidance.

In news, IDCC (+2.8%) filed a complaint against NOK (+2.3%), Huawei and ZTE with International Trade Commission. In rumors, we are hearing AMD (+1.3%) takeover chatter making the rounds.

Among notable analyst upgrades this morning, Ticonderoga upgraded FFIV (+2.3%) to Buy, VLTR (+15.6%) and VCLK (-0.8%) were upgraded to Overweight at Piper Jaffray, S (-0.7%) was upgraded to Outperform at RBC Capital, and FNSR (+9.5%) was upgraded to Buy at Citigroup. In downgrades this morning, Needham downgrades NVDA (-2.2%) to Sell.

10:36 am Broadcom Tops Second Quarter Expectations (BRCM)

Broadcom (BRCM $38.10 +3.19) reported second quarter earnings of $0.72 per share, $0.09 better than the Capital IQ Consensus Estimate of $0.63.

Revenues rose 12.5% year/year to $1.8 billion versus the $1.8 billion consensus.

Product gross margin was 51.1%. The company stated, "Looking forward, we see strong demand for our communications solutions, reinforcing that innovation is driving customer demand. We expect solid growth in revenue and profitability in the third quarter.

icon url

ReturntoSender

08/01/11 10:45 PM

#9418 RE: ReturntoSender #6755

From Briefing.com: 4:30 pm : Stocks started the session with a 1% gain, but rolled over to trade with a 1% loss as participants discarded news that legislative leaders agreed on a debt deal to focus on the tenuous U.S. economy.

Participants first applauded news that leaders of the House and Senate have agreed to certain spending cuts and an increased debt ceiling so as to help avoid a default on U.S. debt. Of course, many recognized that an official vote has yet to be made. Also, debt rating agencies have yet to weigh in, leaving some to wonder whether or not the U.S. will lose its coveted top-notch AAA credit rating.

Nonetheless, the news helped stocks stage a nice gap up at the open. The move offered stocks relief from the near 4% slide that they had suffered during the course of last week's trade. It didn't take long for support to fade, though. Stocks steadily descended from their opening high, then gained momentum to the downside with the release of the latest ISM Manufacturing Index.

The ISM Index for July was widely expected to come in at 54.0. It fell to 50.9 from 55.3 in the prior month instead. As for manufacturing activity abroad, China's PMI Manufacturing Index for July dipped to 50.7 from 50.9 in June. The final July reading for the eurozone PMI Manufacturing Index stayed at 50.5, but Germany's PMI Manufacturing Index for July came in at 52.0, which is slightly less than the 52.1 that was posted in the preliminary reading. France's PMI Manufacturing reading inched up to 50.5 from the 50.1 that was posted in the preliminary reading.

Europe's bourses suffered a rush of aggressive selling shortly before they closed. Their weak finish coincided with additional selling pressure in the broad U.S. equity market.

The S&P 500 may have settled in the red, which made for its sixth straight loss, but it was able to work its way up from its midday low. That meant that it avoided closing below its 200-day moving average after it had traded below the key technical line earlier in the day.

Favor for relatively conservative, dividend paying plays made telecom and utilities today's top performers. As a group, telecom stocks advanced 0.9%. Utilities managed to muster a collective gain of 0.3%.

Every other major sector suffered a loss. Health care stocks were hit the hardest. The sector ended the day with a 1.7% loss, although it had been down by about 2.5% at its session low. Managed care plays slumped as participants shrugged off an upside earnings surprise by Humana (HUM 72.36, -2.22) to focus on the threat of pricing pressure within the industry.

Overall weakness among stocks helped send Treasuries higher again. In turn, the yield on the benchmark 10-year Note dropped below 2.75% for the first time since November.

The greenback also benefited from buying interest. It had trailed a basket of major foreign currencies in the early going, but managed to rally to a 0.8% gain, as of the close of trade. The dollar is still down about 6% for the year, though.

Advancing Sectors: Telecom +0.9%, Utilities +0.3%
Declining Sectors: Energy -0.1%, Tech -0.2%, Consumer Staples -0.3%, Financials -0.3%, Materials -0.4%, Industrials -0.5%, Consumer Discretionary -0.6%, Health Care -1.7%DJ30 -10.75 NASDAQ -11.77 NQ100 -0.4% R2K -0.5% SP400 -0.7% SP500 -5.34 NASDAQ Adv/Vol/Dec 1189/2.23 bln/1400 NYSE Adv/Vol/Dec 1616/1.11 bln/1428

4:31PM QuickLogic announces second-generation DPO technology, increases power savings for smartphones and tablets (QUIK) 4.25 +0.04 :

4:11PM Integrated Device reports EPS in-line, misses on revs (IDTI) 6.71 -0.13 : Reports Q1 (Jun) earnings of $0.12 per share, in-line with the Capital IQ Consensus Estimate consensus of $0.12; revenues fell 4.3% year/year to $151.5 mln vs the $153.7 mln consensus.

(ATML) announced Samsung has selected the Atmel maXTouch mXT224E controller to power its next-generation Galaxy S II touchscreen.

8:04AM Vitesse Semi appoints Martin S. McDermut as Chief Financial Officer (VTSS) 3.60 : Co announces the appointment of Martin McDermut as senior vice president, finance and CFO. Mr. McDermut replaces Rich Yonker who has served as chief financial officer since 2006.

3:13AM Avnet acquires Taiwanese semiconductor distributor Prospect Technology and JC Tally Trading Co; no terms disclosed (AVT) 29.30 : Prospect Technology generated revenue of ~$157 mln during the 2010 calendar year. J.C. Tally generated revenue of ~$90 mln in calendar 2010.

icon url

ReturntoSender

08/02/11 11:19 PM

#9419 RE: ReturntoSender #6755

From Briefing.com: 4:30 pm : An aggressive selling effort left stocks to suffer another loss. The stock market now sits at its lowest level since June.

A higher debt ceiling and new fiscal measures were signed into law today, but that mattered little to a market that remains threatened by the prospect of a U.S. debt rating downgrade and ongoing concerns about the sluggish pace of the economy's recovery.

Data has been almost entirely underwhelming in the wake of the lackluster GDP report that was posted this past Friday. Just yesterday a disappointing ISM Manufacturing Index reading was reported. This morning it was learned that personal spending during June declined by 0.2%, which contrasts with the consensus call for a 0.1% increase issued by economists polled by Briefing.com. As had been expected, personal incomes increased by 0.1% during June, though.

A breakdown by stocks left the S&P 500 to settle at its session low and suffer its worst one-day drop in nearly a year, seemingly a suggestion that the stock market's seven-session slide isn't losing momentum.

Dow component Pfizer (PFE 18.14, -0.87) was among the hardest hit names, despite an upside earnings surprise for the latest quarter. Coach (COH 61.03, -4.26) also sank sharply after it, too, posted better-than-expected earnings results. Foster Wheeler (FWLT 27.02, +0.56) was one of the few names that managed to score a gain; it did so as traders cheered the company's latest quarterly report.

Automakers were mostly weak following their latest monthly sales numbers. Both General Motors (GM 27.05, -1.02) and Ford (F 11.85, -0.50) experienced annual sales increases of slightly less than 10%. Toyota (TM 81.29, -0.48) suffered a 20% year-over-year slump in July sales, but the stock's loss was tempered by a positive response to the company's strong quarterly report.

This session's selling effort was accompanied by robust share volume. In fact, more than 1 billion shares traded hands on the NYSE again today. The pick up in participation comes after the pace of trade had been anemic for several months.

Gold and Treasuries, both traditional safe havens, attracted a bevy of buyers. In turn, gold prices spiked more than 1% to a new record above $1640 per ounce then extended the move in electronic trade. As for Treasuries, the benchmark 10-year Note climbed more than a point so that its yield approached 2.60% for the first time since November.

Advancing Sectors: (None)
Declining Sectors: Consumer Staples -1.3%, Utilities -1.6%, Telecom -1.9%, Health Care -2.3%, Tech -2.3%, Energy -2.7%, Financials -2.8%, Materials -2.9%, Industrials -3.4%, Consumer Discretionary -3.7%DJ30 -265.87 NASDAQ -75.37 SP500 -32.89 NASDAQ Adv/Vol/Dec 443/2.40 bln/2178 NYSE Adv/Vol/Dec 645/1.25 bln/2396

4:26PM Silicon Image beats by $0.02, beats on revs; guides Q3 revs in-line (SIMG) 5.45 -0.20 : Reports Q2 (Jun) earnings of $0.05 per share, excluding non-recurring items, $0.02 better than the Capital IQ Consensus Estimate of $0.03; revenues rose 20.2% year/year to $53.6 mln vs the $52.3 mln consensus. Co issues in-line guidance for Q3, sees Q3 revs of $60-62 mln vs. $61.90 mln Capital IQ Consensus Estimate.

4:26PM Super Micro Computer reports EPS in-line, beats on revs; guides Q1 EPS in-line, revs in-line (SMCI) 12.69 -0.98 : Reports Q4 (Jun) earnings of $0.29 per share, in-line with the Capital IQ Consensus Estimate consensus of $0.29; revenues rose 29.1% year/year to $260.3 mln vs the $251.2 mln consensus. Co issues in-line guidance for Q1, sees EPS of $0.23-0.27 vs. $0.27 Capital IQ Consensus Estimate; sees Q1 revs of $240-260 mln vs. $249.09 mln Capital IQ Consensus Estimate.

4:18PM Monolithic Power beats by $0.02, beats on revs; guides Q3 revs in-line (MPWR) 12.76 -0.47 : Reports Q2 (Jun) earnings of $0.21 per share, $0.02 better than the Capital IQ Consensus Estimate of $0.19; revenues fell 7.4% year/year to $51.6 mln vs the $50.9 mln consensus. Co issues in-line guidance for Q3, sees Q3 revs of $56-60 mln vs. $57.05 mln Capital IQ Consensus Estimate. Sees Q3 gross margin in the range of 52.0% to 52.5%.

MIPS Technologies (MIPS) announced that TRACE32? debuggers from Lauterbach now support the MIPS32 M14K and M14K processor cores.

8:13AM Trina Solar lowers Q2 shipment, gross margin guidance; reaffirms FY11 shipment guidance (TSL) 18.36 : Co lowers Q2 shipment guidance to 395-397 MW from 430-450 MW, gross margin to 17.0-17.5% from low 20s % previously. Gross margin relating to its in-house wafer production and module production to be ~20%, compared to the co's previous guidance of in the mid 20s in percentage terms "While shipment volumes in the second quarter were our highest ever, sales were adversely impacted by extended slower demand and high industry inventory due in part to recently issued regulatory revisions and reduction in solar subsidies in Italy. We expect a significant improvement in production costs and an increase in shipment volumes in Q3. As market demand conditions improve, we see a significant increase in pipeline from our distributors and large commercial and utility segment customers across Europe and North America. We are in discussions with new and existing customers to secure a growing number of sales agreements that cover the second half of the year." Based on its demand outlook for the second half of 2011, the co reiterates its expectation for its full year 2011 PV module shipments of between 1.75 GW to 1.80 GW, representing an increase of 65.6% to 70.3% from 2010.

7:31AM Vishay misses by $0.01, reports revs in-line; guides Q3 revs in-line (VSH) 13.68 : Reports Q2 (Jun) earnings of $0.50 per share, excluding non-recurring items, $0.01 worse than the Capital IQ Consensus Estimate of $0.51; revenues rose 1.2% year/year to $710 mln vs the $715.4 mln consensus. Co issues in-line guidance for Q3, sees Q3 revs of $675-715 mln vs. $711.63 mln Capital IQ Consensus Estimate.

6:04AM Kulicke & Soffa beats by $0.06, beats on revs; guides Q4 revs below consensus (KLIC) 9.27 : Reports Q3 (Jun) earnings of $0.95 per share, $0.06 better than the Capital IQ Consensus Estimate of $0.89; revenues rose 33.0% year/year to $294.4 mln vs the $263.1 mln consensus. Co issues downside guidance for Q4, sees Q4 revs of $155-175 mln vs. $202.71 mln Capital IQ Consensus Estimate. Co states Q3 guidance reflects softening of OSAT demand.

ARM (ARMH) announced that HiSilicon has licensed a range of ARM IP for use in 3G/4G base stations, networking infrastructure, mobile computing and power management applications.

09:34 am TriQuint Semi upgraded to Buy at Kaufman Bros: . Kaufman Bros upgrades TQNT to Buy from Hold saying the upcoming iPhone launch in late 3Q11/early 4Q11 should be a catalyst for the shares. Firm says additional depreciation expense from capex additions likely to hit mostly in 1Q12, or late 4Q11, at the same relative time as the next iPhone ramp
icon url

ReturntoSender

08/04/11 12:57 PM

#9421 RE: ReturntoSender #6755

It's the Investors Intelligence Poll that has a proven track record for helping to point out a market bottom and we still have way more Bulls than Bears in that poll. The last cross over of more bears than bulls was back around mid July to early August last year. That formed a good trading bottom.

http://www.schaeffersresearch.com/streetools/market_tools/investors_intelligence.aspx


Newsletter writers are mostly bullish on a permanent basis. They are also almost always wrong when they finally go bearish enough that the bearish newsletter writer out number the bulls.

Right now we are still....

46.3 Bulls and only 24.7 Bears

Way too Bullish!

JMHO, RtS
icon url

ReturntoSender

08/05/11 12:33 AM

#9423 RE: ReturntoSender #6755

From Briefing.com: 4:30 pm : Aggressive selling resumed today, causing the Dow to drop 500 points, the Nasdaq Composite to plummet 5%, and the S&P 500 to sink 60 points to 1200 for its worst single-session performance in more than two years.

Ongoing concerns about the global economy remained a driving force in today's sell-off, which was steady and orderly. Losses were ushered in with heavy share volume, and left the S&P 500 at its lowest level in nine months, or about 12% below its early May high.

Even safe havens like gold and silver failed to escape selling pressure as traders opted to sell their profitable picks in order to meet margin calls on other holdings. Gold settled lower by 0.5% at $1658.20 per ounce after it had rallied to a new all-time high at $1684.90 per ounce. Silver sank 5.6% to $39.42 after it had hit a three-month high of $42.30 per ounce.

The scope of this session's slide has many wondering what the market has in store tomorrow, when the official nonfarm payrolls report will be released. Today, though, participants were dealt a weekly initial jobless claims tally of 400,000, which isn't much better than the 405,000 initial claims that had been broadly expected among economists polled by Briefing.com.

Renewed macro tension in Europe prompted the European Central Bank President Trichet to provide markets with additional liquidity with an extension of maturities related to financing operations. In a similar vein, Japan expanded its asset purchase plan, but also intervened in the yen, which tumbled more than 3% against the greenback before it could pare some of that loss. Weakness in the yen and euro helped drive the Dollar Index 1.8% higher.

Every single sector in the S&P 500 fell more than 3% today. Materials and energy stocks suffered the worst of it all. The two sectors sank 6.6% and 6.8%, respectively.

Retailers weren't far behind, based on the SPDR S&P Retail ETF (XRT 48.55, -3.38), which fell 6.5%. The group's weakness came not only because of broad market weakness, but also from a generally uninspiring batch of monthly same-store sales results. Although it didn't offer any monthly metric, teen apparel and accessories retailer Aeropostale (ARO 12.53, -3.99) saw almost one quarter of its market cap melt away after the company cut its guidance.

Dow component Kraft (KFT 33.78, -0.52) had gapped up by about 6% to a multi-year high at the open, thanks to news that the company will spin off its North American grocery business, but the blue chip was ultimately imbued by broad market weakness.

Advancing Sectors: (None)
Declining Sectors: Energy -6.8%, Materials -6.6%, Financials -5.2%, Industrials -5.4%, Consumer Discretionary -4.8%, Tech -4.5%, Health Care -3.8%, Telecom -3.3%, Utilities -3.2%, Consumer Staples -3.1%DJ30 -512.76 NASDAQ -136.68 NQ100 -4.6% R2K -6.0% SP400 -5.9% SP500 -60.27 NASDAQ Adv/Vol/Dec 203/3.27 bln/2442 NYSE Adv/Vol/Dec 140/1.82 bln/2968

4:44PM TTM Tech beats by $0.03, beats on revs; guides Q3 EPS below consensus, revs in-line (TTMI) 12.34 -1.17 : Reports Q2 (Jun) earnings of $0.40 per share, excluding non-recurring items, $0.03 better than the Capital IQ Consensus Estimate of $0.37; revenues rose 18.0% year/year to $366.1 mln vs the $359.7 mln consensus. Co issues guidance for Q3, sees EPS of $0.32-0.41, excluding non-recurring items, vs. $0.42 Capital IQ Consensus Estimate; sees Q3 revs of $365-385 mln vs. $378.34 mln Capital IQ Consensus Estimate.

4:32PM Multi-Fineline beats by $0.06, reports revs in-line; guides Q4 revs below consensus (MFLX) 18.97 -1.00 : Reports Q3 (Jun) earnings of $0.38 per share, $0.06 better than the Capital IQ Consensus Estimate of $0.32; revenues rose 6.0% year/year to $191.8 mln vs the $191.1 mln consensus. Co issues downside guidance for Q4, sees Q4 revs of $190-210 mln vs. $217.76 mln Capital IQ Consensus Estimate, and gross margin to range between 11 and 12 percent based on the projected product mix and sales volume.

4:31PM Nanometrics announced that Samsung Electronics has accepted its UniFire 7900 metrology system for process control of advanced wafer scale packaging (NANO) 14.31 -1.29 :

4:21PM MIPS Tech misses by $0.03, misses on revs (MIPS) 6.10 -0.71 : Reports Q4 (Jun) earnings of $0.04 per share, excluding non-recurring items, $0.03 worse than the Capital IQ Consensus Estimate of $0.07; revenues fell 24.5% year/year to $17.6 mln vs the $19.7 mln consensus. "We had strong results for our fiscal year, but our fourth quarter proved to be more challenging than we expected. Despite macroeconomic uncertainty, we remain confident in the market opportunity, and we are taking the steps necessary to achieve long-term success."

4:21PM STEC Inc announces a stock repurchase program of up to $15 mln (STEC) 9.44 -0.77 :

4:19PM Microchip beats by $0.01, reports revs in-line; guides Q2 EPS in-line, revs in-line (MCHP) : Reports Q1 (Jun) earnings of $0.55 per share, excluding non-recurring items, $0.01 better than the Capital IQ Consensus Estimate of $0.54; revenues rose 4.9% year/year to $374.5 mln vs the $376.4 mln consensus. Co issues in-line guidance for Q2, sees EPS of $0.50-0.54 vs. $0.51 Capital IQ Consensus Estimate; sees Q2 revs of $352.0-370.8 mln vs. $366.34 mln Capital IQ Consensus Estimate.

4:09PM First Solar misses by $0.22, misses on revs; guides FY11 EPS in-line, revs below consensus (FSLR) 107.94 -7.31 : Reports Q2 (Jun) earnings of $0.70 per share, $0.22 worse than the Capital IQ Consensus Estimate of $0.92; revenues fell 9.4% year/year to $533 mln vs the $583.1 mln consensus. Co issues mixed guidance for FY11, sees EPS of $9.00-9.50 vs. $9.36 Capital IQ Consensus Estimate; sees FY11 revs of $3600-3700 mln vs. $3.74 bln Capital IQ Consensus Estimate.

4:02PM Rubicon Tech beats by $0.05, reports revs in-line; guides Q3 EPS below consensus, revs below consensus; announces $25 mln common stock repurchase (RBCN) 12.80 : Reports Q2 (Jun) earnings of $0.59 per share, $0.05 better than the Capital IQ Consensus Estimate of $0.54; revenues rose 173.9% year/year to $43 mln vs the $42.7 mln consensus. Co issues downside guidance for Q3, sees EPS of $0.23-0.30 vs. $0.49 Capital IQ Consensus Estimate; sees Q3 revs of $28-34 mln vs. $44.99 mln Capital IQ Consensus Estimate.

4:02PM Brooks Automation reports EPS in-line, beats on revs (BRKS) 8.64 -0.56 : Reports Q3 (Jun) earnings of $0.36 per share, excluding non-recurring items, in-line with the Capital IQ Consensus Estimate consensus of $0.36; revenues rose 18.7% year/year to $186.1 mln vs the $182.2 mln consensus.

Trina Solar Limited (TSL) announced that its subsidiary, Changzhou Trina Solar Energy Co has signed supply agreements with Huanghe Hydropower Development, a subsidiary of China Power Investment Corporation, for two ground-mounted solar projects in China for a total of 30 MW PV modules. Co will supply ~20 MW of PV modules for the Golmud project, of which delivery commenced in June and is expected to extend through August of this year.

7:18AM Anadigics beats by $0.02, reports revs in-line (ANAD) 3.07 : Reports Q2 (Jun) loss of $0.14 per share, excluding non-recurring items, $0.02 better than the Capital IQ Consensus Estimate of ($0.16); revenues fell 31.1% year/year to $35.6 mln vs the $35.7 mln consensus.

2:53AM Tower Semicon beats by $0.03, reports revs in-line; guides Q3 revs above consensus (TSEM) 1.06 : Reports Q2 (Jun) earnings of $0.15 per share, $0.03 better than the Capital IQ Consensus Estimate of $0.12; revenues rose 11.1% year/year to $139.7 mln vs the $139.9 mln consensus. Co issues upside guidance for Q3, sees Q3 revs of $173-183 mln vs. $163.55 mln Capital IQ Consensus Estimate.

09:35 am MEMC Elec downgraded to Hold at Kaufman Bros; tgt lowered to $7: . Kaufman Bros downgrades WFR to Hold from Buy and lowers their tgt to $7 from $10 following earnigns saying one time items hide operational weakness. Firm says end market weakness is likely to be long lasting

icon url

ReturntoSender

08/05/11 11:28 AM

#9424 RE: ReturntoSender #6755

BPNDX is a lagging indicator. A short term bottom can be formed with a quick rebound in the BPNDX. A long term chart of previous long term market bottoms show the actual lows have already been hit and the BPNDX numbers are showing higher lows at the actual market bottoms in 2002 and 2009. This chart will update every market day after the close to give accurate BPNDX numbers:


icon url

ReturntoSender

08/07/11 1:39 PM

#9428 RE: ReturntoSender #6755

Monday Morning Outlook: Bracing for the U.S. Debt Downgrade
Reaction Key technical levels to watch as stocks respond to S&P's ratings cut

by Todd Salamone
8/6/2011 9:30 AM

http://www.schaeffersresearch.com/commentary/observations.aspx?ID=107460&trackback=recapezine

It was a generally brutal week in the equities market -- and that was before Standard & Poor's came out with its late-Friday downgrade of U.S. debt. Despite what The Wall Street Journal described as "a $2 trillion error in S&P's math," the agency predicted a rapidly ballooning domestic deficit, accused the government of instability, and cut its credit rating to AA-plus with a negative outlook -- indicating that additional downgrades are not out of the question. While it could be argued that traders spent most of the week pricing in their panic over just such a move, a relief rally hardly seems inevitable.

Particularly troubling, says Todd Salamone, is the fact that several major support levels were broken by the time last week's wild ride wrapped up. As we head into what will surely be a memorable five days on Wall Street, Todd takes a look at the next technical lines of defense for U.S. stocks. Meanwhile, Rocky White's analysis seems to confirm that more short-term pain is likely, now that the S&P 500 is trading well below its 200-day moving average. Finally, we wrap up with a preview of this week's key economic events, as well as a few sectors of note.

Notes from the Trading Desk: Checking the Market for a Pulse
By Todd Salamone, Senior VP of Research

"Last week's option activity on those major ETFs once again created a roll-over in the combined 20-day buy-to-open put/call volume ratio that we closely follow. It's too early to tell if this is temporary or not, as this action was more than likely related to the uncertainty ahead of Congress' Aug. 2 deadline. The risk to the bulls is an extended decline of this ratio, which would suggest continued hedge-fund liquidations and/or increased shorting among hedge funds. The last time this ratio rolled lower from the spot of last week's peak (in March/April), the SPX corrected 7% from top to trough. At Friday's lows, the SPX had dropped about 4.5%. "While we still feel that the risk-reward scales are tipped in the bulls' favor, one should allow for the possibility of support levels breaking, as the final panic may not yet be in place... Our long model portfolio (Schaeffer's Master Portfolio) has exposure to gold, bonds and several consumer discretionary stocks that are highly shorted, unloved by Wall Street analysts, and displaying strong price action amid favorable earnings momentum."
-- Monday Morning Outlook, July 30, 2011

Gold and bonds proved to be excellent places to hide last week, with both assets soaring as equities indeed broke support levels amid persistent worries about the domestic economy and troubles in Europe. At Friday's low, the S&P 500 Index (SPX - 1,199.38) lost 124 points from the previous week's close, or nearly 10% -- in official "correction" territory, as noted by many media outlets.

Meanwhile, as you might have already guessed, the 20-day customer-only, buy-to-open put/call volume ratio on the major exchange-traded funds (ETFs) retreated sharply lower, in a continuation of the decline we discussed last week. This would indicate that hedged players were in anything but accumulation mode, and were likely liquidating or actively shorting, coincidentally putting a huge amount of pressure on the market.

If you're a bull, you are drawn to the fact that this ratio is approaching levels from which the market has previously staged impressive rallies. But before getting aggressive on the long side, it might be beneficial to see this ratio turn higher once again.


Of course, it might also be worth it to confirm that the market has a pulse, from a price-action perspective, after last week's drastic spill. We noticed, for example, that since the decline from resistance in the 1,340 area, rally attempts have been capped at key intraday moving averages that we follow on a five-minute chart. So, at the very least, aggressive bulls looking for an entry point might wait for the SPX to rally back above these trendlines before initiating new long positions.


Also, the key 1,200 century mark on the SPX is also the approximate site of its 80-week moving average (1,206.10), which caught the lows at the July/August 2010 bottom. The index's weekly close below this trendline and the 1,200 century mark is a cause for concern heading into this week's trading.

If you need more convincing, in terms of price action giving you "permission" to enter new long positions, you should look for the S&P MidCap 400 (MID - 844.78) and Russell 2000 Index (RUT - 714.63) to rally back above 900 and 750, respectively. Without leadership and a much-improved technical backdrop in these indexes, stocks will remain vulnerable.

The 900 level on the MID acted as resistance in 2007-2008 prior to a brutal pullback in this index. The decline back below this former resistance level puts the bears in control, and thus a move down to the index's 80-month moving average, at 764, could be in the offing. The 80-month moving average acted as support at the 2002 bottom and at the July/August 2010 bottom, while a move below this trendline in October 2008 was a precursor of more damage to come.


Turning to the RUT, 750 marked a peak before the May 2010 "flash crash," establishing this round-number level as a significant one to watch. Moreover, the RUT broke below its 80-week moving average last week, which is currently sitting at 729.54. It was the first weekly close below this trendline since September 2009 -- not something the bulls wanted to see.


For what it's worth, the 80-month moving average on the RUT is sitting at 686.91. This trendline was supportive during pullbacks in 1998 and 2001, but when broken to the downside, is predictive of more selling.

Due to Thursday's slide and Friday's steep mid-morning pullback, the CBOE Market Volatility Index (VIX - 32.00) spiked, reaching its highest levels since the aforementioned flash crash. Friday's VIX high of 39.25 was 68% above SPX realized volatility, with extremes being 100% above SPX realized volatility. Therefore, the jury is out as to whether or not the VIX has indeed peaked, but from this perspective, there is certainly room for the VIX to move higher and challenge its May 2010 high in the 48 area.


With the storm cloud of the S&P debt downgrade overhead, the threat of another possible ratings cut on the horizon, and the market's technical backdrop now in question, we advise maintaining long exposure to gold and bonds to hedge your long equity exposure. We remain bearish on big-cap banks and big-cap technology stocks. We still have exposure to consumer-discretionary names, but would not add to this group until price action begins to improve, which could put renewed pressure on the shorts.

Indicator of the Week: S&P 500 Falls Below Its 200-Day Moving Average
By Rocky White, Senior Quantitative Analyst

Foreword: It was another wild week in the market, and the S&P 500 Index (SPX) has now seen its biggest two-week slide since March 2009. The drop has taken us well below the index's 200-day moving average, which is a widely followed trendline among technical analysts. This week, I'm taking a look at past breaks of this moving average to see when the bleeding typically stops.

First Break in 200 Days: Prior to last Tuesday, the SPX had not closed below its 200-day moving average in almost year. Since September 2010, actually -- or, to be specific, 224 trading days. Below is a table showing the last 15 times a cross below the moving average occurred after at least 200 days above it. I also show typical, "at any time" SPX returns since 1975, which covers the time span of the 15 returns.


Notice in the very short term, the average returns are negative, despite the relatively high percentage of positive returns. This is because when the returns are negative, they are very negative. We've already experienced some of this, with the market down almost 5% since Tuesday's close.

The table also shows that if the SPX is negative over the next two weeks, it averages a loss of more than 5% -- doubling the typical average loss of 2.35%, and then some. On a brighter note, despite the bearish short term-returns, the longer-term returns (over three months and six months) significantly outperform typical market returns.

This Week's Key Events: Fed's Latest Rate Decision Due Out Tuesday
Schaeffer's Editorial Staff

Here is a brief list of some of the key events this week. All earnings dates listed below are tentative and subject to change. Please check with each company's respective website for official reporting dates.

Monday

There are no major economic reports scheduled for Monday, which means the U.S. debt downgrade may single-handedly steer the market action. On the earnings front, we'll hear from Tyson Foods (TSN), 99 Cents Only Stores (NDN), Dollar Thrifty Automotive (DTG), Brigham Exploration Co. (BEXP), Coeur d'Alene Mines (CDE), Silver Wheaton (SLW), Clean Energy Fuels (CLNE), Live Nation Entertainment (LYV), MGM Resorts (MGM), and Youku.com (YOKU).

Tuesday

Tuesday's docket features a report on second-quarter productivity and labor costs from the Bureau of Labor Statistics (BLS). However, traders will likely be holding their collective breath ahead of the latest monetary policy decision from the Federal Open Market Committee (FOMC), which is due out in the afternoon. Quarterly earnings results are expected from Walt Disney (DIS), AOL (AOL), Demand Media (DMD), Fuel Systems Solutions (FSYS), Harbin Electric (HRBN), ReneSola (SOL), SunPower (SPWRA), Beazer Homes (BZH), Cree (CREE), Dish Network (DISH), and EchoStar (SATS).

Wednesday

On Wednesday, we'll hear reports on wholesale inventories for June, the July Treasury budget, and weekly petroleum inventories. Scheduled to report earnings are Cisco Systems (CSCO), Computer Sciences (CSC), InterClick (ICLK), Macy's (M), Polo Ralph Lauren (RL), Advance Auto Parts (AAP), MBIA (MBI), News Corp. (NWS), and Jack in the Box (JACK).

Thursday


Weekly jobless claims are due out on Thursday, along with June's trade balance. Brinker International (EAT), Red Robin Gourmet Burgers (RRGB), Wendy's Co. (WEN), Sara Lee (SLE), SodaStream International (SODA), Nvidia (NVDA), Renren (RENN), Hoku Corp. (HOKU), Kohl's (KSS), Nordstrom (JWN), and Molycorp (MCP) are expected to report earnings.

Friday

The economic calendar concludes on Friday with the release of retail sales for July, June's business inventories, and the preliminary Reuters/University of Michigan consumer sentiment index for August. Meanwhile, J.C. Penney (JCP), Century Casinos (CNTY), Mentor Graphics (MENT), and Tree.com (TREE) will share the earnings spotlight.


icon url

ReturntoSender

08/07/11 5:35 PM

#9431 RE: ReturntoSender #6755

Amateur Investors Weekend Stock Market Analysis (8/6/11)

http://www.amateur-investor.net/Weekend_Market_Analysis_Aug_6_11.htm

Volatility has reverted back to the late 2007-2008 time period with large intra day moves occurring. The S&P 500 has followed through to the downside after breaking below its Neckline (black line) in association with a Head and Shoulders Top pattern. Meanwhile remember back in 2010 we also had a potential Head and Shoulders Top pattern but it ended up having a failed breakout after finding support at the 1011 level. The recent Head and Shoulders Top pattern looks like the real deal and I think it's unlikely a big upside reversal to new highs will occur like last time.


Meanwhile the move down from the 2nd Shoulder appears to be evolving into a 5 Wave affair and Friday's bounce is likely Wave 4 which would be followed by the final 5th Wave to complete the first larger Wave #1 down. The target for the 5th Wave would be probably in the 1150's with 1148 the 61.8% Retracement Level calculated from the July 2010 low of 1011 to the April high of 1371. It's certainly possible all of this will complete by next week followed by an even stronger relief rally from mid August through mid September as an "abc" type Wave #2 occurs with a potential back test of the Neckline.


Meanwhile the Volatility Index (VIX) made an explosive move this week and once again when the 16 level has been breached (points A) market corrections of varying magnitudes have followed since 2007 (points B to C).


icon url

ReturntoSender

08/08/11 2:13 PM

#9434 RE: ReturntoSender #6755

In 2008 I started to get in too early. My early entries ended up being down for so long that when we actually got that final 90% upside day in March of 2009 I failed to scale in at the wholesale levels that were offered then.

I also thought that we might see a retest of the bottom formed in March of 2009 like we did with the October 2002 bottom in March of 2003. That did not happen on most major index charts. We actually got a V bottom as the FED and our government tried to avert a complete financial disaster.


The question is now what is left that can be reasonably done with the deficit we already have in place?

When will this sell off end? I don't know but I am waiting until I see that Investors Intelligence Poll on Wednesday before getting an itchy buy finger.

RtS
icon url

ReturntoSender

08/08/11 7:02 PM

#9436 RE: ReturntoSender #6755

Leavitt Brothers - This Time Could Be Much Worse
by admin on August 8, 2011
in Essays/Reports/Article

http://leavittbrothers.com/blog/?p=4736

Here’s the S&P 500 chart going back 15 years. We had a big rally during the late 90’s…a big sell-off from 2000-2002…a big rally from 2003-2007…a big sell-off from 2007-2009…a big rally from 2009 to 2011…and now we’re in the beginning stages of a big sell-off.


My chart as it will update. RtS

Will this time be different? Comparing the current situation to the previous two tops suggests this time could be worse. Here’s why:

The 2000-2002 Bear Market: When the market topped in 2000, the general mood in the country was great, the economy was doing great and prosperity was everywhere. Unemployment was low and housing was, well it was housing – boring and a reliable storage place for wealth. The stock market was very high, and the Fed Funds rate was at 6.5% (after Greenspan raised it in the summer of 2000). If the market was going to come down hard, the circumstances could not have been better.

The people most effected by the tech bubble bursting were the ones best able to bounce back – smart, educated, 25-year olds. Some got jobs with other companies; others started their own companies; and others went back to school to get their MBAs or other advanced degrees. The group most effected had the brains, initiative, talents and ability to take a deep breath and start over. The Fed also had all the tools in the tool box to use to prevent a total market collapse. The Fed Funds rate was lowered to 1.0%. Pain was felt, but other than stock market losses, it wasn’t hard for America to bounce back (even though it took a couple years).

The 2007-2009 Bear Market: When the market topped in 2007, the general mood was pretty good, the economy was doing well, and prosperity was present but not as prevalent as in 2000 (how could it be, the internet enabled the largest expansion of wealth in history). Unemployment was low, and although housing had already topped, it hadn’t come down too much (other than a couple places where it ran out of control) and foreclosures and steep losses were not headline stories yet. The stock market was at all-time highs (not the Nas which was artificially inflated by companies that don’t exist any more), and the Fed Funds rate was at 5.25%. So again, if the market was going to come down, the conditions were pretty good. On the flip side, making matters worse (than 2000), two very expensive wars lingered, and our national debt was becoming a joke.

The banking crisis that followed had the potential to cripple the worldwide economy (unlike the tech bubble bursting), but again America had a cushion and the Fed had access to an assortment of tools to dampen the intense selling pressure (Fed Funds rate lowered to basically 0.0%, banks and insurance companies got bailed out). The country was in a position to avoid a total collapse (whether you agree or disagree with the tactics used).

The 2011-20?? Bear Market: We are nowhere near as well positioned to deal with a bear market. The general mood is very negative. Republican or Democrat – doesn’t matter – people are sick and tired of Washington. If you use the market averages to hint at the economy’s strength, you’d be tricked into thinking things are going well. They aren’t. The averages are controlled by the large, multi-national corporations which can easily tap cheap labor markets overseas and benefit from a favorable exchange rate. The reality is corporations are not growing organically, and the economy hasn’t improved much since the financial crisis ended. Unemployment has been above 9% for 2-1/2 years, and housing is in the dumps and could take two decades to recover. The Fed Funds rate is already at 0.0%. The financial system was bailed out, and even though banks have recorded recorded profits, they’re still sitting on hundreds of billions in losses (thanks partially to suspending market-to-market accounting), and are not much better off today than two years ago. QE1 and QE2 helped prop the market up, but the benefit hasn’t been felt by average Joe American. Other than the market being near its highs, the circumstances for a bear market couldn’t be worse.

In a nut shell, with unemployment high, housing in the dumps, failed bailouts in recent memory, failure Fed stimulus, an already-low Fed Funds rate, what can be done to stimulate the economy or dampen a market collapse? Suspend short selling? That’ll cause a 1-week rally. Then what.

Bottom line…we are not positioned to deal with the stock market getting cut in half.

Jason Leavitt
icon url

ReturntoSender

08/08/11 7:57 PM

#9437 RE: ReturntoSender #6755

From Briefing.com: 5:00 pm : Stocks were slammed today with their worst single-session percentate loss since December, 2008. On the surface, the rout came in response to news that analysts at Standard & Poor's cut the US debt rating, but selling was really due mostly to what the downgrade suggested about macro conditions.

In an unprecedented move, analysts at S&P lowered their rating on US debt during the weekend. In turn, US debt is now rated AA+, down from the top-notch rank of AAA. Given that S&P is widely regarded as the most influential rating agency, it mattered little to market participants that Moody's affirmed their AAA rating on the US.

Although many reports may blame this session's precipitous drop on the S&P downgrade, the sell-off really came in response to what the downgrade signified, which is that the US economic outlook isn't as strong as what many had thought. Moreover, any setback in economic activity could further strain US fiscal conditions, which were only recently addressed after weeks of wrangling among legislative leaders. Of course, the threat that the tenuous fiscal and financial conditions of Europe could deteriorate and create contagion have added to concern.

Amid heightened concerns about the macro environment, many traders are dumping stocks in the interest of building liquidity. Of course, their aggressive selling has only begotten additional selling among stocks.

Financials were hit especially hard this session. The sector slumped to a 10% loss so that it is now down 29% from its February high. Bank of America (BAC 6.51, -1.66) was one of the sector's worst performers. It set a two-year low on its way to a 20% loss as some investment funds liquidated their positions in the stock. It didn't help that the bank was hit with a $10 billion mortgage suit by AIG.

Widespread weakness caused the Volatility Index, often euphemistically dubbed the Fear Gauge, to surge 50% to 48.0 for the first time May 2010. Given the fearfulness exhibited by investors, it wasn't such a surprise that gold continued its climb. Still, it was impressive that the yellow metal surged 4% then extended the climb in after-hours trade to a new record high above $1720 per ounce.

Both the dollar and Treasuries benefited from an interest in safety, too. The greenback was up about 0.5% against a basket of major foreign currencies at the end of the trading day. Meanwhile, the yield on the benchmark 10-year Note settled only a couple of basis points above 2.3%.

Advancing Sectors: (None)
Declining Sectors: Consumer Staples -3.8%, Health Care -5.3%, Telecom -5.4%, Utilities -5.5%, Tech -5.8%, Consumer Discretionary -6.7%, Industrials -6.9%, Materials -7.3%, Energy -8.3%, Financials -10.0%DJ30 -634.76 NASDAQ -174.72 NQ100 -6.1% R2K -8.9% SP400 -8.3% SP500 -79.92 NASDAQ Adv/Vol/Dec 114/3.98 bln/2535 NYSE Adv/Vol/Dec 42/2.54 bln/3030

4:17PM TranSwitch misses by $0.01, misses on revs (TXCC) 2.32 -0.10 : Reports Q2 (Jun) loss of $0.10 per share, excluding non-recurring items, $0.01 worse than the Capital IQ Consensus Estimate of ($0.09); revenues fell 49.6% year/year to $7.1 mln vs the $8 mln consensus. "While we continue to experience near-term softness in demand for our telecom products, we have indications of stabilization and return to growth as we move forward in the second-half of 2011. More importantly, we are making significant progress in our strategy of developing a new growth engine for the fast growing video connectivity market as we move into 2012."

8:15AM TriQuint Semi reports inducement equity grant under NASDAQ marketplace rule 5635 (TQNT) 6.99 : The aggregate grant of 155K shares of TriQuint common stock was made to Klein under the co's 2008 Inducement Award Program. The stock option grant has an effective date of August 5, 2011. The options will vest 25% on August 5, 2012, with the remaining 75% vesting quarterly over the next three years. The stock options have an exercise price of $6.99/share.

8:08AM JA Solar announces $100 mln ADR share repurchase program (JASO) 4.05 :

SMSC (SMSC) announced the USB553x, a family of USB 3.0 hub controllers consisting of 7-port and a 4-port offerings. These new SuperSpeed USB hubs deliver the industry's smallest footprint, "hybrid speed" configuration with an optimized BOM cost for designers of the emerging USB 3.0 ecosystem.

Ixia (XXIA) announced that IxVeriWave, its recent product line acquisition, now supports IPv6 testing over Wi-Fi networks and access points.

Verizon's (VZ) attempts to reach a constructive new contract with two unions representing the company's wireline employees in the Northeast and Mid-Atlantic states were unsuccessful, and union leaders announced a decision to call a strike. In anticipation of this development, Verizon has activated a contingency plan to ensure customers experience limited disruption in service during this time.

NRG Solar, a subsidiary of NRG Energy (NRG), and Eurus Energy America have begun commercial operations at the 45-megawatt Avenal Solar Generating Facility, the largest solar photovoltaic generating facility in California.

AMD (AMD) announced availability of the AMD Accelerated Parallel Processing Software Development Kit v2.5.

Lattice Semiconductor (LSCC) announced that XENTROTEC has chosen the mid-range LatticeECP3 FPGA for use in its digital video recorder solution.

2:08AM Semi Manufacturing appoints Tzu-Yin Chiu as CEO and Executive Director (SMI) 2.72 : Co announces the appointment of Dr. Tzu-Yin Chiu as CEO and Executive Director, effective immediately. Prior to joining co, Chiu was President and CEO of Hua Hong NEC Electronics Company.

Among notable analyst upgrades this morning, INTC (+0.1%) was upgraded to Buy at Standpoint, ATML (-4.0%) was upgraded to Outperform at FBR Capital, EMC (-2.4%) and NTAP (-3.8%) were upgraded to Buy at Auriga, and PAY (-4.4%) and CTL (-3.7%) were upgraded to Strong Buy at Raymond James. In downgrades this morning, TXN (-2.3%) was downgraded to Mkt Perform at FBR Capital, ARW (-4.7%) was downgraded to Neutral at Goldman, and FFIV (-5.7%) was downgraded to Neutral from Buy at Suntrust.
icon url

ReturntoSender

08/10/11 11:28 AM

#9439 RE: ReturntoSender #6755

Stubborn Investors Intelligence Poll voters go even more Bullish in the face of the recent sell off:

http://www.schaeffersresearch.com/streetools/market_tools/investors_intelligence.aspx

 
Date Published Percent Bullish Percent Bearish
08/10 47.3 23.7
08/03 46.3 24.7


icon url

ReturntoSender

08/10/11 5:08 PM

#9440 RE: ReturntoSender #6755

Dividend Stocks - Non Financials - Non Utilities Yielding > 4%

Lots of Stocks Have Recently Become High Yielders
Wednesday, August 10, 2011 at 12:27PM

http://www.bespokeinvest.com/

The decline in equities recently has pushed up the dividend yields on stocks by quite a bit. In fact, the S&P 500 now yields more than the 10-Year Treasury Note.

Even if you take out Financials (including REITs) and Utilities, there are 42 stocks in the Russell 3,000 that currently yield more than 4%. These 42 stocks are listed below. There have to be some good opportunities here, right?

icon url

ReturntoSender

08/10/11 7:41 PM

#9441 RE: ReturntoSender #6755

OT: If the Ten Year Treasury Yield continues to follow its downtrend new lows are coming for its yield:


icon url

ReturntoSender

08/12/11 11:51 PM

#9445 RE: ReturntoSender #6755

Decision Point - Percent Buy Index Way Oversold

The Percent Buy Index (PBI) has reached levels seen only at the bear market lows in 2002-2003 and 2009-2010, and we think it has very negative implications.
At Decision Point we apply a medium-term timing model to all the stocks in the S&P 500 Index, and track the percentage of buy signals. The result is the PBI, a medium-term indicator that is useful for monitoring the direction of internal strength/weakness and overbought/oversold conditions.


The fact that the PBI has reached very oversold levels may offer some people hope that an important bottom is near, but history indicates that that would be a false hope. As you can see in two prevous periods where the PBI has gotten to these levels, the best that can be hoped for is that the formation of an important bottom may be just beginning. In those previous periods it took several months for the bottoming process to be completed.

Also note that the shape of the bottoms is completely different -- one triple bottom and one very lopsided double bottom. But I don't think these are the only kinds of bottoms (or outcomes) that are possible, or that a major bottom is the only possible result of an oversold PBI. In fact, the price decline that generated the recent low PBI readings is relatively small compared to the the two previous ones, so it is likely that we will see something completely different from what has happened before.

Considering the rapid deterioration of both price and internals, I think that a continuation of the decline to much lower levels is probable. That is to say that we'll probably see support at previous bear market lows tested before we'll see this year's highs exceeded.

* * * * * * * * * * * * * * * * * * * * *


Technical analysis is a windsock, not a crystal ball.

icon url

ReturntoSender

08/13/11 4:34 PM

#9447 RE: ReturntoSender #6755

Amateur Investors Weekly Market Analysis

http://www.amateur-investor.net/Weekend_Market_Analysis_Aug_13_11.htm

Since 1900 it's been rare to see a major sell off in the month of August. In fact there have only been "7" occurrences in which the Dow has lost 10% or more calculated from the July close to the August low as shown in the table below.

 
Worst % Drops in August since 1900
(July close to August low)

8/31/1998 -15.4
8/31/1990 -15.3
8/30/1974 -14.0
8/31/2011 -12.7
8/30/1907 -12.2
8/31/1966 -10.4
8/31/1939 -10.3


Here are some monthly charts of the previous "6" occurrences with the letter "A" denoting the month of August. In August of 1907 the Dow closed the month with an 8.4% loss. It continued lower for another 3 months before bottoming in November (point B) with an additional loss of -27%.


The next occurrence was in August of 1939 as the Dow closed down -7.7%. However in this case it only dropped another 5% from August's closing value as it made a low in early September (point B) which was followed by a solid close by the end of the month (points B to C).


Meanwhile the next case was in in August of 1966 in which the Dow close down 7.7% for the month. In this case the Dow made a low in October (point B) and lost an additional -6.7%.


The next occurrence was in August of 1974 as the Dow lost 10.4% for the month. In this case the Dow was very volatile as it didn't make a low until November (point B) with an additional loss of -16%.


Meanwhile the next case was in August of 1990 in which the Dow lost 4.4% for the month. In this case the made a low October (point B) in which it lost an additional -10%.


The next occurrence was in August of 1998 in which the Dow closed lower by -15%. In this case the Dow only dropped another -2% while making a slightly lower low in September (point B) and then rallied into the end of the year.


To sum things up based on past events the Dow should make at least a slightly lower low in the Fall with the 38.2% Retracement Level (black line) just above 10400 a minimum target. The worst case scenario would probably be a retest of the July 2010 low near 9600 which is close to the 50% Retracement Level (green line). A drop back to the 9600 level would roughly be a 9% drop from the current August low of 10604. Finally we could be seeing a 5 Wave affair from the May high as the bounce this week would be Wave 4 of 5 with the target for the final 5th Wave somewhere between 10400 and 10000.

icon url

ReturntoSender

08/13/11 8:17 PM

#9449 RE: ReturntoSender #6755

Monday Morning Outlook: Why Bulls Need the VIX to Stay South of 50
Surveying the technical outlook in the wake of a wildly volatile week for stocks

by Todd Salamone 8/13/2011 1:11 PM

http://www.schaeffersresearch.com/commentary/content/monday+morning+outlook+why+bulls+need+the+vix+to+stay+south+of+50/observations.aspx?click=home&ID=107558

It was an appropriately tumultuous week on Wall Street, as traders around the globe reacted to S&P's U.S. debt downgrade. If any additional evidence was needed to prove that the global financial system had shifted on its axis, Tuesday's Fed statement sealed the deal. Much to their presumable chagrin, the generally hawkish trio of Fisher, Plosser, and Kocherlakota emerged as the unlikely -- and unsuccessful -- defenders of the Fed's famous "extended period" language, which was discarded this past week as the relic of a more optimistic time. Stocks spent the week bouncing between dramatic gains and stomach-churning losses, with the Dow Jones Industrial Average pinballing through its most volatile four-day streak since 2008. By the time Friday's closing bell sounded, the major market indexes were a little worse for the wear, but key support levels remained firmly intact.

This week, Todd Salamone steps back from the fray to offer some calm, rational technical analysis. Encouraging signs of stability are starting to develop, but Todd warns that the bulls can't relax just yet -- especially as the VIX lingers within striking distance of a historically significant round-number level. Meanwhile, Rocky White casts a contrarian eye on the latest Investors Intelligence survey, which revealed a somewhat unlikely increase in optimism. Finally, we wrap up with a preview of this week's major economic and earnings events, as well as a few sectors of note.

Notes from the Trading Desk: Starting to Stabilize, But Still Not Out of the Woods
By Todd Salamone, Senior VP of Research

"The key 1,200 century mark on the SPX is also the approximate site of its 80-week moving average (1,206.10), which caught the lows at the July/August 2010 bottom. The index's weekly close below this trendline and the 1,200 century mark is a cause for concern heading into this week's trading. "...The 900 level on the MID acted as resistance in 2007-2008 prior to a brutal pullback in this index. The decline back below this former resistance level puts the bears in control, and thus a move down to the index's 80-month moving average, at 764, could be in the offing. The 80-month moving average acted as support at the 2002 bottom and at the July/August 2010 bottom, while a move below this trendline in October 2008 was a precursor of more damage to come.

"...The RUT broke below its 80-week moving average last week, which is currently sitting at 729.54. For what it's worth, the 80-month moving average on the RUT is sitting at 686.91. This trendline was supportive during pullbacks in 1998 and 2001, but when broken to the downside, is predictive of more selling."
-- Monday Morning Outlook, August 6, 2011

Last week, on the heels of the Standard & Poor's downgrade of U.S. debt, and in anticipation of a wild week with potential downside repercussions, we gave you some longer-term levels to focus on with respect to the key indexes that we track. The goal was to give you a road map for the volatile week that was about to be.

Indeed, there was nothing good about the S&P 500 Index's (SPX - 1,178.81) close below the 1,200 level and its 80-week moving average, as these developments foreshadowed immediate weakness. But what intrigues us about last week's trading is the low at the 1,100 century mark, which also coincides with the index's 40-month moving average. This trendline covers approximately three years, incorporating monthly closing prices going back to a few months before Lehman Brothers went under, and it capped a rally ahead of May 2010's "flash crash." For Fibonacci players, the pullback to 1,100 represents a 38.2% retracement of the March 2009 low and last May's peak. Additionally, as of the end of August, the 10-year breakeven price on the SPX is located at 1,133,58, which the index was able to rally above by week's end.


The Russell 2000 Index (RUT - 697.50) hit a low in the 650 area, and quickly recovered to close the week above its 80-month moving average, which we mentioned as having significance last week. The 650 level marked a major speed bump in 2005 on the index's way to its peak in 2007, and then briefly acted as support in 2008, before the Lehman situation eventually pushed the RUT back below 650. The RUT finally closed the week at 697.50, which means it remains above a double of its March 2009 low of 342.59.


Turning to the S&P 400 MidCap Index (MID - 843.08), Tuesday and Wednesday's lows in the 770 area were slightly above its 80-month moving average at 764.78, and nearly a 25% haircut from its 1,015 peak. Moreover, with the index rallying late in the week, it closed back above the 800 century mark, which is approximately double its 2009 low.


"...the jury is out as to whether or not the VIX has indeed peaked, but from this perspective, there is certainly room for the VIX to move higher and challenge its May 2010 high in the 48 area."
-- Monday Morning Outlook, August 6, 2011 By Monday's close, the CBOE Market Volatility Index (VIX - 36.36) indeed challenged the 48 area, as realized volatility on the SPX surged as a result of the day's sell-off. The VIX then retreated the rest of the week, after "realized" volatility finally caught up with "implied volatility." For bulls, the pop in the VIX may be very encouraging. As you can see on the chart below, dating back to the "Asian Contagion" worries in 1997, the VIX has peaked five times on its six previous trips to the upper 40s. The exception was the financial crisis in 2008, when credit markets essentially stopped functioning, unlike today.


That said, if you were to look at a daily chart of the VIX in 2008, you'll see that it took about a week for the index to finally take out 50 after its initial run at this level. If the VIX can stay below 50 in the upcoming week, a case can be made for another VIX peak, which would be music to the bulls' ears.

The market showed a little bit of stability late last week that could extend into this week, potentially keeping the VIX below this key round-number level. The SPX, for example, finally managed to advance above key intraday trendlines that had continuously capped rally attempts during the sell-off from 1,340, as we noted last week.

Some of the selling during the past couple of weeks could have been related to, and exaggerated by, big put strikes on index and exchange-traded fund (ETF) options getting breached to the downside. The implications are that sellers of this portfolio insurance (i.e., put sellers) take on additional risk when these breakdowns occur, and they manage this additional risk by shorting more and more equity futures. Once this "delta hedge" selling process ends, equities can begin to regain their footing, as we saw late last week. If such stability continues, the opposite mechanics could occur, as put sellers that are short futures cover their positions, due to the expiration of the remaining out-of-the-money puts that are outstanding.


What does this all add up to? The VIX spike to an area that has historically marked buying opportunities, coincident with various indexes finding support at intriguing levels this past week, suggests you can begin accumulating equities in the small- and mid-cap spaces -- but do so on a smaller scale than normal. The equity market is not out of the woods, despite some initial signs of stability. For example, the RUT is still below 750, and the MID remains below 900. Plus, there are no visible signs in the options market that hedge-fund managers are increasing their long equity positions. Maintain exposure to gold and Treasurys, and continue to avoid the big-cap financials.

Indicator of the Week: A Surprise Bullish Rise in the Investors Intelligence Sentiment Poll
By Rocky White, Senior Quantitative Analyst

Foreword: With rampant volatility triggering the market's biggest three-week drop in over two years, you might expect to see a lot of fear on Wall Street. That's exactly why we were so surprised to see the results of the latest Investors Intelligence (II) sentiment poll. Every week, II surveys financial advisors and reports the percentages that are bullish and bearish on the market (they have a third designation for those on the fence). In the latest weekly survey, the percentage of bulls actually increased, while bears decreased.

Below is a chart showing the percentage of bulls in the weekly II survey alongside the performance of the S&P 500 Index (SPX). (Note: The poll is released on Wednesdays, but the poll is taken the Friday before. So, to match up the price action with the poll results, the chart is only updated through Friday, Aug. 5.) You'll notice the recent uptick in the "bulls" line, despite the index's hard fall. At that point, the market had suffered its biggest two-week slide in more than two years, so we had expected the percentage of bulls to decrease -- signaling pessimism. Over that two-week time frame, the bulls only fell from about 50% to 47%, which is actually a higher percentage than a couple of months ago, when the market was above 1,300.


Bulls Gain Ground in a Down Week: Below is a table showing all weeks where the SPX fell at least 5%, while the percentage of bulls in the II survey actually increased. The last time this happened was late 2008. You'll see the market's weekly return, along with the percentage of II bulls in the week prior to the drop, the week of the drop, and finally the week after the drop (to see if panic set in a week later). However, there were only a handful of occasions where the percentage of bulls declined the next week following a market pullback. It's also worth noting that this latest reading had a relatively high percentage of bulls compared to most other occurrences, coming in second only to the 2001 incident.


Below is a table showing those same dates as above, along with the SPX returns out to a three-month time frame following those dates. As contrarians, we were put off by the bullish increase in the latest II poll, as well as the fact that the market showed some weakness following the last occurrence in 2008. However, after considering the other occasions when the number of bulls increased amid a big weekly drop, the returns were generally pretty bullish.


Of course, we look at many different indicators to gauge investor sentiment and market conditions. For this particular indicator, it makes us feel better that the stubbornness of II bulls does not historically have the bearish implications that we might have expected.

This Week's Key Events: Retail Earnings, Inflation Data on Deck
Schaeffer's Editorial Staff

Here is a brief list of some of the key events this week. All earnings dates listed below are tentative and subject to change. Please check with each company's respective website for official reporting dates.

Monday

The economic calendar kicks off Monday with the Empire State manufacturing index for August. On the earnings front, we'll hear from Lowe's (LOW), Urban Outfitters (URBN), Zagg (ZAGG), Agilent Technologies (A), Estee Lauder (EL), and Harmony Gold Mining (HMY).

Tuesday

Tuesday's docket includes July's housing starts, import/export prices, industrial production, and capacity utilization. Scheduled to report earnings are Home Depot (HD), Wal-Mart Stores (WMT), Saks (SKS), Dick's Sporting Goods (DKS), Dell (DELL), Analog Devices (ADI), and JinkoSolar (JKS).

Wednesday

Inflation data starts to hit the Street on Wednesday, with the release of the producer price index (PPI) and core PPI for July. Also due out is the regularly scheduled report on weekly petroleum supplies. Among the companies expected to share the earnings stage are Target (TGT), Abercrombie & Fitch (ANF), BJ's Wholesale Club (BJ), Staples (SPLS), Hot Topic (HOTT), Deere & Co. (DE), JDS Uniphase (JDSU), NetApp (NTAP), and Canadian Solar (CSIQ).

Thursday


Initial and continuing jobless claims are on the calendar for Thursday, along with the consumer price index (CPI) and core CPI for July. Traders will also hear about existing home sales and the Conference Board's index of leading economic indicators for July, as well as the August Philadelphia Fed index. Meanwhile, notable earnings reporters include Hewlett-Packard (HPQ), Salesforce.com (CRM), Autodesk (ADSK), Marvell Technology (MRVL), Aeropostale (ARO), Dollar Tree (DLTR), GameStop (GME), Foot Locker (FL), JA Solar (JASO), and J.M. Smucker (SJM).

Friday

There are no major economic reports on Friday. Ann Inc. (ANN), China Sunergy (CSUN), and Yingli Green Energy (YGE) round out the week's slate of earnings reports.

icon url

ReturntoSender

08/15/11 7:38 PM

#9453 RE: ReturntoSender #6755

From Briefing.com: 4:30 pm : Broad-based buying not only gave stocks their third straight gain, but helped the S&P 500 close at a session high above 1200.

Stocks started the session sharply higher. Participants showed little regard for an Empire State Manufacturing Index that fell to -7.7, which contrasts with the consensus -0.4 reading. The reading suggests that regional activity contracted further since July, when a -3.8 had been posted.

The positive tone to early trade was partially supported by buying abroad. Asia's major averages all advanced markedly amid news that Japan's economy contracted by 1.3% in the second quarter. The drop in GDP wasn't as bad as what some had feared, though. Europe's bourses staged varied gains ahead of a meeting between officials from France and Germany. The notion that the fiscal and financial challenges facing the region will be addressed helped the euro maintain a lead of more than 1% over the dollar during most of the trading day. The yen surrendered its gain against the greenback.

Early strength attracted additional buyers into the fold, but conviction was tested when the S&P 500 reached the 1200 line. Hesitation there opened the door to some selling, but stocks gradually battled back in afternoon trade. Steady, broad-based buying eventually pushed the broad market measure past the psychologically-significant line to close at a session high. Some traders believe the market's ability to close above 1200 and remain there could go toward helping the stock market stage a longer-term recovery after the steep losses suffered in recent weeks. The S&P 500 is already up more than 100 points, or plus 9%, from the intraday low that it set last Tuesday.

While an improved tone to broad market action typically encourages participants to trade and invest in riskier issues, stodgy and defensive-oriented utilities stocks were today's top performers. As a group, utilities climbed 3.5%, even after many market analysts gave sector members a nod for their steady business models and relatively robust dividend yields during the volatility of the past few weeks.

Energy stocks weren't far behind, however. Collectively, they climbed 3.4%. Drillers were especially strong after Transocean (RIG 57.27, +1.66) announced plans to acquire Norway-based Aker Drilling. Higher oil prices helped the sector, too; the energy component closed pit trade almost 3% higher just shy of $89 per barrel.

Google (GOOG 552.79, -10.98) helped heat up the handset and telecommunications space with a deal of its own. The tech giant announced that it will pay $40 per share for Motorola Mobility (MMI 38.21, +13.74). The offer represents a premium of more than 60% above MMI's closing price last week.

Advancing Sectors: Utilities +3.5%, Energy +3.4%, Financials +3.2%, Telecom +2.3%, Industrials +1.8%, Health Care +1.8%, Tech +1.8%, Materials +1.5%, Consumer Staples +1.4%, Consumer Discretionary +1.4%
Declining Sectors: (None)DJ30 +213.88 NASDAQ +47.22 NQ100 +1.5% R2K +3.0% SP400 +2.7% SP500 +25.68 NASDAQ Adv/Vol/Dec 2132/1.94 bln/499 NYSE Adv/Vol/Dec 2838/1.11 bln/270

4:07PM Agilent beats by $0.04, beats on revs; guides Q4 EPS in-line, revs in-line (A) 37.50 +1.29 : Reports Q3 (Jul) earnings of $0.77 per share, $0.04 better than the Capital IQ Consensus Estimate of $0.73; revenues rose 22.1% year/year to $1.69 bln vs the $1.66 bln consensus. Co issues in-line guidance for Q4, sees EPS of $0.79-0.81 vs. $0.80 Capital IQ Consensus Estimate; sees Q4 revs of $1.74-1.76 bln vs. $1.75 bln Capital IQ Consensus Estimate.

12:55PM Evergreen Solar confirms it filed for chapter 11 reorganization (ESLR) 0.32 -0.10 : In conjunction with the Chapter 11 filing, co entered into a restructuring support agreement with certain holders of more than 70% of the outstanding principal amount of 13% Convertible Senior Secured Notes. The noteholders have agreed to implement the restructuring to be effected through one or more sales of certain of assets including String Ribbon wafer technology business assets. Co will undertake a marketing process and will permit all parties to bid on its assets, as a whole or in groups. The supporting noteholders have agreed to support the Company's restructuring by consenting to cash collateral usage pursuant to a budget during the sale process; and to support the costs of the Bankruptcy Case, including court approval of a plan of reorganization subsequent to the sale process.

7:31AM Motorola Mobility to be acquired by Google (GOOG) for $40/share in cash (MMI) 24.47 : Google (GOOG) and MMI announced that they have entered into a definitive agreement under which Google will acquire Motorola Mobility for $40.00 per share in cash, or a total of about $12.5 billion. The transaction was unanimously approved by the boards of directors of both companies. Motorola Mobility will remain a licensee of Android and Android will remain open. Google will run Motorola Mobility as a separate business. The transaction is expected to close by the end of 2011 or early 2012.

8:44AM Motorola Mobility: Carl Icahn comments on merger of Motorola Mobility and Google (GOOG) (MMI) 24.47 : Carl. C. Icahn commented: "This is a great outcome for ALL shareholders of Motorola Mobility, especially in light of today's markets. In the past three years we have fought long and hard to separate Motorola Mobility from Motorola Solutions, as well as bring Sanjay Jha., as co-CEO. Additionally, we have been strong proponents of the company exploring multiple ways to enhance the value of its patent portfolio. Motorola is activism at its best and we applaud management and the Board for acting so responsibly."

National Semiconductor (NSM) introduced a 16-bit digital-to-analog converter featuring a single-wire interface and 4-to-20 mA current loop drive that simplifies the design of smart transmitters used in industrial two-wire sensor systems.

Varian Semiconductor Equipment Associates (VSEA) announced Friday evening that stockholders voted to approve the merger with Applied Materials (AMAT). The merger was approved by holders of ~52.8 mln shares of Varian's outstanding common stock, and ~ 237K shares voted against the merger.

6:10AM Ascent Solar and TFG Radiant Group announced they have signed a more than $275 mln plus royalties long-term, multi-faceted, strategic partnership (ASTI) 0.75 : The partnership includes investments by TFG Radiant in Ascent and a joint development agreement between TFG Radiant and Ascent to establish manufacturing facilities to be located in East Asia. Under the agreement, TFG Radiant has committed $165 mln for the initial East Asia FAB, bringing the total deal value to about $450 mln plus royalties. TFG Radiant has purchased 6.4 mln shares of Ascent stock at a price of $1.15/share, which represents a premium of 56% relative to the closing price of Ascent stock on August 12. TFG Radiant will receive the right to purchase an additional 9,500,000 shares of Ascent stock, at a price of $1.55 per share. Ascent has agreed to exclusively license its technology for fabrication and distribution of flexible, lightweight copper, indium, gallium, diselenide photovoltaic modules to TFG Radiant for East Asia.

Google (GOOG $550.64 -13.13) and Motorola Mobility (MMI $38.19 +13.72) announced that they have entered into a definitive agreement under which Google will acquire Motorola Mobility for $40.00 per share in cash, or a total of about $12.5 billion. The transaction was unanimously approved by the boards of directors of both companies. Motorola Mobility will remain a licensee of Android and Android will remain open. Google will run Motorola Mobility as a separate business. The transaction is expected to close by the end of 2011 or early 2012.

VanceInfo Tech (VIT $18.92 +1.34) was upgraded to Buy from Hold at Kaufman Bros with a target price of $25 based in valuation and saying they see limited risk to margin outlook in 2011. The firm sees continued top-line momentum led by healthy growth in new verticals and outside of top clients.

VMWare (VMW $93.47 +2.81) was upgraded to Buy from Neutral at Collins Stewart with a target price of $108 saying from a tactical standpoint, their PDR suggests that concerns surrounding VMware's announced licensing/pricing changes have calmed down. VMware quickly adjusted its pricing and entitlements following media/blog furor over its proposed changes, but based on their PDR, they believe the most users were less upset or affected by the changes.

Oracle (ORCL $27.26 -0.13) was moved to Top Picks list at FBR Capital. Firm thinks its diversified software and hardware portfolio positions it well to weather the uncertain economic climate. Additionally, they believe the recent underperformance will reverse as the hardware business should hit an inflection point this year and start posting revenue growth while expanding margins.

Sky-mobi (MOBI $6.76 +0.37) was downgraded to Perform from Outperform at Oppenheimer after its negative pre-announcement on Friday. Management's updated guidance suggests much lower than expected sales growth driven by lower feature phone sales and a difficult operating environment for mobile service providers in China.
icon url

ReturntoSender

08/22/11 6:35 PM

#9467 RE: ReturntoSender #6755

The shortest cyclical downturn was in 1998 from top to bottom which took 13 months. We had the tech bubble right after which took 30 months to play out when the bubble popped. So far we are only 6 months into the latest sell off.

icon url

ReturntoSender

08/24/11 12:14 AM

#9469 RE: ReturntoSender #6755

From Briefing.com: 4:30 pm : The stock market slipped to the neutral line in the early going, but then climbed steadily to finish at a session high with a gain of more than 3%.

Buying interest ahead of the open was bolstered by the robust gains staged abroad, especially in Europe, where the action of the major bourses continues to be regarded as an indicator of confidence in the region's fundamental make-up and macro environment. That said, traders there responded positively to what was actually a relatively mixed batch of economic data, giving the EuroStoxx 50 a 1% gain.

Support at home faded in the first few minutes of trade, though. That left the S&P 500 to slip to the neutral line, but stocks were able to secure support there, just as they did in the prior session. The implied floor encouraged buyers to step back in.

Conviction among buyers seemed to increase once financials joined in the effort. The sector had been hampered by renewed selling pressure against diversified banks and financial services stocks, but even that group eventually garnered support. As a result, the financial sector settled with a gain of more than 3%.

A little past the midway point, stocks slipped amid knee-jerk selling that came in response to reports that government buildings were evacuated following an earthquake in the area. Once it was learned that there weren't any immediate damages of great consequence, stocks were able to resume their upward march, which continued into the close so that stocks settled more than 3% higher.

Energy stocks were the strongest performers overall. As a group they gained more than 4%, led by a mix of oil and gas services players and refiners that rebounded from the prior session's slip.

Names like Google (GOOG 518.82, +20.65) and Apple (AAPL 373.60, +17.16) also outperformed. Their strength helped the Nasdaq Composite edge out its counterparts.

Even before stocks had started their ascent, gold prices were on the retreat following a new all-time high in overnight action. The precious metal climbed as high as $1917.90 per ounce, but ultimately settled with a 1.4% loss at $1863.50 per ounce.

Treasuries didn't make much of a move lower until late in the day. Results from an auction of 2-year Notes indicated strong demand. Specifically, the auction drew a bid-to-cover of 3.44, dollar demand of $120.4 billion, and an indirect bidder participation rate of 31.6%. The prior auction produced a bid-to-cover of 3.14, dollar demand of $109.9 billion, and an indirect bidder rate of 27.7%.

2:47PM Rudolph Tech confirms ruling in case against Camtek (CAMT); court revised one claim construction ruling (RTEC) 7.01 +0.20 : On August 22, the U.S. Federal Circuit Court of Appeals issued a ruling in Rudolph Technologies' long-running patent infringement case against Camtek. In its opinion, the Appellate Court affirmed multiple rulings from trial at the District Court level including finding Rudolph's U.S. Patent No. 6,826,298 valid, the part of the infringement ruling based on the finding that Camtek's Falcon product strobes "based on velocity," and the dismissal of Camtek's claim against Rudolph for inequitable conduct against the U.S. Patent and Trademark Office. The court did, however, revise one claim construction ruling made by the District Court in the original case and remanded it back to the trial court. "While we are disappointed that the court did not affirm all aspects of our verdict against Camtek, we are very pleased to note that the court determined that our patent is valid and that the remaining issue before the District Court is one about which we feel very confident." As part of its ruling, the Appellate Court sent a single issue back to the District Court for resolution in a "limited" proceeding that relates to whether Camtek's Falcon product creates a model using multiple, discrete wafers. "As Rudolph presented solid evidence that Camtek uses multiple whole wafers with the Falcon to train the system, we look forward to a prompt and favorable resolution to this matter with the reinstatement of the judgment of infringement, damages and the permanent injunction."

STMicroelectronics (STM) has expanded its motion-sensor portfolio with a new high-performance three-axis digital-output gyroscope. Housed in a 4x4x1 mm package,

Microchip Technology (MCHP), announced the MCP6V2X family of operational amplifiers.

Mattson Technology (MTSN) announced that a major semiconductor manufacturer has purchased its Millios millisecond anneal system for the evaluation of future logic devices.

McAfee, a unit of Intel (INTC) announced that NEC will offer McAfee Mobile Security pre-installed on its "LifeTouch" series cloud communicator starting August 26, 2011.

09:28 am Suntech Power downgraded to Sell at Collins Stewart; tgt lowered to $4.00: . Collins Stewart downgrades STP to Sell from Neutral and lowers their tgt to $4 from $5.50 due to their belief that it will be difficult for the co to create value for its shareholders in the year ahead and its being viewed as particularly susceptible to ASPs. In the current falling price environment, STP's relatively high expense levels, including relatively inflexible interest expenses, will continue to pressure margins. Their FY11 and FY12 EPS ests are lowered below consensus.

11:23 am S&P Tech Sector Outperforming The Broader Market (JNPR)

The tech sector is trading higher today, ahead of gains in the broader market. Semiconductors are showing relative strength in the tech space with the Philly Semi Index trading 2.0% higher. Among chips in the index, RBCN (+7.6%) is a notable leader, while NXPI (-0.3%) is lagging. Among other major indices, the S&P 500 is trading 1.0% higher, while the NASDAQ is trading 1.4% higher. The QQQ, meanwhile, is trading 1.5% higher. Among tech bellwethers, GOOG (+2.7%) is showing relative strength.

In earnings last night, PWRD (+13.1%) and FMCN (+6.2%) posted quarterly beats.

In news, Samsung Mobile Display and PANL (+18.3%) announced entry into OLED patent license and supplemental material purchase agreements. Also, RP (-12.9%) announced it will acquire Multifamily Technology Solutions for approx. $74.4 mln and updated guidance. In rumors, we are hearing renewed AAPL (+1.8%) for ARMH (+6.3%) takeover chatter making the rounds.

Among notable ratings changes this morning, JNPR (+3.1%) was upgraded to Outperform at Morgan Keegan, Brigantine upgraded PANL (+18.3%) to Buy, Caris upgraded TIVO (+3.5%) to Above Average, and NVDA (+7.6%) was upgraded to Outperform at Wells Fargo.

AVGO (+0.2%) is the notable tech name set to report results today after the close.

icon url

ReturntoSender

08/27/11 1:02 PM

#9473 RE: ReturntoSender #6755

On Treasuries: I wanted to point out the write up I believe from last Monday at StockCharts.com:

http://stockcharts.com/members/analysis/20110822-1.html

If you cannot read it because you are not a StockCharts.com member this was the most important part:

Treasury bonds also have a pretty important vote when it comes to the US economy. In particular, Treasury yields decline when the economic outlook dims. Chart 1 shows the 10-year Treasury Yield ($TNX) dipping below its 2008 low last week. The outlook was pretty dim back in December 2008. The stock market went on to new lows in early 2009 and did not bottom until early March 2009. The fact that this key yield is back near its 2008 lows suggests that the prospects for a double dip are greater than 50%. Also notice that the 10-year Treasury Yield broke support from a massive triangle. Broken support around 24 (2.4%) turns into the first resistance level to watch. Chart 2 shows that the 20-year trend is down and this triangle break signals a continuation of this downtrend.

My Chart that will continue to update:


RtS
icon url

ReturntoSender

08/27/11 1:21 PM

#9474 RE: ReturntoSender #6755

From Briefing.com: Weekly Recap - Week ending 26-Aug-11The S&P 500 rallied 4.7%, marking the first weekly gain in more than a month. Stocks gained in four of the five sessions, though there was still plenty of volatility. Stocks benefited from the potential end to the strife in Libya and a vote of confidence in financials by esteemed investor Warren Buffett.

Buying interest was broad-based with all 10 sectors advancing more than 2.0%. Recently hard-hit cyclical sectors outperformed. Consumer Discretionary rallied 6.0%, tech gained 6.2% and industrials advanced 6.0%.

The main item this week was a statement from Fed Chairman Ben Bernanke at Jackson Hole, Wyoming. Bernanke noted again that the economic recovery has been less robust than what had been hoped, but restated that the FOMC is prepared to employ tools as needed. The benefits and costs of additional stimulus were also discussed, but at this time the Fed appears to have no plans of making any changes to monetary policy. The market initially extended its losses following Bernanke's speech, but quickly rallied to positive territory to end the week on a positive note.

Bank of America (BAC 11.3%) continued to make headlines throughout the week. There was plenty of speculation regarding its financial state, which spurred Warren Buffett to reach out to BofA. Buffett's Berkshire Hathaway (BRK.A 2.1%) invested $5 bln in exchange for preferred shares and warrants. The move helped lift shares of BAC to a weekly gain of 11%.

Apple (AAPL 7.7%) gained 7.7% even as Steve Jobs announced he is stepping down as CEO. Health concerns have been well known so the market had already priced in the possibility of Jobs stepping down.

Outside of equities, gold prices fell 1.2% as margin requirements were raised. Crude oil prices climbed 4.1% and the 10-year Treasury yield increased about 12 bps to 2.19%

In economic news, second quarter GDP was revised to 1.0% from 1.3% advance estimate. That was slightly worse than the Briefing.com consensus of 1.1%.
 
Index Started Week Ended Week Change % Change YTD %
DJIA 10817.60 11284.21 466.61 4.3 -2.5
Nasdaq 2341.84 2479.80 137.96 5.9 -6.5
S&P 500 1123.53 1176.80 53.27 4.7 -6.4
Russell 2000 651.69 691.79 40.10 6.2 -11.7

8:11AM Zoran urges stockholders to vote 'for' the CSR merger; says merger is expected to close Aug 31 (ZRAN) 7.99 :

09:27 am First Solar upgraded to Buy at Collins Stewart; tgt $132: . Collins Stewart upgrades FSLR to Buy from Neutral and sets target price at $132. Firm notes The following factors have led to this upgrade. First, they note share price has declined and now reflects some of the risks that led to their downgrade to Neutral following 1Q11 earnings. Based on their CY12 forecast, co's P/E has declined to 7,4x and converged with its peers after a long period of trading with a premium valuation. They highlight co's backlog of highly profitable utility-scale solar has firmed with the sale of Agua Caliente and three of its other large projects receiving conditional DoE loan guarantees as well as having received additional EPC contracts from Sempra Generation and NRG Energy for large solar projects in NV and CA.

09:49 am Omnivision Guides Fiscal Second Quarter Below Consensus (OVTI)

Omnivision (OVTI $17.05 -7.77) reported fiscal first quarter earnings of $0.76 per share, excluding non-recurring items, $0.05 better than the Capital IQ Consensus Estimate of $0.71.

Revenues rose 43.0% year/year to $276.1 million versus the $276.4 million consensus.

In its fiscal second quarter, the company is expecting to see earnings of $0.52 to $0.64, excluding non-recurring items, versus the $0.80 Capital IQ Consensus Estimate. On the top line, the company sees revenues of $255 million to $275 million versus the $305.3 million Capital IQ Consensus Estimate.

icon url

ReturntoSender

08/28/11 7:24 PM

#9478 RE: ReturntoSender #6755

InvestmentHouse Weekend Market Summary

http://www.investmenthouse.com/weekendmarketsummary.htm

- Bernanke passes on further stimulus, again punting back to Congress and the Executive, and the market can handle it.
- GDP weak, a bit lower than expected.
- Michigan Sentiment up for August but still very low.
- ECB, Fed initiate a new swap line.
- Stocks reverse off of post-Bernanke low, post solid gains, keep the relief bounce alive.

MARKET SUMMARY

What a week: Buffett, Bernanke, economic data, and endless coverage of the east coast storm.

What a week. We had Buffett buying $5B worth of BAC preferred shares on a whim in the bathtub. At least he would have us believe that, although there is more to it without question. There was also an earthquake centered in Virginia near the nation's capital. Now there is nonstop coverage of a hurricane heading toward the East Coast. It is nonstop because it is heading toward New York, and most of the stations are centered in New York. More power to them, I guess. I just wonder what someone upstairs is trying to tell the people in DC given the earthquake and now a major storm moving toward the capital. I would like to think they are saying, "Get it together. Change your ways and let the great American entrepreneurs be free to do what they do best." Okay, maybe that is not exactly what they are saying, but I would hope it is close enough.

In addition to Buffett, there was Bernanke on Friday. That was the focus of the week after the Buffett surprise. On Friday Bernanke did not surprise us. I did not expect economic stimulus to be announced, and he did not do it. As a matter of fact, he reiterated his FOMC statement from August 8th. He said they are ready if something bad develops, but they are not wild about doing anything right now. He punted the ball to the Congress and the administration on August 8th by saying he would keep interest rates at 0% into 2013.

Now he punted again. He told the administration and Congress that they had better get busy with creating long-term solutions to our economy, including better tax policies and rates and getting the regulatory policies in line to promote long-term growth. Even Princeton-educated Bernanke is saying we have problems with the tax rates and problems with the regulations coming out of Washington by the book full each week. That is not how we became great, and it certainly will not get us back to greatness. We have to make some change.

Some will take offense to this, but I thought it was humorous. Today I heard the President talking to the people in the path of the storm. He said if they are told to leave, then they should leave. I had to open my mouth and say that should apply to the people in DC as well President and Congress. Some laughed and some hissed. Some continued to sleep. That was nothing new.

Bernanke did have some rather asinine comments about the debt debate, saying we need to work through these problems without having the kind of debate we had with the debt ceiling. As I said before, that misses the point. We are a country born through debate. We protect speech in our Constitution. It is in our founding document, so we are supposed to talk things out. We are supposed to have heated debate. If you believe in something, you should stand up and passionately represent that belief. You should not do the politically correct thing and knuckle under because the President says that debate is bad for the country. I do not know where that came from. The Founding Fathers of this country were at each other in debate; it is our history for sure. We fought a war to get away from a king who did not want you to say anything bad about him. If you did, you may have ended up missing or dead. Our main enemy for years was the Soviet Union, and dissenters there would disappear in the night never to be seen again.

We have to have debate. We have to be able to say when something is wrong, "The emperor has no clothes," etc. That is our history, but I digress. I just want to draw it all together because I hear so much nonsense every day from supposedly learned scholars and leaders. They say the stupidest things and think they are being smart. They forget that the means are as important as the ends in the United States of America.

When the futures were trading in the morning, things were a bit worrisome since they were lower. Not crashingly low, but lower. There was a problem perceived ahead of Mr. Bernanke's speech in that the ECB and the Fed had opened up a $500B swap line. When that was announced, European markets that had traded stronger promptly reversed and sold off. It was "Oh my gosh, something is up and we do not know what" kind of trade. That dragged U.S. futures down with it, but we did recover.

GDP was worse than expected, but not unbearable. It came in at 1% versus 1.1% expected. The original read was 1.3%. It did not fall below 1%, which was a relief. As Rick Santelli said on CNBC this morning, it is a sad state of affairs when everyone breathes a sigh of relief when it is not below 1%. 1% is atrocious for the USA. Frankly, 1% is probably not where it will stay since the economy has steadily worsened since January. We could still see it falling further.

Michigan Sentiment came in a bit light but better than July. 55.7 when 55.8 expected. Everyone said "whew," since it was not worse on that one either. But that misses the point as well. This is terrible Sentiment. This is bottom of the barrel. We are in a recession, everyone is depressed and worried about their job, their next paycheck, and worried if their kids will go to college. It is not even like Trading Places where Dan Aykroyd tells Eddie Murphy how it is in the pits. One minute you are in great shape, and then in the next they repossess your Bentley and your kids can't go to college. Lately it has just been the latter. In addition to the Bentleys, however, they are repossessing Volkswagens, Chevy trucks, and GMC Suburbans. Things are not good and the sentiment reflects that.

To hear some of the talking heads in New York and on the financial stations, things are fine because a lot of monstrous companies have huge amounts of money sitting in the bank. Things must be great because their profits are great. But some smart people who are supply-side economists forget that big business is not the business of the United States. Small business is the backbone of this country, and that is where jobs come from. We miss the point if we take comfort in a bunch of giant corporations that got huge subsidies and payments out of the so-called stimulus package passed in Obama's first year. We are in serious trouble. If we do not do something quickly, we could lose the golden goose and the driver of our economy for an indefinite period.

But, holy cow, we have the September speech coming. That certainly will solve all our problems. There is talk of 4% nationwide refinancing for everybody's houses. Supposedly that will put money in their pockets. There will be shovel-ready projects focused on jobs, but those are the busy-work jobs. You dig a ditch and then you fill the ditch. John Maynard Keynes says that is stimulus, but it is not. As soon as you take away the stimulus, there is no more activity. Lest you forget, the money that paid that guy digging the ditch comes from taxing someone who actually had a productive endeavor. They are taking money from a productive area that people obviously want because it is making money, and they are putting it in an area that does absolutely nothing. Once the stimulus is gone, the work and money created, if any, is gone as well. That was a lot of talk about policy, but let's look back to the market.

It was not a bad session. Stocks did trade sharply lower after Bernanke's announcement (or lack of announcement). But they reversed nicely and posted up solid gains across the board. Looking at an intraday chart, you can see the dip, the reversal, and then back up into lunch. They kind of sold off in the back half of the afternoon but rebounded into the close.

SP500, +1.5%; NASDAQ, +2.5%; Dow, +1.2%; SP600, +2.3%; SOX, +2.8%.

It seems the market was heartened by the fact that the Fed felt things were not bad enough to jump in with stimulus right now. The market thought maybe Ben Bernanke knows what is going on. Why that would be the case I have no idea, but they took it and ran with it. I do not have a problem with that. We picked up some positions early such as CMG. It did very well. Nice break off of the neat test of the trendline. We picked up SMTC as well, and it posted a nice move. A little double bottom. We got a little FCX. Copper may be coming back from the dead.

It was worth picking up some upside positions as the market reversed, and we will see what happens next week. The indices look pretty decent overall. They closed off well, so there is what I call the Relief Rally Part II in gear for a continued attempt to the upside. Thursday was shaky. Early Friday was not great, but it got it out of its system. Now we could get that additional rally. I do not think it will turn things over. Maybe the Fed does come out with QE3 that actually takes the market and breaks it out of this range over the April peaks. Maybe. But that is all rank speculation right now. I am looking for the pragmatic and the obvious, and that is a move to the November high as step one.

OTHER MARKETS

The other markets reacted, of course, to Ben Bernanke's lack of stimulus as well.

Dollar: 1.4488 versus 1.4386 Euro. Ugly day. Not great, but looking at the chart, the dollar is just in the range it has been for the past six weeks. It is going nowhere despite worries that Europe is going into a depression, not just a recession. That is strange. Is someone intervening? No one is saying anything about it, but it is strange that the dollar is having no headway as Europe sinks, supposedly, closer to depression. Everything I hear is that things are very bad in Europe. That makes the dollar's movement very strange indeed.
Click to view the chart

Bonds: 2.19% versus 2.23% 10 year U.S. Treasury. Bonds rallied. No stimulus. You would think bonds would sell because there would be no buying, but that was not the case. A little worry here because bonds should not be moving up if everyone feels so comfortable with the economy and has such confidence in Ben Bernanke.
Click to view the chart

Gold: $1,797.30, +34.10. Gold traders jumped right back in, all over the yellow stuff. A pretty big move. There was a big reversal. Three days down, big reversal Thursday, and a bounce higher on Friday. Gold is showing no signs of abating its move. That would suggest fear is still there. That is interesting since Ben Bernanke said no stimulus from us "No mas," as Roberto Duran said many years ago, quite famously. Gold still is running higher as if there was inflation and fear. That means there is probably inflation and fear ahead.
Click to view the chart

Oil: $85.37, +0.07. Oil was flat on the day. It was down over two clicks intraday ahead of Bernanke on worries of what he would do. When he said he did not feel it was necessary to initiate any stimulus, oil recovered.
Click to view the chart

The other markets were mixed in their reaction. They were not exactly what you would expect, and that shows that a lot of investors do not know what to expect. You have a strange situation now with all kinds of intervention from governments and quasi-governmental agencies namely the Fed. That totally confuses markets. That is why the dollar is muddling sideways. It does not know who will come in, how they will come in, and what they will do. Gold is running higher simply because people do not know what is going on, but they do not have a good feeling about it. U.S. bonds keep rising as well. Why? Because people do not know what will happen here either, and they are taking in some safe haven with U.S. Treasuries. That seems strange as can be, but that is the mix we are getting. Oh, this just in: Hurricane Irene is still a hurricane.

TECHNICAL SUMMARY

INTERNALS.

The internals were kind of lackluster, but not that bad.

Volume. Volume was up on NASDAQ, 1.8B shares, up 3%. It was down 6% on the NYSE to 1.04B. It is Friday. It is a Ben Bernanke day, it is a hurricane day, and it is a post-Buffett "Feeling good about America because of a back-room deal (but we will not tell anyone that)" kind of week.

Breadth. After being down -4:1, breadth jumped back to 3.6:1 to the upside on NASDAQ. It jumped to 4.3:1 advancers over decliners on the NYSE after a -2.8:1 decline on Thursday. Very solid breadth as the market reversed. You have to like that.

CHARTS

SP500. Looking at the picture of the SP500, you can see the reach lower and the reversal. This is good action. We have the double bottom. We are having a test, and note how the buyers jumped right back in. The sellers lost, the buyers won, closing out the session positive with a 1.5% gain. We are still looking for that move up to the November peak. Originally we were looking for March and even June lows as a possibility. It may still hit there, but we are not going to get that far ahead given the amount of trouble we have had just getting past this point.

We are still looking for a break upside. It did itself a world of good after looking pretty shaky on Thursday. The reach lower and reversal really looks solid. Of course we have to watch out for Monday. We had a lot of strange events this week ending with the Bernanke speech on Friday, and we are having the hurricane as well. There could still be interesting action in the coming week, but it did itself a world of good. We are looking for a bounce higher, maybe to the 50 day EMA as it is pretty close to that November peak. It is also right at this December little test back to the 10 day EMA.

Looking for that move. After that we are not looking for any kind of breakout. Not even a move past 1260 on the SP500. We are looking for a rollover. That is, unless the Fed comes in with some kind of stimulus. Or the Obama administration actually comes up with some real stimulus. I do not know about that. Even if it does, Congress will never pass it. But I digress.

NASDAQ. NASDAQ posted an excellent day, trying to take the lead back with a 2.5% gain. It is at a rebound high now, just edging out the Thursday peak before the market reversed that session. This puts it right at the bottom of the November 2010 consolidation. Things get interesting here. We are also coming into the gap point, filling more of it. I think it will fill it, and then we will get up close to this August peak. That puts it still a bit below that November peak. It has room to move. As with SP500, it did itself a world of good on Friday.

SP600. Nice action for the SP600 as well. Reached lower, reversed, closed positive. No new high on the rally on this leg of it thus far. But it is a good, credible move with a 2.3% gain. It, too, has placed itself in position to bounce higher and continue the relief move come Monday.

SOX. SOX posted a very solid 2.8% gain. It gapped lower, reached down as well and has rebounded. Still not at the high on this leg, but it is cutting into that gap point and has room to run. Several semiconductors actually look like they are worth buying for trades to the upside. I am not saying they are a good investment for the long term, but they have sold off. They look like they are sold out and are ready to move higher, e.g., SMTC. It has a neat double bottom and some good volume to the upside after a higher low on MACD as the stock price made a lower low. We have a little upside momentum that we will take advantage of.

LEADERSHIP

Technology. AAPL posted a great day. We had Steve Jobs stepping down as CEO, and AAPL took a bit of a hit on Thursday. On Friday it came right back. Very nice pattern. I like what I am seeing. I hope Steve Jobs has a recovery.

Software is performing just fine. We have a position in CERN, and it is blazing to the upside yet again. Looking quite good, very strong. We are seeing semiconductors trying to pull off these moves as well. I already talked about SMTC with its good move. KLIC looks like it wants to make a break to the upside as well, doing itself some good work on Friday. Coming back from that Thursday turn.

A lot of these stocks suffered engulfing patterns on Thursday. Some of the indices did as well, but they redeemed themselves somewhat on Friday. Goes to show you how the day-to-day volatility is very high. Buyers and sellers are still fighting it out. As long as they can maintain this lateral move with the double bottom, they have a good chance of making the break higher and continuing the relief bounce.

Financial. JPM gapped lower. It recovered some ground, but not impressive. WFC is not impressive. BAC also not impressive even with $5B of Warren Buffett's money. Of course, if it did not need the money, it would not have made this deal. It was not a good deal for BAC as it gave those warrants out. There are people saying that the company is strong because it did this deal. No. I am not buying that.

Industrial. CAT reversed again. It is still not there. It has better volume. It is trying to make the move higher. JOYG is a very similar position, trying to make that break higher. UTX looks good. It looks just like SP500. Cannot complain about that.

Energy. BTU is continuing its move to the upside. I kind of like that. Not a huge run but not bad. HAL is not bad. It has its own engulfing pattern. It gapped lower and reversed upside. Closed positive, completely swallowing the Thursday price action. That is a positive.

Retail. TIF announced it was actually having good results, and it raised its outlook and gapped above the 200 day EMA. YUM has been very volatile the last three sessions, but it has had a good move off its lows. Possibility of a trade to the upside. Not bad action at all. There are retailers out there that are showing a little life. BWLD is very volatile but trying to hold the trendline and move higher. CMG held a nice test of its lower trendline in the channel and a good solid break upside on rising volume.

THE MARKET

SENTIMENT INDICATORS

VIX. The VIX spiked higher on Friday and then reversed. It is heading very high. If this was a stock, it is narrowing into something of a triangle or a pennant after this nice surge to the upside. It suggests a break to the upside is coming and some more selling. Before that happens, it looks to me like we will get an additional relief bounce. After that it may roll over and then it may get truly ugly. That is what volatility is suggesting to me. We will keep an eye on this. It is suggesting a further break higher. If that is the case, stocks will be heading the other direction.

VIX: 35.59; -4.17
VXN: 34.49; -4.94
VXO: 35.87; -3.87

Put/Call Ratio (CBOE): 1.18; -0.11

Bulls versus Bears:

This is a reading of the number of bullish investment advisors versus bearish advisors. The reason you look at this is that it gives you an idea of how bullish investors are. If they are too bullish then everyone is in the market and it is heading for a top: if everyone wants to be in the market, then all the money is in and there is no more new cash to drive it higher. On the other side of the spectrum if there are a lot of bears then there is a lot of cash on the sideline, and as the market rallies it drags that cash in as the bears give in. That cash provides the market the fuel to move higher. If bears are low it is the same as a lot of bulls: everyone is in and the market does not have the cash to drive it higher.

Not pricing in a lot of fear, the one indicator that is not showing the high levels that would suggest a turn.

Bulls: 40.9% versus 46.2%. Finally a significant drop after stubbornly holding the line (47.2% three weeks back). Moving toward that late June low near 38% Fibonacci Retracement. Hit 49.5% a month back. Highs from April and December (60% readings spanning December through early May 2011). The 5 year high is 62.0. The crossover level at 29% bulls from July 2010 is long gone. 35% is the threshold level suggesting bullishness. To be seriously bearish it needs to get up to the 60% to 65% level.

Bears: 33.3% versus 23.7%. Honey, that is a spike higher. After two weeks at 23.7% bears broke loose and are roaming the markets. This is more indication of the negative sentiment that helps drive markets higher. Almost to the 35% considered bullish. The 35% level is considered bullish for the market overall. For more reference, bearishness hit a 5 year high at 54.4% the last week of October 2008. The move over 50 took bearish sentiment to its highest level since 1995. Extreme negative sentiment. Prior levels for comparison: Bearishness peaked at 37.4% in September 2007. It topped the June 2006 peak (36%) on that run. That June peak eclipsed the March 2006 high (33%) and well above the 2005 highs that spawned new rallies (30% in May 2005, 29.2% in October 2005). That was a huge turn, unlike any seen in recent history.

NASDAQ

Stats: +60.22 points (+2.49%) to close at 2479.85
Volume: 1.839B (+3.08%)

Up Volume: 1.66B (+1.479B)
Down Volume: 193.65M (-1.436B)

A/D and Hi/Lo: Advancers led 3.57 to 1
Previous Session: Decliners led 4.07 to 1

New Highs: 10 (0)
New Lows: 107 (+42)

NASDAQ CHART: Click to view the chart

NASDAQ 100 CHART: Click to view the chart

SOX CHART: Click to view the chart

SP500/NYSE

Stats: +17.53 points (+1.51%) to close at 1176.8
NYSE Volume: 1.044B (-6.2%)

Up Volume: 3.83B (+2.23B)
Down Volume: 400.19M (-3.17B)

A/D and Hi/Lo: Advancers led 4.29 to 1
Previous Session: Decliners led 2.84 to 1

New Highs: 34 (+1)
New Lows: 119 (+50)

SP500 CHART: Click to view the chart

SP600 Chart: Click to view the chart

DJ30

Stats: +134.72 points (+1.21%) to close at 11284.54
Volume DJ30: 244M shares Friday versus 255M shares Thursday.

DJ30 CHART: Click to view the chart

MONDAY

If we thought this past week was busy, next week will be even more so. It will start off with the aftermath of the hurricane on Monday. Both the NASDAQ and the NYSE say they will be open regardless. Good for them. It looks like the hurricane is slowing down in its intensity. It is quick-moving and the intensity is dropping off, and that is exactly the scenario you want. You do not want the storm to have time to develop further as a slow-moving storm will. It is dragging in some dry air, and that is helping weaken it. The path is not good, but the prognosis is improving dramatically because of these factors that are weakening the storm. Believe me, having sweated these out before, it is wonderful news to hear that it is sucking in dry air, moving fast, and losing power.

We have a lot of economic data starting with Personal Income and Spending on Monday. Then there are Pending Home Sales. Consumer Confidence comes in on Tuesday. There is also Case/Shiller. ADP employment comes in on Friday. There is the very important Chicago PMI. It is expected to drop precipitously but remain in expansion levels. Factory orders are on Wednesday as well. Thursday there is Initial Claims and Productivity. The ISM index is expected to contract. That is important. We also have Construction Spending. Friday brings Nonfarm Payrolls, and it is expected to fall. Unemployment is expected to hold. It is all a guess right now. We will keep watching the important average workweek. It has not been rising.

That is a lot of economic data to swallow. That is good; the market needs a continuing catalyst. Maybe it will get it. There is also the new month on Thursday. We may see some painting of the tape heading into that. That could be good for the stock market and the relief rally. Then we could get some new money put into the system on Thursday which would also be, of course, good for the stock market relief rally. I still say it is a relief rally at this point. We are looking for a continued move up on Part II of the bounce, trying to get up to that November peak first. We will continue to look for plays in that direction. We picked up some downside plays last week, and we picked up some upside plays as well. We are balanced.

By no means is this a done deal. The last time the market bounced, it stalled below the 20 day EMA. It tapped at it on Thursday and fell back. It will get another shot on Friday. It had has a big dose of strength at least buyers in the wings because the indices reached down on Friday and then reversed positive to post very nice gains. We will look at more upside in line with this. Some stocks are improving after lying dormant or looking relatively crappy for quite some time.

We may not get long-term investments out of them, but we can get trades out of them as discussed with stocks such as YUM. This is a break through key resistance, a test of that break, and a move back up. We will be looking for those kinds of plays to take advantage of a further relief rally to the upside.

Again, I am not expecting these individual stocks to break out of resistance or the indices to break out of their trading range/resistance areas. No. We are looking to make money to the upside either to the November peak or to the March and June lows. If we get anything beyond that, we will be happy because we will let positions run. We always do. But I do not expect it. There is nothing at this point to suggest it will happen.

There is no new stimulus from the Fed. In fact, the Fed punted over to Congress and the administration. But that very well could be part of the game plan. The Obama administration could have the Fed saying they will not do anything and it is up to the President and Congress. Then Obama comes out with his stimulus package that is a bunch of repackaged Keynesian ideas with maybe one supply-side idea from Art Laffer on top of it. You know he will point to Warren Buffett saying that we should cut one little area of taxes, but we should raise taxes on everyone making 250K dollars or more. That is not going to fly with anyone. I still think it is a plan for reelection versus a plan for saving the economy.

Call me cynical. Call me un-American. Whatever. Some people might call me worse than that because I am talking about the President, but this is the way these guys think. Most of them are all about getting reelected. You have to factor that into anything. I do not take anything at face value when it comes out of DC, that is for sure.

In any event, whatever they decide, it is probably all part of a plan. That plan is also to help gin up the stock market. If they will try that, we will play that move as long as the technical show us that. After it gets up on this bounce, I am not so sure it will be able to maintain it unless the Fed starts forking over the money in terms of liquidity. No policies that Obama puts forth (whether they could pass or not) are not the kind that will turn the economy enough to warrant substantial and sustained gains in the market without Fed liquidity. That is just the way it is. Again, call me cynical, but I know how these guys think. I have seen it before; I study history as everyone should.

We will play this upside, and then we will let it ride as far as it will. If we are pleasantly surprised, so be it. I am happy with that. I hope everything does work out, but I am not expecting it to.

Have a great weekend! I will see you on Monday after the hurricane.

Support and Resistance

NASDAQ: Closed at 2479.85
Resistance:
The 20 day EMA at 2507
2512 is last week's gap down point
2532 is the early August gap down point
2540 is the early November 2010 lower gap point
2555 is the mid-August 2011 peak
2569 is the November gap up point through the April 2010 peak
2580 is the November 2010 closing high
2599 is the June 2011 low
2603 is the March 2011 intraday low (post-Japan low)
The 50 day EMA at 2611
2645-2650ish from December 2010 consolidation
2676 is the January 2010 low
2686 is the January 2011 closing low
The 200 day SMA at 2704
2706 to 2705 is the April 2011 low and the February 2011 and consolidation low (bottom of the trading range) 2723 to 2705 is the range of support at the bottom of the January to May trading range
2759 is the May low
2762 is the February low
2796 is the February gap down point
2816 is the early April peak.
2825 is the 2007 closing peak.
2841 is the February 2011 peak
2862 is the 2007 peak
2879 is the July 2011 peak
2888 is the May 2011 peak

Support:
2469 is the November 2010 low
2331 from October 2010 low and the August 2011 low
2305 from the August 2010 peak (summertime base)
2139 is the May and June 2010 low
2123 is the August 2010 gap down point
2100 from the August 2010 lows

S&P 500: Closed at 1176.80
Resistance:
1178-1180 is the October 2010/November 2010 consolidation low
The 20 day EMA at 1190
1196 is the November 2010 consolidation peak
1209 is the mid-August 2011 high
1220 is the April 2010 peak
1227 is the November 2010 peak
1234 is the August 2011 low
1235 is the mid-December 2010 consolidation low
The 50 day EMA at 1238
1249 is the March 2011 low (post-Japan)
1255 is the late December 2010 consolidation range
1275 is the January 2010 low, early January 2011 peak
The 200 day SMA at 1284
1295 to 1294 is the April 2011 low and the February 2011 consolidation low (bottom of the trading range)
1313 from the August 2008 interim peak
1318.51 is the May low
1325-27 is the March 2008 closing low and the May 2006 peak.
1332 is the early March peak
1340 is the early April 2011 peak
1344 is the February 2011 peak is being challenged again
1357 is the July 2011 peak
1364 is the March 2007 low
1370 is the August 2007 low
1371 is the recent May 2011 peak

Support:
1131 - 1127 from August 2010 base peak.
1119 is the early August closing low
1109 is the mid-September gap up point
1101 is the August 2011 low
1099 from the mid-July interim peak
1040 from the August 2010 lows and May/June 2010 lows
1011 is the summer 2010 low

Dow: Closed at 11,284.54
Resistance:
The 20 day EMA at 11,375
11,452 is the November 2010 peak
11,555 is the March low
The August low at 11,700
11,734 from 11-98 peak
The 50 day EMA at 11,758
11,867 from the August 2009 high and peak on that bounce in the selling.
11,893 from March 2008 closing low
The June low at 11,897 (closing)
The 200 day SMA at 11,987
12,094 is the April 2011 low
12,110 from the March 2007 closing low
12,283 is the March 2011 peak
12,391 is the February 2011 peak
12,876 is the May high
12,754 is the July intraday peak
13,058 from the May 2008 peak on that bounce in the selling

Support:
11,178 from November 2010
10,978 is the bottom of the November 2010 consolidation
10,750 from September 2010
10,720 is the August closing low
10,705-710 from January 2010 peak
10,694-700 from August 2010 peak
9938 is the August 2010 low

Economic Calendar

August 23 - Tuesday
- New Home Sales, July (10:00): -0.7%. 298K actual versus 310K expected, 300K prior (revised from 312K)
- Inventories: 6.6 months versus 6.3 months prior (Existing home sale inventory 9+ months)
- Richmond Fed, August (10:00): -10.0, lowest since 6/09

August 24 - Wednesday
- MBA Mortgage Index, 08/20 (7:00): -2.4% actual versus +4.1% prior
- Durable Orders, July (8:30): 4.0% actual versus 1.9% expected, -1.3% prior (revised from -1.9%)
- Durable Orders -ex T, July (8:30): 0.7% actual versus -0.5% expected, 0.6% prior (revised from 0.4%)
- FHFA Housing Price I, June (10:00): 0.9% actual versus 0.4% prior
- Crude Inventories, 08/20 (10:30): -2.213M actual versus 4.233M prior

August 25 - Thursday
- Initial Claims, 08/20 (8:30): 417K actual versus 400K expected, 412K prior (revised from 408K)
- Continuing Claims, 08/13 (8:30): 3641K actual versus 3700K expected, 3721K prior (revised from 3702K)

August 26 - Friday
- GDP - Second Estimate, Q2 (8:30): 1.0% actual versus 1.1% expected, 1.3% prior
- GDP Deflator - 2nd estimate, Q2 (8:30): 2.4% actual versus 2.3% expected, 2.3% prior
- Michigan Sentiment - Final, August (9:55): 55.7 actual versus 55.8 expected, 54.9 prior

August 29 - Monday
- Personal Income, July (8:30): 0.4% expected, 0.1% prior
- Personal Spending, July (8:30): 0.5% expected, -0.2% prior
- PCE Prices - Core, July (8:30): 0.2% expected, 0.1% prior
- Pending Home Sales, June (10:00): -1.4% expected, 2.4% prior

August 30 - Tuesday
- Case-Shiller 20-city, June (9:00): -4.7% expected, -4.51% prior
- Consumer Confidence, August (10:00): 52.0 expected, 59.5 prior

August 31 - Wednesday
- MBA Mortgage Index, 08/27 (7:00): -2.4% prior
- Challenger Job Cuts, August (7:30): 59.4% prior
- ADP Employment Chang, August (8:15): 100K expected, 114K prior
- Chicago PMI, August (9:45): 52.5 expected, 58.8 prior
- Factory Orders, July (10:00): 1.8% expected, -0.8% prior
- Crude Inventories, 08/27 (10:30): -2.213M prior

September 1 - Thursday
- Initial Claims, 08/27 (8:30): 408K expected, 417K prior
- Continuing Claims, 08/20 (8:30): 3660K expected, 3641K prior
- Productivity-Rev., Q2 (8:30): -0.5% expected, -0.3% prior
- Unit Labor Costs - R, Q2 (8:30): 2.4% expected, 2.2% prior
- ISM Index, August (10:00): 48.5 expected, 50.9 prior
- Construction Spending, July (10:00): 0.1% expected, 0.2% prior
- Auto Sales, September (15:00): 3.93M prior
- Truck Sales, September (15:00): 5.56M prior

September 2 - Friday
- Nonfarm Payrolls, August (8:30): 75K expected, 117K prior
- Nonfarm Private Payrolls, August (8:30): 111K expected, 154K prior
- Unemployment Rate, August (8:30): 9.1% expected, 9.1% prior
- Hourly Earnings, August (8:30): 0.2% expected, 0.4% prior
- Average Workweek, August (8:30): 34.3 expected, 34.3 prior
icon url

ReturntoSender

08/31/11 11:07 PM

#9483 RE: ReturntoSender #6755

From Briefing.com:4:30 pm : The major equity averages were up more than 1% this morning, but some afternoon selling caused the market to wobble. Still, stocks managed to hold on for varied gains.

An improved mood among investors in both Europe and at home has perpetuated further buying interest during recent sessions. That carried over into trade this morning, such that buyers barely reacted to the August ADP Employment Change, which indicated that private payrolls increased by 91,000 when the consensus among economists polled by Briefing.com had called for an increase of 100,000.

In contrast to the prior session, financials provided leadership to the broad market, but the sector's strength wasn't enough to carry stocks through resistance around the 50% retracement of the market's July-August trading range. Stocks gradually descended from there, but buyers resurfaced once stocks slipped into the red. Their efforts were challenged in the final few minutes, but the market managed to hold on for a gain.

Late support helped the stock market lock in its fourth straight gain, or seventh advance in eight sessions. During those eight sessions the S&P 500 has climbed about 8.5%. Despite such a feat, the S&P 500 actually ended August 5.7% lower. The stock market hasn't had such a poor monthly performance since it fell 8.2% in May 2010.

For the month, financials and energy stocks were the worst performers. Both sectors ended August about 10% below their beginning levels. Utilities were actually the best performers of August. They managed to advance 1.7% as a group. Their strength was largely due to the preference of participants for steady businesses and relatively rich dividend yields amid all of the volatility in the first half of the month.

Telecom plays had also traded with strength in the face of volatility, but still ended the month with a 1.4% loss. Part of that is due to a 1.6% drop today. AT&T (T 28.48, -1.14) weighed on the space following word that the Justice Department is challenging the company's acquisition of T-Mobile.

Advancing Sectors: Financials +1.2%, Utilities +0.7%, Energy +0.7%, Industrials +0.7%, Health Care +0.7%, Consumer Discretionary +0.6%, Materials +0.3%, Consumer Staples +0.3%, Tech +0.1%
Declining Sectors: Telecom -1.6%DJ30 +53.58 NASDAQ +3.35 NQ100 +0.2% R2K -0.2% SP400 +0.3% SP500 +5.97 NASDAQ Adv/Vol/Dec 1277/1.99 bln/1284 NYSE Adv/Vol/Dec 1971/1.27 bln/1066

9:40AM Semiconductor Hldrs ETF slips into the red after early stall shy of Tues high -- INTC -0.3% (SMH) 29.20 -0.13 :

9:03AM IBM to acquire i2; Financial terms were not disclosed (IBM) 172.51 : Headquartered in the UK, i2 has 350 employees and additional offices in McLean, Va.; Tucson, Ariz.; Ottawa, Ontario; and Canberra, Australia. The acquisition is anticipated to close in the fourth quarter of 2011, subject to the satisfaction of customary closing conditions and applicable regulatory reviews.

Veeco Instruments (VECO) opened its new Taiwan Technology Center in Hsinchu, Taiwan to provide process support for the rapidly growing LED industry.

First Solar (FSLR), Verve Energy and GE (GE) unit GE Energy Financial Services announced that Australia's first utility-scale solar power project is under way. Output from the 10-megawatt AC project on 80 hectares of cleared land 50km southeast of Geraldton will contribute to offsetting the energy requirements of the Southern Seawater Desalination Plant.

12:40 pm S&P Tech Sector Shows Gains; Underperforming the Broader Market

The tech sector is trading higher today, but trails gains in the broader market. Semiconductors are showing relative weakness in the tech space with the Philly Semi Index trading 0.2% lower. Among chips in the index, CREE (+2.7%) is a notable leader, while ALTR (-2.9%) is under pressure. Among other major indices, the S&P 500 is trading 1.0% higher, while the NASDAQ and the QQQ are trading 0.6% higher. Among tech bellwethers, ORCL (+1.4%) is showing relative strength, while T (-4.3%) is under pressure following reports that the Dept. Of Justice will block T's acquisition of T-Mobile (DTEGY -6.5%).

Elsewhere in news, HPQ (+0.2%) plans to temporarily resume tablet production. In rumors, we are hearing AOL (+4.5%) takeover chatter making the rounds. Separately, we are hearing CSCO (+0.3%) for JDSU (-1.7%).

In earnings last night, SNDA (-4.9%) posted a Q2 miss. This morning, LTXC (-18.5%) also reported a quarterly miss.

Among notable analyst calls this morning, TQNT (-5.5%) was downgraded to Equal Weight at Barclays.

SAI (+1.4%) is the notable tech name set to report results today after the close.

LTX-Credence (LTXC $5.54 -1.07) reported fourth quarter earnings of $0.27 per share, excluding non-recurring items, $0.01 worse than the Capital IQ consensus of $0.28, while revenues rose 6.8% year/year to $62.7 million versus the $65.7 million consensus. The company issued guidance for the first quarter with EPS of ($0.10)-($0.06), which may not be comparable to $0.26 consensus and revenues of $35-39 million, which may not be comparable to $64.88 million consensus.

TriQuint Semi (TQNT $7.53 -0.64) was downgraded to Equal Weight from Overweight at Barclays Capital and their price target was lowered to $6 from $12 saying they believe TriQuint's fourth quarter guidance of up 10% Q/Q is too aggressive and see greater seasonality in the first quarter as Apple iPhone production is pulled back ahead of a new phone in June '12 and the iPad 3 is likely launched.
icon url

ReturntoSender

09/06/11 11:54 PM

#9487 RE: ReturntoSender #6755

From Briefing.com: 4:30 pm : Stocks may have logged their third straight loss, but they managed to fight back from losses of more than 2% to finish the day at session highs.

Traders returned to action from a long, holiday weekend ready to sell. Their effort was rooted in the notion that soured sentiment among Europe's major bourses, some of which descended deeper into bear market territory today, was a tacit sign of rekindled concerns over the region's economic, fiscal, and financial conditions.

Those concerns caused all three major equity averages to descend more than 2% in the opening minutes of trade. Stocks received temporary relief from the August ISM Service Index, which improved to 53.3 from 52.7 to exceed the 51.0 that had been broadly anticipated among economists polled by Briefing.com.

Sellers redoubled their efforts shortly after the ISM's release, taking stocks to session lows. Buyers waded back in from there, but their resolve was tested late in the afternoon as some moved to close their positions for fear of further volatility. Stocks ultimately resumed their climb into the close.

The Nasdaq was most successful at slashing its loss. Amazon.com (AMZN 216.05, +6.05) and Apple (AAPL 379.74, +5.69) were primary leaders for the Nasdaq. Although the Dow more than halved its loss, it lagged its counterparts as financial plays like Bank of America (BAC 6.99, -0.26) remained under pressure until the close.

Johnson & Johnson (JNJ 64.64, +0.57) and Pfizer (PFE 18.65, +0.19) offered the Dow some support. The pair also helped the overall health care sector swing to a 0.3% gain after it had been down more than 3% early on. Health care represented the only major sector to score a gain.

Advancing Sectors: Health Care +0.3%
Declining Sectors: Consumer Discretionary -0.4%, Consumer Staples -0.4%, Tech -0.5%, Utilities -0.6%, Materials -0.7%, Energy -1.1%, Telecom -1.1%, Industrials -1.2%, Financials -1.8% DJ30 -100.96 NASDAQ -6.50 NQ100 +0.00% R2K -0.4% SP400 -0.7% SP500 -8.73 NASDAQ Adv/Vol/Dec 886/1.74 bln/1681 NYSE Adv/Vol/Dec 814/1.12 bln/2213

3:30 pm : In overnight trade, gold futures rallied to a new all-time high of $1923.70 per ounce, aided by news that the Swiss National Bank pegged the franc to the euro, as well as concerns about the state of global economies. Support for futures faded from there, though. As such, Dec gold closed with a 0.1% loss at $1872.30 per ounce. Dec silver, which shed 1.2% to settle at $41.87 per ounce, did not partake in the initial flight to safety; futures traded in negative territory throughout the session and finished just above lows of $41.60 per ounce.

Oct crude oil rallied into the close for about two points, which helped recoup losses. Despite that rally, crude oil was unable to trade into positive territory and finished lower by 0.5% to $86.02 per barrel. Oct natural gas rallied for 1.8% to close at $3.94 per MMBtu. DJ30 -177.74 NASDAQ -27.70 SP500 -17.25 NASDAQ Adv/Vol/Dec 575/1.27 bln/1990 NYSE Adv/Vol/Dec 520/725 mln/2495

4:57PM NVIDIA sees FY13 revs guidance of $4.7-5.0 bln vs. $4.5 bln Capital IQ Consensus Estimate (NVDA) 13.18 +0.2 : It expects GAAP and non-GAAP gross margins of ~51-53%. NVIDIA further anticipates GAAP operating expenses of $1.54 billion to $1.61 bln, and non-GAAP operating expenses of $1.38 billion to $1.43 bln . Non-GAAP operating expenses are expected to exclude stock-based compensation expense, amortization of acquisition-related intangible assets and other acquisition-related costs. Co said, "We see growth across our entire GPU and mobile-processor business," said Jen-Hsun Huang, NVIDIA president and chief executive officer. "The future for computing is visual and mobile, and we are well positioned to lead in this new era."

4:16PM Altera revises down third quarter sales guidance (ALTR) 34.86 +0.11 : Co currently expects third quarter sales to be in the range of down 3 percent to up 1 percent versus second quarter sales. Previous guidance was for sales growth of 2 percent to 6 percent. Current consensus calls for a 4% increase.

12:31PM First Solar announces agreement for 100MW module supply with Reliance Power (FSLR) 87.88 -2.22 : Co announced a 100 megawatt (MW) solar module supply agreement with Reliance Power. First Solar will deliver 40MW of advanced thin film modules to Reliance Power by the end of 2011 for its solar power project in Jaisalmer, which will supply renewable electricity to Mumbai. The delivery of the remaining 60MW is expected be completed in 2012. This agreement is the largest PV module supply agreement in India to date.

O2Micro International (OIIM) was issued 31 claims under United States patent number 7,999,516 for its Battery Charging circuits and methods; a continuation of the invention issued July 2010 under United States patent number 7,750,604.

8:01AM Tegal announced that bids for its intellectual property portfolio for Nanolayer Deposition Technology will be accepted until 5 p.m. PDT on Sept 30, 2011 (TGAL) 2.78 :

7:22AM Fairchild Semi lowers Q3 rev guidance below consensus in 8-K filing; lowers adj. gross margin guidance (FCS) 12.48 : Co lowers Q3 rev guidance to $400-410 mln from $433-446 mln vs $439.53 mln Capital IQ Consensus Estimate; co also lowers adj. gross margin guidance 36.0% to 36.5%, down from the previous guidance of 36.5-36.9%. "Distributor sell through of our products has been lower than expected and we are reducing our shipments into the channel accordingly. Demand from OEM customers has remained stable and we expect to record modest sequential sales growth to direct customers in the third quarter. In the distribution channel, sell through has yet to show signs of the normal seasonal increase in a number of end markets including computing and consumer. Sell through has also been below expectations for appliances as some Asian customers reduce inventories. As expected, we continue to see weak demand from the solar inverter market as well. Given the uncertainty in the demand environment, we decided to aggressively and proactively adjust our supply chain now to maintain lean inventories, especially in the distribution channel. We are also controlling expenses tightly which is reflected in our lower guidance for R&D and SG&A spending."

Xilinx (XLNX) announced that longtime customer Tecnoroll BMB S.r.l. has designed Spartan-6 FPGAs into its new FLEXMod 3.0 digital video broadcast module.

Lattice Semiconductor (LSCC) announced that it is now shipping samples of its MachXO2 PLD family using a 2.5mmx2.5mm 25-ball Wafer Level Chip Scale Package.

Micrel (MCRL) introduced the KSZ84xx family of IEEE 1588v2-enabled Ethernet devices for Industrial Ethernet and Power Substation Automation applications.

10:46 am S&P Tech Sector Down Over Two Percent; RIMM Upgraded, KLAC Downgraded (RIMM)

The tech sector is trading lower today, slightly worse than the losses in the broader market. Semiconductors are also trading in line with weakness in the tech space with the Philly Semi Index trading 2.6% lower. Among chips in the index, STM (-10.5%) is a notable laggard. Among other major indices, the S&P 500 is trading 2.7% lower, while the NASDAQ is trading 2.4% lower. The QQQ, meanwhile, is trading 2.3% lower. Among tech bellwethers, ORCL (-3.6%) is under notable pressure.

In earnings this morning, FCS (0.0%) lowered its Q3 guidance and PRGS (-6.9%) issued downside guidance. In news, HOLI (+4.9%) announced that several members of the co management, lead by the Chairman and CEO, have purchased approximately 725,467 shares of Hollysys as of today.

Among notable analyst upgrades this morning, RIMM (-2.5%) was upgraded to Outperform from Sector Perform at Scotia. Among downgrades, KLAC (-4.1%) was downgraded to Underperform at RBC.

PAY (-2.6%) is the notable name in tech set to report results today after the close.

Fairchild Semi (FCS $12.50 -0.02) lowered third quarter revenue guidance to $400-410 million from $433-446 million versus the $439.53 million Capital IQ consensus. The company also lowers adjusted gross margin guidance 36.0% to 36.5%, down from the previous guidance of 36.5-36.9%. The company stated "Distributor sell through of our products has been lower than expected and we are reducing our shipments into the channel accordingly. Demand from OEM customers has remained stable and we expect to record modest sequential sales growth to direct customers in the third quarter. In the distribution channel, sell through has yet to show signs of the normal seasonal increase in a number of end markets including computing and consumer"

Apple's (AAPL $373.10 -0.95) target was raised to $545 from $515 at Canaccord Genuity. The firm's August channel checks indicated strong sell-through trends for both the iPhone and iPad. Based on solid demand trends for iPhone/iPad, poor sell-through trends for competing tablet offerings, and the ramping iOS ecosystem driving longer-term replacement sales.
icon url

ReturntoSender

09/08/11 7:48 PM

#9490 RE: ReturntoSender #6755

From Briefing.com: 4:30 pm : Stocks slid to a 1% loss amid a lack of leadership today. Financials were a considerable source of weakness.

Following a near 3% surge in the prior session, stocks came under pressure this morning. The shift in sentiment came largely in response to mixed action abroad after analysts at Fitch stated that there is potential for both China and Japan to be hit with a debt rating downgrade. The decision by the European Central Bank (ECB) to keep its target rate at 1.50%, without the mention or introduction of any new monetary policy instrument, also dampened the tone of early trade. ECB President Trichet further dampened the mood by announcing a downward revision to the region's GDP forecast.

The latest weekly initial jobless claims count also proved displeasing. Initial claims climbed 2,000 from the prior week to 414,000, which is greater than the 400,000 claims that had been expected, on average, among economists surveyed by Briefing.com.

Little attention was paid to the July trade deficit, which totaled $44.8 billion after it had been at $53.0 billion the month before. A deficit of $51.5 billion had been expected.

Stocks managed to overcome the early weakness, however. The upturn was helped along by tech stocks, which ultimately faltered to finish with a 0.4% loss after they had been up more than 1% at their session high.

Since the start, financials hampered the broad market. Their weakness eventually dragged down the rest of the market and gave sector a 2.3% loss.

Broad market selling pressure picked up around the same time that Fed Chairman Bernanke delivered a speech to the Minnesota Economic Club. Bernanke offered no new clues about the Fed's plans for monetary policy and the economic outlook, but reminded market participants that a range of tools remain available to the Fed.

Advancing Sectors: (None)
Declining Sectors: Utilities -0.1%, Consumer Staples -0.2%, Tech -0.4%, Telecom -0.6%, Health Care -1.1%, Materials -1.2%, Energy -1.2%, Consumer Discretionary -1.3%, Industrials -1.5%, Financials -2.3%DJ30 -119.05 NASDAQ -19.80 NQ100 -0.4% R2K -2.1% SP400 -1.4% SP500 -12.72 NASDAQ Adv/Vol/Dec 616/1.98 bln/1933 NYSE Adv/Vol/Dec 665/947 mln/2359

5:26PM Applied Materials: IRS recommended that co receive a cash refund in the amount of approx $240 mln plus interest - 8-K (AMAT) 10.85 -0.24 : Co disclosed in its quarterly report on Form 10-Q filed on August 26, 2011, it previously had requested a refund of a portion of the U.S. federal income tax paid in fiscal years 2006 and 2007. Following an audit, the IRS recommended that Applied receive a cash refund in the amount of approximately Co disclosed in its quarterly report on Form 10-Q filed on August 26, 2011, it previously had requested a refund of a portion of the U.S. federal income tax paid in fiscal years 2006 and 2007. Following an audit, the IRS recommended that Applied receive a cash refund in the amount of approximately $240 million plus interest, which recommendation was subject to approval by the Joint Committee on Taxation of the U.S. Congress. 40 million plus interest, which recommendation was subject to approval by the Joint Committee on Taxation of the U.S. Congress.

4:38PM Lam Research announces Martin Anstice to succeed Stephen Newberry as President and CEO effective January 1, 2012; Newberry to continue as Vice Chairman (LRCX) 36.80 -0.43 : Co announced that the company's Board of Directors has appointed Martin B. Anstice to chief executive officer (CEO), effective January 1, 2012. Anstice succeeds Stephen G. Newberry, who will continue serving as vice chairman, an executive position with the company, after his transition as CEO. Anstice will also maintain his current role as president and chief operating officer.

4:31PM Texas Instruments issues 3Q mid quarter update; narrows EPS (more so to the downside) and lowers revenue guidance (TXN) 25.80 -0.09 : Co sees Q3 EPS of $0.56-$0.60 vs. $0.55-0.65 previously and the $0.60 Capital IQ Consensus; with rev of $3.23-3.37 bln vs. $3.4-3.7 bln previously and the $3.54 bln consensus. Call begins at 5:00pm EST.

Xilinx (XLNX) announced that longtime customer, SIGMA Corp has designed Spartan-6 FPGAs into its flagship digital single lens reflex camera, the SIGMA SD1, for professional and enthusiast photographers.

HP (HPQ) introduced the updated HP Pavilion dm1, a consumer notebook PC featuring HP Soft-touch Imprint design, Beats Audio and an exclusive set of innovations designed to improve on the Microsoft Windows experience.

1:26 pm Technology Sector Trading Higher Today With Broader Market (CSCO)

The tech sector is trading just higher today, ahead of slight losses in the broader market. Semiconductors are showing relative strength in the tech space with the Philly Semi Index trading 0.3% higher. Among chips in the index, MU (+5.9%) is a notable leader. Among other major indices, the S&P 500 is trading 0.2% lower, while the NASDAQ is trading relatively flat. The QQQ, meanwhile, is trading 0.2% higher. Among tech bellwethers, ORCL (-3.3%) is under notable pressure, while CSCO (+2.4%) is outperforming.

In earnings last night, SEAC (+2.0%) posted a miss and guided lower.

In news, DRIV (+6.7%) authorized a $100 million share repurchase program. Also, GOOG (+0.5%) acquired Zagat, which is pressuring OPEN (-8.6%).

In rumors, we are hearing ORCL (-3.3%) for HPQ (-0.3%) takeover chatter making the rounds.

Among notable analyst upgrades this morning, CSCO (+2.4%) and JNPR (+1.7%) were upgraded to Buy at Auriga, NCR (+3.2%) was upgraded to Overweight at JP Morgan and SNDK (+4.6%) was upgraded to Positive at Avian. In downgrades, Morgan Keegan downgraded TZOO (-5..2%) to Mkt Perform.

There are no notable names in tech set to report results today after the close. However, TXN (+0.7%) is anticipated to post its mid-qtr update.

Corning (GLW $14.42 -0.11) revised its LCD volume expectations for the third quarter based on lower panel maker utilization rates. The company reaffirmed $10 billion in sales by 2014 ahead of Citi Tech Conference. The company will describe the behavior of the LCD supply chain as "cautious." "Utilization rates remain low as the industry anticipates softer retail demand in the second half of this year. This is somewhat contrary to how retail demand has been acting to date."

Digital River (DRIV $20.21 +1.21) announced that its Board of Directors authorized a share repurchase program of up to $100 million of its outstanding common shares. The shares may be repurchased in the open market or in privately negotiated transactions. "This stock buyback plan reaffirms our confidence in the company's strategy and long-term growth potential and demonstrates our ongoing commitment to increasing shareholder value," said Joel Ronning, Digital River's CEO.

Cisco (CSCO $16.27 +0.39) was upgraded to Buy from Hold at Auriga and its target was raised to $20 from $16. Firm expects the company to regain momentum through a combination of improving product cycles, aggressive pricing and superior execution. Their analysis shows that company is now well positioned to gain market share in key segments like switching, routing and servers in both enterprise and service provider segments from competitors. While they expect continued gross margin erosion due to aggressive pricing from company and competitors, operating expenses restraint should still lead to stable/rising operating margins. They recommend aggressive buying at current levels ahead of the upcoming analyst day.

Juniper Networks (JNPR $21.61 +0.07) was upgraded to Buy from Hold at Auriga and its target was lowered to $26 from $28 as the firm views the stock as attractively valued at current levels which offsets their near-term concerns around intensifying competition and share losses. The firm expects JNPR to face near-term headwinds as nearest competitor CSCO catches up in edge routing, macro trends remain weak and the company bleeds market share in security.
icon url

ReturntoSender

09/10/11 8:13 PM

#9491 RE: ReturntoSender #6755

From Briefing.com: Weekly Recap - Week ending 09-Sep-11Stocks slumped to a 2.7% loss on Friday. Tenuous fiscal and financial conditions in Europe continue to be blamed.

Weakness among Europe's major bourses weighed on sentiment even before U.S. markets opened on Friday. In turn, stocks slid at the start of the session, extending the prior session's slide.

From the start, selling interest was broad based. Pressure intensified in response to headlines that suggested Germany is planning to support certain banks if Greece defaults on its debt. The headline was circulated before trade in Europe closed; it led Germany's DAX to drop to a 4% loss. The euro also sold off in response to the headline. It sank to a 1.6% loss, as of the closing bell.

Weakness in the euro fueled increased demand for the dollar, such that the Dollar Index rallied 1.2% to a five-month high above its 200-day average.

Skittishness among investors stoked volatility, such that the Volatility Index, often euphemistically labeled the Fear Gauge, climbed more than 16% back toward 40. The VIX hasn't been that high since concerns about Europe's stability had last escalated in mid-August.

In response to broad market weakness and heightened volatility, Treasuries scored strong gains. In fact, buyers drove the yield on the benchmark 10-year Note to a new record low near 1.90% after it had been near 2.30% only a couple of weeks ago.

Friday's drop left the S&P 500 to log its fifth loss in six sessions. It also caused the stock market settle the holiday-shortened week 1.7% lower than where it began, giving stocks their sixth weekly decline in seven weeks. The downtrend has left the S&P 500 almost 16% below its 2011 high, but more than 4% above its 2011 low.

Friday's drop made for a discouraging follow-up to the 1% loss logged in the prior session. Stocks were pressured on Thursday in response to a lack of leadership, another weekly initial jobless claims tally above 400,000, and the failure of European Central Bank President Trichet to offer up any kind of plans intended to stimulate growth in the region, despite a downward revision to his GDP forecast for the region.

Stocks scored their only gains of the week on Wednesday, when market participants applauded news that a German court rejected a lawsuit intended to prevent the country from participating in bailouts for the European Union.

The observance of Labor Day kept U.S. markets closed on Monday, but rather than a rested return to the markets on Tuesday, traders were anxious sell. Soured sentiment in Europe underpinned the action. A better-than-expected August ISM Service Index of 53.3 mattered little to market participants.
 
Index Started Week Ended Week Change % Change YTD %
DJIA 11240.26 10992.13 -248.13 -2.2 -5.1
Nasdaq 2480.33 2467.99 -12.34 -0.5 -7.0
S&P 500 1173.97 1154.23 -19.74 -1.7 -8.2
Russell 2000 683.36 673.96 -9.40 -1.4 -14.0

6:30AM Amtech Systems announces withdrawal of $60 mln shelf registration (ASYS) 9.89 : Co announced that its Board of Directors has approved the company's application to the SEC for an order granting the immediate withdrawal of its $60 mln shelf registration statement on Form S-3.

EMC (EMC) announced a collaboration with Adobe Systems Incorporated to deliver the Adobe (ADBE) Creative Suite 5.5 Production Premium video production software with EMC Isilon scale-out NAS storage capabilities.

Texas Instruments (TXN $26.16 -0.36) sees third quarter EPS of $0.56-$0.60 versus $0.55-0.65 previously and the $0.60 consensus, with revenues of $3.23-3.37 billion versus $3.4-3.7 billion previously and the $3.54 billion consensus. The reductions are due to broadly lower demand across a wide range of products, markets and customers.

Tessera Tech (TSRA $12.48 -1.09) sees third quarter revenues of approximately $60 million versus the $74.30 million Capital IQ two estimate average. Third quarter Micro-electronics revenues, which come entirely from Tessera, Inc., a wholly owned subsidiary of Tessera Technologies, Inc., are expected to be approximately $50 million. As a comparison, second quarter 2011 royalties and license fees were $60.5 million and third quarter 2010 royalties and license fees were $72.0 million.

Cisco (CSCO $15.94 -0.35) was upgraded to Sector Perform from Underperform at RBC Capital and the firm raised their target to $17 from $14 saying the situation may have stopped getting worse for Cisco and most of the disruptions (some self inflicted) may now be behind it. With cost cutting to cushion the earnings outlook in the current challenging macro environment, their rating is now Sector Perform.

12:03 pm Technology Sector Trading Higher Today Along With Broader Market (RIMM)

The S&P Technology sector (-1.88%) is lower in the final session of trade in the shortened week and is currently outperforming the losses seen in the broader market (-2.5%).

Sector News: TXN (+1.1%) shares are trading to the upside following its mid-qtr update, where the co guided Q3 EPS to the range of $0.56-$0.60 (vs. $0.60 Capital IQ Consensus), compared to the previous range of $0.55-0.65; co sees revs of $3.23-3.37 billion versus. $3.4-3.7 billion previously and the $3.54 billion consensus. TSRA (-7.1%) shares are weaker after the co guided Q3 revenues of approximately $60 million versus $74.30 million Capital IQ two estimates averages. AAPL (-1.2%), according to reports, won its court battle on sales ban of Samsung's Galaxy tablet in Germany. TZOO (+2.9%) shares got a boost early in the session following a press release that a firm called ChaPaVe Partners planned to commence a tactical tender offer for up to 1.5 mln shares of the outstanding shares of TZOO. Since then, the TZOO CEO has come out to say that they have had no contact with the co claiming the tender offer.

Broker Calls: RIMM (-2%) was downgraded to Underperform from Hold at Jefferies. YOKU (-2.3%) was upgraded to Hold from Sell at Maxim Group. ThinkEquity initiated AXTI (-1.4%) and GTAT (-2.3%) with Buys. Firm initiated CREE (-1.2%), AIXG (-4.7%), and LEDS (+0.2%) with Holds. Finally, the firm initiated RBCN (-4.5%) with a Sell. SYNT (-9.2%) was initiated with a Negative at Susquehanna. CSCO (-1.2%) was upgraded to Sector Perform from Underperform at RBC.


icon url

ReturntoSender

09/11/11 3:13 PM

#9494 RE: ReturntoSender #6755

The Second Lost Decade: An Update of the Secular Equity Market Bear in Equities - Bear Market Bottom P/E Ratio since 1900. Also included the number of recessions.

http://www.pring.com/assets/pdfs/lostdecade.pdf
icon url

ReturntoSender

09/14/11 12:29 AM

#9496 RE: ReturntoSender #6755

From Briefing.com: 4:30 pm : Despite choppy trade, stocks scored strong gains today. The effort made for the market's first back-to-back advance of the month.

Caution related to precarious fiscal and financial conditions in Europe initially kept stocks in check this morning, but before long bank stocks and other financial issues began to bounce, providing an impetus for the broad market to make its way higher. Although the move encountered challenges from sellers, stocks showed resilience by staging a gradual climb to close near session highs. Stocks were helped by headlines that suggested BRIC countries are in talks to purchase eurozone debt.

For the second straight session the Nasdaq outperformed its counterparts. Its strength came as semiconductor stocks extended their prior session climb, taking the Philadelphia Semiconductor Index 2% higher to its best level in one month.

Industrial stocks were the best performers in the broad market. As a group, they climbed 1.9%. Energy stocks and consumer staples stocks lagged all session. The two sectors settled with gains of 0.3% and 0.2%, respectively. Best Buy (BBY 23.35, -1.61) was one of the poorest individual names following disappointing quarterly earnings results, which caused many analysts to reconsider the retailer's business structure. DJ30 +44.73 NASDAQ +37.06 NQ100 1.3% R2K 1.8% SP400 1.5% SP500 +10.60 NASDAQ Adv/Vol/Dec 1932/1.93 bln/609 NYSE Adv/Vol/Dec 2337/1.07 bln/687

4:30PM Ultratech achieves ISO 9001 and 14001 certification for singapore operations and recertification for U.S. facility (UTEK) 19.28 +0.48 :

4:01PM Dell Authorizes additional $5 bln for stock repurchase; an addition to the $2.16 bln remaining from prior authorizations (DELL) 14.90 +0.71 :

1:02PM Intel and Google (GOOG) announced that they will work to enable and optimize future versions of Android for Intel's family of low power Atom processors (INTC) 20.61 +0.33 :

Motorola Mobility (MMI) recently announced it will be acquired by Google (GOOG) has made an investment in Ooyala, a provider of online video management, analytics, personalization and monetization technology and services.

Vitesse Semiconductor (VTSS) announced that Aliathon will license Vitesse's patented portfolio of 40G and 100G hard decision enhanced Forward Error Correction cores for its FPGA and ASSP solutions aimed at emerging Optical Transport Network applications.

WPG Americas anounced it has entered into a non-exclusive distribution agreement with Marvell (MRVL). Under the terms of the agreement, WPG Americas will distribute Marvell's Solid State Lighting products throughout the Americas.

Finisar Corporation (FNSR) introduced the latest member of its ROADM product portfolio, a 1x20 high port count WSS with Flexgrid technology.

Intersil (ISIL $11.02 +0.37) expects its third quarter revenue to range from $184 million to $188 million, versus previous guidance of $205 million to $213 million and the $208.97 million Capital IQ consensus. "Demand during the third quarter has been weaker than expected in all of our end markets. We believe this is the result of broad-based economic weakness, along with some excess inventory consumption. However, we now see signs that inventory is stabilizing, with bookings likely recovering to consumption rates during the remainder of the third quarter."

Diodes (DIOD $17.95 -0.30) reaffirmed guidance for the third quarter with revenues of $160-170 million versus the $164.97 million Capital IQ consensus. The Company is lowering its gross margin guidance to 29 percent plus or minus 1.5 percent, compared to previous guidance of 32 percent plus or minus 1.5 percent. Gross margin is being impacted by weak market conditions resulting in unfavorable pricing and the need to shift the product mix to maintain full loadings at the Company's manufacturing operations.

icon url

ReturntoSender

09/14/11 11:21 AM

#9497 RE: ReturntoSender #6755

More Bears than Bulls! Investors Intelligence Poll
 
Date Published Percent Bullish Percent Bearish
09/14 35.5 40.9
09/07 38.7 37.6

http://www.schaeffersresearch.com/streetools/market_tools/investors_intelligence.aspx


Bearishness has surpassed bullishness. For more reference, bearishness hit a 5 year high at 54.4% the last week of October 2008. The move over 50 took bearish sentiment to its highest level since 1995. Extreme negative sentiment. Prior levels for comparison: Bearishness peaked at 37.4% in September 2007. It topped the June 2006 peak (36%) on that run. That June peak eclipsed the March 2006 high (33%) and well above the 2005 highs that spawned new rallies (30% in May 2005, 29.2% in October 2005). That was a huge turn, unlike any seen in recent history.


RtS
icon url

ReturntoSender

09/14/11 8:09 PM

#9498 RE: ReturntoSender #6755

From Briefing.com: 4:30 pm : Momentum was lost in the final minutes of the session, but the major equity averages still scored gains in excess of 1%. The effort gave stocks their third straight gain.

The S&P 500 is now up 3% week to date. Should the market maintain its positive posture for the next couple of sessions, it will score only its second weekly gain in eight weeks.

Recent buying interest comes in response to improved sentiment related to the precarious fiscal and financial conditions of Europe. In response to such concerns, France and Germany led a call that reportedly concluded Greece will carry out all acts to meet budget plans. That was hardly surprising. Participants also took in stride today news that Credit Agricole and Societe Generale, two of France's leading financial institutions, had their ratings downgraded by analysts at Moody's after the threat of such a decision had already circulated at the start of this week.

Tech proved integral in today's climb. The sector, which is the largest sector by market weight, initially led stocks back from an early slip through near-term resistance. That eventually convinced some traders to set chase. Although the S&P 500 managed to cross 1200, it failed to hold its position there and closed off of its high.

The positive tone to today's trade helped pull down the Volatility Index, which set a two-week high above 43 earlier this week. The VIX is down almost 20% from that mark.

Treasuries had a relatively quiet session, despite strength among stocks and a reduction in expectations for volatility. As such, little reaction was had to the latest 30-year Bond sale, which saw relatively strong demand after auctions earlier this week produced some unimpressive results. The auction drew a bid-to-cover of 2.85, dollar demand of $37.1 billion, and an indirect bidder participation rate of 39.4%.

The dollar had a down day. It shed 0.3% against a collection of competing currencies. Its downturn was largely driven by buying in the euro, which ended the trading day 0.5% higher at $1.375 as sentiment surrounding Europe's situation improved.

Economic data was rather dull. Retail sales for August were flat, which is less than the 0.2% increase that had been broadly expected to follow a downwardly revised 0.3% increase in the prior month. Excluding autos, retail sales increased by 0.1%, but that still failed to meet the 0.3% increase that had been widely anticipated.

The Producer Price Index for August was flat, as had been generally forecasted. Core producer prices increased by a mere 0.1%, which is essentially on par with the 0.2% increase had been anticipated.

Advancing Sectors: Telecom +0.5%, Utilities +0.8%, Health Care +1.0%, Consumer Staples +1.2%, Financials +1.2%, Energy +1.3%, Materials +1.6%, Tech +1.6%, Consumer Discretionary +1.7%, Industrials +1.8%
Declining Sectors: (None)DJ30 +140.88 NASDAQ +40.40 NQ100 +1.5% R2K +1.8% SP400 +1.8% SP500 +15.81 NASDAQ Adv/Vol/Dec 1900/2.32 bln/649 NYSE Adv/Vol/Dec 2219/1.09 bln/776

4:01PM Teradyne announces agreement to acquire LitePoint for $510 mln; 10% or more accretive to 2012 consensus EPS estimates (TER) 12.58 +0.41 : Co announces it has signed a definitive agreement to purchase privately held LitePoint, a provider of production line test equipment for wireless products including smart phones, tablets and WiFi-enabled PCs, for $510 mln net of LitePoint cash and tax benefits plus $70 mln if certain performance targets are met extending through 2012. LitePoint had sales of $86 million in 2010 and is projecting sales of $125-$135 million in 2011.

9:41AM Intel announces senior notes offering; Each tranche will be at, or greater than, the benchmark size of at least $500 mln (INTC) 20.89 +0.13 : Co announced its intention to commence a public offering of senior unsecured notes consisting of 5, 10 and 30-year notes pursuant to an effective shelf registration statement previously filed with the Securities and Exchange Commission. Each tranche will be at, or greater than, the benchmark size of at least $500 mln. Co intends to use the net proceeds from the offering primarily to repurchase shares of common stock; and for general corporate purposes.

Trident Microsystems (TRID) announced its new MAP-X family of audio System-on-Chip designed to deliver HD Audio and Internet connectivity for home audio, AV receivers and sound bars.

09:52 am Dell initiated with a Buy at Merlin; tgt $22: . Merlin initiates DELLwith a Buy and a $22 tgt saying they believe Dell's strategic transformation and associated margin expansion is based on a secular restructuring and not dependent on the vagaries of cyclically driven component price deflation that may be reflected by the current 3.3x EV/EBITDA multiple. Dell's methodical strategic transformation is happening on two fronts with an ongoing series of intellectual property and domain expertise acquisitions complementing the streamlining and simplification of Dell's Client computing business.

10:30 am S&P Tech Sector Outpacing Broader Market; ORCL Upgraded (ORCL)

The tech sector is trading just lower today, outpacing greater losses the broader market. Semiconductors are showing relative strength in the tech space, however, with the Philly Semi Index trading 0.3% higher. Among chips in the index, STM (+5.8%) is a notable leader, while TSM (-2.6%) lags. Among other major indices, the S&P 500 is trading 0.8% lower, while the NASDAQ is trading 0.3% lower. The QQQ, meanwhile, is trading 0.4% lower. Among tech bellwethers, VZ (-0.9%) is under notable pressure, while CSCO (+0.5%) and AAPL (+0.5%) are showing strength.

In earnings this morning, LSCC (+2.2%) lowered its Q3 guidance. In news, DELL (+1.0%) authorized an additional $5 billion for stock repurchase. Elsewhere, EBAY (-1.0%) is reportedly being probed by the DOJ over alleged criminal activity regarding Craigslist.

Among rumors, we are hearing renewed RVBD (+0.1%) takeover chatter making the rounds.

Among analyst ratings changes this morning of significance, ORCL (-0.1%) was upgraded to Positive at Susquehanna.

No notable names in tech are set to report results today after the close.
icon url

ReturntoSender

09/16/11 10:33 AM

#9500 RE: ReturntoSender #6755

KLIC ST Short Sale of 5000 shares@9.21 - This trade is based on the fact that volatility has fallen so much over the last week. When a volatility index stretches more than 10% above or below its 10 day sma it will generally reverse direction as will the market in general in the opposite direction.


This is a dangerous trade in many other ways as the market is rallying in the face of a great deal of pessimism. The kind of pessimism that can lead to a long term bottom. So far though the market action has not supported that formation in my humble opinion.

RtS
icon url

ReturntoSender

09/17/11 9:29 PM

#9502 RE: ReturntoSender #6755

From Briefing.com: Weekly Recap - Week ending 16-Sep-11Quadruple Witching options expiration made for choppy action on Friday, but stocks still scored their fifth straight gain. That string of advances resulted in a weekly gain of 5.4%, which is the best weekly performance since late June, but only the second weekly gain in eight weeks.

Trade this week started on a negative note as participants reacted to speculation that some of France's primary financial institutions would have their debt downgraded. Such speculation would eventually prove prescient later in the week, when analysts at Moody's cut ratings on Societe Generale and Credit Agricole, but on Monday the attention turned to rumors that a sovereign wealth fund from China was talking with Italy about a bond purchase. That news helped stocks stage a rally, which gained traction as short sellers were squeezed out of their positions.

A similar scenario played out on Tuesday, when stocks benefited from headlines that suggested BRIC countries -- that is, Brazil, Russia, India, and China -- began talks to purchase eurozone debt. The headlines supported the notion that some now see value in Europe, which has been a source of weakness for several weeks because of its precarious fiscal and financial conditions.

That said, participants gained further confidence that the dealings in Europe are headed in the right direction because of news that the European Central Bank has coordinated with other central banks, including the Fed, to make dollar loans available to European banks.

By the end of the week, sentiment had improved to the extent that many traders were compelled to make bids for no better reason than to chase gains. In doing so, many shrugged off underwhelming data.

Among this week's major economic releases, retail sales for August were flat, which is less than the 0.2% increase that had been broadly expected. Excluding autos, retail sales increased by 0.1%, but that still failed to meet the 0.3% increase that had been widely anticipated.

The Producer Price Index for August was flat, as had been generally forecasted. Core producer prices increased by a mere 0.1%, which is essentially on par with the 0.2% increase had been anticipated. Meanwhile, overall consumer prices for August increased by 0.4%, which is greater than the 0.2% increase that had been broadly expected. Core consumer prices increased by 0.2%, as had been anticipated, however.

The latest weekly initial jobless claims tally totaled 428,000, which exceeded the 410,000 initial claims that had been broadly expected. Moreover, the latest initial claims total is up 11,000 from the prior week.

As for manufacturing activity, the Empire State Manufacturing Survey for September fell to -8.8 from -7.7 in the prior month. It had been expected to come in at -4.0, based on the Briefing.com consensus. In a similar vein, the Philadelphia Fed Survey for September came in at -17.5, which is an improvement from the -30.7 that was posted in the prior month, but still below the -10.0 that had been expected among economists surveyed by Brieifng.com.

In the corporate space, news that Broadcom (BRCM 35.67, +0.35) will acquire NetLogic (NETL 48.33, +0.22) for $50 per share, which represents a hefty premium over last week's closing price, helped semiconductor stocks lead the tech sector to a strong week. As a sector, tech climbed about 7% this week, but the Philadelphia Semiconductor Index advanced almost 10%.

Strength among semiconductors helped the Nasdaq outperform the Dow and S&P 500 in a few sessions, but not everything in the Nasdaq was so cheery. Netflix (NFLX 155.19, -8.31) and Research In Motion (RIMM 23.93, -5.61) both saw their market caps slashed this week in response to disappointing forecasts.

Best Buy (BBY 25.43, -0.25) was another poor performer. The company had the structure of its business model called into question after it reported earnings that failed to meet what Wall Street had expected.

Nasdaq 100 0.9%. ..S&P Midcap 400 0.0%. ..Russell 2000 0.1%. ..NYSE Adv/Dec 1521/1465. ..NASDAQ Adv/Dec 1396/1224.
 
Index Started Week Ended Week Change % Change YTD %
DJIA 10992.13 11509.09 516.96 4.7 -0.6
Nasdaq 2467.99 2622.31 154.32 6.3 -1.2
S&P 500 1154.23 1216.01 61.78 5.4 -3.3
Russell 2000 673.96 714.31 40.35 6.0 -8.9

5:18PM AnalogicTech announces developments relating to its pending acquisition (AATI) 4.67 +0.19 : Co announced developments relating to its pending acquisition by Skyworks Solutions (SWKS). As detailed in the S-4 filing made by Skyworks on September 9, 2011, two meetings were scheduled in an effort to resolve the matters in dispute between the two companies relating to requested business and financial information, and access to an AnalogicTech officer. These meetings took place on September 13, 2011 and September 15, 2011, respectively. While AnalogicTech believes it had never been in breach of any of its obligations under the merger agreement, to the extent Skyworks asserted there was a breach of the merger agreement, the co believes any such claimed breach was cured by its actions in conjunction with these meetings. The co cannot provide further commentary beyond the information that is in the SEC filings and will continue to keep investors updated through appropriate disclosures.

8:01AM Chipmos Technology reaffirms Q3 rev, gross margin guidance; Aug sales +3.3% QoQ, -9.1% YoY (IMOS) 6.02 : Co reaffirmed Q3 rev to be flat-to-down in the single digits QoQ (no rev est), while maintaining gross margin on a consolidated basis in the range of 4.0% to 9.0%. Revenue for the month of August 2011 was NT$1,474.1 mln or US$50.8 mln, an increase of 3.3% QoQ, -9.1% YoY.

Last night, Research in Motion (RIMM $24.00 -5.54) reported second quarter earnings of $0.80 per share, excluding non-recurring items, $0.09 worse than the Capital IQ Consensus of $0.89, while revenues fell 9.8% year/year to $4.17 billion versus the $4.48 billion consensus. RIMM reports second quarter gross margins were 38.7%. RIMM shipped 10.6 million handheld devices in the second quarter, range of expectations was 11.0-12.5 million units. RIMM ships 200,000 Playbooks in second quarter, shipped approximately 500,000 in first quarter. The company issued guidance for the third quarter with EPS of $1.20-1.40 versus the $1.38 consensus and revenues of $5.3-5.6 billion versus the $5.27 billion consensus. Gross margin percentage for the third quarter is expected to be approximately 37%. BlackBerry Smartphone shipments are expected to be between 13.5 million and 14.5 million units. The company sees guidance at low end for fiscal year 2012 with EPS at low end of $5.25-6.00 versus the $5.06 consensus.

1:06 pm S&P Financial Sector Shows Losses; One of the Worst Performing Sectors Today

The S&P 500 Financial Index is trading lower today as we see some profit taking ahead of the weekend. The index had rallied approx 10% during the week so a pullback from this 176 area should not come as a surprise. News was relatively light with the markets following the buzz around the UBS rogue trader that is likely to cost the bank $2 bln this quarter. Still there were some defenses for UBS with S&P saying that they could still turn a profit. There has been little news out of the Ecofin meeting in Poland surrounding a European TARP which has also aided the decline. But, there was little expected from the meeting so this should hardly come as a surprise.

News of Note

1) On September 14, 2011, St. Joe Company (STJ) entered into a Stockholder Agreement with Fairholme permitting it to acquire beneficial ownership of up to 50% of outstanding common stock. Co had previously approved, in 2009, Fairholme's acquisition of beneficial ownership of up to 30% of outstanding common stock. Pursuant to the terms of the Stockholder Agreement, Fairholme has agreed that, until September 14, 2016, it will vote any shares that it beneficially owns or has proxy voting authority in excess of 33.33% of outstanding common stock in proportion to the manner in which all outstanding shares of common stock are voted. However, the proportional voting requirement will not apply in connection with any public solicitation of proxies for the removal of the directors or nominees by a person or group other than Fairholme.

2) Transatlantic (TRH) and Allied World Assurance (AWH) have mutually terminated their previously announced merger agreement. Consistent with the terms of the merger agreement, Transatlantic has agreed to pay Allied World, within two business days, a termination fee in the amount of $35 mln (and expense reimbursement in the amount of $13.3 mln), and has agreed to pay an additional fee in the amount of $66.7 mln in the event that, prior to September 15, 2012, Transatlantic enters into any definitive agreement in respect of any competing transaction or recommends or submits a competing transaction to its stockholders for adoption, or a transaction in respect of a competing transaction is consummated. TRH's plans includes the approval of a $600 mln open market or negotiated share repurchase program, which adds $455 mln to the co's existing share repurchase authorization.

3) Bloomberg.com reports that sources believe Bank of America (BAC), the lender burdened by its Countrywide Financial takeover, would consider putting the unit into bankruptcy if litigation losses threaten to cripple the parent. The option of seeking court protection exists because the bank maintained a separate legal identity for the subprime lender after the 2008 acquisition. A filing isn't imminent and executives recognize the danger that it could backfire by casting doubt on the financial strength of the largest U.S. bank, the people said. But BAC does want to hold this nuclear option open in case litigation expenses get out of hand.

4) Austria's Finance Minister says Geithner rejected the idea of financial transaction tax.

5) Lloyds Banking (LYG) added to Conviction Buy List at Goldman.

1:02 pm S&P Tech Sector Trading Higher; EBAY Upgraded, ADBE Downgraded (EBAY)

The tech sector is trading higher today, outperforming the broader market. Semiconductors are outperforming the rest of the tech space with the Philly Semi Index trading 2.0% higher. Among chips in the index, CREE (+1.0%) and TSM (+2.9%) are notable leaders, while VECO (-3.2%) is under pressure. Among other major indices, the S&P 500 is trading 0.5% higher, while the NASDAQ is trading 0.5% higher. The QQQ is also trading 0.8% higher. Among tech bellwethers, AAPL (+1.8%) is a leader while NFLX (-5.1%) is lagging.

In earnings RIMM (-17.7%) missed by $0.09 on EPS and guided FY12 EPS at the low end of the previous range. In news, QPSA (+3.6%) and myYearbook reaffirmed commitment to completing merger.

Among notable ratings calls this morning, Wedbush upgraded EBAY (+4.3%) to Outperform, JMP downgraded ADBE (-1.7%) to Market Perform, and Caris downgraded NFLX (-5.1%) to Average.

There are no notable tech names set to report tonight after the close.

09:59 am Texas Instruments Will Raise Quarterly Dividend 31% (TXN)

Texas Instruments (TXN $27.96 +0.25) will raise its quarterly cash dividend 31% to $0.17/share, up from the prior $0.13/share.
icon url

ReturntoSender

09/18/11 4:07 PM

#9505 RE: ReturntoSender #6755

InvestmentHouse Weekend Market Summary

http://www.investmenthouse.com/weekendmarketsummary.htm

- A week of gains on less worry about Europe, but its troubles are not just ending.
- Michigan Sentiment tops expectations but it is still at recession levels.
- Note to Geithner: our politics are not terrible and don't ever take sides with anyone against the family again, ever.
- A bit of a pause after the week's gains would do the rally well.
- Anticipating more upside, but be ready, just in case.

Indices make it five straight even as some worry creeps back in about Europe.

Stocks were able to close out five straight upside sessions with another round of very credible gains. A great return from the prior week shortened by Labor Day and a very solid move took SP500 back near its August peak and broke NASDAQ over its August peak for a new closing high off of the August low. That puts it above its June peak and trying to extend the move, basically waiting for SP500 and the other indices to play a little catch up.

It was a week marked by Europe . . . again, though this time around it was not necessarily about getting stuck in the eye with a stick. Instead some order was brought to the picture as investors believed (hoped?) things were under more control, at least hoping that was occurring. Big central banks put dollar facilities in place for European banks feared to be going under. They had to rely on the ECB to help them conduct their day-to-day activities, as they were unable to obtain dollar reserves. The five largest banks in the world joined together to create a lending facility to allow European banks access to dollars. It seemed to satisfy investors further and helped extend the rally. Moreover, Germany said there would be no "uncontrolled insolvency" of Greece. As I said earlier in the week, however, that leaves the question open of a controlled insolvency, but the markets took heart from Merkel's statement nonetheless.

In general it was an upbeat week with respect to Europe, something of a reversal of roles. Again, it beats getting stuck in the eye with a stick. Overall a positive and that allowed the stock market to rally. Other markets went the opposite way as they retrenched their moves as the stock market recovered. Those markets had rallied on the fear out of Europe. With fear subsiding somewhat, the dollar, bonds, and gold faded off of their recent sharp upside moves. Nothing major, no rollovers, just backtracking after strong moves.

One of the really bothersome issues during the week was the talk of the U.S. and its political process. This administration is really down on our political process. That is not surprising given where I think its true roots lie. Timothy Geithner was talking in Poland on Friday, and it was disturbing and offensive as a citizen to listen to him say that our "politics are terrible." He is referring to the fact that we actually debate things. In our country people have strong convictions and sometimes they disagree with what the administration wants. I'm sorry, but I think that makes our politics the best in the world. We can have this kind of debate in the open, and principled people who have strongly-held beliefs can stand up and say the emperor has no clothes without fear of retribution.

That is the fundamental strength of our system. It does not make it terrible; again, it makes it the best in the world. I don't know about you, but I have had enough of these punks in DC telling the rest of the world and all of us that because we have strong beliefs that are not in line with the leaders in D.C., that we are obstructionists, that our politics are bad and our system does not work. To the contrary, it works. We have the best system in the world when it is allowed to work versus strangling it with regulation (as I spoke about last night with respect to small business) and then picking winners and losers. More making excuses and apologizing to the world. Someone needs to give Geithner a Michael Corleone moment: don't ever again take sides with others against the family, ever.

Another example. Thursday Mr. Sanders, the socialist senator, heard someone complain in Congress about the government stepping in and picking winners and losers and how that was not its business. He said we pick winners and losers. He said that is what we do, so let's not worry about it. Let's just worry about whether we are picking the RIGHT winners and losers. That is a bald-faced admission that the government is involved where it should not be. It is no surprise given what has happened over the last three years with GM, Chrysler, AIG, with Fannie Mae, Freddie Mac, Sallie Mae, etc. The list is endless where they have intruded upon the private sector. It has become so ingrained that these pompous asses in DC think that is their job. Can they actually read? Do they comprehend what the Constitution says? Even the most rudimentary reading leads any rational person to conclude we have a limited government. It is a government with specific, enumerated powers. Nowhere in that document does it even imply the feds are empowered to take over private businesses. Where is the due process in that? The equal protection? Alas, but I digress yet again.

The market is performing well. It was five days up on the SP500 and company. It put it right at its 50 day EMA and below the August peaks. Looking at the intraday chart, stocks were a bit soft to begin with, but they rallied right away. Unfortunately they turned and sold right away as well, putting it to negative. A bit of softness early on was no problem. After this kind of move, I somewhat expected it. I also expected a little volatility given it was expiration and we are ahead of a weekend after four days of gains.

Stocks double bottomed mid-morning (isn't that so often the case?) and turned right back up and rallied. They never made it back to the session high but did a credible job of posting that fifth gain in a row.

SP500, +0.6%; NASDAQ, +0.6%; Dow, +0.66%; SP600, slightly negative at -0.04%; SOX, +0.2%.

The small caps are lagging, chasing the bus hollering "Wait for me." I do not know if the market will wait. With the economy as bad as it is, it is no wonder the small caps are struggling. On the other hand, tech and the chips are leading as they should this time of year. Friday the moves were not bad, just not great moves. Considering the market had rallied five days it is natural for moves to slow down a bit. It is hard to complain with five days up as this is the first time this occurred in quite awhile, and not bad given all of the problems confronting investors and small businesses. Indeed, we have to worry about our own country in addition to Europe. We are not strong by any means as evidenced by sentiment on Friday. Better, but it still shows we have problems.

Michigan Sentiment came in at 57.8, better than the 56.3 expected and 55.7 prior. The sad part is that the future expectations were the lowest since 1980. Things might be better right now, after bouncing back from August when everyone felt bad, but they are not good long term. People do not feel that the economy is heading in the right direction. You see that in all kinds of polls measuring popularity and anything else you can think of.

It is not a great time in America. I do not think it is quite morning in America by any stretch of the imagination as our second Summer of Recovery turned out not to be a recovery. After all, according to a Wall Street Journal poll, one in three now say that we are heading into a recession. That is not a good level of confidence in the economy. Even though the Michigan Sentiment numbers were better, numbers in the 50's are recession level. Anyone who looked at our history and were unbiased in their views would say we are in a recession based on our sentiment. Sentiment indicators are right on the button, and that is where we are.

OTHER MARKETS

Dollar: 1.3788 versus 1.3886 Euro. The dollar rebounded modestly. The dollar cruised up through this week, and then it sold off. Why? It rallied based on how weak Europe is. Now that there action has been taken on the continent to try to alleviate the debt crisis, the dollar pulled back. On Friday it did bounce. In the effort to play "pin the tail on the reason," a lot of the financial stations said people felt the efforts to help the European situation would not be that successful. All in all, the dollar is still in a very sharp uptrend. Looking at the DXYO, it is still holding well above this important support that were the highs hit after it broke its trend. It broke through those this week, and now it is testing them. It looks solid to make this test and then continue to the upside.
Click to view the chart

Bonds: 2.07% versus 2.08% 10 year U.S. Treasury. Bonds overall rallied. There were a lot of auctions of U.S. notes this week, and they did well. Bonds have pulled back; in other words, yields have rallied. They pulled back in price, but it is just a normal test as we saw in late August. Still in excellent shape to move higher. That is not a great vote of economic confidence at this point, but then again, why should there be economic confidence? The numbers give no reason to believe that is the case.
Click to view the chart

Gold: $1,814.70, +33.30. Gold bounced back up after its pullback. It is trying to make a higher low. Very solid bounce. There is no reason it should not bounce. It is in an uptrend. It just had a bit of double-top action. We will see how it fares next week. It will be a very important week because it has come back to some support. It is initially trying to bounce. It may still wander back down toward the 50 day EMA and the intraday lows from the second week of August before it makes a turn back to the upside.
Click to view the chart

Oil: $87.86, -1.54. Oil closed the week down. All week oil banged its head at the 90-day resistance and was unable to move through. That is a serious resistance point. It has come back to test that level, and it had done so the past week and a half, unable to move through. Maybe trying to set up some kind of bullish move, but it is getting squeezed right here. I see no reason it should go up with the economies the way they are. This week with Europe performing supposedly better with the bailouts and what have you, it should have moved higher. It was unable to break through 90, so I do not think it will be able to break through that level now. It should turn back and sell once more.
Click to view the chart

TECHNICAL SUMMARY

INTERNALS.

Volume. Volume spiked higher. It was expiration Friday, so we cannot read too much into that. NASDAQ volume rallied 36% to 2.66B. NYSE volume rallied almost 60% to 1.4B.

Breadth. The advance/decline line was boring with a 1.1:1 reading advancers over decliners on both the NYSE and NASDAQ.

I want to draw attention to one of the sentiment indicators of the bulls and the bears. I reported this earlier in the week, but this bears noting again. It has only happened a few times; that is, the bears crossing over above the bulls. The bears logged a 40.9% reading, up from 37.6% this week. The bulls fell from 38.7% to 35.5%. The bullish players in the market fell below the number of bearish players in the market. It is similar to the put/call ratio that measures the number of puts to calls; when it is higher than one, that is an unusual situation. Usually bulls are more prevalent than bears. More people are out using puts, and that means there is a high level of anticipation that the market will fall.

Historically when it gets extreme, that means the market is ready to rally. It is a very important indicator when you have this crossover of the bears up through the bulls. It does not happen often. It last happened in July 2010. Then the market rallied quite nicely. Now we have a crossover here. Will we get a nice rally off of this? We have five days up, and we will see if it can continue.

CHARTS

SP500. SP500 bumped into the 50 day EMA as it gets close to its August peak. It still has the August peak to deal with. Then it has the November peak at 1227 before it can even consider the March closing low at 1256 and then the June low at roughly 1260. It still has room to run. That is good because even after a little pullback early next week for a day or two, that the gives it a great springboard to move higher and test those levels.

NASDAQ. NASDAQ has already broken up through its June low. It is getting into that resistance range, having cleared its highs on this rally and putting in a new closing high. That is a positive as the techs lead. They typically start to show leadership this time of the year. Up five days. They could pull back and test right into this. I do not know how deep it would go. The 50 day EMA looks like a reasonable level at 2580. It could go back a bit more. A bit of pullback gives it a ramp to rally up further into its resistance level as well.

SP600. The small caps were disappointing. They were down on the session, again trading roughly flat with a doji. They moved up to their mid-August peak. They have not even hit the August high yet, and they are struggling. The economy is weak and the data we saw this week was no better. Indeed, it was worse once more with regional manufacturing and jobless claims. There is no reason to expect small caps to perform any better. There is no reason to perform better given the "Regulation Nation" that Fox News has been detailing all week about how the regulations impact small businesses.

There is a disproportionately heavy impact on the small businesses with respect to all of these regulations being passed. It is killing our economy and our middle class, and that is the irony. The administration talks about rescuing the middle class since it is being beaten to death. The middle class are those people who have their own small businesses. They are getting ground into dust by the regulations and red tape, and they cannot make a go of it anymore. More and more are shuttering their businesses every day, and we will go into economic decline as a result. We are on our way right now. It is not going to change unless there is some change.

SOX. SOX managed a modest gain, but it has had a good move and is a bit tired. This is the time leaders often start to take the lead, and that is exactly what they did. We made some money on some stocks on the way higher this week. We will look to do that after a pullback to test this initial move.

LEADERSHIP

Semiconductors/Technology. Technology was clearly the leader on the week. AAPL was moving nicely. It may have been partly due to RIMM's earnings as it gapped to the downside on its terrible showing. Of course, AAPL benefits from that as it was felt that RIMM's tablet might somehow rival the iPad. Does not look like that will be the case. AAPL the moving up toward its July high, getting some legs and sprinting well. GOOG made a little move. It bounced up to the top of its resistance range. Very important gap points here. It will be a big week for GOOG. Which way will it go?

Techs were performing just fine, and so were semiconductors. NVDA performed well this week. A nice, solid move to the upside. This was pretty much across the board. SLAB was moving higher as well. It put in a nice five-day day rally on its own. We will be looking from some pullback from these leaders in tech and semiconductors next week. It might give us a bit of entry.

China. China was not tearing things up, but it did not look bad. EDU was coming back and testing after a breakout. Looking solid. It could give us some action. We have been trying to get SNDA. It gapped higher on us on Friday over the 50 day EMA. Maybe it will test back this week and we can get in on that play as well. There is a little action in China giving things a decent look.

Retail. Retail had another good week. DG was surging higher almost 2% on Friday. DLTR had a good week as well. It was not a super move on Friday, but it had a nice week. BWLD came back to life. We took some gain off the table on Friday. There are moves out there occurring. They could use a bit of a pullback now to give us some new entry points. That is what we are expecting this week.

We have had five days to the upside. We are looking for a little pullback where we can pick up some of these leaders. We also need to watch for some downside plays. Stocks have rallied, but we have to be ready just in case they do not want to play along with the rally scenario.

THE MARKET

SENTIMENT INDICATORS

VIX. Volatility started to crack on Friday. It had been holding up quite well, and that indicated that the market was still trying to bounce higher. On Thursday and Friday it did start to crack, breaking through these gap points and prior holds in the pullback. There is a bit of wiggle room here, and it did hold at the 50 day EMA. It can still bounce at this point. In other words, the market could sell off, and it would ricochet higher. It is suggesting now that maybe investors are not anticipating a selloff as much as they were. That is a positive.

The market has put in a good week, and next week will be important. The test will tell whether or not it is a normal pullback that the market can rally off of, or if the sellers will come in to rip it and flip it. Then there could be problems to the downside which would, of course, send volatility spiking.

VIX: 30.98; -0.99
VXN: 29.36; -1.31
VXO: 31.28; -1.23

Put/Call Ratio (CBOE): 1.02; 0

Bulls versus Bears:

This is a reading of the number of bullish investment advisors versus bearish advisors. The reason you look at this is that it gives you an idea of how bullish investors are. If they are too bullish then everyone is in the market and it is heading for a top: if everyone wants to be in the market, then all the money is in and there is no more new cash to drive it higher. On the other side of the spectrum if there are a lot of bears then there is a lot of cash on the sideline, and as the market rallies it drags that cash in as the bears give in. That cash provides the market the fuel to move higher. If bears are low it is the same as a lot of bulls: everyone is in and the market does not have the cash to drive it higher.

Bulls: 35.5% versus 38.7%. Falling sharply, down from 40.9% just three weeks back. At that important 35% level considered bullish. Has crossed down through bears, a bullish market indication. Solid move lower from 49.5% in late July. Highs from April and December (60% readings spanning December through early May 2011). The 5 year high is 62.0. The crossover level at 29% bulls from July 2010 is long gone. 35% is the threshold level suggesting bullishness. To be seriously bearish it needs to get up to the 60% to 65% level.

Bears: 40.9% versus 37.6%. Big upside move and through the falling number of bulls. I said it moves quickly when it gets going. For a third week bears are over the 35% threshold considered a bullish indicator and have made that important crossover of bulls. For more reference, bearishness hit a 5 year high at 54.4% the last week of October 2008. The move over 50 took bearish sentiment to its highest level since 1995. Extreme negative sentiment. Prior levels for comparison: Bearishness peaked at 37.4% in September 2007. It topped the June 2006 peak (36%) on that run. That June peak eclipsed the March 2006 high (33%) and well above the 2005 highs that spawned new rallies (30% in May 2005, 29.2% in October 2005). That was a huge turn, unlike any seen in recent history.

NASDAQ

Stats: +15.24 points (+0.58%) to close at 2622.31
Volume: 2.669B (+36.87%)

Up Volume: 1.25B (-270M)
Down Volume: 1.51B (+1.052B)

A/D and Hi/Lo: Advancers led 1.14 to 1
Previous Session: Advancers led 1.98 to 1

New Highs: 35 (+10)
New Lows: 51 (-7)

NASDAQ CHART: Click to view the chart

NASDAQ 100 CHART: Click to view the chart

SOX CHART: Click to view the chart

SP500/NYSE

Stats: +6.9 points (+0.57%) to close at 1216.01
NYSE Volume: 1.421B (+59.48%)

Up Volume: 2.47B (-1.05B)
Down Volume: 2.24B (+1.775B)

A/D and Hi/Lo: Advancers led 1.1 to 1
Previous Session: Advancers led 2.92 to 1

New Highs: 54 (+12)
New Lows: 28 (+3)

SP500 CHART: Click to view the chart

SP600 Chart: Click to view the chart

DJ30

Stats: +75.91 points (+0.66%) to close at 11509.09
Volume DJ30: 425M shares Friday versus 172M shares Thursday.

DJ30 CHART: Click to view the chart

MONDAY

Next week there is more economic data, of course. We cannot get away from it. Tuesday Housing Starts and Permits report. We have a two-day FOMC meeting on Tuesday and Wednesday, for what that is worth. We will not hear much from them. I think there are a lot of issues the Fed has to deal with. Most people will be watching and listening very closely with respect to any Quantitative Easing or other type of stimulus from them. They will not do anything unless it becomes apparent in DC on the fiscal side that the President's so-called jobs plan is dead in water. After they give up on that, then they would like to come in with some sort of stimulus. That would help stocks given the liquidity. That is what this whole move has been based on thus far. If more comes in, stocks will enjoy it.

This is the two-day, September meeting. They said they would talk more about Quantitative Easing, but again, I do not think they will put anything out on this meeting because the President is touting his stimulus. Unless he says they will not pass it and admits defeat without a fight. It could be, because I think this is more of a campaign reelection ploy than a real jobs plan. But I still do not think the Fed will come out unless the President throws up his hands and says he cannot work with the Republicans.

Thursday you have Initial Jobless Claims and Leading Indicators. The Leading Indicators we have seen have not been very leading. They have been up, but the economy is not moving higher.

There is the economic picture. It will have some impact, but the real play is in the technical picture. Five days to the upside, a little pullback, and it sets a good ramp for a continued move higher. It is not too much rocket science at this point. I was laughing earlier because on CNBC today they were saying how everyone is being a technician right now because that is working. It always works but it is only acknowledged as working when the fundamental players cannot figure out what the heck is going on. The market goes back and forth and they see what they call value, but no one wants it.

That is the problem with value investing. A company could be a great value, but still no one wants it. Great values become even greater values they can become super values. At some point they will make a turn and be wanted. The charts show you that. You can wait until then to buy instead of putting your money in it because it is a damn good company and then waiting for six month or a year or longer for it to do something. It is just a different philosophy, kind of like Washington, DC right now, I suppose. Interestingly, one is more successful than the other.

I am looking for a pullback. It is not a good time to enter. We did not buy any new positions on Friday. Indeed, we were taking some gain off the table in AAPL and FLIR. We took those off the table, and it was worth it. Now we look for a pullback to give us some new upside positions. That is where you come in with plays at the ready. There are some great stocks that are already pulling back. There are good stocks we want to get a chance at again. We will see if we can move into those if they give us the pullback.

At the same time, you have to be ready with the just-in-case downside. Things look like they want to rally in the market overall. It is the time of the year for techs to lead and rally, and they are doing that. But if some nasty stuff comes out of Europe if all the good vibes from this week evaporate and things turn negative then we have to be ready for the downside. We already have some in hand. Some we are in are kind of sticking us in the eye right now, but they are also bumping up against resistance. If we get a bit of pullback, we can look at those and take them to the downside, or at least get a better exit point.

What is the culmination? I think we will get a bit of a pullback. Looking at NASDAQ's chart, it has already broken through its June low. So it comes back and tests, and then it makes a new bounced to the upside. That is what we are looking for. I do not think this move is dead yet. I think the liquidity generated by the ECB and the other central banks will have a lingering effect. I think that will make investors anticipate some kind of Quantitative Easing by the Fed. That gives this rally additional legs. We will look to play it more to the upside, particularly after a pullback. Then we will look for the downside. If it turns over and starts to fall after that, then we will be ready to play that. But we also have to be ready this week in case the that good will engendered this past week dissipates on some news out of Europe.

I hate to say it, but Europe is driving this right now along with some technical aspects. We have to play the technical aspects with an idea that the European problem could arise once more and wreck everything. You cannot play solely on that, however. You do not know when that will happen. You look at what stocks are setting up as leadership. They have been doing that and have started to the upside. You play those, and then you take some profits when it is reasonable to do so. Then you continue to play the move as far as you can.

That has been the plan. That has what we have been doing all along in this trading range, and we are not about to stop. Next week we will see if we get a pullback that gives us more entries for some upside to make additional money.

Have a great weekend!

Support and Resistance

NASDAQ: Closed at 2622.31
Resistance:
2645-2650ish from December 2010 consolidation
2676 is the January 2010 low
2686 is the January 2011 closing low
The 200 day SMA at 2705
2706 to 2705 is the April 2011 low and the February 2011 and consolidation low (bottom of the trading range) 2723 to 2705 is the range of support at the bottom of the January to May trading range
2759 is the May low
2762 is the February low
2796 is the February gap down point
2816 is the early April peak.
2825 is the 2007 closing peak.
2841 is the February 2011 peak
2862 is the 2007 peak
2879 is the July 2011 peak
2888 is the May 2011 peak

Support:
2612 is the late August 2011 peak
2603 is the March 2011 intraday low (post-Japan low)
2599 is the June 2011 low
2593 is the November intraday high
The 50 day EMA at 2582
2580 is the November 2010 closing high
2569 is the November gap up point through the April 2010 peak
2555 is the mid-August 2011 peak
2546 is the early September 2011 gap down point
2540 is the early November 2010 lower gap point
2532 is the early August gap down point
2512 is last week's gap down point
2469 is the November 2010 low
2331 from October 2010 low and the August 2011 low
2305 from the August 2010 peak (summertime base)
2139 is the May and June 2010 low
2123 is the August 2010 gap down point
2100 from the August 2010 lows

S&P 500: Closed at 1216.01
Resistance:
The 50 day EMA at 1218
1220 is the April 2010 peak
1227 is the November 2010 peak
1231 is the late August 2011 peak
1234 is the August 2011 low
1235 is the mid-December 2010 consolidation low
1249 is the March 2011 low (post-Japan)
1255 is the late December 2010 consolidation range
1275 is the January 2010 low, early January 2011 peak
The 200 day SMA at 1283
1295 to 1294 is the April 2011 low and the February 2011 consolidation low (bottom of the trading range)
1313 from the August 2008 interim peak
1318.51 is the May low
1325-27 is the March 2008 closing low and the May 2006 peak.
1332 is the early March peak
1340 is the early April 2011 peak
1344 is the February 2011 peak is being challenged again
1357 is the July 2011 peak
1364 is the March 2007 low
1370 is the August 2007 low
1371 is the recent May 2011 peak

Support:
1209 is the mid-August 2011 high
1196 is the November 2010 consolidation peak
1178-1180 is the October 2010/November 2010 consolidation low
1131 - 1127 from August 2010 base peak.
1119 is the early August closing low
1109 is the mid-September 2010 gap up point
1101 is the August 2011 low
1099 from the mid-July interim peak
1040 from the August 2010 lows and May/June 2010 lows
1011 is the summer 2010 low

Dow: Closed at 11,509.09
Resistance:
11,555 is the March low
The 50 day EMA at 11,570
The August low at 11,700
11,717 is the late August 2011 peak
11,734 from 11-98 peak
11,867 from the August 2009 high and peak on that bounce in the selling.
11,893 from March 2008 closing low
The June low at 11,897 (closing)
The 200 day SMA at 12,001
12,094 is the April 2011 low
12,110 from the March 2007 closing low
12,283 is the March 2011 peak
12,391 is the February 2011 peak
12,876 is the May high
12,754 is the July intraday peak
13,058 from the May 2008 peak on that bounce in the selling

Support:
11,452 is the November 2010 peak
11,178 from November 2010
10,978 is the bottom of the November 2010 consolidation
10,750 from September 2010
10,720 is the August closing low
10,705-710 from January 2010 peak
10,694-700 from August 2010 peak
9938 is the August 2010 low

Economic Calendar

September 13 - Tuesday
- Export Prices ex-ag., August (8:30): 0.3% actual versus 0.1% prior (revised from 0.5%)
- Import Prices ex-oil, August (8:30): 0.2% actual versus 0.2% prior (revised from 0.4%)
- Treasury Budget, August (14:00): -$134.2B actual versus -$132.0B expected, -$129.4B prior (revised from -$90.5B)

September 14 - Wednesday
- MBA Mortgage Index, 09/10 (7:00): +6.3% actual versus -4.9% prior
- MBA Mortgage Purchas, 09/10 (7:00): -4.9% prior
- PPI, August (8:30): 0.0% actual versus 0.0% expected, 0.2% prior
- Core PPI, August (8:30): 0.1% actual versus 0.2% expected, 0.4% prior
- Retail Sales, August (8:30): 0.0% actual versus 0.2% expected, 0.3% prior (revised from 0.5%)
- Retail Sales ex-auto, August (8:30): 0.1% actual versus 0.3% expected, 0.3% prior (revised from 0.5%)
- Business Inventories, July (10:00): 0.4% actual versus 0.5% expected, 0.4% prior (revised from 0.3%)
- Crude Inventories, 09/10 (10:30): -6.7M actual versus -3.963M prior

September 15 - Thursday
- Initial Claims, 09/10 (8:30): 428K actual versus 410K expected, 417K prior (revised from 414K)
- Continuing Claims, 09/03 (8:30): 3726K actual versus 3700K expected, 3738K prior (revised from 3717K)
- CPI, August (8:30): 0.4% actual versus 0.2% expected, 0.5% prior
- Core CPI, August (8:30): 0.2% actual versus 0.2% expected, 0.2% prior
- Empire Manufacturing, September (8:30): -8.8 actual versus -4.0 expected, -7.7 prior
- Current Account Balance, Q2 (8:30): -$118.0B actual versus -$121.5B expected, -$119.3 prior
- Industrial Production, August (9:15): 0.2% actual versus 0.0% expected, 0.9% prior (no revisions)
- Capacity Utilization, August (9:15): 77.4% actual versus 77.4% expected, 77.3% prior (revised from 77.5%)
- Philadelphia Fed, September (10:00): -17.5 actual versus -10.0 expected, -30.7 prior

September 16 - Friday
- Net Long-Term TIC Fl, July (9:00): $9.5B actual versus $3.7B prior
- Michigan Sentiment, September (9:55): 57.8 actual versus 56.3 expected, 55.7 prior

September 19 - Monday
- NAHB Housing Market , September (10:00): 15 expected, 15 prior

September 20 - Tuesday
- Housing Starts, August (8:30): 592K expected, 604K prior
- Building Permits, August (8:30): 588K expected, 597K prior
- FOMC Rate Decision, September (14:15): 0.25% prior

September 21 - Wednesday
- MBA Mortgage Index, 09/17 (7:00): +6.3% prior
- Existing Home Sales, August (10:00): 4.70M expected, 4.67M prior
- Crude Inventories, 09/17 (10:30): -6.7M prior
- FOMC Rate Decision, September (14:15): 0.25% expected, 0.25% prior

September 22 - Thursday
- Initial Claims, 09/17 (8:30): 417K expected, 428K prior
- Continuing Claims, 09/10 (8:30): 3730K expected, 3726K prior
- FHFA Housing Price I, July (10:00): 0.9% prior
- Leading Indicators, August (10:00): 0.1% expected, 0.5% prior
icon url

ReturntoSender

09/19/11 11:01 PM

#9506 RE: ReturntoSender #6755

From Briefing.com: 4:30 pm : Traders were guided by Greece today. Concern that the country could default on its debt initially stirred aggressive selling, but headlines that the country is close to securing funding helped the major equity averages slash their losses.

The stock market rallied more than 5% last week, but participants wasted little time paring their positions amid reports that a meeting between officials from Greece failed to produce an austerity plan that would ensure the placement of financial support, which would help the country avoid a default. To little surprise, worries over what could come of the country's moribund finances sent most overseas markets lower.

Global banking plays, especially those with a strong presence in Europe, were hit especially hard by sellers. The bleeding wasn't quite as bad among American banks, but the KBW Bank Index still suffered a loss of almost 3%.

Tech stocks, which collectively represent the largest sector by market weight, tried to help the market trim its loss in afternoon trade. The sector's attempt to turn higher was more influential in the tech-rich Nasdaq, which was able to reduce its loss to about half of what the broad market had been grappling with.

The broad market didn't really begin to rally until the final hour, when headlines surfaced suggesting that Greece's finance minister said the country is close to a deal with the International Monetary Fund, European Union, and European Central Bank, which are being collectively labeled the troika. The market's move lost momentum into the close, but both the Dow and S&P 500 were able to settle with losses that were less than half of what they had suffered at session lows. The Nasdaq, which already had a leg up on its counterparts, actually pushed into positive territory before slipping back into the red.

The dollar had been up more than 1% against a basket of major foreign currencies in the early going, but it pulled back as some participants made a late rotation out of the reserve currency and back into stocks before the closing bell. Still, the dollar ended the trading day about 0.7% higher than where it began.

Treasuries also traded with strong gains, but settled shy of their highs. For a time, the benchmark 10-year Note was up more than a full point, but it still finished with a gain good enough to keep its yield below 2.0%.

Advancing Sectors: (None)
Unchanged: Consumer Discretionary
Declining Sectors: Tech -0.1%, Utilities -0.5%, Health Care -0.9%, Consumer Staples -0.9%, Industrials -0.9%, Telecom -1.1%, Materials -1.4%, Energy -1.5%, Financials -2.7%DJ30 -108.08 NASDAQ -9.48 NQ100 +0.1% R2K -1.7% SP400 -1.4% SP500 -11.92 NASDAQ Adv/Vol/Dec 563/1.89 bln/2040 NYSE Adv/Vol/Dec 674/908 mln/2321

6:11PM Hewlett-Packard selected to build technology infrastructure for next-generation Digital Hospital in Australias (HPQ) 22.91 -0.62 : Hewlett-Packard Australia Pty ltd. announced it has signed a technology services agreement to design, build and maintain a portion of the information, communication and technology systems for the South Australia Government's next-generation digital hospital in Adelaide, Australia.

09:24 am JinkoSolar Holding downgraded to Sell at Collins Stewart; tgt lowered to $10: . Collins Stewart downgrades JKS to Sell from Neutral and lowers their tgt to $10 from $24. Firm notes China news agencies indicates that JKS has been asked to suspend cell production at its Haining facility in Zhejiang, its primary cell facility, accused by local residence of polluting a local river. They state this issue hits co at a very challenging time in the solar industry. They note excess capacity and tepid demand has put extreme pressure on pricing in recent weeks. These issues lead firm to reduce their earnings forecast for co, unrelated to this environmental issue.

09:24 am Coherent initiated with a Buy at Needham; tgt $55: . Needham initiates COHR with a Buy and price target of $55 saying EPS and bookings through the first nine months of F11 and appears on track for a strong FQ4. Firm says while COHR's growth is likely to slow in F12, they expect continued improvement in revenues and EPS, with potential upside coming from COHR's exposure to the fast-growing OLED display and smart phone/tablet markets and its expanded presence in the materials processing market.

11:04 am S&P Tech Sector Down Over One Percent; MU Upgraded, AMAT Downgraded (MU)

The tech sector is trading lower today, worse than the broader market. Semiconductors are showing relative weakness in the tech space with the Philly Semi Index trading 2.5% lower. Among chips in the index, NXPI (-7.9%) is a notable laggard. Among other major indices, the S&P 500 is trading 2.0% lower, while the NASDAQ is trading 1.8% lower. The QQQ, meanwhile, is trading 1.6% lower. Among tech bellwethers, ORCL (-2.9%) is under notable pressure.

In news, SWKS (-3.5%) delivered a notice of breach to AATI (-13.7%).

Among notable analyst upgrades this morning, MU (-0.3%) was upgraded to Neutral at Goldman, BRCM (-2.4%) was upgraded to Outperform at William Blair, and UBS upgraded LLTC (-2.4%), ADI (-1.2%), MXIM (-1.0%), and TXN (-1.2%).

In downgrades, AIXG (-2.4%) was downgraded to Neutral at HSBC, EZCH (-4.6%) was downgraded to Hold at Auriga, POWI (-6.2%) was downgraded to Neutral at Piper Jaffray, ASIA (-12.4%) was downgraded to Neutral at Susquehanna, LRCX (-5.3%) was downgraded to Neutral at Goldman, and AMAT (-3.6%) was downgraded to Sell at Goldman.

There are no notable names in tech set to report results today after the close.

10:53 am Skyworks Delivers a Notice of Breach to Advanced Analogic Technologies (AATI)

On September 19, 2011, Skyworks (SWKS $21.28 -0.79) delivered a notice of breach to Advanced Analogic Technologies (AATI $4.03 -0.64), stating, among other things, that AATI has breached its covenant, agreement and obligation under the Merger Agreement to "act and carry on its business in the usual, regular and ordinary course in substantially the same manner as previously conducted, . . . and use commercially reasonable best efforts, consistent with past practices, to maintain and preserve its and each Subsidiary's . . . assets . . . and preserve its advantageous business relationships with customers."
icon url

ReturntoSender

09/20/11 11:26 PM

#9507 RE: ReturntoSender #6755

From Briefing.com: 4:30 pm : The major market averages recovered from some early selling pressure to trade with gains of roughly 1% for most of the day, but the stock market's failure to extend its gains in the face of resistance provided participants with an excuse to exit their positions, causing stocks to roll over into the close.

Stocks opened in positive territory as participants took their cues from renewed buying interest in Europe, where news that Italy's debt was downgraded came without surprise given speculation last week. An early slip by financials prompted some knee-jerk selling, but stocks were able to stabilize quickly and mount an impressive bounce that took the Dow more than 100 points higher and the S&P 500 to a gain of more than 1%.

However, momentum stalled when the S&P 500 approached the 1220 line. It traded between there and 1215 for more than three hours before sentiment soured and participants, partly seeking the path of least resistance, resorted to selling. The decision to sell also precedes the latest FOMC policy statement, which will be released tomorrow afternoon. The past couple of statements have featured verbiage regarding the Fed's vigilance and readiness to use its policy tools if conditions should permit, but nothing has been let on about new plans to help stimulate the economy.

Also of primary concern is the ability of European officials to contain Greece's financial troubles, so as to help prevent contagion. However, participants never got any updates on the progress of Greece's dealings with the Troika. CNBC did report before the close that officials from the Troika will return to Athens in October, though.

The Dow managed to make it out with an marginal gain, but the S&P 500 logged a loss. Of the three major equity averages, the Nasdaq suffered the worst fate. Aggressive selling sent it to a loss of nearly 1% after it had been up about 1% at its session high. Oracle (ORCL 28.35, -0.67) proved to be a heavy drag ahead of its quarterly report.

Small-cap and mid-cap stocks were hit hard as participants moved to pare risk. That left the S&P 400 to fall to a loss of more than 1%, while the Russell 2000 tumbled to a loss of almost 2%.

Cyclical plays like materials (-1.0%), industrials (-0.7%), energy (-0.6%), and consumer discretionary stocks (-0.6%) finished the day with the worst results. In contrast, defensive-oriented utilities were the top performers for the entire session. They settled with a 1.4% gain after the group had been up in excess of 2% at its session high. Midsession strength among utilities helped the Dow Jones Utility Index climb to its highest level in nearly three years.

Advancing Sectors: Utilities (+1.4%), Health Care (+0.9%), Telecom (+0.5%), Consumer Staples (+0.1%)
Declining Sectors: Materials (-1.0%), Industrials (-0.7%), Energy (-0.6%), Consumer Discretionary (-0.6%), Tech (-0.4%), Financials (-0.3%)DJ30 +7.65 NASDAQ -22.59 NQ100 -0.6% R2K -1.8% SP400 -1.3% SP500 -2.00 NASDAQ Adv/Vol/Dec 713/1.91 bln/1825 NYSE Adv/Vol/Dec 1099/926 mln/1910

4:12PM Adobe Systems beats by $0.01, misses on revs; guides Q4 EPS in-line, revs above consensus (ADBE) 24.64 -0.63 : Reports Q3 (Aug) earnings of $0.55 per share, excluding non-recurring items, $0.01 better than the Capital IQ Consensus Estimate of $0.54; revenues rose 2.3% year/year to $1.01 bln vs the $1.03 bln consensus. Co issues in-line EPS guidance for Q4, sees EPS of $0.57-0.64, excluding non-recurring items, vs. $0.58 Capital IQ Consensus Estimate; sees upside revs guidance of $1.08 bln-1.13 bln vs. $1.06 bln Capital IQ Consensus Estimate. The Co's operating margin is targeted to be 26.5-29.5% on a GAAP basis, and 36-38% on a non-GAAP basis. In addition, the co is targeting its share count to be between 497-499 mln shares, and it is targeting non-operating expense between $17-21 mln. Adobe's GAAP and non-GAAP tax rates are expected to be ~22%. "We delivered strong earnings in Q3. At the high end of our financial targets for our fourth quarter, we will achieve our 10 percent annual revenue growth target as well as earnings growth of 20 percent for the fiscal year."

4:08PM Oracle beats by $0.01, reports revs in-line (ORCL) 28.35 -0.67 : Reports Q1 (Aug) earnings of $0.48 per share, excluding non-recurring items, $0.01 better than the Capital IQ Consensus Estimate of $0.47; non-GAAP revenues rose 10.7% year/year to $8.40 bln vs the $8.35 bln consensus. Non-GAAP new software license revenues were up 17% to $1.5 bln; non-GAAP software license updates and product support revenues were up 16% to $4.0 bln. Non-GAAP hardware systems products revenues were down 5% to $1.0 bln. Non-GAAP operating income was up 21% to $3.6 bln, and non-GAAP operating margin was 42%. "Our high-end server business -- Exadata, Exalogic, and SPARC M-Series -- delivered solid double digit revenue growth in Q1. In contrast, revenue declined in our low-end server business. By moving away from low-margin commodity hardware and focusing on high-end servers, we increased our hardware gross margins from 48% to 54%. Our strategy to grow the profitable parts of our hardware business is paying off."

8:00AM Cypress Semi authorized a new $400 million stock repurchase program (CY) 17.10 :

7:02AM General Electric's Energy unit announces more than $3 bln in new customer agreements (GE) 16.19 : Co announced agreements that include the Middle East, Australia, Europe, Asia and North and South America, more than $1 bln in New Commitments in Brazil in Oil and Gas and Wind Technologies. In addition the co announced 1.6-100 MW wind turbine adds more than $1.5 bln in new commitments. The orders include natural gas production technologies in subsea and liquefied natural gas sectors; natural gas technologies to produce power such as heavy-duty and aeroderivative gas turbines, gas engines and waste-heat recovery solutions; wind turbines; and water treatment, grid infrastructure and equipment optimization technologies. Together, they reflect the expanded set of capabilities GE offers to customers across multiple energy intensive industrial sectors.

09:46 am ARM Holdings upgraded to Buy at The Benchmark Company; tgt $35: . The Benchmark Company upgrades ARMH to Buy from Hold and sets target price at $35. Their bullish thesis centers on the long-term growth prospects for the very profitable Process Division (ARM PD) royalties, which made up 46% of 1H11 total revenue

Xilinx (XLNX $30.53 -0.92) lowered second quarter revenue guidance to down 7-10% QoQ to approximately $554.0-572.4 million versus the $604.30 million Capital IQ consensus (-2.0% QoQ), from +1 to -3% QoQ previously. Weaker than expected sales growth during the quarter is driven primarily by the Communications and Industrial and Other categories. Gross margin forecast remains unchanged at approximately 63%. Operating expenses are expected to be approximately $208 million, lower than $218 million previously.

ARM Holdings (ARMH $29.20 +.0.96) was upgraded to Buy from Hold at The Benchmark Company and the firm set a target price at $35. Their bullish thesis centers on the long-term growth prospects for the very profitable Process Division royalties, which made up 46% of 1H11 total revenue.

Plexus (PLXS $24.50 -1.44) was downgraded to Sell from Neutral at Ticonderoga with a target of $20. The firm notes they are increasingly finding it difficult to justify the company's current valuation relative to its peers, especially in light of disappointing financial performance in recent quarters and growing signs of weakness in core markets.

11:43 am S&P Tech Sector Trading Higher, In-line With the Broader Market (XLNX)

The tech sector is trading higher today, in-line with the broader market. Semiconductors are showing relative weakness in the tech space, however, with the Philly Semi Index trading 0.3% higher. Among chips in the index, XLNX (-2.3%) is a notable laggard. Among other major indices, the S&P 500 is trading 0.5% higher, while the NASDAQ is trading 0.6% higher. The QQQ, meanwhile, is trading 1.0% higher. Among tech bellwethers, AAPL (+2.5%) is outperforming, while CSCO (+0.2%) is under pressure.

In earnings this morning, XLNX (-2.3%) lowered its Q2 rev guidance.

In news last night, MLNX (-10.1%) announces a 3 mln ordinary share offering.

Among notable analyst upgrades this morning, The Benchmark Company upgraded ARMH (+3.8%) to Buy and SAP (+1.4%) was upgraded to Outperform at Wells Fargo. Among notable downgrades, PLXS (-4.9%) was downgraded to Sell at Ticonderoga and LOGI (-4.5%) was downgraded to Sell at Goldman.
icon url

ReturntoSender

09/21/11 8:41 PM

#9508 RE: ReturntoSender #6755

From Briefing.com: 4:30 pm : A negative response to the Fed's "Operation Twist," so labeled by market participants, stirred sellers to action today. Their conviction made it impossible for tech stocks to provide leadership after trading with strength for so much of the session.

The FOMC announced this afternoon that in order to support a stronger economic recovery it intends to purchase $400 billion of Treasuries with maturities of six years to 30 years, while selling an equal amount of Treasuries with remaining maturities of three years or less, by the end of June 2012. Many market pundits had anticipated such a plan, and had already designated it "Operation Twist" to reflect the Fed's focus on selling shorter term Treasuries and buying longer term issues.

To little surprise, the FOMC also reiterated that it expects economic conditions to warrant exceptionally low levels of the federal funds rate at least through mid-2013.

A knee-jerk response to the Policy Statement made for some whipsaw action among stocks, but the major equity averages eventually broke down and descended deep into negative territory. The Dow, S&P 500, and Nasdaq Composite all closed at session lows.

Although nothing slight, the Nasdaq's loss wasn't quite as severe as that of its counterparts. The Nasdaq had been propped up for the better part of the session by tech plays following better-than-expected quarterly reports and forecasts from Oracle (ORCL 29.82, +1.47) and Adobe (ADBE 24.93, +0.29). Autodesk (ADSK 28.71, +0.60) also attracted buyers after analysts at JPMorgan upgraded the stock.

Although not a member of the Nasdaq, software products, solutions, and services outfit Hewlett-Packard (HPQ 23.96, +1.49) staged an impressive performance as participants applauded the idea that the company may be considering the removal of its current Chief Executive.

Tech giant Microsoft (MSFT 26.11, -0.86) announced a 25% hike to its quarterly dividend, but that actually induced a negative reaction as investors regarded it as another sign that the firm continues to struggle to find investment-worthy growth opportunities.

Tech stocks ended the day with a 1.3% loss near its 50-day moving average after the group had been up more than 1% at their session high. Still, their loss was the least severe of any major sector.

Financials fell the hardest. The sector slumped to a 4.9% loss as banking plays and diversified financial services stocks tumbled. Analysts at Moody's announced today that they have downgraded the debt on Bank of America (BAC 6.38, -0.52), Citigroup (C 25.52, -1.41), and Wells Fargo (WFC 23.71, -0.96).

Treasuries rallied in response to the Fed's plan and the stock market's weakness, such that the yield on the benchmark 10-year Note fell back below 1.90% to flirt with record lows.

Advancing Sectors: (None)
Declining Sectors: Tech -1.3%, Utilities -1.7%, Consumer Staples -1.8%, Telecom -2.1%, Health Care -2.6%, Consumer Discretionary -3.0%, Industrials -4.0%, Energy -4.0%, Materials -4.5%, Financials -4.9%DJ30 -283.82 NASDAQ -52.05 NQ100 -1.6% R2K -3.7% SP400 -3.4% SP500 -35.33 NASDAQ Adv/Vol/Dec 444/2.16 bln/2132 NYSE Adv/Vol/Dec 442/1.21 bln/2593

5:00PM CalAmp awarded US patent # 8,001,174 B2 (CAMP) 2.92 -0.02 : Co has been awarded United States Patent # 8,001,174 B2 for techniques related to managing efficient and reliable data exchanges between a central processor and independent on board or remote mobile processors. The invention originated from R&D activities within CalAmp's Wireless Networks business.

4:12PM Red Hat beats by $0.03, beats on revs (RHT) 40.32 +0.32 : Reports Q2 (Aug) earnings of $0.28 per share, excluding non-recurring items, $0.03 better than the Capital IQ Consensus Estimate of $0.25; revenues rose 28.0% year/year to $281.3 mln vs the $271.2 mln consensus. GAAP operating income for the second quarter was $52.5 mln, or 18.7% operating margin. After adjusting for stock compensation and amortization expenses as detailed in the tables below, non-GAAP operating income for the second quarter was $76.4 mln, up 41% year-over-year. Non-GAAP operating margin was 27.2%, up 250 basis points from the year ago quarter. Both GAAP and non-GAAP net income for the quarter included a discrete tax benefit of $2.1 mln, ~$0.01 per diluted share. Excluding this tax benefit, GAAP earnings per share would have been $0.19 and non-GAAP earnings per share would have been $0.28 for the quarter.

7:03AM National Semi: Texas Instruments (TXN) acquisition of National Semiconductor clears regulatory reviews (NSM) 24.92 -0.01 : The companies expect the transaction to be complete on September 23, just slightly ahead of the six- to nine-month timeframe originally anticipated when the acquisition was announced on April 4.

10:55 am S&P Tech Sector Shows Modest Gains

The tech sector is trading higher today, ahead of slight losses the broader market. Semiconductors are trading in line with strength in the tech space with the Philly Semi Index trading 0.4% higher. Among chips in the index, CREE (+3.3%) is a notable leader. Among other major indices, the S&P 500 is trading 0.2% lower, while the NASDAQ and the QQQ are trading 0.4% higher. Among tech bellwethers, ORCL (+6.5%) is a notable leader, while MSFT (-1.7%) under pressure.

In earnings last night, ORCL (+6.5%) posted a slightly better-than-expected Q1 and guided earnings inline with consensus and revs just below the Street ests. ADBE (+2.9%), on the other hand, reported a slight miss for its Q3, but offered upside guidance. This morning, MPWR (-1.1%) lowered its Q3 guidance.

In news, MSFT (-1.7%) raised its quarterly dividend by 25% to $0.20/share. In rumors, we are hearing JDSU (-0.2%) takeover chatter making the rounds.

Among notable analyst upgrades this morning, ADSK (+6.8%) and ROVI (+5.2%) were upgraded to Overweight at JP Morgan. Also of note, Goldman raised its tgt on AAPL (+1.2%) to $520 from $480. In downgrades, VRSN (0.0%) and DOX (-0.5%) were downgraded to Neutral at JP Morgan.

RHT (+0.6%) is the notable name in tech set to report results today after the close.

09:40 am Oracle Guides Fourth Quarter Earnings In-line With Consensus (ORCL)

Oracle (ORCL $30.30 +1.95) reported first quarter earnings of $0.48 per share, excluding non-recurring items, $0.01 better than the Capital IQ Consensus Estimate of $0.47.

Non-GAAP revenues rose 10.7% year/year to $8.40 billion versus the $8.35 billion consensus.

Non-GAAP new software license revenues were up 17% to $1.5 billion; non-GAAP software license updates and product support revenues were up 16% to $4.0 billion. Non-GAAP hardware systems products revenues were down 5% to $1.0 billion. Non-GAAP operating income was up 21% to $3.6 billion, and non-GAAP operating margin was 42%.

"Our high-end server business -- Exadata, Exalogic, and SPARC M-Series -- delivered solid double digit revenue growth in Q1. In contrast, revenue declined in our low-end server business. By moving away from low-margin commodity hardware and focusing on high-end servers, we increased our hardware gross margins from 48% to 54%. Our strategy to grow the profitable parts of our hardware business is paying off."

On the conference call after hours yesterday, the company guided Non-GAAP EPS in the range of $0.56 to $0.58, Capital IQ consensus $0.56; revenues expected to rise 4% to 8%, Capital IQ consensus $9.34 billion or approx +8.2% year/year.

09:34 am Adobe Guides Fourth Quarter Revenue Expectations Above Consensus (ADBE)

Adobe (ADBE $25.93 +1.29) reported third quarter earnings of $0.55 per share, excluding non-recurring items, $0.01 better than the Capital IQ Consensus Estimate of $0.54.

Revenues rose 2.3% year/year to $1.01 billion versus the $1.03 billion consensus.

For the fourth quarter, the company expects to see earnings of $0.57 to $0.64, excluding non-recurring items, versus the $0.58 Capital IQ Consensus Estimate; sees upside revs guidance of $1.08 billion to $1.13 billion versus the $1.06 billion Capital IQ Consensus Estimate.

The Company's operating margin is targeted to be 26.5% to 29.5% on a GAAP basis, and 36% to 38% on a non-GAAP basis. In addition, the co is targeting its share count to be between 497-499 million shares, and it is targeting non-operating expense between $17 million to $21 million. Adobe's GAAP and non-GAAP tax rates are expected to be ~22%.

"We delivered strong earnings in the third quarter. At the high end of our financial targets for our fourth quarter, we will achieve our 10% annual revenue growth target as well as earnings growth of 20% for the fiscal year."

Monolithic Power (MPWR $11.36 -0.18) issued downside guidance for the third quarter with revenues of $52-54 million versus the $57.39 million Capital IQ consensus and below prior guidance of $56-60 million. The company states: "The economy is slowing down considerably. We are slowing down channel inventory to reflect the uncertain business climate."
icon url

ReturntoSender

09/21/11 11:41 PM

#9509 RE: ReturntoSender #6755

Forming a major bottom is a process. It is not something that happens overnight. Just because there is ample evidence of a tremendous amount of pessimism does not mean the market cannot go lower.

For instance in 2008 bearishness hit a 5 year high of 54.4% during the last week of October. Most stocks did not bottom until March of 2009 when bearishness had fallen by more than 10% to 44%. There was still a cross over of more bears than bulls but it took nearly 5 months for the bottom to form.


I am still watching volume. Why? Because it can help determine when a bottom is actually forming. Major bottoms form under low volume. I'm still looking for a 90% upside day, or two days in a row of 80% upside after the selling pressure dissipates.


We are obviously past the market high. We have a lot of pessimism but volume last month was a capitulation month. It would be hard for me to believe we have already formed a bottom. But after 5 months in a row of going down with the kind of sentiment we have now we could certainly rally again after a retest of the August lows.


RtS
icon url

ReturntoSender

09/22/11 7:56 PM

#9512 RE: ReturntoSender #6755

From Briefing.com: 4:30 pm : Aggressive selling pressure sent the stock market down about 4% before it began to bounce into the close. The loss still made for the market's worst one-day percentage drop in a month, though.

A weak finish on Wall Street yesterday and revived concerns about macro conditions, both economic and financial, sent the major global averages sharply lower overnight. That simply perpetuated selling pressure, resulting in a loss of almost 5% for the Global Dow Average, which closed at a new 52-week low.

According to reports, more than 100 stocks listed in the S&P 500 set fresh 52-week lows of their own today. Selling was generally indiscriminate, but natural resource plays suffered the most. As such, the materials sector and energy sector both fell more than 5%.

Weakness among natural resource plays was exacerbated by precipitous drops in commodity prices, such that the CRB Commodity Index fell more than 4% to a new 2011 low. Oil prices weighed most heavily as crude futures fell to $80.51 per barrel for a 6.3% loss, which makes for oil's largest single-session percentage drop since early August. Even gold failed to garner support; it settled with a loss of 3.8% at $1739 per ounce.

The extreme negativity took the Dow down some 500 points and the S&P 500 about 4% lower to set session lows with less than an hour before the closing bell. As if the bleeding wasn't already bad enough, the stock market even threatened to break down further as it slid below its 52-week closing low around the 1120 line. However, some late relief buying brought stocks back from what seemed like the brink of another leg of losses.

The need for safety sent the dollar up sharply. In fact, the Dollar Index climbed more than 1% to set a new multi-month high. Its gains were challenged in the afternoon when the euro was helped by a headline that suggested the European Union is seeking to recapitalize 16 banks. The dollar eventually reclaimed its gains.

Treasuries had an historical day in that the yield on the benchmark 10-year Note dropped to a record low near 1.70%. The Note ended the day more than a full point higher.

All of the action brought plenty of participants in from the sidelines. In turn, share volume on the NYSE climbed to more than 1.7 billion. This is backwards it should say Downside volume outnumbered advancing volume 50 to 1 on the Big Board. But even Briefing.com makes errors so here is their latest... RtS: Advancing volume outnumbered declining volume by more than 50-to-1 on the Big Board.

4:06PM TriQuint Semi lowers Q3 EPS guidance to $0.09-0.11 vs. $0.16 Capital IQ Consensus Estimates, down from $0.16-0.18; lowers revs guidance to $210-215 mln vs. $228.6 mln consensus, down from $225-235 mln (TQNT) 5.17 -0.22 : Co lowers Q3 guidance... Co said, "The reduction in expected revenue and profitability for Q3 is primarily the result of reduced demand from the Company's largest customer, weakness in the communications infrastructure market and softening demand from the China market. Product mix and costs associated with ramping new products are the largest drivers of the sequential reduction in non-GAAP gross margins. The co expects a return to strong sequential revenue growth in the fourth quarter of 2011. No conference call will be held in conjunction with this financial outlook update."

4:05PM Hewlett-Packard confirms it has named Meg Whitman President and Chief Executive Officer (HPQ) 22.80 -1.18 : HPQ has confirmed that its board of directors has appointed Meg Whitman as president and chief executive officer. In addition, Ray Lane has moved from non-executive chairman to executive chairman of the board of directors, and the board intends to appoint a lead independent director promptly. These leadership appointments are effective immediately and follow the decision that Leo Apotheker step down as president and chief executive officer and resign as a director of the company.

4:03PM Cavium Networks guides Q3 rev below consensus -- stock is halted (CAVM) 31.21 -2.06 : Co sees Q3 rev -4 to -6% QoQ to ~$67.3-68.7 mln vs $73.45 mln Capital IQ Consensus Estimate. The co expects that non-GAAP gross margins and non-GAAP operating expenses in the third quarter will be consistent with previous guidance. "Customer revenues have been weaker than expected this quarter, in the enterprise market as well as recognized software services revenue. Sales into the enterprise market were affected by a much larger than expected impact of a hub transition at one of our major customers as well as lower demand from other enterprise customers as they adjust their supply chain inventory due to the softer demand environment. However, we continue to experience high levels of design win activity across multiple product families and are confident that we are well positioned for the future."

12:39PM JinkoSolar Holding provides update on its facility in Haining City, Zhejiang province (JKS) 6.19 +0.43 : As previously reported, Zhejiang Jinko Co., Ltd. ("Zhejiang Jinko"), a subsidiary of JinkoSolar, suspects that a discharge of a small amount of solid waste containing fluoride into a nearby water channel may have occurred at its plant in Haining city. With the exception of one incident on May 11, 2011 related to the trial operation for their 100 MW expansion phase, which the co says is unrelated to the current event, the Haining Water Monitoring Department has never advised us that the quality of the effluent does not meet applicable standards. Other than the possible accidental release of fluoride in the August incident, no fluoride has been released into the environment. Although responsibility for the discharge is still under investigation by local government authorities, on September 7, the co agreed to pay compensation for the crop damage as well as for the death of any livestock and wildlife arising from the pollution incident, if any.

9:18AM Zarlink Semi: Microsemi (MSCC) to acquire Zarlink Semiconductor; amends offers to acquire all of the outstanding common shares and debentures of - Zarlink to CAD$3.98 per share and CAD$1,624.49 per CAD$1,000 principal amount of debentures, respectively (ZARLF.PK) 3.44 -0.03 : Zarlink's Board of Directors unanimously recommends Zarlink shareholders and debentureholders tender their shares or debentures to Microsemi's all cash increased offers. the acquisition will be Immediately accretive to Microsemi's non-GAAP earnings before synergies; expects $0.24 to $0.26 non-GAAP EPS accretion in FY2012. The total transaction value is ~US $525 mln, net of Zarlink's cash which is currently US $ 107 mln. The Amended Offers represent a 67% premium over the closing price of the Shares on the TSX and a 48% premium over the closing price of the Debentures on the TSX on July 19, 2011, the day prior to the initial public announcement of Microsemi's proposal to acquire Zarlink. For the September quarter, net sales for Microsemi are expected to increase from 3% to 5% sequentially. As of this date, Microsemi remains comfortable with its previously announced non-GAAP diluted earnings per share guidance for its fourth Fiscal quarter 2011 of $0.52 to $0.54 vs Capital IQ consensus of $0.53.

9:05AM First Solar announces Topaz Solar Farm Will Not Meet DOE Loan Guarantee Deadline (FSLR) 73.52 : Co announces the Topaz Solar Farm project will not meet the statutory deadline to receive a federal loan guarantee from the U.S. Department of Energy. The Topaz project meets the standards for inclusion in the loan guarantee program and received a conditional commitment for a loan guarantee from DOE on June 30, 2011, but there was insufficient time to process all requirements before the Sept. 30, 2011 deadline specified under Section 1705 of the Energy Policy Act of 2005. First Solar is in advanced talks regarding the sale and financing of the project with potential buyers utilizing a different transaction structure that does not require a DOE loan guarantee. The 230 megawatt Antelope Valley Solar Ranch 1 project and the 550 MW Desert Sunlight project, which also received conditional commitments from DOE for loan guarantees on June 30, remain in the DOE process.

11:29 am S&P Tech Sector Down Sharply; YHOO Upgraded (YHOO)

The tech sector is trading lower today, while the broader market is performing slightly worse. Semiconductors are showing relative weakness in the tech space with the Philly Semi Index trading 3.5% lower. Among chips in the index, NVDA (-7.0%) is a notable laggard, while VECO (+0.2%) is bucking the trend lower. Among other major indices, the S&P 500 is trading 2.9% lower, while the NASDAQ is down 2.7% and the QQQ are trading 2.4% lower. Among tech bellwethers, ORCL (-3.2%) and GOOG (-3.0%) are under notable pressure.

In earnings last night, RHT (+4.0%) posted a Q2 beat and INTU (-1.2%) reaffirmed. This morning, LOGI (-12.4%) lowered guidance.

Among notable analyst upgrades this morning, YHOO (+0.5%) was upgraded to Buy from Hold at Stifel Nicolaus and INTC (-1.0%) was upgraded to Buy at BofA/Merrill. Among downgrades, Needham downgraded CMTL (-2.1%) to Hold. Also of note, YOKU (-8.3%) was removed from the Conviction Buy List at Goldman.

TIBX (+1.3%) is the notable name in tech set to report results today after the close.

11:19 am Leading Indicators Beats Expectations in August

The Conference Board's Leading Economic Indicators Index increased 0.3% in August, down from 0.6% in July. The Briefing.com consensus expected the index to increase 0.1%.

Since seven of the 10 components are known prior to the release, the differences between the consensus and the actual data normally come from the three estimated components: manufacturing orders, consumer goods; manufacturer orders, business capital; and M2 money supply.

In this case, the leading indicators remained positive and beat expectations based on extremely high growth in M2. This subindex accounted for 0.70 percentage points of growth in August, the largest contribution since September 2010. M2 has averaged a 0.08 percentage point contribution since the end of the recession.

Building permits also surpassed expectations earlier in the week (620K actual vs. 585K consensus). Since the consensus estimated the leading indicators using their forecasted building permits figure, the beat also contributed to the better-than-expected leading indicators level.

09:59 am FedEx Tops EPS And Revenue Expectations (FDX)

Fedex (FDX $65.27 -7.23) reported first quarter earnings of $1.46 per share, $0.01 better than the Capital IQ Consensus Estimate of $1.45.

Revenues rose 11.3% year/year to $10.52 billion versus the $10.3 billion consensus.

The company issued in-line guidance for the second quarter, with EPS of $1.40-1.60 versus the $1.55 the Capital IQ Consensus Estimate. The company issued in-line guidance for fiscal year 2012. It lowered EPS to $6.25-6.75 from $6.35-6.85 versus the $6.36 Capital IQ Consensus Estimate. The capital spending forecast for fiscal 2012 remains $4.2 billion.

"The U.S. and global economy grew at a slower rate than we anticipated during the quarter. While FedEx Ground and FedEx Freight achieved improved operating results despite lower than expected growth, the more rapid decline in demand for FedEx Express services, particularly from Asia, outpaced our ability to reduce operating costs. We have slightly reduced our earnings forecast to reflect current business conditions and are aggressively working to adjust our cost structure to match demand levels." The co plans to begin acquiring FedEx common shares. A total of 5.7 million shares may be repurchased under existing share repurchase authorizations. FedEx Express will increase shipping rates by a net average of 3.9% for U.S. domestic, U.S. export and U.S. import services effective January 2, 2012.

09:55 am Consumer Discretionary Index Falls Along With Broader Market (NFLX)

The consumer discretionary group is faring modestly better than the broader market in early trade. The retail group is in the red with the Retail HOLDRS Trust (RTH) down 2.5% and the SPDR S&P Retail ETF (XRT) down 3.2%. Trading higher following earnings/guidance: MLHR +6.7%, SCHL +4.3%... Trading lower following earnings/guidance: KMX -9.1%, MTN -5.5%, RAD -3.7%... Near unchanged mark following earnings/guidance: BBBY.

Other notable mentions: Construction homebuilders under pressure (XHB-3.6%): Standard Pacific (SPF -5.0%) and Lennar (LEN -4.4%) gapped down despite being upgraded before the open. SPF was upgraded to Neutral from Underweight at JPMorgan and LEN was upgraded to Buy from Hold at Citigroup. Hovnanian Entrpr (HOV -3.7%) downgraded to Underweight from Neutral at JPMorgan. PHM-7.1%, RYL-5.8%, DHI -5.2%, MTH -5.4%, MHO -4.7%, TOL -4.4% are also lower.

Analyst related: Netflix (NFLX +1.8%) was upgraded to Outperform at Wedbush and upgraded to Neutral from Sell at UBS. HJ Heinz (HNZ -1.2%) initiated with a Buy at Jefferies. Family Dollar (FDO flat) and Dollar General (DG flat) initiated with Buys at Guggenheim Securities. Steven Madden (SHOO -1.5%), DSW (DSW -2.8%), Deckers Outdoor (DECK -3.3%), lululemon athletica (LULU -4.5%) initiated with a Buy at Auriga. Skechers USA (SKX -3.6%) initiated with a Hold at Auriga. lululemon athletica initiated with a Buy at Argus. Tesla Motors (TSLA -1.7%) was initiated with a Outperform at Robert W. Baird. Walgreens (WAG -2.8%) and CVS Caremark (CVS -2.6%) initiated with a Hold at Deutsche Bank. Hershey Foods (HSY -1.8%) initiated with a Hold at Jefferies. Under Armour (UA -4.5%) was downgraded to Hold at Needham. Diamond Foods (DMND -3.8%) was downgraded to Hold from Buy at Jefferies. Procter & Gamble (PG -2.4%) was downgraded to Neutral from Buy at SunTrust. Urban Outfitters (URBN -3.5%) was downgraded to Underperform at Wedbush.

09:51 am Goodrich To Be Acquired By United Technologies (GR)

United Technologies (UTX $69.50 -5.36) announced it has reached agreement to purchase Goodrich (GR $120.40 +10.91) for $127.50 per share in cash.

This equates to a total enterprise value of $18.4 billion, including $1.9 billion in net debt assumed. United Technologies expects to finance the transaction through a combination of debt and equity issuance.

Following completion of the transaction, UTX is expected to have worldwide sales of approximately $66 billion based on projected 2011 results. UTX expects the transaction will be accretive to earnings in the second year.

Additionally, UTX reaffirms guidance for FY11 (Dec), sees EPS of $5.35-5.45 vs. $5.47 Capital IQ Consensus Estimate; sees FY11 (Dec) revs of approximately $58 billion versus the $58.33 billion Capital IQ Consensus Estimate.

09:42 am Initial Claims Level Declines

The initial claims level declined from 432,000 for the week ending September 10 to 423,000 for the week ending September 17.

The Briefing.com consensus expected the initial claims level to fall to 418,000.

There were no special circumstances affecting the jobless claims data this week. Since the week ending August 12, the initial claims level has remained above the 410,000 upper bound of our "Recovery Zone."

With claims above the upper bound, payroll gains in excess of the 100,000 necessary to support a stable unemployment rate are unlikely. It would not surprise us to see the unemployment rate tick higher in September. The continuing claims level fell from an upwardly revised 3.755 million (from 3.726 million) for the week ending September 3 to 3.727 million for the week ending September 10 and was in-line with consensus expectations.
icon url

ReturntoSender

09/25/11 3:00 PM

#9514 RE: ReturntoSender #6755

Leavitt Brothers - State of the Market Video - Trend is down until it's not:

http://leavittbrothers.com/blog/?p=4883
icon url

ReturntoSender

09/25/11 9:53 PM

#9516 RE: ReturntoSender #6755

There is a pretty good chance that if we break lower we will see the S&P 500 not finish going down until it has an RSI of 30 or lower again on the monthly chart.

I closed my one short position on Thursday because we hit the bottom of our recent trading range on high volatility. Volatility like this usually falls without a lot more short term bad news resulting in a short term market rally.

I don't think the market is reflecting how bad things really are for the average American. If we break down then 1000 is as good a level as any for short term support for the S&P 500 but that might not get us anywhere near an RSI of 30. How low do we have to go before we hit bottom? Time will tell.


In the meantime we are not even close to seeing this market bottom until we get a 90% upside day or two 80% upside days on higher volume in a row.

RtS
icon url

ReturntoSender

09/26/11 10:47 PM

#9518 RE: ReturntoSender #6755

From Briefing.com: 4:30 pm : Stocks scored their strongest single-session surge in more than two weeks amid hopes that a plan to stabilize Europe's flagging financial system is in the works. Banks and other financial issues led the advance.

In the absence of any meaningful data or market-moving corporate news market participants kept their focus on Europe, which saw its major bourses rally during its latest session. Buying there was backed by the belief that officials are finally arranging a coordinated effort to shore up the eurozone's ailing banks and fiscal conditions after months of grappling with precarious conditions.

Stocks were subjected to some afternoon selling after an official from Germany reportedly remarked that there is no intention to increase the eurozone emergency funding plan, but it was later learned from CNBC that eurozone officials are planning for an European investment bank already in existence to use special purpose vehicles to issue bonds that would help finance the purchase of debt. The EFSF would also be used to shore up bank capital.

The major equity averages rallied in response to the CNBC story. Buying remained steady into the close, helping stocks settle at session highs.

Financials, especially banks, led the afternoon advance. They were fueled by the notion that efforts to restore Europe's financial conditions would effectively reduce risk related to their presence in the continent. Overall, the financial sector advanced 4.4%, but the KBW Bank Index bounced 5.2%.

Tech stocks trailed all session, but the sector managed to join in the broad market's late rally to settle with a 1.3% gain. Due to the relative weakness of large-cap tech issues, the Nasdaq was never able to match the performance of its counterparts.

Strength among stocks put pressure on Treasuries, causing the yield on the benchmark 10-year Note to return to 1.90%, which is more than 20 basis points above the record low that it set late last week.

The dollar oscillated for most of the day, but ultimately finished with a slight loss against a collection of competing currencies. The euro ended the day down narrowly against the dollar; its loss was reduced in the wake of the eurozone headlines.

Advancing Sectors: Financials +4.4%, Energy +3.6%, Materials +3.1%, Industrials +2.5%, Consumer Discretionary +2.2%, Consumer Staples +1.8%, Health Care +1.6%, Telecom +1.5%, Tech +1.3%, Utilities +0.8%
Declining Sectors: (None) DJ30 +272.38 NASDAQ +33.46 NQ100 +1.2% R2K +2.0% SP400 +2.0% SP500 +26.52

5:34PM Integrated Device lowers Q2 revs guidance below consensus (IDTI) 5.69 -0.03 : Co lowered revenue guidance for Q2 to $138-141 mln vs. $149.4 mln Capital IQ Consensus Estimate, down 7-9% sequentially and down from $147-153 mln. "The broad-based weakness in customer orders we experienced in the latter half of the June quarter has continued through September," said Dr. Ted Tewksbury, president and CEO of IDT. "In the face of weaker macro-economic growth and shorter component lead times, many of our customers have focused on controlling inventory and remain cautious about placing new orders. This has resulted in lower than anticipated turns-fill for the September quarter."

4:02PM Nanometrics wins multi-system order for integrated metrology (NANO) 15.36 +0.30 : Co announced that its IMPULSE integrated metrology optical critical dimension (OCD) and film analysis system has been selected by a major Korean memory manufacturer for chemical mechanical planarization (CMP) process control. The decision makes the Nanometrics IMPULSE system "tool-of-record" for CMP control of NAND Flash memory in high-volume manufacturing at the 2x nm node. The IMPULSE was selected over competitive offerings following an extended technical evaluation.

8:31AM Freescale Semi lowers Q3 rev guidance below consensus due to weakness in its industrial and networking businesses (FSL) 12.24 : Co lowers Q3 rev guidance to -6 to -8% QoQ to ~$1.13-1.15 bln from flat to -3% QoQ vs. $1.19 bln consensus. The sales decline is attributable primarily to weakness in the co's industrial and networking businesses; Gross margins to show modest sequential improvement despite the sequential decline in sales.

8:02AM Trident Microsystems to reduce workforce to lower EBITDA breakeven point; expects to realize $40-48 mln in savings (TRID) 0.60 : Co announces it will lower its breakeven point through a realignment of its workforce, from ~1,275 employees worldwide to ~1,000 employees by early 2012. As a result of the reductions in labor and other cost saving initiatives, by the first quarter of 2012 the co expects to realize annual operating expense savings of ~$40-48 mln compared with the annualized run rate as of the second quarter of 2011 and to reduce its EBITDA breakeven level (ex-items) to ~$340-360 mln in annual revenues. The co expects to incur total cash restructuring charges of ~$8-10 mln , including ~$2-3 mln in the current quarter ending Sept. 30, 2011.

AMD (AMD) introduced the AMD Radeon E6460 discrete graphics processor as AMD's next generation entry-level embedded graphics processor, complementing the previously announced AMD Radeon E6760.

09:38 am First Solar upgraded to Hold at Maxim Group: . Maxim Group upgrades FSLR to Hold from Sell saying while FSLR's earnings prospects have deteriorated along with industry pricing and the Topaz DOE loan loss, the firm believes the stock's steep decline since July balances risk/reward. While their long term secular concerns about organic demand remain, they expect FSLR to trade within a new range of $55-$80, pending proof of sustainability of its project business.

1:24 pm S&P Tech Sector is Showing Modest Losses; AMD Upgraded, CSCO Downgraded (AMD)

The tech sector is trading just lower today, trailing gains in the broader market. Semiconductors are showing relative weakness in the tech space with the Philly Semi Index trading 1.8% lower. Among chips in the index, VECO (-4.4%) is a notable laggard. Among other major indices, the S&P 500 is trading 0.4% higher, while the NASDAQ is trading 0.7% lower.

The QQQ, meanwhile, is trading 1.1% lower. Among tech bellwethers, IBM (+0.8%) is showing strength while AAPL (-2.1%) is under pressure. In earnings this morning, FSL (-1.0%) lowered its Q3 guidance. In news, TRID (+2.5%) announced it will lower its breakeven point through a realignment of its workforce, from ~1,275 employees worldwide to ~1,000 employees by early 2012.

Among notable analyst upgrades this morning, AMD (-0.3%) was upgraded to Buy at UBS, NVLS (-2.2%) was upgraded to Neutral and KLAC (+1.4%) was upgraded to Positive at Susquehanna, and ABVT (+3.2%) was upgraded to Strong Buy at Raymond James. Among downgrades, CSCO (+0.3%) was downgraded to Hold at Miller Tabak.

There are no notable names in tech set to report results today after the close.

Freescale Semi (FSL $12.10 -0.14) lowered third quarter revenue guidance to minus 6 to 8% quarter over quarter to approximately $1.13-1.15 billion from flat to minus 3% quarter over quarter versus the $1.19 billion consensus. The sales decline is attributable primarily to weakness in the company's industrial and networking businesses. The company said gross margins to show modest sequential improvement despite the sequential decline in sales.

Trident Microsystems (TRID $0.61 +0.01) announced it will lower its breakeven point through a realignment of its workforce, from approximately 1,275 employees worldwide to approximately 1,000 employees by early 2012. As a result of the reductions in labor and other cost saving initiatives, by the first quarter of 2012 the company expects to realize annual operating expense savings of approximately $40-48 million compared with the annualized run rate as of the second quarter of 2011 and to reduce its EBITDA breakeven level (ex-items) to approximately $340-360 million in annual revenues. The company expects to incur total cash restructuring charges of approximately $8-10 million, including approximately $2-3 million in the current quarter ending Sept. 30, 2011.

Advanced Micro (AMD $6.14 -0.03) was upgraded to Buy from Neutral at UBS and the firm raised their target to $9 from $7 saying their Asia trip checks show a resilient desktop market which should benefit the company and based on the track record of new CEO, Rory Read, they believe he will improve AMD's go-to-market execution.
icon url

ReturntoSender

09/28/11 2:02 PM

#9522 RE: ReturntoSender #6755

KLIC ST bot 5000 shares@7.93 - Just expecting volatility to fall a bit and take KLIC higher as it does:


RtS
icon url

ReturntoSender

09/28/11 8:49 PM

#9523 RE: ReturntoSender #6755

From Briefing.com: 4:30 pm : Stocks got a bid in the early going, but a lack of leadership invited selling pressure, which accelerated in afternoon action, leaving stocks to settle at session lows with sizable losses.

Hope that a plan intended to bring stability fiscal and financial conditions in Europe is close to being presented helped take the stock market more than 3% higher during the course of the past two sessions. That also helped prop up stocks this morning, but early gains ultimately proved fleeting as participants resorted to selling after they failed to receive any details related to the rumored plan. Traders also turned against the euro, which was up about 0.7% at its session high, but finished with a fractional loss against the greenback.

A lack of leadership also made it difficult for stocks to hold off sellers. The listless action initially left stocks to spend most of the morning and early afternoon chopping along near the neutral line before pressure picked up in the final few hours.

Although weakness became widespread, materials stocks had to grapple with some of the most aggressive selling. Pressure, compounded by weakness among commodities, sent the sector to a 4.5% loss.

Broad market weakness imbued shares of Accenture (ACN 53.83, +0.18), which settled with only a modest gain after the stock had set a monthly high in response to an upside earnings surprise. Jabil Circuit (JBL 18.84, +1.46) also posted better-than-expected earnings, but its shares did a far better job of preserving gains.

Amazon.com (AMZN 229.50, +5.29) stretched to a new weekly high amid a positive response to the release of its new family of Kindle products.

Despite the stock market's slide, Treasuries failed to find buyers. Instead, the benchmark 10-year Note moved lower once again, even after results from an auction of 5-year Notes proved solid. The auction drew a bid-to-cover ratio of 3.04, dollar demand of $106.4 billion, and an indirect bidder participation rate of 45.9%.

Data failed to portray an improved picture of economic activity. Total durable goods orders and orders less transportation slipped 0.1% during August. A 0.1% increase and a 0.2% decline, respectively, had been generally expected.

Advancing Sectors: (None)
Declining Sectors: Materials -4.5%, Energy -3.0%, Financials -2.9%, Industrials -2.4%, Health Care -1.7%, Consumer Staples -1.7%, Consumer Discretionary -1.7%, Tech -1.4%, Utilities -0.9%, Telecom -0.6%DJ30 -179.79 NASDAQ -55.25 NQ100 -1.5% R2K -4.2% SP400 -3.4% SP500 -24.32 NASDAQ Adv/Vol/Dec 401/1.93 bln/2116 NYSE Adv/Vol/Dec 522/1.05 bln/2523

4:29PM Advanced Micro lowers Q3 revenue guidance (AMD) 6.15 -0.34 : Co announces that revenue for the third quarter ending Oct. 1, 2011 is expected to increase four to six percent as compared to the second quarter of 2011. The company previously forecasted third quarter 2011 revenue to increase 10 percent, plus or minus two percent, from the second quarter of 2011. Current consensus calls for a 9.1% increase over last qtr. In addition, AMD expects third quarter gross margin to be approx 44 to 45%. The company previously forecasted third quarter 2011 gross margin to be approximately 47 percent. 9.1%

Tomorrow before the open look for the following companies to report:

AZZ, DMAN, MU, and XRTX.

8:32AM Microsoft signs agreement with Samsung Electronics to cross-license the patent portfolios of both companies (MSFT) 25.67 : Co announces it has signed a definitive agreement with Samsung Electronics to cross-license the patent portfolios of both cos, providing broad coverage for each co's products. Under the terms of the agreement, MSFT will receive royalties for Samsung's mobile phones and tablets running the Android mobile platform. In addition, the cos agreed to cooperate in the development and marketing of Windows Phone.

8:32AM Advanced Energy announces restructuring plan as part of globalization strategy; expects annual savings of ~$16-20 mln (AEIS) 9.19 : Co announced that as part of its long-term strategic plan, the company is implementing several initiatives to further its long-term globalization strategy. In order to foster growth and enhance profitability, the company is beginning with the alignment of its manufacturing and R&D resources. The company expects the initial actions will be completed in the third quarter of 2011. Under the plan, Advanced Energy will align its engineering resources with the geographic footprint of its customer base. The first step of this restructuring will be a reduction of the company's workforce, primarily in the thin films business unit, resulting in annual savings of ~$6 mln. The affected employees have been notified and we anticipate a smooth transition. As a result, the company expects to take a charge in the third quarter related to the restructuring of ~$2.5 to $3.5 mln. Secondly, over the next 12 to 18 months, the company will continue to evaluate its cost structure as it closes facilities and relocates certain functions to different regions worldwide. As a result, the company anticipates further charges in the amount of $8 to $12 mln, principally for space consolidation, and another $1 mln in additional severance costs over this timeframe. Consequently, co expects total charges of $12 to $16 mln for the initiatives announced, ~$9 to $13 mln of which will be cash expenditures. The actions taken today as well as other cost savings initiatives and margin improvements are expected to deliver annual savings of ~$16 to $20 mln.

ARM (ARMH) and Open-Silicon announced that the companies have signed a comprehensive multi-year licensing agreement for a broad portfolio of ARM technology.

5:22AM JinkoSolar Holding wins bid for 38 MW of solar module supply and signs agreement for the first 18 MW with China Guangdong Nuclear (JKS) 5.83 : Co announces it has won a bid to supply China Guangdong Nuclear Solar Energy Development with 38 MW of photovoltaic modules for two grid-connected PV power plant projects planned in Dunhuang city, Gansu Province and Qinghe County in the Xinjiang Uighur Autonomous Region of China. Co is the only solar module supplier for the two projects. Additionally, co entered into an agreement with China Guangdong Nuclear to supply 18 MW of PV modules for the PV power plant project in Dunhuang City, pursuant to which co will make the first delivery by October 25, 2011.

Amazon.com (AMZN $234.00 +9.79) announced the new latest generation of Kindles. The Kindle Touch has is priced at $99. They also introduced the $149 New Kindle Touch 3G with free 3G. Amazon pays for the 3G connection so there's no monthly fee or annual contract. The Kindle Fire has movies, TV shows, music, books, magazines, apps, games, and web browsing with all the content, free storage in the Amazon Cloud, Whispersync, Amazon's new cloud-accelerated web browser, color touch screen, and dual-core processor and is priced at $199.

10:48 am Action Semi Raises Third Quarter Revenue Guidance (ACTS)

Action Semi (ACTS $2.03 +0.08) raised its third quarter revenue guidance to a range of $15 million to $15.5 million and gross margin of approx 40%.

The company's previous guidance was for the third quarter revenue to be in the range of $12.0 to $13.0 million and gross margin of approximately 40%. Company says "During the third quarter, we experienced stronger than expected demand for our products across a number of end markets, with particular strength in the automotive and boombox and high definition segments."

Last night, Jabil Circuit (JBL $18.80 +1.41) reported fourth quarter earnings of $0.62 per share, excluding non-recurring items, $0.07 better than the Capital IQ consensus of $0.55, while revenues rose 10.3% year/year to $4.3 billion versus the $4.19 billion consensus. The company issued upside EPS guidance for first quarter with EPS of $0.62-0.70, excluding non-recurring items, versus the $0.60 consensus and revenues of $4.3-4.5 billion versus the $4.42 billion consensus.

Last night, SMSC (SMSC $20.01 -0.51) reported second quarter earnings of $0.36 per share, excluding non-recurring items, $0.01 worse than the Capital IQ consensus of $0.37, while revenues rose 8.2% year/year to $112.6 million versus the $112.4 million consensus. The company issued downside guidance for the third quarter with EPS of $0.30-0.37, excluding non-recurring items, versus the $0.45 consensus and revenues of $105-110 million versus the $117.23 million consensus. "Despite a very challenging macro environment, SMSC delivered record revenue in the second quarter of fiscal 2012...We expect modest sequential growth in consumer and automotive sales while PC and industrial sales are anticipated to decline. For the second half of fiscal 2012, while computing and consumer demand is expected to be challenged, we anticipate continued growth in our automotive and wireless audio product sales."
icon url

ReturntoSender

09/29/11 8:08 PM

#9524 RE: ReturntoSender #6755

From Briefing.com: 4:30 pm : The major equity averages were up with big gains before broad selling pressure cut down stocks in afternoon action. A late bounce made for a better looking finish, though.

Stocks ended the prior session in weak fashion, but buyers came rushing back in this morning. Their interest was stirred by news that Germany gave its support to the expansion of the European Financial Stability Facility, which is aimed at shaping up the otherwise precarious financial conditions of the region.

For the first time in a few weeks data also proved encouraging. The latest weekly initial jobless claims count dropped by 37,000 from the prior week to 391,000, which is the first time in more than a month that initial claims fell below 400,000. The consensus among economists polled by Brieifng.com had been pegged at 419,000 initial claims.

What's more, the final reading for second quarter GDP showed growth of 1.3%, which not only marks an increase from the 1.0% growth rate posted in the prior reading, but it also exceeds the 1.2% growth that had been broadly expected.

Both the Dow and S&P 500 pushed ahead to gains in excess of 2% in the early going. Financials led the advance, but tech stocks had a harder time attracting buyers.

Tech's sluggishness eventually gave way to outright weakness, which weighed heavily on the Nasdaq. In fact, the Nasdaq descended all the way to a 2.3% loss after it had been up with a gain of almost 2% in the opening minutes of the session. A bounce in the final hour helped the tech-rich Index recover, however.

Several Chinese stocks also sold off in aggressive fashion, but never really rebounded. Youku.com (YOKU 16.24, -3.64), SINA Corp (SINA 73.23, -7.87), and Baidu.com (BIDU 110.29, -11.13) all tumbled amid reports that suggested authorities are investigating accounting irregularities at many US-listed Chinese companies. Also in the backdrop, China's stock market underperformed other global averages in overnight action by falling 1% to a new 15-month low.

Tomorrow marks the final session of the week and of the third quarter. The S&P 500, up 2% during the course of the past four sessions, is trying to score its third weekly gain in 10 weeks, but such a lengthy stretch of losses has the market down 12% this quarter. That's the worst quarterly performance since the fourth quarter of 2008.

Advancing Sectors: Financials +2.8%, Utilities +1.5%, Energy +1.4%, Industrials +1.4%, Consumer Staples +1.0%, Health Care +0.8%, Telecom +0.8%
Unchanged: Materials
Declining Sectors: Tech -0.4%, Consumer Discretionary -0.9%DJ30 +143.08 NASDAQ -10.82 NQ100 -1.0% R2K +1.7% SP400 +1.0% SP500 +9.34 NASDAQ Adv/Vol/Dec 1580/2.29 bln/957 NYSE Adv/Vol/Dec 2164/1.12 bln/855

4:09PM Micron misses by $0.14, beats on revs (MU) 5.87 -0.25 : Reports Q4 (Aug) loss of $0.14 per share, $0.14 worse than the Capital IQ Consensus Estimate of ($0.00); revenues fell 14.2% year/year to $2.14 bln vs the $2.11 bln consensus. The trial phase of the Rambus (RMBS) antitrust case that was heard in the San Francisco Superior Court ended on September 21, 2011 and the jury is currently deliberating the verdict. The company is unable to predict the outcome of this suit and is unable to reasonably estimate the range of possible loss. An unfavorable outcome could have a material adverse impact on the co's results of operations for the fourth quarter of fiscal 2011.

4:02PM BCD Semiconductor lowers Q3 rev guidance below consensus; lowers Q3 gross margin guidance (BCDS) 5.60 +0.17 : Co lowers Q3 rev guidance to ~$39 mln from $43-45 mln vs $41.83 mln Capital IQ Consensus Estimate. Gross margins are now expected to be ~27% vs. previous guidance of 30%. "The typical seasonal demand increase that we expected to see in the third quarter did not materialize this year. Demand from our Asia customers was soft in all three of our core end markets including computing, consumer and communications. Similar to many other analog semiconductor suppliers, we believe this is attributable to broad-based economic weakness. The change in our gross margin guidance is primarily due to a write-down of inventory in the third quarter that resulted from a decline in expected demand for some of our linear products."

4:01PM Universal Display signs OLED technology license agreement with Pioneer Corporation for lighting (PANL) 48.66 -2.00 : Co announces it has entered into an OLED technology license agreement with Pioneer Corporation. Under the arrangement, Pioneer will be licensed to access and use Universal Display's proprietary UniversalPHOLED phosphorescent and other OLED technologies and materials for the manufacture and sale of OLED lighting products.

3:08AM Nokia continues to align its workforce and operations; to shut down factory in Romania, cutting ~3500 jobs (NOK) 5.55 : Co announces plans to take additional actions to align its workforce and operations. The measures support both the execution of the co's strategy and the savings target the co announced earlier this year, and also target to bring efficiencies and speed to the organization. plans to close its manufacturing facility in Cluj, Romania by the end of 2011, as co's high- volume Asian factories provide greater scale and proximity benefits. The planned closure of the Cluj factory combined with adjustments to supply chain operations is estimated to impact ~2,200 employees. The planned changes in the Location & Commerce business are estimated to impact ~1,300 employees. These personnel reductions are in addition to the measures announced in April and are expected to take effect by the end of 2012.

1:00AM Oracle issues statement regarding 'shopping' of Autonomy prior to HP (HPQ) acquisition (ORCL) 29.46 : Co issues the following statement: "After HP agreed to acquire Autonomy for over $11.7 billion dollars, Oracle commented that Autonomy had been 'shopped' to Oracle as well, but Oracle wasn't interested because the price was way too high. Mike Lynch, Autonomy CEO, then publically denied that his company had been shopped to Oracle. Specifically, Mr. Lynch said, 'If some bank happened to come with us on a list, that is nothing to do with us.' Mr. Lynch then accused of Oracle of being 'inaccurate.' Either Mr. Lynch has a very poor memory or he's lying. 'Some bank' did not just happen to come to Oracle with Autonomy 'on a list.' The truth is that Mr. Lynch came to Oracle, along with his investment banker, Frank Quattrone, and met with Oracle's head of M&A, Douglas Kehring and Oracle President Mark Hurd at 11 am on April 1, 2011. After listening to Mr. Lynch's PowerPoint slide sales pitch to sell Autonomy to Oracle, Mr. Kehring and Mr. Hurd told Mr. Lynch that with a current market value of $6 billion, Autonomy was already extremely over-priced. The Lynch shopping visit to Oracle is easy to verify. We still have his PowerPoint slides."

09:31 am MIPS Tech downgraded to Hold at The Benchmark Company: . The Benchmark Company downgrades MIPS to Hold from Buy. Firm sites 3 reasons for downgrade. These include: 1) The impact Google's pending acquisition of Motorola Mobility is having on the Android ecosystem 2) Their more conservative royalty revenue forecast for co in light of recent semiconductor sales trends and 3) The negative impact consolidation and weak semiconductor industry sales will have on MIPS' license pipeline. Lastly, firm notes in light of the recent rally and their estimate cuts, the shares are not as attractive.

2:22 pm S&P Tech Sector Showing Modest Gains; AMD Lowers Guidance, Gets Downgraded (AMD)

The tech sector is trading higher today, trailing gains in the broader market. Semiconductors are showing relative weakness in the tech space with the Philly Semi Index trading 0.2% lower. AMD (-12.6%) is dragging in index lower. Among other major indices, the S&P 500 is trading 1.0% higher, while the NASDAQ is trading 0.1% higher. The QQQ, meanwhile, is trading 0.3% lower. Among tech bellwethers, ORCL (+2.1%) is showing notable strength.

In earnings last night, AMD (-12.6%) lowered its Q3 revenue guidance. Also, TXI (+0.9%) reported a relatively inline quarter.

In news, SYNA (+1.0%) appointed Rick Bergman as President and CEO. NOK (+4.3%) shut down a factory in Romania and cut ~3500 jobs. Also, HPQ (+3.4%) reportedly hired GS (+3.2%) to fight possible activist investors.

Among notable analyst upgrades this morning, MSI (+1.4%) was upgraded to Positive at Avian. In downgrades, The Benchmark Company downgraded MIPS (-5.0%) to Hold. AMD (-12.6%) was also downgraded at BofA/Merrill, Macquarie, Longbow, and ThinkEquity.

MU (-3.7%) is the notable name in tech set to report results today after the close.
icon url

ReturntoSender

09/30/11 9:23 AM

#9525 RE: ReturntoSender #6755

BOOM: One Of The Best Economic Forecasters Calls For A "New Recession" In The US

Read more: http://www.businessinsider.com/lakshman-achuthan-says-us-going-into-a-new-recession-2011-9#ixzz1ZRSLZ5du

Lakshman Achuthan of ECRI told Bloomberg Radio this morning the US is "tipping into a new recession."

He told Tom Keene that a recession is the "overwhelming message coming out of our forward-looking indicators."

And more ominously: "It is not reversible."

"There is virtually nothing that can be done to avert what is going to happen," he said.

Achuthan cites "dozens of leading indexes for the U.S." and "contagion in what is going on among those leading indicators. It's wildfire, it's recessionary, it is not reversible."

He says that he cannot be sure when the recession will begin — or even if it has begun already — arguing, "this is not a double-dip" because the U.S. very clearly came out of the last recession. The best-case scenario is for a short recession, lasting about 6 months. However, he noted that he's seen no indicators pointing to a turnaround yet.

What's more, he told Keene that this quick succession of recessions "is very consistent with shifting into an era of more frequent recessions."

As for the severity of this oncoming downturn, Achuthan says we just cannot know yet how bad things are going to get. "Whatever the shocks are that you're worrying about today, this morning, if they don't happen you're still going to have a recession, and if they do happen it's going to get a lot worse."

He added that he "wouldn't be surprised" if unemployment rose to double digits, and said that exports — which had held up the economy earlier in the year — were about to go down the tube.

A recession, in Achuthan's terms, happens when "sales disappoint, so production falls, so employment falls, so incomes fall, and then sales fall again." He clarified, "When I call a recession...that means that process is starting to feed on itself, which means that you can yell and scream and you can write a big check, but it's not going to stop."

Achuthan has a great track record. In Summer 2010, while the market was diving, he insisted there was no recession on the way.

Read more: http://www.businessinsider.com/lakshman-achuthan-says-us-going-into-a-new-recession-2011-9#ixzz1ZRRyNqq7
icon url

ReturntoSender

10/01/11 7:41 PM

#9527 RE: ReturntoSender #6755

From Briefing.com: Weekly Recap - Week ending 30-Sep-11A weak performance on Friday resulted in another weekly loss for stocks -- their eighth in 10 weeks of trade. Such an extensive stretch of weakness has left the stock market to log a monthly loss of 7% and a quarterly loss of more than 14%.

Trade on Friday was spent entirely in negative territory. Participants turned to selling after watching markets overseas slide. Trade in Europe, which has influenced sentiment at home for weeks, saw Britian's FTSE fall 1.3%, France's CAC close 1.5% lower, and Germany's DAX drop 2.4% after a 3.0% jump in Eurozone CPI dampened hope for a rate cut by the European Central Bank. Overnight action in Asia saw Hong Kong's Hang Seng slide 2.7%, China's Shanghai Composite slip 0.3%, and Japan's Nikkei finish flat. China's HSBC Manufacturing PMI for September stayed below 50, the dividing line between contraction and expansion, for the third straight month, making some question the country's ability to sustain growth in the face of sluggish global conditions.

The inclination to sell trumped a couple of better-than-expected domestic reports. The Chicago PMI for August bested the Briefing.com consensus call of 54.0 by improving to 60.4 from 56.5 in July. The final September reading on consumer sentiment from the University of Michigan was revised upward to 59.4 from the preliminary reading of 57.8. A reading of 57.5 had been expected.

Personal income and spending numbers for August were less impressive. Income declined by 0.1% while spending increased by 0.2%. Income failed to meet the 0.1% increase expected, on average, by economists polled by Briefing.com, but the increase in spending was exactly in line with what had been expected.

Without any kind of positive leadership, stocks were left to wrestle with sellers throughout the session. Even defensive-oriented stocks succumbed to aggressive selling pressure after they had limited losses in the first half of the day. As a result, all 10 major sectors tumbled to losses in excess of 1%.

Financials and materials stocks fell the hardest. They dropped 3.5% and 3.7%, respectively. They were also some of the poorest performers for all of September and all of the third quarter. During September, financials fell 11.5% while materials tumbled 16.6%. Over the course of the quarter, though, financials shed 23% and materials surrendered a full quarter, 25%, of their market cap.

With selling intensifying into the close, stocks effectively surrendered the gains that they had staged in previous sessions. That caused stocks to record a weekly loss of 0.4%. It all made for an appropriate conclusion to the third quarter, which goes down as the stock market's poorest quarter since a near 23% drop in the fourth quarter of 2008.

Although the action on Friday appeared appropriate in the context of the quarter, it contrasted with trade at the start of the week, when stocks climbed more than 2% on Monday and another 1% on Tuesday. Buying in both days was based largely on hope that officials in Europe are finally crafting a comprehensive plan that will help the region shore up its finances.

Momentum from those two sessions helped stocks open higher on Wednesday, but participants, starved for details of the rumored plan, began to push back against stocks and ultimately dropped the market for a 2% loss. Data that day didn't do anything to bolster the case buying either -- durable goods orders and orders less transportation both slipped 0.1% during August.

But by Thursday, approval from highly influential Germany to expand the European Financial Stability Facility helped stocks snap back. Upbeat data also played a pivotal part. The latest weekly initial jobless claims count dropped by 37,000 from the prior week to 391,000, which is the first time in more than a month that initial claims fell below 400,000. Moreover, the final reading for second quarter GDP showed growth of 1.3%, which not only marked an increase from the 1.0% rate posted in the prior reading, but it also bested the 1.2% growth rate that had been broadly expected.

..Nasdaq 100 -2.7%. ..S&P Midcap 400 -2.9%. ..Russell 2000 -2.8%. ..NYSE Adv/Dec 607/2456. ..NASDAQ Adv/Dec 586/1992.
 
Index Started Week Ended Week Change %Change YTD %
DJIA 10771.48 10913.38 141.90 1.3 -5.7
Nasdaq 2483.23 2415.40 -67.83 -2.7 -9.0
S&P 500 1136.43 1131.42 -5.01 -0.4 -10.0
Russell 2000 652.43 644.16 -8.27 -1.3 -17.8

Last night, Micron (MU $5.16 -0.71) reported a fourth quarter loss of $0.14 per share, $0.14 worse than the Capital IQ Consensus of ($0.00), while revenues fell 14.2% year/year to $2.14 billion versus the $2.11 billion consensus. The trial phase of the Rambus (RMBS $14.08 -0.16) antitrust case that was heard in the San Francisco Superior Court ended on September 21, 2011 and the jury is currently deliberating the verdict. The company is unable to predict the outcome of this suit and is unable to reasonably estimate the range of possible loss. An unfavorable outcome could have a material adverse impact on the co's results of operations for the fourth quarter of fiscal 2011.

Last night, Xyratex (XRTX $9.49 +0.34) reported third quarter earnings of $0.42 per share, excluding non-recurring items, $0.23 better than the Capital IQ consensus of $0.19, while revenues fell 15.9% year/year to $361.8 million versus the $352.8 million consensus. The company issued in-line guidance for the fourth quarter with EPS of $0.27-0.45, excluding non-recurring items, versus the $0.44 consensus and revenues of $343-383 million versus the $372.69 million consensus. Gross profit margin in the third quarter decreased to 16.7%, compared to 17.6% in the same period last year, reflecting significantly lower revenues and gross margins in the Storage Infrastructure business partially offset by increased gross margins in the Networked Storage Solutions business.

Last night, BCD Semiconductor (BCDS $4.87 -0.73) lowered third quarter revenue guidance to approximately $39 million from $43-45 million versus the $41.83 million Capital IQ consensus. Gross margins are now expected to be approximately 27% versus previous guidance of 30%.

Last night, Universal Display (PANL $49.34 +0.68) and PPG Industries (PPG $71.44 -0.91) announced that the companies have entered into a new organic light-emitting diode materials supply and service agreement. Under the new agreement, PPG will remain the exclusive manufacturer of Universal Display's proprietary phosphorescent OLED materials.

Altera (ALTR $32.19 -0.88) was downgraded to Hold from Buy at Auriga and the firm lowered their target to $37 from $42. The firm notes their checks suggest that inventory correction and weaker orders have continued after the co's mid-quarter guidance. Despite the rising operating expenses, they have become incrementally more negative on ALTR's 28nm prospects as they see XLNX likely regaining share on that node. They would wait for the inventory correction to play out and macro trends to stabilize before becoming more constructive on the stock.

5:45PM Tegal announces extension of bid deadline for Nanolayer deposition patent portfolio (TGAL) 1.85 -0.37 : Co announced that bids for its intellectual property portfolio for Nanolayer Deposition Technology (NLD) will be accepted until 5 p.m. PDT on October 15, 2011. Tegal extended the bid deadline, originally set for today, after several additional IC and semiconductor equipment manufacturers expressed interest in the IP portfolio.

4:49PM First Solar: Topaz Solar Farm, North County Watch, and Carrizo Commons Reach Agreement on Topaz Solar Farm (FSLR) 63.21 -1.82 : Topaz Solar Farms, LLC, a subsidiary of First Solar, Inc. (Nasdaq: FSLR), has reached an agreement with North County Watch and Carrizo Commons to dismiss their lawsuit against the 550-megawatt Topaz Solar Farm project that First Solar is developing in San Luis Obispo County.

4:30PM SMTC Corp CFO resigns (SMTX) 1.49 +0.01 : Co announced the resignation of Jane Todd, Senior Vice President, Finance, and Chief Financial Officer. Ms. Todd joined SMTC in 2004 and during her tenure significantly contributed to the stabilization and growth of the organization.

3:33PM First Solar confirms it sells 550-megawatt desert sunlight solar farm (FSLR) 63.67 -1.36 : Co announced completion of the sale of one of the world's largest photovoltaic solar power projects - the 550-megawatt Desert Sunlight Solar Farm near Desert Center, Calif. Co which will continue to build and subsequently operate and maintain the project under separate agreements - has sold the project to affiliates of NextEra Energy Resources the subsidiary of NextEra Energy (NEE) and GE Energy Financial Services (GE). Total indirect local economic benefits to Riverside County, where the solar project is located, are estimated at $336 mln, the majority of which will be generated during construction with the remainder over the minimum 25-year operating period.

8:31AM JinkoSolar Holding announced that it has repurchased in the aggregate amount of 785,900 ADSs, representing 3,143,600 of its ordinary shares since the beginning of the share repurchase program (JKS) 4.96 : The average repurchase price, excluding commissions, was US$6.92 per ADS, and the total purchase price, excluding commissions, was US$5,435,661.

8:01AM Rambus' Cryptography research signs license with smartphone manufacturer (RMBS) 14.24 : Co announced it has signed a license agreement with a major smartphone and tablet manufacturer for the use of CRI's Differential Power Analysis countermeasures patents. Under the agreement, ongoing royalties will be paid for the use of CRI's patented innovations. Specific terms of the agreement and disclosure of the manufacturer are confidential.

8:00AM Vishay Intertechnology announces acquisition of specialty resistor company Huntington Electric for ~$19.6 mln (VSH) 8.82 :

Toshiba and Amkor Technology (AMKR) announced that they have signed a non-binding memorandum of understanding for the acquisition by Amkor of Toshiba Electronics Malaysia, Toshiba's semiconductor assembly operation in Malaysia, together with a license to Amkor for certain related intellectual property rights.

11:15 am S&P Tech Sector Down Over One Percent (MU)

The tech sector is trading lower today, just trailing losses in the broader market. Semiconductors are showing relative weakness in the tech space for the second straight session with the Philly Semi Index trading 1.9% higher. MU (-12.2%) is dragging in index lower. Among other major indices, the S&P 500 is trading 1.2%, while the NASDAQ is trading 1.1% lower. The QQQ is also trading 1.1% lower. Among tech bellwethers, INTC (-2.3%) is showing notable weakness.

In earnings last night, XRTX (+8.3%) reported a Q3 beat and MU (-11.8%) reported a mixed Q4 with an EPS miss and slight upside to revs. Also, BCDS (-15.9%) lowered its Q3 guidance.

In news, PANL (+3.1%) announced it has entered into an OLED technology license agreement with Pioneer Corporation. Also, AMZN (-1.2%) is reportedly interested in buying Palm from HPQ (-3.1%).

Among notable analyst upgrades this morning The Benchmark Company upgraded CEVA (+1.1%) to Buy. In downgrades, ALTR (-2.4%) was downgraded to Hold at Auriga, ITRI (-8.8%) was downgraded to Underperform at BofA/Merrill, and MU (-12.2%) was downgraded to Neutral at Wedbush.

No notable names in tech set to report results today after the close.
icon url

ReturntoSender

10/02/11 1:47 PM

#9529 RE: ReturntoSender #6755

InvestmentHouse Weekend Market Summary

http://www.investmenthouse.com/weekendmarketsummary.htm

- Market closes out quarter still unable to hold gains, but still . . . in the trading range.
- Economy in a modest data bounce with Chicago PMI the latest.
- Income and spending fade with incomes showing negative returns.
- Sentiment very negative: CNBC commentator says has not seen sentiment this bad in his memory.
- Obama's Jimmy Carter 'malaise' moment? Says the US has 'gotten a little soft.'
- At the bottom of the range to start the fourth quarter. Time to bounce? Into earnings?

Bad quarter, but starting Q4 at the bottom of the range.

It was a down close to a down quarter on Friday. The indices fell back toward the August lows. SP500 held at the upper range of the low. Some of the others, such as SP600, came back almost to the prior lows. Not a banner day, but the buyers gave it a shot after a lower open. They rallied the market on some better news. Income and spending were not great. They were down from the prior month and July, but the Chicago PMI came in at 60.4. That was much better than the 54 expected, and it topped the 56.5 in September. There is some improvement, but it was not enough to keep the market up on the day. Stocks rallied toward lunch. They tried to get back to positive but never made it, and then they rolled back to the downside. It was an ugly close. There was no last-minute window dressing. Apparently that was wrapped up on Wednesday. If there was window dressing, it was basically throwing out a lot of stocks.

That took the indices back down to near their August lows. They did not break them. As I have been talking about all along, stocks and indices still in trading ranges are still in trading ranges. Yes, it was a negative close to the quarter. It was a negative quarter, but most of the damage was done in this late-July/early-August selloff. The rest of the quarter they spent their time working laterally in a trading range. They have not given that up. We also have Q4 starting on Monday. It is typically a good quarter for stocks, particularly after you have had a down quarter like the one we just logged in the books. We just need to get through earnings, and we may get a boost from earnings. We have had warnings, such as AMD. We also have a notion that there will be some positive upside as well. We will have to see whether AMD, FDX, and UPS that are warning about energy costs outweigh the positives that are supposedly still in the market that we see in some of the economic data.

The indices took a good licking on the day.

NASDAQ, -2.6%; SP500, -2.5%; Dow, -2.1%; SOX, -3.4%.

OTHER MARKETS

As the stocks sold, those that rally when the stocks are down took off.

Dollar: 1.3390 versus 1.3587. Whether it was worries about Europe or whatever you want to call it, the dollar was surging once more. A big move took it just about to a new closing high on this rally. It looked like the dollar was on the ropes in July and August. It was not rallying even though Europe was having a lot of trouble. When it broke free, it broke big. Now it is in a strong uptrend. It has resumed its move. After breaking the downtrend from January through May, it looked like it was going to give up again. Now it is powering back to the upside; indeed, it is heading back toward the January and late-November highs.
Click to view the chart

Bonds: 1.91% versus 1.99% 10 year U.S. Treasury. Bonds found favor with investors once more. The 10 year did top 2% on the week. It was not able to hold that move, however. It has started to rally back as yields begin to fall. Looking solid with a good gap to the upside. There is a nice test of support and a bounce to the upside. That is what a trendline is made of. You have a good bounce, and you have the little pyramids forming one on top of the other above the 10 and 20 day EMA. Quite solid.
Click to view the chart

Gold: $1,622.30, +5.00. Gold is bouncing around after this large selloff. This is exactly what it needs to do. Base out, set up some form of base. It could double bottom off of this support, form a rounded bottom, or maybe an inverted head and shoulders. We will have to see what happens and how it forms up. I do not think it will bounce right back up. It may give us a bounce. If it does, that will probably be a prelude to a double bottom. We will have to see what happens. Best to let it base out a bit and catch it as it is ready to explode higher. Maybe we can make a trade up toward the 50 day EMA and the August low as part of the double bottom or some other basing action. That is fine. If you want to buy it again for a longer term, let it base out, and we will see what happens. You can always pick up a bit of the yellow stuff on a bounce. If it comes back, then pick up some more as it starts to bounce again.

Gold has peaked. It had a bit of trouble, and now it needs to base out and move back up. For now, it is holding where it needs to hold to do just that.
Click to view the chart

Oil: $79.20, -2.94. Oil had a tough session. It is really struggling. It was down at the bottom of its range again. It has broken below 80, which is roughly the bottom of the $80-90 trading range. It could undercut again and reverse, just as it did a week ago and as it did in early August. This has been a good trading range for oil. There is no new pressure on it. If it does break lower and falls down into the Summer of 2010 base, that is not a positive for the world economy, and thus the U.S. economy and U.S. market. We will be watching gold closely this coming week to see if it hangs on or if it gives it up.
Click to view the chart

THE NEWS

TO VIEW THE ECONOMY VIDEO CLICK THE FOLLOWING LINK:
Economy Summary Video

Some improving economic data but it is just a blip.

We have had an uptick in the economic data in the U.S. Just as a market cannot continue to fall without bouncing every once in a while, the economic news will not continue to spiral downward without ever bouncing back up. We have seen this before. Remember when everyone thought the economy was recovering back in late 2010 and early 2011? We saw an upturn in manufacturing, and everyone thought, thank goodness, we are out of that slow patch. At the time, I noted that was most likely a rebound in what was turning into a continuing downtrend. That is exactly what happened.

Right now there is a bounce in the data. That is normal. This week we saw some improvement in data across the board. Confidence was still in the toilet, but Case/Shiller was stronger. While durable orders were not good, some of the business investment was improving. There are hints here and there that things are positive. The Initial Claims data was 391K. That was the first time below 400K since April. That was a technical issue; it will probably bounce right back above that level, but that is all part of the package. A bit of improvement here and there. The economy tends to move up and down as a unit.

GDP turned out to be a bit better, revised up to 1.3% on the back of some exports and a decline in imports. Again, that is not necessarily good news in the economy, but it helps the GDP number. Pending Home Sales were up year-over-year. But that is a technical thing because August of 2010 was the end of the Home Buyers' Credit. The comparisons were very easy. Nonetheless, the Chicago PMI moved up to 60.4. The final Michigan Sentiment for September was better than expected at 59.4. That topped the prior read as well.

There are some positives that show the economy is picking up, but it will just be a blip. It is doing nothing to show there is a fix in the economy. The news was better, but it did not really help the stock market at all. Even though Spending was in line at 0.2%, it was still well off of the prior levels at 0.7% in July. That did not give the market a heartfelt hug. Then there was news that MS, according to the CDS, is as risky as Italian banks. Go figure that. I do not think that is the case. Maybe if it is that risky, then Italian banks are not that risky after all. I do not think anyone believes that, but I'm just trying to think outside the box.

One President's malaise is another President's 'gotten soft.'

There were some serious negatives weighing on the market, and the positives were not enough to overcome the downside. The markets, like the American people (according to our President) may have "gotten a little soft." He said we have gotten soft over the past two decades. Maybe we were not as diligent. Is that because we were not trying hard or because the government has gone out of bounds with trying to control our lives? I am not just talking about this administration. Look back at the George Bush administration. There was Medicare Part D and all of these new regulations foisted upon us. They talked about it being a reduction in regulations. We had some real winners passed back then such as Sarbanes-Oxley. It is all cumulative and it all weighs down the economy. Now we are seeing the sad effects. Of course the last two and a half years have been brutal with regulations, runaway spending, and attacks on business. But that is the hand we have to play.

The snippet about America getting "a little soft" sure sounds like the Jimmy Carter "malaise" moment. Whether you say the country is in a malaise or that we just got soft and got behind the Chinese and others, it is a similar comment. It is striking to me. I have talked many times about how similar the 1970's are to the present. Massive increases in regulations, the warfare of the rich versus the poor, the windfall profits tax, wanting to take from those who have and give to these who supposedly do not have through no fault of their own. We have had 40+ years of The Great Society, and all we have done is raise those in poverty by two percentage points. We spent $10T or more, and we have done nothing but disintegrate the black family and leave ourselves a huge wave of millions who are dependent on the government. That is not a success. If we have gotten a bit soft, it is not because those of us who are working, productive members of society have not been trying to overcome what the government has thrown down as road blocks. We are definitely in need of an "Its morning in America" response to this attitude of malaise or that America has gotten a little soft.

It is amazing to me how history repeats itself among supposedly highly-educated people. Many people say Obama is the smartest President we have ever had, yet he is making the same mistakes. Anyone who wants to pick up a history book without preconceptions of what is going on can see how we are repeating the same mistakes with our policies. Obviously the view toward our country is the same because the statements are the same and policies are the same. It is striking. It is as striking to me as how the market repeats its patterns over and over again. Why? Because it is driven by humans. It is our human emotions and frailties that prompt us to make the same mistakes over and over again.

Now we are trading with computers, but who programs the computers? When the going gets tough, what happens? We have humans intervening in the markets to "make sure everything works properly." When you have that mechanism where we can step in and regulate, then you will have the same emotions controlling again and again. We may think we are smarter and we may have amassed more knowledge but we have not learned to control our emotions. We have not learned to recognize how they play into our actions. Thus we are apparently destined to repeat our same mistakes over and over again. This comment about America getting a little soft is just another example of how we are doing just that.

TECHNICAL SUMMARY

INTERNALS.

Volume. Volume declined on NASDAQ 11%. It gained 5.6% on the NYSE. It dropped below average on NASDAQ, and it put in an above-average move on the NYSE.

Breadth. Decliners were -3.6:1 on the NYSE. -3.4:1 on NASDAQ. Pretty much a solid beating, but not one that totally routed the market.

CHARTS

As I said all week long, the key is that the markets have not broken out of the trading range.

SP500. SP500 was down 2.5%. It is still above last week's closing low and well above the intraday low. This also keeps it on the upper level of support over the Summer 2010 base highs. As I said, it is still in the range. Maybe it breaks down out of that this week. We will see. But it has done a good job of holding up and bouncing every time that it has come down to this level. We will see if it can do it yet again.

The worrisome feature is it put in a lower high in the middle of the range. As you know, we always watch for higher lows in the middle of the range at an important point to give us an indication that a breakout may be coming. In the same sense, we have to watch for a possible breakdown with a lower high at a key point in the middle of the range. We will keep an eye on that. But we are in a range. As of yet, the range has not broken. Thus we play it like it is in the range. We prepare for the other possibilities, but it has to show us the breakdown. Again, there are such things as false breakdowns where you have a break below and a reversal. We have to be careful on these breaks. If you pile in too quickly, you can get murdered on the reversal.

NASDAQ. NASDAQ is the same situation. Broke to the downside, putting in a lower low on this selling. It is still above the August lows. Comfortably above the August lows, and that still keep it in its trading range. It may come back down. It has a beat on the August double bottom. We will see what happens. It is still in the range, and we will see if it can hold yet again.

SP600. Small caps were down 2.7%. They are at the bottom of the range once again. Still above last week's low, which was a reversal off of the downside. It is very important. Small caps are key for the domestic economy. They do not sell much overseas. There are some exports from small companies it happens but most of their business comes from the good ol' USA. We will see if this can hold. I believe that this is an important leading indicator for the economy, and it is in trouble right now. Very important this week to see where the small cap index holds.

SOX. The semiconductors dove down 3.4%, gapping and closing near the lows. As with NASDAQ, however, they are still well above the August lows that mark the top of the Summer 2010 base. It is above that triple bottom. We will see what happens when it gets back down to this level. Maybe an ABCD, but that may be wishful thinking. It is one of those Missouri markets; I will wait for it to "show me" and go from there.

LEADERSHIP

Momentum stocks. This was a week where momentum leaders got their comeuppance, so to speak. AAPL is still doing well. It closed below the 50 day EMA, and it did so sharply to end the week. It still has an ABCD pattern set up off of this last rally. That does not mean it will hold and rally, but it is a leader and is still hanging in there. Similarly, AMZN has put in an ABCD as well. It might present a good buying opportunity.

Other momentum stocks got shellacked. CMG was hit hard, and it was down again on Friday. PCLN is all the way back down to its June and August lows. There is almost no point of looking at NFLX. It is down hard for the last two weeks. It made us a lot of money, but I said that when it breaks it would break big. It really did. We probably should have played this move after the breakaway gap. We will have to look for that and see if we can take advantage of it as well. There are a lot of stocks that have broken lower, and those were just some of the momentum groups.

Metals. Metals are in trouble as well. FCX is heading to a new low on this selling. AKS also hit a new low on this selling. They are having a lot of trouble in metals. No one wants them right now.

Energy stocks. Energy is having some issues as well. We are playing VLO to the downside. It is diving lower. APC is diving to a new low. Undercutting the new low on the selling and undercutting the August low. There is trouble in energy. If the economies are slowing, why do they need more oil and gas, right? That is what we are seeing.

Stocks holding good patterns. There are leaders who are somewhat holding the line. ORLY sold, but it has come back in a nice ABCD pattern to the 50 day EMA. As noted earlier, AMZN is holding up fairly well. DMND is pulling back after a nice rally. Just a normal pullback. Not all techs are in trouble. KLAC has come back and made a nice flag pattern above the 50 day EMA as well. COL, in aerospace and defense, is looking nice and forming a pennant pattern. There are stocks in very good position to move higher.

THE MARKET

SENTIMENT INDICATORS

Today I heard Bob Pisani on CNBC state that he has not seen sentiment this negative in his memory. That smacks of the 'technical indicators don't work anymore' statement back in the late 2002 that almost marked the bottom of the market to the day.

VIX. The VIX broke to the upside out of its triangle pattern: It held in this range for quite some time. Now it has made a closing high on this new bounce. Looks as if there will be a test of the bottom of the August trading range.

VIX: 42.96; +4.12
VXN: 44.98; +3.82
VXO: 44.11; +5.31

Put/Call Ratio (CBOE): 1.25; +0.06

Bulls versus Bears:

This is a reading of the number of bullish investment advisors versus bearish advisors. The reason you look at this is that it gives you an idea of how bullish investors are. If they are too bullish then everyone is in the market and it is heading for a top: if everyone wants to be in the market, then all the money is in and there is no more new cash to drive it higher. On the other side of the spectrum if there are a lot of bears then there is a lot of cash on the sideline, and as the market rallies it drags that cash in as the bears give in. That cash provides the market the fuel to move higher. If bears are low it is the same as a lot of bulls: everyone is in and the market does not have the cash to drive it higher.

Bulls: 37.6% versus 37.6%. Holding steady and its third week above 35% (35.5% prior). Third week the bulls are below bears and still a powerful sentiment signal. Solid move lower from 49.5% in late July. Highs from April and December (60% readings spanning December through early May 2011). The 5 year high is 62.0. The crossover level at 29% bulls from July 2010 is long gone. 35% is the threshold level suggesting bullishness. To be seriously bearish it needs to get up to the 60% to 65% level.

Bears: 40.9% versus 39.8%. Right back up to 40.9% hit three weeks back. A third week of bears over bulls and five weeks over the 35% threshold considered a bullish indicator and have made that important crossover of bulls. For more reference, bearishness hit a 5 year high at 54.4% the last week of October 2008. The move over 50 took bearish sentiment to its highest level since 1995. Extreme negative sentiment. Prior levels for comparison: Bearishness peaked at 37.4% in September 2007. It topped the June 2006 peak (36%) on that run. That June peak eclipsed the March 2006 high (33%) and well above the 2005 highs that spawned new rallies (30% in May 2005, 29.2% in October 2005). That was a huge turn, unlike any seen in recent history.

NASDAQ

Stats: -65.36 points (-2.63%) to close at 2415.4
Volume: 2.017B (-11.42%)

Up Volume: 201.96M (-697.31M)
Down Volume: 1.87B (+480M)

A/D and Hi/Lo: Decliners led 3.4 to 1
Previous Session: Advancers led 1.71 to 1

New Highs: 3 (-2)
New Lows: 248 (+29)

NASDAQ CHART: Click to view the chart

NASDAQ 100 CHART: Click to view the chart

SOX CHART: Click to view the chart

SP500/NYSE

Stats: -28.98 points (-2.5%) to close at 1131.42
NYSE Volume: 1.118B (+5.67%)

Up Volume: 283.99M (-3.076B)
Down Volume: 4.51B (+3.34B)

A/D and Hi/Lo: Decliners led 3.63 to 1
Previous Session: Advancers led 2.16 to 1

New Highs: 54 (+19)
New Lows: 385 (+202)

SP500 CHART: Click to view the chart

SP600 Chart: Click to view the chart

DJ30

Stats: -240.6 points (-2.16%) to close at 10913.38
Volume DJ30: 213M shares Friday versus 191M shares Thursday.

DJ30 CHART: Click to view the chart

MONDAY

There is a boatload of economic data coming out next week. We will have the ISM Manufacturing Index on Monday. Construction Spending also on Monday. Factory Orders on Tuesday. Challenger Job Cuts and ADP on Wednesday. ISM Services on Wednesday as well. Jobless Claims on Thursday, and they are expected to go back over 401K. We will see. Friday, of course, brings the September jobs report. More data than you can shake a stick at.

On top of that, it is October and we will not be able to get away from earnings. We have to go through this little ritual before we can put in the bottom in October and rally to the upside through the end of the year. That is the traditional way to look at the market. The cool thing this time is that the market has sold off into earnings. There are no earnings to sell into, necessarily; it already did that in July and early August.

After bouncing along for almost two months, now the market is at the bottom of its trading range. It is sitting on top of that Summer 2010 base. This is the point where it will bounce or it will trounce. These earnings could give the movement to the upside that the market needs the impetus to bounce in the face of an ugly Europe. We have had issues. Some of the shippers and trucking companies have been warning. Some of the tech stocks, particularly the chips, have been warning. Some retailers are not pleased with how the August back-to-school season went. As we know, truckers are not trucking as many goods to the stores ahead of Christmas. That is a concern. Retailers are not betting on a good Christmas season, and that is showing up in the trucking. Thus retailers will not be as strong, and you know what it all means. It is a snowball effect.

We are at an important point for the market. Will it hold or will it fold? We are in a new week, a new month, and a new quarter. Indeed, we have a new slate given that the indices are down at the bottom of the trading range. It is not a bad place to get a litmus test of the market moving toward the year end. As noted, it is typically an up time for the market. It is in a very good position to make a move if it will make that move. Accordingly, we have put more upside plays on the report. There are several good stocks that are still in great shape after all of this selling. That has to give you some confidence in what the market will do at the bottom of this range. They could roll over and implode. Maybe something bad comes out. Maybe Europe decides it will not bail everyone and their brother out, and then the markets do not like that and sell off. That caveat is always out there.

Technically, we have the indices down to their key support range. We have some very good stocks that are down, yes, but that are making normal pullbacks after nice runs. They can lead the market back to the upside. Maybe not a breakout. It may be just a bounce back up in the range, but they are there to do it. This is not a situation where it is total despair, where no stock out there looks like it could lead.

We will have some plays to the upside, but we are also letting our plays to the downside run. We let them run on Friday, and they ran quite nicely. If we get a bounce, we will be looking to play some more downside. This is not a moment to step in with a bunch of new downside as the market is falling back down to a support level. You do not want to buy downside into a support level. And if there is a break at that support level, you do not want to pile into the downside. Why? You will get a reversal to test it. That is what this market does unless it is cataclysmic and the mentality is "The economy is going to hell and we have to sell." We will watch for a bounce and play it if it comes. If it does not, we will let our downside run that is currently in place. Then when it bounces back up and gives us a test of this level that fails, we move in for more downside plays at that point.

I meant for this to be shorter, but I did have a lot to say. Now I will go do an Eagle Scout project, and I will remember that there are still great things in this country. I look at these Boy Scouts and my son's troop. He is a 13 year-old who will be an Eagle Scout. That is not a soft person. We are not a soft country. We have as much or more drive as we ever had. I look at these young men in my son's lacrosse teams, football teams, baseball, basketball, and the scouts. I see tough, smart young men and women out there. They are not soft. They will be great.

We have to get our country back to the point that allows them to be great. If anyone perceives us as soft, it is not because of the people of the United States. It is due to those in charge who think they have to be our mommies and daddies and tell us what to do. Just let us be free. Let us be the great people that we are, and we will be the toughest, biggest, best economy and country in the world.

Have a great weekend!

Support and Resistance

NASDAQ: Closed at 2415.40
Resistance:
2512 is last week's gap down point
2532 is the early August gap down point
2540 is the early November 2010 lower gap point
2546 is the early September 2011 gap down point
2555 is the mid-August 2011 peak
The 50 day EMA at 2558
2569 is the November gap up point through the April 2010 peak
2580 is the November 2010 closing high
2593 is the November intraday high
2599 is the June 2011 low
2603 is the March 2011 intraday low (post-Japan low)
2612 is the late August 2011 peak
2645-2650ish from December 2010 consolidation
2676 is the January 2010 low
2686 is the January 2011 closing low
The 200 day SMA at 2701
2706 to 2705 is the April 2011 low and the February 2011 and consolidation low (bottom of the trading range) 2723 to 2705 is the range of support at the bottom of the January to May trading range
2759 is the May low
2762 is the February low
2796 is the February gap down point
2816 is the early April peak.
2825 is the 2007 closing peak.
2841 is the February 2011 peak
2862 is the 2007 peak
2879 is the July 2011 peak
2888 is the May 2011 peak

Support:
2469 is the November 2010 low
2331 from October 2010 low and the August 2011 low
2305 from the August 2010 peak (summertime base)
2139 is the May and June 2010 low
2123 is the August 2010 gap down point
2100 from the August 2010 lows

S&P 500: Closed at 1131.42
Resistance:
1178-1180 is the October 2010/November 2010 consolidation low
1196 is the November 2010 consolidation peak
The 50 day EMA at 1199
1209 is the mid-August 2011 high
1220 is the April 2010 peak
1227 is the November 2010 peak
1231 is the late August 2011 peak
1234 is the August 2011 low
1235 is the mid-December 2010 consolidation low
1249 is the March 2011 low (post-Japan)
1255 is the late December 2010 consolidation range
1275 is the January 2010 low, early January 2011 peak
The 200 day SMA at 1280
1295 to 1294 is the April 2011 low and the February 2011 consolidation low (bottom of the trading range)
1313 from the August 2008 interim peak
1318.51 is the May low
1325-27 is the March 2008 closing low and the May 2006 peak.
1332 is the early March peak
1340 is the early April 2011 peak
1344 is the February 2011 peak is being challenged again
1357 is the July 2011 peak
1364 is the March 2007 low
1370 is the August 2007 low
1371 is the recent May 2011 peak

Support:
1131 - 1127 from August 2010 base peak.
1119 is the early August closing low
1109 is the mid-September 2010 gap up point
1101 is the August 2011 low
1099 from the mid-July interim peak
1040 from the August 2010 lows and May/June 2010 lows
1011 is the summer 2010 low

Dow: Closed at 10.913.38
Resistance:
11,178 from November 2010
The 50 day EMA at 11,404
11,452 is the November 2010 peak
11,555 is the March low
The August low at 11,700
11,717 is the late August 2011 peak
11,734 from 11-98 peak
11,867 from the August 2009 high and peak on that bounce in the selling.
11,893 from March 2008 closing low
The June low at 11,897 (closing)
The 200 day SMA at 11,985
12,094 is the April 2011 low
12,110 from the March 2007 closing low
12,283 is the March 2011 peak
12,391 is the February 2011 peak
12,876 is the May high
12,754 is the July intraday peak
13,058 from the May 2008 peak on that bounce in the selling

Support:
10,978 is the bottom of the November 2010 consolidation
10,750 from September 2010
10,720 is the August closing low
10,705-710 from January 2010 peak
10,694-700 from August 2010 peak
9938 is the August 2010 low

Economic Calendar

September 26 - Monday
- New Home Sales, August (10:00): 295K actual versus 293K expected, 302K prior (revised from 298K)

September 27 - Tuesday
- Case-Shiller 20-city, July (9:00): -4.11% actual versus -4.5% expected, -4.40% prior (revised from -4.52%)
- Consumer Confidence, September (10:00): 45.4 actual versus 46.6 expected, 45.2 prior (revised from 44.5)

September 28 - Wednesday
- MBA Mortgage Index, 09/24 (7:00): +9.3% actual versus 0.6% prior
- Durable Orders, August (8:30): -0.1% actual versus 0.1% expected, 4.1% prior
- Durable Orders ex-Transports, August (8:30): -0.1% actual versus -0.2% expected, 0.7% prior (revised from 0.8%)
- Crude Inventories, 09/24 (10:30): 1.915M actual versus -7.336M prior

September 29 - Thursday
- Initial Claims, 09/24 (8:30): 391K actual versus 419K expected, 428K prior (revised from 423K)
- Continuing Claims, 09/17 (8:30): 3729K actual versus 3715K expected, 3749K prior (revised from 3727K)
- GDP - Third Estimate, Q2 (8:30): 1.3% actual versus 1.2% expected, 1.0% prior
- GDP Deflator - Third, Q2 (8:30): 2.5% actual versus 2.4% expected, 2.4% prior
- Pending Home Sales, August (10:00): -1.2% actual versus -1.5% expected, -1.3% prior

September 30 - Friday
- Personal Income, August (8:30): -0.1% actual versus 0.1% expected, 0.1% prior (revised from 0.3%)
- Personal Spending, August (8:30): 0.2% actual versus 0.2% expected, 0.7% prior (revised from 0.8%)
- PCE Prices - Core, August (8:30): 0.1% actual versus 0.2% expected, 0.2% prior
- Chicago PMI, September (9:45): 60.4 actual versus 54.0 expected, 56.5 prior
- Michigan Sentiment - Final, September (9:55): 59.4 actual versus 57.5 expected, 57.8 prior

October 3 - Monday
- ISM Index, September (10:00): 50.5 expected, 50.6 prior
- Construction Spending, August (10:00): -0.5% expected, -1.3% prior
- Auto Sales, September (15:00): 4.1M expected, 3.97M prior
- Truck Sales, September (15:00): 5.5M expected, 5.43M prior

October 4 - Tuesday
- Factory Orders, August (10:00): -0.1% expected, 2.4% prior

October 5 - Wednesday
- MBA Mortgage Index, 10/01 (7:00): +9.3% prior
- Challenger Job Cuts, September (7:30): 47.0% prior
- ADP Employment Chang, September (8:15): 48K expected, 91K prior
- ISM Services, September (10:00): 53.0 expected, 53.3 prior
- Crude Inventories, 10/01 (10:30): 1.915M prior

October 6 - Thursday
- Initial Claims, 10/01 (8:30): 401K expected, 391K prior
- Continuing Claims, 09/24 (8:30): 3725K expected, 3729K prior

October 7 - Friday
- Nonfarm Payrolls, September (8:30): 63K expected, 0K prior
- Nonfarm Private Payrolls, September (8:30): 90K expected, 17K prior
- Unemployment Rate, September (8:30): 9.1% expected, 9.1% prior
- Hourly Earnings, September (8:30): 0.2% expected, -0.1% prior
- Average Workweek, September (8:30): 34.2 expected, 34.2 prior
- Wholesale Inventories, August (10:00): 0.6% expected, 0.8% prior
- Consumer Credit, August (15:00): $7.0B expected, $12.0B prior
icon url

ReturntoSender

10/02/11 8:09 PM

#9530 RE: ReturntoSender #6755

Monday Morning Outlook: Two Signs of Trouble for Small- and Mid-Cap Stocks
The RUT and MID ended September beneath historically significant technical levels

by Todd Salamone 10/1/2011 11:59 AM
http://www.schaeffersresearch.com/commentary/observations.aspx?ID=108153&trackback=recapezine&am...

The uniformly dismal third quarter is finally over -- but with burning questions about the state of the global economy still unanswered, what do investors have to look forward to? Friday's session ended with a thud, as Wall Street weighed softer manufacturing activity out of China and higher consumer prices in the euro zone, which raised questions about the European Central Bank's ability to accommodate the region's dicey fiscal situation. Plus, we're on the cusp of three solid days' worth of U.S. jobs data, which seems an unlikely source of inspiration, at best.

From a technical standpoint, Todd Salamone notes that the S&P 500 Index still remains well within the confines of its recent trading range. On the other hand, an apparent breakdown for small- and mid-cap stocks gives the bulls cause for concern -- particularly as sentiment continues to deteriorate among big-money players. Meanwhile, Rocky White weighs the historically bearish implications of the Dow's five-month losing streak against typically sunny fourth-quarter seasonality. Finally, we wrap up with a preview of the key economic and earnings events for the week ahead, featuring Friday's nonfarm payrolls report for September.

Notes from the Trading Desk: Hedge Fund Managers Grow Increasingly Gloomy
By Todd Salamone, Senior VP of Research

"With equities pulling back to potential long-term support areas as negative sentiment continues to grow, now is a good time to add equity exposure to your portfolio for a potential rally back to the resistance areas discussed last week. But be careful if there is a break of support, as short-covering activity or a shift from other assets will not be as urgent, undermining the potential reward for the risk you are taking."
- Monday Morning Outlook, September 24, 2011

Coming into last week's trading, the major market indexes were sitting just above significant support areas -- and buyers stepped up to the plate quickly, with the S&P 500 Index (SPX - 1,131.42) rallying 5% by Tuesday afternoon. Unfortunately, that rapid surge higher brought technical resistance levels back into play, and the advance was over almost as soon as it started. The SPX ran up near the top of the recent range, to the 1,200 area, but the index was once again turned back, as sellers proved to be just as powerful as the early-week buyers. For bulls, it was a disappointing end to the week, as Thursday's much-anticipated German vote to approve the expansion of the European Financial Stability Facility (EFSF) failed to provide lasting inspiration for investors.

As we enter this week's trading, the SPX remains locked in the same volatile trading range that has been in place since early August. The sideways channel formed after the SPX had experienced a two-week, 17% decline from its calendar-year highs. While the SPX is still trading above the key 40-month moving average, situated at 1,108, bulls should take note of the lower highs that have occurred on the last two rally attempts.


From a technical perspective, other concerns include the continued deterioration in the technical backdrop of small- and mid-cap stocks, as evidenced by the following developments:

1. The Russell 2000 Index (RUT - 644.16) closed below 650, which was the site of resistance in 2005 prior to acting as support in early 2008.

2. For the first time since September 2010, the S&P 400 MidCap Index (MID - 781.26) experienced a monthly close below 800, which is double its 2009 low. The index remains above its 80-month moving average, situated at 766.80 -- a trendline that marked major lows in 2002 and 2010. As we move into the final quarter of the year, there is not a strong consensus as to whether or not this range will resolve itself to the upside or the downside. However, a recent Reuters poll of global strategists indicated that the SPX would be modestly lower by year's end. In fact, our analysis of option activity on major exchange-traded fund (ETF) options suggests that hedged players could be looking for weakness immediately ahead -- which marks a change from the past few weeks, when we saw evidence that this group was split.

For instance, we are now seeing a roll-over in the 20-day combined buy-to-open put/call ratio on the SPDR S&P 500 ETF Trust (SPY), iShares Russell 2000 Index Fund (IWM) and PowerShares QQQ Trust (QQQ), after a period in which this ratio turned higher. When the ratio is advancing, it is usually evidence that hedge fund managers are buying stocks, as they simultaneously purchase these puts to hedge the long equity positions they're accumulating.

Another hedging tool for those accumulating equities are call options on the CBOE Market Volatility Index (VIX - 42.96), as the VIX will usually advance sharply in the event of a correction. Thus, the profit from the call options could cushion equity losses. But, during the past 20 days, VIX puts have been in heavier demand than VIX calls. During the past several weeks, the VIX's buy-to-open call/put ratio has fallen below 1.0, due to a surge in put buying and a significant decrease in call buying. This could be a signal that the hedge fund world is positioning for a weaker market ahead, and using VIX puts to hedge growing short positions. The market has tended to struggle as this group turns negative, which they appear to be at the moment.

The only piece of good news in the chart below is that the VIX's call/put ratio is approaching extreme lows. A turn higher in the ratio from these levels has been associated with major advances in the equity market on previous occasions. For now, though, bulls should be on guard, as this ratio continues to decline alongside a bearish roll-over in the 20-day combined SPY/QQQ/IWM put/call ratio (second chart below).


Keep tight stops on your long equity positions -- especially those in the consumer-discretionary area, as we are seeing some breakdowns among former leaders in this group. Large-cap banks continue to be the biggest area of vulnerability, and these are names to consider if you are actively shorting. Treasury bonds should remain in your portfolio, and utilities are a sector worth adding, given the attractive dividend yields, strong price action, and the low percentage of "buy" ratings from analysts, hinting at future upgrade potential.

Indicator of the Week: Five-Month Losing Streaks and the Fourth Quarter
By Rocky White, Senior Quantitative Analyst

Foreword: September ended last Friday, and for the fifth month in a row, markets were lower. This is the 15th time since 1900 that the Dow Jones Industrial Average (DJIA) fell five months in a row. Below is a table showing each instance. We're down nearly 15% during the current losing streak. Unfortunately, these streaks do not typically stop at five months. Only six out of 14 times, and only once in the last five occurrences, was the sixth month positive. The longest monthly losing streak ended in 1942, when the Dow was down nine months in a row (December 1941 was the fifth negative month, for the record).


Fourth Quarter: Now, for the good news (such as it is). The following tables summarize Dow returns by quarter since 1950, and over the last 20 years. Historically, the third quarter is easily the worst, and this last one saw the Dow fall about 12%. So, it's good news that it's over, at least. Furthermore, the table shows the fourth quarter has been the most bullish, averaging a gain of about 5%, and reaping a positive return almost 80% of the time over the last 20 years.


I decided to take a closer look to see if any individual stocks stood out during the fourth quarter of the last few years. So, I went back five years and gathered fourth-quarter returns on the most liquid stocks in our database. Only four equities had positive returns in each of the last five fourth quarters, and those outperformers are listed below. Priceline.com (PCLN) has fared the best over the last five fourth quarters, averaging a 20% gain over the final three months of the year. The last stock on the list -- Safeway (SWY) -- stands out from the rest by virtue of the simple fact that it's in a long-term downtrend. But over the last five years, your portfolio would not have been harmed by owning this stock during the fourth quarter.


Finally, below is an expanded list of 20 stocks with the biggest average returns over the past five fourth quarters, looking at those equities that were positive in four of those quarters. You can see from the "Min Return" column that the one negative fourth-quarter return for these stocks was often quite dramatic (remember the fourth quarter of 2008...?).


This Week's Key Events: All Eyes on September Payrolls
Schaeffer's Editorial Staff

Here is a brief list of some of the key events this week. All earnings dates listed below are tentative and subject to change. Please check with each company's respective website for official reporting dates.

Monday

The economic calendar kicks off Monday with the ISM manufacturing index for September and construction spending for August. Wolverine World Wide (WWW) is scheduled to report earnings.

Tuesday

On Tuesday, the Census Bureau will report on August factory orders. On the earnings front, we'll hear the latest quarterly results from Global Payments (GPN) and Yum Brands (YUM).

Wednesday

Employment data starts to roll in on Wednesday, with the release of ADP's private payrolls report for September and the Challenger, Gray & Christmas update on job cuts. Also due out is the ISM services index for September, as well as the usual report on weekly petroleum supplies. Acuity Brands (AYI), Costco Wholesale (COST), Marriott International (MAR), Monsanto (MON), and Ruby Tuesday (RT) are expected to report earnings.

Thursday

Weekly jobless claims are set to hit the Street on Thursday. Notable earnings reports include AngioDynamics (ANGO), Constellation Brands (STZ), Helen of Troy (HELE), and International Speedway (ISCA).

Friday

Friday's marquee economic event is the Labor Department's nonfarm payrolls report for September. Also on the day's docket are wholesale inventories and consumer credit for August, as well as the latest quarterly earnings from Material Sciences (MASC).

And now a few sectors of note...
ssecting The Sectors
Sector Utilities
Bullish

Outlook: The utility sector is often preceded by its "defensive" reputation, and it has indeed emerged as a pocket of technical strength, even amid the recent broad-market turmoil. In fact, the electric utility group currently boasts the highest percentage of stocks trading above their 200-day moving averages among all sectors we follow, at 58%. Plus, the sector sports some attractive dividend yields, which are certainly a selling point in the context of a tumultuous market environment. However, Wall Street hasn't exactly jumped on the bullish bandwagon just yet. Electricity stocks have attracted only 39% "buy" ratings from brokerage firms, which is one of the most bearish ratings configurations around right now. Within the group, Duke Energy (DUK) and Consolidated Edison (ED) have racked up double-digit percentage gains in 2011, and both stocks have recently tagged new annual highs. Nevertheless, there's not a single "buy" endorsement between the two. Going forward, a round of well-deserved upgrades could draw a fresh wave of buyers to the table, helping these stocks extend their positive price action.

Sector Leisure/Retail
Bullish
Outlook: The SPDR S&P Retail ETF (XRT) remains in technical limbo on the charts, with the fund hovering between familiar support and resistance levels. XRT closed last week beneath the round-number $50 level and its year-to-date breakeven at $48.36, but wrapped up the month of September just north of support in the $45 region -- which previously served as resistance in 2007 and 2010. Despite the technical stagnation here, we remain upbeat on select outperformers within the group, and recommend focusing on stocks in solid technical uptrends that are surrounded by skepticism. Amazon.com (AMZN) is one such example, with the shares up more than 20% year-to-date -- despite a 45% surge in short interest over the course of the past month. Whole Foods Market (WFM) also holds contrarian appeal, as the stock has enjoyed a years-long uptrend atop the support of its 10-month moving average. With WFM attracting a significant amount of speculative put buying in recent weeks, there could be some skepticism yet to unwind toward this technical standout. Heavily shorted Sturm Ruger (RGR) is another one to watch, after the stock last week found support near former resistance at the $25 level. As these high-flying discretionary names continue to outperform on the charts, a capitulation by the skeptics could provide an influx of buying pressure.

Sector Large-Cap Tech
Bearish
Outlook: From a broad perspective, the tech-rich Nasdaq Composite (COMP) found resistance last week near the round 2,600 level, which previously served as a layer of support. In similar fashion, the PowerShares QQQ Trust (QQQ) recently spiraled lower after an unsuccessful test of the $60 level -- which represents exactly half its all-time high of $120, set back in March 2000. Within the tech sector, semiconductor stocks are among the more notable laggards, as analysts remain surprisingly upbeat on this underperforming group. The percentage of "buy" ratings on components of the Semiconductor HOLDRS Trust (SMH) peaked at 58.2% in late July, hitting its highest level since May 2010, and remains at an elevated 57.5%. Meanwhile, the percentage of "sells" is resting near an annual low, at 5.2%. In fact, a few upbeat analysts have recently flagged the poor price action in chip stocks as a buying opportunity. However, with a seemingly endless string of semiconductor names slashing their financial guidance in the face of sluggish demand trends, the outlook for this struggling group seems unlikely to improve anytime soon. With SMH faring even worse than the broader QQQ in 2011, the semiconductor sector as a whole could be vulnerable to a shift in sentiment toward the bearish end of the spectrum as the weak technical performance continues.

Sector Financials
Bearish
Outlook: Bad news continues to roll in for the banking sector, as Moody's recently lowered its debt ratings for Bank of America (BAC), Citigroup (C), and Wells Fargo (WFC). The ratings agency maintained a negative outlook on all three banks, noting that the U.S. government is "more likely now than during the financial crisis to allow a large bank to fail should it become financially troubled." Adding to the gloomy headlines, B of A and JPMorgan Chase (JPM) were slapped last week with a new lawsuit regarding their involvement in the mortgage-backed securities market. Plus, concerns continue to linger about European debt exposure, further weakening the already-shaky fundamental outlook. Taking a broader look at the group, the technical backdrop for the Financial Select Sector SPDR (XLF) remains bearish, with the fund sitting on a steep year-to-date decline of nearly 26%. XLF tumbled lower in late August after an unsuccessful test of the $13.50 level, which previously served as major support during 2010. Going forward, this area could prove to be a troublesome resistance level. Meanwhile, the 20-day buy-to-open call/put volume ratio for XLF moved higher recently, suggesting that short sellers are buying calls in order to hedge new bearish bets against the group. Previous upticks in this ratio have coincided with periods of weak price action for banking stocks. However, traders should keep an eye on the aforementioned $13.50 region, as a move back above this area would be a risk to any short positions in the big-cap financial sector.
icon url

ReturntoSender

10/03/11 3:37 PM

#9531 RE: ReturntoSender #6755

Some of the Volatility Indexes are hitting higher highs today. That's not what I would like to see were I completely bullish. Long term market bottoms form on lower highs for these indexes.


The VIX is still showing a lower low but the VXN actually follows the NASDAQ closer:


I also find it unsettling that almost no one is even bitching about the market going lower. Seems we are all resolved that it will go down until it stops. No 90% upside days yet and that's for certain! In fact almost the reverse again today.

RtS
icon url

ReturntoSender

10/03/11 10:54 PM

#9532 RE: ReturntoSender #6755

From Briefing.com: 4:30 pm : The first session of the fourth quarter saw plenty of selling pressure. The effort culminated in a sharp loss for stocks, which settled at new 52-week lows.

Stocks just booked their worst quarter in almost three years, but sellers aren't yet ready to let up. As such, action today opened in negative territory. Participants continued to take their cues from Europe, where Greece admitted that it does not expect to hit a deficit target and the eurozone's PMI Manufacturing Index for September slipped. Between Germany, France, and the United Kingdom, only the UK experienced an increase in its monthly Manufacturing PMI.

The major averages managed to lure some buyers into the fold with help from a dose of upbeat data. Specifically, the ISM Manufacturing Index for September improved to 51.6 from 50.6 when it was widely expected to slip to 50.5. Construction spending swung from a 1.3% decline in July to a 1.4% increase in August, contrasting with the consensus call for a 0.5% decline.

Still, stocks struggled to sustain their midmorning move into positive territory. Once stocks faltered, the broad market was never able to return to higher ground. The struggle invited additional selling pressure, which prompted a steady descent. Bleeding was broad, but financials suffered the worst loss of any major sector by falling 4.5%.

Airlines experienced a dramatic drop, led lower by AMR (AMR 1.98, -0.98), which was caught up in rumors about bankruptcy. The company stated, though, that it is not seeking a prepackaged bankruptcy.

Given such aggressive selling pressure this session, the S&P 500 broke below the 1100 line and settled there for the first time in little more than a year. Both the Dow and Nasdaq also booked 52-week closing lows, but neither breached their one-year intraday lows.

Amid such weakness, many participants sought safety. In turn, the dollar advanced 1.1% against a basket of major foreign currencies and the benchmark 10-year Note climbed about a point and a half so that its yield tumbled to 1.75%. Gold prices advanced more than 2% to almost $1758 per ounce.

Advancing Sectors: (None)
Declining Sectors: Consumer Staples -1.5%, Telecom -1.8%, Utilities -2.3%, Tech -2.3%, Materials -2.6%, Consumer Discretionary -2.9%, Industrials -3.0%, Health Care -3.2%, Energy -3.3%, Financials -4.5%DJ30 -258.08 NASDAQ -79.57 NQ100 -2.5% R2K -5.4% SP400 -4.6% SP500 -32.19 NASDAQ Adv/Vol/Dec 209/1.71 bln/2352 NYSE Adv/Vol/Dec 294/1.39 bln/2789

4:07PM Hewlett-Packard announced that it has acquired control of Autonomy Corporation plc (AUTNF.PK) (HPQ) 22.18 -0.27 : Holders of ~213 mln Autonomy shares have accepted HP's previously announced offer to purchase the entire share capital of Autonomy at a price of 25.50 per share in cash, representing ~87.34% of the current issued share capital of Autonomy. As such, all conditions relating to the offer have now been satisfied, allowing HP to acquire control of Autonomy.

12:48PM Adobe Systems announces agreement to acquire Nitobi, Creator of PhoneGap; financial terms not disclosed (ADBE) 23.69 -0.48 : Co announced it has entered into a definitive agreement to acquire privately held Nitobi Software, the creator of PhoneGap and PhoneGap Build. The acquisition is expected to close by the end of October 2011.

9:03AM Cypress Semi: GSI's (GSIT) alleged infringement ofco's SRAM patents by GSI have ended without a resolution (CY) 14.97 : Co said that negotiations with GSI Technology regarding the alleged infringement of Cypress's SRAM patents by GSI have ended without a resolution. In June, co filed a complaint with the International Trade Commission alleging infringement by GSI of four of its SRAM patents. The complaint seeks an exclusion order from the ITC that would prevent the importation of all infringing GSI SRAMs. The ITC requires disputing companies to meet three times before the trial. Cypress's comments came in the wake of the first of these meetings.

O2Micro International (OIIM) was issued 15 claims under United States patent number 7,999,554 for its Battery Voltage Translator circuitry.

8:02AM Vitesse Semi lowers Q4 rev guidance below consensus; lowers product margin, op-ex guidance (VTSS) 2.95 : Co lowers Q4 rev guidance to $29-30.5 mln from $35-38 mln vs. the $35.8 mln consensus; product margins to 57-59% from 59-61%. "We continue to see softening of global demand as a number of customers manage through existing inventories and curtail purchases due to economic conditions that are impacting performance broadly across our sector, particularly in the Asia Pacific region. A delay in an intellectual property contract also contributed to our reduced revenue expectation. In the quarter, we took actions to further reduce our operating expenses. These measures will reduce 2012 operating expenses by approximately $10 million as compared to 2011."

8:01AM Chipmos Technology announces $10 million share repurchase program (IMOS) 5.17 : Co also announced that ThaiLin Semiconductor, a 42.9%-owned subsidiary of ChipMOS's 84.2% owned subsidiary, ChipMOS TECHNOLOGIES INC. has completed the purchase of demand notes issued by Modern Mind Technology Limited from ChipMOS. ChipMOS received payment of US$39.95 million from ThaiLin on October 3, 2011.

Rudolph Technologies (RTEC) announced that it has shipped its Wafer Scanner 3880 3D Inspection System, multiple NSX Macro Defect Inspection Systems and its Discover Yield Management Software Suite to a semiconductor manufacturer for use in developing through silicon via based processes for advanced 3D IC integration.

7:09AM Tessera Tech: U.S. Court of Appeals for the Federal Circuit reversed a lower court that had dismissed a lawsuit brought by Powertech Technology against Tessera (TSRA) 11.94 : Co announces that on Sept. 30, 2011, the U.S. Court of Appeals for the Federal Circuit reversed a lower court that had dismissed a lawsuit brought by Powertech Technology against Tessera. In March 2010, PTI filed a lawsuit in U.S. District Court seeking a declaration of noninfringement and invalidity regarding a single Tessera, Inc. patent, U.S. Patent No. 5,663,106. The District Court dismissed the lawsuit on procedural grounds, namely, a lack of subject matter jurisdiction. On appeal, the Court of Appeals disagreed, and remanded the matter back to the District Court for further proceedings. The appellate court's decision is not a ruling on the merits of PTI's claims regarding U.S. Patent No. 5,663,106. "We are confident in the merits of our case, and are prepared to move forward following this ruling by the Court of Appeals. Tessera has the option to petition the panel and/or the full Court of Appeals for rehearing within 45 days, and to petition the U.S. Supreme Court for a writ of certiorari within 90 days after entry of the judgment or any requests for rehearing are denied, whichever is later."

Nova Measuring Instruments (NVMI) announced that its Nova T500 stand-alone optical CD metrology system was selected by a leading foundry in Asia for process control of advanced etch applications. Following a thorough evaluation process, multiple orders were placed with Nova to support 28nm process transfer to manufacturing and volume production.

Research In Motion (RIMM) and Tech Data (TECD) announced a new agreement that enables Tech Data to distribute BlackBerry devices, software and technical support services to its channel of over 60,000 value-added resellers in the United States. The agreement also allows Tech Data to support the end-to-end sale of BlackBerry solutions for small to mid-sized businesses through Tech Data's new TDMobility offering operated by ActivateIT, a Tech Data and Brightstar Corp. joint venture company.

Vitesse Semi (VTSS $2.50 -0.44) lowered fourth quarter revenue guidance to $29-30.5 million from $35-38 million versus the $35.8 million Capital IQ consensus, Product margins went to 57-59% from 59-61%. "We continue to see softening of global demand as a number of customers manage through existing inventories and curtail purchases due to economic conditions that are impacting performance broadly across our sector, particularly in the Asia Pacific region. A delay in an intellectual property contract also contributed to our reduced revenue expectation. In the quarter, we took actions to further reduce our operating expenses. These measures will reduce 2012 operating expenses by approximately $10 million as compared to 2011."

Audiocodes (AUDC $2.52 -0.60) issued downside guidance for the third quarter with revenues of $36-37 million versus the $42.18 million Capital IQ Consensus. The company also lowered guidance for fiscal year 2011 with revenues to $155-162 million from $167-174 million versus the $168.80 million consensus. As a result, the company also expects the net income per share for 2011 to be lower than previously forecasted while remaining profitable in the third quarter 2011 on a Non-GAAP basis. The revised estimates for the third quarter and full year 2011 reflect a slow-down in business related to lower than anticipated technology, government and residential business line sales and softer macro-economic conditions in North America and Western Europe.

Advanced Energy (AEIS $7.73 -0.89) was downgraded to Hold from Buy. The firm notes downgrade is based on deterioration of both renewable and thin-film businesses. Their checks suggest increased price competition in the central inverters space and they believe weaker module prices have resulted in delayed installation. Coupled with weakening of the thin film business, they believe consensus estimates are too aggressive and recommend investors be more defensive on the name.
icon url

ReturntoSender

10/06/11 8:21 PM

#9536 RE: ReturntoSender #6755

From Briefing.com: 4:30 pm : Stocks overcame intraday resistance to settle at session highs for another big gain. The stock market has now scored three strong gains in just as many days.

Financials fueled today's rally, but only after the sector overcame early selling pressure. Following a relatively lackluster performance in the prior session, financials faltered this morning, falling to a loss well in excess of 1%. But bank stocks brought the sector back from the red. Bank of America (BAC 6.28, +0.51), one of the most actively traded names by share volume, rallied nearly 9% to its weekly high. It drove the KBW Bank Index to a 4.5% gain and led the financial sector to a 3.2% gain.

Consumer discretionary stocks also scored strong gains, finishing 2.2% for the better. Retailers were in focus amid a relatively mixed round of same-store sales reports for September. J.C. Penney (JCP 28.42, +0.78) managed to stage a strong gain, even though the company cut its earnings forecast.

While financials drove most of the action for the day, it was a broad push into the close that helped the S&P 500 overcome resistance at the 1160 line, which had rebuffed the broad market measure several times throughout the trading session. Stocks didn't breach the line until the final 30 minutes of action.

Strength among stocks put pressure on Treasuries. The corresponding rise in yields took that of the 10-year Note back to 2.00%.

The dollar dove to a loss of about 0.6% against a basket of major foreign currencies. Its tumble came after the euro rallied out of the red to end the day with a 0.6% gain at $1.344. The sterling pound slashed a loss of more than 1% to settle at $1.544 for a loss of only 0.2%. The pound's initial punishment came in response to a decision by the Bank of England (BoE) to increase its asset purchase plan by 75 billion to 275 billion pounds. The BoE kept its benchmark interest rate at 0.50%, though. The European Central Bank (ECB) kept its target at 1.50%, which surprised many since some sort of accommodative measure had become widely expected among market pundits.

Data had little impact on today's trade. The only item on the docket was the latest weekly initial jobless claims count, which increased by 6,000 week-over-week to 401,000. It barely differed from the Briefing.com consensus call for 402,000 initial claims.

Tomorrow brings the always pivotal official non-farm payrolls report. Participants were given a glimpse of the September number by a better-than-expected ADP Employment Change earlier this week, although the ADP is not always statistically identical. No matter the number, though, the reaction to the report should be telling of market sentiment, especially since stocks have rallied 6% during the course of the past three sessions.

Advancing Sectors: Financials +3.2%, Materials +2.5%, Consumer Discretionary +2.2%, Industrials +2.2%, Tech +1.7%, Energy +1.6%, Utilities +1.6%, Health Care +1.1%, Consumer Staples +1.0%, Telecom +0.6%
Declining Sectors: (None)DJ30 +183.38 NASDAQ +46.31 NQ100 +1.6% R2K +2.4% SP400 +2.5% SP500 +20.93 NASDAQ Adv/Vol/Dec 1934/2.25 bln/596 NYSE Adv/Vol/Dec 2592/1.12 bln/461

TriQuint Semiconductor (TQNT) received the "Huawei Green Partner" award in recognition for its ability to provide an environmental management system that ensures product content and manufacturing processes meet or exceed Huawei's stringent green requirements.

ARM (ARMH) and UMC (UMC) announced a long-term agreement that provides UMC foundry customers with access to the latest advanced ARM Artisan Physical IP solutions validated on UMC's 28HPM process technology.

2:55 pm S&P Tech Sector Trading Higher, In-line With Broader Markets

The tech sector is trading higher today, inline with gains in the broader market. Semiconductors are showing relative weakness in the tech space, however, with the Philly Semi Index trading 0.7% higher. MU (-1.2%) is a notable laggard in that index. Among other major indices, the S&P 500 is trading 1.0% higher, while the NASDAQ is trading 1.2% higher. The QQQ, meanwhile, is trading 1.0% higher. Among tech bellwethers, CSCO (+2.5%) is again showing notable strength, while AAPL (-0.5%) lags.

In earnings, OCZ (+13.5%) posted a mixed quarter, but raised guidance.

In news, AAPL's (-0.8%) Chairman Steve Jobs has sadly passed away. Elsewhere, GLW (+6.0%) announced it increased its dividend 50% and a $1.5 billion stock buyback. Among rumors, there continued CMTL (+9.6%) takeover chatter making the rounds. Also, there is a report shooting down speculation that MSFT (+1.5%) is interested in buying YHOO (-3.5%).

Among notable analyst ratings changes this morning, WBMD (+9.4%) was upgraded to Equal Weight at Barclays and PLCM (+4.3%) was upgraded to Buy at Argus.

No notable names in tech are set to report results today after the close.
icon url

ReturntoSender

10/07/11 11:25 AM

#9539 RE: ReturntoSender #6755

Chart of the Day - COTD - Nonfarm Payrolls trend higher but slower than after previous recessions:

http://www.chartoftheday.com/20111007.htm?T

The latest jobs report came out today with the Labor Department reporting that nonfarm payrolls (jobs) increased by 103,000 in September. Today's chart puts the latest data into perspective by comparing nonfarm payrolls following the end of the latest economic recession (i.e. the Great Recession -- solid red line) to that of the prior recession (i.e. 2001 recession -- dashed gold line) to that of the average post-recession from 1954-2000 (dashed blue line). As today's chart illustrates, the current jobs recovery is much weaker than the average jobs recovery that follows the end of a recession. Today's chart also illustrates that the current jobs recovery has been slightly stronger than what occurred following the recession of 2001. However, the already modest upward trend has slowed significantly over the past five months.


icon url

ReturntoSender

10/08/11 3:18 PM

#9541 RE: ReturntoSender #6755

From Briefing.com: Weekly Recap - Week ending 07-Oct-11

Failure to sustain a rebound from midday losses left stocks to roll into the red during the final hour. They still made it out with week 2% higher than where they started.

The major equity averages lacked direction this morning, even though premarket participants had cheered the September jobs report. Nonfarm payrolls grew by 103,000, up from an upwardly revised 57,000 in August. However, the upside surprise is mostly due to the end of a strike at Verizon. Excluding those workers, payrolls increased by 58,000, which is on par with the 60,000 new jobs that had been generally expected among economists polled by Briefing.com. Meanwhile, private payrolls increased by 137,000, which came on top of the upwardly revised 42,000 jobs that were added during the prior month. An increase of 83,000 had been broadly expected.

The number of people entering the workforce was roughly the same as the number of workers who found jobs in September, so the unemployment rate remained at 9.1%, which is exactly what had been expected. However, job gains were mostly part-time, resulting in an increase in underemployment that took the "real" unemployment rate up to 16.5% from 16.2% in the prior month.

Even though the payrolls report proved better-than-expected, stocks lacked leadership at the open of trade. That made it difficult for the major equity averages to extend their streak of gains to a fourth straight session. The listlessness of early trade left stocks to slide into negative territory. Selling intensified in response to news that analysts at Fitch cut their ratings on Italy and Spain. At its low, the stock market was down more than 1%.

Stocks managed to stage a steady afternoon rebound that took the market back to a modest gain, but the move ultimately broke down in the final few minutes of trade. Although the late dive took all three major equity averages into negative territory, losses were steepest for the Nasdaq, which was hurt by weakness among biotech plays. Strength among a few blue chips helped limit the extent of the Dow's decline.

Financials were a drag all session. The sector descended to a 3.7% loss as bank stocks buckled. Banks were likely imbued by news that analysts at Moody's downgraded a dozen banks in the United Kingdom and a handful of others in Portugal.

Financials actually fueled broad market gains in the prior session, but only after the sector rallied back from an early loss. Their leadership yesterday helped the S&P 500 push through resistance at the 1160 line. Of course, the late slide on Friday caused the S&P 500 to finish the week below that mark.

Shares or retailers were also in play yesterday. The attention came after a relatively mixed batch of same-store sales results for September.

Initial weekly jobless claims on Thursday didn't have much of an influence on the mood of market participants, mostly because the 401,000 initial claims essentially matched what had been widely expected. That tally was indicative of an improving labor sector since it stayed at a level that is within the Briefing.com "Recovery Zone."

Europe was in close focus yesterday, too. Participants were generally surprised at the lack of accommodative action taken by the European Central Bank, which opted to keep its benchmark lending rate at 1.50%. The Bank of England opted to keep its target rate at 0.50%, but it increased its asset purchase plan to 275 billion pounds from 200 billion pounds. That news initially put pressure on the pound, but it eventually rallied back and even finished the week on a positive note.

Tuesday and Wednesday saw stocks climb sharply for the broad market's best back-to-back performance in more than a month. On Wednesday, participants were given insight into the official September payrolls number by an ADP Employment Change report that showed that private payrolls increased by 91,000. The Briefing.com consensus had called for an increase of 45,000. Although the report doesn't always accurately forecast the exact payrolls number, it is often directionally accurate relative to expectations. The ISM Services Index for September was shrugged off; it slipped to 53.0 from 53.3 in the prior month, but still narrowly exceeded the 52.8 that had been widely expected.

Trade on Tuesday may have kicked off a three-day rally, which took stocks 6% higher, but what's more impressive is that stocks had to crawl out of a hole that had the S&P 500 at a 52-week low and more than 20% below its May high. The rally from those depths came once participants opted, for the time being, to look past the threat that Greece could default on its debt, let alone meet its deficit reduction targets, and the systemic troubles of the broader eurozone.

Such threats had weighed heavily on trade in the first session of the week, overshadowing an improvement in the ISM Manufacturing Index to 51.6 from 50.6 when it had been expected to slip to 50.5. The increase came amid solid growth in new orders, which actually played a part in the first increase in order backlogs since early summer. Weakness on Monday marked an extension of the selling that caused stocks to slide so sharply in the fourth quarter -- the worst quarter for the market in almost three years. That weakness had many seeking the safety of the benchmark 10-year Note. The Note's yield was down to 1.75% at the start of the week, but climbed back 2.00 by week's end. The bond market will be closed on Monday in observance of Columbus Day

...Nasdaq 100 -0.7%. ..S&P Midcap 400 -1.6%. ..Russell 2000 -2.6%.
 
Index Started Week Ended Week Change % Change YTD %
DJIA 10913.38 11103.12 189.74 1.7 -4.1
Nasdaq 2415.40 2479.35 63.95 2.6 -6.5
S&P 500 1131.42 1155.46 24.04 2.1 -8.1
Russell 2000 644.16 656.21 12.05 1.9 -16.3

3:01PM JinkoSolar Holding announced completion of phase I environment safety upgrade at facility in Haining City, China (JKS) 6.40 -0.39 : Zhejiang Jinko subsidiary conducted a thorough investigation of its temporary waste storage unit adjacent to the manufacturing facility with an independent Chinese Environmental Agency as an immediate response to concerns after a small amount of fluoride was discharged into a nearby waterway due to unforeseen extreme weather conditions. Fluoride is a highly water-soluble component and the small amount released from the Zhejiang site diluted within days. JinkoSolar has taken necessary steps to establish appropriate protocols and prevention plans for extreme weather conditions and now imposes regulations that are stricter than the industry standard.

09:00 am Advanced Micro upgraded to Perform at Oppenheimer: . Oppenheimer upgrades AMD to Perform from Underperform. Firm notes a troubled PC demand outlook, production issues at GlobalFoundries, low yields, product delays and uncertain long-term vision leave AMD precariously positioned, in their view. They note, however, despite lagging all year (off 41% vs peers off 14%), shares have dropped 21% since the pre-announcement. They see further downside as limited and feel this is an opportunity for investors to lock in short profits.

11:18 am S&P Tech Sector Trading Lower, Slightly Worse Than the Dow and S&P 500 (AMD)

The tech sector is trading lower only slightly, inline with losses in the broader market. Semiconductors are outperforming the broader tech space with the Philly Semi Index trading 1.2% higher. CRUS (+3.3%) is a notable leader in that index, while IDCC (-2.1%) is a notable laggard. Among other major indices, the S&P 500 is trading 0.1% higher, while the NASDAQ is trading 0.4 lower. The QQQ, meanwhile, is trading 0.5% lower. Among tech bellwethers, AAPL (-1.1%) is showing notable weakness.

In earnings/guidance, SERV (+11.6%) raised 2011 rev guidance. Also, ANEN (-8.4%) lowered Q1 rev guidance. Finally, SCSC (+3.3%) raised Q1 revs guidance.

In news, ORCL (-0.8%) agreed to pay $199.5 million to resolve false claims suit. ERIC's (-2.1%) stake in joint venture may be bought out by SNE (-3.6%).

Among notable analyst ratings changes this morning, AMD (+1.6%) was upgraded to Perform at Oppenheimer. TSL (-11.1%) was initiated before the open with an Underperform at BofA/Merrill.

No notable names in tech are set to report results today after the close.
icon url

ReturntoSender

10/09/11 11:26 AM

#9542 RE: ReturntoSender #6755

Monday Morning Outlook: With Anxiety Running High, Stocks Fight to Find Purchase
Sentiment surveys are pointing to near-peak levels of gloom and doom on Wall Street

by Todd Salamone 10/8/2011 12:15 PM

http://www.schaeffersresearch.com/commentary/observations.aspx?ID=108248&trackback=recapezine&am...

Stocks scored a win last week, thanks in part to a series of stronger-than-anticipated U.S. employment reports. Despite a rocky start to the fourth quarter, easing concerns about a potential double-dip helped the major market indexes recover from their mid-week lows and settle back into the confines of the recent trading range. The bulls' victory tour ended on a less-than-convincing note, though, as more negative headlines out of Europe resulted in modest losses on Friday. While Todd Salamone is encouraged that the benchmark indexes are still holding steady above historically significant support levels, he also cites evidence to suggest that we haven't yet seen the last of the market's choppy sideways ride. Rocky White echoes that cautious tone after surveying the latest round of Wall Street sentiment polls. Bearish sentiment is running high, and with just cause -- but Rocky warns that there may still be some panic left to be shaken out of this market. Finally, we wrap up with a few sectors of note, as well as a preview of the major economic and earnings reports for the week ahead.

Notes from the Trading Desk: Will Third-Quarter Earnings Provide a Much-Needed Catalyst?
By Todd Salamone, Senior VP of Research

"While the SPX is still trading above the key 40-month moving average, situated at 1,108, bulls should take note of the lower highs that have occurred on the last two rally attempts... "The only piece of good news... is that the VIX's call/put ratio is approaching extreme lows. A turn higher in the ratio from these levels has been associated with major advances in the equity market on previous occasions. For now, though, bulls should be on guard, as this ratio continues to decline alongside a bearish roll-over in the 20-day combined SPY/QQQ/IWM put/call ratio."
- Monday Morning Outlook, October 1, 2011

"The hedge-fund industry just had its fourth-worst quarter on record, according to one industry watcher. Hedge funds lost 5.5% in the quarter, according to Hedge Fund Research Inc., 'trailing only the third and fourth quarters of 2008 and the third quarter of 1998.'"
- The Wall Street Journal's MarketBeat blog, October 7, 2011

Bulls got quite the scare last week, as major benchmarks we follow -- including the S&P 500 Index (SPX - 1,155.46), S&P 400 MidCap Index (MID -799.18), and Russell 2000 Index (RUT - 656.21) -- fell below major areas of potential support that we have been highlighting over the past few weeks. These levels are as follows:


SPX 1,100: Site of its 40-month moving average, a round number, and a 38.2% Fibonacci retracement of the March 2009 low and May 2011 peak.
MID 768-800: 768 is its 80-month moving average, and 800 is double the 2009 low.
RUT 650: Resistance in 2004 and support before Lehman Brothers collapsed in 2008.

Moreover, a benchmark we haven't discussed like the others above is the Dow Jones Industrial Average (DJIA - 11,103.12), which fell below the 11,000 millennium mark. The 11,000 area marked resistance from May 1999 through May 2001 before a bear market took hold, and resumed its role as resistance in 2005 and ahead of the "flash crash" in 2010.

After the above levels were broken, it was a "sell now, ask questions later" mentality on the "risky" small- and mid-cap stocks, as the RUT traded 7.6% lower after 650 was broken, and the MID shed 8.8% after 800 gave way to the bears. Likewise, after 11,000 on the DJIA was breached, it led to an additional 6% haircut.

But equally impressive was the rebound rally that quickly carried these benchmarks back above their respective levels of support within only a couple of days, and back into the range that has been in place since early August. While the sell-off was sharp and quick, we found the respective lows last week to be of interest.

For example, the RUT bottomed near 600. This area carries significance in that:

It is double the low at the height of the Russian ruble and Long-Term Capital Management crisis in 1998;
It was a resistance area in March 2000, and again in 2003-2004;
It is a 50% retracement of the March 2009 low and May 2011 peak; and
600 corresponds with the 60 level on the iShares Russell 2000 Index (IWM) exchange-traded fund (ETF), which is 1/10 the value of the RUT. The 60 strike was the last area of significant put open interest in the October series, and the glut of put contracts at this strike -- and immediately above -- may have accelerated the RUT's downside move, due to delta-hedge selling.


Meanwhile, SPX 1,100 was barely penetrated, as the index traded near 1,075 at its lows last week. The MID bottomed at 731, which was also a low in January 2008, and experienced only one daily close below its important 80-month moving average last week.


So, while it was quite the scare for bulls early last week, benchmark equity indexes continue to cling to longer-term levels of support. However, equally important resistance areas lie just overhead, creating a range-bound environment. Potential near-term catalysts that could move the market out of this range are third-quarter earnings, which get underway next week, and a European Union summit in two weeks.

We found the 5.5% loss that hedge funds experienced in the third quarter as an interesting statistic. On one hand, the third-quarter loss could be a disappointment to those investing cash in strategies that can make money in difficult environments, due to the wide range of strategies and assets available for hedge fund managers to utilize. On the other hand, the 5.5% loss was much better than the 14% loss that the SPX encountered.

With the hedge fund industry's more than $2 trillion in assets, another potential conclusion is that their net exposure to U.S. equities is low, given how correlations among stocks rose during the quarter. Other potential takeaways from the third-quarter performance is that they are investing in other assets, such as currencies, gold, silver, and other commodities, and/or have an above-average short position to offset long equity positions. This is something we have been noting for weeks via our analysis of the options markets, and we still feel that hedge fund managers could dictate the next directional move in the market.

While we did see the buy-to-open call/put ratio on the CBOE Market Volatility Index (VIX - 36.20) tick a little bit higher last week, suggesting some fund managers may be dipping their toes back into the market, the put/call ratio on major equity-based ETFs we follow is still mired in a decline. This suggests rallies will continue to be sold by some fund managers, thereby heightening the odds of a continued sideways chop.


Our advice from last week hasn't changed. That is: Keep tight stops on your long equity positions -- especially those in the consumer-discretionary area, as we are seeing some breakdowns among former leaders in this group. Large-cap banks continue to be the biggest area of vulnerability, and these are names to consider if you are actively shorting. Treasury bonds should remain in your portfolio, and utilities are a sector worth adding, given the attractive dividend yields, strong price action, and the low percentage of "buy" ratings from analysts, hinting at future upgrade potential.

Indicator of the Week: Scanning the Various Sentiment Polls
By Rocky White, Senior Quantitative Analyst

Foreword: As experts on sentiment analysis, we track a whole host of sentiment polls. This week, we'll take a look at a few of these surveys, compare their methodologies, and see what they're telling us about how investors feel right now. Keep in mind that, as contrarians, we consider high levels of pessimism to have bullish implications for the market. Negative sentiment signals the presence of sideline money, as well as the potential for quick, big gains when that money begins buying into the market. Of course, the bullish implications are most valuable when the widespread pessimism runs counter to the market's direction.

Investors Intelligence: I've written about the Investors Intelligence (II) poll before. They've been around a long time; we actually have data from them dating back to the early 1960s. To conduct this poll, II gathers various publications on the market and determines their stance. Then, they show the percentage of financial advisers who are bullish, bearish or expecting a correction (i.e., short-term bearish, but longer-term bullish).

Below is a chart of the percentage of bulls and bears from the II poll going back to 2009. It shows the bears are currently at their highest level since the March 2009 bottom. Accordingly, the bulls are low -- but the percentage was actually lower in August 2010. That August pullback in the S&P 500 Index (SPX) was actually a higher low, as the market was up from a month earlier. However, it really freaked out investors, which was a sign that pessimism was rampant and a rally possible.

Again, we like the pessimism that is evident in the latest II poll -- but at the time the survey was conducted, the market was hitting fresh lows. So, that diminishes the bullish implications.


AAII: AAII stands for the American Association of Individual Investors. Each week, they ask their membership where they think the market is heading in the next six months. Then, they group those responses into three categories -- bullish, bearish, and neutral -- and report the percentage for each.

As you can see from the chart below, this poll is a lot more volatile than the II poll. That makes sense, as those who actually publish their market outlooks would probably be more stubborn about changing their opinion than those who are informally asked every week, "Where are we headed?" In fact, the poll was so volatile from about April 2009 through mid-2010 that it was nearly useless. In late 2010, the bulls climbed to pretty high levels, while the bears fell to very low levels. The market still had some room to the upside at that point, and continued to rise through February 2011. After that, the SPX pulled back significantly and became quite choppy. The index then hit an annual high in May, and we're down significantly since then. Currently, the bears are at a pretty high level, but the bulls are not at their annual lows, and are actually rising.


NAAIM: This is a newer survey, which has data going back to only July 2006. NAAIM stands for the National Association of Active Investment Managers. What sets this poll apart from the rest is that this poll does not simply ask, "Are you bullish or bearish?", but instead asks money managers how their money is actually positioned in the market. They can answer anywhere from -200 (leveraged short) to +200 (leveraged long). This is valuable information, because the fundamental goal of our sentiment analysis is to see where money is positioned. Is it all crowded into the market, or all on the sidelines (or somewhere in between)? This poll asks that direct question.

There are some drawbacks to this poll, which NAAIM acknowledges on their site. For starters, it's not easy for some money managers to sum up their position in one simple number. Also, the sample size for this poll is growing, but it's not very big as of right now.

That being said, below is the chart of the NAAIM survey. It is currently at its lowest reading of all time, and is negative for just the second time ever (the first time was in October 2008, around the peak of the financial crisis). This suggests that money managers are short the market -- so any positive news that comes out, or any signs of life in the market, could spark a fast and furious short-covering rally.


Implications: Each of the polls I mentioned above is showing significant pessimism at the moment. This is to be expected, with the SPX down almost 15% since July. A positive catalyst could change the hearts of these bears, and the market could make a significant move higher. However, the overall price trend is lower, which diminishes the contrarian bullish connotations of the polls. Also, as far as the II and AAII polls go -- while bearish, they're still not as bearish as they were at the March 2009 bottom. This suggests panic could still lead to climactic selling, and another substantial decline.

This Week's Key Events: Alcoa Earnings, Fed Minutes on Deck
Schaeffer's Editorial Staff

Here is a brief list of some of the key events this week. All earnings dates listed below are tentative and subject to change. Please check with each company's respective website for official reporting dates.

Monday

The economic calendar is bare on Monday, as government offices are closed in honor of Columbus Day. Mistras Group (MG) headlines a quiet day on the earnings front.

Tuesday

On Tuesday, the central bank will take the spotlight, with the release of the Federal Open Market Committee's (FOMC) latest meeting minutes on tap. Earnings season unofficially kicks off with Alcoa's (AA) post-close report, with quarterly results also expected from Joe's Jeans (JOEZ), Synergetics USA (SURG), and WD-40 Co. (WDFC).

Wednesday

The weekly MBA mortgage index is the only report of note on Wednesday, but Fed officials Charles Plosser and Sandra Pianalto are both scheduled to deliver speeches. Earnings are expected from PepsiCo (PEP), Adtran Inc. (ADTN), Infosys (INFY), ASML Holding (ASML), and Host Hotels and Resorts (HST).

Thursday

Thursday's calendar includes the August trade balance, the Treasury budget, and the weekly report on jobless claims, as well as the government's holiday-delayed crude inventories update. Google (GOOG), JPMorgan Chase (JPM), Fastenal (FAST), Lindsay Corp. (LNN), Safeway (SWY), and Fairchild Semiconductor (FCS) will share the earnings stage.

Friday

The week wraps up with a flurry of economic data, as September retail sales, import/export prices, August business inventories, and the preliminary Reuters/UMich consumer sentiment index for October are all scheduled to hit the Street. The earnings calendar concludes with reports from Mattel (MAT) and Webster Financial Corp. (WBS).

And now a few sectors of note...

Dissecting The Sectors
Sector Utilities
Bullish
Outlook: The utility sector is often preceded by its "defensive" reputation, and it has indeed emerged as a pocket of technical strength, even amid the recent broad-market turmoil. The PHLX Utility Sector Index (UTY) pulled back this past week, but rebounded after finding support at its 200-day moving average. In fact, the electric utility group currently boasts the highest percentage of stocks trading above their 200-day moving averages among all sectors we follow, at 58%. Plus, the sector sports some attractive dividend yields, which are certainly a selling point in the context of a tumultuous market environment. However, Wall Street hasn't exactly jumped on the bullish bandwagon just yet. Electricity stocks have attracted only 38% "buy" ratings from brokerage firms, which is one of the most bearish ratings configurations around right now. Within the group, Duke Energy (DUK) and Consolidated Edison (ED) have racked up double-digit percentage gains in 2011, and both stocks have recently tagged new annual highs. Nevertheless, there's not a single "buy" endorsement between the two. Going forward, a round of well-deserved upgrades could draw a fresh wave of buyers to the table, helping these stocks extend their positive price action.

Sector Leisure/Retail
Bullish
Outlook: The SPDR S&P Retail ETF (XRT) remains in technical limbo on the charts, with the fund hovering between familiar support and resistance levels. XRT closed last week beneath the round-number $50 level and its year-to-date breakeven at $48.36, but wrapped up the month of September just north of support in the $45 region -- which previously served as resistance in 2007 and 2010, and is currently home to major put open interest of more than 35,000 contracts in the October series. Despite the technical stagnation here, we remain upbeat on select outperformers within the group, and recommend focusing on stocks in solid technical uptrends that are surrounded by skepticism. Amazon.com (AMZN) is one such example, with the shares up nearly 25% year-to-date -- despite a 45% surge in short interest over the course of the past month. Whole Foods Market (WFM) also holds contrarian appeal, as the stock has enjoyed a years-long uptrend atop the support of its 10-month moving average. With WFM attracting a significant amount of speculative put buying in recent weeks, there could be some skepticism yet to unwind toward this technical standout. Heavily shorted Sturm Ruger (RGR) is another one to watch, after the stock last week found support near former resistance at the $25 level. As these high-flying discretionary names continue to outperform on the charts, a capitulation by the skeptics could provide an influx of buying pressure.

Sector Large-Cap Tech
Bearish
Outlook: From a broad perspective, the tech-rich Nasdaq Composite (COMP) now seems to be struggling with resistance in the 2,500 area, shortly after the index suffered a rejection at the formerly supportive 2,600 level. In similar fashion, the PowerShares QQQ Trust (QQQ) spiraled lower after an unsuccessful late-July test of the $60 level -- which represents exactly half its all-time high of $120, set back in March 2000. Within the tech sector, semiconductor stocks are among the more notable laggards, as analysts remain surprisingly upbeat on this underperforming group. The percentage of "buy" ratings on components of the Semiconductor HOLDRS Trust (SMH) peaked at 58.2% in late July, hitting its highest level since May 2010, and remains at an elevated 57.0%. Meanwhile, the percentage of "sells" is resting near an annual low, at 5.4%. In fact, a few upbeat analysts have recently flagged the poor price action in chip stocks as a buying opportunity. However, with a seemingly endless string of semiconductor names slashing their financial guidance in the face of sluggish demand trends, the outlook for this struggling group seems unlikely to improve anytime soon. With SMH faring even worse than the broader QQQ in 2011, the semiconductor sector as a whole could be vulnerable to a shift in sentiment toward the bearish end of the spectrum as the weak technical performance continues.

Sector Financials
Bearish
Outlook: Bad news continues to roll in for the banking sector, with credit default swap (CDS) costs soaring this past week amid ramped-up concerns over a potential European debt contagion. In fact, CDS costs for Morgan Stanley (MS) and Goldman Sachs (GS) jumped to their highest point since the October 2008 financial crisis. Nevertheless, analysts continue to hold these troubled stocks in high regard. Among sector heavyweights MS, GS, Bank of America (BAC), JPMorgan Chase (JPM), Citigroup (C), and Wells Fargo (WFC), Zacks reports a total of 66% "buy" ratings from brokerage firms -- despite the fact that these six stocks have averaged a year-to-date loss of 40.8%. Taking a broader look at the group, the technical backdrop for the Financial Select Sector SPDR (XLF) remains bearish, with the fund sitting on a steep year-to-date decline of nearly 26%. XLF tumbled lower in late August after an unsuccessful test of the $13.50 level, which previously served as major support during 2010. Going forward, this area could prove to be a troublesome resistance level. XLF is also now lingering near a few other crucial technical areas, including $11.76 (double its 2009 low) and $11.62 (a 50% retracement of the 2009 low and 2011 high). Going forward, a breach of these levels could spell serious trouble for financial stocks.

Prepare for the investing week ahead. Every week, Bernie Schaeffer and his staff provide you with their insight about what has happened and, more importantly, what will happen in the market. We dig deep and show you what's happening behind the scenes, and tell you which indicators are predicting major market moves. If you enjoyed this week's edition of Monday Morning Outlook, sign up here for free weekly delivery straight to your inbox.


icon url

ReturntoSender

10/09/11 11:47 AM

#9543 RE: ReturntoSender #6755

InvestmentHouse Weekend Market Summary

http://www.investmenthouse.com/weekendmarketsummary.htm

- Jobs report revs up stocks . . . for a few minutes.
- Jobs report headline is better but the return of striking workers, rising overall unemployed, and the failure to keep up with population growth stall the stock advance.
- Stocks rally then give it back, but no collapse.
- Spending bill raises taxes but not just on those with million dollar annual salaries.
- Europe still a problem as Fitch cuts Spain and Italy.
- Consumer Credit falls the most in 16 months. Looking for a holiday season savior.
- Some solid leaders look spent as others, e.g. chips, try to step in and yet others form nice bottoms.
- Bullish advisors fall below 35%.
- Market in the in between zone: will it test and continue or roll?

Jobs report heralded as improved but the market doesn't necessarily buy it.

Friday was all about the jobs report. The market was up three days in a row (Tuesday, Wednesday, and Thursday), following that nice reversal session. SP500 broke below the range and then sold off further on Tuesday and reversed. Classic textbook move. It put in a very nice run right up to the middle of the range or thereabouts.

On Friday everyone was focused on the jobs report. It was better than expected. Nonfarm payrolls came in at 103K when just 60K were expected. For August it was 0 originally, but it was revised higher to 57K. Indeed, over the prior two months, there was a 99K upside revision. That was quite a nice boost for futures. When the news came out, the SPY jumped nicely. That is fantastic.

We actually had a little traction, but then the market started thinking about it some. What was it thinking about? 45K of those 103K were telecom strikers from VZ returning back to work. You take those out, and you are in line at 60K. But there was the 57K revision, and that is a nice boost. Even the private numbers were better. They came in at 137K versus the 83K prior, and that was revised up from 17K. We had some positive traction, and moreover, the average workweek bumped up to 34.3 from 34.2. But investors found fault even here. They saw that it was just getting back to the level it gave up a couple of months prior. Not good action. It is not really what you want to see, but it is improvement. You just have to take what you can get.

But here is the real rub or maybe there are two rubs. The long term unemployed came in at 6.2M. That is up 200K. Those are the ones who have been unemployed for six months or longer. Then there was also the bad news of the underemployed, what they call the U6 number. That is the total unemployed people who do not have jobs, who may have fallen off the jobless claim rolls, and those who are underemployed. That rose to 16.5% of our jobs pool from 16.2%. That is not good. We have more people underemployed or unemployed. We are not keeping up with population growth, and we are not keeping up at a rate that would lower unemployment.

Indeed, in order to reduce the unemployment rate to 8% over the next year, we would have to create something on the order of 275K jobs a month. It can be done, but it is something that all of the prior stimulus money did not do. I can guarantee you that this $400-500B that the President is touting "pass the bill" will not do that either. It cannot do it. There are some unsavory things in this bill, and just like the healthcare bill, no one read it. Now they are reading, thank goodness. Congress is not doing anything with this. Harry Reid knows he cannot pass it right now, so he will not put it up for a vote. Of course Republicans are getting blamed for that. They are getting blamed for Harry Reid not being able to get enough Democratic senators lined up with him.

There are some nasty things in the bill. One of them being that we start losing deductions for as little as a $125K salary and I am not talking single. That is joint income. Greater than $125K aggregate income and they start stripping away deductions from your income tax. That is called raising your taxes, so you are being lied to. They say they will pay for it just by taxing people who make One million dollars a year or more, but that is BS. Go ahead and read it. Understand it and then tell people what you know. It will not fill the gap, and the President probability knows that. He is probably banking on it not passing so he can blame the other side. As he said on Thursday, he will run against a "do-nothing Congress." Of course that means the Republicans. You gotta love politics.

THE NEWS/ECONOMY

There were several other reports out as well. Wholesale Inventories were down a bit more than expected, but nothing major. Consumer credit was down 9.5B, and it was expected to rise 7B. That is the largest decline in consumer credit in 16 months. It was for August, and September was a bit better looking at Same Store Sales. There is some hope that things are improving. This week KSS said it would hire 40K seasonal workers. That is a big help. There is a lot of fear that the holiday season er, Christmas season is not going to be that strong. Hopefully everyone will decide to go ahead and buy, and then the retailers will need to stock their shelves.

Europe was still in the news, but it was somewhat quiet during the session. It was just the general idea that Europe would do what was necessary. During the session, Fitch downgraded Spain and Italy. After hours there was more activity. I think Belgium was being downgraded by Moody's. So there is a lot going on with Europe, and it may impact what is happening next week. It always seems to be something that is considered, no doubt.

The jobs report was a bit better. You will hear touting and crowing about it, but it is still pathetic. It still means we are net losers when it comes to the unemployment rate. We cannot keep up with population growth, and therefore we cannot reduce the unemployment rate. We are in a bad situation. We are supposedly in a recovering economy, yet we cannot create any jobs. People are saying that this number proves we will avoid recession. The problem is employment lags behind the economy. If we have this little bump in the employment report, you can say, it is improving. But what has happened overall in the past couple of months? The economic data has bounced. It was in a straight decline, but now it has bounced. What has happened? After employment went down, it was really ugly again. Initial jobless claims bounced a bit last week and the week before, and we have had the jobs report come back a bit. It has followed the improvement in the economic data. ECRI says we will have a recession, so we expect the other reports to start turning back down. When that happens, the jobs report will follow it as well.

The Friday Action.

The futures bounced higher on the news, but as the day wore on they gave up and turned negative. They bounced back to positive late in the day, but then rolled over once more. Investors could not make up their minds what they wanted to do ahead of the weekend. That makes some sense given that the market rallied for about three and a half days and then decided to cave in.

It was not a total collapse. Yes, the indices closed lower, but this could just be a test in an otherwise continuing run up the trading range. We have seen it before. Looking back in mid-August when the market started to rally off those lows, there were a couple of days to the upside, then a pause, and then three or four more days upside before it rolled back down. This is not unusual. We will not say this automatically means a rollover. But when you look at some of the indices, they do not necessarily look that great.

NASDAQ is holding at the 10 day EMA. It can pull it off and make another bounce as well. Maybe the Dow can. It went up and showed a doji on the session. The last time it did that at the peak, it sold off. We will see what comes out of this. It is not a done deal that the rally will continue, but it is not a done deal that it will roll over either. It is in the in between area. It will just have to show us what it wants to do. We played some downside today. We bolstered some downside positions because we wanted good representation if this r thing rolls back over. It is hard to move into upside plays, but I see a few out there in case it continues to move higher. Some stocks have already tested for a day or two. They were early leaders, and they are coming back to test. If they put in another test Tuesday and Wednesday, we could have some nice plays to the upside if this proves to be just a little pullback in an otherwise continuing bounce toward the upside peak of the range

SP500, -0.8%; NASDAQ, -1.1%; Dow, -0.2%; SP600, -2.5%; SOX, +0.44%.

OTHER MARKETS

Dollar: 1.338 versus 1.3429 euro. The dollar scored a gain to end the week in an otherwise down week. A nice reach lower to the 20 day EMA, and a recovery to hold the 10 day EMA support. This is exactly what you would expect to see in a continuing uptrend. The dollar is behaving very well, looking like it wants to continue to the upside.
Click to view the chart

Bonds: 2.06% versus 1.99% 10 year U.S. Treasury. Bonds struggled again with the 10 year falling sharply. But the long end is holding at the 20 day EMA and a nice doji. A perfectly natural, nice uptrend. We will see if it can bounce off and continue. Down for the week. There was some better news out of Europe and people kind of felt that Europe was getting things under control. Now comes the lick log. Will bonds bounce back up on some fear? That would likely mean a downturn in stocks as well. We will see. It is set up to do exactly that.
Click to view the chart

Gold: 1635.50, -17.70. Gold was down a little on the day. It has spent the last two weeks basing after that big selloff in mid-September. It has been bouncing around in a narrow range between 1650 and 1600. Looks like it will continue to do that for awhile until it can finish the base, get buyers behind it once more, and move to the upside.
Click to view the chart

Oil: 82.79, +0.20. Virtually flat, but it was up 4.5% on the week. A very good week for oil as it rebounded off the lows. It is now back above 80 and hanging on in that trading range between 80-90. It banged around there all through August and September before it broke lower to start October. Oil is still struggling. It will struggle as long as there is a perception that the world economies are struggling. For now that seems to be the perception that is holding.
Click to view the chart

TECHNICAL SUMMARY

INTERNALS.

The internals were somewhat quiet on the day.

Volume. Volume fell 7% on NASDAQ to 2B shares. It declined 3% on the NYSE to just over 1B shares.

Breadth. Decliners led 3:1 on the NASDAQ and decliners led 2.2:1 on the NYSE. Not a lot of excitement in the internals, but a lot of the fireworks already occurred when the market was selling off and we saw new lows in the thousands on the NYSE.

CHARTS

SP500. SP500 moved higher and reversed. It closed off the low, but it was in the lower half of the range for the day. It tapped the 10 day EMA on the low. It is holding above the August and September interim lows. It looks pretty good. Just taking a day off on lower volume right at the 10 day EMA. It is in the lower half of the range. It still has to prove that it can move up, but it could easily bounce to 1180. 1180-1200 is resistance, and the top of the range is near 1220-1227, that November 2010 peak. It is getting further into the distance, but it is still there and holding SP500 in check. Nonetheless, it has room to run to the upside. That is the point. The question is will it make that run, or will it roll over? We have a downside SPY play waiting in the wings. We are just following it higher to see if it is going to turn over and give us a downside play that we can take advantage of.

NASDAQ. NASDAQ showed very similar action. It tapped the 10 day EMA on its low as well, and then it rebounded off the lows of the session. Still holding in the middle of the range and still in good position to move higher. Very similar to SP500. It could just be a pause. It may want to take another day or two to rest and then make a break back to the upside. It has happened before on NASDAQ back in mid-August in that rally. It just took a day off and then continued to the upside.

SP600. The small caps took it the hardest. They tend to do that given the market we live in and the economy we live in. They fell right back down, but they also held near the 10 day EMA and above the bottom of the prior range before this breakdown and reversal last week. They are in good shape. They can make a bounce higher just as the other indices are. It is just at that decision point. Are they going to track higher to the top of the range or not?

SOX. The semiconductors enjoyed a positive day with that 0.44% gain. Of course they gave away a lot at the end. They rallied up to that resistance I talked about on Thursday at 360, and they tapped at the 50 day EMA. That also puts them at the gap point from mid-September, the peak from late-august, and the peak from mid-August. They ran right into that and showed a doji. That is not good. The stocks have moved four or five days to the upside. They may be winded, and we will see how winded they are. If they reverse, that is not good news. It sold off the last time it showed this kind of tombstone or evening star doji. It is showing one now, and it also showed one back in mid-September. This is a signal in a weak market that tends to point to a pullback. We will see how far it wants to pull back.

In sum, the indices are not in bad shape. They just took a day off after a good reversal and rally last week. The thing is, there are a lot of stocks that look ready to fall good name stocks. We have to be a bit concerned about what we have, but we are willing to give it the benefit of the doubt. We took positions to the downside mostly on Friday. I just want to be a bit more in place for some downside in case it comes. Maybe we have too many, but you want to be ready to make the play if they show you the move,

LEADERSHIP

Many stocks look like they are in position to roll back over. There are some strong stocks that just have the look of being somewhat weak. I will run through some in no particular order. These are stocks that have very high earnings growth rates right now compared to the rest of the market, and they are struggling. HUM has rallied back up to the 200 day EMA, and it looks like it wants to turn over. MA is up to the 50 day EMA, and it wants to break down. It broke through some support, and it looks like it might want to turn over and continue selling. In energy, CLB looks like it wants to go lower. We have been playing IOC, and it looks like it is trying to turn back over as well.

There are some great stocks that have done really well in the past. HLF has a bear flag extraordinaire. Quite a good stock, but it is in a bit of trouble. Kind of hard to find upside stocks in position to buy.

Semiconductors. SLAB has bounced to the upside. KLAC as bounced nicely to the upside. Many of these stocks have rallied. BRCM rallied, but now it is showing a tombstone or an evening star doji. It could turn back over and thus are not currently in a great buy position.

Others outside the chips are getting there, and maybe there is some improvement. WIRE is in manufacturing. It has broken higher and is now testing. Maybe it can put something together. TYL broke its trendline and is coming back to test. Maybe something can set up there as well. EGOV has formed a nice rounded bottom and it broke higher. Maybe it has a handle forming. CTXS is an old favorite. It is forming a rounded bottom, and maybe it can make a break. There are even some financials. STT has a rounded bottom that is trying to form as well. It is not definitive, but MACD is rising so there may be something here after all. In short, there may be some leadership coming from different areas to bolster what the semiconductors did this week. That would be great for the market.

Technology. This is traditionally a time for techs to rally, but some of the big names are struggling. AAPL is struggling after Steve Jobs' death. GOOG looks to be struggling near term as well. It has come up and formed a bear flag. If you are just trading it, it looks like it is working on some trouble. Longer term, after the huge gain, it is trying to form up a new pattern that is overall bullish. It is something of a triangle. That is why I always look at things on a weekly basis. It has a rally, this consolidation, higher lows, a constant top, and a little ascending triangle. After a pullback off of this recent move, it might be worth a play to the upside to try to capture a run to the top of the range. That is longer-term thinking. You have to think both short term and long term if you are going to make money in the market. We have the stock in position to move higher, but it has to come back after this bounce and perhaps give us a higher low. Then it can start back up to give us an entry point.

There are possibilities out here. Near term, a lot of stocks are overbought thanks to the bounce. A little rest, a little test, and a higher low after two or three days of testing and resting would have them ready to move back to the upside. They could provide upside entry points. This bounce got up quickly, and you did not want to chase it. There will be more plays if there is a test that makes a higher low on these good stocks that rallied to the upside, and if they give back a little bit of ground but continue to set up and form good pattern as they make the next break to the upside. Then we will have upside buys. We just have to see which way the market will handle the overall bounce.

THE MARKET

SENTIMENT INDICATORS

VIX. The VIX pulled back as the market rallied this week, but it has come back to sit right at the top trendline of its triangle and right over the 50 day EMA. As with bonds, the VIX is primed for a bounce higher. That would mean that stocks fall. We will see how it turns out. Stocks are in that in between range. They have bounced off the lows, and now what will they do? You could cut the intrigue with a knife.

VIX: 36.2; -0.07
VXN: 37.08; -0.24
VXO: 36.88; -0.29

Put/Call Ratio (CBOE): 1.16; -0.1

Bulls versus Bears:

This is a reading of the number of bullish investment advisors versus bearish advisors. The reason you look at this is that it gives you an idea of how bullish investors are. If they are too bullish then everyone is in the market and it is heading for a top: if everyone wants to be in the market, then all the money is in and there is no more new cash to drive it higher. On the other side of the spectrum if there are a lot of bears then there is a lot of cash on the sideline, and as the market rallies it drags that cash in as the bears give in. That cash provides the market the fuel to move higher. If bears are low it is the same as a lot of bulls: everyone is in and the market does not have the cash to drive it higher.

Bulls: 34.4% versus 37.6%. After pausing a weak bulls fell below the important 35% level suggesting a bullish climate for stocks. Fourth week the bulls are below bears and the gap is widening. A powerful sentiment signal. Solid move lower from 49.5% in late July. Highs from April and December (60% readings spanning December through early May 2011). The 5 year high is 62.0. The crossover level at 29% bulls from July 2010 is long gone. 35% is the threshold level suggesting bullishness. To be seriously bearish it needs to get up to the 60% to 65% level.

Bears: 45.2% versus 40.9%. Spiking higher and well above the bulls and the 35% level considered bullish for the market. Fourth week of bears over bulls and six weeks over the 35% threshold considered a bullish indicator and have made that important crossover of bulls. For more reference, bearishness hit a 5 year high at 54.4% the last week of October 2008. The move over 50 took bearish sentiment to its highest level since 1995. Extreme negative sentiment. Prior levels for comparison: Bearishness peaked at 37.4% in September 2007. It topped the June 2006 peak (36%) on that run. That June peak eclipsed the March 2006 high (33%) and well above the 2005 highs that spawned new rallies (30% in May 2005, 29.2% in October 2005). That was a huge turn, unlike any seen in recent history.

NASDAQ

Stats: -27.47 points (-1.1%) to close at 2479.35
Volume: 2.077B (-6.94%)

Up Volume: 487.75M (-1.502B)
Down Volume: 1.59B (+1.338B)

A/D and Hi/Lo: Decliners led 3.15 to 1
Previous Session: Advancers led 3.31 to 1

New Highs: 9 (0)
New Lows: 59 (+10)

NASDAQ CHART: Click to view the chart

NASDAQ 100 CHART: Click to view the chart

SOX CHART: Click to view the chart

SP500/NYSE

Stats: -9.51 points (-0.82%) to close at 1155.46
NYSE Volume: 1.066B (+3.29%)

Up Volume: 923.68M (-3.816B)
Down Volume: 3.95B (+3.662B)

A/D and Hi/Lo: Decliners led 2.2 to 1
Previous Session: Advancers led 4.76 to 1

New Highs: 31 (+1)
New Lows: 38 (+9)

SP500 CHART: Click to view the chart

SP600 Chart: Click to view the chart

DJ30

Stats: -20.21 points (-0.18%) to close at 11103.12
Volume DJ30: 188M shares Friday versus 190M shares Thursday.

DJ30 CHART: Click to view the chart

MONDAY

How is the market going to bounce? How will it handle the success it has had? We will see what kind of data comes out. Again, after hours there was a problem. There were some cuts in other European entities. I do not know if Belgium will be an earth-moving situation, but it underscores that there are problems even though everyone felt that the ECB and EU were taking the steps needed to start grappling with the problem. After all this time, it is amazing that they are still talking about getting them to grapple with the problem versus actually doing something.

On Tuesday we have the FOMC minutes. Thursday brings initial jobless claims, and those are always big news now. We have the Treasury budget. Friday brings Retail Sales, and that is important. Import and export prices are important as well. There is Michigan Sentiment. We always want to see how the people in Michigan feel.

The big story will be a lot of earnings. It is that time of the year. We have people preparing for the holidays, and we have the preparation for what is typically a run toward the end of the year by stocks. Chips have made good moves this past week. If they test and hold, they could continue higher. We will start seeing earnings. We have had a bounce into earnings. Overall the market is still oversold. It is in its trading range, but I am not convinced it will be able to move higher. We cannot trust our guts. We just watch to see what a lot of stocks are doing. Some good stocks that have been market leaders have are struggling right now, and they are in trouble. We will see how much they can test, holding onto the moves they made this week. Then we will see if it can break back to the upside.

Earnings will play a role. We have had both positive and negative warnings. The rubber will meet the road starting this week. We will see who is still doing well and who is struggling. I think there will be some more struggling, but we have not had a huge number of warnings. There are some key warnings from the likes of FDX and LOW, but not an overwhelming number of warnings.

Earnings will play a role, and Europe will continue to play a role. Then we also have some bickering here in the U.S. There will be a lot of talk about the jobs numbers and what they mean. That will be vis-a-vis the jobs bill that the President wants passed. I call it a "jobs" bill, but I am merely being tongue-in-cheek. It is nothing more than another spending bill. It is a wish list for the people who will get what they want in other words, the FOB (friends of Obama). Those who pay the bills will not get what they want because they will have to pay MORE of the bills. $125K income earners will have to give up some deductions. You can read more about that.

The market has those same problems to deal with. Earnings, Europe, and our own economic issues. So far they have been handling it with aplomb. Yes, they have sold off in July and August, but they have held in the range and broke back higher after selling off and breaking the range. Now we are at the old lick log point. What will happen? Will it continue higher or will it turn back over?

If I was going to bet just for the heck of it, I would bet we test a bit and go higher. If we pull back and it looks like we are going to hold maybe SP500 comes down to 1140 or so and holds we may have to close some of our downside positions. If that is the case, we will get the break higher. There are a lot of stocks in great risk/reward positions to the downside, so we are picking up plays on them. We will look at more plays again for next week in the event that this rolls back over, but we will also pick up some upside plays.

There is not a lot out there for us to play based upon the rally this past week. A lot of stocks are overbought and at the top of their range. There are several stocks that are forming rounded bottoms and have not made their move yet. The semiconductors have rallied to the upside and may just need to pull back a bit, make a higher low, and then try to break out of their range. It can be done. You cannot presume or assume one particular direction in the market.

We have had a bounce and we are back in the range. Are the sellers going to run or will the buyers? We are in a range, and it could go either way. If we get a little pullback that does not break lower, we can close out some downside and be ready for an upside break. A lot of breaks that are overbought right now will set up for a continuation move inside their range.

It is just that kind of market right now. We are back in the range. That is good, I suppose; we have been doing pretty well in that range. We took a lot of gain this week playing that range. It also means that you have to be careful. There is always that one out of left field, and we could have a rollover as the false breakdown becomes a false recovery. We will just watch how the stocks set up. They will start telling us what is happening. If we get a nice, gentle pullback again, then we start looking to the upside. That means we have to button up the downside and get ready for a bounce up toward the top of the range. Again, since we are still in the range, it is just a bounce until it proves otherwise. Consider reading up on some of the things I talked about. You will be surprised at what you find in these bills that people are finally taking the time to read.

Have a great weekend!

Support and Resistance

NASDAQ: Closed at 2479.35
Resistance:
2512 is last week's gap down point
2532 is the early August gap down point
The 50 day EMA at 2537
2540 is the early November 2010 lower gap point
2546 is the early September 2011 gap down point
2555 is the mid-August 2011 peak
2569 is the November gap up point through the April 2010 peak
2580 is the November 2010 closing high
2593 is the November intraday high
2599 is the June 2011 low
2603 is the March 2011 intraday low (post-Japan low)
2612 is the late August 2011 peak
2645-2650ish from December 2010 consolidation
2676 is the January 2010 low
2686 is the January 2011 closing low
The 200 day SMA at 2695
2706 to 2705 is the April 2011 low and the February 2011 and consolidation low (bottom of the trading range) 2723 to 2705 is the range of support at the bottom of the January to May trading range
2759 is the May low
2762 is the February low
2796 is the February gap down point
2816 is the early April peak.
2825 is the 2007 closing peak.
2841 is the February 2011 peak
2862 is the 2007 peak
2879 is the July 2011 peak
2888 is the May 2011 peak

Support:
2469 is the November 2010 low
2331 from October 2010 low and the August 2011 intraday low
2305 from the August 2010 peak (summertime base)
2139 is the May and June 2010 low
2123 is the August 2010 gap down point
2100 from the August 2010 lows

S&P 500: Closed at 1155.46
Resistance:
1178-1180 is the October 2010/November 2010 consolidation low
The 50 day EMA at 1188
1196 is the November 2010 consolidation peak
1209 is the mid-August 2011 high
1220 is the April 2010 peak
1227 is the November 2010 peak
1231 is the late August 2011 peak
1234 is the August 2011 low
1235 is the mid-December 2010 consolidation low
1249 is the March 2011 low (post-Japan)
1255 is the late December 2010 consolidation range
1275 is the January 2010 low, early January 2011 peak
The 200 day SMA at 1277
1295 to 1294 is the April 2011 low and the February 2011 consolidation low (bottom of the trading range)
1313 from the August 2008 interim peak
1318.51 is the May low
1325-27 is the March 2008 closing low and the May 2006 peak.
1332 is the early March peak
1340 is the early April 2011 peak
1344 is the February 2011 peak is being challenged again
1357 is the July 2011 peak
1364 is the March 2007 low
1370 is the August 2007 low
1371 is the recent May 2011 peak

Support:
1131 - 1127 from August 2010 base peak.
1119 is the early August closing low
1109 is the mid-September 2010 gap up point
1101 is the August 2011 low
1075 is the October 2011 intraday low
1099 from the mid-July interim peak
1090 is the early September 2010 gap up point
1040 from the August 2010 lows and May/June 2010 lows
1011 is the summer 2010 low

Dow: Closed at 11,103.12
Resistance:
11,178 from November 2010
The 50 day EMA at 11,319
11,452 is the November 2010 peak
11,555 is the March low
The August low at 11,700
11,717 is the late August 2011 peak
11,734 from 11-98 peak
11,867 from the August 2009 high and peak on that bounce in the selling.
11,893 from March 2008 closing low
The June low at 11,897 (closing)
The 200 day SMA at 11,970
12,094 is the April 2011 low
12,110 from the March 2007 closing low
12,283 is the March 2011 peak
12,391 is the February 2011 peak
12,876 is the May high
12,754 is the July intraday peak
13,058 from the May 2008 peak on that bounce in the selling

Support:
10,978 is the bottom of the November 2010 consolidation
10,750 from September 2010
10,720 is the August closing low
10,705-710 from January 2010 peak
10,694-700 from August 2010 peak
9938 is the August 2010 low

Economic Calendar

October 3 - Monday
- ISM Index, September (10:00): 51.6 actual versus 50.5 expected, 50.6 prior
- Construction Spending, August (10:00): 1.4% actual versus -0.5% expected, -1.4% prior (revised from -1.3%)
- Auto Sales, September (15:00): 4.1M expected, 3.97M prior
- Truck Sales, September (15:00): 5.5M expected, 5.43M prior

October 4 - Tuesday
- Factory Orders, August (10:00): -0.2% actual versus -0.1% expected, 2.1% prior (revised from 2.4%)

October 5 - Wednesday
- MBA Mortgage Index, 10/01 (7:00): -4.3% actual versus +9.3% prior
- Challenger Job Cuts, September (7:30): 211.5% actual versus 47.0% prior
- ADP Employment Change, September (8:15): 91K actual versus 45K expected, 89K prior (revised from 91K)
- ISM Services, September (10:00): 53.0 actual versus 52.8 expected, 53.3 prior
- Crude Inventories, 10/01 (10:30): -4.679M actual versus 1.915M prior

October 6 - Thursday
- Initial Claims, 10/01 (8:30): 401K actual versus 402K expected, 395K prior (revised from 391K)
- Continuing Claims, 09/24 (8:30): 3700K actual versus 3725K expected, 3752K prior (revised from 3729K)

October 7 - Friday
- Nonfarm Payrolls, September (8:30): 103K actual versus 60K expected, 57K prior (revised from 0K)
- Nonfarm Private Payrolls, September (8:30): 137K actual versus 83K expected, 42K prior (revised from 17K)
- Unemployment Rate, September (8:30): 9.1% actual versus 9.1% expected, 9.1% prior
- Hourly Earnings, September (8:30): 0.2% actual versus 0.2% expected, -0.2% prior (revised from -0.1%)
- Average Workweek, September (8:30): 34.3 actual versus 34.2 expected, 34.2 prior
- Wholesale Inventories, August (10:00): 0.4% actual versus 0.5% expected, 0.8% prior
- Consumer Credit, August (15:00): -$9.5B actual versus $7.0B expected, $11.9B prior (revised from $12.0B)

October 11 - Tuesday
- FOMC Minutes, September. 21 (14:00)

October 12 - Wednesday
- MBA Mortgage Index, 10/08 (7:00): -4.3% prior

October 13 - Thursday
- Initial Claims, 10/08 (8:30): 406K expected, 401K prior
- Continuing Claims, 10/01 (8:30): 3700K expected, 3700K prior
- Trade Balance, August (8:30): -$46.1B expected, -$44.8B prior
- Crude Inventories, 10/08 (11:00): -4.679M prior
- Treasury Budget, September (14:00): -$67.0B expected, -$34.6B prior

October 14 - Friday
- Retail Sales, September (8:30): 0.6% expected, 0.0% prior
- Retail Sales ex-auto, September (8:30): 0.3% expected, 0.1% prior
- Export Prices ex-ag., September (8:30): 0.3% prior
- Import Prices ex-oil, September (8:30): 0.2% prior
- Michigan Sentiment, October (9:55): 60.0 expected, 59.4 prior
- Business Inventories, August (10:00): 0.4% expected, 0.4% prior .


icon url

ReturntoSender

10/09/11 2:03 PM

#9544 RE: ReturntoSender #6755

Where's the Bottom? A look back at the October 2002 bottom and the March 2009 bottom. What was being said then and what we should be looking for to help us know when the next bottom forms.

The October 2002 bottom took 31 months to arrive. Even though there was a huge washout heading into the arrival at that bottom financials and banking stocks retained much of there high valuations based on the highs set in early 2000. Unfortunately the BKX was bolstered by beginning of the housing bubble which has in great part led to the economic mess which we are currently well entrenched. A look at a long term monthly chart of the Banking Index (BKX) versus the Semiconductor Index (SOX) overlaying the Volatility Index (VIX) which is often called the FEAR Index as it can be a useful indicator of when the market is forming a bottom amid extremely high reading of the VIX as it generally falls to lower highs even as the market forms lower lows.


When the market really cratered in 2007 - 2008 leading to the market bottom in March of 2009 the cascade downward was led by financial stocks as it became clear that most home loans made leading to the 2007 high were extremely questionable in nature ultimately leading to where we are now; A country with a huge percentage of "Home Owners" underwater on their mortgages with over 16% of the available workforce actually out of work.

You will note that the NASDAQ has actually been in a Bear Market since it originally fell from its lofty perch in March of 2000. You should also note that while the BKX fell to a new low at the March 2009 bottom the NASDAQ did not. Unfortunately the SOX did. How long until we find the next major bottom?


Today the market has the kind of pessimism seen prior to the October 2002 and March 2009 bottoms. However it seems to me that since we are only 6 months from the previous market top that any rally that forms here will be short lived but who knows for sure. If the monthly charts were nearing an RSI of 30 with the kind of pessimism we are currently seeing I would be loading up buying stocks long with all my available cash. Unfortunately I don't believe this will happen for many more months.

Looking above at the monthly charts you can see where we are and where we have been.

I'd like to look back a little closer at the daily charts from October 2002 and March of 2009 and add a little of the commentary that should have helped us see those important market bottoms for what they were when they actually happened.

First the October 2002 bottom which of course did not form until the market had declined for a period of 31 months. I will use a daily six month chart of the S&P 500 overlaying the VIX. Note the importance of volume here in helping to see a bottom was forming. It starts with a single up day of higher volume upside than the previous days down volume. Market bottoms then form with a week and even then a month of higher up volume than the previous month's selling volume as you can see on the NASDAQ chart above.

Here is the October 2002 bottom:

The commentary from Briefing.com one day after the advance began.

http://www.siliconinvestor.com/readmsg.aspx?msgid=18100013

From Briefing.com: General Commentary - Yesterday we noted that the Nasdaq was probing for a bottom near 1100. Based on today's broad-based gains it looks like that floor will hold, and that the index has begun a corrective advance. How long and how far we run will depend on a variety of factors, but if we can build on the gain tomorrow the market will have taken the first steps toward changing the extremely bearish mood on the street.

It's also interesting to note that even though I believe that the Investors Intelligence Poll is the only Poll worth looking at when discussing the chance of an actual bottom forming based on its contrarian value that there were actually more bulls than bears in late September of 2002:

http://www.siliconinvestor.com/readmsg.aspx?msgid=18050079

Sentiment did not show any real surge on Friday. The VIX was up but the VXN (Nasdaq 100) was down. The put/call ratio was up, but it was not screaming. Bullish advisors edged higher to 42.2 while bearish advisors moved up to 34.5; better but not nearly where they would need to be on another bottoming attempt. All in all there is no real concern about the current state of the market or everyone getting out is already out. The latter would be nice for the long term but that is a very positive read of the action.

Calling the 2002 bottom was not easy. Looking back at some of the things I wrote then I am even embarrassed for myself. Zeev was on the Wennerstrom thread at the time projecting a bottom by October 24. It came before that but as we know he was more than close enough. Without further ado here is a chart showing the actually daily action versus the VIX of the S&P 500 in October 2002:


As far as I can tell on the retest in March neither the Investors Intelligence Poll failed to reach a reading of more bears than bulls although a cross over almost happened. In addition an analyst at Briefing.com failed to believe in the ability for the market to rally going forward:

http://www.siliconinvestor.com/readmsg.aspx?msgid=18693635

Briefing.com continues to question tech sector's relative strength given that underlying fundamentals remain soft. Recent evidence suggests that conditions will remain tough for the foreseeable future as companies hold off on IT spending due to uncertainties overseas and the sluggish domestic economy. One explanation we've given for the sector's outperformance stems from fact that 3-yr decline of over 70% has washed out most of the sellers. In other words, if you were going to sell Lucent (LU), PMC-Sierra (PMCS), Siebel Systems (SEBL), etc. there's a good chance you've already done it and moved on.

While lack of sellers may have enabled groups to hold up reasonably well over last couple of months, Briefing.com maintains that investors will need to see more consistent and compelling evidence of a demand recovery if techs are to build on their early year "success." Without growth in end-user demand, sector likely to relinquish its early leadership role.

Robert Walberg


Every major market bottom has similarities while at the same time being completely unique. They can take years to form or happen much more quickly. While I am currently looking for a 90% upside days after what could likely be more months of selling before a true long term bottom forms I will be the first to admit that if the next bottom is anything like the 2002 bottom not many of us will know it is happening until we look way back at it. RtS

How about the March 2009 bottom? A little easier to see I think yet I like most investors did not realize it was the real deal until much later. Forming a major BOTTOM is a process. It is not something that happens overnight. Just because there is ample evidence of a tremendous amount of pessimism does not mean the market cannot go lower.

For instance in 2008 bearishness hit a 5 year high of 54.4% during the last week of October. Most stocks did not BOTTOM until March of 2009 when bearishness had fallen by more than 10% to 44%. There was still a cross over of more bears than bulls but it took nearly 5 months for the BOTTOM to form. Here is the 2009 S&P 500:


The commentary at the bottom in 2009 showed the 90% upside day that ultimately should have told us that the bottom was indeed in place on March 10, 2009:

http://www.siliconinvestor.com/readmsg.aspx?msgid=25483324

Financial stocks surged 15.6% this session, providing leadership to the broader market, which had become quite oversold in recent sessions. The stock market's advance was further helped by short-covering. Still, trading volume on the NYSE climbed above 2 billion shares, which is well above recent averages, suggesting there was also some conviction behind the advance.

Roughly 97% of the companies in the S&P 500 finished with a gain. All 30 of the Dow components closed higher.


And how about the S&P 500 now?


If the market were forming a bottom like 2002 then we just saw this week a both higher volume up days and an up week than the previous days and week's selling. If we had seen a 90% upside day or two 80% upside days one might think the bottom is already in place after a mere 6 months of selling. Is it?

If it is then the bottom certainly is not as clearly defined as the one that formed in either 2002 and certainly not March of 2009.

As always just my humble opinion and as always I reserve the right to be 100% wrong as I often am.

RtS


icon url

ReturntoSender

10/10/11 10:40 PM

#9545 RE: ReturntoSender #6755

From Briefing.com: 4:30 pm : The stock market scored its best single-session percentage gain in almost seven weeks. The effort was broad based and came on the back of a commitment by leading officials in Europe to recapitalize the region's flagging financial institutions.

Early participants focused on news that over the weekend Germany's Chancellor Merkel and France's President Sarkozy pledged to support a plan intended to shore up capital at European banks and financial outfits. Their commitment came across as more unified than what had been previously displayed by the pair. The notion that eurozone leaders will be more concerted in their efforts to stabilize the region's precarious financial conditions, thereby reducing the risk of contagion, emboldened buyers, who engaged in an aggressive bout of buying.

The S&P 500 rallied more than 3% for its best one-day jump since August. That helped the broad market measure push through its 50-day moving average and close above that technical trend line for the first time since July.

No specifics regarding plans to improve financial conditions in Europe are currently available, but bank stocks and financial issues performed as if the risks inherent to their positions in Europe were reduced dramatically. That gave both the KBW Bank Index and the broader financial sector gains of more than 5%.

The euro also won support from traders. The currency rallied 2.0% to $1.365 for one of its best single-session percentage gains in a year.

The euro's bounce put pressure on the dollar, helping to amplify buying interest among commodities. Oil was an especially strong performer in the commodity complex. The energy component climbed almost 3% to close pit trade at $85.41 per barrel.

The combination of higher oil prices and a stronger equity market helped energy stocks rally to a 4.5% gain. They were second only to financials. Materials plays, also helped by higher commodity prices, swung to a 4.2% gain.

Bonds will re-open for regular trading hours tomorrow. The market was closed today in observance of Columbus Day.

Advancing Sectors: Financials +5.1%, Energy +4.5%, Materials +4.2%, Industrials +3.6%, Consumer Discretionary +3.5%, Tech +3.4%, Health Care +2.5%, Telecom +2.1%, Utilities +2.0%, Consumer Staples +1.6%
Declining Sectors: (None) DJ30 +330.06 NASDAQ +86.70 NQ100 +3.5% R2K +4.4% SP400 +3.6% SP500 +39.43 NASDAQ Adv/Vol/Dec 2125/1.57 bln/435 NYSE Adv/Vol/Dec 2784/888 mln/256

9:32AM Motorola Mobility announced that Henan Cable has deployed Motorola M3 Media Server for both Video On Demand and Network Digital Video Recording (MMI) 38.01 +0.10 :

SunEdison, subsidiary of MEMC Electronic Materials (WFR) announced that KGAL GmbH & Co. has recently acquired 33 megawatts of solar photovoltaic systems located in Italy and Spain from SunEdison.

Apple (AAPL $383.47 +13.67) announced pre-orders of its iPhone 4S have topped one million in a single day, surpassing the previous single day pre-order record of 600,000 held by iPhone 4.

10:11 am S&P Tech Sector Showing Strong Gains, In-line With the S&P 500 (AAPL)

The tech sector is trading higher today, inline with gains in the broader market. Semiconductors are showing slight relative strength in the tech space with the Philly Semi Index trading 2.5% higher. MU (+5.6%) is a notable leader in that index. Among other major indices, the S&P 500 is trading 2.3% higher, while the NASDAQ is trading 2.2% higher. The QQQ is also trading 2.2% higher. Among tech bellwethers, AAPL (+3.1%) is showing notable strength.

In news, AAPL (+3.1%) announced iPhone 4S pre-orders top one mln in first 24 hours. Also, it was reported that Alibaba has talked with Temasek for YHOO (+3.5%) stake.

Among notable analyst upgrades this morning, MU (+5.6%) was upgraded to Buy at Citigroup. In downgrades, S (-5.6%) was downgraded at several firms including Deutsche Bank and Kaufman, SFSF (-1.2%) was downgraded to Market Perform at BMO Capital Markets, LOGI (+1.7%) was downgraded to Underperform at BofA/Merrill, and ACN (+0.4%) was downgraded to Neutral at Robert W. Baird.

No notable names in tech set to report results today after the close.
icon url

ReturntoSender

10/12/11 9:07 AM

#9547 RE: ReturntoSender #6755

From Briefing.com: 2:19AM ASML Holding beats by EUR0.06, beats on revs; guides Q4 revs in-line; guides FY11 revs in-line; Q3 bookings above guidance (ASML) 36.17 : Reports Q3 (Sep) earnings of EUR0.84 per share, EUR0.06 better than the Capital IQ Consensus Estimate of EUR0.78; revenues rose 24.0% year/year to EUR1.46 bln vs the EUR1.4 bln consensus. Co issues in-line guidance for Q4, sees Q4 revs of above EUR1.1 bln vs. EUR1.14 bln Capital IQ Consensus Estimate. Co issues in-line guidance for FY11, sees FY11 revs of EUR5.5 bln vs. EUR5.54 bln Capital IQ Consensus Estimate. Additionally, co reports Q3 bookings (excluding EUV) came in just above guidance at EUR514 mln. Co sees Q4 bookings expected at a level above Q3. Aslo sees sales (excluding EUV) to have a gross margin in Q4 2011 of about 42% (about 41% for sales including EUV). R&D costs for Q4 are expected at EUR150 mln to support our strategic investments. SG&A costs are expected at EUR56 mln.

Microsemi (MSCC) announced one of its subcontracted manufacturing facilities located in the Rojana Industrial Park in Ayutthaya, Thailand, has suspended operations due to damage sustained from the region's recent flooding. The industrial park is without power and officials have ordered an evacuation of the area.

Western Digital Corp. (WDC) announced that production of hard drives in its facilities close to Bangkok, Thailand, will be constrained in the current quarter due to the severe flooding in Thailand. The flooding is causing problems with the region's infrastructure, including transportation and utilities, and has resulted in the inundation of some supplier facilities and employee homes.

Freescale Semiconductor (FSL) announced the first of several powerful multicore automotive MCUs that help make it easier for automotive designers to improve engine efficiency and reduce exhaust pollution.

08:35 am : S&P futures vs fair value: +10.50. Nasdaq futures vs fair value: +26.70. Renewed confidence in Europe has the region's major bourses sporting impressive gains today. The action comes as pundits predict that Slovakia will pass the EFSF after the country's officials voted it down last night in conjunction with a no confidence vote in its prime minister. Germany's DAX has advanced 1.1% with help from automakers Daimler, Volkswagen, and BMW. Deutsche Bank (DB) has also provided leadership, but shares of Commerzbank are barely positive. France's CAC has climbed 1.4%. Societe Generale is atop the list of advancing issues. Michelin and Alcatel-Lucent (ALU) have complemented its efforts. Britain's FTSE is up a relatively tame 0.4%. Eurasian Natural Resources and Rangold Resources are a couple of top performers. Royal Bank of Scotland (RBS) and Barclays (BCS) have both bounced to substantial gains, too. Regional data featured an increase of 1.2% in eurozone industrial production during August. That followed a 1.1% increase in the prior month.

Overnight action in Asia saw Japan's Nikkei slip to a 0.4% loss. Flooding in Thailand forced the shuttering of many Japanese factories there. That hurt Nikon and Honda Motor (HMC), but Tokyo Electric and Showa Denko were the worst performers as they booked losses in excess of 5%. Materials and industrial plays performed well, though. Kobe Steel and Mitsui Mining, along with Komatsu and Fuji Heavy Industries, provided support. In Hong Kong, the Hang Seng advanced 1.0%. More impressive is that the Index scored that strong gain after it had tumbled sharply at the open. Property plays provided leadership. Mainland China's Shanghai Composite climbed 3.1% with help from financial outfits like Agricultural Bank of China and Bank of China. The Composite lagged the other major regional averages in the prior session.
icon url

ReturntoSender

10/13/11 8:20 PM

#9549 RE: ReturntoSender #6755

From Briefing.com: 4:30 pm : Tech led the Nasdaq to an enviable gain, but the broad market booked a loss as bank stocks and financial services plays succumbed to aggressive selling pressure.

The mood among market participants this morning was dampened by renewed weakness among Europe's major bourses, which moved lower after Asia's major averages staged strong gains in overnight action. Worries about the quality of third quarter bank earnings also weighed on early sentiment.

JPMorgan Chase (JPM 31.23, -1.97), widely regarded as one of the best run and most fundamentally sound banks in the business, posted this morning an upside earnings surprise, but the results were helped by deterioration in the company's own debt prices. Uncertainty about what other banks and financial services firms may report took the KBW Bank Index down almost 5% and the broader financial sector more than 3% lower before losses were trimmed in afternoon trade.

Pressure eased, but didn't exactly evaporate, in afternoon action. That helped the S&P 500 climb to the neutral line after it had been down more than 1% at its session low. Resistance at the flat line kept the broad market measure in negative territory. The Dow followed suit.

The Nasdaq was more successful in its effort. In turn, it scored another gain, which is actually its seventh in eight sessions. The Nasdaq's strength was owed to tech issues, which collectively climbed 1.0% while almost every other sector failed to either logged a loss or remained mired at the neutral line. Internet search giant Google (GOOG 558.99, +10.49) provided leadership ahead of its quarterly report.

Treasuries advanced, but surrendered some of their gains as the stock market recovered into the close. Results from an auction of 30-year Bonds didn't really have an impact on trade. The auction drew a bid-to-cover of 2.94, dollar demand of $38.2 billion, and an indirect bidder participation rate of 28.7%.

As for today's data, the latest initial jobless claims tally declined by 1,000 week over week to 404,000, which is on par with the 406,000 initial claims that had been broadly expected.

The trade deficit for August came in at $45.6 billion, which is slightly less than the $46.1 billion deficit that had been generally anticipated among economists polled by Briefing.com.

Advancing Sectors: Tech +1.0%, Telecom +0.6%
Unchanged: Utilities
Declining Sectors: Health Care -0.1%, Consumer Staples -0.1%, Consumer Discretionary -0.2%, Energy -0.3%, Materials -0.5%, Industrials -0.9%, Financials -2.4%DJ30 -40.72 NASDAQ +15.51 NQ100 +0.9% R2K -0.2% SP400 +0.1% SP500 -3.59 NASDAQ Adv/Vol/Dec 1226/1.67 bln/1271 NYSE Adv/Vol/Dec 1171/898 mln/1831

4:46PM Emulex required to pay $387,922 in patent trial with Broadcom (BRCM) (ELX) 6.78 -0.08 : Co reported the completion of the trial in the U.S. District Court for the Central District of California, and the resulting partial verdict determining that co is to pay $387,922 in the patent infringement lawsuit filed against Emulex by Broadcom (BRCM). The monetary award of $387,922 was based on U.S. sales by Emulex from the date of filing of the original lawsuit, September 14, 2009, through August 27, 2011. In its annual report Form 10-K for the fiscal year which ended on July 3, 2011, co reported that it had cash, cash equivalents and investments of $183,350,000. The $387,922 award is 0.2 percent of that amount. Although the trial was completed, only a partial verdict was reached involving two patents out of the six patents included in the trial. A mistrial was declared concerning the remaining four patents for which no unanimous verdict was reached.

4:20PM Microchip sees Q2 revs of $340.6 mln vs. $360.2 mln Capital IQ Consensus Estimates; sees EPS of $0.45-0.47 vs. $0.52 consensus (MCHP) 35.31 +0.85 : Co said, "Our net sales activity in the September quarter did not progress as we originally expected. Entering the September quarter we anticipated that business conditions would continue to be impacted by weak, broad-based demand conditions, but would begin to improve towards the latter part of the quarter from the seasonal Christmas builds in Asia. Instead we experienced incrementally stronger headwinds and saw no seasonal Christmas build, which in turn adversely impacted all of our product lines and sales channels. The overall global economic outlook continues to be poor and is adversely impacting our business as well as the rest of the semiconductor industry. While we are disappointed with our September quarter results, we continue to see excellent design win traction in our microcontroller and analog product lines and maintain a strong competitive position. Net sales from our 32-bit microcontroller business was up 10.4% sequentially, and our licensing business was up 6.4% sequentially, both setting new records in the September quarter. Additionally we shipped our 10 billionth microcontroller during the quarter."

4:01PM Maxim Integrated enters into $250 mln credit facility agreement (MXIM) 25.14 +0.77 :

4:00PM Plexus Plexus to receive AS9100 certification in China (PLXS) 26.51 -0.17 : Co announced today that it has successfully completed its audit and has received recommendation for AS9100 certification at its Hangzhou, China facility. AS9100, the quality management standard of the aerospace industry, demonstrates excellence in quality management systems that satisfy the safety, reliability and quality concerns specific to aerospace.

10:23AM Benchmark Elec temporarily closes Thailand facility due to flooding (BHE) 14.66 -0.24 : Co announced today that its subsidiary, Benchmark Electronics (Thailand) Public Company Limited, has temporarily suspended operations as a result of flooding in the surrounding areas of the Hi-Tech Industrial Estate in Ayudhaya, Thailand. The industrial park is without power and officials have ordered an evacuation of the area. Benchmark has moved equipment and inventory to higher ground and, as of today, its facility has not been flooded, however the dike surrounding the Hi-Tech Industrial Estate has been compromised. While the full impact and extent of damage is unknown at this time, Benchmark has insurance coverage for any flood/water damage to its facility and additionally carries business interruption coverage. The company will remain focused on restoring operations to full production levels as quickly as conditions permit.

SMSC (SMSC) announced that Samsung Electronics has licensed SMSC's patented Inter-Chip Connectivity technology.

Nexans, Siemens (SI) and American Superconductor (AMSC) announced the successful qualification of a transmission voltage resistive fault current limiter that utilizes high temperature superconductor wire.

7:34AM Fairchild Semi beats by $0.02, reports revs in-line; guides Q4 revs below consensus (FCS) 12.24 : Reports Q3 (Sep) earnings of $0.34 per share, excluding non-recurring items, $0.02 better than the Capital IQ Consensus Estimate of $0.32; revenues fell 2.7% year/year to $403.2 mln vs the $404.1 mln consensus -- co lowered rev guidance last month; adjusted gross margin of 36.0 percent, down 120 basis points QoQ and 50 basis points YoY. Co issues downside guidance for Q4, sees Q4 revs of $350-370 vs. $395.95 mln Capital IQ Consensus Estimate. "Our current scheduled backlog is nearly sufficient to achieve the low end of this range. We expect adjusted gross margin to be between 32 to 34 percent as we adjust factory loadings lower in the fourth quarter to reduce inventory... Mobile and automotive demand was in line with expectations. Computing demand remained muted and we continue to drive inventory lower in the distribution channel for these products. Consumer and solar demand remains weak. Distribution sell-through decreased 9 percent sequentially which was more than expected and resulted in a modest build of channel inventory. We plan to ship substantially less into the channel than our distribution customers are forecasting for sell through in the fourth quarter. This should enable us to exit this year with a leaner inventory position and be ready to grow sales again in 2012."

6:51AM Hewlett-Packard: Gartner says worldwide PC shipments grew 3.2% in 3Q of 2011; HPQ first in global PC shipments (HPQ) 25.87 : Worldwide PC shipments totaled 91.8 mln units in the third quarter of 2011, a 3.2 percent increase from the third quarter of 2010, according to preliminary results by Gartner. These results are slightly lower than Gartner's earlier projection of 5.1 percent growth for the quarter. HPQ was the No. 1 vendor based on global PC shipments, grew faster than the industry average, and its market share reached 17.7% in the Q3 of 2011. Despite announcing in the middle of 2Q11 the potential spinoff of its PC business, HPQ experienced strong growth in the U.S., while outside the U.S., growth was relatively weak or average. Lenovo (LNVGY) became the second-largest PC vendor in the worldwide market for the first time.

6:03AM Research In Motion reports 'significant increase' in Blackberry service levels (RIMM) 23.88 : Co announced, in Europe, Middle East, India and Africa, they are seeing a significant increase in service levels. Service levels are also progressing well in the U.S., Canada and Latin America and the co is seeing increased traffic throughput on most services, although there are still some delays and services levels may still vary amongst customers. In the US, Email systems are operating and the co is continuing to clear any backlogged messages. Support teams are working to minimize the impact on their customers.

08:55 am Altera downgraded to Neutral from Outperform at Robert W. Baird; tgt lowered to $35 from $46: . Robert W. Baird downgrades ALTR to Neutral from Outperform and lowers their tgt to $35 from $46 saying a slowdown in the FPGA manufacturing supply chain for 4Q suggests lack of revenue momentum for the next few quarters, likely leading ALTR and XLNX shares to remain in a trading range near term. They also note that China-based basestation production has recently slowed.

Fairchild Sem (FCS $13.15 +0.91) reported third quarter earnings of $0.34 per share, excluding non-recurring items, $0.02 better than the Capital IQ consensus of $0.32, while revenues fell 2.7% year/year to $403.2 million versus the $404.1 million consensus. The company lowered revenue guidance last month and adjusted gross margin of 36.0 percent, down 120 basis points quarter over quarter and 50 basis points year over year. The company issued downside guidance for the fourth quarter with revenues of $350-370 million versus the $395.95 million consensus.

Broadcom (BRCM 37.00 +0.81) was upgraded to Outperform from Neutral at Robert W. Baird and the firm raised their target to $46 from $36. The firm notes their field research points to current momentum for company's baseband and connectivity business, along with rebounding order trends in the mobile phone supply chain since August. They state company's wireless momentum is driven by a 3G baseband ramp at Samsung as well as strength in connectivity ICs. Additionally, new 10GbE products should also see momentum starting in 1H12, with Romley acting as a catalyst.

10:23 am S&P Tech Sector Near Flat Line; ALTR, ADS Downgraded (ALTR)
The tech sector is trading relatively flat today, outpacing losses in the broader market. Semiconductors are showing relative strength in the tech space with the Philly Semi Index trading 0.7% higher. NVDA (+4.0%) is a notable leader in that chip index. Among other major indices, the S&P 500 is trading 0.9% lower, while the NASDAQ is trading 0.2% lower. The QQQ, meanwhile, is trading 0.1% higher. Among tech bellwethers, AAPL (+1.0%) is showing notable strength, while ORCL (-1.1%) is under pressure.

In earnings, SMSI (+10.4%) issued downside guidance, while CLWR (+13.9%) issued upside guidance. Also, FCS (+4.6%) posted a slight beat, but guided below consensus.

In news, TXI (-4.4%) suspended its quarterly dividend. Among rumors, there's been speculation that GOOG (+0.2%) may be interested in AKAM (+5.4%), although GOOG reportedly denied such interest. Also, there's SINA (+7.2%) takeover chatter making the rounds.

Among notable analyst upgrades this morning, RAX (+1.4%) was upgraded to Buy at Goldman, NTES (+1.0%) was upgraded to Overweight at Piper Jaffray, and BRCM (+3.3%) was upgraded to Outperform at Baird.

In downgrades, ALTR (-0.6%) was downgraded to Neutral at Baird, ADS (-5.5%) was downgraded to Neutral at Suntrust, and Needham downgraded RNOW (-1.0%) to Hold.

GOOG (+0.2%) is the notable name in tech set to report results today after the close.

10:06 am Fairchild Semi Guides Fourth Quarter Revenue Below Consensus (FCS)
Fairchild Semi (FCS $12.50 +0.26) reported third quarter earnings of $0.34 per share, excluding non-recurring items, $0.02 better than the Capital IQ Consensus Estimate of $0.32.

Revenues fell 2.7% year/year to $403.2 million versus the $404.1 million consensus -- company lowered revenue guidance last month; adjusted gross margin of 36.0 percent, down 120 basis points quarter/quarter and 50 basis points year/year.

For the fourth quarter, the company expects fourth quarter revenue guidance to be $350 million to $370 million versus the $395.95 million Capital IQ Consensus Estimate.

"Our current scheduled backlog is nearly sufficient to achieve the low end of this range. We expect adjusted gross margin to be between 32 to 34 percent as we adjust factory loadings lower in the fourth quarter to reduce inventory... Mobile and automotive demand was in line with expectations. Computing demand remained muted and we continue to drive inventory lower in the distribution channel for these products. Consumer and solar demand remains weak. Distribution sell-through decreased 9 percent sequentially which was more than expected and resulted in a modest build of channel inventory. We plan to ship substantially less into the channel than our distribution customers are forecasting for sell through in the fourth quarter. This should enable us to exit this year with a leaner inventory position and be ready to grow sales again in 2012."
icon url

ReturntoSender

10/14/11 9:34 AM

#9550 RE: ReturntoSender #6755

Chart of the Day - COTD - S&P 500 P/E Ratio at level not seen since 1990

http://www.chartoftheday.com/20111014.htm?T

Today's chart illustrates how the recent rise in earnings as well as the recent stock market action has impacted the current valuation of the stock market as measured by the price to earnings ratio (PE ratio). Generally speaking, when the PE ratio is high, stocks are considered to be expensive. When the PE ratio is low, stocks are considered to be inexpensive. From 1900 into the mid-1990s, the PE ratio tended to peak in the low to mid-20s (red line) and trough somewhere around seven (green line). The price investors were willing to pay for a dollar of earnings increased during the dot-com boom (late 1990s), surged even higher during the dot-com bust (early 2000s), and spiked to extraordinary levels during the financial crisis (late 2000s). As a result of the recent spike in corporate earnings as well as relatively lower stock prices (e.g. the S&P 500 currently trades 11.7% off its April 2011 post-financial crisis highs) the PE ratio has dropped to a level that has not existed since 1990.

icon url

ReturntoSender

10/17/11 10:52 PM

#9553 RE: ReturntoSender #6755

From Briefing.com: 4:30 pm : Broad-based selling took the stock market roughly 2% lower for its worst performance in two weeks. Only on a few occasions did sellers let up, leaving stocks to settle at or near session lows.

Ripe for profit taking after a 6% weekly climb, stocks endured a steady descent today. The push lower began ahead of the open as early participants watched Europe's major bourses falter. Despite all the recent talk about comprehensive eurozone stability plans and deadlines, nothing of substance has been unveiled. Concern that fiscal and financial problems there could continue caused the region's major bourses to log losses well in excess of 1%. Meanwhile, the euro dropped 1.1% to $1.373.

Europe continues to take precedence over corporate headlines. Even a better-than-expected quarterly report from Citigroup (C 27.93, -0.47) couldn't keep the financial services giant from succumbing to broad market weakness. The stock settled near its session low after it had been up markedly in morning trade. Wells Fargo (WFC 24.42, -2.25) suffered its worst single-session percentage loss in two months, or its second worst in two years, after the lender's earnings came short of the consensus estimate. Concerted selling took financials down 3.3%, which is worse than what any other sector suffered, but marquee investment bank and brokerage outfit Goldman Sachs (GS 96.90, +0.17) managed to remain near the neutral line ahead of its report tomorrow morning.

Shares of Halliburton (HAL 34.48, -2.95) surged this past Friday, but the stock gave it all up as analysts shrugged off an upside earnings surprise to scrutinize the line items on the company's latest quarterly report. Several other oil and gas services stocks traded lower in sympathy.

Broad market weakness couldn't completely detract from the enthusiastic response made for a $38 billion merger between Kinder Morgan (KMI 28.19, +1.30) and El Paso (EP 24.45, +4.86). Shares of EP were able to set a new multi-year high.

Tech stocks failed to offer the same leadership that they have in recent sessions. Imbued by broad market weakness, the sector slid to a 1.8% loss. Heavyweight IBM (IBM 186.59, -3.94) was hit hard ahead of its quarterly report. The stock just set a new record high this past Friday.

Utilities were today's strongest performers. The defensive-oriented sector limited its loss to only 0.3%. Many electric utilities, most of which operate regulated businesses, were even able to produce positive returns today.

Although participants were decidedly pessimistic in their approach today, sending the Volatility Index more than 18% higher as of the close, there wasn't a great deal of share volume behind the effort. In fact, share volume on the NYSE failed to break 1 billion.

Advancing Sectors: (None)
Declining Sectors: Financials -3.3%, Materials -3.1%, Industrials -2.7%, Consumer Discretionary -1.9%, Tech -1.8%, Energy -1.7%, Health Care -1.7%, Consumer Staples -0.9%, Telecom -0.7%, Utilities -0.3% DJ30 -247.49 NASDAQ -52.93 NQ100 -1.6% R2K -3.4% SP400 -2.9% SP500 -23.72 NASDAQ Adv/Vol/Dec 463/1.68 bln/2076 NYSE Adv/Vol/Dec 571/905 mln/2456

5:55PM Sunpower: SolarBridge collaborates with SunPower to deliver AC Panels (SPWRA) 8.81 -0.09 : SolarBridge Technologies announced a strategic relationship with SunPower (SPWRA, SPWRB), to supply the company with SolarBridge PantheonTM microinverters for the SunPower(R) E18 & E19 AC Solar Panel series. The AC Solar Panel provides an ultra high-efficiency, easy-to-install rooftop PV solution.

4:17PM IBM beats by $0.06, reports revs in-line; raises FY11 EPS above consensus (IBM) 186.59 -3.94 : Reports Q3 (Sep) earnings of $3.28 per share, excluding non-recurring items, $0.06 better than the Capital IQ Consensus Estimate of $3.22; revenues rose 7.8% year/year to $26.16 bln vs the $26.25 bln consensus. Co issues upside guidance for FY11, raises EPS to at least $13.35, excluding non-recurring items, from at least $13.25, vs. $13.30 Capital IQ Consensus Estimate. Gross margin +140 bps YoY to 46.8%. Total Global Services revenues increased 8% (2%, adjusting for currency). Global Technology Services segment revenues increased 9% (3%, adjusting for currency) to $10.3 billion. Global Business Services segment revenues were up 6% (flat, adjusting for currency) at $4.8 billion. Revenues from the Software segment were $5.8 billion, an increase of 13% (8%, adjusting for currency). Software pre-tax income of $2.2 billion was up 12% year over year. Revenues from the Systems and Technology segment totaled $4.5 billion for the quarter, up 4% (1%, adjusting for currency) from the third quarter of 2010. Systems and Technology pre-tax income was $318 million, an increase of 8% year over year. The Americas' third-quarter revenues were $10.9 billion, an increase of 7% (6%, adjusting for currency) from the 2010 period. Revenues from Europe/Middle East/Africa were $8.0 billion, up 9% (flat, adjusting for currency). Asia-Pacific revenues increased 10% (1%, adjusting for currency) to $6.5 billion.

4:01PM Ingram Micro sees Q3 EPS of $0.32-0.34 vs $0.41 Capital IQ Consensus Estimate; sees revs ~$8.9 bln vs $8.91 bln Capital IQ Consensus Estimate (IM) 18.72 -0.38 : Co said EPS were impacted by the following factors: 1) The market-share recovery in Australia following the implementation of a new enterprise resource planning (ERP) system is progressing at a slower pace than the company anticipated at the start of the third quarter. Efforts to restore revenues are requiring additional marketing costs and competitive pricing actions; 2) In Europe, demand was soft throughout the quarter, particularly in consumer-related segments, which led to a more competitive environment. Co said, "These factors dampened gross margins and operating leverage, which brought earnings per share below the company's expectations for the quarter. Demand in our key customer segment, which serves small and medium businesses, remained relatively solid in most parts of the world. Most areas of our business are performing well, outside of the recovery efforts in Australia and the effects of the European economy. We look forward to providing greater detail on our operations and results during our conference call with investors on October 27."

O2Micro International (OIIM) was issued 5 claims under United States patent number 7,983,301 for its Short Message Service for wireless communications invention.

8:43AM Apple sold over four million of its new iPhone 4S just three days after its launch on October 14 (AAPL) 422.00 : Co announced it sold over four million of its new iPhone 4S after its launch on October 14. In addition, more than 25 million customers are already using iOS 5.

8:06AM Chipmos Technology reports Q3 rev -4.5% QoQ, -5.4% YoY to $146.5 mln (no ests) (IMOS) 5.11 : Co reports Q3 (Sept) rev -4.5% QoQ, -5.4% YoY to $146.5 mln (no ests); Sept rev +5.8% MoM to $51.2 mln.

09:52 am Wells Fargo's Third Quarter Results Fall Short of Expectations (WFC)
Wells Fargo (WFC $25.19 -1.48) reported third quarter earnings of $0.72 per share, $0.01 worse than the Capital IQ Consensus Estimate of $0.73.

Revenues fell 6.0% year/year to $19.63 billion versus the $20.34 bln consensus. Capital increased with Tier 1 common equity reaching $91.9 billion under Basel I, or 9.35% of risk-weighted assets. Under current Basel III proposals, the Tier 1 common equity ratio was an estimated 7.41%.
"The economic recovery has been more sluggish and uneven than anyone anticipated... We can't change the economic environment, yet we have worked hard to control the variables we can -- making our products and services more relevant to individuals and businesses, focusing on the customer, making as many loans as possible and growing new relationships -- as well as fostering longtime ones. We see the results of this focus in growing cross-sell, deposits, and loans. Customers need a trusted financial partner, especially in challenging economic times.Wells Fargo has proven to be that partner over and over again... This was a strong quarter for Wells Fargo, with solid growth in loans, deposits, investment securities and capital, along with improved credit quality and lower expenses... Credit quality continued to improve in the third quarter, our seventh consecutive quarter of declining loan losses and the fourth consecutive quarter of lower nonperforming assets."

Third quarter net charge-offs were $2.6 billion, or 1.37 percent (annualized) of average loans, down $227 million from second quarter net charge-offs of $2.8 billion (1.52 percent). Return on average assets of 1.26%

09:47 am Citigroup Tops Third Quarter Revenue Expectations (C)
Citigroup (C $28.66 +0.26) reported third quarter earnings of $0.84 per share, excluding benefit from CVA of approx $0.39 per share which may not be comparable to the Capital IQ Consensus Estimate of $0.81.

Revenues rose 0.4% year/year to $20.83 billion versus the $19 bln consensus. Third quarter revenues included $1.9 billion of credit valuation adjustment (CVA) reflecting the widening of Citi's credit spreads during the third quarter. Excluding CVA, third quarter 2011 revenues were $18.9 billion, 8% below the prior year period and 8% below the second quarter 2011.

The year-over-year decline in Citigroup revenues, excluding CVA, was driven by lower revenues in both Citicorp and Citi Holdings. Citicorp revenues of $17.7 billion in the third quarter 2011 included $1.9 billion of CVA. Excluding the CVA, Citicorp revenues of $15.8 billion were 2% lower than the third quarter 2010. The decline was largely due to lower revenues in Securities and Banking, which were 12% below the prior year period and more than offset 2% growth in RCB revenues and 7% growth in Transaction Services revenues from the prior year period. Citi Holdings revenues of $2.8 billion were 27% below the prior year period. The decline in Citi Holdings revenues was principally due to the continuing reduction in assets, which fell $132 billion, or 31%, from the prior year period. Citi Holdings assets of $289 billion at the end of the third quarter 2011 represented approximately 15% of total Citigroup assets.

C had a loan loss reserve release of $1.4 Billion in Third Quarter, Down from $2.0 Billion in Each of Second Quarter 2011 and Third Quarter 2010. "In addition, over the past few years we have significantly strengthened our retail partner cards business and it has earned $2.2 billion pre-tax through the first three quarters. After a careful review of the business, which took into account current trends in credit and technology, we have decided that it makes strategic sense to move retail partner cards and a vast majority of its assets from Citi Holdings into Citicorp. The transition will be completed by the end of this year." Citigroup's capital levels and book value continued to increase versus the prior year period.

Book value per share was $60.56 and tangible book value per share4 was $49.50, 8% and 11% increases, respectively, versus the prior year period. Citigroup's Tier 1 Capital Ratio was 13.5% and its Tier 1 Common Ratio was 11.7%.
icon url

ReturntoSender

10/18/11 11:30 PM

#9554 RE: ReturntoSender #6755

From Briefing.com: 4:30 pm : Stocks extended their prior session slide in the opening minutes of trade, but a combination of technical support and leadership from financials led stocks back to higher ground. The effort was extended in response to word that eurozone officials agreed to boost bailout funds, although that story was called into question at the close.

The stock market scored a 2.0% gain today, offsetting a move of similar degree to the downside yesterday. Participants were initially inclined to cut down stocks this morning. Negative sentiment was stirred by news that China, which carries the burden of being the primary supporter of global growth amid tenuous macro conditions, experienced a slowdown in economic growth during the third quarter. The 9.1% growth rate was also less than the 9.3% clip that many had anticipated.

Early selling interest was also ushered in by the threat of a future downgrade of France's pristine debt rating, which was put on negative watch by analysts at Moody's. The notion that the countries in the core of the eurozone, not just those in the region's periphery, face precarious fiscal and financial conditions put pressure on Europe's major bourses and further undermined the morning mood.

The S&P 500 was down about 1% within the first 30 minutes of trade, but it was able to bring buyers back in by holding steady at its 50-day exponential moving average.

Financials also offered leadership. The sector's refusal to turn negative in conjunction with the broad market's early dive convinced many that the sector's strength was sustainable, prompting many to push back into the space. Financials finished the session with a 5% gain.

Bank of America (BAC 6.64, +0.61) was one of the strongest performers. Not only did the stock boast the most robust share volume on the Big Board, but it also swung to a 10% gain. The move made for the stock's best one-day bounce in almost two months. The stock's surge came even though the company's latest quarterly report was muddled with numerous items. Even Goldman Sachs (GS 102.25, +5.35) staged an enviable gain, although the company reported a loss that was worse than what most of Wall Street had expected.

While financials offered leadership, the broad market got an additional boost amid news that leaders from France and Germany agreed to balloon the region's rescue fund to 2 trillion euros, although specifics continue to elude the leaders. Some doubt was cast on the report shortly before the close, causing stocks to surrender a portion of their gains.

The broad market's late bounce failed to carry shares of IBM (IBM 178.90, -7.69) to higher ground. The stock's loss came in the face of an upside earnings surprise and strong forecast. Fellow large-cap tech plays like Intel (INTC 23.40, +0.12) and Apple (AAPL 422.24, +2.25) stayed out of the red, but also lagged ahead of their latest reports.

Not to be ignored, Dow components Johnson & Johnson (JNJ 64.42, +0.63) and Coca-Cola (KO 66.74, -0.26) both bested bottom line expectations, but only JNJ shares were bid higher at the end of the day.

No sector logged a loss, but defensive-oriented issues like utilities, telecom, consumer staples, and health care were the only groups that failed to generate gains greater than 1%. Such relative weakness came as market participants showed an increased appetite for risk.

Advancing Sectors: Financials +5.0%, Energy +3.0%, Industrials +2.9%, Materials +2.4%, Consumer Discretionary +1.8%, Tech +1.0%, Health Care +0.8%, Consumer Staples +0.8%, Telecom +0.8%, Utilities +0.7%
Declining Sectors: (None)DJ30 +180.05 NASDAQ +42.51 NQ100 +1.3% R2K +3.0% SP400 +2.6% SP500 +24.52 NASDAQ Adv/Vol/Dec 1982/1.93 bln/595 NYSE Adv/Vol/Dec 2562/1.09 bln/487

4:35PM Apple misses by $0.22, misses on revs; guides Q1 EPS, revs above consensus (AAPL) 422.24 +2.25 : Reports Q4 (Sep) earnings of $7.05 per share, $0.22 worse than the Capital IQ Consensus Estimate of $7.27; revenues rose 39.0% year/year to $28.27 bln vs the $29.28 bln consensus, 63% of rev from outside U.S. Co issues upside guidance for Q1, sees EPS of $9.30 vs. $8.97 Capital IQ Consensus Estimate; sees Q1 revs of $37.0 bln vs. $36.64 bln Capital IQ Consensus Estimate. Q4 gross margins of 40.3% vs Street est of 39.9% and 38.0% guidance; 17.07 mln iPhones sold in Q4 vs Street est of ~21 mln; 11.12 mln iPads sold in Q4 vs Street est of ~12 mln; reports 4.89 mln Macs sold in Q4 vs Street est of ~4.5 mln. "Customer response to iPhone 4S has been fantastic, we have strong momentum going into the holiday season, and we remain really enthusiastic about our product pipeline."

4:18PM Cree reports EPS in-line, revs in-line; guides Q2 EPS below consensus, revs in-line (CREE) 27.78 +1.17 : Reports Q1 (Sep) earnings of $0.25 per share, in-line with the Capital IQ Consensus Estimate consensus of $0.25; revenues rose 0.2% year/year to $269 mln vs the $268.7 mln consensus. Co issues mixed guidance for Q2, sees EPS of $0.25-0.28 vs. $0.34 Capital IQ Consensus Estimate; sees Q2 revs of $300-320 mln vs. $307.87 mln Capital IQ Consensus Estimate.

4:13PM Intel beats by $0.06, beats on revs; guides Q4 revs above consensus; increases buyback by $10 bln to $14.2 bln (INTC) 23.40 +0.12 : Reports Q3 (Sep) earnings of $0.69 per share, excluding non-recurring items, $0.06 better than the Capital IQ Consensus Estimate of $0.63; revenues rose 28.2% year/year to $14.23 bln vs the $13.84 bln consensus; non-GAAP gross margin -170 bps YoY to 64.4%. Co issues upside guidance for Q4, sees Q4 revs of $14.2-15.2 bln vs. $14.21 bln Capital IQ Consensus Estimate; gross margin percentage: 65%, plus or minus a couple percentage points. Q3 PC Client Group revenue of $9.4 bln, up 22 percent YoY. Data Center Group revenue of $2.5 bln, up 15% YoY. The co generated ~$6.3 bln in cash from operations, paid cash dividends of $1.1 bln, and used $4.0 bln to repurchase 186 mln shares of common stock. Intel's board of directors also voted to increase the co's buyback authorization by $10.0 bln, raising the total unused balance to $14.2 bln at the end of the third quarter. The co also completed a senior notes offering of $5.0 bln primarily for the purpose of repurchasing stock.

4:09PM Juniper Networks reports EPS in-line, beats on revs; guides Q4 EPS in-line, revs below (JNPR) 21.41 +1.01 : Reports Q3 (Sep) earnings of $0.28 per share, in-line with the Capital IQ Consensus Estimate consensus of $0.28; revenues rose 9.3% year/year to $1.11 bln vs the $1.09 bln consensus. Co issues guidance for Q4, sees EPS of $0.32-0.36 vs. $0.36 Capital IQ Consensus Estimate; sees Q4 revs of $1.16-1.22 bln vs. $1.23 bln Capital IQ Consensus Estimate. "The third quarter unfolded as we anticipated, and we achieved the performance objectives we had set for the September quarter... We will continue to carefully manage our expense structure with a focus on investing prudently in the resources that support our growth agenda and maintain our commitment to innovation."

4:08PM Yahoo! beats by $0.04, reports revs in-line; guides Q4 revs in-line (YHOO) 15.47 -0.23 : Reports Q3 (Sep) earnings of $0.21 per share, excluding non-recurring items, $0.04 better than the Capital IQ Consensus Estimate of $0.17; revenues fell 4.6% year/year to $1.07 bln vs the $1.07 bln consensus. Co issues in-line guidance for Q4, sees Q4 revs of $1125-1235 vs. $1.21 bln Capital IQ Consensus Estimate... In order to create more financial certainty, Microsoft (MSFT) and Yahoo! recently agreed to extend the RPS Guarantee in the U.S. and Canada through March 2013.

4:03PM Powerwave sees Q3 rev of $75-79 mln vs $170.11 mln Capital IQ Consensus Estimate (halted) (PWAV) 1.46 +0.01 : Our third quarter revenues were impacted by several factors, which included a significant slowdown in spending by North American network operators, a significant reduction in activity with our original equipment manufacturing customers, coupled with further weakness in several international markets, including Western and Eastern Europe, and the Middle East... From a global perspective, we believe that the current economic environment has caused operators to reduce or postpone their spending plans for the near term while they evaluate the macro-economic pressures in each individual market. The Middle East market has been significantly impacted by the political unrest throughout the region. In addition, in the North American market we believe that the uncertainty arising from the government's recent opposition to the proposed merger of AT&T and T-Mobile, has led to delays in spending as these operators re-evaluate their capital spending plans. All of these factors, combined together, have had a significant impact on our third quarter revenues. While near term visibility remains difficult in our markets, we continue to believe that the long-term demand for improvements in wireless infrastructure remain strong, as global demand for data continues and wireless network operators continue to promote their plans to improve existing coverage and add additional capacity, in the form of 4G capabilities, to wireless networks across the globe. We believe that Powerwave remains positioned to build upon and capture the long-term growth opportunities that are in the wireless infrastructure marketplace." Stock is halted.

ARM and TSMC (TSM) announced that they have taped out the first 20nm ARM Cortex-A15 MPCore processor.

1:06AM Benchmark Elec updates impact of Thailand flooding; expects that the flooding of its Ayudhaya facility will have a significant impact on its revenues and operations for Q4 (BHE) 14.23 : Co announces that flood waters breached the south-side levee protecting the industrial park and the waters have now inundated the Benchmark campus. The Company has extended its suspension of operations in Ayudhaya. The co has begun utilizing capacity in the Asia Pacific region, including re-starting its Korat, Thailand facility, to support the transfer of customer production. The co expects that the flooding of its Ayudhaya facility will have a significant impact on its revenues and operations for the fourth quarter. Benchmark has insurance coverage for the flood/water damage to its facility and also carries business interruption coverage.

Last night, IBM (IBM 178.13 -8.46) reported third quarter earnings of $3.28 per share, excluding non-recurring items, $0.06 better than the Capital IQ Consensus of $3.22, while revenues rose 7.8% year/year to $26.16 million versus the $26.25 billion consensus. The company issued upside guidance for fiscal year 2011 with EPS to at least $13.35, excluding non-recurring items, from at least $13.25, versus the $13.30 consensus. Gross margin +140 bps YoY to 46.8%. Total Global Services revenues increased 8% (2%, adjusting for currency). Global Technology Services segment revenues increased 9% (3%, adjusting for currency) to $10.3 billion. Global Business Services segment revenues were up 6% (flat, adjusting for currency) at $4.8 billion. Revenues from the Software segment were $5.8 billion, an increase of 13% (8%, adjusting for currency). Software pre-tax income of $2.2 billion was up 12% year over year.

EMC (EMC $23.82 +1.14) reported third quarter earnings of $0.37 per share, $0.01 better than the Capital IQ Consensus of $0.36, while revenues rose 18.2% year/year to $4.98 billion versus the $4.93 billion consensus. The company issued upside EPS guidance for fiscal year 2011 with EPS of to exceed $1.48 versus the $1.48 consensus and fiscal year 2011 revenues of to exceed $19.8 billion versus the $19.88 billion consensus. The company expects to repurchase $2 billion of the common stock in 2011.

2:06 pm S&P Tech Sector Showing Modest Gains, Lagging Broader Markets
The tech sector is trading modestly higher today, trailing gains in the broader market. Semiconductors are showing relative strength in the tech space, however, with the Philly Semi Index trading 1.1% higher. NVDA (+2.5%) is a notable leader in that chip index. Among other major indices, the S&P 500 is trading 0.3% higher, while the NASDAQ is trading 0.1% higher The QQQ, meanwhile, is trading up 0.6% on the session. Among tech bellwethers, IBM (-5.1%) is under notable pressure.

In earnings last night, IBM (-5.1%) reported a Q3 EPS beat with in-line revenues and raised FY11 guidance. Elsewhere, VMW (+6.0%) posted a beat and upside guidance. Also, IM (-7.8%) issued downside guidance, while SFSF (-0.7%) issued upside guidance. This morning, CHKP (+0.7%) and EMC (+5.1%) posted Q3 beats.

In news, NUAN (-2.1%) announces proposed $600 mln offering of senior convertible debentures, but did raise Q4 guidance.

Among notable analyst upgrades this morning, TEL (+0.1%) was upgraded to Overweight at JP Morgan. Also, VMW (+6.0%) was added to Conviction Buy List at Goldman.

In downgrades, MOLX (+1.3%) was downgraded to Neutral at JP Morgan, VMW (+6.0%) was downgraded to Hold at Jefferies, and IBM (-5.1%) was downgraded to at BMO Capital and FBN Securities.

AAPL (+0.2%), INTC (+0.3%), JNPR (+3.2%), and YHOO (-1.3%) are the notable names in tech set to report results today after the close.

09:52 am IBM Tops Third Quarter Expectations; Raises Guidance (IBM)

BM (IBM $177.76 -8.83) reported third quarter earnings of $3.28 per share, excluding non-recurring items, $0.06 better than the Capital IQ Consensus Estimate of $3.22.

Revenues rose 7.8% year/year to $26.16 billion versus the $26.25 billion consensus.

In fiscal year 2011, the company raised EPS guidance to at least $13.35, excluding non-recurring items, up from at least $13.25, versus $13.30 Capital IQ Consensus Estimate.

Gross margin +140 bps YoY to 46.8%. Total Global Services revenues increased 8% (2%, adjusting for currency). Global Technology Services segment revenues increased 9% (3%, adjusting for currency) to $10.3 billion. Global Business Services segment revenues were up 6% (flat, adjusting for currency) at $4.8 billion. Revenues from the Software segment were $5.8 billion, an increase of 13% (8%, adjusting for currency).

Software pre-tax income of $2.2 billion was up 12% year over year. Revenues from the Systems and Technology segment totaled $4.5 billion for the quarter, up 4% (1%, adjusting for currency) from the third quarter of 2010. Systems and Technology pre-tax income was $318 million, an increase of 8% year over year. The Americas' third-quarter revenues were $10.9 billion, an increase of 7% (6%, adjusting for currency) from the 2010 period. Revenues from Europe/Middle East/Africa were $8.0 billion, up 9% (flat, adjusting for currency). Asia-Pacific revenues increased 10% (1%, adjusting for currency) to $6.5 billion.
icon url

ReturntoSender

10/19/11 7:58 PM

#9555 RE: ReturntoSender #6755

From Briefing.com: 4:30 pm : The major equity averages descended to varied losses after they had spent the first half of the session chopping along listlessly in mixed fashion.

Momentum from the prior session's broad-based bounce was lost this morning as reports regarding plans to boost bailout funds in the EFSF were contradicted. Headlines indicative of conflicting goings on at meetings between eurozone officials played a part in an afternoon sell-off that left stocks to end the session at lows.

Of the major averages, the Nasdaq suffered the worst loss today. Its outsized decline came as Apple (AAPL 398.62, -23.62) shares dove in response to an earnings miss, which has been a rare occurrence in recent years. Shares of AAPL booked their worst percentage loss in three years. Given the weight of AAPL shares in the Nasdaq, its weakness offset strength in shares of Intel (INTC 24.24, +0.84) and Yahoo! (YHOO 15.94, +0.47), both of which reported a better-than-expected bottom line for the latest quarter.

Materials stocks were actually the worst performers. Challenged to find support, the sector slumped to a 3.0% loss.

Morgan Stanley (MS 16.64, +0.01) posted an upside surprise for the latest quarter, but its shares ended the day only a penny above where they began. In contrast, Travelers (TRV 54.39, +2.93) came short of the consensus earnings estimate, but its shares still rallied to a two-month high. Following its 5% spike yesterday, the financial sector failed to sustain an early bounce that left them to trade flat before descending alongside the rest of the market in late trade. They finished with a collective loss of 1.7%.

Homebuilders failed to sustain buying interest that had the SPDR S&P Homebuilders ETF (XHB 15.18, -0.17) up nicely on the back of news that housing starts climbed in September to an annualized clip of 658,000, which is the fastest pace since April 2010. The consensus among economists polled by Briefing.com had called for a slower rate more on the order of 595,000. Meanwhile, building permits slid to a rate of 594,000 from 610,000 in the prior month. An annualized rate of 610,000 permits had been generally expected.

There weren't any surprises to consumer price data for September. Overall consumer prices increased by 0.3%, just as had been broadly expected, while core prices increased by 0.1%, which is even less than the consensus call for a 0.2% increase. Just yesterday it was learned that overall producer prices increased by 0.8% in September, while core producer prices increased by 0.2% for the month.

There were no surprises to the Fed's latest Beige Book, which indicated that economic activity in many districts expanded at a modest or slight pace during September. A weaker or less certain outlook for business conditions was also generally noted.

Just as stocks wrestled with sellers this afternoon, oil futures came under pronounced pressure. The energy component benefited from an unexpected draw in weekly inventories and even traded as high as $89.69 per barrel before it dropped to $86.11 per barrel for a 2.5% loss. Other commodities were also clipped, resulting in a 1.3% loss for the CRB Commodity Index.

Amid the afternoon selling, the Volatility Index, often euphemistically labeled the Fear Gauge, spiked. At the close it was up more than 9% to trade above 34.

Advancing Sectors: Utilities +0.1%
Declining Sectors: Health Care -0.3%, Consumer Staples -0.4%, Telecom -0.6%, Energy -0.9%, Industrials -1.2%, Consumer Discretionary -1.5%, Financials -1.7%, Materials -3.0%DJ30 -72.43 NASDAQ -53.39 NQ100 -2.0% R2K -2.1% SP400 -1.6% SP500 -15.50 NASDAQ Adv/Vol/Dec 619/1.97 bln/1942 NYSE Adv/Vol/Dec 837/964 mln/2190

4:43PM STMicroelectronics/Ericsson Joint Venture post Q3 results (STM) 7.06 -0.36 : ST-Ericsson, a joint venture of STMicroelectronics (STM) and Ericsson (ERIC), reported financial results for the third fiscal quarter ending October 1, 2011. "Sales in the third quarter came in slightly ahead of expectations, even when excluding $20 million of revenue from IP licensing to a third party," said Gilles Delfassy, president and CEO of ST-Ericsson. "Revenue from new products continued to grow, making up more than half of our total sales. Net sales were $412 mln compared to $565 mln in prior year quarter. Net loss for the joint venture was $211 mln compared to $121 mln in the prior year. For the fourth quarter 2011, ST-Ericsson expects net sales to be slightly up sequentially

4:32PM MKS Instruments beats by $0.09, beats on revs; guides Q4 EPS below consensus, revs below consensus (MKSI) 24.63 -0.28 : Reports Q3 (Sep) earnings of $0.58 per share, $0.09 better than the Capital IQ Consensus Estimate of $0.49; revenues fell 12.1% year/year to $194.5 mln vs the $189.5 mln consensus. Co issues downside guidance for Q4, sees EPS of $0.18-$0.31 vs. $0.39 Capital IQ Consensus Estimate; sees Q4 revs of $145-165 mln vs. $172.00 mln Capital IQ Consensus Estimate. Co states, ""Order levels began to decline in May and continued to decline until the middle of the third quarter. However, since then, orders have remained fairly stable. In conditions like these, our proven strategy is to remain nimble, aggressively identify and pursue new opportunities while simultaneously controlling costs."

4:25PM Xilinx beats by $0.02, misses on revs; guides Q3 revs below consensus (XLNX) 29.60 -1.21 : Reports Q2 (Sep) earnings of $0.47 per share, $0.02 better than the Capital IQ Consensus Estimate of $0.45; revenues fell 10.4% year/year to $555.2 mln vs the $567.2 mln consensus. Xilinx sees Q3 revs down 3-8% sequentially vs. Capital IQ Consensus Estimates of +2.5%. Co issues downside guidance for Q3, sees Q3 revs down 3-8% sequentially, which equates to ~$510.8-538.5 mln vs. $571.61 mln Capital IQ Consensus Estimate.

4:19PM Lam Research misses by $0.02, beats on revs (LRCX) 42.63 -0.88 : Reports Q1 (Sep) earnings of $0.63 per share, excluding non-recurring items, $0.02 worse than the Capital IQ Consensus Estimate of $0.65; revenues fell 15.6% year/year to $680.4 mln vs the $670.8 mln consensus. Gross margin for the September 2011 quarter was $283.9 mln, or 41.7%, compared to gross margin of $338.5 mln, or 45.0%, for the June 2011 quarter. The sequential decrease in gross margin was primarily due to less favorable product mix and reflects the impact of lower factory utilization as a result of the decline in business volumes. Deferred revenue and deferred profit balances at the end of the September 2011 quarter were $179.5 mln and $112.5 mln, respectively.

4:14PM Cirrus Logic beats by $0.01, misses on revs; guides Q3 revs below consensus (CRUS) 17.01 -0.99 : Reports Q2 (Sep) earnings of $0.33 per share, excluding non-recurring items, $0.01 better than the Capital IQ Consensus Estimate of $0.32; revenues rose 1.0% year/year to $101.6 mln vs the $103.5 mln consensus; GM 53.5%. Co issues downside guidance for Q3, sees Q3 revs of $102-108 mln vs. $109.98 mln Capital IQ Consensus Estimate; with GM of 53-55%. "While we are seeing softness in some areas of our business due to issues in the global economy, we still expect significant year over year revenue growth in Q3, and we are well positioned to capitalize on some extraordinary growth opportunities that we believe will enable Cirrus Logic to be a great company for many years."

4:13PM Cohu beats by $0.13, beats on revs (COHU) 11.01 -0.68 : Reports Q3 (Sep) earnings of $0.21 per share, $0.13 better than the Capital IQ Consensus Estimate of $0.08; revenues fell 16.6% year/year to $71.8 mln vs the $71 mln consensus. Orders were $61.4 million for the third quarter of 2011 and $80.6 million for the second quarter of 2011. Orders for semiconductor equipment were $48.5 million in the third quarter of 2011 compared to $69.1 million in the second quarter of 2011. Total consolidated backlog was $74.5 million at September 24, 2011 compared to $84.9 million at June 25, 2011. Cohu expects fourth quarter 2011 sales to be approximately $65 million.

4:06PM Riverbed Technology -- Earnings Mover (RVBD) 22.52 : Stock jumps roughly 1.5-pts in initial reaction, currently up along the $24.00 level. Stock is through its 50-day ema here ($23.58), with some resistance overhead near $25.50-26.00. This is the first time the stock has been above its 50-day ema since mid July.

4:09PM Riverbed Technology beats by $0.03, beats on revs (RVBD) : Reports Q3 (Sep) earnings of $0.24 per share, $0.03 better than the Capital IQ Consensus Estimate of $0.21; revenues rose 29.0% year/year to $190.6 mln vs the $185.5 mln consensus.

12:01PM Freescale Semi licenses ARM Cortex-A7 and Cortex-A15 processor cores (FSL) 12.30 -0.40 : Co plans to incorporate ARM Cortex-A7 and Cortex-A15 processors in single-core and multicore i.MX devices that feature software and pin compatibility and target embedded, automotive infotainment and smart mobile device applications.

10:00AM Semiconductor Hldrs ETF mildly weaker (SMH) 30.38 -0.12 : Although a key component is up substantially (INTC +4.1%), the sector ETF is in the red. Weighing this morning are: LLTC -4.8%, SNDK -2.5%, ADI -2%, AMAT -1%, AMKR -1%, BRCM -2%, LSI -2.5%, MXIM -1.2%, TXN -1.7%, XLNX -1.7%. Short term support for the SMH if follow through is noted is at 30.15/30.05 (The Technical Take). Resistance above this wk/last wk highs (30.64/30.63) is at 30.85/30.90.

Marvell (MRVL) announced Samsung has launched the new S5820, a China 3G TD-SCDMA Android smartphone for China Mobile (CHL).

7:02AM ON Semiconductor updates impact of Thailand flood; co believes that its SANYO Semiconductor division's Thailand operations have been severely damaged by the flood (ONNN) 8.04 : Co believes that its SANYO Semiconductor division's Thailand operations, including buildings and equipment, located at the Rojana Industrial Park in Ayutthaya, Thailand have been severely damaged by the flood. Operations at this location remain suspended. Co has not yet been able to enter its site and buildings and is uncertain as to when it will be able to gain access, due to the extensive flooding. Based on currently available information and given the extent of the potential damage, the company believes it will be unable to re-start probe, assembly and test operations at the Rojana Industrial Park for an indefinite period. The future of this site will be evaluated once the company is able to gain access to its facility.

7:00AM ATMI beats by $0.01, misses on revs (ATMI) 18.47 : Reports Q3 (Sep) earnings of $0.25 per share, $0.01 better than the Capital IQ Consensus Estimate of $0.24; revenues were unchanged from the year-ago period at $95 mln.

11:13 am S&P Tech Sector Down Almost One Percent, Trailing Broader Market (AAPL)
The tech sector is trading lower today, trailing slight gains in the broader market. Semiconductors are showing relative weakness in the tech space with the Philly Semi Index trading 0.8% lower. CREE (-7.8%) is a notable laggard in that chip index. Among other major indices, the S&P 500 is trading up 0.1%, while the NASDAQ is trading 0.4% lower. The QQQ, meanwhile, is trading 0.5% lower on the session. Among tech bellwethers, following earnings AAPL (-4.1%) is under notable pressure, while INTC (+4.1%) is outperforming.

In a busy night of earnings in tech last night, AAPL (-4.1%) reported a rare quarterly miss, although it offered uncharacteristically upside guidance. INTC (+4.1%) reported a Q3 beat on both revs and EPS, in addition to offering upside guidance and increasing its buyback. YHOO (+4.3%) posted a Q4 EPS beat with inline revs and guidance. JNPR (-1.0%) reported a top line beat and inline EPS and guidance. LLTC (-5.2%) posted a Q1 miss and guided below consensus. Also, CKP (-23.3%) and PWAV (-43.2%) issued downside guidance.

In news, ONNN (-11.8%) updated the impact of Thailand flood stating it believes that its SANYO Semiconductor division's Thailand operations have been severely damaged by the flood.

Among notable analyst upgrades this morning, Needham upgraded CTXS (+1.9%) to Buy. In downgrades, ALU (-9.4%) was downgraded to Underperform at Jefferies, JNPR (-1.0%) was downgraded to Market Perform at Wells Fargo, and Stifel Nicolaus downgraded RNOW (-3.8%) to Hold.

WDC (-7.2%) and LRCX (-1.2%) are two notable names in tech set to report results today after the close.

11:02 am Intel Tops Third Quarter Expectations; Sees Fourth Quarter Revenue Above Consensus (INTC)
Intel (INTC $24.33 +0.93) reported third quarter earnings of $0.69 per share, excluding non-recurring items, $0.06 better than the Capital IQ Consensus Estimate of $0.63.

Revenues rose 28.2% year/year to $14.23 billion versus the $13.84 billion consensus; non-GAAP gross margin -170 bps year/year to 64.4%.

For the fourth quarter, the company expects to see revenue of $14.2 billion to $15.2 billion versus the $14.21 billion Capital IQ Consensus Estimate; gross margin percentage: 65%, plus or minus a couple percentage points.

Third quarter PC Client Group revenue of $9.4 billion, up 22 percent year/year. Data Center Group revenue of $2.5 billion, up 15% year/year. The company generated approx. $6.3 billion in cash from operations, paid cash dividends of $1.1 billion, and used $4.0 billion to repurchase 186 mln shares of common stock. Intel's board of directors also voted to increase the company's buyback authorization by $10.0 billion, raising the total unused balance to $14.2 billion at the end of the third quarter. The company also completed a senior notes offering of $5.0 billion primarily for the purpose of repurchasing stock.
icon url

ReturntoSender

10/20/11 8:03 PM

#9556 RE: ReturntoSender #6755

From Briefing.com: 4:30 pm : Movements in the stock market today were closely correlated with comments about debt talks in the eurozone, even if headlines suggested that officials there are doing little more that paying lip service to the topic.

The major equity averages spent the first part of the session chopping along listlessly before participants were prompted to send stocks lower. Their efforts came in response to reports about the possibility that an EU Summit this coming weekend could be postponed. Any delay would only underscore the lack of progress in eurozone debt talks.

However, word that leaders of France and Germany will meet in coming days began to bring buyers back into the fold. That headline came right about the time that the S&P 500 was able to find technical support just below the psychologically-significant 1200 line.

Financials emerged as leaders, but the broad market was initially slow to follow the sector's lead. Financials finished near their session high with a 1.8% gain. Regional lender Fifth Third (FITB 11.63, +0.97) was especially strong on the back of a better-than-expected quarterly report. In contrast, American Express (AXP 46.19, +0.06) only found higher ground in the final minutes, despite an upside earnings surprise of its own.

eBay (EBAY 32.15, -1.03) matched the consensus earnings estimate, but its shares still traded sharply lower, making the stock one of the worst performers in the Nasdaq, which lagged its counterparts for the second straight session. Tech was the real source of weakness for the Nasdaq, though. The sector logged a 0.5% loss for the session, adding to the 2% decline that it suffered yesterday.

There was deluge of data today, including initial jobless claims for the week ended October 15. Claims totaled 403,000, which is spot on with what had been expected, among economists polled by Briefing.com. The latest tally is also little changed from the upwardly revised count of 409,000 claims recorded for the prior week.

The latest Philadelphia Fed Survey improved to 8.7 for October from the -17.5 that was posted in September. The October reading had been expected to remain negative, but improve to merely -8.8.

Existing home sales set an annualized rate in September of 4.91 million units, which is only slightly less than the pace of 4.92 million units that had been generally anticipated among economists surveyed by Briefing.com. The pace recorded for September marked a slowdown from the rate of 5.06 million units posted for the prior month.

Leading Indicators increased by 0.2%, which narrowly missed the 0.3% increase that had been broadly expected.

Advancing Sectors: Financials +1.8%, Materials +1.0%, Energy +0.7%, Utilities +0.6%, Industrials +0.6%, Consumer Staples +0.5%, Consumer Discretionary +0.4%, Health Care +0.1%
Declining Sectors: Telecom -0.1%, Tech -0.5%DJ30 +37.16 NASDAQ -5.42 NQ100 -0.5% R2K +0.3% SP400 +0.4% SP500 +5.51 NASDAQ Adv/Vol/Dec 1193/2.04 bln/1288 NYSE Adv/Vol/Dec 1806/958 mln/1174

6:13PM Hewlett-Packard announced Shane Robison will retire as executive vice president and chief strategy and technology officer effective Nov. 1 (HPQ) 24.74 -0.24 : HP also announced that, in an effort to drive strategy, research and development closer to the company's businesses, it will not be replacing the role of chief strategy and technology officer.

5:54PM Jabil announces 14% increase to quarterly dividend to $0.08 (JBL) 19.30 -0.24 :

4:28PM Cymer reports EPS in-line, misses on revs; guides Q4 revs below consensus (CYMI) 41.36 -2.94 : Reports Q3 (Sep) earnings of $0.36 per share, in-line with the Capital IQ Consensus Estimate consensus of $0.36; revenues fell 9.2% year/year to $128.7 mln vs the $130.2 mln consensus. Co issues downside guidance for Q4, sees Q4 revs of $128 mln vs. $131.80 mln Capital IQ Consensus Estimate.

4:19PM Altera misses by $0.02, misses on revs; guides Q4 revs below consensus (ALTR) 33.03 -0.39 : Reports Q3 (Sep) earnings of $0.57 per share, $0.02 worse than the Capital IQ Consensus Estimate of $0.59; revenues fell 4.7% year/year to $522.5 mln vs the $542.8 mln consensus. Co issues downside guidance for Q4, sees Q4 revs of down 7-11% QoQ to ~$465.0-485.9 mln vs. $532.90 mln Capital IQ Consensus Estimate; gross margin 69.5-70.5%. "Customer reaction to changing global macroeconomic conditions reduced industry demand. Despite this near-term deceleration we saw further growth from our 40-nm products and are very pleased with the successful launch of our 28-nm FPGAs."

4:15PM Freescale Semi beats by $0.06, reports revs in-line (FSL) 12.13 +0.27 : Reports Q3 (Sep) earnings of $0.29 per share, $0.06 better than the Capital IQ Consensus Estimate of $0.23; revenues fell 0.9% year/year to $1.14 bln vs the $1.13 bln consensus. Adjusted gross margin was 46.1%. Microcontroller net sales were $395 mln, compared to $430 mln in the second quarter of 2011 and $418 mln in the third quarter of 2010. RF, Analog and Sensor net sales were $306 mln, compared to $315 mln in the second quarter of 2011 and $272 mln in the third quarter of 2010.

4:13PM Rambus beats by $0.13, beats on revs (RMBS) 16.19 -0.25 : Reports Q3 (Sep) earnings of $0.12 per share, excluding non-recurring items, $0.13 better than the Capital IQ Consensus Estimate of ($0.01); revenues rose 216.4% year/year to $100.3 mln vs the $89.5 mln consensus. Revenue for the third quarter of 2011 was $100.3 million, up 51% sequentially from the second quarter of 2011 primarily due to the recognition of royalties from new licensing agreements signed in the second and third quarter of 2011. As compared to the third quarter of 2010, revenue was up 216% primarily due to the revenue recognized from agreements signed since the third quarter of 2010.

4:12PM Celestica beats by $0.01, beats on revs; guides Q4 EPS in-line, revs below consensus (CLS) 7.86 -0.12 : Reports Q3 (Sep) earnings of $0.26 per share, excluding non-recurring items, $0.01 better than the Capital IQ Consensus Estimate of $0.25; revenues rose 18.3% year/year to $1.83 bln vs the $1.8 bln consensus. Co issues guidance for Q4, sees EPS of $0.23-0.29, excluding non-recurring items, vs. $0.26 Capital IQ Consensus Estimate; sees Q4 revs of $1.70-1.85 bln vs. $1.9 bln Capital IQ Consensus Estimate.

4:12PM Seagate Tech beats by $0.03, misses on revs (STX) 12.06 +0.01 : Reports Q1 (Sep) earnings of $0.34 per share, $0.03 better than the Capital IQ Consensus Estimate of $0.31; revenues rose 4.2% year/year to $2.81 bln vs the $2.9 bln consensus. Co announces the European Commission announced on October 19, 2011 that they have approved under the EU Merger Regulation, Seagate's proposed acquisition of Samsung's hard disk drive assets. The company will continue to work with other regulatory bodies to secure additional approvals in the coming weeks. Seagate believes the transaction will close by the end of calendar year 2011.

4:11PM SanDisk beats by $0.13, reports revs in-line (SNDK) 45.50 +0.32 : Reports Q3 (Sep) earnings of $1.20 per share, $0.13 better than the Capital IQ Consensus Estimate of $1.07; revenues rose 14.8% year/year to $1.42 bln vs the $1.42 bln consensus. Co reports Q3 non-GAAP gross profit margin of 44.3% vs. 42-44% guidance. "We again delivered record revenue and strong profitability, driven by robust demand in our diversified end markets... Our broad portfolio of innovative storage solutions positions us exceedingly well to capitalize on our numerous growth opportunities in smart mobile devices and consumer and enterprise computing platforms."

4:08PM Microsoft reports EPS in-line, beats on revs (MSFT) 27.04 -0.09 : Reports Q1 (Sep) earnings of $0.68 per share, in-line with the Capital IQ Consensus Estimate consensus of $0.68; revenues rose 7.3% year/year to $17.37 bln vs the $17.19 bln consensus. The Microsoft Business Division reported $5.62 billion in first quarter revenue, an 8% increase from the prior year period which included the launch of Office 2010. The Server & Tools segment posted $4.25 billion in first quarter revenue, a 10% increase over the prior year period and the sixth consecutive quarter of double-digit revenue growth. Windows and Windows Live Division revenue was $4.87 billion, a 2% increase over the prior period, in line with the PC market. The co offers updated fiscal 2012 operating expense guidance, including Skype and the associated acquisition-related expenses, of $28.6 billion to $29.2 billion. "We saw customer demand across the breadth of our products, resulting in record first-quarter revenue and another quarter of solid EPS growth."

4:06PM SanDisk -- Earnings Mover (SNDK) 45.50 : Stock jumps 1.5 pts in initial reaction to earnings, currently up near the $47.00 level. The 4.5-mth highs are directly overhead at $47.65.

4:06PM Flextronics reports EPS in-line, beats on revs; guides Q3 EPS below consensus, revs below consensus (FLEX) 6.11 +0.01 : Reports Q2 (Sep) earnings of $0.22 per share, in-line with the Capital IQ Consensus Estimate consensus of $0.22; revenues rose 8.4% year/year to $8.04 bln vs the $7.74 bln consensus. Co issues downside guidance for Q3, sees EPS of $0.18-0.22 vs. $0.24 Capital IQ Consensus Estimate; sees Q3 revs of $7.3-7.7 bln vs. $7.95 bln Capital IQ Consensus Estimate.

4:03PM Ixia beats by $0.06, reports revs in-line (XXIA) 9.52 +0.01 : Reports Q3 (Sep) earnings of $0.16 per share, excluding non-recurring items, $0.06 better than the Capital IQ Consensus Estimate of $0.10; revenues rose 9.0% year/year to $77.3 mln vs the $76.5 mln consensus.

4:02PM Maxim Integrated beats by $0.05, reports revs in-line; guides Q2 EPS below consensus, revs below consensus (MXIM) 24.97 -0.18 : Reports Q1 (Sep) earnings of $0.46 per share, $0.05 better than the Capital IQ Consensus Estimate of $0.41; revenues rose 1.6% year/year to $636 mln vs the $632.8 mln consensus. Co issues downside guidance for Q2, sees EPS of $0.30-0.34 vs. $0.40 Capital IQ Consensus Estimate; sees Q2 revs of $580-620 mln vs. $627.76 mln Capital IQ Consensus Estimate.

1:56PM Suntech Power response to Solar Trade petition - currently reviewing the petition filed (STP) 2.01 -0.07 : Co responded and said "We're currently reviewing the petition filed with the US International Trade Commission and the US Department of Commerce. Anyone can file one of these actions; having filed an action is in no way a validation from the US government as to the merits of the action. Companies listed in the petition are not subject to a single blanket judgment, and each individual company, including Suntech, will respond in accordance with ITC & DOC guidelines..."

8:39AM Ultratech beats by $0.01, misses on revs (UTEK) 19.13 : Reports Q3 (Sep) earnings of $0.39 per share, $0.01 better than the Capital IQ Consensus Estimate of $0.38; revenues rose 44.9% year/year to $54.9 mln vs the $58 mln consensus. Co states, ""Customers are reassessing their capacity expansion plans which are translating into a more conservative outlook. In this current environment, it is imperative that we further our ongoing efforts to deliver superior customer support and provide our customers with reliable, technologically advanced and cost-effective solutions."

09:20 am Celestica downgraded to Neutral at Ticonderoga: . Ticonderoga downgrades CLS to Neutral from Buy as they now getting increasingly concerned around the impact of weakening consumer trends, slowing industrial demand and disappointing enterprise hardware demand on Celestica's business, all of which they believe will negatively impact the company over the next few quarters. They are also getting increasingly concerned about the long-term implications surrounding Celestica's high exposure to Research-in-Motion (RIMM) at 19% of 2Q11 sales.

09:20 am Cohu downgraded to Hold at Needham: . Needham downgrades COHU to Hold from Buy as there isn't enough demand with the larger customers, which they have awaited to order en masse to take up the slack. The firm says, with a lack of near-term catalysts they opt to wait on the sidelines and will get constructive on renewed signs of demand.

Last night, Western Digital (WDC $25.69 +1.25) reported first quarter earnings of $1.10 per share, excluding expenses of $21 million associated with the planned acquisition of Hitachi Global Storage Technologies announced Mar. 7, 2011 and unrelated litigation accruals, $0.13 better than the Capital IQ Consensus Estimate of $0.97, while revenues rose 12.4% year/year to $2.69 bln vs the $2.49 bln consensus.

Last night, Riverbed Technology (RVBD $24.56 +2.04) reported third quarter earnings of $0.24 per share, $0.03 better than the Capital IQ Consensus Estimate of $0.21, while revenues rose 29.0% year/year to $190.6 mln vs the $185.5 mln consensus.

Last night, MKS Instruments (MKSI $24.59 -0.04) reported third earnings of $0.58 per share, $0.09 better than the Capital IQ Consensus Estimate of $0.49, while revenues fell 12.1% year/year to $194.5 million versus the $189.5 million consensus. The company issued downside guidance for the fourth quarter with EPS of $0.18-$0.31 versus the $0.39 Capital IQ consensus and revenues of $145-165 million versus the $172.00 million Capital IQ Consensus Estimate. The company states, "Order levels began to decline in May and continued to decline until the middle of the third quarter. However, since then, orders have remained fairly stable. In conditions like these, our proven strategy is to remain nimble, aggressively identify and pursue new opportunities while simultaneously controlling costs."

Last night, LM Ericsson (ERIC $9.96 +0.28) reported third quarter earnings of SEK1.44 per share, SEK0.05 better than the Capital IQ Consensus Estimate of SEK1.39, while revenues rose 16.8% year/year to SEK 55.5 billion versus the SEK52.67 billion consensus. Gross margin in the quarter was down year-over-year to 35.0%, and down from 37.8% sequentially.

icon url

ReturntoSender

10/23/11 12:08 PM

#9558 RE: ReturntoSender #6755

InvestmentHouse Weekend Market Summary

http://www.investmenthouse.com/weekendmarketsummary.htm

- After fighting off the negatives all week and holding the top of the range, SP500, DJ30 join NASDAQ with a breakout move.
- EU 'intensified negotiations' help fan a Friday rally.
- Earnings overall solid Friday, adding to the upside push.
- Dollar hits post-WWII low versus yen.
- Market defies the negatives and moves into the next range of resistance.
- Rally to a new high? Don't expect it, but will take what the market is giving out.

Indices defy the negativity as SP500, DJ30 follow NASDAQ's breakout.

Where there's a will there's a way, I suppose. The market took about every possible hit you could throw at it. There were problems with the European deal, economic issues here at home, and maybe some earnings that were not quite as good as some felt they should be (e.g., AAPL). Nonetheless, all week it held up in the top of its range AT the top of its range, so to speak. Remember the indices were trading in a range from August into October. The past week moved up to the top of that range and then consolidated laterally. The question was whether they were going to break higher or fall back down in the range. NASDAQ was the first to move to the upside. It broke higher last Friday and then sold back to test. This Friday it gapped higher again, moving back out of its range. This time it was not alone. It was joined by SP500, breaking out of its range. It was also joined by the Dow 30. Even the DJ20 broke higher out of its range. Very solid moves as a group of indices all moved up together.

I have to say, I had my misgivings as to whether this move could occur. After the action on Wednesday and Thursday, I started to change my tune a bit, particularly on Thursday as the indices reached lower, held the bottom of this recent lateral consolidation and rallied back. That is the first time the buyers have stepped in to rally stocks off of an intraday move. That showed a bit more bullish action as the consolidation went into its first week. Apparently that was enough to send it to the upside. Certainly my views and the views of the others here are not going to stop the market's move. The question now is, one, can they sustain the break? Number two, will it move just into this range of resistance below the April peak, or will it try to make the breakout?

Once again, I have to take the negative side. I do not see how it can possibly do that given the outlook for the economy. Then again, the market does not care what I think. It factors in the fact and the beliefs of millions of traders and investors. That is how it makes its moves. Even though we may have misgivings, we recognize the move and we were ready to play the move. Indeed, we have been playing the move even though we did not necessarily like it. It was one of those situations where your gut may say one thing, but you have to keep your eyes open and do what the market tells you to do.

We have a break higher in the indices. They could turn right back down next week if the European meeting this week is not as good as investors think it should be. There could also be some bad earnings next week that flip things back down. The key move now will not about the race higher. It will be the test of this break by SP500, the Dow, and the Dow 20. Will they hold a la the NASDAQ and then begin the move back upside? The interesting thing is NASDAQ already made the break. It has already tested the break and it is heading up. Now these other indices are joining it. Maybe the testing is done. That is one of the reasons we were moving into upside positions on Friday even though we had a gap to the upside. There are very solid plays that we have been looking at. Those that have formed that rounded bottom over the August-October time frame. As they were making breaks higher (as they have been doing in a staggered form all week), we moved into new upside positions.

Was there really a reason for this move on Friday? There was no economic news released. There was a lot of other news. As I mentioned, there was the EU news. There were supposedly "intensified negotiations" reported on in the morning. They were ahead of this weekend meeting, so that got everyone excited. They are talking this time, and Merkel or other Germans are not saying this deal will not fly. Now they were having "intensified negotiations," whatever that means, and the market took that as a positive that some kind of deal would be reached. Indeed, they were throwing out a figure of 1.3T Euros as a bailout amount. Of course that was less than the 2T heard earlier in the week, but that is better than a sharp stick in the eye or a thumbs down from Merkel as seen earlier.

There were some good earnings out. GE's earnings were rather in line and boring. HON reported a nice beat and upside guidance. It took off to the upside, breaking out of that little rounded type of bottom that I have talked about. VZ beat. It was not a great beat, but it was solid. We are seeing that with other stocks this week. INTC, GOOG, and others have posted some great earnings and are moving higher.

So we had reasons, but does it really matter what the reason was for the market to make the breakout? A breakout is a breakout, right? It does not matter what our feelings are or why we believe it happens. There is always the game of "pin the tail on the reason" why the market moved whenever there is a significant break upside or downside. It really does not matter why we think it happened. Everyone can hypothesize, but the market does not the react as much to the day-to-day news. It does short term, do not get me wrong. It will bounce one way or the other based upon a news story, but the overall trend occurs over time.

The indices broke lower to start October. They rallied back to the top of the range, and then they moved laterally along the top of the range until the breakout on Friday. While Friday may have been influenced by some of the news that got things going, the move was set up long before Friday ever came around. Whether it was Europe, earnings, both, or just the phase of the moon does not really matter in the long run. The question is what the technical action is on the breakout and then what happens afterward. As I said, who knows if this breakout can continue, but we do know that we had the break after it rallied up to the top of the range, and then the SP500 and NYSE indices followed the NASDAQ's lead to the upside.

Can it continue? Again I ask that question. I will answer it with another question: Who knows? I do know that things are extremely negative and kind of extremely positive at the same time. That may seem strange. Investor sentiment is way down. The bears have been on top of the bulls for several weeks. The bears are at 41%, sharply lower this week from the last couple of weeks, but they are still above the bulls that are at 35.8%. Those are the investment advisors. We have a cross over that has been ongoing now for close to a month, and it is very bullish. The sentiment is quite negative. At the same time, a lot of people are saying the market has to go up. They are overly exuberant about what will happen with the EU.

I heard some things today that made me think that times may be a-changin', so to speak. Early on I heard comments that I had not heard since the late 1970's. On some of the news shows, some analysts said that the best way for the U.S. to move forward is for it to manage its decline similar to the UK. A lot of this was said back in the late 70's as well. Things like, "The days of the U.S. are over" or "It has seen its best days." It was a nice experiment while it lasted, but how long could this thing called a Republic last, really? Of course then we proceeded to get Ronald Reagan in, and he reignited our entrepreneurial spirit and national pride. Then we had one of the most incredible 20-year booms the world has ever seen, creating over 200M jobs along the way. An amazing period in our history.

This extreme pessimism is a cause for optimism. I heard other things about this rally on the session. "It was a short squeeze. There was no real buying. There was no conviction." It was just expiration, a short squeeze that put the pinch on those that were trading the market short. No doubt rallies start with squeezes, but, again, this rally is a bit beyond that point for the moment. We have had this break to the top, and now a breakout. There will be shorts there because a lot of people are looking right at this 1225-1230 level. When SP500 broke over it, they were caught with their shorts down, so to speak, and they got squeezed where you do not want to get squeezed. That is how these things work. So it was partly that, but it is always partly short squeeze.

Lack of conviction. No one believes in it, and then you have a lot of stocks that have formed up that rounded bottom as I have talked about (HON, for instance). Over the past three months they have moved in this rounded bottom where there is a double bottom, an inverted head and shoulders, a cup pattern whatever it happens to be. Now they are breaking higher. This is the next wave of stocks to lead the market higher, and we are starting to see that happen. Indeed we were buying into that next wave of stocks again on Friday despite the moves already to this point.

When you see companies such as VSEA or LNKD are moving higher, you have to take note of that and participate in the move to the upside. You may not believe in the move. Your gut may tell you not to get involved, but your gut and the market do not go together. As I tell people in the seminars, you have to forget about what you have learned all your life about how you should react to buys and sells. I am not just talking about the stock market; it is about everything in life. You have to forget about all that. You have to start understanding stock movements and why they move. More importantly, just understanding that they are moving and to take advantage of it when they do.

That is the kind of market we are in today. Then when you see stocks set up in these bases, it is telling us there is accumulation ongoing. We may not believe it, but you cannot deny it. They are breaking higher, and you cannot deny that either. You can either be like some of the guys you see on TV and curse the night, or you can light a few candles, call your broker, or get online and make some trades to participate in the move.

On Friday the stocks were moving. They started higher. Futures were up and stocks went higher when the bell rang. There was a mid-day slump, but they never came close to negative. Then they rallied back in the afternoon to finish close to session highs.

SP500, +1.9%; NASDAQ, +1.5%; Dow, +2.3%; SP600, +2.3%; SOX, +2.25%.

Very solid moves. We have seen this back-and-forth movement all week. It is one of the things we were somewhat lamenting, but this time there was a difference. It was not just banging back and forth, day-to-day in a tennis match inside the trading range. This move broke it through the top of the range.

OTHER MARKETS

As you would probably suspect, the other markets were heading in different directions.

Dollar: 1.3863 versus 1.3772 euro. The dollar lost ground. The dollar is now at a post-World War II low versus the Japanese yen. Wow. It was down against the euro for four straight days. That is the first time it has done that since July of 2011. Certain not a banner day for the dollar or a banner week, for that matter. But it was not beaten to a pulp either. It is still holding at its support after a nice break to the upside. The dollar holders are not ready to give up and say that Europe has its problems solved. That is what this chart is telling you. There is some doubt, but they have not given up and said it is a fait accompli.
Click to view the chart

Bonds: 2.21% versus 2.18% 10 year U.S. Treasury. Bonds had fallen back down to the 50 day EMA but, as with the dollar, they have not given up their trend. There is some doubt that Europe will do what it needs to do or at least what our Treasury Secretary and others are telling them they need to do. If they do not, the bonds can bounce right back up on fear. We will have to see how it plays out. This is an important test, but a test in an uptrend nonetheless.
Click to view the chart

Gold: 1,636.20, +23.30. Gold bounced back. This was the week that it broke down from that upwardly-pointing wedge. It came close to 1600, falling down to 1605 on the low. Now it is bouncing. We have gold to the downside. I do not think we have overstayed our welcome on the downside move. Maybe we did, but I still think it will find a lot of resistance at 1650. I still think it will come back lower, closer to 1550 before it moves significantly back to the upside. What will that have set up, mind you? The old ABCD pattern. If it goes down to 1550 or right around the 200 day EMA and bounces from there, that will be a great buy on gold.
Click to view the chart

Oil: 87.46, +1.39. Oil bounced upside once more. It closed off of its high. It is trying to bump back up at the top of the range at 90. It is just above mid-range, and it is trying to hold. It has been very volatile this week, but the theme is still holding this move higher off of the late-September low. Looks like it wants to try to bump 90. That will be a very important test. If Europe comes up with something, it will definitely give that a run. If Europe does not, we will see it fall back down in relatively short order.
Click to view the chart

TECHNICAL SUMMARY

INTERNALS

Internals were solid, but you have to juxtapose that with the fact that it was expiration Friday and that will skew the numbers.

Breadth. Breadth was solid on NASDAQ at 3.5:1. It was a very solid at 5.4:1 on the NYSE.

Volume. Volume actually fell on the NASDAQ by 2.5% to 1.97B. No expiration effect there. It was up 18.5% on the NYSE however, topping 1B shares. Maybe a little expiration bump there, but it was nothing really impressive as far as the trade. It did push volume up to average on the NYSE.

CHARTS

SP500. SP500 broke above resistance. It cleared the recent highs as well as the late-August peaks. It is at 1238. That takes it beyond 1227 that was that November peak. Finally, after several month of waiting, it is now looking toward the March low at 1250 and the June low at 1260 or so. You have another 12 to 22 points before it hits those levels. The large caps are in position to challenge them now. Again, the question is do they rally higher or test first? NASDAQ has already tested and succeeded, so it may just be a case where these indices continue higher following NASDAQ as it has already done the heavy lifting for them. What is the next run? We look for a test to March or June at 1250-1260. That is when things get tough. That will be a serious resistance range. It has to break through that to get to the next serious resistance range that would perhaps allow it to challenge the April and May peaks up near 1370 or so. It is making the headway. It is surprising; you may not believe it is happening, but it is. We will see if it can hold the move and continue on.

NASDAQ. NASDAQ has already made the break. It did so two Friday's back, and it spent this past week testing. There was that Thursday move where it tapped the 50 day EMA and reversed. First-time buyers had showed up intraday, and then it gapped to the upside. It was not a breakout for NASDAQ. It did not clear the prior highs, but it was an important move because it managed to move back up over resistance and has but in what looks to be a successful test of that breakout move. Now it will challenge very significant ranges, as noted before. That takes it all the way back to 2007 levels, these shoulders from that head and shoulders that lead off into the massive decline in 2008. It will be a very tough range for it. It is a breakout, it is a move, but now it has to figure out where it will go from here. It is pretty tight up to these levels at 2700, 2710. That gets it up another 60 or 70 points. That is not a bad move, but it gets it very serious in here with some heavy duty resistance. It may have the help of the SP500 and the Dow to send it higher, however.

DJ30. DJ30 also broke over its recent highs and it broke through the March lows. It is aiming at the June double bottom. That little double bottom is not far away. Serious resistance at 1200 psychological and actual price resistance at that level. It has problems as well. It is just trying to retake all of these prior peaks, but it is a "one step at a time" program. It has to shoot down that resistance. You have to hand it to the indices, they did it on Friday.

SP600. SP600 had a 2.3% gain. Back up to last weeks' highs. Still in their range and still below the August peak. They are following but they are not inspiring a lot of belief that the economy will be super anytime soon.

SOX. The SOX was up 2.25%, well off its high on the day. Still well off last week's high, and well off the September highs. It is just not leading here. I guess we will take following for now, as long as we can get some of the indices to move higher. We have to watch the SOX. It was one of the first to notch the lead lower earlier in the year. If it does not follow here, that is very significant. We would look for the moves by the other indices up into the next range to be truncated ultimately by the SOX acting as an anchor chain and dragging them back down. If the semiconductors do not perform well, the economy will probably not do that well. Any breakout by SP500 and NASDAQ that moves up into this upper range will be impeded by the SOX falling back down. We have to watch for that as the weeks unfold. For now we have a break higher. That is obviously a positive move, and we will play it. The question is how much play we will get out of it.

LEADERSHIP

Financial. JPM was trying to make the break through the 50 day EMA, but it could not. MS is playing above its 50 day EMA, but it could not put a lot of mileage on anything. WFC had a decent move, up over 2%. It is trying to stretch its move. These are not ones to write home about, but they are trying to make hay to the upside. A rounded bottom, a break higher, and struggling a bit. But it is putting the moves on again and trying to make its mark to the upside.

Retail. ANF has an interesting pattern. Nice flag. It has its double bottom/rounded bottom ready to move higher. BEE is breaking higher out of its own rounded bottom. Very interesting. I will call that retail because it is a hotel/motel type. A little stretch, but give me a break. COH is trying to make a break higher. It is not surging, but we did see surges from stocks this week. TSCO is breaking higher. On Friday we saw CMG smash to the upside along with MCD. I am eating crow burgers today for getting out of my MCD the day before earnings. Good call.

Transportation. The transports broke out. CSX broke higher from its lateral consolidation. JBHT formed a nice pennant after it reversed its trend and broke nicely higher. We have rails breaking higher, we have freight breaking higher. Very nice to see the transports following and breaking out with the Dow. That is some kind of Dow theory signal, although it is not a new high. It is just a break higher, but it is a positive synergistic move to the upside.

Energy. Energy remains somewhat of an enigma. It has improved off its lows, but it is not breaking out as other areas are. CHK has rallied up to resistance. Kind of struggling. HAL rallied but it faded this week. It looks like it wants to break to the downside. VLO is trying to make the break over resistance. We will see if it does. The point is that energy has recovered some, but it is not breaking higher. That is an interesting feature as well. It has something to do with economies. Energy follows economies or leads economies, and it is not making a strong move to the upside here. We need to watch this as time goes on.

Technology. AAPL was the big story. It missed its earnings and it is testing its 50 day EMA. GOOG hit its earnings and gapped upside. It is moving laterally. We will see if it can move higher. It was not a breakaway gap, so we will see what it can do. There are others setting up and trying to move well. NTGR has a nice rounded bottom, forming a handle. You have to like that. JNPR is trying to set up and turn the corner as well. RAX had a nice break to the upside, and now it is testing that move. FFIV is the same thing. A nice handle test. These are the cloud companies. They were the big leaders back in 2009. They sold off. They have had a deep correction, and now they are trying to step up and become some of those stocks that take the lead or assist in taking the lead now that some of the horsemen who pulled the markets higher have to take a break.

THE MARKET

SENTIMENT INDICATORS

VIX: 31.32; -3.46
VXN: 31.42; -3.36
VXO: 30.14; -3.42

Put/Call Ratio (CBOE): 0.86; -0.52

Bulls versus Bears:

This is a reading of the number of bullish investment advisors versus bearish advisors. The reason you look at this is that it gives you an idea of how bullish investors are. If they are too bullish then everyone is in the market and it is heading for a top: if everyone wants to be in the market, then all the money is in and there is no more new cash to drive it higher. On the other side of the spectrum if there are a lot of bears then there is a lot of cash on the sideline, and as the market rallies it drags that cash in as the bears give in. That cash provides the market the fuel to move higher. If bears are low it is the same as a lot of bulls: everyone is in and the market does not have the cash to drive it higher.

Bulls: 35.8% versus 34.4%. Rising for the first time in several weeks but still over 35%. 35% is the threshold measuring bullish versus bearish action. Sixth week the bulls are below bears and the gap is widening. A powerful sentiment signal. Solid move lower from 49.5% in late July. Highs from April and December (60% readings spanning December through early May 2011). The 5 year high is 62.0. The crossover level at 29% bulls from July 2010 is long gone. 35% is the threshold level suggesting bullishness. To be seriously bearish it needs to get up to the 60% to 65% level.

Bears: 45.0% versus 46.3%. Fading off the high but still well over 35%, the level considered bullish for the market. Sixth week of bears over bulls and six weeks over the 35% threshold considered a bullish indicator and have made that important crossover of bulls. For more reference, bearishness hit a 5 year high at 54.4% the last week of October 2008. The move over 50 took bearish sentiment to its highest level since 1995. Extreme negative sentiment. Prior levels for comparison: Bearishness peaked at 37.4% in September 2007. It topped the June 2006 peak (36%) on that run. That June peak eclipsed the March 2006 high (33%) and well above the 2005 highs that spawned new rallies (30% in May 2005, 29.2% in October 2005). That was a huge turn, unlike any seen in recent history.

NASDAQ

Stats: +38.84 points (+1.49%) to close at 2637.46
Volume: 1.975B (-2.47%)

Up Volume: 1.73B (+778.28M)
Down Volume: 416.54M (-663.46M)

A/D and Hi/Lo: Advancers led 3.48 to 1
Previous Session: Decliners led 1.09 to 1

New Highs: 40 (+40)
New Lows: 26 (+26)

NASDAQ CHART: Click to view the chart

NASDAQ 100 CHART: Click to view the chart

SOX CHART: Click to view the chart

SP500/NYSE

Stats: +22.86 points (+1.88%) to close at 1238.25
NYSE Volume: 1.075B (+18.52%)

Up Volume: 3.69B (+840M)
Down Volume: 764.71M (-665.29M)

A/D and Hi/Lo: Advancers led 5.41 to 1
Previous Session: Advancers led 1.3 to 1

New Highs: 78 (+50)
New Lows: 16 (-19)

SP500 CHART: Click to view the chart

SP600 Chart: Click to view the chart

DJ30

Stats: +267.01 points (+2.31%) to close at 11808.79
Volume DJ30: 264M shares versus 166M shares Thursday.

DJ30 CHART: Click to view the chart

MONDAY

With those leaders trying to step up, the market has a good shot at continuing this run. That is why we are buying into the move, pure and simple. There is a lot more data next week, and there are a lot of earnings. One third of the SP500 reports earnings in the coming week. It will be a huge week for earnings and for data. Case/Shiller, Consumer Confidence, Durable Goods Orders, New Home Sales, Initial Claims. The advance GDP for the third-quarter will be important. 2.2% we will see. Personal Income and Spending and Michigan Sentiment end the week. A lot of news and a lot of earnings.

Of course we also have our friends over in Europe who will be trying to solve their financial problems. A lot of things can push and pull the market different directions, but we are going to continue to look at these stocks that have had these rounded bottoms and can provide leadership to the upside. Because we have had a break higher in the indices themselves. Again, I do not think they will break to new highs on this, but we can challenge the prior range, rattle around in there and make some money. We sure made money rattling around in this range. Play the move up, see how it tests, and then we can play it for as far as it will run. Then if it sets up into a back-and-forth trading range once more and it is a decent range looking at it. It is just the same size as the one it just broke out from. That gives us plenty of opportunity to make great money. We are going to look to do that using these plays. I am looking at the SP500, but it is the same type of pattern of the other plays that we have been looking at. We will use them until we cannot use them anymore.

Maybe the market runs out of juice because the economy just cannot hang. Okay. It will get there eventually. Until then we will not wring our hands about how terrible the future will be. We can talk about it; it is a lot of fun to make fun of our fearless leaders and talk about how they are screwing up and how we would do things so much better if we were there. That is all part of the process. But it comes down to what the market is doing and how we can make money out of it. Even if we feel like things might be going to hell in a hand basket, if we can make money in the near term buy playing the upside, we will make money in the near term by playing the upside. We may have to flip it back to the downside and make a lot of money as things sell off quickly again, but that is what you do. We are traders and investors in this market. You take what the market gives, and that means you have to be ready to move. And we will be.

For now, I like these little rounded bottoms. We will see how far they can take us. Enjoy your weekend. We are getting carried away by the mosquitoes down here, but I take solace in the fact that winter will be here eventually and two or three of them might die when the weather gets down to 35 or so.

Have a great weekend!

Support and Resistance

NASDAQ: Closed at 2637.46
Resistance:
2643 is the September 2011 high
2645-2650ish from December 2010 consolidation
2676 is the January 2010 low
2686 is the January 2011 closing low
The 200 day SMA at 2692
2706 to 2705 is the April 2011 low and the February 2011 and consolidation low (bottom of the trading range) 2723 to 2705 is the range of support at the bottom of the January to May trading range
2759 is the May low
2762 is the February low
2796 is the February gap down point
2816 is the early April peak.
2825 is the 2007 closing peak.
2841 is the February 2011 peak
2862 is the 2007 peak
2879 is the July 2011 peak
2888 is the May 2011 peak

Support:
2612 is the late August 2011 peak
2603 is the March 2011 intraday low (post-Japan low)
2599 is the June 2011 low
2593 is the November intraday high
2580 is the November 2010 closing high
2569 is the November gap up point through the April 2010 peak
The 50 day EMA at 2563
2555 is the mid-August 2011 peak
2546 is the early September 2011 gap down point
2540 is the early November 2010 lower gap point
2532 is the early August gap down point
2512 is last week's gap down point
2469 is the November 2010 low
2331 from October 2010 low and the August 2011 intraday low
2305 from the August 2010 peak (summertime base)
2139 is the May and June 2010 low
2123 is the August 2010 gap down point
2100 from the August 2010 lows

S&P 500: Closed at 1238.25
Resistance:
1249 is the March 2011 low (post-Japan)
1255 is the late December 2010 consolidation range
1275 is the January 2010 low, early January 2011 peak
The 200 day SMA at 1275
1295 to 1294 is the April 2011 low and the February 2011 consolidation low (bottom of the trading range)
1313 from the August 2008 interim peak
1318.51 is the May low
1325-27 is the March 2008 closing low and the May 2006 peak.
1332 is the early March peak
1340 is the early April 2011 peak
1344 is the February 2011 peak is being challenged again
1357 is the July 2011 peak
1364 is the March 2007 low
1370 is the August 2007 low
1371 is the recent May 2011 peak

Support:
1235 is the mid-December 2010 consolidation low
1231 is the late August 2011 peak
1227 is the November 2010 peak
1220 is the April 2010 peak
1209 is the mid-August 2011 high
1196 is the November 2010 consolidation peak
The 50 day EMA at 1196
1178-1180 is the October 2010/November 2010 consolidation low
1131 - 1127 from August 2010 base peak.
1119 is the early August closing low
1109 is the mid-September 2010 gap up point
1101 is the August 2011 low
1075 is the October 2011 intraday low
1099 from the mid-July interim peak
1090 is the early September 2010 gap up point
1040 from the August 2010 lows and May/June 2010 lows
1011 is the summer 2010 low

Dow: Closed at 11,808.79
Resistance:
11,867 from the August 2009 high and peak on that bounce in the selling.
11,893 from March 2008 closing low
The June low at 11,897 (closing)
The 200 day SMA at 11,966
12,094 is the April 2011 low
12,110 from the March 2007 closing low
12,283 is the March 2011 peak
12,391 is the February 2011 peak
12,876 is the May high
12,754 is the July intraday peak
13,058 from the May 2008 peak on that bounce in the selling

Support:
11,734 from 11-98 peak
11,717 is the late August 2011 peak
The August low at 11,700
11,555 is the March low
11,452 is the November 2010 peak
The 50 day EMA at 11,392
11,178 from November 2010
10,978 is the bottom of the November 2010 consolidation
10,750 from September 2010
10,720 is the August closing low
10,705-710 from January 2010 peak
10,694-700 from August 2010 peak
9938 is the August 2010 low

Economic Calendar

October 17 - Monday
- Empire Manufacturing, October (8:30): -8.48 actual versus -4.0 expected, -8.82 prior
- Industrial Production, September (9:15): 0.2% actual versus 0.2% expected, 0.0% prior (revised from 0.2%)
- Capacity Utilization, September (9:15): 77.4% actual versus 77.5% expected, 77.3% prior (revised from 77.4%)

October 18 - Tuesday
- PPI, September (8:30): 0.8% actual versus 0.2% expected, 0.0% prior
- Core PPI, September (8:30): 0.2% actual versus 0.1% expected, 0.1% prior
- Net Long-Term TIC Fl, August (9:00): $57.9B actual versus $9.1B prior (revised from $9.5B)
- NAHB Housing Market Survey, October (10:00): 18 actual versus 15 expected, 14 prior

October 19 - Wednesday
- MBA Mortgage Index, 10/15 (7:00): -14.9% actual versus +1.3% prior
- CPI, September (8:30): 0.3% actual versus 0.3% expected, 0.4% prior
- Core CPI, September (8:30): 0.1% actual versus 0.2% expected, 0.2% prior
- Housing Starts, September (8:30): 658K actual versus 595k expected, 572K prior (revised from 571K)
- Building Permits, September (8:30): 594K actual versus 610k expected, 625K prior (revised from 620K)
- Crude Inventories, 10/15 (10:30): -4.729M actual versus 1.344M prior

October 20 - Thursday
- Initial Claims, 10/15 (8:30): 403K actual versus 403k expected, 409K prior (revised from 404K)
- Continuing Claims, 10/08 (8:30): 3719K actual versus 3690k expected, 3694K prior (revised from 3670K)
- Existing Home Sales, September (10:00): 4.91M actual versus 4.92M expected, 5.06M prior (revised from 5.03M)
- Philadelphia Fed, October (10:00): 8.7 actual versus -8.8 expected, -17.5 prior
- Leading Indicators, September (10:00): 0.2% actual versus 0.3% expected, 0.3% prior

October 25 - Tuesday
- Case-Shiller 20-city, August (9:00): -3.5% expected, -4.11% prior
- Consumer Confidence, October (10:00): 46.0 expected, 45.4 prior
- FHFA Housing Price Index, August (10:00): 0.8% prior

October 26 - Wednesday
- MBA Mortgage Index, 10/22 (7:00): -14.9% prior
- Durable Orders, September (8:30): -1.0% expected, -0.1% prior
- Durable Orders -ex Transportation, September (8:30): 0.4% expected, 0.0% prior (revised from -0.1%)
- New Home Sales, September (10:00): 300K expected, 295K prior
- Crude Inventories, 10/22 (10:30): -4.729M prior

October 27 - Thursday
- Initial Claims, 10/22 (8:30): 403K expected, 403K prior
- Continuing Claims, 10/15 (8:30): 3700K expected, 3719K prior
- GDP-Adv., Q3 (8:30): 2.2% expected, 1.3% prior
- GDP Deflator, Q3 (8:30): 2.5% expected, 2.5% prior
- Pending Home Sales, August (10:00): -1.0% expected, -1.2% prior

October 28 - Friday
- Personal Income, September (8:30): 0.3% expected, -0.1% prior
- Personal Spending, September (8:30): 0.6% expected, 0.2% prior
- PCE Prices - Core, September (8:30): 0.1% expected, 0.1% prior
- Employment Cost Index, Q3 (8:30): 0.6% expected, 0.7% prior
- Michigan Sentiment - Final, October (9:55): 57.5 expected, 57.5 prior
icon url

ReturntoSender

10/23/11 6:20 PM

#9559 RE: ReturntoSender #6755

An argument for a bottom being in would be based upon anything but expectations for fundamental improvement in the foreseeable future.

Instead we would have to look at sentiment. What do we see at stock market bottoms?

Extremely bearish sentiment.

Yes, we have had that for weeks. Six straight weeks of more bears than bulls in the Investors Intelligence Poll.

http://www.schaeffersresearch.com/streetools/market_tools/investors_intelligence.aspx

Look at the put to call ratio and you will see it is the most bearish it has ever been for a sustained period of time. That means nothing though until it begins a sustained move lower:


But if you look at a shorter term chart you will see it is showing signs of topping and turning lower. That corresponds with long term bottom formation:


We also see improvements in market breadth that were beginning to take place even as the market formed lower lows three weeks ago:

http://investorshub.advfn.com/boards/read_msg.aspx?message_id=66169487

But most telling to me is the fact that on most important charts we will more than likely see not only the higher volume up day, and week but soon month as well on the major market charts.

Daily Chart:


Weekly Chart


Monthly Chart


Volume is very telling. What it is telling me right now is that the market is not at all convinced that whatever kind of recession we might be entering will have anything other than a soft landing.

That said what if we have a 2001 type situation? Volume in early 2001 was suggesting things were not going to get much worse then too. We know now how wrong that actually turned out to be. Check out the monthly chart above where for two months in early 2001 it looked like the market was going to rebound.

More on that in the next post.

RtS
icon url

ReturntoSender

10/24/11 10:40 PM

#9561 RE: ReturntoSender #6755

From Briefing.com: 4:30 pm : Strong buying today gave the stock market its third straight gain. In that time the S&P 500 has marched nearly 4% higher, crossing above the 1250 line for the first time in more than two months.

Trade ahead of the open was somewhat subdued. Participants appeared neither surprised nor disappointed that officials from Europe failed to unveil the makings of a comprehensive plan intended to restore the health of the region's financial conditions. Monthly manufacturing and services reports from the eurozone were also mixed at best, but some took encouragement that China reported overnight an increase in manufacturing activity, as measured by the HSBC Manufacturing PMI.

Corporate news flow was somewhat limited. Among the more notable announcements, Dow component Caterpillar (CAT 91.77, +4.38) posted earnings that exceeded what Wall Street had expected. The industrial machinery outfit complemented the report with a strong earnings forecast. The stock climbed to a two-month high, but its strength couldn't carry the Dow as high as the other major equity averages.

The Nasdaq staged the strongest gains of the primary indices. Its outsized gain was helped along by tech stocks, which settled the session 1.9% higher. Some merger and acquisition activity helped inspire interest for tech issues. Shares of RightNow Tech (RNOW 42.94, +6.98) surged in response to news that it will be purchased for $43 per share, a premium of 20% over last Friday's closing price, by Oracle (ORCL 32.87, +0.75). Owners of ORCL applauded the move, bidding the stock up to a three-month high.

On a related note, CIGNA (CI 45.34, +0.64) announced that it will pay $55 for each outstanding share of HealthSystems (HS 53.71, +13.55). The offer represents a premium of about 40% above where HS settled last week. News of the planned acquisition sent shares of SXC Health Solutions (SXCI 43.37, -13.05) down sharply due to concerns that the company's business may no longer be needed by HealthSystems.

Commodities also climbed today, giving the CRB Commodity Index a 2.4% gain. The move was led by oil, which surged to a two-month high and settled pit trade with a gain of more than 4% at $91.27 per barrel.

The greenback gave up an early gain to end the day on a down note. It had only been up modestly this morning, but a bounce by the euro undercut the dollar and left it to trade 0.2% below a currency-weighted basket by day's end.

Advancing Sectors: Materials +2.3%, Financials +2.2%, Tech +1.9%, Industrials +1.7%, Health Care +1.4%, Consumer Discretionary +1.4%, Energy +1.2%
Declining Sectors: Utilities -0.4%, Consumer Staples -0.6%, Telecom -0.9%DJ30 +104.83 NASDAQ +61.98 NQ100 +2.1% R2K +3.3% SP400 +2.9% SP500 +15.94 NASDAQ Adv/Vol/Dec 2095/1.89 bln/485 NYSE Adv/Vol/Dec 2516/927 mln/519

4:46PM STMicroelectronics misses by $0.01, misses on revs; guides Q4 revs below consensus (STM) 7.46 +0.05 : Reports Q3 (Sep) earnings of $0.09 per share, excluding non-recurring items, $0.01 worse than the Capital IQ Consensus Estimate of $0.10; revenues fell 8.1% year/year to $2.44 bln vs the $2.49 bln consensus. Co issues downside guidance for Q4, sees Q4 revs of $2.15-2.30 bln vs. $2.55 bln Capital IQ Consensus Estimate. Regarding guidance, co said, "Reflecting both revenue and a higher level of unsaturation at our facilities as we make further adjustments to reduce inventory, we anticipate a gross margin range of about 33.5%, plus or minus 1.5 percentage points. We anticipate that 2011 will still be a year of revenue and operating income growth in several businesses, in particular Automotive and MEMS, despite the weaker second half. As evidenced by our year-to-date results, we continue to build on the progress achieved over the course of the last two years in expanding our customer base, introducing new products and focusing on our target growth markets."

4:34PM Texas Instruments beats by $0.03, beats on revs; guides Q4 EPS below consensus, revs in-line (TXN) 31.69 +1.23 : Reports Q3 (Sep) earnings of $0.60 per share, excluding $0.09 in items, $0.03 better than the Capital IQ Consensus Estimate of $0.57; revenues fell 7.3% year/year to $3.47 bln vs the $3.31 bln consensus. Co issues guidance for Q4, sees EPS of $0.43-0.51, excluding $0.15 in non-recurring items, vs. $0.54 Capital IQ Consensus Estimate; sees Q4 revs of $3.26-3.54 bln vs. $3.32 bln Capital IQ Consensus Estimate. TI's third-quarter 2011 gross profit and operating profit were negatively impacted by costs associated with lower levels of factory utilization in the quarter as the company lowered production in response to weaker demand, as well as charges for inventory obsolescence on certain custom programs. These were partially offset by a net benefit resulting from proceeds from ongoing insurance claims associated with the March earthquake in Japan. The company used $450 million in the quarter to repurchase 14.1 million shares of its common stock and paid dividends of $148 million. "Our revenue for the third quarter was higher than we expected though, overall, the quarter was below the seasonal average. We expect the same in the fourth quarter as economic uncertainty continues to weigh on demand in almost every major market segment in which we operate. We are well prepared to continue to gain share in our core businesses, no matter the economic conditions."

4:17PM MIPS Technologies and Starboard reach agreement (MIPS) 5.27 +0.22 : Co announced it has reached an agreement with Starboard Value LP and its affiliates, which beneficially owns ~9.9% of the outstanding shares of MIPS' common stock. Under the agreement, MIPS has agreed to nominate to the MIPS Board two new directors recommended by Starboard, who are not employees of MIPS or Starboard.

4:09PM Volterra Semi beats by $0.03, misses on revs (VLTR) 23.48 +0.99 : Reports Q3 (Sep) earnings of $0.35 per share, $0.03 better than the Capital IQ Consensus Estimate of $0.32; revenues fell 0.7% year/year to $41.3 mln vs the $43.4 mln consensus.

4:04PM Veeco Instruments beats by $0.21, beats on revs; guides Q4 EPS, revs below consensus (VECO) 27.05 +1.61 : Reports Q3 (Sep) earnings of $1.33 per share, excluding non-recurring items, $0.21 better than the Capital IQ Consensus Estimate of $1.12; revenues fell 3.2% year/year to $268 mln vs the $252.3 mln consensus. Co issues downside guidance for Q4, sees EPS of $0.54-0.86, excluding non-recurring items, vs. $1.07 Capital IQ Consensus Estimate; sees Q4 revs of $175-215 vs. $235.71 mln Capital IQ Consensus Estimate. "Our current expectation is orders will remain depressed for a few quarters. While there are many data points indicating that LED lighting is accelerating, weak backlighting demand continues to cause low factory utilization rates. While we do not know how long this slowdown will last, LED pricing declines will continue to stimulate demand for solid state lighting on a global basis." Veeco's third quarter bookings were $133 million, a decline of 57% sequentially. LED & Solar orders declined 59% sequentially to $112 million, with MOCVD orders at $103 million. Data Storage orders were $21 million, down 44% sequentially. The Company's Q3 2011 book-to-bill ratio was .50 to 1. Veeco recorded backlog adjustments of $34 million during the quarter. Veeco's quarter-end backlog was $389 million.

TSMC (TSM) announced that its 28nm process is in volume production and production wafers have been shipped to customers.

12:37 pm S&P Tech Sector Shows Notable Gains, Outperforms Broader Market (ORCL)
The tech sector is trading higher today, outpacing gains in the broader market. Semiconductors are showing relative strength in the tech space with the Philly Semi Index trading 3.3% higher. VECO (+5.5%) is a notable leader in that chip index. Among other major indices, the S&P 500 is trading 1.1% higher, while the NASDAQ is trading 2.2% higher The QQQ, meanwhile, is trading 2.0% higher on the session. Among tech bellwethers, AAPL (+3.0%) is a notable leader, while T (-1.0%) and VZ (-1.5%) are lagging.

In news, ORCL (+1.8%) announced that it has entered into an agreement to acquire RNOW (+19.1%) for $43.00 per share. GOOG (+1.6%) is considering financing a deal with others to acquire YHOO (+2.8%), according to reports. Carl Icahn disclosed a 7.94% stake in WBMD (+11.3%) in 13D filing. Also, there were positive Barron's comments over the weekend on FIO (+14%), saying the co is a potential takeover target.

Among notable analyst research this morning, XLNX (+4.8%) was upgraded to Outperform at Pacific Crest and Brigantine downgraded AVNW (-6.7%) to Hold. Also, TLEO (+4.9%) was named a long Research Tactical Idea at Morgan Stanley.

icon url

ReturntoSender

10/29/11 1:59 PM

#9565 RE: ReturntoSender #6755

From Briefing.com: Weekly Recap - Week ending 28-Oct-11In contrast to the action of the first four sessions of the week, stocks spent Friday trading close to the neutral line for a flat finish.

Trade on Friday lacked excitement. Even with the weekend immediately around the corner, many market participants were compelled to take early rest. Their fatigue came after stocks staged four consecutive swings of 1% or more.

To be fair, though, the final session of the week didn't feature much news flow, or at least enough of the sort that would bring participants back in to the fold. Earnings were generally better than expected, as has been the case all week, but overall broad market participants appeared uninspired by them. That said, Merck (MRK 35.11, +0.80) made a strong move on the back of a better-than-expected report. Fellow blue chip Chevron (CVX 109.64, +0.67) had a quiet session, despite an upside earnings surprise of its own. Whirlpool (WHR 51.80, -8.67) tumbled in response to an earnings miss.

Economic data featured a 0.1% increase in personal income during September, slightly less than the Briefing.com consensus forecast of 0.3% growth. Personal spending increased by 0.6%, just as had been expected. These numbers were already incorporated into the advance reading on third quarter GDP.

On Thursday, advance GDP data showed that the economy expanded at a 2.5% clip during the third quarter. That exceeded the 2.3% growth rate that had been broadly expected to follow the 1.3% increase in output posted in the prior quarter.

Another weekly initial jobless claims tally just above 400,000 was given little discussion, especially since most traders focused their attention on the European Union's (EU) plan aimed at improving the continent's precarious financial conditions. Although specifics weren't released, participants were pleased that the plan will increase the eurozone bailout fund to about $1.4 trillion, recapitalize banks, and cut Greece's debt obligations by 50%. The stock market spiked more than 3% on Thursday for its best single-session performance in more than two weeks, but financials fared even better by boasting a 6% gain as bank stocks benefited quelled concern about their presence in Europe.

Many investors had thought that they would have to wait a few more weeks for the plan, given that a meeting among members of the EU on Wednesday finished without any word related to the matter. Still, the belief that European leaders were committed to finding a solution helped bolster buying interest, such that the stock market gained more than 1%. That contrasted trade on Tuesday, when angst ahead of the meeting left the broad market to tumble 2% for its only loss of the week.

Trade in the first session of the week was broadly positive, resulting in a gain of more than 1% for the stock market. The advance took the S&P 500 back above the 1250 line for the first time in more than two months. Tech stocks, which collectively make up the largest sector by market weight, were some of the top performers, partly fueled by news that Oracle (ORCL 33.69, +0.03) acquired RightNow Tech (RNOW 43.10, -0.16) for a hefty premium over its prior session closing price.

Market participants return on Monday for one final session in October. The S&P 500 heads into that session riding four straight weekly gains and on pace for monthly gain of more than 13%, which would make for one of the stock market's best monthly performances on record.

..Nasdaq 100 +0.1%. ..S&P Midcap 400 -0.3%. ..Russell 2000 -0.6%. ..NYSE Adv/Dec 1484/1512. ..NASDAQ Adv/Dec 1125/1432.
 
Index Started Week Ended Week Change % Change YTD %
DJIA 11808.79 12231.11 422.32 3.6 5.6
Nasdaq 2637.46 2737.15 99.69 3.8 3.2
S&P 500 1238.25 1285.08 46.83 3.8 2.2
Russell 2000 712.42 761.00 48.58 6.8 -2.9

1:26PM Microchip Thailand factories operating normally; no imminent danger due to location (MCHP) 35.55 +0.19 : Co announced that both of its factories in Thailand are continuing to operate normally, and are in no imminent danger of flooding because of where they are located (approximately 50 miles east of Bangkok). There is, however, extensive flooding in other parts of Thailand, including sections of the city of Bangkok, and our heartfelt sympathy and concern goes out to the people of Thailand who have been impacted by these floods.

12:01PM Powerwave announces 1-for-5 reverse stock split and authorized share reduction (PWAV) 0.82 -0.2 : Co announced that its Board of Directors and stockholders have approved a 1-for-5 reverse stock split of its outstanding shares of common stock and a reduction in the number of authorized shares of its common stock, each of which were effective as of October 28, 2011.

Lattice Semiconductor (LSCC) and Valens Semiconductor announced a new and comprehensive HDBaseT camera reference design solution. The HDBaseT reference design is targeted at the surveillance market.

i365, A Seagate (STX) announced that Aspen Healthcare, a private health care provider operating four medical facilities throughout the UK, has replaced its tape-based backup solution with EVault Plug-n-Protect backup and recovery appliances.

Last night, Advanced Micro (AMD $6.00 +0.46) reported third quarter earnings of $0.15 per share, excluding non-recurring items, $0.05 better than the Capital IQ Consensus Estimate of $0.10, while revenues rose 4.4% year/year to $1.69 billion versus the $1.65 billion consensus. The company issued upside guidance for the fourth quarter with revenues of +1-3% quarter over quarter to approximately $1.707-1.775 billion versus the $1.71 billion Capital IQ Consensus Estimate.

Last night, Hewlett-Packard (HPQ $27.71 +0.72) announced that it has completed its evaluation of strategic alternatives for its Personal Systems Group and has decided the unit will remain part of the company. "HP objectively evaluated the strategic, financial and operational impact of spinning off PSG. It's clear after our analysis that keeping PSG within HP is right for customers and partners, right for shareholders, and right for employees," said Meg Whitman, HP president and chief executive officer. "HP is committed to PSG, and together we are stronger."
icon url

ReturntoSender

10/30/11 10:55 AM

#9567 RE: ReturntoSender #6755

Monday Morning Outlook: The No. 1 Technical Risk to the Market
A Fed policy decision and October jobs data are just over the horizon

by Todd Salamone 10/29/2011 9:00 AM

http://www.schaeffersresearch.com/commentary/observations.aspx?ID=108572&trackback=recapezine&am...

Stocks ended the week broadly higher, boosted by major signs of progress out of the debt-laden euro zone. While there are still plenty of details left to hammer out, the united front presented by European leaders was sufficient to send the major market indexes north of significant technical levels. The rally was broad-based, with both small- and large-cap stocks scoring meaningful victories on the charts. Since big-money players have some ground to make up before year-end, it's not unreasonable to think the positive momentum could continue. But, as Todd Salamone notes, there are still several risks to the bullish case as we wrap up the month of October. Fortunately, Rocky White has crunched the numbers on the market's leaders and laggards to find out which names might be poised to outperform during the near term.

Finally, we wrap up with a preview of the key economic and earnings events for the week ahead, as well as a few sectors of note -- including an update on the suddenly surging financial sector.

Notes from the Trading Desk: Hedge Funds Could Play Year-End Catch-Up
By Todd Salamone, Senior VP of Research

"The VIX spike to an area that has historically marked buying opportunities, coincident with various indexes finding support at intriguing levels this past week, suggests you can begin accumulating equities in the small- and mid-cap spaces -- but do so on a smaller scale than normal. The equity market is not out of the woods, despite some initial signs of stability. For example, the RUT is still below 750, and the MID remains below 900."
- Monday Morning Outlook, August 13, 2011

"We have been saying for weeks that the increasingly negative sentiment backdrop could lead to sharp gains in the market, but investors first needed a reason to cover their shorts or move from the sidelines... a positive outcome in Europe could produce a continued fourth-quarter rally, as fund managers aggressively accumulate long positions or short covering emerges as the technical backdrop improves."
- Monday Morning Outlook, October 22, 2011

"The selloff in most of the global markets in the third quarter heavily impacted a large number of hedge funds. In fact, not only did it put many funds into the red for the year, it pushed a huge number of hedge funds below their high water mark. According to HFR, at the end of the third quarter just 19.3 percent of all hedge funds were above that critical level that determines whether their investors' accounts are in the black."
- Institutional Investor, October 21, 2011

Judging by the price action this past Thursday, when the S&P 500 Index (SPX - 1,285.09) rallied 3.4% and the Russell 2000 Index (RUT - 761.00) jumped 5.2%, European leaders' plan to address the sovereign debt issues in their region was well-received. While Europe stole the headlines, a respectable third-quarter U.S. GDP report also soothed wary investors. The 2.5% increase was driven primarily by solid consumer spending as inventory building came in less than expected, brightening the economic landscape ahead.

On the heels of the news, volatility indexes dropped sharply as stocks roared higher, with the Dow Jones Industrial Average (DJIA - 12,231.11) climbing above the 12,000 millennium mark for the first time since Aug. 1, and the PowerShares QQQ Trust (QQQ - 58.94) once again challenging its 2011 highs.

Leadership came from the small- and mid-cap equities, continuing a long trend in which large-cap, defensive names outperform only in weak market environments, while small- and mid-cap stocks lead the charge during bullish runs. Encouraging for the bulls is that the SPX, RUT and S&P 400 MidCap Index (MID - 910.64) advanced above key levels we have identified in the past, and the CBOE Market Volatility Index (VIX - 24.53) fell below a key mark. For example:

The SPX advanced above the 1,255-1,260 zone -- site of its 2011 breakeven point, the 61.8% Fibonacci retracement of this year's high and low point, and its 120-day moving average.
The RUT took back the 750 mark, which is where it was trading right ahead of the Lehman Brothers collapse in 2008 and the flash crash of 2010. But work remains, as the RUT is still 23 points away from making a run at its 2010 year-end close of 783.65.
The MID closed the week back above the critical 900 century mark, an area that acted as resistance for months in 2007 before the index experienced a 55% haircut into the 2009 trough. Furthermore, the MID moved barely back into the green for 2011 as of Friday's close, after rallying above its breakeven at 907.25 to settle at 910.64.
The VIX fell below the 30-31 zone, which is an area that has spelled trouble for the equity market since September and represents double the 2011 low. The VIX's failure to advance above 50 in August, a multi-year resistance level going back to 1997, plus the subsequent break below the 30 mark is encouraging for bulls. The next key level on the VIX is 24, which is August's half-high.


While the technical backdrop has improved on many fronts, there is still work to be done to further pressure the shorts and/or drive sideline cash into the equity market. Some of these risks are still technical related, as multiple potential resistance areas come into play when equities dig out of a deep hole.

That said, three short-term risks to the bullish case include:

[ol]
The RUT is still in the red for 2011, and the MID is barely in the green, with the index's first-half lows just overhead at 920. The fact that the MID is trading around a key round number with historical significance, which also happens to coincide with its year-to-date breakeven, is perhaps the No. 1 risk from a technical perspective. It will be of importance for the MID to make a more convincing move above 900 in order to squeeze more shorts.
Another technical risk relates to the QQQ, a benchmark driven by many large-cap technology stocks. While outperforming impressively, it still has not taken out the 60 level, which is half its all-time high and has marked multiple peaks in 2011.
A third risk is that much of the short covering related directly to the huge build-up of put open interest in exchange-traded fund (ETF) and index options is likely expended, as heavy put strikes that will expire in a few weeks are far out of the money and less sensitive to market gyrations. That said, short covering is still possible on individual equities, and those that are highly shorted with a strong technical and fundamental backdrop are likely to lead if the market continues to rally.
[/ol] The bottom line is, the equity market's backdrop continues to improve, even as many hedge funds have been significantly underinvested and are in the red this year. With more clarity on how Europe plans to address their issues amid an improved technical backdrop, risk-taking could increase significantly and drive stocks higher in the coming months, as fund managers look to play "catch-up" with the year winding down. Risks do remain, so it's still prudent to hedge your long positions -- even though some market players may choose to forgo such a strategy in order to try and capture quick gains in a short period.

Indicator of the Week: Leading & Lagging Stocks During Big Market Gains
By Rocky White, Senior Quantitative Analyst

Foreword: Last Thursday, the S&P 500 Index (SPX) had its third-biggest day of the year, rising 3.4%. Those are the type of days where you get excited to see how your portfolio did. However, there's nothing more demoralizing than being heavily exposed to a stock (or group of stocks) that does not participate in such a strong rally. It got me curious to compare the stocks which did participate against those that did not participate. Is this a signal that non-participating stocks are weak, and should be sold -- or is the opposite true? It seems that many recent studies show that stocks have a strong tendency to mean-revert, where equities that are weak over a certain time frame will generally tend to outperform going forward.

Leading & Lagging Stocks: To analyze this, I looked at days when the SPX gained 3% or more going back to 2010. This time frame includes six prior returns of 3% or more (actually, seven -- but one just occurred on Oct. 10, for which we do not yet have a one-month return). Then, I organized the stocks into three groups based on their relative strength to the market. The stocks that underperformed (relative strength of less than 0.97) are listed as "laggards," those that outperformed (relative strength above 1.04) are the "leaders," and those in the middle... well, they're the "middle."

The table below shows mean reversion ruling the day, as the leading stocks on big up days significantly underperformed the laggards and middle-of-the-road stocks. Meanwhile, the laggards were the strongest performers going forward.


Finally, below is a list of 25 of the most liquid stocks that qualified as "laggards" during Thursday's big market rally. According to the research above, these names could have a tendency to outperform other stocks during the short term. The list is sorted from the worst-performing stocks on Thursday to the best.


This Week's Key Events: FOMC Decision, Jobs Data on the Horizon
Schaeffer's Editorial Staff

Here is a brief list of some of the key events this week. All earnings dates listed below are tentative and subject to change. Please check with each company's respective website for official reporting dates.

Monday

The economic calendar begins with Monday's release of the Chicago purchasing managers index (PMI) for October. Allstate (ALL), Humana (HUM), AvalonBay Communities (AVB), Cavium (CAVM), Leap Wireless (LEAP), Taser International (TASR), Anadarko Petroleum (APC), and W&T Offshore (WTI) are scheduled to report earnings.

Tuesday

The ISM manufacturing index is set to hit the Street on Tuesday, along with data on construction spending and auto sales. On the earnings front, we'll hear from Pfizer (PFE), Marathon Oil (MRO), Valero Energy (VLO), Archer Daniels Midland (ADM), CF Industries (CF), Corinthian Colleges (COCO), Dollar Thrifty Automotive (DTG), Dunkin Brands (DNKN), OpenTable (OPEN), Overseas Shipholding Group (OSG), Primerica (PRI), Sirius XM Radio (SIRI), and XL Group (XL).

Wednesday

The monthly onslaught of jobs data begins on Wednesday, with ADP's private-sector employment report and the Challenger, Gray & Christmas update on monthly job cuts both due for release. Around midday, the Federal Open Market Committee (FOMC) will announce its latest monetary policy decision, with a 2:15 p.m. press conference to follow. Earnings are due out from Kraft Foods (KFT), Mastercard (MA), News Corp. (NWS), Qualcomm (QCOM), AOL (AOL), Time Warner (TWX), Comcast (CMCSA), Clean Harbors (CLH), Transocean (RIG), Dendreon (DNDN), Whole Foods Market (WFM), Tesla Motors (TSLA), and Zipcar (ZIP).

Thursday

As usual, Thursday's calendar features weekly jobless claims. Also on the day's docket are the ISM services index, third-quarter productivity and labor costs, and factory orders. Meanwhile, quarterly earnings reports are expected from American International Group (AIG), Starbucks (SBUX), Kellogg (K), Sara Lee (SLE), Eastman Kodak (EK), Chesapeake Energy (CHK), Alpha Natural Resources (ANR), CBOE Holdings (CBOE), NYSE Euronext (NYX), MGM Resorts (MGM), Agrium (AGU), CBS Corp. (CBS), DirecTV (DTV), Estee Lauder (EL), LinkedIn (LNKD), and SunPower (SPWRA).

Friday

Bright and early Friday morning, all eyes will be on the Labor Department's nonfarm payrolls report for October. The earnings calendar wraps up with reports from Plains Exploration and Production (PXP), Washington Post (WPO), Olympic Steel (ZEUS), YRC Worldwide (YRCW), Broadwind Energy (BWEN), Genpact (G), Horsehead Holding (ZINC), and Madison Square Garden (MSG).

And now a few sectors of note...


Dissecting The Sectors
Sector Utilities
Bullish
Outlook: The utility sector has emerged as a pocket of technical strength in 2011, with the PHLX Utility Sector Index (UTY) breaking out above the $455-$460 region to touch a new three-year high this past week. However, Wall Street hasn't exactly jumped on the bullish bandwagon just yet. Drilling down, 70% of stocks in the electric utility group are trading above their 200-day moving averages, but they've attracted only 40% "buy" ratings from brokerage firms. Meanwhile, the gas utility group boasts the highest percentage of stocks trading above their 200-day moving averages among all sectors we follow, at 76% -- yet these names have garnered only 49% "buy" ratings. The broader utility sector also sports some attractive dividend yields, which are certainly a selling point in the context of a choppy market environment. Within the group, Duke Energy (DUK) and Consolidated Edison (ED) have racked up double-digit percentage gains in 2011, and both stocks are within striking distance of their respective annual highs. Nevertheless, there's not a single "buy" endorsement between the two. Going forward, a round of well-deserved upgrades could draw a fresh wave of buyers to the table, helping these stocks extend their positive price action.

Sector Leisure/Retail
Bullish
Outlook: The Commerce Department noted recently that retail sales rose by a solid 1.1% in September, marking the biggest monthly increase since February. However, the National Retail Federation is predicting a year-over-year slowdown in holiday sales. For what it's worth, this group underestimated 2010 holiday sales growth by more than half -- leaving room for another potential upside surprise this year. Meanwhile, on the charts, the SPDR S&P Retail ETF (XRT) is making a run at its all-time high of $56.44, which was touched back in July. One point of caution is the XRT revisiting a 10% year-to-date gain, as the fund stalled around these returns in May and June. We remain upbeat on select outperformers within the consumer discretionary group, and recommend focusing on stocks in solid technical uptrends that are surrounded by skepticism. Amazon.com (AMZN) got hit hard on earnings last week, but we still like the shares on a pullback. Looking back, AMZN has a long history of sharp, scary pullbacks that are quickly resolved to the upside. Choice restaurant stocks also hold some appeal, with under-loved names like BJ's Restaurants (BJRI), Chipotle Mexican Grill (CMG) and Domino's Pizza (DPZ) basking in the glow of positive earnings reports. As these high-flying discretionary names continue to outperform on the charts, a capitulation by the lingering skeptics could provide an influx of buying pressure.

Sector Gold
Bullish
Outlook: A recent pullback in the SPDR Gold Trust (GLD) was contained by its 120-day moving average, which has played a key role as support over the past couple of years. After meeting up with this reliable technical floor, GLD rallied, breaking out above short-term pressure at its 80-day moving average in the process. On the sentiment front, various indicators we track point to significant pessimism on gold, even as the technical backdrop improves. Plus, cumulative buy-to-open option volume is beginning to pick up once again on GLD, following a recent plunge in activity. Previous downturns in buy-to-open option volume have corresponded with periods of weak price action, whereas increasing buy-to-open volume has corresponded with strength -- suggesting this latest bounce from trendline support could herald the beginning of the next leg higher within GLD's longer-term uptrend.

Sector Financials
Bearish
Outlook: The financial sector outperformed during the second half of October, taking part in a broad-market advance sparked by signs of progress on the European debt crisis. The bears were stung by this bounce in bank stocks, which propelled the Financial Select Sector SPDR (XLF) back above the historically significant $13.50 area. However, the fund is still in negative territory year-to-date, even as the broader S&P 500 Index (SPX) has moved into the green for 2011. Meanwhile, short interest on XLF has increased, and we have seen what appears to be hedged call buying on the fund. In the past, heavy shorting amid XLF call buying has preceded periods of weak price action. It remains to be seen if this most recent bout of shorting activity is smart money at work, especially in light of the sector's sudden outperformance. It's worth noting that the financial group also rallied strongly at this time last year, as beaten-down banks became a favorite among bargain-hunters. Should the market rally into year-end, there is a possibility of repeat performance -- with another possible let-down in 2012. Given this mixed outlook, it may be appropriate to lighten up on short financial exposure at the moment. However, if the group's positive momentum begins to break down, it could signal an opportunity for the bears to pile back on.

Prepare for the investing week ahead. Every week, Bernie Schaeffer and his staff provide you with their insight about what has happened and, more importantly, what will happen in the market. We dig deep and show you what's happening behind the scenes, and tell you which indicators are predicting major market moves. If you enjoyed this week's edition of Monday Morning Outlook, sign up here for free weekly delivery straight to your inbox.

icon url

ReturntoSender

10/31/11 1:49 PM

#9569 RE: ReturntoSender #6755

Lack of volume the last few days really calls into question the lasting nature of this rally. Last week I thought for sure that the volume in October would lead to a sustainable breakout move for the market. But now I'm not so sure. We might not even see enough volume today to get a higher volume up month than we had on the selling last month. That is truly surprising to me what with us now being in the midst of earnings season.


The S&P Mid Cap 400 looks good however adding to my confusion as it has healthy up volume for the month.


RtS
icon url

ReturntoSender

10/31/11 10:40 PM

#9570 RE: ReturntoSender #6755

From Briefing.com: 4:30 pm : The S&P 500 suffered its worst single-session percentage loss in four weeks today, but it still made it out of October with its best monthly gain in nearly 20 years.

Market participants were inclined to sell today. They took their cues from overseas markets this morning and never really looked back. That left stocks to slog along with substantial losses and settle at session lows.

Last week Europe's leaders announced plans to shore up the continent's financial conditions, but it appeared that euphoria related to that announcement evaporated over the weekend. That prompted global participants to drop Germany's DAX and France's CAC for losses of more than 3%.

Confidence in the euro was also lost. In turn, it dove more than 2% against the greenback. The yen was an even poorer performing currency, though. It tumbled more than 3% after Japan's officials intervened in the currency in an effort to curb its strength after it had set a post-WWII record high last week.

Natural resource plays suffered the worst losses this session. That left the energy sector to tumble 4.4% and the materials sector to slide 4.2%. Financials weren't far behind; the sector fell 3.9%.

Defensive in nature, utilities made up the only sector that managed to find positive territory at all this session, but broad market weakness ultimately undermined its efforts and left it to log a 0.7% loss. It was the only sector to limit its loss to less than 1%.

Today's sell-off ate into the gains that the stock market had amassed in the course of the past four weeks, which had the stock market on track for one of its best monthly performances on record. Still, the S&P 500 finished October with a monthly gain of almost 11%, which is not only its first monthly gain since April, but it is also its best monthly performance since December 1991.

Advancing Sectors: (None)
Declining Sectors: Energy -4.4%, Materails -4.2%, Financials -3.9%, Industrials -2.5%, Health Care -1.9%, Tech -1.8%, Telecom -1.7%, Consumer Discretionary -1.5%, Consumer Staples -1.3%, Utilities -0.7%DJ30 -276.10 NASDAQ -52.74 NQ100 -1.7% R2K -2.6% SP400 -2.5% SP500 -31.78 NASDAQ Adv/Vol/Dec 560/1.77 bln/2007 NYSE Adv/Vol/Dec 556/1.11 bln/2464

4:41PM ATMI acquires full control of SDS rights (ATMI) 20.40 -0.61 : Co announced it has taken control of, and responsibility for, worldwide distribution of ATMI's proprietary Safe Delivery Source, or SDS, gas storage and delivery system and related technologies from Matheson Tri-Gas, Inc. The two cos have signed an agreement that terminates Matheson's license, manufacturing, and distribution agreement in exchange for a $95 mln cash payment. "This deal further advances our leading market position and will significantly strengthen our base revenues, margins, and earnings. The transaction will be highly accretive and is expected to generate $7-8 mln of incremental product revenues and $0.08-0.09 of incremental earnings per diluted share on a quarterly basis, beginning in the second quarter of 2012. The expected unfavorable impact on revenues over the combined next two quarters could be up to $16 million, when compared to the expected post-transaction revenue level. Additionally, under existing accounting rules, we expect to take a one-time contract termination charge of ~$80-$85 mln in the fourth quarter, subject to completion of our fair value analysis."

4:07PM Rudolph Tech beats by $0.11, reports revs in-line (RTEC) 7.37 -0.42 : Reports Q3 (Sep) earnings of $0.21 per share, $0.11 better than the Capital IQ Consensus Estimate of $0.10; revenues fell 20.8% year/year to $41.4 mln vs the $41.1 mln consensus.

4:02PM Integrated Device beats by $0.04, reports revs in-line (IDTI) 6.08 -0.16 : Reports Q2 (Sep) earnings of $0.11 per share, $0.04 better than the Capital IQ Consensus Estimate of $0.07; revenues fell 13.3% year/year to $138.3 mln vs the $139.4 mln consensus. "Despite macroeconomic headwinds, we experienced strong sequential growth in Serial RapidIO switches for wireless base stations and timing solutions for consumer devices, as well as robust design activity for new products."

Riverbed Technology (RVBD) announced it has joined the OpenStack community, a global community of developers collaborating on cloud architecture and an open source cloud operating system.

Altera (ALTR) announced it will demonstrate its latest industrial embedded solutions for energy-efficient and safety-integrated drive systems at SPS/IPC/DRIVES Electric Automation Exhibition and Conference in Nuremberg, Germany.

EMCORE (EMKR) announced that the it has been awarded a contract by ASRC Research and Technology Solutions, Greenbelt, Maryland for the design, manufacturing and delivery of solar panels for NASA Ames' Lunar Atmosphere and Dust Environment Explorer mission.

Sonics announced Microchip Technology (MCHP) has licensed a number of its popular on-chip networks and memory subsystems for its 32-bit PIC32 microcontroller family.

Juniper Networks (JNPR) announced that TTK has chosen Juniper Networks MX Series 3D Universal Edge Routers to provide the Ethernet bandwidth required to ensure high-speed connectivity while delivering innovative applications and services such as IP-VPN, L2-VPN, video conference across Russia and IP-transit to its subscribers across 75,000 km of cables running along railway lines and 1,000 access nodes

SanDisk (SNDK $51.26 -2.12) was downgraded to Neutral from Buy with a target price of $58 at Sterne Agee saying they believe Sandisk is one of the best long-term stories with the move to SSD and its 3-bit manufacturing lead, but Sandisk has had a 65% rebound in the last 2 months and is < 10% from its 5-year high. They believe near term Sandisk is baking in most of the upside from near-term positive NAND trends and HDD shortages.

11:43 am S&P Tech Sector Down One Percent, Outperforming S&P 500 (BRCM)
The tech sector is trading lower today, just ahead of losses in the broader market. Semiconductors are showing relative weakness in the tech space, however, with the Philly Semi Index trading 1.8% lower. WFR (-8.7%) is a notable laggard in that chip index. Among other major indices, the S&P 500 is trading 1.4% lower, while the NASDAQ is trading 1.1% lower The QQQ, meanwhile, is trading 1.0% lower on the session. Among tech bellwethers, AAPL (+0.5%) is a notable outperformer, while ORCL (-1.6%) is lagging.

In earnings this morning, SOHU (-9.9%) reported a mixed quarter and guidance, while CYOU (-13.7%) posted a slight beat and inline guidance.

In news, YHOO (-5.3%) is to consider a buyback and dividend rather than sale of company, according to reports. Among rumors, there is chatter of an outside investment in YOKU (-5.9%) making the rounds.

Among notable analyst upgrades this morning, BRCM (-1.2%) was upgraded to Outperform at JMP Securities, CRM (-2.7%) was downgraded to Equal Weight at Global Equity Research, and JNPR (+0.4%) was upgraded to Outperform at RBC Capital. In downgrades, Sterne Agee downgraded SNDK (-4.0%) to Neutral.

LEAP (+0.7%) was the notable names in tech set to report results today after the close.

icon url

ReturntoSender

11/02/11 9:57 PM

#9572 RE: ReturntoSender #6755

From Briefing.com: 4:25 pm : Strength wavered a bit in the wake of the latest FOMC Policy Statement, but stocks ultimately settled with solid gains as buyers stepped back in after the equity market suffered a two-day drubbing.

Entering today's trade stocks had fallen about 5% in just two sessions. Selling was driven by concerns that the implementation of a eurozone bailout package could be disrupted by a referendum issued by Greece. However, concerns over the matter were tempered by expectations that the European Central Bank will discuss the referendum's implications ahead of its latest policy statement, which is scheduled for tomorrow morning.

The FOMC issued its most recent statement today. To little surprise, the FOMC kept its target interest rate at 0.00% to 0.25%. It also stated that the Fed remains prepared to employ its tools to promote a stronger economic recovery and that it will continue to extend the average maturity of its securities holdings. In a question and answer session, Fed Chairman Bernanke indicated that under the right conditions the Fed's purchase of mortgage-backed securities would be considered.

Just before Bernanke's press conference began the Fed's revised growth forecast was released. For fiscal 2011 the Fed expects economic growth to range from 1.6% to 1.7%, down from the range of 2.7% to 2.9%. For 2012, growth is expected the range from 2.5% to 2.9%, down from a range of 3.3% to 3.7%. Additionally, the Fed raised its long-run umemployment rate forecast to 5.6% from 5.4%.

Stocks descended to session lows between the FOMC statement and Bernanke's press conference. They gradually worked their way upward in late afternoon trade, but never returned to the highs that were set in the first half of the session. Still, buying was both strong and broad.

All 10 major sectors settled in positive territory, but energy and financial stocks were the best performers. Both sectors ended the day with gains close to 3%.

MasterCard (MA 357.66, +23.36) was one of the strongest performers on an individual level. Better-than-expected earnings and broad market strength helped the stock reach a record high. On average, earnings continue to exceed Wall Street's expectations.

Data helped provide a positive backdrop to trade. The latest ADP Employment Change showed that private payrolls increased by 110,000 in October. That exceeded the increase of 100,000 that had been widely anticipated. The ADP report provides a glimpse into the offiical jobs report, which will be released Friday morning.

Advancing Sectors: Energy +2.9%, Financials +2.8%, Materials +2.2%, Industrials +1.8%, Utilities +1.7%, Telecom +1.3%, Tech +1.1%, Consumer Discretionary +1.1%, Consumer Staples +0.8%, Health Care +0.6%
Declining Sectors: (None)DJ30 +178.08 NASDAQ +33.02 NQ100 +0.9% R2K +2.7% SP400 +2.2% SP500 +19.62 NASDAQ Adv/Vol/Dec 1958/1.92 bln/563 NYSE Adv/Vol/Dec 2506/957 mln/499

4:12PM Qualcomm beats by $0.02, beats on revs; guides Q1 above consensus; guides FY12 EPS in-line, revs above consensus (QCOM) : Reports Q4 (Sep) earnings of $0.80 per share, $0.02 better than the Capital IQ Consensus Estimate of $0.78; revenues rose 39.6% year/year to $4.12 bln vs the $4.0 bln consensus. Co issues upside guidance for Q1, sees EPS of $0.86-0.92 vs. $0.85 Capital IQ Consensus Estimate; sees Q1 revs of $4.35-4.75 bln vs. $4.25 bln Capital IQ Consensus Estimate. Co issues mixed guidance for FY12, sees EPS of $3.42-3.62 vs. $3.48 Capital IQ Consensus Estimate; sees FY12 revs of $18.0-19.0 bln vs. $17.29 bln Capital IQ Consensus Estimate.

4:11PM TTM Tech reports EPS in-line, misses on revs; guides Q4 EPS in-line, revs below consensus (TTMI) 10.86 +0.40 : Reports Q3 (Sep) earnings of $0.38 per share, excluding non-recurring items, in-line with the Capital IQ Consensus Estimate consensus of $0.38; revenues rose 0.1% year/year to $358.3 mln vs the $374.03 mln consensus. Co issues mixed guidance for Q4, sees EPS of $0.27-0.36, excluding non-recurring items, vs. $0.34 Capital IQ Consensus Estimate; sees Q4 revs of $345-365 mln vs. $375.82 mln Capital IQ Consensus Estimate.

4:03PM Coherent beats by $0.12, reports revs in-line (COHR) 49.65 +1.21 : Reports Q4 (Sep) earnings of $0.96 per share, $0.12 better than the Capital IQ Consensus Estimate of $0.84; revenues rose 1.4% year/year to $210.9 mln vs the $209.85 mln consensus.

9:23AM Benchmark Elec restarts manucaturing facility (BHE) 13.24 : Co announced that its Korat, Thailand facility has begun manufacturing operations. On October 17, 2011, the co announced that it began efforts to put the vacant Korat plant into operation after its main manufacturing facility in Ayudhaya was inundated with floodwaters. As part of the co's Emergency Management Business Continuity Plan, the Korat plant was transformed in record time by an all out effort. The work included remodeling the buildings, moving or procuring manufacturing equipment and inventory, and transferring and hiring employees.

NXP Semiconductors (NXPI) announced that the recently launched Galaxy Nexus from Google (GOOG) incorporates NXP's fully integrated near field communication solution PN65N.

8:07AM O2Micro reports revenue fell 1% to $32.0 mln from $33.7 mln, Capital IQ consensus $31.2 mln; net income $0.04, compared to Capital IQ consensus of $0.04 (OIIM) 3.99 : The company ended the third quarter of 2011 with $119.1 million in unrestricted cash and short-term investments or $3.60 per outstanding ADS. The accounts receivable balance was $14.0 million and represented 41 days sales outstanding at the end of Q3 2011. Inventory was $9.3 million or 66 days and turned over 5.5 times during Q3 2011. As of September 30, 2011, the company had $130.8 million in working capital and the book value was $185.4 million, or $5.60 per outstanding ADS.

8:06AM Sunpower announced agreement with North County Watch and Carrizo Commons to settle and dismiss lawsuit against the 250-megawatt California Valley Solar Ranch project (SPWRA) 9.08 : Under the settlement agreement, SunPower has agreed that the use of the site for the CVSR project will not extend further than 50 years and that the decommissioning and restoration of habitat at the site will occur by that time. In addition, the agreement provides for enhanced communication and collaboration regarding mitigation and monitoring activities during the construction of the project, funding of research on endangered species, and support for the development of a long-term vision for the Carrizo Plain

12:08 pm S&P Tech Over One Percent Higher, Underperforming the S&P 500 (INTC)
The tech sector is trading higher today, just trailing gains in the broader market. Semiconductors are showing relative weakness in the tech space with the Philly Semi Index trading 0.8% higher. WFR (-1.2%) is a notable laggard in that chip index ahead of its earnings tonight. Among other major indices, the S&P 500 is trading 1.7% higher, while the NASDAQ is trading 1.3% higher The QQQ, meanwhile, is trading 0.9% higher on the session. Among tech bellwethers, IBM (+2.1%) is a notable outperformer, while INTC (-0.1%) is lagging.

In earnings last night, SANM (+5.9%) and JDSU (+8.5%) posted quarterly beats on the top and bottom lines, but guided lower. Elsewhere, NVTL (-17.1%) posted a slight beat, but guided shy of consensus. This morning, CTSH (-0.6%) reported a beat and offered upside guidance, while VG (-12.8%) reported a mixed Q3 and SNE (-6.3%) posted a miss and downside guidance.
Among rumors, we are hearing VRSN (+0.2%) takeover chatter and, separately, JNPR (+0.7%) for RVBD (+5.2%) making the rounds again.

Among notable analyst upgrades this morning, ARMH (+1.3%) was upgraded to Outperform at BMO Capital, FXCM (+6.0%) was upgraded to Neutral at Citigroup, PCS (+12.0%) was upgraded to Overweight at JP Morgan, and SOHU (+2.6%) was upgraded to Buy at Deutsche Bank.

In downgrades, INTC (-0.1%) was downgraded to Market Perform at BMO Capital, NXPI (+1.8%) was downgraded to Equal Weight at Morgan Stanley, GLW (+2.0%) was downgraded to Underweight at JP Morgan, and SAI (-1.5%) was downgraded to Underperform at RBC Capital.

CACI (+2.0%), CTL (-0.5%), and QCOM (+2.8%) are the notable names in tech set to report results today after the close.
icon url

ReturntoSender

11/06/11 12:53 PM

#9575 RE: ReturntoSender #6755

Monday Morning Outlook: RUT and MID Face Crucial Tests on the Charts
After a week of wall-to-wall euro drama, portfolio insurance is going to cost you

by Todd Salamone 11/5/2011 10:51 AM
http://www.schaeffersresearch.com/commentary/observations.aspx?ID=108672&trackback=recapezine&am...

Investors could be forgiven for failing to realize that last week's notable economic news included a downwardly revised growth forecast from the U.S. Fed, as well as a fair-to-middling three-day gauntlet of jobs data. For the better part of the past five trading days, perennial bankruptcy candidate Greece dominated the headlines almost entirely, after Prime Minister George Papandreou decided to surprise his euro-zone comrades with a bailout referendum. (Apparently, it's a little more difficult than you'd think to get a continent's worth of politicians on the same page at once.) On the plus side, Papandreou's gambit didn't actually send Greece spiraling into the abyss -- but it didn't exactly inspire confidence among global investors, either.

After snapping their weekly winning streaks, the major market indexes are now planted beneath key levels of resistance. Todd Salamone sees plenty of potential buyers camped out on the sidelines, but he warns that stocks still have more ground to cover before winning over the holdouts. Meanwhile, Rocky White pinpoints a few select outperformers that are trading well above key technical levels, despite a general lack of love from Wall Street. Finally, we wrap up with a preview of the major earnings and economic events for the week ahead, as well as a few sectors of note.

Notes from the Trading Desk: Four Notable Speed Bumps for Stocks
By Todd Salamone, Senior VP of Research

"The RUT is still in the red for 2011, and the MID is barely in the green, with the index's first-half lows just overhead at 920. The fact that the MID is trading around a key round number with historical significance, which also happens to coincide with its year-to-date breakeven, is perhaps the No. 1 risk from a technical perspective. It will be of importance for the MID to make a more convincing move above 900 in order to squeeze more shorts." "The bottom line is, the equity market's backdrop continues to improve, even as many hedge funds have been significantly underinvested and are in the red this year. With more clarity on how Europe plans to address their issues amid an improved technical backdrop, risk-taking could increase significantly and drive stocks higher in the coming months, as fund managers look to play 'catch-up' with the year winding down. Risks do remain, so it's still prudent to hedge your long positions..."
- Monday Morning Outlook, October 29, 2011

Well, we thought we had a little more clarity on the European sovereign debt issues and -- surprise, surprise -- Prime Minister George Papandreou decided early this week that Greek voters should decide whether they wanted to accept the bailout package tailored by European leaders the prior week. The rescue deal included austerity measures that were already unpopular among Greek voters, leaving market participants doubtful of a positive outcome to the proposed referendum. Ambiguity once again became the order of the day with respect to Europe, and key equity indexes -- such as the S&P 400 MidCap Index (MID - 899.46) and PowerShares QQQ Trust (QQQ - 57.80) -- sharply retreated from the resistance levels we discussed in last week's report.

If there is anything we have learned during the past few months, it is that "surprises" have become commonplace, suggesting directional exposure should be hedged, as noted in the excerpt above. The ongoing uncertainty and constant surprises have kept volatility gauges, such as the CBOE Market Volatility Index (VIX - 30.16), relatively elevated compared to their historical averages.

With other world leaders -- including the familiar duo of French President Nicolas Sarkozy and German Chancellor Angela Merkel -- pressuring the Greek government to accept the bailout package, under threat of exile from the euro (another unpopular notion among the disgruntled citizenry), Papandreou spent the rest of the week backpedaling, right up to a narrowly won vote of confidence late Friday. Equities recovered from Tuesday morning's low, and the sell-off was relatively contained by week's end.

The equity market's prospects into year-end still appear to be constructive, as it would seem that a huge build-up in pessimism is still in the early stages of unwinding. For example, an indicator we have not discussed in a long time is the 10-day equity-only, customer-only, buy-to-open put/call volume ratio on the International Securities Exchange (ISE), Chicago Board Options Exchange (CBOE), and NASDAQ OMX PHLX (PHLX). Yes, this is a mouthful, but it is essentially a measure of investor sentiment.

When the ratio rises from low levels (extreme optimism giving way to pessimism), the market has historically struggled. Moreover, when the ratio peaks at high levels and moves lower (extreme pessimism giving way to optimism), equities have historically advanced. As you can see on the chart below, the ratio recently peaked at its highest level since early 2009 and has turned lower. This could be evidence that the shorts are becoming less bold, and are covering their positions, which -- as we said last week -- could sustain a rally. The bulls should find it encouraging that this ratio has plenty of room to fall, based on historical data.


However, there are several overhead speed bumps, or resistance levels, that continue to pose a challenge for the bulls, and are worth keeping in our view. Specifically:

[ol]
The 1,260 region on the S&P 500 Index (SPX - 1,253.23) represents its year-to-date breakeven, as well as significant lows in March and June. SPX 1,253, by the way, is the average year-end target among money managers, as cited in the latest Barron's Big Money poll.
QQQ 60 is half the all-time high, and has acted as an area of resistance on four trips up to this area in 2011.
MID 900 is a round-number area that marked the 2007 peak, and the 2011 breakeven is just seven points north of 900.
The Russell 2000 Index (RUT - 746.49) comes into the week trading in the 750 area, site of its peak ahead of the 2010 "flash crash" and it 320-day moving average, an uncommon long-term average that has been significant in the past. If this trendline is taken out, which the SPX and MID managed to do late last month, the 780 area becomes the next speed bump, site of its 2011 breakeven and support in February, March, and June.
[/ol]
We continue to believe that any advances will be led by small-cap and mid-cap equities and, in fact, small- and mid-cap stocks have been leading the big caps since the lows in early October. In order for this leadership to continue, the MID must sustain a move above 900, and the RUT must get over the 750 mark.


The bottom line is, there appears to be short-covering activity and money moving in from the sidelines as we transition out of an extreme in negative sentiment. With the major equity indexes back in the red, or still in the red, for 2011, some would-be investors may need a little more convincing. That said, there is sufficient buying power available to push equities through the various resistance levels that we have pinpointed for you as we move into year-end. Hedging of your long exposure is still prudent -- although premiums on portfolio insurance are 23% higher than they were the last time we made this recommendation, with the VIX moving from 24.53 to 30.16 over the course of the past week.

Indicator of the Week: Sector Analysis Using Technicals and Sentiment
By Rocky White, Senior Quantitative Analyst

Foreword: I assume most readers are familiar with our contrarian philosophy here at Schaeffer's. Basically, we look for uptrending stocks which are looked upon skeptically by the investing public. This pessimism indicates a lot of potential buyers on the sidelines. As the rally continues, more and more investors will take notice, and that sideline money begins drifting into the stock -- thereby furthering the gains. With any luck, you will have bought into the stock ahead of the rest of the investing crowd, allowing you to enjoy a fast and furious rally.

Sector Analysis: One simple but effective way we analyze sectors is to look at the percentage of stocks that are trading above their 200-day moving average. A sector with a lot of stocks on the rise will show a higher percentage of names above that closely watched trendline. Then, we also look at the percentage of "buy" ratings given to the sector components by analysts.

Based on our contrarian philosophy, we would be bullish on sectors with a high number of stocks above their 200-day moving averages, but with a very low percentage of "buys." Similarly, we look bearishly at sectors that have a minimal percentage of stocks above their 200-day, but a preponderance of bullish analyst ratings.

Looking at the tables below, the first two sectors on the list jump out at you: They're both utilities. The electric and gas groups have about 75% of stocks above their 200-day moving averages, yet the percentage of "buy" ratings from analysts is only 39% for electric utilities, and 48% for gas utilities. These stocks are often considered to be very "boring" and slow-moving, but they have evidently been moving higher for some time now. Clearly, analysts -- and, I'd bet, quite a few others on Wall Street -- haven't noticed or bought into the trend yet.

Compare the utility sectors I just mentioned above to the coal, non-ferrous metals and steel sectors at the bottom of the table. These groups have very few stocks above their 200-day moving averages (just 15%, 14%, and 6%, respectively), yet these names have garnered about 60% "buy" ratings from analysts. It could be just a matter of time before the downgrades start coming in, and investors flee these sectors in search of greener pastures. Where will they put their money next? Why not utilities, which have been doing quite well?


Under-loved Utility Names: Finally, if you're looking for some individual stocks to investigate, below is a table highlighting a number of interesting utility companies. Each of the stocks listed has pretty liquid options, is trading above its 200-day moving average, and has a positive year-to-date return, yet less than half of the analysts rate the stock a "buy."


This Week's Key Events: Cisco Earnings, Consumer Sentiment Data Due Out
Schaeffer's Editorial Staff

Here is a brief list of some of the key events this week. All earnings dates listed below are tentative and subject to change. Please check with each company's respective website for official reporting dates.

Monday

The economic calendar kicks off Monday with the Fed's monthly report on consumer credit. Earnings reports are due out from BroadSoft (BSFT), Cameco (CCJ), Coeur d'Alene Mines (CDE), Delcath Systems (DCTH), Demand Media (DMD), Dish Network (DISH), Hologic (HOLX), Limelight Networks (LLNW), Progressive (PGR), Rackspace Hosting (RAX), and Vivus (VVUS).

Tuesday

The NFIB small business optimism index is slated to hit the Street on Tuesday. On the earnings front, we'll hear from Activision Blizzard (ATVI), Blue Nile (NILE), Caribou Coffee (CBOU), Carrizo Oil and Gas (CRZO), China Automotive Systems (CAAS), Clean Energy Fuels (CLNE), E.W. Scripps (SSP), Fossil (FOSL), Hecla Mining (HL), STEC (STEC), Take-Two Interactive Software (TTWO), Toyota Motor (TM), and Vodafone (VOD).

Wednesday

Data on wholesale inventories is due out Wednesday, along with the usual report on domestic petroleum supplies. The day's earnings calendar includes quarterly results from 99 Cents Only Stores (NDN), Advance Auto Parts (AAP), Ashland (ASH), Cisco Systems (CSCO), Dean Foods (DF), Energy Conversion Devices (ENER), Fuel Systems Solutions (FSYS), General Growth Properties (GGP), General Motors (GM), Green Mountain Coffee Roasters (GMCR), Liz Claiborne (LIZ), Macy's (M), Medivation (MDVN), Ralph Lauren (RL), Silver Wheaton (SLW), and Wendy's (WEN).

Thursday

Thursday brings a relative onslaught of economic news, including import/export prices, the U.S. trade balance, the Treasury budget, and the weekly report on jobless claims. AMC Networks (AMCX), Hoku Corp. (HOKU), Kohl's (KSS), Molycorp (MCP), Nordstrom (JWN), Nvidia (NVDA), Renren (RENN), Viacom (VIA), and Walt Disney (DIS) will share the earnings spotlight.

Friday

The week wraps up on Friday with the Thomson Reuters/University of Michigan consumer sentiment survey for early November. The earnings calendar concludes with reports from Brookfield Asset Management (BAM), D.R. Horton (DHI), and Tree.com (TREE).

And now a few sectors of note...


Dissecting The Sectors
Sector Utilities
Bullish
Outlook: The utility sector has emerged as a pocket of technical strength in 2011, with the PHLX Utility Sector Index (UTY) recently breaking out above the $455-$460 region to touch a new three-year high. However, Wall Street hasn't exactly jumped on the bullish bandwagon just yet. Drilling down, 75% of stocks in the electric utility group are trading above their 200-day moving averages, but they've attracted only 39% "buy" ratings from brokerage firms. Meanwhile, the gas utility group boasts the second-highest percentage of stocks trading above their 200-day moving averages among all sectors we follow, at 74% -- yet these names have garnered only 48% "buy" ratings. The broader utility sector also sports some attractive dividend yields, which are certainly a selling point in the context of a choppy market environment. Within the group, Duke Energy (DUK) and Consolidated Edison (ED) have racked up double-digit percentage gains in 2011, and both stocks are within striking distance of their respective annual highs. Nevertheless, there's not a single "buy" endorsement between the two. Going forward, a round of well-deserved upgrades could draw a fresh wave of buyers to the table, helping these stocks extend their positive price action.

Sector Leisure/Retail
Bullish
Outlook: Same-store sales rose 3.4% in October among retailers tracked by Thomson Reuters, falling short of the consensus estimate for a 4.5% increase. However, retail stocks held up well in the face of this shortfall, suggesting that expectations among investors might have been pegged a little lower. Along those same lines, the National Retail Federation is predicting a year-over-year slowdown in holiday sales. For what it's worth, this group underestimated 2010 holiday sales growth by more than half -- leaving room for another potential upside surprise this year. Meanwhile, on the charts, the SPDR S&P Retail ETF (XRT) has been making a run at its all-time high of $56.44, which was touched back in July. One point of caution is the XRT revisiting a 10% year-to-date gain, as the fund stalled around these returns in May and June. We remain upbeat on select outperformers within the consumer discretionary group, and recommend focusing on stocks in solid technical uptrends that are surrounded by skepticism. Amazon.com (AMZN) got hit hard post-earnings, but we still like the shares on a pullback. Looking back, AMZN has a long history of sharp, scary pullbacks that are quickly resolved to the upside, and this pattern appears to be forming once again. Choice restaurant stocks also hold some appeal, with under-loved names like BJ's Restaurants (BJRI), Chipotle Mexican Grill (CMG) and Domino's Pizza (DPZ) basking in the glow of positive earnings reports. As these high-flying discretionary names continue to outperform on the charts, a capitulation by the lingering skeptics could provide an influx of buying pressure.

Sector Gold
Bullish
Outlook: A recent pullback in the SPDR Gold Trust (GLD) was contained by its 120-day moving average, which has played a key role as support over the past couple of years. After meeting up with this reliable technical floor, GLD rallied, breaking out above short-term pressure at its 80-day moving average in the process. On the sentiment front, various indicators we track point to significant pessimism on gold, even as the technical backdrop improves. For example, a recent survey of 121 portfolio managers found that a hefty 34% are bearish on gold. Among all asset classes, only a few predictable underdogs -- U.S. Treasuries, municipal bonds, and European stocks -- garnered a higher bearish vote. Plus, cumulative buy-to-open option volume is beginning to pick up once again on GLD, following a recent plunge in activity. Previous downturns in buy-to-open option volume have corresponded with periods of weak price action, whereas increasing buy-to-open volume has corresponded with strength -- suggesting this latest bounce from trendline support could herald the beginning of the next leg higher within GLD's longer-term uptrend.

Sector Financials
Bearish
Outlook: The financial sector outperformed during the second half of October, taking part in a broad-market advance sparked by signs of progress on the European debt crisis. The bears were stung by this bounce in bank stocks, which propelled the Financial Select Sector SPDR (XLF) back above the historically significant $13.50 area. However, the fund finished Friday back below this formidable chart region, and is now sitting on a substantial year-to-date loss of 16.7%. XLF was smacked lower after testing the $14.40 area, which roughly coincides with the fund's 52-week breakeven level as of the end of November. Going forward, these staunch layers of technical resistance could continue to keep financials under pressure. Meanwhile, short interest on XLF has increased, and we have seen what appears to be hedged call buying on the fund. In the past, heavy shorting amid XLF call buying has preceded periods of weak price action. It remains to be seen if this most recent bout of shorting activity is smart money at work. However, it's worth noting that the financial group rallied strongly at this time last year, as beaten-down banks became a favorite among bargain-hunters. Should the broader market advance into year-end, there is a possibility of repeat performance -- with another possible let-down in 2012. As another point of short-term caution, financials emerged as the least-liked sector in a recent poll of money managers, suggesting that there may be a good deal of pessimism priced into these stocks already. Given this mixed outlook, it may be appropriate to lighten up on short financial exposure at the moment. However, if the price action continues to break down, it could signal an opportunity for the bears to pile back on in earnest.

Prepare for the investing week ahead. Every week, Bernie Schaeffer and his staff provide you with their insight about what has happened and, more importantly, what will happen in the market. We dig deep and show you what's happening behind the scenes, and tell you which indicators are predicting major market moves. If you enjoyed this week's edition of Monday Morning Outlook, sign up here for free weekly delivery straight to your inbox.


icon url

ReturntoSender

11/07/11 10:42 PM

#9579 RE: ReturntoSender #6755

From Briefing.com: 4:30 pm : A lack of leadership left stocks to roll over this morning, but buyers provided an afternoon lift that helped the major averages settle near session highs with solid gains.

The mood this morning was relatively mixed as market participants ruminated over the implications of a resignation by Greece Prime Minister Papandreou. Last week the Papandreou unnerved many officials, and markets for that matter, by proposing a referendum for the country's bailout package. It is expected that a new prime minister will be named tomorrow. The future of Italy's prime minister was questioned this morning.

Rumors about his possible resignation came amid concerns about the country's fiscal and financial conditions, which continue to drive yields on the Italian debt to new heights. Italy canceled an auction of short-term Notes that was scheduled for later this week.

Although the primary market averages of Italy and Greece scored gains of 1.3% and 1.7%, respectively, the rest of the region failed to find inspiration from those headlines. In turn, the EuroStoxx 50 fell 0.7% in its first session of the new week. For that matter, many of Asia's major averages were weak in overnight trade.

Despite the generally weak action abroad, domestic stocks attempted to trade higher in the opening minutes of trade. Energy issues offered early leadership, but it proved fleeting as the sector inevitably rolled over alongside the rest of the market.

There wasn't any specific headline that brought buyers back into the fold, but the rally by stocks began around the same time that the euro rebounded against the greenback. Even then there weren't any individual leaders, but the Dow still bounced almost 200 points from its low to its high. Meanwhile, the Nasdaq was able to offset a 1% loss.

Although the climb continued right up until the close, share volume was quite paltry, suggesting that there wasn't a great deal of conviction underlying the bidding. By day's end, less than 800 million shares had been traded on the NYSE. Outside of averages, 1 billion shares often makes for a convenient benchmark for share volume and participation.

Advancing Sectors: Health Care +1.2%, Telecom +0.8%, Materials +0.8%, Energy +0.7%, Consumer Staples +0.7%, Tech +0.7%, Utilities +0.6%, Consumer Discretionary +0.5%, Financials +0.4%, Industrials +0.2%
Declining Sectors: (None)DJ30 +85.15 NASDAQ +9.10 NQ100 +0.6% R2K -0.2% SP400 -0.1% SP500 +7.89 NASDAQ Adv/Vol/Dec 1091/1.71 bln/1437 NYSE Adv/Vol/Dec 1638/783 mln/1329

Cryptography Research, a division of Rambus (RMBS), and Keirex Technology announced they have signed a reseller agreement for CRI's DPA Workstation side channel analysis platform.

8:16AM OmniVision lowers Q3 rev guidance below consensus; announces $100 mln stock buyback (OVTI) 17.31 : Co lowers Q3 rev guidance to $212-217 mln from $255-275 mln vs $259.91 mln Capital IQ Consensus Estimate. This revised outlook reflects an unexpected cutback in orders for certain key projects that are currently in production. This has reduced the unit sales of OmniBSI and OmniPixel3-HS based products. The co expects the business environment to remain volatile, especially in consumer-oriented product markets. As such, the co is expecting a more cautionary outlook for its third fiscal quarter. Separately, towards the end of the second fiscal quarter, the co started to ship in very limited quantities the OV8830, the co's 8-megapixel OmniBSI-2 based product. The co will continue to promote this product to key customers, and successful engagement in new projects may in the longer term provide growth opportunities. Stock buy-back OmniVision today announced that its Board of Directors authorized a program to repurchase up to $100 mln of the co's outstanding common stock, effective immediately.

09:06 am Trina Solar downgraded to Hold at Brigantine: . Brigantine downgrades TSL to Hold from Buy saying while Trina continues to be one of the lowest cost producers of silicon solar modules, the sharp industry downturn driven by excess channel inventory, excess production capacity, and weak markets particularly in Europe continue to take a toll on even top-tier suppliers.

Trina Solar (TSL $7.76 -0.32) was downgraded to Sell from Buy at Maxim Group and the firm lowered their tgt to $5 from $22 saying while the stock's 44% gains since its Oct. 4th lows and resilience in the face of its recent guidance may belie it has hit bottom, they believe this is only a temporary short squeezed reprieve. The firm says as the outlook for EPS losses over the next four quarters is fully realized, they expect the stock to come under renewed pressure through year-end and ultimately retest its lows around $5/share.

10:46 am S&P Tech Sector Down Modestly; DRWI, ALU and TECD Downgraded (DRWI)
The tech sector is trading lower today along with losses in the broader market. Semiconductors are showing relative weakness in the tech space, however, with the Philly Semi Index trading 1.2% lower. WFR (-5.2%) is a notable laggard in the chip index. Among other major indices, the S&P 500 is trading 0.2% lower, while the NASDAQ is trading 0.6% lower and the QQQ is trading 0.4% lower on the session. Among tech bellwethers, ORCL (-1.7%) is a notable underperformer.

In earnings this morning, OVTI (-13.5%) lowered Q3 revenue guidance, while BSFT (-5.8%) posted a strong beat but guided below consensus.

In news, TKLC (+11.2%) announced today that it has entered into a definitive agreement to be acquired by a consortium led by Siris Capital Group for $11/share. EXAR (-2.9%) announced its CEO and President resigned and reduced component count in industrial and embedded PCs.

Among rumors, we are hearing ERIC (+0.9%) for CIEN (-3.1%) making the rounds.

Among notable analyst upgrades this morning, DRWI (+3.3%) was upgraded to Buy at Jefferies In downgrades, ALU (-7.4%) was downgraded at Citigroup and WestLB and TECD (-7.8%) was downgraded to Market Perform from Outperform at Raymond James.

RAX (-1.2%) is the notable name in tech set to report results today after the close.
icon url

ReturntoSender

11/08/11 11:09 PM

#9580 RE: ReturntoSender #6755

From Briefing.com: 4:30 pm : Stocks overcame morning selling pressure to stage a steady advance that continued into the close, giving stocks substantial gains. The move was broad based, but for the most part financials led the way.

Market participants bid stocks higher in the opening minutes of trade, but sentiment soured before long. Subsequent selling pressure came as traders shrugged off impressive gains by Europe's major bourses because of questions about how easily eurozone members can establish a unified political front capable of completing and implementing bailout plans.

A lack of follow through selling pressure enabled stocks to stabilize and even slowly work their way back to the flat line, but they bounded once it was reported that the prime minister of Italy will resign after the country's budget plans are passed into law. Concerns about the inability of the Italian government to shore up the country's precarious fiscal and financial conditions have driven the country's debt yields to record heights. There is currently no definitive reading on who will step in as prime minister of Italy, but Greece is expected to name Lucas Papademos to the position of prime minister.

The euro also bounced in response to the headlines about a new political makeup in Italy. At session's end the euro was up 0.6% to $1.384.

All 10 major sectors managed to score gains, but financials staged the strongest moves, scoring a collective a gain of nearly 2%. The financial sector's bounce actually marked a resumption of early leadership efforts. In the early going the sector was up well in excess of 1% before surrendering almost all of that gain amid broad market weakness.

Small-cap stocks and mid-cap stocks staged some sharp reversals of their own. Both the Russell 2000 and the S&P 400 were down in excess of 1% at their session lows, but settled with gains of about 1% or better.

The improved tone to afternoon trade helped push down the Volatility Index for the fifth day in a row. The VIX is still above its 10-day low, though.

Advancing Sectors: Financials +1.9%, Energy +1.4%, Tech +1.2%, Consumer Discretionary +1.1%, Materials +1.1%, Consumer Staples +1.0%, Industrials +1.0%, Health Care +0.9%, Utilities +0.5%, Telecom +0.3%
Declining Sectors: (None)DJ30 +101.79 NASDAQ +32.24 NQ100 +1.2% R2K +1.4% SP400 +1.0% SP500 +14.80 NASDAQ Adv/Vol/Dec 1844/1.85 bln/717 NYSE Adv/Vol/Dec 2231/879 mln/769

5:10PM Adobe Systems also provides future growth strategy in seperate release (ADBE) 30.42 +0.50 : Co reports moving into FY2012, they will focus its research and development and sales and marketing investments on these two opportunities. In Digital Media, the company expects to attract new customers and increase recurring revenue through its new subscription offering. In order to drive increased Digital Marketing bookings, which are recognized as recurring revenue, the company will reduce its investment, and expected license revenue, in certain enterprise solution product lines. These changes will reduce FY2012 revenue growth by approximately four to five percentage points. As a result, the company expects annual revenue growth of approximately four to six percent in FY2012 (current consensus calls for 8.7% FY12 rev growth). However, the company expects non-GAAP operating margins in FY2012 to be similar to those it will achieve in FY2011. Beyond FY2012, the company anticipates double-digit revenue growth with an increasing percentage of recurring revenue. "We believe that by focusing resources on two large initiatives and shifting our business model, we can drive faster and more predictable growth in FY2013 and beyond..."

5:04PM Adobe Systems reaffirms Q4 revenue target, restructures to align business around Digital Media, Digital Marketing (ADBE) 30.42 +0.50 : Co provided a business update for its fourth quarter fiscal year 2011, ending Dec. 2, 2011. The company also announced plans to further align its business around the explosive growth categories of Digital Media and Digital Marketing solutions. Adobe is investing aggressively in Digital Media and Digital Marketing, two growing market areas. In Digital Media, the company is the industry leader in content authoring solutions, enabling customers to create, distribute and monetize digital content. In Digital Marketing, the company intends to be the leader in solutions to manage, measure and optimize digital marketing and advertising. In order to better align resources around Digital Media and Digital Marketing, Adobe is restructuring its business. This will result in the elimination of approximately 750 full-time positions primarily in North America and Europe. The co expects to record in the aggregate approximately $87 million to $94 million in pre-tax restructuring charges. They expect to record approximately $73 million to $78 million of these charges in the fiscal quarter ending Dec. 2, 2011. See separate release issued today for more information regarding the company's strategy and goals with its business realignment. With approximately four weeks remaining in the quarter, the company believes it will achieve fourth quarter revenue within the $1.075 billion to $1.125 billion range it previously provided on Sept. 20, 2011 (current consensus is $1.086 bln). Based on the impact of the restructuring charge discussed above that the company expects to take in the fourth quarter, Adobe updated its targeted GAAP diluted earnings per share range to be $0.30 to $0.38 in the quarter. The company had previously targeted a fourth quarter diluted earnings per share range of $0.41 to $0.50 on a GAAP basis. Adobe continues to target a diluted earnings per share range of $0.57 to $0.64 on a non-GAAP basis in the fourth quarter. Consensus is $0.60.

4:38PM Photronics lowered Q4 revs guidance to $120-122 mln vs $128.91 mln Capital IQ Consensus Estimate, from $125-130 mln; lowers EPS to $0.11-0.13, vs. $0.17 consensus, down from $0.14-0.18 (PLAB) 6.36 +0.28 : PLAB lowers Q4 guidance. Co plans to provide guidance for Q1 of fiscal 2012 during its regularly scheduled Q4 financial results conference call on December 7, 2011. Fourth quarter revenue is expected to be lower than anticipated due to customers scaling back purchases in response to increased softness in both the integrated circuit and flat panel display markets. The company had anticipated a modest slowdown of orders for mainstream IC and FPD photomasks, but did not expect the weakness to continue throughout the quarter. In addition, late in the quarter, Photronics experienced a similar and unexpected slowdown in high-end IC orders. The co noted that Q4 FPD sales declined more significantly than IC orders. For the full fiscal year 2011, Photronics expects to report record annual sales for both IC and FPD photomasks.

4:08PM Action Semi announced that Dr. Zhenyu Zhou will replace Mr. Niccolo Chen as Chief Executive Officer (ACTS) 2.17 +0.03 : In his current role as Senior Vice President at co, he leads the effort for the company's Android-based product line. Dr. Zhou spent the last six years in Shanghai, China as Founder and CEO of Mavrix Technology, a developer of multimedia and mobile TV SOCs for brand name and non-branded cell phone makers in China. He founded Mavrix technology in 2005 and the company was acquired by Actions Semiconductor in 2010.

4:08PM STEC Inc beats by $0.04, beats on revs; guides Q4 EPS below consensus, revs below consensus (STEC) 11.70 -0.02 : Reports Q3 (Sep) earnings of $0.14 per share, excluding non-recurring items, $0.04 better than the Capital IQ Consensus Estimate of $0.10; revenues fell 15.8% year/year to $72.5 mln vs the $70.81 mln consensus. Co issues downside guidance for Q4, sees EPS of ($0.02)-0.00, excluding non-recurring items, vs. $0.11 Capital IQ Consensus Estimate; sees Q4 revs of $55-57 mln vs. $72.47 mln Capital IQ Consensus Estimate.

10:48 am OmniVision downgraded to Perform at Oppenheimer: . Oppenheimer downgrades OVTI to Perform from Outperform after the co posted reduced guidance. Firm notes obviously, Sony's image sensor in the iPhone 4s is a factor, so too is reduced sales of PCs amplified by flooding in Thailand, as well as the prior reduced iPad forecast in CY4Q and soft sales on non-Apple tablets. In addition to yield issues with BSI-2 at TSMC, checks hint at some material compatibility issue with encapsulant materials during packaging of image sensor lenses.

2:42 pm S&P Tech Sector Trading One Percent Higher, Slightly Outperforming the Broader Market
The tech sector is trading higher today, just ahead of broader market. Semiconductors are showing modest strength in the tech space with the Philly Semi Index trading 0.2% higher. Among other major indices, the S&P 500 is trading 1.0% higher, while the NASDAQ is trading 0.9% higher and the QQQ is trading up 1.0%. Among tech bellwethers, T (-0.2%) is underperforming, while AAPL (+1.6%) is showing strength.

In earnings last night, RAX (+7.5%) reported a slight beat, while TWTC (-2.3%) and LLNW (+4.8%) posted inline quarters, although LLNW guided lower.

In news, HPQ (-0.1%) is looking to sell its WebOS unit according to reports.

Among rumors, we are hearing ALTR (-0.2%) for XLNX (+0.6%) takeover chatter making the rounds. Separately, there were reports of private equity speculation surrounding WBMD (+5.3%).

Among notable analyst upgrades this morning, ALU (+0.9%) was upgraded to Market Perform at Bernstein and Kaufman upgraded RAX (+7.5%) to Buy. In downgrades, RIMM (-0.6%) was downgraded to Equal Weight at Barclays, ALU (+0.9%) was downgraded to Neutral at BofA/Merrill, RHT (-0.3%) was downgraded to Neutral at UBS, and Oppenheimer and Wedbush downgraded OVTI (+1.6%).

ATVI (+1.2%) is the notable name in tech set to report results today after the close.
icon url

ReturntoSender

11/09/11 9:09 PM

#9581 RE: ReturntoSender #6755

From Briefing.com: 4:30 pm : Sentiment turned decidedly negative today, resulting in the stock market's worst single-session loss in about two months.

The threat of contagion caused market participants to pare risk today. Efforts were spurred primarily by the continual climb in Italy's debt yields, indicative of dwindling confidence in the country's ability to get a grip on precarious macro conditions. Market pundits have already made it known that Italy's economy is far too large to be aided by a bailout.

Market participants also continue to await the announcement of Greece's new prime minister, who is hoped to lead the country's reform efforts.

Few stocks were spared from the sell-off. Financials fell especially sharply. Their 5% loss came as various banks and financial services firms were pommeled for fear of their exposure to Europe.

Making the beatdown suffered by bank stocks look modest, online jewelry retailer Blue Nile (NILE 32.82, -15.99) lost about a third of its market cap after as traders reacted to disappointing earnings, mixed guidance, and negative analyst commentary.

In addition to broad market weakness, General Motors (GM 22.31, -2.73) and Macy's (M 30.45, -1.71) were undone by weak forecasts, which overshadowed positive earnings surprises from the pair.

Best Buy (BBY 27.22, +0.38) was one bright spot. It settled with a gain of more than 1%, making it one of the best individual performers in the broad market.

In the presence of fear-driven selling, the Volatility Index surged more than 30%. Prior its surge today, the "Fear Gauge" had ended lower for five straight sessions.

The aggressive selling and surge in volatility drove many traders to seek safety in the dollar, which rallied 1.6% against a collection of major currencies. Most of the greenback's gain came against the euro, which tumbled 2.0% to $1.355, a one-month low.

To little surprise, Treasuries also attracted buyers. That sent the yield on the benchmark 10-year Note back below 2.0%. Strength in the 10-year Note was briefly challenged following relatively lackluster auction results this afternoon, but it eventually reclaimed its gains.

Advancing Sectors: (None)
Declining Sectors: Telecom -1.9%, Utilities -2.2%, Consumer Staples -2.3%, Health Care -2.8%, Consumer Discretionary -3.6%, Tech -3.6%, Industrials -3.8%, Energy -4.3%, Materials -4.7%, Financials -5.4%DJ30 -389.24 NASDAQ -105.84 NQ100 -3.6% R2K -4.8% SP400 -4.3% SP500 -46.82 NASDAQ Adv/Vol/Dec 327/2.14 bln/2238 NYSE Adv/Vol/Dec 284/1.11 bln/2771

4:07PM Cisco Systems beats by $0.04, beats on revs (CSCO) 17.61 -0.70 : Reports Q1 (Oct) earnings of $0.43 per share, excluding non-recurring items, $0.04 better than the Capital IQ Consensus Estimate of $0.39; revenues rose 4.7% year/year to $11.26 bln vs the $11.03 bln consensus. During the first quarter of fiscal 2012, Cisco repurchased 100 million shares of common stock under the stock repurchase program at an average price of $15.37 per share for an aggregate purchase price of $1.5 billion. Days sales outstanding in accounts receivable (DSO) at the end of the first quarter of fiscal 2012 were 35 days, compared with 38 days at the end of both the fourth quarter of fiscal 2011 and first quarter of fiscal 2011. Non-GAAP inventory turns were 10.9 in the first quarter of fiscal 2012, compared with 11.4 in the fourth quarter of fiscal 2011, and compared with 10.8 in the first quarter of fiscal 2011. "We delivered a solid quarter... Even in times of limited capital spending, intelligent networks are being deployed to drive new business, revenue and consumption models, enable new customer and employee experiences, and drive efficiencies. Cisco's leadership in networking, video, collaboration and cloud, offered together in an integrated architectural approach, uniquely positions Cisco as a strategic business partner."

Broadcom Corporation (BRCM), NXP Semiconductors (NXPI), Freescale Semiconductor (FSL), and Harman International (HAR) announced the formation of a special interest group established to drive wide scale adoption of Ethernet-based automotive connectivity.

8:13AM Suntech Power sees Q3 revenues of $800 mln, Capital IQ consensus $774 mln; reafirms Q3 shipment guidance (STP) 2.77 : Suntech expects shipments for the third quarter of 2011 to increase by over 15% from the second quarter of 2011, in line with previous guidance. Revenues in the third quarter of 2011 are expected to exceed $800 million. Gross margin is expected to be approximately 13%, at the high end of the previously guided range of 11% to 13%. As a result of the effort to reduce operating expenses, Suntech expects to incur up to $10 million of severance expenses in the second half of 2011. Due to the volatility of the Euro to US dollar exchange rate, particularly in September, Suntech expects to incur a significantly larger than expected non-cash foreign exchange translation loss in the third quarter of 2011.

11:12 am S&P Tech Sector Down Over Two Percent, In-line With The Broader Market (CSCO)
The tech sector is trading lower today along with losses in the broader market. Semiconductors are showing relative weakness in the tech space once again, with the Philly Semi Index trading only 3.0% lower. RBCN (-5.2%) is a notable laggard in the chip index following its earnings. Among other major indices, the S&P 500 is trading 2.3% lower, while the NASDAQ is trading 2.5% lower and the QQQ is trading 2.3% lower on the session. Among tech bellwethers, ORCL (-3.7%) is the notable underperformer.

In earnings last night, SGI (-6.6%) reported a beat with inline guidance, while PANL (+5.9%) and ATVI (-4.9%) posted beats and offered upside guidance. Also, SINA (-8.7%) posted a mixed Q3 with inline guidance and PLAB (-5.0%) lowered guidance.

In news, YHOO (+0.5%), MSFT (-2.1%) and AOL (-3.1%) announced agreements to improve the process of buying and selling premium online display inventory. Elsewhere, ADBE (-10.7%) restructured its business to align business around Digital Media and Digital Marketing.

Among rumors, we are hearing Alibaba and Softbank are seeking partners for a YHOO (+0.5%) acquisition. Separately, there's an analyst out this morning suggesting a potential STX (-2.5%) for STEC (-14.3%) deal.

Among notable analyst upgrades this morning, Needham upgrades SWI (+0.8%) to Buy. In downgrades, DLB (-6.9%) was downgraded to Neutral at Piper Jaffray, DMAN (-4.6%) was downgraded to Underweight at Morgan Stanley, ADSK (-7.2%) was downgraded to Neutral at BofA/Merrill, NVDA (-3.0%) was downgraded to Market Perform at JMP Securities and, following earnings, ROVI (-33.5%) was downgraded at Collins Stewart, Brean Murray, and Credit Agricole.

CSCO (-2.6%) is the notable names in tech set to report results today after the close.

10:10 am Universal Display Tops Third Quarter Expectations; Guides In-line (PANL)
Universal Display (PANL $55.05 +5.61) reported third quarter earnings of $0.12 per share, $0.13 better than the Capital IQ Consensus Estimate of ($0.01), results for the third quarters of 2011 and 2010 included a non-cash gain of $240,000 and non-cash loss of $3.4 million, respectively, on stock warrant liability.

Revenues rose 208.8% year/year to $21.8 million versus the $11.62 million consensus.

For the fourth quarter, the company expects to see revenue below $21.8 million versus $15.64 mln Capital IQ Consensus Estimate. For fiscal year 2011, the company expects revenue to fall in the range of $58 million to $62 million versus the $49.50 million Capital IQ Consensus Estimate.

In fiscal year 2012, the company sees revenue of $90 million to $110 million versus the $103.76 million Capital IQ Consensus Estimate.
icon url

ReturntoSender

11/10/11 8:25 PM

#9582 RE: ReturntoSender #6755

From Briefing.com: 4:30 pm : Both the Dow and S&P 500 scored strong gains today, but lackluster action among tech stocks left the Nasdaq to end the day only narrowly above the neutral line.

The risk trade was turned back on this morning. Participants put in the past the prior session's slump, which was the worst one-day percentage drop for the S&P 500 about three months, to bid stocks higher in the early going. Buyers were compelled by improved market conditions in Europe and, partly, because Italy held a successful auction of 12-month bills. Although the auction commanded a yield comfortably above 6.0%, demand for the country's debt suggested that investors haven't completely given up on the country.

Improved sentiment in Europe helped take the euro higher after it had dropped about 2% against the dollar yesterday. Today it climbed about 0.6% to $1.361.

With an opening gain on the order of 1% things were looking for stocks up in early trade, but before long stocks began to drift lower. Fear of another sell-off perpetuated further selling, but stocks found stability upon reaching the flat line. From there the market was able to rebound, but the path higher was choppy.

Every single sector settled in positive territory, but tech stocks lagged for the entire session. They finished with a paltry gain of 0.1% and ultimately hampered the Nasdaq, which trailed its counterparts since the open. That said, Cisco (CSCO 18.61, +1.00) climbed to a new multi-month high with help from an upside earnings report.

Energy stocks were leaders for the better part of the day. The sector scored a near 2% gain with help from higher oil prices, which settled pit trade more than 2% higher, near $98 per barrel.

Data today had little lasting influence on sentiment. The latest weekly initial jobless claims count totaled 390,000, which is less than than 400,000 claims that had been exected, on average, among economists polled by Briefing.com. The latest tally is also 10,000 less than the prior week total.

The trade deficit contracted to $43.1 billion in September from $44.9 billion in the prior month. A $45.9 billion deficit had been widely expected for September.

As for the Treasury Budget. It had a deficit of $98.5 billion, which is less than the $105.0 billion deficit that had been expected to follow the $140.0 billion deficit from the prior month.

Advancing Sectors: Energy +1.8%, Health Care +1.4%, Industrials +1.1%, Materials +0.9%, Consumer Discretionary +0.9%, Telecom +0.9%, Consumer Staples +0.9%, Utilities +0.6%, Financials +0.6%, Tech +0.1%
Declining Sectors: (None)DJ30 +110.42 NASDAQ +1.96 NQ100 -0.1% R2K +0.7% SP400 +0.3% SP500 +9.62 NASDAQ Adv/Vol/Dec 1574/1.90 bln/940 NYSE Adv/Vol/Dec 2099/897 mln/912

4:03PM Microsemi reports EPS in-line, revs in-line; guides Q1 EPS below consensus, revs above consensus (MSCC) 17.25 -0.07 : Reports Q4 (Sep) earnings of $0.53 per share, excluding non-recurring items, in-line with the Capital IQ Consensus Estimate consensus of $0.53; revenues rose 50.3% year/year to $227.3 mln vs the $226.43 mln consensus. Co issues downside EPS guidance for Q1, sees EPS of $0.38-0.42, excluding non-recurring items, vs. $0.50 Capital IQ Consensus Estimate; sees Q1 revs of $238-246 mln vs. $226.68 mln Capital IQ Consensus Estimate.

9:54AM NXP Semi announced that its subsidiary, NXP B.V together with NXP Funding has launched a transaction seeking commitments for up to $500 mln in new senior secured loans due 2017 (NXPI) 15.52 -0.08 : The proceeds of which would be used to refinance a portion of NXP's existing secured floating rate notes. The new secured loans would be drawn as additional loans under NXP's existing Senior Secured Term Loan Facility due 2017. The lead-left bookrunner on the transaction is Barclays Capital, the investment banking arm of Barclays Bank plc and Credit Suisse will be joint bookrunner.

EMCORE (EMKR) announced that it has ramped up to full-scale production of 56 Gigabits per second Fourteen Data Rate active optical cables for high-performance computing, Ethernet router and switch applications.

7:10AM Kulicke & Soffa beats by $0.02, beats on revs; guides Q1 revs below consensus (KLIC) 9.14 : Reports Q4 (Sep) earnings of $0.31 per share, excluding foreign currency exchange lossses, and write downs in market value of building in Switzerland, $0.02 better than the Capital IQ Consensus Estimate of $0.29; revenues fell 30.4% year/year to $180.4 mln vs the $163.13 mln consensus. Co issues downside guidance for Q1, sees Q1 revs of $100-120 mln vs. $154.81 mln Capital IQ Consensus Estimate.

Last night, Cisco Systems (CSCO $18.50 +1.19) reported first quarter earnings of $0.43 per share, excluding non-recurring items, $0.04 better than the Capital IQ consensus of $0.39, while revenues rose 4.7% year/year to $11.26 billion versus the $11.03 billion consensus. During the first quarter of fiscal 2012, Cisco repurchased 100 million shares of common stock under the stock repurchase program at an average price of $15.37 per share for an aggregate purchase price of $1.5 billion. Days sales outstanding in accounts receivable at the end of the first quarter of fiscal 2012 were 35 days, compared with 38 days at the end of both the fourth quarter of fiscal 2011 and first quarter of fiscal 2011. Non-GAAP inventory turns were 10.9 in the first quarter of fiscal 2012, compared with 11.4 in the fourth quarter of fiscal 2011, and compared with 10.8 in the first quarter of fiscal 2011.

11:09 am S&P Tech Sector Showing Modest Gains
The tech sector is trading lower today, trailing slight gains in the broader market. Semiconductors are showing slight relative weakness in the tech space with the Philly Semi Index trading only 0.3% lower. CREE (-2.2%) is a notable laggard in the chip index, while STM (+1.9%) is a leader. Among other major indices, the S&P 500 is trading 0.2% higher, while the NASDAQ is trading 0.4% lower and the QQQ is trading 0.6% lower on the session. Among tech bellwethers, CSCO (+5.6%) is a notable leader following its earnings report, while AAPL (-2.7%) is underperforming.

In earnings last night, CSCO (+5.6%) reported a Q1 beat and, on the subsequent conference call, the company guided slightly higher. Also, SPRD (-2.0%) posted a beat and offered above consensus guidance, while PEGA (-21.7%) reported a large miss and downside guidance.

Among notable analyst upgrades this morning, CSCO (+5.6%) was upgraded at Deutsche Bank, Raymond James, and Citigroup. In downgrades, CSC (-6.4%) was downgraded to Underweight at JP Morgan and Brigantine downgrades ARUN (-0.3%) to Hold.

NVDA (0.0%) is the notable names in tech set to report results today after the close.
icon url

ReturntoSender

11/12/11 8:00 PM

#9585 RE: ReturntoSender #6755

Amateur Investors Weekend Market Analysis (11/12/11)

http://www.amateur-investor.net/Weekend_Market_Analysis_Nov_12_11.htm

Back in August there was a rare event in the Advance/Decline numbers involving the NYSE. There were two days (8/4 and 8/8) in which the number of Declining stocks exceeded the number of Advancing stocks by a ratio of 95:1. Meanwhile going back to 1930 there has only been a few events in which the number of Declining stocks have exceeded the number of Advancing stocks by a 95 to 1 ratio twice within 5 trading days. These events happened in September of 1946, May of 1940 and April of 1937.

Back in September of 1946 (point A) the chart of the Dow shows it made a bottom in October after losing 25% of its value from the April high. This was then followed by a very choppy consolidation period from late 1946 through late 1949 before finally breaking out in the early 1950's.


Meanwhile back in May of 1940 (point B) the Dow bottomed in June after a 30% drop. This was followed by a 26% rally over the next 5 months which was eventually followed by another leg lower (-33%) from late 1940 through the early part of 1942 (points C to D) as World War II was going on.


Finally going back to April of 1937 (point E) the Dow made a short term bottom in June after losing 17% of its value from the early 1937 peak. This was then followed by a sharp 2 month rally in which the Dow gained 16%. After this sharp 2 month rally the Dow then sold off severely and lost 49% of its value by early 1938.


Furthermore notice the 5 Wave affair down from the early 1937 high as well.


Now if we look at a current monthly chart of the Dow so far it looks somewhat similar to the 1937 time period. There was a 19% drop from May through September which was followed by a sharp 18% rally in October.


Now the question is could we see a similar 5 Wave structure develop with an eventual retest of the previous March 2009 low or will a repeat of the mid to late 1940's occur where the Dow moved nearly sideways exhibiting a very choppy consolidation period?

icon url

ReturntoSender

11/13/11 11:21 AM

#9586 RE: ReturntoSender #6755

InvestmentHouse Weekend Market Summary

http://www.investmenthouse.com/weekendmarketsummary.htm

- ECB buying keeps Italian bond yields lower, gives stocks cover to continue the rebound.
- Michigan sentiment up for three months . . . to still terrible levels.
- Once again when the European intrigue is removed, stocks move higher.
- A new trading range or a steady trend higher to year end?
- Still plenty of solid patterns to keep the indices moving higher.

Get Europe out of the way and stocks want to rise.

On Friday the market showed once again that if we can just get Europe out of the way, stocks really do want to move to the upside. The ECB has been heavily buying bonds starting on Thursday and continuing on Friday. That was able to push Italian bond yields from about 7.5% to below 6.5%. 7% is the magic number that everyone looks at with respect to bond yields. If a 10 year is yielding more than 7%, no one wants your assets. It is very hard to make your economy grow and do what you need to do if you cannot get money, so the ECB is out buying and bond rates were lower. As a result, there was a collective sigh of relief in stock markets around the world. They all performed pretty well, and the U.S. was no exception.

There was not a lot of other news out before the open other than simply a better outlook for Europe, particularly in Italy. There were some U.S. earnings that were pretty decent. DIS performed nicely. It gapped sharply higher. As a matter of fact, members of my family are going to Disney on Ice tonight. More money for the House of Mouse.

There was enough to keep stocks moving higher. When I say enough, I mean without Europe being in the way and trying to louse up the end-of-year move in the rest of the market. This market wants to move higher on seasonal trends and on catch-up by funds. Every time the overlay of Europe is removed, stocks move higher. We saw that on Friday, and that gives hope that toward the end of the year as we move toward Thanksgiving, we will see stocks continue to move higher.

As I have discussed all week and last week, there were certainly plenty of patterns still in position to make a move to the upside. Take away Europe (or at least get used to the idea of Europe) and you have the stock market performing better. Even with the Wednesday downdraft on the Italian job, after the big hits occur because of Europe, the market is moving higher. Taking away Europe or getting used to it maybe the market is becoming somewhat immune to Europe. Maybe. If Europe collapses it will be ugly. But if this is the kind of "stuff" we have to deal with, than perhaps the stock market becomes somewhat immune to the barbs and can continue higher toward the end of the year.

Looking at the intraday chart, futures were up early. When the market opened they rallied nicely. Stocks moved up sharply into mid-morning where they pretty much hit the zenith for the day. They spent the rest of the day range trading, bouncing lower and bouncing higher. But it was in a very tight range. That produced some solid moves after a little dip in the last hour failed. Stocks returned back to their session highs.

SP500, +1.95%; NASDAQ, +2.04%; Dow, +2.19%; SP600, +2.75%; SOX, +3.53%.

Very solid upside gains. Again this was with the problem of Europe removed from the picture.

As for the news moving the session, there was not that much domestically. About a half hour into the session, there was the preliminary read of Michigan Sentiment for November. It came in much better than expected at 64.2 versus 61.3 with 60.9 prior. That is the third straight monthly rise. A lot was made of that. It is true: whenever there is a bounce, a trend one way or the other, that helps. But we have also had that bounce in the economic data overall in the past two to three months. Thus you will have sentiment improving a little. These levels are still terrible levels. In other words, non-recession levels are well over 100, and they are not even close to that after two years of supposed recovery.

The entire week saw some better economic data. That continues the trend over the last two to three months. Initial Claims was the big headliner for the week, coming in at 390K versus the 400K reported the prior week. That finally gets it below 390K. This time it looks like it is there for real. Recall the prior week was revised back up to 400K. There have really been no weeks under 400K before this week.

The data is a bit better overall, and that is good for now. But as I discussed on Thursday and have mentioned the last couple of weeks, 2012 does not look that great. There are so many issues that will impact us in the U.S. that have nothing to do with Europe. I believe we could definitely slide back in recession. I hope I am wrong. That would be great for everybody because there are so many people out of work right now and that need help. I am talking about the real kind of help. Not just giving people money and making some busy work. I mean help that will make jobs that last as opposed to just spending hundreds of billions of dollars on jobs that are here for the moment but then gone. I do not know about you, but I am tired of spending $250-300K on a single job that actually turns out to just be illusory because the company goes out of business. Or spending $200-300K dollars for a single job in a fire department or policeman or teacher. That is an incredible amount of waste. We would be better off just giving them $250K, and then they would have three or four years' worth of salary.

It is incredible what we are doing and that we cannot see what history has done for us. Growth is the real key getting businesses growing not giving away entitlements. It is summed up by the student loans and the high costs of tuition. Looking at the charts, it is almost a dollar-for-dollar track for the amount of money that has been put into the student loan program. Tuition has gone up. The schools are not stupid. They know they will get every dollar put into the system, so they just hike tuition to suck it in as fast as they can. They are maximizing their dollars. And what happens? All it does is inflate tuition. It is the same old story. More money in a contained, closed system with the same amount of product or services means higher-priced products and services. Excess money becomes hot money that inflates prices. That is exactly what happened in schools. It is insane. Children cannot earn their tuition over the summer or over the year as they used to. They have put so much money into the system, and they just suck that money up. Has it gone to more teachers? No. It is gone to more administration and bureaucrats. But I digress. I will not get too deep into that tonight.

Suffice it to say, we have a lot of the same old problems that we always have. In the morning, Mohamed El-Erian of PIMCO was saying that we are not addressing the structural problems we have in the United States. We are just printing more money and trying to spend our way out of it. Spending is the problem right now. He said we have a very real problem and that the economy is near stall speed right now because we are not addressing the structural problems. That is a very good summation. I cannot say I agree with everything Mr. El-Erian says, but he is absolutely right about this.

We have problems that are of a structural nature, and we are not addressing them. We are throwing money at them, and that is exactly what we did before. We are trying to cure debt problems with more debt, and that simply does not work. History shows it does not work. We are really looking at a problem in 2012 as a result.

OTHER MARKETS

Dollar: 1.3746 versus 1.3604 euro. The dollar was down. It is still overall in its uptrend, but it is struggling. The dollar did fall back down and tap the 50 day EMA on the low. It is still above those four peaks from early and midsummer 2011. It is struggling and, of course, it will go back and forth as Europe goes back and forth. But right now it is still holding above an important support. Will the dollar go higher if the U.S. economy falls? It typically does not, but where will people put their money? Not in Europe and not in the dollar, so I do not know. Maybe China? We will see.
Click to view the chart

Bonds: 2.06% 10 year U.S. Treasury. Bonds were closed, so no trade today. Just to recap the week, the bonds stayed pretty strong even with a weak auction on Thursday because there were issues in Europe. The bond market is still holding out. They are saying we could have some problems in Europe and there could be some issues, so we will hang on for now and see what happens later in Europe.
Click to view the chart

Gold: 1,788.10, +28.50. Gold bounced sharply. A very strong move. It is bouncing back up off of a test. It broke higher, it has tested, and now it is looking to move to the upside. Why? Europe is ready to pass its bailout package because it is getting rid of the Greek Prime Minister and the Italian Prime Minister. We will have people in there who are just going to go for total money printing. That is going to feed into inflation. Likely the U.S. will have to do something similar next year when the economy that is now hitting stall speed actually stalls out.
Click to view the chart

Oil: 98.99, +1.21. Oil gained again. Quite a strong day and quite a strong week for oil. It went straight to the upside, and now it is bumping up against the some resistance at 100. It is not having any problems on the way up. It did stumble a bit at 95. There was some resistance there, so it may want to test a bit at 100 before it continues its move to the upside.
Click to view the chart

TECHNICAL SUMMARY

The internals were solid in one respect and weak in another.

Breadth: Breadth was a nice 3.6:1 on NASDAQ and a solid 6:1 advancers over decliners on the NYSE.

Volume: Volume was another story altogether. It fell 16% to a meager 1.5B shares on NASDAQ. It was almost a 20% decline on the NYSE to 691M shares. Again, quite divergent and quite mixed. We are seeing volume down on up days and volume higher on down days. The sellers are definitely stronger, but if you remove the European issue, the sellers do not really have a reason to sell. After all, the U.S. data is getting better, right? We are seeing stocks move to the upside on catch-up and maybe just a feeling that the U.S. has made it through the worst of times with respect to the economic situation.

CHARTS

SP500. SP500 was up for the second day. It moved back up above the June lows. That puts it in this range below the April peak. Maybe we get another trade to the upside. It made a lower high last time, but it also made a higher low. We have a little triangle or pennant pattern forming. It looks like it wants to make the break to the upside. We have very good MACD still in the action. The momentum remains solid. All we have to do is avoid one or two of these days from earlier in the month were Europe reared its head again and sent stocks lower. It does look positive for SP500 to continue to the upside.

NASDAQ. NASDAQ is not as impressive with respect to the chart. It did gap to the upside and is trying to get a pennant of its own going as it sits on top of the August-October peak. It is cracking into this upper tier of the trading range, and we will see if it can make it. It is having a problem with AAPL being a stick in the mud and holding back NASDAQ overall. But it is still managing to make the move upside.

SP600. SP600 looked solid, posting a 2.75% gain. It is forming up a pennant or triangle itself, looking for an upside breakout.

SOX. The semiconductors continue to be the ones to watch. They are the sleepers. They are above their little trendline again with a gap higher on Friday. Maybe a little pennant forming here as well. They are performing well, and we will keep looking at them. If we can pick up some more, we will do that.

After an ugly Wednesday, the indices are right back up. They do not want to give up. They are hanging in there and setting up nicely. Why are they setting up nicely? Because they have leadership to help them along the way.

LEADERSHIP

Semiconductors. LRCX broke higher out of a little pennant or triangle. Look back at the SP500. We have a pennant forming up. There is something similar and we already have the semiconductors making the break to the upside. SLAB had a pennant formed. It is jumping to the upside as well. Semiconductors are going to be performing well. I will not complain about that.

Technology. Techs in general are looking good. GOOG is making the move to the upside. PANL looks good on the upside as well. A is looking solid. It is forming a triangle or pennant pattern; we are seeing just a bit of that here and there in the stock market Even without AAPL, technology is still doing well. 'Tis the season for semiconductors and technology stocks to perform well. It looks like they are trying to do just that.

Retail. Retail is performing well. BWLD has a nice pullback to support. It looks ready to make the move to the upside. LULU is in the middle of its triangle. It is at one of the moments of truth where it has come back to the 50 day EMA right in the middle. The heart of a triangle is forming. It is pinching off toward the end of the triangle, and it will have to make a break sooner than later. Often a higher low at the 50 day EMA leads to a breakout move. We are looking for that as well. PNRA looks like it wants to make the move to the upside. EL has set up nicely after a gap upside on earnings. You like to see these gaps, and then you want to see them continue on to the upside.

Retail is still doing well, but there are some demolitions here. DDS had good earnings but it failed to impress on the margins and was slapped around a bit. There are some of those out there. In retail some are blowing up, but overall they look pretty solid.

Industrial. CAT looked good. Putting in a little buy. It jumped to the upside. It still looks kind of heavy. We have to watch it; we have a downside play on it. But it is trying to make its move. It looked ready to fall, but it is trying to come back. TEX still looks solid as well. With DE it looks like there is some life in the old tractor still.

Miscellaneous. There is still plenty of leadership out there that can make the move for us. Indeed, you can throw out a lot of stocks across many sectors and come up with some really nice patterns. ANSS has a great pattern and a nice surge that it has tested. LNG had a nice pullback, looking very solid. ACE has a great pennant going all its own. TRLG has a nice pullback of its own after a breakout. You can go across many different sectors and find these leaders. That is why I am saying it looks like the market will have more room to move higher. There are so many stocks that have bullish patterns behind them and are under accumulation. That is exactly what you want to see for a market to continue higher. If you can get Europe out of the way, then I believe stocks will rally into the year end and make us some really nice money.

THE MARKET

SENTIMENT INDICATORS

VIX: 30.04; -2.77
VXN: 29.35; -3.32
VXO: 28.72; -2.67

Put/Call Ratio (CBOE): 0.93; -0.23

Bulls versus Bears:

This is a reading of the number of bullish investment advisors versus bearish advisors. The reason you look at this is that it gives you an idea of how bullish investors are. If they are too bullish then everyone is in the market and it is heading for a top: if everyone wants to be in the market, then all the money is in and there is no more new cash to drive it higher. On the other side of the spectrum if there are a lot of bears then there is a lot of cash on the sideline, and as the market rallies it drags that cash in as the bears give in. That cash provides the market the fuel to move higher. If bears are low it is the same as a lot of bulls: everyone is in and the market does not have the cash to drive it higher.

Bulls: 44.2% versus 43.2%. Steady rise from 40.0% and 35.8% the week before that. Still climbing after crossing back above bears. It could not last forever and with the surge in October just a matter of time. Did its work, however, as the market surged off the readings below 35%. 35% is the threshold measuring bullish versus bearish action. Six weeks the bulls were below bears. A powerful sentiment signal. Solid move lower from 49.5% in late July. Highs from April and December (60% readings spanning December through early May 2011). The 5 year high is 62.0. The crossover level at 29% bulls from July 2010 is long gone. 35% is the threshold level suggesting bullishness. To be seriously bearish it needs to get up to the 60% to 65% level.

Bears: 34.7% versus 36.8%. Falling below 35% for the first time in weeks, continuing the fall from 37.9% and 45.0% before that. It did spend seven weeks over the 35% threshold considered a bullish indicator. For more reference, bearishness hit a 5 year high at 54.4% the last week of October 2008. The move over 50 took bearish sentiment to its highest level since 1995. Extreme negative sentiment. Prior levels for comparison: Bearishness peaked at 37.4% in September 2007. It topped the June 2006 peak (36%) on that run. That June peak eclipsed the March 2006 high (33%) and well above the 2005 highs that spawned new rallies (30% in May 2005, 29.2% in October 2005). That was a huge turn, unlike any seen in recent history.

NASDAQ

Stats: +53.6 points (+2.04%) to close at 2678.75
Volume: 1.574B (-16.37%)

Up Volume: 1.36B (+230M)
Down Volume: 228.75M (-519.11M)

A/D and Hi/Lo: Advancers led 3.62 to 1
Previous Session: Advancers led 1.68 to 1

New Highs: 29 (+16)
New Lows: 45 (-23)

NASDAQ CHART: Click to view the chart

NASDAQ 100 CHART: Click to view the chart

SOX CHART: Click to view the chart

SP500/NYSE

Stats: +24.16 points (+1.95%) to close at 1263.85
NYSE Volume: 691M (-18.8%)

Up Volume: 3.11B (+480M)
Down Volume: 243.75M (-1.116B)

A/D and Hi/Lo: Advancers led 6.05 to 1
Previous Session: Advancers led 2.34 to 1

New Highs: 121 (+34)
New Lows: 37 (-30)

SP500 CHART: Click to view the chart

SP600 Chart: Click to view the chart

DJ30

Stats: +259.89 points (+2.19%) to close at 12153.68
Volume DJ30: 134.5M shares Friday versus 168M shares Thursday.

DJ30 CHART: Click to view the chart

MONDAY

There are a lot of economic reports to come. We have a quiet Monday, and then the PPI starts on Tuesday. The big one will be the Retail Sales. What is the consumer doing? Remember, Retail Sales can be fickle. Everyone points to them and says Retail Sales have been moving up nicely. They were up 1.1% back in September. They say things are going great, but we have to factor in pricing. Prices have been higher, so we may not be buying that much more with these increased Retail Sales. That is one of those where you have to watch out. It is too easy to say everything is okay without understanding just how these economic reports are put together.

Empire Manufacturing is very important out of New York. It has not been doing well. It is expected to bounce higher. What these regional manufacturing reports pull off will be key. Are they going to continue to head lower, or will they turn up? Remember, regional manufacturing was the economic indicator showing recovery when nothing else was. They have turned down. There overall number is just clinging above 50 right now; it has not fallen. This will be very important as to what these regions show for October and November. If they say negative and that would be a surprise then the economy will not look so good for 2012. It will look even worse than I have already prognosticated. But it can still move higher toward the end of the year. We have the CPI on Wednesday. It will be important to see what those prices are doing. Then on Thursday we have the Philly Fed. Friday are Leading Indicators. Whatever. They do not mean a heck of a lot. The ECRI is the big Leading Indicator.

The economic reports will have something to do with the market action, no doubt. Particularly if the regional reports come in better than expected or worse than expected. They will have their impact. But right now it really looks like the market just wants to move higher. It was kind of tough to stay with that thesis after Wednesday when the stock market sold so hard on the Italian bond issues. What happened right after that? You remove them and stocks have bounced back up. They want to move higher. If they become somewhat immune to all of this European noise, then they will advance nicely.

There will be other setbacks. That is the way it will be. But look what has happened. With every setback there is a lower high, yes, but a lower low. The pattern is narrowing, sitting on top of support. That is a positive. That is very constructive action that will lead to breakout. You also have many stocks in good position to move higher. We have some great ones we already have positions in, and we are looking to buy some more. Then we have some more coming on this weekend that look solid as well. We will have many stocks that we will be able to choose from that could lead the market higher, and I think they are going to lead the market higher.

We will continue to look for the moves to the upside. We will continue to find those stocks in good bases that are ready to move. How many stocks did I show you tonight that had this pennant pattern forming and are already breaking to the upside? That just goes to show you they are out there and are ready to move. We need to be able to have plays set up to take advantage of that. We will buy even more when they present themselves. There is not a lot of mystery here. It is just that the European issues are adding a little fog of war, so to speak, to the stock market. Overall if you have good patterns, you have resilience. We have seasonal trends and we have funds that want to play catch-up. We have the mix to push the indices higher. Maybe not to a breakout (after all, I do not think 2012 will be all that great economically), but definitely well into this upper-tier trading range. That would give us some really nice gains moving into the holidays. Everyone could use a better holiday this year. Maybe the market will help deliver that despite gasoline prices that will move higher because oil is near $100 a barrel.

Enjoy a beautiful weekend. I hope it is beautiful where you are and I hope it is going well for you. I will see you on Monday with more plays ready to go after a market that looks like it wants to move higher. Although it will be two steps forward and one step back. Overall, it is moving to the upside.

Have a great evening!

Support and Resistance

NASDAQ: Closed at 2678.75
Resistance:
2686 is the January 2011 closing low
The 200 day SMA at 2688
2706 to 2705 is the April 2011 low and the February 2011 and consolidation low (bottom of the trading range) 2723 to 2705 is the range of support at the bottom of the January to May trading range
2754 is the recent October 2011 high
2759 is the mid-May low
2762 is the February low
2796 is the February gap down point
2816 is the early April peak.
2825 is the 2007 closing peak.
2841 is the February 2011 peak
2862 is the 2007 peak
2879 is the July 2011 peak
2888 is the May 2011 peak

Support:
2676 is the January 2010 low
2645-2650ish from December 2010 consolidation
2643 is the September 2011 high
The 50 day EMA at 2613
2612 is the late August 2011 peak
2603 is the March 2011 intraday low (post-Japan low)
2599 is the June 2011 low
2593 is the November intraday high
2580 is the November 2010 closing high
2569 is the November gap up point through the April 2010 peak
2555 is the mid-August 2011 peak
2546 is the early September 2011 gap down point
2540 is the early November 2010 lower gap point
2532 is the early August gap down point
2512 is last week's gap down point
2469 is the November 2010 low
2331 from October 2010 low and the August 2011 intraday low
2305 from the August 2010 peak (summertime base)
2139 is the May and June 2010 low
2123 is the August 2010 gap down point
2100 from the August 2010 lows

S&P 500: Closed at 1263.85
Resistance:
The 200 day SMA at 1272
1275 is the January 2010 low, early January 2011 peak
1295 to 1294 is the April 2011 low and the February 2011 consolidation low (bottom of the trading range)
1313 from the August 2008 interim peak
1318.51 is the May low
1325-27 is the March 2008 closing low and the May 2006 peak.
1332 is the early March peak
1340 is the early April 2011 peak
1344 is the February 2011 peak is being challenged again
1357 is the July 2011 peak
1364 is the March 2007 low
1370 is the August 2007 low
1371 is the recent May 2011 peak

Support:
1258 is June 2011 intraday low
1255 is the late December 2010 consolidation range
1249 is the March 2011 low (post-Japan)
1235 is the mid-December 2010 consolidation low
1231 is the late August 2011 peak
1227 is the November 2010 peak
The 50 day EMA at 1221
1220 is the April 2010 peak
1209 is the mid-August 2011 high
1196 is the November 2010 consolidation peak
1178-1180 is the October 2010/November 2010 consolidation low
1131 - 1127 from August 2010 base peak.
1119 is the early August closing low
1109 is the mid-September 2010 gap up point
1101 is the August 2011 low
1075 is the October 2011 intraday low
1099 from the mid-July interim peak
1090 is the early September 2010 gap up point
1040 from the August 2010 lows and May/June 2010 lows
1011 is the summer 2010 low

Dow: Closed at 12,153.68
Resistance:
12,283 is the March 2011 peak
12,391 is the February 2011 peak
12,754 is the July intraday peak
12,876 is the May high
13,058 from the May 2008 peak on that bounce in the selling

Support:
12,110 from the March 2007 closing low
12,094 is the April 2011 low
The 200 day SMA at 11,976
The June low at 11,897 (closing)
11,893 from March 2008 closing low
11,867 from the August 2009 high and peak on that bounce in the selling.
11,734 from 11-98 peak
11,717 is the late August 2011 peak
The August low at 11,700
The 50 day EMA at 11,653
11,555 is the March low
11,452 is the November 2010 peak
11,178 from November 2010
10,978 is the bottom of the November 2010 consolidation
10,750 from September 2010
10,720 is the August closing low
10,705-710 from January 2010 peak
10,694-700 from August 2010 peak
9938 is the August 2010 low

Economic Calendar

November 7 - Monday
- Consumer Credit, September (15:00): $7.4B actual versus $5.0B expected, -$9.7B prior (revised from -$9.5B)

November 9 - Wednesday
- MBA Mortgage Index, 11/05 (7:00): 10.3% actual versus +0.2% prior
- Wholesale Inventories, September (10:00): -0.1% actual versus 0.5% expected, 0.1% prior (revised from 0.4%)
- Crude Inventories, 11/05 (10:30): -1.370M actual versus 1.826M prior

November 10 - Thursday
- Initial Claims, 11/05 (8:30): 390K actual versus 400K expected, 400K prior (revised from 397K)
- Continuing Claims, 10/29 (8:30): 3615K actual versus 3690K expected, 3707K prior (revised from 3683K)
- Export Prices ex-ag., October (8:30): -1.5% actual versus -0.2% prior (revised from prior)
- Import Prices ex-oil, October (8:30): -0.2% actual versus 0.2% prior
- Trade Balance, September (8:30): -$43.1B actual versus -$45.9B expected, -$44.9B prior (revised from -$45.6B)
- Treasury Budget, October (14:00): -$98.5B actual versus -$105B expected, -$140.4B prior

November 11 - Friday
- Michigan Sentiment, Preliminary November (9:55): 64.2 actual versus 61.3 expected, 60.9 prior. Third straight monthly rise.

November 15 - Tuesday
- PPI, October (8:30): -0.2% expected, 0.8% prior
- Core PPI, October (8:30): 0.1% expected, 0.2% prior
- Retail Sales, October (8:30): 0.4% expected, 1.1% prior
- Retail Sales ex-auto, October (8:30): 0.2% expected, 0.6% prior
- Empire Manufacturing, November (8:30): 0.0 expected, -8.48 prior
- Business Inventories, September (10:00): 0.1% expected, 0.5% prior

November 16 - Wednesday
- MBA Mortgage Index, 11/12 (7:00): 10.3% prior
- CPI, October (8:30): 0.0% expected, 0.3% prior
- Core CPI, October (8:30): 0.1% expected, 0.1% prior
- Net Long-Term TIC Fl, September (9:00): $57.9B prior
- Industrial Production, October (9:15): 0.4% expected, 0.2% prior
- Capacity Utilization, October (9:15): 77.6% expected, 77.4% prior
- NAHB Housing Market Survey, November (10:00): 18 expected, 18 prior
- Crude Inventories, 11/12 (10:30): -1.370M prior

November 17 - Thursday
- Initial Claims, 11/12 (8:30): 400K expected, 390K prior
- Continuing Claims, 11/05 (8:30): 3648K expected, 3615K prior
- Housing Starts, October (8:30): 603K expected, 658K prior
- Building Permits, October (8:30): 603K expected, 594K prior
- Philadelphia Fed, November (10:00): 7.5 expected, 8.7 prior

November 18 - Friday
- Leading Indicators, October (10:00): 0.6% expected, 0.2% prior
icon url

ReturntoSender

11/13/11 5:53 PM

#9588 RE: ReturntoSender #6755

US companies are feeling the impact of Europe

http://finance.yahoo.com/news/us-companies-feeling-impact-european-160229805.html

NEW YORK (AP) -- The tremors from Europe's financial upheaval have reached U.S. shores, rattling consumers and companies.

The consequences have been limited so far. Yet the United States and Europe are so closely linked that any slowdown across the Atlantic is felt here. U.S. makers of cars, solar panels, drugs, clothes and computer equipment have all reported effects from Europe's turmoil.

Worries that Europe's crisis could worsen and spread are spooking investors and consumers just as the holiday shopping season nears. Some fear U.S. consumers could rein in spending. Europe's sputtering growth is already dragging on some U.S. companies' profits and could further slow the U.S. economy.

The crisis "seems to be coming to a head right at the time the U.S. economy is at its most vulnerable," said Mark Vitner, an economist at Wells Fargo.

It's affecting companies like Marlin Steel Wire Products, a 34-employee business based in Baltimore that's been seeking a $4 million contract from a German manufacturer for an industrial steel wire project.

Marlin's CEO, Drew Greenblatt, says the German firm is in "pause mode" because of Europe's turmoil. The German company had promised the order by early November.

Marlin's overall sales are growing briskly. But sales to Europe have been sinking.

"If they were ordering like they customarily do, we would have hired more guys," Greenblatt said.

The European Union is the No. 1 U.S. trading partner. Nearly $475 billion in goods crossed between the regions in the first nine months of 2011. About 14 percent of revenue for the 500 biggest U.S. companies — roughly $1.3 trillion — comes from Europe.

The U.S. economy is especially vulnerable to the European crisis because it's growing so weakly and facing other risks, such as weak hiring, stagnant pay, high energy costs, a wide trade deficit and potentially steep government spending cuts.

"It won't take much to tip us into another recession," said Sung Won Sohn, an economics professor at California State University, Channel Islands. "If Europe gets into any deeper trouble, it will take us and the rest of the world down, too."

The European Union said last week that the region could slip into a "deep and prolonged recession" next year. The Eurozone is expected to grow just 0.5 percent in 2012. That's far below the 1.8 percent growth predicted in the spring.

Wells Fargo estimates that the U.S. economy will grow 2.1 percent next year, 0.4 percentage point lower because of Europe's slowdown. Goldman Sachs thinks the region's slowdown could shave a full percentage point off U.S. growth.

Even if Europe doesn't fall into a downturn, its turmoil is affecting U.S companies and consumers in several ways:

— Stock-market gyrations unsettle consumers and make them more cautious about spending.

— U.S. companies with big European operations are suffering from lower sales, prices and profits.

— Banks worldwide are cutting lending and hoarding cash to create more cushion for potentially deep losses on their holdings of Greek, Italian and other government debt. U.S. and overseas banks are keeping about $1.57 trillion in reserves at the Federal Reserve — a jump of nearly $580 billion in the past year.

— Uncertainty about how much damage Europe could cause is making corporations reluctant to spend their piles of cash to hire and invest.

Not every U.S. company is hurting in Europe, of course. McDonald's Corp., Kraft Foods Inc., Sara Lee Corp. and Oracle Corp. recently reported strong results there. But General Motors Co.'s third-quarter profit fell 15 percent, due mainly to slower sales and higher costs in Europe.

"Things have clearly deteriorated," GM Chief Financial Officer Dan Ammann told investors last week.

Jeff Fettig, CEO of Whirlpool, said late last month that with demand tumbling in parts of Europe, the company plans to lay off 5,000 workers in North America and Europe.

First Solar, based in Phoenix, is postponing plans to finish building a solar panel factory in Vietnam because of a worldwide glut in panels. The glut has been caused by falling demand in Europe, the world's biggest solar market.

Falling prices caused by the glut have sent share prices of established solar panel makers such as First Solar and SunPower tumbling. They've also forced some solar companies such as Solyndra into bankruptcy protection.

Abercrombie & Fitch Co.'s struggles in Europe caused its share price to plummet. Nike Inc. said its last quarterly revenue rose in every region it operates in except Western Europe.

Cisco expects growth in the area to slip about 5 percent during the next three months.

"Europe, we think, is going to be a challenge for us for this next quarter," Cisco CEO John Chambers told analysts Wednesday.

Smaller businesses are being affected, too. Wine exports are suffering because of poor consumer sentiment in Europe and because a weak euro is making U.S. wine costlier by comparison. The European Union accounts for about 38 percent of U.S. wine industry exports.

For banks, the crisis is different, and scarier. They hold debt of European governments and companies that could lose value if the crisis worsens.

The big fear is that big U.S. and European banks would become so worried about each other's ability to cover losses that they'd stop lending to each other. The result could be diminished confidence that would freeze lending and shock the global economy.

Last week, Federal Reserve Chairman Ben Bernanke told soldiers and their families in Texas that Europe posed a "significant risk" to the U.S. economy.

Europe's troubles have been weighing on U.S. stock markets for months. David Hensley, a global economist at JPMorgan Chase, noted that falling stock prices make consumers feel less wealthy and cause some to cut back on spending. That, in turn, slows U.S. growth.

The unease is growing right as the holiday shopping season — which accounts for up to 40 percent of retailers' annual sales — is about to start.

"The retail industry is hyper-sensitive to any sort of national or international crisis that affects consumer confidence," said Brian Dodge of the Retail Leaders Industry Association. "Consumers read the news."

___

Rugaber reported from Washington, Liedtke from San Francisco. AP Business Writers Tom Krisher in Detroit, Sarah Skidmore in Portland, Ore., and Martin Crutsinger in Washington contributed to this report.

Jonathan Fahey can be reached at http://twitter.com/JonathanFahey .
icon url

ReturntoSender

11/14/11 11:33 PM

#9589 RE: ReturntoSender #6755

From Briefing.com: 4:30 pm : Sellers returned to the fold on Monday to hand stocks sizable losses. Financials led the slide.

Financials fell to a 2.0% loss and were weak since the open of trade, which was relatively rocky. Pressure against the sector was largely rooted in an effort by market participants to pare their positions in bank stocks, given the group's sensitivity to the threats of Europe. Sentiment in Europe seemed to sour during the weekend, resulting in losses for the region's major bourses and a sharply lower day for the euro. Pressure came even though embattled Italy approved new austerity measures and held another successful debt offering.

Tech stocks fought to keep sellers at bay for the first couple of hours, but ultimately succumbed to broad market selling pressure to settle with a 0.6% loss. Even IBM (IBM 187.35, -0.03) surrendered a gain after it had been bid higher on the back of word from billionaire investor Warren Buffett that he has been acquiring shares in the company for the past month.

The economic calendar was entirely empty today and earnings were limited to only a handful of names. Lowe's (LOW 23.50, +0.39) posted an upside earnings surprise and issued mixed guidance, but in-line earnings from J.C. Penney (JCP 32.98, -0.94) were overshadowed by a disappointing forecast.

With so few catalysts for trade today, share volume on the NYSE totaled at paltry 700 million. Over the past 50 days share volume has been closer to 1 billion, on average.

Advancing Sectors: (None)
Declining Sectors: Tech -0.6%, Consumer Staples -0.7%, Consumer Discretionary -0.7%, Health Care -0.7%, Industrials -0.7%, Materials -0.9%, Telecom -1.1%, Utilities -1.2%, Energy -1.2%, Financials -2.0%DJ30 -74.70 NASDAQ -21.53 NQ100 -0.6% R2K -1.6% SP400 -1.1% SP500 -12.07 NASDAQ Adv/Vol/Dec 638/1.39 bln/1921 NYSE Adv/Vol/Dec 720/704 mln/2301

6:03PM ANADIGICS CFO and COO resign (ANAD) 2.55 -0.01 : Co announced that Thomas Shields had resigned from the positions of Chief Operating Officer, Executive Vice President, Chief Financial Officer and Secretary, effective November 14, 2011 in order to pursue career advancement opportunities outside of ANADIGICS. Terrence Gallagher, who had served as Vice President, Finance and Controller, has been promoted to the positions of Vice President and Chief Financial Officer. Mr. Shields has agreed to provide consulting services to the company for a period of time to ensure an orderly transition of all of his current responsibilities.

9:03AM FEI announced that it has acquired TILL Photonics of Munich, Germany for ~ $20 mln (FEIC) 40.06 : Co announced that it has acquired TILL Photonics of Munich, Germany. TILL provides sophisticated, high resolution, digital light microscopes and high speed imaging systems for live cell fluorescence microscopy. The purchase price for the acquisition is 14.5 mln (~Co announced that it has acquired TILL Photonics of Munich, Germany. TILL provides sophisticated, high resolution, digital light microscopes and high speed imaging systems for live cell fluorescence microscopy. The purchase price for the acquisition is 14.5 mln (~$20 mln), plus an earn-out payable in two years based on attainment of specified milestones. TILL brings great products, a wealth of technology and a skilled and experienced team to FEI, along with revenues of approximately $8 million for calendar year 2011.0 mln), plus an earn-out payable in two years based on attainment of specified milestones. TILL brings great products, a wealth of technology and a skilled and experienced team to FEI, along with revenues of approximately $8 million for calendar year 2011.

FSI International (FSII) announced that several semiconductor producers have placed additional orders for ANTARES Cryokinetic Cleaning Systems

Lattice Semiconductor (LSCC) announced that Netezza, an IBM Company and the leader in data warehouse appliances, is using the innovative programmable Lattice Power Manager device, the PAC POWR 1220AT8, to integrate and simplify multiple power management functions in a board design.

IBM (IBM $188.81 +1.43) shares spiked after Warren Buffett announced that he has been buying over the last quarter. Buffett said he bought about $10.7 billion worth of shares (approximately 64 million shares. Buffett said he read the annual report through a different lense.

12:38 pm S&P Tech Sector Trading Modestly Lower (CRM)
The tech sector is trading lower today, but ahead of larger losses in the broader market. Semiconductors are showing relative weakness in the tech space, however, with the Philly Semi Index trading 1.0% lower. VECO (-4.4%) is a notable laggard in the chip index. Among other major indices, the S&P 500 is trading 0.8% lower, while the NASDAQ is trading 0.6% lower and the QQQ is trading 0.4% lower on the session. Among tech bellwethers, GOOG (+1.3%) is showing strength, while AAPL (-1.1%) and VZ (-1.1%) are notable underperformers.

In earnings, CTRP (-13.8%) reported a mixed Q3 and guided lower.

In news this morning, Warren Buffett announced that he bought about $10.7 bln worth of IBM (+0.4%).

Among notable analyst upgrades this morning, CRM (+2.8%) was upgraded to Buy at Citigroup and TWTC (0.0%) was upgraded to Overweight at Morgan Stanley. In downgrades, TEF (-2.5%) was downgraded to Neutral at JPMorgan.

There are no notable names in tech scheduled to report results today after the close.
icon url

ReturntoSender

11/15/11 11:30 PM

#9590 RE: ReturntoSender #6755

From Briefing.com: 4:30 pm : Stocks slipped after a choppy start to the session, but buyers eventually stepped back in to provide a broad lift. Their efforts picked up right around the time that trade in Europe wrapped up.

Sentiment this morning was initially imbued by renewed worries about financial conditions in Europe, where the region's major bourses traded with weakness once again. Once trade there was closed, the mood among market participants quickly improved. At about the same time the euro started to move off of its intraday low, although it was still down about 0.7% against the greenback at session's end.

The Nasdaq was able to outperform its counterparts with help from tech stocks. As a group, tech issues advanced 1.3%. Intel (INTC 25.34, +0.71) was a steady leader, but Dell (DELL 15.63, +0.31) also advanced nicely ahead of its quarterly announcement.

Wal-Mart (WMT 57.46, -1.43) weighed on the Dow for virtually the entire session. The stock's weakness came after the retail behemoth failed to produce the earnings expected by Wall Street.

An upside earnings surprise helped Home Depot (HD 38.07, -0.18) shares bounce at the open, but the stock failed to hold that move and never really recovered, not even amid the broad market's afternoon bounce.

Word of an oil leak at a rig run by Chevron (CVX 103.27, -2.90) and Transocean (RIG 47.86, -1.85) dragged down the pair's shares, as well as those of other oil and gas services players. Collectively, energy stocks logged a 0.2% loss, making them the only major sector that failed to score a gain.

Share volume was anemic for the second straight session. Yesterday it barely broke 700 million on the NYSE and today it failed to crack 800 million. Over the past 50 days share volume on the Big Board has averaged about 1 billion shares per session.

A substantial dose of data didn't even attract participants to the action. Overall, the reports were generally proved pleasing.

Retail sales climbed by 0.5% during October. A 0.4% increase had been generally expected. Excluding autos, sales actually increased by 0.6%, which is well above the 0.2% pickup that had been widely anticipated.

Producer prices for October fell by 0.3%, exceeding the 0.2% decline that had been commonly forecasted. Core prices were flat for the month, not too different than the 0.1% increase expected among economists surveyed by Briefing.com.

The Empire State Manufacturing Survey for November improved to 0.6 from -8.5 in the prior month. Many thought it would remain in negative territory by an incremental margin.

Business inventories for September were flat, contrasting with the Briefing.com consensus call for a 0.2% increase.

Advancing Sectors: Tech +1.3%, Industrials +0.6%, Telecom +0.5%, Financials +0.4%, Consumer Discretionary +0.4%, Consumer Staples +0.4%, Utilities +0.2%, Tech +0.2%, Materials +0.1%
Declining Sectors: Energy -0.2%DJ30 +17.18 NASDAQ +28.98 NQ100 +1.1% R2K +1.4% SP400 +1.0% SP500 +6.03 NASDAQ Adv/Vol/Dec 1712/1.68 bln/825 NYSE Adv/Vol/Dec 1903/781 mln/1107

4:11PM Amtech Systems beats by $0.02, beats on revs; guides DecQ sharply lower, cites lower solar capacity expansion plans (ASYS) 10.37 +0.15 : Reports Q4 (Sep) earnings of $0.31 per share, excluding non-recurring items, $0.02 better than the Capital IQ Consensus Estimate of $0.29; revenues rose 31.8% year/year to $59.9 mln vs the $54.3 mln consensus. Co issues downside guidance for Q1 (Dec), sees a loss for the quarter vs. $0.26 Capital IQ Consensus Estimate; sees Q1 revs of $21-23 mln vs. $49.6 mln Capital IQ Consensus Estimate. Co says "The current supply/demand imbalance and global economic conditions have negatively impacted growth in the solar equipment market. Visibility is currently unclear as these conditions have caused solar cell manufacturers, Amtech's principal solar customer base, to significantly slow or push out their capacity expansion plans.

4:08PM Dell beats by $0.07, misses on revs; lowers FY12 revs guidance, reaffirms FY12 operating income guidance (DELL) 15.63 +0.31 : Reports Q3 (Oct) earnings of $0.54 per share, excluding non-recurring items, $0.07 better than the Capital IQ Consensus Estimate of $0.47; revenues fell 1.9% year/year to $15.37 mln vs the $15.66 bln consensus. Dell reaffirms FY12 operating income guidance of +17-23%. Dell sees FY12 revenue at lower end of the range of its revenue outlook of 1-5% full fiscal-year growth; consensus calls for 1.6% growth. "Given the uncertain macroeconomic environment and complexity in working through the industry-wide hard drive issue, the company is trending to the lower end of the range of its revenue outlook of 1 to 5-percent full fiscal-year growth"

4:08PM Fairchild Semi is reversing its March 2009 announcement to close the Mountain Top, Pennsylvania facility (FCS) 14.39 +0.16 : Since the original closure announcement, Fairchild has more than doubled its sales of the high voltage and automotive products which the Mountain Top facility supports. Fairchild expects to continue the rapid expansion of these businesses and determined that retaining the Mountain Top facility will be essential to supporting our customers' current and future needs.

4:07PM Agilent beats by $0.03, misses on revs; guides Q1 EPS in-line, revs in-line; guides FY12 EPS in-line, revs in-line (A) 38.25 +0.70 : Reports Q4 (Oct) earnings of $0.84 per share, excluding non-recurring items, $0.03 better than the Capital IQ Consensus Estimate of $0.81; revenues rose 9.6% year/year to $1.73 bln vs the $1.75 bln consensus. Co issues in-line guidance for Q1, sees EPS of $0.67-0.69 vs. $0.70 Capital IQ Consensus Estimate; sees Q1 revs of $1.65-1.67 bln vs. $1.66 bln Capital IQ Consensus Estimate. Co issues in-line guidance for FY12, sees EPS of $3.00-3.35 vs. $3.12 Capital IQ Consensus Estimate; sees FY12 revs of $6.85-7.15 bln vs. $6.97 bln Capital IQ Consensus Estimate.

9:02AM Arris and Cisco (CSCO) announced an agreement on a wavelength mgmt plan in the C-band that will provide cable operators with International Telecom Union-based full spectrum Dense Wavelength Division Multiplexing multi-wavelength optical solution for increased capacity and expanded services (ARRS) 10.89 :

Taleo (TLEO) announced that Towne Park has selected Taleo's SaaS solution to recruit and onboard top talent for the organization. Cryptography Research, a division of Rambus (RMBS), and Mikron JSC, a division of SITRONICS announced they have signed a license agreement regarding the use of CRI's patents in Mikron products, including Mikron's secure integrated circuits.

Lattice Semiconductor (LSCC) and Phoenix Technologies announced they have signed a distribution agreement for Israel. Under the terms of the agreement, Phoenix Technologies is authorized to sell Lattice's complete portfolio of innovative low power, low cost FPGA, PLD and programmable power management design solutions in the region.

NXP Semiconductors (NXPI) introduced the CLRC663, the first member of a new generation of high-performance proximity contactless reader ICs.

Research In Motion (RIMM) announced two new smartphones based on the BlackBerry 7 operating system, the BlackBerry Bold 9790 and BlackBerry Curve 9380.

LDK Solar (LDK $3.37 -0.16) issued downside guidance for the third quarter with revenues to $460-470 million from $630-680 million versus the $607.84 million Capital IQ consensus, wafer shipments between 285 and 290 megawatts, module shipments between 185 MW and 190 MW, in-house polysilicon production between 2,850 MT and 2,900 MT and in-house cell production between 295 MW and 300 MW. As a result of the rapidly declining market price for wafers and modules during the third quarter of 2011, LDK Solar expects to write-down $45 to $50 million of inventories and expects the gross margin for the third quarter of 2011 to be between negative 3.5% and 5.0%. The company issued downside guidance for fiscal year 2011 with revenues to $2.20-2.25 billion from $2.5-2.7 billion versus the $2.45 billion consensus. wafer shipments between 1.55 gigawatts and 1.65 GW, module shipments between 550 MW and 650 MW, in-house polysilicon production between 10,000 MT and 11,000 MT, in-house cell production between 600 MW and 700 MW and gross margins between 9% and 12%

Riverbed (RVBD $29.74 +1.15) was upgraded to Outperform from Sector Perform at RBC Capital Mkts and the firm raised their target to $35 from $28 based on an improving pipeline across a broader base of customers, stabilizing trends in Europe and view that Riverbed's winrate may start to increase as competitors deemphasize the WAN optimization market.

The tech sector is trading higher today, ahead of modest gains in the broader market. Semiconductors are showing relative strength in the tech space with the Philly Semi Index trading 0.7% higher. VECO (-2.9%) was a notable laggard in the chip index. Among other major indices, the S&P 500 and the NASDAQ are trading 0.7% higher, while the QQQ is trading +1.0% higher on the session. Among tech bellwethers, AAPL (+2.3%) and INTC (+2.8%) are notable leaders, while IBM (+0.6%) is underperforming.

In earnings, TSEM (-3.2%) reported a Q3 miss and guided lower. In news last night, Huawei acquired SYMC's (+0.9%) stake in Huawei Symantec joint venture for $530 mln.

Among notable analyst upgrades this morning, A (+0.9%) was upgraded to Buy at BofA/Merrill and RVBD (+3.1%) was upgraded to Outperform at RBC Capital. Also, JPM was out positive on BRCM (+2.4%), believing that the co won business for Windows Phone-7 smartphones.

In downgrades, STX (-0.3%) was downgraded to Hold at Deutsche Bank and Needham downgraded OVTI (-1.6%) and, separately, WDC (-3.6%) to Hold.

A (+0.9%) and DELL (+1.5%) are notable names in tech scheduled to report results today after the close.

09:15 am Western Digital downgraded to Hold at Needham: . Needham downgrades WDC to Hold from Buy on concerns that either the company is successful in acquiring Hitachi but is forced to pay higher interest rates, issue more stock, or otherwise make concessions that limit the benefits of the deal and that the combined company's balance sheet is severely impaired; or that the deal does not go through (which seems increasingly likely) and that WD is forced to expend considerable cash to recover its manufacturing capabilities, weakening its balance sheet.

09:15 am OmniVision downgraded to Hold at Needham: . Needham downgrades OVTI to Hold from Strong Buy saying while OVTI significantly lowered its F2Q12 revenue outlook on 11/7, they believe OVTI faces two long-term challenges: 1) gross margin compression due to increasing pricing pressure and 2) an accelerating competitive landscape in the 8MP non-Apple smartphone market. Firm says their industry checks indicate that OVTI has lost a considerable share of the non-Apple smartphone market to players such as Samsung, Aptina & Toshiba.
icon url

ReturntoSender

11/16/11 8:29 PM

#9591 RE: ReturntoSender #6755

From Briefing.com: 4:30 pm : Stocks rolled over in the final hour of trade to logg sizable losses. The move lower coincided with a retreat by the euro.

The major equity averages opened trade today with marked losses, but stocks gradually worked their way up to the neutral line. The lack of leadership left stocks to lose momentum and drift back into negative territory.

Selling accelerated in the final hour, right around the time that the euro began its pullback from positive territory. The euro, generally a barometer of confidence in the eurozone, had been down against the greenback in morning trade, but eventually mustered a modest gain. That move proved unsustainable, though, as it forfeited its gain to trade with a 0.3% loss against the dollar by session's end.

Although it wasn't a revelation, analysts at Fitch reminded market participants about the risk of contagion by suggesting that domestic banks could be hurt if the fiscal and financial problems of Europe worsen. For now, though, the analysts have a stable outlook on the U.S. banking industry. In contrast, analysts at Moody's downgraded credit ratings on 10 banks in Germany, which is Europe's strongest, most diversified economy.

Financials had been relatively weak all session and, perhaps appropriately, suffered some of the steepest losses. The sector's 2.5% drop was driven by shares of large-cap diversified financial services players like Bank of America (BAC 5.90, -0.23), which set a new monthly low.

Even energy stocks were imbued by broad market weakness, despite a rally by oil prices to a multi-month high above $100 per barrel. The energy component closed pit trade more than 3% higher at almost $102.60 per barrel, but energy stocks, as a group, logged a 1.5% loss.

Tech stocks tried to offer support on a few occassions, but efforts were repeatedly checked by sellers, culminating in a 1.5% loss for the largest sector by market weight. Dell (DELL 15.25, -0.38) was a steady drag after its tepid guidance cast a pall over an upside earnings surprise.

For the second straight session data did little for traders. The economic calendar featured an October Consumer Price Index that slipped by 0.1%, which is not too different than the consensus call for no change. Core prices made a 0.1% increase, just as had been generally expected. Separately, industrial production increased in October by 0.7%. That exceeded the 0.4% increase that had been broadly expected.

Advancing Sectors: (None)
Declining Sectors: Consumer Staples -0.8%, Utilities -1.3%, Tech -1.5%, Energy -1.5%, Industrials -1.5%, Telecom -1.6%, Health Care -1.8%, Consumer Discretionary -1.9%, Materials -2.4%, Financials -2.5%DJ30 -190.57 NASDAQ -46.59 NQ100 -1.8% R2K -1.8% SP400 -1.4% SP500 -20.90 NASDAQ Adv/Vol/Dec 682/1.95 bln/1880 NYSE Adv/Vol/Dec 720/918 mln/2309

5:05PM SunPower announces entry into new supplemental indentures in connection with common stock reclassification (SPWRA) 7.29 +0.07 : Co announced the execution of four new supplemental indentures, with Wells Fargo Bank, National Association, as trustee, to reflect the stockholder-approved reclassification of the company's Class A common stock and Class B common stock into a single class of common stock on a one-for-one basis as previously announced

4:15PM Applied Materials beats by $0.01, beats on revs; guides Q1 EPS, revs (midopint) below consensus (AMAT) 12.47 -0.17 : Reports Q4 (Oct) earnings of $0.21 per share, excluding non-recurring items, $0.01 better than the Capital IQ Consensus Estimate of $0.20; revenues fell 24.4% year/year to $2.18 bln vs the $2.15 bln consensus. Co issues downside guidance for Q1, sees EPS of $0.08-0.16, excluding non-recurring items, vs. $0.18 Capital IQ Consensus Estimate; sees Q1 revs of -5 to -15% QoQ to ~$1.85-2.07 bln vs. $2.07 bln Capital IQ Consensus Estimate.

2:44PM Rambus confirms the jury in its anti-trust case against Hynix Semiconductor and Micron Technology (MU) has found in favor of the defendants. (RMBS) 18.37 +0.363 : Co announced the jury in its anti-trust case against Hynix Semiconductor and Micron Technology (MU) has found in favor of the defendants. The jury found that Rambus did not meet its burden of proving its case against the two defendants. At issue were Rambus allegations that the defendants illegally conspired to constrain availability of Rambus' RDRAM and keep its prices unnaturally high relative to its competition, while holding competitive DDR pricing low, in an effort to eliminate Rambus' RDRAM memory technology from the marketplace. Upon succeeding in eliminating RDRAM as a competitor in the main memory market, the defendants raised the prices of DDR by as much as 500%. RMBS stated "We are disappointed with this verdict as we believe strongly in our case. We thank our legal team and everyone who has supported Rambus in this case over the past seven years. We do not agree with several rulings that affected how this case was presented to the jury and we are reviewing our options for appeal," (stocks are halted)

9:03AM ZOOM Technologies announced that its 'Leimone' brand 3G mobile phones have been approved by China Mobile (CHL) for its TD-SCDMA product lineup; expected for Q1 2012 (ZOOM) 1.72 : Once approval is obtained, the i99 will be branded with China Mobile's 3G Logo and will be available on China Mobile's vast national retail network and also its Electronic Purchase Platform (EPP), and be sold bundled with China Mobile's various service plans.

F5 Networks (FFIV) announced improved live virtual machine migration capabilities for customers leveraging NetApp (NTAP) unified storage and VMware (VMW) virtualization solutions.

ZOOM Technologies (ZOOM $1.39- 0.33) reported Q3 net income of $1.76 million, while revenues came in at $50.75 million versus the $99.72 million single estimate. The company is estimating the same level of revenue for 2011 and 2010, at slightly over $250 million versus the $331 million single estimate, while net income for 2011 is estimated to be down to about $8 million from $12.8 million in 2010 due to reduced sales resulting from a credit tightening environment in China. However, the company sees the domestic and Asian markets to show improvements in 2012, and coupling a full year of contribution from Portables Unlimited, a cellular service and product distributor in the U.S. that the Company recently acquired, Zoom is projecting 2012 revenue to be in the range of $360 million to $380 million, net income between $12 million to $13 million and EBITDA between $17 million to $19 million.

Autodesk (ADSK $36.23 +2.18) reported thrid quarter earnings of $0.44 per share, $0.04 better than the Capital IQ consensus of $0.40, while revenues rose 15.1% year/year to $548.6 million versus the $544.07 million consensus. The company issued in-line guidance for the fourth quarter with EPS of $0.42-0.45 versus the $0.44 consensus and revenues of $575-590 million versus the $583.08 million consensus. Net revenue for fiscal 2013 is expected to increase by at least 10% compared to fiscal 2012. Autodesk anticipates fiscal 2013 GAAP operating margin to increase by approximately 150 basis points and non-GAAP operating margin to increase by approximately 200 basis points compared to fiscal 2012.

Dell (DELL $15.30 -0.33) reported third quarter earnings of $0.54 per share, excluding non-recurring items, $0.07 better than the Capital IQ Consensus of $0.47, while revenues fell 1.9% year/year to $15.37 billion versus the $15.66 billio consensus. Dell reaffirmed its fiscal year 2012 operating income guidance of +17-23%. Dell sees fiscal year 2012 revenue at lower end of the range of its revenue outlook of 1-5% full fiscal-year growth, while consensus calls for 1.6% growth. "Given the uncertain macroeconomic environment and complexity in working through the industry-wide hard drive issue, the company is trending to the lower end of the range of its revenue outlook of 1 to 5-percent full fiscal-year growth"

Qualcomm (QCOM $57.00 -0.40) at an analyst day reaffirmed guidance for the first quarter with EPS of $0.86-0.92, excluding non-recurring items, versus the $0.90 Capital IQ Consensus and revenues of $4.35-4.75 billion versus the $4.56 billion consensus. The company reaffirmed guidance for fiscal year 2012 with EPS of $3.42-3.62, excluding non-recurring items, versus the $3.59 consensus and revenues of $18.0-19.0 billion versus the $18.43 billion consensus.

Amtech Systems (ASYS $9.17 -1.20) was downgraded to Buy at Feltl & Co. and the firm lowered their target to $10 from $18 after the company reported better than expected results in the quarter, however, this largely reflected a more rapid decrease in the company's solar backlog than they had anticipated.
icon url

ReturntoSender

11/17/11 7:27 PM

#9592 RE: ReturntoSender #6755

From Briefing.com: 4:30 pm : Continued lack of leadership caused stocks to struggle in the face of resistance, which ultimately gave way to a technical breakdown that resulted in steep losses for the major averages.

Sellers hit stocks at the open. The major averages fought back some, but their efforts lacked leadership. That hampered the broad market and kept it from poking into positive territory. Most notably, though, a barrage of selling was brought about by the inability of the S&P 500 to push back above a rising trendline that formed the bottom of a triangle pattern and a simultaneous pullback by the euro.

The slide stabilized once the S&P 500 found the 1210 zone, setting a near one-month low, but stocks never really rebounded from there. The euro also drifted into the close, resulting in only a fractional gain for the day. It is on pace for a 2% weekly loss.

Participation picked up in response to the market's volatility. In recent session's share volume has been anemic, but today it approached 1 billion on the Big Board.

Market movement distracted participants from a dose of generally pleasing data, which featured the latest weekly initial jobless claims count. Initial jobless claims for the week ended November 12 totaled 388,000. Not only is that less than the 398,000 initial claims that had been broadly expected, it marked the lowest initial claims level since April.

Housing starts in October hit an annualized rate of 628,000, which is little changed from the downwardly revised rate of 630,000 units in the prior month, but greater than the pace of 604,000 that had been generally expected. Building permits set an annualized pace of 653,000 to exceed the rate of 603,000 that had been anticipated. Building permits in the prior month had trended at an annualized pace of 589,000.

The Philadelphia Fed Survey for November slipped to 3.6 from 8.7 in the prior month. Many had expected to ease to just 7.5.

Advancing Sectors: (None)
Declining Sectors: Telecom -0.5%, Consumer Staples -0.5%, Utilities -0.6%, Health Care -1.2%, Consumer Discretionary -1.7%, Industrials -1.8%, Financials -2.1%, Energy -2.1%, Tech -2.2%, Materials -2.9%DJ30 -134.86 NASDAQ -51.62 NQ100 -2.3% R2K -1.5% SP400 -1.9% SP500 -20.78 NASDAQ Adv/Vol/Dec 710/2.21 bln/1787 NYSE Adv/Vol/Dec 577/983 mln/2445

5:01PM Agilent appoints Ron Nersesian as Chief Operating Officer (A) 37.21 -1.37 : Co announced that Ron Nersesian has been appointed executive vice president and chief operating officer, effective immediately. Nersesian has been president of Agilent's largest business, the Electronic Measurement Group (EMG), since 2009.

4:25PM Entegris CEO exercises stock options (ENTG) 8.50 -0.31 : Co announces Gideon Argov, president and chief executive officer, exercised and sold in a cashless transaction on the open market 625,500 options at a strike price of $8.35 per option, which were granted to him on November 21, 2004 and which were due to expire on November 21, 2011. Mr. Argov used the net proceeds of that transaction, together with additional personal cash, to then exercise and hold 50,000 options at a strike price of $1.13 per option granted to him on February 10, 2009 and to pay taxes related to that exercise. Following these transactions, Mr. Argov holds approximately 686,350 shares of Entegris stock.

4:06PM Marvell beats by $0.01, beats on revs (MRVL) 13.78 -0.90 : Reports Q3 (Oct) earnings of $0.40 per share, excluding non-recurring items, $0.01 better than the Capital IQ Consensus Estimate of $0.39; revenues fell 1.0% year/year to $950 mln vs the $940.08 mln consensus. Non-GAAP gross margin for the third quarter of fiscal 2012 was 56.8 percent, compared to 58.1 percent for the second quarter of fiscal 2012 and 59.5 percent for the third quarter of fiscal 2011. "We are pleased with our third quarter results as we demonstrated solid growth in the quarter driven by our Mobile and Wireless end market, which grew over 20% sequentially. Our TD mobile phone platforms have been extremely well received by customers..."

9:08AM Cree's Ruud Lighting and Carmanah marketing agreement discontinued (CREE) 29.35 : The exclusive marketing agreement will discontinue as of the expiration of the current agreement on November 6, 2011. This agreement was established in May, 2008 and effectively paired Carmanah stand-alone solar power engines with Ruud Lighting's specification-grade BetaLED exterior LED luminaires. While Carmanah intends to work with Ruud on a non-exclusive basis in continuing to offer these luminaires, the company also recognizes that other world class luminaires will complement its proprietary solar power engines. The expiration of the agreement between Carmanah and Ruud Lighting is an evolution of our relationship and provides both companies the flexibility to explore other opportunities to continue to develop and supply innovative solar powered outdoor lighting products as the adoption of this technology continues to grow.

FSI International (FSII) announced that it received a follow-on order for its ORION Single Wafer Cleaning System from a leading semiconductor producer.

Microsemi (MSCC) announced that its facility in Manila, Philippines now complies with rigorous AS9100 Rev C quality system requirements for aviation, space and defense markets.

First Solar (FSLR) announced cumulative production has reached 5 gigawatts or 66 million solar modules, capable of generating enough clean electricity to power ~2.5 mln homes.

NetApp (NTAP $36.56 -4.16) reported second quarter earnings of $0.63 per share, excluding non-recurring items, $0.04 better than the Capital IQ Consensus Estimate of $0.59, while revenues rose 20.5% year/year to $1.51 billion versus the $1.53 billion consensus. The company issued downside guidance for the third quarter with EPS of $0.56-0.60, excluding non-recurring items, versus the $0.63 consensus and revenues of $1.52-1.61 billion versus the $1.63 billion consensus. "NetApp produced record non-GAAP earnings per share in the second quarter. In aggregate, we saw strong revenue growth across most areas of our business, offset by some unexpected weakness in a handful of our largest accounts."

Applied Materials (AMAT $11.90 -0.57) reported fourth quarter earnings of $0.21 per share, excluding non-recurring items, $0.01 better than the Capital IQ Consensus of $0.20, while revenues fell 24.4% year/year to $2.18 billion versus the $2.15 billion consensus. The company issued downside guidance for the first quarter with EPS of $0.08-0.16, excluding non-recurring items, versus the $0.18 consensus and revenues of -5 to -15% QoQ to approximately $1.85-2.07 billion versus the $2.07 bln consensus.

10:59 am A Dip, but Not a Dive, in the Philadelphia Fed Index
The Philadelphia Fed's Business Outlook Index fell from 8.7 in October to 3.6 in November. The Briefing.com consensus expected the index to fall to 7.5.

Both unfilled orders and new orders weakened. The new orders index barely remained in an expansion cycle as the index fell from 7.8 in October to 1.3 in November. Unfilled orders contracted in November as the index declined from 3.4 in October to -1.5.

The lack of growth in orders put downward pressure on shipments as the index dropped from 13.6 to 7.3. Conversely, the number of employees index increased from 1.4 in October to 12.0 in November, suggesting perhaps that manufacturers do not expect the drop in demand to last long.

If businesses were worried about the long-term outlook, employment would not have strengthened nearly as much and most likely would have contracted.

10:57 am S&P Tech Sector Down Modestly, Underperforming the S&P 500
The tech sector is trading lower today, trailing slight losses in the broader market. Semiconductors are showing relative weakness in the tech space with the Philly Semi Index trading 1.8% lower. AMAT (-5.7%) and MRVL (-4.6%) are the notable laggards in the chip index. Among other major indices, the S&P 500 is trading 0.1% lower, while the NASDAQ is trading 0.3% lower and the QQQ is trading 0.6% lower on the session. Among tech bellwethers, VZ (+0.9%) and IBM (+0.9%) are showing relative strength, while INTC (-0.5%) and MSFT (-0.5%) are underperformers.

In earnings last night, NTAP (-12.2%) reported a mixed Q2 and guided Q3 below consensus, while AMAT (-5.7%) posted a Q4 beat and downside guidance. Elsewhere, Chinese companies YOKU (-19.3%) reported a mixed qtr with downside guidance and QIHU (+5.6%) posted a beat with upside guidance.

Among notable analyst upgrades this morning, Oppenheimer upgraded MU (-1.9%) to Outperform, HOLI (+8.6%) was upgraded to Overweight at Piper Jaffray, and Brigantine upgraded RIMM (-1.4%) to Buy. Also, AMT (+1.1%) was added to the Conviction Buy List at Goldman.

In downgrades, RMBS (+14.1%) was downgraded to Neutral at JPMorgan, DGIT (-10.1%) was downgraded to Underweight at Piper Jaffray, MRVL (-4.8%) was downgraded to Underperform at JMP Securities, and Collins Stewart and Raymond James downgraded NTAP (-12.2%).
icon url

ReturntoSender

11/20/11 3:15 PM

#9595 RE: ReturntoSender #6755

Monday Morning Outlook: Can U.S. Stocks Climb Out of Europe's Shadow? Despite improving economic data, stocks took a euro-inspired drubbing last week by Todd Salamone 11/19/2011 9:41 AM

http://www.schaeffersresearch.com/commentary/content/monday+morning+outlook+can+us+stocks+climb+out+of+europes+shadow/observations.aspx?click=home&ID=108892

Europe remained in the driver's seat this week, with soaring euro-zone bond yields steering U.S. stocks toward tough weekly losses. In the process, quite a few positive economic reports got tossed out with the bathwater -- including a seven-month low in initial jobless claims, and the Empire State manufacturing index's first foray onto positive ground since May. As we enter what's likely to be a light-volume whipsaw of a week, Todd Salamone breaks down a couple of risks to the bullish case, as well as a few signs that negative sentiment is reaching climactic levels. Meanwhile, Rocky White takes a look back at Thanksgiving weeks past to generate a list of stocks that could be poised to outperform as Wall Street prepares for its annual turkey break. Finally, we wrap up with a preview of the upcoming week's major economic and earnings events, as well as a few sectors of note.

Notes from the Trading Desk: SPX Backs Down from a Bout with Breakeven
By Todd Salamone, Senior VP of Research

"The Nasdaq Composite (COMP - 2,678.75) and the SPX continue to dance around their year-to-date breakeven points for the year, which are located at 2,652 and 1,257, respectively... Technical speed bumps remain overhead, and headline risks linger, suggesting hedging is still a prudent strategy. But a breakout above resistance levels could be very rewarding for bulls, as short-covering activity and an abundance of sideline cash could provide the fuel to drive equities during a seasonal period that favors the bulls." "Speaking of the VIX, we find it interesting that the late-October low in the 24 area was half the August peak at 48, while recent peaks on Nov. 1 and Nov. 9 at the 36 area marked a 50% advance from the trough of 24. So, as we said a few weeks ago, not only is VIX 30 significant, but so are VIX 24 and 36..."
- Monday Morning Outlook, November 12, 2011

After the S&P 500 Index (SPX - 1,215.65) was engulfed in a volatile range between 1,120 and 1,220 from August through mid-October, it is becoming clear that another range is possibly taking hold -- this time, between 1,220 and 1,280. For weeks, as noted in this report, the SPX tried to overcome resistance at its year-to-date breakeven point in the 1,257 zone. In fact, prior to Thursday's session, the SPX traded above and below its breakeven level in nine of the past 10 trading days. Finally, another round of gloomy headlines out of Europe pushed the SPX clearly back into the red for 2011. Yields on Italian and Spanish 10-year bonds traded up to 7%, which is the same level that led Portugal, Ireland and Greece to seek bailouts, and European contagion fears were reignited.

As we enter a holiday-shortened week, the SPX sits around the top of the August through mid-October trading range, which coincides with key peaks in the SPX in 2010, including the top prior to the "flash crash." There is also a multitude of intermediate-term and longer-term moving averages situated in this area that have had historical significance over the years, including the 80-day moving average at 1,200, the 80-week moving average at 1,216 (see second chart below), and the 80-month moving average, situated at 1,226. Looking ahead to month-end, it will be critical for the SPX to remain above 1,180 in order to stay in the green for the past 52 weeks. Bulls would prefer that the SPX experience an immediate bounce, as a break of 1,180-1,200 could immediately lead to a revisit of the August-October lows in the 1,100-1,120 vicinity.


We acknowledge that headline risk has grown with respect to Europe, and that this uncertainty continues to weigh on the stock market. That said, we are intrigued by the fact that:

[ol]
There was a host of positive surprises on the economic front this past week, with data on jobless claims, home starts/building permits, and retail sales all coming in better than expected. This might suggest that Europe's problems are not having the doomsday impact some are expecting.
The CBOE Market Volatility Index (VIX - 32.00) was again capped at 36 last week, which is 50% above the early November low and which served as a resistance level in prior weeks.
[/ol] The fact that stocks did not react favorably to stronger-than-expected domestic economic data may be viewed as a concern to bulls, as the market could be saying the data will get worse. And the VIX not venturing back above 40 could be viewed as a complacent reaction to the events unfolding in Europe. But it is hard to imagine that complacency is the order of the day in light of the following:

[ol]
A Bank of America-Merrill Lynch poll of fund managers this month revealed that a net 5% of respondents are underweight equities, compared to February's all-time peak in equity overweights at 67% (the net figure is the difference between overweights and underweights).
Within the same survey, 84% of respondents expected the situation in Europe to deteriorate in the next 12 months, the worst reading since November 2008.
Short interest on U.S. equities recently hit highs last seen in early 2009, when we were on the cusp of a major market bottom.
There have been numerous cover stories recently about Europe and the sovereign debt issues that first came to light at the beginning of 2010.
[/ol] A contrarian might view the above as suggesting that Europe and its troubles are slowly, but surely, getting factored into the marketplace. Both retail and institutional investors have run for the safety of cash, and some are betting against the stock market, given the uncertainty both here and abroad. But as we have been saying for weeks, it will take further improvement in the technical backdrop to force the hands of those betting against the market, and pull cash back into equities. Right now, investors do not feel like they are missing out on a lot amid the headline risk, with the Dow Jones Industrial Average (DJIA - 11,796.16) and the PowerShares QQQ Trust (QQQ - 55.40) up less than 2% in 2011, and small- and mid-cap stocks in the red.

Then again, rallies could be fast and furious, and one might argue that there has been a certain amount of resilience in U.S. markets going back to early 2010. Our message from last week remains the same:

Technical speed bumps remain overhead, and headline risks linger, suggesting hedging is still a prudent strategy. But a breakout above resistance levels could be very rewarding for bulls, as short-covering activity and an abundance of sideline cash could provide the fuel to drive equities during a seasonal period that favors the bulls.

Indicator of the Week: Trading Thanksgiving
By Rocky White, Senior Quantitative Analyst

Foreword: Thanksgiving is this week, so we can expect some pretty low volumes. But what kind of returns are typical during the four-day trading week? Let's take a look to find out how the market has performed during past Thanksgiving weeks.

Thanksgiving Week since 2000: Below is a table showing how the S&P 500 Index (SPX) fared each day of Thanksgiving week since 2000. The entire week has averaged an impressive 1.3% return, with 64% of them positive. For comparison, the average return for any week since 2000 is pretty much flat, with barely half of them positive. However, the Thanksgiving week returns are boosted by one huge 12% jump in 2008.

It has been typical for Thanksgiving week to get off to a good start. Monday has historically been the best session of the holiday week, averaging a return of 0.74%. Tuesday looks to be a very quiet day; only two times in the past 11 years has this day netted a return of more than 1% in either direction (2010 was one of those years). Tuesday is also the only trading day of the week that averages a loss.


Thanksgiving Week Stocks: So, which stocks typically do well during Thanksgiving week? Below are 20 stocks that would have served your portfolio well during Thanksgiving week over the last 10 years. The first five stocks in the table have been positive every single year during the week of Thanksgiving. The rest of the table includes stocks with the highest average returns that have seen only one down year over the last decade.

There are no turkey producers on the list -- but I do notice quite a few retail names. Could investors possibly be buying stocks expected to have a strong Christmas season?


This Week's Key Events: H-P Earnings, FOMC Minutes Headline a Light Holiday Week
Schaeffer's Editorial Staff

Here is a brief list of some of the key events this week. All earnings dates listed below are tentative and subject to change. Please check with each company's respective website for official reporting dates.

Monday

The monthly report on existing home sales is the lone item on Monday's economic agenda. Hewlett-Packard (HPQ), Tyson Foods (TSN), Tech Data (TECD), and Jack in the Box (JACK) are scheduled to report earnings.

Tuesday

On Tuesday, the government's latest gross domestic product (GDP) revision will hit the Street, as well as a report on business activity in the Richmond Fed district. Most notably, though, the Federal Open Market Committee's (FOMC) meeting minutes are slated for release at 2 p.m. Eastern. On the earnings front, we'll hear from Campbell Soup (CPB), Hormel Foods (HRL), Nuance Communications (NUAN), and Pandora Media (P).

Wednesday

On Wednesday, the Labor Department will release its weekly jobless figures a day early, due to the Thanksgiving holiday on Thursday. In addition, Wall Street will digest the regularly scheduled crude inventories report, the final Thomson Reuters/University of Michigan consumer sentiment index for November, and monthly data on durable goods orders and personal incomes and spending. The earnings calendar includes quarterly results from Deere & Co. (DE), Diana Shipping (DSX), ReneSola Ltd. (SOL), and Yingli Green Energy (YGE).

Thursday

The market is closed in observance of Thanksgiving on Thursday.

Friday
The post-holiday docket is bare on Friday, when U.S. markets will close at 1 p.m. Eastern.


And now a few sectors of note...
Dissecting The Sectors
Sector Utilities
Bullish
Outlook: The utility sector has emerged as a pocket of technical strength in 2011, and the PHLX Utility Sector Index (UTY) found support this week near former resistance in the $455 neighborhood. However, Wall Street hasn't exactly jumped on the bullish bandwagon just yet. Drilling down, 64% of stocks in the electric utility group are trading above their 200-day moving averages, but they've attracted only 39% "buy" ratings from brokerage firms. Meanwhile, the gas utility group boasts 72% of stocks trading above their 200-day moving averages -- yet these names have garnered only 48% "buy" ratings. The broader utility sector also sports some attractive dividend yields, which are certainly a selling point in the context of a choppy market environment. Within the group, Duke Energy (DUK) and Consolidated Edison (ED) have racked up double-digit percentage gains in 2011, and both stocks are lingering in annual-high territory. Nevertheless, there's not a single "buy" endorsement between the two. Going forward, a round of well-deserved upgrades could draw a fresh wave of buyers to the table, helping these stocks extend their positive price action.

Sector Leisure/Retail
Bullish
Outlook: Retail sales improved 0.5% in October, according to the Commerce Department -- easily surpassing the consensus forecast for a gain of 0.1%, and marking the fifth consecutive month of rising sales. Despite this data, as well as a steadily improving stream of jobs reports, expectations remain remarkably low for consumer discretionary stocks. For example, the National Retail Federation is predicting a year-over-year slowdown in holiday sales -- but this group underestimated 2010 holiday sales growth by more than half, leaving room for another potential upside surprise this year. That being said, it's crunch time on the charts for the SPDR S&P Retail ETF (XRT), as the fund is sitting right above its 200-day moving average. This trendline previously served as resistance in August and September. On the sentiment front, we're currently seeing an influx of put butterfly spreads on XRT options, which is a strategy fund managers use to guard against corrections. This strategy was also popular during a retail-sector rally around this same time last year. Overall, we remain upbeat on select outperformers within the consumer discretionary group, and recommend focusing on stocks in solid technical uptrends that are surrounded by skepticism. A few of our current favorites within the group include AutoZone (AZO), Advance Auto Parts (AAP), and Nordstrom (JWN).

Sector Gold
Bullish
Outlook: The SPDR Gold Trust (GLD) pulled back below its 80-day moving average this past week, which may have been prompted by news that a popular hedge fund manager liquidated a portion of his stake during the third quarter. Indeed, on the sentiment front, various indicators we track point to significant pessimism on gold, even as GLD holds steady above its longer-term 120-day moving average -- which has played a key role as support over the past couple of years. For example, a recent survey of 121 portfolio managers found that a hefty 34% are bearish on gold. Among all asset classes, only a few predictable underdogs (U.S. Treasuries, municipal bonds, and European stocks) garnered a higher bearish vote. Plus, cumulative buy-to-open option volume continues to accelerate on GLD, following a recent plunge in activity. Previous downturns in buy-to-open option volume have corresponded with periods of weak price action, whereas increasing buy-to-open volume has corresponded with strength.

Sector Financials
Bearish
Outlook: After outperforming during the second half of October, the Financial Select Sector SPDR (XLF) is now trading back below its 80-day moving average and staunch resistance in the historically significant $13.50 area. The fund is currently sitting on a substantial year-to-date loss of 21.6%, significantly underperforming the broader equities market. Meanwhile, as the crisis in Europe continues to rage on, fundamental concerns about sovereign debt exposure are once again on the rise, applying coincident pressure to financial stocks. Also encouraging for the bears is the fact that the XLF's 50-day buy-to-open call/put volume ratio is no longer rolling over sharply, which could indicate that shorts are looking to initiate new bets against the banking sector once again. It's too early to tell just yet -- but with the technical backdrop breaking down, shorting opportunities may emerge again.

Prepare for the investing week ahead. Every week, Bernie Schaeffer and his staff provide you with their insight about what has happened and, more importantly, what will happen in the market. We dig deep and show you what's happening behind the scenes, and tell you which indicators are predicting major market moves. If you enjoyed this week's edition of Monday Morning Outlook, sign up here for free weekly delivery straight to your inbox.
icon url

ReturntoSender

11/22/11 11:21 PM

#9598 RE: ReturntoSender #6755

From Briefing.com: 4:30 pm : Debt and macro concerns continue to underpin pessimism among market participants, prompting many to pare risk. As such, the broad market logged its fourth straight loss.

Sentiment among early traders turned sour with the release of the second estimate of third quarter GDP, which expanded at a clip of just 2.0%. In general, economists had thought that the headline number would go unrevised at a 2.5% growth rate. The downward revision made it less surprising to learn from the latest FOMC minutes that some Committee members believe that the outlook should be eased further.

Uncertainty about the progress of eurozone bailout plans also continues to hang over financial markets. However, headlines that the IMF has established a new liquidity line helped stocks extend a rebound that began when stocks successfully held their ground at the prior session's low, which also marked a monthly low.

Even though the rebound effort took the major equity averages into positive territory, their stay there was brief. The eventual evaporation of buying interest left stocks to drift lower into the close, culminating in another down day for the major averages. Including an incremental loss late last week, the S&P 500 has finished lower in four straight sessions for a cumulative loss of more than 5%.

Advancing Sectors: Health Care +0.2%, Consumer Staples +0.1%
Declining Sectors: Consumer Discretionary -0.1%, Tech -0.2%, Telecom -0.4%, Industrials -0.8%, Materials -0.8%, Financials -0.9%, Energy -1.0%, Utilities -1.3%DJ30 -53.59 NASDAQ -1.86 NQ100 +0.2% R2K -0.8% SP400 -0.6% SP500 -4.94 NASDAQ Adv/Vol/Dec 896/1.79 bln/1595 NYSE Adv/Vol/Dec 1160/876 mln/1862

O2Micro International (OIIM) was issued 19 claims under United States patent number 8,015,452 for its Flexible Bus architecture.

7:07AM JA Solar misses by $0.33, beats on revs; lowers FY11 shipment guidance (JASO) 44.85 : Reports Q3 (Sep) loss of $0.36 per share, $0.33 worse than the Capital IQ Consensus Estimate of ($0.03); revenues fell 31.6% year/year to $388 mln vs the $373.48 mln consensus. Solar cell and module shipments in the fourth quarter are expected to be in the range of ~310 MW to 330 MW. The co currently estimates that total cell and module shipments for full year 2011 will be ~1.6 GW. This compares to the co's previous guidance of 1.8 GW. "While ongoing macro-economic and industry volatility continued to restrain demand, overall product shipments were at the low end of our guidance at 445MW. With the European debt crisis limiting the amount of financing available for solar power projects, we did not see the anticipated demand recovery in major European markets during the month of Sept. However, JA Solar performed relatively well as customers increasingly relied on top tier suppliers with strong liquidity. In the current market environment, where customers have more choices of products and suppliers, we have seen customers shifting more of their orders to suppliers who can deliver high power products together with a strong brand, a reputation for quality, and a healthy balance sheet. JA Solar's suite of industry-leading high-performance products gives us a clear advantage and this is particularly evident in our module shipments for the third quarter, which grew by more than 45% sequentially. Our gross margin for the quarter has been impacted by an inventory provision of US$21.7 million. Excluding this inventory provision, gross margin would have been positive."

5:32AM Suntech Power misses by $0.44, beats on revs; lowers FY11 rev guidance, below consensus (STP) 2.23 : Reports Q3 (Sep) loss of $0.64 per share, $0.44 worse than the Capital IQ Consensus Estimate of ($0.20); revenues rose 8.9% year/year to $809.8 mln vs the $774.29 mln consensus. Co issues downside guidance for FY11, sees FY11 revs of $3.0-3.1 bln vs. $3.12 bln Capital IQ Consensus Estimate and below prior guidance of $3.2-3.4 bln. Full year 2011 capital expenditures are expected to be ~$400 mln, compared to previous guidance of $340-360 mln. Co maintains its wafer capacity at 1.6GW and cell and module production capacity at 2.4GW.

3:46AM LDK Solar misses by $0.35, misses on revs; guides Q4 revs in-line (LDK) 2.83 : Reports Q3 (Sep) loss of $0.87 per share, $0.35 worse than the Capital IQ Consensus Estimate of ($0.52); revenues fell 38.1% year/year to $417.9 mln vs the $517.99 mln consensus. Co issues in-line guidance for Q4, sees Q4 revs of $440-520 mln vs. $497.85 mln Capital IQ Consensus Estimate. Co sees wafer shipments between 200 MW and 270 MW, and module shipments between 180 MW and 270 MW, in-house polysilicon production between 2,200 MT and 2,800 MT, in-house cell production between 220 MW and 250 MW and gross margin between 2% and 7%. With regard to Q3, co states: "During the third quarter, our business was impacted by the continued downturn in the solar industry. Weak market demand and rapidly declining average selling prices throughout the solar supply chain resulted in shipment volumes and revenues lower than what we previously anticipated. While we continue to believe that the significant opportunities to meet global energy needs with solar power will drive long-term market growth, in the near-term we expect challenging conditions in the solar industry to continue. As such, we remain focused on strengthening our balance sheet, increasing our operating efficiencies and improving our cost structure."

Hewlett-Packard (HPQ $25.80 -1.04) reported fourth quarter earnings of $1.17 per share, excluding non-recurring items, $0.04 better than the Capital IQ Consensus of $1.13, while revenues fell 3.5% year/year to $32.12 billion versus the $32.12 billion consensus. The company issued downside guidance for the first quarter with EPS of $0.83-0.86, excluding non-recurring items, versus the $1.12 consensus. The company issued downside guidance for fiscal year 2012 with EPS of at least $4.00, excluding non-recurring items, versus the 4.69 Capital IQ Consensus Estimate. In the Americas, fourth quarter GAAP net revenue was $14.5 billion, down 4% YoY and down 5% when adjusted for the effects of currency. Non-GAAP net revenue in the Americas was $14.6 billion, down 3% year over year and down 4% when adjusted for the effects of currency. Europe, the Middle East and Africa GAAP revenue of $11.7 billion was down 6% year over year and down 10% when adjusted for the effects of currency.

Netflix (NFLX $72.03 -2.44) in filing guided for an unexpected fiscal year 2012 net loss. The company states: "Consistent with our fourth quarter guidance, our domestic streaming and DVD gross cancellations continued to steadily decline in October and the first half of November, while gross additions of new streaming subscribers remained strong. As a result, consistent with our prior guidance, we continue to expect our domestic streaming net additions to be about flat for November as a whole and strongly positive for December. We expect that consolidated quarterly revenue will be relatively flat until we can achieve positive net subscriber additions. As a result of the relatively flat consolidated revs and previously announced increased investment in our International segment, we expect to incur consolidated net losses for the year ending December 31, 2012 (consensus $1.19; FY12 rev growth consensus is +15%). We cannot assure you that our domestic streaming cancellations will continue to decline or that gross new additions will remain strong. If we are unable to repair the damage to our brand and reverse negative subscriber growth, our business, results of operations, including cash flows, and financial condition will continue to be adversely affected."

Daktronics (DAKT $9.06 -0.43) reported second quarter earnings of $0.09 per share, $0.04 worse than the Capital IQ Consensus Estimate of $0.13, while revenues rose 7.1% year/year to $135.9 million versus the $129.12 million consensus. The company issued upside guidance for the third quarter with revenues approaching $118.7 million versus the $109.67 million consensus. "Given the positive top line performance, we were disappointed in the gross margin performance. The good news in this regard is that much of the underperformance was due to one-time costs. These one-time costs included adjustments to reserves for preexisting warranty claims, increased cost estimates on an international project, and new product introduction costs. The impact of these and other one-time items reduced our gross profit percentage by more than two percentage points. We were pleased to see growth in our backlog as we enter what is typically the slowest quarter of our fiscal year. With the strong backlog and despite the fact we have fewer work days in the quarter with the holidays, we could see net sales in the third quarter approaching to the level of the first quarter of fiscal 2012. Taking into account the non-recurring items for this quarter, we also expect that gross profit margins will improve in the third quarter of fiscal 2012."

LDK Solar (LDK $2.82 -0.01) reported a third quarter loss of $0.87 per share, $0.35 worse than the Capital IQ Consensus Estimate of ($0.52), while revenues fell 38.1% year/year to $417.9 million versus the $517.99 million consensus. The company issued in-line guidance for the fourth quarter with revenues of $440-520 million versus the $497.85 million consensus. The company sees wafer shipments between 200 MW and 270 MW, and module shipments between 180 MW and 270 MW, in-house polysilicon production between 2,200 MT and 2,800 MT, in-house cell production between 220 MW and 250 MW and gross margin between 2% and 7%.

12:24 pm Technology Sector Trading In LIne With Overall Market (NVDA)

The tech sector is trading slightly lower today along with losses in the broader market. Semiconductors are showing relative weakness in the tech space with the Philly Semi Index trading 1.4% lower. STM (-3.9%) is a notable laggard in the chip index. Among other major indices, the S&P 500 is trading 0.1% lower, while the NASDAQ is trading 0.1% lower and the QQQ is trading 0.1% lower on the session.

Among tech bellwethers, AAPL (+1.3%) is showing strength, whereas INTC (-1.1%) is a notable underperformer.

In earnings last night, HPQ (-3.1%) reported a slight Q4 earnings beat, but guided lower. Elsewhere, ADI (-3.4%) reported a Q4 miss and guided lower, while BRCD (+12.5%) posted a beat.

Among notable analyst ratings changes this morning, Needham upgraded NVDA (+2.2%) to Buy, while INTC (-1.1%) and ALSK (-6.5%) were downgraded to Underperform at Raymond James.

NUAN (-1.2%) is the notable name in tech scheduled to report results today after the close.

10:06 am JinkoSolar Holding Missed Third Quarter Expectations (JKS)

JinkoSolar Holding (JKS $5.10 -0.60) reported a third quarter loss of $1.62 per share, $1.87 worse than the Capital IQ Consensus Estimate of $0.25.

Revenues rose 23.8% year/year to $279.2 million versus the $277.95 million consensus.

The company issued downside guidance for the fourth quarter with revenues of $180-210 million versus the $254.71 million consensus. For Q4 2011, JinkoSolar expects total solar module shipments to be approximately 180 MW to 210 MW. The company's in-house annual silicon wafer, solar cell and solar module production capacities are expected to remain approximately 1.2 GW each by the end of the year of 2011.

09:59 am Hewlett-Packard Guides Below Fiscal Year 2012 Guidance (HPQ)

Hewlett-Packard (HPQ $25.69 -1.17) reported fourth quarter earnings of $1.17 per share, excluding non-recurring items, $0.04 better than the Capital IQ Consensus Estimate of $1.13. Revenues fell 3.5% year/year to $32.12 billion versus the $32.12 billion consensus.

The company issued downside guidance for the first quarter with EPS of $0.83-0.86, excluding non-recurring items, versus the $1.12 consensus, The company issued downside guidance for fiscal year 2012 with EPS of at least $4.00, excluding non-recurring items, versus the $4.69 Capital IQ Consensus Estimate.

In the Americas, fourth quarter GAAP net revenue was $14.5 billion, down 4% year/year and down 5% when adjusted for the effects of currency. Non-GAAP net revenue in the Americas was $14.6 billion, down 3% year over year and down 4% when adjusted for the effects of currency. Europe, the Middle East and Africa GAAP revenue of $11.7 bln was down 6% year over year and down 10% when adjusted for the effects of currency.
icon url

ReturntoSender

11/24/11 12:38 PM

#9599 RE: ReturntoSender #6755

From Briefing.com: 4:30 pm : Set against an already bearish backdrop, market participants reacted negatively to the Fed's decision to increase capital controls for banks and underwhelming data from both home and abroad. That left stocks to record their sixth straight loss and settle at new monthly lows.

The stock market's slide was extended to a sixth straight session, including an incremental loss late last week. In that time the S&P 500 has fallen more than 7%. In the face of the swoon, Deere & Co. (DE 74.72, +2.80) displayed strength, thanks to an upside earnings surprise and an optimistic outlook.

Broad market participants saw little reason to alter their bearish mindset when it was learned last evening that the Fed ruled that top-tier domestic banks with total consolidated assets of at least $50 billion must submit annual capital plans for review, bringing the number of banks under surveillance to 31. The decision comes at the same time that many investors have shown aversion to bank stocks and other financial issues for fear of their exposure to the precarious conditions in Europe.

The perception of Europe was hardly helped by news that Germany, the continent's strongest and most diverse economy, held a debt auction that drew disappointing demand. Germany also reported that its PMI Manufacturing reading for November fell to 47.9 from 49.1 in the prior month. The November Manufacturing PMI for the broader eurozone eased to 46.4 from 46.5 in October.

China also issued disappointing data. The country's Flash PMI Manufacturing reading for November fell to 48.0 from 51.0 in the prior month. Asia's major averages all moved lower in overnight action.

As for domestic data, initial jobless claims for the week ended November 19 totaled 393,000, which is barely changed from what was posted in the prior week. It is also on par with what had been expected by many economists.

Personal spending during October increased by 0.1%, which is less than the 0.3% increase that had been broadly expected, but personal income increased by 0.4% to exceed the 0.3% increase that had been anticipated.

Durable goods orders for October fell 0.7%, but that is still less than the 0.9% decline that many had expected. Excluding transportation related items, durable goods orders actually jumped by 0.7% in the face of the consensus call for no change.

Although still short of 1 billion shares, trading volume on the NYSE proved greater than what many had suspected ahead of a holiday. U.S. markets will be closed tomorrow in observance of Thanksgiving. They will re-open Friday for a half day of trade.

Advancing Sectors: (None)
Declining Sectors: Consumer Staples -1.4%, Utilities -1.5%, Health Care -1.5%, Consumer Discretionary -2.1%, Telecom -2.1%, Industrials -2.3%, Tech -2.4%, Materials -2.8%, Energy -2.9%, Financials -2.9%DJ30 -236.17 NASDAQ -61.20 NQ100 -2.3% R2K -3.2% SP400 -2.7% SP500 -26.25 NASDAQ Adv/Vol/Dec 382/1.71 bln/2165 NYSE Adv/Vol/Dec 358/876 mln/2692

11:08 am Technology Sector Trading Lower Along With The Overall Market (TIVO)

The tech sector is trading lower today along with losses in the broader market. Semiconductors are showing relative weakness in the tech space with the Philly Semi Index trading 2.3% lower. MU (-6.2%) is a notable laggard in the chip index. Among other major indices, the S&P 500 is trading 1.6% lower, while the NASDAQ is trading 1.5% lower and the QQQ is trading 1.7% lower on the session. Among tech bellwethers, INTC (-1.6%) and AAPL (-1.8%) are notable underperformers.

In earnings this morning, TIVO (+4.1%) reported a Q3 beat, while STV (-13.9%) issued Q4 guidance revenue below single the single estimate.

In news, NOK (-1.4%) Siemens announced the layoff of 17,000 employees globally in attempt to save EUR 1 bln by the end of 2013 and GOOG (-1.1%) is eliminating seven services including Google Wave, according to a Google blog post.

There are no notable tech names reporting tonight after the close.
icon url

ReturntoSender

11/25/11 1:57 PM

#9600 RE: ReturntoSender #6755

Global Sovereign Credit Default Swap Prices

http://www.bespokeinvest.com/

Friday, November 25, 2011 at 10:02AM
Below we highlight the current 5-year CDS (credit default swap) prices for the sovereign debt of 44 countries. The list is sorted by the least to most risky countries, and we also include the year-to-date change for each country. As shown, Norway currently has the lowest default risk, followed closely behind by the USA. Switzerland, Finland, Sweden and Australia are the only other countries with CDS prices that are lower than 100 basis points.

At the bottom of the list is Greece, which has astronomical default risk. Portugal, Argentina and Venezuela rank 2nd, 3rd and 4th worst and all have CDS prices of more than 1,000 basis points.

G7 countries are shaded in light blue (unfortunately we do not have CDS prices for Canada). Italy has extremely high default risk for a G7 country at 571 basis points, which is why investors are so concerned about Europe. And France, which is supposedly a AAA country, also has very high default risk with its CDS trading at 261 basis points. France default risk is up 142% year to date.

We've been hearing a lot recently about how the US is the best place for investors to be right now, and this analysis buoys that claim.


icon url

ReturntoSender

11/26/11 11:30 AM

#9601 RE: ReturntoSender #6755


The S&P 500 may have a P/E now as low as something like 13.8. Historically that's not too high.

http://www.investorsfriend.com/S%20and%20P%20500%20index%20valuation.htm

Without suggesting that the actual P/E ratio here is accurate I refer to the relative scale which suggests that the S&P 500 could fall substantially before we hit a historical bottom:


http://www.multpl.com/

At a time that ECRI is pointing towards another recession and numerous world economies are at risk of credit default I cannot personally believe we have hit bottom yet. Looking at a longer term chart of the S&P 500 it's hard not to look back and remember that until 95 we had not accomplished much in the way of a market advance:


RtS
icon url

ReturntoSender

11/26/11 12:11 PM

#9602 RE: ReturntoSender #6755

Bullish? We nearing being sold off enough that we usually bounce!


RtS
icon url

ReturntoSender

11/26/11 1:08 PM

#9603 RE: ReturntoSender #6755

Lets assume we are going to get a bounce? Will it be much of a bounce? Keep in mind that we don't get back into actual earnings again until Jan 9th when AA reports again. That leaves us with an absence of news and a lot to worry about. Are we closer to all time highs or lows now? Depends on the chart:


RtS
icon url

ReturntoSender

11/28/11 10:49 PM

#9605 RE: ReturntoSender #6755

From Briefing.com: 4:30 pm : A big bounce by Europe's bourses brought about a barrage of buying interest this morning. For the most part, the major averages held the ensuing gains -- some bailed out of their positions in the final hour, but a last minute squeeze lifted stocks at the close.

Market participants in Europe were encouraged by a new eurozone fiscal pact that could make budget discipline legally binding and enforceable, along with word that the IMF is devising a lending plan for Italy, though the latter story was refuted. France's CAC climbed more than 5%, while Germany's DAX advanced well in excess of 4%. Strength throughout the region gave the EuroStoxx 50 a gain greater than 3%.

The display of such positive sentiment in the otherwise precarious continent was welcomed by domestic markets, which have been stuck in a downtrend for more than a week. In fact, seven straight losses for the S&P 500 resulted in a cumulative loss of almost 8%.

The troubles of Europe have long overshadowed corporate news reports and even economic data, but the improvement in the market's mood made it easier to give attention to positive nature of early holiday shopping reports. Record spending levels this past weekend suggest that consumer headwinds might not be as stiff as many had feared. The SPDR S&P Retail ETF (XRT 50.17, +1.67) settled more than 3% higher.

Data was limited to the latest new home sales numbers, which showed that sales during October hit an annualized rate of 307,000. That is slightly less than what had been expected, but up slightly from the downwardly revised pace that was posted in the prior month. The report failed to influence broad market trade, but shares of homebuilders set session highs not long after its release. Homebuilders scored a gain of nearly 4% on the session, as measured by the SPDR S&P Homebuilders ETF (XHB 15.51, +0.55).

Buying interest was certainly broad, but natural resource plays sported the strongest gains. They held their heady gains even after several key commodities pulled back in afternoon trade, causing the CRB Commodity Index to settle well off of its session high with a 0.8% gain.

Commodities gains were partly challenged by the greenback's effort to gain ground against competing currencies -- the dollar cut its loss to 0.5%, about half of what it was at session's open, by day's end partly because interest in the euro had waned.

Advancing Sectors: Materials +3.6%, Energy +3.6%, Tech +3.5%, Industrials +3.3%, Consumer Discretionary +3.0%, Financials +3.0%, Health Care +2.7%, Telecom +2.1%, Consumer Staples +1.5%, Utilities +1.3%
Declining Sectors: (None)DJ30 +291.23 NASDAQ +85.83 NQ100 +3.4% R2K +4.8% SP400 +3.5% SP500 +33.88 NASDAQ Adv/Vol/Dec 2130/1.60 bln/452 NYSE Adv/Vol/Dec 2600/959 mln/496

5:54PM Seagate Tech provides updated financial outlook; guides Q2 and Q3 revs above consensus (STX) 15.99 +0.83 : Co continues to believe that, due to the industry impacts caused by the extensive flooding in Thailand, hard disk drive supply will be significantly constrained for several quarters. For the December 2011 quarter, the company believes the industry will ship between 110-120 million units... The company's component and disk drive factories in Thailand have not been directly affected by the flood; however, the company's ability to manufacture hard disk drives has been impacted due to external component supply constraints as first disclosed on October 12, 2011. For the December 2011 quarter, the company now expects unit shipments of approximately 43 million units and revenue of approximately $2.8 billion (vs $2.65 bln Capital IQ Consensus Estimate). Gross margin as a percent of revenue is expected to be 150-300 basis points above the high-end of the company's long-term, targeted gross margin range of 22-26%... Currently, for the March 2012 quarter, the company expects unit shipments to increase sequentially. Revenue is expected to be at least $3.75 billion (vs $3.22 bln Capital IQ Consensus Estimate) and gross margin as a percent of revenue is expected to be at least 300 basis points above the aforementioned targeted range of 22-26%.

11:02AM Dell provides update on its Cloud Clinical Archive; sees continued growth in cloud-based medical archive (DELL) 14.97 +0.75 : In early 2012, Dell will offer cloud-based managed enterprise archival services as part of its UCA solution in the United Kingdom, supported by the new data center located in Slough. Cloud-based medical archiving will be available to healthcare providers in other regions later in the year

Novellus Systems (NVLS) announced that a California Court of Appeal has fully and unanimously affirmed the company's legal victory in defending itself against a lawsuit brought by Linear Technology (LLTC). In its decision, the court also upheld an award requiring LLTC to reimburse Novellus for more than $5 mln in attorneys' fees and costs that Novellus incurred in defending the lawsuit over the past decade.

O2Micro International (OIIM) announced that on Friday, November 18, 2011, the US Court of Appeals in the Federal Circuit affirmed the ruling that products using accused Beyond Innovation Technology DC to AC converters infringe on two of O2Micro's US patents relating to High-Efficiency Adaptive DC/AC Converter.

EXFO (EXFO) announced the launch of the new BrixHawk Distributed Analyzer for live mobile network troubleshooting, network service optimization and to speed up LTE/3G network rollouts.

ST-Ericsson, a joint-venture of STMicroelectronics (STM) and Ericsson (ERIC) announced the appointment of Didier Lamouche as president and chief executive officer of the co effective December 1, 2011.

Volterra Semi (VLTR $22.57 +0.95) will host its 4th annual analyst day on Nov 29th. Needham says there are a handful of areas that management should address with investors and they remain very bullish on VLTR's opportunities in 2012. The firm continues to believe Volterra Semi is one of their best secular growth stories in their covered analog/mixed signal universe and investors will be rewarded in 2012 as the Server revenue kicks in and drives strong Q/Q revenue comps.

11:20 am Technology Sector Trading Higher Today Along With Gains In Market (RIMM)

The tech sector is trading higher today along with gains in the broader market. Semiconductors are showing relative strength in the tech space with the Philly Semi Index trading 3.6% higher. RBCN (+10.9%) is a notable leader in the chip index.

Among other major indices, the S&P 500 is trading 3.1% higher, while the NASDAQ is trading 3.5% higher and the QQQ is trading 3.4% higher on the session. Among tech bellwethers, ORCL (+4.5%) is a notable outperformer. There were no notable earnings reports in the tech sector this morning.

In news, SINA (-0.8%) is under pressure following negative newsletter chatter. In M&A, there is a report out suggesting QTM (+10.0%) and CVLT (+8.1%) may be takeover targets.

Among notable analyst upgrades this morning, ERTS (+6.5%) was upgraded to Buy at Citigroup, Needham upgraded CRM (+6.7%) to Buy and VZ (+2.7%) was upgraded to Buy at UBS. In downgrades, RIMM (+1.9%) was downgraded to Neutral at Sterne Agee. There are no notable names in tech scheduled to report results today after the close.
icon url

ReturntoSender

11/29/11 11:43 PM

#9606 RE: ReturntoSender #6755

From Briefing.com: 4:30 pm : Stocks settled in relatively mixed fashion after failing to extend an early advance through initial resistance levels.

The stock market climbed from the flat line to a gain of almost 1% in the early going. The effort came as buyers pushed in after their efforts had waned ahead of the open. The move gained momentum with the release of the Consumer Confidence Index for November, which spiked to 56.0 from 39.8 in the prior month. It had been expected to improve to just 42.5.

Although things had been looking up for stocks, buyers' conviction was tested once the S&P 500 ran into resistance just beneath its 50-day moving average around the 1205 region. The inability to build on gains left stocks to oscillate for the rest of the session.

The Nasdaq never really regained its strength. It was weighed down by weakness among large-cap tech plays, which have dragged down the overall tech sector to a 0.7% loss. Amazon.com (AMZN 188.39, -5.76) and eBay (EBAY 28.75, -0.91) were also sources of weakness.

Tiffany & Co. (TIF 67.22, -6.40) was one of the weaker performers after the company issued a disappointing forecast that overshadowed an upside earnings surprise. The stock set a one-month low in the early going.

AMR Corp (AMR 0.26, -1.36) dove more than 80% after the company announced that it has filed for Chapter 11 reorganization rights. Other air carriers ascended in response to the belief that they will benefit from reduced competition.

Energy plays showed strength in the face of lackluster broad market action. The sector climbed 1.5% with help from crude oil, which closed pit trade 1.6% higher at $99.79 per barrel.

Advancing Sectors: Energy +1.5%, Utilities +1.1%, Consumer Staples +1.0%, Telecom +0.7%, Health Care +0.4%, Consumer Discretionary +0.2%, Materials +0.2%
Declining Sectors: Industrials -0.1%, Financials -0.6%, Tech -0.7%DJ30 +32.62 NASDAQ -11.83 NQ100 -0.6% R2K -0.3% SP400 +0.1% SP500 +2.64 NASDAQ Adv/Vol/Dec 966/1.60 bln/1566 NYSE Adv/Vol/Dec 1469/918 mln/1548

4:21PM OmniVision beats by $0.16, beats on revs; guides Q3 EPS below consensus, revs below consensus (OVTI) 11.19 -0.53 : Reports Q2 (Oct) earnings of $0.48 per share, $0.16 better than the Capital IQ Consensus Estimate of $0.32; revenues fell 9.0% year/year to $217.9 mln vs the $214.56 mln consensus. Co issues downside guidance for Q3, sees EPS of $0.05-0.17 vs. $0.26 Capital IQ Consensus Estimate; sees Q3 revs of $160-180 mln vs. $201.43 mln Capital IQ Consensus Estimate. (Stock is halted)

2:14PM Hewlett-Packard refutes inaccurate claims; clarifies on printer security (HPQ) 27.03 +0.50 : Co says "there has been sensational and inaccurate reporting regarding a potential security vulnerability with some HP LaserJet printers. No customer has reported unauthorized access. Speculation regarding potential for devices to catch fire due to a firmware change is false." While HP has identified a potential security vulnerability with some HP LaserJet printers, no customer has reported unauthorized access. The specific vulnerability exists for some HP LaserJet devices if placed on a public internet without a firewall. In a private network, some printers may be vulnerable if a malicious effort is made to modify the firmware of the device by a trusted party on the network. In some Linux or Mac environments, it may be possible for a specially formatted corrupt print job to trigger a firmware upgrade.

Magma Design Automation (LAVA) announced that since its release 18 months ago, Tekton has grown its customer base to more than 25 companies, achieving the fastest adoption rate of any tool in the company's history.

Seagate Tech (STX $16.93 +0.94) continues to believe that, due to the industry impacts caused by the extensive flooding in Thailand, hard disk drive supply will be significantly constrained for several quarters. For the December 2011 quarter, the company believes the industry will ship between 110-120 million units. The company's component and disk drive factories in Thailand have not been directly affected by the flood; however, the company's ability to manufacture hard disk drives has been impacted due to external component supply constraints as first disclosed on October 12, 2011. For the December 2011 quarter, the company now expects unit shipments of approximately 43 million units and revenue of approximately $2.8 billion (versus $2.65 billion consensus). Gross margin as a percent of revenue is expected to be 150-300 basis points above the high-end of the company's long-term, targeted gross margin range of 22-26%.

Corning (GLW $13.38 -1.47) expects fourth quarter SCP's LCD glass volume to be up 5% to 10% sequentially versus original guidance of more than 20% volume growth. The company's combined LCD glass volume, which includes both its wholly owned business and SCP, is now expected to be up slightly sequentially versus previous guidance of up more than 10%. Additionally, he will explain that LCD glass price declines are expected to be more significant in Q4. As a result, consolidated equity earnings are expected to be down 30% versus original guidance of down 5%.

11:54 am Technology Sector Traidng Nearly Flat Today (RIMM)

The tech sector is trading flat today, trailing gains in the broader market. Semiconductors are trading roughly in line with the tech space with the Philly Semi Index trading 0.1% higher. CRUS (+3.4%) is a notable leader in the chip index.

Among other major indices, the S&P 500 is trading 0.7% higher, while the NASDAQ is trading 0.1% higher and the QQQ is flat on the session. Among tech bellwethers, INTC (+1.3%) and VZ (+1.4%) are notable underperformers. In earnings last night, STX (+4.2%) guided Q2 and Q3 revenues above consensus.

This morning, PAY (-1.6%) offered Q4 rev guidance above consensus and issued mixed guidance for FY12. In news, GLW (-11.8TLEO %) lowered its LCD glass volume and capacity guidance at a Credit Suisse Conference. Also, reports indicated that private equity firm THL may be interested in a buyout of YHOO's (+3.7%) US business. Among rumors, we are hearing TLEO (+1.7%) takeover chatter making the rounds.

Among notable analyst upgrades this morning, RIMM (+7.7%) was upgraded to Market Perform at Bernstein, HPQ (+3.1%) was upgraded to Outperform at RBC Capital, and SONS (+8.5%) was upgraded to Outperform at Northland. There were no notable downgrades in the space this morning.

There are no notable names in tech scheduled to report results today after the close.
icon url

ReturntoSender

11/30/11 8:00 PM

#9607 RE: ReturntoSender #6755

What Happened Today?

http://leavittbrothers.com/blog/?p=5078

Two days ago I asked if everyone was having fun. Today I can ask the same question. We know we are in a market dominated and controlled by news from Europe – whether you like it or not.

First, we got news China cut its reserve requirment. This motivates the banks to lend more aggressively. By itself this would give the market a little boost.

But the big news came later. Six central banks (the European Central Bank, U.S. Federal Reserve, Bank of England and the central banks of Canada, Japan and Switzerland) announced a coorindated effort to provide liquidity to the global financial system. The key is that it’s a coordinated effort, that a committmment has been made by numerous entities. Europe has help; they will not have to fend for themselves.

So what specifically does this mean?

Central banks loan money to each other. The US Fed effectively lowered its rate by 50 basis points. That means the ECB can borrow at a lower rate, then convert the dollars to euros, and then lend those euros to countries that are having a hard time raising money in the open market. It’s the equivalent to lowering the discount rate here in the US. It means when Italy is having hard time raising money in the private market (or when rates get too high), it can turn the the ECB for a low-interest loan. There isn’t enough money in Europe to bailout all the troubled countries, so in steps the the US Fed and other central banks with a promise to loan money to the ECB when the ECB needs it.

Italy will need to raise $400 billion euros in 2012. Currently the IMF has $100 billion euros that it can devote to Italy. Obviously this is a major issue. With the lowered rate, Italy indirectly has improved access to money. The US Fed has become the lender of last resort.

The market cheered this news. Instead of Italy and Spain missing a debt payment and setting off a negative chain reaction, they’ll have access capital when they need it. The market gapped up huge, held its gains all day and then rallied into the close. The Russell small caps rallied 6%; the Nas 100 lagged but still gained almost 4%. Every group I follow (there are over 100) moved up more than 1% and most gained 3 or 4% or more. Volume was huge. Wall Street breathed a huge sigh of relief – the world isn’t coming to an end…or so it seems.

But this doesn’t solve any problems. It doesn’t help Italy or Spain with their debt issues. It helps them make debt payments in the near term but doesn’t solve any other issues. It is a short term fix. All it does is buy a little time. Isn’t that the definition of kicking can down the road?

To me this news is nothing but a major warning, or admission on the part of the central banks that Europe is in trouble. Central banks are always calm and never show much emotion (think Alan Greenspan testifying). When things are good, they don’t get overly excited. When things are bad, they don’t want to cause a panic, so they don’t let on to how bad things are. But actions speak louder than words. It’s hard (or impossible) for the central bankers to justify this coordinated effort if things in Europe weren’t dire, if Europe weren’t about to unravel.

From a stock market standpoint, the effort is good news – the central banks are not going to let the system collapse. But what the move implies in not even slightly comforting.
icon url

ReturntoSender

11/30/11 8:15 PM

#9608 RE: ReturntoSender #6755

From Briefing.com: 4:30 pm : A bevy of upbeat headlines drove the Dow back above 12,000 as stocks scored their best single-session advance in three months. Stocks are now on pace for their best weekly performance since the first quarter of 2009.

Building on the bounce that began at the beginning of this week, buyers pushed back into stocks after officials in China announced overnight lower reserve requirement ratios for the country's banks. Their efforts were ratcheted up when it was learned that several major central banks, including the Fed, will coordinate efforts to ease pressure in global money markets.

Buying interest was further bolstered by news that the ADP Employment Change for November showed an increase in private payrolls of 205,000, which is far greater than the increase of 125,000 that had been expected, on average, among economists polled by Briefing.com. Data for the prior month was revised upward to reflect an increase of 130,000 private payrolls. However, the Fed's Beige Book for October would later indicate that hiring during that month was generally subdued.

The Chicago PMI improved to its best level since April by spiking from 58.4 in October to 62.6 in November. Many had actually expected the number to slip to 57.5. Pending home sales for October also proved impressive, despite expectations for an underwhelming number. Specifically, an incremental increase of 0.1% had been anticipated, but instead a spike of 10.4% was posted.

The decidedly upbeat nature of today's headlines induced a buying effort that was both strong and broad from start to finish. Moreover, the move came on above-average share volume.

Stocks have now scored three straight gains, but what is most impressive is in that time the broad market has climbed more than 7% to almost fully offset the losses suffered in the seven preceding sessions.

With participants so willing to pile on risk, Treasuries traded lower. In turn, the yield on the benchmark 10-year Note moved back above 2.00%, setting a new 10-day high along the way.

The dollar also dropped today. At session's close it was down nearly 1% against a collection of competing currencies. The euro gained the most ground against the greenback.

The Volatility Index, often euphemistically referred to as the Fear Gauge, returned to its monthly low amid the market's rally. By day's end it was down more than 9%. Just last week it had traded near its monthly high.

Advancing Sectors: Financials +6.6%, Materials +5.9%, Energy +5.5%, Industrials +5.1%, Tech +4.0%, Health Care +3.7%, Telecom +3.3%, Consumer Discretionary +3.2%, Utilities +2.8%, Consumer Staples +2.4%
Declining Sectors: (None)DJ30 +490.05 NASDAQ +104.83 NQ100 +3.8% R2K +5.9% SP400 +5.0% SP500 +51.77 NASDAQ Adv/Vol/Dec 2148/2.41 bln/464 NYSE Adv/Vol/Dec 2705/1.66 bln/394

4:25PM Magma Design: Synopsys (SNPS) to acquire Magma Design Automation for $7.35/Magma share in cash (LAVA) 5.72 +0.17 : Under the terms of the merger agreement, Synopsys will acquire Magma for $7.35 per Magma share in cash, resulting in a transaction value of ~$507 million net of cash and debt acquired. The boards of directors of both companies have unanimously approved the transaction. The closing of the merger is subject to customary conditions, including approval by the stockholders of Magma as well as U.S. regulators. In the event the merger closes as expected in the second calendar quarter of 2012, Synopsys anticipates it to be modestly accretive to non-GAAP earnings per share in its fiscal 2012. Synopsys plans to fund the acquisition with a combination of cash and debt, with the specifics to be determined at the time of close. (LAVA halted)

4:12PM LDK Solar announces plan to issue RMB3 bln notes (LDK) 3.55 +0.16 : China Minsheng Banking Corp. ("CMBC") will act as underwriter and the notes will be issued in four tranches with each tranche priced in line with the then prevailing market conditions. The first tranche, consisting of an aggregate principal amount of RMB500,000,000 (approximately USD78,800,000), will be issued on December 7, 2011 and will be due on December 8, 2014. The second tranche, consisting of an aggregate principal amount of RMB500,000,000, is currently scheduled to be issued in first quarter of 2012; the third tranche, consisting of an aggregate principal amount of RMB1,000,000,000, is currently scheduled to be issued in second quarter of 2012; and the fourth tranche, consisting of an aggregate principal amount of RMB1,000,000,000, is currently scheduled to be issued in the third quarter of 2012. LDK Solar intends to use the net proceeds of the offering to replace short-term debts.

4:04PM Finisar beats by $0.01, reports revs in-line; guides Q3 EPS, revs below consensus (FNSR) 18.44 +1.33 : Reports Q2 (Oct) earnings of $0.23 per share, excluding non-recurring items, $0.01 better than the Capital IQ Consensus Estimate of $0.22; revenues rose 0.2% year/year to $241.5 mln vs the $242.23 mln consensus. Co issues downside guidance for Q3, sees EPS of $0.20-0.24, excluding non-recurring items, vs. $0.26 Capital IQ Consensus Estimate; sees Q3 revs of $235-250 mln vs. $250.02 mln Capital IQ Consensus Estimate.

4:02PM Sigma Designs beats by $0.16, misses on revs (SIGM) 6.97 +0.12 : Reports Q3 (Oct) loss of $0.08 per share, excluding non-recurring items, $0.16 better than the Capital IQ Consensus Estimate of ($0.24); revenues fell 49.0% year/year to $39.7 mln vs the $43 mln consensus.

Skyworks Solutions (SWKS) announced that it has begun volume shipments of analog control switches to Siemens Healthcare for their state-of-the-art MAGNETOM magnetic resonance imaging scanners.

Tokyo Electron and ASML (ASML) announced an agreement to accelerate joint development activities of EUV and ArF Immersion using state-of-the-art lithography clusters.

Kilopass Technology and United Microelectronics (UMC) jointly announced that they have expanded their existing manufacturing license agreement. In addition to the 40nm low-power process in the current agreement, the extension will cover UMC technology processes spanning from 55nm to 130nm.

Advanced Analogic Tech (AATI $5.75 +1.41) and Skyworks (SWKS $15.84 +1.34) announced that the two companies have amended their previously announced merger agreement. Under the terms of the revised merger agreement, Skyworks will acquire all of the outstanding shares of AnalogicTech for $5.80 per share in cash through a tender offer that Skyworks intends to commence within seven business days. The companies expect the transaction to be completed in January 2012. Skyworks intends to finance the tender offer with cash on hand. The tender offer will not be subject to financing and, among other things, will be conditioned upon a majority of the shares of AnalogicTech common stock outstanding being tendered and no injunctions being issued prohibiting the offer or the merger. AATI has addressed and satisfactorily clarified all issues previously raised by Skyworks. As part of the settlement, the companies have agreed to voluntarily dismiss the claims asserted against each other in the Delaware Chancery Court. Skyworks and AnalogicTech have mutually determined that their respective claims were insignificant in light of the overall value of the transaction.

Alliance Fiber (AFOP $7.70 -0.62) issued downside guidance for the fourth quarter with revenues of below $11 million versus $11.54 million single estimate. The reduction in outlook for the fourth quarter reflects lower order rates due to a greater than expected slowdown at Asian and European customers and worsening effects on the market due to the Thailand floods.

OmniVision (OVTI $10.28 -0.91) reported second quarter earnings of $0.48 per share, $0.16 better than the consensus of $0.32, while revenues fell 9.0% year/year to $217.9 million versus the $214.56 million consensus. The company issued downside guidance for the third quarter with EPS of $0.05-0.17 versus the $0.26 consensus and revenues of 160-180 million versus the $201.43 million consensus.

11:51 am Technology Sector Trading Higher As Market Soars (LEAP)

The tech sector is trading much higher today, along with gains in the broader market. Semiconductors are showing relative strength in the tech space with the Philly Semi Index trading 4.7% higher. RBCN (+18.1%) is a notable leader in the chip index.

Among other major indices, the S&P 500 and the NASDAQ are trading 3.6% higher, while the QQQ is up 3.4% on the session. Among tech bellwethers, CSCO (+5.7%), ORCL (+5.6%), and INTC (+5.3%) are notable outperformers. In earnings last night, OVTI (-6.5%) posted a Q2 beat but guided well below consensus. In news, reports suggest that private equity firm Silver Lake, possibly in a bid with MSFT (+2.4%), offered to purchase a minority stake in YHOO (+1.2%) for $16.60/share.

Also, the FCC will let T (+2.6%) withdraw its application for T-Mobile (DTEGY +6.0%) merger, according to reports. Among notable analyst upgrades this morning, LEAP (+13.1%) was upgraded to Outperform from Sector Perform at RBC Capital. Also, SNDK (+6.0%) was named a long Research Tactical Idea at Morgan Stanley. Among downgrades, GLW (0.0%) was downgraded to Underperform from Outperform at Credit Agricole.

There are no notable names in tech scheduled to report results today after the close.
icon url

ReturntoSender

12/04/11 12:23 PM

#9612 RE: ReturntoSender #6755

InvestmentHouse Weekend Market Summary

http://www.investmenthouse.com/weekendmarketsummary.htm

- Stocks initially rally on Europe, jobs report, but by session's end the trade went flat.
- Jobs are slowly following the economic improvement higher.
- Jobs report appears better but more people left the workforce than found jobs.
- Near term the European bid is a positive, but some head and shoulders patterns are not pleasing for the upside longer term.

Jobs report is heartening but not and stocks rally but not.

It was jobs Friday, and that means all eyes were on the monthly jobs report. It is important to note that the jobs report was not necessarily the driver on the day. Early on, stocks were higher. It was not because of the jobs report as futures were up before the report came out. There was news out of Europe that a scheme had been derived whereby central banks could make an end run around the constitutions that were blocking direct central bank aid to those countries needing help. The plan is basically that central banks would loan to the IMF, and then the IMF would generously turn around and give the money to those countries in need of assistance.

Nothing like a good, old-fashioned socialist end run around constitutional law to pump the markets up. Of course the markets do not care if it is constitutional or not. The markets care if there is liquidity. Markets care if there is money to invest in financial instruments and debt instruments and thus drive them higher. When that happens and the perception is that the money is there or on the way, stocks are going to trade higher. That is exactly what they were doing. When it hit 8:30 EST, there was a surge to the upside. Then there was an "I am not sure what the heck it all meant" pullback. That was on the jobs report.

Depending on what side of the fence you are on, or whether you are just a person who listens to rational thought and facts, you had a different opinion about what the jobs report meant. I am not going to tell you exactly what it is, although I am sure you already know what the numbers were at this point. The stocks shot up, looking good at first, and then stocks pulled back all session. The Dow was up over 100 points. By the end of the day, however, it closed flat.

SP500, -0.2%; NASDAQ, +0.03%; Dow, -0.01%; SP600, +0.341%; SOX, -0.2%

Flat as a pancake. Could not go anywhere and did not want to. Stocks were just lethargic. That is totally understandable given what stocks have done on the week. This was a huge week. At one point, when the Dow was up over 120 points, it had logged the best week it had ever logged in a points term. But it could not hold the move, and they faded back to flat as you can see by the tombstone doji on SP500.

It was not the best week ever, but it was a doggone good week. Stocks were just a bit tired after breaking back out of the August-October trading range. Of course there are some burrs under the saddle, so to speak. SP500 tried the June low but could not break through. It was not a clear breakout. Let's face it, after such a huge run and then bumping up against resistance, you cannot expect them to make a break at the end of the week. Especially with a jobs report that was not that great, despite the headlines and despite trumpeting from certain sectors of the government.

THE NEWS

I have talked a lot about it, and I guess we have to hit that news and hit it hard. The jobs number is not that great on the headline. It was 120K versus 123K expected, but there were great revisions for September and October. September was revised up 52K. October was revised up 20K, pushing that to 100K. Overall with the revisions, it was not that bad. It is averaging 132K per month for the year, and that is right where you need to keep up with population increases and people just coming out of school.

So are we there? No, we are obviously not there. But the headline was the unemployment rate. It tumbled to 8.6% from 9% when, of course, 9% was expected. Holy cow. What is going on? The last time it was at this 8.6 level was March of 2009. Surely the economy is starting to really hum. You would expect employment to pick up after three months of improvement in economic data. That is exactly what has been occurring. But it is not worth 0.4% on the unemployment number. What is going on? It is going to take awhile to explain, but stick with me.

Overall, unemployment fell 600K to 13.3M. Those who have been unemployed over six months were 5.7M. That was a decline as well. Sounds pretty good, but the workforce fell 315K jobs. That means basically those people who have not looked for work for four weeks are not counted. Who has not been looking for work for four weeks? Those are the people who have run out of unemployment benefits. As soon as they run out of those benefits they quit going through the motions of saying "I am looking," and they just give up. There are no jobs out there, and they go away. That was the lowest level since January. In other words, that is it biggest drop since January as far as the workforce goes. Again, 315K people.

One of the problems is that 6.6M people are not in the workforce but actually want work. This kind of gets hard to get your hands around and maybe your head as well. There are now more people out of work and without benefits (by the tune of 700K) than there were at the same time last year. Even though there is supposedly improvement, more people are out of work and without benefits right now. Indeed, the share of industries that are adding jobs fell to 54.7%. That is the lowest in a year. The average time for being unemployed rose to an all-time high. Those are not great numbers, and at least half of the decline in the unemployment rate was caused simply by people dying or giving up and leaving the workforce. This is the strange feature that we have to deal with right now.

Typically when the economy improves and jobs start to improve, we get a spike in the unemployment rate. Just trust me when I say that it is true. The people who have been out of the market, those that we are seeing leave see that the economy is getting better. They either sense it or see people getting jobs or they hear it on the news. Then they go back and look for work. Those that disappeared off of the rolls and are no longer participating in the job search suddenly show back up. Employers tend to lag the rest of the economy. They do not want to hire until they absolutely have to hire. Then they pull the trigger and start hiring those people. The initial surge of those who came back in but could not find a job (thus the spike the unemployment rate) are hired, and then the unemployment rate drops. That happens right at the turn of the economy, of course. Things get better and people come back in. They sense it is better, but the jobs are not there jet. The unemployment rate spikes, and then it starts to go down because businesses have to hire at that point. But we have never had the spike in unemployment. We have had unemployment at 9% or more for years now.

I am borrowing from Investor's Business Daily. In 2009, unemployment spiked above 9%, and it has stayed until just the last month. We have had years of high unemployment. What has happened? There has been no big surge at the end of the recession. You have a surge at the beginning when everyone gets laid off, and then there is a surge at the end when people come back to look before the jobs are really there. What has happened instead this time, with this protracted level of 9%+ unemployment, the workforce has atrophied and withered away. There is no spike in employment, just another dousing to the labor force.

Let us think about that. When to employers hire? When they absolutely have to. They have been burned having people on when the economy fell. You typically see certain things happen. You see average hours worked jump because they have to get more and more productivity out of the workers that are there. They do not want to hire yet. Business gets better and better, so they push those people more and more. They make them work more hours, until they say "If you do not pay me more or get someone else, I'm out of here." Look what is happening: The average workweek is flat at 34.3. It even fell three weeks ago. Hourly earnings were down 0.1%. They were expected to rise 0.2%. They are not working more, and they are not paying people more. They are obviously not overtaxed. These are problems with this report.

I do not mean to say things are not getting better. No doubt that there are more jobs out there. There is some hiring going on, but it is not a boom in hiring. It is not enough to account for a 0.4% drop in the unemployment rate. It looks like we have some funky and downright strange monkeying around with the numbers. There is reason to account for a drop, but it looks as if there is overreaching. They are factoring in too much, and the problem is they are government numbers. If an administration wants to fudge, they can. I do not care if it is Democrat or Republican. These guys are starved for some good news, and I think they are overplaying their hand. As I said, the fall in people saying they found work would account for a bit more than half of the decline in the jobs number. That would have reduced it, but there is way too much of a decline for what the numbers show. They do not real tell a story.

While there has obviously been improvement in the economy over the last three months, it is not to this extent. The numbers themselves show there are reasons for the fall. Things are really not a lot better than they were with more people out of work and without benefits then there were a year ago. We still have problems even though things are turning, but let us be positive. We need some positive news in this country. There are way too many people still out of work. Even looking at the U6, which was down to 15.6M from 16.2M people, that is still unbelievably too many. It is terrible. We have to get business going.

This idea of 99% and 1% is a serious problem we have to deal with. I was discussing this with several people and small business leaders in the area, and they said they see nothing wrong with someone saying "I want what you have" if they start a business or get a job and work their rears off to get it. Instead, we have people saying "I want what you have, and I am going to petition the government to take from you what you have worked for so they can give it to me." That, I am afraid, is the huge difference we have today versus pretty much the entirety of this country's history.

Just look at the entitlement programs. I heard one fellow last night discussing it, and he said really we have $100T in debt when you factor in all the entitlements and liabilities. It is not what you can do for your country, but what the heck can my country give to me. And if they have to take it from someone else to do so, that is fine. But here is the sad truth. They could confiscate all of the wealth in this country all of the profits from the Fortune 500 companies, and they could tax the rich people all they want and more, and still they would never pay our entitlements. They would never pay it down.

The only thing we can do is stop and come up with different ways to fund these liabilities. With respect to Social Security, Medicare, and even Medicaid, that is ultimately what we will have to do. We have to change the game for people who are coming up into the system. Those who we made promises to and who have paid in and cannot change, we have to take care of them. But for those who are coming up through the system, we have to change it. The numbers do not work. The math is not there. We live longer than we did when the system was designed. You had to cheat death for two years to collect any Social Security. Now we have to change it. The question is whether we are smart enough to do that. We have a lot of people who want to spread misinformation about any possible change being the end of our country. If we do NOT change, that will undoubtedly mean the end of our country.

OTHER MARKETS

The news impacted the other markets as well. It was the European news that really had the anticipated effect on our bonds and dollar. It did not hurt that the jobs report was a bit better. But our debt instruments and our currency reacted inversely to what they should have on a stronger U.S. economy. That tells you something else about the impact of that jobs report and what it really meant on Friday.

Dollar: 1.3405 versus 1.3464 euro. The dollar was up against the euro, but it was down against just about everything else. A stronger jobs report should have seen a stronger dollar. It did not. The dollar is not in danger right now, much to the chagrin of the administration and the Fed that want to inflate our way out of this. Because there are other issues in the world, people are still hanging onto dollars versus Euros.
Click to view the chart

Bonds: 2.05% versus 2.09% 10 year U.S. Treasury. Bonds rallied. The 10 year moved up and drove rates down. Bonds should have sold and rates should have rallied on a strong jobs report with a good news situation for the U.S. That was not the case. People were buying U.S. bonds. Bonds are bouncing off the 50 day EMA, continuing their rally off of the July low.
Click to view the chart

Gold: 1,749.40, +9.60. Gold closed slightly higher. It rallied more intraday and backed off toward the close. Still in its triangle and still trying to look for a new breakout to the upside.
Click to view the chart

Oil: 100.94, +0.74. Oil closed up. It is still having trouble putting mileage on that 100 level. It broke through it, it fell back to 95, and it has kind of melted higher since. I do not think it will have many issues moving forward. But with China this week having its PMI starting to contract (that is its factory output) and then lowering reserve requirements on its banks to reliquify its economy, oil has a bit of a pause. It is worried about China being able to suck up all that excess oil in the world. Oil did not just blast off once more. But again, I do not think it is really in trouble.
Click to view the chart

TECHNICAL SUMMARY

INTERNALS

Breadth. Advancers led 1.5:1 on NASDAQ and 1.5:1 on the NYSE.

Volume. Volume fell 10% to a measly 1.6B shares on NASDAQ. It rose 4% on the NYSE to 815M, but that was rather pathetic and well below average as well.

CHARTS

SP500. A broader top set in to start this year. A head and shoulders with the crash into July and August. A recovery and now struggling. This week was a good week for the SP500. It moved up to the March and June lows, but it could not punch through. It tried to do so on Friday, but it was not the day. It got thrust back, showing a tombstone doji at the top of this range. Despite the great week, that tombstone doji suggests there may be a fall back. The jobs report did not instill a lot of excitement on Friday, but maybe the market was just tired. It is at a critical level. It broke down from that head and shoulders. It rebounded, sold, and it made a higher low. Now it has to prove itself once more. We will have to see.

It is in a range, no doubt. It may be over the August-October range, but it has not broken back up through this key level. It did so once, but it could not hold the move. Now it looks like it might falter below that. We will have to see how it plays out. The bid from Europe will play a big role in the weeks to come. If it is still there, if the market still perceives more money is coming, the bid will remain and stocks should rise. After all, they love liquidity and they love handouts. As long as it is on this side of the ocean or on the continent side of the ocean, stocks will love it. But they will have to come up with something, and Friday it was not enough. They had another inkling of what was to come, but it was not enough to keep stocks moving to the upside.

NASDAQ. NASDAQ posted no gain. It gapped higher, closed flat. It is still above its June peak, so it has a little momentum. Really it has not had a breakaway move from the August-October range. The jury is out on it as well. It gapped and reversed. That is not necessarily great action, but it was on low volume at the end of the week of a strong move higher. It really was not in the mood to go anywhere. But as with SP500, it had that head and shoulders, the break down, and now it is coming up to test again. We will just have to see what happens. Again, if the bid remains thanks to European influences (or, more correctly, European liquidity), NASDAQ should find a bid and resume the move to the upside.

SP600. The small caps posted the best gain of the day, but they are still below their March and June lows, showing a doji just as SP500 did. Showing it right below the 200 day EMA as well as that late-October peak which was the recovery peak off of that sharp selling into early October. The small caps have something to prove as well. They have to get through this level. But after such a big move, they can afford to come back, test a little bit, and then make the next break to the upside. We will see if that comes true. If the economic data continues to improve and we get that liquidity, it should not be a problem.

SOX. Semiconductors broke through that downtrend off of the February peak, but they could not hold it into the close. Again they are suffering from the same problems as the rest of the indices. That was just a doggone good week that took it up to resistance. Now maybe it will have to rest a bit before it makes the break through.

LEADERSHIP

I need to go through a lot of sectors and will show you a lot of charts. They are not representative of every stock in the market. There are still stocks that are in great shape. Oh, look at all the foreshadowing. But these are worrisome.

Semiconductors. Remember that the semiconductors are a leadership index. They tend to move higher before the rest of the market and lower before the rest of the market. That is because chips are in everything. If there will be an economic recovery, they will see it first. That is exactly what happened in 2008. They bottomed in Q4 and rallied. Then when everything else hit the lows in March, they were just making a higher low. They were off to the races, and this has happened so many times. It happened out of the 2000 recession. It has happened in pretty much every recession I have been through. I have played the chips as the leader out of that recession. It is really cool. I love it. They led out of this one, but they also led to the downside.

What have they formed here? You can see a pretty good head and shoulders has set up in the SOX. Looking at the SMH, that head and shoulders is pattern shaping up. Looking at individual semiconductors, you can also see the head and shoulders. BRCM has a broad top and a breakdown recently. Now it is coming up to test the bottom of that breakdown. Longer term, BRCM looks really weak. LRCX has also put in this big head and shoulders dating back to early 2010. Am I scaring you yet? That is not the intention. I just want to point things out. There are problems that will have to be dealt with.

Industrial. Industrials are always important. This is one of the areas that have been doing really well. We have had the export economy under President Obama. These are the big companies that have been performing very well. GE may be in a trading range. It could be setting up a head and shoulders of its own. That is not that clear. Let us look a little deeper. CAT looks like a real topping pattern. Big run. Look at the three highs, and a lower high in the selloff. The first really major correction since the low in March of 2009. Now it has returned back up to the bottom of that trading range.

It does not look that great. Are there worse patterns? Look at IR. It is a big manufacturing company. It has a head and shoulders with a really wimpy shoulder. It has moved up recently, sure, but it is very worrisome longer term. HON has been a leader. Its stock pattern matches that of the indices. We will see what happens. It looks to be running out of some juice, although it still has a little power. HUN is big into chemicals. A head and shoulders. ASH is another big chemical company. It has a very rounded top. Note this second peak in the middle of 2011. MACD is lower. It is running out of steam, or so it appears to be longer term.

Energy. BTU has a head and shoulders. HAL should be doing great, but it has kind of a toppy pattern. It broke sharply lower, a lower high. Looks to be struggling. SLB is a very similar pattern.

China. SINA peaked and it is breaking down. Of course we have been playing it to the downside. CTRP is a Chinese stock that we love to play. It put in that broad top and has rolled over.

Technology. Some technology stocks are having problems. We have a play on NTGR, but it is longer term trying to set up a head and shoulders. As an aside, just because they have longer-term issues does not mean we cannot play them short term to the upside. What do we know about head and shoulders? They do not always consummate. But this is just worrisome. I am drawing attention to it because you have to stay ahead of the game.

ORCL set up a head and shoulders this year. It sold off, and now it is making a lower high. That does not mean it is not going to bounce back up. We just need to watch it. CA has that big head and shoulders forming up.

Shipping. TK, an important transportation company, is setting up that long term, two-year head and shoulders top.

Metals. FCX has that big, rounded top. It is making a right shoulder right now. It was a long left shoulder, and the right shoulder may also take awhile to consummate. It is setting up. Looking at the Copper index overall, it has the same kind of big head and shoulders pattern. There is a big top in Steel and Iron. It never even made it back to the prior high before kind of rolling over.

Grains/Foods. Grains are a problem as well. CORN has a head and shoulders. That seems weird. If we are recovering and the world is growing, we should need corn. Why would corn prices look to be rolling over? The cotton index, BAL, had a huge rally in 2010. It looks to have peaked out, forming its head and shoulders as well. For those that love their morning cup of joe, JO looks as if it has peaked and rolled over after a big rally as well.

It is not as severe. This is just in 2011. A lot of these other patterns are spanning two years. The SOX is a two-year span. It had that big run on the initial Quantitative Easing, and then it had a pause. It had a run on the second Quantitative Easing, but it looks like it is ready to roll over. If we do not get another round of Quantitative Easing or some kind of stimulus or financial liquidity over in Europe, we might see this roll over.

I guarantee you the central banks and our Fed are watching all of these charts. They are not so pronounced on our indices, but they are still there. Never recaptured the 2008 high, and they have this rollover look to them. The SP500 has it. NASDAQ has it, too, although it did manage to take out the 2008 high. The small caps look better. They took out the high, but they are still struggling. Small caps need to be leading the way if there is to be a real economic recovery in the U.S.

I point these out not to say the world is ending and we should all run into a cave right now. I point it out to show you that we are not as strong as some are saying. We are supposedly recovering from the Great Recession and have turned the corner. In the U.S, some say how strong we are every morning on the financial stations. Maybe we look strong relative to a bunch of the European countries, but we are not strong in the way of leading the world like we used to be. Not even close. We have to be concerned that we are getting a head fake. We have to watch out for that one "in your ear" as Shoeless Joe Jackson warned Moonlight Graham in "Field of Dreams."

We could be setting up for the one in our ear. We are being told everything is recovering. We are being told that the central banks have it under control and will make things work. But that may not be the case. The patterns are worrisome; something nefarious this way comes (sorry Ray Bradbury). There could be problems if some more liquidity is not pumped into the markets. Every time Alan Greenspan saw this set up, he knew he had to pump in more liquidity. But all that has done is build a house of cards bigger and bigger, or inflated the bubble more and more. Eventually it has to pop or be deflated. That is what worries me. I have looked at a large cross section of stocks and materials, and there are similar patterns setting up.

Retail. Retail stocks are still performing very well. RL continues to move higher. VFC continues to move higher. PVH is still moving to the upside, and BBBY is still moving to the upside. It is hard to argue with those and I am not arguing. The consumer is spending, and that may lead the world out of trouble. I will not write that off. I am just saying we have to be careful looking ahead while we are trading, investing, and moving in on our position plays. We just have to keep this in mind and know that it is out there.

If it starts to come together, we need to be ready. That is all we ever do; it is nothing new. It is just another part of our job to keep you informed and for you to keep yourself informed as we move forward. Just know the big patterns, the overlays, as we trade in a day-to-day, week-to-week, and month-to-month basis. If you do that, you will stay out of trouble. You know what is coming, but do not let it totally color your short-term actions so that you think everything will fall.

Take what the market gives. If you have good upside setups as we have had, you take them. Maybe it is in a context of an overall top that ultimately breaks down. That does not mean we cannot make money then.

THE MARKET

SENTIMENT INDICATORS

VIX: 27.52; +0.11
VXN: 27.69; +0.49
VXO: 27.93; +0.25

Put/Call Ratio (CBOE): 0.98; +0.04

Bulls versus Bears:

This is a reading of the number of bullish investment advisors versus bearish advisors. The reason you look at this is that it gives you an idea of how bullish investors are. If they are too bullish then everyone is in the market and it is heading for a top: if everyone wants to be in the market, then all the money is in and there is no more new cash to drive it higher. On the other side of the spectrum if there are a lot of bears then there is a lot of cash on the sideline, and as the market rallies it drags that cash in as the bears give in. That cash provides the market the fuel to move higher. If bears are low it is the same as a lot of bulls: everyone is in and the market does not have the cash to drive it higher.

Bulls: 44.2% versus 47.4% versus 44.2%. Right back down to the level hit three weeks back though still well above 35%. 35% is the threshold measuring bullish versus bearish action. Six weeks the bulls were below bears. A powerful sentiment signal. Solid move lower from 49.5% in late July. Highs from April and December (60% readings spanning December through early May 2011). The 5 year high is 62.0. The crossover level at 29% bulls from July 2010 is long gone. 35% is the threshold level suggesting bullishness. To be seriously bearish it needs to get up to the 60% to 65% level.

Bears: 30.5% versus 32.6% versus 34.7%. Unlike bulls that backed off, bears continued their more bullish stance as they became more endangered. The index did spend seven weeks over the 35% threshold considered a bullish indicator. For more reference, bearishness hit a 5 year high at 54.4% the last week of October 2008. The move over 50 took bearish sentiment to its highest level since 1995. Extreme negative sentiment. Prior levels for comparison: Bearishness peaked at 37.4% in September 2007. It topped the June 2006 peak (36%) on that run. That June peak eclipsed the March 2006 high (33%) and well above the 2005 highs that spawned new rallies (30% in May 2005, 29.2% in October 2005). That was a huge turn, unlike any seen in recent history.

CHARTS

NASDAQ

Stats: +0.73 points (+0.03%) to close at 2626.93
Volume: 1.634B (-10.02%)

Up Volume: 769.11M (-280.89M)
Down Volume: 876.4M (+116.6M)

A/D and Hi/Lo: Advancers led 1.52 to 1
Previous Session: Decliners led 1.71 to 1

New Highs: 44 (+3)
New Lows: 41 (-17)

NASDAQ CHART: Click to view the chart

NASDAQ 100 CHART: Click to view the chart

SOX CHART: Click to view the chart

SP500/NYSE

Stats: -0.3 points (-0.02%) to close at 1244.28
NYSE Volume: 815M (+4.09%)

Up Volume: 2.49B (+820M)
Down Volume: 1.58B (-410M)

A/D and Hi/Lo: Advancers led 1.56 to 1
Previous Session: Decliners led 1.56 to 1

New Highs: 121 (+1)
New Lows: 11 (-4)

SP500 CHART: Click to view the chart

SP600 Chart: Click to view the chart

DJ30

Stats: -0.61 points (-0.01%) to close at 12019.42
Volume DJ30: 150M shares Friday versus 144M shares Thursday.

DJ30 CHART: Click to view the chart

MONDAY

Now that we have the jobs report out of the way, we still have plenty of economic data. There are Factory Orders, ISM Services, and then Initial Jobless Claims, of course. It will be interesting to see how Wholesale Inventories are shaping up ahead of the holidays. Then we finish the week with the first look at the Michigan Sentiment for December.

That is all well and good, but what will rule the roost? It will be what is happening in Europe. Why? The jobs report did not light any fires in the U.S. on Friday. It may be that the market was a bit tired, but it is also at resistance. The jobs report was not that great. It is just following a lukewarm recovery in the U.S. While the recovery is nice, the ECRI still says it will not prevent a recession in 2012. That ties in somewhat to those longer-term head and shoulders charts.

The SP500 is below the March and June lows. It is showing a doji after a nice week. Can it continue? We will find out. We have a lot of great upside setups. We also see a lot of downside setups, and it is somewhat worrisome. As a matter of fact, we will probably put on another play on the SDS or the SPY because of this pattern. We had a sharp selloff, we had a rebound to a lower high right below important resistance. There was a fade, and then a rebound to a lower high right below an important resistance. We may be range-bound again, but we will have to let it show us what it will do. We will be ready either way. That means we have to be ready on the positions we took to the upside. If we get back down in the range and want to turn around, we will kill them, go downside, and make some money.

If we are range-bound, so be it. If we are not, so be it. The bid is the key. Will the EU, the individual countries, the IMF, the ECB, and even the U.S. Fed keep that bid under Europe and thus the bid under the U.S? The Federal Reserve here does not want to go on QE3 if it can avoid it. It may accomplish its goals by Europe inflating its currency and financial markets, and thus dragging us along with it. After all, as we saw in July and August, it was Europe pulling us down. If it can inflate their asset prices and pull us up, too, it will do whatever it can to help short of out-and-out lending money to the EU.

Given the mindset of the Ben Bernanke Fed and the change in the ECB with the change in leadership from Mr. Trichet, I think we could very well maintain that bid and continue to the upside. That is what I expect to happen, but my expectations will not tell the market what to do. We simply have to be ready. While I expect Europe to continue to come out with clever plans to form some kind of Quantitative Easing, we just have to be ready in case things turn ugly after a fantastic week in the U.S. stock market.

I will see you on Monday. Have an outstanding weekend!

Support and Resistance

NASDAQ: Closed at 2626.93
Resistance:
2643 is the September 2011 high
2645-2650ish from December 2010 consolidation
The 200 day SMA at 2674
2676 is the January 2010 low
2686 is the January 2011 closing low
2706 to 2705 is the April 2011 low and the February 2011 and consolidation low (bottom of the trading range) 2723 to 2705 is the range of support at the bottom of the January to May trading range
2754 is the recent October 2011 high
2759 is the mid-May low
2762 is the February low
2796 is the February gap down point
2816 is the early April peak.
2825 is the 2007 closing peak.
2841 is the February 2011 peak
2862 is the 2007 peak
2879 is the July 2011 peak
2888 is the May 2011 peak

Support:
2612 is the late August 2011 peak
2603 is the March 2011 intraday low (post-Japan low)
2599 is the June 2011 low
2593 is the November intraday high
The 50 day EMA at 2593
2580 is the November 2010 closing high
2572 is the November 2-11 gap down point
2555 is the mid-August 2011 peak
2546 is the early September 2011 gap down point
2535 is the November gap down point
2532 is the early August gap down point
2512 is last week's gap down point
2469 is the November 2010 low
2331 from October 2010 low and the August 2011 intraday low
2305 from the August 2010 peak (summertime base)
2139 is the May and June 2010 low
2123 is the August 2010 gap down point
2100 from the August 2010 lows

S&P 500: Closed at 1244.28
Resistance:
1249 is the March 2011 low (post-Japan)
1255 is the late December 2010 consolidation range
1258 is June 2011 intraday low
The 200 day SMA at 1265
1275 is the January 2010 low, early January 2011 peak
1295 to 1294 is the April 2011 low and the February 2011 consolidation low (bottom of the trading range)
1313 from the August 2008 interim peak
1318.51 is the May low
1325-27 is the March 2008 closing low and the May 2006 peak.
1332 is the early March peak
1340 is the early April 2011 peak
1344 is the February 2011 peak is being challenged again
1357 is the July 2011 peak
1364 is the March 2007 low
1370 is the August 2007 low
1371 is the recent May 2011 peak

Support:
1235 is the mid-December 2010 consolidation low
1231 is the late August 2011 peak
1227 is the November 2010 peak
1220 is the April 2010 peak
The 50 day EMA at 1218
1209 is the mid-August 2011 high
1196 is the November 2010 consolidation peak
1178-1180 is the October 2010/November 2010 consolidation low
1131 - 1127 from August 2010 base peak.
1119 is the early August closing low
1109 is the mid-September 2010 gap up point
1101 is the August 2011 low
1075 is the October 2011 intraday low
1099 from the mid-July interim peak
1090 is the early September 2010 gap up point
1040 from the August 2010 lows and May/June 2010 lows
1011 is the summer 2010 low

Dow: Closed at 12,019.42
Resistance:
12,094 is the April 2011 low
12,110 from the March 2007 closing low
12,284 is the October 2011 peak
12,391 is the February 2011 peak
12,754 is the July intraday peak
12,876 is the May high
13,058 from the May 2008 peak on that bounce in the selling

Support:
The 200 day SMA at 11,946
The June low at 11,897 (closing)
11,893 from March 2008 closing low
11,867 from the August 2009 high and peak on that bounce in the selling.
11,734 from 11-98 peak
11,717 is the late August 2011 peak
The August low at 11,702
The 50 day EMA at 11,688
11,555 is the March low
11,452 is the November 2010 peak
11,178 from November 2010
10,978 is the bottom of the November 2010 consolidation
10,750 from September 2010
10,720 is the August closing low
10,705-710 from January 2010 peak
10,694-700 from August 2010 peak
9938 is the August 2010 low

Economic Calendar

November 28 - Monday
- New Home Sales, October (10:00): 307K actual versus 312K expected, 303K prior (revised from 313K)

November 29 - Tuesday
- Case-Shiller 20-city, September (9:00): -3.6% actual versus -3.0% expected, -3.80% prior
- Consumer Confidence, November (10:00): 56.0 actual versus 42.5 expected, 40.9 prior (revised from 39.8)
- FHFA Housing Price Index, September (10:00): +0.9% actual versus -0.1% prior

November 30 - Wednesday
- MBA Mortgage Index, 11/26 (7:00): -11.7% actual versus -1.2% prior
- Challenger Job Cuts, November (7:30): -12.8% actual versus 12.6% prior
- ADP Employment Change, November (8:15): 206K actual versus 125K expected, 130K prior (revised from 110K)
- Productivity-2nd Rev., Q3 (8:30): 2.3% actual versus 2.6% expected, 3.1% prior
- Unit Labor Costs, Q3 (8:30): -2.5% actual versus -2.1% expected, -2.4% prior
- Chicago PMI, November (9:45): 62.6 actual versus 57.5 expected, 58.4 prior
- Pending Home Sales, October (10:00): 10.4% actual versus 0.1% expected, -4.60% prior
- Crude Inventories, 11/26 (10:30): 3.932M actual versus -6.219M prior

December 1 - Thursday
- Initial Claims, 11/26 (8:30): 402K actual versus 390K expected, 396K prior (revised from 393K)
- Continuing Claims, 11/19 (8:30): 3740K actual versus 3650K expected, 3705K prior (revised from 3691K)
- ISM Index, November (10:00): 52.7 actual versus 51.0 expected, 50.8 prior
- Construction Spending, October (10:00): 0.8% actual versus 0.3% expected, 0.2% prior
- Auto Sales, December (15:00): 4.27M prior
- Truck Sales, December (15:00): 5.84M prior

December 2 - Friday
- Nonfarm Payrolls, November (8:30): 120K actual versus 123K expected, 100K prior (revised from 80K)
- Nonfarm Private Payr, November (8:30): 140K actual versus 141K expected, 117K prior (revised from 104K)
- Unemployment Rate, November (8:30): 8.6% actual versus 9.0% expected, 9.0% prior
- Hourly Earnings, November (8:30): -0.1% actual versus 0.2% expected, 0.2% prior
- Average Workweek, November (8:30): 34.3 actual versus 34.3 expected, 34.3 prior

December 5 - Monday
- Factory Orders, October (10:00): -0.4% expected, 0.3% prior
- ISM Services, November (10:00): 53.4 expected, 52.9 prior

December 7 - Wednesday
- MBA Mortgage Index, 12/03 (7:00): -11.7% prior
- Crude Inventories, 12/03 (10:30): 3.932M prior
- Consumer Credit, October (15:00): $7.0B expected, $7.4B prior

December 8 - Thursday
- Initial Claims, 12/03 (8:30): 395K expected, 402K prior
- Continuing Claims, 11/26 (8:30): 3700K expected, 3740K prior
- Wholesale Inventories, October (10:00): 0.2% expected, -0.1% prior

December 9 - Friday
- Trade Balance, October (8:30): -$44.0B expected, -$43.1B prior
- Michigan Sentiment, December, Preliminary (9:55): 65.0 expected, 64.1 prior
icon url

ReturntoSender

12/05/11 11:45 PM

#9613 RE: ReturntoSender #6755

From Briefing.com: 4:15 pm : The U.S. markets started the day with substantial gains and held steady for most of the day, but afternoon headlines regarding the potential for negative European outlook revisions from Standard & Poors knocked the wind out of stocks.

This morning, stocks began the day with gains alongside strength in European markets as borrowing costs declined sharply in Italy and Spain. This activity followed news Italy unveiled a new austerity plan and reports that the ECB is preparing an injection of EUR1 trillion for the EU through additional bond buying. Then encouraging headlines about agreement between Germany's Merkel and France's Sarkozy helped markets add to their gains after the open.

However, this afternoon the major market averages pared their gains after headlines indicated that S&P was placing Germany and France on ‘creditwatch negative.' This knocked equities back from their highs, and then another headline that S&P will place all 17 Euro nations on ratings downgrade watch sent markets to fresh lows.

Outside of the macro headlines, today's news flow was relatively light. Before the open, it was announced that SuccessFactors (SFSF 29.44, +1.66) would be acquired by SAP for $40.00 per share in cash, representing a 52% premium over its Dec 2 closing price and an enterprise value of ~$3.4 bln.

In economic news, the ISM Services Index for November came in at 52.0, which is down slightly from the 52.9 that was posted in the prior month. It also failed to meet the Briefing.com consensus estimate of 53.4. Factory orders fell 0.4% during October, just as had been expected by those economists surveyed by Briefing.com. Orders for the prior month were revised downward to reflect a 0.1% decline.DJ30 +78.41 NASDAQ +28.83 SP500 +12.80 NASDAQ Adv/Vol/Dec 1754/1.75 bln/778 NYSE Adv/Vol/Dec 2377/893 mln/686

8:33AM O2Micro approved an additional $30 mln under its current program to repurchase its ordinary shares, including ordinary shares represented by ADS (OIIM) 4.42 :

8:29AM Emcore awarded solar panel manufacturing contract by ATK for Orbital's Commercial Resupply Services missions (EMKR) 0.96 : Co announced that it has been awarded a solar panel manufacturing contract by ATK (ATK) to utilize ZTJ solar cells in the new lightweight and highly-efficient ATK Ultraflex solar arrays. The solar panels will be used to power cargo delivery spacecraft for Orbital Sciences Corporation's Commercial Resupply Services missions to the International Space Station. Under contract with NASA, Orbital will provide cargo logistics support services to the ISS, beginning in 2012. EMCORE's solar panels will be assembled into deployable solar arrays by ATK's Solar Arrays and Deployables business based in Goleta, California. The arrays will then be delivered to Orbital Sciences Corporation for integration into their Cygnus space vehicles.

7:03AM DSP Group announces $10 mln acquisition of BoneTone Communications (DSPG) 31.25 : Co announced the exercising of its option to acquire BoneTone Communications, a provider of innovative chip solutions that redefine audio quality and voice intelligibility in mobile devices and headsets. BoneTone's products are expected to generate revenues already in 2012.

SAP AG (SAP $59.29 -0.25) and SuccessFactors (SFSF $39.71 +13.46) announced that SAP's subsidiary, SAP America, has entered into a definitive merger agreement with SuccessFactors in SAP would offer to acquire all outstanding shares of common stock of SuccessFactors for $40.00 per share in cash, representing a 52% premium over its Dec 2 closing price and an enterprise value of approxmately $3.4 billion. The transaction is expected to close in the first quarter of 2012 and be slightly dilutive to SAP's Non-IFRS earnings per share in 2012 and accretive in subsequent years.

Research In Motion (RIMM $16.76 +0.01)'s target was lowered to $16 from $24 at Wunderlich. The firm notes niche differentiation with customers that desire private network security might be preserved by sustaining the BlackBerry Network, but scaling the private network derived business model to compete with the broader industry is impractical in their view. They highlight that Friday's pre-announcement obliterated the prospects of an exit strategy based on 3Q12 earnings from BlackBerry 7 channel sell-in and feel an indefinite period of decline has now begun.

11:12 am Technology Secotr Trading Higher Today Ahead Of Broader Market Slightly (SFSF)

The tech sector is trading higher today, just outpacing gains in the broader market. Semiconductors are trading inline with strength in the tech space with the Philly Semi Index trading 1.7% higher. RBCN (+6.8%) is a notable leader in the chip index. Among other major indices, the S&P 500, the NASDAQ, and the QQQ are all trading 1.6% higher. Among tech bellwethers, ORCL (+3.0%) is showing notable strength.

There were no notable earnings in the tech space. In news, SFSF (+51.3%) announced it was to be acquired by SAP (-1.2%) for $40 per share. TLEO (+19.1%) is trading higher in sympathy.

Among notable analyst upgrades this morning, TLEO (+19.1%) was upgraded to Outperform at BMO Capital Markets and TEL (+2.9%) was upgraded to Buy at Goldman. Among downgrades, MOLX (+0.8%) and ADSK (+0.4%) were downgraded at Goldman.

There are no notable names in tech scheduled to report results today after the close.
icon url

ReturntoSender

12/06/11 11:46 PM

#9614 RE: ReturntoSender #6755

From Briefing.com: 4:30 pm : Stocks spent the better part of the session bobbing along the neutral line before a bout of buying interest induced a broad market bounce, but that move was ultimately countered by sellers.

An absence of economic data and material corporate announcement kept stocks close to the flat line for most of the session, at least until word surfaced that officials in Europe are considering an increase in the size of proposed firewalls. Stocks responded to the report by bouncing to a solid gain.

However, a lack of leadership left stocks unable to resist the late efforts of sellers, who were successful in sending the broad market back near the neutral line. The Dow did manage to hold on for a modest gain, thanks to strength among a few blue chips. The Nasdaq ultimately settled in the red after it had lagged all session.

Neither the dollar nor the euro did much today. As such, both finished flat.

Commodities managed to overcome early weakness, resulting in a 0.2% gain for the CRB Index. Silver led the effort by rallying to just above $32.75 per ounce for a gain greater than 1% after the precious metal had been down about 2% in early pit trade.

The lack of trading catalysts kept many on the sidelines, resulting paltry trading volume. Participation is likely to remain depressed tomorrow, given that the economic calendar remains without meaningful data. That will likely keep many focused on an upcoming announcement from the European Central Bank and the outcome of a eurozone summit.

Advancing Sectors: Materials +0.8%, Health Care +0.5%, Telecom +0.3%, Consumer Staples +0.2%, Utilities +0.2%, Industrials +0.2%, Energy +0.1%
Unchanged: Tech
Declining Sectors: Financials -0.1%, Consumer Discretionary -0.2%DJ30 +52.30 NASDAQ -6.20 NQ100 -0.2% R2K +0.00% SP400 -0.3% SP500 +1.39 NASDAQ Adv/Vol/Dec 1094/1.49 bln/1409 NYSE Adv/Vol/Dec 1505/802 mln/1488

4:31PM Photronics beats by $0.01, reports revs in-line (PLAB) 6.04 -0.05 : Reports Q4 (Oct) earnings of $0.14 per share, $0.01 better than the Capital IQ Consensus Estimate of $0.13; revenues rose 11.1% year/year to $122.2 mln vs the $122.39 mln consensus.

HP (HPQ) announced it has acquired Hiflex Software GmbH, a privately held global software solutions provider specializing in web-to-print and management information systems solutions for printing services. Financial terms of the transaction were not disclosed.

Photronics (PLAB) announced it is streamlining its operating infrastructure in Asia by ceasing the manufacture of semiconductor photomasks at its Singapore facility. Co estimates that this action will result in an annualized cost savings of ~$3-4 mln, the majority of which will be cash.

Texas Instruments (TXN $30.26 +0.03) was upgraded to Mkt Outperform from Mkt Perform at JMP Securities and the firm set a target price at $36 based on the emergence of favorable cycle indicators and their belief in the co's ability to drive upside margin leverage going forward.

Needham raises their Novellus (NVLS $36.56 +0.96) tgt to $40 from $37 following the mid quarter update. The firm prefers co over mid/large-cap semi equipment stocks for its strong positions at leading capex spenders, low exposure to second-tiered DRAM customers, improved leverage of its financial model and aggressive buyback program.
icon url

ReturntoSender

12/08/11 8:30 PM

#9616 RE: ReturntoSender #6755

From Briefing.com: 4:30 pm : Market participants displayed their bearish side by driving stocks down to weekly lows following a flurry of headlines from Europe. Some relief was offered in the final hour, but sellers redoubled their efforts.

News that the latest initial jobless claims tally declined to 381,000, which is less than the 395,000 initial claims that had been broadly expected, helped strengthen sentiment ahead of the open. Participants were hardly surprised by the European Central Bank (ECB) decision to lower its main refinancing operations rate to 1.00% from 1.25% and also trim the rate on its marginal lending facility to 1.75% from 2.00%, but buying was further bolstered by the ECB's move to extend collateral eligibility to asset-backed securities.

Buying interest was checked before the opening bell, though. The shift in sentiment was spurred by news that the ECB has turned more cautious in its economic outlook and that the vote to reduce interest rates was not unanimous. The proof of dissension among Europe's leading policy makers made many participants skeptical of the ability of officials at the eurozone summit, which is scheduled to conclude tomorrow, to progress in their efforts to overcome persistently precarious economic and financial conditions.

Also out today, the European Banking Authority's stress test results determined that bank recapitalization needs increased since a series of test results were issued in October. German banks were hit with especially stiff selling pressure following the report.

Amid the messy mosaic of eurozone headlines and a weaker picture of European banks, stocks were left to descend steadily throughout the session. In the closing minutes stocks tried to trim losses in conjunction with headlines that suggested a banking license may be tied to the eurozone bailout fund so as to allow direct bank recapitalization, but buying was quickly countered by sellers who were only stopped by the closing bell.

Advancing Sectors: (None)
Declining Sectors: Consumer Staples -1.0%, Utilities -1.5%, Tech -1.5%, Health Care -1.8%, Telecom -1.8%, Consumer Discretionary -2.0%, Industrials -2.3%, Energy -2.6%, Materials -3.0%, Financials -3.7%DJ30 -198.67 NASDAQ -52.83 NQ100 -1.6% R2K -3.1% SP400 -2.6% SP500 -26.66 NASDAQ Adv/Vol/Dec 363/1.82 bln/2171 NYSE Adv/Vol/Dec 405/930 mln/2600

6:27PM Diodes reaffirms Q4 revs guidance of $140-150 mln vs. $145.2 mln Capital IQ Consensus Estimates (DIOD) 20.61 -0.60 : Co stated that it is maintaining its previous guidance for the fourth quarter of 2011 including its revenue guidance of between $140 million and $150 million, or down 7 to 13 percent sequentially and its gross margin guidance of 25 percent, plus or minus 1.5 percent.

4:37PM Texas Instruments: Color on EPS guidance (see 16:32 comment) (TXN) 29.92 -0.75 : In co's Q3 results, TXN said EPS will be negatively impacted by about $0.15 from acquisition-related costs in the fourth quarter. Excluding this item, TXN's guidance would be $0.36-0.40, vs. the $0.46 consensus, down from $0.43-0.51 prior guidance.

4:32PM Texas Instruments lowers Q4 EPS to $0.21-0.25 from $0.28-0.36, lowers revs guidance to $3.19-3.33 bln consensus, vs. $3.406 bln Capital IQ Consensus Estimates, down from $3.26-3.54 bln prior guidance (TXN) 29.92 -0.75 : The reductions are due to broadly lower demand across a wide range of markets, customers and products, except for Wireless applications processors.

4:19PM Altera drops almost 12% to $31.30 after lowering Q4 revs guidance; see 16:16 comment (ALTR) 35.48 -0.89 :

4:16PM Altera lowers Q4 revs guidance to down 13-16%, from down 7-11% vs. Capital IQ Consensus Estimates of down 9% (ALTR) 35.48 -0.89 : The revenue outlook has deteriorated across all major vertical markets, including both large and small customers. With the exception of North America, which will benefit from rising military sales, all geographic regions will be weak. As the quarter has progressed, economic uncertainty, macroeconomic concerns, and, in some instances, lower than planned sales have resulted in customers reducing demand on Altera. Consistent with the third quarter, Altera believes it will continue to under ship customer end demand in the fourth quarter.

7:02AM Ciena misses by $0.04, beats on revs; guides Q1 revs (CIEN) 11.91 : Reports Q4 (Oct) earnings of $0.03 per share, $0.04 worse than the Capital IQ Consensus Estimate of $0.07; revenues rose 9.1% year/year to $455.5 mln vs the $450.17 mln consensus. Co issues guidance for Q1, sees Q1 revs of $435-455 mln vs. $454.15 mln Capital IQ Consensus Estimate. "We continue to deliver on the growth and operating efficiency milestones we laid out early last year, and remain focused on delivering operating leverage from the business. Our strong fourth quarter financial performance included positive cash flow and a second consecutive quarter of as-adjusted operating profit," said Gary Smith, president and CEO of Ciena... While macroeconomic uncertainty remains, we are taking market share because customers recognize our differentiation and the strong alignment of our portfolio with their network architecture priorities."

6:37AM Methode Electronics misses by $0.04, beats on revs; reaffirms FY12 EPS guidance, revs guidance; reaffirms FY13 EPS guidance, revs guidance (MEI) 8.83 : Reports Q2 (Oct) earnings of $0.01 per share, $0.04 worse than the Capital IQ Consensus Estimate of $0.05; revenues rose 7.6% year/year to $115.9 mln vs the $112.76 mln consensus. Co reaffirms guidance for FY12, sees EPS of $0.13-0.21 vs. $0.17 Capital IQ Consensus Estimate; sees FY12 revs of $450-465 mln vs. $455.11 mln Capital IQ Consensus Estimate. Co reaffirms guidance for FY13, sees EPS of $0.52-0.67 vs. $0.55 Capital IQ Consensus Estimate; sees FY13 revs of $495-525 mln vs. $513.92 mln Capital IQ Consensus Estimate. Consolidated gross margins as a percentage of sales were 18.0 percent in the Fiscal 2012 second quarter compared to 21.9 percent in the same period of Fiscal 2011. The decrease was due primarily to design, development and engineering costs for new automotive programs launching in Fiscal years 2012 and 2013.

General Electric (GE), through its healthcare IT business, and Microsoft (MSFT) announced plans to create a joint venture aimed at helping healthcare organizations and professionals use real-time, system-wide intelligence to improve healthcare quality and the patient experience.

Texas Instruments (TXN $30.26 +0.03) was upgraded to Mkt Outperform from Mkt Perform at JMP Securities and the firm set a target price at $36 based on the emergence of favorable cycle indicators and their belief in the co's ability to drive upside margin leverage going forward.

Needham raises their Novellus (NVLS $36.56 +0.96) tgt to $40 from $37 following the mid quarter update. The firm prefers co over mid/large-cap semi equipment stocks for its strong positions at leading capex spenders, low exposure to second-tiered DRAM customers, improved leverage of its financial model and aggressive buyback program.
icon url

ReturntoSender

12/09/11 12:30 PM

#9617 RE: ReturntoSender #6755

Chart of the Day - COTD - Earnings Surge Near Bubble Tops

http://www.chartoftheday.com/201112092.htm?T

With third-quarter earnings largely in the books (99% of S&P 500 companies have reported for Q3 2011), today's chart provides some long-term perspective on the current earnings environment by focusing on 12-month, as reported S&P 500 earnings. Today's chart illustrates how earnings declined over 92% from its Q3 2007 peak to Q1 2009 low which brought inflation-adjusted earnings to near Great Depression lows. Since its Q1 2009 low, S&P 500 earnings have surged (up over 1100%) and currently come in at a level that is greater than what occurred at the peak of the dot-com bubble and very near what occurred at the peak of the credit bubble. It is interesting to note that the original run up in real earnings from Great Depression lows to credit bubble highs took over 78 years. The current spike has taken 29 months.


icon url

ReturntoSender

12/11/11 1:26 PM

#9618 RE: ReturntoSender #6755

From Briefing.com: Weekly Recap - Week ending 09-Dec-11Stocks closed out the week on a strong note, helping the broad market book another weekly gain. Europe remained the primary topic of trade.

Traders took early cues from Europe, where the region's major bourses bounced because of the focus on news that eurozone officials agreed to tighter fiscal controls and also to make funds available to the International Monetary Fund for use in the rapid deployment of the European Financial Stability Facility, rather than the challenge of establishing changes to the eurozone treaty. Given the dissension and dysfunction that has been displayed so often during recent months, the eurozone summit was generally regarded as a step in the right direction. That helped drive the EuroStoxx 50 more than 1% higher, but the euro only gained 0.2% to end the session at $1.338.

Reports of progress in Europe were complemented by encouraging inflation data from China, which reported sharp declines in both CPI and PPI for November. Domestic data featured the preliminary Consumer Sentiment Survey for December from the University of Michigan. It improved to a six-month high of 67.7.

Equities traded with strength amid the hope that the macro picture might improve because of Europe's efforts to shore up its precarious financial and economic conditions, while cooler inflation in China could mean that the country can curb inflation without sacrificing economic growth.

Although buying was broad based, financials spent most of the session out in front of the rest of the market. The sector settled the session 2.3% higher with help from banking plays and diversified financial institutions.

Industrials were slower in their ascent, but the sector also scored a strong gain of 2.2%. General Electric (GE 16.84, +0.53) was a leader in the space after the conglomerate announced a dividend increase that many took as a sign of confidence in cash flow.

Other corporate news was less encouraging. Both Texas Instruments (TXN 29.94, +0.02) and DuPont (DD 45.04, -1.48) cut their outlooks, but those reports were generally shrugged off by a market that remained fixated on the events in Europe.

The broadly positive bias displayed by stocks stayed intact all session, helping the major equity averages settle the session near their highs. Share volume may have been light, but stocks still cut prior session losses to give the S&P 500 a near 1% weekly gain.

The bounce on Friday helped stocks offset part of the prior session's slide, which was the worst one-day drop for the stock market in about two weeks. To little surprise, that decline was driven by a mosaic of headlines from Europe. Participants were hardly surprised that the European Central Bank (ECB) cut its target lending rate, but there was a negative response to news that the vote was not unanimous and that ECB became more cautious in its economic outlook. The tone certainly wasn't helped by the European Banking Authority report that capital shortfalls increased in their latest stress test.

News that the ECB will extend collateral eligibility to asset-backed securities was overshadowed, as was the latest weekly initial jobless claims tally. Initial jobless claims totaled 381,000, which is less than the 395,000 initial claims had been widely expected.

Mid-week trade kept stocks mired near the neutral line as participants were reminded about the headline risk associated with Europe when it was learned that analysts at S&P were focusing on the European Union's top-notch credit rating. Tuesday trade was lackluster amid an absence of economic data and material corporate announcements.

Action this week began with a solid gain on Monday, when traders took encouragement from a decline in the borrowing costs of Italy and Spain -- a tacit sign of increased confidence in the two countries -- after Italy unveiled a new austerity plan. It was also learned that the ECB intends to inject one trillion euros for use in additional bond buying. Reports that Germany's Merkel and France's Sarkozy were making concerted efforts to lead Europe through its crises were also taken positively, although analysts at S&P put Germany and France on "creditwatch negative," while also placing all 17 euro nations on ratings downgrade watch. Little was made of the November ISM Services Index, which eased to 52.0 from 52.9 in the prior month and failed to meet the Briefing.com consensus estimate of 53.4.
 
Index Started Week Ended Week Change % Change YTD %
DJIA 12019.42 12184.26 164.84 1.4 5.2
Nasdaq 2626.93 2646.85 19.92 0.8 -0.2
S&P 500 1244.28 1255.19 10.91 0.9 -0.2
Russell 2000 735.02 745.40 10.38 1.4 -4.9
1:35PM Hewlett-Packard announced it will contribute the webOS software to the open source community (HPQ) 28.33 +0.67 : Co plans to continue to be active in the development and support of webOS. By combining the innovative webOS platform with the development power of the open source community, there is the opportunity to significantly improve applications and web services for the next generation of devices.

10:36AM Motorola Mobility confirms German Court rules in favor of Motorola Mobility in Apple (AAPL) litigation (MMI) 38.88 +0.04 : Co confirmed that the court in Manheim, Germany has ruled that Apple's European sales company, Ireland-based Apple Sales International, is infringing one of Motorola Mobility's core cellular communications patents related to data packet transfer technology (GPRS) through its sales of the iPhone and iPad devices. The Court granted Motorola Mobility's requests for an injunction and damages.

10:04AM Semiconductor Hldrs ETF edges off support zone (SMH) 30.33 -0.17 : Noted a support zone at 29.95/29.83 for the SMH in The Technical Take. This marked some congestion and the top of its late Nov gap. The SMH was hit early (TXN guidance) but after reaching 29.81 it has put together a rebound. The top of today's gap is at 30.40 with unchanged at 30.50.

6:41AM Lattice Semi announced it has entered into a definitive agreement to acquire SiliconBlue Technologies for ~ $62 mln in cash (LSCC) 6.58 : Co announced it has entered into a definitive agreement to acquire SiliconBlue Technologies. Under terms of the agreement, Lattice Semiconductor will pay ~$62 million in cash for SiliconBlue Technologies. The acquisition is subject to standard closing conditions, with a targeted close in the fourth quarter of 2011. Lattice Semiconductor ended the third quarter of 2011 with a cash, cash equivalents and short-term marketable securities balance of $267.2 mln.

6:37AM Lattice Semi lowers revenue guidance to a sequential revenue decline of 14-17% vs a decline of 4-9% prior guidance and 7.3% decline Capital IQ consensus (LSCC) 6.58 : Expectations for both gross margin percentage and total operating expenses are unchanged from prior guidance, at ~ 59% plus or minus 2% of revenue, and ~$35.6 million, including ~$1.0 mln in restructuring charges, respectively. Lowered guidance due to further softening of demand primarily in the communications business in December.

Semiconductor Manufacturing International (SMI) announced it entered into an agreement with Elpida Memory settling all pending arbitration claims and counterclaims relating to the parties' Amended and Restated 200mm Wafer Products Business Agreement. Under the terms of the Settlement Agreement, the co will pay Elpida $21 mln.

TE Connectivity (TEL $32.36 +0.30) reaffirmed guidance for the first quarter with EPS of $0.68-0.72 versus the $0.70 consensus and revenues of $3.4-3.5 billion versus the $3.44 billion consensus. The company reaffirmed guidance for fiscal year 2012 with EPS of $3.10-3.40 versus the $3.27 consensus and revenues of $14.3-14.9 billion versus the $14.68 billion consensus.

Leap Wireless (LEAP $9.96 +0.60) announced that it has entered into definitive agreements to acquire 12 MHz of 700 MHz A block spectrum in Chicago from Verizon Wireless (VZ) for $204 million and to sell Verizon Wireless excess PCS and AWS spectrum in various markets across the U.S for $188 million. This additional spectrum in the Chicago area will supplement the 10 MHz of spectrum Leap currently operates in Chicago. The companies anticipate that both transactions will close simultaneously, subject to regulatory approvals and other customary closing conditions. The sale of spectrum in these transactions will not impact Leap's operations in its existing operating markets. In addition, Leap's non-controlled, majority-owned venture, Savary Island Wireless, has also entered into a definitive agreement with Verizon Wireless to sell AWS spectrum in various markets for $172 million, subject to regulatory approvals and other customary closing conditions.

Texas Instruments (TXN $30.26 +0.03) was upgraded to Mkt Outperform from Mkt Perform at JMP Securities and the firm set a target price at $36 based on the emergence of favorable cycle indicators and their belief in the co's ability to drive upside margin leverage going forward.

Needham raises their Novellus (NVLS $36.56 +0.96) tgt to $40 from $37 following the mid quarter update. The firm prefers co over mid/large-cap semi equipment stocks for its strong positions at leading capex spenders, low exposure to second-tiered DRAM customers, improved leverage of its financial model and aggressive buyback program.

09:36 am Texas Instruments Down After Lowering Q4 Guidance Late Yesterday (TXN)
Texas Instruments (TXN $28.61 -1.31) is trading notably lower this morning after lowering its fourth quarter guidance after the close yesterday in its mid-quarter update.

The company reduced fourth quarter earnings guidance to $0.36 to $0.40 vs. the $0.46 consensus, down from $0.43-0.51 prior guidance. Revenue guidance was reduced to $3.19 billion to $3.33 billion consensus, versus the $3.406 billion Capital IQ Consensus Estimates, down from $3.26 billion to $3.54 billion prior guidance.

The reductions are due to broadly lower demand across a wide range of markets, customers and products, except for Wireless applications processors.
icon url

ReturntoSender

12/13/11 11:32 PM

#9621 RE: ReturntoSender #6755

From Briefing.com: 4:30 pm : The stock market was sporting an impressive gain in the early going, but the confluence of technical resistance, another retreat by the euro, and disappointment over the Fed's failure to give additional consideration to further quantitative easing forced stocks lower.

Prior to the open market participants were dealt some underwhelming retail sales numbers for November. Specifically, both total sales and sales less autos increased by 0.2%, but total sales had been generally expected to increase by 0.6%, while sales less autos had been generally expected to post a 0.5% increase.

Big box electronics retailer Best Buy (BBY 23.79, -4.28) issued another disappointing announcement for its third fiscal quarter that featured an earnings miss. The stock would inevitably slump for one of its worst performances of the past few years.

However, most traders were willing to look past such negative themes, focusing rather on the cues that were coming from Europe. Renewed buying interest there was partly credited to encouraging data from Germany, but day-to-day shifts in sentiment have been a recurring theme in recent months. Europe's major bourses would eventually slide.

Prior to Europe's pullback, stocks were able to build on their opening gains because of rumors that the Fed might make more than mere mention of the possibility of further quantitative easing. That took the stock market to an early gain of about 1%, but the inability of the S&P 500 to overcome technical resistance and a retreat by the euro dashed those gains. The euro ended the day about 1.1% lower at $1.303, which makes for its lowest level in 11 months.

Stocks found support at the flat line and even made a modest rebound, but sellers soon redoubled their efforts upon receiving the latest FOMC policy statement, which did not make any new mention of plans for further quantitative easing, but recognized that strains in global financial markets continue to pose significant downside risks to the economic outlook. To little surprise, the Fed kept target interest rate in the range of 0.00% to 0.25% and remained committed to extending the average maturity of its holdings.

Given the uncertainty of the macro picture, many investors continue to crave the safety of Treasuries, even with the yield on the benchmark 10-year Note at only 2.0%. Results from an auction of 10-year Notes today showed dollar demand of $74.1 billion on a bid-to-cover of 3.53 and an indirect bidder participation rate of 61.9%. For comparison, an average of the last six auctions gives dollar demand of $65.2 billion on a bid-to-cover of 3.03 and an indirect bidder rate of 42.2%.

Advancing Sectors: Utilities +0.5%
Declining Sectors: Telecom -0.1%, Health Care -0.2%, Consumer Staples -0.3%, Energy -0.5%, Tech -0.9%, Industrials -1.1%, Financials -1.5%, Materials -1.7%, Consumer Discretionary -2.0%DJ30 -66.45 NASDAQ -32.99 NQ100 -1.0% R2K -2.1% SP400 -1.9% SP500 -10.74 NASDAQ Adv/Vol/Dec 586/1.75 bln/1948 NYSE Adv/Vol/Dec 857/927 mln/2171

FSI International (FSII) announced it received a follow-on order for its ORION Single Wafer Cleaning System from a leading semiconductor producer to be used for BEOL applications.

6:04AM Cabot Micro Proposed leveraged recapitalization with special cash dividend of $15/share and Increase in authorized share repurchase program to $150 million (CCMP) 40.23 : Co intends to pay a special cash dividend of $15 per share, or ~$345 mln in aggregate, to its shareholders during the first quarter of calendar year 2012. Approximately half of the dividend is expected to be funded from the company's cash balance, and the remaining amount is expected to be funded with new debt. Payment of the special dividend is contingent upon arranging the associated financing with terms and conditions that are acceptable to the company. In addition, the Board has authorized an increase in the company's existing share repurchase program to $150 mln, from the previous available authorization of ~$83 mln.

Xilinx (XLNX) has expanded its footprint in the Asia Pacific region to include an R&D center, consolidating its local sales, marketing and application engineering operations into a single site.

icon url

ReturntoSender

12/14/11 9:00 PM

#9622 RE: ReturntoSender #6755

From Briefing.com: 4:30 pm : The stock market's third straight tumble has it down more than 3% this week. The downward path comes as participants revert to a negative bias bolstered by the absence of progress related to the improvement of Europe's precarious conditions.

For three straight days the path of least resistance for stocks has been downward. Negative sentiment has been induced by a muddled and tenuous macro outlook. Moreover, participants are growing weary of the lack of progress by Europe's leaders in restoring economic and financial conditions in both the core and periphery of the continent. That has provided fodder for rumors of further sovereign debt downgrades in the region.

Dwindling confidence in the region has the euro on a downward path. It dropped to an 11-month low, before stabilizing and finishing the session with a 0.4% loss at $1.298.

Efforts to pare risk extended to commodities, causing the CRB Index to drop 3.4%. The CRB hasn't had such a poor performance since September. Among the more closely tracked commodities, gold futures prices fell 4.6% to settle at $1587.70 per ounce, while silver futures prices were pressed to $28.86 per ounce for a 7.6% loss. Crude oil ended down 5.2% at $94.95 per barrel -- a smaller-than-expected weekly inventory draw didn't help.

The combination of sharply lower oil prices and broad market weakness made energy plays today's poorest performers. The sector slid almost to a loss of almost 3%. Everything from exploration plays to drillers to refiners were caught up in the sector's sell-off.

Benefiting from the drop in oil prices, airline shares ascended in the face of broad market weakness. Meanwhile, financials managed to limit losses to a collective decline of only 0.3%, despite the possible implications if problems in Europe persist, let alone worsen.

Treasuries extended their gains. Another strong auction helped. Results from an offering of 30-year Bonds drew a bid-to-cover of 3.05, dollar demand of $39.7 billion, and an indirect bidder rate of 32.5%. For comparison, an average of the past six auctions gives a bid-to-cover of 2.62, dollar demand of $36.4 billion, and indirect bidder participation of 31.6%.

Advancing Sectors: (None)
Declining Sectors: Health Care -0.2%, Financials -0.3%, Consumer Staples -0.5%, Telecom -0.6%, Utilities -0.8%, Industrials -1.1%, Consumer Discretionary -1.2%, Materials -1.2%, Tech -1.7%, Energy -2.7%DJ30 -131.46 NASDAQ -39.96 NQ100 -1.6% R2K -1.3% SP400 -1.6% SP500 -13.91 NASDAQ Adv/Vol/Dec 902/1.78 bln/1672 NYSE Adv/Vol/Dec 844/929 mln/2195

5:52PM Novellus pops ~$3.55 to $38.25 following news that Lam Research (LRCX) will buy NVLS (NVLS) :

5:51PM Novellus to be purchased by Lam Research (LRCX); Based on the closing price of LRCX's stock on Dec 14, 2011, the transaction values NVLS at a price of $44.42/common share (NVLS) 34.70 -0.61 : LRCX announced that it has entered into a definitive merger agreement to acquire Novellus Systems (NVLS) in an all-stock transaction valued at ~$3.3 billion. The combined enterprise, which will retain the name of Lam Research Corp., will be a semiconductor equipment co with a broad portfolio of market-leading products and multiple opportunities to drive value creation through significant revenue and cost synergies. Total cost synergies are expected to be ~$100 million on an annualized basis by the fourth quarter of 2013. In addition, Lam announced a $1.6 billion common stock repurchase program. This new program, which replaces Lam's existing share repurchase program, is targeted to be executed over the 12 months following the close of the transaction. Lam expects the transaction to be accretive to its non-GAAP earnings within one year after transaction close. Under the terms of the agreement, Novellus stockholders will receive 1.125 shares of Lam Research common stock for each share of Novellus that they own, in a tax-free exchange. Based on the closing price of Lam's stock on December 14, 2011, the transaction values Novellus at a price of $44.42 per common share. Upon closing, Lam and Novellus stockholders will own approximately 59 percent and 41 percent, respectively, of the combined company.

O2Micro International (OIIM) was issued 18 claims under United States patent number 8,040,341 for its Brightness Control System.

7:14AM First Solar lowers FY11 sales and EPS guidance below consensus; issues downside FY12 revenue guidance; issues FY12 EPS guidance (FSLR) 42.57 : Co lowers guidance for FY11 (Dec), sees EPS of $5.75-6.00 vs. $6.50-$7.50 prior guidance vs. $6.85 Capital IQ Consensus Estimate; sees FY11 (Dec) revs of $2.8-2.9 bln vs. $3.0-3.3 bln prior guidance vs $3.18 bln Capital IQ Consensus Estimate. Co issues guidance for FY12 (Dec), sees EPS of $3.75-4.25, may not be comparable to $7.20 Capital IQ Consensus Estimate; sees FY12 (Dec) revs of $3.7-4.0 bln vs. $4.11 bln Capital IQ Consensus Estimate. The primary reason for the revised 2011 guidance is continued delays of certain projects in First Solar's systems business due to weather and other factors. Not included in the revised guidance are expected charges related to a series of initiatives to accelerate operating cost reductions and improve overall operating efficiency, the majority of which the Company expects to incur in the current quarter. These charges include up to $0.75 per fully diluted share of impairment and associated charges primarily related to certain equipment, and a severance charge of up to $0.10 per fully diluted share related to a workforce reduction of approximately 100 associates, less than 1.5% of First Solar's workforce. "Our diverse business model and robust project pipeline will help First Solar generate a significant amount of cash in 2012 while improving operational efficiencies, but we are recalibrating our business to focus on building and serving sustainable markets rather than pursuing subsidized markets," (stock is halted)

6:00AM Powerwave files lawsuit against Microelectronics Technology for patent infringement (PWAV) 1.92 : Co announced that it has filed a patent infringement lawsuit against Microelectronics Technology and MTI Laboratory in the United States District Court for the Central District of California, Southern Division. The suit alleges that MTI is infringing US Patent 6,818,477 entitled "Method of Mounting a Component in an Edge Plated Hole Formed in a Printed Circuit Board." The suit further alleges that MTI is making, using, selling, offering for sale and/or importing communications products such as Remote Radio Heads which contain circuit boards that embody the inventions claimed in US Patent 6,818,477 owned by Powerwave Technologies.

NVIDIA (NVDA) announced that BGI, the world's largest genomics institute, has slashed the time to analyze batches of DNA sequencing data from nearly four days to just six hours using a NVIDIA Tesla GPU-based server farm.

09:25 am Volterra Semi downgraded to Buy at Needham; tgt lowered to $28: . Needham downgrades VLTR to Buy from Strong Buy and lowers their tgt to $28 from $29 given the recent recovery in VLTR shares they revisited their thesis and fine tuned their model by making slight reductions to their aggressive Q1 2012 estimates.

10:57 am S&P Tech Sector Down 1.5%
The tech sector is trading lower today, trailing lesser losses in the broader market. Semiconductors are showing relative strength in the tech space, however, with the Philly Semi Index trading only 0.7% lower. BRCM (+4.8%) is a standout following upside guidance, while RBCN (-4.1) is a notable laggard in the chip index. Among other major indices, the S&P 500 is trading 0.7% lower, while the NASDAQ is trading 1.3% lower and the QQQ is 1.2% lower on the session. Among tech bellwethers, CSCO (-2.3%) is a notable underperformer.

In earnings last night, SQNS (-29.6%) lowered guidance well below consensus. This morning, BRCM (+4.8%) raised Q4 guidance above consensus.

Among rumors, we are hearing GOOG (-0.8%) for IDCC (+1.1%) making the rounds.

Among notable analyst upgrades this morning, APKT (-2.6%) was upgraded to Outperform at Morgan Keegan and RCI (0.0%) was upgraded to Outperform at RBC Capital. Also, EBAY (-0.7%) was resumed with a Buy at Goldman and added to its Conviction Buy List. Among downgrades, ADTN (-2.1%) was downgraded to Hold at Jefferies, ACOM (-6.1%) was downgraded to Equal Weight at Morgan Stanley, and Needham downgraded VLTR (-3.1%) to Buy.
icon url

ReturntoSender

12/15/11 3:11 PM

#9623 RE: ReturntoSender #6755

Oil Hits Resistance while Gold Breaks Down. Possible indicators that the market may be headed lower despite the latest job numbers.


In a Bear Market and a Corresponding Recession Not One Sector of the Market is Spared. Even Gold Normally Seen as a Safe Harbor Sells Off.

You can see here that Gold is selling off Below both its 50 and 200 day sma's. This something not seen since the 2008/2009 economic downturn:


JMHO, RtS
icon url

ReturntoSender

12/15/11 8:33 PM

#9624 RE: ReturntoSender #6755

From Briefing.com: 4:30 pm : Stocks had looked like they would come rallying back from three straight losses, but the broad market's inability to overcome resistance in the early going prompted many participants to exit their positions. Stocks chopped along for the rest of the session and eventually settled with modest gains.

After watching the stock market descend more than 3% during the course of the past three sessions, buyers were finally brought back into the fold. Their interest was initially stirred because Europe's major bourses had been able to bounce on the back of a successful debt offering from Spain and news of improved eurozone manufacturing activity during December. Those themes also helped lift the euro off of the multi-month lows that it had set in the prior session. China reported overnight that it also experienced an improvement in manufacturing activity during December.

Market participants were also encouraged by domestic data. The latest initial weekly jobless claims tally fell to 366,000, which is the smallest count since May 2008. Economists polled by Briefing.com had generally expected a tally on the order of 390,000.

Overall producer prices increased in November by 0.3%, which came as a surprise since a more tepid increase of 0.1% had been generally expected. However, core producer prices increased by an in-line 0.1%.

The Empire State Manufacturing Survey improved to 9.5 for December. Many had expected a reading of just 3.0 for the Survey. The Philadelphia Fed Survey scored a reading of 10.3 in December, surpassing expectations for something closer to 4.5.

Industrial production data was a bit more blemished, but that was generally overlooked. It showed a 0.2% decline in overall activity, contrasting with the consensus call for a 0.2% increase. Industrial production last declined in April.

Although quarterly reports were limited in quantity, a couple of notable announcements featured solid overall results, even if the response to those announcements varied. The latest from FedEx (FDX 83.47, +6.18) featured a better-than-expected bottom line. Discover Financial Services (DFS 23.07, -0.75) had an upside earnings surprise of its own and even increased its quarterly dividend.

Even with all the encouraging headlines, the S&P 500 still couldn't overcome resistance in the 1225 region, which contains its 50-day moving average. The failure to build on opening gains made many skeptical of the stock market's strength. That prompted plenty of people to pocket profits and drive down the major averages. Although the broad market stayed in positive territory, stocks never returned to session highs.

Financials had been the biggest beneficiaries of the early bounce by breaking out to a 1.5% gain. By session's end all of that was dashed -- the sector finished flat.

Technology-related stocks lagged almost all session, causing the tech-rich Nasdaq to trail its counterparts. Tech stocks settled with a collective loss of 0.3%, which is the worst of the major sectors.

Defensive-oriented issues displayed strength for most of the session. That helped the consumer staples, health care, and utilities sectors all book gains of 1% or more. Utilities stocks are actually among this year's strongest performers; the sector is currently sitting on a year-to-date gain of about 11%, while the broad market is down about 3% this year.

Advancing Sectors: Utilities +1.4%, Health Care +1.1%, Consumer Staples +1.0%, Industrials +0.7%, Materials +0.6%, Consumer Discretionary +0.2%, Telecom +0.2%
Unchanged: Financials
Declining Sectors: Energy -0.2%, Tech -0.3%DJ30 +45.33 NASDAQ +1.70 NQ100 -0.3% R2K +1.1% SP400 +0.8% SP500 +3.93 NASDAQ Adv/Vol/Dec 1465/1.74 bln/1067 NYSE Adv/Vol/Dec 1872/860 mln/1108

4:23PM Research In Motion beats by $0.08, misses on revs; guides Q4 EPS, revs below consensus (RIMM) 15.13 +0.05 : Reports Q3 (Nov) earnings of $1.27 per share, $0.08 better than the Capital IQ Consensus Estimate of $1.19; revenues fell 5.9% year/year to $5.17 bln vs the $5.24 bln consensus. The rev breakdown for the quarter was ~79% for hardware, 19% for service and 2% for software and other revenue. During the quarter, RIM shipped ~14.1 million BlackBerry smartphones and ~150,000 BlackBerry PlayBook tablets; GAAP GM -1630 bps YoY to 27.3%; smartphone shipments +33% QoQ to 14.1 mln. Co issues downside guidance for Q4, sees EPS of $0.80-0.95 vs. $1.10 Capital IQ Consensus Estimate; sees Q4 revs of $4.6-4.9 bln vs. $5.05 bln Capital IQ Consensus Estimate. Gross margin percentage for the fourth quarter is expected to be ~38%. BlackBerry smartphone shipments are expected to be between 11-12 mln units. "Despite the challenges faced in the third quarter, the BlackBerry subscriber base grew to almost 75 mln customers around the world. In addition, RIM launched a range of new BlackBerry 7 based smartphones globally and introduced holiday promotions that helped drive growth in the installed base of BlackBerry PlayBook users... As part of our commitment to improving our performance to better meet the expectations of shareholders and customers, we continue to evaluate ways to improve in several areas of the Company's operations. It may take some time to realize the benefits of these efforts and the platform transition that we are undertaking, but we continue to believe that RIM has the right set of strengths and capabilities to maintain a leading role in the mobile communications industry."

4:13PM Freescale Semi realigns product groups; creates two new strategic product groups - Networking & Multimedia Solutions and Automotive & Industrial Solutions (FSL) 12.17 +0.03 :

4:09PM Adobe Systems beats by $0.07, misses on revs; guides Q1 EPS in-line, revs in-line; guides FY12 EPS in-line, revs above consensus (ADBE) 26.46 -0.06 : Reports Q4 (Nov) earnings of $0.67 per share, $0.07 better than the Capital IQ Consensus Estimate of $0.60; revenues rose 14.4% year/year to $1.15 mln vs the $1087.23 mln consensus. Co issues in-line guidance for Q1, sees EPS of $0.54-0.59, excluding non-recurring items, vs. $0.57 Capital IQ Consensus Estimate; sees Q1 revs of $1.025-1.075 bln vs. $1.05 bln Capital IQ Consensus Estimate. Co issues mixed guidance for FY12, sees EPS of $2.37-2.47, excluding non-recurring items, vs. $2.43 Capital IQ Consensus Estimate; sees FY12 revs of $4.4-4.5 bln vs. $4.35 bln Capital IQ Consensus Estimate.

8:04AM Texas Instruments announced that it is transferring its stock exchange listing to The NASDAQ Global Select Market from The New York Stock Exchange, effective January 1, 2012 (TXN) 28.04 : Co announced that it is transferring its stock exchange listing to The NASDAQ Global Select Market from The New York Stock Exchange, effective January 1, 2012. TI shares will begin trading as a NASDAQ-listed security on January 3, 2012, and will continue to trade under the symbol TXN.

Poynt Corporation announced an agreement with Nokia (NOK) to preload its mobile platform, timesPoynt and Times Internet Limited on all Nokia Lumia 710 and Nokia Lumia 800 smartphones in India.

09:27 am Magma Design downgraded to Underperform at Needham: . Needham downgrades LAVA to Underperform from Buy saying the shares are within 2% of the offer price from Synopsys with likely several more months until the close. More significantly, however, firm says their analysis of LAVA's recently filed 10-Q and earlier filings reveals that the company has seen a sharp spike in up front revenue in 2 of the last 3 quarters, which they think suggests the company's sustainable revenue run rate could be materially below recent and projected levels if it were to adhere to its targeted 10% up front model. They note Magma will have to report at least one more quarter before the expected closure of its acquisition by SNPS.

11:02 am S&P Tech Sector Is Down Modestly, While The S&P 500 Is In Positive Territory
The tech sector is trading slightly lower today, trailing gains in the broader market. Semiconductors are showing relative strength in the tech space, however, with the Philly Semi Index trading 0.5% higher. NVLS (+21.8%) is lifting the chip index after it was acquired. Among other major indices, the S&P 500 is trading 0.4% higher, while the NASDAQ is trading flat and the QQQ is 0.2% lower on the session. Among tech bellwethers, CSCO (-2.7%) is a notable underperformer.

In earnings last night, PAY (-7.1%) reported Q4 beat and provided mixed Q1 guidance, but upside FY12 guidance.

In news last night, LRCX (-3.2%) announced it entered into a merger agreement to acquire NVLS (+21.8%) in an all-stock transaction valued at ~$3.3 billion.

Among notable analyst ratings changes this morning, LEAP (+7.2%) and PCS (+4.3%) were upgraded to Buy at Mizuho, SWKS (+2.5%) was upgraded to Buy at Deutsche Bank, BRCM (+0.5%) was upgraded to Outperform at Wells Fargo. Also, AAPL (0.0%) was named a long Research Tactical Idea at Morgan Stanley.

ACN (+0.8%), RIMM (-0.2%), and ADBE (+0.8%) are the notable names in tech scheduled to report results today after the close.

10:49 am FedEx Up 5% Following Earnings/Guidance Results This Morning (FDX)
FedEx (FDX $81.23 +3.94) is trading notably higher this morning earnings/guidance results and is currently about a half of a point below its session high of $81.65.

Earlier, the company reported earnings of $1.57 per share, $0.04 better than the Capital IQ Consensus Estimate of $1.53.

Revenues rose 10.0% year/year to $10.59 billion versus the $10.61 billion consensus.

For the third quarter, the company expects to see earnings in the range of $1.25 to $1.45 versus $1.31 Capital IQ Consensus Estimate. For its fiscal year 2012, the company reaffirmed earnings guidance at $6.25 to $6.75 versus $6.30 Capital IQ Consensus Estimate.

In order to continue the modernization of the co's aircraft fleet, FedEx Express has signed an agreement with Boeing (BA) to purchase 27 new 767-300F aircraft, with three arriving in fiscal 2014 and six per year in fiscal 2015-2018. "FedEx Express took action during the quarter to adjust its network, particularly in Asia, as recent inventory destocking trends have impacted demand for our FedEx Express services. The deferral of our 777 aircraft deliveries is a continuation of those efforts, enabling us to make appropriately-timed international 777 capacity additions over the next decade. With these actions, we expect fiscal 2013 capital expenditures to moderate to ~$3.8 billion."

10:17 am Philly Fed Business Outlook Improves in December
Manufacturing conditions in the Philadelphia Fed region improved in December as the Philadelphia Fed's Business Outlook increased from 3.6 in November to 10.3 in December.

New and unfilled orders both strengthened in December. The New Orders Index increased from 1.3 in November to 9.7 in December. Unfilled orders returned to an expansion mode, increasing from -1.5 in November to 7.2 in December.

In a slightly unusual twist, the gains in orders did not immediately affect growth in shipments. While shipments continued to expand in December, the rate of expansion softened slightly as the respective index fell from 7.3 in November to 6.7. The drop was most likely the result of the pickup in unfilled orders and should lead to stronger growth over the next few months.

The employment outlook weakened in December. The Number of Employees Index fell from 12.0 in November to 10.7 in December. At the same time, the Average Employees Workweek Index dropped from 11.0 to 2.5.

10:06 am Industrial Production Declines for the First Time Since April
Industrial production declined 0.2% in November after increasing 0.7% in October. The Briefing.com consensus expected industrial production to increase 0.2%.

After increasing 0.5% in October, manufacturing production fell 0.4% in November.

While the decline in manufacturing is disappointing, the sector had been running hot for the past few months. In this situation, a slight pullback is not unusual or a sign of trending weakness. In fact, the New York Fed's Empire Manufacturing Survey already showed a pickup in manufacturing activities in December. Our expectation is that solid growth across the manufacturing sector will return next month.

Half of the decline in manufacturing production in November can be attributed to weakness in motor vehicle production.

Motor vehicle assemblies fell from 9.15 mln SAAR in October to 8.66 mln SAAR in November. That is the lowest number of assemblies since July. Auto assemblies declined from 3.17 mln SAAR in October to 3.11 mln SAAR in November. Truck assemblies declined from 5.71 mln SAAR to 5.29 mln SAAR.

Outside of the motor vehicle sector, most manufacturing sectors edged downward, which was in-line with the weakness seen in the November Fed regional manufacturing surveys.

Mining production, which increased 2.1% in October, slowed and increased only 0.1% in November. Utilities production rebounded and increased 0.2% in November after declining in each of the previous three months.

10:01 am PPI Inches Higher on a Stronger-than-Expected Increase in Food Price
Producer prices increased 0.3% in November after declining 0.3% in October. The Briefing.com consensus expected the PPI to increase 0.1%.

Almost the entire gain can be attributed to a 1.0% gain in food prices, which specifically came from an 11.5% price jump in fresh and dry vegetables. As expected, energy price growth remained soft and increased only 0.1% in November.

Excluding food and energy, core prices increased 0.1% and matched consensus expectations.

There were no unusual trends in core growth.

Pricing pressures down the manufacturing pipeline remain weak in November. Core intermediate prices declined for the third time since August while core crude prices declined for the second consecutive month.
icon url

ReturntoSender

12/18/11 5:03 PM

#9625 RE: ReturntoSender #6755

From Briefing.com: Weekly Recap - Week ending 16-Dec-11The stock market was bid higher in the early going, but for the second straight session its failure to overcome resistance resulted in selling that left the major averages to finish the week in relatively mixed fashion.

This morning stocks benefited from strong buying on above-average volume, which was inflated by quadruple witching options expiration. Another pullback in sovereign debt yields was regarded as a relatively tacit sign that confidence in the precarious eurozone periphery may have improved, at least for the time being. That notion also helped the euro, although the currency's early gain was eventually clipped.

Although Europe's bourses ultimately forfeited their gains to end the week on a down note, many there seemed unsurprised by the decision by Fitch to cut ratings on several of the continent's major financial outfits. Bank of America (BAC 5.20, -0.06) and Goldman Sachs (GS 90.10, -1.80) were included in that list, but financials still provided leadership. The sector settled with a 0.5% gain after retreating alongside the broad market.

The broad market had been up about 1% in the early going, but rolled over after it failed to push past a key pivot point. Interestingly, that point proved too much to overtake after the S&P 500 successfully cleared its 50-day moving average, which had been a challenging line in the prior session and in the opening minutes of trade on Friday.

The modest gain helped improve the stock market's weekly performance, but not by much. Stocks suffered a weekly loss of slightly less than 3%. They're also down about 3% year to date.

The inability to overcome resistance in the prior session also prompted participants to turn against stocks. Buyers had initially began to scoop up stocks after the broad market had tumbled for a cumulative loss of more than 3% during the course of only three sessions. Sentiment was strengthened amid a successful debt offering from Spain and news of improved eurozone manufacturing activity during December. Domestic data also provided encouragement in the early going, but it was eventually shrugged off.

The first three sessions of the week saw stocks average losses of about 1%. A lack of progress by Europe's leaders in restoring economic and financial conditions in both the core and periphery of the continent often hung over the minds of many traders. Those themes also implicated the euro; it dropped to an 11-month low near $1.29 on Wednesday before making a modest recovery in the back half of the week. The euro suffered a weekly loss of 2.6%.

Trade on Tuesday saw stocks advance in the early going, but inevitably rolled over as participants opted to sell after the Fed failed to offer any new sign that it may be considering the implementation of another round of quantitative easing. Instead, the Fed kept its target interest rate in the range of 0.00% to 0.25% and remained committed to extending the average maturity of its holdings, as had been widely expected.

The week began with participants discouraged by data that showed China, a key player in keeping the global economy afloat, experienced a slowdown in export growth during November. Concerns were also raised about the formidable task associated with the efficient implementation of plans established during the previous week's eurozone summit.

Corporate news was mixed this week. Dow component and semiconductor bellwether Intel (INTC 23.23, -0.08) disappointed investors at the beginning of the week by issuing a cautious outlook. Big box electronics retailer Best Buy (BBY 23.19, -0.17) posted earnings that came short of what Wall Street had expected. On the positive side of things, FedEx (FDX 84.89, +1.42) reported a better-than-expected bottom line, while Discover Financial Services (DFS 24.23, +1.16) posted an upside earnings surprise of its own. The company also increased its quarterly dividend. A strong quarterly report from Adobe Systems (ADBE 28.20, +1.74) proved pleasing to investors at week's end.

Data for the week featured retail sales numbers for November that featured a 0.2% increase in both total sales and sales less autos. Total sales had been expected to increase by 0.6%, while sales less autos had been generally expected to post a 0.5% increase.

The latest initial weekly jobless claims tally dropped to a 43-month low of 366,000. Economists polled by Briefing.com had expected something closer to 390,000.

December readings for the Empire State Manufacturing Survey and the Philadelphia Fed Survey improved to 9.5 and 10.3, respectively. It was generally expected that the Empire State Manufacturing Survey would improve to 3.0 and that the Philly Fed Survey would improve to just 4.5.

Industrial production declined by 0.2%, which contrasted with the consensus call for a 0.2% increase. Industrial production last declined in April.

November price data were also posted this week. Overall producer prices increased by 0.3%, but core prices increased by 0.1%. Total consumer prices were flat, but core prices increased by 0.2%. All producer price measures and consumer price measures had been expected to increase by 0.1%. There was nothing unusual in the core data that suggests inflationary problems may be gaining traction as we head into 2012.

Precarious market conditions spurred above-average demand at the latest series of Treasury auctions. An auction of 3-year Notes drew a bid-to-cover of 3.62, dollar demand of $115.8 billion, and an indirect bidder participation rate of 39.1%. An auction of 10-year Notes attracted dollar demand of $74.1 billion on a bid-to-cover ratio of 3.53 and an indirect bidder participation rate of 61.9%. A 30-year Bond auction drew a bid-to-cover of 3.05, dollar demand of $39.7 billion, and an indirect bidder rate of 32.5%. By the end of the week the yield on the benchmark 10-year Note dropped to a two-month low just beneath 1.85%.
 
Index Started Week Ended Week Change % Change YTD %
DJIA 12184.26 11866.39 -317.87 -2.6 2.5
Nasdaq 2646.85 2555.33 -91.52 -3.5 -3.7
S&P 500 1255.19 1219.66 -35.53 -2.8 -3.0

09:15 am Linear Tech upgraded to Outperform at Oppenheimer; tgt $36: . Oppenheimer upgrades LLTC to Outperform from Perform and sets target price at $36 saying typical of past corrections, in July, LLTC was one of the first to identify and react to the looming 2H11 slowdown. Firm says order patterns have since stabilized, as the channel continues working inventories ever leaner-a classic over-correction. Similar to TXN's mid-quarter, tey look for a soft 2Q (Dec) print in January, but anticipate a broad inventory re-stock in 1H12 will breathe fresh life into shares.

11:54 am S&P Tech Sector Showing Gains, Slightly Outperforming the S&P 500
The tech sector is trading higher today, just ahead of gains in the broader market. Semiconductors are showing relative strength in the tech space with the Philly Semi Index trading 1.3% higher. WFR (+5.2%) is the standout in the chip index. Among other major indices, the S&P 500 is trading 0.7% higher, while the NASDAQ is trading 1.1% higher and the QQQ is 0.9% higher on the session. Among tech bellwethers, MSFT (+2.1%) are showing strength, while IBM (-1.6%) is a notable underperformer.

In earnings last night, ADBE (+7.3%) and ACN (-4.9%) reported quarterly beats and provided guidance in-line with consensus. Elsewhere, RIMM (-10.7%) posted Q3 results in-line with the company's preannouncement and provided guidance below consensus.

In news, ZNGA (+0.5%) opened for trading at $11, above its $10 pricing. Elsewhere, SINA (-4.1%) is lower today on news that Beijing officials will require microblogs to register real names of its users. Among rumors, we are hearing WDC (+2.1%) takeover chatter making the rounds. Among notable analyst upgrades this morning, Oppenheimer upgraded LLTC (+1.7%) to Outperform.

Among downgrades, SAP (-1.8%) was downgraded to Neutral at BofA/Merrill and ERIC (-2.6%) was downgraded to Neutral at UBS.

10:13 am Research In Motion Down Almost 12% On Yesterday's Earnings/Guidance Results (RIMM)
Research In Motion (RIMM $13.38 -1.75) is trading sharply lower following its earnings and guidance results after the close yesterday.

Late yesterday, the company reported earnings of $1.27 per share, $0.08 better than the Capital IQ Consensus Estimate of $1.19.

Revenues fell 5.9% year/year to $5.17 bln vs the $5.24 bln consensus.

The revenue breakdown for the quarter was ~79% for hardware, 19% for service and 2% for software and other revenue. During the quarter, RIM shipped ~14.1 million BlackBerry smartphones and ~150,000 BlackBerry PlayBook tablets; GAAP GM -1630 bps YoY to 27.3%; smartphone shipments +33% QoQ to 14.1 mln.

For the fourth quarter, the company expects to see earnings guidance of $0.80 to $0.95 versus the $1.10 Capital IQ Consensus Estimate; sees revenues of $4.6 billion to $4.9 billion versus the $5.05 billion Capital IQ Consensus Estimate. Gross margin percentage for the fourth quarter is expected to be ~38%.

BlackBerry smartphone shipments are expected to be between 11-12 mln units. "Despite the challenges faced in the third quarter, the BlackBerry subscriber base grew to almost 75 mln customers around the world. In addition, RIM launched a range of new BlackBerry 7 based smartphones globally and introduced holiday promotions that helped drive growth in the installed base of BlackBerry PlayBook users... As part of our commitment to improving our performance to better meet the expectations of shareholders and customers, we continue to evaluate ways to improve in several areas of the Company's operations. It may take some time to realize the benefits of these efforts and the platform transition that we are undertaking, but we continue to believe that RIM has the right set of strengths and capabilities to maintain a leading role in the mobile communications industry."

09:49 am Adobe Up Almost 7% On Yesterday's Earnings/Guidance Results (ADBE)
Adobe (ADBE $28.29 +1.83) is trading notably higher following its earnings/guidance results after the close yesterday.

Late yesterday, the company reported earnings of $0.67 per share, $0.07 better than the Capital IQ Consensus Estimate of $0.60.

Revenues rose 14.4% year/year to $1.15 million versus the $1087.23 million consensus.

For the first quarter, the company issued earnings results of $0.54 to $0.59, excluding non-recurring items, versus $0.57 Capital IQ Consensus Estimate; sees first quarter revenue of $1.025 billion to $1.075 billion versus the $1.05 bln Capital IQ Consensus Estimate.

For its fiscal year 2012, the company expects to see earnings of $2.37 to $2.47, excluding non-recurring items, versus $2.43 Capital IQ Consensus Estimate; sees revenues of $4.4 billion to $4.5 billion versus the $4.35 billion Capital IQ Consensus Estimate.
Russell 2000 745.40 722.05 -23.35 -3.1 -7.9
icon url

ReturntoSender

12/19/11 10:47 PM

#9627 RE: ReturntoSender #6755

From Briefing.com: 4:30 pm : Modest broad market gains in the early going were undermined by a weak financial sector, which tumbled more than 2% to drag the rest of the stock market to a new December low.

News flow was lacking this morning, leaving market participants with few trading cues, let alone actual catalysts. In turn, stocks took their direction from Europe's bourses, which were initially bid higher. However, support for Europe's bourses waned into their close. Soured sentiment there exacerbated selling in an already weak financial sector, which continues to wrestle with concerns about the exposure of banks and financial services firms to the precarious financial and economic conditions of Europe. News that European Finance Ministers have agreed to provide 150 billion euros to the International Monetary Fund did nothing to assuage concerns.

Financials likely suffered from some forced selling after shares of Bank of America (BAC 4.99, -0.21) broke below $5 per share to set its lowest level in more than two years. As a group, financials fell 2.3%, which is worse than what any other sector had suffered. The highly influential sector now sits at its lowest level since the end of November. Such weakness weighed heavily on broader market trade, causing the major equity averages to close at new December lows.

The dollar did little during the day, but ultimately ended the session about 0.3% for the better. Interest in the currency picked up into the close.

Treasuries continued their climb, albeit modestly. The bid came despite results from an auction of 2-year Notes that suggested demand had weakened since a series of auctions for longer-term Notes last week. The auction today drew a bid-to-cover of 3.45, dollar demand of $120.8 billion, and an indirect bidder rate of 21.6%.

Participation today was unimpressive, resulting in very little share volume. That's likely owed to the absence of trading catalysts and traders, who are beginning to leave their desks for the holiday season.

Advancing Sectors: (None)
Declining Sectors: Health Care -0.3%, Consumer Staples -0.4%, Telecom -0.7%, Utilities -0.8%, Tech -1.1%, Industrials -1.1%, Consumer Discretionary -1.2%, Energy -1.7%, Materials -1.9%, Financials -2.3%DJ30 -100.13 NASDAQ -32.19 NQ100 -1.0% R2K -1.9% SP400 -1.7% SP500 -14.31 NASDAQ Adv/Vol/Dec 569/1.55 bln/2026 NYSE Adv/Vol/Dec 644/775 mln/2386

9:32AM TranSwitch's TXC-44144 HDplay transceiver integrated circuit has been selected by Universal Microelectronics for the U-HD1080S video switch product (TXCC) 2.84 +0.02 :

8:32AM Xilinx lowers Q3 rev guidance below consensus; raises gross margin guidance (XLNX) 31.21 : Co lowers Q3 sales guidance to -9 to -12% QoQ to ~$488.6-505.2 mln from -3 to -8% QoQ vs $517.19 mln Capital IQ Consensus Estimate. Weaker sales during the quarter are driven primarily by a decline in large customer business in the Communications end market. Gross margin is expected to be ~65%. This is a revision from previous guidance of ~64%.

8:02AM Broadcom announced that court has found that Emulex (ELX) infringed two Broadcom patents (BRCM) 28.72 : Co announced today that the United States District Court for the Central District of California has found that Emulex Corporation (ELX) infringed two Broadcom patents: U.S. Patent Nos. 7,058,150 and 7,471,691. The infringing products include Emulex's BladeEngine 2 (BE2), BladeEngine 3 (BE3) and Lancer (XE201) chips and four of Emulex's Fibre Channel switch products. The BE2 and BE3 are 10 Gigabit Ethernet controllers, which are sold as Ethernet controllers and used in Emulex's OneConnect Converged Network Adapters. The Court also rejected Emulex's challenge to the validity of the patents. In addition, the Court rejected Emulex's challenge to an earlier damages award for the '150 patent.

Mattson Technology (MTSN) announced that it has received orders for multiple SUPREMA photoresist strip systems from a leading semiconductor manufacturer.

icon url

ReturntoSender

12/20/11 11:34 PM

#9628 RE: ReturntoSender #6755

From Briefing.com: 4:30 pm : The risk trade was flipped back on today. That brought about a barrage of buying that drove stocks up from December closing to their best single-session gain of the month.

Stocks settled the prior session in weak fashion by closing at their lowest levels of December, but the tone of trade improved overnight with help from Europe. In contrast to the action on Monday, Europe's bourses were able to sustain strong gains, which were underpinned by strong demand and lower yields at Spain's latest debt auction. A few solid business and consumer sentiment surveys from Europe also helped bolster confidence.

Stronger sentiment across the Atlantic also spurred the euro sharply higher. It finished shy of its session high, but still booked a 0.5% gain.

Domestic stocks were quick to build on opening gains. Their ascent seemed to slow only briefly when the S&P 500 crossed its 50-day moving average and again before it passed last week's closing low. The stock market's climb was likely made easier by a lack of share volume. That said, participation did pick up into the close.

Commodities also scored strong gains, giving the CRB Index a 2.0% gain today. It hasn't made such a strong move since October. Its climb was helped by the dollar's downturn.

The combination of broad market strength and support for commodities made natural resource plays some of the session's best performers. Materials stocks and energy stocks collectively climbed close to 4%.

Financials were also leaders. The sector settled with a near 4% gain of its own, undeterred by steps proposed by the Federal Reserve to strengthen regulation and supervision of large bank holding companies or those designated to be systemically important. Many were unsurprised that the Fed would want risk-based capital and leverage requirements.

Big gains by homebuilders sent the SPDR S&P Homebuilders ETF (XHB 16.79, +0.84) more than 5% higher. The group was helped by news that housing starts and building permits for November hit annualized rates of 685,000 units and 681,000 permits, respectively. Economists polled by Brieifng.com had expected housing starts to hit a pace of 627,000 units and building permits to reach a clip of 633,000 permits.

CVS Caremark (CVS 39.80, +3.24) was one of the better performing individual names. An in-line earnings outlook wasn't a big deal, but the company's decision to hike its dividend by 30% prompted a positive response.

AT&T (T 29.12, +0.38) ended its bid for Deutsche Telekom's T-Mobile USA. That decision led to a downgrade from analysts at JP Morgan, but the stock was still able to score a solid gain.

General Mills (GIS 39.27, -0.32) was one of the few stocks that failed to gain today. The stock was hurt by a disappointing quarterly report that featured an earnings miss. Nike (NKE 93.63, +0.25) managed to muster a modest gain, but the stock had a difficult time sustaining support ahead of its quarterly report.

Advancing Sectors: Energy +4.0%, Materials +3.9%, Financials +3.8%, Industrials +3.4%, Tech +3.1%, Consumer Discretionary +2.8%, Health Care +2.1%, Utilities +2.1%, Telecom +1.9%, Consumer Staples +1.9%
Declining Sectors: (None)DJ30 +337.32 NASDAQ +80.59 NQ100 +3.0% R2K +4.2% SP400 +3.5% SP500 +35.95 NASDAQ Adv/Vol/Dec 2198/1.83 bln/465 NYSE Adv/Vol/Dec 2687/933 mln/375

6:11PM Motorola Mobility reports that Initial Determination from ITC Finds That Motorola Mobility Did Not Violate Six of the Seven Patents (MMI) 38.70 +0.01 : Motorola Mobility Holding (MMI) announced that it has received notice that the Administrative Law Judge ("ALJ") in the U.S. International Trade Commission ("ITC") action brought by Microsoft (MSFT) against Motorola Mobility has issued an initial determination. The ALJ determined that Motorola Mobility does not violate six of the seven Microsoft patents listed in Microsoft's suit. The Company noted that Microsoft had previously dropped two patents from its original case which included nine patents.

4:03PM Jabil Circuit reports EPS in-line, misses on revs; guides Q2 EPS in-line, revs below consensus (JBL) 19.95 +0.99 : Reports Q1 (Nov) earnings of $0.65 per share, in-line with the Capital IQ Consensus Estimate consensus of $0.65; revenues rose 6.0% year/year to $4.33 bln vs the $4.41 bln consensus. Co issues mixed guidance for Q2, sees EPS of $0.52-0.62, excluding non-recurring items, vs. $0.59 Capital IQ Consensus Estimate; sees Q2 revs of $4.0-4.2 bln vs. $4.22 bln Capital IQ Consensus Estimate.

4:03PM FSI Intl misses by $0.02, misses on revs; guides Q2 revs above consensus (FSII) 3.00 -0.10 : Reports Q1 (Nov) loss of $0.08 per share, $0.02 worse than the Capital IQ Consensus Estimate of ($0.06); revenues rose 22.0% year/year to $13.3 mln vs the $17.76 mln consensus. Co issues upside guidance for Q2, sees Q2 revs of $30-35 mln vs. $25.73 mln Capital IQ Consensus Estimate. Co said, "A portion of the expected revenue is subject to the receipt of purchase orders and the shipment and recognition of revenue occurring in the quarter. Based upon the anticipated gross profit margin and operating expense level, the co expects to report between $2.0-3.0 million of net income for the second quarter of fiscal 2012.

KVH Industries (KVHI) announced that it has received a $7.6 mln order for its single-axis fiber optic gyros from an international defense contractor to support weapon and optical stabilization in remote weapon stations for the U.S. military. Delivery of this order will begin immediately and continue into 2013.

Credorax announced that it has selected AMD (AMD) Opteron processors for its proprietary NextGen ePower Payment Processing and Acquiring Platform.

10:33 am F5 Networks upgraded to Outperform at Oppenheimer; tgt $125: . Oppenheimer upgrades FFIV to Outperform from Perform and sets target price at $125. The firm's call is not based on specific near-term business performance (which could very well still be challenging), but rather is aimed at positioning investors into 2012. They believe FFIV has opportunities to gain share in the ADC market in 2012 and expand its footprint in the carrier market as more network applications are adopted.

11:30 am Jefferies Up 17% On This Morning's Earnings (JEF)
Jefferies (JEF $13.74 +1.94) is trading sharply higher today, which is driven by the company's earnings results that were released this morning.

Earlier, the company reported fourth quarter earnings of $0.17 per share, excluding non-recurring items, in-line with the Capital IQ Consensus Estimate consensus of $0.17.

Net revenues, less mandatorily redeemable preferred interest fell 16.4% year/year to $556 million versus the $567.84 million consensus. Net revenues in Investment Banking were $261 million compared to $292 million in prior year.

"We are proud of our 3,851 employee-partners who successfully navigated an extremely challenging fourth quarter that included continuing global volatility compounded by a November filled with a barrage of misinformation about Jefferies. Our firm responded by reducing our total balance sheet by nearly one quarter, decreasing our leverage to 9.9x from 12.9x, maintaining the already high quality of our inventory, and delivering solid profitability," commented Richard B. Handler, Chairman and Chief Executive Officer of Jefferies.

Average firmwide VaR $9.47 million compared to $10.48 million in Q3... Adjusted tangible book value per share is $13.74 compared to $13.18 in Q3... Fixed Income revenues $140 million compared to $33 million in Q3... Equity revenue $27 million compared to $58 million in Q3... Debt revenue $62 million compared to $128 million in Q3... Capital markets revenue $89 million compared to $186 million in Q3... Advisory fees $172 million compared to $107 million in Q3.

11:25 am S&P Tech Sector Up Sharply, In-line With Broader Market
The tech sector is trading higher today along with gains in the broader market. Semiconductors are showing relative strength in the tech space, however, with the Philly Semi Index trading 3.8% higher. RBCN (+8.3%) is a standout in the chip index. Among other major indices, the S&P 500 is trading 2.4% higher, while the NASDAQ is trading 2.5% higher and the QQQ is 2.4% higher on the session. Among tech bellwethers, CSCO (+3.8%) and INTC (+3.1%) are showing strength.

In earnings last night, RHT (-8.0%) reported a slight Q3 beat, but posted disappointing billings.

In news, T (+0.9%) ended its bid to acquire T-Mobile (DTEGY +0.8%). T will recognize a pretax accounting charge of $4 bln in Q4 2011. S (+3.2%) is trading slightly higher on the news. Elsewhere, AAPL (+2.3%) won its patent infringement against HTC. Also, CHTR (+5.0%) named former CVC (+0.9%) Thomas Rutledge as CEO.

Among notable analyst upgrades this morning, Oppenheimer upgraded FFIV (+6.6%) to Outperform and KLAC (+5.2%) was upgraded to Overweight at JP Morgan. Also, MCRS (+5.5%) was upgraded to Top Pick at RBC Capital.

Among downgrades, T (+0.9%) and NVLS (+3.6%) were downgraded at JP Morgan and RHT (-8.0%) was downgraded at BofA/Merrill.

ORCL (+1.1%) and JBL (+6.0%) are notable names in tech scheduled to report results today after the close.
icon url

ReturntoSender

12/21/11 8:43 PM

#9629 RE: ReturntoSender #6755

From Briefing.com: 4:15 pm : A gradual afternoon ascent helped the broad market slash its loss, but pronounced weakness among tech issues undermined the rebound effort. That left the major equity averages to settle with varied results.

Stocks were dragged down in the early going when participants responded to a reversal by Europe's major bourses, which failed to sustain gains that followed a bank borrowing report from the European Central Bank. Although the report suggested that the needs of banks have been more than adequately met, it also indicated that more firms were in need of funding. The euro was never able to fully overcome selling pressure; it was down 0.5% against the greenback by session's end.

Oracle (ORCL 25.77, -3.40) added to the pessimistic tone of early trade. The software outfit disappointed investors with weaker-than-expected revenue and earnings. The company's quarterly report was further tainted by a tepid outlook. The stock was able to resist efforts to take it to a new 52-week low and even got some relief in late afternoon trade, but the shares still suffered their worst single-session slide in years.

Many other tech stocks were weakened by Oracle's report, such that the overall sector sank to a 2.0% loss. Tech stocks, which make up the largest sector by market cap, weighed heavily on broad market trade. In fact, tech was the only sector in 10 that failed to finish in positive territory, but the S&P 500 still only managed to muster a narrow gain. Meanwhile, the tech-rich Nasdaq was never able to catch up with its counterparts.

Leadership was never clear, but energy stocks helped provide a broad market lift in afternoon trade. Collectively they scored a 1.2% gain with help from higher oil prices, which closed at $98.70 per barrel for a 1.5% gain following an unexpectedly large draw from weekly inventories.

While the broad market was mired in the red for most of the session utilities ascended 1.5%, notching a new 52-week high along the way. Even when excluding dividends utilities have been one of the best performing sectors of the year; they're up more than 13% year to date. Constellation Energy (CEG 39.45, +0.95) came into closer focus when the stock dove in response to headlines that its merger with Exelon (EXC 43.24, +0.91) could be blocked, but that rumor was later dispelled.

A better-than-expected bottom line and a solid future orders increase gave shares of Nike (NKE 96.23, +2.60) strong gains, but not enough to send the stock back to the record high that it had set earlier this month. The rest of the discretionary space mustered only a modest gain.

Data today was limited to November existing home sales numbers, which improved to an annualized rate of 4.42 million units from 4.25 million units, but that was still short of the 5.03 million unit rate that had been expected, on average, among economists polled by Briefing.com. Authorities also reported that sales from 2007 through 2010 were revised downward by 14%.

Advancing Sectors: Utilities +1.5%, Energy +1.2%, Consumer Staples +1.1%, Health Care +0.7%, Financials +0.6%, Telecom +0.4%, Materials +0.3%, Consumer Discretionary +0.3%, Industrials +0.2%
Declining Sectors: Tech -2.0%DJ30 +4.16 NASDAQ -25.76 NQ100 -1.4% R2K +0.2% SP400 +0.2% SP500 +2.42 NASDAQ Adv/Vol/Dec 1255/1.85 bln/1298 NYSE Adv/Vol/Dec 1852/820 mln/1169

4:16PM Aehr Test Systems received order in excess of $1 mln for its ABTSTM high power burn-in system; expected to ship this fiscal year (AEHR) 0.62 -0.04 :

4:03PM Micron misses by $0.09, misses on revs (MU) 5.54 -0.25 : Reports Q1 (Nov) loss of $0.19 per share, $0.09 worse than the Capital IQ Consensus Estimate of ($0.10); revenues rose 20.9% year/year to $2.09 bln vs the $2.12 bln consensus. The company's consolidated gross margin remained at 15 percent for the first quarter of fiscal 2012. Improvements in NAND Flash margins were offset by declines in DRAM. Revenue from sales of NAND Flash products was 6 percent higher in the first quarter of fiscal 2012 compared to the fourth quarter of fiscal 2011 due to an 18 percent increase in sales volume partially offset by a 10 percent decrease in average selling prices. Revenue from sales of DRAM products was essentially unchanged in the first quarter of fiscal 2012 compared to the previous quarter, as a 14 percent increase sales volume was offset by a 12 percent decrease in average selling prices. Sales of NOR Flash products were approximately 14 percent of total net sales for the first quarter of fiscal 2012.

10:01AM Benchmark Elec resumes 2010 stock repurchase program (BHE) 13.11 -0.09 : Co announced that it is restarting its 2010 stock repurchase program. The Company has repurchased 4.2 million shares totaling $64 million and has $36 million remaining under the 2010 repurchase program. The Company suspended the repurchase of its common shares in October due to the significant uncertainty regarding the ultimate financial impact of the flooding in Thailand.

Benchmark Electronics (BHE) announced that its Ayudhaya, Thailand facility has restarted operations a week ahead of our planned schedule.

8:02AM Rambus settles stockholder suit related to past stock option backdating (RMBS) 7.25 : Co announced it has agreed to settle one of the two remaining stock option related lawsuits. The settlement will resolve the matter captioned Stuart Steele, v. Rambus originally filed in 2008, related to stock option grants that were not correctly dated or accounted for prior to 2006, with the vast majority of incorrectly dated grants occurring between 1998 and 2001. The case was scheduled to go to trial in March 2012, and Rambus has agreed to settle the claims against it and the individual defendants for $10.85 mln.

09:37 am Cree initiated with a Buy at Needham: . Needham initiates CREE with a Buy. Firm notes co is an ideal name for investors looking to add exposure to this growing area. While they believe the near-term sector weakness will persist into 2012, they are positive on the long-term growth trajectory of LED in general lighting, especially in the commercial sector, and they believe co will see outsized benefit from accelerated market adoption. With the stock down 70% over the last 12 months on sector weakness, they believe now is a good time to own this marquee name before evidence of LED adoption becomes apparent and drives the share price higher.

09:37 am Aixtron initiated with a Hold at Needham: . Needham initiates AIXG with a Hold. Firm notes the co has steadily lost market share over the last 3 years and believes Veeco beat co by 1 point of share in 2011. Without any meaningful catalyst, they believe the two competitors will split evenly the MOCVD sector going forward. Due to substantial over-investment of capacity over the last 2 years, they believe MOCVD shipments will remain depressed over the next 12-18 months, despite continued growth of LED demand.

09:49 am Oracle Trading Significantly Lower Following Earnings/Guidance Results Late Yesterday (ORCL)
Oracle (ORCL $25.43 -3.74) is trading significantly lower following its earnings/guidance results that were released after the close yesterday.

The company reported second quarter earnings of $0.54 per share, excluding non-recurring items, $0.03 worse than the Capital IQ Consensus Estimate of $0.57.

Revenues rose 1.9% year/year to $8.81 billion versus the $9.23 billion consensus.

Second quarter new software license revenue growth of 9% vs guidance in the range from 6% to 16%. "Non-GAAP operating margins increased to 45% in second quarter, and we expect those margins to keep growing... We have expanded our worldwide sales capacity by adding over 1,700 sales professionals in the first half of this fiscal year," said Oracle President, Mark Hurd. "We believe that this increase in our field organization combined with innovative new products like Fusion Cloud ERP and Cloud CRM will enable solid organic growth in the second half of this year... Sales of our engineered systems accelerated in second quarter. Exadata growth was well over 100% compared to last year, and Exalogic grew more than 100% on a sequential basis. We shipped our first SPARC SuperCluster in second quarter and expect to begin deliveries of our Exalytics system and the Oracle Big Data Appliance in third quarter."

Oracle announced that its Board of Directors authorized the repurchase of up to an additional $5.0 bln of common stock under its existing share repurchase program in future quarters.

On its conference call, the company said it sees third quarter Non-GAAP EPS of $0.55-0.58 vs. $0.59 CIQ Estimates. Company said it sees new software license growth ranging b/w 2-12% in constant currency and 0 to 10% in U.S. dollars. Sees hardware product revenue growth rate of (14%) to (4%), in constant currency or (15%) to (5%) in U.S. dollars and that does not include the hardware support revenue. Company sees total Non-GAAP revenue growth of 3-7% in constant currency, and 1-5% in U.S. dollars. On a GAAP basis co sees total revenue growth 4-7% in constant currency, and 2-5% in U.S. dollars.
icon url

ReturntoSender

12/27/11 11:02 PM

#9632 RE: ReturntoSender #6755

From Briefing.com: 4:10 pm : Stocks finished the little changed as a lack of news flow from Europe combined with mixed data in the U.S. wasn't enough to push the Dow to a fifth consecutive day of gains. However, today’s fractional gain in the S&P 500 was enough to boost the index to its fifth winning session in a row. Data showed the Consumer Confidence Index for December rose to 64.5 from 56.0 in the prior month. It had been expected to improve to just 58.0. The Case-Shiller 20-city Index was less impressive, falling 3.4% year/year.

Gaming stocks rallied after the U.S. Justice Department is said to have reversed a previous ruling and will now let states decide if they want to legalize internet poker. Pokertek (PTEK 0.83, +0.10), Boyd Gaming (BYD 7.63, +0.68), Las Vegas Sands (LVS 43.99, +0.45), and MGM Resorts International (MGM 10.42, +0.46) all ended higher on the news.

Mead Johnson Nutrition (MJN 69.08, +3.79) rallied 5.8% after the company announced a new round of safety tests confirmed the safety of its Enfamil powdered formula. The stock plunged more than 20% late last week on reports that a Missouri infant's death was linked to the formula.

European financials were under pressure today as the Italian 10-yr yield hovered near 7.00% ahead of the upcoming Italian auctions. Market participants will be closely watching tomorrow's issuance, as well as Thursday's, in an effort to gauge the demand for Italian paper. Shares of Deutsche Bank (DB 38.67, -0.43) and Barclays (BCS 11.13, -0.20) lost 1.1% and 1.8% respectively.

Sears Holding (SHLD 33.38, -12.47) plunged 27.2% after the company announced quarter-to-date same store sales fell by 5.2%. The company also said it would close between 100 and 120 Kmart and Sears full-line stores.

Computer Sciences Corp. (CSC 24.09, -2.39) tumbled 9.0% after announcing it will be required to recognize a material impairment of its net investment in the contract with U.K. National Health Service in the third quarter of fiscal year 2012. This has caused the company to withdraw its previously disclosed fiscal year 2012 financial guidance.

Treasuries ended the day with small gains as light buying dropped the 10-yr yield to 2.009%. Meanwhile, mild selling dropped the dollar index to 79.80. A 15 pip gain in the euro pushed the single currency up to 1.3070. DJ30 -2.65 NASDAQ +6.56 SP500 +0.10 NASDAQ Adv/Vol/Dec 1260/934.9 mln/1309 NYSE Adv/Vol/Dec 1543/495.3 mln/1460

4:09PM Emcore sees Q1 FY2012 to be in a range of $36 to $38 million vs $52.35 mln Single Analyst estimate with the sequential revenue decline primarily attributable to the flood impact to its Fiber Optics business (EMKR) :

4:06PM Emcore reports Q4 EPS loss of ($0.15) vs ($0.03) single analyst est; revenues fall 4% YoY to $52.1 mln vs $53.04 mln Single analyst est (EMKR) 0.86 :

6:41AM Sony: Samsung to acquire all of Sony's shares of S-LCD, making the joint venture its wholly-owned subsidiary for cash consideration of ~KRW 1.08 trillion; SNE currently reevaluating FY2012 forecast (SNE) 17.93 : Under the agreement, Samsung will acquire all of Sony's shares of S-LCD Corporation, the two companies' LCD panel manufacturing joint venture, making S-LCD a wholly owned subsidiary of Samsung. In consideration for the share transfer, cash consideration of ~KRW 1.08 trln* will be paid to Sony by Samsung. As a result of this transaction, a non-cash impairment loss of ~JPY 66 bln is expected to be incurred by Sony in the third quarter of the fiscal year ending March 31, 2012, due to the reevaluation of its S-LCD shares. This loss includes an impact from the fluctuation of exchange rate. Despite this one-time loss, Sony estimates that the transaction will result in substantial savings on and after January 1, 2012 in respect of costs associated with its procurement of LCD panels. The current estimate of the yearly savings in respect of such costs is ~JPY 50 bln, compared to LCD panel procurement costs estimated for the fiscal year ending March 31, 2012. Neither the one-time loss nor the estimated cost savings were included in Sony's forecast of consolidated financial results for the current fiscal year ending March 31, 2012. SNE is currently reevaluating this forecast, taking into account this transaction and other factors that might affect its full year FY2011 consolidated financial results forecast.

McAfee, a unit if Intel (INTC), announced it is teaming up with Nippon Telegraph and Telephone East to provide technology to create a mobile security application that will be used on the "Hikari iFrame" tablet.

icon url

ReturntoSender

12/31/11 3:59 PM

#9634 RE: ReturntoSender #6755

From Briefing.com: Weekly Recap - Week ending 30-Dec-11Another volatile year has passed and the U.S. stock market, as measured by the S&P 500, was the picture of relative strength. Close to unchanged for the year, the S&P 500 outperformed every major developed market and nearly every developing market. While the showing by the S&P 500 was not as strong on an absolute basis as many had wished, it was a stalwart showing in the face of double-digit percentage declines for most other major markets.

The year certainly started on an optimistic note. The S&P 500 jumped 2.3% in January and was up 8.4% by the end of April. By early August, however, the S&P 500 was down 11.0% for the year. The marked reversal of fortune was precipitated by a string of caustic events that included a spike in energy costs related to the Arab Spring, the aftereffects of the Tohoku earthquake and tsunami that hit Japan, the eurozone’s sovereign debt crisis, and the debilitating debt ceiling negotiations that ultimately prompted Standard & Poor’s to downgrade the U.S. debt rating from AAA to AA+.

In last year’s Year-In-Perspective comment, we said the market outlook was “relatively bullish, but 2011 could be another bumpy year.” While this wasn’t an extremely bold prediction, it did turn out to be quite accurate. Nobody though could have predicted the twists and turns that this year took.

In brief, 2011 was a year that saw highly correlated and extremely volatile trading action. Fundamental factors provided a base layer of support throughout the year, but they ultimately took a back seat to macro developments that drove large, headline-driven swings in the capital markets.

4:30 pm : Although the effort encountered resistance, the stock market was able to build on an early gain and overcome resistance to put itself back in positive territory for the year.

Early market participants provided a modest bid in the face of muddled action abroad and a new 11-month low for the euro following a mixed debt auction in Italy. The euro eventually worked its way higher and, in turn, bolstered broad market buying interest; the currency climbed out of the red to end the trading day with a 0.4% gain against the greenback. The euro is still down more than 3% this year, though.

Financials helped boost the broad market by providing leadership. The sector fully recovered from their prior session slump by bouncing to a 1.6% gain. Banks proved to be a primary driver of that move. However, bank stocks remain the reason for the sector's poor performance this year -- the KBW Bank Index is down 23% this year while the broader financial sector is off by 18% year to date.

Defensive-oriented stocks have generally outperformed in 2011. Year to date, utilities stocks are up more than 15%, consumer staples stocks are collectively up 11%, and the health care sector is up more than 10%.

All 10 major sectors scored strong gains today, though. Despite such broad-based strength, the S&P 500 had a hard time moving more than a couple of points above the 1258 zone, which contains its 2011 starting point and its 200-day moving average. Still, stocks never retreated and ultimately prevailed in overcoming resistance. The lack of share volume likely helped the move -- with only a half billion shares traded on the NYSE share volume was only about half of its average daily volume. Nonetheless, the S&P 500 is now fractionally positive for the year.

Economic data had little sway with the broad market, but shares of homebuilders were helped by a surprisingly strong pending home sales report. Pending home sales for November increased by 7.3%, which is greater than the 0.6% increase that had been generally expected among economists polled by Briefing.com, but less than the 10.4% increase recorded in the prior month.

The Chicago PMI for December also exceeded expectations. Although it eased down to 62.5 from 62.6 in the prior month, it was better than the reading of 60.1 that had been generally expected.

Weekly initial jobless claims jumped to 381,000 from the multi-month low of 366,000 posted for the previous week. Economists polled by Briefing.com had expected, on average that initial claims would be closer to 368,000.

The commodities complex failed to benefit from the positive tone displayed in the stock market and the dollar's decline from a multi-month high. That left the CRB Index to suffer a 0.2% loss. That said, several commodities were able to recover from new or near multi-month lows. The CRB is positioned for a year-to-date loss of about 8.5%.

Advancing Sectors: Financials +1.6%, Industrials +1.3%, Energy +1.2%, Materials +1.1%, Consumer Discretionary +1.1%, Health Care +1.0%, Tech +0.9%, Telecom +0.9%, Utilities +0.8%, Consumer Staples +0.7%
Declining Sectors: (None)DJ30 +135.63 NASDAQ +23.76 NQ100 +0.8% R2K +1.3% SP400 +1.4% SP500 +13.38 NASDAQ Adv/Vol/Dec 1888/1.03 bln/724 NYSE Adv/Vol/Dec 2381/531 mln/637

7:04AM Tegal sells Nanolayer Deposition patent portfolio for ~$4 mln (TGAL) 2.31 : To date, ~$3.6 mln has been received. Co reports that discussions are ongoing for placement of Lot 4 of the portfolio, which applies to copper barrier and low-k dielectric technology. "Interest in Lot 4 is coming primarily from IC device manufacturers, reports Robert Ditizio, Tegal's Chief Technologist, whereas interest in Lots 1 through 3 was driven largely by equipment manufacturers."

Outlook for 2012: Attractive Valuations Reflect Uncertain Times

The European debt crisis and resulting economic impact are the biggest unknowns/risks for 2012. Despite the anticipated weakness in Europe, the U.S. economy is expected to grow at a sluggish pace around 2% over the next several quarters. While this isn’t an exciting outlook, and is not likely to lead to a big improvement in the employment picture, the relative value argument for equities remains quite strong. As mentioned above, with the S&P 500 trading at 12x forward earnings, the market valuation has gotten more attractive from where we stood at the end of 2010 (14x). The earnings yield of 8.2% is very attractive when compared to a 1.9% yield on 10-year treasuries. Additionally, U.S. corporate balance sheets are strong with record levels of cash. While these factors argue for an investment in equities, the attractive valuations are a reflection of the increased risk premiums being demanded in the face of so much uncertainty.

While the European situation is the biggest potential risk for 2012, it is a known variable the market has been dealing with for quite some time now. The current situation is factored in to market values. Other variables that are likely to play a part in market valuations and volatility include the trajectory of China’s economy, the political dynamics ahead of the 2012 U.S. presidential election, and geopolitical issues that crop up around the world (North Korea, Iran seem like potential areas of concern).

As we close out the year, Briefing.com would like to thank you for your business and wish you a Happy New Year. As always, our team of analysts will continue to work tirelessly in 2012 to bring you the most important market intelligence that influences the financial markets and your portfolio every day.

Wishing you the best in 2012!

-The Briefing.com Team

http://finance.yahoo.com/marketupdate/storystocks
icon url

ReturntoSender

01/01/12 3:05 PM

#9636 RE: ReturntoSender #6755

InvestmentHouse Weekend Market Summary

http://www.investmenthouse.com/weekendmarketsummary.htm

- Lackluster session then late selling send SP500 negative for 2011.
- DJ30 and SP600 face new year trying to lead a continuation of the rally.
- Earnings can keep the upside move alive, then kill it as investors ask 'is that all?'
- Predictions? Europe will remain an issue, North Korea and Iran are more trouble, no real US rally despite election year, more economic issues, blah blah, blah. Watch the market, be aware of history, and take what the market gives.

Lackluster session keeps SP500 flat for 2011, belies the year that was.

There is not a lot to say about the Friday session. It was very quiet, and futures were up modestly. Stocks started higher but faded, and they were never able to recapture any excitement. Looking at the SPY chart, it was trending to the downside all session. It was not a completely steady trend; things in the afternoon got quite volatile with a couple of very strong selloffs. There was a recovery the last hour off of that sharp, mid-afternoon selloff that sent the indices to session lows. In the last few minutes of trading, however, programs came in and sold the market. The effect was to push the SP500 negative by 0.04 for 2011.

SP500 had been coasting all day in positive territory for the year, albeit a weak positive gain. It was thrown away in the last minute, but it did not really matter as it finished flat on the year. What does matter is how stocks trade during the year. It was that bounce up and down. There was the initial trading range through mid year, the selloff, the second trading range, and then the recovery that made us the money. You get money from the moves and not from flatlining. We did have movement even though the year ended flat overall.

The Dow did finish upside on the year. Looking back to December 31, the Dow was near 11600 but closed at 12200. Around a 600 point gain. Nothing dramatic, but it was to the upside. Dow was obviously a relative outperformer for the year. The SP600 came on late in the year, and it finished lower for the year. It ended 2010 at 415.73 and it closed at 415.10. It, too, was down for the year, but it was the movement in the year that makes the difference for us.

This is one of those years where they look back and say that the stock market did nothing for people. They will say it has not done anything for the last 10 to eleven years, but that is not true. If you buy one thing and hold it forever, that would be the case, but that is not what happens in the real world of stock trading and investing at least not these days. It is incorrect to say (as some of our politicians like to) that stocks are inherently bad and risky for those looking for retirement. That is why we never changed Social Security.

Fortunately or unfortunately, that will have to change regardless of your views; we simply cannot afford the system as it is. But that is another story that we will have to fight over in 2012, just as we have tried to fight it in 2011 and 2010. Of course nothing has been done. In an election year, of course, still nothing will be done. We have to look to 2013 before anything serious can be addressed with respect to this issue.

It was a day highlighted by the usual year-end predictions for the coming year. You know my belief on that. It is a fool's errand to try predicting what will happen with enough specificity to invest by it. As I talked about on Thursday, there were events in 2011 that no one could have predicted. There was the Japanese earthquake and subsequent tsunami and its impact on Japan and the rest of the world. The U.S. economy came to a near standstill after that natural disaster, waiting to see how severe things were. We also had the debt crisis and the debate in September that acted to stymie the U.S. economy as well. There were no predictions with respect to those, and those are the kinds of things that make the difference in any year, particularly in investing.

I will talk more about my predictions when we get to the wrap up and look ahead to next week. I do have a few things to throw out, but nothing as earth-shaking as a comet striking the U.S. or anything like that. It is all common sense to anyone who looks at the headlines, knows a little history, and who has spent a bit of time investing.

SP500, -0.43%; NASDAQ, -0.33%; Dow, -0.57%; SP600, -0.94%; SOX, -0.41%.

It was down across the board except for the Dow. Again, it was the relative-strength performer. It really came into its own late in the year, showing it was the relative strength leader as NASDAQ the index that tried to lead starting the last quarter of 2010 faded and became a laggard to close out the year.

OTHER MARKETS

Dollar. 1.2940 versus 1.2981 euro. The dollar managed a modest gain on the year. It traded sharply lower and then had to recover off of the April and May lows to post that gain. It was a solid recovery. Much to the chagrin of the Treasury, the Fed, and probably the Obama administration, the dollar has firmed as the European markets have come under more and more pressure. As the dollar firmed, gold sold off for a variety of reasons. One of them lately being the dollar strength not requiring people running to the safety of gold. That is a tenuous argument, but it is one of the reasons that saw gold weaken at the end of the year.

Bonds. 1.88% versus 1.90% 10 year U.S. Treasury. Bonds rallied on the session. Bonds started the year with the 10 year over 3%. Many predicted that the bond bull market was over. Bill Gross was one of them, and he came back later in the year and said he was wrong. It surprised many people because it was anticipated that the U.S. economy would recover in 2011. It looked better at the end of 2010, but then it fell back into its old habits and sold. And it sold and Europe sold, the bond market strengthened. U.S. bonds were much more attractive given what was out in the rest of the world. Even China was having trouble slowing down in 2011. Early until the year it was restricting reserves and forcing banks to require more collateral and reserves for lending. Now it has done the opposite because, as usual, central banks are wrong in their guesstimates of what will happen and they overshot. Now they are panicking and trying to head the other way. All that does is make U.S. bonds look better.

Gold. 1,567.80, +26.90. Gold sold off at the end of the year after a tremendous rally up through August, but it was up 10% for the year. On Friday gold reversed early losses and posted a nice gain. It is a nice reversal for the yellow metal, and it roared back. What will happen? As noted, gold was up 10% for the year. Commodities overall were down 8.3%. That was after a 17% gain in 2010. Commodities could be under pressure again in 2012. Gold will most likely sell more as will silver (down for the year) in 2012. Much of the selling at the end of the year was due to margin calls and people having to raise cash. As the U.S. economy looked to be improving, there was also less need to run to gold to hedge against any downside in the U.S. as well as other places, such as China and Europe. Gold suffered. It is likely to suffer even more, and I think we will get a buy point in gold in 2012. It just will not be at the first of the year.

Oil. 98.83, -0.81. Oil was off for the session. Oil has rallied nicely through the late spring, sold off on the European worries and has now recovered. There are still European issues, but the U.S. looks better and that has helped bolster the price of oil. It is something of a paradox. You have a mostly weak world when it comes to economics, but oil is holding near 100. It is having trouble getting over the 103 level, and there is significant resistance from prior peaks in this range. It is not a surprise that it is moving laterally after a very nice October to November run. It is having something of a difficult time moving through. We will see if it can make the break. There is a little ABCD pattern, and it has bounced off of that.

It will be very interesting to see what happens in 2012. If Iran does something insane, oil will become "gold" and leap to the upside. We will see how that plays out. Again, that is one of those predictions. You can make educated guesses, but as for investing, what if it does not happen? You could face the other side of the coin. Let the market tell you what it will do, and then take what it is giving. That is our motto. We avoid making grand predictions and becoming invested in making grand predictions. If they do not come true, you either panic because you are in the wrong positions and need to get out of them (investing on emotion at that point). Or you do not do anything if it does not work your way, and then you are stymied. In that case, you cannot see the market moving and make money off of that move regardless of whether it is where you thought it would go or not. That is what you need to do to be a good investor and trader today. You have to look at the market and take what it gives. That has been our motto for years, and it is even more apropos in the current market climate.

TECHNICAL SUMMARY

Volume. +2.25% NASDAQ; +2.1% NYSE. For two out of three days, we had volume increase on the downside. That shows there are a bit more sellers in the market, but on very low volume.

Breadth. -1.1:1 NASDAQ; -1.1:1, NYSE. Breadth was not really worth discussing.

CHARTS

I will talk more about trends than specifics, but there are a few specific points to note.

SP500. SP500 closed fractionally lower for the year. It remains in an end of year uptrend, trying to break from this overall trading range that saw a peak back in April and in July. That was the top of this run, and it has been trying to recover ever since. It has been burdened by the problems coming out of Europe, even though the U.S. economic data has improved over the past four months.

We see the trading range, the break higher, and now a pair of higher lows and a higher high (that could not quite hold) trying to produce the next move to the upside. That can get it into this trading range toward the April and July peaks to end the rally, so to speak. Then it could move up in January, play around in that range for awhile, and then likely run out of gas and fall.

DJ30. The Dow is very interesting. It has been the relative strength leader in the market after NASDAQ abdicated that role in Q4. The Dow managed a pair of higher lows off of the October low which marked the bottom of the selling for now. And it made a nominally higher high as well. Very key moves. Higher lows and a higher high are always important. That opens it up to play in that upper trading range toward the April peak at 12,876. The Dow closed at 12,217, so it has room to play to the upside.

I want to draw your attention to another aspect. In August, the 50 day EMA crossed through and below the 200 day EMA. That was after the initial selloff, and it acts as something of a confirmation. The market struggled after that. It ultimately did recover, and it has been in this current return of the rally. Now the 50 day EMA is on the verge of crossing back up through the 200 day EMA. Whereas the cross below or down through the 200 day EMA is called the "death cross," a cross back to the upside is called the "golden cross." It is supposed to bring gold, it is a good thing, etc. As with the selloff in July and August, it had already occurred when the cross took place. Just as this rebound has started to occur as the cross is getting ready to take place. In theory it produces more of an upside. It produced hardly any significant further downside after the cross in August.

Take that for what it is worth. It is a good indication of a trend, but it is not a guarantee that that trend will continue to build upon itself. There are many people making statements about this as far as predictions for 2012. Again, look what happened when the death cross occurred. There was not much death here just a trading range and it broke back to the upside. The Dow is posting a leadership role moving into 2012. That is very good. It was leading to the upside and did a large part of the heavy lifting in carrying NASDAQ upside in that late 2011 rally.

NASDAQ. NASDAQ is not looking as strong, but it still has improvement in progress. It is still mostly in the clutches of that August-October trading range, or "the eurozone" as I like to call it. It has put in a pair of higher lows. It has yet to put in a higher high. That is what we are waiting for. It is in good position, sliding laterally this past week along the 50 day EMA. That puts it where it can produce a bounce to the upside.

It is following rather than leading. But as I noted last night, following the Dow and the SP600 is good enough for now. Remember, we want them to get up in that April-July trading range, move up a bit more, and make us money on our current upside plays. That is really all we are looking for.

SP600. The small caps fell almost 1% on the session, but that put them simply back at the 200 day EMA. Still in position to run higher. SP600 made a pair of higher lows and a nominal higher high. They faded back, unable to hold that move over the October peak. It is in excellent position to make the break to the upside and continue that move. Again, as with the other indices, that would put in this playground from April into July. The July peak for SP600 is at 462, and the index closed at 415. That gives it plenty of room to play and run to the upside. It is in good position to begin that move for the start of the year.

Remember, small caps and the first of the year tend to go together. Why? The theory is that the big money funds pick up the small caps because they have the greatest potential for percentage returns. They like to have them in the portfolio and grab the gains they make during the year. It starts in January, they buy them and it pushes them higher. Then whether they move up or not is problematic based on the economic activity, of course. We know that the market takes that economic activity into account months before it is anticipated to show itself. The small caps are helping lead the market higher along with the Dow, and that is a positive for the market overall if it can hold this move and continue with a break to the upside to a new higher high.

SOX. SOX was down 0.4%. It is very similar to NASDAQ, still struggling in that eurozone range. It is below the 50 day EMA, working laterally and trying to get a little steam up to make a break higher. It does not have the series of higher lows, it does not have the strength of the other indices. Maybe it will be a follower such as NASDAQ, which would be a positive for more upside. But it could be the problem that turns the market pack down as it did in November. We will see. My prediction (and it is only through January) is that the market continues higher as the SOX follows along the SP500, the Dow, and the small caps. Then when earnings come in, we start to have a giveback of any breakout to the upside. That is when we have to deal with the reality of 2012.

LEADERSHIP

I will be speaking in broad terms on leadership.

There are groups that have performed well. When there is trouble, utilities do perform better. They were one of the leadership groups in 2011. On the other hand, financials were down 17%. They were the anti-leaders. Stocks from small business service companies such as HMSY were performing very well, helping out. There were semiconductors that performed quite nicely despite the overall laggard nature of the chips. SIMO posted a very nice upside gain.

There is some retail still in position to move higher after having already moved up during the year. RL could break higher from a downward-pointing wedge. TJX is continuing its upside move. HD continues to look solid to the upside. CMG is still working higher inside of its channel. Retail of various shapes is performing quite nicely even while some sectors inside of retail are struggling. DECK continued to the downside on Friday, landing us a very nice gain on our downside play.

Which sectors will lead in 2012? We will see what the market tells us. We have sectors setting up nicely to move higher that have been moving up and are set up. We have been taking advantage of those. Those would include some of the drugs stocks, medical appliances, small business stocks, and the software stocks. We have been taking positions in those as well as retail. We have been taking positions in those because that is what is setting up. What will set up at the end of the year? I do not know. I will say we will probably get a good buy in gold later in the year. Just not right now.

As always, we will watch the sectors and see what the money is moving into and out of. We will play those to the upside and downside, respectively.

THE MARKET

SENTIMENT INDICATORS

VIX: 23.4; +0.75
VXN: 23.13; +0.06
VXO: 22.98; +1.03

Put/Call Ratio (CBOE): 0.87; -0.23

Bulls versus Bears:

This is a reading of the number of bullish investment advisors versus bearish advisors. The reason you look at this is that it gives you an idea of how bullish investors are. If they are too bullish then everyone is in the market and it is heading for a top: if everyone wants to be in the market, then all the money is in and there is no more new cash to drive it higher. On the other side of the spectrum if there are a lot of bears then there is a lot of cash on the sideline, and as the market rallies it drags that cash in as the bears give in. That cash provides the market the fuel to move higher. If bears are low it is the same as a lot of bulls: everyone is in and the market does not have the cash to drive it higher.

Bulls: 50.5% versus 45.3%. After a drop the bulls charged with a big jump over 50. This is starting to get into the overdone range and could be part of the picture that tops out the current in January. 35% is the threshold measuring bullish versus bearish action. Six weeks the bulls were below bears. A powerful sentiment signal but now dissipating. Highs from April and December (60% readings spanning December through early May 2011). The 5 year high is 62.0. The crossover level at 29% bulls from July 2010 is long gone. 35% is the threshold level suggesting bullishness. To be seriously bearish it needs to get up to the 60% to 65% level.

Bears: 29.5% versus 30.5%. Bears are not really buying into the bullish scenario. Down but at the level hit three weeks back. The average the past month is 30%. The index spent seven weeks over the 35% threshold considered a bullish indicator. For more reference, bearishness hit a 5 year high at 54.4% the last week of October 2008. The move over 50 took bearish sentiment to its highest level since 1995. Extreme negative sentiment. Prior levels for comparison: Bearishness peaked at 37.4% in September 2007. It topped the June 2006 peak (36%) on that run. That June peak eclipsed the March 2006 high (33%) and well above the 2005 highs that spawned new rallies (30% in May 2005, 29.2% in October 2005). That was a huge turn, unlike any seen in recent history.

NASDAQ

Stats: -8.59 points (-0.33%) to close at 2605.15
Volume: 1.042B (+2.26%)

Up Volume: 375.29M (-462.24M)
Down Volume: 623.84M (+462.72M)

A/D and Hi/Lo: Decliners led 1.17 to 1
Previous Session: Advancers led 2.56 to 1

New Highs: 34 (+1)
New Lows: 60 (-15)

SP500/NYSE

Stats: -5.42 points (-0.43%) to close at 1257.6
NYSE Volume: 483M (+2.11%)

Up Volume: 1.03B (-1.01B)
Down Volume: 1.19B (+990.61M)

A/D and Hi/Lo: Decliners led 1.1 to 1
Previous Session: Advancers led 3.73 to 1

New Highs: 163 (+42)
New Lows: 17 (-12)

DJ30

Stats: -69.48 points (-0.57%) to close at 12217.56
Volume DJ30: 96M shares Friday versus 84.6M shares Thursday.

TUESDAY

As for looking into the future, I will start with the coming week. There will be a plethora of economic data starting on Tuesday. The ISM Index for the country will be out, and it is expected to continue its improvement. FOMC minutes will also be out that afternoon. We also have Factory Orders and Auto Sales on Wednesday. Then we will have the warm-ups to the Friday jobs report. Challenger and ADP Employment will come out. The Initial Jobless Claims are expected to drop again. ISM Services will come out as well. On Friday we have that payroll report. They are expecting 150K new jobs and a little bump higher in the unemployment rate. We will see. The worker pool is in a secular downtrend. Maybe that is changing now. Maybe there is more excitement about the jobs picture. After all, this week those saying that jobs were easier to find were up significantly versus those saying jobs were hard to find. Maybe we are at an inflexion point where we will see it turn. Heaven knows we need to see that happen.

We will have a full plate to start the week. That will be interesting, but one thing that will start taking precedence is earnings. It is one of the things that has been hampering the market as seen by the semiconductors. We had a lot of warnings out from the chips, and that caused a lot of our problems. ORCL missed badly in December. We will have a lot of earnings coming out in January. I think that could be one of the significant drivers in the current action of the market. Indeed, I think we can have a continued move higher (hopefully more of an upside move than we have seen lately) in the first couple of weeks of earnings. They do not really get started until the second week of January. That means we have an upside move maybe through the third week of the month. Then we will get the gist of what is going on. At that point we could have some issues. We could get good enough news to keep the rally moving until investors say "is that all?" And start selling things off. We could also get some bad news that could kill the rally right off the bat. Those are the possibilities as I see them. That is my prediction for at least the first part of 2012.

There could be a lot of issues after that even if we get the rally to the upside on an initially good outlook. We have Europe. That will continue to be on the front-to-middle burner of the market stove. There were worries that Europe would announce some kind of dissolution of the eurozone this week. That was a real worry out there. Then we have U.S. data. The economic data is improving. Can it continue to do so into 2012? We had improving data at the end of 2010. It could not hold up through the first part of 2011, but it has not made a comeback. Frankly, it has held up more than I thought it would. Thus you see the value of predictions. I thought the data would have already turned over by now, and it has not. I can live with that.

Then there are the external political issues. We have Iran talking about closing the Strait of Hormuz. It says if it is threatened it will do that. North Korea made statements today, basically threatening the south. It said there would be new changes in the world. You have this view that the U.S. is in a weakened condition, and people are taking their shots at us, so to speak. That will continue through this year.

It is an important election year, and that is another issue we have in the U.S. It is not only the U.S. economic data, but how well Congress, the administration, and the judiciary can play along with each other. There will be some very important decisions by the Supreme Court. It will happen earlier rather than later in the year. They have already announced that they are taking the argument on the ObamaCare case. They will hear it in March. They are setting aside a full three days of hearings, I believe. That will probably give us an answer before July, which was previously anticipated. We will have that answer before the elections, and that will be very important.

Then we have the Republican primaries leading up to the November election. All of this will have a huge impact on the economy and the stock market. Typically the market rises in an election year, but I am not so sure that will be the case this time around. There are so many issues confronting the U.S. The belief is that whoever is in the White House at the end of the year will make the difference as to how effectively the U.S. is able to deal with these issues. There is a concern that if the current administration feels like it will not win, it may do as much as it can on the way down. I am not so sure that the current administration can be counted out in this election. I do not think that is the case at all.

If the market goes down and the economy tanks, the chance of reelection falls tremendously. If it continues its improvement, people might give him the benefit of the doubt. Despite everything they disagree with, they may let the President have another four years. I have my opinions on how that will be, but that is one of the things that the market will be factoring in over the year. We will be looking at how the market factors these things in.

There are a lot of bold predictions about what it will do. I have made the predictions I am willing to make. They are not classic predictions at all, other than what the market is telling us now in the short term. That is what we always do, and that is what we will continue to do. My goal is not to be right on what is going on in the world. Although, looking at history, it really tells you what is happening. It has been very accurate thus far. That does aid in our decision-making on where to invest and what to look into. But the market is often not rational in the near term. It overshoots to the upside, and it overshoots to the downside. While things may even out over time, a lot of the money is made when it overshoots one way or the other. Despite what we believe should happen, we look at what the market IS doing and what IS happening in stocks. We will continue to do that and take what the market gives.

Right now we are still looking for that move up into January. If something major happens in Europe or if North Korea or Iran does something crazy, then all bets are off. That would be true regardless of what the situation was going into it. We just have to play with what the market is setting up to move. We have been able to play upside and downside of late because it is that kind of a market. I think we will still be able to do that because I believe the market will move higher but then be unable to continue the move and ultimately give the decline. That means a lot of stocks that are in trouble will not really recover during a rally that may ensue in this April to July level. That is why we can continue to play the upside and downside. When the upside does break, as I believe it will, then we will have already taken profits. We are looking to take gain as the market trades to its peak in this range. Then we can look to play more downside as well.

Have an outstanding New Year's celebration. I hope you can be with your family and friends, and I hope you have a wonderful time. We have had a very trying 2011 in terms of all the problems that have confronted the U.S. and the world. I know a lot of you have had personal issues as well, personal problems with the fires and floods we have had this year. It has been a very difficult year for a lot of people.

I am happy to say we have done very well with our market plays. We have been making a lot of great money with that, and I hope that helped you out. We are looking to do the same this year. I have a concern that it will be another very trying year in terms of economics for many people. I hope I am wrong. I am always concerned about that. I want us to look ahead and hope for the U.S. to be a great entrepreneurial nation again. We can lead the world and create those jobs and technologies that will raise our standard of living for ourselves, our children, and our grandchildren. My concern is that we are not doing that now. That we will hand off a worse country than we ever have before in terms of the outlook for our children and grandchildren. But we are a great country and a great people. If we are allowed to be entrepreneurs and inventors and do not have the government crowding us out of what we are best at doing, there is no doubt that we can be the world leader again. As Darrell Royal at UT used to say, we just have to go back and 'dance with who brung us.' If we do that, we will be great.

I will see you on Tuesday. Have an outstanding weekend!

Support and Resistance

NASDAQ: Closed at 2605.15
Resistance:
2612 is the late August 2011 peak
2643 is the September 2011 high
2645-2650ish from December 2010 consolidation
The 200 day SMA at 2661
2676 is the January 2010 low and the December 2011 peak
2686 is the January 2011 closing low
2706 to 2705 is the April 2011 low and the February 2011 and consolidation low (bottom of the trading range) 2723 to 2705 is the range of support at the bottom of the January to May trading range
2754 is the recent October 2011 high
2759 is the mid-May low
2762 is the February low
2796 is the February gap down point
2816 is the early April peak.
2825 is the 2007 closing peak.
2841 is the February 2011 peak
2862 is the 2007 peak
2879 is the July 2011 peak
2888 is the May 2011 peak

Support:
2603 is the March 2011 intraday low (post-Japan low)
2599 is the June 2011 low and NASDAQ
The 50 day EMA at 2596
2593 is the November intraday high
2580 is the November 2010 closing high
2572 is the November 2-11 gap down point
2555 is the mid-August 2011 peak
2546 is the early September 2011 gap down point
2535 is the November island reversal gap point
2532 is the early August gap down point
2469 is the November 2010 low
2441 is the November 2011 low
2331 from October 2010 low and the August 2011 intraday low
2305 from the August 2010 peak (summertime base)
2139 is the May and June 2010 low
2123 is the August 2010 gap down point
2100 from the August 2010 lows

S&P 500: Closed at 1257.60
Resistance:
1258 is June 2011 intraday low
The 200 day SMA at 1259
1267 is the December 2011 peak
1275 is the January 2010 low, early January 2011 peak
1295 to 1294 is the April 2011 low and the February 2011 consolidation low (bottom of the trading range)
1313 from the August 2008 interim peak
1318.51 is the May low
1325-27 is the March 2008 closing low and the May 2006 peak.
1332 is the early March peak
1340 is the early April 2011 peak
1344 is the February 2011 peak is being challenged again
1357 is the July 2011 peak
1364 is the March 2007 low
1370 is the August 2007 low
1371 is the recent May 2011 peak

Support:
1255 is the late December 2010 consolidation range
1249 is the March 2011 low (post-Japan)
1235 is the mid-December 2010 consolidation low
The 50 day EMA at 1232
1231 is the late August 2011 peak
1227 is the November 2010 peak
1220 is the April 2010 peak
1209 is the mid-August 2011 high
1196 is the November 2010 consolidation peak
1178-1180 is the October 2010/November 2010 consolidation low
1158 is the November 2011 low
1131 - 1127 from August 2010 base peak.
1119 is the early August closing low
1109 is the mid-September 2010 gap up point
1101 is the August 2011 low
1075 is the October 2011 intraday low
1099 from the mid-July interim peak
1090 is the early September 2010 gap up point
1040 from the August 2010 lows and May/June 2010 lows
1011 is the summer 2010 low

Dow: Closed at 12,217.56
Resistance:
12,258 is the December 2011 peak
12,284 is the October 2011 peak
12,391 is the February 2011 peak
12,754 is the July intraday peak
12,876 is the May high
13,058 from the May 2008 peak on that bounce in the selling

Support:
12,110 from the March 2007 closing low
12,094 is the April 2011 low
The 200 day SMA at 11,947
The 50 day EMA at 11,905
The June low at 11,897 (closing)
11,893 from March 2008 closing low
11,867 from the August 2009 high and peak on that bounce in the selling.
11,734 from 11-98 peak
11,717 is the late August 2011 peak
The August low at 11,702
11,555 is the March low
11,452 is the November 2010 peak
11,178 from November 2010
10,978 is the bottom of the November 2010 consolidation
10,750 from September 2010
10,720 is the August closing low
10,705-710 from January 2010 peak
10,694-700 from August 2010 peak
9938 is the August 2010 low

Economic Calendar

December 27 - Tuesday
- Case-Shiller 20-city, October (9:00): -3.4% actual versus -3.0% expected, -3.5% prior (revised from -3.6%)
- Consumer Confidence, December (10:00): 64.5 actual versus 58.0 expected, 55.2 prior (revised from 56.0)

December 28 - Wednesday
- MBA Mortgage Index, 12/24 (7:00): -2.6% prior

December 29 - Thursday
- Initial Claims, 12/24 (8:30): 381K actual versus 368K expected, 366K prior (revised from 364K)
- Continuing Claims, 12/17 (8:30): 3601K actual versus 3600K expected, 3567K prior (revised from 3546K)
- Chicago PMI, December (9:45): 62.5 actual versus 60.1 expected, 62.6 prior
- Pending Home Sales, November (10:00): 7.3% actual versus 0.6% expected, 10.4% prior
- Crude Inventories, 12/24 (11:00): 3.899M actual versus -10.570M prior

January 3 - Tuesday
- ISM Index, December (10:00): 53.4 expected, 52.7 prior
- Construction Spending, November (10:00): 0.5% expected, 0.8% prior
- FOMC Minutes, 12/13 (14:00)

January 4 - Wednesday
- MBA Mortgage Index, 12/31 (7:00): -2.6% prior
- Factory Orders, November (10:00): 2.1% expected, -0.4% prior
- Auto Sales, December (14:00): 4.36M prior
- Truck Sales, December (14:00): 5.98M prior

January 5 - Thursday
- Challenger Job Cuts, December (7:30): -12.8% prior
- ADP Employment Change, December (8:15): 180K expected, 206K prior
- Initial Claims, 12/31 (8:30): 375K expected, 381K prior
- Continuing Claims, 12/24 (8:30): 3620K expected, 3601K prior
- ISM Services, December (10:00): 53.0 expected, 52.0 prior
- Crude Inventories, 12/31 (11:00): 3.899M prior

January 6 - Friday
- Nonfarm Payrolls, December (8:30): 150K expected, 120K prior
- Nonfarm Private Payrolls, December (8:30): 170K expected, 140K prior
- Unemployment Rate, December (8:30): 8.7% expected, 8.6% prior
- Hourly Earnings, December (8:30): 0.2% expected, -0.1% prior
- Average Workweek, December (8:30): 34.3 expected, 34.3 prior
icon url

ReturntoSender

01/03/12 11:59 PM

#9637 RE: ReturntoSender #6755

From Briefing.com: 4:30 pm : 4:30 pm : Stocks started 2012 on a strong note by scoring its best single-session percentage move in two weeks. The effort took the stock market to a two-month closing high.

A lack of corporate news and domestic data ahead of the open left many market participants to take their cues from foreign averages. Buying abroad was backed by a manufacturing reading from China that suggested activity began to expand after it had contracted in the prior month. India also reported its best manufacturing reading in six months. Manufacturing data from Europe also proved relatively encouraging. Recent manufacturing activity in the United Kingdom made a modest contraction, but to a lesser extent than had been anticipated. A reading on eurozone manufacturing activity was more in-line with expectations.

An advance by the euro also proved beneficial to stocks. By session's end the euro was sporting a 0.8% lead against the greenback. Stocks took little time to sprint higher following the toll of the opening bell.

Collective gains remained strong, on the order of 2%, following the release of the December ISM Manufacturing Index, which improved to 53.9 from 52.7 in November. That exceeded expectations for a reading of 53.4.

Construction spending for November also proved supportive of early gains. It increased by 1.2%, which bested the 0.5% increase that had been generally expected after a downwardly revised 0.2% decline during October.

Financial and materials stocks, the two worst performing sectors of 2011, led early gains, but the pair lacked the influence to take the S&P 500 past resistance at its multi-month closing high of 1285. From there stocks drifted lower before they made a modest attempt to reclaim gains.

4:30PM Aehr Test Systems announced that Gayn Erickson has been appointed CEO of the company, effective January 3, 2012 (AEHR) 0.59 +0.07 : Mr. Erickson is replacing Rhea Posedel as CEO. He has also been appointed as a member of the board of directors. Rhea Posedel, Aehr Test Systems' founder, chairman and previous CEO, led the search for his replacement and has been appointed Executive Chairman of Aehr Test, effective January 3, 2012.

4:11PM Natl Instruments sees Q4 revenue of approx $279 mln, Capital IQ consensus $294.5 mln; sees non-GAAP EPS in the range of $0.26-0.27, consensus $0.32 (NATI) 26.37 +0.42 : Sequentially, the company saw the greatest reduction in year-over-year revenue growth in Europe, where revenue growth in US dollars dropped from 25 percent year-over-year in Q3 to 3 percent in Q4. In Asia and in the Americas year-over-year organic revenue growth in Q4 was approximately 10 percent. Including acquisitions, year-over-year revenue growth in the Americas was approximately 20 percent. "While it is clear that the industrial economy, especially in Europe, experienced a slowdown in Q4, we believe the diversity of our business and the solid execution of our sales force allowed us to continue to gain market share," said James Truchard, NI president, co-founder and CEO. "Going forward, we will be very disciplined in managing our expenses, while ensuring we continue to serve the growing industries that are fundamental to the needs of society such as energy, medical, communications, and academic." The company will provide final results and detailed guidance for Q1 2012 in its Q4 2011 conference call on Jan. 31, 2012.

4:06PM Advanced Analogic Tech concludes internal investigation and moves forward with filing its Third Quarter 10-Q; found no improper conduct (AATI) 5.79 +0.01 : The allegations were made by Skyworks Solutions (SWKS) in connection with an arbitration proceeding then pending in the Delaware Court of Chancery regarding AnalogicTech's accounting treatment of certain revenue that the Company reported for the three months ended June 30, 2011.

4:02PM Brooks Automation announces expansion of Life Science Systems business with acquisition of Celigo Cell Cytometer product line (BRKS) 10.41 +0.14 : Co announced that it had completed the acquisition of the Celigo Cell Cytometer product line from Cyntellect, a privately held life sciences co.

2:15PM NXP Semi subsidiary files form 15F to terminate its reporting obligations in the United States (NXPI) 15.85 +0.48 : Co announced that its wholly-owned subsidiary, filed a Form 15F with the U.S. SEC with the intention of voluntarily terminating the duty that the NXP Subsidiary has to file reports in accordance with section 15 of the Securities Exchange Act of 1934 in relation to its outstanding Euro-denominated Floating Rate Senior Secured Notes due 2013.

Lattice Semiconductor (LSCC) announced the transfer of its Standard Military Drawing product portfolio to Arrow Electronics, effective immediately. Customers now have a new supply channel for these discontinued products.

3:20AM LDK Solar invests in Sunways AG; intends to submit to shareholders a public takeover offer for all outstanding shares (LDK) 4.19 : Co announces it has entered into an investment agreement with Sunways AG, a German stock corporation with its shares listed on the Frankfurt Stock Exchange, to acquire ~33% of Sunways' increased share capital following a capital increase from its authorized capital. In the capital increase, LDK will subscribe for a total of 5.79 mln new shares of Sunways to be issued against a cash contribution and contributions in kind. The issue amount of the shares to be granted against the cash contribution amounts to a total of EUR2,201,805.50. Simultaneously, LDK has announced its intention to submit to the Sunways shareholders a public takeover offer for all outstanding shares in the company.

09:08 am Riverbed Technology upgraded to Outperform at Oppenheimer; tgt $30: . Oppenheimer upgrades RVBD to Outperform from Perform and sets target price at $30. Following their US/Europe channel checks, they believe Riverbed's 4Q11 sales are tracking in line with to slightly above expectations due to a typical year-end flush. In addition, traction and interest in Riverbed's newer products seem to be rising although they expect tangible progress here only in 2H12. Looking ahead to 1Q12, they've raised ests as demand looks to be stronger than they expected across geographies with a solid pipeline building. Overall, it seems Riverbed's momentum is still very strong, and they like its competitive position and strong execution.

11:48 am S&P Tech Sector Up 2%, Just Ahead Of The Broader Market
The tech sector is trading higher today, slightly outpacing the broader market. Semiconductors are showing relative weakness in the tech space with the Philly Semi Index trading 1.6% higher. STM (+8.6%) is a standout, while SNDK (-2.5%) is a notable laggard in the chip index. Among other major indices, the S&P 500 is trading 2.0% higher, while the NASDAQ is trading 2.1% higher and the QQQ is 2.3% higher on the session. Among tech bellwethers, CSCO (+4.2%) is showing strength, while VZ (-0.5%) is a notable underperformer.

In earnings Friday after the close, TSTC (-19.0%) lowered FY11 guidance. This morning, RMBS (+8.0%) and RVSN (+2.4%) raised its guidance.

In news, RIMM (+9.0%) is higher today attributed to a Financial Post story from overnight suggesting co is "leaning toward new chairman".

Among notable analyst upgrades this morning, Oppenheimer upgraded RVBD (+7.5%) to Outperform, CSCO (+4.2%) was upgraded to Overweight at JP Morgan, ALTR (+2.1%), SMTC (+3.1%) and ATML (+4.3%) were upgraded to Buy at Goldman, MU (+8.1%), LSI (+2.4%), and CYMI (+3.2%) were upgraded to Overweight at Barclays, PAY (+4.3%) was upgraded to Outperform at RBC, and FIO (+13.8%) was upgraded to Overweight at Morgan Stanley.

Among downgrades, AMT (-0.6%) was downgraded to Neutral at JP Morgan, PMCS (-0.2%), MCHP (+1.6%), SNDK (-2.5%) and ISIL (-1.6%) were downgraded at Goldman, and AMAT (+1.1%), INTC (+1.1%), FSL (+2.7%), and MCHP (+1.6%) were downgraded at Barclays.

09:55 am Rambus Trading Higher This Morning After Raising Revenue Outlook (RMBS)
Rambus (RMBS $8.25 +0.70) is trading notably higher after raising its revenue outlook earlier this morning.

Earlier, the company raised its fourth quarter revenue guidance to $83 million versus $69.00 million Capital IQ Consensus Estimate, well above its prior guidance of $66 million to $71 million.
icon url

ReturntoSender

01/04/12 10:21 PM

#9638 RE: ReturntoSender #6755

From Briefing.com: 4:30 pm : Stocks faltered in the early going amid a revival of themes that plagued equities in 2011. They battled back, but finished flat after repeatedly failing to do anything more than periodically poke into positive territory.

Sentiment was dampened this morning by concerns about financial conditions in Spain and uncertainty over the financial flexibility of Hungary, which is not a eurozone member, but is significant enough that weakness there could undermine continental conditions. China's Premier, Wen Jiabo, made note of the economic difficulty that his country faces, stirring some to reconsider the ability of China to lead a global economic recovery.

A lack of leadership in the face of those themes left stocks to slide, but the broad market secured support when the S&P 500 came in contact with the 1268 line. From there stocks slowly worked their way to the flat line, but never made any truly meaningful move above the neutral line.

Although they lack market weight, consumer discretionary stocks displayed strength. Apparel and accessories plays joined automakers, which reported solid December sales results, to take the sector to a 0.7% gain. No other sector performed as well.

Financials were laggards for the entire session, but a bounce by regional lenders helped the sector improve its position in afternoon trade. Financials finished the session with a 0.5% loss.

A barometer of economic and financial sentiment in Europe, the euro traded lower today. Its 0.8% slide to $1.294 more than offset its prior session climb. Other currencies fared better so the Dollar Index made a more moderate advance of 0.5%.

Treasuries failed to attract support in the face of the stock market's struggle to trade higher. That left the yield on the benchmark 10-year Note to return to about 2.0%.

Advancing Sectors: Energy +0.2%, Tech +0.3%, Industrials +0.5%, Materials +0.6%, Consumer Discretionary +0.7%
Declining Sectors: Health Care -0.6%, Telecom -0.6%, Financials -0.5%, Utilities -0.5%, Consumer Staples -0.2%DJ30 +21.04 NASDAQ -0.36 NQ100 +0.3% R2K -0.7% SP400 -0.3% SP500 +0.24 NASDAQ Adv/Vol/Dec 970/1.68 bln/1536 NYSE Adv/Vol/Dec 1479/759 mln/1548

5:46PM Seagate Tech is trading 7% higher following upbeat Q3 revs guidance (see 17:11 post) (STX) 16.82 +0.39 :

5:11PM Seagate Tech sees Q3 revs of $4.2-$4.5 bln vs. $3.8 bln CIQ Estimates (STX) 16.82 +0.39 : Co provided preliminary financial results for its fiscal second quarter ended December 30, 2011. The acquisition of Samsung Electronics Co., Ltd's hard disk drive business closed on Dec 19, 2011 and these preliminary financial results include Samsung operating activity from that date. The co shipped ~47 mln disk drives, which included ~700,000 Samsung disk drives, and expects to report revenue for Q2 2012 of $3.1-3.2 bln. Before giving effect to charges related to the acquisition of Samsung's hard disk drive business that are not yet determinable, the co expects gross margin as a percent of revenue to be at least 30.5%, operating expenses (Product Development, Marketing and Administrative) to be ~$390 mln, and diluted outstanding shares to be 440 mln. The co continues to believe that during calendar 2012 unit demand will exceed supply and combined with the high growth rate in the demand for raw storage, the exabyte shortage will be more pronounced than the unit shortage, and as a result pricing is expected to remain stable. The co's outlook for the March 2012 quarter excludes certain costs related to integration activities, transition support services and acquisition related costs associated with the acquisition of Samsung's hard disk drive operations as they are not yet determinable. Specifically for the March 2012 quarter, and before giving effect to the acquisition related charges referenced above, the co expects unit shipments to increase as compared to the December quarter, revenue of $4.2-$4.5 billion, gross margin as a percent of revenue of at least 33%, and operating expenses (Product Development, Marketing and Administrative) to be ~$415 mln. Based on the shares outstanding at the beginning of the March 2012 quarter, diluted outstanding shares are expected to be ~480 mln.

4:02PM FSI Intl announced that a device producer has placed orders for multiple ANTARES CryoKinetic Cleaning Systems (FSII) 3.80 -0.07 : The systems are expected to ship in fiscal 2012.

10:43AM EZchip disclosed that it has selected Marvell (MRVL) to be the ASIC partner for its next generation network processor (EZCH) 28.64 -0.80 :

10:01AM SMTC Corp receives State of California FDB medical device manufacturing license (SMTX) 2.75 +0.07 : Co announced the licensing by the State of California Food and Drug Branch (FDB) to manufacture Class 1 and Class 2 medical devices.

OCZ Technology Group (OCZ) announced that the OCZ Deneva2 30GB and 60GB mSATA SSDs, part numbers D2CSTEMS1A10-0030 and D2CSTEMS1A10-0060 have been tested with Intel (INTC) Smart Response Technology and have passed the performance benchmarks for the 'While Using' portion of the responsiveness requirements in the 2012 Ultrabook Definition.

8:32AM Apple: iPhone 4S arrives in China on January 13 (AAPL) 411.23 : Co announced that iPhone 4S will be available in China and 21 additional countries on Friday, January 13. "Customer response to our products in China has been off the charts," said Tim Cook, Apple's CEO.

8:25AM Trident Microsystems and Cayman subsidiary announced earlier filing for chapter 11 protection (TRID) 0.20 : Co announced that the Company and its Cayman subsidiary, Trident Microsystems have filed voluntary petitions under Chapter 11 of the United States Bankruptcy Code in the United States Bankruptcy Court for the District of Delaware. Trident will shortly file for protection in the Cayman Islands as well. Trident intends to continue to operate all of its business lines in the ordinary course and has ample liquidity to do so, while it completes the Bankruptcy approval process regarding the sale of its Set-Top-Box business to Entropic and explores strategic alternatives for its remaining business units.

Mattson Technology (MTSN) announced that it has received follow-on orders for its Helios? XP rapid thermal processing system from a major Asian foundry.

HP (HPQ) unveiled new consumer PCs and commercial displays that offer consumers and professionals superb design, performance and convenience. HP Omni27 PC,the co's first 27-inch all-in-one PC, and the first non-touch HP PC to feature exclusive HP Magic Canvas software is among the releases.

1:07AM Tessera Tech issues statement regarding Director nominations (TSRA) 16.91 : Co announces it has received a letter from Starboard Value and Opportunity Master Fund and its affiliates and director nominees. In the letter Starboard stated it holds less than 1.3% of the shares outstanding and intends to nominate candidates to fill half of the positions on the co's Board. According to the letter, Starboard holds 622,916 shares of the co, 621,916 of which it purchased in December 2011, and intends to nominate Messrs. Maury Austin, Peter Feld and Jeffery McCreary for election at the 2012 Annual Meeting of the Stockholders. According to public filings, Starboard owns ~9.9% of MIPS Technologies, where Austin is the former CFO and McCreary is a board member.

09:06 am Powerwave downgraded to Hold at Brigantine: . Brigantine downgrades PWAV to Hold from Buy. Firm notes based on preliminary reports from companies addressing a similar customer base, it suspects that PWAV saw sales levels lower than what it had previously expected in the December quarter; however, it appears that spending at AT&T may have resumed somewhat. Compounding the issue, firm believes, is the general global economic malaise that could translate to continued depressed carrier directed sales levels at least through the first quarter of 2012. Also, in recognizing the challenging environment, we are reducing our estimates for 4Q11 and FY12.
icon url

ReturntoSender

01/05/12 8:39 PM

#9639 RE: ReturntoSender #6755

From Briefing.com: 4:30 pm : Leadership from financials helped give the broad market a modest gain after market participants weighed the troubles of Europe against the latest dose of domestic data.

The same old concerns about financial and economic conditions in Europe took yields on sovereign debt in the country higher today and kept constant pressure on the euro, which descended more than 1% to a 15-month low just beneath $1.280. News that many of Europe's financial institutions still prefer to park their cash at the European Central Bank was also regarded as a sign of diffidence in the region.

Negativity stemming from those themes was temporarily tempered prior to the open by the latest ADP Employment Change, which offered an encouraging glimpse into the official nonfarm payrolls report due tomorrow by suggesting that private payrolls increased by 325,000 during December. The jump in payrolls far exceeded the increase of 180,000 that had been expected, on average, by economists polled by Briefing.com.

The latest weekly initial jobless claims count declined by 15,000 week-over-week to 372,000, which is on par with the 375,000 initial claims that had been widely anticipated, but that report received less attention since it was hardly surprising.

The latest ISM Services Index, which was released shortly after the open, didn't garner a great deal of attention either. It came in at 52.6 for December, up from 52.0 in the prior month, but still slightly less than the 53.0 that had actually been broadly forecasted.

Although data was regarded as in-line to positive, stocks still slumped to a marked loss in morning trade. However, once initial support levels held stocks were able to begin working their way higher. In contrast to the prior session, though, the broad market was able to push into positive territory, rather than be rebuffed at the flat line.

Financials were primary driver in the stock market's effort to trade higher. The sector scored a 1.4% gain with help from bank stocks, which collectively climbed almost 2%, as measured by the KBW Bank Index.

Agricultural plays Monsanto (MON 76.68, +4.01) and Mosaic (MOS 53.30, +1.00) were among the top individual performers of the session, thanks to better-than-expected earnings results. Despite their strength, the rest of the materials sector scored a gain of only 0.3%.

The consumer discretionary sector was able to put together a 0.7% gain despite early weakness among retailers, which were initially weighed down by an underwhelming round of same-store sales results for December.

Advancing Sectors: Financials +1.4%, Consumer Discretionary +0.7%, Tech +0.5%, Materials +0.3%, Health Care +0.2%, Utilities +0.2%
Unchanged: Industrials
Declining Sectors: Consumer Staples -0.2%, Telecom -0.5%, Energy -0.6%DJ30 -2.72 NASDAQ +21.50 NQ100 +0.8% R2K +0.7% SP400 +0.7% SP500 +3.76 NASDAQ Adv/Vol/Dec 1537/1.85 bln/977 NYSE Adv/Vol/Dec 1839/829 mln/1186

4:02PM RF Micro Device sees Q3 revenues of $225 mln; Capital IQ consensus $250 mln (RFMD) 5.64 +0.17 : RFMD's revenue for the December 2011 quarter was approximately $225 million (Capital IQ consensus $250 mln). In RFMD's Cellular Products Group (CPG), revenue was approximately $179 million, as sales of 2G components to China-based customers for entry-level handsets were below expectations. In RFMD's Multi-Market Products Group (MPG), revenue was approximately $46 million, reflecting broad weakness in MPG's end markets. The Company noted customer demand softened during the December quarter, with end-of-quarter 2G demand significantly below customer forecasts. RFMD expects gross margin for the December 2011 quarter will decline approximately 9 points sequentially, due to the lower revenue, lower factory utilization, and inventory reserves. Sales of RFMD's components for 3G/4G smartphones increased sequentially approximately 16% during the December 2011 quarter. Bob Bruggeworth, president and CEO of RFMD, said, "RFMD is navigating broadly lower demand in 2G handsets and softness across MPG's markets. Despite this challenging macro environment, RFMD is winning new business with industry-leading products and technologies, and we fully expect to grow in fiscal 2013, supported by market share gains, new product launches, and expanding relationships with both channel partners and customers." In the March 2012 quarter, RFMD anticipates normal seasonality in the handset industry and in MPG's end markets.

4:02PM SMTC Corp adopts shareholder friendly policies, announces standstill agreement with Red Oak Partners (SMTX) 2.75 +0.11 : Co announces changes to its Charter and Bylaws aimed at improving shareholder rights, and an agreement with its largest shareholder, Red Oak Partners, LLC to limit its voting rights in certain circumstances. The Charter and Bylaw Changes include "After retaining a leading provider of shareholder corporate governance solutions to recommend ways to make its policies more shareholder friendly, SMTC's Board of Directors adopted changes to its Charter and Bylaws including: Special meetings may now be called up to twice per year by holders of 10% or more of shares outstanding. Previously, shareholders were unable to call special meetings; Shareholders are no longer limited to the number of Directors they may nominate for election to the Board. Previously, shareholders were limited to nominating three Directors; SMTC's Tax benefits preservation shareholder rights plan ("Net Operating Loss Plan," or "NOL plan") may no longer be extended at the Board's discretion - in the future an extension will require sha Removal of a stakeholder clause considered poor policy by governance experts and which impeded SMTC's singular focus on shareholder value."

8:12AM Marvell says Foresight Platformdesigned into Google TV (MRVL) 14.50 : Marvell (MRVL) announced that the new Foresight Platform, powered by the Marvell ARMADA 1500 HD Media System-on-a-Chip, has been designed into the next generation of Google (GOOG) TVs debuting at CES 2012.

Microsemi (MSCC) announced the company's RF Integrated Solutions facility in Folsom, Calif. achieved compliance with new AS9100:2009 quality system requirements for aviation, space and defense markets.

TranSwitch (TXCC) announced that the Company's TXC-44144 HDplay transceiver integrated circuit has been selected by Universal Microelectronics for the U-HD1080S video switch product.

11:15 am S&P Tech Sector Down Modestly, Outperforming The S&P 500
The tech sector is trading slightly lower today, ahead of losses in the broader market. Semiconductors are showing relative strength in the tech space, however, with the Philly Semi Index trading 0.3% higher. MRVL (+4.7%) is a standout in the chip index. Among other major indices, the S&P 500 is trading 0.7% lower, while the NASDAQ is trading 0.3% lower and the QQQ is 0.2% lower on the session. Among tech bellwethers, ORCL (+0.6%) is showing strength, while CSCO (-1.3%) is a notable underperformer.

In earnings last night, STX (+5.7%) and OCLR (+14.0%) issued upside guidance. WDC (+4.6%) is higher in sympathy with STX. This morning, PLXS (+6.3%) narrowed guidance above consensus, while ROG (-4.9%) and MSPD (+2.1%) lowered guidance.

In news, MRVL (+4.5%) announced its the new Foresight Platform has been designed into the next generation of GOOG (-1.2%) TVs.

Among rumors, we are hearing IBM (-1.2%) for RHT (+0.8%) takeover chatter making the rounds.

Among notable analyst upgrades this morning, NOK (+4.2%) was upgraded to Outperform at Credit Suisse, LSI (+5.6%) was upgraded to Outperform at Wedbush, and APKT (+2.9%) was upgraded to Strong Buy at Raymond James.

Among downgrades, The Benchmark Company downgraded GOOG (-1.2%) to Hold and YHOO (-1.6%) was downgraded to Hold at Jefferies.

GPN (-1.1%) is the notable name in tech scheduled to report results today after the close.

icon url

ReturntoSender

01/08/12 11:36 AM

#9641 RE: ReturntoSender #6755

InvestmentHouse Weekend Market Summary

http://www.investmenthouse.com/weekendmarketsummary.htm

- A solid jobs report reflects the economic improvement, but stocks did not buy into it, at least on Friday.
- Rare revisions to the unemployment rate, the simple are you employed or not survey, raises eyebrows and questions about data accuracy and perhaps explains the market's lukewarm response.
- Dollar and bonds still acting as a safe haven for European funds.
- Stocks close the week with a flat session, unable to build upon the Tuesday, start of the year rally.
- Boat show indicator starts to turn positive but job cuts in 2012 are already high.
- Market still sports many levels of positive patterns supporting a continued move toward the prior highs.

Cool response to a decent jobs report suggests investors don't believe everything they are told in an election year.

Looking at the morning chart of the SP500 futures, you would not have thought a good jobs report was released. Looking at the chart of the day, it also does not look like much is happening. SP500 actually closed lower on the session. That somewhat belies a jobs report that was solid. It was not great, but it was pretty good. It topped expectations at 200K nonfarm payrolls, 50K more than originally anticipated. There was a revision to the downside in November by 20K. When you factor in some upside revisions in October, it was just an 8K job write down between the two months. The nonfarm private payrolls topped expectations, coming in at 212K. That topped the 170K expected. The prior month was also revised down to 120K from 140K.

The unemployment rate dropped 0.2% to 8.5% after it was revised up to 8.7% in November. It is rare to have an upside revision. It is strange because the unemployment number is completely based on a household survey. What reason would there be to revise when it is based on actual calls they made? That put the entire read of the unemployment rate into an even more skewed and skeptical eye than usual. A lot of people think there is some monkey business going on with the employment data. It just so happens that we get into an election year and suddenly the unemployment rate drops substantially below 9%, where it has been for years. It was pretty strange to have a revision, even if it was to the upside. As noted, it brought some skeptics out, and that was reflected in the morning action.

Looking at the intraday chart, you do not see the kind of enthusiasm you would expect this report to generate. There was more good news on the report with the average workweek. It bumped up to 34.4 hours when it was expected to hold steady at 34.3. It has been stagnant at 34.3 for months. What does a tenth of a percent bump mean? It reflects 200K jobs. Lo and behold, there are your 200K jobs. It was a solid report, and it reflects the improvement in the economy over the prior four months just as we felt it would. We also felt that given a decent, solid report, the market might want to bump higher. It might break it free to move to the upside after a good surge on Tuesday, and then a drift for the rest of the week. It continued to drift.

When the news came out, there was an initial pop. Just before the embargo was released, you could see the SP futures jump to the upside. The news hit a bit early. Before CNBC or Bloomberg got the news out, it surged to the upside and then fell back. Futures were up to begin. They got a bit more juice when the news came out, but then they fell back down. As the market opened up it traded lower. It recovered but then range traded for the rest of the day and closed virtually flat. Once again, the growth sectors were leading the way. They lost one of their important components, the SP600, as it turned in a negative session. As you recall on Thursday, there was the triumvirate of NASDAQ, SP600, and the SOX all posting solid gains in a growth renaissance of sorts. But it was not so much of a renaissance on Friday. It was a bit disappointing after a couple of months of solid economic data and a week that showed continued economic improvement. Perhaps some of the news was already built into the gain in the market that we saw on Tuesday.

Even with the disappointing action on Friday, we still look at the market overall in position to continue the moving higher, with SP500 clearing the October peak and then trading up toward the 2011 highs from April, May, and July. We see too many good patterns out there from too many solid sectors to think otherwise. It is interesting because the jobs report somewhat reflects this. There are positives on every sector of jobs growth. It was not huge growth, but construction gained 17K. I believe they said it was the first gain since 2006.

There were widespread employment gains. There are widespread good patterns in the market. With that kind of support for this move, you tend to have continued upside moves -- at least for the near term while those patterns somewhat consummate themselves. After that maybe it rolls back over. A lot of people said we could see similar action in the economic data as we saw in 2010 and 2011 (as I have been saying for a couple of months now). Improvement in late 2010 and then a peak and a decline in 2011. Lo and behold, I am reading all week, especially on Thursday and Friday, that we will have that same kind of action. A weakening 2012 before it picks up once again. But it all remains to be seen.

What we are worried about now is what we are always worried about. That is what is happening right here and right now. We keep an eye on the horizon, of course, so we can take what the market gives.

OTHER MARKETS

Once again the action in the other markets is getting somewhat turned around. Thursday the action somewhat behaving as you would think it would in a normal time. In other words, we had some improving U.S. economic data across the board, and we saw the dollar move higher and bonds move lower. That made a lot of sense. The dollar should strengthen if the economy strengthens. Bonds should move lower and yields should move higher if the economy is strengthening. It makes sense; you do not need the safety of Treasuries, you do not need to grab that yield. You put risk money out there to make a bigger return. Plus, money will be worth more down the road than it is now, so interest rates should rise. It makes sense (hey, something in economics actually does).

Dollar. 1.2730 versus 1.2788 euro. The dollar surged to the upside yet again. A big week for the greenback as it continues to break higher. There are still a lot of worries about what will happen in the eurozone. Will it break up? Will there be defaults? Will there be a smaller eurozone? Those clouds will continue to hound the continent as well as the U.S. markets through 2012. But the dollar was stronger because we have a stronger economy. And Europe still stinks -- I will admit that.

Bonds. 1.95% versus 1.99% 10 year U.S. Treasury. Bonds were surging on the session as well. The 10 year has been hovering around that 2% level. There was a sharp break. Bonds rallied and yields tumbled. That is the opposite of what they should be doing on strong U.S. data. Then again, we are not in a situation where the U.S. is making its own wake. We have to worry about Europe, and I think we will still have a real problem out of China. I think the economy will go into some collapse in different areas. Real estate over there is just primed, but that is another story. We have that European issue, and that will continue to attract European currency to U.S. Treasuries and the safe havens. Therefore we see bonds rally.

It is not just the banks putting the money over here. ECB overnight deposits rose to a record yet again. The banks are keeping the money in Europe. They are keeping it near at hand, too; they are not just shipping it to the U.S. and buying Treasuries in a carry trade (although some of them are). We may have a possibility of some improvement in Europe as money gets put to work over there. I hope that is why they are putting money in the ECB overnight deposits. Then it is close at hand and when they need it they can use it and invest it instead of just parking it in the U.S. and doing that carry trade that U.S. banks did for so long. They borrowed for 0% from the Fed and then bought bonds and got a guaranteed return. There is still money going into U.S. bonds even with a stronger U.S. economy. That tells you there are still problems in the rest of the world, and they are seeking the safety of the U.S. Treasury market. As the dollar rallies, obviously they are buying U.S. dollars as well.

Gold. 1,617.30, -5.60. Gold was off slightly. Gold trades in many different markets and closes at different times. Looking at this chart, it looks like it is up and down. Do not get too bent out of shape about the actual closing numbers; it is the trend that matters. Here we have a doji below the 200 day EMA. It is at other resistance as well. It is right at the resistance from the September and October lows and the consolidation back in August. It could still fall from here. I am still looking at a downside play in gold.

Oil. 101.77, -1.45. Oil took a modest downside day. Still in great shape to make a new break higher. It is trying to put in a higher low near the 10 day EMA at the top of its range. It bounced up and has come back to test. If it puts in this higher low, it is in excellent position to break to the upside. No reason oil should fall now, despite troubles in Europe and despite troubles in China. That is, unless they become front-burner, raging issues. Iran is causing a lot of trouble in the Middle East, and that is helping prop prices higher despite a larger than expected build in the U.S. inventories announced on Thursday.

TECHNICAL SUMMARY

Volume. -7.5% NASDAQ, 1.7B; -16% NYSE, 648M. Volume fell off the table sharply.

Breadth. -1.2:1 NASDAQ; -1.2:1 NYSE. Breadth was mealy-mouthed as well.

CHARTS

SP500. We had a couple of higher lows formed in late November and mid December. You had a higher high, and now it is trying to break over the October high on SP500. We had a consolidation, a big break to the upside on Tuesday as the New Year trade got underway, and then pretty much a lateral move to a slight drift higher to end the week. That leaves the SP500 just below the October peak. October clocks in at 1285 on the high, and SP500 closed almost 1278. It is right there. It has put in higher lows, and it is consolidating laterally. It is in good shape to make the break higher.

The question is whether it will get the impetus to get that break. A lot of patterns still look good. The financials have been improving. They took the day off Friday, and that is why we got no traction on the SP500. Overall, its position is one of strength and there are still good patterns to push it and the other indices higher. This coming week we may get a little more lateral move. Maybe a slip back, or maybe not. It looks good either way. We could get a little giveback or just a new break to the upside. We look for it to take out that October peak. If it does, that is a positive sign for the next week or two for a rally up toward those April and July peaks. We are looking for a good, sharp rally. Then we may get the pullback. Some people say 1300 is the peak, and it may be. We just have to take what it gives and let the play run. For now we have the upside bias that we wanted to see. It is playing out the way we wanted it to.

DJ30. DJ30 was down on the day, but it was a modest loss. It broke to that new high. It is testing it as the 10 day EMA rises above it. I think when the 10 day gets there, it will make its move. It has a good shot to get to 12750. That is the double top from July. That would be a very good move for it. That puts it up another 400 points or so. That can make us money on the positions we already have that are already logging good gains.

NASDAQ. NASDAQ edged higher. It was one of the market leaders again, although it did not make much headway. It is above the 200 day EMA. It is at other resistance from way back, some other gap points March and January. It is still roughly at the early-December peak. It has moved just past it, but it has a lot of resistance still overhead. It is fighting, but it is making some moves, getting help from stocks such as AAPL, GOOG, NTGR, and other big name techs that are moving to the upside for now. They are showing good momentum and carrying this pre-earnings into early earnings rally to the upside.

SP600. The small caps could not make it a threesome when it came to the growth indices moving higher again. They faded back 0.3%. Still in this lateral move. Looked like they wanted to make the break on Tuesday. Tried it, did it, but could not hold it. Now they are still measuring it, moving laterally over the 200 day EMA and right at that late-October peak. In excellent position, as with the Dow, to continue to the upside.

SOX. SOX was up. It was a market-leading kind of move, although it was a weak move. There were semiconductors moving, breaking higher off of the lows in their patterns. That is positive. This will help. The SOX is still mired in its trading range, but it is trying to make a move to the upside. If it does rally higher over the next couple of weeks, the rest of the market will benefit from that. I am not saying it will make the breakout even over the November peaks, but it does not have to for us to make money. If it merely moves to those levels, that means the rest of the market will break above its October peaks and go into that April-to-July trading range and bounce up toward the top of the that range. Then we make some nice money on this end of 2011/beginning of 2012 rally that we have been looking for and have been playing. Why have we been playing it? The individual stock patterns have been saying please come in and buy us because we are going higher.

LEADERSHIP

I have been talking a lot about stocks that are forming good patterns and moving higher. Stocks that have done so already and others that are coming up to fill in the void and provide that extra support for the momentum to the upside. Those waves of new buys coming in. That is always the lifeblood of any rally. It has to live off the initial stocks that move higher, and then it has others step up to take the baton, so to speak, and continue the move.

Financial. Financials have finally started to step up over the past week. The gap higher on Tuesday started money into the sector, and then they continued up through Thursday. Friday was not their day. They were off, but still just modestly, and holding their gains. JPM was off slightly, but it had a very good week under its belt. WFC is the same situation. A great week to the upside after clearing the 200 day EMA a couple of weeks back and testing it. It is moving quite well. Financial institutions have joined the party and are moving up. If they continued to do so, the SP500 makes the break over the October peak, and we continued this rally up near those April and July peaks.

Medical/Healthcare. Healthcare is not getting a lot of play but it has been doing fine. JAZZ had a nice 10% move up, making a super break to the upside. MYL is testing back this week, but it has had a great run under its belt so far. TEVA has rallied up to its 200 day EMA. Looks as if it wants to continue on.

Retail. Retail has had its home runs and its strikeouts, but it is also holding up well and continuing to the upside. Many stores are doing the upside move, continuing up from Thursday. PIR continued its move after a great blast upside on Thursday. We took some gain off the table for LULU on Friday because it ran right up to its upper trendline. Was not quite to our target, but it was very close. After a nice move up for the week, we decided to bank some gain before next Monday just to have it in pocket. SCSS broke to the upside, looking good. Very solid move. Retail is hanging in there. It is not only those patterns that have already moved, but we see stocks that look like they could move as well. GES could make the upside break as well and continue to provide support to the market and to this sector overall.

Technology/Semiconductors. Technology has tried to step up and lead over the last few days. GOOG is pulling back, but it is at the 10 day EMA. It might give us another buy for a continued bounce to the upside. AAPL was churning away again, moving up another 4+ clicks on the session. SNDK looks like it was trying to break higher out of its triangle. Other chips are looking solid as well. ALTR looks like it might try to make a break to the upside. ATML is moving up off of its lows, breaking higher on some solid volume. During the week, MU gapped higher and rallied up to its 200 day EMA.

These are some of the chips I am talking about. While the stocks overall may not look that great, it is getting some support from various chips. Those could really add to the move to the upside over the next couple of weeks and put some life into this market (something more than just this gradual drift we have seen). I could show you a lot more, but I need something left to put on the report. It is where these stocks are set up in these bases. These rounded bottoms or trading ranges -- whatever you want to look at. There are many different patterns out there. We are seeing a lot of little triangles at the bottom of a selloff. They are setting up to move higher. We see them in many sectors, just as we saw jobs growth in many sectors.

I cannot emphasize enough what a positive this is for the market. You have to have a lot of stocks in position to move up, and in a staggered position. It is like buying fruit. If you buy a dozen peaches and they are all ripe, they will start to rot before you can eat them. Or if you have some that are very ripe and some that are real really green, you may not be able to eat all the ripe peaches before they rot, and then the others you have to wait a week before they are ready. But if you stagger them, then you can eat peaches constantly and enjoy them. The market comes up, these others ripen, they move, and you eat them. You grab the others as they come along and ripen. You get the idea with respect to how important it is to have several good sectors in position to move higher to keep rallies moving.

THE MARKET

SENTIMENT INDICATORS

VIX. The VIX is trading down to the low it hit two weeks ago. The market had a little struggle at this level. There is a support level here. It may try to bounce, and the market may try to consolidate a bit. When we look at the charts, you will see it is already consolidating. I am not putting too much stock in what the VIX is showing now. It is not an absolute correlation. A lot of talk about it, but the talk has not done anyone much good. Everyone has been saying the market is going to fall or what have you. Yet the market keeps rising. They said the Christmas rally would end, and then the market keeps going up. It is not going gangbusters, but it is showing that positive action. That is the low to high action. Once again we saw the market dip on Friday and then it recovered as bids came back. They did not knock the cover off the ball, but they did come back in. It is a positive, though it was not raging. As long as the buy stays there my thesis remains in place that the market continues to move up.

VIX: 20.63; -0.85
VXN: 20.52; -0.88
VXO: 19.77; -0.37

Put/Call Ratio (CBOE): 0.96; +0.13

Bulls versus Bears:

This is a reading of the number of bullish investment advisors versus bearish advisors. The reason you look at this is that it gives you an idea of how bullish investors are. If they are too bullish then everyone is in the market and it is heading for a top: if everyone wants to be in the market, then all the money is in and there is no more new cash to drive it higher. On the other side of the spectrum if there are a lot of bears then there is a lot of cash on the sideline, and as the market rallies it drags that cash in as the bears give in. That cash provides the market the fuel to move higher. If bears are low it is the same as a lot of bulls: everyone is in and the market does not have the cash to drive it higher.

Bulls: 49.5% versus 50.5%. Fading modestly on a week of consolidation ahead of the first of the year, but still well above the 45.3% from three weeks back. Still probing the overdone range and could be part of the picture that tops out the current in January, but it is not there yet. 35% is the threshold measuring bullish versus bearish action. Six weeks the bulls were below bears. A powerful sentiment signal but now dissipating. Highs from April and December (60% readings spanning December through early May 2011). The 5 year high is 62.0. The crossover level at 29% bulls from July 2010 is long gone. 35% is the threshold level suggesting bullishness. To be seriously bearish it needs to get up to the 60% to 65% level.

Bears: 30.5% versus 29.5%. Right back up to the same level sported three weeks back as bears remain skeptical. Skeptics in the face of a move is a good sign the move continues. Lower but not anywhere near suggesting investors are carefree. The average the past month and more is 30%. The index spent seven weeks over the 35% threshold considered a bullish indicator. For more reference, bearishness hit a 5 year high at 54.4% the last week of October 2008. The move over 50 took bearish sentiment to its highest level since 1995. Extreme negative sentiment. Prior levels for comparison: Bearishness peaked at 37.4% in September 2007. It topped the June 2006 peak (36%) on that run. That June peak eclipsed the March 2006 high (33%) and well above the 2005 highs that spawned new rallies (30% in May 2005, 29.2% in October 2005). That was a huge turn, unlike any seen in recent history.

NASDAQ

Stats: +4.36 points (+0.16%) to close at 2674.22
Volume: 1.693B (-7.54%)

Up Volume: 994.71M (-375.29M)
Down Volume: 676.22M (+239.24M)

A/D and Hi/Lo: Decliners led 1.24 to 1
Previous Session: Advancers led 1.55 to 1

New Highs: 43 (+2)
New Lows: 34 (+7)

SP500/NYSE

Stats: -3.25 points (-0.25%) to close at 1277.81
NYSE Volume: 648M (-16.17%)

Up Volume: 1.24B (-1.39B)
Down Volume: 2.28B (+670M)

A/D and Hi/Lo: Decliners led 1.18 to 1
Previous Session: Advancers led 1.52 to 1

New Highs: 107 (+1)
New Lows: 14 (-4)

DJ30

Stats: -55.78 points (-0.45%) to close at 12359.92
Volume DJ30: 131M shares Friday versus 158M shares Thursday.

MONDAY

Next week we will have more economic data, but I want to talk about a couple of other economic indicators first before I get into that. One of them is what I called the "boat show" indicator. The boat shows are just getting started now, and the New York one as has been underway. After a five-year decline in new boat sales, they are finally starting to see them rise. They have been on the rise since August 2011. During the recession, new boat sales fell 55%. Previously-owned boats declined only 7%. The pre-owned is the largest part of the market, but the new boats, just as in housing sales, are always important because it gives a better indication of the health of the market. If people are looking to buy new, they have the money and the confidence to do so.

There is an old saying in the economy that the luxury is the last to go down when the economy goes down and the first to come back when the economy comes back. Regardless of their size, boat sales are considered a luxury item. You need the extra cash to buy one. It is nice to see them improving in sales. We will have to see how the boat shows hold out, but that is a positive indication for the economy coming back. It flies somewhat in the face of the idea that the economy will go down in 2012. There are reasons for it to go down, but there are reasons to think it is on the comeback trail as well. The smaller boats are still outperforming the big ones. The small ones always come back faster. It will be interesting to see if the big luxury yachts come back this year.

Another important indicator is jobs. They were better on Friday, but there is another indicator out there. Already this year there have been 2,348 job cuts announced. Boeing has announced cuts. A solar company has announced cuts. And Pepsi will announce cuts as well. They will be significant. They will not be huge numbers, but already we are seeing job cuts as the economy is supposedly improving. That is something to keep an eye on as we move forward because jobs lag the economy. If we are seeing job cuts after seeing an improvement in the jobs numbers, that could indicate that we have seen the apex of the jobs recovery. Then we could start seeing it come back down over 2012, particularly if the economists saying that the economy will fall are actually correct.

As for the actual data next week, we have Consumer Credit along with Wholesale and Business Inventories. Retail Sales for December will be out on Thursday, and that will be big. Friday we have Michigan Sentiment. Those are the big ones for the week. That said, we have to go back and look at the market overall and what I anticipate ahead. It is basically what I have talked about earlier.

The bias is upside right now. There are plenty of good patterns in the market to continue the push to the upside. If we avoid any major problems out of Europe and any major problems from China, the market has a very good shot over the next 2-3 weeks of rising up into the initial rounds of earnings (starting next week) and putting in some good gains toward the July and even the April and late-May peaks. Again, that would put SP500 up around 1350. Plenty of room to run to the upside and make us a lot of money. We have great positions that are already moving. Indeed, we took just a bit of gain off the table on Friday. If we get some more days to the upside, even with this slow drift up, our plays are hitting or coming close to our targets.

As the market moves up, if it has another great surge as it did in mid December or late November, we will have plays hitting targets all over. That is exactly what we have been playing for. We will take partial profits on that, and then we will see how the market handles these peaks. If it struggles, and I think it might, we will book some more of the gain. We will leave a little bit there because if there is a breakout we want to be in those stocks. I have said it many times before: The market can run further than you ever think it could, either upside or downside. It can run more than you would ever rationally believe was possible. Why? Because the market always overshoots near term. Longer term it evens out, but near term it always overshoots. If it gets a good rally going, it can keep going and going. It has a tendency to do the opposite of what a lot of smart people think it should do -- or what your gut tells you it can do. If you rely on your gut when you are investing or trading in the market, you typically end up gutted.

Watch what the stocks are telling you. If they are saying "buy me" as MU said this week, then you buy them. If they bounce off of support such as BWLD did this week, you buy it. If you see a decent move or a decent pattern in a stock like FWLT and it starts to move, pick up some shares. If it works, you make good money. If it does not work, you have a good risk/reward point and you can get out of it. You are not hurt significantly. You have more risk to the gain than you have to the loss, and that is the way you play the game.

We have more exposure in great stocks now because we have good patterns out there. We will take advantage of it as long as the market continues. As Roy McAvoy said in Tin Cup, "You ride her till she bucks ya." Of course Roy was not that great a success. He was a great striker, but he did not have the mental aspect of the game. That is what you do by watching what the market tells you versus playing from your gut.

We will continue to watch what this market tells us. Right now I think it is telling us to continue buying. My caveat is that we may be getting to the point where we do not want to buy too many more stocks. We have a lot of good positions. If the market does rally up to the old highs and stalls, that will put our upside positions in with great gains for us. If we buy a lot of them ahead of the peaks, that leaves us in a position where we could be left high and dry when the tide goes out. We will play the stocks that have good patterns, that are not extended, and that can make us money in this kind of move. If we stay with stocks that are not extended, we will be fine.

I will see you on Monday. Have a great weekend!

Support and Resistance

NASDAQ: Closed at 2674.22
Resistance:
2676 is the January 2010 low and the December 2011 peak
2686 is the January 2011 closing low
2706 to 2705 is the April 2011 low and the February 2011 and consolidation low (bottom of the trading range) 2723 to 2705 is the range of support at the bottom of the January to May trading range
2754 is the recent October 2011 high
2759 is the mid-May low
2762 is the February low
2796 is the February gap down point
2816 is the early April peak.
2825 is the 2007 closing peak.
2841 is the February 2011 peak
2862 is the 2007 peak
2879 is the July 2011 peak
2888 is the May 2011 peak

Support:
The 200 day SMA at 2660
2645-2650ish from December 2010 consolidation
2643 is the September 2011 high
2612 is the late August 2011 peak
The 50 day EMA at 2605
2603 is the March 2011 intraday low (post-Japan low)
2599 is the June 2011 low and NASDAQ
2593 is the November intraday high
2580 is the November 2010 closing high
2572 is the November 2-11 gap down point
2555 is the mid-August 2011 peak
2546 is the early September 2011 gap down point
2535 is the November island reversal gap point
2532 is the early August gap down point
2469 is the November 2010 low
2441 is the November 2011 low
2331 from October 2010 low and the August 2011 intraday low
2305 from the August 2010 peak (summertime base)
2139 is the May and June 2010 low
2123 is the August 2010 gap down point
2100 from the August 2010 lows

S&P 500: Closed at 1277.81
Resistance:
1293 is the October 2011 peak
1295 to 1294 is the April 2011 low and the February 2011 consolidation low (bottom of the trading range)
1313 from the August 2008 interim peak
1318.51 is the May low
1325-27 is the March 2008 closing low and the May 2006 peak.
1332 is the early March peak
1340 is the early April 2011 peak
1344 is the February 2011 peak is being challenged again
1357 is the July 2011 peak
1364 is the March 2007 low
1370 is the August 2007 low
1371 is the recent May 2011 peak

Support:
1275 is the January 2010 low, early January 2011 peak
1267 is the December 2011 peak
The 200 day SMA at 1259
1258 is June 2011 intraday low
1255 is the late December 2010 consolidation range
1249 is the March 2011 low (post-Japan)
The 50 day EMA at 1239
1235 is the mid-December 2010 consolidation low
1231 is the late August 2011 peak
1227 is the November 2010 peak
1220 is the April 2010 peak
1209 is the mid-August 2011 high
1196 is the November 2010 consolidation peak
1178-1180 is the October 2010/November 2010 consolidation low
1158 is the November 2011 low
1131 - 1127 from August 2010 base peak.
1119 is the early August closing low
1109 is the mid-September 2010 gap up point
1101 is the August 2011 low
1075 is the October 2011 intraday low
1099 from the mid-July interim peak
1090 is the early September 2010 gap up point
1040 from the August 2010 lows and May/June 2010 lows
1011 is the summer 2010 low

Dow: Closed at 12,359.92
Resistance:
12,391 is the February 2011 peak
12,754 is the July intraday peak
12,876 is the May high
13,058 from the May 2008 peak on that bounce in the selling

Support:
12,284 is the October 2011 peak
12,258 is the December 2011 peak
12,110 from the March 2007 closing low
12,094 is the April 2011 low
The 50 day EMA at 11,978
The 200 day SMA at 11,955
The June low at 11,897 (closing)
11,893 from March 2008 closing low
11,867 from the August 2009 high and peak on that bounce in the selling.
11,734 from 11-98 peak
11,717 is the late August 2011 peak
The August low at 11,702
11,555 is the March low
11,452 is the November 2010 peak
11,178 from November 2010
10,978 is the bottom of the November 2010 consolidation
10,750 from September 2010
10,720 is the August closing low
10,705-710 from January 2010 peak
10,694-700 from August 2010 peak
9938 is the August 2010 low

Economic Calendar

January 3 - Tuesday
- ISM Index, December (10:00): 53.9 actual versus 53.4 expected, 52.7 prior
- Construction Spending, November (10:00): 1.2% actual versus 0.5% expected, -0.2% prior (revised from 0.8%)
- FOMC Minutes, 12/13 (14:00)

January 4 - Wednesday
- MBA Mortgage Index, 12/31 (7:00): -3.7% actual versus -2.6% prior
- Factory Orders, November (10:00): 1.8% actual versus 2.1% expected, -0.2% prior (revised from -0.4%)
- Auto Sales, December (14:00): 4.36M prior
- Truck Sales, December (14:00): 5.98M prior

January 5 - Thursday
- Challenger Job Cuts, December (7:30): 30.6% actual versus -12.8% prior
- ADP Employment Change, December (8:15): 325K actual versus 180K expected, 204K prior (revised from 206K)
- Initial Claims, 12/31 (8:30): 372K actual versus 375K expected, 387K prior (revised from 381K)
- Continuing Claims, 12/24 (8:30): 3595K actual versus 3620K expected, 3617K prior (revised from 3601K)
- ISM Services, December (10:00): 52.6 actual versus 53.0 expected, 52.0 prior
- Crude Inventories, 12/31 (11:00): 2.209M actual versus 3.899M prior

January 6 - Friday
- Nonfarm Payrolls, December (8:30): 200K actual versus 150K expected, 100K prior (revised from 120K)
- Nonfarm Private Payrolls, December (8:30): 212K actual versus 170K expected, 120K prior (revised from 140K)
- Unemployment Rate, December (8:30): 8.5% actual versus 8.7% expected, 8.7% prior (revised from 8.6%)
- Hourly Earnings, December (8:30): 0.2% actual versus 0.2% expected, 0.0% prior (revised from -0.1%)
- Average Workweek, December (8:30): 34.4 actual versus 34.3 expected, 34.3 prior

January 9 - Monday
- Consumer Credit, November (15:00): $7.6B prior

January 10 - Tuesday
- Wholesale Inventories, November (10:00): 1.6% prior

January 11 - Wednesday
- MBA Mortgage Purchasing Index, 01/07 (7:00): -3.7% prior
- Crude Inventories, 01/07 (10:30): 2.209M prior

January 12 - Thursday
- Initial Claims, 01/07 (8:30): 372K prior
- Continuing Claims, 12/31 (8:30): 3595K prior
- Retail Sales, December (8:30): 0.2% prior
- Retail Sales ex-auto, December (8:30): 0.2% prior
- Business Inventories, November (10:00): 0.8% prior
- Treasury Budget, December (14:00): -$78.1B prior

January 13 - Friday
- Trade Balance, November (8:30): -$43.5B prior
- Export Prices ex-agriculture, December (8:30): -0.1% prior
- Import Prices ex-oil, December (8:30): -0.2% prior
- Michigan Sentiment, January (9:55): 69.9 prior

icon url

ReturntoSender

01/08/12 2:32 PM

#9642 RE: ReturntoSender #6755

Leavitt Brothers State of the Market Video:

http://leavittbrothers.com/blog/?%20p=5220

I follow all of these indicators discussed here and a lot more if anyone wants to see more charts then I can share them. Bottom line is the market advance thus far has been good but not broad enough, nor led enough by small caps, or on high enough volume to indicate to me that the market has much chance of breaking out of the range we have seen.

RtS
icon url

ReturntoSender

01/09/12 10:54 PM

#9643 RE: ReturntoSender #6755

From Briefing.com: 4:30 pm : The major equity averages mustered modest gains after muddling along for most of the session. The slog was a consequence of listlessness amid a lack of catalysts.

An absence of data and market-moving corporate news this morning left market participants with few cues in the early going. Participants also shrugged off a bounce by the euro, which ended the day with a 0.7% gain against the greenback, because Europe's bourses failed to display the same positive sentiment by trading lower. A meeting between officials from France and Germany failed to produce any encouraging headlines about efforts to restore conditions in the European continent.

Although the broad market was range bound for most of the day, industrials stocks eventually moved ahead of the herd. As a group, industrials were able to ascend to a 0.8% gain. That bested both energy and financials, which finished with gains of 0.6% and 0.5%, respectively. Technology stocks, which collectively represent the largest sector by market weight, offset that strength by trading down to a 0.3% loss, even though shares of semiconductor players were boosted by positive analyst commentary.

While many participants were focused on the prospects of earnings season, which is unofficially ushered in by Dow component Alcoa (AA 9.43, +0.27), Inhibitex (INHX 23.70, +13.83) attracted attention because Bristol Myers Squibb (BMY 33.91, -0.31) will pay a premium of about 160% over the stock's prior session closing price so that the company may be acquired. Shares of Achillion Pharma (ACHN 9.72, +1.80) traded higher in conjunction with the announcement.

Although earnings season may be unofficially under way, market participants will still have to go without any economic data of consequence until later in the week. Since the earnings season doesn't get going in earnest until next week and economic news will be limited in coming days, trade may remain anemic, even after all of the end-of-year holidays and vacations. With less than 800 million shares traded on the NYSE today, the paltry share volumes of the past couple of weeks do not yet appear to have passed.

Advancing Sectors: Industrials +0.8%, Energy +0.6%, Financials +0.5%, Materials +0.2%, Utilities +0.2%, Health Care +0.2%, Consumer Staples +0.1%
Unchanged: Consumer Discretionary
Declining Sectors: Telecom -0.1%, Tech -0.3%DJ30 +32.77 NASDAQ +2.34 NQ100 -0.2% R2K +0.5% SP400 +0.5% SP500 +2.89 NASDAQ Adv/Vol/Dec 1433/1.79 bln/1074 NYSE Adv/Vol/Dec 1908/720 mln/1088

4:57PM PLX Tech lowers Q4 revs guidance to $25.7-25.9 mln vs. $29.9 Capital IQ Estimates, down from $28-32 mln (PLXT) 2.99 +0.01 : Co lowers Q4 revs guidance. Gross margin is expected to improve to ~59% and the cash position will increase due to significant inventory reduction. Operating expenses are expected to be lower than previous guidance. "The quarter has not shaped up as we had anticipated due to the December distribution business being significantly lower than prior months, this was primarily driven by very weak demand for our connectivity products. The flooding in Thailand also negatively impacted our storage controller business, further contributing to the shortfall. Our PCI Express and Ethernet segments were relatively robust versus our other products in Q4. We have built a good backlog of our PCI Express Gen3 product due to the anticipated ramp in early 2012 of the launch of Intel's Romley platform."

4:46PM Emulex reports Q2 prelim revs of $127-128 mln vs. $124.1 mln CIQ Estimates, exceeding the high end of the co's guidance of $121-127 mln; reports prelim Non-GAAP EPS of $0.24-0.25 vs. $0.17 CIQ Est., exceeding high end of prior guidance $0.17-0.20 (ELX) 7.39 +0.04 : "Our preliminary results for the December quarter once again demonstrate our commitment to deliver better than industry revenue growth and even stronger earnings growth. Outstanding execution by our operations team overcame the mid-quarter supply constraints from the Thailand flooding, bringing us back to full capacity and allowing us to exceed the high end of our revenue and earnings guidance for the quarter," continued McCluney. "With the benefit of the upcoming OEM server platform refresh cycle related to Intel Corporation's Romley chipset and the expanding adoption of converged networks, Emulex is exceptionally well positioned to continue to deliver shareholder value in 2012," McCluney concluded.

4:33PM Rambus' Cryptography Research and CPU Tech sign patent license agreement for DPA Countermeasures (RMBS) 8.02 +0.03 : This agreement covers the use of CRI's patented countermeasures to differential power analysis (DPA) attacks for CPU Tech's tamper-resistant products, including the Acalis(R) family of secure processors. This license also covers software developed by CPU Tech customers when executing on licensed CPU Tech chips.

4:17PM SMSC drops 8% on disappointing earnings/guidance, currently trading around 23.00 (SMSC) 24.98 : See earlier comments for details.

4:07PM SMSC misses by $0.13, reports revs in-line; guides Q4 EPS below consensus, revs below consensus (SMSC) 24.98 -0.39 : Reports Q3 (Nov) earnings of $0.21 per share, $0.13 worse than the Capital IQ Consensus Estimate of $0.34; revenues fell 0.7% year/year to $106.2 mln vs the $107.07 mln consensus. Co issues downside guidance for Q4, sees EPS of ($0.13)-($0.21) vs. $0.30 Capital IQ Consensus Estimate; sees Q4 revs of $89-93 mln vs. $104.52 mln Capital IQ Consensus Estimate. The lower than expected GAAP and non-GAAP net income and earnings per diluted share are mainly a result of a higher effective tax rate for the third quarter. "Both our automotive and wireless audio products achieved quarterly revenue records. However, this was offset by weak PC, industrial and other consumer product demand. We are projecting fourth quarter sales of $89 to $93 million, reflecting a steeper than historical seasonal decline due to the combination of a continued weak demand environment and lower post holiday consumer product sales. Our current outlook is for revenue to increase in the first quarter of fiscal 2013... Going forward, we will continue to align and manage our expenses in light of the weak demand environment to protect our earnings and drive profitability toward our long term target model while investing and focusing on the high growth areas of our business. Our effective tax rate is expected to be unusually high in the second half of this fiscal year due to the transition to our international structure and lower global profits. However going forward, we expect this new structure to result in a significantly lower effective tax rate in fiscal 2013. "

4:07PM Alcoa misses by $0.02, beats on revs; Co sees FY12 global aluminum demand to grow 7% and are forecasting a global deficit in primary aluminum supply (AA) 9.43 +0.27 : Reports Q4 (Dec) loss of $0.03 per share, excluding non-recurring items, $0.02 worse than the Capital IQ Consensus Estimate of ($0.01); revenues rose 6.0% year/year to $5.99 bln vs the $5.76 bln consensus. Alcoa sees FY12 global aluminum demand to grow 7 percent and are forecasting a global deficit in primary aluminum supply.

4:07PM Cirrus Logic pops 1-1.5 pts in light after hours trading following guidance raise (CRUS) 16.97 : Trading up near its July-Oct/8-mth high near $18.50. See 16:04.

4:04PM Cirrus Logic raises Q3 rev guidance above consensus; sees Q4 revs above consensus (CRUS) 16.97 +0.47 : Co announced estimated net revenue based on preliminary unaudited financial results for the third fiscal quarter, which ended on Dec. 31, 2011, of approximately $122 million (vs $105.08 mln Capital IQ Consensus Estimate). Previously, the company anticipated revenue to be between $102 million and $108 million. Revenue from audio products is estimated at $105 million and revenue from energy products is expected to be approximately $17 million. The company expects gross margin to be approximately 54 percent and combined R&D and SG&A expenses are estimated to be approximately $600,000 above the upper end of guidance, due primarily to additional product development expenses. At this early stage in the March quarter, the company is currently expecting revenue of approximately $105 million (vs $98.49 mln Capital IQ Consensus Estimate), which represents year over year revenue growth of approximately 15 percent. "Q3 was a great quarter for Cirrus Logic, and we are particularly pleased that the last few weeks of the quarter were much stronger than we had anticipated, indicating that demand remains robust following the holiday season."

4:09PM Juniper Networks drops 1.50 to 20.00 level on downside guidance (JNPR) 21.53 +1.10 :

4:08PM Juniper Networks lowers guidance for Q4 (JNPR) : Co lowers guidance for Q4, sees EPS of $0.26-$0.28 vs. Capital IQ consensus of $0.34, and vs. prior guidance of $0.32-$0.36; sees revenue of $1.11-$1.12 bln vs. consensus of $1.19 bln, and vs. prior guidance of $1.16-$1.22 bln. Non-GAAP operating margin is expected to be below the company's prior outlook of 21% to 23% due to lower than expected Non-GAAP gross margins which were impacted by reduced revenue. Co states, "Although the company's results are not yet finalized, fourth quarter performance is below the company's previous outlook primarily due to weaker than expected router demand from service providers. While this was not limited to any single geography, a significant portion of the impact was from US service providers. In addition, product book-to-bill was approximately 1."

4:01PM QuickLogic sees Q4 revs $4.3 mln vs $5.0 mln Capital IQ Consensus Estimate (QUIK) 3.13 +0.14 : New product revenue was approximately $1.7 million while mature product revenue was approximately $2.6 million. "New product revenue was above the guidance given during the company's third quarter earnings call. However, the revenue impact of lower bookings for our mature products, which we attribute to general economic conditions in our mature product markets, was greater than expected," said Andy Pease, QuickLogic's President and CEO. The Company will announce its final fiscal fourth quarter and year-end results and hold its scheduled earnings conference call on February 7, 2012.

9:03AM Benchmark Elec sees Q4 results modestly above the high end of previous ranges (BHE) 14.41 : Co expects to report revenue and EPS modestly above the high end of guidance for Q4. The co provided Q4 revenue guidance of $475-525 mln ($495.7 mln Capital IQ Consensus), with corresponding diluted EPS, excluding restructuring charges and the impact of Thailand flood costs, of $0.00 to $0.11 ($0.04 consensus) on Oct 27, 2011.

7:29AM NXP Semi announced it currently does not anticipate the recently announced Chapter 11 filing by Trident Microsystems (TRID) to have a material impact on its non-GAAP results for the fourth quarter of 2011 (NXPI) 16.89 : Based on the equity accounting methodology used to account for NXP's equity interest in Trident Microsystems, and irrespective of the Chapter 11 filing, the carrying value of the investment on NXP's balance sheet is anticipated to be zero as of the end of the fourth quarter of 2011, compared to the ~$18 mlnas of the end of the third quarter 2011.

icon url

ReturntoSender

01/10/12 9:02 PM

#9644 RE: ReturntoSender #6755

From Briefing.com: 4:30 pm : The broad market ran up to a multi-month high in the early going, but spent the rest of the session drifting along. Although the stock market settled shy of its session high, it still booked its best gain in a week.

Buying interest was largely based on the robust gains staged by many of the major averages abroad, including those in both Europe and Asia. Overseas gains came amid word that analysts at Fitch believe France and Germany will maintain their top-notch credit ratings in 2012, while many in Asia are hoping that China will ease monetary policy after leaders commented last week about the difficulty facing the country's economy.

Banks were among the best performers abroad. That helped fire up shares of domestic financial issues, resulting in a 2.0% gain for the sector. With a 1.8% gain, materials stocks were close behind, but nearly every other sector settled with a gain of less than 1%. Defensive-oriented issues gained the least.

Market participants were treated to the unofficial start of earnings season, which got going when Alcoa (AA 9.44, +0.01) announced quarterly results after the prior session's close. The company's strong top line results initially overshadowed its earnings miss, but enthusiasm eventually subsided so that the stock surrendered all but a penny of its gain. Only a handful of other earnings reports were released; none of them was of any real interest to the broad market.

Data was limited to an inconsequential wholesale inventory report for November. It showed a 0.1% increase when an increase of 0.5% had been generally expected.

Unfortunately for participants reliant upon trading catalysts, the flow of data doesn't pick up until later in the week and earnings season really doesn't get going in earnest until next week. Participation, or share volume, presumably won't pick up until then; as a consequence of the absence of catalysts far less than 1 billion shares traded hands on the NYSE today.

Advancing Sectors: Financial +2.0%, Materials +1.8%, Industrials +1.4%, Health Care +0.9%, Energy +0.7%, Consumer Discretionary +0.6%, Tech +0.5%, Telecom +0.4%, Consumer Staples +0.4%, Utilities +0.1%
Declining Sectors: (None)DJ30 +69.78 NASDAQ +25.94 NQ100 +0.7% R2K +1.4% SP400 +1.3% SP500 +11.38 NASDAQ Adv/Vol/Dec 1847/1.84 bln/707 NYSE Adv/Vol/Dec 2323/841 mln/690

JDSU (JDSU) announced that Australia's Telstra has chosen the JDSU HST-3000 handheld test solution to ensure quality video, data and voice services. Telstra selected the HST-3000 for its ability to locate and proactively troubleshoot service-impacting issues in its copper and ADSL network infrastructure.

Broadcom (BRCM) announced that that its STB platforms support the Comcast (CMCSA) Device Software Reference Design Kit and tru2way on-screen guides.

Qualcomm (QCOM) Atheros and Broadcom (BRCM) announced mutual commitment to HomePlug technology. The cos have validated the performance and reliability of their solutions when operating together.

8:31AM Ixia raises Q4 rev guidance above consensus; sees EPS guidance at high end of previous range (XXIA) 9.98 : Co raises Q4 rev guidance to $83-84 mln from $79-82 mln vs $81.30 mln Capital IQ Consensus Estimate; co sees non-GAAP EPS at the high end of $0.14-0.17 previous guidance vs. the $0.16 consensus. "Our topline and earnings momentum are encouraging as we exit 2011. In the fourth quarter we had robust sales of our High-Speed Ethernet solutions and overall demand was solid across all geographies, with particular strength in North America. Additionally, by leveraging our sales channel, we achieved higher than expected sales of our Wi-Fi testing solutions from the recent VeriWave acquisition."

NXP Semiconductors N.V. (NXPI) announced the first automotive-qualified global multi-standard digital radio co-processor to include Digital Radio Mondial.

Nokia (NOK) and AT&T (T) announced the Nokia Lumia 900, the first of Nokia's Windows Phone-based range to feature high-speed LTE connectivity.

Lumiotec and Universal Display (PANL) announced that the companies have entered into an OLED technology license agreement. Under the new agreement, Lumiotec will be licensed to integrate Universal Display's proprietary UniversalPHOLED phosphorescent and other OLED technologies and materials into OLED lighting products.

Monster Digital announced it is teaming with Seagate Technology (STX) to make it easy to upgrade laptop and desktop PC storage to Seagate's Momentus XT solid state hybrid drive

1:13 pm S&P Tech Sector Showing Gains, Slightly Underperforming The S&P 500
The tech sector is trading higher today, trailing gains in the broader market. Semiconductors are trading in line with the tech space, with the Philly Semi Index trading 0.6% higher. CRUS (+13.3%) is the standout in the chip index. Among other major indices, the S&P 500, the NASDAQ, and the QQQ are trading 1.1% higher. Among tech bellwethers, ORCL (+0.6%) is showing strength, while GOOG (-0.2%) is underperforming.

In earnings last night, SMSC (-3.3%) posted a miss and guided lower and OCZ (-8.5%) reported a mixed qtr and guided higher. Elsewhere, JNPR (+0.3%) lowered guidance, while CRUS (+13.3%) and ELX (+14.6%) issued upside guidance. In news, WBMD (-26.1%) announced the termination of discussions regarding potential corporate transaction. In addition, its CEO resigned and the company guided lower.

Among rumors, we are hearing YHOO (+0.9%) for AOL (+1.0%), and separately DELL (+1.6%) for RAX (+0.8%), takeover chatter making the rounds.

Among notable analyst upgrades this morning, Wunderlich upgraded VDSI (+12.2%) to Buy, Oppenheimer upgraded VIT (+5.9%) to Outperform, JNPR (+0.3%) was upgraded to Overweight at Piper Jaffray, ELX (+14.6%) was upgraded to Sector Perform at Pacific Crest, and Stifel Nicolaus upgraded CRUS (+13.3.%) to Buy.

Among downgrades, XRX (+0.4%) was downgraded to Equal Weight at Barclays, SUPX (-1.7%) was downgraded to Neutral at Lazard, and JNPR (+0.3%) was downgraded to Neutral at BofA/Merrill.

SNX (+0.7%) is the notable name in tech scheduled to report results today after the close.
icon url

ReturntoSender

01/11/12 10:02 AM

#9645 RE: ReturntoSender #6755

KLIC ST Short Sale 5000 shares of KLIC@10.39 - Looks like I am either early or wrong taking this position right now but KLIC is at the top of its recent range on low volume. Much like the market itself. This should work out in my favor in my opinion.


RtS
icon url

ReturntoSender

01/11/12 11:58 PM

#9646 RE: ReturntoSender #6755

From Briefing.com: 4:30 pm : 4:30 pm : Another day of lackluster trade left the major equity averages to finish mixed. The lack of news flow over the past two days has many participants looking forward to a flurry of announcements tomorrow.

Losses by Europe's bourses and a weaker euro, which trailed the dollar by about 0.4% all session, hampered stocks for most of the session. Trade was also made lackluster by the absence of data and meaningful corporate announcements.

A gradual climb by financials provided a lift later in the session, helping the broad market settle at the flat line. Financials finished with a 1.0% gain, outperforming the broad market for the third straight session. Materials stocks also collectively climbed 1.0% in an extension of their prior session run.

Many solar plays soared as analysts considered the possibility of stronger demand from Germany. The group's strength helped give the Nasdaq a modest lead over its counterparts.

Energy stocks lagged all session. The sector's 1.3% loss came amid softer energy prices -- oil prices closed with a 1.2% loss at $100.96 per barrel, but natural gas prices suffered a 5.8% drop to close at $2.77 per MMBtu.

Treasuries attracted modest support. Strong demand at an auction of 10-year Notes helped. The offering drew a bid-to-cover ratio of 3.29, dollar demand of $69.1 billion, and an indirect bidder rate of 38.3%. For comparison, an average of the past six auctions results in a bid-to-cover of 3.08, dollar demand of $66.2 billion, and an indirect bidder rate of 44.0%.

The only economic release today was the Fed's Beige Book, but that is merely a collection of anecdotal information. It generally indicated that national economic activity expanded at a modest to moderate pace from late November through December.

As a consequence of the dearth of news flow participation remained limited. That made for a paltry trading volume total of less than 800 million shares on the NYSE.

Although earnings season doesn't get going in earnest until next week, market participants are looking forward to the latest European Central Bank announcement, weekly initial jobless claims, monthly retail sales, monthly business inventory numbers, and the latest Treasury Budget, all of which are due tomorrow and represent potential trading catalysts.

Advancing Sectors: Financials +1.0%, Materials +1.0%, Telecom +0.7%, Industrials, +0.3%, Tech +0.2%, Consumer Discretionary +0.1%
Unchanged: Health Care
Declining Sectors: Utilities -0.4%, Consumer Staples -0.6%, Energy -1.3%DJ30 -13.02 NASDAQ +8.26 SP500 +0.40 NASDAQ Adv/Vol/Dec 1495/1.73 bln/1016 NYSE Adv/Vol/Dec 1668/759 mln/1359

4:52PM EXFO misses by $0.03, misses on revs; guides Q2 EPS below consensus, revs below consensus (EXFO) 6.45 +0.49 : Reports Q1 (Nov) earnings of $0.05 per share, $0.03 worse than the Capital IQ Consensus Estimate of $0.08; revenues fell 1.8% year/year to $66.4 mln vs the $67.38 mln consensus. Co issues downside guidance for Q2, sees EPS of $0.00-0.04 vs. $0.10 Capital IQ Consensus Estimate; sees Q2 revs of $65-70 mln vs. $72.37 mln Capital IQ Consensus Estimate.

9:45AM Riverbed Technology announced that it has purchased certain assets of Expand Networks, including its intellectual property, out of liquidation in Israel; financial terms not disclosed (RVBD) 26.84 +0.34 :

10:43 am S&P Tech Sector Up Modestly, While S&P 500 Is Slightly Lower
The tech sector is trading slightly higher today, ahead of gains in the broader market. Semiconductors are showing relative strength in the tech space with the Philly Semi Index trading 0.3% higher. WFR (+11.3%) is a standout in the chip index. Among other major indices, the S&P 500 is trading 0.3% lower, while the NASDAQ is roughly flat and the QQQ is 0.1% higher on the session. Among tech bellwethers, CSCO (+1.0%) is showing strength, while AAPL (-1.0%) is a notable underperformer.

In earnings, SNX (+6.6%) reported a Q4 beat and guided Q1 in-line. SMCI (-6.6%) lowered Q2 guidance, while SAAS (+1.0%) issued upside guidance.

In news, MSFT (0.0%) cautioned during an analyst conference that Q4 PC sales will probably be lower than expected because of supply constraints stemming from flooding in Thailand. Elsewhere, YOKU (+6.0%) signed content deal with Twentieth Century Fox for Youku premium platform.

Among notable analyst upgrades this morning, ALU (+5.3%) was upgraded to Buy at Deutsche Bank, NSR (+0.2%) was upgraded to Buy at Goldman, and MKTG (+4.2%) was upgraded to Overweight at Morgan Stanley. Among downgrades, WBMD (-0.8%) was downgraded to Underweight at Morgan Stanley.

No notable names in tech scheduled to report results today after the close.

icon url

ReturntoSender

01/12/12 8:55 PM

#9648 RE: ReturntoSender #6755

From Briefing.com: 4:30 pm : Some disappointing data resulted in a shallow slide for stocks this morning, but the broad market staged a gradual recovery so that it settled with a modest gain. Stocks now enter Friday riding a week-to-date gain greater than 1%.

After a few days without any data of consequence participants anxiously awaited monthly retail sales numbers and the latest weekly initial jobless claims tally, but both came short of what had been widely expected. Specifically, retail sales during December increased 0.1%, while sales less autos actually fell 0.2%. Economists polled by Briefing.com had expected, on average, respective increases of 0.4% and 0.3%. Little attention was paid to the upward revisions of the prior month.

Initial weekly jobless claims mad an unexpected jump to 399,000 from 375,000, which is where many had expected them to remain. Continuing jobless claims climbed to 3.63 million from 3.61 in the prior week.

The data cast a pall over news that recent debt offerings from both Spain and Italy were successful, which initially helped drive Europe's bourses higher before sentiment was soured by cautious, although unsurprising, comments about downside risks to economic activity in the region from European Central Bank (ECB) President Draghi. Draghi's comments came in a press conference that followed the ECB's decision to keep its target interest rate at 1.00%. Also, the Bank of England opted to keep its interest rate at 0.5% and its asset purchase plan at 275 billion pounds.

The euro displayed resilience today. Selling undercut an early gain, but the currency rallied so that it was at $1.283, up 0.9%, by session's end.

As a consequence of the euro's rally, the dollar traded lower, but that failed to help energy prices. Natural gas fell another 2.5% to settle pit trade at a 28-month low of $2.70 per MMBtu, while oil futures settled pit trade with a 1.9% loss at a 2012 closing low of $99.07 per barrel.

Softer oil and gas prices weighed on the energy stocks all session. The sector settled with a 0.9% loss. In contrast, materials stocks staged a strong advance by scoring a 1.5% gain. While energy stocks made up the session's worst performing sector, materials were the best.

Financials faltered alongside the broad market in the early going, but were able to stage a gradual recovery. Banks were generally quiet ahead of the latest quarterly announcement from JPMorgan Chase (JPM 36.85, +0.19), which will set the bar for bank stocks when it reports tomorrow morning.

Although the broad market was basically without legitimate leadership for the second straight session, technical support played a part in today's advance. The stock market's early slide was stemmed when the S&P 500 tested the 1286 line, which was recently an area of resistance before the broad market measure gapped above it earlier this week.

Treasuries were quiet today, but there was a mild flurry of selling following results from an auction of 30-year Bonds. The auction drew a bid-to-cover of 2.60, dollar demand of $33.8 billion, and an indirect bidder participation rate of 31.9%. For comparison, an average of the previous six auctions results in a bid-to-cover of 2.69, dollar demand of $37.2 billion, and an indirect bidder rate of 29.8%.

Advancing Sectors: Materials +1.5%, Industrials +0.9%, Tech +0.4%, Financials +0.4%, Telecom +0.3%, Consumer Discretionary +0.3%, Health Care +0.2%
Declining Sectors: Consumer Staples -0.1%, Utilities -0.2%, Energy -0.9%DJ30 +21.57 NASDAQ +13.94 NQ100 +0.4% R2K +0.4% SP400 +0.2% SP500 +3.02 NASDAQ Adv/Vol/Dec 1535/1.69 bln/967 NYSE Adv/Vol/Dec 1838/770 mln/1151

Microsoft (MSFT) and LG Electronics have signed a patent agreement that provides broad coverage under Microsoft's patent portfolio for LG's tablets, mobile phones and other consumer devices running the Android or Chrome OS Platform. The contents of the agreement have not been disclosed.

7:57AM EXFO correction: Beats Q1 EPS by $0.01; guides Q2 rev below consensus (EXFO) 6.45 : Last night we incorrectly compared GAAP results to non-GAAP estimates. The co reported Q1 (Nov) earnings of $0.09 per share, ex-$0.04 in amortization and stock based compensation, $0.01 better than the Capital IQ Consensus Estimate of $0.08; revenues fell 1.8% year/year to $66.4 mln vs the $67.38 mln consensus. Co issues guidance for Q2, sees EPS of $0.04-0.08, ex-$0.04 in amortization and stock based compensation, vs the $0.06 Capital IQ single estimate, however, other estimate providers have a $0.10 consensus; co sees Q2 revs of $65-70 mln vs. $72.37 mln Capital IQ Consensus Estimate... The previous comment has been removed.

icon url

ReturntoSender

01/14/12 5:15 PM

#9649 RE: ReturntoSender #6755

From Briefing.com: Weekly Recap - Week ending 13-Jan-12Concerns about sovereign debt downgrades stirred sellers on Friday, but stocks were able to cut losses. That ensured the broad market a modest weekly gain of about 1%. Stocks slid to a loss in excess of 1% this morning. The descent came in response to headlines that downgrades could be in store for several eurozone countries. France actually confirmed that analysts at S&P made a single-notch downgrade to the country's credit rating. That decision contradicted word earlier this week that analysts at Fitch expect France to keep its top-notch credit rating in 2012.

Banking bellwether and Dow component JPMorgan Chase (JPM 35.84, -0.98) reported disappointing quarterly results this morning. It made for a lackluster follow-up to the unceremonious start that earnings season made earlier this week when fellow blue chip Alcoa (AA 9.80, -0.13) posted a mixed report. The financial sector suffered all session as most other diversified banks and financial services stocks traded lower in sympathy.

Not a single sector scored a gain on Friday, but shares of many retailers were helped higher by the latest Consumer Sentiment Survey from the University of Michigan. It improved from 69.9 in December to 74.0 in the preliminary reading for January. Not only did that best the Briefing.com consensus call for a reading of 71.2, but it marked the highest reading since May 2011.

The euro had a volatile week before it suffered a sharp slide on Friday. The currency ended the day at $1.2681, which makes for a -1.1% loss.

Prior to Friday participants were dealt a sizable dose of data after being deprived from such catalysts for a few days. Retail sales during December increased 0.1%, while sales less autos fell 0.2%. Both came short of what had been expected, but prior month sales were revised upward. Economists noted that sales weakened while aggregate earnings increased, likely since consumer debt remains a hindrance for current consumption.

Initial weekly jobless claims made an unexpected jump to 399,000 from 375,000, which is where many had expected them to remain. Initial claims have steadily increased over the past few weeks, but the latest increase is likely due to disappointing December retail sales resulting in staffing cuts.

After the European Central Bank (ECB) and Bank of England opted to keep interest rate targets at 1.00% and 0.5%, respectively, ECB President Draghi offered a reminder of the substantial downside risks to regional economic activity. Although the nature of the comments was unsurprising, Draghi's words cast a pall over news that recent debt offerings from both Spain and Italy were successful.

Midweek trade was mostly listless and lackluster, a consequence of little news flow. The only economic item was the Fed's Beige Book. Once again it made mention of a modest increase in economic activity, but did nothing to assuage concerns about the pace of the economic recovery.

Tuesday saw stocks jump in response to robust gains staged by many of the major averages abroad. Investors gained confidence from word that analysts at Fitch believe both France and Germany will maintain their top-notch credit ratings in 2012. Meanwhile, some believe that China might ease monetary policy so as to hedge against disruptions to the country's economy.

Trade on Monday was generally uneventful as market participants prepared for the unofficial start of earnings season. It got going when Alcoa (AA) announced quarterly results after the close. The Dow component posted a strong top line, but its earnings came short of what Wall Street had expected.

The pace of earnings announcements will pick up next week, but traders will have to wait an extra day since U.S. markets will be closed on Monday in observance of Martin Luther King, Jr. Day.

Treasury Auction recap: Results from an auction of 3-year Notes featured a bid-to-cover of 3.73, dollar demand of $119.4 billion, and an indirect bidder rate of 38.5%. For comparison, the prior auction featured a bid-to-cover of 3.62, dollar demand of $115.8 billion, and an indirect bidder rate of 39.1%. An average of the past six auctions results in a bid-to-cover of 3.33, dollar demand of $106.6 billion, and an indirect bidder rate of 38.9%. An auction of 10-year Notes drew a bid-to-cover ratio of 3.29, dollar demand of $69.1 billion, and an indirect bidder rate of 38.3%. For comparison, an average of the past six auctions results in a bid-to-cover of 3.08, dollar demand of $66.2 billion, and an indirect bidder rate of 44.0%. An auction of 30-year Bonds drew a bid-to-cover of 2.60, dollar demand of $33.8 billion, and an indirect bidder participation rate of 31.9%. For comparison, an average of the previous six auctions results in a bid-to-cover of 2.69, dollar demand of $37.2 billion, and an indirect bidder rate of 29.8%. ..NYSE Adv/Dec 1062/1972. ..NASDAQ Adv/Dec 796/1676.
 
Index Started Week Ended Week Change % Change YTD %
DJIA 12359.92 12422.06 62.14 0.5 7.3
Nasdaq 2674.22 2710.67 36.45 1.4 2.2
S&P 500 1277.81 1289.09 11.28 0.9 2.5
Russell 2000 749.71 764.20 14.49 1.9 -2.5
5:04PM Maxim Integrated: Cypress (CY) drops trade secret lawsuit against Maxim Integrated Products (MXIM) 25.95 -0.33 : Cypress Semiconductor (CY) announced that it has dropped its trade secret lawsuit against MXIM. The lawsuit charged Maxim with trying to gain access to Cypress's touchscreen intellectual property by unfairly targeting key Cypress employees. Cypress dropped the lawsuit "without prejudice," so it can be filed again in the future if necessary.

4:15PM KEMET drops 10% on light volume to $6.64 after lowering Q4 revs guidance (see 16:11 comment) (KEM) 7.39 -0.26 :

4:11PM KEMET lowers Q3 revs guidance expectations to $217-219 mln vs. $232.8 mln CIQ Est (KEM) 7.39 -0.26 : Co announced that its Q3 results are expected to be below the company's previous outlook due to softening demand in its European and Asian markets, as well as continued distribution inventory rebalancing. The company now expects Q3 revenue to be ~$217-219 million vs. $232.8 Capital OQ Consensus Estimates, lower than the previous expectation range of $228 million to $238 million. Third quarter order-intake was up slightly over Q2, and the co believes that its market share remains unchanged. The co now expects the Q3 consolidated gross margin as a percent of net sales to be in the 18% to 19% range, lower than the previous gross margin guidance as a percent of net sales range of 19% to 22%.

09:16 am Mattson upgraded to Buy at Needham; tgt $3: . Needham upgrades MTSN to Buy from Hold and sets target price at $3. The firm believes the Helio XP RTP tool and the etch products are finally reaching adoption, and expect the company to ship both products to multiple customers. Additionally, they believe the benefits of cost cutting efforts will materialize in 2012, enabling MTSN to deliver profitability as early as 2Q12. With outsized exposure to the leading capex spenders coupled with new product ramp, they believe MTSN could significantly outperform the industry in the coming year.

10:44 am S&P Tech Sector Down 1.2%, In-line With The S&P 500
The tech sector is trading lower today, along with losses in the broader market. Semiconductors are showing relative weakness in the tech space with the Philly Semi Index trading 1.9% lower. WFR (-7.5%) is a notable laggard in the chip index. Among other major indices, the S&P 500 is trading 1.3% lower, while the NASDAQ is trading 1.2% lower and the QQQ is 1.1% lower on the session. Among tech bellwethers, IBM (-1.8%) is a notable underperformer.

In earnings, JDAS (-12.4%) issued downside guidance last night. This morning, SAP (+1.6%) guided Q4 revs above consensus.

In news, AAPL (-0.5%) suspended sales of its iPhone today in China in response to unruly crowds outside stores.

Among notable analyst upgrades this morning, CTXS (-1.4%) was upgraded to Buy at Citigroup. Among downgrades, AKAM (-4.9%) was downgraded to Neutral at DA Davidson and VMW (-4.9%) was downgraded to Sell at Citigroup.

icon url

ReturntoSender

01/15/12 12:21 PM

#9650 RE: ReturntoSender #6755

Leavitt Brothers Key Indicators Video - Time to be Cautious:

http://leavittbrothers.com/blog/?%20p=5244

Updating Charts provided by yours truly RtS


On the Put to Call Ratio it's actually the turn in direction that advises caution to either longs or shorts. The 10 day sma on the $CPC has fallen recently to .85 which while relatively low means little unless the $CPC begins to move higher. Back in 2000 .05 was too low. Now .75 has served as a definite line in the sand and a market turning number but these numbers and charts are always evolving with changes in the market. Evolving in such a way that what happened last time only tells us when there is more risk or less risk in going either long or short. RtS


On a longer term chart a 60 day sma of the $CPC shows just how much the prevailing trend of buying put potential has changed throughout the Bear market we have been in since March of 2000:


RtS
icon url

ReturntoSender

01/15/12 12:25 PM

#9651 RE: ReturntoSender #6755

InvestmentHouse Weekend Market Summary:

http://www.investmenthouse.com/weekendmarketsummary.htm

- France spills the beans early on an S&P downgrade and the market takes its licks.
- Stocks sell but once again they recover off the lows with the low to high intraday action. If S&P action occurred a couple of months back we would be talking about Black Friday part 2.
- JPM disappoints but the reaction in the stock and financials is minimally negative.
- Michigan Sentiment posts a nice January bounce.
- Europe has its reasons for backing off its Iranian oil embargo plans. What are our reasons for not taking Canada's oil, producing our own, creating thousands of jobs, giving people incomes to buy homes given low rates, and lowering the price of oil and gasoline?
- Earnings and economic data for the short week ahead, and still we see plenty of upside patterns that we will take advantage of if they show the moves.
- S&P downgrade portend an EU recovery? When S&P downgraded the US our economy rebounded.
- Quantitative Easing III likely on the way: it is an election year, Bernanke knows which side will preserve his job, and his henchmen are laying the groundwork.

A backend loaded news week overcomes some pretty negative news and holds up just fine.

Monday is Martin Luther King Day, so the financial markets will be closed. I was worried about that because there may be something happening in Europe over that long weekend. While we will be closed on Monday, other markets will be open and we might be behind the curve. That could lead to some significant selling on Friday in anticipation that something may happen. As it turns out, this morning our friends the French let slip that S&P would downgrade the credit of seven European nations (one being France) from AAA to AA+. They stole S&P's thunder, but it did not matter. Reuters carried the story and the news was out. As a matter of fact, I am glad France did this.

Futures were somewhat lower because JPM missed in its revenue guidance, and that put a pall across the market. Financials had been moving up well, and this news knocked them back. But that is okay; it is a normal profit-taking day after a good run higher. This was not carnage for JPM or any of the other financials. It did have futures trading under water, but not desperately so. Then came France spilling the beans about the S&P downgrade. When that news hit, futures really tumbled. When the market opened it continued to fall to the downside, looking for a bottom after this news.

What would have happened a couple of months ago? The Dow would have dropped 300-400 points easily. The Dow was down, but it only fell 160 points on the low. That was no 400 points drop. I have seen 400 point drops, and this was no 400-point drop. Indeed, the Dow reached down and tapped at the 20 day EMA which is coincident with the late-October peak. It tapped it and recovered beautifully off the lows to close down about 50 points. Great action. What was that? I said great intraday action.

This was bad news, but we all knew it was coming. We have been dealing with the PIIGS for over a year now. We all knew there were problems and knew nothing had been done. There has been some deft kicking of the can down the road, but nothing major. Mind you, the ECB did finally get in the game. Mr. Draghi has started to cut rates, and a lot of the pundits have been saying that the ECB helped the EU avoid a catastrophe. Maybe that is the case. Maybe they flooded enough liquidity in there to get things thawed out a bit. We do know that the dollar LIBOR has dropped for the first time in months. It went from below 20 to 58. Now it slid back to 57. I can live with that. There is a little improvement, and things are loosening up in Europe. So, timely as ever, S&P comes in and downgrades. France and Austria were knocked down a notch. They knocked Italy, Spain, and Portugal down two notches. There was an expected downgrade, but there is always a reaction to that harsh reality slap in the face, even if we all knew it was coming. That is what we saw from the market on Friday. Again, even though we have been dealing with this for over a year, it is good to see that the rating companies finally got in and let us all know that there is truly a problem in Europe.

Europe is probably going into a recession. It is likely already there, and it may be an ugly one. But it is taking steps to improve liquidity, and hopefully it will expand their debt enough to float them out, similar to what we have done in the U.S. That may lead to horrible inflation down the road. I do not know for sure. I have a pretty good idea, but the Fed keeps saying it will not happen. So we stick our heads in the sand, believe, and buy stocks. That is apparently what happened on Friday.

Stocks were down, but then after a half hour in the day, Michigan Sentiment came out at 74 versus the 71.2 expected. That helped turn the market back to the upside. Anything over 70 is good. It was 69.9 back in December, and this is the first read from January. That looks solid. Never mind that the trade balance was a bit worse than expected. Export prices fell again. We can live with that, too, I guess. It was the Michigan Sentiment that helped turn the market back to the upside. Indeed, while stocks did not ever recover to positive, they did not do badly. It is more of that low to high action that is the hallmark of this current rally.

Even on days where it is up, it starts low and finishes high. It is able to pull it off. There is more of that bullish bias start the New Year and the "January effect." Funds are looking to put money to work. They always do at this time of year in order to get the big percentage gains for the smaller stocks. Things in the US are improving, and they want to buy the small stuff, let it appreciate, and then get good gains to start the year. Then they can back off and coast as the year moves ahead. Why? A lot of people are saying this may be a tough year for the economy even after it gets a good start to the end of 2011, as we saw back in 2010. A good finish, but it cannot keep the mo. We will have to see what happens there, and I am still worried about it. I was saying that four and five months ago. I was worried about what would happen after the first of the year.

For now, the market is moving higher. For now, that is a good omen for the economy. The small caps are continuing to move up, and that is always a positive. We do not want to go against the market. That is why, despite our misgivings in our gut about what may happen in 2012, we defer to what the market is showing with many stocks in position to buy. We have been taking advantage of them, and they have been working for us. Not going to complain about that. Sure, there are clinkers out there. They always happen. We are coming into earnings season, we have pre-announcements and warnings, and there are stocks gapping upside and downside. You are in the game, and that will happen. But we have a lot of great positions. We never put everything in one position. That is just money management. You spread your trades out, you make no trade bigger than a certain percentage of your portfolio. You manage your money, in other words, and you will make money.

In any event, we are seeing this low to high action, which is positive for the market. That is a positive for this rally continuing. Even in the face of some very negative news out of Europe, this market was able to recover off of its low. The Dow was down 160 points, coming up over 100 points off of its low to close. Buyers using dips to move in. As a result, the indices cut their losses significantly.

SP500, -0.5%; NASDAQ, -0.5%; Dow, -0.4%; SP600, -0.9%; SOX, -2.1%

Not a great day, but not the carnage that could have been. Again, you have to look at the low to high action, still showing a bullish or upside bias to the market even on a negative day.

OTHER MARKETS

You can see a response to the European news in the other markets.

Dollar. 1.2676 versus 1.2825 euro. The DXY0 looks like the dollar was down, but it was not down against the euro. These are lows of the euro versus the dollar we have not seen since 2010. Against the other currencies, the dollar was a bit weaker, so the DXY0 overall was lower. The DXYO was higher on Thursday when the dollar was lower against the euro. You see how it works; it is not just the dollar/euro that moves the DXY0. Overall the dollar continues its way higher, testing the late-September/early-October high as it continues to trend up the 20 day EMA. Indeed, it traded below the 20 day EMA intraday and recovered to hold that support level. The dollar continues its strength. We would love to see the dollar strengthen. We are all tired of our dollars being worth less than they were three years ago or even longer than that. Even George W. Bush's presidency pursued a somewhat weak-dollar policy. He just was not so open about it.

Bonds. 1.84% versus 1.97% 10 year U.S. Treasury. Bonds had a rip-roaring day. Big moves. Bonds bouncing back to the upside. It was a bit of a fear trade with the downgrades from several EU countries. Some money fled to the U.S. This was a huge move for the 10 year, and it will probably give some of that back as the news is absorbed into the market.

Gold. 1,631.10, -16.60. Gold was down on the day. Gold has been an enigma. It looked as if it wanted to break higher, but it broke lower. It looked like it wanted to break down, and then it broke higher. Now it is holding over the 200 day EMA, indeed, bouncing back up off of that level intraday on Friday. Gold is a jumbled pattern right now. At some point we will get a good buy in gold. We are just waiting for it to show up. This pattern is hard to love right now, but I will note one thing. There was a triangle, a breakdown. Now you have a double bottom at roughly the 78% Fibonacci retracement. In theory, you could get a move back up to the prior high off of this double bottom. That is something to look at, but it is such a jumbled pattern.

It did come back from a lower low that undercut that September low. Whenever you see that false breakdown and a recovery, that is a positive. People used it to step in, and it held right on top of the April to July consolidation. It is a logical point for it to hold again as it did in September. When it undercut it again and did not fail, that showed there were buyers still here. I still think it could roll over at this point. There is resistance where it is right now. A gap higher from early August, the peak in October, and then the lows in November. It has resistance; we just have to see if it falls back down. Then it would have to test this old low again that has proven to be support thus far. If gold continues higher from here, it is probably a trade up to the old high. That is what you shoot for with a double bottom at the lower Fibonacci extensions.

Oil. 98.68, -0.29. Oil had something of a rough week. A rough week in that it was really holding up well thanks to Iran wanting to close the Strait of Hormuz and saying it would do so if there were economic sanctions against it. That ratcheted up the price of oil. It looked like it was ready break above that November peak, and then Europe said they could not impose that oil embargo for another six months. Why? Some EU countries may not be able to replace that oil. Frankly, their economies are in the toilet. If they had to go elsewhere to get oil, it would be more costly. Then Iran said it will close the Strait of Hormuz, and that would raise the price of oil even further. That would put more pressure on the economies, and did I mention they were already in the toilet? That would probably flush the toilet and then we would have a bunch of the PIIGS rooting around in the sewer. It did not want to take any action to exacerbate the problem for its member nations. It said they did not like what Iran is doing. If it gets a nuke, it will be a real problem. But if they go down in the toilet, that is a real problem, too. The old, "I will save myself first and then worry about everyone else later" mentality. We are looking at six months down the road.

That is a long explanation to say that oil fell, but it did not fall out of its pattern. Not at all. It tapped the 50 day EMA on Friday and bounced to a doji. Looks like it wants to bounce right back up.

THE NEWS

TO VIEW THE ECONOMY SUMMARY VIDEO CLICK THE FOLLOWING LINK:
Economy Summary Video

Why are we not creating readily available jobs, lowering oil costs, and putting more money in American pockets?

TECHNICAL SUMMARY

The internals were lackluster, but that is what you would expect.

Volume. -0.5% NASDAQ; +3.8% NYSE. NASDAQ's volume did not increase on the worries out of Europe. Not bad. It did rally on the NYSE, but it also did so as the indices recovered off of their lows. Stocks in general bounced off their lows. That is positive. Buyers step in and drive things back up on higher volume. That is a good indication. When we look at the charts, you will see where they bounced off of. That makes is look even better.

Breadth. -2:1 NASDAQ; -1.9:1 NYSE. Breadth was not that great and not that bad. No major problems, and that goes along with what I talked about earlier with the reaction to the news.

CHARTS

SP500. SP500 just undercut the recent support level, the flat plateau to begin the year, and it rebounded off of that 10 day EMA. It lost the move over the October peak temporarily, but recovered it on a closing basis. Still good action. It reached down, reversed, volume was up. Buyers came in and supported the SP500, and likely those financials were holding it up as well. They still make a difference on the SP500.

NASDAQ. NASDAQ had decent action as well. It sold off, it recovered. It is holding the line, although it is still below the October and November peaks. It is doing what we want and playing along. You could say we have something of an island reversal. It could end up being that. We have a gap higher and a cluster at the top. It could be primed to gap lower; it all depends on earnings. It is earnings season now, and the question is how those big names will drive NASDAQ. The NYSE indices look good. Tech is not in a leadership position as far as its pattern is showing. It is not the time of year for tech to be a leader, so the fact that it is following along is a positive. It would be even more positive if it was leading, but you take what you can get.

DJ30. On the Dow you can see it a bit plainer. It almost touched the 20 day EMA and reversed, and it closed to hold above the 10 day EMA. It, too, saw volume increase as it rebounded and is in the next trading range up to the April and July peaks. Perfect action on the Dow.

SP600. The small caps were down on the day, but they tapped the 10 day EMA and bounced. That was also a tap at the October peaks. It held that level and rebounded, albeit modestly, along with the rest of the indices. It did no harm. It left itself in good shape to continue the move.

SOX. SOX lost 2% on the day. It is very NASDAQ-ish in its pattern. A gap higher, testing back. It could gap lower, and that would be all she wrote. After all, it is at the top of the range. It is walking on thin ice. It is holding above the early-December peak. Maybe that will hold it up. By the way, that is also coincident with the high from September. Maybe that will hold it and bounce it. Note that September looks very similar with the gap higher, the gap lower, and then it sold off. That was an island reversal. Here we have the gap higher and it is sagging. We have to wait and see if the SOX can hang on. Similar to the NASDAQ, it is not an index you would anticipate to lead at this time of the year. But we are seeing several semiconductors stocks performing well and continuing to perform well as others try to step up. It is a totally mixed sector right now, and we will see if they can continue to hold the line.

LEADERSHIP

Financial. The financials were knocked back on JPM's numbers. Next week there is a basket full of earnings. That includes WFC, one of the nice performers in this group. It has not just been the big names, but the regionals such as STT. It was performing quite well. They all got knocked back on Friday, but it was nothing major. We will look for a little more test, and maybe the earnings season in these stocks will give them more of a test. Next week, a lot of these will report, as noted. After that, maybe they could have the impetus to move to the upside.

Technology. AAPL looks like there is a little flag and it wants to break to a new high. GOOG has come back, and we will have to see. It has a more bearish flavor to it, but it could hold the line and make a break to the upside. CERN is trying to hang on and rebound. NTGR is showing a lot of life. It is testing again after a nice break to the upside. Unable to break through the November and December peaks, but it looks like it wants to do it this time, so it will have room to the upside. Tech is not looking great overall, but there are stocks that look really good. We want to take advantage of those.

Drugs/Healthcare. JAZZ surged to the upside, and now it is coming back for a test. BABY had a break to the upside, and now it is coming back to test. We are seeing a lot of this in drugs as well. OFIX was surging higher last week. Once again, many sectors are performing well.

This week I went over how well building materials have been doing. Home builders, engineering firms, materials, and construction are all performing better. That is the "stuff" that helps stronger economies. We did not have these kinds of moves in these kinds of stocks in the other failed attempts for the economy to move higher. In 2010 there were three quarters of 3% and almost 4% gain in GDP that evaporated in the wind. It could not hold because there was not any substance. This time we have some substance going. That is why things could be better in 2012. Maybe it will not fizzle as it did in 2010 and 2011. It remains to be seen. I am still in the Missouri "Show Me" State. You have to show the good moves, but it could do it. It is an election year, and many strange things can happen.

THE MARKET

SENTIMENT INDICATORS

VIX: 20.91; +0.44
VXN: 21.38; +0.59
VXO: 20.13; +0.95

Put/Call Ratio (CBOE): 0.74; -0.11

Bulls versus Bears:

This is a reading of the number of bullish investment advisors versus bearish advisors. The reason you look at this is that it gives you an idea of how bullish investors are. If they are too bullish then everyone is in the market and it is heading for a top: if everyone wants to be in the market, then all the money is in and there is no more new cash to drive it higher. On the other side of the spectrum if there are a lot of bears then there is a lot of cash on the sideline, and as the market rallies it drags that cash in as the bears give in. That cash provides the market the fuel to move higher. If bears are low it is the same as a lot of bulls: everyone is in and the market does not have the cash to drive it higher.

Bulls: 51.1% versus 49.5%. Back up but hanging around 50%. Over the past three months a steady increase. Still probing the overdone range and could be part of the picture that tops out the current in January, but it is not there yet. 35% is the threshold measuring bullish versus bearish action. Six weeks the bulls were below bears. A powerful sentiment signal but now dissipating. Highs from April and December (60% readings spanning December through early May 2011). The 5 year high is 62.0. The crossover level at 29% bulls from July 2010 is long gone. 35% is the threshold level suggesting bullishness. To be seriously bearish it needs to get up to the 60% to 65% level.

Bears: 29.8% versus 30.5%. Back and forth around 30% where it has flat-lined for 6 weeks. Bears remain skeptical. Skeptics in the face of a move is a good sign the move continues. Lower but not anywhere near suggesting investors are carefree. The average the past month and more is 30%. The index spent seven weeks over the 35% threshold considered a bullish indicator. For more reference, bearishness hit a 5 year high at 54.4% the last week of October 2008. The move over 50 took bearish sentiment to its highest level since 1995. Extreme negative sentiment. Prior levels for comparison: Bearishness peaked at 37.4% in September 2007. It topped the June 2006 peak (36%) on that run. That June peak eclipsed the March 2006 high (33%) and well above the 2005 highs that spawned new rallies (30% in May 2005, 29.2% in October 2005). That was a huge turn, unlike any seen in recent history.

NASDAQ

Stats: -14.03 points (-0.51%) to close at 2710.67
Volume: 1.656B (-0.54%)

Up Volume: 586.93M (-533.07M)
Down Volume: 1.03B (+517.52M)

A/D and Hi/Lo: Decliners led 2.1 to 1
Previous Session: Advancers led 1.6 to 1

New Highs: 40 (-24)
New Lows: 24 (0)

SP500/NYSE

Stats: -6.41 points (-0.49%) to close at 1289.09
NYSE Volume: 734M (+3.82%)

Up Volume: 853.11M (-1.407B)
Down Volume: 2.74B (+1.08B)

A/D and Hi/Lo: Decliners led 1.87 to 1
Previous Session: Advancers led 1.6 to 1

New Highs: 108 (-7)
New Lows: 24 (+9)

DJ30

Stats: -48.96 points (-0.39%) to close at 12422.06
Volume DJ30: 161M shares Friday versus 128M shares Thursday.

TUESDAY

Next week is a short week, but there is a lot of data. It starts with New York Empire Manufacturing on Tuesday. On Tuesday we also have Industrial Production and Capacity PPI on Wednesday. On Thursday there are Initial Claims, and we got close to 400K this week. We also have CPI, but it is not expected to do much. Housing Starts, Building Permits, and the Philly Fed are all very important. Existing Home Sales are on Friday.

Some big news, but all of it will pale in comparison to the flood of earnings that come out next week. As noted, there are a lot in financial and lot in tech. You name it, they will be announcing. We have had a lot of pre-announcements and some surprises to the downside. A lot of those, but we have also had some great ones to the upside. We are looking for the market to continue its upside moves to have that upside bias even as the numbers come out.

Remember, often in earnings you get that initial surge in the first couple of weeks of earnings. Everyone thinks the results are great and some big names drive the indices higher. Then investors get the picture, and they realize things are okay but not that great. Then you have the fall off. We have all been there. In July things took off, and then it was not so great. But then the earnings came back late. Investors thought it was pretty good, but it was not enough to hold. In April things were not so great, but then things took off. They were better than they thought.

We are coming in a little hot. We get a couple of weeks of good earnings announcements as we are coming in hot, and then we go down. In July we came in hot and went down. In April we came in hot and went down, but then we were back up. We could get that shakeout in the financial area. We have stocks in position to test, and some are already testing, setting up for new moves.

I think we have a couple more weeks to the upside. Will we take a bunch of new positions? Not really. We have some great ones that are moving. If the market be continues up, we will bank more profit on them just as we did this past week. But we can still take new positions. As a matter of fact, we found a bunch of plays this week and weekend that we can put money to work in. Some of these already have the news out, so we do not really have to worry about them. I always like that. The news is out, they have gapped to the upside, and we are looking maybe for a continuation move off a breakaway gap. Those are always nice.

That is what I like about earnings. Even though we do not always stay in the stocks during earnings season, it sets up new moves either upside or downside. We love playing those breakaway gaps after the news comes out. We may get a gap fill. If you do not, you will have more upside. Or if it goes the other way, you will have more downside. Even in earnings season we get opportunity coming into the numbers and after the numbers.

We will just take what the market gives. Right now there is a synergistic, positive combination of better economic data, earnings that are pretty good, pre-announcements that are worrisome, and then the sense that maybe Europe has it under control. S&P came out with downgrades, but S&P is always late to the party. When S&P comes out, maybe things are better. What happened with the U.S.? S&P downgraded, and then the economic data started to improve. Could Europe now start to improve? It very well could be. With that in mind, we will not turn down opportunity as it presents itself. If a stock is in good position, is not extended, has room to run, and we can take advantage it, then yes, we will. I will not say," Yes we can" because I might throw up if I did. I will say yes, we WILL take advantage of that.

I want to mention that the Fed is making some noise. There was another Fed FOMC member out today talking about the worry the Fed has that the economy will not be able to sustain this move. There are pundits positing that the Fed is thinking about QE3. Why on earth would we need QE3 if the data is improving as it has been? We have data that is improving that was not on the other attempts. Like I said, the materials, the housing, and the home builders stocks are improving. That is something we have not seen before. It makes this look a bit more sustainable. Why would we need QE3 and more inflation pressure? Because it is an election year.

Ben Bernanke is the most political Fed chairman we have ever had. He knows he is gone as soon as any Republican is elected. Rick Perry said something about hanging him in Texas. I do not know what he was talking about. Ron Paul would just get rid of the Fed altogether. You get the picture. He is siding with the guy who will keep him, and it is an election year. The economy has been showing signs of improvement. It probably does not need any more stimulus. We do not need it for the inflation reasons, that is for sure. We may just get QE3 anyway to pump up those financial assets even more. We all realize what happened with QE1 and QE2. There is 1 and 2, and now there is the selloff as we had in 2010. And we are looking for number 3. Perhaps that is why the market has been moving up in anticipation of that. It could be. Do not be surprised if we get QE3. If we do, stocks will take off. Of course we will make a lot of money if that happens. We better make a lot because we will have to worry about inflation. We can make a lot and then buy some gold with the profits.

Do not be surprised if that happens. That is my new thought for 2012. I am not too much into predictions; I am just talking about the possibilities. It sure looks like the Fed is setting it up. All I am doing is reading what is out there I am not predicting. The Fed is setting up QE3 because it is an election year. The Fed wants their guy, the guy in power, to get reelected. At least that is what Ben Bernanke wants. Then he will keep his job and hopefully, in his mind, he will go down as the guy who saved us all from the brink. We will see what happens.

I will see you on Tuesday. Have a great weekend!

Support and Resistance

NASDAQ: Closed at 2710.67
Resistance:
2754 is the recent October 2011 high
2759 is the mid-May low
2762 is the February low
2796 is the February gap down point
2816 is the early April peak.
2825 is the 2007 closing peak.
2841 is the February 2011 peak
2862 is the 2007 peak
2879 is the July 2011 peak
2888 is the May 2011 peak

Support:
2706 to 2705 is the April 2011 low and the February 2011 and consolidation low (bottom of the trading range) 2723 to 2705 is the range of support at the bottom of the January to May trading range
2686 is the January 2011 closing low
2676 is the January 2010 low and the December 2011 peak
The 200 day SMA at 2658
2645-2650ish from December 2010 consolidation
2643 is the September 2011 high
The 50 day EMA at 2620
2612 is the late August 2011 peak
2603 is the March 2011 intraday low (post-Japan low)
2599 is the June 2011 low and NASDAQ
2593 is the November intraday high
2580 is the November 2010 closing high
2572 is the November 2-11 gap down point
2555 is the mid-August 2011 peak
2546 is the early September 2011 gap down point
2535 is the November island reversal gap point
2532 is the early August gap down point
2469 is the November 2010 low
2441 is the November 2011 low
2331 from October 2010 low and the August 2011 intraday low
2305 from the August 2010 peak (summertime base)
2139 is the May and June 2010 low
2123 is the August 2010 gap down point
2100 from the August 2010 lows

S&P 500: Closed at 1289.09
Resistance:
1295 to 1294 is the April 2011 low and the February 2011 consolidation low (bottom of the trading range)
1313 from the August 2008 interim peak
1318.51 is the May low
1325-27 is the March 2008 closing low and the May 2006 peak.
1332 is the early March peak
1340 is the early April 2011 peak
1344 is the February 2011 peak is being challenged again
1357 is the July 2011 peak
1364 is the March 2007 low
1370 is the August 2007 low
1371 is the recent May 2011 peak

Support:
1293 is the October 2011 peak
1275 is the January 2010 low, early January 2011 peak
1267 is the December 2011 peak
The 200 day SMA at 1258
1258 is June 2011 intraday low
1255 is the late December 2010 consolidation range
1249 is the March 2011 low (post-Japan)
The 50 day EMA at 1248
1235 is the mid-December 2010 consolidation low
1231 is the late August 2011 peak
1227 is the November 2010 peak
1220 is the April 2010 peak
1209 is the mid-August 2011 high
1196 is the November 2010 consolidation peak
1178-1180 is the October 2010/November 2010 consolidation low
1158 is the November 2011 low
1131 - 1127 from August 2010 base peak.
1119 is the early August closing low
1109 is the mid-September 2010 gap up point
1101 is the August 2011 low
1075 is the October 2011 intraday low
1099 from the mid-July interim peak
1090 is the early September 2010 gap up point
1040 from the August 2010 lows and May/June 2010 lows
1011 is the summer 2010 low

Dow: Closed at 12,422.06
Resistance:
12,754 is the July intraday peak
12,876 is the May high
13,058 from the May 2008 peak on that bounce in the selling

Support:
12,391 is the February 2011 peak
12,284 is the October 2011 peak
12,258 is the December 2011 peak
12,110 from the March 2007 closing low
12,094 is the April 2011 low
The 50 day EMA at 12,061
The 200 day SMA at 11,959
The June low at 11,897 (closing)
11,893 from March 2008 closing low
11,867 from the August 2009 high and peak on that bounce in the selling.
11,734 from 11-98 peak
11,717 is the late August 2011 peak
The August low at 11,702
11,555 is the March low
11,452 is the November 2010 peak
11,178 from November 2010
10,978 is the bottom of the November 2010 consolidation
10,750 from September 2010
10,720 is the August closing low
10,705-710 from January 2010 peak
10,694-700 from August 2010 peak
9938 is the August 2010 low

Economic Calendar

January 9 - Monday
- Consumer Credit, November (15:00): $20.4B actual versus $7.0B expected, $6.0B prior (revised from $7.6B)

January 10 - Tuesday
- Wholesale Inventories, November (10:00): 0.1% actual versus 0.6% expected, 1.2% prior (revised from 1.6%)

January 11 - Wednesday
- MBA Mortgage Purchas, 01/07 (7:00): +4.5% actual versus -3.7% prior
- Crude Inventories, 01/07 (10:30): 4.958M actual versus 2.209M prior

January 12 - Thursday
- Initial Claims, 01/07 (8:30): 399K actual versus 375K expected, 375K prior (revised from 372K)
- Continuing Claims, 12/31 (8:30): 3628K actual versus 3600K expected, 3609K prior (revised from 3595K)
- Retail Sales, December (8:30): 0.1% actual versus 0.4% expected, 0.4% prior (revised from 0.2%)
- Retail Sales ex-auto, December (8:30): -0.2% actual versus 0.3% expected, 0.3% prior (revised from 0.2%)
- Business Inventories, November (10:00): 0.3% actual versus 0.5% expected, 0.8% prior
- Treasury Budget, December (14:00): -$84.0B expected, -$78.1B prior

January 13 - Friday
- Trade Balance, November (8:30): -$47.8B actual versus -$44.0B expected, -$43.3B prior (revised from -$43.5B)
- Export Prices ex-ag., December (8:30): -0.2% actual versus -0.2% prior (revised from -0.1%)
- Import Prices ex-oil, December (8:30): 0.1% actual versus -0.2% prior
- Michigan Sentiment, January (9:55): 74.0 actual versus 71.2 expected, 69.9 prior

January 17 - Tuesday
- New York Empire Manufacturing, January (8:30): 10.0 expected, 9.5 prior

January 18 - Wednesday
- MBA Mortgage Index, 01/14 (7:00): +4.5% prior
- MBA Mortgage Purchase Index, 01/14 (7:00): +4.5% prior
- PPI, December (8:30): 0.1% expected, 0.3% prior
- Core PPI, December (8:30): 0.1% expected, 0.1% prior
- Net Long-Term TIC Fl, November (9:00): $4.8B prior
- Industrial Production, December (9:15): 0.5% expected, -0.2% prior
- Capacity Utilization, December (9:15): 78.1% expected, 77.8% prior
- NAHB Housing Market , January (10:00): 21 expected, 21 prior

January 19 - Thursday
- Initial Claims, 01/14 (8:30): 387K expected, 399K prior
- Continuing Claims, 01/07 (8:30): 3613K expected, 3628K prior
- Core CPI, December (8:30): 0.0% prior
- CPI, December (8:30): 0.1% expected, 0.0% prior
- Core CPI, December (8:30): 0.1% expected, 0.2% prior
- CPI, December (8:30): 0.2% prior
- Housing Starts, December (8:30): 670K expected, 685K prior
- Building Permits, December (8:30): 680K expected, 681K prior
- Philadelphia Fed, January (10:00): 10.0 expected, 10.3 prior
- Crude Inventories, 01/14 (11:00): 4.958M prior

January 20 - Friday
- Existing Home Sales, December (10:00): 4.57M expected, 4.42M prior
icon url

ReturntoSender

01/17/12 8:44 PM

#9652 RE: ReturntoSender #6755

From Briefing.com: 4:30 pm : 5:19PM Linear Tech almost 3 pts. higher following Q2 financial results; positive Q3 guidance pushes stock higher, as high as $32.70 (LLTC) 29.87 -0.19 :

5:16PM Linear Tech misses by $0.01, reports revs in-line; guides Q3 revs above consensus (LLTC) 29.87 -0.19 : Reports Q2 (Dec) earnings of $0.38 per share, $0.01 worse than the Capital IQ Consensus Estimate of $0.39; revenues fell 23.3% year/year to $294.33 mln vs the $293.07 mln consensus. Co issues upside guidance for Q3, sees Q3 revs growth of 4-8% sequentially, which calculates to ~$306.10-317.9 mln vs. $302.76 mln Capital IQ Consensus Estimate.

"This was an encouraging quarter in a difficult global economic environment. We met the mid point of our guidance and we believe that we are at an inflection point in our business. Bookings, which started slowly, strengthened in December and continued strengthening in January. In these challenging times we maintained strong profitability, reporting operating margins at 45% of sales. Given the improvement in our bookings and our current outlook for the March quarter, we are estimating that we will grow quarterly revenues sequentially in the 4-8% range for our Q3. As we announced earlier, we have acquired Dust Networks, a provider of wireless sensor networks. Although Dust will initially have minimal impact on our quarterly financial results, we are optimistic about growth prospects for Dust in its emerging markets and the synergies between Dust and Linear in bringing rugged, low power, wireless solutions to the industrial and other end-markets."

4:21PM Cree earnings correction: Q3 EPS guidance is not for a loss but is below consensus (CREE) 23.33 +0.43 : Earlier we reported Q3 EPS guidance was for a loss of $0.18-0.25 when it was really for net income of $0.18-0.25 per share. The prior comment has been removed and should have read as follows:

Reports Q2 (Dec) earnings of $0.25 per share, excluding non-recurring items, $0.01 worse than the Capital IQ Consensus Estimate of $0.26; revenues rose 18.3% year/year to $304.1 mln vs the $309.61 mln consensus, non-GAAP gross margin of 35.3%. Co issues downside guidance for Q3, sees EPS of $0.18-0.25, excluding non-recurring items, vs. $0.30 Capital IQ Consensus Estimate; sees Q3 revs of $290-310 mln vs. $320.64 mln Capital IQ Consensus Estimate, non-GAAP gross margin 35-36%. Inventory decreased $16.3 mln from Q1 of fiscal 2012 to $187.4 mln and represents 85 days of inventory.

Encouraging data helped stocks set multi-month highs in the early going, but a substantial portion of the market's gains were surrendered by session's end. Participants drove stocks higher in the opening minutes of trade.

Buying interest was fostered by news that China's fourth quarter GDP climbed 8.9% from the prior year. Even though that marked a deceleration from the 9.1% annual rate posted in the prior month, it proved better than what had been anticipated by many. Retail sales and industrial production for December also posted double-digit increases over the year. Early traders also had a positive response to an upbeat economic survey from Germany and a better-than-expected Empire Manufacturing Survey of 13.5 for January.

Although the early advance took the S&P 500 above the 1300 line for the first time since this past summer, the broad market measure was unable to sustain the move. It began to waver as stocks reacted to efforts by the dollar to make up ground against the euro, which had been up nearly 1% this morning, but saw that gain halved by session's end.

After easing off of early highs stocks spent the better part of the session drifting sideways. The action seemingly allowed morning gains to consolidate, but it didn't establish much of a floor since stocks faltered in the final 90 minutes. Still, the broad market managed to hold on for a modest gain.

Financials became a drag on trade. The sector, which was the only one to log a loss, ended the day down 0.8%. An earnings miss from Citigroup (C 28.22, -2.52) and in-line results from Wells Fargo (WFC 29.83, +0.22) made for uninspiring results ahead of announcements from a bevy of financial outfits tomorrow morning.

Advancing Sectors: Health Care +0.7%, Tech +0.7%, Energy +0.7%, Materials +0.6%, Consumer Discretionary +0.5%, Consumer Staples +0.4%, Telecom +0.4%
Unchanged: Utilities
Declining Sectors: Financials -0.8%DJ30 +60.01 NASDAQ +17.41 NQ100 +0.9% R2K +0.2% SP400 +0.3% SP500 +4.58 NASDAQ Adv/Vol/Dec 1365/1.80 bln/1170 NYSE Adv/Vol/Dec 1841/810 mln/1151

7:32AM Vishay announces acquisition of HiRel Systems, a Specialty Inductor Company for $85 mln (VSH) 10.43 : Co announced the acquisition of HiRel Systems, a supplier of high reliability transformers, inductors, coils, and power conversion products. The purchase price was approximately $85 million, including repayment of HiRel debt, and subject to customary post-closing adjustments.

6:22AM Motorola Mobility: The ALJ ruled in favor of Motorola Mobility, finding no violation for any of the three Apple patents listed in Apple's suit (MMI) 38.45 : Co announces that it has received notice that the Administrative Law Judge (ALJ) in the U.S. International Trade Commission (ITC) action brought by Apple (AAPL) against MMI has issued an initial determination. The ALJ ruled in favor of Motorola Mobility, finding no violation for any of the three Apple patents listed in Apple's suit. The ALJ ruled in favor of Motorola Mobility, finding no violation for any of the three Apple patents listed in Apple's suit.

AMD (AMD) announced the first AMD Fusion Center of Innovation at the University of Illinois at Urbana-Champaign, designed to focus on the innovative developer environment and software performance advancements enabled by heterogeneous computing.

10:46 am S&P Tech Sector Up 1%, Outpacing The Broader Market
The tech sector is trading higher today, ahead of gains in the broader market. Semiconductors is trading inline with strength in the tech space with the Philly Semi Index trading 1.0% higher. STM (+8.1%) is a standout in the chip index. Among other major indices, the S&P 500 is trading 0.7% higher, while the NASDAQ is trading 0.9% higher and the QQQ is 1.0% higher on the session. Among tech bellwethers, AAPL (+1.2%) is showing strength, while VZ (-0.3%) is a notable underperformer.

In earnings, KEM (+1.1%) issued downside guidance Friday night. This morning, CHKP (+4.1%) reported a slight Q4 beat, while CPWR (-7.7%) guided lower.

Among notable analyst upgrades this morning, G (+1.2%) and EXLS (+4.6%) were upgraded to Outperform at Wells Fargo, AMAT (+3.1%) was upgraded to Outperform at RBC Capital, and CSRE (+7.6%) was upgraded to Overweight at JP Morgan. Among downgrades, INTC (+0.6%) was downgraded to Neutral at JP Morgan.

LLTC (+0.5%) is a notable name in tech scheduled to report results today after the close.

10:21 am TD Ameritrade Down On This Morning's Earnings Results (AMTD)
TD Ameritrade (AMTD $16.03 -0.27) reported first quarter earnings of $0.28 per share, $0.02 better than the Capital IQ Consensus Estimate of $0.26.

Revenues fell 0.4% year/year to $653.4 million versus the $672.86 million consensus.

Additionally, co reports net new client assets of $10.2 bln, an annualized growth rate of 11% of beginning client assets; Average client trades per day of ~367,000, essentially flat; Record interest rate sensitive assets of $79 bln, an increase of 16%; and client assets of ~$406 bln, an increase of 5%.

10:13 am Wells Fargo Higher, But Pulling Back, Following This Morning's Earnings Result (WFC)
Wells Fargo (WFC $30.11 +0.50 ) reported fourth quarter earnings of $0.73 per share, in-line with the Capital IQ Consensus Estimate consensus of $0.73. Revenues fell 4.1% year/year to $20.61 bln vs the $20.07 bln consensus. "We are pleased with revenue performance in the quarter. Both net interest income, which benefited from the growth in earning assets and an increase in the net interest margin, and noninterest income, which was bolstered by strong mortgage banking and capital markets results, were up this quarter." Businesses generating linked-quarter revenue growth included asset-backed finance, capital markets, commercial banking, commercial real estate, corporate banking, corporate trust, credit card, equipment finance, government and institutional banking, insurance, international, merchant services, mortgage, real estate capital markets and retail sales finance. Net interest income was $10.9 bln, up from $10.5 bln in third quarter 2011. Noninterest income was $9.7 bln, compared with $9.1 bln in third quarter 2011. The $627 mln increase was driven by increases of $531 mln in mortgage banking and $337 mln in trading, debt and equity gains. Card fees declined $333 mln from third quarter due to a $365 mln decline in debit interchange fees partially offset by improved credit card fee revenue. Total loans were $769.6 bln at December 31, 2011, up $9.5 bln from $760.1 bln at Sept 30, 2011.

Capital increased in the fourth quarter, with Tier 1 common equity reaching $95.1 bln under Basel I, or 9.46 percent of risk-weighted assets. Under current Basel III proposals, the Tier 1 common equity ratio was an estimated 7.49 percent. The co redeemed $5.8 bln of trust preferred securities in the quarter, repurchased 27 mln shares of its common stock, plus an additional estimated 6 mln shares through a forward repurchase transaction that will settle in first quarter 2012, and paid a quarterly common stock dividend of $0.12 per share.

"Credit remained strong and within expectations in the fourth quarter. Consumer losses were essentially flat from third quarter while commercial losses increased slightly as we experienced normal period-to-period fluctuation. Based on our current forecasts, we expect continued improvement in credit in 2012."

10:06 am Citigroup Over 3% Lower After Missing Q4 Expectations (C)
This morning, Citigroup (C $29.66 -1.08) reported fourth quarter earnings of $0.38 per share, $0.23 worse than the Capital IQ Consensus Estimate of $0.61.

Revenues fell 6.4% year/year to $17.2 billion versus the $18.55 billion consensus. fourth quarter Net Credit Losses declined 40% y/y to $4.1 bln; Full Year 2011 Net Income of $11.3 bln up 6% y/y; Full Year 2011 revenues of $78.4 bln compared to $86.6 bln in 2010; Citicorp Loans of $465.4 Billion grew 14% y/y; Full Year 2011 Net Credit Losses of $20.0 Billion Compared to $30.9 Billion in 2010; Loan Loss Reserve Release of $1.5 Billion in fourth quarter, down 35% from the Prior Year; Tier 1 Common of $115.1 Billion, Tier 1 Common Ratio Increased to 11.8% Year-over-Year, Book Value Per Share up 8% to $60.78, Tangible Book Value Per Share up 12% to $49.81.

Citicorp revenues of $14.0 billion in the fourth quarter 2011 included $(74) million of CVA/DVA compared to $(1.0) billion in the prior year period. Excluding CVA/DVA, Citicorp revenues of $14.1 billion were 8% below the prior year. The decline was largely due to lower revenues in Securities and Banking, which, excluding CVA/DVA, were 29% below the prior year period and more than offset a 1% growth in RCB revenues and 2% growth in Transaction Services revenues from the prior year period.

Citi Holdings revenues of $2.8 billion in the fourth quarter 2011 were 30% below the prior year period. The decline in Citi Holdings revenues was principally due to the continuing reduction in assets, which decreased $90 billion, or 25%, from the end of 2010. Citi Holdings assets of $269 billion at the end of the fourth quarter 2011 included approximately $45 billion related to Citi's retail partner cards business which, as previously announced, Citi intends to transfer into Citicorp during the first quarter 2012.

Citigroup's net income declined 11% from the fourth quarter 2010 to $1.2 billion in the fourth quarter 2011, reflecting a $1.2 billion decline in year-over-year revenues, a $465 million increase in operating expenses and a $470 million increase in the provision for taxes, which offset a $2.0 billion improvement in the cost of credit from the prior year period. The credit reserve release reflects a lower level of inherent losses remaining in the portfolio. Fourth quarter 2011 expenses included $557 million of legal and related costs and the previously announced repositioning charge of $428 million. Additionally, as previously announced, the $470 million increase in the provision for taxes includes a tax charge of $300 million due to a write-down in the value of Japanese deferred tax assets reflecting legislation in Japan that decreased the corporate income tax rate.

12:53PM MEMC Elec issues statement to clarify its solar plans in Japan (WFR) 4.58 +0.15 : Co commented on various news articles and Internet reports regarding SunEdison's involvement in the Japan solar market. The company is aware of certain media reports during the past 24 hours regarding SunEdison's future plans for solar project development in Japan. While SunEdison remains interested in this market, the company's plans in Japan are not yet firm due to uncertain project economics. Feed-in-tariff rates have not been determined by Japanese officials, and therefore neither project pricing nor project costs can be known at this time. As a result, the size of SunEdison's future investment in solar project development in Japan, if any, has not yet been determined. As the company's plans in this market evolve, appropriate public announcements will be made to keep investors informed.

12:31PM Cirrus Logic vacillating near last week's nine month high of 20.60 (CRUS) 20.60 +1.18 :

9:05AM Magma Design announces SuVolta expands commitment to Magma's FineSim SPICE (LAVA) 7.16 : Co announced today that SuVolta has expanded its business relationship with Magma by entering into a licensing agreement to use the FineSim SPICE multi-CPU circuit simulator.

8:09AM Chipmos Technology reports Dec revs decreased 3.9% y/y to $48.3 mln; Q4 revs $152.3 mln (no ests) (IMOS) 6.79 : Co expects to benefit from stable demand and utilization levels in the first quarter of 2012, with revenue for the full year 2012 increasing approximately 10% compared to the full year 2011. All U.S. figures in this release are based on the exchange rate of NT$30.27 to US$1.00 as of December 30, 2011.
icon url

ReturntoSender

01/19/12 12:01 AM

#9653 RE: ReturntoSender #6755

From Briefing.com: 4:30 pm : Stocks started the session at the flat line, but were able to put together a steady ascent that took the broad market to its best level in several months.

Participants initially assumed a positive posture ahead of the open as they took into consideration mixed action abroad and word that the International Monetary Fund would like to expand its lending capacity, reportedly in the range of $600 billion to $1 trillion, in order to be able to meet a perceived financing shortfall. Strikingly, the news came the same day that the World Bank lowered its global growth forecast. The World Bank now expects an increase of 2.5%, down from a 3.6% increase, for 2012 and growth of 3.1%, down from 3.6%, for 2013.

However, support for stocks waned with the approach of the open. That left the major equity averages to start the session on a flat note, but technology stocks, which collectively represent the largest sector by market weight, were quick to offer leadership. They scored a 1.6% gain and helped keep the tech-rich Nasdaq out in front of its counterparts for virtually the entire day.

Yahoo! (YHOO 15.92, +0.49) was among the Nasdaq's better performers following news that the Internet search firm's co-founder Jerry Yang will be departing from the company. Still, semiconductor stocks shined the brightest in the Nasdaq; they climbed 5.0%, as measured by the Philadelphia Semiconductor Index.

Not to be overshadowed, financials rallied back from an early slip to score a 1.7% gain as a group. The move was led by investment bank and brokerage play Goldman Sachs (GS 104.31, +6.63), which proved itself a deft navigator of murky market conditions and persistently precarious conditions in Europe by posting an upside earnings surprise that likely fueled some short-covering among those who had been pessimistic about the firm's prospects in the face of formidable headwinds. By extension, shares of Morgan Stanley (MS 17.35, +1.10) bounced ahead of the firm's quarterly report tomorrow morning. Strength in the sector came even though a handful of other financial outfits, including U.S. Bancorp (USB 29.08, +0.31) and Northern Trust (NTRS 41.22, -0.71), offered up results that were more mixed overall.

A stronger euro helped perpetuate a positive tone among market participants. As of the closing bell, the currency had climbed 0.9% against the greenback. It now sports a week-to-date gain of 1.4%.

Although the broad market was able to work its way up to a sizable gain and settle at its highest level since this past summer, many defensive-oriented issues failed to follow the action. Instead, utilities and consumer staples stocks settled at the flat line, while telecom mustered a mere gain of 0.3%.

Economic data was pretty much shrugged off by market participants. Producer prices for December slipped by 0.1%, but core producer prices increased by 0.3%. Many economists had expected that each price measure to increase by 0.1%. Industrial production during December increased by 0.4%, which is only slightly less than the 0.5% increase that had been broadly anticipated.

Advancing Sectors: Financial +1.7%, Tech +1.6%, Consumer Discretionary +1.6%, Energy +1.5%, Materials +1.1%, Industrials +0.9%, Health Care +0.5%, Telecom +0.3%
Unchanged: Utilities, Consumer Staples
Declining Sectors: NoneDJ30 +96.88 NASDAQ +41.63 NQ100 +1.4% R2K +1.8% SP400 +1.6% SP500 +14.37 NASDAQ Adv/Vol/Dec 1948/2.01 bln/603 NYSE Adv/Vol/Dec 2406/798 mln/632

5:52PM Trident Microsystems (TRIDQ) common stock expected to trade on OTC markets beginning Jan. 19, 2012 (TRID) 0.16 +0.02 : Co announced that it anticipates that its common stock will begin trading under the symbol "TRIDQ" on the OTCQB marketplace, operated by OTC Markets Group, on Thursday, Jan. 19, 2012.

4:26PM Xilinx beats by $0.04, beats on revs; guides Q4 revs above consensus (XLNX) 35.30 +1.95 : Reports Q3 (Dec) earnings of $0.41 per share, excludes $0.06 tax benefit, $0.04 better than the Capital IQ Consensus Estimate of $0.37; revenues fell 9.9% year/year to $511.1 mln vs the $496.82 mln consensus. Co issues upside guidance for Q4, sees Q4 revs up 2-6% QoQ, which equates to ~$521.3-541.8 mln vs. $504.92 mln Capital IQ Consensus Estimate. Gross margin is expected to be approximately 64% to 65%.

4:20PM eBay beats by $0.03, beats on revs; guides Q1 EPS, revs below consensus; guides FY12 EPS below consensus, revs above (EBAY) 30.34 -0.19 : Reports Q4 (Dec) earnings of $0.60 per share, $0.03 better than the Capital IQ Consensus Estimate of $0.57; revenues rose 35.5% year/year to $3.38 bln vs the $3.32 bln consensus. Co issues downside guidance for Q1, sees EPS of $0.50-0.51 vs. $0.54 Capital IQ Consensus Estimate; sees Q1 revs of $3.05-3.15 bln vs. $3.16 bln Capital IQ Consensus Estimate. Co issues mixed guidance for FY12, sees EPS of $2.25-2.30 vs. $2.32 Capital IQ Consensus Estimate; sees FY12 revs of $13.7-14.0 bln vs. $13.67 bln Capital IQ Consensus Estimate. Non-GAAP operating margin decreased to 28.7% for the quarter, compared to 29.5% for the same period last year. The decrease in non-GAAP operating margin was due primarily to the impact of acquisitions and business mix. PayPal ended the quarter with 106.3 million active registered accounts, a 13% increase year over year. On average, PayPal added a million new accounts every month in 2011. PayPal revenue for the quarter increased 28% year over year driven primarily by continued merchant and consumer adoption as well as increased penetration on eBay. In the fourth quarter, revenue from PayPal's international markets exceeded revenue from the U.S. for the first time, reflecting the co's strong global footprint and growth in emerging markets. PayPal's net total payment volume (TPV) grew 24% to $33.4 billion in the fourth quarter of 2011. The company's mobile payment volume reached $4.0 billion in 2011, more than five times the mobile payment volume in the prior year, as more consumers used their smartphones and tablets to pay online.

4:10PM Sanmina-SCI misses by $0.03, misses on revs; guides Q2 EPS in-line, revs in-line (SANM) 10.50 +0.34 : Reports Q1 (Dec) earnings of $0.28 per share, excluding non-recurring items, $0.03 worse than the Capital IQ Consensus Estimate of $0.31; revenues fell 9.6% year/year to $1.5 bln vs the $1.56 bln consensus. Co issues in-line guidance for Q2, sees EPS of $0.24-0.30, excluding non-recurring items, vs. $0.30 Capital IQ Consensus Estimate; sees Q2 revs of $1.45-1.55 bln vs. $1.53 bln Capital IQ Consensus Estimate. "The revenue decline in the first quarter was caused by weakness in the Communications Networks segment and the Thailand floods that impacted shipments to some Enterprise Computing & Storage, and Multimedia customers... our second quarter remains challenging, input from our customers indicates we should see improvements in the second half of 2012." The Company also announced that it intends to redeem up to $150 million of its 8.125% notes due in 2016. The Company expects to use cash on hand for the redemption and expects the call date to be March 1, 2012.

4:09PM Plexus beats by $0.03, reports revs in-line; guides Q2 EPS above consensus, revs above consensus (PLXS) 33.25 +0.61 : Reports Q1 (Dec) earnings of $0.51 per share, $0.03 better than the Capital IQ Consensus Estimate of $0.48; revenues fell 6.4% year/year to $529.7 mln vs the $527.57 mln consensus. Co issues upside guidance for Q2, sees EPS of $0.51-$0.58 vs. $0.50 Capital IQ Consensus Estimate; sees Q2 revs of $550-$580 mln vs. $548.41 mln Capital IQ Consensus Estimate.

4:09PM F5 Networks beats by $0.02, beats on revs; guides Q2 EPS, revs above consensus (FFIV) 108.46 +2.15 : Reports Q1 (Dec) earnings of $1.03 per share, excluding non-recurring items, $0.02 better than the Capital IQ Consensus Estimate of $1.01; revenues rose 19.9% year/year to $322.4 mln vs the $319.06 mln consensus. Co issues upside guidance for Q2, sees EPS of $1.05-1.07, excluding non-recurring items, vs. $1.05 Capital IQ Consensus Estimate; sees Q2 revs of $332-337 mln vs. $330.70 mln Capital IQ Consensus Estimate. "Strong sales in APAC, Japan, and particularly North America offset the seasonal slowdown that typically characterizes the first quarter of a new fiscal year. We were also pleased that sales in the EMEA region exceeded our expectations. Strength in product sales was driven in part by growing demand for VIPRION 2400, our recently introduced midrange chassis product, across all regions and vertical markets. As a result, sales of all VIPRION products nearly tripled compared to the first quarter of fiscal 2011. In addition, sales of our vCMP (Virtual Clustered Multiprocessing) module, which enables customers to run multiple virtual BIG-IPs on a single VIPRION, were very strong during the quarter. Increasing attach rates for Application Security Manager, Access Policy Manager and other BIG-IP software modules also boosted sales, and demand for BIG-IP virtual editions continued to outpace our expectations." Q1 non-GAAP operating margin of 37.8%.

10:34AM Semiconductor Hldrs ETF extends gap higher start near its Oct/five month high at 32.74 -- session high 32.69 (SMH) 32.67 +1.04 : TSM +2.9% (stalled just shy of last wk/52-wk high from June at 13.98/14.05), TXN +6.5%, BRCM +4.4% (200 ema/sma at 34.00/33.96), ALTR +6.3% (200 sma at 39.84), AMAT +1.3% (testing its 200 ema at 11.97), ARMH +1.6%, ADI +5.3%, XLNX +3.3%.

9:08AM Agilent initiates quarterly dividend at $0.10 per share (A) 39.99 : Dividend to be paid on April 25 to all shareholders of record as of the close of business on April 3.

1:50AM ASML beats by $0.16, beats on revs; guides Q1 revs above consensus; guides Q2 (Jun) revs above consensus; intends to increase dividend by 15% (ASML) 42.59 : Reports Q4 (Dec) earnings of EUR0.69 per share, EUR0.16 better than the Capital IQ Consensus Estimate of EUR0.53; revenues fell 20.4% year/year to EUR1.21 bln vs the EUR1.14 bln consensus. Co issues upside guidance for Q1, sees Q1 revs of EUR1.2 bln vs. EUR982.92 mln Capital IQ Consensus Estimate. Co issues upside guidance for Q2 (Jun), sees Q2 (Jun) revs of EUR1.2 bln vs. EUR1.01 bln Capital IQ Consensus Estimate. With regard to outlook, co states Sales are expected to have a gross margin in Q1 2012 of about 43%. R&D costs for Q1 are expected at EUR145 mln to support our strategic investments. SG&A costs are expected at EUR 54 mln. Co intends to increase the dividend by 15% compared with last year. Therefore, co will submit a proposal to declare a dividend in respect of 2011 of EUR0.46 per ordinary share, compared with a dividend of EUR0.40 per ordinary share paid in respect of 2010. Co expects first half 2012 net sales of about EUR2.4 bln. Net bookings in Q4 2011 of EUR 710 mln; Q1 2012 bookings expected at a level above Q4 2011 bookings.

Cree (CREE $23.44 +0.11) reported second quarter earnings of $0.25 per share, excluding non-recurring items, $0.01 worse than the Capital IQ consensus of $0.26, while revenues rose 18.3% year/year to $304.1 million versus the $309.61 million consensus, non-GAAP gross margin of 35.3%. The company issued downside guidance for the third quarter with EPS of $0.18-0.25, excluding non-recurring items, versus the $0.30 Capital IQ Consensus Estimate with revenues of $290-310 million versus the $320.64 million consensus.

Linear Tech (LLTC $32.07 +2.20) reported second quarter earnings of $0.38 per share, $0.01 worse than the Capital IQ Consensus Estimate of $0.39, while revenues fell 23.3% year/year to $294.33 million versus the $293.07 million consensus. The company issued upside guidance for the third quarter with revenue growth of 4-8% sequentially, which calculates to approximately $306.10-317.9 million versus the $302.76 million consensus. "This was an encouraging quarter in a difficult global economic environment. We met the mid point of our guidance and we believe that we are at an inflection point in our business. Bookings, which started slowly, strengthened in December and continued strengthening in January. In these challenging times we maintained strong profitability, reporting operating margins at 45% of sales. Given the improvement in our bookings and our current outlook for the March quarter, we are estimating that we will grow quarterly revenues sequentially in the 4-8% range for our Q3. As we announced earlier, we have acquired Dust Networks, a provider of wireless sensor networks. Although Dust will initially have minimal impact on our quarterly financial results, we are optimistic about growth prospects for Dust in its emerging markets and the synergies between Dust and Linear in bringing rugged, low power, wireless solutions to the industrial and other end-markets."

ASML (ASML $42.89 +0.30) reported fourth quarter earnings of EUR0.69 per share, EUR0.16 better than the Capital IQ Consensus of EUR0.53, while revenues fell 20.4% year/year to EUR1.21 billion versus the EUR1.14 billion consensus. The company issued upside guidance for the first quarter with revenues of EUR1.2 billion versus the EUR982.92 million Capital IQ Consensus Estimate. The company also issued upside guidance for the second quarter with revenues of EUR1.2 billion versus the EUR1.01 bln Capital IQ Consensus Estimate.

12:59 pm S&P Tech Sector Up 1.5%, Well Above The Broader Market
The tech sector is trading higher today, ahead of gains in the broader market. Semiconductors are showing relative strength in the tech space, however, with the Philly Semi Index trading 4.8% higher. NXPI (+11.3%) and POWI (+11.0%) are standouts in the chip index. Among other major indices, the S&P 500 is trading 0.7% higher, while the NASDAQ is trading 1.1% higher and the QQQ is 1.0% higher on the session. Among tech bellwethers, ORCL (+2.1%) is showing strength, while VZ (-0.3%) and MSFT (-0.3%) are notable underperformers.

In earnings, LLTC (+9.4%) reported a roughly inline Q2, but guided higher. This morning, APH (+10.2%) posted a Q4 beat and guided FY12 ahead of consensus.

In news, YHOO (+2.7%) announced that Jerry Yang has resigned from its Board of Directors. Among rumors, we are hearing Samsung is not interested in RIMM (-2.9%) following yesterday's reports the two might working together.

Among notable analyst upgrades this morning, CHKP (-0.2%) was upgraded to Outperform from Market Perform at Raymond James. Among downgrades, GOOG (+0.1%) was downgraded to Market Perform at Wells Fargo.

EBAY (-1.1%) and SANM (+2.9%) are two notable names in tech scheduled to report results today after the close.

11:05 am Cree Trading 4% Higher Following Earnings/Guidance (CREE)
After the close yesterday, the Cree (CREE $24.28 +0.95) reported second quarter earnings of $0.25 per share, excluding non-recurring items, $0.01 worse than the Capital IQ Consensus Estimate of $0.26.

Revenues rose 18.3% year/year to $304.1 million versus the $309.61 million consensus, non-GAAP gross margin of 35.3%.

For the third quarter the company issued earnings guidance of $0.18 to $0.25, excluding non-recurring items, versus $0.30 Capital IQ Consensus Estimate; sees third quarter revenues of $290 millon to $310 million versus $320.64 million Capital IQ Consensus Estimate, non-GAAP gross margin 35-36%. Inventory decreased $16.3 mln from the first quarter of fiscal 2012 to $187.4 million and represents 85 days of inventory.

10:05 am Goldman Sachs Trading Over 3% Higher Following Earnings Results (GS)

09:55 am Manufacturing Production Rebounds in December
After declining 0.3% in November, industrial production rebounded in December and increased 0.4%. The Briefing.com consensus expected industrial production to increase 0.5%.

The drop in industrial production in November was related to a 0.4% decline in manufacturing production. As we expected, the fall in manufacturing was not the start of a downturn in the sector as production rose 0.9% in December.

Production of durable and nondurable goods increased at nearly the same rate, 0.9% and 0.8% respectively.

Motor vehicles and parts production increased 0.6% in December after falling 2.6% in November. This was the result of a slight increase in motor vehicle assemblies -- 8.91 mln SAAR from 8.77 mln SAAR. Assemblies remain below the recent October peak of 9.17 mln SAAR. Auto assemblies increased from 3.20 mln SAAR in November to 3.29 mln SAAR in December. Light truck assemblies increased to 5.35 mln SAAR from 5.29 mln SAAR.

Mining production increased a modest 0.3% in December while utilities production declined 2.7% as unseasonably warm weather reduced demand for heating.
icon url

ReturntoSender

01/19/12 8:58 PM

#9654 RE: ReturntoSender #6755

From Briefing.com: 4:14PM Intel beats by $0.04, beats on revs; guides Q1 revs in-line (INTC) 25.63 +0.24 : Reports Q4 (Dec) non-GAAP earnings of $0.68 per share, excluding non-recurring items, $0.04 better than the Capital IQ Consensus Estimate of $0.64; revenues rose 22% year/year to $13.9 bln vs the $13.72 bln consensus. Co reported GAAP EPS of $0.64. Co issues in-line guidance for Q1, sees Q1 revs of $12.3-13.3 bln vs. $12.78 bln Capital IQ Consensus Estimate; Sees Q1 gross margin percentage of 63% and 64% Non-GAAP (excluding amortization of acquisition-related intangibles), both plus or minus a couple percentage points; Q1 R&D plus MG&A spending of approximately $4.4 billion. Sees amortization of acquisition-related intangibles of approximately $75 million; no impact of equity investments and interest and other. Sees Q1 depreciation of approximately $1.5 billion... INTC sees 2012 gross margin of 64% and 65% Non-GAAP (excluding amortization of acquisition-related intangibles), both plus or minus a few percentage points; sees 2012 Capital Spending $12.1-12.9 bln... "With outstanding execution the company performed superbly, growing revenue by more than $10 billion and eclipsing all annual revenue and earnings records. With a tremendous product and technology pipeline for 2012, we're excited about the global growth opportunities presented by Ultrabook systems, the data center, security and the introduction of Intel-powered smartphones and tablets."

4:10PM Microsoft beats by $0.02, reports revs in-line (MSFT) 28.12 -0.11 : Reports Q2 (Dec) earnings of $0.78 per share, $0.02 better than the Capital IQ Consensus Estimate of $0.76; revenues rose 4.7% year/year to $20.89 bln vs the $20.91 bln consensus. "Coming out of the Consumer Electronics Show, we're seeing very positive reviews for our new phones and PCs, and a strong response to our new Metro style design that will unify consumer experiences across our phones, PCs, tablets, and television in 2012... The Microsoft Business Division reported $6.28 billion in second quarter revenue, a 3% increase from the prior year period, and a 7% increase excluding the prior year recognition of deferred revenue for the Office 2010 technology guarantee program." Microsoft is revising operating expense guidance downward to $28.5 billion to $28.9 billion for the full year ending June 30, 2012.

4:09PM Google misses by $0.95, misses on revs (GOOG) 639.57 +6.66 : Reports Q4 (Dec) earnings of $9.50 per share, excluding non-recurring items, $0.95 worse than the Capital IQ Consensus Estimate of $10.45; revenues rose 27.6% year/year to $8.13 bln vs the $8.41 bln consensus; gross rev +25% to $10.58 bln vs. the $10.91 bln consensus. Revenues from outside of the United States totaled $5.60 billion, representing 53% of total revenues in the fourth quarter of 2011, compared to 55% in the third quarter of 2011 and 52% in the fourth quarter of 2010... Q4 Paid Click q/q 17%, y/y 34%; Cost-per Click q/q -8%, y/y -8%... Operating expenses, other than cost of revenues, were $3.38 billion in 4Q11, or 32% of revenues, compared to $2.51 billion in the fourth quarter of 2010, or 30% of revenues. As of Dec 31, 2011, cash, cash equivalents, and short-term marketable securities were $44.6 billion. On a worldwide basis, Google employed 32,467 full-time employees as of December 31, 2011, up from 31,353 full-time employees as of September 30, 2011.

4:08PM IBM beats by $0.09, reports revs in-line; guides FY12 EPS above consensus (IBM) 180.52 -0.55 : Reports Q4 (Dec) earnings of $4.71 per share, $0.09 better than the Capital IQ Consensus Estimate of $4.62; revenues rose 1.6% year/year to $29.49 bln vs the $29.73 bln consensus. IBM Gross Margin 49.9% vs 49.86% estimates. Co issues upside guidance for FY12, sees EPS of $14.85 vs. $14.81 Capital IQ Consensus Estimate. Co reported Gross Margin 49.9% vs 49.86% estimates. Co also reaffirmed that they are well on track toward their long-term roadmap for operating earnings per share of at least $20 in 2015. Co reporte Software rev up 9%; Global Technology Services revenue up 3%; Global Business Services revenue up 3%, 2 percent adjusting for currency; Services backlog of $141 bln, up $4 billion as reported, up $5 billion adjusting for currency, quarter to quarter; and Systems and Technology revenue down 8%.

4:02PM Ingram Micro sees Q4 EPS above consensus; Names Alain Monie Chief Executive Officer (IM) 18.84 +0.03 : The company issues upside guidance; co said that it expects its non-GAAP earnings for Q4 to exceed the average of analysts' estimates of 55 cents. Separately, co announced the promotion of Alain Monie to chief executive officer, effective tomorrow. Monie, who will also retain his current title of president, succeeds Gregory M. Spierkel, who will remain at the company until April 15, 2012, to assist in the management transition. Monie announced the promotion of Alain Monie to chief executive officer, effective tomorrow. Monie, who will also retain his current title of president, succeeds Gregory M. Spierkel, who will remain at the company until April 15, 2012, to assist in the management transition.

4:30 pm : The broad market notched a new multi-month high as stocks scored varied gains following a flurry of earnings reports and economic releases.

A strong finish to the prior session and decisive buying abroad helped position stocks for a positive open. Market participants also focused on better-than-expected earnings results from several widely-held names, including eBay (EBAY 31.51, +1.17), United Health (UNH 52.32, -1.62), Union Pacific (UNP 112.18, +2.36), Freeport McMoRan (FCX 44.37, -0.10), and Morgan Stanley (MS 18.28, +0.93). Bank of America (BAC 6.96, +0.16) came short of the bottom line consensus, but that was initially shrugged off since the diversified banking and financial services giant showed improvement in other areas. Declaration of bankruptcy by Eastman Kodak (EK 0.36, -0.20) came as little surprise to many.

Economic data was really rather mixed. December consumer prices were unchanged overall, but core prices inched up during by 0.1%. Both measures had been expected to increase by just 0.1%.

Weekly initial jobless claims dropped by 50,000 to 352,000, which is considerably less than the tally of 385,000 that had been expected, on average, among economists polled by Briefing.com and the lowest tally since 2008.

Housing starts for December had been widely expected to hit an annualized rate of 673,000 units, but instead came in at a rate of 657,000, down from the prior month rate of 685,000 units.

The Philadelphia Fed Survey for January improved to 7.3 from 6.8 in the prior month, but that was still less than the reading of 10.0 that had been expected among many economists. Another bounce by the euro, which is widely regarded as a barometer of eurozone sentiment, provided stocks with a positive catalyst.

The euro's early retreat to the flat line was shadowed by the S&P 500, but both were able to rebound. By session's end the euro was resting on a 0.8% gain against the greenback and enters Friday with a week-to-date gain of 2.2%.

The broad market's path higher was relatively choppy and without much volume, but nonetheless it enabled the stock market to book its best close since this past summer. The S&P 500 is now up more than 20% from the 52-week intraday low set this past fall and only about 4% below the multi-year high that it set last spring.

Advancing Sectors: Industrials +0.9%, Financials +0.9%, Consumer Discretionary +0.9%, Tech +0.7%, Energy +0.4%, Consumer Staples +0.2%, Telecom +0.2%
Unchanged: Health Care
Declining Sectors: Utilities -0.8%DJ30 +45.03 NASDAQ +18.62 NQ100 +0.7% R2K +0.4% SP400 +0.8% SP500 +6.46 NASDAQ Adv/Vol/Dec 1463/1.99 bln/1040 NYSE Adv/Vol/Dec 1955/806 mln/1025

9:06AM Cypress Semi reported that as a result of the discovery phase of its litigation with GSI, the accused products list was expanded in the ongoing ITC action to include GSI's standard Synchronous and ZBT SRAMs (CY) 16.67 : In addition, in a filing with the International Trade Commission on Nov 21, 2011, a proprietary product made by GSI (GSIT) for its largest customer was also added to the suit. The new additions to the ITC action were added to the original complaint filed with the ITC in June 2011, which also alleges infringement by GSI's SigmaQuad-II, SigmaQuad-III and SigmaDDR SRAM families of four Cypress SRAM patents. The Cypress complaint seeks an exclusion order from the ITC that would prevent the importation of all infringing GSI SRAMs

7:33AM Fairchild Semi misses by $0.01, misses on revs; guides Q1 revs below consensus (FCS) 14.53 : Reports Q4 (Dec) earnings of $0.15 per share, $0.01 worse than the Capital IQ Consensus Estimate of $0.16; revenues fell 14.7% year/year to $339.4 mln vs the $358.41 mln consensus. Co issues downside guidance for Q1, sees Q1 revs of $340-370 mln vs. $383.02 mln Capital IQ Consensus Estimate. Co states current scheduled backlog is sufficient to achieve the low end of this range. This guidance includes about a 1% impact to sales from the flooding in Thailand.

6:01AM Microsemi announced it has acquired the telecom clock generation, synchronization, packet timing and synthesis business from Maxim Integrated Products (MXIM); terms not disclosed (MSCC) 19.58 :

Texas Instruments (TXN $30.26 +0.03) was upgraded to Mkt Outperform from Mkt Perform at JMP Securities and the firm set a target price at $36 based on the emergence of favorable cycle indicators and their belief in the co's ability to drive upside margin leverage going forward.

Needham raises their Novellus (NVLS $36.56 +0.96) tgt to $40 from $37 following the mid quarter update. The firm prefers co over mid/large-cap semi equipment stocks for its strong positions at leading capex spenders, low exposure to second-tiered DRAM customers, improved leverage of its financial model and aggressive buyback program.

12:22 pm S&P Tech Sector Up Almost 1%, Outperforming Broader Market
The tech sector is trading higher today, ahead of gains in the broader market. Semiconductors are showing relative strength in the tech space with the Philly Semi Index trading 1.8% higher. RBCN (+7.4%) is a standout in the chip index. Among other major indices, the S&P 500 is trading 0.5% higher, while the NASDAQ is trading 0.8% higher and the QQQ is 0.8% higher on the session. Among tech bellwethers, ORCL (+0.6%) and CSCO (+1.8%) are showing strength, while VZ (+0.03%) is a notable underperformer.

In earnings last night, FFIV (+12.6%), XLNX (+0.4%), and PLXS (+10.4%) posted quarterly beats and issued upside guidance. Elsewhere, SANM (-3.1%) reported a miss with slightly downside guidance, while EBAY (+4.2%) posted a beat, but guided lower.

In news, Carl Icahn disclosed an 11.64% stake in WBMD (+2.6%) in an amended 13D filing out last night, up from 9.99% reported on 11/25. Icahn believes co should use its cash to repurchase up to $1 bln in shares at $30.00 in a Dutch auction.

Among a busy day in rumors, we are hearing NTAP (+8.3%) takeover chatter, renewed T (+0.2%) for DISH (+2.6%) chatter, Toshiba for SNDK (+0.8%), and AKAM (+1.8%) takeover chatter making the rounds.

Among notable analyst upgrades this morning, FFIV (+12.6%) was upgraded to Buy at BofA/Merrill and ONNN (+3.4%) was upgraded to Buy at UBS. Among downgrades, XLNX (+0.1%) was downgraded to Hold from Buy at Deutsche Bank and AMAP (-5.1%) was downgraded to Hold at Jefferies.

FLEX (+4.0%), GOOG (+0.7%), IBM (+0.5%), and MSFT (+0.2%) are the notable names in tech scheduled to report results today after the close.
icon url

ReturntoSender

01/22/12 1:34 PM

#9655 RE: ReturntoSender #6755

From Briefing.com: Weekly Recap - Week ending 20-Jan-12The S&P 500 poked into positive territory in the final minutes of the session to book its best closing level since summer. Although it made for only an incremental gain, the broad market measure has now finished in higher ground for four straight sessions. That helped the broad market book a 2.0% weekly gain, which marked its third consecutive weekly climb.
|
Action was mostly muddled today, but financials made a late emergence to score a 0.7% gain and give the stock market a helpful lift. The sector had spent most of the session mired near the neutral line as participants processed quarterly reports from regional lenders Comerica (CMA 29.58, +0.90) and Fifth Third Bancorp (FITB 13.18, -0.38) and financial services outfit American Express (AXP 50.04, -0.91). Fifth Third was the only one that came short of the consensus earnings estimate.

A raft of heavy hitters from the tech sector was out with results, too. Between Google (GOOG 586.00, -53.57), IBM (IBM 188.52, +8.00), Microsoft (MSFT 29.71, +1.59), and Intel (INTC 26.38, +0.75), Google was the only one that failed to generate the earnings that Wall Street had expected. The sector settled with a narrow gain of 0.2%.

Not to be overlooked, blue chip conglomerate General Electric (GE 19.15, +0.00) posted an upside earnings surprise of its own. It was subjected to early pressure, but overcame the selling to settle at the flat line.

Plenty of market action in recent weeks has been driven by the dollar-euro dynamic, given the tacit signals about economic health and financial sentiment conveyed by the currencies. Relative to a collection of competing currencies, the greenback mustered an incremental gain after three straight slides that resulted in a weekly loss of about 1.7%. The euro slipped just 0.2% against the greenback, but still settled the week with a 2.0% gain at $1.29.

Economic data was limited to December existing home sales, which hit an annualized rate of 4.61 million units. That bested the rate of 4.55 million units that had been generally expected.

The combination of earnings reports from several widely-held names and monthly options expirations helped lift share volume above recent levels, but the final tally on the NYSE remained less than 1 billion.

Leading up to the week's end, trade on Thursday saw stocks score varied gains as participants digested a deluge of data and a raft of earnings reports. Overall consumer prices were unchanged during December, but core prices increased by 0.1% when both had been expected to increase by 0.1%. As for weekly initial jobless claims, they made a surprisingly sharp drop to a multi-year low of 352,000. Housing starts for December were somewhat disappointing since they fell to an annualized rate of 657,000, which is less than the rate of 673,000 units that had been expected. The Philadelphia Fed Survey for January hit 7.3, but that was still shy of the 10.0 that had been expected among many economists.

Earnings in focus on Thursday featured upside surprises from eBay (EBAY 31.92, +0.41), United Health (UNH 52.27, -0.05), Union Pacific (UNP 112.84, +0.66), Freeport McMoRan (FCX 43.10, -1.27), and Morgan Stanley (MS 18.39, +0.11). Bank of America (BAC 7.07, +0.11) actually came short of the bottom line consensus. Eastman Kodak (EK 0.31, +0.01) came into focus for its declaration of bankruptcy.

Trade on Wednesday took Goldman Sachs (GS 108.74, +1.06) sharply higher after the investment bank and brokerage outfit posted an upside earnings surprise. Yahoo! (YHOO 15.96, -0.16) also got a bid when it was learned that co-founder Jerry Yang will leave the company.

Data was limited to news that producer prices for December slipped by 0.1%, but core producer prices increased by 0.3%. Many economists had expected that each price measure to increase by 0.1%. Separately, industrial production during December increased by 0.4%, which is only slightly less than the 0.5% increase that had been broadly anticipated.

There was some mid-week buzz about the International Monetary Fund wanting to expand its lending capacity, reportedly in the range of $600 billion to $1 trillion, in order to be able to meet a perceived financing shortfall. That same day the World Bank lowered its global growth forecast to reflect 2012 growth of 2.5% and 2013 growth of 3.1%.

Since domestic markets were closed on Monday in observance of Martin Luther King Day, the week started on Tuesday with traders encouraged by news that China's fourth quarter GDP climbed 8.9% from the prior year. Even though that marked a deceleration from the 9.1% annual rate posted in the prior month, it proved better than what had been anticipated by many. The country also reported that retail sales and industrial production for December climbed at a double-digit clip from one year ago.

Although they would offer leadership later in the week, financials faltered Tuesday as participants responded to an earnings miss from Citigroup (C 29.64, +0.31) and in-line results from Wells Fargo (WFC 30.54, +0.39)

...Nasdaq 100 -0.2%. ..S&P Midcap 400 +0.0%. ..Russell 2000 +0.3%.
 
Index Started Week Ended Week Change % Change YTD %
DJIA 12422.06 12720.48 298.42 2.4 4.1
Nasdaq 2710.67 2786.70 76.03 2.8 7.0
S&P 500 1289.09 1315.38 26.29 2.0 4.6
Russell 2000 764.20 784.62 20.42 2.7 5.9

11:00AM Intel names Brian Krzanich COO (INTC) 26.08 +0.45 : Co has promoted Brian Krzanich to chief operating officer, reporting to Paul Otellini, president and CEO. Krzanich had previously been a senior vice president in charge of Intel's worldwide manufacturing. In his new role, Krzanich will continue to oversee manufacturing and also take on responsibility for internal IT and human resources, functions that previously reported into Bryant. Co also announced Kirk Skaugen, Intel vice president and head of Intel's data center business, will become the new head of the PC Client Group, succeeding Intel Vice President Mooly Eden, and reporting to Perlmutter.

6:42AM General Electric beats by $0.01, misses on revs (GE) 19.15 : Reports Q4 (Dec) earnings of $0.39 per share, excluding non-recurring items, $0.01 better than the Capital IQ Consensus Estimate of $0.38; revenues fell 7.9% year/year to $37.97 bln vs the $40.08 bln consensus, +4% ex-NBCU impact. Revenues were negatively impacted by lower Ending Net Investment (ENI) at GE Capital, FX and slower growth in Europe. GE's Q4 Industrial segment revenues were $26.8 billion, up 10%. Industrial sales of $26.7 billion increased 11% ex-NBCU and were down 7% YoY. Industrial segment organic revenue was up 5% for the quarter. Industrial emerging market revenues were up 25%, driven by double-digit growth in Brazil, Russia, China, India and the ASEAN region. GE Capital Services revenues of $11.6 billion were down 9% YoY. GE Capital's Q4 earnings were $1.6 billion, up 58% from the prior year. GE Capital made significant strides during Q4 in achieving its strategic objectives of generating attractive returns, diversifying its funding base and positioning the business for long-term growth. Infrastructure orders for the quarter were $28.6 billion, up 15% from the prior year. Organic orders grew 9% in Q4, marking the seventh consecutive quarter of positive growth, and Industrial emerging market orders were up 26%. Equipment book-to-bill was 1.23 for the quarter and 1.14 for the year. Strong Energy and Aviation orders led the growth. GECC/GECS Tier 1 Common Ratios of 11.4%/9.9%. Backlog at record $200 bln.

Last Night, Google (GOOG $585.05) reported fourth quarter earnings of $9.50 per share, excluding non-recurring items, $0.95 worse than the Capital IQ consensus of $10.45, while revenues rose 27.6% year/year to $8.13 billion versus the $8.41 billion consensus. Revenues from outside of the United States totaled $5.60 billion, representing 53% of total revenues in the fourth quarter of 2011, compared to 55% in the third quarter of 2011 and 52% in the fourth quarter of 2010. Q4 Paid Click quarter over quarter 17%, year over year 34%; Cost-per Click quarter over quarter -8%, year over year -8%.

Last Night, IBM (IBM $185.30 +4.78) reported fourth quarter earnings of $4.71 per share, $0.09 better than the Capital IQ consensus of $4.62, while revenues rose 1.6% year/year to $29.49 billion versus the $29.73 billion consensus. IBM Gross Margin 49.9% vs 49.86% estimates. The company issued upside guidance for fiscal year 2012 with EPS of $14.85 versus the $14.81 Capital IQ Consensus. Co also reaffirmed that they are well on track toward their long-term roadmap for operating earnings per share of at least $20 in 2015. The company reported Software rev up 9%; Global Technology Services revenue up 3%; Global Business Services revenue up 3%, 2 percent adjusting for currency; Services backlog of $141 billion, up $4 billion as reported, up $5 billion adjusting for currency, quarter to quarter; and Systems and Technology revenue down 8%.

Last night, Microsoft (MSFT $29.00 +0.88) reported second quarter earnings of $0.78 per share, $0.02 better than the Capital IQ consensus of $0.76. while revenues rose 4.7% year/year to $20.89 billion versus the $20.91 billion consensus. "Coming out of the Consumer Electronics Show, we're seeing very positive reviews for our new phones and PCs, and a strong response to our new Metro style design that will unify consumer experiences across our phones, PCs, tablets, and television in 2012... The Microsoft Business Division reported $6.28 billion in second quarter revenue, a 3% increase from the prior year period, and a 7% increase excluding the prior year recognition of deferred revenue for the Office 2010 technology guarantee program." Microsoft is revising operating expense guidance downward to $28.5 billion to $28.9 billion for the full year ending June 30, 2012.

Last night, Intel (INTC $25.79 +0.16) reported fourth quarter non-GAAP earnings of $0.68 per share, excluding non-recurring items, $0.04 better than the Capital IQ Consensus of $0.64, while revenues rose 22% year/year to $13.9 billion versus the $13.72 bln consensus. Co reported GAAP EPS of $0.64. Co issues in-line guidance for Q1, sees Q1 revs of $12.3-13.3 bln vs. $12.78 bln Capital IQ Consensus Estimate; Sees first quarter gross margin percentage of 63% and 64% Non-GAAP, both plus or minus a couple percentage points; Q1 R&D plus MG&A spending of approximately $4.4 billion. Sees amortization of acquisition-related intangibles of approximately $75 million; no impact of equity investments and interest and other. The company sees Q1 depreciation of approximately $1.5 billion and it sees 2012 gross margin of 64% and 65% Non-GAAP (excluding amortization of acquisition-related intangibles), both plus or minus a few percentage points.

Last night, Skyworks (SWKS $20.38 +1.16) reported first quarter earnings of $0.51 per share, ex non-recurring items, $0.02 better than the Capital IQ Consensus of $0.49, while revenues rose 17.5% year/year to $393.7 million versus the $389.56 million consensus. The company issued guidance for the second quarter with EPS of $0.40, may not be comparable to $0.40 consensus and revenues of $360 million, including a partial contribution from AATI, may not be comparable to $349.63 mln consensus.

09:22 am Texas Instruments downgraded to Hold at Needham: . Needham downgrades TXN to Hold from Buy saying they do not anticipate there to be much upside in store for investors when Q4 earnings are reported on Monday; rather they expect an in line print for Q4 and the 1.5% Q/Q consensus revenue decline may in fact turn out to be flat Q/Q or, optimistically, flat to up 2%. Firm says this is not enough, and believe investors will be selling on the news.

09:22 am ON Semiconductor downgraded to Hold at Needham: . Needham downgrades ONNN to Hold from Buy saying they believe that the recent boost in share price and investor sentiment in their universe is applicable to select names and not the overall Analog/Mixed Signal group. Specifically in the case of ONNN they do not anticipate Q1 revenue guidance provided on their Q4 earnings print (likely in two weeks) will exceed the consensus estimates of essentially flat at $761 mln.
icon url

ReturntoSender

01/22/12 8:42 PM

#9659 RE: ReturntoSender #6755

I think first and foremost I need to admit that there is a strong probability that the selling that led to the October bottom was a mere hiccup for our market that could subsequently lead to even higher highs off the March 2009 bottom. Election year cycles and the desire to support the fledgling job recovery while the FED chief hopes to keep his job may lead to a continuation of the rally with QE3 in the works if there is any slippage:


This chart both supports the view that the rally from the March 2009 bottom is ongoing and eventually at risk of another perhaps even larger sell off. Note that the drop to 77 on the BPNDX on Friday leaves us with a lower high of 80 on the BPNDX at this stage. At the bottom of the chart the number of stocks above their 200 day sma's could expand significantly from here and still print lower highs. There could be quite a bit more rally ahead of us but this bull run (within a bear) is getting longer in the tooth instead of actually being the beginning of a new Bull Market in my humble opinion.


I thought that last week for instance would be a down week but I for one admit I was wrong. It's okay though for me since I do have some long positions benefiting despite my KLIC short position being a definite mistake.

So when would the market logically be hit with some profit taking if it does not happen next week? The latest I would expect would be after CSCO reports on Feb 8th. The CSCO report is typically the last meaningful large cap tech to report every earnings season. Selling almost always happens post CSCO in the absence of additional earnings news to continue to support the market.

JMHO< RtS

icon url

ReturntoSender

01/23/12 10:59 PM

#9660 RE: ReturntoSender #6755

From Briefing.com: 5:11PM STMicroelectronics misses by $0.01, misses on revs; guides Q1 revs in-line with consensus (STM) 7.22 -0.08 : Reports Q4 (Dec) loss of $0.01 per share, excluding non-recurring items, $0.01 worse than the Capital IQ Consensus Estimate of ($0.00); revenues fell 22.7% year/year to $2.19 bln vs the $2.24 bln consensus. Based on current visibility, we believe bookings have bottomed. Co sees Q1 revs declining 4-10% sequentially, which equates to ~$2.0-2.1 bln vs. $2.06 bln CIQ Estimates. Looking to Q1, "we expect billings to bottom, as we see stronger than seasonal billings for ST's wholly-owned businesses offset by a very significantly weaker revenue performance from ST-Ericsson. Preliminary industry analysts' forecasts indicate that the overall semiconductor market should stabilize in 2012. For ST, we see the opportunity to continue to grow in selected markets during 2012 but we remain concerned about the macro-economic uncertainty. Consequently, we plan in the near-term to continue to maintain reduced levels of loading at our facilities. We will continue to focus on capital management, taking a prudent approach with respect to inventory levels and capital investments, with the goal of maintaining and expanding our free cash flow. Based largely upon a very significantly weaker sequential sales outlook for wireless, the co anticipates total revenues to sequentially decrease about 4-10% in Q1 of 2012. As a result, and reflecting an improved, but still high level of unsaturation at our facilities, gross margin in Q1 is expected to be about 33.0%, plus or minus 1.5 percentage points.

4:23PM Volterra Semi beats by $0.05, beats on revs (VLTR) 28.86 +0.15 : Reports Q4 (Dec) earnings of $0.30 per share, excluding non-recurring items, $0.05 better than the Capital IQ Consensus Estimate of $0.25; revenues rose 9.1% year/year to $38.78 mln vs the $38.25 mln consensus.

4:30 pm : Things looked bullish in the early going, but a mid-morning reversal left stocks to spend the rest of the session slowly working their way back to the flat line.

Trade today opened on a flat note, but stocks were quickly bid up to a solid gain that resulted in a new multi-month high. However, stocks were unable to sustain the move, even as the euro displayed considerable strength.

The euro sported an impressive lead over the greenback for the entire session. The currency's climb to a near three-week high above $1.30 came amid heightened anticipation for revised measures to prevent a default by Greece. Although no new details were officially released, some speculate that Greece won't be getting any more money from the International Monetary Fund or the Eurozone.

Chatter related to the latter matter coincided with the stock market's pullback, possibly reflecting a mix of frustration and disappointment related to the drawn out process of shoring up conditions in Greece.

Early leaders, tech and financials were caught up in the stock market's slide. Both sectors were up about 1% at their session highs, but each retreated into the red alongside the broad market. They eventually fought back to book modest gains, but neither displayed the same leadership as what was exhibited shortly after the open.

End results were mostly mixed as defensive-oriented telecom traded down to a 0.8% loss and health care fell 0.5%, but utilities mustered a 0.3% gain. Consumer staples stocks slipped 0.2%, which is actually on par with the 0.2% loss and 0.3% loss that cyclical sectors like consumer discretionary and industrials shed, respectively.

No economic data was released today and only a dearth of earnings announcements was made ahead of the open. Halliburton (HAL 35.44, -0.76) was the most widely held name in the handful of companies that announced. Although the oil and gas services play posted an upside earnings surprise, its shares still wrestled with selling pressure all session, even as the rest of the energy sector worked its way to a 0.7% gain, which is bettter than what any other group achieved.

Share volume was paltry once again, barely coming close to 1 billion on the NYSE Big Board. Although it is easy to blame the lack of participation on the absence of news flow and economic data, apathy has been a recurring theme for a few months.

Advancing Sectors: Energy +0.7%, Tech +0.4%, Financials +0.3%, Utilities +0.3%
Declining Sectors: Telecom -0.8%, Health Care -0.5%, Industrials -0.3%, Consumer Staples -0.2%, Consumer Discretionary -0.2%, Materials -0.1% DJ30 -11.66 NASDAQ -2.53 NQ100 +0.00% R2K -0.2% SP400 +0.00% SP500 +0.62 NASDAQ Adv/Vol/Dec 1110/1.68 bln/1350 NYSE Adv/Vol/Dec 1756/723 mln/1259

9:01AM QLogic announces definitive agreement to sell InfiniBand assets to Intel (INTC) for $125 mln; Sale expected to close within this quarter (QLGC) 16.55 :

8:57AM Research In Motion gives up entire pre-mkt gain on new CEO announcement, now -3% at 16.50 (RIMM) 17.00 : See multiple RIMM comments in archive for additional details on CEO news and conference call coverage.

5:47AM Research In Motion names Thorsten Heins President and CEO; Mike Lazaridis named Vice Chair of the Board (RIMM) 17.00 : Co announced that, acting on the recommendation of its Co-CEO to implement the succession plan they previously submitted to the Board, it has unanimously named Thorsten Heins as President and CEO. Heins was also appointed to RIM's Board. The Board acted after conducting its own due diligence. Both appointments are effective immediately. On the transition to CEO by Mr. Heins, Mr. Lazaridis said, "There comes a time in the growth of every successful company when the founders recognize the need to pass the baton to new leadership. Jim and I went to the Board and told them that we thought that time was now. With BlackBerry 7 now out, PlayBook 2.0 shipping in February and BlackBerry 10 expected to ship later this year, the company is entering a new phase, and we felt it was time for a new leader to take it through that phase and beyond. Jim, the Board and I all agreed that leader should be Thorsten Heins."

Mattson Technology (MTSN) announced that it has shipped its Millios millisecond annealing system to another major foundry.

11:48 am S&P Tech Sector Up Slightly, Outperforming S&P 500
The tech sector is trading slightly higher today, just ahead of gains in the broader market. Semiconductors are showing relative weakness in the tech space, however, with the Philly Semi Index trading 0.1% lower. RBCN (+4.0%) is a standout, while VECO (-2.5%) is a notable laggard in the chip index. Among other major indices, the S&P 500, the NASDAQ, and the QQQ are trading 0.1% higher on the session. Among tech bellwethers, INTC (+1.8%) and AAPL (+1.5%) are showing strength, while VZ (-1.5%) is a notable underperformer.

In earnings, IRF (-1.7%) lowered guidance this morning. In news, RIMM (-6.4%) named Thorsten Heins as President and CEO, unseating incumbent Co-CEOs Mike Lazaridis and Jim Balsillie.

Among rumors, we are hearing CSCO (-0.8%) for FNSR (-1.5%) takeover chatter making the rounds.

Among notable analyst upgrades this morning, RIMM (-6.4%) was upgraded to Hold at Deutsche Bank. Among downgrades, FBR Capital downgrades CNQR (-2.7%) to Mkt Perform, ARW (-2.2%) and AVT (-1.4%) were downgraded to Outperform at Raymond James, Stifel Nicolaus downgrades MFLX (-3.0%) to Hold, RIMM (-6.4%) was downgraded to Hold at ThinkEquity, and HRS (-0.3%) was downgraded to Equal Weight at Barclays.

STM (0.0%), VMW (-2.4%), WDC (-1.1%), and TXN (-1.3%) are the notable names in tech scheduled to report results today after the close.

Research In Motion (RIMM $15.86 -1.14) announced that, acting on the recommendation of its Co-CEO to implement the succession plan they previously submitted to the Board, it has unanimously named Thorsten Heins as President and CEO. Heins was also appointed to RIM's Board. The Board acted after conducting its own due diligence. Both appointments are effective immediately. On the transition to CEO by Mr. Heins, Mr. Lazaridis said, "There comes a time in the growth of every successful company when the founders recognize the need to pass the baton to new leadership. Jim and I went to the Board and told them that we thought that time was now. With BlackBerry 7 now out, PlayBook 2.0 shipping in February and BlackBerry 10 expected to ship later this year, the company is entering a new phase, and we felt it was time for a new leader to take it through that phase and beyond. Jim, the Board and I all agreed that leader should be Thorsten Heins."

Rimage (RIMG $11.47 -1.71) announced that it sees Q4 non-GAAP EPS of ($0.12)-(0.14) (including Qumu transaction costs but ex-the amortization of intangibles) versus the ($0.02)-0.01 previously, may not compare to the $0.11 GAAP Capital IQ single estimate. The company sees GAAP EPS of ($0.15)-(0.17)], while revs to $22 million from $24-26 million versus the $24.80 million Capital IQ single estimate. The company also announced that it expects to generate cash from operations in the fourth quarter. In addition, through its quarterly dividend and stock repurchase activities, it returned almost $4 mln back to shareholders during the fourth quarter.

Jive Software (JIVE $15.32 +0.07) was initiated with a Outperform and price target of $20 at BMO Capital Markets The firm notes that Jive shares trade at a 27% premium to the IPO price of $12 and now command an enterprise value to projected 2012 revenue multiple of about 9x, at the high end of the software spectrum. While the stock is hardly cheap, they conclude that it will be able to sustain its valuation multiple as long as the company delivers billings growth at or above a 35%-40% range. They believe that it can.

Brigantine raises their Apple (AAPL $427.08 +6.78) target to $500 from $450. Thursday last week Apple launched new software targeting text books and the education market, a historically strong vertical for the company and a market that has strangely avoided the benefits of digitalization that have revolutionized almost every other industry. Meanwhile, competitors in the smartphone space have noted serious divots in CY4Q sales volumes that the firm suspects may have been won by the new 4S and lower prices on older model iPhones. On that basis, the firm is modestly adjusting estimates up in advance of Apple's earnings report tomorrow.


icon url

ReturntoSender

01/24/12 9:09 PM

#9661 RE: ReturntoSender #6755

From Briefing.com: 4:34PM Apple beats by $3.79, beats on revs; guides Q2 EPS, revs above consensus (AAPL) 420.41 -7.00 : Reports Q1 (Dec) earnings of $13.87 per share, $3.79 better than the Capital IQ Consensus Estimate of $10.08; revenues rose 73.3% year/year to $46.33 bln vs the $39.04 bln consensus. Co issues upside guidance for Q2, sees EPS of ~$8.50 vs. $8.00 Capital IQ Consensus Estimate; sees Q2 revs of ~$32.5 bln vs. $31.94 bln Capital IQ Consensus Estimate. Apple reports 37.4 mln iPhones sold in Q1 vs Street est of ~30 mln; 15.43 mln iPads sold in Q1 vs Street est of ~14 mln; Q1 gross margins of 44.7% vs Street est of 40.7% and 40% guidance. "Apple's momentum is incredibly strong, and we have some amazing new products in the pipeline... We are very happy to have generated over $17.5 bln in cash flow from operations during the December quarter."

6:07PM NVIDIA fell as much as 5.6% to $14.10 after lowering guidance (see 18:01 comment); now at $14.50 (NVDA) 14.94 +0.33 :

6:01PM NVIDIA lowers Q4 revs guidance to $950 mln plus or minus 1%, which equates to ~$940.5- $959.5 mln vs. $1.06 bln CIQ Estimate, down from $1.066 bln plus or minus 2%, which equates to ~$1.045-1.087 bln (NVDA) 14.94 +0.33 : Co lowers Q4 revs guidance. The global disk-drive shortage caused by the flooding in Thailand had more impact on the mainstream GPU segment than anticipated. Shipments by some PC OEMs were reduced. And the higher prices of disk-drives constrained some PC OEMs' ability to include a GPU in their systems. Additionally, the Tegra 2 mobile business declined more rapidly than expected, ahead of devices based on the Tegra 3 processor ramping into production in Q1 of calendar-year 2012. No conference call will be held in conjunction with this business update. Additional commentary pertaining toQ4 will be available when NVIDIA reports financial results on Feb. 15, 2012.

4:18PM Altera beats by $0.03, beats on revs; guides Q1 revs below consensus (ALTR) 40.12 +0.44 : Reports Q4 (Dec) earnings of $0.45 per share, $0.03 better than the Capital IQ Consensus Estimate of $0.42; revenues fell 17.6% year/year to $457.8 mln vs the $446.25 mln consensus. Co issues downside guidance for Q1, sees Q1 revs declining 5-9% sequentially, which equates to ~$416.6-434.9 mln vs. $454.58 mln Capital IQ Consensus Estimate.

4:06PM AXT agreed with the Administrative Commission of Tianjin Economy and Technology Development Zone to establish second manufacturing facility in Tianjin, China; co has committed $12.5 mln investment in construction (AXTI) 5.17 +0.18 :

4:03PM RF Micro Device misses by $0.01, reports revs in-line; guides Q4 EPS below consensus, revs below consensus (RFMD) 4.85 -0.24 : Reports Q3 (Dec) earnings of $0.02 per share, $0.01 worse than the Capital IQ Consensus Estimate of $0.03; revenues fell 19.2% year/year to $225.4 mln vs the $225.04 mln consensus. Co issues downside guidance for Q4, sees EPS of $0.00 to ($0.02) vs. $0.03 Capital IQ Consensus Estimate; sees Q4 revs of $185 mln vs. $204.48 mln Capital IQ Consensus Estimate. "During the December quarter, RFMD's market share gains in smartphones were offset by less than forecasted demand from manufacturers of handsets in China. Despite this, RFMD was able to generate cash flow from operations of approximately $46 million and free cash flow of approximately $38 million. In the March 2012 quarter, we currently expect sequential improvement in gross margin, and we anticipate RFMD's gross margin will return to historical levels as revenue growth resumes."

4:30 pm : The broad market was sold in the early going, but it managed to pare its loss by session's end. The effort was sluggish and generally without leadership.

Disappointment and frustration related to ongoing wrangling between Greece and its creditors sent stocks lower immediately after the open, but the major averages were able to find support before losses became too great. Stocks spent the next couple of hours working their way up from those early lows, but momentum eventually slowed so that stocks were left to drift sideways into the close.

The action was similar to that of the euro, which was able to fully recover from an early loss, but failed to generate enough momentum to move into positive territory.

Tech had appeared to be a source of leadership as it fought its way up to a modest gain, but its efforts were checked. The largest sector by market weight spent the rest of the day dancing along the neutral line before it eked out a narrow gain. Texas Instruments (TXN 32.54, -0.65) was a heavy drag, despite a better-than-expected earnings report. Western Digital (WDC 36.88, +2.17) was among the session's best performers overall following an upside earnings surprise of its own.

Market participants also had varied responses to better-than-expected results from blue chips Johnson & Johnson (JNJ 65.00, +0.00), DuPont (DD 49.41, +0.06), and McDonald's (MCD 98.75, -2.20). Fellow Dow components Travelers (TRV 58.00, -2.29) and Verizon (VZ 37.79, -0.61) both traded lower after they posted earnings that came short of what had been widely expected.

Coach (COH 67.97, +3.73) shares climbed aggressively to an all-time high after it announced earnings that exceeded what Wall Street had estimated. The stock helped give the consumer discretionary sector a 0.4% gain, which is better than what any other sector accomplished.

Although the Fed began its two-day meeting today, there weren't any economic releases. That may have weighed on participation, which was especially poor today -- less than 750 million shares were traded on the NYSE.

An auction of 2-year Notes drew a bid-to-cover ratio of 3.75, dollar demand of $131.3 billion, and an indirect bidder participation rate of 32.9%. For comparison, an average of the past six auctions results in a bid-to-cover ratio of 3.58, dollar demand of $125.4 billion, and an indirect bidder rate of 33.1%.

Advancing Sectors: Consumer Discretionary +0.4%, Health Care +0.1%, Tech +0.1%, Industrials +0.1%
Unchanged: Materials
Declining Sectors: Financial -0.2%, Energy -0.3%, Consumer Staples -0.4%, Utilities -0.8%, Telecom -1.3%DJ30 -33.07 NASDAQ +2.47 NQ100 -0.1% R2K +0.7% SP400 +0.4% SP500 -1.37 NASDAQ Adv/Vol/Dec 1491/1.65 bln/1000 NYSE Adv/Vol/Dec 1619/742 mln/1376

7:34AM Verizon misses by $0.01, reports revs in-line (VZ) 38.40 : Reports Q4 (Dec) earnings of $0.52 per share, $0.01 worse than the Capital IQ Consensus Estimate of $0.53; revenues rose 7.7% year/year to $28.44 bln vs the $28.4 bln consensus. "Verizon finished 2011 very strong, both in terms of revenue growth and by delivering an 18.2 percent total return to our shareholders for the full year, and the company has great momentum for 2012... Verizon Wireless produced particularly strong growth in the fourth quarter. While that diluted wireless margins in the short term, it is good news for revenue and margin growth over the long term, particularly given our leadership in the rapidly developing 4G LTE ecosystem."

6:53AM EMC beats by $0.03, beats on revs; guides FY12 EPS in-line, revs in-line (EMC) 23.44 : Reports Q4 (Dec) earnings of $0.49 per share, excluding non-recurring items, $0.03 better than the Capital IQ Consensus Estimate of $0.46; revenues rose 14.0% year/year to $5.57 bln vs the $5.49 bln consensus. Co issues in-line guidance for FY12, sees EPS of $1.70, excluding non-recurring items, vs. $1.71 Capital IQ Consensus Estimate; sees FY12 revs of $22 bln vs. $22.02 bln Capital IQ Consensus Estimate. EMC expects to repurchase $700 mln of the co's common stock in 2012. "We expect to grow over two times faster than our estimate of IT spending growth [FY12]."

Lattice Semiconductor (LSCC) announced the immediate availability of Low Power, High Speed, and Mini Package additions to the LatticeECP3 FPGA family.

1:23AM Semtech Plans to Acquire Gennum Corp for ~$494 mln; expected to be accretive by more than $0.20 in FY13 (SMTC) 26.89 : Co and Gennum Corp, announce they have entered into a definitive arrangement agreement for Semtech to acquire all of the outstanding shares of Gennum for a total consideration of ~CAD500 mln (~$494 mln). Co estimates that the acquisition will result in at least $15 mln in annual synergies, which Semtech expects will be achieved in full in Semtech's fiscal year 2014. Management expects that the acquisition will be accretive to non-GAAP earnings per share by more than 20 cents in fiscal year 2013 and more than 40 cents in fiscal year 2014. Management believes the acquisition of Gennum will extend co's leading portfolio of infrastructure products to the metro, access and enterprise computing markets and will enable Semtech to provide its customers with more platforms to differentiate their own high-speed voice, video and data transmission products.

09:32 am Western Digital upgraded to Buy at Needham;: . Needham upgrades WDC to Buy from Hold and sets target of $41 as a majority of the concerns leading to its November downgrade have been alleviated (mainly the profitability/cash burn of the company post-flood). Firm's concerns around the complexity of closing the HGST on time were well-founded in November. Bottomline, the unique supply/demand situation in the HDD industry today, combined with the pending consolidation, create a tide that will continue to lift all boats including WDC.

Western Digital (WDC $36.99 +2.29) reported second quarter earnings of $1.51 per share, excluding charges and expenses related to the Thailand flooding and the planned acquisition of Hitachi Global Storage Technologies, $0.80 better than the Capital IQ Consensus of $0.71, while revenues fell 19.4% year/year to $2 billion versus the $1.84 billion consensus. "We have made substantial progress in restoring WD's manufacturing capabilities in the aftermath of the historic flooding in Thailand, and this is reflected in our second quarter financial results and in the resumption of our operations there. While much work remains to be done over the next several quarters to reach our pre-flood manufacturing capabilities, the progress thus far is significantly ahead of our original expectations and is a tribute to the dedicated and effective actions of our employees, contractors and Thai government agencies, the efforts of our supply partners and the support of our customers. We are grateful to all involved in this extraordinary effort."

Texas Instruments (TXN $33.05 -0.14) reported fourth quarter earnings of $0.48 per share, excluding $0.23 in charges, $0.09 better than the Capital IQ consensus of $0.39, while revenues fell 3.0% year/year to $3.42 billion versus the $3.26 billion consensus. The company issued guidance for the first quarter with EPS of $0.26-0.34, may not be comparable to the $0.39 consensus, EPS will be negatively impacted by about 9 cents from $170 million of total acquisition-related charges that will include about $150 million of acquisition charges and, additionally, about $20 million included in cost of revenue; restructuring charges will negatively impact EPS by about 1 cent. The company sees first quarter revenues of $3.02-3.28 billion versus the $3.22 billion consensus Estimate. Baseband revenue is expected to decline from $279 million in the fourth quarter to about $75 million in the first quarter, and range from $50 million to $100 million in each remaining quarter of 2012. In addition to financial results, TI also announced plans to close two older semiconductor manufacturing facilities in Hiji, Japan, and Houston, Texas, over the course of the next 18 months. Production from these sites will be moved to other more advanced TI facilities. "Revenue in the fourth quarter was higher than expected across all our major product lines, reinforcing our belief that we're at the bottom of this downturn. I'm pleased to say that despite the downturn and the lower factory utilization that came with it, cash flow from operations was strong and well above levels as compared with similar points in prior downturns."

11:00 am Verizon Wireless Down 2% Following Earnings Results (VZ)
Earlier this morning, Verizon (VZ $37.52 -0.88) reported fourth quarter earnings of $0.52 per share, $0.01 worse than the Capital IQ Consensus Estimate of $0.53; revenues rose 7.7% year/year to $28.44 bln vs the $28.4 bln consensus. "Verizon finished 2011 very strong, both in terms of revenue growth and by delivering an 18.2 percent total return to our shareholders for the full year, and the company has great momentum for 2012... Verizon Wireless produced particularly strong growth in the fourth quarter. While that diluted wireless margins in the short term, it is good news for revenue and margin growth over the long term, particularly given our leadership in the rapidly developing 4G LTE ecosystem."

10:50 am Polycom up 16% On Earnings/Guidance Results (PLCM)
After the close yesterday, Polycom (PLCM $21.37 +2.95) reported fourth quarter earnings of $0.41 per share, $0.12 better than the Capital IQ Consensus Estimate of $0.29; revenues rose 19.7% year/year to $407 mln vs the $400.81 mln consensus.

"2011 closed strong with full-year revenues of $1.5 billion, driven by particular strength in sales of the Polycom RealPresence Platform and broad geographic growth... Enabled by Polycom's innovations, we experienced unprecedented demand for our secure, interoperable, unified collaboration solutions by both enterprise and service provider customers. Leveraging our industry-leading technology and powerful network of strategic partners, Polycom's cloud, mobility, and software-driven infrastructure strategy is beginning to yield and we look forward to another year of solid growth in 2012."

Polycom issues guidance on earnings call: Sees Q1 revs down 2% from Q4, which equates to $398.9 mln vs $397.82 mln Capital IQ Consensus Estimate; sees non-GAAP operating margin of 18.0%.

10:43 am Texas Instruments Down Modestly On Earnings Results (TXN)
Late yesterday, Texas Instruments (TXN $32.99 -0.20) reported fourth quarter earnings of $0.48 per share, excluding $0.23 in charges, $0.09 better than the Capital IQ Consensus Estimate of $0.39; revenues fell 3.0% year/year to $3.42 bln vs the $3.26 bln consensus.

For the first quarter, the company issued first quarter earnings guidance of $0.26 to $0.34, which may not be comparable to $0.39 Capital IQ Consensus Estimate, EPS will be negatively impacted by about 9 cents from $170 mln of total acquisition-related charges that will include about $150 mln of acquisition charges and, additionally, about $20 million included in cost of revenue; restructuring charges will negatively impact EPS by about 1 cent.

On the too line, the company sees revenues of $3.02 billion to $3.28 billion versus the $3.22 billion Capital IQ Consensus Estimate. Baseband revenue is expected to decline from $279 million in the fourth quarter to about $75 million in the first quarter, and range from $50 million to $100 million in each remaining quarter of 2012. In addition to financial results, TI also announced plans to close two older semiconductor manufacturing facilities in Hiji, Japan, and Houston, Texas, over the course of the next 18 months. Production from these sites will be moved to other more advanced TI facilities. "Revenue in the fourth quarter was higher than expected across all our major product lines, reinforcing our belief that we're at the bottom of this downturn. I'm pleased to say that despite the downturn and the lower factory utilization that came with it, cash flow from operations was strong and well above levels as compared with similar points in prior downturns."
icon url

ReturntoSender

01/26/12 12:13 AM

#9662 RE: ReturntoSender #6755

From Briefing.com: 6:03PM Teradyne beats by $0.04, beats on revs; guides Q1 EPS above consensus, revs above consensus (TER) 16.13 -0.17 : Reports Q4 (Dec) earnings of $0.16 per share, excluding non-recurring items, $0.04 better than the Capital IQ Consensus Estimate of $0.12; revenues fell 4.3% year/year to $297 mln vs the $284.75 mln consensus. Co issues upside guidance for Q1, sees EPS of $0.22-0.33, excluding non-recurring items, vs. $0.19 Capital IQ Consensus Estimate; sees Q1 revs of $360-400 mln vs. $305.63 mln Capital IQ Consensus Estimate.

4:22PM MIPS Tech misses by $0.02, misses on revs (MIPS) 5.35 -0.09 : Reports Q2 (Dec) earnings of $0.01 per share, $0.02 worse than the Capital IQ Consensus Estimate of $0.03; revenues fell 30.1% year/year to $15.3 mln vs the $16.24 mln consensus.

4:15PM Lam Research beats by $0.04, beats on revs (LRCX) 43.55 +0.20 : Reports Q2 (Dec) earnings of $0.34 per share, $0.04 better than the Capital IQ Consensus Estimate of $0.30; revenues fell 32.9% year/year to $584 mln vs the $571.45 mln consensus.

4:10PM SanDisk beats by $0.03, reports revs in-line (SNDK) 52.36 +1.18 : Reports Q4 (Dec) earnings of $1.29 per share, excluding non-recurring items, $0.03 better than the Capital IQ Consensus Estimate of $1.26; revenues rose 18.8% year/year to $1.58 bln vs the $1.57 bln consensus. "The secular demand trends for NAND flash remain vibrant and we are particularly excited about the new growth opportunities for our business in the Enterprise and Client Computing markets."

4:09PM SanDisk -- Earnings Mover (SNDK) 52.34 : Sees some initial weakness following earnings as it drops down roughly 1.5-2 pts into the $50.50-51.00 area. The $49.00-50.00 zone comes into play here next to the 50-day ema.

4:05PM LSI Logic beats by $0.03, reports revs in-line; guides Q1 EPS above consensus, revs above consensus (LSI) 7.08 -0.06 : Reports Q4 (Dec) earnings of $0.13 per share, excluding non-recurring items, $0.03 better than the Capital IQ Consensus Estimate of $0.10; revenues rose 11.1% year/year to $523 mln vs the $526.12 mln consensus. Co issues upside guidance for Q1, sees EPS of $0.09-0.15, excluding non-recurring items, vs. $0.09 Capital IQ Consensus Estimate; sees Q1 revs of $550-590 mln vs. $511.27 mln Capital IQ Consensus Estimate.

4:03PM Coherent reports EPS in-line, misses on revs (COHR) 56.95 -0.83 : Reports Q1 (Dec) earnings of $0.82 per share, in-line with the Capital IQ Consensus Estimate consensus of $0.82; revenues rose 4.2% year/year to $190.8 mln vs the $194.4 mln consensus. The book-to-bill ratio was 1.06, resulting in backlog of $365.5 million at December 31, 2011 compared to a backlog of $356.5 million at October 1, 2011 and a backlog of $308.9 million at January 1, 2011.

4:30 pm : The broad market was able to fight through moderate selling pressure this morning, but gains didn't come until after the Federal Open Market Committee (FOMC) issued its latest Policy Statement. The afternoon advance eventually gained enough momentum to take the stock market to a new multi-month high.

A blowout quarterly report from Apple (AAPL 446.66, +26.25) helped prop up the Nasdaq and the rest of the tech sector (+1.0%) this morning, but most stocks started the session in the red. Of little inspiration were better-than-expected earnings from Boeing (BA 75.82, +0.46), United Technologies (UTX 77.65, -0.13), and ConocoPhillips (COP 69.98, -0.63) as Europe's bourses traded lower amid further frustration surrounding Greece's failure to compromise with its creditors.

Selling pressure slowly eased, but buyers didn't really step in until the FOMC announced that it will keep the federal funds rate at 0.00% to 0.25%. It also stated that economic conditions are likely to warrant such exceptionally low rates through at least late 2014.

The ensuing advance was temporarily interrupted when the Fed disclosed that it now expects GDP for 2012 to grow in a range of 2.2% to 2.7% this year, down from the range of 2.5% to 2.9% that it had stated previously. Fed Chairman Bernanke acknowledged, though, that if inflation remains below target and employment remains slow there is a case for further policy action.

Materials stocks scored some of the strongest gains overall; the sector settled 1.6% higher. Energy stocks were able to turn an early loss of about 1% into a 1.1% gain. Their effort was likely complemented by a climb in commodity prices.

General weakness among commodities this morning had the CRB Index in the red, but it was able to swing to a 0.5% gain. The dollar's downturn helped make its climb a little easier.

Treasuries also traded higher today, but they settled shy of their session highs. The yield on the benchmark 10-year Note saw its yield drop below 2.00% before it eventually worked its way back to that mark. Also in the mix was an auction of 5-year Notes that drew a bid-to-cover of 3.17, dollar demand of $111.0 billion, and an indirect bidder participation rate of 43.3%. For comparison, the prior auction attracted a bid-to-cover ratio of 2.86, dollar demand of $100.1 billion, and an indirect bidder rate of 50.6%, while an average of the past six auctions results in a bid-to-cover of 2.88, dollar demand of $100.8 billion, and an indirect bidder rate of 45.1%.

While stocks, commodities, and Treasuries responded positively to the Fed's commentary, the dollar took a dive. It had been up markedly in morning trade, but was down about 0.5% by session's end.

The first piece of actual domestic data in three days was the latest monthly pending home sales report. It showed that pending home sales for December fell 3.5%, which is slightly steeper than the 3.0% decline that had been generally expected.

Advancing Sectors: Materials +1.6%, Utilities +1.6%, Industrials +1.2%, Energy +1.1%, Tech +1.0%, Consumer Staples +1.0%, Consumer Discretionary +0.7%, Health Care +0.7%, Telecom +0.3%, Financials +0.2%
Declining Sectors: (None)DJ30 +83.10 NASDAQ +31.67 NQ100 +1.3% R2K +1.0% SP400 +1.0% SP500 +11.41 NASDAQ Adv/Vol/Dec 1682/1.94 bln/851 NYSE Adv/Vol/Dec 287/830 mln/723

O2Micro International (OIIM) was issued 17 claims under U.S. patent number 7,948,455 for its White LED apparatus and methodology.

7:35AM Molex misses by $0.02, misses on revs; guides Q3 EPS in-line, revs in-line (MOLX) 27.43 : Reports Q2 (Dec) earnings of $0.38 per share, excluding non-recurring items, $0.02 worse than the Capital IQ Consensus Estimate of $0.40; revenues fell 4.9% year/year to $857.6 mln vs the $889.84 mln consensus. The impact of the floods in Thailand reduced revenue in the December quarter by approximately $15 million. Co issues in-line guidance for Q3, sees EPS of $0.32-0.36 vs. $0.38 Capital IQ Consensus Estimate; sees Q3 revs of $830-860 mln vs. $873.68 mln Capital IQ Consensus Estimate.

7:31AM Silicon Labs beats by $0.06, beats on revs; guides Q1 revs above consensus (SLAB) 47.07 : Reports Q4 (Dec) earnings of $0.49 per share, $0.06 better than the Capital IQ Consensus Estimate of $0.43; revenues rose 13.2% year/year to $126.69 mln vs the $119.8 mln consensus. Co issues upside guidance for Q1, sees Q1 revs of $120-125 mln vs. $118.04 mln Capital IQ Consensus Estimate. Gross margin remained stable at 61.2 percent. R&D investment increased to $29.6 million due primarily to increased tape out activity, and as planned, SG&A remained flat at $22.5 million.

7:15AM Corning reports EPS in-line, beats on revs; sees LCD products to grow from ~3.2 bln to 3.6 bln square feet in 2012 (GLW) 14.62 : Reports Q4 (Dec) earnings of $0.33 per share, excluding non-recurring items, in-line with the Capital IQ Consensus Estimate consensus of $0.33; revenues rose 6.9% year/year to $1.89 bln vs the $1.84 bln consensus. Co expects significant double-digit price declines over the cumulative two-quarter period (Q4 and Q1). Co is not anticipating much sequential change in the overall glass market in the first quarter. Volume at its wholly owned business should be in line with the glass market. The co expects the retail market for LCD products to grow from about 3.2 bln to 3.6 bln square feet in 2012. Equity earnings in the first quarter are expected to decline in the range of 5-20%, excluding special items, (caculating to ~$0.37-0.44 and may not be comparable to $0.35 CIQ est) due to lower earnings at both Dow Corning and Samsung Corning Precision Materials.

7:13AM Motorola Solutions beats by $0.05, reports revs in-line; issues downside Q1 EPS guidance; upside Q1 revs guidance; inline FY12 revs guidance (MSI) 47.83 : Reports Q4 (Dec) earnings of $0.87 per share, $0.05 better than the Capital IQ Consensus Estimate of $0.82; revenues rose 5.3% year/year to $2.3 bln vs the $2.28 bln consensus. Co issues downside EPS guidance for Q1, sees EPS of $0.50-0.55 vs. $0.56 Capital IQ Consensus Estimate. Co sees Q1 revs of +4% vs +3.4% Capital IQ consensus estiamte. Co sees FY12 revenue growth of ~ +5% vs ~ +5% Capital IQ consensus estimate. "Our record fourth quarter capped a very strong and exciting year for our company," said Greg Brown, chairman and CEO of Motorola Solutions. "We streamlined and strengthened our portfolio, grew operating earnings more than five times revenue growth, expanded operating margins, generated strong cash flow and prioritized return of capital to our shareholders."

Rainmaker Systems (RMKR) announced a new agreement with an existing major software client to launch a new program to convert trial subscriptions into scalable subscription revenue with initial deployments in North America and Latin America.

Last night, Apple (AAPL $449.30 +28.89) reported first quarter earnings of $13.87 per share, $3.79 better than the Capital IQ consensus of $10.08; revenues rose 73.3% year/year to $46.33 billion versus the $39.04 billion consensus. The company issued upside guidance for the second quarter with EPS of approximately $8.50 versus the $8.00 consensus with revenues of approximately $32.5 billion versus the $31.94 billion consensus. Apple reported 7.4 million iPhones sold in Q1 versus Street estimate of approx 30 million; 15.43 million iPads sold in Q1 versus street estimate of approx 14 million. First quarter gross margins of 44.7% versus street estimate of 40.7% and 40% guidance. "Apple's momentum is incredibly strong, and we have some amazing new products in the pipeline... We are very happy to have generated over $17.5 bln in cash flow from operations during the December quarter."

Last night, Yahoo (YHOO $15.53 -0.17) reported fourth quarter earnings of $0.24 per share, in-line with the consensus of $0.24, while revenues fell 3.0% year/year to $1.17 billion versus the $1.19 billion consensus. The company issued in-line guidance for the first quarter with revenues of $1.025-1.105 billion versus the $1.07 billion consensus. Income from operations for the first quarter of 2012 is expected to be in the range of $105-155 million.

Last night, Fusion-io (FIO $26.67 -3.67) reported second quarter earnings of $0.05 per share, $0.01 better than the Capital IQ Consensus Estimate of $0.04, while revenues rose 169.6% year/year to $84.1 million versus the $76.44 million consensus; gross margin in Q2 was 52.0% compared to 58.7% in prior year. Operating margin was a loss of 4.8%. FIO sees FY12 rev growth of 65-70% versus the consensus expectation for +60%; the company sees Non-GAAP gross margin between 54-56% and Non-GAAP operating margin for 2012 to be approximately 8%. The company issued in-line guidance for the third quarter with revenues of $85 million versus the $80.75 million consensus. The company sees gross margins in the range of 50% and Non-GAAP operating margin is expected to be breakeven to 5%.

Last night, Advanced Micro (AMD $6.55 +0.02) reported fourth quarter earnings of $0.04 per share, ex-$0.28 in impariments in global foundries investments but including $0.14 in other charges, may not be comparable to the consensus of $0.16, while revenues rose 2.5% year/year to $1.69 billion versus the $1.71 billion consensus. Gross margin was 46 percent, a sequential increase of one percent. Computing Solutions segment revenue increased two percent sequentially and seven percent year-over-year. Graphics segment revenue decreased five percent sequentially and 10 percent year-over-year. The company issued in-line guidance for the first quarter with revenues of (11)-(5%) quarter over quarter to approximately $1.505-1.606 billion versus the $1.6 bln consensus..

Last night, NVIDIA (NVDA $14.21 -0.71) lowered fourth quarter revenue guidance to $950 million plus or minus 1%, which equates to ~$940.5- $959.5 million versus the $1.06 billion CIQ Estimate, down from $1.066 billion plus or minus 2%, which equates to approximately $1.045-1.087 billion. The global disk-drive shortage caused by the flooding in Thailand had more impact on the mainstream GPU segment than anticipated. Shipments by some PC OEMs were reduced. And the higher prices of disk-drives constrained some PC OEMs' ability to include a GPU in their systems. Additionally, the Tegra 2 mobile business declined more rapidly than expected, ahead of devices based on the Tegra 3 processor ramping into production in Q1 of calendar-year 2012. No conference call will be held in conjunction with this business update. Additional commentary pertaining toQ4 will be available when NVIDIA reports financial results on Feb. 15.

11:23 am S&P Tech Sector Up Modestly, While S&P 500 Is In The Red
The tech sector is trading slightly higher today, outpacing losses in the broader market. Semiconductors are showing relative weakness in the tech space, however, with the Philly Semi Index trading 0.1% lower. AMD (+2.8%) is a standout, while RBCN (-11.2%) is a notable laggard in the chip index. Among other major indices, the S&P 500 is trading 0.2% higher, while the NASDAQ is trading 0.4% higher and the QQQ is 0.6% higher on the session. Among tech bellwethers, AAPL (+6.6%) is the lone name showing strength, while GOOG (-2.0%) is a notable underperformer.

In earnings last night, AAPL (+6.6%) posted a blowout Q1 in which the company beat the Street on every metric. Elsewhere, CA (+10.3%) posted a beat, upside guidance and raised its dividend, ALTR (-0.3%) posted a beat with downside guidance, AMD (+2.8%) reported a mixed qtr, YHOO (-0.7%) posted a slight miss with inline guidance, FIO (-17.0%) reported a top and bottom line beat margins eroded, and NVDA (-3.4%) issued a downside preannouncement. This morning, SAP (-0.4%) reported a beat, while ERIC (-15.8%) missed.

In news, GWRE (+32.6%) priced its 8.85 mln share IPO at $13.00 per share, up from 7.5 mln shares expected to price in the $10-12 range. Among rumors, we are hearing RMBS (+2.7%) takeover chatter making the rounds.

Among notable analyst upgrades this morning, TSS (+4.8%) was upgraded to Underperform from Sell at Credit Agricole. Among downgrades, NVDA (-3.4%) was downgraded to Underperform at JMP Securities Macquarie downgrades ORCL (-1.5%) to Neutral.

SYMC (+1.2%) and SNDK (+0.6%) are the notable names in tech scheduled to report results today after the close.
icon url

ReturntoSender

01/26/12 11:28 PM

#9663 RE: ReturntoSender #6755

From Briefing.com: 4:26PM Motorola Mobility beats by $0.14, beats on revs (MMI) 38.67 +0.07 : Reports Q4 (Dec) earnings of $0.20 per share, excluding non-recurring items, $0.14 better than the Capital IQ Consensus Estimate of $0.06; revenues rose 0.3% year/year to $3.44 bln vs the $3.4 bln consensus. The Company continues to work closely with Google to complete the proposed acquisition of Motorola Mobility as expeditiously as possible.

4:18PM KLA-Tencor beats by $0.07, beats on revs (KLAC) : Reports Q2 (Dec) earnings of $0.72 per share, excluding non-recurring items, $0.07 better than the Capital IQ Consensus Estimate of $0.65; revenues fell 16.2% year/year to $642.5 mln vs the $629.45 mln consensus. "A resurgence in demand from foundry customers drove strong order growth in the second quarter and has given KLA-Tencor excellent momentum as we begin calendar 2012."

4:17PM Emulex beats by $0.02, reports revs in-line; guides Q3 EPS in-line, revs in-line (ELX) 9.28 -0.04 : Reports Q2 (Dec) earnings of $0.26 per share, excluding non-recurring items, $0.02 better than the Capital IQ Consensus Estimate of $0.24; revenues rose 12.9% year/year to $128.7 mln vs the $127.85 mln consensus. Co issues in-line guidance for Q3, sees EPS of $0.17-0.19, excluding non-recurring items, vs. $0.17 Capital IQ Consensus Estimate; sees Q3 revs of $121-125 mln vs. $121.43 mln Capital IQ Consensus Estimate.

4:13PM Freescale Semi beats by $0.08, misses on revs (FSL) 15.69 +0.09 : Reports Q4 (Dec) earnings of $0.07 per share, $0.08 better than the Capital IQ Consensus Estimate of ($0.01); revenues fell 14.3% year/year to $1.01 bln vs the $1.03 bln consensus.

4:09PM Riverbed Technology beats by $0.01, reports revs in-line (RVBD) 29.92 +0.33 : Reports Q4 (Dec) earnings of $0.25 per share, excluding non-recurring items, $0.01 better than the Capital IQ Consensus Estimate of $0.24; revenues rose 22.6% year/year to $202.8 mln vs the $201.04 mln consensus. "The business has been executing well and fourth quarter revenue growth was fueled by strong enterprise sales in both the U.S. and EMEA. Despite higher disk drive costs resulting from recent Thai floods, we reported strong gross and operating margins in the fourth quarter. We believe our past investments in our core and new products will continue to yield solid revenue and profit growth in 2012."

4:08PM Juniper Networks beats by $0.01, reports revs in-line; guides Q1 EPS below consensus, revs below consensus (JNPR) 22.37 -0.25 : Reports Q4 (Dec) earnings of $0.28 per share, $0.01 better than the Capital IQ Consensus Estimate of $0.27; revenues fell 5.7% year/year to $1.12 bln vs the $1.12 bln consensus. Co issues downside guidance for Q1, sees EPS of $0.11-0.14 vs. $0.27 Capital IQ Consensus Estimate; sees Q1 revs of $960-990 mln vs. $1.1 bln Capital IQ Consensus Estimate; sees gross margin in the range of 63-64%.

4:06PM Lattice Semi misses by $0.01, beats on revs; guides Q1 revs above consensus (LSCC) 6.64 -0.04 : Reports Q4 (Dec) earnings of $0.05 per share, $0.01 worse than the Capital IQ Consensus Estimate of $0.06; revenues fell 4.0% year/year to $70.2 mln vs the $68.95 mln consensus. Co issues upside guidance for Q1, sees Q1 revs increasing 1-5% q/q (approx $70.7-73.7 mln) vs. $69.64 mln Capital IQ Consensus Estimate.

4:06PM Micros Systems reports EPS in-line, revs in-line (MCRS) 51.66 -20.50 : Reports Q2 (Dec) earnings of $0.51 per share, excluding non-recurring items, in-line with the Capital IQ Consensus Estimate consensus of $0.51; revenues rose 9.4% year/year to $270.4 mln vs the $270.22 mln consensus.

4:05PM Celestica beats by $0.01, misses on revs; guides Q1 EPS in-line, revs slightly below consensus (CLS) 7.68 -0.15 : Reports Q4 (Dec) earnings of $0.27 per share, excluding non-recurring items, $0.01 better than the Capital IQ Consensus Estimate of $0.26; revenues fell 6.5% year/year to $1.75 bln vs the $1.78 bln consensus. Co issues mixed guidance for Q1, sees EPS of $0.18-0.24 vs. $0.23 Capital IQ Consensus Estimate; sees Q1 revs of $1.6-1.7 bln vs. $1.72 bln Capital IQ Consensus Estimate.

4:03PM Cirrus Logic beats by $0.01, reports revs in-line; guides Q4 revs above consensus (CRUS) 22.07 +0.06 : Reports Q3 (Dec) earnings of $0.43 per share, $0.01 better than the Capital IQ Consensus Estimate of $0.42; revenues rose 28.0% year/year to $122.4 mln vs the $121.96 mln consensus. Co issues upside guidance for Q4, sees Q4 revs of $108-122 mln vs. $103.92 mln Capital IQ Consensus Estimate. Q4 gross margin is expected to be between 54 percent and 56 percent.

4:03PM Micron announces retirement of Mark Durcan as President and Chief Operating Officer (MU) 7.55 -0.31 : Co announced that Mark Durcan, President and COO, will be retiring at the completion of co's current fiscal year at the end of Aug 2012. Mark W. Adams, the co's VP of Worldwide Sales, will succeed Mr. Durcan as President and COO upon Mr. Durcan's retirement.

4:03PM Maxim Integrated beats by $0.02, reports revs in-line; guides Q3 EPS below consensus, revs in-line (MXIM) : Reports Q2 (Dec) earnings of $0.34 per share, excluding non-recurring items, $0.02 better than the Capital IQ Consensus Estimate of $0.32; revenues fell 3.5% year/year to $591.4 mln vs the $595.94 mln consensus. Co issues mixed guidance for Q3, sees EPS of $0.25-0.29 vs. $0.32 Capital IQ Consensus Estimate; sees Q3 revs of $555-585 mln vs. $581.64 mln Capital IQ Consensus Estimate.

4:02PM Microsemi reports EPS in-line, revs in-line; guides Q2 EPS in-line (MSCC) 20.38 -0.45 : Reports Q1 (Dec) earnings of $0.39 per share, in-line with the Capital IQ Consensus Estimate consensus of $0.39; revenues rose 30.6% year/year to $240.9 mln vs the $240.8 mln consensus. Co issues in-line guidance for Q2, sees EPS of $0.43-$0.48 vs. $0.46 Capital IQ Consensus Estimate.

4:01PM Seagate Tech increases dividend by 39% and announces $1 bln share repurchase. (STX) 19.80 +0.03 : Co increases quarterly cash dividend from $0.18 to $0.25 per share, an increase of 39%. The increase is effective with the dividend payable on March 1 to shareholders of record as of the close of business on Feb 15. Additionally, the Board has authorized the repurchase an additional $1 bln of its outstanding common shares. The January 2012 authorization extends Seagate's commitment to enhancing shareholder value by utilizing the robust cash generation ability of its business. To date, Seagate has utilized approx $1.1 biln against the existing $2 bln share repurchase authorization approved by the Board on Nov 29, 2010 to repurchase 67.8 mln shares. The remaining balance of the November 2010 authorization ($0.9 billion) is expected to be utilized by the end of fiscal year 2012 (June 29, 2012), market and other economic conditions permitting.

"These actions by the Board demonstrate our ongoing commitment to maximize shareholder value. The Board and the management team remain confident in the co's ability to maintain a strong balance sheet and sustain exceptional cash generation from the business." Seagate expects to fund the dividend and share repurchases through a combination of cash on hand, future cash flow from operations and potential alternative sources of financing.

4:30 pm : Although the effort encountered resistance, the stock market was able to build on an early gain and overcome resistance to put itself back in positive territory for the year.

Early market participants provided a modest bid in the face of muddled action abroad and a new 11-month low for the euro following a mixed debt auction in Italy. The euro eventually worked its way higher and, in turn, bolstered broad market buying interest; the currency climbed out of the red to end the trading day with a 0.4% gain against the greenback. The euro is still down more than 3% this year, though.

Financials helped boost the broad market by providing leadership. The sector fully recovered from their prior session slump by bouncing to a 1.6% gain. Banks proved to be a primary driver of that move. However, bank stocks remain the reason for the sector's poor performance this year -- the KBW Bank Index is down 23% this year while the broader financial sector is off by 18% year to date.

Defensive-oriented stocks have generally outperformed in 2011. Year to date, utilities stocks are up more than 15%, consumer staples stocks are collectively up 11%, and the health care sector is up more than 10%.

All 10 major sectors scored strong gains today, though. Despite such broad-based strength, the S&P 500 had a hard time moving more than a couple of points above the 1258 zone, which contains its 2011 starting point and its 200-day moving average. Still, stocks never retreated and ultimately prevailed in overcoming resistance. The lack of share volume likely helped the move -- with only a half billion shares traded on the NYSE share volume was only about half of its average daily volume. Nonetheless, the S&P 500 is now fractionally positive for the year.

Economic data had little sway with the broad market, but shares of homebuilders were helped by a surprisingly strong pending home sales report. Pending home sales for November increased by 7.3%, which is greater than the 0.6% increase that had been generally expected among economists polled by Briefing.com, but less than the 10.4% increase recorded in the prior month.

The Chicago PMI for December also exceeded expectations. Although it eased down to 62.5 from 62.6 in the prior month, it was better than the reading of 60.1 that had been generally expected.

Weekly initial jobless claims jumped to 381,000 from the multi-month low of 366,000 posted for the previous week. Economists polled by Briefing.com had expected, on average that initial claims would be closer to 368,000.

The commodities complex failed to benefit from the positive tone displayed in the stock market and the dollar's decline from a multi-month high. That left the CRB Index to suffer a 0.2% loss. That said, several commodities were able to recover from new or near multi-month lows. The CRB is positioned for a year-to-date loss of about 8.5%.

Advancing Sectors: Financials +1.6%, Industrials +1.3%, Energy +1.2%, Materials +1.1%, Consumer Discretionary +1.1%, Health Care +1.0%, Tech +0.9%, Telecom +0.9%, Utilities +0.8%, Consumer Staples +0.7%
Declining Sectors: (None)DJ30 +135.63 NASDAQ +23.76 NQ100 +0.8% R2K +1.3% SP400 +1.4% SP500 +13.38 NASDAQ Adv/Vol/Dec 1888/1.03 bln/724 NYSE Adv/Vol/Dec 2381/531 mln/637

9:33AM SanDisk gaps lower following earnings as it dips down into its mid Dec low near $47.00 (SNDK) 46.80 -5.48 : The 200-day ma's come into play below near $45.00-46.00.

Axcelis Technologies (ACLS) announced a strategic service partnership with ULVAC TECHNO to support Axcelis semiconductor processing systems in Japan.

8:16AM Ultratech beats by $0.01, misses on revs (UTEK) 27.54 : Reports Q4 (Dec) earnings of $0.42 per share, $0.01 better than the Capital IQ Consensus Estimate of $0.41; revenues rose 28.7% year/year to $56.1 mln vs the $58.8 mln consensus.

8:04AM Cypress Semi beats by $0.03, beats on revs (CY) 19.15 : Reports Q4 (Dec) earnings of $0.32 per share, $0.03 better than the Capital IQ Consensus Estimate of $0.29; revenues rose 7.0% year/year to $242.3 mln vs the $236.68 mln consensus. All core divisions and most major product lines decreased sequentially as expected. Non-GAAP consolidated gross margin for Q4 was 56.1%, down 1.8 percentage points from the previous quarter due mainly to product mix and factory.

Booking visibility will remain limited into Q1 due to historically low lead-times, continued inventory adjustments and ongoing concerns over worldwide macroeconomic issues. Book-to-bill ratio for Q4 was 0.58, a decrease from that of Q3 and less than the normal seasonal figure. Consequently, expect Q1 revenue also to decrease at a rate greater than normal. The expected decrease in revenue includes not only the seasonal factor, but also some revenue decreases due to tablet end sales. Assuming no further macroeconomic deterioration, expect that bookings and revenue will bottom out in Q1 2012 and lead to a strong second half as many new product design wins ramp into production.

6:31AM Nokia convenes annual general meeting 2012; dividend of EUR 0.20 per share will be proposed for 2011; will propose 360 mln share repurchase (NOK) 5.26 : The Board will propose to the Annual General Meeting that a dividend of EUR 0.20 per share be paid for the fiscal year 2011. The ex-dividend date would be May 4, 2012, the record date May 8, 2012 and the payment date on or about May 23, 2012. The Board will propose that the Annual General Meeting authorize the Board to resolve to repurchase a maximum of 360 million Nokia shares. The proposed maximum number of shares is the same as in the Board's current share repurchase authorization and it represents less than 10 % of all the shares of the Company.

NXP Semiconductors (NXPI) announced the availability of several new LED driver ICs in its SSL2108x family for compact, non-dimmable retrofit lamps, following the success of the SSL21081.

09:18 am Suntech Power downgraded to Sell at Stifel Nicolaus: . Stifel Nicolaus downgrades STP to Sell from Hold following a surge in solar equities they continue to be cautious on the sector, as they see the recent optimism as short-lived ahead of additional subsidy revisions in Germany, and as checks indicate that pricing remains still challenging and inventories high in a seasonally weak period.

12:26 pm S&P Tech Sector Up Modestly, In-line With The S&P 500
The tech sector is trading slightly lower today, along with losses in the broader market. Semiconductors are showing relative strength in the tech space, however, with the Philly Semi Index trading 0.1% higher. TER (+4.9%) is a standout, while SNDK (-9.2%) is a notable laggard in the chip index. Among other major indices, the S&P 500 is trading 0.2% lower, while the NASDAQ is trading 0.1% higher and the QQQ is 0.1% lower on the session. Among tech bellwethers, GOOG (+0.4%) is showing strength, while T (-2.1%) is a notable underperformer.

In earnings last night, SNDK (-9.2%), SYMC (-1.3%), and CTXS (-3.4%) each posted slight upside to its quarterly earnings results with inline revenues, but all offered downside guidance. This morning, NOK (+3.7%) posted a modest earnings beat, while T (-2.1%) reported a mixed Q4.

In news, RNWK (+29.7%) announced it has signed an agreement to sell a significant number of its patents and its video codec software to INTC (-0.7%) for a purchase price of $120 mln.

Among notable analyst upgrades this morning, EFII (+3.6%) was upgraded to Outperform at BMO Capital. Among downgrades, GLW (-2.4%) was downgraded to Underweight at Morgan Stanley and ADP (-2.0%) was downgraded at Well Fargo and Citi.

CLS (-1.5%), FSL (+2.6%), and JNPR (+0.7%) are the notable names in tech scheduled to report results today after the close
icon url

ReturntoSender

01/28/12 4:42 PM

#9664 RE: ReturntoSender #6755

From Briefing.com: 4:30 pm : Although the effort encountered resistance, the stock market was able to build on an early gain and overcome resistance to put itself back in positive territory for the year.

Early market participants provided a modest bid in the face of muddled action abroad and a new 11-month low for the euro following a mixed debt auction in Italy. The euro eventually worked its way higher and, in turn, bolstered broad market buying interest; the currency climbed out of the red to end the trading day with a 0.4% gain against the greenback. The euro is still down more than 3% this year, though.

Financials helped boost the broad market by providing leadership. The sector fully recovered from their prior session slump by bouncing to a 1.6% gain. Banks proved to be a primary driver of that move. However, bank stocks remain the reason for the sector's poor performance this year -- the KBW Bank Index is down 23% this year while the broader financial sector is off by 18% year to date.

Defensive-oriented stocks have generally outperformed in 2011. Year to date, utilities stocks are up more than 15%, consumer staples stocks are collectively up 11%, and the health care sector is up more than 10%.

All 10 major sectors scored strong gains today, though. Despite such broad-based strength, the S&P 500 had a hard time moving more than a couple of points above the 1258 zone, which contains its 2011 starting point and its 200-day moving average. Still, stocks never retreated and ultimately prevailed in overcoming resistance. The lack of share volume likely helped the move -- with only a half billion shares traded on the NYSE share volume was only about half of its average daily volume. Nonetheless, the S&P 500 is now fractionally positive for the year.

Economic data had little sway with the broad market, but shares of homebuilders were helped by a surprisingly strong pending home sales report. Pending home sales for November increased by 7.3%, which is greater than the 0.6% increase that had been generally expected among economists polled by Briefing.com, but less than the 10.4% increase recorded in the prior month.

The Chicago PMI for December also exceeded expectations. Although it eased down to 62.5 from 62.6 in the prior month, it was better than the reading of 60.1 that had been generally expected.

Weekly initial jobless claims jumped to 381,000 from the multi-month low of 366,000 posted for the previous week. Economists polled by Briefing.com had expected, on average that initial claims would be closer to 368,000.

The commodities complex failed to benefit from the positive tone displayed in the stock market and the dollar's decline from a multi-month high. That left the CRB Index to suffer a 0.2% loss. That said, several commodities were able to recover from new or near multi-month lows. The CRB is positioned for a year-to-date loss of about 8.5%.

Advancing Sectors: Financials +1.6%, Industrials +1.3%, Energy +1.2%, Materials +1.1%, Consumer Discretionary +1.1%, Health Care +1.0%, Tech +0.9%, Telecom +0.9%, Utilities +0.8%, Consumer Staples +0.7%
Declining Sectors: (None)DJ30 +135.63 NASDAQ +23.76 NQ100 +0.8% R2K +1.3% SP400 +1.4% SP500 +13.38 NASDAQ Adv/Vol/Dec 1888/1.03 bln/724 NYSE Adv/Vol/Dec 2381/531 mln/637

4:49PM EMCORE announces one for four reverse stock split (EMKR) 1.26 +0.03 : Co announced that its Board of Directors has approved a one for four reverse stock split (the "Reverse Stock Split") of EMCORE common stock. The Reverse Stock Split was approved by EMCORE's shareholders at its June 14, 2011 annual meeting. The Reverse Stock Split will become effective following the filing of an amendment to EMCORE's corporate charter.

1:22PM Riverbed Technology: Following earnings, stock climbs modestly higher intraday as buyers begin to take it back up into its gap down highs near $24.00 (RVBD) 24.00 -5.91 :

10:57AM Riverbed Technology: Following earnings, stock sinks to fresh gap down lows as it begins to probe the $22.00-23.00 support zone (RVBD) 23.05 -6.87

Seagate Tech (STX $20.88 +1.08) increased quarterly cash dividend from $0.18 to $0.25 per share, an increase of 39%. The increase is effective with the dividend payable on March 1 to shareholders of record as of the close of business on Feb 15. Additionally, the Board has authorized the repurchase an additional $1 billion of its outstanding common shares. The January 2012 authorization extends Seagate's commitment to enhancing shareholder value by utilizing the robust cash generation ability of its business. To date, Seagate has utilized approximately $1.1 billion against the existing $2 billion share repurchase authorization approved by the Board on Nov 29, 2010 to repurchase 67.8 mln shares. The remaining balance of the November 2010 authorization ($0.9 billion) is expected to be utilized by the end of fiscal year 2012 (June 29, 2012), market and other economic conditions permitting.

Microsemi (MSCC $19.06 -1.32) reported first quarter earnings of $0.39 per share, in-line with the Capital IQ Consensus consensus of $0.39, while revenues rose 30.6% year/year to $240.9 million versus the $240.8 million consensus. The company issued in-line guidance for the second quarter with EPS of $0.43-$0.48 versus the $0.46 consensus.

Cirrus Logic (CRUS $20.90 -1.17) reported third quarter earnings of $0.43 per share, $0.01 better than the Capital IQ Consensus of $0.42, while revenues rose 28.0% year/year to $122.4 million versus the $121.96 million consensus. The company issued upside guidance for the fourth quarter with revenues of $108-122 million versus the $103.92 million consensus. Fourth Quarter gross margin is expected to be between 54 percent and 56 percent.

Juniper Networks (JNPR $20.31 -2.07) reported fourth quarter earnings of $0.28 per share, $0.01 better than the Capital IQ Consensus of $0.27, while revenues fell 5.7% year/year to $1.12 billion versus the $1.12 bln consensus. The company issued downside guidance for the first quarter with EPS of $0.11-0.14 versus the $0.27 consensus with revenues of $960-990 million versus the 1.1 billion consensus and the company sees gross margin in the range of 63-64%.

Riverbed Technology (RVBD $23.59 -6.33) reported fourth quarter earnings of $0.25 per share, excluding non-recurring items, $0.01 better than the Capital IQ Consensus Estimate of $0.24, while revenues rose 22.6% year/year to $202.8 million versus the $201.04 million consensus. "The business has been executing well and fourth quarter revenue growth was fueled by strong enterprise sales in both the U.S. and EMEA. Despite higher disk drive costs resulting from recent Thai floods, we reported strong gross and operating margins in the fourth quarter. We believe our past investments in our core and new products will continue to yield solid revenue and profit growth in 2012."

09:23 am Seagate Tech target raised to $26 at Brean Murray: . Brean Murray raises their STX tgt to $26 from $23 as STX is meaningfully increasing both its share repurchase plans and its dividend. The firm notes that STX reports Dec Q results Tues Jan 31 and they would be buying the stock at current levels, as they believe minimally the share repurchase suggests another $0.55 to CY12 EPS (worth at least $2 in stock) and they would argue at least 0.5x -- 1.0x in P/E expansion from the dividend increase.

11:00 am KLA-Tencor Up 5% On Earnings/Guidance (KLAC)
KLA-Tencor (KLAC $52.56 +2.30) reported second quarter earnings of $0.72 per share, excluding non-recurring items, $0.07 better than the Capital IQ Consensus Estimate of $0.65.

Revenues fell 16.2% year/year to $642.5 million versus the $629.45 million consensus.

"A resurgence in demand from foundry customers drove strong order growth in the second quarter and has given KLA-Tencor excellent momentum as we begin calendar 2012."

10:54 am S&P Tech Sector Just Under Unchanged Levels
The tech sector is trading slightly higher today, ahead of losses in the broader market. Semiconductors are showing relative strength in the tech space, however, with the Philly Semi Index trading 0.4% higher. KLAC (+4.6%) is a standout, while CRUS (-5.5%) is a notable laggard in the chip index. Among other major indices, the S&P 500 is trading 0.3% lower, while the NASDAQ is trading 0.1% higher and the QQQ is 0.05% higher on the session. Among tech bellwethers, GOOG (+1.0%) is showing strength, while CSCO (-1.5%) is a notable underperformer.

In earnings last night, JNPR (-8.4%), SYNA (+3.6%), and RVBD (-21.5%) posted slight quarterly beats, but offered downside guidance. CRUS (-5.5%) and KLAC (+4.8%) posted beat and raises. VRSN (0.1%) reported a slight miss, but issued upside guidance. Elsewhere, FSL (+2.0%) reported a mixed quarter, QLGC (+4.3%) posted a beat, CLS (+6.0%) posted a mixed quarter with slightly downside guidance, and FICO (-10.7%) posted a beat and reaffirm.

Among notable analyst upgrades this morning, LOGI (+2.1%) was upgraded to Neutral at Citigroup, Needham upgraded SYNA (+3.6%) to Buy. Among downgrades, JNPR (-8.4%) was downgraded at Morgan Keegan, Auriga, and Stifel Nicolaus.

10:27 am Juniper Down 9% On Earnings/Guidance (JNPR)
Late yesterday, Juniper (JNPR $20.35 -2.02) reported fourth quarter earnings of $0.28 per share, $0.01 better than the Capital IQ Consensus Estimate of $0.27.

Revenues fell 5.7% year/year to $1.12 bln vs the $1.12 bln consensus.

For the first quarter, the company expects to see earnings in the range of $0.11 to $0.14 versus $0.27 Capital IQ Consensus Estimate; sees first quarter revenue of $960 million to $990 million versus the $1.1 billion Capital IQ Consensus Estimate; sees gross margin in the range of 63% to 64%.
icon url

ReturntoSender

01/29/12 3:03 PM

#9666 RE: ReturntoSender #6755

InvestmentHouse Weekend Market Summary

http://www.investmenthouse.com/weekendmarketsummary.htm

- GDP tries to stymie the rally, but stocks recover in the afternoon.
- Still bumping the highs, still not breaking through.
- GDP at 2.8% is inflated by inventories adding almost 2 points to the total. This is recovery? Anyone could get this result by flooding the economy with dollars.
- GDP internals tell why Bernanke downplayed the economy Wednesday.
- Consumer Sentiment continues to improve thank goodness.
- Dollar struggles (where is the strong dollar mantra?), bonds rally on Fed action, economic data.
- Leaders rallied Friday but the market is not done selling as tops, even for near term tests, take a bit of time to form.
- Can make money but now our game plan has to change with the indices at the prior highs.

GDP internals underscore the problems with the economy and those that may come.

In the closing alert on Friday I included a note I sent to the traders in the office about my feelings on where this market was. We typically discuss that note live between the traders in the afternoon to figure out where we want to go and make sure we are all in the same page. We also look out over the next session or, in this case, Monday and next week. I included part of that note because I think it did a good job of spelling out what I was talking about on Wednesday and Thursday with respect to where the market is going in the coming week or two based on the additional information we received Friday in the economic numbers.

First I will go over a bit of the background for the day, and then I will get into that note in particular. It was a mixed back-and-forth session that saw the NYSE large cap indices struggling. The SP500 and the DJ30 closed slightly lower, but it was a growth day. The growth indices such as NASDAQ, SP600, and the SOX staked out the lead on the day, posting upside gains. Looking at where they closed on the session, if this market wants to sell (as surely seemed the case on Thursday), it does not seem to want to sell that hard. Stocks declined after the premarket GDP data came out. That data showed a consumer less consumption-minded and business falling sharply while inventories piled higher as a result.

In the backward world of GDP calculation, without inventories rising due to less spending, GDP would have risen only 0.8%. Now that is growth, my friends. The worry is we have a repeat of early 2011 when the economy sputtered after a good finish to 2010. Indeed, that finish was better than the first read of Q4 in 2011 showed us on Friday. The market had its issues.

SP500, -0.16%; NASDAQ, +0.4%; Dow, -0.58%; SP600, +0.59%; SOX, +0.34%; NASDAQ 100, +0.29%.

The market took a hit early on when the GDP numbers came out. At 2.8%, that was significantly less than expected. There are other factors I alluded to that I will talk about later. There was a recovery, however. A rebound but then a slump into lunch. Buyers reasserted themselves. They bought on a dip, driving stocks higher in the afternoon, pushing NASDAQ and the SP600 back to positive. It brought SP500 and the Dow well off of their lows to close out the session. SP500 bounced up off of its 10 day EMA. Again, if the market is trying to sell, it is not trying to sell that hard.

OTHER MARKETS

There was an impact from the weaker GDP numbers.

Dollar. 1.3209 versus 1.3156 euro. The dollar sold. With a weaker economy, why do you need to invest your money in the dollar? Money gets pulled out of weakening economies, and that is what the dollar showed on Friday. In the premarket alert this morning, I talked about the Fed's policies and what it is doing to the dollar. That would include the administration's policies as well. When was the last time you heard that old mantra that "A strong dollar is in the best interest of the United States?" In Bill Clinton's administration we heard it all the time. Even in President Bush's administration, although they did not really believe it, they still said it. Today I could not remember the last time I heard anyone from the Obama administration say that a strong dollar is in the best interest of the United States.

I know some of you will e-mail and say they said it on this day or that day. My point is that we used to hear it all the time on CNBC, Bloomberg, Fox Business, or wherever. You could not swing a dead cat without hitting someone in the administration who said something about a strong dollar being in the interest of the United States. And before I get the cat lovers writing in, that is just a phrase from Huckleberry Finn.

In any event, the dollar did not have a lot of faith in the U.S. recovery as investors fled the dollar for other currencies.

Bonds. 1.90% versus 1.96% 10 year U.S. Treasury. Bonds rallied on the news. Why? People get scared when the economy weakness. They want safety and they ran to U.S. Treasuries. It does not hurt that the Fed's policies are pushing people toward Treasuries once again even though they are not yielding anything. Why? The Fed says it will keep interest rates low. You can make money as bonds rally and yields fall. Indeed, it was enough today to have the Fed's Lacker say that the U.S. may have to raise rates before 2014.

That is damage control. The Fed is stretching the 0% interest rate timetable, and it does not like how that is being received and commented on in the financial markets. It is trying to say this is not just the printing press running again. "We are aware that there could be inflation, blah, blah, blah." No one is really buying it just as no one in the Bush era really bought the policy statement that they believed a strong dollar was in the interest of the U.S. Actions speak louder than words. They did so in the Bush administration with respect to the dollar, and they are now with the Fed's treatment of bonds and interest rates.

As an aside, it is no wonder that the Fed did what it did and Bernanke said what he did in the Q&A; the Fed got a pre-look at these numbers and was not impressed with what it saw. Thus it said it would keep these rates lower. But it has to do the damage control. It made that promise to keep money cheap and free to the big banks and companies. While the Fed cannot do anything else because it has itself in a box, it is really not helping. It is pushing money away from the U.S. as we see in the dollar.

Bonds are still in trouble, but they rallied back up to the 50 day EMA. The 5 year reached a record low yield at 0.75%.

Gold. 1,732.60, +2.70. Gold did not do a lot. That was after a big run for the week. After hours gold was up another 15 clicks. It continued to run. The Fed promises cheap, easy money and gold sees is as inflationary. Gold broke out of its range to the upside when it looked ready to roll over and head back down. It all hinged on what the Fed did, and you see the result.

Oil. 99.47, -0.23. Oil was virtually flat on the session. Still struggling in the range. Still not following, still not rising. A lot of it depends on what happens with Iran and others. Oil is being held hostage somewhat, if you will pardon the rather hackneyed allusion to the 1970's when Iran was involved with U.S. hostages.

THE ECONOMY

TO VIEW THE ECONOMY SUMMARY VIDEO CLICK THE FOLLOWING LINK:
Economy Summary Video

TECHNICAL SUMMARY

Volume. -14% NASDAQ, 1.73B; -5.5% NYSE, 759M. Volume fell off the table. There was no selling strength, and there was no real buying strength.

Breadth. 1.87:1 NASDAQ; 1.85:1 NYSE. Breadth was to the upside.

On Friday many were saying that the Thursday reversal that I talked about quite extensively was apparently nothing. It may be nothing, but it is not likely. As discussed in the office this afternoon, this is one of those times you can get burned jumping in too quickly if you were expecting to get into trades and stay in for several weeks. Why? The market is likely hitting a level where it caps out this move near term. Does it roll over? Move sideways? Just test modestly? It can be any of those. We could get a rollover of significance that breaks down into this lower range. We could get a rollover that just tests the October peak. Or we could get a lateral, choppy move for weeks on end. Even if a rollover is coming and even if stocks will fall over the next few weeks, it often takes time for buyers to finally run out of steam and stop buying on the dips.

Looking at the mid-2010 recovery, we had that inverted head and shoulders and the rally back up to that prior peak. Right when it came back up to the peak before it broke out, it stalled and faded back from that April peak and tested just a bit. But then it turned around, broke out, and started the nice rally into April through July. Fast forwarding to the current situation, the indices are in the process of bumping into that prior peak. The Dow made that run on Thursday and reversed. It did not roll over completely, but it threw a big doji and was down on Friday. Not selling off, but it was down. They have not made that test, however. That is the same test from 2010. But that is likely to happen, and they are likely to come back and test near that October peak. That was the recovery high that they had a little trouble moving through. They will come back and test that to some degree. It has not been answered yet as to how far.

This time around why is it different? Why might it not continue to the upside? Things are not that great right now. GDP was crappy at 2.8%. As I noted, 1.9 points of that was an inventory bill as consumer and business spending dropped off even with auto sales up 38%. This may be an overall top, and not the bump of the prior high that precedes a test that then leads to a breakout. Again, that is the action we saw back in late 2010. As I noted, however, that is not an answered question as of yet. Thus you will always have up and down action as we saw on Friday. Part of the market did fine and other parts struggled. It is likely going to be choppy for awhile. Those that move in too quickly in anticipation of an upside breakout or a downside breakdown often get ground up in the choppy action.

Your next statement might be, "Then why the heck are we even worrying about this right now?" Because the subscribers and those of us in the office that want to trade positions can make money. You have to look for the juicy, ripe moves to the upside and downside that can make us nice gains without having to break any resistance or support. You want to capture moves without needing any kind of breakout or breakdown because in a choppy, indecisive market that is testing those prior highs, you are not going to get as many breakouts. Just when you get the move going, you hit resistance and at it stalls out and fades. If you have to break through resistance, you will be in trouble. You end up getting stuck in a play or you have to bail on the play or just have some dead money for awhile. If you are banking on a breakout in order to make money, the odds are stacked against you in this market and the market that is likely to come over the next few weeks. The probabilities do not have your back as they have. Again, that kind of action can grind you up if you are looking to position trade for several weeks.

What do you do? For now you play partials. Do not get too far into a potentially choppy market, and you play the really ripe moves where you do not have to make that break through any resistance or break down through support to make some nice money. We are not trying to pick up a dollar while risking a dollar or two. You still want to have that good ratio. A good probability of a sold return but without making the move through a resistance level. That makes finding plays a lot harder. That is what everyone was moaning about today while looking ahead for the weekend. That is one of the reasons we had this talk. You have to put your mind in sync with what the market is showing you. Do not try to force that square peg into a round hole. Be smarter.

Again, we will play partial positions. We took a couple of partial positions today. We also took gain on other positions and closed some others. You have to continue your position maintenance. You have to be smart. This is not the time to load the boat. Things looked great on Friday, and we made some money on plays that moved wonderfully for us. I was very pleased with the action on Friday, and not because I feel the troubles are over and the market is going to race higher now or lower over the next 5 days. I was pleased because our positions made us a lot more money.

Many surged. JAZZ made a nice break to the upside. NFLX continued to push higher after its gap to the upside. SCSS moved up. KLAC continued its move on good volume. LULU was up as well on a good move. SOHU posted a nice 6%+ gain. STX broke higher out of a lateral consolidation. Those are just a few of them that moved up nicely, and this is on top off a great week for us. Leaders in good position making their moves. We are not assuming that this will last, however. We let most of them run today. We did not take a lot of gain. We will watch closely next week, careful to bank more gain if they start to wear out (i.e. the market bumps up against that resistance again and starts to falter).

Remember, it takes a bit of time for the momentum to wear out. The momentum is upside right now. If it keeps bumping up against those prior highs and selling off, it will wear itself out. Thus it is likely to give us that test. If it holds on that pullback, we will see new setups, no doubt. Indeed, we see some pretty juicy setups with no resistance overhead to be broken in order to make us the kind of money to makes the play worthwhile. We will look at those this weekend for the coming week.

There you have it. That is basically the meeting we had this afternoon talking about what we are doing and why we are doing it. It just summarized what I have been saying over the past several sessions. You have to play smart now and get the probabilities in your favor. You have to keep them in your favor and not lose sight of what is happening in the market overall. We can still make great money, but we have to protect what we have made to this point. Do not be caught up in days such as Friday that saw a lot of our positions the leaders making great moves. You can say, "Man, this market is going to higher." But leaders lead, right? They perform better than other stocks, and they were leading on Friday. But if the market cannot break through these highs, those leaders will not be able to take us out of it all by themselves. They, too, will come back.

THE CHARTS

I will just note that all of the major indices other than the SOX experienced the 50 day EMA moving up through the 200 SMA. Most places look at the 50 day EMA versus the SMA. The EMA is the one that most of the traders are watching now. We know the SP500 and the Dow have already made that move along with the NASDAQ. On the SP600 the golden cross as occurred. That is an overall bullish indication. Why? The 10 day, 20 day, and the 50 day are now sloping to the upside. The momentum is moving higher. If it sustains, the 200 day will flatten further and then turn up. Then all of the major indices will be moving higher. That is a powerful trend.

If there is a test, do not panic. With what we see in stocks and EMAs as well, it could precipitate a test of the cross. Then, just about the time that the test and the cross start to materialize as the 50 day slides lower, stocks should find their bottom and break back to the upside. That would be perfectly normal. It is all in the test. It is how stocks and indices test moves that tells you the tale as to the underlying strength. This cross is a good indication, but it is not the answer in itself.

THE MARKET

SENTIMENT INDICATORS

VIX: 18.53; -0.04
VXN: 19.31; -0.25
VXO: 18.06; +0.49

Put/Call Ratio (CBOE): 0.88; -0.1

Bulls versus Bears:

This is a reading of the number of bullish investment advisors versus bearish advisors. The reason you look at this is that it gives you an idea of how bullish investors are. If they are too bullish then everyone is in the market and it is heading for a top: if everyone wants to be in the market, then all the money is in and there is no more new cash to drive it higher. On the other side of the spectrum if there are a lot of bears then there is a lot of cash on the sideline, and as the market rallies it drags that cash in as the bears give in. That cash provides the market the fuel to move higher. If bears are low it is the same as a lot of bulls: everyone is in and the market does not have the cash to drive it higher.

Bulls: 50.0% versus 50.0%. Still at the flat line as it has been for all of January. To the end of 2011 showed a slow, steady increase to this level. Still probing the overdone range and could be part of the picture that tops out the current in January, but it is not there yet. 35% is the threshold measuring bullish versus bearish action. Six weeks the bulls were below bears. A powerful sentiment signal but now dissipating. Highs from April and December (60% readings spanning December through early May 2011). The 5 year high is 62.0. The crossover level at 29% bulls from July 2010 is long gone. 35% is the threshold level suggesting bullishness. To be seriously bearish it needs to get up to the 60% to 65% level.

Bears: 28.7% versus 29.8%. Backing off but just modestly from that 30% level where bears moved down to in early December and have held ever since. Again, bears are not growing but they are not necessarily buying into the upside move. Back and forth around 30% where it has flat-lined for 8 weeks. Again, Bears remain skeptical. Skeptics in the face of a move is a good sign the move continues. Lower but not anywhere near suggesting investors are carefree. The average the past month and more is 30%. The index spent seven weeks over the 35% threshold considered a bullish indicator. For more reference, bearishness hit a 5 year high at 54.4% the last week of October 2008. The move over 50 took bearish sentiment to its highest level since 1995. Extreme negative sentiment. Prior levels for comparison: Bearishness peaked at 37.4% in September 2007. It topped the June 2006 peak (36%) on that run. That June peak eclipsed the March 2006 high (33%) and well above the 2005 highs that spawned new rallies (30% in May 2005, 29.2% in October 2005). That was a huge turn, unlike any seen in recent history.

NASDAQ

Stats: +11.27 points (+0.4%) to close at 2816.55
Volume: 1.736B (-13.89%)

Up Volume: 973.01M (+329.94M)
Down Volume: 716.4M (-483.6M)

A/D and Hi/Lo: Advancers led 1.87 to 1
Previous Session: Decliners led 1.23 to 1

New Highs: 71 (-27)
New Lows: 9 (-4)

SP500/NYSE

Stats: -2.1 points (-0.16%) to close at 1316.33
NYSE Volume: 759M (-5.6%)

Up Volume: 1.96B (+420M)
Down Volume: 1.95B (-1.1B)

A/D and Hi/Lo: Advancers led 1.85 to 1
Previous Session: Decliners led 1.04 to 1

New Highs: 177 (-68)
New Lows: 8 (-1)

DJ30

Stats: -74.17 points (-0.58%) to close at 12660.46
Volume DJ30: 164M shares Friday versus 131M shares Thursday.

MONDAY

We have a ton of economic data. It will be the first Friday of the new month, and that means we will have the payrolls report ending the week. Everyone will be looking at that. It will be interesting to see how that turns out. Can it continue to improve? Or will what appears to be a slowdown in Q4 in some very key economic metrics starts to slow down the improvement (for want of a better word) in employment.

On Monday there is Personal Income and Spending. Tuesday brings the Case/Shiller, the Chicago PMI, and Consumer Confidence as well. We have ADP on Wednesday as well as the ISM. Huge numbers. Challenger on Thursday, Initial Jobless Claims on Thursday. Productivity on Thursday. Friday brings not only the employment report but Factory Orders and the ISM Services. A huge week of news, not to mention more earnings.

It will be a busy news week. There will be a lot more on Europe. There were downgrades by Fitch of Spain and Italy on Friday. No surprise there with a two-notch downgrade. There will be more Europe news that may or may not impact negatively on the market. We have been able to overcome a lot of that, but now we are back at these highs. That tends to magnify the news that is negative. Investors naturally pull back and wait to see.

Remember that we could see a choppy back-and-forth. Thursday was down. Friday was quasi up. The big cap NYSE was not. Otherwise tech and growth was up, and our leaders performed well. We have down days and we will have up days. I do not think we will get a breakout. Typically you do not get that move on the first try. What happened back in the summer of 2010 is classic. You have the rally and then, in the fall, the tap of the prior high and the test before the breakout. We will have to watch and see.

If the Fed announces another QE3 at some point, the market will break out and go to the upside. Before that happens, the Fed will be watching to see how they perform at these prior highs and if we get a fall back. The deeper the fall back, the better the chance we have of the Fed acting. Why? The Fed knows that if the market falls back it is seeing 2012 weakening. After the GDP advance report for Q4 that was released on Friday, we understand why Bernanke talked down the economy on Wednesday in the press conference.

Prepare for chop. It will happen. Do not get too married to positions. Do not stay heavy in all positions. We have lightened up on a lot of them. Those we have been taking lately have been partials. When we move into any new plays coming up, it will be partials. We will take our gain. We will take that partial and reduce it even more by logging the gain when we get there (or we get darn close) as we have been. We can make money in this, no doubt about it. We just have to adapt and cannot apply breakout strategies in all cases. Maybe there will be some, but we will play those on the test. The market will be choppy and up and down. Again, that can grind you up.

Do not be impatient. This is one of those times that patience pays off. Take the move when it is there. Do not chase the bus and do not rush in too quickly. Those are very much related at these times in the market. You can chase the bus and be in too quickly at the same time. It makes no sense, but it has the same effect. That is the way I look at it. The other day I said you do not have to be that smart to make money in the market, but you just have to think a little differently. There is an example of it.

In any event, we will get good plays where we do not have to make breakouts. We do not have to count on a break to make us money. Harder to find, yes. Fewer plays, yes. That is the way it is at these potential tops and bottoms where the market is trying to figure out itself what will happen. Be smart and be patient. Let the plays come, and then jump on them when you see them. If they do not go your way, we will get the heck out of Dodge. Preserve your money. Take the money when it is there for taking. Do not try to push for something that is not there; the odds are against you in this kind of market, and it will most likely be taken away from you.

I will see you on Monday for a busy news week. Have a great weekend!

Support and Resistance

NASDAQ: Closed at 2816.55
Resistance:
2816 is the early April peak.
2825 is the 2007 closing peak.
2841 is the February 2011 peak
2862 is the 2007 peak
2879 is the July 2011 peak
2888 is the May 2011 peak

Support:
2796 is the February gap down point
2762 is the February low
2759 is the mid-May low
2754 is the recent October 2011 high
2706 to 2705 is the April 2011 low and the February 2011 and consolidation low (bottom of the trading range) 2723 to 2705 is the range of support at the bottom of the January to May trading range
2686 is the January 2011 closing low
2676 is the January 2010 low and the December 2011 peak
The 50 day EMA at 2674
The 200 day SMA at 2659
2645-2650ish from December 2010 consolidation
2643 is the September 2011 high
2612 is the late August 2011 peak
2603 is the March 2011 intraday low (post-Japan low)
2599 is the June 2011 low and NASDAQ
2593 is the November intraday high
2580 is the November 2010 closing high
2572 is the November 2-11 gap down point
2555 is the mid-August 2011 peak
2546 is the early September 2011 gap down point
2535 is the November island reversal gap point
2532 is the early August gap down point
2469 is the November 2010 low
2441 is the November 2011 low
2331 from October 2010 low and the August 2011 intraday low
2305 from the August 2010 peak (summertime base)
2139 is the May and June 2010 low
2123 is the August 2010 gap down point
2100 from the August 2010 lows

S&P 500: Closed at 1316.33
Resistance:
1318.51 is the May low
1325-27 is the March 2008 closing low and the May 2006 peak.
1332 is the early March peak
1340 is the early April 2011 peak
1344 is the February 2011 peak
1357 is the July 2011 peak
1364 is the March 2007 low
1370 is the August 2007 low
1371 is the recent May 2011 peak

Support:
1313 from the August 2008 interim peak
1295 to 1294 is the April 2011 low and the February 2011 consolidation low (bottom of the trading range)
1293 is the October 2011 peak
1275 is the January 2010 low, early January 2011 peak
1267 is the December 2011 peak
The 50 day EMA at 1268
1258 is June 2011 intraday low
The 200 day SMA at 1257
1255 is the late December 2010 consolidation range
1249 is the March 2011 low (post-Japan)
1235 is the mid-December 2010 consolidation low
1231 is the late August 2011 peak
1227 is the November 2010 peak
1220 is the April 2010 peak
1209 is the mid-August 2011 high
1196 is the November 2010 consolidation peak
1178-1180 is the October 2010/November 2010 consolidation low
1158 is the November 2011 low
1131 - 1127 from August 2010 base peak.
1119 is the early August closing low
1109 is the mid-September 2010 gap up point
1101 is the August 2011 low
1075 is the October 2011 intraday low
1099 from the mid-July interim peak
1090 is the early September 2010 gap up point
1040 from the August 2010 lows and May/June 2010 lows
1011 is the summer 2010 low

Dow: Closed at 12,660.46
Resistance:
12,754 is the July intraday peak
12,876 is the May high
13,058 from the May 2008 peak on that bounce in the selling

Support:
12,391 is the February 2011 peak
12,284 is the October 2011 peak
12,258 is the December 2011 peak
The 50 day EMA at 12,244
12,110 from the March 2007 closing low
12,094 is the April 2011 low
The 200 day SMA at 11,972
The June low at 11,897 (closing)
11,893 from March 2008 closing low
11,867 from the August 2009 high and peak on that bounce in the selling.
11,734 from 11-98 peak
11,717 is the late August 2011 peak
The August low at 11,702
11,555 is the March low
11,452 is the November 2010 peak
11,178 from November 2010
10,978 is the bottom of the November 2010 consolidation
10,750 from September 2010
10,720 is the August closing low
10,705-710 from January 2010 peak
10,694-700 from August 2010 peak
9938 is the August 2010 low

Economic Calendar

January 25 - Wednesday
- MBA Mortgage Index, 01/21 (7:00): -5.0% actual versus 23.1% prior
- Pending Home Sales, December (10:00): -3.5% actual versus -3.0% expected, 7.3% prior
- FHFA Housing Price Index, November (10:00): +1.0% actual versus -0.2% prior
- Crude Inventories, 01/21 (10:30): +3.56M actual versus -3.438M prior
- FOMC Rate Decision, January (12:30): 0-0.25% actual versus 0.25% expected, 0.25% prior. Extended low rates from mid-2013 to late 2014. Wow.

January 26 - Thursday
- Initial Claims, 01/21 (8:30): 377K actual versus 375K expected, 356K prior (revised from 352K)
- Continuing Claims, 01/14 (8:30): 3554K actual versus 3550K expected, 3466K prior (revised from 3432K)
- Durable Orders, December (8:30): 3.0% actual versus 2.0% expected, 4.3% prior (revised from 3.7%)
- Durable Orders -ex A, December (8:30): 2.1% actual versus 0.7% expected, 0.5% prior (revised from 0.3%)
- New Home Sales, December (10:00): 307K actual versus 321K expected, 314K prior (revised from 315K)
- Leading Indicators, December (10:00): 0.4% actual versus 0.7% expected, 0.2% prior (revised from 0.5%)

January 27 - Friday
- Chain Deflator - Q4, First iteration (8:30): 2.6% prior
- GDP - Q4, First iteration (8:30): 2.8% actual versus 3.2% expected, 1.8% prior
- Chain Deflator-Adv., Q4 (8:30): 0.4% actual versus 1.5% expected, 2.6% prior
- Michigan Sentiment - Final, January (9:55): 75.0 actual versus 74.2 expected, 74.0 prior

January 30 - Monday
- Personal Income, December (8:30): 0.4 expected, 0.1% prior
- Personal Spending, December (8:30): 0.1 expected, 0.1% prior
- PCE Prices - Core, December (8:30): 0.2 expected, 0.1% prior

January 31 - Tuesday
- Employment Cost Index, Q4 (8:30): 0.4 expected, 0.3% prior
- Case-Shiller 20-city, November (9:00): -2.6 expected, -3.4% prior
- Chicago PMI, January (9:45): 62 expected, 62.5 prior
- Consumer Confidence, January (10:00): 67 expected, 64.5 prior

February 1 - Wednesday
- MBA Mortgage Index, 01/28 (7:00)
- ADP Employment Change, January (8:15): 175K expected, 325K prior
- ISM Index, January (10:00): 54.7 expected, 53.9 prior
- Construction Spending, December (10:00): 0.4% expected, 1.2% prior
- Crude Inventories, 01/28 (10:30)
- Auto Sales, January (14:00): 13.5M expected, 4.20M prior
- Truck Sales, January (14:00): 6.04M prior

February 2 - Thursday
- Challenger Job Cuts, January (7:30): 30.6% prior
- Initial Claims, 01/28 (8:30): 375K expected,
- Continuing Claims, 01/21 (8:30): 3525K expected,
- Productivity-Preliminary, Q4 (8:30): 0.6% expected, 2.3% prior
- Unit Labor Costs, Q4 (8:30): 0.8% expected, -2.5% prior

February 3 - Friday
- Nonfarm Payrolls, January (8:30): 170K expected, 200K prior
- Nonfarm Private Payrolls, January (8:30): 145K expected, 212K prior
- Unemployment Rate, January (8:30): 8.5% expected, 8.5% prior
- Hourly Earnings, January (8:30): 0.2% expected, 0.2% prior
- Average Workweek, January (8:30): 34.4 expected, 34.4 prior
- Factory Orders, December (10:00): 1.6% expected, 1.8% prior
- ISM Services, January (10:00): 53.1 expected, 52.6 prior
icon url

ReturntoSender

01/30/12 11:08 PM

#9667 RE: ReturntoSender #6755

From Briefing.com: 4:25PM Advanced Energy reports EPS in-line, misses on revs; guides Q1 EPS above consensus, revs in-line (AEIS) 11.13 -0.13 : Reports Q4 (Dec) earnings of $0.01 per share, in-line with the Capital IQ Consensus Estimate consensus of $0.01; revenues fell 22.8% year/year to $112.5 mln vs the $114.06 mln consensus. Co issues guidance for Q1, sees EPS of ~$0.00 vs. ($0.02) Capital IQ Consensus Estimate; sees Q1 revs of $95-105 mln vs. $97.78 mln Capital IQ Consensus Estimate. "While market conditions remain uncertain in the near-term, our focus is centered on accomplishing the objectives we laid out at our analyst day to realign our cost structure, accelerate revenue growth and effectively utilize our cash. Once implemented, these actions should improve our profitability and deliver exceptional value to our shareholders."

4:07PM Rudolph Tech beats by $0.07, beats on revs (RTEC) 10.05 -0.07 : Reports Q4 (Dec) earnings of $0.15 per share, $0.07 better than the Capital IQ Consensus Estimate of $0.08; revenues fell 19.3% year/year to $43.6 mln vs the $39 mln consensus.

4:02PM Integrated Device beats by $0.02, reports revs in-line (IDTI) 6.64 +0.08 : Reports Q3 (Dec) earnings of $0.06 per share, $0.02 better than the Capital IQ Consensus Estimate of $0.04; revenues fell 18.6% year/year to $120 mln vs the $120.75 mln consensus. "Despite weaker demand for communications, consumer and PC solutions during the December quarter, we saw improved bookings trends for server-related products. New product introductions and design wins increased during the quarter and we continue to win prestigious awards for innovation. While some customer ramps have been delayed by macroeconomic factors, we remain well positioned for multi-year growth driven by the ongoing rollout of cloud computing, 4G wireless infrastructure and mobility platforms."

4:30 pm : The stock market managed to fight back from an early sell-off, but it still logged its third straight loss.

Early action was decidedly weak as market participants responded to sizable losses abroad and ongoing concerns related to Greece's inability to reach a compromise with its creditors. Greece's struggles come as Europe's leaders gather again to discuss and finalize bailout plans.

Limited in both scope and quality, earnings reports did nothing to improve the mood among morning participants. In a similar vein, news that Pep Boys (PBY 14.93, +2.85) will be bought by Gores Group for $15 per share, which represents a premium of about 24% over the stock's closing price last week, made hardly a ripple in the broad market.

Economic data was limited to a 0.5% increase in personal income and no change in personal spending during December. Economists polled by Briefing.com had expected, on average, that income would increase by 0.4% and that spending would increase by 0.1%. However, core personal consumption expenditures increased by 0.2% during December, just as many had expected.

Amid the negativity of early trade the S&P 500 was quickly dropped for a loss of roughly 1%. That positioned the broad market measure for its poorest performance in more than a month, but support at the 1300 line helped stocks stage a steady rebound. The climb lost momentum as both the Nasdaq and the Dow struggled to extend their advance into positive territory, but stocks still settled well above their session lows.

Financials failed to participate in the stock market's rebound. Instead, the sector suffered a 1.0% loss, which makes it the poorest performing sector of the session. In contrast, tech stocks traded up to a 0.3% gain. Still, that wasn't as impressive as the 0.6% advance booked by telecom stocks after many of them had ended Friday at their weekly lows.

Although most stocks were able to improve their positions by day's end, traditional safe havens like the dollar traded with strength all session. The greenback eased off of its morning high, but still maintained a gain of about 0.5% against a basket of major foreign currencies througout the rest of the day. Meanwhile, buying among Treasuries took the benchmark 10-year Note up enough to trim its yield to a one-month low beneath 1.85%.

Advancing Sectors: Telecom +0.6%, Tech +0.3%
Unchanged: Materials
Declining Sectors: Health Care -0.1%, Consumer Discretionary -0.2%, Industrials -0.4%, Energy -0.4%, Consumer Staples -0.5%, Utilities -0.5%, Financials -1.0%DJ30 -6.74 NASDAQ -4.61 NQ100 +0.1% R2K -0.8% SP400 -0.5% SP500 -3.32 NASDAQ Adv/Vol/Dec 860/1.65/1670 NYSE Adv/Vol/Dec 1103/744 mln/1876

Sanmina-SCI (SANM) today called for redemption on March 1, 2012 of $150.0 mln in aggregate principal amount of its 8.125% Senior Subordinated Notes due 2016 ($400 mln aggregate principal outstanding).

7:02AM Motorola Solutions Board of directors increases stock repurchase program authorization from up to $2.0 bln to up to $3.0 bln (MSI) 45.83 : This increase of up to $1.0 bln is in addition to the up to $2.0 bln announced in July 2011, raising the total authorization to up to $3.0 bln. After stock repurchases of approximately $1.1 bln through Dec. 31, 2011, Motorola Solutions will have up to approximately $1.9 bln for its stock repurchase program in 2012.

Lattice Semiconductor (LSCC) and Weikeng Industrial announced they have signed an expanded distribution agreement. Under the terms of the agreement, Weikeng Technology is authorized to sell Lattice's complete portfolio of innovative low power, low cost FPGA, PLD and programmable power management solutions across southeast Asia and India.

1:38 am S&P Tech Sector Unchanged, Outperforming The S&P 500
The tech sector is trading slightly lower today, outpacing larger losses in the broader market. Semiconductors are showing relative weakness in the tech space, however, with the Philly Semi Index trading 1.7% lower. CRUS (+2.6%) is a standout, while CREE (-5.4%) and NXPI (-5.4%) are notable laggards in the chip index. Among other major indices, the S&P 500 is trading 0.8% lower, while the NASDAQ is trading 0.5% lower and the QQQ is 0.4% lower on the session.

Among tech bellwethers, AAPL (+1.1%) are showing strength, while INTC (-0.6%) is a notable underperformer. It was a quiet morning in tech sector with no notable news or earnings. Among analyst upgrades this morning, PRGS (+2.6%) was upgraded to Outperform at JMP Securities, Argus upgraded MSI (0.0%) to Buy, and MCHX (+1.4%) was upgraded to Outperform at BMO Capital. Among downgrades, MEI (-2.2%) was downgraded to Neutral at Robert W. Baird.

There are no notable names in tech scheduled to report results today after the close.
icon url

ReturntoSender

02/01/12 11:57 PM

#9669 RE: ReturntoSender #6755

From Briefing.com: 4:26PM MagnaChip Semi beats by $0.06, reports revs in-line (MX) 10.20 +0.47 : Reports Q4 (Dec) earnings of $0.26 per share, $0.06 better than the Capital IQ Consensus Estimate of $0.20; revenues fell 3.2% year/year to $180.8 mln vs the $179.98 mln consensus. Co states, " "Smartphones, tablet PCs, AMOLED displays and Ultrabooks are some examples of growth drivers for MagnaChip in 2012 as well as our rapidly expanding customer base and new product introductions for the power solutions segment... Looking ahead, we believe there are indications that the first quarter of 2012 could be the bottom of our revenue downturn based on the strength of orders for new products coming from our smartphone and tablet PC customers."

4:21PM Intersil beats by $0.03, reports revs in-line; guides Q1 EPS below consensus, revs below consensus (ISIL) 11.67 +0.41 : Reports Q4 (Dec) earnings of $0.16 per share, $0.03 better than the Capital IQ Consensus Estimate of $0.13; revenues fell 14.5% year/year to $165.8 mln vs the $166.45 mln consensus. Co issues downside guidance for Q1, sees EPS of $0.05-$0.09 vs. $0.14 Capital IQ Consensus Estimate; sees Q1 revs of $152-160 mln vs. $169.82 mln Capital IQ Consensus Estimate.

4:20PM Qualcomm beats by $0.07, beats on revs; guides Q2 EPS above consensus, revs above consensus; guides FY12 EPS in-line, revs above consensus (QCOM) 59.56 +0.74 : Reports Q1 (Dec) earnings of $0.97 per share, excluding $0.01 loss per share attributable to the QSI segment, $0.11 loss per share attributable to certain share-based compensation and $0.03 loss per share attributable to certain acquisition-related items, $0.07 better than the Capital IQ Consensus Estimate of $0.90; revenues rose 39.8% year/year to $4.68 bln vs the $4.58 bln consensus. Co issues upside guidance for Q2, sees EPS of $0.91-0.97 vs. $0.89 Capital IQ Consensus Estimate; sees Q2 revs of $4.6-5 bln vs. $4.5 bln Capital IQ Consensus Estimate. Co raised guidance for FY12, sees EPS of $3.55-3.75 up from $3.42-3.62 vs. $3.60 Capital IQ Consensus Estimate; sees FY12 revs of $18.7-19.7 bln up from $18-19 bln vs. $18.45 bln Capital IQ Consensus Estimate. Co reported MSM shipments of 156 million units, up 32 percent y-o-y and 23 percent sequentially.

4:15PM Mattson beats by $0.05, beats on revs (MTSN) 2.39 +0.12 : Reports Q4 (Dec) loss of $0.07 per share, $0.05 better than the Capital IQ Consensus Estimate of ($0.12); revenues rose 1.0% year/year to $41.7 mln vs the $35.38 mln consensus.

4:14PM JDS Uniphase beats by $0.05, beats on revs; guides Q3 revs in-line (JDSU) 13.13 +0.44 : Reports Q2 (Dec) earnings of $0.15 per share, excluding non-recurring items, $0.05 better than the Capital IQ Consensus Estimate of $0.10; revenues fell 13.4% year/year to $413.1 mln vs the $391.01 mln consensus. Co issues in-line guidance for Q3, sees Q3 revs of $410-425 mln vs. $417.43 mln Capital IQ Consensus Estimate.

4:11PM Cadence Design beats by $0.02, beats on revs; guides Q1 EPS in-line, revs above consensus; guides FY12 EPS in-line, revs above consensus (CDNS) 10.80 +0.24 : Reports Q4 (Dec) earnings of $0.17 per share, excluding non-recurring items, $0.02 better than the Capital IQ Consensus Estimate of $0.15; revenues rose 23.7% year/year to $308 mln vs the $300.47 mln consensus. Co issues mixed guidance for Q1, sees EPS of $0.14-0.16, excluding non-recurring items, vs. $0.14 Capital IQ Consensus Estimate; sees Q1 revs of $305-315 mln vs. $292.87 mln Capital IQ Consensus Estimate. Co issues mixed guidance for FY12, sees EPS of $0.60-0.70, excluding non-recurring items, vs. $0.64 Capital IQ Consensus Estimate; sees FY12 revs of $1.24-1.28 bln vs. $1.23 bln Capital IQ Consensus Estimate.

4:30 pm : Stocks settled shy of their session highs, but still booked big gains on the day. Not only did that free the broad market from its recent funk, but it gave stocks one of their best performances in the past couple of weeks.

In the early going market participants maintained their bullish bias in the face of a relatively disappointing ADP Employment Change. The report suggested that private payrolls increased by 170,000 in January, rather than by 200,000, as had been broadly expected. The report is widely regarded as a preview of the official payrolls report that is due Friday.

Positive sentiment in Europe was a primary underpinning of the stock market's early strength. Market participants made note of a successful debt offering from financially precarious Portugal. While mixed manufacturing data from China was shrugged off by many, news that a handful of PMI Manufacturing readings from the eurozone made incremental improvements were also regarded as a positive. Notably, a compromise with creditors continues to elude Greece.

Strength in the euro reflected sentiment in Europe. It led the greenback for the entire session and was up about 0.5% as of the closing bell.

Morning trade got a little choppy with the release of the latest ISM Manufacturing Index and some monthly construction spending numbers. The ISM Manufacturing Index improved in January to 54.1 from 53.1 in the prior month, but many had expected it to make a slightly stronger climb to 54.5. Construction spending during December increased by 1.5%, which is far better than the 0.4% that had been expected. Spending in the prior month had increased by 0.4%.

Leadership from financials helped lift the broader market. The sector climbed to a gain greater than 2% before momentum stalled. As a group, financials finished with a 1.7% gain, which is better than what any other sector achieved.

The S&P 500 also drifted lower in afternoon trade, but before doing so it came in contact with the 1330 line, which stands just a few points below the 52-week intraday high that it set last week.

Earnings, generally positive overall, provided an encouraging backdrop to trade today. Seagate Tech (STX 25.53, +4.39) surged in response to an upside earnings surprise and strong guidance. Fellow tech play Broadcom (BRCM 37.13, +2.78) also attracted strong buying interest on the back of a better-than-expected earnings report. Whirlpool (WHR 61.64, +7.32) shares set a new multi-month high in response to an upside earnings surprise of their own.

Amazon.com (AMZN 179.46, -14.98) failed to attracted buyers following its quarterly report. The company's bottom-line beat was overshadowed by a light revenue figure and a disappointing forecast. Even with AMZN shares in such weak shape the Nasdaq managed to outperform its counterparts. Still, its performance still wasn't as strong as that of either the Russell 2000 or the S&P 400, which climbed 1.7% and 1.8%, respectively.

Advancing Sectors: Financials +1.7%, Industrials +1.1%, Materials +1.1%, Health Care +1.0%, Tech 0.9%, Consumer Staples +0.8%, Telecom +0.7%, Energy +0.5%, Utilities +0.4%, Consumer Discretionary +0.3%
Declining Sectors: (None)DJ30 +83.55 NASDAQ +34.43 NQ100 0.9% R2K +1.7% SP400 +1.8% SP500 +11.67 NASDAQ Adv/Vol/Dec 1939/2.11 bln/605 NYSE Adv/Vol/Dec 2504/893 mln/521

Research In Motion (RIMM) announced that BlackBerry smartphones running on the BlackBerry 7 and BlackBerry 7.1 Operating Systems have been awarded FIPS 140-2 certification by the National Institute of Standards and Technology and the Communications Security Establishment Canada, certifying the phones for government use.

7:00AM ATMI beats by $0.06, beats on revs (ATMI) 23.38 : Reports Q4 (Dec) earnings of $0.20 per share, excluding a contract termination charge of $1.68 per diluted share, $0.06 better than the Capital IQ Consensus Estimate of $0.14; revenues fell 5.9% year/year to $90.3 mln vs the $87.59 mln consensus. "We ended 2011 with $114 million in cash and marketable securities, after spending $95 million for the SDS Direct transaction and $3 million for SDS inventories, giving us ample flexibility to pursue additional strategic growth opportunities. Despite the uncertainty in the macroeconomic environment and the anticipated softness in the first quarter, we are excited about our opportunities for growth given the incremental revenues and cash that are expected to be generated from the SDS Direct transaction and new product revenues in both our Microelectronics and LifeSciences product lines as our customers continue to ramp to volume production."

Broadcom (BRCM $36.05 +1.69) reported fourth quarter earnings of $0.68 per share, excluding non-recurring items, $0.03 better than the Capital IQ Consensus of $0.65, while revenues fell 6.7% year/year to $1.82 billion versus the $1.8 billion consensus.

Seagate Tech (STX $24.17 +3.06) reported second quarter earnings of $1.32 per share, excluding non-recurring items, $0.24 better than the Capital IQ Consensus of $1.08, while revenues rose 17.5% year/year to $3.19 billion versus the $3.13 billion consensus.

icon url

ReturntoSender

02/02/12 11:07 PM

#9670 RE: ReturntoSender #6755

From Briefing.com: 4:30 pm : 4:16PM Novellus beats by $0.26, beats on revs (NVLS) 49.34 : Reports Q4 (Dec) earnings of $0.73 per share, $0.26 better than the Capital IQ Consensus Estimate of $0.47; revenues fell 26.5% year/year to $282.7 mln vs the $277.24 mln consensus. Bookings in the fourth quarter of 2011 were $286.9 million, up $60.0 million or 26.4 percent from third quarter 2011 bookings of $226.9 million. Fourth quarter shipments of $276.5 million were down $25.1 million or 8.3 percent from $301.6 million in the third quarter of 2011.

4:28PM Cymer beats by $0.20, beats on revs; guides Q1 revs below consensus (CYMI) 50.92 +0.01 : Reports Q4 (Dec) earnings of $0.40 per share, $0.20 better than the Capital IQ Consensus Estimate of $0.20; revenues rose 4.1% year/year to $152.9 mln vs the $127.89 mln consensus. Co issues downside guidance for Q1, sees Q1 revs of appros $138 mln vs. $148.09 mln Capital IQ Consensus Estimate. The co also expects Installed Base Products revenue to remain at or above the prior quarter level led by installed base growth, increased ArF pulses and light source product enhancements. They anticipate shipping a similar number of DUV ArF Immersion light sources, as compared to last quarter, but a lower number of KrF. The co anticipates recognizing revenue on fourth 3100 EUV source and third TCZ system. The firm will continue to invest in EUV development resources, manufacturing capacity, and field support. They view 2012 as a pivotal year for advancing power and performance for 3100 fielded sources and 3300 source demand." For Q1 the co also expects gross margin to be approx 48 to 49%, R&D expenses to be approximately $39 to $41 mln, SG&A expenses to be approximately $16.5 million and the effective tax rate to be approximately 32%.

4:17PM Microchip beats by $0.01, reports revs in-line; guides Q4 EPS in-line, revs in-line (MCHP) 37.69 +0.13 : Reports Q3 (Dec) earnings of $0.42 per share, excluding non-recurring items, $0.01 better than the Capital IQ Consensus Estimate of $0.41; revenues fell 10.5% year/year to $329.2 mln vs the $328.72 mln consensus. Co issues in-line guidance for Q4, sees EPS of $0.43-0.47, excluding non-recurring items, vs. $0.44 Capital IQ Consensus Estimate; sees Q4 revs of $332.4-345.6 mln vs. $337.85 mln Capital IQ Consensus Estimate.

4:07PM Power Integrations beats by $0.02, beats on revs; guides Q1 revs in-line (POWI) 37.06 +0.28 : Reports Q4 (Dec) earnings of $0.29 per share, excluding non-recurring items, $0.02 better than the Capital IQ Consensus Estimate of $0.27; revenues fell 8.6% year/year to $66.7 mln vs the $66.03 mln consensus. Co issues in-line guidance for Q1, sees Q1 revs of $64-70 mln vs. $67.48 mln Capital IQ Consensus Estimate. Gross margins are expected to be flat to 50 basis points higher compared with the fourth quarter;

4:05PM Ixia beats by $0.01, beats on revs (XXIA) : Reports Q4 (Dec) earnings of $0.18 per share, $0.01 better than the Capital IQ Consensus Estimate of $0.17; revenues rose 7.6% year/year to $83.7 mln vs the $82.55 mln consensus. "Accelerated demand for our 10G and high-speed Ethernet solutions drove growth in the quarter along with higher than expected sales of LTE and Wi-Fi testing solutions. We saw especially strong demand from equipment manufacturers and from customers in North America..."

Stocks had a choppy, range bound session that concluded with mixed results for the major averages. The action precedes the highly anticipated payrolls report.

The major averages mustered varied gains in the early going, but they failed to sustain the move. That resulted in a downward drift, but only the Nasdaq was able to stay out of the red. The Nasdaq was also the only major average to settle with a solid gain. The Nasdaq's relative strength was partly owed to strong performances by the likes of Amazon.com (AMZN 181.72, +2.26), which rebounded from its prior session slide, and Qualcomm (QCOM 60.73, +1.17), which complemented a better-than-expected earnings report with strong guidance.

Although not a Nasdaq constituent, tech-related global payments company MasterCard (MA 381.57, +23.95) was a top performer today. The stock rallied on the back of an upside earnings surprise. Collectively, tech stocks scored a gain of just 0.3% today.

Social network outfit Facebook was in focus following the company's filing for an initial public offering. Most reports suggest the company could be valued up to $100 billion, which would more than quadruple the $23 billion valuation that Google (GOOG 585.11, +4.28) garnered in its IPO.

A handful of retailers had strong results, even though only half of the 20 retailers covered today by Briefing.com analysts posted same-store sales that exceeded expectations. Gap (GPS 21.52, +2.07), Target (TGT 52.00, +0.58), and Costco (COST 85.51, +2.29) were among those with more impressive results, while Macy's (M 35.23, +1.24) and Nordstrom (JWN 49.11, -0.41) were among those that disappointed.

Financials had been a source of leadership in late morning trade, but the sector's gains were petered out and it was left to drift sideways into the close. Still, it settled with a 0.5% gain, which means that it outperformed the broad market for the third straight session.

Health care stocks lagged all session and settled with a 0.4% gain. The sector's weakness was partly owed to disappointment over the latest quarterly reports from Boston Scientific (BSX 5.84, -0.25) and CIGNA (CI 44.13, -1.55). Even Cardinal Health (CAH 42.22, -0.86) traded lower in sympathy, despite its upside earnings surprise.

Fed Chairman Bernanke was in focus during his testimony to the House of Representatives Budget Committee. He indicated that the sluggish expansion of the economy has left it vulnerable to shocks, but noted that concerns about the domestic outlook and developments in Europe are abating.

Bernanke's comments came a day before the release of the official monthly payrolls report, which will be posted tomorrow morning. The pivotal nature of the report made for a more subdued session of trade as many market participants displayed caution. The consensus among economists polled by Briefing.com pegs the increase to nonfarm payrolls at 155,000. Yesterday the ADP Employment Change, which is often directionally accurate relative to expectations, came short of the consensus estimate.

With the monthly payrolls report on the horizon, a modest amount of attention was paid to the latest initial jobless claims tally, which declined by 12,000 to 367,000. That's actually less than the 375,000 initial claims that had been expected, on average, among economists polled by Briefing.com.

Fourth quarter productivity and cost data also made few waves. Productivity increased 0.7%, as had been expected, but labor costs climbed 1.2%, which is greater than the 0.7% increase that had been broadly expected.

Advancing Sectors: Energy +0.5%, Financials +0.5%, Consumer Staples +0.3%, Tech +0.3%, Telecom +0.1%
Declining Sectors: Industrials -0.1%, Consumer Discretionary -0.1%, Utilities -0.3%, Health Care -0.4%, Materials -0.5% DJ30 -11.05 NASDAQ +11.41 NQ100 +0.3% R2K +0.4% SP400 +0.1% SP500 +1.45 NASDAQ Adv/Vol/Dec 1525/1.90 bln/990 NYSE Adv/Vol/Dec 1695/810 mln/1289

8:04AM KEMET signs agreement to acquire Niotan for $30 mln (KEM) 9.41 : Co announced that it has signed an agreement to acquire all of the outstanding shares of Niotan, a manufacturer of tantalum powders, from an affiliate of Denham Capital Management. Niotan has been a significant supplier of tantalum powder to KEMET for several years. KEMET will pay an initial purchase price of $30 mln at the closing of the transaction and additional deferred payments of $45 mln over a thirty month period after the closing. KEMET will also be required to make quarterly royalty payments for tantalum powder produced by Niotan after the closing of the transaction, in an aggregate amount equal to $10 mln by Dec 31, 2014. The transaction is subject to customary closing conditions, including expiration or termination of the waiting period under the Hart-Scott-Rodino Act, and is expected to close in Mar 2012.

7:17AM Benchmark Elec beats by $0.07, beats on revs; guides Q1 EPS in-line, revs above consensus (BHE) 17.89 : Reports Q4 (Dec) earnings of $0.17 per share, excluding non-recurring items, $0.07 better than the Capital IQ Consensus Estimate of $0.10; revenues fell 10.8% year/year to $559 mln vs the $516.76 mln consensus. Co issues mixed guidance for Q1, sees EPS of $0.17-0.23, excluding non-recurring items, vs. $0.18 Capital IQ Consensus Estimate; sees Q1 revs of $550-590 mln vs. $541.51 mln Capital IQ Consensus Estimate.bhe

1:37AM Qualcomm recommends rejection of below-market mini-tender offer by TRC Capital (QCOM) 59.56 : Co announces it has been notified of an unsolicited "mini-tender" offer by TRC Capital Corporation to purchase up to 2 mln shares, or ~0.12%, of co's outstanding common stock at a price of $55.00 per share in cash. TRC's offer price is ~4.5% below the $57.59 closing price of Qualcomm common stock on January 18, 2012, the day before the offer commenced. The offer is subject to various conditions, including TRC's ability to obtain sufficient financing necessary to fund its financial obligations arising from the offer. Qualcomm does not endorse TRC's mini-tender offer and recommends that Qualcomm stockholders do not tender their shares since the offer is below the current market price for Qualcomm shares.

Last night, Qualcomm (QCOM $61.21 +1.58) reported first quarter earnings of $0.97 per share, excluding $0.01 loss per share attributable to the QSI segment, $0.11 loss per share attributable to certain share-based compensation and $0.03 loss per share attributable to certain acquisition-related items, $0.07 better than the Capital IQ Consensus Estimate of $0.90, while revenues rose 39.8% year/year to $4.68 billion versus the $4.58 billion consensus. The company issued upside guidance for the second quarter with EPS of $0.91-0.97 versus the $0.89 Capital IQ Consensus Estimate; sees Q2 revs of $4.6-5 billion versus the $4.5 billion consensus. The company raised guidance for fiscal year 2012 with EPS of $3.55-3.75 up from $3.42-3.62 versus the $3.60 Capital IQ Consensus with revenues of $18.7-19.7 billion up from $18-19 billion versus the $18.45 billion consensus. The company reported MSM shipments of 156 million units, up 32 percent yeaer over year and 23 percent sequentially.

Last night, JDS Uniphase (JDSU $12.69 -0.76) reported second quarter earnings of $0.15 per share, excluding non-recurring items, $0.05 better than the Capital IQ Consensus of $0.10, while revenues fell 13.4% year/year to $413.1 million versus the $391.01 million consensus. The comapny issued in-line guidance for the third quarter with revenues of $410-425 million versus the $417.43 million consensus.

09:25 am Intersil downgraded to Hold at Needham: . Needham downgrades ISIL to Hold from Buy following earnings. The firm says near-term the turns requirement for Q1 is flat at 35% and given management's clear inclination to keep inventory very low, ISIL's revenue is poised to bounce sharply when demand returns. They expect the shares to have a muted to favorable response to this otherwise lackluster print and guide and would suggest investors take advantage of this share strength to downsize positions. Firm says given their lowered estimates they can no longer justify a Buy rating in ISIL shares and have consequently downgraded their rating.

10:30 am S&P Tech Sector Trading Modestly Higher, Slightly Outpacing S&P 500
The tech sector is trading higher today, ahead of gains in the broader market. Semiconductors are showing strength in line with the tech space with the Philly Semi Index trading 0.7% higher. MKSI (+6.6%) is a notable standout in the chip index. Among other major indices, the SPY and the QQQ are trading 0.3% higher on the session. Among tech bellwethers, QCOM (+2.8%) is showing strength, while AAPL (-0.1%) and IBM (-0.1%) are under a little pressure.

In earnings last night, QCOM (+2.8%) posted a quarterly beat and offered upside guidance. Elsewhere, JDSU (-5.4%) also posted a beat, but reported guidance inline with consensus, CNQR (+10.0%) posted a beat with mixed guidance, EA (+8.4%) posted a beat with downside guidance, and OTEX (+14.7%) reported a beat. This morning, ADS (+1.3%) posted a bottom line beat with inline revs and below consensus Q1 guidance.

In news last night, Facebook (FB) filed to go public, confirming much of the speculation ahead of the highly anticipated S-1 filing.

Among notable analyst upgrades this morning, DELL (+2.2%) was upgraded to Overweight at JPMorgan, RDWR (+1.8%) was upgraded to Outperform at RBC Capital, Stifel Nicolaus upgraded OTEX (+14.7%) to Buy, and CNQR (+10.0%) was upgraded to Buy at UBS.

Among downgrades, JDSU (-5.4%) was downgraded to Neutral at UBS, CTL (-2.1%) was downgraded to Neutral at Goldman and Needham downgraded ISIL (-5.7%) to Hold.

APKT (+2.3%), CAVM (+2.3%), and NVLS (+0.3%) are a few notable names in tech scheduled to report results today after the close.
icon url

ReturntoSender

02/04/12 9:50 PM

#9671 RE: ReturntoSender #6755

From Briefing.com: Weekly Recap - Week ending 03-Feb-12A couple of pleasing economic reports brought about a barrage of broad-based buying today. That drove both the Dow and S&P 500 to multi-month highs, while the Nasdaq notched its best level in more than a decade.

Market participants turned bullish with the release of the official payrolls report for January. The unemployment rate surprised many by falling to 8.3% from 8.5%, which is where most economists had expected it to remain. Behind the headline number, nonfarm payrolls jumped by 243,000 when an increase of 155,000 had been widely expected. Private payrolls climbed by 257,000 when an increase of 168,000 was what many economists had forecasted.

The ISM Service Index jumped in January to 56.8 from 52.6 in the prior month, exceeding the 53.1 that had been expected, on average, among economists polled by Briefing.com.

December factory orders climbed 1.1%, which is less than the 1.5% increase that had been widely expected, but the report was given less regard since fourth quarter GDP data was already released last week. Buying was aggressive in the early going, but action in the afternoon became quiet. Still, a steady bid allowed stocks to enter a consolidative, sideways drift.

Financials scored the strongest gains. Their near 3% rally fed a weekly gain of more than 4%. The sector's strong finish to this week's trade contrasted its start, which featured a 1.0% loss on Monday.

The S&P 500 advanced more than 2% for the week. That stands as its fifth consecutive weekly gain, including an incrementally higher finish last week. Stocks haven't had such a strong streak of gains since the S&P 500 scored seven straight weekly gains to round out 2010 and start 2011.

Climbs of the past several weeks may have lacked share volume, but investors concerned only with portfolio growth will likely be pleased that the S&P 500 settled at its highest level since summer, the Dow booked its best close since 2008, and the Nasdaq is now at its highest level since late 2000. Amid the stock market's strength, the Volatility Index has tumbled to its lowest level in seven months. At about 17, it is down more than 25% year to date.


Participants were generally less risk averse today, but the dollar didn't suffer from any kind of a concerted selling effort. Although it was unable to sustain a gain, it was flat against a collection of competing currencies by session's end.

Treasuries were trounced, however. The benchmark 10-year Note was dropped a full point. That took its yield back to where it started the week.

Action among stocks was more varied before trade commenced Friday. Earnings in focus included better-than-expected results from Dow Chemical (DOW 34.18, +0.64), Qualcomm (QCOM 61.06, +0.33), MasterCard (MA 390.32, +8.75), Cardinal Health (CAH 42.05, -0.17), Seagate Tech (STX 26.42, +0.67), Broadcom (BRCM 37.67, +0.67), Whirlpool (WHR 68.66, +4.30), Pfizer (PFE 21.20, +0.09), and Eli Lilly (LLY 39.51, -0.09). Exxon Mobil (XOM 84.92, +1.39) had in-line earnings results, while Amazon.com (AMZN 187.68, +5.96), Boston Scientific (BSX 6.03, +0.19), and CIGNA (CI 43.55, -0.58) came short of what Wall Street had expected of their earnings.

Retailers were out with monthly same-store sales results, but overall numbers were uninspiring. Gap (GPS 21.71, +0.19) and Target (TGT 52.14, +0.14) were among those that exceeded expectations, but Macy's (M 36.12, +0.89) and Nordstrom (JWN 50.27, +1.16) were among those that disappointed.

Social network outfit Facebook made headlines by filing for an initial public offering that some estimate will value the company up to $100 billion. That would more than quadruple the $23 billion valuation that Google (GOOG 596.33, +11.22) garnered in its IPO.

Market participants also had plenty of data to digest this week. Given the significance of the payrolls report on Friday, only modest attention was given to the latest weekly initial jobless claims tally. It showed that 367,000 claims were filed. That's less than the 375,000 initial claims that had been broadly expected.

The ADP Employment Change gave market participants a mid-week preview of the official payrolls report. It suggested that private payrolls increased in January by 170,000, which is less than the increase of 200,000 that many economists had expected.

The ISM Manufacturing Index improved in January to 54.1 from 53.1 in the prior month, but many had expected it to make a slightly stronger climb to 54.5. China reported mixed manufacturing data, but a handful of major eurozone members reported incremental improvements in their PMI Manufacturing readings.

The latest Chicago PMI fell to 60.2 in January from 62.5 in the prior month, contrasting the consensus forecast for a modest improvement to 62.8. The Consumer Confidence Index for January also proved disappointing. It fell to 61.1 from 64.8 in the prior month, clashing with expectations for an improvement to 67.0.

In the wake of last week's Advance fourth quarter GDP report personal spending data for December caused little stir. It was unchanged for the month. That's not too different than the expected increase of 0.1%. Core personal consumption expenditures increased by 0.2%, just as many had expected. Of interest to some, though, was news that the lack of spending came in the face of an increase in personal income of 0.5%, which actually exceeds the 0.4% increase that had been expected.

Fed Chairman Bernanke offered up testimony on the economy to the House of Representatives Budget Committee, but his statement caused little stir. Few were surprised by his analysis that the sluggish expansion of the economy has left it vulnerable to shocks. Bernanke did indicate, though, that concerns about the domestic outlook and developments in Europe are abating, even as Greece continues to grapple with creditors over its lending terms.
 
Index Started Week Ended Week Change % Change YTD %
DJIA 12660.46 12862.23 201.77 1.6 5.3
Nasdaq 2816.55 2905.66 89.11 3.2 11.5
S&P 500 1316.33 1344.90 28.57 2.2 6.9
Russell 2000 798.85 831.11 32.26 4.0 12.2

1:59PM Micron issues statement regarding death of CEO (MU) 7.95 +0.23 : "We are deeply saddened to announce that Steve Appleton, Micron Chairman and CEO, passed away this morning in a small plane accident in Boise. He was 51. Our hearts go out to his wife, Dalynn, his children and his family during this tragic time. Steve's passion and energy left an indelible mark on Micron, the Idaho community and the technology industry at large. The company expects to provide additional information later today." Stock is halted.

8:11AM Corning at investor conference: $10 bln rev goal by 2014 is achievable (GLW) 12.94 : At annual investor meeting: "As a company, we are approaching a lower level of profitability driven by LCD glass price declines. We expect these to moderate as glass capacity and demand come into balance. Our plan is to march up from this level with increased sales and profits, reaching $10 billion in sales in 2014." While Corning LCD glass sales are likely to be flat through 2014, the business will remain highly profitable and continue to generate large amounts of cash. "We now expect the Telecommunications, Specialty Materials, Environmental Technologies, and Life Sciences business segments to be the primary drivers of increased sales and profits going forward.. Advances in the areas of fiber-to-the-home installations, enterprise network (data centers) solutions, optical fiber sales, and wireless applications, all are expected to contribute to Corning's Telecommunications segment growth, which could see sales approaching $3 billion in a few years."

10:43 am S&P Tech Sector Up Over 1%, In-line With The S&P 500
The tech sector is trading higher today, just ahead of gains in the broader market. Semiconductors are showing relative strength in the tech space with the Philly Semi Index trading 1.6% higher. POWI (+5.8%) is a notable standout in the chip index. Among other major indices, the SPY and the QQQ are trading 1.2% higher on the session, while the NASDAQ is trading 1.4% higher. Among tech bellwethers, INTC (+2.1%) is showing strength.

In earnings last night, N (+6.5%) and DRIV (+5.2%) posted quarterly beats and offered mixed guidance, INFN (+13.2%) posted a beat, CAVM (-1.7%) reported a beat and guided lower, and TRMB (+7.4%) posted a beat and raise. Elsewhere, APKT (+5.3%) reported a miss and issued downside guidance, while ATML (+1.0%) preannounced lower Q4 revs.

Aside from earnings, there was little notable news in the tech space. Among rumors, however, we are hearing BX (+1.2%) is looking into LBO of BRCD (+1.3%). Among notable analyst upgrades this morning, INFN (+13.2%) was upgraded to Neutral at JP Morgan.

Among downgrades, APKT (+5.2%) was downgraded at Mizuho and Needham, OPEN (-0.4%) was downgraded to Hold at ThinkEquity, and RIMM (-1.2%) was downgraded to Underperform at Jefferies.
icon url

ReturntoSender

02/05/12 3:44 PM

#9672 RE: ReturntoSender #6755

InvestmentHouse Weekend Market Update:

http://www.investmenthouse.com/weekendmarketsummary.htm

- Jobs beat expectations, provide additional strength to the rally.
- As DJ30 knocks on the door, NASDAQ, SP600 kick the son of a (expletive) in and break to post-bear market highs.
- There are no doubt more jobs, but just how many and what quality? A look into the manipulation of the internal numbers providing the results.
- January ISM shows strong employment gains in the midst of a banking layoff binge.
- Factory orders quietly slip in December, matching the decline in other data, but no one cares as all eyes are on the lagging jobs data.
- Iran preparing a 6,000 mile range 'Great Satan' missile. No, we don't need a missile defense system in the 'modern' era of terrorist warfare.
- More upside or time for a test? At least the indices are dealing more from a position of strength.

Jobs send the indices on a further run with no signs of any selling into the news.

I am starting with the NASDAQ as my initial chart, and you probably know why. Unlike SP500 that was bumping up against the February highs, and unlike the DJ30 that was trying to get through its prior bear-market high but failed, NASDAQ and the SP600 borrowed an old expression from Bum Phillips, the coach of the former Houston Oilers. After a tough loss to arch rival Pittsburgh in an AFC Championship game, Coach Phillips made the famous statement, "Last year we knocked on the door, this year we beat on the door, and next year we're gonna kick the son of a [blank] in." While the Dow was knocking on the door over the past two weeks, NASDAQ and the SP600 took control of the market. They took leadership in the market and they kicked the son of a [blank] in.

Of course it was the jobs report that fueled the action. The market had already risen substantially, and when jobs and unemployment both came in better than expected, stocks gapped to the upside and ran higher. There was no sign of selling on the day. Stocks started higher, quickly ran to the upside, and then slowly bled higher into lunch. After that it was more of a holding position for the back half of the day. All afternoon stocks traded in a narrow range, but they never gave up ground. There was no inclination to sell. Even after the run to this point and breaking through resistance, the sellers were not to be found. We did do some selling. There were some stocks that did not participate. There were some stocks that have earnings coming up, and we used the nice pop in the market and the increase in volatility to take some gain in options.

Overall it was just some position maintenance. We let our stocks run because they are running well. We did not want to get in front of the move, particularly when no one really wanted to sell. Perhaps it is all about the jobs and the belief that the economy has turned the corner and is going to improve. Jobs are lagging, however, and we have seen slowdowns in the economic data across the board over the past month-and-a-half to two months. We even saw more of that on Friday with the Factory Orders, but that was just ignored. There is no reason to worry about downers when you have jobs going. But jobs lag and the other data leads. It is softening. It has not turned over, but we have to keep an eye on it in the future.

On Friday that was not the question. It was nirvana. Jobs were up, things were looking good, and we would probably have another "recovery summer" as Tim Giethner put it on the day when he addressed some issues with respect to the economy and the dollar. Without a doubt, the markets liked the news and closed up.

SP500, +1.5%; NASDAQ +1.6%; Dow, +1.25%; SP600, +2.1%; SOX, +1.8%

Very solid gains pushing the indices to the highs, beyond the highs, and leaving them in a position of strength if there is going to be a test. Yes, the indices look overbought a bit, but as we have often seen, they can be overbought for a long period of time before they ever decide to come back. If the market will go up, we will go up with it. That is why we were not getting in front of the move. We were letting a lot of our positions run and build up some great profits. If we need to take them next week, we will. But right now we were not going to get out, break off this run, and be the sacrificial lamb so others could make money.

We took positions when times may not have been so clear-cut and wonderful. Stocks were saying "buy us" at this interim bottom when they were forming their rounded bottoms. They looked like they were going to break up while the market was still trying to come back to the downside. Well, you buy when stocks say "buy me," regardless of what your guts are saying. They are probably saying "Do not even look; I am getting sick." If you have to, keep the Pepto-Bismol buy your desk and buy when your head tells you to move in. Then you can enjoy these kinds of runs - these runs that even extended beyond what our thesis was.

Remember, we were expecting a run up toward these highs, no doubt. We were not expecting them to take them out. That does not mean they will hold the gains. It does not mean they will not reverse and sell off. But we will not step in front of it. If we think we are smarter and start picking tops and bottoms, that is when we end up missing out on the moves.

OTHER MARKETS

The other markets were not quite as strong as we thought they might be in some circumstances, and they were as you would expect them to be on stronger economic data in other circumstances.

Dollar. 1.3151 versus 1.3144 euro. The dollar was down on the day versus the euro, and it was basically flat against the other currencies even with our strong numbers. It did reach 1.3066 euro early in the day. That was a big gain on the dollar, but it could not hold it. Why not? There may be some issues with these numbers. I alluded to some of them earlier when talking about the jobs numbers lagging with respect to the other economic indicators. But there is also something in the internals of the numbers.

I will go into this in more detail in the economic section, but there are real problems with these numbers, even though they look good, most everyone was willing to accept them, and the trend is improving. There are actual jobs out there and bodies being put to work. People are getting jobs, but it is the number of jobs and the percentage of people working that have serious problems with them. Not to mention what kind of jobs they are getting temporary, permanent, high paying, low paying. There are some real problems. While the jobs are the jobs, it looks like there could be some down-right manipulation of the numbers going into the equation to determine what percentage of people are employed or unemployed. It looks like the dollar might have figured some of that out during the session.

Bonds. 1.93% versus 1.83% 10 year U.S. Treasury. Bonds sold. Bounced up to the top of the range, and then it closed down close to the bottom of the range with a gap. But notice how it held the range with a doji. It has been trading in this tight, up-and-down range for the past three months, and it is still holding it even after the barn-burner jobs report.

Gold. 1,740.20, -19.10. It was down a lot harder intraday. It is almost surreal when listening to Mr. Bernanke talking on Wednesday about how things were still problematic for the economy. Of course, the week before, the Fed said it would keep interest rates low until the end of 2014, and gold broke to the upside. Then gold sold off, of course, as it should when strong economic numbers came out. But it rebounded. It still looks strong. Still looks like it wants to go to the upside. Maybe gold understands that there are other things afoot. There is the Fed that is very easy and wants to keep pumping money into the equation, but maybe things are not as strong as they appear on the surface. There is an old saying, "All that glitters is not gold." And all that appears in the jobs numbers are not jobs. I will elaborate on that a bit later.

Oil. 97.79, +1.43. Oil bounced. Of course you would expect it to on some better economic data. It sold down to 96 or near the bottom of the range and it bounced. That is exactly what you would expect. We have tensions with Iran. Now it supposedly has a missile that can go 6K miles or thereabouts. It is dubbed the "Great Satan" because it can deliver a payload to the United States. I wish we had continued working on that missile defense shield. I guess some very smart people decided we did not need it because warfare was going to be different now in the age of terrorism. Maybe and maybe not. It will be different, but it will also be the same in some ways. If someone can develop an intercontinental ballistic missile and carry a warhead to the United States, there we go again. They wield a lot of power and we have that mutual ensured destruction thing again. Nice. Of course we assume the other side wants to live and does not want to bring about the end of the world. Well, times have changed indeed. That is modern of warfare, and it is even worse than it was before. Even more reason to want a nuclear missile shield. But I digress. I have just been readying the stories and they are not that pleasant.

THE NEWS

TO VIEW THE ECONOMY OVERVIEW CLICK THE FOLLOWING LINK:
Economy Summary Video

Issue 1: Unbelievable Numbers and Assumptions.

1.2M workers dropped from the workforce from December to January!

Lower worker pool and you get more APPARENT employment
100 workers in work force. 80 are working.
80/100 = 80% employment or 20% unemployment

Reduce workers in work force to 90. 80 still working.
80/90 = 88.9% employment or 11.1% unemployment rate.

Long-term Workforce participation = 65.8%
Government figure for January: dropped to 63.7% on the ASSUMPTION that 1.8M people left. SHRINKING THE WORK POOL as in the example above.

Why leave? Government says they are retirees.

Really? The 55+ age group participation in the workforce is SPIKING as more and more older citizens are forced to work later in life because their retirements are gone.

The population expanded to 242.2M. If you apply the long term participation rate that is in line with the statistics versus the government's artificially lower level and account for those the government says are no longer in the work force through its 'adjustment,' you get unemployment at 11.5%! That is a 'true' number versus the artificial and very POLITICALLY TIMELY adjustment to the downside that shrinks the unemployment rate.

The Administration was ready, and as soon as there were more 'bodies' going to work per the non-farm payrolls report it 'adjusted' the worker pool, using the non-farm payrolls showing job creation as cover for the change. It argues there are more jobs. Yes there are, but NOWHERE NEAR THE NUMBER NEEDED TO COME UP WITH AN 8.3% UNEMPLOYMENT RATE.

ISSUE 2: What kind of jobs are being created?
Part-Timer Economy.

January reports 699K temporary workers, a record increase putting part-timers at 27.739M, the third highest ever.

Only 10% of the jobs increase was due to full-time jobs!

Low Paying Jobs.

Moving from higher paying jobs to lower paying jobs. Bankers laid off by the thousands even as the employment rate moves higher.

CRT Capital said today that 113K of the non-farm payrolls jobs were low pay jobs. Typically couriers and messengers decrease in January after the holidays but they were still strong. When those jobs go, the numbers go down.

Remember in the Bush administration and that economic recovery the carping about the 'quality' of jobs created? Where is the worry about this now? Are we so starved for jobs this time around that we are taking anything, taking the 'new normal' idea Bernanke espoused Thursday regarding the unemployment rate with respect to the types of jobs we will have in the US?

Is our view of the problems with the jobless report overly picky or just BS?

Some commentators said Friday that US data is now no more reliable than China and its manipulation of its releases.

Bernanke as late as Thursday did not see this coming.
The CBO did not see it coming, predicting unemployment back over 9% by year end.

Indeed the trend is belying historical trends: Unemployment rate goes up BEFORE jobs because the perception the economy is better. People re-enter and look for jobs that are not there yet, spiking unemployment rate.

This time the rate is dropping AS there is meager jobs creation. After several months of economic improvement have people really given up and not come back to the jobs market? In other words is this time different? It certainly seems what is different is the government's 'adjustments' to the input data.

We would be THRILLED to see unemployment really fall as jobs really recover. The problem is the unemployment number is hogwash, and EVEN IF it is correct, it is no byproduct of the Administration's actions. It took three years to get to this point and indeed it is the government ending its stimulus programs and Congress blocking more of them that is allowing the economy to get back on track somewhat.

The problems are still here because the policies are still there. Gasoline is spiking again and will be over $4/gallon this summer at this rate; there is no change in Administration policy on this and indeed its actions are further stymieing improvement (e.g. Canadian pipeline). Food costs are still spiking and nothing suggests that is backing off despite the Fed's belief there is no inflation. 40,000 new regulations as of January 1 continue to undermine and browbeat small businesses, making profitability ever more elusive. And let us not forget the Defense Authorization Act that, for the first time, allows the government to use our military as a police force and allows the warrantless and secret removal and detention without representation of ANY US citizen deemed, in the opinion of the President or authorized party, a terrorist threat.

In conclusion, the recovery is simply not that great. Q4 GDP was atrocious with most of the gains due to inventories piling up. Even taken at face value it is a paltry level, one-third of what it should be in similar recoveries at this period. The jobs rate is up as the non-farm levels show, but it is still pathetic and we are swapping high pay jobs for low pay jobs as we push IPO's offshore and discourage investment in the US. We are conditioning the youth to a 'new normal' of European mediocrity and stand the very real risk of losing our economic dominance and condemning our progeny to generations of decreased standard of living.

TECHNICAL SUMMARY

Volume. NASDAQ +12%, 2.12B; NYSE, 13%, 827M. Buyers are moving in and showing more strength as the market has shown more strength to the upside over the past month or more.

Breadth. NASDAQ +4:1; NYSE +3.7:1. Advancers were solid. Growth stocks leading the way yet again.

THE CHARTS

I have already talked about kicking in doors. Who is doing the kicking and who is just knocking?

SP500. SP500 is still is not above its February peak. It is trying and it is close. It is there, but it just has not made the move. That would also be at the late-July interim peak as well as the late-May interim peak. There is resistance at 1345 that SP500 has not moved through. Not to mention getting up to 1385 where the May peak resides. There is still plenty of upside for SP500 to play catch up if it wants to do that. That would give NASDAQ and the other indices that broke out the chance to move higher before they come back to test. That is not a bad scenario. As I said earlier, that is dealing from strength versus looking up from the bottom side of the resistance.

DJ30. DJ30 gained a nice 1.25%. That pushed it right up to a new post bear-market high. Indeed, it closed at a new post-bear market high, but it just did not take out that prior peak at 12876. It came close, closing at 12862. Just a few short points away, but it was not able to kick the door in. It is still knocking and has to prove it can make the move.

NASDAQ. NASDAQ is a thing of beauty. It has been very strong over the past week, straight to the upside. Hard to maintain that kind of ballistic move without a test. But, as I said, it can be testing from a position of strength now. Coming back after breaking through is always better than moving up to it and fading. I did not expect it to do this on this move; just a little hitch in the get-along on the way up. It is what it is. You play what the market gives and do not try to be smarter than the market and outguess it. That just causes you to either miss out on big runs or get ripped apart betting against the market move. That is why we take gains at the logical points but we always leave stuff on the table to continue higher. We are making even more money right now as NASDAQ helps lead the way to the upside.

SP600. Speaking of leadership to the upside, you have to talk about the small caps. They, too, put in that new high, closing at about 463. That puts it over 460, and that breaks it to that new post-bear market high with a big leap up in the back half of the week. Ones again they are more from a position of strength. Also, small caps are just good harbingers of economic action down the road. If they are breaking to new highs, that is a positive for the U.S. economy down the road as well.

SOX. Semiconductors have been leaders of late, no doubt. Even if the chart is not breaking to any new highs, it is breaking to higher highs. It cleared that July peak and is now taking on the next step at the late-May peak. It will be a series of trying to take out after another. Stepping up and shooting them down. That is how it works when you are digging yourself out of a hole. It is doing it with a bit of flair with strong moves from component stocks. The neat thing is that some have been leading all the way to the upside and others are just now getting in gear. Now they are helping the index to the upside as money seeks different levels of semiconductors to look for those big percentage gains.

Remember, the mutual funds are out early in the year playing catch up, and they are also playing the January effect game (even though it is now February). They see a bit of recovery and they see that they are behind. They are trying to look for big gains. They play the stocks that have been beaten down. That is why we saw all of those rounded bottoms that ultimately started to break to the upside. Some of them started sooner than others. AKAM made the break to the upside. Some of them have been coming around later to the party. SWKS formed this rounded double bottom and broke to the upside, finally making the move. Broke through the trend and has continued to run. It has happened at different stages, but that is the strength of the market. You kept getting different waves of leaders emerging as money moves around, looking for the percentage gains in these big moves off of the lows.

LEADERSHIP

There were some issues with stocks. It is easier to point out stocks that are having problems or did not follow than those that were up because, as we saw from the breadth, most stocks rallied.

Metals. AKS was down on the day. I was wondering mid-session why this stock was not participating. The other steel stocks were not surging, but they seemed to be performing. This was an aberration that I noticed.

Industrial Equipment. Some stocks in industrial equipment were not. HOLI is not necessarily in a bad situation, but it was not doing anything on the day. It continued to sell off, not benefiting from the good news in the market overall.

Retail. DG was down on the day. It has not performed well. It has been trending to the upside, but it has not been breaking or running to the upside. That was questionable. Why was it not participating on a good market day?

Autos. AAPY and ORLY moved up but were not looking that strong. They were laggards in the move. Were they laggards because of individual stories or is it just a sign that stocks are getting somewhat tired overall and are not ready to move higher? It was a combination of both.

Stocks have run a long way. Many are tired and many are at the point where they need to test. A further move up in the market will not necessarily drive those early leaders further to the upside. On the other hand, the stocks that have been beaten down that have started to turn the corner, they should move to the upside. We did see that occurring as well.

What does this mean in terms of leadership? It means some stocks are tired. We still see many stocks that are coming off of the lows, getting new money pushed their way. As of Friday, there was no reason for any of the hedge funds or mutual funds to stop putting money into those stocks.

THE MARKET

SENTIMENT INDICATORS

VIX. We have not looked at the VIX in awhile; there has been no point. Frankly, there is still no point in looking at it. It has tumbled down to 17 from 30 back in early December. I said it did not seem to matter too much anymore that it had broken free from tracking the market. That is exactly what has happened. It sold off as the market has rallied, which you would expect. But just because it has done that does not mean we should all of a sudden expect a surge or selloff. Why? Because the VIX can move laterally for months or even years at low levels and not indicate a selloff is coming. Just because it is down to an old level does not mean anything. It has to set up a correlation, and right now it is not there.

VIX: 17.1; -0.88
VXN: 18.21; -0.68
VXO: 16.19; -0.84

Put/Call Ratio (CBOE): 0.77; -0.11

Bulls versus Bears:

This is a reading of the number of bullish investment advisors versus bearish advisors. The reason you look at this is that it gives you an idea of how bullish investors are. If they are too bullish then everyone is in the market and it is heading for a top: if everyone wants to be in the market, then all the money is in and there is no more new cash to drive it higher. On the other side of the spectrum if there are a lot of bears then there is a lot of cash on the sideline, and as the market rallies it drags that cash in as the bears give in. That cash provides the market the fuel to move higher. If bears are low it is the same as a lot of bulls: everyone is in and the market does not have the cash to drive it higher.

Bulls: 48.9% versus 50.0%. A dip as the market continues upside but basically still at the flat line as it was for all of January. To the end of 2011 showed a slow, steady increase to this level. Still probing the overdone range and could be part of the picture that tops out the current in January, but it is not there yet. 35% is the threshold measuring bullish versus bearish action. Six weeks the bulls were below bears. A powerful sentiment signal but now dissipating. Highs from April and December (60% readings spanning December through early May 2011). The 5 year high is 62.0. The crossover level at 29% bulls from July 2010 is long gone. 35% is the threshold level suggesting bullishness. To be seriously bearish it needs to get up to the 60% to 65% level.

Bears: 29.8% versus 28.7%. Right back up to 29.8% again after a brief dip. Bears remain skeptical, but the market is riding that skepticism upside. Basically holding at that 30% level where bears moved down to in early December and have held ever since. Again, bears are not growing but they are not necessarily buying into the upside move. Back and forth around 30% where it has flat-lined for 8 weeks. Again, Bears remain skeptical. Skeptics in the face of a move is a good sign the move continues. Lower but not anywhere near suggesting investors are carefree. The average the past month and more is 30%. The index spent seven weeks over the 35% threshold considered a bullish indicator. For more reference, bearishness hit a 5 year high at 54.4% the last week of October 2008. The move over 50 took bearish sentiment to its highest level since 1995. Extreme negative sentiment. Prior levels for comparison: Bearishness peaked at 37.4% in September 2007. It topped the June 2006 peak (36%) on that run. That June peak eclipsed the March 2006 high (33%) and well above the 2005 highs that spawned new rallies (30% in May 2005, 29.2% in October 2005). That was a huge turn, unlike any seen in recent history.

NASDAQ

Stats: +45.98 points (+1.61%) to close at 2905.66
Volume: 2.123B (+12.39%)

Up Volume: 1.8B (+570M)
Down Volume: 341.64M (-266.36M)

A/D and Hi/Lo: Advancers led 3.98 to 1
Previous Session: Advancers led 1.54 to 1

New Highs: 262 (+97)
New Lows: 14 (-2)

SP500/NYSE

Stats: +19.36 points (+1.46%) to close at 1344.9
NYSE Volume: 827M (+13.29%)

Up Volume: 3.94B (+1.53B)
Down Volume: 622.33M (-1.008B)

A/D and Hi/Lo: Advancers led 3.67 to 1
Previous Session: Advancers led 1.34 to 1

New Highs: 299 (+91)
New Lows: 7 (-1)

DJ30

Stats: +156.82 points (+1.23%) to close at 12862.23
Volume DJ30: 142M shares Friday versus 114M shares Thursday.

MONDAY

We had a great finish to the week and an excellent week upside as far as stocks are concerned. We have more earnings news coming out next week. We also have more economic data, although it does back off from the onslaught of the prior week.

Wholesale Inventories will be an interesting report, but that is all the way to Thursday. That will be the same day as Initial Jobless Claims. We saw inventories jump up in the Q4 GDP report, and we want to see what they are showing in December and whether they are up. They were expected to rise quite a bit from the prior read. Friday we have the Trade Balance. It will be interesting to see, although no one is paying attention to it. The Treasury Budget is out, but no one seems to care about that either. There will be Michigan Sentiment, and that will be the new preliminary for February. We will see if it can hold its own. It is expected to drop off a bit, but it should probably pick up given the market moves. Stock market gains drive a lot of sentiment, but you have to offset that with very high gasoline prices right now. Frankly, they are shockingly high in February. They will be over $4 come summer, and that will put a lot of angst into American wallets jobs or no.

Despite having purportedly improved the jobs situation, we are still going to have problems when people have extraordinarily high food prices compared to last year. The gasoline prices are also extraordinarily high since the President took office. There are issues he will have to deal with, and I am not so sure that the jobs numbers will hold up. If we keep seeing these incredible manipulations of the numbers, someone will eventually say "What the hell?" Maybe then they will pay attention to what is going on versus just blindly following the pablum being issued. But enough said on that.

What do we have for the week? Technically we have NASDAQ and SP600 at new post-bear market highs. That is an important move. Does it mean you buy? No. It does not necessarily mean you buy at all. The market has run hard to this point with just a little test. We may get some more follow-through push to the upside as some people "me too" it early in the week. Then we may get a test. We will eventually have to have a test of this, but a lot of it will depend on what SP500 and the Dow can do. Can they continue to push higher and make a break as well? They have room to run. SOX and SP500 and the Dow can play catch up and drive higher, and at the same time that would allow NASDAQ and the SP600 to gain some more before we have a test.

Without a doubt, we will find more plays that are in position to move. We could not do much on Friday with the gaps to the upside. Most positions gapped and ran early. You do not want to chase that bus, particularly after the indices have already moved up sharply on the week off of a test. We did not want to chase them, but instead I think we might get some early giveback at some point early in the week. That will give us better entry points on some positions that just gapped and ran away from us. As I have said before, when you get to these levels, the probabilities are not in your favor to chase. We will wait for good opportunity.

There are some stocks that did not move or did not move a lot. That does not mean they are shunned and that no one will pick them up. It just means that, as this market moves up, they are building their patterns. They have not been turned to as the next sector to be anointed with new money. If the market stays healthy and keeps building in better economic data for the future, it will turn to these sectors that are setting up new patterns to break higher. The money will want to go where the chance for larger gains are. That is basically what I am talking about the probabilities. Certain stocks will run too high, then we want to rotate our money into another area that has not run yet and drive it to the upside and make good percentage returns from those.

We will be looking at the next potential areas money can flow to. Money may have already flowed into them at one point, has left it for awhile and is recycling that area and letting it recharge and then comes back into it. Or it just has not made the move yet and wants to find that break to the upside. They are out there. Even as the market has raced higher, some have been left behind. Perhaps they are starting to break down trendlines and reverse to the upside. We will be looking for those to augment our buys.

Again, it is nice to be in the position where you are in plays that you bought when times were not so clear but are now pulling in some good bucks for us again as they continue runs maybe after a pause or maybe straight to the upside. It is no time to sit on our laurels, of course. We will look for additional places to put our money. You have to keep rolling your money into new winners. As you take some off the table, you have to find places to put it if it is there. We will do that.

I noted earlier that on Friday there really was no inclination to sell. NASDAQ closed near its high, and SP600 closed near its high as well. Indeed, all of the indices closed at or very near their highs for the day. No selling pressure; that is true overall. But I want to point something out when looking at some charts of stocks at the close. There was interesting action. There were some Market On Close sell orders that hit. Many stocks sold off right as the market closed. Big orders were put in that drained these stocks to the downside. They bounced back up a bar or two later with a nice recovery, but there were sales out there. Some big money was taking some positions off of the table late in the day.

Looking at the SPY, you can see some big reaches down. Some of these were market orders, obviously, but there was huge volume on these sales. Look at the huge spike in volume in VLTR as it sold off but recovered. That means there were some Market On Close sells. Some big funds were selling on the close. They did not want to sell during the session. They saw the market holding its gains and moving higher into the close, so they waited and put in the orders. Then at the end of the day there was big selling. But it is just in a few. They bounced right back. The thing is, there are some sellers out there. There were some willing to sell into this strength just not in the traditional way that we usually see it.

Next week, we watch for a pullback. We watch to see if we can get something going on a test that gives us a chance to move in and pick up some stocks that may have run away from us during the week or on Friday but come back. If they come back and hold, then we can step in. But we have to watch out. If the big money wants to sell more, we just have to wait. We will mind our positions and take some gain from these good moves upside that we let run on Friday. We will watch our positions, take gain as needed, and then see if there is a deeper selloff or just a test of that rush to end the week that gives us new entry points. One I have been looking at is the GLD. It broke out, and I still think it will go higher. We will just have a play if we can catch it off of a test either at the 10 day EMA as it closed or lower. We will be willing to make that play as well.

We have an interesting market and a really interesting week ahead to see how it tests. We will be ready either way. Things have been going basically according to plan thus far. We have banked a lot of money, so we have some money to put to work, and we also have a lot of money on the table that we will take if things get rocky.

Have a great weekend!

Support and Resistance

NASDAQ: Closed at 2859.68
Resistance:
2862 is the 2007 peak
2879 is the July 2011 peak
2888 is the May 2011 peak and post-bear market high

Support:
2841 is the February 2011 peak
2825 is the 2007 closing peak.
2816 is the early April peak.
2796 is the February gap down point
2762 is the February low
2759 is the mid-May low
2754 is the recent October 2011 high
2706 to 2705 is the April 2011 low and the February 2011 and consolidation low (bottom of the trading range) 2723 to 2705 is the range of support at the bottom of the January to May trading range
The 50 day EMA at 2698
2686 is the January 2011 closing low
2676 is the January 2010 low and the December 2011 peak
The 200 day SMA at 2661
2645-2650ish from December 2010 consolidation
2643 is the September 2011 high
2612 is the late August 2011 peak
2603 is the March 2011 intraday low (post-Japan low)
2599 is the June 2011 low and NASDAQ
2593 is the November intraday high
2580 is the November 2010 closing high
2572 is the November 2-11 gap down point
2555 is the mid-August 2011 peak
2546 is the early September 2011 gap down point
2535 is the November island reversal gap point
2532 is the early August gap down point
2469 is the November 2010 low
2441 is the November 2011 low
2331 from October 2010 low and the August 2011 intraday low
2305 from the August 2010 peak (summertime base)
2139 is the May and June 2010 low
2123 is the August 2010 gap down point
2100 from the August 2010 lows

S&P 500: Closed at 1325.54
Resistance:
1325-27 is the March 2008 closing low and the May 2006 peak.
1332 is the early March peak
1340 is the early April 2011 peak
1344 is the February 2011 peak
1357 is the July 2011 peak
1364 is the March 2007 low
1370 is the August 2007 low
1371 is the recent May 2011 peak

Support:
1318.51 is the May low
1313 from the August 2008 interim peak
1295 to 1294 is the April 2011 low and the February 2011 consolidation low (bottom of the trading range)
1293 is the October 2011 peak
The 50 day EMA at 1276
1275 is the January 2010 low, early January 2011 peak
1267 is the December 2011 peak
1258 is June 2011 intraday low
The 200 day SMA at 1257
1255 is the late December 2010 consolidation range
1249 is the March 2011 low (post-Japan)
1235 is the mid-December 2010 consolidation low
1231 is the late August 2011 peak
1227 is the November 2010 peak
1220 is the April 2010 peak
1209 is the mid-August 2011 high
1196 is the November 2010 consolidation peak
1178-1180 is the October 2010/November 2010 consolidation low
1158 is the November 2011 low
1131 - 1127 from August 2010 base peak.
1119 is the early August closing low
1109 is the mid-September 2010 gap up point
1101 is the August 2011 low
1075 is the October 2011 intraday low
1099 from the mid-July interim peak
1090 is the early September 2010 gap up point
1040 from the August 2010 lows and May/June 2010 lows
1011 is the summer 2010 low

Dow: Closed at 12,705.41
Resistance:
12,754 is the July intraday peak
12,876 is the May high
13,058 from the May 2008 peak on that bounce in the selling

Support:
12,391 is the February 2011 peak
The 50 day EMA at 12,308
12,284 is the October 2011 peak
12,258 is the December 2011 peak
12,110 from the March 2007 closing low
12,094 is the April 2011 low
The 200 day SMA at 11,980
The June low at 11,897 (closing)
11,893 from March 2008 closing low
11,867 from the August 2009 high and peak on that bounce in the selling.
11,734 from 11-98 peak
11,717 is the late August 2011 peak
The August low at 11,702
11,555 is the March low
11,452 is the November 2010 peak
11,178 from November 2010
10,978 is the bottom of the November 2010 consolidation
10,750 from September 2010
10,720 is the August closing low
10,705-710 from January 2010 peak
10,694-700 from August 2010 peak
9938 is the August 2010 low

Economic Calendar

January 30 - Monday
- Personal Income, December (8:30): 0.5% actual versus 0.4% expected, 0.1% prior
- Personal Spending, December (8:30): 0.0% actual versus 0.1% expected, 0.1% prior
- PCE Prices - Core, December (8:30): 0.2% actual versus 0.2% expected, 0.1% prior

January 31 - Tuesday
- Employment Cost Index, Q4 (8:30): 0.4% actual versus 0.4% expected, 0.3% prior
- Case-Shiller 20-city, November (9:00): -3.7% actual versus -3.2% expected, -3.4% prior
- Chicago PMI, January (9:45): 60.2 actual versus 62.8 expected, 62.2 prior (revised from 62.5)
- Consumer Confidence, January (10:00): 61.1 actual versus 67.0 expected, 64.8 prior (revised from 64.5)

February 1 - Wednesday
- MBA Mortgage Index, 01/28 (7:00): -2.9% actual versus -5.0% prior
- ADP Employment Change, January (8:15): 170K actual versus 200K expected, 292K prior (revised from 325K)
- ISM Index, January (10:00): 54.1 actual versus 54.5 expected, 53.1 prior (revised from 53.9)
- Construction Spending, December (10:00): 1.5% actual versus 0.4% expected, 0.4% prior (revised from 1.2%)
- Crude Inventories, 01/28 (10:30): 4.175M actual versus 3.558M prior
- Auto Sales, January (14:00): 4.20M prior
- Truck Sales, January (14:00): 6.04M prior

February 2 - Thursday
- Challenger Job Cuts, January (7:30): +38.9% actual versus +30.6% prior
- Initial Claims, 01/28 (8:30): 367K actual versus 375K expected, 379K prior (revised from 377K)
- Continuing Claims, 01/21 (8:30): 3437K actual versus 3538K expected, 3567K prior (revised from 3554K)
- Productivity-Preliminary, Q4 (8:30): 0.7% actual versus 0.7% expected, 1.9% prior (revised from 2.3%)
- Unit Labor Costs, Q4 (8:30): 1.2% actual versus 0.7% expected, -2.1% prior (revised from -2.5%)

February 3 - Friday
- Nonfarm Payrolls, January (8:30): 243K actual versus 155K expected, 203K prior (revised from 200K)
- Nonfarm Private Payr, January (8:30): 257K actual versus 168K expected, 220K prior (revised from 212K)
- Unemployment Rate, January (8:30): 8.3% actual versus 8.5% expected, 8.5% prior
- Hourly Earnings, January (8:30): 0.2% actual versus 0.2% expected, 0.1% prior (revised from 0.2%)
- Average Workweek, January (8:30): 34.5 actual versus 34.4 expected, 34.5 prior (revised from 34.4)
- Factory Orders, December (10:00): 1.1% actual versus 1.5% expected, 2.2% prior (revised from 1.8%)
- ISM Services, January (10:00): 56.8 actual versus 53.1 expected, 53.0 prior (revised from 52.6)

February 7 - Tuesday
- Consumer Credit, December (15:00): $8.5B expected, $20.4B prior

February 8 - Wednesday
- MBA Mortgage Index, 02/04 (7:00): -2.9% prior
- Crude Inventories, 02/04 (10:30): 4.175M prior

February 9 - Thursday
- Initial Claims, 02/04 (8:30): 370K expected, 367K prior
- Continuing Claims, 01/28 (8:30): 3475K expected, 3437K prior
- Wholesale Inventories, December (10:00): 0.4% expected, 0.1% prior

February 10 - Friday
- Trade Balance, December (8:30): -$48.2B expected, -$47.8B prior
- Michigan Sentiment, February Preliminary (9:55): 74.0 expected, 75.0 prior
- Treasury Budget, January (14:00): -$40.0B expected, -$49.8B prior
icon url

ReturntoSender

02/06/12 10:52 PM

#9673 RE: ReturntoSender #6755

From Briefing.com: 4:22PM Veeco Instruments announces LG Siltron and Epistar selections of VECO MOCVD systems (VECO) 27.14 -0.03 : Co announced today that LG Siltron, a South Korean epi wafer manufacturer, recently selected the TurboDisc K465i gallium nitride ( Metal Organic Chemical Vapor Deposition (MOCVD) System for production of gallium nitride on silicon (GaN-on-Si) wafers for power electronics and LED devices. Co also Veeco announced that Epistar recently selected the K465iTM TurboDisc gallium nitride (GaN) Metal Organic Chemical Vapor Deposition (MOCVD) System for development of light emitting diodes (LEDs) grown on silicon substrates.

4:05PM Veeco Instruments beats by $0.05, reports revs in-line; guides Q1 EPS below consensus, revs below consensus (VECO) 27.14 -0.03 : Reports Q4 (Dec) earnings of $0.72 per share, excluding non-recurring items, $0.05 better than the Capital IQ Consensus Estimate of $0.67; revenues fell 36.1% year/year to $191.7 mln vs the $192.99 mln consensus. Co issues downside guidance for Q1, sees EPS of $0.13-0.34, excluding non-recurring items, vs. $0.40 Capital IQ Consensus Estimate; sees Q1 revs of $115-140 mln vs. $151.73 mln Capital IQ Consensus Estimate. "We don't see signs of near-term improvement in the LED environment and the current overcapacity situation could mean that MOCVD orders remain at these depressed levels for multiple quarters. In Data Storage, while overall market conditions are healthy, the continued consolidation of our customer base will likely mean that order patterns will fluctuate from quarter to quarter."

4:06PM PMC-Sierra reports EPS in-line, misses on revs (PMCS) : Reports Q4 (Dec) earnings of $0.13 per share, in-line with the Capital IQ Consensus Estimate consensus of $0.13; revenues fell 4.2% year/year to $152.6 mln vs the $155.32 mln consensus. "Our annual net revenues grew 3% in a roughly flat year for the semiconductor industry. While difficult conditions impact our near-term outlook, we see good signs of recovery in 2012, including a strong increase in bookings. PMC is well positioned to deliver the infrastructure required to support high traffic growth on storage, optical and mobile networks."

4:30 pm : The major equity averages finished with fractional losses. The lack of news flow resulted in especially light volume.

Market participants returned their focus to the tribulations of Greece amid an absence of economic data and market-moving corporate reports. Frustration and disappointment over Greece's ongoing struggles with austerity measures and creditors prompted participants to clip stocks this morning. More rumors regarding a potential agreement made their rounds, but stocks showed little trust in them.

The euro was able to overcome early weakness and score itself a gain against the greenback. As of session's end, the euro was up 0.2% against the dollar.

Although the broad market remained in the red for the entire session, the major equity averages were able to turn a modest decline into only a fractional loss.

Broad market action may have been lackluster, but energy stocks put on an impressive performance. They staged a steady ascent that saw the sector settle at its session high with a 1.1% gain. What's more, the move came in the face of softer oil prices, which fell nearly 1% to about $97 per barrel.

In contrast, financials lagged for the entire session. They settled with a 0.5% loss, which isn't severe, but it still makes for one of the poorest performances among the 10 major sectors.

Medco Health Solutions (MHS 58.47, -5.14) put on one of the poorest individual performances in response to headlines that about potential disruptions to plan to acquire Express Scripts (ESRX 49.67, -2.42).

Participation in recent months has regularly been very light, but the dearth of headlines today took share volume to an abysmal level. In fact, the near 690 million shares that were traded on the NYSE made today one of the lightest non-holiday sessions of the past decade.

News flow will pick up some tomorrow. On the earnings docket are BP (BP 46.87, +0.30), Coca-Cola (KO 68.03, -0.05), and UBS (UBS 14.37, -0.30). Tuesday also brings a testimony to the Senate Budget Committee from Fed Chairman Bernanke, whose comments are unlikely to deviate from those he delivered last week to the House Budget Committee, and the latest in consumer credit.

Advancing Sectors: Energy +1.1%, Telecom +0.3%
Unchanged: Consumer Staples, Tech
Declining Sectors: Consumer Discretionary -0.1%, Industrials -0.2%, Utilities -0.4%, Health Care -0.4%, Materials -0.5%, Financials -0.5%DJ30 -17.10 NASDAQ -3.67 NQ100 +0.00% R2K -0.3% SP400 -0.1% SP500 -0.57 NASDAQ Adv/Vol/Dec 1025/1.67 bln/1505 NYSE Adv/Vol/Dec 1235/686 mln/1770

9:48AM Semiconductor Hldrs ETF hovering near low (SMH) 34.22 -0.40 : Noted lagging performance in Nasdaq as Semi SMH weighed. The weakest performers thus far include: INTC -1.4%, ADI -1.4%, ALTR -1.7%, AMD -1.4%, AMKR -1.3%, ATML -2%, BRCM -2%, KLAC -1.8%, LLTC -1.5%, LSI -1.9%, MU -2.5%, MXIM -1.3%, NVLS -2.1%, TER -2%, XLNX -1.5%, MRVL -2.1%, MCHP -1.3%. The SMH is attempting to stabilize near support mentioned in The Technical Take at 34.15/34.10 (session low 34.17).

8:02AM Rambus acquires Unity Semiconductor for $35 mln in cash (RMBS) 7.56 : Co announced it has acquired privately-held Unity Semiconductor, a memory technology company for an aggregate of $35 mln in cash. As part of this acquisition, the Unity team members have joined Rambus to continue developing innovations and solutions for next-generation non-volatile memory. This acquisition will expand the breadth of Rambus' memory technologies and will open up new markets for licensing. The boards of directors of both companies have approved the acquisition and it has closed.

1:38AM Micron appoints Mark Durcan as CEO; appoints Director Robert Switz as Chairman; appoints VP of Worldwide Sales, Mark Adams as President (MU) 7.95 :

11:37 am S&P Tech Sector Down Slightly, In-line With S&P 500
The tech sector is trading lower today, along with losses in the broader market. Semiconductors are showing relative weakness in line with the tech space with the Philly Semi Index trading 1.4% lower. NXPI (-3.3%) is a notable laggard in the chip index. Among other major indices, the SPY is trading 0.2%, while the NASDAQ and the QQQ are trading 0.3% lower on the session. Among tech bellwethers, GOOG (+1.4%) is showing strength, while TXN (-1.3%) is under a little pressure.

In earnings this morning, SOHU (-14.6%) posted a quarterly beat but issued downside guidance, while CYOU (-11.8%) posted a beat with mixed guidance.

In news Friday night, MU (-2.3%) announced its President/COO Marc Durcan will assume the responsibilities of CEO until a successor is appointed by the Board, pursuant to co's bylaw's. This morning, VZ (+0.2%) and CSTR (+0.9%) announced the formation of a joint venture that will offer Redbox new release DVD and Blu-ray Disc rentals combined with a new video on-demand streaming and download service from Verizon.

Among notable analyst upgrades this morning, GLW (+0.3%) was upgraded at Piper Jaffray and RVBD (+4.4%) was upgraded to Outperform at Pacific Crest. Among downgrades, CBEY (-7.0%) was downgraded to Neutral at Citigroup and CHA (-5.1%) was downgraded to Underperform at Credit Suisse.

PMCS (-1.4%) and VECO (+0.2%) are two notable names in tech scheduled to report results today after the close.

icon url

ReturntoSender

02/07/12 11:21 PM

#9674 RE: ReturntoSender #6755

From Briefing.com: 4:06PM TTM Tech beats by $0.09, beats on revs (TTMI) 13.46 +0.07 : Reports Q4 (Dec) earnings of $0.34 per share, excluding non-recurring items, $0.09 better than the Capital IQ Consensus Estimate of $0.25; revenues fell 3.3% year/year to $361.5 mln vs the $351.78 mln consensus.

4:33PM TTM Tech also announced that it will temporarily close its SYE plant located in Dongguan, China (TTMI) 13.46 +0.07 : Co also announced that it will temporarily close its SYE plant located in Dongguan, China for repairs and upgrades to the facility. TTM expects to transfer the majority of SYE's production and many of the employees to other facilities located in South China and expects to provide continuous support to its customers with minimal interruption. The Company expects to spend approximately $6 million for the maintenance and repair work and expects the project to be completed by the end of the second quarter of 2012. TTM anticipates a reduction of revenue of about $3 million to $6 million for each of the first two quarters of 2012 due to the transition of production to other facilities. Costs associated with this project are expected to have a slight impact on margins in the first half of 2012. The Company anticipates production at the SYE facility to resume during the third quarter of 2012.

4:30PM Advanced Micro announced the departure of Emilio Ghilardi as senior vice president and chief sales officer, effective immediately (AMD) 7.13 +0.21 : Rory Read, AMD president and chief executive officer, will serve as interim chief sales officer while the company actively seeks a replacement.

4:23PM FormFactor beats by $0.02, beats on revs (FORM) 5.26 -0.01 : Reports Q4 (Dec) loss of $0.45 per share, $0.02 better than the Capital IQ Consensus Estimate of ($0.47); revenues fell 31.2% year/year to $30.2 mln vs the $29.2 mln consensus.

4:03PM FSI Intl announced that it received a follow-on order for its ORION Single Wafer Cleaning System from a leading semiconductor producer (FSII) 4.46 -0.10 : Co announced that it received a follow-on order for its ORION Single Wafer Cleaning System from a leading semiconductor producer. The system will be used for FEOL applications. The company expects to ship the system in the second half of fiscal 2012.

4:30 pm : Stocks slipped in response to some early selling, but once they worked their way into higher ground they entered into a sideways drift that lasted almost all afternoon.

Dwindling confidence in Greece's ability to establish and implement new austerity measures undermined early sentiment. Rumors regarding a forthcoming agreement continue to permeate trade, but many of those stories are followed with headlines about further delays to discussions.

Despite frustration over Greece, an absence of economic data, and a lack of leadership among stocks, stocks were able to attract buyers in early trade. Their support spurred a rebound that took all three major equity averages into positive territory, where the spent the rest of the session drifting along narrowly above the neutral line.

With a 0.7% advance, utilities stocks collectively scored the strongest gains, despite their stodgy, defensive-oriented stature. Energy stocks weren't far behind; they climbed 0.5% with help from a rebound in oil prices, which overcame an early loss to settle pit trade with a 1.6% gain at $98.54 per barrel. BP Plc (BP 46.60, -0.27) was able to cut its loss, but still couldn't score an actual gain as shares wrestled with sellers in the wake of the company's latest quarterly report, which included a dividend hike to $0.08 from $0.07 per quarter.

Dow component Coca-Cola (KO 68.55, +0.52) put together a solid gain following an upside earnings surprise for the latest quarter, but fellow blue chip Microsoft (MSFT 30.35, +0.15) set a new 52-week high.

Swiss investment and banking outfit UBS AG (UBS 14.27, -0.10) slid in response to a disappointing quarterly report. Domestic investment banks and brokerage plays were implicated by the report. As a group financials finished the session with a fractional loss.

The only actual economic data for the day featured the latest consumer credit numbers, which showed that consumer credit spiked during December to $19.3 billion. That's more than double the Briefing.com consensus of $8.5 billion in consumer credit.

Fed Chairman Bernanke delivered a testimony to the Senate Budget Committee today, but his comments came without surprise since they mirrored those delivered last week to the House Budget Committee.

Advancing Sectors: Utilities +0.7%, Energy +0.5%, Consumer Discretionary +0.4%, Tech +0.3%, Health Care +0.3%, Consumer Staples +0.1%
Unchanged: Telecom, Industrials
Declining Sectors: Financials -0.1%, Materials -0.3%DJ30 +33.07 NASDAQ +2.09 NQ100 +0.2% R2K -0.1% SP400 +0.2% SP500 +2.72 NASDAQ Adv/Vol/Dec 1201/1.77 bln/1336 NYSE Adv/Vol/Dec 1689/728 mln/1299

Veeco Instruments (VECO) announced that SemiLEDs Corporation (LEDS) has recently qualified the TurboDisc K465i gallium nitride Metal Organic Chemical Vapor Deposition System for high-volume production of high brightness light emitting diodes at its manufacturing facility in Taiwan.

7:34AM Vishay misses by $0.04, misses on revs (VSH) 12.80 : Reports Q4 (Dec) earnings of $0.15 per share, $0.04 worse than the Capital IQ Consensus Estimate of $0.19; revenues fell 19.9% year/year to $551.4 mln vs the $570.63 mln consensus. Commenting on the outlook, co states: "Our orders seem to have bottomed out and our book-to-bill is above 1 for January 2012. We anticipate a substantial recovery once the inventory correction in the supply chain is complete...Based on current order trends, we anticipate similar revenues as in quarter four 2011 at a slightly improved gross margin." Current Q1 CIQ rev est is $562.3 mln.

Novellus Systems (NVLS) announced the addition of the VECTOR Strata to the company's dielectric product offerings.

Last night, Veeco Instruments (VECO $28.05 +0.91) reported fourth quarter earnings of $0.72 per share, excluding non-recurring items, $0.05 better than the Capital IQ Consensus of $0.67, while revenues fell 36.1% year/year to $191.7 million versus the $192.99 million consensus. The company issued downside guidance for the first quarter with EPS of $0.13-0.34, excluding non-recurring items, versus the $0.40 consensus with revenues of $115-140 million versus the 151.73 million consensus. "We don't see signs of near-term improvement in the LED environment and the current overcapacity situation could mean that MOCVD orders remain at these depressed levels for multiple quarters. In Data Storage, while overall market conditions are healthy, the continued consolidation of our customer base will likely mean that order patterns will fluctuate from quarter to quarter."

PMC-Sierra (PMCS 6.72 -0.02) reported fourth quarter earnings of $0.13 per share, in-line with the Capital IQ Consensus of $0.13, while revenues fell 4.2% year/year to $152.6 million versus the $155.32 million consensus. "Our annual net revenues grew 3% in a roughly flat year for the semiconductor industry. While difficult conditions impact our near-term outlook, we see good signs of recovery in 2012, including a strong increase in bookings. PMC is well positioned to deliver the infrastructure required to support high traffic growth on storage, optical and mobile networks."

10:48 am S&P Tech Sector Just Under The Unchanged Line
The tech sector is trading just lower today, along of losses in the broader market. Semiconductors are showing slight relative weakness in line with the tech space, however, with the Philly Semi Index trading 0.3% lower. IDCC (-6.2%) is a notable laggard in the chip index. Among other major indices, the SPY is trading 0.2% lower, while the NASDAQ is 0.3% lower and the QQQ is trading 0.2% lower on the session. Among tech bellwethers, AAPL (+0.5%) is showing strength, while TXN (-0.7%) and INTC (-0.7%) are under a little pressure.

In earnings last night, RATE (+1.0%) posted a quarterly beat but issued downside guidance, while PMCS (+3.6%) posted a slight miss. Also, IDCC (-6.2%) lowered its guidance. This morning, IT (-3.6%) posted an inline quarter, while VSH (-10.3%) reported a miss.

In news, CSTR (+18.2%) announced that Redbox has agreed to purchase assets of NCR's (+7.4%) entertainment line of business. The acquisition includes the purchase of the DVD kiosks, certain retailer contracts, and DVD inventory from NCR's entertainment line of business.

Among notable analyst upgrades this morning, FN (+6.1%) was upgraded to Overweight at Morgan Stanley. Among downgrades, CYOU (+2.0%) was downgraded to Neutral at Goldman, Stifel Nicolaus downgraded RATE (+1.0%) to Hold, Argus downgrades DRIV (-1.2%) to Hold, and SOHU (-2.9%) was downgraded to Hold at RBS.

NTGR (-1.5%) and VCLK (+0.6%) are two notable names in tech scheduled to report results today after the close.

icon url

ReturntoSender

02/09/12 12:10 AM

#9675 RE: ReturntoSender #6755

From Briefing.com: 4:30PM Ingram Micro beats by $0.15, beats on revs (IM) 19.72 +0.20 : Reports Q4 (Dec) earnings of $0.70 per share, excluding $0.02 per diluted share negative impact of the reorganization charges recorded in the quarter, $0.15 better than the Capital IQ Consensus Estimate of $0.55; revenues rose 0.7% year/year to $9.95 bln vs the $9.72 bln consensus. For the full year 2012, the company currently expects revenue growth in-line with current IT spending forecasts of low to mid-single digit growth over 2011 (Current rev growth consensus is 4.4%). For the 2012 first quarter, revenues are currently expected to be flat to slightly down compared to the year earlier period due to expected year-over-year declines in EMEA revenues driven primarily by continued uncertainty surrounding the European economy and current expectations for a year-over-year decline in Australia's revenue contribution (Current Q1 rev consensus calls for 0.5% growth). First quarter 2012 gross margin is expected to trend down sequentially in-line with seasonal norms after removing the impact of hard disk drive pricing in the fourth quarter of 2011, which the company does not expect will provide meaningful additional benefit in the first quarter of 2012.

4:28PM Diodes reports EPS in-line, misses on revs; guides Q1 revs in-line (DIOD) 26.16 -0.05 : Reports Q4 (Dec) earnings of $0.09 per share, excluding non-recurring items, in-line with the Capital IQ Consensus Estimate consensus of $0.09; revenues fell 12.5% year/year to $143.3 mln vs the $145.22 mln consensus. Co issues in-line guidance for Q1, sees Q1 revs of $138-148 mln vs. $145.30 mln Capital IQ Consensus Estimate. Gross profit margin was 24.8 percent, compared to 38.3 percent in the fourth quarter 2010 and 28.1 percent in the third quarter of 2011

4:27PM Nanometrics beats by $0.09, beats on revs; guides Q1 EPS in-line, revs above consensus (NANO) 20.63 -0.10 : Reports Q4 (Dec) earnings of $0.10 per share, excluding non-recurring items, $0.09 better than the Capital IQ Consensus Estimate of $0.01; revenues fell 1.7% year/year to $45.3 mln vs the $41.73 mln consensus. Co issues mixed guidance for Q1, sees EPS of $0.09-0.13, excluding non-recurring items, vs. $0.10 Capital IQ Consensus Estimate; sees Q1 revs of $52-55 mln vs. $46.23 mln Capital IQ Consensus Estimate.

4:19PM TriQuint Semi -- Earnings Mover (6.84) (TQNT) : Drops 9% after bottom line miss tests/stabilizes near early month gap/Jan high at 6.25. Currently at 6.45.

4:11PM ON Semiconductor beats by $0.07, beats on revs; guides Q1 revs in-line (ONNN) 9.12 -0.05 : Reports Q4 (Dec) earnings of $0.13 per share, $0.07 better than the Capital IQ Consensus Estimate of $0.06; revenues rose 32.6% year/year to $767.9 mln vs the $759.04 mln consensus. Co issues in-line guidance for Q1, sees Q1 revs of $720-760 mln vs. $757.68 mln Capital IQ Consensus Estimate. Co also sees backlog levels for the first quarter of 2012 represent approx 80 to 85% of their anticipated first quarter 2012 revenues. They expect that average selling prices for the first quarter of 2012 will be down approximately two to three percent when compared to the fourth quarter of 2011. The non-GAAP outlook for the first quarter of 2012 includes stock-based compensation expense of approx $8 to $10 mln. Co sees non GAAP GM of 31.5-32.5%.

4:08PM Cisco Systems beats by $0.04, beats on revs (CSCO) 20.43 +0.23 : Reports Q2 (Jan) earnings of $0.47 per share, $0.04 better than the Capital IQ Consensus Estimate of $0.43; revenues rose 10.6% year/year to $11.5 bln vs the $11.23 bln consensus. During the second quarter of fiscal 2012, Cisco repurchased 26 million shares of common stock under the stock repurchase program at an average price of $17.84 per share for an aggregate purchase price of $466 million. As of January 28, 2012, Cisco had repurchased and retired 3.6 billion shares of Cisco common stock at an average price of $20.47 per share for an aggregate purchase price of approximately $73.8 billion since the inception of the stock repurchase program. The remaining authorized amount for stock repurchases under this program is approximately $8.2 billion with no termination date. During the second quarter of fiscal 2012, Cisco also paid a cash dividend of $0.06, or $322 million... Cisco also announced that on February 7, 2012 its Board of Directors declared a quarterly dividend of $0.08 per common share, a two-cent increase over the previous quarter's dividend, to be paid on April 25, 2012 to all shareholders of record as of the close of business on April 5, 2012. Future dividends will be subject to Board approval.

4:06PM Atmel reports EPS in-line, misses on revs (ATML) 10.10 +0.04 : Reports Q4 (Dec) earnings of $0.14 per share, excluding non-recurring items, in-line with the Capital IQ Consensus Estimate consensus of $0.14; revenues fell 16.2% year/year to $383.6 mln vs the $391.46 mln consensus. Non-GAAP gross margin was 48.7% in the fourth quarter of 2011, which compares to 50.4% in the immediately preceding quarter and 50.0% in the fourth quarter of 2010.

4:30 pm : For the second straight session a dearth of headlines left stocks to slog along in mixed fashion, but the broad market still mustered a modest gain, which marked its fifth advance in six sessions and its best close in seven months.

Stocks gave up early gains to trade with modest losses, but they were able to gradually battle their back into positive territory. Financials and tech issues, arguably the two most influential sectors, traded out in front of the action. Strength in the two sectors resulted in gains in 0.8% and 0.7%, respectively.

Ralph Lauren (RL 171.49, +14.42) was a top performer by percent gained. The stock's surge to a record high followed an upside earnings surprise. Dow component Walt Disney (DIS 41.27, +0.29) also posted better-than-expected earnings, as did Time Warner (TWX 38.54, +0.44). Time Warner complemented its report with strong guidance and a dividend hike, but the stock failed to sustain an early advance. Sprint (S 2.41, -0.04) rebounded from an early slump that came in response to an earnings miss, but the stock ultimately returned to the red.

There wasn't a single dose of data released today. And although headlines suggested that the Troika is looking for Greece to pledge permanent spending cuts, terminate government jobs, trim its minimum wage, and increase sales tax, market participants also continue to await official developments from the flagging country.

Both the dollar and the euro had a relatively quiet day of trade. As of the closing bell, both were essentially flat for the session.

Treasuries also traded quietly. Not even strong demand at an auction of 10-year Notes drove traders to action. The auction drew a bid-to-cover of 3.05, dollar demand of $73.2 billion, and an indirect bidder participation rate of 38.9%. For comparison, an average of the past six auctions results in a bid-to-cover of 3.10, dollar demand of $67.9 billion, and an indirect bidder rate of 43.4%.

The lack of headlines and action continues to make for paltry participation. That left share volume on the NYSE below 800 million once again.

Advancing Sectors: Financials +0.8%, Tech +0.7%, Industrials +0.2%, Materials +0.2%, Consumer Discretionary +0.2%
Unchanged: Telecom, Utilities, Consumer Staples
Declining Sectors: Health Care -0.1%, Energy -0.6%DJ30 +5.75 NASDAQ +11.78 NQ100 +0.5% R2K +0.1% SP400 +0.1% SP500 +2.91 NASDAQ Adv/Vol/Dec 1428/1.97 bln/1099 NYSE Adv/Vol/Dec 1741/765 mln/1257

8:05AM Vishay Precision misses by $0.04, reports revs in-line (VPG) 15.91 : Reports Q4 (Dec) earnings of $0.09 per share, $0.04 worse than the Capital IQ Consensus Estimate of $0.13; revenues rose 2.9% year/year to $56.4 mln vs the $56.78 mln consensus. Co sees Q1 revs of $53-58 mln. "Market demand in the US and Asia remained fairly stable. However, European demand dropped significantly from the third quarter, which resulted in lower revenues for the fourth quarter, mainly for the Weighing Modules and Control Systems (WMCS) segment."

8:04AM Rambus announced it has signed a patent license agreement with NVIDIA; Agreement covers a broad range of integrated circuit products (RMBS) 7.55 : Co announced it has signed a patent license agreement with NVIDIA (NVDA). The agreement covers the use of Rambus patented innovations in a broad range of integrated circuit products offered by NVIDIA. In addition, the two companies have settled all outstanding claims, including resolution of past use of Rambus' patented innovations. The term of this agreement is five years; other details are confidential.

6:15AM AU Optronics January rev -22% MoM and -28% YoY to NT$21.71 bln (AUO) 5.67 : Due to the Chinese New Year holidays and fewer workdays in January 2012, large-sized panel(a) shipments, with applications on desktop monitor, notebook PC, LCD TV and other applications, decreased by 15% month-over-month to nearly 7.31 million units. As for small-and-medium-sized panels, the shipments were around 10.33 million units, down by 33% month-over-month.

3:02AM AU Optronics misses by NT$0.67, misses on revs (AUO) 5.67 : Reports Q4 (Dec) loss of $2.34 per share, NT$0.67 worse than the Capital IQ Consensus Estimate of (NT$1.67); revenues fell 12.8% year/year to NT$89.5 bln vs the NT$94.66 bln consensus. Looking into 2012, co states panel demands are expected to gradually recover, and our capacity utilization rates are also expected to improve quarter over quarter.

3:17AM Nokia plans changes to its manufacturing operations to increase efficiency in smartphone production (NOK) 5.13 : Co announces planned changes at its factories in Komarom, Hungary, Reynosa, Mexico and Salo, Finland. The measures follow a review of smartphone manufacturing operations that Nokia announced last September and aim to increase the company's competitiveness in the diverse global mobile device market. As a consequence of the plans, the number of steps in manufacturing and the amount of work carried out at the sites in Komarom, Reynosa and Salo are expected to decrease substantially. The changes are anticipated to impact ~4,000 employees in total.

2:31AM United Micro beats by NT$0.01, beats on revs (UMC) 2.66 : Reports Q4 (Dec) earnings of NT$0.09 per share, NT$0.01 better than the Capital IQ Consensus Estimate of NT$0.08; revenues fell 22.0% year/year to NT$24.43 bln vs the NT$23.63 bln consensus. Co also provides Q1 Outlook & Guidance Quarter-over-Quarter Guidance. Co sees Wafer shipment to "Increase marginally;" Wafer ASP in USD to decrease approximately 5%; Operating Margin in Low single-digit percentage range; Capacity utilization in High 60% range; Co sees consumer and computer segments will outpace communication segment. Co's 2012 CAPEX budget is ~$2 bln

Rambus (RMBS $8.18 +0.63) announced it has signed a patent license agreement with NVIDIA (NVDA). The agreement covers the use of Rambus patented innovations in a broad range of integrated circuit products offered by NVIDIA. In addition, the two companies have settled all outstanding claims, including resolution of past use of Rambus' patented innovations. The term of this agreement is five years; other details are confidential.

09:21 am TTM Tech downgraded to Buy at Needham; tgt $15: . Needham downgrades TTMI to Buy from Strong Buy and sets target price at $15 given the growth of tablets, high-end NA networking, and cellphones, they are comfortable that TTMI should be able to grow its topline for C12 in the low to mid-single digit range. However, various events (facilities upgrade, higher labor costs, and a slower Asia Pac PCB business) do weigh on the margins, limiting EPS upside and price target of $15.

12:26 pm S&P Tech Sector Just Above The Unchanged Line, Outperforming The S&P 500
The tech sector is trading slightly lower today, along with losses in the broader market. Semiconductors are showing relative strength in the tech space, however, with the Philly Semi Index trading 0.6% higher. NVDA (+2.7%) is showing relative strength, while IDCC (-1.6%) is a notable laggard in the chip index. Among other major indices, the SPY is trading 0.2% lower, while the NASDAQ is 0.3% lower and the QQQ is trading 0.2% lower on the session. Among tech bellwethers, TXN (+0.6%) is showing strength, while QCOM (-0.7%) is under pressure.

In earnings last night, OPEN (-11.7%) posted a quarterly beat, VCLK (+2.3%) posted a beat and raise, and NTGR (-6.0%) reported a slight qtrly beat with inline guidance. This morning, S (-3.5%) posted a bottom line miss with slight upside to the top line, AUO (-2.7%) posted a miss and CTSH (-1.5%) reported slight upside to the qtr and guidance.

In news, RMBS (+8.9%) announced it has signed a patent license agreement with NVDA (+2.7%).

Among rumors, we are hearing renewed MU (+2.2%) and, separately, RIMM (-1.0%) takeover chatter making the rounds. Among notable analyst upgrades this morning, OPEN (-11.7%) was upgraded to Overweight at Piper Jaffray and VSH (+6.0%) was upgraded to Overweight at JP Morgan. Among downgrades, DMD (-6.3%) was downgraded to Underweight at Morgan Stanley, NTGR (-6.0%) was downgraded to Hold at Deutsche Bank and OPEN (-11.7%) was downgraded at Oppenheimer and Credit Suisse.

ONNN (0.0%), CSCO (-0.2%) and IM (+0.4%) are two notable names in tech scheduled to report results today after the close.
icon url

ReturntoSender

02/09/12 10:11 PM

#9676 RE: ReturntoSender #6755

From Briefing.com: 4:41PM First Solar disclosed on September 30, 2011, the DOE finalized a federal loan and loan guarantee of up to $646 mln to support project financing for the Antelope Valley Solar Ranch One project (FSLR) 49.01 +3.21 : As previously reported on a Current Report on Form 8-K filed with the SEC on September 30, 2011, the DOE finalized a federal loan and loan guarantee of up to $646 mln to support project financing for the Antelope Valley Solar Ranch One project developed, sold to Exelon Corporation (EXC) and will build, operate and maintain. Because all conditions have not yet been satisfied, the parties have agreed to extend the timeframe for initial funding of the loan to February 24, 2012. If initial funding of the loan has not occurred by such date and such date is not extended further, Co would repurchase AVSR for an amount equal to the purchase price paid by Exelon for the project, ~$75 mln, plus certain other costs incurred by Exelon related to the project. If First Solar were to repurchase AVSR, the reacquired project would then become available for sale by First Solar to another party. First Solar expects its current cash and other capital resources would be sufficient to enable First Solar to repurchase AVSR, if necessary, while meeting First Solar's working capital and capital expenditure needs.

4:35PM Sierra Wireless reports EPS in-line, revs in-line; guides Q1 EPS above consensus, revs above consensus (SWIR) 7.52 +0.21 : Reports Q4 (Dec) earnings of $0.08 per share, in-line with the Capital IQ Consensus Estimate consensus of $0.08; revenues fell 12.0% year/year to $147.2 mln vs the $148.06 mln consensus. Co issues upside guidance for Q1, sees EPS of $0.06-$0.10 vs. $0.02 Capital IQ Consensus Estimate; sees Q1 revs of $143-$148 mln vs. $141.64 mln Capital IQ Consensus Estimate.

4:24PM Amkor beats by $0.04, reports revs in-line; guides Q1 EPS, revs in-line (AMKR) 6.21 +0.05 : Reports Q4 (Dec) earnings of $0.11 per share, $0.04 better than the Capital IQ Consensus Estimate of $0.07; revenues fell 8.9% year/year to $684 mln vs the $686.36 mln consensus. Co states, "As part of our continuing efforts to rationalize our cost structure, we have initiated a voluntary retirement program in Japan. While the ultimate amount of the charge for this restructuring initiative will depend on the level of employee participation, we currently anticipate incurring a charge of around $6 million in the first quarter 2012," Co issues guidance for Q1, which does not include an estimate for the Japan restructuring charge, sees EPS of ($0.03)-$0.09, which may not compare to the $0.08 Capital IQ Consensus Estimate; sees Q1 revs of $615-$665 mln vs. $649.00 mln Capital IQ Consensus Estimate.

4:23PM NXP Semi reports EPS in-line, revs in-line; guides Q1 EPS in-line, revs above consensus (NXPI) 21.99 +0.11 : Reports Q4 (Dec) earnings of $0.24 per share, excluding non-recurring items, in-line with the Capital IQ Consensus Estimate consensus of $0.24; revenues fell 13.6% year/year to $931 mln vs the $930.04 mln consensus. Co issues mixed guidance for Q1, sees EPS of $0.10-0.24 vs. $0.18 Capital IQ Consensus Estimate; sees Q1 revs of $927-984 mln vs. $920.51 mln Capital IQ Consensus Estimate.

4:21PM Intel: New York Attorney General agrees to terminate antitrust lawsuit against co (INTC) 26.86 +0.02 : Co and the New York Attorney General have agreed to terminate the lawsuit alleging violation of U.S. and state antitrust laws that was filed by the New York Attorney General in Nov 2009. The agreement, which follows a Dec 2011 court ruling that greatly reduced the scope of the New York Attorney General's lawsuit, expressly states that Intel does not admit either any violation of law or that the allegations in the complaint are true, and it calls for no changes to the way Intel does business. The agreement includes a payment of $6.5 mln from Intel that is intended only to cover some of the costs incurred by the New York Attorney General in the litigation.

4:08PM Amtech Systems beats by $0.15, beats on revs; guides MarQ revs below consensus (ASYS) 11.26 +0.08 : Reports Q1 (Dec) loss of $0.09 per share, $0.15 better than the Capital IQ Consensus Estimate of ($0.24); revenues fell 54.0% year/year to $24.7 mln vs the $22.1 mln consensus. Co issues downside guidance for Q2 (Mar), sees Q2 revs of $20-22 mln vs. $25.7 mln Capital IQ Consensus Estimate. Co says the current supply/demand imbalance and global economic conditions continue to impact solar cell manufacturers, Amtech's principal customer base.

4:03PM Monolithic Power beats by $0.03, beats on revs; guides Q1 revs above consensus (MPWR) 16.27 -0.04 : Reports Q4 (Dec) earnings of $0.15 per share, $0.03 better than the Capital IQ Consensus Estimate of $0.12; revenues rose 0.8% year/year to $47.5 mln vs the $46.44 mln consensus. Gross margin was 50.5%. Co issues upside guidance for Q1, sees Q1 revs of $46.0-50.0 mln vs. $44.46 mln Capital IQ Consensus Estimate. Co expects gross margin similar to 4Q11.

4:02PM Rubicon Tech announces $20 mln 2012 customer contract (RBCN) 12.58 +0.62 : Co announced today that it has entered into a new contract with its largest customer for large-diameter sapphire wafers. The amount of the contract is $20 mln, and it represents a baseline level of shipments that will be made from June through Dec 2012. The previous contract expired at the end of Dec. In another matter, Rubicon disclosed today that the co, as an accommodation to certain key customers of its small-diameter sapphire ingots, wrote off $1.8 mln of accounts receivable in the fourth quarter.

4:01PM Brooks Automation beats by $0.02, beats on revs; guides Q2 EPS above consensus, revs above consensus (BRKS) 11.29 +0.04 : Reports Q1 (Dec) earnings of $0.06 per share, $0.02 better than the Capital IQ Consensus Estimate of $0.04; revenues fell 32.6% year/year to $120.2 mln vs the $117.46 mln consensus. Co issues upside guidance for Q2, sees EPS of $0.15-0.20 vs. $0.09 Capital IQ Consensus Estimate; sees Q2 revs of $132-140 mln vs. $121.70 mln Capital IQ Consensus Estimate.

4:30 pm : For the third straight session the stock market rode a modest gain into the close. The moves may not have been exciting to watch, but they've put the broad market on pace for its sixth straight weekly gain and at its best level in seven months.

Trade this week has kept a consistent pattern: stocks run into some morning selling pressure, but gradually work their way higher. In the first session of the week stocks finished flat, but in the past three they have managed modest gains.

In each of the past two sessions tech stocks have provided support. The largest sector by market weight advanced 0.7% yesterday and another 1.0% in the latest round of action. The sector's latest effort was led by the likes of Akamai Tech (AKAM 38.06, +3.62) and Visa (V 112.42, +4.07). Each posted an upside earnings surprise for the latest quarter. Cisco (CSCO 20.00, -0.43) also posted better-than-expected bottom-line results, but the stock still ran into selling pressure.

Shares of Whole Foods (WFMI 82.02, +4.09) won over market participants with its latest quarterly report. The stock helped lead the consumer staples sector to a 0.5% gain. In contrast, PepsiCo (PEP 64.27, -2.47) dropped sharply following its upside earnings surprise.

The positive correlation between stock prices and the euro has lessened in recent days. As such, the major averages moved little in response to the euro's 0.4% climb to a near two-month high of $1.33. However, the euro remains sensitive to headlines regarding a forthcoming austerity plan from Greece's politicians -- to little surprise the story was the topic of rumors again today.

Market participants were also unsurprised by the decision of the European Central Bank to keep its target lending rate at 1.00%, but some were pleased to learn that the ECB expanded collateral guidelines. Meanwhile, the Bank of England kept its target rate at 0.5%, but expanded its lending program by 50 billion to 225 billion pounds.

China attracted some attention for its latest inflationary reading, which showed that consumer prices there experienced a 4.5% increase in January. That proved to be hotter than many had anticipated.

Domestic data featured the latest initial weekly jobless claims tally, which totaled 358,000. Economists polled by Briefing.com had, on average, called for an initial claims count closer to 370,000.

Wholesale inventories showed a 1.0% increase during December, but that number was given very little attention by market participants.

Treasuries attracted buyers after a weak start, which actually sent the yield on the benchmark 10-year Note to a 10-day high. By session's end the Note's yield eased back below 2.05%. In play were results from an auction of 30-year Bonds that featured strong dollar demand of $39.5 billion, a bid-to-cover of 2.47, and an indirect bidder rate of 29.2%. For comparison, an average of the past six auctions results in dollar demand of $36.7 billion, a bid-to-cover of 2.65, and an indirect bidder participation rate of 28.8%.

Advancing Sectors: Tech +1.0%, Consumer Staples +0.5%, Consumer Discretionary +0.2%, Materials +0.1%, Industrials +0.1%
Declining Sectors: Telecom -0.1%, Energy -0.1%, Utilities -0.2%, Financials -0.4%, Health Care -0.4% DJ30 +6.51 NASDAQ +11.37 NQ100 +0.7% R2K -0.4% SP400 +0.2% SP500 +1.99 NASDAQ Adv/Vol/Dec 1134/2.14 bln/1405 NYSE Adv/Vol/Dec 1522/759 mln/1482

9:03AM Cypress Semi's AgigA Tech awarded patent covering primary functionality of AGIGARAM Family (CY) 18.37 : AgigA Tech, a subsidiary of Cypress Semiconductor, announced that the United States Patent and Trademark Office has issued U.S. Patent No. 8,074,034, "Hybrid Non-Volatile RAM", covering the primary functionality of the AGIGARAM product family. AGIGARAM is a new class of non-volatile memory developed to meet the need for higher-density, higher-performance memory for enterprise-class storage and server applications.

9:02AM KEMET announced that there will be no negative impact on the Company's tantalum powder supply as a result of the recent closing of Global Advanced Metals' Wodgina, Australia tantalum mine (KEM) 9.91 :

7:36AM Am Superconductor beats by $0.08, beats on revs; issues Q4 EPS guidance, revs guidance (AMSC) 6.03 : Reports Q3 (Dec) loss of $0.34 per share, excluding non-recurring items, $0.08 better than the Capital IQ Consensus Estimate of ($0.42); revenues fell 42.7% year/year to $18.1 mln vs the $15.55 mln consensus. Co issues guidance for Q4, sees EPS of better then ($0.39), excluding non-recurring items, vs. ($0.28) Capital IQ Consensus Estimate; sees Q4 revs to exceed $27 mln vs. $30.96 mln Capital IQ Consensus Estimate.

Cisco Systems (CSCO $19.91 -0.52) reported second quarter earnings of $0.47 per share, $0.04 better than the Capital IQ Consensus of $0.43, while revenues rose 10.6% year/year to $11.5 billion versus the $11.23 billion consensus. During the second quarter of fiscal 2012, Cisco repurchased 26 million shares of common stock under the stock repurchase program at an average price of $17.84 per share for an aggregate purchase price of $466 million. As of January 28, 2012, Cisco had repurchased and retired 3.6 billion shares of Cisco common stock at an average price of $20.47 per share for an aggregate purchase price of approximately $73.8 billion since the inception of the stock repurchase program. The remaining authorized amount for stock repurchases under this program is approximately $8.2 billion with no termination date. During the second quarter of fiscal 2012, Cisco also paid a cash dividend of $0.06, or $322 million. Cisco also announced that on February 7, 2012 its Board of Directors declared a quarterly dividend of $0.08 per common share, a two-cent increase over the previous quarter's dividend, to be paid on April 25, 2012 to all shareholders of record as of the close of business on April 5, 2012. Future dividends will be subject to Board approval.

ON Semiconductor (ONNN $9.59 +0.47) reported fourth quarter earnings of $0.13 per share, $0.07 better than the Capital IQ Consensus of $0.06, while revenues rose 32.6% year/year to $767.9 million versus the $759.04 mln consensus. The company issued in-line guidance for the first quarter with revenues of $720-760 million versus the $757.68 million consensus The company also sees backlog levels for the first quarter of 2012 represent approximately 80 to 85% of their anticipated first quarter 2012 revenues. They expect that average selling prices for the first quarter of 2012 will be down approximately two to three percent when compared to the fourth quarter of 2011. The non-GAAP outlook for the first quarter of 2012 includes stock-based compensation expense of approx $8 to $10 million. The company sees non GAAP GM of 31.5-32.5%.

Needham raised their target on Apple (AAPL $483.59 +6.87) to $620 from $540. The firm notes since its previous valuation report, the most important changes in the competitive landscape have occurred in the media tablet market. With the introduction of the Amazon (AMZN $183.17 -2.31) Kindle Fire and other low-priced tablets, tablet sales have grown at a much faster pace than it previously forecast. From the iPad's perspective, the device has launched a massive attack on the business market prompting us to materially increase its forecast of iPad sales as well. Courtesy of the halo effect, the increase in its forecast of iPad sales has, in turn, translated into an increase in its forecast of Mac sales, which is also invading the business market.

12:25 pm S&P Tech Sector About 1% Higher, Outperforming The S&P 500
The tech sector is trading higher today, ahead of marginal losses in the broader market. Semiconductors are showing relative weakness in line with the tech space with the Philly Semi Index trading only 0.1% higher. WFR (+5.9%) is a notable leader in the chip index. Among other major indices, the SPY is trading 0.1% lower, while the NASDAQ and the QQQ are trading 0.1% higher on the session. Among tech bellwethers, AAPL (+3.6%) is showing strength, while ORCL (-0.8%) and CSCO (-0.8%) are under a little pressure.

In earnings last night, CSCO (-0.8%) posted a Q2 beat and offered inline guidance. JNPR (+0.3%) is lower on the report. Elsewhere, TWTC (-0.6%) posted a slight quarterly beat, while AKAM (+9.2%) posted a solid beat and upside guidance. IM (-1.6%) and TQNT (-9.7%) also posted beats but offered disappointing guidance. ATML (-2.1%) posted a top line miss with inline EPS.

In news, ORCL (-0.8%) announced that it has entered into an agreement to acquire TLEO (+17.2%) for $46.00/share. KNXA (+2.5%) and SABA (+4.5%) are up in sympathy.

Among notable analyst upgrades this morning, AVID (+0.8%) was upgraded to Overweight at JP Morgan, ONNN (+4.2%) was upgraded to Outperform at Wedbush.

Among downgrades, CSCO (-0.8%) was downgraded at ISI and MKM, Needham downgraded IM (-1.6%) to Hold, SOHU (-2.5%) was downgraded to Hold at Deutsche Bank, and ATML (-2.1%) was downgraded at Wedbush.

ATVI (+0.1%), NUAN (+1.4%), NXPI (-0.5%), and LNKD (-1.1%) are two notable names in tech scheduled to report results today after the close.

10:14 am Cisco Down 2.4% On Earnings/Guidance Results (CSCO)
After the close yesterday, Cisco (CSCO $19.95 -0.48) reported second quarter earnings of $0.47 per share, $0.04 better than the Capital IQ Consensus Estimate of $0.43; revenues rose 10.6% year/year to $11.5 bln vs the $11.23 bln consensus. During the second quarter of fiscal 2012, Cisco repurchased 26 million shares of common stock under the stock repurchase program at an average price of $17.84 per share for an aggregate purchase price of $466 million.

As of January 28, 2012, Cisco had repurchased and retired 3.6 billion shares of Cisco common stock at an average price of $20.47 per share for an aggregate purchase price of approximately $73.8 billion since the inception of the stock repurchase program. The remaining authorized amount for stock repurchases under this program is approximately $8.2 billion with no termination date.

During the second quarter of fiscal 2012, Cisco also paid a cash dividend of $0.06, or $322 million... Cisco also announced that on February 7, 2012 its Board of Directors declared a quarterly dividend of $0.08 per common share, a two-cent increase over the previous quarter's dividend, to be paid on April 25, 2012 to all shareholders of record as of the close of business on April 5, 2012. Future dividends will be subject to Board approval.

On conference call sees third quarter EPS of $0.45-0.47 vs $0.45 Capital IQ Consensus Estimate; sees Q3 Non-GAAP gross margins of 61.5-62.0%.
icon url

ReturntoSender

02/11/12 7:05 PM

#9677 RE: ReturntoSender #6755

From Briefing.com: Weekly Recap - Week ending 10-Feb-12

Concerns that gridlock could keep Greece from getting more bailout money spurred some relatively aggressive selling that resulted in the stock market's worst session since December. Ensuing losses also sent the stock market into the red for the week, snapping a streak of five straight weekly gains.

News this morning that eurozone officials are likely to suspend funds intended for Greece until the country agrees to more austerity measures and the country signs them into law aroused suspicions that the plan will face another prolonged debate in parliament that will ultimately take the flagging country closer to default.

Headlines about a forthcoming agreement helped lift the euro to a near two-month high against the greenback yesterday, but it rolled over in response to today's story. By session's end it was at $1.318 for a 0.7% loss.

The greenback's strength today was augmented by an interest in safety, which also helped take Treasuries higher. That took the yield on the benchmark 10-year Note back below 2.00% from the 10-day high that it set in the prior session.

Perhaps of little surprise, defensive-oriented stocks suffered the least today. For instance, the Utilities sector shed only 0.1%, while the Consumer Staples sector settled with a loss of just 0.2%. Health Care fell 0.3%.

Cyclically sensitive stocks were hit hard. As a consequence, the Materials sector sank 1.8%. Its loss was the worst of the 10 major sectors. With market participants less tolerant of risk the Volatility Index spiked to a three-week high of almost 22. It eased back from there, but was still up more than 11% by the closing bell.

Selling also extended into the commodity complex, resulting in a 1.1% loss for the CRB Index. Oil prices tumbled 1.2% to $98.68 per barrel, while gold prices closed pit trade with a 0.9% loss at $1725 per ounce and silver settled with a 1.2% loss at $33.60 per ounce.

Prior to Friday stocks didn't move very dramatically. As such, the broad market finished with a fractional loss on Monday. Trade on Tuesday, Wednesday, and Thursday finished with modest gains after the broad market managed to overcome some modest morning selling pressure. Those measured moves still put the S&P 500 at its best level in seven months by Thursday.

Earnings this week were generally upbeat, but the reports had little influence on overall trade. Nonetheless, both Akamai Tech (AKAM 38.43, +0.37) and Visa (V 113.90, +1.48) impressed with their latest quarterly report, but fellow tech play and Dow component Cisco (CSCO 19.90, -0.10) was clipped in the session that immediately followed its upside earnings surprise. Fellow blue chip Coca-Cola (KO 67.94, -0.03) posted its own upside earnings surprise this week. Rival PepsiCo (PEP 63.95, -0.32) did the same. Dow component Walt Disney (DIS 41.45, -0.08) also posted better-than-expected earnings. Time Warner (TWX 37.52, -0.19) did, too, but complemented its upside surprise with a dividend hike. BP Plc (BP 46.35, -0.42) also announced an increase to its dividend.

Domestic data was light this week. Friday featured a preliminary reading on consumer sentiment for February from the University of Michigan. It made a surprise slip to 72.5 from 75.0 in the prior month. The Treasury deficit for January made an unexpectedly steep drop to $27.4 billion from the near $50 billion deficit posted in the prior month, while the overall trade deficit grew by $1.7 billion to $48.8 billion in December.

Earlier in the week data was limited to news that the latest tally of initial weekly jobless claims totaled 358,000, which is less than the 370,000 initial claims that had been generally expected among economists polled by Briefing.com. Consumer credit spiked during December to $19.3 billion to more than double what had been widely expected. Wholesale inventories showed a surprisingly sharp 1.0% increase during December.

Fed Chairman Bernanke testified to the Senate Budget Committee about the economy and its outlook in the first half of the week, but becaue his comments did not deviate from those delivered last week to the House Budget Committee market participants considered it a non-event.

Data from abroad was also in the mix this week, but a focal point was European Central Bank (ECB) President Draghi's decision to expand ECB collateral guidelines, effectively making policy there more accommodative. The ECB did keep its target lending rate at 1.00%, though. As an aside, the Bank of England opted to leave its target rate at 0.5%, but expanded its lending program by 50 billion to 225 billion pounds.
 
Index Started Week Ended Week Change % Change YTD %
DJIA 12862.23 12801.23 -61.00 -0.5 4.8
Nasdaq 2905.66 2903.88 -1.78 -0.1 11.5
S&P 500 1344.90 1342.64 -2.26 -0.2 6.8
Russell 2000 831.11 813.33 -17.78 -2.1 9.8

NXP Semi (NXPI $22.81 +0.82) reported fourth quarter earnings of $0.24 per share, excluding non-recurring items, in-line with the consensus of $0.24, while revenues fell 13.6% year/year to $931 million versus the $930.04 million consensus. The company issued mixed guidance for the first quarter with EPS of $0.10-0.24 versus the $0.18 consensus with revenues of $927-984 million versus the $920.51 million consensus.

11:19 am S&P Tech Sector Down, But Slightly Outperforming The Broader Markets
The tech sector is trading lower today, just ahead of losses in the broader market. Semiconductors are showing relative weakness in line with the tech space, however, with the Philly Semi Index trading 1.6% lower. WFR (-4.7%) is a notable laggard in the chip index. Among other major indices, the SPY is trading 1.0% lower, while the NASDAQ is trading 0.9% lower and the QQQ is trading 0.8% lower on the session. Among tech bellwethers, TXN (-1.2%) and INTC (-0.7%) are under notable pressure.

In earnings last night, LNKD (+14.1%) posted a Q2 beat and offered inline guidance. Elsewhere, NUAN (-13.3%) posted a Q1 miss and issued inline guidance, NXPI (+0.8%) posted an inline qtr with slightly above consensus guidance and ATVI (-1.8%) reported a beat and downside guidance. This morning, ALU (+13.4%) posted a slight beat.

In news, ALBCF (-3.9%) is considering taking Hong Kong unit private, which would give YHOO (+0.4%) stake in Alibaba, according to reports.

Among notable analyst upgrades this morning, JDSU (+2.5%) was upgraded to Outperform at Credit Suisse and PROJ (+1.5%) was upgraded to Outperform at Wells Fargo. Also, ATVI (-1.8%) was added to Conviction Buy List at Goldman.

Among downgrades, NCR (-1.5%) was downgraded to Neutral from Buy at Goldman and EA (-4.4%) and ATVI (-1.8%) were downgraded to Neutral at Macquarie.
icon url

ReturntoSender

02/12/12 11:00 AM

#9678 RE: ReturntoSender #6755

Leavitt Brothers - Time to be Defensive:

http://leavittbrothers.com/blog/?p=5342

icon url

ReturntoSender

02/12/12 11:12 AM

#9679 RE: ReturntoSender #6755

InvestmentHouse Weekend Market Summary

http://www.investmenthouse.com/weekendmarketsummary.htm

A modest pullback as the indices struggle with the prior highs.

A Greek bondholder deal is not a Greek austerity deal. Investors were concerned because there were riots in the streets, and the head of one of the three political parties said he would not vote for the current austerity package because it was designed to humiliate the Greeks. They did not want to be under the boot of the Germans. That sums up the feeling on the continent about those haves and the have-nots. Those who have already gone through their austerity and have relative prosperity versus those who just wanted to do their own thing.

I am reminded of the cartoon about the grasshopper and the ant. The ant worked so hard during the days of summer to put away food while the grasshopper sat back, strummed his guitar, and sang a song about how working could wait. Come winter, the ant had a nice, warm home full of food, and the grasshopper was starving to death. You know the story. I do not think the Greeks would appreciate that analogy, but it is somewhat similar to how things are going. They have to bite the bullet and, as I said the other night, we will have to do the same at some point. They do not want to do it, and that is understandable. As I mentioned last night, we did end up seeing pictures with the haze of not only tear gas but of burning autos dimming the natural beauty of Greece. It is a shame for such a beautiful place.

That news roughed up the futures, and they were starting to the downside. They tried to recover a bit into the open and could not make much of a move. They were heading in the right direction until things started. They did recover, and then it was back and forth the entire day, never gaining any kind of traction. It looked like things were turning up at the opening bell, but the Michigan Sentiment numbers brought the market right back down. They were not horrible, but they did miss expectations. It did not do much from there, although it did manage something of a late rally that cut the losses. But that is all it did.

SP500, -0.69%; NASDAQ, -0.8%; Dow, -0.69%; SP600, -1.42%; SOX, -2%; NASDAQ 100, -0.65%.

AAPL was not able to keep the NASDAQ 100 going, although AAPL was up pretty decently early in the session before things lost their mojo. Then it fell into that backsliding mode.

OTHER MARKETS

When there is worry about Europe and Greece, we start having improvement.

Dollar. 1.3171 versus 1.3290 euro. The dollar managed to bounce, but it was down on the week. Money continued to flow back to Europe from the U.S. on the sign that things were a bit better. That is, of course, taking Friday out of the equation. There is just something about people rioting in the streets, tear gas, and fires that quell the feeling that everything is just fine.

Bonds. 1.96% versus 2.04% 10 year U.S. Treasury. Bonds rebounded with a bounce back up toward the 50 day EMA. Back in the range but at the bottom of the range nonetheless. Money is being moved back out for the same reason it is moving out of the dollar. They are better on the day, but overall they are still trending down as money flows back to Europe.

Gold. 1,725.30, -15.90. Gold was up and down, but it still finished lower. It did rebound after hours and improve itself. It still looks like it will try to make a bounce. It held the 20 day EMA on the low, and it bounced nicely off that level.

Oil. 98.68, -1.23. Even though we imported incredible amounts of oil at an all-time high in 2011, it was down on the day. It also tested lower, but it rebounded and bounced up higher in its range this week.

Oil is still range bound, as are bonds, the dollar, and gold. They are all trading in a range, and they are all trading as you would expect as the news comes out day to day. But none of them are breaking out or breaking down. That tells us that things are not necessarily decided in Europe. Our stock market has rallied in anticipation of maybe a resolution, but then bonds have sold back, raising yields. But there have been no major breakthroughs that would suggest anything serious has changed. We head into another week with the markets banging up against those old highs yet again. And bonds, the dollar, gold, and oil are all roughly moving around in their ranges as well. It is as if they are all waiting for the definitive moment to take place or something new to come out.

With the markets where they are now, on Friday we saw that they can be rattled a bit. No doubt the market is a bit overbought and subject to upset when the news does not go its way. Greece did the market no favors, one that has its indices trying to break through the prior highs. There were some nominal breaks over the past week, but nothing that was able to extend and rally to the upside. The selling was pretty innocuous. It was not heavy across the board. Volume was lower. It was not anything that will scare investors too much ...yet. That is the way it always starts, however. It is something little. It reminds me of the Kurt Russell movie 'Big Trouble in Little China.' They were questioning Egg Shen and he says, "It was just a little thing. But that is how it always happens." We had just a little move on Friday, but that does not mean there will not be more selling. Sometimes the selling comes in quietly like a thief in the night. Other times it is like shock and awe when it starts. We have had a good run to the upside. Buyers still want to buy in, and we may just have a nice backslide. That remains to be seen, and this coming week will answer more of those questions.

Maybe it is a bit down the road, but a test would not hurt at all. As you know, we were taking positions seriously. If they showed signs of trouble, we were getting out of them. We want to keep the gain we have. One of the problems with the market is it has a lot of potential inflation because of all of the money printing. You want to make as much money as you can to keep ahead of inflation. You want to buy some commodities and buy some gold, and that is what we have been doing. You kind of take care of things from both ends. As Ronald Reagan said, one of the most patriotic things you can do is be a person for free enterprise, start your own business, make as much money as you can, and then give as little of it as you can to the government. When you are in an inflationary environment, that is all the more important. You have to hang onto all those extra bucks because they will be worth less. Not worthless, but worth less.

TECHNICAL SUMMARY

The internals were not that impressive.

Volume. NASDAQ -18%, 1.75B; NYSE -1.7%, 697M. Volume was down, and it was already quite low even before that drop. Volume overall has fallen considerably, so overall volume will not shock you if it is lower or higher.

Breadth. NASDAQ -2.9:1; NYSE -3.1. Decliners led thanks to the small caps suffering. Pretty obviously slanted toward the downside, but nothing grotesquely out of the norm or compared to what we have seen over the past year.

THE CHARTS

There was no big action. Friday was rather innocuous. It is a small start that may lead to something, but it was not showing it on Friday.

SP500. SP500 is back below the February peak, but it is holding the 10 day EMA. It is still in the steady rise. Looking at this, you might say this is no issue. If you ignore all of the tops, you may think that is no big deal at all. But that is not the case. We know they are there, but thus far the market has not broken. You just have to be concerned in the event that things get worse. What looks to be nothing can (as easily as not) develop into something, particularly when you are at prior highs.

DJ30. The Dow shows this. It broke through, but it just could not make it stick. The fell to the 10 day EMA as well, and now it is trading around in a range. It is still trying to hold, but it could easily come back and test the 50 day EMA that is marked roughly with the late-October peak. We have a place that is perfectly logical for the market to pull back and then turn back to the upside. That is much more logical than continuing on as it is without a pullback. Then again, the market does not always act according to our logic.

NASDAQ. The NASDAQ is very similar. It is holding its breakout, sitting with a doji on the 10 day EMA. A little island reversal. On Wednesday to Thursday there is a gap, and on Thursday to Friday a gap to the downside. Maybe that will lead to more selling, but it is nothing heavy duty. The bigger ones were back a week ago with that gap to the upside. If it gaps down from there, we have a pullback to the 50 day EMA. It is also roughly coincident with the late-October peak.

SP600. The small caps are a bit more interesting. The SP600 does not show a lot. Up and down, sliding just below the 10 day EMA. But if you look at the ETF that is traded, it gapped in something of an island reversal that one of the subscribers pointed out today. It gapped upside last week, it gapped downside on Friday. Could be a selloff. But how deep? You just look for a pullback down to that October high. At this point there is nothing to suggest otherwise.

SOX. The SOX was beaten up a bit. The chips took it on the chin. They have been one of the leaders, and they were roughed up somewhat. The question is whether they are going to lead to the downside. Some patterns got suddenly quite rocky. Not terrible, but not as comfortable as they were. It was like going over a big pothole in the road. The question is whether it smoothes back out or if we have more potholes that degrade and take it down to these October and early-November highs.

The markets are bumping up against those highs. There were some nominal breaks that everyone was excited about, but they are not able to push through. There is no follow-through, and that is something I always talk about. That is the key to anything whether it is a breakout of a stock or a selloff off a stock that breaks below support but then comes back and does not sell off. No follow through. The buyers cannot push the indices up through that resistance and make it stick or put mileage between it and those key points. If there is no follow-through, then the other side (whether you are upside or downside) tends to come back in. They push back and have some backsliding. That leaves us the possibly that we could have a bit of trouble, but that is what we have been looking for.

LEADERSHIP

Semiconductors. The chips are struggling a bit. Nothing major, but a bit of a struggle. ALTR is coming back toward the 200 day EMA. TXN is gapping downside, having a hard time getting through that early-January high. MRVL is one we have been watching and playing. It has been struggling. There is a little bit of hitch in the get-along, but that is okay. We are just being careful. We can get better setups out of these with a pullback. Why ride through something that is not looking that great in hopes that it gets better? Instead we can just let it come back and give us a test that sets it up a lot better. That is the theme I have been hounding you about for the past week. If you have a little trouble, do not mess around; just take it off the table and then maybe we will come back and later get a better buy on it.

Technology. It was a great week for AAPL. It was up 0.25 on Friday. It was showing a doji, but that was after a really nice run. We took some excellent gain off the table on the move. GOOG has had a good move to the upside. There are some interesting features. It has filled part of gap, and now it is up at a resistance point. If we draw another resistance line, it is bumping up against this range of resistance. We could see a downside move that would aid the market in testing. Is that not putting a positive spin on it?

Miscellaneous. Even though there are some trouble areas and potential problems, most every other area looks great from what we can tell. How do you tell? You look at the charts. I want to go through a group of stocks that we have that look good. TEX is performing very well. ARAY was off on the day, but it has had a great run. It was not showing that it is wearing out. TREX did not have a spectacular move, but it was down with a doji to the 10 day EMA. Plenty of positives with stocks still showing good action, good moves, and holding the market to the upside. That does not mean that these will continue to do so. Things start off quietly sometimes and then get worse. That is why we do not want to let positions get out of hand and start to hurt us.

THE ECONOMY

TO VIEW THE ECONOMIC SUMMARY VIDEO CLICK THE FOLLOWING LINK:
Economy Summary Video

Michigan Sentiment lower but in keeping with the recovering trend.

A wider trade gap is a good thing.

THE MARKET

SENTIMENT INDICATORS

VIX. Volatility did bounce. It rose significantly on the day. It was up +11.5%, but it tapped the 50 day EMA and backed off. That means the market is having a rough patch and reacting as you would think when it sold. It is still very low, but volatility can remain low for long periods of time. This will be the key move where it bumped that 50 day EMA because there are other peaks along the way from back in the summer and in late 2010. That will be a level up around 22 that tries to keep it in check.

VIX: 20.79; +2.16
VXN: 20.94; +2.04
VXO: 18.76; +1.86

Put/Call Ratio (CBOE): 1.1; +0.23

Bulls versus Bears:

This is a reading of the number of bullish investment advisors versus bearish advisors. The reason you look at this is that it gives you an idea of how bullish investors are. If they are too bullish then everyone is in the market and it is heading for a top: if everyone wants to be in the market, then all the money is in and there is no more new cash to drive it higher. On the other side of the spectrum if there are a lot of bears then there is a lot of cash on the sideline, and as the market rallies it drags that cash in as the bears give in. That cash provides the market the fuel to move higher. If bears are low it is the same as a lot of bulls: everyone is in and the market does not have the cash to drive it higher.

Bulls: 52.1% versus 48.9%. After a dip from 50.0% bulls are picking up steam. At the highest level since April and May of 2011, the peak of the post-bear market high. Now the indices are back at that level and so are the bulls. All the more reason to watch this action at the prior highs. 35% is the threshold measuring bullish versus bearish action. Six weeks the bulls were below bears. A powerful sentiment signal but now dissipating. Highs from April and December (60% readings spanning December through early May 2011). The 5 year high is 62.0. The crossover level at 29% bulls from July 2010 is long gone. 35% is the threshold level suggesting bullishness. To be seriously bearish it needs to get up to the 60% to 65% level.

Bears: 28.7% versus 29.8%. Still around the 30% level but starting to back off, matching the same level as three weeks back. A bit less fearful as the indices probe the prior highs. Not at a bearish level but they are growing more confident even as the market hits the prior highs and is not blasting on through. For more reference, bearishness hit a 5 year high at 54.4% the last week of October 2008. The move over 50 took bearish sentiment to its highest level since 1995. Extreme negative sentiment. Prior levels for comparison: Bearishness peaked at 37.4% in September 2007. It topped the June 2006 peak (36%) on that run. That June peak eclipsed the March 2006 high (33%) and well above the 2005 highs that spawned new rallies (30% in May 2005, 29.2% in October 2005). That was a huge turn, unlike any seen in recent history.

NASDAQ

Stats: -23.35 points (-0.8%) to close at 2903.88
Volume: 1.759B (-17.57%)

Up Volume: 405.95M (-654.05M)
Down Volume: 1.37B (+418.54M)

A/D and Hi/Lo: Decliners led 2.87 to 1
Previous Session: Decliners led 1.23 to 1

New Highs: 43 (-67)
New Lows: 14 (+4)

SP500/NYSE

Stats: -9.31 points (-0.69%) to close at 1342.64
NYSE Volume: 697M (-1.69%)

Up Volume: 819.86M (-1.45B)
Down Volume: 3B (+1.25B)

A/D and Hi/Lo: Decliners led 3.08 to 1
Previous Session: Advancers led 1.01 to 1

New Highs: 88 (-106)
New Lows: 11 (+4)

DJ30

Stats: -89.23 points (-0.69%) to close at 12801.23
Volume DJ30: 123M shares Friday versus 157M shares Thursday.

MONDAY

We are going into next week a bit cautiously, but we are looking for a test. Maybe it will hold and continue higher, but we are looking for a test that we can make plays off of. Plenty of data comes out next week. Tuesday we have Retail Sales back out. We have Business Inventories, and it will be important to see if they are rising. Empire Manufacturing is on Wednesday. On Thursday we have the Initial Claims, Philly Fed, Housing Starts, Building Permits, and the PPI. Friday we have the Leading Economic Indicators. Plenty to move the market, not to mention Greece and what will happen there over the weekend.

Considering all of that, we have to figure out what we want to do for the coming week. Frankly, I would love one more push to the upside and to take more gain off of the table. But you cannot count on that. The Friday action was not bad, but it may not get better. If we get a push downside, we need to be ready to continue what we are doing. Take gain off of the table, close positions, and do not let them hurt us. We have made a lot of great money, and we do not want to lose any of it. You will lose a little bit because, as you ride up, obviously you have positions that are not padded with a nice gain on them. You have to be quick. If you see they are in trouble, you take them off. If it gaps lower, then so be it. That is the way it goes.

It does not look like it will do that, but we are not going to sit around and wait for things to get down to the 50 day EMA without doing anything. We can buy back in at that point. I have a concern that this might be more than just a pullback. So many are positive that this is a great market to buy and that all we need is a little test and everything will be fine. But tests usually get to the point of discomfort. They want to scare you out as you see your profits evaporating. If you are back in the market down from October of 2011 and it comes right down here, then you will not feel much discomfort. But not everyone gets in right at the bottom, and you buy along the way. We do not want to get uncomfortable with positions. That is why we were taking them off of the table without much hesitation on Friday. We have been ruthless on them all week long, taking gains as well as taking trailing stop losses.

Just keep cool. There are still a lot of good patterns out there. We will look at some to the upside and some to the downside. There are some great patterns both ways, and we will get opportunity out of those. We have some that are still down at the bottom and ready to move up. If the market wants to go higher, if it gets some good news over the week, we could do that. We could get another week or two of run to the upside.

The market will go further than you think it should. Even now I think it should pull back. This is something that I have been thinking about all along. Remember, if it got to this target, I did not think it would go higher. But it could. That is just my thought; it is not the market's final word. I can kind of hear it walking up behind me and saying it might fall here. I am just listening and I am ready. I have a little adrenaline going (or maybe that is just coffee).

The point is we have to be ready. We need to know what we have, which is a good chunk of positions that are still in good shape. We have already banked a bunch of gain on them. If we get in any trouble, we want to take those off, too, and just wait for good opportunity. There are some of them that we can let ride. They are in great shape and we will not sell them out, like some old positions in AAPL. We might sell some calls on that, but we are not going to dump those shares because we have a little pullback in the market.

Again, my thesis is that this is just a pullback in the market and not a major decline. I may be proved wrong. If we get a pullback to the 50 day EMA or the late-October peak and it holds and we see a bunch of patterns setting up, we will be ready to buy again. We may be ready to buy on the way down if some early leaders find their purchase before the rest of the market and start move up. That is fine. We will just take them on a stock-by-stock basis. Overall I feel there could be a pullback, but we cannot be sure until the market lets us know. We have just been positioning ourselves to be ready for it, and we will continue to do so.

I will see you on Monday. We have a big week ahead, and we will preserve some money and make some money.

Have a great weekend!

Support and Resistance

NASDAQ: Closed at 2903.88
Resistance:
3026 from 10/2000 low
3042 from 5/2000 low

Support:
2888 is the May 2011 peak and post-bear market high
The 10 day EMA at 2881
2879 is the July 2011 peak
2862 is the 2007 peak
2841 is the February 2011 peak
2825 is the 2007 closing peak.
2816 is the early April 2011 peak.
2754 is the October 2011 high
The 50 day EMA at 2743
2706 to 2705 is the April 2011 low and the February 2011 and consolidation low (bottom of the trading range) 2723 to 2705 is the range of support at the bottom of the January to May trading range
2686 is the January 2011 closing low
2676 is the January 2010 low and the December 2011 peak
The 200 day SMA at 2663
2645-2650ish from December 2010 consolidation
2643 is the September 2011 high
2612 is the late August 2011 peak
2603 is the March 2011 intraday low (post-Japan low)
2599 is the June 2011 low and NASDAQ
2593 is the November intraday high
2580 is the November 2010 closing high
2572 is the November 2-11 gap down point
2555 is the mid-August 2011 peak
2546 is the early September 2011 gap down point
2535 is the November island reversal gap point
2532 is the early August gap down point
2469 is the November 2010 low
2441 is the November 2011 low
2331 from October 2010 low and the August 2011 intraday low
2305 from the August 2010 peak (summertime base)
2139 is the May and June 2010 low

S&P 500: Closed at 1342.64
Resistance:
1357 is the July 2011 peak
1364 is the March 2007 low
1370 is the August 2007 low
1371 is the recent May 2011 peak

Support:
1344 is the February 2011 peak
1340 is the early April 2011 peak
1332 is the early March 2011 peak
1325-27 is the March 2008 closing low and the May 2006 peak.
The 20 day EMA at 1323
1318.51 is the May low
1313 from the August 2008 interim peak
1295 to 1294 is the April 2011 low and the February 2011 consolidation low (bottom of the trading range)
1293 is the October 2011 peak
The 50 day EMA at 1290
1275 is the January 2010 low, early January 2011 peak
1267 is the December 2011 peak
1258 is June 2011 intraday low
The 200 day SMA at 1258
1255 is the late December 2010 consolidation range
1249 is the March 2011 low (post-Japan)
1235 is the mid-December 2010 consolidation low
1231 is the late August 2011 peak
1227 is the November 2010 peak
1220 is the April 2010 peak
1209 is the mid-August 2011 high
1196 is the November 2010 consolidation peak
1178-1180 is the October 2010/November 2010 consolidation low
1158 is the November 2011 low
1131 - 1127 from August 2010 base peak.
1119 is the early August closing low
1109 is the mid-September 2010 gap up point
1101 is the August 2011 low
1075 is the October 2011 intraday low
1099 from the mid-July interim peak

Dow: Closed at 12,801.23
Resistance:
12,876 is the May high
13,058 from the May 2008 peak on that bounce in the selling

Support:
12,754 is the July intraday peak
The 20 day EMA at 12,700
The 50 day EMA at 12,426
12,391 is the February 2011 peak
12,284 is the October 2011 peak
12,258 is the December 2011 peak
12,110 from the March 2007 closing low
12,094 is the April 2011 low
The 200 day SMA at 11,991
The June low at 11,897 (closing)
11,893 from March 2008 closing low
11,867 from the August 2009 high and peak on that bounce in the selling.
11,734 from 11-98 peak
11,717 is the late August 2011 peak
The August low at 11,702
11,555 is the March low
11,452 is the November 2010 peak
11,178 from November 2010
10,978 is the bottom of the November 2010 consolidation
10,750 from September 2010
10,720 is the August closing low
10,705-710 from January 2010 peak
10,694-700 from August 2010 peak
9938 is the August 2010 low

Economic Calendar

February 7 - Tuesday
- Consumer Credit, December (15:00): $19.3B actual versus $8.5B expected, $20.4B prior

February 8 - Wednesday
- MBA Mortgage Index, 02/04 (7:00): +7.5% actual versus -2.9% prior
- Crude Inventories, 02/04 (10:30): 0.304M actual versus 4.175M prior

February 9 - Thursday
- Initial Claims, 02/04 (8:30): 370K expected, 367K prior
- Continuing Claims, 01/28 (8:30): 3475K expected, 3437K prior
- Wholesale Inventories, December (10:00): 0.4% expected, 0.1% prior

February 10 - Friday
- Trade Balance, December (8:30): -$48.8B actual versus -$48.2B expected, -$47.1B prior (revised from -$47.8B)
- Michigan Sentiment, February Preliminary (9:55): 72.5 actual versus 74.0 expected, 75.0 prior
- Treasury Budget, January (2:00): -$27.4B actual versus -$40.0B expected, -$49.8B prior

February 14 - Tuesday
- Retail Sales, January (8:30): 0.8% expected, 0.1% prior
- Retail Sales ex-auto, January (8:30): 0.5% expected, -0.2% prior
- Export Prices ex-ag., January (8:30): -0.2% prior
- Import Prices ex-oil, January (8:30): 0.1% prior
- Business Inventories, December (10:00): 0.5% expected, 0.3% prior

February 15 - Wednesday
- MBA Mortgage Index, 02/11 (7:00): 7.5% prior
- Empire Manufacturing, February (8:30): 14.0 expected, 13.5 prior
- Net Long-Term TIC Flow, December (9:00): $59.8B prior
- Industrial Production, January (9:15): 0.6% expected, 0.4% prior
- Capacity Utilization, January (9:15): 78.6% expected, 78.1% prior
- NAHB Housing Market , February (10:00): 26 expected, 25 prior
- Crude Inventories, 02/11 (10:30): 0.304M prior
- FOMC Minutes, 1/25 (14:00)

February 16 - Thursday
- Initial Claims, 02/11 (8:30): 365K expected, 358K prior
- Continuing Claims, 02/04 (8:30): 3505K expected, 3515K prior
- Housing Starts, January (8:30): 670K expected, 657K prior
- Building Permits, January (8:30): 675K expected, 679K prior
- PPI, January (8:30): 0.3% expected, -0.1% prior
- Core PPI, January (8:30): 0.1% expected, 0.3% prior
- Philadelphia Fed, February (10:00): 10.0 expected, 7.3 prior

February 17 - Friday
- CPI, January (8:30): 0.3% expected, 0.0% prior
- Core CPI, January (8:30): 0.2% expected, 0.1% prior
- Leading Indicators, January (10:00): 0.5% expected, 0.4% prior
icon url

ReturntoSender

02/13/12 11:01 PM

#9680 RE: ReturntoSender #6755

From Briefing.com: 4:24PM Ultra Clean Holdings pops ~16% to $9.03 on thin volume after hours following earnings/guidance results ( see 16:22 post) (UCTT) 7.80 +0.04 :

4:22PM Ultra Clean Holdings beats by $0.03, beats on revs; guides Q1 EPS above consensus, revs above consensus (UCTT) 7.80 +0.04 : Reports Q4 (Dec) earnings of $0.06 per share, excluding non-recurring items, $0.03 better than the Capital IQ Consensus Estimate of $0.03; revenues fell 27.8% year/year to $86.9 mln vs the $85.3 mln consensus. Co issues upside guidance for Q1, sees EPS of $0.15-0.18 vs. $0.10 Capital IQ Consensus Estimate; sees Q1 revs of $105-110 mln vs. $88.98 mln Capital IQ Consensus Estimate.

4:20 pm : Stocks started the day higher on encouraging news about agreement from Greece on proposed austerity measures. The early bid waned off the open, but buyers stepped back in around mid-morning and stocks closed right around the levels where they opened, with the S&P 500 adding 0.7%.

After weeks of haggling over austerity plan details, many market participants were concerned that Greece's parliament would drag its feet in passing new measures, but, over the weekend, the country approved the plan, bringing it closer to securing additional bailout funds. That said, eurozone officials still have to approve Greece's plan. There are also challenges associated with implementing any new measures.

The news inspired buying abroad, resulting in varied gains for the world's major equity averages. Domestic averages have followed suit, but they have wavered since the start of the session. Nonetheless, improved sentiment in the wake of the Greece headline has helped take the Dow Jones Global Index up to a 0.7% gain.

Industrial stocks were the strongest today, with the sector gaining 1.2%. Financials, which are considered to be most sensitive to the European crisis, were the second strongest sector, finishing the day +0.9%.

Tech stocks, which make up the largest sector by market weight, were a laggard, gaining 0.6% on the day.

Despite the relatively unimpressive performance of tech stocks, the tech-rich Nasdaq actually maintained a narrow lead over its counterparts today. Apple (AAPL 502.60, +9.18) was a leader in the Nasdaq as it made a push past the psychologically significant $500 level earlier.

Late in the session, a technical glitch halted crude oil trading on the CME. After the halt, crude resumed trading higher and is now around $100.57. Crude ended 1.8% higher at $100.40/barrel in floor trading. Feb natural gas remained in the red all session. The energy component attempted to erase all of its losses in early morning activity, but couldn't hold and closed 2% lower at $2.43/MMBtu.

There haven't been any other stories of great importance today -- earnings reports are sparse and without broad consequence and there hasn't been a single economic announcement. That has likely further depressed participation today, resulting in trading volume that was well below average.DJ30 +72.81 NASDAQ +27.51 SP500 +9.13 NASDAQ Adv/Vol/Dec 1864/1.57 bln/692 NYSE Adv/Vol/Dec 2370/682.6 mln/719

10:13AM Marvell and VeriSilicon Holdings announce a licensing agreement for ZSP G3 cores (MRVL) 15.84 -0.21 : The agreement includes the Dual-MAC ZSP800M and ZSP880M synthesizable DSP cores which are area and power optimized for efficient mobile application and digital entertainment platform solutions.

Trina Solar (TSL) announced that its multicrystalline modules manufactured with European-sourced silicon wafers have been certified by the independent Italian institute ICIM and fulfill GSE requirements for a 10% feed-in tariff premium in Italy.

7:34AM NXP Semi announced that its subsidiary together with NXP Funding is intending to redeem all of its outstanding Euro-denominated 8 5/8% Senior Notes due October 2015 (NXPI) 21.62 : Co announced that its subsidiary, NXP B.V., together with NXP Funding is intending to redeem all of its outstanding Euro-denominated 8 5/8% Senior Notes due October 2015, and all outstanding U.S. dollar-denominated 9 1/2% Senior Notes due October 2015, in the total amount of ~$775 mln. These proposed redemptions would be financed by a $300 mln draw-down under the existing Revolving Credit Facility, as well as by new secured loans up to $475 mln, subject to their completion.

7:06AM KVH Industries reports EPS in-line, revs in-line; guides Q1 EPS below consensus, revs below consensus; guides FY12 revs below consensus (KVHI) 9.90 : Reports Q4 (Dec) earnings of $0.11 per share, in-line with the Capital IQ Consensus Estimate consensus of $0.11; revenues rose 18.1% year/year to $31.9 mln vs the $31.91 mln consensus. Co issues downside guidance for Q1, sees EPS of ($0.09)-($0.03) vs. $0.05 Capital IQ Consensus Estimate; sees Q1 revs of $25.5-28.5 mln vs. $28.74 mln Capital IQ Consensus Estimate. Co issues downside guidance for FY12, sees FY12 revs of +10-15% YoY, calc'ing to $123.7-129.4 mln vs. $132.56 mln Capital IQ Consensus Estimate.

MagnaChip Semiconductor (MX) announced that its foundry services has begun ramping its 0.35um mixed-signal process for Micro Electro Mechanical Systems Accelerometer applications.

Lattice Semiconductor Corporation (LSCC) announced that it has shipped more than 20 mln programmable mixed signal devices.

NVIDIA (NVDA $16.14 +0.24) was upgraded to Outperform from Mkt Perform at FBR Capital and the firm put a target of $20 on the stock. The Firm notes their upgrade is a short-term tactical upgrade for a move toward $20, with integrated GPU attach rate risks and lower PC BOM cost risks still major challenges for co in coming quarters. They generally believe shares are at the bottom of their trading range near $12 and overbought above $20, with valuation now reasonably attractive at 13.5x P/E.

10:10 am S&P Tech Sector Trading Higher, About In-line With The S&P 500
The tech sector is trading higher today, along with gains in the broader market. Semiconductors are showing relative weakness in line with the tech space with the Philly Semi Index trading only 0.1% higher. AMD (+3.1%) is a notable leader in the chip index, while CREE (-2.6%) is a laggard. Among other major indices, the SPY is trading 0.6% higher, while the NASDAQ and the QQQ are trading 0.8% higher on the session. Among tech bellwethers, AAPL (+1.4%) is showing strength, while TXN (-0.7%) are under a little pressure.

In news, TXCC (+3.9%) announced at-the-market issuance program to sell up to $10 mln in stock. Among rumors, we are hearing APKT (+3.1%) takeover chatter making the rounds.

Among notable analyst upgrades this morning, NVDA (+0.9%) was upgraded to Outperform at FBR Capital and AMD (+3.1%) was upgraded to Outperform at Bernstein. Among downgrades, MRVL (-1.6%) and BRCM (-1.0%) were downgraded to Hold at The Benchmark Company, NTAP (-1.4%) was downgraded to Hold at ThinkEquity and MWW (-3.2%) was downgraded to Sell at Citigroup.

FIS (+1.2%) is the notable name in tech scheduled to report results today after the close.
icon url

ReturntoSender

02/14/12 9:36 PM

#9681 RE: ReturntoSender #6755

From Briefing.com: 4:30 pm : Stocks staged a late rally that left the Dow and Nasdaq to finish at the neutral line and the S&P 500 to settle with only a fractional loss after all three had spent the session wrestling with selling pressure.

Market participants applied pressure to stocks in the wake of news that analysts at Moody's downgraded the debt ratings of several countries in the eurozone periphery. They also issued negative outlooks on France, Austria, and the United Kingdom. The headline acted as a reminder of the precarious conditions that persist in the eurozone even as efforts to restore conditions in flagging Greece continue.

Monthly retail sales were mixed. Overall retail sales for January were up 0.4%, but that's only half of the 0.8% increase that had been broadly expected to follow the flat rate posted for the prior month. Excluding autos, retail sales climbed by 0.7% to exceed the 0.5% increase that had been forecasted to follow a downwardly revised 0.5% decline in the prior month.

Export and import price data showed too little movement for traders to consider worthy of their attention. Business inventory data for December also failed to inspire; overall inventories increased by 0.4%, which is slightly less than the 0.5% increase that had been broadly anticipated.

Early losses were broad, but the stock market's slide was hardly steep. However, sellers were enticed to redouble their efforts with every failed rebound effort by the broad market. That trend took stocks to session lows late in the day, but without the command of any headline or catalyst buyers stepped in with some strong bidding once stocks stabilized narrowly beneath the depths set in the prior session.

The late squeeze higher helped every sector cut its loss. Still, both financials and materials stocks suffered collective losses slightly greater than 1%. The two groups lagged all session.

A lack of share volume likely made the stock market's upward move a little easier, given that individual bids carry greater relative weight on lightly traded sessions. In fact, during the final 30 minutes of trade share volume on the NYSE surged from less than a half billion shares to almost 750 million shares. Although that final tally is still quite paltry, it reflects a near 50% surge in share volume during the final leg of trade.

The greenback staged a strong advance today, resulting in a 0.6% gain for the Dollar Index. Most of that move is owed to a weaker yen, which tumbled so that its exchange rate climbed more than 1% to 78.40 yen per dollar following the decision of Japan's central bank to increase the size of its asset purchase program by about 18% to 65 trillion yen from 55 trillion yen.

Advancing Sectors: Consumer Staples +0.4%, Health Care +0.3%, Utilities +0.2%, Energy +0.2%, Tech +0.2%
Declining Sectors: Telecom -0.1%, Consumer Discretionary -0.1%, Industrials -0.3%, Financials -1.1%, Materials -1.3%DJ30 +4.24 NASDAQ +0.44 NQ100 +0.2% R2K -0.5% SP400 -0.1% SP500 -1.27 NASDAQ Adv/Vol/Dec 967/2.10 bln/1570 NYSE Adv/Vol/Dec 1088/744 mln/1904

7:27AM Tegal announces continuing discussions for balance of nanolayer deposition patent portfolio (TGAL) 3.99 : Co announced renewed efforts to make available the balance of its semiconductor process-related intellectual property portfolio. The remaining portfolio consists of thin film structures and process technology pertaining to copper barrier and low-k dielectric technology. On December 30, 2011, Tegal announced that it had sold over thirty patents from Lots 1-3 of its Nano Layer Deposition Patent Portfolio to multiple bidders for an aggregate consideration of approximately $4 million.

Microsemi (MSCC) announced its participation in a multi-disciplinary consortium funded by the European Union (Seventh Framework Programme, FP7) tasked with developing standardized Electro Mechanical Actuators for aerospace applications to eliminate hydraulic circuits, pumps and reservoirs.

Mattson Technology (MTSN) announced that a leading semiconductor manufacturer has accepted its paradigmE etch system for the production of advanced logic chips.

NXP Semiconductors (NXPI) announced its LPC1100LV series, the world's first ARM Cortex-M0 microcontroller with dual supply voltage of 1.65V to 1.95V VDD and 1.65V to 3.6V VIO.

Rackspace (RAX $54.66 +5.43) reported fourth quarter earnings of $0.18 per share, $0.02 better than the Capital IQ Consensus of $0.16, while revenues rose 32.0% year/year to $283.3 million versus the $280.89 million consensus.

Ultra Clean Holdings (UCTT $8.92 +1.12) reported fourth quarter earnings of $0.06 per share, excluding non-recurring items, $0.03 better than the Capital IQ Consensus Estimate of $0.03, while revenues fell 27.8% year/year to $86.9 million versus the $85.3 mln consensus. The company issued upside guidance for the first quarter with EPS of $0.15-0.18 versus the $0.10 consensus and revenues of 105-110 million versus the $88.98 million consensus.

11:30 am S&P Tech Sector Down Modestly, In-line With Broader Markets
The tech sector is trading lower today along with losses in the broader market. Semiconductors are showing slight relative strength in the tech space. The Philly Semi Index is trading only 0.2% lower. WFR (-7.2%) is a notable laggard in the chip index, while MU (+4.8%) is showing strength. Among other major indices, the SPY is trading 0.4% lower, while the NASDAQ is 0.5% lower and the QQQ is trading 0.3% lower on the session. Among tech bellwethers, AAPL (+0.2%) is showing strength, while TXN (-1.1%) is under notable pressure.

In earnings last night, FIS (+7.3%) posted a slight beat and increased its dividend. RAX (+10.0%) also reported a quarterly beat.

In news, the Dept of Justice cleared GOOG's (-0.6%) purchase of MMI (+0.1%) and the acquisitions of Certain Patents by AAPL (+0.2%), MSFT (-1.0%) and RIMM (-1.5%).

Among rumors, there are reports that ALU (+2.5%) may be nearing a deal with S (-1.7%). Elsewhere, there is renewed IDCC (-0.7%) takeover chatter making the rounds.

Among notable analyst upgrades this morning, The Benchmark Company upgraded RAX (+10.0%) to Buy. Among downgrades, ASIA (-3.3%) was downgraded to Hold at Jefferies following earnings last night, NTCT (-7.0%) was downgraded to Neutral at Sterne Agee and SMT (0.0%) was downgraded to Equal Weight at Morgan Stanley.

ZNGA (+4.7%) is one of the more notable names in tech scheduled to report results today after the close.
icon url

ReturntoSender

02/16/12 12:09 AM

#9682 RE: ReturntoSender #6755

From Briefing.com: 4:30 pm : Stocks settled with sizable losses near session lows following a mid-session swoon.

The tone ahead of the open was actually positive. Premarket participants were encouraged by news that China intends to expand its investment in Europe, although enthusiasm was tempered by a negative response to headlines that eurozone officials may wait to doll out bailout funds to Greece due to doubts about sincerity of the flagging country's commitment to new austerity measures which were approved by its parliament this past weekend.

The first half of the session was mostly mixed with the S&P 500 chopping along with a modest gain, the Dow down because of lackluster action among blue chips, and the Nasdaq sporting an enviable gain with help from tech stocks.

Apple (AAPL 497.67, -11.79) was also a source of support for the Nasdaq. However, a sudden and concerted shift in sentiment sent the stock sliding from an all-time high above $525, which reflected a climb of more than 25% since it reported earnings less than one month ago, into the red on strong volume. Given the stock's size and influence -- it is the single greatest stock by market cap -- it weighed heavily on broad market action and prompted many participants to slap on sell orders. The retreat took the major equity averages into the red. None could recover.

Upside earnings surprises from Comcast (CMCSA 28.52, +1.27) and Teva Pharma (TEVA 45.04, +1.52) helped their shares maintain impressive gains in the face of the sell-off. Despite better-than-expected results of its own, Deere & Co. (DE 84.28, -4.77) shares dropped sharply to a new monthly low. Strikingly, Abercrombie & Fitch (ANF 48.30, +3.71) shares surged to a new two-month high after the apparel retailer unveiled earnings that came short of the consensus. Encouraging commentary from company management was credited for restoring confidence in the stock.

Economic data wasn't altogether exciting. The Empire Manufacturing Survey hit 19.5 in February, up from 13.5 in the prior month. It also exceeded the reading of 14.0 that had been widely anticipated.

Industrial production for January proved disappointing. Data showed no change, which contrasts with the 0.6% increase that had been broadly expected to follow a 1.0% increase in the prior month.

The Housing Market Index impressed some participants by stretching to 29 in February from 25 in the prior month. Many thought that it would improve to just 26.

Minutes from the most recent FOMC meeting failed to induce any meaningful broad market action. However, Regional Fed President Lacker dissented in regard to the description of the time period over which economic conditions were likely to warrant exceptionally low levels of the federal funds rate, which stands at 0.00% to 0.25%, because he expects a tightening of monetary policy to prevent inflation projections or expectations prior to the end of 2014.

The dollar didn't see a great deal of action today. Instead, it generally held near the flat line, which is right about where it was by session's end. That said, the euro shed about 0.5% against the greenback to trade at $1.31. Concerns about Greece appeared to overshadow some eurozone GDP data that was generally better than what many had predicted. The headline numbers for fourth quarter GDP featured a 0.3% decline for the eurozone, a 0.2% decline in Germany, and a 0.2% increase in France. Just the other day analysts at Moody's announced they had assigned a negative outlook to France's credit rating.

Although it appeared that the risk trade was turned off, oil prices finished pit trade at $101.78 per barrel for a 1.0% gain. Buying interest was bolstered by concerns about Iran's armament efforts and possible plans by the country to cut its exports.

Advancing Sectors: (None)
Unchanged: Materials
Declining Sectors: Health Care -0.2%, Consumer Staples -0.2%, Energy -0.3%, Consumer Discretionary -0.5%, Telecom -0.5%, Financials -0.6%, Utilities -0.6%, Tech -0.6%, Industrials -1.4%DJ30 -97.33 NASDAQ -16.00 NQ100 -0.8% R2K -0.8% SP400 -0.3% SP500 -7.27 NASDAQ Adv/Vol/Dec 940/2.02 bln/1595 NYSE Adv/Vol/Dec 1276/806 mln/1736

4:37PM MEMC Elec misses by $0.05, misses on revs; guides Q1 revs in-line (WFR) 4.65 -0.07 : Reports Q4 (Dec) loss of $0.21 per share, $0.05 worse than the Capital IQ Consensus Estimate of ($0.16); revenues fell 15.6% year/year to $717.8 mln vs the $770.64 mln consensus. MEMC Elec sees Q1 revs down 10-15% sequentially; consensus calls for a ~15% decline (Q1 revs of approx $609-645 mln vs. $623.52 mln Capital IQ Consensus Estimate).

For the first quarter 2012: Semiconductor cycle bottom in Q1 2012 Expecting 10% - 15% lower revenue in Q1 2012 vs. Q4 2011, Orders picking up for Q2 2012; Solar energy systems interconnection volume of less than 100 MW Approximately, 50 MW will be recognized for non-GAAP revenue, Approximately 45 MW of balance sheet projects; Solar energy systems average pricing of approximately $4.25/watt; Operating expenses less than $110 million; Capital spending less than $50 million; Interest / other expense less than $25 million; Non-GAAP tax rate of approximately 30%.

For the full year 2012: Semiconductor revenue flat year-over-year, Revenue in second half 2012 stronger than in first half 2012, Solar energy systems sales volume greater than 400 MW; Solar energy systems average pricing of approximately $3.75/watt; Operating expenses less than $375 million; Capital spending less than $175 million; Interest/other expense less than $100 million; Non-GAAP tax rate of approximately 30%.

4:32PM Photronics reports EPS in-line, misses on revs (PLAB) 7.53 +0.08 : Reports Q1 (Jan) earnings of $0.09 per share, excluding non-recurring items, in-line with the Capital IQ Consensus Estimate consensus of $0.09; revenues fell 7.1% year/year to $112.2 mln vs the $113.72 mln consensus.

4:20PM NVIDIA -- Earnings Mover (NVDA) 16.17 : Negative initial reaction to earnings as price sinks down roughly $0.50-0.75 down into the $15.50 zone. Initial after hours spike low down near $15.20.

4:12PM Agilent reports EPS in-line, revs in-line; guides Q2 EPS below consensus, revs below consensus; guides FY12 EPS in-line, revs in-line (A) 43.64 -0.14 : Reports Q1 (Jan) earnings of $0.69 per share, excluding non-recurring items, in-line with the Capital IQ Consensus Estimate consensus of $0.69; revenues rose 7.6% year/year to $1.64 bln vs the $1.65 bln consensus. Co issues downside guidance for Q2, sees EPS of $0.71-0.73, excluding non-recurring items, vs. $0.78 Capital IQ Consensus Estimate; sees Q2 revs of $1.70-1.72 bln vs. $1.75 bln Capital IQ Consensus Estimate. Co issues in-line guidance for FY12, sees EPS of $3.13-3.23, excluding non-recurring items, vs. $3.16 Capital IQ Consensus Estimate; sees FY12 revs of $6.92-7.02 bln vs. $6.97 bln Capital IQ Consensus Estimate.

4:07PM NetApp reports EPS in-line, revs in-line; guides AprQ in-line (NTAP) 39.88 +0.76 : Reports Q3 (Jan) earnings of $0.58 per share, excluding non-recurring items, in-line with the Capital IQ Consensus Estimate consensus of $0.58; revenues rose 21.4% year/year to $1.57 bln vs the $1.56 bln consensus. Co issues in-line guidance for Q4 (Apr), sees EPS of $0.60-0.65, excluding non-recurring items, vs. $0.63 Capital IQ Consensus Estimate; sees Q4 revs of $1.645-1.725 bln vs. $1.68 bln Capital IQ Consensus Estimate.

SanDisk (SNDK) announced it has entered into a worldwide, exclusive agreement with Diskeeper Corp. to license its caching software solutions for solid state disk drives.

8:55AM SanDisk announced it agrees to Acquire FlashSoft; financial terms not disclosed (SNDK) 47.00 : Co intends to sell FlashSoft's products as standalone software, as well as offer these software products in combination with its growing portfolio of SAS, PCIe and SATA enterprise solutions. The FlashSoft acquisition is expected to be neutral to SanDisk's earnings in 2012 and accretive in 2013. Additional details of the acquisition were not released.

8:07AM Chipmos Technology reported revenue for the month of January 2012 was NT$1,443.0 mln or US$48.7 mln, a decrease of 1.2% from the month of December 2011 and a decrease of 6.8% from the same period in 2011 (IMOS) 8.62 :

12:54 pm S&P Tech Sector Shows Modest Gains, But Is Outperforming The S&P 500
The tech sector is trading higher today, outpacing minor losses in the broader market. Semiconductors are showing relative strength in the tech space; the Philly Semi Index is trading 1.3% higher. CREE (+4.6%) is a notable leader in the chip index. Among other major indices, the SPY is trading 0.1% lower, while the NASDAQ is 0.2% higher and the QQQ is trading 0.3% higher on the session. Among tech bellwethers, AAPL (-0.3%) is showing strength, while T (-0.5%) is under pressure.

In earnings last night, ZNGA (-12.6%) posted a slight beat with inline guidance, while QSFT (-8.8%) reported a mixed qtr and guided above consensus. In news, Third Point, which owns 5.56% of YHOO (-0.8%), disclosed last night its intention to nominate 4 to the Board of YHOO. Elsewhere, SNDK (+2.6%) announced this morning it will acquire FlashSoft, which is expected to become accretive in 2013. Among rumors, LNKD (-0.2%) is reportedly in talks to enter China.

Among notable analyst upgrades this morning, The Benchmark Company upgraded FIO (+3.4%) to Buy and FIS (+1.7%) was upgraded to Neutral at JP Morgan.

Among downgrades, ZNGA (-12.6%) was downgraded at Robert W. Baird, BofA/Merrill, and Barclays. Also, PWAV (-14.6%) was downgraded to Underweight at JP Morgan, RAX (-0.3%) was downgraded to Market Perform at Raymond James, ASIA (-1.8%) was downgraded to Sell at UBS, ORCL (+0.1%) was downgraded to Above Average at Caris, and DELL (-0.1%) was downgraded to Underperform at Sterne Agee.

A (+0.9%), CTL (+0.3%), NTAP (+2.3%), and NVDA (+0.4%) are some notable names in tech scheduled to report results today after the close.
icon url

ReturntoSender

02/16/12 9:34 PM

#9683 RE: ReturntoSender #6755

From Briefing.com: 4:15PM Applied Materials beats by $0.06, beats on revs; guides Q2 EPS, revs above consensus (AMAT) 13.21 +0.31 : Reports Q1 (Jan) earnings of $0.18 per share, excluding non-recurring items, $0.06 better than the Capital IQ Consensus Estimate of $0.12; revenues fell 18.5% year/year to $2.19 bln vs the $1.97 bln consensus. Co issues upside guidance for Q2, sees EPS of $0.20-0.28, excluding non-recurring items, vs. $0.16 Capital IQ Consensus Estimate; sees Q2 revs +5-15% QoQ to ~$2.30-2.52 bln vs. $2.09 bln Capital IQ Consensus Estimate. Backlog -$230 mln QoQ to $2.2 bln.

4:12PM SunPower reports surprise profit, misses on revs; guides Q1 EPS in-line, revs below consensus; guides FY12 revs in-line (SPWR) 7.48 +0.15 : Reports Q4 (Dec) earnings of $0.16 per share, excluding non-recurring items, $0.27 better than the Capital IQ Consensus Estimate of ($0.11); revenues fell 39.9% year/year to $563.4 mln vs the $652.4 mln consensus. Co issues guidance for Q1, sees EPS of ($0.05)-(0.20), excluding non-recurring items, vs. ($0.23) Capital IQ Consensus Estimate; sees Q1 revs of $420-495 mln vs. $596.22 mln Capital IQ Consensus Estimate. Co issues in-line guidance for FY12, sees FY12 revs of $2.6-3.0 bln vs. $2.69 bln Capital IQ Consensus Estimate. and MW recognized to be in the range of 900 MW to 1,200 MW. SunPower remains committed to achieving break even or better non-GAAP profitability and a year-end unrestricted cash balance of more than $300 million, while investing in cost reduction initiatives.

3:32PM Semiconductor Hldrs reaches new high of 35.30, nearing its eight month high from July at 35.36 (SMH) 35.28 +0.79 : INTC +1.2%, MRVL +3.6%, KLAC +3.5%, ALTR +2.8%, BRCM +2.8%, LRCX =2.7%, XLNX +2.7%.

11:18AM NVIDIA continues its opening reversal higher following earnings as buyers take it up into modest gap down high territory near $16.00 (NVDA) 16.00 -0.16 :

11:10AM RF Micro Device responds to patent infringement claim - will vigorously defend its position (RFMD) 5.02 +0.14 : Co responded to the filing of a patent infringement lawsuit by Peregrine Semiconductor Corporation relating to radio frequency integrated circuits (RFICs) and switching technology:

RF Micro Devices has a strong intellectual property portfolio relating to RFICs and switching technology that it has developed over many years, and RFMD intends to vigorously defend its position in this lawsuit. As a leading technology company, RFMD respects the intellectual property rights of others and takes care to avoid infringements. RFMD is fully committed to its entire product portfolio, and all RFMD products will continue to be provided to RFMD's customers without interruption while this lawsuit is being contested.

10:31AM Ramtron signs global distribution agreement with Digi-Key Corporation (RMTR) 2.25 +0.01 : The distribution agreement will make Ramtron's entire line of F-RAM-enabled semiconductors available for purchase from www.digikey.com and Digi-Key's international websites.

8:02AM Trina Solar subsidary announces $100 mln structured term loan facility (TSL) 9.16 : Co announced today that its wholly-owned subsidiary, Trina Solar (Changzhou) Science & Technology Co. Ltd., has obtained a three-year structured term loan facility from Standard Chartered Bank. The structured term loan facility is for an amount of up to $100 mln dollars, which may be drawn down in single or multiple tranches within the first 12 months. Each tranche is for a term of up to 36 months from the initial drawdown date, and may be extended for up to another two years. The facility will support the Company's announced East Campus project, which is expected to add approximately 500 MW of cell and module capacity and feature its high-efficiency Honey cell technology.

7:34AM Freescale Semi announces launch of new financing under senior secured credit facilities (FSL) 17.20 : Co announced that Freescale Semiconductor, its wholly owned indirect subsidiary, is seeking commitments for a new senior secured term loan facility under its existing senior secured credit facilities in an aggregate principal amount of up to $500 mln. The proceeds from the new term loans are intended to be used to redeem, repurchase or otherwise acquire a portion of Freescale's senior subordinated notes due 2016 and, at Freescale's option, a portion of its senior notes due 2014, and to pay related redemption premiums, fees and expenses.

Socket Mobile (SCKT) announced a partnership with nSales. The collaboration enables sales representatives to quickly enter orders, look up account information, and check inventory levels during customer visits using a solution based on the Apple iPad (AAPL).

NetApp (NTAP $42.41 +2.56) reported third quarter earnings of $0.58 per share, excluding non-recurring items, in-line with the Capital IQ Consensus of $0.58, while revenues rose 21.4% year/year to $1.57 billion versus the $1.56 billion consensus. The company issued in-line guidance for the fourth quarter EPS of $0.60-0.65, excluding non-recurring items, versus the $0.63 consensus with revenues of $1.645-1.725 billion versus the $1.68 billion consensus.

Agilent (A $42.32 -1.32) reported first quarter earnings of $0.69 per share, excluding non-recurring items, in-line with the Capital IQ Consensus of $0.69, while revenues rose 7.6% year/year to $1.64 billion versus the $1.65 bln consensus. The company issued downside guidance for the first quarter with EPS of $0.71-0.73, excluding non-recurring items, versus the $0.78 Capital IQ Consensus with revenues of $1.70-1.72 billion versus the $1.75 billion consensus The company issued in-line guidance for fiscal year 2012 with EPS of $3.13-3.23, excluding non-recurring items versus the $3.16 consensus with fiscal year 2012 revenues of $6.92-7.02 billion versus the $6.97 billion consensus.

Nvidia (NVDA $15.46 -0.77) reported fourth quarter earnings of $0.26 per share, excluding non-recurring items, $0.02 better than the consensus of $0.24, while revenues rose 7.5% year/year to $953.2 million versus the $950.1 million consensus. Co issues downside guidance for the first quarter with revenues of $900-930 million versus the 948.7 million consensus. Non-GAAP gross margin in Q4 was 52.5%, and the company guided first quarter on-GAAP gross margin at 48.5-50.5%.

4:30 pm : Stocks staged a steady ascent that settled with the S&P 500 at its best level in about nine months. The effort was broad-based, but lacked share volume.

Although a bullish bias prevailed, action opened with the broad market near the neutral line. Participants were initially somewhat divided on how to respond to the latest wave of headlines. Without any reports of progress traders continued to express concern about potential problems in delivering bailout funds to Greece after it became apparent earlier in the week that eurozone officials are skepitcal of the flagging country's commitment to newly approved austerity measures.

Morning sentiment was also challenged by the threat that analysts at Moody's might reduce their ratings on a bevy of major banks and financial institutions, including Bank of America (BAC 8.09, +0.31), Citigroup (C 32.71, +0.99), JPMorgan Chase (JPM 38.00, +0.60), and Goldman Sachs (GS 114.74, +1.57).

There was a substantial dose of traders to digest, too. Overall, though, it proved pleasing.

The latest weekly initial jobless claims count totaled 348,000, which is less than 365,000 initial claims that had been broadly expected to follow the upwardly revised prior week tally of 361,000. Continuing claims made a significant decline to 3.43 million from 3.53 million.

Housing starts improved in January to an annualized rate of 699,000 from an upwardly revised rate of 689,000 in the prior month. That surpassed the pace of 671,000 housing starts that had been broadly expected. Building permits made a modest improvement to an annualized rate of 676,000 from a downwardly revised rate of 671,000, but that was on par with what had been widely expected.

Producer prices proved more mixed. Total producer prices in January were up 0.1%, which is less than the 0.3% increase that had been broadly predicted, but core producer prices climbed at a clip of 0.4% to double the increase that had been widely expected.

After the open, the Philadelphia Fed Survey for February rang in at 10.2. That marked strong improvement over the 7.3 posted in the prior month and narrowly surpassed the 10.0 that had been expected, on average, among economists polled by Briefing.com.

Once the data was out of the way stocks engaged in a steady ascent that was initially led by the financial sector. Financials were able to overcome early weakness associated with the threat of a downgrade to many of the sector's major constituents to collectively climb to a 1.6% gain.

The Financial sector's effort was matched by the Tech sector, which is the largest sector by market weight. A break-out by Microsoft (MSFT 31.28, +1.24) to a four-year high made the stock a leader among tech issues. It also helped the Nasdaq move ahead of its counterparts.

Although short-covering likely played a part, General Motors (GM 27.17, +2.24) shares also staged an impressive move that settled with the stock at its best level since summer. The automaker's earnings fell short of the consensus estimate, but that was countered by a strong revenue figure and news of increased market share.

As market participants returned to riskier assets the dollar dropped out of favor after it had been bid higher in the early going. By session's end the euro had climbed 0.6% against the greenback, while the sterling pound advanced 0.7% against it.

Treasuries also traded lower. Their slide sent the yield on the benchmark 10-year Note back up to almost 2.0% after it had been at a weekly low near 1.90% just yesterday.

Apathy continues to detract from share volume. More specifically, a lack of participation today kept total share volume on the NYSE near 800 million, which is on par with trends of the past several months.

Advancing Sectors: Materials +1.7%, Financials +1.6%, Tech +1.6%, Energy +1.2%, Utilities +1.1%, Industrials +0.8%, Consumer Staples +0.7%, Health Care +0.7%, Telecom +0.7%, Consumer Discretionary +0.5%
Declining Sectors: (None)DJ30 +123.13 NASDAQ +44.02 NQ100 +1.4% R2K +2.0% SP400 +1.5% SP500 +14.81 NASDAQ Adv/Vol/Dec 1945/1.92 bln/602 NYSE Adv/Vol/Dec 2293/805 mln/750

10:45 am S&P Tech Sector Up Modestly
The tech sector is trading higher higher today by 0.3%, in line with gains in the broader market. Semiconductors are showing relative strength in the tech space; the Philly Semi Index is trading 0.8% higher. NITT (+1.4%) is a notable leader in the chip index. Among other major indices, the SPY & NASDAQ are trading 0.3% higher. Among tech bellwethers, AAPL (-1.0%) is showing weakness.

In earnings last night, NVDA (-1.8%) posted a slight beat, however reported disappointing guidance. Elsewhere, NTAP (+6.0%) reported an in line quarter.

In news, there were reports that Alibaba was planning on agreeing to terms for a $3 billion loan. In addition, there were reports that More cities in China have stopped AAPL (-1.0%) Ipad orders

Among notable analyst upgrades this morning, ITRI (+18.6%) was upgraded to Buy from Hold at ThinkEquity following strong earnings, AMZN (-4.1%) was downgraded to Equal Weight from Overweight at Morgan Stanley, WFT (-0.8%) was upgraded to Hold from Underperform at Jefferies. MXIM (+1.6%) was initiated with an Outperform at RBC Capital.

AMAT (+0.8%), BIDU (+0.6%) and RP (-8.0%) are among notable tech names to report tonight after the close.

09:54 am Nvidia trades lower by over 4% following guidance

Nvidia (NVDA $15.46 -0.77) reported fourth quarter earnings of $0.26 per share, excluding non-recurring items, $0.02 better than the consensus of $0.24, while revenues rose 7.5% year/year to $953.2 million versus the $950.1 million consensus.

The company issued downside guidance for the first quarter with revenues of $900-930 million versus the 948.7 million consensus. Non-GAAP gross margin in Q4 was 52.5%, and the company guided first quarter on-GAAP gross margin at 48.5-50.5%.

09:51 am NetApp trades higher By Over 6% following earnings and guidance

NetApp (NTAP $42.41 +2.56) reported third quarter earnings of $0.58 per share, excluding non-recurring items, in-line with the Capital IQ Consensus of $0.58, while revenues rose 21.4% year/year to $1.57 billion versus the $1.56 billion consensus.

The company issued in-line guidance for the fourth quarter EPS of $0.60-0.65, excluding non-recurring items, versus the $0.63 consensus with revenues of $1.645-1.725 billion versus the $1.68 billion consensus.
icon url

ReturntoSender

02/18/12 7:36 PM

#9684 RE: ReturntoSender #6755

From Briefing.com: Weekly Recap - Week ending 17-Feb-12The broad market mustered a modest gain on Friday, feeding a 1.4% gain for the week. The climb has the S&P 500 at a new nine-month high.

A steady climb in the prior session was followed by only modest buying this morning. Many participants seemed hesitant to commit new money to the market now that it is up more than 25% from its October intraday low. The hesitation allowed stocks to drift lower, but the broad market was able to find support at the flat line. From there it gradually worked its way to a narrow gain, which helped feed the stock market's sixth weekly advance in seven weeks.

Financials offered support by climbing to a 0.6% gain, but consumer discretionary stocks were the session's best performers with their 0.8% climb.

Tech stocks, which represent the largest sector by market weight, lagged all session and settled with an incremental loss. Still, relative weakness among tech issues weighed on the Nasdaq, which had actually outperformed its counterparts in the prior session to book its best close since late 2000.

Hardly any commotion came in response to headlines that both the House and Senate have passed payroll tax extensions since both were widely expected to do so.

There weren't any official updates on the dealings between officials from Greece and the eurozone, but the euro managed to attract some support. It finished the week near $1.32. That made for a 0.2% gain on Friday, but a 0.3% loss for the week.

The expiration of monthly options drove share volume higher, but the number of shares exchanged on the NYSE still didn't come anywhere close to breaking 1 billion.

Global Themes for the Week

Earlier this week China's officials expressed their intent to expand their country's investment in Europe. That helped bolster confidence in the precarious eurozone.

Greece's parliament approved austerity measures last weekend, but market participants became concerned that efforts to get the flagging country bailout funds will remain bogged down because of stories suggesting that eurozone officials question the sincerity of Greece's commitment to measures intended to shore up fiscal and financial conditions.

Even though most of the market's concern is on Greece, and other countries in the eurozone periphery, market participants were reminded of precarious conditions in the core of Europe when analysts at Moody's issued negative outlooks on France, Austria, and the United Kingdom. Meanwhile, headline GDP for the fourth quarter featured a 0.3% decline for the eurozone, a 0.2% decline in Germany, and a 0.2% increase in France.

Corporate Developments

Consistent with the the patterns and trends of the past several weeks, earnings announcements had little influence over broad market trade, but they did drive stock-specific swings.

Among the more widely held names that reported this past week, Comcast (CMCSA 29.17, +0.52), Teva Pharma (TEVA 44.65, +0.50), Deere & Co. (DE 83.87, +0.76), Marsh McLennan (MC 32.22, +0.72), MetLife (MET 38.86, +0.19), HJ Heinz (HNZ 54.47, +2.37), and Nordstrom (JWN 51.14, -1.04) all posted Upside earnings surprises. Abercrombie & Fitch (ANF 48.48, -0.01), General Motors (GM 27.34, +0.17), Enbridge (ENB 37.73, -1.65), and Marriott (MAR 34.93, +0.11) missed the consensus estimate.

Separately, Kellogg (K 52.53, -0.03) announced that it has agreed to acquire the Pringles brand from Procter & Gamble (PG 64.91, -0.29) for nearly $2.7 billion. SanDisk (SNDK 47.79, -0.44) announced it has agreed to acquire FlashSoft, but the financial terms of the deal were not disclosed.

A bevy of major banks and financial institutions, including Bank of America (BAC 8.02, -0.07), Citigroup (C 32.92, +0.21), JPMorgan Chase (JPM 38.47, +0.47), were thrown into a negative light when analysts at Moody's decided to review their ratings. The news only temporarily slowed the ascent of financials and bank stocks, which have taken the KBW Bank Index up to a new multi-month high.

Although there weren't any driving headlines, Apple (AAPL 502.12 -0.09) experienced some mid-week volatility that sent the stock retreating from a record high above $525 per share, which reflected a climb of more than 25% since it reported earnings barely a month ago. Given that the stock is the single largest by market cap, its movement pulled the broad market along with it.

Data Review

The latest weekly initial jobless claims tally made a surprise drop to 348,000. That stands as a near four-year low and is consistent with the steady decline in claims reaching back to the beginning of the year.

Housing starts improved in January to an annualized rate of 699,000 from an upwardly revised rate of 689,000 in the prior month. That surpassed the pace of 671,000 housing starts that had been broadly expected. What's more, the three-month moving average hit a rate of 697,000 units, which stands as a three-year high. That suggests that builders expect demand to strengthen and supports the idea that the housing market is improving.

Measures of both consumer prices and core consumer prices in January increased by 0.2%, contrasting with calls for a 0.3% increase in overall prices and a 0.1% increase in core prices. Overall consumer prices climbed 2.9% from the prior year, but core consumer prices climbed 2.3% year over year for their sharpest annual increase since 2008.

Total producer prices were up 0.1% in January as a drop in residential energy and gas prices offset higher gasoline prices. Meanwhile, a run up in pharmaceutical costs drove core prices 0.4% higher for their biggest jump since summer. Respective increases of 0.3% and 0.1% had been expected, on average, among economists polled by Briefing.com.

Leading Indicators climbed by 0.4% in January for their fourth consecutive increase, but economists polled by Briefing.com had generally expected a 0.5% jump. The actual score was hampered by some unexpected weakness in manufacturer orders of consumer goods and non-defense capital goods that exclude aircraft.

The Philadelphia Fed Survey improved in February to 10.2 from 7.3 in the prior month. Economists had generally expected a reading on the order of 10.0, so the improvement wasn't a complete surprise. Underlying data showed a pickup in unfilled orders, which should provide production stability into next month.

The Empire Manufacturing Survey improved to 19.5 in February from 13.5 in the prior month, surpassing the reading of 14.0 that had been widely anticipated.

News that industrial production in January was flat disappointed since the consensus among economists polled by Briefing.com called for a 0.6% increase after industrial production had increased by 1.0% in the prior month.

Overall retail sales for January increased by 0.4% following flat sales in the prior month, but a much stronger increase of 0.8% had been broadly expected. Slower-than-expected clip came as auto sales stalled. Taking autos out of the equation, retail sales actually climbed by 0.7%, which bested the 0.5% increase that had been widely predicted to follow a 0.5% decline in the prior month.

Total business inventories increased in December by 0.4%, which is slightly less than the 0.5% increase that had been broadly expected to follow the 0.3% increase in the prior month. Underlying data is thought unlikely to have any significant effect on revisions to the headline GDP number for the fourth quarter.

The only relative surprise to minutes from the most recent FOMC meeting was that Regional Fed President Lacker made it known that he believes exceptionally low levels of the federal funds rate, which stands at 0.00% to 0.25%, may need tightening prior to the end of 2014 so as to prevent inflation projections or expectations.

..Nasdaq 100 -0.3%. ..S&P Midcap 400 -0.2%. ..Russell 2000 -0.2%.

 
Index Started Week Ended Week Change % Change YTD %
DJIA 12801.23 12949.87 148.64 1.2 6.0
Nasdaq 2903.88 2951.78 47.90 1.6 13.3
S&P 500 1342.64 1361.23 18.59 1.4 8.2
Russell 2000 813.33 828.68 15.35 1.9 11.8

8:02AM Suntech Power sees Q4 revenues in the range of $610-630 mln, consensuss $558 mln (STP) 3.37 : Suntech exceeded shipment guidance for the fourth quarter of 2011. The Company previously expected shipments to decline by ~20% from Q3, but currently anticipates shipments to decline by ~10% q/q. Revenues in the fourth quarter of 2011 are expected to be in the range of $610 million to $630 million. Gross margin is expected to be in the middle of the previously guided range of 9% to 11%. STP expects shipments for the full year 2011 to be approximately 2.09GW, above previous guidance of 2GW. Revenues for the full year 2011 are expected to be in the range of $3.13-3.15 bln, consensus $3.03 bln. In the fourth quarter of 2011, due to continuing stringent working capital management, Suntech significantly reduced accounts receivable and inventory by a total of approximately $450 million, which was partially offset by an approximate $85 million decrease in accounts payable. This result exceeds Suntech's stated goal to reduce accounts receivable and inventory by a total of $200 million in the fourth quarter of 2012. Net debt declined by approximately $200 million in the fourth quarter of 2011. Cash and restricted cash increased from $567.7 million as of September 30, 2011 to over $700 million as of December 31, 2011.

In Q3, Suntech initiated an assessment of its goodwill, intangibles, and certain investments. Suntech recently completed its analysis and has recorded impairment charges of $571 million in the third quarter of 2011. These charges consist of $407 million in non-cash impairments of goodwill and intangible assets; $109 million of non-cash impairments of Suntech's investments in, and prepayments to, Nitol Solar and Shunda; and a $55 million non-cash write-down of equipment and facilities.

Applied Materials (AMAT $13.54 +0.33) reported first quarter earnings of $0.18 per share, excluding non-recurring items, $0.06 better than the Capital IQ consensus of $0.12, while revenues fell 18.5% year/year to $2.19 billion versus the $1.97 billion consensus. The company issued upside guidance for the second quarter with EPS of $0.20-0.28, excluding non-recurring items, versus the $0.16 consensus with revenues of +5-15% quarter over quarter o ~$2.30-2.52 billion versus the 2.09 bln consensus. Backlog -$230 mln quarter over quarter to $2.2 billion.

Dell (DELL 18.24 -0.23) downgraded to Neutral from Outperform at Robert W. Baird; tgt raised to $20 following good share price performance in C11 and YTD. They expect a solid FQ4 next week but see balanced risk/reward at current levels.


icon url

ReturntoSender

02/21/12 9:17 PM

#9686 RE: ReturntoSender #6755

From Briefing.com: 4:08PM Dell misses by $0.01, reports revs in-line; guides Q1 revs slightly below consensus; guides FY13 EPS above consensus (DELL) 18.21 +0.05 : Reports Q4 (Jan) earnings of $0.51 per share, excluding non-recurring items, $0.01 worse than the Capital IQ Consensus Estimate of $0.52; revenues rose 2.2% year/year to $16.03 bln vs the $15.98 bln consensus. Co issues downside guidance for Q1, sees Q1 revs down about 7% QoQ to ~$14.91 bln vs. $15.09 bln Capital IQ Consensus Estimate. Co issues upside guidance for FY13, sees EPS of exceed $2.13, excluding non-recurring items, vs. $2.04 Capital IQ Consensus Estimate. Large Enterprise had revenue of $4.9 billion in the quarter, a 5% increase with broad-based growth across both client and enterprise solutions and services. Services revenue increased 18%. Public revenue was $3.9 billion, a 1% decrease. The segment was affected by continued weakness in U.S. Federal and Western Europe. Services revenue increased 7% and Dell IP storage revenue was up 32%.

4:30 pm : The Dow's failure to overtake the psychologically significant 13,000 line left stocks to drift lower for a mixed finish. Commodities put on an impressive performance, though.

A modestly higher open was quickly challenged by sellers, but support for the broad market near the neutral line helped restore buying interest. However, the ensuing rebound was capped because the Dow encountered resistance at 13,000, which had gone untested for about 45 months. Resistance there proved too much for stocks, leaving all three major equity averages to steadily surrender their gains and slip into negative territory late in the day. A final flurry of buying helped the averages improve their positions, but final results remained mixed.

Energy stocks maintained impressive gains for the duration of the day. The sector settled with a 0.8% gain, which is better than what any other sector achieved. They were helped by higher oil prices, which climbed nearly 3% to a multi-month closing high above $106 per barrel amid ongoing concerns about the suspension of supply from Iran to parts of Europe.

General strength in other parts of the commodity complex lifted the CRB Index to a 1.6% gain, which stands as its best one-day advance since the first trading session of 2012.

Demand for commodities helped natural resource plays in the basic materials sector trade higher, too, but the sector surrendered some of its gains in conjunction with the broad market's afternoon pullback. The Materials sector still settled with a 0.6% gain.

Health care stocks lagged all session before settling with a 0.7% loss. Medco Health Systems (MHS 63.19, -0.82) shares spiked in the early going, but descended steadily to settle at a session low with a sizable loss despite an upside earnings surprise.

Walmart (WMT 60.07, -2.41) hampered the Dow's efforts by dropping to a new monthly low after the company reported earnings that came short of the consensus estimate. Home Depot (HD 46.92, +0.21) had an upside earnings surprise, while fellow Dow component Kraft (KFT 38.57, +0.57) matched the consensus.

Traders were generally unenthused by long-awaited news that eurozone officials finally agreed to give Greece another bailout after there had been speculation last week that the process would become bogged down. Reports that China's officials moved to loosen policy in the country by trimming reserve requirements for their country's banks.

Treasuries traded lower all session. Relief was provided by neither the stock market's afternoon retreat nor results from an auction of 2-year Notes. The auction drew a bid-to-cover ratio of 3.54, dollar demand of $123.9 billion, and an indirect bidder participation rate of 35.7%. For comparison, an average of the past six auctions results in a bid-to-cover ratio of 3.69, dollar demand of $129.0 billion, and an indirect bidder rate of 34.0%.

Advancing Sectors: Energy +0.8%, Telecom +0.6%, Materials +0.6%, Tech +0.4%, Industrials +0.3%
Declining Sectors: Financials -0.1%, Utilities -0.3%, Consumer Discretionary -0.3%, Consumer Staples -0.4%, Health Care -0.7%DJ30 +15.82 NASDAQ -3.21 NQ100 +0.2% R2K -0.7% SP400 -0.4% SP500 +0.98 NASDAQ Adv/Vol/Dec 955/1.80 bln/1617 NYSE Adv/Vol/Dec 1508/798 mln/1501

7:20AM Ciena lowers Q4 rev guidance; reaffirms non-GAAP gross margin guidance (CIEN) : Co issues downside guidance for Q1 (Jan), lowers Q1 (Jan) revs to ~$415 mln from $435-455 mln vs. $447.65 mln Capital IQ Consensus Estimate. Adjusted gross margin is expected to be in-line with the previous guidance of the low 40s percent range. "We are disappointed in our expected first quarter revenue results. As previously stated, we continue to experience longer customer deployment and revenue recognition cycles as a result of our greater mix of international and solutions-oriented sales. When combined with the impact of the seasonality of our business and the calendar timing of our first fiscal quarter, this trend had a more significant effect than previously anticipated, and resulted in revenue recognition delays on a few solutions-oriented projects with new customers, especially in international markets. However, we believe that first quarter revenue results are not reflective of the underlying strength of the business and ongoing customer demand. Specifically, product orders grew ~20% YoY, shipments were strong, and our ending backlog increased for the quarter. And, as evidence of our ability to drive operating leverage, we expect to be cash flow positive from operations and to achieve positive free cash flow for the quarter."

TriQuint Semiconductor (TQNT) unveiled the industry's smallest dual-band PA duplexer for global 3G and 4G smartphones.

Cisco (CSCO) announced that Magyar Telekom, Hungary's largest telecommunications company, is deploying 4G long-term evolution multimedia services using Cisco mobile Internet solutions.

1:25AM STMicroelectronics announces CFO Carlo Ferro assigned to ST-Ericsson as COO; co's chief accounting officer, Mario Arlati appointed ST CFO (STM) 6.95 :

09:30 am Skyworks upgraded to Buy at Charter Equity: . Charter Equity upgrades SWKS to Buy from Mkt Perform based on a greater likelihood of a big rebound in content in the iPhone 5. They believe Skyworks has landed the LTE slots while retaining the Wi-Fi PA and is in good standing to win one of the dual-band PADs. This could push revenue per phone to as high as $3.60 from the $1.60 it has in the 4S.

1:56 pm S&P Tech Sector +0.3%, In-line With S&P 500
The tech sector is trading higher today, slightly ahead of gains in the broader market. Semiconductors are showing relative weakness in the tech space, however, with the Philly Semi Index trading 0.5% lower. KLAC (-3.4%) is a notable laggard in the chip index, while STM (+6.6%) is showing strength. Among other major indices, the SPY and QQQ are trading 0.4% higher, while the NASDAQ is 0.2% higher on the session. Among tech bellwethers, AAPL (+1.9%) is showing strength, while ORCL (-0.6%) is under pressure.

In earnings, CIEN (+7.3%) lowered Q4 revenue guidance, while DAKT (-10.0%) posted a mixed qtr.

In news, CHA (+2.5%) has singed an agreement with AAPL (+1.9%) to sell iPhones, according to reports. Among a busy day in rumors, we are hearing ASIA (+8.6%), RIMM (+0.5%), and PCS (+0.1%) takeover chatter making the rounds.

Among notable analyst upgrades this morning, AEIS (+7.7%) was upgraded to Buy at Citigroup and DANG (+1.7%) was upgraded to Outperform at Credit Suisse.

Among downgrades, ORCL (-0.6%) was downgraded to Market Perform at JMP, KLAC (-3.5%) and LRCX (-2.9%) were downgraded to Neutral at JP Morgan, INFY (-0.1%) was downgraded to Neutral at Credit Suisse, OVTI (-0.7%) was downgraded to Neutral at Lazard and RAX (-0.3%) was downgraded to Neutral at Cowen.

BRCD (-1.6%), DELL (+0.2%), and INTU (+0.3%) are some notable names in tech scheduled to report results today after the close.
icon url

ReturntoSender

02/23/12 9:23 PM

#9688 RE: ReturntoSender #6755

From Briefing.com: 4:16PM AXT misses by $0.01, reports revs in-line; guides Q1 EPS in-line, revs above consensus (AXTI) 5.10 +0.09 : Reports Q4 (Dec) earnings of $0.08 per share, $0.01 worse than the Capital IQ Consensus Estimate of $0.09; revenues fell 21.2% year/year to $21.2 mln vs the $21.34 mln consensus. Co issues mixed guidance for Q1, sees EPS of $0.07-0.11 vs. $0.09 Capital IQ Consensus Estimate; sees Q1 revs of $21-24 mln vs. $20.90 mln Capital IQ Consensus Estimate.

4:13PM Rubicon Tech misses by $0.04, misses on revs; guides Q1 EPS below consensus, revs below consensus (RBCN) 12.17 -0.21 : Reports Q4 (Dec) earnings of $0.04 per share, $0.04 worse than the Capital IQ Consensus Estimate of $0.08; revenues fell 34.2% year/year to $19.4 mln vs the $21.13 mln consensus. Co issues downside guidance for Q1, sees EPS of ($0.14) - ($0.10) vs. $0.13 Capital IQ Consensus Estimate; sees Q1 revs of $8-12 mln vs. $24.62 mln Capital IQ Consensus Estimate. The co also believes that as pricing and utilization improve we will gradually move back to their targeted gross margin of over 40 percent. Co also says "We expect capacity utilization among the LED chip makers to continue to improve throughout the first half of this year, looking beyond the first half of 2012, the outlook for sapphire substrates is for very strong growth, as LEDs gain momentum in the general lighting market, where LED penetration presently is only in the single digits, and as LED penetration into the auto market continues and the backlighting market strengthens. Rubicon continues to be the market leader in terms of capability and cost, and we are well positioned for the market rebound.. "

4:13PM Marvell beats by $0.03, reports revs in-line (MRVL) 16.05 +0.05 : Reports Q4 (Jan) earnings of $0.21 per share, excluding non-recurring items, $0.03 better than the Capital IQ Consensus Estimate of $0.18; revenues fell 17.5% year/year to $743 mln vs the $740.2 mln consensus. Non-GAAP gross margin for the fourth quarter of fiscal 2012 was 54.5 percent, compared to 56.8 percent for the third quarter of fiscal 2012 and 59.4 percent for the fourth quarter of fiscal 2011. Non-GAAP gross margin for fiscal year 2012 was 57 percent compared to 59.7 percent for fiscal year 2011.

4:07PM Univ Elec beats by $0.04, beats on revs; guides Q1 EPS in-line, revs in-line; guides FY12 EPS in-line, revs above consensus (UEIC) 19.66 +0.68 : Reports Q4 (Dec) earnings of $0.40 per share, $0.04 better than the Capital IQ Consensus Estimate of $0.36; revenues rose 14.7% year/year to $117.6 mln vs the $116.22 mln consensus. Co issues in-line guidance for Q1, sees EPS of $0.19-0.25 vs. $0.23 Capital IQ Consensus Estimate; sees Q1 revs of $104-110 mln vs. $109.74 mln Capital IQ Consensus Estimate. Co issues mixed guidance for FY12, sees EPS of $1.65-1.85 vs. $1.74 Capital IQ Consensus Estimate; sees FY12 revs of $500-520 mln vs. $496.16 mln Capital IQ Consensus Estimate.

4:30 pm : After an early slip stocks battled back to book solid gains. The effort resulted in a multi-month closing high for the S&P 500 and a multi-year closing high for the Dow.

Stocks were without leadership in the early going as market participants had an underwhelming response to news that initial weekly jobless claims remain near four-year lows. The latest tally totaled 351,000, which is unchanged week over week, and generally on par with the 355,000 initial claims that had been broadly expected.

Overnight news that the European Union expects eurozone GDP for 2012 to decline by 0.3% instead of expand by 0.5%, as had been previously projected, seemed to undermine sentiment, but only seemed to delay a rally by the euro. By session's end the euro was sporting a 0.9% gain at $1.337.

Although the initial inclination among traders was to sell, buyers were quick to step back in with a bid. Momentum petered out when the S&P 500 came in contact with its weekly closing high, but a late lift took the broad market measure to its best close in nearly 10 months and within a fraction of its best close since 2008.

Financials were the session's top performers, although the sector had a relatively sluggish start. Diversified financial services plays and brokerage issues led the sector's advance in a strong follow-up to a weak performance in the prior session. Collectively, financials climbed 1.0% for the day.

Shares of struggling retailer Sears (SHLD 61.80, +9.72) surged as many traders cheered the company's strategy in spite of a deep earnings miss, contributing to the Nasdaq's outperformance. Hewlett-Packard (HPQ 27.05, -1.89), Kohl's (KSS 49.11, -3.08), and Target (TGT 54.50, +1.53) all posted upside earnings surprises, but each issued downside guidance.

Even though the latest weekly oil inventory report's bigger-than-expected build of 1.63 million barrels was regarded as a bearish cue, oil prices extended their upward trend by climbing 1.4% to set a new multi-month closing high of $107.89 per barrel. The energy component's climb comes in conjunction with geopolitical concerns in Iran.

A strong auction of 7-year Notes brought Treasuries into closer focus today. The sale drew a bid-to-cover ratio of 3.11, dollar demand of $90.2 billion, and an indirect bidder participation rate of 41.8%. For comparison, an average of the past six auctions results in a bid-to-cover ratio of 2.83, dollar demand of $82.1 billion, and an indirect bidder rate of 34.9%. The benchmark 10-year Note briefly saw its yield dip below 2.00% before inching back up to that mark by session's end.

Advancing Sectors: Financials +1.0%, Telecom +0.7%, Consumer Discretionary +0.5%, Consumer Staples +0.5%, Energy +0.5%, Tech +0.5%, Industrials +0.1%, Materials +0.1%, Health Care +0.1%
Declining Sectors: Utilities -0.2%DJ30 +46.02 NASDAQ +23.81 NQ100 +0.6% R2K +1.8% SP400 +0.9% SP500 +5.80 NASDAQ Adv/Vol/Dec 1818/1.73 bln/735 NYSE Adv/Vol/Dec 2164/763 mln/843

Cisco (CSCO) and NetApp (NTAP) are announcing the availability of a Cisco Validated Design for the FlexPod shared infrastructure and Microsoft (MSFT) private cloud.

7:23AM Trina Solar misses by $0.51, beats on revs; guides Q1, FY12 shipment volume (TSL) 9.76 : Reports Q4 (Dec) loss of $0.93 per share, $0.51 worse than the Capital IQ Consensus Estimate of ($0.42); revenues fell 32.1% year/year to $435.7 mln vs the $348.84 mln consensus; shipments 425 MW. Guidance: For the first quarter of 2012, the co expects its shipment volume for PV modules to be between 400 MW and 430 MW. The co expects its overall gross margin for Q1 will be in the low teens in percentage terms, taking into account wafer and cell requirements outsourced to third party suppliers to meet demand in excess of its internal capacity. Such guidance is based on the average exchange rate between the Euro and U.S. dollar from January 1, 2012 to February 23, 2012. For FY12, the co expects total PV module shipments between 2.0 GW and 2.1 GW, which would represent an increase of 32.5% to 39.1%, respectively, from 2011.

6:58AM LTX-Credence misses by $0.04, misses on revs; guides Q3 EPS, revs below consensus (LTXC) 7.25 : Reports Q2 (Jan) loss of $0.20 per share, $0.04 worse than the Capital IQ Consensus Estimate of ($0.16); revenues fell 54.1% year/year to $24.1 mln vs the $28.11 mln consensus. Co issues downside guidance for Q3, sees EPS of ($0.12)-(0.17), excluding non-recurring items, vs. ($0.07) Capital IQ Consensus Estimate; sees Q3 revs of $28-32 mln vs. $35.50 mln Capital IQ Consensus Estimate. "While visibility remains limited, certain customers and segments in our target markets are showing signs of recovery. In particular, semiconductor companies with exposure to the mobility space are adding test capacity."

ARM (ARMH) and MediaTek announced an extension to their long-standing relationship with a new MediaTek license for a broad range of market leading, high-performance ARM Intellectual Property.

Hewlett-Packard (HPQ $26.99 -1.95) reported first quarter earnings of $0.92 per share, excluding non-recurring items, $0.05 better than the Capital IQ consensus of $0.87, while revenues fell 7.0% year/year to $30.04 billion versus the $30.75 billion consensus. The company issued downside guidance for the second quarter with EPS of $0.88-0.91, excluding non-recurring items versus the $0.95 consensus. The company reaffirmed guidance for fiscal year 2012 with EPS of at least $4.00, excluding non-recurring items, versus the $4.10 consensus. In the Americas, first quarter revenue was $13.2 billion, down 9% year over year and down 8% when adjusted for the effects of currency. Europe, the Middle East and Africa revenue of $11.7 billion was down 4% year over year and down 5% when adjusted for the effects of currency. Revenue in Asia Pacific was $5.2 billion, representing a 10% decrease year over year and down 12% when adjusted for the effects of currency. Revenue in HP's commercial businesses declined 4% year over year. Revenue in HP's consumer businesses, within PSG and IPG, was collectively down 23% year over year. Co returned $1.0 billion in cash to shareholders in the form of dividends and share repurchases.

Analog Devices (ADI $39.85 +0.03) reported first quarter earnings of $0.46 per share, $0.02 worse than the Capital IQ Consensus of $0.48, while revenues fell 11.1% year/year to $648 million versus the $662.28 million consensus. The company issued downside guidance for the second quarter with EPS of $0.48-0.53 versus the $0.55 consensus and revenues of $655-675 million versus the $683.61 million consensus.

Juniper Networks (JNPR $23.04 -0.75) was downgraded to Mkt Perform from Outperform at FBR Capital and the firm lowered their target to $21 from $25 based on overwhelming evidence of an increasing number of product delays and performance issues in multiple new and existing products, which will respectively diminish Juniper's ability to reaccelerate revenue and earnings growth in 2012.

11:49 am Hewlett-Packard Down 4% On Earnings/Guidance Results (HPQ)
Late yesterday, Hewlett-Packard (HPQ $27.75 -1.19) reported Q1 (Jan) earnings of $0.92 per share, excluding non-recurring items, $0.05 better than the Capital IQ Consensus Estimate of $0.87; revenues fell 7.0% year/year to $30.04 bln vs the $30.75 bln consensus.

For the second quarter, the company expects to see earnings of $0.88-0.91, excluding non-recurring items, vs. $0.95 Capital IQ Consensus Estimate. Co reaffirms guidance for FY12, sees EPS of at least $4.00, excluding non-recurring items, vs. $4.10 Capital IQ Consensus Estimate. In the Americas, first quarter revenue was $13.2 billion, down 9% year over year and down 8% when adjusted for the effects of currency.

Europe, the Middle East and Africa revenue of $11.7 billion was down 4% year over year and down 5% when adjusted for the effects of currency. Revenue in Asia Pacific was $5.2 billion, representing a 10% decrease year over year and down 12% when adjusted for the effects of currency. Revenue in HP's commercial businesses declined 4% year over year. Revenue in HP's consumer businesses, within PSG and IPG, was collectively down 23% year over year. Co returned $1.0 billion in cash to shareholders in the form of dividends and share repurchases.

11:29 am S&P Tech Sector Trading Higher And Ahead Of The S&P 500
The tech sector is trading higher today, slightly ahead of a roughly flat broader market. Semiconductors are showing relative weakness in the tech space, however, with the Philly Semi Index trading 0.2% lower. WFR (-3.5%) is a notable laggard in the chip index, while IDCC (+4.3%) is showing strength. Among other major indices, the SPY is trading 0.3% higher, while the NASDAQ and the QQQ are 0.7% higher on the session. Among tech bellwethers, IBM (+2.4%) is showing notable strength today, while GOOG (-0.3%) is under pressure.

In earnings, HPQ (-5.5%) reported a mixed Q1 and guided Q2 lower and reaffirmed FY12 guidance. ADI (-0.7%) and MANT (-1.4%) posted quaterly misses and issued downside guidance, while AVGO (+2.8%) and PCS (+9.6%) topped quaterly estimates.

Among rumors, there's a newsletter out today discussing M&A for ASIA (-0.9%).

Among notable analyst upgrades this morning, ERIC (+3.6%) was upgraded to Overweight at JPMorgan and LVLT (+8.9%) was upgraded to Overweight at Morgan Stanley.

Among downgrades, ITRI (-2.1%) was downgraded to Underperform at BofA/Merrill, JNPR (-2.0%) was downgraded to Mkt Perform at FBR Capital, SINA (-0.5%) was downgraded to Equal Weight at Barclays and MELI (-1.1%) was downgraded to Neutral at JP Morgan.

CRM (+1.4%) and TIVO (+1.5%) are some notable names in tech scheduled to report results today after the close.
icon url

ReturntoSender

02/26/12 10:03 AM

#9690 RE: ReturntoSender #6755

InvestmentHouse Weekend Market Summary

http://www.investmenthouse.com/weekendmarketsummary.htm

-Stocks start stronger, give up the gains for a mixed close as the slow slog continues.
- Slow overall, but some solid moves from solid leaders.
- Michigan Sentiment Final jumps again.
- New home sales fall in January, but opposite of Existing Home Sales, they do so because of an upward revision in December numbers.
- Geithner says 'no quick fix' for gasoline problem. No there is not, but we would already be 'fixed' if we had taken action back when they last said there was no quick fix . . .
- President pushes algae fuel as he takes credit for higher oil production that had its beginnings before he was even running for President and when he has only 3% of offshore zones closed to drilling.
- Excess money helping fuel higher fuel prices.
- Indices end the week basically unchanged, i.e. still rising but making virtually no overall progress. Individual stocks are the upside key for now as we watch for rollover signs.

Indices try to make a meaningful move but suffer the afternoon dips.

Friday was heralded as the day that the Dow crossed 13K, and surely it did. It moved up to a whopping 13,014. It could not hold it again, however, and faded back below the magical 13K on the close. SP500 was said to have made a new closing high since 2008. Yea verily, it did, but it also did not break above its May intraday high. When you are talking about old highs, you have to talk about where it made it intraday. If you are playing a stock or index, then that makes a difference in a technical sense. Am I splitting hairs? Yes, I am.

There was virtually no change in the market as the indices closed mixed, but they did give up an early gain. We had a bit of that high-to-low action versus the low-to-high action that has been the hallmark of this rally. The low-to-high action is a positive because it shows buyers stepping in whenever there is a dip. We saw that this morning. Stocks open and sold back. There was that first-hour dip, and buyers came in and rallied stocks to session highs and pushed the SP500 to that new closing high. It was really looking good, almost breaking through the prior peak marking that bear market high. It could not quite do it, and it faded at that high. The buyers did not stay around until the close on Friday. It was hardly catastrophic. As noted, the indices are still very solid in their ranges, bumping up against -- or in some instances -- actually moving through the prior bear market highs.

We have the same action of a slow, steady move to the upside even though it was not shared by all of the indices on Friday.

SP500, +0.17%; NASDAQ, +0.23%; Dow, -0.1%; SP600, -0.4%; SOX, -0.2%

As I said, it was a mixed market. It was spread between the growth and the more stoic and staid large cap NYSE stocks and indices as well. It was a definite mixed bag on the day, and it was quite frustrating and boring. The indices are continuing this climb to nowhere. We have heard about the Bridge to Nowhere in Alaska. This is definitely not a move to nowhere, but it seems like it is going nowhere fast. There was an up day followed by a down day. Or a good, solid break to the upside followed by several days lateral. It is hard for the market to put together two (and dare we ask for three?) strong upside sessions back-to-back. I would even settle for every other day. Instead we get the slow slog to the upside.

That does not mean there were not good moves on the day. Some of the plays we were looking at broke nicely to the upside. FOSL is one of those apparel retailers doing quite well. It had a solid 2.5% break to the upside. VFC, another apparel maker, bounced nicely off of the 10 day EMA on rising volume. A very nice pullback to test its breakout, and it started to resume the move. They are out there. They are making upside moves, but it is more of a stock-by-stock basis. They are definitely moving, but the bigger moves are coming on individual names versus the overall market. That says something in itself; perhaps the market is tired. I have been saying that for a while.

Has it slowed the market? Yes. But it has not stopped the market. The move is definitely slower, but it is still moving higher and it has not put in that rounded-look looking top you get before selloffs. KLAC has a very classic-looking rounded top. The stock continued to work higher through late 2011, but as it did, MACD was putting in lower highs even as the stock put in higher price highs. Then there is a round off top spanning early January until basically this week. It broke below the 50 day EMA, and it tried to test on Wednesday and Thursday. Then Friday it broke lower once more. We have the move up on waning momentum, and then the rounding out at the top. Now perhaps we will have the rollover.

That puts this market in what they like to call on the financial stations "a stock-picker's market." That is where you have to get the right names. If you are a fundamental investor, that makes life very difficult for you. That is where technical analysis comes in. Frankly, we are always picking stocks. Every day we go through a big list of possible plays where we might put our money, and we decide whether it is worth it. Of those that are, we decide which have the best risk/reward, the best pattern, and are ready to go. Those are the ones that make it on the report. It is not something new for us, but it is something they like to talk about because it makes things a little more mysterious and supposedly difficult for the average investor. Anyone can do this, however. You do not have to be all that smart; you just have to understand how the market works and understand that it does not work the way you were taught that things should work. But that is a whole other story. While I teach some of it here, I have to teach classes to really get into that.

OTHER MARKETS

The other markets pretty much kept the trends they were following for the week as well.

Dollar. 1.3456 versus 1.3367 euro. It was a tough week for the dollar, and the closed lower again. It was a multi-month low versus the dollar (or a high versus the dollar, whichever way you want to look at it). It broke the dollar below its recent range in the index. The dollar stopped rising against the yen, and that has fueled this quick drop on Thursday and Friday in the DXY0. Of course it is down sharply against the euro as well.

The dollar should be getting stronger, in theory, if the U.S. economy is supposed to be stronger in the future. There is that offsetting problem of the eurozone. Money is moving back to the continent after spending time in the U.S. That is one of the reasons why the dollar is losing ground versus the euro. They are selling dollars in favor of buying euros.

Bonds. 1.98% versus 1.99% 10 year U.S. Treasury. Bonds were up overall on the day, although the 10 year posted a very modest gain. Bonds are holding in their range. They have a little triangle set up, and they bounced this week. We will see if they can make a breakout. That would be counterintuitive to a stronger economy in the U.S. and a stronger recovery in Europe. Bonds would be stronger if there was worry about the economic future here, in Europe, or both. The fact that they are rallying would suggest some kind of problem down the road. It is important to note that they have not broken out and they are at the bottom of their range. While they may be rebounding this week, we have to the see if it is just a relief move or something more significant. Right now it does not suggest that it is anything terribly serious. If this pattern forms up a bit better and bonds start to make the breakout, that suggests something is out there that we have to worry about yet again.

Gold. 1,776.30, -9.90. Gold was off on the session. It took a breather after a very solid move up on the week. This week saw it resume the breakout from the channel formed from the fall off 2011 into early 2012. There was the breakout, the test, and then a great move to the upside this week. There was a little giveback on Friday. That is perfectly normal after a good week to the upside

Oil. 109.76, +1.93. Oil continues higher, painfully so. Quite the breakout on the week. Indeed, it was an impressive three-week move for oil. We were looking for a test but it was not showing up at the end of the week. Why not? There is stress from Iran and its issues with Israel, as well as other problems in the Middle East that keep tensions higher with respect to oil. Also there is the possibility of sanctions against Iran by the eurozone coming later. Iran is making it clear that it does not view that as a friendly act. No kidding.

There is also the dollar and its decline. As we used to see and talk about a lot in the past, oil tends to rise as the dollar weakens because it is nominated in dollars. It takes more dollars to buy every barrel of oil when the dollar value declines. You do not hear much about this right now as to why oil is high, but that is a very good reason why the moves are accelerating to the upside. The dollar is accelerating its decline against other currencies. It takes more dollars to have the same value for a barrel of oil. This despite the fact that there is a lot of oil in the U.S. right now. The President is taking credit for making the increased oil production possible. I will talk about that more later, but it is absolutely crazy. That is like a newly-elected mayor cutting the ribbon on a completed 20-story building that a company built and saying, "Thanks to the policies I have implemented, we were able to build this." A lot of it was built well before the mayor ever showed up. That is exactly what happened with the additional energy production we have now.

TECHNICAL SUMMARY

Internally it was rather boring on Friday.

Volume. NASDAQ -7.2%, 1.6B; NYSE -17%, 581M. Volume fell fairly sharply.

Breadth. NASDAQ, -1.2:1; NYSE +1.2:1

THE CHARTS

SP500. The SP500 is bumping right at that old post bear market high from 2011. It could not take it out. It fell back, but it put in that closing high that got everyone excited. Again, that does not mean much because it did not take out those old highs. It is still bumping, still working on it, and still not there.

DJ30. Same story with the Dow. It moved to a nominal new high, but then it faded back and was unable to close out the deal. Up on the week, yes, but still struggling to extend this break above those July 2011 highs.

NASDAQ. NASDAQ was up as well. It continues to try putting a little distance between it and those prior highs, but it is not making much headway. A nice 1-2-3 pullback during the week, a nice break to the upside on Thursday, but it could not consummate it on Friday. Very similar to last week.

SP600. The small caps were down a bit, struggling right below the prior peak. Moving now in a four-week lateral range, trying to get out of there. Not looking bad or rolling over, but we do see MACD falling lower, as with the other indices. It is making a lower high as the indices bump and try to put in that higher high. A bit of loss of momentum.

SOX. Last night I talked about the SOX and its nice pullback to the 20 day EMA. It tried to put in the bounce on Friday. It could not consummate it and fell back. Not a catastrophic rollover; it is still sitting above the 20 day EMA. It can still make the move, and we will see if it does. The semiconductors could provide a big boost for this market. If they get back on track and make more of these solid 3-4 session upside moves, that would really goose the other indices to the upside.

LEADERSHIP

Semiconductors/Technology. I want to discuss those that I said were key and that we needed to watch. BRCM is attempting to hold at the 20 day EMA, make a higher low, and then try to push through the October 2011 peak. Very important test for BRCM because it is one of those AAPL-related semiconductors. Speaking of AAPL, it was up again. It posted a 1%+ gain on the day. It is right below this prior reversal-day peak. This will be an important test for AAPL. It has come right back up to that peak. The question is will it consolidate, make a higher low and break higher? Will it move right on through or will it reverse? Lower volume. MACD is still trying to make a move. It is nothing definitive yet. It is maybe just a bit low. We will see. This is a very important test for AAPL.

KLAC has put in that rounded top. It looks to be heading lower. That is the problem with chip equipment. NVLS has a rounded top. It is trying to hold the 50 day EMA, and it may do it. We will see. There is some trouble in semiconductors, but there are also good tidings there as well. Stocks such as BRCM are holding the line.

Retail. Retail remains solid. VFC had a nice break to the upside. It gave us the entry we were looking for. RL is trying to set up again for the new break to the upside. FOSL broke to a new rally high after that surge. It has given us the entry we were looking for as well.

Medical/Healthcare. ISRG looks to be making a new break to the upside. HNSN is another stock that we have played in the past. It looks like it could try to make a break to the upside. It has some serious resistance, but I just want to point out stocks that look to be coming around.

Manufacturing. HOLI had a nice break to the upside on Thursday and Friday. IR had a very nice flag pattern back to the 10 day EMA. We still have great stocks in great position to move higher, and they are moving higher. It is hard to bet against this kind of market.

What makes this kind of market run? Liquidity, baby. It has been the pump all along. Liquidity has fueled this recovery since basically day one. The turn at the bottom was from massive liquidity pumped into the system. For the initial rally, QE1 is what turned it. None of those other programs worked; QE1 brought stocks off of the bottom. Then we had the 2010 test. They did not know if there would be a QE2, and then it was announced in August. An inverted head and shoulders. The announcement was the catalyst, and shortly thereafter the market took off on another run up through early 2011. We knew that QE2 was ending in June, and the market started to falter ahead of that. It topped. It put in a head and shoulders. There was no QE3 announced, and the market sold off. Europe started to burn. With no QE3 the U.S. fell. The U.S. was in trouble, and then they announced twist. Twist rescued the market off of the lows. It was not enough to send it higher, however, because we still had the European problems. Then the Fed, the ECB, and four other world central banks got together and created dollar facilities for European banks. Thus we have had the move from mid-December to the present based on that liquidity.

We are back at the highs. We have had great runs and we are still having great runs thanks to the continued liquidity. As long as we have these good leaders moving, we can play them to the upside. Liquidity really drives the market.

THE ECONOMY

Treasury Secretary Geithner says 'no quick fixes' to gasoline price issue. If we started at some point in the last 30, 20, or even 10 years we would not, again, be having this discussion.

There's gold (black gold?) in them thar' swamps! President takes credit for increased oil production, makes more claims about 'green' energy.

ECRI still calling for a mid-year recession.

Recession call made September 2011, forecasting a recession by mid-2012. You won't know you are in one until about 6 months later.

Definitive data show no recovery, indeed things are getting worse:
-Annualized GDP peaked in Q3 2010. By Q2 2011 it fell to 1.5%. The last read was 1.6%. Since the peak it has flat-lined at 1.5%.
-Personal Income is down.
-Overall sales are down (recall the inventory surge in Q4 2011 GDP number?)
-Industrial Production is at a 22 month low.

This pushed the Coincident Index to a 21 month low (see chart). In the last 50 years this has equaled a recession.

Why is sentiment up? Central Banks have printed trillions in currency. As I discussed last week, that is why we have had the economic lift we have had. Not stimulus, not real growth, just extra money.

Money Velocity: Trillions of dollars out there but velocity is at a record low in the US and near record lows in China and Europe. The money is not getting used but going into the financial markets just as it did in, for example, 1999 when the Fed pumped all that Y2K money into the economy and it was put in the stock market.

Personal disposable income: Negative for the past five months!!

TO VIEW THE ECONOMY OVERVIEW CLICK THE FOLLOWING LINK:
Economy Summary Video

THE MARKET

SENTIMENT INDICATORS

Sentiment is starting to play in the market. The VIX was up slightly, but it closed very low at 17.3. There was a decline in bulls and a rise in bears. This is markedly different from the spike we saw in bulls and the decline in bears over the last two weeks. Bulls came in at 51.1% while the bears rose to 26.6%. The 51.4 is up from 54.8 the prior week. The bears were at 25.8. Not a huge spike, but even as the market moves higher we are getting some issues with respect to how well the market is behaving. So much so that the slow move, even though it is to the upside, is getting a lot of people nervous. Bears are rising and bulls are falling from pretty steep levels, and that could suggest an interim top. Perhaps not a top of the rally, but an interim top.

The put/call ratio bumped up to 1.09. That is only on the CBOE, not the combination of all the put/call exchanges that, for instance, Investor's Business Daily uses. On IBD, the put/call ratio looks like it was around 0.84, but we do not have the latest numbers on that yet. We will have to see when it comes out over the weekend, but it will most likely be up. That shows that people are nervous. Does this mean that a bunch of speculators are out buying puts? No, although we have been buying some as the positions present themselves. We bought more positions today on KLAC to the downside, but that is different versus the big money managers buying puts for protection for a decline. They are anticipating a pullback, and it seems like everyone is anticipating it. What happens when everyone anticipates something? It tends to do the opposite, at least for a while. Thus the uptrend continues for now.

VIX: 17.31; +0.51
VXN: 18.27; -0.14
VXO: 15.44; +0.16

Put/Call Ratio (CBOE): 1.09; +0.11

Bulls versus Bears:

This is a reading of the number of bullish investment advisors versus bearish advisors. The reason you look at this is that it gives you an idea of how bullish investors are. If they are too bullish then everyone is in the market and it is heading for a top: if everyone wants to be in the market, then all the money is in and there is no more new cash to drive it higher. On the other side of the spectrum if there are a lot of bears then there is a lot of cash on the sideline, and as the market rallies it drags that cash in as the bears give in. That cash provides the market the fuel to move higher. If bears are low it is the same as a lot of bulls: everyone is in and the market does not have the cash to drive it higher.

Bulls: 51.1% versus 54.8%. After a quick and big spike higher bulls are right back down near that 50% level where it held for several weeks. Hit the highest level since April and May of 2011, the peak of the post-bear market high. Now the indices are back at that level and so are the bulls. All the more reason to watch this action at the prior highs. 35% is the threshold measuring bullish versus bearish action. Six weeks the bulls were below bears. A powerful sentiment signal but now dissipating. Highs from April and December (60% readings spanning December through early May 2011). The 5 year high is 62.0. The crossover level at 29% bulls from July 2010 is long gone. 35% is the threshold level suggesting bullishness. To be seriously bearish it needs to get up to the 60% to 65% level.

Bears: 26.6% versus 25.8%. Back up a bit but still lower than the 28.7% three weeks back. As with bulls, a quick and big break upside, but now right back down. After spending weeks at 30%ish, bulls are faltering big time. Not at a bearish level but they are growing more confident even as the market hits the prior highs and is not blasting on through. For more reference, bearishness hit a 5 year high at 54.4% the last week of October 2008. The move over 50 took bearish sentiment to its highest level since 1995. Extreme negative sentiment. Prior levels for comparison: Bearishness peaked at 37.4% in September 2007. It topped the June 2006 peak (36%) on that run. That June peak eclipsed the March 2006 high (33%) and well above the 2005 highs that spawned new rallies (30% in May 2005, 29.2% in October 2005). That was a huge turn, unlike any seen in recent history.

NASDAQ

Stats: +6.77 points (+0.23%) to close at 2963.75
Volume: 1.602B (-7.18%)

Up Volume: 937.03M (-322.97M)
Down Volume: 679.7M (+187.71M)

A/D and Hi/Lo: Decliners led 1.21 to 1
Previous Session: Advancers led 2.44 to 1

New Highs: 110 (+12)
New Lows: 8 (-15)

SP500/NYSE

Stats: +2.28 points (+0.17%) to close at 1365.74
NYSE Volume: 581M (-16.76%)

Up Volume: 1.77B (-880M)
Down Volume: 1.61B (+520M)

A/D and Hi/Lo: Advancers led 1.21 to 1
Previous Session: Advancers led 2.6 to 1

New Highs: 162 (+30)
New Lows: 3 (-1)

DJ30

Stats: -1.74 points (-0.01%) to close at 12982.95
Volume DJ30: 89.4M shares Friday versus 120M shares Thursday.

MONDAY

Next week there is a lot of economic data. Monday brings Pending Home Sales. Tuesday is Durable Orders, Case/Shiller, and Consumer Confidence. Wednesday there is the second estimate of GDP and Chicago PMI. Very important. Thursday is Initial Claims, Person Income and Spending, and the ISM Index for February. All will be important, particularly in light of the ECRI reiteration of the call for a mid-2012 recession. That is just the situation we have.

Where do go from here? The indices are basically up at the old highs, unable to push further but not falling. As I said earlier, this is what they call "a stock picker's market," and we have seen some really great stocks moving to the upside. The indices are not rolling over at least not yet. Since they are not showing signs of that rounded top rollover, we are not going to bet against them overall right now. We are not that comfortable with a lot of new positions, but they keep showing themselves so we will keep taking them. We will let our positions run as long as they will. If any get in trouble, we will take some off of the table as we have been doing. We are not letting them get out of hand on us.

What does that mean for the coming week? A lot of data. We still have to keep that eye on the exit just in case things turn. Typically you get a rollover. Typically, as noted on Thursday, it takes awhile for this to work through the system. But the initial moves can be sharp as we saw in February. You get the climb and then, boom, a sharp selloff. But then you almost always get that recovery. If it does not make it, you are done and it will sell off. But this was a classic ABCD pattern. You have the strong move, the pull back, the bounce to a lower high. Then there is the sell off to a lower low, and then you have a rally right back up to the prior peak. That is what ABCD does and what you are looking for. That was the top. It tried again. Not bad, but that was false. It did not have the MACD with it. It was already in some trouble and it rolled over. We were worried at the time, and it proved to be correct.

We have not had the selloff yet. It may come up next week. You do not know. At some point there will be a punctuated selloff. Do we get out now and just wait for it? You can, but you might miss some action. You always get to that last point where you say, "Should I stay or should I go?" That is the question. But we are investors/traders and we have to take advantage of what the market gives. If we see moves like VFC, we want to take advantage of those because they can make us money even if the market is getting ready to top. We just have to be careful. It behooves us to watch the exit, watch our positions, and be pretty ruthless with taking stops as we have been. We are protecting our gain. We are not letting any of it go, and we are still making money to the upside. We will continue to do that. But we are fully cognizant of the fact that the indices, while they are breaking through the old highs, are not showing great strength. We watch for topping, we watch for any sharp pullbacks, but we can wait for a bounce to exit. That is typical these situations. You get a pullback and a bounce, a pullback and at bounce.

Even though we get selling, let us keep our heads. Protect your positions, but to not totally panic if we cannot get out of everything. Just wait for your time, and you typically get a better exit point. Then we will get better setups to the downside as well. Those stocks that broke down will rebound and fail, and we can get more downside entry points and make money to the downside as the upside folds up shop.

I hope that makes sense to you. Have a great weekend, and I will see you on another busy Monday. It is another week where we watch and see if this is the one where the move runs out of juice.

Support and Resistance

NASDAQ: Closed at 2963.75
Resistance:
3026 from 10/2000 low
3042 from 5/2000 low

Support:
The 10 day EMA at 2937
The 20 day EMA at 2900
2888 is the May 2011 peak and post-bear market high
2879 is the July 2011 peak
2862 is the 2007 peak
2841 is the February 2011 peak
2825 is the 2007 closing peak.
2816 is the early April 2011 peak.
The 50 day EMA at 2804
2754 is the October 2011 high
2706 to 2705 is the April 2011 low and the February 2011 and consolidation low (bottom of the trading range) 2723 to 2705 is the range of support at the bottom of the January to May trading range
2686 is the January 2011 closing low
2676 is the January 2010 low and the December 2011 peak
The 200 day SMA at 2668
2645-2650ish from December 2010 consolidation
2643 is the September 2011 high
2612 is the late August 2011 peak
2603 is the March 2011 intraday low (post-Japan low)
2599 is the June 2011 low and NASDAQ
2593 is the November intraday high
2580 is the November 2010 closing high
2572 is the November 2-11 gap down point
2555 is the mid-August 2011 peak
2546 is the early September 2011 gap down point
2535 is the November island reversal gap point
2532 is the early August gap down point
2469 is the November 2010 low
2441 is the November 2011 low
2331 from October 2010 low and the August 2011 intraday low
2305 from the August 2010 peak (summertime base)
2139 is the May and June 2010 low

S&P 500: Closed at 1365.74
Resistance:
1370 is the August 2007 low
1371 is the May 2011 peak, the post-bear market high

Support:
1364 is the March 2007 low
1357 is the July 2011 peak
1344 is the February 2011 peak
The 20 day EMA at 1344
1340 is the early April 2011 peak
1332 is the early March 2011 peak
1325-27 is the March 2008 closing low and the May 2006 peak.
1318.51 is the May low
1313 from the August 2008 interim peak
The 50 day EMA at 1311
1295 to 1294 is the April 2011 low and the February 2011 consolidation low (bottom of the trading range)
1293 is the October 2011 peak
1275 is the January 2010 low, early January 2011 peak
1267 is the December 2011 peak
1258 is June 2011 intraday low
The 200 day SMA at 1258
1255 is the late December 2010 consolidation range
1249 is the March 2011 low (post-Japan)
1235 is the mid-December 2010 consolidation low
1231 is the late August 2011 peak
1227 is the November 2010 peak
1220 is the April 2010 peak
1209 is the mid-August 2011 high
1196 is the November 2010 consolidation peak
1178-1180 is the October 2010/November 2010 consolidation low
1158 is the November 2011 low
1131 - 1127 from August 2010 base peak.
1119 is the early August closing low
1109 is the mid-September 2010 gap up point
1101 is the August 2011 low
1075 is the October 2011 intraday low
1099 from the mid-July interim peak

Dow: Closed at 12,982.95
Resistance:
13,058 from the May 2008 peak on that bounce in the selling

Support:
12,876 is the May high
The 20 day EMA at 12,836
12,754 is the July intraday peak
The 50 day EMA at 12,576
12,391 is the February 2011 peak
12,284 is the October 2011 peak
12,258 is the December 2011 peak
12,110 from the March 2007 closing low
12,094 is the April 2011 low
The 200 day SMA at 11,999
The June low at 11,897 (closing)
11,893 from March 2008 closing low
11,867 from the August 2009 high and peak on that bounce in the selling.
11,734 from 11-98 peak
11,717 is the late August 2011 peak
The August low at 11,702
11,555 is the March low
11,452 is the November 2010 peak
11,178 from November 2010
10,978 is the bottom of the November 2010 consolidation
10,750 from September 2010
10,720 is the August closing low
10,705-710 from January 2010 peak
10,694-700 from August 2010 peak
9938 is the August 2010 low

Economic Calendar

February 22 - Wednesday
- MBA Mortgage Index, 02/18 (7:00): -4.5% actual versus -1.0% prior
- Existing Home Sales, January (10:00): 4.57M actual versus 4.63M expected, 4.38M prior (revised from 4.61M)
- Up 4.3% in January. Down 5% in December, revised lower. 5% - 4.3%= net negative.
- Inventories: 2.31M unites. Lowest March 2005.

February 23 - Thursday
- Initial Claims, 02/18 (8:30): 351K actual versus 355K expected, 351K prior (revised from 348K)
- Continuing Claims, 02/11 (8:30): 3392K actual versus 3450K expected, 3444K prior (revised from 3426K)
- FHFA Housing Price I, December (10:00): 0.7% actual versus 0.7% prior (revised from 1.0%)
- Crude Inventories, 02/18 (11:00): 1.633M actual versus -0.171M prior

February 24 - Friday
- Michigan Sentiment - Final, February (9:55): 75.3 actual versus 73.0 expected, 72.5 prior
- New Home Sales, January (10:00): 321K actual versus 315K expected, 324K prior (revised from 307K). -0.9%. 5% revision upside in December.

February 27 - Monday
- Pending Home Sales, January (10:00): 1.0% expected, -3.5% prior

February 28 - Tuesday
- Durable Orders, January (8:30): -1.4% expected, 3.0% prior
- Durable Orders -ex Transports, January (8:30): 0.2% expected, 2.2% prior
- Case-Shiller 20-city, December (9:00): -3.6% expected, -3.7% prior
- Consumer Confidence, February (10:00): 62.5 expected, 61.1 prior

February 29 - Wednesday
- MBA Mortgage Index, 02/25 (7:00): -4.5% prior
- MBA Mortgage Purchases Index, 02/25 (7:00): -4.5% prior
- GDP - Second Estimate, Q4 (8:30): 2.8% expected, 2.8% prior
- GDP Deflator - Second, Q4 (8:30): 0.4% expected, 0.4% prior
- Chicago PMI, February (9:45): 60.0 expected, 60.2 prior
- Crude Inventories, 02/25 (10:30): 1.633M prior

March 1 - Thursday
- Initial Claims, 02/25 (8:30): 355K expected, 351K prior
- Continuing Claims, 02/18 (8:30): 3425K expected, 3392K prior
- Personal Income, January (8:30): 0.4% expected, 0.5% prior
- Personal Spending, January (8:30): 0.3% expected, 0.0% prior
- PCE Prices - Core, January (8:30): 0.2% expected, 0.2% prior
- ISM Index, February (10:00): 54.5 expected, 54.1 prior
icon url

ReturntoSender

02/28/12 8:59 PM

#9691 RE: ReturntoSender #6755

From Briefing.com: 4:30 pm : Continued support from buyers into the close resulted in strong finishes for the major equity averages. Specifically, the S&P 500 booked its best close since 2008; the Dow settle above the 13,000 for the first time since 2008, and; the Nasdaq notched another closing high that reaches back more than a decade.

Solid gains by the major bourses abroad helped promote buying interest ahead of the US open, but the tone was undermined by news that durable goods orders fell in January by 4.0% when a 1.4% decline had been broadly expected to follow an upwardly revised 3.2% increase in the prior month. Excluding transportation, durable goods orders declined during January by 3.2%, which contrasts sharply with the 0.2% increase that many economists had expected to follow a downwardly revised increase of 2.1% in the prior month.

Buying interest was revived by the Conference Board's Consumer Confidence Index, which spiked in February to 70.8 from 61.5 in the prior month. Many had expected only a modest improvement to 62.5.

Stocks lost their direction for a time, but the support for the broad market at the neutral line brought buyers back into the fold. Some afternoon profit taking forced the S&P 500 and Dow to test the neutral line again, but continued support there gave way to a late rebound that helped stocks reclaim most of their gains.

Tech proved to be a primary source of leadership. The sector, which is the largest by market weight, scored a 0.9% gain with help from semiconductor and equipment stocks. Their advance also helped the Nasdaq outperform its counterparts.

Apple (AAPL 535.41, +9.65) was a primary driver of the Nasdaq's advance today. The stock's move to a new record high has resulted in a market cap of almost a half trillion dollars, which is greater than any other company.

Airline stocks ascended to give the NYSE Arcaa Airline Index a gain greater than 2%. Their climb was helped by a 1.8% drop in oil prices, which settled pit trade at $106.55 per barrel.

Elsewhere in the commodity complex, gold prices gained 0.8% to close pit trade at $1788.30 per ounce. Along the way the yellow metal cleared $1790 per ounce to set a three-month high. Silver prices surged 4.5% to $37.17 per ounce, which makes for a new multi-month closing high.

In the backdrop, the dollar traded with weakness all day. By the closing bell it trailed a collection of competing currencies by about 0.5%.

Advancing Sectors: Tech +0.9%, Consumer Discretionary +0.7%, Health Care +0.5%, Consumer Staples +0.3%, Telecom +0.3%, Materials +0.2%, Financials +0.2%
Declining Sectors: Industrials -0.1%, Energy -0.2%, Utilities -0.4%DJ30 +23.61 NASDAQ +20.60 NQ100 +1.0% R2K -0.4% SP400 -0.2% SP500 +4.59 NASDAQ Adv/Vol/Dec 1207/1.79 bln/1324 NYSE Adv/Vol/Dec 1544/755 mln/1446

4:34PM First Solar misses by $0.33, misses on revs; reaffirms FY12 EPS guidance, guides FY12 revs in-line (FSLR) 36.39 : Reports Q4 (Dec) earnings of $1.26 per share, excluding non-recurring items, $0.33 worse than the Capital IQ Consensus Estimate of $1.59; revenues rose 8.2% year/year to $660 mln vs the $784.06 mln consensus. Co issues mixed guidance for FY12, sees EPS of $3.75-4.25, excluding non-recurring items, vs. $4.18 Capital IQ Consensus Estimate; sees FY12 revs of $3.5-3.8 bln (compared to $3.7-4.0 bln previously forecasted) vs. $3.79 bln Capital IQ Consensus Estimate.

"First Solar's performance in the quarter was impacted by an aggressive competitive environment, an uncertain regulatory environment, warranty-related charges, and restructuring costs incurred to help position our business for the future," said Mike Ahearn, Chairman and interim Chief Executive Officer of First Solar. "Despite these headwinds, we continue to make strides reducing manufacturing costs, increasing module efficiency, and successfully building out our captive project pipeline. These improvements, combined with our recent restructuring and strategic repositioning, enhance our competitive position in a very challenging environment."

4:32PM O2Micro issued 4 claims under US patent for its Power Management System (OIIM) 5.25 +0.05 :

4:24PM Universal Display beats by $0.06, beats on revs (PANL) 45.68 +0.81 : Reports Q4 (Dec) earnings of $0.12 per share, $0.06 better than the Capital IQ Consensus Estimate of $0.06; revenues rose 73.1% year/year to $18.7 mln vs the $17.88 mln consensus. "Results continue to reflect increased penetration of our OLED materials and technology into the commercial display market, as well as growth in research and development efforts from a broad cross-section of manufacturers developing new applications for our OLED materials and technology. As revenues scale, our strong gross margins and operating leverage are driving an improved bottom line and delivering value for our shareholders. In addition, with OLEDs having eclipsed the inflection point, our operations are also now generating positive cash flow, which is adding to our overall financial strength. With manufacturers announcing plans to expand OLED productive capacity, to introduce a host of new products featuring OLED displays, and to develop OLED white lighting products, we believe the company is in a strong position to benefit from a market with significant growth opportunities."

4:22PM Universal Display -- Earnings Mover (PANL) 45.68 : Positive initial reaction to earnings as price jumps up roughly 3-pts in light after hours action up into the $48.50-49.00 area.

4:08PM STEC misses by $0.01, beats on revs; guides Q1 EPS below consensus, revs above consensus (STEC) 9.32 -0.12 : Reports Q4 (Dec) loss of $0.02 per share, $0.01 worse than the Capital IQ Consensus Estimate of ($0.01); revenues fell 38.1% year/year to $58.1 mln vs the $56.13 mln consensus. Co issues mixed guidance for Q1, sees EPS of ($0.14)-($0.16) vs. ($0.08) Capital IQ Consensus Estimate; sees Q1 revs of 49-51 vs. $48.55 mln Capital IQ Consensus Estimate. "We are encouraged by the signs of the market growth for enterprise SSDs and by the specific feedback we are getting from our early customer engagements around our new products... While we acknowledge that competitive challenges persist, we are confident in the robustness of our solutions and in our abilities to innovate to meet our customers' needs. We are still anticipating that many of our customers will complete their qualification of our products by the end of the second quarter of 2012. However, until qualifications are completed, we cannot accurately project what the sell-through of these products will be."

4:06PM FormFactor provides an update on impact of Elpida Memory reorganization filing, says not currently expected to have a material impact in the near term on co's financial position or results of operations (FORM) 5.20 +0.11 : Co announced that Elpida Memory, Inc.'s filing of corporate reorganization proceedings in Japan is not currently expected to have a material impact in the near term on FormFactor's financial position or results of operations. As disclosed in FormFactor's Annual Report on Form 10-K for fiscal 2011, filed earlier this month, sales to companies in the Elpida Memory group represented 18.2% of FormFactor's 2011 revenues, including sales to Rexchip Electronics Corporation and Tera Probe, Inc., which are not directly involved in the corporate reorganization proceedings. FormFactor has a long standing relationship with Elpida Memory and remains committed to supporting Elpida Memory's wafer test requirements as it works through its corporate reorganization.

11:27AM Semiconductor Hldrs ETF notches new session high of 35.17, flirting with its Feb/nine month close high at 35.19 (SMH) 35.15 +0.61 : Note that its July intraday high and nine month intraday peak from Feb are at 35.36/35.49 -- BRCM +3.3%, NVLS +3.4%, MU +5.5%, LLTC +2.3%, KLAC +1.9%, TXN +1.9%, ADI +2%, AMD +1.5%, AMKR +1.8%, ATML +1.8%, SNDK +1.5%, XLNX +1.9%.

9:03AM Micron and Intel (INTC) announced that the companies have entered into agreements to expand their NAND Flash memory joint venture relationship (MU) 8.73 : The agreements, which are designed to improve the flexibility and efficiency of the joint venture, include a NAND Flash supply agreement for Micron to supply NAND products to Intel and agreements for certain joint venture assets to be sold to Micron. Under terms of the agreement, Intel is selling its stake in two wafer factories in exchange for approximately $600 million-the approximate book value of Intel's share. Additionally, Intel will be receiving approximately half of the consideration in cash and the remaining amount will be deposited with Micron, which may be refunded or applied to Intel's future purchases under the NAND Flash supply agreement. The agreements also extend the companies' successful NAND Flash joint development program and expand it to include emerging memory technologies. As part of these agreements, Micron will increase its share of the overall NAND Flash output and optimize its global manufacturing network by purchasing the assets of IM Flash Singapore (IMFS) and the IM Flash Technologies (IMFT) assets in Manassas, Va.

9:02AM Corning will reaffirm growth expectations today at the Morgan Stanley Technology, Media & Telecom Conference (GLW) 13.52 : Co's CFO will reiterate the company's previous guidance of significant double-digit price declines over the cumulative two-quarter period, starting in the fourth quarter of last year. Curran and Flaws will also confirm that Corning's other businesses are on track to meet the following previously disclosed growth expectations.

Lattice Semiconductor (LSCC) announced the adoption of the MIPI Battery Interface standard within the iCE40 mobileFPGA family of products.

RF Micro Devices (RFMD) announced the expansion of the co's family of PowerSmart power platforms to include multiple new 3G and 4G LTE PowerSmart product variants.

Skyworks Solutions (SWKS) announced that several of its front-end solutions are being leveraged by the industry's baseband providers for their smartphone platforms currently supporting the world's mobile broadband standards.

Powerwave Technologies (PWAV) announced general availability of new low power, wideband Nexus FT dual and 6-band repeaters for commercial frequencies in North America. Co also announced a new digital repeater platform, Nexus RT 5000.

RF Micro Devices (RFMD) announced it has been selected to support multiple devices for a manufacturer of 3G/4G smartphones.

Oppenheimer downgraded Nokia (NOK $5.42 -0.02) to Underperform from Perform reflecting concern about the pace of the Windows transition and growing pressures on the low-end from Android. The firm believes Lumia's yet to strike a chord with consumers, and now expect a prolonged and slow ramp to fill in the Symbian gap.

10:44 am S&P tech Sector Trading Higher; Currently Best Performing S&P Sector
The tech sector is trading higher today, ahead of a roughly flat broader market. Semiconductors are showing relative strength in the tech space with the Philly Semi Index trading 1.3% higher. MU (+5.4%) and STM (+5.5%) are notable leaders in the chip index. Among other major indices, the SPY is trading 0.1% higher, while the NASDAQ and the QQQ are 0.2% higher on the session. Among tech bellwethers, TXN (+1.7%) is showing notable strength today, while ORCL (-0.6%) is under pressure.

In earnings, SINA (+11.2%) reported a mixed quarter and offered guidance. This morning, TECD (-5.8%) also posted a mixed qtr.

In news, YHOO (+0.3%) issued a warning to Facebook over patent holdings, according to reports. Elsewhere, KITD (-1.1%) announced the formation of strategic transaction committee due to recent inquiries and conversations.

Among notable analyst upgrades this morning, TTEK (+2.9%) was upgraded to Buy at Stifel. Among downgrades, FNSR (-3.3%) was downgraded to Hold from Buy at Jefferies and NOK (-1.7%) was downgraded to Underperform at Oppenheimer.

VRSK (+0.3%) and TTEC (-0.2%) are some notable names in tech scheduled to report results today after the close.
icon url

ReturntoSender

02/29/12 11:38 PM

#9692 RE: ReturntoSender #6755

From Briefing.com: 4:30 pm : Stocks attempted to return to positive territory after a mid-morning reversal took the major equity averages into the red, but resistance at the neutral line invited sellers to redouble their efforts and drop stocks for marked losses.

The Dow, S&P 500, and Nasdaq each traded up to new multi-year highs in the early going, but the move was short lived. Traders turned on stocks when prepared remarks for Fed Chairman Bernanke's semiannual FOMC report to the House Financial Services Committee began to circulate. His comments contained no surprises, but likely disappointed some because they also failed to offer reassurance that the Fed remains committed to an accommodative monetary policy, especially after fourth quarter GDP data was revised upward.

Fourth quarter GDP grew at a clip of 3.0%, which is greater than the 2.8% that had been reported in the advance reading. No revision had been expected.

A stronger economic picture was painted by a Chicago PMI of 64.0 for February. That exceeded the reading of 60.0 that had been broadly expected to follow the prior month reading of 60.2.

Later in the day the Fed's Beige Book reported that overall economic activity continued to increase at a modest to moderate pace in January and early February.

Although the macro picture continues to improve, many market participants are questioning if that is priced into the stock market now that the S&P 500 has climbed about 10% year to date and sits at levels not seen since 2008. The interest in taking some risk off of the table likely played a part in the stock market's intraday pullback and then its inability to return to higher ground.

Financials offered leadership in the early going. The sector ran up to a gain of about 1% before encountering any headwinds. It settled the session with a 0.5% loss.

Materials stocks were among the worst performers. The sector slumped 1.7% as many metals and mining issues took a hit in conjunction with a slump in precious metals prices. Silver settled with a 7.0% loss at $34.58 per ounce while gold prices closed at $1710 per ounce for a 4.4% loss after both had put on impressive performances in the prior session.

Oil managed to score a gain after two days of selling, though. Crude oil futures contract prices climbed 0.5% to close pit trade $107.09 per barrel even after weekly inventory data showed a bigger-than-expected build of more than 4 million barrels.

The Dollar Index set a two-month low yesterday, but it rallied to a 0.7% gain today. Most of that move is owed to weakness in the euro, which tumbled about 1.1% to about $1.33. Earlier today it was learned that the European Central Bank made more than $700 billion available to the continent's banks in the form of three-year loans.

Advancing Sectors: Consumer Staples +0.3%
Declining Sectors: Telecom -0.1%, Utilities -0.1%, Consumer Discretionary -0.1%, Financials -0.5%, Health Care -0.5%, Industrials -0.5%, Tech -0.5%, Energy -1.0%, Materials -1.7%DJ30 -53.05 NASDAQ -19.87 NQ100 -0.4% R2K -1.6% SP400 -0.6% SP500 -6.50 NASDAQ Adv/Vol/Dec 656/2.11 bln/1911 NYSE Adv/Vol/Dec 1029/1.11 bln/1979

4:18PM Freescale Semi announced completion of new financing under senior secured credit facilities and redemption of $500 mln principal amount of senior subordinated notes (FSL) 16.14 -0.42 : Co amended its Credit Facility to, among other things, enter into a new senior secured term loan facility in an aggregate principal amount of $500 mln. Borrowings under the new term loan facility bear interest, at a rate equal to for eurocurrency rate loans, LIBOR plus 4.75%.

4:16PM PMC-Sierra announced earlier it has acquired Maxim Integrated Products (MXIM) 12Gb/s SAS expander technology; financial erms not disclosed (PMCS) 6.87 -0.06 :

4:16PM Advanced Micro to acquire SeaMicro for $334 mln, of which $281 mln will be paid in cash (AMD) 7.35 -0.17 : The acquisition does not change AMD's 2012 financial guidance and the transaction is expected to be accretive to earnings after 2012. AMD will fund the cash portion of the acquisition with existing cash reserves. AMD will hold a conference call for the financial community at 4:45 p.m. EST to discuss the announcement.

4:02PM Finisar beats by $0.01, reports revs in-line; guides Q4 EPS below consensus, revs below consensus (FNSR) 20.29 -1.50 : Reports Q3 (Jan) earnings of $0.23 per share, excluding non-recurring items, $0.01 better than the Capital IQ Consensus Estimate of $0.22; revenues fell 7.6% year/year to $243 mln vs the $244.6 mln consensus. Co issues downside guidance for Q4, sees EPS of $0.18-0.22, excluding non-recurring items, vs. $0.25 Capital IQ Consensus Estimate; sees Q4 revs of $235-239 mln vs. $254.29 mln Capital IQ Consensus Estimate.

Maxim Integrated Products (MXIM) announced it has made an investment in Scintera Networks.

6:10AM Lattice Semi announced earlier a $20 mln stock repurchase program (LSCC) 6.71 : Co announced that its Board of Directors has approved a stock repurchase program pursuant to which up to $20 million of its outstanding common stock may be repurchased from time to time. The duration of the repurchase program is twelve months.

STEC (STEC $9.34 -0.02) reported a fourth quarter loss of $0.02 per share, $0.01 worse than the Capital IQ Consensus of ($0.01), while revenues fell 38.1% year/year to $58.1 million versus the $56.13 mln consensus. The company issued mixed guidance for the first quarter with EPS of ($0.14)-($0.16) versus the ($0.08) consensus and revenues of 49-51 versus the $48.55 million consensus. "We are encouraged by the signs of the market growth for enterprise SSDs and by the specific feedback we are getting from our early customer engagements around our new products... While we acknowledge that competitive challenges persist, we are confident in the robustness of our solutions and in our abilities to innovate to meet our customers' needs. We are still anticipating that many of our customers will complete their qualification of our products by the end of the second quarter of 2012. However, until qualifications are completed, we cannot accurately project what the sell-through of these products will be."

Universal Display (PANL $42.11 -2.93) reported fourth quarter earnings of $0.12 per share, $0.06 better than the Capital IQ Consensus of $0.06, while revenues rose 73.1% year/year to $18.7 million versus the $17.88 mln consensus. "Results continue to reflect increased penetration of our OLED materials and technology into the commercial display market, as well as growth in research and development efforts from a broad cross-section of manufacturers developing new applications for our OLED materials and technology. As revenues scale, our strong gross margins and operating leverage are driving an improved bottom line and delivering value for our shareholders. In addition, with OLEDs having eclipsed the inflection point, our operations are also now generating positive cash flow, which is adding to our overall financial strength. With manufacturers announcing plans to expand OLED productive capacity, to introduce a host of new products featuring OLED displays, and to develop OLED white lighting products, we believe the company is in a strong position to benefit from a market with significant growth opportunities."
icon url

ReturntoSender

03/03/12 8:46 PM

#9696 RE: ReturntoSender #6755

From Briefing.com: Weekly Recap - Week ending 02-Mar-12Stocks finished the week in lackluster fashion, but the S&P 500 still posted another weekly gain -- the eighth in nine weeks. Commodities were cut down, though.

Early action was choppy and without leadership. It was also undermined by weakness in the Energy sector, which came under pressure in conjunction with lower oil prices. The Energy sector settled with a 1.1% loss, which is worse than what any other sector suffered, while oil closed pit trade with a 1.9% loss at $106.68 per barrel. Earlier this week oil hit a multi-month high near $110 per barrel.

The major equity averages set impressive marks of their own earlier this week. The Nasdaq notched its highest level in more than a decade, while the Dow and S&P 500 both printed their best intraday levels since 2008. Along the way the Nasdaq Composite kissed the 3,000 mark, but failed to hold its ground there. The Dow closed above the psychologically significant 13,000 line after a few failed attempts, but was backed down by week's end.

With the major equity averages trading at such heady levels, many pundits are predicting a pullback, especially since stocks are showing some signs of fatigue. In anticipation of possible volatility, there was strong rotation into the dollar. The dollar marked its lowest level of the past three months earlier this week, but it finished out the week in impressive fashion. Its 0.8% gain on Friday helped fuel a weekly gain of 1.2%. Efforts to reduce risk were more pronounced among commodities. While oil's tumble made the most headlines, the rest of the complex was also clipped aggressively. That resulted in a 1.0% loss for the CRB Index on Friday. It fell 1.5% for the week.

Share volume has been paltry all week and was especially pathetic on Friday. Against an uncertain near-term outlook for the market, the absence of corporate news or economic data of consequence suppressed share volume, which barely totaled 520 million shares on the NYSE.

Market participants got a substantial helping of data on Thursday, overshadowing a raft of same-store sales results, which actually proved impressive.

The latest initial jobless claims count totaled 351,000, which is little changed from the prior week's tally of 353,000, but also on par with the 355,000 claims that had been expected, on average, among economists polled by Briefing.com. The numbers were supportive of an improving labor market picture, even though the headline unemployment rate remains elevated.

Personal spending increased in January by 0.2%, but income increased by 0.3%. Neither was as strong as what had been expected -- the Briefing.com consensus called for a 0.4% increase in both pieces of data.

The ISM Manufacturing Index fell to 52.4 in February from 54.1 in the prior month, but it still suggested that manufacturing activity expanded during the month. Nonetheless, expectations called for an improvement to 54.7, making the report a disappointment.

Construction spending for January also proved displeasing. It slipped by 0.1%, which isn't drastic, but it came in stark contrast with expectations for a 1.0% increase.

Fed Chairman Bernanke delivered a semiannual monetary policy report to the Senate Banking Committee on Thursday, but his comments reflected those he delivered to the House Financial Services Committee on Wednesday. Altogether the Chairman's remarks weren't surprising, but the lack of reassurance regarding the Fed's commitment to an accommodative monetary policy was credited for inviting selling interest.

Prior to Bernanke's report market participants learned that fourth quarter GDP was revised upward to a clip of 3.0%, which is greater than the 2.8% that had been reported in the advance reading. The upward revision came as a surprise since no change had been expected, but there response to the news was restrained.

Consistent with an improving macro picture, the Fed's Beige Book indicated that overall economic activity continued to increase at a modest to moderate pace in January and early February. That's not to say that all activity is consistently improving, though.

Data unveiled earlier in the week indicated that durable goods orders fell in January by 4.0%, which is far worse than the 1.4% decline. The steeper-than-expected drop follows an upwardly revised 3.2% increase in the prior month. Excluding transportation, durable goods orders declined during January by 3.2%, which contrasts sharply with the 0.2% increase that many economists had expected to follow a downwardly revised increase of 2.1% in the prior month.

The Conference Board's Consumer Confidence Index ran up 70.8 in February. It was at only 61.5 the month before. Many had expected only a modest improvement to 62.5. Sentiment surrounding housing improved with news that pending home sales increased by 2.0% in January. That was double the pace that had been generally predicted among economists.

Europe was in sharp focus at the start of the week because of news that G-20 officials want eurozone officials to establish additional financial safeguards before more funds are made available to the International Monetary Fund for commitment to the continent. It came back into focus by mid-week because of news that more than 800 banks in Europe cumulatively borrowed more than $700 billion in three-year loans through the second installment of its LTRO operation. Reports of individual funding by week's end helped bolster confidence in several European banks.

There wasn't a great deal of corporate news in play this week, but Apple (AAPL 545.18, +0.71) made headlines when its market cap ballooned to more than a half of a trillion dollars.

Earnings announcements were relatively limited, but Transocean (RIG 54.19, +0.62) posted numbers that were met with a positive response earlier this week. Home improvement retailer Lowe's (LOW 28.13, -0.25) announced quarterly results that featured an upside earnings surprise.
 
Index Started Week Ended Week Change % Change YTD %
DJIA 12982.95 12977.57 -5.38 -0.0 6.2
Nasdaq 2963.75 2976.19 12.44 0.4 14.2
S&P 500 1365.74 1369.63 3.89 0.3 8.9
Russell 2000 826.92 802.42 -24.50 -3.0 8.3

5:32PM Rambus reports that ITC Administrative Judge issues initial determination in Rambus matter (RMBS) 6.81 -0.25 : Co announced it received notice that the Administrative Law Judge (ALJ) for its U.S. International Trade Commission (ITC) action against LSI Logic, MediaTek, ST Microelectronics and other Respondents has issued an Initial Determination. According to the notice, ALJ Theodore R. Essex found there to be no violation of Section 337 of the Tariff Act of 1930 for the patents in question. The action is Investigation Number 337-TA-753.

7:06AM Tessera Tech subsidiary to acquire assets of Vista Point Technologies from Flextronics International for $23 mln in cash (TSRA) 16.73 : Tessera Technologies announced that its wholly-owned subsidiary, DigitalOptics Corporation, has agreed to acquire certain assets of Vista Point Technologies, a Tier One qualified camera module manufacturing business, from Flextronics International Ltd. (FLEX). DOC will pay approximately $23 mln in cash, subject to certain adjustments and costs at closing, for certain assets of Flextronics's camera module business located in Zhuhai, China, along with the equity interests of a wholly-owned foreign enterprise that will own those assets. The transaction, which is expected to close in the third quarter, if not sooner, includes existing customer contracts and a lease to an approximately 135,000-square-foot facility. DOC anticipates that the business will have a capacity to manufacture approximately 50 million camera module units per year.

icon url

ReturntoSender

03/04/12 2:22 PM

#9697 RE: ReturntoSender #6755

InvestmentHouse Weekend Market Summary

http://www.investmenthouse.com/weekendmarketsummary.htm

-Stocks change their character a bit: lack of news and stocks fall instead of rise.
- Geithner complains of collective 'amnesia' about financial reform complaints, but who has the memory problem?
- Large cap indices sport modest losses, but the small caps are already heading to the 50 day EMA.
- Despite the improvement in economic data some very troubling countercurrents have developed.
- No breakdown yet and market rallies can last much longer than common sense, but be careful with your gains.

Nature hates a vacuum and so do markets.

There was little change in the stock market on Friday, but this may be a case where a little change turns out to be a lot of change. It is said that nature abhors a vacuum, and stock markets and financial markets generally feel the same way. Friday there was a news vacuum. There was nothing on schedule to be released given that leap year forced the jobs report to be released next Friday. With nothing on tap and nothing happening on the earnings front, that left the financial stations and investors (and thus the markets) all on their own to divine which direction they wanted to go.

To be fair, there were a few stories out. The Iran claims about the Saudi pipeline explosion were still reverberating, and people were wondering why they were such suckers. Treasury Secretary Giethner had an op-ed in the Wall Street journal. He talked about collective amnesia with respect to those carping about the financial reform bills because they seemed to have already forgotten what got us into trouble. But there are some other issues there. It seems like Mr. Giethner has some of his own amnesia, and that will need to be delved into as well.

What the markets did in that vacuum was one of the bigger stories and perhaps an untold story of the session. SP500 went nowhere. It was unable to hold the move through its prior bear market high, and that was similar to the other indices. In the case of NASDAQ, it was unable to break and hold 3K, and the Dow was unable to close above 13K. Those may not be significant numbers other than in investors' minds, but the action showed something different. Without news what has this market done for the past 2.5-3 months? It has risen. There was a lot of news out. We saw economic data improving almost daily in most respects. There are some troubling things out there. But on days where there was no news, stocks rose. The path of least resistance, as we often hear, was up.

On Friday stocks started the day a bit lower but were trying to move higher. Weak opens in a rising market often lead to higher closes. They were trending upside as the trade got underway. But unlike other sessions, they were unable to close the deal out to the upside, indeed slipping significantly into lunch and managing just a modest late recovery that could not hold into the close. That left the indices with minor losses.

SP500, -0.32%; NASDAQ, -0.43%; Dow, -0.02%; SP600, -1.64%; SOX, -1.04%.

OTHER MARKETS

Dollar. 1.3205 versus 1.3314 euro. The dollar was higher. That would be proper with a strengthening economy, but it was also aided by some worries about Europe yet again. It was a decent move, and it was also up sharply against the yen. That is the main reason for the strong move off the bottom of the pattern. The dollar had traded down to its support and was able to bounce.

Bonds. 1.98% versus 2.03% 10 year U.S. Treasury. Bonds were back up off of their lows that they gapped down to on Thursday. Still in that very narrow range, narrowing down into the point. The question will be whether it breaks out to the upside or if it breaks to the downside and falls as it should given a recovering economy (at least that is what we are told).

Gold. 1,709.20, -13.00. Gold was down a bit on the day. It tanked over $80 on Wednesday, rebounded modestly Thursday, and could not hold any move up on Friday. Gold is showing problems. If the Fed will not perform more Quantitative Easing, you would expect gold to suffer a bit simply because there is not excess inflation. But there is inflation out there. We saw inflation crop up in the GDP numbers and the CPI. This is somewhat strange behavior, but it may just be near term and part of the reverberations of Bernanke's testimony on Wednesday.

Oil. 106.68, -2.16. Oil was down on the session. It was an up and down week for oil. A nice test classic as a matter of fact. A good bounce on Thursday, but then Friday it faded back. That may have been because the pipeline explosion story was revealed to be bogus.

Let us get back to the stock market. To us one of the big stories of the day was that the indices failed to rise with a lack of news as they have done for the last three months basically the life of this rally. Another very important aspect of the day was that even though the large caps had nominal losses, the small caps did not. They sold off over 1.5% and are well on their way to the 50 day EMA. That is something we said the indices overall were going to do when they tested.

We can see by the SP600 and the Russell 2000 index that they sold hard and are on their way to a 50 day EMA test. Nothing is wrong with that. That is something we said likely needed to happen, but they were far and away the downside leaders. Small caps are so important to the economic health of the United States. We have had no jobs created because most jobs come from small companies. I know there have been some articles written lately about how that is not the case because these companies cannot even afford to employ the owners. We are talking about the startups that have new ideas and that generate new jobs and new technologies for the next generation. Thus they create big companies from something small. CSCO and DELL are not big job creators anymore, but they were when they were growing from garages into the huge companies they are today.

Small caps are also very sensitive to domestic issues. Things have been improving in the U.S. The data started get better and better about six months ago. I was chronicling that at the time and talking about how it flew in the face of what ECRI was forecasting. The rollover in small caps is disturbing. It was not a complete rollover, however; it is a normal test, which is what we expect the other indices to do as well. The question is how far it goes.

It was somewhat worrisome to see how the entire week played out. There were several changes under the surface. I have already hit on two the failure to rise and lack of volume and news, and then the small caps suddenly leading sharply to the downside. Of course that had many pundits' tongues wagging on Friday about an economic slowdown joining the party from what we were talking about last week in terms of the ECRI reiteration of its recession call.

Looking at the other indices, of course there is absolutely no rollover yet. The Dow has flattened out a bit as I noted a Thursday. MACD is making a lower high as the index made a higher high. It looks like it could be at the apex of a rounded top. It COULD be. You can read a lot of things into charts that could be there. We have to anticipate what could be there, but then you have to move in on what is actually there.

It is somewhat concerning, and it harkens back to last weekend's talk about the ECRI calling a recession. There is a lot of data that is not improving, and it is key data at that. It is data that has, over time, proved to be the critical in determining whether an economy expands or contracts. That includes income. It includes sales, industrial production, and it also includes the annual GDP growth of course. This past week we saw some issues with these, even though GDP was revised up to a 3% growth rate. You can take out a big jump in inventories that were brought about in large part by slowing sales for both consumers and business. That was one of the worrisome issues with the first and second iterations of the GDP report. This week we saw personal incomes. They were negative when you adjust for inflation. And when you adjust for inflation, spending was flat for the past three months. We are not seeing any improvement, just as the ECRI warned and before the data even before this new data was released.

I do not care how foolishly bullish some are on certain morning financial stations. They see only the good things despite several bad indications. You have to take note of what is happening here. It is a cause for concern if we get $5 per gallon gasoline and it is already over $4 in some places. It is concerning if you are getting negative wage growth thanks to inflation, as we are. It is concerning if you have flat spending adjusted for inflation, as we are. If you have construction spending falling even in warm weather, as seen in January. It was warm but it was down -0.1% when a 1% gain was expected. If you get plummeting Durable Goods Orders as we saw in January even if there was a tax reason for at least part of it. All of these are a reason for concern. Add to that the markets' reaction to Mr. Bernanke's Wednesday testimony. It was a relatively innocuous testimony unless you were expecting some mention of QE3, which was noticeably lacking from his speech. Perhaps that is the rub given what some economic indicators may be leading us to sense.

There could be some issue still to come. You see a drop in gold and a reverberation through the markets on this rather painless speech. That is reminiscent of some of Mr. Greenspan's commentary in years past. He would say certain things that were meant to shock the markets, and then others that were not meant to but did nonetheless. That was the beginning of the end of a particular move in the markets. I am not saying that is what has happened now. As noted in the charts, it is far from what has happened in this situation or where we closed up as of Friday.

Do not forget that if President Obama is reelected, your taxes will go higher because we will see the end of the Bush tax cuts. They will not be renewed. There will be several taxes embedded in the healthcare plan that will kick in as well. And taxes are a tax on the economy. We already talked earlier in the week about the UK's experiment that just gave another textbook example of why raising taxes does not increase revenues. We are going that route, and we will see it happen again.

The market is a handicapper in the long term. Short term it goes back and forth. It has swings that overshoot the market in both directions. It looks down the road, however, and that is where the main trends emerge. Stocks have been moving higher, no question. Most of the move we have seen since the bottom in 2009 was the lift from liquidity by two big Quantitative Easing bouts from the Federal Reserve. We had trouble when QE2 ended, and then Operation Twist came in which provided further liquidity. We also had the liquidity facilities in Europe that helped pull the U.S. markets out of the eurozone from July to October 2011. That is what the market has been riding higher now. But, again, we saw the response to Bernanke's lack of conversation about QE2 in his Wednesday testimony.

We have a lot of economic indicators that are not showing the kind of growth we should have if the economy is really recovering. The ECRI is picking up on that and reiterating its recession call. We also have the long-term implications of taxes increasing in continued regulation through the EPA enforcing Cap and Trade, through the healthcare management, and innumerable executive orders that have led to thousands of new regulations this year alone. These are all policies we have tried before, after the Great Depression and during the 1970's. They did not work. We eventually pulled out of them because we changed policies. But right now the indicators (or the future indicators of elections) are suggesting that these policies will be in place because the president is showing that he is still quite popular. We could have the same policies remain in place, and that is not conducive to rising stock prices, particularly in the long term.

We are not there yet. It is a great leap from the Friday close to what I just went through. The SP500 and Dow are still bumping up against the post bear market highs. The NASDAQ is at a post bear market high. Very difficult to say that we are about to roll over. But, as I have been saying all along, you have to watch for the door. We have the tiger by the tail, but the rally is looking a bit old now. We have been anticipating a pullback. Why not just be ready for one? If it gets worse, it gets worse. Again, it is a long, long leap from where we are now to the scenario of recession and deep trouble I just went through. But we cannot stick our heads in the sand and ignore it by being overly bullish and expecting that the U.S. consumer will be able to withstand no wage growth, flat spending, and gasoline in the $4, $5 or even $6 per gallon range through the summer. We would not come away economically unscathed. It is likely not in the cards, so the question is how bad it will be. We need to be ready, but that does not mean we will stop playing the rallies and make money.

TECHNICAL SUMMARY

Friday was a nothing session.

Volume. NASDAQ -7.8%, 1.74B; NYSE -13.5%, 650M. There was no volume driving the moves, so there was no major force at work. You have to factor that in when you consider the moves made by the indices, particularly the SP600.

Breadth. NASDAQ -2.4:1; NYSE -2:1. Getting there but really nothing major with the breadth readings we see in more significant moves. The fact that it was at 2:1 when the Dow and SP500 were virtually flat does show that the small caps were the struggling group.

THE CHARTS

SP500. SP500 is still bumping up against the May and April 2011 peaks. It has not made a clear break from that level by any stretch. It is actually struggling at that level.

DJ30. DJ30 did move through its prior bear market highs, but it has been unable to move forward. It looks to be rounding out the top. It could be at the apex of a rounded top that comes back for a test of the October high near 12,200 or maybe even a little lower. That would be your first target on any pullback because there is nothing overtly nefarious about the economic activity or the market activity. You have to look deeper into the numbers, and a lot of people do not want to do that. Let's face it, we have had a lot of bad times, and people to want enjoy some good times.

NASDAQ. NASDAQ is holding at new post-bear market highs. It has put some distance between its prior peak in the summer of 2011. NASDAQ still looks just fine. It is wearing out a bit. MACD is a bit lower, but nothing major at all. It is nothing that would suggest a major tank or rollover. Indeed, if it does test, you would expect it to maybe fill this gap from early February and find support at that level.

SP600. The small caps are the issue. They were down 1.6% on the session, but they are still well above the 50 day EMA, even though they are selling hard and leading the market lower. It looks like they will hit it, but we will have to see how it reacts there. There is plenty of support from a shelf back in January. A shelf of price consolidation as well as the 50 day EMA. You can also see other levels at the same point as the 50 day EMA that have held in the past. That would be around 440.

SOX. SOX was worrisome as well, down 1%. A lot of semiconductors stocks are looking somewhat shaky right now, suddenly turning a little negative when it looked like they would be able to supply support for the rest of the market.

LEADERSHIP

Semiconductors. TXN has been performing fairly well. It is back down toward the bottom of its range, and it suddenly got heavy again. We are seeing that in a lot of stocks. All of a sudden they are just a bit heavy, losing their momentum. ALTR was a leader to the upside, and it has struggled and broken down. We are playing SIMO short. It has been breaking to the downside as well. Some problems, yes, but overall semiconductors are trying to hold up. BRCM is one of the key stocks because it is so related to AAPL. It is selling off. It has something of a little head and shoulders, a top that it put in at the October peak. Maybe we are due for a test to fill this gap or maybe a lower gap. Nothing major yet; it is just showing the same kind of sluggishness and lack of momentum as other semiconductors.

Manufacturing/Machinery. Manufacturing and equipment looks a little top heavy as well. CAT is putting in a rounded top. It has not broken lower, but MACD has made a lower high as the stock has just put in a little higher high. Maybe at the apex of the top, similar to the Dow. DE broke lower, tried to hold, and it is starting to move to the downside below the 50 day EMA. BGC looked good recently with a nice bounce. But all of a sudden its character has changed somewhat. It is trying to break below a key support level, and it was falling pretty hard on Friday. A lot of these stocks started to show wear-and-tear on Friday. CRDN broke to the downside. A little head and shoulders action breaking downside as well.

There are some problems with semiconductors and those important manufacturing stocks. IRF was breaking below the 50 day EMA. They are not the only ones, but they have been leaders. They have been performing well and are now struggling. You always have to watch for that because the market is made up of leaders. Leaders, by definition, move ahead of the market. While the indices may still be posting their slow, steady uptrends, some of the leaders are starting to have trouble and break to the downside. CMG is posting virtually a move straight to the upside for the past two months. You rarely see moves like this. This does not last forever, but for now it is. That leads us to the quandary of what we will do over the next few weeks.

THE MARKET

SENTIMENT INDICATORS

VIX. The VIX is at 17 or so. That is a level where the market has found trouble in the past and sold off, spiking the volatility reading higher. These spikes coincided with volatility readings at these levels. I hate to use this as an indicator because volatility can remain low for a long period of time while the market continues to run higher.

VIX: 17.29; +0.03
VXN: 18.23; -0.45
VXO: 15.2; -0.03

Put/Call Ratio (CBOE): 0.95; -0.06

This is a reading of the number of bullish investment advisors versus bearish advisors. The reason you look at this is that it gives you an idea of how bullish investors are. If they are too bullish then everyone is in the market and it is heading for a top: if everyone wants to be in the market, then all the money is in and there is no more new cash to drive it higher. On the other side of the spectrum if there are a lot of bears then there is a lot of cash on the sideline, and as the market rallies it drags that cash in as the bears give in. That cash provides the market the fuel to move higher. If bears are low it is the same as a lot of bulls: everyone is in and the market does not have the cash to drive it higher.

Bulls: 51.1% versus 51.1%. Holding lower from 54.8%. Even as stocks continued to rise, bulls faded. That is a decent indication and does not show excessive ebullience. That was the highest level since April and May of 2011, the peak of the post-bear market high. Now the indices are back at that level and so are the bulls. All the more reason to watch this action at the prior highs. 35% is the threshold measuring bullish versus bearish action. Six weeks the bulls were below bears. A powerful sentiment signal but now dissipating. Highs from April and December (60% readings spanning December through early May 2011). The 5 year high is 62.0. The crossover level at 29% bulls from July 2010 is long gone. 35% is the threshold level suggesting bullishness. To be seriously bearish it needs to get up to the 60% to 65% level.

Bears: 25.5% versus 26.6%. Right back down to the 25% level. Bulls slacken, bears slacken. Kind of a mixed signal and getting low enough to show some wear in the market. Was 28.7% a month back. After spending weeks at 30%ish, bulls are faltering big time. Not at a bearish level but they are growing more confident even as the market hits the prior highs and is not blasting on through. For more reference, bearishness hit a 5 year high at 54.4% the last week of October 2008. The move over 50 took bearish sentiment to its highest level since 1995. Extreme negative sentiment. Prior levels for comparison: Bearishness peaked at 37.4% in September 2007. It topped the June 2006 peak (36%) on that run. That June peak eclipsed the March 2006 high (33%) and well above the 2005 highs that spawned new rallies (30% in May 2005, 29.2% in October 2005). That was a huge turn, unlike any seen in recent history.

NASDAQ

Stats: -12.78 points (-0.43%) to close at 2976.19
Volume: 1.74B (-7.84%)

Up Volume: 659.53M (-530.47M)
Down Volume: 1.07B (+463.35M)

A/D and Hi/Lo: Decliners led 2.43 to 1
Previous Session: Advancers led 1.29 to 1

New Highs: 75 (-11)
New Lows: 25 (0)

SP500/NYSE

Stats: -4.46 points (-0.32%) to close at 1369.63
NYSE Volume: 650M (-13.45%)

Up Volume: 1.21B (-1.47B)
Down Volume: 2.06B (+950M)

A/D and Hi/Lo: Decliners led 2.03 to 1
Previous Session: Advancers led 2.09 to 1

New Highs: 108 (-41)
New Lows: 18 (+9)

DJ30

Stats: -2.73 points (-0.02%) to close at 12977.57
Volume DJ30: 94M shares Friday versus 139M shares Thursday.

MONDAY

The first thing we will do is let positions that are running continue to run. We will not cut them off simply because we have concerns about what the future may hold. Remember that I am talking longer term trends versus nearer term trends. We also have to look and see what is coming up for the week. We have some Factory Orders and ISM Services. Factory Orders will be very important given the Durable Goods numbers. We have ADP employment, one of the precursors to the Friday jobs report. We also have Productivity revisions for Q4. We all know how productivity destroys jobs and makes the unemployment rate go higher (or so say the President and his top advisor).

We have Challenger Job Cuts along with the Initial Jobless Claims, and then Friday is the biggie. The Nonfarm Payrolls are expected to be good although I believe they are sandbagging it from the expectations. You might ask why jobs would be good if things are getting worse as some are saying. I have said that could be a possible route the economy takes in 2012. Jobs lag. The economy has been improving for six months, and jobs have been following it higher. If it turns back down, jobs will be the last to turn.

We will let existing positions run if they are running. It is hard to complain about CMG. It is hard to complain about what RL is doing or LULU. I am not complaining, although I could probably find some reason. But why bother? They are making us money, so let your winners run. We will also do what we have done with the stocks that started to struggle. We have gotten rid of the ones breaking lower and having trouble. We did it all week and the week before. Some stocks are getting tired, no doubt. They have had good runs and are starting to break lower. ARAY was one we took off of the table on Friday. It was not a major collapse. It had a nice pullback, but then it started to drop further. Maybe it is just a shakeout, but it fell below its 20 day EMA and we did not want to mess around with it. We locked in the rest of the gain. We got a nice gain off of this one, and we will see if it sets up again.

That is a key point. We can always get back into these if this market will continue to move to the upside. We can move back in and make our gains. Then we have to worry about new plays. That also means if new plays keep presenting themselves to the upside, then we are take advantage of them. We would be foolish not to. This week several stocks said they wanted to move to the upside and started to make the break, so we moved in with them. That is what you have to do. As long as they present themselves and they are quality, you move with them.

At the same time, there are downside plays that are showing up, and you have to take advantage of them. HMSY and one we moved into on Friday. It has rolled. It put in the lower MACD as it made a series of tops, and it broke to the downside. KLAC is one we have been in for a few days now, and it looks like it is trying to turn back down. It has not made that sharp break, but it is showing that same lower MACD, lower highs and rolling over.

This is one of those times in the market where we have to look both ways before we cross the street. We can play some upside, we can play some downside, but things are getting a bit more interesting even though the indices not really doing much. Indeed it is because they are not doing much after such a long run that it is interesting. But that in and of itself would not do it unless you start see the breakdowns from important stocks. These are stocks that helped lead the market to the upside and are struggling. If more and more start to break down, obviously the move will wear out and fall. That is when we have to take shelter, protect our gains, and play the downside.

It is a natural transition. We have started having more and more plays on the report to the downside. We still have a predominant number to the upside because the trends in the market are still up. We are still getting presented great upside opportunities. But as things turn choppier, which they typically would do after this type of slow, upside run, then we will start to see more plays breaking lower. We need to patiently wait for good setups and move in. There are always some early leaders to the downside. There are always early leaders to the upside as well. But most stocks take their time about changing direction. We just need to be patient and let them show us if they will break to the downside. Then we can play them when they make definitive breaks.

It could be a bit rockier ahead. It could be a bit choppier. We will look both ways. If the market wants to continue to the upside, if Bernanke announces or hints at some QE3, then it will go higher and we will gladly let it run to the upside. We will position ourselves accordingly with more upside plays. If it is not forthcoming and it turns out that his seemingly innocuous statement on Wednesday turns out to be a game changer, then it will happen naturally. We will position ourselves and make the transition that will show up in the plays, and we will take what the market gives.

I will see you on Monday and count down to the jobs report. Have a great weekend!

Support and Resistance

NASDAQ: Closed at 2976.19
Resistance:
3026 from 10/2000 low
3042 from 5/2000 low

Support:
The 20 day EMA at 2931
2888 is the May 2011 peak and PRIOR post-bear market high
2879 is the July 2011 peak
2862 is the 2007 peak
2841 is the February 2011 peak
The 50 day EMA at 2835
2825 is the 2007 closing peak.
2816 is the early April 2011 peak.
2754 is the October 2011 high
2706 to 2705 is the April 2011 low and the February 2011 and consolidation low (bottom of the trading range) 2723 to 2705 is the range of support at the bottom of the January to May trading range
2686 is the January 2011 closing low
2676 is the January 2010 low and the December 2011 peak
The 200 day SMA at 2672
2645-2650ish from December 2010 consolidation
2643 is the September 2011 high
2612 is the late August 2011 peak
2603 is the March 2011 intraday low (post-Japan low)
2599 is the June 2011 low and NASDAQ
2593 is the November intraday high
2580 is the November 2010 closing high
2572 is the November 2-11 gap down point
2555 is the mid-August 2011 peak
2546 is the early September 2011 gap down point
2535 is the November island reversal gap point
2532 is the early August gap down point
2469 is the November 2010 low
2441 is the November 2011 low
2331 from October 2010 low and the August 2011 intraday low
2305 from the August 2010 peak (summertime base)
2139 is the May and June 2010 low

S&P 500: Closed at 1369.63

Resistance:
1371 is the May 2011 peak, the post-bear market high
1425 from May 2008 closing highs
1433 from August 2007 closing lows
1440 from November 2007 closing lows

Support:
1357 is the July 2011 peak
The 20 day EMA at 1354
1344 is the February 2011 peak
1340 is the early April 2011 peak
1332 is the early March 2011 peak
1325-27 is the March 2008 closing low and the May 2006 peak.
The 50 day EMA at 1322
1318.51 is the May 2011 low
1313 from the August 2008 interim peak
1295 to 1294 is the April 2011 low and the February 2011 consolidation low (bottom of the trading range)
1293 is the October 2011 peak
1275 is the January 2010 low, early January 2011 peak
1267 is the December 2011 peak
1258 is June 2011 intraday low
The 200 day SMA at 1258
1255 is the late December 2010 consolidation range
1249 is the March 2011 low (post-Japan)
1235 is the mid-December 2010 consolidation low
1231 is the late August 2011 peak
1227 is the November 2010 peak
1220 is the April 2010 peak
1209 is the mid-August 2011 high
1196 is the November 2010 consolidation peak
1178-1180 is the October 2010/November 2010 consolidation low
1158 is the November 2011 low
1131 - 1127 from August 2010 base peak.
1119 is the early August closing low
1109 is the mid-September 2010 gap up point
1101 is the August 2011 low
1099 from the mid-July interim peak
1075 is the October 2011 intraday low

Dow: Closed at 12,977.57
Resistance:
13,058 from the May 2008 peak on that bounce in the selling

Support:
The 20 day EMA at 12,892
12,876 is the May high
12,754 is the July intraday peak
The 50 day EMA at 12,649
12,391 is the February 2011 peak
12,284 is the October 2011 peak
12,258 is the December 2011 peak
12,110 from the March 2007 closing low
12,094 is the April 2011 low
The 200 day SMA at 12,009
The June low at 11,897 (closing)
11,893 from March 2008 closing low
11,867 from the August 2009 high and peak on that bounce in the selling.
11,734 from 11-98 peak
11,717 is the late August 2011 peak
The August low at 11,702
11,555 is the March low
11,452 is the November 2010 peak
11,178 from November 2010
10,978 is the bottom of the November 2010 consolidation
10,750 from September 2010
10,720 is the August closing low
10,705-710 from January 2010 peak
10,694-700 from August 2010 peak
9938 is the August 2010 low

Economic Calendar

February 27 - Monday
- Pending Home Sales, January (10:00): 2.0% actual versus 1.0% expected, -1.9% prior (revised from -3.5%)

February 28 - Tuesday
- Durable Orders, January (8:30): -4.0% actual versus -1.4% expected, 3.2% prior (revised from 3.0%)
- Durable Orders -ex T, January (8:30): -3.2% actual versus 0.2% expected, 2.1% prior (revised from 2.2%)
- Case-Shiller 20-city, December (9:00): -4.0% actual versus -3.6% expected, -3.8% prior (revised from -3.7%)
- Consumer Confidence, February (10:00): 70.8 actual versus 62.5 expected, 61.5 prior (revised from 61.1)

February 29 - Wednesday
- MBA Mortgage Index, 02/25 (7:00): -0.3% actual versus -4.5% prior
- MBA Mortgage Purchas, 02/25 (7:00): -4.5% prior
- GDP - Second Estimate, Q4 (8:30): 3.0% actual versus 2.8% expected, 2.8% prior
- GDP Deflator - 2nd Estimate, Q4 (8:30): 0.9% actual versus 0.4% expected, 0.4% prior
- Chicago PMI, February (9:45): 64.0 actual versus 60.0 expected, 60.2 prior
- Crude Inventories, 02/25 (10:30): 4.160M actual versus 1.633M prior

March 1 - Thursday
- Initial Claims, 02/25 (8:30): 351K actual versus 355K expected, 353K prior (revised from 351K)
- Continuing Claims, 02/18 (8:30): 3402K actual versus 3425K expected, 3404K prior (revised from 3392K)
- Personal Income, January (8:30): 0.3% actual versus 0.4% expected, 0.5% prior
- Personal Spending, January (8:30): 0.2% actual versus 0.4% expected, 0.0% prior
- PCE Prices - Core, January (8:30): 0.2% actual versus 0.2% expected, 0.1% prior (revised from 0.2%)
- ISM Index, February (10:00): 52.4 actual versus 54.7 expected, 54.1 prior
- Construction Spending, January (10:00): -0.1% actual versus 1.0% expected, 1.4% prior (revised from 1.5%)
- Auto Sales, February (14:00): 5.00M prior
- Truck Sales, February (14:00): 5.73M prior

Friday:

Nothing!!!

March 5 - Monday
- Factory Orders, January (10:00): -1.9% expected, 1.1% prior
- ISM Services, February (10:00): 56.0 expected, 56.8 prior

March 7 - Wednesday
- MBA Mortgage Index, 03/03 (7:00): -0.3% prior
- ADP Employment Change, February (8:15): 220K expected, 170K prior
- Productivity-Revised, Q4 (8:30): 0.9% expected, 0.7% prior
- Unit Labor Costs - Revised, Q4 (8:30): 1.1% expected, 1.2% prior
- Crude Inventories, 03/03 (10:30): 4.160M prior
- Consumer Credit, January (15:00): $13.4B expected, $19.3B prior

March 8 - Thursday
- Challenger Job Cuts, February (7:30): 38.9% prior
- Initial Jobless Claims, 03/03 (8:30): 355K expected, 351K prior
- Continuing Claims, 02/25 (8:30): 3405K expected, 3402K prior

March 9 - Friday
- Nonfarm Payrolls, February (8:30): 207K expected, 243K prior
- Nonfarm Private Payrolls, February (8:30): 220K expected, 257K prior
- Unemployment Rate, February (8:30): 8.3% expected, 8.3% prior
- Hourly Earnings, February (8:30): 0.2% expected, 0.2% prior
- Average Workweek, February (8:30): 34.5 expected, 34.5 prior
- Trade Balance, January (8:30): -$48.1B expected, -$48.8B prior
- Wholesale Inventories, January (10:00): 0.6% expected, 1.0% prior
icon url

ReturntoSender

03/05/12 11:17 PM

#9699 RE: ReturntoSender #6755

From Briefing.com: 4:05 pm : Equities were stuck in negative territory all day long, with initial weakness following the announcement that China would target 7.5% growth in 2012, its lowest target since 2004. Also weighing on global equities were disappointing data points out of Europe. Here in the U.S., both ISM Services and factory orders numbers were above expectations, however, they were unable to provoke buying. Stocks hit their lows around mid-day, with the Nasdaq Composite (-0.9%) underperforming the broader S&P 500 (-0.4%) as Apple (AAPL 533.16, -12.02) showed notable intraday weakness, on no apparent news. Some buying interest lifted stocks off their lows this afternoon, finishing their day approximately 0.4% off the lows.

Today's economic data included the February ISM Service reading and January Factory Orders. The ISM Service Index jumped to 57.3 in February from 56.8 in the prior month, surpassing the 57.0 Briefing.com consensus. Factory orders were less exciting. During January they decreased by 1.0%, which is better than the 1.9% decrease that had been widely expected.

Corporate news was relatively light today, but there were a few items worth noting. Shares of American International Group (AIG 30.41, +0.61) finished higher by 1.9% after the company announced it has sold $6 billion worth of ordinary shares of its Asia subsidiary AIA in an effort to repay its federal government bailout. The U.S. Treasury owns 77% of American International Group after its massive $182 billion bailout of the company during the heart of the 2008 financial crisis.

BP (BP 47.96, +0.46) traded higher by 1.0% after the company indicated it has reached a settlement agreement related to Gulf oil spill claims for $7.8 billion. The agreement will compensate individuals and businesses for economic loss and medical claims resulting from the 2010 oil spill. The payment will be made from the $20 billion compensation fund set aside by the company.

Archipelago Learning (ARCL 11.09, +2.05) jumped 22.5% after the company announced it would be acquired for approximately $291 million, or $11.10 per share. The purchase price represents a 23% premium to Friday’s close.

Walgreen (WAG 33.33, +0.64) finished higher by 2.0% despite announcing February same store sales fell 4.6% (-1.4% Retail Metrics Consensus). Total sales for the second quarter of fiscal year 2012 were $18.63 billion, slightly above the $18.53 billion Capital IQ Consensus Estimate).

Treasuries saw modest selling pressure all session long as a loss of 24/32 had the long bond leading the way lower. Meanwhile, a more modest decline of 8/32 dropped the 10-yr to 99 29/32 while its yield flirted with the 2.00% threshold. Despite today’s selling, the yield curve ended the day unchanged at 170 basis points.

There is no economic data scheduled for tomorrow. There are approximately 15 companies scheduled to report earnings tomorrow morning, although, none are market moving reports. Major events to be aware of later this week include the Greek debt swap deadline (Thursday) and the February employment report (Friday), both of which could be broad market volatility catalysts.DJ30 -14.76 NASDAQ -25.71 SP500 -5.30 NASDAQ Adv/Vol/Dec 1140/1.64 bln/1370 NYSE Adv/Vol/Dec 1231/701.1 mln/1816

2:04PM Semiconductor Hldrs ETF slides to new session low of 33.38 in recent trade to probe its 50 ema at 33.34 (SMH) 33.40 -0.83 : The SMH lagged last week as it did not confirm new highs with the market averages. Today it has broken below its Feb range lows with the recent dip flirting with its 50 ema. It has not probed this average as support since the late Dec bull breakout -- INTC -1.8% has probed its Feb range lows at 26.36/26.35 (session low 26.36).

Rambus (RMBS) announced it has signed a five year patent license agreement with MediaTek covering the use of Rambus patented innovations in a broad range of integrated circuit products offered by MediaTek Inc. In addition, the two cos have settled all outstanding claims, including resolution of past use of Rambus' patented innovations. Other terms are confidential.

6:07AM Advanced Micro amends Wafer Supply agreement with Globalfoundries; to record one time charge of $703 mln in Q1 2012 (AMD) 7.46 : Co announced that it entered into an amendment to its Wafer Supply Agreement with GLOBALFOUNDRIES Inc. In this amendment, AMD and GLOBALFOUNDRIES agreed to a negotiated wafer price mechanism for 2012. AMD also agreed to transfer its remaining ownership interest in GLOBALFOUNDRIES to GLOBALFOUNDRIES and, as a result, AMD will no longer hold an equity stake in GLOBALFOUNDRIES. Under the amended agreement GLOBALFOUNDRIES waived the exclusivity arrangement for AMD to manufacture certain 28nm APU products at GLOBALFOUNDRIES for a specified period. As a result, AMD agreed to pay GLOBALFOUNDRIES a cash payment of $425 mln. In addition, AMD issued a promissory note to GLOBALFOUNDRIES for the payments due by October 2, 2012 and first quarter 2013. AMD expects to record a one-time charge of $703 mln in Q1 2012 consisting of the above-mentioned $425 mln cash payment and the remainder will be a non-cash charge. AMD's Q1 2012 non-GAAP gross margin guidance of approximately 45% and the 2012 non-GAAP gross margin guidance of 44% - 48% remain unchanged.

Advanced Micro (AMD $7.35 -0.11) announced that it entered into an amendment to its Wafer Supply Agreement with Global Foundries. In this amendment, AMD and Global Foundries agreed to a negotiated wafer price mechanism for 2012. AMD agreed to pay Global Foundries a cash payment of $425 mln. In addition, AMD issued a promissory note to Global Foundries for the payments due by October 2, 2012 and first quarter 2013. AMD expects to record a one-time charge of $703 million in Q1 2012 consisting of the above-mentioned $425 million cash payment and the remainder will be a non-cash charge. AMD's Q1 2012 non-GAAP gross margin guidance of approximately 45% and the 2012 non-GAAP gross margin guidance of 44% - 48% remain unchanged.

Canaccord Genuity says checks indicated strong global share gains continue with the Apple (AAPL $545.96 +0.68) iPhone 4S selling well in international markets including Brazil, Russia, and China. While Android tablets were a primary focus at last year's MWC, most Android OEMs offered tablets but focused meetings on new smartphone offerings. Firm says with the iPad 3 expected to be announced on March 7, they believe Apple will likely dominate tablet market share for the remainder of 2012.

09:19 am Jabil Circuit downgraded to Buy at Needham: . Needham downgrades JBL to Buy from Strong Buy and raises their tgt to $29 from $26, citing valuation. Firm notes that YTD, JBL's stock has improved 32.8% and reached their prior price target. They believe JBL still warrants a Buy rating at a multiple of ~12x. Overall, they believe JBL's execution and positive mix momentum should continue to drive the model in 2012.
icon url

ReturntoSender

03/06/12 8:57 PM

#9700 RE: ReturntoSender #6755

From Briefing.com: 4:30 pm : Stocks eased up from session lows late in the day, but the broad market still booked its worst loss of 2012. The sell-off initially came with an increase in participation, but the pace of trade eventually moderated so that total share volume remained in line with recent trends.

Last week stocks scored their eighth weekly gain in nine tries to set new multi-year highs, but they began to show fatigue in the final days of that stretch. The struggle to extend the climb made many market participants both edgy and curious if stocks were on the cusp of a pullback. Against that backdrop news earlier this week that GDP for China is expected to slow to a 7.5% clip from an 8.0% pace was followed by word this morning that fourth quarter eurozone GDP remained at -0.3% revived concerns about global growth, effectively giving many traders an excuse to exit their positions.

Share volume was relatively strong in the early going. Many participants appeared anxious to sell after they had stood pat on their long positions, patiently watching stocks run higher in recent weeks. The rush to sell slowed as time passed, however, leaving overall share volume on the NYSE to total about 875 million shares. That's on the order of what has been averaged in recent months.

Financials were hit the hardest today. The sector suffered a 2.5% loss, but is still up more than 10% year to date. Defensive-oriented sectors like Utilities, Telecom, and Consumer Staples managed to limit their losses to less than 1%. Specifically, they fell 0.5%, 0.8%, and 0.8%, respectively. Altogether, though, the stock market suffered its worst single-session slide in nearly three months.

Widespread weakness spurred the Volatility Index more than 15% higher so that it is back near its monthly high. It had been at a multi-month low only two weeks ago.

Commodities were also clipped as traders took risk off of the table. The action was so aggressive that the CRB Index fell 1.6% in its worst single-session slide in two months. Oil was a particularly weak performer; futures prices fell 1.9% to $104.72 per barrel.

An interest in safety took Treasuries higher, driving down the yield on the benchmark 10-year Note to 1.95%, but that's still comfortably above last week's lows near 1.90%.

The US dollar and Japanese yen also benefited from a flight to safety. Buyers took the Dollar Index up 0.7% to trade at six-week high above its 50-day moving average. The yen was up in excess of 1% against the greenback, but by the closing bell it had eased back so that it traded with at 80.85 yen per dollar for a 0.8% gain.

Advancing Sectors: (None)
Declining Sectors: Utilities -0.5%, Telecom -0.8%, Consumer Staples -0.8%, Tech -1.1%, Health Care -1.4%, Consumer Discretionary -1.5%, Energy -1.6%, Materials -2.2%, Industrials -2.3%, Financials -2.5%DJ30 -203.66 NASDAQ -40.16 NQ100 -1.0% R2K -2.1% SP400 -1.9% SP500 -20.97 NASDAQ Adv/Vol/Dec 451/1.86 bln/2104 NYSE Adv/Vol/Dec 262/878 mln/2772

4:31PM Photronics purchases U.S. nanoFab Building from Micron Technology (MU) (PLAB) 6.20 -0.22 : Co announces it paid approx $35 mln to Micron Technology (MU) in connection with the purchase of its U.S. nanoFab building in Boise, ID that it previously leased from the building's owner Micron. In connection therewith, the Company also amended its credit facility adding a 5-year term loan for $25 million and reducing interest rates by 25 basis points on borrowings as defined in the credit facility. As a result of the purchase, Photronics' operating lease with Micron for the nanoFab facility has been cancelled. This reduced the Company's related outstanding operating lease commitments by a total of $15 million for fiscal years 2013 and 2014. Accordingly, as a result of this transaction, beginning in fiscal year 2013, the Company's net cash flow will improve by approximately $5 million annually and its expenses will be reduced by approximately $5 million annually. Co says the acquisition of this state-of-the-art facility is another step forward in their ongoing work to improve cash flow and reduce expenses.

4:23PM Cypress Semi to resume trading at 16:25 ET (CY) 16.01 -0.58:

4:14PM Novellus reported that it is not making any changes to its prior guidance, announced on the Company's earnings call held on February 2, 2012 (NVLS) 44.12 +0.01 :

7:34AM Qualcomm increases dividend to $0.25/share from $0.215/share and announces new $4.0 billion stock repurchase program (QCOM) 62.10 : Co announced that its Board of Directors has approved a 16% increase in the Company's quarterly cash dividend and, effective immediately, a new $4.0 bln stock repurchase program to replace the prior $3.0 billion stock repurchase program, which had $948 million of repurchase authority remaining, net of put options outstanding.

DSP Group (DSPG) announced that its XciteR VoIP chipset solution is powering a compact analog telephone adapter recently released by Grandstream Networks.

AMD (AMD) announced it has invested in Nuvixa, a developer of gesture-based video communication and presentation solutions, through AMD Ventures.

10:45 am S&P Tech Sector In The Red, Slightly Underperforming The S&P 500
The tech sector is trading lower today, slightly below the broader market. Semiconductors are showing inline weakness in the tech space with the Philly Semi Index trading 1.4% lower. CREE (-5.3%) is a notable laggard in the chip index, while RBCN (+2.7%) is showing strength. Among other major indices, the SPY and the QQQ are trading 1.3% lower, while the NASDAQ is 1.5% lower on the session. Among tech bellwethers, MSFT (+0.1%) is showing lone strength today, while GOOG (-3.2%) is under notable pressure.

In earnings last night, PAY (+5.5%) reported a better-than-expected qtr and offered inline guidance. This morning, TECD (-1.1%) also posted a mixed qtr.

In news last night, MWW (+9.7%) announced that it has retained Stone Key Partners and BofA Merrill Lynch as financial advisors in connection with its review of strategic alternatives, which was previously announced by the Company on March 1, 2012. Elsewhere, QCOM (-0.9%) increased its dividend to $0.25/share from $0.215/share and announced a new $4.0 billion stock repurchase program.

Among notable analyst upgrades this morning, OVTI (+5.5%) was upgraded to Outperform at Robert W. Blair and RP (-0.3%) was upgraded to Top Pick at RBC Capital. Among downgrades, EPAY (-2.9%) was downgraded to Hold from Buy at Craig Hallum.

P (-1.5%) is a notable name in tech scheduled to report results today after the close
icon url

ReturntoSender

03/07/12 11:15 PM

#9703 RE: ReturntoSender #6755

From Briefing.com: 4:30 pm : The major equity averages rebounded from a sharp loss in the prior session to book strong gains. Underlying share volume was on par with recent trends.

Following the worst one-day drop for the S&P 500 in nearly three months market participants came back with a strong bid. Financials became the favorite sector, but had actually seemed a bit groggy in the early going as the sector tried to work through a hangover from the 2.5% drop that it suffered in the prior session. Financials settled trade today with a 1.3% gain.

The Consumer Discretionary sector scored a 1.0% gain as shares of retailers continued their climb. Even American Eagle (AEO 15.54, +0.91) rallied hard despite a disappointing quarterly report and forecast.

Industrials also advanced 1.0%. The group was led by General Electric (GE 18.77, +0.35), which benefited from word ahead of its Investor Day that expectations are still in place for double-digit revenue growth in the company's global growth regions.

Apple (AAPL 530.69, +0.43) shares set session highs in the opening minutes of trade, but responded negatively to the company's unveiling of its latest iPad. The stock was able to recover from the red and eke out an incremental gain, though.

Utilities fell early, but finished at the flat line. They were the only sector that failed to book a gain.

The dollar benefited from a flight to safety in the prior session, but it experienced some modest selling today. That left it to lose about 0.2% against a collection of competing currencies. The Volatility Index was down about 8% by session's end. Its drop came a day after it had spiked to trade near its one-month high.

Data today didn't do a whole lot to induce trade. Still, market participants took note that the latest ADP Employment Change reading indicated that private payrolls climbed in February by 216,000, which is on par with the increase of 218,000 that had been expected, on average, among economists polled by Briefing.com. The February figure also came as an improvement over the upwardly revised increase of 173,000 private payrolls reported for January.

Fourth quarter productivity and labor cost data both experienced some substantial revisions from the preliminary readings. The latest report indicated that productivity increased by 0.9%, which is an improvement over the 0.7% increase reported previously. Many had expected the revised reading to show an increase of 0.8%. Unit labor costs climbed 2.8%, which is far greater than the 1.2% increase featured in the preliminary reading and sharper than the 1.1% increase that had been widely anticipated.

Consumer credit climbed to $17.8 billion in February from a downwardly revised $16.3 billion in the prior month. Economists polled by Briefing.com had forecasted, on average, a decline to $12.0 billion.

Barely 800 million shares traded hands today on the NYSE. Although that's not very impressive by historical averages, it is in stride with recent trends.

Tomorrow's calendar of events is weighted toward the early morning. The Bank of England will announce its latest decision on interest rates at 7:00 AM ET. The European Central Bank will follow at 7:45 AM ET. Domestic economic data is limited to the latest weekly jobless claims tally at 8:30 AM ET. Tomorrow also marks the deadline for the Greece's planned Bond swap.

Advancing Sectors: Financials +1.3%, Industrials +1.0%, Consumer Discretionary +1.0%, Tech +0.7%, Energy +0.6%, Telecom +0.5%, Health Care +0.4%, Materials +0.4%, Consumer Staples +0.1%
Unchanged: Utilities
Declining Sectors: (None)DJ30 +78.18 NASDAQ +25.37 NQ100 +0.7% R2K +1.1% SP400 +1.0% SP500 +9.27 NASDAQ Adv/Vol/Dec 1859/1.57 bln/643 NYSE Adv/Vol/Dec 2375/801 mln/645

4:32PM Semtech beats by $0.02, misses on revs; guides Q1 EPS below consensus, revs below consensus (SMTC) 28.14 +0.55 : Reports Q4 (Jan) earnings of $0.32 per share, excluding non-recurring items, $0.02 better than the Capital IQ Consensus Estimate of $0.30; revenues fell 10.6% year/year to $104 mln vs the $105.17 mln consensus. Co issues downside guidance for Q1, sees EPS of $0.28-0.32, excluding non-recurring items, vs. $0.36 Capital IQ Consensus Estimate; sees Q1 revs of $102-108 mln vs. $111.70 mln Capital IQ Consensus Estimate.

4:15PM Semtech acquires wireless long range IP provider Cycleo for ~$5 mln in cash (SMTC) 28.14 +0.55 : Co announced it acquired Cycleo SAS and all of its assets, related companies and operations. Under the terms of the agreement, Semtech paid the stockholders of Cycleo $5 million in cash at closing. The stockholders will be able to earn up to an additional $16 million in cash based on the achievement of revenue and operating profit goals over the next four years. The transaction was funded from Semtech's existing international cash reserves. Semtech estimates the transaction will have no material impact to earnings in its current fiscal year.

TranSwitch (TXCC) announced that its Atlanta 2000 LTE Gateway Reference Design has been selected by coM.sat GmbH Kommunikationssysteme for the coM.sat 2012 LTE.

TriQuint Semiconductor (TQNT) officially opened TriQuint International Pte, its new International Headquarters in Singapore.

7:05AM Ciena misses by $0.13, misses on revs; guides Q2 revs in-line (CIEN) 13.44 : Reports Q1 (Jan) loss of $0.17 per share, $0.13 worse than the Capital IQ Consensus Estimate of ($0.04); revenues fell 3.8% year/year to $416.7 mln vs the $426.27 mln consensus. Co issues in-line guidance for Q2, sees Q2 revs of $435-460 mln vs. $449.63 mln Capital IQ Consensus Estimate; sees Q2 adjusted (non-GAAP) gross margin percentage in the low 40s range, adjusted (non-GAAP) operating expense in the low $180s million range. "Our first quarter revenue reflects the combined effects of seasonality and longer customer deployment and revenue recognition cycles as a result of our greater mix of international and solutions-oriented sales... However, our first quarter revenue does not reflect the underlying strength of the business and ongoing customer demand. We expect sequential revenue growth in the fiscal second quarter, and we anticipate that our operating results for the second half of fiscal 2012 will be stronger than the first half."

Pericom Semiconductor (PSEM) announced that its Board of Directors has unanimously adopted a new shareholder rights plan, effective March 6, 2012. The Rights Plan was adopted following the expiry of the Company's previous shareholder rights plan.

Cypress Semi (CY $15.67 -0.34) provided an update to its guidance for the first quarter of 2012 that was previously issued on January 26, 2012. The company says they have recently seen some order decreases, mostly in certain wire line and handset customers. In addition they are seeing weaker than expected revenues from their distribution channel, mainly due to lower turns business in Europe and Asia. These factors are resulting in a negative impact to previously expected Q1 2012 revenue. The company also says "Customer backlog and bookings stabilized in January and we have seen improvements for the last six weeks. We continue to believe that first quarter will be the bottom for revenue and bookings, and at this point expect Q2 revenue to grow sequentially. However the macro environment and order patterns remain very fluid and lead-times are near historical lows, impacting visibility, any estimate in this environment has a high degree of risk and current estimates could differ materially from actual results. We continue to remain very optimistic about our competitive positioning, our design-win penetration and our new product offerings, in particular our Gen4 TrueTouch? touch-sensing solutions, PSoC 3 and 5 programmable-systems-on-chip, USB 3.0 controllers and trackpad solutions." The company issued downside guidance for the first quarter with EPS of $.08-0.11 versus the $0.16 consensus and revenues of $180-190 million versus $205.92 million consensus.

11:32 am S&P Tech Sector Higher, Just Ahead Of The S&P 500
The tech sector is trading higher today, slightly ahead of gains in the broader market. Semiconductors are showing relative strength in the tech space with the Philly Semi Index trading 1.3% higher. SPRD (6.5%) is a notable leader in the chip index. Among other major indices, the SPY is trading 0.4% higher, while the NASDAQ is trading 0.7% higher and the QQQ is 0.6% higher on the session. Among tech bellwethers, TXN (+1.4%) is showing notable strength today, while only CSCO (-0.2%) is under pressure.
|
In earnings, CY (-1.4%) lowered its Q1 guidance. This morning, CIEN (+8.3%) posted a Q1 miss, but issued inline guidance.

In news, NUAN (+2.4%) announced a definitive agreement to acquire TRCR (+39.5%) for $29.50/share. Among rumors, there's renewed RIMM (0.0%) takeover chatter making the rounds.

Among notable analyst upgrades this morning, GCA (+21.6%) was upgraded to Buy at Compass Point. Also, ADP (+1.2%) was added to the U.S. Focus List at Credit Suisse.

Among downgrades, CCIH (-12.0%) was downgraded to Sector Perform at Pacific Cres

09:42 am Ciena shares trade higher by over 7% despite missing on earnings and issuing in line guidance

Ciena (CIEN $14.42 +0.98) reported a fourth quarter loss of $0.17 per share, $0.13 worse than the Capital IQ consensus of ($0.04), while revenues fell 3.8% year/year to $416.7 million versus the $426.27 million consensus. The company issued in-line guidance for the second quarter with revenues of $435-460 million versus $449.63 million consensus.

The company also sees adjusted gross margin percentage in the low 40s range. "Our first quarter revenue reflects the combined effects of seasonality and longer customer deployment and revenue recognition cycles as a result of our greater mix of international and solutions-oriented sales... However, our first quarter revenue does not reflect the underlying strength of the business and ongoing customer demand. We expect sequential revenue growth in the fiscal second quarter, and we anticipate that our operating results for the second half of fiscal 2012 will be stronger than the first half."
icon url

ReturntoSender

03/08/12 11:26 PM

#9704 RE: ReturntoSender #6755

From Briefing.com: 4:30 pm : Broad-based buying drove the stock market to another strong gain today. The action makes for the broad market's best back-to-back performance in more than three months.

All 10 major sectors staged gains, but Materials and Industrials put on the most impressive performances. They scored gains of 1.6% and 1.4%, respectively. Hot Topic (HOTT 9.86, +1.07) and Coach (COH 76.82, +3.43) led the Consumer Discretionary sector to a 1.0% gain. Shares of HOTT spiked to a near three-year high as buying interest heated up in response to stronger-than-expected earnings, upside guidance, and a dividend hike. Encouraging comments from Coach management at a conference took shares of the apparel and accessories outfit up sharply to a record high before momentum began to wane.

McDonald's (MCD 96.96, -3.22) was unable to take part in the Consumer Discretionary sector's climb due to disappointment over the company's latest monthly comparable store sales report. Comparable sales in the US grew by 11.1%, but global growth grew at a less rapid clip of 7.5%.

Heavyweight Apple (AAPL 541.99, +11.30) advanced impressively as investors and traders dismissed news that the Justice Department claims that the company colluded to raise electronic book prices.

The highly influential Financial sector experienced some seesaw-like action before fighting its way to a 1.0% gain. AIG (AIG 28.31, -1.14) failed to follow the rest of the sector after it was learned that the Treasury Department has filed to offer more than 200 million common shares of AIG for $29.00 per share.

Positive sentiment was supported by confidence that Greece's debt swap was met with strong demand. The swap concluded today, but official results will not be released until early Friday morning. Such speculation helped take down debt yields of countries in the eurozone periphery and gave a boost to the euro, which was up 1.0% to $1.327 at the closing bell.

The euro was hardly influenced by the European Central Bank's decision to keep its target interest rate at 1.00%, as had been generally expected. The Bank of England also opted to stand pat on its policy, which has an interest rate target of 0.5% and an asset purchase program of 325 billion pounds.

The only dose of data was the latest weekly jobless claims, which totaled 362,000. Economists polled by Briefing.com had expected, on average, a tally closer to 355,000 on the heels of an upwardly revised claims count of 354,000 for the prior week. The numbers are unlikely to influence expectations for the official monthly payrolls report that will be released tomorrow morning -- the consensus among economists polled by Briefing.com calls for non-farm payrolls to increase by 250,000, private payrolls to climb by 275,000, and a headline unemployment rate of 8.3%.

Strong buying in back-to-back sessions has the S&P 500 up 1.7% in only two days. It also has the Volatility Index back below 18. This past Tuesday a barrage of selling caused the euphemistically labeled Fear Gauge to spike to 21.

Advancing Sectors: Materials +1.6%, Industrials +1.4%, Health Care +1.2%, Tech +1.1%, Financials +1.0%, Consumer Discretionary +1.0%, Telecom +0.7%, Consumer Staples +0.6%, Energy +0.5%, Utilities +0.4%
Declining Sectors: (None)DJ30 +70.61 NASDAQ +34.73 NQ100 +1.1% R2K +1.3% SP400 +1.2% SP500 +13.28 NASDAQ Adv/Vol/Dec 1824/1.61 bln/695 NYSE Adv/Vol/Dec 2406/716 mln/615

4:31PM Texas Instruments lowers Q1 EPS to $0.25-0.29 from $0.26-0.34 prior guidance excluding $0.10 in acquisition costs vs $0.32 Capital IQ Consensus Estimate; lowers revs to $2.99-3.11 bln from $3.02-3.28 bln prior guidance vs $3.16 bln Capital IQ Consensus Estimate (TXN) 32.60 -0.05 : Co said the reductions are due to lower demand for Wireless products.

6:20AM Suntech Power misses by $0.45, beats on revs (STP) 2.92 : Reports Q4 (Dec) loss of $0.76 per share, $0.45 worse than the Capital IQ Consensus Estimate of ($0.31); revenues fell 33.4% year/year to $629 mln vs the $596.04 mln consensus. Gross margin in the first quarter of 2012 is expected to be in the range of 3% to 6%. As a result of lower than expected inventory level and seasonal weakness in demand, Suntech expects shipments in Q1 to decline by ~30% QoQ. For FY12, Suntech expects shipments to be in the range of 2.1-2.5GW. "Looking into 2012, we expect excess capacity and further policy adjustments in Europe and the U.S. will result in a sustained period of intense competition in the solar industry. In this context, our top priorities are to continue to drive down our production cost, invest in channel development and bring to market the most competitive product offerings. These actions will help us maintain our position as the leading supplier of solar products."

09:21 am Ciena upgraded to Buy at Stifel Nicolaus; tgt $20: . Stifel Nicolaus upgrades CIEN to Buy from Hold and sets target price at $20 based on checks at the optical show OFC, they believe that demand for 40 and 100G is increasing with most component vendors seeing firm orders from system vendors. They believe the fact that pricing on 40/100G is now fairly comparable to 10G is helping spur demand. Additionally, coherent 40/100G have been in the market long enough to give carriers greater comfort in deploying the solution. Firm also says Ciena is seeing positive demand in the US despite a flat capex environment with spending skewed toward wireless. This syncs with their view that being exposed to the right area in terms of customer spending priorities is important and they believe that both Verizon and AT&T (both large Ciena customers) are committed to 40/100G upgrades.

Semtech (SMTC $25.84 -2.30) reported fourth quarter earnings of $0.32 per share, excluding non-recurring items, $0.02 better than the Capital IQ Consensus of $0.30. while revenues fell 10.6% year/year to $104 million versus the $105.17 million consensus. The company issued downside guidance for the first quarter with EPS of $0.28-0.32, excluding non-recurring items, versus the $0.36 consensus with revenues of $102-108 versus the $111.70 million consensus.

icon url

ReturntoSender

03/11/12 1:15 PM

#9707 RE: ReturntoSender #6755

InvestmentHouse Weekend Market Summary

http://www.investmenthouse.com/weekendmarketsummary.htm

- Jobs are decent, stocks bounce, but the indices are still below the recent peaks.
- Some stocks continue to look super, and others bounced back but look a lot like mere relief bounces.
- Jobs continue to improve but the best jobs are 50% temporary, job quality and pay has degraded, long-term unemployment is still incredibly high, and another 10 years is needed at this rate to get back to even.
- January Trade Deficit jumps to the highest in 3+ years. That is not a bad thing.
- Economy at escape velocity? Does the jobs report scuttle any vestiges of a QE3? ECRI versus areas of economic improvement.
- Friday did not answer the rally or correction question, but it sure left the table set for this week to try and formulate an answer.
- Many more downside setups, but good stocks continue running and there are more than a few upside setups as well.

Stocks bounce on jobs report but don't surge. Don't turn and sell off either.

Friday brought the jobs report. Of course the news about jobs dominated the headlines, and it dominated the action in the markets as well. Jobs were decent. They came in better than expected at 227K, and December and January were revised higher. The unemployment rate held at 8.3% despite more people coming back into the jobs market. That means there were more jobs available to soak them up. That was great news, and the market did bounce to the upside. There were problems with the report, but there are problems with every report. The trend is better, but there are issues about this trend. Yes, the numbers are better, but there are other factors to consider. I will get to those later.

Stocks were up, but where did they get up to? The SP500 is back at its May highs. That puts it at about the prior post bear market peak. It did not do any real damage to that level. Indeed, it faded back after moving through it intraday. There is similar action on the DJ30 with a bounce back up toward a prior high. Not even making that level. NASDAQ bounced back up to its prior high, but it did not move through it either. Up on the day, for sure, but it was not stellar action.

This leaves the market in position to answer the question next week as to whether it will make a breakout or if it will fade back and consolidate or correct. There are still stocks set up to the upside. There are stocks that have been running well that continue to run to the upside and perform very well. At the same time, there are stocks set up to fall, and they are key stocks as well. We will see how it shakes out, but we will be ready for either direction. The market is at a point where it has run a long way. It is bumping at resistance and has not been able to make the break through. It is trying to buy some time just as the Fed tried to buy time and hope that its policies took effect to get the market moving before inflation took off. The market is trying to move laterally, buy some time, and let it catch its breath and consolidate so it can try to make the next move higher.

Looking at the morning action, futures were moving higher up into the actual release of the jobs report. They had been hesitating, but they did slightly tick higher ahead of the report. They faded after it came out, but the market caught itself and rallied higher as trading began. It held up well for most of the day before fading in the afternoon and trading laterally. It did manage a bounce late in the session to put a bit better face on it and to hold the gains. But as noted, the major indices did not move through their prior peaks. They did not scare anyone with their power. On the other hand, they did not roll over and sell off. That was one of the scenarios we were watching for, and it did not develop. But the indices did not provide a clear picture as to whether it was a hands-down winner and they were going to move higher, or if they were just going to bump up at those highs again and roll back over.

The gains were decent on the day, but nowhere near what they were on Thursday.

SP500, +0.36%; NASDAQ, +0.6%; Dow, +0.11%; SP600, +1.28%; SOX, +1.08%

Looking at the percentage gains, there is a definite bias toward the growth indices or growth sectors. They were the ones leading higher, and frankly they helped lead the market to the upside on this last leg up to the prior highs. Now we will see if they continue on and give the indices the punch needed to break through those highs, or if the lagging sides of the market such as manufacturing (as seen with CAT) pull them back down once more. There is also a third scenario. Perhaps those that are moving higher and those that are setting up to break to the upside will provide enough impetus to hold the market high (or at least hold where it is now) as the others fade. Kind of like the new replacing the old that are tired and holding the status quo.

That does not do much for moving higher, but think of it kind of like the unemployment rate today. It held at 8.3% even as more people came back to the market. That is typically what drives up unemployment rate, but there were enough jobs to offset them. Kind of the yin and yang, or like the Seinfeld episode where he was even-steven. He threw $20 out the window and then he found $20 in a pocket somewhere. That is hardly the case here; not a true, pure analogy, but you get the idea. The market is set up. The question is which way it will go.

OTHER MARKETS

Dollar. 1.3116 versus 1.3280 euro. The dollar posted a gain against the euro, but it was down against the other currencies and the DXYO lost ground. It is in this double bottom at a support level. It rallied through the hump in the pattern, but it gapped right back down. A little mini-island reversal. We will probably see a pullback to the bottom of the range as the U.S. struggles against the other currencies. The Japanese yen is a little stronger. The Bank of Japan will probably try to intervene as it does not want a stronger yen. It has not wanted a stronger yen in the past 15 years that I can recall. Maybe even longer.

You would expect the dollar to be stronger on a better jobs report. It just was not across the board.

Bonds. 2.05% versus 2.01% 10 year U.S. Treasury. The 10 year sold as you would anticipate. The notable move was above 2% for the week, and that drove bonds down to the bottom of the range at the bottom of this triangle. They did bounce off of the lows. It is getting interesting. Will they be able to mount a run higher off of the bottom of the triangle? They are pinched down into the point of the triangle, and this is the lick log. They will have to either make a break or not. At this point in the past they have showed the doji similar to what they showed on Friday and have bounced, but they have never broken out. As noted, this is the lick log. Something will happen over the next week with bonds. They could break down, which would suggest that the Fed will not post more Quantitative Easing and that the economy is good enough for bond yields to rise. The question is will the Fed let them rise? It still wants that easy money policy. Maybe no QE3, but it wants to keep the rates low.

Gold. 1,711.20, +12.50. Gold had an interesting day, and indeed an interesting week. Gold has been somewhat of an enigma trade. It broke out of its channel in late January. It rallied a bit, tested, made a higher low, and then broke to the upside. It looked solid, and then came the Bernanke testimony two Wednesdays back. He did not say anything about QE3. Investors wondered "Where the heck is our inflation trade?" Then they sold gold. Gold continued down, but it held at the 200 day EMA and at some interim peaks and valleys. It bounced. Not big, but Wednesday, Thursday, and Friday it was to the upside. Friday was volatile, but it snapped back and posted a good gain up to the 50 day EMA.

Looks as if gold wants to try to make the break back to the upside. Maybe there is a realization that there will be inflation whether or not the Fed pulls out a QE3. Jim Rogers is saying that there is no question that prices are up and that the government is lying to us about prices. The EPI shows inflation at 8% on the stuff you buy every day versus throwing in the washer and dryer, the flat screen TV, and personal computers. We all know those prices are going down, but the prices of the things that we eat and put in our tank and simply need to get by every day are going up. Perhaps that is why gold looks to have found a bottom and is looking to bounce once more.

Oil. 107.40, +0.82. Oil closed higher as well. It was down early, but then it reversed. That makes sense given the economy is improving, even if Europe is down, China is trying to slow, and Brazil's GDP fell to 2.7% growth. Then there are all the troubles in Iran. I heard it said today that we are at the World War II moment now. The longer we wait (and we have already waited too long) the more costly it gets if we are truly serious about stopping Iran from getting nuclear weapons. Or we will just let them have nuclear weapons, and many believe the administration is willing to let that happen versus having any serious confrontation.

I can see the setup, however, that Israel will be forced to act before it gets it too late and the ability to stop Iran gets beyond their technology. And then we do not back Israel. We may say that Israel acted without our permission, and that could get kind of ugly. But I digress. Suffice it to say that there are a lot of tensions in Middle East that are not helping the price of oil.

TECHNICAL SUMMARY

The internals were kind of lackluster, but it was a Friday.

Volume. NASDAQ -2.5%, 1.56B; NYSE -0.5%; 662M. It is a little disappointing to see volume decline as the market continued to recover. Recall that volume was quite accelerated on Tuesday with the selling, and that shows there are more sellers in the market. But there are three days to the upside. Does that mean anything? Yes and no. It is good to see the market bounce back up, but we will look at the technical picture momentarily. Even though it did rebound, the light volume and where it closed are indicative of a continued issue with breaking through these levels. That does not necessarily mean it will roll over, but it could trade in that range.

Breadth. NASDAQ +2.4:1; NYSE +2.3:1. Breadth was not bad. Small caps and techs in general were better than large cap techs. The smaller issues were helping to fill in the market and push it higher. That is what it needs because a lot of big names are struggling right now. We need a bunch of soldiers to fill in the gap and hold that market to the upside.

THE CHARTS

SP500. I am looking at that Tuesday selloff. Volume was up. It was not huge, but volume was huge a week before when SP500 broke to its new post bear market high, but then reversed and gave it back. The two largest volume days in the past two weeks have been to the downside. That is not necessarily great news. Looking at the third highest volume session in the last two months, we can see that it was an upside day. It is about 2:1 when you look at the big volume days.

That said, we held at the February peak and had a three-day rebound. A three-day pullback and a three-day rebound on declining volume. SP500 even reached through the prior post bear market high on Friday, but it could not hold the move and closed right at that prior high. It is set up now. It can fall back in the range and continue to trade. It can fall back further down toward the 50 day EMA or the October peak. Or it could make the breakout. The odds of a breakout may not be that great. The odds of a breakdown are not that great either. Unfortunately, I am talking about a narrow, choppy trading range. I would prefer to have a trading range that was big and that we can easily play up and down, but we may not get that.

DJ30. The Dow is similar, but not in as good of shape as the SP500. Recall that the Dow is the one that looks like it is having this rollover top. And you can see the head and shoulders. It tried to break through those highs from early February that set up the left shoulder. It got close. It went through the high from early February, but it pulled back well off of its high to close. It could be in the formation of that right shoulder. We are still looking at that as a potential downside play, to see the Dow break lower and come back to test these lows in the range from late January. That gives us a nice downside play to take advantage of as the Dow trades in a range, consolidating the gains. I think that is the most likely scenario for all of the indices. Not a huge breakout and not a big selloff. Just range trading. After all, the economy is improving. Europe is getting its stuff all in one pile. There should not be any reason to sell off (at least not an overt reason).

NASDAQ. NASDAQ put in a decent day, moving back up to its prior high. Volume has been a bit lower on the rebound. But techs were no doubt in the lead just as they were in the lead on the rally to the upside. That helped the market make its positive break. The question mark we have is that as NASDAQ matches the prior high (the new post-bear market high, those levels hit in late February) then MACD is making a lower high. We are running out of a little momentum. Does that mean a rip roaring selloff? No. Probably range trading, as I mentioned. It bounced once off of its prior high just as it did after it broke through it in early February. So it looks like that could be a support level where we see NASDAQ trade basically between 3000 down to 2900. It could drop lower toward the 50 day EMA at 2856. We will have to see how it plays out. There is this gap also from early February, and that could provide a needed gap fill. That would put it basically where the 50 day EMA is right now around 2860. It is not a big move 100-120 points to the downside.

SP600. The small caps also posted a nice day. Up three days in a row after some ugly downside a week and a half ago. It broke through the 50 day EMA on Tuesday, but then it tried to recover Wednesday. It could not do it, but Thursday and Friday it marched right back through. Now it is at a key level. It could not bust through it on Friday, fading back. But it is still strong to the upside as the small caps help push up the breadth. They posted nice gains. This could be the support that the market needs, with those other guys coming in and holding it up while the household, name-brand stocks take a breather.

SOX. The SOX posted a nice gain as well, up over 1%. The third day to the upside after this doji on Tuesday. 1-2-3 down, doji, and then 1-2-3 back up. This is going to be more problematic. Perhaps we get a little head and shoulders set up. Perhaps. Maybe this is the test back up. We will see if it breaks. As with the rest of the indices, three days to the upside, recovery from the selling, but not a clear affirmation that they will break to a new rally high on this move. I do not think that was shown at all. Indeed, with the number of downside setups we are seeing versus the number of upside setups, they are getting pretty even in the market. That does not necessarily mean it will tank; it just means that as money moves from one area to another, it drops that area that it left but bolsters the area it is moving to. That somewhat maintains the status quo. It is kind of maddening, and semiconductors were maddening for everyone here today. It is amazing when these moves happen and people get on edge and everything starts bothering them. "Where it heck is my pen?" All of a sudden a pen becomes very important. When times are good they will just grab another one. Today it was, "Who took my pen?!"

Stocks like KLAC and NVLS were moving up. All of a sudden they broke back up after they looked to be breaking down. But I digress. The transports were three days up as well, but a doji at the 50 day EMA. They definitely remain one of the downside indicators for the market overall.

LEADERSHIP

There are downside setups, upside setups, and those that are in between.

Retail. Some retailers continue to perform quite well. FOSL is continuing its move to the upside. Hard to complain about that with a 2.6% gain. TJX was up 1% on the day. HLF was up 3.6% on the day. Strong moves indeed. NKE was up 2%, and SCSS was up 3.7%. Retail across the board continues to perform very well.

Semiconductors. The semiconductors were trying to come back from the dead and bugging the heck out of us. KLAC broke back up through the 50 day EMA. NVLS broke back up above its channel line. Not bad. Not all of them are out of the woods. SLAB remains unable to bounce after selling off hard. BRCM bounced up off that doji at the 200 day EMA. Maybe it makes the break. We are still watching it for a possible downside play.

Manufacturing/Machinery. Then you have the stocks that have been the old standbys and doing so well. CAT is not looking so hot right now, and that goes across the board when it comes to manufacturing stocks. JOY is showing a bear flag, bouncing up after gapping down. It looks like it could roll down pretty hard from here.

Metals. There are issues with some metals stocks. AKS is bouncing back after selling off. There have been really ugly downtrends. FCX bounced modestly, but has turned back down on Friday on volume when most everything else was moving to the upside.

Miscellaneous upside movers. There are downside setups in key areas as well. What wins out? We have a lot of potential downside moves, but we also have stocks that are running to the upside and looking quite strong. There are other stocks that we moved into during the week or have bought recently and are performing very well. OSIS, for instance, looks solid and is bouncing up higher again. GTLS is making a further upside break. KIRK came back very well from an initial rude treatment on its jobs report. MA is not blowing it out, but it is moving up nicely. IACI in retail is performing well.

As you can see, there are stocks breaking higher after pretty decent consolidations, and they are supporting the market just as other stocks are in trouble and are undermining the market's advance. The net effect thus far? It has not been a breakdown, obviously. It has been some weakness in the market overall, but it looks like it might be turning into a sideways chop or range trade versus any kind of major selloff. Of course, that is exactly the thesis we have been putting out there. That there will be rotation in the market, but there will not be a major selloff as a result. Just a test/correction that is much needed, but that will not end the rally, particularly if the economic data continues to look good.

We just have to watch out for a major selloff. That may suggest (as it did in 2011) that the economic data will not hold up, and maybe ECRI is right and we will have a selloff into the summer or fall.

THE ECONOMY

Jobs continue their improvement trend. The questions relate to permanence, quality, and patience.

More people finding jobs . . .

227K new jobs, 233K private, upside December and January revisions.
8.3% unemployment even with 500K people coming back into the workforce.

Noteworthy: Participation rate rose to 63.9% from 63.7% in January BUT the unemployment rate did not rise. Typically it jumps again as people come back into the workforce.
Conclusion: Enough jobs were created to soak up those coming back into the market OR they are giving up and creating their own companies.
Disconnect: Not enough jobs to keep up with population so how could unemployment remain constant?

But will they feel this way before too long?

Reality Check 1: Those unemployed greater than 27 weeks are STILL over 50% of the unemployed. The HIGH in the 1980's deep recession was 26%. At this point in that recession we were growing at 7% GDP per quarter for several quarters with millions of quality jobs created.

Reality Check 2: Over one-half of the professional and business services sector jobs growth (45K jobs out of 84K created) were temporary jobs. Companies are still at the 'try before you buy' stage.

Reality Check 3: Job quality is poor. During the Bush years the knock on the recovery was 'job quality.' These are even worse with lower pay (wages are negative), lower end jobs. 71,000 were in private healthcare at the low end.

Reality Check 4: At the current rate of job creation, one that does not even meet population growth, it will take 10 YEARS to get back to pre-recession levels. If it improves to 350K/month it still takes 7 years!

Reality Check 5: With the very mild winter construction jobs still lost 13,000 workers. Retail, the supposed bastion of the economic recovery, lost 7,400 workers.

Not enough jobs to keep up with population growth, more people came back into the market, but unemployment rate remained steady.

Perhaps means sole proprietorships or small businesses emerging. That is a positive for the economy.

Positives and the same old negatives. Overall better than where we were.

Trade Deficit surges, but that shows we want to buy more.

Wholesale Inventories rise less than expected, but sales are less than expected as well.

TO VIEW THE ECONOMY OVERVIEW CLICK THE FOLLOWING LINK:
Economy Summary Video

THE MARKET

SENTIMENT INDICATORS

VIX. The VIX is back down to the recent levels that have led to bounces in volatility and minor corrections in the stock market. There have just been minor corrections, right? We are trading in a range, and they are somewhat related now. They have come into sync with one another, but they are not big moves. As I have said before, volatility can remain low for years while the stock market rallies. The fact that it is bouncing around in this range is not indicative that the market is about to roll over. Although the more it trades as this and shows the inability to break out, that could lead to a breakdown. But, as I said, the indices are buying time. They are trying to hold up and trying to be a little stingy with their gains. They want to hang onto them while they rest, consolidate, and prepare for the next move. You like to see stocks hold their gains because you can continue your upside without any appreciable loss. That is the sign of a healthy market.

VIX: 17.11; -0.84
VXN: 18.11; -0.94
VXO: 15.37; -0.76

Put/Call Ratio (CBOE): 0.9; -0.04

This is a reading of the number of bullish investment advisors versus bearish advisors. The reason you look at this is that it gives you an idea of how bullish investors are. If they are too bullish then everyone is in the market and it is heading for a top: if everyone wants to be in the market, then all the money is in and there is no more new cash to drive it higher. On the other side of the spectrum if there are a lot of bears then there is a lot of cash on the sideline, and as the market rallies it drags that cash in as the bears give in. That cash provides the market the fuel to move higher. If bears are low it is the same as a lot of bulls: everyone is in and the market does not have the cash to drive it higher.

Bulls: 47.9% versus 51.1%. After holding flat for two weeks the bulls are fading after the pullback from the highs. Good to see the bullishness back off. It is not excessive, it is not excessively low either. They are off the 55+ level even near the highs as investors get a bit pensive. Bigger picture that is good for the upside. That was the highest level since April and May of 2011, the peak of the post-bear market high. Now the indices are back at that level and so are the bulls. All the more reason to watch this action at the prior highs. 35% is the threshold measuring bullish versus bearish action. Six weeks the bulls were below bears. A powerful sentiment signal but now dissipating. Highs from April and December (60% readings spanning December through early May 2011). The 5 year high is 62.0. The crossover level at 29% bulls from July 2010 is long gone. 35% is the threshold level suggesting bullishness. To be seriously bearish it needs to get up to the 60% to 65% level.

Bears: 26.6% versus 25.5%. Right back up to the level three weeks back. A bit more uncertainty among bears but not running higher to levels that suggests a new surge upside. Makes sense given where the indices are. As with bulls, not excessive either way. Solidly lower after fter spending weeks at 30%ish. Not at a bearish level but they are growing more confident even as the market hits the prior highs and is not blasting on through. For more reference, bearishness hit a 5 year high at 54.4% the last week of October 2008. The move over 50 took bearish sentiment to its highest level since 1995. Extreme negative sentiment. Prior levels for comparison: Bearishness peaked at 37.4% in September 2007. It topped the June 2006 peak (36%) on that run. That June peak eclipsed the March 2006 high (33%) and well above the 2005 highs that spawned new rallies (30% in May 2005, 29.2% in October 2005). That was a huge turn, unlike any seen in recent history.

NASDAQ

Stats: +17.92 points (+0.6%) to close at 2988.34
Volume: 1.561B (-2.44%)

Up Volume: 1.13B (-30M)
Down Volume: 436.53M (+13.02M)

A/D and Hi/Lo: Advancers led 2.42 to 1
Previous Session: Advancers led 2.56 to 1

New Highs: 121 (+43)
New Lows: 21 (-1)

SP500/NYSE

Stats: +4.96 points (+0.36%) to close at 1370.87
NYSE Volume: 662M (-0.45%)

Up Volume: 2.33B (-670M)
Down Volume: 1.22B (+706.64M)

A/D and Hi/Lo: Advancers led 2.33 to 1
Previous Session: Advancers led 3.93 to 1

New Highs: 159 (+39)
New Lows: 6 (-4)

DJ30

Stats: +14.08 points (+0.11%) to close at 12922.02
Volume DJ30: 103M shares again, same as the 103M shares Thursday.

MONDAY

There is a lot of economic data even after the jobs report. We will see Retail Sales. FOMC has a rate decision on Tuesday. We will have Empire Manufacturing and the Philly Fed. We will see the PPI as well as Industrial Production and Capacity Utilization. All of those are pretty important based on what ECRI has been forecasting. A lot these feed more or less directly into its model. It will be an important week of economic data yet again.

I want to get back to a comment I made earlier. I said that Friday did not really answer whether there was a rally or correction, but it did leave the table set for next week to make that determination. Again I do not think there is much likelihood of a breakout unless NASDAQ and the small caps can lead the move to a breakout aided by the chips, of course and garner enough strength to pull those stocks that are set up to the downside along with them and to keep them from falling. If that happens, great. That makes us money on our upside positions. We can continue to play those because we will get more breakthroughs, but we will also have to watch a test. The best time to move in after three days to the upside is to get a test instead of buying on the breakout. Four days up. How many times has this market made a four-day move? Or five or six or seven? Not many. You get a breakout, then it comes back and makes a test, and that is when you want to play.

I do not think we will get that. If we do, we will be ready to play it when we test. For now, we will still be looking for some upside plays that look good. As noted, money is moving through the market. Just because the market moves up and down in a range does not mean that stocks will go down on the days that are down and up on the days that are up. There is rotation. Money is flowing into different, new areas and pushing those stocks higher as it comes out of some of the large cap names that have helped lead the market to this point.

The market can decline on any given day, but those stocks can rally on any given day. We will continue to look for those because they can make us money. If they are set up right and have not made big runs and are set to make the breaks and rallies, then we can continue to play those. But there are also many stocks to the downside, as noted. We have plays on the report, and we will continue to put more on. There are getting to be more downside setups about as many as there are upside. That is an indication of a market changing character. Not necessarily for a crash, of course, based upon what I have been talked about. But it is that sideways chop and maybe a bit of a deeper test. We will have to see how that plays out. But we have to be ready to play these downside plays that present themselves.

It has been tough to the downside, I admit that. You get them slapped back in your face with the "buy on the dips" mentality, but you keep putting some money their way because they will break and sell off ( perhaps pretty big). We will play the ranges now. Our expectations will be just to play the ranges, and we will even be looking at some index plays. If we are going into a range, we can play that and make money just as we can make money off of stocks trading in a range and off of indices trading in a range. At the same time we get the stocks that break out and run higher, and then we make money off of those. And there are those that break down because the money is leaving them and going elsewhere. We can make money off of those as well.

There is always a way to make money in the markets. You just have to recognize what the market is doing, adjust your expectations accordingly, and make your plays within those parameters. Then you take profits when it is logical. If the market goes beyond your expectations, then you let part of it run and you will pick up gain on that. If it plays up to your expectations and turns when you think it does, then you have made your money and you go looking at the next play the other way.

I will see you on Monday for another busy week. I think we will get some consolidation for awhile. Have a great weekend!

Support and Resistance

NASDAQ: Closed at 2988.34
Resistance:
3000 is the February 2012 post-bear market high
3026 from 10/2000 low
3042 from 5/2000 low

Support:
2900 is the March 2012 low
2888 is the May 2011 peak and PRIOR post-bear market high
2879 is the July 2011 peak
2862 is the 2007 peak
The 50 day EMA at 2856
2841 is the February 2011 peak
2825 is the 2007 closing peak.
2816 is the early April 2011 peak.
2754 is the October 2011 high
2706 to 2705 is the April 2011 low and the February 2011 and consolidation low (bottom of the trading range) 2723 to 2705 is the range of support at the bottom of the January to May trading range
2686 is the January 2011 closing low
2676 is the January 2010 low and the December 2011 peak
The 200 day SMA at 2676
2645-2650ish from December 2010 consolidation
2643 is the September 2011 high
2612 is the late August 2011 peak
2603 is the March 2011 intraday low (post-Japan low)
2599 is the June 2011 low and NASDAQ
2593 is the November intraday high
2580 is the November 2010 closing high
2572 is the November 2-11 gap down point
2555 is the mid-August 2011 peak
2546 is the early September 2011 gap down point
2535 is the November island reversal gap point
2532 is the early August gap down point
2469 is the November 2010 low
2441 is the November 2011 low
2331 from October 2010 low and the August 2011 intraday low
2305 from the August 2010 peak (summertime base)
2139 is the May and June 2010 low

S&P 500: Closed at 1370.87

Resistance:
1371 is the May 2011 peak, the post-bear market high
1378 is the February 2012 peak
1425 from May 2008 closing highs
1433 from August 2007 closing lows
1440 from November 2007 closing lows

Support:
1357 is the July 2011 peak
1344 is the February 2011 peak
1340 is the early April 2011 peak
1332 is the early March 2011 peak
The 50 day EMA at 1328
1325-27 is the March 2008 closing low and the May 2006 peak.
1318.51 is the May 2011 low
1313 from the August 2008 interim peak
1295 to 1294 is the April 2011 low and the February 2011 consolidation low (bottom of the trading range)
1293 is the October 2011 peak
1275 is the January 2010 low, early January 2011 peak
1267 is the December 2011 peak
The 200 day SMA at 1259
1258 is June 2011 intraday low
1255 is the late December 2010 consolidation range
1249 is the March 2011 low (post-Japan)
1235 is the mid-December 2010 consolidation low
1231 is the late August 2011 peak
1227 is the November 2010 peak
1220 is the April 2010 peak
1209 is the mid-August 2011 high
1196 is the November 2010 consolidation peak
1178-1180 is the October 2010/November 2010 consolidation low
1158 is the November 2011 low
1131 - 1127 from August 2010 base peak.
1119 is the early August closing low
1109 is the mid-September 2010 gap up point
1101 is the August 2011 low
1099 from the mid-July interim peak
1075 is the October 2011 intraday low

Dow: Closed at 12,922.02
Resistance:
13,056 is the February 2012 high
13,058 from the May 2008 peak on that bounce in the selling

Support:
12,876 is the May high
12,754 is the July intraday peak
The 50 day EMA at 12,691
12,391 is the February 2011 peak
12,284 is the October 2011 peak
12,258 is the December 2011 peak
12,110 from the March 2007 closing low
12,094 is the April 2011 low
The 200 day SMA at 12,019
The June low at 11,897 (closing)
11,893 from March 2008 closing low
11,867 from the August 2009 high and peak on that bounce in the selling.
11,734 from 11-98 peak
11,717 is the late August 2011 peak
The August low at 11,702
11,555 is the March low
11,452 is the November 2010 peak
11,178 from November 2010
10,978 is the bottom of the November 2010 consolidation
10,750 from September 2010
10,720 is the August closing low
10,705-710 from January 2010 peak
10,694-700 from August 2010 peak
9938 is the August 2010 low

Economic Calendar

March 5 - Monday
- Factory Orders, January (10:00): -1.0% actual versus -1.9% expected, 1.4% prior (revised from 1.1%)
- ISM Services, February (10:00): 57.3 actual versus 56.0 expected, 56.8 prior

March 7 - Wednesday
- MBA Mortgage Index, 03/03 (7:00): -1.2% actual versus -0.3% prior
- ADP Employment Change, February (8:15): 216K actual versus 218K expected, 173K prior (revised from 170K)
- Productivity-Revised, Q4 (8:30): 0.9% actual versus 0.9% expected, 0.7% prior
- Unit Labor Costs - Revised, Q4 (8:30): 2.8% actual versus 1.1% expected, 1.2% prior
- Crude Inventories, 03/03 (10:30): 0.832M actual versus 4.160M prior
- Consumer Credit, January (15:00): $17.8B actual versus $12.0B expected, $16.3B prior (revised from $19.3B)

March 8 - Thursday
- Challenger Job Cuts, February (7:30): 2.0% actual versus 38.9% prior
- Initial Claims, 03/03 (8:30): 362K actual versus 355K expected, 354K prior (revised from 351K)
- Continuing Claims, 02/25 (8:30): 3416K actual versus 3405K expected, 3406K prior (revised from 3402K)

March 9 - Friday
- Nonfarm Payrolls, February (8:30): 227K actual versus 206K expected, 284K prior (revised from 243K)
- Nonfarm Private Payrolls, February (8:30): 233K actual versus 220K expected, 285K prior (revised from 257K)
- Unemployment Rate, February (8:30): 8.3% actual versus 8.3% expected, 8.3% prior
- Hourly Earnings, February (8:30): 0.1% actual versus 0.2% expected, 0.1% prior (revised from 0.2%)
- Average Workweek, February (8:30): 34.5 actual versus 34.5 expected, 34.5 prior
- Trade Balance, January (8:30): -$52.6B actual versus -$48.2B expected, -$50.4B prior (revised from -$48.8B)
- Wholesale Inventories, January (10:00): 0.4% actual versus 0.6% expected, 1.1% prior (revised from 1.0%)

March 12 - Monday
- Treasury Budget, February (14:00): -$229.0B expected, -$222.5B prior

March 13 - Tuesday
- Retail Sales, February (8:30): 1.0% expected, 0.4% prior
- Retail Sales ex-auto, February (8:30): 0.7% expected, 0.7% prior
- Business Inventories, January (10:00): 0.6% expected, 0.4% prior
- FOMC Rate Decision, March (14:15): 0.25% expected, 0.25% prior

March 14 - Wednesday
- MBA Mortgage Index, 03/10 (7:00): -1.2% prior
- Current Account Balance, Q4 (8:30): -$113.8B expected, -$110.3B prior
- Export Prices ex-ag., February (8:30): 0.0% prior
- Import Prices ex-oil, February (8:30): 0.1% prior
- Crude Inventories, 03/10 (10:30): 0.832M prior

March 15 - Thursday
- Initial Claims, 03/10 (8:30): 358K expected, 362K prior
- Continuing Claims, 03/03 (8:30): 3415K expected, 3416K prior
- Empire Manufacturing, March (8:30): 15.0 expected, 19.5 prior
- PPI, February (8:30): 0.5% expected, 0.1% prior
- Core PPI, February (8:30): 0.2% expected, 0.4% prior
- Net Long-Term TIC Fl, January (9:00): $17.9B prior
- Philadelphia Fed, March (10:00): 12.5 expected, 10.2 prior

March 16 - Friday
- CPI, February (8:30): 0.4% expected, 0.2% prior
- Core CPI, February (8:30): 0.2% expected, 0.2% prior
- Industrial Production, February (9:15): 0.5% expected, 0.0% prior
- Capacity Utilization, February (9:15): 78.8% expected, 78.5% prior
- Michigan Sentiment, March (9:55): 76.0 expected, 75.3 prior
icon url

ReturntoSender

03/12/12 10:57 PM

#9708 RE: ReturntoSender #6755

From Briefing.com: 4:30 pm : The stock market spent the session chopping along listlessly in low volume trade before booking a flat finish. The lackluster action precedes the latest FOMC Policy Statement tomorrow.

Mixed action abroad and an absence of consequential headlines left stocks to open with modest losses. A lack of leadership then left the broad market to muddle along in the early going.

The highly influential Financial sector was an early source of weakness. Weighed down by diversified and regional banks it fell to a loss of about 1% before support was secured. Financials were able to fight off some of the selling to slash losses, but they still ended the day down 0.3%.

Tech stocks, collectively the largest sector by market weight, stayed close to the flat line for most of the session, but were able to book a 0.2% gain. That said, semiconductor plays traded with weakness, resulting in a 1.0% loss for the Philadelphia Semiconductor Index. Losses by semiconductor plays hampered the tech-rich Nasdaq so that it lagged its counterparts by a narrow margin.

Defensive in nature, Utilities (+1.1%), Telecom (+0.5%), and Consumer Staples (+0.5%) all benefited from a steady bid, but their lack of market weight did little to lift the broad market.

The dollar spent the day trailing a basket of major foreign currencies. By session's end it was off by about 0.2%.

Treasuries had attracted a solid bid in the early going, but support faded as trade progressed. That left the benchmark 10-year Note to drift down to the flat line by session's end. Results from an auction of 3-year Notes had little bearing on intraday action -- the offering drew a bid-to-cover ratio of 3.44, dollar demand of $110.1 billion, and an indirect bidder participation rate of 34.6%. For comparison, the an average of the past six auctions results in a bid-to-cover ratio of 3.42, dollar demand of $109.4 billion, and an indirect bidder rate of 36.2%.

Without any announcements or headlines of great consequence many traders saw little reason to take a position ahead of the FOMC Policy Statement tomorrow afternoon. The apathetic attitude resulted in abysmally low share volume, which failed to surpass 650 million shares on the NYSE.

Advancing Sectors: Utilities +1.1%, Consumer Staples +0.5%, Telecom +0.5%, Tech +0.2%, Industrials +0.1%
Declining Sectors: Health Care -0.1%, Financials -0.3%, Consumer Discretionary -0.3%, Energy -0.3%, Materials -0.6%DJ30 +37.69 NASDAQ -4.68 NQ100 +0.00% R2K -0.4% SP400 -0.4% SP500 +0.22 NASDAQ Adv/Vol/Dec 1088/1.33 bln/1432 NYSE Adv/Vol/Dec 1368/643 mln/1629

4:27PM Cypress Releases Ericsson (ERIC) from ITC complaint regarding SRAM patent infringement by GSI Technology (GSIT) (CY) 15.67 -0.27 : Co announced that it has filed a joint motion to release Ericsson (ERIC) from Cypress's complaint to the United States International Trade Commission (ITC) regarding alleged infringement of Cypress's SRAM patents by GSI Technology (GSIT). Cypress's complaint seeks an exclusion order from the ITC that will prevent the importation of all infringing GSI SRAMs. The ITC action against GSI lists known importers of products that incorporate the accused GSI SRAMs. Cypress has reached an agreement with Ericsson which resulted in the removal of the company from the ITC action.

9:38AM Advanced Photonix, Inc. signs agreement with value-added reseller for its T-Gauge measurement system (API) 0.76 +0.03 :

9:16AM Flextronics to acquire Stellar Microelectronics, terms not disclosed (FLEX) 7.17 : Co announced today that it has entered into a definitive agreement to acquire Stellar Microelectronics, a full service Electronics Manufacturing Services (EMS) provider based in Valencia, Calif., specializing in advanced custom packaging solutions utilizing the latest microelectronics technologies for the aerospace, defense and medical manufacturing markets. Stellar Microelectronics' annual revenue run rate is just under $100 mln. Additional terms of the deal were not disclosed.

8:02AM First Solar and NRG Energy (NRG) announced an agreement for First Solar to construct NRG's 26 megawatt Avra Valley solar project near Tucson, Ariz (FSLR) 27.48 : Electricity from the Avra Valley solar project will be sold to Tucson Electric Power under a 20-year power purchase agreement. The project will utilize First Solar's advanced thin-film photovoltaic technology, mounted on the company's single-axis tracker system, which rotates the solar modules to follow the sun throughout the day. The tracker system extends the peak energy production period, providing more electricity in the afternoon, when energy demand is greatest.

7:04AM DSP Group announces entering into a share repurchase program for up to 750,000 shares of its common stock (DSPG) 6.48 : As of today, 1,220,000 shares of co's common stock remained available for repurchase under its board authorized share repurchase program, of which 750,000 shares are now subject to this share repurchase program.

11:23 am S&P Tech Sector Modestly Lower, In-line With Market
The tech sector is trading lower today, in line with losses in the broader market. Semiconductors are showing relative weakness in the tech space, however, with the Philly Semi Index trading 1.1% lower. WFR (-3.1%) is a notable laggard in the chip index. Among other major indices, the SPY is trading 0.1% lower, while the NASDAQ and the QQQ are 0.2% higher on the session. Among tech bellwethers, QCOM (+1.3%) is showing notable strength today.

There were no notable names in tech to report earnings this morning.

In news, YOKU (+12.0%) and TUDO (+146.3%) announced that they have signed a definitive agreement for Tudou to combine with Youku in a 100% stock-for-stock transaction.

Among rumors, there's DELL (-0.9%) for RVBD (-2.9%) takeover chatter making the rounds.

Among notable analyst upgrades this morning, CHL (+1.2%) was upgraded to Overweight at HSBC, FSL (-1.0%) was upgraded to Outperform from Sector Perform at RBC, and LPS (+1.3%) was upgraded to Overweight at Barclays.

Among downgrades, ORCL (-2.2%) was downgraded to Hold from Buy at Jefferies.

There are no notable names in tech scheduled to report results today after the close.
icon url

ReturntoSender

03/13/12 11:17 AM

#9709 RE: ReturntoSender #6755

Volatility Indexes are hitting lower lows:


Not a lot of fear out there. Of course the VIX has proven it can stay low for years. Question is should we take this as an all clear sign or a warning of an impending top?

RtS
icon url

ReturntoSender

03/13/12 9:43 PM

#9710 RE: ReturntoSender #6755

From Briefing.com: 4:30 pm : The stock market staged an aggressive advance that resulted in its best single-session performance of 2012 and marked new multi-year highs. A positive tone permeated trade for the entire session, but buying didn't really ramp up until after the FOMC released its latest Policy Statement and financial giant JPMorgan Chase made an encouraging announcement.

To little surprise the FOMC opted to keep its fed funds target rate at 0.00% to 0.25% and maintained its outlook that low rates of resource utilization and subdued inflation are likely to warrant exceptionally low levels for the fed funds rate at least through late 2014. However, the idea that a steadily improving economy means that the Fed is less likely to offer additional monetary stimulus was met with some indecision, resulting in choppy trade for stocks. In contrast, the dollar pushed up to a nice gain against a collection of competing currencies while gold prices took a dive in electronic trade so that futures prices for the yellow metal were near $1670 per ounce.

Financials were steady leaders throughout the session, but the sector bounded to a gain of almost 4% after JPMorgan Chase (JPM 43.39, +2.85) announced that it has increased its quarterly dividend to $0.30 per share from $0.25 per share and also authorized $15 billion for repurchasing stocks. The announcement was taken as a sign of financial health ahead of results from the latest round of government stress tests, which will be released at 4:30 PM ET. Test results had been previously scheduled for release later this week.

The bullish bias to trade took the Volatility Index another leg lower. In fact, the euphemistically labeled Fear Gauge set a new multi-year low this morning.

With stocks looking so strong and volatility down, Treasuries encountered concerted selling. The action caused the yield on the benchmark 10-year Note to climb above 2.12% for a three-month high. Results from an auction of 10-year Notes failed to provide support. The offering drew a bid-to-cover ratio of 3.24, dollar demand of $68.0 billion, and an indirect bidder participation rate of 38.6%. For comparison, an average of the past six auctions results in a bid-to-cover ratio of 3.07, dollar demand of $67.2 billion, and an indirect bidder participation rate of 44.0%.

Retail sales results for February were released earlier today. They provided a positive backdrop to the action. Overall sales climbed by 1.1%, which is greater than the upwardly revised 0.6% increase booked in the prior month and narrowly better than the 1.0% increase that had been generally expected. Excluding autos, retail sales were up 0.9%, which bested the Briefing.com consensus call for a 0.6% increase, but it isn't quite as strong as the 1.1% increase experienced in the prior month.

Advancing Sectors: Financials +3.9%, Industrials +2.1%, Tech +2.0%, Materials +1.7%, Consumer Discretionary +1.5%, Health Care +1.4%, Energy +1.3%, Consumer Staples +0.6%, Telecom +0.6%, Utilities +0.2%
Declining Sectors: (None)DJ30 +217.97 NASDAQ +5622 NQ100 +1.9% R2K +2.1% SP400 +2.0% SP500 +24.87 NASDAQ Adv/Vol/Dec 1976/1.69 bln/569 NYSE Adv/Vol/Dec 2496/907 mln/569

4:06PM PMC-Sierra announces $275 mln stock repurchase program (PMCS) 7.00 +0.11 : PMC expects to fund the repurchases through the use of available cash resources.

4:01PM Analog Devices will move to NASDAQ from NYSE effective April 2, 2012 (ADI) 39.42 +0.78 :

8:02AM Xilinx raises quarterly dividend 15.8% to $0.22 from $0.19 per share (XLNX) 36.16 : The quarterly dividend will be payable on June 6, 2012 to all stockholders of record at the close of business on May 16, 2012.

8:01AM Dell announces intent to acquire SonicWALL, a network security and data protection co; expected to close in the second quarter of Dell's FY13; financial terms not disclosed (DELL) 16.96 : Centerview Partners LLC served as an advisor to SonicWALL. The transaction is expected to close within 45 days.

HP (HPQ) announced that IDC Frontier has selected HP Networking solutions to enhance its network infrastructure to meet increasing demand for cloud services.

11:01 am S&P Tech Sector Up 1%, Outperforming Broader Market
The tech sector is trading higher today, just ahead of gains in the broader market. Semiconductors are showing slight relative strength in the tech space with the Philly Semi Index trading 1.1% higher. MU (+4.3%) is a notable leader in the chip index, while CREE (-0.8%) is showing weakness. Among other major indices, the SPY is trading 0.7% higher, while the QQQ, and the NASDAQ are trading 0.8% higher on the session. Among tech bellwethers, ORCL (+1.2%) is showing notable strength today.

In earnings last night, COOL (-13.8%) posted a mixed qtr and offered in line guidance. In news, YHOO (+0.1%) has filed a lawsuit against Facebook (FB) over 10 patents. Elsewhere, DELL (+0.7%) acquired SonicWall from private equity and XLNX (+1.3%) raised its quarterly dividend 15.8% to $0.22.

Among rumors, INTC (+1.5%) is moving into streaming home video market which could be a windfall for ENTR (+3.5%). Also, we are hearing T (+0.4%) for RAX (+2.4%) chatter making the rounds.

There were no notable analyst upgrades this morning, however, FXCM (+3.0%) was added to the Focus List at JP Morgan.

Among downgrades, CSOD (-2.3%) was downgraded to Neutral from Buy at Goldman and MANT (-3.9%) and BAH (-2.6%) were downgraded to Underperform at Wells Fargo.

There are no notable names in tech scheduled to report results today after the close.
icon url

ReturntoSender

03/14/12 11:36 PM

#9711 RE: ReturntoSender #6755

4:30 pm : The major equity averages booked a mixed finish as participants opted to rest on the heady gains scored in the prior session.

Stocks bounded in the prior session to set new multi-year highs. That drove buying abroad, but the positive tone was unable to extend into trade today. Instead, the broad market generally remained mired near the neutral line.

Economic data failed to act as a catalyst for trade. It featured a 0.4% increase in overall import prices. Excluding oil, import prices eased down by 0.1%. Prior month import prices featured increases of 0.3% and 0.1%, respectively. Export prices increased by 0.4%, or 0.5% when excluding agricultural items. The prior month saw export prices increase by 0.2% and 0.5%, respectively.

The fourth quarter current account deficit reportedly totaled $124.1 billion. A deficit of $113.8 billion had been expected, on average, among economists polled by Briefing.com.

Given the near 4% surge achieved by Financials in the prior session, the sector didn't have much of a reaction to news that only four of 19 banks came short of targets established in the latest round of stress tests. That said, many bank stocks were able to extend their gains, driving the KBW Bank Index to a 1.3% gain and its best level since last summer.

Tech stocks, which collectively carry the greatest market weight of any sector, traded with strength for most of the session. Gains were checked in mid-afternoon trade, but it was able to bounce off of the neutral line to score a 0.6% gain. Apple (AAPL 589.58, +21.48) shares continue to climb, resulting in new record highs and a market cap of nearly $550 billion. The stock's latest leg of gains came in combination of strong momentum and positive analyst commentary.

Treasuries were trounced. The action took the yield on the benchmark 10-year Note to a new multi-month high above 2.25%.

Also a traditional safe haven, gold prices dropped precipitously -- more than $50 -- to almost $1640 per ounce. That stoked selling in the SPDR Gold Trust ETF (GLD 159.57, -2.56), which tumbled to its lowest level since January.

The notion that an improving macro picture, albeit at a sluggish pace, diminishes the need for more monetary stimulus in the near term continues to bolster buying interest in the greenback. The dollar had ascended to a 0.5% gain against a basket of major foreign currencies by day's end.

Advancing Sectors: Tech +0.6%
Unchanged: Financials, Health Care
Declining Sectors: Consumer Discretionary -0.1%, Industrials -0.2%, Consumer Staples -0.3%, Materials -0.5%, Telecom -0.5%, Energy -1.0%, Utilities -1.4%DJ30 +16.42 NASDAQ +0.85 NQ100 +0.4% R2K -0.9% SP400 -0.7% SP500 -1.67 NASDAQ Adv/Vol/Dec 805/1.66 bln/1745 NYSE Adv/Vol/Dec 800/853 mln/2230

4:17PM First Solar announced it has hired James Hughes as Chief Commercial Officer (FSLR) 27.10 -0.22 :

3:33PM Motorola Solutions seeks declaratory judgment against Round Rock Research on patent claims (MSI) 50.50 +0.01 : The lawsuit, filed in the U.S. District Court for the District of Delaware, seeks a declaratory judgment that U.S. Patent Nos. 5,500,650; 5,627,544; 5,974,078; 6,459,726; and RE41,531 are not infringed by Motorola Solutions' RFID products and that one or more claims of Round Rock's patents are invalid.

2:33PM LSI Industries selected by Asbury Automotive Group to supply LED site lighting in both new and existing facilities. (LYTS) 7.12 -0.16 : Asbury operates 79 retail stores across the United States.

First Solar (FSLR) announced its 100% stake in Maryland Solar, a 20-megawatt photovoltaic solar power project in Hagerstown, Md.

7:14AM LSI Logic raises Q1 EPS, rev guidance above consensus (LSI) 8.54 : Co raises Q1 guidance, reflecting a stronger than expected hard disk drive market recovery and ramp of flash-based products issues upside guidance for Q1 (Mar), raises EPS to $0.12-0.16, excluding non-recurring items, from $0.09-0.15 vs. $0.12 Capital IQ Consensus Estimate; raises Q1 (Mar) revs to $585-615 mln from $550-590 mln vs. $571.73 mln Capital IQ Consensus Estimate. "We are benefiting from better than expected strength in the hard disk drive market in the quarter as our team has done a great job working with our customers to meet this additional demand. This revised guidance reflects strength in our hard disk drive business as well as upside in our projections for our flash-based products."

Clearwire (CLWR $2.24 +0.10) and Cricket announced that they have entered into a five-year wholesale agreement. With the agreement, Cricket will become the second operator to have signed on to leverage Clearwire's forthcoming LTE Advanced-ready network, which will provide capacity off-load services to supplement Cricket's own LTE network. Cricket currently plans to deploy LTE across approximately two-thirds of its current network footprint over the next two to three years and to cover up to approximately 25 million POPs with LTE network technology in 2012.

Kopin (KOPN $3.51 -0.12) was downgraded to Hold from Buy at Needham and the firm is removing their 12-month price target of $4.50. The firm notes, management provided 2012 annual guidance of $110-120 million, significantly below their $160 million estimate, primarily due to Defense Department budget cuts adversely affecting KOPN's military segment. With a projected loss of $(0.01) in 2012 and little earnings growth likely in 2013, they found ourselves hard pressed to maintain the Buy rating.

11:01 am Technology Sector trading higher today ahead of broader market

The tech sector is trading higher today, ahead of slight gains in the broader market. Semiconductors are showing relative strength in the tech space with the Philly Semi Index trading 0.6% higher. RBCN (+5.3%) is a notable leader in the chip index.

Among other major indices, the SPY is trading 0.1% higher, while the QQQ is 0.5% higher and the NASDAQ is trading 0.2% higher on the session. Among tech bellwethers, AAPL (+2.6%) is again showing notable strength today.

In earnings this morning, LSI (+5.3%) raised its Q1 guidance above consensus. In news last night, PMCS (+2.9%) announced a $275 mln stock repurchase program.

Elsewhere, RVSN (+4.5%) is set to be acquired by Avaya according to reports. Among rumors, we are hearing renewed FIO (+3.6%) takeover chatter making the rounds.

Among notable analyst upgrades this morning, AMT (+1.5%) was upgraded to Overweight at JP Morgan and ALU (+1.7%) was upgraded to Outperform at BMO Capital. Also, NXPI (+3.7%) and ALTR (+2.1%) was added to the Conviction Buy List at Goldman. Among downgrades, Needham downgraded KOPN (-3.6%) to Hold, JNPR (-2.0%) was downgraded to Market Perform at BMO Capital and CCI (-2.7%) was downgraded at Goldman and JP Morgan.

There are no notable names in tech scheduled to report results today after the close.
icon url

ReturntoSender

03/15/12 9:33 PM

#9712 RE: ReturntoSender #6755

From Briefing.com: 4:30 pm : Early trade was lackluster as market participants appeared reluctant to either bet on or against a stock market that has consistently shrugged off precarious conditions in Europe, ongoing concerns about prospects for global growth, and debate over the necessity of monetary stimulus. The ascent has the S&P 500 on pace for its fifth straight weekly advance and its tenth in 11 tries. The hot streak has the broad market measure above 1400 for the first time since mid-2008.

Financials have fueled the latest leg of gains. The sector had a quiet follow-up to the near 4% surge that it scored two days ago, but this session it added almost 2% more. Financials are now up more than 20% year to date. That makes them the best performing sector of 2012.

Among financial issues, banks were especially strong as buyers continued to flock to the space following the recent release of stress test results -- the KBW Bank Index bounded to a 2.7% gain.

Tech stocks aren't far behind Financials in terms of their year-to-date performance, but the sector, which mustered a 0.3% gain today, was hampered by weakness in Apple (AAPL 585.56, -4.02). The biggest stock by market weight opened the day at a record high of roughly $600 per share, but it gradually descended into negative territory. Still, the stock is up more than 40% year to date, leaving some to question just how long the stock can continue its climb.

Data released this morning had little influence over trade. Initial jobless claims for the week ended March 10 totaled 351,000, which is down 14,000 week over week, but not too different than the 355,000 initial claims that had been broadly expected.

Producer prices for February increased by 0.4% month over month, but a 0.5% increase had been broadly anticipated. Core producer prices increased by a more moderate 0.2% month over month, as had been generally expected.

The Empire Manufacturing Survey improved to 20.2 in March from 19.5 in February, contrasting with the consensus call for a reading of 15.0. The Philadelphia Fed Survey improved to 12.5 in March from 10.2 in February, but that matched what had been broadly forecasted.

There aren't any earnings reports of consequence scheduled for this evening or tomorrow morning, but Friday does bring monthly consumer price data at 8:30 AM ET, monthly industrial production numbers at 9:15 AM ET, and the preliminary reading on consumer sentiment for March from the University of Michigan at 9:55 AM ET. Worth noting, too, is that tomorrow is a quadruple witching options expiration day, which could add to volume and volatility.

Advancing Sectors: Financials +1.9%, Industrials +1.2%, Materials +0.8%, Consumer Discretionary +0.4%, Telecom +0.4%, Tech +0.3%, Consumer Staples +0.2%, Health Care +0.2%, Energy +0.1%
Declining Sectors: Utilities -0.1%DJ30 +58.66 NASDAQ +15.64 NQ100 +0.2% R2K +1.0% SP400 +0.9% SP500 +8.32 NASDAQ Adv/Vol/Dec 1672/1.67 bln/833 NYSE Adv/Vol/Dec 1811/844 mln/1208

4:05PM Micrel announced it has signed a definitive agreement to acquire a controlling interest in PhaseLink Company; acquisition to be dilutive to earnings per share by ~ $0.02 per share on a non-GAAP basis in 2012 and accretive within 18 months of closing (MCRL) 10.50 +0.17 : Co announced it has signed a definitive agreement to acquire a controlling interest in PhaseLink Company, a private company based in Taiwan and Silicon Valley. The transaction is expected to close in the second quarter of 2012. Micrel currently expects the acquisition to be dilutive to earnings per share by ~ $0.02 per share on a non-GAAP basis in 2012 and accretive within 18 months of closing. Micrel expects to operate PhaseLink as a wholly owned subsidiary.

Synopsys (SNPS) and Applied Materials (AMAT) announced a collaboration to develop technology computer-aided design models for semiconductor devices.

8:03AM Cisco Systems confirms intent to acquire NDS; expected to be accretive to EPS in the first full year on a non-GAAP basis (CSCO) 20.19 : CSCO announced its intent to acquire NDS Group Ltd., a provider of video software and content security solutions that enable service providers and media companies to securely deliver and monetize new video entertainment experiences. "The acquisition of NDS will complement and accelerate the delivery of Videoscape, Cisco's comprehensive platform that enables service providers and media companies to deliver next-generation entertainment experiences. Acquiring NDS will broaden Cisco's opportunities in the service provider market, expanding its reach into emerging markets, such as China and India, where NDS has an established customer footprint. Under the terms of the agreement, Cisco will pay approximately $5 billion, including the assumption of debt and retention-based incentives, to acquire all of the business and operations of NDS. The acquisition has been approved by the boards of directors of both companies." The net impact to Cisco is expected to be accretive to EPS in the first full year on a non-GAAP basis. This was reported earlier - see 5:56 comment.

Presto Engineering and LTX-Credence (LTXC) announced the selection of the LTX-Credence X-Series tester platform for use on customer engagements targeting the wireless communications, automotive and industrial markets.

icon url

ReturntoSender

03/17/12 7:55 PM

#9713 RE: ReturntoSender #6755

From Briefing.com: Weekly Recap - Week ending 16-Mar-12The broad market spent Friday plodding along narrowly above the neutral line, despite quadruple witching options expiration. The lackluster action comes as stocks trade at multi-year highs.

Gains in the final session of the week were only modest, but they helped the S&P 500 secure a weekly gain of more than 2%. That stands as the stock market's fifth straight weekly gain, or tenth in 11 tries. That hot streak has the S&P 500 up more than 11% year to date and sitting above 1400 for the first time since mid-2008. Along the way the stock market has managed to overcome precarious conditions in Europe, ongoing concerns about global growth prospects, and debate over the plausibility of additional monetary stimulus.

The S&P 500 now trades at about 14.3x trailing 12-month earnings and 13.0x forward earnings. The 5-year historical price-to-trailing earnings average stands at about 16.5, while the 5-year historical average for price-to-forward earnings is about 13.2.

The latest Investor Sentiment Survey from the American Association of Individual Investors suggests that more than 45% of members remain bullish. Its long-term average is closer to 39%.

As a corollary, the Volatility Index is back near its multi-year lows beneath 15. In little more than a week the euphemistically labeled Fear Gauge is down approximately 30%.

Financials had a quiet Friday, but were the primary drivers behind the stock market's advance this week. Conveying its confidence and effectively hinting at satisfactory stress test results, JPMorgan Chase (JPM 44.57, -0.13) announced earlier this week a dividend increase and a $15 billion share repurchase authorization. That brought about concerted buying interest among bank stocks, which collectively climbed close to 7% this week. Citigroup (C 36.69, +0.42) sat out some of that due to disappointment that it, along with three other outfits from a total of 19 firms, came short of certain targets set in the latest round of government mandated stress tests. Collectively, the Financial sector's constituents climbed nearly 6% this week. Year to date, the sector is up more than 20%, which is better than what any other sector has achieved.

Tech, the largest sector by market weight, isn't far behind the Financial sector in terms of its performance in 2012. Year to date tech stocks are collectively up almost 20% after a 3% advance this week. Apple (AAPL 585.57, +0.01) has been an absolute juggernaut and a leader for Tech in 2012; even though it is the largest stock by market cap, which is actually greater than the combined weight of both IBM (IBM 206.01, +0.01) and Microsoft (MSFT 32.60, -0.25), the stock has rallied more than 40% year to date. However, since hitting $600 per share the stock has started to waver some.

The belief that the economy is strengthening helped the dollar trade up to its highest level in nearly two months earlier this week. It lost momentum more recently, resulting in a couple of losses that left the greenback to book a weekly loss of about 0.3%.

Fixed Income Focus

Treasuries were trounced on a couple of occasions this week. Their slide sent the yield on the benchmark 10-year Note as high as 2.35%, which was notched early on Friday before it fought to pare its loss. The Note's yield hasn't been that high since October.

There were a few auctions earlier in the week, but none of them generated results that induced buying interest. The offering of 3-year Notes drew a bid-to-cover ratio of 3.44, dollar demand of $110.1 billion, and an indirect bidder participation rate of 34.6%. For comparison, the an average of the past six auctions results in a bid-to-cover ratio of 3.42, dollar demand of $109.4 billion, and an indirect bidder rate of 36.2%.

The 10-year Notes sale drew a bid-to-cover ratio of 3.24, dollar demand of $68.0 billion, and an indirect bidder participation rate of 38.6%. An average of the past six auctions results in a bid-to-cover ratio of 3.07, dollar demand of $67.2 billion, and an indirect bidder participation rate of 44.0%.

The week's final auction, a 30-year Bond sale, drew a bid-to-cover of 2.70, dollar demand of $35.1 billion, and an indirect bidder participation rate of 29.0%. For comparison, an average of the past six auctions results in a bid-to-cover of 2.72, dollar demand of $37.8 billion, and an indirect bidder participation rate of 31.6%.

A Bevy of Economic Reports

The economic calendar this past week was highlighted by the latest FOMC statement. To little surprise the Committee opted to keep the fed funds target rate at 0.00% to 0.25%. It also maintained an outlook that would likely to warrant exceptionally low levels for the fed funds rate at least through late 2014. Although the Fed has been accommodative in its policy efforts, there has been a growing belief among market pundits that further stimulus will likely be put on hold because since the economy continues to improve, albeit at a slow pace.

Retail sales in February increased by 1.1% to outpace the upwardly revised 0.6% increase of the prior month. February results were also slightly better than the 1.0% increase that had been widely expected. Excluding autos, retail sales increased by 0.9%. That bested the Briefing.com consensus call for a 0.6% increase, but it still wasn't as strong as the 1.1% climb in the prior month.

Import prices were up 0.4% in February. Excluding oil, import prices were down 0.1%. In the prior month overall import prices and prices less oil increased by 0.3% and 0.1%, respectively. Export prices increased by 0.4%, or 0.5% when excluding agricultural items. Respective increases of 0.2% and 0.5% were experienced in the prior month.

The fourth quarter current account deficit reportedly totaled $124.1 billion. A deficit of $113.8 billion had been expected, on average, among economists polled by Briefing.com.

Initial jobless claims for the week ended March 10 totaled 351,000. Down 14,000 week over week and not too different than the 355,000 initial claims that had been broadly expected, weekly jobless claims trends continue to suggest improvement in the labor market.

Overall producer prices increased by 0.4% in February, but core producer prices increased by just 0.2%. The general consensus had pegged the increase in overall producer prices at 0.5% and the increase in core producer prices at 0.2%. During the prior month overall producer prices were up only 0.1%, while core producer prices were up 0.4%.

As for consumer prices, they climbed 0.4% in February, while core prices increased by a mere 0.1%. The increase to overall prices was precisely what had been expected, on average, among economists polled by Briefing.com, but the increase in core prices was actually less than the 0.1% increase that had been generally expected. Both overall prices and core prices had increased by 0.2% in the prior month.

In contrast to the consensus call for a drop to 15.0, the Empire Manufacturing Survey for March improved to 20.2, which stands as its highest level in well over a year. Meanwhile, the Philadelphia Fed Survey for March improved to a multi-month high of 12.5, exactly as had been commonly forecasted.

Industrial production in February was flat. That contrasted with the Briefing.com consensus call for a 0.5% increase. Prior month numbers were revised upward to reflect a 0.4% increase, though.

The University of Michigan released its preliminary March reading on consumer sentiment. A reading of 75.8 had been broadly anticipated to follow the one-year high of 75.3 printed in the prior month, but instead the reading eased down to 74.3.

..Nasdaq 100 -0.1%. ..S&P Midcap 400 -0.1%. ..Russell 2000 -0.2%.
 
Index Started Week Ended Week Change % Change YTD %
DJIA 12922.02 13232.62 310.60 2.4 8.3
Nasdaq 2988.34 3055.26 66.92 2.2 17.3
S&P 500 1370.87 1404.17 33.30 2.4 11.7
Russell 2000 817.00 830.18 13.18 1.6 12.0

NXP Semiconductors (NXPI) introduced the TDA18250A and TDA18260A, its latest high-performance single and dual silicon tuners for cable set-top-boxes covering worldwide digital cable standards.

ReneSola (SOL $2.78 +0.32) reported a fourth quarter loss of $0.43 per share, $0.11 worse than the Capital IQ Consensus of ($0.32), while revenues fell 51.4% year/year to $187.7 million versus the $147.34 million consensus. The company issued upside guidance for the first quarter with revenues of $180-190 million versus the $153.87 million consensus. Total solar wafer and module shipments in fourth quarter 2011 were 339.9 megawatts, exceeding company guidance and an increase of 3.5% from 328.5 MW in Q3 2011. For the first quarter of 2012, the company expects total solar wafer and module shipments to be in the range of 400-420 MW. For the full year 2012, the co expects total solar wafer and module shipments to be in the range of 1.8-2.0 GW.

09:24 am Microsoft upgraded to Buy at Argus; tgt $39: . Argus upgrades MSFT to Buy from Hold and sets target price at $39 saying with Windows 8 likely to launch in calendar 3Q12, Microsoft may finally have an operating system that can compete in both the PC and tablet environments. Based on early reviews, it looks like the company has gotten the technology right; success will now depend on execution and marketing.

icon url

ReturntoSender

03/18/12 6:06 PM

#9715 RE: ReturntoSender #6755

InvestmentHouse Weekend Market Summary

http://www.investmenthouse.com/weekendmarketsummary.htm

- Choppy go nowhere expiration but indices hold the week's gains.
- Frogs mating in March. Things just don't seem right economically.
- Industrial production flat, missing expectations, but January revisions make it a wash.
- Capacity revised to a 4 year high in January, but declines for the first time in a year in February.
- Michigan Sentiment shows the impact of gasoline prices, misses its mark.
- Fuel demand falls to a 3 year low and other gasoline related facts.
- February CPI hits a 10 month high, AKS raises its steel prices.
- Inflation hits the lower incomes the hardest, so where are the protestors regarding administration policies that create inflation, produce the worst recovery since the 1930's, and impacts the '99%' the hardest?
- UK drops the 50% '1% rich' tax, bowing to history and basic economics.
- Tax Revenues down in the 2012 'continuing expansion'.
- Expiration week brought some good profits. A pullback and we can be in position to make some more.
- The dilemma: will new money (bond money) put a floor under any pullback or will slowing economic data impact the market? Has to change the character to buy into the latter.

Lots of volume, no movement, market holding its gains.

It was difficult to figure out what I would talk about this weekend. We spoke about it in the office quite a bit. Most of the activity on Friday had to do with economic news, and there was a lot there to discuss. Despite the good spin that people continue trying to put on some of these numbers, they simply are not that great. They are not that bad, but people tend to think that relatively pathetic data looks good because we have been in such a horrid recession for so long. For instance, look at sentiment levels and expectations about the present and the future. As one person noted today, we have not seen such exuberance since 1987. But it also matters where you have been. I am sure when we came out of the Great Depression and started having economic activity that was not terrible for a change, people got pretty exuberant. Our expectations are lowered over time the worse things are.

You may remember the old joke, "The beatings will continue until moral improves." It is not quite the same thing, but you get the idea. The situation is not ideal, but it is not as bad as it was. We are told by the Fed and the administration that it could be worse, so we should just do the best we can. Keep that old stiff upper lip, as the British would say. Speaking of the British, they decide to drop that 50% rich tax that was actually producing less in tax revenue. It seems that someone picked up a history book or an Economics 101 textbook. They realize if they raise the incremental rates too high, they actually produce less tax revenue. Yes, they figured it out by doing a case study themselves. If only we would listen over here.

There was not much action on the day. There were other days this week where the market chopped around and did not move anywhere, notably on Wednesday after that big Tuesday move. Remember the headlines from Wednesday about investors being confused and not understanding the market because it is up one day and then goes nowhere the next. As I pointed out at the time, there was not much reason for confusion about that. It is just the way markets work.

Friday was the same sort of thing, but it was also expiration week and expiration Friday. We got some big volume, just not any big stock moves. They had already given us two good days on the week. They just chopped around to end the week near the flatline at least for the session. Overall stocks posted nice gains for the week, continuing the rally as apparently some bond money is moving into stocks. I will talk about that later with respect to fund flows because it is rather strange. But I digress for now.

SP500, +0.11%; NASDAQ, -0.04%; Dow, -0.15%; SP600, -0.33%; SOX, +0.1%

Big moves, indeed. I jest. The only big moves were on volume, and that was strictly due to expiration. No big change in trading volumes.

OTHER MARKETS

The other markets somewhat continued the themes of the week.

Dollar. 1.3168 versus 1.3085. The dollar advanced nicely and then sold off on Thursday and Friday. It had a good move against the yen and a good move against the euro, but there was no reason to build in more gains, apparently on the supposed economic data. Maybe currency traders felt that the gains in the economic data where not as strong as the headlines indicated, and thus the dollar backed off. Kind of unfortunate because it was reaching the December and January highs, and we would have liked to see it break through. It was not going to do it, and it faded back.

You want to see the dollar moving in sync with the economy. It is struggling to break through a very important peak from January. If we look back, that is a level it struggled at in late 2010 and early 2011. It was an important bottom in the summer of 2010. The dollar is still well off of its high. It is trying to recover, and it should do that as the economy recovers. If it breaks over this January peak, that will be an important move.

Bonds. 2.29% versus 2.28% 10 year U.S. Treasury. Bonds had one of their worst weeks in a long time. On Friday was there a modest relief bounce. Friday other yields improved, and that helped bounce the overall bond picture. But on the week, bonds broke out of their triangle pattern. This should be expected. If the economy is improving, bonds are less needed as a safe haven. Investors are more risk tolerant and would put more money into equities. That appears to be what is happening, but I will talk more about that later.

Gold. 1,656.10, -3.30. Gold had a tough week again. It traded sharply lower on Wednesday, dropping over 50 points. It recovered some on Thursday. Friday it lost a little ground, but it closed basically flat. It came back from the low again, and it looks like the level around $1,635 has some stickiness to it. It is trying to bounce here, but it has a pretty tough road to hoe. You can make out an ABCD pattern. You would to want see it make the stick and bounce at this point. We will find out if it does or not. A lot of technicians are saying gold is bearish. It does have a little head and shoulders pattern because it is not the cleanest ABCD. A lot of people forget about or do not understand the ABCD pattern, so they get blindsided by it a bit. We still do here sometimes because you can get so in the mode of downside that perhaps you do not think that this stock is just doing the old shakeout. In any event, we will see if that is the case for gold or not. It is set up to do it, and we will see if it makes the move.

Oil. 107.03, +1.84. Oil was up on the session. It is bouncing off of its pennant or flag test of the breakout from that November to February trading range. Interestingly enough, Brent Crude accelerated on the session. Unfortunately, it is the one that we base our gasoline prices off of. It closed at $126, blasting higher 3 points in the afternoon session.

The stories that we were able to dig up said that it was related to a belief that Israel may attack Iran at any time. There are so many sites that have to be figured into the equation, and Israel cannot afford to let Iran get too far along in other words, to get past the Israelis' technology to take out the sites. If it goes too late, only the U.S. could have the capability to do it. We do not give that capability out; we do not sell it even to our allies. That was one reason Brent accelerated. It was also ahead of a weekend. Everyone is always a bit worried over the weekend about geopolitical events. That is when things can happen, and then the markets are closed and you cannot do anything about it. So they try to get themselves square. Thus the rally in Brent. It dragged WTI higher with it.

TECHNICAL SUMMARY

The internals do not mean a lot with respect to Friday's action due to expiration.

Volume. NASDAQ +21%, 2B; NYSE +60%, 1.21B. That is far, far outpacing any volume we have seen of late, but a big spike in volume does not mean a thing because of expiration.

Breadth. NASDAQ -1.1:1; NYSE, -1.2:1.

New highs/New lows are not slowing anything special. The market is not at extremes on this rally. It is not showing anything that would suggest that the rally is about to turn over. After all, as I noted before, the market broke through its prior highs. It did so quite easily as new money appears to be coming in. Or something else us pushing it higher, whether it is rotation or not. Stocks are moving higher, and they moved higher pretty broadly to make that breakout. What is going on here? We saw a huge spike on Friday, but throw it out widow. Look at all this volume. Average volume, my friends, is down to around 725-750M shares on the NYSE. It is the same on NASDAQ. It is showing lower overall volume; markedly lower than in, say, 2009. We are talking 20% lower levels of trade.

I have often talked about the retail investor not controlling the market. It is the big money. Without anyone putting money into the funds, then you have a problem with volume because it will be lower. If the funds do not have as much new money coming in to put to work, volumes will be rather static. They will move money around between sectors versus dumping continual new money into the stocks. And if they put new money into it, the volume will go up. Supply and demand, more action. But that is not happening. The retail investor is not powering into the market. There are some stats showing that hedge funds have inflows that were up 2% in January and up 3% in February. But the most recent U.S. equity funds flows were down 1.4B just this past week in March. That does not just mean hedge funds, but mutual funds and those fund managers that run a lot of money as well. So money may be moving in from the bonds but, net, money was flowing out of equity funds in the U.S. It is a conundrum. Is it a 99% versus 1% situation? Are people that jaded with the market? Could be. A lot of people got burned. The Flash Crash was tough, the tsunami was tough. The debacle of last year was tough on investors.

There is also a lack of jobs. Millions upon millions are still not working, and at the current rate of job creation it will take 10 years to get back to where we were. There is not that much disposable income to put into the stock market either. There is a combination of people who got burned and maybe lost what they had, and then you have people who just do not have to money to put it back in and build it up. That is a sad situation because they really need to use the stock market to help beat inflation. They were too late on the bond rally they may have caught the tail end of it and now maybe they are shifting over to the equities just in time to catch the tail end of that. Maybe they are smart. Maybe they are waiting for a pullback. That would be a first, but we will see. I will tell you one thing, the funds are still buying aggressively. If not with new funds, at least they are moving money around the market. Every time there is a dip, they are trying to pick up new shares.

A bit of a long-winded discussion on what is happening in the market, but you can see that it will bleed over into the charts.

THE CHARTS

SP500. SP500 went nowhere on Friday, but it had a good week. It broke out above its prior post bear market high from the summer of 2011, and it put in some good moves. Not every day, but it is solidly moving to the upside.

DJ30. DJ30 broke to a new high as well. It tested its old high and blew right through. A solid week here.

NASDAQ. NASDAQ was the same story. Nice moves. Not as impressive, but AAPL is up near $600, and it is bumping its head a bit. That is most of the NASDAQ right now. If AAPL tests, the NASDAQ will test back to its breakout. But it nonetheless broke out. It will be testing from a position of strength versus trying to break on through to the other side (apologies to the Doors)

SP600. The small caps pattern is the most interesting. They have yet to clearly break through the prior post bear market high not only from the summer of 2011, but from February of 2012. They have tried it, but they could not do it and sold off. They are trying again, but have been unable to do it. It looks like they will have the mojo to get it taken care of, but I do not know, however, if they can pull the breakout here. And this is very important. It ties into the economic data.

If the economic data is rolling over and there are some indications that it is starting to have problems then we will see it in the small caps. They will fail in their breakout attempt. That is if we will have economic problems. That will be one of your leading indicators. If the small caps have trouble, then we could have trouble elsewhere. This time if the small caps are struggling (as they were before everything burned up in the financial crisis and the first ever part of the recovery and the export economy), then there is no big China consumption, Brazilian consumption, or Indian consumption. Everyone is struggling. Europe is obviously struggling. So if the small caps go down, where will we find our growth? That is the worrisome aspect of what the small caps are showing.

SOX. The SOX is back up to its February peak. It has had a good two weeks, but it has yet to break through. Another growth area, another important area for the market. Will the semiconductors be able to break through, or will they be rebuffed once again? They are at an important level. There is a lot of congestion from early 2011, and they still have yet to clear their February 2012 peak. Another important test. Small caps and semiconductors are very important to watch moving forward.

LEADERSHIP

Financial. I will not go into a lot of leadership charts tonight. There is no real reason to because I discussed it a lot during the week. The main point to understand is that the financial stocks had a good week. They broke back to the upside and started with their leadership that helped break SP500 out to the upside. Very important move. Semiconductors enjoyed something of a recovery. And since they broke their downside channels, they helped provide a move to the upside. The question is, looking at that SOX chart, will they continue that?

Industrial. I would be remiss if I did not address the industrials that recovered nicely last week. CAT is the poster child for these. It is the bellwether and the one you always look at. It did break back up through a gap point. A very important move. Now it is right at the late January peak, and that is above the February peak. Once again a big test for CAT. Will it continue higher or will it roll over? MACD made a lower high. It is still struggling. Very interesting, indeed. It would be more interesting if MACD had dropped sharply lower on this test versus the levels from back in late December of 2011. We will see what happens there. GE looks good. It is powering to the upside. It broke out and is moving well.

Technology. Techs were doing fine, but some of the big names like AAPL are struggling. It does not look like it will roll over. We have seen this before. We saw it in mid February, we saw it in early March, and it did not die. But the move has been amazing. It is somewhat parabolic if you look back in time. It has really accelerated its moves over the past three months. Leaders tend to do that. A blowoff? Who knows? I will say that it has gapped upside, and it is poised to gap to the downside. That would be an important move indeed.

Energy. Those are the big names. There are a lot of smaller names that look good, particularly in energy. We are seeing small names and large cap names looking solid. SN is one we like a lot. It is pretty new, and it has a great set up. OII was performing quite well. DVN is an independent oil and gas company. A nice break to the upside. There are others out there as well. XEC looks good to make a break. Energy is showing growth or what looks to be growth. It has great patterns, and it should at these prices. Perhaps we will get some leadership from energy stocks. They are not the only ones; they are all over the market. You will see these stocks that are setting up nice patterns and making upside breaks. We saw them all week long.

They vary from health care and stocks such as CYH. A nice little test, breaking to the upside. And you have the clean energy types as well. CDTI is setting up a great pattern and trying to make a move. GSM had a great break to the upside. There are fewer name brands more of the household brands that have set up these patterns and are ready to break to the upside. Indeed, they are starting to make that break and helping lead the market. Stocks such as GSM. It is hardly extended and overpriced. In fact, it is showing the same kind of rounded bottom and the higher lows and higher MACDs setting up. A lot of the leaders showed us that way back when they started this rally out of the eurozone burning from last year.

THE ECONOMY

Frogs mating in March. Something is not right.

Economic Data is not quite right, but nothing you can point to shows a rollover.

Warmer weather hurt holiday sales but then helped early 2012 apparel sales.

Likely helped improve the jobs picture. Lagging indicator advancing on the improved second half 2011 economic data AND aided by warm weather requiring some more bodies at Home Depot, Lowe's, apparel stores.

PROBLEM: We are seeing a decline in the early 2012 data similar to 2011.
Not as dramatic but there are indications the data is slowing, not to mention internal inconsistencies.

Saw this in other data on the week:
Jobless claims: the leading employment indicator, and it stopped improving the past three weeks. Not rolling over, but planning out.
Employment report: Temporary workers even at this stage of 'recovery,' 10 years to recover jobs at this rate, missing/disappearing workers from the pool.
PPI: 5 months of increasing price trends
Regional Manufacturing: Massive spike in prices paid, new orders, shipments, unfilled orders plunging. Inventories jumping (0.9 versus -12.9, Philly).
Retail sales: Core sales 0.5% February versus 1.0% January. Two-thirds of the increase in retail sales due to gasoline price spikes and auto channel stuffing.

Saw it on Friday again.

CPI, February (8:30): 0.4% actual versus 0.4% expected, 0.2% prior
Year/Year: 2.9% versus 2.9% January.

Core CPI, February (8:30): 0.1% actual versus 0.2% expected, 0.2% prior
Year/Year: 2.2% versus 2.3% January.

Food prices flat for February
Gasoline prices +6%

Bonds: Bounced some on the news, supposedly because CPI gives the Fed more room for more stimulus.

Industrial Production, February (9:15): 0.0% actual versus 0.5% expected, 0.4% prior (revised from 0.0%)
Big miss, but January revision made it a wash.
Point: can the data be trusted? How can the misses be so large?

Capacity Utilization, February (9:15): 78.7% actual versus 78.8% expected, 78.8% prior (revised from 78.5%)
A mixed bag: 78.8% from January (revised) was the highest reading in 4 years. On the other hand, the February reading was the first decline since April 2011. Of course it was up from the previous, unrevised reading . . .
Sum: Utilization is not bad but not at a level requiring any kind of capital investment to expand capacity. Definitely no bottlenecks.

Michigan Sentiment, March (9:55): 74.3 actual versus 75.8 expected, 75.3 prior
Shows the influence of gasoline prices on consumers.
Expectations six months out declined.
Inflation expectations rose to 4.0% from 3.3%.
More respondents saying they are going to cut down on eating out and generally pulling back. That is NOT the sign of a growing positive wave in the economy.
Contra: Retail stock charts continue their nice uptrends and indeed some look ready to break higher once more.

Tax Revenues based upon withholding lower year to day 2012 versus same time in 2011. Stronger economic activity?

The numbers ebb and flow, but almost through Q1 in an economic expansion tax receipts are lower.

$8.35B less than 2011 (Daily Treasury Statement, Department of Treasury)
How can a recovery be accelerating when tax revenues are down?

We know that tax revenues rise even as rates are cut because economic expansion generates more jobs and a larger base to tax.

If revenues are down you know 1) there is less economic activity because 2) less incomes and income to tax.

Summary:
Slowing data yes.
Still has not broken any uptrends, however.
Stock market is not showing any major rollover in economic activity.

TO VIEW THE ECONOMY OVERVIEW CLICK THE FOLLOWING LINK:
Economy Summary Video

THE MARKET

SENTIMENT INDICATORS

VIX . There is so much talk about the VIX right now and what it means for the market. You cannot turn on a station, swing a dead cat, or throw a rock at your neighbor's dog without hearing something about the complacency in the market, the VIX falling to lows not seen in a year, and that a selloff is imminent. It may be imminent, but the market has deified the last "imminent" point of a selloff which was when the SP500 and the other indices tested their recent highs on a bounce and broke right on through. It threw that pretty much out the window. But now they are saying that it is down near the April of 2011 lows which are also the January of 2011 lows, and the February and December 2010 lows . We did not have a big market selloff as those times, did we? We had some dipping, no doubt, but we did not have major selloffs. The big selloff came in August through October when the eurozone was burning (more or less literally). Volatility shot higher and the market sold off. Now we had the market rallying as volatility declines.

As we have seen many times before, volatility can stay at these low levels for years if the market is rallying. If money is coming into the market, it will trump whatever the volatility is telling us or is purported to be telling us. For instance, if the bond market continues to sell off and the money from the stock market comes into the stock market (as it should if the economy is getting better and bonds become less of a safe haven and people put money in riskier assets), then the stock market should continue higher and the VIX should continue lower. Or it should move laterally for however long the market wants to move.

I know that is unsavory for a lot of people who like to put a lot of emphasis on the VIX. But, looking back to 2003 and to 2007 when things really got ugly and we slid into the financial crisis, the stock market continued to rally for five years while VIX slide lower and lower. The stock market was higher, and the VIX lower and moving laterally. The rally was not doomed until the stock market was hitting highs and then volatility started to move higher. That is something that I always talk about as the most important indicator when it comes to volatility. When a market is selling and volatility spikes to massive levels as we saw in 2008, you will get a rally in stocks at some point after those massive spikes. Not immediately; it takes awhile to work through the system. But when you do, you get a nice rally. That is a great use for volatility.

But in times when the market is rallying and volatility is low, you will get some up and down swings, and you sometimes get a correlation going between volatility and stock prices. They will twist back and forth, kissing each other and going apart. But that correlation does not always happen. The most important aspect of volatility in a revising market is when volatility starts to rise as the market continues to rise after volatility has been flat lining or heading lower. If that is what we see, that is one of the signs of a major correction coming.

Looking back to 2000, you can see the market moving higher and volatility was low, but then it started to jump. In March of 2000 volatility spiked. The market was still moving higher. It went back down because the market continued up, but then it started spike again and the market rolled over. It happened in 2007. It is not happening right now. Volatility is still finding its bottom as the stock market rises.

VIX: 14.47; -0.95
VXN: 16.47; -0.78
VXO: 13.73; -0.86

Put/Call Ratio (CBOE): 0.78; +0.08

This is a reading of the number of bullish investment advisors versus bearish advisors. The reason you look at this is that it gives you an idea of how bullish investors are. If they are too bullish then everyone is in the market and it is heading for a top: if everyone wants to be in the market, then all the money is in and there is no more new cash to drive it higher. On the other side of the spectrum if there are a lot of bears then there is a lot of cash on the sideline, and as the market rallies it drags that cash in as the bears give in. That cash provides the market the fuel to move higher. If bears are low it is the same as a lot of bulls: everyone is in and the market does not have the cash to drive it higher.

Bulls: 43.6% versus 47.9% versus 51.1%. Bullish sentiment is breaking even as stocks hit higher highs. Well, this data does not reflect the week's upside break and that may change things a bit. Nonetheless, advisors are turning pessimistic about the market rally, and that in itself provides the upside fuel. Again, it is not excessive, it is not excessively low either. They are off the 55+ level even near the highs as investors get a bit pensive. Bigger picture that is good for the upside. That was the highest level since April and May of 2011, the peak of the post-bear market high. Now the indices are back at that level and so are the bulls. All the more reason to watch this action at the prior highs. 35% is the threshold measuring bullish versus bearish action. Six weeks the bulls were below bears. A powerful sentiment signal but now dissipating. Highs from April and December (60% readings spanning December through early May 2011). The 5 year high is 62.0. The crossover level at 29% bulls from July 2010 is long gone. 35% is the threshold level suggesting bullishness. To be seriously bearish it needs to get up to the 60% to 65% level.

Bears: 26.6% versus 26.6% versus 25.5%. Holding at the slightly elevated level from the prior week. Bears are a bit more negative but still not at a level suggesting a new surge. Nonetheless stocks continue to break higher. As with bulls, not excessive either way. Solidly lower after spending weeks at 30%ish. Not at a bearish level but they are growing more confident even as the market hits the prior highs and is not blasting on through. For more reference, bearishness hit a 5 year high at 54.4% the last week of October 2008. The move over 50 took bearish sentiment to its highest level since 1995. Extreme negative sentiment. Prior levels for comparison: Bearishness peaked at 37.4% in September 2007. It topped the June 2006 peak (36%) on that run. That June peak eclipsed the March 2006 high (33%) and well above the 2005 highs that spawned new rallies (30% in May 2005, 29.2% in October 2005). That was a huge turn, unlike any seen in recent history.

NASDAQ

Stats: -1.11 points (-0.04%) to close at 3055.26
Volume: 2.009B (+20.73%)

Up Volume: 1.07B (-140M)
Down Volume: 997.5M (+550.86M)

A/D and Hi/Lo: Decliners led 1.09 to 1
Previous Session: Advancers led 1.97 to 1

New Highs: 148 (+20)
New Lows: 16 (-13)

SP500/NYSE

Stats: +1.57 points (+0.11%) to close at 1404.17
NYSE Volume: 1.215B (+58.41%)

Up Volume: 2.98B (-400M)
Down Volume: 2.01B (+1.168B)

A/D and Hi/Lo: Decliners led 1.18 to 1
Previous Session: Advancers led 1.51 to 1

New Highs: 136 (+6)
New Lows: 8 (-7)

DJ30

Stats: -20.14 points (-0.15%) to close at 13232.62
Volume DJ30: 392M shares Friday (expiration) versus 161M shares Thursday.

MONDAY

We enter next week with a dilemma. If there is any new money coming in (maybe from bonds), will it put a floor under any pullback in the market? Thus far it has done that. Every time there has been what looks to be a selloff, we have had a buy into that that has driven the market higher. Or with the slowing economic data prevail and impact the market and send it lower? The SP600 charts will tell more of that picture for us. It is still unable to break through its prior highs. That is going to be the question. But in order for the latter to work in other words, the breakdown we need a change of character in the market.

As noted, thus far the buyers have supported each dip. It is definitely about buying on the dips. It is basically the big money going it because there are not that many retail investors here. We thought there might be a shot this past week when the large cap indices came up and tested their prior highs. They blew right through them. Now they will be coming back to test from a position of strength. A bit of a pullback will be good for us. We were able to take some nice gain off of the table this week. Very good profits. A pullback, and we will be in position to pick up more of those name brand stocks as well as the house brands we have been talking about buying of late.

While we may be uncomfortable about what the economy will bring and just how serious this economic recovery is, we will have to deal with the fact that the market is not pricing that in. Maybe it is just a liquidity binge that is still pushing the market and the economy to the upside. If that is the case, then that is the case. We will just take what the market gives. We do not think we are smarter than the market. We prepare, set up, and you take some downside at the right times. If it does not work out, then it does not work out. But you keep playing the main push with most of your money. That is what we have been doing.

We will continue to play the upside until the market shows that it is changing its character. Nothing last week showed a change of character. Indeed, a break above the prior highs affirmed the existing upside bias. It will have to show a change of that character in order to dramatically change our position in the market. We may have our misgivings, but those misgivings have been overrun by the market action on every dip.

We will let our continuing positions run and make us money. We will keep looking at the house brands that we were picking up this week because they keep showing great setups. If we get the pullback after expiration (which is often the case; we had a great expiration week), and if we get a pullback for a day or two to start next week, we might be able to pick up some of the name brands at a much better price at a nice little test as they come back and test the break through the prior peaks. We can ride them to make more money as well.

Have an outstanding weekend. It is spring already in a lot of the country since we did not have a winter. Get out there and enjoy it.

Support and Resistance

NASDAQ: Closed at 3055.26
Resistance:
3227 is the April 2000 intraday low
3401 is the May 2000 closing low

Support:
3042 from 5/2000 low
3026 from 10/2000 low
3000 is the February 2012 post-bear market high
The 20 day EMA at 2978
2910 is the recent March 2012 low
2900 is the March 2012 low
2888 is the May 2011 peak and PRIOR post-bear market high
The 50 day EMA at 2889
2879 is the July 2011 peak
2862 is the 2007 peak
2841 is the February 2011 peak
2816 is the early April 2011 peak.
2754 is the October 2011 high
2706 to 2705 is the April 2011 low and the February 2011 and consolidation low (bottom of the trading range) 2723 to 2705 is the range of support at the bottom of the January to May trading range
2686 is the January 2011 closing low
The 200 day SMA at 2682
2676 is the January 2010 low and the December 2011 peak
2645-2650ish from December 2010 consolidation
2643 is the September 2011 high
2612 is the late August 2011 peak
2603 is the March 2011 intraday low (post-Japan low)
2599 is the June 2011 low and NASDAQ
2593 is the November intraday high
2580 is the November 2010 closing high
2555 is the mid-August 2011 peak
2535 is the November island reversal gap point
2441 is the November 2011 low

S&P 500: Closed at 1404.17

Resistance:
1425 from May 2008 closing highs
1433 from August 2007 closing lows
1440 from November 2007 closing lows

Support:
1378 is the February 2012 peak
The 20 day EMA at 1371
1371 is the May 2011 peak, the post-bear market high
1357 is the July 2011 peak
1344 is the February 2011 peak
1340 is the early April 2011 peak
The 50 day EMA at 1340
1332 is the early March 2011 peak
1318.51 is the May 2011 low
1295 to 1294 is the April 2011 low and the February 2011 consolidation low (bottom of the trading range)
1293 is the October 2011 peak
1275 is the January 2010 low, early January 2011 peak
1267 is the December 2011 peak
The 200 day SMA at 1261
1258 is June 2011 intraday low
1255 is the late December 2010 consolidation range
1249 is the March 2011 low (post-Japan)
1235 is the mid-December 2010 consolidation low
1231 is the late August 2011 peak
1227 is the November 2010 peak
1220 is the April 2010 peak
1209 is the mid-August 2011 high
1196 is the November 2010 consolidation peak
1178-1180 is the October 2010/November 2010 consolidation low
1158 is the November 2011 low
1131 - 1127 from August 2010 base peak.
1119 is the early August closing low
1109 is the mid-September 2010 gap up point
1101 is the August 2011 low
1099 from the mid-July interim peak
1075 is the October 2011 intraday low

Dow: Closed at 13,232.62
Resistance:
13,668 from 12-2007 peak
13,692 from 6-2007 peak
14,022 from 7-07 peak

Support:
13,058 from the May 2008 peak on that bounce in the selling
13,056 is the February 2012 high
12,876 is the May high
The 50 day EMA at 12,777
12,754 is the July intraday peak
12,391 is the February 2011 peak
12,284 is the October 2011 peak
12,258 is the December 2011 peak
12,110 from the March 2007 closing low
12,094 is the April 2011 low
The 200 day SMA at 12,037
The June low at 11,897 (closing)
11,734 from 11-98 peak
11,717 is the late August 2011 peak
The August low at 11,702
11,555 is the March low
11,452 is the November 2010 peak
11,178 from November 2010
10,978 is the bottom of the November 2010 consolidation
10,750 from September 2010
10,720 is the August closing low
10,705-710 from January 2010 peak
10,694-700 from August 2010 peak

Economic Calendar

March 12 - Monday
- Treasury Budget, February (14:00): -$231.7B actual versus -$229.0B expected, -$222.5B prior

March 13 - Tuesday
- Retail Sales, February (8:30): 1.1% actual versus 1.0% expected, 0.6% prior (revised from 0.4%)
- Retail Sales ex-auto, February (8:30): 0.9% actual versus 0.6% expected, 1.1% prior (revised from 0.7%)
- Business Inventories, January (10:00): 0.7% actual versus 0.6% expected, 0.6% prior (revised from 0.4%)
- FOMC Rate Decision, March (14:15): 0.25% actual versus 0.25% expected, 0.25% prior

March 14 - Wednesday
- MBA Mortgage Index, 03/10 (7:00): -2.4% actual versus -1.2% prior
- Current Account Balance, Q4 (8:30): -$124.1B actual versus -$113.8B expected, -$110.3B prior
- Export Prices ex-ag., February (8:30): 0.5% actual versus 0.0% prior
- Import Prices ex-oil, February (8:30): -0.1% actual versus 0.1% prior
- Crude Inventories, 03/10 (10:30): 1.750M actual versus 0.832M prior

March 15 - Thursday
- Initial Claims, 03/10 (8:30): 351K actual versus 355K expected, 365K prior (revised from 362K)
- Continuing Claims, 03/03 (8:30): 3343K actual versus 3415K expected, 3424K prior (revised from 3416K)
- Empire Manufacturing, March (8:30): 20.2 actual versus 15.0 expected, 19.5 prior
- PPI, February (8:30): 0.4% actual versus 0.5% expected, 0.1% prior
- Core PPI, February (8:30): 0.2% actual versus 0.2% expected, 0.4% prior
- Net Long-Term TIC Fl, January (9:00): $101.0B actual versus $19.1B prior (revised from $17.9B)
- Philadelphia Fed, March (10:00): 12.5 actual versus 12.5 expected, 10.2 prior

March 16 - Friday
- CPI, February (8:30): 0.4% actual versus 0.4% expected, 0.2% prior
- Core CPI, February (8:30): 0.1% actual versus 0.2% expected, 0.2% prior
- Industrial Production, February (9:15): 0.0% actual versus 0.5% expected, 0.4% prior (revised from 0.0%)
- Capacity Utilization, February (9:15): 78.7% actual versus 78.8% expected, 78.8% prior (revised from 78.5%)
- Michigan Sentiment, March (9:55): 74.3 actual versus 75.8 expected, 75.3 prior

March 19 - Monday
- NAHB Housing Market Survey, March (10:00): 31 expected, 29 prior

March 20 - Tuesday
- Housing Starts, February (8:30): 705K expected, 699K prior
- Building Permits, February (8:30): 695K expected, 676K prior

March 21 - Wednesday
- MBA Mortgage Index, 03/17 (7:00): -2.4% prior
- Existing Home Sales, February (10:00): 4.61M expected, 4.57M prior
- Crude Inventories, 03/17 (10:30): 1.750M prior

March 22 - Thursday
- Initial Claims, 03/17 (8:30): 355K expected, 351K prior
- Continuing Claims, 03/10 (8:30): 3363K expected, 3343K prior
- FHFA Housing Price I, January (10:00): 0.7% prior
- Leading Indicators, February (10:00): 0.6% expected, 0.4% prior

March 23 - Friday
- New Home Sales, February (10:00): 321K expected, 321K prior
icon url

ReturntoSender

03/19/12 11:07 PM

#9716 RE: ReturntoSender #6755

From Briefing.com: 4:30 pm : Although Apple was a strong performer following news of its dividend and share repurchase plan, Financials were the primary drivers behind the broad market's move to a new multi-year high. Momentum slowed in late afternoon action, however.

Early trade was largely lackluster amid a lack of actionable headlines and general weakness among Europe's major bourses. Market participants were also slow to take encouragement from news that heavyweight Apple (AAPL 601.10, +15.53) plans to open its coffers, currently stuffed with close to $100 billion in cash, to help fund a quarterly dividend of $2.65 per share starting in the fourth quarter of its fiscal 2012 and a $10 billion share repurchase program commencing in fiscal 2013. A positive response to the news helped the stock settle above $600, extending the torrid run that has made it the largest company by market cap -- shares are now up nearly 50% year to date.

Financials finished the day with a 0.6% gain, which is less than half of what it had achieved at its session high. The sector's run higher helped lift the S&P 500 above 1412 for the first time since mid-2008. However, when Financials faltered in afternoon trade the broad market followed suit to finish shy of its session high.

Bank stocks were the primary source of the swing. They initially climbed higher without much regard for the weakness displayed by bank stocks listed on Europe's major bourses this morning. Their upward push took the KBW Bank Index to a gain greater than 1.5%, which came as a strong follow-up to its near 7% weekly gain, but then profit taking undercut the move. The KBW Bank Index ended the day with a more moderate gain of about 0.5%.

The Dow barely finished the day with a gain. Home Depot (HD 48.83, -0.22) hampered it during the day. The stock's weakness came alongside a disappointing monthly Housing Market Index reading from the NAHB.

Utilities suffered the only loss among the major sectors. They finished the day at session lows with a 0.5% loss. The defensive-oriented sector is now down nearly 4% year to date. No other sector is in the red in 2012.

The dollar endured some more selling, extending its decline from the near two-month high that it set last week. By session's end it was quoted with a loss of about 0.4% against a basket of major foreign currencies. The dollar's downturn helped support the commodity complex, such that the CRB Index booked a 0.5% gain.

Treasuries encountered more selling. The action lifted the yield on the benchmark 10-year Note closer to 2.40% before easing back as the stock market drifted lower in afternoon trade.

Advancing Sectors: Tech +0.8%, Energy +0.6%, Financials +0.6%, Materials +0.5%, Consumer Discretionary +0.5%, Industrials +0.1%, Telecom +0.1%, Consumer Staples +0.1%
Unchanged: Health Care
Declining Sectors: Utilities -0.5%DJ30 +6.51 NASDAQ +23.06 NQ100 +0.8% R2K +0.9% SP400 +0.2% SP500 +5.58 NASDAQ Adv/Vol/Dec 1659/1.54 bln/901 NYSE Adv/Vol/Dec 1884/721 mln/1106

4:38PM Ixia reaffirms 2012 Q1 revs guidance of $82-85 mln vs $83.6 mln Capital One IQ Consensus Est; announces CEO transition and appointment of Victor Alston as Chief Operating Officer (XXIA) 13.57 +0.91 : Co announced that Victor Alston has been appointed as Ixia's Chief Operating Officer and will stand for election to the Board of Directors at the Company's annual meeting of shareholders scheduled to be held on May 10, 2012. In addition, the Company announced that Atul Bhatnagar, the Co's President and CEO, will be leaving the Company effective as of the date of the annual meeting and will not stand for reelection to the Board. Ixia also announced that Mr. Alston will succeed Mr. Bhatnagar as President and CEO following Mr. Bhatnagar's departure from the Co. "The Co's sales activity for the first quarter of 2012 is tracking in accordance with expectations, and we expect our revenues for the current quarter to be in line with our previously stated guidance of $82 million to $85 million."

11:51AM Semiconductor Hldrs ETF edge above Feb peak (SMH) 35.59 +0.31 : Noted earlier that Semi SMH was displaying relative strength. The recent upside extension not only took out its morning peak but also exceeded its Feb high of 35.49 allowing it to set a new nine month high of 35.62 -- TSM +2%, TXN +1.8%, BRCM +2.3%, ASML +1%, AMAT +0.7%, ARMH +1.3%, ADI +1%, INTC -0.2%.

8:01AM Broadcom granted permanent injunction against Emulex (ELX) in patent infringement suit (BRCM) 37.81 : Co announced that the U.S. District Court for the Central District of California issued a decision granting Broadcom's request for a permanent injunction against certain products of Emulex Corporation (ELX) previously found to infringe two Broadcom patents. The permanent injunction will prohibit Emulex from importing, manufacturing, using and selling the enjoined products in the United States and from assisting others in doing the same. The injunction is subject to a "sunset" period. For the '150 patent, the sunset started on October 12, 2011 and will run until April 12, 2013. For the '691 patent, the sunset started on Dec 16, 2011 and will run until June 16, 2013. During the sunset period, Emulex will be permitted to continue certain sales of enjoined products, but only for use in customer devices for which the customer had placed a firm order for production quantities of affected Emulex products prior to the start of the sunset period. During the sunset period, Emulex will be required to pay Broadcom a royalty of 9 percent on those sales. Emulex also will be prohibited from competing for new design-wins with the enjoined products.

NXP Semiconductors N.V. (NXPI) announced that China-based Ningbo Baishi Electric is the world's first CFL manufacturer to pass Stage 5 of the EU Ecodesign requirements for non-directional household lamps, which go into effect onSeptember 1, 2013.

AMD (AMD) announced worldwide availability of its full line of next generation AMD Radeon HD 7000 Series GPUs

Apple (AAPL $595.77 +9.10) announced plans to initiate a dividend and share repurchase program commencing later this year. The company planned to initiate a quarterly dividend of $2.65 per share sometime in the fourth quarter of its fiscal 2012, which begins on July 1, 2012. Additionally, the company's Board of Directors has authorized a $10 billion share repurchase program commencing in the Company's fiscal 2013, which begins on September 30, 2012. The repurchase program is expected to be executed over three years, with the primary objective of neutralizing the impact of dilution from future employee equity grants and employee stock purchase programs. "We have used some of our cash to make great investments in our business through increased research and development, acquisitions, new retail store openings, strategic prepayments and capital expenditures in our supply chain, and building out our infrastructure. You'll see more of all of these in the future," said Tim Cook, Apple's CEO. "Even with these investments, we can maintain a war chest for strategic opportunities and have plenty of cash to run our business. So we are going to initiate a dividend and share repurchase program." "Combining dividends, share repurchases, and cash used to net-share-settle vesting RSUs, we anticipate utilizing approximately $45 billion of domestic cash in the first three years of our programs," said Peter Oppenheimer, Apple's CFO. "We are extremely confident in our future and see tremendous opportunities ahead."

LDK Solor (LDK $4.84 -0.06) revised its fourth quarter guidance for revenue to be in the range of $440-450 million (versus the $435.9 million CIQ est), wafer shipments between 215 and 220 megawatts, cells and module shipments between 250-260 MW, in-house polysilicon production between 2,100-2,300 MT and in-house cell production between 130-150 MW. The company previously forecasted fourth quarter revenue to be in the range of $440-520 million with wafer shipments between 200-270 MW, and module shipments between 180-270 MW, in-house polysilicon production between 2,200-2,800 MT, in-house cell production between 220-250 MW. As a result of the rapidly declining market price for wafers and modules during the fourth quarter of 2011, the company expects to incur a write-down of inventories, realize impairment charges on contractual purchase agreements, and therefore, expects gross margin to be negative. In addition, some provisions for accounts receivable and fixed assets may also be required. For fiscal 2012, the company estimates its revenue in the range of $2.0-2.7 billion (versus $2.23 billion CIQ est).

Broadcom (BRCM $38.60 +0.81) announced that the U.S. District Court for the Central District of California issued a decision granting Broadcom's request for a permanent injunction against certain products of Emulex Corporation (ELX) previously found to infringe two Broadcom patents. The permanent injunction will prohibit Emulex from importing, manufacturing, using and selling the enjoined products in the United States and from assisting others in doing the same. The injunction is subject to a "sunset" period. For the '150 patent, the sunset started on October 12, 2011 and will run until April 12, 2013. For the '691 patent, the sunset started on Dec 16, 2011 and will run until June 16, 2013. During the sunset period, Emulex will be permitted to continue certain sales of enjoined products, but only for use in customer devices for which the customer had placed a firm order for production quantities of affected Emulex products prior to the start of the sunset period. During the sunset period, Emulex will be required to pay Broadcom a royalty of 9 percent on those sales. Emulex also will be prohibited from competing for new design-wins with the enjoined products.

Apple (AAPL 595.00 +9.38) target was raised to $700 from $635 at Mizuho. The firm expects the company to initiate a dividend and start buying back its stock. Additionally, given the strong reception to the iPad release and upcoming iPhone product cycle, they are raising our estimates. Their new target reflects strong market position and continued lead over its competition. They are raising iPad shipment assumptions for March to 12.5 mln from 10 mln and for FY12, they now expect co to sell ~62 mln units vs. 52 mln previously.

09:58 am Broadcom shares rise by 2% following news of injunction

Broadcom (BRCM $38.65 +0.84) announced that the U.S. District Court for the Central District of California issued a decision granting Broadcom's request for a permanent injunction against certain products of Emulex Corporation (ELX $10.35 +0.07) previously found to infringe two Broadcom patents. The permanent injunction will prohibit Emulex from importing, manufacturing, using and selling the enjoined products in the United States and from assisting others in doing the same.

The injunction is subject to a "sunset" period. For the '150 patent, the sunset started on October 12, 2011 and will run until April 12, 2013. For the '691 patent, the sunset started on Dec 16, 2011 and will run until June 16, 2013. During the sunset period, Emulex will be permitted to continue certain sales of enjoined products, but only for use in customer devices for which the customer had placed a firm order for production quantities of affected Emulex products prior to the start of the sunset period. During the sunset period, Emulex will be required to pay Broadcom a royalty of 9 percent on those sales. Emulex also will be prohibited from competing for new design-wins with the enjoined products.

09:35 am Apple shares trade higher by 2% following news of dividend and $10 billion share repurchase program

Apple (AAPL $596.75 +11.38) announced plans to initiate a dividend and share repurchase program commencing later this year. The company planned to initiate a quarterly dividend of $2.65 per share sometime in the fourth quarter of its fiscal 2012, which begins on July 1, 2012. Additionally, the company's Board of Directors has authorized a $10 billion share repurchase program commencing in the Company's fiscal 2013, which begins on September 30, 2012. The repurchase program is expected to be executed over three years, with the primary objective of neutralizing the impact of dilution from future employee equity grants and employee stock purchase programs.

"We have used some of our cash to make great investments in our business through increased research and development, acquisitions, new retail store openings, strategic prepayments and capital expenditures in our supply chain, and building out our infrastructure. You'll see more of all of these in the future," said Tim Cook, Apple's CEO. "Even with these investments, we can maintain a war chest for strategic opportunities and have plenty of cash to run our business. So we are going to initiate a dividend and share repurchase program." "Combining dividends, share repurchases, and cash used to net-share-settle vesting RSUs, we anticipate utilizing approximately $45 billion of domestic cash in the first three years of our programs," said Peter Oppenheimer, Apple's CFO. "We are extremely confident in our future and see tremendous opportunities ahead."
icon url

ReturntoSender

03/20/12 8:49 PM

#9717 RE: ReturntoSender #6755

From Briefing.com: 4:30 pm : Stocks slumped in early trade, but managed to gradually trim losses throughout the session. The major averages still settled with varied losses, though.

The stock market saw its gains pared in the prior session as profit takers pulled it down from a new multi-year high, but selling pressure was much more pronounced this morning. Weakness abroad and concerns about how global economic growth could be impacted by a slowdown in China stoked selling. Members of the steel and metals industry reportedly expect steel production to ease, while country officials announced another fuel price increase.

Plans to increase fuel prices in China for the second time this year came alongside word that Saudi Arabia will increase oil exports to the U.S. That drove down crude oil prices to $106.10 per barrel for a 2.3% loss. Weekly oil inventory numbers will be posted tomorrow at 10:30 AM ET.

Oil's slide weighed heavily on the Energy sector, which suffered a 1.4% loss. Oil and gas equipment and services plays were among the sector's poorest performers. Other key commodities were caught up in concerted selling, too, such that the CRB Index suffered a 1.2% loss. That stands as its worst single-session slide in two weeks. Gold prices dropped 1.2% to settle pit trade at $1647.30 per ounce, while silver suffered a 3.2% loss by settling at $31.89 per ounce.

A pullback by the dollar took some of the pressure off of precious metals this morning, but the relief was only temporary. Although the greenback ended the day below its best levels, support narrowly above the neutral line helped it secure a 0.2% gain against a basket of major foreign currencies.

Financials were the best performers of the day. The sector overcame some early weakness and even fought through a few flurries of selling that forced it back to the flat line to score a 0.4% gain. Investment banks and brokerages led the way.

Overall action was rather uninspiring, but shares of Tiffany & Co. (TIF 73.27, +4.59) rallied sharply to a new multi-month high in response to strong guidance by the company. Disappointing earnings in its most recent quarter were forgiven.

Economic data today was limited to monthly housing starts, which hit an annualized rate of 698,000 units in February. That's down from the prior month's upwardly revised rate of 706,000 units and less than the pace of 705,000 units that had been broadly expected. Building permits for February improved to a rate of 717,000 from 682,000 in the prior month. That bested the rate of 695,000 that had been expected, on average, by economists polled by Briefing.com. The latest monthly existing home sales numbers will be released Wednesday at 10:00 AM ET.

Advancing Sectors: Financials +0.4%, Consumer Discretionary +0.2%, Utilities +0.1%, Telecom +0.1%
Unchanged: Consumer Staples
Declining Sectors: Tech -0.1%, Health Care -0.5%, Materials -0.6%, Industrials -1.1%, Energy -1.4%DJ30 -68.94 NASDAQ -4.17 NQ100 +0.2% R2K -1.0% SP400 -0.7% SP500 -4.23 NASDAQ Adv/Vol/Dec 758/1.50 bln/1771 NYSE Adv/Vol/Dec 985/710 mln/2000

4:06PM Oracle beats by $0.06, reports revs in-line (ORCL) 30.10 +0.34 : Reports Q3 (Feb) earnings of $0.62 per share, $0.06 better than the Capital IQ Consensus Estimate of $0.56; revenues rose 3.4% year/year to $9.06 bln vs the $9.03 bln consensus. Oracle reported new software license revenue growth of +8% in constant currency vs +2-12% guidance. "Oracle is on track to deliver the highest operating margins in our history this year... Oracle can achieve these record margins as an integrated hardware and software company because we are focusing on high margin systems where hardware and software are engineered to work together... Hardware revenue for our engineered systems grew 139% this quarter and going into Q4, we have a record pipeline... In applications, Fusion in the Cloud is winning with great success against niche HCM cloud vendors in the US and worldwide. Our modular, integrated platform of 100 apps available in the cloud or on-premise is a key differentiator."

4:04PM Jabil Circuit beats by $0.01, beats on revs; guides Q3 EPS in-line, revs in-line (JBL) 26.49 -0.64 : Reports Q2 (Feb) earnings of $0.58 per share, excluding non-recurring items, $0.01 better than the Capital IQ Consensus Estimate of $0.57; revenues rose 7.8% year/year to $4.24 bln vs the $4.09 bln consensus. Co issues in-line guidance for Q3, sees EPS of $0.60-0.70, excluding non-recurring items, vs. $0.64 Capital IQ Consensus Estimate; sees Q3 revs of $4.2-4.4 bln vs. $4.34 bln Capital IQ Consensus Estimate.

3:39PM Suntech Power responds to U.S. Department of Commerce's preliminary decision to impose countervailing duties of 2.9% on Suntech's crystalline silicon photovoltaic cells imported from China (STP) 3.54 +0.41 : Andrew Beebe, Suntech's Chief Commercial Officer said:
"This initial decision reflects the reality that Suntech's global success is based on free and fair competition. Nonetheless, unilateral trade barriers, large or small, will further delay our transition away from fossil fuels at a time when the majority of Americans demand cleaner and more secure energy such as solar."

"As a global company with global supply chains and manufacturing facilities in three countries, we are well prepared for the future. Regardless whether tariffs are imposed on solar cells from China, we can provide our customers in the U.S. with hundreds of megawatts of high-quality and affordable solar products that are not subject to tariffs. As a local manufacturer with production in Arizona, we will continue to remain an active member of the American solar industry and maintain focus on making solar energy affordable for everyone, everywhere."

11:23AM Semiconductor Hldrs ETF displaying some relative strength in recent trade, notches minor new rebound/session high (SMH) 35.48 -0.16 : KLAC is probing yesterday's multi-week high at 52.56. Its Jan/52-wk peak is at 53.05. INTC +0.4%, NVLS +0.7%, ARMH +1%.

Xilinx (XLNX) underscored its commitment to the emerging, high-growth market and its growing employee base in India with the inauguration of a new, expanded Xilinx India site in Hi-Tech city. The 131,000 square-foot office building is more than double the size of the previous site to accommodate engineering labs and collaboration space for end-to-end product development.

Qualcomm Atheros, the networking and connectivity subsidiary of Qualcomm (QCOM), announced the optimized new time division multiple access software for Ethernet-over-Coax applications and Qualcomm Atheros' first entry-level EoC solution, the QCA6411 chipset, that provide, end-to-end broadband access solutions for Chinese multi-system operators.

Freescale Semiconductor (FSL) announced a partnership with First Automobile Works, and the establishment of a FAW-Freescale joint automotive lab. The joint lab will be established in the Technology Center of FAW and will be a shared research and development lab focusing on new technology R&D, powertrain control, chassis control, active safety, new energy technologies and other automotive electronics

AMD (AMD) announced the latest solution as part of its ongoing Web/Cloud initiative with the launch of the new AMD Opterom 3200 Series processor.

Adobe Systems (ADBE $33.11 -1.40) reported first quarter earnings of $0.57 per share, excluding non-recurring items, in-line with the Capital IQ Consensus of $0.57, while revenues rose 1.7% year/year to $1.04 billion versus the $1.05 bln consensus. The company issued in-line guidance for the second quarter with EPS of $0.57-0.61, excluding non-recurring items, versus the $0.60 consensus with revenues of $1.09-1.14 billion versus the $1.1 bln consensus. The company issued guidance for fiscal year 2012 with the Efficient Frontier acquisition, it raised its EPS to $2.38-2.48 from $2.37-2.47, may not be comparable to $2.42 consensus and raised revenues to +6-8% YoY (from +4-6%) to approximately $4.47-4.55 billion, may not be comparable to $4.41 billion consensus Estimate. Deferred revenue grew by $17.3 million quarter over quarter to a total of $549.0 million. "We delivered solid earnings in Q1, achieved revenue within our targeted range and began to build excitement for our upcoming creative product release."

Apple (AAPL $596.56 -4.44) announced it has sold three million of its new iPad, since its launch on Friday, March 16. "The new iPad is a blockbuster with three million sold - the strongest iPad launch yet"

OmniVision (OVTI $19.58 -0.15) was Upgraded to Buy from Hold at Needham on higher ests on iPad 3 momentum and sets target price at $24. While they initially believed Samsung was slotted for the 5MP socket for the iPad 3, according to thirdparty teardown sites, OVTI is supplying both the 5MP BSI-2 back-camera and 0.3 VGA front-camera. This news is consistent with OVTI's above-consensus guidance and checks that indicate OVTI has meaningfully increased its capacity at TSMC. With an iPad 3 design win, the upside to revenues and earnings would be significant.

09:13 am OmniVision upgraded to Buy at Needham: . Needham upgrades OVTI to Buy from Hold on higher ests on iPad 3 momentum and sets target price at $24. While they initially believed Samsung was slotted for the 5MP socket for the iPad 3, according to thirdparty teardown sites, OVTI is supplying both the 5MP BSI-2 back-camera and 0.3 VGA front-camera. This news is consistent with OVTI's above-consensus guidance ($35MM+) and checks that indicate OVTI has meaningfully increased its capacity at TSMC. With an iPad 3 design win, the upside to revenues and earnings would be significant.

09:36 am Adobe shares fall by nearly 4% following miss on revenues

Adobe Systems (ADBE $33.09 -1.41) reported first quarter earnings of $0.57 per share, excluding non-recurring items, in-line with the Capital IQ Consensus of $0.57, while revenues rose 1.7% year/year to $1.04 billion versus the $1.05 bln consensus. The company issued in-line guidance for the second quarter with EPS of $0.57-0.61, excluding non-recurring items, versus the $0.60 consensus with revenues of $1.09-1.14 billion versus the $1.1 bln consensus.

The company issued guidance for fiscal year 2012 with the Efficient Frontier acquisition, it raised its EPS to $2.38-2.48 from $2.37-2.47, may not be comparable to $2.42 consensus and raised revenues to +6-8% YoY (from +4-6%) to approximately $4.47-4.55 billion, may not be comparable to $4.41 billion consensus Estimate. Deferred revenue grew by $17.3 million quarter over quarter to a total of $549.0 million. "We delivered solid earnings in Q1, achieved revenue within our targeted range and began to build excitement for our upcoming creative product release."
icon url

ReturntoSender

03/22/12 8:36 PM

#9719 RE: ReturntoSender #6755

From Briefing.com: 4:30 pm : Sellers were stirred to action by disappointing economic data from both Europe and China. Their efforts kept the major equity averages in negative territory all session.

Sentiment soured ahead of the open as market participants responded to news that China's latest PMI fell to a four-month low that suggested further contraction in activity. Things didn't look any better in Europe, where the broad eurozone PMI hit a three-month low that also pointed to a slowdown in activity.

Given the decidedly negative implications of such news, a better-than-expected initial jobless claims tally was shrugged off. Consistent with recent trends, the latest tally fell to a multi-year low of 348,000, which is less than the 355,000 initial jobless claims that had been broadly expected.

Once trade opened, the broad market chopped its way down to a loss of almost 1% before it found support. Its attempt to work its way upward eventually lost momentum and gave way to renewed selling, but all three major equity averages managed to hold the session lows set in the early going. That gave confidence to some traders, who bid stocks higher in a late flurry of buying.

Despite the late lift, Consumer Staples and Utilities were the only two sectors to settle in positive territory. They eked out gains of only 0.2% and 0.1%, respectively.

Cyclical plays performed poorly throughout the entire session; some of their losses were tied to weakness among commodities. As such, the Energy sector fell more than 2% so that it is now down more than 4% in only three days as another concerted selling effort took crude oil to $105.37 per barrel for a 1.7% loss. Oil prices actually probed a monthly low near $104.50 per barrel prior to the close of pit trade, while natural gas prices fell nearly 4% to $2.27 per MMBtu for a lifetime closing low on the April futures contract.

FedEx (FDX 92.50, -3.32) shares fell hard to a fresh weekly low, despite an upside earnings response. Discover Financial (DFS 32.49, +0.85) shares rallied to a strong gain after opening the day in the red amid what was initially an underwhelming response to the better-than-expected bottom line results that the firm reported. Nike (NKE 110.99, +0.55) overcame selling pressure to score a solid gain ahead of its latest quarterly report.

The dollar gave up an early gain to trade near the neutral line for most of the session, but the yen rallied sharply. By session's end it was up 1.0% against the greenback, putting the currency at 82.50 yen per dollar.

Advancing Sectors: Consumer Staples +0.2%, Utilities +0.1%
Declining Sectors: Consumer Discretionary -0.2%, Tech -0.3%, Health Care -0.3%, Telecom -0.5%, Industrials -1.1%, Financials -1.4%, Materials -1.6%, Energy -2.1%DJ30 -78.48 NASDAQ -12.00 NQ100 -0.2% R2K -1.0% SP400 -1.1% SP500 -10.11 NASDAQ Adv/Vol/Dec 777/1.50 bln/1719 NYSE Adv/Vol/Dec 740/763 mln/2243

4:03PM Micron misses by $0.03, beats on revs (MU) 8.71 -0.03 : Reports Q2 (Feb) loss of $0.23 per share, $0.03 worse than the Capital IQ Consensus Estimate of ($0.20); revenues fell 8.4% year/year to $2.07 bln vs the $2.01 bln consensus.

Trina Solar (TSL) announced that it will launch a partner program for installers in German-speaking markets on April 2, 2012.

7:46AM Hewlett-Packard announced an $800 mln, six-year services agreement with Sabre Holdings (HPQ) 23.46 : Co announced an $800 million, six-year services agreement with Sabre Holdings to enhance Sabre's technology infrastructure by implementing HP's networking and flexible storage solutions.

Altera (ALTR) and TSMC (TSM) announced the joint development of heterogeneous 3D IC test vehicle using TSMC's Chip-on-Wafer-on-Substrate integration process.

Lattice Semiconductor (LSCC) and Acal BFi, a division of Acall, announced they have signed a distribution agreement. Acal Technology is authorized to sell Lattice's complete portfolio of innovative low power, low cost FPGA, PLD and programmable power management design solutions across France.

Apple (AAPL 599.51 -2.98) target raised to $660 from $575 at Hilliard Lyons. The firm raised its target following dividend initiation and buyback.

Western Digital (WDC $40.40 +0.95) was upgraded to Strong Buy from Buy at Needham and the firm raised their target to $66 from $50. They believe that the acquisition of HGST by WD, despite regulatory hurdles worldwide, will prove to be a pivotal point in HDD history and drive record profitability for both WDC and STX. As they have also argued in our STX thesis, with no need to price aggressively to maintain market share, they expect the group to operate rationally and within profitability metrics consistent with WD historically.

10:19 am Tech sector trading lower today but is ahead of broader market

The tech sector is trading higher today, ahead of larger losses in the broader market. Semiconductors are showing slight relative weakness in the tech space, however, with the Philly Semi Index trading 0.5% lower. NXPI (-1.6%) is a notable laggard in the chip index. Among other major indices, the SPY is trading 0.5% lower, while the QQQ is 0.2% lower and the NASDAQ is trading 0.3% lower on the session. Among tech bellwethers, GOOG (+0.6%) is showing notable strength today, while ORCL (-0.8%) is under pressure.

In earnings last night, INTU (-2.9%) reported through March 17, total TurboTax federal units were up 8% compared to the same period last year and reaffirmed FY12 revenue guidance. In news, MSFT (0.0%) and TIVO (+0.9%) reached an agreement whereby MSFT has agreed to dismiss all of its pending litigation against TIVO.

Among notable analyst upgrades this morning, Needham upgraded WDC (+3.6%) to Strong Buy, Robert W. Baird upgraded NSR (+2.6%) to Outperform and OPEN (+3.5%) was upgraded to Outperform at Raymond James. Among downgrades, RAX (-4.4%) was downgraded to Neutral from Buy at Goldman.

ACN (-0.9%) and MU (-0.7%) are notable names in tech scheduled to report results today after the close.
icon url

ReturntoSender

03/24/12 5:18 PM

#9720 RE: ReturntoSender #6755

From Briefing.com: Weekly Recap - Week ending 23-Mar-12Dow +34.59 at 13080.73, Nasdaq +4.60 at 3067.92, S&P +4.33 at 1397.11

The stock market ended the week with a modest gain, but it still booked a weekly loss of 0.5%, which marks the first weekly decline for the S&P 500 in more than a month, and only the second in 12 weeks.

That hot streak took the S&P 500 to its highest level since mid-2008 earlier this week, but many opted to take profits in response to renewed concerns about global economic conditions. Questions about the health of China were stirred when leaders in the metals industry suggested that the country’s steel production is leveling off. Worries were further stoked later in the week by news that China’s PMI reading fell to a four-month low and indicated that activity is tightening.

PMI data from Europe indicated the same when it fell short of expectations. Both Fed Chairman Bernanke and Treasury Secretary Geithner testified on Europe's economic crisis this week, but neither made any riveting remark. As such, their comments did nothing to swing stocks or prompt a shift in sentiment.

Cyclical stocks encountered some concerted selling amid macro concerns. During the course of only three days the Energy sector fell more than 4%, although it advanced 1.0% on Friday. It shed 3.0% for the week. The action in the Energy sector was closely correlated with crude oil trade.

By settling at $106.86 per barrel oil prices gained 1.4% on Friday, but fell 0.2% for the week. Along the way the energy component probed a monthly low near $104.50 per barrel. Action early in the week took into account plans for China to implement another fuel price increase. Later in the week it was learned that a review of permit applications for the southern leg of the Keystone Pipeline will likely be expedited. On Friday headlines suggested that Iran could curtail its oil exports, but Saudi Arabia had already pledged to increase oil exports to the U.S.

Financial plays and bank stocks provided leadership at the start of this week, but the sector later wavered. On Friday the Financial sector advanced 0.9% so that it was flat for the week. Up 21% year to date, Financials are still the top performers into the first three months of 2012.

Tech is still close behind in terms of its first quarter performance; it is up 20% year to date. The largest sector by market weight has been led by the largest stock by market cap – Apple (AAPL 596.05, -3.29). Narrowly off of a record high north of $600, shares of AAPL are up nearly 50% this year. The company made headlines at the start of the week with news that it will pay a quarterly dividend of $2.65 per share starting in its fiscal fourth quarter of 2012, and also begin a $10 billion share repurchase program in fiscal 2013. Apple’s cash hoard currently stands at close to $100 billion.

Other notable corporate announcements this week include better-than-expected earnings and upside guidance from Accenture (ACN 64.88, +1.36). Nike (NKE 107.42, -3.57) announced an upside earnings surprise of its own, along with a double-digit annual percentage increase in futures orders. FedEx (FDX 92.38, -0.12), Discover Financial (DFS 33.83, +1.34), and Oracle (ORCL 28.55, -0.08) all announced upside earnings surprises this week. Tiffany & Co. (TIF 71.45, -1.03) reported earnings that came short of the consensus estimate, but the company made up for that failure by offering strong guidance.

Domestic economic data released this week was limited in scope.

Indicative of an improving jobs picture, the latest weekly initial jobless claims tally fell to a multi-year low of 348,000, which is less than the 355,000 initial jobless claims that had been expected, on average, among economists polled by Briefing.com.

Existing home sales hit an annualized pace of 4.59 million units in February, down from a rate of 4.63 million in the prior month. The slower pace came as little surprise since the consensus among economists polled by Briefing.com had called for a clip of 4.60 million units.

New home sales declined in February by 1.6% to an annualized rate of 313,000 units, which is less than the pace 323,000 units that had been broadly expected. Inventory levels remained at 150,000 for the second straight month, but months-of-supply increased to 5.8 from 5.7.

Housing starts hit an annualized rate of 698,000 units in February. That's down from the prior month's upwardly revised rate of 706,000 units. Economists had generally expected starts to remain near that rate. However, building permits improved in February to a rate of 717,000 from 682,000 in the prior month, besting the rate of 695,000 that had been generally anticipated.

Last week the dollar traded up to a near one-month high, but selling this week caused it to suffer a 0.6% weekly loss against a basket of major foreign currencies and settle narrowly beneath its 50-day moving average. The euro advanced 0.5% on Friday to $1.327. That helped feed a weekly gain of 0.7% against the greenback. The yen had perhaps the strongest finish to the week; it rallied roughly 1% on Thursday and again on Friday to reach its best level of the week. As of the close of trade on Friday the currency traded at 82.42 yen per dollar.

Treasuries experienced some whippy action this week. Early on the yield of the benchmark 10-year Note had flirted with 2.40% for a multi-month high, but by Friday it was down as low as 2.21%, which stands as its worst level in more than a week, before easing up to about 2.24% by the end of the trading day. ..Nasdaq 100 -0.1%. ..S&P Midcap 400 +0.6%. ..Russell 2000 +1.0%.
 
Index Started Week Ended Week Change % Change YTD %
DJIA 13232.62 13080.73 -151.89 -1.1 7.1
Nasdaq 3055.26 3067.92 12.66 0.4 17.8
S&P 500 1404.17 1397.11 -7.06 -0.5 11.1
Russell 2000 830.18 830.03 -0.15 -0.0 12.0

Apple (AAPL 599.51 -2.98) target raised to $660 from $575 at Hilliard Lyons. The firm raised its target following dividend initiation and buyback.

Western Digital (WDC $40.40 +0.95) was upgraded to Strong Buy from Buy at Needham and the firm raised their target to $66 from $50. They believe that the acquisition of HGST by WD, despite regulatory hurdles worldwide, will prove to be a pivotal point in HDD history and drive record profitability for both WDC and STX. As they have also argued in our STX thesis, with no need to price aggressively to maintain market share, they expect the group to operate rationally and within profitability metrics consistent with WD historically.

icon url

ReturntoSender

03/26/12 11:28 PM

#9722 RE: ReturntoSender #6755

From Briefing.com: 4:30 pm : A concerted, broad-based buying effort gave the stock market its best start to a new week of trade in about four months. The bounce comes after stocks booked only their second weekly loss in a dozen weeks of trade.

Stocks displayed strength for the entire session. More than half of the 10 major sectors scored gains in excess of 1%. The best moves were booked by Health Care and Tech, both of which bounded for gains of 1.7%. Financial and Consumer Discretionary sectors were close behind with gains of 1.6%.

The Nasdaq Composite and Nasdaq 100 were able to outperform the other headline averages with help from their large-cap constituents. Qualcomm (QCOM 68.59, +1.90), biotech play Biogen Idec (BIIB 125.80, +4.84), and discretionary play Amazon.com (AMZN 202.87, +7.83) were especially strong.

Small-cap stocks stood out for their heady gains, too. Altogether they climbed almost 2%, as measured by the Russell 2000.

Utilities and Telecom stocks lagged all session, but even those two defensive-oriented sectors scored gains of 0.8% and 0.5%, respectively.

The dollar dropped to a modest loss shortly before the open of trade then extended its slide into the session's close. By the end of the day it was down about 0.6% against a basket of major foreign currencies. The dollar's descent made it easier for gold and silver prices to rise in excess of 1% so that they settled pit trade at $1685.70 per ounce and $32.78 per ounce, respectively. Oil had a relatively quiet session that saw it close pit trade with a 0.2% gain at $107.08 per barrel.

Headlines were limited, but those that were released came out this morning. Early traders initially took heart from news that Germany's latest business climate reading improved to a multi-month high. That spurred the German bourse higher, and helped temper concerns related to Spain's ability to implement fiscal reform.

Additionally, Fed Chairman Bernanke's indication that job market conditions remain far from normal was regarded by many as a tacit sign that the Fed recognizes the need for accommodative policies.

Little attention was paid overall to the report, but in some circles it was noted that pending home sales fell in February by 0.5%, which contrasts the Briefing.com consensus call for a 0.5% increase.

Advancing Sectors: Tech +1.7%, Health Care +1.7%, Financials +1.6%, Consumer Discretionary +1.6%, Industrials +1.5%, Materials +1.4%, Energy +0.9%, Utilities +0.8%, Consumer Staples +0.8%, Telecom +0.6%
Declining Sectors: (None)DJ30 +160.90 NASDAQ +54.65 NQ100 +1.8% R2K +1.9% SP400 +1.4% SP500 +19.40 NASDAQ Adv/Vol/Dec 1952/1.59 bln/607 NYSE Adv/Vol/Dec 2306/742 mln/734

Spanlink Communications, a Cisco (CSCO) partner, announced that it has partnered with Convergys (CVG) to provide a cloud-based contact center solution leveraging the Cisco contact center platform. The offering, anticipated to launch later this year, will initially service North American and European companies with more than 100 worldwide contact center agents.

O2Micro International (OIIM) was issued 28 claims under US patent for its Power Management System with Controllable Adapter Output.

Integrated Device Technology (IDTI) announced that IDT's RapidIO Gen 2 interface intellectual property has been selected by Texas Instruments (TXN) for its TMS320C665x multicore digital signal processors.

AMD (AMD) announced Rockwell Collins (COL) has selected the AMD Radeon E2400 embedded graphics processor for inclusion in its highly-intuitive, integrated flight deck solution, Pro Line Fusion.

Micron (MU $8.23 -0.16) was downgraded to Perform from Outperform until profitability Abecomes visible. The firm says, if MU does not get hijacked into buying some or all of Elpida, they think it's on the right path to profitability and on FCF as most of capex spend is done for the year.

HP (HPQ $23.68 +0.04) Board of Directors authorized a 10% increase in its regular quarterly cash dividend to $0.132/share. The increase will be effective when the HP Board of Directors declares HP's next dividend, which is expected to occur in May 2012. HP's previously announced dividend payable on April 4, 2012 for stockholders of record on March 14, 2012 will not be increased and will remain at $0.12 per share.

09:36 am HP shares rise just under 1% following dividend increase

HP (HPQ $23.86 +0.23) Board of Directors authorized a 10% increase in its regular quarterly cash dividend to $0.132/share.

The increase will be effective when the HP Board of Directors declares HP's next dividend, which is expected to occur in May 2012. HP's previously announced dividend payable on April 4, 2012 for stockholders of record on March 14, 2012 will not be increased and will remain at $0.12 per share.
icon url

ReturntoSender

03/27/12 8:15 PM

#9723 RE: ReturntoSender #6755

From Briefing.com: 4:30 pm : Stocks spent most of the session slogging along the flat line in a sideways chop, but a late bout of selling dropped the major equity averages into the red and left them to settle at session lows.

An absence of headlines and trading catalysts made for a rather mixed open, but the broad market did manage to muster enough of a gain to set an incrementally improved multi-year high before backing down amid a lack of leadership. Market participants opted to apply pressure to stocks with the release of the Conference Board's latest Consumer Confidence Index, which declined to 70.2 from an upwardly revised 71.6 for the prior month, even though the decline was on the order of what had been widely anticipated.

Selling failed to gain momentum, but participants weren't willing to do anything more than provide enough support to keep stocks near the neutral line, or at least until the final hour.

Strength among Tech stocks had helped the Nasdaq stay in positive territory for nearly the entire session. However, it broke below the neutral line in the final minutes of trade as the Tech sector traded lower alongside the rest of the market. Tech still eked out a 0.1% gain so that the sector stands alongside Utilities and Health Care as the only sector to score a gain. Utilities and Health Care booked gains of 0.4% and 0.3%, respectively.

Resuming the weak price action displayed during trade last week, Energy stocks were a drag today. The sector suffered a 0.9% loss, which came even though oil prices were able to overcome a mid-session slip to settle with a 0.2% gain just above $107.30 per barrel.

Walgreen Co. (WAG 34.80, +0.43) was a strong performer in the face of broad market listlessness. The stock scored its gain on the back of an upside earnings surprise, which is also what helped Lennar (LEN 27.63, +1.23). Education services provider Apollo Group (APOL 39.54, -3.66) also announced better-than-expected earnings, but the company's cautious outlook was enough of a reason for traders to cut down the stock.

The stock market's late slide stoked volatility expectations, such that the Volatility Index spiked more than 9% to close out the day comfortably above 15.

That helped Treasuries reclaim some of their gains and settle near session highs. Treasuries were treated positively following results from an auction of 2-year Notes. The offering drew a bid-to-cover of 3.69, dollar demand of $129.2 billion, an indirect bidder rate of 34.1%. For comparison, the prior auction drew a bid-to-cover ratio of 3.54, dollar demand of $123.9 billion, and an indirect bidder rate of 35.7%, while an average of the past six auctions drew a bid-to-cover ratio of 3.70, dollar demand of $129.6 billion, and an indirect bidder rate of 34.7%.

The dollar ended the day with a gain of about 0.2% after it had spent the better part of the session plodding along near the unchanged mark. Most of the greenback's gain is owed to a downturn by the euro, which settled the session at about $1.332.

Advancing Sectors: Utilities +0.4%, Health Care +0.3%, Tech +0.1%
Declining Sectors: Materials -0.2%, Consumer Staples -0.2%, Consumer Discretionary -0.2%, Industrials -0.2%, Energy -0.9%, Telecom -0.9%, Financials -1.0%DJ30 -43.90 NASDAQ -2.22 NQ100 +0.2% R2K -0.7% SP400 -0.4% SP500 -3.99 NASDAQ Adv/Vol/Dec 945/1.65 bln/1581 NYSE Adv/Vol/Dec 1243/730 mln/1736

4:07PM EXFO misses by $0.06, misses on revs; guides Q3 EPS below consensus, revs in-line (EXFO) 7.28 -0.06 : Reports Q2 (Feb) earnings of $0.02 per share, $0.06 worse than the Capital IQ Consensus Estimate of $0.08; revenues fell 7.1% year/year to $66.9 mln vs the $68.61 mln consensus. Bookings reached $60.6 million in the second quarter of fiscal 2012 compared to US$57.6 million in the same period last year and US$71.4 million in the first quarter of 2012. The company's book-to-bill ratio was 0.91 in the second quarter of 2012 and 0.99 at the mid-way mark of fiscal 2012. Gross margin amounted to 64.7% of sales in the second quarter of fiscal 2012 compared to 61.4% in the second quarter of 2011 and 64.8% in the first quarter of 2012. Co issues mixed guidance for Q3, sees EPS of $0.05-0.09, excluding non-recurring items, vs. $0.10 Capital IQ Consensus Estimate; sees Q3 revs of $68-73 mln vs. $72.26 mln Capital IQ Consensus Estimate.

2Micro International (OIIM) was issued 24 claims under a U.S. patent for its Conversion Circuit Systems invention.

4:06PM Synnex beats by $0.11, misses on revs; guides Q2 EPS below consensus, revs below consensus (SNX) 43.64 -0.25 : Reports Q1 (Feb) earnings of $1.02 per share, $0.11 better than the Capital IQ Consensus Estimate of $0.91; revenues fell 1.6% year/year to $2.46 bln vs the $2.54 bln consensus. Co issues downside guidance for Q2, sees EPS of $0.87-0.91 vs. $0.94 Capital IQ Consensus Estimate; sees Q2 revs of $2.45-2.55 bln vs. $2.59 bln Capital IQ Consensus Estimate.

12:16 pm Technology sector trading higher today with market
The tech sector is trading higher today, just ahead of gains in the broader market. Semiconductors are showing slight relative strength in the tech space with the Philly Semi Index trading 0.2% higher. MU (+4.0%) is a notable leader in the chip index, while STM (-4.3%) is showing weakness. Among other major indices, the SPY is trading 0.1% higher, while the the QQQ is 0.3% higher and the NASDAQ is trading 0.2% higher on the session. Among tech bellwethers, AAPL (+1.1%) is showing notable strength today.

In earnings this morning, recent IPO EPAM (+7.1%) posted quarterly beat and issued upside guidance.

In news last night, OPXT (+46.9%) and OCLR (-8.8%) agreed to a merger.

Among notable analyst upgrades this morning, Oppenheimer upgraded DANG (+7.5%) to Outperform. While in downgrades, STM (-4.5%) was downgraded to Hold at Societe Generale.

SNX (-0.2%) is the notable name in tech scheduled to report results today after the close.
icon url

ReturntoSender

03/28/12 11:38 PM

#9724 RE: ReturntoSender #6755

From Briefing.com: 4:30 pm : A flat start gave way to a steady descent that had the stock market positioned for its poorest performance in three weeks, but some late buying helped stocks halve their losses.

Without any leadership or positive catalysts to help stocks extend their multi-year highs, many participants opted to pare risk and pocket profits. The effort gained momentum and had the S&P 500 down about 1% before the decline steadied.

Natural resource plays were hit the hardest. Their drop came in close connection with lower commodity prices. At their session lows both the Energy sector and the Materials sector were flirting with losses of 2%. The stock market's effort to trim losses late in the day helped them limit their losses to 1.2% and 1.5%, respectively.

Oil was under sharp pressure all session, such that the energy component settled with a 1.9% loss at $105.40 per barrel. A bigger-than-expected build in weekly oil inventory numbers reflected renewed concerns about softer demand. The rest of the commodity complex was weak, too, such that the CRB Index fell 1.3% for its worst single-session slide in three weeks.

Financials were integral in the stock market's late upturn; no other sector was able to fully overcome selling pressure and settle in positive territory. Collectively, Financials scored a 0.4% gain.

Bank stocks were source of strength. Their resilience in the face of broad market weakness resulted in a 0.9% gain for the KBW Bank Index. Investment banking and brokerage outfit Goldman Sachs (GS 126.36, +0.03) was able to work its way to the flat line after wrestling with a sizable loss that came despite the firm's decision to restructure its Board. The move is widely regarded as a bow to investors amid negative publicity pertaining to the firm's culture.

Only a handful of earnings announcements were made ahead of the open, but none of them had any significant influence over market sentiment. Although the line-up for tomorrow will be limited, the latest numbers from Best Buy (BBY 26.62, -0.31) will be posted ahead of the open.

The dollar attracted only modest buying interest today, but even that faded so that the Dollar Index was up about 0.1% by day's end. The Japanese yen seemed to benefit more from those who wanted safety; as of the closing bell the dollar-yen exchange rate was down nearly 0.5% to 82.77 yen per dollar. Also in the mix was a weakened sterling pound, which fell to a 0.4% loss against the greenback after it had set a fractionally improved multi-month high in the prior session. Its move lower followed news that the United Kingdom revised data downward to show that its economy contracted by 0.3% during the fourth quarter. On a related note, the final reading on U.S. fourth quarter GDP will be released tomorrow morning at 8:30 AM ET.

The only dose of domestic data released today was the latest in durable goods orders. Overall orders increased by 2.2% during February, but that is actually a slower pace than the 2.8% increase that had been expected, on average, among economists polled by Briefing.com. Prior month orders data were revised slightly higher to reflect a 3.6% decline. Excluding transportation items, durable goods orders were up 1.6% in February. That is a stronger clip than the 1.0% increase that had been generally expected among economists polled by Briefing.com, but still relatively underwhelming when compared to loftier estimates that were widely issued. Nonetheless, the latest figure marks an improvement from the prior month decline of 3.0%.

Advancing Sectors: Financials +0.4%
Declining Sectors: Tech -0.2%, Consumer Staples -0.2%, Health Care -0.3%, Utilities -0.8%, Consumer Discretionary -0.9%, Telecom -1.0%, Industrials -1.0%, Energy -1.2%, Materials -1.5%DJ30 -71.52 NASDAQ -15.39 NQ100 -0.4% R2K -0.7% SP400 -0.6% SP500 -6.98 NASDAQ Adv/Vol/Dec 887/1.75 bln/1636 NYSE Adv/Vol/Dec 1122/817 mln/1901

O2Micro International (OIIM) was issued 20 claims under U.S. patent for its Battery Management System.

EMCORE (EMKR) announced that it had entered into a definitive agreement, subject to closing conditions, to sell certain assets and transfer certain obligations of its Vertical Cavity Surface Emitting Lasers-based product lines to Sumitomo Electric Device Innovations USA. The consideration for this sale will be $17 mln in cash, subject to closing adjustments.

8:05AM Emcore announces $17 mln sale of assets for its VCSEL-based product lines (EMKR) 4.85 : Co announced today that it had entered into a definitive agreement to sell certain assets and transfer certain obligations of its Vertical Cavity Surface Emitting Lasers (VCSEL)-based product lines to Sumitomo Electric Device Innovations USA, Inc. (SEDU). The consideration for this sale will be $17 million in cash, subject to closing adjustments. In fiscal year 2011, the VCSEL-based product lines contributed approximately 5% of EMCORE's overall revenue.

8:03AM Cisco Systems Announces Intent to Acquire ClearAccess, a company that provides TR-069-based software to service providers for the provisioning and management of residential and mobile devices; financial terms not disclosed (CSCO) 20.85 : Specific financial terms of the transaction are undisclosed. The acquisition of ClearAccess is subject to various standard closing conditions and is expected to be complete in the fourth quarter of Cisco's fiscal year 2012.

EXFO (EXFO $6.90 -0.38) reported second quarter earnings of $0.02 per share, $0.06 worse than the Consensus of $0.08, while revenues fell 7.1% year/year to $66.9 million versus the $68.61 million consensus. Bookings reached $60.6 million in the second quarter of fiscal 2012 compared to $57.6 million in the same period last year and US$71.4 million in the first quarter of 2012. The company's book-to-bill ratio was 0.91 in the second quarter of 2012 and 0.99 at the mid-way mark of fiscal 2012. Gross margin amounted to 64.7% of sales in the second quarter of fiscal 2012 compared to 61.4% in the second quarter of 2011 and 64.8% in the first quarter of 2012. Co issues mixed guidance for Q3, sees EPS of $0.05-0.09, excluding non-recurring items, vs. $0.10 Capital IQ Consensus Estimate; sees Q3 revs of $68-73 million versus the $72.26 million consensus.

1:22 pm Information Technology Sector trading lower today along with market

The tech sector is trading just higher today, ahead of losses in the broader market. Semiconductors are showing relative weakness in the tech space with the Philly Semi Index trading 1.4% lower. WFR (-6.8%) is a notable laggard in the chip index. Among other major indices, the SPY is trading 0.8% lower, while the QQQ is 0.7% lower and the NASDAQ is trading 0.8% lower on the session. Among tech bellwethers, GOOG (+1.2%) is showing notable strength today, while VZ (-1.1%) is under pressure.

In earnings, SNX (-13.4%) posted a mixed Q1 and issued downside guidance. This morning, PRGS (-3.1%) reported a Q1 beat.

Among notable analyst upgrades this morning, DTV (+1.5%) was upgraded to Buy at Citi and NVDA (+1.9%) upgraded to Market Perform at JMP Securities. Among downgrades, VZ (-1.1%) was downgraded to Sector Perform at RBC, SNX (-12.8%) was downgraded to Neutral at Citigroup, FFIV (-0.6%) was downgraded to Sector Perform at FBN Securities, and Oppenheimer downgraded AUDC (-7.1%) to Perform. RHT (-0.8%) is a notable name in tech scheduled to report results today after the close.
icon url

ReturntoSender

03/30/12 12:38 PM

#9726 RE: ReturntoSender #6755

Chart of the Day - S&P 500 Ratio

http://www.chartoftheday.com/201203302.htm?T

Today's chart illustrates how the recent rise in earnings as well as recent stock market action has impacted the current valuation of the stock market as measured by the price to earnings ratio (PE ratio). Generally speaking, when the PE ratio is high, stocks are considered to be expensive. When the PE ratio is low, stocks are considered to be inexpensive. From 1900 into the mid-1990s, the PE ratio tended to peak in the low to mid-20s (red line) and trough somewhere around seven (green line). The price investors were willing to pay for a dollar of earnings increased during the dot-com boom (late 1990s), surged even higher during the dot-com bust (early 2000s), and spiked to extraordinary levels during the financial crisis (late 2000s). As a result of the continued surge in corporate earnings the PE ratio remains at a level not often seen since 1990 despite what has been a significant upward trend in stock prices so far this calendar year.


icon url

ReturntoSender

03/31/12 10:06 PM

#9727 RE: ReturntoSender #6755

From Briefing.com: Weekly Recap - Week ending 30-Mar-12Broad support on Friday helped the S&P 500 come back after booking three straight declines. The effort helped feed a weekly gain of 0.8%, which stands as the eleventh weekly advance in 13 tries for the S&P 500. That hot streak drove the broad market measure to a 3.1% gain for March -- its fourth straight monthly gain -- and a 12.0% gain for the first quarter. That marks the best quarterly performance for the stock market since 2009 and the best first quarter performance since 1998.

Tech stocks were integral in the stock market's streak of gains, but they were relatively weak today. That hampered the Nasdaq. In fact, Tech fell 0.4% and was the only sector to settle in the red. Despite that, Tech still scored a 1.0% weekly gain, a 5.0% monthly gain, and a 21.1% quarterly gain.

For the second straight day Energy emerged as a leader after a listless start to the session. Energy stocks advanced 0.8% on Friday, but fell 0.5% for the week and 3.4% for the month. The Energy sector was up 3.4% in the first quarter, but that paled in comparison to the 17.6% that it had rallied in the fourth quarter.

Energy's action this week came in close connection to movement in oil prices. Earlier this week oil prices fell to a new monthly low narrowly above $102 per barrel, but it bounced back to $103 per barrel today. As a proxy for oil's action this week, the US Oil Fund (USO 39.23, -0.06) fell 3.6% this week and 4.0% for the month. It advanced 2.9% for the quarter.

Corporate news today was limited in scope and generally without consequence. For the most part economic data was also shrugged off.

Personal income reportedly increased in February by 0.2%, but that is slightly less than the 0.3% increase that had been generally expected. However, personal spending grew by 0.8%, which is faster than the 0.6% increase that had been broadly expected.

The Chicago PMI slipped to 62.2 in March from 64.0 in February. A tick down to 63.0 had been broadly expected.

The final reading on consumer sentiment in March from the University of Michigan improved to 76.2 from the preliminary reading of 74.3, which is where economists polled by Briefing.com had generally expected the reading to remain.

Earlier in the week it was announced that the Conference Board's latest Consumer Confidence Index declined to 70.2 from an upwardly revised 71.6 for the prior month. The decline was on the order of what had been widely anticipated, though.

The latest initial jobless claims count climbed 9,000 week-over-week to 359,000, which is greater than the tally of 350,000 that had been expected, on average, among economists polled by Briefing.com.

Durable goods orders increased by 2.2% during February, but that is actually a slower pace than the 2.8% increase that had been broadly expected. Prior month orders data were revised slightly higher to reflect a 3.6% decline. Excluding transportation items, durable goods orders were up 1.6% in February. That is a stronger clip than the 1.0% increase that had been widely expected, but still relatively underwhelming when compared to loftier estimates that were widely issued. Nonetheless, the latest figure marks an improvement from the prior month decline of 3.0%.

The final reading on fourth quarter GDP continued to show that the economy expanded at a rate of 3.0%, just as had been widely anticipated, but in a separate event Fed Chairman Bernanke seemed to give tacit indication that the Fed recognizes the need for accommodative policies, given that job market conditions remain far from normal.

...Nasdaq 100 -0.1%. ..S&P Midcap 400 +0.0%. ..Russell 2000 -0.2%.
 
Index Started Week Ended Week Change %Change YTD %
DJIA 13080.73 13212.04 131.31 1.0 8.1
Nasdaq 3067.92 3091.57 23.65 0.8 18.7
S&P 500 1397.11 1408.47 11.36 0.8 12.0
Russell 2000 830.03 830.30 0.27 0.0 12.1

4:08PM Analog Devices announces that it has acquired Multigig, financial terms were not disclosed (ADI) 40.40 +0.39 : Co announces that it has acquired Multigig. Co says the acquisition will enhance ADI's clocking capabilities in stand-alone and embedded applications, and will strengthen ADI's industry-leading position in delivering high-speed data converters and signal processing solutions. Analog Devices acquired Multigig, Inc. in a cash transaction completed on March 30, 2012. The engineers will become part of ADI's existing clock design team and will move to ADI's San Jose, CA facility.

12:55PM Research In Motion edges above early high -- session high 14.54 (RIMM) 14.51 +0.78 : The stock reported a Q1 miss but stated that they are evaluating strategic alternatives. The opening high at 14.49 has been slightly breached in recent trade with an area of technical interest slightly above at 14.65/14.80. This marks it 50 ema, March recovery high and 50 sma.

7:17AM ASM Intl NV announced that Dutch Supreme Court dismissed request for enquiry (ASMI) 38.84 : Co announced that the Dutch Supreme Court confirmed the decision of the Enterprise Court dated April, 14 2011 that there are no grounds to order an enquiry into the affairs of the co as requested by Fursa and Hermes in 2008. Fursa and Hermes were ordered to pay the co's legal expenses. Decision is final and cannot be appealed.

Acacia Research (ACTG) announced that its DRAM Memory Technologies subsidiary has entered into a settlement agreement with Integrated Silicon Solution (ISSI) regarding patents related to double data rate SDRAM devices. The settlement agreement resolves litigation that was pending in the Central District of California.

08:09 am Research In Motion downgraded to Underperform at FBR Capital; tgt lowered to $11: . FBR Capital downgrades RIMM to Underperform from Mkt Perform and lowers their tgt to $11 from $14 following earnings. The firm notes the co suspended quantitative guidance, but guided business metrics lead them to believe its turnaround strategy could take significantly more time to develop and execute. CEO Hein's commentary on the call highlighted that "substantial change is what RIM needs" in order to stabilize the business-and they agree. Overall the firm says, the challenges appear immense. They expect the company's longer-term viability to hinge on the success of BB10 OS and, potentially, a single smartphone product currently under development and expected to be on the market in 2H12. It appears that one of the most significant stock catalysts, M&A, is being de-emphasized by management, providing little hope of substantial upside.

11:51 am Technology sector trading flat today despite market gains

The tech sector is trading lower today, trailing the broader market. Semiconductors are showing relative strength in the tech space, however, with the Philly Semi Index trading 0.6% higher. SPRD (+4.0%) is a notable leader in the chip index. Among other major indices, the SPY is trading 0.3% higher today, while the QQQ is flat on the session and the NASDAQ is trading 0.1% higher on the session. Among tech bellwethers, AAPL (-1.2%) is under notable pressure, while TXN (+1.4%) is showing strength.

In earnings last night, RIMM (+4.6%) reported a Q1 miss, but stated that the company is evaluating strategic alternatives. Elsewhere, TIBX (-4.5%) posted quarterly beat and issued a new buyback program. In news last night, AAPL (-1.2%) and Foxconn have agreed to new labor standard in China, according to reports.

Also last night, Soros Fund Mgmt disclosed a 7.98% stake in DRIV (+2.2%).

Among notable analyst upgrades this morning, LNKD (+0.5%) was upgraded to Positive at Susquehanna. While in downgrades, RIMM (+4.6%) was downgraded to Underperform at FBR and Needham downgraded XRTX (-10.6%) to Hold. There are no notable names in tech scheduled to report results today after the close.
icon url

ReturntoSender

04/02/12 10:49 PM

#9732 RE: ReturntoSender #6755

From Briefing.com: 4:05 pm : The major averages ended the day with strong gains as they got the second quarter started out on the right foot. Equities opened with modest losses, but quickly reversed to gains following the ISM Index beat, and have been trending higher throughout the session. A 0.9% surge had the Nasdaq pacing the advance while the S&P 500 climbed 0.7%, and the Dow lagged with a gain of 0.4%. Both the S&P 500 and the Dow Jones Industrial Average closed at multi-year highs.

Groupon (GRPN 15.27, -3.10) fell 16.9% after the company revised its fourth quarter and fiscal year 2011 financial results. The revisions occurred because inadequate refund reserves (and higher than expected customer returns) resulted in a reduction to Q4 2011 revenue of $14.3 million, and to an increase of fourth quarter operating expenses that reduced operating income by $30.0 million, net income by $22.6 million, and earnings per share by $0.04.

DirecTV (DTV 49.94, +0.60) added 1.2% despite losing service to Tribune Co. television stations. The two parties saw their agreement end on Sunday, and have yet to reach terms on a new deal. The blackout will prevent Chicagoans with DirecTV from seeing Bulls, Blackhawks, Cubs, and White Sox games scheduled on WGN.

French beauty company Coty announced that it has submitted a non-binding proposal to acquire Avon (AVP 22.68, +3.32) for $23.25 per share in cash, representing a 21% premium to Friday's close. The deal was rejected by Avon.

Dunkin’ Brands (DNKN 30.63, +0.55) is trading up 0.8% after announcing an exclusive multi-year product and marketing agreement with Coca-Cola (KO 74.14, +0.13). The deal will include more than 9,400 Dunkin’ Donuts and Baskin-Robbins restaurants across the United States, and will begin later this month.

Treasuries saw small gains as most of the earlier buying was erased. The 10-yr yield fell 2 .3 bps on the session to finish at 2.193%. Little change along the yield curve saw the 2-10-spread hold steady at 188 bps.

Data picks up a bit on Tuesday as factory orders, the FOMC minutes, and auto/truck sales are released.DJ30 +52.45 NASDAQ +28.13 SP500 +10.42 NASDAQ Adv/Vol/Dec 1766/1.72 bln/764 NYSE Adv/Vol/Dec 2279/751.9 mln/772

4:34PM Rambus has signed a license agreement with Fern Howard (RMBS) 6.39 -0.06 : This agreement enables Fern Howard to sell advanced lighting products based on Rambus lighting solutions incorporating Rambus patented innovations including MicroLens optics technology.

O2Micro International (OIIM) was issued 24 claims under U.S. patent for its Battery Cell Monitoring topology.

8:02AM Dell announces intent to acquire Wyse Technology; end-to-end datacenter infrastructure stack for these solutions is expected to exceed $15 billion by 2015 (DELL) 16.59 : Co announced it has signed a definitive agreement to acquire Wyse Technology to extend its desktop virtualization offerings. The addition of Wyse will expand Dell's desktop virtualization capabilities and provide new solutions and services opportunities for the full range of Dell's enterprise offerings. The transaction was approved by the board of directors of each company and is expected to be accretive to Dell non-GAAP earnings in the second half of its Fiscal Year 2013. Additional terms of the transaction were not disclosed. The transaction remains subject to customary conditions and is expected to close in the second quarter of Dell's FY13.

7:33AM Power Integrations agrees to acquire privately held CT-Concept Technologie AG for ~ $115 mln (POWI) 37.12 : CONCEPT's management team and employees will remain at the company's Biel headquarters, which will become Power Integrations' center of excellence for high-voltage driver design. Wolfgang Ademmer will continue as president of CONCEPT and will also become a vice president of Power Integrations, reporting directly to Mr. Balakrishnan. Based on full-year 2011 results, Power Integrations estimates that the acquisition will add approximately 10 percent to its annual revenues, and expects the transaction to be immediately accretive to its non-GAAP gross margin, operating margin and earnings per share. The company expects the transaction to close during the second quarter of 2012.

Integrated Silicon Solution (ISSI) announced that it is sampling RLDRAM 3 memory. RLDRAM 3 memory offers a 576Mb density with the DRAM industry's fastest random access times.

Canaccord's monthly channel checks indicated strong sales trends for Apple's (AAPL $607.09 +7.72) iPhone 4S at all three U.S. carriers and strong overall iPhone sales in international markets, with particular strength driven by the iPhone 4S launch at China Telecom (CHA) and Unicom (CHU). Firm maintains belief Apple is well positioned for strong C2012/13 sales and earnings growth driven by new product introductions, including the new iPad, the pending refresh of MacBook Air/Pro, an LTE iPhone likely in Q3/C2012, and potentially Apple TV exiting C2012.

1:21 pm Technology Sector Higher today, ahead of market

The tech sector is trading just highertoday, just ahead gains in the broader market. Semiconductors are showing relative weakness in the tech space with the Philly Semi Index trading 0.4% higher. LLTC (-1.6%) is a notable laggard in the chip index, while VECO (+2.2%) is bucking the trend. Among other major indices, the SPY is trading 0.9% higher today, while the QQQ is 0.8% higher and the NASDAQ is trading 0.8% higher on the session. Among tech bellwethers, AAPL (+2.4%) is showing strength, while TXN (-1.1%) is under notable pressure.

In earnings this morning, GPN (-3.4%) reported a mixed Q3 and inline guidance following last week's announcement of a data breach. In news, SINA (-1.5%) is trading lower following reports that China has issued a ban against microblogging. Also, VOD's (+2.4%) Deputy Chairman John Buchanan will resign from VOD and become Chairman of ARMH (+3.1%), according to reports, and TWER (+10.9%) disclosed on Friday it signed a Wi-Fi agreement with a national wireless carrier utilizing current and future rooftop assets.

Among notable analyst upgrades this morning, KNXA (+4.7%) was upgraded to Outperform at Raymond James. While in downgrades, TXN (-1.2%) and LLTC (-2.6%) were downgraded to Neutral at UBS. Also, CCOI (-0.4%) was downgraded to Underperform at BofA/Merrill and VLTR (-2.5%) was downgraded to Average at Caris.

There are no notable names in tech scheduled to report results today after the close.

icon url

ReturntoSender

04/03/12 8:43 PM

#9733 RE: ReturntoSender #6755

From Briefing.com: 4:30 pm : Weakness among stocks was exacerbated with the release of the most recent FOMC meeting minutes, which contained some surprisingly hawkish verbiage, but stocks were able to pare their losses in late afternoon trade.

Limited leadership and weakness among Energy and Financial stocks left the broad market to drift lower in morning and early afternoon trade. Selling intensified once it was learned that that members of the Federal Open Market Committee took the collective position that forward guidance is conditional on economic developments, making dates for policy subject to revision in response to significant changes in the economic outlook. Although this mindset should not have come as a surprise, many market participants turned against stocks because of the belief that further quantitative easing may not be as probable as previously thought.

The S&P 500 traded down to a loss of about 1%, which put it in line with its prior session low, before it was able to find support. Stocks then spent the final 90 minutes slashing losses.

The Nasdaq was able to hold up better than either of its counterparts for the duration of the day. Although it still logged a modest loss, it was propped up by Apple (AAPL 629.32, +10.69). Already the largest stock by market cap, shares of AAPL logged a new record high in response to positive analyst commentary. The stock is now up a whopping 55% year to date.

The idea of fewer dollars in circulation provided a catalyst for the dollar to trade higher after it had been essentially flat all morning. By day's end it was up 0.7% against a basket of major foreign currencies.

The confluence of the FOMC's hawkish tone and the gain by the greenback took most commodities sharply lower. The CRB Index logged a 0.5% loss, but that didn't capture the dive in precious metals prices, which closed pit trade before the FOMC minutes were released.

Treasuries were also cut down aggressively. The action swung the yield on the benchmark 10-year Note up to almost 2.29% after it had traded only narrowly above 2.15% this morning.

Actual data was limited today, but factory orders increased by 1.3%, which is on par with the 1.4% increase that had been expected, on average, among economists polled by Briefing.com. Britain posted its best PMI Construction number since 2010 and China's PMI Services reading set a six-month high.

Advancing Sectors: Utilities +0.1%
Declining Sectors: Telecom -0.1%, Consumer Discretionary -0.1%, Tech -0.1%, Health Care -0.1%, Industrials -0.6%, Consumer Staples -0.6%, Financials -0.7%, Materials -0.9%, Energy -1.0%DJ30 -64.94 NASDAQ -6.13 NQ100 -0.1% R2K -0.7% SP400 +0.3% SP500 -5.66 NASDAQ Adv/Vol/Dec 769/1.79 bln/1768 NYSE Adv/Vol/Dec 1057/816 mln/1942

5:03PM O2Micro's driving circuit invention granted U.S. patent (OIIM) 5.48 -0.02 : Co was issued 18 claims under United States patent number 8,044,608 for its Driving Circuit invention. O2Micro's patented invention includes a dimming controller to drive light sources. User-controlled brightness allows the end-user to set their desired level of brightness in LEDs.

5:02PM SanDisk extends losses after cutting Q1 revenue guidance and fell as low as $46.40, down 7.3%; stock is now at $47.00 (SNDK) 50.05 +0.45 :

4:46PM SanDisk lowers Q1 revs guidance to ~$1.2 bln vs $1.3 bln Capital IQ Consensus, down from $1.3-1.35 bln; lowers gross margin guidance (SNDK) 50.05 +0.45 : Co lowers Q1 revenue guidance due to weaker than expected pricing and demand, the co estimates total revenue to be ~$1.2 billion, down from the previously forecasted revenue range of $1.30-1.35 bln. Total gross margin is also expected to be below the previously guided range of 39% to 42%. SanDisk will release its first-quarter financial results and provide business commentary at its earnings conference call to be held on April 19, 2012.

4:02PM Vishay announces amendment to credit agreement and incremental facility agreement to increase credit agreement total commitment to $528 mln (VSH) 11.91 -0.06 : Co has received incremental revolving commitments in the aggregate principal amount of $78 mln, increasing the total credit facility commitment to $528 mln. The incremental revolving commitments have terms and conditions identical to the terms and conditions of the existing commitments under the credit facility. The other terms and conditions of the credit facility were unchanged.

HP (HPQ) Enterprise Services announced it has been selected by the U.S. Army to provide the DoD and other federal agencies with enterprise cloud computing services under the Army Private Cloud contract. The APC2 is an indefinite delivery/indefinite quantity contract award with a $249 mln ceiling over a one-year base period and four one-year options.

7:45AM Apple: AAPL ticks to new all-time highs @ 624.39 in premarket trade following multiple broker price target increases; AAPL now printing 623.00 (AAPL) 618.63 :

ARM (ARMH), Gemalto and Giesecke & Devrient announced the creation of a joint venture that will focus on improving security for smart connected devices by developing a Trusted Execution Environment based on ARM TrustZone security technology.

10:16 am Technology sector trading higher today and is ahead of broader market

The tech sector is trading higher today, ahead of losses in the broader market. Semiconductors are showing relative weakness in the tech space, however, with the Philly Semi Index trading 0.4% lower. WFR (-3.8%) is a notable laggard in the chip index, while AVGO (+0.6%) is bucking the trend. Among other major indices, the SPY is trading 0.1% lower today, while the QQQ is 0.4% higher and the NASDAQ is trading 0.2% higher on the session. Among tech bellwethers, AAPL (+1.8%) is showing strength, while MSFT (-0.8%) is under pressure.

In earnings last night, CAVM (+3.5%) reported that Q1 results will come in lower than expected. In news last night, GWRE (-2.8%) and SBAC (-1.5%) both filed stock offerings.

Among notable analyst upgrades this morning, Stifel Nicolaus upgrades GPN (+1.0%) to Buy. Also, Piper Jaffray says AAPL (+1.8%) will reach $1000 in 2014 and become first $1 trln company. While in downgrades, VOD (-0.6%) was downgraded to Neutral at Davenport. Also, there is a negative Forbes report out on QIHU (-12.0%).

There are no notable names in tech scheduled to report results today after the close.
icon url

ReturntoSender

04/04/12 11:46 PM

#9734 RE: ReturntoSender #6755

From Briefing.com: 4:30 pm : For only the second time in 2012 the S&P 500 logged a 1.0% loss. The downturn came in response to some familiar concerns, namely sovereign debt and uncertainty about domestic monetary policy.

Sentiment soured well ahead of the open as trade in Europe was weakened by underwhelming demand for a recent debt offering from Spain. Such an indication that investors remain leery of the country's ability to implement and sustain fiscal reform sent higher bond yields of countries in the eurozone periphery. Although not a profound idea that data will play a part in monetary policy, many market participants continued to dwell on the implications of the hawkish verbiage included in the FOMC meeting minutes that were released yesterday.

Data certainly didn't stir any buying interest. The ADP Employment Change indicated that private payrolls increased by 209,000 during March, but that was slightly less than the increase of 217,000 that many economists had expected. After the open the ISM Services Index for March was released, but its reading of 56.0 was less than the 56.7 that had been broadly expected to follow the 57.3 that had been printed in the prior month. On a more positive note, recent PMI Services readings of Germany, France, and the United Kingdom were all revised higher.

The S&P 500 was down in excess of 1% at its session low, but stocks were able to attract some support during afternoon action. Still, the stock market could not cut its loss to less than 1%.

Tech stocks, which make up the largest sector by market weight, were an especially heavy drag. The sector was down about 2% at its session low, but ended the day with a 1.4% loss. Such weakness caused the Tech-rich Nasdaq to underperform its counterparts.

Financials booked some of the biggest losses of all. The sector fell 1.6% for the day. Diversified financial services players like Citigroup (C 35.04, -1.33) and JPMorgan Chase (JPM 44.41, -1.01) grappled with pronounced selling pressure.

Materials stocks suffered a 1.4% loss, collectively, in conjunction with both broad market weakness and a concerted sell-off among commodities. Weakness in the commodity complex dropped the CRB Index for a 1.9% loss, which stands as its worst single-session slide of 2012.

The negative tone surrounding commodities was likely exacerbated by a stronger dollar, which was off of its session high, but still up nearly 0.4% against a basket of major foreign currencies at the closing bell. Most of the greenback's gain came against the euro, which failed to receive help from the European Central Bank following its decision to keep its target interest rate at 1.00%.

Treasuries attracted buyers after sliding sharply in the prior session. That pulled the yield on the benchmark 10-year Note down from a 10-day high near 2.30% to slightly less than 2.25%.

Advancing Sectors: None
Unchanged: Telecom
Declining Sectors: Utilities -0.2%, Consumer Staples -0.3%, Health Care -0.6%, Industrials -0.7%, Consumer Discretionary -1.0%, Energy -1.2%, Materials -1.4%, Tech -1.4%, Financials -1.6%DJ30 -124.80 NASDAQ -45.48 NQ100 -1.4% R2K -1.7% SP400 -1.4% SP500 -14.42 NASDAQ Adv/Vol/Dec 481/1.80 bln/2064 NYSE Adv/Vol/Dec 588/832 mln/2424

SanDisk (SNDK $45.67 -4.39) lowered first quarter revenue guidance due to weaker than expected pricing and demand, the co estimates total revenue to be ~$1.2 billion, down from the previously forecasted revenue range of $1.30-1.35 billion. Total gross margin is also expected to be below the previously guided range of 39% to 42%. SanDisk will release its first-quarter financial results and provide business commentary at its earnings conference call to be held on April 19, 2012.

EMC (EMC $29.43 -0.41) was initiated with a Buy at Mizuho with a target of $34. The firm highlights co has an 80% stake in VMware, which has not only become a standard for virtual environments, but is also becoming a systems management vendor of choice for cloud environments. They feel the secular tailwind combined with strong execution by management, an ongoing product cycle and recent investments in channel development will continue to drive upside to estimates and stock price performance.
icon url

ReturntoSender

04/07/12 7:33 PM

#9735 RE: ReturntoSender #6755

From Briefing.com: Weekly Recap - Week ending 06-Apr-12Coming off of the strongest quarterly performance since 2008 and the best first quarter since 1998, stocks scored strong gains on Monday, but things weakened from there.

A better-than-expected ISM Manufacturing Index helped stimulate buying interest at the beginning of the week. The effort gave the broad market a new multi-year closing high.

Sentiment soured on Tuesday as participants responded to some surprisingly hawkish verbiage contained in the minutes from the most recent FOMC meeting. Although the idea that the Fed's guidance will be conditional on economic developments shouldn't be surprising, many regarded that view as anti-quantitative easing rhetoric. Selling dropped the stock market to a 1% loss before it began to rebound.

Data on Tuesday was limited to a relatively in-line increase in factory orders of 1.3%.

Selling extended into trade on Wednesday, forcing the S&P 500 to a 1.0% loss for only the second time in 2012. Lingering uncertainty about monetary policy following the FOMC minutes played a part in the downturn, as did renewed concerns about sovereign debt. The latter theme was made clear by the increase in yields on Spain's debt after the country's latest debt auction drew underwhelming demand.

Domestic data didn't do anything to stem losses. The ISM Services Index, which came in at 56.0, declined more than what had been generally expected to follow the 57.3 that had been printed in the prior month.

The ADP Employment Change indicated that private payrolls increased by 209,000 during March, but that was slightly less than the increase of 217,000 that many economists had expected. The report is usually regarded as a preview of the official monthly payrolls report.

Action on Thursday was listless and lackluster. It left the S&P 500 to suffer its third straight loss, although the move lower was only slight. Still, with the U.S. equity markets closed on Friday for holiday observance the string of down days resulted in a 0.7% weekly loss. That's only the third weekly loss for the stock market in 14 weeks of trade.

In the backdrop was another rise, albeit a modest one, in yields of Europe's sovereign debt. Trade was mostly cautious as market participants positioned their portfolios for the official monthly payrolls report that will be released on Friday. The Briefing.com consensus calls for an increase of 200,000 to nonfarm payrolls. The latest weekly initial jobless claims tally was shrugged off. At 357,000 it was on par with what had been broadly forecasted.

Tech, the largest sector by market weight, traded with a solid gain for the better part of the day, but the broader market was reluctant to follow its lead. Tech's strength was more distinguishable in the Nasdaq, which outperformed its counterparts for the duration of the day.

Consumer Discretionary stocks outperformed for almost the entire session and booked a 0.7% gain, helped by a raft of retailers that reported some impressive same-store sales results. A better-than-expected quarterly report from Bed Bath & Beyond (BBBY 71.85, +5.62) helped shares of the home furnishing outfit bound to a new record high.

Materials stocks ran up to an early gain on the order of 1% before rolling over. The sector settled the session with a 0.6% loss. Energy stocks also failed to hold early gains; they suffered a 0.5% loss.

Despite the downturn among natural resource plays, most commodity futures prices traded higher so that the CRB Index booked a 0.5% gain. The bounce by commodities came after they had suffered steep losses during the course of the two previous days, including a near 2% drop for the CRB that stands as its worst single-session slide of 2012. Those losses were largely driven by the tone of comments included in the FOMC minutes.

The FOMC minutes were a positive catalyst for the dollar this week. With a 0.4% gain on Thursday the greenback enters Friday with a week-to-date gain of 1.3%. Currency markets will be open on Friday even though U.S. equity markets will be closed.

Most of the dollar's advance this week came against the euro, which enters Friday at a three-week low of $1.306, down 2.0% week-to-date. Earlier this week the European Central Bank opted to keep its target interest rate at 1.00%, while the Bank of England announced on Thursday that it will keep its target rate at 0.5% and leave its asset purchase plan at 325 billion pounds.

As an aside, the United Kingdom reported disappointing Manufacturing and Industrial Production data on Thursday. That comes after it had posted its best PMI Construction number since 2010 earlier in the week. It also reported an upwardly revised PMI Services reading, as did Germany and France.

Recent PMI data from China proved pleasing, but in focus will be the country's first quarter GDP figure due next week.

..Nasdaq 100 +0.6%. ..S&P Midcap 400 -0.4%. ..Russell 2000 -0.3%. ..NYSE Adv/Dec 1282/1695. ..NASDAQ Adv/Dec 1172/1318.
 
Index Started Week Ended Week Change % Change YTD %
DJIA 13212.04 13060.14 -151.90 -1.1 6.9
Nasdaq 3091.57 3080.50 -11.07 -0.4 18.2
S&P 500 1408.47 1398.08 -10.39 -0.7 11.2
Russell 2000 830.30 818.18 -12.12 -1.5 10.4

10:43 am Technology Sector trading lower today behind the broader market

The tech sector is trading lower today, just behind the broader market. Among major indices, the SPY is trading 0.1% lower today, while the QQQ is 0.03% higher and the NASDAQ and SOX are trading 0.1% lower on the session. Among tech bellwethers, ORCL (+0.5%) is showing strength, while CSCO (-1.0%) is under notable pressure.

In earnings last night, MERU (-15.4%) lowered its Q1 revenue guidance. This morning, HIMX (+20.8%) raised its Q1 guidance, while PMTC (-19.0%), PLCM (-17.5%), and PLNR (-6.1%) lowered guidance.

In news, GLUU (+3.7%) acquired the rights to Deer Hunter. Among rumors, we are hearing renewed RIMM (-0.4%) takeover chatter making the rounds. Among notable analyst upgrades this morning, PAY (+4.1%) and WU (+0.9%) were upgraded to Buy at Goldman. While in downgrades, LNKD (+0.4%), ADTN (-2.8%) and CIEN (-3.5%) were downgraded at Raymond James and QSII (-2.3%) was downgraded to Equal Weight at Morgan Stanley.

There are no notable names in tech scheduled to report results today after the close.
icon url

ReturntoSender

04/08/12 1:43 PM

#9736 RE: ReturntoSender #6755

Leavitt Brothers Update on Market Breadth Indicators:

http://trk.cp20.com/Tracking/t.c?RdJv-Sdkx-pPHUM9
icon url

ReturntoSender

04/08/12 9:12 PM

#9737 RE: ReturntoSender #6755

InvestmentHouse Weekend Market Update:

http://investmenthouse2.com/cntdirplus.asp?name=IHDaily&zid=2770189&eeid=XFcqVytdVygELD4ZXlAyUFpZGFAqWg==

- Stocks bide some time ahead of trader-less Friday jobs report.
- France debt auction shows shades of Italy with higher rates and weak demand.
- Spanish 10 year bond revisits last fall's spread with German bonds.
- Money fleeing Europe for the US once again and even US instruments are impacted.
- Jobless claims hit a 4 year low so the news outlets tell us without any asterisk just as the Department of Labor tells them.
- Same Store Sales feast again on the warm winter and early Easter.
- Money fleeing US equity markets . . . still . . . as investors pull money and insiders sell.
- Indices bounce but they do not wipe away the Wednesday flops. This makes next week most interesting for the life of this part of the rally.

Jobs Report Addition: STILL!!

Jobs report failed to surprise other than it was a miss even in the face of serious seasonal adjustments. When it is 70 degrees and more in February and March then seasonal adjustments don't really apply; yet they ARE applied. The net result is pushing up the numbers beyond what they really are.

Even so it was a pretty big miss.

Non-Farm: 120K VS 200K exp, 240K prior (revised from 227K)
Unemployment rate: 8.2% vs 8.3% exp, 8.3% prior
Hourly earnings: 0.2% vs 0.2% vs 0.3% revised from 0.1%
Workweek: 34.5 versus 34.5 expected, 34.6 prior, revised up from 34.5

Aggregate hours: -0.2% vs +0.5% February
How do you upwardly revised the workweek? With lower aggregate hours? That is the same as revising the unemployment rate itself as seen a few months back. It just is not something that needs revising.

Workforce: -164K
Employment: -34K
Those Not in the labor force back to a new high: 87.9M! Census as of 7-11 put the US population at 311.6M. That means 28% of the US is not in the workforce. When you factor in those of working age (237.8M) only the number rises to 37% of the population can work but are not working for some reason.

Do we have a selloff or rally on these numbers?

Futures traded for 45 minutes then closed. Adjusting for Fair Value:
DJ: -143
SP: -19.75
NASD: -33.4

Bonds 2.08% vs 2.17%

The numbers clearly disappointed the stock market and other markets. Think: if these numbers are aided by seasonal adjustments, something we will see very starkly in April's numbers when the adjustments should stop (maybe the Fed won't want to . . . ), the numbers must really have been bad.

Knee-jerk is down; bad numbers warrant selling. That is the 'real world' response to such stimulus. Now overlay the world we are in with a President desperate for re-election, eager to promise whatever it takes, and a Fed chairman who wants to be remembered as the fellow who prevented another Great Depression. He has been trying to keep a lid on the hawks. This number gives him leverage.

Question: is it enough to put QE 3 on the table again? Not likely, but probably takes either weaker data elsewhere or the April jobs report with a weak number again, revealing what paper tigers the spring payrolls numbers are. This morning the President is touting over 600K jobs created in Q1. What about the 5.05M NEW jobless claims in Q1? While not apples to apples the comparison shows that more people are losing jobs or unable to find jobs versus finding new jobs.

Of course, if the financial markets tank the Fed will be there, liquidity in hand. Thus, as for next week, unless there is some overt sign over the weekend from the Fed (and there should not be unless it is completely without credibility) investors likely take things into their own hands and sell, perhaps creating their own financial crisis that compels the Fed to act. That would rally the market eventually but not near term (duh!).

In sum, that likely means that where the futures went out they likely open on Monday.

Flat ahead of Friday jobs report and market closure.

This will be the Thursday and the weekend market update, although I will have something to say about the jobs report on Friday when the market is not open.

I will digress right off the bat. As you recall, the February jobs report was pushed back to March 9 from March 2. March 2 was the first Friday of that month and traditionally the day that the jobs report is announced. They pushed it back because it was inconvenient for the federal government to have it ready at that point. Now it will be inconvenient for the financial markets and investors and traders, as well as those who look upon Good Friday as one of the holiest days in the Christian religion. It is definitely inconvenient for them, but the government will release the data anyway. I guess that tells you what this government thinks about the financial markets, traders, investors, and a major religion (probably THE major religion) in the United States. But I digress. Am I a little bitter? I will let you decide.

There was a lot of news on both sides of the Atlantic. We had scheduled U.S. data with the jobless claims. We had a lot of unscheduled data on the continent, which was somewhat of a problem. I will get to that when I discuss the economic issues. The overriding factor is the jobs report that is out on Friday and the inability to trade that jobs report.

Stocks started lower after that Wednesday flop, but they quickly recovered. The SPYders turned to positive by mid-morning. They sold back and then managed to rebound in the back half of the afternoon. They never quite captured the glory of the first morning move, although there was not much glory there anyway. When you look at the end results, even with the indices recovering off of the lows, SP500 was down -0.06%. Oh, what a terrible loss. It kind of sums up the day.

SP500, -0.06%; NASDAQ, +0.4%; Dow, -0.11%; SP600, -0.25%; SOX, +0.31%; NASDAQ 100, +0.64%.

Notably, NASDAQ 100 was up. I wonder why. AAPL was up, and so was PCLN. Those are two huge players in NASDAQ. The stocks just bracketed the zero line, basically going nowhere. Again, that is understandable given that the market is closed on Friday. Yet we have a huge at least that is what we are led to believe economic report coming out.

Looking at the gain on SP500, it is up 12% thus far in 2012. 15% of that move is attributable to AAPL and its large market cap weighting. I have often said that the NASDAQ is AAPL, and it is starting to look as if the SP500 is AAPL as well.

OTHER MARKETS

It was a lackluster day as investors awaited the Friday jobs report. Other markets still managed to continue their recent moves with some rebounds from some heavy bludgeoning.

Dollar. 1.3061 versus 1.3139 euro. The dollar managed to post a further gain. It was a strong gain against Europe. The dollar is on a mini-roll, bouncing up off of a higher low. It had an ABCD pattern. A little double bottom at the D point, and it has bounced. It was shaky on the day. There are a lot of issues in the economies of Europe and the U.S. that are impacting how currencies are trading. There were bonds problems in Europe again. That is causing a run into some U.S. dollars. The old greenback is getting more money coming across the continent yet again. It looks as if there is still strength here as the eurozone continues to degenerate. Some are saying it is degenerating "again," but in reality it never really stopped. We can look into that more when we get to the economy section.

Bonds. 2.17% versus 2.23% 10 year U.S. Treasury. Bonds were benefiting to the upside for a second day after that big drop on Tuesday. Wednesday fell from a 2.30% yield on Tuesday. We see a rebound from that big break lower. Will it recover? It was not look healthy. Looks like it could turn and drop from here, but it is making the good ol' college try at rebounding.

Gold. 1,634.00, +19.90. Gold tried to come back from that Tuesday and Wednesday bludgeoning. It bounced to the upside in a decent recovery. Unfortunately, it got the squat kicked out of it on the prior two sessions, dropping it from the confluence of the 200 day SMA and the 50 day EMA. It is trying to hold, and it is hanging on by it is fingernails.

Oil. 103.29, +1.82. Oil managed to post a bounce as well. It broke sharply lower. It rebounded and then broke lower hard on Wednesday. It had a little relief bounce on Thursday that took it back up toward the 50 day EMA. But that does not clear it. It does not wash away the prior two big down days. Oil still finds itself having to struggle to get back up through this near resistance. After just posting a good test, it broke down. Now we see if it is a false break and can reverse or if it continues lower. Frankly, it looks like it will continue down into this range spanning November into early February.

In sum, the markets continue to respond to the news of the week. On Thursday there were reports all over the place. You had the weekly jobless report. You had the Challenger layoff report. Same Store Sales were out from all of the chain stores. There were auctions in France. Spanish yields were being compared to German yields. You name it and it was pretty much there. But the markets did not want to do anything major. Number one because of a pretty nasty flop to the downside that they suffered on Wednesday as part of the ongoing back and forth volatility. I will say "relatively recent" back and forth volatility because the moves have been pretty steady up to this point. These are not massive swings that I was talking about last night. I was talking about the volatility picking up day to day. But these are not massive moves. They are substantial back-and-forth action, and it is a bit different character than we have seen, but we are not getting the huge 2% moves. That would really show a lot of volatility.

We are getting a little chop in the pattern that suggests, after this slow move and low volume advance, that we could get a pullback. But it does not look like anything major. If we come back to the 50 day EMA which sits right on top of the February peaks for SP500, then you have a pretty good pullback that sets things up to move again. Even so, you have SP500 holding the 20 day EMA and showing a doji on the candlestick chart. Maybe it wants to hold here. Yes, there is a little more volatility. Yes, there may be a little bit of change in the weather coming, but it definitely has not changed its character yet. It certainly did not want to do that on Thursday just ahead of the jobs report. Maybe the jobs report comes out big and we get a large advance. Maybe it misses and we do not. Everyone is banking on a beat.

I was listening to all of the financial stations after hours, and they are all talking about the potential of a really big beat. I was reading stories about the jobless claims and how they are down to the 360K range. They say that is really conducive to jobs growth. Frankly, just because it is down in a trend and they did not lay off as many as they did the week before (although that is questionable, and I will talk about that) it does not mean that they are hiring. You can slow down how many people you lay off without having to hire anyone right back. We still have a very high number of people being laid off. If you look back to times when the economy was halfway decent, you would get a weekly jobless claims in the 50K range. Here we are talking over 350K. That is not all that strong.

TECHNICAL SUMMARY

Volume. NASDAQ -15%, 1.53B; NYSE -11.5%, 657M.

Breadth. NASDAQ -1.16:1; NYSE -1.13:1. Breadth was modest. After some pretty aggressive -4:1 readings on Wednesday, they flattened out as you would expect because the market overall flattened out. No real action whatsoever. The internals do not really tell us a thing.

THE CHARTS

SP500. The charts do not tell us much either. There is a doji at the 20 day EMA on SP500 as noted above. That same volatility, and the Wednesday drop is still there. That is not a huge drop. We can look back to March 6th and see that the index posted a sharp decline. It was significantly larger than on Wednesday. Wednesday was no watershed breakdown; in fact, it is still holding the 20 day EMA. But we are seeing chop back and forth. It is happening more rapidly. In other words, you are seeing a move up followed by sharp moves down. Beforehand we were seeing moves that maybe made just a one-day move, but then they consolidated and moved again for one day. Then they consolidated and moved again for one day. Then they consolidated as we saw in January.

We saw similar action in February. A break to the upside, a week and a half laterally, then a break to the upside. Two weeks lateral, a little test, and then a break to the upside. Again with a decent rally in the first two weeks of March. Now we are seeing chop back and forth. One day up and then immediately testing. Another day up and immediately testing. It is still not breaking down, but it is a little choppier, a little more worrisome. Running out of some mojo perhaps? MACD definitely shows that. A lower high at a higher high. You have to take that into consideration. You see a little slowdown, but as of yet there is no change in market character.

DJ30. DJ30 showed a doji with a slight loss. It is holding above the lows of the last three weeks. It is still continuing its trading range, and it is still above that February consolidation range that marked the top of the February move. It is not breaking down either. It could easily bounce back up from this range, but it is a little choppier. One day up and followed by, again, the selling. Definitely not a change of character yet, however. It is showing shades of hanging around in the wrong neighborhood, but it has not left the good neighborhood yet. It is just edging over toward that fence and looking over to see what is happening. That is how it always happens. You tell the kids, "You might just be curious about what is over there, but as soon as you look, something you do not expect will happen." Then the next thing you know, they are calling mom and dad with a problem.

NASDAQ. NASDAQ posted a gain, bouncing off of the 20 day EMA after falling to that level on Wednesday. The NASDAQ has not been down to the 20 day EMA since early March when it broke it but bounced right back. It did not break it this time, so maybe it will exhibit even further strength than it did in early March. We will see. It has to prove it. It has AAPL and PCLN on its side, so it has some silver bullets still in the gun. If those two ever stop rallying, it could be bad not only for NASDAQ but for the SP500 as well. NASDAQ has no change of character; it is just testing the 20 day EMA. That is a relatively important test given how it has treated the 20 day EMA thus far; in other words, never coming close to it except once in the last several months. This does have some intrigue about it.

SP600. The small caps were down modestly. They were holding over the 50 day EMA, which is coincident with the late July 2011 peak. If we go back more, it is the May peak as well. It is holding at a significant level, some prior highs in the rally. That is what you want to see. On the other hand, it has given up its breakout to a new post bear market high. We wanted to put some distance here, finally. Remember that it had a hard time breaking out. It got rebuffed when it finally did break out once, but it made a higher low and broke out again. It looked strong, tested, bounced again, and then gave it up again. Maybe it will bounce out of here or maybe not. A lot of it depends on what the economy will do, and the beauty of the small cap index is that it kind of shows us what will happen with the economy in terms of domestic small businesses. Frankly, it is better than the bond market right now because the bond market is being manipulated by the Fed. We really cannot get a clear read thanks to heavy, heavy intervention by our FOMC.

SOX. SOX was up modestly. It managed to close just above the 50 day EMA, similar to what it did back in early March. It has shades of NASDAQ with a gap lower and a gap back up that continued the move. Perhaps this is just another 50 day EMA test. There is nothing abnormal about a stock or index coming back to test the 50 day EMA after a rally. The problem is that it just barely shaved that prior high hit in February before falling back. It is not exhibiting a lot of power. It just barely cleared that high, tried to consolidate, and then it gapped to the downside on Wednesday. I am somewhat concerned about these guys, but they have not totally changed character either. We can let them go and just see if they can follow along with NASDAQ if AAPL and PCLN can continue higher as well.

LEADERSHIP

Retail. I will talk about retail first because it was Same Store Sales day. That is always a good time to step in and look under the skirt, so to speak. Retail has been performing. It is one of the best sectors, but it had been showing some lethargy of late. RL has been moving laterally ever since it gapped higher in early February. Maybe it caught a little fire, rallying to the upside nicely on Thursday. Good for RL.

Of course, PCLN moved higher as well. We have to consider it retail because it sells plane tickets, car rentals, and that type of thing. Very solid. COH is hugging the 50 day EMA. Will it bounce this time or not? TJX had a nice move to the upside. That is looking quite good overall. Same Store Sales were good overall. LULU was much better than expected, with warm weather aiding the advance once again. Retail has been blessed with warm weather that has started to move out those spring inventories much quicker than usual. And there is also an early Easter. It is so early that the government will not embargo the jobs report on Friday to kick it to next week. But I do not want to seem too bitter about that.

Overall retail looks very solid. No complaints. Of course we had BBBY, the darling of the day. It announced some good results the night before, and, of course, Same Store Sales were great. It bounced sharply to the upside with a gap and run on big volume. Cool. Retail still looks super.

Industrial Equipment. What about those stocks that bounced but have not quite made it back? CAT tapped the 10 day EMA again on the high and faded. It is trying to regroup. I noted last night that a lot of these stocks that have rolled and are in trouble (or seem to be) just will not give it up. They will not say "uncle" and sell off. That shows there is still some kind of bid in this market. TEX is trying to set up a pennant. Here is something to watch out for. This pennant looks solid. When the bull market ended in 2000, we saw this pattern a lot. That is what we have to worry about. They cratered off of this pattern. If we see stocks breaking downside and not getting back up off of these big pennants, we know that there is trouble ahead. But it may not be horrific trouble. These have rebounded and now we see how they perform after this rebound. We may get a downside play on JOY.

Healthcare. Let's look at some of the health care plans and how they are performing. AET rallied, jumped up on the Supreme Court argument. Now it is fading for a nice test. HUM is doing the same thing. Not bad at all. Those have a specific driver. If the Obamacare is repealed, they tend to do better because they will not be forced into certain coverage that they do not want. They are showing a response to a direct stimulus. The rest of the market is just continuing on as it has been, trying to figure out what will happen in the U.S. vis-a-vis Europe.

Miscellaneous. We still have the same picture. We have great stocks that continue to move higher, no doubt. CMG was breaking to the upside nicely on Thursday. There are other stocks that are still struggling. BWLD is still a great stock, but it is having a bit of toppy action. It has not broken its trend, but it is getting that rounded look to it.

Then there are those stocks that are just coming up out of the lows and have formed patterns. They have not made big runs yet, but they look ready to do that. EXPD is an example. We have the winners that continue to run. We did not close those out on Thursday ahead of the jobs report. We have stocks such as EXPD that have made a break to the upside and are consolidating, and they still look great to go. We were not closing those out, that is for sure. Why would you close out stocks that look so good? Then there are others in, say, tech land. DRIV looked so good just a week ago, but it is not looking so good right now. That is somewhat disturbing. It is not crushing us, but it is just not helping.

That is one of the problems on NASDAQ, for instance. A lot of stocks are just not helping the cause, relying on too few generals. Remember, NASDAQ 100 was the far and away leader on the day with a +0.64% gain. A few generals. The troops may not be falling. A little day-to-day volatility thrown in with that kind of action, and you have to be careful. That is exactly what we were doing on Thursday. We were just streamlining it a bit to keep the best patterns, the best trends in our quiver while we wait for the jobs report (and our inability to do anything about it on Friday).

Of course, would we really do anything? The jobs report will be there. I know I have been grousing about it, but it will be there no matter what, whether we are trading or not. The only thing that we would be acting upon would be after the numbers came out. If it is bad, maybe over the weekend they will be able to digest it. If it is good, then maybe we will get some buys if the market does not just roar out of the gates. Either way, it will probably not make that much difference. But it is sure fun to complain about.

THE ECONOMY

ALL IS WELL IN EUROPE, CRISIS OVER: THEN WHY SECRET MEETINGS, WEAK BOND AUCTIONS, AND EVEN SOME TROUBLE REFLECTED IN U.S. CDS?

France bond sale struggles to find takers, similar to Italy on Wednesday.

Italy cannot find enough willing buyers for its bonds, failing to meet its funding goals. It had to offer more in interest, but even that could not induce enough buyers to cover the goal.

France had a weak demand for its bond sale Thursday. It was better than Italy. It damn well should have been.

Spain: Its 10 year bond yield spread with the German Bund hit 400BP intraday, the first time since November 2011.

Credit Swaps in the US bouncing. Posted the biggest rise in four months.

Bernanke meets in New York with the head of the families (the Big Banks).

Art Cashin spoke Thursday of a secret banker's meeting with Bernanke last week.

Fortune has learned that attendees included Jamie Dimon (J.P. Morgan), Bob Diamond (Barclays), Brady Dougan (Credit Suisse), Larry Fink (Blackrock), Gerald Hassell (Bank of New York Mellon), Glenn Hutchins (Silver Lake), Colm Kelleher (Morgan Stanley), Brian Moynihan (Bank of America), Steve Schwarzman (Blackstone Group) and David Vinar (Goldman Sachs).

Sources say Bernanke spoke at length about monetary policy, in an apparent effort to persuade attendees that they needed to take a more active role in helping to deal with the European debt crisis. He spent virtually no time discussing regulation, although that mantle got taken up by both Dimon (domestic regulation) and Schwarzman (global regulation).

TO VIEW THE ECONOMY SUMMARY VIDEO CLICK THE FOLLOWING LINK:
Economy Summary Video

OUTFLOWS CONTINUE, INSIDER SALES AS WELL.

The Dukes after their failed attempt to corner the frozen concentrated orange juice market.

Outflows continue their pace as one wonders just how much more the retail investor can take out.

March 28: -$3.5B

For 2012 thus far: -$19B

Same period 2011: -$10B

Bloomberg charts insider selling.

February: Insiders sell $6.8B
March: -$5.8B
Buying: February and March = 'negligible'

Gartmann: Insider selling 'concerning,' reaching 'epidemic proportions.'

Jobless claims down but up, less layoffs mean more hiring, and other illogic in the news media.

Things are that good? According to some in the media . . .

Initial Claims, 03/31 (8:30): 357K actual versus 355K expected, 363K prior (revised from 359K)

AP (Chistopher Rugaber): "The number of people seeking U.S. unemployment benefits fell to a four-year low last week, suggesting employers kept hiring in March at a healthy pace."

Week Actual Expected Prior Revised from
1/5/2012 372 375 387 381
1/12/2012 399 375 375 372
1/19/2012 352 385 402 399
1/26/2012 377 375 356 352
2/2/2012 367 375 379 377
2/16/2012 348 365 361 358
2/23/2012 351 355 351 348
3/1/2012 351 355 353 351
3/8/2012 362 355 354 351
3/15/2012 351 355 365 362
3/22/2012 348 355 353 351
3/29/2012 359 350 364 348
4/5/2012 357 355 363 359

THE MARKET

SENTIMENT INDICATORS

VIX: 16.7; +0.26
VXN: 17.96; +0.01
VXO: 15.79; +0.44

Put/Call Ratio (CBOE): 0.95; -0.04

Bulls versus Bears

This is a reading of the number of bullish investment advisors versus bearish advisors. The reason you look at this is that it gives you an idea of how bullish investors are. If they are too bullish then everyone is in the market and it is heading for a top: if everyone wants to be in the market, then all the money is in and there is no more new cash to drive it higher. On the other side of the spectrum if there are a lot of bears then there is a lot of cash on the sideline, and as the market rallies it drags that cash in as the bears give in. That cash provides the market the fuel to move higher. If bears are low it is the same as a lot of bulls: everyone is in and the market does not have the cash to drive it higher.

Bulls: 50.5% versus 48.4%. Well, turning right back up and gunning for the 51% peak hit a month back. Plenty of bullishness on the financial stations, even calls of Dow 17,000. Bullish sentiment is returning. Again, it is not excessively bullish. They are off the 55+ level even near the highs as investors get a bit pensive. Bigger picture that is good for the upside. That was the highest level since April and May of 2011, the peak of the post-bear market high. Now the indices are back at that level and so are the bulls. All the more reason to watch this action at the prior highs. 35% is the threshold measuring bullish versus bearish action. Six weeks the bulls were below bears. A powerful sentiment signal but now dissipating. Highs from April and December (60% readings spanning December through early May 2011). The 5 year high is 62.0. The crossover level at 29% bulls from July 2010 is long gone. 35% is the threshold level suggesting bullishness. To be seriously bearish it needs to get up to the 60% to 65% level.

Bears: 22.6% versus 23.6%. Down further from 26.6% three weeks back and having held at 25% to 26% for weeks. Still not excessive either way. Solidly lower after spending weeks at 30%ish. Not at a bearish level but they are growing more confident even as the market hits the prior highs and is not blasting on through. For more reference, bearishness hit a 5 year high at 54.4% the last week of October 2008. The move over 50 took bearish sentiment to its highest level since 1995. Extreme negative sentiment. Prior levels for comparison: Bearishness peaked at 37.4% in September 2007. It topped the June 2006 peak (36%) on that run. That June peak eclipsed the March 2006 high (33%) and well above the 2005 highs that spawned new rallies (30% in May 2005, 29.2% in October 2005). That was a huge turn, unlike any seen in recent history.

NASDAQ

Stats: +12.41 points (+0.4%) to close at 3080.5
Volume: 1.529B (-14.68%)

Up Volume: 835.14M (+634.56M)
Down Volume: 694.32M (-895.68M)

A/D and Hi/Lo: Decliners led 1.16 to 1
Previous Session: Decliners led 4.38 to 1

New Highs: 58 (+25)
New Lows: 52 (-8)

SP500/NYSE

Stats: -0.88 points (-0.06%) to close at 1398.08
NYSE Volume: 657M (-11.46%)

Up Volume: 1.09B (+520.02M)
Down Volume: 2.18B (-1.08B)

A/D and Hi/Lo: Decliners led 1.33 to 1
Previous Session: Decliners led 4.17 to 1

New Highs: 63 (+21)
New Lows: 42 (-9)

DJ30

Stats: -14.61 points (-0.11%) to close at 13060.14
Volume DJ30: 109M shares Thursday versus 125M shares Wednesday.

MONDAY

We have the jobs report on Friday, and 200K is expected. It is impossible to tell where the print will be because we just cannot tell what the government will do with the numbers. They are totally unreliable. As far as the unemployment rate at 8.3%, who knows what they will have. They move workers in and out of the jobs pool on a month-to-month basis. Sometimes it is daily. It is impossible to trust it. I will say they probably do not want to do too much with it because, if they do, it will be too noticeable. I guarantee you by midsummer that it will be under 8% regardless. The economy could be going back into recession, and it will be under 8% because that is a magic number for the election. I hate to sound cynical, but this absurdity of millions of workers disappearing overnight in January when the unemployment rate dropped just shows how absurd and how manipulated this has become.

Next week we have the usual suspects ending with the CPI on Friday. That should be very interesting because prices are rising and we have the preliminary Michigan Sentiment. In any event, the big news will still be on Friday. Of course we have to look at it from that perspective.

In the prior section, I went over my read of what will happen after the jobs report. It may not make any difference whatsoever that the market is closed. The weekend will give investors a chance to digest it, whether it is good or bad. It could be good, and it probably will be good for the very reason I just talked about. There is nothing in it for current people in power to have a weak report. We will figure out one way or another to make it more positive.

Thus we may get a surge to the upside. Of course we will be looking for opportunities to the upside if that occurs. There are still good patterns set up, and there are some great pullbacks in place that could make us some money. Of course the name of the game is to make some money no matter what you think of the merits of a rally or selloff (or whatever the market condition is). It does not matter what we think because the market is not listening to us. I do not care who you are, you do not have a crystal ball that tells you what will happen. I listen to these people on the financial stations every day and they tell you, looking straight into the camera, exactly will happen. But they do not have a clue. I mean, they have as much of a clue as anyone else that can make educated guesses. The market makes fools out of people who act upon educated guesses. The collective of millions upon millions of investors there is where your real power and knowledge. It will do what it wants to do.

We will be ready. We will look at upside, and downside. I have a suspicion that the jobs report will be just fine, thank you. We anticipate playing more upside, even though we did streamline the last few days because we did not want to go into the number with our castanets hanging out, so to speak. We wanted good, solid positions, and money available to put to work on other good, solid patterns that we can play on a good jobs report. The question is will a good report defeat the recent day-to-day volatility that has cropped up in the market? That will remain to be seen as well. As noted earlier, this is not devastating back-and-forth action. It is just a little bit of a change in the character. We will have to see if anything develops from there.

NASDAQ is down at it is 20 day EMA, a place that it has infrequently visited in this rally. That makes this a bit interesting as well. Certainly the action on Thursday was not enough to wipe away what happened on Wednesday. Given that, whatever occurs next week in the wake of the jobs report will be the telltale move of the near term. That is the next market run. A lot of people are expecting NASDAQ to bounce right up off of this 20 day EMA and continue. Frankly, it probably will do that. Even with the FOMC saying it would remove liquidity. Better yet, it said it would not put any more in until something broke. That is not the same as taking it off. There is still a lot in the system, so it could easily continue to the upside. But just as soon as we make that conclusion, it could make the breakout lower on the idea that the gravy train is over. The economy may not be strong enough to support economic activity without extra liquidity. If that is the case, the market will sell off.

Gosh, make up your mind. Well, we do not have to. We just play what the market gives us. We are set up really well. We are in some great positions, and we have other great positions we are looking to buy. We will have some more of those in the weekend report. We will be looking at the downside, too, in case things break. We have a lot of profit built up in these positions. We will be taking some because we have some April options, and expiration is coming in a couple of weeks. You have to remain flexible. Just as soon as you feel that you have it licked, then you get blindsided. You get that one "in your ear" as Shoeless Joe Jackson admonished the rookie Moonlight Graham in 'Field of Dreams.'

Have an excellent weekend whether you celebrate the Easter holiday or you practice any other religion. Enjoy family and friends. I talk a lot about economic troubles in the past and good times to come. It all starts at home; it all starts with your friends and family. We need to remember them at this time of year. Let us also remember those that are less fortunate in terms of their economic status and their health. We have several subscribers working with health issues, so let us watch after them as well. I am sorry if that gets anyone upset, but I cannot help it; this time of year means a lot to me. Have a great weekend. I will see you on Monday, but I will also have something to say after the jobs report.

Support and Resistance

NASDAQ: Closed at 3080.50
Resistance:
3134 is the March 2012 post-bear market peak
3227 is the April 2000 intraday low
3401 is the May 2000 closing low

Support:
The 20 day EMA at 3064
3042 from 5/2000 low
3026 from 10/2000 low
3000 is the February 2012 post-bear market high
The 50 day EMA at 2976
2910 is the recent March 2012 low
2900 is the March 2012 low
2888 is the May 2011 peak and PRIOR post-bear market high
2879 is the July 2011 peak
2862 is the 2007 peak
2841 is the February 2011 peak
2816 is the early April 2011 peak.
2754 is the October 2011 high
The 200 day SMA at 2711
2706 to 2705 is the April 2011 low and the February 2011 and consolidation low (bottom of the trading range) 2723 to 2705 is the range of support at the bottom of the January to May trading range
2686 is the January 2011 closing low
2676 is the January 2010 low and the December 2011 peak
2645-2650ish from December 2010 consolidation
2643 is the September 2011 high
2612 is the late August 2011 peak
2603 is the March 2011 intraday low (post-Japan low)
2599 is the June 2011 low and NASDAQ
2593 is the November intraday high
2580 is the November 2010 closing high
2555 is the mid-August 2011 peak
2535 is the November island reversal gap point
2441 is the November 2011 low

S&P 500: Closed at 1398.08

Resistance:
1425 from May 2008 closing highs
1433 from August 2007 closing lows
1440 from November 2007 closing lows

Support:
The 20 day EMA at 1398
1378 is the February 2012 peak
1371 is the May 2011 peak, the post-bear market high
The 50 day EMA at 1368
1357 is the July 2011 peak
1344 is the February 2011 peak
1340 is the early April 2011 peak
1332 is the early March 2011 peak
1318.51 is the May 2011 low
1295 to 1294 is the April 2011 low and the February 2011 consolidation low (bottom of the trading range)
1293 is the October 2011 peak
1275 is the January 2010 low, early January 2011 peak
The 200 day SMA at 1269
1267 is the December 2011 peak
1258 is June 2011 intraday low
1255 is the late December 2010 consolidation range
1249 is the March 2011 low (post-Japan)
1235 is the mid-December 2010 consolidation low
1231 is the late August 2011 peak
1227 is the November 2010 peak
1220 is the April 2010 peak
1209 is the mid-August 2011 high
1196 is the November 2010 consolidation peak
1178-1180 is the October 2010/November 2010 consolidation low
1158 is the November 2011 low
1131 - 1127 from August 2010 base peak.
1119 is the early August closing low
1109 is the mid-September 2010 gap up point
1101 is the August 2011 low
1099 from the mid-July interim peak
1075 is the October 2011 intraday low

Dow: Closed at 13,060.14
Resistance:
13,668 from 12-2007 peak
13,692 from 6-2007 peak
14,022 from 7-07 peak

Support:
13,058 from the May 2008 peak on that bounce in the selling
13,056 is the February 2012 high
The 50 day EMA at 12,939
12,876 is the May high
12,754 is the July intraday peak
12,391 is the February 2011 peak
12,284 is the October 2011 peak
12,258 is the December 2011 peak
The 200 day SMA at 12,114
12,110 from the March 2007 closing low
12,094 is the April 2011 low
The June low at 11,897 (closing)
11,734 from 11-98 peak
11,717 is the late August 2011 peak
The August low at 11,702
11,555 is the March low
11,452 is the November 2010 peak
11,178 from November 2010
10,978 is the bottom of the November 2010 consolidation
10,750 from September 2010
10,720 is the August closing low
10,705-710 from January 2010 peak
10,694-700 from August 2010 peak

Economic Calendar

April 2 - Monday
- ISM Index, March (10:00): 53.4 actual versus 53.0 expected, 52.4 prior
- Construction Spending, February (10:00): -1.1% actual versus 0.5% expected, -0.8% prior (revised from -0.1%)

April 3 - Tuesday
- Factory Orders, February (10:00): 1.3% actual versus 1.4% expected, -1.1% prior (revised from -1.0%)
- FOMC Minutes, 3/13 (14:00)
- Auto Sales, March (14:00): 5.5M prior
- Truck Sales, March (14:00): 5.9M prior

April 4 - Wednesday
- MBA Mortgage Index, 03/31 (7:00): 4.8% actual versus -2.7% prior
- ADP Employment Chang, March (8:15): 209K actual versus 217K expected, 230K prior (revised from 216K)
- ISM Services, March (10:00): 56.0 actual versus 56.7 expected, 57.3 prior
- Crude Inventories, 03/31 (10:30): 9.009M actual versus 7.102M prior

April 5 - Thursday
- Challenger Job Cuts, March (7:30): -8.8% actual versus 2.0% prior
- Initial Claims, 03/31 (8:30): 357K actual versus 355K expected, 363K prior (revised from 359K)
- Continuing Claims, 03/24 (8:30): 3338K actual versus 3360K expected, 3354K prior (revised from 3340K)

April 6 - Friday
- Nonfarm Payrolls, March (8:30): 200K expected, 227K prior
- Nonfarm Private Payrolls, March (8:30): 215K expected, 233K prior
- Unemployment Rate, March (8:30): 8.3% expected, 8.3% prior
- Hourly Earnings, March (8:30): 0.2% expected, 0.1% prior
- Average Workweek, March (8:30): 34.5 expected, 34.5 prior
- Consumer Credit, February (15:00): $14.0B expected, $17.8B prior

April 10 - Tuesday
- Wholesale Inventories, February (10:00): 0.5% expected, 0.4% prior

April 11 - Wednesday
- MBA Mortgage Index, 04/07 (7:00): 4.8% prior
- Export Prices ex-ag., March (8:30): 0.5% prior
- Import Prices ex-oil, March (8:30): -0.1% prior
- Crude Inventories, 04/07 (10:30): 9.009M prior
- Treasury Budget, March (14:00): -$188.2B prior

April 12 - Thursday
- Initial Claims, 04/07 (8:30): 355K expected, 357K prior
- Continuing Claims, 03/31 (8:30): 3350K expected, 3338K prior
- PPI, March (8:30): 0.3% expected, 0.4% prior
- Core PPI, March (8:30): 0.2% expected, 0.2% prior
- Trade Balance, February (8:30): -$52.0B expected, -$52.6B prior

April 13 - Friday
- CPI, March (8:30): 0.3% expected, 0.4% prior
- Core CPI, March (8:30): 0.2% expected, 0.1% prior
- Michigan Sentiment, April Preliminary (9:55): 76.1 expected, 76.2 prior

icon url

ReturntoSender

04/09/12 10:53 PM

#9738 RE: ReturntoSender #6755

From Briefing.com: 4:20 pm : Stock closed with a 1.1% loss on the day. The market showed some resilience intraday as the S&P 500 bounced about 0.6% from this morning's low to the afternoon high, but late-day weakness put a dent in that recovery effort. The S&P 500 is down around 2.6% over the past four days. As discussed throughout the day, today's decline follows Friday's disappointing employment data and precedes the Q1 earnings reporting season, which is expected to show more sluggish earnings growth than recent years.

As discussed in today's Page One report, expectations are for the S&P 500 in aggregate to post an increase in earnings of only about 3% compared to the first quarter of 2011. Reports in the end tend to come in above expectations, but the first quarter gain will undoubtedly be lower than the 14% gain for all of 2011, or the 9% gain for the fourth quarter of 2011.

Alcoa (AA 9.60, -0.03) kicks off earnings season with its earnings report tomorrow night, although AA's earnings should not be viewed as a barometer for the rest of earnings season. More importantly, we get reports from Google (GOOG 630.84, -1.48) on Thursday afternoon, followed by JP Morgan (JPM 43.89, -0.45) and Wells Fargo (WFC 33.42, -0.31) Friday morning.

Although there weren't any major earnings announcements today, there were several pieces of influential corporate news. Molina Healthcare (MOH 25.65, -9.36) fell 27% after the company was informed it was not selected to participate in the Ohio Medicaid Managed Care Plan Request for Applications. The company's contract with the state will expire without renewal at the end of 2012. Competitor, Centene (CNC 42.97, -7.83) is lower by 15% on similar news.

Shares of Eli Lily (LLY 39.72, -0.76) are down 1.6% despite the company announcing the Food and Drug Administration has approved Amyvid for use in patients under evaluation for Alzheimer's and other diseases related to cognitive decline.

Shares of AOL (AOL 26.40, +7.98) are one of the few bright spots, trading up 42% after the company announced a $1 billion patent deal with Microsoft (MSFT 31.10, -0.42). The deal pays AOL $1.056 billion in cash for more than 800 of its patents and their related applications. Today's announcement includes the sale of stock of an AOL subsidy upon which the company expects to see a capital loss for tax purposes.

Finally, it was also reported that Facebook will buy mobile photo sharing company Instagram, for $1 billion. This initially led to weakness in Shutterfly (SFLY 28.21, -1.26), due to competitive concerns, but it has since recovered the majority of its headline-driven decline.

Looking at fixed income, treasuries saw gains for a fourth consecutive session and have now erased all of their losses following the March 13 FOMC meeting. Today's buying has dropped the 10-yr yield to a low of 2.019% but closing near 2.037%. Flattening persists along the yield curve with the 2-10-yr spread tighter at 171.5 basis points.

Finally, volume was relatively light today, with Europe still closed for Easter.DJ30 -130.55 NASDAQ -33.42 SP500 -15.88 NASDAQ Adv/Vol/Dec 462/1.33 bln/2080 NYSE Adv/Vol/Dec 636/724.8 mln/2415

Apple (AAPL $627.76 -5.98) was downgraded to Neutural from Buy at BTIG Research and the firm is removing their price target of $600 which was surpassed. The firm's downgrade is based on their belief that investors should pause to consider: the changing dynamics in the post-paid wireless industry, which has seen margins squeezed by the frequent upgrade activity of iPhone customers, the sustainability of a $600 iPhone and possible need for a price cut, and the elevated expectation that the company will deliver another revolutionary product into the market.

AOL (AOL $26.42 +8.03) and Microsoft (MSFT $31.15 -0.36) announced that it has entered into a definitive agreement to sell over 800 of its patents and their related patent applications to Microsoft (MSFT) and to grant Microsoft a non-exclusive license to its retained patent portfolio for aggregate proceeds of $1.056 billion in cash. AOL also received a license to the patents being sold to Microsoft. The patent sale includes the sale of the stock of an AOL subsidiary upon which AOL expects to record a capital loss for tax purposes and as a result, cash taxes in connection with the sale should be immaterial. Additionally, AOL expects to utilize approximately $40 million of its existing deferred tax assets, representing approximately 20 percent of its total deferred tax assets, to offset any ordinary income taxes resulting from the license of its remaining patent portfolio. AOL management and its Board of Directors intend to return a significant portion of the sale proceeds to shareholders and will determine the most efficient and effective method to do so prior to the closing of the transaction. Pro forma for the sale and license, as of December 31, 2011, AOL would have had approximately $15 per share of cash on hand. The transaction is expected to be completed by the end of 2012.

10:19 am Technology stocks trading lower today along with broader market

The tech sector is trading lower today along with losses in the broader market. Semiconductors are showing relative weakness in the tech space, however, with the Philly Semi Index trading 1.9% lower. RBCN (-4.9%) is a notable laggard in the chip index, while IDCC (+3.2%) is bucking the trend. Among other major indices, the SPY is trading 1.3% lower today, while the QQQ is 1.2% lower and the NASDAQ is trading 1.4% lower on the session.

Among tech bellwethers, ORCL (-1.7%) and INTC (-1.6%) are under notable pressure. In earnings, CKSW (-13.1%) lowered Q1 rev guidance. In news, AOL (+42.5%) announced that it has entered into a definitive agreement to sell over 800 of its patents and their related patent applications to MSFT (-1.4%) and to grant Microsoft a non-exclusive license to its retained patent portfolio for aggregate proceeds of $1.056 billion in cash. IDCC (+3.2%), VHC (+1.2%), and RIMM (+3.5%) are getting picked up as sympathy plays on the news.

Among notable analyst upgrades this morning, SBAC (+0.1%) was upgraded to Buy at Citigroup. While in downgrades, BTIG Research downgraded AAPL (-0.9%) to Neutral, PLCM (-2.5%) was downgraded to Sector Perform at RBC, MITK (-6.5%) was downgraded to Market Perform at JMP Securities and Stifel Nicolaus downgraded FFIV (-3.3%) to Hold. There are no notable names in tech scheduled to report results today after the close.

09:35 am AOL surges over 35% following $1 bln patent deal with Microsoft (MSFT)

AOL (AOL $24.88 +6.46) and Microsoft (MSFT $31.17 -0.37) announced that it has entered into a definitive agreement to sell over 800 of its patents and their related patent applications to Microsoft Corporation (MSFT) and to grant Microsoft a non-exclusive license to its retained patent portfolio for aggregate proceeds of $1.056 billion in cash. AOL also received a license to the patents being sold to Microsoft. The patent sale includes the sale of the stock of an AOL subsidiary upon which AOL expects to record a capital loss for tax purposes and as a result, cash taxes in connection with the sale should be immaterial.

Additionally, AOL expects to utilize approximately $40 million of its existing deferred tax assets, representing approximately 20 percent of its total deferred tax assets, to offset any ordinary income taxes resulting from the license of its remaining patent portfolio. AOL management and its Board of Directors intend to return a significant portion of the sale proceeds to shareholders and will determine the most efficient and effective method to do so prior to the closing of the transaction. Pro forma for the sale and license, as of December 31, 2011, AOL would have had approximately $15 per share of cash on hand. The transaction is expected to be completed by the end of 2012.
icon url

ReturntoSender

04/10/12 9:53 PM

#9739 RE: ReturntoSender #6755

From Briefing.com: 4:10 pm : Equities saw heavy selling today as European sovereign debt worries moved back into the forefront. Selling of peripheral debt caused the Italian and Spanish 10-yr yields to spike as much as 30 basis points to 5.67% and 5.99% respectively. The rise in yields sparked a flight into the safety of German Bunds with the 2-, 5-, and 10-yr yields falling to record lows. Here in the U.S., equities opened flat, and held their early levels until whole inventories came in with a larger than expected 0.9% gain. Sellers piled on after a few minutes of choppy trade and remained in control all session long as the Nasdaq paced today’s decline with a loss of 1.8%.

European financials saw significant selling pressure on the rise of peripheral yields. Numerous financial stocks were halted across Italy, and that weighed on Barclays (BCS 13.01, -0.73), Deutsche Bank (DB 43.50, -1.48), and Societe Generale (SCGLY.PK 4.85, -0.32).

Best Buy (BBY 21.32, -1.33) lost 5.9% after the resignation of Chief Executive Officer Brian Dunn. The company named Director Mike Mikan interim CEO until a permanent replacement is hired. Shares surged more than 4.0% in initial reaction to Mr. Dunn’s resignation, but the stock rolled over as equities sold off.

ViroPharma (VPHM 22.44, -6.17) finished down 21.6% on word that Akorn launched the generic version of the company’s Vancocin after the Food & Drug Administration denied its citizen petition regarding bioequivalence and exclusivity. Today’s weakness dropped the stock to its worst levels since November 28.

Shares of SuperValue (SVU 6.13, +0.81) gained 15.2% following the company’s better than expected fourth quarter earnings. The company announced earnings per share of $0.38 which topped Capital IQ Consensus Estimate of $0.36 per share. Revenues missed expectations, coming in at $8.23 billion on expectations of $8.32 billion.

Grain ETFs fell despite today’s bullish grains report. The USDA World Agricultural Supply and Demand report (WASDE) indicated global corn ending stocks (inventory) fell 1.82 million metric tons (mmt), or 1.5%, to 122.71 mmt, driven by inventory declines outside of the U.S. Also, South American crop production is expected to drop as estimates for Argentina (to 22 mmt from 21.5) and Brazil (to 11.5 mmt from 12) declined. Select grain ETFs Powershares DB Agriculture Fund (DBA 27.51, -0.37), iPath Dow Jones-UBS Gains Sub-Index (JJG 46.75, -0.75), and Teucrium Corn (CORN 38.79, -0.62) are moved lower on broad-based market weakness.

Treasuries saw strong gains as today’s flight to safety dropped the 10-yr yield below 2.00% for the first time in a month. Curve flattening continued with the 2-10-yr spread tightening to 169.5 basis points. Meanwhile, corporate bonds underperformed with iShares iBoxx $ Investment Grade ETF (LQD 115.52, -0.07) down 0.1%, and SPDR Barclays Capital High Yield ETF (JNK 38.69, -0.14) sliding 0.4% to see a seventh consecutive session of losses.

Wednesday’s data slate includes the weekly MBA Mortgage Index, import/export prices, the Treasury budget, and the Fed’s Beige Book. Treasury will hold a 10-yr note reopening.DJ30 -213.66 NASDAQ -55.86 SP500 -23.61 NASDAQ Adv/Vol/Dec 464/1.90 bln/2049 NYSE Adv/Vol/Dec 463/970.7 mln/2610

4:18PM LDK Solar has changed the Q4 release date to April 30 from April 12; mgmt needs additional time to finalize certain items (LDK) 3.23 -0.07 : Co says mgmt needs additional time to finalize certain items, including an impairment analysis of long-lived assets and an assessment of inventory write-downs and provisions for certain receivables. These provisions and the previously provided outlook for the fourth quarter 2011 are preliminary estimates and the Company has yet to complete its preliminary review and compilation of its financial information for the quarter. Results are subject to change based on further review by management.

4:09PM Alcoa beats by $0.13, beats on revs; reaffirms FY12 global alumina demand +7% (AA) 9.32 -0.28 : Reports Q1 (Mar) adj. earnings of $0.10 per share, $0.13 better than the Capital IQ Consensus Estimate of ($0.03); revenues rose 0.8% year/year to $6.01 bln vs the $5.75 bln consensus. The improvement over 4Q11 results was driven by strong productivity improvements across all businesses, higher realized prices for aluminum, and improved volume and mix. These were offset somewhat by a lower realized alumina price and higher input costs. Alcoa recorded revenue growth in Q1 across global end markets, including industrial products (14%), automotive (13%), packaging (11%), and commercial transportation (11%), compared to fourth quarter 2011. Compared to first quarter 2011, revenues were up in commercial transportation (32%), aerospace (15%), and automotive (7%), while revenues were down in industrial products (14%) and building and construction (5%). Alcoa is raising its 2012 global growth forecast for the aerospace market 3 percentage points (13-14%), and expects global growth in the automotive (3-7%), commercial transportation (1-5%), packaging (2-3%), building and construction (2.5 - 3.5%), and industrial gas turbine (1-2%) markets. Alcoa continues to project a global aluminum supply deficit in 2012 and reaffirmed its forecast that global aluminum demand would grow 7% in 2012, on top of the 10% growth seen in 2011.

4:06PM Applied Micro lowers Q4 guidance (AMCC) 6.26 -0.08 : Co issues downside guidance for Q4 (Mar), sees EPS of ($0.10)-($0.12) vs. ($0.08) Capital IQ Consensus Estimate; sees Q4 (Mar) revs of $48.9 mln vs. $52.04 mln Capital IQ Consensus Estimate. "The overall shortfall of $3.1M was spread across both the Transport and Processor product families. Our OTN revenue and sequential ramp came through as expected and did not contribute to the revenue shortfall. The revenue shortfall is related to slowness in the service provider space and the overall wire line market weakness."

4:06PM SMSC beats by $0.22, misses on revs; guides Q1 EPS above consensus, revs above consensus (SMSC) 24.23 -0.08 : Reports Q4 (Feb) earnings of $0.05 per share, excluding non-recurring items, $0.22 better than the Capital IQ Consensus Estimate of ($0.17); revenues fell 11.2% year/year to $89.9 mln vs the $90.95 mln consensus. Co issues upside guidance for Q1, sees EPS of $0.29-0.38, excluding non-recurring items, vs. $0.27 Capital IQ Consensus Estimate; sees Q1 revs of $98-102 mln vs. $97.70 mln Capital IQ Consensus Estimate.

4:00PM RF Micro Device announced that Jerry Neal, co-founder and executive vice president of marketing, is retiring from RFMD, effective May 31, 2012 (RFMD) 4.38 -0.07 :

O2Micro International (OIIM) was issued 28 claims under a U.S. patent for its Power System invention. Co was also issued 16 claims for its Light Source Driving Circuit methodology.

Sanmina-SCI (SANM) announced it has redeemed $100.0 mln in aggregate principal amount of its 8.125% Senior Subordinated Notes due 2016.

Dell (DELL $16.59 -0.01) announced it has signed a definitive agreement to acquire Wyse Technology to extend its desktop virtualization offerings. The addition of Wyse will expand Dell's desktop virtualization capabilities and provide new solutions and services opportunities for the full range of Dell's enterprise offerings. The transaction was approved by the board of directors of each company and is expected to be accretive to Dell non-GAAP earnings in the second half of its Fiscal Year 2013. Additional terms of the transaction were not disclosed. The transaction remains subject to customary conditions and is expected to close in the second quarter of Dell's fiscal year 2013.

Canaccord's monthly channel checks indicated strong sales trends for Apple's (AAPL $607.09 +7.72) iPhone 4S at all three U.S. carriers and strong overall iPhone sales in international markets, with particular strength driven by the iPhone 4S launch at China Telecom (CHA) and Unicom (CHU). Firm maintains belief Apple is well positioned for strong C2012/13 sales and earnings growth driven by new product introductions, including the new iPad, the pending refresh of MacBook Air/Pro, an LTE iPhone likely in Q3/C2012, and potentially Apple TV exiting C2012.

09:28 am Qualcomm target raised to $75 at Oppenheimer: . Oppenheimer raises their QCOM tgt to $75 from $70 as they expect a good March quarter from QCOM spurred by Apple (AAPL) and Samsung. They are also incrementally more comfortable QCOM will gain share in 2012-13 due to its favorable vendor mix as the iPhone 5 and new Galaxy phones launch and with increased 4G LTE adoption. They are raising their estimates accordingly and see the potential for upside as normal chipset ASP declines could be muted by accelerating LTE adoption (2012 EPS raised to $3.81 from $3.71 vs $3.86 CIQ consensus).

10:50 am Technology sector trading just ahead of broader market

The tech sector is trading slightly higher today, just ahead of losses in the broader market. Semiconductors are showing relative strength in the tech space, however, with the Philly Semi Index trading 0.4% higher. CREE (+7.0%) is a notable leader in the chip index, while STM (-3.8%) is bucking the trend. Among other major indices, the SPY is trading 0.3% lower today, while the QQQ is 0.1% lower and the NASDAQ is trading 0.2% lower on the session. Among tech bellwethers, AAPL (+1.0%) is showing notable strength.

In earnings last night, HLIT (-3.1%) lowered its Q1 guidance. This morning, SMI (+4.9%) raised its Q1 guidance, while SNE (-7.7%) lowered its guidance. In news, XRIT (+38.5%) announced an agreement that DHR (-1.0%) would acquire the company for $5.55 per share. Among rumors, we are hearing renewed MSFT (-0.4%) for RIMM (-1.2%) takeover chatter making the rounds.

Among notable analyst upgrades this morning, DELL (+1.5%), CALX (+4.2%), and INFN (+3.6%) were upgraded to Equal Weight from Underweight at Morgan Stanley. While in downgrades, APH (-1.2%) was downgraded at Keybanc to Hold.

There are no notable names in tech scheduled to report results today after the close.
icon url

ReturntoSender

04/11/12 11:58 PM

#9740 RE: ReturntoSender #6755

From Briefing.com: 4:10 pm : Stocks finished off their best levels as the early morning excitment following the Spanish auctions and better than expected earnings from Alcoa faded over the course of the session. The Fed's latest Beige Book was released this afternoon, and suggested that overall economic activity in the dozen Fed districts continued to increase at a modest to moderate pace in February and early March. Reports of consumer spending were "encouraging." However, stocks saw little response to the Beige Book, and drifted lower over the remainder of the session as some traders worried the good news would prevent the Fed from implementing a third round of quantitative easing later this year.

Shares of Alcoa (AA 9.90, +0.58) jumped 6.2% after the company posted a surprise gain of $0.10 per share for the first quarter when the Capital IQ Consensus Estimate was calling for a loss of $0.03. Revenues climb 0.8% YoY to $6.01 billion, and the company raised its 2012 global growth forecast for the aerospace market three percentage points. The company also expects global aluminum demand to grow 7% in 2012.

Nokia (NOK 4.24, -0.79) plunged 15.7% after the company lowered its first quarter devices and services operating margin guidance to approximately -3%. This compares with the company’s previous forecast which projected a a range of “around breakeven, ranging either above or below by approximately 2%.” Competitive industry dynamics, particularly in India, the Middle East, Africa, and China were stated as reasons for the change in forecast.

JC Penney (JCP 34.43, +1.22) gained 3.7% after announcing the departure of CFO Michael Dastugue. COO Michael Kramer will hold the position as interim CFO until a replacement can be found.

Banco Santander (STD 6.70, +0.19), Barclays (BCS 13.49, +0.48), and Deutsche Bank (DB 45.06, +1.56) finished off their opening highs as traders took profits on the early surge. The strength in European financials came after Italy raised EUR11 bln through the sale of short-term bills. The space will remain in focus tomorrow as Italy readies for 5- and 10-yr note auctions.

Apple (AAPL 626.20, -2.24) lost 0.4% after the Department of Justice filed an antitrust suit against the company and several publishers who they say colluded to fix eBook prices.

Treasuries ended the day off their worst levels, but still saw sizable losses as traders dumped maturities and moved back into riskier assets. The 10-yr fell just less than half a point and saw its yield climb four basis points to 2.028%. Today’s selling swung the yield curve steeper as the 2-10-yr spread widened to 174.5 basis points. DJ30 +89.54 NASDAQ +25.24 SP500 +10.12 NASDAQ Adv/Vol/Dec 1964/1.48 bln/549 NYSE Adv/Vol/Dec 2429/779.4 mln/643

4:01PM Micron launches $870 mln offering of convertible senior notes (MU) 7.17 +0.02 : Co announced that it intends to offer, subject to market and other considerations, $435.0 mln aggregate principal amount of convertible senior notes due 2032 and $435.0 mln aggregate principal amount of convertible senior notes due 2032. The terms of the Notes will require Micron to repurchase such Notes at the option of the holders for cash on dates to be determined, in each case at a purchase price equal to the principal amount thereof plus accrued and unpaid interest to, but excluding the repurchase date.

Mattson Technology (MTSN) announced that a CMOS image sensor manufacturer has accepted the paradigmE etch system, which was shipped in the 4Q 2011, for use in its production facility.

SMSC (SMSC $28.69 +2.46) reported fourth quarter earnings of $0.05 per share, excluding non-recurring items, $0.22 better than the Capital IQ Consensus of ($0.17), while revenues fell 11.2% year/year to $89.9 million versus the $90.95 mln consensus. The company issued upside guidance for the first quarter with EPS of $0.29-0.38, excluding non-recurring items, versus the $0.27 consensus and revenues of $98-102 million versus the $97.70 million consensus.

Applied Micro (AMCC $6.25 -0.01) issued downside guidance for the fourth quarter with EPS of ($0.10)-($0.12) versus the ($0.08) consensus and fourth quarter revenues of $48.9 million versus the $52.04 million Capital IQ Consensus Estimate. "The overall shortfall of $3.1M was spread across both the Transport and Processor product families. Our OTN revenue and sequential ramp came through as expected and did not contribute to the revenue shortfall. The revenue shortfall is related to slowness in the service provider space and the overall wire line market weakness."

09:44 am SMSC shares spike over 10% following beat on earnings per share

SMSC (SMSC $26.72 +2.49) reported fourth quarter earnings of $0.05 per share, excluding non-recurring items, $0.22 better than the Capital IQ Consensus of ($0.17), while revenues fell 11.2% year/year to $89.9 million versus the $90.95 mln consensus.

The company issued upside guidance for the first quarter with EPS of $0.29-0.38, excluding non-recurring items, versus the $0.27 consensus and revenues of $98-102 million versus the $97.70 million consensus.

09:42 am Applied Micro shares little changed despite downside guidance

Applied Micro (AMCC $6.26 +0.00) issued downside guidance for the fourth quarter with EPS of ($0.10)-($0.12) versus the ($0.08) consensus and fourth quarter revenues of $48.9 million versus the $52.04 million Capital IQ Consensus Estimate.

"The overall shortfall of $3.1M was spread across both the Transport and Processor product families. Our OTN revenue and sequential ramp came through as expected and did not contribute to the revenue shortfall. The revenue shortfall is related to slowness in the service provider space and the overall wire line market weakness."

09:39 am Alcoa kicks off earnings season with beat on top and bottom lines, shares rise over 6%

Alcoa (AA $9.95 +0.63) reported first quarter adjusted earnings of $0.10 per share, $0.13 better than the consensus of ($0.03), while revenues rose 0.8% year/year to $6.01 billion versus the $5.75 billion consensus. The improvement over 4Q11 results was driven by strong productivity improvements across all businesses, higher realized prices for aluminum, and improved volume and mix. These were offset somewhat by a lower realized alumina price and higher input costs.

Alcoa recorded revenue growth in Q1 across global end markets, including industrial products (14%), automotive (13%), packaging (11%), and commercial transportation (11%), compared to fourth quarter 2011. Compared to first quarter 2011, revenues were up in commercial transportation (32%), aerospace (15%), and automotive (7%), while revenues were down in industrial products (14%) and building and construction (5%). Alcoa is raising its 2012 global growth forecast for the aerospace market 3 percentage points (13-14%), and expects global growth in the automotive (3-7%), commercial transportation (1-5%), packaging (2-3%), building and construction (2.5 - 3.5%), and industrial gas turbine (1-2%) markets. Alcoa continues to project a global aluminum supply deficit in 2012 and reaffirmed its forecast that global aluminum demand would grow 7% in 2012, on top of the 10% growth seen in 2011.

09:36 am Nokia shares fall more than 12% following profit warning

Nokia (NOK $4.39 -0.64) currently estimates that its non-IFRS Devices & Services operating margin in Q1 was approx. -3%, compared to the previously expected range of "around breakeven, ranging either above or below by ~2 percentage points" primarily due to Competitive industry dynamics, which negatively affected net sales in the Mobile Phones and Smart Devices business units, particularly in India, the Middle East and Africa and China; and gross margin declines, particularly in the Smart Devices business unit. Nokia currently estimates that Devices & Services net sales in Q1 were EUR 4.2 bln, comprised of Mobile Phones net sales of EUR 2.3 billion (71 million units), Smart Devices net sales of EUR 1.7 billion (12 million units), and Devices & Services Other net sales of EUR 0.2 billion. Based on the preliminary view, Nokia ended the first quarter 2012 around the high end of our normal 4 to 6 week channel inventory range, but on an absolute unit basis, channel inventories declined sequentially. In Q1, Nokia sold more than 2 million Lumia devices at an ASP of approxmately EUR 220. Furthermore, Nokia has seen sequential growth in Lumia device activations every month since starting sales of Lumia devices in November 2011. Lumia has gained market share with both distribution partners and consumers. The Windows Phone ecosystem is also attracting developers and has expanded rapidly with more than 80,000 applications available.

Q2 outlook: The company expects its non-IFRS Devices & Services operating margin in the second quarter to be similar to or below the first quarter 2012 level. This outlook reflects that the first quarter of 2012 benefit related to lower warranty costs is expected to be non-recurring, as well as expectations regarding a number of factors including: - competitive industry dynamics continuing to negatively affect the Smart Devices and Mobile Phones business units; - timing, ramp-up, and consumer demand related to new products; and- the macroeconomic environment... Nokia will continue to increase its focus on accelerating Lumia sales, as well as on lowering the company's cost structure, improving cash flow and maintaining a strong financial position.
icon url

ReturntoSender

04/15/12 10:10 AM

#9742 RE: ReturntoSender #6755

From Briefing.com: Weekly Recap - Week ending 13-Apr-12Dow -136.99 at 12849.52, Nasdaq -44.22 at 3011.33, S&P -17.30 at 1370.27.

The S&P 500 closed down 2.0% for the week and saw its biggest weekly decline in 2012 as European sovereign debt fears and disappointing U.S. data weighed. Worries over the health of Spain came to a head on Friday after it was reported net borrowing by Spanish banks from the European Central Bank surged to EUR228 billion in March from EUR152 billion in February.

That news sent Spanish CDS up to a record high near 500 basis points, and caused its 10-yr yield to climb back above 6.00%. Economic data here in the U.S. also disappointed as claims data and Michigan Sentiment fell short of estimates.

This week's losses came despite a two-day rally in the middle of the week that saw equities climb more than 2.0% on the possibility of more quantitative easing following a speech from Fed Vice Chairman Janet Yellen who suggested the Fed could hold rates low through 2015 if necessary.

Earnings season got started on the right foot as Alcoa, Google, JP Morgan Chase, and Wells Fargo all reported better than expected results.
 
Index Started Week Ended Week Change % Change YTD %
DJIA 13060.14 12849.59 -210.55 -1.6 5.2
Nasdaq 3080.50 3011.33 -69.17 -2.2 15.6
S&P 500 1398.08 1370.26 -27.82 -2.0 9.0
Russell 2000 818.18 796.29 -21.89 -2.7 7.5
3:40PM Earnings Preview for the week of April 16th-20th (SUMRX) : Of the hundreds of companies reporting earnings the week of April 16th-20th some of the bigger names include:

Monday: C, MTB, BRO, ICUI.
Tuesday: KO, CMA, FRX, GS, JNJ, NTRS, STT, AMTD, USB, CREE, IBM, INTC, ISRG, STX, and YHOO.
Wednesday: ABT, BLK, FCFS, HAL, PJC, PII, STJ, TXT, AXP, CBST, EBAY, FFIV, MAR, QCOM, VMW, and YUM.
Thursday: BAC, BX, DD, EMC, FITB, KEY, MS, NOK, NUE, BTU, PM, LUV, VZ, ALTR, CMG, CB, ETFC, FSL, MBFI, MSFT, SNDK, and TPX
Friday: AEP, CP, GE, HON, KCI, and SLB

8:01AM Micron announces pricing of convertible senior notes offerings (MU) 7.12 : Co announced the pricing of an offering of $480.0 mln aggregate principal amount of its 2.375% convertible senior notes due 2032 and $390.0 mln aggregate principal amount of its 3.125% convertible senior notes due 2032.

Maxthon announced its collaboration with Intel (INTC). Though this partnership, Maxthon will work closely with Intel to optimize its browser-based GPU acceleration technology with Intel's next generation of chips.

Google (GOOG $635.00 -16.01) reported first quarter earnings of $10.08 per share, excluding non-recurring items, $0.44 better than the Capital IQ Consensus of $9.64; net revenues rose 24.5% year/year to $8.14 billion versus the $8.15 bln consensus. Aggregate paid clicks, which include clicks related to ads served on Google sites and the sites of our Network members, increased approxmately 39% over the first quarter of 2011 and increased approxmately 7% over the fourth quarter of 2011. Average cost-per-click, which includes clicks related to ads served on Google sites and the sites of our Network members, decreased approxmately 12% over the first quarter of 2011 and decreased ~6% over the fourth quarter of 2011. Non-GAAP operating income in the first quarter of 2012 was $3.94 billion, or 37% of revenues. This compares to non-GAAP operating income of $3.23 billion, or 38% of revenues, in the first quarter of 2011. Operating expenses, other than cost of revenues, were $3.47 billion in the first quarter of 2012, or 33% of revenues, compared to $3.34 billion in the first quarter of 2011, or 39% of revenues. As of March 31, 2012, cash, cash equivalents, and short-term marketable securities were $49.3 billion. Operating expenses, other than cost of revenues, were $3.47 billion in the first quarter of 2012, or 33% of revenues, compared to $3.34 billion in the first quarter of 2011, or 39% of revenues. Google announced that its Board of Directors unanimously approved a stock dividend proposal designed to preserve the corporate structure that has allowed Google to remain focused on the long term. Proposal would effectively implement 2-for-1 stock split while preserving long-term governance structure.

Powerwave (PWAV $1.42 -0.73) issued downside guidance for the frist quarter with revenues of $40-45 mln versus the $62.30 million consensus. For the first quarter, the company continued to encounter weakness in several of its markets, as network operators continued to be conservative in their spending plans and several markets continued to delay capital spending plans.

Infosys (INFY $49.09 -7.68) reported fourth quarter earnings of INR40.54 per share, INR0.72 worse than the consensus of INR41.26, while revenues rose 22.1% year/year to INR88.52 billion but may not compare to the INR92.15 bln consensus. The company issued guidance for the first quarter with EPS of INR36.89, may not be comparable to INR40.29 consensus and revenues of INR90110-91000, may not be comparable to INR94.47 billion consensus The company issued guidance for fuscak year 2013 with EPS of INR158.76-161.41, may not be comparable to INR169.08 consensus and revenues of INR384310-391360, may not be comparable to INR397.08 bln consensus.

10:21 am CPI gain in line with expectations

Consumer prices increased 0.3% in March, down from 0.4% in February and exactly in-line with the Briefing.com consensus expectation. Gasoline prices increased 1.7% in March after increasing 5.7% in February. The gain in gasoline more than offset a 0.4% decline in household energy services and led the overall energy index up 0.9%. This was in direct contrast to the March PPI, where the seasonal adjustments deflated the gasoline prices by such a large extent that overall energy prices were down on a month-to-month basis.

Food prices increased 0.2%. Year-over-year, headline inflation declined to 2.7%. That is the sixth consecutive monthly decline. Excluding food and energy, core prices increased 0.2% in March, up from 0.1% in February and also in-line with expectations. All of the major sub-indices showed positive price growth in March. Strong price increases for used vehicles (1.3%) and shelter (0.2%) provided the bulk of the gain in core prices. Year-over-year, core prices continued its steady upward trend and increased to 2.3%.

10:20 am Weak employment growth weighs down consumer sentiment

The preliminary reading of the University of Michigan Consumer Sentiment Index for April decreased from 76.2 in March to 75.7. The Briefing.com consensus expected the index to hold fairly stable at 76.1.

Consumer sentiment generally trends with changes in oil/gasoline prices, unemployment, the stock market, and media reports. With gasoline prices holding pretty steady over the past few weeks, the slight decline in sentiment is most likely a response to the sudden deceleration in employment growth announced in the March employment report. That likely led the Present Conditions Index down from 86.2. in March to 80.7 in April.

Consumers seem to believe, however, that the weakness in the economic situation is temporary. The Future Expectations Index increased from 69.8 to 72.5. That its highest level since reaching 73.5 in September 2009. The drop in sentiment does not affect our consumption outlook. Consumption growth is reliant upon income growth. As long as the employment numbers return to an upward moving track, consumption growth will follow suit regardless of the performance of the Consumer Sentiment Index.

10:05 am Well Fargo shares fall by 2% despite beat on earnings

Wells Fargo (WFC +33.43 -0.59) reported first quarter earnings of $0.75 per share, $0.03 better than the consensus of $0.72, while revenues rose 5.0% year/year to $21.64 billion versus the $20.5 bln consensus. Revenue increased $1 billion from fourth quarter 2011, to $21.6 billion. Total revenue increased due to growth in noninterest income, including strong mortgage banking and market sensitive revenues, while net interest income remained stable. Businesses generating linked-quarter revenue growth included asset-backed finance, brokerage services, capital finance, capital markets, commercial banking, corporate banking, corporate trust, dealer services, equity funds, global remittance, insurance, international, mortgage banking, personal credit management, real estate capital markets, retail sales finance, private student lending, and wealth management.

Net interest income was $10.9 billion, in line with fourth quarter 2011. Average earning assets were essentially unchanged from the prior quarter. The net interest margin increased to 3.91 percent from 3.89 percent in fourth quarter 2011 as the benefit of disciplined deposit pricing and redeployment of short-term investments into long-term securities offset the runoff of higher yielding loans and investments.

09:53 am JP Morgan shares decline by nearly 2% despite beat on earnings

JPMorgan (JPM $43.93 -0.91) reported first quarter GAAP earnings of $1.31 per share, $0.16 better than the Capital IQ GAAP Consensus Estimate of $1.15; revenues rose 5.9% year/year to $26.71 billion versus the $24.6 billion consensus. Net income was $5.4 billion, down by $172 million, or 3%, from the prior year. The decrease in earnings was driven by higher noninterest expense, largely offset by higher net revenue. Noninterest revenue was $15.6 bln, up by $1.8 bln, or 13%, from the prior year.

The increase was driven by higher mortgage fees and related income and a $1.1 bln benefit from the Washington Mutual bankruptcy settlement, partially offset by lower principal transaction revenue, driven by a $907 mln loss from DVA. Net interest income was $11.8 bln, down by $187 mln, or 2%, compared with the prior year. Credit: The provision for credit losses was $726 mln, down $443 mln, or 38%, from the prior year. The total consumer provision for credit losses was $637 mln, down $918 mln from the prior year. The decrease in the consumer provision reflected improved delinquency trends across most consumer portfolios compared with the prior year, partially offset by the effect of a lower net reduction in the allowance for loan losses compared with the prior year. Consumer net charge-offs1 were $2.4 bln, compared with $3.6 bln in the prior year, resulting in net charge-off rates of 2.60% and 3.77%, respectively. The Firm's allowance for loan losses to end-of-period loans retained was 3.11%, compared with 4.10% in the prior year.

The Firm's nonperforming assets totaled $11.7 bln at March 31, 2012, down from the prior-year level of $15.0 bln and up from the prior-quarter level of $11.0 bln... Noninterest expense was $18.3 bln, up 15% from the prior year, driven by higher compensation and noncompensation expense, including $2.5 bln of additional litigation reserves, predominantly for mortgage-related matters.

09:50 am Google shares decline by 2% following miss on revenues and declines in cost per click

Google (GOOG $638.16 -12.86) reported first quarter earnings of $10.08 per share, excluding non-recurring items, $0.44 better than the Capital IQ Consensus of $9.64; net revenues rose 24.5% year/year to $8.14 billion versus the $8.15 bln consensus. Aggregate paid clicks, which include clicks related to ads served on Google sites and the sites of our Network members, increased approximately 39% over the first quarter of 2011 and increased approximately 7% over the fourth quarter of 2011. Average cost-per-click, which includes clicks related to ads served on Google sites and the sites of our Network members, decreased approximately 12% over the first quarter of 2011 and decreased ~6% over the fourth quarter of 2011.

Non-GAAP operating income in the first quarter of 2012 was $3.94 billion, or 37% of revenues. This compares to non-GAAP operating income of $3.23 billion, or 38% of revenues, in the first quarter of 2011. Operating expenses, other than cost of revenues, were $3.47 billion in the first quarter of 2012, or 33% of revenues, compared to $3.34 billion in the first quarter of 2011, or 39% of revenues. As of March 31, 2012, cash, cash equivalents, and short-term marketable securities were $49.3 billion. Operating expenses, other than cost of revenues, were $3.47 billion in the first quarter of 2012, or 33% of revenues, compared to $3.34 billion in the first quarter of 2011, or 39% of revenues. Google announced that its Board of Directors unanimously approved a stock dividend proposal designed to preserve the corporate structure that has allowed Google to remain focused on the long term. Proposal would effectively implement 2-for-1 stock split while preserving long-term governance structure.


icon url

ReturntoSender

04/17/12 8:31 PM

#9748 RE: ReturntoSender #6755

From Briefing.com: 4:15 pm : Equities finished near their best levels of the session as enthusiastic investors gobbled up shares after Spain was able to successfully raise EUR3.2 billion through the sale of 12- and 18-month bills. The auctions were met with robust investor demand despite the rise in yields, and shelved contagion fears for the time being. Today’s gains came despite disappointing housing starts and industrial production data which both missed market expectations.

Futures firmed up ahead of the opening bell after Coca-Cola, Goldman Sachs, and Johnson & Johnson all reported better than expected results.

Coca-Cola (KO 73.95, +1.51) rallied after the company announced better than expected earnings of $0.89 per share on revenues of $11.14 billion. The company had robust volume growth in emerging markets as India (+20%), China (+9%), and Brazil lead the way. However, the company warned the European financial crisis and slowdown in China may impact sales in those economies in the coming quarters.

Shares of Goldman Sachs (GS 116.86, -0.87) slipped 0.7%. Weakness comes after the company announced beat on both its top and bottom lines, announcing earnings per share of $3.92 on revenues of $9.95 billion. Annualized return on average common shareholders’ equity was 12.2% for the first quarter. Today’s selling comes after the stock ran into resistance at its 50-day moving average.

Johnson & Johnson (JNJ 64.22, +0.24) pared its early losses and finished the day with a 0.4% gain. The company announced earnings per share of $1.37 which was $0.03 better than the Capital IQ Consensus Estimate, and said revenues fell 0.2% year over year to an in-line $16.14 billion. Domestic sales for the company fell 2.2% while international sales declined 2.5% on an operational increase of 0.4% and a negative currency impact of 2.9%.

European financials saw strong gains on the heels of this morning’s Spanish bill auctions. Deutsche Bank (DB 46.31, +1.92) and Barclays (BCS 14.09, +0.53) both saw gains in excess of 3.5% while Spain's Banco Santander (STD 6.55, +0.12) underperforming with a 1.9% advance.

Apple (AAPL 609.70, +29.57) surged 5.1% after some early selling dropped the stock to a low of $571.91. Buyers emerged following five days of losses in which the stock dropped more than 9%. The company is scheduled to report its quarterly earnings on April 24.

Treasuries finished near session lows, but losses were rather contained as the long bond’s 0.4% decline to 99 12/32 paced the selling. The 10-yr yield ticked back above 2.00%, finishing at 2.009%. Steepening occurred along the yield curve as the 2-10-yr spread widened to 174 basis points.

Tomorrow’s data is limited to the weekly MBA Mortgage Index which is due out at 7 am ET.DJ30 +194.13 NASDAQ +54.42 SP500 +21.21 NASDAQ Adv/Vol/Dec 1939/1.49 bln/602 NYSE Adv/Vol/Dec 2352/709.8 mln/698

5:07PM Linear Tech reports EPS in-line, revs in-line; guides Q4 revs in-line (LLTC) 33.15 +0.64 : Reports Q3 (Mar) earnings of $0.42 per share, in-line with the Capital IQ Consensus Estimate consensus of $0.42; revenues fell 11.6% year/year to $312.4 mln vs the $312.38 mln consensus. Co issues in-line guidance for Q4, sees Q4 revs growth of 4-8% sequentially, which equates to ~$324.9-337.4 mln vs. $328.95 mln Capital IQ Consensus Estimate. "Given the improvement in our bookings and the broad distribution of this strength across all our major end-markets, we are estimating that we will again grow quarterly revenues sequentially in the 4-8% range in our Q4. We also expect operating income and operating margin to improve." "

4:16PM IBM beats by $0.15, reports revs in-line; guides FY12 EPS above consensus (IBM) 207.45 +4.73 : Reports Q1 (Mar) earnings of $2.78 per share, $0.15 better than the Capital IQ Consensus Estimate of $2.63; revenues rose 0.4% year/year to $24.7 bln vs the $24.81 bln consensus. Co issues upside guidance for FY12, sees EPS of at least $15.00 vs. $14.90 Capital IQ Consensus Estimate; prior guidance was for "at least $14.85". IBM reports Q1 GAAP gross margins of 45.1%; Street Expectations approx 45.3%. Net income margin increased 0.8 points to 12.4 percent. Total operating (non-GAAP) net income margin increased 1.1 points to 13.2%.

Global Technology Services segment revenues increased 2 percent (up 3 percent, adjusting for currency) to $10.0 billion. Global Business Services segment revenues were down 2 percent (down 1 percent, adjusting for currency) to $4.6 billion.

IBM's tax rate was 20.1 percent, down 4.9 points year over year; operating (non-GAAP) tax rate was 20.6 percent, down 4.4 points. The lower tax rate was due to a one-time benefit associated with a tax restructuring in Latin America. The benefit offset the company's first-quarter workforce rebalancing expense, similar to first-quarter 2011 when a one-time gain from asset sales offset workforce rebalancing expenses. The company expects its full-year 2012 effective tax rate on a GAAP and operating (non-GAAP) basis to be in the range of 24 percent; and excluding the one-time benefit in the first quarter, the rate is expected to be in the range of 25 percent.

"In the first quarter, we drove strong profit and earnings per share growth. We delivered another excellent software performance, expanded services margins, and continued the momentum in our growth initiatives... Our investments in growth market countries continued to generate strong revenue growth across software, hardware and services while contributing to the company's ongoing margin expansion."

4:12PM Intel beats by $0.03, reports revs in-line; guides Q2 revs in-line (INTC) 28.47 +0.07 : Reports Q1 (Mar) earnings of $0.56 per share, excluding non-recurring items, $0.03 better than the Capital IQ Consensus Estimate of $0.53; revenues rose 0.5% year/year to $12.91 bln vs the $12.84 bln consensus. PC Client Group revenue of $8.5 billion, down 7 percent QoQ. Data Center Group revenue of $2.5 billion, down 10 percent QoQ. Other Intel architecture group revenue of $1.1 billion, down 2% QoQ. Co issues in-line guidance for Q2, sees Q2 revs of $13.1-14.1 bln vs. $13.41 bln Capital IQ Consensus Estimate; with non-GAAP gross margin of 63% plus or minus a couple percentage points; co sees FY12 GM 65%, +/- a couple percentage points.

4:07PM Seagate Tech beats by $0.54, beats on revs (STX) 27.89 -0.63 : Reports Q3 (Mar) earnings of $2.64 per share, excluding non-recurring items, $0.54 better than the Capital IQ Consensus Estimate of $2.10; revenues rose 65.1% year/year to $4.45 bln vs the $4.36 bln consensus. Gross margin came in at 37% vs 31.6% in DecQ. Note, co usually guides on the call, which starts at 6pm ET.

4:03PM Cree misses by $0.01, misses on revs; guides Q4 EPS below consensus, revs below consensus (CREE) 31.90 +0.98 : Reports Q3 (Mar) earnings of $0.20 per share, $0.01 worse than the Capital IQ Consensus Estimate of $0.21; revenues rose 29.9% year/year to $284.8 mln vs the $300.57 mln consensus. Co issues downside guidance for Q4, sees EPS of $0.20-0.26, excluding non-recurring items, vs. $0.28 Capital IQ Consensus Estimate; sees Q4 revs of $295-315 mln vs. $323.61 mln Capital IQ Consensus Estimate; sees GAAP gross margin targeted to be 35% +/- and non-GAAP gross margin targeted to be 36% +/-; Operating expenses are targeted to increase by +/- $5 million on a GAAP basis and +/- $4 million on a non-GAAP basis. The tax rate is targeted at 13.0% for fiscal Q4.

4:02PM Intel earnings mover: INTC initially spikes to new multi-year highs @ 29.30, now trading modestly lower on Q1 earnings results (INTC) 28.47 :

4:02PM Aehr Test Systems regains compliance with NASDAQ minimum bid price rule (AEHR) 1.45 +0.20 :

4:01PM Flextronics awarded AS9100C aerospace and defense quality certification at three U.S. facilities (FLEX) 7.08 +0.20 : Co announced that three of its U.S. facilities located in Charlotte, North Carolina; Austin, Texas; and Milpitas, California, have separately received certification under the AS9100C aerospace and defense quality standard.

Research In Motion (RIMM) announced that BlackBerry Mobile Voice System 5.1 now supports OpenScape Voice V6 from Siemens (SI) Enterprise Communications. The solution allows customers to access desk phone functionality on their BlackBerry smartphone.

TranSwitch Corp. (TXCC) announced that its HDplay 44143 dual-mode HDMI/DisplayPort transceiver has been selected by Grandbeing for its MS0501-N003 3D Video switch.

9:00AM MIPS Tech: China's SICMicro selects MIPS Technologies' processor IP for new set-top box chip (MIPS) 6.28 : Co announces that SICMicro selected MIPS32 processor cores for the new generation of its highly-secure decoder SoCs for China's rapidly-growing ABS-S set-top box market. ABS-S is the direct-to-home technology for satellite transmission in China, supporting broadcast, data distribution and interactive services.

8:03AM First Solar (halted -- will resume trade at 8:30) restructures operations; cuts 30% of workforce, closes German manufacturing facility, indefintely idles four lines in Maylasia (FSLR) 20.82 : Co is restructuring its operations in response to deteriorating market conditions in Europe and to reduce costs and align its organization with sustainable market opportunities. As part of this program, First Solar will close its manufacturing operations in Frankfurt (Oder), Germany, in 4Q12. Additionally, the co will indefinitely idle four production lines at its manufacturing center in Kulim, Malaysia, on May 1, 2012. These actions, combined with other personnel reductions in Europe and the U.S., will reduce First Solar's global workforce by approximately 2,000 positions, about 30 percent of the total. The restructuring initiatives are expected to reduce First Solar's costs by $30-60 million this year and $100-120 million annually going forward. In addition, the co's average manufacturing cost is expected to improve to $0.70-$0.72 per watt in 2012 as a result of the changes, below prior expectations of $0.74 per watt. In 2013 the co estimates average module manufacturing costs will range from $0.60 to $0.64 per watt. To achieve these significant cost savings, the Company will record restructuring and other related charges of $245-370 million, of which $80-120 million are cash expenditures. First Solar expects to incur these charges primarily during the first quarter of 2012 and the rest over the course of this year... In addition, First Solar has voluntarily paid down ~$145 million of debt ahead of schedule in 2012, which represents repayment in full for outstanding amounts under the Company's German loan agreement.

icon url

ReturntoSender

04/17/12 9:43 PM

#9749 RE: ReturntoSender #6755

It's interesting that today's rally was not on higher volume. That leaves it somewhat questionable to me. I watched part of Cramer on Mad Money tonight where he was suggesting that the recent action in the VIX had not indicated any incumbent rise of volatility ahead. Why? Because it did not print a higher high recently:


True but we actually have more than one volatility index. The VXN and the VXO which once was the old VIX have printed higher highs after higher lows:


Bottom line to me is that trends change over time. There usually is not a single event, or indicator that tips us off to when they are changing, but to say that volatility is not flashing a potential change based on the action of the VIX alone is not fair. Worse yet is that it may be inaccurate.

icon url

ReturntoSender

04/19/12 12:11 AM

#9750 RE: ReturntoSender #6755

From Briefing.com: 4:30 pm : The broad market spent the session bouncing along in negative territory. Its inability to push into positive territory left it to book a modest loss.

Stocks slid at the open of trade as market participants responded to weakness among Europe's major bourses, which were imbued by renewed concerns about Spain's financial health. The S&P 500 tried to trim its loss, but twice it retested the low that it set in the early going. Although support there invited buyers back into the fold, the move lost momentum when both the S&P 500 and the Nasdaq reached their morning rebound highs. That left stocks to drift lower into the close.

Financials staged a mid-morning rebound that fizzled out when the sector came in contact with the flat line. It fell from there and spent the rest of the day dragging along with a sizable loss. It settled the day down 0.8%. BlackRock (BLK 196.01, -5.80) was among the poorer performers in the Financial sector following the firm's latest quarterly report. PNC Financial (PNC 63.78, +0.37) surrendered some of its gain, but still settled in positive territory following the release of its latest earnings results. Both outfits reported upside earnings surprises.

Both Intel (INTC 27.95, -0.52) and IBM (IBM 200.13, -7.32) bested what Wall Street had expected of their earnings results, but neither attracted buyers. Instead, their weakness weighed on the Tech sector, which suffered a 0.8% loss. Better-than-expected bottom line results helped both Seagate Technology (STX 28.96, +1.07) and Yahoo! (YHOO 15.49, +0.48) stage impressive advances, though.

Energy stocks managed to finish the day with only a 0.2% loss, despite lower oil prices. Crude oil futures contracts closed pit trade with the energy component priced at $102.67 per barrel, which makes for a 1.5% loss. Oil prices had actually pared losses in the minutes that immediately followed a bearish weekly inventory report. Oilfield services outfit Halliburton (HAL 34.17, +1.51) was a standout in the space, thanks largely to a positive response to its better-than-expected earnings report.

Earnings from Abbott Labs (ABT 60.46, +0.03) were also in play today. The stock experienced some whipsaw swings in the first half of the day, but ultimately finished a few cents higher.

Select shares of hotels, resorts, and casinos players helped the Consumer Discretionary sector put together a 0.2% gain, while Internet retailer eBay (EBAY 35.87, -0.21) traded lower ahead of its quarterly report. Consumer Discretionary stocks made up the only major sector that was able to settle in positive territory, but their general lack of weight undermined their ability to lift the rest of the market.

Advancing Sectors: Consumer Discretionary +0.2%
Declining Sectors: Consumer Staples -0.1%, Energy -0.2%, Materials -0.3%, Utilities -0.3%, Health Care -0.3%, Industrials -0.4%, Telecom -0.5%, Tech -0.8%, Financials -0.8% DJ30 -82.79 NASDAQ -11.37 NQ100 -0.3% R2K -0.9% SP400 -0.4% SP500 -5.64 NASDAQ Adv/Vol/Dec 746/1.59 bln/1734 NYSE Adv/Vol/Dec 988/721 mln/2002

4:19PM Lam Research beats by $0.05, beats on revs (LRCX) 42.04 -0.74 : Reports Q3 (Mar) earnings of $0.50 per share, excluding non-recurring items, $0.05 better than the Capital IQ Consensus Estimate of $0.45; revenues fell 18.6% year/year to $658.9 mln vs the $643.07 mln consensus. "We continue to make substantive progress in advancing the capabilities of our core products in etch and single-wafer clean to help our customers address next-generation process challenges. Additionally, we are moving steadily towards the expected completion of our acquisition of Novellus Systems, with integration planning well underway. These activities combine to make calendar 2012 a transformative year for the Company, and we are excited about the opportunities we see ahead."

4:11PM Qualcomm beats by $0.05, beats on revs; guides Q3 EPS, revs in-line; raises low end of FY12 EPS, below consensus, reaffirms FY12 revs guidance (QCOM) 66.99 -0.24 : Reports Q2 (Mar) earnings of $1.01 per share, excluding non-recurring items, $0.05 better than the Capital IQ Consensus Estimate of $0.96; revenues rose 27.7% year/year to $4.94 bln vs the $4.81 bln consensus. Metrics -- MSM chip shipments: 152 million units, up 29% y-o-y and down 3% sequentially. December quarter total reported device sales: ~$51.7 billion, up 29% y-o-y and 25% sequentially. December quarter estimated 3G/4G device shipments: ~239 to 243 million units, at an estimated average selling price of ~$211 to $217 per unit. Co issues guidance for Q3, sees EPS of $0.83-0.89, excluding non-recurring items, vs. $0.89 Capital IQ Consensus Estimate; sees Q3 revs of $4.45-4.85 bln vs. $4.76 bln Capital IQ Consensus Estimate. Co issues mixed guidance for FY12, raises EPS to $3.61-3.76, excluding non-recurring items, from $3.55-3.75 vs. $3.78 Capital IQ Consensus Estimate; reaffirms FY12 revs of $18.7-19.7 bln vs. $19.4 bln Capital IQ Consensus Estimate.

4:03PM Plexus beats by $0.02, reports revs in-line; guides Q3 EPS in-line, revs in-line (PLXS) 33.08 -0.41 : Reports Q2 (Mar) earnings of $0.56 per share, $0.02 better than the Capital IQ Consensus Estimate of $0.54; revenues rose 1.0% year/year to $573.5 mln vs the $567.94 mln consensus. Co issues in-line guidance for Q3, sees EPS of $0.60-0.66, excluding any unanticipated non-recurring items and including option expense, vs. $0.63 Capital IQ Consensus Estimate; sees Q3 revs of $590-620 mln vs. $603.71 mln Capital IQ Consensus Estimate.

LTX-Credence (LTXC) announced that SWINDON Silicon Systems, a supplier of analog and mixed-signal ASICs for the automotive, industrial and consumer markets, has added multiple Diamond test systems to its production base of Diamond testers.

Research In Motion (RIMM) announced its most affordable BlackBerry 7 smartphone for customers in India, the new BlackBerry Curve 9220 smartphone.

SunEdison, a subsidiary of MEMC Electronic Materials (WFR) announced the activation of a 25 Megawatt solar photovoltaic power plant located within a multi-developer, multi-facility.

Intel (INTC $27.66 -0.82) reported first quarter earnings of $0.56 per share, excluding non-recurring items, $0.03 better than the Capital IQ Consensus of $0.53; revenues rose 0.5% year/year to $12.91 bln vs the $12.84 bln consensus. PC Client Group revenue of $8.5 billion, down 7 percent QoQ. Data Center Group revenue of $2.5 billion, down 10 percent QoQ. Other Intel architecture group revenue of $1.1 billion, down 2% QoQ. Co issues in-line guidance for Q2, sees Q2 revs of $13.1-14.1 billion versus the $13.41 billion consensus, with non-GAAP gross margin of 63% plus or minus a couple percentage points. Company sees FY12 GM 65%, +/- a couple percentage points.

IBM (IBM $202.34 -5.11) reported first quarter earnings of $2.78 per share, $0.15 better than the Capital IQ consensus of $2.63; revenues rose 0.4% year/year to $24.7 billion versus the $24.81 bln consensus. The company issued upside guidance for fiscal year 2012 with EPS of at least $15.00 versus the $14.90 consensus. Prior guidance was for "at least $14.85". IBM reports Q1 GAAP gross margins of 45.1%; Street Expectations approx 45.3%. Net income margin increased 0.8 points to 12.4 percent. Total operating (non-GAAP) net income margin increased 1.1 points to 13.2%. Global Technology Services segment revenues increased 2 percent (up 3 percent, adjusting for currency) to $10.0 billion. Global Business Services segment revenues were down 2 percent (down 1 percent, adjusting for currency) to $4.6 billion. IBM's tax rate was 20.1 percent, down 4.9 points year over year; operating (non-GAAP) tax rate was 20.6 percent, down 4.4 points. The lower tax rate was due to a one-time benefit associated with a tax restructuring in Latin America. The benefit offset the company's first-quarter workforce rebalancing expense, similar to first-quarter 2011 when a one-time gain from asset sales offset workforce rebalancing expenses. The company expects its full-year 2012 effective tax rate on a GAAP and operating (non-GAAP) basis to be in the range of 24 percent; and excluding the one-time benefit in the first quarter, the rate is expected to be in the range of 25 percent. "In the first quarter, we drove strong profit and earnings per share growth. We delivered another excellent software performance, expanded services margins, and continued the momentum in our growth initiatives... Our investments in growth market countries continued to generate strong revenue growth across software, hardware and services while contributing to the company's ongoing margin expansion."

Seagate Tech (STX $29.03 +1.11) reported third quarter earnings of $2.64 per share, excluding non-recurring items, $0.54 better than the Capital IQ Consensus of $2.10, while revenues rose 65.1% year/year to $4.45 billion versus the $4.36 billion consensus. Gross margin came in at 37% vs 31.6% in DecQ.

Yahoo (YHOO $15.46 +0.45) reported first quarter earnings of $0.23 per share, $0.06 better than the Capital IQ Consensus of $0.17, while revenues rose 1.2% year/year to $1.08 billion versus the $1.05 billion consensus. The company issued in-line guidance for the second quarter with revenues of $1.03-1.14 billion versus the $1.07 billion consensus. Total operating expenses less TAC for the second quarter of 2012 is expected to be in the range of $915 million to $945 million, which includes $40 million to $50 million of transition-related expenses. Income from operations for Q2 is expected to be in the range of $115-195 million.

Cree (CREE $30.07 -1.83) reported third quarter earnings of $0.20 per share, $0.01 worse than the consensus of $0.21, while revenues rose 29.9% year/year to $284.8 million versus the $300.57 million consensus. The company issued downside guidance for the fourth quarter EPS of $0.20-0.26, excluding non-recurring items versus the $0.28 consensus and revenues of $295-315 million versus the $323.61 million consensus. Co sees GAAP gross margin targeted to be 35% +/- and non-GAAP gross margin targeted to be 36% +/-; Operating expenses are targeted to increase by +/- $5 million on a GAAP basis and +/- $4 million on a non-GAAP basis. The tax rate is targeted at 13.0% for fiscal fourth quarter.

09:43 am Seagate Technology shares rise by nearly 4% following better than expected earnings
Seagate Tech (STX $28.68 +1.00) reported third quarter earnings of $2.64 per share, excluding non-recurring items, $0.54 better than the Capital IQ Consensus of $2.10, while revenues rose 65.1% year/year to $4.45 billion versus the $4.36 billion consensus. Gross margin came in at 37% vs 31.6% in DecQ.

09:40 am Yahoo shares rise by 2% following beat on revenues

Yahoo (YHOO $15.35 +0.34) reported first quarter earnings of $0.23 per share, $0.06 better than the Capital IQ Consensus of $0.17, while revenues rose 1.2% year/year to $1.08 billion versus the $1.05 billion consensus. The company issued in-line guidance for the second quarter with revenues of $1.03-1.14 billion versus the $1.07 billion consensus.

Total operating expenses less TAC for the second quarter of 2012 is expected to be in the range of $915 million to $945 million, which includes $40 million to $50 million of transition-related expenses. Income from operations for Q2 is expected to be in the range of $115-195 million.

09:38 am Intel shares fall 3% following in line revenues and guidance

Intel (INTC $27.51 -0.96) reported first quarter earnings of $0.56 per share, excluding non-recurring items, $0.03 better than the Capital IQ Consensus of $0.53; revenues rose 0.5% year/year to $12.91 bln vs the $12.84 bln consensus. PC Client Group revenue of $8.5 billion, down 7 percent QoQ. Data Center Group revenue of $2.5 billion, down 10 percent QoQ.

Other Intel architecture group revenue of $1.1 billion, down 2% QoQ. Co issues in-line guidance for Q2, sees Q2 revs of $13.1-14.1 billion versus the $13.41 billion consensus, with non-GAAP gross margin of 63% plus or minus a couple percentage points. Company sees FY12 GM 65%, +/- a couple percentage points.

09:36 am IBM shares decline nearly 4% following slightly weaker than expected revenues

IBM (IBM $202.78 -4.68) reported first quarter earnings of $2.78 per share, $0.15 better than the Capital IQ consensus of $2.63; revenues rose 0.4% year/year to $24.7 billion versus the $24.81 bln consensus. The company issued upside guidance for fiscal year 2012 with EPS of at least $15.00 versus the $14.90 consensus. Prior guidance was for "at least $14.85". IBM reports Q1 GAAP gross margins of 45.1%; Street Expectations approx 45.3%. Net income margin increased 0.8 points to 12.4 percent.

Total operating (non-GAAP) net income margin increased 1.1 points to 13.2%. Global Technology Services segment revenues increased 2 percent (up 3 percent, adjusting for currency) to $10.0 billion. Global Business Services segment revenues were down 2 percent (down 1 percent, adjusting for currency) to $4.6 billion. IBM's tax rate was 20.1 percent, down 4.9 points year over year; operating (non-GAAP) tax rate was 20.6 percent, down 4.4 points. The lower tax rate was due to a one-time benefit associated with a tax restructuring in Latin America. The benefit offset the company's first-quarter workforce rebalancing expense, similar to first-quarter 2011 when a one-time gain from asset sales offset workforce rebalancing expenses. The company expects its full-year 2012 effective tax rate on a GAAP and operating (non-GAAP) basis to be in the range of 24 percent; and excluding the one-time benefit in the first quarter, the rate is expected to be in the range of 25 percent.
icon url

ReturntoSender

04/21/12 10:16 PM

#9752 RE: ReturntoSender #6755

From Briefing.com: Weekly Recap - Week ending 20-Apr-12An afternoon descent dashed gains and left stocks to settle at session lows. Still, the S&P 500 was able to cling to a fractional gain after logging losses in the two previous sessions.

The broad market measure also booked its first weekly gain, 0.6%, in three weeks. Market participants were without domestic data today. That left traders to focus on action in Europe and the latest round of earnings reports.

Despite mixed overnight action in Asia that left Japan's Nikkei to end the week down nearly 1% and Hong Kong's Hang Seng to advance by about 1.5%, Europe's major bourses put together strong gains on the back of a surprisingly strong IFO business climate survey from Germany. Strong retail sales numbers were also reported by the United Kingdom. Germany's DAX ended the week more than 1% below where it began, France's CAC actually eked out a fractional gain for the week, but Britain's FTSE fell about 2% for the week.

Strong earnings reports from a broad range of industry players provided a positive backdrop to early trade. Blue chips McDonald's (MCD 95.94, +0.66) and General Electric (GE 19.36, +0.22) both performed well because of a positive response to their latest quarterly announcements. Microsoft (MSFT 32.42, +1.41) put together an impressive performance, but the stock's strength wasn't enough to offset weakness in Apple (AAPL 572.98, -14.46), which boasts a market cap that is about double that of MSFT. Shares of AAPL also carry the greatest weight of any stock in either the S&P 500 or the Nasdaq.

Tech stocks, which settled the day down 0.5%, were joined in negative territory by Financials, which also fell 0.5%. Arguably the two most influential sectors, both lagged for virtually the entire session. Their weakness ultimately dragged down the broader market in afternoon trade.

Still, many defensive-oriented stocks managed to maintain most of their gains. Consumer Staples scored a 0.9% gain, while Utilities advanced 1.0% and Telecom laid claim to a 0.7% gain.

The dollar ran into some rather stiff selling that left it to lose 0.5% against a basket of major foreign currencies. It fell about 0.9% for the week. Most of that downturn was due to renewed strength in the euro, which climbed 0.6% on Friday to about $1.32. That helped fuel a 1.1% weekly gain.

Despite weakness in the dollar, commodities had another negative week that saw the CRB Index fall 0.5% for the week. The CRB has suffered five consecutive weekly losses for a cumulative decline of about 5%.

The expiration of monthly options helped take share volume on the NYSE to almost 1 billion, which is well above average levels of the past several months.

Advancing Sectors: Utilities +1.0%, Consumer Staples +0.9%, Industrials +0.8%, Telecom +0.7%, Health Care +0.5%, Consumer Discretionary +0.2%, Materials +0.1%.

Declining Sectors: Energy -0.1%, Financials -0.5%, Tech -0.5%..Nasdaq 100 -0.4%. ..S&P Midcap 400 +0.3%. ..Russell 2000 +0.6%. ..NYSE Adv/Dec 1973/1040. ..NASDAQ Adv/Dec 1499/1010.
 
Index Started Week Ended Week Change % Change YTD %
DJIA 12849.59 13029.26 179.67 1.4 6.6
Nasdaq 3011.33 3000.45 -10.88 -0.4 15.2
S&P 500 1370.26 1378.53 8.27 0.6 9.6
Russell 2000 796.29 804.05 7.76 1.0 8.5

2:29PM Apple continues to trend lower intraday, eyeing its 50-day ma's below.... (AAPL) 576.71 -10.81 : Under distribution for 8 out of the last 9-days since its April 10th $644.00 peak, AAPL is trending lower this afternoon towards Tuesday's low of 571.91. There's a "runaway gap" zone from March 14 in play between 568.18/575.40, with its 50-day simple/exponential moving averages just below that at 569.22/566.86. Failure for price to hold these key zones, would suggest further weakness down towards the early March highs/breakout support near 548/555.

FSI International (FSII) announced that several leading device producers have placed orders for ANTARES CryoKinetic Cleaning Systems. The systems are expected to ship in fiscal 2012.

7:52AM Lattice Semi Correction: Misses by $0.01 on a GAAP basis, with revenue in-line; guides Q2 rev below consensus (LSCC) : Last night we incorrectly compared Q1 GAAP EPS to the non-GAAP consensus; the comment has been removed and should have read as follows:

HP (HPQ) announced that HP Enterprise Services has been awarded a 7 year contract valued at ~ $39.8 mln by the Defense Information Systems Agency to help enhance the DoD's ability to detect IT system vulnerabilities.

6:39AM General Electric beats by $0.01, beats on revs (GE) 19.14 : Reports Q1 (Mar) earnings of $0.34 per share, excluding non-recurring items, $0.01 better than the Capital IQ Consensus Estimate of $0.33; revenues fell 8.2% year/year to $35.18 bln vs the $34.7 bln consensus, up 4% ex-the impact of NBCU.

GE's Q1 Industrial segment revenues were $23.7 bln, up 14%. Industrial segment organic revenue was up 11% for the quarter. Industrial growth market revenues were up 14%, driven by double-digit growth in Australia, Canada, China, Russia, Latin America, and Sub-Saharan Africa. The U.S. was also strong with Industrial segment revenues up 17%. Industrial segment profit was up 10% to $3.3 bln and segment operating profit margins showed improvement in Healthcare and Transportation in the first quarter. While margins were down in total in the quarter, we expect them to increase 50 basis points over the total year as businesses continue to implement productivity projects and recognize value gap improvements. In addition, pricing on new orders was up 50 basis points in total with higher prices in 4 out of 5 businesses. Cash generated from Industrial operating activities was up 22% at $2.1 bln. At the end of the first quarter, GE had $84 bln of consolidated-cash and cash equivalents.

GE Capital's first quarter earnings were $1.8 bln, flat from last year, but up 27% excluding the 1Q'11 Garanti sale impact. The co believes that GE Capital's strong business performance should continue for the year. Margins on new business continue to be attractive, with overall portfolio margins increasing. Real Estate turned its first profit since 3Q 2008. GECC's Tier One common ratio of 10.4% has never been stronger.

Infrastructure orders were a record high for the first quarter at $23.1 bln, up 20% from the prior year. Organic orders grew 14% in the first quarter, marking the eighth consecutive quarter of positive growth. Industrial growth market orders were up 21%. All businesses grew equipment orders at double-digit rates for the quarter.

"This quarter we witnessed broad-based strength in orders across all our Infrastructure businesses and in both equipment and services. We see encouraging leading indicators driven by global growth. Our strategy to invest in technology and global growth platforms continues to produce results with 11% organic Industrial segment revenue growth and 10% Industrial segment profit growth in the first quarter... We are positioned for double digit growth and our Industrial cash plan remains solid. We expect to return excess cash from GE Capital over the course of 2012, subject to review by the Federal Reserve."

Microsoft (MSFT $32.30 +1.30) reported third quarter earnings of $0.60 per share, $0.02 better than the Capital IQ Consensus of $0.58, while revenues rose 6.0% year/year to $17.41 billion versus the $17.16 billion consensus. The Server & Tools business posted $4.57 billion in Q3 revenue, a 14% increase from the prior year period, driven by double-digit revenue growth in SQL Server and more than 20% growth in System Center revenue. The Microsoft Business Division reported $5.81 bln in third-quarter revenue, a 9% increase from the prior year period, reflecting the continued strength of Office 2010 with businesses and consumers. Dynamics posted an 11% revenue increase from the prior year period, with Dynamics CRM revenue growing more than 30%. The Windows and Windows Live Division posted revenue of $4.62 bln, a 4% increase from the prior year period. Strong Windows 7 adoption continued with enterprise desktops on Windows 7 now up to 40% worldwide. The Online Services Division reported revenue of $707 million, a 6% increase from the prior year period, and operating loss improvement of approximately $300 mln. The Entertainment & Devices Division posted revenue of $1.62 billion, a decrease of 16% from the prior period due to a soft gaming console market. Outlook: Microsoft is revising operating expense guidance downward and now offers a range of $28.3 bln to $28.7 bln for FY12 from $28.5-28.9 billion. Microsoft also offers preliminary fiscal year 2013 operating expense guidance of $30.3-30.9 billion, representing 6% to 8% growth from the mid-point of fiscal year 2012 guidance.

Riverbed Technology (RVBD $20.35 -7.51) reported first quarter earnings of $0.20 per share, in-line with the Capital IQ Consensus of $0.20, while revenues rose 11.6% year/year to $183 million versus the $186.03 million consensus. "In a seasonally difficult quarter, we completed a major product cycle and achieved results within our guidance range... Looking ahead, we expect our new Steelhead, Granite, and Cascade products, along with Stingray and Whitewater, to form the basis for Riverbed's next leg of growth as we continue to execute on our vision to deliver a complete performance platform. Our competitive position is strong, our addressable market is growing, and we are optimistic about the opportunity before us."

SanDisk (SNDK $34.93 -5.54) reported first quarter earnings of $0.63 per share, $0.08 worse than the Capital IQ Consensus of $0.71, while revenues fell 6.8% year/year to $1.21 billion versus the $1.21 billion consensus. The company also reported Gross margin of 35.8%. Co also reported "Our first quarter results were adversely impacted by lower-than-expected pricing and demand weakness in certain segments and we expect similar trends in the second quarter as well, we believe a seasonally stronger demand environment in the second half of the year, combined with our diversifying portfolio of mobile and SSD solutions, will allow us to deliver strong sequential revenue growth in the third and fourth quarters..."

Rambus (RBMS $5.34 -0.26) reported a first quarter loss of $0.25 per share, $0.02 worse than the Capital IQ Consensus of ($0.23), while revenues rose 0.6% year/year to $62.9 million versus the $63 million consensus.

Advanced Micro (AMD $8.01 +0.02) reported first quarter earnings of $0.12 per share, excluding non-recurring items, $0.03 better than the Capital IQ Consensus of $0.09, while revenues fell 1.7% year/year to $1.59 billion versus the $1.56 bln consensus. The company issues upside guidance for the second quarter with revenues flat to +6% quarter over quarter to $1.585-1.680 billion versus the $1.59 billion consensus. Computing Solutions segment revenue decreased eight percent sequentially and was flat year-over-year. The sequential decrease was driven by seasonally lower sales in the Client business. Graphics segment revenue was flat sequentially and decreased 7 percent year-over-year. GPU revenue was up in a seasonally down quarter, due to higher improved desktop GPU ASP in the channel, offset by seasonally lower game console royalty revenue. The year-over-year decrease was primarily driven by lower demand for desktop and mobile graphics. Non-GAAP gross margin was 46%, flat sequentially. "A complete top-to-bottom introduction of new APU offerings, combined with ample product supply resulting from continued progress with our manufacturing partners, positions us to win and grow."

12:49 pm Technology sector trading higher today with the market

The tech sector is trading higher today, inline with gains in the broader market. Semiconductors are also showing relative weakness, however, with the Philly Semi Index trading 1.2% lower. SNDK (-14.2%) is a notable laggard in that chip index. Among other major indices, the SPY, the QQQ and the NASDAQ are all trading 0.8% higher on the session. Among tech bellwethers, MSFT (+5.4%) is a standout, while AAPL (+2.2%) is showing weakness.

In earnings last night, MSFT (-3.1%) reported a beat, while SNDK (-14.2%) and RVBD (-26.5%) posted slight misses and issued downside guidance. Elsewhere, AMD (+1.3%) posted a beat with inline guidance and ALTR (-6.5%) reported a miss and offered inline guidance. There were few notable analyst upgrades this morning. Among those, XXIA (+13.3%) was upgraded to Buy at Wunderlich. While in downgrades, RVBD (-26.5%) and SNDK (-14.2%) where each downgraded at a host of firms on the Street following last night's earnings.

09:43 am General Electric shares rise 2% following beat on earnings

General Electric (GE $19.50 +0.37) reported first quarter earnings of $0.34 per share, excluding non-recurring items, $0.01 better than the Capital IQ Consensus of $0.33, while revenues fell 8.2% year/year to $35.18 billion versus the $34.7 bln consensus, up 4% ex-the impact of NBCU. GE's Q1 Industrial segment revenues were $23.7 billion, up 14%. Industrial segment organic revenue was up 11% for the quarter. Industrial growth market revenues were up 14%, driven by double-digit growth in Australia, Canada, China, Russia, Latin America, and Sub-Saharan Africa. The U.S. was also strong with Industrial segment revenues up 17%. Industrial segment profit was up 10% to $3.3 bln and segment operating profit margins showed improvement in Healthcare and Transportation in the first quarter. While margins were down in total in the quarter, we expect them to increase 50 basis points over the total year as businesses continue to implement productivity projects and recognize value gap improvements. In addition, pricing on new orders was up 50 basis points in total with higher prices in 4 out of 5 businesses.

Cash generated from Industrial operating activities was up 22% at $2.1 bln. At the end of the first quarter, GE had $84 bln of consolidated-cash and cash equivalents. GE Capital's first quarter earnings were $1.8 bln, flat from last year, but up 27% excluding the 1Q'11 Garanti sale impact. The co believes that GE Capital's strong business performance should continue for the year. Margins on new business continue to be attractive, with overall portfolio margins increasing. Real Estate turned its first profit since 3Q 2008. GECC's Tier One common ratio of 10.4% has never been stronger. Infrastructure orders were a record high for the first quarter at $23.1 bln, up 20% from the prior year. Organic orders grew 14% in the first quarter, marking the eighth consecutive quarter of positive growth. Industrial growth market orders were up 21%. All businesses grew equipment orders at double-digit rates for the quarter. "This quarter we witnessed broad-based strength in orders across all our Infrastructure businesses and in both equipment and services. We see encouraging leading indicators driven by global growth. Our strategy to invest in technology and global growth platforms continues to produce results with 11% organic Industrial segment revenue growth and 10% Industrial segment profit growth in the first quarter... We are positioned for double digit growth and our Industrial cash plan remains solid. We expect to return excess cash from GE Capital over the course of 2012, subject to review by the Federal Reserve."

09:41 am Sandisk shares plunge over 13% following miss on EPS

SanDisk (SNDK $35.07 -5.48) reported first quarter earnings of $0.63 per share, $0.08 worse than the Capital IQ Consensus of $0.71, while revenues fell 6.8% year/year to $1.21 billion versus the $1.21 billion consensus. The company also reported Gross margin of 35.8%.

The company also reported "Our first quarter results were adversely impacted by lower-than-expected pricing and demand weakness in certain segments and we expect similar trends in the second quarter as well, we believe a seasonally stronger demand environment in the second half of the year, combined with our diversifying portfolio of mobile and SSD solutions, will allow us to deliver strong sequential revenue growth in the third and fourth quarters..."

09:39 am Riverbed shares plunge over 25% following miss on revenues and downside guidance on call

Riverbed Technology (RVBD $20.64 -7.20) reported first quarter earnings of $0.20 per share, in-line with the Capital IQ Consensus of $0.20, while revenues rose 11.6% year/year to $183 million versus the $186.03 million consensus.

"In a seasonally difficult quarter, we completed a major product cycle and achieved results within our guidance range... Looking ahead, we expect our new Steelhead, Granite, and Cascade products, along with Stingray and Whitewater, to form the basis for Riverbed's next leg of growth as we continue to execute on our vision to deliver a complete performance platform. Our competitive position is strong, our addressable market is growing, and we are optimistic about the opportunity before us."

09:35 am Microsoft shares rise nearly 4% following beat on earnings

Microsoft (MSFT $32.19 +1.18) reported third quarter earnings of $0.60 per share, $0.02 better than the Capital IQ Consensus of $0.58, while revenues rose 6.0% year/year to $17.41 billion versus the $17.16 billion consensus. The Server & Tools business posted $4.57 billion in Q3 revenue, a 14% increase from the prior year period, driven by double-digit revenue growth in SQL Server and more than 20% growth in System Center revenue. The Microsoft Business Division reported $5.81 bln in third-quarter revenue, a 9% increase from the prior year period, reflecting the continued strength of Office 2010 with businesses and consumers.

Dynamics posted an 11% revenue increase from the prior year period, with Dynamics CRM revenue growing more than 30%. The Windows and Windows Live Division posted revenue of $4.62 bln, a 4% increase from the prior year period. Strong Windows 7 adoption continued with enterprise desktops on Windows 7 now up to 40% worldwide. The Online Services Division reported revenue of $707 million, a 6% increase from the prior year period, and operating loss improvement of approximately $300 mln. The Entertainment & Devices Division posted revenue of $1.62 billion, a decrease of 16% from the prior period due to a soft gaming console market.

Outlook: Microsoft is revising operating expense guidance downward and now offers a range of $28.3 bln to $28.7 bln for FY12 from $28.5-28.9 billion. Microsoft also offers preliminary fiscal year 2013 operating expense guidance of $30.3-30.9 billion, representing 6% to 8% growth from the mid-point of fiscal year 2012 guidance.
icon url

ReturntoSender

04/23/12 5:56 PM

#9755 RE: ReturntoSender #6755

From Briefing.com: 4:54PM STMicroelectronics misses by $0.09, reports revs in-line (STM) 5.95 -0.63 : Reports Q1 (Mar) loss of $0.14 per share, excluding non-recurring items, $0.09 worse than the Capital IQ Consensus Estimate of ($0.05); revenues fell 20.4% year/year to $2.02 bln vs the $2.02 bln consensus.

Outlook: While there are still macro-economic uncertainties, we believe billings have bottomed in Q1. Bookings have improved across the board during the course of the first quarter. "Based on current visibility, we expect broad-based growth in all product segments during Q2 leading to revenue growth of about 7.5% at the mid-point of our guidance. Looking further ahead we also anticipate broad-based revenue growth with a strong acceleration in MEMS and Analog in the second half of 2012 thanks to our new and innovative products and our expanding customer base."

Co expects second quarter 2012 revenues to grow sequentially in the range of about +7.5%, plus or minus 3 percentage points. As a result, gross margin in the second quarter is expected to be about 34.4%, plus or minus 1.5 percentage points, and assumes an improvement from the first quarter amount from fab loading and manufacturing performance.

4:34PM Texas Instruments beats by $0.03, beats on revs; guides Q2 EPS in-line, revs in-line (TXN) 31.89 -0.58 : Reports Q1 (Mar) earnings of $0.32 per share, excluding non-recurring items, $0.03 better than the Capital IQ Consensus Estimate of $0.29; revenues fell 8.0% year/year to $3.12 bln vs the $3.05 bln consensus. Co issues in-line guidance for Q2, sees EPS of $0.36-0.44, excluding non-recurring items, vs. $0.40 Capital IQ Consensus Estimate; sees Q2 revs of $3.22-3.48 bln vs. $3.29 bln Capital IQ Consensus Estimate. For the full year of 2012, TI continues to expect approximately the following: R&D expense: $2.0 billion; Capital expenditures: $0.7 billion; Depreciation: $1.0 billion; Annual effective tax rate: 28%.

"As we expected, our business cycle bottomed in the first quarter, and early signs of growth began to emerge... Orders were up 13 percent, and backlog is growing again. Particularly encouraging is the breadth of increased orders across geographical regions and markets, including the industrial sector. "Sales in our Analog segment were about level with the prior quarter. We continue to make progress with Silicon Valley Analog, formerly National Semiconductor, as this product line gains traction with customers and holds a strong position in the important industrial market. Sales in Embedded Processing were up 7 percent led by growth in the automotive and communications infrastructure markets. Sales in our Wireless segment declined sharply as we entered the final phase of our exit from baseband products, which were less than 3 percent of total sales in the quarter. We are expanding the reach of our Wireless segment into multiple markets and experiencing strong diversity in our design-ins."

4:28PM Ultra Clean Holdings beats by $0.03, beats on revs; guides Q2 EPS in-line, revs below consensus (UCTT) 7.25 -0.26 : Reports Q1 (Mar) earnings of $0.20 per share, $0.03 better than the Capital IQ Consensus Estimate of $0.17; revenues fell 12.7% year/year to $110.6 mln vs the $107.1 mln consensus. Co issues mixed guidance for Q2, sees EPS of $0.16-0.19 vs. $0.18 Capital IQ Consensus Estimate; sees Q2 revs of $100-105 mln vs. $106.84 mln Capital IQ Consensus Estimate. Semiconductor revenue was 85.1% of total revenue for the first quarter of 2012 compared to 79.6% in the previous quarter and revenue outside the U.S. accounted for 32% of the total revenue for the first quarter of 2012 compared to 29% for the previous quarter. Gross margin for the first quarter of 2012 was 14.2%, compared to 11.0% for the fourth quarter of 2011 and 13.9% for the first quarter of 2011.

4:11PM Sanmina-SCI reports EPS in-line, misses on revs; guides Q3 EPS below consensus, revs below consensus (SANM) 9.77 -0.32 : Reports Q2 (Mar) earnings of $0.27 per share, in-line with the Capital IQ Consensus Estimate consensus of $0.27; revenues fell 6.8% year/year to $1.46 bln vs the $1.51 bln consensus. Co issues downside guidance for Q3, sees EPS of $0.26-0.32, excluding non-recurring items, vs. $0.36 Capital IQ Consensus Estimate; sees Q3 revs of $1.475-1.525 bln vs. $1.57 bln Capital IQ Consensus Estimate. "As we expected, our second quarter continued to be challenged by relatively flat demand across most of our markets and a decline in the multimedia segment.."Based on our outlook for the third quarter and feedback from our customers, we remain encouraged that we should see improvements in the second half of the calendar year."

4:08PM Volterra Semi beats by $0.05, beats on revs (VLTR) 31.83 -0.96 : Reports Q1 (Mar) earnings of $0.32 per share, excluding non-recurring items, $0.05 better than the Capital IQ Consensus Estimate of $0.27; revenues rose 23.1% year/year to $42.1 mln vs the $40.2 mln consensus.

4:30 pm : The major equity averages fell hard in early trade. Although they were able to trim losses in a slow and steady fashion, broad losses were still booked.

Market participants were spooked this morning by news that China's latest manufacturing reading improved from the prior month, but pointed to yet another month of tighter activity. Manufacturing readings from Germany and France were also disappointing. France added to concerns about the eurozone with speculation that the country may experience a political shakeup that could carry implications for the country's plans for fiscal and financial reform. In a similar vein, Netherlands officials failed to reach an agreement on their country's budget.

Those themes, along with the losses suffered by the major averages of Asia and the bourses of Europe, dropped domestic markets for losses in excess of 1% this morning. The S&P 500 stabilized at its monthly closing low of 1358, which is also just a single point above its monthly intraday low of 1357, but the Nasdaq Composite notched a new monthly low before it found support.

Upon finding a floor, the broad market was able to trend upward at a modest pace in afternoon trade. The Energy sector made a more rapid recovery that took it all the way to the flat line after it had been down more than 1% in morning trade. Still, the sector's rebound lost momentum at the flat line. As such, the sector settled with a 0.1% loss. Baker Hughes (BHI 41.07, +0.61) was a leader among Energy issues ahead of its quarterly report tomorrow morning, but ConocoPhillips (COP 72.33, -0.55) shares remained in the red after the integrated outfit reported this morning an earnings miss.

Crude oil was also able to cut its loss, but not completely so. It set a session low of $101.82 per barrel, but settled the day with a 0.7% loss at $103.09 per barrel.

Other resource related plays were less impressive in their ability to rebound. Materials stocks were down about 2% at their session low, but ended the day with a 1.4% loss. Diversified metals and miners were particularly poor performers, as was US Steel (X 28.22, -0.77), which reports its latest quarterly results tomorrow morning.

Energy stocks ended the day as the best performing sector of the session, but Materials were the worst.

As investor skittishness decreased during afternoon trade demand for the safety of the dollar declined. Still, the greenback ended the day with a gain of about 0.2% against a basket of major foreign currencies.

Treasuries made modest gains, too. The benchmark 10-year Note saw its yield move to a monthly low closer to 1.90% this morning, but some of that gain was given back. The yield on Germany's 10-year Bund actually fell to a record low of 1.57%.

Advancing Sectors: None
Declining Sectors: Energy -0.1%, Utilities -0.6%, Telecom -0.7%, Tech -0.7%, Health Care -0.8%, Financials -0.8%, Industrials -1.0%, Consumer Discretionary -1.1%, Materials -1.4%, Consumer Staples -1.5%DJ30 -102.09 NASDAQ -30.00 NQ100 -1.0% R2K -1.5% SP400 -1.1% SP500 -11.59 NASDAQ Adv/Vol/Dec 613/1.76 bln/1931 NYSE Adv/Vol/Dec 789/784 mln/2231

9:30AM Cirrus Logic's Board of Directors issues statement regarding passing of Cirrus Logic Chairman and co-founder Michael L. Hackworth (CRUS) 20.74 -0.33 : 'We are deeply saddened by the loss of our friend and Chairman Mike Hackworth. In creating Cirrus Logic he led the way for the fabless semiconductor industry, and with the company's success proved that "real men really don't need fabs." Through his work and philanthropy he had a tremendous positive impact on thousands of people. We will miss him greatly. Our thoughts go out to his family in this sad time.'

8:33AM Ixys raises Q4 revenue guidance above consensus; issues upside FY12 revenue guidance (IXYS) 12.01 : Co raises guidance for Q4 (Mar), sees Q4 (Mar) revs of $86-87 mln from prior guidance of $84-86.4 mln vs. $86.00 mln Capital IQ Consensus Estimate. Co issues upside guidance for FY12 (Mar), sees FY12 (Mar) revs of $367-368 mln vs. $366.11 mln Capital IQ Consensus Estimate. The gross margin for the fourth quarter ended March 31, 2012 are estimated to be around 33% or 34%, which would be a significant increase over the gross margin of 28.9% in the December 2011 quarter.

Lasertel, a subsidiary of SELEX Galileo, a Finmeccanica co, and Veeco Instruments (VECO) announced that Lasertel has purchased a second high-throughput, multi-wafer GEN200 Edge Molecular Beam Epitaxy production system from Veeco to increase their manufacturing capacity for laser diodes.

8:02AM MEMC Elec corrects market rumors: 'Ahmad Chatila remains CEO' (WFR) 3.50 : Co stated "We have been made aware of rumors relating to the company which may be causing concern...and we wish to make it absolutely clear that Ahmad Chatila remains our CEO....The restructuring led by Ahmad and management announced in December 2011 is reflective of this engagement, but the announced restructuring was not the end of our work."

Nokia (NOK) officially started the development of its manufacturing facility in Vietnam. ARM today announced that MStar, a leading semiconductor supplier for display and digital home solutions, has licensed the ARM Cortex-A9 MPCore and ARM926EJ-S processors, in addition to a range of ARM system IP for use in smart-TVs, set-top-boxes and smartphones.

BWS Financial downgrades Rambus (RMBS $4.60 -0.30) to Hold from Buy saying the company continues to find ways to disappoint investors. Even though new licensees have been signed, the Company has not been able to generate an increase in revenue as a result of discounts to the royalty rate. The firm says it now seems, as the Company tries to gain acceptance with other patents in the portfolio, as though RMBS could be treading near breakeven for the next two to three quarters.

10:14 am Technology sector trading lower as overall market declines

The tech sector is trading lower today, roughly inline with losses in the broader market. Semiconductors are also showing relative weakness within the tech space. The Philly Semi Index is trading 2.0% lower. STM (-4.9%) is a notable laggard in the chip index, while SNDK (+3.2%) is bucking the trend. Among other major indices, the SPY is trading 1.4% lower today, while the QQQ is 1.5% lower and the NASDAQ is trading 1.6% lower on the session. Among tech bellwethers, ORCL (-1.9%) is showing notable weakness.

In earnings, XRX (+0.8%) reported a Q1 beat and offered inline guidance, while CHL (+4.1%) posted a miss. In news, TLAB (-1.3%) announced its CEO was diagnosed with colon cancer.

Also, VOD (+0.1%) has agreed to purchase Cable & Wireless Worldwide for $1.7 bln, according to reports. Among rumors, there is chatter of AAPL (-1.1%) iPhone nano launch this year making the rounds.

Among notable analyst upgrades this morning, ARMH (-2.7%) was upgraded to Neutral at JP Morgan and FTE (-1.7%) was upgraded to Buy at Nomura. While in downgrades, ABVT (0.0%) was downgraded to Sector Perform at RBC Capital. SANM (-3.6%), TXN (-1.4%) and STM (-4.9%) are the notable names in tech scheduled today after the close.
icon url

ReturntoSender

04/24/12 8:39 PM

#9756 RE: ReturntoSender #6755

From Briefing.com: 4:30 pm : 4:35PM Apple beats by $2.26, beats on revs; guides Q3 EPS, revs (traditionally conservative) below consensus (AAPL) 560.28 -11.42 : Reports Q2 (Mar) earnings of $12.30 per share, $2.26 better than the Capital IQ Consensus Estimate of $10.04; revenues rose 58.9% year/year to $39.19 bln vs the $36.76 bln consensus. Co issues downside guidance for Q3, sees EPS of ~$8.68 vs. $9.95 Capital IQ Consensus Estimate; sees Q3 revs of ~$34 bln vs. $37.42 bln Capital IQ Consensus Estimate -- AAPL typically issues conservative guidance. Co reports 35.1 mln iPhones sold in Q2 vs Street est of ~30.5 mln; 11.8 mln iPads sold in Q2 vs Street est of ~12 mln; 4.0 mln Macs sold in Q2 vs Street est of ~4.5 mln; Q2 gross margins of 47.4% vs Street est of 42.7% and 42% guidance. "The new iPad is off to a great start, and across the year you're going to see a lot more of the kind of innovation that only Apple can deliver. Our record March quarter results drove $14 billion in cash flow from operations."

4:25PM Super Micro Computer misses by $0.03, misses on revs; guides Q4 EPS in-line, revs above consensus (SMCI) 17.81 +0.52 : Reports Q3 (Mar) earnings of $0.19 per share, $0.03 worse than the Capital IQ Consensus Estimate of $0.22; revenues rose 2.5% year/year to $240.2 mln vs the $251.74 mln consensus. Co issues mixed guidance for Q4, sees EPS of $0.27-0.32 vs. $0.29 Capital IQ Consensus Estimate; sees Q4 revs of $280-310 mln vs. $274.88 mln Capital IQ Consensus Estimate.

4:23PM Tessera Tech subsidiary DigitalOptics announced it has licensed its Face Tracker facial tracking technology to Cammsys Co, a camera module maker focused on the mobile phone market (TSRA) 16.30 +0.02 :

4:03PM RF Micro Device misses by $0.01, beats on revs; guides Q1 EPS below consensus, revs in-line (RFMD) : Reports Q4 (Mar) loss of $0.02 per share, excluding non-recurring items, $0.01 worse than the Capital IQ Consensus Estimate of ($0.01); revenues fell 11.9% year/year to $187.9 mln vs the $185.26 mln consensus. Co issues mixed guidance for Q1, sees EPS of $0.00-0.02 vs. $0.03 Capital IQ Consensus Estimate; sees Q1 revs of $202 mln vs. $202.39 mln Capital IQ Consensus Estimate.

The Dow and S&P 500 booked solid gains today, but the Nasdaq faltered amid weakness in Tech stocks and heavyweight Apple.

The tone of trade ahead of the open was generally positive, thanks to renewed buying interest in Europe. However, when Europe's bourses began to give back their gains, sentiment softened at home. Confidence was further undermined by news that there was a drop in the number of Apple (AAPL 560.28, -11.42) products connected to the AT&T (T 31.72, +1.11) network. That news put pressure on shares of AAPL ahead of its quarterly report, but shares of T were able to score strong gains on the back of their better-than-expected earnings results.

Shares of AAPL hampered the Nasdaq since the open. Weakness in the Tech-rich Index was exacerbated by Symantec (SYMC 16.01, -2.06), which issued a disappointing forecast. Netflix (NFLX 87.68, -14.16) was also a source of weakness amid disappontment over its latest quarterly report and outlook.

A positive response to the latest dose of data helped the broad market bounce in mid-morning trade. Participants were generally pleased to learn that new home sales for March hit an annualized pace of 328,000, which is greater than the clip of 318,000 that had been broadly anticipated. Moreover, prior month numbers were revised upward to reflect an annualized pace of 353,000.

The Consumer Confidence Index eased back in April to 69.2 from 70.2 in the prior month. A reading of 69.5 had been generally expected.

Stocks encountered some selling in afternoon trade, but Financials and Energy helped prop up the broad market. They booked gains of 1.1% and 0.7%, respectively. Strength among blue chips helped the Dow maintain a lead over its counterparts for the better part of the day. In addition to AT&T, 3M (MMM 88.49, +1.36) and United Technologies (UTX 79.85, +0.10) reported upside earnings surprises of their own. Coach (COH 71.87, -3.25) and Texas Instruments (TXN 31.36, -0.53) also reported earnings that exceeded what had been widely anticipated, but neither settled in positive territory.

Advancing Sectors: Telecom +2.8%, Industrials +1.2%, Financials +1.1%, Utilities +0.8%, Energy +0.7%, Health Care +0.4%
Unchanged: Consumer Staples, Materials
Declining Sectors: Tech -0.6%, Consumer Discretionary -0.3%DJ30 +74.39 NASDAQ -8.85 NQ100 -0.6% R2K +0.8% SP400 +0.3% SP500 +5.03 NASDAQ Adv/Vol/Dec 1639/1.68 bln/893 NYSE Adv/Vol/Dec 2037/752 mln/985

3:38PM Juniper Networks (halted) beats by $0.03, beats on revs; guides Q2 EPS below consensus, revs in-line (JNPR) 22.21 +2.04 : Reports Q1 (Mar) earnings of $0.16 per share, excluding non-recurring items, $0.03 better than the Capital IQ Consensus Estimate of $0.13; revenues fell 6.3% year/year to $1.03 bln vs the $977.76 mln consensus. Non-GAAP operating margin for Q1 was 12.0% compared to 18.6% in 4Q11, and 22.3% in the prior year first quarter. Co issues guidance for Q2, sees EPS of $0.15-0.17, excluding non-recurring items, vs. $0.20 Capital IQ Consensus Estimate; sees Q2 revs of $1.03-1.06 bln vs. $1.05 bln Capital IQ Consensus Estimate. Juniper estimates that its non-GAAP gross margin will be roughly in line compared to Q1. Juniper expects its non-GAAP operating margin for Q2 to be in the range of 12% and 14%. "Looking ahead, we will manage the business assuming the near-term environment requires continued caution." JNPR popped ~10% as upside Q1 results leaked but the stock is now halted and Q2 EPS was below consensus.

11:05AM Texas Instruments - - Earnings Mover (TXN) 31.54 -0.35 : Slides lower to a fresh 13-week low this morning in as it gives up its initial higher opening in response to last night's earnings. Note the 200-day exponential moving average (31.45) and the mid-January bullish gap along 31.38 area in play. Next level of interest below is $31 followed by its 200-day simple moving average around 30.33.

9:37AM IBM confirms $7.0 bln for stock repurchase program and 13% quarterly dividend increase (IBM) 199.98 +1.34 : Co also confirmed a quarterly dividend increase to $0.85/share from $0.75/share. The board today also authorized $7 billion in additional funds for use in the company's stock repurchase program. This amount is in addition to ~$5.7 bln remaining at the end of March from a prior authorization.

9:04AM Riverbed Technology appoints David Greene as Chief Marketing Officer (RVBD) 19.21 : Prior to joining Riverbed, Greene served as vice president of worldwide marketing for BMC Software's $2B portfolio of IT management software businesses.

AMD (AMD) announced a collaboration with Adobe Systems (ADBE) to optimize a new set of GPU-accelerated features for Adobe products including the newly announced Adobe Photoshop CS6.

7:07AM Celestica beats by $0.04, beats on revs; guides Q2 EPS in-line, revs below consensus (CLS) 8.41 : Reports Q1 (Mar) earnings of $0.25 per share, excluding non-recurring items, $0.04 better than the Capital IQ Consensus Estimate of $0.21; revenues fell 6.1% year/year to $1.69 bln vs the $1.67 bln consensus. Co issues mixed guidance for Q2, sees EPS of $0.20-0.26, excluding non-recurring items, vs. $0.25 Capital IQ Consensus Estimate; sees Q2 revs of 1.65-1.75 bln vs. $1.76 bln Capital IQ Consensus Estimate. "Consistent with our strategy, we continued to invest to support the growth of existing and new customers and we made further progress on our revenue diversification. We also returned value to shareholders through our share repurchase program. Although visibility remains limited, customer demand is stabilizing. Our focus continues to be on delivering innovative supply chain solutions to our customers while delivering strong and consistent financial returns for our shareholders." The company expects a negative $0.04 to $0.06 per share (pre-tax) aggregate impact on an IFRS basis for the following items: stock-based compensation and amortization of intangible assets.

Lattice Semiconductor (LSCC) announced the immediate availability of its low cost, low power MachXO2 family of programmable logic devices in a new 32 QFN package.

2:30AM ARM Holdings reports EPS in-line, beats on revs (ARMH) 27.58 : Reports Q1 (Mar) earnings of GBP0.03 per share, in-line with the Capital IQ Consensus Estimate consensus of GBP0.03; revenues rose 14.2% year/year to GBP132.5 mln vs the GBP129.59 mln consensus. Co states while Q1 industry shipments declined sequentially, most analysts expect the industry to recover in the second half. In that context, co expects that group dollar revenues for the full-year 2012 will be in line with current market expectations.

Sanmina-SCI (SANM $9.30 -0.95) reported first quarter earnings of $0.27 per share, in-line with the Capital IQ Consensus Estimate consensus of $0.27, while revenues fell 6.8% year/year to $1.46 billion versus the $1.51 billion consensus. The company issued downside guidance for the third quarter with EPS of $0.26-0.32, excluding non-recurring items, versus the $0.36 Capital IQ Consensus, with revenues of $1.475-1.525 billion versus the $1.57 billion consensus. "As we expected, our second quarter continued to be challenged by relatively flat demand across most of our markets and a decline in the multimedia segment.."Based on our outlook for the third quarter and feedback from our customers, we remain encouraged that we should see improvements in the second half of the calendar year."

Ultra Clean Holdings (UCTT $7.21 -0.04) reported first quarter earnings of $0.20 per share, $0.03 better than the Capital IQ Consensus of $0.17, while revenues fell 12.7% year/year to $110.6 million versus the $107.1 million consensus. The company issued mixed guidance for the second quarter with EPS of $0.16-0.19 versus the $0.18 consensus with revenues of $100-105 million versus the $106.84 million consensus. Semiconductor revenue was 85.1% of total revenue for the first quarter of 2012 compared to 79.6% in the previous quarter and revenue outside the U.S. accounted for 32% of the total revenue for the first quarter of 2012 compared to 29% for the previous quarter. Gross margin for the first quarter of 2012 was 14.2%, compared to 11.0% for the fourth quarter of 2011 and 13.9% for the first quarter of 2011.

Texas Instruments (TXN $32.21 +0.32) reported first quarter earnings of $0.32 per share, excluding non-recurring items, $0.03 better than the Capital IQ Consensus of $0.29, while revenues fell 8.0% year/year to $3.12 billion versus the $3.05 bln consensus. The company issued in-line guidance for the second quarter with EPS of $0.36-0.44, excluding non-recurring items, versus the $0.40 consensus with revenues of $3.22-3.48 billion versus the $3.29 billion consensus. For the full year of 2012, TI continues to expect approximately the following: R&D expense: $2.0 billion; Capital expenditures: $0.7 billion; Depreciation: $1.0 billion; Annual effective tax rate: 28%. "As we expected, our business cycle bottomed in the first quarter, and early signs of growth began to emerge... Orders were up 13 percent, and backlog is growing again. Particularly encouraging is the breadth of increased orders across geographical regions and markets, including the industrial sector. "Sales in our Analog segment were about level with the prior quarter. We continue to make progress with Silicon Valley Analog, formerly National Semiconductor, as this product line gains traction with customers and holds a strong position in the important industrial market. Sales in Embedded Processing were up 7 percent led by growth in the automotive and communications infrastructure markets. Sales in our Wireless segment declined sharply as we entered the final phase of our exit from baseband products, which were less than 3 percent of total sales in the quarter. We are expanding the reach of our Wireless segment into multiple markets and experiencing strong diversity in our design-ins."

Netflix (NFLX $86.91 -14.93) reported a first quarter loss of $0.08 per share, $0.19 better than the Capital IQ consensus of ($0.27), while revenues rose 21.0% year/year to $870 million versus the $866.72 million consensus. NetFlix reports Q1 Total Domestic Streaming Total Subs of 23.41 million, guidance was 22.8-23.6 million. The company issued mixed guidance for the second quarter with EPS of -0.10-0.14, excluding non-recurring items, versus the ($0.18) consensus and revenues of $873-895 million versus the $891.04 million consensus. Sees Q2 Domestic streaming total subs in the range of 23.6-24.2 mln. Domestic Streaming: Added 1.7 million total net additions (and 1.9 million paid net additions) in the quarter, and reaching 23.4 million total streaming members. The domestic streaming segment delivered $67 million of contribution profit, equivalent to a 13% contribution margin. We exceeded our domestic streaming contribution margin target of around 11%, due to slightly lower than expected content, delivery, and customer service expenses. Outlook -- Increased Seasonality in Net Adds: We anticipate that U.S. streaming contribution margin will expand in Q2 to about 15%. For Q3 onward, we are targeting 100 bps of average margin expansion per quarter, consistent with our January guidance. We think our 2012 domestic streaming net adds will be about the same as in 2010 (about 7 million), and that gross adds will approximately follow the 2010 seasonal pattern. Due to this increased net add quarterly seasonality, Q2 net adds will be below those of 2010, despite Q2 gross adds following the traditional seasonal pattern, and despite us expecting to match 2010 in annual net additions. The Starz deal for 15 Disney Pay TV 1 output titles, plus some catalog films, ended in February. There was no discernible change in churn or viewing levels. Instead, the trend towards watching episodic TV. Even with our continued content investment, we anticipate a small contribution profit in Canada in Q2 and will remain profitable in this market going forward. This is a quarter earlier than our January expectations for Canadian profitability... expect Latin America and the UK and Ireland to take longer than 8 quarters to reach sustained profits as we build membership and invest in content improvements. Given our expected return to global profitability in Q2, and how well we've been received in the UK, we've decided to open an additional attractive European market in Q4 of this year. DVD members declined this quarter to 10.1 million, slightly better than our expectations. About 7 million of these 10 million also subscribe to our streaming service. Going forward, we believe DVD will continue to decline but at a slower pace than the past few quarters. Looking forward to Q2, sequential growth in domestic streaming contribution profit will offset the decline in DVD contribution profit from Q1, while improvements in profitability in each of the international markets will reduce the international losses by approximately $11 million (based on the midpoint of guidance). As a result, we are forecasting a much earlier return to global profitability than anticipated on a Q2 net income / (loss) range of ($6) to $8 million. The improvement in the outlook is a result of continued member growth (both domestically and internationally), as well as increased efficiency of our content and marketing spending.

09:40 am F5 Networks upgraded to Buy at Wunderlich; tgt raised to $145: . Wunderlich upgrades FFIV to Buy from Hold and raises their tgt to $145 from $120 following earnings. Firm says accelerating product revenue growth, record gross margin, and book/bill of more than one made F5 Networks' 2Q12 a significant milestone. None of these metrics represented dramatic change, but were all positive in terms of direction.

10:21 am Technology sector trading higher today along with market

The tech sector is trading just higher today, trailing gains in the broader market. Semiconductors are showing relative weakness with the Philly Semi Index trading 0.1% only higher. SPRD (+4.4%) is showing strength in the chip index, while RBCN (-2.0%) in under pressure. Among other major indices, the SPY is trading 0.5% higher today, while the QQQ is up 0.1% and the NASDAQ is trading 0.2% higher on the session. Among tech bellwethers, T (+3.5%) is showing notable strength, while AAPL (-1.2%) lags.

In earnings last night, TXN (-0.1%) reported a Q1 beat and offered inline Q2 guidance, while SANM (-11.2%) posted a slight miss and guided lower. Elsewhere, VLTR (+0.1%) posted a beat but gave a cautious outlook and STM (-1.3%) reported an earnings miss. This morning, T (+3.5%) reported a mixed quarter with upside EPS and roughly inline revs and SYMC (-8.9%) lowered guidance. Also, ARMH (-5.3%) reported a slight beat, while CLS (+9.8%) and LXK (-5.5%) posted quarterly beats but guided below consensus.

In news, IBM (+1.6%) announced a $7 bln stock repurchase and 13% quarterly dividend increase. Among notable analyst upgrades this morning, RMBS (+5.4%) was upgraded to Overweight at JP Morgan. While in downgrades, CSOD (-5.3%) was downgraded to Equal Weight at Barclays and CSGS (-1.5%) was downgraded to Sector Perform at RBC Capital. AAPL (-1.2%), BIDU (-1.4%), JNPR (+1.0%) and WIT (+1.9%) are a few notable names in tech scheduled to report quarterly results today after the close.
icon url

ReturntoSender

04/25/12 6:31 PM

#9757 RE: ReturntoSender #6755

From Briefing.com: 4:30 pm : 4:36PM Integrated Silicon misses by $0.02, misses on revs; guides Q3 EPS midpoint below, revs in-line (ISSI) 10.67 +0.10 : Reports Q2 (Mar) earnings of $0.21 per share, excluding non-recurring items, $0.02 worse than the Capital IQ Consensus Estimate of $0.23; revenues fell 1.3% year/year to $62.5 mln vs the $64.38 mln consensus. Co issues in-line guidance for Q3, sees EPS of $0.21-0.28, excluding non-recurring items, vs. $0.28 Capital IQ Consensus Estimate; sees Q3 revs of $63-68 mln vs. $67.40 mln Capital IQ Consensus Estimate. "Our revenue in the March quarter reflected normal seasonality combined with softer demand in the communications and consumer markets. This weakness was partially offset by stronger demand in the automotive and the industrial, medical, and military markets."

4:34PM O2Micro's LED invention and voltage detection invention each issued U.S. patent (OIIM) 5.29 +0.23 : Co was issued 18 claims under United States patent number 8,076,867 for its Driving Circuit invention. Co was also issued 18 claims under United States patent number 8,076,959 for its Voltage Detection invention.

4:29PM Mattson beats by $0.03, beats on revs (MTSN) 2.38 -0.07 : Reports Q1 (Mar) loss of $0.01 per share, $0.03 better than the Capital IQ Consensus Estimate of ($0.04); revenues rose 7.4% year/year to $50.5 mln vs the $46.03 mln consensus. "The first quarter of 2012 was a solid start for Mattson Technology driven by a strong increase in sales. "We approached breakeven for the quarter, and our efforts to improve gross margins and reduce operating expenses are on track to bring the Company into profitability during the year. At the same time that we are improving our financial performance, we also have extended our growth potential."

4:29PM Intersil misses by $0.01, reports revs in-line; guides Q2 EPS below consensus, revs in-line (ISIL) 10.86 +0.18 : Reports Q1 (Mar) earnings of $0.06 per share, $0.01 worse than the Capital IQ Consensus Estimate of $0.07; revenues fell 21.6% year/year to $156 mln vs the $156.64 mln consensus. Co issues mixed guidance for Q2, sees EPS of $0.08-$0.11 vs. $0.12 Capital IQ Consensus Estimate; sees Q2 revs of $162-$170 mln vs. $169.07 mln Capital IQ Consensus Estimate.

4:26PM Xilinx beats by $0.08, beats on revs; guides Q1 revs above consensus (XLNX) 34.78 +0.78 : Reports Q4 (Mar) earnings of $0.49 per share, $0.08 better than the Capital IQ Consensus Estimate of $0.41; revenues fell 4.9% year/year to $559 mln vs the $532.3 mln consensus. Co issues upside guidance for Q1, sees Q1 revs up 1-5% sequentially, which equates to approx $564.9-$586.9 mln vs. $555.34 mln Capital IQ Consensus Estimate. Gross margin is expected to be approximately 65-66%. Operating expenses are expected to be approximately $220 million, including $2 million of amortization of acquisition-related intangibles.

4:07PM TriQuint Semi reports EPS in-line, revs in-line; guides Q2 below consensus (TQNT) : Reports Q1 (Mar) earnings of $0.02 per share, in-line with the Capital IQ Consensus Estimate consensus of $0.02; revenues fell 3.4% year/year to $216.7 mln vs the $214.62 mln consensus. Co issues downside guidance for Q2, sees EPS of ($0.10)-(0.15) vs. $0.06 Capital IQ Consensus Estimate; sees Q2 revs of $170-185 mln vs. $223.03 mln Capital IQ Consensus Estimate.

4:06PM Cirrus Logic beats by $0.01, reports revs in-line; guides Q1 revs below consensus; expects to transition to a sharply higher level of revenue beginning in the September quarter (CRUS) 22.30 +2.29 : Reports Q4 (Mar) earnings of $0.36 per share, excluding non-recurring items, $0.01 better than the Capital IQ Consensus Estimate of $0.35; revenues rose 21.0% year/year to $110.6 mln vs the $109.98 mln consensus. Co issues downside guidance for Q1, sees Q1 revs of $96-106 mln vs. $107.48 mln Capital IQ Consensus Estimate. Co said Q1 FY13 Gross margin is expected to be between 53 percent and 55 percent,.While the company expects to grow revenue substantially during FY '13, year-over-year revenue in Q1 is currently forecasted to grow approximately 10 percent. Due to the timing of various product introductions later this year, the company expects to transition to a sharply higher level of revenue beginning in the September quarter. In connection with this transition, the company also announced that it has entered into an unsecured, one-year $100 million revolving credit agreement that provides access to additional working capital the company may need in order to support the production ramps of multiple new products this fall.

4:05PM LSI Logic beats by $0.06, beats on revs; guides Q2 EPS in-line, revs above consensus (LSI) 8.43 +0.40 : Reports Q1 (Mar) earnings of $0.20 per share, $0.06 better than the Capital IQ Consensus Estimate of $0.14; revenues rose 31.4% year/year to $622 mln vs the $599.82 mln consensus. Co issues guidance for Q2, sees EPS of $0.15-0.21 vs. $0.16 Capital IQ Consensus Estimate; sees Q2 revs of $630-670 mln vs. $619.63 mln Capital IQ Consensus Estimate.

4:04PM Microsemi reports EPS in-line, revs in-line; guides Q3 EPS in-line, revs above consensus (MSCC) 20.20 +0.63 : Reports Q2 (Mar) earnings of $0.46 per share, excluding non-recurring items, in-line with the Capital IQ Consensus Estimate consensus of $0.46; revenues rose 20.1% year/year to $249.3 mln vs the $248.46 mln consensus. Co issues in-line EPS guidance for Q3, sees EPS of $0.51-0.55, excluding non-recurring items, vs. $0.51 Capital IQ Consensus Estimate; sees Q3 revs growth of 3-5% sequentially, which equatues to ~$256.8-261.8 mln vs. $256.62 mln Capital IQ Consensus Estimate.

The Fed was in focus this afternoon, but today's advance is really owed to a strong rally by the market's biggest stock, Apple (AAPL 610.00, +49.72).

Shares of AAPL lagged in the prior session because of concerns about a decline in the number of connections its products made to data networks in the last quarter, but those worries were put to rest with the release of financial results that far surpassed what Wall Street had expected. Strength in the stock helped drive the Tech sector to a gain greater than 3%, and helped lead the Tech-Rich Nasdaq to a gain of more than 2%.

Although the advance by AAPL shares helped bring about a strong, broad bid, Telecom stocks had difficulty building on their prior session performance. The sector settled with a gain of just 0.1% after it had advanced almost 3% yesterday.

The Fed was busy at work today. Fed Chairman Bernanke stated during his press conference that the FOMC is prepared to take additional actions, if necessary. That reassured many market participants that further quantitative easing is still a possibility. Stocks traded higher in response to the remark, but they could not hurdle the heights set in the early going.

Bernanke’s comments came shortly after the Fed’s forecast for GDP was released. The Fed now anticipates that real GDP for 2012 will grow at a pace between 2.4% and 2.9%, up from the range of 2.2% to 2.7% that was issued in January. However, the forecast for 2013 now calls for real GDP growth to range from 2.7% to 3.1%, down from the range of 2.8% to 3.2%, while the range for growth in 2014 is expected to range from 3.1% to 3.6%, down from 3.3% to 4.0%. Longer run growth is still expected to range from 2.3% to 2.6%. Inflation estimates for the next couple of years are capped at 2.0%.

Earlier in the day the FOMC indicated in its Policy Statement that inflation has picked up somewhat, but the outlook for inflation over the medium run remains subdued. With that in mind the FOMC kept its fed funds rate at 0.00% to 0.25%, and anticipates exceptionally low levels of the fed funds rate at least through late 2014.

Only little attention was paid to the latest durable goods orders data, which were released ahead of the open. Total durable goods orders dropped in Mach by 4.2%, which is steeper than the 1.7% decline that had been broadly expected. Prior month numbers were revised lower to reflect an increase of 1.9%. Excluding transportation items, durable goods orders declined in March by 1.1%, which comes in stark contrast with the 0.5% increase that had been broadly anticipated. Orders less transportation for the prior month had increased by an upwardly revised 1.9%.

Boeing (BA 77.08, +3.87), Caterpillar (CAT 103.44, -4.96), Credit Suisse (CS 25.19, -1.02), Eli Lilly (LLY 40.80, +0.84), Northrop Grumman (NOC 63.01, +0.28), Sprint Nextel (S 2.43, -0.04), and WellPoint (WLP 70.40, -0.36) were among the more widely held names that were in focus for their latest earnings results. Each exceeded what had been widely expected of it. However, both Delta Air Lines (DAL 10.48, +0.00) and GlaxoSmithKline (GSK 46.00, -1.21) came short of the consensus.

Advancing Sectors: Tech +3.2%, Materials +2.3%, Consumer Discretionary +1.7%, Health Care +1.1%, Energy +0.9%, Financials +0.9%, Consumer Staples +0.5%, Utilities +0.5%, Industrials +0.3%, Telecom +0.1%
Declining Sectors: NoneDJ30 +89.16 NASDAQ +68.03 NQ100 +2.7% R2K +1.8% SP400 +1.8% SP500 +18.72 NASDAQ Adv/Vol/Dec 1846/1.71 bln/671 NYSE Adv/Vol/Dec 2323/822 mln/686

7:34AM Silicon Labs beats by $0.02, beats on revs; guides revs in-line (SLAB) 40.36 : Reports Q1 (Mar) earnings of $0.43 per share, $0.02 better than the Capital IQ Consensus Estimate of $0.41; revenues rose 5.1% year/year to $125.7 mln vs the $123.33 mln consensus. The company expects revenue for the second quarter to be up 3-7% sequentially (consensus +3.2%).

7:19AM Corning beats by $0.02, beats on revs (GLW) 13.35 : Reports Q1 (Mar) earnings of $0.30 per share, $0.02 better than the Capital IQ Consensus Estimate of $0.28; revenues fell 0.2% year/year to $1.92 bln vs the $1.87 bln consensus.

Outlook: "After two successive quarters of significant LCD glass price declines, we expect our price declines will be much more moderate this quarter," James B. Flaws, vice chairman and chief financial officer, said. At the same time, Flaws pointed out that LCD glass volumes are expected to be consistent in the company's wholly owned business and up slightly in Samsung Corning Precision this quarter. The company expects stronger LCD glass volume growth later in the year, driven primarily by normal retail seasonality. Telecommunications segment sales are expected to grow in the range of low to mid-teens, driven by continued strong demand worldwide for fiber-to-the-home products, enterprise network solutions, and fiber and cable products.... Fiber-to-the-home demand is expected to remain robust in North America, parts of Europe, and Australia... Specialty Materials segment sales are anticipated to grow in the range of 10% to 15%, driven primarily by the continued demand for Corning Gorilla Glass for the handheld and information technology markets... Environmental Technologies segment sales are expected to be consistent with the first quarter, which was a record in sales and profitability for the business segment. In the Life Sciences segment, Corning forecasts sales to increase in the range of 5% to 10% as the company realizes the full synergies of recent acquisitions.

Dow Corning's equity earnings in the second quarter are expected to improve, driven by volume increases in the silicone and polysilicon markets. Corning's tax rate in the second quarter is expected to be approximately 20%, in line with the first quarter.

Apple (AAPL $612.29 +52.01) reported first quarter earnings of $12.30 per share, $2.26 better than the Capital IQ Consensus of $10.04, while revenues rose 58.9% year/year to $39.19 billion versus the $36.76 billion consensus. The company issued downside guidance for the third quarter with EPS of approximately $8.68 versus the $9.95 consensus with revenues of approximately $34 billion versus the $37.42 billion consensus. AAPL typically issues conservative guidance. The company reported 35.1 million iPhones sold in Q2 versus Street estimate of approximately 30.5 mln; 11.8 mln iPads sold in Q2 versus Street est of approximately 12 mln; 4.0 million Macs sold in Q2 versus Street est of approximately 4.5 mln; Q2 gross margins of 47.4% vs Street est of 42.7% and 42% guidance. "The new iPad is off to a great start, and across the year you're going to see a lot more of the kind of innovation that only Apple can deliver. Our record March quarter results drove $14 billion in cash flow from operations."

Before the close yesterday, Juniper Networks (JNPR $21.22 -0.40) reported first quarter earnings of $0.16 per share, excluding non-recurring items, $0.03 better than the Capital IQ Consensus of $0.13, while revenues fell 6.3% year/year to $1.03 billion versus the $977.76 million consensus. Non-GAAP operating margin for Q1 was 12.0% compared to 18.6% in 4Q11, and 22.3% in the prior year first quarter. Co issues guidance for Q2, sees EPS of $0.15-0.17, excluding non-recurring items,versus the $0.20 consensus and revenues of $1.03-1.06 billion versus the $1.05 billion consensus. Juniper estimates that its non-GAAP gross margin will be roughly in line compared to Q1. Juniper expects its non-GAAP operating margin for Q2 to be in the range of 12% and 14%. "Looking ahead, we will manage the business assuming the near-term environment requires continued caution." JNPR popped ~10% as upside Q1 results leaked but the stock is now halted and Q2 EPS was below consensus.

12:32 pm Technology sector trading higher today following Apple Earnings

The tech sector is trading higher today, outpacing gains in the broader market. Semiconductors are also showing relative weakness in the tech space, however, with the Philly Semi Index trading 1.4% higher. CRUS (+9.7%) is a notable leader in that chip index, while MU (-1.4%) lags. Among other major indices, the SPY is trading 1.0% higher today, while the QQQ is 2.3% higher and the NASDAQ is trading 1.9% higher on the session. Among tech bellwethers, AAPL (+8.7%) is showing notable strength.

In earnings last night, AAPL (+8.7%) posted a blowout Q2 and offered its typical conservative guidance. Elsewhere, JNPR (-3.4%) and BIDU (-2.7%) both reported quarterly beats but provided downside guidance, while CYMI (-1.2%) posted a beat but offered higher than expected expense guidance. This morning, SAP (+0.7%) and WIT (-4.2%) each posted quarterly results that fell just short of consensus. S (+0.8%) and GLW (+5.8%), on the other hand, reported a quarterly beats. In news, CRAY (+22.6%) agreed to sell interconnect hardware assets to INTC (+1.1%).

Among notable analyst upgrades this morning, AAPL (+8.7%) was upgraded to Outperform at Scotia Capital, CALX (+15.4%) was upgraded to Buy from Neutral at UBS, ARMH (+2.1%) was upgraded to Hold at Jefferies and CYMI (-1.2%) was upgraded to Outperform at Credit Suisse. While in downgrades, SYMC (+0.4%) was downgraded at RBC and Lazard and Stifel Nicolaus downgraded AXE (-3.0%) to Hold.
icon url

ReturntoSender

04/26/12 10:59 PM

#9758 RE: ReturntoSender #6755

From Briefing.com: 5:00PM KLA-Tencor beats on the top and bottom line by a notable margin (KLAC) 55.11 +1.91 : Reports Q3 (Mar) earnings of $1.27 per share, excluding non-recurring items, $0.17 better than the Capital IQ Consensus Estimate of $1.10; revenues rose 0.8% year/year to $840.5 mln vs the $800.02 mln consensus. Co will guide Q4 EPS/rev on the call.

4:43PM Applied Micro beats by $0.01, reports revs in-line (AMCC) 6.36 +0.21 : Reports Q4 (Mar) loss of $0.10 per share, excluding non-recurring items, $0.01 better than the Capital IQ Consensus Estimate of ($0.11); revenues fell 13.3% year/year to $48.8 mln vs the $48.97 mln consensus.

4:43PM Nanometrics misses by $0.02, beats on revs; guides Q2 revs below consensus; sees Q2 non-GAAP margin of 45-46% (NANO) 19.00 +0.60 : Reports Q1 (Mar) earnings of $0.12 per share, $0.02 worse than the Capital IQ Consensus Estimate of $0.14; revenues fell 10.6% year/year to $55.5 mln vs the $53.77 mln consensus. Co issues guidance for Q2, sees EPS of $0.05-0.09, may not be comparable to $0.23 Capital IQ Consensus Estimate; sees Q2 revs of $51-54 mln vs. $58.67 mln Capital IQ Consensus Estimate. "The first quarter was a solid start to 2012, with a 23% increase in revenues driven by record OCD shipments that more than offset sequential declines in some of our other business areas. Our newest OCD platform, the Atlas-II, has easily surpassed the initial revenue contribution and growth rate of any of our prior product launches, and is on track to being the most successful new product ever developed by Nanometrics. We are also encouraged by improving expectations for capital spending in 2012, particularly among Nanometrics' largest customers, and the commercial benefits of being a key supplier to the leaders in the industry." For the second quarter, management expects non-GAAP gross margin in the range of 45% to 46%, GAAP gross margin in the range of 44% to 45%, operating expenses to range from flat to up $0.3 million from the first quarter, and other expenses to be $0.4 to $0.5 million.

4:35PM Cray beats by $0.10, beats on revs; guides Q2 revs above consensus; raises FY12 revs above consensus (CRAY) 8.90 +0.39 : Reports Q1 (Mar) earnings of $0.13 per share, $0.10 better than the Capital IQ Consensus Estimate of $0.03; revenues rose 181.5% year/year to $112.3 mln vs the $99 mln consensus. Co issues upside guidance for Q2, sees Q2 revs of ~ $85 mln vs. $54.00 mln Capital IQ Consensus Estimate. Co raises guidance for FY12, sees FY12 revs of $430-450 mln from prior guidance of $400-420 mln vs. $404.17 mln Capital IQ Consensus Estimate. Overall gross margins for the year are anticipated to be in the 35 percent range. With $22 million in expected co-funding credits for research and development and the anticipated incremental savings from the announced asset sale, total operating expenses are expected to be about $120 million. Based on this outlook, we expect to be solidly profitable for 2012. The pending $140 million transaction with Intel (INTC) does not impact the Company's revenue and gross margin outlook. "This week we also announced a significant agreement with Intel which substantially improves our growth and financial options. Our interconnect hardware program has been a strong part of our business for some time but as we look to the future we see more opportunities in other areas of differentiation -- areas we also focus on currently. This transaction allows us to increase our focus on these technologies and to further expand on our commitment to drive growth from our core supercomputing business and our new initiatives in mid-range supercomputing, storage and big data. I'm also pleased to be increasing our revenue and profit outlook as we are off to a fast start to what I believe will be a banner year for the Company."

4:32PM Skyworks beats by $0.02, reports revs in-line; guides Q3 EPS in-line, revs above consensus (SWKS) 25.50 +0.28 : Reports Q2 (Mar) earnings of $0.42 per share, excluding non-recurring items, $0.02 better than the Capital IQ Consensus Estimate of $0.40; revenues rose 12.1% year/year to $364.7 mln vs the $361.18 mln consensus. Co issues mixed guidance for Q3, sees EPS of $0.44, excluding non-recurring items, vs. $0.44 Capital IQ Consensus Estimate; sees Q3 revs of $383 mln vs. $381.17 mln Capital IQ Consensus Estimate.

4:28PM Western Digital beats by $0.97, beats on revs (WDC) 45.25 +0.96 : Reports Q3 (Mar) earnings of $2.52 per share, $0.97 better than the Capital IQ Consensus Estimate of $1.55; revenues rose 34.8% year/year to $3.04 bln vs the $2.42 bln consensus. " Our third quarter performance demonstrates the potential of the new Western Digital, with just three and a half weeks of HGST results combined with the standalone WD business,"

4:26PM Amkor beats by $0.02, beats on revs; guides Q2 EPS in-line, revs in-line (AMKR) 5.91 +0.19 : Reports Q1 (Mar) earnings of $0.06 per share, $0.02 better than the Capital IQ Consensus Estimate of $0.04; revenues fell 1.5% year/year to $655 mln vs the $639 mln consensus. Co issues in-line guidance for Q2, sees EPS of $0.08-0.16 vs. $0.13 Capital IQ Consensus Estimate; sees Q2 revs of $670-700 mln vs. $688.50 mln Capital IQ Consensus Estimate.

4:22PM MIPS Tech beats by $0.02, beats on revs (MIPS) : Reports Q3 (Mar) loss of $0.01 per share, $0.02 better than the Capital IQ Consensus Estimate of ($0.03); revenues fell 23.9% year/year to $15.3 mln vs the $13.93 mln consensus.

4:22PM NXP Semi beats by $0.01, beats on revs; guides Q2 EPS above consensus, revs above consensus (NXPI) 25.02 +0.96 : Reports Q1 (Mar) earnings of $0.19 per share, excluding non-recurring items, $0.01 better than the Capital IQ Consensus Estimate of $0.18; revenues fell 9.6% year/year to $978 mln vs the $956.97 mln consensus. Co issues upside guidance for Q2, sees EPS of $0.38-0.43, excluding non-recurring items, vs. $0.34 Capital IQ Consensus Estimate; sees Q2 revs of $1.04-1.07 bln vs. $1.01 bln Capital IQ Consensus Estimate.

4:12PM Ingram Micro beats by $0.04, reports revs in-line (IM) 19.50 +0.18 : Reports Q1 (Mar) earnings of $0.43 per share, excluding an aggregate benefit of approximately 15 cents per diluted share, $0.04 better than the Capital IQ Consensus Estimate of $0.39; revenues fell 1.0% year/year to $8.63 bln vs the $8.67 bln consensus. For the 2012 second quarter, sales are expected to be flat to slightly up sequentially (vs consensus of ~+1.1% QoQ). 2012 second quarter gross margin is expected to trend down sequentially, reflecting the removal of the residual benefit from hard disk drive pricing realized in the 2012 first quarter, as well as normal seasonal declines such as lower fee-based logistics business.

4:07PM Coherent misses by $0.10, misses on revs (COHR) 56.17 +0.91 : Reports Q2 (Mar) earnings of $0.73 per share, $0.10 worse than the Capital IQ Consensus Estimate of $0.83; revenues fell 3.8% year/year to $193.3 mln vs the $196.55 mln consensus.

4:04PM Seagate Tech announces $2.5 bln share repurchase (STX) 31.09 +0.07 : Co announced that its Board of Directors has authorized the Company to repurchase up to $2.5 billion of its outstanding ordinary shares. Seagate, as a result of the April 2012 Authorization and other current repurchase authorizations, currently has a total authorized unutilized capacity for repurchases of approximately $3.5 billion under these authorizations. "The repurchase authorization reflects the confidence that the Board and the executive management team have in Seagate's ability to generate cash, while still investing in innovation and growth opportunities," said Steve Luczo, CEO of Seagate. Seagate expects to fund the share repurchase through a combination of cash on hand, future cash flow from operations and potential alternative sources of financing.

4:03PM Maxim Integrated beats by $0.05, reports revs in-line; guides Q4 EPS above consensus, revs in-line (MXIM) 27.60 +0.27 : Reports Q3 (Mar) earnings of $0.33 per share, excluding non-recurring items, $0.05 better than the Capital IQ Consensus Estimate of $0.28; revenues fell 5.9% year/year to $571.2 mln vs the $571.17 mln consensus. Co issues guidance for Q4, sees EPS of $0.37-0.41, excluding non-recurring items, vs. $0.34 Capital IQ Consensus Estimate; sees Q4 revs of $590-620 mln vs. $601.89 mln Capital IQ Consensus Estimate.

4:30 pm : Early action was choppy and listless as market participants responded to renewed weakness in Europe, where an economic sentiment indicator from the European Commission made a steeper-than-expected decline during April. Disappointing weekly jobless claims data at home didn't help the mood of morning trade. The latest initial claims count totaled 388,000, which is greater than the 373,000 claims that economists polled by Briefing.com had generally expected, and is consistent with the prior week tally of 389,000 claims.

Stocks responded positively to news that pending home sales spiked in March by 4.1%, which is far greater than the 0.5% increase that economists polled by Briefing.com had generally expected. The SPDR S&P Homebuilders ETF (XHB 21.35, +0.42) climbed to a near 2% gain shortly after the release of the report, but that gain was given back before the ETF made a steady ascent alongside the broad market in afternoon trade.

The broad market had difficulty building on the bit of buying that followed the pending home sales report, leaving the major equity averages to chop along in a rather tight range not too far above the neutral line. However, the tone of trade improved in the afternoon. The buying that ensued put the broad market on a steady climb that made for a nice extension of the prior session's advance. The S&P 500 had cleared the 1400 line for before it eased back to close there. The broad market measure now enters Friday sporting a week-to-date gain of about 1.6%, which would make for the best weekly performance in six weeks of trade.

Telecom has been one of the best performers of the past week. The sector bested every other sector today by advancing another 1.7%, which puts it on pace for a weekly gain of nearly 4%. Financials, Energy, and Tech -- typical leaders -- all traded in stride with the broader market, settling with gains of 0.8%, 0.7%, and 0.6%, respectively.

The latest round of earnings proved less impressive than those of the recent past. Flaws in the reports of Akamai Tech (AKAM 33.15, -5.60), Dow Chemical (DOW 34.85, -1.23), and Las Vegas Sands (LVS 56.97, -1.81) overshadowed their better-than-expected earnings. PepsiCo (PEP 66.37, -0.30) also failed to put together a gain, despite its upside earnings surprise. Meanwhile, Exxon Mobil (XOM 86.07, -0.78) and UPS (UPS 78.25, -1.40) both came short of the consensus. Colgate-Palmolive (CL 99.47, -0.11) and BristolMyers (BMY 33.76, -0.53) both had in-line earnings.

Advancing Sectors: Telecom +1.7%, Consumer Discretionary +1.2%, Consumer Staples +0.8%, Financials +0.8%, Energy +0.7%, Tech +0.6%, Industrials +0.6%, Utilities +0.6%
Declining Sectors: Health Care -0.1%, Materials -0.2%DJ30 +113.90 NASDAQ +20.98 NQ100 +0.6% R2K +0.8% SP400 +1.0% SP500 +9.29 NASDAQ Adv/Vol/Dec 1575/1.75 bln/946 NYSE Adv/Vol/Dec 2048/775 mln/953

O2Micro International (OIIM) was issued 22 claims under U.S. patent for its Power Delivery System and 18 claims for its LED Balancing Circuits and Methods.

6:47AM Aixtron misses by EUR0.08, misses on revs (AIXG) 16.78 : Reports Q1 (Mar) loss of EUR0.12 per share, EUR0.08 worse than the Capital IQ Consensus Estimate of (EUR0.04); revenues fell 79.6% year/year to EUR42 mln vs the EUR62.29 mln consensus. The most significant factor in this development was the year on year decrease in demand for MOCVD deposition equipment for LED applications. Compared to the previous quarter, revenues decreased by 70% from EUR 140.1m in Q4/2011. Equipment sales were EUR 29.3m in Q1/2012 (Q4/2011: EUR 128.1m; Q1/2011: EUR 190.5m), which represents 70% of the total Q1/2012 revenues (Q4/2011: 91%; Q1/2011: 93%). In the first three months of 2012, a high percentage, namely 76% of total revenues, were generated by sales to customers in Asia, however, this is 13 percentage points lower than the 89% recorded in Q1/2011 and 16 percentage points lower than the 92% in Q4/2011. The total equipment order backlog of EUR 136.2m at March 31, 2012 was 58% lower than the EUR 321.1m at the same point in time in 2011, 3% lower than the EUR 141.0m recorded as of December 31, 2011 but comparatively stable compared with the 2012 opening backlog as of January 1, 2012, which had been revalued to EUR 136.8m, reflecting the 2012 budget USD/EUR exchange rate of 1.40 USD/EUR. Outlook: With the reluctance of customers to invest in the current economic climate, especially in the larger Asian markets, the co's order intake visibility remains limited. Mgmt however remains confident that the increase in equipment investments for LEDs in general lighting applications will materialize during the course of the next twelve months. Based on the business and market development in the first quarter of 2012, Management still believes that 2012 will be a transitional year with lower revenues and potential customer consolidation, but retains its more positive outlook for the second half of the year. However, due to the limited business visibility mgmt is still unable to offer a precise full year revenue figure at this point in time, but reiterates its targeted EBIT profitability in 2012.

LSI Logic (LSI $8.74 +0.31) reported first quarter earnings of $0.20 per share, $0.06 better than the Capital IQ Consensus of $0.14, while revenues rose 31.4% year/year to $622 million versus the $599.82 million consensus. The company issued guidance for the second quarter with EPS of $0.15-0.21 versus the $0.16 consensus and revenues of $630-670 million versus the $619.63 million consensus.

Cirrus Logic (CRUS $28.07 +2.97) reported fourth quarter earnings of $0.36 per share, excluding non-recurring items, $0.01 better than the consensus of $0.35, while revenues rose 21.0% year/year to $110.6 million versus the $109.98 million consensus. The company issued downside guidance for the first quarter with revenues of $96-106 million versus the $107.48 mln consensus. The company said Q1 FY13 Gross margin is expected to be between 53 percent and 55 percent,.While the company expects to grow revenue substantially during FY '13, year-over-year revenue in Q1 is currently forecasted to grow approximately 10 percent. Due to the timing of various product introductions later this year, the company expects to transition to a sharply higher level of revenue beginning in the September quarter. In connection with this transition, the company also announced that it has entered into an unsecured, one-year $100 million revolving credit agreement that provides access to additional working capital the company may need in order to support the production ramps of multiple new products this fall.

TriQuint Semi (TQNT $4.98 -0.54) reported first quarter earnings of $0.02 per share, in-line with the Capital IQ Consensus of $0.02, while revenues fell 3.4% year/year to $216.7 million versus the $214.62 million consensus. The company issued downside guidance for the second quarter with EPS of ($0.10)-(0.15) versus the $0.06 consensus and revenues of $170-185 million versus the $223.03 million consensus.

11:00 am Technology sector trading higher today along with market

The tech sector is trading higher today, outpacing slight gains in the broader market. Semiconductors are also showing relative strength with the Philly Semi Index trading 1.6% higher. CRUS (+13.3%) is the notable leader in the chip index. Among other major indices, the SPY is trading 0.1% higher today, while the QQQ is up 0.2% and the NASDAQ is trading 0.3% higher on the session. Among tech bellwethers, VZ (+0.9%) is showing notable strength.

In earnings last night, LSI (-1.5%), CTXS (+9.9%), XLNX (+6.2%), and AKAM (-8.2%) both posted quarterly beats with upside guidance. Elsewhere, TQNT (-3.6%) reported an inline qtr and provided downside guidance. This morning, SWI (+18.8%) posted a beat and offered inline guidance, while NUAN (+8.6%) preannounced upside Q2 results and PCS (-8.7%) posted a miss.

Among rumors, there are reports that Japanese video game maker Nexon is interested in EA (+5.5%). Among notable analyst upgrades this morning, CTXS (+9.9%) was upgraded at FBR and Mizuho, AKAM (-8.2%) was upgraded to Buy at Jefferies and SLAB (+4.0%) was upgraded to Buy at Citigroup. While in downgrades, SAP (+0.5%) was downgraded to Market Perform at Wells Fargo and PCS (-8.7%) was downgraded to Perform at Oppenheimer. CELL (+0.4%), IM (+0.3%), ZNGA (+0.8%), NXPI (+2.1%), KLAC (+3.1%), and WDC (+1.3%) are a few notable names in tech scheduled to report quarterly results today after the close.
icon url

ReturntoSender

04/28/12 12:19 PM

#9759 RE: ReturntoSender #6755

Chart of the Day - Earnings Surge

http://www.chartoftheday.com/201204292.htm?T

With first-quarter earnings season well underway (over 65% of S&P 500 corporations have reported), today's chart provides some long-term perspective to the current earnings environment by focusing on 12-month, as reported S&P 500 earnings. Today's chart illustrates how earnings declined over 92% from its Q3 2007 peak to Q1 2009 low which brought inflation-adjusted earnings to near Great Depression lows. Since its Q1 2009 low, S&P 500 earnings have surged (up an inflation-adjusted 1120%) and currently come in at a level that is well above its dot-com bubble peak and fast approaching its credit bubble peak. It is interesting to note that the original run up in real earnings from Great Depression lows to dot-com highs took over 67 years. The current spike has taken 34 months. In the end, if corporate earnings were to continue to beat expectations (of those that reported so far this quarter, a relatively high 70% have beat expectations), then inflation-adjusted S&P 500 earnings could make new, all-time record highs this year -- a dramatic reversal from three short years ago.

icon url

ReturntoSender

04/28/12 3:04 PM

#9760 RE: ReturntoSender #6755

I think it's somewhat obvious that those earnings come from more multinational companies than at any other time in history. In addition a stock like AAPL which has the highest weighting in the S&P 500 also has had huge earnings.

How long can AAPL continue to pile up earnings growth?

It will not last forever. Not that I am suggesting anyone short AAPL. Far from it. I just would not be buying long now. For the most part all I am saying is that S&P 500 earnings at or near all time highs has always proven to be unsustainable in the past.

Note that if you overlaid those high points in earnings in 1999/2000 and Q/3 top in 2007 you would also find past market tops:


For more on where the S&P 500 is now:

http://www.bespokeinvest.com/

The S&P 500 has now bounced 3.05% from its April closing low on the 10th. The index now needs to gain 1.48% to take out its bull market closing high of 1,419.04. Below is an update of our trading range screen for the 30 largest stocks in the S&P 500. The dots indicate where the stock is currently trading, while the end of the tail shows where the stock was trading one week ago. A green dot means the stock has moved higher within its trading range over the last week, while a red dot means the stock has moved lower.

For each stock, the neutral (N) zone represents between one standard deviation above and below its 50-day moving average. The light red shading represents between one and two standard deviations above the 50-day, and vice versa for the light green shading. The dark red shading represents between two and three standard deviations above the 50-day, and vice versa for the dark green shading. Moves into the red shading are considered overbought, while moves into the green shading are considered oversold.

Just 5 of the stocks shown have moved lower within their trading ranges over the last week, while 25 have moved higher. Johnson & Johnson (JNJ), AT&T (T) and Verizon (VZ) have had the biggest moves higher since last Thursday's close.

At the moment, 8 of the 30 largest S&P 500 stocks are in overbought territory, while 4 are oversold. Four stocks are in extreme overbought territory -- AT&T (T), Pfizer (PFE), Coca-Cola (KO) and Verizon (VZ). The 4 oversold stocks are Wal-Mart (WMT) -- which was overbought last week, Cisco (CSCO), McDonald's (MCD) and ConocoPhillips (COP).

Looking at year to date performance, the biggest stock in the S&P 500 (and in the world) -- Apple (AAPL) -- is up the most out of all the stocks listed with a gain of 50.54%. Bank of America (BAC) ranks a close second with a YTD gain of 49.19%, followed by JP Morgan (JPM), Citigroup (C), Microsoft (MSFT) and Wells Fargo (WFC). Google (GOOG) has been the biggest loser out of the 30 biggest stocks so far this year with a decline of 4.44%. McDonald's (MCD) -- which was one of the best performing stocks in 2011 -- is down the second most at -4.43%.


RtS
icon url

ReturntoSender

04/28/12 6:09 PM

#9761 RE: ReturntoSender #6755

Business Cycle & Stock Performance

Because sector funds have a narrow focus, you should be familiar with the factors that may affect the industry in question.

http://personal.fidelity.com/products/funds/content/sector/cycle.shtml

Based on a comprehensive analysis of the relevant facts, you may arrive at a judgment as to what the industry's performance will be like going forward. One technique commonly used by is to monitor the business cycle for clues as to what may be happening in the market.

Business Cycle Basics

By examining empirical evidence, the investor can attempt to create a framework for viewing present and future events as they unfold. There are two key questions the investor may want to ask:

1. Will the historic pattern hold, or will it be altered? To answer that, you'll need to ascertain whether the factors driving today's market are fundamentally unchanged, or whether the situation has evolved incrementally or even been radically changed.

2. Has the market already taken the anticipated future events into account? If the factors driving the industry are the traditional cyclical ones, the market usually will have taken them into account, because they are expected. If the factors represent a new element in the equation, then the market may not be expecting them and may not have adjusted accordingly.

Business Cycle and Relative Stock Performance

The following chart shows a typical business cycle and the points at which various economic sectors tend to outperform the broader market. Click any number in the chart to learn about the cyclical characteristics of a particular industry. Note that at this time the Consumer Non Cyclicals(Staples) and Healthcare Sectors are outperforming. This may be a sign of investor worry or an impending Bear Market. RtS


The chart above shows a typical business cycle and the points at which various economic sectors tend to outperform the broader market. Please note that the chart should be used for illustrative purposes only. The chart is a historical representation of stock performance movements relative to the business cycle and is not intended to convey any current or future economic outlook. Choose a Sector for a detail description of its role in the business cycle.

Source: 2000, Standard and Poor's, a division of McGraw-Hill Companies, based on a study analyzing the differences in market returns of 90 Industries vs the S&P 500 during 10 complete economic cycles from December 1945 - December 1995.

Consumer Non-Cyclicals

Stocks in consumer non-cyclicals (food) and consumer growth industries (cosmetics, tobacco, beverages) tend to experience fairly steady demand and are less sensitive to changes in the business cycle. These stocks typically attract investors when the economic cycle or bull market has matured, or is in the early stages of contraction.

I will use the BP Indices and some of the older Amex Industry Holder ETF's to show these relationships. RtS


Consumer Cyclicals (durable & non-durable)

Stocks in this category include durables and non-durables that are sensitive to interest rates as well as the business cycle. Investors typically seek them out when the economy is in the late stages of contraction.


Healthcare

In general, stocks in this sector move similarly to consumer non-cyclicals. This sector is considered defensive, meaning companies in this sector are generally unaffected by economic fluctuations. The healthcare industry consists of pharmaceutical firms, HMOs, biotechnology firms and medical equipment suppliers. Pharmaceutical companies are affected by competitive market shares, the pace of FDA approvals, patent lives, and the strength of the R&D pipelines. Many biotechnology firms are still in the development stage with their fortunes largely determined by investor perceptions of the relative merits of their R&D pipelines. With future new financing likely to be more difficult to obtain than in the past, strategic alliances between major drug companies and biotech firms are expected to increase.


Financials

Stocks in housing-related industries tend to respond well to falling interest rates and are often targeted by investors in the mid to late stages of an economic contraction. Non-mortgage-dependent banks are generally driven by commercial and consumer loan growth, and tend to be favored by investors during the middle of the cycle.


Technology

Technology stocks can be cyclical to the degree that they depend on capital spending and business or consumer demand. However, they may also have long-term growth potential as technological products find broader applications and as new technologies are developed. Technology stocks are usually popular during early to mid stages of an economic expansion.


Basic Industry

Profits of basic industries are driven by high utilization of capacity and strong market demand for products. Therefore, their stocks tend to be popular with investors late in an economic expansion. For basic material companies, the global economic picture and supply/demand equation also affect stock price movements.


Capital Goods

Capital spending tends to increase midway through the business cycle, as the economy is heating up and higher demand for products leads companies to expand their production capacity. Demand in global export markets is key for agricultural equipment, industrial machinery, and machine tools.


Transportation

Railroads and other surface carriers tend to react early to a pickup in the economy. Airlines are subject to cyclical fuel costs, usage versus capacity, and competitive pressures on airfares.


Energy

This category includes large integrated international companies, domestic exploration companies, and energy services companies. Each industry has its own dynamics, but ultimately all are driven by the supply and demand picture for energy worldwide. Political events have historically had a major impact on these industries. Stocks tend to be popular with investors late in the business cycle.


Utilities

Electric companies have historically been very sensitive to interest rates because of the large debt financing costs they must incur in order to build their infrastructures. These stocks tend to perform well in an environment of declining interest rates. Telephone companies may offer attractive long-term growth opportunities, as they diversify and compete in recently deregulated telecommunications markets.


Precious Metals

Precious metals and the stocks of companies that mine and process them can be affected by industrial and consumer demand, but the largest factor contributing to volatility in this category is generally inflationary pressure. Investors often flock to this category late in the expansion cycle.


icon url

ReturntoSender

04/30/12 11:13 PM

#9766 RE: ReturntoSender #6755

From Briefing.com: 4:33PM Advanced Energy beats by $0.06, beats on revs; guides Q2 EPS in-line, revs in-line (AEIS) 11.94 -0.29 : Reports Q1 (Mar) earnings of $0.06 per share, excluding the impact of $2.6 million in restructuring charges recorded in the first quarter, $0.06 better than the Capital IQ Consensus Estimate of ($0.00); revenues fell 23.2% year/year to $105.8 mln vs the $100.07 mln consensus. Co issues in-line guidance for Q2, sees EPS of $0.11-0.14 vs. $0.13 Capital IQ Consensus Estimate; sees Q2 revs of $114-120 mln vs. $112.90 mln Capital IQ Consensus Estimate.

4:20PM Integrated Device beats by $0.02, beats on revs, announces acquisition of Fox Electronics for ~$30 mln (IDTI) 6.73 +0.00 : Reports Q4 (Mar) earnings of $0.05 per share, $0.02 better than the Capital IQ Consensus Estimate of $0.03; revenues fell 17.7% year/year to $119.1 mln vs the $117.3 mln consensus. Co states, "Our Q4 results reflect improving trends in our communications and enterprise computing businesses, and underscore increased traction of our new product categories as revenue from new products increased to 13 percent from 10 percent in the prior quarter. In addition, gross margins were 300 basis points better than expected, highlighting improved product mix and lower inventory reserves." Co also announced that it acquired Fox Electronics, a leading global supplier of frequency control products (FCPs), in an all-cash transaction for approximately $30 million, of which $26 million was paid at closing. Fox Electronics' revenue was approximately $23 million in calendar year 2011, and the company is profitable.

4:14PM PLX Tech misses by $0.06, misses on revs- co to be acquired (PLXT) 3.98 -0.08 : Reports Q1 (Mar) loss of $0.12 per share, excluding non-recurring items, $0.06 worse than the Capital IQ Consensus Estimate of ($0.06); revenues fell 9.6% year/year to $25.4 mln vs the $26.84 mln consensus.

4:07PM PLX Tech to be acquired by Integrated Device (IDTI) for approx. $7.00/share (PLXT) 3.98 -0.08 : IDTI and PLXT announced that they have signed a definitive agreement pursuant to which IDT will acquire PLX. Under the terms of the agreement, unanimously approved by the boards of directors of both companies, IDT will acquire all of the outstanding shares of PLX common stock pursuant to an exchange offer, followed by a second step merger. In the acquisition, PLX stockholders will receive (i) $3.50 in cash and (ii) 0.525 shares of IDT common stock for each PLX common share outstanding. Based on IDT's closing stock price on April 27, 2012, the transaction is valued at approximately $7.00 per PLX share and results in a total transaction value of approx $330 mln. IDT currently projects the transaction to be accretive to non-GAAP earnings by the third fiscal quarter of 2013 with more significant accretion by fiscal year 2014, in each case based on an assumed closing during the first fiscal quarter of 2013... Under the terms of the merger agreement, PLX may solicit superior proposals from third parties for a "go shop" period of 30 calendar days continuing through May 30,

4:16PM LDK Solar to file extension for 2011 Form 20-F (LDK) 3.18 +0.22 : Co announced that it will file a Form 12b-25 to extend the filing date of its Annual Report on Form 20-F for the year ended December 31, 2011. The co is unable to file its Form 20-F for the year ended December 31, 2011 on or before the prescribed due date of April 30, 2012 because it needs additional time to finalize certain items in its fourth quarter 2011 financial results, primarily caused by the changes in market conditions, including an impairment analysis of long-lived assets and an assessment of inventory write-downs and provisions for certain receivables. The company anticipates that the Form 20-F will be filed on or before May 15, 2012.

4:10PM Rudolph Tech misses by $0.04, beats on revs (RTEC) 10.80 -0.12 : Reports Q1 (Mar) earnings of $0.09 per share, $0.04 worse than the Capital IQ Consensus Estimate of $0.13; revenues fell 9.7% year/year to $45.7 mln vs the $44.7 mln consensus. Co states, "First quarter 2012 gross margin was 52 percent, as compared with 53 percent in the fourth quarter 2011. The decrease in margin in the quarter was primarily due to lower software sales and an increase in lower margin transparent metrology product sales in the quarter."

4:08PM PMC-Sierra beats by $0.01, misses on revs (PMCS) 7.07 -0.07 : Reports Q1 (Mar) earnings of $0.06 per share, $0.01 better than the Capital IQ Consensus Estimate of $0.05; revenues fell 16.1% year/year to $132.1 mln vs the $133.62 mln consensus. Co states, "...We expect sequential improvement in our business in Q2 and a stronger second half of 2012."

Mattson Technology (MTSN) has received a follow-on order for its Millios millisecond annealing system from a semiconductor manufacturer. The system will be used for the volume production of advanced logic devices.

NVIDIA (NVDA) announced the GeForce GTX 690, the world's fastest consumer graphics card.

4:30 pm : April ended on a modestly lower note, perhaps appropriately since it marked the first monthly loss for the S&P 500 since November.

Stocks had a four session streak of gains and a run of four straight monthly gains snapped today. Motivation to bid stocks higher was undermined by news that Spain's economy is officially in recession and then participants were dealt some lackluster domestic data. Personal spending increased by 0.3% during March, but that's a slower clip than the 0.5% increase that had been expected, on average, among economists polled by Briefing.com. The smaller-than-expected increase came despite a stronger-than-expected pickup in personal income, which increased by 0.4% when a 0.2% increase had been widely anticipated. As for core personal consumption expenditures (PCE), they increased by 0.2% month over month, as had been broadly expected. Separately, the latest Chicago PMI reading came in at 56.2, which is well below the 60.0 that had been expected broadly.

Earnings reports were anything but stellar. Humana (HUM 80.59, -7.23) was among the more widely held names to report, but its earnings mess was met with a concerted selling effort that sank the stock some 8% to a 2012 low. Merck (MRK 39.24, +0.78) offered the Health Care sector support by pushing higher in response to news that it won a patent infringement lawsuit.

There were a couple of impressive performances in the midst of marred broad market action. Sunoco (SUN 49.29, +8.38) spiked to a multi-year high because of news that it will be acquired by Energy Transfer Partners (ETP 49.63, +1.71) in a deal that values shares of the former at $50.13 per share. That news inspired interest in a handful of oil and gas refiners and marketers, helping the broader Energy sector work its way up to a 0.5% gain, which is second only to the 0.6% gain staged by Telecom. Barnes & Noble (BKS 20.75, +7.07) settled at a session low, but still booked a gain of about 50% on the back of news that the company has entered a strategic partnership with Microsoft (MSFT 32.01, +0.03) to accelerate the transition into e-reading.

Advancing Sectors: Telecom +0.6%, Energy +0.5%, Utilities +0.2%
Declining Sectors: Health Care -0.1%, Consumer Staples -0.3%, Consumer Discretionary -0.5%, Financials -0.6%, Materials -0.7%, Industrials -0.9%, Tech -0.9%DJ30 -14.68 NASDAQ -22.84 NQ100 -0.6% R2K -1.0% SP400 -0.8% SP500 -5.45 NASDAQ Adv/Vol/Dec 855/1.60 bln/1680 NYSE Adv/Vol/Dec 1181/846 mln/1841

11:03 am Technology sector lower today along with market

The tech sector is trading lower today, inline with losses in the broader market. Semiconductors is showing relative strength in the tech space, however, with the Philly Semi Index trading only 0.3% lower. MU (+1.1%) is a notable leader in that chip index, while STM (-3.7%) is under pressure. Among other major indices, the SPY is trading 0.5% lower today, while the QQQ is 0.5% lower and the NASDAQ is trading 0.6% lower on the session. Among tech bellwethers, AAPL (-1.8%) is showing notable strength, while T (+0.7%) is showing strength.

In earnings this morning, Chinese gamers CYOU (+7.9%) posted a beat and inline guidance, while SOHU (-7.8%) reported a beat with below consensus guidance. In news, BKS (+64.8%) and MSFT (+0.2%) announced the formation of a strategic partnership in a new BKS subsidiary. BKS and MSFT have settled their patent litigation, and moving forward, Barnes & Noble and Newco will have a royalty-bearing license under Microsoft's patents for its NOOK eReader and Tablet products. Among rumors, DMD (+22.8%) was in talks to go private over the weekend, DMD prevented bid from private equity firm, according to reports.

There were no notable analyst upgrades this morning in the tech space. Among downgrades, however, PAY (-10.0%) was downgraded to Sell at Deutsche Bank and NOK (-1.1%), TSYS (-8.1%), and ALU (-3.1%) were downgraded at RBC Capital. SBAC (+0.6%) is one of the few notable names in tech scheduled to report quarterly results today after the close.

icon url

ReturntoSender

05/01/12 7:54 PM

#9767 RE: ReturntoSender #6755

From Briefing.com: 4:47PM Rubicon Tech expects Q1 revs of $10 mln vs $10.26 mln consensus, EPS of ($0.15) vs ($0.10) consensus, guided for Q2 (RBCN) 10.31 +0.86 : Co expects revenue for the first quarter of approx $10 million vs $10.26 mln consensus, in line with its guidance of $8 to $12 million. Rubicon recorded expense of $1.8 million in the quarter associated with scrap and re-work of wafers. The company signed a new contract with its major six-inch wafer customer in February of this year, and this expense is associated with bringing wafers produced prior to the signing of the new contract to the revised specifications defined in the new agreement. Other factors impacting the quarter were a product mix reflecting a greater than expected proportion of lower margin two- through four-inch cores and an additional tax benefit. The company expects to report a loss of approximately $0.15 per share for the quarter, vs ($0.10) consensus, and compared with earlier guidance of a loss between $0.10 and $0.14 per share. "We anticipated that we would need to rework some of the wafers already produced to meet the new specifications. During the re-work process, some wafers became dimensionally non-compliant and needed to be scrapped... The scrap charge is related only to wafers produced prior to the signing of the new agreement. This is not a problem with new production as these new specifications are well within our standard process capabilities." Regarding the second quarter outlook, the co said, "We are seeing the market begin to rebound in the second quarter with an increase in orders for two- through four-inch sapphire cores and an increase in six-inch wafer sales for both the LED and SoS markets. However, pricing remains low. The co expects revenue in the second quarter of $15 to $18 mln vs $15.36 mln consensus and a loss per share of $0.10 to $0.14 vs ($0.01) consensus

4:41PM Fairchild Semi accuses Power Integrations' LED Power Conversion Products in new patent lawsuit (FCS) 14.37 +0.20 : Co announced it has filed new patent infringement claims against Power Integrations' LinkSwitch-PH LED power conversion products. The new lawsuit follows last week's jury verdict finding that Power Integrations' LinkSwitch-II and LinkSwitch-CV products infringe Fairchild patent claims. Fairchild is asserting three new patents that extend the company's primary side regulation technology, already found infringed by Power Integrations, to LED power conversion technology.

4:21PM TTM Tech misses by $0.07, misses on revs; guides Q2 EPS in-line, revs in-line (TTMI) : Reports Q1 (Mar) earnings of $0.15 per share, $0.07 worse than the Capital IQ Consensus Estimate of $0.22; revenues fell 12.3% year/year to $300.5 mln vs the $320.66 mln consensus. Co issues in-line guidance for Q2, sees EPS of $0.18-0.27 vs. $0.27 Capital IQ Consensus Estimate; sees Q2 revs of $320-340 mln vs. $338.95 mln Capital IQ Consensus Estimate.

4:18PM Flextronics beats by $0.06, reports revs in-line; guides Q1 EPS in-line, revs below consensus (FLEX) 6.77 +0.09 : Reports Q4 (Mar) earnings of $0.28 per share, $0.06 better than the Capital IQ Consensus Estimate of $0.22; revenues fell 6.0% year/year to $6.38 bln vs the $6.44 bln consensus. Co issues mixed guidance for Q1, sees EPS of $0.20-0.24 vs. $0.24 Capital IQ Consensus Estimate; sees Q1 revs of $5.9-6.3 bln vs. $6.74 bln Capital IQ Consensus Estimate.

4:09PM FormFactor beats by $0.18, beats on revs (FORM) 5.69 +0.09 : Reports Q1 (Mar) loss of $0.29 per share, $0.18 better than the Capital IQ Consensus Estimate of ($0.47); revenues fell 13.9% year/year to $34.8 mln vs the $32.15 mln consensus. Co states, "Q1 started very slowly but recovered later in the quarter as DRAM manufacturers increased their probe card purchases. Overall demand for our products increased in Q1 and we continued to focus on new product technologies and improving operational performance to deliver better long-term financial results."

4:08PM Broadcom beats by $0.10, beats on revs (BRCM) 36.71 +0.11 : Reports Q1 (Mar) earnings of $0.65 per share, excluding non-recurring items, $0.10 better than the Capital IQ Consensus Estimate of $0.55; revenues rose 0.6% year/year to $1.83 bln vs the $1.78 bln consensus.

4:01PM Anadigics misses by $0.03, reports revs in-line (ANAD) 2.18 -0.03 : Reports Q1 (Mar) loss of $0.21 per share, $0.03 worse than the Capital IQ Consensus Estimate of ($0.18); revenues fell 34.7% year/year to $28.4 mln vs the $28.53 mln consensus. As of March 31, 2012, cash, cash equivalents and short and long-term marketable securities totaled $84.0 million.

4:30 pm : A broad-based bid on the back of some better-than-expected data drove the S&P 500 up more than 1% so that it traded near the multi-year highs set about a month ago, but a gradual decline in afternoon action left the broad market measure hand over about half of its gain.

Early trade was relatively flat as limited trade abroad, stemming from holiday observance, left participants with few directional cues. China reported a Manufacturing PMI reading of 53.3, which is its best reading in about one year, but still less than what had been widely expected. The United Kingdom underwhelmed with its PMI reading of 50.5. Sentiment swung positive almost immediately with the release of the ISM Manufacturing Index, which made surprise improvement to 54.8 from 53.4 in the prior month. News that construction spending increased by 0.1% in March when a 0.5% increase had been broadly anticipated was given little attention.

Financials and Energy helped lead the market's climb. Each sector had ascended to a gain of about 2% before support waned into the close. They still scored gains in excess of 1%, though. Marsh McLennan (MMC 34.35, +0.90) provided a pleasing quarterly report that spurred its shares higher, helping to lead the broader Financial sector. Diversified financial services plays also contributed, while Genworth Financial (GNW 6.15, +0.14) outperformed ahead of its quarterly report. Despite an earnings miss, Chesapeake Energy (CHK 19.60, +1.16) was a top performer among Energy issues, whereas Marathon Petroleum (MPC 41.21, -0.40) slid after it reported an upside earnings surprise. Valero (VLO 24.84, +0.14) also bested expectations for the bottom line, but its shares surrendered a chunk of gains. BP Plc (BP 42.70, -0.71) was pressured for the entire session following its quarterly report, but Anadarko Petroleum (APC 75.06, +1.85) staged a strong gain following its release. Amid the action crude oil climbed more than 1% to clear $106 per barrel for the first time in more than one month.

Although its earnings proved greater than what Wall Street had anticipated, Pfizer (PFE 22.78, -0.12) returned to the red after it had overcome an early loss. Archer Daniels Midland (ADM 33.02, +2.19) was one of the session's top performers. The stock set a multi-month high following a bottom line beat that came despite a relatively light revenue figure. Tech was one of the weaker performing sectors, settling with a gain of only 0.2%.

Heavyweights like Microsoft (MSFT 32.01, -0.01), Apple (AAPL 582.13, -1.85), Cisco (CSCO 19.98, -0.18), and Google (GOOG 604.43, -0.42) hampered the sector, and also dragged on the Nasdaq, which trailed its counterparts into the close and barely eked out a gain.

Tomorrow's calendar features the ADP Employment Report at 8:15 AM ET. It is expected to provide a glimpse into the monthly payrolls report scheduled for release on Friday. Monthly factory orders figures are due tomorrow at 10:00 AM ET. Weekly crude oil inventory data will be posted at 10:30 AM ET.

Advancing Sectors: Energy +1.4%, Financials +1.1%, Materials +0.5%, Telecom +0.5%, Utilities +0.5%, Consumer Discretionary +0.5%, Health Care +0.3%, Industrials +0.3%, Consumer Staples +0.2%, Tech +0.2%
Declining Sectors: NoneDJ30 +65.69 NASDAQ +4.08 NQ100 +0.1% R2K -0.1% SP400 +0.4% SP500 +7.91 NASDAQ Adv/Vol/Dec 1184/1.84 bln/1333 NYSE Adv/Vol/Dec 1960/766 mln/1059

TriQuint Semiconductor (TQNT) has been selected by the Defense Advanced Research Projects Agency to lead a $12.3 mln development program focused on ultra-fast gallium nitride switch technology for the Microscale Power Conversion program.

Veeco Instruments (VECO $33.90 +3.71) reported first quarter earnings of $0.49 per share, excluding non-recurring items, $0.28 better than the Capital IQ Consensus of $0.21, while revenues fell 45.1% year/year to $139.9 million versus the $126.1 mln consensus. For the second quarter, the company sees EPS of $0.29-0.48, excluding non-recurring items, versus the $0.24 consensus and revenues of $120-145 million versus the $128.0 million consensus. The company issued in-line guidance for fiscal year 2012 with revenues of $500-600 million versus the $538.4 million consensus. "While MOCVD bookings grew modestly in the first quarter, we have not yet seen a clear inflection in customer buying patterns. LED customers remain cautious about capacity investment plans and it is still unclear when the MOCVD market will recover. Some positive signs are emerging, including increasing tool utilization rates in Korea, Taiwan and China, and a pick-up in customer quoting activity. Overall, we are seeing positive trends in LED lighting -- lower prices, more LED lamp products, and heightened consumer awareness. LED manufacturers are focused on how to position their businesses for growth as LEDs become the dominant lighting technology. Despite the business decline in 2012, we firmly believe that the future MOCVD market opportunity will be larger than what we have experienced so far."

09:36 am Veeco Instruments shares rise over 12% following sizeable beat on earnings

Veeco Instruments (VECO $34.20 +4.01) reported first quarter earnings of $0.49 per share, excluding non-recurring items, $0.28 better than the Capital IQ Consensus of $0.21, while revenues fell 45.1% year/year to $139.9 million versus the $126.1 mln consensus. For the second quarter, the company sees EPS of $0.29-0.48, excluding non-recurring items, versus the $0.24 consensus and revenues of $120-145 million versus the $128.0 million consensus.

The company issued in-line guidance for fiscal year 2012 with revenues of $500-600 million versus the $538.4 million consensus. "While MOCVD bookings grew modestly in the first quarter, we have not yet seen a clear inflection in customer buying patterns. LED customers remain cautious about capacity investment plans and it is still unclear when the MOCVD market will recover. Some positive signs are emerging, including increasing tool utilization rates in Korea, Taiwan and China, and a pick-up in customer quoting activity. Overall, we are seeing positive trends in LED lighting -- lower prices, more LED lamp products, and heightened consumer awareness. LED manufacturers are focused on how to position their businesses for growth as LEDs become the dominant lighting technology. Despite the business decline in 2012, we firmly believe that the future MOCVD market opportunity will be larger than what we have experienced so far."

Integrated Device (IDTI $6.12 -0.65) reported fourth quarter earnings of $0.05 per share, $0.02 better than the Capital IQ Consensus of $0.03, while revenues fell 17.7% year/year to $119.1 million versus the $117.3 million consensus. Co states, "Our Q4 results reflect improving trends in our communications and enterprise computing businesses, and underscore increased traction of our new product categories as revenue from new products increased to 13 percent from 10 percent in the prior quarter. In addition, gross margins were 300 basis points better than expected, highlighting improved product mix and lower inventory reserves." The company also announced that it acquired Fox Electronics, a leading global supplier of frequency control products, in an all-cash transaction for approximately $30 million, of which $26 million was paid at closing. Fox Electronics' revenue was approximately $23 million in calendar year 2011, and the company is profitable.
icon url

ReturntoSender

05/02/12 6:54 PM

#9768 RE: ReturntoSender #6755

From Briefing.com: 4:30 pm : 4:18PM AXT misses by $0.04, beats on revs; guides Q2 EPS below consensus, revs in-line (AXTI) 5.05 +0.01 : Reports Q1 (Mar) earnings of $0.05 per share, $0.04 worse than the Capital IQ Consensus Estimate of $0.09; revenues fell 4.3% year/year to $23.5 mln vs the $22.64 mln consensus. Co issues guidance for Q2, sees EPS of $0.04-0.06 vs. $0.10 Capital IQ Consensus Estimate; sees Q2 revs of $23-25 mln vs. $24.52 mln Capital IQ Consensus Estimate.

4:15PM Atmel beats by $0.01, beats on revs (ATML) 8.99 +0.14 : Reports Q1 (Mar) earnings of $0.08 per share, excluding non-recurring items, $0.01 better than the Capital IQ Consensus Estimate of $0.07; revenues fell 22.5% year/year to $357.8 mln vs the $351.95 mln consensus. "As we predicted, our business bottomed during the first quarter, and we are well positioned to capitalize on the improving industry environment," said Steve Laub, Atmel's President and Chief Executive Officer. "The introduction of our new AVR, ARM Cortex, maXTouch S and XSense products set a strong foundation for sequential growth throughout 2012 and beyond."

4:12PM Novatel Wireless misses by $0.06, beats on revs; guides Q2 EPS below consensus, revs below consensus (NVTL) 2.81 -0.11 : Reports Q1 (Mar) loss of $0.14 per share, excluding non-recurring items, $0.06 worse than the Capital IQ Consensus Estimate of ($0.08); revenues rose 62.1% year/year to $100.2 mln vs the $92.55 mln consensus. Co issues downside guidance for Q2, sees EPS of ($0.17)-($0.07) vs. $0.05 Capital IQ Consensus Estimate; sees Q2 revs of $92-104 mln vs. $115.84 mln Capital IQ Consensus Estimate.

4:10PM JDS Uniphase reports EPS in-line, misses on revs; guides Q4 revs below consensus (JDSU) 12.04 -0.24 : Reports Q3 (Mar) earnings of $0.11 per share, excluding non-recurring items, in-line with the Capital IQ Consensus Estimate consensus of $0.11; revenues fell 9.9% year/year to $409.2 mln vs the $420.28 mln consensus. Co issues downside guidance for Q4, sees Q4 revs of $415-435 mln vs. $458.08 mln Capital IQ Consensus Estimate.

4:09PM ON Semiconductor beats by $0.03, reports revs in-line; guides Q2 revs in-line (ONNN) 8.31 +0.00 : Reports Q1 (Mar) earnings of $0.12 per share, $0.03 better than the Capital IQ Consensus Estimate of $0.09; revenues fell 14.5% year/year to $744.4 mln vs the $742.89 mln consensus. Gross margin was 32.9%. Co issues in-line guidance for Q2, sees Q2 revs of $745-785 mln vs. $783.97 mln Capital IQ Consensus Estimate. Co states, "Backlog levels for 2Q12 represent approximately 80 to 85% of our anticipated second quarter 2012 revenues. We expect that average selling prices for the second quarter of 2012 will be down approximately one to two percent when compared to the first quarter of 2012. The non-GAAP outlook for the second quarter of 2012 includes stock-based compensation expense of approximately $8 to $10 million."

4:01PM Atmel announces $200 mln addition to stock repurchase program (ATML) 8.99 +0.14 :

Disappointing jobs data played a part in sending the major equity averages to sizable losses in early trade, but stocks were able to improve their position, resulting in a relatively mixed finish.

Early participants were generally uninspired by the latest round of earnings reports, which featured upside surprises from MasterCard (MA 451.58, -4.32), Broadcom (BRCM 36.89, +0.18), CVS Caremark (CVS 45.92, +1.21), and Time Warner (TWX 37.29, -0.63). Their reports were partly overshadowed by another disappointing Manufacturing PMI reading from the eurozone.

Sentiment ahead of the open soured further when it was learned that the latest ADP Employment Report suggested that nonfarm private payrolls increased by only 119,000 during April, despite expectations for an increase of 170,000. The report is often regarded as a harbinger for the government's official monthly payrolls report, the latest of which will be released this Friday.

Energy and Financial stocks were leaders in the prior session, but they lagged this session. Persistent weakness in the pair hampered the broad market's effort to trade higher. Energy settled with a 1.6% loss; Chesapeake Energy (CHK 16.74, -2.86) was especially weak in the wake of a displeasing quarterly report that included relatively light revenue and earnings. Financials, which fell 1.0% as a group, were weighed down by diversified financial services stocks and investment banking and brokerage shares.

The Consumer Discretionary sector put together a 0.5% gain in the face of broad market weakness, but its lack of weight limited its ability to offer any real leadership. Teen apparel retailers were especially strong after American Eagle (AEO 20.90, +3.01) raised its earnings forecast; the ensuing surge in shares of AEO took its stock price to its best level in about four years.

Although stocks were able to fight through some selling, commodities were clipped for sizable losses. As a result, the CRB Commodity Index suffered a 1.3% loss, which snapped a six-session streak of gains. The CRB hasn't had such a weak performance in three weeks. A stronger dollar certainly didn't help the case for commodities; the greenback gained 0.4% against a basket of major foreign currencies, but most of that move came because the euro was weakened in the wake of disappointing eurozone data.

Advancing Sectors: Consumer Discretionary +0.5%, Consumer Staples +0.3%, Industrials +0.1%, Tech +0.1%
Unchanged: Telecom
Declining Sectors: Health Care -0.1%, Utilities -0.6%, Materials -0.6%, Financials -1.0%, Energy -1.6%DJ30 -10.75 NASDAQ +9.41 NQ100 +0.3% R2K +0.3% SP400 +0.2% SP500 -3.51 NASDAQ Adv/Vol/Dec 1367/1.83 bln/1157 NYSE Adv/Vol/Dec 1304/779 mln/1683

Broadcom (BRCM $36.37 -0.33) reported first quarter earnings of $0.65 per share, excluding non-recurring items, $0.10 better than the Capital IQ Consensus of $0.55, while revenues rose 0.6% year/year to $1.83 billion versus the $1.78 billion consensus.

09:35 am Broadcom shares fall just under 1% despite beat on earnings
Broadcom (BRCM $38.26 -0.44) reported first quarter earnings of $0.65 per share, excluding non-recurring items, $0.10 better than the Capital IQ Consensus of $0.55, while revenues rose 0.6% year/year to $1.83 billion versus the $1.78 billion consensus.

icon url

ReturntoSender

05/08/12 8:18 PM

#9773 RE: ReturntoSender #6755

From Briefing.com: 4:35PM TranSwitch misses by $0.08, misses on revs; announces offering of 1,315,006 shares of the Common Stock (TXCC) 2.05 -0.02 : Reports Q1 (Mar) loss of $0.18 per share, $0.08 worse than the Capital IQ Consensus Estimate of ($0.10); revenues fell 54.9% year/year to $3.7 mln vs the $5.67 mln consensus. "While the results of the first quarter were disappointing, we continue to make progress toward the launch of our new video connectivity business... We are steadily expanding the list of potential customers for HDplay products and are anticipating production start in the third quarter. Equally important, we have introduced our first mobile product, HDmobile, with a compelling set of features for the fast growing market of smart phones and tablets." The Company also announced that it entered into a Securities Purchase Agreement dated May 8, 2012 with certain purchasers to sell 1,315,006 shares of the Common Stock for gross proceeds of $2,445,911. Each share of Common Stock was sold for a purchase price of $1.86.

4:10PM STEC misses by $0.02, reports revs in-line; guides Q2 EPS below consensus, revs below consensus (STEC) 7.70 -0.34 : Reports Q1 (Mar) loss of $0.17 per share, $0.02 worse than the Capital IQ Consensus Estimate of ($0.15); revenues fell 46.9% year/year to $50.4 mln vs the $49.97 mln consensus. Co issues downside guidance for Q2, sees EPS of ($0.28) - ($0.26) vs. ($0.13) Capital IQ Consensus Estimate; sees Q2 revs of $40-42 mln vs. $52.01 mln Capital IQ Consensus Estimate. CO says "We remain encouraged by the increase in overall market activity for enterprise SSDs and are making significant strides with the fourth-generation of our ZeusIOPS? SSD, and our MACH16 SSD, PCIe SSD, and EnhanceIO caching software. In the face of a growing and competitive market, we are confident in these solutions and in our abilities to innovate to meet our customers' needs. Although we have experienced longer-than-expected qualification cycles due to the complexity and customization of our products, we anticipate a few customers will qualify some of our products in this quarter, with several others expected to be completed in the third quarter of 2012. However, until qualifications are completed, we cannot accurately project the sales of these products. That said, we believe that the revenue level in the second quarter of 2012 represents a trough period for us. We also believe that our technologies and the products that are built on those technologies will drive future revenue growth."

4:07PM Diodes reports EPS in-line, revs in-line; guides Q2 revs above consensus (DIOD) 21.34 +0.31 : Reports Q1 (Mar) earnings of $0.09 per share, in-line with the Capital IQ Consensus Estimate consensus of $0.09; revenues fell 10.5% year/year to $144.7 mln vs the $143.94 mln consensus. Co issues upside guidance for Q2, sees Q2 revs of $155-164 mln vs. $155.53 mln Capital IQ Consensus Estimate. Firm also says expect gross margin to be 26 percent, plus or minus 2 percent. Operating expenses, without consideration of any gain on sale of assets, are expected to be down slightly from first quarter on a percent of revenue basis. Firm expects income tax rate to range between 7 and 13 percent, and shares used to calculate GAAP EPS for the second quarter are anticipated to be approximately 47.2 million.

4:30 pm : A wave of widespread weakness sank the stock market more than 1% to its lowest level in two months, but a steady climb in afternoon trade helped stocks slash losses.

Amid a lack of meaningful earnings announcements and a complete absence of domestic data, most market participants opted to sell stocks at the open due to lingering concerns about the implications of recent political elections in Europe -- Europe's major bourses settled their latest session with steep losses, dropping the EuroStoxx by 1.5%.

Domestic averages attempted to stabilize after enduring an opening leg down, but selling regained traction to take the S&P 500 below the 1350 line for the first time snce early March. A failed rebound attempt left stocks to drift lower again, but their ability to stay off of session lows suggested was enough support to prevent further losses. From there stocks began a steady ascent that saw the Dow recover more than 100 points.

Energy stocks staged one of the more impressive swings. The sector was down more than 2% at its session low, but settled the day down only 0.4%. Meanwhile, crude oil recovered from a session low of $95.57 per barrel to settle pit trade at $97.13 per barrel for a 0.8% loss. Despite the upturn, the closing price stands as the lowest closing level for the June contract this year. Natural gas prices also recoverd from negative territory to close pit trade at $2.39 per MMBtu for a 2.6% gain.

Defensive in nature, Utilities and Health Care scored gains of 0.2%, but neither was down dramatically at any point during the day. Telecom suffered a 0.2% loss after it had spent most of the session outperforming the other major sectors.

The turn in tone took the Volatility Index from above 20, which hasn't been eclipsed for almost a month, back to about 19 by the closing bell. The resulting increase for the VIX was less than 1%, although it had been up nearly 10% earlier in the day.

Volatility seemed to excite some traders. Share volume on the NYSE didn't break the 1 billion mark, but it did hit 900 million, which is above averages for the past few months.

The dollar advanced another 0.3% against a basket of major foreign currencies today. That puts it comfortably above its 50-day moving average, which was first crossed late last week, at a new three-week high.

Treasuries also attracted a solid bid, or at least enough to send the yield on the 10-year Note even closer to 1.80% for a new a three-month low before it eased off that mark. Results from an auction of 3-year Notes today resulted in a bid-to-cover ratio of 3.65, dollar demand of $116.8 billion, and an indirect bidder participation rate of 35.7%. For comparison, the prior auction drew a bid-to-cover of 3.36, dollar demand of $107.5 billion, and an indirect bidder rate of 39.9%, while an average of the last six auctions results in a bid-to-cover of 3.48, dollar demand of $111.3 billion, and an indirect bidder rate of 36.4%.

Advancing Sectors: Health Care +0.2%, Utilities +0.2%
Declining Sectors: Consumer Staples -0.1%, Telecom -0.2%, Industrials -0.3%, Energy -0.4%, Materials -0.5%, Tech -0.5%, Financials -0.7%, Consumer Discretionary -1.3%DJ30 -76.44 NASDAQ -11.49 NQ100 -0.4% R2K -0.1% SP400 -0.2% SP500 -5.86 NASDAQ Adv/Vol/Dec 1205/2.17 bln/1313 NYSE Adv/Vol/Dec 1188/900 mln/1800

Acme Packet (APKT) announced that WIND Mobile selected the Acme Packet Net-Net Session Director session border controllers to securely connect WIND's voice over internet protocol core network with other service providers

8:48AM Research In Motion appoints Kristian Tear as Chief Operating Officer and Frank Boulben as Chief Marketing Officer (RIMM) 11.82 : Mr. Tear joins RIM from Sony Mobile Communications, where he served as Executive Vice President. At RIM, Mr. Tear will serve as Chief Operating Officer overseeing all operational functions for handhelds and services, including research and development, products, global sales, manufacturing and supply chain. Mr. Boulben is the former Executive Vice President of Strategy, Marketing and Sales for LightSquared. Mr. Boulben will oversee global marketing efforts at RIM.

8:05AM Vishay Precision misses by $0.01, misses on revs; guides Q2 revs in-line (VPG) 13.82 : Reports Q1 (Mar) earnings of $0.12 per share, $0.01 worse than the Capital IQ Consensus Estimate of $0.13; revenues fell 6.2% year/year to $55.8 mln vs the $56.47 mln consensus. Co issues in-line guidance for Q2, sees Q2 revs of $54-59 mln vs. $58.82 mln Capital IQ Consensus Estimate. Commenting on the Q, co states: "Orders in Europe and the Americas improved in the first quarter of 2012 compared to the fourth quarter of 2011, mainly in the FTP segment and the Force Sensors segment. We experienced a decrease in orders for the Asian markets in the FTP segment...We are seeing some stability in our end markets for the first quarter of 2012."

7:38AM Monolithic Power wins more than $9.4 mln in attorneys' fees and costs against O2 Micro (OIIM) (MPWR) 20.71 : Co announced that the United States District Court for the Northern District of California had issued an order finding O2 Micro International (OIIM) liable for ~ $9.1 million in attorneys' fees and non-taxable costs, plus interest, in connection with the patent litigation that MPS won in 2010. This award is in addition to the ~ $340,000 in taxable costs that the Court had earlier ordered O2 Micro to pay to MPS in connection with the same lawsuit. MPS anticipates that O2 Micro will appeal the Court's orders and the final judgment.

Qualcomm (QCOM) and Clearwire (CLWR) announced that Qualcomm will add support for Clearwire's upcoming LTE TDD network to its line of multi-mode LTE chipsets with the inclusion of support for 3GPP's Band 41 radio frequency.

ON Semiconductor (ONNN) introduced a new series of Field Stop Insulated Gate Bipolar Transistors targeted at industrial motor control and consumer products

Lattice Semiconductor (LSCC) announced that eight devices of its iCE40 "Los Angeles" mobileFPGA family have been fully qualified and released into volume production.

Rackspace (RAX $49.95 -7.84) reported earnings of $0.17 per share, $0.01 worse than the consensus of $0.18, while revenues rose 30.9% year/year to $301 million versus the $300.04 million consensus. The adjusted EBITDA margin for the quarter was 33.4% compared to 36.1% in the previous quarter and 33.0% for the first quarter of 2011. Total server count increased to 82,438 up from 79,805 servers at the end of the previous quarter, and total customers increased to 180,866, up from 172,510 at the end of the previous quarter.

Electronic Arts (EA $14.21 -0.92) reported fourth quarter earnings of $0.17 per share, $0.01 better than the consensus of $0.16, while revenues fell 1.8% year/year to $977 million versus the $959.19 million consensus. The company issued downside guidance for the first quarter with EPS of -$0.45-0.40 vs. ($0.33) Capital IQ Consensus Estimate, with revenues of $500 million versus the $581.85 million consensus,. The company issued mixed guidance for fiscal year 2013 with EPS of $1.05-1.20, excluding non-recurring items, versus the $1.13 consensus and revenues of $4.30 billion versus the $4.52 billion consensus.

NetQin Mobile (NQ $10.96 -1.09) reported first quarter earnings of $6.387 mln may not be comparable to $6.18 million consensus, while revenues rose 110.5% year/year to $16 million versus the $14.73 million consensus. The company issued upside guidance for the second quarter with revenues of $17.5-17.8 versus the $16.59 million consensus. THe company issued upside guidance for fiscal year 2012 with revenues of $73-75 million up from $70-72 million versus the $71.90 million consensus.

09:53 am Electronic shares trading lower by 4% following downside guidance

Electronic Arts (EA $14.40 -0.72) reported fourth quarter earnings of $0.17 per share, $0.01 better than the consensus of $0.16, while revenues fell 1.8% year/year to $977 million versus the $959.19 million consensus. The company issued downside guidance for the first quarter with EPS of -$0.45-0.40 vs. ($0.33) Capital IQ Consensus Estimate, with revenues of $500 million versus the $581.85 million consensus,.

The company issued mixed guidance for fiscal year 2013 with EPS of $1.05-1.20, excluding non-recurring items, versus the $1.13 consensus and revenues of $4.30 billion versus the $4.52 billion consensus.

09:50 am Raclspace trading sharply lower by 13% following miss on earnings per share

Rackspace (RAX $49.83 -8.02) reported earnings of $0.17 per share, $0.01 worse than the Capital IQ consensus of $0.18, while revenues rose 30.9% year/year to $301 million versus the $300.04 million consensus.

The adjusted EBITDA margin for the quarter was 33.4% compared to 36.1% in the previous quarter and 33.0% for the first quarter of 2011. Total server count increased to 82,438 up from 79,805 servers at the end of the previous quarter, and total customers increased to 180,866, up from 172,510 at the end of the previous quarter.
icon url

ReturntoSender

05/09/12 8:37 PM

#9774 RE: ReturntoSender #6755

From Briefing.com: 4:30 pm : For the second straight session concerns about the implications of political uncertainty in Greece dropped the major equity averages in excess of 1%, but stocks managed to slash losses.

This morning market participants took their cues from Europe, where the region's major bourses faltered, debt yields spiked, and the euro retreated to a multi-month low of less than $1.30, all amid worries that political impasse in Greece could undermine the country's commitment to austerity measures and, in turn, complicate the country's next bailout tranche. Concerns about the latter were put to rest by afternoon reports that the EFSF will make more than 5 billion euros available to Greece.

At its low, the S&P 500 traded beneath the depths set during the prior session, but didn't quite challenge the March low of about 1340. As for the Dow, it dipped its prior session low, but did not break under its April low. Meanwhile, the Nasdaq probed its prior session low, but did not violate it.

Tech proved pivotal in helping drive stocks up from session lows. The largest sector by market weight was down 1.5% at its session low, but completely overcame that deficit and extended its climb to a narrow gain before being backed down to a 0.1% loss. Microsoft (MSFT 30.76, +0.26) was a primary leader, but shares of CISCO (CSCO 18.78, +0.07) managed a modest gain ahead of the company's quarterly report.

Fellow Dow component Disney (DIS 45.02, +0.72) scored a strong gain of its own. The stock was bid up to a new 52-week high on the back of a better-than-expected earnings report.

Financials were left out of the recovery effort for the second straight session, mostly because of the perception about their vulnerability to eurozone tumult. The sector's 1.2% loss today came on top of a 0.7% drop in the prior session. Month to date, the Financial sector is down more than 3%, or slightly worse than the S&P 500 in that time.

Although the broad market was able to fight through selling pressure, it was unable to turn the move into a gain. Once the S&P 500 came in contact with the neutral line sellers redoubled their efforts to keep the stock market in the red. While the Dow came close to the neutral line, the Nasdaq actually poked into positive territory for an incremental gain before it was pushed lower.

The stock market's afternoon slip helped Treasuries reclaim only a small portion of their gains. Early strength had the yield on the benchmark 10-year Note to a 2012 low of 1.80%. Results from an auction of 10-year Notes drew a bid-to-cover of 2.90, dollar demand of $69.6 billion, and an indirect bidder rate of 38.7%. For comparison, the prior auction attracted a bid-to-cover of 3.08, dollar demand of $64.7 billion, and an indirect bidder participation rate of 38.5%, while an average of the past six auctions results in a bid-to-cover of 3.14, dollar demand of $68.8 billion, and an indirect bidder rate of 42.9%.

Gold prices were pared again. It set a session low of $1578.50 per ounce, but settled with a 0.7% loss at $1593.80 per ounce.

Crude oil prices fell for a sixth straight session, closing at $96.79 per barrel. Prices are down more than 8% in those six sessions.

Advancing Sectors: None
Declining Sectors: Utilities -0.1%, Tech -0.1%, Consumer Discretionary -0.5%, Telecom -0.5%, Consumer Staples -0.7%, Energy -0.7%, Materials -0.8%, Health Care -0.9%, Financials -1.2%, Industrials -1.2%DJ30 -97.03 NASDAQ -11.56 NQ100 -0.3% R2K -0.5% SP400 -0.4% SP500 -9.14 NASDAQ Adv/Vol/Dec 881/2.05 bln/1610 NYSE Adv/Vol/Dec 967/940 mln/2044

4:08PM Cisco Systems beats by $0.01, reports revs in-line (CSCO) 18.78 +0.07 : Reports Q3 (Apr) earnings of $0.48 per share, excluding non-recurring items, $0.01 better than the Capital IQ Consensus Estimate of $0.47; revenues rose 6.6% year/year to $11.59 bln vs the $11.58 bln consensus. "We delivered solid results this quarter with record revenue and non-GAAP earnings per share," said John Chambers, Cisco chairman and CEO. "We are successfully executing against our long-term strategic plan of growing profit faster than revenue, and in a cautious IT spending environment, we continue to outperform our competitors." Cash flows from operations were $3.0 billion for the third quarter of fiscal 2012, compared with $3.1 billion for the second quarter of fiscal 2012, and compared with $3.0 billion for the third quarter of fiscal 2011. Non-GAAP inventory turns were 11.1 in the third quarter of fiscal 2012, compared with 10.8 in the second quarter of fiscal 2012, and compared with 10.3 in the third quarter of fiscal 2011.

Marvell (MRVL) and Osram Opto Semiconductors announced the availability of the Marvell-Osram two-color LED downlight reference design. Co will showcase LED lighting solutions with complete reference designs and control software for building residential and commercial lighting products at LIGHTFAIR International 2012, May 9 - 11, 2012.

Ballard Power Systems (BLDP) and Anglo American Platinum are working in partnership on a number of early-stage stationary and motive power applications of clean, zero-emission fuel cells in the South African market. Research In Motion (RIMM) released a new smartphone for socially-connected.

HP (HPQ) announced powerful business products packed with energy-efficiency, security and performance features designed to meet customer needs across industries such as healthcare, retail, and media and entertainment.


icon url

ReturntoSender

05/10/12 9:18 PM

#9775 RE: ReturntoSender #6755

From Briefing.com: 4:10 pm : 6:00PM Teradyne and Corelis announce agreement to bolster boundary-scan in-circuit test capability (TER) 15.62 -0.05 : Co announced that it has entered into an OEM agreement with Corelis, Inc. to sell and distribute a package of Corelis ScanExpress boundary-scan test execution and diagnostic software and hardware modules. The solution establishes a straightforward integration path for adding advanced boundary-scan and embedded test capabilities to Teradyne's popular TestStation legacy GR228X family of In-Circuit Test systems.

4:04PM Brooks Automation beats by $0.02, beats on revs; guides Q3 EPS below consensus, revs in-line (BRKS) 10.67 +0.20 : Reports Q2 (Mar) earnings of $0.20 per share, excluding non-recurring items, $0.02 better than the Capital IQ Consensus Estimate of $0.18; revenues fell 27.7% year/year to $139.3 mln vs the $136.2 mln consensus. Co issues guidance for Q3, sees EPS of $0.15-0.20, excluding non-recurring items, vs. $0.22 Capital IQ Consensus Estimate; sees Q3 revs of $140-147 mln vs. $145.39 mln Capital IQ Consensus Estimate. Order bookings for the second quarter of fiscal 2012 grew 20.9% to $155.3 million, compared to order bookings in the fiscal first quarter of $128.5 million. Bookings included strong Life Science Systems orders for fiscal 2013 delivery. "We generated revenue and earnings during the quarter at the high end of our guidance range due to a number of factors including 21% sequential growth in our Product Solutions segment as we had full participation in the front end semiconductor market recovery and we improved consolidated gross margin by 110 basis points on a sequential basis. In addition, our Life Science Systems revenue continued to grow and achieved profitability absent purchase accounting adjustments. We are pleased with the continued progression of this business segment."

The Dow avoided its seventh consecutive day of losses after withstanding some late-day selling to finish with a gain of 20 points. The S&P 500 closed up 0.3% to lead the way while the Nasdaq finished fractionally in the red. News flow out of Europe was rather quiet as markets await word as to whether or not the newly elected Greek leaders are able to form a coalition government. This morning’s claims data was mixed as initial claims missed estimates while continuing claims beat.

European financials recorded strong gains as National Bank of Greece (NBG 2.05, +0.15) and Banco Santander (STD 6.33, +0.32) rallied 7.9% and 5.3% respectively. Germany's Deutsche Bank (DB 40.30, +0.90) and Britain's Barclays (BCS 13.47, +0.41) saw less notable advances, but still outperformed.

Cisco Systems (CSCO 16.81, -1.97) plunged 10.5% following yesterday's earnings. The company announced earnings per share of $0.48 which was $0.01 better than the Capital IQ Consensus Estimate while posting in-line revenues of $11.59 billion. The company now expects to see earnings per share of $0.44 to $0.46 per share on expectations of $0.49 and revenue growth of 2% to 5% versus consensus expectations of a 7.1% increase. Macro headwinds were given as reasons for the downbeat outlook.

Shares of Priceline (PCLN 681.11, -37.84) tumbled 5.3% following yesterday's better than expected earnings as guidance was disappointing. The company announced earnings of $4.28 per share which was $0.30 better than the Capital IQ Consensus Estimate, and in-line revenues of $1.04 billion. Guidance weighed as the company said it expects revenues to increase 18 to 23% year over year, compared with analyst expectations of a 26% increase.

Kohl's (KSS 48.66, -2.20) fell 4.3% after the company reported earnings of $0.63 per share which was $0.02 better than the Capital IQ Consensus Estimate. The company's revenues were in-line with estimates, climbing 1.9% year over year to $4.24 billion. Management also reaffirmed its fiscal year 2013 earnings per share guidance of $4.75 which is $0.01 below the consensus estimate of $4.76. However, the stock weakened as the company's gross margins disappointed.

Treasuries trimmed their losses following this afternoon's solid $16 billion 30-yr bind reopening. The auction drew 3.090% and saw a 2.73x bid/cover as indirect bidders took down a larger than average 33.8% of the offering. Dollar demand was the strongest since August 2010, coming in at $43.6 billion. The 10-yr yield finished the day up 4.9 basis points at 1.884% after hitting a session high of 1.921%.

Volume on the floor of the New York Stock Exchange was weak as just 784 million shares changed hands.DJ30 +19.98 NASDAQ -1.07 SP500 +3.41 NASDAQ Adv/Vol/Dec 1437/1.93 bln/1128 NYSE Adv/Vol/Dec 1893/784.1 mln/1128

12:09PM Cisco Systems extends drop to -10% (CSCO) 16.86 -1.92 : Slide reaches back to its Mid-Oct reaction low and the top of the June-Sep trade range/bull breakout point at 16.80/16.84.

Qualcomm (QCOM) and Digibras Industria do Brasil (owner of the brands CCE Info and CCE Mobi) have entered into 3G and 4G license agreements. Under the terms of the agreements, Qualcomm has granted CCE worldwide, royalty-bearing patent licenses to develop, manufacture and sell 3G WCDMA and TD-SCDMA, and 4G OFDMA subscriber units and routers.

6:14AM Canadian Solar beats by $0.04, misses on revs; sees Q2 gross margin between 8-10% (CSIQ) 3.21 : Reports Q1 (Mar) loss of $0.49 per share, $0.04 better than the Capital IQ Consensus Estimate of ($0.53); revenues fell 26.5% year/year to $325.8 mln vs the $361.47 mln consensus.

Guidance: For the second quarter of 2012, shipments are expected to be in the range of ~430 MW to 450 MW, with gross margin expected to be between 8% and 10%. The Company reiterates its annual guidance to ship ~1,800 MW to 2,000 MW of solar products in 2012.

"Our results reflect the continued successful execution of our near-term and long-term business strategy. This is evidenced by the improvement of our gross margin after factoring out one-time items, the geographic diversification of our revenue mix and our ability to generate positive operating cash flow in a seasonally slow quarter. We are very pleased with the continued progress of our total solutions business and expect it will enhance our financial results as we move through 2012 and beyond. We continue to evaluate costs across our global organization."

Intel's (INTC) McAfee announced increased focus and updated security solutions specifically designed to meet the needs of small to medium sized businesses with new SMB security solutions and channel programs bring cost-effective and easy-to-use solutions

3:09AM Micron confirms discussions with Elpida Memory Trustees (MU) 6.36 : Co confirms it is engaged in discussions with Elpida Memory trustees to acquire Elpida's business. MU made the announcement following a May 10 approval by the Tokyo District Court allowing Elpida's trustees to negotiate an agreement with Micron, pursuant to which Micron would become Elpida's sponsor and acquire Elpida's entire business in accordance with the corporate reorganization proceedings. Elpida, filed a petition for commencement of Corporate Reorganization Proceedings with the Tokyo District Court under the Corporate Reorganization Act of Japan on Feb. 27, 2012, which proceedings have been commenced.

Cisco Systems (CSCO $17.20 -1.58) reported third quarter earnings of $0.48 per share, excluding non-recurring items, $0.01 better than the Capital IQ Consensus of $0.47, while revenues rose 6.6% year/year to $11.59 billion versus the $11.58 bln consensus. "We delivered solid results this quarter with record revenue and non-GAAP earnings per share," said John Chambers, Cisco chairman and CEO. "We are successfully executing against our long-term strategic plan of growing profit faster than revenue, and in a cautious IT spending environment, we continue to outperform our competitors." Cash flows from operations were $3.0 billion for the third quarter of fiscal 2012, compared with $3.1 billion for the second quarter of fiscal 2012, and compared with $3.0 billion for the third quarter of fiscal 2011. Non-GAAP inventory turns were 11.1 in the third quarter of fiscal 2012, compared with 10.8 in the second quarter of fiscal 2012, and compared with 10.3 in the third quarter of fiscal 2011.

Silicon Graphics (SGI $7.15 -1.90) reported third quarter earnings of $0.11 per share, $0.14 better than the Capital IQ Consensus of ($0.03), while revenues rose 38.8% year/year to $199.4 million versus the $189.91 million consensus. The company issued guidance for the fourth quarter with EPS of ($0.52) - ($0.37), may not be comparable to $0.16 Capital IQ Consensus Estimate; sees Q4 revs of $177-197 million versus the $208.87 million consensus. Fourth quarter fiscal year 2012 non-GAAP EPS guidance excludes earnings per share impacts from share-based compensation and amortization of intangibles are anticipated to be approximately $0.10. In addition, SGI anticipates earnings per share impact from restructuring charges of ~$0.10 in Q4 FY12. Regrading FY12, co said A large deal originally anticipated to revenue in fourth quarter fiscal year 2012 slipped to Q1 FY13. Product transition and new products to be available late Q4 FY12, resulting in delay in demand from customers as they wait availability of the new products A number of large deals with low gross margin expected to revenue in fourth quarter fiscal year 2012.

Universal Display (PANL $35.57 -3.59) reported a first quarter loss of $0.03 per share, $0.07 worse than the Capital IQ Consensus Estimate of $0.04, while revenues rose 31.3% year/year to $12.6 million versus the $16.28 million consensus. Results in the first quarter do not include the recognition of any revenue under a licensing agreement with Samsung Mobile Display under which SMD is obligated to make payments to the Company of $15 million in each of the second and fourth quarters of this year. Had the Company recognized these payments on a pro rata quarterly basis over the year, it would have resulted in an additional $7.5 million of royalty and license fees revenue in the first quarter. The Company will incur a license fee of 3% payable to its university partners, and 16.5% payable as tax on sales to South Korea in connection with the SMD licensing revenue.

Priceline.com (PCLN) reported first quarter earnings of $4.28 per share, $0.30 better than the consensus of $3.98, while revenues rose 28.1% year/year to $1.04 billion versus the $1.04 billion consensus. The company issued in-line guidance for the second quarter with EPS of $7.20-7.40 versus the $7.34 Capital IQ Consensus Estimate.The Group's international operations contributed revenues in the 1st quarter of $617 million, a 58.5% increase versus a year ago (approximately 65% on a local currency basis). The Group's gross profit for the 1st quarter was $743 million, a 47.0% increase from the prior year. The Priceline Group said it was targeting the following for 2nd quarter 2012: Year-over-year increase in total gross travel bookings of approximately 26% - 31%; Year-over-year increase in international gross travel bookings of approximately 32% - 37% (an increase of approximately 41% - 46% on a local currency basis); Year-over-year increase in domestic gross travel bookings of approximately 5% - 10%; Year-over-year increase in revenue of approximately 18% - 23% (Capital IQ consensus approximately +26%); Year-over-year increase in gross profit of approximately 31% - 36%; Non-GAAP net income per diluted share of $7.20 to $7.40.

09:26 am Cree initiated with a Buy at Stifel Nicolaus; tgt $38: . Stifel Nicolaus initiates CREE with a Buy and price target of $38 saying although they expect volatility in earnings and the stock over the near term, they see strong secular drivers for Cree as the company designs innovative products aimed to drive adoption of LEDs in general lighting. They expect recent announcements of high performance, attractively priced LED products to drive momentum over the next 6-12 months.

10:25 am Technology sector trading lower despite broad market gains

The tech sector is trading lower today, despite gains in the broader market. Semiconductors are again showing relative weakness with the Philly Semi Index trading lower by 0.4?y. STM (+2.3%) is a notable leader in that chip index, while WFR (-7.3%) is a notable laggard. Among other major indices, the SPY is trading 0.6% higher today, while the QQQ and the NASDAQ are trading -0.2% lower on the session. Among tech bellwethers, AAPL (+0.6%) is showing relative strength for the sector.

In earnings last night, CSCO (-8.4%) announced disappointing guidance on the conference call and PCLN (-4.3%) reported an inline quarter. Among notable analyst upgrades this morning, VRTU (+3.5%) was upgraded before the open to Buy from Hold at BB&T Capital Mkts. JDSU was upgraded to Buy from Neutral at UBS. In downgrades, DLB (-2.8%) was downgraded to Neutral from Overweight at JP Morgan.

CA. HSFT are notable names in tech scheduled to report quarterly results today after the close.
icon url

ReturntoSender

05/12/12 4:02 PM

#9776 RE: ReturntoSender #6755

From Briefing.com: Weekly Recap - Week ending 11-May-12Failure to sustain a rebound left the stock market to suffer another loss, resulting in a weekly decline of a little more than 1%.

Worries about the health and the transparency of operations at diversified banks and financial services institutions were revived when JPMorgan Chase (JPM 36.96, -3.78), considered among the best in the business, announced that it has tagged $2 billion in trading losses. It mattered little to market participants that such a loss was partially offset by $1.0 billion in securities gains. The stock suffered its worst percentage drop late last summer, while the rest of the Financial sector surrendered 1.2%.

Adding to the negative tone were concerns about China’s economy rate after the country’s latest reading on retail sales and industrial production pointed to slower growth.

Participants responded to the stories by sending stocks lower at the open, but the major equity averages began to fight through the selling almost immediately. The effort was led by Tech, which climbed out of the red to a solid gain. It also helped the Nasdaq run ahead of its counterparts. Among Tech issues, semiconductor-related plays were particularly strong.

A surprise improvement in the Consumer Sentiment Survey from the University of Michigan seemed to encourage traders to extend the bounce. The Survey reading of 77.8, marked an improvement from the 76.4 that had been posted in the prior month. It also bested the 76.0 that had been broadly expected.

The only other dose of data today was a surprise 0.2% decline in overall producer prices during April. The 0.2% increase in core producer prices was exactly what had been expected.

Although stocks were able to reverse their way out of the red, momentum was lost when the S&P 500 reached its prior session high. Its failure to extend past that point was followed by a steady decline, which left nearly every sector to settle in negative territory – Telecom scored the only gain of the session by putting together an impressive 1.2% advance with help from integrated telecom issues.

Action leading up to Friday was mostly weak, extending the price action at the end of the prior week. However, stocks scored their first meaningful gain in seven sessions on Thursday, but only after withstanding some late-day selling.

Focus during the day remained on Greece as leaders there worked to form a coalition government after there had been uncertainty surrounding the shape that the government would take following political impasse earlier in the week.

The latest weekly initial jobless claims count held steady slightly below 370,000, which is generally on par with the tally of 365,000 that had been generally expected. There is speculation that the elevated claims levels during the first three weeks of April were the result of seasonal adjustment biases and not a change in overall labor conditions. As such, there may be payroll growth in May that exceeds that of April, but possibly less than what was achieved during December through February.

Stocks started the week on a flat note. The lackluster action came amid an absence of data. Financials had offered leadership, but the broad market generally failed to follow. Tech stocks lagged.

Sellers attempted to reclaim control of stocks on Tuesday by driving the S&P 500 down more than 1% before it began to slash losses. The slide came amid concerns that the election of a Socialist to the Presidency of France and political impasse in Greece could carry implications for the direction of and commitment to austerity plans. Stocks began their recovery effort after the broad market was able to maintain a floor above levels set back in March.

Action on Tuesday took the Volatility Index up nearly 10% to trade above 20 for the first time in almost a month and then back to about 19 for an overall increase of less than 1%.

Concerns about the implications of political uncertainty in Greece persisted in mid-week trade. That saw the major equity averages drop in excess of 1% -- this time taking the S&P 500 within a few points of its March low -- but once again selling pressure eased and losses were reduced.

Sentiment was helped when the EFSF made it known that more than 5 billion euros will be available to Greece, despite the political impasse in the country. That didn’t fully eliminate worry about the exposure of Financials to tumult in the eurozone.

In response to revived concerns about eurozone conditions the euro retreated to a multi-month low around $1.29 this week. That helped lift the Dollar Index above its 50-day moving average. Including incrementally positive finishes, the dollar has advanced for 10 straight days against a basket of major foreign currencies. The greenback booked back-to-back weekly gains of 1.0%.

Earnings season is winding down, but this week still featured a few important players. Dow component Disney (DIS 45.56, +0.28) scored a strong gain that took shares to a 52-week high on the back of better-than-expected earnings.

Fellow blue chip Cisco Systems (CSCO 16.50, -0.31) plunged after the company’s upside earnings surprise was overshadowed by a disappointing forecast.

Macy’s (M 37.98, +0.15) posted an upside earnings surprise, as did Kohl's (KSS 48.18, -0.48), but shares of the latter were sold in response to a dissatisfying forecast. Earnings from Nordstrom (JWN 50.96, -2.57) missed the consensus estimate.

Teva Pharmaceutical (TEVA 41.81, -0.24) posted pleasing earnings. Toyota Motor (TM 80.71, +0.98) did, too, but its outlook proved mixed relative to what had been projected already by Wall Street.

ArcelorMittal (MT 16.01, -0.36) was also in the mixed. Its earnings missed the consensus estimate.

Most commodities were sold this week. As such, the CRB Index suffered a 1.0% drop on Friday and a 1.8% decline for the week. It has fallen in seven of the past eight sessions.

Among the more closely tracked commodities, crude oil prices fell 2.5% to a 2012 closing low of $96.03 per barrel. In stark contrast, natural gas prices climbed 10% during the course of trade this week to settle pit trade on Friday at $2.51 per MMBtu.

As for precious metals, gold prices fell to $1584 per ounce for a 3.7% weekly loss, while silver sank to $28.91 per ounce, feeding a 5.0% weekly loss. Treasuries attracted many looking to trim risk. Buying interest sent the yield on the 10-year Note fractionally below 1.80% for a multi-month low.

Auctions this week featured an offering of 3-year Notes that drew a bid-to-cover ratio of about 3.7, dollar demand of $116.8 billion, and an indirect bidder participation rate of 35.7%. An offering of 10-year Notes drew a bid-to-cover of 2.9, dollar demand of $69.6 billion, and an indirect bidder rate of 38.7%. An auction of 30-year Bonds drew a bid-to-cover of 2.7, an indirect bidder rate of 33.8%, and dollar demand of $43.6 billion.

..Nasdaq 100 +0.00%. ..S&P Midcap 400 +0.1%.
 
Index Started Week Ended Week Change %Change YTD %
DJIA 13038.27 12820.60 -217.67 -1.7 4.9
Nasdaq 2956.34 2933.82 -22.52 -0.8 12.6
S&P 500 1369.10 1353.39 -15.71 -1.1 7.6
Russell 2000 791.84 790.06 -1.78 -0.2 6.6

9:53AM Semiconductor Hldrs extends strong early run fills this week's gap at 33.23 to test 38% retrace of May decline at 33.28 -- session high 33.27 (SMH) 33.20 +0.33 : Top performing Semi names include: NVDA +9.8%, LRCX +1.8%, MRVL +1.7%, INTC +1.6%, ALTR +1.3%, XLNX +1.3%, BRCM +1%, LLTC +0.7%.

7:35AM NVIDIA reports Q1 EPS in-line with slight rev upside; guides Q2 revs above consensus with GM flat to up 200 bps QoQ (NVDA) 23.09 : Reports Q1 (Apr) earnings of $0.16 per share, excluding non-recurring items, in-line with the Capital IQ Consensus Estimate consensus of $0.16; revenues fell 3.9% year/year to $924.9 mln vs the $916.5 mln consensus, with non-GAAP GM -210 bps QoQ to 50.4%. Co issues upside guidance for Q2, sees Q2 revs of $990 mln - $1.05 bln vs. $979.11 mln Capital IQ Consensus Estimate. Non-GAAP gross margin is expected to be 51.5%, plus or minus one percentage point.

10:31 am : S&P Information Technology Index

The tech sector is trading higher today, ahead of gains in the broader market. Semiconductors are also showing relative strength with the Philly Semi Index trading 1.3% higher. NVDA (+8.3%) is a notable leader in that chip index. Among other major indices, the SPY is trading 0.2% higher today, while the QQQ is up 0.8% and the NASDAQ is trading 0.6% higher on the session. Among tech bellwethers, MSFT (+2.5%) is showing notable strength.

In earnings last night, BRKS (-3.1%) posted a beat, but guided lower, while NUAN (-0.2%) reported an inline qtr and raised guidance and CA (-1.1%) reported a beat and downside guidance. Also, INTC (+2.1%) reaffirmed guidance at its analyst day. This morning, NVDA (+8.1%) posted slight upside to its Q1 and guided above consensus. In news, there is a Bloomberg article that indicates institutional demand for FB IPO is weaker-than-expected while retail demand is robust. Among rumors, LEAP (+9.0%) and T (+1.9%) had recent discussions regarding merger, according to reports. Also, we are hearing BIDU (-1.5%)-for-SOHU (-0.2%) making the rounds.

Among notable analyst upgrades this morning, T (+1.9%) and VZ (+1.9%) were upgraded to Outperform at Credit Suisse and ERIC (+0.8%) upgraded to Buy from Neutral at UBS. While in downgrades, WIN (-1.2%) was downgraded to Neutral at Citigroup and KEM (-12.0%) was downgraded to Underperform at BofA/Merrill .

icon url

ReturntoSender

05/13/12 10:34 AM

#9777 RE: ReturntoSender #6755

Amateur Investors Weekend Stock Market Analysis (5/12/12)

http://www.amateur-investor.net/Weekend_Market_Analysis_May_12_2012.htm

The % of cash held by Mutual Funds remains at all time lows as the latest reading was 3.3% which is far below the long term average of 6.8% (black line). Prior to the last Secular Bull Market which began in the early 1980's notice Mutual Funds had quite a bit of cash on hand as the red line stayed above well above the 6.8% level. However since the late 1990's the % of Mutual Fund cash has stayed below the long term average as we have been witnessing a Secular Bear Market. With the % of Mutual Fund Cash at historic lows it's hard to imagine a new Secular Bull Market can develop until they begin to build up higher cash levels.


Finally it wouldn't be a big surprise if the S&P 500 eventually tests its longer term upward trend line (black line) this Summer in the mid 1240's. Notice this trend line also intersects the 23.6% Retracement Level calculated from the March 2009 of 667 to the recent 1422 high as well.

icon url

ReturntoSender

05/14/12 7:16 PM

#9779 RE: ReturntoSender #6755

From Briefing.com: 4:30 pm : Concerns about the implications of continued political impasse in Greece undermined sentiment in the early going and sent stocks sharply lower at the open. Although pressure eased and the broad market slashed its loss in half, sellers redoubled their efforts late in the day to force stocks to finish near session lows.

Seemingly incapable of forming an elected government, Greece stirred sovereign concerns this morning. That drove down Europe's major bourses, lifted debt yields of countries in the eurozone periphery, and pressured the euro, which fell about 0.5% against the greenback to set a new multi-month low.

Financials were a steady drag on trade. The sector settled the session with a 2.1% loss, which is worse than what any other sector suffered. Beyond broad market weakness, investment banks, brokerage outfits, and diversified financial services players were hurt by concerns that a failure to honor austerity plans by jockeying eurozone politicians carries consequences for eurozone debt and broader financial conditions. A recent trading bluner by JPMorgan Chase (JPM 35.79, -1.17) has also tainted the perception of many firms.

Energy stocks were also a steady drag; they suffered a collective loss of 1.6%. As had been the case last week, Energy's weakness came in close connection with another drop in oil prices, which fell to a multi-month low of $93.85 per barrel before it settled pit trade with a loss of 1.3% at $94.76 per barrel.

Without the help of the two highly influential sectors stocks had a harder time generating enough momentum to extend the broad market's recovery effort into late afternoon trade. Instead, the S&P 500 came within a couple of points of last week's close before it rolled over and declined steadily into the close.

The stock market's final descent drove higher the Volatility Index, which was up about 10% to a multi-month high of almost 22 by the day's end.

There wasn't a single sector that scored a gain, but defensive-oriented stocks did a decent job of limiting losses. Utilities declined only 0.3%, while Health Care and Consumer Staples both fell 0.4%. Telecom declined 0.5%. Still, Groupon (GRPN 11.73, +1.84) was a standout by surging almost 20% ahead of its quarterly report.

Treasuries attracted the interest of safety seekers, such that the yield on the benchmark 10-year Note dropped below 1.80% for the first time in a few months. By the closing bell the Note's yield was about 1.78%.

Advancing Sectors: None
Declining Sectors: Utilities -0.3%, Consumer Staples -0.4%, Health Care -0.4%, Telecom -0.5%, Tech -0.9%, Industrials -1.2%, Consumer Discretionary -1.4%, Materials -1.4%, Energy -1.6%, Financials -2.1%DJ30 -125.25 NASDAQ -31.24 NQ100 -1.0% R2K -1.4% SP400 -1.2% SP500 -15.04 NASDAQ Adv/Vol/Dec 615/1.66 bln/1923 NYSE Adv/Vol/Dec 472/802 mln/2578

4:32PM Photronics beats by $0.02, reports revs in-line (PLAB) 5.82 +0.10 : Reports Q2 (Apr) earnings of $0.14 per share, $0.02 better than the Capital IQ Consensus Estimate of $0.12; revenues fell 11.7% year/year to $117.5 mln vs the $116.82 mln consensus. Operating margin improves by 270 bps sequentially to 11.3%.

4:10PM Agilent beats by $0.05, beats on revs; guides JulQ EPS in-line, revs above consensus; guides FY12 EPS in-line, revs in-line (A) 38.88 -0.57 : Reports Q2 (Apr) earnings of $0.78 per share, excluding non-recurring items, $0.05 better than the Capital IQ Consensus Estimate of $0.73; revenues rose 3.3% year/year to $1.73 bln vs the $1.71 bln consensus. For Q3 (Jul), co sees EPS of $0.82-0.84, excluding non-recurring items, vs. $0.83 Capital IQ Consensus Estimate; sees Q3 revs of $1.77-1.79 bln vs. $1.76 bln Capital IQ Consensus Estimate. Co issues in-line guidance for FY12, sees EPS of $3.18-3.24, excluding non-recurring items, vs. $3.19 Capital IQ Consensus Estimate; sees FY12 revs of $6.94-7.00 bln vs. $6.95 bln Capital IQ Consensus Estimate.

4:09PM Groupon reports EPS in-line, beats on revs; guides Q2 revs in-line (GRPN) 11.73 +1.83 : Reports Q1 (Mar) earnings of $0.02 per share, excluding non-recurring items, in-line with the Capital IQ Consensus Estimate consensus of $0.02; revenues rose 89.6% year/year to $559.3 mln vs the $530.45 mln consensus. Gross billings, which reflects the gross amounts collected from customers for Groupons sold, excluding any applicable taxes and net of estimated refunds, increased 103% to $1.35 billion in the first quarter 2012, compared with $668.2 million in the first quarter 2011. Free cash flow, a non-GAAP financial measure, was $70.6 million for the first quarter 2012. At the end of the quarter, Groupon had $1.2 billion in cash and cash equivalents and no long-term debt.

Co issues in-line guidance for Q2, sees Q2 revs of $550-590 mln vs. $560.11 mln Capital IQ Consensus Estimate. Income from operations for the second quarter 2012 is expected to be between $25 million and $45 million, compared with a loss from operations of $101.0 million in the second quarter 2011.

1:40PM Silicon Labs awaits official complaint before exerting established RF patent portfolio (SLAB) 33.70 -0.59 : Co learned today of MaxLinear's announcement of a declaratory judgment against the company to obtain a ruling that MaxLinear products, such as the MxL301 and MxL601 tuner ICs, do not infringe nineteen patents owned by Silicon Labs. Silicon Labs has not yet received the official complaint, and will determine its response upon review. The company pointed out it has "an extensive patent portfolio in RF-related technologies of more than 200 patents, a heritage of first-of-a-kind innovations in iDTV and other markets, and a track record of vigorously defending its patents against infringement."

10:29AM Research In Motion shows some relative strength against opening broad-based extension lower as buyers take it up into its recent 6-day range high near $12.00 (RIMM) 11.83 +0.05 : Staggered resistance all over the place to the upside (given the consistent daily downtrend), but showing some individual relative strength thus far this morning.

9:03AM NVIDIA and intellectual ventures partner to acquire portfolio of wireless patent assets; terms not disclosed (NVDA) 31.15 : Co announced that they have jointly acquired a set of patents developed and owned by IPWireless. The portfolio comprises approximately 500 patents granted and pending in the wireless communications area, including concepts in LTE, LTE-Advanced and 3G/4G technologies. Terms of the acquisition, which closed on April 30, 2012, were not disclosed.

O2Micro International (OIIM) was issued 22 claims under U.S. patent for its Temperature Detection methodology.

Atmel (ATML) announced that Ingenico has selected Atmel maXTouch touchscreen controllers for its Ingenico iWL200 Series portable payment terminals with touch capability.

Microsemi (MSCC) announced that its radiation-tolerant RTAX-S/SL field programmable gate arrays have been qualified by the U.S. Defense Logistics Agency as Qualified Manufacturers List Class V in accordance with military performance standard MIL-PRF-38535 space-level qualification requirements.

icon url

ReturntoSender

05/16/12 5:53 PM

#9781 RE: ReturntoSender #6755

From Briefing.com: 4:30 pm : Buying interest in the early going gave way to selling pressure that resulted in the ninth loss in 11 sessions for the S&P 500. Many traders took their cues from the euro.

Despite sizable losses in Asia during overnight trade and mixed action among Europe's major bourses, market participants bid stocks higher ahead of the open. Positive sentiment was supported by news that housing starts improved in April to an annualized rate of 717,000 from an upwardly revised rate of 699,000 in the prior month to exceed the consensus forecast for a rate of 680,000 units. Building permits were more on par with what had been expected -- the annualized rate of 715,000 came in only slightly below the rate of 730,000 that had been broadly anticipated.

Industrial production also proved impressive. It increased during April by 1.1%, which is more than double the 0.5% increase that had been broadly expected.

Within the first hour of action the S&P 500 was up almost 1% and within about five points of its prior session high, but the move failed to hold as early strength among Energy and Financials faded. Those two sectors descended to losses of 0.5% and 1.5%, respectively. That put the Energy sector at a new low for 2012, while Financials sit at their worst level since January.

Retailers JC Penney (JCP 26.75, -6.75) and Abercrombie & Fitch (ANF 39.50, -5.90) were among the poorest individual performers of the session. Both stocks plummeted to new multi-month lows in the wake of underwhelming quarterly reports. Target (TGT 55.32, +0.24) managed to maintain a modest gain following its latest earnings announcement, though.

Deere (DE 74.18, -2.44) was also out today with its latest quarterly report, which featured a better-than-expected bottom line. However, shares of the farming machinery outfit still fell.

A few minutes of broad market turbulence followed the release of the latest FOMC minutes, which indicate that broad financial market conditions have changed little. The minutes state that bank credit slowed in March, but overall it expanded at a solid pace for the first quarter. It was also noted that financial strains within the euro area increased.

The latter point in mind, headlines today suggested that the ECB may be suspending services to certain banks in Greece. That stirred some selling interest against the currency. It managed to recover to the neutral line, but by the closing bell it was back in the red to suffer a 0.2% loss against the greenback.

Advancing Sectors: Consumer Staples +0.3%, Health Care +0.2%
Declining Sectors: Utilities -0.1%, Industrials -0.1%, Consumer Discretionary -0.1%, Telecom -0.4%, Energy -0.5%, Tech -0.8%, Materials -1.2%, Financials -1.5%DJ30 -33.45 NASDAQ -19.72 NQ100 -0.7% R2K -0.6% SP400 -0.9% SP500 -5.86 NASDAQ Adv/Vol/Dec 839/1.96 bln/1660 NYSE Adv/Vol/Dec 985/872 mln/2024

4:07PM MEMC Elec announces it will transition the Chief Financial Officer role to Brian Wuebbels from the co's current CFO, Mark Murphy (WFR) 2.13 -0.18 : Murphy resigned as MEMC's Chief Financial Officer, effective May 16, 2012, to return to Praxair (PX) to become President, Praxair Surface Technologies. Mr. Murphy will work with MEMC in a consulting role in the near term to assist in the transition. Mr. Wuebbels has been appointed to the position of Executive Vice President and Chief Financial Officer succeeding Murphy effective the same date. Mr. Wuebbels has been with MEMC since 2007, most recently as Vice President and General Manager - Balance of System Products.

O2Micro International (OIIM) was issued 13 claims under U.S. patent for its Signal Detection Circuitry.

Kulicke & Soffa (KLIC) announced a planned expansion of its Singapore global headquarters.

11:14 am S&P Information Technology Index
The tech sector is trading higher today, just trailing gains in the broader market. Semiconductors are also showing relative weakness with the Philly Semi Index trading virtually flat on the session. Among other major indices, the SPY is trading 0.7% higher today, while the QQQ is up 0.4% and the NASDAQ is trading 0.5% higher on the session. Among tech bellwethers, GOOG (+2.5%) is showing notable strength, while INTC (-0.7%) is lagging.

In earnings last night, SINA (+13.0%) and OPXT (+3.3%) both posted quarterly misses.

In news, FB raised its IPO size by 25%. Among rumors, we are hearing RIMM (+2.6%) takeover chatter making the rounds.

Among notable analyst upgrades this morning, CSCO (+1.7%) was upgraded to Overweight at Barclays, SINA (+13.2%) was upgraded at Barclays and Credit Suisse and AKAM (+0.2%) was upgraded to Neutral at Citigroup. Also, EPAM (+7.5%) was added to Top Picks Live list at Citigroup While in downgrades, KLAC (-3.8%), LRCX (-5.3%), and NVLS (-5.3%) were downgraded to Underweight at JPMorgan.

There are no notable names in tech scheduled to report quarterly results today after the close.
icon url

ReturntoSender

05/17/12 6:25 PM

#9782 RE: ReturntoSender #6755

From Briefing.com: 4:30 pm : Stocks started the session near the neutral line, but ultimately the path of least resistance was into the red, resulting in the stock market’s tenth loss in 12 sessions and new multi-month lows for the major averages.

Market participants that opted to abide by the adage, “Sell in May and Go Away” appear prescient with stocks on the slide and down more than 6% month to date. Precarious conditions in the Eurozone have prompted many to take their cues from the euro, often pressuring stocks when the currency takes a dive. Despite efforts to stabilize against the dollar, the euro ultimately eased down to a loss of about 0.2% as of the closing bell. At about $1.270, the euro hasn’t been that low since January.

Giving further credence to Eurozone concerns, Greece's long-term rating was cut to CCC from B- by analysts at Fitch in response to heightened risk that the country will exit the euro. After it was indicated yesterday that some of Greece’s banks may no longer be eligible for the services of the European Central Bank, speculation picked up today that Spanish banks may be on the brink of another downgrade.

Negativity surrounding European banks tainted the perception of domestic Financial stocks, forcing the sector down to a 2.1% loss.

Consumer Discretionary stocks were actually the worst performers of the session. They sank 2.7%. Abercrombie & Fitch (ANF 36.55, -2.95) extended the precipitous drop that it suffered in the prior session, while GameStop (GME 18.52, -2.32) and Dollar Tree (DLTR 95.13, -6.17) both fell hard in response to downside guidance that cast a pall over earnings results. Bucking the negative broad market bias and calls for a strategic overhaul, Sears Holding (SHLD 52.42, +1.55) pleased shareholders by announcing a spin-off of Sears Canada alongside its latest quarterly results. Retail giant Walmart (WMT 61.67, +2.48) also scored an impressive gain, thanks to a strong report.

Apple (AAPL 530.12, -15.96) dropped to a new two-month low as traders rotated out of the Tech heavyweight. Shares of AAPL had rallied almost 60% from the start of the year to their record high in April, but they are now down more than 15% since setting their zenith. The stock’s slide today created an especially heavy drag on the Nasdaq.

Widespread weakness among stocks sent the Volatility Index up more than 8% to 24 for the first time in 2012. The euphemistically titled “Fear Gauge” is now up in excess of 60% from the lows that it set less than two months ago.

Heightened volatility and continued weakness among stocks resulted in further rotation into Treasuries. It was reported shortly after the close that the Note’s yield set a new record low narrowly beneath 1.70%.

Data today ranged from the unsurprising to the disappointing. Specifically, the latest initial jobless claims tally totaled 370,000, which is unchanged from the prior week and on par with the 365,000 claims that had been broadly expected.

The May reading of Philadelphia Fed Index fell to -5.8 from 8.5 in the prior month. Economists polled by Briefing.com had expected, on average, an improvement to 8.8.

Leading Indicators also surprised to the downside. They showed a 0.1% decline, which contrasts with the 0.2% increase that had been broadly forecasted.

Advancing Sectors: Telecom +0.4%
Declining Sectors: Utilities -0.6%, Consumer Staples -0.7%, Energy -0.7%, Health Care -1.0%, Tech -1.7%, Industrials -2.0%, Materials -2.1%, Financials -2.1%, Consumer Discretionary -2.7%DJ30 -156.06 NASDAQ -60.35 NQ100 -2.1% R2K -2.3% SP400 -2.7% SP500 -19.94 NASDAQ Adv/Vol/Dec 484/2.06 bln/2023 NYSE Adv/Vol/Dec 420/945 mln/2665

4:17PM Applied Materials beats by $0.03, beats on revs; guides Q3 EPS in-line, revs in-line; guides FY12 EPS in-line, revs in-line (AMAT) 10.48 -0.18 : Reports Q2 (Apr) earnings of $0.27 per share, $0.03 better than the Capital IQ Consensus Estimate of $0.24; revenues fell 11.3% year/year to $2.54 bln vs the $2.4 bln consensus. Co issues in-line guidance for Q3, sees EPS of $0.21-0.29 vs. $0.26 Capital IQ Consensus Estimate; sees Q3 revs flat to down 10% sequentially, or roughly $2.286-2.540 bln vs. $2.46 bln Capital IQ Consensus Estimate. Co issues in-line guidance for FY12, sees EPS of high end of $0.85-0.95 range vs. $0.95 Capital IQ Consensus Estimate; sees FY12 revs of high end of $9.1-9.5 bln range vs. $9.52 bln Capital IQ Consensus Estimate.

5:44PM GT Advanced Technologies announces orders totaling $8 mlnfor DSS 450 MonoCast upgrades and DSS 450HP furnaces to Taiwan-based Utech Solar Corp (GTAT) 4.49 -0.83 : Co announced that it has received two orders totaling $8 million from Taiwan-based wafer manufacturer UTECH Solar. One order is for its new DSS 450 MonoCast) silicon growth technology and the other order is for additional GT DSS 450HP casting furnaces. UTECH will upgrade a portion of their current GT DSS450 casting furnaces to begin producing MonoCast wafers, which will strengthen its competitive position as a wafer supplier to meet the expected demand for higher efficiency solar cells. In addition, UTECH is also increasing its total wafer production capacity with additional GT DSS450HP multicrystalline casting furnaces to meet the demand from its key customers.

5:23PM Trina Solar Statement on preliminary determination of antidumping duty in the United States (TSL) 6.08 -0.52 : Trina Solar Limited (TSL) offers the following statement regarding the preliminary determination of antidumping duties by the U.S. Department of Commerce (the "DOC"). On May 17, 2012, a preliminary determination was announced by the DOC in Washington, DC regarding the exportation of crystalline silicon photovoltaic cells and modules from China. A preliminary antidumping duty ("AD") rate of 31.14% was calculated to apply to the importation into the United States of Trina Solar's solar cells and modules/panels produced in China. The DOC also preliminarily determined that the AD investigation does not apply to modules manufactured in China that incorporate solar cells produced in a third country. This decision is consistent with DOC's prior preliminary determination in the parallel countervailing duty ("CVD") investigation of the same products. The DOC found "critical circumstances" and therefore the AD rate will apply retroactively to imports, beginning approximately 90 days prior to the preliminary determination. Trina Solar continues to actively defend its position in these administrative proceedings.

4:02PM Marvell announces initiation of a quarterly dividend of $0.06 per share and increases share repurchase authorization by $500 mln to a total of $2.5 bln (MRVL) 13.30 -0.26 :

3:45PM Suntech Power responds to to preliminary decision on tariffs in the antidumping investigation of pv cells from China: 'Duties do not reflect the reality of a highly-competitive global solar industry' (STP) 2.13 -0.13 : Co offered the following statement regarding the U.S. Department of Commerce's preliminary decision to impose antidumping duties of 31.22% on Suntech's crystalline silicon photovoltaic cells imported from China:

"These duties do not reflect the reality of a highly-competitive global solar industry. Suntech has consistently maintained a positive gross margin as revenues are higher than our cost of production. We will work closely with the Department of Commerce prior to their final decision to demonstrate why these duties are not justified by fact," said Andrew Beebe, Suntech's Chief Commercial Officer. "As a global company with global supply chains and manufacturing facilities in three countries, including the United States, we are providing our U.S. customers with hundreds of megawatts of quality solar products that are not subject to these tariffs. Despite these harmful trade barriers, we hope that the U.S., China and all countries will engage in constructive dialogue to avert a deepening solar trade war. Suntech opposes trade barriers at any point in the global solar supply chain. All leading companies in the global solar industry want to see a trade war averted. We need more competition and innovation, not litigation."

11:02AM Silicom Limited secures a Design Win for its 10Gpbs multi-port network adapters from a new customer; co projects sales related to this Design Win will total ~ $1 mln per year (SILC) 14.17 +0.02

SMSC (SMSC) announced that Victory Concept Electronics has selected SMSC's KleerNet technology to deliver low latency, lossless wireless audio streaming technology.


icon url

ReturntoSender

05/21/12 7:33 PM

#9785 RE: ReturntoSender #6755

From Briefing.com: 4:30 pm : There were few catalysts for trade today, but the S&P 500 staged its strongest performance in two months to snap a six-session losing streak.

Market participants were without any influential economic data today and only a dearth of corporate announcements. Home improvement retailer Lowe's (LOW 25.60, -2.88) reported stronger-than-expected earnings, but issued disappointing guidance, while Yahoo! (YHOO 15.58, +0.16) announced that it will sell half of its stake in Alibaba. JPMorgan Chase (JPM 32.51, -0.98) made it known at an industry conference that the firm has suspended its share repurchase program, but that it intends to maintain its dividend.

As has been the case for several weeks, macro-related topics were given the most attention. Leaders of China conveyed a willingness to consider accommodative policies with regard to stimulating economic growth. With regard to Europe, Group of Eight leaders made known their interest in keeping the eurozone intact.

The euro was down narrowly around the time of the open, but it was able to stage a solid advance against the greenback. By session's end it was up little more than 0.3% so that it traded above $1.28.

Tech stocks lacked leadership in the early going, but the sector eventually pushed out in front of the broad market to provide strong leadership. The sector's 2.8% gain was led by Apple (AAPL 561.28, +30.90), which is the single largest stock by market cap. The weight of AAPL shares and the strength of its gains also helped the Nasdaq outperform its counterparts, such that its gain was more than double that of the Dow.

Telecom and Utilities lagged all session. Telecom settled at the flat line, but Utilities eked out a 0.2% gain. Their lackluster performance comes after they managed to limit losses last week, which marked the worst week for the S&P 500 since November.

Last week's slide left the broad market at its lowest level since January, so naturally many market watchers are wondering if today's big bounce is simply owed to short covering, a bout of bargain hunting, or a combination thereof, especially amid so few catalysts.

Advancing Sectors: Materials +3.0%, Tech +2.8%, Industrials +2.2%, Energy +2.1%, Consumer Discretionary +1.6%, Financials +1.0%, Health Care +0.9%, Consumer Staples +0.4%, Utilities +0.2%
Unchanged: Telecom
Declining Sectors: NoneDJ30 +135.10 NASDAQ +68.42 NQ100 +2.7% R2K +2.3% SP400 +2.3% SP500 +20.77 NASDAQ Adv/Vol/Dec 1957/1.85 bln/582 NYSE Adv/Vol/Dec 2577/798 mln/434

8:32AM Riverbed Technology increases authorized share repurchase by $150 mln to $300 mln (RVBD) 15.42 : "We believe the current share price does not reflect the strength of Riverbed's long-term growth prospects," said Jerry M. Kennelly, Riverbed's president and chief executive officer. "This action underscores our confidence in our business and our continued commitment to maximizing value for our shareholders."

8:30AM O2Micro was issued 20 claims under United States patent number 8,143,857 for its Battery Monitoring System; co was also issued 20 claims under U.S. patent for its Battery Charging invention (OIIM) 4.86 :

Western Digital (WDC) announced that it is transferring its stock exchange listing to NASDAQ Global Select Market from the New York Stock Exchange. WD shares will begin trading on the NASDAQ exchange beginning June 1, 2012, and the ticker symbol will remain WDC.

Western Digital (WDC $35.71 +1.05) announced an increased authorization of $1.5 billion of its common stock under its share repurchase program. The additional repurchase authorization is effective immediately and extends the program by five years, during which time additional shares can be authorized for repurchase. The amount of purchases will depend on market conditions and corporate considerations. Share repurchases will be made on the open market. "The decision to increase WD's stock repurchase program is part of our capital allocation strategy to efficiently deploy cash to shareholders while maintaining strategic flexibility," said John Coyne, chief executive officer of WD. "We believe that Western Digital's stock is a compelling investment based on our ability to create additional value for our customers and shareholders in the growth markets we serve."

Cadence Design Systems (CDNS) announced that Nufront's NS115 chipset integrated the Cadence configurable DDR3/3L/LPDDR2 Memory Controller and Hard PHY IP core in its dual-core ARM Cortex-A9 based mobile applications processor.

Bright House Networks and Cisco (CSCO) announced that they are working together to help enterprises, government, healthcare, and education institutions better handle security defenses in their networks.

Amkor Technology (AMKR) announced that it plans to build a state-of-the-art factory and global research and development center in the Incheon Free Economic Zone, which is located in the greater metropolitan area of Seoul, Korea.

12:44AM Ultra Clean Holdings announces merger agreement with American Integration Technologies (UCTT) 5.32 : Co announces it has signed a merger agreement with American Integration Technologies, also a supplier of critical subsystems to the semiconductor capital equipment, medical, energy, industrial and aerospace industries. UCTT will pay a purchase price of ~$99 mln. The consideration will consist of $74 mln in cash and 4.5 mln shares of UCTT common stock. The consideration is subject to a post-closing balance sheet adjustment. AIT had ~$170 mln in revenue in its last fiscal year ended December 31, 2011.

icon url

ReturntoSender

05/23/12 12:26 AM

#9786 RE: ReturntoSender #6755

From Briefing.com: 4:30 pm : Leadership from Financials had lifted the broad market to a nice gain, but a dive by the euro prompted participants to sell. Ensuing pressure sent the major averages into the red before a final rebound took the stock market to the flat line.

Financials led the broad market through choppy trade this morning. The sector was up about 2% with help from shares of banks and diversified financial services outfits. The Financial sector's gains petered out into the afternoon and were fully forfeited in the final hour, but a bounce off of the flat line enabled the sector to book a 0.7% gain.

Tech stocks, which were leaders in the prior session, generally lagged during trade today. The sector settled with a 0.3% loss. Energy stocks matched that move, but Materials slid 0.6% to suffer the worst loss of any major sector. Materials stocks had outperformed in the prior session by posting a 3% gain.

Many retailers were unable to sustain their gains, forcing the SPDR S&P Retail ETF (XRT 58.39, +0.05) back to the flat line after it had been up more than 1%. Quarterly reports from Best Buy (BBY 18.46, +0.29), Urban Outfitters (URBN 28.10, +1.94), and Polo Ralph Lauren (RL 150.27, +3.97) were in focus. Polo Ralph Lauren actually doubled its dividend to $0.40 per share.

News flow slowed in afternoon trade, so many became closely focused on comments from a former Greece prime minister who stated that the country may exit the euro. Although many believe that such a development would actually strengthen the euro, the currency sold off amid speculation about near-term costs and implications of the event. As of the final bell the euro trailed the dollar by about 1.0%. Prior to the open of trade it was learned that the OECD now expects a mild economic contraction in the euro area.

The Japanese yen was also hit with selling pressure. Its weakness followed a decision by analysts at Fitch to downgrade Japan's long-term debt rating to A+ from AA.

The greenback's gain didn't help the case for commodities. Broad selling pressure there sent the CRB Index to a 1.1% loss.

The only dose of domestic data centered on existing home sales, which set an annualized rate of 4.62 million during April. A rate of 4.65 million had been broadly expected.

Advancing Sectors: Financials +0.7%, Utilities +0.6%, Consumer Discretionary +0.3%, Industrials +0.2%, Consumer Staples +0.1%
Declining Sectors: Telecom -0.1%, Health Care -0.2%, Energy -0.3%, Tech -0.3%, Materials -0.6%DJ30 -1.67 NASDAQ -8.13 NQ100 -0.2% R2K -0.7% SP400 +0.2% SP500 +0.64 NASDAQ Adv/Vol/Dec 923/1.84 bln/1604 NYSE Adv/Vol/Dec 1560/846 mln/1457

4:06PM Dell misses by $0.03, misses on revs; guides Q2 revs below consensus (DELL) 15.08 +0.11 : Reports Q1 (Apr) earnings of $0.43 per share, $0.03 worse than the Capital IQ Consensus Estimate of $0.46; revenues fell 4.0% year/year to $14.42 bln vs the $14.91 bln consensus. Co issues downside guidance for Q2, sees Q2 revs growth of 2-4% q/q (~$14.7-15.0 mln) vs. $15.47 bln Capital IQ Consensus Estimate.

Dell Enterprise Solutions and Services revenue grew 2% y/y to $4.5 billion and contributed half of Dell's gross margin; The ESS revenue grew 5% excluding third-party storage. Dell Services revenue was $2.1 billion, up 4%. Services backlog increased 9% to $15.4 billion. Dell-owned storage grew 24% to $423 million. Server and networking revenue grew 2%.

Large Enterprise revenue was $4.4 billion in the quarter, a 3% decline. Operating income for the quarter was $402 million, or 9.1% of revenue. Public revenue was $3.5 billion, a 4%decrease. Operating income for the quarter was $271 million, or 7.8% of revenue. Small and Medium Business revenue grew 4% to $3.5 billion. Enterprise Solutions and Services revenue increased 17%, led by services revenue growth of 23% and servers and networking of 16%. SMB had $389 million in operating income, or 11.2% of revenue. Consumer revenue was $3 billion, a 12% decline. Operating income was $32 million or 1.1 percent of revenue.

Asia-Pacific and Japan revenue was flat but China increased 9 percent. EMEA revenue was down 1 percent in the quarter. Americas was down 7 percent. Revenue in the BRIC countries increased 4 percent.

4:05PM Dell down sharply after missing on Q1 earnings and issuing Q2 revs guidance below consensus; stock down% 8.4% at $13.82 (DELL) :

IBM (IBM) announced the opening of a branch office in the city of Da Nang in Central Vietnam as part of the co's continued geographic expansion initiative to increase its presence in key growth markets.

Ciena (CIEN) announced that Indiana Fiber Network will deploy
Ciena's 5430 Packet-Optical Reconfigurable Switching System and OneConnect Intelligent Control Plane software to expand the capacity and service flexibility of its backbone network, and provide assured service delivery.

9:04AM PLX Tech: Integrated Device Technology (IDTI) commences exchange offer to acquire all outstanding shares of common stock of PLX Technology for $3.50 in cash and 0.525 shares of IDT common stock for each PLX common share outstanding (PLXT) 6.42 : Integrated Device Technology (IDTI), through a wholly owned subsidiary, is commencing today an exchange offer to acquire all outstanding shares of common stock of PLX Technology, Inc. (PLXT) for (i) $3.50 in cash and (ii) 0.525 shares of IDT common stock for each PLX common share outstanding, without interest and less any applicable withholding taxes.

8:36AM Cree announces Michael McDevitt appointed as interim CFO (CREE) 29.09 : Co announced that John Kurtzweil has resigned as executive vice president-finance and chief financial officer, effective May 21, 2012, to become the CFO of Extreme Networks (EXTR), and that Michael McDevitt has been appointed CFO on an interim basis. Cree has commissioned a search for a replacement through Russell Reynolds Associates, executive search consultants.

8:33AM Extreme Networks: John T. Kurtzweil to Join Extreme Networks as Chief Financial Officer (EXTR) 3.60 : EXTR announced that John T. Kurtzweil will join the Company as chief financial officer and senior vice president. Kurtzweil comes to Extreme Networks from Cree; he has worked as CFO with leading technology companies such as CREE, CRUS and ONNN. On June 29th, Kurtzweil will succeed Interim CFO Jim Judson, who will continue as a consultant during a transition period.

STEC (STEC) announced that Nexenta Systems has certified an all-STEC SSD configuration using a combination of ZeusRAM and ZeusIOPS SSDs to increase read/write capabilities within its NexentaStor ZFS-based storage platform.

Zoom Tech (ZOOM $1.23 -0.07) reports Q4 revenue increased 60% y/y to $139 million and reports net loss of $2.01 million compared to income of $5.1 mln in prior year period; no estimates available. Net loss in the quarter resulted from lowered margins in the EMS sector, increased R&D expenditures, one-time acquisition related expenses and impairment of goodwill... In the last few months of 2011, despite a credit tightening environment and that we engaged in less profitable manufacturing contracts in order to maintain a stable employment level at the factory, our normal operations would still have managed a slight net income of approximately $1 million in the fourth quarter of 2011. However, one-time acquisition related expenses, increase R&D expenditures and impairment of goodwill, resulted in a net loss for the quarter... Looking ahead, Mr. Gu remarked, "From the beginning of the year 2012, we anticipate a shift from the traditional assembly-focused manufacturing for our OEM customers to delivering whole phone solutions to large mobile operators and well-known brands in Asia. These activities should enable Zoom in 2012 to return to normal profitability and healthy margins."

Cree (CREE $25.99 -3.10) announced that John Kurtzweil has resigned as executive vice president-finance and chief financial officer, effective May 21, 2012, to become the CFO of Extreme Networks (EXTR $3.70 +0.10), and that Michael McDevitt has been appointed CFO on an interim basis. Cree has commissioned a search for a replacement through Russell Reynolds Associates, executive search consultants.

11:17 am Technonlogy Sector trading higher today but trails the broader market

The tech sector is trading just higher today, trailing larger gains in the broader market. Semiconductors are also showing relative weakness with the Philly Semi Index trading 0.6% lower. CREE (-6.1%) is a notable laggard in that chip index. Among other major indices, the SPY is trading 0.7% higher today, while the QQQ is up 0.4% and the NASDAQ is trading 0.5% higher on the session. Among tech bellwethers, QCOM (+1.1%) is showing notable strength, while FB (-4.5%) is again showing weakness.

In earnings, VOD (+2.6%) reported FY12 EPS of GBP0.15 which may not compare to the GBP0.16 CIQ est, while revs increased 1.2% YoY to GBP43.4 bln vs the GBP45.3 bln CIQ est. In news, RRD (-0.4%) announced it would acquire EDGR (+47.2%) for $1.092/share, while EXTR (+1.4%) disclosed it granted an exemption to Soros to acquire additional shares of the common stock. Elsewhere, MS (+2.8%) lowered its estimates on FB very close to the IPO, according to reports.

There are no notable analyst ratings changes this morning. However, STX (-5.9%) and WDC (-4.6%) are under pressure this morning following cautious commentary from Morgan Stanley regarding an increase in channel inventory. ADI (-0.1%) and DELL (+0.1%) are the notable name in tech scheduled to report quarterly results today after the close.
icon url

ReturntoSender

05/23/12 11:58 PM

#9787 RE: ReturntoSender #6755

From Briefing.com: 4:30 pm : The major market averages fell in excess of 1% as the euro descended to a near two-year low, but support in afternoon action helped the broad market rally out of the red.

The tone ahead of the open was firmly negative as participants responded to renewed weakness abroad – the bourses of Europe had already closed when comments were made on Monday regarding possible plans by Greece to exit the euro. The averages of Asia also had to account for that headline, along with Monday’s announcement that Japan’s long-term debt rating was cut by analysts at Fitch. More recently, the World Bank trimmed its growth forecast for China to a rate slightly above 8%.

Talks today among European leaders about the need for stability were widely credited for helping the euro firm up this morning. The euro even made an incremental gain against the greenback, but eventually sellers renewed their efforts. The ensuing slide sent the euro to less than $1.26, or its lowest level in nearly two years. It eased up from there, but was still down about 0.6% against the greenback at the close of the session.

Energy stocks were a heavy drag on trade for most of the session, down nearly 2% at their lowest level of the day. The sector rallied to a 0.4% gain.

Materials stocks made an even more impressive swing into positive territory. The sector was also down almost 2%, but rallied all the way to a gain of more than 1%.

The swings by natural resource plays were more impressive in light of the losses suffered by commodities. Overall weakness in the commodity complex left the CRB Index to fall 1.8%, which stands as its worst single-session slide since early April. Oil fell to a new 2012 low of $89.28 per barrel before closing at $89.80 per barrel.

Short covering likely helped fuel the stock market’s afternoon reversal. Given the stretch of losses suffered by stocks in recent weeks and persistently precarious conditions in the eurozone, many market participants had placed bets that the path of least resistance would be downward. Once stocks stabilized and started to turn higher, many were prompted to exit their positions so as to take profits or protect against additional upside action.

Although the broad market was able to rebound in impressive fashion, Dell (DELL 12.49, -2.59) still endured its worst one-day drop in more than a decade to set a new 52-week low. The stock’s precipitous drop was owed to a disappointing quarterly report. Fellow Tech outfit Hewlett-Packard (HPQ 21.08, -0.70) suffered a marked loss ahead of its latest earnings announcement.

New home sales numbers for April made up the only dose of domestic data today. They hit an annualized rate of 343,000, which is up from the prior month rate of 332,000, and a little better than the rate of 339,000 that had been broadly expected.

Advancing Sectors: Materials +1.1%, Industrials +0.6%, Consumer Discretionary +0.6%, Energy +0.4%, Financials +0.4%, Tech +0.2%
Declining Sectors: Telecom -0.2%, Consumer Staples -0.3%, Health Care -0.6%, Utilities -0.7%DJ30 -6.66 NASDAQ +11.04 NQ100 +0.3% R2K +0.7% SP400 +0.6% SP500 +2.23 NASDAQ Adv/Vol/Dec 1362/1.92 bln/1143 NYSE Adv/Vol/Dec 1826/863 mln/1182

4:12PM Hewlett-Packard beats by $0.07, beats on revs; guides Q3 EPS below consensus; guides FY12 EPS above consensus; announces restructuring (HPQ) 21.08 -0.70 : Reports Q2 (Apr) earnings of $0.98 per share, $0.07 better than the Capital IQ Consensus Estimate of $0.91; revenues fell 3.0% year/year to $30.69 bln vs the $29.91 bln consensus. Hewlett-Packard launches multi-tear restructuring to fuel innovation and enable investment; expects to save $3.0-3.5 bln exiting FY14. Co issues downside guidance for Q3, sees EPS of $0.94-0.97, excluding non-recurring items, vs. $1.02 Capital IQ Consensus Estimate. Co issues upside guidance for FY12, sees EPS of $4.05-4.10, excluding non-recurring items, vs. $4.04 Capital IQ Consensus Estimate and at least $4.00 previously.

Q2: Personal Systems Group (PSG) revenue was flat YoY with a 5.5% operating margin. Commercial revenue increased 3%, and Consumer revenue declined 4% while Workstations revenue was down 1% YoY. Desktop units were up 5%, notebook units were down 6% and total units were down 1%. Services revenue declined 1% YoY with an 11.3% operating margin. Technology Services revenue was flat YoY, Application and Business Services revenue grew 1% and IT Outsourcing revenue declined 3% YoY. Imaging and Printing Group (IPG) revenue declined 10% YoY with a 13.2% operating margin. Commercial hardware revenue was down 4% YoY with commercial printer units down 7%. Consumer hardware revenue was down 15% YoY with a 13% decline in printer units. Enterprise Servers, Storage and Networking (ESSN) revenue declined 6% YoY with an 11.2% operating margin. Networking revenue was up 2%, Industry Standard Servers revenue was down 6%, Business Critical Systems revenue was down 23%, and Storage revenue was up 1% YoY. HP Financial Services revenue grew 9% YoY driven by a 4% increase in net portfolio assets and a 5% increase in financing volume. The business delivered a 9.9% operating margin. Software revenue grew 22% YoY with a 17.7% operating margin, including the results of Autonomy. Software revenue was driven by 7% license growth, 17% support growth, and 72% growth in services. Autonomy saw a significant decline in license revenue.

Co also outlined plans for a multi-year productivity initiative designed to simplify business processes, advance innovation and deliver better results for customers, employees and shareholders. The restructuring is expected to generate annualized savings in the range of $3.0 to $3.5 billion exiting fiscal year 2014, of which the majority will be reinvested back into the co. HP expects to use the savings to boost investment in innovation around its three areas of strategic focus: cloud, big data and security, as well as in other segments that offer attractive growth potential. As part of the restructuring, HP expects ~27,000 employees to exit the co, or 8.0% of its workforce as of Oct. 31, 2011, by the end of fiscal year 2014. The co is offering an early retirement program, so the total number of employees affected will be impacted by the number of employees that participate in the early retirement plan. In addition to these restructuring actions, HP expects to achieve additional savings from non-headcount cost reductions, including supply chain optimization, SKU and platform rationalization, go-to-market strategy simplification and business process improvement.

4:03PM Semtech postpones earnings by one day, they were due tonight but will be released tomorrow after the close, cites accounting complexities (SMTC) 32.86 -0.44 : "Due to complexities of certain purchase accounting determinations related to Semtech's acquisition of Gennum Corporation, it has taken longer than anticipated to finalize our interim financial statements."

7:20AM Suntech Power misses by $0.26, reports revs in-line; guides Q2 shipments and gross margin higher QoQ; reaffirms FY12 shipments (STP) 1.98 : Reports Q1 (Mar) loss of $0.74 per share, $0.26 worse than the Capital IQ Consensus Estimate of ($0.48); revenues fell 53.3% year/year to $409.5 mln vs the $413.49 mln consensus. Q1 gross profit was $2.4 million and gross margin was 0.6% compared to $62.3 million and 9.9%, respectively, in the fourth quarter of 2011; and $182.7 million and 20.8% in the first quarter of 2011. Gross profit and gross margin in the first quarter of 2012 were impacted by a provision for preliminary U.S. countervailing and anti-dumping duties of $19.2 million, or 4.7% of revenues. The sequential decline in gross margin was further impacted by sales price declining faster than the cost of production. "First quarter shipments were 27% lower than our fourth quarter shipments, which is better than our previous projection of a 30% decline. The sequential decrease in shipments was primarily due to limited inventory on hand early in the quarter and a planned reduction in our production level over Chinese New Year. During the quarter, we reduced our total production cost by 6% sequentially, despite lower utilization, and maintained a healthy cash balance." Guidance: Suntech expects shipments in Q2 to increase by more than 20% from the first quarter of 2012. Gross margin in the second quarter of 2012 is expected to be in the range of 3% to 6%. For FY12, Suntech maintains the guidance for shipments to be in the range of 2.1GW to 2.5GW. Suntech expects to maintain cell and module production capacity at 2.4GW and wafer capacity at 1.6GW in 2012. Full year 2012 capital expenditures are expected to be in the range of $120 million to $150 million. Capital expenditures will primarily be related to payments for equipment and services already received, and technology upgrades to production lines.

7:01AM LTX-Credence beats by $0.03, reports revs in-line; guides Q4 EPS, revs above consensus (LTXC) 6.18 : Reports Q3 (Apr) loss of $0.10 per share, excluding non-recurring items, $0.03 better than the Capital IQ Consensus Estimate of ($0.13); revenues fell 47.5% year/year to $30.8 mln vs the $30.51 mln consensus. Co issues upside guidance for Q4, sees EPS of $0.00-0.04, excluding non-recurring items, vs. ($0.04) Capital IQ Consensus Estimate; sees Q4 revs of $42-46 mln vs. $37.03 mln Capital IQ Consensus Estimate. "Our recent product introductions, the Diamondx and DragonRF, are key components of the Company's growth strategy, and we are excited about the positive feedback we have received from customers. Over the next fiscal year we expect Diamondx and DragonRF to account for approximately 20-30% of our product revenues, as customers who have already adopted these new technologies ramp in volume, and additional customers come on board. As fourth quarter guidance suggests, the new cycle is gaining momentum as business is expanding beyond the mobility markets. The Company is well positioned as we enter the next growth phase due to a broadening of our customer base and our strong lineup of products."

Dell (DELL $13.06 -2.01) reported first quarter of $0.43 per share, $0.03 worse than the Capital IQ Consensus of $0.46, while revenues fell 4.0% year/year to $14.42 billion versus the $14.91 bln consensus. The company issued downside guidance for the second quarter with revenue growth of 2-4% quarter over quarter (calculating to about $14.7-15.0 billion) vs. $15.47 bln Capital IQ Consensus Estimate. Dell Enterprise Solutions and Services revenue grew 2% y/y to $4.5 billion and contributed half of Dell's gross margin; The ESS revenue grew 5% excluding third-party storage. Dell Services revenue was $2.1 billion, up 4%. Services backlog increased 9% to $15.4 billion. Dell-owned storage grew 24% to $423 million. Server and networking revenue grew 2%. Large Enterprise revenue was $4.4 billion in the quarter, a 3% decline. Operating income for the quarter was $402 million, or 9.1% of revenue. Public revenue was $3.5 billion, a 4?crease. Operating income for the quarter was $271 million, or 7.8% of revenue. Small and Medium Business revenue grew 4% to $3.5 billion. Enterprise Solutions and Services revenue increased 17%, led by services revenue growth of 23% and servers and networking of 16%. SMB had $389 million in operating income, or 11.2% of revenue. Consumer revenue was $3 billion, a 12% decline. Operating income was $32 million or 1.1 percent of revenue. Asia-Pacific and Japan revenue was flat but China increased 9 percent. EMEA revenue was down 1 percent in the quarter. Americas was down 7 percent. Revenue in the BRIC countries increased 4 percent.

Trina Solar (TSL $5.05 -0.27) reported first quarter loss of $0.42 per share, $0.12 worse than the Capital IQ consensus of ($0.30), while revenues fell 36.5% year/year to $349.9 million versus the $389.72 million consensus. Solar module shipments were ~380 MW for the first quarter of 2012, compared to the Company's previous guidance of between 400 MW to 430 MW, representing a decrease of 10.6% sequentially. Gross margin was 5.8% in the first quarter of 2012, compared to the Company's previous guidance of low teens in percentage terms, compared to 7.1% in the fourth quarter of 2011 and 27.5% in the first quarter of 2011. The sequential decrease in gross margin was due primarily to anti-dumping and countervailing duty provisions offsetting reduced costs, while the year-on-year decrease in gross margin was due primarily to module average selling price declines in excess of reduced costs. Guidance: For Q2, the Company expects to ship between 500 MW to 520 MW of PV modules. The co believes its overall gross margin for the second quarter, including the impact of provisions for potential countervailing and anti-dumping duties, will be ~10%. This figure takes into account wafer and cell requirements outsourcing to third party suppliers to meet demand in excess of its internal capacity. Such guidance is based on the exchange rate between the Euro and U.S. dollar as of May 23, 2012. For the full year 2012, the co expects total PV module shipments between 2.0 to 2.1 GW, representing an increase of 32.5% to 39.1%, respectively, from 2011.

09:08 am Facebook initiated with a Buy at Needham; tgt $40: . Needham initiates FB with a Buy and price target of $40. With over 900m monthly unique users, they believe FB is an option on the World. The best question for FB is how to value it. Their point of view is that FB should be valued based on rev potential from total minutes spent on FB times its powerful margin expansion engine. FB represents ~14% of time spent online globally (comScore), suggesting that its rev potential is $14B globally and $6B from the US alone. They note large cap growth stocks are rare.

09:07 am Dell downgraded to Neutral at Mizuho; tgt $15: . Mizuho downgrades DELL to Neutral from Buy with a $15 tgt saying results clearly disappointed on the top-line and earnings fronts and believes that the macro uncertainty combined with its sales execution issues could continue to weigh on its performance for the next few quarters. Despite an attractive valuation relative to its historical range, they believe a more back-end loaded FY13 combined with lack of near-term catalysts and continued macro uncertainty will make the stock range-bound in the near term.
icon url

ReturntoSender

05/29/12 11:02 PM

#9793 RE: ReturntoSender #6755

From Briefing.com: 4:30 pm : A retreat by the euro to a near two-year low caused stocks to surrender gains, but the major equity averages were able to find support and tick higher into afternoon trade.

The major equity averages were bid up more than 1% this morning as momentum built amid speculation that plans for new spending in China were a sign of the country’s plans for further stimulus. Comments that political leaders in Greece want to remain in the euro were also treated as a positive, although the news failed to provide the euro with a bid.

What was a narrow loss for the euro in the early going grew to something more sizable by midsession. The currency’s drop to $1.250, its lowest level in almost two years, came shortly after analysts at Egan Jones announced they had downgraded the debt rating of Spain. Concerns over macro conditions and the health of banking conditions in Spain had already weighed on Spain’s IBEX before the announcement – it ended the day down more than 2%, while many of the other major bourses of the region staged solid gains.

The euro’s retreat prompted market participants to pare their positions in stocks, forcing all three major equity averages to hand over about half of their gains before stabilizing. The broad market became range bound for the next few hours, but managed to gradually reclaim gains into the close. The euro was also able to lift off of its session low into the close.

Materials stocks were the strongest performers throughout the session. The sector settled the session with a 1.7% gain. It was up about 2% at its best level of the day. Steel stocks were among the sector's strongest performers.

Energy stocks were also strong in the early going, but the sector had a harder time of retracing its pullback. In turn, Energy settled with a gain of 1.3%. Meanwhile, crude oil settled with a 0.1% loss at $90.75 per barrel after it had been up more than 1% at its pit session high of $92.25 per barrel in morning action.

Tech, the largest sector by market weight, provided steady broad market support. The sector also settled shy of its session high, but still booked a 1.4% gain. The highly influential Financial sector finished with a similar gain.

There wasn’t a single sector that suffered a loss, but defensive-oriented Utilities slipped into negative territory on a few occasions. Despite that, the sector managed to muster a 0.4% gain. Fellow defensive issues also lagged.

Economic data were largely inconsequential today. Although, many were surprised to see the Consumer Confidence Index for May fall to 64.9 from a downwardly revised 68.7 in the prior reading since just last week the University of Michigan had posted the strongest Consumer Sentiment Survey in four years.

The economic calendar will remain light ahead of the second reading on first quarter GDP on Thursday and the official monthly payrolls report on Friday.

Advancing Sectors: Health Care +0.4%, Utilities +0.4%, Consumer Staples +0.6%, Telecom +0.8%, Industrials +1.2%, Energy +1.3%, Consumer Discretionary +1.3%, Financials +1.4%, Tech +1.4%, Materials +1.7%
Declining Sectors: None

Dow +1.0%, S&P 500 +1.1%, Nasdaq +1.2%, Nasdaq 100 +1.3%, S&P 400 +1.3%, Russell 2000 +1.4%DJ30 +125.86 NASDAQ +33.46 NQ100 +1.3% R2K +1.4% SP400 +1.3% SP500 +14.60 NASDAQ Adv/Vol/Dec 1755/1.64 bln/757 NYSE Adv/Vol/Dec 2391/708 mln/640

4:37PM Research In Motion extends losses, falls as much as 15.4% to $9.50; now at $9.71 (RIMM) 11.23 +0.23 :

4:36PM Research In Motion resumes 11% lower at $10.00 following business update, co sees Q1 operating loss, hires JP Morgan and RBC to assist co in reviewing performance; see 16:23 comment (RIMM) 11.23 +0.23 :

4:08PM FormFactor raises Q2 rev guidance above consensus (FORM) 5.76 +0.11 : Co issues upside guidance for Q2 (Jun), sees Q2 (Jun) revs of $50-54 mln vs. $44.93 mln Capital IQ Consensus Estimate, higher than the company's previous revenue guidance of $43 to $47 million. Customer demand across the DRAM and Flash memory segments are the main drivers for the increase to the company's expected revenue results. "Industry conditions in Q2 are more favorable than we anticipated and our improved lead times are enabling us to meet customer requests to accelerate certain product deliveries," said Tom St. Dennis, CEO. "While we are encouraged by the marketplace momentum for our Matrix architecture memory solutions, our outlook for the second half of the year is tempered by concerns about softness in the personal computer markets and the potential impact of macroeconomic forces."

4:06PM Nanometrics announces $20 mln share repurchase program (NANO) 14.90 +0.17 : This $20 mln program is effective immediately and will be funded using the company's available cash.

4:01PM Vishay to offer $150 mln of convertible senior debentures (VSH) 10.39 +0.44 : Co announces its intention to commence an offering, subject to market conditions and other factors, of $150 million principal amount of convertible senior debentures. The debentures would be due in 2042 and are to be offered and sold only to qualified institutional buyers pursuant to Rule 144A under the Securities Act of 1933, as amended. The interest rate, conversion rate and the other terms will be determined by negotiations between Vishay and the initial purchasers of the debentures. Vishay intends to use the net proceeds from this offering, together with cash on hand, to repurchase

O2Micro International (OIIM) was issued 6 claims under U.S. patent for its Battery Management System with Energy Balance invention.

Sanmina-SCI (SANM) announced that its Defense and Aerospace Division has received NSA Type 1 certification from the National Security Agency for the Integrated Secure Wireless Intercommunications System.

HP (HPQ) has amicably resolved patent litigation with Brazil-based Multilaser Industrial Ltda. relating to HP's integrated printhead inkjet cartridges. As part of the settlement, Multilaser acknowledges that HP's patents are valid and were infringed upon.

Flextronics (FLEX) has filed its 2012 financial statements on Form 10-K with the SEC. As a result of recent events impacting the finances and liquidity of one of the co's customers in the concentrated solar photovoltaic market, the co has recognized a $32.0 mln charge for the write-down of inventory and provisions for doubtful accounts.


icon url

ReturntoSender

05/30/12 6:17 PM

#9794 RE: ReturntoSender #6755

From Briefing.com: 4:30 pm : Renewed worries about the health and fate of the eurozone brought about a negative tone that permeated trade for the entire session.

The possibility of European bank recapitalizations offered only temporary relief to market participants focused on the precarious fiscal, financial, and economic conditions in the eurozone periphery, where debt yields were forced higher. Selling among the region’s major bourses resulted in sizable losses, including a 1.4% loss for the EuroStoxx 50. The euro also took a tumble, such that it set a near two-year low of less than $1.24. As of the closing bell it had fallen 0.9% against the greenback.

An interest in safety spurred demand for Japan's yen, which pulled down the yen-dollar exchange rate to a new multi-month low of less than 78.9 yen per dollar.

Gold garnered buying interest after it had spent early pit trade in negative territory. The yellow metal set a session low of $1530.40 per ounce, but the appeal of its safety features helped propel the precious metal to $1563.90 per ounce for a 1.0% gain in the face of a stronger dollar. In contrast, the greenback’s gain seemed to make oil’s slide a little easier. Oil prices fell to a 2012 low of $87.46 per barrel before they settled with a 3.2% loss at $87.84 per barrel.

The combination of sharply lower oil prices and broad weakness among equities resulted in outsized losses for Energy stocks. The sector slumped to a 3.0% loss, which is worse than what any other sector suffered. Oil and gas equipment, exploration, drilling, and services stocks were all caught up in the sell-off.

Financials also fell hard. The sector’s 2.2% loss was driven by weakness among banking plays and diversified financial services issues. SLM Corp (SLM 14.04, +0.36) was one of the few Financial plays to attract buying interest – the stock’s gain followed news that the company has earmarked an additional $400 million for share repurchases.

Monsanto (MON 76.41, +1.66) also managed to muster an impressive gain following the firm’s latest financial forecast. The rest of the Materials sector suffered a 1.7% loss.

Telecom stocks did the best job of resisting selling pressure. The sector’s 0.6% loss was less than what any other sector suffered. The sector’s relative strength is consistent with its performance in 2012 – Telecom stocks are up nearly 7% this year, whereas the broad market is up little more than 4%.

Amid such widespread weakness the Volatility Index made a double-digit percentage spike that took it up near 24. The Fear Gauge’s multi-month high remains at 25, which was set a couple of weeks ago when stocks were at multi-month lows.

A want for safety sent Treasuries up sharply, such that the yield on the benchmark 10-year Note dropped to a record low narrowly above 1.60%.

The only item on the economic calendar featured pending home sales, which dropped during April by 5.5% when a 0.6% increase had been broadly expected.

The flow of economic data picks up tomorrow with the release of the second reading on first quarter GDP, weekly initial jobless claims, and the latest monthly ADP Employment Change. Friday will bring the official monthly payrolls report.

Advancing Sectors: None
Declining Sectors: Telecom -0.6%, Health Care -0.7%, Tech -0.7%, Utilities -0.8%, Consumer Staples -0.9%, Consumer Discretionary -1.6%, Materials -1.7%, Industrials -1.7%, Financials -2.2%, Energy -3.0%DJ30 -160.83 NASDAQ -33.63 NQ100 -0.8% R2K -2.0% SP400 -1.9% SP500 -19.10 NASDAQ Adv/Vol/Dec 536/1.64 bln/2004 NYSE Adv/Vol/Dec 396/766 mln/2627

5:22PM Rudolph Tech issues Q2 guidance in presentation slides (RTEC) 8.70 -0.03 : Co issues mixed guidance for Q2 (Jun), sees EPS of $0.16-0.17, excluding non-recurring items, vs. $0.18 Capital IQ Consensus Estimate; sees Q2 (Jun) revs of $52.6-54.7 mln vs. $53.33 mln Capital IQ Consensus Estimate.

LTX-Credence Corp. (LTXC) announced that Global Mixed-Mode Technology has selected the ASLx as its test platform.

Skyworks Solutions (SWKS) has commenced volume production of several RF solutions supporting Broadcom (BRCM) 5G WiFi chips - including minicards for access points, routers and customer premise equipment.

7:30AM Vishay prices offering of $150 million of 2.25% convertible senior debentures (VSH) 10.39 : Co announced the pricing of its offering of $150 million principal amount of 2.25% convertible senior debentures due 2042. The sale is expected to close May 31, 2012. Interest will be payable on the debentures semi-annually at a rate of 2.25% per annum. In addition to ordinary interest, beginning on June 1, 2022, contingent interest will accrue in certain circumstances relating to the trading price of the debentures and under certain other circumstances.

Xilinx (XLNX) announced initial shipments of the Virtex-7 H580T FPGA, a 3D heterogeneous all programmable product.

Research In Motion (RIMM $10.19 -1.06) provided a business update. The company's CEO Thorsten Heins stated "In terms of challenges, as I mentioned on the March financial results conference call, RIM is going through a significant transformation as we move towards the BlackBerry 10 launch, and our financial performance will continue to be challenging for the next few quarters. The on-going competitive environment is impacting our business in the form of lower volumes and highly competitive pricing dynamics in the marketplace, and we expect our Q1 results to reflect this, and likely result in an operating loss for the quarter. We are continuing to be aggressive as we compete for our customers' business - both enterprise and consumer - around the world, and our teams are working hard to provide cost-competitive, feature-rich solutions to our global customer base. On the positive side, we expect to further increase our cash position in Q1 from the approximately $2.1 billion we had at the end of fiscal 2012." "The CORE (cost optimization and resource efficiency) program we told you about previously is focused on delivering key operational savings through various initiatives. The financial objectives for the CORE program are targeted to drive $1 billion in savings by the end of fiscal 2013, based on our Q4 run rate...While there will be significant spending reductions and headcount reductions in some areas throughout the remainder of the fiscal year, we will continue to spend and hire in key areas such as those associated with the launch of BlackBerry 10, and those tied to the growth of our application developer community. We will share more details regarding our progress throughout the year as programs are implemented or changes are completed." "To further enhance our commitment to successfully completing our transformation, after the release of our year-end financial results, we engaged J.P. Morgan Securities LLC and RBC Capital Markets to assist the Company and our Board of Directors in reviewing RIM's business and financial performance."

FormFactor (FORM $6.21 +0.45) issues upside guidance for the second quarter with revenues of $50-54 million versus the $44.93 million consensus, higher than the company's previous revenue guidance of $43 to $47 mln. Customer demand across the DRAM and Flash memory segments are the main drivers for the increase to the company's expected revenue results. "Industry conditions in Q2 are more favorable than we anticipated and our improved lead times are enabling us to meet customer requests to accelerate certain product deliveries," said Tom St. Dennis, CEO. "While we are encouraged by the marketplace momentum for our Matrix architecture memory solutions, our outlook for the second half of the year is tempered by concerns about softness in the personal computer markets and the potential impact of macroeconomic forces."
icon url

ReturntoSender

05/31/12 9:16 PM

#9795 RE: ReturntoSender #6755

From Briefing.com: 4:30 pm : Disappointing data played a part in dropping the S&P 500 to the 1300 line, which provided a floor for a rebound amid renewed interest in Financials, but the attempt to advance lost steam and left the stock market to suffer its second straight loss. During the course of May the broad market sank more than 6%, which makes it the worst month since September.

The major equity averages all dropped in excess of 1% in the prior session as attention returned to the troubles of Europe. Those concerns appeared to be tempered this morning as debt yields in the region retreated and the euro attracted a modest bid.

Those developments helped improve the mood among traders ahead of the open, but sentiment was undermined by a few economic reports that failed to meet expectations.

The latest ADP Employment Change report suggests that private payrolls increased during May by 133,000, which is less than the increase of 157,000 that had been expected, on average, among economists polled by Briefing.com. The report is often regarded as a preview of the official monthly payrolls report, which is due tomorrow.

Weekly initial jobless claims had remained near 370,000 for the past few weeks, but the latest tally increased to 383,000. It had been widely expected to come in at 368,000.

A revised reading of first quarter GDP also proved displeasing. It suggested that the economy expanded at a clip of 1.9%, down from the 2.2% increase that was featured in the preliminary reading, and less than the 2.0% pace that had been broadly anticipated.

The Chicago PMI reading made an unexpected pullback in May to 52.7 from 56.2 in April. Economists polled by Briefing.com had expected, on average, that it would improve to 57.0.

An absence if encouraging data and a midmorning pullback by the euro to a near two-year low of just $1.23 made it easy for stocks to slide to sizable losses. The S&P 500 was down about 1% to the 1300 line before it stabilized.

Technical support coincided with an upturn by Financials to help lift the broad market into afternoon trade. Financials were able to settle with a 0.7% gain amid help from bank stocks and shares of diversified financial services firms. Although Financials put on one of the better performances of the day, they fell more than 9% in May to suffer one of the worst monthly performances of any sector.

Telecom stocks were also strong today, but they have been performing well all month. The sector scored a 0.8% gain today, and a near 3% gain for the month. No other sector advanced in May. Many market participants have come to favor the sector’s defensive characteristics and relatively rich dividend yields. Some of those same features made Utilities the strongest performers of 2011.

While many stocks were able to slash their losses in afternoon action, the S&P 500 didn’t make a meaningful move into positive territory until the final 30 minutes. The effort came apart into the close, though, resulting in a return to negative territory by the closing bell.

For the second straight session Energy was the worst performing sector. It suffered a 0.9% loss; along the way it set a new seven-month low. Its descent has come in close correlation to a retreat by oil prices, which set new 2012 lows today at $85.86 per barrel before it settled pit trade at $86.51 per barrel for a 1.5% loss.

The end of the month brought about an increase in share volume, such that the number of shares traded on the NYSE surged above 1 billion to one of the highest tallies of 2012.

Advancing Sectors: Telecom +0.8%, Financials +0.7%, Utilities +0.6%
Declining Sectors: Consumer Discretionary -0.3%, Consumer Staples: -0.3%, Industrials -0.3%, Health Care -0.4%, Materials -0.5%, Tech -0.6%, Energy -0.9%DJ30 -26.41 NASDAQ -10.02 NQ100 -0.5% R2K +0.00% SP400 -0.3% SP500 -2.99 NASDAQ Adv/Vol/Dec 1195/2.11 bln/1350 NYSE Adv/Vol/Dec 1442/1.32 bln/1557

7:07AM Ciena beats by $0.07, beats on revs; guides Q3 revs in-line (CIEN) 11.88 : Reports Q2 (Apr) earnings of $0.04 per share, $0.07 better than the Capital IQ Consensus Estimate of ($0.03); revenues rose 14.3% year/year to $477.6 mln vs the $446.7 mln consensus. Co issues in-line guidance for Q3, sees Q3 revs of $455-485 mln vs. $472.40 mln Capital IQ Consensus Estimate. "Our second quarter was highlighted by strong revenue growth and positive overall operating performance, which demonstrated our ability to deliver operating leverage..We remain confident that we are well positioned for future growth and continue to expect our second half operating results to be stronger than the first half." Co sees Q3 Adjusted (non-GAAP) gross margin of approximately 40 percent.

icon url

ReturntoSender

06/03/12 12:26 PM

#9797 RE: ReturntoSender #6755

InvestmentHouse Weekend Market Summary

http://www.investmenthouse.com/weekendmarketsummary.htm

- A confluence of negative economic news gives stocks an old-fashioned tail kicking.
- 2% to 4% losses on the indices and a quick trip to the 200 day SMA.
- Gold surges, dollar fades versus Euro as US economic issues finally sink in.
- US jobs truly pathetic.
- China, US, European manufacturing point to a global slowdown.
- Incomes still not keeping up with inflation.
- 'No recession' say the pundits. They are wrong.
- Whose economic mess is this (other than ours of course)?
- After a 200 day SMA break, more selling but likely a pretty quick test.

Perfect storm of issues sweeps market lower.

The perfect storm was building with a confluence of negatives from around the globe. The U.S. jobs report was awful at 69K nonfarm payrolls produced. There are other details that I will discuss later that made it even more unsavory. The U.S. ISM came in well below expectations. China's PMI came in at 50.4, much lower than expected. The EU PMI came in at a three-year low at 45.1. Thank goodness for Greece and Italy who beat expectations while others missed such as Germany and France. Without them it would have been much worse. China is a known problem, Europe is a known disaster, and then we have the U.S. I will put it this way: It was not nearly as strong as some are saying. I will go into more detail later.

The news hit as you would expect. Futures fell off early in the morning on a lot of the data from the Far East. It flatlined overnight and then sold off hard on the U.S. data. The market sold down from the opening. There was a modest short covering rally attempt in the afternoon which did very little before trailing off into the close. The result was an old-fashioned tail kicking.

SP500, -2.46%; NASDAQ, -2.82%; Dow, -2.2%; SP600, -3.08%; SOX, -4.1%.

It was an ugly day no matter how you slice it. Looking at the charts, there was a significant drop that pushed the indices through their recent lows as well as the 200 day EMA. That has stocks approaching the next support already, and there will be a lot of potential support on the way down just as there is always resistance on the way up. The question is whether the news is bad enough to push stocks down significantly from here, or will they find support and base? As of Friday, no one was saying much good about the economy. There were a few out there saying there would be no recession and that this is the time to buy. It may turn out to be the time to buy, but we will see stocks telling us that is the case.

Not all stocks sold off. Not all of them collapsed. It was not a total bloodbath, but it was a significant drop for the market. It is an important drop because it takes out another consolidation attempt at relatively high levels of the pullback. It upset any ABCD pattern attempt. Now the market will have to realign itself and base out once more at a lower level from 2011.

OTHER MARKETS.

As you likely anticipated, the trends of late -- driven by the fears of late -- continued to hold. Not completely, however. There were some changes because of the dramatic change in the fortunes of the U.S. economic picture.

Dollar. 1.2430 versus 1.2368 euro. The dollar surged early. It has been running up against the euro, and you would anticipate a surge because the European data was bad. Even though the U.S. data was bad, it was not as bad as over there. The problem is that the dollar, after surging, closed lower. The reason? The Fed is back in play now. The Fed has been protesting that will not raise rates and that it is not time to do it. But all of a sudden, Friday's jobs report was somehow a game changer. Not all the other debilitating data, mind you, with respect to manufacturing, durable goods orders, etc. You saw it all. No, it has to do with jobs. A lagging indicator. They were going to wait until they saw the whites of their eyes, I guess, looking at the most lagging of indicators to make policy.

It is here. I talked about the ECRI last week, and it was looking at incomes and jobs. The jobs have arrived at that tipping point. Now the dollar is suddenly realizing that the Fed is back in play, and it might start printing some money. It might not be able to wait as the card of last resort, the last one to play in the event of trouble. So the dollar faded.

Bonds. 1.47% versus 1.57% 10 year U.S. Treasury. Even though the dollar may be worried about the Fed printing more money, bonds were not. Bonds still rocketed higher, and the 10 year hit another record. Huge moves on the week. There is money in flight to U.S. treasuries. This appears to be a secular move that, as Gary Kaminsky said, may likely push the 10 year yield down to 1%. It is getting close, and it has dropped a long way in a short period of time. The U.S. may have its troubles, but money is flying to bonds from overseas and here in the U.S.

As I said last night, this is not a sign of health as some were saying. It is a sign of major trouble, and it was forecasting more weak economic data in the U.S. Bonds are exploding to the upside. I do not see anything stopping it right now. There will be pullbacks, but the move was set up with this rally, pennant, and now an explosive gap. Not a good sign for the U.S. or the rest of the world economically.

Gold. 1,621.40, +57.20. Gold had a different story to tell. My, how fortunes have changed. It spent the last three weeks moving laterally after tapping at the upper trendline of its prior downward-pointing channel. It has formed a second smaller channel. It moved laterally, and it kept tapping lower and rebounding. We said something was up with gold, and it took off to the upside. Why? Money printing. If the Fed has to print, gold suddenly becomes much more valuable because the U.S. dollar becomes much less valuable. There is also that fear factor. The U.S. is heading into recession, and that scares investors around the world. They look to U.S. treasuries as safety because they still think the U.S. government will remain solvent for now. And they look to gold because it is a good store of value. They say you can buy a good suit with an ounce of gold now just as you could 200 years ago. Gold jumped up, and it is likely to continue higher as long as the bad news continues to gel.

Oil. 83.17, -3.36. Oil tanked. Who needs oil when you have a glut of it in the U.S. and there is no economic activity (or falling economic activity) around the world? Europe is a litany of negative manufacturing reports, contracting at a faster pace. China is not contracting yet, but it is on the cusp at 50.4. As far as it has dropped, it seems like it is already in recession.

We have no need for all this oil. We have no need for all these commodities. But interesting things are happening in commodities. Some are being bought simply as hedges and stores of value when paper assets suddenly look very risky. People were de-leveraging on Friday. That was almost a cathartic, cleansing move to the downside. It is not over. We may get a bounce because we broke the 200 day EMA and are right above other support. Often you get a rebound after that kind of action. It is not likely a rebound that will make any significant advance unless we get different stories that change the game. What would that be? You know it as well as I do: The Fed comes out with QE3 or QE4 or whatever name or number you want to pin on it. That would help pump up financial stocks. But as we know, it would not have that big of an impact this time. What happened with the other Quantitative Easing rounds? We had big moves in equities. We had a big move off of the March 2009 low. Then we had a big move off of the August 2010 low, but it was not as big as the initial move. Then we had the Operation Twist move. It made a nominal new high but could not make it stick. The move was much smaller than under QE2.

What does this mean? Each round of this money-printing stimulus has less of an impact. The marginal returns diminish. You have to have real growth at some point, and we do not have that in the United States. The recession supposedly ended in June of 2009. We have virtually no job creation and virtually no economic advance even though the recession supposedly ended. All of the stimulus came after the recession was officially declared over. It failed to do anything for us. Any advance today has been because of the Fed's massive liquidity and money printing.

We have some series troubles ahead of us. It is coming home now. It is not over. We are still in an uptrend. We may come down and tap that trend, and the Fed will announce "Quantitative Easing Whatever" and off we go again. Eventually we will not get the bounce; we will just get a rollover. We have to produce real economic growth, and we have had 3.5 years of these policies from the White House. The one thing they have proved is that Keynesian economics simply does not work. It only creates massive deficits, monetary transfers from the producers to the lotus eaters, and we suffer. Rome fell doing the same things we are doing now. Japan has entered into a multi-decade depression doing the things we are doing now. It is a grim scenario. Hopefully we will wake up before November.

TECHNICAL SUMMARY

Volume. NASDAQ -6.8%, 1.95B; NYSE +4.63%, 891M. The internals were not that impressive, but it is Friday and people were not around. That is often the case in the summer. You would have expected a lot more volume to the downside. It is almost a positive that volume did not explode higher with the indices down 2+%. With those kinds of moves, you would expect tremendous volume dumping stocks. That was not the case, so maybe there is a little silver lining there.

Breadth. NASDAQ -5:1; NYSE -6:1. Decliners were leading big. Big negatives on both of them. It may be getting a bit extreme.

New Lows. NASDAQ 1054; NYSE 209. New lows are not bad. You would expect to see 500-600 new lows to suggest that we are getting near a bottom. But that would only be an isolated stat. You have to put everything else in there as well: Call ratio, technical picture, volatility. The whole nine yards has to come together or it does not mean a lot.

The internals were not that bad. They were negative, as you might expect, but they were not horrid to the downside.

THE CHARTS

SP500. SP500 undercut the recent lows as well as the 200 day EMA. Now it is closing in on a relatively key support range around 1260. That is not too far for it to fall, and after it reaches that level, it will likely attempt a bounce to the upside. Stocks do not typically rally straight up. They have their pyramids, one on top of the other, and they sell in the same manner. There could be a big meltdown on the first move, and then a bounce, then a selloff, and then you see the little pyramids moving to the downside. After a bit more selling, we will likely get a little bounce even out of the old SP500. Relatively speaking, it is not in bad shape. It is still holding a significant portion of its rally.

Looking at the Fibonacci retracement chart, the SP500 has moved through the 50% retracement of this move off of the November 2011 low. It is still a relatively normal pullback. It is just virulent, and it is coming at a time when we have declining economic data. It is not one where we just have a normal pullback. This is pretty ugly. You could say it is leading some of the data, but really it has been following the data. That suggests that maybe it will not be a horrific selloff. Things are gloomy. I was very gloomy in the opening when discussing our economy and, indeed, the world economy. But the market itself is not showing that it is all Armageddon. But it never does, at least not right away. It has to fall into the selloff, and it is doing that right now.

We need to watch support levels. Can it hold the next support level or the one after that? How strong are the moves to the downside? Right now a 50% retracement is no big deal at all, and it has plenty of support below it. We will see if it can hold that support. We will not just think the world is over and we need to run for the hills. That is not smart. That is not the way you play the game in the stock market. You watch, you see where things hold, you watch oversold conditions, you watch leadership. Then when things get right, you make your move.

DJ30. DJ30 clearly undercut the 200 day EMA. No question of its weakness right here. It is falling toward the next support around 11900. That is one level, but it is always a range. We will look anywhere from 11735, and indeed a bit lower. We look for a hold and a bounce attempt after that. It, too, has not put in a deep test of its last move on Operation Twist, so it is still in decent shape.

NASDAQ. NASDAQ cracked its 200 day EMA as well, but it did not just blow through it. It is already approaching the next support, and it is not in bad shape. It is still coming back to test, yes, but it has very good support starting at around 2705 down to 2675. There is that range of support still below it, and it can hold and make a decent rally off of that.

Again, we cannot get overly negative and turn gloomy. You cannot get overly positive when things are moving higher either. You have to analyze what is going on. Everyone is negative right now. There was a selloff, but it was not the end of the world for the NASDAQ; it is still in its pattern. If it can hold at these next support levels or even the lows from 2011 before that eurozone selloff, it puts itself in very good shape to move higher again.

SP600. SP600 broke below the 200 day EMA. It, too, is struggling. They are all struggling. No surprise there. There is some support at 410 still to come, so it has a near support level to bump down to. Another five points lower, and then it can reverse and maybe try to bounce a bit to test. Very important, it broke through some important support levels. If it does hold or if it rolled over after another bounce, it has a considerable way to drop to roughly 390. That is a significant drop for the small caps.

SOX. The semiconductors were crushed. Down over 4%, gapping below the recent lows and selling off. Already down below the 200 day EMA, so that is not in play. The next support levels in play are a long way down near 345. It has another 8-10 points to the downside. Semiconductors do not look good. They were leading lower and, true to form, they are leading the market to the downside as the rest of the market decides to follow these commodities to the downside that are in everything we buy now.

LEADERSHIP

Leadership may not be exactly what you think.

Metals. Metals did not do too badly on the day. FCX was actually up. Looks like it is trying to bottom. MACD is coming in a bit higher as the stock tests a prior low. In steel, some of these look as if they are trying to bottom. AKS is very similar to FCX.

Retail. Retail was not doing great, but stocks such as AMZN held up just fine. Not all did as well. BWLD gapped below the 50 day EMA. That is not good. CMG is a stock that looked good on Thursday, but it gapped below the 50 day EMA as well. It is not over. It is still putting in a base, but it sure looked a lot better on Thursday. Of course a lot of stocks looked better before Friday.

Drugs. Medical stocks will probably perform better. IDIX came in nice. It is holding up very well. Then there were problems with AMGN. It imploded and broke to the downside. It is a situation where there may be a transition taking place. What should be a good sector is struggling a bit. A lot of people will turn to it in times of trouble, thought. We will look there for possibilities.

Internet. Internet continues to look decent. WWWW is holding up very well. EXPE is holding up nicely. It is holding at the 10 day EMA and not paying attention to what is going on.

There are cracks in some of the leadership groups, but we also see some of the leaders of the leadership sectors holdings up just fine. That is a positive, but overall things look to the downside. We may get a bounce soon. FCX looks like it wants to move higher. Maybe we will get a little commodities action moving to the upside because money works that way out of fear, looking for hard assets to put money into. The problem is, if there is deflation, they will not be safe harbors either. We will continue to look for stocks that are in good defensive sectors and can make us money to the upside. And we will look for stocks that look good no matter what. If they look good and are ready to bounce, we can put some money into it. Of course, you do not want to stack a lot of money into the upside on new plays because we have had such a pernicious turn to the downside. We have downside plays that are working for us.

In energy, LUFK has turned down and is really falling hard. AAP is heading to the downside. CTAS dropped hard as well. It will be that way. GRA is one of our downside stocks, and it is gapping lower just as we anticipated. BID is gapping down and selling as well.

There are stocks in trouble, and they are from many different sectors. That is no surprise looking at the downside breadth. We will continue to look for opportunity there, although gaps to the downside such as we saw on Friday do not present the best buying opportunities. That is why we move into them when we see them setting up. That will give us the gains. When you see the move, you play it. If everything looks right and it is in sync, it can make you money. Sometimes it will give you a head fake and you have to get out. We saw these setting up, and we started moving into them even when people were still talking about the stock market running higher. Look what is happening now.

THE ECONOMY

TO VIEW THE ECONOMY VIDEO CLICK THE FOLLOWING LINK:
Economy Summary Video

Jobs fall short, revisions to prior months eviscerate any claim of improvement as Labor Secretary talks of the need to export more goods. Hopelessly confused in the White House.

More people looked for work but fewer found it in May, and as it turns out, in April and March as well.

Workforce: +642,000, the biggest increase since 11/07. Looked for work bout could not find it.
Participation rate: 63.8% vs 63.6% April.

Nonfarm Payrolls, May (8:30): 69K actual versus 150K expected, 77K prior (revised from 115K)
Nonfarm Private Payrolls, May (8:30): 82K actual versus 168K expected, 87K prior (revised from 130K)
Unemployment Rate, May (8:30): 8.2% actual versus 8.1% expected, 8.1% prior
Hourly Earnings, May (8:30): 0.1% actual versus 0.2% expected, 0.1% prior (revised from 0.0%)
Average Workweek, May (8:30): 34.4 actual versus 34.5 expected, 34.5 prior

April: -38K jobs from original report.
March: -11K jobs from original report.

Construction -12K; Leisure -9K
Gains: Healthcare +33K; Manufacturing +12K

Huge yet ignored stat: Average workweek FELL.

Personal Income trending lower in April and we know now it was lower in May.

ISM still positive but sliding fast, missing expectations.
ISM Index, May (10:00): 53.5 actual versus 54.0 expected, 54.8 prior

Back to the Land of the Lotus Eaters: Cramer, JPM Asset Management: There won't be a recession. According to ECRI and the Chicago PMI, we could already be there.

Another trip to the Island of the Lotus Eaters: denial of our economic situation continues.

Prepare for another 'I was wrong' moment on the Daily Show, Cramer.

Cramer has talked up how our economy is 'strong' for several months now. It is not strong. The numbers show this is the worst recovery since the Great Depression. I detailed many of the lowlights last night. Maybe we are strong compared to pitiful Europe, but we are not strong by any comparison to US standards and frankly even European standards (the old standards pre-EU).

As Archie Bunker once told Edith on 'All in the Family,' with his continued talk of the strength of the US, Cramer has painted himself into a corner and thrown away the key.

Why? Because last week I went through the ECRI recession call and reiteration in detail. The missing link, the last holdout, was jobs. Incomes have already rolled over in real terms (see chart), and as jobs follow (a lagging indicator of course) that is only going to get worse.

Now all of the pieces are in place and ECRI says we may already be in recession given the magnitude of the decline in such a short time period. This dovetails with the conclusions the Chicago PMI author's stated following its release this week and the rapid decline it chronicled. They concluded that the US was heading into recession given the key factors watched were down three consecutive months.

You can keep a stiff upper lip and deny the numbers. It certainly looked as if the US was far from recession fears, but ECRI made the call and as the months passed and we moved toward the target dates, the data has consistently eroded despite the Administration trying everything it could to mask the true numbers. As the evidence continues to mount and the data continues to deteriorate it is clearer that resistance to the notion a recession in the US is coming is futile. It may already be here.

This economic disaster didn't start in this Administration, but this Administration has utterly failed to resolve it.

Learning the hard way that there is a reason the communist regimes fall and the socialist ones barely produce results.

Stimulus signed into law 2/17/09. Recession ended 6/09.

Sure doesn't feel as if the recession is over.

Recovery well below the average of the past 10 recoveries.

Even with the stimulus we have 15 million unemployed and no quarters of 4% or better growth.

Trends have turned back down and ECRI's recession call is about or is reality.

You own everything since June 2009 Mr. President.

THE MARKET

SENTIMENT INDICATORS

VIX: 26.66; +2.6
VXN: 28.63; +2.74
VXO: 26.21; +3.15

Put/Call Ratio (CBOE): 1.37; +0.29

Bulls versus Bears

This is a reading of the number of bullish investment advisors versus bearish advisors. The reason you look at this is that it gives you an idea of how bullish investors are. If they are too bullish then everyone is in the market and it is heading for a top: if everyone wants to be in the market, then all the money is in and there is no more new cash to drive it higher. On the other side of the spectrum if there are a lot of bears then there is a lot of cash on the sideline, and as the market rallies it drags that cash in as the bears give in. That cash provides the market the fuel to move higher. If bears are low it is the same as a lot of bulls: everyone is in and the market does not have the cash to drive it higher.

Bulls: 39.3% versus 38.3%. Back up to the level three weeks back, seemingly an absurd reading given the market, but it has been somewhat skittish of late. Likely just a hiatus before heading back lower and toward 35% threshold for a bullish read, down from 43.0% and 41.9% a month back. This is lining up with the put/call ratio. Still over 35% (below which is considered bullish) but dropping fast. Just as the market found support to bounce the bulls ran. Off the 55+ level hit in late February. That was the highest level since April and May of 2011, the peak of the post-bear market high. 35% is the threshold level suggesting bullishness. To be seriously bearish it needs to get up to the 60% to 65% level.

Bears: 24.5% versus 26.6%. Rather odd action in line with the bulls as bears back off from the high on this move. Still higher than the 22.3% three weeks back. Pausing, but as with the bulls, likely to run higher after this week and its action. Over 35% to is the threshold to be really be a good upside indicator. Back to the 25% to 26% level it held for weeks; we will see if it breaks through this time. For reference, bearishness hit a 5 year high at 54.4% the last week of October 2008. The move over 50 took bearish sentiment to its highest level since 1995. Extreme negative sentiment. Prior levels for comparison: Bearishness peaked at 37.4% in September 2007. It topped the June 2006 peak (36%) on that run. That June peak eclipsed the March 2006 high (33%) and well above the 2005 highs that spawned new rallies (30% in May 2005, 29.2% in October 2005). That was a huge turn, unlike any seen in recent history.

NASDAQ

Stats: -79.86 points (-2.82%) to close at 2747.48
Volume: 1.957B (-6.81%)

Up Volume: 78.62M (-748.45M)
Down Volume: 1.88B (+610M)

A/D and Hi/Lo: Decliners led 5.07 to 1
Previous Session: Decliners led 1.13 to 1

New Highs: 12 (-18)
New Lows: 154 (+52)

SP500/NYSE

Stats: -32.29 points (-2.46%) to close at 1278.04
NYSE Volume: 891.448M (+4.63%)

Up Volume: 346.11M (-1.694B)
Down Volume: 4.25B (+1.85B)

A/D and Hi/Lo: Decliners led 5.94 to 1
Previous Session: Decliners led 1.05 to 1

New Highs: 52 (-10)
New Lows: 209 (+30)

DJ30

Stats: -274.88 points (-2.22%) to close at 12118.57
Volume DJ30: 163M shares Friday versus 205M shares Thursday.

MONDAY

Next week the economic data does not slow down much. We have factory orders on Monday, ISM service on Tuesday, and on Wednesday we have productivity. Of course our president thinks that kills jobs, so we have to be careful of that. Productivity has been going down, hasn't it? It was -0.5 prior, and jobs have not been blasting off to the upside. Gee whiz, could they possibly be wrong? The history of the economy shows that they are. Thursday brings initial claims and consumer credit. That will be interesting as well. Then on Friday we have wholesale inventories. That will give us some more ideas as to what the U.S. manufacturing sector is doing. Trade balance will also be interesting. We will see what happens there.

We have more data, but we had the big daddy week of data this week. We see the results. It was an ugly May, and now it has been an ugly start to June. No new money came in, but maybe it will next week. We anticipate that there will be some more downside. There is this next support level for SP500, and it was dropping quickly toward that level on Friday. A little bit further to the downside, another 30 points or so, and that lets the VIX bounce a bit higher to those old lows. Then you get a rebound move.

So we get a rebound. Here is the point as to why this is even more significant than the prior attempts: These are very important levels because they are the lows from 2011 before the eurozone selloff. These where the lows after QE2 started to run its course and everyone know it would be pulled. That makes them extremely important because, if the market breaks through them, it falls well back down into the move from 2010. That makes the Fed's job that much harder, trying to rescue the market. I discussed this last night. Does it move now and try to fix it before it gets worse? Or does it want to act as the ace-in-the-hole, trying to come to the rescue as the white knight for the market and the world economy if things start to tank yet again? That is the dilemma the Fed is in, and it will probably try to keep its powder dry. It cannot go on in on this kind of news right now; it would be seen as premature.

We will probably get more of a selloff. We will get the stock market falling down to the next support. From there it will bounce, and then it likely falls again. There is no Quantitative Easing coming right now. The Fed may end up surprising everyone, but it has been making noise as if it would not do that. That will be the game changer, if the Fed decides to step in.

China is out there as well. If it announces big stimulus, that will also help the market. That will bounce things, but will it take them back up? I do not think so. If the Fed steps in, that would be a game changer, and financial assets will rally because the Fed carries a pretty big float of money. When it throws it in, we will get movement. First it will be a psychological move that will bounce it higher. It will continue. It will not be as strong as these other moves have been in the past. That will be the problem. The Fed steps in, we get a nice rally, and we take advantage of it. We take our gains in our downside if that happens, and then we throw into the upside with good names in good position to move. We make what we can, and we watch for when things start to roll. It may be another several-month run. I do not think it would be, but whatever it is, we will take it. We always take what the market gives.

Until the Fed acts, it is downside biases with a bounce off of support coming after a little bit more downside. We have to continue to play those moves now. When the Fed comes out, it is a game changer and we go upside.

I know it was a tough week out there. Just put it all in perspective, watch what is happening, act accordingly, and you will come out fine.

Have a great weekend!

Support and Resistance

NASDAQ: Closed at 2747.48
Resistance:
2754 is the October 2011 high
The 200 day SMA at 2757
2816 is the early April 2011 peak.
The 10 day EMA at 2832
2841 is the February 2011 peak
2862 is the 2007 peak
2879 is the July 2011 peak
2888 is the May 2011 peak and PRIOR post-bear market high
2900 is the March 2012 low
2910 is the recent March 2012 low
The 50 day EMA at 2924
3000 is the February 2012 post-bear market high
3026 from 10/2000 low
3042 from 5/2000 low
3090 is the mid-March interim high
3134 is the March 2012 post-bear market peak
3227 is the April 2000 intraday low
3401 is the May 2000 closing low

Support:
2706 to 2705 is the April 2011 low and the February 2011 and consolidation low (bottom of the trading range) 2723 to 2705 is the range of support at the bottom of the January to May trading range
2686 is the January 2011 closing low
2676 is the January 2010 low and the December 2011 peak
2645-2650ish from December 2010 consolidation
2643 is the September 2011 high
2612 is the late August 2011 peak
2603 is the March 2011 intraday low (post-Japan low)
2599 is the June 2011 low and NASDAQ
2593 is the November intraday high
2580 is the November 2010 closing high
2555 is the mid-August 2011 peak
2535 is the November island reversal gap point
2441 is the November 2011 low

S&P 500: Closed at 1278.04

Resistance:
The 200 day SMA at 1285
1293 is the October 2011 peak
1295 to 1294 is the April 2011 low and the February 2011 consolidation low (bottom of the trading range)
The 10 day EMA at 1313
1318.51 is the May 2011 low
1332 is the early March 2011 peak
1340 is the early April 2011 peak
1344 is the February 2011 peak
The 50 day EMA at 1349
1357 is the July 2011 peak
1371 is the May 2011 peak, the post-bear market high
1378 is the February 2012 peak
1422.38 is the Post-bear market high (March 2012)
1425 from May 2008 closing highs
1433 from August 2007 closing lows
1440 from November 2007 closing lows

Support:
1275 is the January 2010 low, early January 2011 peak
1267 is the December 2011 peak
1258 is June 2011 intraday low
1255 is the late December 2010 consolidation range
1249 is the March 2011 low (post-Japan)
1235 is the mid-December 2010 consolidation low
1231 is the late August 2011 peak
1227 is the November 2010 peak
1220 is the April 2010 peak
1209 is the mid-August 2011 high
1196 is the November 2010 consolidation peak
1178-1180 is the October 2010/November 2010 consolidation low
1158 is the November 2011 low
1131 - 1127 from August 2010 base peak.
1119 is the early August closing low
1109 is the mid-September 2010 gap up point
1101 is the August 2011 low
1099 from the mid-July interim peak
1075 is the October 2011 intraday low

Dow: Closed at 12,118.57
Resistance:
The 200 day SMA at 12,254
12,258 is the December 2011 peak
12,284 is the October 2011 peak
12,391 is the February 2011 peak
The 10 day EMA at 12,441
12,754 is the July intraday peak
The 50 day EMA at 12,764
12,876 is the May high
13,056 is the February 2012 high
13,058 from the May 2008 peak on that bounce in the selling
13,297 is the April 2012, post bear market high
13,668 from 12-2007 peak
13,692 from 6-2007 peak
14,022 from 7-07 peak

Support:
12,110 from the March 2007 closing low
12,094 is the April 2011 low
The June low at 11,897 (closing)
11,734 from 11-98 peak
11,717 is the late August 2011 peak
The August low at 11,702
11,555 is the March low
11,452 is the November 2010 peak
11,178 from November 2010
10,978 is the bottom of the November 2010 consolidation
10,750 from September 2010
10,720 is the August closing low
10,705-710 from January 2010 peak
10,694-700 from August 2010 peak

Economic Calendar

May 29 - Tuesday
- Case-Shiller 20-city Price Index, March (9:00): -2.6% actual versus -2.8% expected, -3.5% prior
- Consumer Confidence, May (10:00): 64.9 actual versus 69.4 expected, 68.7 prior (revised from 69.2)

May 30 - Wednesday
- MBA Mortgage Index, 05/26 (7:00): -1.3% actual versus 3.8% prior
- Pending Home Sales, April (10:00): -5.5% actual versus 0.6% expected, 3.8% prior (revised from 4.1%)

May 31 - Thursday
- Challenger Job Cuts, May (7:30): 66.7% actual versus 11.2% prior
- ADP Employment Chang, May (8:15): 133K actual versus 157K expected, 113K prior (revised from 119K)
- Initial Claims, 05/26 (8:30): 383K actual versus 368K expected, 373K prior (revised from 370K)
- Continuing Claims, 05/19 (8:30): 3242K actual versus 3250K expected, 3278K prior (revised from 3260K)
- GDP - Second Estimate, Q1 (8:30): 1.9% actual versus 2.0% expected, 2.2% prior
- GDP Deflator - Second Estimate, Q1 (8:30): 1.7% actual versus 1.5% expected, 1.5% prior
- Chicago PMI, May (9:45): 52.7 actual versus 57.0 expected, 56.2 prior
- Crude Inventories, 05/26 (11:00): 2.213M actual versus 0.883M prior

June 1 - Friday
- Nonfarm Payrolls, May (8:30): 69K actual versus 150K expected, 77K prior (revised from 115K)
- Nonfarm Private Payrolls, May (8:30): 82K actual versus 168K expected, 87K prior (revised from 130K)
- Unemployment Rate, May (8:30): 8.2% actual versus 8.1% expected, 8.1% prior
- Hourly Earnings, May (8:30): 0.1% actual versus 0.2% expected, 0.1% prior (revised from 0.0%)
- Average Workweek, May (8:30): 34.4 actual versus 34.5 expected, 34.5 prior
- Personal Income, April (8:30): 0.2% actual versus 0.3% expected, 0.4% prior
- Personal Spending, April (8:30): 0.3% actual versus 0.3% expected, 0.2% prior (revised from 0.3%)
- PCE Prices - Core, April (8:30): 0.1% actual versus 0.2% expected, 0.2% prior
- ISM Index, May (10:00): 53.5 actual versus 54.0 expected, 54.8 prior
- Construction Spending, April (10:00): 0.3% actual versus 0.5% expected, 0.3% prior (revised from 0.1%)
- Auto Sales, May (14:00): 5.0M prior
- Truck Sales, May (14:00): 6.0M prior

June 4 - Monday
- Factory Orders, April (10:00): 0.1% expected, -1.9% prior (revised from -1.5%)

June 5 - Tuesday
- ISM Services, May (10:00): 53.0 expected, 53.5 prior

June 6 - Wednesday
- MBA Mortgage Index, 06/02 (7:00): -1.3% prior
- Productivity-Rev., Q1 (8:30): 0.7% expected, -0.5% prior
- Unit Labor Costs-Rev., Q1 (8:30): 2.3% expected, -2.0% prior
- Crude Inventories, 06/02 (10:30): 2.213M prior

June 7 - Thursday
- Initial Claims, 06/02 (8:30): 375K expected, 383K prior
- Continuing Claims, 05/26 (8:30): 3250K expected, 3242K prior
- Consumer Credit, April (15:00): $12.7B expected, $21.4B prior

June 8 - Friday
- Trade Balance, April (8:30): -$49.9B expected, -$51.8B prior
- Wholesale Inventories, April (10:00): 0.5% expected, 0.3% prior
icon url

ReturntoSender

06/04/12 6:16 PM

#9798 RE: ReturntoSender #6755

From Briefing.com: 4:30 pm : An afternoon squeeze helped stocks slash losses, but neither the S&P 500 nor the Dow was able to turn a gain. In contrast, the Nasdaq managed to push into positive territory and settle at a session high.

A disappointing non-manufacturing PMI reading from China had dampened sentiment ahead of the open, but market participants became encouraged by a bounce by several of Europe’s bourses. The improved tone proved to be short lived, though; stocks made a modest uptick in the opening minutes of action, but quickly reversed into the red. The major equity averages were down with sizable losses that made for new multi-month lows before they were able to stabilize.

Tech offered leadership to an afternoon squeeze that took the S&P 500 just past the flat line. The broad market measure was unable to extend the move into a meaningful gain because of resistance there. Stocks made a final push into the close, but the S&P 500 was once again rebuffed where it began the session. The Dow also failed to extend its final push into positive territory, but the Nasdaq was able to book a nice gain. The Nasdaq 100 scored an even stronger gain

Although Tech takes most of the credit for leading the stock market’s afternoon rebound, Telecom was the best performing sector of the session. Telecom scored a 0.7% gain, helping to extend the near 3% advance that it achieved in May, when no other major sector was able to score a monthly gain.

Financials and Industrials were at the opposite end of things. Both sectors fell 1.0%. Financials were burdened by bank stocks, while Industrials were undercut by weakness in construction and farming machinery issues.

The CRB Commodity Index managed to snap a four session losing streak that saw it fall for a cumulative decline of nearly. The Energy complex was particularly helpful as crude oil scored a 0.9% gain at $83.95 per barrel. Shortly before the close it set a session high of $84.17 per barrel.

Little regard was given to a strong bounce by the euro while the stock market was in retreat mode this morning. The action contrasts with that of recent weeks, during which the euro was widely regarded as a primary cue for market participants. Nonetheless, the euro advanced about 0.7% against the greenback today.

Advancing Sectors: Telecom +0.7%, Financials +0.5%, Consumer Discretionary +0.5%, Utilities +0.4%, Health Care +0.3%, Consumer Staples +0.3%, Materials +0.1%
Unchanged: Energy
Declining Sectors: Financials -1.0%, Industrials -1.0%DJ30 -17.11 NASDAQ +12.53 NQ100 +0.8% R2K +0.0% SP400 -0.5% SP500 +0.14 NASDAQ Adv/Vol/Dec 1245/1.75 bln/1267 NYSE Adv/Vol/Dec 1288/824 mln/1734

4:06PM Aehr Test Systems receives additional FOX order (AEHR) 1.16 -0.09 : Co announced that it has received an order for an additional FOX-1 system to a leading flash memory manufacturer. "The FOX-1 system, using an Aehr Test Systems' WaferPak contactor, allows parallel testing of thousands of die on a 300mm wafer with only a single touchdown."

7:51AM Semiconductors - 2H12 outlook - another mid-year pullback, another buying opportunity? - Sterne Agee (SMH) : Sterne Agee says they did not hear much change in outlook from the companies in the Semi group through multiple conferences in May, there has been some cautious IT commentary. Nonetheless, as usual, semi stocks have corrected 25-35% while the SOX is down 20%+. As in 2010 and 2011, they believe we could have a rally into year end from these depressed levels, as key valuations approach 2010-2011 inflection levels and fundamentals better. The firm's potential shopping list includes QCOM, AVGO, ADI, RFMD, AMCC and also a second look at the Memory companies MU & SNDK.

Vitesse Semiconductor (VTSS) expanded its widely deployed E-StaX-III Enterprise Ethernet switch family with the VSC7431, the industry's lowest power and scalable 28-port Gigabit Ethernet switch with Layer 3 managed routing capabilities.

Analog Devices (ADI) introduced the ADuCM360, a fully integrated, 4-kSPS, 24-bit data acquisition system-on-a-chip incorporating dual, high-performance, multi-channel sigma-delta A/D converters, a 32-bit ARM CortexTM M3 MCU, and flash/EE memory.

KVH Industries (KVHI) will offer its mini-VSAT Broadbandsm service and TracPhone satellite communications terminals to maritime customers throughout South America through Tesacom, South America's leading mobile satellite service provider.

09:59 am Tech sector trading flat today in line with broader market

The tech sector is trading higher today, along gains in the overall market. Semiconductors are in line with the tech sector also trading flat on the session. MRVL (+2.1%) is a notable leader in that chip index. Among other major indices, the SPY is trading 0.1% lower today, while the QQQ and the NASDAQ are trading at the flat line. Among tech bellwethers, FB (-2.2%) is again showing notable weakness after co was initiated with an Underperform at Bernstein.

In news, EPIQ (+6.5%) approved $35 mln share repurchase program.

In Broker Research, OVRL (-0.5%) was initiated with a Buy at Needham. IPHI (+9.8%) Inphi upgraded to Overweight from Neutral at Piper Jaffray. AUDC (+1.2%) initiated with an Outperform at Credit Suisse.

There are no notable names in tech scheduled to report quarterly results today after the close.
icon url

ReturntoSender

06/05/12 10:21 PM

#9799 RE: ReturntoSender #6755

From Briefing.com: 4:25 pm : The stock market overcame a lackluster start and some underwhelming data from the eurozone to score a solid gain by settling near its session high.

A mixed batch of Services PMI readings from Europe and a downturn in eurozone retail sales made many participants cautious this morning. It had been hoped that a teleconference between G-7 finance ministers would provide progress in addressing the persistently precarious conditions facing the eurozone, or especially Spain, given the country’s recent struggles. Reports indicated that macro developments in and potential policy responses were discussed, but nothing monumental came of it. That has left many looking to the European Central Bank, which will make its latest announcement tomorrow morning.

The latest ISM Services Index, which improved incrementally in May to 53.7 from 53.5 in the prior month to best the Briefing.com consensus call of 53.1, was released after the open and met with a positive response. However, the broad market had a hard time extending the move.

Financials ran up to an early lead with help from regional lenders, investment banks, diversified financial services players, and insurance outfits. The sector settled with a 1.7% gain, which helped it recoup some of the outsized losses that it had suffered in the previous two sessions.

Most other stocks were reluctant to follow Financials higher, but an afternoon advance by Tech – the largest sector by market weight – provided the necessary push to drive the broad market higher. Tech settled the session with a 0.7% gain.

Telecom stocks were at the opposite end of things. The defensive-oriented sector outperformed in the past couple of sessions, but today it slid to a 0.2% loss. Consumer Staples, the only other sector that suffered a loss, also fell 0.2%, collectively.

While limited weakness helped the broad market book a solid gain, the performances of small-caps and mid-cap stocks were even more impressive. A willingness to take on their risk helped both the Russell 2000 and S&P 400 book gains greater than 1%.

For the second straight session little regard seemed to be given to the euro, which was a key catalyst for stocks in recent weeks. The currency dropped to a 0.4% loss against the greenback after it had scored a strong gain in the prior session.

Advancing Sectors: Industrials +0.2%, Utilities +0.4%, Consumer Discretionary +0.4%, Health Care +0.5%, Energy +0.6%, Tech +0.7%, Materials +0.8%, Financials +1.7%
Declining Sectors: Consumer Staples -0.2%, Telecom -0.2%DJ30 +26.49 NASDAQ +18.10 SP500 +7.32 NASDAQ Adv/Vol/Dec 1610/1.58 bln/875 NYSE Adv/Vol/Dec 2231/680 mln/764

4:32PM RF Micro Device to outsource manufacturing of wafer starting material; expected to result in non-cash GAAP charge of ~$0.02-0.03 related to equipment and invetory write-offs (RFMD) 4.03 +0.47 : Co announced it has entered into a definitive agreement to transfer its molecular beam epitaxy (MBE) wafer growth facility to IQE plc., a global supplier of advanced semiconductor wafers. RFMD's MBE growth facility supplies MBE wafer starting material to RFMD's wafer manufacturing facilities, which RFMD will continue to own and operate in Greensboro, NC, and Newton Aycliffe, UK. RFMD's GaAs semiconductor products incorporate transistor layers grown on either an MBE or metal organic chemical vapor deposition (MOCVD) process. RFMD outsources all MOCVD-based starting material, and RFMD will outsource MBE-based starting material with the completion of the transfer. In conjunction with the transfer, RFMD and IQE have entered into a supply agreement under which IQE will supply RFMD MBE- and MOCVD-based starting material. The transfer and supply agreement will lower RFMD's manufacturing costs, beginning in the September 2012 quarter. In the June 2012 quarter, RFMD currently estimates the transaction will result in a non-cash GAAP charge of approximately $0.02 to $0.03 related to equipment and inventory write-offs and will be approximately neutral to non-GAAP operating results.

2:02PM Hewlett-Packard confirms it expanded Converged Cloud portfolio (HPQ) 21.67 +0.61 : Today's announcements include solutions for: Delivering converged cloud services for the airline industry; Building hybrid cloud environments; Managing the next generation of cloud applications; Increasing office productivity with cloud print solution; and Closing the IT cloud expertise skills gap.

O2Micro International (OIIM) was issued 20 claims under U.S. patent for its Battery Charging System invention with Trickle Charging/Discharging control.

8:13AM Freescale Semi names Gregg Lowe as President and CEO (FSL) 8.74 : Lowe comes to Freescale from Texas Instruments where he served as senior vice president and manager of the Analog business. As part of the transition, the board has appointed J. Daniel McCranie as non-executive chairman of the board of directors. McCranie currently serves on Freescale's board of directors.
icon url

ReturntoSender

06/07/12 8:47 PM

#9801 RE: ReturntoSender #6755

From Briefing.com: 4:30 pm : The stock market opened trade with a gain of about 1%, but by session’s end it fell to a flat finish.

A decision by China's central bank to trim its benchmark interest rate helped perpetuate a positive tone among market participants, who bid stocks up in the prior session for the S&P 500’s best one-day bounce since December. Sentiment was also helped by the belief that efforts will be made to improve banking and financial conditions in Spain and that the Fed will take steps further stimulate the domestic economy.

An in-line weekly initial jobless claims count of 377,000 did little to disrupt the positive tone ahead of the open. However, there was some disappointment associated with continuing claims, which climbed to about 3.29 million from roughly 3.26 million.

Stocks were knocked down from their early perch by a flurry of selling that came after Fed Chairman Bernanke failed to hint at plans for further quantitative easing in the immediate future during his speech before Congress.

Stocks attempted to gradually reclaim gains. From time to time the effort was interrupted by the dollar’s attempts to undo its loss. By session’s end it was down just 0.1% against a basket of major foreign currencies. The euro ended the day at the unchanged mark after it had moved up to a weekly high this morning. Despite recent relief, many pundits remain concerned that the euro will be weighed down by the persistently precarious conditions in the eurozone, most notably in Greece and Spain. Spain held a successful debt auction earlier today, but had its debt rating downgraded to BBB from A afterward.

The broad market’s afternoon flush left the Nasdaq to suffer a sizable loss. It was hurt by weakness among large-cap Tech issues. Blue chips seemed to help prop up the Dow during the day. The broad-based S&P 500 settled at the neutral line, unable to extend its advance to a third straight day.

Up by about 1% or more in the early going, Energy and Financials had been sources of strength, but both rolled over right alongside the rest of the market. Telecom stocks were clipped again, leaving the defensive-oriented sector to suffer a 0.7% loss.

Corporate news flow was limited, but consumer electronics retailer Best Buy (BBY 19.70, -0.19) announced this morning that Chairman and Founder Richard Schulze has resigned from the Board to explore options for his 20% stake in the company. Effective immediately, Hatim Tyabji will assume the Chairman role after serving as Chairman of the Audit Committee.

Advancing Sectors: Materials +0.2%, Consumer Staples +0.2%, Energy +0.2%, Industrials +0.6%, Utilities +0.7%
Unchanged: Health Care
Declining Sectors: Consumer Discretionary -0.1%, Financials -0.2%, Tech -0.4%, Telecom -0.7%DJ30 +46.17 NASDAQ -13.70 NQ100 -0.4% R2K -0.6% SP400 -0.5% SP500 -0.14 NASDAQ Adv/Vol/Dec 1017/1.63 bln/1481 NYSE Adv/Vol/Dec 1389/854 mln/1635

4:16PM Altera reaffirms Q2 rev guidance in business update (ALTR) 33.01 -0.76 : Co sees sequential revenue growth for the second quarter is expected to be in line with the company's previous guidance for growth of 14 percent to 18 percent from the first quarter -- equates to ~$437.5-452.8 mln vs $445.91 mln consensus. Altera's 40-nm and 28-nm products will be up strongly from first quarter levels. As previously expected, growth will be broad across most of the company's vertical markets.

9:38AM Skyworks firmer off the open, approaches its 52-wk high from March at 29.01 -- session high 28.96 (SWKS) 28.86 +0.46 :

Advanced Energy Industries (AEIS) announced that its inverter, the AE 500, has been successfully commissioned at one of 13 projects, totaling 4.5MW, developed by American Clean Energy at Toms River Regional School District in Ocean County, N.J.

HP (HPQ) announced that the Circuit Court of Cook County, Ill., is using HP Thin Client technology supported by HP ProLiant blade servers and HP storage with virtualization software.

Acacia Research (ACTG) announced that its DRAM Memory Technologies subsidiary has entered into a settlement agreement with Etron Technology regarding patents related to double data rate SDRAM devices. The settlement agreement resolves litigation that was pending in the Central District of California.

Phoenix Technologies announced it has signed an agreement with Intel (INTC) to be its collaborative partner for BIOS. The two companies will jointly develop the new reference UEFI firmware for the Intel code base.

Needham downgrades Juniper Networks (JNPR $17.15 -0.33) to Hold from Buy saying they believe Juniper is a solid company with respectable growth prospects in a sector that is at risk of considerable disruption. Routing and Enterprise Switching markets are likely to undergo fundamental change as networks topologies shift to adapt to virtualization, cloud services and the integration of service provider routing with the optical transport layer. Firm says while they think Juniper can continue to grow as this transition occurs, they are concerned about the trajectory of margins and think investors will pressure valuation in the data plane networking companies as risk increases.

10:26 am S&P Technology sector trading higher along with the overall market

The tech sector is trading higher today, inline with marginal gains in the broader market. Semiconductors are also showing slight relative weakness with the Philly Semi Index trading 0.1% lower. STM (+2.3%) is a notable leader in that chip index, while VECO (-2.4%) lags. Among other major indices, the SPY is trading 0.4% higher today, while the QQQ is up 0.3% and the NASDAQ is trading 0.2% higher on the session. Among tech bellwethers, AAPL (+2.2%) is showing notable strength.

In earnings last night, SEAC (-3.7%) posted a Q1 earnings and revenue miss, while VRNT (+4.2%) reported a quarterly beat. In news, CACI (+10.4%) announced a new share repurchase program, its CEO will retire, and offered revised guidance. Virgin Mobile USA; S (+0.7%) announced it will offer Apple's AAPL (+0.4%) iPhone to its prepaid customers beginning Friday, June 29. Also, ATVI (-2.9%) is trading lower following reports out that VIVEF (0.0%) is considering sale of its stake in ATVI.

Among notable analyst upgrades this morning, Oppenheimer upgrades SINA (+2.9%) to Outperform and CACI (+10.4%) was upgraded to Buy at Lazard. While in downgrades, JNPR (-3.8%) was downgraded to Hold at Needham. CMTL (-0.1%) is the only notable name in tech scheduled to report quarterly results today after the close.
icon url

ReturntoSender

06/09/12 4:52 PM

#9803 RE: ReturntoSender #6755

From Briefing.com: Weekly Recap - Week ending 08-Jun-12

Dow +0.8%, S&P 500 +0.8%, Nasdaq +1.0%, Nasdaq 100 +0.9%, S&P 400 +0.9%, Russell 2000 +1.1%

On Friday stocks fought to reclaim the gains surrendered in the prior session. The broad market not only overcame an early loss, but managed to book a strong gain.

Financials proved to be a source of strength. The sector ascended from an early loss to a 1.2% gain with help from bank stocks, which collectively climbed 1.6%, based on the KBW Bank Index. Tech contributed to the effort by trading up to a 0.9% gain. For the week Financials advanced almost 5%, while Tech advanced little more than 4%.

Telecom scored the strongest gain after some mixed performances earlier in the week. The sector’s 1.5% gain contributed to a weekly advance of nearly 3%, which is less than what the broad market achieved.

Of the major sectors, only Energy failed to find positive territory. For the week it was up almost 4%, but on Friday it finished flat amid lower oil prices. Oil prices were down more than 2% in early pit trade, but managed to improve their position by the close. The energy component ended the day at $84.09 per barrel for a 0.8% loss. Earlier this week oil prices set a new 2012 low beneath $82 per barrel.

Shares of McDonald’s (MCD 87.75, -0.63) also sat out of the stock market’s advance. The stock was pressured because of disappointment surrounding the company’s less-than-impressive 3.3% increase in global sales during May.

Data had hardly any sway, if any at all, with market participants. Releases featured a slightly narrower trade deficit of about $50 billion, along with an in-line 0.6% increase in wholesale inventories.

The euro endured selling for the entire session, but was able to halve an early loss so that it ended the day about 0.5% lower at $1.25. In contrast to recent weeks, action among stocks was less correlated to the euro’s movements this week.

Reports suggest that Europe’s leaders will convene this weekend to address Spain’s struggling banking system. The weekend also brings some price data from China.
 
Index Started Week Ended Week Change % Change YTD %
DJIA 12118.57 12554.20 435.63 3.6 2.8
Nasdaq 2747.48 2858.42 110.94 4.0 9.7
S&P 500 1278.04 1325.6 47.62 3.7 5.4
Russell 2000 737.42 769.19 31.77 4.3 3.8


8:00AM SMTC Corp announced successful buyout of Chinese jv partner, Alco Electronics, and expansion at Dongguan China manufacturing facility (SMTX) 3.23 :

1:05AM MEMC Elec acknowledges Moody's action; limited from making additional borrowings (WFR) 1.72 : Co acknowledges today's debt rating downgrade by Moody's Investors Services. With regard to this, co states: "While we are disappointed with Moody's decision, we have been proactively planning for this potential rating action in order to minimize its impact on the company. At the present time we are comfortable with the company's cash and liquidity position. As a result of the downgrade, we will be limited from making additional borrowings under our North American non-recourse revolving construction facility, but repayment of outstanding borrowings under the facility of approximately $110 million will not be accelerated. Cash needs in the second quarter which would have been met with this facility will now instead likely result in a reduction of our cash balance of approximately $15 million to $20 million."

Altera (ALTR $33.16 +0.15) sees sequential revenue growth for the second quarter is expected to be in line with the company's previous guidance for growth of 14 percent to 18 percent from the first quarter -- equates to approximately $437.5-452.8 million versus the $445.91 million consensus. Altera's 40-nm and 28-nm products will be up strongly from first quarter levels. As previously expected, growth will be broad across most of the company's vertical markets

10:09 am Information Technology index declines with losses in overall market

The tech sector is trading lower today, roughly inline with losses in the broader market. Semiconductors are also showing relative strength, however, with the Philly Semi Index trading 0.2% higher. MU (+2.0%) is a notable leader in that chip index. Among other major indices, the SPY is trading 0.4% lower today, while the QQQ is down 0.1% and the NASDAQ is trading 0.3% lower on the session. Among tech bellwethers, FB (+3.3%) is showing notable strength, while ORCL (-1.3%) is under pressure.

In earnings last night, AGYS (-2.4%) posted a Q4 earnings miss, CMTL (+4.6%) reported a beat and raise, and PRGS (-10.0%) issued downside guidance. Among rumors, we are hearing NOK (+4.2%) takeover chatter making the rounds. Also, there is a VZ (+0.7%)-for-NFLX (+0.9%) rumor circulating.

Among notable analyst upgrades this morning, YHOO (+0.5%) was upgraded to Outperform at Bernstein and FTR (+0.6%) was upgraded to Neutral from Underperform at BofA/Merrill . While in downgrades, NTAP (-2.3%) was downgraded to Equal Weight at Barclays.

There are no notable names in tech scheduled to report quarterly results today after the close.
icon url

ReturntoSender

06/10/12 11:36 AM

#9804 RE: ReturntoSender #6755

InvestmentHouse Weekend Market Summary

http://www.investmenthouse.com/weekendmarketsummary.htm

- Stocks not dead after Thursday reversal, post a steady come from behind move to reverse prior week's losses.
- Friday's fears not that fearful and investors comfortable holding stocks over the weekend.
- Gold suffers a down week but ends it looking as if it wants to bounce.
- Best weekly move of the year, lowest volume of the year.
- SOX, NASDAQ sport small island reversals as all indices complete two-thirds of a potential inverted head and shoulders.
- 'The economy is fine' and other incredible statements of the week.
- Already in recession?: part 2. Others coming around to ECRI's wage evaluation . . . finally.
- Trucking fuel usage jumps in May.
- Big weekend: Eurogroup meeting, China economic data, and Spain, after hours Friday (and 11p.m. Spanish time), balks at bank bailout conditions.
- Weekend data will help set the stage as indices try to continue the rebound, but the patterns just don't look great.

Stocks finish strong, just in time apparently.

Stocks proved that they are not dead after the Thursday reversal. Indeed, they posted a straight-ahead, come-from-behind move early to reverse last week's losses and post a very nice upside bounce on the week. Stocks finished strong, apparently just in time. Bear Grylls is the "Man vs. Wild" guy. My sons and I like him. His motto, which his grandfather taught him, is "Finish strong and finish five minutes early." It looks as if it was just in time for the market. After the close, Spain announced that it had issues with some of the requirements necessary for its bank bailout. That may be a problem come Monday. We will see how the weekend handles it because a lot of news is coming out between now and then. That includes a boatload of Chinese data as well as more news from the EU as they meet on further plans.

Bear Grylls: Finish strong, finish 5 minutes early . . .
Bear: Hard worker, risk taker, dream pursuer. The antithesis of the current administration.

Bear is quite a guy. He is a hard worker and a risk taker. He is a dream pursuer. He is kind of the antithesis of the current administration.

There were some worries on Friday, but they were not enough to stall the recovery for the week.

McDonald's missed same store sales estimates on a weak Europe and China.

The arches of MCD were a bit battered as it missed its same store estimates on a weak Europe and a weak China. Imports and exports declined, and that is not a good sign for the economy. Why? Historically, when we import a lot of goods, that means the economy is doing fine. We are an exporting economy now as our President wanted. The problem is, as MCD found out, China and Europe are not that strong. If you throw in India and Brazil, as I have said all week and in weeks past, if those go down, we do not have anyone to sell our goods to. That is the heartache of being an export economy: when your buyer does not want to buy. Australia is finding that out as a big commodities producer. It sells, a lot of them to China, but China is canceling contracts before they ship or even when they are already on the boat and headed their way. It seems all that China is interested in buying is gold right now. It bought 100M pounds from Hong Kong in the past month. It looks like it will have to take further advantage of the drop in gold price over the past few weeks.

Imports/Exports both decline, not a good sign for our economy.

On the upside . . .

On the upside Friday, there was apparently hope for Spain. I do not know what prompted it other than there is talk of the bailout. We find out after hours that Spain has some issues with that. There are more discussions to be had this weekend to help figure out what they will do with the Spanish economy. It looks to be falling as well.

Perhaps we need to think bigger picture. Maybe Alberto Contador (Spain) after his two-year dope suspension ends in August -- the suspension that stripped him of his 2010 Tour de France title --maybe he will be back in the saddle in August and provide Spain with its true hope. Remember, in bad economic times we smoke cigarettes, we drink liquor, and we look for releases whether it is in movies or sporting events. Looks like Spain might be taking a look at Alberto.

Hope for Spain?

Alberto Contador's (Spain) 2-year doping suspension that stripped him of his third Tour de France title ends in August. Looking at Spain's issues, he may be the only hope the country has.

U.S. wholesale inventories rose. That is not bad news either because sales rose 1.1% as well. The 0.6% increase can be disturbing if it is because no one is buying. But a 1.1% increase is almost three times the rate in March. It looks like a pretty good number. We have a couple of decent economic reports on the week after a string of misses. Inventories go into the beat side of the category as well.

US Wholesale inventories rise but sales also rise.

The market performed pretty well the session. With a low-to-high move starting soft, starting negative, but reversing and rallying to the upside. It is interesting see investors still ready to buy before a weekend session and a week of upside moves, particularly after they threw back the gains from Thursday. Then it looked as if the market was ready to reverse to the downside.

SP500, +0.81%; NASDAQ, +0.97%; Dow, +0.75%; SP600 +1.09%; SOX, +1.43%.

Solid gains. Not breakneck, but very solid and a great way for the upside to cap a week of gains. These are gains that recovered most of the losses from the prior week. SP500 was higher, but it just gave them all away. Nonetheless a very credible recovery. As I will talk about in the technicals, there were issues with the move, but that has been this market all along. Of course, looking at the action you can understand that weak internals have not led to continued gains of late.

OTHER MARKETS.

Dollar. 1.2499 versus 1.2600 euro. The DXYO chart shows the dollar down, but that is against a basket of roughly 25 currencies. It is not just euro-centric. Nonetheless, the euro plays an important role, and the dollar was up against the euro on Friday. Overall, the dollar is taking a nice week-long pullback to the 20 day EMA. It looks very solid. At least solid in terms of continuing the move higher. Why would it do that? Simply because the Fed did not opt to be any more dovish with respect to stimulus. Bernanke basically parroted the same statement he has had of late: "We have a gun and we are ready to use it if necessary. But now is not the time to use it." We see a nice pullback to support by the dollar. It broke out of the December-May pattern. It did so in mid-May. It has come back to test. It is in perfect position to rally yet again.

Bonds. 1.64% versus 1.65% 10 year U.S. Treasury. Premarket the 10 year bond was at 1.57% and showing a very solid gain on the session. The week saw bonds give back the move from the prior week's worries about the jobs report propelled bonds to the upside. This week they came back to test. When Bernanke did not offer any more stimulus or reasons to buy bonds, they kind of stalled out. They tried to move and bounce off a test of support. They just could not close it out on the day. Still in position to move higher, however.

Gold. 1,591.70, +3.70. Gold is very interesting. It was down big on the day. It was again down big premarket after that huge 40+ point drop on Thursday. That drop resulted from Mr. Bernanke's lack of any new stimulus or hope of any new stimulus offers. It was down on the week thanks to Thursday, but it looks as if it wants to bounce right back up. A big reversal with a doji with tail from the midpoint of its second range where it tapped resistance. This was in the form of the week-long lateral move in the third week of May. It held and bounced to the upside. It acts as if it wants to move right back up.

Maybe it is anticipating some European intervention over the weekend. After all, what is going on in Europe? The U.S., thanks to Mr. Giethner, is encouraging Europe to adopt a TARP-like rescue package. Of course we did not really follow our TARP that was outlined in Congress. We just gave the banks the money and told them to use is as they saw fit versus buying toxic assets. Maybe that would have worked better. It is what we did back in the savings and loan crisis in the 1980's and early 1990's. Perhaps it would not have been a bad idea to do the same thing here because they worked pretty well. We recovered much more rapidly than we have now. Sorry, Mr. President, but your comments this week were totally off base, incorrect, and out-and-out misrepresentations. Of course we also had a President who had implemented recovery economic plans that actually work. Historically they show they work, and of course they worked again. We are in a different situation, but we still have a poor recovery, and gold is anticipating some stimulus to bounce is back to the upside yet again.

Oil. 84.09, -0.73. Oil fell on the session. A rough week. It was up later, but, as with gold, it appears to want to bounce off of the recent selloff. It has been a long, ugly way down. Where are those speculators when you need them? We have had a drop from $110 down to $84. That is a significant drop, and a relief bounce would be normal. The problem that oil will have is China, Europe, India, and Brazil. Weaker economies overseas and a lot of oil in the U.S. because private production -- in areas that were started years before this President took office -- are now producing nicely. We have a glut of oil. That is good for us as consumers and as a country because at least we do not have to push all of our money down the gas tank and burn it. We can use it for other things and maybe spur a bit of economic activity.

I will say, however, that gasoline prices are not falling nearly as rapidly as oil prices. Perhaps we need to have an investigation now. Oil prices are dropping. They wanted to have an investigation when they were rising, so why not have one when they are not dropping as fast as oil prices? After all, where I am located on the Gulf coast of Texas, we have a 14% drop in gasoline prices. But oil, as judged by WTI has dropped roughly 27%. Where is the investigation? Let us appoint a special prosecutor for this. It seems important enough. After all, the most serious internal intelligence leak in decades, as both sides of the aisle are calling it, apparently does not warrant a special prosecutor according to our President. When Valerie Plume was supposedly outed several years ago, no one was really put in danger and no big secrets were revealed, but we needed a special prosecutor on that. But we do not need one now. Not in the most serious breach in decades. We can just push it behind the doors and not worry about it. It is an election year after all, and we do not want to face those tough issues and questions. But I digress as usual.

TECHNICAL SUMMARY

Volume. NASDAQ -15%; NYSE -19%. This as stocks bounced to solid gains.

Breadth. NASDAQ 1.85:1; NYSE 2.3:1. Breadth was less than spectacular. Very anemic internals for this move. We can say it was just Friday. This was the best week of the year to the upside for stocks. It was the lowest volume of the year for stocks, and that is true even when taking out holiday weeks. Very low volume is accompanying the best move of the year. That is not encouraging. Even though the charts are somewhat suggestive of improvement, the internals are not very encouraging right now.

THE CHARTS

SP500. We had the selloff, the three week move, a bounce to the 20 day EMA, and then a selloff the prior week. We had a good bounce off of a solid support level. A nice reversal doji and a rally back up. Looked like things were reversing on Thursday with that tombstone doji, but stocks rebounded to positive after selling early. There was no volume, so you cannot put a lot of faith in this move. On the other hand, MACD is trying to put in a higher low even as stocks put in a lower low. That is a positive indication. Not really a higher low, just a bit lower, but it did not blow out this mid-May low and MACD. There were some positives there. Looking at the chart, you have support and a pretty serious selloff. It went down to next support and then bounced as you would anticipate. There was two-thirds of an inverted head and shoulders. Left shoulder, head, and now maybe it fades and forms a right shoulder. We will have to see what that means. SP500 held where it needed to, and it bounced and has a decent pattern.

DJ30. Very similar action from the Dow. It sold lower the prior week, held near a support level from late 2011, and it has bounced as well. Maybe a left shoulder, maybe a head, and a right shoulder to come? We will see.

NASDAQ. NASDAQ is more instructive. There was a gap lower on the big selloff two weeks back. The index sold and held above support, similar to what we saw on SP500, the next range of support. It showed a doji, bounced, and then gapped higher on Wednesday. A bit of an island reversal. Maybe we get an inverted head and shoulders as well. MACD did put in a higher low as NASDAQ put in a lower low. Historically this is not a good time of year to buy tech stocks, but they are acting as if they want to move up. There was a gap lower, a gap back up, and a little island reversal. It was not an extreme selloff, but it was a pretty good selloff. It bounced to the upside, and we may get an inverted head and shoulders at the bottom of a selloff. Those are bullish patterns. How many times have we seen those perform well for us?

SP600. SP600 showed similar action as well. The potential head holding in that range from late 2011. Kind of a left shoulder, maybe the head. We will see.

SOX. SOX is interesting. We had a pretty ugly selloff. It cut well into its mid- to late 2011 range. Indeed it is at the lower half of the bottoms from late November and December of that year. We had a gap down one day, we had a doji, it moved back up the next day and then a gap. Three days and a gap is an island reversal as well, and a potential inverted head and shoulders here.

We may have room for some upside just looking at the technical pattern. Do not get me wrong, this is not a strong pattern. We have a tremendous amount of overhead supply in these indices. SOX has a very rounded top. The SP600 has a head and shoulders. NASDAQ has a very rounded top as well. They held at logical support, the next major support to the downside. They have bounced; as we have seen, NASDAQ and SOX put in something of an island reversal look and rallied on the week. Weigh that against the internals: Very low volume. Summertime. Maybe that is the question. There has been low volume for a long time, although it did pick up over the past several months. Maybe we can just blame it on summertime. The dog days drying up the volume. When you do have dried-up volume, obviously stocks can be moved easier by just a few big players stepping in and pushing things around. Perhaps that is what we are seeing here.

Does that give you much confidence? Not really. This topping pattern is much large than this little bottoming attempt that is being put in over the past three weeks. Nonetheless, we have some upside out of it. We will see if it can push higher. We are not convinced, and thus we have downside plays in position. We still have more downside plays we are looking at, and we have upside plays that are performing. As long as they are performing, I think we will just let them do that.

LEADERSHIP

Technology. Some old names are trying to come back around. AAPL has been working on a base ever since peaking in early April. It has the makings of an inverted head and shoulders. If AAPL will be a leader to the upside, you would expect it to be ahead of the overall market. Indeed it is. It was up on Friday. It looks like it is past the midpoint of its new base. It could very well lead the market to the upside. It could. We will have to see it, but we are more than happy to let our positions run. There is interest in GOOG as well. It was up on the week although it had an ugly reversal on Thursday. It managed to come off the gap lower on Friday. In terms of support, it is holding at an old support level and is trying to make a bounce there. GOOG is also proving interesting.

It is not really the time of year for techs in general. But leaders show themselves, and right now you have to be playing leaders to the upside with great patterns and decent fundamentals. Downside, you want to play the stocks that are just in bad patterns. Even good stocks sell back and present downside opportunity. We are seeing movement in some of these just as we have all along. This is no mystery. There is not a lot of leadership, but there are very good patterns in good stocks that warrant buys if the move unfolds and gives us the buy indication.

Internet. There are some strong groups. I have noted that Internets are performing well over the last several weeks. EXPE made a good move on Friday, and we picked up some more positions there. WWWW has broken out, and it put in a test. A good entry point.

Retail. AMZN is performing well. It has a nice bounce and a very test to end the week. Even AEO is set up well to make a break higher. A lot of retail leaders have come under fire, but there are still areas in retail, specific stocks that you can move into on upside plays.

Healthcare/Drugs. The health care plans are moving upside. It looked like they might be in some trouble, but they have put in some moves and look decent. AET and HUM both had good moves on Friday. The drug stocks have also performed. There are moves to the upside.

Industrial. There are a lot of stocks that are weak as well. They are bouncing but still need more work such as the industrial equipment and CAT. There is even hope here, although they are ugly patterns. Perhaps they are due a bounce. If the market overall can build off of this week's move, maybe it will test back and form a right shoulder and put in an inverted head and shoulders at the bottom of the May selloff. That would be a bullish indication for a better bounce to come.

THE ECONOMY

TO VIEW THE ECONOMY VIDEO CLICK THE FOLLOWING LINK:
Economy Summary Video

A week of incredible statements from the White House.

Lowest spending administration in 60 years, 3 million 'green' jobs, more jobs created than the previous recession and recovery, and the economy is fine. Does the President really believe that? Really?

As President leaves the WH Briefing Room Friday it doesn't look as if even he believes what he just said.

"The economy is fine." You could see everyone's jaws drop when the President made that pronouncement during a long, rambling, and 40 minute late statement on the economy. He had to walk it back later in the day as aides rushed him onto television after the republicans and others ripped into him for that statement. It is "absolutely clear" that the US economy is "not doing fine" the President said later in the day as he pulled a 180 on his first statement, shifting to blame Congress for the lack of real recovery.

What is his argument? That if the Congress enacted his jobs plan many months ago we would have another million or two jobs now. Really? We spent over $800B in his first stimulus/jobs program and as we reported last week, those jobs cost anywhere from $554K to $4.1M EACH, depending upon what CBO numbers you use. And do you remember it went from created jobs to saved or created jobs? It was fiction, but of course the President wants to spend more money on more of the same because he can just make up numbers, just as he did this past week.

We have already discussed the 'lowest spending administration in 60 years' misrepresentation as well as the 3 million green jobs created. More accurately, those jobs were not created; they were just reclassified. The bike shop personnel, bus gas pumpers, bus drivers, janitors in 'green businesses, etc. were already there. They just changed the classification and voila, jobs are created. Green jobs at that.

The fine economy, however, as incredible as it was, was not the biggest misrepresentation of the day. The President, complete with straight face, stated that this recovery, the slowest since the Great Depression in every metric as we have detailed from many studies of this recovery versus past recoveries and indeed averages of the 10 past recoveries, had created more jobs than the prior recovery. They say you can make charts and numbers say anything you want them to. Apparently the President feels he can say anything he wants about any set of data.

We have gone from a President who could not construct and utter a complete sentence to an eloquent President who, particularly this last week, cannot be honest with the citizenry regarding the state of the economy.

Others coming to ECRI's recession conclusion as incomes negative.

HERE WE GO AGAIN???

A couple of weeks back I detailed ECRI's argument for recession and that the final factor was in place: income. Incomes adjusted for inflation have rolled over.

Friday The Consumer Metrics Institute and Trim-Tabs Charles Biderman issued a report that has the groups 'really worried' that the economy, adjusted for inflation, is already in a contraction. Three years into a recovery and we get 1.9% GDP? Trend GDP is over 3%. Oh yes, the economy is fine so no need to worry.

The duo notes per-capita income, i.e. money available for households to spend, is negative. A modestly rising GDP driven mostly by consumer spending (retail sales are the only leading economic group). That leaves CMI and Biderman asking 'where is the money coming from?' From one-time increases: refinancing mortgages added $50B; savings rates, after a jump early in the crisis, are diving, adding an estimated $200B annually; student loans to the tune of $100B; $50B from 'strategic defaults'. Those have kept the spending up, but as noted, they are one-hit wonders; once gone they don't come back. Incomes are negative and cannot support this level of spending. Falling oil prices help but not enough.

The conclusion: the US may ALREADY be in the first quarter of a recession. That would almost perfectly jibe with ECRI's call for a recession this summer, a call made last September. ECRI was roundly criticized and even ridiculed by some, but it stuck with its guns and we look as if we are heading that way IF not already there as CMI and Biderman fear.

Oh, and if this does happen or is happening, no way the administration can blame others. Well, no. I should say there is no credible way of blaming others. The administration is already laying the groundwork for its claims: 'if only Congress had passed our jobs plans we would be out of this buy now.' Make book on it.

One more thing: ECRI's annualized growth rate of the US leading index has turned negative again. Moreover, Germany's imports plunged 4.8%, the biggest drop in 2 years. Exports fell 1.7%. As with the US and the 'decoupling' cadre, it appears that Germany cannot withstand the decline of the rest of the EU either. Both the US and Germany saw imports and exports fall, and that does not speak well of foreign economies or domestic.

THE MARKET

SENTIMENT INDICATORS

VIX: 21.23; -0.49
VXN: 22.55; -1.26
VXO: 20.18; -0.78

Put/Call Ratio (CBOE): 0.96; -0.02

Bulls versus Bears

This is a reading of the number of bullish investment advisors versus bearish advisors. The reason you look at this is that it gives you an idea of how bullish investors are. If they are too bullish then everyone is in the market and it is heading for a top: if everyone wants to be in the market, then all the money is in and there is no more new cash to drive it higher. On the other side of the spectrum if there are a lot of bears then there is a lot of cash on the sideline, and as the market rallies it drags that cash in as the bears give in. That cash provides the market the fuel to move higher. If bears are low it is the same as a lot of bulls: everyone is in and the market does not have the cash to drive it higher.

Bulls: 34.0% versus 39.3% versus 38.3%. Plunging as expected though with this week's move they may bounce right back up. Below 35% on the move, however, and that puts it below the threshold and is a bullish indicator. Seems to be working as the market bounced. Off the 55+ level hit in late February. That was the highest level since April and May of 2011, the peak of the post-bear market high. 35% is the threshold level suggesting bullishness. To be seriously bearish it needs to get up to the 60% to 65% level.

Bears: 26.6% versus 24.5% versus 26.6%. Right back up but nowhere near a 35% high reading that would really start things upside, or at least set a better foundation. It is always the best signal of bulls and bears cross paths so to speak. Not bad given the bulls action, but not the best signal. Over 35% is the threshold to be really be a good upside indicator. For reference, bearishness hit a 5 year high at 54.4% the last week of October 2008. The move over 50 took bearish sentiment to its highest level since 1995. Extreme negative sentiment. Prior levels for comparison: Bearishness peaked at 37.4% in September 2007. It topped the June 2006 peak (36%) on that run. That June peak eclipsed the March 2006 high (33%) and well above the 2005 highs that spawned new rallies (30% in May 2005, 29.2% in October 2005). That was a huge turn, unlike any seen in recent history.

NASDAQ

Stats: +27.4 points (+0.97%) to close at 2858.42
Volume: 1.375B (-15.28%)

Up Volume: 1.08B (+674.29M)
Down Volume: 279.24M (-910.76M)

A/D and Hi/Lo: Advancers led 1.85 to 1
Previous Session: Decliners led 1.5 to 1

New Highs: 36 (-6)
New Lows: 34 (+5)

SP500/NYSE

Stats: +10.67 points (+0.81%) to close at 1325.66
NYSE Volume: 623M (-18.77%)

Up Volume: 2.55B (+800M)
Down Volume: 839.4M (-1.401B)

A/D and Hi/Lo: Advancers led 2.36 to 1
Previous Session: Decliners led 1.2 to 1

New Highs: 76 (-5)
New Lows: 36 (+11)

DJ30

Stats: +93.24 points (+0.75%) to close at 12554.2
Volume DJ30: 111M shares Friday versus 131M shares Thursday.

MONDAY

There is a tremendous amount of data to come over the weekend and in the coming week. There is a lot of scheduled data. After the trade deficit on Friday, we have import and export prices on Tuesday. Retail sales on Wednesday. PPI is out and business inventories. Thursday brings continuing jobs claims and CPI. On Friday there is empire manufacturing and Michigan sentiment. Not to mention production and utilization. Important data again kicking up, and it is not just the U.S., of course. It never is anymore.

We have the Eurogroup meeting this weekend to discuss what to do about Greece, Spain, Italy, you name it. We will see if some accord can be reached there. As noted, after hours Spain said they are not comfortable with the requirements for the bank bailout. That news would have very much impacted the market if it has come out before the close, but it did not. We will see if the market can forget about it over the weekend. Futures were not pulverized after hours. They faded a bit, but they were recovering later in the session.

We also have China's economic data, and a lot of it is coming out over the weekend. That is something that people were already looking to this week as weaker numbers came out of that country. That will play a big role. We will see what comes out of the big-boy economies. Of course that will be the impact on U.S. manufacturers, producers, wholesalers and retailers. That is obviously important with respect to the stock market and future earnings.

There are still a lot of issues. There is still the fact that we could already be in a recession in the U.S. and just do not want to admit it. Of course there is all the election rhetoric. The administration will never admit that things are as bad as they are while the Republicans are probably overplaying the way things are. Although Romney has been pretty fair with it. He has not said the economy stinks. He has been accused of talking the economy down. How? How is he being accused of talking the economy down? He is just stating facts about how bad it is and how pathetic the recovery has been despite the President's lofty discussions of how they have spent less than any other administration in 60 years, et cetera. That rings rather hollow. But it is an election year, and that is the kind of nonsense and crapola you get.

We have to look at what we will do about the problems. The Fed is looking to the Congress and administration to get something done. It feels is cannot do anything more. On June 20th, we will see that the Fed will likely not do anything. It would have to change its talk, and maybe it will. Perhaps it will say something to the effect of "We do not want to do anything, it is up to Congress and the President to get something done. But if they do not do something, we will do what we can." That would be the change to indicate stimulus at the August meeting, or perhaps sooner if things deteriorate. Remember that we could already be in a recession or close to tripping into one.

In any event, the market held up well. It will try to continue the rebound. The patterns overall do not look great. We do not have a lot of leadership. We did not have a lot of volume on the move to the upside. All of those mitigate and lean against some continued move. Nonetheless, the indices are trying to set up and move higher. If we get leadership or at least upside bounces from some key stocks such as AAPL and GOOG, and maybe some manufacturing stocks continue their rebound off of their selloffs, we get another nice rally. The indices held at a key support level, and they have reversed. They showed more strength than anticipated, bouncing almost all the way back up to take out the prior week's losses. With that kind of move, we could see a pullback and a break higher.

What will we do about it? We play the good stocks as we have been doing. If we see good downside plays, do not shy away from those. As we have seen, those can be quite lucrative, and they made us some very good money over the past few weeks. We will keep looking for those as we did on Wednesday and Thursday to see if they set up and then if they give us the move. Friday's move was encouraging that the move did not sell off ahead of a weekend that holds a lot of question marks about China and the eurozone. And who knows what other geopolitical mess might arise.

It showed a bit of backbone. With that, it could very well try to bounce further. If so, we will play good quality patterns to the upside and get what we can from them. Use bounces to get rid of stocks that are not performing to the upside as well as we want. Focus on the ones that are doing well, and then just be ready when this runs out of gas. I think it will. I think there are too many troubles for the U.S. to avoid it. Then again, you take what the market gives.

Enjoy the weekend, and I will see you on Monday.

Support and resistance

NASDAQ: Closed at 2858.42
Resistance:
2862 is the 2007 peak
2879 is the July 2011 peak
2888 is the May 2011 peak and PRIOR post-bear market high
2900 is the March 2012 low
The 50 day EMA at 2905
2910 is the recent March 2012 low
3000 is the February 2012 post-bear market high
3026 from 10/2000 low
3042 from 5/2000 low
3090 is the mid-March interim high
3134 is the March 2012 post-bear market peak
3227 is the April 2000 intraday low
3401 is the May 2000 closing low

Support:
2841 is the February 2011 peak
2816 is the early April 2011 peak.
The 200 day SMA at 2767
2754 is the October 2011 high
2706 to 2705 is the April 2011 low and the February 2011 and consolidation low (bottom of the trading range) 2723 to 2705 is the range of support at the bottom of the January to May trading range
2686 is the January 2011 closing low
2676 is the January 2010 low and the December 2011 peak
2645-2650ish from December 2010 consolidation
2643 is the September 2011 high
2612 is the late August 2011 peak
2603 is the March 2011 intraday low (post-Japan low)
2599 is the June 2011 low and NASDAQ
2593 is the November intraday high
2580 is the November 2010 closing high
2555 is the mid-August 2011 peak
2535 is the November island reversal gap point
2441 is the November 2011 low

S&P 500: Closed at 1325.66

Resistance:
1332 is the early March 2011 peak
1340 is the early April 2011 peak
The 50 day EMA at 1341
1344 is the February 2011 peak
1357 is the July 2011 peak
1371 is the May 2011 peak, the post-bear market high
1378 is the February 2012 peak
1422.38 is the Post-bear market high (March 2012)
1425 from May 2008 closing highs
1433 from August 2007 closing lows
1440 from November 2007 closing lows

Support:
1295 to 1294 is the April 2011 low and the February 2011 consolidation low (bottom of the trading range)
1293 is the October 2011 peak
The 200 day SMA at 1288
1275 is the January 2010 low, early January 2011 peak
1267 is the December 2011 peak
1258 is June 2011 intraday low
1255 is the late December 2010 consolidation range
1249 is the March 2011 low (post-Japan)
1235 is the mid-December 2010 consolidation low
1231 is the late August 2011 peak
1227 is the November 2010 peak
1220 is the April 2010 peak
1209 is the mid-August 2011 high
1196 is the November 2010 consolidation peak
1178-1180 is the October 2010/November 2010 consolidation low
1158 is the November 2011 low
1131 - 1127 from August 2010 base peak.
1119 is the early August closing low
1109 is the mid-September 2010 gap up point
1101 is the August 2011 low
1099 from the mid-July interim peak
1075 is the October 2011 intraday low

Dow: Closed at 12,554.20
Resistance:
The 50 day EMA at 12,688
12,716 is the April 2012 closing low
12,754 is the July intraday peak
12,876 is the May high
13,056 is the February 2012 high
13,058 from the May 2008 peak on that bounce in the selling
13,297 is the April 2012, post bear market high
13,668 from 12-2007 peak
13,692 from 6-2007 peak
14,022 from 7-07 peak

Support:
12,391 is the February 2011 peak
The 200 day SMA at 12,286
12,284 is the October 2011 peak
12,258 is the December 2011 peak
12,110 from the March 2007 closing low
12,094 is the April 2011 low
The June low at 11,897 (closing)
11,734 from 11-98 peak
11,717 is the late August 2011 peak
The August low at 11,702
11,555 is the March low
11,452 is the November 2010 peak
11,178 from November 2010
10,978 is the bottom of the November 2010 consolidation
10,750 from September 2010
10,720 is the August closing low
10,705-710 from January 2010 peak
10,694-700 from August 2010 peak

Economic Calendar

June 4 - Monday
- Factory Orders, April (10:00): -0.6% actual versus 0.1% expected, -2.1% prior (revised from -1.9%)

June 5 - Tuesday
- ISM Services, May (10:00): 53.7 actual versus 53.1 expected, 53.5 prior

June 6 - Wednesday
- MBA Mortgage Index, 06/02 (7:00): 1.3% actual versus -1.3% prior
- Productivity-Rev., Q1 (8:30): -0.9% actual versus -0.8% expected, -0.5% prior
- Unit Labor Costs-Rev, Q1 (8:30): 1.3% actual versus 2.3% expected, 2.0% prior
- Crude Inventories, 06/02 (10:30): -0.111M actual versus 2.213M prior

June 7 - Thursday
- Initial Claims, 06/02 (8:30): 377K actual versus 375K expected, 389K prior (revised from 383K)
- Continuing Claims, 05/26 (8:30): 3293K actual versus 3250K expected, 3259K prior (revised from 3242K)
- Consumer Credit, April (15:00): $6.5B actual versus $12.7B expected, $12.4B prior (revised from $21.4B)

June 8 - Friday
- Trade Balance, April (8:30): -$50.1B actual versus -$49.7B expected, -$52.6B prior (revised from -$51.8B)
- Wholesale Inventories, April (10:00): 0.6% actual versus 0.5% expected, 0.3% prior

June 12 - Tuesday
- Export Prices ex-ag., May (8:30): 0.2% prior
- Import Prices ex-oil, May (8:30): 0.1% prior
- Treasury Budget, May (14:00): -$125.0B expected, -$57.6B prior

June 13 - Wednesday
- MBA Mortgage Index, 06/09 (7:00): 1.3% prior
- Retail Sales, May (8:30): -0.2% expected, 0.1% prior
- Retail Sales ex-auto, May (8:30): 0.0% expected, 0.1% prior
- PPI, May (8:30): -0.7% expected, -0.2% prior
- Core PPI, May (8:30): 0.2% expected, 0.2% prior
- Business Inventories, April (10:00): 0.2% expected, 0.3% prior
- Crude Inventories, 06/09 (10:30): -0.111M prior

June 14 - Thursday
- Initial Claims, 06/09 (8:30): 375K expected, 377K prior
- Continuing Claims, 06/02 (8:30): 3275K expected, 3293K prior
- CPI, May (8:30): -0.2% expected, 0.0% prior
- Core CPI, May (8:30): 0.1% expected, 0.2% prior
- Current Account Balance, Q1 (8:30): -$130.9B expected, -$124.1B prior

June 15 - Friday
- Empire Manufacturing, June (8:30): 13.5 expected, 17.1 prior
- Net Long-Term TIC Fl, April (9:00): $36.2B prior
- Industrial Production, May (9:15): 0.1% expected, 1.1% prior
- Capacity Utilization, May (9:15): 79.1% expected, 79.2% prior
- Michigan Sentiment, June (9:55): 77.0 expected, 79.3 prior
icon url

ReturntoSender

06/12/12 12:25 AM

#9805 RE: ReturntoSender #6755

From Briefing.com: 4:30 pm : Spain’s first step toward shoring up its banking system brought about a bid that gave the major equity averages a positive open, but support waned steadily throughout the session, leaving stocks to settle at session lows with sizable losses.

Market participants initially applauded news that Spain has requested $125 billion for its banks since that would help provide confidence and security to the rest of Europe’s banking system, in which domestic financial outfits are heavily invested. However, any form of euphoria that remained by the time US markets opened dithered away throughout the trading day as focus returned to the persistently precarious conditions facing the rest of Europe.

Strength in the euro also faded. It was up modestly in morning action, but by the afternoon it was trailing the dollar. Unable to recover, the euro fell about 0.3% against the greenback.

While selling was broad, Financials, Tech, and Materials were hit the hardest. Each sector slid to a loss of almost 2%. Spanish banking outfit Banco Santander (STD 5.92, -0.19) slumped – the firm had its rating cut by analysts at Fitch. Meanwhile, Apple (AAPL 571.17, -9.15) also reversed into the red to cause a heavy drag. The company’s latest developers conference failed to inspire sustainable gains in the stock.

Telecom scored the only gain of the session. The sector was up about 1% at its session high, but settled only narrowly above the neutral line. Telecom stocks outperformed during the month of May, but were relatively quiet last week. AT&T (T 34.59, +0.04) was a source of strength as it traded up to $35 per share for the first time since 2008 before being imbued by broad market weakness.

A few key commodities were also caught up in the selling effort. Crude oil prices were up in early pit trade, but settled with a 1.8% loss at $82.59 per barrel, just above its session low of $82.51 per barrel. Selling even extended into electronic trade so that prices were below $82 per barrel after the close of pit trade. However, gold prices were able to recover from an early retreat into the red to push its way back above the breakeven line. Gold managed to settle 0.3% higher at $1596.70 per ounce.

Advancing Sectors: Telecom +0.1%
Declining Sectors: Utilities -0.2%, Consumer Staples -0.4%, Health Care -0.9%, Industrials -1.2%, Energy -1.2%, Consumer Discretionary -1.6%, Tech -1.7%, Materials -1.8%, Financials -1.9%DJ30 -142.97 NASDAQ -48.69 NQ100 -1.6% R2K -2.4% SP400 -2.0% SP500 -16.73 NASDAQ Adv/Vol/Dec 566/1.47 bln/1931 NYSE Adv/Vol/Dec 617/740 mln/2411

6:03PM Diodes reaffirms Q2 revenue guidance of $155-164 mln vs Capital IQ Consensus estimate of $159.6 mln (DIOD) 19.06 -0.84 : Co stated that it is maintaining its guidance for the second quarter of 2012, which includes the expectation that revenue will range between $155 mln and $164 mln, or up 7 percent to 13 percent sequentially. Gross margin is expected to be 26 percent, plus or minus 2 percent. Operating expenses, without consideration of any gain on the sale of assets in the first quarter of 2012, are expected to be down slightly from first quarter on a percent of revenue basis. The income tax rate for the second quarter is expected to range between 7 and 13 percent, and shares used to calculate GAAP EPS are anticipated to be approximately 47.2 mln.

4:30PM Juniper Networks announces new common stock repurchase authorization of up to $1 bln (JNPR) 16.40 -0.49 : Co announced a new stock repurchase program which enables the Company to purchase up to $1 billion of the Company's common stock. This new authorization is in addition to the $1 billion stock repurchase program approved in 2010. As of March 31, 2012, there was approximately $162.2 million of remaining authorized funds under the 2010 stock repurchase program. "This authorization will enable the Company to continue its on-going share maintenance plan which is designed to reduce dilution from the issuance of shares related to its employee stock plans."

4:05PM Finisar beats by $0.02, misses on revs; guides Q1 EPS, revs below consensus (FNSR) 13.47 -1.41 : Reports Q4 (Apr) earnings of $0.23 per share, excluding non-recurring items, $0.02 better than the Capital IQ Consensus Estimate of $0.21; revenues rose 1.3% year/year to $239.9 mln vs the $244.04 mln consensus. Co issues downside guidance for Q1, sees EPS of $0.11-0.15, excluding non-recurring items, vs. $0.24 Capital IQ Consensus Estimate; sees Q1 revs of $218-233 mln vs. $251.80 mln Capital IQ Consensus Estimate; non-GAAP op. margin ~5.5-7.0%. "Continued strength in datacom revenues were offset by lower telecom revenues. The lower telecom revenues were primarily the result of sluggish carrier capital expenditures and the full three month impact of annual price reductions for telecom products. We were pleased that our gross margin for the quarter exceeded our guidance, resulting in earnings per diluted share which was at the upper end of our guidance range."

2:15PM Apple confirms Mountain Lion will be available in July from Mac App Store (AAPL) 580.79 +0.51 : OS X Mountain Lion will be available in July from the Mac App Store for $19.99. Mountain Lion requires Lion or Snow Leopard (OS X v10.6.8 or later), 2GB of memory and 8GB of available space.

1:51PM Apple confirms introduction of new MacBook Pro with retina display (AAPL) 581.17 +0.85 : Co unveiled an all new 15-inch MacBook Pro featuring a stunning Retina display, all flash storage and quad-core processors in a radically thin and light design. It measures a mere 0.71 inches and weighs only 4.46 pounds. Featuring an engineered aluminum unibody design and an all flash storage architecture, the all new MacBook Pro is the lightest MacBook Pro ever and nearly as thin as a MacBook Air. Flash storage that is up to four times faster than traditional notebook hard drives enables the all new MacBook Pro to play four simultaneous streams of uncompressed 1080p HD video from internal storage. The flash storage architecture also delivers improved reliability, instant-on responsiveness and 30 days of standby time. The 15-inch MacBook Pro is available with a 2.3 GHz quad-core Intel Core i7 processor with Turbo Boost speeds up to 3.3 GHz, 8GB of memory and 256GB of flash storage starting at $2,199; and with a 2.6 GHz quad-core Intel Core i7 processor with Turbo Boost speeds up to 3.6 GHz, 8GB of memory and 512GB of flash storage starting at $2,799. Configure-to-order options include faster quad-core processors up to 2.7 GHz, up to 16GB of memory and flash storage up to 768GB.

1:30PM Apple confirms updated MacBook Air with Intel (INTC) Core processors, faster graphics and flash storage that is up to twice as fast as the previous generation (AAPL) 584.83 +4.51 : Co updated MacBook Air with the latest Intel (INTC) Core processors, faster graphics and flash storage that is up to twice as fast as the previous generation. The current generation 13-inch and 15-inch MacBook Pro have also been updated with the latest Intel Core processors and graphics from NVIDIA (NVDA).

First Solar (FSLR) announced it will design, construct and maintain two utility-scale solar photovoltaic power projects totaling 159 megawattsAC for AGL Energy as part of Australia's Solar Flagships Program.

8:26AM First Solar and Intermolecular (IMI) announce joint program to accelerate solar PV roadmap (FSLR) 12.80 : Co and Intermolecular (IMI) announced a collaboration and licensing agreement aimed at accelerating the efficiency roadmap for First Solar's cadmium-telluride photovoltaic technology. Under a newly signed collaborative development program, First Solar will leverage Intermolecular's High Productivity Combinatorial platform in the development of its advanced, CdTe-based, thin film PV manufacturing technology. The program addresses new opportunities in certain critical materials and processes that may significantly influence the conversion efficiency of CdTe technology. Technical work is to be performed jointly at Intermolecular's San Jose, Calif., facility and in First Solar's research and development labs.

Lattice Semiconductor (LSCC) announced power management solutions that will greatly simplify and increase the reliability of power failure protection circuitry in Solid State Drives.

NXP Semiconductors (NXPI) introduced the SSL21101, the first in a new family of GreenChip LED driver ICs featuring Smart Digital Control technology.

Cantor Fitzgerald upgrades EMC (EMC $24.68 +0.04) to Buy from Hold and lowers their tgt to $30 from $31. The upgrade is part of a broader analysis on estimate and valuation risk across their coverage group. EMC carries the highest quality and most predictable earnings in the group. The high end refresh this quarter and Isilon software upgrade later this year are expected to extend EMC's competitive lead in the market. With no company owning more than 35% share today, we view the pace of consolidation as likely to accelerate to the "80/20" rule over the next 3-5 years. We view EMC as best positioned to garner the lion's share of this consolidation wave.

Cantor Fitzgerald upgrades Brocade (BRCD $4.70 +0.05) to Buy from Hold and raises their tgt to $6 from $5.50. The firm says, share gains in high-margin Fibre Channel are expected throughout the year, given time to market lead in 16Gb. They say it appears increasingly likely the company will seek to monetize part of its San Jose campus, which will dramatically (positively) impact the balance sheet.

icon url

ReturntoSender

06/12/12 10:39 PM

#9806 RE: ReturntoSender #6755

From Briefing.com: 4:30 pm : Continued concerns over problems facing countries in the Eurozone periphery couldn't stop the major US equity averages from settling at session highs with strong gains today.

During the prior session stocks rolled over to suffer sizable losses in what many pundits believed was the stock market saying that Spain's request over the weekend for $125 billion to bailout its banks is too little too late. Today, though, stocks staged an impressive advance that saw the major equity averages score strong, broad-based gains. The effort came despite a bailout request by Cyprus, which is the third smallest country in the eurozone with a population of less than 1 million people and an economy that accounts for 0.2% of eurozone GDP, but perhaps more alarmingly that Italy might need financial support and that Spain may need more than a bailout for its banks. Such concerns sent the countries' debt yields higher this morning -- in fact, the yield on Spain's 10-year Note climbed to a record high above 6.8%.

Some stepped in with a bid ahead of the open to lift equity futures, but action in the opening minutes was generally choppy. That gave way to an early slip that sent both the Nasdaq and the S&P 500 to slight losses while the Dow danced narrowly above the neutral line. Before long, though, buyers began to make their way back into the fold. Their efforts took the S&P 500 up to 1320 before resistance interrupted the move. Some selling ensued, but stocks remained resilient and were even squeezed higher into the close.

All 10 major sectors finished the session in positive territory, but the best gains were booked by Materials, Financials, and Industrials. Gains among those sectors ranged from 1.6% to 1.8%. Utilities were at the opposite end of the spectrum. They settled with a gain of only 0.2% after they had spent all morning and early afternoon in the red.

Texas Instruments (TXN 28.24, +0.59) was a strong among the better individual performers following its revised earnings forecast. Company management now expects earnings to range from $0.38 to $0.42 per share after it had previously forecasted that earnings would range from $0.36 to $0.44 per share.

Domestic data was limited to the latest monthly Treasury budget and monthly import and export price data. None was of meaningful concern to market participants, especially when Europe remains in such sharp focus.

The euro also attracted buyers in the face of the persistently precarious conditions facing the eurozone; it mustered a 0.3% gain against the greenback. Treasuries traded lower for the entire session.

The selling effort lifted the yield on the benchmark 10-year Note back above 1.65%. Results from an auction of 3-year Notes failed to inspire a positive response. The offering attracted a Bid-to-Cover of 3.53, Dollar Demand of $113.1 billion, and an Indirect Bidder participation rate of 27.0%. For comparison, the prior auction drew a Bid-to-Cover of 3.65, Dollar Demand of $116.8 billion, and an Indirect Bidder rate of 35.7%, while an average of the past six auctions results in a Bid-to-Cover of 3.52, Dollar Demand of $112.5 billion, and an Indirect Bidder rate of 35.9%.

Advancing Sectors: Materials +1.8%, Financials +1.7%, Industrials +1.6%, Energy +1.3%, Consumer Discretionary +1.2%, Tech +1.1%, Telecom +1.0%, Health Care +0.9%, Consumer Staples +0.6%, Utilities +0.2%
Declining Sectors: None DJ30 +162.57 NASDAQ +33.34 NQ100 +1.2% R2K +1.3% SP400 +1.1% SP500 +15.25 NASDAQ Adv/Vol/Dec 1727/1.58 bln/763 NYSE Adv/Vol/Dec 2360/723 mln/652

4:02PM Dell says enterprise solutions strategy is delivering on financial commitments; adopts quarterly dividend beginning in Q3 (DELL) 11.97 +0.11 : Michael Dell, chairman and CEO, will tell analysts at 2012 Analyst Meeting (starts today), that it executed on its commitment to grow profitability and op income while expanding its enterprise solutions and services. Co also announced that its Board of Directors has adopted a dividend policy under which the company intends to pay quarterly cash dividends on its common stock beginning in the third quarter of the current fiscal year. Dell expects the initial dividend rate to be $0.32 per share per year, or $0.08 per share quarterly. "Our efforts to streamline our operations and shift the mix of our business over the past several years have resulted in sustainably strong cash flow from operations, enabling us to increase the percentage of capital we've allocated to research and development, capital expenditures and acquisitions while maintaining an ongoing share repurchase program, the payment of a quarterly cash dividend to Dell's shareholders adds another element to our disciplined capital allocation strategy." The company expects that through the dividend and share repurchases, it will increase its target range for distribution of capital to shareholders from 10-30 percent of free cash flow to 20-35 percent. Gladden said that Dell is confident in its continuing ability to make the necessary investments to grow its portfolio of enterprise solutions and services while initiating the quarterly dividend and continuing share repurchases. Co projects its enterprise solutions, software and services business will grow at a 10 percent compounded annual growth rate through fiscal year 2016 and represent an increasing percentage of Dell's operating income margin. Gladden said that while Dell has become a solutions and services company, it remains committed to a profitable end-user computing business. "By exercising discipline and being selective on the business we pursue, we expect to continue to run a profitable end-user business, we've gained share in the high-value portion of the industry for six of the last seven quarters and see this part of our business continuing to contribute operating income in excess of 5% of revenue."

9:58AM Vishay Precision signed Richwood International as an authorized distributor of its Vishay Foil Resistors brand products in Korea (VPG) 14.11 +0.10 :

O2Micro International (OIIM) was issued 15 claims under U.S. patent for its LED Driving methodology.

NXP Semiconductors (NXPI) and Giesecke & Devrient announced an agreement enabling G&D to integrate NXP's MIFARE technology into its portfolio of secure SIM products.

5:50AM Cypress Semiconductor (CY) proposes to acquire Ramtron for $2.48 per share in cash (RMTR) 1.81 : Cypress Semi (CY) announces that it has submitted a proposal to Ramtron (RMTR) to acquire all of its outstanding stock for $2.48 per share in cash. This offer represents a 37% premium to Ramtron's closing stock price on June 11, 2012. "We believe that our offer provides compelling value to Ramtron's stockholders," said T.J. Rodgers, President and Chief Executive Officer of Cypress. CY adds "Last year, we attempted to negotiate an acquisition of Ramtron, but our offer of $3.01 per share--which represented the same 37% premium to Ramtron's then-current stock price as we are offering today--was summarily rejected. Soon thereafter, Ramtron sold almost 20% of its stock in a dilutive public offering at a net price of $1.79 per share."

LitePoint, a wholly owned subsidiary of Teradyne, (TER), announced that leading provider of networking products, TP-Link, is using the IQxel for 802.11ac networking product development.

Juniper Networks (JNPR) announced the immediate availability of the Juniper Networks QFX3000-M QFabric System, that extends the full benefits of Juniper's first QFabric System, the QFX3000-G, to mid-sized data centers. Also, Juniper has added enhancements to its EX8200 switches running Virtual Chassis technology, enabling customers for the first time to manage up to four data center cores as a single switch.

Seagate Technology (STX) introduced Backup Plus storage devices, its reinvented consumer storage product family that delivers the easiest setup, one-click backup and the ability to save and share your content on Facebook and Flickr.

Adobe Systems Incorporated (ADBE) announced Adobe Connect 9, the latest version of the company's Web conferencing software for enterprises and government agencies worldwide. Adobe Connect 9 delivers an all-in-one solution for producing webinars, as well as innovations in mobile-to-mobile collaboration and mobile learning.

Stifel believes Texas Instruements (TXN $28.27 +0.62)'s 2Q12 mid-quarter update supports its view that current back-end and test capacity buys remain on track for the June/July quarters. The firm also believes that overall IC trends will continue to trend higher in September, which should help maintain the current buying spree. Firm believes the two biggest beneficiaries from TI's comments are Teradyne (TER) and LTX-Credence (LTXC). In its view, both companies are likely tracking to plan on the SoC test front. Firm also expects this positive momentum to carry into their respective September/October quarters.

Finisar (FNSR $13.69 +0.22) reported fourth quarter earnings of $0.23 per share, excluding non-recurring items, $0.02 better than the Capital IQ Consensus of $0.21, while revenues rose 1.3% year/year to $239.9 million versus the $244.04 million consensus. The company issued downside guidance for the first quarter with EPS of $0.11-0.15, excluding non-recurring items, versus the $0.24 consensus and revenues of $218-233 million versus the $251.80 million consensus Estimate; non-GAAP op. margin ~5.5-7.0%. "Continued strength in datacom revenues were offset by lower telecom revenues. The lower telecom revenues were primarily the result of sluggish carrier capital expenditures and the full three month impact of annual price reductions for telecom products. We were pleased that our gross margin for the quarter exceeded our guidance, resulting in earnings per diluted share which was at the upper end of our guidance range."

Juniper Networks (JNPR $16.54 +0.14) announced a new stock repurchase program which enables the Company to purchase up to $1 billion of the Company's common stock. This new authorization is in addition to the $1 billion stock repurchase program approved in 2010. As of March 31, 2012, there was approximately $162.2 million of remaining authorized funds under the 2010 stock repurchase program. "This authorization will enable the Company to continue its on-going share maintenance plan which is designed to reduce dilution from the issuance of shares related to its employee stock plans."

10:48 am Tech sector trading nearly flat today, in line with broader market

The tech sector is trading just higher today, inline with slight gains in the broader market. Semiconductors are also showing relative strength with the Philly Semi Index trading 0.6% higher. RBCN (+2.0%) is a notable leader in that chip index. Among other major indices, the SPY, the QQQ, and the NASDAQ are all trading 0.1% lower on the session. Among tech bellwethers, TXN (+1.8%) is showing notable strength, while GOOG (-1.5%) is under pressure.

In earnings last night, TXN (+1.8%) narrowed its Q2 guidance inline with consensus. Also, FNSR (+1.1%) posted a mixed quarter and guided lower. In news, JNPR (-0.2%) announced a $1 bln stock repurchase plan. Elsewhere, CY (+2.1%) announced that it has submitted a proposal to RMTR (+36.5%) to acquire all of its outstanding stock for $2.48/share. FIO (+2.6%) confirmed it entered into an OEM relationship with CSCO (+0.6%). PAY (-6.8%) disclosed update on trial, noting the jury completed its deliberations and returned an unfavorable verdict.

Among notable analyst upgrades this morning, National Securities upgrades TXN (+1.8%) to Buy. While in downgrades, GAME (+1.0%) was downgraded to Neutral at Lazard. There are no notable names in tech scheduled to report quarterly results today after the close.
icon url

ReturntoSender

06/13/12 6:39 PM

#9807 RE: ReturntoSender #6755

From Briefing.com: 4:25 pm : For the second time this week stocks rolled over in afternoon trade to suffer sizable losses.

Market participants displayed caution ahead of the open as Europe’s bourses traded lower and domestic retail sales disappointed. Retail sales declined during May by 0.2%, which is greater than the 0.1% decline that had been broadly expected. Excluding autos, retail sales declined by 0.4%, which contrasts with a Briefing.com consensus that called for no change. Prior month numbers were revised downward so that overall retail sales declined by 0.2% and sales less autos declined by 0.3%.

Producer price data proved less influential. Overall producer prices declined during May by 1.0%, which is steeper than the 0.7% decline that had been widely forecasted, but core producer prices experienced an in-line increase of 0.2%.

Although stocks were able to work through some modest selling pressure in morning trade, they struggled to extend the move. Financials eventually offered leadership, but the broad market remained reluctant to follow. The path of least resistance proved to be downward amid such broad market anemia. The major averages managed to make a modest bounce in the final minutes of trade, but broad losses were still booked.

Materials stocks and Consumer Discretionary stocks suffered the most. Both sectors sank to a 1.5% loss. The former was hurt primarily by diversified chemicals players, while the latter was undermined by weakness among retailers – SPDR S&P Retail ETF (XRT 56.46, -1.60).

Financials, which had mustered a solid gain with help from JPMorgan Chase (JPM 34.30, +0.53), finished the day with a 0.5% loss. In a testimony before the Senate Banking Committee, JPMorgan Chase CEO Jamie Dimon stated that he expects the bank to be solidly profitable in the current quarter, and that progress has already been made in reducing risk following the firm’s massive trading loss that received so much attention several weeks ago.

There weren’t any encouraging headlines regarding efforts to shore up conditions in the eurozone, but the euro staged a strong advance against the greenback. By session’s end the euro was up 0.5% to $1.257.

Treasuries attracted buying interest amid the stock market's slide, such that the yield on the benchmark 10-year Note returned to almost 1.60%. Also in play were results from an auction of 10-year Notes. The offering attracted a Bid-to-Cover of 3.06, Dollar Demand of $64.2 billion, and an Indirect Bidder rate of 42.0%. For comparison, the prior auction attracted a Bid-to-Cover of 2.90, Dollar Demand of $69.6 billion, and an Indirect Bidder participation rate of 38.7%, while an average of the last six auctions results in a Bid-to-Cover of 3.18, Dollar Demand of $69.8 billion, and an Indirect Bidder rate of 42.4%.

Advancing Sectors: Telecom +0.1%
Declining Sectors: Utilities -0.1%, Health Care -0.1%, Consumer Staples -0.3%, Financials -0.5%, Tech -0.7%, Industrials -1.0%, Energy -1.1%, Consumer Discretionary -1.5%, Materials -1.5%DJ30 -77.42 NASDAQ -24.46 NQ100 -0.7% R2K -1.3% SP400 -1.4% SP500 -9.30 NASDAQ Adv/Vol/Dec 747/1.59 bln/1727 NYSE Adv/Vol/Dec 954/683 mln/2072

3:30 pm : Crude oil came off its morning low of $82.15 per barrel to push into positive territory, extending its climb to a session high of $84.02 per barrel shortly after weekly inventory data showed that gasoline inventories had a draw of 1.72 million barrels when a build of 1.40 million barrels had been anticipated. Weekly crude oil inventories experienced a smaller-than-expected draw of 191,000 barrels. The energy component failed to sustain its gain and fell back into the red, settling with a 0.9% loss at $82.56 per barrel.

Natural gas chopped around in negative territory for its entire floor session. It set a session high of $2.23 per MMBtu, but fell lower as it headed into the close. It settled at its session low of $2.18 ber MMBtu with a 2.7% loss.

Gold popped into positive territory ahead of pit trade open. It traded up to a session high of $1626.00 per ounce, but fell back to the unchanged mark. Despite the dip, the yellow metal was able to reclaim gains in afternoon action and settle the pit session 0.4% higher at $1619.90 per ounce. Silver rallied to a session high of $29.09 per ounce in early morning action, but later fell into negative territory to a session low of $28.77 per ounce. It spent the afternoon session attempting to rebound, ultimately settling at $28.93 per ounce, just a penny below the break-even line

12:44PM Semiconductor Hldrs back hovering slightly under session high of 31.80 (SMH) 31.76 +0.11 : The high from last week and early this week are just above at 31.85/31.89. Note that its 200 sma comes into play at 32.05 -- INTC +1%, ASML +2.6%, AMAT +0.7%, ARMH +1.6%, SNDK +0.9%, KLAC +1.2%.

Ciena (CIEN) announced that Sprint (S) is upgrading its optical backbone network with Ciena's 6500 Packet-Optical Platform.

O2Micro International (OIIM) was issued 23 claims under U.S. patent for its Power Converter Current Control invention.

Through a strategic technology partnership with ARM (ARMH), AMD (AMD) will integrate the established ARM TrustZone technology into future Accelerated Processing Units via a system-on-a-chip design methodology.

AMD (AMD) announced immediate availability of the AMD FirePro W600 professional graphics card, the co's first professional graphics card to leverage AMD's Graphics Core Next architecture and 28nm production technology, for use in high-resolution, content-rich, multi-screen display wall environments.

Dell (DELL $12.57 +0.60) announced that its Board of Directors has adopted a dividend policy under which the company intends to pay quarterly cash dividends on its common stock beginning in the third quarter of the current fiscal year. Dell expects the initial dividend rate to be $0.32 per share per year, or $0.08 per share quarterly. "Our efforts to streamline our operations and shift the mix of our business over the past several years have resulted in sustainably strong cash flow from operations, enabling us to increase the percentage of capital we've allocated to research and development, capital expenditures and acquisitions while maintaining an ongoing share repurchase program, the payment of a quarterly cash dividend to Dell's shareholders adds another element to our disciplined capital allocation strategy." The company expects that through the dividend and share repurchases, it will increase its target range for distribution of capital to shareholders from 10-30 percent of free cash flow to 20-35 percent. Gladden said that Dell is confident in its continuing ability to make the necessary investments to grow its portfolio of enterprise solutions and services while initiating the quarterly dividend and continuing share repurchases. Co projects its enterprise solutions, software and services business will grow at a 10 percent compounded annual growth rate through fiscal year 2016 and represent an increasing percentage of Dell's operating income margin. Gladden said that while Dell has become a solutions and services company, it remains committed to a profitable end-user computing business. "By exercising discipline and being selective on the business we pursue, we expect to continue to run a profitable end-user business, we've gained share in the high-value portion of the industry for six of the last seven quarters and see this part of our business continuing to contribute operating income in excess of 5% of revenue."
icon url

ReturntoSender

06/17/12 8:50 PM

#9808 RE: ReturntoSender #6755

From Briefing.com: Weekly Recap - Week ending 15-Jun-12

Dow +115.26 at 12767.17, Nasdaq +36.47 at 2872.80, S&P +13.74 at 1342.84

Coming off of its best week of 2012, the S&P 500 tacked on another 1.3% this week. Precarious conditions of Europe remained in focus, but so were economic data, weekend elections in Greece, and an upcoming Fed meeting.

Trade this past week opened in pessimistic fashion as market participants dropped the stock market for a loss of more than 1% upon considering that Spain’s request for $125 billion to shore up its banks might be too little, too late. In fact, Banco Santander had its rating cut by analysts at Fitch, while analysts at Moody’s downgraded Spain’s rating. The yield on the country’s 10-year Note went on to climb to a record high above 7.0% before easing back by the end of the week.

Market participants made note of a bailout request by Cyprus on Tuesday, but were less concerned about the country’s problems than those with larger economies – the Cyprus economy accounts for only 0.2% of eurozone GDP. Buyers eventually made their way back into the fold. Stocks benefited further from a late squeeze that helped the broad market settle at a session high with a gain greater than 1%.

Amid a dearth of corporate announcements Texas Instruments (TXN 27.86, +0.13) attracted positive attention for narrowing its earnings forecast to range from $0.38 to $0.42 per share after it had previously forecasted earnings of $0.36 to $0.44 per share.

In midweek trade stocks rolled over to suffer sizable losses. Financials had offered leadership as JPMorgan Chase (JPM 35.03, +0.38) CEO Jamie Dimon stated in a testimony to the Senate Banking Committee that he expects the bank to be solidly profitable in the current quarter, and that progress has already been made in reducing risk following the firm’s massive trading loss that received so much attention several weeks ago.

Prior to the stock market’s downturn participants had also attempted to shrug off lackluster retail sales, which declined during May by 0.2% when a 0.1% decline had been broadly expected. Excluding autos, retail sales declined by 0.4%, which contrasts with a Briefing.com consensus that called for no change. Prior month numbers were revised downward so that overall retail sales declined by 0.2% and sales less autos declined by 0.3%.

Producer price data for May featured a 1.0% increase in overall producer prices and a 0.2% increase in core producer prices. The Brieifng.com consensus called for a 0.7% decline in overall prices and a 0.2% increase in core producer prices. Consumer price data came the next day. Overall consumer prices declined during May by 0.3%, while core prices increased by 0.2%. Economists polled by Briefing.com had expected, on average, a decline in overall prices of 0.2%, but an increase in core prices of 0.1%.

Also out on Thursday was the latest weekly initial jobless claims count, which increased to 386,000 from 380,000 when a tally of 375,000 initial claims had been expected, on average, among economists polled by Briefing.com.

Despite the generally underwhelming nature of the data, sentiment strengthened as participants regarded it as possible fodder for the Fed to take accommodative action when it meets next week. Stocks were also helped by headlines purporting that central banks will respond with a coordinated effort, if necessary, after political elections are held in Greece this coming weekend. Those themes helped drive the stock market to a gain on the order of 1%.

In the face of broad market strength sharp losses were suffered by Nokia (NOK 2.48, +0.13) and Credit Suisse (CS 18.88, +0.91). Shares of the former plummeted in response to the company’s pessimistic profitability forecast, while the latter was hurt by concerns that the firm will move to raise new capital at the urging of officials.

The idea that disappointing data will help encourage the Fed to enact another round of quantitative easing remained a theme in the final session of the week. Short covering likely helped push the stock market up 1% to a one-month high, while the dollar declined to a three-week low.

The Empire Manufacturing Survey for June fell to 2.3 from 17.1 in the prior month. Many had expected the Survey to ease down to just 13.5. Also in play was the University of Michigan’s preliminary survey of consumer sentiment for June. The Survey fell to 74.1 from the 79.3, though it had been expected to come in closer to 77.0.

For most of the session Tech stocks provided leadership after a lackluster display in the prior session. As a group, Tech stocks scored a 1.4% gain. That was matched by Financials, which had traded with only a middling gain for most of the morning and early afternoon. The biggest bounce was booked by Energy, though; the sector rallied 1.8%.

Telecom stocks were at the opposite end of the spectrum. The defensive-oriented sector settled with a 0.1% gain.

The dollar had actually traded with moderate strength overnight, but ultimately drifted into the red so that by the stock market’s closing bell it was down about 0.6% against a basket of major foreign currencies. For the week the dollar declined more than 1%.The dollar’s decline on Friday was largely due to a stronger yen, such that the dollar-yen exchange rate fell 0.9% to about 78.7. The sterling pound also garnered buying interest; it advanced 1.0% to $1.57. The euro was up solidly overnight, but pulled back so that it was flat for most of Friday. By the closing bell it was up 0.2% to about $1.27.

The expiration of quarterly options drove share volume on the NYSE to far above average daily volume trends for the past several months.

Although participants displayed an increased tolerance for risk, Treasuries still benefited from healthy demand. In turn, the yield on the benchmark 10-year Note moved back below 1.60%.

Gold also gained. The yellow metal pushed up about 0.5% to a little more than $1628 per ounce. For the week it advanced more than 2%.

Crude oil prices oscillated on Friday before they settled with an incremental gain only pennies above $84 per barrel. The energy component's price slipped by only pennies from the prior week. As an aside, OPEC announced earlier this week that it plans to keep daily oil production at 30 million barrels.

Nasdaq 100 +1.2%. ..S&P Midcap 400 +1.0%. ..Russell 2000 +1.2%.
 
Index Started Week Ended Week Change % Change YTD %
DJIA 12554.20 12767.17 212.97 1.7 4.5
Nasdaq 2858.42 2872.80 14.38 0.5 10.3
S&P 500 1325.66 1342.84 17.18 1.3 6.8
Russell 2000 769.19 771.32 2.13 0.3 4.1

9:23AM Motorola Solutions to acquire Psion Plc. for $1.36 per share in cash (MSI) 47.37 : Co and Psion Plc. announced that they have agreed on the terms of a recommended offer by Motorola Solutions for all Psion shares for 88 pence ($1.36) in cash per Psion share. It is intended that the acquisition will be effected by way of a recommended cash offer. Psion has been a pioneer in ruggedized mobile computing products and their application in industrial segments around the world. Under the terms of the acquisition, Psion shareholders will receive 88 pence ($1.36) in cash for each Psion share through a recommended cash offer, valuing Psion's issued ordinary share capital at ~ GBP129 million ($200 million). The consideration represents a premium of ~ 45% to the closing price of 60.5 pence per Psion share on June 14, 2012, the last trading day prior to this announcement and a premium of ~ 66% to the six-month average price of 52.9 pence per Psion share prior to June 15, 2012. The acquisition is expected to close in the fourth quarter of 2012. Motorola Solutions expects to realize cost and revenue synergies resulting in margin expansion opportunities and expects the transaction to be accretive to earnings per share on a non-U.S. GAAP basis in the first full year following completion and on a U.S. GAAP basis in the second full year following completion.

Oppenheimer upgraded Nokia (NOK $2.41 +0.06) to Perform from Underperform noting as expected, Nokia announced sizable layoffs and lowered its 2Q12 outlook. Firm says the cost cuts buy Nokia more time to turn around its business without bleeding cash in the process. They still have doubts the changes would transform Nokia into a fast-moving differentiated OEM. And with competitive headwinds getting stronger, macro getting weaker, and Nokia's workforce distracted, they still see near-term risk in the shares. However firm says to short here means they have 100% conviction in W8 failure. To go long is to think the opposite. Right now they just don't know.

11:27 am Information Technology trading higher today along with the market

The tech sector is trading higher today, in line with gains in the broader market. Semiconductors are showing relative strength with the Philly Semi Index trading 0.9% higher. WFR (+4.6%) is a notable leader in that chip index. Among other major indices, the SPY, the QQQ, and the NASDAQ are all trading 0.6% higher on the session. Among tech bellwethers, ORCL (+2.2%) is showing notable strength, while QCOM (-1.4%) is under pressure again today. There were no notable names in tech to report earnings last night or this morning. In news, there are reports that DELL (-0.4%) is the 'strategic' $2.15 bln bidder for QSFT (-0.01%). Among rumors, we are hearing renewed takeover chatter on PMCS (+1.3%) and, separately, private equity interest in ASIA (+11.3%).

Among notable analyst upgrades this morning, Oppenheimer and Citigroup upgraded NOK (+4.7%), SAI (+3.2%) was upgraded to Overweight at JP Morgan, SINA (+0.9%) was upgraded to Buy at Credit Agricole, and ORCL (+2.3%) was upgraded to Buy at ThinkEquity While in downgrades, NOK (+4.7%) was downgraded to Neutral at Credit Suisse.
icon url

ReturntoSender

06/18/12 10:50 PM

#9811 RE: ReturntoSender #6755

From Briefing.com: 4:30 pm : Large-cap Tech helped lift the Nasdaq to a strong gain, but both the Dow and S&P 500 spent most of the session mired in choppy, lackluster trade.

Although Greece’s Athex 20 climbed more than 4% on Monday in response to early election polls that pointed to a preference for the country's pro-austerity party, market sentiment was generally softened by renewed worries related to precarious conditions in Spain. Such concerns dropped the country’s IBEX 35 for a 3% loss and took the yield on its 10-year Note back above 7%.

The notion that the Fed could announce another round of quantitative easing in a couple of days also did little to support broad market buying. It also failed to weaken the dollar. For the day, the dollar advanced about 0.4% against a basket of major foreign currencies. Most of that move was against the euro, which was down about 0.5% by the end of the trading day. Still, that’s only about half the size of the loss that the euro had suffered in the early going.

Gains by the greenback and concerns about softer demand sent oil prices to a new multi-month low of almost $82 per barrel this morning. The energy component managed to cut its loss so that it ended the day down 0.8% at $83.34 per barrel.

Lower oil prices combined with a downtrend in Energy shares took the Energy sector to a 0.8% loss today. No other sector performed as poorly.

Financials also acted as a drag, especially shares of diversified banks and financial services players. Altogether the Financial sector fell about 0.6%.

In contrast, a 0.6% gain by Tech made the sector second only to Consumer Discretionary in terms of performance. Large-cap Tech issues like Apple (AAPL 585.78, +11.65), eBay (EBAY 42.49, +1.82), and Google (GOOG 570.85, +6.34) were especially helpful in pushing the Nasdaq out in front of its two counterparts. However, not all Tech stocks were strong; aggressive selling against Hewlett-Packard (HPQ 21.05, -0.59) took the stock, which is not a Nasdaq member, back near its two-week low.

No corporate reports or economic data of consequence were released today. Monthly housing starts and building permits numbers will be released tomorrow morning.

Advancing Sectors: Consumer Discretionary +0.7%, Tech +0.6%, Materials +0.5%, Health Care +0.5%, Utilities +0.4%, Telecom +0.2%, Industrials +0.2%, Consumer Staples +0.2%
Declining Sectors: Financials -0.6%, Energy -1.0%DJ30 -25.35 NASDAQ +22.53 NQ100 +0.8% R2K +0.2% SP400 +0.8% SP500 +1.94 NASDAQ Adv/Vol/Dec 1275/1.58 bln/1253 NYSE Adv/Vol/Dec 1775/707 mln/1233

ARM (ARMH) Gemalto and Giesecke & Devrient announced the creation of a joint venture dedicated to delivering a secure, accessible environment for advanced services running on the growing range of connected devices. ACE today announces the launch of a new product line for its UK Property & Casualty portfolio.

Dell (DELL $16.59 -0.01) announced it has signed a definitive agreement to acquire Wyse Technology to extend its desktop virtualization offerings. The addition of Wyse will expand Dell's desktop virtualization capabilities and provide new solutions and services opportunities for the full range of Dell's enterprise offerings. The transaction was approved by the board of directors of each company and is expected to be accretive to Dell non-GAAP earnings in the second half of its Fiscal Year 2013. Additional terms of the transaction were not disclosed. The transaction remains subject to customary conditions and is expected to close in the second quarter of Dell's fiscal year 2013.

Canaccord's monthly channel checks indicated strong sales trends for Apple's (AAPL $607.09 +7.72) iPhone 4S at all three U.S. carriers and strong overall iPhone sales in international markets, with particular strength driven by the iPhone 4S launch at China Telecom (CHA) and Unicom (CHU). Firm maintains belief Apple is well positioned for strong C2012/13 sales and earnings growth driven by new product introductions, including the new iPad, the pending refresh of MacBook Air/Pro, an LTE iPhone likely in Q3/C2012, and potentially Apple TV exiting C2012.

12:46 pm Technology sector trading slightly higher today, and ahead of broader market

The tech sector is trading higher today, outpacing a roughly flat broader market. Semiconductors are also showing relative strength with the Philly Semi Index trading 1.1% higher. IDCC (+28.2%) is helping boost that chip index after its deal with INTC (+0.4%). Among other major indices, the SPY is trading 0.1% lower today, while the QQQ is up 0.5% and the NASDAQ is trading 0.4% higher on the session. Among tech bellwethers, FB (+5.2%) is showing notable strength, while ORCL (-3.1%) is under pressure.

There were no earnings reports of note this morning in the tech space.

In news, IDCC (+28.2%) announced that certain of co's subsidiaries have signed a definitive agreement to sell to INTC (+0.4%) roughly 1,700 patents and patent applications for $375 million in cash. The company also announced to double its share repurchase plan and reaffirmed Q2 revenue guidance.

Among rumors, we are hearing a finance deal circulating for CLWR (-3.4%).

Among notable analyst upgrades this morning, PAY (+5.7%) was upgraded to Buy at UBS. While in downgrades, RMBS (-6.7%) was downgraded to Neutral at JP Morgan.

There are no notable names in tech scheduled to report quarterly results today after the close. However, MSFT (-0.8%) is scheduled to hold an event this afternoon, at which many suspect will be related to a MSFT tablet.
icon url

ReturntoSender

06/19/12 10:25 PM

#9812 RE: ReturntoSender #6755

From Briefing.com: 4:30 pm : The stock market scored its third gain of at least 1% in four sessions and settled above its 50-day moving average for the first time in more than a month as market participants pushed the major averages higher ahead of tomorrow's highly anticipated FOMC policy statement and press conference with Fed Chairman Bernanke.

Amid persistent macro headwinds that have made for sluggish economic growth and precarious conditions across the eurozone there has been growing anticipation for some sort of additional stimulus measure to be unveiled by the FOMC tomorrow. Such a notion dropped the dollar by about 0.7% against a basket of major foreign currencies, although most of that came as the euro traded higher following a modest reduction in Spain's debt yields.

Defensive-oriented stocks were lackluster throughout the session. Most favor was given to Financials, which collectively climbed 1.7%. JPMorgan Chase (JPM 35.38, +0.76) CEO Jamie Dimon was back on Capital Hill to give a testimony to the House Financial Services Committee, but nothing was stated that deviated from comments made to the Senate Banking Committee last week.

There was only a dearth of other corporate announcements today. FedEx (FDX 91.01, +2.50) shares fell at the open of trade, but were quick to rally out of the red. The company posted an upside earnings surprise, but issued downside guidance. Oracle (ORCL 27.96, +0.84) had an in-line outlook on better-than-expected earnings.

Advancing Sectors: Materials +2.0%, Financials +1.7%, Energy +1.4%, Industrials +1.2%, Tech +1.0%, Health Care +1.0%, Consumer Discretionary +0.9%
Declining Sectors: Consumer Staples -0.1%, Utilities -0.2%, Telecom -0.2%DJ30 +95.51 NASDAQ +34.43 NQ100 +1.1% R2K +1.8% SP400 +1.1% SP500 +13.20 NASDAQ Adv/Vol/Dec 1903/1.82 bln/601 NYSE Adv/Vol/Dec 2565/771 mln/488

3:30 pm : Crude oil traded in positive territory for all of pit trade. It touched a session high of $84.73 per barrel and a session low of $83.86 per barrel by the afternoon. However, the energy component regained upward momentum to settle at $84.33 per barrel for a 0.9% gain. Meanwhile, natural gas struggled in negative territory for its entire pit session, plunging to a session low of $2.51 per MMBtu. A rally into the close pushed natural gas up to $2.55 per MMBtu, but that still made for a 3.0% loss.

After a positive open precious metals extended yesterday's losses, despite weakness in the dollar. Gold set a session high of $1631.90 per ounce as floor trade opened, but fell to a session low of $1618.10 per ounce in afternoon action. Its efforts to erase the loss proved unsuccessful, leaving gold to settle for a 0.2% loss at $1623.30 per ounce. Silver touched a session high of $28.79 per ounce, but found itself in the red by late morning action. It dipped to a session low of $28.27 per ounce before settling with a 1.0% loss at $28.37 per ounce.DJ30 +109.06 NASDAQ +35.40 SP500 +13.75 NASDAQ Adv/Vol/Dec 1910/1.46 bln/585 NYSE Adv/Vol/Dec 2575/495 mln/465

4:11PM Adobe Systems beats by $0.01, beats on revs; guides Q3 EPS in-line, revs below consensus; guides FY12 in-line (ADBE) 32.89 +0.26 : Reports Q2 (May) earnings of $0.60 per share, excluding non-recurring items, $0.01 better than the Capital IQ Consensus Estimate of $0.59; revenues rose 9.9% year/year to $1.12 bln vs the $1.11 bln consensus. Co issues mixed guidance for Q3, sees EPS of $0.56-0.61, excluding non-recurring items, vs. $0.61 Capital IQ Consensus Estimate; sees Q3 revs of $1.075-1.125 bln vs. $1.13 bln Capital IQ Consensus Estimate. Co issues in-line guidance for FY12, sees EPS of $2.40-2.46, excluding non-recurring items, from its prior targeted range of $2.38 to $2.48, vs. $2.44 Capital IQ Consensus Estimate. For fiscal year 2012, the company narrowed its annual revenue growth target to a range of six to seven percent, versus its prior target range of six to eight percent, and inline with consensus of +6.7%.

4:10PM FSI Intl beats by $0.04, reports revs in-line; guides Q4 revs below consensus (FSII) 4.44 +0.25 : Reports Q3 (May) earnings of $0.25 per share, $0.04 better than the Capital IQ Consensus Estimate of $0.21; revenues rose 98.3% year/year to $50.76 mln vs the $50.4 mln consensus. Co issues downside guidance for Q4, sees Q4 revs of $40-45 mln vs. $48.07 mln Capital IQ Consensus Estimate. "The company anticipates that fourth quarter orders will decline from the $41.8 million third quarter level. Despite the growing demand for 32/28nm devices, we believe that global economic uncertainty is causing customers to reassess their near-term capital spending. In addition, the scheduling of several facility construction and conversion plans is impacting the timing of capital equipment orders. Based upon the anticipated gross profit margin and the operating expense run rate, the company expects net income of $4.0 to $5.0 million for the fourth quarter of fiscal 2012. The company expects to generate cash from operating activities in the fourth quarter, as we continue to manage inventory and accounts receivable levels."

4:08PM Applied Materials names Gary Dickerson as President (AMAT) 11.17 +0.17 : Co announced the appointment of Gary Dickerson as president of the company, effective June 19, 2012. Mr. Dickerson brings more than 30 years of semiconductor industry experience, including recently as the chief executive officer of Varian Semiconductor Equipment Associates, which Applied Materials acquired in 2011.

4:06PM Jabil Circuit reports EPS in-line, revs in-line; guides Q4 EPS, revs below consensus (JBL) 19.42 +0.41 : Reports Q3 (May) earnings of $0.64 per share, in-line with the Capital IQ Consensus Estimate consensus of $0.64; revenues rose 0.5% year/year to $4.25 bln vs the $4.29 bln consensus. Co issues downside guidance for Q4, sees EPS of $0.54-0.66, excluding non-recurring items, vs. $0.67 Capital IQ Consensus Estimate; sees Q4 revs of $4.1-4.35 bln vs. $4.39 bln Capital IQ Consensus Estimate. "We are delighted with the outstanding performance of our Diversified Manufacturing Services sector overall and we are actively expanding our capacity in order to meet the growing demands of numerous customers and products. The ramp-up of new products, combined with specific customer challenges and muted end-markets give us plenty to focus on in the fourth fiscal quarter. We believe success in the fourth quarter will set the stage for a brisk fiscal 2013 and a continuation of record setting years."

4:02PM Integrated Device announces extension of exchange offer expiration date in PLX Technology (PLXT) transaction (IDTI) 5.41 -0.04 : Co announced that it is extending the expiration date of its exchange offer for all outstanding shares of common stock of PLX Technology (PLXT). The exchange offer was previously scheduled to expire at the end of the day on June 20, 2012, at 12:00 midnight, New York City time. The exchange offer is being extended as the applicable waiting period pursuant to the Hart-Scott-Rodino Antitrust Improvements Act of 1976 has not yet expired or been terminated, and the exchange offer is now set to expire at the end of the day on July 12, 2012, at 12:00 midnight, New York City time, unless further extended. Approximately 5.8 million shares, or approximately 13.0% of PLX's outstanding common stock, had been tendered as of 12:00 midnight at the end of the day on June 18, 2012.

11:30AM Dell awarded 10 year National Institutes of Health CIO-SP3 contract vehicle with $20 bln ceiling (DELL) 12.32 -0.10 : Co announced it was chosen as one of the prime recipients by the National Institutes of Health's (NIH) Information Technology Acquisition and Assessment Center (NITAAC) for their Chief Information Officer - Solution and Partners 3 (CIO-SP3) contract. CIO-SP3 is a multiple award Government Wide Acquisition Contract (GWAC) with a ceiling value of $20 billion. The 10-year indefinite-delivery indefinite-quantity (IDIQ) contract offers IT support for Federal Enterprise Architecture, the Federal Health Architecture and the Department of Defense Department Enterprise Architecture. Under this contract, Dell has the opportunity to deliver a wide range of services, including software development, enterprise management systems, digital government, critical infrastructure protection and information assurance, integration services, IT operations and maintenance, outsourcing, imaging, CIO support, and IT services for biomedical research, health sciences, health care and general IT.

SanDisk (SNDK) announced a mobile memory card for smartphones and tablets with up to 95MB/sec read and up to 90MB/sec write speeds.

NVIDIA (NVDA) announced that the SAGA system, India's most powerful supercomputer and the holder of the 85 position on the Top500 list released yesterday, is leveraging NVIDIA GPUs to dramatically improve the design and analysis of the delivery vehicles critical to the nation's space program.

12:33AM Microsoft unveils Window based tablets 'Surface' (MSFT) 29.84 : Co introduces 2 models of Surface will be available: one running an ARM (ARMH) processor featuring Windows RT, and one with a third-generation Intel (INTC) Core processor featuring Windows 8 Pro. Co states Surface will be a premium way to experience all that Windows has to offer. Surface for Windows RT will release with the general availability of Windows 8, and the Windows 8 Pro model will be available about 90 days later. Both will be sold in the Microsoft Store locations in the U.S. and available through select online Microsoft Stores. Suggested retail pricing will be announced closer to availability and is expected to be competitive with a comparable ARM tablet or Intel Ultrabook-class PC. OEMs will have cost and feature parity on Windows 8 and Windows RT.

09:42 am Oracle shares rise 5% following surprise early earnings release; company beat by 4 cents
Oracle (ORCL $28.59 +1.46) reported fourth quarter earnings of $0.82 per share, $0.04 better than the Capital IQ consensus of $0.78, while revenues rose 1% year/year to $11.0 billion versus the $10.88 bln consensus. "Our record-breaking fourth quarter featured several all-time highs for Oracle: new software license sales of $4 billion, total software revenue of $8 billion, total revenue of $11 bln, and EPS of 82 cents." The company also announced that its Board of Directors authorized the repurchase of up to an additional $10.0 bln of common stock under its existing share repurchase program in future quarters.

09:40 am Microsoft shares rise by 2% following introduction of Surface tablet

Microsoft (MSFT $30.46 +0.62) introduced 2 models of Surface will be available: one running an ARM (ARMH) processor featuring Windows RT, and one with a third-generation Intel (INTC) Core processor featuring Windows 8 Pro.

The company states Surface will be a premium way to experience all that Windows has to offer. Surface for Windows RT will release with the general availability of Windows 8, and the Windows 8 Pro model will be available about 90 days later. Both will be sold in the Microsoft Store locations in the U.S. and available through select online Microsoft Stores. Suggested retail pricing will be announced closer to availability and is expected to be competitive with a comparable ARM tablet or Intel Ultrabook-class PC. OEMs will have cost and feature parity on Windows 8 and Windows RT.

Oracle (ORCL $28.65 +1.54) reported fourth quarter earnings of $0.82 per share, $0.04 better than the Capital IQ consensus of $0.78, while revenues rose 1% year/year to $11.0 billion versus the $10.88 bln consensus. "Our record-breaking fourth quarter featured several all-time highs for Oracle: new software license sales of $4 billion, total software revenue of $8 billion, total revenue of $11 bln, and EPS of 82 cents." The company also announced that its Board of Directors authorized the repurchase of up to an additional $10.0 bln of common stock under its existing share repurchase program in future quarters.

Autodesk (ADSK $34.43 +0.79) reaffirmed guidance for the second quarter with EPS of $0.46-0.51 versus the $0.49 Capital IQ Consensus and revenues of $580-600 million versus the $593.84 million consensus. The company reaffirmed guidance for fiscal year 2013 with revenues of up at least 10% to $2.438 billion versus the $2.43 billion consensus. The company also anticipates fiscal 2013 GAAP operating margin to increase by approximately 120 basis points and non-GAAP operating margin to increase by approximately 200 basis points compared to fiscal 2012. The company announced that its Board of Directors has approved the repurchase of up to 30 mln shares of the co's common stock, in addition to the approximately 12 mln shares that remained at the end of the first quarter of fiscal 2013 under previously authorized share repurchase programs. The repurchase plan provides Autodesk with the authorization to cover dilution and reduce shares outstanding over time.

Microsoft (MSFT $30.53 +0.69) introduced 2 models of Surface will be available: one running an ARM (ARMH) processor featuring Windows RT, and one with a third-generation Intel (INTC) Core processor featuring Windows 8 Pro. Co states Surface will be a premium way to experience all that Windows has to offer. Surface for Windows RT will release with the general availability of Windows 8, and the Windows 8 Pro model will be available about 90 days later. Both will be sold in the Microsoft Store locations in the U.S. and available through select online Microsoft Stores. Suggested retail pricing will be announced closer to availability and is expected to be competitive with a comparable ARM tablet or Intel Ultrabook-class PC. OEMs will have cost and feature parity on Windows 8 and Windows RT.

ISI notes the Microsoft (MSFT $30.53 +0.69) new tablet, named Surface, will come in two models (e.g., Windows RT and Windows 8 Pro) and Microsoft's suggested pricing would be competitive with comparable tablets. From a hardware perspective, ISI believes key differentiators for both tablets will be their VaporMg cover/keyboard (adds ~3.5mm thickness) which also serves as a full multi-touch keyboard and connectivity options (e.g., USB port, microSD, etc.) While ISI believes Surface will appeal to users looking for a Windows tablet capable of running Windows-based productivity software (e.g., Office, Photoshop, etc.), firm does not see it altering competitive dynamics in the tablet market. In ISI's view, AAPL's unparalleled ecosystem (e.g., 225k+ iPad apps, iCloud, iTunes, etc.) provide a sustainable advantage and remain comfortable with its CY12 and CY13 iPad estimates of 64.3mil and 80.0mil units.

09:10 am Celestica downgraded to Hold at Argus: . Argus downgrades CLS to Hold from Buy noting the co will wind down its manufacturing relationship with Research in Motion, which accounted for 19% of 1Q12 revenue, by the end of 2012. Firm says the loss of this business will deny Celestica a big seasonally inflected finish to 2012 and result in negative revenue comparisons through at least 2Q13. With the loss of RIM, Celestica will also return to a disproportionate reliance on legacy EMS services, where margins are thin and in some cases declining.
icon url

ReturntoSender

06/21/12 8:12 PM

#9813 RE: ReturntoSender #6755

From Briefing.com: 4:30 pm : Aggressive, broad-based selling drove the stock market lower for its worst single-session loss since December, eating into the heady gains that had been scored during the course of the four sessions leading up to a series of Fed announcements made yesterday.

Only one day ago did the Fed announce its intent to extend “Operation Twist” into the end of the year and unveil a reduced economic forecast, playing a part in the prior session's lackluster finish. Market participants were given little reassurance about prospects abroad today, though. China posted another decline in its PMI manufacturing report, which pointed to the eighth consecutive month of contraction. Germany, Europe’s most diverse and robust economy, also posted a disappointing number that pointed to tighter activity, but activity in France proved stronger than what had been anticipated.

Domestic data featured a Flash PMI Manufacturing of 52.9 – the worst reading in 11 months. Worse still, the Philadelphia Fed Survey fell unexpectedly to -16.6 for June, registering its worst reading since August 2011.

Existing home sales were less jarring. They set an annualized rate of 4.55 million units during May. That is in stride with the rate of 4.56 million units that had been generally expected among economists surveyed by Briefing.com. However, the pace for May is down from the prior month rate of 4.62 million units.

Leading Indicators for May proved pleasing. They increased by 0.3%, which is better than the flat reading that had been widely forecasted to follow the 0.1% decline in the prior month.

No sector was able to avoid the sell-off. Losses ranged from a 0.7% slide by the defensive-oriented Telecom sector to the Energy sector’s 4.0% tumble.

Energy’s outsized loss was owed to a combination of broad market weakness and a sharp drop in oil prices amid demand concerns. Crude oil notched a new 2012 low of $77.96 per barrel for the August contract before it settled with a 3.9% loss at $78.26 per barrel.

While stocks settled at session lows with steep losses, the Volatility Index ended the day near its high with a gain of about 15.5%. It only recently registered a monthly low.

Treasuries traded with relatively limited gains, despite such pronounced weakness among stocks. Buying in the benchmark 10-year Note took its yield back near 1.6%. As an aside, Spain also saw its debt yields ease back so that its 10-year issue carried a yield of a little more than 6.5%.

The greenback garnered strong interest. By session’s end it was up almost 1.0% against a basket of major foreign currencies, namely the euro and the sterling pound.

The dollar’s advance likely exacerbated selling among precious metals. Gold closed with a 3.1% loss at $1565.90 per ounce, just above its session low of $1564.80 per ounce. Silver tumbled to a new multi-month low of $26.80 per ounce for the July contract before it settled pit trade at $26.86 per ounce for a 5.4% loss.

Advancing Sectors: None
Declining Sectors: Energy -4.0%, Materials -3.3%, Tech -2.6%, Financials -2.3%, Consumer Discretionary -2.2%, Industrials -2.1%, Health Care -1.4%, Consumer Staples -1.2%, Utilities -1.0%, Telecom -0.7%DJ30 -250.82 NASDAQ -71.36 NQ100 -2.5% R2K -2.5% SP400 -2.7% SP500 -30.18 NASDAQ Adv/Vol/Dec 516/1.77 bln/1973 NYSE Adv/Vol/Dec 571/865 mln/2470

3:30 pm : Soured sentiment in the stock market and a series of economic reports that included weak PMI manufacturing numbers from abroad and a disappointing Philadelphia Fed Survey weighed heavily on most of the commodity complex today. The resulting 2.1% drop for the CRB Index was its worst one-day loss since December.

In particular, crude oil extended its descent to a new 2012 low of $77.96 per barrel for the August contract before it settled with a 3.9% loss at $78.26 per barrel. Natural gas, however, popped to a floor session high of $2.63 per MMBtu and settled with a 2.4% gain at $2.58 per MMBtu, despite a weekly inventory build that was greater than what had been widely expected.

Precious metals were under stiff selling pressure during their pit sessions. Efforts were likely exacerbated by a stronger dollar, which was recently up as 0.9% against a basket of major foreign currencies. Gold extended its overnight slide as it fell deeper into negative territory, closing with a 3.1% loss at $1565.90 per ounce, just above its session low of $1564.80 per ounce. Silver tumbled to a new multi-month low of $26.80 per ounce for the July contract before it settled pit trade at $26.86 per ounce for a 5.4% loss.DJ30 -221.06 NASDAQ -65.31 SP500 -26.23 NASDAQ Adv/Vol/Dec 520/1.29 bln/1940 NYSE Adv/Vol/Dec 595/495 mln/2400

1:02PM Rudolph Tech acquires NanoPhotonics; acquisition is expected to be accretive within first 12 months (RTEC) 8.61 -0.20 : Co announced that it has acquired the assets of NanoPhotonics GmbH, Mainz, Germany. The addition of NanoPhotonics' inspection technology and its substantial intellectual property portfolio will strengthen Rudolph's established presence in the high-growth advanced packaging market. "NanoPhotonics is profitable and the acquisition is expected to be accretive within the first 12 months. It will add approximately $2 million per quarter to our overall revenues and will not have a material effect on our second quarter results." While terms were not disclosed, Rudolph noted that this all-cash transaction used less than five percent of the Company's overall cash. Rudolph plans to maintain and expand a technology center in Mainz, Germany as operations are integrated into the Company.

11:45AM Methode Electronics and AgileSwitch announce marketing and technology partnership (MEI) 7.81 -0.17 : Co and AgileSwitch announced a marketing and technology partnership. As part of this agreement, AgileSwitch will provide IGBT gate drives which provide the highest performance for energy conversion inverters and systems. Methode Electronics' Power Solution Group will supply bus bar architectures and thermal management solutions in combination with local design capabilities and global manufacturing. Together, the two companies are creating fully integrated sub-system solutions for the power electronics industry.

Applied Micro Circuits (AMCC) announced the opening of its new Bangalore design center.

7:05AM Ramtron: Cypress Semiconductor (CY) commences tender offer for Ramtron International for $2.68 per share in cash (RMTR) 2.75 : Co announced that it has commenced a tender offer to acquire all of the outstanding common stock of Ramtron International (RMTR) for $2.68 per share in cash. This represents a 48% premium over Ramtron's closing price of $1.81 per share on June 11, 2012, the day before Cypress (CY) publicly disclosed its offer for Ramtron, and a significant increase to Cypress's prior offer. The offer and withdrawal rights will expire at 12:00 midnight, New York City time, on July 19, 2012, unless the offer is extended

Micron (MU $5.86 -0.27) reported a third quarter loss of $0.32 per share, $0.12 worse than the Capital IQ Consensus of ($0.20), while revenues rose 1.5% year/year to $2.17 billion versus the $2.01 bln consensus. Revenues from sales of DRAM products in the third quarter of fiscal 2012 were 20% higher due primarily to a 12% increase in sales volume and a 7% increase in average selling prices compared to the second quarter of fiscal 2012, which included the adverse impact of a $58 million charge to revenue. Revenues from sales of NAND Flash products were slightly higher in the third quarter of fiscal 2012 compared to the second quarter of fiscal 2012, due primarily to an approximate 40% increase in sales volume offset by decreases in average selling prices. Sales of NOR Flash products were approximately 10% of total net sales for the third quarter of fiscal 2012. The company's consolidated gross margin of 11% in the third quarter of fiscal 2012 was slightly higher than the second quarter of fiscal 2012. Improvements in margins from sales of DRAM and NOR Flash products were partially offset by declines in margins from sales of NAND Flash products.

Red Hat (RHT $52.48 -3.96) reported first quarter earnings of $0.30 per share, excluding non-recurring items, $0.03 better than the Capital IQ Consensus of $0.27, while revenues rose 18.9% year/year to $314.7 million versus the $310.74 million consensus. Subscription revenue for the quarter was $272.6 million, up 21% year-over-year.

Argus initiated Facebook (FB $32.31 +0.71) with a Hold saying while the company has become the giant of the social networking business, its botched IPO has raised a number of concerns about its business model. Management has begun to address questions regarding the efficacy of advertising on Facebook, though it is still unclear how it will monetize the fast growth in mobile access.

09:40 am RedHat shares fall over 5% following disappointing earnings
Red Hat (RHT $52.81 -3.71) reported first quarter earnings of $0.30 per share, excluding non-recurring items, $0.03 better than the Capital IQ Consensus of $0.27, while revenues rose 18.9% year/year to $314.7 million versus the $310.74 million consensus. Subscription revenue for the quarter was $272.6 million, up 21% year-over-year.

09:38 am Micron shares fall 3% following disappointing earnings

Micron (MU $5.93 -0.19) reported a third quarter loss of $0.32 per share, $0.12 worse than the Capital IQ Consensus of ($0.20), while revenues rose 1.5% year/year to $2.17 billion versus the $2.01 bln consensus. Revenues from sales of DRAM products in the third quarter of fiscal 2012 were 20% higher due primarily to a 12% increase in sales volume and a 7% increase in average selling prices compared to the second quarter of fiscal 2012, which included the adverse impact of a $58 million charge to revenue.

Revenues from sales of NAND Flash products were slightly higher in the third quarter of fiscal 2012 compared to the second quarter of fiscal 2012, due primarily to an approximate 40% increase in sales volume offset by decreases in average selling prices. Sales of NOR Flash products were approximately 10% of total net sales for the third quarter of fiscal 2012. The company's consolidated gross margin of 11% in the third quarter of fiscal 2012 was slightly higher than the second quarter of fiscal 2012. Improvements in margins from sales of DRAM and NOR Flash products were partially offset by declines in margins from sales of NAND Flash products.
icon url

ReturntoSender

06/23/12 7:31 PM

#9815 RE: ReturntoSender #6755

From Briefing.com: Weekly Recap - Week ending 22-Jun-12The stock market ended the week 0.6% below where it began. That is really the result of a dramatic one-day drop, though.

Broad market trade began the week in a relatively choppy, lackluster manner. Participants generally shrugged off news that early election polls in Greece pointed to a preference for the country's pro-austerity party. The apparent indifference came as precarious conditions in Spain took the yield on the country’s 10-year Note back above 7%.

Stocks advanced 1% on Tuesday for their strongest performance of the week as market participants prepared for announcements from the Fed scheduled for the following day. The effort gave the stock market its first finish above its 50-day moving average in more than a month.

Data featured a housing starts number for May that hit an annualized rate of 708,000, which is a little light relative to the rate of 719,000 that had been generally expected. However, the prior month figures were revised upward to reflect an annual rate of 744,000 housing starts.

Building permits climbed from the prior month's upwardly revised rate of 723,000 to 780,000 for May to best the pace of 725,000 that had been expected, on average, among economists polled by Briefing.com.

Although most of the market’s focus was on forthcoming Fed commentary, JPMorgan Chase (JPM 35.99, +0.48) CEO Jamie Dimon provided participants with some theater by returning to Capitol Hill for a testimony to the House Financial Services Committee. Nothing was stated that deviated from comments made to the Senate Banking Committee last week. FedEx (FDX 90.54, -0.09) posted an upside earnings surprise, but issued downside guidance, while Oracle (ORCL 28.00, +0.19) had an in-line outlook on better-than-expected earnings.

On Wednesday it was all about the Fed. The latest FOMC Directive moved to extend "Operation Twist" through the end of the year in an effort to extend the average maturity of the Fed's securities holdings. Fed Chairman Bernanke stated that additional asset purchases would be considered by the Fed if necessary, but many participants had hoped for more from the Fed this time around, especially in light of the Fed’s lackluster forecast for 2012.

The Fed now expects real GDP growth for 2012 to range from 1.9% to 2.4%, down from the range of 2.4% to 2.9% that was previously projected. Unemployment for 2012 is now expected to range from 8.0% to 8.2%, which is up from the previously forecasted range of 7.8% to 8.0%.

Corporate news was overshadowed, though it featured a disappointing forecast from Procter & Gamble (PG 59.83, +0.08) and word that JPMorgan Chase exited some 65-70% of its losing position. Discover Financial (DFS 33.61, +0.16) served up in-line earnings and guidance that helped earn it favorable reviews from a few analysts.

Perhaps it was a delayed response to the Fed’s Directive and forecast, or maybe it was disappointing economic data, but stocks fell more than 2% on Thursday for their worst single-session slump since December.

Prior to the open market participants learned that China’s PMI manufacturing report pointed to an eighth consecutive month of contraction. Germany, Europe’s most diverse and robust economy, also posted a disappointing number that pointed to tighter activity. Domestic data featured a Flash PMI Manufacturing of 52.9 – the worst reading in 11 months. The Philadelphia Fed Survey fell unexpectedly to -16.6 for June. It was its worst reading since August 2011.

Existing home sales set an annualized rate of 4.55 million units during May, as had been generally expected, but the pace was stronger in the prior for month when it registered a rate of 4.62 million units. Leading Indicators for May increased by 0.3%, which is better than the flat reading that had been widely forecasted to follow the 0.1% decline in the prior month.

On Friday stocks fought to recover some of their prior session losses. The effort concluded with the three major equity averages at or near session highs with varied gains. The Nasdaq outperformed its counterparts with help from some large-cap Tech players. Blue chips fared less well, hampering the Dow.

Headlines were relatively light, but news that analysts at Moody’s downgraded credit ratings several banks created some buzz. Despite the action, shares of banks and diversified financial services players attracted buyers, such that the KBW Bank Index climbed in excess of 1%.

All 10 major sectors settled in positive territory. Utilities were at the bottom end of things as market participants showed little interest for the defensive-oriented sector. It advanced just 0.1%.

Small-cap stocks scored particularly strong gains, as measured by the Russell 2000, which settled higher by about 1.4%. The annual reconstitution of the Russell Indices took place today.

Volatility cooled considerably amid the generally improved tone. In fact, the Volatility Index fell about 10% after it had spiraled higher in the prior session.

Nasdaq 100 +1.1%. ..S&P Midcap 400 +0.6%. ..Russell 2000 +1.4%.
 
Index Started Week Ended Week Change % Change YTD %
DJIA 12767.17 12640.78 -126.39 -1.0 3.5
Nasdaq 2872.80 2892.42 19.62 0.7 11.0
S&P 500 1342.84 1335.02 -7.82 -0.6 6.2
Russell 2000 771.32 775.16 3.84 0.5 4.6

8:31AM Sanmina-SCI calls for redemption of 8.125% senior subordinated notes due 2016 (SANM) 7.21 : Co is calling for redemption on July 23, 2012 all of its 8.125% Senior Subordinated Notes due 2016 (the "Notes"). The aggregate principal amount of the Notes currently outstanding is $150.0 million. The CUSIP number for the Notes being called for redemption is 800907 AK3. Upon redemption, holders of the Notes being redeemed will receive $1,027.08 per $1,000 principal amount of Notes, plus accrued and unpaid interest on the Notes being redeemed to, but excluding, the redemption date. The redemption is anticipated to be funded through borrowings under the Co's credit facilities and other financings.

8:30AM First Solar reports LA County Approves the co to Start Module Installation at AV Solar Ranch One (FSLR) 14.67 : The Los Angeles County Department of Public Works and FSLR have reached an agreement on the installation of solar modules at the Solar Ranch One photovoltaic (PV) power plant currently under construction in the Antelope Valley. The agreement enables First Solar to continue construction activities of the 230-megawatt power plant that, when completed in 2013, will generate enough electricity to power 75,000 homes. Installation of the modules had been delayed while First Solar and Public Works worked to achieve agreement related to the module code certifications.

Ubiquiti Networks (UBNT $13.63 +0.26) announced that on June 20, the U.S. federal court for the Northern District of California granted the Company's application for a temporary restraining order enjoining Kozumi USA Corp. and its owner Shao Wei (William) Hsu and anyone in active concert or participation with them from: 1) using in any manner any registered trademark owned by Ubiquiti, or any name or mark that wholly incorporates or is confusingly similar to Ubiquiti's trademarks; 2) moving, destroying, or otherwise disposing of any items confusingly or deceptively similar to Ubiquiti's products and that bear any of Ubiquiti's trademarks; 3) moving, destroying or otherwise disposing of any records or documents containing information related to the manufacturing, distributing, delivering, shipping, importing, exporting, marketing, promoting, selling or otherwise offering for sale of items that bear any of Ubiquiti's trademarks; 4) assisting, aiding or abetting any other person or business entity in engaging in or performing any of the above activities. The Company had filed a lawsuit seeking to stop the illegal counterfeiting of its products by a counterfeiting ring led by Kozumi and Hsu.

ISI Notes, NetApp (NTAP $29.71 +0.16) will host its 2012 Financial Analyst Day next week June 26. The firm expects a discussion of overall market trends, NTAP's competitive positioning and technology differentiation. The firm's key expectations for the event include: 1) clarity around Jul-12 guidance which the firm views as overly conservative, 2) Data ONTAP 8.1 adoption, particularly in scale-out environments and 3) competitive positioning vs. larger storage vendors. They do not expect NTAP to provide full-year guidance in light of macro uncertainty.

Argus notes Motorola Solutions (MSI $47.38 -0.11) is acquiring Psion plc, a maker of ruggedized computers, to broaden its geographic reach and add customers and technology to its enterprise business. Ruggedized computing accords with Motorola Solutions' enterprise products and may have some application in the first-responder or even military market. Psion's purchase price of $200 million does not represent an enormous cash drain or risk for Motorola Solutions.

10:04 am The tech sector is trading higher today, in line with gains in the broader market. Semiconductors ar
The tech sector is trading higher today, in line with gains in the broader market. Semiconductors are also showing relative strength with the Philly Semi Index trading 0.9% higher. NXPI (+4.8%) is a notable leader in that chip index. Among other major indices, the SPY is trading 0.4% higher today, while the QQQ and the NASDAQ are trading 0.4% higher on the session. Among tech bellwethers, FB (+3.3%) is showing notable strength.

It has been a quiet morning in the tech space with no news or earnings of note.

Among notable analyst upgrades this morning, GLW (+0.5%) was upgraded to Neutral at JP Morgan. While in downgrades, EA (+0.1%) was downgraded to Neutral at Citigroup.

icon url

ReturntoSender

06/24/12 12:03 PM

#9816 RE: ReturntoSender #6755

InvestmentHouse Weekend Market Update by Jon Johnson

http://www.investmenthouse.com/weekendmarketsummary.htm

- Stocks answer Thursday with a solid, albeit modest in comparison, rebound.
- Indices up but still below key levels after the Thursday selloff.
- Commodities bounce, but it is weak, much weaker than stocks overall.
- Friday was light on data but what was out there was not positive.
- A western hemisphere economic power and China agree not to use dollars.
- Recent leadership, big name leaders still look quite savory.
- Earnings results and warnings are upon us and the early tabulations leaning heavily toward misses.
- Stocks bounce, still look good for an upside move, just need the leaders to keep their patterns moving.

Close but no cigar. A good bounce Friday in response to the selloff, but still hills to climb.

Stocks rebounded on Friday after the Thursday gut punch. It was a solid and credible rebound, although it paled in comparison to the selloff on Thursday. Moreover, NASDAQ and the SP500 failed to take out the 50 day EMA. SP500 failed to recapture the range it had on Tuesday but gave up on Thursday. NASDAQ just cracked above the range of resistance but failed at the 50 day EMA. Close but no cigar. I am not talking about the infamous Bill Clinton cigar; I am talking about Big Jake, the John Wayne and Richard Boone movie. John Wayne looked as if he was beaten, and Richard Boone said, "Close but no cigar, mister," referring to the fact that John Wayne almost pulled it off. Of course the Duke made the comeback, rescued the kid, got the gold back, and just about righted all the wrongs in the world. Your typical John Wayne movie.

The day may have been close but no cigar, but it did what it needed to do. In the face of that Thursday selloff, stocks rebounded and put in a credible move. More than that, the stocks we have been watching in the biotech area, drugs in particular, and the household name-brand leaders which started to lead the market back to the upside did pretty well. Looking at biotech, NKTR bounced to the upside on a good volume surge. That might have something to do with the Russell rebalance on the day. At the end of the day the Russell indices were rebalanced, and that caused a lot of buying and selling of stocks within those indices based upon their valuation increases or decreases. That ramped up the volume on the session similar to an expiration volume.

We did see good moves in the biotech drugs. We also saw the good moves in other stocks that have been leading the move but that took a hit on Thursday. CMG bounced where it needed to off near support. PCLN held the line where it needed to and bounced. These are not huge moves, but they are doing what they need to. ISRG had a nice bounce to the upside off of the test. That is exactly what we needed to see happen, and it bodes well for the attempt to continue this move off of the Thursday selling.

On Thursday night I stuck my neck out and said I still believe the market would try to rally again before any major selloff to the downside. It still feels that the Fed has to announce some kind of Quantitative Easing or further liquidity stimulus, so I think we will get that rally to the upside. It is just a question of how far it will go. I do not think it will break into new high territory; I think it will just test them. That will probably be it. Then the market turns back over and starts selling toward a late summer/early fall US economic recession. Glum news for a Friday, but you have to call it as you see it. Otherwise you get blindsided or the old Field of Dreams "in your ear."

Looking at the intraday chart, there is something of a parabolic move from the Thursday selloff into the Friday rally, but it is quite lopsided. The moves upside on Friday are nowhere compared to the downside slump on Thursday. Nonetheless, stocks put in a somewhat choppy morning but found their footing at lunch. Then they rallied nicely into the close, putting in a decent move and completing the week doing what it had to do. That was to come back against that Thursday break higher.

SP500, +0.72%; NASDAQ, +1.17%; Dow, +0.53%; SP600, +1.28%; SOX, +1.59%.

On any other day, those would be very good numbers. Juxtaposed against the Thursday 2%+ selloff, however, they do not look that stellar. The indices and individual stocks did what they needed to do, and that was to bounce some from the Thursday selling. The question is whether they will continue the move into next week or run out of juice. They are at a critical level. We saw SP500 at the 50 day EMA, bumping up against that important level. Lots of work to do, but at least it gave itself the chance to do it. That is what counts, at least for Friday.

There was not a lot of news on Friday. What was out there was not that positive. German business confidence hit a two-year low and was down for the second month straight. We also have to remember that the various and sundry banks were downgraded on Thursday evening by Moody's. But they had a decent day. BAC tapped its 50 day EMA on the low and rebounded with a decent gain. Financials overall did quite well. MA had an outstanding move. You have a double bottom with handle on the lower trendline of its ascending channel. It broke nicely to the 50 day EMA.

There was not an overall negative reaction to the downgrades. As I said on Thursday, that could mean the bottom for financials for now as they rally to the upside with the overall market bouncing. It does not mean they will continue the move and break to new highs, but it very well could mark the bottom for this round of selling. They look pretty good.

Earnings misses and warnings in all the wrong places.

Darden Restaurants miss on earnings, same store sales, lower guidance.

Olive Garden chefs sample the sauce.
'It needs something . . . '
'Yeah, someone to eat it.'

Other news out there was bothersome. It is that string of earnings and warnings that we have seen. DRI (Olive Garden and Red Lobster) missed on earnings. Same store sales were quite low, and it lowered its guidance. In the picture of Olive Garden chefs sampling the sauce, one says, "It needs something." The other says, "Yeah, someone to eat it." Apparently do not have as much traffic at the stores as consumers feel the pinch of zero wage growth. It is actual negative wage growth when adjusted for inflation. They have used their savings; they have taken what they could from their houses, and now their houses are worth much less. Their wages just are not growing to keep up with prices.

You can only spend for so long when you are spending at a deficit, particularly when you cannot get credit. We have tons of potential liquidity, but it is similar to Tantalus in Greek mythology. He could not reach the grapes or apples, and when he bent down to try to quench his thirst with water, it receded below him. Of course there was the classic Star Trek "Dagger of the Mind" on the Tantalus colony.

We have tons of liquidity. We do not have a liquidity problem in the world and in the United States; we have an inability to reach the liquidity. Mortgage lending standards are too high. Lending standards to small businesses are too high. That is always the case whenever we try to come out of a recession. The banks, financial agencies, and overseers learn their lesson after the cows have left the barn. They make standards tough after we have crashed and when we need the money.

I have talked to several small businesses, and WFC has contacted them recently about small loans. Many of them said, "We tried to get a small loan from you a year or two ago, but you turned us down." The people from WFC act astounded that that could have possibly happened. That is just the way it is. They say one thing, but you cannot get the money. We have heard this over and over again. Thus our economy stumbles along. There is no money if you want it, and there is the uncertainty with the debt crisis, the fiscal crisis, the tax crisis, and with the health care tax crisis. Small businesses just do not feel that confident with hiring. Is there any wonder there is no hiring? You can see it. You want it but you cannot have it. That is kind of like the President. He does not understand why businesses will not hire when the ones apparently seem to have the money.

Getting back to the market, the indices did what they had to do, albeit not in a spectacular move that took back key levels.

OTHER MARKETS.

Dollar. 1.2560 versus 1.2557 euro. The dollar was about flat on the session, losing a bit of ground. It was up and then down. It closed losing just a bit of ground, basically flat on the day. It was a big move on Thursday. Why? Because no Fed intervention and no cheapening of the money. Therefore it recovered some of the losses of the prior three weeks.

Bonds. 1.67% versus 1.61% 10 year US Treasury. Big losses as bonds fell below the 20 day EMA. They did remain in the three week lateral move. Not too much of an issue. The thing is, if there is no worry in the rest of the world, there is no need to run to safety in the US Treasury market. If there is fear, you will see treasuries rally and yields decline. There was not too much fear out there on Friday. There was not too much fear of the Fed buying either as bonds gave up fairly substantial ground on the 10 year.

Gold. 1,566.80, -1.30. Gold was utterly pounded on Thursday. It managed the most modest of rebounds, showing a doji right at the close from Thursday. It may very well be a continuation doji; in other words, it continues lower. Although the gold price is down four straight sessions, and perhaps after a selloff near the bottom of the range, it would be ripe for a rebound.

This all depends on what the Fed will do with the dollar. If it wants to gut the dollar with more Quantitative Easing, then gold will surge. Many people anticipate that gold will surge higher. The problem is the interim. What will it do? I will say that gold is safe inside the range that has formed off of the mid-May low.

Oil. 79.73, +1.53. Oil rebounded. It was beaten badly on the week, falling sharply on Thursday and Friday. It did manage to break through a support level that extends back to the summer of 2011. It rebounded on Friday, but it was unable to take back that level. The indices were unable to take back certain key levels that they gave up after they just took them on Tuesday. So they really did not want them. No follow-through. I will talk about that in the charts.

We will look at what happens to oil next week. It has rebounded up to resistance after breaking below the bottom of its two and a half week range, a range that looked quite solid. The bottom caved and it is testing now. What are the odds that it will break higher? Not much, particularly if the dollar remains relatively strong on no Quantitative Easing. If the dollar breaks, we could see oil rebound. As the dollar falls, it takes more dollars to buy every barrel of oil.

More on the dollar: Brazil and China agree to a currency swap.

For this discussion, please see the Video Market Summary.
Market Overview Video

Here's to the renmimbi. Brazil and China agree to a currency swap.
First in western hemisphere and the largest economy to do so.

Cashin: Cannot raise rates or let them rise as our debt would surge. We have covered this before. If the 10 year rose to 4% our debt would triple or more. Whether he wants to or not Bernanke is forced to manipulate rates.

TECHNICAL SUMMARY

Internals

Volume. NASDAQ +27%, 2.25B; NYSE +6%, 832M. Why the lopsided volume? A lot of the Russell stocks trade on the NASDAQ, and there was a rebalance on Friday. That means a lot of buying and selling in those stocks as portfolios are adjusted to reflect the market cap percentage of each of those stocks in the new readjusted indices.

Breadth. NASDAQ 2.4:1; NYSE 2.2:1. Breadth was decent.

THE CHARTS

SP500. You can see that inverted head and shoulders. You can also see that Thursday tried to break up the whole pattern. It cast the move right back down to the neckline. Stocks bounced where they had to on Friday but did not get through the 50 day EMA or that February 2011 peak. SP500 has a lot of work cut out for it next week. I still believe that looking at the strength of a lot of the brand names as well as the sectors that are getting money (biotech, drugs), SP500 could bounce. Financials are still getting money, and that is so key for SP500.

DJ30. Not really a different tale here. The 50 day EMA is still blocking it. Same drop, holding at the neckline as well. We just need to see a break to the upside. It most likely follows SP500 if it moves.

NASDAQ. NASDAQ showed the same action. Up to the 50 day EMA, just cracking into the higher trading range, but it was nothing significant. No real break here. It is too close to make a call that it broke back up. We see the same action with the inverted head and shoulders. We also see solid action from a lot of big NASDAQ stocks that look ready to move higher. If they move higher, NASDAQ moves higher as well.

SP600. SP600 bounced off of the 200 day EMA, put in a decent percentage gain, but they are still mired in their pattern. Definitely followers and not leaders. With the economy struggling as it is, that makes a lot of sense. SP600 will follow NASDAQ and company higher if they break higher. I do not believe it will lead because I am looking for a rollover in the market as they maybe challenge the prior highs. If that is the case, that would be in advance of a recession. Thus the small caps would not be really running hard in any event.

SOX. SOX bounced modestly off of support as well, but it did not put in that much of a move. It is at the neckline as well. It could bounce from here, but it never made it past this upper point of its resistance channel. I do not look for much from the semiconductors. It is not the time of year for them anyway, even if things were better and the prospects for economic improvement were better.

LEADERSHIP

'Name Brand' stocks. I noted that the NASDAQ leaders were still looking sold. PCLN looks good, and ISRG looks just fine. Of course there is the old standby AAPL. It continues to work on its pattern as well. There are still big names in NASDAQ that can rally and produce very nice gains for us.

Financial/Financial Services. It is not just limited to NASDAQ. There are financial and consumer stocks in the NYSE that look fine. MA had a great move. CME looks as if it is ready to bounce. V was blasting off to the upside in a new rally high. V could very well be worth taking a buy here even though it was up 4.5% on Friday. With a little pullback on Monday, it may be a good one to move into. There is strength in financials and financial-related companies on the NYSE. That tells you that the Fed is likely going to act based on the actions of these stocks that would do well with more liquidity pushed into the system.

Drugs. NKTR is looking good. HZNP gapped above the 200 day EMA. ARNA had a tougher day, but look at the move that it has had.

These areas are very hot because money is growing in their direction. We have the leadership groups of financials, biotech drugs, and then the big-name stocks that most people seem to love. They are all moving up very well.

THE ECONOMY

TO VIEW THE ECONOMY VIDEO CLICK THE FOLLOWING LINK:
Economy Summary Video

Earnings outlooks are not looking so good.

It should not be surprising. The economy is slowing, companies are hiring even less, and companies are starting to warn and indeed miss on earnings. When China, India and Brazil were still expanding a two and three years back the US multinational corporations cleaned up. They were laying off, consolidating, and selling a lot of product overseas. They made a lot of money, kept a lot of it offshore, and had no reason to hire here. Remember, GE and many of its large cap brethren have been jobs losers for years even when they enjoy profit growth.

Now the story has changed. We are an export nation now as per the desires of our President. The small business, entrepreneur class has not only been neglected but openly attacked with a deluge of record keeping regulations that sap time and money from businesses who have neither to spend on intrusive and excessive government oversight. With taxes and particularly regulations, this government has stifled our small business class, the main creator of innovation and wealth in the US.

With the big economies our multinationals sell to slowing, so are profits. This time we don't have a small business class to fall back on and keep our economy growing. Exports drying up, no internal engine to grow the economy. Thus corporate profits, and outlooks, are heading south.

Pepsi, Federal Express, Phillip Morris, Procter and Gamble, Bed Bath and Beyond, United Technologies (industrial products) and now Darden (restaurants) have all either missed earnings, warned, or see a slowdown here or coming.

Thus far there are 3.6 warnings for every 1 raise of earnings expectations. That is the worst ratio since Q3 2001. A slowing world economy and a slowing US economy make comps to 2011 much harder. Expectations will need to be taken lower.

Before that, however, the market has a window to rally back up to or very near the prior highs before earnings season hits full bloom and spooks investors as to just how bad the US economy is getting. We want to play that move but we also need to be aware of the limits of a further rally. It can test the prior highs, hit them, even surpass them (particularly if another QE is announced), but we do not believe it can overcome the drag from the economic slowdown here in the US.

THE MARKET

SENTIMENT INDICATORS

VIX: 18.11; -1.97
VXN: 19.12; -1.66
VXO: 17.9; -1.89

Put/Call Ratio (CBOE): 0.99; -0.13

Bulls versus Bears

This is a reading of the number of bullish investment advisors versus bearish advisors. The reason you look at this is that it gives you an idea of how bullish investors are. If they are too bullish then everyone is in the market and it is heading for a top: if everyone wants to be in the market, then all the money is in and there is no more new cash to drive it higher. On the other side of the spectrum if there are a lot of bears then there is a lot of cash on the sideline, and as the market rallies it drags that cash in as the bears give in. That cash provides the market the fuel to move higher. If bears are low it is the same as a lot of bulls: everyone is in and the market does not have the cash to drive it higher.

Bulls: 37.2% versus 37.2%. Holding steady but it will be interesting to see how Thursday impacts next week's numbers. Bulls moved back over 35% after hitting 34% and below that key 35% level. The market moved on the fall. Now we see if it can continue. Hard drop to 34 from 39.3% as economic reality and a choppy stock market hit, but the firming has the bulls lifting their heads again. Off the 55+ level hit in late February. That was the highest level since April and May of 2011, the peak of the post-bear market high. 35% is the threshold level suggesting bullishness. To be seriously bearish it needs to get up to the 60% to 65% level.

Bears: 25.6% versus 26.6%. After two weeks at 26.6% bears fell. Market bounces do that. Unlike bulls, bears never did get close to the 35% level that is very bullish. It is always the best signal of bulls and bears cross paths so to speak. Not bad given the bulls action, but not the best signal. Over 35% is the threshold to be really be a good upside indicator. For reference, bearishness hit a 5 year high at 54.4% the last week of October 2008. The move over 50 took bearish sentiment to its highest level since 1995. Extreme negative sentiment. Prior levels for comparison: Bearishness peaked at 37.4% in September 2007. It topped the June 2006 peak (36%) on that run. That June peak eclipsed the March 2006 high (33%) and well above the 2005 highs that spawned new rallies (30% in May 2005, 29.2% in October 2005). That was a huge turn, unlike any seen in recent history.

NASDAQ

Stats: +33.33 points (+1.17%) to close at 2892.42
Volume: 2.246B (+27.4%)

Up Volume: 3.2B (+2.941B)
Down Volume: 1.22B (-300M)

A/D and Hi/Lo: Advancers led 2.38 to 1
Previous Session: Decliners led 3.93 to 1

New Highs: 71 (+25)
New Lows: 53 (+4)

SP500/NYSE

Stats: +9.51 points (+0.72%) to close at 1335.02
NYSE Volume: 832M (+5.72%)

Up Volume: 4.18B (+3.914B)
Down Volume: 1.93B (-1.83B)

A/D and Hi/Lo: Advancers led 2.22 to 1
Previous Session: Decliners led 4.31 to 1

New Highs: 45 (-3)
New Lows: 39 (0)

DJ30

Stats: +67.21 points (+0.53%) to close at 12640.78
Volume: 210M shares Friday versus 146M shares Thursday.

MONDAY

We have a huge week next week. Huge. I cannot say that enough. Huge. Maybe that is enough. We have a lot of data. Consumer confidence, durables orders, pending home sales, Q1 GDP revisions. We also have personal income and spending, Chicago PMI, and the Michigan Sentiment final. On Monday we likely get the Supreme Court's ruling on the Obamacare case as well as the Arizona immigration case. These are such important issues facing us for the election as well as for the economy. It is so entwined and such a large part of our economy.

We will have earnings as well. As I have said, the earnings are worrisome because we have so many misses coming up. We have seen more misses now versus upside surprises. That is not really surprising given that everyone says profits are slowing down. The economy is slowing down. We are going into a recession in our view, so you expect things to slow. That does not mean the market necessarily has to fall because everyone thinks it will. I believe the market will try to rally into earnings, and then it will set itself up for a fall. I believe it will try to break back up, realizing that the Fed will have to act.

The Fed cannot worry about what the stock market is doing; it has to worry about what jobs are doing. Jobs are what it staked its claim on, so it will have a problem with jobs if there is an issue. We could see a move before the June/early-July jobs report. Why? Because the Fed gets it ahead of time. If it sees that things are bad, it may want to avoid a shock to the market and provide stimulus. There is risk. People might panic and say, "What is wrong with things?" But overall the market will like that because it wants more liquidity. It wants that extra Quantitative Easing stimulus. We could very well see that happen, but it will not happen soon. I believe the market will rise in anticipation of that event, however. There are just so many good-looking patterns from the household names and from other areas including financials, the biotech drugs, and a scattering of stocks here and there that continue to hold up well.

After we get a move to the upside, I am worried about a rollover. But we will play what the market gives us. When it starts to roll, we will probably naturally start migrating out of those just as we naturally started migrating into drugs and biotech as they started to perform better. That is just the way it works. We will be watching for positive, still upside moves. If things do not work out, we will have to have some downside. But when we have the good household brand names ready to move up, we want to take advantage of those because money tends to pile into them like crazy when they move. It is the same with the other areas that are still getting money. When money started to run into them, they can make impressive moves.

We have to worry about earnings coming down the road. We have to worry about more data coming down the road. We have to worry about Europe, no doubt. But the market understands all of that, and it is still holding up (albeit Thursday was a challenge). It anticipates liquidity as a result of all of this news. Additional liquidity will give us a move upside in the market. It will not be like QE1 or as good as QE2, but it is a move we can play. The market is setting itself up to continue back up to these prior highs. Maybe it breaks beyond them only to roll over from there. We will let the market tell us what it will do at that point, but we will continue to look for the good sectors that are moving well and the household names that are moving. We picked up some of those already last week. We will see if there are any others that we can get into or that can provide us a good entry point to take advantage while the market gives us the upside move. As noted, I do not think it will be there later in the summer. But the market will have its final say on that.

We will just get ready for the next one. It will be a big. It is history in the making. If you keep a journal, you will be writing a lot. There will be some very interesting stuff coming up. Have a great weekend!

Support and resistance

NASDAQ: Closed at 2892.42
Resistance:
The 50 day EMA at 2894
2900 is the March 2012 low
2910 is the recent March 2012 low
2962 is the April 2012 low
3000 is the February 2012 post-bear market high
3026 from 10/2000 low
3042 from 5/2000 low
3090 is the mid-March interim high
3134 is the March 2012 post-bear market peak
3227 is the April 2000 intraday low
3401 is the May 2000 closing low

Support:
2888 is the May 2011 peak and PRIOR post-bear market high
2879 is the July 2011 peak
2862 is the 2007 peak
2841 is the February 2011 peak
2816 is the early April 2011 peak.
2810 is the low in the shoulders
The 200 day SMA at 2785
2754 is the October 2011 high
2706 to 2705 is the April 2011 low and the February 2011 and consolidation low (bottom of the trading range) 2723 to 2705 is the range of support at the bottom of the January to May trading range
2686 is the January 2011 closing low
2676 is the January 2010 low and the December 2011 peak
2645-2650ish from December 2010 consolidation
2643 is the September 2011 high
2612 is the late August 2011 peak
2603 is the March 2011 intraday low (post-Japan low)
2599 is the June 2011 low and NASDAQ
2593 is the November intraday high
2580 is the November 2010 closing high
2555 is the mid-August 2011 peak
2535 is the November island reversal gap point
2441 is the November 2011 low

S&P 500: Closed at 1335.02

Resistance:
1340 is the early April 2011 peak
The 50 day EMA at 1339
1344 is the February 2011 peak
1357 is the July 2011 peak
1359 is the April 2012 low
1371 is the May 2011 peak, the post-bear market high
1378 is the February 2012 peak
1422.38 is the Post-bear market high (March 2012)
1425 from May 2008 closing highs
1433 from August 2007 closing lows
1440 from November 2007 closing lows

Support:
1332 is the early March 2011 peak
1309 is the right shoulder low from June 2012
1295 to 1294 is the April 2011 low and the February 2011 consolidation low (bottom of the trading range)
1293 is the October 2011 peak
The 200 day SMA at 1295
1275 is the January 2010 low, early January 2011 peak
1267 is the December 2011 peak
1258 is June 2011 intraday low
1255 is the late December 2010 consolidation range
1249 is the March 2011 low (post-Japan)
1235 is the mid-December 2010 consolidation low
1231 is the late August 2011 peak
1227 is the November 2010 peak
1220 is the April 2010 peak
1209 is the mid-August 2011 high
1196 is the November 2010 consolidation peak
1178-1180 is the October 2010/November 2010 consolidation low
1158 is the November 2011 low
1131 - 1127 from August 2010 base peak.
1119 is the early August closing low
1109 is the mid-September 2010 gap up point
1101 is the August 2011 low
1099 from the mid-July interim peak
1075 is the October 2011 intraday low

Dow: Closed at 12,640.78
Resistance:
The 50 day EMA at 12,679
12,716 is the April 2012 closing low
12,754 is the July intraday peak
12,876 is the May high
13,056 is the February 2012 high
13,058 from the May 2008 peak on that bounce in the selling
13,297 is the April 2012, post bear market high
13,668 from 12-2007 peak
13,692 from 6-2007 peak
14,022 from 7-07 peak

Support:
12,391 is the February 2011 peak
12,369 is the left shoulder low from May 2012
The 200 day SMA at 12,350
12,284 is the October 2011 peak
12,258 is the December 2011 peak
12,110 from the March 2007 closing low
12,094 is the April 2011 low
The June low at 11,897 (closing)
11,734 from 11-98 peak
11,717 is the late August 2011 peak
The August low at 11,702
11,555 is the March low
11,452 is the November 2010 peak
11,178 from November 2010
10,978 is the bottom of the November 2010 consolidation
10,750 from September 2010
10,720 is the August closing low
10,705-710 from January 2010 peak
10,694-700 from August 2010 peak

Economic Calendar

June 18 - Monday
- NAHB Housing Market Index, June (10:00): 29 actual versus 28 expected, 28 prior (revised from 29)

June 19 - Tuesday
- Housing Starts, May (8:30): 708K actual versus 719K expected, 744K prior (revised from 717K)
- Building Permits, May (8:30): 780K actual versus 725K expected, 723K prior (revised from 715K)

June 20 - Wednesday
- MBA Mortgage Index, 06/16 (7:00): -0.8% actual versus 18.0% prior
- Crude Inventories, 06/16 (10:30): 2.861M actual versus -0.191M prior
- FOMC Rate Decision, June (24:30): 0.25% actual versus 0.25% expected, 0.25% prior

June 21 - Thursday
- Initial Claims, 06/16 (8:30): 387K actual versus 380K expected, 389K prior (revised from 386K)
- Continuing Claims, 06/09 (8:30): 3299K actual versus 3278K expected, 3299K prior (revised from 3278K)
- Existing Home Sales, May (10:00): 4.55M actual versus 4.56M expected, 4.62M prior
- Philadelphia Fed, June (10:00): -16.6 actual versus -0.2 expected, -5.8 prior
- Leading Indicators, May (10:00): 0.3% actual versus 0.0% expected, -0.1% prior
- FHFA Housing Price Index, April (10:00): 0.8% actual versus 1.6% prior (revised from 1.8%)

Next week

June 25 - Monday
- New Home Sales, May (10:00): 350K expected, 343K prior

June 26 - Tuesday
- Case-Shiller 20-city Price Index, April (9:00): -2.5% expected, -2.6% prior
- Consumer Confidence, June (10:00): 64.0 expected, 64.9 prior

June 27 - Wednesday
- MBA Mortgage Index, 06/23 (7:00): -0.8% prior
- Durable Orders, May (8:30): 0.5% expected, 0.0% prior (revised from 0.2%)
- Durable Orders -ex Transports, May (8:30): 0.7% expected, -0.9% prior (revised from -0.6%)
- Pending Home Sales, May (10:00): 0.5% expected, -5.5% prior
- Crude Inventories, 06/23 (10:30): 2.861M prior

June 28 - Thursday
- Initial Claims, 06/23 (8:30): 385K expected, 387K prior
- Continuing Claims, 06/16 (8:30): 3290K expected, 3299K prior
- GDP - Third Estimate, Q1 (8:30): 1.9% expected, 1.9% prior
- GDP Deflator - Third, Q1 (8:30): 1.7% expected, 1.7% prior

June 29 - Friday
- Personal Income, May (8:30): 0.1% expected, 0.2% prior
- Personal Spending, May (8:30): 0.1% expected, 0.3% prior
- PCE Prices - Core, May (8:30): 0.2% expected, 0.1% prior
- Chicago PMI, June (9:45): 52.4 expected, 52.7 prior
- Michigan Sentiment - Final, June (9:55): 74.1 expected, 74.1 prior


icon url

ReturntoSender

06/26/12 7:49 PM

#9818 RE: ReturntoSender #6755

From Briefing.com: 4:30 pm : The major equity averages booked varied gains as market participants provided a rather broad bid following the drubbing of the prior session.

Consumer Discretionary stocks were the strongest performers with a collective climb of 1.2%. Apollo Group (APOL 35.81, +3.34) rallied hard after the for-profit education provider posted better-than-expected profits and a strong revenue forecast. Harley Davidson (HOG 46.18, -1.74) was a laggard in the group despite yesterday's news of strong earnings and an upgrade today by analysts at Barclays.

Fellow Discretionary play Best Buy (BBY 19.37, +0.86) benefited from a late flurry of buying interest amid headlines that suggested the company's founder may be seeking certain strategic options for the company after following his recent resignation as Chairman. The stock was unable to sustain all of its gain, however.

News Corp (NWS 21.96, +1.68) also attracted attention related to its strategic direction with news that the company is considering the possibility of spinning off part of its operations. The news helped the stock climb to a new 52-week high.

Energy stocks were also strong. As a group they gained 1.1%. Refiners were generally in favor. As an aside, oil prices settled with a 0.2% gain at $79.34 per barrel after overcoming an intraday loss.

With Europe still in focus German Chancellor Merkel reiterated her refusal for Germany to share liability for what many believe has been an absence of fiscal responsibility on the part of eurozone countries now in precarious shape. Despite the relative strength and diversity of Germany's economy, analysts at Egan Jones downgraded it today to AA- from A+. They also assigned a Negative Outlook to the rating.

Economic data was somewhat limited in that it featured a Case-Shiller 20-city Home Price Index that declined just 1.9% when many had expected a 2.5% decline. However, the Conference Board's latest Consumer Confidence Index fell to 62.0 from 64.4 in the prior month, disappointing many who had thought the Index would ease to only 64.0.

Advancing Sectors: Consumer Discretionary +1.2%, Energy +1.1%, Financials +0.6%, Health Care +0.3%, Utilities +0.3%, Telecom +0.3%, Tech +0.3%, Consumer Staples +0.2%, Industrials +0.2%, Materials +0.1%
Declining Sectors: NoneDJ30 +32.01 NASDAQ +17.90 NQ100 +0.6% R2K +0.4% SP400 +0.6% SP500 +6.27 NASDAQ Adv/Vol/Dec 1383/1.59 bln/1091 NYSE Adv/Vol/Dec 1918/712 mln/1084

3:30 pm : Crude oil touched a session high of $79.68 per barrel in morning pit action, but fell into negative territory soon after. A session low of $78.32 per barrel was set after it was reported that German Chancellor Merkel reiterated her refusal for Germany to share liability for what some pundits believe is an absence of fiscal responsibility. Despite the dip, crude found buying support and erased the loss to settle with a 0.2% gain at $79.34 per barrel. Natural gas fell into the red moments after pit trade opened and touched a session low of $2.66 per MMBtu. However, the move was short lived as the energy component climbed back into positive territory and trended higher for the remainder of floor trade. It settled at its session high of $2.77 per MMBtu for a gain of 3.0%.

Precious metals struggled during all of pit trade. Gold set a session low of $1568.20 per ounce before it inched slightly higher in afternoon trade, settling at $1574.60 per ounce for a loss of 0.8%. Silver’s losses were more significant as the metal finished 1.6% lower at $27.05 per ounce.DJ30 +60.58 NASDAQ +20.44 SP500 +8.77 NASDAQ Adv/Vol/Dec 1495/1.25 bln/950 NYSE Adv/Vol/Dec 2070/460 mln/930

4:14PM Nanometrics confirms its SPARK-API macro defect inspection system has been qualified by device manufacturer in Asia for advanced 2X nm devices (NANO) 14.98 -0.02 :

1:33PM JinkoSolar Holding will supply modules to 5.75MW array of solar panels located on the site of the former Canton landfill in Canton, MA. (JKS) 3.61 -0.35 : In partnership with Boston-based renewable energy project developer Southern Sky Renewable Energy LLC (SSRE), the project brings life to the two decades-long unused space, serving as a valuable revenue generator and clean power solution for the local community.

10:31AM Intel slide to new three week low of 25.76 in recent trade (INTC) 25.81 -0.24 : The recent extension leaves the stock slightly above its 200 ema at 25.67 with its 200 sma at 25.58.

Cree (CREE) announced that Cree and SemiLEDs (LEDS) have agreed to end the parties' patent infringement litigation. As part of the settlement, SemiLEDs agreed to the entry of an injunction effective Oct 1, 2012 that prohibits the importation and sale of the SemiLEDs accused products in the U.S. and has made a one-time payment to Cree for past damages

9:15AM SanDisk acquires enterprise storage software maker Schooner Information Technology; terms of the transaction were not disclosed (SNDK) 35.87 : Co announced the acquisition of Schooner Information Technology, an enterprise software co located in Silicon Valley that develops flash-optimized database and data store solutions. Schooner's products complement SanDisk's growing portfolio of enterprise solid state disk (SSD) and flash-optimized software offerings that enable customers to accelerate the performance of data-intensive applications and reduce overall cost of ownership. Schooner's team of database and flash optimization experts have joined SanDisk's Enterprise Storage Solutions team. Schooner's products will be optimized for SanDisk's enterprise SSD portfolio as well as for enterprise SSDs from third parties.

Marvell (MRVL) announced its participation in the Wi-Fi Alliance's Wi-Fi CERTIFIED Passpoint test bed program. Marvell, and the Wi-Fi Alliance, alongside leading device makers and operators, will work together to drive standards-based certification of Passpoint, which will deliver a cellular-like connectivity experience to Wi-Fi networks.

Texas Instruments (TXN) and AirHop Communications announced their collaboration to integrate AirHop's eSON advanced self-organizing network software on TI's KeyStone-based small cell System-on-Chips

Adobe Systems (ADBE) today announced Adobe PhotoshopLightroom 4 software is now available as part of Adobe Creative Cloud membership. Lightroom is the essential digital photography workflow solution helping amateur and professional photographers quickly import, manage, enhance and showcase images.

09:11 am Veeco Instruments upgraded to Buy at Stifel Nicolaus; tgt $48: . Stifel Nicolaus upgrades VECO to Buy from Hold and sets target price at $48 saying while they do not see any imminent turn in the LED industry as a whole, they do believe that the current excess capacity situation is not likely to dramatically worsen. They also believe that at these price levels, the downside is likely limited versus the potential upside.

09:38 am LDK Solar shares fall 6% following disappointing first quarter results

LDK Solar (LDK $1.86 -0.16) reported first quarter earnings of ($1.46) versus the ($1.07) consensus; revenue -74% year over year to $200 million versus the $225.5 million. Shipped 164.4 megawatts (MW) of wafers, 153.9 MW of cells and modules in the first quarter; Produced a total of ~1,900.8 MT of polysilicon during the first quarter; and Produced a total of ~51.2 MW of cells during the first quarter. Co sees Q2 rev to be in the range of $220-270 mln vs. the $370 mln consensus, wafer shipments between 300 MW and 350 MW, cells and module shipments between 140 MW and 180 MW, in-house polysilicon production between 520 MT and 570 MT and in-house cell production between 80 MW and 100 MW. For fiscal 2012,

The comapny lowered fiscal year 2012 revenue guidance to $1.5-2.0 bln from $2.0-2.7 billion versus the $2.09 billion consensus, lowers polysilicon production to between 5,000 MT and 7,000 MT from $12-15K MT, of which shipments to 3rd party customers are expected to be between 2,000 MT and 3,000 MT, wafer production between 2.0 gigawatts (GW) and 2.5 GW, of which shipments to 3rd party customers are expected to be between 1.2 GW and 1.5 GW, in-house cell production between 0.7 GW and 1.0 GW, and module production between 0.9 GW and 1.2 GW, with cell and module shipments to 3rd party customers between 0.8 GW and 1.0 GW and inverter shipments between 200 MW to 250 MW. LDK Solar expects PV system project construction to be in the range of 400 MW to 600 MW and to recognize between 270 MW and 360 MW through project sales and EPC services for 3rd party customers.
icon url

ReturntoSender

06/27/12 6:16 PM

#9819 RE: ReturntoSender #6755

From Briefing.com: 4:30 pm : Stocks settled just shy of session highs to secure strong gains. The effort was led by Energy.

For the second straight session the Energy sector outperformed the broad market. Building on its 1.1% bounce in the prior session the sector climbed almost 2% today. It was led by shares of oil and gas exploration players and drilling outfits. As an aside, oil prices closed pit trade with a 1.2% gain at $80.28 per barrel, despite news that the latest weekly inventory report featured a smaller-than-expected draw, which is generally regarded by analysts as a bearish sign because it points to softer demand.

Consumer Discretionary stocks also performed well in the prior session, but were unable to put together a sustainable gain in trade today. As such, the sector settled with a sligh loss.

Corporate earnings were limited to only a handful of widely held names, including General Mills (GIS 37.55, -0.60), which posted an upside earnings surprise that was overshadowed by weak guidance. Monsanto (MON 80.89, +3.02) and Lennar (LEN 28.70, +1.31) reported strong earnings of their own, but the latter was likely helped by some better-than-expected pending home sales numbers.

Pending home sales spiked during May by 5.9% to exceed the 0.5% uptick that had been broadly expected. The jump also makes for a positive turn from the 5.5% drop that was experienced in the prior month.

In other economic news, durable goods orders increased in May by 1.1%, which is more than double the 0.5% increase that had been expected, on average, among economists polled by Briefing.com. Excluding transportation related items, durable goods orders increased in May by a much more tepid 0.4%, which is less than the 0.7% increase that had been broadly anticipated. Prior month data was revised to show that overall orders declined by 0.2% and orders less transportation declined by 0.6%.

There weren't many headlines out of Europe ahead of the two-day European Union summit, but yields on the debt of Italy and Spain did eased back narrowly. The euro traded with limited movement for most of the session, but by the closing bell it was down nearly 0.2% against the greenback.

Treasuries also traded quitely for most of the session. Lackluster results from an offering of 5-year Notes did not drive any meaningful action. The offering drew a Bid-to-Cover of 2.61, Dollar Demand of $91.5 billion, and an Indirect Bidder participation rate of 35.1%. For comparison, the prior auction drew a much better Bid-to-Cover of 2.99, Dollar Demand of $104.7 billion, and an Indirect Bidder rate of 42.6%. An average of the past six auctions results in a Bid-to-Cover of 2.98, Dollar Demand of $104.2 billion, and an Indirect Bidder participation rate of 44.6%.

Advancing Sectors: Energy +1.9%, Financials +1.2%, Industrials +1.1%, Utilities +1.1%, Health Care +1.1%, Materials +0.9%, Consumer Staples +0.7%, Tech +0.7%, Telecom +0.3%
Declining Sectors: Consumer Discretionary -0.1%DJ30 +92.34 NASDAQ +21.26 NQ100 +0.6% R2K +1.5% SP400 +0.9% SP500 +11.86 NASDAQ Adv/Vol/Dec 1766/1.63 bln/709 NYSE Adv/Vol/Dec 2387/684 mln/660

3:30 pm : Crude oil rose to a session high of $80.92 per barrel in morning pit action before it pulled back to a session low of $79.76 per barrel following weaker-than-anticipated inventory data that showed a draw of 133,000 barrels when a draw of 1.3 million barrels had been expected. The energy component regained strength in afternoon floor trade, though; it settled the session with a 1.2% gain at $80.28 per barrel.

Natural gas had a strong start to its pit session. However, it came under selling pressure after touching a session high of $2.94 per MMBtu. The energy component gave up all of the session's gains and settled with a 0.4% loss at $2.80 per MMBtu.

Gold began pit trade in negative territory and dropped to a session low of $1563.10 per ounce. It popped into positive territory to a session high of $1584.60 per ounce in the absence of any clear catalysts. Following choppy action ahead of tomorrow's EU Summit, gold managed to settle the session at $1578.80 per ounce, or 0.3% higher. Silver, on the other hand, extended yesterday's slide as it spent most of its floor session in the red. It briefly broke into positive territory and touched a session high of $27.27 per ounce, but ultimately finished with a 0.3% loss at $26.96 per ounce. DJ30 +103.12 NASDAQ +23.40 SP500 +13.06 NASDAQ Adv/Vol/Dec 1715/1.27 bln/755 NYSE Adv/Vol/Dec 2315/430 mln/700

3:02PM NVIDIA Tegra 3 drives Google's (GOOG) $199 Nexus 7 tablet (NVDA) 13.12 +0.39 : Co announced that Nexus 7 from Google, the first $199 quad-core 7-inch tablet running on the newest version of Android 4.1 (Jelly Bean), features the NVIDIA Tegra 3 mobile processor. Driving Nexus 7 is the Tegra 3 processor, which features a unique 4-PLUS-1 quad-core architecture for outstanding performance and exceptional battery life.

1:32PM Apple slips to fresh lows to challenge the $573.00 area, ahead of yesterday's close near $572.00 (AAPL) 573.10 +1.01 :

9:04AM Maxim Integrated invests total of $200 mln on expansion and upgrades of facilities (MXIM) 24.64 : Co announced a $200 million multiyear investment to upgrade its U.S. wafer fabrication facilities in Beaverton, Oregon; Dallas and San Antonio, Texas; and San Jose, California. Maxim will use the multiyear investment to upgrade manufacturing equipment, improve process technologies, convert to newer technology nodes, and assimilate production from recently acquired companies. This investment is consistent with previously disclosed estimates for capital expenditures in Maxim's fiscal years 2012 and 2013. Co will invest $75 million to upgrade its semiconductor fabrication facility in Beaverton, Oregon. Maxim, which purchased the 226,000 square foot facility from Tektronix, Inc. in 1994, will upgrade manufacturing equipment, improve process technologies, and convert to newer technology nodes. Also, co will invest ~ $65 million to expand its semiconductor fabrication facility (fab) in San Antonio. Maxim, which purchased the 380,000 square foot facility from Philips Semiconductors, Inc. in 2003, will also be upgrading fab equipment.

8:00AM Cypress Semi Enters into a $430 Million Senior Secured Revolving Credit Facility (CY) 12.52 : Co announced that it has entered into a five-year senior secured revolving credit facility with a group of lenders led by Morgan Stanley Senior Funding, Inc. as administrative agent and collateral agent. The facility enables the company to borrow up to $430 million on a revolving basis. The credit facility bears interest at LIBOR plus 2.25 percent on the drawn amount. There is a commitment fee payable of 0.375 percent per annum on any undrawn amounts. The credit facility contains customary affirmative, negative and financial covenants for similarly rated companies. The Company expects to draw down a total of $153 million immediately and is permitted to use the borrowings for working capital, acquisitions, stock repurchases and other general corporate purposes.

7:31AM Qualcomm and Akamai (AKAM) collaborate to optimize mobile page loads and improve mobile user experience (QCOM) 53.91 : Co announced that the two companies are collaborating on the implementation of new protocol enhancements for mobile devices. These optimizations will be designed to improve page performance and promote greater bandwidth efficiency on mobile devices. This collaboration will develop and deliver features to significantly improve Web browsing performance on Qualcomm's Snapdragon processor-based devices accessing content delivered by Akamai's Aqua Mobile Accelerator. The companies expect that consumers can begin benefiting from these optimizations for Android devices in the fourth quarter of 2012.

10:40 am Technology sector trading higher today as market recovers

The tech sector is trading higher today, inline with gains in the broader market. Semiconductors are showing relative strength with the Philly Semi Index trading 1.3% higher. CREE (+3.2%) is a notable leader in that chip index.

Among other major indices, the SPY is trading 0.8% higher today, while the QQQ is up 0.8% and the NASDAQ is trading 0.9% higher on the session. Among tech bellwethers, ORCL (+2.1%) is showing notable strength, while FB (-2.7%) is under pressure.

In earnings this morning, ENTR (+30.1%) reported upside guided. In news, COOL (+13.3%) confirmed its partnership with ZNGA (-4.9%). FB's (-2.7%) quiet period was lifted today, so many firms on Wall Street were able to publish coverage on the stock. To recap, there has been 8 positive ratings, 7 neutral ratings, and 1 underperform rating.

Among notable analyst upgrades this morning, RVBD (-0.5%) was upgraded to Hold at Jefferies and SINA (+2.3%) was upgraded to Buy at UBS. While in downgrades, IFNNY (-2.6%) was downgraded at HSBC and JP Morgan. PAYX (+1.2%) and PRGS (+1.3%) were notable names in tech scheduled to report quarterly results today after the close.
icon url

ReturntoSender

06/30/12 11:56 AM

#9821 RE: ReturntoSender #6755

From Briefing.com: Weekly Recap - Week ending 29-Jun-12Dow +277.83 at 12880.09, Nasdaq +85.56 at 2935.05, S&P +33.12 at 1362.16

The S&P 500 bounced 2.5% to score its best one-day percentage gain since December. The move helped fuel a strong weekly and monthly gain, but wasn’t enough to move stocks out of the red for the month.

A foray into stocks followed news that Eurozone officials have opened the door for Spain's banks to be directly recapitalized with bailout funds once Europe sets up a single banking supervisor. Moreover, Spain will not have to take on additional sovereign debt.

Market participants were also pleased to learn of a growth package worth 120 billion euros that will be aimed at boosting the European Investment Bank’s lending capacity.

The commitment of additional funds to address precarious conditions was taken as a positive rather than as a negative with implications for fiscal conditions. In turn, the euro rallied aggressively. By session’s end the euro was up 1.7% against the greenback.

Improved sentiment among market participants and a decidedly weaker dollar helped the case for commodities. In fact, the CRB Commodity Index rallied 4.6% for its best single-session spike in almost three years.

Crude oil was a primary driver of the CRB’s climb ahead of the EU's Iran oil sanctions set to begin on July 1. The energy component rallied 9.4% to settle at $85.02 per barrel, which translates into a 6.6% weekly gain.

With oil prices up and market participants willing to take on more risk, Energy stocks rallied to a collective gain of a little more than 3%. Still, they were slightly outperformed by Industrials and Tech plays; those two sectors each scored gains of 3.3%.

Utilities, which are decidedly defensive, encountered some selling after pushing higher in the early going. The sector was able to find support at the flat line before fighting to reclaim gains. It settled the session with a 0.6% gain, only a fraction of what the broad market scored.

Nike (NKE 87.78, -9.11) shares suffered a precipitous drop despite the decidedly positive tone to broad market trade. The stock’s slump came in response to a disappointing quarterly report. Ford (F 9.59, -0.50) shares also fell hard; the company’s latest profit forecast proved displeasing. A relatively soft forecast from Accenture (ACN 60.09, +3.46) was forgiven amid an upside earning surprise and broad market strength.

Personal income increased in May by 0.2%, which is slightly greater than the 0.1% increase that had been widely expected. However, personal spending stayed flat, instead of increasing by 0.1% as had been broadly anticipated. Core personal consumption expenditures were up 0.1% month over month. They had been generally expected to increase by 0.2%.

The June Chicago PMI reading of 52.9 came as little surprise since economists had generally expected a reading of 53.0 to follow the prior month reading of 52.7.

The only other item on the economic calendar was the University of Michigan's final Consumer Sentiment Survey for May. It eased down to 73.2 from the 74.1 that was posted in the preliminary Survey. Many had expected the reading to go unrevised.

In addition to encouraging news from Europe, participation picked up today as investment managers moved to rebalance and window dress their portfolios for the close of the quarter. For the second quarter the S&P 500 shed a little more than 3%. That was due to losses suffered in the past two months, offset partly by a 4.0% gain for June. The stock market’s 2.0% gain this week stands as its best performance since the first full week of the month

Nasdaq 100 +3.1%. ..S&P Midcap 400 +2.8%. ..Russell 2000 +2.9%.
 
Index Started Week Ended Week Change % Change YTD %
DJIA 12640.78 12880.09 239.31 1.9 5.4
Nasdaq 2892.42 2935.05 42.63 1.5 12.7
S&P 500 1335.02 1362.16 27.14 2.0 8.3
Russell 2000 775.16 798.49 23.33 3.0 7.8

4:52PM O2Micro lowers Q2 revenue guidance to $27.9-28.5 mln vs $31.0 mln Capital IQ Consensus Est, down from $30.3-31.8 mln (OIIM) 4.41 +0.06 : Co lowers Q2 revenue guidance to $27.9-28.5 million, versus previous guidance of $30.3 million to $31.8 million. In addition, gross margin for the second quarter is now expected to be 55% to 56%.

The reduction in anticipated revenue for the second quarter is primarily the result of broad-based weakness in demand in our end markets. Sterling

"O2Micro is navigating broadly through lower demand in all of our end markets. We believe this is the result of broad-based economic weakness, coupled with excess inventory correction. Despite this challenging macro-economic environment, we are expecting growth in the latter half of 2012, primarily from our new product launches and expanding relationships with our partners and customers."

No conference call will be held in conjunction with this financial guidance update. Additional information will be available when the Company reports its Q2 2012 results prior to market open on August 1, 2012.

8:32AM First Solar appoints Georges Antoun COO (FSLR) 14.74 : Co announced that Georges Antoun has been appointed Chief Operating Officer. Antoun will initially have responsibility for manufacturing, R&D, quality and product management. Most recently Antoun was a venture partner at Technology Crossover Ventures, a private equity and venture firm.

8:31AM IPG Photonics acquires 22.5% minority interest in russian subsidiary (IPGP) 43.18 : Co announced that it purchased the outstanding 22.5% minority interest in its Russia-based subsidiary, NTO IRE-Polus, that it previously sold to Open Joint Stock Company "Rusnano." IPG regained complete control of NTO for $55.4 million in cash. The Company expects the transaction to be accretive starting in the third quarter of 2012. The net income attributed to Rusnano's non-controlling interest in NTO had resulted in a reduction to IPG Photonics' earnings of $0.07 per diluted share in 2011 and $0.01 per diluted share in the first quarter of 2012.

United Microelectronics (UMC) has licensed IBM (IBM) technology to expedite the development of the foundry's next generation 20nm CMOS process with FinFET 3D transistors.

Resarch in Motion (RIMM $7.76 -1.37) reported a first quarter loss of $0.37 per share, $0.29 worse than the Capital IQ consensus of ($0.08), while revenues fell 42.7% year/year to $2.81 billion versus the $3.04 bln consensus. Shipments of BlackBerry smartphones were 7.8 million and shipments of BlackBerry PlayBook tablets were approximately 260,000. BlackBerry 10 smartphone launch now scheduled for Q1 of calendar 2013. The Company expects the next several quarters to continue to be very challenging for its business based on the increasing competitive environment, lower handset volumes, potential financial and other impacts from the delay of BlackBerry 10, pressure to reduce RIM's monthly infrastructure access fees, and the Company's plans to continue to aggressively drive sales of BlackBerry 7 handheld devices. The Company expects to report an operating loss in the second quarter of fiscal 2013, as RIM continues to invest in marketing programs and continues to work through the transition to BlackBerry 10, as well as the Company's fixed costs being allocated over a lower volume of shipments. This outlook excludes the impact of charges related to the CORE Program. Briefing Note: Q2 Capital IQ consensus is -$0.07.

10:50 am Information Technology shares rise by 2% as market moves higher

The tech sector is trading higher today, outpacing gains in the broader market. Semiconductors are also showing relative strength with the Philly Semi Index trading 3.1% higher. NXPI (+7.5%) is a notable leader in that chip index. Among other major indices, the SPY is trading 1.9% higher today, while the QQQ and the NASDAQ are trading 2.2% higher on the session. Among tech bellwethers, TXN (+4.6%) is showing notable strength.

In earnings last night, ACN (+5.1%) reported a mixed quarter and guided lower. Elsewhere, RIMM (-17.9%) posted a miss and downside guidance, while TIBX (+8.1%) reported a Q2 beat. Also, VCLK (+11.9%) issued upside Q2 revenue guidance. In news, ADBE (+2.7%) announced it will be discontinuing its development of the Flash Player for mobile browsers. ServiceNow NOW (+30.6%) opened for trading at $23.75 after pricing IPO at $18. ]

Among notable analyst upgrades this morning, ORCL (+4.3%) was upgraded to Outperform at RBC. While in downgrades, RIMM (-17.9%) was downgraded at CIBC, Scotia, and Societe Generale, VOD (+0.2%) was downgraded to Hold at Jefferies, and WIT (+4.5%) was downgraded at BofA/Merrill.
icon url

ReturntoSender

07/01/12 7:48 PM

#9822 RE: ReturntoSender #6755

InvestmentHouse Weekend Market Summary

http://www.siliconinvestor.com/reply.aspx?sub=37144&nonstock=False&replytoid=28239958&replytype=Pub&OrigType=Pub

- Stocks ride an unexpected EU E-TARP agreement to 3% gains, overlooking another round of weak US economic data and earnings misses.
- EU to use emergency fund for supporting Italian, Spanish bonds.
- Other markets react as if US QE was announced.
- Spending flat for the first time in 6 months, incomes post a modest gain.
- Only 42% of the average wage consists of wages. The other 58%: entitlements.
- Michigan Sentiment final for June hits a low for 2012.
- Chicago PMI still above 50, but survey authors say this is a 'wicked' report. Wicked in a bad way.
- The rally: trying to withstand earnings warnings, economic data and continue toward the prior highs.

It's an E-TARP and stocks rally.

It's a bailout US-style for southern Europe.

Of course that raises the same old question about moral hazard . . .

But stocks don't really care about that!

Ring the bells and dance in the street for TARP European style. We called it E-TARP. Everyone was celebrating including the US. Stocks rallied 2-3% on the indices. Of course that raises the question about moral hazard. When the little girl in the cartoon asks Santa Claus whether the kids on the naughty list get a lump of coal, he says, "No, of course not. They get a bailout." Those who act irresponsibly are the ones we all have to pay for. You would think that, as parents, we would know this lesson. It applies not only to kids but to any human being (and a lot of animals). We have not seemed to learn that.

The indices surged to the upside. These were big moves that took them up to the highs of a couple weeks back. SP500 and SP600 cleared those highs, at least on a closing basis. Strong moves, indeed. Futures were up in the wee hours of the morning on a deal that the European leaders struck. It would use the emergency fund for supporting -- and you can read that as "buying" -- Spanish and Italian bonds. That is the US version of a bailout. It is the old TARP. We did not necessarily do it that way, but that was the intent. That sent stocks higher. Futures were up all night, and stocks just got better with age as the market rally continued.

SP500, +2.49%; NASDAQ, +3%; Dow, +2.2%; SP600, +3%; SOX, +4.35%

It was a boffo day to say the least.

The E-TARP effect was enough to overcome some fairly weak US data in personal income and spending. Michigan sentiment also hit a 2012 low. The Chicago PMI showed a report that, even though it was above 50, the authors called "wicked." It was not wicked in a good way. But stocks had seen that story before in the US; what they really cared about was Europe getting grips on liquidity, and they surged.

OTHER MARKETS.

The other markets reacted as you would expect, I guess. A lot of them acted as if the world would be all candy and apples come Christmastime.

Dollar. 1.2658 versus 1.2435 euro. The dollar tanked. A huge move down in the dollar to the 50 day EMA. That is where it held on the last dump. We will see if it does so again. Last time it was a much more orderly pullback to test the breakout. It still has a chance of putting in a higher low. It just received a pretty big setback, obviously, when it was viewed that the bailout in Europe will help firm the euro by firming European economies.

Bonds. 1.65% versus 1.59% 10 year US Treasury. Bonds tanked. A big drop in bonds as you would expect. Overall they held up fairly well, however.

Gold. 1,603.50, +53.10.Gold surged. After all, if we start reducing the value of currencies, then we need to raise the price of gold. It jumped much higher.

Oil. 85.02, +7.32. Oil had a banner day. A big break to the upside. I noted that it was moving laterally in a consolidation. But it looked as if it was setting up at the 10 day EMA for another fall, as we have seen in this trend lower that started in early May. It did not happen. I guess the perception that there will be improvement in the European economy helped bolster demand for oil, not to mention the dollar falling like a stone. Nothing like that to pump up the price of anything based in dollars.

Interestingly, there were even more countries this week who said they would not use dollars when dealing with China. Chile was the most recent saying they will use the renminbi with them. That makes Brazil, Chile, Korea, and the list goes on. Some friendly and some unfriendly. They are dealing with China directly in renminbi and bypassing the dollar. We will see that more and more. At one point we may just see the dollar quietly slip into reserve currency oblivion similar to the pound. That will have dire ill effects on the US economy.

I have talked about this at length before. It does not seem to matter whether it was Bush or Obama. They are content to let the dollar crater. Frankly, they have to be because the debts are so big. If they ever hope to repay them, they need cheap dollars. Unfortunately that eviscerates every US citizen's retirements. What is good for the profligate spenders in our government is not good for those that have to earn the money. Then the government takes that money from us in order to provide us goods and services that we may not want or need or that should be provided by the private sector. But what can I say? That is the way it will be from now on. We have Obamacare, and the likelihood of repeal is very small. I doubt the republicans will win the Senate. It is a tossup as to whether even Romney can defeat Obama with his horrid economic record. Enough said on that.

Other markets reversed according to a massive stimulus program similar to what they would do if there was a stimulus program in the US. Of course stocks reacted in the same way with upside vigor.

TECHNICAL SUMMARY

Internals

Volume. NASDAQ +7%, 1.73B; NYSE +19%, 745M. A solid increase in volume to the upside. Now the question is: Was that all payoff the E-TARP? Surely some of it was because of that. There was a lot of short covering ongoing. A lot of stocks were shorted. NYSE short interest was at the highest since October 2011. That was quite a surge. When you get that high of a reading, you will have a counter move. That is what we saw. Sentiment reached somewhat of an extreme level, and we had a reaction to the other side. If you get too many shorts or too many longs, you get to the point of extreme levels where it needs adjusting. We got something of an adjustment on Friday, I would say.

Breadth. NASDAQ 5.7:1; NYSE 6.6:1. Breadth was impressive. It was a strong day in terms of internals. Typically if you have just short covering, you are looking at a rather narrow rally with breadth not anywhere approaching the 5:1 and 6:1 levels that we saw on Friday. This has attributes of real strength to the move. I guess the exuberance is noteworthy, and it is expected because the Europeans seem to be in agreement. They have crossed a bridge that heretofore they did not want to take -- or at least Germany did not want to take it. Now it looks like they are there, so that is worth celebrating, indeed. Stocks did just that.

Again, the question is whether there will be staying power after that move. All the others have failed. Of course all the others have not reached this level of stimulus or liquidity injection that the bond support provides. That is a completely different animal. Thus we can understand the exuberance in all of the markets whether in Europe or in the United States.

THE CHARTS

SP500. There was a big break to the upside by SP500. It also moved to a closing high, at least in terms of the mid-June highs. It did not make an intraday high, but it produced a closing high on some very solid, above-average volume. Thursday volume jumped up above average as the index reached lower and reverse. This is decent action as well. Let's recap. We had the top and a selloff, but immediately upon the conclusion of the three-week selloff, we had the formation of an inverted head and shoulders. It put that in right above the next support level. It broke higher, could not make it hold, but then it formed something of an ABCD pattern. This week it has been moving up. With this rally at the end of the month, it gave SP500 its best June ever. The Dow put in its best June since 1999. It was noteworthy. The move set some records.

Again, will the move be able to keep the records going into July? That is the question. I will talk about that shortly. As a precursor, I still think it can get up into this range where the March and April highs were before it rolls over again.

DJ30. DJ30 showed similar action. It, too, put in a higher closing high over the mid-June peaks. These are solid. Higher lows, bounces, higher closing highs. That is building; that is not tailing off. We see some strength coming.

NASDAQ. NASDAQ put in a new closing high. It was not able to put in a new intraday high over those mid-June highs, however. But it did not do a bad job. It put in that closing high and it made a higher low. It held at support. You name it. It is the same as SP500. It takes out this recent high, and it is playing in the range of the March and April peaks.

SP600. The small caps were impressive, indeed. Not only putting in a higher closing high above the mid-June highs but also simply a higher high. Very solid. It has broken back into the range that it was rejected from two weeks back and a month ago. Not bad.

SOX. SOX put in the biggest percentage move on the day, of course. It just has not played along yet. It broke through the 50 day EMA, but it is not above its next resistance. It has yet to break through. It tried it two weeks ago and failed. We will see what happens here. The key for the indices is whether they are going to be able to hold this move. When you ask whether they will be able to hold, of course you have to ask whether they have leadership to push them to the upside.

LEADERSHIP

Big Names. AAPL was up 2.6%. A solid, respectable move. Not a blowout move, but we will take it. AMZN was very good as well, up 3.2%. Very solid, very respectable. It is an outstanding pattern. PCLN was not bad. It gapped to the upside, but it stopped at the 50 day EMA. GOOG was rolling off of the bottom of its range. Look at this big gap. It had been banging up and down at a support level, and it gapped to the upside after that doji on Thursday. Not bad.

Financial. If you just saw JPM, you would think financials did not have a very good day. But outside of that stock they did. BAC rallied almost 6% in a solid upside break. WFC added 3%. Very nice, indeed. TCBI gapped to the upside, but it could not keep the move rolling. Financials overall held up very well. They did not have huge moves in some instances, but some of the leaders were performing just fine.

Medical/Drugs/Healthcare. We had the same results from some of the medical stocks. ALGN posted a very credible 4.9% move. ARAY moved up 4.5%. Medical appliances, health services and drugs are moving up well. Some that had fallen back ahead of the ruling were moving back up such as CERN. It gained almost 6%. That leadership group continues.

Homebuilders, Materials. Once again, the builders are looking strong. BZH was up 7.6%. KBH reported very good earnings and rallied over 12%. Strong moves from the home builders, and some materials are also moving well. LPX rallied 3%. That is another sector that continues to lead.

Industrials. DE continues to the upside, gapping through the 200 day EMA. CAT bounced as well, up 2.75%, although it is still mired in the muck. It is coming back, but it does not look like it has any real pattern. The interesting thing, however, is that it has a higher MACD as the stock put in a lower price low. We could be seeing the formation of a bottom. The question is how much room do you have to run? You can get yourself up to 95 or so. Another 10 points is a possibility for a play to the upside. We will be looking at this one as well as some other plays in this sector to see if we can get enough of a gain and have enough sweet spots, so to speak, to take out of the middle of the move.

Software. Software is looking good again, although it has been treacherous. There are some nice bases out here. TIBX gapped to the upside in its little cup base. It posted a nice pullback to the Fibonacci. AZPN made a nice upside break out of its triangle.

Energy. Energy is rebounding. HAL has bounced nicely, but it is just up to the 20 day EMA, showing a doji in a continuing downtrend. That is one of the problems we are seeing. A lot of stocks have bounced to the upside, but they still do not have great patterns. APC is considered a gas play predominantly, although it has a lot of oil as well. It gapped up to the 50 day EMA, matching the highs from two weeks ago.

We have service stocks that are still trending lower but have bounced. We have oil stocks that have been beaten up but have been trying to turn the corner and bounce as well. We will be looking at some those to see if they can produce anything. If there is going to be some kind of turn in oil, it would be worth picking it up. We will have to see if there are any better patterns that what we have seen in our quick scan.

The point is there are still good stocks in position to lead, and others are stepping up such as software. That is what you like to see. The defensive stocks held up nicely through the selling, and so did the household brand stocks. For the most part they did just fine, and now they are trying to bounce and help lead. All week we were saying that they needed to step up if this move would continue. On Friday they did that. The question for next week -- and it is just a four-day week because of the July 4th holiday on Wednesday -- is whether they can keep the move rolling and post some nice gains before they decide to turn back over.

THE ECONOMY

TO VIEW THE ECONOMY VIDEO CLICK THE FOLLOWING LINK:
Economy Summary Video

Income benefits from inflation decline but spending hits a 6 month low.

Personal Income, May (8:30): 0.2% actual versus 0.1% expected, 0.2% prior
Personal Spending, May (8:30): 0.0% actual versus 0.1% expected, 0.1% prior (revised from 0.3%)

Still counting the change as wage growth remains tepid.
Wages up just 3% year/year.

Private wages trend lower as entitlements make up more and more of take home.

Wages % of take home pay.

1959: 54% private wages versus entitlements.
1980-1990: 45%
2000-2011: 42%

Conclusion: The average wage earner gets more from the government than from the employer via a paycheck. Is it any wonder we have people voting for more and more entitlements? And who pays them? Those whose percent of private wages is the highest. That is the 'other people's money' Margaret Thatcher talked of.

June Final Michigan Sentiment hits a 2012 low. What happened to the cheer in Michigan?

Sentiment at 73.2 when 74.1 was expected? What about Government Motors helping the economy? Oh the heartbreak.

Chicago PMI for June rises, but report is described as 'wicked' in a bad way.

Not the play.

Chicago PMI, June (9:45): 52.9 actual versus 53.0 expected, 52.7 prior

Prices Paid: -6.4
Inventories up
Order backlogs down
New Orders down: 51.9 vs 52.9

No new orders and thus eating into the backlogs with nothing to replace them to keep activity going.

Down 3 straight months. A sign of trouble for the economy according to the report authors.

THE MARKET

SENTIMENT INDICATORS

VIX: 17.08; -2.63
VXN: 18.65; -2.86
VXO: 16.54; -3.15

Put/Call Ratio (CBOE): 0.89; -0.09

Bulls versus Bears

This is a reading of the number of bullish investment advisors versus bearish advisors. The reason you look at this is that it gives you an idea of how bullish investors are. If they are too bullish then everyone is in the market and it is heading for a top: if everyone wants to be in the market, then all the money is in and there is no more new cash to drive it higher. On the other side of the spectrum if there are a lot of bears then there is a lot of cash on the sideline, and as the market rallies it drags that cash in as the bears give in. That cash provides the market the fuel to move higher. If bears are low it is the same as a lot of bulls: everyone is in and the market does not have the cash to drive it higher.

Bulls: 38.7% versus 37.2%. Bounced after two weeks flat. It is now back above 35% after hitting 34% in early June. It did its job and the market is on the rally. Hard drop to 34 from 39.3% as economic reality and a choppy stock market hit. Off the 55+ level hit in late February. That was the highest level since April and May of 2011, the peak of the post-bear market high. 35% is the threshold level suggesting bullishness. To be seriously bearish it needs to get up to the 60% to 65% level.

Bears: 24.7% versus 25.6%. Falling for the second week after two weeks at 26.6%. Never did get close to the 35% level that is very bullish. It is always the best signal of bulls and bears cross paths so to speak. Not bad given the bulls' action, but not the best signal. Over 35% is the threshold to be really be a good upside indicator. For reference, bearishness hit a 5 year high at 54.4% the last week of October 2008. The move over 50 took bearish sentiment to its highest level since 1995. Extreme negative sentiment. Prior levels for comparison: Bearishness peaked at 37.4% in September 2007. It topped the June 2006 peak (36%) on that run. That June peak eclipsed the March 2006 high (33%) and well above the 2005 highs that spawned new rallies (30% in May 2005, 29.2% in October 2005). That was a huge turn, unlike any seen in recent history.

NASDAQ

Stats: +85.56 points (+3%) to close at 2935.05
Volume: 1.88B (+8.67%)

Up Volume: 1.75B (+1.289B)
Down Volume: 295.12M (-1.005B)

A/D and Hi/Lo: Advancers led 5.69 to 1
Previous Session: Decliners led 1.63 to 1

New Highs: 144 (+98)
New Lows: 27 (-37)

SP500/NYSE

Stats: +33.12 points (+2.49%) to close at 1362.16
NYSE Volume: 874M (+17.32%)

Up Volume: 3.93B (+1.88B)
Down Volume: 623.63M (-1.286B)

A/D and Hi/Lo: Advancers led 6.62 to 1
Previous Session: Advancers led 1.3 to 1

New Highs: 235 (+143)
New Lows: 9 (-34)

DJ30

Stats: +277.83 points (+2.2%) to close at 12880.09
Volume: 191M shares Friday versus 126M shares Thursday.

MONDAY

Next week is a full calendar of economic data. The ISM index is on Monday. Factory orders are on Tuesday. Thursday we have our usual pre-jobs report warm up with Challenger and ADP initial jobless claims. Of course we have the nonfarm payrolls as well. Wednesday the market is closed for the 4th. Everyone should go out and enjoy that. I will not comment on what I think we ought to do, but I think everyone has their own idea of how they need to participate and how we need to bring about the change we need in this country.

A lot of data but also a lot of earnings. As we saw on Friday, it still plays a big role. Ford announced that its European losses were tripling. We have had a spate of rather poor earnings warnings and results of late with almost 4:1 negative over positive pre-announcements. We will see how this goes. Profits are down; we know they are falling. We are concerned about what the results will show. Next week is still a rather light week for earnings. We have gone through the list, and there are not that many. The following week is where things really start. That means that earnings may not play as big of a role. A lot of companies will be going into quiet time. While we will get some warnings, it may slow down. It is the holiday week, and they may not want to give them, or they may sneak some in. You never know about that; you always have to watch out for that late in the week.

It will also be a new month. June went out with a big finish, and one of the best months for June in many years. Now we have July to face. Of course, that will mean earnings and the meat of the summer. It also means that if the indices continue this move, they will be punching up toward the March and April peaks. It has been our thesis that we will get a continued rally off of this inverted head and shoulders that formed above the prior resistance point. And we are getting that. It has a good initial move, and a test that was kind of dicey. We still saw patterns and stocks looking good, so we hung with it. Sure enough, there was a good break higher on this week. It was capped off by the Friday move. We want to see it continue and break higher next week.

Do we buy a lot of new positions? That will be the question. We do not think we will get a move up through these prior highs -- or if it does it will not hold. We can ride our existing positions higher and do quite well on that move. We will look for some new ones that have not made their breaks yet or are just starting to make their breaks and are not extended. They are out there. They are the next tier of stocks moving higher, and they will play a support role in the continuing move to the upside. We will look for some of those to play but, at the same time, we need to start looking for some downside plays. If we get another few days of upside, that will put the indices at the foothills of the highs from March and April. In that case, we need to be ready in case things want to turn back to the downside or the euphoria from another European deal runs out of gas.

That is the concern, of course. Will this rally be able to continue on the hope of an E-TARP bailout really bringing about good economic results in Europe? Will it be able to withstand earnings warnings or earnings themselves? How about all the economic data next week? Do we want to be around on Friday when the jobs report comes in, or do we want to be out? Last time was a pitiful 69K. They are expecting 100K this time. I think that may just be wishful thinking because the economy has gotten worse rather than better since the prior report. We will see.

We want to focus on winners and focus on the good patterns as we have been. They have been panning out for us. If we get two or three more days of rallying, we will be able to take more gain off of the table for those plays. It will be probably a natural transition at that point over to looking at downside plays as they bump up against the next resistance levels. It will be a natural progression into those if we see the move start to run out of gas. For now it looks as if it still wants to move higher. We will not argue with the move, particularly if the central banks and the leaders of the countries in need start offering more stimulus that reflects the United States style.

Finally, there is the issue of the Fed. With jobs out Friday, that will be the key it is looking for. Another poor performance well less than expectations could trigger our Fed. The Fed now has the Europeans doing what the Fed has been saying they need to do, and our Treasury Secretary as well. The Fed might feel that they do not have to do anything for now. They likely convinced the Europeans to take this step. Germany made a 180 degree turn. I wonder what caused that? But they did make the step. If it was at the urging of the Fed, now the Fed can sit back a bit, let that run its course, and wait on any new Quantitative Easing stimulus.

There is a lot ahead. A lot of issues, but there are issues that this market has faced every day, and it is moving to the upside. As long as it has the leadership it will move. And we want to participate in that move. We will continue to pick up sweet plays. We are not overloading because we have been buying all along. There are still plays in position, and we will be more than happy to pick them up and let them run for us.

Enjoy getting ready for that 4th of July celebration. Have a great weekend!

Support and resistance

NASDAQ: Closed at 2935.05
Resistance:
2942 is the mid-June 2012 high
2950 is the mid-April closing low
2962 is the April 2012 low
3000 is the February 2012 post-bear market high
3024 is the gap point from early May
3026 from 10/2000 low
3042 from 5/2000 low
3076 is the late April 2012 high
3090 is the mid-March interim high
3134 is the March 2012 post-bear market peak
3227 is the April 2000 intraday low
3401 is the May 2000 closing low

Support:
2910 is the recent March 2012 low
2900 is the March 2012 low
The 50 day EMA at 2889
2888 is the May 2011 peak and PRIOR post-bear market high
2879 is the July 2011 peak
2862 is the 2007 peak
2841 is the February 2011 peak
2816 is the early April 2011 peak.
2810 is the low in the shoulders
The 200 day SMA at 2794
2754 is the October 2011 high
2706 to 2705 is the April 2011 low and the February 2011 and consolidation low (bottom of the trading range) 2723 to 2705 is the range of support at the bottom of the January to May trading range
2686 is the January 2011 closing low
2676 is the January 2010 low and the December 2011 peak
2645-2650ish from December 2010 consolidation
2643 is the September 2011 high
2612 is the late August 2011 peak
2603 is the March 2011 intraday low (post-Japan low)
2599 is the June 2011 low and NASDAQ
2593 is the November intraday high
2580 is the November 2010 closing high
2555 is the mid-August 2011 peak
2535 is the November island reversal gap point
2441 is the November 2011 low

S&P 500: Closed at 1362.16

Resistance:
1371 is the May 2011 peak, the post-bear market high
1378 is the February 2012 peak
1406 is the early May 2012 peak
1422.38 is the Post-bear market high (March 2012)
1425 from May 2008 closing highs
1433 from August 2007 closing lows
1440 from November 2007 closing lows

Support:
1359 is the April 2012 low
1357 is the July 2011 peak
1344 is the February 2011 peak
1340 is the early April 2011 peak
The 50 day EMA at 1337
1332 is the early March 2011 peak
1309 is the right shoulder low from June 2012
The 200 day SMA at 1299
1295 to 1294 is the April 2011 low and the February 2011 consolidation low (bottom of the trading range)
1293 is the October 2011 peak
1275 is the January 2010 low, early January 2011 peak
1267 is the December 2011 peak
1258 is June 2011 intraday low
1255 is the late December 2010 consolidation range
1249 is the March 2011 low (post-Japan)
1235 is the mid-December 2010 consolidation low
1231 is the late August 2011 peak
1227 is the November 2010 peak
1220 is the April 2010 peak
1209 is the mid-August 2011 high
1196 is the November 2010 consolidation peak
1178-1180 is the October 2010/November 2010 consolidation low
1158 is the November 2011 low
1131 - 1127 from August 2010 base peak.
1119 is the early August closing low
1109 is the mid-September 2010 gap up point
1101 is the August 2011 low
1099 from the mid-July interim peak
1075 is the October 2011 intraday low

Dow: Closed at 12,880.09
Resistance:
13,056 is the February 2012 high
13,058 from the May 2008 peak on that bounce in the selling
13,297 is the April 2012, post bear market high
13,668 from 12-2007 peak
13,692 from 6-2007 peak
14,022 from 7-07 peak

Support:
12,754 is the July intraday peak
12,716 is the April 2012 closing low
The 50 day EMA at 12,671
12,391 is the February 2011 peak
The 200 day SMA at 12,387
12,369 is the left shoulder low from May 2012
12,284 is the October 2011 peak
12,258 is the December 2011 peak
12,110 from the March 2007 closing low
12,094 is the April 2011 low
The June low at 11,897 (closing)
11,734 from 11-98 peak
11,717 is the late August 2011 peak
The August low at 11,702
11,555 is the March low
11,452 is the November 2010 peak
11,178 from November 2010
10,978 is the bottom of the November 2010 consolidation
10,750 from September 2010
10,720 is the August closing low
10,705-710 from January 2010 peak
10,694-700 from August 2010 peak

Economic Calendar

June 25 - Monday
- New Home Sales, May (10:00): 369K actual versus 350K expected, 343K prior

June 26 - Tuesday
- Case-Shiller 20-city, April (9:00): -1.9% actual versus -2.5% expected, -2.6% prior
- Consumer Confidence, June (10:00): 62.0 actual versus 64.0 expected, 64.4 prior (revised from 64.9)

June 27 - Wednesday
- MBA Mortgage Index, 06/23 (7:00): -7.1% actual versus -0.8% prior
- Durable Orders, May (8:30): 1.1% actual versus 0.5% expected, -0.2% prior (revised from 0.0%)
- Durable Orders -ex Transports, May (8:30): 0.4% actual versus 0.7% expected, -0.6% prior (revised from -0.9%)
- Pending Home Sales, May (10:00): 5.9% actual versus 0.5% expected, -5.5% prior
- Crude Inventories, 06/23 (10:30): -0.133M actual versus 2.861M prior

June 28 - Thursday
- Initial Claims, 06/23 (8:30): 386K actual versus 385K expected, 392K prior (revised from 387K)
- Continuing Claims, 06/16 (8:30): 3296K actual versus 3283K expected, 3311K prior (revised from 3299K)
- GDP - Third Estimate, Q1 (8:30): 1.9% actual versus 1.9% expected, 1.9% prior
- GDP Deflator - Third, Q1 (8:30): 2.0% actual versus 1.7% expected, 1.7% prior

June 29 - Friday
- Personal Income, May (8:30): 0.2% actual versus 0.1% expected, 0.2% prior
- Personal Spending, May (8:30): 0.0% actual versus 0.1% expected, 0.1% prior (revised from 0.3%)
- PCE Prices - Core, May (8:30): 0.1% actual versus 0.2% expected, 0.1% prior
- Chicago PMI, June (9:45): 52.9 actual versus 53.0 expected, 52.7 prior
- Michigan Sentiment -, June (9:55): 73.2 actual versus 74.1 expected, 74.1 prior

July 2 - Monday
- ISM Index, June (10:00): 52.2 expected, 53.5 prior
- Construction Spending, May (10:00): 0.2% expected, 0.3% prior

July 3 - Tuesday
- Factory Orders, May (10:00): 0.4% expected, -0.6% prior
- Auto Sales, June (14:00): 4.7M prior
- Truck Sales, June (14:00): 5.9M prior

July 5 - Thursday
- MBA Mortgage Index, 06/30 (7:00): -7.1% prior
- Challenger Job Cuts, June (7:30): 66.7% prior
- ADP Employment Change, June (8:15): 105K expected, 133K prior
- Initial Claims, 06/30 (8:30): 385K expected, 386K prior
- Continuing Claims, 06/23 (8:30): 3283K expected, 3296K prior
- ISM Services, June (10:00): 53.0 expected, 53.7 prior
- Crude Inventories, 06/30 (11:00): -0.133M prior

July 6 - Friday
- Nonfarm Payrolls, June (8:30): 100K expected, 69K prior
- Nonfarm Private Payrolls, June (8:30): 105K expected, 82K prior
- Unemployment Rate, June (8:30): 8.2% expected, 8.2% prior
- Hourly Earnings, June (8:30): 0.2% expected, 0.1% prior
- Average Workweek, June (8:30): 34.4 expected, 34.4 prior
icon url

ReturntoSender

07/02/12 7:06 PM

#9824 RE: ReturntoSender #6755

From Briefing.com: 4:15 pm : The major equity averages finished the day mixed but near highs, spending the day recovering from a disappointing ISM Index, which knocked the wind out of stocks at 10:00 ET. The S&P 500 closed with a 0.3% gain and the Nasdaq Composite finished 0.6% higher. However, the Dow Jones Industrial Average was the laggard today, finishing 0.1% lower as Industrials and Materials stocks weighed.

Before the open, there were there were several major deals announced. Quest Software (QSFT 27.82, +0.01) was acquired by Dell (DELL 12.39, -0.12) for $28 per share, representing only a slight premium to Friday's closing price for Quest since the deal that had been widely rumored prior to this morning's announcement... Bristol-Myers Squibb (BMY 36.02, +0.07) will acquire Amylin Pharmaceuticals (AMLN 30.70, +2.50) for $31.00 per share in cash, representing an aggregate purchase price of ~$5.3 billion and 10% premium to Friday's closing price for Amylin. The total value of the transaction, including Amylin's net debt and a contractual payment obligation to Eli Lilly (LLY 42.99, +0.08) together totaling about $1.7 billion, is ~$7 billion... Additionally, Brightpoint (CELL 9.01, +3.60) will be acquired by Ingram Micro (IM 17.55, +0.08) for $9.00 per share in cash, representing a 66% premium to Friday's closing price for Brightpoint... Micron (MU 6.55, +0.24) finished higher by 4% after acquiring Japanese chip maker Elpida for about $750 mln... Finally, Lincare (LNCR 41.34, +7.32) will be acquired by The Linde Group for $41.50 per share in cash, representing a 22% premium to Friday's closing price for Lincare. The total consideration of the transaction will be $4.6 billion.

After a modestly higher open, equities saw a negative reaction to a disappointing ISM Index reading, which slipped below 50.0 for the first time since July 2009. The index fell from 53.5 in May to 49.7 in June. The Briefing.com consensus expected the ISM Index to fall to 52.2. The start of a contraction cycle in manufacturing is notable, but the data have been teetering on the edge of a contraction for quite some time. A better than expected construction spending reading was a slight offset, as it jumped 0.9% in May after increasing an upwardly revised 0.6% in April. The Briefing.com consensus expected construction spending to increase 0.2%. The pickup in construction was driven primarily by growth in the private residential construction sector.

Equities moved lower on the econ data, while treasuries saw buying interest send the 10-year note yield down 9 bps to 1.57%.

Since this morning's data, equities have been range-bound in quiet, pre-holiday trading conditions. The afternoon was uneventful.

No companies reported earnings after tonight's close, and none are scheduled to report earnings tomorrow.

Keep in mind that U.S. markets close early tomorrow and will be closed all day on Wednesday for the Fourth of July holiday. Markets will resume their normal hours on Thursday. Select retailers are expected to report June Sales before the market re-opens. Also note that the Bank of England and the ECB will issue new policy statements on Thursday morning. There is also an abundance of employment data due out on Thursday and Friday, highlighted by Friday's June Employment Report from the government. Next week, Alcoa (AA 8.62, -0.13) kicks off earnings season on Monday after the close.DJ30 -8.70 NASDAQ +16.18 SP500 +3.35 NASDAQ Adv/Vol/Dec 1601/1.8 bln/900 NYSE Adv/Vol/Dec 2151/736 mln/904

3:30 pm : Crude oil was under selling pressure for all of pit trade. The energy component popped to a session high of $84.42 per barrel following headlines suggesting that Iran lawmakers are drafting a bill to propose blocking the Strait of Hormuz for oil tankers. However, the move was short lived as oil immediately consolidated and later fell to a session low of $82.06 per barrel. Crude spent the afternoon session inching higher and settled floor trade with a 1.5% loss at $83.71 per barrel.

Despite struggling in negative territory and touching a floor session low of $2.74 per MMBtu, natural gas was able to erase today's losses as buyers stepped in during afternoon action and settled pit trade unchanged at $2.82 per MMBtu.

Gold and silver came off their respective pit session lows of $1589.00 per ounce and $27.31 per ounce that were set in morning action and trended upwards as the stronger dollar consolidated. The metals reduced most of their losses so that gold settled 0.4% lower at $1597.70 per ounce while silver finished with a loss of 0.6% at $27.50 per ounce.DJ30 -46.09 NASDAQ +4.35 SP500 -1.07 NASDAQ Adv/Vol/Dec 1305/1411 mln/1186 NYSE Adv/Vol/Dec 1826/470 mln/1185

5:30PM Cadence Design acquires Sigrity, a signal and power integrity technology provider, for ~$80 mln (CDNS) 11.22 +0.24 : Co announced it has acquired Sigrity, Inc., a leading signal and power integrity technology provider. The acquisition was completed on July 2, 2012 at a purchase price of approximately $80 million. Primarily due to the impact of purchase accounting rules on deferred revenue and the transition to a ratable license model for Sigrity products, the transaction is expected to be slightly dilutive to fiscal 2012 earnings per share, and then slightly accretive for 2013. Cadence expects that the transition of Sigrity's business to Cadence's ratable business model, and the amortization of Sigrity's deferred revenue will be substantially complete by the end of fiscal 2013. The transaction is not expected to impact Cadence's previously disclosed profitability goals for fiscal 2013.

4:41PM TranSwitch: Richard J. Lynch appointed as new Chairman (TXCC) 1.09 -0.01 : Co announced that effective today, the Board of the Company has appointed Mr. Richard (Dick) J. Lynch as the new Chairman of the Board and Chairman of the Executive Committee. Mr. Lynch was the Chief Technology Officer of Verizon Communications and, before that, of Verizon Wireless. He now runs a consulting and advisory business.

4:32PM Microsoft announces non-cash accounting charge; as a result of its 2012 impairment review, a write down of its Online Services Division goodwill of ~$6.2 bln is required (MSFT) 30.56 -0.03 : Co announced that it will take a non-cash, non-tax-deductible income statement charge for Q4 of FY12 for the impairment of goodwill in its Online Services Division segment, mostly related to its 2007 aQuantive, acquisition. Under accounting guidelines, cos are required to conduct an annual goodwill impairment test for each business unit. Goodwill arises in an acquisition when the fair value paid for a business exceeds the value of the identifiable net assets. The goodwill in the Online Services Division was substantially the result of the 2007 acquisition of aQuantive.

4:06PM Rambus announces that it has received notification from the International Trade Commission extending the target date for completion of its investigation until July 25, 2012 (RMBS) 5.76 +0.02 : This action was brought by Rambus against LSI Logic, ST Microelectronics (STM) and other Respondents alleging violation of Section 337 of the Tariff Act of 1930. The action is Investigation Number 337-TA-753.

Intellectual Ventures and Silicon Laboratories (SLAB) entered into an intellectual property license agreement providing Silicon Labs with access to the majority of IV's extensive patent portfolio.

O2Micro International (OIIM) announced that it was issued 20 claims under U.S. patent for its circuits and methods for Power Conversion.

8:31AM Quest Software: DELL will acquire QSFT for $28 a share (QSFT) 27.81 : Co announced they have entered into a definitive agreement for Dell to acquire Quest (QSFT). Terms and Closing Under terms of the agreement, approved by the boards of directors of both companies, Dell will pay $28.00 per share in cash for each share of Quest for an aggregate purchase price of approximately $2.4 billion, net of Quest's cash and debt. The transaction is expected to close in Dell's third fiscal quarter, subject to approval by Quest's shareholders and customary conditions.

Mattson Technology (MTSN) announced that it has shipped its Millios millisecond annealing system to a major semiconductor manufacturer.

6:48AM Ixia acquires BreakingPoint for $160 mln in cash (sees deal accretive on non-GAAP basis in first full quarter); raises low end of Q2 rev guidance (XXIA) 12.02 : Co acquires BreakingPoint Systems for $160 mln in cash. The transaction is anticipated to close in 3Q12, and is subject to customary closing conditions and approvals. The acquisition of BreakingPoint enables Ixia to provide an end-to-end solution that monitors, tests, and optimizes converged networks. Without an ongoing security and performance-testing regimen, even the most sophisticated networks and data centers fail to ensure business continuity in the face of crippling cyber attacks and dynamic application conditions. BreakingPoint grew revenue over 40 percent in calendar 2011 to $33.5 million while generating gross margin of 87 percent for the year. For calendar 2012, Ixia expects BreakingPoint's revenue to again grow by more than 40 percent, and anticipates that the BreakingPoint transaction will be accretive to non-GAAP earnings in the first full quarter of operations after the acquisition closes. sees Q2 revs of $87-89 mln from $86-89 mln vs $87.67 mln Capital IQ Consensus Estimate. In addition to this amount, Ixia expects its recent Anue Systems acquisition to add ~$3-4 mln in additional revenue in Q2 for the period from the June 1, 2012 acquisition closing date to June 30, 2012.

6:32AM Micron and Elpida have signed a definitive sponsor agreement for Micron to acquire and support Elpida for ~$2.5 bln in total consideration (MU) 6.31 : Cos have signed a definitive sponsor agreement for Micron to acquire and support Elpida. The agreement has been entered into in connection with Elpida's corporate reorganization proceedings conducted under the jurisdiction of the Tokyo District Court. Under the agreement, 200 bln Yen (~USD $2.5 bln assuming 80 Yen/USD) total consideration, less certain reorganization proceeding expenses, will be used to satisfy the reorganization claims of Elpida's secured and unsecured creditors. Micron will acquire 100 percent of the equity of Elpida for 60 bln Yen (~USD $750 mln) to be paid in cash at closing. In addition, 140 bln Yen (~USD $1.75 bln) in future annual installment payments through 2019 will be paid from cash flow generated from Micron's payment for foundry services provided by Elpida, as a Micron subsidiary. As a result of these payments, all pre-petition debt obligations of Elpida will be fully discharged under the corporate reorganization proceedings. In a related transaction, Micron also announced today a separate agreement with Powerchip Tech, a Taiwanese corporation, and certain of its affiliates to acquire the Powerchip group's 24 percent share of Rexchip Electronics Corporation for ~10 bln NTD (~USD $334 mln assuming 30 NTD/USD). Elpida's assets include a 300 millimeter (mm) DRAM fabrication facility located in Hiroshima, Japan; an approximate 65% ownership interest in Rexchip, whose assets include a 300mm DRAM fabrication facility located in Taiwan; and an assembly and test facility located in Akita, Japan. Together with the Rexchip shares acquired from Powerchip, Micron will control ~89 percent of Rexchip's outstanding shares. The fab assets of Elpida and Rexchip together can produce more than 200,000 300mm wafers per month, which would represent an approximate 50 percent increase in Micron's current manufacturing capacity. Elpida's reorganization plan is currently anticipated to be submitted to the Tokyo District Court for approval in August 2012. The transactions are expected to close in the first half of calendar 2013. Micron's purchase of the Powerchip group's Rexchip shares will occur upon close of the Elpida transaction.

09:17 am LSI Logic initiated with a Buy at Mizuho; tgt $10: . Mizuho initiates LSI with a Buy and price target of $10. The firm says, while near-term demand trends for HDDs appear to be weakening, they believe that recent share price weakness reflects declining investor expectations. Considering LSI's market and product re-positioning over the past several years and observing recent execution successes, they believe that shares are attractively valued ahead of sales and profitability growth.
icon url

ReturntoSender

07/03/12 6:44 PM

#9825 RE: ReturntoSender #6755

From Briefing.com: 1:05 pm : After starting the day flat, a bullish bias intraday left stocks to close with decent gains ahead of the holiday. The S&P 500 finished the shortened session up by 0.6%.

The early bid was helped by a better-than-expected Factor Orders report, which came in at +0.7% vs. the +0.4% Briefing.com consensus. Equities moved to session highs on the data, after drifting higher off the open.

The energy sector was the biggest outperformer today, gaining 2.4% alongside strength in crude oil, which surged 4.6%. Crude oil is now up roughly 13% since last week's low of $77.20 per barrel that was set during Thursday's pit action. The move began on Friday in response to stronger sentiment and a drop in the dollar following the agreement between EU leaders to provide relief fund access to sovereign debt and Spanish banks. Oil saw continued strength yesterday on headlines suggesting that Iranian lawmakers are drafting a bill to propose blocking the Strait of Hormuz for oil tankers. Strength continues today as buyers act on more reports stating that delivery of millions of barrels of crude oil from Iran to China may be at risk following freight disputes, and as the U.S. sends additional military units to the Persian Gulf in order to deter Iran from blocking the Strait of Hormuz.

European markets gained for third consecutive session. Resource-related companies outperformed today alongside the strength in commodities. The current theme in the marketplace is central bank action, and investors are looking ahead to Thursday's ECB meeting, where expectations of a 25-bp cut are being priced in. Germany's DAX finished higher by 1.3% and the UK's FTSE gained 0.8%.

In Asia, China's non-manufacturing PMI came in at a 3-month high, and there were reports suggesting the potential for more reserve requirement cuts in China before the end of 2012. China's Shanghai Composite showed a slight gain of +0.1%, while Japan's Nikkei was +0.7%. Hong Kong's Hang Seng index finished +1.5%, after it was closed for a holiday yesterday.

U.S. corporate news was light. Microsoft (MSFT 30.76, +0.20) recouped initial losses and finished the day higher by 0.7% after announcing it would write down its Online Services Division goodwill by $6.2 billion. The non-cash charge is mostly related to its 2007 aQuantive acquisition. After a busy day of M&A news yesterday, there was another deal announced today. MModal (MODL 14.02, +1.09) will be acquired by One Equity Partners, the private investment arm of JP Morgan Chase (JPM 35.88, -0.10) for $14.00 per share in an all-cash transaction. The transaction is valued at approximately $1.1 billion and the purchase price represents an 8% premium to yesterday's closing price for MModal.

U.S. markets will be closed tomorrow for the 4th of July holiday.DJ30 72.43 NASDAQ 24.85 SP500 8.51 NASDAQ Adv/Vol/Dec 1763/993 mln/657 NYSE Adv/Vol/Dec 2374/458 mln/633

12:30 pm : August crude oil has been on a steady climb during today's pit trade as buyers reacted to strong factory orders data and reports suggesting that delivery of millions of barrels of crude oil from Iran to China may be at risk following freight disputes. The energy component touched a session high of $88.04 per barrel and is now just below that level, sporting a gain of over 4%.

Natural gas also has been in positive territory, trading as high as $2.87 per MMBtu in morning floor action. It has since slightly pulled-back but is still up over 1%.

Precious metals have been advancing gains in their pit sessions. Gold recently touched a floor session high of $1625.70 per ounce and is currently up about 1.5%. Silver climbed to a pit session high of $28.44 and is now just below that level, up 2.9%.

Briefing.com note: Despite an early close in U.S. equity markets today, trading in oil, nat gas, gold, silver and copper will all close at their normal times today.DJ30 +47.49 NASDAQ +19.9 SP500 +6.35 NASDAQ Adv/Vol/Dec 2253/767.4 mln/761 NYSE Adv/Vol/Dec 2223/283 mln/727

8:01AM Finisar agrees to acquire RED-C optical networks for ~ $23.8 mln in cash in initial consideration for all of RED-C's outstanding equity (FNSR) 14.36 : Co announced today that it has entered into an agreement to acquire all of the outstanding equity interests in RED-C Optical Networks, Inc., a Delaware corporation, with subsidiary operations in Tel Aviv, Israel. The acquisition will broaden Finisar's product lines primarily for telecom applications by adding key amplification technologies, including Erbium Doped Fiber Amplification, Raman amplification and dynamic Hybrid amplification. These technologies are considered critical for ROADM line cards and are increasingly important in cost-effectively extending the reach of transceivers and transponders especially for 100 Gb/s and 40 Gb/s coherent transmission, ultra-long repeaterless links, and low latency networks.

Microsoft (MSFT $30.28 -0.28) announced that it will take a non-cash, non-tax-deductible income statement charge for Q4 of FY12 for the impairment of goodwill in its Online Services Division segment, mostly related to its 2007 aQuantive, acquisition. Under accounting guidelines, company's are required to conduct an annual goodwill impairment test for each business unit. Goodwill arises in an acquisition when the fair value paid for a business exceeds the value of the identifiable net assets. The goodwill in the Online Services Division was substantially the result of the 2007 acquisition of aQuantive. As a result of its 2012 impairment review, co has determined that a write down of its Online Services Division goodwill of approximately $6.2 billion is required. Bing search share in the U.S. has been increasing, revenue per search has been growing, MSN is the No. 1 portal in 29 markets worldwide and the company's partnership with Yahoo! has continued to expand geographically. While the Online Services Division business has been improving, the company's expectations for future growth and profitability are lower than previous estimates. The company completed its acquisition of aQuantive on Aug. 13, 2007, in an all-cash transaction valued at just over $6.3 billion, While the aQuantive acquisition continues to provide tools for Microsoft's online advertising efforts, the acquisition did not accelerate growth to the degree anticipated, contributing to the write down. Co does not expect this accounting write down to affect its ongoing business or financial performance.

TranSwitch (TXCC $1.13 0.04) issued in line guidance for the second quarter with revenues of $3.5-4.0 million versus the $3.58 million consensus, The Company also announced that it immediately plans to implement a restructuring which will result in annual savings of ~$8.0 mln and that these savings will begin to be recognized in the third quarter of 2012. Of this amount, TranSwitch expects approximately $4.6 million in annual savings from reduced employee-related costs and the remaining $3.4 mln from other cost savings initiatives.

09:10 am Microsoft shares fell 1% following news of Q4 charge

Microsoft (MSFT $30.15 -0.41) announced that it will take a non-cash, non-tax-deductible income statement charge for Q4 of FY12 for the impairment of goodwill in its Online Services Division segment, mostly related to its 2007 aQuantive, acquisition. Under accounting guidelines, company's are required to conduct an annual goodwill impairment test for each business unit. Goodwill arises in an acquisition when the fair value paid for a business exceeds the value of the identifiable net assets. The goodwill in the Online Services Division was substantially the result of the 2007 acquisition of aQuantive.

As a result of its 2012 impairment review, co has determined that a write down of its Online Services Division goodwill of approxmately $6.2 billion is required. Bing search share in the U.S. has been increasing, revenue per search has been growing, MSN is the No. 1 portal in 29 markets worldwide and the company's partnership with Yahoo! has continued to expand geographically. While the Online Services Division business has been improving, the company's expectations for future growth and profitability are lower than previous estimates. The company completed its acquisition of aQuantive on Aug. 13, 2007, in an all-cash transaction valued at just over $6.3 billion, While the aQuantive acquisition continues to provide tools for Microsoft's online advertising efforts, the acquisition did not accelerate growth to the degree anticipated, contributing to the write down. Co does not expect this accounting write down to affect its ongoing business or financial performance.
icon url

ReturntoSender

07/05/12 8:39 PM

#9826 RE: ReturntoSender #6755

From Briefing.com: 4:20 pm : Not much has changed over the course of the afternoon, with quiet trading conditions ahead of tomorrow's employment report. As mentioned earlier, equities started the day lower despite some better-than-expected employment data and central bank easing in Europe and China. Stocks made lows a half-hour after the open on slightly worse than expected ISM services data, but managed to show some improvement off the lows, with the retail and technology sectors outperforming throughout the day.

To recap the central bank activity this morning, China cut interest rates for the second time in a month and the Bank of England expanded its asset purchase program. Then the ECB cut rates by 0.25%. The Bank of England and ECB moves were in-line with expectations, so the biggest surprise this morning was China's rate cut. However, many had expected China to continue to ease, so while the timing may be surprising, the policy move itself isn't.

In U.S. economic data, the June ADP Employment reading helped futures move back into positive territory, as it showed an increase of 176K jobs from May to June on a seasonally adjusted basis. This was much better than the 105K Briefing.com consensus. However, markets saw little reaction to the weekly initial jobless claims reading of 374K, which was better than the 385K Briefing.com consensus. The ISM services index was reported at 52.1, which was slightly below the 53.0 Briefing.com consensus, and a decline from May's 53.7 reading.

European markets turned negative following ECB and BoE actions that were generally in-line with expectations. The euro weakened in the wake of the ECB rate cut and with a lowered growth outlook from ECB President Draghi. Germany's DAX finished down 0.5% while the UK's FTSE finished marginally higher by 0.1%.

In Asia, China's Shanghai Composite underperformed with a 1.2% decline, while Japan's Nikkei fell 0.3% and Hong Kong's Hang Seng rose 0.5%. Those markets were closed prior to the Chinese rate cut.

Retailers are one of the strongest sectors in the market, gaining more than 1% on average vs. a 0.5% decline in the broader market despite weaker than expected June comparable store sales results. Of the 20 that have reported, 14 retailers missed expectations while six beat. This is the largest number of misses since last May.

The technology sector was also an area of strength, with a 0.1% gain in the Nasdaq 100 vs. the 0.5% loss in the broader market. The biggest gainer in the Nasdaq 100 is Netflix (NFLX 81.72, +9.68), which closed +13% after the company's CEO said its streaming service had its highest month of content consumption. A 2% gain in Apple (AAPL 609.94, +10.53) also helped the tech sector.

On the other hand, Financials (XLF, 14.59 -0.22) underperformed. Part of the weakness was attributed to the shadow cast by the Barclay's LIBOR probe. British officials are reportedly investigating multiple large banks for rate manipulation. JPMorgan (JPM 34.38, -1.50) was a notable laggard.

Volume was below average. However, there is the potential for heavier trading around tomorrow's June nonfarm payrolls report before the open, which is expected to show an increase of around 100K.DJ30 -47.15 NASDAQ 0.04 SP500 -6.44 NASDAQ Adv/Vol/Dec 1149/1.37 bln/1336 NYSE Adv/Vol/Dec 1329/684 mln/1695

3:30 pm : An advance by the dollar following central bank easing in Europe and China and better-than-expected employment data put pressure on precious metals and crude oil during today's pit trade. Gold tumbled to a pit session low of $1598.40 per ounce but was able to erase some losses as it inched slightly higher for the remainder of its session. It ultimately finished 0.7% lower at $1609.90 per ounce.

Silver also inched higher after sliding to a floor session low of $27.53 per ounce and eventually settled at $27.68 per ounce, or 2.2% lower. Crude oil fell to a session low of $86.58 per barrel, but stronger-than-anticipated inventory data that showed a draw of 4.27 mln barrels when a draw of 2.3 mln barrels was expected briefly pushed prices into positive territory to a session high of $88.06 per barrel.

The energy component pulled-back slightly in afternoon action and settled 0.7% lower at $87.13 per barrel... Natural gas, on the other hand, spent most of its floor session in the black. A rally heading into the close pushed prices higher so that nat gas settled with a 1.4% gain at $2.94 per MMBtu, just below its session high of $2.95 per MMBtu.DJ30 -22.14 NASDAQ +4.66 SP500 -4.00 NASDAQ Adv/Vol/Dec 1163/1123 mln/1289 NYSE Adv/Vol/Dec 1342/454 mln/1664

4:53PM Seagate Tech reports selected preliminary Q4 results: expects revenues of $4.5 bln (vs $4.87 bln Capital IQ Consensus Estimate) and non-GAAP gross margin of 33.6% (STX) 25.08 -0.05 : Co announced selected preliminary financial results for its fourth fiscal quarter of 2012, which ended on June 29, 2012. Seagate expects to report record revenue of approximately $4.5 billion (vs $4.87 bln Capital IQ Consensus Estimate) and non-GAAP gross margin of 33.6%. These preliminary results compare to the Company's previous expectations for revenue of at least $5 billion and non-GAAP gross margin of at least 34.5%. Seagate expects to report record unit shipments for the June quarter of approximately 66 million, reflecting approximately 45 exabytes of storage capacity and maintaining approximately 42% market share. During the quarter the company paid $1.2 billion to redeem over 45 million ordinary shares and exited June with 396 million basic shares outstanding. Cash, cash equivalents, restricted cash and short term investments totaled $2.2 billion at the end of the June quarter.

"Seagate expects to report another record quarter of revenue in the June quarter, however we did not meet our expected revenue and margin plan," said Steve Luczo, Seagate chairman and chief executive officer. "The June quarter's shortfall was due primarily to two factors. First, we did not achieve our planned market share growth as we reduced shipments in response to the industry's faster than expected recovery from their supply chain disruption. Second, we experienced an isolated supplier quality issue that affected one of our enterprise product lines. This product issue impacted enterprise product unit shipments by approximately 1.5 million units and drove our non-GAAP gross margin below our targeted plan. While this disruption to our business was disappointing, we acted quickly and conservatively by suspending shipments of the affected products. We have resolved the issue and have resumed fulfilling our supply commitments to customers." Luczo continued, "Based on the macro-economic concerns indicated by a broad base of customers, we are approaching the September quarter conservatively and aligning our business for a relatively flat addressable market and modest improvements in our product mix. We are adjusting our production and inventory planning accordingly, and we expect average selling prices and margins to remain relatively stable in the September quarter. We also continue to expect to exit the calendar year with non-GAAP gross margins exceeding 30%."

4:00PM Broadcom and Emulex (ELX) reach partial settlement and worldwide patent agreement (BRCM) 33.69 : Broadcom and Emulex (ELX) announced that the companies have entered into a partial settlement and worldwide patent license agreement relating to the patent litigation in the U.S. Federal District Court in Santa Ana, California. The agreement will result in the dismissal of certain of Broadcom's infringement claims against Emulex. Emulex also receives a license to Broadcom U.S. Patents Nos. 7,471,691; 7,058,150; 6,424,194 and related families for certain fields of use including Fibre Channel applications. The fields of use licensed to Emulex are related, in part, to the Emulex XE201 (Lancer) ASICs, that are capable of Fibre Channel and Ethernet, 16Gbps Fiber Channel HBAs, Fibre Channel SOCs and other FC products. Emulex will pay to Broadcom a release and license fee of $58 million in cash.

Sterne Agee downgraded Avanced Micro (AMD $5.90 -0.13) to Neutral from Buy and sets target price at $8.50 as material upside to consensus might be limited given PC transition and competitive headwinds. While the firm has been positive on AMD for a long time, and AMD is executing well, and taking Desktop-graphics market share with its Trinity and Radeon 7970 platforms, they believe the slowing PC market limits upside. The firm's checks with PC ODMs are showing JunQ has trended modestly lighter and current July-Aug builds are tracking flat q/q ahead of the Win8 transition.

10:34 am Information Technology sector is trading lower today with the market

The tech sector is trading lower today, slightly outpacing losses in the broader market. Semiconductors are also showing relative weakness, however, with the Philly Semi Index trading 1.8% lower. NXPI (-3.8%) and STM (-3.7%) are notable laggards in that chip index. Among other major indices, the SPY is trading 0.6% lower today, while the QQQ and the NASDAQ are trading 0.4% lower on the session. Among tech bellwethers, AAPL (+1.0%) is showing notable strength, while INTC (-1.7%) is under pressure.

In earnings. late Tuesday night, SMSC (-0.2%) posted a Q1 beat. In news, RNWK (-6.2%) announced its CEO has resigned. Among rumors, there are multiple reports out indicating that AAPL (+1.0%) is preparing for a launch of a smaller iteration of its iPad. Among notable analyst upgrades this morning, CHU (+7.2%) was upgraded to Neutral at HSBC and YNDX (+2.8%) was upgraded to Buy at BofA/Merrill. While in downgrades, Sterne Agee downgraded AMD (-3.0%) to Neutral. There are no notable names in tech scheduled to report quarterly results today after the close.
icon url

ReturntoSender

07/08/12 11:30 AM

#9828 RE: ReturntoSender #6755

InvestmentHouse Weekend Market Summary

http://www.investmenthouse.com/weekendmarketsummary.htm

- Weak jobs report too weak for stocks, not weak enough for the Fed, and the market sells.
- A last hour rumor/report from the Fed's designated leak reporter helps lift stocks from the lows.
- Gold sees no rate cut regardless of the Fed leaker.
- Defensive Blame Bush for what he left Obama? What about what Clinton left Bush?
- Index charts still look technically fit, but earnings can change that picture.

Jobs report: on the right track or a gut punch?

Obama: A step in the right direction Romney: A gut punch

Dueling speeches but the facts are the facts. 80K non-farm jobs on top of 77K the prior week (revised up from 69K). 225K for the entire quarter, the lowest since 2010. In a week that saw national manufacturing fall back into contraction where it has not been since 2009, I suppose it is fitting that job creation fell back to levels of the same period. The sad irony is, jobs creation never came close to mirroring the success of the manufacturing recovery. Indeed, the prior two years saw hiring fizzle after starting to pick up, but this time manufacturing is now down and June retail sales were the worst in 3 years with 0.1% growth. With manufacturing, a leading indicator (remember, it telegraphed the recovery) turned back to contraction, can the President really say the economy is on the right path because a lagging indicator is hanging on to historically weak levels?

He can say it, and he did, but he is wrong. There is no recovery in labor. The employment:population ratio held at 58.6%, down from 59.4% in June 2009 when the recession ended. The decade average is 63%. Going nowhere for three years. Instead, once more we had to hear (endure?) talk of how bad things were when he took over. Yes the housing crash compounded by outlandish and irresponsible spending was bad. As noted on Tuesday, however, Paul Krugman, the Nobel Prize winning Keynesian the administration loves, advocated a housing bubble in order to get over the tech and overall stock market crash set up at the end of the Clinton administration. And we all know the likes of Senator Dodd, Schumer, and Congressman Frank who advocated and quite frankly threatened mortgage companies and banks if they did not extend loans to constituents even as the Bush Administration called for reigning in Fannie and Freddie. Bush was not innocent; he advocated home ownership and spent like crazy with his Medicare Part D, but can Obama really call that out today as a cause of our problems when he has spent more in his term than all Presidents preceding him combined?

I remember writing about the first couple of years of the Bush administration and how the economy was performing. I went through the litany of events that confronted the country during that time. On March 2000 the stock market topped thanks to major monetary policy blunders from Alan Greenspan (recall he flooded the economy with money pre-Y2K even as he hiked rates, pulled it ALL back in March, then raised rates with another 50BP kicker in May; the market pitched over and the economy finished falling into the recession that was starting under the end of the Clinton years). It was a monumental bubble and a monumental crash. In the aftermath there was virtually no investment in the US for 3 straight years. During that period we lost our technology edge and thousands upon thousands of tech jobs that went overseas in a brain drain and those jobs never came back. Then there was the corporate malfeasance with Tyco's CEO plundering his company, Worldcom officers bankrupting that company, and Enron's smartest guys in the room epitomizing the height of corporate arrogance and then the depth of corporate collapse. That was followed by the 9-11 terror attacks JUST when the stock market was starting to turn the corner in a signal the recession was ending. That plunged us back into recession.

Remember, it was the housing market that remained strong throughout. Nesting, 'stay-cations,' and an abundance of easy money courtesy of Greenspan (at the urging of the likes of Krugman) was seen as the force that kept the economy from totally cratering given business was dormant after the beating it received at the hands of the Fed. Cisco's Chambers said at the time he had never seen the business cycle turn so fast from so good to so bad. Thousands of companies went bust and those that did not spent years eating the inventory build up accrued before the rug was pulled. It is no wonder we lost so many jobs overseas as companies were hesitant to invest and encounter the same troubles again from a Fed and government that could so easily spike the punch bowl and then take it away.

So as you see, it was not a situation of a simple decision to create the housing bubble out of nothing. It was the LAST lap of a race to the bottom so to speak as the Fed officials and the government in the form of the Congress and Executive tried to patch one policy misstep with another one. The tech crash was bad. The housing crash was simply a bigger bubble on top of that bubble. The current Fed stimulus gambit, similar to China's building binge, is another last ditch attempt to thwart another massive collapse, one that tried to happen in 2008 but that was propped up. As the Great Depression showed us, propping up only prolongs the pain. The Great Depression would have ultimately ended without WWII, but it would have taken another 10 years to do so.

That means the prognosis is not good for us now as we are trying to wind down wars and cut spending, but at the same time not freeing companies and entrepreneurs from massive new regulations in every aspect of business so they can truly grow us out of this mess. We used to laugh at the Eurozone's huge increase in regulations when the countries combined. The result of that overregulation is clear, but what is also sadly clear is that we are following in its footsteps. The clear, empirical evidence shows that their way does not produce equality, balanced budgets, quality healthcare, or decent levels of economic activity. We fought a war to break away from that system and now we are willingly going back? Is that a 'step in the right direction?'

Stocks see through the rhetoric, see no rate cuts, sell on weak data and not much economic hope.

Stocks saw through it all. Weak numbers again, back to 2010 levels, but not weak enough for the Fed to act. Futures flopped fairly hard as stocks opened lower and sold through lunch. Midmorning we posited the possibility of an afternoon run, but also noted that the indices were holding over the 10 day EMA, the near support level for a 'normal' test. Of course the test was a bit much for just one day though I do note it was nowhere near as negative as it was the prior 'test' of the breakout from the inverted head and shoulders.

The indices double bottomed and started upside off the second bottom with two hours left. Just when they were out of steam on a short bounce, the Wall Street Journal's Hilsenrath, the Fed's leaker of choice, issued a short narrative about the jobs report and what the Fed could likely do. The blurbs came across one at a time but it went like this: weak jobs increases likelihood of Fed action but doesn't ensure it. Fed hawks want to wait for more serious threats, but some officials are interested in bond purchases. That my friends is QE. There was a lot more, but that was the gist. It said NOTHING new but it was what the Fed wanted out there to help bolster the markets. 'Jawboning' as they used to call it when Greenspan talked for minutes and said nothing, similar to the governor in 'The Best Little Whorehouse in Texas.'

Yes, a definite maybe but it was enough for the markets. The indices bounced, cut the losses, and looked pretty decent on the close above the 10 day EMA. In position to bounce next week, maybe after a bit more testing, but of course earnings will have something to say about that as the season cranks up and the warnings are running almost 5:1 over upside surprises. Makes sense: the economy is slowing down fast, heading toward ECRI's recession.

OTHER MARKETS.

Dollar. 1.2281 versus 1.2391 euro. Weak data but not enough for more stimulus. The dollar rallied. Typically the dollar falls on weak economic data but when everyone expects a Fed move, the lack of one is celebrated and built back into the price of a greenback. Also, don't forget that China is cutting rates, Europe is cutting rates, and the UK is printing money in its UK-TARP program. All of that makes the dollar look a bit greener and the dollar exploded higher for a second day after falling back to the 50 day EMA. It has now broken out again, clearing the late May highs.

Bonds. 1.54% versus 1.60% 10 year US Treasury. Bonds should rise as economic data craps out. Also, the hint the Fed might buy mortgage backed securities doesn't hurt. Bonds gapped upside but note they are STILL in the now 5-week lateral range, holding the break higher to an elevated level as they ride out the indecision with the Fed. Thing is, with the weak economic data OR the Fed action bonds are winners once again.

Gold. 1578.80, -30.60. Winning, as Charlie Sheen would spout, is not what gold is up to right now. It rallied to the top of its two month range, waited on the Fed, got the thumbs down, dove lower. Back through the 50 day EMA and likely moving back to 1550ish as it waits on the FOMC. Note it didn't take much solace from the Hilsenrad missive.

Oil. 84.43, -2.79. Oil faded from the 50 day EMA test, falling to the 20 day EMA. Weak economy so no need for oil. Moreover, the dollar shot higher so it takes less dollars to buy the same amount of oil. Good support for oil as it also sits on the early June two week consolidation. Depends upon what the Fed does because the US economy and the world economies stink.

TECHNICAL SUMMARY

Internals

Volume. NASDAQ +2.4%, 1.42B; NYSE -11.8%, 543M. Summer, Friday, holiday week, low volume. Not bad for a selloff, however.

Breadth. NASDAQ -2.6:1; NYSE -2:1. Stronger downside breadth but let's face it, in this environment that is just nothing.

THE CHARTS

SP500. Rallied to the May 2011 peak at 1370, paused, then sold back Friday. Undercut the 10 day EMA on the low but the late market move closed out SP500 just over that near support. You prefer to see the move occur over a few sessions, not just one, but this happened the third week of June on that 'test' and it held. Holding the 10 day EMA is good; but now the real test this week. 1344 is important (February 2011 peak) as you want to see SP500 put in a decent higher low to continue the move. It is set up, but those earnings are coming . . .

DJ30. All the way to the 50 day EMA on the session low but the Dow also rebounded late to close right at the 10 day EMA. A hold of the 50 day EMA would be good and we note it closed over the lower level of the support range as well.

NASDAQ. As with SP500, NASDAQ fell to the 10 day EMA in one session with a big step lower. Of course not as big as in June, but still no gentle 1-2-3 pullback. It did tap it on the low and rebounded to close. Continued low volume so no major dumping though in the summer and with such light trade it is more a game of support and leadership moves versus volume . . . in most cases. Holding over the June peak and that leaves NASDAQ in good shape to bounce if earnings come in well. Ironic. Techs were poor performers Friday, but the index overall looks good.

SP600. -1.23%. Fell back sharply from the solid move to the upper resistance range. A great move off the 200 day SMA and now a test. It could easily make the 10 day EMA (443) on this drop, putting it back at the next support range.

SOX. -2.50%. Chips continued their split action though overall they were roughed up Friday. Through the 50 day EMA as well as the 20 day EMA, falling to the support at 372ish. We said SOX was not strong, just following, and as soon as things started to hit the fan SOX was out the exit fast.

LEADERSHIP

Defensive in flavor as you would expect. Drugs/healthcare still performing, housing not bad, financials struggling. Many leaders are giving the pullback we wanted and thus we are looking for buys in drugs and the like, not to mention some strong stocks such as PCLN. Surprisingly, some metals held up.

Big names. AAPL took the day off but a great move on the week. AMZN shows a nice doji near the 10 day EMA. PCLN looks super on its pullback; looking at a new play there.

Drugs. Pulling back but orderly, unlike the indices. ABAX, AMRN, ARNA, NUVA, OREX. Not bad.

Metals. Surprising. FCX is testing the 50 day EMA break. STLD is sliding laterally after a good break over resistance. Others holding up as well.

Materials. LPX, MAS, CX (cement) all are pulling back in some form or another to test their moves.

Financial. Tried to check up on the session but about all they did was not sell further after gapping lower. JPM, BAC, C all gapped to a doji. Not too promising but we will see if they can gap back upside next week.

THE MARKET

SENTIMENT INDICATORS

VIX: 17.1; -0.4
VXN: 18.65; +0.22
VXO: 16.7; -0.47

Put/Call Ratio (CBOE): 1.09; +0.23

Bulls versus Bears

This is a reading of the number of bullish investment advisors versus bearish advisors. The reason you look at this is that it gives you an idea of how bullish investors are. If they are too bullish then everyone is in the market and it is heading for a top: if everyone wants to be in the market, then all the money is in and there is no more new cash to drive it higher. On the other side of the spectrum if there are a lot of bears then there is a lot of cash on the sideline, and as the market rallies it drags that cash in as the bears give in. That cash provides the market the fuel to move higher. If bears are low it is the same as a lot of bulls: everyone is in and the market does not have the cash to drive it higher.

Bulls: 42.5% versus 38.7% versus 37.2%. What a rebound as bulls survived the sharp drop after the breakout, building as the market rebounded into the Fourth of July. Hit 34% in early June. It did its job and the market is on the rally. Hard drop to 34 from 39.3% as economic reality and a choppy stock market hit. Off the 55+ level hit in late February. That was the highest level since April and May of 2011, the peak of the post-bear market high. 35% is the threshold level suggesting bullishness. To be seriously bearish it needs to get up to the 60% to 65% level.

Bears: 24.5% versus 24.7% versus 25.6%. Still hovering around the 25% level, never getting close to the 35% level that is bullish. It is always the best signal of bulls and bears cross paths so to speak. Not bad given the bulls' action, but not the best signal. Over 35% is the threshold to be really be a good upside indicator. For reference, bearishness hit a 5 year high at 54.4% the last week of October 2008. The move over 50 took bearish sentiment to its highest level since 1995. Extreme negative sentiment. Prior levels for comparison: Bearishness peaked at 37.4% in September 2007. It topped the June 2006 peak (36%) on that run. That June peak eclipsed the March 2006 high (33%) and well above the 2005 highs that spawned new rallies (30% in May 2005, 29.2% in October 2005). That was a huge turn, unlike any seen in recent history.

NASDAQ

Stats: -38.78 points (-1.3%) to close at 2937.33
Volume: 1.415B (+2.39%)

Up Volume: 287.08M (-407.78M)
Down Volume: 1.13B (+423.18M)

A/D and Hi/Lo: Decliners led 2.59 to 1
Previous Session: Decliners led 1.17 to 1

New Highs: 56 (-73)
New Lows: 29 (+12)

SP500/NYSE

Stats: -12.9 points (-0.94%) to close at 1354.68
NYSE Volume: 543M (-11.85%)

Up Volume: 469.12M (-428.55M)
Down Volume: 2.18B (+120M)

A/D and Hi/Lo: Decliners led 2.08 to 1
Previous Session: Decliners led 1.3 to 1

New Highs: 128 (-112)
New Lows: 10 (+1)

DJ30

Stats: -124.2 points (-0.96%) to close at 12772.47
Volume: 96.8M shares Friday versus 97.8M shares Thursday.

MONDAY

Some economic data later in the week but let's face it, most of the big news on the economy is out and investors will turn to earnings. Earnings start slow but pick up speed toward the end of the week as well.

The indices are set up in some pretty decent pullbacks and leaders are in good shape. As noted in our alerts, we went over the positions several times looking for those with weak links. We closed some, but we have gravitated toward stocks and sectors that are getting the money (drugs, healthcare in general, homebuilders, materials) and as they were holding up quite nicely we were not going to cut them off, at least on Friday. We had that choice because earnings do start slow next week and we can get a better view of investor sentiment toward earnings buy watching the reaction to the initial round that has basically no big names.

As noted, the indices are set decently and there is leadership. That leadership has held well even in the prior dip that tested the inverted head and shoulders breakout. While we expect them to at least do the same here, being defensive, earnings are a bit different beast. If investors sour on the outlooks, even good patterns and 'safer' defensive sectors can and will take hits. That is why we were really poring over the plays Friday to see what we wanted to close.

If the action starts to erode further, we will close out more and flip some downside plays on the burner. Don't want to try and ride out an earnings season we feel will disappoint in the raw numbers that will take stellar guidance to overcome. With this economic data, while hope springs eternal, it is a chance to take. Thus we see how they react early in the week and have the goal of sticking only with the strongest that continue their 1-2-3 type pullbacks for the upside.

Why so concerned this time around? Because we know profits are lower; companies have warned us about this. Also, if the numbers suddenly show that ECRI's recession call is indeed on point, stocks will lead the move and head lower first. It would take the Fed to act in order to reverse the action, but quite frankly, despite the afternoon 'leak,' the Fed doesn't want to act. That is why it leaked, pulling a 'Greenspan.' It wants to talk the markets through it without having to act. That won't offset weak outlooks. Further, it will TAKE a selloff to get the Fed to act given the 'improvement' in the jobs to 80K.

In sum, we like the patterns overall in the indices, and there are still some great pullbacks in the defensive leadership groups such as biotech drugs. We will look at those for new entries in the defensive category that can also make us money as they have been doing. The pullback is what we wanted with them. We will be ready to close existing positions that hack around, unable to build toward a move. If bad news hits, they are the first to go. Then we have some downside to play it as well, though likely the bottom falls out at once on some earnings worries, if that is going to happen, and the gaps are hard to play. If we see weak stocks breaking down, we pick up some positions downside and then when the news hits, they implode and make us money.

It is always so much fun when the Fed and government are nosing in. The market is showing resilience BECAUSE of that presence and the carrot of more stimulus. IF THE MARKET BREAKS DOWN that means it does not believe stimulus is coming and is factoring in a weak economy. That eventually brings the Fed in, but we don't want to ride it down waiting for the 'when' as in when the Fed will act.

Traveling Monday through Wednesday, checking out some companies as I love to do, so the reports will be cut back some, but you will still get the best analysis there is.

Have a great weekend!

Support and resistance

NASDAQ: Closed at 2937.33
Resistance:
2942 is the mid-June 2012 high
2950 is the mid-April closing low
2962 is the April 2012 low
3000 is the February 2012 post-bear market high
3024 is the gap point from early May
3026 from 10/2000 low
3042 from 5/2000 low
3076 is the late April 2012 high
3090 is the mid-March interim high
3134 is the March 2012 post-bear market peak
3227 is the April 2000 intraday low
3401 is the May 2000 closing low

Support:
The 10 day EMA at 2922
2910 is the recent March 2012 low
2900 is the March 2012 low
The 50 day EMA at 2900
2888 is the May 2011 peak and PRIOR post-bear market high
2879 is the July 2011 peak
2862 is the 2007 peak
2841 is the February 2011 peak
2816 is the early April 2011 peak.
2810 is the low in the shoulders
The 200 day SMA at 2801
2754 is the October 2011 high
2706 to 2705 is the April 2011 low and the February 2011 and consolidation low (bottom of the trading range) 2723 to 2705 is the range of support at the bottom of the January to May trading range
2686 is the January 2011 closing low
2676 is the January 2010 low and the December 2011 peak
2645-2650ish from December 2010 consolidation
2643 is the September 2011 high
2612 is the late August 2011 peak
2603 is the March 2011 intraday low (post-Japan low)
2599 is the June 2011 low and NASDAQ

S&P 500: Closed at 1354.68

Resistance:
1357 is the July 2011 peak
1359 is the April 2012 low
1363.46 is June 2012 high
1371 is the May 2011 peak, the post-bear market high
1378 is the February 2012 peak
1406 is the early May 2012 peak
1422.38 is the Post-bear market high (March 2012)
1425 from May 2008 closing highs
1433 from August 2007 closing lows
1440 from November 2007 closing lows

Support:
The 10 day EMA at 1351
1344 is the February 2011 peak
The 50 day EMA at 1342
1340 is the early April 2011 peak
1332 is the early March 2011 peak
1309 is the right shoulder low from June 2012
The 200 day SMA at 1303
1295 to 1294 is the April 2011 low and the February 2011 consolidation low (bottom of the trading range)
1293 is the October 2011 peak
1275 is the January 2010 low, early January 2011 peak
1267 is the December 2011 peak
1258 is June 2011 intraday low
1255 is the late December 2010 consolidation range
1249 is the March 2011 low (post-Japan)
1235 is the mid-December 2010 consolidation low
1231 is the late August 2011 peak
1227 is the November 2010 peak
1220 is the April 2010 peak
1209 is the mid-August 2011 high

Dow: Closed at 12,772.47
Resistance:
13,056 is the February 2012 high
13,058 from the May 2008 peak on that bounce in the selling
13,297 is the April 2012, post bear market high
13,668 from 12-2007 peak
13,692 from 6-2007 peak
14,022 from 7-07 peak

Support:
12,754 is the July intraday peak
12,716 is the April 2012 closing low
The 50 day EMA at 12,700
The 200 day SMA at 12,416
12,391 is the February 2011 peak
12,369 is the left shoulder low from May 2012
12,284 is the October 2011 peak
12,258 is the December 2011 peak
12,110 from the March 2007 closing low
12,094 is the April 2011 low
The June low at 11,897 (closing)
11,734 from 11-98 peak
11,717 is the late August 2011 peak
The August low at 11,702
11,555 is the March low
11,452 is the November 2010 peak
11,178 from November 2010
10,978 is the bottom of the November 2010 consolidation
10,750 from September 2010
10,720 is the August closing low
10,705-710 from January 2010 peak
10,694-700 from August 2010 peak

Economic Calendar

July 2 - Monday
- ISM Index, June (10:00): 49.7 actual versus 52.2 expected, 53.5 prior
- Construction Spending, May (10:00): 0.9% actual versus 0.2% expected, 0.6% prior (revised from 0.3%)

July 3 - Tuesday
- Factory Orders, May (10:00): 0.7% actual versus 0.4% expected, -0.7% prior (revised from -0.6%)

July 5 - Thursday
- MBA Mortgage Index, 06/30 (7:00): -6.7% actual versus -7.1% prior
- Challenger Job Cuts, June (7:30): -9.5% actual versus 66.7% prior
- ADP Employment Change, June (8:15): 179K actual versus 105K expected, 136K prior (revised from 133K)
- Initial Claims, 06/30 (8:30): 374K actual versus 385K expected, 388K prior
- Continuing Claims, 06/23 (8:30): 3306K actual versus 3283K expected, 3302K prior (revised from 3296K)
- ISM Services, June (10:00): 52.1 actual versus 53.0 expected, 53.7 prior
- Crude Inventories, 06/30 (11:00): -4.270M actual versus -0.133M prior

July 6 - Friday
- Nonfarm Payrolls, June (8:30): 80K actual versus 100K expected, 77K prior (revised from 69K)
- Nonfarm Private Payrolls, June (8:30): 84K actual versus 105K expected, 105K prior (revised from 82K)
- Unemployment Rate, June (8:30): 8.2% actual versus 8.2% expected, 8.2% prior
- Hourly Earnings, June (8:30): 0.3% actual versus 0.2% expected, 0.2% prior (revised from 0.1%)
- Average Workweek, June (8:30): 34.5 actual versus 34.4 expected, 34.4 prior

July 9 - Monday
- Consumer Credit, May (15:00): $9.5B expected, $6.5B prior

July 11 - Wednesday
- MBA Mortgage Index, 07/07 (7:00): -6.7% prior
- Trade Balance, May (8:30): -$48.9B expected, -$50.1B prior
- Wholesale Inventories, May (10:00): 0.3% expected, 0.6% prior
- Crude Inventories, 07/07 (10:30): -4.270M prior
- FOMC Minutes, 6/20 (14:00)

July 12 - Thursday
- Initial Claims, 07/07 (8:30): 375K expected, 374K prior
- Continuing Claims, 06/30 (8:30): 3300K expected, 3306K prior
- Export Prices ex-ag., June (8:30): -0.5% prior
- Import Prices ex-oil, June (8:30): -0.1% prior
- Treasury Budget, June (14:00): -$43.1B prior

July 13 - Friday
- PPI, June (8:30): -0.6% expected, -1.0% prior
- Core PPI, June (8:30): 0.2% expected, 0.2% prior
- Michigan Sentiment, Preliminary July (9:55): 73.5 expected, 73.2 prior
icon url

ReturntoSender

07/09/12 5:31 PM

#9829 RE: ReturntoSender #6755

Leavitt Brothers Four Divergences That Concern Me:

http://leavittbrothers.com/blog/?p=5791

icon url

ReturntoSender

07/10/12 2:11 PM

#9831 RE: ReturntoSender #6755

SNIP: Marvell Technology (Nasdaq: MRVL ) is not the biggest fan of the year 2012. The company is trading near a 52-week low and has had a year-to-date return of -20.5%. Why would such a tremendous semiconductor manufacturer suffer in the golden age of technology? Because some bozos think smartphone sales are winding down. I don't really want to get in that argument, but let's say two things: (1) No they aren't. (2) Tablets.

Marvell trades at just under eight times forward earnings. Eight times forward earnings for a company that sells its products to a sector that is projected to grow more than 20% in 2014. Many semiconductors have been hurt this year, but Marvell is leading the downhill race in stock price. Competitor Texas Instruments (Nasdaq: TXN ) is expecting a sharp decrease in EPS for 2012, and it holds a forward P/E of 12.3. The company will see similar growth to Marvell in the following years, but you get my point. While hard-drive sales are admittedly slowing, Apple and Samsung are selling 10 gazillion products per nanosecond (no citation available on that figure, rough estimate). And yes, Marvell sells to both of those companies.

All things considered, Marvell is a victim of market stupidity, not poor management.

http://www.fool.com/investing/general/2012/07/10/get-off-the-beach-and-start-buying-stocks.aspx#.T_xunfXd6So

Anyone else looking at MRVL besides me? I am not going in yet but seriously I agree with the above analysis. It's just that I believe the market is headed lower until August at the soonest. Maybe not finding a bottom until October. Even the weekly chart on MRVL is oversold:


RtS
icon url

ReturntoSender

07/10/12 7:27 PM

#9832 RE: ReturntoSender #6755

From Briefing.com: 4:10 pm : Markets closed lower for a fourth consecutive session as a drop of 1.0% saw the Nasdaq pace the decline. Stocks shrugged off the disappointing import/export data from China and opened with solid gains after EU finance ministers announced a plan to expedite EUR30 billion for the recapitalization of Spanish banks. The major averages gave up those gains in the first hour of trading, and then dropped precipitously after engine maker Cummins lowered its full-year 2012 revenue outlook.

Shares of Cummins (CMI 86.91, -8.53) fell sharply after the company announced it expects its full-year revenue outlook for 2012 to match 2011 despite prior guidance suggesting an increase of 10%. The company also announced it anticipates second quarter revenues will come in at around $4.45 billion, well short of the Capital IQ Consensus Estimate which is calling for $5.08 billion. Not to go unnoticed was the company increasing its quarterly dividend 25% to $0.50 per share. Today’s weakness dropped the stock to levels not seen since December. Caterpillar (CAT 80.27, -2.87) moved lower in reaction to the announcement.

Alcoa (AA 8.40) slid 4.1% despite announcing in-line earnings per share results, and a revenue beat that was accompanied by the company reaffirming its aluminum outlook for the remainder of 2012.

Applied Materials (AMAT 10.71, -0.30) shed 2.7% after the company lowered its fiscal year 2012 sales guidance, and announced it expects both third quarter earnings per share and revenues to come in at the lower end of the their expected ranges.

Patriot Coal (PCXCQ.PK 0.21, -0.10) plunged more than 50% after the company confirmed plans to file for Chapter 11 reorganization. Those who follow the stock should note the ticker change from ‘PCX’ to ‘PCXCQ.PK.’ Peabody Energy (BTU 22.44, -0.87) and Arch Coal (ACI 6.11, -0.56) are names that have some exposure to the company.

Coca-Cola (KO 77.98, +0.00) finished flat after the company announced a two-for-one stock split which will increase its shares outstanding to 11.2 billion from 5.6 billion.

Miners were under pressure as the underlying metals saw heavy selling. Gold lost more than $20 at $1568 per ounce while the selling pressure in silver has dropped it $0.65 to near $26.75 per ounce. Agnico Eagle Mines (AEM 38.74, -1.67) was one of the worst performing gold miners while pure play silver miner Silver Wheaton (SLW 26.12, -1.19) slipped 4.4% on the session. Both underperformed the broad-based Market Vectors Gold Miners ETF (GDX 42.87, -1.38).

Treasuries ended on session highs as an afternoon selloff in equities sparked a safety bid. The long bond ended the day up close to half a point as its yield slid 2.6 bps to 2.594%. A less aggressive bid in the 10-yr note lowered its yield by 1.5 bps to 1.498%. Flattening along the yield curve caused the 2-10-yr spread to narrow to 122 bps.

Data picks up tomorrow as the weekly MBA Mortgage Index, the trade balance, wholesale inventories, and the FOMC minutes are all released. Treasury will hold a $21 bln 10-yr note reopening. DJ30 -83.17 NASDAQ -29.44 SP500 -10.99 NASDAQ Adv/Vol/Dec 817/1.65 bln/1653 NYSE Adv/Vol/Dec 1024/727.3 mln/2010

3:30 pm : Crude oil struggled in the red for its entire floor session as the dollar advanced. The energy component set a session high of $85.79 per barrel in early morning action but quickly pulled-back and fell lower. The decline accelerated in afternoon pit trade as crude plummeted to a session low of $83.68 per barrel and settled with a 2.3% loss at $83.92 per barrel.

Natural gas also fell deeper into negative territory as its pit session progressed. Despite efforts to consolidate losses and brushing a session high of $2.83 per MMBtu in late morning action, nat gas slid further and closed with a 4.9% loss at $2.74 per MMBtu.

Gold rose to a pit session high of $1602.00 per ounce in early morning action on EU finance ministers' announcement that Spain would be given EUR 30 bln by the end of July to help recapitalize banks. However, the enthusiasm faded and sellers stepped in as the dollar regained strength. The yellow metal erased all of its earlier gains and slid to a session low of $1578.70 per ounce before settling floor trade with a 0.6% loss at $1579.40 per ounce.

Silver briefly broke into positive territory and brushed a pit session high of $27.53 per ounce before trending lower for the remainder of the session. It dropped as low as $26.82 per ounce before closing the session at $26.89 per ounce, or 2.0% lower.DJ30 -116.09 NASDAQ -38.69 SP500 -15.00 NASDAQ Adv/Vol/Dec 737/1358.4 mln/1722 NYSE Adv/Vol/Dec 880/485 mln/2137

4:06PM Rambus and Discretix announce they have entered into an agreement enabling Discretix to develop products incorporating Differential Power Analysis (RMBS) 5.07 -0.26 : Cryptography Research, a division of Rambus (RMBS), and Discretix announced they have entered into an agreement enabling Discretix to develop products incorporating Differential Power Analysis countermeasures for use by licensees of CRI's DPA patents.

4:06PM SMSC stockholders approve merger with Microchip (MCHP) (SMSC) 36.81 -0.01 : The acquisition is expected to be completed in the third quarter of calendar 2012, subject to antitrust clearance in China and other customary closing conditions.

9:11AM Applied Materials sees Q3 EPS, rev at low end of piror guidance; sees FY12 EPS, rev below prior guidance (AMAT) 11.01 : Co issues downside guidance for Q3 (Jul), sees EPS of lower half of $0.21-0.29 vs. $0.25 Capital IQ Consensus Estimate; sees Q3 (Jul) revs of low end of $2.286-2.54 bln vs. $2.43 bln Capital IQ Consensus Estimate. Co issues downside guidance for FY12 (Oct), sees EPS of below $0.85-0.95 vs. $0.94 Capital IQ Consensus Estimate; sees FY12 (Oct) revs of below $9.1-9.5 bln vs. $9.5 bln Capital IQ Consensus Estimate. The co will provide a new target range during its August 15 earnings call, however it expects that the demand changes could have a $0.15 to $0.20 impact on full-year non-GAAP EPS results. The co also revised its calendar year 2012 industry forecast for wafer fab equipment spending to $30 to $33 billion, compared to its previous expectation of $32 to $35 billion, in line with the market changes.

8:32AM KLA-Tencor increases quarterly dividend 14% to $0.40/share (KLAC) 45.62 :

Verizon Wireless (VZ, VOD) and Research In Motion (RIMM) confirmed the BlackBerry Curve 9310 smartphone details.

Socket Mobile (SCKT) announced a partnership with LightSpeed. The collaboration pairs the Socket Bluetooth Cordless Hand Scanner Series 7 barcode scanners with the LightSpeed for Apple's (AAPL) iPad application.

6:33AM GSI Technology announces that court issued a decision upholding the sufficiency of the antitrust claims asserted by GSI in its Complaint against Cypress Semiconductor (CY) (GSIT) 4.95 : Co announced that on Friday, July 6, the United States District Court for the Northern District of California in San Jose issued a decision upholding the sufficiency of the antitrust claims asserted by GSI in its Complaint against Cypress Semiconductor (CY). The Complaint, filed on July 22, 2011, charges Cypress with conducting an unlawful combination and conspiracy, by and through the QDR Consortium, to exclude GSI and other competitors from the market for high-performance static random access memory (SRAM) devices known as fast synchronous Quad Data Rate (or QDR) SRAMs and Double Data Rate (or DDR) SRAMs. Cypress had moved to dismiss the Complaint arguing that the claims asserted by GSI failed to state a claim under federal or state antitrust laws. In its decision, the Court rejected virtually all of Cypress' arguments. The Court held that GSI's Complaint adequately alleges that the anti-competitive, collusive and conspiratorial conduct of Cypress and certain co-conspirators violates Section 1 of the Sherman Act and also constitutes unlawful restraints of trade and unfair competition under applicable provisions of California law. The Complaint seeks treble damages, in an amount to be determined at trial, a preliminary and permanent injunction prohibiting the continuation of the unfair and illegal business practices and recovery of GSI's attorneys' fees and costs. The decision in GSI's favor will allow GSI to pursue pre-trial discovery on all of the claims alleged.

6:31AM Mattson lowers Q2 revenue guidance below consensus; sees Q2 EPS at lower end of prior range (full range in line with consensus); Co does not expect net sales to exceed Q2 2012 levels until early 2013 (MTSN) 1.68 : Co sees Q2 EPS guidance at lower end of previous range of ($0.06) - $0.02, excluding non-recurring items, vs. $0.00 Capital IQ Consensus Estimate. Co also lowers Q2 revenue guidance to $33-35 mln from prior guidance of $40-50 mln vs. $47.12 mln Capital IQ Consensus Estimate. The Company does not expect the majority of the delayed strip system shipments to this foundry customer to occur until early 2013. In addition, as previously noted by the Company, the Company had been expecting a softening in the NAND business during the second quarter of 2012 and this softness now appears likely to extend beyond the second quarter of 2012. For these reasons, net sales are expected to be significantly lower in the third quarter of 2012 than the second quarter. In the absence of an increase in demand for delivery of equipment during the fourth quarter, the Company does not expect net sales to exceed second quarter 2012 levels until early 2013.

Analog Devices (ADI) introduced a two-channel, high-performance 14-bit, 125-MSPS A/D converter that reduces total power consumption by 22 percent over competing solutions.

09:36 am Applied Materials shares fall 3% following downside third quarter and fiscal year 2012 guidance
Applied Materials (AMAT $10.62 -0.38) issued downside guidance for the third quarter with EPS of lower half of $0.21-0.29 versus the $0.25 consensus and revenues at the low end of $2.286-2.54 billion versus the $2.43 billion consensus. The company issued downside guidance for fiscal year 2012 with EPS of below $0.85-0.95 versus the $0.94 consensus and revenues below $9.1-9.5 billion versus the $9.5 bln consensus. The company will provide a new target range during its August 15 earnings call, however it expects that the demand changes could have a $0.15 to $0.20 impact on full-year non-GAAP EPS results. The co also revised its calendar year 2012 industry forecast for wafer fab equipment spending to $30 to $33 billion, compared to its previous expectation of $32 to $35 billion, in line with the market changes.

09:34 am ASML shares rise 8% following agreement with Intel and equity investment

Intel (INTC $25.98 -0.18) announced it has entered into a series of agreements with ASML (ASML $52.22 +3.72) intended to accelerate the development of 450-millimeter wafer technology and extreme ultra-violet lithography totaling EUR 3.3 billion (approximately $4.1 bln). The objective is to shorten the schedule for deploying the lithography equipment supporting these technologies by as much as two years, resulting in significant cost savings and other productivity improvements for semiconductor manufacturers. INTC to also initially purchase 10% of pre-transaction issued shares of ASML for EUR 1.7 billion ($2.1 billion) and commit to purchase an additional 5% of post-transaction issued shares as part of ASML's program to enable minority investments of up to a 25% equity stake to its largest customers INTC will then hold a total of 15% of ASML's issued shares.

The total equity investment will be EUR 2.5 billion (approximately $3.1 billion). As part of these agreements, Intel is also committing to advanced purchase orders for 450-mm and EUV development and production tools from ASML. ASML has stated its intention to sell up to a 25% aggregate stake in the company to Intel and other semiconductor manufacturers in this program. ASML is currently in discussions with other customers and has publicly indicated it expects others in the industry to participate in the R&D and equity program. Regardless of the outcome of ASML's discussions with other customers and upon completion of this two-phase program, Intel's ownership stake in ASML will not exceed 15 % of ASML's post-transaction issued shares and will be subject to lock-up and voting restrictions. ASML has stated its intention to sell up to a 25 % aggregate stake in the company (on a post-transaction basis) to Intel and other semiconductor manufacturers in this program. ASML is currently in discussions with other customers and has publicly indicated it expects others in the industry to participate in the R&D and equity program.

Advanced Micro (AMD $5.29 -0.33) issued downside guidance for the second quarter with revenue to approximately 11% QoQ (from flat to +6% QoQ) to approximately $1.41 billion versus the $1.63 billion consensus Estimate. The lower preliminary rev results are primarily due to business conditions that materialized late in Q2, specifically softer-than-expected channel sales in China and Europe as well as a weaker consumer buying environment impacting the co's Original Equipment Manufacturer business. The company expects second quarter gross margin to be ~in line with prior guidance. Operating expenses for the second quarter are expected to improve and to be approximately 8 percent less than prior guidance of approximately $605 million, a result of tightly controlled expenses in the quarter. The company will report in July 19.

Intel (INTC $26.15 +0.00) announced it has entered into a series of agreements with ASML (ASML $52.19 +3.74) intended to accelerate the development of 450-millimeter wafer technology and extreme ultra-violet lithography totaling EUR 3.3 billion (approximately $4.1 bln). The objective is to shorten the schedule for deploying the lithography equipment supporting these technologies by as much as two years, resulting in significant cost savings and other productivity improvements for semiconductor manufacturers. INTC to also initially purchase 10% of pre-transaction issued shares of ASML for EUR 1.7 billion ($2.1 billion) and commit to purchase an additional 5% of post-transaction issued shares as part of ASML's program to enable minority investments of up to a 25% equity stake to its largest customers INTC will then hold a total of 15% of ASML's issued shares. The total equity investment will be EUR 2.5 bln (~$3.1 bln). As part of these agreements, Intel is also committing to advanced purchase orders for 450-m and EUV development and production tools from ASML. ASML has stated its intention to sell up to a 25% aggregate stake in the company to Intel and other semiconductor manufacturers in this program. ASML is currently in discussions with other customers and has publicly indicated it expects others in the industry to participate in the R&D and equity program. Regardless of the outcome of ASML's discussions with other customers and upon completion of this two-phase program, Intel's ownership stake in ASML will not exceed 15 % of ASML's post-transaction issued shares and will be subject to lock-up and voting restrictions. ASML has stated its intention to sell up to a 25 % aggregate stake in the company (on a post-transaction basis) to Intel and other semiconductor manufacturers in this program. ASML is currently in discussions with other customers and has publicly indicated it expects others in the industry to participate in the R&D and equity program.

Applied Materials (AMAT $10.74 -0.27) issued downside guidance for the third quarter with EPS of lower half of $0.21-0.29 versus the $0.25 consensus and revenues at the low end of $2.286-2.54 billion versus the $2.43 billion consensus. The company issued downside guidance for fiscal year 2012 with EPS of below $0.85-0.95 versus the $0.94 consensus amd revenues below $9.1-9.5 billion versus the $9.5 bln consensus. The company will provide a new target range during its August 15 earnings call, however it expects that the demand changes could have a $0.15 to $0.20 impact on full-year non-GAAP EPS results. The company also revised its calendar year 2012 industry forecast for wafer fab equipment spending to $30 to $33 billion, compared to its previous expectation of $32 to $35 billion, in line with the market changes.
icon url

ReturntoSender

07/11/12 6:52 PM

#9833 RE: ReturntoSender #6755

From Briefing.com: 4:15 pm : A late-day rally lifted the S&P 500 into positive territory moments ahead of the close, but the index finished with fractional losses to close lower for a fifth straight session. The index rallied from session lows to session highs in the final 90 minutes of trading on a somewhat mysterious move before slipping back below the flat line ahead of the close. Selling also dropped the Dow and Nasdaq 0.4% and 0.5% respectively.

This afternoon’s FOMC Minutes failed to mention more quantitative easing by the Fed, but suggested ‘further policy stimulus likely would be necessary to promote satisfactory growth,’ and that the Fed should study ‘new tools’ for easing. Several members also suggested the potential for a ‘significant slowdown’ in China. Both the trade deficit and wholesale inventories were released this morning with relatively in-line readings having a muted impact on trade.

Asian markets rallied into their respective closes after Chinese Premier Wen Jiabao suggested it is “important to promote a reasonable growth in investment” Elsewhere, Spanish Prime Minister Mariano Rajoy announced new austerity measures which are expected to trim the country’s deficit by EUR65 billion. Spain’s IBEX outperformed with a 1.2% advance as the Spanish 10-yr yield eased 16 basis points 6.58%.

Luxury goods maker Burberry (BURBY 37.05, -2.55) fell sharply after announcing disappointing earnings. The company said sales increased 11.0% for the quarter to GBP408 mln, but that number fell short of the GBP418 mln Capital IQ Consensus Estimate. U.S. rival Coach (COH 55.84, -1.08) lost 1.9% as it piggybacked the move.

Jeans makers were hit after privately held Levi Strauss announced weak second quarter results. The company stated that while it experienced growth in the U.S., both its Asian and European businesses were weak. High cotton prices and the stronger dollar also played a role in the disappointing quarter. Guess (GES 26.91), True Religion Apparel (TRLG 26.78, -1.86), and V F Corp. (VFC 135.69, -1.55) all lost ground on the news.

Shares of teen retailer Abercrombie & Fitch (ANF 34.12, +1.35) surged following a New York Times report suggesting the company is planning a ‘massive’ share buyback.

Regional consumer electronics retailer hhgregg (HGG 7.34, -4.20) hit a three and a half-year low after the company guided its fiscal first quarter results below consensus and lowered its full-year 2013 outlook. Peer Best Buy (BBY 19.37, -1.77) slid in response.

Second quarter earnings reports remain light in terms of volume, but the early negative results against low expectations are providing credibility to the negative sentiment in markets. Last night Adtran (ADTN 23.01, -4.18), OCZ Technology (OCZ 4.50, -0.95), and Voxx International (VOXX 8.04, -1.73) all missed top and bottom line expectations. That brings the Briefing.com calendar results to 10 misses, two in-lines, and one beat thus far for earnings.

Treasuries finished the day flat despite this afternoon’s superb 10-yr reopening. The auction drew a record low at-auction yield of 1.459% and a strong 3.61x bid/cover were reached as direct bidders took down an extremely high 45.4% of the offering. Sellers immediately faded the rally and dropped the complex back to pre-auction levels where it sat for the remainder of the session. The long bond saw slight performance, ending the day up 7/32 at 108 13/32 as its yield slid 0.5 bps to 2.589%. A flat session for the 10-yr note caused its yield to hold steady at 1.498% after post-auction buying dropped it to a low of 1.452% (1.440% record low).

Tomorrow’s data is limited to initial and continuing claims and import/export prices which will be released 8:30 am ET, as well as the Treasury budget which is due out at 2 pm ET.DJ30 -48.59 NASDAQ -14.35 SP500 -0.02 NASDAQ Adv/Vol/Dec 1209/1.57 bln/1233 NYSE Adv/Vol/Dec 1608/768.0 mln/1433

3:30 pm : Crude oil began pit trade in positive territory and popped higher following stronger-than-expected inventory data that showed a draw of 4.696 mln barrels when a draw of 1.4 mln barrels was widely anticipated. It touched a session high of $86.49 per barrel but pulled-back slightly in afternoon action following FOMC minutes. Still, the energy component managed to book a gain of 2.3% as it closed at $85.89 per barrel.

Natural gas also advanced higher in today's pit trade. It opened at its session low of $2.77 per MMBtu and worked its way up to settle at its session high of $2.86 per MMBtu for a 4.4% gain.

Gold spent most of its pit session in negative territory. It came off its session low of $1569.60 per ounce set in morning action and traded a little higher in choppy fashion. Although the yellow metal broke into the black a few times, it was unable to sustain any gains and eventually settled the session 0.2% lower at $1575.90 per ounce. Silver, however, found buying support after it brushed a pit session low of $26.88 per ounce. It rose as high as $27.24 per ounce, but a pull-back heading into the close left silver with a 0.5% gain as it closed at $27.03 per ounce. Both metals tanked in electronic trade as the dollar rallied following the release of FOMC minutes, but silver has since recovered the loss.

Corn prices fell in today's pit trade and settled at $7.03 per bushel despite a bullish corn production forecast by the USDA due to dry/hot weather. CNBC suggested that one of the reasons for the slide was that the USDA will help farmers with the drought. As a result, corn futures fell as much as 8.4% off its session high for the day to $6.86.DJ30 -88.32 NASDAQ -26.03 SP500 -4.46 NASDAQ Adv/Vol/Dec 1046/1273.8 mln/1386 NYSE Adv/Vol/Dec 1330/504 mln/1693

4:57PM KEMET receives clearance from European Commission on acquisition of 34% interest in NEC Tokin (KEM) 5.47 -0.03 : Co announced that it received regulatory clearance from the European Commission under the European Union (EU) Merger Regulation for its proposed acquisition of a 34% interest in NEC Tokin by KEMET Electronics Corporation, its wholly owned subsidiary. As previously announced on March 12, 2012, KEMET entered into a definitive agreement to acquire this interest for $50 mln. The transaction remains subject to satisfaction of customary closing conditions, including receipt of required regulatory approval in China. While a definitive closing date cannot yet be determined, KEMET continues to expect that the transaction will close during its second fiscal quarter, ending September 30, 2012.

4:16PM Tessera Tech distributes mid-year CEO letter to stockholders; 'We are excited about the significant progress made with our digital imaging business' (TSRA) 14.98 -0.16 : Co's CEO stated: 'We are at various stages of the sales cycle with potential customers for additional portfolios we own, including for example those relating to DRAM circuitry. As discussed previously, the sales cycle for the long-term, running-royalty license agreements we pursue is largely driven by discussions among licensing teams and engineers from both parties and can take 18 months or longer to close... As we have said before, we may have disputes with our customers, some of which may involve litigation... we believe no single dispute-related event will have a long-term impact on the ability of our patent monetization...Because of the aggressive steps we have taken around the globe, DOC is now well positioned to provide a vertically integrated solution to the camera module market. Our near term business goal is to quickly become a key player in the camera module market, which today is fragmented and depends on older legacy technologies."

4:02PM Integrated Device announces extension of exchange offer expiration date in PLX Technology (PLXT) transaction (IDTI) 5.06 -0.10 : Co announced that it is extending the expiration date of its exchange offer for all outstanding shares of common stock of PLX Technology, Inc. (NASDAQ: PLXT). The exchange offer was previously scheduled to expire at the end of the day on July 12, 2012, at 12:00 midnight, New York City time. The exchange offer is now set to expire at the end of the day on August 9, 2012, at 12:00 midnight, New York City time, unless further extended. Approximately 15.7 million shares, or approximately 35.1% of PLX's outstanding common stock, had been tendered as of 12:00 midnight at the end of the day on July 10, 2012.

8:03AM PLX Tech announced Entropic Communications (ENTR) acquired specific direct broadcast satellite intellectual property and corresponding technologies from the co for $8 mln (PLXT) 5.90 : The purchased assets relate to the design and development of a digital channel stacking switch semiconductor product for up to $8 million. In addition to the asset purchase agreement, Entropic will pay a one-time $4 million licensing fee for intellectual property which is related to the acquired assets.

Juniper Networks (JNPR) announced that Telefonica Digital has selected Juniper Networks Junos Pulse Mobile Security Suite to create a branded mobile security service for its consumer customer base across Europe.

OCZ Tech (OCZ $4.48 -0.97) reported first quarter loss of $0.17 per share, $0.05 worse than the consensus of ($0.12), while revenues rose 53.9% year/year to $113.6 million versus the $115.6 mln consensus. The company issued in-line guidance for the second quarter with revenues of $130-140 million versus the $132.11 million consensus. The company reaffirmed guidance for fiscal year 2013 with revenues of $630-700 million versus the $653.20 million consensus. Non-GAAP gross margins are expected to increase in Q213 and to exit the year in excess of 30%, with typical sequential gross margin increases of 100 to 250 basis points per quarter throughout the fiscal year, subject to changes in product mix as the SSD landscape continues to evolve. "During the quarter, we achieved record bookings of nearly $140 million reflecting increased order activity associated with the transition to our new generation Everest 2 based Vertex 4 and Agility 4 product lines introduced during the quarter. As a point of reference, during the quarter we shipped over 100,000 units of these new Everest 2 based products with gross margins of over 30...We believe our ongoing investments in technology and sales and marketing provide a clear strategic advantage as we bring innovative SSD products to the market.

The Benchmark Company notes, after tracking below their $12.5 mln gross estimate for most of June, TravelZoo (TZOO $22.15 -0.02) Local Deals segment witnessed a greater-than-expected end of quarter surge, bringing estimated gross revenue to nearly $12 million. During the month, the firm also noted a significant increase in direct deals and deals without voucher counts, leaving them comfortable with their 2Q12 Local Deals revenue estimate of $32.5 million gross, or $9.4 million net. However, barring a few incremental market additions during the quarter, they have seen few other signs indicating that the proposed headcount ramp and subscriber reacceleration initiatives have yet to benefit results, with July pacing under $9 million gross.

Mizuho expects a slight shortfall in revenues and in-line EPS as Apple (AAPL $603.90 -4.38) has already started experiencing a slowdown due to the impending iPhone 5 launch. For F4Q12, iPads should enjoy strong momentum while iPhones could experience continued slowdown as the iPhone 5 is likely to be launched in early October. Guidance will likely be below consensus, which can move slightly lower but should remain meaningfully above guidance. Firm expects the iPhone 5 cycle to be a strong near-term driver of earnings and stock outperformance. Firm expects the co to ship around 27 million iPhones versus the consensus of approximately 29-30 million devices.

icon url

ReturntoSender

07/12/12 6:52 PM

#9834 RE: ReturntoSender #6755

From Briefing.com: 4:10 pm : The major averages opened sharply lower before stabilizing and working their way to session highs in the final half-hour of trade. However, they were unable to hold those levels as sellers took control in the final minutes, and prevented the averages from seeing their first winning session in six days. The Dow climbed into positive territory late in the session, but ended down 0.3%. Both the S&P 500 and Nasdaq fared worse, shedding 0.5% and 0.8% respectively.

Shares of Infosys (INFY 38.75, -4.87) plunged 11.2% after the company missed on the bottom line and lowered its full-year 2013 revenue guidance. The company reported earnings of $0.73 per share on expectations of $0.74, and saw revenues climb 4.8% to $1.75 billion to narrowly beat the Capital IQ Consensus Estimate of $1.73 billion. Full-year 2013 revenue guidance was lowered to plus 5% from plus 8.0%.

Hotel stocks were under pressure after Marriott International (MAR 35.58, -2.45) reported in-line earnings per share of $0.42, and announced revenues fell 6.6% year over year to $2.78 billion which missed the Capital IQ Consensus Estimate of $2.84 billion. Notable was the weakness in markets outside of North America as business in both the Middle East and Asia saw a slowdown in the luxury market. Peers Starwood Hotels & Resorts Worldwide (HOT 48.66, -2.72) and Hyatt Hotels (H 34.10, -1.65) piggybacked the losses.

Wells Fargo (WFC 32.85, -0.42) lost 1.3% after the company announced a $125 million settlement with the U.S. Department of Justice, resolving previous claims some of the company’s mortgages may have discriminated against select African-American and Hispanic borrowers. The settlement comes ahead of the company’s earnings which are due out before tomorrow’s opening bell. Rival J.P. Morgan Chase & Co. (JPM 34.04, -0.55) will also release earning’s ahead of tomorrow’s open.

Merck (MRK 42.91, +1.70) gained 4.1% after the company announced it was concluding its Phase 3 trial for Odanacatib, its investigational cat-K inhibitor for osteoporosis, early after the study met its primary efficacy outcomes at its first planned interim analysis. Citigroup upgraded the stock to ‘buy’ from ‘neutral’ on the news.

Grain prices pushed higher following yesterday’s pullback as the worst drought since 1988 continued to put upward pressure on prices. The Teucrium Corn Fund (CORN 47.39, +1.44) and iPath Dow Jones-UBS Grains Subindex ETF (JJG 57.82, +1.08) saw notable outperformance.

Treasuries ended with solid gains as today’s buying dropped the 10-yr yield to 1.479% where it settled just less than 4 bps above its June 1 low print of 1.440%.

Tomorrow will see PPI and core PPI will be released at 8:30 am ET, and will be followed by the latest Michigan Sentiment reading at 9:55 am ET. DJ30 -31.26 NASDAQ -21.79 SP500 -6.69 NASDAQ Adv/Vol/Dec 997/1.67 bln/1459 NYSE Adv/Vol/Dec 1119/763.8 mln/1906

3:35 pm : Crude oil began pit trade in negative territory, dipping to a session low of $84.14 per barrel. However, the energy component began to trade upwards and broke into the black in afternoon action. It responded to news that the US is expanding sanctions against Iran and popped to a session high of $86.37 per barrel moments before settling with a 0.1% gain at $85.94 per barrel.

Natural gas slid to a floor session low of $2.72 per MMBtu following weak inventory data that showed a build of 33 bcs when a build of 30 bcf was anticipated. Despite the decline, it was able to recover all of the loss and settled 0.3% higher at $2.87 per MMBtu.

Gold prices extended overnight losses during today's pit trade as the dollar advanced. Sellers also reacted to yesterday's FOMC minutes released after the pit close that lacked commitment to more monetary stimulus. The yellow metal dipped to a session low of $1554.40 per ounce and a rally mid-session pushed prices as high as $1569.40 per ounce. God ultimately settled at $1565 per ounce, or 0.7% lower.

Silver, on the other hand, was able to find buying support and broke into positive territory, even after trading as low as $26.42 per ounce in morning action. It popped to a session high of $27.33 per ounce but pulled back as it headed into the close and settled with a 0.5% gain at $27.16 per ounce.DJ30 +4.16 NASDAQ -13.5 SP500 -2.1 NASDAQ Adv/Vol/Dec 1047/1383.9 mln/1407 NYSE Adv/Vol/Dec 1285/532.8 mln/1739

4:02PM Aehr Test Systems receives $1 mln order for multiple ABTS advanced burn-in and test systems from Taiwanese service provider (AEHR) 1.34 +0.06 :


HP (HPQ) continued to be in the top position in worldwide PC shipments. It accounted for 14.9% of the market, but its global shipments declined 12.1%. Some of HP's disappointing results were due to internal issues from the organizational changes. HP's PC business has not been back to pre re-structuring level yet. The co also faced aggressive pricing from Lenovo in the professional market, and threats from companies such as ASUS and Samsung in the already crowded consumer markets. Lenovo' s shipment growth continued to exceed the worldwide average, significantly narrowing the market share gap with HP. Acer managed to increase shipments compared to a year ago, and the co was able to clear its inventory issues, and prepare for the growth. Dell (DELL) has been in a process of transforming itself from a PC supplier to solution provider for professional markets. ASUS showed the strongest growth among the top 5 vendors worldwide, as its shipments increased 38.6% in Q2 of 2012. In the U.S., PC shipments totaled 15.9 million units in Q2 of 2012, a 5.7% decline from the same period last year. The slowdown in the U.S. market was largely attributed to weak consumer spending on PCs.

Lattice Semiconductor (LSCC) and Leopard Imaging announced the release of a dual camera module kit that allows the DaVinci TMS320DM368 video processor from Texas Instruments (TI) to interface to two 720p image sensors.

09:24 am SAP shares rise 4% following upside guidance
SAP (SAP $59.00 +2.27) issued upside guidance for the second quarter with revenues of EUR3.9 billion versus the $3.8 billion consensus. The second quarter software revenue reaches upper end of the second quarter outlook; non-IFRS software and software-related service revenue increased 21% to euro 3.14 Billion (15% at Constant Currencies); the 10th consecutive quarter of double-digit growth in Non-IFRS software and software-related service revenue supported by stellar results in SAP HANA, Mobile and Cloud. Q2 Non-IFRS Operating Profit Increased by 15% to euro 1.17 billion (8% at Constant Currencies), growth operating margin -240 bps YoY to 23.6%. "Our record performance speaks for itself. We delivered double-digit growth in all regions driven by strong momentum from the core as well as SAP HANA, mobile and the cloud. The results came in at the upper end of our second quarter software revenue guidance in an uncertain macro-economic environment."

icon url

ReturntoSender

07/14/12 10:41 AM

#9835 RE: ReturntoSender #6755

From Briefing.com: Weekly Recap - Week ending 13-Jul-12Dow +203.82 at 12777.09, Nasdaq +42.28 at 2908.47, S&P +22.02 at 1356.78

Today's 1.7% rally in stocks took the S&P 500 back to flat on the week, after a somewhat disappointing start to earnings season. Today's earnings from financial heavyweights J.P. Morgan Chase (JPM 36.07, +2.03) and Wells Fargo (WFC 33.91, +1.06) provided a boost to the financial sector, which was the strongest sector in the market. While today's results were taken as a positive, there have been several warnings in the tech sector and lackluster results from the majority of other companies that have reported thus far.

Looking more closely at today's earnings, J.P. Morgan reported its highly anticipated second quarter results, and gave additional details on the highly-publicized 'London Whale' trade. The loss from the trade is approximately $5.8 billion year-to-date, and statements that the trade has been largely unwound soothed some fears. Overall results would be viewed as 'noisy' given the number of one-time items that included the CIO loss, DVAs, reserve builds, and litigation expense. The underlying performance of the Investment Bank unit and Housing was a positive for the firm, and has helped shares recover. Wells Fargo posted numbers that were slightly better than consensus as housing helped provide a solid quarter for the bank in a difficult environment.

Aside from the big bank earnings, this morning's data showed PPI run at a hotter than expected 0.1% month over month clip and a Michigan Sentiment number that fell short of estimates with a 72.0 print. The equity market saw no reaction to the negative sentiment reading.

The euro hit multi-year year lows this week, but gained sharply vs. the dollar shortly after today's U.S. equity market open. The euro finished the week at $1.2240. Treasuries have witnessed some light selling on today's return to risk with the 10-yr yield climbing two basis points to 1.50%.

Looking back on the week, Alcoa (AA 8.42, +0.12) kicked off earnings season reporting in-line EPS and better than expected revenue. AA also reaffirmed its forecast for 2012. The S&P finished nearly unchanged on Monday.

On Tuesday, markets closed lower for a fourth consecutive session as a drop of 1.0% saw the Nasdaq pace the decline. Losses accelerated mid-day after Cummins (CMI 88.63, +2.86) announced it expects its full-year revenue outlook for 2012 to match 2011 despite prior guidance suggesting an increase of 10%.

On Wednesday, a late-day rally lifted the S&P 500 into positive territory moments ahead of the close, but the index finished with fractional losses to close lower for a fifth straight session. The FOMC Minutes failed to mention more quantitative easing by the Fed, but suggested ‘further policy stimulus likely would be necessary to promote satisfactory growth,' and that the Fed should study ‘new tools' for easing. The minutes were taken as a disappointment for stocks.

On Thursday, things were quiet ahead of the bank earnings and Chinese GDP data overnight as the S&P fell 0.5% on the day.

Next week, earnings season will dominate the headlines and have a bigger influence on the market. Over 200 companies will report Q2 results, including many Dow components; most of the large cap financials and some major technology bellwethers. Citigroup (C 20.02, -0.02) will kick things off on Monday morning.
 
Index Started Week Ended Week Change % Change YTD %
DJIA 12772.47 12777.09 4.62 0.0 4.6
Nasdaq 2937.33 2908.47 -28.86 -1.0 11.6
S&P 500 1354.68 1356.78 2.10 0.2 7.9
Russell 2000 807.14 800.99 -6.15 -0.8 8.1

7:31AM NVIDIA suspended operations today of the NVIDIA Developer Zone (NVDA) 12.40 : NVIDIA suspended operations today of the NVIDIA Developer Zone (developer.nvidia.com). "We did this in response to attacks on the site by unauthorized third parties who may have gained access to hashed passwords. We are investigating this matter and working around the clock to ensure that secure operations can be restored."

Microsemi (MSCC) announced that an independent organization providing technical and scientific research, development and advisory services to national security space programs has completed reliability testing of Microsemi's commercial-grade Axcelerator FPGAs. The tests lasted more than four years with an accumulated total of more than 26 mln device-hours of testing without a single antifuse failure.

Finisar (FNSR $12.49 +0.10) was initiated with a Hold at Needham. The firm notes continue to think Finisar is the best positioned company in the Optical components market. They think they are the strongest in the critical WSS component arena with their industry leading Liquid Crystal on Silicon technology. They also highlight, with sluggish and slowing economic conditions the telecom segment is seeing limp volumes and struggling for growth. They think the big opportunity for Finisar is to drive share gains in the WSS market through the sale of integrated line cards.

10:49 am S&P Information Technology sector trading higher as market rises

The tech sector is trading higher today, along with gains in the broader market. Yet, semiconductors are showing relative weakness with the Philly Semi Index trading only 0.6% higher. WFR (-0.9%) is a notable laggard in that chip index. Among other major indices, the SPY is trading 1.3% higher today, while the QQQ and the NASDAQ are trading 1.0% higher on the session. Among tech bellwethers, MSFT (+2.3%) and QCOM (+2.0%) are showing notable strength.

In earnings last night, LXK (-10.2%) became the latest tech company to lower Q2 guidance. This morning, IGTE (+3.9%) posted a Q2 miss. Also, IMOS (+6.6%) cut Q2 rev guidance. In news last night, APKT (+3.5%) announced a stock repurchase program of up to $200 mln. Among notable analyst upgrades this morning in the tech space, FTE (+5.0%) was upgraded to Hold at Deutsche Bank. In downgrades, FIS (+0.6%) was downgraded to Neutral at Robert W. Baird, SIGM (-2.2%) was downgraded to Sell at UBS, ASML (+1.2%) was downgraded to Neutral at Nomura, and TSS (-0.7%) was downgraded to Equal Weight at Barclays.
icon url

ReturntoSender

07/15/12 10:51 AM

#9837 RE: ReturntoSender #6755

InvestmentHouse Weekend Market Update:

http://www.investmenthouse.com/weekendmarketsummary.htm

- Same news, but market bounces this time because it was technically ready to do so.
- JPM, WFC earnings not spectacular, but don't reveal any new horrors. Financials bounce and thus SP500.
- Indices put in another higher low, and despite a pretty sharp fall the past week, that keeps the overall positive basing action.
- Leaders rebound nicely as do most stocks after the oversold condition.
- China GDP slowest in three years . . . at 7.6%.
- Singapore GDP falls 1.1%
- Producer Prices stage a rebound while the core again rises at 0.2%
- Michigan Sentiment, expected to rise, falls.
- Lots of earnings, lots of economic data, Bernanke testimony, and still room to move upside in the week ahead.

Same old stories as when the market sold, but stocks were simply ready to bounce.

Just another day of the same news for world economies . . .

It was just another day in the world economic markets. In other words, the world economies continue to show the same troubles that they have for months and, yea verily, even years now. China's GDP slowed down to the slowest level in three years, but that was still at 7.6%. Nonetheless, it is the trend. Remember that our labor secretary said it is the trend that matters. That is true in terms of the Chinese GDP because it continues to slow. Moody's cut Italy closer to junk status. It arguably needs to be there already. Michigan Sentiment was weaker than expected. It was supposed to rise, but it came in lower at 72 versus 73.2. Singapore is where Jim Rogers lives now because it is supposedly the freest, most business-friendly country in the world. Its GDP was -1.1%, and it is struggling as well. We noted that yesterday with my Levi's jeans picture. Levi's has a big slowdown in Asian markets for its jeans, and that is always a hot market for its denim products.

Lots of problems, indeed, but stocks sidestepped the issues and rebounded. You could say it was because JPM's losses were not as horrendous as feared (and JPM was up almost 6%) or that WFC's inline earnings were a big relief for everyone. Indeed, WFC jumped 3.23%. But recall that the market was simply oversold. For the past two evenings I have been talking about how the market was down five to six days and was showing doji near support. Looking at the SP600, on Thursday there was that big doji that held the 50 day EMA. Then we saw the bounce to the upside. There may have been some decent news. I guess you could say that the financials helped spark the move, but there was enough bad news to offset these relatively minor earnings beats or inline results. Maybe it was just relief that it was not worse. That is the same thing as an oversold bounce. Am I right or am I right? That is what Ned the Head would say.

Yes, Ned, in the end you were right, and that is exactly what happened. And -- bing! -- the markets moved right up. A nice, solid bounce off of that oversold condition and the pullback. What happened? We had a higher low. You can see the third higher low on the SP600. Higher high, higher low, higher high, higher low, and now could it possibly be that the indices will move to a higher high again, surpassing the early-June peak and playing in the range of the post bear market stock market highs from earlier in 2012? We will see. They certainly started that attempted move on Friday.

Stocks were up all day. It was not exactly clear that they would hold onto their moves heading into the open, but futures did hold modest gains. We were somewhat concerned that it was not a big bounce, but that was good in retrospect because a big bounce typically flares out in a weaker market. This one opened more like a flat market with modest gains, and it built into them quickly and held the gains all the way through the session. Very good high to even higher action on the day. That is following those six days to the downside that set up the oversold condition, but they did so at a higher low.

SP500, +1.65%; NASDAQ, +1.48%; Dow, +1.62%; SP600, +1.42%, SOX, +0.94%

SOX has been down 1-2% or more. It bounced but we did not expect to lead. I have been saying it would follow but definitely not lead, and it was surely in the following position. Other than that, the rest of the stocks were up evenly. Growth lagged the NYSE large caps, but they were parallel in their moves.

OTHER MARKETS.

Dollar. 1.2249 verse 1.2196 euro. The dollar continued an advance overall against its basket of other currencies, but it was unable to move higher against the euro. It stalled out a little bit to end the week, tapping lower, but each day it rebounded off of those lows. It still looks as if wants to move higher. That is not a dollar that is anticipating Fed action, but if you look at a lot of headlines, the reason the market was up on Friday was supposedly because of possible Fed action next week. That is the way it has been of late: possible Fed action next week. We keep looking for that, but it will not come anytime soon. We will let stocks rise in anticipation, but the dollar is definitely not factoring in being undercut by more Fed stimulus.

Bonds. 1.49% versus 1.48% 10 year US Treasury. Bonds were basically flat. A strong move over the past week to the upside, and kind of tailing off at the end of the week. Still below the late-May/early-June peak, but it is making a good showing of moving to the upside and challenging those levels. That would be based on a weaker US economy and weaker economies elsewhere that are putting funds from other countries into US Treasuries. And if the Fed does want to start some asset buying, that could help bonds as well. Thus we see the bond market improving and holding gains.

Gold. 1,578.70, +13.40. Gold enjoyed a good session. Afterhours it was higher near 1,588 or thereabouts. Gold sold most of the week, held at support, and bounced with a doji on Thursday and continued higher on Friday. It is still in the range. It is not out of it by any stretch. It has been banging around in the same range since mid-May. That does not mean it will break out this time, although it has put in a couple of higher lows. We will watch, but it is not imminent in terms of a breakout. It just will not give up more ground.

Oil. 87.40, +1.38. A lateral week for oil, consolidating the break of the May to June downtrend. It held near support. It bounced up and down all week, and then Friday is broke higher. We will see if it can make the real breakout over the early July peak; that is the next level it has to deal with along with the 50 day EMA. Questionable, but there are still tensions in the world with even more reports of weak economies. That is helping to bolster the price of oil, although it is clearly off of its prior highs.

TECHNICAL SUMMARY

Internals.

The internals were somewhat lackluster again.

Volume. NASDAQ, -21%, 1.33B; NYSE -12%, 623M. No volume to accompany the moves, but it was a Friday in the summer with light volume already, so that is not surprising. It is an oversold bounce. If it wants to do more, we will see if it can handle it. I will also note that the upside moves have not occurred on a lot of volume in any regard, whether it is at the start of the move, on the test, or on the bounces off of those tests.

Breadth. NASDAQ 2.7:1; NYSE 5:1. Breadth was lackluster. The small caps and mid caps played a big role in pushing the move to the upside.

THE CHARTS

SP500. SP500 came off of those twin doji and the lower reach on Thursday. A nice reversal. A solid move but no volume, as noted. It does not really matter. As you recall, a lot of these moves had very little volume on the way up. We had the lower low back in late-May/early-June, and the doji off of that. That was the head of the inverted head and shoulders. The breakout, the test, and a marginal higher low that did hold. A new break to a higher high, and then a higher low this past week. Looks as if SP500 wants to rally and challenge the July highs at 1375. That is the next key level, and it is just about 19 points away. After that we look for a move near 14-15. That was the target. That is the higher-high target that we are looking for it to hit. It has a series of higher lows and higher highs. We will see if SP500 can put in the old higher high

DJ30. The Dow showed similar action. It bounced off of a doji as well. It had a higher low above the 200 day EMA and the June low. A nice break through the 50 day EMA. It is on its way to the June high as well at 12,961. That breaks it out and gives it a shot at these triple tops from earlier in the year at 13,250.

NASDAQ. NASDAQ bounced as well, as it should have, off of that nice doji at support. It moved through the 50 day EMA as well. Very low, below-average volume. Quite disappointing in that sense, but just continues to build. The high in March, the selloff, the inverted head and shoulders, the breakout, the higher low in late June. There is the higher high, now a higher low in mid-July, and a new break to the upside. Target? Remember 3,001. There is this gap point from early May, and that is what we are looking for in this move to a higher high. That would not be much of a higher high, and it might make it up to the gap down point at 3,025. That would be a good target for this run. It can definitely do it ahead of earnings or as they start to unfold given the nice oversold condition that it is bouncing from and the positive higher lows in this ongoing base. Remember what I said the other day: This is not a selloff; this is a base. Higher lows and higher highs. This is building -- or at least trying to build -- for something better. That applies not only to NASDAQ but all of the indices that we review.

SP600. SP600 had a nice 1.4% move off of a doji at the 50 day EMA from Thursday. Nice, orderly pullback. It held above support and other interim highs and prior lows, and it bounced. Excellent action. Looking for a run to 455-ish, which is the early-July peak. It should make it past that. It should get up around 460-462 with a higher high on this move.

SOX. The SOX posted the laggard move of the day. It could not even rally 1% in a strong overall stock market bounce. I do note that it is at the early-June low. It held that level and is trying to bounce. It is a logical point to bounce inside of this trading range that peaks out near 390. It closed at 357, and that gives it plenty of room to follow the other indices back up and not have to break out from its trading range. That is good because it does not look as if it would want to break out of its trading range given the lackluster performance of the index. Semiconductors are now commodities, and therefore they perform as such overall. There are certainly individual stocks that are in individually hot markets for semiconductors, but overall the PC chip makers, the memory makers, etc. are not performing as well.

LEADERSHIP

Big Names. AAPL had a good week. It faded in a nice test, held above key levels, and started to bounce. It was not an impressive day on Friday, just a bounce as you would anticipate. There was some talk on the afterhours shows about GOOG running up to 700. It could do that. It is down near support and trying to bounce. It did bounce up on Friday, but it was nothing major on this move either. It was only up 1%, similar to AAPL. Not a lot of big movement from some of the big names. PCLN is a high-value stock. It has not been a market leader, but it shows the same thing: no major movement. It was down all week, and there was not much of a bounce on Friday. It is a bit disconcerting that these big names are not powering ahead. It is also interesting to note that they are still basing similar to the indices, but that other stocks are stepping up and managing to push the market to the upside.

Homebuilders/Materials. The home builders were back in the mix. KBH jumped but closed well off of its high. BZH had a tough session. It closed down almost 1.5%. Some of these leaders were not that strong, from the big names, some of the home builders, and even the materials suppliers for the home builders. That, too, is somewhat disconcerting.

Financials. Financials performed well given the earnings. JPM and WFC posted nice moves. BAC posted a solid 4.5% bounce. They were ready. Remember I said that they were set and, if they got just a bit of decent news, they could bounce. They did just that, and they were moving up quite nicely.

Industrial. Industrials also made a move, but it was more of a relief bounce. CMI bounced but on lower volume. The same thing you will see with CAT. It was a bounce but not a lot of pop.

Energy. We have not looked at energy in a while, so I will look at a cross section of energy stocks. As oil prices have bounced and firmed, so have the patterns of the energy stocks. APC held over the 50 day EMA. Nice Thursday and Friday moves. HAL bounced. It held decently but it was nothing major. Looking at some of the big names, CVX bounced as well. It is very similar in pattern to APC. They moved up, firmed, and are moving laterally and trying to consolidate. Not bad action there.

Retail. Retail remains very much mixed. COST started to break higher out of a pennant. RL is still bumping along in the same range for the past 2.5 months. You have feast or somewhat famine from the retailers. I like I what I saw with SBUX. Nice bounce the past couple sessions. We picked up some positions on it to see if this big-name retailer can continue what looks to be a good base-building process and a point where it is ready to make a higher move inside of its base.

We do have retailers that are still looking solid. We also have some that do not, but it is a very big sector. Frankly the mix is interesting because a lot of the retailers that are performing better are, of course, the big value discounters such as DLTR and COST. They are performing, but it is also interesting to see a stock like SBUX performing and trying to move higher as well.

Drugs/Healthcare. This sector was under a little pressure but seemed to be pulling it out of the hat toward the end of the week. We saw improvement across the board. ABAX started to move back up. It was representative of many stocks in this area. EXAS broke higher on the week after moving laterally. OREX enjoyed a great week, and BCRX enjoyed a nice week as well. A lot of these are in the drugs. Biotechs are still getting money pushed their way. We have been picking up those positions, again, as they started to break to the upside.

Summary. What do we have? As I talked about earlier, there is some more of the same. We have the same areas getting money. But note that some of the big names, while they are still in a basing process, do not look as strong or are not leading as hard as they were. That is what worrisome. But then we see other stocks that have been down but are now breaking upside. FAST in materials and construction is one of them. It goes along with some others that have been beaten down but are moving higher from good patterns such as SBUX. We could be getting another wave of leadership building in, and that is exactly what the market needs. You have to have new waves of leaders come in to push the market higher on new legs. The market has been moving on up with the higher lows and higher highs, and it will need stocks to carry it to that next higher high.

THE MARKET

SENTIMENT INDICATORS

VIX: 16.74; -1.59
VXN: 19.09; -1.88
VXO: 16.08; -1.99

Put/Call Ratio (CBOE): 1; +0.02

Bulls versus Bears

This is a reading of the number of bullish investment advisors versus bearish advisors. The reason you look at this is that it gives you an idea of how bullish investors are. If they are too bullish then everyone is in the market and it is heading for a top: if everyone wants to be in the market, then all the money is in and there is no more new cash to drive it higher. On the other side of the spectrum if there are a lot of bears then there is a lot of cash on the sideline, and as the market rallies it drags that cash in as the bears give in. That cash provides the market the fuel to move higher. If bears are low it is the same as a lot of bulls: everyone is in and the market does not have the cash to drive it higher.

Bulls: 44.7% versus 42.5%. Continuing an impressive run after undercutting 35%, the threshold for bullishness, in early June. You would expect it to rise and it has. Still not at a dangerous level, just working as it should. As noted, hit 34% in early June. It did its job and the market is on the rally. Hard drop to 34 from 39.3% as economic reality and a choppy stock market hit. Off the 55+ level hit in late February. That was the highest level since April and May of 2011, the peak of the post-bear market high. 35% is the threshold level suggesting bullishness. To be seriously bearish it needs to get up to the 60% to 65% level.

Bears: 24.5% versus 24.5%. Holding basically at the same level for over a month. 24.7% before, and 25.6% before that. Never got close to the 35% level that is bullish, but it looks as if the bulls did the work. Over 35% is the threshold to be really be a good upside indicator. For reference, bearishness hit a 5 year high at 54.4% the last week of October 2008. The move over 50 took bearish sentiment to its highest level since 1995. Extreme negative sentiment. Prior levels for comparison: Bearishness peaked at 37.4% in September 2007. It topped the June 2006 peak (36%) on that run. That June peak eclipsed the March 2006 high (33%) and well above the 2005 highs that spawned new rallies (30% in May 2005, 29.2% in October 2005). That was a huge turn, unlike any seen in recent history.

NASDAQ

Stats: +42.28 points (+1.48%) to close at 2908.47
Volume: 1.33B (-20.93%)

Up Volume: 994.33M (+515.45M)
Down Volume: 330.25M (-909.75M)

A/D and Hi/Lo: Advancers led 2.68 to 1
Previous Session: Decliners led 1.37 to 1

New Highs: 116 (+61)
New Lows: 34 (-34)

SP500/NYSE

Stats: +22.02 points (+1.65%) to close at 1356.78
NYSE Volume: 623M (-12.01%)

Up Volume: 2.81B (+1.835B)
Down Volume: 381.64M (-2.228B)

A/D and Hi/Lo: Advancers led 4.97 to 1
Previous Session: Decliners led 1.7 to 1

New Highs: 202 (+99)
New Lows: 17 (-41)

DJ30

Stats: +203.82 points (+1.62%) to close at 12777.09
Volume: 121M shares Friday versus 148M shares Thursday.

MONDAY

Next week is a big week. Lots of economic data of all kinds and of all import. We have retail sales, the New York PMI, industrial production and capacity, the CPI, and the core CPI. Those are the consumer prices. Housing starts are always big. Then we have initial claims and existing home sales and the Philly Fed on Thursday.

On top of all that, we have earnings starting next week, and lots of them. Thus far we have not seen any of our plays or positions deal with earnings. We have picked up some immediately on the heels of earnings, but we have not had them go through earnings yet. We saw some that are approaching; if they are not moving well, we will pare them off. We would like to, as per our plan, get a continued move to the upside for the market overall as the earnings get underway. The key will be what happens when the first big names start announcing. Will the market slam back? As noted, today JPM and WFC announced, and the move was positive for the market. That is great. That is what we want to see keep up. We want that initial euphoria or just "this is not as bad as everyone said it was."

As I said on Thursday night, it may not be as bad as everyone thinks. People have turned so negative on earnings. I am negative about earnings, but even so, I have to realize that when everyone else gets overly negative that the market is ready to bounce simply because people have discounted too much bad news -- more than is really going to be there. That is exactly what we are seeing with the charts and the stocks rebounding: higher lows and higher highs. We have put in what looks to be a higher low now, and we will be looking for a higher high as the week continues.

What do we do with that? Will we be like the dog that caught the car and does not know exactly what to do with it? No. We want a continued oversold bounce that takes it up to our next logical target. That is 14-15 or so on the SP500, which puts it at a higher high, and then take profits from there. Maybe not all of them off of the table, but a good chunk of profits. We will be doing that as the market moves to the upside. We have great positions that we have already had in place which survived this selling, held support, and are now moving up. We have others that we picked off as the market started to bottom and started to move higher. We have taken some gain and we will continue to take gain as the market makes that move.

The question is: Do we want to take more positions as the market moves? We can do that. Some stocks will not announce earnings for quite some time. Others have already announced them, and we can try to move in on plays with those. But the point to remember is that the more movement we get to the upside, the less we want to buy. That is because you are running out of room to make the money you want to make. That is why we have been buying as the market started to turn off of this low. We will let them rally, take some gain, and maybe even take more (or all) off the table as earnings approach.

I still think earnings will ultimately be a disappointment. But early on, given the fact that those indices have pulled back into the numbers, they have a prime technical bounce ahead of them from the looks of it. I also have to say, as noted earlier and on Thursday, that the indices continue to build bases. These are not selloff patterns. We are having higher lows and higher highs, and a good rounded-bottom base. That is a positive. As long as we get new leadership coming to the fore -- with stocks that have been dormant maybe showing life -- then the market gets that extra push it needs to continue the move to the upside. Again, new leadership blood has to show up, and it looks as if there is some even as other areas that were solid are struggling a bit and are not putting in the same kind of move that the rest of the market is. Again, that is normal. A rally market will do that. Leaders have to pause and let others come to the fore. We will see if we get more of those. We definitely got good pullbacks in the stocks we wanted to see. A lot in the drug area did very well and some of the others like banks. It looks like the hold builders are trying to do that as well.

We have some good pullbacks, and we are able to take advantage of them. We will try to do the same with an eye on earnings up ahead and with an eye on the logical targets up ahead as well. Remember that this is still an economy that is falling, that the world economies are still in trouble, and that a lot of this move may be based on expected future stimulus from the Fed that would move the market higher. That seems like kind of a stretch, I know, but with the weak economic data, that is about the only thing you can attribute this to other than the economy actually recovering. I cannot see that as a possibility, but I cannot totally rule that out. That is just the way the market works.

We will let these positions run. We will make some money next week, and we will see just how far this higher low can move. Have a great weekend!

Support and resistance

NASDAQ: Closed at 2908.47
Resistance:
2910 is the recent March 2012 low
2942 is the mid-June 2012 high
2950 is the mid-April closing low
2962 is the April 2012 low
3000 is the February 2012 post-bear market high
3024 is the gap point from early May
3026 from 10/2000 low
3042 from 5/2000 low
3076 is the late April 2012 high
3090 is the mid-March interim high
3134 is the March 2012 post-bear market peak
3227 is the April 2000 intraday low
3401 is the May 2000 closing low

Support:
The 50 day EMA at 2900
2900 is the March 2012 low
2888 is the May 2011 peak and PRIOR post-bear market high
2879 is the July 2011 peak
2862 is the 2007 peak
2841 is the February 2011 peak
2816 is the early April 2011 peak.
The 200 day SMA at 2811
2810 is the low in the shoulders
2754 is the October 2011 high
2706 to 2705 is the April 2011 low and the February 2011 and consolidation low (bottom of the trading range) 2723 to 2705 is the range of support at the bottom of the January to May trading range
2686 is the January 2011 closing low
2676 is the January 2010 low and the December 2011 peak
2645-2650ish from December 2010 consolidation
2643 is the September 2011 high
2612 is the late August 2011 peak
2603 is the March 2011 intraday low (post-Japan low)
2599 is the June 2011 low and NASDAQ

S&P 500: Closed at 1356.78

Resistance:
1357 is the July 2011 peak
1359 is the April 2012 low
1363.46 is June 2012 high
1371 is the May 2011 peak, the post-bear market high
1378 is the February 2012 peak
1406 is the early May 2012 peak
1422.38 is the Post-bear market high (March 2012)
1425 from May 2008 closing highs
1433 from August 2007 closing lows
1440 from November 2007 closing lows

Support:
1344 is the February 2011 peak
The 50 day EMA at 1342
1340 is the early April 2011 peak
1332 is the early March 2011 peak
1309 is the right shoulder low from June 2012
The 200 day SMA at 1307
1295 to 1294 is the April 2011 low and the February 2011 consolidation low (bottom of the trading range)
1293 is the October 2011 peak
1275 is the January 2010 low, early January 2011 peak
1267 is the December 2011 peak
1258 is June 2011 intraday low
1255 is the late December 2010 consolidation range
1249 is the March 2011 low (post-Japan)
1235 is the mid-December 2010 consolidation low
1231 is the late August 2011 peak
1227 is the November 2010 peak
1220 is the April 2010 peak
1209 is the mid-August 2011 high

Dow: Closed at 12,777.09
Resistance:
13,056 is the February 2012 high
13,058 from the May 2008 peak on that bounce in the selling
13,297 is the April 2012, post bear market high
13,668 from 12-2007 peak
13,692 from 6-2007 peak
14,022 from 7-07 peak

Support:
12,754 is the July intraday peak
12,716 is the April 2012 closing low
The 50 day EMA at 12,694
The 200 day SMA at 12,458
12,391 is the February 2011 peak
12,369 is the left shoulder low from May 2012
12,284 is the October 2011 peak
12,258 is the December 2011 peak
12,110 from the March 2007 closing low
12,094 is the April 2011 low
The June low at 11,897 (closing)
11,734 from 11-98 peak
11,717 is the late August 2011 peak
The August low at 11,702
11,555 is the March low
11,452 is the November 2010 peak
11,178 from November 2010
10,978 is the bottom of the November 2010 consolidation
10,750 from September 2010
10,720 is the August closing low
10,705-710 from January 2010 peak
10,694-700 from August 2010 peak

Economic Calendar

July 9 - Monday
- Consumer Credit, May (15:00): $17.1B actual versus $9.5B expected, $10.0B prior (revised from $6.5B)

July 11 - Wednesday
- MBA Mortgage Index, 07/07 (7:00): -2.1% actual versus -6.7% prior
- Trade Balance, May (8:30): -$48.7B actual versus -$48.9B expected, -$50.6B prior (revised from -$50.1B)
- Wholesale Inventories, May (10:00): 0.3% actual versus 0.3% expected, 0.6% prior
- Crude Inventories, 07/07 (10:30): -4.696M actual versus -4.270M prior
- FOMC Minutes, 6/20 (14:00)

July 12 - Thursday
- Initial Claims, 07/07 (8:30): 350K actual versus 375K expected, 376K prior (revised from 374K)
- Continuing Claims, 06/30 (8:30): 3304K actual versus 3300K expected, 3318K prior (revised from 3306K)
- Export Prices ex-ag., June (8:30): -1.4% actual versus -0.6% prior (revised from -0.5%)
- Import Prices ex-oil, June (8:30): -0.3% actual versus -0.1% prior
- Treasury Budget, June (14:00): -$59.7B actual versus -$60.0B expected, -$43.1B prior

July 13 - Friday
- PPI, June (8:30): 0.1% actual versus -0.6% expected, -1.0% prior
- Core PPI, June (8:30): 0.2% actual versus 0.2% expected, 0.2% prior
- Michigan Sentiment, July (9:55): 72.0 actual versus 73.5 expected, 73.2 prior

July 16 - Monday
- Retail Sales, June (8:30): 0.2% expected, -0.2% prior
- Retail Sales ex-auto, June (8:30): 0.1% expected, -0.4% prior
- Empire Manufacturing, July (8:30): 3.8 expected, 2.3 prior
- Business Inventories, May (10:00): 0.2% expected, 0.4% prior

July 17 - Tuesday
- CPI, June (8:30): 0.1% expected, -0.3% prior
- Core CPI, June (8:30): 0.2% expected, 0.2% prior
- Net Long-Term TIC Fl, May (9:00): $25.6B prior
- Industrial Production, June (9:15): 0.3% expected, -0.1% prior
- Capacity Utilization, June (9:15): 79.2% expected, 79.0% prior
- NAHB Housing Market , July (10:00): 30 expected, 29 prior

July 18 - Wednesday
- MBA Mortgage Index, 07/14 (7:00): -2.1% prior
- Housing Starts, June (8:30): 743K expected, 708K prior
- Building Permits, June (8:30): 765K expected, 780K prior
- Crude Inventories, 07/14 (10:30): -4.696M prior

July 19 - Thursday
- Initial Claims, 07/14 (8:30): 365K expected, 350K prior
- Continuing Claims, 07/07 (8:30): 3300K expected, 3304K prior
- Existing Home Sales, June (10:00): 4.65M expected, 4.55 prior
- Philadelphia Fed, July (10:00): -10.0 expected, -16.6 prior
- Leading Indicators, June (10:00): -0.2% expected, 0.3% prior
icon url

ReturntoSender

07/16/12 6:31 PM

#9838 RE: ReturntoSender #6755

From Briefing.com: 4:10 pm : Stocks finished the day with modest losses after disappointing data provoked selling. This morning's retail sales numbers fell short of estimates while business inventories registered a larger than expected build. The data was not all bad as Empire Manufacturing topped forecasts.

Citigroup (C 26.81, +0.16) gained 0.6% following its mixed quarterly results. The company announced earnings per share of $0.95 which topped the Capital IQ Consensus Estimate of $0.90, but revenues were light at $18.64 billion. Elsewhere on the earnings front, Woodward (WWD 34.54, -1.51 -2.13) guided third quarter revenue and earnings per share below consensus. The industrial company also lowered its full-year 2012 outlook. On the other hand, j2 Global (JCOM 28.47, +2.24) rallied 8.5% after it guided second quarter earnings per share and revenue above consensus.

The SPDR S&P Retail ETF (XRT 58.87, -0.35) lagged after June retail sales came in below expectations.

Gilead Sciences (GILD 51.94, +0.77) announced the FDA approval of Truvada, an oral drug for reducing the risk of acquiring HIV.

Shares of Par Pharmaceutical (PRX 50.00, +13.42) rose on news the company will be taken private at $50.00 per share in cash which is a 37% over Friday’s closing price. The transaction values the company at $1.9 billion. Today’s gains have the stock trading at levels last seen in April 2004.

Visa (V 127.15, +3.06) and Mastercard (MA 436.89, +7.29) both added close to 1.7% after settling merchant litigation. The settlement removes an overhang with the two companies on the hook for a $6.6 billion settlement. Visa’s share represents approximately $4.4 billion while Mastercard will pay roughly $2.2 billion.

The grain complex climbed as the worst drought since 1988 continues put upward pressure on prices. Teucrium Corn (CORN 49.85, +1.82) and iPath Dow Jones-UBS Gains Sub-Index (JJG 61.01, +2.48) once again saw outperformance with both holding gains of close to 4.0%. The two names are both up close to 40% over the past month.

Treasuries ended at post-data lows as traders moved out of the complex amid a rebound in risk assets. This morning’s buying dropped the 5-yr yield to a record low 0.577% while the 10-yr yield narrowly escaped a record low print as it hit 1.442% (1.440% record low). Slight flattening of the yield curve saw the 2-10-yr spread narrow to 123.5 bps.

Tuesday will see CPI and core CPI released at 8:30 am ET, net long-term TIC flows cross the wires at 9 am ET, industrial production and capacity utilization announced at 9:15 am ET, and the NAHB Housing Market Index at 10 am ET. Also of note is Chairman Bernanke’s semi-annual “Monetary Policy Report to the Congress” in front of the Senate Banking Committee at 10 am ET. DJ30 -49.88 NASDAQ -11.53 SP500 -3.14 NASDAQ Adv/Vol/Dec 879/1.40 bln/1603 NYSE Adv/Vol/Dec 1359/601.8 mln/1670

3:35 pm : The dollar index extended losses in the afternoon session, which would typically boost all commodities. However, it only seemed to give crude oil strength, which rose as high as $88.55/barrel. After rallying over $2/barrel off its LoD, WTI crude oil finished the day over 1% higher at $88.42/barrel. After selling off in early morning action, Aug natural gas futures continued to trade in a tight consolidated pattern for the rest of today's session, just above its session low. At the end of the day, nat gas closed 2.4% lower at $2.80/MMBtu.

Precious metals, on the other hand, traded in a tight pattern following its morning rally. Aug gold ended its floor trading session 10 cents lower at $1591.90/oz, while Sept silver lost 4 cents to $27.32/oz.

Grains really showed solid gains on a continuation of hot/dry weather in the Midwest. Dec corn rose 5% to $7.77/bushel, Sept wheat rose 4.6% to $8.87/bu and Nov soybeans rose 2.5% to $15.91/bu.DJ30 -39.77 NASDAQ -10.12 SP500 -2.65 NASDAQ Adv/Vol/Dec 922/1168.8 mln/1524 NYSE Adv/Vol/Dec 1377/419 mln/1620

4:05PM Agilent & AT4 wireless announced that they have signed a definitive agreement for Agilent to acquire the assets of AT4 wireless' Test Systems business (A) 36.83 -0.21 : Co and AT4 wireless today announced that they have signed a definitive agreement for Agilent to acquire the assets of AT4 wireless' Test Systems business. Privately held AT4 wireless, based in Malaga, Spain, is a global provider of testing services and solutions for wireless communications. The acquisition is expected to be completed by early August, subject to customary closing conditions. Financial details were not disclosed.

Spreadtrum Communications (SPRD) announced that Spreadtrum's SC8810 smartphone platform was selected by Mozilla to showcase its HTML5 operating system, Firefox OS, running on low-cost smartphone devices.

Lattice Semiconductor (LSCC) announced version 2.0 of its Lattice Diamond design software, the flagship design environment for Lattice FPGA products.

12:31AM Research In Motion receives verdict against co in patent case brought by Mformation (RIMM) 7.24 : Co announces that a jury returned a verdict against RIMM in the amount of $147.2 mln in an action brought by Mformation in the U.S. District Court for the Northern District of California. RIMM is disappointed by the outcome and is evaluating all legal options. Additionally, the trial judge has yet to decide certain legal issues that might impact the verdict. RIMM will await those rulings before deciding whether to pursue an appeal.

FBR Capital downgrades Texas Instruments (TXN $28.52 -0.50) to Underperform from Mkt Perform and lowers their tgt to $24.50 from $30 as they think more downside risks exist for TXN shares versus other chip stocks trading near trough valuations. TI's 3Q12 revenue guidance could be worse than the Street (like many peers) and with risk to the Street's 2013 estimates. Further, they are concerned about challenges in TI's wireless business, gross margin impacts from its 1Q12 die bank inventory build-ahead, and whether TI has too much capacity following its National acquisition.

10:02 am Tech Stocks Trading lower today along with broader market

The tech sector is trading lower today, roughly inline with losses in the broader market. Semiconductors are also showing relative weakness, however, with the Philly Semi Index (SOX) trading 1.3% lower. VECO (+4.3%) is a notable laggard in the chip index. Among other major indices, the SPY is trading 0.5% lower today, while the QQQ and the NASDAQ are trading 0.6% lower on the session. Among tech bellwethers, FB (-3.1%) is showing notable weakness.

In earnings, JCOM (+5.5%) increased its Q2 guidance. In news, PRGS (-1.4%) announced the appointment of Melissa Cruz as Chief Financial Officer and the election of Phil Pead as Non-Executive Chairman. Also of note, MSFT (-1.0%) announced it will make an announcement at 12:00 Pacific Time (3:00 pm ET). Among rumors, AAPL's (+0.3%) iPhone 5, with design changes, has entered into production according to reports from AppleInsider.

Among notable analyst upgrades this morning in the tech space, Oppenheimer upgraded WNS (+4.2%) to Outperform and QCOM (-1.7%) was upgraded to Hold at Societe Generale. In downgrades, SNDK (-1.5%) was downgraded to Neutral at Robert W. Baird, FBR Capital downgraded TXN (-1.7%) to Underperform, and SSNC (-2.0%) was downgraded to Outperform at Raymond James. There are no notable names in tech scheduled to report quarterly results today after the close.

icon url

ReturntoSender

07/18/12 8:45 PM

#9839 RE: ReturntoSender #6755

From Briefing.com: 4:15 pm : Stocks finished near session highs as the recent flight into risk produced the third day of gains in the past four. Today’s 0.7% advance has the S&P 500 back near its early July highs and 8.5% above the June 1 low. The Nasdaq was the top performer among the major averages, ending the day with up 1.1%.


The Fed’s Beige Book was released this afternoon and suggested “overall economic activity continued to expand at a modest to moderate pace in June and early July.” Excerpts from the Beige Book hinted that reports on residential housing were “largely positive” and drought caused “stress to crops and livestock” while indicating employment grew at a “tepid pace.”

Earnings season is now in high gear with Intel (INTC 26.21, +0.83) and financials dominating the landscape over the past 18 hours. Results from financials have been 'better than feared,' but it is notable that the group was a laggard. Bank of America (BAC 7.53, -0.39) beat on the bottom line but missed on revenues. This caused some selling in the stock as investors view the bottom line beat was due to cost cutting and not a strengthening of the business. Some other notable financials reporting included Bank of New York (BK 21.69, -0.03), Blackrock (BLK 175.05, -1.10), Credit Suisse (CS 18.35, +0.65), and U.S. Bancorp (USB 33.48, +0.53).

Homebuilders finished in-line following this morning’s mixed housing starts and building permits data. The SPDR S&P Homebuilders ETF (XHB 21.56, +0.14) gained 0.7% with action holding just below the almost four-year high set back in May. Pulte Group (PHM 10.80, -0.37) and KB Home (KBH 9.89, -0.06) saw relative underperformance.

Vivus (VVUS 29.00, +2.54) rose 9.6% after receiving Food & Drug Administration approval for its obesity drug Qsymia. The announcement has shares of Arena Pharmaceuticals (ARNA 9.98, -1.07) under pressure as the approval allows for competition with its obesity drug Belviq.

Proctor & Gamble (PG 64.82, +0.03) slumped to session lows after the Board of Directors announced it anonymously supports the recently disclosed plan to return the company to levels that “produce the best long-term value for shareholders” and Chief Executive Officer Bob McDonald as he leads the implementation of the plan. The stock was able to rebound off its worst levels and finish slightly in the green.

Treasuries finished with modest gains during what turned out to be a relatively quiet session. Yields in the belly of the curve saw the biggest declines with the 7-yr sliding 3.3 bps to 0.960% while a 2.2 bp decline dropped the 10-yr yield to 1.479%. Little change along the yield curve saw the 2-10-yr spread hold at 126 bps.

Data concludes for the week tomorrow with initial and continuing claims crossing the wires at 8:30 AM ET and existing home sales, the Philly Fed, and leading indicators due out at 10 AM ET. DJ30 +103.16 NASDAQ +32.56 SP500 +9.11 NASDAQ Adv/Vol/Dec 1476/1.74 bln/1129 NYSE Adv/Vol/Dec 1889/727.4 mln/1129

3:35 pm : Crude oil found buying support during today’s pit trade on a number of catalysts that included tension in Syria, better-than-anticipated inventory data, and comments from Fed Chairman Ben Bernanke that toned down the risk of a double-dip recession. Crude climbed out of negative territory and touched a session high of $90.04 per barrel. Although it pulled-back slightly in early afternoon action, it settled with a 0.9% gain at $89.89 per barrel.

Natural gas steadily climbed higher during its floor session. It popped to a session high of $3.02 per MMBtu but quickly corrected the move. Nevertheless, it settled pit trade 6.1% higher at $2.97 per MMBtu.

Gold and silver dipped to their respective floor session lows of $1567.20 per ounce and $26.85 per ounce following better-than-expected housing data. The metals then trended upwards to their session highs of $1582.90 per ounce for gold and $27.30 per ounce for silver as the dollar lost steam, but once again pulled-back in afternoon action. Gold settled pit trade 1.2% lower at $1570.70 per ounce while silver settled with a 1.0% loss at $27.08 per ounce. DJ30 107.21 NASDAQ 31.53 SP500 9.08 NASDAQ Adv/Vol/Dec 1457/1487.5/1011 NYSE Adv/Vol/Dec 1872/506.1/1120

4:10PM IBM beats by $0.08, misses on revs; raises FY12 EPS above consensus (IBM) 188.25 +4.60 : Reports Q2 (Jun) earnings of $3.51 per share, excluding non-recurring items, $0.08 better than the Capital IQ Consensus Estimate of $3.43; revenues fell 3.3% year/year to $25.78 bln vs the $26.34 bln consensus. Co issues upside guidance for FY12, raises EPS to at least $15.10, excluding non-recurring items, from at least $15.00 vs. $15.05 Capital IQ Consensus Estimate. The Americas' second-quarter revenues were $11.1 billion, a decrease of 1% (up 1%, adjusting for currency) from the 2011 period. Revenues from Europe/Middle East/Africa were $7.9 billion, down 9% (flat, adjusting for currency). Asia-Pacific revenues increased 2% (up 4%, adjusting for currency) to $6.3 billion. OEM revenues were $512 million, down 24% compared with the 2011 second quarter. Software revenue, flat, up 4% adjusting for currency; Services revenue down 3%, up 1% adjusting for currency: Services pre-tax income up 18%; Services backlog of $136 billion, down 6%, flat adjusting for currency; Systems and Technology revenue down 9%, down 7% adjusting for currency; Growth markets revenue up 2%, up 8% adjusting for currency; Business analytics revenue up 13% in the first half; Smarter Planet revenue up more than 20% in the first half; Cloud revenue doubled first-half 2011 revenue.

5:06PM IBM conference call summary (call is currently in Q&A) (IBM) 188.20 +4.60 :

Mgmt noted that deadwinds included currency fluctuations and volatility for translation and hedging dynamics. Total operating expense and other income was down 6%. Co is dealing with significant currency dynamics which impacted its revenue lines by ~ $1 bln, or almost 4 points.
Co had $150 mln of workforce balancing in the quarter primarily in Europe.
Co should see ongoing benefits to the GTS portfolio.
GBS returned to a more typical level of profitability.
Co saw strength in Russia and China. China was up over 20% this quarter, gaining share again. Co is continuing to build its capabilities there. They expanded the number of branch offices and now have 68 face-to-face and over 100 virtual branch offices open across all of China.
Europe saw mixed performance as Italy and France were down.

4:34PM Skyworks beats by $0.01, beats on revs; guides Q4 EPS in-line, revs in-line (SWKS) 28.65 +1.12 : Reports Q3 (Jun) earnings of $0.45 per share, excluding non-recurring items, $0.01 better than the Capital IQ Consensus Estimate of $0.44; revenues rose 9.2% year/year to $389 mln vs the $383.02 mln consensus. Co issues in-line guidance for Q4, sees EPS of 0.50-0.51, excluding non-recurring items, vs. $0.51 Capital IQ Consensus Estimate; sees Q4 revs of 415-420 mln vs. $418.03 mln Capital IQ Consensus Estimate. "Our strategic diversification across OEMs and chipset partners is enabling us to produce consistently strong operating results despite the macro economy. Specifically, we are gaining share within adjacent vertical markets including automotive, medical, avionics, military, location services and broadband communications. At the same time, our innovative solutions are powering the world's most popular smartphones, tablets, home automation platforms and network infrastructure systems. In short, we have created a differentiated business model that is delivering demonstrable, best in class mobile internet growth with analog semiconductor shareholder returns."

4:24PM Xilinx beats by $0.02, beats on revs; guides Q2 revs below consensus (XLNX) 32.01 +1.12 : Reports Q1 (Jun) earnings of $0.47 per share, $0.02 better than the Capital IQ Consensus Estimate of $0.45; revenues fell 5.3% year/year to $582.8 mln vs the $574.03 mln consensus. Co says sales for Q2 are expected to be down 4% to 8% sequentially, this calculates to ~$536.17 -559.48 vs. $587.33 mln Capital IQ Consensus Estimate. Co also says Q2 gross margin is expected to be approximately 66%. Operating expenses are expected to be approximately $220 million, including $2 million of amortization of acquisition-related intangibles. Other income and expense is expected to be an expense of approximately $8 million. Fully diluted share count is expected to be approximately 274 million. September quarter tax rate is expected to be approximately 16%.

4:22PM eBay beats by $0.01, beats on revs; guides Q3 EPS in-line, revs just below consensus; reaffirms FY12 EPS, revs guidance (EBAY) 40.46 +1.39 : Reports Q2 (Jun) earnings of $0.56 per share, excluding non-recurring items, $0.01 better than the Capital IQ Consensus Estimate of $0.55; revenues rose 23.1% year/year to $3.4 bln vs the $3.36 bln consensus. Co issues guidance for Q3, sees EPS of $0.53-0.55, excluding non-recurring items, vs. $0.55 Capital IQ Consensus Estimate; sees Q3 revs of $3.3-3.4 bln vs. $3.41 bln Capital IQ Consensus Estimate. Co reaffirms guidance for FY12, sees EPS of $2.30-2.35, excluding non-recurring items, vs. $2.35 Capital IQ Consensus Estimate; sees FY12 revs of $13.8-14.1 bln vs. $14 bln Capital IQ Consensus Estimate. Q2 non-GAAP op margin of 27.3% vs 26.9% last qtr and 27.6% year ago; Q2 active users of 104.8 mln vs 102.4 mln last qtr. PayPal ended the quarter with 113.2 million active registered accounts, a 13% increase over the second quarter of 2011. PayPal revenue increased 26% year over year, driven primarily by increased penetration on eBay as well as continued merchant and consumer adoption and strong growth in Bill Me Later. "Our entire company is strong, but we're particularly pleased with eBay Marketplaces, which delivered its strongest organic growth in gross merchandise volume, excluding vehicles, since 2006. And mobile continues to be a game changer. We now expect eBay and PayPal mobile to each transact $10 billion in volume in 2012 -- that's more than double 2011, a staggering surge in mobile shopping and payments on devices that did not exist just a few years ago. Retail is at an inflection point, and we are helping to reshape how people around the world shop and pay."

4:08PM F5 Networks reports EPS in-line, revs in-line; guides Q1 (Dec) EPS below consensus, revs below consensus (FFIV) 98.59 +6.83 : Reports Q3 (Jun) earnings of $1.14 per share, in-line with the Capital IQ Consensus Estimate consensus of $1.14; revenues rose 21.3% year/year to $352.6 mln vs the $353.16 mln consensus. "Overall, revenue growth slowed in Q3, but revenue by region was generally consistent with historical patterns; 57 percent for the Americas (primarily the United States) and 43 percent for EMEA and APJ, with EMEA contributing 21 percent of the total.

Co issues downside guidance for Q1 (Dec), sees EPS of $1.16-1.19, excluding non-recurring items, vs. $1.24 Capital IQ Consensus Estimate; sees Q1 (Dec) revs of $360-370 mln vs. $383.97 mln Capital IQ Consensus Estimate. Lowered guidance is due to 'cautious spending environment'.

4:05PM Qualcomm misses by $0.01, misses on revs; guides Q4 EPS below consensus, revs below consensus; guides FY12 EPS below consensus, revs below consensus (QCOM) 56.05 +1.59 : Reports Q3 (Jun) earnings of $0.85 per share, excluding non-recurring items, $0.01 worse than the Capital IQ Consensus Estimate of $0.86; revenues rose 27.8% year/year to $4.63 bln vs the $4.68 bln consensus. Co issues downside guidance for Q4, sees EPS of $0.78-0.84 vs. $0.89 Capital IQ Consensus Estimate; sees Q4 revs of $4.45-4.85 bln vs. $4.9 bln Capital IQ Consensus Estimate. Co issues downside guidance for FY12, sees EPS of $3.61-3.67 vs. $3.74 Capital IQ Consensus Estimate, down from prior guidance of $3.61-3.76; sees FY12 revs of $18.7-19.1 bln vs. $19.21 bln Capital IQ Consensus Estimate, down from prior guidance of $18.7-19.7 bln.

"Looking forward, our growth estimates for 3G/4G device shipments in calendar 2012 have moderated slightly, and we now expect the demand profile of the calendar year to be more back-end loaded as new devices are launched for the holiday season. Although our outlook for semiconductor volumes in the fiscal fourth quarter has been reduced from our prior expectations, we are ramping supply of our 28 nanometer chipsets to help enable what we expect to be a strong December quarter for our semiconductor business."

4:03PM Plexus beats by $0.03, reports revs in-line; guides for Q4 (PLXS) 27.45 +0.76 : Reports Q3 (Jun) earnings of $0.66 per share, $0.03 better than the Capital IQ Consensus Estimate of $0.63; revenues rose 8.9% year/year to $608.81 mln vs the $606.77 mln consensus. Co issues guidance for Q4, sees EPS of $0.60-0.66 vs. $0.66 Capital IQ Consensus Estimate; sees Q4 revs of $590-620 mln vs. $624.29 mln Capital IQ Consensus Estimate. Co says "Looking further ahead, we anticipate that the macro-environment will continue to be challenging, making longer-range growth projections exceptionally difficult. Our optimism about longer-term growth is anchored in our strong new wins performance over the past year that should result in revenue growth strengthening in fiscal 2013. However, with this difficult macro backdrop, we currently anticipate that the end-market environment will continue to be challenging for many of our customers, resulting in muted growth for mature production programs. Optimizing results under our financial model relies on a balanced mix, where growing mature programs yield typically better operating performance, and offset the production startup costs we experience in the earlier phases of new programs. While we believe that our current level of operating margin performance is industry leading, it is below our target, which we believe may be difficult to achieve in an environment where our revenue growth is heavily biased to ramping new program wins versus end-market growth of mature programs."

7:01AM Silicon Labs announced it has filed a patent infringement lawsuit against MaxLinear (MXL) in the Southern District of California (SLAB) 35.85 : Co announced it has filed a patent infringement lawsuit against MaxLinear in the Southern District of California, San Diego Division. This lawsuit continues patent litigation against MaxLinear (MXL) that now involves 20 Silicon Laboratories patents related to RF and mixed-signal design.

Lattice Semiconductor (LSCC) announced that its low cost, ultra-low power iCE40 mobileFPGA family has been named a finalist in the highly regarded e-Legacy Awards competition sponsored by Electronic Product Design magazine.

3:59AM ASML beats by EUR0.03, reports revs in-line; guides Q3 revs in-line (ASML) 51.50 : Reports Q2 (Jun) earnings of $0.71 per share, EUR0.03 better than the Capital IQ Consensus Estimate of EUR0.68; revenues fell 1.9% year/year to EUR1.23 bln vs the EUR1.23 bln consensus. Co issues in-line guidance for Q3, sees Q3 revs of ~EUR1.2 bln vs. $1.23 bln Capital IQ Consensus Estimate. With regard to Outlook, co states: "We executed H1 2012 as planned and expect sales to remain steady in the second half. The second half revenue level is expected to be between EUR 2.2 billion and 2.4 billion and looks sustained by an increase of NAND memory critical layer systems shipments, stability of DRAM memory systems sales, and slower 28/32 nm Logic in the second half compared with the first half. The exact level of sales achieved in the second half will depend on the strength of NAND pick up, itself fueled by new ultrabook PCs and new smartphone ramps. The mid-pt of H2 guidance is below current aggregate estimate of ~EUR2.46 bln.

Intel (INTC $26.12 +0.74) reported second quarter GAAP earnings of $0.54 per share, $0.02 better than the Capital IQ Consensus of $0.52, while revenues rose 3.6% year/year to $13.5 billion versus the $13.56 bln consensus. The company issued in-line guidance for the third quarter with revenues of $13.8-14.8 billion versus the $14.64 billion consensus. PC Client Group revenue of $8.7 billion, up 3 percent sequentially. Sees Q2 gross margin percentage: 63-64% Non-GAAP (excluding amortization of acquisition-related intangibles), both plus or minus a couple of percentage points. Intel sees fiscal year 2012 revenue up between 3 percent and 5 percent year over year, down from the prior expectation for high single-digit growth (consensus is for +4.7%)... "The second quarter was highlighted by solid execution with continued strength in the data center and multiple product introductions in Ultrabooks and smartphones... As we enter the third quarter, our growth will be slower than we anticipated due to a more challenging macroeconomic environment. With a rich mix of Ultrabook and Intel-based tablet and phone introductions in the second half, combined with the long-term investments we're making in our product and manufacturing areas, we are well positioned for this year and beyond."

Yahoo (YHOO $15.96 -0.00) reports second quarter earnings of $0.27 per share, excluding non-recurring items, $0.01 better than the Capital IQ Consensus Estimate of $0.26, while revenues rose 0.5% year/year to $1.08 bln vs the $1.09 bln consensus. Display revenue ex-TAC was $473 million, a 1 percent increase compared to $467 million for the second quarter of 2011. Search revenue ex-TAC was $385 million, a 4 percent increase compared to $371 million for the second quarter of 2011. Cash flow from operating activities for the second quarter of 2012 was $275 million, a 17 percent decrease compared to $331 million for the same period of 2011. Free cash flow was $93 million for the second quarter of 2012, a 2 percent decrease compared to $96 million for the same period of 2011. Cash, cash equivalents, and investments in marketable debt securities were $2,401 million at June 30, 2012 compared to $2,530 million at December 31, 2011, a decrease of $129 million.

EMC (EMC $25.04 +2.13) announced it sees Q2 EPS $0.39 versus the $0.40 Capital IQ Consensus Estimate, with revs $5.31 billion versus the $5.30 billion consensus. The company continues to expect to achieve its full-year 2012 goals of $22 billion in revenue and non-GAAP EPS of $1.70 (versus consensus of $22.1 billion & $1.73, respectively). EMC also announced a series of senior executive appointments: David Goulden, Executive Vice President and CFO, has been appointed President and COO of EMC Corporation, reporting to Tucci. Pat Gelsinger, EMC President and COO of Information Infrastructure Products, has been appointed CEO of VMware (VMW), effective September 1st, and will also join the VMware Board of Directors. Paul Maritz, VMware's present CEO, is joining EMC as Chief Strategist, reporting to Tucci, effective September 1st. Maritz will remain on the VMware Board of Directors.

10:37 am Information Technology sector rises and outpacing broader market

The tech sector is trading higher today, ahead of gains in the broader market. Semiconductors are showing relative strength with the SOX trading 2.6% higher. NXPI (+5.5%) is a notable leader in the chip index. Among other major indices, the SPY is trading 0.4% higher today, while the QQQ is up 0.9% and the NASDAQ is trading 0.7% higher on the session. Among tech bellwethers, only AAPL (-0.1%) and VZ (-2.3%) are showing any weakness. In earnings, there appears to be an early trend: INTC (+2.9%), YHOO (+0.1%) and FIS (-5.0%) all reported mixed Q2 results, beating on EPS and missing on revs.

Elsewhere, ROVI (-41.2%) guided down and EMC (+9.3%) and VMW (+9.2%) issued largely inline guidance. This morning, ERIC (+3.5%), ASML (+4.3%), and CHKP (+5.4%) posted a slight beats. APH (+12.7%), on the other hand, topped estimates and raised guidance. In news, EMC (+9.3%) and VMW (+9.2%) announced that EMC divisional COO will become the CEO of VMW and that current VMW CEO will be joining EMC as a strategist. Among rumors, BGR reports that AAPL's (-0.1%) iPhone is set for a fall launch equipped with LTE and NFC (NXPI +5.5%). There were no notable analyst upgrades this morning in the tech space. Yet in downgrades, ROVI (-41.2%) was downgraded at a host of firms including JPM and Piper. Elsewhere, AMT (-2.8%) was downgraded to Neutral at Citigroup, DLB (-2.5%) was downgraded to Underweight at JP Morgan, and CYMI (-0.1%) was downgraded to Equal Weight at Barclays. IBM (-0.8%) and QCOM (+2.2%) are the most notable names in tech scheduled to report quarterly results today after the close.
icon url

ReturntoSender

07/19/12 9:53 PM

#9840 RE: ReturntoSender #6755

From Briefing.com: 4:15 pm : Stocks finished with modest gains despite this morning's disappointing economic data and slew of earnings reports that saw bottom line beats accompanied by top line misses. All of today's economic data fell short of expectations with initial and continuing claims, existing home sales, the Philadelphia Fed, and leading indicators all missing their marks. Technology shares were strong as the Nasdaq paced today's advance with a 0.8% gain. Meanwhile, the S&P 500 tacked on 0.3% to finish at a two-month high.


International Business Machines (IBM 195.34, +7.09) was a notable winner, rallying 3.8% and regaining its 200-day moving average as the stock was able to shake off a top line miss.

YUM! Brands (YUM 65.86, +0.31) was another example of the low second quarter expectations as erased early selling pressure and pushed back into positive territory. This despite a $0.03 miss on the bottom line. The company did outpace revenue expectations which appears to be enough to offset cost concerns at this point.

Morgan Stanley (MS 13.25, -0.74) was a notable underperformer after the firm missed on both the top and bottom lines.

Technology names eBay (EBAY 43.95, +3.49), Qualcomm (QCOM 58.44, +2.39), F5 Networks (FFIV 102.75, +4.16), Mellanox Technologies (MLNX 93.90, +27.52) and Skyworks Solutions (SWKS 29.17, +2.53) are ended higher after reporting earnings following yesterday's closing bell.

New Oriental Education & Technology (EDU 11.20, +1.70) jumped 17.9% after the company responded to accusations from research firm Muddy Waters. The research firm suggested a significant number of the firm’s 664 owned and operated schools and learning centers were instead operated by franchisees and that the company represented these operations as their own. A response from the company suggested, “The Muddy Waters report is wrong....New Oriental has never included these cooperation facilities, which never exceeded 21 facilities in total, in the counts of its own schools and learning centers, nor has New Oriental included student enrollments from these cooperation facilities as its own student enrollments.”

Shares of Walgreens (WAG 34.62, +3.65) and Express Scripts (ESRX 58.76, +1.07) rallied after the two companies announced a pharmacy network agreement. Terms of the contract were not disclosed; however, the deal will allow Walgreens to participate in the broadest Express Scripts retail network available to new and existing clients. Today’s gains had shares of Express Scripts testing all-time highs near the $60 level.

Homebuilders Toll Brothers (TOL 29.42, -0.19) and Lennar Corp. (LEN 30.32, -0.06) fell 0.6% and 0.2% respectively after this morning's disappointing existing home sales data.

Treasuries finished near session lows as most maturities finished just below their respective flat lines. The complex was unable to garner any meaningful strength despite today’s lackluster economic data as the 10-yr yield ticked up to 1.515%.

There is no data set for release tomorrow.DJ30 +34.66 NASDAQ +23.30 SP500 +3.73 NASDAQ Adv/Vol/Dec 1093/1.66 bln/1463 NYSE Adv/Vol/Dec 1563/756.6 mln/1463

3:25 pm : Crude oil steadily climbed higher during today’s pit session as the dollar weakened. It came off its session low of $90.67 and peaked at $92.97 in afternoon action. Although it pulled back slightly into the close, the energy component booked a solid gain of 3.2% at $92.81 per barrel. Natural gas touched a session high of $3.03 per MMBtu following better-than-expected inventory data that showed a build of 28 bcf when a build of 30 bcf was anticipated. It then spent the majority of pit trade chopping around just above the unchanged line before settling up 1.0% at $3.00 per MMBtu.

Precious metals also saw a boost from the weaker dollar and disappointing U.S. data. Both gold and silver spent their entire sessions in the black, touching respective highs of $1591.50 and $27.58 per ounce. However, a sell-off to session lows moments before the close left gold to settle with a gain of 0.6% at $1580.10 while silver booked a 0.5%advance, closing at $27.21 per ounce.DJ30 +37.84 NASDAQ +25.07 SP500 +3.60 NASDAQ Adv/Vol/Dec 1139/1.37 bln/1341 NYSE Adv/Vol/Dec 1537/525.2 mln/1481

5:15PM Monolithic Power wins in patent dispute and obtains injunction order against Fitipower (MPWR) 19.50 +0.75 : Co announced that on June 14, 2012, the Intellectual Property Court (IP Court) in Taiwan issued a judgment finding Fitipower Integrated Technology (Fitipower) infringes MPS Patent No. I299935. The IP Court also granted an injunctive relief ordering Fitipower to destroy and to stop making, selling, importing, use and offer to sell infringing products and datasheets including TA2154, FR9758, FR9706 and FP6340. In the ruling, the IP Court awarded MPS monetary damages in the amount of $1.8 mln New Taiwan Dollars against Fitipower. MPS Patent No. I299935 enables efficient low-voltage, low-current power conversion such as DC-DC step-down converter applications. In 2010, MPS filed two patent infringement lawsuits against Fitipower with the IP Court in Taiwan.

4:22PM Advanced Micro misses by $0.01, reports revs in-line; guides Q3 revs below consensus (AMD) 4.86 -0.03 : Reports Q2 (Jun) earnings of $0.06 per share, excluding non-recurring items, $0.01 worse than the Capital IQ Consensus Estimate of $0.07; revenues fell 10.2% year/year to $1.41 bln vs the $1.41 bln consensus; non-GAAP GM flat QoQ at 46%. Co issues downside guidance for Q3, sees Q3 revs of -4 to +2% QoQ to ~$1.35-1.42 bln vs. $1.5 bln Capital IQ Consensus Estimate. "Overall weakness in the global economy, softer consumer spending and lower channel demand for our desktop processors in China and Europe made the closing weeks of the quarter challenging. We are taking definitive steps to improve our performance and correct the issues within our control as we expect headwinds will continue in the third quarter as the industry sets a new baseline. We remain optimistic about our core businesses as well as future opportunities with our competitively differentiated next-generation Accelerated Processor Units (APUs). Our recently launched Trinity APU continues to gain traction with customers."

4:10PM Microsoft beats by $0.11 (MSFT) 30.67 +0.22 : Reports Q4 (Jun) earnings of $0.73 per share, excluding non-recurring items, $0.11 better than the Capital IQ Consensus Estimate of $0.62; GAAP revenues rose 4.0% year/year to $18.06 bln; non-GAAP rev +7% to $18.6 bln, consensus is $18.21 bln consensus. The Server & Tools business revenue grew 13% for the fourth quarter and 12% for the full year. The Microsoft Business Division revenue grew 7% for the fourth quarter and 7% for the full year reflecting continued momentum in Office 2010 sales. The Windows & Windows Live Division revenue declined 13% for the fourth quarter and 3% for the full year. Adjusting for the impact of the Windows Upgrade Offer, Windows Division non-GAAP revenue declined 1% for the fourth quarter and 1% for the full year. Windows 7 adoption continued with more than 50% of worldwide enterprise desktops now running Windows 7. The next version of Windows will release to manufacturing this August and will become generally available October 26, 2012. The Online Services Division revenue grew 8% for the fourth quarter and 10% for the full year reflecting growth in our search business. Bing organic U.S. search market share was 15.6% for the month of June 2012, up 120 points from the prior year period. The Entertainment and Devices Division revenue grew 20% for the fourth quarter and 8% for the full year primarily reflecting the addition of Skype. "Over the coming year, we'll release the next versions of Windows, Office, Windows Server, Windows Phone, and many other products and services that will drive our business forward and provide unprecedented opportunity to our customers and partners."

4:08PM SanDisk beats by $0.02, beats on revs (SNDK) : Reports Q2 (Jun) earnings of $0.21 per share, $0.02 better than the Capital IQ Consensus Estimate of $0.19; revenues fell 24.9% year/year to $1.03 bln vs the $1.02 bln consensus.

4:07PM Rambus misses by $0.09, misses on revs (RMBS) 5.21 +0.00 : Reports Q2 (Jun) loss of $0.29 per share, $0.09 worse than the Capital IQ Consensus Estimate of ($0.20); revenues fell 15.1% year/year to $56.2 mln vs the $62.95 mln consensus.

4:06PM Freescale Semi beats by $0.04, beats on revs; guides Q3 revs below consensus (FSL) 10.21 +0.68 : Reports Q2 (Jun) earnings of $0.07 per share, excluding non-recurring items, $0.04 better than the Capital IQ Consensus Estimate of $0.03; revenues fell 15.9% year/year to $1.03 bln vs the $1 bln consensus. Co issues downside guidance for Q3, sees Q3 revs of $955-1005 vs. $1.06 bln Capital IQ Consensus Estimate, Q3 gross margins to decrease approximately 75 basis points on a sequential basis.

4:06PM Google beats by $0.03, beats on revs (GOOG) 593.06 +12.30 : Reports Q2 (Jun) earnings of $10.12 per share, $0.03 better than the Capital IQ Consensus Estimate of $10.09; revenues rose 39.0% year/year to $9.61 bln vs the $8.41 bln consensus.

GOOG Q2 Costs per click +1% q/q; -16% y/y; Q1 results were -6% q/q, -12% y/y. GOOG Q2 Paid Clicks +1% q/q, +42% y/y; Q1 results +7% q/q, +39% y/y.

Traffic acquisition costs, the portion of revenues shared with Google's partners, increased to $2.60 billion in the second quarter of 2012, compared to $2.11 billion in the second quarter of 2011. TAC as a percentage of advertising revenues was 25% in the second quarter of 2012, compared to 24% in the second quarter of 2011.

Operating expenses, other than cost of revenues, were $4.0 billion in the second quarter of 2012, or 33% of revenues, compared to $2.97 billion in the second quarter of 2011, or 33% of revenues.

Excluding gains related to our foreign exchange risk management program, had foreign exchange rates remained constant from the first quarter of 2012 through the second quarter of 2012, our Google revenues in the second quarter of 2012 would have been $68 million higher.

4:04PM Integrated Device acquires NXP's (NXPI) data converter assets and Alvand Technologies; terms not disclosed (IDTI) 5.06 +0.01 : These transactions solidify IDT's position as a comprehensive solutions provider for wireless infrastructure. The Company can now offer its customers a one-stop shop for wireless base stations, including radio frequency (RF) components, analog-to-digital converters (ADCs), digital-to-analog converters (DACs), Serial RapidIO switches and bridges, high-performance timing devices, data compression IP, and power management ICs. The acquisitions increase the Company's dollar content in the base station by offering all the key components in the signal chain.

4:02PM Universal Display and Plextronics announce strategic alliance to develop next-generation OLED material systems (PANL) 37.68 +1.53 : Co and Plextronics announced they have entered into a strategic alliance to accelerate the development and commercialization of solution-based OLED material systems incorporating Plextronics' hole injection and hole transport materials with Universal Display's phosphorescent OLED emissive layer materials. The companies entered into a three-year joint development agreement, and Universal Display made a $4 mln investment in Plextronics.

9:50AM Semiconductor Hldrs ETF gap higher extension brings resistance zone into play (SMH) 31.56 +0.44 : Strong performance on Wednesday has been extended off the open with the gap higher start testing resistance in the 31.55/31.67 area which marks the 62% retrace of June/July decline and 50 ema (session high 31.59). Yesterday's leader INTC -1% has stalled near its 50 ema for the second day in a row -- BRCM +4.4%, MRVL +3.4%, ALTR +1.7%, SNDK +1.5%, NVDA +1.1%.
Research In Motion (RIMM) released an update of the BlackBerry 10 developer toolkits. The toolkits are available in beta as free downloads.

8:16AM Ultratech beats by $0.02, beats on revs (UTEK) 30.77 : Reports Q2 (Jun) earnings of $0.41 per share, $0.02 better than the Capital IQ Consensus Estimate of $0.39; revenues rose 9.6% year/year to $59.1 mln vs the $54.83 mln consensus.

8:01AM Oracle announced that it has entered into an agreement to acquire substantially all of the assets of Skire; financial terms not disclosed (ORCL) 30.49 : Co announced that it has entered into an agreement to acquire substantially all of the assets of Skire, a leading provider of capital program management and facilities management applications available both in the cloud and on-premise.

7:35AM Verizon reports EPS in-line, revs in-line (VZ) 45.89 : Reports Q2 (Jun) earnings of $0.64 per share, in-line with the Capital IQ Consensus Estimate consensus of $0.64; revenues rose 3.7% year/year to $28.55 bln vs the $28.54 bln consensus... Retail postpaid ARPU grew 3.7 percent over second-quarter 2011, to a record $56.13, the highest growth in three years. Retail postpaid data ARPU increased to $24.53, up 15.4 percent year over year. Retail service ARPU grew 3.4 percent year over year, to a record $54.29... Co reported 1.2 million retail net customer additions, excluding acquisitions and adjustments, includes 888,000 retail postpaid net customers; low retail postpaid churn of 0.84 percent; 94.2 million total retail customers; 88.8 million total retail postpaid customers.

"Verizon delivered another strong quarter of earnings growth and cash generation, and we remain on track to meet our financial objectives and produce solid double-digit earnings growth for the year... We reported sequential improvement in second-quarter Wireline margins, and we expect to see that improving trend carry through the second half of the year. We also look forward to the closing of strategic transactions and to the integration of process improvements that will set the stage for continued long-term profitable growth across all our business units."

7:32AM Fairchild Semi misses by $0.02, misses on revs; guides Q3 revs below consensus (FCS) 13.33 : Reports Q2 (Jun) earnings of $0.14 per share, excluding non-recurring items, $0.02 worse than the Capital IQ Consensus Estimate of $0.16; revenues fell 16.6% year/year to $361.5 mln vs the $370.67 mln consensus. Co issues downside guidance for Q3, sees Q3 revs of $360-380 mln vs. $389.44 mln Capital IQ Consensus Estimate. "Our current scheduled backlog is nearly sufficient to achieve the low end of this range. We expect adjusted gross margin to be flat to up 150 basis points due primarily to better product mix. We anticipate R&D and SG&A spending to be roughly flat with the prior quarter. The adjusted tax rate is forecast at 15 percent plus or minus 3 percent for the quarter. Consistent with our usual practices, we are not assuming any obligation to update this information, although we may choose to do so before we announce third quarter results

12:55AM Emcore provides update on manufacturing for its flood-impacted fiber optics products (EMKR) 4.70 : Co announces it expects to be fully recovered from the impact of the Thailand floods on its manufacturing operations, and able to achieve pre-flood production levels on all of its continuing product lines by October 2012. Co expects increased shipments for its fiber optics segment in the coming quarters as manufacturing volume ramps to normal levels.

IBM (IBM $194.14 +5.89) reported second quarter earnings of $3.51 per share, excluding non-recurring items, $0.08 better than the Capital IQ Consensus of $3.43, while revenues fell 3.3% year/year to $25.78 billion versus the $26.34 billion consensus. The company issued upside guidance for fiscal year 2012 with raised EPS to at least $15.10, excluding non-recurring items, from at least $15.00 versus the $15.05 consensus. The Americas' second-quarter revenues were $11.1 billion, a decrease of 1% (up 1%, adjusting for currency) from the 2011 period. Revenues from Europe/Middle East/Africa were $7.9 billion, down 9% (flat, adjusting for currency). Asia-Pacific revenues increased 2% (up 4%, adjusting for currency) to $6.3 billion. OEM revenues were $512 million, down 24% compared with the 2011 second quarter. Software revenue, flat, up 4% adjusting for currency; Services revenue down 3%, up 1% adjusting for currency: Services pre-tax income up 18%; Services backlog of $136 billion, down 6%, flat adjusting for currency; Systems and Technology revenue down 9%, down 7% adjusting for currency; Growth markets revenue up 2%, up 8% adjusting for currency; Business analytics revenue up 13% in the first half; Smarter Planet revenue up more than 20% in the first half; Cloud revenue doubled first-half 2011 revenue.

F5 Networks (FFIV $97.82 -0.77) reported third quarter earnings of $1.14 per share, in-line with the Capital IQ consensus of $1.14, while revenues rose 21.3% year/year to $352.6 million versus the $353.16 mln consensus. "Overall, revenue growth slowed in Q3, but revenue by region was generally consistent with historical patterns; 57 percent for the Americas (primarily the United States) and 43 percent for EMEA and APJ, with EMEA contributing 21 percent of the total. The company issued downside guidance for the first quarter with EPS of $1.16-1.19, excluding non-recurring items, vs. $1.24 Capital IQ Consensus Estimate; sees Q1 (Dec) revs of $360-370 mln vs. $383.97 mln Capital IQ Consensus Estimate. Lowered guidance is due to 'cautious spending environment'

Qualcomm (QCOM $58.79 +2.79) reported third quarter earnings of $0.85 per share, excluding non-recurring items, $0.01 worse than the Capital IQ Consensus of $0.86, while revenues rose 27.8% year/year to $4.63 billion versus the $4.68 billion consensus. The company issued downside guidance for the fourth quarter with EPS of $0.78-0.84 versus the $0.89 consensus and revenues of $4.45-4.85 billion versus the $4.9 billion consensus. The company issued downside guidance for the fiscal year 2012 with EPS of $3.61-3.67 versus the $3.74 consensus, down from prior guidance of $3.61-3.76; sees FY12 revenues of $18.7-19.1 billion versus the $19.21 billion consensus, down from prior guidance of $18.7-19.7 billion. "Looking forward, our growth estimates for 3G/4G device shipments in calendar 2012 have moderated slightly, and we now expect the demand profile of the calendar year to be more back-end loaded as new devices are launched for the holiday season. Although our outlook for semiconductor volumes in the fiscal fourth quarter has been reduced from our prior expectations, we are ramping supply of our 28 nanometer chipsets to help enable what we expect to be a strong December quarter for our semiconductor business."

Skyworks (SWKS $29.00 +2.36) reported third quarter arnings of $0.45 per share, excluding non-recurring items, $0.01 better than the Capital IQ consensus of $0.44, while revenues rose 9.2% year/year to $389 mln vs the $383.02 million consensus. The company issued in-line guidance for the fourth quarter with EPS of 0.50-0.51, excluding non-recurring items, versus the $0.51 consensus and revenues of 415-420 million versus the $418.03 million consensus. "Our strategic diversification across OEMs and chipset partners is enabling us to produce consistently strong operating results despite the macro economy. Specifically, we are gaining share within adjacent vertical markets including automotive, medical, avionics, military, location services and broadband communications. At the same time, our innovative solutions are powering the world's most popular smartphones, tablets, home automation platforms and network infrastructure systems. In short, we have created a differentiated business model that is delivering demonstrable, best in class mobile internet growth with analog semiconductor shareholder returns."

eBay (EBAY $44.17 +3.75) reported second quarter earnings of $0.56 per share, excluding non-recurring items, $0.01 better than the Capital IQ consensus of $0.55, while revenues rose 23.1% year/year to $3.4 billion versus the $3.36 billion consensus. The company issued guidance for the third quarter with EPS of $0.53-0.55, excluding non-recurring items, versus the $0.55 consensus with revenues of $3.3-3.4 billion versus the $3.41 billion consensus. The company reaffirmed guidance for fiscal year 2012 with EPS of $2.30-2.35, excluding non-recurring items, versus the $2.35 consensus and revenues of $13.8-14.1 billion versus the $14 billion consensus. Q2 non-GAAP op margin of 27.3% vs 26.9% last qtr and 27.6% year ago; Q2 active users of 104.8 mln vs 102.4 mln last qtr. PayPal ended the quarter with 113.2 million active registered accounts, a 13% increase over the second quarter of 2011. PayPal revenue increased 26% year over year, driven primarily by increased penetration on eBay as well as continued merchant and consumer adoption and strong growth in Bill Me Later. "Our entire company is strong, but we're particularly pleased with eBay Marketplaces, which delivered its strongest organic growth in gross merchandise volume, excluding vehicles, since 2006. And mobile continues to be a game changer. We now expect eBay and PayPal mobile to each transact $10 billion in volume in 2012 -- that's more than double 2011, a staggering surge in mobile shopping and payments on devices that did not exist just a few years ago. Retail is at an inflection point, and we are helping to reshape how people around the world shop and pay."

09:16 am Skyworks upgraded to Buy at Sterne Agee; tgt $31: . Sterne Agee upgrades SWKS to Buy from Neutral and sets target price at $31, following earnings, as the overall handset market improves into 2H12 with improving 28nm-Snapdragon supply. Firm believes 1H12 gives a base case in the handset market, post a significant OEM handset market share reshuffle and 2H12 units should incrementally improve as the handset market coalesces around the leaders Apple-Samsung-China. Firm's upgrade is primarily based on improving visibility into the Handset Supply Chain.

09:28 am Qualcomm shares rise 5% despite miss on EPS

Qualcomm (QCOM $59.04 +2.08) reported third quarter earnings of $0.85 per share, excluding non-recurring items, $0.01 worse than the Capital IQ Consensus of $0.86, while revenues rose 27.8% year/year to $4.63 billion versus the $4.68 billion consensus. The company issued downside guidance for the fourth quarter with EPS of $0.78-0.84 versus the $0.89 consensus and revenues of $4.45-4.85 billion versus the $4.9 billion consensus. The company issued downside guidance for the fiscal year 2012 with EPS of $3.61-3.67 versus the $3.74 consensus, down from prior guidance of $3.61-3.76; sees FY12 revenues of $18.7-19.1 billion versus the $19.21 billion consensus, down from prior guidance of $18.7-19.7 billion.

"Looking forward, our growth estimates for 3G/4G device shipments in calendar 2012 have moderated slightly, and we now expect the demand profile of the calendar year to be more back-end loaded as new devices are launched for the holiday season. Although our outlook for semiconductor volumes in the fiscal fourth quarter has been reduced from our prior expectations, we are ramping supply of our 28 nanometer chipsets to help enable what we expect to be a strong December quarter for our semiconductor business."

09:25 am IBM shares rise 2% following beat on EPS and upside guidance

IBM (IBM $193.14 +4.86) reported second quarter earnings of $3.51 per share, excluding non-recurring items, $0.08 better than the Capital IQ Consensus of $3.43, while revenues fell 3.3% year/year to $25.78 billion versus the $26.34 billion consensus. The company issued upside guidance for fiscal year 2012 with raised EPS to at least $15.10, excluding non-recurring items, from at least $15.00 versus the $15.05 consensus.

The Americas' second-quarter revenues were $11.1 billion, a decrease of 1% (up 1%, adjusting for currency) from the 2011 period. Revenues from Europe/Middle East/Africa were $7.9 billion, down 9% (flat, adjusting for currency). Asia-Pacific revenues increased 2% (up 4%, adjusting for currency) to $6.3 billion. OEM revenues were $512 million, down 24% compared with the 2011 second quarter. Software revenue, flat, up 4% adjusting for currency; Services revenue down 3%, up 1% adjusting for currency: Services pre-tax income up 18%; Services backlog of $136 billion, down 6%, flat adjusting for currency; Systems and Technology revenue down 9%, down 7% adjusting for currency; Growth markets revenue up 2%, up 8% adjusting for currency; Business analytics revenue up 13% in the first half; Smarter Planet revenue up more than 20% in the first half; Cloud revenue doubled first-half 2011 revenue.

09:15 am SkyWorks shares soar over 10% following better than expected earnings

Skyworks (SWKS $29.30 +2.66) reported third quarter earnings of $0.45 per share, excluding non-recurring items, $0.01 better than the Capital IQ consensus of $0.44, while revenues rose 9.2% year/year to $389 mln vs the $383.02 million consensus. The company issued in-line guidance for the fourth quarter with EPS of 0.50-0.51, excluding non-recurring items, versus the $0.51 consensus and revenues of 415-420 million versus the $418.03 million consensus.

"Our strategic diversification across OEMs and chipset partners is enabling us to produce consistently strong operating results despite the macro economy. Specifically, we are gaining share within adjacent vertical markets including automotive, medical, avionics, military, location services and broadband communications. At the same time, our innovative solutions are powering the world's most popular smartphones, tablets, home automation platforms and network infrastructure systems. In short, we have created a differentiated business model that is delivering demonstrable, best in class mobile internet growth with analog semiconductor shareholder returns."

09:12 am Ebay shares are bid about 7% higher following beat on EPS and revenues

eBay (EBAY $43.58 +3.12) reported second quarter earnings of $0.56 per share, excluding non-recurring items, $0.01 better than the Capital IQ Consensus of $0.55, while revenues rose 23.1% year/year to $3.4 billion versus the $3.36 billion consensus. The company issued guidance for the third quarter with EPS of $0.53-0.55, excluding non-recurring items, versus the $0.55 consensus with revenues of $3.3-3.4 billion versus the $3.41 billion consensus. The company reaffirmed guidance for fiscal year 2012 with EPS of $2.30-2.35, excluding non-recurring items, versus the $2.35 consensus and revenues of $13.8-14.1 billion versus the $14 billion consensus. Q2 non-GAAP op margin of 27.3% vs 26.9% last qtr and 27.6% year ago; Q2 active users of 104.8 mln vs 102.4 mln last qtr.

PayPal ended the quarter with 113.2 million active registered accounts, a 13% increase over the second quarter of 2011. PayPal revenue increased 26% year over year, driven primarily by increased penetration on eBay as well as continued merchant and consumer adoption and strong growth in Bill Me Later. "Our entire company is strong, but we're particularly pleased with eBay Marketplaces, which delivered its strongest organic growth in gross merchandise volume, excluding vehicles, since 2006. And mobile continues to be a game changer. We now expect eBay and PayPal mobile to each transact $10 billion in volume in 2012 -- that's more than double 2011, a staggering surge in mobile shopping and payments on devices that did not exist just a few years ago. Retail is at an inflection point, and we are helping to reshape how people around the world shop and pay."
icon url

ReturntoSender

07/22/12 12:51 PM

#9841 RE: ReturntoSender #6755

From Briefing.com: Weekly Recap - Week ending 20-Jul-12

Dow -120.79 at 12822.57, Nasdaq -40.60 at 2925.3, S&P -13.85 at 1362.66

Stocks saw a persistent bid over the first four days of this week, helped by low expectations for earnings results and continued hope that the Fed will eventually step in with additional quantitative easing. The low expectations into earnings helped several major index components move higher on what might normally be considered to be lackluster earnings reports, characterized by slight earnings beats and revenue misses. The continued Fed hopes allowed broader markets to shake off disappointing economic data. While stocks gained over the first four sessions of the week, sentiment turned negative on Friday as European concerns weighed on stocks, paring the week’s gain down to just 0.5%.

Stocks opened lower on Friday and showed weakness over the course of the day, as renewed worried about Spain knocked Spain's equity market down 5.8% and weighed heavily on other European markets. Spain's 10-year yield climbed back above the 7.0% level to end the week at 7.2%. Egan Jones downgraded Spain's sovereign debt rating to CC+ from CCC+ following word the Spanish region of Valencia needs government help to meet its debt obligations. The EU also recently released a Memorandum of Understanding on the bailout of the Spanish banking sector which calls for a EUR30 billion tranche to be released shortly, ahead of a stress test of the system which will be completed by the end of September. A Spanish roadmap will be created by the end of November.

Looking at U.S. equity movers, Chipotle Mexican Grill (CMG 316.98, -86.88) saw its largest ever percentage loss for one session after disappointing the Street on the top line, and warning about costs in the back half of the year. Other momentum restaurant stocks such as Panera Bread (PNRA 144.97, -5.72) and Starbucks (SBUX 51.96, -2.24) also showed relative weakness.

Looking at the technology sector, flash memory producer SanDisk (SNDK 38.70, +3.62) was a notable outperformer after the company beat second quarter estimates and gave a bullish outlook for the remainder of the year. On the other hand, chip maker Advanced Micro Devices (AMD 4.22 -0.64) missed reduced expectations and guided third quarter revenue below expectations.

Google (GOOG 610.82, +17.76) was one of the lone bright spots this morning as the stock trades up close to 3.0% after announcing earnings of $10.12 per share which beat the Capital IQ Consensus Estimate of $10.09 per share. The company also announced revenues surged 39% year over year to $9.61 billion which was well above the consensus estimate of $8.41 billion. Key metric paid clicks rose 1% quarter over quarter and 42% year over year.

Treasuries saw heavy buying dropping yields across the curve to near record lows. Today’s session brought about a record low print in the 5-yr yield as it hit 0.576%. Meanwhile, the benchmark 10-yr yield holds just above its record low 1.440%. Significant flattening of the yield curve has the 2-10-yr spread tighter at 124.5 basis points... Today was also the July options expiration.

Recapping the first four days of the week, we'd note that Monday started with weakness in China following comments from Chinese Premier Wen Jiabao, which suggested China's economic recovery may take some time. Elsewhere, reports out of Europe indicated that the ECB was looking to impose losses on bondholders of Spanish banks which are most impacted by the crisis. Earnings season continued as Citigroup (C 25.93, -0.65) finished slightly higher following its mixed quarterly results. The S&P was nearly flat on the day.

On Tuesday, the flow of earnings continued as market participants awaited the highly anticipated testimony by Ben Bernanke. Goldman Sachs (GS 94.16, -0.84) beat top and bottom line estimates, but only finished marginally higher on the day. Mosaic (MOS 57.50, -0.12) finished higher by over 4% following better than expected results. On the other hand, Johnson & Johnson (JNJ 68.63, -0.90) missed revenue expectations and lowered FY12 guidance. As far as the Bernanke testimony, one key item that stuck out was the mention of possible deflation, which may have been interpreted as one potential justification for more quantitative easing. Shortly following this mention, markets seemed to catch a bid, and the S&P finished 1.6% higher on the day.

On Wednesday, The Fed's Beige Book was released and suggested "overall economic activity continued to expand at a modest to moderate pace in June and early July." Excerpts from the Beige Book hinted that reports on residential housing were "largely positive" and drought caused "stress to crops and livestock" while indicating employment grew at a "tepid pace." The S&P managed a 0.6% again for the session.

On Thursday, earnings season stepped into high gear. Morgan Stanley (MS 12.78, -0.47) shares fell 5% after the bank reported disappointing earnings and revenues. MS reported Q2 earnings of $0.28 per share including its Debt Valuation Adjustment, or DVA, and $0.16 excluding DVA. The Capital IQ consensus called for EPS of $0.33. Revenues were also below expectations. International Business Machines (IBM 192.45, -2.69) was a notable winner, rallying 3.8% and regaining its 200-day moving average as the stock was able to shake off a top line miss. The S&P inched out a gain of 0.3%.

Looking to next week, approximately 750 companies that we cover are expected to report second quarter results, including 175 companies in the S&P 500. Apple (AAPL 604.30, -10.02) will announce its results on Tuesday afternoon, and Facebook (FB 28.76, -0.24) will report its first quarter as a public company following Thursday's closing bell. On Monday morning, McDonald's Corp. (MCD 91.58, -1.18), Halliburton (HAL 30.77, +0.56), and Eaton Corp. (ETN 39.06, -0.47) will report their results.
 
Index Started Week Ended Week Change % Change YTD %
DJIA 12777.09 12822.57 45.48 0.4 5.0
Nasdaq 2908.47 2925.30 16.83 0.6 12.3
S&P 500 1356.78 1362.66 5.88 0.4 8.4
Russell 2000 800.99 791.54 -9.45 -1.2 6.8

8:00AM Ramtron receives extended offer by Cypress Semiconductor (CY) to be acquired (RMTR) 2.75 : Cypress Semiconductor (CY) announced that it has extended its tender offer to acquire all of the outstanding stock of RMTR for $2.68 per share in cash to 5:00 p.m., New York City time, on August 3, 2012. The offer was previously scheduled to expire at 12:00 midnight, New York City time, on July 19, 2012. CY's offer represents a 48% premium over Ramtron's closing price of $1.81 per share on June 11, 2012, the day before CY publicly disclosed its offer for Ramtron. The all-cash offer is not conditioned on due diligence or financing. In addition, CY announced that the waiting period pursuant to the Hart-Scott-Rodino Antitrust Improvements Act of 1976, as amended, applicable to its acquisition of Ramtron has expired and that CY has received the necessary regulatory clearance pursuant to the German merger control laws. CY does not believe that any other regulatory approvals are necessary in connection with the acquisition.

7:45AM General Electric will reorganize its Energy business into three standalone businesses effective in 4Q12 (GE) 19.80 : Co will reorganize its Energy business into three standalone businesses effective in 4Q12. The Energy headquarters organizational layer will be phased out by the end of 2012. This change will speed decision making, reduce layers and decrease cost. The three new businesses will report directly to GE Chairman and CEO Jeff Immelt: GE Power and Water: It provides full lifecycle solutions for power generation customers, including renewable energy and water processing technologies. It will have ~41,000 employees and planned rev of ~$28 billion in 2012. GE Oil and Gas: It provides equipment and services for all segments of the offshore and onshore oil and gas industry, including turbomachinery and drilling and surface, subsea, and pipeline equipment and services. It will have ~33,000 employees and planned rev of ~$15 billion in 2012. GE Energy Mgmt: It consists of technology solutions for the delivery, mgmt, conversion, and optimization of electrical power for customers across multiple energy-intensive industries. It will have ~27,000 employees and will have planned rev of ~$7 billion in 2012. GE will begin reporting separate segment financial results for these three businesses beginning with the fourth quarter of 2012.

6:37AM General Electric beats by $0.01, reports revs in-line; on track to deliver double digit earnings growth in FY12 (GE) 19.80 : Reports Q2 (Jun) earnings of $0.38 per share, excluding non-recurring items, $0.01 better than the Capital IQ Consensus Estimate of $0.37; revenues rose 2.5% year/year to $36.5 bln vs the $36.8 bln consensus. Co is on track to deliver double digit earnings growth in FY12 (consensus +12%). Revenues were negatively impacted by $0.9 bln due to FX and further shrinkage of GE Capital business. GE Capital revenues of $11.5 bln decreased 8% from last year, driven by lower assets in-line with plan. GE's Q2 Industrial segment revenues were $25.0 bln, up 9%. Industrial segment organic revenues were up 10% for the quarter. Industrial growth market revenues were up 17%, driven by double-digit growth in Australia, Canada, China, Latin America, the Middle East/North Africa, Southeast Asia and Russia. Industrial segment profit was up 7% to $3.7 bln and segment operating profits were strong in Energy Infrastructure and Transportation, up 13% and 58%, respectively. In addition, pricing on orders was up 1.2% in total with higher prices in 4 out of 5 businesses. Energy Infrastructure pricing was up 1.8%. Cash generated from operating activities was up 55% at $6.8 bln. GE ended the quarter with $74 bln of consolidated cash and cash equivalents. Infrastructure orders were $23.1 bln, down 1% primarily driven by a 37% decrease in orders for wind turbines. Orders were up 8% on a year-to-date basis. Total orders performance included: Aviation up 5% and Transportation up 2%.

"GE Capital's strong operating performance and capital position allowed it to return a $3 bln dividend to the parent, and our Industrial segments delivered another quarter of double-digit organic revenue growth. Our strategy to invest in growth markets is paying off, as we achieved orders expansion in growth markets of 14% and revenue growth of 17%. We ended the quarter with a record backlog... Our Industrial outlook remains positive. Margins have stabilized and Energy, Oil & Gas, and Transportation performed very well with double-digit profit increases. We are confident in our double-digit EPS growth expectations for 2012 and are raising our operating cash expectations to $17-19 bln based upon the restart of the GE Capital dividend."

NCR Corp (NCR) reported second quarter earnings of $0.65 per share, excluding non-recurring items, $0.06 better than the Capital IQ Consensus of $0.59, while revenues rose 10.8% year/year to $1.41 billion versus the $1.46 bln consensus. The company reaffirmed guidance for fiscal year 2012 with EPS of $2.40-2.47 versus the $2.49 consensus and fiscal year 2012 revenues to increase in the range of 11 to 13 percent on a constant currency basis compared with 2011. The company lowered GAAP EPS slightly.

Advanced Micro (AMD) reported second quarter earnings of $0.06 per share, excluding non-recurring items, $0.01 worse than the Capital IQ consensus of $0.07, while revenues fell 10.2% year/year to $1.41 bln vs the $1.41 bln consensus, where non-GAAP GM flat QoQ at 46%. The company issued downside guidance for the third quarter with revenues of -4 to +2% QoQ to approximately $1.35-1.42 billion versus the $1.5 billion consensus. "Overall weakness in the global economy, softer consumer spending and lower channel demand for our desktop processors in China and Europe made the closing weeks of the quarter challenging. We are taking definitive steps to improve our performance and correct the issues within our control as we expect headwinds will continue in the third quarter as the industry sets a new baseline. We remain optimistic about our core businesses as well as future opportunities with our competitively differentiated next-generation Accelerated Processor Units (APUs). Our recently launched Trinity APU continues to gain traction with customers."

Microsoft (MSFT) reported fourth quarter earnings of $0.73 per share, excluding non-recurring items, $0.11 better than the Capital IQ Consensus of $0.62, while GAAP revenues rose 4.0% year/year to $18.06 billion, non-GAAP rev +7% to $18.6 billion, consensus is $18.21 bln consensus. The Server & Tools business revenue grew 13% for the fourth quarter and 12% for the full year. The Microsoft Business Division revenue grew 7% for the fourth quarter and 7% for the full year reflecting continued momentum in Office 2010 sales. The Windows & Windows Live Division revenue declined 13% for the fourth quarter and 3% for the full year. Adjusting for the impact of the Windows Upgrade Offer, Windows Division non-GAAP revenue declined 1% for the fourth quarter and 1% for the full year. Windows 7 adoption continued with more than 50% of worldwide enterprise desktop now running Windows 7. The next version of Windows will release to manufacturing this August and will become generally available October 26, 2012. The Online Services Division revenue grew 8% for the fourth quarter and 10% for the full year reflecting growth in our search business. Bing organic U.S. search market share was 15.6% for the month of June 2012, up 120 points from the prior year period. The Entertainment and Devices Division revenue grew 20% for the fourth quarter and 8% for the full year primarily reflecting the addition of Skype. "Over the coming year, we'll release the next versions of Windows, Office, Windows Server, Windows Phone, and many other products and services that will drive our business forward and provide unprecedented opportunity to our customers and partners."

Google (GOOG) reported second quarter earnings of $10.12 per share, $0.03 better than the Capital IQ consensus of $10.09, while revenues rose 39.0% year/year to $9.61 billion versus the $8.41 billion consensus. GOOG Q2 Costs per click +1% q/q; -16% y/y; Q1 results were -6% q/q, -12% y/y. GOOG Q2 Paid Clicks +1% q/q, +42% y/y; Q1 results +7% q/q, +39% y/y. Traffic acquisition costs, the portion of revenues shared with Google's partners, increased to $2.60 billion in the second quarter of 2012, compared to $2.11 billion in the second quarter of 2011. TAC as a percentage of advertising revenues was 25% in the second quarter of 2012, compared to 24% in the second quarter of 2011. Operating expenses, other than cost of revenues, were $4.0 billion in the second quarter of 2012, or 33% of revenues, compared to $2.97 billion in the second quarter of 2011, or 33% of revenues. Excluding gains related to our foreign exchange risk management program, had foreign exchange rates remained constant from the first quarter of 2012 through the second quarter of 2012, our Google revenues in the second quarter of 2012 would have been $68 million higher.

SanDisk (SNDK) reported second quarter earnings of $0.21 per share, $0.02 better than the Capital IQ consensus of $0.19, while revenues fell 24.9% year/year to $1.03 billion versus the $1.02 billion consensus.

09:21 am Sandisk shares soar over 10% following earnings
SanDisk (SNDK $39.05 +3.97) reported second quarter earnings of $0.21 per share, $0.02 better than the Capital IQ consensus of $0.19, while revenues fell 24.9% year/year to $1.03 billion versus the $1.02 billion consensus.

09:17 am Google shares rise 3% following beat on revenues
Google (GOOG $609.00 +15.94) reported second quarter earnings of $10.12 per share, $0.03 better than the Capital IQ consensus of $10.09, while revenues rose 39.0% year/year to $9.61 billion versus the $8.41 billion consensus. GOOG Q2 Costs per click +1% q/q; -16% y/y; Q1 results were -6% q/q, -12% y/y. GOOG Q2 Paid Clicks +1% q/q, +42% y/y; Q1 results +7% q/q, +39% y/y. Traffic acquisition costs, the portion of revenues shared with Google's partners, increased to $2.60 billion in the second quarter of 2012, compared to $2.11 billion in the second quarter of 2011. TAC as a percentage of advertising revenues was 25% in the second quarter of 2012, compared to 24% in the second quarter of 2011. Operating expenses, other than cost of revenues, were $4.0 billion in the second quarter of 2012, or 33% of revenues, compared to $2.97 billion in the second quarter of 2011, or 33% of revenues. Excluding gains related to our foreign exchange risk management program, had foreign exchange rates remained constant from the first quarter of 2012 through the second quarter of 2012, our Google revenues in the second quarter of 2012 would have been $68 million higher.

09:12 am Microsoft shares rise 1% following better than expected earnings

Microsoft (MSFT $31.03 +0.36) reported fourth quarter earnings of $0.73 per share, excluding non-recurring items, $0.11 better than the Capital IQ Consensus of $0.62, while GAAP revenues rose 4.0% year/year to $18.06 billion, non-GAAP rev +7% to $18.6 billion, consensus is $18.21 bln consensus. The Server & Tools business revenue grew 13% for the fourth quarter and 12% for the full year. The Microsoft Business Division revenue grew 7% for the fourth quarter and 7% for the full year reflecting continued momentum in Office 2010 sales. The Windows & Windows Live Division revenue declined 13% for the fourth quarter and 3% for the full year.

Adjusting for the impact of the Windows Upgrade Offer, Windows Division non-GAAP revenue declined 1% for the fourth quarter and 1% for the full year. Windows 7 adoption continued with more than 50% of worldwide enterprise desktops now running Windows 7. The next version of Windows will release to manufacturing this August and will become generally available October 26, 2012. The Online Services Division revenue grew 8% for the fourth quarter and 10% for the full year reflecting growth in our search business. Bing organic U.S. search market share was 15.6% for the month of June 2012, up 120 points from the prior year period. The Entertainment and Devices Division revenue grew 20% for the fourth quarter and 8% for the full year primarily reflecting the addition of Skype. "Over the coming year, we'll release the next versions of Windows, Office, Windows Server, Windows Phone, and many other products and services that will drive our business forward and provide unprecedented opportunity to our customers and partners."
icon url

ReturntoSender

07/22/12 1:02 PM

#9842 RE: ReturntoSender #6755

InvestmentHouse Weekend Market Summary

http://www.investmenthouse.com/weekendmarketsummary.htm

- Stock market suddenly takes note of Europe once more, feels top-heavy, and mediocre earnings are not enough to continue the rally.
- Spain's biggest region asks for a bailout, bond yields surge, and oh yes, Egan Jones downgrades the country.
- And the market rallied on this? Better than expected earnings, but 45% are missing revenues expectations.
- More jobs cuts from financial sector.
- A backdoor way to get the unemployment rate lowered.
- Serious issues face the world yet stocks are climbing.
- A key test of the slow yet technically solid rally. Will there be an earnings mid-life crisis?

Shades of Wiley Coyote: after all the economic data and the first week earnings 'beats,' investors suddenly remember Europe really is bad news.

Not there yet in terms of the market, but investors did wake up to Europe again on Friday, harshing the rally's mellow.

Thursday I digressed into Wiley Coyote territory and Friday there was something of a deja vu experience along those lines. A good technical setup and who knows what else has rallied stocks from the June low. Investors ignored ever worsening US economic data and pretty much any news from the rest of the world and pushed stocks slowly but steadily higher. They even ignored the Fed failing to come to the table with more stimulus (well, after a bit), and rallied stocks back to a higher high. They were excited by rather mediocre earnings where 45% of those reporting have missed on revenues, and rallied stocks to yet another higher high. Lower expectations helped that move, affirming the old saying that those expecting nothing are never disappointed.

The lack of sales is critical. We have seen this before. When things started to get "better" at the beginning of the recovery back in 2009, companies were cutting costs and not hiring or spending. They were still able to sell overseas because Europe, China, India, and Brazil had not tanked yet. So they piled up good stockpiles of cash and held onto it. They were wise to do that because things are turning back down. Mr. Shiller, an ever-present bear of late, said on Friday morning that if the US isn't already in a recession, it is darn close.

Stocks were moving up, and they had put in a new high. Then it happened. It was nothing new, just another iteration of the same old problem: Europe. Spain's Valencia province, its largest I believe and quite beautiful, told the Spanish government it needed a bailout to meet its debt obligations.

After a terrible bond auction earlier in the week, Spaniards protested the austerity. Even with the supposed austerity, Valencia peeled off the road like a rider in the Tour de France popping and falling to the back of the peleton. Its austerity is not keeping it from defaulting and its citizens hate it. And this is just the start. For good measure, Egan Jones downgraded Spain.

At the back of the pack there is little hope of catching up. Spain is already giving up from all appearances.

It seems US investors suddenly realized those problems still exist and as the earnings are showing, they are impacting US companies. The US is not an island, particularly given the move to an export economy the past four years. When others you sell to are sick, it doesn't really help if you are not as sick as they are. If they can't take what you are selling you are not richer because your goods pile up in warehouses.

Thus futures were lower early on and stocks opened lower and sold into midday. They finally caught bottom but could not bounce, instead trading in a narrow range along that midday low through the closing bell.

Didn't help it was expiration, that earnings, while better, were not going to be that great, and that the market had rallied four out of five sessions heading into expiration. Classic setup for some selling, but with the Thursday earnings we felt we would get just a bit more upside before the sellers took over. Not the case; other issues predominated and we had to spend the day in limbo, tending positions, watching the pullback, watching just how sharp it was.

Turns out it was not that bad. Volume fell on NYSE and was up just modestly on NASDAQ, hardly a massive expiration spike and that is decent given the market was lower. In short, not a big dumping of shares. Indeed, the indices held above the 10 day EMA on the close. Now you don't necessarily want to drop that far on the first day of selling, but in this rally the pullbacks are rather sharp, but as of Friday the indices were still in good shape to survive and fight another day, or at least try to push for another higher high after a test.

OTHER MARKETS.

There was movement, although some of the charts do not do the moves justice.

Dollar. 1.2157 versus 1.2268. The dollar spiked against the euro, but it was still not spiking against other currencies such as the yen. Therefore the DXY0 is still somewhat in a pullback stage while the dollar spikes against the euro. The dollar is still in excellent position to break higher with this modest pullback holding at the 20 day EMA.

Bonds. 1.46% versus 1.51% 10 year US Treasury. Bonds surged. The Treasury is acting as a safe haven, as is the US dollar versus the euro as the European issues reemerge. Remember, in northern Europe investors are paying Germany and Finland to hold their money. In other words, they have negative rates of return on their 2 year bonds.

Gold. 1,582.70, +2.30. Gold rallied modestly. Gold was down earlier on the dollar's strength. But even with the dollar stronger against the euro, gold managed to rally. That shows a fear trade here as well.

Oil. 91.90, -0.76. Oil was down on the session, but it has had a stellar week. It was up 5% as it broke above the early July peak and rallied nicely. Oil obviously has impetus to the upside given the geopolitical concerns with Iran and Israel, not to mention the problems in Syria and the tensions that has caused between the US, China, and Russia as the latter two vetoed another security council resolution to do something with respect to Syria and the slaughter of its citizens.

The world is a tough place out there, and despite what they call advancements in human rights and advancements in their thinking about the world and their citizens, nothing has really changed with Russia and China. They still support dictators (as we do at times), and they will still, seemingly no matter what the situation is, take whatever side is not the US side. But I digress.

TECHNICAL SUMMARY

Internals.

Volume. NASDAQ, +2.5%, 1.7B; NYSE, -4%, 721M. Volume was up during the week somewhat, so there was a bit of expiration action there all week long. The daily action was mixed. It was a flip from the situation on Thursday that saw NASDAQ with lower volume and the NYSE with higher volume. That tells us there was not a lot of dumping. In any event, any increase in volume for any stock was basically related to expiration. You cannot take a lot from that.

Breadth. NASDAQ, -2.8:1; NYSE -2:1. That is more significant that what we have seen of late; then again, it is expiration. I am not putting too much stock in it given that it was expiration Friday. We will see how things play out next week. It could give us a better read, because all week long it was rather lackluster. That is not necessarily good on the way up, but it was not too terrible on the test either.

THE CHARTS

SP500. SP500 pulled back above the 10 day EMA. A bit more than you want to see with a 1% loss, but we have seen this before. We have seen this movie on the other two pullbacks on this rally. The only thing that makes this significant is that it has broken up into the final range, so to speak, where the highs from 2012 were put in. Thus it is feeling some resistance from the upside. It has been a good technical rally, and it is still in technically good shape even with a 1% loss on the first day of a pullback. It did give up the higher high over that early-July peak.

That has been somewhat the case on these rallies: You get a break and, almost immediately, they are peeling back off of that higher high. We will see if we can hold anywhere from the 10 day EMA down to the 50 day EMA. The 50 day EMA is at about 1346. You are looking at another 16 points or so. That is fairly significant, but when you consider that today was down 14 points, it is not that horrendous.

NASDAQ. NASDAQ fell to the 10 day EMA as well, and it held. It never did make that higher high this time, but it did put in a higher low, and it could still work on it. Techs are just lagging. It is not their time of year yet, even though they did have some good earnings. INTC helped bump things up, but it could not hold the move. So we fade back, and we will see if it can hold between the 10 day EMA and the 50 day EMA at 2905. That is just another 20 points to the downside. It is basically half of what it lost on Friday. It may be a tall order to hold, but how many times have we seen a big drop only to see it dry up the next day and start holding at support? It will have the chance to do that next week.

SP600. SP600 took it hard. It was down 1.2%, but it held the 20 day EMA. That keeps it in the next higher trading range that the broke into. But, similar to NASDAQ, it did not put in a higher high. It has put in a higher low, however. I am worried about the small caps. They had a stellar move and breakout in late June, but they have since lagged. That is not surprising given the deterioration in the US economic data. It will be important in the coming week whether or not they can hold or if they start to fold.

SOX. SOX had a couple of good days on Wednesday and Thursday. It made it up to the bottom of the trading range and, sure enough, it reversed off of that. We will watch them. SP600 and the SOX will be key to watch early next week. SOX tends to lead to the downside as it did this past time. It lagged on the move to the upside, and that means not as much upside strength as downside virulence. So if it turns over and falls, it will be tough for NASDAQ to continue to drive higher.

We have another crossroads. A good technical position on SP500. It is not bad on the NASDAQ but not nearly as strong. We have one index -- or maybe two indices if you throw the Dow in -- performing pretty well, technically making a higher high. The others are following along, and those others just so happen to be the growth sectors.

LEADERSHIP

Big Names. All week long the move has been more of a large cap move. The stocks that have been receiving the money during the worry in the original selling from May into June and even early July -- the defensive areas -- gave up some ground as money rotated into other areas. AAPL was up on the week, but it gave it back on Friday. It was a big name that did not hang on, but there were others that did. While AMZN did not have a stellar move, it put in almost 1% to the upside, adding to its gain. PCLN squeezed out another gain, but it was up and not reversing. That is rather important. GE missed on its revenues, but it still managed to hold with a modest gain although it was a wild trading session.

Technology. There were some key moves in technology stocks that hampered NASDAQ and are ominous for next week. MSFT produced fairly decent earnings, but it gapped to the upside and reversed. That is the downside engulfing pattern. It swallowed up the prior day and, indeed, it swallowed up this move and closed at the 50 day EMA. We will see what happens. Last time we saw one of these, it faded a bit more but was able to rally off of it. INTC surprised on its earnings even though it cut its 2012 forecast in half. But it did rally nicely on Wednesday on this news. Great. It made it to the 50 day EMA, but then it started down. On Friday it gapped below the 200 day EMA and sold, closing at the session low. We are not getting good action after the fact. We are getting initial good results, but afterwards not so much.

QCOM is one of the stocks that is trying to hold after its gap to the upside. We will see. NASDAQ is struggling, and it never made that higher high. Technically it is still okay, but it has a question mark by it simply because it could not put in that higher high. Some big techs were down on Friday (throw in AAPL there). They were not just down, but they made significant moves, particularly if you look at MSFT.

Homebuilders/Materials. This was a week that saw some of the leaders break. They had been holding up in a pullback, but then, boom. BZH is one of those. But then you turn the page and see KBH holding nicely at support. LPX in materials broke hard and made a modest recovery on Friday, but it was not convincing. On the other hand, CX had a nice break higher and posted very good upside on Friday. There is some good action.

Drugs/Medical. NKTR was moving nicely. Its pullback still looks good for a move to the upside. NUVA still looks just fine as it holds at the 20 day EMA, trying to set up for a new move. We did see problems in a lot of the other stocks in these areas. EXAS is moving lower. Maybe it sets up an ABCD pattern, but we will have to see what happens. There were some breaks to the downside in a group that has been quite solid. ABAX started to fall off of the table as well. The question is, if the market gets defensive again, are these areas going to improve again and have money return their way? It is possible. Some are holding up well and could give us a nice break back to the upside. OREX is one of those; it has a very nice pullback underway. We could get money returning and pushing things up if the market gets spooked again and money flows away from the stocks that it turned to during the week and have started to do that on Friday.

Metals. There are still a lot of questions in areas such as metals. FCX did not have bad news, but it was down on Friday. Some of the other steel stocks that have looked good continue to hold up such as SCHN. They still have their earnings to come, however.

The problem we found at the end of the week was a market in transition. Some of the leaders, the defensive group, were getting a lot of good money, performing well, and putting up great patterns, but they started to lose their edge. Money flowed into some big names, and it did so quite rapidly. But then, almost as quickly, it started to struggle.

Energy. Maybe some of the newly-minted leaders from energy such as IOC and others will help carry the day. There are problems in the world that are causing oil to go up. It is not economic growth by any stretch. But you take it wherever you can get it, right? Energy is enjoying gains based upon the geopolitical tensions.

Overall, however, the market is in transition right now. We will have to see where the money flows as the next week unfolds. It is very important as earnings come out and investors react to the earnings, the US economic data, and, as seen on Friday, the reawakening of the problems in Europe.

THE ECONOMY

Financial sector announces more layoffs.

In yet another sign of the times some big names in finance are cutting more jobs. MS is cutting 700 additional positions, bringing the 2012 total to 4000 and we are just halfway through the year in terms of quarters reported. Citi is laying off another 350. Deutche Bank announced it will sack an additional 1,000.

On the bright side I guess you could say that at least they have those employees to lay off. Some of our larger companies have lost jobs for decades. At least the financial arena rallies in number of jobs and then fades, following the whims of the economy and markets.

The government hits on another way to lower the unemployment rate.

Recall our continuous and lengthy discussions a few months back about how the Administration would lower the unemployment rate below 8% by the election? The plan was to shrink the work pool, dropping eligible workers into oblivion. Recall the month in the spring when 1.2M workers disappeared from January to February? Gone. The administration said they were retirees, but we know the fastest growing employment demographic is the over 55 crowd simply because their retirements have been wiped out.

The idea at the time was to lower the number of overall workers. If you slow job losses any, then the unemployment rate improves: A relatively steady number of workers divided by a smaller number of overall available workers raises the percentage of those working. It is all a fiction; there are no more people working than before, indeed less, but because the overall number of available workers is trimmed by the government bean counters, it looks as if a greater percentage of people are working.

Problem is, everyone caught onto this and the Administration had to figure out a new way to get the rate lower by election.

If you cannot do it directly, simply write an executive order overturning a law passed by Congress and you can right your own laws.

A week ago we wondered about the Administration deciding on its own that it would no longer require those seeking welfare to show they are attempting to gain employment. That was the pillar of the Clinton/Gingrich welfare reform and it is (was?) very popular for the entire nation. Moreover, it worked.

But, it can now be used as a tool to lower the unemployment rate, again without really getting anyone employed. The Administration did not entirely eliminate the work requirement, BUT there are MAJOR changes in what is called 'work.'

Bed rest is work. Smoker cessation classes is work. 'Journaling' (keeping a journal) is now work. So is massage (getting one), exercise, parent/teacher meetings, helping a friend with household tasks or errands.

All require you to do something, but is it something considered 'work' in the sense you could get paid for it? Hardly.

The result, however, is increasing the number of 'workers' in the workforce. Instead of having to decrease the workforce monthly through bogus calculations that everyone saw through, now under the 'authority' of its unilateral executive decision, without creating one additional paying job, the Obama administration is going to reduce the unemployment rate by 'creating' jobs where none existed before. Same activities that no one considered jobs are suddenly jobs. Voila, the unemployment problem is over. Nirvana.

THE MARKET

SENTIMENT INDICATORS

VIX: 16.27; +0.82
VXN: 18.2; +0.71
VXO: 15.99; +0.24

Put/Call Ratio (CBOE): 1; +0.14

Bulls versus Bears

This is a reading of the number of bullish investment advisors versus bearish advisors. The reason you look at this is that it gives you an idea of how bullish investors are. If they are too bullish then everyone is in the market and it is heading for a top: if everyone wants to be in the market, then all the money is in and there is no more new cash to drive it higher. On the other side of the spectrum if there are a lot of bears then there is a lot of cash on the sideline, and as the market rallies it drags that cash in as the bears give in. That cash provides the market the fuel to move higher. If bears are low it is the same as a lot of bulls: everyone is in and the market does not have the cash to drive it higher.

Bulls: 43.6% versus 44.7%. Dropping after a bump higher the previous week. The volatility suggests bulls are starting to turn. Undercut 35%, the threshold for bullishness, in early June. You would expect it to rise and it has. Still not at a dangerous level, just working as it should. As noted, hit 34% in early June. It did its job and the market is on the rally. Hard drop to 34 from 39.3% as economic reality and a choppy stock market hit. Off the 55+ level hit in late February. That was the highest level since April and May of 2011, the peak of the post-bear market high. 35% is the threshold level suggesting bullishness. To be seriously bearish it needs to get up to the 60% to 65% level.

Bears: 24.5% versus 24.5%. Again holding at 24.5% for the third week. Holding at the same level for over a month. 24.7% before, and 25.6% before that. Never got close to the 35% level that is bullish, but it looks as if the bulls did the work. Over 35% is the threshold to be really be a good upside indicator. For reference, bearishness hit a 5 year high at 54.4% the last week of October 2008. The move over 50 took bearish sentiment to its highest level since 1995. Extreme negative sentiment. Prior levels for comparison: Bearishness peaked at 37.4% in September 2007. It topped the June 2006 peak (36%) on that run. That June peak eclipsed the March 2006 high (33%) and well above the 2005 highs that spawned new rallies (30% in May 2005, 29.2% in October 2005). That was a huge turn, unlike any seen in recent history.

NASDAQ

Stats: -40.6 points (-1.37%) to close at 2925.3
Volume: 1.731B (+2.46%)

Up Volume: 417.88M (-602.12M)
Down Volume: 1.42B (+744.79M)

A/D and Hi/Lo: Decliners led 2.79 to 1
Previous Session: Decliners led 1.26 to 1

New Highs: 43 (-43)
New Lows: 52 (+13)

SP500/NYSE

Stats: -13.85 points (-1.01%) to close at 1362.66
NYSE Volume: 721.106M (-3.8%)

A/D and Hi/Lo: Decliners led 1.99 to 1
Previous Session: Advancers led 1.12 to 1

New Highs: 124 (-48)
New Lows: 37 (+16)

DJ30

Stats: -120.79 points (-0.93%) to close at 12822.57
Volume: 210M shares Friday versus 139M shares Thursday. Expiration.

MONDAY

The economic calendar is not as intense as it has been of late. Some interesting stuff comes on Friday with GDP for Q2 as well as the Michigan Sentiment. All eyes will be looking toward that finale for the week, but we will get a new home sales read on Wednesday. After the existing home sales, it will be interesting to see where they stack up, particularly given the housing starts we saw.

Then, of course, we have a key test of the rally that is slow yet still technically solid. At least it is technically solid on SP500. The question is: With the earnings starting to have a midlife crisis, where all of a sudden people realize, as noted on Thursday, that the emperor has no clothes and earnings simply are not that good. They are not, but they are better than expected. But earnings that are better than expected but still cruddy can only carry a market so far. Thus we have to watch the test closely on SP500 as well as SP600 and the SOX.

There are so many issues facing the world right now. We have food issues with the corn crop in the US and problems in other parts of the world as well. We could have a shortage of food for a significant part of the world. We will have higher prices in the US because so much of our food stock is based upon corn and its by-products. We continue to have trouble in the financial institutions with LIBOR. Now there is talk of manipulation of other markets. One that I have posited as being manipulated is gold. Note how it has come back in this narrow range and is not going anywhere despite all of the issues. There is the Fed not pushing or stimulus as well as all of the worries in Europe where there is more stimulus. Yet gold has gone nowhere. That is just like LIBOR. LIBOR was all over the place, then all of a sudden it just went dormant and did not move for months on end. Now we have gold trading in this narrowing range even with all of the strife in the world.

We have the Middle Eastern situation. We have Syria going up in flames. The US is vying with China and Russia over what will happen there. We have Egypt, its elections, and the problems with the military taking over. We have Israel and Iran butting heads and getting to a flashpoint right now. We have a great buildup in the Persian Gulf, which I think we needed to do to show that we were there.

Then we have the world economies. It is not just financial institutions; the world economies are in serious trouble right now. Peter Shiller believes, as I do now, that the US is likely already in a recession. Others believe the same thing. Brazil might be there as well, and India could be. China is not but it seems like it is a recession given how much it has slowed down. The EU is in recession as well. We have worsening problems ahead.

It does not look good if you put all that together for the stock market, yet the stock market continues to hold up. Manipulation here as well? I doubt it. But at some point it has to take into consideration all of the issues that are confronting the world. While it has not rolled over as it did in 2011 when Europe went down, it is moving through a technically-sound base. It is at an important level of resistance, and that makes next week important. We will not be too lenient after two higher lows and three higher highs. We have been closing some positions. If they got close, then we were closing some. Others have fallen hard. If it is close, we will at least take some off the table and then put ourselves in better position in case things get ugly.

That said, there are still those stocks in defensive areas that look very good and could give us new buys in the near term as money is still flowing their way. That is exactly where you want to be for the upside. I think it is time to be defensive once again. We will look for some downside plays on top just in case we get the break to the downside. Thus far the market is holding up. It has a significant pullback on Friday, but it was not a breakdown by any stretch on SP500 or NASDAQ or even the SP600. We will approach next week with caution. We have good stops on our positions. We do not have as many positions open now, and the ones that we have are more defensive. We could turn right back to a defensive posture in the markets.

Not a great prognosis for the world economies, for the US economy, or for the market necessarily. But you always take what the market gives you. As it is still holding up a good technical pattern, we will look for those stocks in good technical patterns but with a bit more of a defensive bent. I have a feeling that money will flow out of the areas it moved into last week as quickly as it moved into them.

Enjoy the weekend. I know there is a lot going on in the US. Our hearts go out to the people in Colorado. We pray for those that did not go home last night and for those who have to deal with that loss. It is always hardest on those who are left. We just need to keep cool heads, pray for those families, and pray for those who are meeting their maker. And we can redouble our resolve to make this country a place where people have hope for the future again and hope for themselves and their neighbors versus having to hope that the government takes care of them.

Have a great weekend.

Support and resistance

NASDAQ: Closed at 2925.30
Resistance:
2942 is the mid-June 2012 high
2950 is the mid-April closing low
2962 is the April 2012 low
2988 is the July 2012 high
3000 is the February 2012 post-bear market high
3024 is the gap point from early May
3026 from 10/2000 low
3042 from 5/2000 low
3076 is the late April 2012 high
3090 is the mid-March interim high
3134 is the March 2012 post-bear market peak
3227 is the April 2000 intraday low
3401 is the May 2000 closing low

Support:
2910 is the March 2012 low
The 50 day EMA at 2905
2900 is the March 2012 low
2888 is the May 2011 peak and PRIOR post-bear market high
2879 is the July 2011 peak
2866 is the July 2012 closing low
2862 is the 2007 peak
2841 is the February 2011 peak
The 200 day SMA at 2824
2816 is the early April 2011 peak.
2810 is the low in the shoulders
2754 is the October 2011 high
2706 to 2705 is the April 2011 low and the February 2011 and consolidation low (bottom of the trading range) 2723 to 2705 is the range of support at the bottom of the January to May trading range
2686 is the January 2011 closing low
2676 is the January 2010 low and the December 2011 peak
2645-2650ish from December 2010 consolidation
2643 is the September 2011 high
2612 is the late August 2011 peak
2603 is the March 2011 intraday low (post-Japan low)
2599 is the June 2011 low and NASDAQ

S&P 500: Closed at 1362.65

Resistance:
1363.46 is June 2012 high
1371 is the May 2011 peak, the post-bear market high
1375 is the early July 2012 peak
1378 is the February 2012 peak
1406 is the early May 2012 peak
1422.38 is the Post-bear market high (March 2012)
1425 from May 2008 closing highs
1433 from August 2007 closing lows
1440 from November 2007 closing lows

Support:
1359 is the April 2012 low
1357 is the July 2011 peak
The 50 day EMA at 1346
1344 is the February 2011 peak
1340 is the early April 2011 peak
1332 is the early March 2011 peak
1325 is the July 2012 intraday low
The 200 day SMA at 1313
1309 is the right shoulder low from June 2012
1295 to 1294 is the April 2011 low and the February 2011 consolidation low (bottom of the trading range)
1293 is the October 2011 peak
1275 is the January 2010 low, early January 2011 peak
1267 is the December 2011 peak
1258 is June 2011 intraday low
1255 is the late December 2010 consolidation range
1249 is the March 2011 low (post-Japan)
1235 is the mid-December 2010 consolidation low
1231 is the late August 2011 peak
1227 is the November 2010 peak
1220 is the April 2010 peak
1209 is the mid-August 2011 high

Dow: Closed at 12,822.57
Resistance:
13,056 is the February 2012 high
13,058 from the May 2008 peak on that bounce in the selling
13,297 is the April 2012, post bear market high
13,668 from 12-2007 peak
13,692 from 6-2007 peak
14,022 from 7-07 peak

Support:
12,754 is the July intraday peak
The 50 day EMA at 12,721
12,716 is the April 2012 closing low
The 200 day SMA at 12,507
12,391 is the February 2011 peak
12,369 is the left shoulder low from May 2012
12,284 is the October 2011 peak
12,258 is the December 2011 peak
12,110 from the March 2007 closing low
12,094 is the April 2011 low
The June low at 11,897 (closing)
11,734 from 11-98 peak
11,717 is the late August 2011 peak
The August low at 11,702
11,555 is the March low
11,452 is the November 2010 peak
11,178 from November 2010
10,978 is the bottom of the November 2010 consolidation
10,750 from September 2010
10,720 is the August closing low
10,705-710 from January 2010 peak
10,694-700 from August 2010 peak

Economic Calendar

July 24 - Tuesday
- FHFA Housing Price I, May (10:00): 0.8% prior

July 25 - Wednesday
- MBA Mortgage Index, 07/21 (7:00)
- New Home Sales, June (10:00): 374K expected, 369K prior
- Crude Inventories, 07/21 (10:30)

July 26 - Thursday
- Initial Claims, 07/21 (8:30): 375K expected, 386K prior
- Continuing Claims, 07/21 (8:30): 3300K expected, 3300K prior
- Durable Orders, June (8:30): 1.0% expected, 1.3% prior (revised from 1.1%)
- Durable Orders - ex , June (8:30): 0.0% expected, 0.7% prior (revised from 0.4%)
- Pending Home Sales, June (10:00): 0.7% expected, 5.9% prior

July 27 - Friday
- GDP-Adv., Q2 (8:30): 1.2% expected, 1.9% prior
- Chain Deflator-Adv., Q2 (8:30): 1.5% expected, 2.0% prior
- Michigan Sentiment -, July (9:55): 72.0 expected, 72.0 prior
icon url

ReturntoSender

07/23/12 6:50 PM

#9843 RE: ReturntoSender #6755

From Briefing.com: 4:20 pm : U.S. equity markets opened the session sharply lower on renewed European worries. International Monetary Fund officials voiced concerns over Greece being able to continue servicing its debt. In addition, Spain instated a three-month short selling ban on all stocks, while Italy did the same for financial and insurance firms. Despite the early selling pressure and flight to safety, markets recovered more than half of their losses, as sellers lacked a catalyst to push stocks to new lows.


European financials were under severe pressure this morning as sellers attacked the complex on renewed sovereign debt concerns. Traders continued to watch peripheral yields as both the Italian and Spanish 10-yr yields surged to 6.317% and 7.431% respectively. Deutsche Bank (DB 28.76, -1.29) and Barclays (BCS 9.58, -0.33) saw heavy losses of 4.3% and 3.3% respectively.

The ability for U.S. equities to see some safe-haven buying may very well rest on the performance of companies over the next few weeks. Restaurants continued to record poor performances with industry bellwether McDonalds (MCD 88.94, -2.64) missing expectations as headwinds from overseas and on rising costs of food products weighed on results. Industrial goods producer Eaton (ETN 40.57, +1.51) beat on the bottom line but failed to match revenue expectations. Elsewhere, Oil services giant Halliburton (HAL 31.51, +0.74) was one of the few bright spots as it beat on bottom and top line expectations.

The consumer discretionary sector was down 1.3%. Toy maker Hasbro (HAS 35.19, +1.35) bucked the trend today after reporting better than expected second quarter earnings. On the other hand, women's clothing retailer Wet Seal (WTSLA 2.66, -0.30) was lower after the company terminated its Chief Executive Officer and lowered second quarter guidance.

Nexen (NXY 25.90, +8.84) was up 51.8% after announcing it will be acquired by Chinese energy giant CNOOC (CEO 193.96, -8.79) for $27.50 per share in cash. The deal values Nexen at approximately $15.1 billion while keeping the total debt burden of the company at $4.3 billion. Canada’s Industry Minister has recently confirmed the deal is under foreign investment review.

GNC Holdings (GNC 37.40, -0.25) was down 0.6% after announcing the Board of Directors elected Chief Executive Officer Joseph Fortunato to replace Norman Axelrod as Chairperson of the Board. The stock opened on session lows, touching $35.50 before buyers emerged at near support dating back to the middle of June.

Thirty-eight companies are scheduled to report earnings after hours. Texas Instruments (TXN 26.82, -0.43) will be in focus, as technology stocks have been underperforming early in the earnings season. In addition, Steel Dynamics (STLD 12.22, -0.20) may provide a glimpse into the health of the construction and durable goods sectors.

Second quarter earnings continue to flow this week with notables Baidu.com (BIDU 107.10, -3.13), Altria (MO 35.49, -0.42), Apple (AAPL 603.83, -0.47), and Ford Motor Company (F 9.17, -0.04) all scheduled to release their latest quarterly results.

Treasuries saw steady selling over the course of the session after the early morning flight to safety dropped yields into record territory. Early buying saw the benchmark 10-yr yield hit an all-time low of 1.395% before selling ran it back up to its current 1.438%. A flatter yield curve has the 2-10-yr spread trading tighter at 121.5 bps.

After opening the session at 20.41, the Volatility Index, or VIX, eased to 18.62, which was a 14.3% gain for the session.DJ30 -101.11 NASDAQ -35.15 SP500 -12.14 NASDAQ Adv/Vol/Dec 509/1.53 bln/1990 NYSE Adv/Vol/Dec 712/743.1 mln/2344

3:30 pm : Crude oil struggled in negative territory for its entire pit session as the dollar strengthened in response to renewed European sovereign debt concerns. The energy component touched a session low of $87.94 per barrel in morning action and inched to a session high of $89.78 per barrel. However, a sell-off heading into the close left crude to settle with a 4.2% loss as it closed at $88.09 per barrel.

Despite opening pit trade in the red and brushing a session low of $2.99 per MMBtu moments later, natural gas was able to find buying support and pop into positive territory to a session high of $3.13 per MMBtu. After chopping around near the unchanged line in afternoon action, it settled at $3.12 per MMBtu, booking a gain of 1.3%. The stronger dollar also put pressure on precious metals.

Gold dipped to a floor session low of $1562.00 per ounce but was able to recover some losses as it traded up to a session high of $1579.70 per ounce and later settled with a 0.4% loss at $1577.10 per ounce.

Silver fell to a pit session low of $26.61 per ounce in morning action and trended higher for the remainder of its session to close at $27.02 per ounce, or 1.0% lower.DJ30 -86.24 NASDAQ -29.00 SP500 -10.29 NASDAQ Adv/Vol/Dec 564/1286.5 mln/1912 NYSE Adv/Vol/Dec 768/517 mln/2271

4:34PM Texas Instruments beats by $0.04, reports revs in-line; guides Q3 EPS, revs below consensus (TXN) 26.82 -0.43 : Reports Q2 (Jun) earnings of $0.44 per share, excluding non-recurring items, $0.04 better than the Capital IQ Consensus Estimate of $0.40; revenues fell 3.6% year/year to $3.34 bln vs the $3.34 bln consensus. Co issues downside guidance for Q3, sees EPS of $0.41-0.49, excluding non-recurring items, vs. $0.50 Capital IQ Consensus Estimate; sees Q3 revs of $3.21-3.47 bln vs. $3.55 bln Capital IQ Consensus Estimate. Compared with a year ago, lower gross profit in the quarter primarily reflects lower revenue and the associated costs from low levels of factory utilization. Compared with Q1, higher gross profit reflects higher revenue, which more than offset lower insurance proceeds related to the March 2011 earthquake in Japan. "TI revenue in the second quarter was about as we had expected. Our Analog and Embedded Processing segments grew sequentially, while our Wireless segment declined. Although we believe customers and distributors have low inventory levels, the global economic environment is causing both to become increasingly cautious in placing new orders. Our backlog grew last quarter but orders slowed in the month of June and our backlog coverage for September is lower than normal. As a result of this increased uncertainty, we currently estimate that our revenue in the third quarter will be about even with last quarter and below our seasonal average growth rate. If customer demand increases as the quarter progresses, we are ready to support higher shipments with short product lead times, a strong inventory position and available manufacturing capacity.

4:34PM Ultra Clean Holdings reports EPS in-line, revs in-line; guides Q3 EPS below consensus, revs in-line (UCTT) 6.00 -0.16 : Reports Q2 (Jun) earnings of $0.17 per share, in-line with the Capital IQ Consensus Estimate consensus of $0.17; revenues fell 23.8% year/year to $101.95 mln vs the $102.83 mln consensus. For Q3, co sees EPS of $0.10-0.14 vs. $0.18 Capital IQ Consensus Estimate; sees Q3 revs of $107-112 mln vs. $108.6 mln Capital IQ Consensus Estimate.

4:08PM Volterra Semi misses by $0.02, misses on revs (VLTR) 25.22 +0.02 : Reports Q2 (Jun) earnings of $0.32 per share, excluding non-recurring items, $0.02 worse than the Capital IQ Consensus Estimate of $0.34; revenues rose 4.5% year/year to $43.6 mln vs the $44.4 mln consensus.

Ramtron International (RMTR) has entered into a Manufacturing and License Partnering Agreement with ROHM of Japan. Under the long-term agreement, ROHM will manufacture F-RAM-based semiconductor products for Ramtron on ROHM's established F-RAM manufacturing line.

Marvell (MRVL) and Wilocity announced a new partnership to bring tri-band Wi-Fi solutions enabled with 802.11ad to market.

TSMC (TSM) and ARM (ARMH) announced a multi-year agreement extending their collaboration beyond 20-nanometer technology to deliver ARM processors on FinFET transistors.

Research In Motion (RIMM) learned that the International Trade Commission has terminated its investigation after making a determination in favor of RIMM that the only asserted claim of Kodak's (EKDKQ) U.S. Patent No. 6,292,218 for electronic cameras is invalid.

09:21 am Cypress Semi upgraded to Hold at Cantor Fitzgerald: . Cantor Fitzgerald upgrades CY to Hold from Sell. They believe that the downside is probably limited from here and that there is the potential that 4Q12 will be better than they currently project. They believe the acquisition of RMTR would prove to be accretive to CY and would be in the best interests of both cos. However, the shares of Ramtron are trading above the offer price, and it is not clear that Cypress will prevail. They are cutting their ests for 2012 and 2013.

10:34 am S&P Technology sector trading lower as market falls on Spain worries

The tech sector is trading lower today, trailing losses in the broader market. Semiconductors are showing relative weakness with the SOX trading 2.4% lower. CREE (-5.5%) is a notable laggard in the chip index. Among other major indices, the SPY is trading 1.8% lower today, while the QQQ is down 2.3% and the NASDAQ is trading 2.4% lower on the session. Among tech bellwethers, MSFT (-3.4%) is showing notable weakness.

In earnings last night, BAH (-2.9%) lowered its FY13 revenue guidance. There was no significant news in the industry this morning. Among notable analyst upgrades this morning in the tech space, Cantor Fitzgerald upgraded CY (-7.8%) to Hold. In downgrades, VRSN (-4.9%) was downgraded to Neutral at Citigroup, CSRE (-0.3%) was downgraded to Hold at Jefferies, and ATMI (-6.8%) was downgraded to Sell at UBS. BIDU (-4.3%), VMW (-3.3%), WIT (-4.1%), STM (-2.1%), and TXN (-2.3%) are the notable names in tech scheduled to report quarterly results today after the close.
icon url

ReturntoSender

07/25/12 7:21 PM

#9845 RE: ReturntoSender #6755

From Briefing.com: 4:15 pm : Following an afternoon rally, U.S. equities failed to hold session highs and ended mixed. The Dow advanced by nearly 0.5%, while the S&P 500 was essentially unchanged and Nasdaq fell by 0.3%. Mixed earnings and a new home sales reading that missed expectations provided the day's headlines. Egan Jones issued a downgrade of Italy's sovereign rating to CCC+ from B+. Despite weak results from Apple (AAPL 574.97, -25.95), technology was the best performing sector in the S&P 500 today.


Symantec (SYMC 14.96, +1.79), Altera (ALTR 34.41, +3.74), and Juniper Networks (JNPR 16.51, +1.70) reported positive results combined with a better-than-expected outlook. As a result, all three stocks were up in excess of 10%. In addition, Symantec (SYMC 14.96, +1.79) announced the firing of Chief Executive Officer Enrique Salem who will be replaced by the company's Chairman, Steve Bennett.

Financials were also one of the top sectors today.

The SPDR Financial Select Sector ETF (XLF 14.27, +0.06) was up by 0.4%. Within the sector, Morgan Stanley (MS 12.96, +0.34) led the way, posting a 2.7% gain. Citigroup (C 25.79, +0.55) and Goldman Sachs (GS 95.96, +1.49) also advanced by 2.2%, and 1.6% respectively. Wells Fargo (WFC 33.16, -0.07) was the main underperformer, ending the day 0.2% down.

Natural Grocers (NGVC 17.86, +2.86) ended the day up 19% following this morning's initial public offering. The company has been compared to Whole Foods Market (WFM 84.53, +0.53) which will release its third quarter results following today's closing bell.

Shares of General Motors (GM 18.80, -0.22) were down 1.2% after rival Toyota Motor (TM 72.51, -0.47) grabbed the first-half global sales lead. The company announced first-half sales of 4.67 million vehicles, which fell approximately 300,000 short of Toyota's number. Today's selling has dropped the stock below the $19.00 level for the first time since the company emerged from bankruptcy in November 2010.

Netflix (NFLX 60.29, -20.10) was the S&P 500's worst performer after second quarter subscriber growth came in below expectations. Investors were also concerned over higher costs and increased competition going forward.

Precious metals climbed higher in today's pit trade as the dollar weakened on comments from European Central Bank council member Ewald Nowotny suggesting Europe's rescue fund should receive a banking license. Gold climbed to a session high of $1609.10 per ounce before settling just below that level at $1607.70 for a gain of 2.0%. Silver pulled-back slightly in morning action to a session low of $27.05 per ounce but quickly regained momentum. It booked a 2.5% gain as it closed near session highs at $27.48.

In addition to another set of earnings, Thursday's data includes initial and continuing unemployment claims, durable orders, and pending home sales.

Treasury will auction $29 billion 7-yr notes.DJ30 +58.73 NASDAQ -8.75 SP500 -0.42 NASDAQ Adv/Vol/Dec 1433/1.7 bln/1002 NYSE Adv/Vol/Dec 1631/783.1 mln/1398

3:35 pm : Crude oil slid into the red and to its floor session low of $86.82 per barrel following weak inventory data that showed a build of 2.717 mln barrels when a draw of 1.0 mln barrels was anticipated. Despite the fall, the energy component managed to gain momentum and popped back into positive territory in afternoon action. A rally heading into the close pushed prices higher such that crude settled with a 0.6% gain at $89.03 per barrel.

Natural gas fell deeper into negative territory, dipping as low as $3.05 per MMBtu in afternoon pit action. It closed floor trade 3.5% lower at $3.07 per MMBtu, posts its first loss in six sessions.

Precious metals climbed higher in today's pit trade as the dollar weakened on comments from ECB council member Ewald Nowotny suggesting Europe's rescue fund should receive a banking license. Gold climbed to a session high of $1609.10 per ounce and settled just below that level at $1607.70 per ounce for a gain of 2.0%. Silver pulled-back slightly in morning action to a session low of $27.05 per ounce but quickly regained momentum. It booked a 2.5% gain as it closed at $27.48 per ounce, just below its session high of $27.49 per ounce.DJ30 +57.52 NASDAQ -9.36 SP500 -0.73 NASDAQ Adv/Vol/Dec 1380/1446.6 mln/1055 NYSE Adv/Vol/Dec 1578/545 mln/14194

6:29PM Teradyne beats by $0.19, beats on revs; guides Q3 EPS below consensus, revs below consensus (TER) 13.45 +0.22 : Reports Q2 (Jun) earnings of $0.77 per share, $0.19 better than the Capital IQ Consensus Estimate of $0.58; the $0.77 figure excluded acquired intangible asset amortization, non-cash convertible debt interest, and included income taxes on a cash basis. Revenues rose 33.5% year/year to $548 mln vs the $510.87 mln consensus. Co issues downside guidance for Q3, sees EPS of 0.41-0.51 vs. $0.53 Capital IQ Consensus Estimate; sees Q3 revs of 420-460 mln vs. $483.01 mln Capital IQ Consensus Estimate.

4:39PM MKS Instruments misses by $0.03, misses on revs; guides Q3 EPS below consensus, revs below consensus (MKSI) 26.32 +0.84 : Reports Q2 (Jun) earnings of $0.35 per share, excluding non-recurring items, $0.03 worse than the Capital IQ Consensus Estimate of $0.38; revenues fell 7.1% year/year to $177.4 mln vs the $186.6 mln consensus. Co issues downside guidance for Q3, sees EPS of $0.14-0.27 vs. $0.36 Capital IQ Consensus Estimate; sees Q3 revs of $140-160 mln vs. $182.44 mln Capital IQ Consensus Estimate.

4:37PM Lam Research misses by $0.04, misses on revs (LRCX) 34.24 +0.05 : Reports Q4 (Jun) earnings of $0.60 per share, excluding non-recurring items, $0.04 worse than the Capital IQ Consensus Estimate of $0.64; revenues fell 1.4% year/year to $741.8 mln vs the $810.98 mln consensus. Lam Research reports Q4 gross margin of 40.2% vs 45.0% in the same quarter as last year

4:36PM Cohu misses by $0.06, beats on revs (COHU) 8.74 +0.01 : Reports Q2 (Jun) loss of $0.09 per share, $0.06 worse than the Capital IQ Consensus Estimate of ($0.03); revenues fell 26.6% year/year to $59.4 mln vs the $58.51 mln consensus. Orders were $69.8 million for the second quarter of 2012 and $53.0 million for the first quarter of 2012. Orders for semiconductor equipment were $59.5 million in the second quarter of 2012 compared to $41.4 million in the first quarter of 2012. Total consolidated backlog was $62.0 million at June 30, 2012 compared to $51.6 million at March 31, 2012. Cohu expects third quarter 2012 sales to be approximately $60 million.

4:28PM Cadence Design beats by $0.01, beats on revs; guides Q3 EPS, revs above consensus; raises FY12 guidance above consensus (CDNS) 11.42 +0.20 : Reports Q2 (Jun) earnings of $0.19 per share, excluding non-recurring items, $0.01 better than the Capital IQ Consensus Estimate of $0.18; revenues rose 15.2% year/year to $326 mln vs the $321.13 mln consensus. Co issues upside guidance for Q3, sees EPS of $0.18-0.19, excluding non-recurring items, vs. $0.17 Capital IQ Consensus Estimate; sees Q3 revs of $325-335 mln vs. $323.64 mln Capital IQ Consensus Estimate. Co issues upside guidance for FY12, sees EPS of $0.70-0.74, excluding non-recurring items, vs. $0.70 Capital IQ Consensus Estimate; sees FY12 revs of $1.295-1.315 bln vs. $1.29 bln Capital IQ Consensus Estimate.

4:27PM Western Digital beats by $0.39, beats on revs (WDC) 32.47 +0.70 : Reports Q4 (Jun) GAAP earnings of $2.87 per share, $0.39 better than the Capital IQ Consensus Estimate of $2.48; revenues rose 97.8% year/year to $4.75 bln vs the $4.25 bln consensus. "In the June quarter, demand was in line with our forecast as industry shipments reached 157 million units, bringing total HDD shipments for the year to 599 million units. Our WD and HGST subsidiaries both performed ahead of plan in Q4, delivering great products with consistent execution, resulting in strong revenue growth, gross margin and cash flows."

4:22PM Flextronics beats by $0.01, misses on revs; guides Q2 EPS in-line, revs below consensus (FLEX) 6.25 +0.19 : Reports Q1 (Jun) earnings of $0.23 per share, excluding non-recurring items, $0.01 better than the Capital IQ Consensus Estimate of $0.22; revenues fell 20.2% year/year to $5.99 bln vs the $6.07 bln consensus. Co issues mixed guidance for Q2, sees EPS of $0.21-0.25 vs. $0.25 Capital IQ Consensus Estimate; sees Q2 revs of $5.9-6.3 bln vs. $6.45 bln Capital IQ Consensus Estimate.

4:09PM Intersil misses by $0.03, misses on revs; guides Q3 EPS below consensus, revs below consensus (ISIL) 9.56 -0.07 : Reports Q2 (Jun) earnings of $0.08 per share, $0.03 worse than the Capital IQ Consensus Estimate of $0.11; revenues fell 22.0% year/year to $163 mln vs the $166.03 mln consensus. Co issues downside guidance for Q3, sees EPS of 0.10-0.12 vs. $0.19 Capital IQ Consensus Estimate; sees Q3 revs of $156-163 mln vs. $178.25 mln Capital IQ Consensus Estimate. "Our bookings rate grew during most of the second quarter, but began to deteriorate in June. We closed the second quarter with a book-to-bill ratio slightly less than one," said Bell. "Given continued uncertainty about the worldwide economy, we are forecasting sub-seasonal revenue for the third quarter. However, our significantly reduced operating expenses will drive strong EPS improvement in the third quarter."

4:08PM Applied Micro beats by $0.02, beats on revs (AMCC) 5.08 +0.19 : Reports Q1 (Jun) loss of $0.18 per share, excluding non-recurring items, $0.02 better than the Capital IQ Consensus Estimate of ($0.20); revenues fell 32.1% year/year to $41.3 mln vs the $40.06 mln consensus. "Although market conditions remain challenging we remain cautiously optimistic about the remainder of our fiscal year and are tracking to our plan at this time."

4:07PM LSI Logic beats by $0.03, beats on revs; guides Q3 EPS in-line, revs in-line (LSI) 6.07 +0.12 : Reports Q2 (Jun) earnings of $0.21 per share, $0.03 better than the Capital IQ Consensus Estimate of $0.18; revenues rose 31.8% year/year to $660 mln vs the $644.3 mln consensus. Co issues in-line guidance for Q3, sees EPS of $0.14-0.20 vs. $0.18 Capital IQ Consensus Estimate; sees Q3 revs of $620-660 mln vs. $658.64 mln Capital IQ Consensus Estimate. "We are pleased with our performance in the second quarter as we delivered strong growth and further expanded our profitability in a challenging macroeconomic environment,..Demand, particularly for our flash-related products, was driven by rapid adoption across client and datacenter computing where customers are increasingly turning to LSI to enhance or accelerate application performance."

4:05PM TriQuint Semi beats by $0.03, reports revs in-line; guides Q3 EPS in-line, revs below consensus (TQNT) 4.93 +0.07 : Reports Q2 (Jun) loss of $0.09 per share, $0.03 better than the Capital IQ Consensus Estimate of ($0.12); revenues fell 22.2% year/year to $178 mln vs the $177.59 mln consensus. Co issues mixed guidance for Q3, sees EPS of $0.00, excluding non-recurring items, vs. $0.00 Capital IQ Consensus Estimate; sees Q3 revs of $195-205 mln vs. $205.28 mln Capital IQ Consensus Estimate.

3:27PM Hewlett-Packard slips under yesterday's low of 17.81 to set a new multi-year low of 17.77 (HPQ) 17.77 -0.22 :

9:39AM Semiconductor Hldrs ETF provides early leadership (SMH) 31.18 +0.86 : Aggressive run in ALTR +16% (nearing its 200 ema at 35.74) has helped propel the SMH sharply higher in early dealings -- BRCM +8.9%, INTC +1.6%, TXN +1.6%, ASML +1.9%, AMAT +1.9%, ADI +1.6%, TER +1.8%, XLNX +2.7%, SNDK +1.2%, LLTC +1.5%.

Applied Micro Circuits (AMCC) has shipped two mln 10G Optical Transport Network ports to system providers.

Stonestreet One has partnered with Freescale Semiconductor (FSL) on the development of a radio module supporting Bluetooth Smart that will bring ultra-low power connectivity to a wide variety of healthcare devices.

7:33AM Silicon Labs beats by $0.04, beats on revs; guides Q3 revs above consensus (SLAB) 34.94 : Reports Q2 (Jun) earnings of $0.51 per share, $0.04 better than the Capital IQ Consensus Estimate of $0.47; revenues rose 7.5% year/year to $135.7 mln vs the $132.05 mln consensus. Co issues upside guidance for Q3, sees Q3 revs of $140-145 mln vs. $139.10 mln Capital IQ Consensus Estimate. All three of the co's major product categories, Access, Broadcast and Broad-based, grew sequentially in the second quarter. Co states: "Our business is hitting on all cylinders, underscoring the strength of our portfolio and ability to gain market share...The global build-out of infrastructure to support growing bandwidth needs, the emergence of the Internet of Things, and the increasing importance of energy efficient and green technology all require analog-intensive, mixed-signal ICs."

7:33AM STEC: SEC Provides Investigation Closure Letters to STEC and Its Presidend (STEC) 7.12 : Co has received investigation closure letters that the Staff of the SEC does not intend to recommend any enforcement action against either STEC or Mark Moshayedi, STEC's president, chief operating officer and chief technical officer.

7:14AM Corning reports EPS in-line, misses on revs (GLW) 12.06 : Reports Q2 (Jun) earnings of $0.31 per share, in-line with the Capital IQ Consensus Estimate consensus of $0.31; revenues fell 4.8% year/year to $1.91 bln vs the $2.01 bln consensus. "LCD glass retail and supply chain market statistics were generally in line with our expectations. As a whole, our other businesses grew 2% year-over-year...However, we are concerned about the continuing economic challenges in Europe and China's decelerating GDP growth. We have seen signs that the unsettled global economy impacted some of our businesses in the past quarter. For example, in Europe our Environmental Technologies segment saw reduced sales of light-duty filters for auto emission systems. We are alert to the fact that the economic woes may grow, and consumers may reduce their spending, which could impact our customers. If we see further weakness, we will respond with appropriate actions," For the third quarter, Flaws noted that Corning expects LCD glass volume for the company's wholly owned business and Samsung Corning Precision to grow in the low double digits sequentially.

7:11AM Motorola Solutions beats by $0.01, beats on revs; guides Q3 EPS below consensus, revs in-line; raised FY12 revs in-line (MSI) 45.32 : Reports Q2 (Jun) earnings of $0.70 per share, $0.01 better than the Capital IQ Consensus Estimate of $0.69; revenues rose 8.3% year/year to $2.15 bln vs the $2.11 bln consensus. Co issues mixed guidance for Q3, sees EPS of $0.69-0.74 vs. $0.78 Capital IQ Consensus Estimate; sees Q3 revs of ~+3% YoY Growth calc to ~$2168.15 vs. $2.19 bln Capital IQ Consensus Estimate. Co raised guidance for FY12, sees FY12 revs of 5-6% growth from prior guidance of +5% calc to ~$8.603-$8.695 bln vs. $8.67 bln Capital IQ Consensus Estimate. Government segment sales were $1.5 billion, up 14 percent from the year-ago quarter, driven by growth in all regions. "Our strong revenue and earnings growth continues to demonstrate the strength and resiliency of our business. We also are pleased to continue to return capital to our shareholders through an increased dividend and expanded share repurchase program."

7:08AM ATMI beats by $0.02, misses on revs (ATMI) 18.74 : Reports Q2 (Jun) earnings of $0.35 per share, $0.02 better than the Capital IQ Consensus Estimate of $0.33; revenues rose 1.8% year/year to $105.9 mln vs the $107.65 mln consensus. "We see wafer starts for 2012 modestly stronger than 2011, with typical seasonal patterns expected during the second half. Our customers are continuing to ramp and develop leading-edge technology nodes, and we are working with them to help them solve their material challenges. The SDS Direct transition is behind us and we should experience full-quarter benefits going forward. Our LifeSciences customers continue to move to high-volume production using our single-use technology, although the third quarter is typically affected by the seasonal business cycle in Europe."

6:49AM ARM Holdings beats Q2 ests; guides FY12 revs in-line (ARMH) 22.34 : Reports Q2 (Jun) earnings of GBP0.036 per share, better than the Capital IQ Consensus Estimate of GBP0.03; revenues rose 15.0% year/year to GBP135.5 mln vs the GBP129.84 mln consensus. Co sees FY12 revs in-line with GBP553.06 mln Capital IQ Consensus Estimate. Outlook: ARM enters the second half of 2012 with a record order backlog and a robust opportunity pipeline. Relevant data for the second quarter, being the shipment period for ARM's Q3 royalties, points to a small sequential increase in industry revenues. Q4 royalties are harder to predict as macroeconomic uncertainty may impact consumer confidence, and some analysts have become less confident in the semiconductor industry outlook in the second half. However, building on our strong performance in the first half, we expect overall Group dollar revenues for full year 2012 to be in line with market expectations.

Mattson Technology (MTSN) announced that a major foundry has placed an order for the paradigmE etch system, which is now in production in this third etch customer's fab.

Apple (AAPL $578.48 -22.52) reported third quarter earnings of $9.32 per share, $1.06 worse than the Capital IQ Consensus of $10.38, while revenues rose 22.6% year/year to $35.02 billion versus the $37.35 bln consensus. The company issued downside guidance for Q4, sees EPS of ~$7.65 versus the $10.23 consensus and revenues of approximately $34 billion versus the $37.94 bln consensus. Co typically guides conservatively but this looks particularly low. Co reports 26 mln iPhones sold in Q3 vs Street est of ~29 mln; 17 mln iPads sold in Q3 vs Street est of approximately 16 million, 4.0 mln Macs sold in Q3 vs Street est of approximately 4.5 mln. Gross margin was 42.8% vs Street est of 43.8% and 41.5% guidance, compared to 41.7 percent in the year-ago quarter. International sales accounted for 62 percent of the quarter's revenue. "We've also just updated the entire MacBook line, will release Mountain Lion tomorrow and will be launching iOS 6 this Fall. We are also really looking forward to the amazing new products we've got in the pipeline." Apple's Board of Directors has declared a cash dividend of $2.65 per share of the Company's common stock. The dividend is payable on August 16, 2012, to stockholders of record as of the close of business on August 13, 2012.

Riverbed Technology (RVBD $16.60 +4.10) Reports Q2 (Jun) earnings of $0.23 per share, excluding non-recurring items, $0.02 better than the Capital IQ Consensus Estimate of $0.21; revenues rose 16.5% year/year to $198.5 mln vs the $194.3 mln consensus.

Juniper Networks (JNPR $16.29 +1.47) reported second quarter earnings of $0.19 per share, $0.03 better than the Capital IQ consensus of $0.16, while revenues fell 4.1% year/year to $1.07 billion versus the $1.05 billion consensus. The company says "...While the long-term fundamentals driving demand for high-performance networking remain solid, our outlook for the September quarter reflects continued near-term macro uncertainty. While our new products are resonating with our customers, many customers continue to be cautious about their investment prioritization and timing around project deployments. We remain focused on prudently managing our business to ensure disciplined operational execution..." Juniper estimates that its non-GAAP gross margin for the third quarter will be roughly flat, at the high end of the revenue range. Juniper expects its non-GAAP operating margin for the third quarter will be in the range of 13% to 14%. Co issues downside guidance for Q3, sees EPS of $0.17-0.20, excluding $0.02 due to net interest expense from debt, vs. $0.21 consensus and revenues of 1.04-1.075 billion versus the $1.11 billion consensus.

Broadcom (BRCM $33.37 +2.60) reported second quarter earnings of $0.72 per share, excluding non-recurring items, $0.05 better than the Capital IQ consensus of $0.67, while revenues rose 9.7% year/year to $1.97 billion versus the $1.95 billion consensus.

RF Micro Device (RFMD $3.85 -0.43) reported first quarter earnings of $0.01 per share, in-line with the Capital IQ consensus of $0.01, while revenues fell 5.4% year/year to $202.7 million versus the $201.93 mln consensus. The company issued downside guidance for the second quarter with EPS of $0.00-0.01 versus the $0.05 consensus and revenues of "flat to down 5% sequentially" (roughly $192.6-202.7 million ) versus the $222.42 million consensus.

09:16 am Cymer downgraded to Hold at Stifel Nicolaus: . Stifel Nicolaus downgrades CYMI to Hold from Buy following earnings and based on near term valuation reasons. Firm notes the company generally met consensus expectations and its outlook also reflected current industry trends (some softness in September and a likely pickup in December). Their downgrade is driven by the near term limited upside they see with the stock at current prices, particularly given the uncertainty in the marketplace as well as the volatility in the group.

09:27 am Netflix shares plunge nearly 20% following disappointing guidance
Netflix (NFLX $64.29 -16.10) reported second quarter earnings of $0.11 per share, $0.06 better than the Capital IQ consensus of $0.05, while revenues rose 12.8% year/year to $889 million versus the $889.02 million consensus. The company issued in-line guidance for the third quarter with EPS of -0.10-0.14 versus the $0.09 consensus and revenues of $890-911 million versus the $910.12 million Capital IQ Consensus Estimate.

09:23 am Riverbed shares soar over 25% following better than expected earnings
Riverbed Technology (RVBD $18.30 +3.75) reported second quarter earnings of $0.23 per share, excluding non-recurring items, $0.02 better than the Capital IQ consensus of $0.21, while revenues rose 16.5% year/year to $198.5 million versus the $194.3 million consensus.

09:21 am Apple shares fall 4% following miss on earnings; several key metrics disappoint
Apple (AAPL $572.99 -28.07) reported third quarter earnings of $9.32 per share, $1.06 worse than the Capital IQ consensus of $10.38, while revenues rose 22.6% year/year to $35.02 billion versus the $37.35 bln consensus. The company issued downside guidance for Q4, sees EPS of ~$7.65 versus the $10.23 consensus and revenues of approximately $34 billion versus the $37.94 bln consensus. The company typically guides conservatively but this looks particularly low. Co reports 26 mln iPhones sold in Q3 vs Street est of ~29 mln; 17 mln iPads sold in Q3 vs Street est of approximately 16 million, 4.0 mln Macs sold in Q3 vs Street est of approximately 4.5 mln. Gross margin was 42.8% vs Street est of 43.8% and 41.5% guidance, compared to 41.7 percent in the year-ago quarter. International sales accounted for 62 percent of the quarter's revenue. "We've also just updated the entire MacBook line, will release Mountain Lion tomorrow and will be launching iOS 6 this Fall. We are also really looking forward to the amazing new products we've got in the pipeline." Apple's Board of Directors has declared a cash dividend of $2.65 per share of the Company's common stock. The dividend is payable on August 16, 2012, to stockholders of record as of the close of business on August 13, 2012.
icon url

ReturntoSender

07/26/12 7:40 PM

#9846 RE: ReturntoSender #6755

From Briefing.com: 4:15 pm : After four consecutive losing sessions, U.S. indices and their European counterparts ended the day firmly in the black.


European trading was uneventful during the early part of the session. However, markets took off immediately after comments from European Central Bank President Mario Draghi. The central bank's president said officials are "ready to do whatever it takes to preserve the euro." Following the statement, risk assets spiked and never looked back. Spain's IBEX closed 6% higher, and Italy's MIB posted a 5.6% gain. Furthermore, France's CAC and German DAX also rose by 4% and 2.8% respectively.

Spain's 10-yr yield declined 44 basis points to 6.93% while the yield on Italy's 10-yr debt fell 39 basis points to 6.06%.

The risk rally contributed to a higher open in U.S. equities which sustained the opening levels throughout the day. The three main indices closed near session highs.

The energy sector led the charge as the SPDR Energy Select Sector ETF (XLE 69.00, +1.91) advanced nearly 3% while the materials and retail sectors lagged the broader market gains.

Major financials were one of the main beneficiaries of today's market advance. The SPDR Financial Select Sector ETF (XLF 14.49, +0.22) was up over 1.5%. American Express (AXP 57.76, +1.71) was higher by 3% while Citigroup (C 26.28, +0.49), and Bank of America (BAC 7.17, +0.10) advanced 2% and 1.4% respectively.

Communication solutions provider MetroPCS (PCS 8.59, +2.31) surged 37%. The advance came on the heels of a positive second quarter earnings report. In addition, the company expects to launch 4G service before quarter's end. Sprint Nextel (S 4.05, +0.68) also posted a considerable gain, climbing 20%. The firm's earnings beat expectations on increased iPhone sales.

Zynga (ZNGA 3.18, -1.90) was one of the weakest performers following a second quarter loss and slowing revenue growth. Its shares fell almost 40%. The significant weakness spilled over to Facebook (FB 26.85, -2.50) which receives 11% of its revenues from the company. Facebook was down more than 6% ahead of its after-hours earnings release.

Crude oil spent its entire floor session in positive territory, touching a session high of $90.47 per barrel. It gave up some of its gains as the day progressed, and settled with a 0.4% gain at $89.40.

Today's rally adversely impacted the dollar index which fell to near-term support at 82.67 before rebounding to 82.85. The British pound was the strongest performer against the dollar, up over 1.2% at 1.5685. The euro also rallied against the greenback, posting a 1.1% advance to 1.2285.

The latest weekly initial jobless claims count totaled 353,000, which is better than the 381,000 that had been expected, on average, among economists polled by Briefing.com. The latest tally is also down from the upwardly revised prior week count of 388,000. As for continuing claims, they fell to about 3.287 million from 3.300 million.

Roughly 115 companies are set to report their results after-hours. Some notable names include: Amazon (AMZN 220.01, +2.96), Coinstar (CSTR 59.22, -0.05), Facebook (FB 26.85, -2.50), and Starbucks (SBUX 52.41, +2.00).

The busy earnings schedule continues before Friday's open with names like AON (AON 46.48, +0.34), Chevron (CVX 108.27, +2.21), and Merck (MRK 43.33, +0.71) set to report.

Friday's economic data includes second quarter GDP at 8:30 AM ET and University of Michigan Consumer Sentiment at 9:55 AM ET.DJ30 +211.88 NASDAQ +39.01 SP500 +22.13 NASDAQ Adv/Vol/Dec 1615/1.88 bln/852 NYSE Adv/Vol/Dec 2247/898.1 mln/823

3:30 pm : Crude oil spent its entire floor session in positive territory, touching a session high of $90.47 per barrel moments after pit trade opened. It gave up some of its gains as the day progressed and settled with a 0.4% gain at $89.40 per barrel.

Natural gas popped to a pit session high of $3.13 per MMBtu following better-than-expected inventory data that showed a build of 26 bcf when a build of 30 bcf was anticipated. Moments later, it slid into the red to a session low of $3.02 per MMBtu. However, buyers stepped in and pushed prices back up such that natural gas settled with a 1.0% gain at $3.10 per MMBtu.

Gold extended yesterday's gains following a slide by the dollar on renewed hopes of monetary easing after ECB President Mario Draghi stated that "sharing national sovereignty on EU level to come" and that the ECB is "ready to do whatever it takes to preserve the euro." The yellow metal climbed to a pit session high of $1620.00 per ounce and despite briefly dipping into negative territory, it managed to settle 0.5% higher at $1615.00 per ounce. Silver, on the other hand, lost steam after brushing a floor session high of $27.72 per ounce and fell into the red as it headed into afternoon pit action. It eventually settled for a 0.1% loss at $27.44 per ounce. DJ30 +202.94 NASDAQ +36.68 SP500 +20.77 NASDAQ Adv/Vol/Dec 1580/1536.5/893 NYSE Adv/Vol/Dec 2173/617 mln/858

4:56PM Microsemi beats by $0.02, reports revs in-line; guides Q4 EPS in-line, revs in-line (MSCC) 18.22 +0.70 : Reports Q3 (Jun) earnings of $0.55 per share, $0.02 better than the Capital IQ Consensus Estimate of $0.53; revenues rose 19.6% year/year to $259.2 mln vs the $258.8 mln consensus. Co issues in-line guidance for Q4, sees EPS of $0.57-0.60 vs. $0.57 Capital IQ Consensus Estimate; sees Q4 revs of $262-268 mln vs. $264.79 mln Capital IQ Consensus Estimate.

4:32PM Ingram Micro beats by $0.01, beats on revs; guides Q3 revs below consensus (IM) 15.43 +0.02 : Reports Q2 (Jun) earnings of $0.39 per share, excluding $0.01 in non-recurring items, $0.01 better than the Capital IQ Consensus Estimate of $0.38; revenues rose 0.3% year/year to $8.78 bln vs the $8.66 bln consensus. Co issues downside guidance for Q3, sees Q3 revs of $8.78 bln vs. $8.97 bln Capital IQ Consensus Estimate, with gross margins to remain under pressure. The company will also incur incremental interest costs of ~$2 million in the third quarter associated with the bridge financing facility entered into at the time of the BrightPoint acquisition announcement.

4:18PM Maxim Integrated increases quarterly dividend by 9% to $0.24 per share from $0.22 per share (MXIM) 25.99 +0.47 :

4:17PM KLA-Tencor beats by $0.18, beats on revs (KLAC) 49.66 +0.72 : Reports Q4 (Jun) earnings of $1.49 per share, excluding non-recurring items, $0.18 better than the Capital IQ Consensus Estimate of $1.31; revenues were unchanged from the year-ago period at $892.5 mln.

4:17PM QLogic misses by $0.01, reports revs in-line (QLGC) 12.60 +0.44 : Reports Q1 (Jun) earnings of $0.26 per share, excluding non-recurring items, $0.01 worse than the Capital IQ Consensus Estimate of $0.27; revenues fell 9.8% year/year to $130.4 mln vs the $131.1 mln consensus.

4:09PM Nanometrics beats by $0.07, beats on revs; guides Q3 EPS below consensus, revs below consensus (NANO) 14.32 +0.08 : Reports Q2 (Jun) earnings of $0.13 per share, $0.07 better than the Capital IQ Consensus Estimate of $0.06; revenues fell 17.4% year/year to $53.2 mln vs the $51.92 mln consensus. Co issues downside guidance for Q3, sees EPS of ($0.07)-$0.02 vs. $0.06 Capital IQ Consensus Estimate; sees Q3 revs of $40-45 mln vs. $49.84 mln Capital IQ Consensus Estimate. For Q3 management expects non-GAAP gross margin in the range of 46% to 49%, and operating expenses to increase between $0.4 million and $0.7 million from the second quarter.

4:05PM Ixia beats by $0.02, beats on revs (XXIA) : Reports Q2 (Jun) earnings of $0.18 per share, excluding non-recurring items, $0.02 better than the Capital IQ Consensus Estimate of $0.16; revenues rose 33.8% year/year to $92.3 mln vs the $88.87 mln consensus.

4:02PM Veeco Instruments misses by $0.01, beats on revs; guides Q3 EPS in-line, revs in-line; guides FY12 revs in-line (VECO) 33.74 +2.98 : Reports Q2 (Jun) earnings of $0.37 per share, excluding non-recurring items, $0.01 worse than the Capital IQ Consensus Estimate of $0.38; revenues fell 48.4% year/year to $136.6 mln vs the $134.0 mln consensus. Co issues in-line guidance for Q3, sees EPS of $0.22-0.38 vs. $0.34 Capital IQ Consensus Estimate; sees Q3 revs of $120-140 mln vs. $133.9 mln Capital IQ Consensus Estimate. Co issues in-line guidance for FY12, sees FY12 revs of $520-560 mln vs. $546.1 mln Capital IQ Consensus Estimate

4:01PM Coherent beats by $0.09, beats on revs (COHR) 44.85 +1.25 : Reports Q3 (Jun) earnings of $0.83 per share, excluding non-recurring items, $0.09 better than the Capital IQ Consensus Estimate of $0.74; revenues fell 6.9% year/year to $196.4 mln vs the $194.14 mln consensus.

1:22PM Cohu correction: Beat by $0.01; beat on revs; guided Q3 rev below consensus (COHU) 8.78 +0.06 : Las night we compared GAAP EPS to non-GAAP estimates. The previous comment has been removed and should have read as follows.

Reports Q2 (Jun) non-GAAP loss of $0.01 per share, $0.01 better than the Capital IQ two estimate average of ($0.02); revenues fell 26.6% year/year to $59.4 mln vs the $58.5 mln est. Co sees Q3 rev of ~$60 mln vs. the $65.4 mln two est avg. Orders were $69.8 mln for Q2 and $53.0 million for Q1. Orders for semi equipment were $59.5 million in Q2 compared to $41.4 million in Q1. Total consolidated backlog was $62.0 mln at June 30, 2012 compared to $51.6 million at March 31, 2012.

7:24AM Benchmark Elec beats by $0.04, beats on revs; guides Q3 EPS in-line, revs in-line (BHE) 13.89 : Reports Q2 (Jun) earnings of $0.32 per share, excluding non-recurring items, $0.04 better than the Capital IQ Consensus Estimate of $0.28; revenues rose 7.5% year/year to $630 mln vs the $607.35 mln consensus. Co issues in-line guidance for Q3, sees EPS of $0.27-0.32, excluding non-recurring items, vs. $0.30 Capital IQ Consensus Estimate; sees Q3 revs of $595-625 mln vs. $620.15 mln Capital IQ Consensus Estimate. "We are very pleased with the solid execution of our team for the second quarter in a weakening environment. Notably, our revenue and margin improvements were achieved while supporting numerous program ramps from previous quarters' bookings as well as the ongoing Thailand recovery efforts. Looking forward, the second quarter business development efforts provided strong bookings which is meaningful as these upcoming program launches together with the programs recently introduced will drive positive momentum in the face of a challenging macro environment."

Rambus (RMBS) announced that the ITC has issued its notice of final determination in the action brought by Rambus against LSI Logic, ST Microelectronics and other Respondents. ITC affirmed the initial determination of Administrative Law Judge Theodore R. Essex that there was no violation of Section 337 of the Tariff Act of 1930 with respect to the asserted patents

6:19AM Cabot Micro beats by $0.01, beats on revs (CCMP) 29.49 : Reports Q3 (Jun) earnings of $0.55 per share, $0.01 better than the Capital IQ Consensus Estimate of $0.54; revenues rose 3.5% year/year to $115.7 mln vs the $113.32 mln consensus.

TriQuint Semi (TQNT $5.30 +0.37) reported second loss of $0.09 per share, $0.03 better than the consensus of ($0.12), while revenues fell 22.2% year/year to $178 million versus the $177.59 million consensus. The company issued mixed guidance for the third quarter with EPS of $0.00, excluding non-recurring items, versus the $0.00 consensus Estimate, with revenues of $195-205 million versus the $205.28 million Capital IQ Consensus Estimate.

Citrix Systems (CTXS $72.58 -2.48) reported second quarter earnings of $0.71 per share, excluding non-recurring items, $0.12 better than the Capital IQ consensus of $0.59, while revenues rose 15.9% year/year to $615.2 million versus the $612.68 mln consensus. The company issues mixed guidance for the third quarter with EPS of $0.64-0.66, excluding non-recurring items, versus the $0.71 consensus and revenues of $645-655 million versus the $645.42 million consensus. The company issued upside guidance for fiscal year 2012 with EPS of $2.78-2.81, excluding non-recurring items, versus the $2.77 consensus and revenues of $2.56-2.58 billion versus the $2.55 billion consensus. Fiscal year 2012 guidance is slightly raised from mgmt's ests from the prior qtr.

Akamai Tech (AKAM $33.26 +5.05) reported second quarter earnings of $0.43 per share, excluding non-recurring items, $0.06 better than the Capital IQ consensus of $0.37, while revenues rose 19.6% year/year to $331.3 million versus the $326.48 million consensus. "Akamai's very strong second quarter results were driven on the top line by increased adoption of our cloud infrastructure solutions as well as continued growth of content delivery solutions," said Paul Sagan, President and CEO of Akamai. "Our bottom line performance was the result of significant benefits we have begun to realize from improvements we are making to scale our network operations."

Western Digital (WDC $38.64 +6.17) reported fourth quarter GAAP earnings of $2.87 per share, $0.39 better than the Capital IQ Consensus of $2.48, while revenues rose 97.8% year/year to $4.75 billion versus the $4.25 bln consensus. "In the June quarter, demand was in line with our forecast as industry shipments reached 157 million units, bringing total HDD shipments for the year to 599 million units. Our WD and HGST subsidiaries both performed ahead of plan in Q4, delivering great products with consistent execution, resulting in strong revenue growth, gross margin and cash flows."

Zynga (ZNGA $3.05 -2.03) reported second quarter earnings of $0.01 per share, $0.04 worse than the Capital IQ Consensus of $0.05, while revenues rose 19.1% year/year to $332.5 million versus the $338.63 million consensus. The company issues downside guidance for fiscal year 2012 with EPS of $0.04-0.09 versus the $0.26 consensus. Bookings are projected to be in the range of $1.15-$1.225 billion. The company states, "We are lowering our outlook to reflect delays in launching new games, a faster decline in existing web games due in part to a more challenging environment on the Facebook web platform, and reduced expectations for Draw Something." Bookings increased by 10% year/year to $302 million. Daily Active Users (DAUs) grew by 23% to 72 million from 59 million a year ago. Monthly Active Users (MAUs) were up 34% year/year to 306 million. Average Daily Bookings per User (ABPU) dropped to $0.046 from $0.051 a year ago.
icon url

ReturntoSender

07/29/12 11:45 AM

#9848 RE: ReturntoSender #6755

InvestmentHouse Weekend Market Summary:

http://www.investmenthouse.com/weekendmarketsummary.htm

- SP500, Dow break to new rally highs as 'anticipation' rally throttles up.
- Investors ignoring fading economic data in favor of stimulus.
- Weak Q2 GDP initial read beats expectations, revisions show the recession was not as bad but the recovery under Obama is even worse than thought.
- No reason not to rally further, but is market banking on a QE announcement this week or is it just factoring in that QE is coming for certain?

Market anticipates stimulus, but unlike the 1970's ketchup commercial, it is not waiting.

A second day of strong upside moves across the market saw the NYSE large cap indices break to new rally highs. Financials and energy moved, and indeed most sectors advanced as NYSE breadth posted a solid 5:1 read. The stimulus anticipation move, reinvigorated by the ECB's Draghi on Thursday, surged full bore Friday, unworried by the weak US GDP reading and Germany's late and rather weak 'nein' to bond purchases.

While Europe has in the past told Treasury Secretary Geithner to mind his own business when it came to resolving the debt crisis (see September 2011), it appears that Europe is now willing to go ahead and buy those bonds as Germany's protest thus far is, as noted, tepid. It would appear that, as is usually the case, necessity is the mother of capitulation.

Let me make our position perfectly clear. The distinctions are dramatic. You see, the US Fed bought US bonds. We don't like that. We plan to buy EUROPEAN bonds.
Much different. - - Mario Draghi, ECB chief.

The indices continued the Thursday rally. As noted Wednesday night, SP500 was in position to move higher and the ECB tossed up the softball. Friday the market, now with the promise of Fed action either next week or in September AND the ECB head talking cocksure that he has what it takes and will do what it takes. A two-fer that sprung the fourth upside leg of the rally and helped keep it rolling into the weekend.

SP500 +1.91%; NASDAQ +2.24%; DJ30 1.46%; SP600 2.28%; SOX 2.31%

SP500 and DJ30 broke to new rally highs, surpassing the early July peak and putting SP500 just 36 points and DJ30 263 points away from a post-bear market high marked by the May 2012 peaks. At the current pace, that would take less than two days to hit. NASDAQ and SP600, well, they are still quite a way off the recent highs, but they are dutifully following, and unlike Thursday, the small caps participated in the move and provided a nice rounding out of breadth.

OTHER MARKETS.

The other markets continued the move from Thursday that was incongruous to the news out of Europe in some respects.

Dollar. 1.2317 versus 1.2283 euro. The dollar fell in its second down day. You would think the euro would fall if Europe will put forth stimulus. But with the US also saying it will provide Quantitative Easing, the notion is that the US is already stumbling along, so maybe this will bring Europe back and strengthen the euro. So the dollar was down and the euro was up. They are both still in their trends, however: The dollar trending higher and the euro trending lower.

Bonds. 1.55% versus 1.43% 10 year US Treasury. Bonds struggled. Pretty much a beating about the head and shoulders. That is a tremendous decline. Why? If Europe will get better magically, then the US Treasury will not be needed as much as a safe haven. Therefore there has been some unloading of bonds over the past couple of sessions, particularly on Friday. Note that after breaking above the late-May/early-June high, bonds immediately reversed and sold down. No follow-through to the upside. That is always something to watch for: On a break higher or a break lower, is there follow-through to the upside? Here that is not the case. More than that, there was a gap to the downside and a stiff tumble lower.

Gold. 1,622.70, +2.90. Gold was not surging but it did okay. It was up higher afterhours, and it put in a good move on the week. We got the 1-2 punch, right? We had the Fed saying it will give some kind of stimulus, and then on Thursday the ECB said it would do whatever it takes. Gold is sensing inflation and possibly sensing the fear that some central banks are telegraphing to us given their statements about what action they will take. There is the worry of inflation and a little fear that is pumping up the price. Not huge moves, but a good break higher.

Why aren't there huge moves with gold? This has a look of LIBOR to it. A lot has happened in June and July. A lot happened before that as well, yet gold has been going nowhere. This smacks of manipulation. And I believe the next manipulation story to hit, for lack of a better phrase, will involve gold. The manipulation is to the downside because it should be racing ahead on worries of inflation given what the ECB and the US Fed are saying in public. They are committing themselves in public to these actions.

Oil. 90.13, +0.74. Oil posted another gain. It pulled back from the prior week and then bounced Wednesday, Thursday, and Friday. Nothing major, but it was bouncing higher once more. After all, if Europe will do whatever it takes to make things right, oil will obviously be worth more because of the booming European economy to come, right? Yeah, right. It is an inflation play. That is why it was bouncing.

TECHNICAL SUMMARY

Internals.

Volume. NASDAQ +8%, 2.06B; NYSE -1%, 824M. NYSE was down from a decent volume gain on Thursday. It was kind of down within still stronger overall reads to end the week.

Breadth. NASDAQ +3.3:1; NYSE +5:1. Breadth was stronger. The NYSE was helped out by those small and mid caps that did not participate on Wednesday.

THE CHARTS

SP500. SP500 broke above the June and July peaks and cleared to a new higher high on the rally off of the June lows. The inverted head and shoulders, the breakout, and then three tests have resulted in three higher highs. That is very solid action. A good technical move as the market continues up towards those peaks. That would put SP500 at 1422.38. That is the post bear market high it hit in April that the SP500 will be shooting for. Our target on this move has been 1415 or so. Not far away at all, but anywhere in this range up to that high is a logical point for the index to hit. I will talk later about just what the market is factoring in and what it believes the situation to be. That may have an impact on how far this move can actually run.

DJ30. DJ30 showed similar action, clearing those June and July peaks. It was just about 260 points away from its triple highs that span March into May of this year. It is in great shape to continue to the upside and challenge those levels, similar to SP500.

NASDAQ. NASDAQ has yet to clear the June high. It has yet to clear the July peak. It was unable to put in a higher high on the last move, and that was a change of character of the entire recovery. It put in question its ability to move. It is a growth index; techs are growth. If growth is not that great, then there is lag. We see NASDAQ lagging, and the next important move for it to make is above 2988. That is the early-July peak. If it gets over there, it can run to up to 3000 and bump the bottom of the gap. But if it moves up over that other level, then it should go up and fill the gap at 3025. There is still room to move for NASDAQ as well.

SP600. SP600 posted a very solid gain, but it is also much lower than the other indices. It is still below the early-July high, still below the June high, but it is bouncing. Something of an ABCD pattern, and it is rallying. Remember that an ABCD pattern puts the target at the prior peak around 455. That is another nine points away. SP600 is moving. It has lagged simply because the economic data has been so poor. There is no question why it would have lagged. If the economic data is not here in the US, small caps just do not perform as well. How they act at the high coming up at 455 will tell us a lot about just what the economy will do. Thus far, the small caps have not broken down at all. In fact they are basing, and they were moving along with the rest of the market. But they started to lag on this last go round because they broke to a lower low. A lower high and a lower low. These areas between the July and June peak will be critical on the continued coming move.

SOX. SOX had a good later part of the week, particularly on Wednesday and Friday. It is very close to important resistance at 390-391. Two tops at that level, a consolidation in May, and another consolidation in January. Very important. If we go way back in time, this has held at other times in the past. It is approaching a serious level. That move and the test along with the test that the small caps make at 455 will tell us quite a bit about what the expectations are for the economy and how those two indices react to that nearer resistance. If there is a reversal, then the large cap indices will probably follow them down as well, capping this rally.

We are coming to loggerheads. There are the indices that have been basing and are moving up. As we can see, SP500 broke to a higher high. We have the economic data that continues lower. We have no real stimulus coming for the economy other than the Fed's liquidity. That has a short term and positive impact on financial instruments (stocks, etc.), but it becomes of shorter duration in terms of the impact the more times they go to that well. The Fed does not want to go to that well, but it feels it needs to do something before the election. It cannot wait much longer without looking political. Although any move now is somewhat political no matter what the Fed does. That is why Bernanke is saying, "Darn, what will I do now?"

We have the markets coming up. If the Fed provides liquidity, they can continue. If the Fed does not, then they may stumble near term, but they know they will get it. The question is: If the economic data falls off the table, even as asset prices try to rise, how long will they be able to rise before they are dragged lower by economic data tumbling into recession levels?

LEADERSHIP

Big Names. The big names had a good day. Some of them did not participate at all on Thursday, but they were in the game on Friday. AAPL moved higher. It was helped by AMZN with the ...super earnings? No. They were not super, but AMZN does not care. It said it will do what they always do, and that always results in them making a ton of money. They said they have done it before and will do it again. The earnings may not be that great, but AMZN is so cocksure about what they are doing, people think that they better buy into them now. That is exactly what they did. PCLN exploded higher, up 9%. It was a mere $55 move on the day. Big names were participating in a big away, and that helped push the indices higher.

Retail. Some of the retailers such as AMZN are doing quite well. EBAY came back after some issues heading into its earnings. It posted those great earnings, and it tested and started to ramp higher once again on rising volume. Not bad. RL was showing signs of activity in the week. It did bounce. It had a flat day on Friday, but if you look at some others that are posting earnings next week, you can see some solid results coming out, or at least the moves in anticipation of solid results.

COH was moving back above the 50 day EMA. It is coming off of its own little selloff and inverted head and shoulders. There is your breakout. COST is performing very well, continuing its upside move and breaking to a new rally high on Friday. Retail continues to do well. The savings rate was up, so perhaps there is a view that at least consumers will have money to spend even though they do not have jobs. This is one of the strange dichotomies in this market. People are saying, "The savings rate is up, so people are saving! Yeehaw!" But let's face it: A lot of people do not have jobs. Those who are making money may be saving more of it, but it is a small percentage. That will not help the consumption side of the economy that much.

Energy. Energy stocks are enjoying a nice renaissance of sorts, moving higher. CVX posted good earnings last week and is moving to a new rally high. XOM reported confusing earnings, but it continued to move to the upside. Go figure. PTEN had a nice break to the upside and then advanced that move on Friday. There is good movement in the energy sector as well.

Materials. Some of the building materials are moving great. We have a play on CX, and it broke to a new rally high on Friday. It looks as if even LPX, after its stint at the 50 day EMA, might be back in the game as it posted a nice 4+% move off of the 50 day EMA.

Industrials. Earlier in the week I was down on the industrials because they moved but did not look that great. But CAT put in a nice move on Friday, and it is trying to base out. No doubt it is trying to put in a rounded bottom. MACD is making higher lows as the stock put in a lower low. It could make a break. It has room to run up to around 95. That is not a huge move, but as I like to say in the office, that makes it damn interesting in terms of a play. TEX just decided to take off to the upside. Some of the industrials are coming back to life. Staying power is a worry. You do not want to let these stocks get too far away from you. You cannot jump into them at this point until we see what will happen with the resistance, what kind of pullback we get, and what kind of entry that gives us as well.

Financials. It did not hurt that the financials were performing on Friday. JPM jumped through the 200 day EMA. BAC wasn't flying. It made it back to the 200 day EMA and, after its selloff, that did not hurt. WFC was up, matching last week's highs and trying to make a new break. TCBI blasted off to a new rally high after a week of testing at the 50 day EMA.

Summary. As noted, a broad range of stocks from a broad range of sectors contributed to the market move on Friday. This was after a very narrow move on Thursday. We are getting must more participation. With both the Fed and the ECB saying they will do whatever it takes, investors were much freer with their money, and they put it to work. Very interesting. We will have to see how this plays out ahead, and just try to get into the mind of the aggregate of investors and what they think will happen over the next couple of weeks.

THE ECONOMY

TO VIEW THE ECONOMY VIDEO CLICK THE FOLLOWING LINK:
Economy Summary Video

GDP revisions show the recession was not as bad as thought. SO WHY IS THE RECOVERY SO SLOW? You know why.

You would think that a beat on the GDP expectations would be celebrated. I suppose it was, but it was more akin to when initial reports from a wreck count 25 people injured but it turns out to only be 22. Not much solace.

And thus the 1.5% read versus the 1.4% (or 1.2%) expected, depending upon who you poll, was better but did not win over many hearts and minds.

The internals didn't provide much solace either, and as revisions are going to reflect the growing awareness that the economy is slowing faster.

Consumer spending: 1.5% versus 2.4% Q1. That added 1.05% to GDP versus adding 1.72% in Q1. It was still the biggest addition to the report but it is slowing as well. With median family incomes 6% less now than in 2000 (per the New York Times) spending would be lower anyway. Add onto that the excess debt and frozen consumer credit market and it is not surprising consumer spending is weakening further.

Business investment fell for the third straight quarter. Fixed investment 0.76 versus 1.18. All investment categories fell except for equipment and software (0.51 versus 0.39) and inventories (0.32 versus -0.39). The latter is not a good indication as new orders continue to fall, telling you that inventories are rising for a lack of sales.

Output gap. This is the measure of the difference between Real GDP (inflation-adjusted) and Potential GDP (where we should be based upon the population, etc.). The gap is 5.41% of GDP, the highest in three quarters and is at a level that, surprise, shows up in recessions.

The Revisions.

But we find out that things are, or at least were, better than our jobs, bank accounts, savings, and debts tell us. The government revised GDP figures back to 2009 and in that revision the Obama administration finally got a couple of quarters of GDP higher than a 3-handle. Back in Q4 2009 and Q4 2011 GDP hit a post-recession high of 4.1%. No coincidence those are the quarters of investment to take advantage of tax breaks for expensing equipment purchases. That 4.1% in 2011 was just a respite, an island in a sharp decline. Even the revisions have not helped much in terms of elevating the view of the 'recovery.'

Indeed the revisions show us just how dramatic the decline has been. FIRST, the recession was not as bad as the Obama administration has whined about. Not at all. SECOND, the 2.6% drop from Q4 2011 to present is the fastest decline since 2008 when the economy was in freefall. That is NOT good news for the rest of the summer and fall. Moreover, during the 'recovery' from mid-2009 up to 2012 GDP grew by 5.8% versus the 6.2% previously reported. This was already the weakest recovery since the Great Depression and now it has been shown to be even weaker. Indeed, median GDP in all post-war recoveries is 15.1% higher at this point in the recovery versus what it was when the recession began. The Obama recovery? Just 1.7 lousy percent.

What do you take from this? There is NO REASON this recovery should be this slow. It was not nearly as deep as thought. The problem is the POLICIES used to try and fix the problem as well as the blatant big government, central control agenda pushed via the 'affordable' healthcare act and executive orders. Massive government spending, massive regulation, massive new programs creating higher taxes, uncertainty, and thousands of new 'laws' business and individuals must follow. You have to laugh and simultaneously wince in pain when you hear President Obama just this week tell crowds how 'his way' has 'worked.'

How? Worked to produce the slowest post-GD recovery from what was not nearly as bad a recession as thought? If the republican nominee and his staff had any brains (and that is open to debate) they could take this data, this latest comment, add it to the 'you didn't build it' and 'the private sector is just fine' statements and run all the way to the White House.

My first commercial would juxtapose an entrepreneur who built a successful business, a true 'he built that' story, but who is now struggling under regulation and the recession, forced to lay off workers and on the verge of collapse against the GDP numbers showing the slowest recovery in modern history and saying to the President 'He built that, YOU built this.'

My second commercial would show the recession to prosperity recovery figures from two of the most popular and successful Presidents of our time, Ronald Reagan and Bill Clinton. It asks what policies they used to get there: both cut taxes, reduced government, and reformed and reduced regulation. It would then show Obama saying 'we tried it their way and it didn't work. Our way is working.' At the same time it would detail the increase in government size, the increase in spending, the increase in debt, the increase in regulation, and the increase in taxes the administration wants. The result: 1.7%, the lowest GDP recovery in history. 42 consecutive months of a record 8+% unemployment. 23 million people STILL unemployed. 200,000 small businesses lost from 2008 to 2010. It then asks the question: Whose way works Mr. President?

THE MARKET

SENTIMENT INDICATORS

VIX: 16.7; -0.83
VXN: 18.58; -1.53
VXO: 16.35; -0.3

Put/Call Ratio (CBOE): 0.89; -0.09

Bulls versus Bears

This is a reading of the number of bullish investment advisors versus bearish advisors. The reason you look at this is that it gives you an idea of how bullish investors are. If they are too bullish then everyone is in the market and it is heading for a top: if everyone wants to be in the market, then all the money is in and there is no more new cash to drive it higher. On the other side of the spectrum if there are a lot of bears then there is a lot of cash on the sideline, and as the market rallies it drags that cash in as the bears give in. That cash provides the market the fuel to move higher. If bears are low it is the same as a lot of bulls: everyone is in and the market does not have the cash to drive it higher.

Bulls: 40.4% versus 43.6% and 44.7%. Continuing the fade after the run upside from early June. That volatility did indeed suggest bulls were fading, and as the case often is, just as the market turned they are turning bearish. Undercut 35%, the threshold for bullishness, in early June. You would expect it to rise and it has. Still not at a dangerous level, just working as it should. As noted, hit 34% in early June. It did its job and the market is on the rally. Hard drop to 34 from 39.3% as economic reality and a choppy stock market hit. Off the 55+ level hit in late February. That was the highest level since April and May of 2011, the peak of the post-bear market high. 35% is the threshold level suggesting bullishness. To be seriously bearish it needs to get up to the 60% to 65% level.

Bears: 26.6% versus 24.5% for three weeks and 24.7% before that. Never got close to the 35% level on the last run higher and likely won't get there anytime soon as the market rallies further upside on this leg. Over 35% is the threshold to be really be a good upside indicator. For reference, bearishness hit a 5 year high at 54.4% the last week of October 2008. The move over 50 took bearish sentiment to its highest level since 1995. Extreme negative sentiment. Prior levels for comparison: Bearishness peaked at 37.4% in September 2007. It topped the June 2006 peak (36%) on that run. That June peak eclipsed the March 2006 high (33%) and well above the 2005 highs that spawned new rallies (30% in May 2005, 29.2% in October 2005). That was a huge turn, unlike any seen in recent history.

NASDAQ

Stats: +64.84 points (+2.24%) to close at 2958.09
Volume: 2.065B (+7.95%)

Up Volume: 1.59B (+210M)
Down Volume: 479.36M (-129.09M)

A/D and Hi/Lo: Advancers led 3.3 to 1
Previous Session: Advancers led 2.01 to 1

New Highs: 92 (+49)
New Lows: 57 (-31)

SP500/NYSE

Stats: +25.95 points (+1.91%) to close at 1385.97
NYSE Volume: 824M (-0.72%)

A/D and Hi/Lo: Advancers led 4.97 to 1
Previous Session: Advancers led 2.74 to 1

New Highs: 247 (+70)
New Lows: 29 (-31)

DJ30

Stats: +187.73 points (+1.46%) to close at 13075.66
Volume: 161M shares Friday versus 133M shares Thursday.

MONDAY

Next week is big in terms of economic data. Earnings will continue, so we will not have a slowdown there. Despite my misgiving about this week, although it did sell off early on earnings, the second week of earnings proved to be a barn burner. But it was not the earnings that did it. In spite of some disappointing earnings we saw, the markets rallied. Again, it was the one-two punch of the US Fed saying they will give us Quantitative Easing at some point and the ECB saying they will do whatever it takes. That is what really moved the market.

We will have a lot of important data starting on Tuesday. There is a little Personal Income, and that is always important. There is Case/Schiller; it is lagging but nonetheless important. Chicago PMI will be very important. Then we will come into Wednesday with the ISM. Will we turn in another negative month or will we be positive? This all leads up to the Nonfarm Payrolls on Friday. What will that be? How will that affect the presidential race? Blah, blah, blah. You know how it goes. Whether it is truth or fiction, we will see. I know things are getting worse. I am wondering how the administration will fix the problem. Before it was shrinking down the number of workers in the work pool so it makes it look like more people are working. Now the tack is to change the definition of work and what it takes to get welfare so people can claim to be working. That will boost the actual employment rate and lower the unemployment rate without anyone getting a job. How cool is that?

On Wednesday, August 1, we have a little thing called an FOMC rate decision. That is a date specified by the Fed as one in which it could act to initiate more Quantitative Easing. The slightly better than expected report on GDP, revised to 1.4 expected, put Bernanke in an even further quandary than he was already in.

That takes us to the Fed and what this market is really anticipating. What happens if the Fed does not initiate more Quantitative Easing on Wednesday? Will the market sell off because this rally has just been anticipation of the Fed doing that? It could. It has been a good run. The indices could move back up near the post bear market highs and stall and roll over. Maybe SP500 gets to 1400-1415 and runs outs of gas. Perhaps. Maybe it is a big deeper than that, however.

Maybe the market is already factoring in that Quantitative Easing will happen. The Fed says it will happen, so why not factor it in? Why not just build those asset prices higher just as if the Fed had already moved on Quantitative Easing? That is an intriguing thought. Looking at the power of today's rally and how it expanded to other areas versus the rather narrow Thursday move, I got to thinking about that. We were all discussing how strong the move was as we watched our positions run higher. We were pleased by this, and at the same time wondering. Maybe the market is already factoring in that Quantitative Easing is coming and they will go ahead and push those stock prices higher pre-announcement. That is an interesting concept. It also raises the question of whether they will sell on the news if there is Quantitative Easing announced on Wednesday. I do not think it will be announced on Wednesday, but that is an interesting aspect: run into the news and then sell off even though the market gets what wants to.

I posit that there will be more upside than just this move. I would suggest that, while there may be a temporary pullback if no Quantitative Easing is announced, the move will continue. I know this is a change from what I was looking at earlier, but the Fed has now come out and clearly said that it will perform some Quantitative Easing. That has always been good for financial assets because liquidity does not really go into the economy; it goes into financial instruments and they appreciate in value.

Bernanke said he wants to make people feel wealthier, but they are not feeling wealthier with the economy so bad. The one way to do it is to continue jacking up asset prices. That makes it pretty easy if that is the case, and we want to be playing that move. And we are. We were moving in and will continue to do. If we get some kind of pullback after the announcement (or lack of announcement), then we watch for the opportunity to buy into new positions.

What will we do in the interim? If we continue to get that run up to Wednesday, and if we do get a move up to 1415 or maybe even higher (although that puts it right at the prior peak), then we need to take some gain off of the table. Then if there is a disappointment and it comes back, we can buy into new positions as well. Then we are set very nicely for a continued move that will no doubt come because the market will continue to anticipate Quantitative Easing in the future. Therefore it can continue to rally on that promises of Quantitative Easing. Thus far this move is not strong enough or had not been big enough to account for all of the Quantitative Easing appreciation and assets.

That is how we have to take it at this point. A strong move. It is harder to move into new positions, of course, but it is not bad in terms of getting a pullback or picking up some positions on stocks that have not really surged yet. Then you ride them up into the next high, take some gain, and then let them come back, pick them up, and buy for the rally into the actual Quantitative Easing announcement in September.

Things could still roll over at 1400-1415. That is still a decent move. We will let our positions run. If we get entries and we think it is worthwhile to take some -- although we are already somewhat extended in two days -- we can pick them up. We will take what the market gives. Then we get a little pullback after some disappointment. It may be a little bit bigger pullback because all of these have been stout. Then we watch for the turn and pick them up again for the next run.

I will see you Monday for a jam-packed week. Have a great evening!

Support and resistance

NASDAQ: Closed at 2958.09
Resistance:
2962 is the April 2012 low
2988 is the July 2012 high
3000 is the February 2012 post-bear market high
3024 is the gap point from early May
3026 from 10/2000 low
3042 from 5/2000 low
3076 is the late April 2012 high
3090 is the mid-March interim high
3134 is the March 2012 post-bear market peak
3227 is the April 2000 intraday low
3401 is the May 2000 closing low

Support:
2950 is the mid-April closing low
2942 is the mid-June 2012 high
2910 is the March 2012 low
The 50 day EMA at 2903
2900 is the March 2012 low
2888 is the May 2011 peak and PRIOR post-bear market high
2879 is the July 2011 peak
2866 is the July 2012 closing low
2862 is the 2007 peak
2841 is the February 2011 peak
The 200 day SMA at 2833
2816 is the early April 2011 peak.
2810 is the low in the shoulders
2754 is the October 2011 high
2706 to 2705 is the April 2011 low and the February 2011 and consolidation low (bottom of the trading range) 2723 to 2705 is the range of support at the bottom of the January to May trading range
2686 is the January 2011 closing low
2676 is the January 2010 low and the December 2011 peak
2645-2650ish from December 2010 consolidation
2643 is the September 2011 high
2612 is the late August 2011 peak
2603 is the March 2011 intraday low (post-Japan low)
2599 is the June 2011 low and NASDAQ

S&P 500: Closed at 1385.97

Resistance:
1406 is the early May 2012 peak
1422.38 is the Post-bear market high (March 2012)
1425 from May 2008 closing highs
1433 from August 2007 closing lows
1440 from November 2007 closing lows

Support:
1378 is the February 2012 peak
1375 is the early July 2012 peak
1371 is the May 2011 peak, the post-bear market high
1363.46 is June 2012 high
1359 is the April 2012 low
1357 is the July 2011 peak
The 50 day EMA at 1348
1344 is the February 2011 peak
1340 is the early April 2011 peak
1332 is the early March 2011 peak
1325 is the July 2012 intraday low
The 200 day SMA at 1318
1309 is the right shoulder low from June 2012
1295 to 1294 is the April 2011 low and the February 2011 consolidation low (bottom of the trading range)
1293 is the October 2011 peak
1275 is the January 2010 low, early January 2011 peak
1267 is the December 2011 peak
1258 is June 2011 intraday low
1255 is the late December 2010 consolidation range
1249 is the March 2011 low (post-Japan)
1235 is the mid-December 2010 consolidation low
1231 is the late August 2011 peak
1227 is the November 2010 peak
1220 is the April 2010 peak
1209 is the mid-August 2011 high

Dow: Closed at 13,075.66
Resistance:
13,297 is the April 2012, post bear market high
13,668 from 12-2007 peak
13,692 from 6-2007 peak
14,022 from 7-07 peak

Support:
13,058 from the May 2008 peak on that bounce in the selling
13,056 is the February 2012 high
12,754 is the July intraday peak
The 50 day EMA at 12,736
12,716 is the April 2012 closing low
The 200 day SMA at 12,547
12,391 is the February 2011 peak
12,369 is the left shoulder low from May 2012
12,284 is the October 2011 peak
12,258 is the December 2011 peak
12,110 from the March 2007 closing low
12,094 is the April 2011 low
The June low at 11,897 (closing)
11,734 from 11-98 peak
11,717 is the late August 2011 peak
The August low at 11,702
11,555 is the March low
11,452 is the November 2010 peak
11,178 from November 2010
10,978 is the bottom of the November 2010 consolidation
10,750 from September 2010
10,720 is the August closing low
10,705-710 from January 2010 peak
10,694-700 from August 2010 peak

Economic Calendar

July 27 - Friday
- GDP-Adv. First Read, Q2 (8:30): 1.5% actual versus 1.4% expected, 2.0% prior (revised from 1.9%)
- Chain Deflator-Adv., Q2 (8:30): 1.6% actual versus 1.6% expected, 2.0% prior
- Michigan Sentiment -, July (9:55): 72.3 actual versus 72.0 expected, 72.0 prior

July 31 - Tuesday
- Personal Income, June (8:30): 0.4% expected, 0.2% prior
- Personal Spending, June (8:30): 0.1% expected, 0.0% prior
- PCE Prices - Core, June (8:30): 0.1% expected, 0.1% prior
- Employment Cost Index, Q2 (8:30): 0.5% expected, 0.4% prior
- Case-Shiller 20-city, May (9:00): -1.8% expected, -1.9% prior
- Chicago PMI, July (9:45): 52.5 expected, 52.9 prior
- Consumer Confidence, July (10:00): 61.0 expected, 62.0 prior

August 1 - Wednesday
- MBA Mortgage Index, 07/28 (7:00): 0.9% prior
- ADP Employment Chang, July (8:15): 125K expected, 179K prior
- ISM Index, July (10:00): 49.9 expected, 49.7 prior
- Construction Spending, June (10:00): 0.5% expected, 0.9% prior
- Crude Inventories, 07/28 (10:30): 2.717M prior
- Auto Sales, July (14:00): 4.9M prior
- Truck Sales, July (14:00): 6.1M prior
- FOMC Rate Decision, July (14:15): 0.25% expected, 0.25% prior

August 2 - Thursday
- Challenger Job Cuts, July (7:30): -9.5% prior
- Initial Claims, 07/28 (8:30): 365K expected, 353K prior
- Continuing Claims, 07/21 (8:30): 3298K expected, 3287K prior
- Factory Orders, June (10:00): 0.6% expected, 0.7% prior

August 3 - Friday
- Nonfarm Payrolls, July (8:30): 100K expected, 80K prior
- Nonfarm Private Payrolls, July (8:30): 105K expected, 84K prior
- Unemployment Rate, July (8:30): 8.2% expected, 8.2% prior
- Hourly Earnings, July (8:30): 0.2% expected, 0.3% prior
- Average Workweek, July (8:30): 34.5 expected, 34.5 prior
- ISM Services, July (10:00): 52.2 expected, 52.1 prior

icon url

ReturntoSender

07/31/12 6:34 PM

#9851 RE: ReturntoSender #6755

From Briefing.com: 4:15 pm : Stocks remained in a tight range throughout the day before settling on their session lows. Market action was similar to that observed yesterday as the major indices hovered around their respective unchanged levels for most of the session. Low volume and in-line economic data contributed to an uneventful session as investors await tomorrow's comments from the Federal Reserve and Thursday's European Central Bank rate decision.


Personal income increased by 0.5% in June, which was slightly greater than the 0.4% expected increase. Personal spending was unchanged, instead of increasing by 0.1% as had been broadly anticipated. Core personal consumption expenditures ticked up 0.2% month over month, in-line with expectations. Additionally, consumer confidence came in at 65.9 on expectations of a 61.0 reading.

Summer vacations and the on-going Olympics are some of the possible reasons for today's lackluster market action. Weak volume headlined the day before late-day selling pushed the total number of traded shares closer to the 50-day average.

As equities traded without direction, the dollar index ended down 0.2%. At 1.2305, the euro maintained its 0.4% advance versus the dollar after choppy morning trade.

Fueled by a positive earnings surprise and better-than-expected revenue growth, United States Steel (X 20.65, +1.73) was one of the day's best performers, finishing up 9%.

Energy was the worst performing sector today. Down 5%, Nabors Industries (NBR 13.84, -0.74) was the main laggard. Today's sell-off coincided with the stock testing $14.60 resistance which has held for the past six months.

With more than 100 companies set to report earnings after hours, competitors Electronic Arts (EA 11.02, -0.21) and Take-Two Interactive (TTWO 8.78, -0.35) bear watching. EA has been stuck in a downtrend throughout the year. At $11, the stock is testing lows not seen since 1999. Take-Two has also been slumping, albeit not as severely as EA. The current $9 level has provided strong support for the stock during the past three years.

Frontier Communications (FTR 3.92, +0.21) will also report earnings after the bell. The company's shares started the day flat but managed to build up a 5.7% advance over the course of the session. The consensus estimate calls for earnings of $0.06 per share on revenue of $1.24 billion.

In addition to tomorrow's results of the FOMC meeting scheduled for 2:15 PM ET, ADP Employment Change will be reported at 8:15 AM ET and will be followed by the ISM Index and construction spending at 10 AM ET.DJ30 -64.33 NASDAQ -6.32 SP500 -5.98 NASDAQ Adv/Vol/Dec 1022/1.73 bln/1466 NYSE Adv/Vol/Dec 1234/887.9 mln/1779

3:35 pm : Crude oil extended yesterday's losses following numerous European headlines and U.S. economic data. Weakness also came ahead of tomorrow's policy directive from The Federal Reserve. It came off its pit session high of $90.11 per barrel and plummeted into negative territory moments after floor trade opened. It touched a session low of $87.52 per barrel before it consolidated and closed with a 1.9% loss at $88.07 per barrel.

Natural gas traded up to a floor session high of $3.28 per MMBtu in morning action but lost momentum. It fell into negative territory to a session low of $3.16 per MMBtu. However, buyers stepped in during afternoon action and helped push prices higher. Natural gas erased the entire loss and managed to book a 0.3% gain as it closed at $3.22 per MMBtu.

Precious metals followed in crude's footsteps and fell into negative territory despite a weaker dollar. Gold slid off its pit session high of $1631.60 per ounce and brushed a session low of $1614.20 per ounce moments before pit close. It settled at $1615.40 per ounce, or 0.5% lower, after volatile and choppy trading. Silver was also unable to stay above the break-even level and moved into the red in afternoon action. It settled with a 0.4% loss at $27.90 per ounce, just above its session low of $27.86 per ounce.DJ30 -35.88 NASDAQ -1.96 SP500 -3.74 NASDAQ Adv/Vol/Dec 1132/1423.7 mln/1329 NYSE Adv/Vol/Dec 1309/507 mln/1672

5:53PM Jabil Circuit announces pricing of $500 mln 4.700% senior notes (JBL) 21.70 +0.49 : Co announced today the pricing of its offering of $500.0 million 4.700% senior unsecured notes due 2022 (the "Offering"). These notes will be issued at 99.992% of par. Jabil intends to use the net proceeds from the Offering (i) to repay outstanding borrowings under its revolving senior credit facility and (ii) for general corporate purposes.

4:31PM Microchip announces receipt of antitrust clearance from China for SMSC acquisition (MCHP) 33.38 +0.02 :

4:18PM TTM Tech misses by $0.06, reports revs in-line; guides Q3 EPS below consensus, revs below consensus (TTMI) 10.94 +0.30 : Reports Q2 (Jun) earnings of $0.17 per share, $0.06 worse than the Capital IQ Consensus Estimate of $0.23; revenues fell 10.6% year/year to $327.42 mln vs the $329.26 mln consensus. "Second quarter revenue was within our expected range as sales increased following the normal seasonality we experienced in the first quarter. However, weaker than expected demand for advanced technology PCBs as well as higher labor costs in Asia impacted margins and earnings during the quarter." Co issues downside guidance for Q3, sees EPS of $0.16-0.24 vs. $0.33 Capital IQ Consensus Estimate; sees Q3 revs of $340-360 mln vs. $363.10 mln Capital IQ Consensus Estimate. "As we enter the second half of the year, we are beginning to receive orders in our Asia Pacific segment for new handheld products. This improving advanced HDI demand in the second half of 2012 is beginning to materialize as anticipated and should improve our results."

4:16PM Silicon Image beats by $0.02, beats on revs; guides Q3 revs above consensus (SIMG) 3.92 -0.06 : Reports Q2 (Jun) earnings of $0.05 per share, excluding non-recurring items, $0.02 better than the Capital IQ Consensus Estimate of $0.03; revenues rose 19.0% year/year to $63.8 mln vs the $61.08 mln consensus. Co issues upside guidance for Q3, sees Q3 revs of $73-75 mln vs. $72.37 mln Capital IQ Consensus Estimate, with gross margin of ~58%.
4:15PM Atmel reports EPS in-line, misses on revs (ATML) 5.86 -0.16 : Reports Q2 (Jun) earnings of $0.08 per share, in-line with the Capital IQ Consensus Estimate consensus of $0.08; revenues fell 23.1% year/year to $368.2 mln vs the $372.1 mln consensus. Non-GAAP gross margin was 44.6% in the second quarter of 2012 compared to 43.2% in the immediately preceding quarter and 52.3% in the second quarter of 2011.

MIPS Technologies (MIPS) together with Ingenic Semiconductor and Karbonn Mobiles announced availability in India of the Android 4.1 'Jelly Bean' tablet.

Axcelis Technologies (ACLS) announced the first shipment of the co's Purion M medium current implanter.

8:16AM Trina Solar lowers Q2 module shipment outlook; lowers gross margin expectations (TSL) 4.84 : The Company estimates its solar module shipments in Q2 to be between 390 MW to 420 MW, compared to the Company's previous guidance of 500 MW to 520 MW. Additionally, for Q2, co estimates that overall gross margin, including the impact of a provision for potential countervailing and anti-dumping duties and a non-cash inventory write-down in the range of $26-28 mln to $28 million, to be 7.0% to 9.0%, compared to the Company's previous guidance of approximately 10%.

The Company further expects that its operating expenses in the second quarter of 2012 will be impacted by: 1) A receivables provision between $45 million to $48 million primarily for certain customers' accounts receivables; and 2) A foreign currency exchange loss between $22 million to $23 million, which was net of changes in fair value of derivative instruments.

The Company will confirm or revise its previous shipment guidance of between 2.0 to 2.1 GW for the full year 2012 during its second quarter 2012 earnings conference call.

"An overcapacity-induced deflationary pricing environment caused the shortfall in gross margin," said Mr. Jifan Gao, Chairman and CEO of Trina Solar. "Shipment volume fell short of our targets as US market uncertainty on the preliminary impact of the tariff resulted in stagnant demand in North America, and the timing of several large projects in China was pushed to the second half of 2012. Amidst these market conditions, we strived to maintain reasonable gross profits. The receivables provision results largely from the overdue balances for certain customers. Meanwhile, the Company is making a strong effort to collect payments from these customers."

7:48AM Canadian Solar lowers Q2 module shipment expectations; raises gross margin outlook due to one-time items (CSIQ) 2.64 : For the second quarter of 2012, Canadian Solar expects recognized solar module shipments to increase to approximately 410 MW to 420 MW (prior 430-450 MW). This compares to shipments of 343 MW in the first quarter of 2012 and 287 MW in the second quarter of 2011. The Company now expects gross margin for the second quarter of 2012 to range from 12.0% to 12.5% due to the positive impact of one-time items, which it estimates to total approximately 4% (prior 8-10%).

In addition, the Company expects net foreign exchange loss to be approximately $8 million for the second quarter of 2012, resulting mainly from the impact of the decrease in value of the Euro compared to the US dollar during the quarter.

7:32AM Vishay misses by $0.02, reports revs in-line; guides Q3 revs in-line (VSH) 8.76 : Reports Q2 (Jun) earnings of $0.24 per share, excluding non-recurring items, $0.02 worse than the Capital IQ Consensus Estimate of $0.26; revenues fell 17.2% year/year to $588 mln vs the $589.13 mln consensus. Co issues in-line guidance for Q3, sees Q3 revs of $570-610 vs. $588.48 mln Capital IQ Consensus Estimate.

Cirrus Logic (CRUS $35.97 +6.14) reported first quarter earnings of $0.22 per share, $0.01 better than the Capital IQ Consensus of $0.21, while revenues rose 7.4% year/year to $99 million versus the $101.63 million consensus. The company issues upside guidance for Q2, sees Q2 revs of $170-190 mln vs. $130.64 mln Capital IQ Consensus Estimate. Q2 gross margin is expected to be between 52 percent and 54 percent, inline with consensus of 53.9%. In addition, the company is announcing the sale of assets associated with its Apex Precision Power business in Tucson, Ariz., for $26 million. After the sale, Cirrus Logic will continue to maintain a high voltage/high power IC design team in Tucson. This transaction is expected to close within 45 days, subject to certain standard closing conditions. More information is included in our quarterly Shareholder Letter.

Seagate Tech (STX $27.92 -2.51) reported fourth quarter earnings of $2.41 per share, $0.12 worse than the consensus of $2.53, while revenues rose 56.8% year/year to $4.48 billion versus the $4.55 bln consensus. The company also reported gross margin of 33.6%. Co also announced it increased quarterly dividend by 28% to $0.32 per share

Sterne Agee notes, Key PC-NB-Enterprise HDD supplier Seagate (STX) after the close guided to a September quarter "down 10%+ q/q" noting purchasing delays ahead of Win8 and Macro uncertainties. They believe the "down 10% q/q" could imply challenges for both Intel (INTC 25.76 +0.00) and AMD (AMD $4.09 -0.01) They believe the PC group faces challenges with a down 10% q/q HDD shipments in typically the strongest PC quarter ahead of back to school and holidays.

09:18 am Seagate shares fall 8% following earnings
Seagate Tech (STX $27.88 -2.55) reported fourth quarter earnings of $2.41 per share, $0.12 worse than the consensus of $2.53, while revenues rose 56.8% year/year to $4.48 billion versus the $4.55 bln consensus. The company also reported gross margin of 33.6%. Co also announced it increased quarterly dividend by 28% to $0.32 per share

09:14 am Cirrus Logic shares soar over 21% following large upside Q2 revenue guidance
Cirrus Logic (CRUS $36.20 +6.36) reported first quarter earnings of $0.22 per share, $0.01 better than the Capital IQ Consensus of $0.21, while revenues rose 7.4% year/year to $99 million versus the $101.63 million consensus. The company issues upside guidance for Q2, sees Q2 revs of $170-190 mln vs. $130.64 mln Capital IQ Consensus Estimate. Q2 gross margin is expected to be between 52 percent and 54 percent, inline with consensus of 53.9%. In addition, the company is announcing the sale of assets associated with its Apex Precision Power business in Tucson, Ariz., for $26 million. After the sale, Cirrus Logic will continue to maintain a high voltage/high power IC design team in Tucson. This transaction is expected to close within 45 days, subject to certain standard closing conditions. More information is included in our quarterly Shareholder Letter.
icon url

ReturntoSender

08/02/12 12:45 AM

#9852 RE: ReturntoSender #6755

From Briefing.com: 4:20 pm : Markets saw choppy action during today's eventful session. The Nasdaq fell by 0.7% while the S&P and the Dow shed almost 0.3% each. The morning started with a technical glitch at Knight Capital Group (KCG 6.94, -3.39) which caused nearly 150 stocks to behave erratically. After staying positive for the majority of the day, stocks returned to negative territory in light of the Federal Open Market Committee's Statement.

The FOMC decided to keep its target range for the federal funds rate at 0 to 0.25%. It currently anticipates that "economic conditions--including low rates of resource utilization and a subdued outlook for inflation over the medium run--are likely to warrant exceptionally low levels for the federal funds rate at least through late 2014."

The Committee said it will "closely monitor incoming information on economic and financial developments and will provide additional accommodation as needed to promote a stronger economic recovery and sustained improvement in labor market conditions in a context of price stability."

Economic data was mixed this morning with ADP Employment Change surprising to the upside while the ISM Index and construction spending disappointed.

The ADP National Employment Report indicated employment in the nonfarm private business sector rose 163K in July. This was above the 125K expected by the consensus. In addition, the previous month's reading was revised down to 172K from 176K.

The July ISM Index came in worse than expected at 49.8 vs. the 50.1 consensus estimate, and up slightly from June's 49.7 reading. June construction spending rose 0.4% month over month vs. the 0.9% expected by Briefing.com consensus.


Crude oil spent most of its pit session in an uptrend, getting a boost from the bullish inventory data that showed a draw of 6.5 million barrels when a draw of 1.0 million was anticipated. The energy component climbed to a session high of $89.49 per barrel, but then plummeted to a session low of $87.92 in reaction to the little-changed FOMC statement. Crude recovered the loss quickly and settled with a 1.0% gain at $88.97.

The euro turned down sharply following the FOMC announcement and ended at 1.2225 versus the dollar.

Today's selling pressure has had the biggest impact on the consumer discretionary sector. The S&P 500 component was down near 1%.

Frontier Communications (FTR 4.34, +0.42) was the best performing S&P 500 component. The company reported earnings of $0.08 per share which was $0.02 ahead of the consensus estimates. Revenues fell compared to last year, but at $1.26 billion, the number still came in ahead of the forecasted $1.25 billion. With an 11% advance, the stock is attempting to break out of a long-term down channel dating back to early 2011.

Genworth Financial (GNW 4.48, -0.56) was the main laggard, down 11%. The company missed earnings estimates by $0.02 while reporting revenue of $2.52 billion which was above the $2.5 billion consensus. The stock dipped to lows not seen since May of 2009.

Insurers MetLife (MET 30.43, -0.34) and Prudential (PRU 47.58, -0.70) were both down roughly 1.2% ahead of their after-hours releases. The consensus estimate calls for MetLife to earn $1.25 per share on revenues of $16.98 billion. Meanwhile, Prudential is expected to earn $1.54 per share on $10.64 billion in revenues.

In addition, Yelp (YELP 18.82, -1.14) is also scheduled for an after-hours earnings release. The stock was 5.7% lower ahead of its earnings with the company expecting to reveal a loss of $0.06 per share on revenues of $30.69 million.

The European Central Bank and Bank of England are scheduled to opine tomorrow morning.

Tomorrow's economic data includes Challenger Job Cuts at 7:30 AM ET, initial and continuing claims at 8:30 AM ET, and factory orders at 10 AM ET.DJ30 -32.55 NASDAQ -19.31 SP500 -4.00 NASDAQ Adv/Vol/Dec 758/1.69 bln/1932 NYSE Adv/Vol/Dec 1238/1.03 bln/1980

4:25PM Hewlett-Packard issues statement in resopnse to propsed ruling in ongoing litigation with Oracle (ORCL) relating to the Intel Itanium platform (HPQ) 17.65 -0.58 : Co stated: "Today's proposed ruling is a tremendous win for HP and its customers. The Superior Court of the State of California, Santa Clara County, has confirmed the existence of a contract between HP and Oracle that requires Oracle to port its software products to HP's Itanium-based servers. We expect Oracle to comply with its contractual obligation as ordered by the Court." The Court found in favor of HP and against Oracle on both the breach of contract and promissory estoppel causes of action brought by HP.

4:17PM Rubicon Tech patent allowed for In-situ Crystal Orientation (RBCN) 10.51 +0.46 : Co announced that the United States Patent and Trademark Office (USPTO) has allowed Rubicon's patent application entitled, "Intelligent Machines and Process for Production of Monocrystalline Products with Goniometer Continual Feedback." The patent covers Rubicon's equipment and process developed to perform in-situ orientation of its sapphire crystals within the various fabrication tools used by the Company.

4:16PM First Solar reports Q2 (Jun) results, beats on revs; guides FY12 revs above consensus (FSLR) 14.80 -0.74 : Reports Q2 (Jun) earnings of $1.27 per share, may not be comparable to the Capital IQ Consensus Estimate of $0.92; revenues rose 79.5% year/year to $957 mln vs the $822.19 mln consensus. The second quarter of 2012 was impacted by pre-tax charges of $36 million (reducing EPS by $0.39), relating to restructuring and certain costs in excess of normal warranty. Co issues guidance for FY12, sees EPS of $4.20-4.70, may not be comparable to $3.88 Capital IQ Consensus Estimate; sees FY12 revs of $3.6-3.9 bln vs. $3.47 bln Capital IQ Consensus Estimate.

4:08PM First Solar to develop 139 MW Campo Verde Solar Project (FSLR) 14.80 -0.72 : Co announced it is developing the 139 megawattAC (MW) Campo Verde Solar Project, located near El Centro in Imperial County, Calif. Campo Verde is expected to start construction in the third quarter of 2012 and be completed in 2013, creating about 250 construction jobs. San Diego Gas & Electric will purchase the project's output under a 20-year power purchase agreement, which was approved on May 24, 2012 by the California Public Utilities Commission.

4:15PM AXT misses by $0.02, beats on revs (AXTI) 3.43 -0.06 : Reports Q2 (Jun) earnings of $0.04 per share, $0.02 worse than the Capital IQ Consensus Estimate of $0.06; revenues fell 16.3% year/year to $25.15 mln vs the $24.09 mln consensus. Co also says "... As we move into Q3, the demand environment appears to be more challenging, particularly in certain geographies. We are continuing to approach the current business environment with measured conservatism based on mixed industry data points and expect to see weaker than normal seasonal performance as a result. However, we have worked diligently to improve our operating structure and efficiency and are well-positioned with key customers in each of our markets. We view improving market conditions, new customer qualifications and a bottoming of raw material pricing as key catalysts for our growth later this year and beyond."

4:07PM FormFactor beats by $0.05, beats on revs (FORM) 5.82 -0.30 : Reports Q2 (Jun) loss of $0.08 per share, $0.05 better than the Capital IQ Consensus Estimate of ($0.13); revenues rose 17.6% year/year to $54.8 mln vs the $51.9 mln consensus.

4:06PM Extreme Networks reports EPS in-line, beats on revs; guides Q1 EPS below consensus, revs in-line (EXTR) : Reports Q4 (Jun) earnings of $0.08 per share, excluding non-recurring items, in-line with the Capital IQ Consensus Estimate consensus of $0.08; revenues fell 2.4% year/year to $87.6 mln vs the $84.43 mln consensus. Co issues mixed guidance for Q1, sees EPS of $0.01-0.05, excluding non-recurring items, vs. $0.07 Capital IQ Consensus Estimate; sees Q1 revs of $75-82 mln vs. $79.80 mln Capital IQ Consensus Estimate.

4:02PM Cirrus Logic Appoints Al Schuele as Chairman of the Board of Directors (CRUS) 35.91 -0.86 : Mr. Schuele was first elected to co's Board of Directors in July 2011. Schuele has been a general partner since 2000 with Sevin Rosen Funds, a high tech venture capital firm, and is currently a director of Javelin Semiconductor.

11:28 am Information Technology sector down slightly today

The tech sector is trading lower today, trailing gains in the broader market. Semiconductors are showing inline weakness with the SOX trading 0.2% lower. VECO (-3.8%) is a notable laggard in the chip index, while IDCC (+14.1%) is the standout leader. Among other major indices, the SPY is trading 0.4% higher today, while the QQQ is up 0.1% and the NASDAQ is trading 0.1% lower on the session. Among tech bellwethers, FB (-2.3%) is showing notable weakness.

In earnings last night, DRIV (-25.4%) and EA (-0.1%) reported quarterly miss and provide below consensus guidance, while FTR (+10.7%) and SIMG (+26.0%) posted qtrly beats and BMC (-5.3%) reported a miss and offered in line guidance. This morning, AMT (+0.4%) reported an inline qtr and guided lower. Among rumors, there were reports that LNVGY (+6.6%) may be interested in purchasing NOK (+4.1%). A LNGVY exec dissmissed the rumor this morning. Among notable analyst ratings changes this morning in the tech space, DRIV (-25.4%) was downgraded to Mkt Perform at Raymond James, BMC (-5.2%) was downgraded at Credit Suisse and Raymond James, and TECD (-3.8%) was downgraded to Underperform at BofA/Merrill. DOX (-0.4%) and TTEC (-0.1%) are the notable names in tech scheduled to report quarterly results today after the close.
icon url

ReturntoSender

08/02/12 6:56 PM

#9853 RE: ReturntoSender #6755

From Briefing.com: 4:25 pm : Today's action was focused on the comments from European Central Bank President Mario Draghi. During his press conference, Mr. Draghi failed to announce new measures to help stem the European debt crisis. The S&P 500 quickly dropped to 1,360 and hovered around that level until the final hour of the session. During the final 60 minutes stocks were able to recover a portion of their losses, and the S&P 500 finished down 0.7%.


European indices were considerably higher ahead of the press conference before sharply reversing into negative territory. Spain's IBEX plunged 5.2%, while Italy's MIB tumbled 4.6%. Spain's 10-yr yield was holding at 6.65% ahead of the announcement and rallied to close up 43 basis points at 7.165%.

The latest weekly initial jobless claims count totaled 365,000, which was in-line with the 365,000 that had been expected. The tally is also up from the upwardly revised prior week count of 357,000. As for continuing claims, they fell to about 3.272 million from 3.291 million.

June Factory Orders showed a 0.5% decrease which was worse than the 0.6% increase that had been expected.

Knight Capital Group (KCG 2.58, -4.36) finished near session lows as yesterday's execution glitch is said to have cost the firm $440 million in direct losses. Several firms have indicated that they have used other systems to route their orders. With 155 million shares traded, volume in the stock has been more than 100 times the average daily volume of 1.2 million.

First Solar (FSLR 17.93, +3.13) surged 21% after the company handily beat earnings and revenue estimates. Today's jump lifted the stock past resistance near $16.60 which had held since mid-May.

Abercrombie & Fitch (ANF 29.06, -4.96) dropped 14.6% after issuing disappointing guidance. Lower sales expectations spilled over to competitor Aeropostale (ARO 13.08, -6.37) whose shares fell 32.8% on heavy volume.

Gap (GPS 33.17, +3.75) was able to buck the trend. Shares advanced 12.8% after the retailer reported better-than-expected same store sales and improved its second quarter outlook.

Given their European exposure, financial stocks have felt the brunt of today's selling. The SPDR Financial Select Sector ETF (XLF 14.48, -0.11) slid 0.8%. Morgan Stanley (MS 13.03, -0.48) was down 3.5%.

European financials were hit especially hard with Deutsche Bank (DB 28.35, -1.45) and Barclays (BCS 10.05, -0.38) lower by 4.9% and 3.6% respectively.

The euro saw volatile trading around the Mario Draghi press conference. The single currency rose to 1.2365 versus the dollar in anticipation of the bank president's comments. The euro tumbled to 1.2210 after Mr. Draghi failed to offer fresh plans to solve the region's debt crisis. Following a brief pause, it fell further, touching 1.2170.

Crude oil brushed a session low of $86.92 per barrel as equity markets opened before recovering some of its losses in morning action. Crude managed to trade up to a session high of $88.48 but was unable to sustain the momentum and eventually settled down 2.0% at $87.20.

More than 100 companies will report their quarterly results after the bell.

Energy components EOG Resources (EOG 96.12, -4.32) and Sunoco (SUN 47.37, -0.81) saw respective losses of 4.3% and 1.7% ahead of their results.

Shares of Kraft Foods (KFT 38.94, -0.45) saw a steady rise but were unable to push through resistance in the $40.00 area. The company's earnings are due out after the bell with Investors expecting $0.66 in earnings on $14.1 billion revenues.

LinkedIn (LNKD 93.51, -2.13) is also scheduled to report today. Estimates call for earnings of $0.16 on revenues of $215.97 million.

Nonfarm payrolls, nonfarm private payrolls, unemployment rate, hourly earnings, and average workweek will be released tomorrow at 8:30 AM ET.DJ30 -92.18 NASDAQ -10.44 SP500 -10.32 NASDAQ Adv/Vol/Dec 1031/1.79 bln/1418 NYSE Adv/Vol/Dec 1147/826.1 mln/1897

3:30 pm : Crude oil spent its entire pit session in the red as the dollar gained strength on President Draghi's comments that fell short of expectations for further action from the ECB to support Europe's ailing economy. It brushed a session low of $86.92 per barrel as equity markets opened and then attempted to recover some losses in morning action. Crude managed to trade up to a session high of $88.48 per barrel but was unable to sustain momentum and eventually settled the session 2.0% lower at $87.20 per barrel.

Natural gas tanked following weak inventory data that showed a build of 28 bcf when a build of 20 bcf was widely expected. It continued the decline for the remainder of pit trade and closed at $2.92 per MMBtu, just above its session low of $2.91 per MMBtu, for a 7.9% loss. Today's session is the first time that natural gas for September delivery has settled below $3.00 per MMBtu since July 19, 2012.

Gold and silver popped to their respective pit session highs in morning action on ECB's announcement that it is leaving rates unchanged at 0.75% as expected. However, the sentiment wore off quickly and both metals plunged into negative territory following the rally in the dollar. Gold fell to a session low of $1586.30 per ounce and settled slightly higher at $1590.50 per ounce for a loss of 1.0%. Silver's decline was sharper as it slid as low as $26.88 per ounce and closed 1.9% lower at $26.99 per ounce.DJ30 -129.42 NASDAQ -15.64 SP500 -13.86 NASDAQ Adv/Vol/Dec 997/1497.3 mln/1429 NYSE Adv/Vol/Dec 1065/577 mln/1944

4:46PM Sierra Wireless beats by $0.12, beats on revs; guides Q3 EPS below consensus, revs below consensus (SWIR) 9.38 -0.14 : Reports Q2 (Jun) earnings of $0.30 per share, excluding non-recurring items, $0.12 better than the Capital IQ Consensus Estimate of $0.18; revenues rose 19.7% year/year to $167.4 mln vs the $158.88 mln consensus. Co issues downside guidance for Q3, sees EPS of $0.14-0.19, excluding non-recurring items, vs. $0.21 Capital IQ Consensus Estimate; sees Q3 revs of $157-162 mln vs. $165.65 mln Capital IQ Consensus Estimate. "Exceptionally strong sales of our 4G Mobile Computing products, combined with steady growth in our Machine-to-Machine business, led to higher than expected revenue and profitability in the second quarter of 2012,"

4:18PM Rubicon Tech beats by $0.06, beats on revs; guides Q3 EPS below consensus, revs below consensus (RBCN) 10.70 +0.19 : Reports Q2 (Jun) loss of $0.06 per share, $0.06 better than the Capital IQ Consensus Estimate of ($0.12); revenues fell 60.5% year/year to $17 mln vs the $16.14 mln consensus. Co issues downside guidance for Q3, sees EPS of ($0.05)-(0.02) vs. $0.01 Capital IQ Consensus Estimate; sees Q3 revs of $18-21 mln vs. $22.24 mln Capital IQ Consensus Estimate.

4:11PM Integrated Device: Synaptics (SYNA) acquires Pacinian and the Video Display Operation of IDTI; terms not disclosed (IDTI) 5.12 +0.04 :

4:07PM ON Semiconductor reports EPS in-line, misses on revs; guides Q3 revs below consensus (ONNN) 6.84 -0.07 : Reports Q2 (Jun) earnings of $0.14 per share, excluding non-recurring items, in-line with the Capital IQ Consensus Estimate consensus of $0.14; revenues fell 17.8% year/year to $744.8 mln vs the $765.44 mln consensus. Co issues downside guidance for Q3, sees Q3 revs of $725-765 mln vs. $810.32 mln Capital IQ Consensus Estimate. "Backlog levels for the third quarter of 2012 represent approximately 80 to 85 percent of our anticipated third quarter 2012 revenues. We expect that average selling prices for the third quarter of 2012 will be down approximately one to two percent when compared to the second quarter of 2012. The non-GAAP outlook for the third quarter of 2012 includes stock-based compensation expense of approximately $7 to $9 million."

4:04PM ON Semiconductor announces Chief Financial Officer transition (ONNN) 6.84 -0.07 : Co announced that its Executive Vice President and Chief Financial Officer, Donald Colvin, and the company have mutually agreed to Mr. Colvin's resignation as an officer of the company. It is anticipated that Mr. Colvin will continue in his current positions at the company for up to 90 days while the company conducts a search for a replacement chief financial officer. This search process has already been launched by the Board of Directors and is in process

9:01AM LSI Logic's Board of Directors authorizes new $500 mln stock repurchase program (LSI) 6.98 : Co announced that its Board of Directors has authorized the repurchase of up to $500 million of its common stock, with repurchases to be funded with available cash and short-term investments. This new program is in addition to the $75 million that remained available under the company's existing $750 million authorization as of the end of second quarter.

8:31AM Research In Motion introduces 4G LTE BlackBerry playbook tablet (RIMM) 7.11 : Co launched the new 4G LTE BlackBerry PlayBook tablet with built-in support for cellular networks. The new 4G LTE BlackBerry PlayBook maintains a sleek and ultra-portable form while delivering overall faster performance over the original BlackBerry PlayBook.

09:48 am First Solar shares spike over 19% following beat on revenues
First Solar (FSLR $17.80 +2.97) reported second quarter earnings of $1.27 per share, may not be comparable to the Capital IQ Consensus of $0.92, while revenues rose 79.5% year/year to $957 million versus the $822.19 million consensus. The second quarter of 2012 was impacted by pre-tax charges of $36 million (reducing EPS by $0.39), relating to restructuring and certain costs in excess of normal warranty. The company issued guidance for fiscal year 2012 with EPS of $4.20-4.70, may not be comparable to $3.88 consensus and revenues of of $3.6-3.9 billion versus the $3.47 billion consensus.
icon url

ReturntoSender

08/04/12 6:17 PM

#9854 RE: ReturntoSender #6755

From Briefing.com: Weekly Recap - Week ending 03-Aug-12

Dow +217.29 at 13101.28, Nasdaq +58.13 at 2967.9, S&P +25.99 at 1390.99

Friday's action saw a broad market rally which started with optimism across European markets. A strong nonfarm payroll report combined with a positive ISM Services print supported the day's gains. After advancing 1% at open, equities added to their strength. As a result, the Nasdaq gained 2% and the S&P 500 rose by 1.9%.
Nonfarm payrolls came in at 163K versus the expected 100K Briefing.com consensus while nonfarm private payrolls added 172K against expectations of a 105K increase. The unemployment rate of 8.3% ticked up from its previous reading of 8.2%.

The July ISM Services index was reported at 52.6, slightly above the 52.3 Briefing.com consensus, and up from June's 52.1 reading.

European indices closed firmly higher after yesterday's volatile session. Italy's MIB and Spain's IBEX soared by 6.3% and 6.0% respectively. France's CAC jumped 4.4% and Germany's DAX gained 3.9%.

U.S. listings of European financials rose sharply with Deutsche Bank (DB 31.21, +2.86) and Barclays (BCS 10.66, +0.61) gaining 10.0% and 6.1% respectively.

The strength in European banks followed a significant drop in Italian and Spanish yields. Italy's 2-yr yield declined 54 basis points to 3.11% while Spain's 2-yr yield eased 88 basis points at 3.91%.

The financial sector was the best performer today. With considerable gains throughout, Morgan Stanley (MS 13.78, +0.75) gained 5.8% while Citigroup (C 27.41, +1.23) advanced 4.7%.

Knight Capital Group (KCG 4.05, +1.47) has rebounded off all-time lows after securing a line of credit which has allowed the firm to continue operating for the day. Despite today's rally, shares of Knight remain down 60.9% on the week. It is expected that some sort of longer-term resolution for KCG will come next week, with reports today suggesting several potential bidders/investors are reviewing the company.

LinkedIn (LNKD 108.51, +15.00) gained 16% after reporting in-line EPS and better than expected revenues and full-year guidance. Today's considerable bid has taken the shares above the 20- and 50-day moving averages.

Procter & Gamble (PG 65.50, +1.99) gained 3.1% after beating earnings estimates but coming up short on revenues.

The dollar index was considerably lower amid today's risk rally. At 82.45, the index ended down 1.1%. The euro was the top performer among the major currencies against the dollar with today's 200 pip advance running it up to 1.2375. Other currencies which saw strong gains include the Australian dollar (up 0.9% at 1.0555) while the British pound has added 0.8% to 1.5640.

Crude oil got a major boost today, gaining nearly 5% after the better than expected employment data, positive performance in Europe while also benefitting from the dollar's decline. The energy component lifted from its session low of $88.31 per barrel and steadily climbed higher, settling just below its session high of $91.79. Despite selling pressure seen in previous sessions following little-changed FOMC and ECB statements, crude finished the week with a 1.4% gain at $91.40.

Corporate earnings and central bank comments headline the week.

Looking back on the week, Monday's equity markets were quiet for the duration of the session with the S&P 500 finishing nearly flat on the day. One notable deal was announced before the open. Shaw Group (SHAW 39.47, +0.43) gained 55% after the firm was acquired by Chicago Bridge & Iron (CBI 36.44, +1.00) CB&I will pay a total of $3 billion or $46 per share of Shaw.

Tuesday's action was similar to that observed on the day before as the major indices hovered around their respective unchanged levels for most of the session. Low volume and in-line economic data contributed to an uneventful session as investors awaited comments from the Federal Reserve and the European Central Bank later in the week. As far as earnings, US Steel (X 21.72, +0.66) was one of the day's best performers, finishing up 9% after it beat earnings expectations. The S&P 500 edged lower by 0.4%.

On Wednesday before the open, The ADP National Employment Report indicated employment in the nonfarm private business sector rose 163K in July. This was above the 125K expected by the consensus. About 15 minutes following the opening bell, approximately 150 stocks began to behave erratically. It was later determined that a technology issue at Knight Capital Group (KCG 4.05, +1.47) was behind the abnormal activity. Later in the day, the Federal Open Market Committee repeated that it would ‘monitor incoming information on economic and financial developments and will provide additional accommodation as needed.' The FOMC kept its pledge to keep rates low to at least late 2014. The S&P 500 fell 0.3 that day.

Thursday's trade was focused on the comments from European Central Bank President Mario Draghi. During his press conference, Mr. Draghi failed to announce new measures to help stem the European debt crisis. Knight Capital Group (KCG 4.05, +1.47) finished near session lows as Wednesday's execution glitch is said to have cost the firm $440 million in direct losses. Several firms have indicated that they have used other systems to route their orders. The S&P 500 finished down 0.7%. In Corporate news, Abercrombie & Fitch (ANF 29.37, +0.31) dropped 14.6% after issuing disappointing guidance. Finally, retailers reported July same store sales, which overall came in above expectations with sixteen retailers beating estimates—the most since April of last year (three companies missed).

Earnings Season enters home stretch.

Just over 80% of the S&P 500 has reported quarterly results so far during this earnings season. Roughly two thirds of them have beat earnings estimates. On the other hand, roughly 56% of companies have missed sales expectations. Guidance has been decidedly cautious.

Next week is the final very heavy week of earnings season. Over 500 companies are expected to report, including more than 40 companies in the S&P 500. Cognizant (CTSH 57.86, +1.58) and Tyson Foods (TSN 15.40, +0.25) will report on Monday morning.
 
Index Started Week Ended Week Change % Change YTD %
DJIA 13075.66 13096.17 20.51 0.2 7.2
Nasdaq 2958.09 2967.90 9.81 0.3 13.9
S&P 500 1385.97 1390.99 5.02 0.4 10.6
Russell 2000 796.00 788.48 -7.52 -0.9 6.4

10:21AM Semiconductor Hldrs extends up to June highs/range top (SMH) 32.71 +0.71 : The SMH has struggled to build value above its 200 sma/ema over the last week but has broken above this short term range to probe the top of its broad multi-month trade range from June at 32.79/32.84 (session high 32.78). Top performers today include: INTC +2.3%, TXN +2.9%, BRCM +2.4%, ASML +3.7%, ARMH +2.9%, XLNX +2.1%, TER +2.4%, SNDK +2.3%, LSI +2.4%.

Futuremark announced that Acer, Intel (INTC), Qualcomm (QCOM) and SingTel-Optus have joined its Benchmark Development Program to create a new 3DMark gaming benchmark for Android-based tablets and smartphones.

ON Semiconductor (ONNN $10.01 -0.69) reported second quarter earnings of $0.14 per share, excluding non-recurring items, in-line with the Capital IQ consensus of $0.14, while revenues fell 17.8% year/year to $744.8 million versus the $765.44 million consensus. The company issued downside guidance for the third quarter with revenues of $725-765 million versus the $810.32 million consensus. "Backlog levels for the third quarter of 2012 represent approximately 80 to 85 percent of our anticipated third quarter 2012 revenues. We expect that average selling prices for the third quarter of 2012 will be down approximately one to two percent when compared to the second quarter of 2012. The non-GAAP outlook for the third quarter of 2012 includes stock-based compensation expense of approximately $7 to $9 million."

10:33 am S&P Information Technology trading lower along with the broader market

The tech sector is trading higher today, inline with gains in the broader market. Semiconductors are showing inline strength with the SOX trading 1.8% higher. RBCN (-7.5%) is a notable laggard in the chip index, while STM (+8.7%) is showing strength. Among other major indices, the SPY is trading 1.8% higher today, while the QQQ and the NASDAQ are trading 1.9% higher on the session. Among tech bellwethers, TXN (+3.0%) is a leader, while FB (-0.1%) is showing weakness again.

In earnings last night, SYNA (+14.9%) posted a slight beat and guided below consensus, ATVI (-4.7%) reported a beat but issued downside guidance, and LNKD (+14.3%) posted a slight beat and raise. Elsewhere, OPEN (+17.3%) reported a slight beat and offered inline guidance, and ONNN (-5.1%) posted a miss and issued downside guidance. This morning, IT (+5.8%) posted a slight beat and guided inline. In news, AOL (+3.1%) announced a $550 mln share buyback. Also, ONNN (-5.1%) announced its CFO resigned.

Among notable analyst upgrades this morning in the tech space, OPEN (+17.3%) was upgraded to Outperform at Oppenheimer, TDC (+5.2%) was upgraded at Sterne Agee and Hillard Lyons, and DWRE (+9.5%) was upgraded to Buy at Goldman. In downgrades, Oppenheimer downgraded VSAT (-9.5%) to Perform, ARBA (-0.1%) and INTU (+1.3%) were downgraded to Equal Weight at Barclays, SCOR (-23.8%) was downgraded to Hold at Deutsche Bank, NOK (+4.2%) was downgraded to Sell at Goldman, and CNQR (-2.8%) was downgraded to Sell at Goldman.
icon url

ReturntoSender

08/06/12 8:45 PM

#9856 RE: ReturntoSender #6755

From Briefing.com: 4:20 pm : The advances made by U.S. equities during the first 30 minutes held through most of the day as thin volume and lack of economic data contributed to a lackluster trading day. As the session entered its final minutes, stocks came off highs and finished near the bottom of the day's range. The S&P 500 ended higher by 0.2%.


Asian markets closed considerably higher following Friday's positive U.S. nonfarm payroll report. Japan's Nikkei gained 2.0%, Hong Kong's Hang Seng rose 1.7%, while shares in Shanghai advanced 1.4%.

In Europe, Spain's IBEX finished 4.4% higher after trading was halted for nearly 5 hours due to a technical issue. Other European indices posted more modest gains with France's CAC and Germany's DAX both rising by 0.8%, while UK's FTSE advanced 0.4%.

The Nasdaq outperformed other indices and ended higher by 0.7%. The above-average gains were driven by multiple companies posting double digit percent gains.

Pluristem Therapeutics (PSTI 3.80, +0.49) was 14.8% higher after reporting that the company's treatment has been able to save the life of a patient exhibiting bone marrow failure.

Online gaming developer Changyou.com (CYOU 23.00, +3.63) gained 18.7% after beating its earnings and revenue forecast.

Knight Capital Group (KCG 3.07, -0.98) has bounced off lows but ended the session down 24.2% after this morning's news indicated the company had raised $400 million through the sale of preferred, convertible stock.

With gains of 1.1%, the Materials sector was the best performer today. United States Steel (X 22.94, +1.22) was the best performer within the group and ended higher by 5.6%. In addition, Newmont Mining (NEM 46.12, +1.45) and Freeport-McMoRan (FCX 34.34, +0.84) were up 3.3% and 2.5% respectively.

Down 0.3%, utilities were the biggest laggard in the S&P 500. Within the space, Exelon (EXC 38.06, -0.41) shed 1.1% while Duke Energy (DUK 68.21, -0.39) was off by 0.6%.

The dollar index ended off by 0.1% as the performance of major currencies against the greenback has been mixed. At 78.22, the Japanese Yen was up 0.3% against the dollar. The euro has come off session highs at 1.2425 and it currently trades near 1.2395. The common currency advanced 0.1% against the U.S. dollar.

The 10-yr yield on U.S. Treasuries has declined 2 basis points, to 1.56%.

Nearly 70 companies are scheduled to release their quarterly results after today's closing bell. Some notable names include Caribou Coffee (CBOU 10.95, -0.50), Chesapeake Energy (CHK 17.68, -0.21), Plantronics (PLT 33.47, +0.27), and Leap Wireless (LEAP 5.52, +0.30).

In addition, almost 80 firms will report before tomorrow's open. Cablevision (CVC 15.83, +0.29), CVS Caremark (CVS 44.90, +0.15), Fossil (FOSL 69.79, +1.36), MGM Resorts (MGM 9.38, +0.12), and Office Depot (ODP 1.74, -0.04) are some stocks which bear watching. Tomorrow's economic data is limited to consumer credit, due out at 3 PM ET.DJ30 +21.34 NASDAQ +22.01 SP500 +3.24 NASDAQ Adv/Vol/Dec 1522/1.49 bln/927 NYSE Adv/Vol/Dec 1892/647.2 mln/1124

3:35 pm : Crude oil popped into positive territory following rumors suggesting that Syria's Assad was killed or injured in a blast. However, headlines crossed that Russian Interior Minister denied issuing the tweet. It is worth noting that a story from Reuters on Friday discussed how its Twitter feed had been hacked so we would be a cautious of odd tweets in the coming days. The energy component continued to climb higher as it also got a boost from a weaker dollar. It settled floor trade 1.0% higher at $92.30, or just below its session high of $92.38 per barrel.

Natural gas slid to a pit session low of $2.82 per MMBtu in morning action but found buying support soon after. It trended in an upward pattern for the remainder of its floor session and settled 1.0% higher at $2.91 per MMBtu. Precious metals extended Friday's gains as the weaker dollar gave them a boost.

Gold came off its pit session low of $1608.30 per ounce and traded up to a session high of $1618.40 per ounce by late morning. It pulled-back slightly in afternoon action but still managed to close 0.4% higher at $1616.00 per ounce. Silver touched a session low of $27.61 per ounce moments after pit trade opened but climbed out of negative territory in late morning action. It brushed a session high of $27.95 per ounce and settled just below that level at $27.87 per ounce with a gain of 0.3%.DJ30 70.42 NASDAQ 29.45 SP500 7.08 NASDAQ Adv/Vol/Dec 1634/1189.8 mln/824 NYSE Adv/Vol/Dec 2027/417 mln/956

5:37PM Advanced Micro announces pricing of private offering of $500 mln of senior notes (AMD) 4.01 -0.08 : Co announced that it has agreed to sell $500 million aggregate principal amount of its 7.50% Senior Notes due 2022 in a private offering. AMD intends to close the transaction on or around August 15, 2012. AMD estimates that the net proceeds from the issuance and sale of the senior notes will be approximately $491 million after deducting the initial purchasers' discounts and estimated offering expenses. AMD intends to use the net proceeds for general corporate purposes and working capital, which may include the following: (i) the repayment or repurchase of some or all of its outstanding 5.75% Convertible Senior Notes due 2012, (ii) repayment or repurchase of some or all of its outstanding 6.00% Convertible Senior Notes due 2015, (iii) cash payments to GLOBALFOUNDRIES related to the 28nm product limited waiver of exclusivity, or (iv) potential strategic transactions.

4:08PM Power Integrations beats by $0.07, misses on revs; guides Q3 revs below consensus (POWI) 37.30 +0.80 : Reports Q2 (Jun) earnings of $0.49 per share, $0.07 better than the Capital IQ Consensus Estimate of $0.42; revenues fell 4.7% year/year to $76.38 mln vs the $81.13 mln consensus. Co issues downside guidance for Q3, sees Q3 revs of 76-82 mln vs. $88.59 mln Capital IQ Consensus Estimate. "Like many of our peers, we have experienced a slowdown in demand of late, and second-quarter revenues fell short of our expectations. However, our non-GAAP gross margin expanded by more than three percentage points thanks to continued execution on our cost-reduction efforts and a more favorable end-market mix during the quarter. In all, our non-GAAP gross margin is up nearly five points in the past three quarters, and we expect it to remain above the 50-percent benchmark in the second half of the year. The combination of a higher gross margin and our lower tax rate will help support our earnings and cash flow even in the face of a muted demand environment."

4:06PM Intersil announces stock repurchase program of up to $50 mln of common stock (ISIL) 8.96 +0.11 : Co announced that Intersil's Board of Directors has authorized the repurchase of up to $50 million of the company's common stock. At the end of the second quarter of 2012, Intersil's cash and short term investments totaled $316.1 million. As of June 29, 2012, there were approximately 127.6 million shares outstanding.

4:03PM Emcore consolidates terrestrial concentrating photovoltaics business into its joint venture, Suncore Photovoltaics (EMKR) 5.07 +0.05 : Co announced that it has entered into a definitive agreement, subject to closing conditions, to consolidate its terrestrial concentrating photovoltaics (CPV) system engineering and development efforts into its joint venture, Suncore Photovoltaics. In order to streamline the development and engineering effort for CPV systems, EMCORE and Suncore have entered into a definitive agreement to consolidate intellectual property and development efforts for both ground mount and rooftop terrestrial CPV products, including key engineering, and sales and marketing personnel, to a wholly-owned subsidiary of Suncore in the United States. Suncore's subsidiary will fund all ongoing R&D, marketing, sales and business development related to terrestrial CPV systems. EMCORE will continue to own all of its intellectual property related to solar cell technology and maintain investment activities to advance CPV cell performance to serve a broader customer base within the CPV industry.

10:00AM Cisco Systems early gains to resistance zone (CSCO) 16.63 +0.28 : The early advance has seen the stock test a resistance zone marked by its 50 day ema (capped upside in June) and Mid-July high at 16.64/16.80 (session high 16.70).

O2Micro International (OIIM) announced the introduction of two Direct Current-to-Direct Current converter controllers for notebook markets.

8:03AM Ramtron: Cypress Semiconductor (CY) extends tender offer to acquire RMTR to Aug 17, 2012 (RMTR) 2.60 : Cypress Semiconductor announced that it has extended its tender offer to acquire all of the outstanding stock of Ramtron International for $2.68 per share in cash to 5:00 p.m., New York City time, on August 17, 2012. The offer was previously scheduled to expire at 5:00 p.m., New York City time, on August 3, 2012. Cypress's offer represents a 48% premium over Ramtron's closing price of $1.81 per share on June 11, 2012, the day before Cypress publicly disclosed its offer for Ramtron. Except for the extension of the expiration date, all other terms and conditions of the offer remain unchanged. The all-cash offer is not conditioned on due diligence or financing. Cypress continues to believe that its offer represents full and fair value and provides Ramtron's stockholders with immediate liquidity at a substantial premium in a very volatile market. Cypress stated " If you are stalling in the hope that we will lose interest in an acquisition, it bears repeating that we are committed to acquiring Ramtron and that commitment will not waiver. We will not allow you an unlimited amount of time to stand in the way of our offer while failing to provide your stockholders with a fair opportunity to consider it or a superior alternative."

7:34AM Qualcomm appoints Chief Marketing Officer (QCOM) 60.24 : Co announced that Anand Chandrasekher has joined the Company as chief marketing officer (CMO). Most recently, he was senior vice president, general manager for the Ultra Mobility Group at Intel Corporation, with responsibility for the Intel (INTC) Atom processor family.

ASML (ASML $57.98 -0.14) announced that TSMC (TSM $14.18 +0.00) has joined its Customer Co-Investment Program for innovation, committing to invest EUR276 mln in research and development of next generation lithography technologies, which include Extreme Ultraviolet lithography technology and 450-millimeter lithography tools, over the next five years as well as EUR838 mln in a 5% ASML equity stake. The objective of the Co-Investment Program is to accelerate ASML's development of EUV technology beyond this current generation and ASML's development of future 450 mm silicon wafer technology, both due in the second half of this decade.

icon url

ReturntoSender

08/07/12 11:00 PM

#9857 RE: ReturntoSender #6755

From Briefing.com: 4:20 pm : After opening higher by 0.5%, stocks maintained their gains throughout the session. Similar to yesterday, low volume kept the markets relatively flat following the opening thrust higher. With no economic data of note being released, stocks maintained their gains and came off their highs towards the end of the session. As the day ended, the S&P 500 faded towards its opening level and the index ended up 0.5%.

Fossil (FOSL 91.77, +21.98) surged by 31.5% after the company increased full-year guidance following an earnings and revenue beat. Today's buying lifted the stock out of a range which has held for three months. Competitor Movado (MOV 25.78, +3.06) benefited from Fossil's strength as investors expect Movado to also surprise to the upside. Shares of the luxury goods producer ended higher by 13.5%.

US Home Systems (USHS 12.53, +3.47) gained 38.3% after Home Depot (HD 52.40, +0.40) agreed to buy the company for $12.50 per share.

Energy was today's strongest performer. Within the group, Overseas Shipholding Group (OSG 6.66, +0.62) leaped 10.3% after a company director purchased 100,000 shares at $5.82. Chesapeake (CHK 19.37, +1.67) jumped 9.4% following a positive earnings report.

Financials showed considerable strength. The SPDR Financial Select Sector ETF (XLF 14.94, +0.06) advanced 0.4%. Within the sector, JPMorgan Chase (JPM 37.01, +0.71) and Citigroup (C 28.89, +0.33) rose by 2.0% and 1.2% respectively. In addition, Morgan Stanley (MS 14.50, +0.36) gained 2.6%.

Telecommunications was one of the weakest sectors. Inteliquent (IQNT 12.14, -1.78) weighed down the group after posting earnings and revenues below-expectations. The company also lowered their full-year forecast. Today's 12.8% decline puts the stock back at its mid-May levels.

Shares of major pharmaceutical producers did not participate in today's advance. Elan (ELN 11.15, -0.10), Pfizer (PFE 23.74, -0.52), and Johnson & Johnson (JNJ 68.29, -0.55) announced that they will stop developing a treatment for Alzheimer's disease because of disappointing clinical results. All three stocks posted losses with Elan and Pfizer losing 0.9% and 2.1% respectively while Johnson & Johnson was off by 0.8%.

The dollar index was virtually unchanged as the dollar's performance against the major currencies was mixed. The reserve currency gained 0.5% against the Japanese yen, and currently trades near 78.60. The British pound advanced 0.2% against the greenback to near 1.5630. The euro came off session highs and ended unchanged versus the dollar. The single currency trades around 1.2400. Also of note, the Australian dollar crossed 1.0600 which was a level not seen in five months. The Aussie has pulled back slightly since, to 1.0555.

As earnings season winds down, a few notable companies have yet to report their quarterly results. Express Scripts (ESRX 56.02, +0.04), Priceline.com (PCLN 679.80, +14.68), and Walt Disney (DIS 49.81, +0.16) will release their earnings following today's close.

In addition, Dean Foods (DF 12.42, +0.20), Dish Network (DISH 30.67, +0.16), and Polo Ralph Lauren (RL 153.03, +2.97) will report tomorrow morning.

Tomorrow's economic data includes the MBA Mortgage Index due out at 7 AM ET.

In addition, preliminary nonfarm productivity and unit labor costs will be released at 8:30 AM ET. Treasury will auction off 10-yr notes.DJ30 +51.09 NASDAQ +25.95 SP500 +7.12 NASDAQ Adv/Vol/Dec 1599/1.85 bln/880 NYSE Adv/Vol/Dec 1949/728.4 mln/1065

3:30 pm : Energy: Sept crude oil ($92.30 +0.90) rallied this morning for over $1/barrel, off its session low of $90.63, which was hit 15 minutes after floor trading began. Crude went on to rise as high as $92.39 right when pit trading was ending.

Aug natural gas ($2.91 +0.03) started the overnight session and the early morning session in negative territory before gaining steam, which began an uptrend that has basically lasted since morning action. After bottoming out in the morning at $2.80, nat gas went on to climb 12 cents of 4.3% to its floor trading high of $2.92/MMBtu. In after hours trade, nat gas has extended those gains are just hit $2.94.

Metals: August gold ($1616.00 +7.20) and Sept silver ($27.87 +0.09) began to move higher this morning and rose to their session highs mid-morning (Gold $1617.90, Silver $27.95). Gold went on to inch lower for the rest of the session and in after hours activity, but has only pulled back $2 per ounce. Silver, in after hours trade, is back neat the unchanged mark. July copper closed 2 cents higher at $3.39.DJ30 +61.27 NASDAQ +27.49 SP500 +8.14 NASDAQ Adv/Vol/Dec 1615/1553.4 mln/855 NYSE Adv/Vol/Dec 1959/491 mln/1037

7:00PM Sigma Designs' Z-Wave approved for use in home control devices in Japan (SIGM) 6.83 +0.02 : Co announced that Japan's Ministry of Public Management, Home Affairs, and Telecommunications, has approved a radio frequency range for low-power RF device usage in Japan. As a direct result, Sigma Z-Wave-based control and automation devices for smart homes and small business can be used in the region without the need for radio station licensing. Z-Wave is one of Sigma Designs' fastest-growing technologies, and the company has seen significant worldwide adoption over the past few years, particularly in the smart home automation and control, security, telecommunications and energy markets.

4:39PM Photronics lowers Q3 guidance (PLAB) 6.14 +0.14 : Co issues downside guidance for Q3 (Jul), lowers EPS to $0.14-0.16 from $0.14-0.18 vs. $0.16 Capital IQ Consensus Estimate; lowers Q3 (Jul) revs to ~$116 mln from $118-123 mln vs. $121.83 mln Capital IQ Consensus Estimate. Third quarter revenue is expected to be lower than previously anticipated due to softening demand during the last few weeks of July for high-end integrated circuit (IC) and flat panel display (FPD) photomasks. "The general worldwide softness in demand for semiconductors and displays began to affect photomask orders especially high-end IC, principally memory, during the past few weeks."

4:18PM Pericom Semi beats by $0.02, beats on revs; guides Q1 revs in-line (PSEM) 8.17 -0.15 : Reports Q4 (Jun) earnings of $0.10 per share, $0.02 better than the Capital IQ Consensus Estimate of $0.08; revenues fell 12.5% year/year to $37.9 mln vs the $36.03 mln consensus. Co issues in-line guidance for Q1, sees Q1 revs of $36-40 mln vs. $37.06 mln Capital IQ Consensus Estimate. The co also sees Q3 non-GAAP gross margins to be in the 36.2% to 38.2% range. Non-GAAP operating expenses are expected to be in the range of $11.4 million to $11.9 million and the effective tax rate is expected to be approximately 24-30% on a non-GAAP basis.

4:13PM STEC misses by $0.01, reports revs in-line; guides Q3 EPS below consensus, revs below consensus (STEC) 7.52 -0.22 : Reports Q2 (Jun) loss of $0.27 per share, excluding non-recurring items, $0.01 worse than the Capital IQ Consensus Estimate of ($0.26); revenues fell 50.7% year/year to $40.7 mln vs the $41.02 mln consensus. Co issues downside guidance for Q3, sees EPS of $(0.31)-(0.27), excluding non-recurring items, vs. ($0.19) Capital IQ Consensus Estimate; sees Q3 revs of $40-42 mln vs. $48.83 mln Capital IQ Consensus Estimate.

4:05PM Cree beats by $0.02, reports revs in-line; mid-point of SepQ EPS guidance below consensus, revs below consensus (CREE) 26.34 +0.59 : Reports Q4 (Jun) earnings of $0.25 per share, excluding non-recurring items, $0.02 better than the Capital IQ Consensus Estimate of $0.23; revenues rose 26.2% year/year to $306.8 mln vs the $306.2 mln consensus. Co issues downside guidance for Q1 (Sep), sees EPS of $0.23-0.28, excluding non-recurring items, vs. $0.28 Capital IQ Consensus Estimate; sees Q1 revs of $305-325 mln vs. $328.7 mln Capital IQ Consensus Estimate.

8:49AM Silicon Labs: MaxLinear (MXL) files claims asserting Silicon Labs infringes MaxLinear patents used in a broad range of Silicon Labs' products (SLAB) 38.33 : MaxLinear (MXL) announced that it has filed counterclaims against Silicon Laboratories (SLAB) in U.S. District Court in the Southern District of California, San Diego Division. The patent counterclaims assert that a broad range of Silicon Laboratories' products spanning TV tuners and receivers, satellite and FM and multiband receivers, and wireless MCUs infringe one or more of three MaxLinear patents: United States Patent Nos. 7,362,178; 8,198,940; and 7,778,613. The counterclaims seek damages and an injunction to stop the sale of the infringing Silicon Laboratories products.

7:47AM RDA Microelectronics beats by $0.01; misses on revs; guides revs below consensus (RDA) 10.18 : Reports Q2 EPS of $0.32 vs $0.31 CIQ est; revs increased 40% YoY to $94.4 mln vs $96.1 mln CIQ est. For the third quarter of 2012, the co expects revenue to be in the range of $100-110 mln vs $$114.1 mln CIQ est. The co expects gross margins to be in the range of 30.8-31.2%.

AMD (AMD) launched its latest line of workstation graphics, leading with the AMD FirePro(TM) W9000 Graphics Processing Unit, according to co, the most powerful workstation graphics card ever created. Co also launched the AMD FirePro A300 Series Accelerated Processing Unit for entry-level and mainstream desktop workstations.

10:36 am S&P Information Technology trading higher today with gains in the broader market

The tech sector is trading higher today, inline with gains in the broader market. Semiconductors are showing relative strength, however, with the SOX trading 1.7% higher. NXPI (+6.9%) is a notable leader in the chip index. Among other major indices, the SPY is trading 0.7% higher today, while the QQQ and the NASDAQ are trading 0.8% higher on the session. Among tech bellwethers, CSCO (+2.2%) is showing notable weakness, while GOOG (-0.8%) is trending lower.

In earnings last night, LEAP (-22.3%) and TWTC (-2.7%) posted a qtrly misses, while JDAS (-1.6%) reported a mixed Q2 and BSFT (+29.5%) posted a beat. This morning, NUAN (-0.6%) reported a Q3 beat. In news, HTCH (+0.8%) named Richard Penn President and CEO and Wayne M. Fortun was appointed Chairman of the board.

Among notable analyst upgrades this morning in the tech space, AMAT (+3.2%), LSI (+4.3%), FLEX (+6.6%) and FSL (+8.8%) were upgraded at Goldman. In downgrades, LEAP (-22.3%) was downgraded at Baird and Hudson Square, while ATML (+3.8%) and SANM (-2.5%) were downgraded to Neutral at Goldman. RAX (+2.5%) is the notable name in tech scheduled to report quarterly results today after the close.
icon url

ReturntoSender

08/08/12 6:52 PM

#9858 RE: ReturntoSender #6755

From Briefing.com: 4:15 pm : Equities began today's session slightly lower before climbing back to break-even. The morning gains coincided with advances in European indices ahead of their close. After marking session highs near 1,404, the S&P 500 fell back to its unchanged level and stayed there for the remainder of the day.


Telecommunications sector outperformed the broader market as Cincinnati Bell (CBB 3.94, +0.20) advanced 5.4% following an earnings beat. The company also announced the IPO of its CyrusOne unit which operates Cincinnati Bell's data center business. Today's breakout lifted the shares back to levels last seen in late March of this year.

Consumer staples were lifted by Dean Foods (DF 17.46, +5.04) which announced the planned IPO of its organic food division, The WhiteWave Foods. Shares of the company soared by 40.6%, and today's buying brought the stock near its early July levels.

Bloomin' Brands (BLMN 12.41, +1.41), the parent company of Outback Steakhouse, began trading publicly this morning. After opening at $11.64 shares of the company surged by 12.8%.

Priceline.com (PCLN 562.32, -117.48) plunged 17.3% after missing on revenues. The company issued lower third quarter guidance, blaming the cloudy outlook on the persisting European debt crisis. Today's selling pressure dropped the stock down to levels not seen since mid-February.

Standard Chartered (SCBFF 21.10, +2.15) gained 11.4% as the investigation into the bank's illicit dealings with Iran continues. The stock has rebounded partially after falling 14.2% yesterday.

McDonald's (MCD 87.53, -1.48) reported flat same-store sales during the month of July. The report put a damper on third quarter earnings expectations for the fast food giant which ended lower by 1.7%.

Research in Motion (RIMM 7.62, +0.31) jumped to $8.25 following rumors of a potential partnership with Samsung. Samsung later denied having interest in a partnership, but shares of Research in Motion held on to some of their gains and ended higher by 4.2%.

Crude oil popped to a session high of $94.72 per barrel following larger-than-anticipated draw of 3.7 million barrels when a draw of 1.5 million was expected. The move was short-lived, however, and the energy component trended lower for the remainder of trade. Crude fell back into negative territory and slid below the $93.00 level moments before it settled with a 0.3% loss at $93.39.

Gold came off its session low of $1606.20 per ounce and broke into positive territory in mid-morning action. It brushed a session high of $1619.50 and spent the rest of the day chopping around just below that level. The yellow metal closed 0.2% higher at $1615.90 despite a stronger dollar. Silver also came off its session low of $27.70 per ounce that was set moments after trade opened. However, the white metal fell back into the red after it brushed its session high of $28.21 and settled 0.1% lower at $28.07.

Retailer Kohl's (KSS 52.06, +0.23) and fast food chain Wendy's (WEN 4.54, -0.01) are scheduled to report quarterly results before tomorrow's open.

A few economic data points will be reported tomorrow. Initial and continuing claims and the trade balance will be reported at 8:30 AM ET. In addition, wholesale inventories will be released at 10 AM ET.DJ30 +7.04 NASDAQ -4.61 SP500 +0.87 NASDAQ Adv/Vol/Dec 1089/1.82 bln/1388 NYSE Adv/Vol/Dec 1528/637.1 mln/1449

3:30 pm : Crude oil popped to a floor session high of $94.72 per barrel following stronger-than-anticipated inventory data that showed a draw of 3.7 million barrels when a draw of 1.5 million was expected. The move was short-lived, however, and the energy component trended lower for the remainder of pit trade. It fell back into negative territory and slid below the $93.00 level moments before it settled with a 0.3% loss at $93.39.

Natural gas spent its entire pit session in the red, dipping as low as $2.90 per MMBtu in afternoon action. It attempted to recover some losses as it headed into the close and finished the session 1.0% lower at $2.93 per MMBtu.

Gold came off its pit session low of $1606.20 per ounce and broke into positive territory in mid-morning action. It brushed a session high of $1619.50 and spent the rest of the day chopping around just below that level. It closed 0.2% higher at $1615.90 despite a stronger dollar. Silver also came off its session low of $27.70 per ounce that was set moments after floor trade opened. However, the metal fell back into the red after it brushed its session high of $28.21 and settled 0.1% lower at $28.07.DJ30 +19.80 NASDAQ -2.56 SP500 +1.55 NASDAQ Adv/Vol/Dec 1139/1.52 bln/1340 NYSE Adv/Vol/Dec 1497/431.5 mln/1444

4:03PM Diodes misses by $0.05, reports revs in-line; guides Q3 revs below consensus (DIOD) 18.89 -0.26 : Reports Q2 (Jun) earnings of $0.14 per share, excluding non-recurring items, $0.05 worse than the Capital IQ Consensus Estimate of $0.19; revenues fell 6.2% year/year to $159.2 mln vs the $159.57 mln consensus. Co issues downside guidance for Q3, sees Q3 revs of $162-170 mln vs. $173.23 mln Capital IQ Consensus Estimate. "As we look to the second half of 2012, we are approaching the challenging environment cautiously as we began to see demand moderate in June and growth in China is proving to be softer than expected. That said, we remain focused on executing on our profitable growth model...We expect gross margin to be 28 percent, plus or minus 2 percent."

9:11AM Hewlett-Packard raises Q3 EPS guidance; announces $8 bln services impairment; raises restructuring charge estimate; announces Enterprise Services mgmt changes (HPQ) 18.96 : Co issues upside guidance for Q3 (Jul), raises EPS to ~$1.00, excluding non-recurring items, from $0.94-0.97 vs. $0.97 Capital IQ Consensus Estimate. HP expects to record a non-cash pre-tax charge for the impairment of goodwill within its Services segment of ~$8 bln in the third quarter of its fiscal 2012. HP also updated the amount of the pre-tax charge it expects to record in the third quarter of fiscal 2012 in relation to its restructuring program announced on May 23, 2012. The change is primarily driven by a higher than anticipated acceptance rate under its early retirement program and faster than expected implementation of the workforce reduction program. Accordingly, HP now expects to record a pre-tax charge of ~$1.5 bln to $1.7 bln, an increase from its previous estimate of ~$1 bln, in its third quarter of fiscal 2012 that will be included in its GAAP financial results. Co announced that it has appointed Mike Nefkens, currently senior vice president and general manager of HP Enterprise Services (ES) -- EMEA, to lead HP ES on an acting basis. John Visentin, who previously ran HP ES, will be leaving the company to pursue other interests. HP also announced today that Jean-Jacques Charhon, senior vice president and chief financial officer of HP ES, was appointed chief operating officer for HP ES. Charhon will focus on increasing customer satisfaction and improving service delivery efficiency, which will help drive profitable growth.

Marvell (MRVL) and Yulong Telecommunication announced the new-generation Coolpad 8180 smartphone powered by the Marvell PXA920H chipset is available for China Mobile customers.

8:05AM Vishay Precision beats by $0.02, misses on revs; guides Q3 revs below consensus (VPG) 13.49 : Reports Q2 (Jun) earnings of $0.21 per share, $0.02 better than the Capital IQ Consensus Estimate of $0.19; revenues fell 11.0% year/year to $55.3 mln vs the $56.15 mln consensus. Co issues downside guidance for Q3, sees Q3 revs of $52-57 mln vs. $57.56 mln Capital IQ Consensus Estimate. "We expect that shipment of our products in the third quarter will be seasonally lower compared to first and second quarters of 2012. Europe currently represents approximately 41% of our total revenues and we typically experience a slowdown in that region during the third quarter."

6:15AM MEMC Elec beats by $0.16, beats on revs; sees 2nd half 2012 revs stronger then first half (WFR) 2.05 : Reports Q2 (Jun) earnings of $0.14 per share, $0.16 better than the Capital IQ Consensus Estimate of ($0.02); revenues rose 8.4% year/year to $808.4 mln vs the $748.21 mln consensus. GAAP gross margin in the 2012 second quarter was 13.2%, compared to 24.3% in the 2011 second quarter and 10.9% in the 2012 first quarter. Non-GAAP gross margin was 16.7% in the 2012 second quarter, compared to 25.2% in the 2011 second quarter and 10.0% in the 2012 first quarter. Second quarter 2011 GAAP and non-GAAP net income was positively impacted by $64.5 million, reflecting an after tax benefit of $132.6 million related to the LTA resolution, partially offset by $68.1 million in various other charges.

Outlook: Co sees Q3 Semiconductor revenue up 3% to 8% sequentially, Solar energy systems non-GAAP sales volume in the range of 40 MW to 60 MW. For FY12 co sees: Semiconductor revenue down 2% to 5% year-over-year. Revenue in second half 2012 stronger than in first half 2012. Solar energy systems non-GAAP sales volume greater than 400 MW.

Xilinx (XLNX) announced it has increased the peak processing performance of the Zynq-7000 All Programmable SoC family to 1 GHz, and is also providing smaller form factor packaging to enable higher system performance and programmable systems integration.

Cree (CREE $27.22 +0.88) reported second quarter earnings of $0.25 per share, excluding non-recurring items, $0.02 better than the Capital IQ consensus of $0.23, while revenues rose 26.2% year/year to $306.8 million versus the $306.2 million consensus. The company issued downside guidance for the first quarter with EPS of $0.23-0.28, excluding non-recurring items, versus the $0.28 consensus and revenues of $305-325 million versus the $328.7 million consensus.
icon url

ReturntoSender

08/09/12 9:08 PM

#9859 RE: ReturntoSender #6755

From Briefing.com: 4:20 pm : Today's session started on a down note. After a brief rise into positive territory, the S&P 500 turned negative at midday. The S&P 500 then recovered, but the index closed unchanged on the day.


Energy was one of today's top performers as coal stocks paced the advance.

Alpha Natural Resources (ANR 7.25, +0.95) surged 15.1% after yesterday's 9.0% drop following the company's disappointing earnings report. James River Coal (JRCC 2.52, +0.29) missed revenue forecasts by $2 million and reported a loss which was narrower than analysts had expected. Despite the mixed report, the stock soared 13.0%. Arch Coal (ACI 7.42, +0.49) advanced 7.1% as it benefited from the significant gains of other coal-related names.

The consumer discretionary sector was generally weaker, but post-earnings buying lifted some restaurant stocks within the space.

Red Robin Gourmet (RRGB 32.24, +3.56) jumped 12.4% after beating earnings expectations. The company also reported in-line revenues and expects comparable net restaurant sales for the remainder of the year. Competitor Brinker International (EAT 34.43, +1.87) climbed 5.7% after reporting in-line revenues and issuing upside guidance for fiscal year 2013. Shares of the company are at a 52-week high, and are approaching record highs near $35.50.

Consumer staples were today's main laggard. Monster Beverage (MNST 61.20, -6.57) plunged 9.7% after missing earnings expectations by $0.02 and missing revenue forecasts by $3 million. Monster peers Dr Pepper Snapple (DPS 45.01, -0.47) and Coca-Cola (KO 79.24, -0.32) shed 1.0% and 0.4% respectively.

The Dow Jones Transportation Average, which often serves as the bellwether for overall economic health, underperformed the broader market. Airlines weighed on the index with Delta Airlines (DAL 9.07, -0.32) down 3.4%, United Continental Holdings (UAL 17.89, -0.43) lower by 2.4% and JetBlue (JBLU 5.02, -0.11) off 2.1%.

In M&A news, Robbins & Myers (RBN 59.63, +12.83) announced it will be acquired by National Oilwell Varco (NOV 76.98, +0.64) for $60.00 per share in cash, representing a 28% premium to yesterday's closing price for RBN. Shares of Robbins & Myers soared 27.4% on the news.

Crude oil spent most of its session trading in choppy fashion. It stayed mostly in positive territory despite a stronger dollar. Crude set a session high of $94.21 per barrel in late morning action, but gave up its gains as it headed into the close. The energy component slid to a session low of $93.08 and recovered in time to settle just above the unchanged line at $93.42.

As the second quarter earnings season nears its end, few notable companies have yet to report. Educational services provider DeVry (DV 19.87, +0.19), fashion retailer Nordstrom (JWN 55.08, -0.37), and chipmaker NVidia (NVDA 14.71, +0.48) will report after today's close. In addition, department store operator J.C. Penney (JCP 22.10, +0.70) will report its quarterly results before Friday's open.

Today's volume was well below average as just over 575 million shares changed hands.

The latest weekly initial jobless claims count totaled 361,000, which was lower than the expected 375,000. The tally was also down from the prior week count of 365,000. As for continuing claims, they rose to about 3.332 million from 3.272 million.

The trade deficit narrowed to $42.9 billion during June after an upwardly revised prior month deficit of $48.0 billion. Economists polled by Briefing.com had expected that the June deficit would come in at $47.5 billion.

Wholesale inventories were down 0.2% in June which is lower than the increase of 0.3% that had been broadly forecasted.

Tomorrow's economic data releases are limited to export prices ex-agriculture and import prices ex-oil. These will be reported at 8:30 AM ET. In addition the Treasury budget will be announced at 2 PM ET.DJ30 -10.45 NASDAQ +7.39 SP500 +0.58 NASDAQ Adv/Vol/Dec 1368/1.63 bln/1097 NYSE Adv/Vol/Dec 1649/575.8 mln/1354

3:30 pm : Crude oil spent most of its pit session trading in choppy fashion. It mostly stayed in positive territory despite a stronger dollar. Crude set a session high of $94.21 per barrel in late morning action but gave up its gains as it headed into the close. It slid to a session low of $93.08 per barrel and recovered just in time to settle just above the unchanged line at $93.42 per barrel.

Natural gas popped to a session high of $3.12 per MMBtu following bullish inventory data that showed a build of 24 bcf when a build of 30 bcf was anticipated. However, it sold-off moments before pit trade closed and gave up most of the day's gains, settling just 0.3% higher at $2.94 per MMBtu. The plunge took prices down ~ 6% in just a matter of minutes.

Gold oscillated between positive and negative territory in today's pit trade. Moves came in response to weak Chinese data, better-than-expected U.S. weekly jobless claims and a narrower trade deficit.

Silver climbed out of the red in late morning action but lost momentum after it peaked at $28.15 per ounce. It spent the afternoon pit session near the unchanged line and settled 0.1% higher at $28.11 per ounce.DJ30 -4.51 NASDAQ 7.87 SP500 1.40 NASDAQ Adv/Vol/Dec 1363/1357.2/1074 NYSE Adv/Vol/Dec 1671/377 mln/1305

4:25PM NVIDIA beats by $0.05, beats on revs; guides Q3 revs above consensus (NVDA) 14.71 +0.48 : Reports Q2 (Jul) earnings of $0.27 per share, $0.05 better than the Capital IQ Consensus Estimate of $0.22; revenues rose 2.7% year/year to $1.04 bln vs the $1.01 bln consensus. Q3 non-GAAP gross margins are expected to be flat relative to the prior quarter, at 52.0 percent. Co issues upside guidance for Q3, sees Q3 revs of $1.15-1.25 bln vs. $1.1 bln Capital IQ Consensus Estimate. Co also sees non-GAAP operating expenses are expected to be approximately $350 million. Q3 GAAP and non-GAAP tax rates are expected to be approximately 20 percent, plus or minus one percentage point, excluding any discrete tax events that may occur during the quarter, which, if realized, may increase or decrease our third quarter GAAP and non-GAAP tax rates. If the U.S. research tax credit is reinstated into tax law, the co estimates annual effective tax rate for the fiscal year 2013 to be approximately 16 percent. They estimate depreciation and amortization for the third quarter to be approximately $57 million to $59 million. Capital expenditures are expected to be in the range of $30 million to $40 million.

4:12PM Amtech Systems beats by $0.21, beats on revs; guides Q4 revs below consensus (ASYS) 4.11 +0.15 : Reports Q3 (Jun) loss of $0.31 per share, $0.21 better than the Capital IQ Consensus Estimate of ($0.52); revenues fell 66.2% year/year to $24.3 mln vs the $19.27 mln consensus. Co issues downside guidance for Q4, sees Q4 revs of $15-$17 mln vs. $22.78 mln Capital IQ Consensus Estimate. Co states, "The supply/demand imbalance for solar cells and modules continues to negatively impact the entire solar supply chain... Gross margin percentage in the September quarter is expected to be similar to the June quarter. Total SG&A and R&D expenses are expected to be lower. The company expects to incur a net loss in the fourth quarter."

4:02PM Amtech Systems announces further cost reductions; expects annual expense savings of $6-$7 million in Fiscal 2013 (ASYS) 4.11 +0.15 : The savings will come primarily from selling, general and administrative, and non-essential research and development costs.

4:03PM Brooks Automation misses by $0.05, misses on revs; guides Q4 EPS below consensus (BRKS) 9.57 +0.00 : Reports Q3 (Jun) earnings of $0.14 per share, $0.05 worse than the Capital IQ Consensus Estimate of $0.19; revenues fell 24.6% year/year to $140.4 mln vs the $144.25 mln consensus.

Co issues downside guidance for Q4, sees EPS of $0.00-0.16 vs. $0.19 Capital IQ Consensus Estimate. Revenues are expected to decrease between 15 and 20%.

"While we achieved the bottom end of our revenue guidance in an increasingly difficult market environment, the mix of those revenues resulted in our net income slightly below our earnings guidance."

NDS, part of Cisco (CSCO), and Canal Digital, the leading DTH pay-TV provider in the Nordics, today announced that they are collaborating to launch a next-generation TV platform as a hosted, managed service. Enabling both satellite and Over-the-Top service delivery, the new platform will allow Canal Digital subscribers to access content anytime, anywhere and on multiple devices, whether in the home or on the go.

ARM (ARMH) and Cadence Design Systems (CDNS) announced the availability of the first in a series of combined solutions enabling designers to improve performance, power and time-to-market for ARM Cortex-A series processor-based system-on-chips

O2Micro International (OIIM) announced that it was issued 20 claims under United States patent number 8,219,333 for its Battery Management System Protection invention. Analog Devices (ADI) introduced two multiplexers that are able to guarantee latch-up prevention in high-voltage industrial applications operating up to 22 V.

09:08 am Apple initiated with a Buy at Stifel Nicolaus; tgt $825: . Stifel Nicolaus initiates AAPL with a Buy and price target of $825 saying the co's off-balance sheet inventory and manufacturing investments, which have a historically high correlation with forward revenue/shipments, imply material upside to their/consensus estimates; indicative of significant/positive fall product transition story. Firm also says a major near-term catalyst is Apple's widely-anticipated iPhone 5 launch in September/October. As part of this release, the firm will be focused on an LTE support at China Mobile, the world's largest carrier at +683 mln mobile subs (67 mln 3G subs). Based on Apple's success at China Unicom (~30% 3G penetration), they model China Mobile to offer as much as $6 of incremental EPS in 2013.

10:56 am Technology Sector is trading higher today along with the broader market

The tech sector is trading higher today, ahead of slight gains in the broader market. Semiconductors are showing relative strength with the SOX trading 0.6% higher. Within the chip index, WFR (+7.5%) is again a notable standout. Among other major indices, the SPY is trading 0.1% higher today, while the QQQ and the NASDAQ are trading 0.3% higher on the session. Among tech bellwethers, CSCO (+2.4%) is showing notable strength, while T (-0.7%) is under moderate pressure today.

In earnings last night, SGI (+22.7%) posted a mixed quarter, but offered upside guidance. CTL (+2.2%) reported upside EPS and inline revs, while the company generally guided inline. This morning, HIMX (+5.4%) raised its guidance, while FXCM (-7.2%) posted a mixed quarter, CCOI (-4.7%) missed ests and OSIS (+6.9%) posted a beat. In news, VRNG (-3.5%) announced a $31 mln offering, as well as announced that it had entered into a Patent Purchase Agreement with NOK (+3.4%). Among rumors, Samsung shot down recent speculation that it was interested in RIMM (+1.8%).

Among notable analyst upgrades this morning in the tech space, CSCO (+2.4%) was upgraded to Overweight at Piper Jaffray, it was also added to Conviction Buy List. On the other end, NTAP (-1.2%) was downgraded to Hold at Cantor. NVDA (+0.8%) is the only notable name in tech scheduled to report quarterly results today after the close.
icon url

ReturntoSender

08/12/12 11:23 AM

#9861 RE: ReturntoSender #6755

InvestmentHouse Weekend Market Summary - ECRI Update: 'We are in Recession'

http://www.investmenthouse.com/weekendmarketsummary.htm

- Weak Chinese exports slow the market rally. Yeah, right.
- Some say 'get out!' of the market. Again? Who is left?
- ECRI Update: 'We are in recession'
- And the key is . . . still no jobs.
- Of course the market has to test from here, right?

Chinese exports blamed for the sluggish market.

Friday we were told the market was sluggish because Chinese exports were down. It was just a 1% growth rate versus 8% expected. Exports to Europe were down 16%. Surely the market was feeding off of that bad news. But hold on. This entire move has been based in part upon the thesis that China was slowing and would have to come forth with more economic stimulus. Earlier this week the market supposedly rallied due to a weaker China and the need for stimulus. So what the heck is going on? It is the usual game of "pin the tail on the reason for the market action" that the financial stations play every day. You cannot listen to what the financial stations and experts are saying. Number one, most of them are talking their own book. Number two, a bunch of journalism majors out there are reading what the little parrots (who are talking their own book) are whispering into their ears.

Thus we get the incongruous results. One day the market rallies on the fact that China is weak and may have to come up with stimulus, and the ECB and the US may come up with stimulus. Then on another day in the same week, it is supposedly down for the very same reasons. Thus you see my somewhat humorous pictures of the Chinese representative telling Joe Biden saying, "Sorry, but we will not be able to buy as many Treasuries as you may have wanted." And then you see the China ship listing because it has been buying so many US Treasuries. Let's face it: If China has a serious economic slowdown, it will not want to buy as many. It will not have to because it won't have to support such a huge trade deficit. And if China's people decide that they are consumers, that they actually have wealth, we could have the same problem again.

In any event, this was the news blamed for a relatively sluggish session in the market. But it was not that sluggish. While the market did start lower, and futures were even negative, basically they rallied from the open. While it was lackluster, they did spurt higher late in the day. That brought nearly all of the indices back to positive. It was sluggish, but it was not necessarily because of China.

SP500, +0.22%; NASDAQ, +0.07%; Dow, +0.32; SP600, -0.11%; SOX, +0.49%.

It was sluggish, but they did come back. But sluggish because of China? They rallied earlier in the week because of China. Could it possibly be the result of a good move to the upside right below prior post-bear market highs and let need for a bit of consolidation? Yes. As I discussed on Thursday, this is good action. A lateral move, consolidating, reaching lower, and then the rebound on Friday. It shows that that the buyers are still there. The sellers are absent, and the market is just taking a pause. Perhaps it is a pause that refreshes.

Time to Get Out! of the market?

Some are saying 'Get Out!' Not so fast.

I am struck in the last couple of days by a lot of people saying to simply get out of the market. I have the Amityville Horror poster saying "For God's sake, get out!" but is it really that bad? Is the market ready to implode? Looking at the economic conditions, things are not great by any stretch. We will see the GDP get written down from 1.5%, which is already terrible. Consumption data as well as the Wholesale Inventories were grossly miss-guessed in the first iteration, and they will come down. We could already be in recession -- even the technical, textbook version of it.

Do we really need to get out just because of that? Typically, yes, but we have something else on the table that I have talked about extensively. Indeed, this whole rally has been based on this Fed injection. We may get something from the Chinese now. Europe is sure that it will do something any day. We were told that on Friday. And the US is still there if things do not improve; in other words, if the trumped-up jobs report that shows 163K jobs gets to the point where they cannot even make up numbers as they did this July. Then we will have US stimulus coming as well. That is what the market is rising upon.

Longer term, things do not look good for the economy. It cannot continue to escape death simply by the Fed promising money injections, and even injecting money into the system. As we have seen for the last three years, that keeps things alive and stumbling along on a liquidity hydroplane, but it does not get you to sustained, supportable, and expanding economic growth.

But nearer term, it is that liquidity that is doing the trick for financial assets. It is the very fact that the economy is so bad that the liquidity is keeping the market higher. On CNBC Thursday, Art Cashin discussed how there are piles of cash on the sidelines not being utilized. Banks get them. They have the money, but they don't want to lend it because they want to put the money into sure things. There are the bond deals, etc. where they can get guaranteed income. Even those that have good enough credit scores to borrow are not borrowing. What would they do with the money? Business is not good enough. They are not going to hire anybody due to regulations and the uncertainty and expense associated with them.

So the money sits there, but not really. Remember, I said that the banks invest it to make sure returns. That is why we are seeing oil go up, gold rise, and why we see commodities starting to rise again. That is why stocks are higher as well. The money is not all left in the vault; it is put into the stock market. In the near term, that is exactly why we are seeing the market rise. The economy? No. It does not support this move one iota. Indeed, the small caps are lagging this move because of that. They are showing us that this is not a great economy. It is all about the dollar. And it is not its value, but the dollars that the Fed is printing or putting into the system through low interest rates, through Operation Twist, and through repos that we saw last week that pumped $500M into the market just like that.

So we were told that the market is a bit sluggish for the past couple of days because of this China thing. No, the China thing, along with other things affecting the other economies, is what is keeping the stock markets around the world moving higher right now. It is the promise of (and the fact of) excess liquidity in the system.

OTHER MARKETS.

Dollar. 1.2295 versus 1.2293 euro. The dollar was flat. The dollar overall is somewhat higher on the week, but it is still in a downtrend over the past three weeks. That does not mean it is in a downtrend overall. It is trying to move higher, although it could see an abrupt and ugly entry if the Fed does anything. Right now there is tension. The ECB says it will come forth with stimulus, and that is seen as a more probable outcome than the US doing anything near term. Thus we see the dollar holding at support even though it should be fading given what the US economy is doing -- it is weakening. Currencies weaken when the economy weakens and with the promise --or shall I say threat -- of more stimulus.

Bonds. 1.64% versus 1.69% 10 year US Treasury. Bonds bounced right back to the upside on the safe haven idea based upon the other economic data. Maybe, maybe not. There has been a break over the last three weeks, and then bonds broke below the 50 day EMA and support from the June consolidation. They bumped right back above that with a little gap on Friday. The next moves will be important. Do they break down further? If the Fed will not be buying bonds, I guess they would lose a little value and rates would rise. I will talk more about that later.

Gold. 1623.60, +3.40. Gold continues to rise. Not a huge move, but gold continues to push and press to the upside. It wants to break away. We have all the talk of liquidity being a sure deal. We have China having problems, and it will likely put more stimulus into the picture. The US will have to do that because the economic data is good enough. Considering all of that, then gold prices would rise. The thing is, and this is the big thing, gold is not anywhere near where it needs to be. Gold should be stronger than this based on what we have seen in the past in terms of problems with the ECB and with China. It is not happening this time. Last summer when the ECB was struggling, look what happened with gold. Gold spiked from 1500 to close to 2K. It was at 1915 on the high. A huge run. We have tremendous problems right now. Indeed, they are worse problems than we had last summer. We have massive unemployment in Spain, Italy, and Greece; there are massively high yields to their bonds and huge spreads. And the answer is more debt? Hmm. Okay. In any event, gold wants to go up. When it breaks, it will break big.

Oil. 92.87, -0.49. Oil was down slightly on the session. It has been running on a tear, and it took a little pause over the week. A nice break to the upside, a lateral move, and setting up a new move higher above the 10 day EMA. We had this downtrend from May into late June, and now we are swinging back to the upside. You have noticed gasoline prices rising. The import prices that we just reported this week will be out the window because oil is right back up. It does not look like oil will go lower. Why not? Because you can talk about the problems all over the world -- and there are problems, do not get me wrong. Iran and Israel pose a big problem. You have Russia getting involved with it, and they are a major oil producer. We have fires in some California refineries and shutdowns. There is upward pressure in any event. But there is also the inflation pressures that I believe will take over relatively quickly. It is not inflation itself; it is the fear of inflation that drives these commodities higher. They move in advance. They do not wait until there is inflation and then take off. We will see these commodities start to bleed higher even more so. Droughts do not help. Geopolitical tensions do not help. We will see this pressure continue from various fronts as we move forward.

TECHNICAL SUMMARY

Internals.

Volume. NASDAQ 1.55B, -7%; NYSE 508M, -1.36%. Volume fell to significantly lower levels. Thursday we went over the declines in the NYSE volume year-over-year and year-to-date. Impressive numbers in the 15%+ range.

Breadth. NASDAQ -1.2:1; NYSE +1.2:1. Breadth was nondescript.

THE CHARTS

SP500. The SP500 rallied to a new rally high off of the June low, and then it moved laterally. It did not want to give up any gains. It sold back on that China scare early on Friday, but then it recovered nicely. It is nice action, indeed, because it reached lower toward the 10 day EMA and rebounded for a modest gain. We are not so worried about the gain; we liked the dip and the recovery. Still showing no sellers coming in. Buyers are a bit slack right now. They are not rushing in, but they let it dip, they let it recover, and they are still holding their gains. The market is stingy. The does not want to give up the gains even though it is right below the post-bear market highs. As I said before, this can end at any point. It can fall on Monday. But the fact that the sellers are gone is a good indication. It gives the market a chance to rest and then to work laterally, maybe a little lower, and then springboard up toward the new highs. It seems crazy. It does not seem logical with this terrible economy, but we have the promise of all that extra liquidity.

NASDAQ. NASDAQ showed the same action. It started lower with a gap. It held the lows of Wednesday and Thursday and rebounded to a modest gain. Just barely positive, but it is the same action. It is holding above the July peaks, moving laterally, waiting for that 10 day EMA to rise up to it. Perhaps NASDAQ can make a run at the post-bear market highs around 3135. You cannot complain about the way it is holding up and the way that techs have shown relative strength -- maybe not on this session, but over the past couple of weeks.

SP600. It makes no sense that SP600 should be rising. It is moving laterally, waiting on the 10 day EMA. They are lagging because the economy is lagging, but they are also rising and following the rest of the indices simply because of the liquidity out; there. There is no reason they shouldn't continue to follow. If the other indices break higher, they should as well. They are very important to watch, though, because if they do break and the rest of the indices do not, that would be an indication that the economic data is finally catching up to the stimulus. At some point, liquidity will not be able to hold the dam. It will break and things will cascade down if we do not change what we are doing. We are not there yet at all. Liquidity is doing its trick, and the SP600 is able to rise even though the economic outlook is tepid.

SOX. SOX posted a decent gain, up 0.5%. It is continuing its steady rise over the last four weeks. It broke right through the 200 day EMA this week, and it kept on going. It is not near its prior peaks. It is more into prior resistance than anything else, and it is primed for a pullback. It is matching the January consolidation, the March dip, the April dip, and a gap point from late April. It is at a resistance point, and it has had a solid steady run to the upside. A pullback to test would be great. Indeed, we would like to see that from all of the indices to start next week. Not a big test, but just a dip back down. They have been moving laterally, and that leaves them a little vulnerable. The longer they move laterally, the better chance they have of moving to the upside. But it is always nice to get a little of the fluff out and then make the run higher. But the market will do what wants it do, and we will play whatever it does.

LEADERSHIP

Energy. For the last couple of weeks we have seen the energy stocks, particularly small energy stocks, performing well. They are turning the corner and are rallying. Friday was not a bad day for them at all. PH is industrials equipment but also energy-related equipment. It has turned the corner and is moving up quite nicely. PTEN has done well. It took a day off, but it held its gains. XEC is moving higher and had enjoyed a nice 2%+ day on Friday as well. PVA was flat to down on the session, but it was solid overall with a nice breakout.

Retail. Retail still looks decent. AMZN is setting up nicely. M reported good earnings on the week. It gapped it up, and it is kind of working laterally now. Even WFM sold off, gapped back up, and is in the bottom trendline of its channel. It could make the rally back to the upside. RL gapped down on earnings, but it is coming back and is still trying to form this rounded bottom and continue the move to the upside. It is not perfect in retail; there were a lot of implosions as well. It is tough to see retail continuing given the plight of the American worker, the lack of jobs, and the very slow (basically zero) growth in wages. I will talk about that when I discuss the ECRI call again. They are hanging in there in many circumstances.

Telecom. HLIT looks as if it is rounding the corner, breaking higher and testing. Looks like wants to move higher. EGHT broke higher, and it is fading to test now.

Technology. I have talked about technology with software and semiconductors, and they continue to perform. FFIV broke higher and is testing. It might lead to another entry point. FLEX had a nice gap through the 200 day EMA and some other resistance. It had a very nice test to end the week. There is room for it to run, I suppose, although it would have to get further ahead. It looks like it needs a little bit more upside potential. We will check those numbers out, but you get the idea.

There are stocks in these positions that we are looking at and looking for as they make the turns off of the bottom. That is really what this move is about right now: Catching stocks that are turning off the bottom and coming in to help out and give the rally to the upside more support to push it through those prior post bear market highs. But it will need something, and that would be more stocks. What do those more stocks need? A reason to move higher. And that would be all that liquidity in the market looking for new places to go. That would be these stocks that are turning back up. They are just saying, "Fine. If the money is coming, we will put it into the market." As they turn, they get more money thrown to them, and they provide support for where the indices are now and push them further to the upside.

THE ECONOMY

TO VIEW THE ECONOMY VIDEO CLICK THE FOLLOWING LINK:
Economy Summary Video

ECRI: 'We are likely in recession now.'

Leading indicator is bumping down with lower and lower highs.

ECRI is surprised that the leading indicator IS AS WEAK AS IT IS given all of the cash and liquidity added to the system.

Chronology is the same as it was in the original call. If not Q1 then in mid-2012

Conclusion: There is no jobs growth (Duh!). This is a hallmark of recessions, and thus the argument we are not in a recession because of current government figures adjusted to make things appear better is not hiding the salient factor in a recession: no jobs.

Look at Clinton and Reagan, the best performers far and away. This is the boom That Reagan started, Bush almost screwed up, and Clinton reinvigorated.

Look at Obama's standing in this group. You say your policies are the same as President Clinton's? You say your way is 'working' Mr. Obama? You are WRONG, horribly so, on both counts.

ECRI: Yo-yo economy with more and more recessions. More frequent recessions mean you destroy the ability to grow income.

Companies have to squeeze costs to maintain profitability, and humans, workers, are costs.

The alarming result: People in prime earnings years (35 to 54) they have lost jobs over the past two years. This is the time in your life you make your most money.

The people at work are those 55 and over because they have to work longer because they lost their money.

Our Conclusion: As noted, manufacturing and trade sales peaked in December 2011 and as a result business are not and will not hire more. Thus there won't be new jobs under this cycle and under these policies that PROLONG this cycle versus letting it clear.

Economy is slipping into recession or is there. If have more recessions, high employment is here to stay along with long duration employment that takes a LONG expansion to bring it down.

Question: when will people realize what is going on? They are frogs in a pot of warming water. When they are boiling they realize they are in serious trouble and have to act or die.

What are some policies that are worth noting that are different between the Reagan era that started THE big boom for the US economy and the past 20 years?

Back when Reagan launched his ambitious Emergency Economic Recovery Act of 1981 interest rates and inflation had exploded. Carter's big government, big spending, big regulation policies compounded the Nixon-era slowdown and sent the country into, by Carter's own words, a 'crisis of confidence,' later attributed as his 'malaise' speech.

Carter's last laugh? 'And you thought there was a crisis of confidence under me!'

Reagan policies energized investment in the US once again. If you took a chance and were right, you would get to reap the reward, keep your gains without government crawling down your shirt.

At the same time, Federal Reserve Chairman Volcker, scared to death inflation would explode higher (reality check: it ALREADY had), hiked interest rates. A well-known story is told where one of Volcker's aides stormed into his office and asked if Volcker wanted to be the Fed head at the time inflation spiraled out of control. That so unnerved Volcker he agreed to start hiking interest rates.

Lo and behold, the twin policies of creating incentives to invest in the US and buy capital goods and create new businesses coupled with prudently tight monetary policy propelled domestic investment and entrepreneurship, kept the dollar strong so others wanted to invest in the US, exploded growth, and in so doing, inflation melted away. Supply, innovation, and production created new jobs, created new wealth, and exploded demand.

What have we had since? A Fed that was so afraid of messing up the streak that each time an inevitable and normal recession came along, a dip in the business cycle from 10+% growth, they panicked and cut interest rates. Again and again the Fed cut rates, cheapening our currency. We came to rely upon Fed rate cuts versus sound fiscal policy as displayed under Reagan and to a lesser extent Clinton to create prosperity.

In so doing we shifted what generated our wealth and increasing standard of living from investment in the US with continued attempts at keeping demand spiking higher. Economy slows and consumers get a bit slow, add more money they can spend. Time and again this was done even as the regulations were tightened again after loosening under Reagan and some under Clinton. Less business investment, more spiking of consumer demand.

Is it ANY WONDER we lost our manufacturing base? When Greenspan broke the stock market rally and economy in 2000 by draining all liquidity from the system, the job was done. Business investment ended in the US for three years. It went overseas along with the jobs we COULD have created but opted to cede to foreign countries. There was no longer investment in the US, just decreasing the value of the dollar to spike more demand.

Do you remember the 'experts' at the time saying the dollar had been too high for too long and this was just a reversion? Why was it higher? Because the US was the BEST place in the world for business and EVERYONE flocked to it to invest their money. That made dollars very valuable: demand was great, so was the value. When we stopped encouraging investment through our regulations and with the Fed in an overarching easing mode year after year, we were no longer the place to invest. Enter China, India, Brazil, South Korea, Indonesia, etc.

Instead of fighting the problem by going back to what works we sped up the devaluation of our currency and added more and more federal programs that saddled more regulations and cost on businesses. Investment fell further and further.

Now we are at the crisis point. A $16T debt that is really $70T. No investment, no jobs. A Fed hell bent on keeping our currency worthless. An administration that says it is business friendly as it passes policies that have raised the cost per employee on small businesses to $10K per worker per year. If you were a foreign company would you want to put your money into that environment? They have spoken, and they are not. The only thing they are doing is buying our Treasuries so we stay afloat in the hope we will someday make a comeback and can pay off our debts to them.

THE MARKET

SENTIMENT INDICATORS

VIX. The VIX continues to drop. It dropped significantly on a relatively modest rise on Friday. It is still above the March consolidation lows, so there is still room before there is any pressure. But remember, last time it looked as if the market was going to fall. It did not tank, it just corrected. Volatility bounced up slightly higher, and then the move early this week plopped it right back down. You can argue that volatility is getting to the point where it does not seem to want to move lower. That would suggest a move higher. That would also suggest market selling. But that is a tricky game to get into. It is suggesting there is some top-heaviness, but it has not stalled the move yet.

VIX: 14.74; -0.54
VXN: 15.89; -0.52
VXO: 13.89; -0.11

Put/Call Ratio (CBOE): 0.99; +0.13

Bulls versus Bears

This is a reading of the number of bullish investment advisors versus bearish advisors. The reason you look at this is that it gives you an idea of how bullish investors are. If they are too bullish then everyone is in the market and it is heading for a top: if everyone wants to be in the market, then all the money is in and there is no more new cash to drive it higher. On the other side of the spectrum if there are a lot of bears then there is a lot of cash on the sideline, and as the market rallies it drags that cash in as the bears give in. That cash provides the market the fuel to move higher. If bears are low it is the same as a lot of bulls: everyone is in and the market does not have the cash to drive it higher.

Bulls: 43.6% versus 39.4% versus 40.4%. Bulls traded at this level three weeks back, slipped in the last leg lower but have charged back . . now that the market has rallied nicely, putting in a higher high in the rally. Undercut 35%, the threshold for bullishness, in early June. You would expect it to rise and it has. Still not at a dangerous level, just working as it should. As noted, hit 34% in early June. It did its job and the market is on the rally. Hard drop to 34 from 39.3% as economic reality and a choppy stock market hit. Off the 55+ level hit in late February. That was the highest level since April and May of 2011, the peak of the post-bear market high. 35% is the threshold level suggesting bullishness. To be seriously bearish it needs to get up to the 60% to 65% level.

Bears: 25.5% versus 27.7% versus 26.6%. A jump from 24.5% a month back where bears hibernated for several weeks, and now easing back as the market rallies and bulls breed larger numbers. Never made it to the 35% that can be a bullish indication, but the bulls were weak enough back in June. Over 35% is the threshold to be really be a good upside indicator. For reference, bearishness hit a 5 year high at 54.4% the last week of October 2008. The move over 50 took bearish sentiment to its highest level since 1995. Extreme negative sentiment. Prior levels for comparison: Bearishness peaked at 37.4% in September 2007. It topped the June 2006 peak (36%) on that run. That June peak eclipsed the March 2006 high (33%) and well above the 2005 highs that spawned new rallies (30% in May 2005, 29.2% in October 2005). That was a huge turn, unlike any seen in recent history.

NASDAQ

Stats: +2.22 points (+0.07%) to close at 3020.86
Volume: 1.547B (-6.92%)

Up Volume: 794.2M (-215.8M)
Down Volume: 732.91M (+81.33M)

A/D and Hi/Lo: Decliners led 1.21 to 1
Previous Session: Advancers led 1.21 to 1

New Highs: 46 (-15)
New Lows: 35 (-3)

SP500/NYSE

Stats: +3.07 points (+0.22%) to close at 1405.87
NYSE Volume: 508M (-1.36%)

A/D and Hi/Lo: Advancers led 1.19 to 1
Previous Session: Advancers led 1.26 to 1

New Highs: 109 (-28)
New Lows: 7 (-3)

DJ30

Stats: +42.76 points (+0.32%) to close at 13207.95
Volume: 86M shares Friday versus 84M shares Thursday and 85M shares Wednesday.

MONDAY

The economic data ramps up next week. It does not start on Monday, but on Tuesday we get Retail Sales. That is very important. They were down 0.5% in June. We will see if they are catching a little back-to-school wind in the sales in July. PPI is out as well. Business inventories will be important given that Wholesale Inventories showed a surprise and strong decline.

On Wednesday we have a lot more info. There is the CPI, the Empire Manufacturing Report, and industrial production and utilization. All very important. On Thursday we have initial claims, housing starts, building permits, and the Philly Fed. Friday Michigan Sentiment will be the next important read. There was a bit of a bump higher from a tank lower back in June. June down and July up. We will see where August heads. There is plenty of action next week along with some more earnings, but they are starting to wind down.

Back to the market. We had a rally that took the SP500 and NASDAQ to a higher high on this rally, and just below the prior post-bear market highs. They are bumping up against the resistance, and they have run quite decently on this last leg. We are a bit extended. What will happen? They could sell off. They could break out. They could continue to consolidate. Thus far the sellers have not materialized. The buyers have just stopped buying with any sense of strength for now, and the market is just working laterally. Surely after this move it has to come back and test. After all, we had problems with China weighing on the market. We are likely to get more problems from Europe and other areas. But things are so bad that it is the "bad is good" scenario. If we get bad news, that just means more chance of stimulus, at least in the eyes of the market. This whole move has been based upon that belief.

You would think it has to come back and test nonetheless. We would love that. We would like a bit of a pullback to begin the week. A slide back to the 10 day EMA on SP500, or a slide back to the July peaks on NASDAQ. That would be great because then they could bounce from there and run, or do whatever. Whether they make new highs or not, you would think they could put in a good, solid effort and at least give them a run for their money.

There are many patterns that continue to look good enough to help carry the market higher. There are not thousands out there doing this. Implosions. That is a problem of the weaker economy. As companies report weaker earnings as a result of the economy, they get punished for it. But enough have reported better than expected earnings and did not kill themselves on guidance that they are still moving higher. That is assisting the market move.

We might get a little pullback to start the week. We said that this week it broke the string of nine down Mondays. But this has been a run, it has moved laterally, and the catalyst could be there to send it higher. But the real catalyst at this point will be a pullback to a near support level, and then the renewed belief of some form of stimulus. With a little bit of pullback and some of the fluff taken out of the market gains, they will be ready to move up again barring any major changes in the news. The news has been bad enough. If we get some geopolitical issues, though, then we have problems. That is the wild card that scares people. They kind of have a handle on this debt crisis and the coming stimulus for now. I do not think they grasp how horrific it could be in the future. They do have a handle on what they think it is for now. With that, the market can rally even though not a lot of people are excited about this.

We did see the bulls climb pretty sharply and the bears fall fairly significantly. But they were not major moves. It is enough to show that people are starting to buy into this now that we are up since early June. That is a bit disconcerting because the more people buy into it, the less chance we have of a significant move higher. The people that are in the market -- the few that are there from what we are told -- use up their ammo and have nothing else to put into it.

That still means that these prior highs will be quite important no matter what the market does near term. A little pullback and rally. Obviously whether or not they can take out those prior highs will be the peak. They are close. If they make any kind of significant move from here, they have to break on through to the other side as the Doors sang about.

We will see if the market can turn this consolidation, this little handle, into a new run to the upside this coming week. Have a great weekend!

Support and resistance

NASDAQ: Closed at 3020.86
Resistance:
3024 is the gap point from early May
3026 from 10/2000 low
3042 from 5/2000 low
3076 is the late April 2012 high
3090 is the mid-March interim high
3134 is the March 2012 post-bear market peak
3227 is the April 2000 intraday low
3401 is the May 2000 closing low

Support:
3000 is the February 2012 post-bear market high
2988 is the July 2012 high
2962 is the April 2012 low
2950 is the mid-April closing low
The 50 day EMA at 2927
2942 is the mid-June 2012 high
2910 is the March 2012 low
2900 is the March 2012 low
2888 is the May 2011 peak and PRIOR post-bear market high
2879 is the July 2011 peak
2866 is the July 2012 closing low
2862 is the 2007 peak
The 200 day SMA at 2850
2841 is the February 2011 peak
2816 is the early April 2011 peak.
2810 is the low in the shoulders
2754 is the October 2011 high
2706 to 2705 is the April 2011 low and the February 2011 and consolidation low (bottom of the trading range) 2723 to 2705 is the range of support at the bottom of the January to May trading range
2686 is the January 2011 closing low
2676 is the January 2010 low and the December 2011 peak
2645-2650ish from December 2010 consolidation
2643 is the September 2011 high
2612 is the late August 2011 peak
2603 is the March 2011 intraday low (post-Japan low)
2599 is the June 2011 low and NASDAQ

S&P 500: Closed at 1405.87

Resistance:
1406 is the early May 2012 peak
1422.38 is the Post-bear market high (March 2012)
1425 from May 2008 closing highs
1433 from August 2007 closing lows
1440 from November 2007 closing lows

Support:
1378 is the February 2012 peak
1375 is the early July 2012 peak
1371 is the May 2011 peak, the post-bear market high
1363.46 is June 2012 high
The 50 day EMA at 1362
1359 is the April 2012 low
1357 is the July 2011 peak
1344 is the February 2011 peak
1340 is the early April 2011 peak
1332 is the early March 2011 peak
The 200 day SMA at 1326
1325 is the July 2012 intraday low
1309 is the right shoulder low from June 2012
1295 to 1294 is the April 2011 low and the February 2011 consolidation low (bottom of the trading range)
1293 is the October 2011 peak
1275 is the January 2010 low, early January 2011 peak
1267 is the December 2011 peak
1258 is June 2011 intraday low
1255 is the late December 2010 consolidation range
1249 is the March 2011 low (post-Japan)
1235 is the mid-December 2010 consolidation low
1231 is the late August 2011 peak
1227 is the November 2010 peak
1220 is the April 2010 peak
1209 is the mid-August 2011 high

Dow: Closed at 13,207.95
Resistance:
13,297 is the April 2012, post bear market high
13,668 from 12-2007 peak
13,692 from 6-2007 peak
14,022 from 7-07 peak

Support:
13,058 from the May 2008 peak on that bounce in the selling
13,056 is the February 2012 high
12,971 is the early July 2012 high
The 50 day EMA at 12,854
12,754 is the July intraday peak
12,716 is the April 2012 closing low
The 200 day SMA at 12,620
12,391 is the February 2011 peak
12,369 is the left shoulder low from May 2012
12,284 is the October 2011 peak
12,258 is the December 2011 peak
12,110 from the March 2007 closing low
12,094 is the April 2011 low
The June low at 11,897 (closing)
11,734 from 11-98 peak
11,717 is the late August 2011 peak
The August low at 11,702
11,555 is the March low
11,452 is the November 2010 peak
11,178 from November 2010
10,978 is the bottom of the November 2010 consolidation
10,750 from September 2010
10,720 is the August closing low
10,705-710 from January 2010 peak
10,694-700 from August 2010 peak

Economic Calendar

August 7 - Tuesday
- Consumer Credit, June (15:00): $6.5B actual versus $10.0B expected, $16.7B prior (revised from $17.1B)

August 8 - Wednesday
- MBA Mortgage Index, 08/04 (7:00): -1.8% actual versus 0.2% prior
- Productivity-Preliminary, Q2 (8:30): 1.6% actual versus 1.5% expected, -0.5% prior (revised from -0.9%)
- Unit Labor Costs -Preliminary, Q2 (8:30): 1.7% actual versus 0.4% expected, 5.6% prior (revised from 1.3%)
- Crude Inventories, 08/04 (10:30): -3.729M actual versus -6.522M prior

August 9 - Thursday
- Initial Claims, 08/04 (8:30): 361K actual versus 375k expected, 367K prior (revised from 365K)
- Continuing Claims, 07/28 (8:30): 3332K actual versus 3290K expected, 3279K prior (revised from 3272K)
- Trade Balance, June (8:30): -$42.9B actual versus -$47.5B expected, -$48.0B prior (revised from -$48.7B)
- Wholesale Inventories, June (10:00): -0.2% actual versus 0.3% expected, 0.0% prior (revised from 0.3%)
- Wholesale Sales, June: -1.4% versus -1.1% prior

August 10 - Friday
- Export Prices ex-ag., July (8:30): -0.3% actual versus -1.5% prior (revised from -1.4%)
- Import Prices ex-oil, July (8:30): -0.4% actual versus -0.3% prior
- Treasury Budget, July (14:00): -69.6B actual versus -$71.0B expected, -$129.4B prior

August 14 - Tuesday
- Retail Sales, July (8:30): 0.2% expected, -0.5% prior
- Retail Sales ex-auto, July (8:30): 0.3% expected, -0.4% prior
- PPI, July (8:30): 0.2% expected, 0.1% prior
- Core PPI, July (8:30): 0.2% expected, 0.2% prior
- Business Inventories, June (10:00): 0.2% expected, 0.3% prior

August 15 - Wednesday
- MBA Mortgage Index, 08/11 (7:00): -1.8% prior
- CPI, July (8:30): 0.2% expected, 0.0% prior
- Core CPI, July (8:30): 0.2% expected, 0.2% prior
- Empire Manufacturing, August (8:30): 5.0 expected, 7.4 prior
- Net Long-Term TIC Flow, June (9:00): $55.0B prior
- Industrial Production, July (9:15): 0.6% expected, 0.4% prior
- Capacity Utilization, July (9:15): 79.3% expected, 78.9% prior
- NAHB Housing Market , August (10:00): 35 expected, 35 prior
- Crude Inventories, 08/11 (10:30): -3.729M prior

August 16 - Thursday
- Initial Claims, 08/11 (8:30): 368K expected, 361K prior
- Continuing Claims, 08/04 (8:30): 3300K expected, 3332K prior
- Housing Starts, July (8:30): 763K expected, 760K prior
- Building Permits, July (8:30): 770K expected, 755K prior
- Philadelphia Fed, August (10:00): -5.0 expected, -12.9 prior

August 17 - Friday
- Michigan Sentiment, Preliminary August (9:55): 72.2 expected, 72.3 prior
- Leading Indicators, July (10:00): 0.2% expected, -0.3% prior
icon url

ReturntoSender

08/12/12 11:54 AM

#9862 RE: ReturntoSender #6755

Amateur Investors Weekend Stock Market Analysis (8/11/12)

http://www.amateur-investor.net/Weekend_Market_Analysis_Aug_11_2012.htm

The NYSE Composite shows its longer term downward and upward trend lines are converging using a log scale. Thus this is leading to the formation of a large Triangle pattern which looks to be nearing completion. Typically once a Triangle completes a large move will follow in one direction or the other. If we are seeing a Bearish Triangle then the "e" leg is almost done as it approaches the top of the downward trend line.


Meanwhile if we zoom in closer the key characteristic of a Triangle is a series of Zig Zags which appears to be the case. If the last Zig Zag "e" is nearing completion and this is a bearish Triangle then we would see a sharp reversal to the downside as we move into the Fall. To eliminate the Triangle possibility the NYSE will have to rise above the peak for "c" which was at 8328.

icon url

ReturntoSender

08/13/12 6:30 PM

#9867 RE: ReturntoSender #6755

From Briefing.com: 4:15 pm : Equities began today's session on a slightly negative note. After reaching session lows before the European close, stocks staged a slow recovery but were unable to break into positive territory. The S&P 500 ended lower by 0.1%.


Consumer staples were one of the top performing sectors. Within the group, Sysco (SYY 30.14, +1.30) jumped 4.5% after reporting earnings and revenues ahead of expectations. Campbell Soup (CPB 34.35, +1.04) also contributed to strength within the space. The packaged food producer gained 3.1% after Goldman Sachs upgraded the stock from ‘sell' to ‘conviction buy.'

The materials sector was the weakest performer, with the biggest laggards found in metal producers. United States Steel (X 22.86, -0.55) ended lower by 2.4% and Olympic Steel (ZEUS 16.42, -0.41) was down 2.4%. However, paper producers outperformed the rest of the sector. Shares of International Paper (IP 33.94, +1.31) gained 4.0% after Credit Suisse upgraded the company's stock from ‘neutral' to ‘outperform.' Louisiana-Pacific (LPX 12.56, +0.56) rose 4.7% as the stock marked a new 52-week high.

Google (GOOG 660.01, +18.01) advanced 2.8% after the company announced up to 4,000 jobs will be cut from its Motorola Mobility business. Reports also indicated that Google will buy the Frommer's brand from publisher John Wiley & Sons (JW.B 47.41, -0.25). Today's bid put shares of Google at a level not seen since mid-April.

Meanwhile, Yelp (YELP 23.87, -1.98) and TripAdvisor (TRIP 33.52, -1.58) slumped 7.7% and 4.5% respectively on concerns that Google's purchase of Frommer's will increase competition in the travel publishing business.

Sears Holdings (SHLD 54.36, +2.94) surged 5.7% after announcing plans to spin off about 1,200 stores which will be listed under the ticker ‘SHOS.' In addition, a Barron's story published over the weekend suggested that Sears' controlling investor may be engineering a ‘slow-motion liquidation' which could lead to a doubling of the share price.

The volatility index, or the VIX, slid 6.7%, to 13.75. The VIX is currently at levels last seen in June of 2007.

Groupon (GRPN 7.55, +0.11) gained 1.5% ahead of its earnings release after the close. The consensus calls for earnings of $0.03 on revenues of $573.45 million. Shares of the online deal site are down more than 61% from its November 2011 IPO price of $20.00.

With the earnings season drawing to a close, a handful companies have yet to report their earnings. A few notable retailers will headline tomorrow's releases. Dick's Sporting Goods (DKS 50.54, +0.19) is expected to earn $0.63 on $1.42 billion in revenues while analysts expect Home Depot (52.82, -0.24) to report earnings of $0.98 on revenues of $20.74 billion.

Two notable apparel retailers are also scheduled to report tomorrow morning. Michael Kors (KORS 42.35, +0.03) is expected to earn $0.20 on $367.96 million revenues while TJX Companies (TJX 44.24, -0.22) is expected to report earnings of $0.55 on revenues of $5.93 billion.

Today's volume was well below average with just over 484 million shares traded on the New York Stock Exchange.

Tomorrow's economic data includes retail sales, retail sales ex-auto, PPI, and core PPI, all of which will be reported at 8:30 AM ET. In addition, business inventories will be released at 10 AM ET.DJ30 -38.52 NASDAQ +1.66 SP500 -1.76 NASDAQ Adv/Vol/Dec 1068/1.31 bln/1363 NYSE Adv/Vol/Dec 1112/484.1 mln/1887

3:30 pm : Crude oil rallied in morning pit action on concerns in the Middle East following reports noting that an oil tanker struck a U.S. Navy ship near the Strait of Hormuz over the weekend. However, the Strait remained open and shipping through the waterway was not affected. Despite the early strength, the energy component sold-off sharply off its session high of $94.14 per barrel and fell into the red after equity markets opened. Crude dipped to a session low of $92.03 per barrel but managed to erase most of its losses as it settled at $92.76 per barrel, 0.2% lower.

Natural gas spent most of floor trade chopping around in negative territory after it slid off its session high of $2.79 per MMBtu. It finished at its session low of $2.73 per MMBtu, or 1.4% lower.

Precious metals trended lower on the lack of news even with a weaker dollar. Gold gave up its overnight gains and spent the majority of its pit session in the red, selling off sharply as it headed into the close. The yellow metal settled with a 0.7% loss at $1611.60 per ounce, just above its session low of $1611.50 per ounce. Silver touched a session high of $28.02 per ounce in early morning action and dipped to a session low of $27.72 per ounce moments before closing with a loss of 1.0% at $27.77 per ounce.DJ30 -52.15 NASDAQ -3.73 SP500 -3.57 NASDAQ Adv/Vol/Dec 0941/1102.3 mln/1482 NYSE Adv/Vol/Dec 960/319 mln/2032

Newport News Public School District in Virginia installed more than 185 Cree (CREE) LED exterior luminaires.

9:03AM FSI Intl: Tokyo Electron to acquire FSI International for $6.20 per share in cash (halted) (FSII) 4.04 : The cos have entered into a definitive agreement under which TEL will acquire FSI for $6.20 per share in cash, or an aggregate equity purchase price of approximately $252.5 million. The acquisition, which will be completed pursuant to a cash tender offer followed by a second step merger, has been unanimously approved by the boards of directors of TEL and FSI. The board of directors of FSI unanimously recommends that FSI's shareholders tender their shares into the tender offer. The transaction is expected to close in calendar year 2012.

RF Micro Devices (RFMD) has begun production shipments of its ultra-high efficiency power amplifiers to Samsung (SSNLF) in support of the Galaxy S3 4G LTE smartphone
8:24AM Broadcom announced its intention to offer ~ $500 mln of senior notes (BRCM) 35.36 :

8:00AM Xilinx Board authorizes repurchase of up to $750 mln of the co's outstanding common stock (XLNX) 33.71 :

Applied Materials (AMAT) has signed an enhanced two-year contract with GLOBALFOUNDRIES to service all AppliedMaterials equipment at its Fab 1 in Dresden, Germany.

GLOBALFOUNDRIES and ARM (ARMH) announced a multi-year agreement to jointly deliver optimized system-on-chip solutions for ARM processor designs on GLOBALFOUNDRIES' 20-nanometer and FinFET process technologies.

6:01AM MagnaChip Semi announced that its Board of Directors approved an extension of its existing stock repurchase program through October 27, 2013 (MX) 13.13 : The stock repurchase program, originally adopted effective October 27, 2011, had been scheduled to terminate on October 27, 2012. The Board also increased the total amount of common stock the Company may purchase under the stock repurchase program by an additional $25 million, subject to applicable legal and contractual restrictions, for a maximum aggregate repurchase amount under the program of up to $60 million. As of June 30, 2012, the Company had repurchased an aggregate amount of $28.7 million of common stock under the program.

10:39 am S&P Infomation Technology shares fall today as market pulls back

The tech sector is trading lower today, roughly inline with losses in the broader market. Semiconductors are showing relative weakness, however, as the SOX trading 1.2% lower. Within the chip index, VECO (-5.5%) is a notable standout. Among other major indices, the SPY is trading 0.3% lower today, while the QQQ is down 0.2% and the NASDAQ is trading 0.4% lower on the session. Among tech bellwethers, INTC (-1.2%) and TXN (-1.1%) are showing notable weakness. There were no notable earnings this morning in the tech space. In news, however, CMVT (+0.9%) agreed to be acquired by VRNT (+0.7%). Also, YTEC (+3.9%) entered into merger agreement for 'going private' transaction for $3.90 per share.

Among notable analyst upgrades this morning in the tech space, WNS (-0.9%), WU (-2.2%), FISV (+0.4%), BR (-0.7%), EXLS (-1.8%), HPY (+1.8%), and VRTU (+1.7%) were upgraded at JP Morgan, GOOG (+1.2%) was upgraded to Overweight at Morgan Stanley, and S (+2.0%) was upgraded to Buy at BofA/Merrill. In downgrades, Stifel Nicolaus downgraded YHOO (-0.3%) to Hold, VECO (-5.8%) was downgraded to Hold at Deutsche Bank, SYNT (-4.9%) and GPN (-2.5%) were downgraded at JP Morgan, and IFNNY (-0.7%) was downgraded to Neutral at Citigroup. GRPN (+1.6%) is the only notable name in tech scheduled to report quarterly results today after the close.
icon url

ReturntoSender

08/15/12 11:30 AM

#9869 RE: ReturntoSender #6755

KLIC Short Sale ST/MT 5000 shares@11.94 - Overbought and due for some retrenchment I hope.


RtS
icon url

ReturntoSender

08/15/12 10:21 PM

#9870 RE: ReturntoSender #6755

From Briefing.com: 4:20 pm : Equities started the day on a down note before staging a slow climb towards session highs. With thin volume and economic data largely in-line, today's action occurred mostly around the unchanged line. An afternoon push attempted to lift stocks to a higher close but the move lacked conviction. As a result, the Nasdaq ended higher by 0.5% while the S&P 500 and Dow finished flat.

Shares on the Nasdaq outperformed the broader market. Within the group, Akamai Tech (AKAM 36.80, +1.36) and Limelight (LLNW 2.60, +0.09) were up 3.8% and 3.6%, respectively. Both network companies rose on rumors which suggested AT&T (T 37.10, -0.15) will re-sell CDN services provided by either of the two companies. Both vendors are negotiating, with Akamai viewed as the favorite to win the contract.

Abercrombie & Fitch (ANF 35.23, +2.90) was a session leader after beating on earnings and revenues. Shares of the apparel producer jumped 9.0% in reaction to the results. Competitors Aeropostale (ARO 13.63, +0.40) and American Eagle (AEO 21.13, +0.29) got a lift from the positive Abercrombie & Fitch results. The two stocks gained 3.0% and 1.4%, respectively.

Two popular retailers saw contrasting performance following their earnings releases. Staples (SPLS 11.49, -1.96) plunged 14.6% after missing on earnings and revenues. Today's selling dropped the shares to levels not seen since October 2002. Meanwhile, Target (TGT 64.50, +1.12) advanced 1.8% after exceeding earnings estimates and reporting in-line revenues.

Energy was one of today's main laggards despite crude oil climbing 1.2% to $94.50 and testing levels last seen in mid-May. The spike in crude comes on renewed tensions between Israel and Iran.

Looking closer at the sector, Contango Oil & Gas (MCF 55.12, -4.76) slid 8.0% after announcing its Chairman and CEO, Kenneth Peak will be taking a medical leave of absence. Other energy names also showed significant losses despite the lack of news driving their declines. Alpha Natural Resources (ANR 6.61, -0.23) was down 3.4% while WPX Energy (WPX 14.58, -0.37) slipped 2.5%.

Gun makers Smith & Wesson (SWHC 8.60, -1.16) and Sturm Ruger (RGR 45.39, -2.69) were under pressure after receiving downgrades from KeyBanc Capital Markets. Smith & Wesson fell 11.9% after being downgraded from ‘buy' to ‘hold' while Sturm Ruger slumped 5.6% after being lowered from ‘hold' to ‘underweight.' The downgrades were handed down as analysts believe the industry is near its peak profitability.

With the majority of second quarter results already delivered, a handful of names remain on the earnings calendar. Cisco Systems (CSCO 17.35, +0.18) and Applied Materials (AMAT 11.80, +0.09) will report after today's close. Cisco is expected to earn $0.45 on $11.61 billion revenues while the consensus calls for Applied Materials to deliver earnings of $0.22 on revenues of $2.32 billion.

Retail names will headline tomorrow's reports before the bell. Analysts are expecting Dollar Tree (DLTR 50.00, -0.62) to earn $0.47 on revenues of $1.71 billion while retail giant Wal-Mart (WMT 74.45, +0.44) is expected to report earnings of $1.17 on $114.80 billion revenues.

The Housing Market Index for August registered a reading of 37. That was up from the prior month, and better than the reading of 35 that had been expected, on average, among economists polled by Briefing.com.

Separately, industrial production increased during July by 0.6%, which was in-line with expectations. The reading follows the revised 0.1% increase experienced in the prior month. Capacity utilization hit 79.3%, which was also in-line with expectations, and up from the prior month reading of 78.9%.

Consumer prices were unchanged during July, which was slightly cooler than the 0.2% increase that had been generally expected. Core prices increased by 0.1%, which fell short of the 0.2% increase expected by economists polled by Briefing.com.

Tomorrow's economic data will be focused on jobs data and housing. Housing starts, building permits, and initial and continuing claims will be reported at 8:30 AM ET. The monthly Philadelphia Fed survey will be released at 10 AM ET.DJ30 -7.36 NASDAQ +13.95 SP500 +1.60 NASDAQ Adv/Vol/Dec 1719/1.49 bln/768 NYSE Adv/Vol/Dec 1899/497.8 mln/1113

3:30 pm : Crude oil rallied into positive territory on better-than-expected inventory data that showed a draw of 3.699 mln barrels when a draw of 1.5 mln barrels was anticipated. The energy component advanced further and set a session high of $94.96 per barrel in afternoon action. It pulled-back slightly in the last hour of pit trade but still booked a 1.0% gain as it settled at $94.35 per barrel. It is worth noting that reports came out this morning suggesting that Israel is planning a strike on Iran's nuclear facilities before the November U.S. elections.

Natural gas, on the other hand, lost yesterday's momentum and tumbled deeper into negative territory. It settled 2.8% lower at $2.75 per MMBtu, just above its session low of $2.74 per MMBtu.

Gold came off its pit session low of $1596.30 per ounce and popped into positive territory in reaction to weaker-than-anticipated manufacturing data. The yellow metal continued to advance despite strength in the dollar. It touched a session high of $1608.80 per ounce and eventually settled the session with a 0.3% gain at $1606.60 per ounce.

Silver followed suit as it came off its session low of $27.54 per ounce and rallied into the black. It popped to a session high of $27.96 per ounce in morning action but was unable to hold the momentum. It pulled-back as the session progressed and settled with a 0.2% gain at $27.80 per ounce.DJ30 -5.59 NASDAQ +12.35 SP500 +1.68 NASDAQ Adv/Vol/Dec 1621/1244.6 mln/829 NYSE Adv/Vol/Dec 1805/335 mln/1146


4:20PM Applied Materials beats by $0.02, reports revs in-line; guides Q4 EPS, revs below consensus (AMAT) 11.80 +0.09 : Reports Q3 (Jul) earnings of $0.24 per share, excluding non-recurring items, $0.02 better than the Capital IQ Consensus Estimate of $0.22; revenues fell 15.9% year/year to $2.34 bln vs the $2.32 bln consensus. "Economic uncertainty is weighing on top of a seasonal pullback to produce weaker near-term demand." Backlog decreased by $551 million to $1.82 billion. Gross margin was 41.6 percent on a non-GAAP basis, down from 42.1 percent, in line with the decrease in net sales. Co issues downside guidance for Q4, sees EPS of $0.00-0.06, excluding non-recurring items, vs. $0.12 Capital IQ Consensus Estimate; sees Q4 revs -25-40% QoQ to ~$1.40-1.76 bln vs. $1.94 bln Capital IQ Consensus Estimate.


4:11PM Cisco Systems beats by $0.02, reports revs in-line; raises quarterly dividend 75% to $0.14 (CSCO) 17.35 +0.18 : Reports Q4 (Jul) earnings of $0.47 per share, excluding non-recurring items, $0.02 better than the Capital IQ Consensus Estimate of $0.45; revenues rose 4.4% year/year to $11.69 bln vs the $11.61 bln consensus. During Q4, Cisco repurchased 108 mln shares of common stock under the stock repurchase program at an average price of $16.62 per share for an aggregate purchase price of $1.8 bln. The remaining authorized amount for stock repurchases under this program is ~$5.9 bln with no termination date. Cash flows from operations were $3.1 bln for the fourth quarter of fiscal 2012, compared with $3.0 bln for the third quarter of fiscal 2012, and compared with $2.8 bln for the fourth quarter of fiscal 2011. Cash flows from operations were $11.5 bln for fiscal 2012, compared with $10.1 bln for fiscal 2011. Cash and cash equivalents and investments were $48.7 bln at the end of the fourth quarter of fiscal 2012, compared with $48.4 bln at the end of the third quarter of fiscal 2012, and compared with $44.6 bln at the end of 4Q11.

Co raises its quarterly dividend 75% to $0.14 (yield 3.2% at closing price). "Cisco has the financial strength and flexibility to effectively invest in our business, pursue strategic opportunities, such as acquisitions, as well as return a minimum of 50% of our free cash flow annually through dividends and share repurchases to our shareholders."

4:09PM Agilent misses by $0.04, misses on revs; guides Q4 EPS below consensus, revs below consensus (A) 40.47 -0.01 : Reports Q3 (Jul) earnings of $0.79 per share, excluding non-recurring items, $0.04 worse than the Capital IQ Consensus Estimate of $0.83; revenues rose 1.9% year/year to $1.72 bln vs the $1.79 bln consensus. Co issues downside guidance for Q4, sees EPS of $0.80-0.82, excluding non-recurring items, vs. $0.93 Capital IQ Consensus Estimate; sees Q4 revs of $1.76-1.78 bln vs. $1.88 bln Capital IQ Consensus Estimate.

4:06PM Tessera Tech announces C. Richard Neely, Jr. has been named executive vice president and chief financial officer, effective immediately (TSRA) 14.44 +0.04 : The Company also announced that its former CFO, Michael Anthofer, has resigned his position to pursue other interests and opportunities. Neely joins the Company from Livescribe, Inc., a privately held consumer electronics manufacturer and retailer of digital "Smartpens," which he joined in Feb. 2011 as CFO.

4:04PM NetApp beats by $0.04, misses on revs; guides Q2 EPS in-line, revs in-line (NTAP) 31.75 +0.33 : Reports Q1 (Jul) earnings of $0.42 per share, excluding non-recurring items, $0.04 better than the Capital IQ Consensus Estimate of $0.38; revenues fell 0.9% year/year to $1.45 bln vs the $1.46 bln consensus. Co issues in-line guidance for Q2, sees EPS of $0.45-0.50, excluding non-recurring items, vs. $0.47 Capital IQ Consensus Estimate; sees Q2 revs of $1.5-1.6 bln vs. $1.54 bln Capital IQ Consensus Estimate.

9:49AM Intel a Dow laggard tests/stabilizes at support at its 50/200 sma at 26.19/26.17 -- session low 26.19 (INTC) 26.34 -0.14 :

7:51AM Nokia comments on S&P's credit rating announcement; says 'decision on the co is limited' (NOK) 2.49 : Timo Ihamuotila, Nokia's Executive Vice President and CFO, commented on today's rating decision from Standard & Poor's: "The impact of Standard & Poor's decision on the company is limited. As we continue our transition, we are applying a strong focus on cash conservation while simultaneously reducing our operating costs and making our operating model stronger and more agile. We ended the second quarter 2012 with gross and net cash both higher than a year earlier. With gross cash of EUR 9.4 billion and net cash of EUR 4.2 billion, we have a strong financial position and robust liquidity profile. We also have access to additional liquidity via a revolving credit facility of EUR 1.5 billion. This is entirely undrawn, available to us until March 2016, and comes without any financial covenants."

JDS Uniphase (JDSU $11.57 +0.89 ) reported fourth quarter earnings of $0.15 per share, excluding non-recurring items, $0.03 better than the Capital IQ consensus of $0.12, while revenues fell 6.9% year/year to $439.3 million versus the $423 million consensus. The company issued in-line guidance for the first quarter with revenues of $415-435 versus the $429.51 million consensus.

10:04 am Technology sector trading slightly higher along with gains in the broader market

The tech sector is trading higher today, just ahead of gains in the broader market. Semiconductors are showing relative strength with the SOX trading 0.5% higher. Within the chip index, SPRD (+4.5%) is a notable standout. Among other major indices, the SPY is trading 0.2% higher today, while the QQQ and the NASDAQ are trading 0.3% higher on the session. Among tech bellwethers, FB (+4.7%) is showing strength, while INTC (-0.6%) is showing weakness.

In tech earnings last night, JDSU (+8.5%) reported a better-than-expected quarter and guided inline. In news, LLNW (+6.3%) and AKAM (+3.2%) are trading higher on reports that T (-0.5%) is shutting down its Content Delivery Network, potentially re-selling AKAM or LLNW services.

Among notable analyst upgrades this morning in the tech space, JIVE (+3.0%) was upgraded to Outperform at Baird. In downgrades, VOD (-1.2%) was downgraded to Neutral at BofA/Merrill and OCZ (-6.6%) was downgraded to Neutral at Sterne Agee. A (-0.9%), AMAT (+1.1%), CSCO (+0.8%), and NTAP (+2.9%) is the only notable name in tech scheduled to report quarterly results today after the close.

Don, I agree with Kirk. You are awesome! ;-)
icon url

ReturntoSender

08/19/12 11:49 AM

#9872 RE: ReturntoSender #6755

InvestmentHouse Weekend Market Summary:

http://www.investmenthouse.com/weekendmarketsummary.htm

- Nothing flashy but stocks continue the Thursday upside break with some big techs and small caps leading the way.
- Let's release from the SPRO for no effect other than political posturing. Moreover, demand is so low it would have no impact.
- Michigan Sentiment rises on current conditions, falls hard on expectations as inflation expectations jump.
- LEI rise on stock market gains.
- $500B unused highway funds released for jobs to fix our 'crumbling' roads. I travel a lot but have not seen them. Where are the 'crumbling' roads?
- Eating out less? You are apparently not alone.
- The path for QE3 is clear: Geithner requires Fannie to divest faster. But someone has to buy those MBS. Hmmm. The Fed?
- Stocks set to test the post-bear market highs. We have good positions so plan on going into the week with our eyes wide open as to how the sellers and buyers react.

It was nothing flashy, but stocks continued the Thursday break higher from that lateral consolidation. Of course that put them all the closer to their 2012 post-bear market highs. They did not challenge to break them on the day, but there were some good indications from leadership as NASDAQ and the small caps were in the lead to the upside.

When growth is leading, it is a positive for the market. Indeed, futures were somewhat flat to down premarket, but then they started to rally into the open. Stocks held up decently as the data was released. There was the Michigan Sentiment survey, which was a bit better than expected, but some of the internal numbers were not that good. The Leading Economic Indicators for July were better than expected, but it relies so heavily on the stock market, and no one believes in the rally, and no retail investors are in it. The reasons for its inclusion in the LEI are dubious right now, but the market enjoyed the news and continued to the upside. Indeed, it rallied into the afternoon after trading back and forth all morning. The market closed near session highs, putting in a very respectable move.

SP500 +0.19%
NASDAQ +0.46%
Dow +0.19%
SP600 +0.8%
SOX -0.76%

The SOX was down thanks to MRVL and its warning about the future. Its chips go into a lot of devices such as phones and tablets. It was not a big move to the upside for the market. It was not a big move at all, but it was a solid affirmation of sorts to the Thursday break higher. It is important that the indices did not immediately turn back over but instead continued their push to the upside.

Anything can happen over the weekend. There is so much geopolitical tension ongoing here as well as in the Middle East. It could be that Israel launches an attack this weekend. It seems strange, but it could happen. Of course oil was higher and many other commodities were higher on that kind of news. The indices are just below those prior highs but, as noted noticed on Thursday, they are showing very good technical action along with many stocks.

It was not a perfect day necessarily. There were some issues to overcome, but there was some help as well. Early in the day German Chancellor Merkel said they will do whatever it takes to save the euro. She also agreed to at least mull over reducing the requirements on Greece in terms of austerity.

Okay, we will do [hard swallow] whatever it takes to save the euro. Alright, alright. We will also agree to ease up on the Greeks. Happy?

Reminds me of 'Blazing Saddles' where the townspeople were going to give land to certain groups but not the Irish. After the deal was turned down, the Irish were reluctantly included.

It was enough to overcome some Fed pushback regarding further stimulus.

Plosser (Philly Fed President): 'Very dubious' about whether additional bond purchases would have a positive impact. "There are diminishing returns to these actions" he told Hilsenrath at the WSJ. "The evidence is not strong that somehow [bond purchases] are going to help the unemployment rate move faster to where we'd like it to be. I don't see that there is much benefit."

Plosser underscores the Fed's focus on employment over any other indication right now.

But . . . Geithner sets the stage for QE3

Still pis - - er, angry over FHFA head DeMarco telling him socialism was not the way to go in response to Geithner's proposal for mortgage principal reductions that would force responsible mortgage payers to pay for those perhaps less responsible, Treasury Secretary Geithner now requires Fannie and Freddie to pay not 10% but 100% of their income directly to the Treasury and to speed up the wind down of their portfolios to 15% a year versus 10%. This means the portfolios will be drawn down four years earlier.

What is the effect? Well, these GSA's are now fully nationalized given they have to turn over 100% of their incomes and totally answer to the Treasury.

Problem 1: Who or what will buy the excess investment portfolio as it comes up? Who indeed? Perhaps the . . . Fed? Geithner just mapped out the plan for QE3 whether the Fed likes it or not.

Problem 2: Fannie and Freddie had about $6T in debt. Does that mean this debt is now to be added onto the existing $15.9T in debt now on the books? It won't be but it is there nonetheless.

But Apple rescues the day.

AAPL continues its run, hits a new high ahead of product announcements.

AAPL has been on a run for almost a month now after a gap lower on earnings. Very nice, indeed. It tends to run ahead of the product announcements, and that is exactly what it has been doing and was continuing to do on Friday.

With AAPL being such a large market cap, that is why we saw the NASDAQ and the SP500 move higher. But it was not limited to AAPL; many stocks performed well on the day. ATHN made a good comeback, rising 2.75%. EBAY posted a nice gain as well, gapping up out of a month-long lateral consolidation, rising over 2%. CAT did not have a huge move, but it was a nice 1.5% gap to the upside to a new closing high on this break higher. BABY put in a good two-day run after reversing on Wednesday, rising 3.25%.

Looking at manufacturing equipment, FAST was up over 2%. Retail was not left out. PII reversed off of some Wednesday selling and put in a strong Thursday and Friday. It was up 2.4% on Friday. RL is another retailer showing strength. It broke above the 200 day EMA after something of a cup with handle base. Strong volume on that breakout. SSYS, another tech, had a nice lateral consolidation similar to the market after it ran to a new high. It had a strong 4.5% break to the upside on Friday.

It was not just AAPL doing the pulling, although it did do its share. A lot of other stocks contributed to the move, and they were not just drifting higher. Solid breaks to the upside, posting 2% to 5%+ gains on the session.

OTHER MARKETS

Some were resting and some were moving.

Dollar. 1.2321 versus 1.2364 euro. The dollar was resting. A modest gain after working laterally all week. It is still in a tightening something of a pennant pattern, holding near the 50 day EMA and trying to set up for a new break to the upside. It seems torn between the Fed potentially acting with more stimulus, the Fed potentially NOT acting with more stimulus, and mixed economic data. That data sometimes looks good in the headlines, but when you look at the guts of each report, it pretty much stinks. We are getting a flatline from the dollar right now.

Bonds. 1.81% versus 1.84% 10 year US Treasury. A modest gain in treasuries, bouncing off of the 200 day EMA after a week of selling. This selling has been ongoing for three weeks as it stair-stepped to the downside. This past week was a severe drop, plucking it right down on the 200 day EMA. But, as noted, it was a modest bounce, and it closed off of its high for the session. Not a lot of strength. Perhaps it got a little bit of energy from Treasury Secretary Giethner's actions with respect to Fannie Mae. But this is not a big move; it is more of a relief bounce off of the selling to the 200 day EMA.

Gold. 1619.40, +1.20. Gold rose modestly. Not a bad week overall. It sold early and then rebounded on Thursday. Still moving laterally, slowly rising in something of a cup base. We will see what happens. Commodities are showing a bit more of an inflation bent of late, and gold is no exception.

Oil. 96.01, +0.41. I will spend a little more time talking about oil. It rallied up close to the 200 day EMA. Will it be repulsed here? There are many factors affecting oil right now. One that I already talked about is the tensions between Israel and Iran and whether there will be some kind of attack this weekend or in the near term. The window is closing were Israel can actually do something.

There were other stories impacting oil on the day. There was the talk of the administration ready to use the Strategic Petroleum Oil Reserve to release oil and hopefully hold off rising oil prices. Why is that important? Consider that for every $10 rise in Brent, you get a $0.22 rise in US domestic gasoline prices. In July there was a $10 rise in Brent and, yes, gasoline prices rose $0.22 on average in the US. Now it is up another $10 since then, so we can expect another $0.22 rise in gasoline prices in what is possibly the worst time for the President. Everything seems to be piling up negative right now: the unemployment rate is rising, and now energy prices are moving back up when they thought they were getting under control.

Their release from the SPRO will not likely help. Remember that they did this last year. There was a short release. Brent fell $4, but then it bounced right back up. History shows that when we do this, it often goes down but then bounces back up even higher than it was before. That in itself makes it a dubious course to pursue. Also it is obvious pandering for votes. The Obama administration has been clear that it wants gasoline prices higher than they are now so it can push more of its "clean energy" programs. It wants it higher, but it will bow to what it thinks is public pressure every once in awhile and release a little from the SPRO to tamp down prices.

It is so hypocritical to do that since they want prices higher. Their policies have been geared to drive prices higher just like electricity prices. Yet they will pander when necessary. That is nothing new; most other administrations do the same things. It is just so obvious, and when things are already so negative, it makes you shake your head. I am sick of it. But whether we are all sick of it or not, it is what it is. And the market does what it will do.

Here is the kicker: We are seeing oil rise, yet demand is very weak. Deliveries for petroleum fell 2.7% in July year-over-year. That is the lowest level for any month since September 2008. The API reports that US oil demand was just over 18M barrels in July, and that was the weakest for any July since 1995. It fell 2.3% year-over-year. The deliveries for oil are down because obviously our demand is down. You can talk to any supplier and hear that there is plenty of oil out there. It is just trading at a higher price, but demand is way down. Is it because prices are so high? No. We were this high last year. The problem is just less economic activity right now. That is why we are getting such low demand and low need for oil.

Obviously it is the speculators driving it higher, correct? This is the same market that brought is lower a few months ago. We can see the downtrend from late April into early July. Now we have some more geopolitical tensions on top of everything else, so we have a build back to the upside in a rather bullish, something of a cup-with-handle pattern that looks like it could break out to the upside.

TECHNICAL SUMMARY

Internals. The internals were mixed.

Volume. NASDAQ -16%, 1.6B; NYSE +13%, 614M. Still very low trade, but it looks like NYSE indices got a bit of the expiration trade on Friday.

Breadth. NASDAQ +1.7:1; NYSE +1.6:1. Breadth was ho-hum.

THE CHARTS

SP500. SP500 did move higher to that post-bear market high at about 1423. It is not far away at all, basically five points away. It is right in the zone of "We better sell because a market top is coming," or that it has shown a good lateral consolidation, great technical action, a good pattern, and it is breaking higher on Thursday. It might just blow through this level. Well have to see how it plays out. Technically things still look solid. Good stocks are coming to the fore. SP500 is putting in higher highs and higher lows. Volume is low, but it has been low for many, many, many months. That has been a complaint for the past couple of years on the stock market, so take that for what it's worth.

NASDAQ. NASDAQ continued higher as well. It is below its peaks, but it is moving in on the May intraday high. The overall high on the move was 3134. It is not far away either, just about 60 points. It has room to move before it hits the top. As with SP500, it is looking strong. We will have to see how much strength it has when it gets there.

SP600. SP600 is looking very good. It was up +0.8%, moving up through the lower resistance on Thursday and continuing up to the February and April shoulders to the head and shoulders pattern that led to the May to June selloff. It is coming up to interim resistance. It is there, and now we see if it will fade a little bit back to the lower support in this range and then break higher or if it is just repelled or, frankly, if it just keeps moving higher.

It just so happens that the indices are moving well. The stocks are moving well, and they just so happen to be at the prior highs. If those highs were not there, we would all be saying, "What a great move. What strength it is showing. What great technical action." If those highs were down here or way up higher, we would be saying it was great technical action higher. Higher high, higher lows, testing, holding the gain, and breaking out. You see the point. That is why we just have to see how it plays out. I note that we have good leadership as stocks move higher.

SOX. SOX was down on the day thanks to MRVL, but it is still performing very well for the week. It broke through resistance a week and a half ago, testing and then bouncing to the upside.

LEADERSHIP

I will not go into a lot of specifics, but I will note that the stocks we have been following all week from various sectors, after that Tuesday hiccup that saw stocks such as FFIV sell pretty aggressively on Tuesday, there was an immediate reversal. Not only that, but there was a breakout. So we had a shakeout, effectively, and then a reversal and a move higher. It happened in technology as we see in FFIV. It happened in retail in many circumstances. I am looking at RL's chart. It happened across the board in retail. We saw the same thing in energy with good continued moves to the upside on stocks that have turned the corner. We even got some industrials moving better. CAT broke to the upside. It is hard to complain when old CAT gets moving and looks solid even in the face of some weaker DE earnings.

Not every stock in every sector is performing, but we are seeing quality stocks in many sectors performing well, and that is what makes a market move higher. Stocks coming from bases to emerge as leaders. We have seen it with many stocks across the board in different sectors. We have been picking them up as well. That is a sign of health in the market. The indices broke a good lateral consolidation on the week. They were driven by stocks that have had money put their way. They were not necessarily the original market leaders on the rally, but they are now trying to place themselves in the ranks of leadership or at least help the move higher.

With that, the market still has a good foundation to move to the upside despite the overriding gloom like we saw all week on the financial stations. They had the "get out now" mentality based upon the indices being at those prior highs. That is not a bad reason. Last night I went through the list and said I could not argue with them at all. But it is about what the market does rather than what we think it will do. Thus we kept seeing this good technical action and this lateral consolidation as still a positive. And it made the break higher.

It will have to prove itself again next week when they challenge those old highs, but that is what you do when you move up or move down.

THE ECONOMY

TO VIEW THE ECONOMY VIDEO CLICK THE FOLLOWING LINK:
Economy Summary Video

Michigan preliminary August rises but expectations fall and inflation expectations rise.

Michigan Sentiment, Preliminary August (9:55): 73.6 actual versus 72.2 expected, 72.3 prior

Usually not that important. In prosperous times consumers always say they are going to save but they don't. They feel good about the future and they spend.

But . . . sentiment is important when the economy and future are so uncertain. If people are down and don't think things will improve, they do not consume.

Current expectations: 87.8 versus 82.7 in July.
Tied to the jobs report and weekly claims: but they are less than reliable.

Expectations: lowest since 12/2011

LEI is up on the stock market. But how relevant is the stock market in terms of wealth with so few participating?

Leading Indicators, July (10:00): 0.4% actual versus 0.2% expected, -0.4% prior (revised from -0.3%)

Look at where the gains are: Initial claims, Building Permits, Stock prices, Interest rate spreads.

Look at where the losses or no growth sectors are: ISM new orders, Consumer expectations, goods orders, workweek, business investment.

Gains are in areas where the data is dubious or controlled by the government/Fed.

Thus as usual, the LEI is a report that is best ignored in favor of ECRI that has a perfect record and has called the recession we are likely in right now.

President to use $500M for infrastructure jobs on our 'crumbling' roads. Seen this before; it didn't work. But when you can buy votes from the uniformed . . . $473M is cheap.

Crumbling roads in the US? Not on most I travel on as well as our contacts in various industries . . .

President announced releasing $473M in unspent highway funds for infrastructure work and new jobs. As you recall, this is what the original 'stimulus' bill, a.k.a. spending bill, did, only on a grander scale. How much recovery did we get from that? None. Money shot down the hole on projects that were not, 'ha, ha' as the President joked, not as shove-ready as they thought.

Indeed, recent studies from several government agencies and independent agencies concluded the infrastructure spending from the 'stimulus' bill had absolutely ZERO impact on job creation.

Why is the President ready to spend again? Because this past week, DESPITE higher non-farm payroll gains and lower weekly jobless claims, 44 states reported HIGHER unemployment levels. Do you need any more evidence that the data the government produces is obviously inaccurate? Do you need any more evidence that the so-called infrastructure spending job creation doesn't work? Apparently those in charge do. Either that or they are in simple denial, blinded by their agendas versus results. Hell, they are not stupid. They likely KNOW it has no impact but want to pander for votes. Ah, now it all makes sense.

News headlines talked of using the funds to rebuild our 'crumbling' infrastructure. I hear that a lot. I travel a lot. I travel by road and air. Texas, Louisiana, Mississippi, Alabama, Georgia, Tennessee, Pennsylvania, Colorado, New Mexico, Utah California are a few states I have been in recently. I talk with a lot of business owners who travel and truckers as well.

I observe some issues with our transit system. Some states do not have roads up to par with all of the funding they receive. A couple are terrible. Some are bad. Most, however, have great roads.

When I travel I always see states working on their roads, using their funds and the federal tax dollars earmarked for their roads wisely. The businessmen and truckers I talk with say most roadways are fine.

Where then, are the roads crumbling? MORE IMPORTANTLY, WHERE DID THE MONEY GO IN THOSE STATES where the roads and bridges are not up to par? THAT is the question. Do you ever notice when driving how sometimes when you go from state to state and even COUNTY to COUNTY in a state that the road quality changes? Throwing more money at a bad SYSTEM is NOT the answer. If a state uses highway funds for other projects or for good old graft and fraud, more money only lines the pockets of those abusing the system.

The state of the roads in many states is a pretty good barometer of the efficiency and management ability of any state's government. If it cannot keep the roads up, one of its primary functions, then you know the other programs are terrible as well.

Feeding the fat man as Ronald Reagan used to say.

But you know what? That is how it works here. If a state cannot get it together and satisfy its citizens, the citizens can make changes with who is elected or they can leave for better states. THAT is the great equalizer, not a federal government that takes money from the well-run and prosperous states and gives it to poorly run, poorly managed states. Ronald Reagan called that 'feeding the fat man,' i.e. contributing to the bad habits and poor health of entities that don't have the willpower to do what is right.

Eating Out less and less.

In June and July the amount US citizens spent on eating out plunged dramatically. The July drop was so steep it started hitting levels from 2008 during the height of the economic meltdown.

Source: Boomberg

This is a hard evidence response to the weak sentiment expectations regarding the future. People spend less when the future is in doubt. Eating out is a key barometer of views about the future because it is so easy to cut back in this area. It is a clear physical manifestation of those views.

THE MARKET

SENTIMENT INDICATORS

VIX. Volatility fell again. It bounced on Tuesday when there was something of a hiccup in the market, but it immediately turned back down and undercut the lows for the week. It also undercut the lows from March. Those are important because in April 2011 and March 2012, when volatility hit this level, the market sold off. Not immediately, but within a few weeks to a couple of months the market sold off. Everyone is watching this now and thinking that it could do the same thing here. It is breaking lower. It has been very low and hardly moved at all.

An interesting note is that on Monday when the market was lower, volatility was lower that day as well. That is unusual. I think that shows something of what is going on with volatility right now. In other words, it is not trading necessarily in parallel with the market. There are so few traders right now in late summer that the relationship is not exactly as it should be. It will probably change once we get back into September, people get back from their vacations, and everyone is ready to get back to business. I am just noting that bit of an aberration. Overall it is low. It is where it has been on the prior two occasions when the market did sell. It is worth noting as the indices themselves bump up against the post-bear market highs.

VIX: 13.45; -0.84
VXN: 13.79; -1.02
VXO: 13.42; -0.7

Put/Call Ratio (CBOE): 0.75; -0.09

Bulls versus Bears

This is a reading of the number of bullish investment advisors versus bearish advisors. The reason you look at this is that it gives you an idea of how bullish investors are. If they are too bullish then everyone is in the market and it is heading for a top: if everyone wants to be in the market, then all the money is in and there is no more new cash to drive it higher. On the other side of the spectrum if there are a lot of bears then there is a lot of cash on the sideline, and as the market rallies it drags that cash in as the bears give in. That cash provides the market the fuel to move higher. If bears are low it is the same as a lot of bulls: everyone is in and the market does not have the cash to drive it higher.

Bulls: 43.6% versus 43.6% versus 39.4%. Wow, talk about lack of care. Bulls, elevate from recent levels mind you, held steady. Makes sense given the lateral move below the prior highs that had so many pundits negative. Undercut 35%, the threshold for bullishness, in early June. You would expect it to rise and it has. Still not at a dangerous level, just working as it should. As noted, hit 34% in early June. It did its job and the market is on the rally. Hard drop to 34 from 39.3% as economic reality and a choppy stock market hit. Off the 55+ level hit in late February. That was the highest level since April and May of 2011, the peak of the post-bear market high. 35% is the threshold level suggesting bullishness. To be seriously bearish it needs to get up to the 60% to 65% level.

Bears: 26.6% versus 25.5% versus 27.7%. Bounced back up to a level from four weeks back. Also makes sense given the lateral move that had many pundits calling for a market rollover. Never made it to the 35% that can be a bullish indication, but the bulls were weak enough back in June. Over 35% is the threshold to be really be a good upside indicator. For reference, bearishness hit a 5 year high at 54.4% the last week of October 2008. The move over 50 took bearish sentiment to its highest level since 1995. Extreme negative sentiment. Prior levels for comparison: Bearishness peaked at 37.4% in September 2007. It topped the June 2006 peak (36%) on that run. That June peak eclipsed the March 2006 high (33%) and well above the 2005 highs that spawned new rallies (30% in May 2005, 29.2% in October 2005). That was a huge turn, unlike any seen in recent history.

NASDAQ

Stats: +14.2 points (+0.46%) to close at 3076.59
Volume: 1.612B (-16.04%)

Up Volume: 824.93M (-485.07M)
Down Volume: 788.7M (+190.9M)

A/D and Hi/Lo: Advancers led 1.68 to 1
Previous Session: Advancers led 2.09 to 1

New Highs: 93 (+6)
New Lows: 28 (+6)

SP500/NYSE

Stats: +2.65 points (+0.19%) to close at 1418.16
NYSE Volume: 614M (+12.87%)

A/D and Hi/Lo: Advancers led 1.63 to 1
Previous Session: Advancers led 2.59 to 1

New Highs: 188 (+31)
New Lows: 12 (+1)

DJ30

Stats: +25.09 points (+0.19%) to close at 13275.2
Volume: 138M shares Friday versus 114M shares Thursday.

MONDAY

Earnings are winding down, and there will not be much economic data on the table. On Tuesday we have the FOMC minutes. It will be interesting to see who said what, but we all know who the dissenters and the proponents are for more Quantitative Easing or some form of stimulus.

Existing home sales are on Wednesday. We always watch home sales, of course. New home sales are on Thursday along with initial claims. Then on Friday we get the volatile durable goods orders. It will not be a heavy week in terms of the kind of economics that will impact the election. Home sales are important, but it is going to take a lot to get that moving. We have already shown earlier in the week that there are still issues with that huge shadow inventory -- around 13.5M units --hanging out there that could impact it. It would send things reeling if the economy does not improve, if there is a fiscal cliff issue and those people become stressed even further and have to default on their mortgages.

I have already covered a lot of this, but here we go. A lot of next week will focus on those old highs. No surprise. The indices are tickling them right now. They have shown great resolve and technical fortitude on the rise. Thursday was a very nice break to the upside, and it was continued on Friday. Not spectacular but it continued the move. The sellers did not immediately jump in.

It is a new week. It will not be September yet, so not everyone will be back, but that does not mean we can just ride this momentum higher. You have to pay attention to these highs. It is the facts of the market that you have to watch important levels. And, let's face it, recovery highs are important levels. It has taken awhile to get back. It was a lot of work to get up here, longer than it took to fall from April to June. That warrants care to be taken next week.

We did not buy much on Friday. We got a good move on Thursday, and we picked up some positions then. We already had many in the bank, so we are just letting them run. We have to be a little careful, though. There are a lot of people who think that the market will fall from this level. Sometimes there is a self-fulfilling prophecy that helps bring these predictions about. There are not that many people playing in the market right now, so a few groups can take control and send things down. It has not happened yet.

Good, solid technical action, and more solid action on Thursday and Friday. If other stocks that are supporting this move continue to have money put into them, those stocks that are "turning the corner" and rallying, then these indices can break on through and perhaps test from above the old highs or from new post-bear market highs. Just looking at the stocks, the indices, and those that are emerging as leaders, it certainly seems that the market wants to break these highs or at least run up to them. We will continue to look for plays that will make that play if it continues.

Early next week there will be some testing. We will have to see how it plays out. By testing I mean bumping up against these highs, most likely. It may want to come back and test to the downside, and that gives us entry points. Are we going to jump into a lot of new positions? Not necessarily. We will look at some, but we will also be adjusting the buy points to the downside for the plays we have where we have been following the move to the upside. If the markets want to reverse, this is a darn good place for it to do that. We could make some really good risk/reward plays to the downside if it does want to reverse.

We go into the early week not planning on buying a lot of new positions until we see how those old highs are handled. We have been riding a nice move to the upside. Now that we are bumping up against these old highs, it may not about the time to be the most aggressive. We will see how it plays out as we let our stocks continue to run. If they do run, great. If they pull back a little bit, hold, and bounce off of that, that is great. Then we can pick up some more. But we just want to see how it plays out. We will not just run into the room before looking around a bit. As one of my first bosses said, "You don't want to go into the room with a big light on your head that's flashing 'dumb ass.'" In other words, he is saying walk in, keep your eyes open, and keep your powder dry. Then when you see how things are going, you can react. That is what we need to do at these prior highs.

I will see you on Monday. Have a great weekend!

Support and resistance

NASDAQ: Closed at 3062.39
Resistance:
3076 is the late April 2012 high
3090 is the mid-March interim high
3134 is the March 2012 post-bear market peak
3227 is the April 2000 intraday low
3401 is the May 2000 closing low

Support:
3042 from 5/2000 low
3026 from 10/2000 low
3024 is the gap point from early May
3000 is the February 2012 post-bear market high
2988 is the July 2012 high
2962 is the April 2012 low
2950 is the mid-April closing low
The 50 day EMA at 2943
2942 is the mid-June 2012 high
2910 is the March 2012 low
2900 is the March 2012 low
2888 is the May 2011 peak and PRIOR post-bear market high
2879 is the July 2011 peak
2866 is the July 2012 closing low
2862 is the 2007 peak
The 200 day SMA at 2856
2841 is the February 2011 peak
2816 is the early April 2011 peak.
2810 is the low in the shoulders
2754 is the October 2011 high
2706 to 2705 is the April 2011 low and the February 2011 and consolidation low (bottom of the trading range) 2723 to 2705 is the range of support at the bottom of the January to May trading range
2686 is the January 2011 closing low
2676 is the January 2010 low and the December 2011 peak
2645-2650ish from December 2010 consolidation
2643 is the September 2011 high
2612 is the late August 2011 peak
2603 is the March 2011 intraday low (post-Japan low)
2599 is the June 2011 low and NASDAQ

S&P 500: Closed at 1415.51

Resistance:
1422.38 is the Post-bear market high (March 2012)
1425 from May 2008 closing highs
1433 from August 2007 closing lows
1440 from November 2007 closing lows

Support:
1406 is the early May 2012 peak
1378 is the February 2012 peak
1375 is the early July 2012 peak
1371 is the May 2011 peak, the post-bear market high
The 50 day EMA at 1369
1363.46 is June 2012 high
1359 is the April 2012 low
1357 is the July 2011 peak
1344 is the February 2011 peak
1340 is the early April 2011 peak
1332 is the early March 2011 peak
The 200 day SMA at 1329
1325 is the July 2012 intraday low
1309 is the right shoulder low from June 2012
1295 to 1294 is the April 2011 low and the February 2011 consolidation low (bottom of the trading range)
1293 is the October 2011 peak
1275 is the January 2010 low, early January 2011 peak
1267 is the December 2011 peak
1258 is June 2011 intraday low
1255 is the late December 2010 consolidation range
1249 is the March 2011 low (post-Japan)
1235 is the mid-December 2010 consolidation low
1231 is the late August 2011 peak
1227 is the November 2010 peak
1220 is the April 2010 peak
1209 is the mid-August 2011 high

Dow: Closed at 13,250.11
Resistance:
13,297 is the April 2012, post bear market high
13,668 from 12-2007 peak
13,692 from 6-2007 peak
14,022 from 7-07 peak

Support:
13,058 from the May 2008 peak on that bounce in the selling
13,056 is the February 2012 high
12,971 is the early July 2012 high
The 50 day EMA at 12,904
12,754 is the July intraday peak
12,716 is the April 2012 closing low
The 200 day SMA at 12,643
12,391 is the February 2011 peak
12,369 is the left shoulder low from May 2012
12,284 is the October 2011 peak
12,258 is the December 2011 peak
12,110 from the March 2007 closing low
12,094 is the April 2011 low
The June low at 11,897 (closing)
11,734 from 11-98 peak
11,717 is the late August 2011 peak
The August low at 11,702
11,555 is the March low
11,452 is the November 2010 peak
11,178 from November 2010
10,978 is the bottom of the November 2010 consolidation
10,750 from September 2010
10,720 is the August closing low
10,705-710 from January 2010 peak
10,694-700 from August 2010 peak

Economic Calendar

August 14 - Tuesday
- Retail Sales, July (8:30): 0.8% actual versus 0.2% expected, -0.7% prior (revised from -0.5%)
- Retail Sales ex-auto, July (8:30): 0.8% actual versus 0.3% expected, -0.8% prior (revised from -0.4%)
- PPI, July (8:30): 0.3% actual versus 0.2% expected, 0.1% prior
- Core PPI, July (8:30): 0.4% actual versus 0.2% expected, 0.2% prior
- Business Inventories, June (10:00): 0.1% actual versus 0.2% expected, 0.3% prior

August 15 - Wednesday
- MBA Mortgage Index, 08/11 (7:00): -4.5% actual versus -1.8% prior
- CPI, July (8:30): 0.0% actual versus 0.2% expected, 0.0% prior
- Core CPI, July (8:30): 0.1% actual versus 0.2% expected, 0.2% prior
- Empire Manufacturing, August (8:30): -5.9 actual versus 5.0 expected, 7.4 prior
- Net Long-Term TIC Fl, June (9:00): $9.3B actual versus $55.9B prior (revised from $55.0B)
- Industrial Production, July (9:15): 0.6% actual versus 0.6% expected, 0.1% prior (revised from 0.4%)
- Capacity Utilization, July (9:15): 79.3% actual versus 79.3% expected, 78.9% prior
- NAHB Housing Market , August (10:00): 37 actual versus 35 expected, 35 prior
- Crude Inventories, 08/11 (10:30): -3.699M actual versus -3.729M prior

August 16 - Thursday
- Initial Claims, 08/11 (8:30): 368K expected, 361K prior
- Continuing Claims, 08/04 (8:30): 3300K expected, 3332K prior
- Housing Starts, July (8:30): 763K expected, 760K prior
- Building Permits, July (8:30): 770K expected, 755K prior
- Philadelphia Fed, August (10:00): -5.0 expected, -12.9 prior

August 17 - Friday
- Michigan Sentiment, Preliminary August (9:55): 73.6 actual versus 72.2 expected, 72.3 prior
- Leading Indicators, July (10:00): 0.4% actual versus 0.2% expected, -0.4% prior (revised from -0.3%)

August 21 - Tuesday
- FOMC Minutes, 7/31 (14:00)

August 22 - Wednesday
- MBA Mortgage Index, 08/18 (7:00): -4.5% prior
- Existing Home Sales, July (10:00): 4.55M expected, 4.37M prior
- Crude Inventories, 08/18 (10:30): -3.699M prior

August 23 - Thursday
- Initial Claims, 08/18 (8:30): 365K expected, 366K prior
- Continuing Claims, 08/11 (8:30): 3298K expected, 3305K prior
- FHFA Housing Price I, June (10:00): 0.8% prior
- New Home Sales, July (10:00): 368K expected, 350K prior

August 24 - Friday
- Durable Orders, July (8:30): 2.5% expected, 1.3% prior (revised from 1.6%)
- Durable Orders -ex T, July (8:30): 0.5% expected, -1.4% prior (revised from -1.1%)
icon url

ReturntoSender

08/21/12 5:52 PM

#9874 RE: ReturntoSender #6755

From Briefing.com: 4:20 pm : Equities got off to a strong start today but could not hold their gains into the afternoon. The S&P 500 briefly touched a 4-year high before retreating to session lows. Total volume was better than what has been seen in recent days, but remained well below average. The Dow underperformed and finished lower by 0.5% while the S&P 500 shed 0.4%.

Financial stocks outperformed the broader market as the components appeared to be benefit from the rotation out of traditionally safer stocks found in the utility and telecom sectors. Major names showed considerable intraday strength, but final gains were a bit slimmer due to the afternoon sell-off. JPMorgan Chase (JPM 38.04, +0.67) and Citigroup (C 30.73, +0.75) added 1.8% and 2.5%, respectively. Today's strength has Citigroup up nearly 16.0% since its earnings report in mid-July. European financials were even more exuberant as Deutsche Bank (DB 34.07, +1.38) and Credit Suisse (CS 18.68, +0.59) gained 4.2% and 3.3%, respectively.

The materials sector also showed strength. Within the group, A.M. Castle & Co (CAS 11.69, +2.47) surged 26.8% after Platinum Equity bought a 6.0% stake through metal processor Ryerson. The private equity firm also said it might try to buy the rest of the company. Meanwhile, Freeport-McMoRan (FCX 36.49, +1.13) advanced 3.2%.

The Dow Jones Transportation Average outperformed the market. After yesterday's rally in airline stocks was brought on by a fare hike, Delta Airlines (DAL 9.71, +0.25) enjoyed its second day of gains. Shares of the carrier ended higher by 2.6%. Trucking stocks were also stronger with Con-Way (CNW 31.24, +0.46) up 1.5%.

Coal stocks rallied after the U.S. Court of Appeals in Washington threw out an Environmental Protection Agency rule over limits on sulfur dioxide and nitrogen oxide emissions. Alpha Natural Resources (ANR 6.90, +0.40) jumped 6.2% on the news. Other coal names have faded some of the post-ruling gains, but they remained bid. Westmoreland Coal (WLB 7.94, +0.45) and Peabody Energy (BTU 23.79, +0.85) advanced by 6.0% and 3.7%, respectively.

Earlier today, tech giant Apple (AAPL 656.06, -9.08) marked an all-time high at $674.88, but some late morning selling dropped it into negative territory. The stock remained there for the remainder of the session and finished with a loss of 1.4%. Elsewhere, Daktronics (DAKT 9.43, +1.37) soared 17.0% after beating on earnings and revenues.

Shares within the telecommunications space weighed on the major averages. Neutral Tandem (IQNT 10.99, -0.56) slid 4.9% as selling pressure pushed the stock down to levels last seen in mid-March. Meanwhile, Verizon (VZ 42.89, -0.81) and AT&T (T 36.59, -0.30) ended lower by 1.9% and 0.8%, respectively.

There are a few names of interest remaining on the tail end of the earnings calendar. Dell (DELL 12.34, -0.22) will report earnings after today's close. The personal computer retailer is expected to earn $0.45 on $14.66 billion revenues. Meanwhile, Williams-Sonoma (WSM 38.23, +0.90) will also report after the bell. The culinary retailer is expected to report earnings of $0.41 on $863.84 million revenues.

Tomorrow morning, two apparel companies will report their quarterly results. Analysts expect American Eagle Outfitters (AEO 20.83, +0.38) to earn $0.21 on revenues of $738.72 million. Elsewhere, expectations call for Express (EXPR 16.90, -0.03) to earn $0.17 on $467.42 million revenues.

Tomorrow's economic calendar includes three releases. The MBA Mortgage Index will be announced at 7 AM ET, and existing home sales will be reported at 10 AM ET. Finally, the FOMC minutes will be released at 2 PM ET.DJ30 -68.06 NASDAQ -8.95 SP500 -4.96 NASDAQ Adv/Vol/Dec 1065/1.53 bln/1385 NYSE Adv/Vol/Dec 1309/640.9 mln/1648

3:30 pm : Crude oil traded higher in today's floor trade on a decline in the dollar and further tensions in the Middle East. Earlier today, reports suggested that President Obama has warned about military action against Syria if the country deploys chemical or biological weapons. The energy component climbed to a session high of $97.85 per barrel but lost steam in afternoon action. Despite the pull-back, crude still managed to book a gain of 0.6% as it settled at $96.89 per barrel.

Natural gas fell 11 cents, or 4%, to a floor session low of $2.70 per MMBtu following reports that a U.S. Court put on hold an EPA rule over limits on sulfur dioxide and nitrogen oxide emissions. However, concerns over weather-related disruption of production in the Gulf had buyers step in and quickly correct the move. It then popped to a session high of $2.84 per MMBtu, but a sell-off heading into the close left natural gas to settle unchanged at $2.78 per MMBtu.

Precious metals gained steam as the dollar fell in response to reports of further evidence that the ECB may be moving toward capping yields on Italy and Spain. In addition, Spain held a successful auction which has helped sentiment.

Gold traded higher for a fifth consecutive pit session and touched a new three-and-a-half month high of $1643.60 per ounce. The yellow metal then traded in a consolidative pattern and settled with a 1.2% gain at $1642.90 per ounce.

Silver also climbed higher in today's floor trade. It came off its session low of $28.92 per ounce and settled with a solid 2.9% gain at $29.42 per ounce, or just below its session high of $29.44 per ounce.DJ30 -77.13 NASDAQ -13.49 SP500 -6.32 NASDAQ Adv/Vol/Dec 1026/1301.8 mln/1417 NYSE Adv/Vol/Dec 1215/430 mln/1745

4:10PM Dell beats by $0.05, misses on revs; guides Q3 revs and FY13 EPS below consensus (DELL) 12.34 -0.22 : Reports Q2 (Jul) earnings of $0.50 per share, excluding non-recurring items, $0.05 better than the Capital IQ Consensus Estimate of $0.45; revenues fell 7.5% year/year to $14.48 bln vs the $14.66 bln consensus; desktop and mobility revenue contracted. Large Enterprise revenue was $4.5 billion in the quarter, a 3% decline. Operating income was $433 million, or 9.5% of revenue. Enterprise Solutions and Services revenue increased 9% on 17% growth in server and networking revenue and 5% increase in services. Public revenue was $4.1 billion, a 6% decrease. Operating income for the quarter was $379 million, or 9.3% of revenue. Server and networking revenue increased 4%. Small and Medium Business revenue was $3.3 billion, a 1% decline. Operating income was $382 million, or 11.7% of revenue. Enterprise solutions and services grew 15% led by an increase of 27% in services revenue and 16% in servers and networking. Consumer revenue was $2.6 billion, a 22% decline. Operating income was $14 million or 0.5% of revenue. Revenue in Americas was down 6%; EMEA was down 7%, and Asia-Pacific and Japan revenue was down 12%. Revenue in BRIC countries was down 15%.

Co issues downside guidance for Q3, sees Q3 revs -2 to -5% QoQ to ~$13.76-14.19 bln vs. $14.87 bln Capital IQ Consensus Estimate. Co issues downside guidance for FY13, sees EPS of at least $1.70, excluding non-recurring items, but including $0.02-0.03 dilution from Quest acquisition, vs. $1.91 Capital IQ Consensus Estimate; guidance from February was for over $2.13.

4:07PM Ultra Clean Holdings lowers Q3 rev guidance to $96-101 mln vs $109.93 mln Capital IQ Consensus Estimate; says one larger customer has decided to insource a portion of their business (UCTT) 6.70 : While the company is not providing new earnings per share guidance it is reconfirming the forecasted tax rate for the quarter. During the company's second quarter earnings conference call on July 23, 2012 the company stated that it expected revenue for the third quarter of 2012 to range between $107 million to $112 million, with earnings per share in the range of $0.10 to $0.14. In addition, the company forecasted a tax rate of 32% for the third quarter and a tax rate of 28% for the year. "As discussed during our second quarter conference call, we continue to see a decline in demand within the semiconductor capital equipment industry in the second half of 2012. This decline has been greater than previously expected but we project it to flatten out during the fourth quarter of 2012."

"Additionally, one of our larger semiconductor equipment customers has decided to insource a portion of their gas panel business in the future. While this decision will not have a material impact on our revenue in the second half of 2012, it could have a negative quarterly impact of 7% to 9% on total revenue by the end of 2013."

4:04PM Analog Devices reports EPS in-line, misses on revs; guides Q4 EPS below consensus, revs below consensus (ADI) 40.34 -0.20 : Reports Q3 (Jul) earnings of $0.56 per share, in-line with the Capital IQ Consensus Estimate consensus of $0.56; revenues fell 9.9% year/year to $683 mln vs the $692.53 mln consensus. Gross margin was 65.6% and Op Margin 32%, ex restructuring charges. Co issues downside guidance for Q4, sees EPS of $0.54-0.60 vs. $0.61 Capital IQ Consensus Estimate; sees Q4 revs of $685-715 mln vs. $716.56 mln Capital IQ Consensus Estimate. Sees gross margins of approx 65%. Op expense expected to be approx $231 mln.

Marvell (MRVL) and SanDisk (SNDK) announced their collaboration on a new generation of microservers for enterprise cloud storage that combines Marvell's ARM reference design with SanDisk's SATA SSD modules

8:07AM Best Buy misses by $0.11, reports revs in-line; reduces/suspends earnings outlook; suspends share repurchases after buying back 6.3 mln shares in Q2 (BBY) 18.16 : Reports Q2 (Jul) earnings of $0.20 per share, excluding non-recurring items, $0.11 worse than the Capital IQ Consensus Estimate of $0.31; revenues fell 2.8% year/year to $10.55 bln vs the $10.62 bln consensus. Domestic comp store sales decline of 1.6% improved compared to fiscal first quarter decline of 3.7%. Domestic estimated market share maintained year-over-year. U.S. big box square footage reduced by 4% year-over-year; Domestic revenue per square foot up 1% year-over-year. Similar to the first quarter of fiscal 2013, International segment year- over-year operating income decline driven primarily by lower revenue in China, Canada and increased competitive conditions in Europe. Domestic segment total Services category revenue increased ~6%. The co repurchased $122 million, or 6.3 million shares, of its common stock at an average price of $19.28 per share during the fiscal second quarter. The co has suspended its share repurchases for fiscal 2013 as it goes through the transition to a new CEO.

Due to lowered expectations for industry wide sales and the uncertainty associated with several key product launches expected in the second half of fiscal 2013, the co has reduced its annual earnings expectations (previously $3.50-3.80, consensus: $3.61). In addition, the co has just announced a new CEO who will start in early September. Given these factors, the co does not intend to further provide or update earnings guidance for fiscal 2013. The co will continue to provide forward looking commentary on business trends. The co continues to expect to achieve its domestic market share goals for the fiscal year and expects to generate free cash flow in the range of $1.25 billion to $1.5 billion for fiscal 2013.

7:03AM Trina Solar misses by $0.47, misses on revs; sees Q3 shipments higher QoQ; lowers FY12 shipment guidance (TSL) 4.84 : Reports Q2 (Jun) loss of $1.30 per share, $0.47 worse than the Capital IQ Consensus Estimate of ($0.83); revenues fell 40.3% year/year to $346.1 mln vs the $383.91 mln consensus. Solar module shipments were ~419 MW for Q2, following the Company's revised guidance of 390 MW to 420 MW, representing an increase of 10.2% sequentially . Gross margin was 8.4% in Q2, following the co's revised guidance of 7.0% to 9.0%, compared to 5.8% in the first quarter of 2012 and 17.0% in 2Q11.

For Q3, the Company expects to ship between 450 MW to 480 MW of PV modules. The co believes its overall gross margin, taking into account wafer and cell quantities outsourced from third party suppliers to meet demand in excess of its internal capacity and other needs, for the third quarter will be middle-single digits in percentage terms. Such guidance is based on the exchange rate between the Euro and U.S. dollar as of August 21, 2012.

For FY12, the co revises its expectations for total PV module shipments to be between 1.75 GW to 1.80 GW, compared to its previous guidance of 2.0 to 2.1 GW

12:56AM FEI and Hitachi High-Tech settle patent dispute (FEIC) 55.69 : Co announces it has reached a mutually acceptable agreement with Hitachi High-Technologies to settle an ongoing dispute regarding certain HHT patents relating to focused ion beam systems. In exchange for HHT's agreement to dismiss all currently pending claims and to grant future license rights to FEIC for the FIB patents, FEIC will make a one-time payment of $15 mln to HHT. FEIC has previously recorded charges of $5.4 mln related to pending claims pursuant to this patent dispute. The remaining $9.6 mln of the payment announced will be recorded as prepaid royalties and amortized over a period estimated at ~7 years.

09:19 am Corning resumed with a Buy at Stifel Nicolaus; tgt $15: . Stifel Nicolaus resumes coverage of GLW with a Buy and sets target price at $15 saying capacity concerns are overblown while display headwinds are easing. Firm also says margins are poised to expeand.

09:19 am Suntech Power downgraded to Sell at Argus: . Argus downgrades STP to Sell from Hold amid potential affiliate fraud. Firm notes Founder Zhengrong Shi has stepped down as CEO and been replaced by CFO David King. At the end of July, Suntech stated that it may have been the victim of fraud by affiliate Global Solar Fund (GSF). German bonds supposedly serving as collateral on loan guarantees made by Suntech to GSF may be nonexistent. Suntech discovered the problem while exploring the sale of its 80% stake in GSF to help meet a loan obligation coming due in March 2013.
icon url

ReturntoSender

08/22/12 8:05 PM

#9875 RE: ReturntoSender #6755

From Briefing.com: 4:15 pm : Equities spent the majority of today's session in the red. After a lower open, stocks traded in a tight range until the release of FOMC minutes. After breaking through the unchanged line, stocks could not push much higher as they registered a flat close. The Nasdaq outperformed and ended higher by 0.2%.

The FOMC minutes revealed a discussion between members regarding the costs and benefits of a new large-scale asset purchase program, otherwise thought of as "QE3." Members of the committee agreed that additional easing could provide support for the economic recovery by further depressing longer-term interest rates. However, few members voiced concern over the impact such easing would have on markets which deal in Treasury securities and agency mortgage backed securities. Overall, the committee appears to be maintaining their stance and will provide additional easing if general economic conditions deteriorate further.

Homebuilders saw notable strength after Toll Brothers (TOL 33.01, +1.20) reported strong quarterly results highlighted by a $0.19 earnings beat. Rivals Standard Pacific (SPF 6.49, +0.29), PulteGroup (PHM 13.29, +0.50), MDC Holdings (MDC 33.88, +0.95), and DR Horton (DHI 19.01, +0.76) were all up between 3.5% and 5.0%.

Shares of two apparel retailers headed in opposite directions after announcing earnings. Express (EXPR 15.02, -1.87) slumped 11.1% after reporting an earnings beat and a revenue miss. Meanwhile, American Eagle Outfitters (AEO 22.13, +1.30) surged 6.2% after announcing in-line earnings and issuing upside guidance.

Discover Financial (DFS 38.43, +1.43) ended higher by 3.9% after announcing a partnership which will allow PayPal subscribers to use their accounts at retail merchants who accept the Discover card as a form of payment. Discover marked a new all-time high of $39.13 following the news while shares of PayPal's parent company, EBay (EBAY 47.00, +1.15) advanced 2.5%.

Dell (DELL 11.68, -0.66) slid 5.4% after delivering mixed earnings. The personal computer manufacturer exceeded earnings estimates but missed on revenues while issuing downside guidance. Peer Hewlett-Packard (HPQ 19.20, -0.73) was lower by 3.7% ahead of its earnings release after today's close.

Stocks in the telecom space were lower as MetroPCS (PCS 9.71, -0.44) slipped 4.3%. The pay-as-you-go carrier was down after introducing an unlimited plan with a monthly fee of $55. A price battle between the wireless provider and rival T-Mobile has been ongoing. Today, T-Mobile announced their own unlimited plan with a price tag of $89.99 per month.

Existing home sales for July hit an annualized rate of 4.47 million units, which is weaker than the rate of 4.55 million units that had been generally expected among economists surveyed by Briefing.com. The pace for July is up from the prior month rate of 4.37 million units.

Treasury yields had been on a steady rise since late July. However, longer dated yields were able to hold their 200-day moving averages after rising close to 50 basis points apiece as a result of the selling. After seeing a couple days of modest gains, heavy buying throughout today's session dropped yields to their lowest levels in more than a week. Declines of close to 9 basis points in both the 10- and 30-yr yields dropped them to 1.719% and 2.825%, respectively.

Tomorrow's economic data includes initial and continuing claims at 8:30 AM ET. In addition, the FHFA Housing Price Index and new home sales will be reported at 10 AM ET.DJ30 -30.82 NASDAQ +6.41 SP500 +0.32 NASDAQ Adv/Vol/Dec 916/1.42 bln/1543 NYSE Adv/Vol/Dec 1175/600.8 mln/1830

3:35 pm : In energy, Sept crude oil Crude oil was volatile today and reached a floor session high of $97.50/barrel. Brent crude oil and WTI crude oil are both near a 3-month high as Middle East tension has helped create upside in prices. By the end of today's session, crude oil finished 0.4% higher at $97.24/barrel.

Sept natural gas recovered somewhat today, on choppy trade, after pulling back yesterday on the reports that a U.S. Court has put on hold an EPA rule over limits on sulfur dioxide and nitrogen oxide emissions. Nat gas ended 5 cents higher at $2.83/MMBtu.

In metals, Dec gold and Sept silver were trading near the unchanged line during the afternoon session, but both closed just modestly lower. Following the FOMC minutes, however, both gold and silver to new highs for the day. Sept copper rose 2 cents at $3.47/lb, just above its session low of $3.35. Gold finished pit trade about $2 lower at $1640.60, while silver rose 0.4% to $29.54.DJ30 -29.04 NASDAQ +7.07 SP500 +0.77 NASDAQ Adv/Vol/Dec 940/1190.1 mln/1506 NYSE Adv/Vol/Dec 1178/392 mln/1804

4:36PM Semtech reports EPS in-line, revs in-line; guides Q3 EPS below consensus, revs below consensus (SMTC) 24.77 -0.35 : Reports Q2 (Jul) earnings of $0.41 per share, in-line with the Capital IQ Consensus Estimate consensus of $0.41; revenues rose 15.7% year/year to $150.7 mln vs the $149.97 mln consensus. Non-GAAP gross profit margin for the second quarter of fiscal year 2013 was 61.2%. Non-GAAP gross profit margin for the second quarter of fiscal year 2012 was 60.6%. "The second quarter of fiscal year 2013 was another record quarter for Semtech. Our organic business grew 10% sequentially, and the $35 million, excluding IP revenue, posted by Gennum was a quarterly record for that business. Our 1,384 design wins and 21 new products indicate continued demand for our highly differentiated solutions. We believe our market-leading products, balanced end market exposure, and diversified growth platforms will enable us to deliver sustainable growth and profitability for our shareholders." Co issues downside guidance for Q3, sees EPS of $0.41-0.45 vs. $0.48 Capital IQ Consensus Estimate; sees Q3 revs of $148-154 mln vs. $158.14 mln Capital IQ Consensus Estimate. Capital expenditures are expected to be approximately $8.0 mln.

4:11PM Hewlett-Packard reports Q3 EPS in-line with slight upside preannouncment, misses on revs; lowers FY12 EPS slightly, in-line (HPQ) 19.20 -0.73 : Reports Q3 (Jul) earnings of $1.00 per share, excluding non-recurring items, $0.02 better than the Capital IQ Consensus Estimate of $0.98 an in-line with guidance from Aug 8 of ~$1.00; revenues fell 4.9% year/year to $29.67 bln vs the $30.19 bln consensus. Co issues in-line guidance for FY12, lowers EPS to $4.05-4.07, excluding non-recurring items, from $4.05-4.10 vs. $4.06 Capital IQ Consensus Estimate.

Personal Systems Group (PSG) revenue was down 10% YoY with a 4.7% operating margin. Commercial revenue decreased 9%, and Consumer revenue declined 12%. Desktop units were down 6%, notebook units were down 12% and total units were down 10%. Imaging and Printing Group (IPG) revenue declined 3% YoY with a 15.8% operating margin. Commercial hardware revenue and units were up 4% YoY. Consumer hardware revenue was down 13% YoY with a 23% decline in printer units. Services revenue declined 3% YoY with an 11.0% operating margin. Technology Services revenue was down 1% YoY, Application and Business Services revenue was flat, and IT Outsourcing revenue declined 6% YoY. Enterprise Servers, Storage and Networking (ESSN) revenue declined 4% YoY with a 10.9% operating margin. Networking revenue was up 6%, Industry Standard Servers revenue was down 3%, Business Critical Systems revenue was down 16%, and Storage revenue was down 5% YoY. Software revenue grew 18% YoY with an 18.0% operating margin, including the results of Autonomy. Software revenue was driven by 2% license growth, 16% support growth, and 65% growth in services. HP Financial Services revenue was flat YoY as the 2% increase in net portfolio assets was offset by a 2% decrease in financing volume. The business delivered a 10.4% operating margin.

4:10PM Rambus announces restructuring (RMBS) 4.76 -0.04 : With this restructuring and related cost saving measures, Rambus expects an overall net cash savings of $30-$35 million annually. The majority of the reduction in expenses are being made in general and administrative (G&A), while the company continues to invest in strategic businesses.

"After reviewing our expenses in detail, we have concluded that the support infrastructure can be reduced to improve profitability," said Dr. Ronald Black, Rambus chief executive officer. "While we have refined some of our R&D investments, we are preserving all of our strategic initiatives as we believe they will drive significant growth in the future."

The reductions in expense and associated workforce will begin in the coming weeks and are expected to be completed during the fourth quarter of 2012. As a result of this action, the company will reduce its workforce by approximately 15%. Satish Rishi, Rambus chief financial officer, stated: "We expect to take a charge for severance, on a cash basis, of approximately $6 million over the next two quarters. We are also reviewing our assets, businesses, and other contractual obligations and may take additional charges by the end of the year. Excluding these charges, and including additional investment in strategic initiatives, we expect significant net cash savings of approximately $30-$35 million annually."

11:14AM Agilent and China Mobile (CHL) agree to collaborate to develop solutions for next-generation radio access network (A) 36.85 -0.28 : The two companies signed a memorandum of understanding to initiate a collaboration that will focus on developing technology and test methods for a next-generation cloud-based radio access network, or C-RAN.

Riverbed Technology (RVBD) announced a reinforced commitment to the federal market with delivery of critical assessment and validation for its Cascade application-aware network performance management solutions that support requirements of U.S. DoD, civilian government agencies, and many private sector companies.

Manila Electric and Cisco (CSCO) announced they are collaborating on a holistic approach to providing reliable computing and networking infrastructure as a foundation for operations on a smart grid.

Dell (DELL $11.63 -0.71) reported second quarter earnings of $0.50 per share, excluding non-recurring items, $0.05 better than the Capital IQ consensus of $0.45, while revenues fell 7.5% year/year to $14.48 billion versus the $14.66 billion consensus; desktop and mobility revenue contracted. Large Enterprise revenue was $4.5 billion in the quarter, a 3% decline. Operating income was $433 million, or 9.5% of revenue. Enterprise Solutions and Services revenue increased 9% on 17% growth in server and networking revenue and 5% increase in services. Public revenue was $4.1 billion, a 6% decrease. Operating income for the quarter was $379 million, or 9.3% of revenue. Server and networking revenue increased 4%. Small and Medium Business revenue was $3.3 billion, a 1% decline. Operating income was $382 million, or 11.7% of revenue. Enterprise solutions and services grew 15% led by an increase of 27% in services revenue and 16% in servers and networking. Consumer revenue was $2.6 billion, a 22% decline. Operating income was $14 million or 0.5% of revenue. Revenue in Americas was down 6%; EMEA was down 7%, and Asia-Pacific and Japan revenue was down 12%. Revenue in BRIC countries was down 15%. The company issued downside guidance for the third quarter with revenues of -2 to -5% QoQ to approximately $13.76-14.19 billion versus the $14.87 billion consensus. The company issued downside guidance for fiscal year 2013 with EPS of at least $1.70, excluding non-recurring items, but including $0.02-0.03 dilution from Quest acquisition, versus the $1.91 consensus, guidance from February was for over $2.13.

Analog Devices (ADI $39.95 -0.39) reported third quarter earnings of $0.56 per share, in-line with the Capital IQ consensus of $0.56, while revenues fell 9.9% year/year to $683 million versus the $692.53 mln consensus. Gross margin was 65.6% and Op Margin 32%, ex restructuring charges. The company issued downside guidance for the fourth quarter with EPS of $0.54-0.60 versus the $0.61 consensus and revenues of h5-715 million versus $716.56 million consensus. Sees gross margins of approx 65%. Op expense expected to be approx $231 million.

Intuit (INTU $58.55 -0.40) reported fourth quarter earnings of $0.03 per share, excluding non-recurring items, $0.03 worse than the Capital IQ consensus of $0.06, while revenues rose 13.6% year/year to $651 million versus the $652.54 million consensus. The company issued upside guidance for the first quarter with EPS of $(0.07)-(0.06), excluding non-recurring items, versus the ($0.08) consensus, and downside first quarter revenue guidance of $630-640 million versus the $653.08 million consensus. The company issues in-line guidance for fiscal year 2013 with EPS $3.32-3.38, excluding non-recurring items, versus $3.36 consensus and revenues of $4.55-4.65 billion versus the $4.62 billion consensus.

Needham raises their Apple (AAPL $654.56 -1.36) target to $750 from $620. Since the firm's previous valuation exercise in February 2012, AAPL's sales have continued to grow, although more slowly than in the hype-growth period following the launch of the iPad and iPhone 4S. The increase in their price target stems chiefly from across-theboard upward revisions in all of AAPL's businesses, with the iPhone contributing almost half of the increase. The firm says, iPad sales have likewise continued to grow faster than the rate forecast in their valuation model, thanks to the device's dramatic invasion of the business and education markets.

09:14 am Dell shares fall 5% following disappointing guidance

Dell (DELL $11.62 -0.72) reported second quarter earnings of $0.50 per share, excluding non-recurring items, $0.05 better than the Capital IQ consensus of $0.45, while revenues fell 7.5% year/year to $14.48 billion versus the $14.66 billion consensus; desktop and mobility revenue contracted. Large Enterprise revenue was $4.5 billion in the quarter, a 3% decline. Operating income was $433 million, or 9.5% of revenue. Enterprise Solutions and Services revenue increased 9% on 17% growth in server and networking revenue and 5% increase in services. Public revenue was $4.1 billion, a 6% decrease. Operating income for the quarter was $379 million, or 9.3% of revenue. Server and networking revenue increased 4%. Small and Medium Business revenue was $3.3 billion, a 1% decline. Operating income was $382 million, or 11.7% of revenue.

Enterprise solutions and services grew 15% led by an increase of 27% in services revenue and 16% in servers and networking. Consumer revenue was $2.6 billion, a 22% decline. Operating income was $14 million or 0.5% of revenue. Revenue in Americas was down 6%; EMEA was down 7%, and Asia-Pacific and Japan revenue was down 12%. Revenue in BRIC countries was down 15%. The company issued downside guidance for the third quarter with revenues of -2 to -5% QoQ to approximately $13.76-14.19 billion versus the $14.87 billion consensus. The company issued downside guidance for fiscal year 2013 with EPS of at least $1.70, excluding non-recurring items, but including $0.02-0.03 dilution from Quest acquisition, versus the $1.91 consensus, guidance from February was for over $2.13.
icon url

ReturntoSender

08/25/12 5:31 PM

#9877 RE: ReturntoSender #6755

From Briefing.com: Weekly Recap - Week ending 24-Aug-12

Dow +100.51 at 13163.08, Nasdaq +16.39 at 3069.79, S&P +9.05 at 1411.13

After beginning the session in the red, stocks rallied after rumors suggested the European Central Bank is considering setting a yield band target as part of the new bond buying program. The news broke 15 minutes before the European close and caused a 50 pip spike in the euro as well as a rise to session highs by the major indices. The euro ended up giving up those gains, while U.S. stocks managed to build on the strength. At the end of the day, the S&P 500 closed higher by 0.7% on below average volume.

Durable goods orders were reported this morning, showing an increase in July by 4.2%, which was better than the 2.5% increase that had been expected, on average, among economists polled by Briefing.com. This comes after the prior month's reading was revised up from 1.3% to 1.6%. Excluding transportation related items, durable goods orders decreased in July by 0.4%, which is worse than the 0.6% increase that had been broadly anticipated. The prior month's reading was revised from -1.4% to -2.2%.

Telecom was the top performing sector as major players made considerable advances. Verizon (VZ 43.17, +0.92) advanced by 2.2% while Sprint Nextel (S 4.88, +0.10) and Frontier Communications (FTR 4.63, +0.07) ended higher by 2.1% and 1.7%, respectively.

The healthcare space also outperformed with two major names making headlines. Watson Pharmaceuticals (WPI 83.31, +4.68) gained 6.0% after its generic substitute for the Lidoderm pain patch was approved. Lidoderm's original manufacturer Endo Health (ENDP 32.17, +0.29) rose by 0.3%. Meanwhile, Eli Lilly (LLY 43.86, +1.46) climbed 3.4% after announcing the results of its clinical trials focused on patients with Alzheimer's disease. Even though the trials did not meet the top goals, the company highlighted some positive outcomes.

In the utilities sector, Black Hills (BKH 33.42, +2.41) surged 7.8% after the company sold its Williston Basin oil and gas assets for $243 million. Peers MDU Resources Group (MDU 22.07, +0.31) and AES Corporation (AES 11.51, +0.13) added 1.4% and 1.1%, respectively.

Major financials traded mostly in-line with the broader market. The SPDR Financial Select Sector ETF (XLF 15.13, +0.08) gained 0.5%. American Express (AXP 57.49, +1.07) and Goldman Sachs (GS 104.96, +0.88) were the top performers as they closed higher by 1.9% and 0.9%, respectively. However, European financials did not share the optimism as Barclays (BCS 11.86, -0.19) slipped 1.6% and UBS (UBS 11.20, -0.10) slid 0.9%.

Two names managed impressive reversals off lows brought on by disappointing earnings. After being down more than 4.0% in pre-market, Salesforce (CRM 148.54, +1.77) rallied by nearly 6.0% after reporting an earnings beat and in-line revenues. Autodesk (ADSK 30.13, -5.58) also saw a significant reversal. The early weakness was brought on by a disappointing quarterly report which showed a miss on earnings and revenues as well as downside guidance. Shares of the technology company have rallied more than 7.0% off lows but the stock ended down by 15.6%.

The euro was lower today but up on the week, after a weeklong rally took the common currency from 1.2295 to 1.2560. The euro began showing weakness in the early part of the session, but the rate cap rumor made rounds just ahead of the European close and led to an initial pop in the currency. The talks were viewed as risk-positive and lifted the euro to 1.2560 before fading to 1.2510.

Treasury yields had been rising steadily since marking all-time lows in late July. After reaching 1.835%, treasuries hovered near the level for a few days before turning lower again. The 10-yr yield had declined to 1.650% over the course of this week before today's selling put an end to the streak and lifted the 10-yr to 1.678%.

Weekly Review: FOMC Minutes Highlight Slow Week

On Monday, equities endured a day of lackluster action headlined by thin volume. After reaching lows during the first hour of trade, stocks staged a slow, session-long recovery. As a result, the major indices ended flat. Coventry Health Care (CVH 41.74, -0.13) as it surged 20.3% after being acquired by Aetna (AET 38.72, -0.58) in a $7.3 billion deal.

Tuesday's session got off to a strong start but stocks could not hold their gains into the afternoon. The S&P 500 briefly touched a 4-year high before retreating to session lows. Total volume was better than what has been seen in recent days, but remained well below average. The Dow underperformed and finished lower by 0.5% while the S&P 500 shed 0.4%. European financials outperformed as Deutsche Bank (DB 34.05, -0.29) gained 4.2%.

On Wednesday, equities spent the majority of the session in the red. After a lower open, stocks traded in a tight range until the release of FOMC minutes, which indicated that the Federal Reserve could provide additional easing if general economic conditions deteriorate further. After breaking through the unchanged line, stocks could not push much higher as they registered a flat close. The Nasdaq outperformed and ended higher by 0.2%. Dell (DELL 11.26, +0.02) slid 5.4% after delivering mixed earnings.

Thursday opened slightly lower and equities spent the remainder of the session in negative territory. July home sales were reported at an annualized rate of 372,000. Meanwhile, initial unemployment claims data before the open came in a little worse than expected, as the reading increased to 372,000 from the 368,000 observed in the prior week. United States Steel (X 20.81, -0.38) slid 7.0% after Dahlman Rose downgraded the steel sector.
 
Index Started Week Ended Week Change % Change YTD %
DJIA 13275.20 13157.97 -117.23 -0.9 7.7
Nasdaq 3076.59 3069.79 -6.80 -0.2 17.8
S&P 500 1418.16 1411.13 -7.03 -0.5 12.2
Russell 2000 819.89 809.19 -10.70 -1.3 9.2

7:08AM ReneSola misses by $0.06, beats on revs; guides Q3 revs below consensus; reaffirms FY12 shipment guidance (SOL) 1.79 : Reports Q2 (Jun) loss of $0.40 per share, $0.06 worse than the Capital IQ Consensus Estimate of ($0.34); revenues fell 6.5% year/year to $233 mln vs the $220.31 mln consensus. Total solar wafer and module shipments in Q2 2012 were 503.7 megawatts, exceeding Company guidance and representing an increase of 8.1% from 466.0 MW in Q1 2012. Q2 2012 gross profit was US$1.3 million with a gross margin of 0.6%, compared to a gross loss of US$8.0 million with a gross margin of negative 3.8% in Q1 2012.

Co issues downside guidance for Q3, sees Q3 revs of $200-220 mln vs. $238.25 mln Capital IQ Consensus Estimate. The co expects total solar wafer and module shipments to be in the range of 510 MW to 530 MW; solar module shipments are expected to be in the range of 150 MW to 170 MW. The co maintains its previously announced full year 2012 guidance of 2.2 GW to 2.4 GW of total solar wafer and module shipments.

Freescale Semiconductor (FSL) is adding an entry-level device family designed primarily for the automotive instrument cluster market to its S12 MagniV mixed-signal microcontroller (MCU) portfolio.

1:12AM Amkor: Federal Circuit Court issues favorable ruling in Amkor's patent case against Carsem (AMKR) 4.80 : Co announces the U.S. Court of Appeals for the Federal Circuit issued a favorable ruling in Amkor's appeal in its patent infringement case against Carsem before the U.S. International Trade Commission. In the underlying ITC proceedings, the Administrative Law Judge had ruled that certain Carsem Dual and Quad Flat No-Lead Packages infringe certain claims of one of Amkor's patents relating to MicroLeadFrame technology. However the ITC subsequently ruled that the infringed claims were invalid and terminated the proceedings. The Federal Circuit Court has now reversed the ITC's determination of invalidity, and remanded the matter to the ITC for further proceedings consistent with its opinion.

Aruba Networks (ARUN $19.46 +2.54) target raised to $17 from $11 at Mizuho. Firm sees evidence of a lengthening sales cycle and potential competitive headwinds. While consensus FY13 estimates are likely to remain intact for now, sparking a near-term relief rally in the shares, they continue to remain on the sidelines, particularly given what they view as aggressive growth expectations and premium valuation at 25x EPS (well above peers and growth rate).

Autodesk (ADSK $29.65 -6.03) reported second quarter earnings of $0.48 per share, $0.01 worse than the Capital IQ consensus of $0.49, while revenues rose 4.2% year/year to $569 million versus the $593.63 million consensus. The company issued downside guidance for the third quarter with EPS of $0.40-0.45 versus the $0.50 consensus and revenues of $550-570 million versus $602.08 million consensus. Net revenue for fiscal 2013 is now expected to increase by 4-6% compared to fiscal 2012 (consensus calls for 9.8% rev growth). Autodesk now anticipates fiscal 2013 GAAP operating margin to decrease by approximately 210 basis points and non-GAAP operating margin to increase by approximately 150 basis points compared to fiscal 2012. "Our own execution challenges, combined with an uneven global economy, resulted in disappointing revenue results for the quarter... Organizational changes we made within the company earlier this year slowed us down during the quarter."

Salesforce (CRM $143.97 -2.08) reported second quarter earnings of $0.42 per share, $0.03 better than the Capital IQ consensus of $0.39, while revenues rose 34.1% year/year to $732 million versus the $728.14 million consensus. Geographic Breakdown- Americas $507 mln compared to $367 million in prior year up 38%; Europe revenues were $124 mln compared to $102 mln in prior, up 22%, and Asia Pacific revenues were $99 million compared to $77 million in prior year, up 22%. Deferred revenue- On the balance sheet as of July 31, 2012 was $1.34 billion, an increase of 43% on a year-over-year basis. Current deferred revenue increased by 38% year-over-year to $1.27 billion, benefited in part by longer invoice durations. Non-current deferred revenue increased by 293% year-over-year to $69 million. Unbilled deferred revenue, representing business that is contracted but unbilled and off balance sheet, ended the second quarter at approximately $2.8 billion, up from approximately $2.7 billion at the end of the fiscal first quarter. The company issued mixed guidance for the third quarter with EPS of $0.31-0.32, excluding non-recurring items, versus the $0.34 consensus and revenues of $773-777 million versus the $769.40 million consensus. The company issued mixed guidance for fiscal year 2013 with EPS of $1.48-1.51, excluding non-recurring items, versus the $1.50 consensus and revenues of $3.025-3.035 versus the $3.02 billion consensus.

Mentor Graphics (MENT $16.36 +0.12) reported second quarter earnings of $0.21 per share, excluding non-recurring items, $0.04 better than the Capital IQ consensus of $0.17; revenues rose 12.7% year/year to $240.8 million versus the $239.51 million consensus. The company issued in-line guidance for the third quarter with EPS of approximately $0.28, excluding non-recurring items, versus the $0.28 consensus and revenues of approximately $265 million versus the $265.85 million consensus. The company issued guidance for fiscal year 2013 with raised EPS by $0.01 to approximately $1.38, excluding non-recurring items, versus the $1.38 Capital IQ consensus, reaffirmed fiscal year 2013 revenues of approximately $1.1 billion versus the $1.1 billion consensus. During the quarter, the co continued its share buy-back, repurchasing 1.4 million shares for $20 million "Revenues and earnings were an all-time record for a second quarter, and bookings were at the second highest level for any second quarter in company history. A weak euro, a weak rupee, and a strong yen worked to our advantage."

09:23 am Seagate Tech downgraded to Hold at Stifel Nicolaus: . Stifel Nicolaus downgrades STX to Hold from Buy as they see a more balanced risk/reward profile at current levels. Firm says this is not a negative call on Seagate nor the HDD industry, but rather a reflection of their effort to maintain discipline and capitalize on what has been strong share performance.

09:23 am Facebook upgraded to Buy at Capstone Investments; tgt $26: . Capstone Investments upgrades FB to Buy from Hold and sets target price at $26 saying they believe that the FB shares' 16X '13E EV/EBITDA multiple provides investors with upside to the Company's core business and potential returns from new businesses the stock price currently does not give the Company credit for.

10:23 am Tech Sector shares are trading lower in line with the broader market
The tech sector is trading lower today, inline with losses in the broader market. Semiconductors are showing relative weakness, however, with the SOX trading 1.0% lower. Within the chip index, VECO (-4.6%) is a notable laggard. Among other major indices, the SPY is trading 0.3% lower today, while the QQQ and the NASDAQ are trading 0.4% lower on the session. Among tech bellwethers, only AAPL (+1.2%) is showing strength. There were no earnings of note in the tech space. In news, the ZAGG (-14.0%) CEO stepped down, the board appoints Randy Hales as interim CEO and the co reaffirmed FY12 revenue guidance.

Among notable analyst upgrades this morning in the tech space, Capstone Investments was upgraded FB (-0.3%) to Buy. In downgrades, RDA (-3.0%) was downgraded to Neutral at UBS, Stifel Nicolaus downgraded STX (-1.9%) to Hold, and TI (-4.8%) was downgraded to Neutral at JPMorgan. FN (-0.9%) is the only notable name in tech scheduled to report quarterly results today after the close.
icon url

ReturntoSender

08/26/12 11:35 AM

#9878 RE: ReturntoSender #6755

Amateur Investors Weekend Stock Market Analysis (8/25/12)

http://www.amateur-investor.net/Weekend_Market_Analysis_Aug_25a_2012.htm

A few weeks ago I talked about how the NYSE Composite was developing a potentially large Triangle pattern. One of the characteristics of a Triangle is a decrease in overall volume. Notice the 9 Month Moving Average of Volume (blue line) in the NYSE has decreased dramatically over the past few years and is back to levels not seen since the late 1990's. Also keep in mind Triangles typically are associated with either the 4th Wave of a 5 Wave pattern or a "B" Wave of an "ABC" corrective pattern. In this case it looks like a "B" Wave so that would mean "C" would follow to complete a larger "ABC" pattern from the 2007 high.


Meanwhile in the shorter term one could also argue there is a smaller Triangle developing within the larger one. The NYSE may have completed "c" of the Triangle which will be followed by "d" and "e" in the weeks ahead as the series of lower Highs and higher Lows continue.

icon url

ReturntoSender

08/26/12 7:06 PM

#9879 RE: ReturntoSender #6755

InvestmentHouse Weekend Market Summary

http://www.investmenthouse.com/weekendmarketsummary.htm

- Stocks start lower but ECB, Bernanke pull another Friday rescue.
- Bernanke says the Fed has scope.
- Durable Goods Orders surge on aircraft, dive on everything else.
- Obama-Side Economics: Incomes are now lower in the recovery than they were in the recession.
- Missing the obvious because clinging to hope.
- Indices bounce where they had to but with Jackson Hole on Friday, stocks may just bide time.
- At these levels, despite still overall good technical action, the risk/reward is just not what it was for the upside.

Bernanke sees 'scope for further action,' and the indices use his scope to rally back.

Stocks were lower for the fourth session as the indecision at the prior post-bear market highs continued weighing on investors and traders. Indeed, the sellers took control on Tuesday and continued to push stocks lower Friday. Modest declines but yet another day of red numbers.

Then the ECB said it was outlining a bond buying plan of action, this even after Draghi said the ECB had to wait for a German court ruling on the ESM before it could formulate a bond plan. While the statements from Europe are enough to leave any sane person scratching his or her head (or other body parts of individual preference), they seemed to console the stock markets.

Then the silver bullet was let. Once again the WSJ, via the pen of Mr. Hilsenrath, came to the market's rescue. Third time in just about as many weeks. This time it was from no other than Bernanke himself, speaking in a letter to Daryl Issa, addressing the Fed's use of its monetary policy weapons and perceptions the Fed was a market and political group of hacks (the WSJ published the letter via Hilsenrath). One area of particular concern was the use of further stimulus, if there was anything left for the Fed to use, and the potential impact.

The key line as reported a thousand times Friday: "There is scope for further action by the Federal Reserve to ease financial conditions and strengthen the recovery." Now that statement certainly could have been worded more precisely. I am still not sure I understand whether the chairman was playing a massive joke on us all, referring not to the availability of additional stimulus methods but instead to the mouthwash to at least make the situation smell minty fresh.

Whatever the meaning, the market liked it. DJ30 was down 30 points on the low. It finished 100 points higher. The indices all reversed, not to big gains, but considering they traded negative o start and then rallied back, it was not bad action.

SP500 9.05, 0.65%
NASDAQ 16.39, 0.54%
DJ30 100.51, 0.77%
SP600 1.55, 0.34%
SOX 0.58%

Now there is no doubt the economy could use some strengthening. This week revealed more data indicating that the economy, if it is heading in the right direction as we are told, is moving in the slowest pace in history. We already know this is the worst recovery since the Great Depression, and the data is not getting better.

July Durable Goods Orders rose on the strength of Boeing orders. Take them out and it dove negative, 1% from where it was supposed to be. Further, we know that the July figure will be gutted this next month because Qantas cut a huge order for Dreamliners. So much for transports pulling us through.

Durable Orders, July (8:30): 4.2% actual versus 2.5% expected, 1.6% prior (revised from 1.3%)
Durable Orders -ex Transports, July (8:30): -0.4% actual versus 0.6% expected, -2.2% prior (revised from -1.4%)
Business orders: -3.4% versus -0.2% expected, -2.7% prior (revised lower from -1.4%)

Look at the ex-transports number: up from June, but still negative. Business orders diving much more than anticipated and roaring past a downwardly revised June number. Investment has fallen off the table of late as reported last night when discussing the commercial real estate market.

What is equally if not more disturbing: we learned that since the Obama recovery began in 2009 (and I use recovery only as the popular media is using it), incomes are 4.8% lower than they were BEFORE the recovery started. During the recession itself incomes only fell 2.6%! 800,000 more people are classified as long term unemployed than when the recession supposedly ended. 85% of the middle class say it is harder to maintain their standard of living than it was 10 years ago.

That poses the question: if a recovery leaves US citizens worse off in terms of earning power than they had during the recession, is it really a recovery?

Recovery turning over or is it simply that a recovery requires a turning back to free market, limited government principals that made the US great?

Indeed, this absurdly backward outcome from the past 3.5 year's economic policies shows just how flawed the Obama approach was and still is: it put money into the banks (0% interest loans), large corporations (GM, GE) and friends of the Administration (Solyendra, etc.), but the majority of taxpaying citizens who footed that bill got no jobs, and those who did received less money. Ah, that 'job quality' I discussed in the spring, just ahead of this the third summer of recovery.

$900B in the first round of Keynesian stimulus. Still 14M+ unemployed, still negative in terms of net jobs, and those with jobs bring home less money.

The Obama-side economics apologists lambast 'trickle down' economics, but when that was tried under Reagan and Clinton it worked because it was much more than trickle: tens of millions of jobs created, new technologies, higher standard of living across the board. The Obama-side economic plan saw NO flow, trickle, or otherwise to the lower levels. Indeed, based upon the wages numbers, it TOOK money from the workers and put it into the large corporations, the EXACT thing the Administration and the Occupiers supposedly decry.

So, despite the truly idiotic parrots who call themselves analysts on the financial stations currently claiming the economic data is too strong for more stimulus, the facts show that the 'recovery' is hardly that.

INDEED, think about this: the government statistics, as pointed out here the past few months, are so deviant from the reality of low to no job creation, wage declines, negative manufacturing reports, and negative durables orders, does it not make sense that we are ALREADY in recession and the analysts are simply in denial? The data overwhelmingly shows we have slowed and slowed sharply this summer. In denying the obvious and trying to point out the few inconsistent and indeed fabricated positives as proof of economic recovery, these people are showing their lack of basic pragmatism when looking at economic data. I say we are already in recession now.

OTHER MARKETS

Dollar. 1.2511 versus 1.2562 euro. The dollar was up versus the euro but down against everything else. It surged at one point. The ECB news helped it rally to the upside. It goes up when the ECB says it will do something. That makes sense, of course, given that the ECB would be eviscerating its currency for once, and that would make ours stronger. But when Bernanke said there was still scope, the dollar fell right back down. It remains in its rounded top with a potential head and shoulders. A shoulder and a head are in place right now.

Bonds. 1.68% versus 1.67% 10 year US Treasury. Bonds closed flat. They gapped higher, reversed and lost a little bit of ground. It has been a strong run on the week given the economic data and the commentary out of the Fed. A nice, big run to the upside off of a double bottom at the 200 day EMA. It is still a toppish pattern right now, and it is bumping up against resistance and fading. We will see what happens as bonds continue trying to run back and recover some of that lost ground. They have some serious resistance to deal with at this level in terms of gaps and other consolidations.

Gold. 1672.30, -0.50. Gold was flat for a change. Gold has been streaking to the upside, looking very strong. It just had to take a pause after that strong rally this week. A lot of talk from the Fed, a lot of talk from the ECB, and then gold was right back in the game. It has been higher anyway before this talk, and then it made a serious break up through the 200 day EMA on the week. That also took it through some important resistance levels. Now it is bumping up against the other highs. It is a tough job getting out of a hole, but it is doing it with the aid of some inflation worries. Despite what a lot of pundits say, more QE appears to be pricing into the various markets.

Oil. 96.15, -0.12. Oil was down a bit on Friday, but it has had a good last couple of weeks. It broke higher, consolidated this week, and still looks to be in position to continue the move to the upside.

TECHNICAL SUMMARY

Internals.

Volume. NASDAQ -3%, 1.3B; NYSE -13%, 468M. Meager volume, indeed, as the indices bounced back to the upside. Once more we see more downside volume than upside. It is Friday in late summer, so you have to take some of the volume -- or lack thereof -- into account for that reason. Nonetheless, overall volume could not find many supporters on the way back up.

Breadth. NASDAQ +1.5:1; NYSE +1.86:1. This was after -2:1 on Wednesday. The advance/decline line was decent but nothing to write home about.

THE CHARTS

SP500. The charts tell the story. After a selloff below the 10 day EMA and down to the 20 day EMA on Thursday, the SP500 tapped that 20 day EMA on the Friday low and recovered. It closed near the session high. Not bad action at all. That was where it needed to hold and put in a bounce. It was not anything stellar, volume was lower. It is still not out of the woods; it just did what it needed to do. As noted, this is pretty good action if you get rid of these and do not factor them into the picture. I do not know you cannot rely do that, but let's just pretend. This is a pretty solid pattern: higher highs, higher lows, a lateral consolidation, a break, a test of it. It looks pretty good. The only thing is when you peel back this cover and see that it is at these old highs. That gets everyone quaking in their boots. It is not a great time of year. The end of August and into September is typically the worst month for the market. Not great news, but it is still a pretty decent pattern overall.

DJ30. Even the Dow recovered, bouncing up through the 20 day EMA.

NASDAQ. NASDAQ gapped below the 10 day EMA that it has very nicely held, and it reversed right back to the upside and closed with a very solid, credible gain on the session. That keeps it right in line with that late-April peak. It is still below the March post-bear market highs, but it is putting in the right moves to advance and make a try at that former high.

SP600. The small caps managed to rebound off of pullback, holding at the 20 day EMA with something of a doji. Not a great move, but it did what it needed to do right at that former peak. It held where it had to, and on Monday we will see if they can continue the move that was ECB-led and then Bernanke-led on Friday.

SOX. SOX had a nice bounce off of the 20 day EMA. Nice test, nice bounce, and it held the old breakout point. It is looking very solid overall and in great shape to continue to the upside.

NASDAQ, SP600, SP500, and the SOX all look great to continue upside. Why won't they? There are many reasons that they would not and many reasons that they would. A lot of the won'ts have to do with the prior highs and just idea that they have run far enough and cannot make the break. I will not necessarily subscribe to that. I did not like the action on the week, but it did not show me that there was a total breakdown. The Dow broke through and gave back its last breakout and run. That is not a positive by any stretch, but the other indices held and bounced. They still remain positive. There is still a bit of leadership out there to propel the stocks higher as well, even though there are some groups such as energy that continued their troubles on Friday.

LEADERSHIP

Energy. Some energy stocks were breaking down. PTEN broke. It did try to recover off of the lows, and it did manage to recover some ground. A lot of the energy has left the energy sector, at least temporarily. We see some good tests, such as APA. It is showing a doji at the 50 day EMA and trying to turn the corner. Even APC has formed a little pennant or triangle of sorts at the 50 day EMA. It might to be able to make a break to the upside as well. We will have to see. It got a bit heavy last week. Maybe it was just a test and they can continue to the upside. We will see if that is the case.

Financial. Financials are starting to come back around again, helping out the rest of the market. BAC looks good with this nice flag pullback to the 10 day EMA. JPM has a nice pullback to the 200 day EMA. Even WFC is trying to hold at the 20 day EMA and put in a bounce. Although it does not look as good as it has in the past, it is still trending to the upside. This is a jumbled trend, however.

Industrial. CAT is trying to hang on at the 50 day EMA. JOY is trying to do the same, right at the 50 day EMA. These will be important tests come next week if they can make the break to the upside.

Retail. Retail continues to perform. RL broke to the upside with a solid gain on the session. KORS broke sharply higher as well. We are seeing these kinds of sharp breaks from apparel. Retail is doing all right. DECK was not screaming higher on Friday, but it held at the 10 day EMA. It has a nifty pullback after a nice initial break of that downtrend that moved through the 50 day EMA and passed that last high.

These stocks are still holding. Retail continues to show that it wants to move higher in anticipation of more sales, even though we learned that citizens just do not have as much money as they used to. The jobs they are working now do not pay as much. Is this the sign of a secular decline in the country? Is it a true change where we no longer advance our standard of living? Where we have to agree to take less money? Why? Because in the government spent it all, so no one else has any money to spend.

It seems like rudimentary economics and finance, but our government has not grasped that. If it spends all the money, we cannot make enough money to repay it because the life is sucked out of the economy and out of our capital investment. But I digress.

There are still areas that can lead the market to the upside. There were some breakdowns on the week, no doubt. Some techs went down, some medical stocks went down. There were some problems, but there are still leaders out there. There are enough to move the market higher; it is just a matter of whether the money comes back in and starts pushing stocks once more.

THE MARKET

SENTIMENT INDICATORS

VIX. The VIX rallied nicely on the week, and a little bit of selling will do that. It bounced back down from the 20 day EMA on Friday given that the market posted a solid recovery. Still, it put in a little double bottom at those prior lows that bounced the VIX higher and the market lower in 2011 and earlier this year. We still have the issue of a potential selloff even though the markets held at near support and bounced on Friday. That was good action to take, but it does not necessarily mean that the indices will continue higher from here. They will need that leadership to come back around and provide, well, more leadership.

VIX: 15.18; -0.78
VXN: 16.6; +1.28
VXO: 14.62; -2.06

Put/Call Ratio (CBOE): 0.85; -0.08

Bulls versus Bears

This is a reading of the number of bullish investment advisors versus bearish advisors. The reason you look at this is that it gives you an idea of how bullish investors are. If they are too bullish then everyone is in the market and it is heading for a top: if everyone wants to be in the market, then all the money is in and there is no more new cash to drive it higher. On the other side of the spectrum if there are a lot of bears then there is a lot of cash on the sideline, and as the market rallies it drags that cash in as the bears give in. That cash provides the market the fuel to move higher. If bears are low it is the same as a lot of bulls: everyone is in and the market does not have the cash to drive it higher.

Bulls: 43.6% versus 43.6% versus 39.4%. Wow, talk about lack of care. Bulls, elevate from recent levels mind you, held steady. Makes sense given the lateral move below the prior highs that had so many pundits negative. Undercut 35%, the threshold for bullishness, in early June. You would expect it to rise and it has. Still not at a dangerous level, just working as it should. As noted, hit 34% in early June. It did its job and the market is on the rally. Hard drop to 34 from 39.3% as economic reality and a choppy stock market hit. Off the 55+ level hit in late February. That was the highest level since April and May of 2011, the peak of the post-bear market high. 35% is the threshold level suggesting bullishness. To be seriously bearish it needs to get up to the 60% to 65% level.

Bears: 26.6% versus 25.5% versus 27.7%. Bounced back up to a level from four weeks back. Also makes sense given the lateral move that had many pundits calling for a market rollover. Never made it to the 35% that can be a bullish indication, but the bulls were weak enough back in June. Over 35% is the threshold to be really be a good upside indicator. For reference, bearishness hit a 5 year high at 54.4% the last week of October 2008. The move over 50 took bearish sentiment to its highest level since 1995. Extreme negative sentiment. Prior levels for comparison: Bearishness peaked at 37.4% in September 2007. It topped the June 2006 peak (36%) on that run. That June peak eclipsed the March 2006 high (33%) and well above the 2005 highs that spawned new rallies (30% in May 2005, 29.2% in October 2005). That was a huge turn, unlike any seen in recent history.

NASDAQ

Stats: +16.38 points (+0.54%) to close at 3069.79
Volume: 1.321B (-2.97%)

Up Volume: 863.15M (+474.47M)
Down Volume: 453.76M (-525.15M)

A/D and Hi/Lo: Advancers led 1.5 to 1
Previous Session: Decliners led 1.97 to 1

New Highs: 56 (+20)
New Lows: 33 (-2)

SP500/NYSE

Stats: +9.05 points (+0.65%) to close at 1411.13
NYSE Volume: 468M (-13.22%)

A/D and Hi/Lo: Advancers led 1.86 to 1
Previous Session: Decliners led 2.23 to 1

New Highs: 77 (+18)
New Lows: 13 (-1)

DJ30

Stats: +100.51 points (+0.77%) to close at 13157.97
Volume: 88M shares Friday versus 108M shares Thursday.

MONDAY

There is a lot more economic data back on the agenda next week. Tuesday Consumer Confidence is the main read. Wednesday the second reading the GDP on the Q2 is out. It is expected to rise to 1.6%. They are lunatics for thinking that. The numbers may show that, but with inventories and the issues we have with exports and other areas, I don't see how that could be. I think it is all a bunch of hogwash right now. I think we are in negative numbers, and we will have revisions in the future that will show historically that we were in a recession.

Pending Home Sales are out. Thursday we have Initial Claims, as always, and then Personal Income and Spending. Very important, particularly in light of the word we got this week that wages are not rising but are actually down. Friday we have the important Chicago PMI. Michigan Sentiment, and Factory Orders. A trio of fairly important data. Sentiment and Confidence (we get that Tuesday) are tied in when there are very strong, long, negative times in the economy. They tend to be more truthful and leading as to what consumers are actually going to do. Versus good times when they always say they will cut back but never do.

We have quite an agenda for the data, but, of course, we still have to look at the technical picture because it will key much of the action. I am talking about SP500 and its test of the 20 day EMA as well as NASDAQ's test of the 10 day EMA and the SP600 holding at the 20 day EMA as well. All of those are important, and if we get a nice break higher, then they get it at least a shot at the prior bear market highs.

There are many analysts out there every day talking about how things are negative and are going down. That makes sense because the economy is so bad and the market has rallied well in a bad economic period. This has all been in anticipation of the Fed and ECB taking action. It cannot be on the economic data because the market is too smart to be fooled by government tinkering of the data. Yes, on a near-term basis it will react positively to the smoke and mirrors, but ultimately it sees through it. Ultimately more data comes in, and the market is always a leading indicator.

The question is, what is the market seeing that makes it go up or down? If it was just the economy, right now this market has been going down for these past two to three months and not going higher. As it is, it sees more stimulus and more liquidity. Not that it will work or that it will save the economy, but for what it can do near term for the market. That is to push it higher with a flush of liquidity that will not be used by anyone (because there are no jobs). Banks will just borrow for 0% and buy foreign bonds, or even our bonds, and get a return off of those. The money will not be put to work.

As reported earlier in the week, velocity is at an all-time low. It is lower than it was in the Great Depression. Velocity is how many times money turns over. It is the old story about the magic penny: "If you hold it tight you will not have any; but lend it, spend it, and you'll have so many they roll all over the floor." Remember that one? That is the velocity. It is how many times a single dollar moves through the economy as a loan, something that is then used to buy something else, and then it is spent on something else. It keeps turning over hands. There is no velocity right now.

Those who are getting the money -- the banks -- are not lending it. They are putting it into safe returns. The big companies made a bunch of money off of that stimulus, and they are not spending it either. They are hoarding it. Revenues are declining, so they will not be spending money on improving capital investment or their businesses. They are hanging on to see what will happen and who will be elected. There is no real spending of money; there is a hoarding of money. If there is more liquidity put into the market, that means it does not go into the economy and is used that way. Instead it goes into financial instruments from the banks or from companies that use it and put it into commodities or other types of investments other than increasing overhead costs. That is why the market likes it: It goes directly into the financial instruments, and that drives them higher.

Talk about ruining a nice view . . .

That is what this rally is based on. There is also the Jackson Hole Conference in Wyoming next week. Bernanke will be there with his cohorts as well as some others from the ECB and elsewhere. They will be discussing the word's economic future and how they can control it -- I mean, how they can help it along in recovery. That will be a point where the markets will look to Bernanke for some kind of guidance. Friday he gave a bit in the letter to Darrell Issa, and he may be giving some more. The fear is that he will not do anything because of that "strong economic data" we have seen of late. True, Bernanke does not want to do anything if he can avoid it. Thus he might put it off next week and wait until later in September. Remember, they said it would be in August or September, and the implication was that it would be at the August or September meeting and not at some point in between or off the cuff.

The market could be disappointed next week if it does not get any news from Mr. Bernanke on Quantitative Easing. It likely will not. It may get a little bone thrown to it, but it will not get a definitive announcement of any Quantitative Easing. It will want to do so with the ECB, perhaps. It says it still has to wait on Germany. Near term there could be an upset in the market. An upset in the market would send it down a bit given that it is bumping up at those prior highs.

We will just watch how the indices interact at this level. We are not totally comfortable with what we are seeing with some stocks breaking lower, but we continue to see stocks move. When you have a stock like RL breaking sharply to the upside again, it is hard to think that everything is totally negative in our economy. If that is the case, as long as these stocks continue to set up, we like what we see. Despite the old highs right overhead, we will not call the top of the market. We will be darn careful here. We will keep our stops up because we have seen stocks breaking down and good patterns cracking under the stress. It is a stressful time in the market because the buyers and the sellers are fighting it out right here at those old highs.

Right now we have a good move to the upside. On what? Hopes of stimulus. This entire rally, as noted before, is about stimulus. So if Jackson Hole does not come out with anything positive, we will get thrown back. We will be very careful with the upside. It is only prudent to be careful right now. Why? Because the risk/rewards are not as great for the market overall because they are bumping right up against highs. RL has a better risk/reward because it has a nice rounded bottom, it broke higher, tested, and now it is breaking higher. It has room to run. That is a different risk scenario, but the entire market is not there. Much of the market is higher than this. Therefore even plays like RL have more risk associated with them merely because the market overall is higher. In quality stocks such as RL, we will put some money to work to the upside. Overall we have to be cautious next week, however. We have to wait for the Jackson Hole commentary. Then we can see the reaction and move in with more plays at that point, upside or downside. We want to be ready for both.

Bernanke's Jackson Hole speech is not until Friday. There will be movement ahead of that. The question is whether we will get any significant movement or if it will be a choppy, lateral trade? We have had a good pullback to the 20 day EMA on SP500. We had a bounce to the upside on low volume, but driven by Bernanke's statements. It could very well move to the upside and continue the run. If it does, that is fantastic and we will let our plays run. I do not think we will get off that easy this week. I think it will be more of a choppy move, bouncing up and down and not really able to break through those highs before Friday. We will wait and see what Bernanke does. Near term, if he does not come through, he could be setting us up for some downside for a little bit of time.

If we do not get much movement before Friday, we are looking at taking some off the table. If we get movement before Friday, then that market is set up for some potential disappointment or a little sell on the news. We may just be taking some of the table on Friday, regardless of what happens. Bernanke is a wild card, and I have my doubts as to whether he will announce anything significant at Jackson Hole versus waiting until the September Fed meeting.

I will see you on Monday. Have a great weekend!

Support and resistance

NASDAQ: Closed at 3069.79
Resistance:
3076 is the late April 2012 high
3090 is the mid-March interim high
3101 is the August 2012 high
3134 is the March 2012 post-bear market peak
3227 is the April 2000 intraday low
3401 is the May 2000 closing low

Support:
3042 from 5/2000 low
3026 from 10/2000 low
3024 is the gap point from early May
The 20 day EMA at 3021
3000 is the February 2012 post-bear market high
2999 is the bottom of the August 2012 consolidation
2988 is the July 2012 high
The 50 day EMA at 2970
2962 is the April 2012 low
2950 is the mid-April closing low
2942 is the mid-June 2012 high
2910 is the March 2012 low
2900 is the March 2012 low
2888 is the May 2011 peak and PRIOR post-bear market high
2879 is the July 2011 peak
The 200 day SMA at 2868
2866 is the July 2012 closing low
2862 is the 2007 peak
2841 is the February 2011 peak
2816 is the early April 2011 peak.
2810 is the low in the shoulders
2754 is the October 2011 high
2706 to 2705 is the April 2011 low and the February 2011 and consolidation low (bottom of the trading range) 2723 to 2705 is the range of support at the bottom of the January to May trading range

S&P 500: Closed at 1411.13

Resistance:
1422.38 is the prior post-bear market high (March 2012)
1427 is the August 2012 peak
1425 from May 2008 closing highs
1433 from August 2007 closing lows
1440 from November 2007 closing lows

Support:
1406 is the early May 2012 peak
1402.22 is the closing low of the August 2012 lateral consolidation
The 20 day EMA at 1399
1378 is the February 2012 peak
The 50 day EMA at 1378
1375 is the early July 2012 peak
1371 is the May 2011 peak, the post-bear market high
1363.46 is June 2012 high
1359 is the April 2012 low
1357 is the July 2011 peak
1344 is the February 2011 peak
1340 is the early April 2011 peak
The 200 day SMA at 1334
1332 is the early March 2011 peak
1325 is the July 2012 intraday low
1309 is the right shoulder low from June 2012
1295 to 1294 is the April 2011 low and the February 2011 consolidation low (bottom of the trading range)
1293 is the October 2011 peak
1275 is the January 2010 low, early January 2011 peak
1267 is the December 2011 peak
1266 is the June 2012 base low

Dow: Closed at 13,157.97
Resistance:
13,297 is the April 2012, prior post bear market high
13,331 is the August 2012 post-bear market high
13,668 from 12-2007 peak
13,692 from 6-2007 peak
14,022 from 7-07 peak

Support:
The 20 day EMA is at 13,111
13,058 from the May 2008 peak on that bounce in the selling
13,056 is the February 2012 high
12,971 is the early July 2012 high
The 50 day EMA at 12,964
12,754 is the July intraday peak
12,716 is the April 2012 closing low
The 200 day SMA at 12,680
12,391 is the February 2011 peak
12,369 is the left shoulder low from May 2012
12,284 is the October 2011 peak
12,258 is the December 2011 peak
12,110 from the March 2007 closing low
12,094 is the April 2011 low
12,035 is the June 2012 base low
The June 2011 low at 11,897 (closing)
11,734 from 11-98 peak
11,717 is the late August 2011 peak

Economic Calendar

August 21 - Tuesday
- FOMC Minutes, 7/31 (14:00)

August 22 - Wednesday
- MBA Mortgage Index, 08/18 (7:00): -7.4% actual versus -4.5% prior
- Existing Home Sales, July (10:00): 4.47M actual versus 4.55M expected, 4.37M prior
- Crude Inventories, 08/18 (10:30): -5.412M actual versus -3.699M prior
- FOMC Minutes, 7/31 (14:00)

August 23 - Thursday
- Initial Claims, 08/18 (8:30): 372K actual versus 365K expected, 368K prior (revised from 366K)
- Continuing Claims, 08/11 (8:30): 3317K actual versus 3298K expected, 3313K prior (revised from 3305K)
- FHFA Housing Price I, June (10:00): 0.8% prior
- New Home Sales, July (10:00): 372K actual versus 368K expected, 359K prior (revised from 350K)
- FHFA Housing Price I, June (10:00): 0.7% actual versus 0.6% prior (revised from 0.8%)

August 24 - Friday
- Durable Orders, July (8:30): 4.2% actual versus 2.5% expected, 1.6% prior (revised from 1.3%)
- Durable Orders -ex Transports, July (8:30): -0.4% actual versus 0.6% expected, -2.2% prior (revised from -1.4%)
- Business orders: -3.4% versus -0.2% expected, -2.7% prior (revised lower from -1.4%)

August 28 - Tuesday
- Case-Shiller 20-city, June (9:00): -0.3% expected, -0.7% prior
- Consumer Confidence, August (10:00): 65.5 expected, 65.9 prior

August 29 - Wednesday
- MBA Mortgage Index, 08/25 (7:00): -7.4% prior
- GDP - Second Estimate, Q2 (8:30): 1.6% expected, 1.5% prior
- GDP Deflator - Second, Q2 (8:30): 1.6% expected, 1.6% prior
- Pending Home Sales, July (10:00): 0.0% expected, -1.4% prior
- Crude Inventories, 08/25 (10:30): -5.412M prior

August 30 - Thursday
- Initial Claims, 08/25 (8:30): 370K expected, 372K prior
- Continuing Claims, 08/18 (8:30): 3300K expected, 3317K prior
- Personal Income, July (8:30): 0.3% expected, 0.5% prior
- Personal Spending, July (8:30): 0.5% expected, 0.0% prior
- PCE Prices - Core, July (8:30): 0.1% expected, 0.2% prior

August 31 - Friday
- Chicago PMI, August (9:45): 53.8 expected, 53.7 prior
- Michigan Sentiment - Final, August (9:55): 73.6 expected, 73.6 prior
- Factory Orders, July (10:00): 2.0% expected, -0.5% prior
icon url

ReturntoSender

08/27/12 6:38 PM

#9880 RE: ReturntoSender #6755

From Briefing.com: 4:15 pm : Equities began today's session on a positive note before retreating to the unchanged line. As the European markets closed for the day, U.S. stocks lifted to session highs, but the gains did not hold into the close. As a result, the S&P 500 finished flat on low volume while the Dow shed 0.3%.

Technology stocks outperformed the broader market with Apple (AAPL 675.68, +12.45) advancing 1.9% after the tech giant won its patent battle against Samsung. Apple's competitor, and the maker of Android operating software, Google (GOOG 669.22, -9.41) slid 1.4% after the verdict. Elsewhere, Universal Display (PANL 39.26, -3.47), which has a partnership agreement with Samsung, fell 8.1% as investors showed concern over the impact of the Apple ruling on the maker of organic LED screens. The selling may have been excessive as Wedbush Securities, Cowen Group, and Goldman Sachs have all come out to defend Universal Display by saying investor concerns are overblown.

Utility stocks were among the session's top performers. Electric distributor Black Hills (BKH 34.13, +0.71) ended higher by 2.1% while Exelon (EXC 37.05, +0.22) added 0.6%. Gas utility companies were also higher with National Fuel Gas (NFG 50.34, +0.39) and WGL Holdings (WGL 40.06, +0.29) advancing near 0.8% each.

Health care stocks traded mostly in-line with the market today. However, the SPDR Health Care Select Sector ETF (XLV 38.78, +0.04) marked a fresh all-time best at $38.94. The ETF was boosted by Bristol-Myers Squibb (BMY 32.89, +0.32), Eli Lilly (LLY 44.59, +0.73), and Unitedhealth Group (UNH 54.61, +0.45) as all three posted gains near 1.5%.

Stocks in the materials space underperformed the broader market. The sector was dragged down by Freeport-McMoRan (FCX 35.65, -0.48) and Dow Chemical (DOW 29.43, -0.46), both of which were down near 1.5%. Meanwhile, Monsanto (MON 86.13, +0.79) advanced 0.9% after announcing a new testing program from the company's Integrated Farming System Platform is set to launch next year.

Multiple mergers and acquisitions were announced today.

Kenexa (KNXA 45.79, +13.40) surged 41.4% after IBM (IBM 195.69, -2.08) agreed to purchase the human resources management software maker for $1.3 billion. IBM will pay $46.00 per share of Kenexa in a transaction which represents a 42.0% premium to Friday's closing price of $32.39.

Hertz Global Holdings (HTZ 14.21, +1.06) jumped 8.1% after announcing the purchase of Dollar Thrifty Automotive Group (DTG 87.08, +6.08). The transaction which has been five years in the making values Dollar Thrifty at $2.3 billion, or $87.50 per share. This represents an 8.0% premium to Friday's closing price of $81.00. In addition, Hertz has announced an agreement to sell its Advantage unit to Franchise Services of North America and Macquarie Capital.

Hudson City Bancorp (HCBK 7.45, +1.01) soared 15.7% after agreeing to be acquired by M&T Bank (MTB 89.82, +3.95) in a $3.7 billion deal. M&T will pay $7.22 per share of Hudson City, representing a 12.0% premium to Friday's close of $6.44.

After rising up to the 200-day moving average over the past two weeks, yields have been on a steady decline. The Treasury complex continues to rally off its August lows with today's one point gain in the long bond dropping the 30-yr yield four basis points to 2.756%. Meanwhile, a more modest advance of 11/32 in the 10-yr lowered the benchmark yield three basis points to 1.647%. Tomorrow's $35 billion, 2-yr auction will be a good gauge of investor demand as it will be the first auction in over two weeks.

Tomorrow's economic releases are limited to the Case-Shiller 20-city Index at 9 AM ET and consumer confidence at 10 AM ET.DJ30 -33.30 NASDAQ +3.40 SP500 -0.69 NASDAQ Adv/Vol/Dec 1228/1.36 bln/1235 NYSE Adv/Vol/Dec 1422/504.3 mln/1571

3:30 pm : Crude oil traded in positive territory in the overnight session as Tropical Storm Isaac posed concerns over production in the Gulf Coast. Strength also came following reports of a fire that shut down an Iraqi crude oil pipeline to Turkey and reports of a refinery explosion in Venezuela.

However, the energy component tumbled over $3.00 into the red as the National Hurricane Center stated that the hurricane is not expected to strengthen past a Category 1 storm. The forecasted reduction of the hurricane's severity took crude's prices down to a session low of $94.41 per barrel.

Crude continued to struggle in negative territory and settled with a 0.6% loss at $95.54 per barrel. Natural gas fell off its session high of $2.74 per MMBtu and trended lower into negative territory. It settled with a 1.9% loss at $2.65 per MMBtu, just above its session low of $2.64 per MMBtu.

Gold dipped to a floor session low of $1668.50 per ounce moments before equity markets opened. However, buyers stepped in and took the yellow metal into positive territory. After trading in a consolidative pattern in afternoon action, gold settled 0.2% higher at $1675.50 per ounce, just below its session high of $1676.00 per ounce.

Silver continued last week's advance. It came off its session low of $30.80 per ounce and later popped to a session high of $31.17 per ounce. Although silver pulled-back slightly heading into the close, it settled 1.3% higher at $31.04 per ounce.DJ30 -19.32 NASDAQ +2.75 SP500 0.48 NASDAQ Adv/Vol/Dec 1184/1101.2 mln/1271 NYSE Adv/Vol/Dec 1412/321 mln/1563

12:01PM Seagate Tech and Supermicro (SMCI) for strategic alliance to offer customers Seagate Pulsar SSD line (STX) 34.26 -0.20 : Co announced a strategic alliance with Supermicro (SMCI) to focus on expanding the market for Seagate Pulsar solid state drives (SSDs). As part of the initiative, Supermicro customers will have access to the latest Pulsar.2 enterprise-class, MLC-enabled products featuring 2.5" form factors with SAS2/SATA3 6Gb/s performance in up to 800GB capacities. Qualified Seagate SSD products will be listed on Supermicro's product web pages.

11:01AM Agilent acquires assets of Auroro SFC Systems, provider of supercritical fluid chromatography products for lab research and analysis (A) 37.52 -0.33 : Financial details were not disclosed.

SanDisk (SNDK) announced it is working with Virident Systems on projects to combine Virident hardware technology with FlashSoft software from SanDisk.

8:31AM Ixys announces its Board of Directors has authorized an additional stock repurchase program of up to 1 mln shares of its common stock (IXYS) 9.42 :

8:00AM Ramtron: Cypress Semiconductor (CY) Increases All-Cash Offer for Ramtron International to $2.88 Per Share (RMTR) 2.63 : Cypress Semiconductor (CY) announced that it has increased its all-cash offer to acquire all of the outstanding stock of Ramtron International (RMTR) to $2.88 per share from $2.68 per share. The increased offer represents a 59% premium over Ramtron's closing price of $1.81 per share on June 11, 2012, the day before Cypress publicly disclosed its offer for Ramtron.

The revised offer will expire at 5:00 p.m., New York City time, on September 11, 2012. The offer was previously scheduled to expire at 5:00 p.m., New York City time, on August 24, 2012. Other than the increase in the offer price and the extension of the expiration date, all other terms and conditions of the offer remain unchanged. The all-cash offer is not conditioned on due diligence or financing.

ASML Holding NV (ASML) announced that Samsung Electronics (SSNLF) has joined its Customer Co-Investment Program for Innovation and has committed to contribute EUR276 mln to ASML's research and development of next generation lithography technologies over five years.

Lattice Semiconductor (LSCC) announced promotional pricing for its recently released iCEblink40 Evaluation Kits. The iCE40 mobileFPGA family, fabricated on non-volatile 40nm technology, is optimized for consumer and mobile applications that require low cost, low power and small footprint programmable logic devices.

AMD (AMD) launched the AMD FirePro S9000 and S7000, the industry's most powerful dual- and single-slot server graphics cards for compute, virtual desktop infrastructure and workstation graphics deployments in data centers

3:13AM Maxim Integrated sees no material near-term impact from Apple (AAPL) v. Samsung (SSNLF) verdict (MXIM) 28.16 : Co announces it has reviewed the verdict in Apple (AAPL) v. Samsung Electronics (SSNLF) as well as the ruling of the Seoul Central District Court in a lawsuit filed by Samsung against Apple, both of which concluded last week. At this time, co does not believe these lawsuits will have any material impact on Maxim's September quarter revenues. In reference to the California jury verdict in Apple v. Samsung, it appears that this lawsuit was not focused on the newer generation Samsung products that comprise most of Maxim's sales to Samsung in the December quarter.

Oppenheimer raised their Apple (AAPL $680.00 +16.78) target to $800 from $680. The firm notes, AAPL got a decisive win against Samsung on Friday as a US jury awarded it $1.05B in damages for IP-infringement. The firm says, this is a key win for AAPL, but the war's not over. The immediate impact on numbers might not be significant (for Samsung and Apple's shipments) as the appeal could delay shipment disruption and as the impact is only in the US where Apple's share is already high. Beyond the court case, they expect a strong December/March with another record iPhone launch and the mini-iPad introduction and they are raising estimates for the mini-iPad and see potential iPhone upside.

10:48 am Information Technology sector trading higher today

The tech sector is trading higher today, ahead of slight losses in the broader market. Semiconductors are showing relative weakness with the SOX trading 0.5% lower. Within the chip index, RBCN (-1.8%) is a notable standout. Among other major indices, the SPY is trading 0.1% lower today, while the QQQ and the NASDAQ are trading 0.2% higher on the session. Among tech bellwethers, AAPL (+2.2%) is showing strength, while GOOG (-1.6%) is showing notable weakness. There were no earnings this morning in the tech space.

In news out this weekend, AAPL (+2.2%) was awarded ~$1 bln in Samsung patent infringement case. NOK (+8.4%) and MSFT (+0.7%) are showing strength following the news, while GOOG (-1.6%) and PANL (-10.3%) are under pressure. Also, IBM (-0.4%) agreed to acquire KNXA (+41.5%) for $46/share. Elsewhere, AOL (+2.1%) entered into a $600 mln accelerated stock repurchase agreement and announced the authorization of a $5.15 per share special cash dividend. Among rumors, AAPL's (+2.2%) iPad mini release date is scheduled for October, according to reports. Also, we are hearing renewed FIO (+0.1%) takeover chatter. There were no notable analyst upgrades this morning in the tech space. In downgrades, Argus downgraded ADSK (-0.3%) to Hold and BRCM (-0.5%) was downgraded to Neutral at Nomura. There are no notable names in tech scheduled to report quarterly results today after the close.
icon url

ReturntoSender

08/28/12 10:13 PM

#9882 RE: ReturntoSender #6755

From Briefing.com: 4:15 pm : Equities began today's session on a positive note before retreating to the unchanged line. As the European markets closed for the day, U.S. stocks lifted to session highs, but the gains did not hold into the close. As a result, the S&P 500 finished flat on low volume while the Dow shed 0.3%.

Technology stocks outperformed the broader market with Apple (AAPL 675.68, +12.45) advancing 1.9% after the tech giant won its patent battle against Samsung. Apple's competitor, and the maker of Android operating software, Google (GOOG 669.22, -9.41) slid 1.4% after the verdict. Elsewhere, Universal Display (PANL 39.26, -3.47), which has a partnership agreement with Samsung, fell 8.1% as investors showed concern over the impact of the Apple ruling on the maker of organic LED screens. The selling may have been excessive as Wedbush Securities, Cowen Group, and Goldman Sachs have all come out to defend Universal Display by saying investor concerns are overblown.

Utility stocks were among the session's top performers. Electric distributor Black Hills (BKH 34.13, +0.71) ended higher by 2.1% while Exelon (EXC 37.05, +0.22) added 0.6%. Gas utility companies were also higher with National Fuel Gas (NFG 50.34, +0.39) and WGL Holdings (WGL 40.06, +0.29) advancing near 0.8% each.

Health care stocks traded mostly in-line with the market today. However, the SPDR Health Care Select Sector ETF (XLV 38.78, +0.04) marked a fresh all-time best at $38.94. The ETF was boosted by Bristol-Myers Squibb (BMY 32.89, +0.32), Eli Lilly (LLY 44.59, +0.73), and Unitedhealth Group (UNH 54.61, +0.45) as all three posted gains near 1.5%.

Stocks in the materials space underperformed the broader market. The sector was dragged down by Freeport-McMoRan (FCX 35.65, -0.48) and Dow Chemical (DOW 29.43, -0.46), both of which were down near 1.5%. Meanwhile, Monsanto (MON 86.13, +0.79) advanced 0.9% after announcing a new testing program from the company's Integrated Farming System Platform is set to launch next year.

Multiple mergers and acquisitions were announced today.

Kenexa (KNXA 45.79, +13.40) surged 41.4% after IBM (IBM 195.69, -2.08) agreed to purchase the human resources management software maker for $1.3 billion. IBM will pay $46.00 per share of Kenexa in a transaction which represents a 42.0% premium to Friday's closing price of $32.39.

Hertz Global Holdings (HTZ 14.21, +1.06) jumped 8.1% after announcing the purchase of Dollar Thrifty Automotive Group (DTG 87.08, +6.08). The transaction which has been five years in the making values Dollar Thrifty at $2.3 billion, or $87.50 per share. This represents an 8.0% premium to Friday's closing price of $81.00. In addition, Hertz has announced an agreement to sell its Advantage unit to Franchise Services of North America and Macquarie Capital.

Hudson City Bancorp (HCBK 7.45, +1.01) soared 15.7% after agreeing to be acquired by M&T Bank (MTB 89.82, +3.95) in a $3.7 billion deal. M&T will pay $7.22 per share of Hudson City, representing a 12.0% premium to Friday's close of $6.44.

After rising up to the 200-day moving average over the past two weeks, yields have been on a steady decline. The Treasury complex continues to rally off its August lows with today's one point gain in the long bond dropping the 30-yr yield four basis points to 2.756%. Meanwhile, a more modest advance of 11/32 in the 10-yr lowered the benchmark yield three basis points to 1.647%. Tomorrow's $35 billion, 2-yr auction will be a good gauge of investor demand as it will be the first auction in over two weeks.

Tomorrow's economic releases are limited to the Case-Shiller 20-city Index at 9 AM ET and consumer confidence at 10 AM ET.DJ30 -33.30 NASDAQ +3.40 SP500 -0.69 NASDAQ Adv/Vol/Dec 1228/1.36 bln/1235 NYSE Adv/Vol/Dec 1422/504.3 mln/1571

3:30 pm : Crude oil traded in positive territory in the overnight session as Tropical Storm Isaac posed concerns over production in the Gulf Coast. Strength also came following reports of a fire that shut down an Iraqi crude oil pipeline to Turkey and reports of a refinery explosion in Venezuela.

However, the energy component tumbled over $3.00 into the red as the National Hurricane Center stated that the hurricane is not expected to strengthen past a Category 1 storm. The forecasted reduction of the hurricane's severity took crude's prices down to a session low of $94.41 per barrel.

Crude continued to struggle in negative territory and settled with a 0.6% loss at $95.54 per barrel. Natural gas fell off its session high of $2.74 per MMBtu and trended lower into negative territory. It settled with a 1.9% loss at $2.65 per MMBtu, just above its session low of $2.64 per MMBtu.

Gold dipped to a floor session low of $1668.50 per ounce moments before equity markets opened. However, buyers stepped in and took the yellow metal into positive territory. After trading in a consolidative pattern in afternoon action, gold settled 0.2% higher at $1675.50 per ounce, just below its session high of $1676.00 per ounce.

Silver continued last week's advance. It came off its session low of $30.80 per ounce and later popped to a session high of $31.17 per ounce. Although silver pulled-back slightly heading into the close, it settled 1.3% higher at $31.04 per ounce.DJ30 -19.32 NASDAQ +2.75 SP500 0.48 NASDAQ Adv/Vol/Dec 1184/1101.2 mln/1271 NYSE Adv/Vol/Dec 1412/321 mln/1563

9:40AM Intel retests its seven month low from July at 24.68 -- session low 24.69 (INTC) 24.73 -0.11 :

Cisco (CSCO) and EMC (EMC) announced further collaboration to help accelerate IT transformation by providing customers with choice and flexibility via "three paths to the cloud" - custom-design infrastructure, validated reference architectures, and pre-integrated converged infrastructure

ARM (ARMH) and Synopsys (SNPS) have signed a multi-year agreement that expands Synopsys' access to a broad range of ARM intellectual property.

Texas Instruments (TXN) announced support for OpenMP Application Program Interface on multicore DSPs.

QLogic Corp. (QLGC) announced that the latest research from Dell'Oro Group and Crehan Research confirms that QLogic gained global market share in the 10Gb Fibre Channel over Ethernet adapter market for Q2 of calendar year 2012, increasing the co's presence in the 10Gb Ethernet market.

8:03AM Ramtron to review increased unsolicited tender offer from Cypress Semiconductor (CY) (RMTR) 2.85 : Co announced that its Board of Directors will carefully review and consider, in consultation with its financial and legal advisors, the increased unsolicited tender offer from Cypress Semiconductor Corporation (CY) to acquire all outstanding stock of Ramtron at a price of $2.88 per share in cash. Ramtron's Board intends to advise stockholders of its recommendation in due course by making available to stockholders and filing with the Securities and Exchange Commission an amended Schedule 14D-9. Ramtron stockholders are advised to take no action at this time pending the review of the increased tender offer by the Company's Board of Directors. Needham & Company, LLC is serving as Ramtron's financial advisor and Shearman & Sterling LLP is serving as Ramtron's legal advisor.

Microsemi (MSCC) has achieved National Institute of Standards and Technology certification for the advanced encryption standard algorithm on its ultra-secure TRRUST-Stor solid state drive designed for critical data storage.

7:06AM Xilinx Acquires Embedded Linux Solutions Provider PetaLogix; financial terms not disclosed (XLNX) :

10:48 am Information Technology sector trading higher today

The tech sector is trading higher today, ahead of slight losses in the broader market. Semiconductors are showing relative weakness with the SOX trading 0.5% lower. Within the chip index, RBCN (-1.8%) is a notable standout. Among other major indices, the SPY is trading 0.1% lower today, while the QQQ and the NASDAQ are trading 0.2% higher on the session. Among tech bellwethers, AAPL (+2.2%) is showing strength, while GOOG (-1.6%) is showing notable weakness. There were no earnings this morning in the tech space.

In news out this weekend, AAPL (+2.2%) was awarded ~$1 bln in Samsung patent infringement case. NOK (+8.4%) and MSFT (+0.7%) are showing strength following the news, while GOOG (-1.6%) and PANL (-10.3%) are under pressure. Also, IBM (-0.4%) agreed to acquire KNXA (+41.5%) for $46/share. Elsewhere, AOL (+2.1%) entered into a $600 mln accelerated stock repurchase agreement and announced the authorization of a $5.15 per share special cash dividend. Among rumors, AAPL's (+2.2%) iPad mini release date is scheduled for October, according to reports. Also, we are hearing renewed FIO (+0.1%) takeover chatter. There were no notable analyst upgrades this morning in the tech space. In downgrades, Argus downgraded ADSK (-0.3%) to Hold and BRCM (-0.5%) was downgraded to Neutral at Nomura. There are no notable names in tech scheduled to report quarterly results today after the close.
icon url

ReturntoSender

08/29/12 8:14 PM

#9884 RE: ReturntoSender #6755

From Briefing.com: 4:10 pm : Today's lackluster session saw equities hover within points of the unchanged line for the majority of the day. Economic data was mostly positive, but did little to inspire investor confidence. As a result the S&P 500 ended higher by 0.1% on light volume.

The Federal Reserve has released its August Beige Book which aggregates economic condition reports from the twelve Federal Reserve Districts. The Book suggested "economic activity continued to expand gradually in July and early August." It also noted an improvement has taken place in credit conditions and the housing market. Sales and construction continue to rise gradually while employment is holding steady or showing only marginal improvement. Several Districts cited declining demand for staffing services while most Districts indicated that retail activity, including auto sales, had increased since the last Beige Book.

Healthcare stocks were higher as a handful of names advanced on upgrades. Genetic Technologies (GENE 3.93, +0.81) soared 26.0% after positive comments were made by boutique firm Lodge Partners. PROLOR Biotech (PBTH 4.88, +0.19) ended higher by 4.1% following the initiation of coverage at Oppenheimer where the stock was given an ‘outperform' rating with a $7.00 price target. Elsewhere, Cyberonics (CYBX 49.67, +3.31) advanced 7.1% as the shares were upgraded from ‘hold' to ‘buy' at Canaccord Genuity. In addition, analysts at Piper Jaffray elevated the price target for Cyberonics from $44.00 to $52.00.

For-profit education stocks slumped after Lincoln Educational Services (LINC 4.27, -0.09) was downgraded from ‘outperform' to ‘perform' at Oppenheimer. The downgrade was attributed to slowing enrollment as well as seven campus closures. As a result, shares of Lincoln slid 2.1%. Other for-profit education stocks were also lower as slowing enrollment will likely affect all providers. Career Education (CECO 3.22, -0.11) and DeVry (DV 18.60, -0.52) slipped 3.3% and 2.7%, respectively.

Yelp (YELP 22.37, +4.11) surged 22.5% as the share lock-up expired today. The event was anticipated by short sellers as it often leads to insider selling. However, Yelp was able to buck the trend and instead made an advance. Other social media names were mixed as Groupon (GRPN 4.31, -0.06) fell 1.4% and Pandora Media (P 10.08, -0.10) slipped 1.0% ahead of its earnings release after the close.

Energy stocks trailed behind the broader market as crude oil fell over 1.0%. Halliburton (HAL 33.51, -0.57) lost 1.7% while Schlumberger Limited (SLB 72.96, -1.14) ended lower by 1.6%. Meanwhile, GreenHunter Energy (GRH 2.24, +0.08) climbed 3.7% after eliminating all outstanding convertible preferred shares.

The second estimate of second quarter GDP pointed to a 1.7% increase, up from the 1.5% increase that was featured in the preliminary reading. The upwardly revised increase was better than the 1.6% improvement that economists polled by Briefing.com had expected. Also, the second quarter GDP Deflator was left unrevised to reflect a 1.6% increase.

Pending home sales for July increased by 2.4%, which was better than the unchanged reading that had been expected. The rise also made for a positive turn from the 1.4% decrease that was experienced in the prior month.

Tomorrow's economic data includes initial and continuing claims as well as personal income and spending. All data points will be released at 8:30 ET.

The U.S. Treasury will hold a $29 billion 7-yr note auction.DJ30 +4.49 NASDAQ +4.05 SP500 +1.19 NASDAQ Adv/Vol/Dec 1467/1.23 bln/966 NYSE Adv/Vol/Dec 1781/509.4 mln/1168

3:35 pm : Crude oil touched a floor session high of $96.37 per barrel moments after pit trade opened but quickly fell back into the red. It trended lower and dipped to a session low of $94.76 per barrel in late morning action. Buyers stepped in during the afternoon floor session and brought prices up slightly and the energy component finally settled with a 0.8% loss at $95.50 per barrel. Crude's weakness came on weaker-than-anticipated inventory data that showed a build of 3.778 mln when a draw of 1.8 mln was expected. Expectations that disruption in oil production in the Gulf of Mexico from Hurricane Isaac will be limited also played a role in the decline.

Natural gas came off its pit session low of $2.61 per MMBtu that was set in morning action and trended higher for the remainder of floor trade. It booked a gain of 1.9% as it closed at $2.68 per MMBtu, just below its session high of $2.70 per MMBtu. A stronger dollar following better-than-expected U.S. GDP data put pressure on precious metals in today's floor trade.

Gold tumbled to a session low of $1654.40 per ounce in morning action and spent the remainder of the session working on erasing the loss. Despite inching higher, the yellow metal settled with a 0.4% loss at $1663.10 per ounce. Silver fell off its session high of $30.91 per ounce and brushed a session low of $30.52 per ounce. It then trended higher and closed just 0.2% lower at $30.83 per ounce.DJ30 +25.25 NASDAQ +6.06 SP500 +2.92 NASDAQ Adv/Vol/Dec 1445/1037.7 mln/956 NYSE Adv/Vol/Dec 1839/342 mln/1098

10:23AM Intel: INTC -1.3% ticks to new multi-month range lows @ 24.67 (INTC) 24.67 -0.33 :

8:03AM Axcelis Tech wins high volume, follow-on order for Integra RS Plasma Dry Strip Systems from chipmaker (ACLS) 1.01 : Co announced that it has received a multiple system, follow-on order from one of the world's leading semiconductor manufacturers for the Company's IntegraTM RS plasma dry strip system. The systems will be used in production of 3x nm and below NAND Flash devices at leading edge fabs in Asia and the US. The systems began shipping this month.

6:38AM JA Solar misses by $0.23, misses on revs; sees Q3 shipments lower QoQ; lowers FY12 shipment guidance (JASO) 1.07 : Reports Q2 (Jun) loss of $0.37 per share, $0.23 worse than the Capital IQ Consensus Estimate of ($0.14); revenues fell 32.3% year/year to $284.4 mln vs the $289.18 mln consensus. Shipments were 418 MW, in line with the low end of the Company's previous guidance of 420 MW, and an increase of 14.2% from 366 MW in 1Q12. For Q3, the co expects total cell and module shipments to be between 350 MW and 370 MW. For the full year 2012, the co now expects total cell and module shipments to be between 1.5 GW and 1.8 GW, compared with the previously provided full year guidance of 1.8 GW to 2.0 GW. The revised estimates reflect the Company's prioritization of maintaining a healthy financial position over short-term shipment gains.

6:31AM Integrated Device and Intel (INTC) partner to develop integrated silicon solution for Intel's wireless charging technology (IDTI) 5.17 : IDT announced that Intel has selected IDT to develop an integrated transmitter and receiver chipset for Intel's wireless charging technology based on resonance technology. Intel, along with IDT, aims to deliver validated reference designs that are targeted for deployment in Ultrabooks, all-in-one PCs, smartphones, and standalone chargers. IDT is targeting samples of a resonance receiver IC by the end of the year, and the transmitter IC is expected to sample in the first half of 2013.

LTX-Credence (LTXC $5.84 +0.00) reported fourth quarter earnings of $0.04 per share, excluding non-recurring items, $0.01 better than the Capital IQ consensus of $0.03, while revenues fell 30.8% year/year to $43.4 million versus the $44.2 million consensus. The company issued downside guidance for the first quarter with EPS of $0.01-0.05 versus the $0.11 consensus and revenues of $42-46 million, excluding non-recurring items, versus the $48.2 million consensus. "Our outlook for the first fiscal quarter is supported by strength in the mobility and automotive markets plus initial revenue contributions from the Diamondx. While macroeconomic conditions have caused some customers to hold off on capital purchases, others remain in a steady pace of capacity expansion. As we begin the new fiscal year, our product lineup, focus on key market segments and new business development opportunities should lead to year-over-year growth."

10:12 am S&P Information Technology Index trading slightly higher today

The tech sector is trading just higher today, ahead of a flat broader market. Semiconductors are showing relative weakness, however, with the SOX trading 0.1% lower. Within the chip index, WFR (-1.8%) is a notable laggard. Among other major indices, the SPY is flat on the day, while the QQQ and the NASDAQ are trading modestly higher on the session. Among tech bellwethers, INTC (-1.0%) is showing notable weakness.

There were no earnings of note in the tech space last night or this morning. In news, ZNGA's (-1.6%) Chief Creative Officer is leaving the company to head a startup company. ZNGA, however, is backing the new company, according to reports. In notable analyst research this morning in the tech space, Oppenheimer upgraded ANGI (+5.6%) to Outperform. There are no notable names in tech scheduled to report quarterly results today after the close.

icon url

ReturntoSender

08/30/12 7:27 PM

#9885 RE: ReturntoSender #6755


From Briefing.com: 4:15 pm : Equities hit session lows during the first hour of trade before spending the rest of the session climbing off those levels. Headlines out of Europe indicated the International Monetary Fund sees a "major challenge" in implementing measures for Greece. Another comment which rattled the markets came from Slovak Prime Minister, Robert Fico, who suggested there is a 50% chance of a euro area breakup. The news resulted in a sharp sell-off in risk assets as crude oil, gold, silver, and the euro all fell to session lows. Stocks were able to recover some of their losses before succumbing to late-day selling pressure which resulted in the S&P 500 closing lower by 0.8%.

Consumer staples showed slimmer losses than other sectors. Within the space, Costco Wholesale (COST 98.59, +1.48) advanced 1.5% after August same store sales increased by 6.0%. Other consumer names like Procter & Gamble (PG 66.88, +0.01), and CVS Caremark (CVS 45.20, -0.23) chopped around the unchanged line throughout the session as they resisted the broad market pressure.

Healthcare stocks also outperformed as few components moved on news. Sarepta Therapeutics (SRPT 14.40, +1.80) surged 14.3% after receiving some positive press over the course of the week. Today's advance came after a CBS affiliate in Jackson, MO profiled a 12-year old patient whose quality of life has improved exponentially thanks to Sarepta's Eteplirsen, which is a drug used in treatment of muscular dystrophy. Meanwhile, Sucampo Pharma (SCMP 4.98, +0.15) ended higher by 3.1% after the company's only holder of class B common stock converted all of its shares into class A common stock. Elsewhere, Geron (GERN 2.63, +0.22) and Oncolytics Biotech (ONCY 2.77, +0.13) moved higher after Stifel Nicolaus initiated coverage with a ‘buy' rating. The two stocks gained 9.1% and 4.9%, respectively on the news.

A handful of technology firms reported their earnings since yesterday's close. TIVO (TIVO 9.04, -0.32) slipped 3.4% after beating on earnings and guiding third quarter revenues below consensus. Elsewhere, Methode Electronics (MEI 9.38, +0.43) closed higher by 4.8% following an earnings beat and raised guidance, while CIENA (CIEN 13.46, -3.26) slumped 19.5% after posting an earnings miss and guiding lower.

Networking companies were under pressure after CIENA's cautious guidance. Management cited slower roll-outs, suggesting fewer funds are being used by corporations towards capital expenditures. The negative outlook spilled over to other networking companies as Juniper Networks (JNPR 17.75, -0.73), JDS Uniphase (JDSU 11.07, -0.68), and F5 Networks (FFIV 97.39, -4.70) lost between 4.0% and 6.0%. Meanwhile, Cisco Systems (CSCO 18.90, -0.30) outperformed, shedding 1.6%.

Energy stocks were one of the worst performers. With crude oil lower by 0.8%, the SPDR Energy Select Sector ETF (XLE 70.82, -0.76) fell 1.1% while most of the major names slipped in excess of 1.0%. Apache (APA 85.09, -1.44), Anadarko Petroleum (APC 68.26, -1.46), EOG Resources (EOG 105.89, -2.16), and Halliburton (HAL 32.81, -0.70) posted the widest losses and were all down roughly 2.0%.

The latest weekly initial jobless claims count totaled 374,000, which was higher than the expected 370,000. Today's tally matched the revised prior week count of 374,000. As for continuing claims, they fell to about 3.316 million from 3.321 million.

Separately, personal income increased by 0.3% in July, which was in-line with expectations. Personal spending rose by 0.4%, which was lower than the expected increase of 0.5%. Core personal consumption expenditures were unchanged month-over-month, against expectations of a 0.1% increase.

Tomorrow's economic data includes Chicago PMI at 9:45 ET, Michigan Sentiment at 9:55 ET, and factory orders at 10:00 ET.

Federal Reserve Chairman Ben Bernanke will comment on monetary policy in a highly anticipated address from Jackson Hole, WY at 10:00 ET.DJ30 -106.70 NASDAQ -32.48 SP500 -11.01 NASDAQ Adv/Vol/Dec 619/1.21 bln/1843 NYSE Adv/Vol/Dec 824/511.7 mln/2124

3:35 pm : Crude oil declined in today's pit trade as energy companies assessed Isaac's impact ahead of resuming production in the Gulf of Mexico. A stronger dollar also put pressure on the energy component. Crude fell off its session high of $95.49 per barrel and dipped as low as $93.95 per barrel in late morning action. It then spent the remainder of the session trading just above that level and settled with a 0.9% loss at $94.61 per barrel.

Natural gas trended higher for most of its floor session. It tanked to a session low of $2.64 per MMBtu following inventory data that showed a build of 66 bcf when a build of 65 bcf was anticipated. However, the move quickly corrected and natural gas popped right back into positive territory. It eventually settled 2.6% higher at $2.75 per MMBtu, just below its session high of $2.76 per MMBtu. Precious metals tumbled into negative territory in response to a rally in the dollar.

Gold touched a session high of $1666.70 per ounce moments after floor trade opened and fell as low as $1652.30 per ounce. The yellow metal slightly pushed-off the session low and settled with a 0.4% loss at $1657.00 per ounce after trading in a consolidative pattern in afternoon action. Silver climbed to a session high of $30.97 per ounce in early morning action but fell to a session low of $30.26 per ounce in afternoon pit trade. It inched slightly higher as it headed into the close but still settled with a 1.5% loss at $30.45 per ounce.

As a reminder, investors are awaiting tomorrow's highly-anticipated Jackson Hole speech by Federal Reserve Chairman Ben Bernanke for any hints that would suggest further policy accommodations.DJ30 0-6.39 NASDAQ Adv/Vol/Dec 688/974.0/1730 NYSE Adv/Vol/Dec 872/329 mln/2053

4:21PM OmniVision misses by $0.01, beats on revs; guides Q2 EPS in-line, revs above consensus (OVTI) 15.91 -0.24 : Reports Q1 (Jul) earnings of $0.21 per share, excluding non-recurring items, $0.01 worse than the Capital IQ Consensus Estimate of $0.22; revenues fell 6.5% year/year to $258.1 mln vs the $243.42 mln consensus. Co issues in-line EPS guidance for Q2, sees EPS of $0.21-0.37, excluding non-recurring items, vs. $0.33 Capital IQ Consensus Estimate; sees upside Q2 revs guidance of $355-390 vs. $270.26 mln Capital IQ Consensus Estimate.

4:15PM Lam Research announces retirement of Chairman James W. Bagley; Stephen G. Newberry appointed as successor (LRCX) 33.39 -0.76 : Co announced that James W. Bagley, who has served as the company's chairman of the board of directors for the last 15 years, has decided to retire from the industry, including his position on Lam's board, effective as of the company's annual meeting of stockholders which will be held on November 1, 2012. The board appointed Lam's current vice-chairman, Stephen G. Newberry, to succeed Bagley as chairman upon Mr. Newberry's reelection to the board at the annual meeting.

2:34PM MKS Instruments aquires Korean RF company in a cash transaction (MKSI) 26.95 -0.22 : Co announced the acquisition of Plasmart, Inc. of Daejeon, Korea in a cash transaction closed yesterday. Plasmart develops radio frequency (RF) plasma generation and monitoring systems for the semiconductor, flat panel display, AMOLED and solar photovoltaic industries.

9:03AM STEC CEO files judicial answer to the SEC's Civil Complaint; states 'I could not have known at the time of the stock offering the two key 'facts' on which the SEC's case largely rests' (STEC) 7.62 : Co announces its CEO has filed his answer in response to the SEC civil complaint filed last month. With regard to the response, he states: "As my answer shows, I pursued a sale of shares through a public offering at significant additional cost to me in order to establish a more transparent and orderly process, which also protected STEC and its shareholders from large and unexplained piecemeal sales that would have been triggered under my pre-existing 10b5-1 plan as the company's stock rose rapidly. The answer also explains that I could not have known at the time of the stock offering the two key 'facts' on which the SEC's case largely rests."

7:04AM Ciena misses by $0.02, reports revs in-line; guides Q4 revs below consensus (CIEN) 16.72 : Reports Q3 (Jul) loss of $0.04 per share, $0.02 worse than the Capital IQ Consensus Estimate of ($0.02); revenues rose 8.9% year/year to $474.1 mln vs the $473.66 mln consensus; adj. gross margin -430 bps YoY to 38.2%. Co issues downside guidance for Q4, sees Q4 revs of $455-480 mln vs. $499.46 mln Capital IQ Consensus Estimate, with adj. gross margin of ~40%. "We continue to win in the market and take share as demonstrated by a solid operating performance in the third quarter. We are experiencing the effects of ongoing macroeconomic challenges and slower than expected roll-outs of new design wins. However, our approach to the market is working, our OPn architecture vision is gaining traction with customers globally, and our view of the long-term opportunity is unchanged."

Oppenheimer raised their Apple (AAPL $680.00 +16.78) target to $800 from $680. The firm notes, AAPL got a decisive win against Samsung on Friday as a US jury awarded it $1.05B in damages for IP-infringement. The firm says, this is a key win for AAPL, but the war's not over. The immediate impact on numbers might not be significant (for Samsung and Apple's shipments) as the appeal could delay shipment disruption and as the impact is only in the US where Apple's share is already high. Beyond the court case, they expect a strong December/March with another record iPhone launch and the mini-iPad introduction and they are raising estimates for the mini-iPad and see potential iPhone upside.

11:07 am Information Technology Index trading lower today along with the broader market

The tech sector is trading lower today, along with losses in the broader market. Semiconductors are showing relative weakness with the SOX trading 0.9% lower. Within the chip index, NXPI (-2.6%) is a notable laggard. Among other major indices, the SPY is trading 0.5% lower today, while the QQQ and the NASDAQ are trading 0.5% lower on the session. Among tech bellwethers, FB (-1.9%) is showing strength, while VZ (-1.1%) is under pressure.

In tech earnings, TIVO (-3.1%) posted a Q2 earnings beat and guided Q3 revs below consensus. This morning, MEI (+3.1%) reported a Q1 beat and raised guidance, while CIEN (-16.6%) posted a Q3 miss and guided lower. In news, G (+0.9%) announced a $2.24/sh special dividend. Also, SAC Capital reported a 5.2% stake in TIVO (-3.1%). Among rumors, Bloomberg discussed LXK's (+2.0%) valuation which may make the company a takeover target. XRX (-0.5%) was named as possible buyer.

In notable analyst upgrades this morning in the tech space, BCOV (+2.6%) was upgraded to Strong Buy at Raymond James. Among downgrades, ANGI (-5.1%) was downgraded to Hold at Canaccord, ERIC (-3.1%) was downgraded to Underperform at Credit Suisse, and KLAC (-1.8%) was downgraded to Neutral at Susquehanna. SAI (+0.2%) is the only notable name in tech scheduled to report quarterly results today after the close.
icon url

ReturntoSender

09/02/12 8:04 PM

#9887 RE: ReturntoSender #6755

InvestmentHouse Weekend Market Summary

http://www.investmenthouse.com/weekendmarketsummary.htm

- Bernanke gives the same old line at Jackson Hole, Markets act as if it was something new.
- Textbook case studies of how monetary policy impacts the economy and how Keynesian policy impacts . . . debt?
- Stocks rebounded Friday post-Bernanke, but it was not a definitive move. That may be definitive in itself.
- China manufacturing falls negative for the first time in 9 months.
- Japan, South Korea production falls.
- European unemployment hits a record high as inflation rises: stagflation returns.
- The contrary indicator has spoken? Barron's calls the market 'Tough as Teflon.'
- Stocks react but not to the extent of gold, dollar, bonds: stocks have priced in the promise of stimulus in the run. They now need the fact of stimulus to breakout.
- Defensive stocks from May and June have tested and set up anew.

Same words, a bit of different emphasis, stocks rebound from selling, gold surges.

I hear the cutthroats are biting . . . Have you been fishing yet? Listen . . . hear that fish? Fly rod packed, right? I prefer a red nymph...
Friday was all about Jackson Hole and what Mr. Bernanke would say. Would it be the foreshadowing of another QE as it was in 2010? Would it be the actual announcement of QE3? Well, it was really neither in my book. I believe the hype was simply overplayed. The market was up (and down) after the speech, but the move was nothing to suggest a game changer.

As my graphic shows, there was a lot of hype, but what were they really talking about? A lot of them are up there just to go fishing. As the graphic indicates, there are several conversations with Mr. Bernanke and other foreign dignitaries where they are just talking about the fish, whether their rods are packed, and what they are biting on.

Looking at the speech itself, I am reminded of an old Far Side cartoon where the owner is talking to his dog, and you hear his long speech from the dog's perspective. All the dog hears is "Blah, blah, blah, blah, blah," and then every once in awhile he understands "Rover."

Blah blah blah blah interest rates near 0% through 2014 blah blah blah blah blah
Blah blah blah head winds housing . . . fiscal policy . . . Europe's debts blah blah
Blah blah blah monetary policy limits cannot neutralize fiscal risks blah blah blah
Blah blah blah blah blah blah blah blah blah blah blah blah blah blah blah blah blah
Fed "will provide additional policy accommodation as needed to promote a stronger economic recovery and sustained improvement in the labor market."

That's how the Jackson Hole speech seemed to me. It was the same stuff we have heard before: Interest rates will remain near 0% through 2014; there are headwinds in the housing market; fiscal policy; Europe's debts; and monetary policy has limits that cannot neutralize fiscal risk. There he is talking about the state governments and the federal government, saying "You have to get your act together because there is only so much we can do." That is what I have been saying all along, and I am not the only one. Others have said you can only do so much with liquidity. You can maybe keep things from falling off a cliff for a certain period of time, but ultimately you have serious issues. Monetary policy cannot create growth alone.

There was a lot of the same old same old. Even the last line of his speech was nothing new. He said the Fed would provide additional policy accommodation as needed to promote a stronger economic recovery and sustained improvement in the labor market. We have heard it all before, but the markets -- and not just the stock market -- took it as if the door was left wide open for more Quantitative Easing. Indeed it is. The Fed said over a month ago that the door was wide open, and that it would do something in August or September. Mr. Bernanke was not that specific this time, but he did not close the door he opened earlier. We are still looking at more Quantitative Easing if the conditions warrant.

What conditions would warrant that? The Fed has a laser-like focus on unemployment. This Friday brings the August jobs report. If it is a stinker, the Fed is set to act. Why? The Fed has stated it wants to focus on unemployment. That is its goal. It will not give in until it sees the whites of solid jobs growth. That won't happen unless we get some severe monkeying with the numbers. It will have to be worse than the July numbers where actual negative reads were turned positive by aberrant adjustments that were well beyond several standard deviations.

Maybe the federal government was just laying the groundwork for an even bigger distortion this month, but I doubt it; I do not think they could get away with that much. Maybe the reigning party wants to have some Quantitative Easing announced and have the markets rally. I don't see that has a benefit because then the other side would just say "Look, they are trying to rescue a terrible economy with even more Quantitative Easing because our president is providing no leadership. You can almost see it already in the headlines. They already have their press releases prepared for whatever happens. But the market was focused on what the Fed did not do, and Mr. Bernanke did not close the door that he opened a month ago with respect to Quantitative Easing.

It did not matter that there were problems in the rest of the world. Indeed, the futures were up despite reports out of Japan that its industrial production had worsened. There were also reports out of South Korea that its industrial production had worsened. Now we have reports from China that its manufacturing is declining. Yes, it is actually in contraction for the first time in nine months. That is not good news, but futures were well up, bouncing back from the Thursday selloff. We had other Fed speakers out even before Bernanke. Bullard said we should not wait before we take "big action." Williams said the Fed would not raise rates until 2015, not just the 2014 that Mr. Bernanke stated in his Jackson Hole speech later that morning. Eurozone unemployment hit a record high at 11.3% in July, and inflation jumped to 2.6% from 2.4%. Not to worry. Who cares if gasoline prices were up 8.8% in August? It was up $0.31, the highest it has ever been heading into Labor Day.

It was not going to make any difference to market because it wanted to bounce back. It wanted to believe that more QE was coming that would help the market out. Of course it will help the market out to a certain extent. Stocks have run well since July; they are back at the old highs. If we look back in time, as I always love to do, we had a nice move in 2009 when QE1 was first announced. QE2 was announced and we had a pretty good move, but it was not as good. Then we fumbled around and had Operation Twist that provided a lesser move. QE will provide more than Operation Twist because that was basically status quo. We were not taking any money out of the system, we were just rolling it over again and again. It is not the same as adding new liquidity.

What does new liquidity do? With the economies in the world so slow and with banks still so unwilling to lend, new QE would simply go into financial assets and the like. It would increase their price. It would cause inflation in financial assets and what they believe to be a corresponding rise in the so-called wealth effect. That is, the more money people have on paper -- real or not -- the wealthier they feel and the more they spend. That is not utterly true, however. It has not been proven, but it is a widely accepted notion that seems to be logically sound.

But what have we really seen? Even with all of these financial gains since 2009, when we have seen the Standard and Poor's rally from just over 650 to just over 1400. We have not seen any growth in small businesses. They have not put any more money into their businesses. No one has hired anybody. Indeed, wages have gone down almost 5% on average in the US. We are not seeing any real, lasting economic growth. It does not cause growth. This is the new textbook study as to how monetary policy does not create growth alone. Add on top of that the Keynesian Trillion Dollar Baby that was spent and the other Keynesian attempts at economic stimulus that have utterly failed. The only economic gain we have had of the 1.5% average is because of monetarily policy keeping things from falling off a cliff.

This is classic, new economic textbook, real-time data showing us that those policies do not work. On Friday Bernanke was trying to tell us that they do not work. But since investors know that Bernanke's warnings about fiscal policy will go unheeded in an election year and nothing will be done (or could be done) until after the election, the markets know they will get more QE. They price that in. The question is what will happen near term. Longer term, when the stimulus is announced or is anticipated to be announced -- likely next week if the jobs number is poor -- the market will rally. How far? We will just have to see how much impact it has.

Even though the market finished to the upside on Friday, it was not a strong day. There was no change in the status of having rallied up to the prior highs and now being unable to continue. But it is also not falling off yet. The day was not convincing. There was the big selloff Thursday and a rebound on Friday, but it couldn't take out that Thursday range. Indeed, it gave up highs that were above the Thursday high. This is no answer to what actually happened on Friday, and thus we have "Blah, blah, blah" from Ben Bernanke still ruling the day. When will he pull the trigger? I could be wrong, but it does not look like the market wants to rally until it knows more about what could happen.

I will throw out another interesting thing that could happen. In addition to Quantitative Easing, he is probably going to extend and magnify Operation Twist with the goal of driving interest rates -- particularly mortgage rates --as close to zero as possible. Mr. Bernanke wants to make it so cheap to own a home that we try to foment another housing bubble. There won't be the nothing-down loans since that is prevented now, but money will be so cheap for homes. He will want to force people back in. Looking at how rents have surged, that makes sense. Rents always surge at the end of an economic cycle and leading into the next housing recovery. I do not think we are near an economic run now, but the housing market has been beaten down long enough where it can try to start modest recoveries. No one has any money to buy a house, right? Wages are down, and net worth is way down. They have to do something to make housing affordable, and that is to get interest rates close to zero. The lower the rates are, the more house you can afford. That is likely what will happen. The question for the market is WHEN will it happen?

We have taken a quick look at SP500 and saw what it did on the day. It was up as were the other indices.

SP500 +0.51%
NASDAQ +0.6%
Dow +0.69%
SP600 +0.34%
SOX +1.4%

All of the stock indices were higher, but as we will see later, they were not totally impressive.

OTHER MARKETS

Dollar. 1.2571 versus 1.2536 euro. The dollar took a hammering. It looks to be down a lot worse on the DXY0 because it fell against all the other currencies. It was really hit. It has a head and shoulders type of topping pattern. It is trying to hold some support. Indeed, it bounced off of a support level on the intraday low Friday. But the dollar traders believe that the Fed is embarking on new Quantitative Easing, and they were getting out ahead of the curve.

Bonds. 1.57% versus 1.63% 10 year US Treasury. The TLT play bit us in the rear end. Even though Bernanke did not announce anything, the market was ready enough for QE and believes it is coming. As I said, it knows that Congress will not be able to do anything. The president certainly will not provide any leadership or put anything forth. You have to do some work other than campaigning.

Bonds surged above the 50 day EMA. Huge moves indeed.

Gold. 1687.30, +30.20. Talk about a big move. A huge breakout move after the breakout over the 200 day EMA was tested last week. Gold is anticipating more inflation, of course. It actually got news of more inflation out of the eurozone with the 2.6% versus 2.4%. What do you call that? Remember from back in the 1970's: you are getting stagflation in the eurozone. Unemployment is at a record high at 11.3%. Inflation is surging. The UK is in recession, Spain and Italy are in recession. All these countries are in recession. Inflation is running higher, and unemployment is running higher. They have stagflation. Wow, it raises its head yet again.

Oil. 96.47, +1.85. Even with the world economies in recession, oil is moving higher. It is a commodity. It is also something priced in dollars. When dollars tank because of additional stimulus that will undermine the value of the currency, oil rises along with other commodities priced in dollars. Oil bounced back up to the 200 day EMA. I do not think that will stop it. It hit it a couple weeks ago and faded last week and tested. It held at the 20 day EMA and is on the bounce right now.

TECHNICAL SUMMARY

Internals.

Volume. NASDAQ +13%, 1.35B; NYSE +27%, 586M. It is sad to say that those are big numbers. They are very low volumes, but SP500 volume close to average on that. You have to say, in the relative sense, that it was bigger volume. In comparison to days of yore, it was pathetic volume, of course. But we live and trade and invest in the market we have now, not the one we had a year ago, two years ago or five years ago. Volume is volume, and you look at it relative to what it is in more recent history versus reminiscing about how great things were when we were young or how hard we had to work to do anything back then. We have all heard those stories. It is not necessarily from our grandparents, either. The economy has been so bad that those times when we had it better are not that far away.

Breadth. NASDAQ +1.65:1; NYSE +2.4:1. Advancers led, but it was not impressive. Not at all. The downside numbers were heavier on Thursday. It was not that strong a day internally even though volume was up. We can look at the charts to explain why.

THE CHARTS

SP500. Volume was up and the indices were up. SP500 closed well off of its high. SP500 hit 1413 on the high, and it closed at 1406. It basically gave away half of its move. It rallied, but it could not hold. It did manage to hold the 20 day EMA, and that keeps it in the same range it has been, but it does not change the character one iota. I would argue that because it was unable to really establish and hold the rally on Friday, that it was a disappointing session longer term -- or over the next few days. "Longer term" has been really compressed. We have so many events and data points coming out, any one of which could cause the Fed to act.

NASDAQ. NASDAQ tested all the way to the 20 day EMA and rebounded for a gain. It did gap higher, tested lower after Bernanke, and then it gyrated. The entire market gyrated after the Bernanke speech. There were big moves at first, and then they narrowed down as the afternoon went on. What does that tell us? A big fight, the inability to really resolve the fight, and no change in the indices.

Some people may point to the long reach lower on NASDAQ and the rebound and say the buyers obviously came back in. Obviously they did, but this was just in that gyration post-Bernanke. There is no change in the position. Maybe that is good. Maybe it will continue from here. But because it was unable to move even on things that were read as positive in terms of QE -- by the gold market, the bond market, the dollar market, the oil market, and by all commodities -- I think that is a negative near term for stocks.

I have been proved wrong before, but I see no change on what was perceived by all the other markets as good QE news. It shoved those markets higher to nice breakout gains, but it did not happen for stocks.

SP600. SP600 tested the 20 day EMA on the low. It bounced back to positive, but it changed nothing. It is still trending higher, and the small caps actually look pretty good. Higher highs, higher lows. This last one is struggling, but it still has its trend going. It is not a washout. It was not a change in character for any of the indices, I want to make that clear. I do not think it was a change in character that will cause a rally up through the recent highs right now until we get something more. In other words, until the Fed says, "This is what we will do. We just have to see what happens next week." That is a big difference, but it is not what Mr. Bernanke said.

We have the markets still in the same position, but what were they before the Fed came out? They could not make the break before the Fed came out. The Fed came out, and then they could not make the break anyway. Maybe something will happen after Labor Day that brings in more buyers. We will have to see, but the Fed action did not show that that will be the case.

SOX. The SOX looks just fine. It is in the same position it was before Friday. A doji, and it recovered from that Thursday selling that took it down to the 200 day EMA. It bounced off of that level, and it is still in position with a double bottom with handle base. The stocks could still rocket forward and provide leadership. The question is whether it will provide leadership next week. Will they do anything before the Fed acts? They could. They could take a leadership role and start coming to the fore. Leaders move before the actual numbers hit, and we can very well see the SOX take a leadership role. If investors anticipate stimulus coming, they will start looking at leaders to take them higher.

LEADERSHIP

Retail. Thus far, leaders have been in the retail sector. They have shown the most life. AMZN has been performing very well. We can look at any number of the other retail stocks, and most of them have been performing just fine. RL is one. We have been looking at DECK as a possible new buy. It did not hurt itself at all on Friday, and it still leaves itself in excellent position to rally to the upside. Retail still remains strong. It could be one of the leadership areas, but the problem is there are not many good stocks in retail to buy right now.

Medical. Drugs, biotech, and some medical instruments look to be on the comeback trail. ARNA has a nice pullback in place. It could make a nice run. DSCO had a nice break to the upside, and now it is working laterally and testing that break. Not bad at all. LXRX had a nice pullback. MDGN had a nice test. The problem is these are somewhat low-volume stocks. It does not mean you cannot play them, but you have to realize that they are a bit low volume. OSIR has nice action as well. These stocks that led in May and June into July have had a pullback as the market rallied off of the June low. The market turned less defensive at that point, and other areas rallied such as technology.

Tech. Technology is on the defensive a bit. It has made it up to those prior peaks, or just below them, as seen in the NASDAQ, but it stalled there. As worry, concern, and fear rises anew regarding the economy, what is coming back into vogue? The more defensive plays that were in play ahead of that June rally that were leading up in the May and mid-June selloff. Those have come back and based out as the market rallied to the upside and as other growth areas took over. Now they look ready to start moving higher once again.

Financial. Financials could be an aid to the market. MS is up a bit, but I am not convinced that it is a pattern I want to buy. BAC is not bad. This is a nice flag pattern that it put in over the last two weeks. Perhaps it is ready to provide some upside action. Financials have some life. There are some possibilities there, and they are very important to help lead the market. They have improved. But I feel that some of the patterns are just not there yet. But we will see how it plays out. If BAC rallies it could help provide leadership for the market.

THE MARKET

SENTIMENT INDICATORS

VIX. The VIX faded on Friday thanks to the bounce in the market overall. It has bounced off of the prior lows from March 2012 and May 2011. It has put in a move as the markets faded, but it has not been a large fade in the stock market yet. It has come back to throw a doji over the 50 day EMA. That suggests this is just a continuation doji, and it could continue higher. If the VIX continues higher, that means stocks fall. As I said earlier, the movement of the indices, particularly SP500 on Friday, was not convincing that they want to move higher near term without actually hearing something from the Fed saying "This is what we will do." We may get a further pullback in the market before next Friday and the jobs report. The Fed might feel compelled to do something at that point if the number is weak enough. That is how the volatility looks to play into the market action this coming week.

VIX: 17.47; -0.36
VXN: 18.35; -0.68
VXO: 16.32; -0.88

Put/Call Ratio (CBOE): 0.91; -0.15

Bulls versus Bears

With the indices bumping bear market highs, SP500 moving through them only to reverse rather violently intraday, and with sentiment truly low, Barron's issues a cover article about the invincible stock market.

In reality the article's implication that investor confidence is bubbling over is simply wrong: it is liquidity that has pushed stocks higher and funds are scared to death of missing out on any upside moves. The retail investor? Nowhere to be seen. The retail investor is a faint shadow of what he/she was in the early 2000's and is showing no love for equities.

This is a worrisome sign but for the fact it is so wrong in that the average investor and indeed even the hedge funds fear this market and if possible avoid it. Thus the 'cover effect' may not be as great here given it does not reflect the general sentiment towards stocks. That does not, however, save the near term market that is bumping against the highs after stimulus promised but does not have any new stimulus in hand, at least yet.

This is a reading of the number of bullish investment advisors versus bearish advisors. The reason you look at this is that it gives you an idea of how bullish investors are. If they are too bullish then everyone is in the market and it is heading for a top: if everyone wants to be in the market, then all the money is in and there is no more new cash to drive it higher. On the other side of the spectrum if there are a lot of bears then there is a lot of cash on the sideline, and as the market rallies it drags that cash in as the bears give in. That cash provides the market the fuel to move higher. If bears are low it is the same as a lot of bulls: everyone is in and the market does not have the cash to drive it higher.

Bulls: 48.9% versus 43.6% versus 43.6% versus 39.4%. Jumping upside as the stock indices managed to hold gains and avoid a selloff. Never mind SP500 posted a nasty reversal about two weeks back and has not recovered. While bullish sentiment is not overblown it is suggesting this move is a bit overcooked. Undercut 35%, the threshold for bullishness, in early June. You would expect it to rise and it has. Still not at a dangerous level, just working as it should. As noted, hit 34% in early June. It did its job and the market is on the rally. Hard drop to 34 from 39.3% as economic reality and a choppy stock market hit. Off the 55+ level hit in late February. That was the highest level since April and May of 2011, the peak of the post-bear market high. 35% is the threshold level suggesting bullishness. To be seriously bearish it needs to get up to the 60% to 65% level.

Bears: 24.5% versus 26.6% versus 25.5% versus 27.7%. As with bulls, bears are moving in a more bearish direction, i.e. significantly fewer in number with a drop to the lowest level in a month. Never made it to the 35% that can be a bullish indication, but the bulls were weak enough back in June. Over 35% is the threshold to be really be a good upside indicator. For reference, bearishness hit a 5 year high at 54.4% the last week of October 2008. The move over 50 took bearish sentiment to its highest level since 1995. Extreme negative sentiment. Prior levels for comparison: Bearishness peaked at 37.4% in September 2007. It topped the June 2006 peak (36%) on that run. That June peak eclipsed the March 2006 high (33%) and well above the 2005 highs that spawned new rallies (30% in May 2005, 29.2% in October 2005). That was a huge turn, unlike any seen in recent history.

NASDAQ

Stats: +18.25 points (+0.6%) to close at 3066.96
Volume: 1.351B (+13.22%)

Up Volume: 860.57M (+703.23M)
Down Volume: 526.43M (-493.57M)

A/D and Hi/Lo: Advancers led 1.65 to 1
Previous Session: Decliners led 3.11 to 1

New Highs: 63 (+26)
New Lows: 23 (-5)

SP500/NYSE

Stats: +7.1 points (+0.51%) to close at 1406.58
NYSE Volume: 586M (+27.11%)

A/D and Hi/Lo: Advancers led 2.37 to 1
Previous Session: Decliners led 2.48 to 1

New Highs: 140 (+56)
New Lows: 20 (-11)

DJ30

Stats: +90.13 points (+0.69%) to close at 13090.84
Volume: 119M shares Friday versus 90M Thursday.

TUESDAY

It is a huge week of data for the market next week. It is a shortened week due to Labor Day on Monday, but it will be packed. ISM will be on Tuesday. It is expected to flatline at 50. We will see. Chicago was better, and that will help it out. But we have seen everything else down: Richmond, Philly, Dallas, you name it. They have all been down outside of Chicago.

We have the Challenger report on Friday and Initial Claims on Thursday. A big lead in to Friday. Then we have the Non-farms Payroll. 130K is expected, but I think it is all smoke and mirrors. I do not know how they are making any jobs out there at all. No one is hiring. The big companies are laying off. Lexmark is laying off 17K people. Small companies are not hiring. They cannot afford to because with every person they hire they have $10K+ of costs associated with that new hire. Those are small businesses, and they are disproportionately skewed to impact small businesses more. The major job creator in our country throughout its history is being penalized for hiring new workers.

What happens when you tax or penalize someone for doing something? They will not do it. What happens when you reward someone for doing something, or at least remove the risk? They do it. Right now small businesses are being threatened with higher taxes and administrative costs if they hire somebody, so they will not do it. Through the policies in place, the greatest job creator in our economy is being penalized to the tune of over $10K for every person they hire. So they are not hiring. That is why the jobs report is not getting any better.

We have a big week ahead. We know that we will have the same problems. We have the possibility of issues in Europe at any point. There is the possibility of issues in China at any point. China just announced its first decline in manufacturing in nine months. We will also hear worsening news out of Europe. Germany will go into recession. We have that event-risk type of situation out there in addition to the scheduled data.

Then we have the actual market itself. While it did not crack on Friday, it was unable to use what was widely perceived by the gold, dollar, and bond market as very pro-QE3. All of those broke either higher or lower based on this, but the stock market was unable to do that. It maintained status quo; at least it did not selloff. As I said before, that is almost as telling as if it broke lower. What does that mean? It did not break lower, and while it may not be able to rally near term, it is ready to. Once there is more clarity, maybe with the jobs report, it will be ready to rally. It did not break down, and that does not mean it will tumble here. But we could get some downside all next week ahead of the employment report. That will be a trigger point for any Fed action. We could make some money on our downside plays such as the SDS and the TECS if the indices fall from where they closed on Friday. As noted, that was at status quo.

Next week we will be looking for new areas that are coming back in vogue such as some of the drug stock areas. They have a more defensive lean given the problems in the rest of the world that came out on Friday. We already knew about them, but new data was released. The US did not have bad data, but it is still not great. And we don't know how fudged it is. We will look at those because they are setting up the best. A lot of the other stocks have already moved up with the markets, so they are near these old highs and may not be as good of buys as they could be. That is fine. We can just play what is setting up. That is what you always do. We still have positions that can make the move, hold up, and continue when the market continues to the upside. As long as they can hold. A lot of them look in very good shape to do that.

The game plan is to watch where the money is going. Looks like it is heading over to the drug stocks. Even if they are smaller, they have great patterns and we can make money off of that. Watch for some downside. That is still out there, too, and we may be able to get a play through the week to the downside on some of these stocks that have set up to break. There is no guarantee that the market will rally back up after the jobs report. If it is bad enough, it probably will because then we have the Fed coming in. If it is good, maybe the market sells because we may not have the Fed come in. What happened here? We had a move higher based on Fed stimulus promises. All we got on Friday was another promise for stimulus. It has priced in the promise of stimulus, and now it wants to see real stimulus to continue on.

We could get some downside if the market does not get anything near term. If the jobs report is strong enough and the Fed does not act, then the market that has priced in the promise of stimulus (and still only has the promise), it will likely pull back and sell off more. Maybe we get that drop down to the 50 day EMA on the SP500 as a result. It is just not automatic. The action on Friday for the stock market was somewhat worrisome. The other markets very much telegraphed what they had planned because they pulled back ahead of the number. They were in position to make a move. Gold made a nice pullback to test. The stock market has not done that. There you have the reason for the disparate responses between stocks and all of the other markets that are sensitive to inflation and the moves that the Fed makes with respect to our currency.

Enjoy Labor Day, and I will see you on Tuesday. Have a great weekend!

Support and resistance

NASDAQ: Closed at 3066.96
Resistance:
3076 is the late April 2012 high
3090 is the mid-March interim high
3101 is the August 2012 high
3134 is the March 2012 post-bear market peak
3227 is the April 2000 intraday low
3401 is the May 2000 closing low

Support:
3042 from 5/2000 low
The 20 day EMA at 3039
3026 from 10/2000 low
3024 is the gap point from early May
3000 is the February 2012 post-bear market high
2999 is the bottom of the August 2012 consolidation
2988 is the July 2012 high
The 50 day EMA at 2988
2962 is the April 2012 low
2950 is the mid-April closing low
2942 is the mid-June 2012 high
2910 is the March 2012 low
2900 is the March 2012 low
2888 is the May 2011 peak and PRIOR post-bear market high
2879 is the July 2011 peak
The 200 day SMA at 2879
2866 is the July 2012 closing low
2862 is the 2007 peak
2841 is the February 2011 peak
2816 is the early April 2011 peak.
2810 is the low in the shoulders
2754 is the October 2011 high
2706 to 2705 is the April 2011 low and the February 2011 and consolidation low (bottom of the trading range) 2723 to 2705 is the range of support at the bottom of the January to May trading range

S&P 500: Closed at 1406.58

Resistance:
1406 is the early May 2012 peak
1422.38 is the prior post-bear market high (March 2012)
1427 is the August 2012 peak
1425 from May 2008 closing highs
1433 from August 2007 closing lows
1440 from November 2007 closing lows

Support:
1402.22 is the closing low of the August 2012 lateral consolidation
The 50 day EMA at 1383
1378 is the February 2012 peak
1375 is the early July 2012 peak
1371 is the May 2011 peak, the post-bear market high
1363.46 is June 2012 high
1359 is the April 2012 low
1357 is the July 2011 peak
1344 is the February 2011 peak
1340 is the early April 2011 peak
The 200 day SMA at 1338
1332 is the early March 2011 peak
1325 is the July 2012 intraday low
1309 is the right shoulder low from June 2012
1295 to 1294 is the April 2011 low and the February 2011 consolidation low (bottom of the trading range)
1293 is the October 2011 peak
1275 is the January 2010 low, early January 2011 peak
1267 is the December 2011 peak
1266 is the June 2012 base low

Dow: Closed at 13,090.84
Resistance:
13,297 is the April 2012, prior post bear market high
13,331 is the August 2012 post-bear market high
13,668 from 12-2007 peak
13,692 from 6-2007 peak
14,022 from 7-07 peak

Support:
13,058 from the May 2008 peak on that bounce in the selling
13,056 is the February 2012 high
The 50 day EMA at 12,986
12,971 is the early July 2012 high
12,754 is the July intraday peak
12,716 is the April 2012 closing low
The 200 day SMA at 12,707
12,391 is the February 2011 peak
12,369 is the left shoulder low from May 2012
12,284 is the October 2011 peak
12,258 is the December 2011 peak
12,110 from the March 2007 closing low
12,094 is the April 2011 low
12,035 is the June 2012 base low
The June 2011 low at 11,897 (closing)
11,734 from 11-98 peak
11,717 is the late August 2011 peak

Economic Calendar

August 31 - Friday
- Chicago PMI, August (9:45): 53.0 actual versus 53.8 expected, 53.7 prior
- Michigan Sentiment - Final, August (9:55): 74.3 actual versus 73.6 expected, 73.6 prior
- Factory Orders, July (10:00): 2.8% actual versus 2.0% expected, -0.5% prior

September 4 - Tuesday
- ISM Index, August (10:00): 50.0 expected, 49.8 prior
- Construction Spending, July (10:00): 0.5% expected, 0.4% prior
- Auto Sales, August (14:00): 5.0M prior
- Truck Sales, August (14:00): 6.0M prior

September 5 - Wednesday
- MBA Mortgage Index, 09/01 (7:00): -4.3% prior
- Productivity-Rev., Q2 (8:30): 1.8% expected, 1.6% prior
- Unit Labor Costs - R, Q2 (8:30): 1.4% expected, 1.7% prior

September 6 - Thursday
- Challenger Job Cuts, August (7:30): -44.5% prior
- ADP Employment Change, August (8:15): 140K expected, 163K prior
- Initial Claims, 09/01 (8:30): 375K expected, 374K prior
- Continuing Claims, 08/25 (8:30): 3300K expected, 3316K prior
- ISM Services, August (10:00): 52.2 expected, 52.6 prior
- Crude Inventories, 09/01 (11:00): 3.778M prior

September 7 - Friday
- Nonfarm Payrolls, August (8:30): 130K expected, 163K prior
- Nonfarm Private Payrolls, August (8:30): 145K expected, 172K prior
- Unemployment Rate, August (8:30): 8.3% expected, 8.3% prior
- Hourly Earnings, August (8:30): 0.2% expected, 0.1% prior
- Average Workweek, August (8:30): 34.5 expected, 34.5 prior
icon url

ReturntoSender

09/04/12 11:34 PM

#9889 RE: ReturntoSender #6755

From Briefing.com: 4:15 pm : Stocks opened unchanged before falling into the red after today's economic data missed expectations. The August ISM Index was reported at 49.6 versus the 50.0 Briefing.com consensus, while July construction spending fell 0.9% month-over-month, against the expected increase of 0.5%. After reaching session lows 90 minutes after the open, stocks staged a slow climb higher which was punctuated by a broad-based mid-afternoon rally. Stocks rallied back near the flat line where they remained until the end of the day. As a result, the S&P 500 slipped 0.1% while Nasdaq gained 0.3%.

The telecom sector outperformed as Cincinnati Bell (CBB 5.06, +0.37) surged 7.9% after Raymond James upgraded the stock from ‘outperform' to ‘strong buy.' Elsewhere in the sector, shares of Verizon (VZ 43.70, +0.76) tacked on 1.8% after the company announced recent activation of its 4G LTE network coverage in Binghamton and Catskill, New York. Other names like CenturyLink (CTL 42.72, +0.46) and Windstream (WIN 9.97, +0.10) were up roughly 1.0% as investors rotated into safer, higher-yielding stocks.

The materials sector was the day's worst performer after the disappointing July construction spending numbers. The group's weakness was most apparent among steel producers as AK Steel (AKS 5.02, -0.20), Cliffs Natural Resources (CLF 33.68, -2.16), and United States Steel (X 18.78, -0.67) dipped between 3.4% and 6.0%. The negative construction spending data weighed on steelmakers despite two prominent producers reaching labor deals with union workers. United States Steel has reached a tentative agreement with United Steelworkers on a three year contract while Cliffs Natural Resources agreed to a short-term labor contract extension while negotiations continue.

Coal stocks were under heavy pressure after analysts at Dahlman Rose downgraded Peabody Energy (BTU 20.90, -0.73), Alpha Natural Resources (ANR 5.53, -0.41), and Walter Energy (WLT 30.73, -1.97) from ‘buy' to ‘hold.' The three names were down between 3.0% and 7.0% following the downgrades. The weakness spilled over to other coal names such as Arch Coal (ACI 5.79, -0.32), which slumped 5.2%. Elsewhere, CONSOL Energy (CNX 28.83, -1.37) slipped 4.5% as it moved with peers and on the news it will temporarily idle its Buchanan Mine in southwestern Virginia.

Three Nasdaq components were on the move following new analyst comments. Graphic chip producer, NVIDIA (NVDA 13.27, -0.75) slid 5.4% after being downgraded from ‘equal weight' to ‘underweight' by Evercore. In addition, Susquehanna downgraded NVIDIA from ‘positive' to ‘neutral.' Meanwhile, GameStop (GME 20.41, +1.33) ended higher by 7.0% following a Goldman Sachs upgrade from ‘neutral' to ‘buy.' Elsewhere, TiVo (TIVO 9.54, +0.45) advanced 5.0% after JP Morgan upgraded the stock from ‘neutral' to ‘overweight.'

Netflix (NFLX 55.93, -3.79) fell 6.4% after Amazon (AMZN 247.88, -0.39) announced a new Prime instant video agreement with Epix. The agreement is expected to increase competition in online video streaming as it takes aim at the core business of Netflix.

Shares of major financials were mixed as most listings traded in-line with the broader market. However, a handful of names outperformed. Morgan Stanley (MS 15.51, +0.51) gained 3.4% after being upgraded by JP Morgan and Credit Agricole. In addition, Goldman Sachs (GS 106.41, +0.69) tacked on 0.7% despite being downgraded from ‘neutral' to ‘underweight' at JP Morgan.

Tomorrow's economic data includes the MBA Mortgage Index at 7:00 ET and both nonfarm productivity and unit labor costs which will be reported at 8:30 ET.DJ30 -54.90 NASDAQ +8.10 SP500 -1.64 NASDAQ Adv/Vol/Dec 1508/1.47 bln/954 NYSE Adv/Vol/Dec 1773/639.2 mln/1229

3:35 pm : Crude oil lost its overnight momentum and fell into negative territory as equity markets opened. The energy component plunged even further on weaker-than-expected manufacturing and construction spending data. It touched a pit session low of $94.97 per barrel and settled for a 1.2% loss at $95.34 per barrel.

Natural gas, on the other hand, came off its session low of $2.79 per MMBtu and climbed into positive territory moments after floor trade opened. It advanced to a session high of $2.89 per MMBtu in early morning action and spent the remainder of the session chopping around just below that level. Natural gas eventually settled 2.1% higher at $2.86 per MMBtu. Precious metals extended last week's gains in today's pit trade.

Gold brushed a session low of $1690.10 per ounce moments after equity markets opened but broke above the $1700.00 per ounce mark following the U.S. economic data mentioned above. The yellow metal peaked at $1701.60 per ounce and then slightly pulled-back. Even with a stronger dollar index, gold booked a 0.5% gain as it closed at $1696.10 per ounce.

Silver spent its morning floor session trading in a rather consolidative pattern and started inching higher in the last hour of floor trade. It finished 3.1% higher at $32.40 per ounce, just below its session high of $32.44 per ounce.DJ30 -23.46 NASDAQ +13.79 SP500 +1.64 NASDAQ Adv/Vol/Dec 1535/1223.3 mln/900 NYSE Adv/Vol/Dec 1840/404 mln/1148

4:41PM SemiLEDs announces senior management changes: current President and COO to transition to role of Chief Scientist (LEDS) 1.96 -0.06 : Co announced changes to its senior management team. After serving as President, Chief Operating Officer and director of SemiLEDs, Dr. Anh Chuong Tran has transitioned to the role of Chief Scientist. As the Chief Scientist of SemiLEDs, Dr. Tran will dedicate his time to SemiLEDs' technology and product development efforts. The Board of Directors of SemiLEDs has appointed Mr. Trung T. Doan, currently the Chairman of the Board and Chief Executive Officer, to the additional role of President.

4:04PM Finisar misses by $0.02, misses on revs; guides Q2 EPS below consensus, revs in-line (FNSR) 13.52 -0.22 : Reports Q1 (Jul) earnings of $0.12 per share, excluding non-recurring items, $0.02 worse than the Capital IQ Consensus Estimate of $0.14; revenues fell 3.4% year/year to $220.5 mln vs the $226.42 mln consensus. Co issues guidance for Q2, sees EPS of $0.12-0.16, excluding non-recurring items, vs. $0.19 Capital IQ Consensus Estimate; sees Q2 revs of $225-240 mln vs. $236.70 mln Capital IQ Consensus Estimate. "As expected, our first quarter of fiscal year 2013 was challenging. This was primarily the result of sluggish macroeconomic conditions, especially in Europe, as well as the slowing of economic growth in China. Generally telecom spending throughout the world has been soft. In addition, we had two fewer shipping days in the first quarter than in the previous quarter. However, I am happy to report that we expect revenue growth to resume in the second quarter. In addition, we expect to hold operating expenses relatively flat, excluding the impact of a full quarter of the RED-C acquisition. Thus, we expect operating income will grow in the second quarter."

9:37AM ARM Holdings gaps aggressively lower, hovering between its 200 sma and 50 ema at 26.09 and 25.94 -- session low 25.97 (ARMH) 25.97 -1.27 :

Ciena (CIEN) announced a strategic agreement with the Russian telecoms operator VimpelCom, for the upgrade and expansion of its national optical network.

8:37AM IPG Photonics acquires privately held JPSA Laser expected to be dilutive by $0.01 to $0.02 per share in 2012, accretive in 2013. (IPGP) 61.49 : Co announces the acquisition of privately held New Hampshire-based J.P. Sercel Associates, a global supplier of UV excimer and diode pumped solid state industrial laser micromachining systems for precision processing in high-volume manufacturing. JPSA is anticipated to add ~$4 mln to IPG's revenues for the remainder of 2012. At current revenue levels, the acquisition is expected to be dilutive by $0.01-0.02 per share in 2012, and is expected to be accretive in 2013. Financial terms were not disclosed. The acquired business will operate under the name IPG Microsystems LLC.

The University of Manchester and FEI (FEIC) announced the installation of the Titan G2 80-200 scanning transmission electron microscope at the University's School of Materials

Cypress Semiconductor (CY) announced that Lite-On Technology has selected Cypress's 2.4-GHz WirelessUSB-NL radio-on-a-chip for its next-generation wireless keyboard and mouse set.

7:34AM Tower Semicon was chosen by Vishay Intertechnology (VSH) for high volume manufacturing engagement through 2018 (TSEM) 7.90 : Co announced earlier the expansion of its business relationship with Vishay-Siliconix with a five-year agreement under the terms of which TowerJazz will manufacture two Vishay Siliconix product families at TowerJazz's Japanese facility (Fab 4) as well as multiple Vishay Siliconix product families at TowerJazz's Fabs 1 and 2 in Migdal HaEmek, Israel.

Integrated Device Technology (IDTI) has become a member of the Alliance for Wireless Power.

Rudolph Technologies (RTEC) announced that a global industry research center in Asia has purchased Rudolph's MetaPULSE G Metrology System for advanced packaging process development activity.

7:04AM Nokia debuts free music streaming service in the USA (NOK) 2.82 : Co announced the launch of its free music streaming service Nokia Music in the USA. Nokia Music is a free mobile experience exclusive to Nokia Lumia handsets. A separate announcement today will unveil a collaboration between Nokia Music, AT&T (T) and Green Day around the band's new album Uno. The promotion will see Green Day perform an exclusive concert and provide exclusive playlists to Nokia Music for AT&T consumers.

STMicroelectronics (STM) announced that Benedetto Vigna, Executive Vice President, General Manager, Analog, MEMS and Sensors Group, will deliver a keynote speech at the SEMICON Taiwan 2012 MEMS Forum to address the key factors of ST's leadership and the new trends in MEMS for the smart phone and tablet market.

1:17AM FormFactor to acquire MicroProbe for $100 mln in cash and $16.8 mln in stock; sees accretion in 1Q13 (FORM) 5.09 : Co announces that it has signed a merger agreement with Astria Semiconductor, the parent co of MicroProbe. FROM will acquire MicroProbe for $100 mln in cash and $16.8 million in stock, subject to customary adjustments. The merger is subject to customary conditions and is expected to close in the first half of FORM's fiscal quarter ending December 29, 2012. MicroProbe generated $87.3 mln in revenue in its fiscal year ended December 31, 2011, growing 46% year-over-year and delivering a non-GAAP EBITDA margin of ~20%. MicroProbe and its affiliated companies have ~360 employees worldwide. After the merger the combined co expects to realize the following significant benefits: (-) FORM will be the industry leading supplier to the high growth advanced SOC probe card market; (-) Improved and immediately accretive financial performance beginning in the first quarter of 2013; (-) Technology leadership across the Memory and SOC advanced probe card markets.

TowerJazz (TSEM) announced the expansion of its business relationship with Vishay (VSH) -Siliconix with a five-year agreement under the terms of which TowerJazz will manufacture two Vishay Siliconix product families at TowerJazz's Japanese facility (Fab 4) as well as multiple Vishay Siliconix product families at TowerJazz's Fabs 1 and 2 in Migdal HaEmek, Israel.

Oppenheimer raised their Apple (AAPL $680.00 +16.78) target to $800 from $680. The firm notes, AAPL got a decisive win against Samsung on Friday as a US jury awarded it $1.05B in damages for IP-infringement. The firm says, this is a key win for AAPL, but the war's not over. The immediate impact on numbers might not be significant (for Samsung and Apple's shipments) as the appeal could delay shipment disruption and as the impact is only in the US where Apple's share is already high. Beyond the court case, they expect a strong December/March with another record iPhone launch and the mini-iPad introduction and they are raising estimates for the mini-iPad and see potential iPhone upside.

09:23 am Vishay upgraded to Buy at Stifel Nicolaus; tgt $13: . Stifel Nicolaus upgrades VSH to Buy from Hold and sets target price at $13 saying they believe the component supplier is well positioned for margin expansion and strong cash flow generation when the component-cycle recovers. Although visibility into the demand picture over the next few quarters remains uncertain, they believe fundamentals have at least stabilized following several significant number cuts, and inventory levels across the supply-chain are relatively lean.

09:22 am Peregrine Semi initiated with a Outperform at Oppenheimer; tgt $20: . Oppenheimer initiates PSMI with a Outperform and price target of $20. After 22 years as a private fabless RFIC supplier, PSMI went public August 8 at $14/sh. Peregrine leverages proprietary UltraCMOS technology to produce parts for the handset, infrastructure and aerospace markets. Handset is the co's top growth/upside driver. As a key supplier to leading OEMs Apple and Samsung, PSMI is the No. 1 supplier of RF antenna switches for smartphones. The increasing complexity of 3G/4G RF front-ends in this high growth segment play to PSMI strengths, positioning the co for long-term success.
icon url

ReturntoSender

09/05/12 2:54 PM

#9897 RE: ReturntoSender #6755

icon url

ReturntoSender

09/05/12 8:22 PM

#9898 RE: ReturntoSender #6755

From Briefing.com: 4:15 pm : Equities spent the majority of the session chopping around the unchanged line. The early morning volatility coincided with a Bloomberg TV report which indicated the European Central Bank bond purchase program is said to pledge unlimited, sterilized buying of bonds. However, the exuberance was short-lived as European Central Bank officials declined to comment, and reports out of Germany suggested Chancellor Angela Merkel would only support the program in the near-term. Afternoon trade was mostly quiet as the S&P 500 remained in a narrow range before closing lower by 0.1%.

The telecom sector got off to a strong start and maintained its gains throughout the day. Sprint (S 4.95, +0.15) advanced 3.1% as it outperformed other holdings within the iShares Dow Jones US Telecom ETF (IYZ 24.39, +0.13).

The Dow Jones Transportation Average continued its recent streak of underperformance; however, individual components within the group showed significant divergence. Shares of major airlines saw a relatively strong bid as United Continental Holdings (UAL 19.07, +0.97) led the major carriers with a 5.4% gain. Delta Air Lines (DAL 8.89, +0.33) added 3.9% after announcing August consolidated passenger unit revenue increased by 4.0% on a year-over-year basis. Meanwhile, companies specializing in logistics slipped after FedEx (FDX 85.80, -1.74) lowered its first quarter guidance, citing weaker global demand. FedEx shed 2.0% while UPS (UPS 71.94, -1.76) slid 2.4% and Con-way (CNW 29.97, -1.21) ended lower by 3.9%.

Financial stocks have traded mostly in-line with the broader market. However, several names diverged from the rest of the group. Goldman Sachs (GS 109.94, +3.53) was the best performer as it ended higher by 3.3%. On the downside, American Express (AXP 57.19, -1.42) dipped 2.2% as it trailed the other majors. Elsewhere, European financials were mostly higher with UBS (UBS 11.38, +0.29) and Credit Suisse (CS 19.24, +0.34) posting gains of 2.6% and 1.8%, respectively.

Restaurant operator Bloomin' Brands (BLMN 13.86, +0.41) advanced 3.1% after delivering its first earnings report as a publically traded company. The quarterly report showed second quarter earnings growth of 23.0% compared to the same period last year. Meanwhile, two names which began trading within the past twelve months also finished on a positive note. Facebook (FB 18.58, +0.85) closed higher by 4.8% after announcing Chief Executive Officer, Mark Zuckerberg, has no intention to sell any shares for at least twelve months. Meanwhile, Jefferies initiated coverage of the stock with a ‘buy' rating and a $30.00 price target. Zynga (ZNGA 2.92, +0.09) rose by 3.2% as it benefited from the strength in Facebook.

Nokia (NOK 2.38, -0.45) slumped 15.9% after the company unveiled its new Lumia 920 phone which features an improved camera and wireless charging capabilities. The phone is based on the Windows operating system, developed by Microsoft (MSFT 30.39, +0.01).

Productivity data for the second quarter showed an increase of 2.2%, which was an improvement over the 1.6% increase that had been reported in the preliminary reading. It is also better than the 1.8% increase that had been broadly expected. Unit labor costs for the first quarter were revised lower to reflect a 1.5% increase after they had reportedly increased by 1.7% in the preliminary reading. Economists polled by Briefing.com had expected that unit labor costs would tick down in the revised reading to reflect an increase of 1.4%.

A handful of economic data points will be released tomorrow. Challenger job cuts will be reported at 7:30 ET. ADP Employment Change is scheduled for an 8:15 ET release, while initial and continuing claims will hit the wires at 8:30 ET. The ISM Services report will top off the day's data at 10 ET.

Also of note, the European Central Bank will announce its interest rate decision at 7:45 ET which will be followed by Mario Draghi's press conference at 8:30 ET. In addition, the Bank of England will opine tomorrow morning at 7:00 ET. The central bank is expected to keep both its benchmark interest rate and its asset purchase program steady at 0.50% and GBP375 billion.DJ30 +11.54 NASDAQ -5.79 SP500 -1.50 NASDAQ Adv/Vol/Dec 1078/1.42 bln/1381 NYSE Adv/Vol/Dec 1407/675.6 mln/1553

3:30 pm : Crude oil touched a session high of $95.72 per barrel as pit trade opened but plunged into the red and to a session low of $94.26 per barrel moments after trading in the equity markets began. Despite the fall, the energy component erased the losses and climbed back into the black by afternoon action. Crude then chopped around near the unchanged line and settled four cents higher at $95.38 per barrel.

Natural gas trended lower into negative territory after it brushed a pit session high of $2.84 per MMBtu in morning action. It fell as low as $2.78 per MMBtu just before it settled with a 2.1% loss at $2.80 per MMBtu.

Gold see-sawed between positive and negative territory in choppy fashion during today's pit trade. Action came ahead of tomorrow's anticipated ECB meeting. It touched a session low of $1691.50 per ounce and peaked at $1697.60 per ounce. The yellow metal eventually settled slightly lower with a 0.1% loss at $1694.20 per ounce. Silver brushed a session high of $32.43 per ounce in morning action but was unable to stay in positive territory. It spent the remainder of its session trading just below the unchanged level and settled 0.2% lower at $32.33 per ounce.DJ30 +16.02 NASDAQ -4.67 SP500 -0.89 NASDAQ Adv/Vol/Dec 1124/1.13 bln/1325 NYSE Adv/Vol/Dec 1415/418.2 mln/1526

4:04PM PLX Tech: IDT (IDTI) announces extension of exchange offer expiration date to Oct 4 in PLX Technology transaction (PLXT) 5.68 -0.08 : As previously announced on May 22, 2012, IDT commenced an exchange offer to acquire all outstanding shares of common stock of PLX for (i) $3.50 in cash and (ii) 0.525 shares of IDT common stock for each PLX common share outstanding, without interest and less any applicable withholding taxes. The exchange offer is being made pursuant to a Prospectus/Offer to Purchase, dated May 22, 2012, and in connection with an Agreement and Plan of Merger, dated April 30, 2012, which IDT and PLX previously announced on April 30, 2012.

10:10AM Semiconductor Hldrs ETF extends rebound off support (SMH) 32.46 unch : Early weakness in the SMH held at support at 32.19/32.16 (yesterday's low/50 sma) with the rebound recently reaching back near the flat line (session low 32.49) -- MRVL, NVDA, AMAT, INTC, XLNX, ALTR, SNDK.

9:02AM MEMC Elec announces settlement of TCS supply agreements (WFR will pay EUR 70 mln) (WFR) 2.98 : Co announced that its affiliate, MEMC Electronic Materials, SpA, and Evonik Industries, have agreed to settle and resolve disputes related to two long-term take-or-pay supply agreements for the supply of trichlorosilane (TCS) to MEMC's Merano, Italy polysilicon facility. Pursuant to the settlement agreements, MEMC will pay Evonik a total of 70 million Euro in full settlement of all obligations under the terminated supply agreements, with such payments to be made in installments over the next five quarters, including the payment of 10 million Euro in the current quarter. As part of strategic restructuring initiatives announced in December 2011, MEMC indicated it would idle the Merano facility and would consider closing the facility unless dramatic feedstock, power and other cost reductions were achieved.

RF Micro Devices (RFMD) is enabling Samsung's (SSNLF) next-generation GALAXY Note II with RFMD's PowerSmart Power Platforms.

MicroVision (MVIS) and Intersil (ISIL) announced an agreement to partner on the development of advanced, integrated chipsets for MicroVision's patented high definition PicoP display technology.

Cypress Semiconductor (CY) has shipped over 1 bln capacitive touch units.

STMicroelectronics (STM) introduced a new pressure sensor that allows mobile phones and other portable devices to calculate their vertical elevation relative to sea-level with very high accuracy.

Altera (ALTR) announced it is shipping in production all three of its 28-nm FPGA families, including Stratix V, Arria V and Cyclone V devices. Altera achieves this industry milestone with the latest shipment of the largest Cyclone V FPGA in its low-cost, low-power product family.

1:19AM Oracle to continue building the latest versions of its database and other software to HP (HPQ) Itanium computers (ORCL) 31.57 : Co iisues the following statement: "Previously, Oracle announced that it would stop developing new versions of its software on Itanium microprocessors. For example, that meant version 12c of the Oracle database due out in early 2013 would not be available on Itanium. However, a judge recently ruled that Oracle has a contract to continue porting its software to Itanium computers for as long as HP sells Itanium computers. Therefore, Oracle will continue building the latest versions of its database and other software covered by the judge's ruling to HP Itanium computers. Oracle software on HP's Itanium computers will be released on approximately the same schedule as Oracle software on IBM's Power systems."

Last night after the close, Finisar (FNSR $13.53 +0.01) reported Q1 (July) earnings of $0.12 per share, excluding non-recurring items, $0.02 worse than the Capital IQ consensus estimate of $0.14. Revenues fell 3.4% year/year to $220.5 million vs. the $226.42 million consensus. The company issued guidance for Q2 with EPS of $0.12-0.16, excluding non-recurring items, vs. the $0.19 Capital IQ consensus and revenues of $225-240 mln vs. the $236.70 mln Capital IQ consensus. The company stated, "As expected, our first quarter of fiscal year 2013 was challenging. This was primarily the result of sluggish macroeconomic conditions, especially in Europe, as well as the slowing of economic growth in China. Generally telecom spending throughout the world has been soft. In addition, we had two fewer shipping days in the first quarter than in the previous quarter. However, I am happy to report that we expect revenue growth to resume in the second quarter. In addition, we expect to hold operating expenses relatively flat, excluding the impact of a full quarter of the RED-C acquisition. Thus, we expect operating income will grow in the second quarter."

11:41 am S&P 500 Info Tech Sector +0.2%
The tech sector is trading just higher today, along with slight gains in the broader market. Semiconductors are showing relative weakness with the SOX trading 0.2% lower. Within the chip index, STM (-5.7%) is a notable laggard. Among other major indices, the SPY is trading 0.1% higher today, while the QQQ is up 0.2% and the NASDAQ is trading 0.1% higher on the session. Among tech bellwethers, FB (+4.6%) is showing notable strength, while AAPL (-0.2%) is bucking the trend in the market.

In tech earnings, FNSR (+0.4%) posted a Q1 miss and guided Q2 EPS below consensus. GWRE (+9.2%), on the other hand, reported a Q4 beat.

In news, MOVE (+1.6%) acquired TigerLead and increased its gudiance. Elsewhere, FB () disclosed that CEO Zuckerberg has not adopted a Rule 10b5-1 Plan and has informed FB that he has no intention to conduct any sale transactions in FB securities for at least 12 months.

In notable analyst upgrades this morning in the tech space, BT (+0.5%) was upgraded to Overweight at JP Morgan and QLIK (+6.4%) was upgraded to Overweight at Morgan Stanley.

Among downgrades, PT (-3.4%) was downgraded to Underweight at JP Morgan, STM (-5.7%) and AMD (-2.8%) were downgraded to Neutral at UBS, and DMD (-1.8%) was downgraded to Hold at Jefferies.

PAY (+0.4%) and VRNT (-1.3%) are the notable names in tech scheduled to report quarterly results today after the close.
icon url

ReturntoSender

09/06/12 10:36 PM

#9899 RE: ReturntoSender #6755

From Briefing.com: 4:20 pm : Stocks began today's session sharply higher, and added to their gains throughout the opening hour of trade. The remainder of the day was spent hovering near session highs. The bullish sentiment was sparked after Mario Draghi confirmed yesterday's reports of a European Central Bank plan to buy bonds of troubled sovereigns who ask for aid. The program will be limited to bonds maturing within three years. Better-than-expected U.S. economic data also added to the upbeat tone which resulted in a broad market rally. The Nasdaq closed at a 12-year high while the S&P 500 settled at levels not seen since January 2008. The two indices finished higher by 2.2% and 2.0%, respectively.

With monetary policy as this morning's theme, financials rallied broadly. The SPDR Financial Select Sector ETF (XLF 15.52, +0.36) added 2.4%. Bank of America (BAC 8.35, +0.40) was the top performer with a 5.0% gain. Citigroup (C 31.12, +1.35), and JPMorgan Chase (JPM 38.69, +1.58) followed closely and posting gains near 4.5%. Shares of JPMorgan Chase shrugged off a Bloomberg TV report which indicated that the company is facing an escalating senate probe related to its CIO losses. Meanwhile, Morgan Stanley (MS 16.25, +0.57) and Goldman Sachs (GS 113.54, +3.60) finished higher by 3.6% and 3.3%, respectively.

U.S. listings of European financials showed even bigger gains as Deutsche Bank (DB 37.61, +2.48) and Barclays (BCS 12.31, +0.79) jumped 7.1% and 6.9%, respectively.

The materials sector gained 2.6% as it outperformed the broader market. Within the group, AK Steel (AKS 5.37, +0.48) surged 9.8% after being upgraded from ‘neutral' to ‘buy' by Longbow Research. Elsewhere in the sector, Randgold Resources (GOLD 108.70, +6.31) advanced 6.2% after JPMorgan upgraded the stock from ‘neutral' to ‘overweight.'

Amazon (AMZN 251.38, +5.16) gained 2.1% after unveiling the newest version of its Kindle Fire tablet at an event in Los Angeles. Today's buying lifted the shares of the online retailer to a fresh all-time high. Amazon's peer eBay (48.91, +1.75) added 3.7% as it traded at levels not seen since January of 2005.

Solid state drive maker, OCZ Technology (OCZ 4.35, -1.01) slumped 18.8% after lowering its second quarter revenue expectations. The lowered guidance was followed by downgrades at Needham and FBN Securities. After lowering OCZ from ‘buy' to ‘hold,' Needham also downgraded Seagate (STX 31.70, -0.83) from ‘strong buy' to ‘hold' and maintained its ‘strong buy' rating on Western Digital (WDC 43.11, +1.27). Seagate slipped 2.6%, while Western Digital finished higher by 3.0% in reaction to the comments.

For-profit education stocks showed considerable strength as they outperformed the broader market. The group rally was led by Career Education (CECO 3.61, +0.27), which surged 8.1%. Corinthian Colleges (COCO 2.35, +0.19) jumped 8.6% while Apollo Group (APOL 30.39, +2.20) and ITT Educational Services (ESI 35.84, +1.99) finished higher by 7.8% and 5.9%, respectively.

The August ISM Services index was reported at 53.7, which was above the 52.4 Briefing.com consensus, and up from July's 52.6 reading.

According to the ADP National Employment Report, employment in the nonfarm private business sector rose 201K in August. This was above the 143K expected by Briefing.com consensus. In addition, the previous month's reading was revised up to 173K from 163K.

Separately, the latest weekly initial jobless claims count totaled 365,000, which was lower than the 373,000 that had been expected. The tally was below the revised prior week count of 377,000. As for continuing claims, they fell to about 3.322 million from 3.328 million.

Tomorrow's economic data will be headlined by the much anticipated August nonfarm payrolls report and the unemployment rate. In addition nonfarm private payrolls, hourly earnings, and average workweek will be reported. All of the data points will be released at 8:30 ET.DJ30 +244.52 NASDAQ +66.54 SP500 +28.68 NASDAQ Adv/Vol/Dec 1938/1.85 bln/541 NYSE Adv/Vol/Dec 2413/736.5 mln/623

3:30 pm : Crude oil and precious metals rose in morning pit trade following the ECB's decision to leave rates unchanged and Mario Draghi's confirmation of yesterday's reports of an ECB plan to buy bonds with maturities shorter than three years.

Action also came on a number of U.S. economic data. Crude popped to its session high of $97.71 per barrel on better-than-anticipated inventory data that showed a draw of 7.426 mln barrels when a draw of 5.0 mln barrels was widely expected. However, prices pulled-back and crude oil inched lower for the remainder of the session. It brushed a session low of $95.19 per barrel moments before closing 0.2% higher at $95.59 per barrel.

Gold came off its pit session low of $1698.80 per ounce and traded up to a session high of $1711.90 per ounce. It pulled-back slightly in afternoon action but still settled 0.6% higher at $1705.00 per ounce. The yellow metal rose to its highest level since March, brushing a high of $1716.90 per ounce in overnight trade. Silver dipped to a session low of $32.38 per ounce but quickly advanced to a session high of $32.99 per ounce. Like gold, it pulled-back in afternoon action and settled with a 1.1% gain at $32.69 per ounce.

Natural gas rallied to its session high of $2.87 per MMBtu in reaction to stronger-than-expected inventory data that showed a build of 28 bcf when a build of 30 bcf was anticipated. The move was short-lived, however, as prices quickly fell into the red. Although it recovered some gains in late morning and afternoon action, a sell-off heading into the close had natural gas settle 0.7% lower at $2.78 per MMBtu.DJ30 +215.93 NASDAQ +62.35 SP500 +25.91 NASDAQ Adv/Vol/Dec 1901/1551.4 mln/566 NYSE Adv/Vol/Dec 2366/487 mln/668

4:09PM Rambus' Cryptography Research and Sigma (SIGM) will collaborate to integrate the CRI CryptoFirewall security technology into its multimedia set-top box (RMBS) 4.59 +0.23 : Cos announced that Sigma Designs will collaborate with CRI to integrate the CRI CryptoFirewall(TM) security technology into its multimedia set-top box (STB) system-on-a-chip (SoC) solutions. The advanced CryptoFirewall security core will help Sigma Design provide its customers with the ability to provide robust hardware security in their digital entertainment solutions.

United Microelectronics (UMC) announced a collaborative effort with STMicroelectronics (STM) for 65nm CMOS image sensor technology using backside illumination.

6:00AM Trina Solar responds to the European Commission's initiation of an anti-dumping investigation concerning certain solar energy products originating in China (TSL) 4.19 : The European Commission announced the initiation of an anti-dumping investigation concerning imports into the European Union of crystalline silicon photovoltaic modules and key components originating in China. Trina Solar is one of the China-based suppliers of these products to the EU. Trina Solar believes the allegations made by Germany's Solarworld AG and other, thus far anonymous, petitioners of the so-called EU ProSun group will eventually prove to be unfounded, and that Trina Solar's transactions with its EU customers were and are made in accordance with international fair trade practices. These allegations threaten the ability of EU consumers to receive the benefits of clean and innovative solar energy products at a fairly-traded, market-competitive price. Trina plans to contest the allegations vigorously. "We are cooperating with the European Commission to ensure it receives all required information to arrive at a balanced and fair conclusion. Additionally, we welcome Chancellor Merkel's constructive approach to a dialogue and are ready to participate in any dialogue which may be initiated," said Ben Hill, President of Trina Solar Europe.

Tessera Tec (TSRA $14.71 -0.09) announced today that Tessera, Inc. has received an initial payment of ~ $20 million from Amkor Technology related to the interim award the International Court of Arbitration of the International Chamber of Commerce issued on July 6, 2012, in favor of Tessera in its dispute with Amkor.

Sigma Designs (SIGM $6.78 +0.02) reported a second quarter loss of $0.12 per share, may not be comparable to the Capital IQ consensus of ($0.31), while revenues rose 46.3% year/year to $68.3 million versus the $64.88 mln consensus. The primary reason for the increase in revs over the previous quarter was the addition of DTV revenues of $26.6 million as a result of the acquisition of the DTV business from Trident Microsystems. Non-GAAP adjustments for the second quarter consisted of $2.0 million in amortization expense for acquired intangibles related to acquisitions, $2.7 million in non-cash stock-based compensation expenses, $2.5 million of inventory mark-up, $1.6 million of gain associated with the valuation of the assets acquired from Trident and $3.5 million in expenses associated with our acquisition of Trident's DTV business.

09:27 am Sigma Designs downgraded to Hold at BWS Financial; tgt lowered to $6: . BWS Financial downgrades SIGM to Hold from Buy and lowers their tgt to $6 from $9 saying the IPTV promise at Sigma Designs (SIGM) has disappeared and with it the most likely revenue growth catalyst. SIGM is no longer anticipating a surge in service provider roll-out of next generation IPTV processors to occur in the second half of the calendar year. Firm notes the headline numbers were better than they had forecast as the DTV business reported $2.6 million more in revenue than their estimate. It turns out the beat from DTV was the result of customer pre-orders occurring one quarter early.

10:44 am S&P Technology INdex trading higher today as broad market gains

The tech sector is trading higher today, along with gains in the broader market. Semiconductors are showing relative strength as well with the SOX trading 2.7% higher. Within the chip index, SNDK (+7.8%) is a notable standout. Among other major indices, the SPY is trading 1.4% higher today, while the QQQ and the NASDAQ are trading 1.5% higher on the session. Among tech bellwethers, CSCO (+2.6%) is showing notable strength.

In tech earnings, PAY (-10.3%) posted a Q3 earnings beat but missed revenue and guided below consensus. Elsewhere, VRNT (+3.5%) reported a Q2 beat and lowered guidance and OCZ (-21.6%) preannounced downside Q2 revenues. In news, EPIQ (+1.8%) increased its dividend. Also, Z (-2.9%) announced plans for a 3.5 mln share offering. In notable analyst upgrades this morning in the tech space, ATVI (+4.1%) was upgraded to Overweight from Neutral at Piper Jaffray. Among downgrades, Needham, Craig Hallum, and FBN downgraded OCZ (-21.6%), Oppenheimer downgraded CNQR (-0.2%) to Perform, DCM (-0.2%) was downgraded to Neutral at Goldman and NOK (-1.5%) was downgraded to Sell at Deutsche Bank and Societe Generale. There are no notable names in tech scheduled to report quarterly results today after the close.
icon url

ReturntoSender

09/08/12 1:23 PM

#9900 RE: ReturntoSender #6755

From Briefing.com: Weekly Recap - Week ending 07-Sep-12

Dow +14.64 at 13311.82, Nasdaq +0.61 at 3136.42, S&P +5.80 at 1437.92

Stocks got off to a mixed start after this morning's jobs data proved to be a disappointment. The anemic numbers turned into yet another argument in favor of additional easing while lower guidance from a technology bellwether contributed to a divergence in the major averages. The S&P 500 finished higher by 0.4% while the Nasdaq ended flat.

Nonfarm payrolls were reported at 96K versus the 130K Briefing.com consensus. The prior reading was revised down to 141K from 163K. In addition, nonfarm private payrolls added 103K against the 144K consensus. Separately, the unemployment rate was reported at 8.1% versus the 8.3% consensus estimate as the dip in the unemployment rate was attributed to more people leaving the workforce.

Major financials rallied after disappointing jobs data sparked another round of quantitative easing hopes. The SPDR Financial Select Sector ETF (XLF 15.68, +0.16) advanced 1.0% as Bank of America (BAC 8.80, +0.45) and Morgan Stanley (MS 17.08, +0.83) gained over 5.0% each. Other major names showed less robust advances as Citigroup (C 32.06, +0.94) and Goldman Sachs (GS 116.33, +2.79) added 3.0% and 2.5%, respectively. Meanwhile, European financials continued their exuberance for the second day in a row. Barclays (BCS 13.17, +0.86) and Deutsche Bank (DB 40.20, +2.59) jumped near 7.0% each.

Stocks listed in the Dow underperformed the broader market as two notable components showed weakness. Kraft Foods (KFT 39.99, -2.32) slid 5.5% after providing an update on its planned spin-off. Beginning October 1, 2012 the company will separate into two entities. Kraft Foods Group which will hold the North America grocery business will begin trading under the ticker ‘KRFT' while Kraft Foods will be renamed Mondelez International and trade under the symbol ‘MDLZ.' Today's weakness came after the company announced it expects Kraft Foods full-year 2013 earnings at $2.60 per share. Meanwhile, technology companies within the index are slumped after Intel (INTC 24.19, -0.90) cut its third quarter guidance below consensus. The technology bellwether slid 3.6% while Cisco (CSCO 19.56, -0.16), Microsoft (MSFT 30.95, -0.39), and Hewlett-Packard (HPQ 17.42, -0.17) lost between 0.8% and 1.5%.

Technology stocks outside of the Dow were also under pressure after Intel's guidance cut. Peer AMD (AMD 3.45, -0.21) slumped 5.7% while related names, NVIDIA (NVDA 13.40, -0.33) and Micron (MU 6.42, -0.25) slipped 2.4% and 3.8%, respectively.

The materials sector settled higher by 2.0% as it outperformed other sectors. Over the past two days, China announced plans to increase infrastructure spending which may bode well for basic materials demand. Iron and steel names showed biggest gains as Cliffs Natural Resources (CLF 39.91, +5.05) jumped 14.5%. Meanwhile, United States Steel (X 20.89, +1.68), AK Steel (AKS 5.78, +0.41), and Freeport-McMoRan (FCX 39.43, +3.09) posted advances near 8.0%.

Within the healthcare space, biotechnology stocks weighed on the rest of the sector. The SPDR S&P Biotech ETF (XBI 91.59, -0.43) slipped 0.5%. Spectrum Pharmaceuticals (SPPI 12.01, -0.59) posted the biggest loss within the group as it finished lower by 4.7%. Meanwhile, Medivation (MDVN 105.65, -2.97) and Theravance (THRX 23.91, -0.28) fell 2.7% and 1.2%, respectively. On the upside, pharmaceutical company Peregrine (PPHM 4.50, +1.43) surged 46.6% after reporting that its Bavituximab drug has doubled the median overall survival rate in lung cancer patients who are taking part in the company's phase II trial.

Internet radio provider Pandora (P 10.47, -2.10) slumped 16.7% after reports suggested Apple (AAPL 680.44, +4.17) may include internet radio on its devices and integrate the service into its iTunes store. Apple finished higher by 0.6% after marking a fresh all-time high at $681.50 while today's selling has dropped shares of Pandora back to levels last seen before its August 30 earnings report.

Week in Review: Mario Draghi Press Conference Highlights the Week

On Monday, stocks got off to a strong start before stumbling slightly when Federal Reserve Chairman Ben Bernanke did not hint at additional easing, but instead reaffirmed his commitment to act if economic conditions worsen. Mr. Bernanke commented on the stagnation of the labor market, calling it a "grave concern" which bears monitoring. As a result, the S&P 500 finished higher by 0.5%. European financials saw broad advances as plans to create a Spanish "bad bank" surfaced. Banco Bilbao Vizcaya Argentaria (BBVA 8.27, +0.23) gained 5.0%.

On Tuesday, stocks opened unchanged before falling into the red after economic data missed expectations. The August ISM Index was reported at 49.6 versus the 50.0 Briefing.com consensus, while July construction spending fell 0.9% month-over-month, against the expected increase of 0.5%. After reaching session lows 90 minutes after the open, stocks staged a slow climb higher which was punctuated by a broad-based mid-afternoon rally. Stocks rallied back near the flat line where they remained until the end of the day. As a result, the S&P 500 slipped 0.1% while Nasdaq gained 0.3%. NVIDIA (NVDA 13.40, -0.33) slid 5.4% after being downgraded from ‘equal weight' to ‘underweight' by Evercore.

Wednesday's session was spent mostly around the unchanged line. The early morning volatility coincided with a Bloomberg TV report which indicated the European Central Bank bond purchase program was said to pledge unlimited, sterilized buying of bonds. However, the exuberance was short-lived as European Central Bank officials declined to comment, and reports out of Germany suggested Chancellor Angela Merkel would only support the program in the near-term. Afternoon trade was mostly quiet as the S&P 500 remained in a narrow range before closing lower by 0.1%. FedEx (FDX 87.38, -0.16) shed 2.0% after lowering its first quarter guidance, citing weaker global demand.

On Thursday, equities began sharply higher, and added to their gains throughout the opening hour of trade. The remainder of the day was spent hovering near session highs. The bullish sentiment was sparked after Mario Draghi confirmed Thursday's reports of a European Central Bank plan to buy bonds of troubled sovereigns who ask for aid. The program will be limited to bonds maturing within three years. Better-than-expected U.S. economic data also added to the upbeat tone which resulted in a broad market rally. The Nasdaq closed at a 12-year high while the S&P 500 settled at levels not seen since January 2008. The two indices finished higher by 2.2% and 2.0%, respectively. The SPDR Financial Select Sector ETF (XLF 15.68, +0.16) added 2.4%.
 
Index Started Week Ended Week Change %Change YTD %
DJIA 13090.84 13306.64 215.80 1.6 8.9
Nasdaq 3066.96 3136.42 69.46 2.3 20.4
S&P 500 1406.58 1437.92 31.34 2.2 14.3
Russell 2000 812.09 842.27 30.18 3.7 13.7

11:02AM ASML shareholders approve Customer Co-Investment Program (ASML) 56.26 -1.61 : Co announced that it has received the approval by the Extraordinary General Meeting of shareholders of its Customer Co-Investment Program and that the US anti-trust clearance process is complete. The essential elements of the Customer Co-Investment Program are now final. The EGM also approved the proposal to authorize the Board of Management for the period from 7 September 2012 through 25 October 2013 to (i) issue additional shares or rights to subscribe for shares in the capital of the Company, limited to 5% of the issued share capital at 25 April 2012; issue an additional 5% of the issued share capital at 25 April 2012, which 5% can only be used in connection with mergers, acquisitions and/or alliances; and restrict or exclude the pre-emption rights in connection with any such issuances, in each case subject to the approval of the Supervisory Board. This authorization replaces the corresponding authorization granted at the AGM held on 25 April 2012. ASML expects to execute the Synthetic Buyback in late November 2012, with the expected ex-entitlement date on 26 November 2012, the record date expected to be 28 November 2012 and the cash payment date expected to be 3 December 2012. Following the issuance of new shares to Intel (INTC), TSMC (TSM) and Samsung Electronics (SSNLF) in connection with the program, and subject to statutory requirements, ASML intends to implement the Synthetic Buyback as follows. The cash capital repayment will be EUR 9.18 per share and the reverse share split will be 77 for 100.

11:01AM Agilent signs exclusive supply agreement to provide components for Liposcience's Vantera Clinical Analyzer (A) 38.31 +0.83 : Co announced that it has entered into an exclusive supply agreement with LipoScience Inc. to provide nuclear magnetic resonance (NMR) components for LipoScience's Vantera Clinical Analyzer. The analyzer is the first fully-automated NMR diagnostic platform designed specifically for the clinical laboratory and cleared by the U.S. Food and Drug Administration.

10:36AM Amazon.com: AMZN now trades +3% into new multi-year highs @ 259.00 (AMZN) :

10:19AM Apple: AAPL +0.60% sets new all-time highs @ 681.50 (AAPL) 680.51 +4.21 :

Marvell (MRVL) and ZeroDesktop announced they are collaborating to deliver a cost-effective alternative to traditional PC-based computing.

8:07AM Intel lowers Q3 rev guidance by 7.7%, below consensus (INTC) 25.10 :

Co issues downside guidance for Q3 (Sep), lowers Q3 (Sep) revs to $12.9-13.5 bln from $13.8-14.8 bln vs. $14.23 bln Capital IQ Consensus Estimate.
Co cites weaker than expected demand in a challenging macroeconomic environment.
Co is seeing customers reducing inventory in the supply chain vs. the normal growth in Q3 inventory; softness in the enterprise PC market segment; and slowing emerging market demand.
The data center business is meeting expectations.
Co lowers/narrows Q3 gross margin guidance 100 bps to 62%, plus or minus one percentage point; vs. the previous expectation of 63%, plus or minus a couple of percentage points. Expectations for R&D and MG&A spending and depreciation in the third quarter remain unchanged. Full-year capital spending is expected to be below the low-end of the co's previous outlook of $12.1-12.9 bln, as the co accelerates the re-use of existing equipment to the 14nm node.

Advantech, eInfochips, and Texas Instruments (TXN) have developed the HTTP Live Streaming protocol stack for high-performance video streaming application server deployments.

Broadcom (BRCM) announced the industry's first 5G WiFi DOSCIS 3.0 cable gateway platform. Co also announced it is the first to integrate Community Wi-Fi software on all DOCSIS 3.0 cable modem and gateway platforms.
Rovi (ROVI) and Broadcom (BRCM) announced that Broadcom's latest IPTV platforms will support DivX Plus Streaming.

Cisco (CSCO) revealed its expanded and enhanced content delivery network portfolio, branded as the Cisco Videoscape Distribution Suite

Broadcom (BRCM) announced the release of validated drivers for OpenTV 5, the latest, most open and most powerful set-top box middleware from NAGRA.

Cantor Fitzgerald downgrades Nvidia (NVDA $13.45 -0.28) to Hold from Buy and lowers their tgt to $13.50 from $20. While Nvidia continues to do well in these segments, the firm expects little to no growth over the next several years. The remaining 20% of revenues are coming primarily from sales of GPUs into the non-Apple (AAPL) tablet market and to a lesser extent into the handset market. In the firm's opinion, NVDA success in the tablet market is already reflected in the share price. Furthermore, in the medium to long term, they believe that APs and GPUs will be completely absorbed into the baseband processors (ala Qualcomm (QCOM) and Broadcom (BRCM).

Intel (INTC $24.14 -0.95) issued downside guidance for the third quarter with revenues to $12.9-13.5 billion from $13.8-14.8 billion versus the $14.23 billion consensus The company cites weaker than expected demand in a challenging macroeconomic environment. The company is seeing customers reducing inventory in the supply chain versus the normal growth in Q3 inventory; softness in the enterprise PC market segment; and slowing emerging market demand. The data center business is meeting expectations. The company lowers/narrows Q3 gross margin guidance 100 bps to 62%, plus or minus one percentage point; versus the previous expectation of 63%, plus or minus a couple of percentage points. Expectations for R&D and MG&A spending and depreciation in the third quarter remain unchanged. Full-year capital spending is expected to be below the low-end of the co's previous outlook of $12.1-12.9 billion, as the company accelerates the re-use of existing equipment to the 14nm node.

icon url

ReturntoSender

09/09/12 3:10 PM

#9901 RE: ReturntoSender #6755

InvestmentHouse Weekend Market Summary

http://www.investmenthouse.com/weekendmarketsummary.htm

- Where we stand now: a look back at the stimulus rally.
- Dollar tanks, gold soars, all on what the Fed will or won't do.
- Non-Farm Payrolls weak, as unemployment rate hits 11.2%, both despite failing attempts, again, to make things look better than they are.
- INTC pulls its guidance, sparking the tablet/PC debate anew, but PC's won't die.
- Stocks at a new high on presumed liquidity. Entries are more taxing here, but a bit of a pullback to start the week will help.

You can't fight the Fed . . . as long as it delivers.

The recent action, indeed the entire move off the June low, has demonstrated the old adage 'you cannot fight the Fed.' When the Fed gets in its collective mind it wants to bring about a result, it will stay at it until it, as another Fed adage that I discovered (as many others have as well), it goes too far. Right now the Fed is focused on the new 2012 slowdown that has the US, in my view, already in recession. Its concern is, ironically, a lagging indicator, employment. At this stage in the 'recovery' (a.k.a. renewed meltdown), things are so bad, the jobs situation has been so negative for so long, the Fed is viewing jobs as a leading indicator for everything else. Basically the Fed feels that if jobs don't get better, nothing is going to get better because the US worker psyche is so damaged. Thus everyone, the Fed and Fed-watchers, were anxiously awaiting the Friday August jobs report.

This was an important economic data point, one that many are saying will force the Fed to finally deliver upon its promise of more stimulus 'if the conditions warrant.' At 96K new jobs and unemployment falling to 8.1% thanks to a mass exodus of disappointed job seekers, likely the 'conditions' are ripe for action. Think about it. Typically unemployment RISES in a recovery as more people look for work. The jobs market is SO bad (and as a corollary, the benefits if you don't work are at the highest ever), people are simply giving up looking altogether. Perhaps that is what Bernanke is talking about when he urges the government to take fiscal action. Not likely, as that is a more subtle aspect of economics (if you pay someone to do something, they will do it), but it is a fiscal issue that needs to be addressed. Okay, just one paragraph and I am already digressing. Going to be one of those reports I suppose.

If you step back and look at the rally thus far, aside from Thursday (heck, even including Thursday), you see a rally based upon the promise of more liquidity. Back in June, our entire premise for the rally was the promise to add more liquidity to the system. Technically stocks held good position even through the mid-June selling. That told me that the market was not rolling but was setting up for a new move, a move at the time I relayed to you was based upon the hope, that later turned to promise from Bernanke himself, of more stimulus.

I Ben Bernanke, do promise more stimulus. You can trust me. More is on the way. How much? Oh, about this much . . .

Along the way the Fed convinced Mario Draghi of the ECB that only US-style QE would work for Europe. Geithner started sowing those seeds over a year ago with his trips to Europe where, at first, he was almost booed off the Continent. The Euros believed this was a US centered problem and they were just feeling the side effects. As the European economies turned to road kill, however, the ECB dogma turned, primarily with the retirement of Mr. Trichet. With him went the remaining vestiges of inflation fighting as the ECB's prime directive.

With Draghi the focus turned to preserving the EU and the euro. As we found out in July, that meant, at least to Draghi, 'at any cost.' The markets loved it. Now Europe was biting the apple of QE, or at least promising to. Everyone waited for Merkel and Germany to issue the usual 'Nein!' post-haste. It didn't come. Oh yes a few lower officials protested, but Germany appeared to acquiesce to Draghi's bold statements.

Then came the August FOMC meeting. No stimulus was announced, but this was just days after Draghi's bold statements. The Fed had cover to look tough, to be bold, to . . . stay the course. A rather bizarre July jobs report also gave the Fed some room to tap dance as the BLS turned a negative actual jobs print into a jobs gain thanks to truly astounding variations in the birth/death rate and seasonal adjustments for the month of July, adjustments not made in about forever for the month.

Thus when Jackson Hole and Bernanke's typical Friday speech at the 'symposium' (a.k.a. trout fishing trip) rolled around just last Friday, he offered no further QE, just the wink and a nod that more was coming.

Oh, you didn't see that wink and nod? You thought the speech was identical to what he has said over the past several weeks? Man, you must have missed it because the market certainly saw something in that same text and delivery we have seen before.

This is, however, what is really meant by 'coordinated' central bank action. Draghi would take a new tack for the ECB. This would allow the US Fed to lay low, keep its powder dry, to provide advice on a plan that has 'worked' while Draghi changed the mindset in Europe. The old 'good cop/bad cop' routine on a global economic level.

Then the past week Draghi and company leaked the plan for bond buying a day before the ECB voted on it. The markets responded nicely. Then in a twist from the norm, when the plan was released on Thursday, markets surged on the news versus the rumor. SP500 and NASDAQ broke to new post-bear market highs and they held them. All indices surged. Friday, not so much. A weak-kneed jobs report puts the Fed right back in the stimulus play, and while gold surged, the stock indices hesitated. Perhaps a bit hung over from the Thursday party, but still expecting Fed stimulus.

But not so fast. Everything and I mean everything regarding stimulus at this point is just a promise. Draghi's bold statements, while not overtly challenged by Germany, are just statements at this point, Thursday vote or no. Why? Because the German high court still has to rule on the bond buying issue, the opinion due next Wednesday.

Surprise, surprise (as Gomer Pyle used to say), that is the day before the FOMC September rate decision meeting concludes. Once again the ECB goes first, then the US Fed. This time there may be a different script, a change in the good cop/bad cop routine. No one appears to be factoring a German chop block on Draghi's ECB designs. The Germans have been uncharacteristically quiet post-whatever it takes comments. Perhaps German officials are simply laying low, avoiding the political heat, and letting the court do the dirty work.

If the German court drops the hammer on 'whatever it takes,' then the Fed is front and center. It will be forced to act. Stimulus promise becomes stimulus delivered, regardless of Friday's jobs report that most people are saying has forced the Fed's hand this coming week. No, the real force may be the German court which, by all legal arguments, should find that the bond buying is against the German charter. Of course, the 'not so affordable healthcare act' should have been struck down here in the US but a political court, claiming it was not political, found a way to support it (and stick us all with unlimited tax liability for just being a citizen, as we shall see unfold in the years to come). So, the law is no guarantee when courts, the arbiters of the law, are involved.

And your meaning is . . .

So, you are asking yourself (or are sending off an email to me right now), what the hell does all of that mean for the market? It means that this entire rally off of the June low, including last Thursday's super surge that took SP500 and NASDAQ to new post-bear market highs, is still all driven on the PROMISE of stimulus (funny, when I typed that I typed in 'inflation;' Freudian slip I suppose. No, I guess that was really a Milton Friedman-like slip.).

There is still no stimulus in the bank so to speak, and thus this rally on the hope and dream of more Fed QE and indeed ECB QE is vaporous. Yes China has announced additional stimulus to build rails and roads (railroads?) and the horrid US jobs report could very well be the 'additional data,' of the crappy sort, that pushed the Fed to act. But for now it is all hope and change, er, hope and dream stimulus. Perhaps, just perhaps, that is why stocks waffled Friday. Nah; gold surged on the session so gold traders are thinking QE and the resultant currency diminution and inflation.

Stimulus will still come. The Administration wants it.

One way or another, however, despite the reality of just a promise of stimulus, the markets are likely to get their stimulus. The jobs report, despite being spun as a drop in the unemployment rate (thanks to the exodus of almost 400K people from the ranks of looking, a.k.a. hoping, for a job), there was nothing good in this report. It was easily bad enough to warrant stimulus. Perhaps that is what the Administration wanted so it did not go too far in toying with the numbers to make it look better. After all, stimulus at this point has much more impact on financial markets and the so-called 'wealth effect' than anything the Administration can do in the few months ahead of the election. So, let a worse number out, get the Fed to act, blame Congress and the republicans for doing nothing and forcing the Fed to act, and hope that that is enough so there is not a change in November (how is that for a play on 'hope and change'?). Sometimes I crack myself up. Sometimes.

THE MARKET ACTION.

All of this culminated with that strong Thursday surge in stocks that saw stock indices hitting new post-bear market highs as well as gold hitting a new recovery high. Many undercurrents are at work. Stocks love the liquidity promised by Draghi and the Fed. They are running on that hope. Gold loves inflation and weaker currencies, both the likely and real result of more QE by the Fed. It is all one big party . . . until it ends.

It didn't end Friday, but it was not a party either. Stocks were understandably a bit hung over but managed, in most cases, to move modestly further to the upside. Futures were up early in the session and opened higher, but then it was a struggle through most of the day. Indeed, until the last hour, stocks traded in a very narrow range with modest gains to losses on some of the indices. Late in the day a bump higher took SP500 to a session high, and it closed with a very decent gain on the session and to close out the week.

SP500 +0.4%
NASDAQ +0.02%
Dow +0.11%
SP600 +0.49%
SOX -0.82%

No big losses at all, but just a stall. A hangover, as it were. The markets have a big week next week with the FOMC decision for September as well as the German high court's ruling on whether bond buying is legal under the German constitution. Stocks were understandably indecisive on Friday, although they were hardly in the mood to give anything serious back. We may get a bit of a pullback to start the week as they ponder what will happen at the German high court and with the US Fed. Again, I do not think that will stall the moves. I do believe that there is enough to continue the move, based on everything I have outlined above, if the Fed makes its move to the next Quantitative Easing.

OTHER MARKETS

The other markets mostly performed as you would expect if there will be Fed action. That would have its implications on various markets.

Dollar. 1.27991 versus 1.2637 euro. The dollar was hit hard. It put in something of a toppish head and shoulders pattern, and it is breaking to the downside. It is tough. When you are the reserve currency and you fall, everything that you buy increases in price. Why? Because everything is priced in your currency, so it is a double whammy if you are the reserve currency. Although it gives a lot more flexibility and options with printing money, it does have its drawbacks. Now every barrel of oil will cost more. Every ton of ore will cost more. If it is priced in dollars, it will hurt. Not that we would escape it if we were not the reserve currency; if your currency falls in value, things will be more expensive. It is just more notable and very painful for us because we have that double whammy. As the dollar falls, you will see what it did to other commodities in a moment.

The dollar tried to hold at the upper support and failed rather horribly. Makes you wonder what will happen if the Fed actually does announce this week that they are going with Quantitative Easing.

Bonds. 1.66% versus 1.67% 10 year Treasury. Bonds were strange on the day. Typically with the jobs report being weak and economic data being weak, bonds tend to rally because investors move into them for safety. If the Fed is going to initiate bond buying in another Quantitative Easing round, bonds should improve as well because they will be buying bonds.

Here is something to consider: what will Quantitative Easing look like in this round? Will it be just another round of the Fed purchasing treasuries? That is like Operation Twist on a grander scale. Kind of. At least this bond buying would inject more liquidity, which is what the market really wants. What I am hearing and what I have talked about before is that the Fed may want to focus on buying mortgage-backed securities with the goal of driving mortgage rates down to basically 0. That will force people to refinance and bring more money into the economy. A lot of people have refinanced over the past few years, and there has been a drop off in that. Remember a lot of the commentators said that houses can no longer be used as piggy banks. Everyone has done their refinancing, and they have tapped out their equity. If you drop rates more, you can get more people to refinance and maybe make some more money every week. Voila, you are in better shape overall. More money going into the economy, in other words.

Bonds may not be rallying on this news similar to what they did last week when Bernanke spoke at Jackson Hole conference. Maybe this week the bond market, which is supposedly smarter money, is saying it will be mortgage-backed securities that the Fed will focus on versus out-and-out buying of bonds. Interesting -- I hope. Hopefully I did not put you to sleep with that.

Gold. 1740.10, +34.50. Gold surged. Screaming to the upside. A clear breakout, a test of the breakout, and now on a full-fledged run to the upside. Lowering the value of the currency makes gold rise in price, and it also increases the odds of inflation. We already have a lot of money in the system, and we already have a huge amount of debt. It makes sense that gold would anticipate inflation rising from that. Gold is surging to the upside, and I do not see a top in mind. Looks like 1800 or so from that February-March peak will be the next point to shoot for. There is a little bit of resistance when it reaches that level.

Oil. 96.42, +0.89. Oil was up on the day. It did not break the 200 day EMA. It is moving laterally. As the dollar fell, naturally the oil rose even though the economic outlook for the US and the rest of the world stinks. Nonetheless, when the dollar falls, oil prices will rally because oil is dominated in dollars. We are still looking for a breakout. A nice cup with handle of sorts, a little inverted head and shoulders at the bottom. We are looking for a breakout, and we will see if it can deliver.

TECHNICAL SUMMARY

Internals. It was not as vigorous a day on Friday. As noted, it was a bit hung over.

Volume. NASDAQ -9.5%, 1.7B; NYSE 623M. Note that it is an elevated volume on NASDAQ. We have seen volume push in to the upside over the last week. Volume was down on the NYSE as well.

Breadth. NASDAQ +1.4:1; NYSE +2.1:1. Breadth backed off. Positive breadth and still overall positive volume. As the buyers have definitely moved in, some shorts have covered.

THE CHARTS

SP500. There is a lot of short interest typically down at the bottom of a selloff, and short covering drives the rally higher. As this juncture, there is a lot of pessimism even with the market at its highs because it was all driven by stimulus. There was concern as to whether the ECB would follow through with any stimulus. They are still concerned about that. The German court as not ruled, as we know. There is also a lot of awareness of economic weakness and problems facing the country such as the fiscal cliff. There was a lot of pessimism even though stocks were up at the prior highs.

There was quite a bit of short interest, and this could be a short squeeze, but it is also overall buying. We saw strong breadth on Thursday. It was 3.8:1 on NYSE and 3.4:1 on NASDAQ. It was fairly broad buying pushing the indices higher. SP500 is now in a new post-bear market high. It is looking solid, although it likely will come back and test. It may be a little pensive ahead of the FOMC meeting this week.

NASDAQ. After NASDAQ broke to that new post-bear market high on Thursday, it did stall on Friday. It was not a major stall; just a little doji, and likely a continuation doji. Again, we could get a pullback to test the break. It is right at the old highs, so it does not have a lot of room to give. A little pause would not be unusual to start the week. Frankly, it just depends on where investors wake up. Do they believe that more stimulus is coming and want to put money in ahead of the FOMC? Or will they be pensive and wait for the German high court and the FOMC to deliver the news?

That is where we are now. We have a breakout, and indicators point to the upside. Although you always have some backfilling and testing.

SP600. SP600 showed the same type of action. It broke to a new closing high. It moved to a new post-bear market high, intraday and closing, on Friday. Continuing the move, continuing the breakout and looking quite solid.

SOX. SOX backed off on Friday, but it has that good pattern with the double bottom with handle. A great break to the upside on Thursday, but it backed off on Friday. The INTC news came out. It cut its Q3 revenue estimates, and it withdrew its full year revenues and gross margin estimates.

We have a problem with INTC. It is suffering from the PC market as is DELL and HPQ. I do not think the PC market will die, but it is shifting. Tablets are out, and a lot of people have those. A lot of companies cannot use tablets, however. In our group we cannot use tablets because they do not have enough horsepower to run the trading software that we need along with the high-intensity graphics and the volume of data that we get. We need the high-speed processors and lots of RAM in order to run those.

DELL makes a PC tablet with a screen that you can flip, and you can load it up with the best processors and RAM there is. It is a high-performance machine in a tablet package. And maybe the MSFT version coming out later in the year will be decent. But you cannot use an iPod or the Samsung tablet for anything that takes serious computer power. We looked into it, and all of the trading platforms laughed when we asked about using a tablet. But I digress.

My point is that the PC market is in contraction, no doubt. But there will be some kind of merging of the tablets and the PCs because the tablets simply do not have the power right now to do what we need. They are great for people just sending emails and a few pictures. For serious stuff, we need the PC chips. INTC is down; I am not saying I would invest in it. But that explains where we are and why the chips were down, so to speak.

I still like the pattern here. Why? What goes into phones, tablets, and basically everything? Different kinds of chips. There are other stocks that performed well, even though INTC, a PC-based chip maker, is struggling.

LEADERSHIP

As noted on Thursday, stocks basically went up.

Energy. Even energy stocks were going back up. A lot of that is due to it dollar heading down. I don't want to spend a lot of time jumping into stocks, but I want to point out that there are stocks moving. HAL in one. We had even looked at it in this reversal. Being foolish, we did not jump in after the big reversal at an important level. Blame me on that one. Others spotted it and I said we should hold off. CVX looked a bit weak, but it has bounced back up to a new rally high. Energy looks good.

Financial. BAC is one we have played because it was a great entry point with a great price point. It is performing well. Second position on this one, running to the upside, looking very strong as it moves higher. It is not the only one. Even the financial service companies look good. JPM is another big bank doing well. MS is running higher, moving through the 200 day EMA. Financials of all strips are doing well. Why? Because there will be more money put into the system. More money in the system means they make more money.

Technology/Telecom/Semis. Techs are not bad as well. AAPL is just going with the flow. It is not leading at the moment, it is just rolling on momentum. Although it did hit a new closing high. A lot of stocks are already up, but there are others that look like they might be able to make a turn. LVLT is more in the communications market. That is where we are seeing those still with room to turn to the upside. Another is APKT. It looks like it might be ready to turn and move. They are out there, but a lot of techs have already run to the upside pretty well.

Surprisingly, JNPR has made a turn and it is breaking to the upside. MSPD broke down on us last time, but it looks to be setting up a double bottom with rising MACD. We will keep an eye on that. There are still possibilities that we can look into and maybe pick up something. CREE is another. It has potential to the upside in the tech, telecom, and chip areas.

Retail. Retail continues to look good. More money hopefully means more wealth effect, I guess. RL is breaking to the upside quite nicely. LULU had an explosive move as its earnings came in. Not terribly great but better than expected. They are moving higher as well.

Healthcare/Drugs. We have seen the health care and drugs perform. They are still looking good. Maybe it is still just turning the corner. It might be something we can buy into. LCAV is trying to break back to the upside. That is interesting. SVNT it also interesting, coming off of a flag pattern. They are out there. They are moving again, and we were into some of them. Obviously they have been running well for us. They were starting to perform better when things got a little bit dicey as the SP500 traded up to these other highs and backed off. We saw defensive plays start to perform again. Thursday and Friday the general market overall performed, but it took these stocks higher with it. It also shows another indication that there was broad buying in the market.

Metals. With inflation comes asset price increases and financial price increases on commodities. FCX surged to the upside. What a big move. AA put in two strong days. Really a strong day on Friday, rising almost 4% when a lot of the market was waffling on that session. The metals are surging, anticipating inflation and a lower dollar. As the dollar fell, copper and aluminum jumped to the upside.

THE ECONOMY

TO VIEW THE ECONOMY VIDEO CLICK THE FOLLOWING LINK:
Economy Summary Video

So much more to the Non-Jobs report than the headlines.

NONFARM PAYROLLS, August (8:30): 96K actual versus 130K expected, 141K prior (revised from 163K)
Nonfarm Private Payrolls, August (8:30): 103K actual versus 144K expected, 162K prior (revised from 172K)

Only 52.2% of companies added jobs in August, the lowest since February 2010.
4 out of 5 months of less than 100K jobs this year.

UNEMPLOYMENT RATE, August (8:30): 8.1% actual versus 8.3% expected, 8.3% prior

Participation: 368,000 more people left the work force, driving the participation rate to 63.5% from 63.7%, the lowest in 31 years.

BUT, the US civilian population (outside of prisons) has grown 186K/month to 243.5M in August, an all-time high.

REAL UNEMPLOYMENT RATE: 11.2% to 11.7% depending upon whether you use a steady participation rate (the first number) or the 3 decade average (the second number).

Since 1948 there have been 82 months of unemployment greater than 8%. 43 of those months (52%) have occurred under Obama.

Hourly Earnings, August (8:30): 0.0% actual versus 0.2% expected, 0.1% prior

Average Workweek, August (8:30): 34.4 actual versus 34.5 expected, 34.4 prior (revised from 34.5)

Mark Zandi on CNBC
There was talk of conspiracies at the BLS on CNBC, mostly in mocking tones. Mark Zandi, the supposedly unbiased, independent economist scoffed at the idea of data manipulation, saying there is a formula used to calculate the numbers and thus there is 'no way' they can be manipulated.

Of course, that is assuming the data input in the formula is correct, and indeed that is the POINT Mr. Zandi.

Yes we all know that 2 + 2 = 4. We know 2 is constant. But, what if you define 2 as some other number? You then alter the result EVEN IF THE FORUMLA IS THE SAME.

When the BLS makes seasonal adjustments you would assume it does so in a rational manner. As seen in July, there was no rational manner. It did not correspond to any adjustments in the past 20 years, even in those years where July 4th fell at the same time as it did this July. Same for the birth/death rate. It was a factor of 10 above any other July over the past decade and more.

The formula is what the formula is. It is the age-old idea of garbage in, garbage out, however, where the issue arises.

Secular Change in Employment?

Part time workers are becoming the norm.

As of August, 8M additional workers were classified as part-time compared to the start of current recession/depression 4 years back.

An additional 5.2M part-time workers are considered marginally attached to the workforce, working part time.

Total: 13.2M part-time workers who want more work on top of 12.5+M completely unemployed gives you 25.7M unemployed versus the U6 report of 14.7M 'underemployed.'

Meaning: The employment market is shifting from full employment to part-time, contract work. The legal practice is already turned this way before the depression. Document reviews are mostly conducted by contract attorneys working for large companies that manage document reviews for large law firms. More cost effective because lower hourly rates, limited benefits.

Can the Fed do anything about this? No.

THE MARKET

SENTIMENT INDICATORS

VIX. When volatility was down at the March 2012 and the May 2011 lows in mid August, the talk was that a major selloff was coming. Even on Tuesday of last week we heard some of the brokers saying a major plunge was coming and to get out of the market now. Volatility did run higher, and the market did fade, but it was just some. It was not a major fade. There were some spikes in there; it did not look good necessarily. There was that reversal session on SP500, the selloffs on these two sessions, but they were always followed by upside recoveries.

If you get too wrapped up in the VIX, you can get burned. I know people got burned doing that. We even had some short positions. We take short positions as a hedge when we are at these highs, but our plays are still predominantly upside because of the good technical action overall and some good leadership. Nonetheless, a lot of people went deeply short, and they are getting squeezed to say the least.

While the VIX did hit that low and bounced, it is nowhere near the prior bounces, and it has already reversed sharply.

VIX: 14.38; -1.22
VXN: 15.44; -1.57
VXO: 13.37; -1.31

Put/Call Ratio (CBOE): 0.74; -0.12

Bulls versus Bears

Bulls: 51.0% versus 48.9% versus 43.6%. Five weeks and up from 39%. Bulls are felling pretty solid now. Another 10 points and not that great, but 10 points is a long way from here and the market can run quite a bit in that interval. Undercut 35%, the threshold for bullishness, in early June. You would expect it to rise and it has. Still not at a dangerous level, just working as it should. As noted, hit 34% in early June. It did its job and the market is on the rally. Hard drop to 34 from 39.3% as economic reality and a choppy stock market hit. Off the 55+ level hit in late February. That was the highest level since April and May of 2011, the peak of the post-bear market high. 35% is the threshold level suggesting bullishness. To be seriously bearish it needs to get up to the 60% to 65% level.

Bears: 24.5% versus 24.5% versus 26.6%. Down from 27.7% five weeks back. Still above the May lows so still some room to work with, i.e. room for the indices to rally. Never made it to the 35% that can be a bullish indication, but the bulls were weak enough back in June. Over 35% is the threshold to be really be a good upside indicator. For reference, bearishness hit a 5 year high at 54.4% the last week of October 2008. The move over 50 took bearish sentiment to its highest level since 1995. Extreme negative sentiment. Prior levels for comparison: Bearishness peaked at 37.4% in September 2007. It topped the June 2006 peak (36%) on that run. That June peak eclipsed the March 2006 high (33%) and well above the 2005 highs that spawned new rallies (30% in May 2005, 29.2% in October 2005). That was a huge turn, unlike any seen in recent history.

NASDAQ

Stats: +0.61 points (+0.02%) to close at 3136.42
Volume: 1.708B (-9.63%)

Up Volume: 842.23M (-807.77M)
Down Volume: 883.8M (+640.01M)

A/D and Hi/Lo: Advancers led 1.39 to 1
Previous Session: Advancers led 3.38 to 1

New Highs: 159 (-34)
New Lows: 30 (0)

SP500/NYSE

Stats: +5.8 points (+0.4%) to close at 1437.92
NYSE Volume: 623M (-6.17%)

A/D and Hi/Lo: Advancers led 2.16 to 1
Previous Session: Advancers led 3.79 to 1

New Highs: 307 (-14)
New Lows: 13 (-1)

DJ30

Stats: +14.64 points (+0.11%) to close at 13306.64
Volume: 142M shares Friday versus 108M shares Thursday. Elevated volume on the week for the Dow as well.

MONDAY

There is a veritable cornucopia of economic news out next week. It starts slow but builds rapidly. On Wednesday we have the pricing. Wholesale, import and export prices. It will be important to look at those with the dollar's action. This will be delayed, but it will be good to see what the trend is because we know where the trend is going right now.

Thursday brings another initial claims, PPI, and then there is the big decision from the FOMC. I checked the site, and it is saying Thursday when it usually comes out on Wednesday. We will make sure we know what is going on with that. Why do we think it was moved back? Because the German high court decision is due on Wednesday the 12th. What has been the pattern lately? Europe first and the US second. That way the US can try to keep its powder dry. If the German court comes back with a "nein," that means the US will have to act because the markets will react negatively to that. We will need some kind of backstop, and I believe that is how the Fed sees itself right now.

Friday will be an important session. Not only trading post-FOMC and German high Court, but there are retail sales for August. Very important. Consumer prices for August are also very important. Not to mention industrial production and capacity utilization. Then throw in Michigan Sentiment, not to mention inventories for businesses. They will not be building because of production; they will be building because of lack of sales. We know manufacturing is down across the nation.

We have a HUGE week of data. What does it all mean? Looking back at the markets, we had a big breakout on Thursday and a little continuation on Friday. Maybe a bit of softness, a little bit of indecision ahead of the Wednesday and Thursday important announcements from the German high court and the FOMC. I don't believe it will be anything where the market turns tail and runs. I don't believe we will see any kind of major reversal occur off of this breakout move. Too many indices are strong, and a lot of stocks are high right now. They could use a test, though, and that test could be the pause that refreshes, particularly if there is liquidity coming. Liquidity answers all prayers in financial markets.

We have a breakout, and we may have a test. Then we have a resumption. We were buying on a lot of these days. The market was down, but remember that it would not give up. I came out before it broke to the upside and said we had these reversals, but they have not been given up. We keep seeing patterns in stocks saying "pick up some interest." So we did, and we are glad. Thursday the market gapped higher and ran, and we were not able to get as many positions as we wanted to. We got some, and we are happy to have those. Friday was an even worse day because we did not get any real giveback from the market. We could use a pullback to get some actual plays. We bird-dogged a few of them when talking about the leaders, but it is pretty thin out there when looking for stocks in position to buy right now. We will likely get a pullback off of this good move, and that will give us positions we can take once they do that.

As for Monday, this will be a time for patience. We will have a few plays on the report to look at, but we would like to see two or three days of indecision and maybe a little pullback to give us better entry points. We can even buy some before the news comes out on Thursday. Why? Frankly, I think the Fed has to act whether it wants to or not. If the German high court rules against the bond plan, then the Fed has to act. If the German high court rules for it, that is fine, but then the US economic data was so bad on Friday, I think it still has to act.

Bernanke is much more political than other Fed chairman have been, and he wants to keep his job. He knows if the Republicans win he will lose his job. He will not pause for one second in thinking about whether to push forth new stimulus. The best way for him to keep his job is to keep the current party in power. Since they cannot impact the economy that much before the election, then they will impact what they can: The stock market through liquidity. Liquidity has an immediate effect, and it will have an impact on the stock market. At least the Obama administration could say that the stock market is up. We all know it is because of liquidity, but we are smarter than most. The masses think that the stock market is up so things must be good. They do not understand that it is all made of paper and debt. Maybe they do. Maybe I am just jaded in my years of doing this.

To summarize, there are not a lot of great buys right now. We had a great break to the upside, and it will still probably go higher. We need better entry points. We need a bit of a pullback. There are some stocks that look good and are ready to move higher. We can enter those if they continue. But overall, we would like to see stocks come back and test a bit and maybe give us the opportunity to buy into what we could not buy into on Thursday or Friday thanks to those gaps and runs that never came back.

With that in mind, we will be patient. And we will be happy that we bought stocks when the market was waffling just because the stocks were saying, "buy me." We bought them because that is what you do. You might think that things do not look right, it is too high, and there are so many negatives in the world. But if the stocks are saying "look at me," you better pay attention and at least put some money to work. That is what we were doing. We did not back up the truck, but we were putting some money to work. We already have some great upside positions that continue to work for us as well.

With a little pullback, we can exit out of the upside that gapped and ran. We are just looking for a better exit point on a lot of those. We can use this to pick up some upside as the market turns back higher on the news of the German court and/or the US Fed putting forth stimulus. I made the call, and we will see if we get it now.

I will see you on Monday. Have a great weekend!

Support and resistance

NASDAQ: Closed at 3136.42
Resistance:
3134 is the March 2012 post-bear market peak: broken, not forgotten.
3227 is the April 2000 intraday low
3401 is the May 2000 closing low

Support:
3101 is the August 2012 high
3090 is the mid-March interim high
3076 is the late April 2012 high
The 20 day EMA at 3062
3042 from 5/2000 low
3026 from 10/2000 low
3024 is the gap point from early May
The 50 day EMA at 3005
3000 is the February 2012 post-bear market high
2999 is the bottom of the August 2012 consolidation
2988 is the July 2012 high
2962 is the April 2012 low
2950 is the mid-April closing low
2942 is the mid-June 2012 high
2910 is the March 2012 low
2900 is the March 2012 low
The 200 day SMA at 2889
2888 is the May 2011 peak and PRIOR post-bear market high
2879 is the July 2011 peak
2866 is the July 2012 closing low
2862 is the 2007 peak
2841 is the February 2011 peak
2816 is the early April 2011 peak.
2810 is the low in the shoulders
2754 is the October 2011 high
2706 to 2705 is the April 2011 low and the February 2011 and consolidation low (bottom of the trading range) 2723 to 2705 is the range of support at the bottom of the January to May trading range

S&P 500: Closed at 1437.92
Resistance:
1440 from November 2007 closing lows

Support:
1433 from August 2007 closing lows
1425 from May 2008 closing highs
1427 is the August 2012 peak
1422.38 is the prior post-bear market high (March 2012)
The 20 day EMA at 1408
1406 is the early May 2012 peak
1402.22 is the closing low of the August 2012 lateral consolidation
The 50 day EMA at 1389
1378 is the February 2012 peak
1375 is the early July 2012 peak
1371 is the May 2011 peak, the post-bear market high
1363.46 is June 2012 high
1359 is the April 2012 low
1357 is the July 2011 peak
1344 is the February 2011 peak
The 200 day SMA at 1342
1340 is the early April 2011 peak
1332 is the early March 2011 peak
1325 is the July 2012 intraday low
1309 is the right shoulder low from June 2012
1295 to 1294 is the April 2011 low and the February 2011 consolidation low (bottom of the trading range)
1293 is the October 2011 peak
1275 is the January 2010 low, early January 2011 peak
1267 is the December 2011 peak
1266 is the June 2012 base low

Dow: Closed at 13,306.64
Resistance:
13,331 is the August 2012 post-bear market high
13,668 from 12-2007 peak
13,692 from 6-2007 peak
14,022 from 7-07 peak

Support:
13,297 is the April 2012, prior post bear market high
13,058 from the May 2008 peak on that bounce in the selling
13,056 is the February 2012 high
The 50 day EMA at 13,014
12,971 is the early July 2012 high
12,754 is the July intraday peak
The 200 day SMA at 12,735
12,716 is the April 2012 closing low
12,391 is the February 2011 peak
12,369 is the left shoulder low from May 2012
12,284 is the October 2011 peak
12,258 is the December 2011 peak
12,110 from the March 2007 closing low
12,094 is the April 2011 low
12,035 is the June 2012 base low
The June 2011 low at 11,897 (closing)
11,734 from 11-98 peak
11,717 is the late August 2011 peak

Economic Calendar

September 4 - Tuesday
- ISM Index, August (10:00): 49.6 actual versus 50.0 expected, 49.8 prior
- Construction Spending, July (10:00): -0.9% actual versus 0.5% expected, 0.4% prior
- Auto Sales, August (14:00): 5.0M prior
- Truck Sales, August (14:00): 6.0M prior

September 5 - Wednesday
- MBA Mortgage Index, 09/01 (7:00): -2.5% actual versus -4.3% prior
- Productivity-Rev., Q2 (8:30): 2.2% actual versus 1.8% expected, 1.6% prior
- Unit Labor Costs - R, Q2 (8:30): 1.5% actual versus 1.4% expected, 1.7% prior

September 6 - Thursday
- Challenger Job Cuts, August (7:30): -36.9% actual versus -44.5% prior
- ADP Employment Change, August (8:15): 201K actual versus 143K expected, 173K prior (revised from 163K)
- Initial Claims, 09/01 (8:30): 365K actual versus 373K expected, 377K prior (revised from 374K)
- Continuing Claims, 08/25 (8:30): 3322K actual versus 3300K expected, 3328K prior (revised from 3316K)
- ISM Services, August (10:00): 53.7 actual versus 52.4 expected, 52.6 prior
- Crude Inventories, 09/01 (11:00): -7.426M actual versus 3.778M prior

September 7 - Friday
- Nonfarm Payrolls, August (8:30): 96K actual versus 130K expected, 141K prior (revised from 163K)
- Nonfarm Private Payrolls, August (8:30): 103K actual versus 144K expected, 162K prior (revised from 172K)
- Unemployment Rate, August (8:30): 8.1% actual versus 8.3% expected, 8.3% prior
- Hourly Earnings, August (8:30): 0.0% actual versus 0.2% expected, 0.1% prior
- Average Workweek, August (8:30): 34.4 actual versus 34.5 expected, 34.4 prior (revised from 34.5)

September 10 - Monday
- Consumer Credit, July (15:00): $10.0B expected, $6.5B prior

September 11 - Tuesday
- Trade Balance, July (8:30): -$44.0B expected, -$42.9B prior

September 12 - Wednesday
- MBA Mortgage Index, 09/08 (7:00): -2.5% prior
- Export Prices ex-agriculture, August (8:30): -1.4% prior
- Import Prices ex-oil, August (8:30): -0.3% prior
- Wholesale Inventories, July (10:00): 0.3% expected, -0.2% prior
- Crude Inventories, 09/08 (10:30): -7.426M prior

September 13 - Thursday
- Initial Claims, 09/08 (8:30): 369K expected, 365K prior
- Continuing Claims, 09/01 (8:30): 3300K expected, 3322K prior
- PPI, August (8:30): 1.2% expected, 0.3% prior
- Core PPI, August (8:30): 0.2% expected, 0.4% prior
- FOMC Rate Decision, September (24:30): 0.25% expected, 0.25% prior
- Treasury Budget, August (14:00): -$134.1B prior

September 14 - Friday
- Retail Sales, August (8:30): 0.7% expected, 0.8% prior
- Retail Sales ex-auto, August (8:30): 0.8% expected, 0.8% prior
- CPI, August (8:30): 0.6% expected, 0.0% prior
- Core CPI, August (8:30): 0.2% expected, 0.1% prior
- Industrial Production, August (9:15): -0.2% expected, 0.6% prior
- Capacity Utilization, August (9:15): 79.2% expected, 79.3% prior
- Michigan Sentiment, September (9:55): 73.3 expected, 74.3 prior
- Business Inventories, July (10:00): 0.4% expected, 0.1 prior
icon url

ReturntoSender

09/09/12 3:47 PM

#9902 RE: ReturntoSender #6755

Amateur Investors Weekend Stock Market Analysis (9/8/12)

http://www.amateur-investor.net/Weekend_Market_Analysis_Sep_8_2012.htm
icon url

ReturntoSender

09/10/12 8:25 PM

#9903 RE: ReturntoSender #6755

From Briefing.com: 4:15 pm : Following a mostly uneventful, range-bound trading day, equities saw a late afternoon push to session lows. The major averages saw a notable divergence as the Dow slipped 0.4% while the S&P 500 and Nasdaq slid 0.6% and 1.0%, respectively.

The Dow Jones Transportation Average outperformed the broader market as most components posted gains. Airlines United Continental (UAL 20.06, +0.36) and Delta (DAL 9.38, +0.10) ended higher by 1.8% and 1.1%, respectively. Meanwhile, trucking stocks also showed strength. JB Hunt (JBHT 52.16, +0.51) and Con-way (CNW 29.98, +0.38) both gained near 1.0%.

Technology stocks lagged as major names within the space traded lower. Intel (INTC 23.26, -0.93) slid 3.8% as it remained under pressure after lowering its guidance on Friday. However, Intel's peer, AMD (AMD 3.47, +0.02) gained 0.6% after Goldman upgraded the shares from ‘sell' to ‘neutral.' In addition, major networking stocks showed weakness. F5 Networks (FFIV 96.63, -3.64) finished lower by 3.6%, while Cisco (CSCO 19.15, -0.41) slid 2.1%. Elsewhere, two tech giants traded near their respective all-time highs. Apple (AAPL 662.74, -17.70) marked a fresh all-time best at $683.29, but reversed into negative territory and ended down 2.6%. Meanwhile, Google (GOOG 700.77, -5.38) shed 0.8% as it nears its all-time high of $714.87.

Shares listed in the materials space advanced as names within the sector benefited from China's plan to increase infrastructure spending. Companies specializing in construction materials were led by Martin Marietta (MLM 84.18, +3.05) which added 3.8% after being upgraded from ‘equal weight' to ‘overweight' at Stephens. Meanwhile, Vulcan (VMC 41.44, +1.09) and Headwaters (HW 7.38, +0.43) advanced 2.7% and 6.2%, respectively.

Four paper and packaging producers slumped after receiving downgrades from Deutsche Bank. Rock-Tenn (RKT 66.97, -3.37), International Paper (IP 34.97, -1.51), Packaging Corp of America (PKG 32.44, -0.83), and KapStone (KS 20.75, -0.47) all lost between 2.0% and 5.0% on the news. The downgrade took place after the stocks went on a sharp rally in anticipation of a price increase in the fall. Deutsche Bank is skeptical as to the true ability of the producers to implement and maintain the said price hikes.

Casino and gaming stocks were mostly higher after Nevada Gaming Control Board reported July Las Vegas Strip revenues increased by 27.5% year-over-year. Boyd Gaming (BYD 6.32, +0.21), Isle of Capri Casinos (ISLE 6.42, +0.14), MGM Resorts (MGM 10.92, +0.22), and Wynn Resorts (WYNN 103.09, +0.35) added between 0.3% and 3.5%. Meanwhile, Caesars (CZR 7.10, -0.12), and Las Vegas Sands (LVS 43.41, -0.89) started the session in the black but ended lower by 1.7% and 2.0%, respectively.

According to the Federal Reserve, consumer credit decreased by $3.3 billion in July. This follows the prior month's reading of $6.5 billion, and is lower than the $10.0 billion that had been broadly expected among economists polled by Briefing.com.

Tomorrow's economic data is limited to July trade balance which will be reported at 8:30 ET.DJ30 -52.35 NASDAQ -32.40 SP500 -8.84 NASDAQ Adv/Vol/Dec 1006/1.53 bln/1448 NYSE Adv/Vol/Dec 1194/616.1 mln/1802

3:35 pm : Crude oil spent most of its pit trade chopping around in negative territory. The energy component slid to a session low of $95.34 per barrel in morning action. It then broke into positive territory but quickly fell back into the red. However, buyers stepped in as crude oil headed into the close and pushed prices up such that it closed 0.1% higher at $96.53 per barrel.

Natural gas came off its floor session low of $2.69 per MMBtu and inched higher for its entire session. A rally in the last half hour of pit trade took prices as high as $2.84 per MMBtu and had natural gas settle with a 4.9% gain at $2.81 per MMBtu. A stronger dollar and weak Chinese trade data put pressure on precious metals during today's pit session.

Gold spent its entire session in the red, dipping as low as $1729.20 per ounce. It settled slightly above that level at $1731.70 per ounce for a 0.5% loss. Silver came off its session low of $33.42 per ounce and briefly poked into positive territory where it touched a session high of $33.87 per ounce. Unable to hold on to the momentum, the metal fell back into the red and settled 0.3% lower at $33.63 per ounce.DJ30 -26.41 NASDAQ -27.87 SP500 -6.10 NASDAQ Adv/Vol/Dec 1083/1276.2 mln/1366 NYSE Adv/Vol/Dec 1314/403 mln/1648

4:09PM First Solar confirms Agua Caliente solar project achieved a peak generating capacity of 250 MW AC; expected to be complete on schedule in 2014 (FSLR) 20.79 +0.35 :

4:06PM Agilent prices $400 mln of senior notes; notes will mature in Oct 2022 and will bear interest at an annual rate of 3.20% (A) 38.26 -0.16 : Co announced the pricing of a series of its senior notes in an aggregate principal amount of $400 million, in an underwritten, registered public offering. The notes will mature in October 2022 and will bear interest at an annual rate of 3.20 percent. The offering is expected to close on September 13, 2012, subject to customary closing conditions.

2:14PM The S&P is down 0.2% with technology as the weakest performing sector (SPY) :
Sector Ticker % Change YTD % Change
Technology XLK -0.5% 21%
Industrials XLI -0.2% 9%
Financials XLF -0.2% 20%
Health Care XLV -0.1% 14%
Cons. Staples XLP 0.0% 10%
Energy XLE 0.1% 6%
Utilities XLU 0.2% 2%
Cons. Disc. XLY 0.3% 20%
Materials XLB 0.5% 11%
Telecom IYZ 0.5% 19%

8:31AM Fairchild Semi Appoints Vijay Ullal President and Chief Operating Officer (FCS) 15.00 : Co announces that Vijay Ullal has been appointed President and COO. He has 30 years of experience in the semiconductor industry including engineering and operations leadership positions at Intel (INTC), Saratoga Semiconductor and most recently, Maxim Integrated Products (MXIM). Ullal spent the last five years as Group President, Consumer Solutions Division driving strong sales growth in their mobile, consumer and automotive businesses.

Veeco Instruments (VECO) announced that Nantong Tongfang Semiconductor has received shipment of Veeco's TurboDisc K465i MOCVD System for research of GaN-on-Si high brightness light emitting diodes. The system was delivered to Tongfang's new LED Technology Center in Nantong, China.

8:02AM Ramtron unanimously concludes Cypress' (CY) revised unsolicited tender offer is inadequate; Board unanimously recommends stockholders not tender their shares (RMTR) 2.82 : Co announced that its Board of Directors has carefully reviewed the revised unsolicited tender offer from Cypress Semiconductor (CY) to acquire all outstanding stock of Ramtron at a price of $2.88 per share in cash, in consultation with its financial and legal advisors, and unanimously concluded that the revised offer is inadequate, does not reflect the intrinsic value of the Company, and is not in the best interest of Ramtron and its stockholders. Therefore, the Board unanimously recommends that Ramtron stockholders reject the revised offer and not tender their shares into the revised offer.

7:58AM Western Digital announces that Steve Milligan will become CEO of the co on Jan 2, 2013, succeeding John Coyne, who is retiring on that same date (WDC) 41.86 : Milligan is currently president of Western Digital and will retain the title of president when he becomes CEO. Following Coyne's retirement, Milligan will be appointed to the Western Digital board of directors.

7:01AM Mellanox Tech announces retirement of Michael Gray and names Jacob Shulman as CFO in planned transition; Transition to be effective on November 5, 2012 (MLNX) 110.85 : Co announced that Michael Gray, the Company's CFO, will retire from his current position effective November 5, 2012. Gray has served as the Company's CFO since December 2004. Today, the Company also announced that its Board of Directors has appointed Jacob Shulman, Mellanox's vice president of finance, as the Company's new CFO, effective November 5, 2012. The transition process in the finance department from Gray to Shulman's leadership will commence immediately, and Gray's day-to-day employment with the Company will continue until February 4, 2013. Gray has no plans to join another company in a similar CFO capacity and intends to spend more time with his family in Oregon.

09:19 am Seagate Tech downgraded to Hold at Argus: . Argus downgrades STX to Hold from Buy saying the STX shares are approaching their 12-month target price of $34, but their deeper concern is the deterioration in the PC market. Firm notes PC sales worldwide were flat in 2Q12 year-over-year and down 2% sequentially, and the 3Q12 guidance reduction from Intel signals further declines ahead.

10:38 am Tech Sector trading lower today, and behind the broader market

The tech sector is trading lower today, trailing slight gains in the broader market. Semiconductors are showing relative weakness as well with the SOX trading 0.6% lower. Within the chip index, STM (-2.9%) is a notable laggard. Among other major indices, the SPY is trading 0.04% higher today, while the QQQ and the NASDAQ are trading 0.3% lower on the session. Among tech bellwethers, INTC (-2.6%) is showing notable weakness. In news, MLNX (-10.3%) announced the retirement of its CFO.

In notable analyst upgrades this morning in the tech space, S (+4.2%) was upgraded to Buy at Nomura and AMD (+2.6%) was upgraded to Neutral at Goldman. Among downgrades, ERIC (-0.3%) was downgraded to Neutral at UBS, DOX (-1.0%) was downgraded to Hold at Jefferies and Argus downgraded STX (-0.8%) to Hold. PANW (+1.2%) is the only notable name in tech scheduled to report quarterly results today after the close.
icon url

ReturntoSender

09/11/12 11:22 PM

#9904 RE: ReturntoSender #6755

From Briefing.com: 4:20 pm : Equities were broadly higher throughout the day before late afternoon selling sent the Nasdaq into negative territory. The dip also pushed the other indices lower, but they were able to hold most of their gains. The Dow finished higher by 0.5% while the Nasdaq ended flat.

The energy sector was the top performer as the SPDR Energy Select Sector ETF (XLE 73.91, +0.78) finished higher by 1.1%. Within the group, Halliburton (HAL 35.35, +1.08) added 3.2%, while Anadarko Petroleum (APC 71.62, +1.22) and National Oilwell Varco (NOV 83.13, +2.11) gained between 1.7% and 2.6%.

Solar stocks were broadly higher with the Guggenheim Solar ETF (TAN 17.52, +0.46) ending firmer by 2.7%. First Solar (FSLR 21.80, +1.01) rose 4.9% after signing a power purchase agreement with PG&E (PCG 43.32, -0.13) for 72 megawatts of solar electricity generated at two photovoltaic plants in central California. First Solar also announced that its Agua Caliente project achieved a peak generating capacity of 250 megawatts. Meanwhile, ReneSola (SOL 1.51, +0.09) jumped 6.3% after announcing the release of its Micro RePlus inverter module.

The financial sector outperformed the broader market. Within the space, Bank of America (BAC 9.03, +0.45) led the advancers with a 5.2% gain. Earlier today, Morgan Stanley (MS 17.25, +0.64) announced it will purchase the remainder of the Morgan Stanley Smith Barney stake held by Citigroup (C 32.66, +0.83). Morgan Stanley and Citigroup finished higher by 3.9% and 2.6% respectively.

European banks continued their recent rally as Deutsche Bank (DB 42.62, +2.44) added 6.1% after announcing plans to cut costs by EUR4.5 billion in order to improve its capital position. The stock is up 55.9% since its 52-week low was hit on July 25th. Other European financials were also stronger as Barclays (BCS 13.72, +0.62) and Banco Santander (7.84, +0.24) posted gains of 4.7% and 3.2%, respectively.

Apparel and luxury retailers were under pressure after Burberry cut its profit expectations for the second half of the fiscal year. The lower guidance clouded the outlook for companies with a similar line of business. Ralph Lauren (RL 156.22, -4.09) and Coach (COH 61.48, -1.12) slid 2.6% and 1.8%, respectively. Meanwhile, Fossil (FOSL 84.95, -0.92) and Tiffany (TIF 62.26, -0.78) both shed near 1.2%.

Chipmaker AMD (AMD 3.75, +0.28) surged 8.1% after announcing a strategic licensing agreement with provider of 3D technology, RealD (RLD 9.82, -0.15). In addition, AMD announced an investment in CiiNOW, a provider of cloud gaming technology.

Facebook (FB 19.43, +0.62) advanced 2.6% as Chief Executive Officer Mark Zuckerberg is scheduled to speak at the TechCrunch Disrupt Conference at 17:00 ET. This will be Mr. Zuckerberg's first public interview since the company's initial public offering in May.

Another company which began trading recently, Groupon (GRPN 4.61, +0.34) finished higher by 8.0% after a reported increase in site traffic during the month of August. Shares of the online deals site have rebounded slightly after marking an all-time low at $4.00 last week.

The trade deficit widened to $42.0 billion during July after a downwardly revised prior month deficit of $41.9 billion. Economists polled by Briefing.com had expected that the deficit for July would come in at $44.0 billion.

Tomorrow's economic data shows the weekly MBA Mortgage Index will be released at 7:00 ET. Also, export prices ex-agriculture and import prices ex-oil will be reported at 8:30 ET while wholesale inventory data will hit the wires at 10:00 ET.DJ30 +69.07 NASDAQ +0.51 SP500 +4.48 NASDAQ Adv/Vol/Dec 1452/1.54 bln/994 NYSE Adv/Vol/Dec 2027/667.1 mln/973

3:35 pm : Crude oil chopped around in positive territory for its entire floor session. It popped to a session high of $97.39 per barrel and brushed a session low of $96.61 per barrel. It then traded in a fairly consolidative pattern and settled 0.5% higher at $97.04 per barrel.

Natural gas took off as pit trade opened and trended higher as the session progressed. It touched the $3.00 per MMBtu level in afternoon action and settled with a notable 6.4% gain at $2.99 per MMBtu.

Precious metals rallied in early morning pit action as the dollar index fell following Moody's warnings of a one notch downgrade of the U.S. However, both gold and silver were unable to hold on to the momentum and pulled-back in late morning and afternoon action.

Gold eased to a session low of $1732.80 per ounce shortly after touching a session high of $1740.50 per ounce and settled with a 0.2% gain at $1735.10 per ounce. Silver brushed a session high of $33.88 per ounce but gave up the gains and closed 0.1% lower at $33.58 per ounce.DJ30 +69.75 NASDAQ -1.85 SP500 +4.13 NASDAQ Adv/Vol/Dec 1333/1327.6 mln/1104 NYSE Adv/Vol/Dec 1913/429 mln/1061

4:34PM Trina Solar announces plan to streamline its organizational structure to optimize business operations (TSL) 4.23 +0.13 : "In order to overcome the challenges of an increasingly competitive landscape in today's solar PV industry and achieve sustainable development, we are taking company-wide initiatives to streamline our organization. These initiatives include separating our PV module and systems business units and adopting an operating expense reduction program, which will involve some headcount reductions," said Mr. Jifan Gao, Chairman and CEO of Trina Solar, "These measures will enhance the Company's agility in responding to the needs of different customers and commercial opportunities. The Company also hopes that these initiatives will allow us to improve our competitiveness and elevate our standing as an industry leader in measures beyond cost leadership." "In bringing down our operating expenses, we will become a more competitive organization," said Mr. Terry Wang, CFO of Trina Solar. "This streamlining is planned to enhance management efficiency. Going forward, our continued success in the solar PV industry will largely depend upon our ability to strategically allocate our resources in the most efficient manner."

4:31PM Texas Instruments narrows revs outlook in-line with consensus, raises bottom end of EPS guidance (TXN) 28.58 -0.09 : Texas Instruments narrows revs outlook to $3.27-3.41 bln vs $3.3 bln consensus, raises bottom end of EPS guidance to $0.45-0.49, excluding $0.07 in charges (noted in the co's most recent earnings release) vs $0.45 consensus, up from $0.41-0.49, ex $0.07 in charges.

4:05PM Diodes maintains third quarter 2012 guidance (DIOD) 18.64 +0.08 : Co stated that it is maintaining its guidance for the third quarter of 2012, which includes the expectation that revenue will range between $162 and $170 mln vs $166.57 mln consensus. Gross margin is expected to be 28 percent, plus or minus 2 percent. Operating expenses are expected to be 21.4 percent of revenue, plus or minus 1 percent. The income tax rate for the third quarter is expected to range between 7 and 13 percent, and shares used to calculate GAAP EPS are anticipated to be approximately 47.2 million.

Intel (INTC) also announced the availability of the Intel Perceptual Computing SDK 2013 Beta, which includes the voice SDK components from Nuance, giving developers the ability to leverage the power of Dragon to create applications and experiences that drive natural, intuitive voice interactions.

LSI Corp. (LSI) announced that its HA-DAS solutions have been selected by Intel (INTC) to enhance its storage portfolio
AMD (AMD) announced an investment in CiiNOW, a provider of cloud gaming technology.

8:03AM MEMC Elec's SunEdison announces expansion of project finance revolving credit facility (WFR) 3.11 : Co announced today that it completed a $40 million expansion of its project finance revolving credit facility, bringing the total capacity of the facility to $150 mln.

Microsemi (MSCC) has teamed with Emcraft Systems to deliver a miniaturized system-on-module for embedded applications.

Integrated Device Technology (IDTI) announced a DDR4 register and temperature sensor that meet the industry's performance requirements.

AMD (AMD) announced it has entered into a strategic licensing agreement with RealD (RLD), which will pair AMD FirePro professional graphics with RealD's patented BlueLine technology to address the rapid adoption of 3D-capable displays and digital light processing projectors in corporate boardrooms, educational institutions and the media and entertainment industry.
icon url

ReturntoSender

09/13/12 9:22 PM

#9906 RE: ReturntoSender #6755

From Briefing.com: 4:20 pm : Today's session was highlighted by a risk rally sparked by the Federal Reserve's decision to increase policy accommodations by purchasing additional agency mortgage-backed securities at a pace of $40 billion per month. The program is open-ended by design, which allows the Federal Reserve to terminate it once the employment picture shows substantial improvement. The S&P 500 was the best performing index and it settled higher by 1.6%.

In addition, the Federal Reserve has released its latest economic projections. Among items of note, the 2012 GDP growth expectation has been lowered, while the outlook for 2013 and 2014 was raised. This year's GDP is now expected to increase by a rate between 1.7% to 2.0%, which is lower than the previous forecast of growth between 1.9% and 2.4%. Looking ahead, the 2013 GDP growth is now expected to be between 2.5% and 3.0% while the previous forecast suggested growth expectations between 2.2% and 2.8%. The Federal Reserve extended its forward guidance, suggesting rates will likely remain at exceptionally low levels through at least mid-2015. Lastly, ‘Operation Twist' will conclude at the end of 2012.

Financial stocks made broad advances following the news. Bank of America (BAC 9.40, +0.43) led all majors with an advance of 4.8%. Meanwhile, Citigroup (C 34.45, +1.40), JPMorgan Chase (JPM 41.40, +1.48), Wells Fargo (WFC 35.55, +1.22), and American Express (AXP 59.05, +1.78) all posted gains between 3.0% and 4.2%. The SPDR Financial Select Sector ETF (XLF 16.15, +0.41) advanced 2.6%.

The materials sector outperformed with a 2.5% gain. The group was paced by steelmakers as AK Steel (AKS 6.44, +0.36), Cliffs Natural Resources (CLF 43.18, +2.56), and Steel Dynamics (STLD 12.40, +0.60), all added between 5.0% and 6.3%. Paper and packaging stocks were lifted as well. Louisiana-Pacific (LPX 14.60, +0.37) and Neenah Paper (NP 30.11, +0.63) both gained near 2.5%. Among chemical producers, OM Group (OMG 20.15, +1.06) and LyondellBasell (LYB 51.92, +2.31) jumped 5.6% and 4.7%, respectively.

Coal stocks within the energy sector made notable advances. Alpha Natural Resources (ANR 8.23, +0.89) surged 12.1% while Arch Coal (ACI 7.39, +0.68) spiked 10.1%. Large energy names Halliburton (HAL 36.44, +0.71) and ConocoPhillips (COP 57.65, +1.11) both closed higher by 2.0%.

The 30-yr yield briefly crossed the 3.00% threshold and closed at 2.967%, its highest yield in four months. Maturities across the rest of the complex reversed their post-FOMC selling to finish the day with fractional gains. The 10-yr yield settled at 1.756% after running to almost 1.840% in reaction to the Federal Reserve launching another round of quantitative easing.

Overall producer prices rose by 1.7% in August, which is hotter than the 1.2% increase that had been widely forecasted. Core producer prices were up 0.2% which is in-line with the 0.2% Briefing.com consensus.

Separately, the latest weekly initial jobless claims count totaled 382,000, which is higher than the 369,000 that had been expected. The tally is above the revised prior week count of 367,000. As for continuing claims, they fell to about 3.283 million from 3.322 million.

The U.S. Treasury has released its August budget which showed a deficit of $191 billion. This was slightly better than the broadly expected deficit of $192 billion.

Tomorrow's economic calendar contains a full slate of releases. Retail sales, retail sales ex-auto, CPI, and core CPI will all be announced at 8:30 ET. Industrial production and capacity utilization will hit the wires at 9:15 ET, while the Michigan Sentiment and business inventories will be released at 9:55 ET and 10:00 ET, respectively.DJ30 +206.51 NASDAQ +41.52 SP500 +23.43 NASDAQ Adv/Vol/Dec 1783/1.83 bln/676 NYSE Adv/Vol/Dec 2406/802.4 mln/647

3:35 pm : Most commodities simply rallied following the Fed's announcement this afternoon, mainly the metals including gold, silver, copper, platinum and palladium.

In the energy space, crude oil popped and displayed some real volatility in the early minutes of the Fed's announcement by selling off to $96.50, immediately after rallying to $98.46 due to the Fed news. Ultimately, that sell-off was recovered as traders bid up oil futures and pushed it higher into the close, ending the day 1.3% higher at $98.30/barrel.

Natural gas spent today's session in negative territory and really didn't move following the Fed's announcement. Nat gas was in the red in early morning action and extended losses as it dropped to $2.96 on bearish inventory data at 10:30am ET. Nat gas began to surge higher, just before 1pm ET, which erased over half of the day's losses. By the end of the day, nat gas ended 2 cents lower at $3.04/MMBtu.

Precious metals are the big winners on the Fed's announcement. Gold rallied as much as approx. $50/oz, while silver surged as much as $2/oz (or 6%) all due to the Fed's announcement. By the end of the floor trading session, Dec gold ended 2.2% higher at $1772/oz and Dec silver finished 4.1% higher at $34.67/oz.DJ30 +209.51 NASDAQ +43.11 SP500 +23.54 NASDAQ Adv/Vol/Dec 1787/1543.6 mln/672 NYSE Adv/Vol/Dec 2368/564 mln/669

4:20PM Analogic beats by $0.50, beats on revs; guides for high single-digit organic revenue growth in FY13 (ALOG) 69.19 +0.44 : Reports Q4 (Jul) earnings of $1.32 per share, excluding non-recurring items, $0.50 better than the Capital IQ Consensus Estimate of $0.82; revenues rose 11.6% year/year to $151 mln vs the $140.6 mln consensus. "Continuing to improve on our fiscal 2012 baseline, for fiscal 2013 we expect another year of high single-digit organic revenue growth (consensus calls for 7% total rev growth -- not organic -- over FY12 rev just reported) on continued improving non-GAAP operating margin."

4:01PM Methode Electronics names new Chairman of the Board and declares quarterly dividend (MEI) 10.20 +0.19 : Co announced that Mr. Batts decided not to stand for the position of chairman of the board but will remain a director. The Company's board of directors has named Mr. Aspatore as the new chairman of the board effective immediately. Methode's board of directors has declared a quarterly dividend of $0.07 per share to be paid on October 26, 2012, to common stockholders of record at the close of business on October 12, 2012.

11:22AM NXP Semi narrows Q3 guidance at Analyst Day (NXPI) 25.44 +0.43 : As mentioned at 11:16, NXPI issued in-line guidance for Q3 (Sep), co narrowed EPS to $0.53-0.59, excluding non-recurring items, from $0.50-0.62 vs. $0.54 Capital IQ Consensus Estimate; narrowed Q3 (Sep) rev growth to +6-8% QoQ to ~$1.16-1.18 bln (from +4-10%) vs. $1.17 bln Capital IQ Consensus Estimate.

NVIDIA (NVDA) introduced two new high-performance GPUs, the NVIDIA GeForce GTX 660 and GeForce GTX 650.

2:03AM ASML issues shares in connection with Customer Co-Investment Program (ASML) 55.62 : Co announces that it has issued the shares for two of the three participating customers in its Customer Co-Investment Program, issuing a total of 75,573,452 shares to two Dutch Foundations established for this purpose. ASML issued 62,977,877 shares to the Foundation established for Intel (INTC), whose Foundation issued a corresponding number of depositary receipts to Intel. ASML issued 12,595,575 shares to the Foundation established for Samsung (SSNLF) whose Foundation issued a corresponding number of depositary receipts to Samsung. The shares are subject to a shareholders agreement, which, among other things, provides that these shares may not be voted other than in exceptional circumstances. The share issues resulted in aggregate proceeds of EUR 3,016 million. The shares for TSMC (TSM), the other participant in the Co-Investment Program, are expected to be issued at the end of October 2012.

1:10AM Verizon to offer iPhone 5 on its 4G LTE Network on Sep 21; pre-order sales begin on Sep 14 (VZ) 44.89 : Verizon Wireless announces it will offer Apple's (AAPL) iPhone 5 on its 4G LTE network beginning Fri., Sep 21 at 8am EDT. Customers will be able to pre-order iPhone 5 online beginning Fri, Sep 14 at 3am EDT online. iPhone 5 will be available starting at $199.99 for the 16 GB model, $299.99 for the 32 GB model and $399.99 for the 64 GB model with a new two-year customer agreement.

Sterne Agee lowers their Intel (INTC $23.01 -0.18) target to $22 from $24. The firm believes while July-August PC builds were weaker with a pause ahead of Win8 and weak BRIC demand, high Win8 platform ASPs + consumer training for new Win8 interface are driving more DecQ caution. The firm's checks with Taiwan ODMs indicate DecQ NB builds should improve 7-10% q/q, modest given a flat SepQ, but they believe an already high INTC in-house inventory and high PC retail chain inventory might be a drag on DecQ builds.

Openheimer notes September marks Qualcomm's (QCOM $62.64 +0.20) fiscal year-end, which means new annual guidance. Firm believes mgmt's first take on FY13 could set the mid-point of guidance slightly below current consensus, while calling out only small improvements to QCT margins. However, firm expects mgmt's tone to be mostly positive highlighting new areas of growth (tablets, small cell, etc.) suggesting room for upside. It's positive on Qualcomm's fundamental position and believe it is well positioned for share gains driven by AAPL and China growth and as it capitalizes on pent-up 4G LTE demand and smartphone expansion.
icon url

ReturntoSender

09/15/12 12:16 PM

#9907 RE: ReturntoSender #6755

From Briefing.com: Weekly Recap - Week ending 14-Sep-12

Dow +53.51 at 13598.55, Nasdaq +28.12 at 3183.95, S&P +5.78 at 1465.77

Today's session started on a positive note as stocks appeared poised for a second day of broad post-FOMC gains. However, the major averages marked their respective session highs during the first hour of trade and headed lower since. The Nasdaq was able to outperform as it held the bulk of its gains throughout the day. Afternoon selling pressure increased slightly after Egan Jones lowered the credit rating of the U.S. from ‘AA' to ‘AA-.‘ Looking at the major indices, the Nasdaq led the way with a 0.9% gain while the Dow and S&P 500 added 0.4% each.

Financial stocks continued to rally after yesterday's news. The SPDR Financial Select Sector ETF (XLF 16.28, +0.13) closed higher by 0.8% as most major names advanced. The ETF has seen a 4.0% rally since the Fed's announcement. Bank of America (BAC 9.55, +0.15), Morgan Stanley (MS 18.24, +0.34), and Wells Fargo (WFC 36.13, +0.58) all posted gains near 1.5%. European financials were also in focus as monetary easing in the U.S. carries global implications. Barclays (BCS 14.81, +0.46), Deutsche Bank (DB 44.28, +1.41), and UBS (UBS 13.48, +0.46) all gained near 3.5%.

Stocks within the defensive telecom space were lower as the sector underperformed the broader market. Verizon (VZ 44.53, -1.05) and AT&T (T 37.26, -0.89) both slid near 2.3%. The two telecom giants saw relative weakness after Stifel Nicolaus downgraded both stocks from ‘buy' to ‘hold.' With the majority of the sector sliding, Sprint (S 5.26, +0.06) and MetroPCS (PCS 10.63, +0.15) were able to buck the trend and post respective gains of 1.2% and 1.4%.

AK Steel (AKS 5.87, -0.57) slumped 8.9% after lowering its third quarter guidance on expectations of a 7% quarterly decrease in the price of steel. Following the announcement, AK Steel was downgraded by Credit Agricole. Other steelmakers continued to rally along with producers of basic materials. Steel Dynamics (STLD 13.01, +0.61) added 4.9%, while Cliffs Natural Resources (CLF 45.55, +2.37) advanced 5.5%.

Office supply retailer OfficeMax (OMX 8.15, +1.04) surged 14.6%. Earlier, the company confirmed it would extinguish a non-recourse liability which is related to Lehman-backed timber notes. Because of this, OMX will recognize a non-cash, pre-tax gain of $671.1 million in the third quarter. Today's buying lifted the stock to a 21.2% gain on the week. Meanwhile, peer Staples (SPLS 12.21, +0.25) advanced 2.1% following recent rumors of a possible private equity buyout.

Western Digital (WDC 41.06, -1.51) fell 3.6% after lowering its revenue guidance for the first quarter. Shares of the hard drive producer have been in a downtrend since the stock reached a 2-year high at $45.48 on August 17.

Social media stocks were on the rise. Facebook (FB 22.00, +1.28) jumped 6.2% following reports which suggested the company is set to introduce a real-time ad program. FB's peer Zynga (ZNGA 3.18, +0.22) surged 7.4% after the company hired an online-gambling executive, Maytal Olsha as its new Chief Operating Officer. Elsewhere, Groupon (GRPN 5.27, +0.51) soared 10.7% as the stock of the online deals site continues rebounding after reaching an all-time low of $4.00 on September 4.

A slew of economic data points hit the wires today.

Consumer prices increased by 0.6% during August, which was in-line with the 0.6% gain that had been generally expected. Core prices increased by 0.1%, which was slightly short of the 0.2% increase expected by economists polled by Briefing.com.

Separately, retail sales rose during August by 0.9%, which was better than the 0.7% increase that had been broadly expected. The prior month's reading was revised down to show an increase of 0.6%. Excluding autos, retail sales rose by 0.8%, which was in-line with the Briefing.com consensus call.

Industrial production decreased during August by 1.2%, which was worse than the 0.2% decrease that had been widely expected. The reading followed the revised 0.5% increase experienced in the prior month. Capacity utilization hit 78.2%, which was worse than the 79.2% that had been expected and down from the revised prior month reading of 79.2%.

The preliminary University of Michigan Survey for September came in at 79.2, which was ahead of the prior month's 74.3, and better than the reading of 73.5 that had been widely expected.

Lastly, monthly business inventory data for July showed an inventory build of 0.8% for the month which was slightly above the 0.4% that had been expected.

On Monday, the Empire Manufacturing Index will be released at 8:30 ET.

Week in Review: Focus Turns to Federal Reserve as QE3 is Launched

Monday's session was mostly uneventful, as the range-bound trading day concluded with a late-afternoon push to session lows. The major averages saw a notable divergence as the Dow slipped 0.4% while the S&P 500 and Nasdaq slid 0.6% and 1.0%, respectively. Airlines were stronger as United Continental (UAL 20.06, -0.03) advanced 1.8%.

On Tuesday, equities were broadly higher throughout the day before late afternoon selling sent the Nasdaq into negative territory. The dip also pushed the other indices lower, but they were able to hold most of their gains. The Dow finished higher by 0.5% while the Nasdaq ended flat. Groupon (GRPN 5.27, +0.51) finished higher by 8.0% after a reported increase in site traffic during the month of August.

On Wednesday, stocks started the day higher but were only able to hold a portion of their gains in a session which saw two pullbacks to the unchanged line. After spending most of the day in the black, the S&P 500 ended higher by 0.2%. The Dow Jones Transportation Average, which has been on a steady rise over the past week, added 0.8%.

Thursday's session was highlighted by a risk rally sparked by the Federal Reserve's decision to increase policy accommodations by purchasing additional agency mortgage-backed securities at a pace of $40 billion per month. The program is open-ended by design, which allows the Federal Reserve to terminate it once the employment picture shows substantial improvement. The S&P 500 was the best performing index and it settled higher by 1.6%. Financials rallied on the news and Bank of America (BAC 9.55, +0.15) led all majors with an advance of 4.8%.
 
Index Started Week Ended Week Change %Change YTD %
DJIA 13306.64 13593.37 286.73 2.2 11.3
Nasdaq 3136.42 3183.95 47.53 1.5 22.2
S&P 500 1437.92 1465.77 27.85 1.9 16.6
Russell 2000 842.27 864.70 22.43 2.7 16.7

8:01AM Chipmos Technology August revenue declines 0.4% MoM (IMOS) 15.02 : Co reported its unaudited consolidated revenue for the month of August 2012. Revenue for the month of August 2012 was NT$1,740.6 mln or US$58.3 mln, a decrease of 0.4% from the month of July 2012 and an increase of 18.1% from the same period in 2011.

Tessera Tech (TSRA $14.90 +0.00) reported that Q3 2012 total revenue is expected to range between $66.5-69.0 mln, an increase of approximately 8% to 12% from the prior quarter. Revenue from the Intellectual Property segment is expected to range between $53.0 million and $54.0 million, and includes the payment of approximately $20 million related to the interim award the International Court of Arbitration of the International Chamber of Commerce (ICC) issued on July 6, 2012, in favor of Tessera in its dispute with Amkor Technology (AMKR). This payment will be reflected in two income statement categories, approximately $16.0 million to $17.0 million in royalty and license fees and approximately $3.0 million to $4.0 million in other income. Non-GAAP operating expenses for the third quarter 2012, excluding litigation expenses, are expected to range between $57.0 million and $59.0 million, which compares to $43.3 million in the prior quarter and includes expenses related to both the operations of the DigitalOptics Corporation's Zhuhai based camera module facility and to the new lens manufacturing facility in Taiwan, which will require an initial investment of approximately $30 million.

Western Digital (WDC $43.39 +0.81) announced at its Investor Day a capital allocation plan that includes the adoption by its Board of Directors of a cash dividend policy and an increased authorization of $1.5 billion under its share repurchase program. At its webcast Investor Day, the company indicated that beginning in its current fiscal year 2013, it is targeting a return to shareholders of approximately 50% of its free cash flow through a mix of cash dividends and share repurchases. Under the dividend policy, the company intends to pay a quarterly cash dividend on its common stock beginning with the quarter ending Sept. 28, 2012. Directors declared today a dividend of $0.25 per common share, payable on Oct. 15, 2012, to the company's shareholders of record as of Sept. 28, 2012. The additional repurchase authorization is effective immediately. The company also announced that it now expects the industry's total available market (TAM) for hard drives in the September quarter to be approximately 140 million units versus its earlier forecast of 157 million units, due to muted demand and inventory rebalancing. As a result, the company now expects revenue for its first quarter ending Sept. 28, 2012, will be approximately $3.9 billion to $4.0 billion, compared with its previous expectation of $4.2 billion to $4.3 billion (Capital IQ Consensus Estimate is $4.28 bln). The company continues to estimate its gross margin for the September quarter to be approximately 30 percent on a non-GAAP basis. The company reiterated its non-GAAP $10 earnings per share target for the fiscal year ending June 28, 2013 (Capital IQ Consensus Estimate is $9.39).

09:22 am Analogic upgraded to Buy at Needham; tgt $85: . Needham upgrades ALOG to Buy from Hold and sets target price at $85 following earnings. The firm notes, Security revenue at $28.3M was about double the firm's estimate and at its highest level since management began to break it out in 2006. While they don't expect a repeat of this excellent performance next quarter they think this business segment may finally be ready to realize its potential. This quarter was helped by the initial shipments of the high-throughput scanners and they see additional launches of the TSA replacement program and Smith's new scanner in F2H13 that could build the momentum.

09:23 am AT&T and Verizon: . Stifel says while they continue to believe both Verizon (VZ) and AT&T will dominate the U.S. telecom sector, with market share gains in wireless growing ever wider, they also believe that given current valuation levels, the two mega-caps could be used as a near-term source of funds for investors as EPS numbers get adjusted because of a strong iPhone 5 launch and as the QE3/risk-on trade becomes more prevalent. As such, they are lowering their ratings on both names to Hold from Buy.
09:59 am S&P Information Technology trading higher today; outpacing broader market

The tech sector is trading higher today, ahead of gains in the broader market. Semiconductors are showing relative strength as well with the SOX trading 1.6% higher. Within the chip index, CRUS (+6.1%) is a notable standout. Among other major indices, the SPY is trading 0.6% higher today, while the QQQ is up 0.9% and the NASDAQ is trading 0.8% higher on the session. Among tech bellwethers, FB (+3.0%) is showing strength, while VZ (-1.3%) is under pressure.

In tech earnings last night, TSRA (+0.4%) guided Q3 revenues above consensus, although it does include a $20 mln payment related to an arbitration award. In news, AAPL's (+1.6%) iPhone 5 pre-sales sold out in an hour late last night. There were no notable analyst upgrades this morning in the tech space. Among downgrades, however, SYNA (-1.8%) was downgraded to Neutral at Lazard, LVLT (-1.6%) was downgraded to Underperform at Raymond James, and T (-0.9%) & VZ (-1.3%) were downgraded to Hold at Stifel.

09:17 am Tessera Tech shares little changed following upside guidance

Tessera Tech (TSRA $14.90 +0.00) reported that the third quarter 2012 total revenue is expected to range between $66.5-69.0 million, an increase of approximately 8% to 12% from the prior quarter. Revenue from the Intellectual Property segment is expected to range between $53.0 million and $54.0 million, and includes the payment of approximately $20 million related to the interim award the International Court of Arbitration of the International Chamber of Commerce issued on July 6, 2012, in favor of Tessera in its dispute with Amkor Technology (AMKR). This payment will be reflected in two income statement categories, approximately $16.0 million to $17.0 million in royalty and license fees and approximately $3.0 million to $4.0 million in other income. Non-GAAP operating expenses for the third quarter 2012, excluding litigation expenses, are expected to range between $57.0 million and $59.0 million, which compares to $43.3 million in the prior quarter and includes expenses related to both the operations of the DigitalOptics Corporation's Zhuhai based camera module facility and to the new lens manufacturing facility in Taiwan, which will require an initial investment of approximately $30 million.

09:13 am Western Digital shares spike 2% following new dividend and increase in share repurchases

Western Digital (WDC $43.40 +0.82) announced at its Investor Day a capital allocation plan that includes the adoption by its Board of Directors of a cash dividend policy and an increased authorization of $1.5 billion under its share repurchase program. At its webcast Investor Day, the company indicated that beginning in its current fiscal year 2013, it is targeting a return to shareholders of approximately 50% of its free cash flow through a mix of cash dividends and share repurchases. Under the dividend policy, the company intends to pay a quarterly cash dividend on its common stock beginning with the quarter ending Sept. 28, 2012.

Directors declared today a dividend of $0.25 per common share, payable on Oct. 15, 2012, to the company's shareholders of record as of Sept. 28, 2012. The additional repurchase authorization is effective immediately. The company also announced that it now expects the industry's total available market (TAM) for hard drives in the September quarter to be approximately 140 million units versus its earlier forecast of 157 million units, due to muted demand and inventory rebalancing. As a result, the company now expects revenue for its first quarter ending Sept. 28, 2012, will be approximately $3.9 billion to $4.0 billion, compared with its previous expectation of $4.2 billion to $4.3 billion (Capital IQ Consensus Estimate is $4.28 bln). The company continues to estimate its gross margin for the September quarter to be approximately 30 percent on a non-GAAP basis. The company reiterated its non-GAAP $10 earnings per share target for the fiscal year ending June 28, 2013 (Capital IQ Consensus Estimate is $9.39).
icon url

ReturntoSender

09/16/12 11:48 AM

#9908 RE: ReturntoSender #6755

InvestmentHouse Weekend Market Summary:

http://www.investmenthouse.com/weekendmarketsummary.htm

- Stocks ride the QE3 momentum higher in the face of daunting economic data, but close well off the early highs.
- On confusing stock market rallies with economic turns.
- Mortgage yield/Treasury yield spreads compress to a record low, just as Ben wants. But will the money get to where he wants it?
- Marc Faber: Fed will destroy the world.
- Retail sales headline jumps, take out autos and gas, it slumps.
- CPI surging, pushing the biggest gain since July 2009 on food and gas. But we don't eat and drive, right?
- Industrial production flops and Capacity posts a major backtrack in August.
- The outrider: Michigan Sentiment surges as stock market rises and inflation expectations fall.
- Manpower reports rather shocking numbers.
- Gasoline at an all-time high for this time of year.
- It would appear our image in foreign eyes is no better.
- Stocks pull back late in the session ahead of the weekend. Will a test similar to the prior Thursday rally ensue? Need a bit of backfilling for some better buys.

Stocks Spring in the Arab Fall.

Remember the old commercial about the kid who leaves Santa the cheese for a snack and receives a copious amount of Christmas booty? 'Ah the power of cheese' the commercial says. Despite outbreaks of violence at 20 US facilities around the world in what is dubbed the Arab Fall (also called the US Foreign Policy Slumber), stocks continued their rally on Friday. Ah, the power of . . . liquidity?

The stock indices finished well off of their highs but still logged impressive gains on top of the Thursday blowout (the second straight Thursday surge) as some sectors that sat out the Thursday surge played catch up (e.g. semiconductors).

SP500 5.78, 0.40%
NASDAQ 28.12, 0.89%
DJ30 53.51, 0.40%
SP600 0.94%
SOX 1.19%

This week saw SP500, NASDAQ, DJ30, SP600, and SP400 (mid-caps) all break to new post bear market highs, the latter two moving to new all-time highs. DJ20 transports have put in an impressive 7 session run, but for all the work, they are still well off their post-bear market highs hit in July 2011. Transports are up, but they are not confirming the Dow 30's new high. Semiconductors? Well, they look ready for a continued move up, but they were stuck in the gate. They finally broke higher and Friday traded to a new recovery high . . . only to fade and close below the early August peak. Strong overall, but still a few bugs in the system.

The Immediate Impacts of QE3.

Of course the big news continued to be the FOMC and its open-ended QE3 that started (and I repeat, started) with $40B/month in purchases of MBS added to its ongoing Operation Twist. Friday you could see the immediate impact of the action as the spread between mortgage rates and US Treasuries hit all-time lows. It won't take much more of this before the US 30 year mortgage is, in the market's pricing mechanism, AS SAFE AS Treasuries!

Confusing a liquidity rally with economic growth?

Economic growth did not occur with the prior two QE binges, and it won't occur with this one. As I have reported before, and it is reporting versus opining, it won't create economic growth. History shows excess liquidity from loose monetary policy does not create growth, it just facilitates it when the right policies are put in place. Sure Bernanke used some lofty rhetoric Thursday about helping the middle class and creating jobs, but economic history shows liquidity itself does not do this and Bernanke knows it. Here it is again: liquidity keeps the economy afloat, from grinding to a halt. It is the super grease applied in the hope the economy can keep stumbling along until the President abandons his socialist agenda or is replaced and Congress can actually hold a vote on a budget, the fiscal cliff, or anything other than a vote to adjourn.

Of course there are those who think more with their emotions than with whatever head they have, and on Friday their emotions and mouths were running faster than their brains. There is one certain balding fellow who has an MO of talking himself into a frenzy and then spouting off. You can see the adrenaline kick in and his speech shift gears as he feels the rush. Well, he bowed down to Bernanke Friday and said Ben was working for those without jobs. That was just the warm up.

BAC, CAT, JOY, FCX were all declared buys. Never mind BAC was up 18% in a week and was going to gap higher, just below the March peak. Cramer declared China has turned and India is coming back. He reiterated his buy on KO in the crescendo to the bluster. Why? Apparently because stock prices are turning along with or ahead of foreign markets. Also apparent: he is the type of emotional response person the Fed expects its 'wealth effect' polices to work on.

Once again there is confusion between a liquidity driven rally and an economic driven rally. Typically stocks do presage economic recoveries. In this instance they do not. Stocks have rallied, in some cases indices to new all-time highs, off the March 2009 lows. New all-time highs suggest things are great economically. The facts show, however, they are not.

Two quarters of barely 4% growth in the entire recovery that started in 2009. 1.5% average economic growth the past year. Unemployment in reality over 11% and the jobs that have been created are massively skewed to the lowest end of the pay scale. We are still 4.6M jobs in the hole from when the recovery supposedly started. US workers are making their lowest incomes in 17 years with the median income dropping 4% in four years. 8.7M people added to the disability roles in 2012 alone. US citizens in poverty have jumped to 15% of the population. 1 in 7 citizens are on food stamps. US competitiveness has fallen from number 1 to number 7 in 4 years.

Where is the money? The Fed liquidity and the close to $1T in stimulus went to large corporations, financial institutions, and overseas (remember part of the stimulus was to give Brazil money to drill in US owned waters?). Banks get to borrow money for nothing and then choose whether to lend or sock it away in guaranteed returns. They have chosen to do the latter and many STILL are losing money. Administration initiatives and policies were geared to help the large multinational exporting companies and friends, not the small businesses who rely on the US economy and US wages for their prosperity, the businesses that create the majority of US jobs and create our wealth.

The blather was absurd and wholly unsupported by the facts. Yes liquidity is powerful. Open-ended buying of MBS (and soon Treasuries, corporate debt, small business debt, etc.) has profound effects on stocks . . . and the dollar, and gold, and retirement accounts, those living on fixed incomes (we are tossing the retirees to the wolves), etc. But IT DOES NOT MEAN the economy is strong or that China or India are back because some industrial stocks are responding to the liquidity rush.

The question is, will the money get to where Ben wants it?

It also does not mean that the money gets to the middle class as Bernanke opined or the unemployed as Cramer spluttered. Since 2009 the Fed has been very generous with its money. The Administration claims it has created millions of jobs and that the economy is headed in the right direction. Yet look again at the statistics cited above. Has the money moved to those needing it? The empirical evidence of the status of the average US citizen shows it has not.

Contrary to the Administration's stump speeches and daily press briefings touting how it is focused on the middle class and the need for a vibrant, healthy middle class, its policies have left them in shambles. Yes it was bad to begin with but in four years things have turned dramatically worse. There is a reason the above stats show 4 years as the benchmark. That roughly coincides when this 'recovery' supposedly started and when the President took over. In that period the plight of the middle class has worsened while the VERY groups vilified have indeed prospered under these policies. Handouts do not lift they impoverished; they ensure they do not rise because they are trained to take handouts versus take the risks necessary to prosper, i.e. get more education, start a business, etc.

Marc Faber: The Fed's policies will destroy the world.

Faber emphatically stated Friday that "the fallacy of monetary policy in the US is to believe this money will go to the man on the street. It won't. It goes to the Mayfair economy of the well-to-do people and boosts asset prices of Warhols."

A Mayfair economy is one that benefits the already well to do. That is EXACTLY what we have seen since 1999 even with the 'reforms' of Dodd/Frank, the banking regulation law that has managed to concentrate more assets in the five largest banks than before and will, as many economists are predicting, drive small banks out of business.

Things are not getting better for workers, for the middle class.

In the meantime, Manpower reports that 72% of the companies surveyed are NOT planning on any hiring anytime soon. Why? Because of the ongoing uncertainty with healthcare costs (we still don't know the costs even though we have passed it to see what is in it as Pelosi advised), the economy, the election, and most often cited, the fiscal cliff that will raise taxes in 7 areas at last count, including the AMT, healthcare, marginal income tax rates.

On top of that, for the first time in history gasoline prices at this time are above $4/gallon. Yes those energy and foreign relations policies certainly are working in our favor right now.

Gas tops $4/gallon on average in the US in September for the first time ever.

The terrible thing is, as the dollar further implodes thanks to the open-ended QE3, oil prices will only rise and thus gasoline prices, because oil is denominated in dollars. Every barrel we import rises in price as the dollar declines. It is a vicious cycle where the same people who have lost out the last four years continue to lose out.

With the CPI for August surging 0.6% overall (and that INCLUDES food and energy because those are the most relevant costs right now Mr. Bernanke), the largest surge since June of 2009, it does not look as if inflation is under control. That made the Michigan Sentiment Survey surge in September laughable. Why? Because the survey showed inflation expectations FALLING. How wrong can that be, and thus what a misguided report to use for any barometer of economic health. Remember this, consumers may feel good, but if their incomes are falling as they have been and credit as tight as it is despite the Fed's liquidity measures, they cannot keep spending even if they want to.

The Arab Fall as viewed abroad.

It always seems to be the case when we focus on our internal problems and design policies to address them we do so in a vacuum, pretending nothing else will impact what we do internally. Of course that is never the case as it almost always occurs that just when the Fed or Administration takes an action for a planned result, something occurs elsewhere to throw a monkey in the wrench as John McClain in 'Die Hard' would say.

The Arab Fall and attacks against US embassies and interests abroad is now something we have to respond to and spend money on. This when we don't have any money. Our enemies know we are in a precarious economic position; you only have to read a paper or scan the internet to know that. As our economic policies the past four years have damaged not helped the middle class, our foreign policy is revealed as failing as well, at least in the eyes of other nations.

German news outlets concur Obama's 'be nice to them, they will be nice to us' has failed.

Liberal leaning news outlets:

"Four years ago, Obama pledged to seek reconciliation with the Muslim world. Now, it is doubtful whether he has succeeded. The US and its European allies now have to ask themselves how much support they still enjoy in the countries of the Arab Spring."

Conservative leaning news outlets:

"US President Barack Obama's Middle East policy is in ruins. Like no president before him, he tried to win over the Arab world. After some initial hesitation, he came out clearly on the side of the democratic revolutions. In this context, he must accept the fact that he has snubbed old close allies such as Israel, Saudi Arabia and the Egyptian military. And now parts of the freed societies are turning against the country which helped bring them into being. Anti-Americanism in the Arab world has even increased to levels greater than in the Bush era. It's a bitter outcome for Obama."

OTHER MARKETS

Dollar. 1.3316 versus 1.2981 euro. It has officially broken above the 1.3 euro level, but we call it breaking below because it is a weakening of the dollar versus a strengthening. No doubt that the QE announced on Thursday had a lot to do with the Thursday and Friday declines that pushed it through an important support level and down to the next important support level, but the trend was already in place at least a month before that. It topped out in late July, putting in something of a head and shoulders, and it has rolled over and broken down.

The big break came just over a week ago on the Friday after the ECB announced that it had agreed to its deal. That plunged it through an important support level that was marked in part bit March 2012 peak. It has already taken out this range of resistance and is at the next level. It is, however, now a series of declines. There will be rebounds to test the levels that have been broken, but the dollar is in a significant downtrend, and there is nothing right now to prop it up. The Fed has embarked upon an announced, open-ended QE. It is not only open-ended as to time; it is open-ended as to amounts and as to what assets the Fed will interact with in order to achieve its policy goals which are purportedly to assist the middle class. Everyone talks a good game about the middle class, but talk and even the policies promulgated thus far have done nothing but drive the middle class further into its own depression hell.

Bonds. 1.87% versus 1.74% 10 year US Treasury. Bonds were gapping, screaming to the downside with a 13 BP decline. These are incredible moves. It gapped below the mid-August double bottom lows at the 200 day EMA. There was a gap up at that point back in May. It has totally given that up, and it has broken that support. As Bill Gross stated on Friday, "Buy a house, buy gold, buy assets." He has been selling bonds on this rally, and now he has basically sold out of bonds, maybe shorting them.

Bonds are heading lower and, as noted, Bernanke is getting what he wants in the mortgage-backed security buying as the spread between mortgages and US Treasuries is the lowest it has ever been. Indeed, it is not much further before mortgage-backed securities -- mortgages themselves --could be as "safe" as US Treasuries in terms of their yields. That is almost incomprehensible. That means Joe down the street is as good of a risk as the US government. That is a startling prospect, but that is exactly what the market is telling us based on the movement on Friday.

Gold. 1772.80, +0.70. Gold continued its uptrend, but it was nothing compared to Thursday and the Thursday prior when the ECB announced its agreement. Gold is leaping higher, testing, leaping higher, and testing. It is closing in on the prior highs at about 1920 from September 2011. It has interim highs ahead of that around 1792 to 1800, and those will be the next resistances. Gold backed off from a high at 1780 on Friday, so it is feeling a bit of the repulsion at this level. It has had a tremendous run over the past month and a half anyway. A little triangle at the bottom of the pattern and then an explosive move upside. It has had a long run. It could move up a little bit more, but it is starting to feel the resistance, and it will most likely post at least one of these flag tests. After this kind of run, you might expect something more along the lines of this lateral pennant pattern that formed before the break higher.

Is there anything to make gold go down? Not really. The Fed has open-ended buying. The tension around the world with US interests in embassies and now the embassies of other countries is exacerbating the fear and the push into gold. The question is whether it will continue such massive runs. Likely not, but we could see steady gains as inflation rallies. The CPI jumped up 0.6%. Even though that was in line with expectations, it was the biggest gain since June 2009. Craziness is out there, but the Fed says all of this is transitory, of course, and does not mean anything. Does anyone really believe that right now?

Oil. 99.00, +0.69. Oil closed well off of its high. It is being driven a lot by fear with respect to what is going on in the Middle East, but it is also driven by the dollar's decline. Every barrel of oil it marked in dollars, and thus every decline in the dollar increases the price per barrel of oil that we import. It will not get better anytime soon because the dollar continues to fall and inflation continues to rise. Thus oil will most likely rise.

It broke out this week above the 200 day EMA after three weeks of toiling laterally below that resistance. It was a strong break on Thursday, of course, as the dollar plunged, and a continued moved on Friday. Although, as noted, it did close well off of its high. It is in a resistance range from November through January of 2011 and early 2012. That is a point it will likely have to work through and get up to the lows of the high range from February and March. That puts it right at the late-April/early-May high near 106. It is right at the century mark. It has a little room to run higher, but the point is that it is steadily working its way higher as the dollar falls and tensions rise in the rest of the world, particularly in the oil-producing regions.

TECHNICAL SUMMARY

Internals.

Volume. NASDAQ +1.96B; NYSE +8.5%, 792M. Another upside day with some expanding volume. That is always a good sign. The indices did close off of their highs, so it was not a clean, pure move to the upside. There was some selling pushing the indices back to the downside, and that shows the VIX action. There could be a little top on this move after two huge surges over the past week. It is a big move with a breakout. Markets like to test breakouts, particularly when there is nothing to drive the market since we know what the Fed will do.

That does not mean it will not continue to rise. It simply means that the Fed has acted, the news is out, and the big surge is in. Now it is a matter of consolidating and rallying just as you would expect in a normal uptrend. The point is that we could get a bit of a pullback similar to what I showed earlier when discussing the VIX, and that provides buying opportunities.

Breadth. NASDAQ +1.8:1; NYSE +2.2:1. Breadth was not fantastic on Friday. Decent, solid, and unspectacular.

New Highs. NYSE: +133, 536; NASDAQ: 253. There was a new level of highs on the NYSE not seen in about a year. That increased even further on Friday. The NASDAQ is nowhere near that level. The big move on the NYSE was due to the small cap index and the mid-cap index punching into new all-time high territory. There are many more stocks on the SP400 and SP600 than the SP500, of course. There are many more small stocks than there are large cap stocks. It is just the nature of the game. In any ecosystem, there are fewer of the biggest predators. That is why we see the new highs perform so well. It is good news to see the small and mid caps performing. It belies the economics we are seeing.

THE CHARTS

SP500. SP500 has moved to a new post-bear market high. It closed nicely higher, but it gave back almost twice as many points as it made on the session. That just means that it may be a little tired after two huge rallies in one week. It may want to pullback just as it has done on these previous pullbacks when VIX got down to the level where it is now.

NASDAQ. NASDAQ held more of its gain. Of course it has been a little bit behind the other indices. It is due for some catch up. It broke above its March peak on Thursday, and it extended the move on Friday on more volume. It may want to come back and test a bit as well. It looks solid, but every big move usually gets tested. With the Fed out, big moves may not be as plentiful, but there will still be steady inputs of money into the market because a lot of funds will want to play catch up through the end of the year.

SP600. There was a new high here. It closed somewhat off of the high, but it was almost a 1% gain. Very strong and solid. It is continuing the move. This has been quite a blast higher over the past three weeks, and if the rest of the market wants to take a pause, it could do so as well. But I do not see anything stopping the momentum.

SOX. SOX is a bit different. It broke through the August peak early, but it could not hold the move. Even though it gained the most at 1.2%, that has not broken it out of its pattern. Still a double bottom with handle. It tried the breakout and was rebuffed on Friday. It still looks pretty good, but it is notably lagging as is the DJ20. Obviously all is not well, and the analysis is interesting.

Summary. Small caps and mid-caps are performing well, and that would suggest that the economy will perform well down the road. Of course the NASDAQ, SP500, and the Dow are performing well. Large caps get the money in these kinds of situations. Not all of it, but they are automatic buys for a lot of fund managers. They look at certain names and put money into them when the Fed or some other force says "buy stocks." That is just what they are doing. The interesting feature is that the DJ20 is nowhere near its high, and the SOX is nowhere near its highs either. They are lagging. Those are two very economically sensitive sectors. Semiconductors are commodities, and they go into everything. Some are in more demand because of the mobile revolution with the iPhone, Samsung, and the tablets. They are in great demand, but they are lagging overall, as are transports. Very important. But look at FDX. It has warned that things are not totally rosy. I have talked to a lot of trucking, transport, and shipping companies. They are doing nothing ahead of the fiscal cliff because they want to see the outcome.

It is very telling that the two important economically sensitive areas are lagging substantially, even as some of the economically sensitive areas are moving higher. Why would the small caps and mid-caps be performing if the economy will not do that great? Remember what I said last week: The market turned in 2009 when the Fed finally put together all of the pieces of its puzzle in terms of aid. The last pieces involved buying mortgage-backed securities and the debts and paper of small companies. That provided the impetus that turned the market. I believe the runs we are seeing in the small caps and the mid-caps are based upon a belief that the Fed will accomplish similar types of stimulus specifically related to them as part of its steps to drive employment higher.

LEADERSHIP

It is not so much what stocks were moving up; everything is getting a bid. It is how they reacted on Friday after the Thursday surge and an additional move on Friday to end the week.

A lot of stocks such as AAPL that have jumped and gapped higher but then posted a doji on the day. AAPL is one, AMZN is one, and GS is another. SCSS is surged higher. It has been a great two weeks. They reached near the prior peak and faded off the high. We booked some gain. BAC is a similar story. They are not reversing or falling over, but they may be a little tired now. If you factor in the VIX and its action on Friday and what happened the last time the VIX got to this level, we could be due for a pullback. As noted, that would not be a bad thing.

There is some amount of weakness in the drug sector which has been one of the stronger defensive areas. It is a little bit weak now. Utilities are a bit weak, as well. They are defensive. They have been down, and they were down on Friday. They bounced on Thursday when everything moved, but Friday told more of the tale after the euphoric rush was over. Utilities are a bit defensive and a bit weak. I am not saying that drugs are breaking down or utilities are breaking down; they are just lagging. That has been the case of late when the appetite for growth areas in the market resumed. We saw that in June and July. Drugs had led the way higher, but when the rally in June occurred when most of the market moved higher, the drugs based out and tended to consolidate more.

There are defensive areas under some fire, but that simply shows you that the buying is broad and looking for growth areas versus playing defense because of the economy. The economy had a lot of those drugs and health care stocks looking good because the economy did not look good. With the promise of stimulus and now stimulus here with more liquidity, the prospects for the rest of the market look good or even better, so that is why those stocks have jump back up as funds rush to get money to work and some play catch up before the end of the year.

THE ECONOMY

Retail sales headline jumps, take out autos and gas, it slumps.

Retail Sales, August (8:30): 0.9% actual versus 0.7% expected, 0.6% prior (revised from 0.8%)
Retail Sales ex-auto, August (8:30): 0.8% actual versus 0.8% expected, 0.8% prior

Take out Gas and Autos and you get a 0.1% gain versus 0.4 expected and 0.8 prior (revised from 0.9).
As you can see, gasoline was a large part of the increase: consumers may be buying less but the price is higher and sales are measured in overall money spent, not units.

This is the fifth expectations miss in six months.

CPI surging, pushing the biggest gain since July 2009 on food and gas. But we don't eat and drive, right?

CPI, August (8:30): 0.6% actual versus 0.6% expected, 0.0% prior
Core CPI, August (8:30): 0.1% actual versus 0.2% expected, 0.1% prior

Biggest rise since June 2009

Motor fuel up 9%, food 0.2%, rent and housing 0.3% each. Fortunately no one needs gas or food so we can strip that out and get a tame 0.1% reading. All is well. Print away.

Industrial production flops and Capacity posts a major backtrack in August.
Industrial Production, August (9:15): -1.2% actual versus -0.2% expected, 0.5% prior (revised from 0.6%)

Largest 1 month decline since 3/2009, ironically when the first QE kicked in.

Capacity Utilization, August (9:15): 78.2% actual versus 79.2% expected, 79.2% prior (revised from 79.3%)

Lowest level of the year and a big drop at that.

THE MARKET

SENTIMENT INDICATORS

VIX. The market rose on Friday. It rose on Thursday, of course, but on Friday it posted some fairly decent gains. But look what happened to volatility: It rose as the market rose. Typically, they move inversely. In other words, as fear rises, volatility will rise, and the market falls. Looking at the chart, volatility rose 3.27% on Friday as the market rallied. Look where volatility rallied from. This is the old low that I have been talking about from April of 2011, March of 2012, and this August. It bounced off of those levels each time it has hit them. It is interesting that volatility moved higher on Friday even as the stock market moved higher, because that is an abnormal type of move. The fact that it is bouncing off of this support level is noteworthy. I am suggesting that the stock market is ready to fall based on this, if this relationship remains true.

Looking at what the SP500 did last time the volatility index hit this level and bounced, it was just a modest fade. That fade formed, broke through, and it looked like it was in trouble. But then it reversed two Thursdays ago with the ECB agreement. Volatility rose off of the support level, but SP500 faded just modestly. So, yes, while the market may be in for a bit of a pause based upon this (caveat: if that relationship holds true), it may not be much of a pause. That would give us more of a buying opportunity that we would like to see after that Thursday surge followed by furthered Friday gains. We had some great positions moving into that surge, and we are happy about that. But you always want to take advantage of more gains when they show up. If you get a pullback with something like the VIX bouncing and the SP500 fading a bit, you want to be ready for that and use it to your advantage.

Bulls versus Bears

Bulls: 51.1% versus 51.0% versus. Edging higher as investors waited on the Fed. This will no doubt soar next week as the FOMC decision and the marekt surge are factored in. Then you have to worrk about the 60% to 65% bullish levels that flash a warning sign. A big move up over the past month from 43.6% and that after five at 39%. Undercut 35%, the threshold for bullishness, in early June. You would expect it to rise and it has. Still not at a dangerous level, just working as it should. As noted, hit 34% in early June. It did its job and the market is on the rally. Hard drop to 34 from 39.3% as economic reality and a choppy stock market hit. Off the 55+ level hit in late February. That was the highest level since April and May of 2011, the peak of the post-bear market high. 35% is the threshold level suggesting bullishness. To be seriously bearish it needs to get up to the 60% to 65% level.

Bears: 25.5% versus 24.5%. Spent two weeks at 24.5%, down from 27.7% six weeks ago. Bulls were not buying it, but they will be next week. Never made it to the 35% that can be a bullish indication, but the bulls were weak enough back in June. Over 35% is the threshold to be really be a good upside indicator. For reference, bearishness hit a 5 year high at 54.4% the last week of October 2008. The move over 50 took bearish sentiment to its highest level since 1995. Extreme negative sentiment. Prior levels for comparison: Bearishness peaked at 37.4% in September 2007. It topped the June 2006 peak (36%) on that run. That June peak eclipsed the March 2006 high (33%) and well above the 2005 highs that spawned new rallies (30% in May 2005, 29.2% in October 2005). That was a huge turn, unlike any seen in recent history.

NASDAQ

Stats: +28.12 points (+0.89%) to close at 3183.95
Volume: 1.959B (+6.03%)

Up Volume: 1.58B (+170M)
Down Volume: 424.11M (-20.46M)

A/D and Hi/Lo: Advancers led 1.82 to 1
Previous Session: Advancers led 2.54 to 1

New Highs: 253 (+34)
New Lows: 23 (+4)

SP500/NYSE

Stats: +5.78 points (+0.4%) to close at 1465.77
NYSE Volume: 792M (+8.49%)

A/D and Hi/Lo: Advancers led 2.2 to 1
Previous Session: Advancers led 3.77 to 1

New Highs: 536 (+133)
New Lows: 11 (-2)

DJ30

Stats: +53.51 points (+0.4%) to close at 13593.37
Volume: 185M shares Friday versus 119M shares Thursday.

MONDAY

Next week we have more economic data, of course. September is always considered the worst month for the market. It tends to drop more in September than any other time, but we had a rousing start thanks to external forces upon the market. Frankly, trends and patterns in the market during different times of the year always have to take second chair to external forces that matter such as the policies from Congress and the administration and the monetary policy and asset purchase movements of the Federal Reserve.

Nonetheless, we still want to check out the data because it tells the rest of the story, as Paul Harvey used to say. It tells what likely happens when the Fed stimulus, even though it is there, is no longer effective at effectuating the plans for the Fed and, vicariously, Congress. Why? Congress would not have gone on break if it did not know that the Fed would act. There was the Schumer admonition to Bernanke, "Get to work Mr. Chairman," and he fell right into their hands. Since Bernanke figured they would not act, he acted. If he did nothing, then they may have had to act. That is how it works. These elected officials are there to get elected again and again and again instead of going home after a couple of terms. They will not address something if they feel it is unpopular and would inhibit their chances of reelection. I am telling you what you already know, but it is worth pointing out every once in awhile.

The data starts on Monday with Empire Manufacturing. It is expected to be negative but to improve. Why? Michigan Sentiment improved, so everyone thinks things must be getting better. But, as I talked about earlier, it was bogus. They feel like inflation expectations are down when inflation is running higher. In any event, it will be important to see since it is a regional manufacturing report.

We have a bit of housing outlook on Tuesday. It is nothing major, or at no one will really pay attention to it. Who cares about their current account or the TIC index and how many countries are actually buying our securities? On Wednesday we have the housing starts and building permits for August. That will be huge. Existing home sales will be huge as well. On Thursday we have the jobless claims as always. We will also have Philly Fed, and that is quite significant. With Empire Manufacturing, that will give us a pretty good idea of how the manufacturing sector is faring after its slowdown over the past several months.

We have some economic data, but we already have the Fed out. It is not quite time for earnings yet, so the market will be working in the way a market typically ebbs and flows. As noted earlier, with the VIX where it is and trying to bounce and the fact that we have had two huge surges in a week, we may get a little pullback. Maybe not as long like the two and a half week pullback we had most recently, but maybe a three, four, or five day turn (maybe not even that long) before a renewed move back to the upside.

Stocks could always come out of the gate running next week. They may try to make that move to the upside with funds feeling their oats, so to speak, and wanting to get out and play catch up toward the end of the year. A lot of funds were very negative about the market. As I often say, you can have your feelings based on what the economy and the action of stocks tell you, but you ultimately cannot let your feelings get in the way of what the market is doing. Your feelings can get you ready and have you on edge as you should always be. Do not ever assume anything in the market; as soon as you do, you will get killed. They get you ready, but you have to check them at the door when the market starts showing you things or individual stocks are saying "buy me" or "sell me." That is all there is to it. We are not smarter than the market. We can be in position, but we have to do what the market does. You are not ever smarter. You cannot tell the market what to do, but you can anticipate its moves and know how it has been moving. Then when it makes that move, you make the play because you are ready. That is why we look at all of this.

What we need now is a bit of a pullback, no doubt. We could use a test as the VIX may be indicating. The pullback lets us get some positions on stocks that jumped ahead or gapped away on Thursday or Friday. There are still good stocks out there, but they are extended, and we want to let them come back and get better entry points.

The question that always arises is, can we still look at the stocks that have run a long way? Sure you can. If they set up in this kind of environment with the Fed in the back of the market pushing, stocks that have run high can always run higher. You just want to get a good buy. You do not want to jump in because Cramer or someone on Friday was saying you need to buy BAC or CAT. BAC moved huge. CAT is up for two weeks, and it gapped to the upside on Friday. Not a good time to buy. Do not get carried away like they are. The problem with listening to these guys is that they get emotional and they tell you to buy at the wrong times. Check your emotions at the door, know what a good buy is, and know the stocks you want to buy. When they set up, you can buy them. In this environment with the Fed putting a bid in the market, you will be able to buy on pretty much every dip. The Fed is there, and the money fund managers will be coming in to push stocks higher toward end of the year.

Find stocks that you like. That is what we do every day. We make plays on the ones in good position. We always have the ones that we would love to play, but a lot of them are not in position right now. They will be after a pullback, however, and we can put more money on the table with respect to those in new plays. Or if they got away from us before, we can initiate totally new buys on them. I will see you on Monday. Try not to get down from all the news around the world.

Have a great weekend!

Support and resistance

NASDAQ: Closed at 3183.95
Resistance:
3227 is the April 2000 intraday low
3401 is the May 2000 closing low

Support:
3134 is the March 2012 post-bear market peak: broken, not forgotten.
3101 is the August 2012 high
The 20 day EMA at 3091
3090 is the mid-March interim high
3076 is the late April 2012 high
3042 from 5/2000 low
The 50 day EMA at 3029
3026 from 10/2000 low
3024 is the gap point from early May
3000 is the February 2012 post-bear market high
2999 is the bottom of the August 2012 consolidation
2988 is the July 2012 high
2962 is the April 2012 low
2950 is the mid-April closing low
2942 is the mid-June 2012 high
2910 is the March 2012 low
The 200 day SMA at 2905
2900 is the March 2012 low
2888 is the May 2011 peak and PRIOR post-bear market high
2879 is the July 2011 peak
2866 is the July 2012 closing low
2862 is the 2007 peak
2841 is the February 2011 peak
2816 is the early April 2011 peak.
2810 is the low in the shoulders
2754 is the October 2011 high
2706 to 2705 is the April 2011 low and the February 2011 and consolidation low (bottom of the trading range) 2723 to 2705 is the range of support at the bottom of the January to May trading range

S&P 500: Closed at 1465.77

Resistance:
1499 from January 2008
1539 from June 2007

Support:
1440 from November 2007 closing lows
1433 from August 2007 closing lows
1425 from May 2008 closing highs
1427 is the August 2012 peak
The 20 day EMA at 1424
1422.38 is the prior post-bear market high (March 2012)
1406 is the early May 2012 peak
1402.22 is the closing low of the August 2012 lateral consolidation
The 50 day EMA at 1399
1378 is the February 2012 peak
1375 is the early July 2012 peak
1371 is the May 2011 peak, the post-bear market high
1363.46 is June 2012 high
1359 is the April 2012 low
1357 is the July 2011 peak
The 200 day SMA at 1349
1344 is the February 2011 peak
1340 is the early April 2011 peak
1332 is the early March 2011 peak
1325 is the July 2012 intraday low
1309 is the right shoulder low from June 2012
1295 to 1294 is the April 2011 low and the February 2011 consolidation low (bottom of the trading range)
1293 is the October 2011 peak
1275 is the January 2010 low, early January 2011 peak
1267 is the December 2011 peak
1266 is the June 2012 base low

Dow: Closed at 13,593.37
Resistance:
13,668 from 12-2007 peak
13,692 from 6-2007 peak
14,022 from 7-07 peak

Support:
13,331 is the August 2012 post-bear market high
13,297 is the April 2012, prior post bear market high
The 50 day EMA at 13,087
13,058 from the May 2008 peak on that bounce in the selling
13,056 is the February 2012 high
12,971 is the early July 2012 high
The 200 day SMA at 12,785
12,754 is the July intraday peak
12,716 is the April 2012 closing low
12,391 is the February 2011 peak
12,369 is the left shoulder low from May 2012
12,284 is the October 2011 peak
12,258 is the December 2011 peak
12,110 from the March 2007 closing low
12,094 is the April 2011 low
12,035 is the June 2012 base low
The June 2011 low at 11,897 (closing)
11,734 from 11-98 peak
11,717 is the late August 2011 peak

Economic Calendar

September 10 - Monday
- Consumer Credit, July (15:00): -$3.3B actual versus $10.0B expected, $9.8B prior (revised from $6.5B)

September 11 - Tuesday
- Trade Balance, July (8:30): -$42.0B actual versus -$44.0B expected, -$41.9B prior (revised from -$42.9B)

September 12 - Wednesday
- MBA Mortgage Index, 09/08 (7:00): 11.1% actual versus -2.5% prior
- Export Prices ex-agriculture, August (8:30): 0.4% actual versus -0.3% prior
- Import Prices ex-oil, August (8:30): -0.2% actual versus -0.4% prior
- Wholesale Inventories, July (10:00): 0.7% actual versus 0.3% expected, -0.2% prior
- Crude Inventories, 09/08 (10:30): 1.994M actual versus -7.426M prior

September 13 - Thursday
- Initial Claims, 09/08 (8:30): 382K actual versus 369K expected, 367K prior (revised from 365K)
- Continuing Claims, 09/01 (8:30): 3283K actual versus 3300K expected, 3332K prior (revised from 3322K)
- PPI, August (8:30): 1.7% actual versus 1.2% expected, 0.3% prior
- Core PPI, August (8:30): 0.2% actual versus 0.2% expected, 0.4% prior
- FOMC Rate Decision, September (24:30): 0.25% actual versus 0.25% expected, 0.25% prior
- Treasury Budget, August (14:00): -$190.5B actual versus -$192.0B expected, -$134.1B prior

September 14 - Friday
- Retail Sales, August (8:30): 0.9% actual versus 0.7% expected, 0.6% prior (revised from 0.8%)
- Retail Sales ex-auto, August (8:30): 0.8% actual versus 0.8% expected, 0.8% prior
- CPI, August (8:30): 0.6% actual versus 0.6% expected, 0.0% prior
- Core CPI, August (8:30): 0.1% actual versus 0.2% expected, 0.1% prior
- Industrial Production, August (9:15): -1.2% actual versus -0.2% expected, 0.5% prior (revised from 0.6%)
- Capacity Utilization, August (9:15): 78.2% actual versus 79.2% expected, 79.2% prior (revised from 79.3%)
- Michigan Sentiment, Preliminary September (9:55): 79.2 actual versus 73.5 expected, 74.3 prior
- Business Inventories, July (10:00): 0.8% actual versus 0.4% expected, 0.1% prior

September 17 - Monday
- Empire Manufacturing, September (8:30): -3.0 expected, -5.9 prior

September 18 - Tuesday
- Current Account Balance, Q2 (8:30): -$125.6B expected, -$137.3B prior
- Net Long-Term TIC Fl, July (9:00): $9.3B prior
- NAHB Housing Market , September (10:00): 38 expected, 37 prior

September 19 - Wednesday
- MBA Mortgage Index, 09/15 (7:00): 11.1% prior
- Housing Starts, August (8:30): 772K expected, 746K prior
- Building Permits, August (8:30): 800K expected, 812K prior
- Existing Home Sales, August (10:00): 4.58M expected, 4.47M prior
- Crude Inventories, 09/15 (10:30): 1.994M prior

September 20 - Thursday
- Initial Claims, 09/15 (8:30): 375K expected, 382K prior
- Continuing Claims, 09/8 (8:30): 3292K expected, 3283K prior
- Philadelphia Fed, September (10:00): -5.0 expected, -7.1 prior
- Leading Indicators, August (10:00): 0.0% expected, 0.4% prior
icon url

ReturntoSender

09/17/12 6:07 PM

#9909 RE: ReturntoSender #6755

From Briefing.com: 4:10 pm : Stocks began today's session on a negative note after the September Empire Manufacturing Survey registered its worst reading since April 2009. The bearish sentiment was then extended as unfounded rumors of tapping into the strategic petroleum reserve sent the major averages to fresh session lows. As a result, the S&P 500 ended lower by 0.3%.

Healthcare stocks outperformed the broader market on strength in biotech companies. The iShares Nasdaq Biotechnology ETF (IBB 143.15, +1.39) advanced 1.0% as Gilead Sciences (GILD 65.80, +3.78) added 6.1% after positive comments were made by analysts before the open. Meanwhile, Spectrum Pharmaceuticals (SPPI 12.91, +0.90) and Onyx Pharmaceuticals (ONXX 81.26, +4.59) gained between 6.0% and 7.5%.

In M&A news, medical equipment supplier, IRIS (IRIS 19.54, +6.12) surged 45.6% after announcing that the company will be acquired by Danaher (DHR 54.84, +0.08) for $19.50 per share. The purchase price represents a 45.3% premium to IRIS' Friday closing price of $13.42. Following the acquisition, Feltl & Co downgraded shares of IRIS from ‘buy' to ‘hold.' Elsewhere, Complete Genomics (GNOM 3.02, +0.35) jumped 13.1% after the company entered into a definitive merger agreement with China-based BGI-Shenzhen. Per the agreement, a wholly-owned U.S. subsidiary of BGI-Shenzhen will launch a tender offer to purchase all outstanding shares of GNOM for $3.15 per share, representing an 18.0% premium to GNOM's Friday closing price of $2.67.

The Dow Jones Transportation Average slipped 1.5% as it underperformed the broader market. Within the bellwether group, only UPS (UPS 74.23, +0.55) and CSX Corp (CSX 23.26, +0.10) managed to stay marginally positive. Airline stocks were generally lower after Southwest Airlines (LUV 9.05, -0.02) and Delta (DAL 9.23, -0.04) raised roughly 10% of their round trip fares by $10. The two carriers both shed near 0.3%. Trucking and railroad stocks also showed considerable weakness as Con-way (CNW 29.22, -1.33) and Kansas City Southern (KSU 81.24, -2.39) ended lower by 4.4% and 2.9%, respectively.

Shares of major financials showed weakness after last week's broad rally. The SPDR Financial Select Sector ETF (XLF 16.13, -0.15) slipped 0.9% as most major names posted losses in the neighborhood of 1.0%. Bank of America (BAC 9.30, -0.25) and Morgan Stanley (MS 17.80, -0.44) both fell near 2.5%, while JPMorgan Chase (JPM 41.19, -0.38) and Goldman Sachs (GS 119.90, -1.46) lost near 1.0% each.

The materials sector was the weakest performer. The SPDR Materials Select Sector ETF (XLB 37.76, -0.59) slumped 1.5% as steel producers lagged after a series of downgrades. AK Steel (AKS 5.53, -0.34), Cliffs Natural Resources (CLF 42.36, -3.19), Reliance Steel & Aluminum (RS 54.99, -2.67), and United States Steel (X 21.31, -1.04) all posted losses between 4.5% and 7.0% after JP Morgan downgraded shares of the steelmakers from ‘overweight' to ‘neutral.'

Looking at tomorrow's earnings, FedEx (FDX 89.28, -0.87) will report its first quarter results before the bell. The company will be in focus after it recently lowered its earnings guidance to $1.37-1.43 from the original forecast of $1.45-1.60 per share.

The Empire Manufacturing Survey for September registered a reading of -10.4, which was down from the prior month's reading of -5.9. Economists polled by Briefing.com had expected that the Survey would rise to -3.0.

A handful of economic data points will be reported tomorrow. The current account balance will be released at 8:30 ET, while net long-term TIC flows and the NAHB Housing Market Index will be reported at 9:00 ET and 10:00 ET, respectively.DJ30 -40.27 NASDAQ -5.28 SP500 -4.58 NASDAQ Adv/Vol/Dec 945/1.42 bln/1500 NYSE Adv/Vol/Dec 936/665.9/2089

3:30 pm : Crude oil touched a session high of $99.52 per barrel in morning action but pulled back into negative territory by afternoon floor trade. The energy component then slid over 4 points to a session low of $94.65 per barrel.

Without a clear explanation for the dramatic move, the weakness in crude oil has been attributed to a number of factors, including rumors of a strategic oil reserve release (which have since been denied by the White House), along with chatter of a potential "fat-finger" trade, in combination with light volume and a break of technical levels. Crude erased some of the loss but still settled 2.4% lower at $96.52 per barrel.

Natural gas spent its entire pit session in the red. It fell off its session high of $2.93 per MMBtu and brushed a session low of $2.86 per MMBtu. It spent the remainder of floor trade trading in a consolidative pattern and closed 2.4% lower at $2.87 per MMBtu.

Gold touched a floor session high of $1775.80 per ounce in morning action and slid to a session low of $1767.00 per ounce shortly after. However, the move quickly corrected, and the yellow metal spent the remainder of its pit session trading near the unchanged line. It ultimately settled 0.1% lower at $1770.70 per ounce. Silver pulled back off its session high of $34.70 per ounce set in morning action and inched lower. It closed pit trade with a 0.7% loss at $34.39 per ounce.

Soybeans fell their exchange limit in today's floor trade. The weakness in grains was attributed to speculation of better-than-anticipated yields for select crops following improved weather conditions for the U.S. sowing season.DJ30 -62.72 NASDAQ -14.80 SP500 -7.81 NASDAQ Adv/Vol/Dec 821/1116.1 mln/1619 NYSE Adv/Vol/Dec 763/387 mln/2200

5:52PM Microsoft outlines revenue recognition for the Office offer (MSFT) 31.20 +0.00 : Co announced the details of the Office offer providing consumers, students and small businesses who buy qualifying Office 2010 or Office for Mac 2011 the option to upgrade during the time of promotion. Starting October 19, people who purchase Office 2010 or Office for Mac 2011 will qualify to download, for free, one year of Office 365 Home Premium or the equivalent Office 2013 offering, when available. Small business customers in applicable markets will also be eligible for a three-month trial of Office 365 Small Business Premium. In association with the Office offer, Microsoft will defer revenue from eligible sales under the program to the earlier of the fulfillment date or the program's expiration date. For the first quarter of fiscal year 2013, Microsoft will defer an estimated $100 million to $140 million of revenue related to licenses sold into distribution channels that will be subsequently sold to end customers under the terms of the offer. The deferral only impacts the timing of revenue recognition and will not impact cash flows from operations.

4:13PM Advanced Micro announced that Thomas Seifert informed the company of his decision to resign as senior VP and CFO to pursue other opportunities (AMD) 4.02 +0.11 : Co announced that Devinder Kumar, senior vice president and corporate controller, will serve as interim CFO while a search commences for Seifert's replacement. Kumar has served as the Company's corporate controller since 2001. Seifert's departure is not based on any disagreement over the company's accounting principles or practices, or financial statement disclosures.

4:02PM Apple: AAPL crosses the $700.00 mark for the 1st time ever in extended hours trade (AAPL) 699.781 :

9:03AM Flextronics announces Board of Directors authorization for additional share repurchases (FLEX) 6.61 : Co announces that its Board of Directors has authorized a share repurchase plan. Repurchases under the co's share repurchase plans are subject to an aggregate limit under Singapore law of 10% of the Company's outstanding ordinary shares as of the Company's Extraordinary General Meeting held in August 2012. This new authorization permits the repurchase of ordinary shares up to the current maximum under the 10% limitation.

9:03AM VirnetX re-files ITC complaint against Apple (AAPL) (VHC) 29.13 : Co announced that on Sep 14, 2012, its wholly-owned subsidiary, VirnetX, Inc. has re-filed its complaint with the United States International Trade Commission alleging that Apple (AAPL) has engaged in unfair trade practices by the importation, sale for importation, and sale after importation of certain devices with secure communication capabilities that infringe one or more claims of VirnetX's U.S. Patent No. 8,051,181. The accused products include the latest iPhones, iPads, iPods, and Macintosh computers.

8:30AM Apple iPhone 5 pre-orders top 2 mln in first 24 hours (AAPL) 691.28 : Co announced pre-orders of its iPhone 5 topped two million in just 24 hours, more than double the previous record of one million held by iPhone 4S. Demand for iPhone 5 exceeds the initial supply and while the majority of pre-orders will be delivered to customers on September 21, many are scheduled to be delivered in October. iPhone 5 will be available at 356 Apple retail stores in the US beginning at 8 a.m. local time on Friday, September 21. iPhone 5 will roll out worldwide to 22 more countries on September 28.

AAPL is testing new all time highs near $697 (all-time high is @ $696.98 from Friday) in the premarket.

7:01AM Xilinx acquires wireless backhaul solutions provider Modesat Communications; financial terms not disclosed (XLNX) 35.23 : Co announced the acquisition of substantially all of the assets of Modesat Communications, a wireless backhaul solutions provider.

Ascent Solar Technologies (ASTI) announced the retail debut of the co's EnerPlex solar assisted battery case for Apple's (AAPL) iPhone 4 and 4S in the U.S. and all of N. America with one of the co's distributors, CommXPERTS.

Finisar (FNSR) announced a demonstration of the industry's first densely packaged 2x1xN two-slot ROADM linecard with Flexgrid capabilities.

LDK Solar (LDK $1.19 -0.05) reported second quarter GAAP net loss of $2.00 per share vs the ($1.43) Capital IQ consensus; revs approximately 53% YoY to $235.4 million versus $237.5 million Capital IQ estimate. Additionally, company Shipped 316.7 megawatts of wafers, 135.6 MW of cells and modules in the second quarter; Produced a total of ~538.1 metric tons of polysilicon during the second quarter; and Produced a total of approximately 90.8 MW of cells during the second quarter. For Q3, LDK Solar estimates its revenue to be in the range of $220-260 mln vs $460.0 million est, wafer shipments between 190-240 MW, cells and module shipments between 140-180 MW. For FY12, LDK Solar estimates its revenue to be in the range of $1.1-1.5 billion versus the $1.69 billion est, polysilicon shipments between 1,100-1,400 MT, wafer shipments between 0.9 gigawatts and 1.2 GW, cell and module shipments between 550-750 MW and inverter shipments between 170-210 MW. The company expects PV system project construction to be in the range of 200-300 MW and to recognize between 110-150 MW through project sales and EPC services for 3rd party customers.

Apple (AAPL $699.50 +8.50) announced pre-orders of its iPhone 5 topped two million in just 24 hours, more than double the previous record of one million held by iPhone 4S. Demand for iPhone 5 exceeds the initial supply and while the majority of pre-orders will be delivered to customers on September 21, many are scheduled to be delivered in October. iPhone 5 will be available at 356 Apple retail stores in the US beginning at 8 a.m. local time on Friday, September 21. iPhone 5 will roll out worldwide to 22 more countries on September 28.

The Benchmark Company raises their JDA Software (JDAS $31.49 +0.00) target to $36 from $32 ahead of the co's analyst day on September 18. They expect management to fill in more details around its recently announced strategy to reposition JDAS from a vendor of traditional SCP applications to a provider of cloud-based planning and optimization solutions. Former comments from management suggest that it does not plan to create a "pure" single instance, multi-tenant cloud SCP solution. Instead, it's pursuing a hybrid-cloud approach by offering existing applications as an extension of JDAS's managed services through a hosted offering.

10:49 am S&P Information Technology Index trading slightly lower today along with the overall market

The tech sector is trading lower today, along with losses in the broader market. Semiconductors are showing relative weakness with the SOX trading 0.8% lower. Within the chip index, TER (-2.9%) is a laggard. Among other major indices, the SPY is trading 0.2% lower today, while the QQQ is down 0.2% and the NASDAQ is trading 0.3% lower on the session. Among tech bellwethers, AAPL (+1.0%) is showing strength, while CSCO (-1.7%) is showing notable weakness.

There were no tech earnings of note this morning. In news, T (-0.1%) reports record sales for iPhone 5, while AAPL (+1.0%) announced iPhone 5 pre-orders top 2 mln in first 24 hours. There were no notable analyst upgrades this morning in the tech space. Among downgrades, however, PLT (-3.4%) was downgraded to Neutral at Mizuho, SAI (-3.1%) was downgraded to Mkt Perform at Raymond James, OPEN (-4.7%) was downgraded to Neutral at Piper Jaffray and INTC (-0.4%), VLTR (-4.2%) & AMD (0.0%) were downgraded to Neutral at Longbow. There are no notable names in tech scheduled to report quarterly results today after the close.
icon url

ReturntoSender

09/19/12 8:57 PM

#9922 RE: ReturntoSender #6755

Fed's George: QE3 has market, inflation risks

By Greg Robb WASHINGTON (MarketWatch) - More asset purchases by the Federal Reserve could create distortions in financial markets and ignite inflation, said Esther George, the head of the Kansas City Federal Reserve Bank, according to a report Wednesday in the Oklahoman newspaper. "Anytime you have the government involved, you have to think something is not happening right. Right now, at zero interest rate, the markets really aren't pricing risk. They're not really functioning the way they normally would," George said in a speech at the KC Fed's Oklahoma City branch. The Fed last week voted to begin a third round of buying assets - $40 billion a month of mortgage-backed securities - in an effort to boost the economy and drive down the unemployment rate. The Fed said it would hold rates near zero until mid-2015 even after the economy started to recovery. While only one voting member of the Federal Open Market Committee dissented from the new policy, several presidents of the Fed regional banks have since disclosed that they argued against taking the steps. Many, like George, said they are worried the Fed plan could rekindle inflation.

http://www.marketwatch.com/story/feds-george-qe3-has-market-inflation-risks-2012-09-19?link=MW_latest_news
icon url

ReturntoSender

09/19/12 10:58 PM

#9924 RE: ReturntoSender #6755

Investors Intelligence reaches the nearly 30% spread between Bullish Newsletter Writer and those Bearish. The latest reading is 54.2 bullish and 24.5 bearish:

http://www.schaeffersresearch.com/streetools/market_tools/investors_intelligence.aspx


A 30% spread has often led to a short term market top but the spread has been much wider at long term major market tops.

RtS
icon url

ReturntoSender

09/22/12 10:54 AM

#9925 RE: ReturntoSender #6755

From Briefing.com: Weekly Recap - Week ending 21-Sep-12

Dow -17.46 at 13584.65, Nasdaq +4.00 at 3179.96, S&P -0.11 at 1460.15

Equities began the session on a higher note as quadruple witching contributed to a volume surge at the start. However, after reaching session highs within the first few minutes of trade, the major averages spent the rest of the day drifting towards the unchanged line. As a result the S&P 500 finished flat.

Telecom stocks outperformed as the sector traded higher by 0.6%. MetroPCS (PCS 11.62, +0.43) added 3.8% after the company announced it will carry ZTE's Anthem 4G smartphone—the first ZTE 4G device available in the U.S. Other telecom names were also on the rise as Sprint (S 5.65, +0.21) jumped 3.9% while AT&T (T 38.10, +0.16), 0.21) and Verizon (VZ 45.69, +0.20) both gained 0.4%.

Meanwhile, Inteliquent (IQNT 9.38, -1.02) slid 9.8% after the company's President and Chief Operating Officer, Surendra Saboo announced he will resign from the company, effective October 1, 2012. In addition, IQNT's Chief Financial Officer, Robert Junkroski will also step down on October 1, 2012. Following the pair of resignations, Raymond James downgraded shares of Inteliquent from ‘market perform' to ‘underperform.'

The healthcare sector was also one of the top performers. Within the group, Dehaier Medical (DHRM 2.45, +0.91) soared 59.1% after winning a three-year procurement agreement from a major Ukrainian medical equipment manufacturer. Elsewhere, Halozyme Therapeutics (HALO 7.95, +1.54) surged 24.0% after announcing with partner ViroPharma (VPHM 30.31, +2.13) that the Federal Drug Administration has enabled ViroPharma to resume clinical studies of Cinryze in combination with rHuPH20. Shares of VPHM gained 8.3% after the announcement.

On the downside, VIVUS (VVUS 21.00, -2.72) slumped 11.5% after the company announced it expects to receive an opinion recommending against the approval for weight loss drug Qsiva (trade name Qsymia in the U.S.) from the Committee for Medicinal Products for Human Use in Europe.

The Dow Jones Transportation Average shed 1.0% as it continued its recent underperformance. Expeditors International (EXPD 36.78, -0.75), UPS (UPS 71.88, -0.73), and Norfolk Southern (NSC 65.00, -1.11) all slid between 1.0% and 2.0%. Only Overseas Shipholding Group (OSG 7.31, +0.15) managed to stay positive within the group of twenty transportation stocks.

Shares of Indian companies rallied after India's Sensex index advanced 2.2% to close at its highest level in 14 months. The general strength resulted from the announcement of economic reforms in the country. As a result, The India Fund (IFN 22.50, +0.33) rose 1.5%.

U.S. listings of Indian companies made broad advances as financials ICICI Bank (IBN 39.74, +2.09) and HDFC Bank (HDB 36.78, +0.77) added 5.6% and 2.1%, respectively. Elsewhere, copper producer Sterlite Industries (SLT 7.74, +0.40) jumped 5.5% and car maker Tata Motors (TTM 25.35, +0.70) ended firmer by 2.8%.

Shares of tire makers were under pressure after KeyBanc downgraded Goodyear (GT 12.73, -0.65) and Cooper Tire (CTB 19.94, -2.05) from ‘buy' to ‘hold.' The downgrade resulted from uncertainty over expiring Chinese tariffs, as well as declining tire prices. Goodyear slipped 4.9% while Cooper Tire slid 9.3% in the wake of the rating cut.

Week in Review: Equities Quiet Following QE3

On Monday, stocks began the session on a negative note after the September Empire Manufacturing Survey registered its worst reading since April 2009. The bearish sentiment was then extended as unfounded rumors of tapping into the strategic petroleum reserve sent the major averages to fresh session lows. As a result, the S&P 500 ended lower by 0.3%. IRIS (IRIS 19.47, +0.01) surged 45.6% after announcing that the company will be acquired by Danaher (DHR 54.90, -0.12) for $19.50 per share.

Tuesday's session was mostly uneventful as equities remained near their opening levels throughout the day. The major averages showed some divergence as the S&P 500 shed 0.2% while the Dow added 0.1%. Defensive stocks outperformed as the consumer staples sector was the top performer of the day. FedEx (FDX 84.39, -0.78) beat on earnings and revenues while lowering its second quarter and full-year guidance.

On Wednesday, equities began on a slightly higher note after the Bank of Japan raised its asset purchase target in an attempt to inject additional liquidity into the market and to weaken the yen. Stocks were also boosted slightly by data which indicated an uptick in existing home sales as well as building permits. However, late day selling pushed the major averages off session highs as the S&P 500 settled higher by 0.1%. AutoZone (AZO 371.80, +0.17) added 3.4% after delivering a mixed quarterly report.

Thursday's session got off to a slow start after bearish data from around the world overshadowed investor optimism. Japan reported a wider-than-expected trade deficit while the French and Eurozone PMI readings were well short of expectations. Domestically, the weekly initial claims exceeded expectations. After marking session lows thirty minutes into the trading day, the major averages set off on a climb towards positive territory. As a result, the S&P 500 finished flat. Norfolk Southern (NSC 65.00, -1.11) fell 9.1% after the railroad lowered its guidance due to slumping demand and decreasing revenues from fuel surcharges.
 
Index Started Week Ended Week Change %Change YTD %
DJIA 13593.37 13579.47 -13.90 -0.1 11.1
Nasdaq 3183.95 3179.96 -3.99 -0.1 22.1
S&P 500 1465.77 1460.15 -5.62 -0.4 16.1
Russell 2000 864.70 855.53 -9.17 -1.1 15.5

TriQuint Semiconductor (TQNT) has received a $2.7 mln contract from the Defense Advanced Research Projects Agency to triple the power handling performance of gallium nitride circuits.

Allegro MicroSystems & and United Microelectronics (UMC) announced a strategic agreement between the two companies for Allegro to utilize UMC for foundry technology and manufacturing. The companies will start production with Allegro's 4th generation 0.6um BCD commercial product line later this year.

09:08 am Oracle shares 3% following in line EPS

Oracle (ORCL $33.25 +0.99) reported first quarter earnings of $0.53 per share, excluding non-recurring items, in-line with the Capital IQ consensus of $0.53, while non-GAAP revenues fell 2.3% year/year to $8.21 billion versus the $8.42 billion consensus. "On a non-GAAP basis, new software licenses and cloud software subscriptions sales grew 11% in constant currency (guidance +5-15%) and operating margin increased to 44% in Q1. Q1 operating cash flow increased to a record high of $5.7 billion. We're off to a good start in the new year. Exadata, Exalogic, Exalytics and our other engineered systems grew more than 100% in the quarter. For the full year, we expect to double engineered systems sales to well over $1 billion. Oracle's new cloud business is also approaching a $1 billion annual run rate. These two businesses will drive Oracle's growth for years to come. A little more than a week from now we will announce lots of enhancements to the Oracle Cloud."
icon url

ReturntoSender

09/24/12 11:22 PM

#9931 RE: ReturntoSender #6755

From Briefing.com: 4:15 pm : Stocks began the week on a down note after Germany's Ifo Business Climate Index missed expectations. The major averages marked their session lows during the opening minutes before setting on a day-long climb towards the unchanged line. Due to weakness in Apple, the tech-heavy Nasdaq underperformed with a loss of 0.6%. Meanwhile, the S&P 500 shed 0.2%.

The Nasdaq trailed other indices after Apple (AAPL 690.79, -9.30) reported selling just five million iPhone 5s over the weekend, while some expected sales to reach as much as 10 million units. As a result, Apple ended lower by 1.3%.

Utility stocks were the top performer as the risk-off trade took hold. Natural gas producer Questar (STR 20.10, +0.73) added 3.8% after shares of the company were upgraded from ‘neutral' to ‘buy' at UBS. Other utility names which benefited from rotation into safer sectors included AES Corporation (AES 11.24, +0.12), Exelon (EXC 35.87, +0.49), and Pinnacle West (PNW 53.40, +0.84). The three stocks all gained between 1.0% and 1.6%.

The Dow Jones Transportation Average rose by 1.0% as it broke its recent streak of underperformance. Within the group, railroad stocks rebounded after Norfolk Southern (NSC 66.28, +1.28) cut its guidance last week. Norfolk Southern ended higher by 2.0% while other railroad names also advanced. CSX (CSX 21.36, +0.23), Kansas City Southern (KSU 77.08, +1.08), and Union Pacific (UNP 121.11, +1.74) all posted gains between 1.0% and 1.5%.

In the materials sector, steel stocks were under pressure after Citigroup downgraded a pair of steelmakers. United States Steel (X 19.59, -0.35) shed 1.8% after being downgraded from ‘buy' to ‘neutral,' while AK Steel (AKS 5.01, -0.24) settled lower by 4.6% after its rating was cut from ‘neutral' to ‘sell.' The weakness spilled over to other steel names as AM Castle (CAS 12.20, -0.25) and Cliffs Natural Resources (CLF 40.77, -0.16) lost 0.4% and 2.0%, respectively.

Paper and packaging stocks traded higher after Credit Suisse raised their targets on select stocks within the group. The firm raised their target on International Paper (IP 36.78, +1.27) from $40 to $44, Packaging Corp of America (PKG 34.95, +1.20) from $36 to $41, and Rock-Tenn (RKT 73.75, +5.03) from $73 to $82. The three stocks all gained between 3.5% and 7.3% following the positive commentary. Elsewhere, KapStone (KS 21.80, +1.19) advanced 5.8% after Stephens upgraded the shares from ‘equal weight' to ‘overweight.'

Questcor (QCOR 19.08, -11.05) slumped 36.7% after disclosing that the U.S. government is investigating the company for its promotional practices. In addition, Leerink Swank downgraded the shares of the company from ‘outperform' to ‘market perform. Note that Questcor fell 40.0% last week amid concerns around insurance coverage for the company's Acthar gel.

Peregrine Pharma (PPHM 1.16, -4.23) plunged 78.5% after announcing discrepancies in its data from its Phase IIb trial of bavituximab in patients with second-line non-small cell lung cancer. The company said that investors should not rely on clinical data that was disclosed on or before September 7, 2012. Since September 7, Peregrine has rallied more than 75.0% on what was previously thought to be encouraging trial data.

The Case-Shiller 20-city Index will be reported at 9:00 ET, while consumer confidence and the FHFA Housing Price Index will be released at 10:00 ET.

The U.S. Treasury will auction off 2-yr notes.DJ30 -20.55 NASDAQ -19.18 SP500 -3.26 NASDAQ Adv/Vol/Dec 1112/1.66 bln/1371 NYSE Adv/Vol/Dec 1214/625.6 mln/1800

3:30 pm : A stronger dollar put pressure on crude oil in today's floor trade. The energy component dropped as low as $91.06 per barrel and spent most of afternoon action trading near that level. A slight rally heading into the close pushed prices higher but still left crude to settle with a 1.1% loss at $91.88 per barrel.

Natural gas traded lower in choppy fashion, dipping to a session low of $3.00 per MMBtu. It later popped to a session high of $3.07 per MMBtu and ultimately closed 1.3% lower at $3.04 per MMBtu. Precious metals struggled in negative territory for their entire pit sessions as a stronger dollar put pressure on prices.

Despite inching slightly higher after coming off their respective session lows of $1760.10 and $33.69 per ounce, both gold and silver were unable to erase losses. Gold settled 0.8% lower at $1764.60 per ounce while silver closed with a 1.9% loss at $33.99 per ounce.DJ30 +3.45 NASDAQ -18.28 SP500 -1.38 NASDAQ Adv/Vol/Dec 1150/1376.0 mln/1319 NYSE Adv/Vol/Dec 1292/398 mln/1696

8:30AM Apple iPhone 5 first weekend sales top 5 mln, below expectations (AAPL) 700.10 : Co has sold over five million of its new iPhone 5, just three days after its launch on September 21, and more than 100 million iOS devices have been updated with iOS 6, the world's most advanced mobile operating system. iPhone 5 is available in the US, Australia, Canada, France, Germany, Hong Kong, Japan, Singapore and the UK, and will be available in 22 more countries on September 28 and more than 100 countries by the end of the year. Demand for iPhone 5 exceeded the initial supply and while the majority of pre-orders have been shipped to customers, many are scheduled to be shipped in October. "While we have sold out of our initial supply, stores continue to receive iPhone 5 shipments regularly and customers can continue to order online and receive an estimated delivery date. We appreciate everyone's patience and are working hard to build enough iPhone 5s for everyone."

Briefing.com note: Initial feedback is that expectations were for more than 6 mln, and even 8-10 mln at the high end.

8:01AM Emcore enters into OEM agreement with Lake Shore Cryotronics to supply Terahertz systems and components (EMKR) 5.70 : Co announced that it has entered into an OEM agreement with Lake Shore Cryotronics to supply an OEM version of the PB7200 Portable Frequency Domain Terahertz (THz) Spectrometer.

Marvell (MRVL) and Micrel (MCRL) announced a fully interoperable IEEE 802.3 standard-compliant Ethernet PHY for in-vehicle networking.

NXP Semiconductors N.V. (NXPI) introduced the LFPAK56D portfolio, a range of dual Power-SO8 MOSFETs specifically designed for automotive applications such as fuel injection, ABS and stability control. The LFPAK56D range is in volume production and is available immediately

Texas Instruments (TXN) introduced the new $199 Sitara AM335x ARM Cortex-A8 Starter Kit with a 4.3-inch LCD display supporting rotation and tilt capabilities via the on-board accelerometer that provides an affordable platform for smart appliances, industrial automation and networking applications and other devices requiring a touch screen interface.

Nufront and ARM (ARMH) announced that Nufront has broadened its portfolio of ARM technology with licenses for the ARM Cortex-A15 MPCore Processor and ARM Mali-T658 Graphics Processing Unit. Access to the advanced intellectual property from ARM will enhance the scalability of Nufront's next generation application processor designs, delivering powerful 3G-ready solutions to OEMs for smartphones, tablet computers and smart-TVs.

11:15 am Information Technology Index trading lower, trailing the broader market

The tech sector is trading lower today, trailing narrower losses in the broader market. Semiconductors are showing relative weakness as well with the SOX trading 1.3% lower. Within the chip index, VECO (-9.4%) is a notable laggard. Among other major indices, the SPY is trading 0.3% lower today, while the QQQ is down 0.7% and the NASDAQ is trading 0.6% lower on the session. Among tech bellwethers, FB (-6.1%) is under notable pressure following a negative Barron's article out over the weekend, while GOOG (+1.5%) is bucking the trend. There were no tech earnings of note this morning. In news, AAPL (-1.3%) reported selling 5 mln iPhones in its first weekend of sales. This was below what many expected.

Elsewhere, TIVO (+6.1%) announced a settlement of patent litigation With VZ (0.0%). VZ will provide TIVO total compensation worth at least $250.4 mln and both cos agreed to dismiss all pending litigation with prejudice. Also, LMLP (+81.8%) was acquired by DRIV (+1.1%) for $3.45/share in cash. The acquisition is expected to be accretive to DRIV's earnings in its 2013 fiscal year. In notable analyst upgrades this morning in the tech space, RBCN (+3.4%) was upgraded to Neutral at Goldman. Among downgrades, ATML (-4.7%) was downgraded to Neutral at UBS, FNSR (-4.5%) was downgraded to Mkt Perform at Raymond James, and VECO (-9.3%) was downgraded to Sell at Goldman. PAYX (-0.1%) and RHT (-1.2%) are the only notable names in tech scheduled to report quarterly results today after the close.
icon url

ReturntoSender

09/25/12 6:24 PM

#9932 RE: ReturntoSender #6755

From Briefing.com: 4:15 pm : Equities began today's session slightly higher before receiving an additional boost from positive consumer confidence data. Despite the upbeat data, stocks were unable to maintain the bullish tone as the major averages slipped into negative territory around midday. Stocks then extended their slide which also coincided with weakness in crude oil and the euro. The selling was broad-based, but financials, materials, industrials, and technology were among the worst performers. As a result, the S&P 500 ended lower by 1.1%.

Broadly speaking, today's weakness may have been a reflection of some end-of-quarter profit taking as the S&P has added 6.2% over the last three months and 15.0% since the start of the year. Additionally, the inability to sustain a rally after the strong confidence number may have exposed the idea the market is probably overbought short-term, and certainly in the face of weakening fundamentals.

Health care stocks were the top performer as the risk-off trade was today's theme. Neogen (NEOG 42.83, +2.83) jumped 7.1% after reporting mixed earnings. The company beat on earnings, while revenues fell $1 million short of estimates.

A handful of health care stocks moved on news. DARA BioSciences (DARA 1.15, +0.07) closed higher by 6.5% after announcing the establishment of a vertically integrated commercial platform for specialty oncology care and support products. Meanwhile, Genetic Technologies (GENE 3.60, +0.25) spiked 7.5% after the company announced its BREVAGen has been cleared for sale in the state of Florida. Lastly, Sinovac (SVA 2.68, +0.19) surged 7.6% after being awarded tenders in Beijing and Shanghai to supply inactivated Hepatitis-A vaccine under an expanded immunization program.

The technology sector was generally weaker as its biggest component, Apple (AAPL 673.54, -17.25) settled lower by 2.5%.

Cognex (CGNX 34.70, -3.25) fell 8.6% after Piper Jaffray downgraded the shares of from ‘neutral' to ‘underweight' while also lowering the price target from $30 to $27.

Paychex (PAYX 33.41, -0.97) slipped 2.8% despite beating on earnings and reporting in-line revenues. In addition, the company reaffirmed its full-year 2013 guidance. Following the report, Citigroup and UBS downgraded the company. Citigroup cut Paychex from ‘neutral' to ‘sell' while UBS lowered its rating from ‘buy' to ‘neutral.'

German semiconductor maker, Infineon Technology (IFNNY 6.60, -0.43) slid 6.1% after the company lowered its fourth and first quarter guidance. The management also said it will define and implement measures to improve future profitability. Details regarding these measures will be announced at the company's annual press conference on November 14, 2012.

The lower guidance weighed on other semiconductor producers. Atmel (ATML 5.46, -0.45) lost 7.6%, while STMicroelectronics (STM 5.66, -0.22) and Texas Instruments (TXN 27.83, -0.85) shed between 3.0% and 3.7%.

The Dow Jones Transportation Average underperformed as the bellwether group finished lower by 0.9%. Despite weakness in the space, two names saw notable outperformance. Shipper Matson (MATX 20.73, +0.21) led the complex, up 1.0%. Meanwhile, CH Robinson (CHRW 59.04, +0.47) advanced 0.8% after announcing the planned acquisition of Phoenix International for $571.5 million in cash and $63.5 million in newly-issued CH Robinson stock.

Railroad outperformed in the early going. However, the afternoon selling pressure pushed the group lower. Norfolk Southern (NSC 65.07, -1.21) slid 1.8% while Union Pacific (UNP 120.38, -0.73), CSX (CSX 21.17, -0.19) and Kansas City Southern (KSU 76.36, -0.72) all lost between 0.6% and 0.9%.

The latest consumer confidence reading for September came in at 70.3 when economists were expecting a reading of 63.0. Today's number followed prior month's 65.9 print.

The July Case-Shiller 20-city Home Price Index rose 1.2% when a 0.8% increase had been generally expected. This comes against a prior month's reading of 0.5%.

Separately, the latest Housing Price Index from the FHFA was also just released. For July, the Index increased by 0.2%, which follows a 0.7% increase in the prior month.

In tomorrow's economic data, the weekly MBA Mortgage Index will be reported at 7:00 ET, while new home sales will cross the wires at 10:00 ET.

The U.S. Treasury will auction off $35 billion in 5-yr notes.DJ30 -101.30 NASDAQ -43.05 SP500 -15.30 NASDAQ Adv/Vol/Dec 669/1.91 bln/1847 NYSE Adv/Vol/Dec 811/755.8 mln/2244

3:30 pm : Crude oil rose to a pit session high of $93.10 per barrel on heightened Iran tensions over new sanctions and reports of Iran firing test missiles. However, prices tumbled into the red as Philadelphia Fed President Charles Plosser stated that the latest QE3 will not cure friction in labor markets and that the easing will be ineffective. Crude sold off to a session low of $91.06 per barrel and settled at $91.37 per barrel for a 0.6% loss.

Natural gas dipped to a session low of $3.05 per MMBtu moments after pit trade opened. Despite trading in a fairly consolidative pattern near the $3.07 per MMBtu level for most of the session, a rally heading into the close pushed prices higher to $3.11 per MMBtu for a 2.3% gain.

Gold erased its early gains as a sell-off prompted by options expiration took prices back to the unchanged level. The yellow metal popped to a session high of $1770.90 per ounce in morning action but quickly fell into negative territory as it headed into afternoon floor trade. It inched slightly higher after brushing a session low of $1762.80 per ounce and managed to settle with a 0.1% gain at $1766.60 per ounce.

Silver climbed to a session high of $34.54 per ounce moments after floor trade opened but lost steam in afternoon trade. It dipped to a session low of $33.80 per ounce and eventually closed 0.1% lower at $33.94 per ounce.DJ30 -73.30 NASDAQ -31.27 SP500 -10.94 NASDAQ Adv/Vol/Dec 805/1549.0 mln/1677 NYSE Adv/Vol/Dec 917/453 mln/2089

4:32PM IBM: Virginia M. Rometty elected Chairman (IBM) 204.98 -0.31 : The IBM board of directors today elected Virginia M. Rometty chairman of the board, effective October 1, 2012. Mrs. Rometty succeeds Samuel J. Palmisano, who is stepping down from the board effective October 1, 2012. Mrs. Rometty, 55, is currently IBM's president and chief executive officer.

4:06PM Jabil Circuit misses by $0.04, beats on revs; guides Q1 EPS below consensus, revs below consensus; authorizes $100 mln share repurchase program (JBL) 20.97 -0.40 : Reports Q4 (Aug) earnings of $0.54 per share, $0.04 worse than the Capital IQ Consensus Estimate of $0.58; revenues rose 1.4% year/year to $4.34 bln vs the $4.22 bln consensus. Co issues downside guidance for Q1, sees EPS of $0.51-0.62 vs. $0.67 Capital IQ Consensus Estimate; sees Q1 revs of $4.3-4.5 bln vs. $4.51 bln Capital IQ Consensus Estimate. "Results for the fourth quarter were negatively impacted by a challenging new program ramp in our Specialized Services sector...Additionally demand remained weak in most of our business segments." Management also announced that the Jabil Board of Directors has authorized the repurchase of up to $100 million worth of shares of the Company's common stock during the next twelve months.

4:01PM MEMC Elec announces termination of Conergy Wafer Supply Agreement; receive payment of $21.2 million through the irrevocable letter of credit (WFR) 2.82 -0.15 : Co announced that it and its subsidiary, MEMC Singapore Pte. Ltd., have agreed with Conergy AG to terminate their long-term solar wafer supply agreement. Under the terms of the supply agreement, originally signed in October 2007, MEMC was to supply solar wafers to Conergy pursuant to pre-set pricing over a 10-year period on a take or pay basis. As part of the agreement, Conergy advanced funds to MEMC in the form of a refundable capacity reservation deposit and also provided a letter of credit to secure the take-or-pay obligations. Since the market downturn in early 2009, issues with respect to Conergy's price and volume purchase obligations under the supply agreement have created challenges to finding a mutually beneficial arrangement between the parties, leading to a reduction in the size of the supply agreement in January 2010.

The companies have now agreed to terminate the supply agreement. Pursuant to a termination agreement executed today, MEMC will receive payment of $21.2 million through the irrevocable letter of credit established by Conergy under the wafer supply agreement. MEMC will refund to Conergy the refundable capacity reservation deposit currently held by MEMC in an approximately equal amount. Conergy will also make payments on outstanding payables in the amount of $5.5 million. In addition, Conergy has agreed to transfer to MEMC Conergy's portfolio of operations and maintenance contracts covering solar power plants in Germany, Italy and Spain representing up to approximately 175 megawatts. There can be no assurance that the parties will conclude this transfer successfully.

4:01PM Universal Display contracts with Duksan Hi-Metal to provide manufacturing services for OLED host material in Korea (PANL) 35.63 -0.59 : Universal Display (PANL) and Duksan Hi-Metal Company announced that the companies have entered into a master services agreement to enhance Universal Display's local presence and expansion in Korea. As the first initiative under the agreement, Duksan will provide manufacturing services for one of Universal Display's host products for certain Korean customers. Universal Display and Duksan will also explore additional areas for collaboration to better serve and support the needs of the growing Korean OLED industry.

8:01AM Axcelis Tech lands global support solutions contract for leading chip manufacturer valued at $30 mln (ACLS) 1.11 : Co announces that it has signed a 5 year, comprehensive global support contract with one of the world's leading semiconductor manufacturers valued at $30 mln. Co will support a full suite of Axcelis implant, cleaning and thermal processing equipment at multiple fabs in the U.S.

09:08 am Super Micro Computer initiated with a Buy at Wunderlich; tgt $17: . Wunderlich initiates SMCI with a Buy and price target of $17 as demand for high-performance computing continues to outpace that of the broader server market, they believe SMCI's broad-based portfolio uniquely positions it as a primary beneficiary of this trend. They believe the stock's recent decline off April highs is largely the result of a number of external issues that have now been largely resolved, in their opinion, presenting investors with an attractive opportunity to acquire shares at current levels.

10:56 am Technology Sector trading higher today slightly underperforming the overall market

The tech sector is trading slightly higher today, trailing larger gains in the broader market. Semiconductors are showing relative weakness with the SOX trading 0.1% lower. Within the chip index, STM (-2.6%) is a notable laggard. Among other major indices, the SPY is trading 0.3% higher today, while the QQQ is up 0.3% and the NASDAQ is trading 0.4% higher on the session. Among tech bellwethers, GOOG (+1.4%) is once again showing notable strength, while ORCL (-0.7%) is under pressure. In tech earnings last night, PAYX (-2.9%) posted a slight Q1 beat, while RHT (-2.4%) reported a modest Q2 miss. RHT also offered guidance just below consensus. This morning, FDS (-4.5%) posted a slight Q4 beat and issued inline guidance. Also, IFNNY (-6.5%) issued downside guidance. In news, the US PTO grants VRNG (+0.9%) a patent for Mobile video dating service.

Among rumors, we are hearing renewed takeover chatter on JIVE (+0.6%). In notable analyst upgrades this morning in the tech space, TIVO (+4.2%) was upgraded to Buy at Lazard. Among downgrades, PAYX (-2.9%) was downgraded at Citi and UBS, CGNX (-5.9%) was downgraded to Underweight at Piper, CSGS (-1.8%) was downgraded to Neutral at Citigroup, AXE (-3.9%) was downgraded to Underperform at Credit Suisse, ADP (-1.1%) was downgraded to Neutral at UBS, NOK (+0.7%) was downgraded to Underperform at BMO and LPL (-1.6%) was downgraded to Mkt Perform at Bernstein. JBL (+1.0%) and SNX (+0.4%) are the only notable names in tech scheduled to report quarterly results today after the close.
icon url

ReturntoSender

09/26/12 5:09 PM

#9933 RE: ReturntoSender #6755

It will take a huge spike higher in the fear indexes like the VIX, more bears than bulls in the Investors Intelligence Poll and a lot of guts for me to go long more than just short term in the future.

http://investorshub.advfn.com/boards/read_msg.aspx?message_id=11535837

http://www.schaeffersresearch.com/streetools/market_tools/investors_intelligence.aspx

Why not be more excited about going long? Because we have already had nearly four years of a bull market run. The SOX has already topped, even if the rest of the market is still capable of rallying on to new highs, I can't see the SOX being in favor until we get a big enough downturn.


But that does not mean I'm against buying stocks long in this group for a swing trade when the market makes a short term bottom.

RtS
icon url

ReturntoSender

09/26/12 5:28 PM

#9934 RE: ReturntoSender #6755

What that means to me is that it's probably still safe to take a risk going long when the usual October bottom forms this year. What am I looking for first? A minimum spike high enough in the Volatility Indexes that they hit their upper Bollinger Band and %B Channel. For the VIX that means a pop to 18.5 to 19 minimum.


LRCX is due to report Oct 15th. INTC the day after. I would expect the market to have found a bottom and be rallying in advance of these earning but only after the market trades down near an RSI (14) of 30 for the NASDAQ and other major indexes. The SOX is nearly there already!


If all this happens it's probably a good idea to buy something before earnings for a swing trade.

RtS
icon url

ReturntoSender

09/27/12 6:12 PM

#9936 RE: ReturntoSender #6755

From Briefing.com: 4:15 pm : Equities got off to a strong start despite a string of negative economic data. The third estimate of second quarter GDP indicated growth of 1.3% which was well below the prior reading of 1.7%. Elsewhere, durable goods orders also showed notable weakness as new orders declined by 13.2% during August. Excluding transportation related items, durable goods orders decreased by 1.6%. Weekly initial claims were the sole bright spot as the reading of 359k was below the broadly-anticipated 379k. The major averages extended their gains after Spain announced its 2013 budget which included spending cuts and no tax hikes. The key averages continued rallying throughout the afternoon and the S&P 500 settled higher by 1.0%.

Technology stocks outperformed the broader market. Within the group, Apple (AAPL 681.32, +16.14) started in the red, but ended higher by 2.4%.

Among semiconductor producers, AMD (AMD 3.43, +0.11) gained 3.3% as it rebounded from recent weakness. Meanwhile, NXP Semiconductors (NXPI 25.37, +1.61) rose by 6.8% after positive comments about the company were made at JPMorgan.

Two tech stocks headed in opposite directions after reporting their earnings. Progress Software (PRGS 21.23, +2.07) spiked 10.8% after announcing an earnings beat and a revenue miss.

On the downside, Comtech (CMTL 27.43, -0.95) slid 3.4% despite beating on earnings and revenues. In addition, the company issued full-year 2013 guidance which was in-line with analyst expectations.

OCZ Technology (OCZ 3.41, +0.08) added 2.4% after reports indicated the company held talks with Seagate (STX 31.93, +0.95) regarding a possible acquisition. However, the talks fell apart after OCZ's Chief Executive Officer requested a seat on Seagate's board of directors as part of the merger.

Financials also outperformed as the SPDR Financial Select Sector ETF (XLF 15.64, +0.14) rose by 0.9%. Morgan Stanley (MS 16.84, +0.41) and Bank of America (BAC 8.97, +0.15) posted the largest advances among the majors. The two listings finished higher by 2.5% and 1.8%, respectively.

Meanwhile, Discover (DFS 39.70, +2.68) surged 7.2% after reporting earnings and revenues ahead of expectations.

The health care sector trailed the broader market as a handful of names moved on news. Peregrine Pharma (PPHM 1.11, -0.55) fell 33.1% after disclosing it received a written notice of default from one of its lenders due to the recent discovery of a major discrepancy in treatment group coding for one of its clinical trials. Peregrine complied with the request and issued full payment on September 25, 2012.

On the upside, Achillion Pharma (ACHN 10.29, +0.80) gained 8.5% after providing positive proof-of-concept data with ACH-3102.

The Dow Jones Transportation Average traded in-line with the Dow Industrials. Railroad and shipping stocks showed strength within the 20-stock group. Kansas City Southern (KSU 76.96, +1.60) was the top performing railroad as it gained 2.1%. Meanwhile, Overseas Shipholding Group (OSG 7.05, +0.34) and Expeditors International (EXPD 36.81, +0.79) advanced 5.1% and 2.2%, respectively.

Airline stocks were generally lower after United Continental (UAL 19.36, -0.80) updated its third quarter guidance. UAL slipped 4.0% after reporting that it expects third quarter capacity to be lower by 1.4%, while passenger unit revenues are expected to be down between 1.0% and 2.0%. United Continental peers traded lower on related weakness. JetBlue (JBLU 4.84, -0.06) and Southwest (LUV 8.88, -0.04) lost 1.2% and 0.5%, respectively.

In tomorrow's economic data, personal income, personal spending, and core PCE prices will be released at 8:30 ET. In addition, Chicago PMI will be reported at 9:45 ET while the Final Michigan Sentiment will cross the wires at 9:55 ET.DJ30 +72.46 NASDAQ +42.90 SP500 +13.83 NASDAQ Adv/Vol/Dec 1796/1.64 bln/663 NYSE Adv/Vol/Dec 2285/634.1 mln/748

3:30 pm : Crude oil trended higher in positive territory and rose as high as $92.32 per barrel on speculation that China will put forward another stimulus plan. The energy component eventually settled the floor session 2.2% higher at $91.89 per barrel.

Natural gas fell to its session low of $3.21 per MMBtu following weaker-than-anticipated inventory data that showed a build of 80 bcf when a build of 75 bcf was expected. However, buyers stepped in and pushed prices up higher. Natural gas touched a session high of $3.32 per MMBtu in afternoon action and closed with a 2.2% gain at $3.29 per MMBtu.

Precious metals climbed higher during today's pit trade as investors reacted to Spain's government news conference where the country announced its 2013 budget. Gains also came on China speculation.

Gold brushed a session low of $1764.00 per ounce moments after floor trade began in response to durable orders and initial claims data, but prices rebounded quickly and the yellow metal trended higher. It hit a session high of $1782.90 per ounce in afternoon action and settled with a 1.6% gain at $1780.40 per ounce.

Silver came off its session low of $34.20 per ounce and touched a session high of $34.81 per ounce before closing 2.1% higher at $34.66 per ounce.DJ30 +84.52 NASDAQ +42.98 SP500 +14.27 NASDAQ Adv/Vol/Dec 1816/1332.7 mln/623 NYSE Adv/Vol/Dec 2282/403 mln/742

4:12PM Research In Motion beats by $0.19, beats on revs (RIMM) 7.14 +0.14 : Reports Q2 (Aug) loss of $0.27 per share, $0.19 better than the Capital IQ Consensus Estimate of ($0.46); revenues fell 31.1% year/year to $2.87 bln vs the $2.5 bln consensus.

-- RIMM reports Q2 gross margins of 26.0%; Street expectations 28.4%, Q1 28.0%.

-- BlackBerry subscriber base increased to approximately 80 million global subscribers.

-- Cash, cash equivalents, short-term and long-term investments increased by approximately $100 million to $2.3 billion at the end of the second quarter

-- Cash flow from operations was approximately $432 million in the second quarter.

-- Shipments of BlackBerry smartphones were 7.4 million and shipments of BlackBerry PlayBook tablets were approximately 130,000.

"Despite the significant changes we are implementing across the organization, our second quarter results demonstrate that RIM is progressing on its financial and operational commitments during this major transition," said Thorsten Heins, President and CEO. "Subscribers grew to approximately 80 million global users, revenue grew sequentially from the first quarter, cash, cash equivalents, short-term and long-term investments increased by approximately $100 million to $2.3 billion, and carriers and developers are responding well to previews of our upcoming BlackBerry 10 platform. Make no mistake about it, we understand that we have much more work to do, but we are making the organizational changes to drive improvements across the company, our employees are committed and motivated, and BlackBerry 10 is on track to launch in the first calendar quarter of 2013."


4:10PM Research In Motion trades up to 8.20 on better than expected earnings, units (RIMM) 7.14 +0.14 :

4:07PM Micron misses by $0.03, misses on revs (MU) 6.01 +0.08 : Reports Q4 (Aug) loss of $0.24 per share, $0.03 worse than the Capital IQ Consensus Estimate of ($0.21); revenues fell 8.3% year/year to $1.96 bln vs the $2.13 bln consensus. "In 2012, despite difficult market conditions and lower average selling prices, we continued to execute on our technology and manufacturing roadmaps and moved our products increasingly into premium segments. Our focus throughout 2013 is to drive additional cost reductions and advance our leading-edge memory technology to achieve increased manufacturing efficiencies,"

Revenues from sales of NAND Flash products were 12 % lower in the fourth quarter of fiscal 2012 compared to the third quarter of fiscal 2012, due to an 11 % decrease in sales volume. Revenues from sales of DRAM products in the fourth quarter of fiscal 2012 were 9 % lower compared to the third quarter of fiscal 2012 due to a 9 % decrease in sales volume. Sales of NOR Flash products were approximately 12 % of total net sales for the fourth quarter of fiscal 2012. The company's consolidated gross margin of 11 % in the fourth quarter of fiscal 2012 was essentially unchanged from the third quarter of fiscal 2012. Improvements in margin from sales of NAND Flash and NOR Flash products were offset by declines in margins from sales of DRAM products.

4:05PM Rambus and Fujitsu Semiconducter sign patent license agreement (RMBS) 5.30 +0.01 : Co announced it has signed a patent license agreement with Fujitsu Semiconductor Limited. This six-year agreement covers the use of Rambus patented innovations implemented in a broad range of integrated circuit (IC) products offered by Fujitsu Semiconductor. Financial terms of the agreement are confidential.

4:02PM Emcore announces proposed public offering of $8 mln of its common stock (EMKR) 5.87 +0.12 : Co plans to use any proceeds from the offering for general corporate purposes. In connection with the offering, B. Riley & Co., LLC is acting as sole underwriter.

Mellanox Technologies (MLNX) announced that its end-to-end InfiniBand solutions have been selected to connect Atlantic.Net cloud infrastructures.

8:34AM First Solar to build New Mexico solar projects totaling 20 megawatts for PNM (FSLR) 20.90 : Co announced agreements to construct four solar power plants totaling 20 megawatts (MW) AC of generating capacity for PNM Resources, Inc. First Solar will provide engineering, procurement and construction services, using its advanced thin-film photovoltaic (PV) modules. PNM has the option to expand the agreement to a total of 22 MWAC. The new solar projects are in addition to five projects totaling 22 MW that First Solar completed for PNM in 2011. The solar plants could be in service by the end of 2013, although the schedule is dependent on project approval by the New Mexico Public Regulation Commission, whose decision is expected in the fourth quarter of 2012. The four projects are expected to create a total of up to 450 construction jobs at peak.

TranSwitch (TXCC) has begun shipping production volumes of its HDplay transceiver for a new High Definition projector developed by a top tier manufacturer in Asia.

Intel (INTC $22.72 +0.07) issued a statement in response to unsubstantiated news reports about comments made by Intel CEO Paul Otellini in a meeting with employees. "Intel has a long and successful heritage working with Microsoft on the release of Windows platforms, delivering devices that provide exciting experiences, stunning performance, and superior compatibility. Intel fully expects this to continue with Windows 8..Intel, Microsoft and our partners have been working closely together on testing and validation to ensure delivery of a high-quality experience across the nearly 200 Intel-based designs that will start launching in October. Intel CEO Paul Otellini is on record as saying "Windows 8 is one of the best things that ever happened to Intel," citing the importance of the touch interface coming to mainstream computing and the huge wave of exciting new Ultrabook, tablet and convertible device innovations coming to the market."

09:19 am Alcoa downgraded to Hold at Dahlman Rose: . Dahlman Rose downgrades AA to Hold from Buy as they expect aluminum prices to remain range-bound and do not believe the shares will be appropriately valued under the current corporate structure. A difficult decision to spin off its downstream businesses could ultimately be the key. Though LME aluminum prices caught a bit of a bid in Sept, they haven't seen signs of any fundamental changes that should provide support for a meaningful move higher, and see prices fluctuating between $0.85 and $1.05/lb over the next 12 months.

09:19 am Freescale Semi initiated with a Buy at Needham, tgt $12: . Needham initiates FSL with a Buy and price target of $12. With the shares down ~50% from its IPO in May 2011, firm likes the risk/reward profile at these levels. There are three fundamental reasons for its bullish stance: 1) deleveraging story with predictable interest expense reduction leading to significant EPS accretion and lower costs of capital; 2) gross margin expansion driving significant leverage in the model; and 3) exposed to multi-year secular trends in the semiconductor industry.

09:18 am General Motors initiated with a Hold at Stifel Nicolaus: . Stifel initiates GM with a Hold. As a global leader, firm believes GM has taken upon itself to lead the charge in driving a multi-faceted, multi-year automotive industry turnaround. While it sees GM as leading in some respects and chasing in others, firm sees the future of the global automotive industry as characterized by largely rationalized vehicle production, increased parts/engines/systems platform commonality, reduced global architectures, and broadly improving vehicle quality. These improvements in the assembly of vehicles is also set against the backdrop of shorter product cycles attempting to keep pace with a) rapidly evolving 21st century technology, and b) ever-changing consumer demand.

11:07 am Tech Sector is trading higher today along with the overall market

The tech sector is trading higher today, along just ahead of gains in the broader market. Semiconductors are showing relative strength as well with the SOX trading 0.5% higher. Within the chip index, AMD (+3.0%) is a notable standout. Among other major indices, the SPY is trading 0.3% higher today, while the QQQ and the NASDAQ are trading 0.4% higer on the session. Among tech bellwethers, ORCL (+1.2%) is showing notable strength, while MSFT (-0.7%) is a laggard.

In tech earnings last night, CMTL (-2.5%) posted a Q4 beat and guided inline with consensus. Elsewhere, PRGS (+9.8%) reported a mixed Q3. In news, INTC (+0.5%) issued a statement in response to unsubstantiated news reports about comments made by CEO Paul Otellini in a meeting with employees. "Intel has a long and successful heritage working with MSFT (-0.7%) on the release of Windows platforms, delivering devices that provide exciting experiences, stunning performance, and superior compatibility. Intel fully expects this to continue with Windows 8." Among rumors, NOK (+0.7%) may look to eliminate its dividend according to a Bloomberg article. The Register is suggesting that OCZ (+9.6%) acquisition talks were held with STX (+0.1%), but the deal collapsed after CEO of OCZ requested seat on STX board of directors as part of merger. In notable analyst upgrades this morning in the tech space, MXIM (+1.6%) was upgraded to Buy at Jefferies. Among downgrades, ALTR (-1.7%) & HPQ (+1.1%) were downgraded at Jefferies. ACN (+0.6%), MU (+0.5%), and RIMM (+0.9%) are the notable names in tech scheduled to report quarterly results today after the close.
icon url

ReturntoSender

09/29/12 8:32 PM

#9937 RE: ReturntoSender #6755

From Briefing.com: Weekly Recap - Week ending 28-Sep-12Equities stumbled out of the gate before the September Chicago PMI added to the risk-off sentiment. The survey revealed a contractionary reading of 49.7, while expectations called for the number to be closer to 52.9. After marking session lows, equities remained near the bottom of the range until the results of Spain's bank stress test were announced. The reported EUR59.3 billion capital shortfall was within the expected range which brought on a round of buyers who took the key averages to their session highs. The brief rally was short lived as the major indices followed it with a return to their opening levels. As a result, the S&P 500 finished lower by 0.5%.

Industrial stocks outperformed slightly. Electrical equipment manufacturer AZZ (AZZ 37.98, +3.22) jumped 9.3% after beating on earnings and revenues. In addition, the company issued upside full-year guidance and announced the acquisition of Canadian Galvcast Manufacturing.

Pentair (PNR 44.82, +1.44) advanced 3.3% after authorizing an initial stock repurchase program in the amount of $400 million. The program was first announced in March 2012 and will commence immediately.

Farm equipment stocks were generally higher following this morning's Department of Agriculture crop report which showed a notable decline in grain inventory. Deere (DE 82.47, +0.37) and AGCO (AGCO 47.47, +0.55) added between 0.5% and 1.2% each. The PowerShares DB Agriculture ETF (DBA 29.41, +0.44) saw notable outperformance as it gained 1.5%.

The bellwether Dow Jones Transportation Average has been a notable underperformer on the quarter, and it trailed the broader market again today. Overseas Shipholding Group (OSG 6.60, -0.45) was a notable laggard within the group as shares of the shipping company fell 6.4%. Railroads remained weak as CSX (CSX 20.75, -0.36) and Kansas City Southern (KSU 75.78, -1.18) both lost near 1.5%.

Financial stocks showed intraday strength, but ended up mostly in-line with the broader market. The SPDR Financials Select Sector ETF (XLF 15.59, -0.05) shed 0.3%.

Bank of America (BAC 8.83, -0.14) slid 1.6% after announcing that it has reached a $2.43 billion settlement in Merrill Lynch acquisition-related class action litigation. Due to the litigation expense, Bank of America sees a third quarter charge of $0.28.

American Express (AXP 56.86, +0.29) added 0.5% and was the only major name which ended higher on the day.

The University of Michigan's final Consumer Sentiment Survey for September fell to 78.3 from the 79.2 which was posted in the preliminary Survey. Economists had expected the reading to be revised down to 79.0.

Personal income increased in August by 0.1%, which was below the expected increase of 0.2%. Personal spending increased by 0.5%, which was in-line with expectations. Core personal consumption expenditures were higher by 0.1%, which was also in-line with expectations.

On Monday, the ISM Index and construction spending data will be released at 10:00 ET.

Week in Review: Stocks Stumble as Focus Turns Back to Spain

On Monday, stocks began the week on a down note after Germany's Ifo Business Climate Index missed expectations. The major averages marked their session lows during the opening minutes before setting on a day-long climb towards the unchanged line. Due to weakness in Apple, the tech-heavy Nasdaq underperformed with a loss of 0.6%. Meanwhile, the S&P 500 shed 0.2%. Apple (AAPL 667.10, -14.21) ended lower by 1.3% after reporting selling just five million iPhone 5s over the weekend, while some expected sales to reach as much as 10 million units.

Tuesday's session started slightly higher before equities received an additional boost from positive consumer confidence data. Despite the upbeat numbers, stocks were unable to maintain the bullish tone as the major averages slipped into negative territory around midday. Stocks then extended their slide which also coincided with weakness in crude oil and the euro. The selling was broad-based, but financials, materials, industrials, and technology were among the worst performers. As a result, the S&P 500 ended lower by 1.1%.German semiconductor maker, Infineon Technology (IFNNY 6.44, -0.12) slid 6.1% after the company lowered its fourth and first quarter guidance.

On Wednesday, equities started in the red after Spain and the country's fiscal struggles were put back in the spotlight. The major indices marked session lows during the first hour before reversing and attempting a return to the unchanged line. However, due to the lack of a catalyst, the key averages were unable to sustain a meaningful rally. As a result, the S&P 500 slipped 0.6%. The Nasdaq underperformed and settled lower by 0.8%. Homebuilder stocks were broadly weaker as the SPDR S&P Homebuilders ETF (XHB 24.83, -0.21) lost 2.3%.

Thursday's session got off to a strong start despite a string of negative economic data. The third estimate of second quarter GDP indicated growth of 1.3% which was well below the prior reading of 1.7%. Elsewhere, durable goods orders also showed notable weakness as new orders declined by 13.2% during August. Excluding transportation related items, durable goods orders decreased by 1.6%. Weekly initial claims were the sole bright spot as the reading of 359k was below the broadly-anticipated 379k. The major averages extended their gains after Spain announced its 2013 budget which included spending cuts and no tax hikes. The key averages continued rallying throughout the afternoon and the S&P 500 settled higher by 1.0%. Discover (DFS 39.73, +0.02) surged 7.2% after reporting earnings and revenues ahead of expectations. ..NYSE Adv/Dec 1176/1849. ..NASDAQ Adv/Dec 862/1610.
 
Index Started Week Ended Week Change % Change YTD %
DJIA 13579.47 13437.13 -142.34 -1.0 10.0
Nasdaq 3179.96 3116.23 -63.73 -2.0 19.6
S&P 500 1460.15 1440.67 -19.48 -1.3 14.6
Russell 2000 855.53 837.45 -18.08 -2.1 13.0

2:05PM MEMC Elec subsidiary sells 30MW Spectrum Solar Project to Southern Company (SO) and Turner Renewable Energy (WFR) 2.69 -0.08 : SunEdison, a subsidiary of MEMC Electronic Materials, announced that the company's forthcoming Spectrum Solar Project, a 30 megawatt (AC) / 37.5 MW (DC) solar photovoltaic power plant has been sold to Southern Company (SO) and Turner Renewable Energy. Construction of the project is expected to begin in October on a 311 acre site in Clark County, Nevada, with commercial operation anticipated during the second quarter of 2013. In addition to developing the plant, SunEdison will be responsible for ongoing operations and maintenance

12:47PM SMTC Corp signs agreement to acquire the assets of EMS provider Seksun Array Electronics (Suzhou) Co. Ltd.; expects the acquisition to be immediately accretive (SMTX) 3.07 +0.05 : Co announced the signing today of an agreement to acquire the manufacturing assets of Seksun Array Electronics (Suzhou) Co. Ltd.'s in Suzhou, China. The acquisition is expected to close in Q4, 2012. This acquisition will further expand SMTC's operations and capabilities in China, strengthen its global footprint, and support the growth of new business in the region. Seksun provides printed circuit board assembly and full "box build" systems integration focused on low volume, high mix business for the industrial, commercial and medical sectors. SMTC expects the acquisition to be immediately accretive.


8:01AM Emcore priced an underwritten public offering of 1,593,400 shares of common stock at a price to the public of $5.46 per share (EMKR) 5.87 : The offering was increased from what was previously announced due to demand from investors.


Research In Motion (RIMM $8.00 +0.87) reported a second quarter loss of $0.27 per share, $0.19 better than the Capital IQ Consensus Estimate of ($0.46), while revenues fell 31.1% year/year to $2.87 billion versus the $2.5 bln consensus. RIMM reports Q2 gross margins of 26.0%; Street expectations 28.4%, Q1 28.0%. BlackBerry subscriber base increased to approximately 80 million global subscribers. Cash, cash equivalents, short-term and long-term investments increased by approximately $100 million to $2.3 billion at the end of the second quarter. Cash flow from operations was approximately $432 million in the second quarter. Shipments of BlackBerry smartphones were 7.4 million and shipments of BlackBerry PlayBook tablets were approximately 130,000. "Despite the significant changes we are implementing across the organization, our second quarter results demonstrate that RIM is progressing on its financial and operational commitments during this major transition," said Thorsten Heins, President and CEO. "Subscribers grew to approximately 80 million global users, revenue grew sequentially from the first quarter, cash, cash equivalents, short-term and long-term investments increased by approximately $100 million to $2.3 billion, and carriers and developers are responding well to previews of our upcoming BlackBerry 10 platform. Make no mistake about it, we understand that we have much more work to do, but we are making the organizational changes to drive improvements across the company, our employees are committed and motivated, and BlackBerry 10 is on track to launch in the first calendar quarter of 2013."

Micron (MU $6.15 +0.13) reported fourth quarter loss of $0.24 per share, $0.03 worse than the Capital IQ Consensus of ($0.21), while revenues fell 8.3% year/year to $1.96 billion versus the $2.13 bln consensus. "In 2012, despite difficult market conditions and lower average selling prices, we continued to execute on our technology and manufacturing roadmaps and moved our products increasingly into premium segments. Our focus throughout 2013 is to drive additional cost reductions and advance our leading-edge memory technology to achieve increased manufacturing efficiencies," Revenues from sales of NAND Flash products were 12 % lower in the fourth quarter of fiscal 2012 compared to the third quarter of fiscal 2012, due to an 11 % decrease in sales volume. Revenues from sales of DRAM products in the fourth quarter of fiscal 2012 were 9 % lower compared to the third quarter of fiscal 2012 due to a 9 % decrease in sales volume. Sales of NOR Flash products were approximately 12 % of total net sales for the fourth quarter of fiscal 2012. The company's consolidated gross margin of 11 % in the fourth quarter of fiscal 2012 was essentially unchanged from the third quarter of fiscal 2012. Improvements in margin from sales of NAND Flash and NOR Flash products were offset by declines in margins from sales of DRAM products.

10:27 am S&P Information Tech sector trading lower today along with the borader market

The tech sector is trading lower today, along with losses in the broader market. Semiconductors are showing inline weakness with the SOX trading 0.5% lower. Within the chip index, STM (-3.0%) is a notable laggard. Among other major indices, the SPY is trading 0.6% lower today, the QQQ and the NASDAQ are trading 0.6% lower on the session as well. Among tech bellwethers, QCOM (-1.4%) is showing notable weakness, while FB (+4.8%) is bucking the trend. In tech earnings last night, ACN (+6.0%) posted inline Q4 EPS, slightly better-than-expected revs, and guided above consensus. Elsewhere, RIMM (+11.8%) reported a Q2 beat, while MU (+2.4%) posted a Q4 miss. This morning, ADTN (-8.9%) issued downside Q3 guidance. In news, AAPL (-1.0%) CEO issued a letter apologizing for iOS 6 Maps. Among rumors, discussions between AAPL and SNE (-2.5%) regarding music streaming service for iPhone hit a snag, according to reports.

In notable analyst upgrades this morning in the tech space, RIMM (+11.8%) was upgraded to Sector Perform at Scotia Capital. While among downgrades, ADTN (-9.2%) was downgraded to Underperform from Buy at BofA/Merrill
icon url

ReturntoSender

09/30/12 2:13 PM

#9938 RE: ReturntoSender #6755

InvestmentHouse Weekend Market Summary

http://www.investmenthouse.com/weekendmarketsummary.htm

- Stocks soften on the last day of the quarter, disrupting further window dressing, starting lower on Spain skepticism, worsening on more very weak US data.
- Thursday rebound falters but indices still above June up trendlines.
- Chicago PMI 'unexpectedly' breaks 50, jars mainstream media into saying business activity shrinking 'for first time' in 3 years. What?
- Confidence versus reality: Michigan Sentiment rises and Personal Spending outstrips negative disposable income. Mathematics dictates that cannot continue.
- Gasoline prices spike 18% in three days.
- Hydraulic Fracturing reduces US carbon footprint to the lowest in 20 years, surpasses Kyoto carbon reduction requirements at zero cost: free markets over regulation wins again.
- Friday pullback provides another shot at stocks that jumped away Thursday.
- New quarter will test QE3 resilience.

No follow through to the Thursday bounce but the indices hold their trends.

Something happened on the way to a second day of quarter ending window dressing. There was news, but it wasn't much to trip a solid move. Japan reported weak industrial production (-1.3%)? What is new about that? Some speculated there was some buyer's remorse after investors thought more about Spain's 'fall on the sword' austerity proudly announced Thursday. Interesting theories, but they really didn't explain the steady erosion in futures from the wee morning hours.

The US data release at 8:30ET turned out to be the low, but you could hardly say the fade stopped because of the data as it was not good to downright weak by the time the Chicago PMI hit a half hour into trade. Futures were recovering into the open and stocks were rising from the lower start when the Chicago PMI came in below 50, in contraction, for the first time in three years.

That news killed the rebound attempt, sending stocks to new session lows. Midmorning they recovered and the move continued into early afternoon. A low to high move looked to be in place, but after lunch the renewed bids disappeared. The indices slid toward the close, holding above session lows but still sporting losses averaging 0.5%. Not a harsh selloff but certainly not a continuation of the Thursday bounce toward quarter end.

SP500 -6.48, -0.45%
NASDAQ -20.37, -0.65%
DJ30 -48.84, -0.36%
SP600 -0.71%
SOX -0.83%

Disappointing way to end the quarter, but SP500 is still holding its up trendline and indeed all of the indices are above their June trendlines. That does not mean, however, there is no room for some more consolidation near term as VIX moves a bit higher, but overall leadership still looks good with certain sectors and stocks in position to move even as some of the bigger names that led the last leg of the rally higher look to test further.

THE NEWS

US economic data dominated the news flow, and once again it was a question of apparent consumer confidence versus unquestionably bad, though to the administration 'on the right track' data. With this kind of data, data that directly impacts consumers' ability to act upon that confidence, you have to wonder just how long this bump in confidence will last. It is as if the consumer does not comprehend the fiscal cliff, just how bad the Libya incident was on many levels, the precarious position of our economy and country. As Galadriel said in 'The Fellowship of the Ring': the quest stands upon the edge of a knife. Stray but a little, and it will fail.

Michigan Sentiment rises sharply, though not as much as expected.

Michigan Sentiment - Final, September (9:55): 78.3 actual versus 79.0 expected, 79.2 preliminary versus 74.3 final August.

The rather irrational consumer continued to show rather irrational confidence as the Michigan Sentiment Survey more or less lived up to its preliminary number. About the only thing going the consumer's way is housing as a bottom is in though how long it takes to get off the bottom is a big question. Shadow inventory at 13.1M houses is a big question mark. But after so long in the tank, any improvement buoys spirits.

That is good, because the list of reasons to be glum is downright impressively depressing. Incomes down 8.2% in four years. Gasoline prices up over 100% and RBOB up 18% in the past three days. Disposable income negative. Company planned hiring is down to 29% from 36%. Dollar under pressure driving savings into the ground. Food prices surging and only going to get worse into next summer as pork and beef prices surge thanks to shortages due to the drought. Yes, many reasons to be optimistic.

Personal Incomes see negative disposable income as wages/income lose ground to inflation. Spending rises on price increases, but how long can it continue?

Personal Income, August (8:30): 0.1% actual versus 0.2% expected, 0.1% prior (revised from 0.3%)

The irony: Farm incomes jumped 8% despite a devastating drought this year. Is it because prices are up on the crop that will make it to market? Some. But according to data from the government (and it may be skewed in order to promote more government involvement in markets), the gains are the opposite: the gains are from government crop insurance payments (tax dollars) and indeed an extra $10B is just reported to have been added to crop insurance payouts and that is boosting incomes on the farm.

Personal Spending, August (8:30): 0.5% actual versus 0.5% expected, 0.4% prior

PCE Prices - Core, August (8:30): 0.1% actual versus 0.1% expected, 0.1% prior (revised from 0.0%)
PCE Prices - Overall: 0.4%. Largest gain since 3/2011

Disposable Income: -0.3%

Sentiment may have met its match in the reality of incomes. Yes the headline was up though by just 0.1%. July was revised lower, taking away a decent 0.3% gain.

Spending continued its rise, up 0.5% as expected.

Many on the financial stations were initially exited by the spending, supposed evidence of a still strong consumer. Even the more liberal financial websites and stations had to note, however grudgingly, that spending rose because prices were up, not the amount of goods purchased. A 0.4% rise in prices, the largest since March 2011, forced consumers to part with more money than they wanted for items such as food and gas. Of course those two items are scrubbed from the CPI so I suppose they don't really exist.

Nonetheless, the consumer remains confident as the Michigan survey reports.

There is a collision ahead. Desire versus reality. Sentiment versus the pocketbook. Disposable income fell 0.3% in August. Incomes are down over 8% in four years and down 1.1% in August. The savings rate fell to -3.7%, indicating consumers are spending more than they are taking in.

With disposable income back into negative territory yet again, consumers simply will not have the funds available to continue spending without going on a massive credit binge. Oh great, just what we need. Not only the government has unsustainable debt, but there are $1T in student loans with a 13% ($120B) default rate way back in 2009 when times were better (Dept. of Education data), and now consumers have to take on a new pile of debt just to survive due to inflation, declining wages, or just plain old joblessness. At least we don't have to worry about mortgage debt spiraling out of control again; no one can qualify!

Chicago joins the rest of the manufacturing nation in contraction.

The Midwest was the holdout thanks to Ohio and Wisconsin and their improving economies thanks to reforms implemented by their governors. Apparently no region is an island as the Chicago region PMI, after three years, dipped into contraction.

Chicago PMI, September (9:45): 49.7 actual versus 52.9 expected, 53.0 prior

It is a big deal, but it is not as big as the news media made it out to be. Bloomberg headlines screamed the following: "Business Activity in U.S. Shrinks for First Time Since 2009. Business activity in the U.S. unexpectedly contracted in September for the first time in three years, adding to signs manufacturing will contribute less to the economic recovery."

Really? What about Richmond, Philly, New York, Dallas and all the other regions already in contraction? What about the national ISM in contraction June through August? What a totally biased headline to make it look as if just now things are getting worse for manufacturing. It has trended lower since 2010 and has spent the last quarter of the past 12 months in contraction.

New orders: 47.4 versus 54.8
Employment: 52 versus 57.1, the weakest reading since 3/2010
Prices: 63.2 versus 57.0

Summary of the Data: Stagflation is back

The Friday data by itself is a sad microcosm of the US economy. Manufacturing, the source of strength in whatever recovery the US has enjoyed in its QE spiked attempt at survival, has turned negative again across the board despite massive Fed action and because of government policies attacking business with higher costs and regulations.

As a result there is still virtually no job creation on a relative recovery basis despite government conjuring up over 300,000 'new' jobs with benchmark revisions. On top of no significant new jobs, those with jobs see their wages and salaries declining over the past four years and in August actually turning negative in terms of disposable income.

While economic activity turns negative in manufacturing (and we saw GDP dive below expectations with a 1.25% reading) and wages and salaries decline, the cost of living is increasing. The drought is a cause of this, but so is overall inflation in energy, tuition, healthcare, etc. The drought is simply that extraneous event that always hits when the government/Fed is attempting to engineer a solution versus letting markets handle the problems. As discussed in the Economy section below, the free market can accomplish amazing results that no one dreamed possible when viewed in terms of mandates and regulations designed to bring about a result.

The end result: we are seeing the start of 'stagflation' here in the US. I reported a couple of months ago that it was in Europe already. I reported over a year ago the US was headed for another round of this 1970's plague. The Fed knows it and that is one reason it has promised to keep interest rates artificially low until 2015. In the 1970's rates soared to 14% and beyond. With inflation added to that the drag on economic activity was numbing.

As we have seen (learned again?), however, just keeping rates down and liquidity available does not prevent stagflation. It has lengthened the time for it to take effect, but the lack of response to stimulus in the face of anti-business regulations coupled with extreme levels of liquidity is resulting in the inevitable rise in prices, reduction in wages, and lackluster economic activity known as stagflation.

Consumer sentiment is up on the perception things will get better, aided by the talk of a bottom in the housing market. That is the largest asset, even after the housing crash, for the majority of citizens. The prospect of a recovery in prices naturally raises hope that the end is in sight. There are harder aspects to see clearly, at least at first, that will sink sentiment again. Rising inflation, falling real wages, declining disposable income, higher healthcare costs now and even worse in 2013 are harder to see as they erode over time. The irony is the American spirit lifts confidence and hope for the future and it is rising for the election only to be dashed in late 2012 and in 2013 thanks to these impacts, the fiscal cliff, continued high energy costs, and a continuation of the same policies that have undermined every effort of the American entrepreneur to overcome.

OTHER MARKETS

On Friday the other markets were driven by the same news and trends that have pushed them somewhat contra-trend over the past two to two and a half weeks.

Dollar. 1.2864 versus 1.2913 euro. The dollar was stronger. You might ask how this could possibly be given that the US economic data was so horrid on Thursday and again on Friday. Remember we had GDP that was terrible followed by the Chicago PMI flipping negative for the first time in three years. We had personal income with disposable income at -0.3%. Not good.

We had issues in Europe. Spain was a question mark. On Thursday it came out with the plan that would embark upon austerity and yet bring about wealth for everybody. The problem with Spain is that it is not really a capitalist country, at least not in the true sense, so austerity will not necessarily breed entrepreneurism. Although we understand that there is entrepreneurism alive in well in Spain; it is just under the table beyond the government's reach. Nonetheless, since Europe has seen its trouble, the dollar acted as a safe haven. As it acts as a safe haven, of course it rises. It is still not out of the bear flag. It has rallied up to the 20 day EMA. It has not broken through yet. Technically on Friday it cracked it, but that is no big revelation. We see stocks trade around resistance or support frequently, break it, bounce back, etc., and then continue as if nothing was wrong.

We still have a big rollover, but we have a bounce off of a support level. It is holding, and it picked up a bit of steam on Friday.

Bonds. 1.64% 10 year US Treasury. Bonds were virtually flat. You would expect bonds to also act as safe havens if there was trouble in the US economy (there was) or if there is trouble in Europe that would cause a flight from the continent (there was). Yet bonds gave up most of their gain on the session. They could not make any real further headway over the Wednesday peak when they gapped to the upside through the 50 day EMA. They are sitting on the 50 day EMA. They have retaken some resistance. That is rather surprising, but with the bad news out there, bonds as a safe haven makes some perverse sense yet again. We do have bonds holding gains after breaking some resistance. Then again, they are bumping right up against the next resistance levels. It is a long, tough road to hoe for the bond market, but on the week it did pretty well. Next week with the start of the new quarter, we will see if bonds are still interesting to investors based upon world events and based upon the US economic data that remains rather horrid or, as one commentator put it today, "putrid."

Gold. 1773.60, -6.90. Gold was down. It rallied on the day but then faded into the afternoon and the close. Is that any major change? Not at all. Gold continues to bump up against the highs from March. It has moved laterally for the past two weeks. It is understandable that it would have some resistance at this level. It is showing it, but it is not giving up gains. It is working laterally, consolidating. That tells us that it will want to try breaking through this November 2011 and February 2012 peak. That would take it over 1800. Then it has a shot to run at the highs from 2011 which put it near $2000, but it was closer to the $1900 level on the high.

Nonetheless, with QE3 out there, gold has a backstop, no doubt. It is just resting right now because it has put in one heck of a run from late July into September. A little more consolidation, a little more bad news in the world that would prompt more printing or the prospects of more printing, and then you have gold breaking up higher and likely breaking that resistance at 1800.

Oil. 92.19, +0.34. Oil was up on the day, but it was not a bounce that changed the current outlook. Oil broke lower three weeks back. It bounced and tested the 50 day EMA, it failed, it rolled over through Wednesday, and it has recovered up to the 10 day EMA. That is just below the 50 day EMA, as of Friday, showing a doji. It looks as if oil is ready to slide back down. Why would it do that? The dollar has been on a run higher, and that has pushed oil lower. It bounced on Thursday when the dollar was down a bit. Now it has bounced back up to near resistance with the dollar moving higher on worries out of Europe. Then we might see oil turn lower yet again.

Will this make any difference for us at the pump? It usually does, but here is the rub this time around: Over the past three days, the RBOB gasoline price has gone up 18%. Even though oil is overall down over the past two weeks, we will see prices rise somewhat dramatically over the next week or so. It is not a question of supply of oil; it is a question of capacity to refine the oil into gasoline. That has been the problem for several years. That is why we have seen gasoline prices more than double during this administration.

What has been done about it? Nothing. Because lowering gasoline prices is not part of the administration's energy agenda. It is not an energy plan; it is an agenda. It is not designed to reduce any of our costs. It is not designed to push us off of hydrocarbons. As you read in the economic section, we should let free enterprise work. It has gotten us out of a carbon emission jam that all of the wind power, solar power, and electric car subsidies have been unable to even approach. It has done in a matter of a few years what the Kyoto Treaty wanted people to do over 20 years. It is truly an amazing story, so be sure to read it.

It looks as if oil is in a bear flag and wants to top out and roll back over. A lot of its movement will depend upon what the dollar does simply because the world economy is not in good shape, as we saw this past week and as was underscored on Friday in the US. Thus it will not demand as much oil. It takes a falling dollar and rising tensions around the world likely to push oil back up given the capacity we are seeing right now.

TECHNICAL SUMMARY

Internals.

Volume. NASDAQ +3.5%, 1.82B; NYSE 15%, 662M. Downside day and volume was up. Not necessarily a good thing. Although the indices did bounce off of the lows, so you can say they got some buying. It pushed the stocks higher, and that is a positive, but they had a hard time holding it. The last hour was back and forth, and the indices ended with a bit of a downdraft to close. I would not call it the buyers rushing back in to save the indices and push them higher, but as we will see in the charts, they did a decent job of holdings the trendline.

Breadth. NASDAQ -1.9:1; NYSE -1.5:1. Nothing really here. Once again the internals have been rather nondescript. I do note that there has been better breadth in the 2.5:1 to 3:1 category on the upside days versus just -1.5 on the downside days. That is a positive as well.

THE CHARTS

SP500. SP500 was down. It bounced off of its lows to close at the 20 day EMA. It remains above the trendline off of the June low. It looks good. It makes continual moves to the upside, higher and higher pyramids. It has pulled back and looks good. Now it just needs to hold and break higher. You can see that higher volume as it tested and bounced modestly. Perhaps that is a positive indication. Maybe or maybe not, but it beats a sharp stick in the eye. We need to see more of a test on Monday or so and then a break back to the upside.

NASDAQ. NASDAQ was a little choppier. It has further to go to the downside, at least to the trendline that is lurking just below the 50 day EMA near 3068. It hit the 20 day EMA on the open, gapped down to it, and it sold from there. Not a horrible down day, but volume was up. It is holding right above the April and May peak as well as the consolidation from August. It bounced in a good place. It play want to come back a little more, however, if we get some of that VIX-type of selling I talked about earlier.

SP600. The small caps had a tough two weeks, but they landed on the trendline. They held on Wednesday, bounced on Thursday, and came right back to it on Friday. Not bad. It moved for about a week or so on the trendline in mid August. We could get a move along the trendline as the VIX sells off. That is exactly this period in August when the small cap index was moving laterally and slightly higher along the trendline. VIX was rallying and the rest of the market was pulling into a modest pullback. We could very well see the small caps echo the same move here. The question is whether the small caps will hold up given that the economic news has turned so sour.

SOX. The SOX bounced nicely on Thursday. After the Wednesday doji at support, it kind of just floundered on Friday, down -0.8%. Nothing major. The major move was already in on Tuesday when it broke below support. It has had a rebound back up near that resistance level, and it has not done much with it. More will be seen next week as the new quarter starts and we see if there is any money brought to the market at that time.

DJ30/DJ20. The Dow undercut the 20 day EMA on the lows, but it recovered to hold it on the close as it, too, looks quite strong in its run to the upside. It is the strongest index right now.

What about the transports and the Dow Theory? Will they confirm the move to the new high by the DJ30? As of Friday they were not. It looked like they were trying to bounce Wednesday and Thursday, and then on Friday they got dumped to the downside. But all is not lost. On the low it tapped at the mid-May lows, and it rebounded somewhat. It looks like it is working this support. It is not a clean break to the upside, but it is working it and trying to make it happen. It still could make the move back upside in this rolling range. We will see. We will give it the opportunity to do that. If Dow Theory is going to be consummated, it will have to move to the upside. If it does not make that break, theory has it that the Dow will not be able to hold the break to the new high.

LEADERSHIP

There are still many stocks in position to move as some of the rally leaders come back again after bouncing some on Thursday.

Technology/Semiconductors. FFIV looks really great in its pullback to test the highs in its base. MSPD is a semiconductors. It looks pretty good, unlike many. It is starting to break higher out of a lateral consolidation. MXWL has a nice test of the 50 day EMA. Kind of a cup-with-handle-with-handle pattern. Some technology looks pretty good, but not all of the chips look so grand. CRUS gapped and rallied, and then a week ago it gapped lower. Now it is having trouble at the 50 day EMA. LSI has a big rollover, and it looks rather weak right now.

Looking at some of the big names, AAPL had apologies and what have you with respect to the maps application on its iPhone 5. I do not know about this CEO. Listening to what happened today, and then the deal with the dividend along with everything else we have seen, I am beginning to wonder if the Jobs era has already ended. In other words, I wonder if the momentum from Jobs and the "products in the pipeline" has waned as fast as QE3. We will see.

Financial. The financials look decent. BAC had a nice pullback to the 20 day EMA. MS had a nice test of the 200 day EMA after its breakout. GS is very similar, holding at the 20 day EMA after a cup with handle breakout and run. They still look good and like they could still move to the upside.

Metals. Some of the metals are showing some life. FCX has put in the base, handle, breakout, and the test. BHP looks interesting. It has had a break of the trendline and has tested it. But on Friday it was not able to extend the Thursday move, so we will see if it can hold and make the new break to the upside. What is not working in metals? Steel. It looks pretty pathetic. STLD has broken down and has not really gone up. It is somewhat indicative of all of the steel sector in general.

Retail. Retail continues to look solid. LULU is still in a very nice ABCD pullback to the 20 day EMA. FDO extended its Thursday upside break. Indeed, it had a good, solid week all the way around. DLTR still looks like it wants to break higher. But note that, outside of LULU, some of the best-looking retail stocks are the deep discounters that work in recessions such as DLTR and FDO. The economic data looks so pathetic right now, and that is why these stocks are shaping up and looking better and better for the move to the upside.

Rally Leaders. AMZN bounced back down just a little bit after that Thursday move, but it is holding the 20 day EMA. It looks solid. EBAY looks like it might want to come back and test a little more as well. Some of those leaders on the move higher have a little heaviness right now. Even EBAY, thanks to this move that is coming back, has a little head and shoulders formed at the top of this run. It was not a great setup with the action on Friday with no follow-through to the upside.

THE ECONOMY

Free markets defeat mandates: US cuts carbon footprint below Kyoto mandates by . . . 2012.

It is not just the US reporting the astounding news. As the Olympics caught the world's attention this summer, Paris-based International Energy Agency reported that the US posted the 'largest reduction of emissions of all countries or regions' since 2006, a 7.7% decline. The US Energy Information Agency, based upon the first five months of 2012, expects US CO2 emissions to decline by 14% from their peak in 2007.

Indeed, this year could very well see the US carbon emissions falling below 1990 levels, the very target set under the Kyoto treaty, a treaty the US found the wisdom not to enter. California has a 'cap and trade' law and it requires 1990 emissions . . . by 2020.

Was it tough mandates and subsidies for electric cars, wind power, and solar initiatives to save us from the evils of rising CO2 emissions? After all, our President promised that electricity rates "would necessarily skyrocket" under his plans. Did he carry through with designs that we all would not like because of the price tag for the changes and the price to the economy in terms of economic slowing caused by the huge price tag (but of course would all thank him later for cleaner air, receding oceans, and a healing planet)? Did we have to spend the trillions estimated to reach the Kyoto Treaty mandates and suffer the associated pain?

NO! The cost: ZERO. Moreover, electricity rates are LOWER. A quick reduction in carbon emissions at no cost? How?

Was this simply good fortune, a gift from the heavens? Well, if you consider a capitalist economy and free enterprise good fortune or a gift from heaven, the answer would be 'yes.'

The catalyst: technology advances in the private sector involving hydraulic fracturing of horizontal wellbores. Horizontal drilling revolutionized the oil and gas industry. Instead of drilling vertically and puncturing a small area of the horizontal extent of a hydrocarbon reservoir, horizontal drilling allowed running a wellbore through the entire horizontal extent of a hydrocarbon (oil and gas) bearing formation. One well, more production, lower cost energy.

Fracturing augments the cost savings as liquids are pumped into the reservoir at high pressure, fracturing the formation so hydrocarbons flow to the wellbore more easily and rapidly, increasing the production and again lowering costs for every barrel or MCF produced. Indeed, formations considered too 'tight' to economically produce hydrocarbons, e.g. shale, are now adding millions of barrels of oil and billions of MCF in natural gas to US reserves.

The result: natural gas prices have dropped so dramatically that communities across the nation are switching to natural gas powered electricity plants. Natural gas prices have not been this low in 35 years (inflation adjusted) and are 3 to 5 times lower this year versus 2005-06. Cleaner burning, cheaper natural gas (45% less carbon per energy unit) has garnered so much of the market that our carbon footprint has plunged over the past two years and is at 20 year lows. This is even more impressive considering 57M more energy consumers exist today than 20 years ago according to the Census Department. Indeed, carbon emissions per person are down 20%, at the lowest levels since 1961. Per year, the reduction in US emissions is TWICE THE TOTAL EFFECT of the Kyoto Protocol carbon emissions in the rest of the world. Natural gas power generation has risen from 20% to 32% as of April 2012, telling you there is still a lot of room to make more gains. Amazing.

But then again, not. Instead of placing burdens in the trillions of dollars on industry (and in the end consumers through price pass-through) to retrofit or completely build new machinery and plants to reduce emissions, instead of mandating expensive and economically infeasible 'alternative' energy sources, we utilized a readily available natural resource to affect a major reduction in air pollutants that not only cost us nothing, but BENEFITTED all involved.

Companies discovered massive new sources of resources to sell. The costs of finding those resources, thanks to the new technologies and application of technologies, plummeted. The companies sell the product, and even with lower prices thanks to the success of the new methods, make money and employ workers. Energy producing regions in the US are about the only major economic hubs in the economy.

Consumers and communities make money on the deal. Natural gas power is cheaper. The cleaner burning gas means no costs associated with reducing emissions. Consumers see their power bills fall. We should all see health benefits as well.

The world benefits from a massive reduction in carbon from one of the largest industrial economies on the earth.

Again, the cost? Nothing. It works because free enterprise works. Trillions of dollars in costs on mandated, inefficient regulations and forms of power? Economic slowing as a result of costs that 'necessarily skyrocket' energy prices? No. Indeed the 30,000 heavily subsidized and environmentally damaging wind turbines in the US reduce emissions only by one-tenth versus natural gas. Biofuels by only 10 megatons. Solar just 3 megatons. The costs of those? Staggering in terms of kilowatt hours thanks to subsidies and inefficient technologies, not to mention creating unforeseen environmental damage (e.g. wind farms changing the climate at the surface due to mixing of hot and cold air; the slaughter of eagles and migratory birds that is going virtually unreported). Compare natural gas: it has reduced US emissions 400 to 500 megatons per year.

Compare this to Europe as well with its mandated solar and wind power initiatives at the cost of $20B per year since 1990. The improvement: per person emissions are down by less than half of the US reduction of just the past two years. $440B over 20 years in Europe for half of the US reduction since 2010. US cost: $0.

Capitalism shows it works. If left to its own means it finds or creates the latest technologies to efficiently meet challenges faced by society and the economy.

If there was ever a case study as to why regulation should be limited to the necessities and the government should allow great minds and entrepreneurs to pursue the best ideas, and yes, profit, this is it. It was NEVER believed the US could reach these levels by 2012 and indeed by 2020. The data show clearly that the impact of hydraulic fracturing is the catalyst in this massive reduction in cost, the conversion to natural gas generated power, and thus the reduction in carbon emissions. Go tell it on the mountain.

THE MARKET

SENTIMENT INDICATORS

VIX. A big hit on Thursday as the market bounced, but on Friday it was back up modestly. 6% is modest compared to some of the recent moves, but it did hold at support and it bounced. We may see some more selling in the market as the VIX moves up toward that late-August peak. It held at the same support that has lunched other selling. It has made big strides higher as the market sold hard through Wednesday. Now it looks as if it has paused and could continue as the new quarter starts. That would mean a little more pullback in the overall markets. But we also need to look at the technical patterns on the charts to see how much pullback there should be if they hold logical support or if there would be more if volatility wants to surge higher.

VIX: 15.73; +0.89
VXN: 17.01; +0.56
VXO: 14.57; +1.09

Put/Call Ratio (CBOE): 0.99; +0.17

Bulls versus Bears

Bulls: 51.0% versus 54.2% versus 51.1%. Back to pre-QE3 levels as quick as they ran up. Still below the 60% to 65% bullish levels that flash a warning sign, and that is a positive for a continued rally . . . likely after a bit more pullback. Up from 43.6% over 5 weeks and that after five weeks at 39%. Undercut 35%, the threshold for bullishness, in early June. As noted, hit 34% in early June. It did its job and the market is on the rally. Hard drop to 34 from 39.3% as economic reality and a choppy stock market hit. Off the 55+ level hit in late February. That was the highest level since April and May of 2011, the peak of the post-bear market high. 35% is the threshold level suggesting bullishness. To be seriously bearish it needs to get up to the 60% to 65% level.

Bears: 24.5% versus 24.5% versus 25.5%. Steady at 24.5%. Bears have sat at this level three of the past four weeks. Still a bit skeptical but they appear to be in a holding pattern as the fiscal cliff and election approach. March and April saw lower lows in the 21% range. On the last run never made it to the 35% that can be a bullish indication, but the bulls were weak enough back in June. Over 35% is the threshold to be really be a good upside indicator. For reference, bearishness hit a 5 year high at 54.4% the last week of October 2008. The move over 50 took bearish sentiment to its highest level since 1995. Extreme negative sentiment. Prior levels for comparison: Bearishness peaked at 37.4% in September 2007. It topped the June 2006 peak (36%) on that run. That June peak eclipsed the March 2006 high (33%) and well above the 2005 highs that spawned new rallies (30% in May 2005, 29.2% in October 2005). That was a huge turn, unlike any seen in recent history.

NASDAQ

Stats: -20.37 points (-0.65%) to close at 3116.23
Volume: 1.822B (+3.52%)

Up Volume: 781.68M (-518.32M)
Down Volume: 1.07B (+692.52M)

A/D and Hi/Lo: Decliners led 1.88 to 1
Previous Session: Advancers led 2.62 to 1

New Highs: 74 (-18)
New Lows: 20 (-1)

SP500/NYSE

Stats: -6.48 points (-0.45%) to close at 1440.67
NYSE Volume: 662M (+15.33%)

A/D and Hi/Lo: Decliners led 1.54 to 1
Previous Session: Advancers led 3.02 to 1

New Highs: 149 (+8)
New Lows: 13 (+4)

DJ30

Stats: -48.84 points (-0.36%) to close at 13437.13
Volume: 147M shares Friday versus 114M Thursday.

MONDAY

Next week is big in terms of data. The data train does not slow, building into the September jobs report on Friday. It will be an important one. It is the next-to-last one before the election. Expectations are 120K after the benchmarks were revised up 382K for the last 12 months ending in March. Who knows what can happen here? The polls show that the President is comfortably ahead, but not a lot of people believe those polls. Frankly, they are oversampled one way. I don't know about you, but a lot of people I know do not answer the phone for the pollsters or do not participate. They keep it close to the vest, at least in terms of letting the pollsters know who they want to vote for.

We have a lot of news coming out, and it is all basically a warm up. Given the Chicago tumble, the neat one will be the ISM out on Monday. We are expecting it to be negative again. It is expected to rise some, but I don't see that. It has probably slipped further than anticipated because the surprises have been to the downside. Tuesday is kind of a nothing day. Wednesday we get the ISM service and also the ADP. That is always good for a laugh or two. Then on Thursday we get the Challenger report. Factory orders will be important. We will see if Initial Claims rise or fall unexpectedly. It is getting close to the election, so we can expect some monkeying around with those.

Of course we have the nonfarm payrolls. Will the unemployment rate fall magically below 8% this time? It is about time for them to pull that miracle, isn't it? Of course no one would believe it because the companies have all told us that the plans on hiring have declined in a very short period of time. They were already low, and now they are even lower. We will not really get any employment, and any numbers that say otherwise are bogus. I know no one likes to hear that, and people think, "Go away, conspiracy theorist." But think about it. Who is hiring?

There are pockets in the country where they are hiring like crazy. All the energy producing areas are booming. Texas looks good. Ohio is decent. Virginia is decent. Florida is decent. They are all states with Republican governors as well. Interesting. They are doing better than the other states. In any event, I will not get too much into that. It is what it is. They will report what they will report, and then we will pick the numbers apart. If they got fast and loose with the revisions, the adjustments, or with things such as the birth/death rate, we will talk about it. Not that anyone else will because it is just not apparently important to anyone that the truth comes out.

What about this window dressing that did not show up on Friday? That leaves the question as to what will happen on Monday. There are still some good stocks in pullbacks that could test back further. EBAY, as noted earlier, is a bit troubling. It has a bit of a head and shoulders formed, but those do not mean that much necessarily. You could argue the same thing for AMZN as well. But if it pulls back a little bit more to trend, perhaps, even the 50 day EMA, it is still in great shape to move higher. As VIX continues to work a bit further higher, we could see these big names come back a bit more. But as we looked at the leaders, there are some areas such as the drugs that look super and are moving to the upside.

As a matter of fact, I forgot to talk about those drugs initially. Trust me, the drugs are looking quite good. Let's flip through some of them so I can help you see what I have been seeing in those stocks. OSIR had a good 8% move on Friday. BCRX looked to have broken down, but it is now trying to break back to the upside. ARIA had a great move, still in progress. CELG looks like it might be ready to rebound off of a nice flag. PCYC is moving higher as well out of its nice 50 day EMA test. As you can see, the drug stocks are doing fine. They are set up well, and some are already running. Others are ready to run. A little bit defensive, but that is okay. They were defensive yet they tend to go up when the rest of the market goes higher as well.

The point is there will be stocks that will want to pull back. At the same time, there are stocks that want to move higher. Since our overall thesis is that stocks will resume the move thanks to QE3, once this pullback is completed, then we look for buys as they fade in the pullback.

The question I had in the headlines is: Will there be further pullback or will new money enter into the new quarter? It might, but likely VIX has a little more work to do. A little more pullback in these names that rallied high but are now fading over the past couple of weeks to test. The new quarter may not have a lot of initial resilience with the QE3, but we do expect it to show up shortly thereafter. Remember, right now -- and this will change in the future -- the market is rallying to stimulus. It is rallying on the $40B+ purchases of mortgage-backed securities, which is the start of QE3. And it is just the start. The economy will not get any better, and thus the Fed will put more stimulus on the table. That will be good for financial assets. Maybe not as potent as before, but it will provide a backstop. We think we will be able to get more upside out of this.

Pretty simple. I don't want to sound pollyanna-ish because it kind of came back in our face on Friday. But we look for the pullbacks of those stocks that have rallied and need to come back a bit. We also look at the stocks that are already set up well and can continue to the upside even as the rest of the market takes a little breather.

It always concerns you when there is just no follow-through as there was on Friday. You also have to look at the good patterns. You look at the good patterns of the leaders and the leader wannabes. The overall catalyst for the move is still there, and it will be there. While we do not expect to have the same effect as QE1, or QE2 for that matter, the move on the announcement of QE3 is not the culmination. It may have been the culmination of this move off of June in anticipation from the promise, but after this consolidation we fully anticipate the bids to come back in and drive things higher. We may be proved wrong, but we will see the patterns break down before that.

I will see you on Monday for another fact-filled week. It will also be a fiction-filled week as we hear about economic reports and what he did and she did and what the cat saw and what the parrot repeated in the presidential campaign.

Have a great weekend!

Support and resistance

NASDAQ: Closed at 3116.23
Resistance:
The 20 day EMA at 3125
3134 is the March 2012 post-bear market peak: broken, not forgotten.
3227 is the April 2000 intraday low
3401 is the May 2000 closing low

Support:
3101 is the August 2012 high
3090 is the mid-March interim high
3076 is the late April 2012 high
The 50 day EMA at 3068
The June up trendline at 3056
3042 from 5/2000 low
3026 from 10/2000 low
3024 is the gap point from early May
3000 is the February 2012 post-bear market high
2999 is the bottom of the August 2012 consolidation
2988 is the July 2012 high
2962 is the April 2012 low
2950 is the mid-April closing low
2942 is the mid-June 2012 high
The 200 day SMA at 2926
2910 is the March 2012 low
2900 is the March 2012 low

S&P 500: Closed at 1440.67

Resistance:
1475 is the September 2012 high
1499 from January 2008
1539 from June 2007

Support:
The 20 day EMA at 1440
1440 from November 2007 closing lows
1433 from August 2007 closing lows
1432 is the June up trendline
1425 from May 2008 closing highs
1427 is the August 2012 peak
1422.38 is the prior post-bear market high (March 2012)
The 50 day EMA at 1416
1406 is the early May 2012 peak
1402.22 is the closing low of the August 2012 lateral consolidation
1378 is the February 2012 peak
1375 is the early July 2012 peak
1371 is the May 2011 peak, the post-bear market high
1363.46 is June 2012 high
1359 is the April 2012 low
The 200 day SMA at 1359
1357 is the July 2011 peak
1344 is the February 2011 peak
1340 is the early April 2011 peak
1332 is the early March 2011 peak
1325 is the July 2012 intraday low
1309 is the right shoulder low from June 2012
1295 to 1294 is the April 2011 low and the February 2011 consolidation low (bottom of the trading range)
1293 is the October 2011 peak
1275 is the January 2010 low, early January 2011 peak
1267 is the December 2011 peak
1266 is the June 2012 base low

Dow: Closed at 13,437.13
Resistance:
13,668 from 12-2007 peak
13,692 from 6-2007 peak
14,022 from 7-07 peak

Support:
The 20 day EMA at 13,411
13,331 is the August 2012 post-bear market high
13,297 is the April 2012, prior post bear market high
The 50 day EMA at 13,229
13,058 from the May 2008 peak on that bounce in the selling
13,056 is the February 2012 high
12,971 is the early July 2012 high
The 200 day SMA at 12,850
12,754 is the July intraday peak
12,716 is the April 2012 closing low
12,391 is the February 2011 peak
12,369 is the left shoulder low from May 2012
12,284 is the October 2011 peak
12,258 is the December 2011 peak
12,110 from the March 2007 closing low
12,094 is the April 2011 low
12,035 is the June 2012 base low
The June 2011 low at 11,897 (closing)
11,734 from 11-98 peak
11,717 is the late August 2011 peak

Economic Calendar

September 25 - Tuesday
- Case-Shiller 20-city, July (9:00): +1.2% actual versus 0.8% expected, 0.5% prior
- Consumer Confidence, September (10:00): 70.3 actual versus 63.0 expected, 61.3 prior (revised from 60.6)
- FHFA Housing Price Index, July (10:00): 0.2% actual versus 0.7% prior

September 26 - Wednesday
- MBA Mortgage Index, 09/22 (7:00): +2.8% actual versus -0.2% prior
- New Home Sales, August (10:00): -0.3%; 373K actual versus 380K expected, 374K prior (revised from 372K)
- Crude Inventories, 09/22 (10:30): -2.446M actual versus 8.534M prior

September 27 - Thursday
- Initial Claims, 09/22 (8:30): 359K actual versus 379K expected, 385K prior (revised from 382K)
- Continuing Claims, 09/15 (8:30): 3271K actual versus 3270K expected, 3272K prior
- Durable Orders, August (8:30): -13.2% actual versus -5.0% expected, 4.1% prior (revised from 4.2%)
- Durable Orders ex-Transports, August (8:30): -1.6% actual versus -0.2% expected, -1.3% prior (revised from -0.6%)
- GDP - Third Estimate, Q2 (8:30): 1.3% actual versus 1.7% expected, 1.7% prior
- GDP Deflator - Third, Q2 (8:30): 1.6% actual versus 1.6% expected, 1.6% prior
- Pending Home Sales, August (10:00): -2.6% actual versus 0.5% expected, 2.4% prior

September 28 - Friday
- Personal Income, August (8:30): 0.1% actual versus 0.2% expected, 0.1% prior (revised from 0.3%)
- Personal Spending, August (8:30): 0.5% actual versus 0.5% expected, 0.4% prior
- PCE Prices - Core, August (8:30): 0.1% actual versus 0.1% expected, 0.1% prior (revised from 0.0%)
- Chicago PMI, September (9:45): 49.7 actual versus 52.9 expected, 53.0 prior
- Michigan Sentiment - Final, September (9:55): 78.3 actual versus 79.0 expected, 79.2 prior

October 1 - Monday
- ISM Index, September (10:00): 49.7 expected, 49.6 prior
- Construction Spending, August (10:00): 0.4% expected, -0.9% prior

October 2 - Tuesday
- Auto Sales, September (14:00): 5.3M prior
- Truck Sales, September (14:00): 6.3M prior

October 3 - Wednesday
- MBA Mortgage Index, 09/29 (7:00): +2.8% prior
- ADP Employment Change, September (8:15): 133K expected, 201K prior
- ISM Services, September (10:00): 53.0 expected, 53.7 prior
- Crude Inventories, 09/29 (10:30): -2.446M prior
- FOMC Minutes, 9/12 (14:00)

October 4 - Thursday
- Challenger Job Cuts, September (7:30): -36.9% prior
- Initial Claims, 09/29 (8:30): 365K expected, 359K prior
- Continuing Claims, 09/22 (8:30): 3273K expected, 3271K prior
- Factory Orders, August (10:00): -6.0% expected, 2.8% prior

October 5 - Friday
- Nonfarm Payrolls, September (8:30): 120K expected, 96K prior
- Nonfarm Private Payrolls, September (8:30): 130K expected, 103K prior
- Unemployment Rate, September (8:30): 8.1% expected, 8.1% prior
- Hourly Earnings, September (8:30): 0.2% expected, 0.0% prior
- Average Workweek, September (8:30): 34.4 expected, 34.4 prior
- Consumer Credit, August (15:00): $5.0B expected, -3.3B prior
icon url

ReturntoSender

10/01/12 6:19 PM

#9939 RE: ReturntoSender #6755

From Briefing.com: 4:15 pm : Today's session began with an extension of the bullish sentiment observed in overseas action. Following a higher open, U.S. equities got an additional boost from the ISM Index which was reported at 51.5 against the expectations of a 49.7 reading. After rallying to session highs, the Dow held the bulk of its gains, while the S&P 500 and Nasdaq spent the remainder of the session in a slow retreat towards the unchanged line. As a result, the Dow climbed 0.6%, the S&P 500 added 0.3%, and the Nasdaq slipped 0.1%.

The financial sector was one of the day's top performers. The SPDR Financial Select Sector ETF (XLF 15.66, +0.07) advanced 0.5% as major names within the sector all showed gains. Goldman Sachs (GS 116.86, +3.18) ended higher by 2.8%, while Bank of America (BAC 8.96, +0.13) added 1.5%. Meanwhile, Citigroup (C 32.75, +0.03) finished flat after its shares were downgraded from ‘buy' to ‘neutral' at Sterne Agee.

European financials also rallied. Credit Suisse (CS 21.67, +0.52) advanced 2.5%, while Barclays (BCS 14.14, +0.27) and Deutsche Bank (DB 40.21, +0.56) registered gains near 1.7% each.

Despite the outperformance of financials, those names specializing in real estate investment trusts were relatively weaker. The iShares Dow Jones US Real Estate ETF (IYR 63.92, -0.46) slipped 0.7%. Among individual names, Prologis (PLD 34.58, -0.45), Vornado (VNO 80.29, -0.76), and Weingarten (WRI 27.66, -0.45) all fell between 0.9% and 1.6%.

The health care space also displayed relative strength as a handful of stocks moved on analyst comments. Healthcare Services Group (HCSG 23.81, +0.95) gained 4.2% after UBS initiated coverage of the stock with a ‘buy' rating. Meanwhile, Allscripts (MDRX 12.84, +0.42) advanced 3.4% following an upgrade from ‘neutral' to ‘outperform' at Cowen. In addition, Allscripts was also upgraded by ISI Group.

Blyth (BTH 26.77, +0.78) added 3.0% after announcing that it bought back 283,300 shares between September 26-28.

Tenet Healthcare (THC 6.48, +0.21) rose by 3.4% after unveiling a four-point plan to drive shareholder value creation. A $500 million authorization to repurchase common stock in open market transactions was one of the key points of the plan. In addition, effective October 11, 2012, a reverse stock split will occur. As a result of the reverse split, one new Tenet share will be issued in exchange for every four existing shares.

The Dow Jones Transportation Average trailed the broader market. The bellwether group added 0.1% as trucking and shipping stocks weighed on the complex. Overseas Shipholding Group (OSG 6.49, -0.11) and Matson (MATX 20.16, -0.75) lost 1.7% and 3.6%, respectively.

All five airlines listed in the transportation average showed relative outperformance. Alaska Air (ALK 35.17, +0.11) added 0.3% while Delta (DAL 9.47, +0.31), JetBlue (JBLU 4.86, +0.07), Southwest (LUV 8.86, +0.09), and United Continental (UAL 19.79, +0.29) posted gains between 1.0% and 3.4%.

Chinese internet stocks were broadly weaker today. Baidu (BIDU 112.77, -4.12) shed 3.5% after its shares were downgraded from ‘buy' to ‘hold' at Jefferies. In addition, the price target was lowered from $135 to $125. Peers, Sohu.com (SOHU 41.33, -0.76) and Qihoo (QIHU 21.81, -0.24) slipped 1.8% and 1.1%, respectively. Meanwhile, Youku (YOKU 18.70, +0.31) rose by 1.7% as it outperformed its peers.

August construction spending fell 0.6% month-over-month, against the expected increase of 0.4%.

Tomorrow's economic data is limited to just two releases. Auto and truck sales will be reported at 14:00 ET.DJ30 +77.98 NASDAQ -2.70 SP500 +3.82 NASDAQ Adv/Vol/Dec 1397/1.71 bln/1073 NYSE Adv/Vol/Dec 1886/672.7 mln/1166

3:30 pm : Crude oil traded higher during today's pit trade following stronger-than-anticipated ISM data. The energy component touched a session high of $93.33 per barrel moments after floor trade began but pulled-back as it headed into afternoon action. It chopped around just above the unchanged line for the remainder of the session and settled 0.3% higher at $92.44 per barrel.

Natural gas took off from its session low of $3.38 per MMBtu and trended higher for most of its pit session. It closed at its session high of $3.48 per MMBtu for a 4.8% gain.

Gold and silver rallied to their respective session highs of $1794.40 per ounce and $35.44 per ounce following dovish comments from Chicago Fed President Charles Evans noting that more accommodation is needed to reach a more appropriate unemployment rate of 5-7%.

However, both precious metals slid to the unchanged level as the equity market opened. Gold spent the remainder of floor trade trading in choppy fashion and settled 0.5% higher at $1782.80 per ounce. Silver trended slightly higher and closed with a 1.0% gain at $34.94 per ounce.DJ30 +68.68 NASDAQ -8.62 SP500 +2.10 NASDAQ Adv/Vol/Dec 1308/1414.0/1173 NYSE Adv/Vol/Dec 1781/436 mln/1250

4:38PM Extreme Networks announces $75 mln share buyback plan (EXTR) 3.30 -0.05 : Co announced its Board of Directors has authorized the repurchase of common stock worth up to $75 million which may be purchased over the next three years from time to time in the open market or in privately negotiated transactions. Extreme Networks will fund the share repurchases from cash on hand, which was approximately Co announced its Board of Directors has authorized the repurchase of common stock worth up to $75 million which may be purchased over the next three years from time to time in the open market or in privately negotiated transactions. Extreme Networks will fund the share repurchases from cash on hand, which was approximately $200 million as of September 30, 2012. As of August 6, 2012, there were approximately 95 million shares of common stock outstanding.00 million as of September 30, 2012. As of August 6, 2012, there were approximately 95 million shares of common stock outstanding.

11:34AM Intel sets new session high of 23.07, the first thrust high off its Sep low is at 23.14 (INTC) 23.05 +0.40 : Stock has significantly lagged behind the overall market for the last five months. It set an 11 month low last week before rebounding to 23.14 on Thursday. The new session high of 23.07 leaves it mildly under this first thrust high.

8:04AM MEMC Elec announces $200 million financing (WFR) 2.75 : Co announced it closed a new $200 million term loan on September 28, 2012. The term loan is secured by a second priority lien on substantially all of the company's assets, including a pledge of all the equity interests of each of its domestic subsidiaries, other than certain project subsidiaries, and 66% of the voting equity interests of its first-tier foreign subsidiaries. Each of the company's subsidiary guarantors under its first lien revolving credit facility is also a guarantor under this term loan. The term loan, which was fully drawn at the closing, has a maturity of five years.

7:31AM Qualcomm implements new corporate structure (QCOM) 62.47 : Co completed its previously announced plans to modify its corporate structure. As previously stated, the corporate structure changes have been implemented, among other reasons, in order to enhance Qualcomm's ability to quickly deliver products to its customers, while further protecting and insulating its valuable patent portfolio from any claims resulting from actions and activities by portions of the company other than the Qualcomm Technology Licensing Division (QTL). Qualcomm did not undergo this restructuring in anticipation, or as part, of spinning out either the QTL or QCT businesses, nor was this change in response to any third party actions or claims.

The new corporate structure features the parent company, Qualcomm Incorporated, which includes QTL and corporate functions, as well as most of Qualcomm's patent portfolio, and a wholly owned subsidiary, Qualcomm Technologies (QTI), which, along with its subsidiaries, now operates substantially all of Qualcomm's research and development activities, as well as product and services businesses, including its semiconductor business, QCT.

10:37 am S&P Information Technology Index trading higher today along with the broader market

The tech sector is trading higher today, along with gains in the broader market. Semiconductors are showing relative weakness, however, with the SOX trading only 0.7% higher. Within the chip index, AMD (-3.0%) is a notable laggard. Among other major indices, the SPY is trading 1.0% higher today, while the QQQ is up 1.0% and the NASDAQ is trading 0.9% higher on the session. Among tech bellwethers, FB (+3.5%) is a standout, while MSFT (-1.9%) is showing notable weakness. In tech earnings, ALVR (-7.2%) lowered FY12 guidance below consensus. In news, Workday set an IPO range of $21-24, which values the company at ~$3.6 billion. Among rumors, we are hearing TWTC (+4.2%) M&A chatter making the rounds.

In notable analyst upgrades this morning in the tech space, RTEC (+3.4%) was upgraded to Outperform at Credit Suisse and BCOV (+7.0%) was upgraded to Top Pick at RBC. Among downgrades, SYNA (-0.9%) was downgraded to Sector Perform at Pacific Crest, QSII (-2.5%) was downgraded to Underweight at Morgan Stanley, MSFT (-0.3%), RP (-1.8%), FTNT (+0.2%), CVLT (-1.4%), CHKP (-0.9%) & VMW (+1.0%) were downgraded at RBC, CCOI (-0.6%) & S (-2.9%) were downgraded to Mkt Perform at Raymond James, MRCY (-4.7%) & BIDU (-2.4%) were downgraded to Hold at Jefferies, ALU (-3.5%) was downgraded to Sell at UBS, NOW (-3.4%) was downgraded to Sell at UBS and BRKS (-2.4%) & NOK (+5.6%) were downgraded to Underperform at Credit Suisse. There are no notable names in tech scheduled to report quarterly results today after the close.
icon url

ReturntoSender

10/02/12 10:46 PM

#9940 RE: ReturntoSender #6755

From Briefing.com: 4:15 pm : The major averages got off to a strong start, but the bullish bias faded shortly after the open. Headlines out of Europe provided another risk-off signal as reports suggested that a Spanish aid request is not imminent. After marking their session highs during the first five minutes of trade, the key indices spent most of the session trending lower. However, a rally in the final hour of trading lifted the S&P 500 and Nasdaq into positive territory while the Dow closed with a small loss of 0.2%.

The health care sector was the day's top performer. Within the space, biotech stocks showed strength which was reflected by the iShares Nasdaq Biotechnology ETF (IBB 145.18, +1.54) adding 1.1%. Looking at individual names, Amgen (AMGN 86.35, +1.27) traded at its all-time high before closing higher by 1.5%. Meanwhile, Gilead (GILD 69.17, +1.73) also marked a fresh all-time best as the shares gained 2.5%.

On the downside, ArQule (ARQL 2.18, -2.81) fell 56.3%. The weakness followed the company's announcement regarding the discontinuation of Phase 3 MARQUEE clinical trial in non-small cell lung cancer after determination that study would not meet its primary endpoint. As a result of the announcement, Needham downgraded ArQule from ‘buy' to ‘hold.'

Telecom stocks also outperformed as buyout speculation lifted one name to its best level since July 2011. MetroPCS (PCS 13.57, +2.05) spiked 17.8% after a Bloomberg TV report suggested the company may be nearing a deal with Deutsche Telecom/T-Mobile. Peer, Leap Wireless (LEAP 7.59, +0.59) surged 8.4% while Sprint (S 4.90, -0.28) slipped 5.4%.

The materials sector was the weakest performer as steel and aluminum producers were under pressure. AK Steel (AKS 4.79, -0.09), Cliffs Natural Resources (CLF 38.55, -0.33), and United States Steel (X 18.99, -0.32) all posted losses between 0.8% and 1.8%.

Elsewhere in the sector, Mosaic (MOS 55.76, -2.25) slid 3.9% after missing on both earnings and revenues. The company's earnings per share were reported $0.15 below consensus estimates, while revenues fell $180 million short of estimates. In its defense, the company cited longer annual maintenance shut-downs and challenges posed by hurricanes, noting demand for products outpaced Mosaic's ability to produce and deliver.

Wassau Paper (WPP 8.67, -0.49) slid 5.4% after lowering its full-year guidance due to lower profitability at its facility in Brainerd, Minnesota. Other paper names were mixed as Neenah Paper (NP 27.91, -0.67) shed 2.3% while Louisiana-Pacific (LPX 13.00, +0.32) gained 2.5%.

The Dow Jones Transportation Average edged up as it outperformed the remaining industrials. Airline stocks enjoyed their second consecutive day of gains as Delta Airlines (DAL 9.77, +0.30) and JetBlue Airways (JBLU 4.98, +0.11) rose by 3.2% and 2.4%, respectively.

Meanwhile, shipping stocks led the transportation complex. Overseas Shipholding Group (OSG 7.08, +0.59) jumped 9.1% after its joint venture with Euronav secured a new charter deal. Peer, Matson (MATX 20.50, +0.34) added 1.7% on related strength.

Financial stocks showed some relative outperformance. Citigroup (C 33.26, +0.51) was the top performer among the majors. The financial giant gained 1.6% after Keefe Bruyette upgraded shares of Citigroup from ‘market perform' to ‘outperform.' Elsewhere in the sector, JPMorgan Chase (JPM 40.92, -0.05) shed 0.1% after New York Attorney General, Eric Schneiderman announced he would file a lawsuit against the bank over mortgage-backed securities sold by Bear Stearns.

In tomorrow's economic data, the MBA Mortgage Index will be reported at 7:00 ET. In addition, the ADP Employment Change and ISM Services will be released at 8:15 ET and 10:00 ET, respectively.DJ30 -32.75 NASDAQ +6.51 SP500 +1.26 NASDAQ Adv/Vol/Dec 1258/1.57 bln/1192 NYSE Adv/Vol/Dec 1589/596.3 mln/1406

3:30 pm : Crude oil oscillated between positive and negative territory despite a weaker dollar. It touched a pit session high of $92.78 per barrel in afternoon action, but slid back into negative territory as it headed into the close. The energy component settled 0.6% lower at $91.89 per barrel, or just above its session low of $91.82 per barrel.

Natural gas climbed into the black after trading as low as $3.40 per MMBtu in early morning pit action. It inched higher for most of its session and settled with a 1.4% gain at $3.53 per MMBtu.

Precious metals struggled in negative territory without much help from the weak dollar. Gold fell off its overnight session high of $1786.60 per ounce and tumbled as low as $1772.30 per ounce in morning pit action. It settled the choppy session at $1775.80 per ounce, or 0.4% lower. Silver also tumbled to a session low of $34.42 per ounce after trading as high as $35.12 per ounce in overnight action. It eventually settled with a 0.8% loss at $34.67 per ounce.DJ30 -53.33 NASDAQ -1.12 SP500 -1.91 NASDAQ Adv/Vol/Dec 1161/1336.2 mln/1282 NYSE Adv/Vol/Dec 1410/414 mln/1551

Mattson Technology (MTSN) has shipped its first follow-on Helios XP rapid thermal processing system to a major foundry customer

Extreme Networks (EXTR $3.35 +0.05) announced its Board of Directors has authorized the repurchase of common stock worth up to $75 million which may be purchased over the next three years from time to time in the open market or in privately negotiated transactions. Extreme Networks will fund the share repurchases from cash on hand, which was approximately Co announced its Board of Directors has authorized the repurchase of common stock worth up to $75 million which may be purchased over the next three years from time to time in the open market or in privately negotiated transactions. Extreme Networks will fund the share repurchases from cash on hand, which was approximately $200 million as of September 30, 2012. As of August 6, 2012, there were approximately 95 million shares of common stock outstanding.00 million as of September 30, 2012. As of August 6, 2012, there were approximately 95 million shares of common stock outstanding.

FBR Capital Markets are adjusting their Microsoft (MSFT $29.65 +0.16) estimates to reflect the impact of the Office 2013 upgrade program on the company's revenues. While the firm believes the company is in the midst of a healthy product cycle. they remain concerned over headwinds in the PC market in 2012 and beyond in the face of the macro environment, European weakness, consumerization of IT, and supply chain issues. To this point, they are taking a wait-and-see approach on the prospects of the new operating system and its potential impact to growth. THey are lowering their F1Q13 revenue and pro forma EPS estimates from $16.8 billion and $0.60 to $16.7 billion and $0.59, respectively (First Quarter Capital IQ Consensus $0.60/16.56 billion). FBR notes

Research In Motion's (RIMM $7.82 -0.04) August-ending quarter's result was significantly stronger than many investors expected. While a look at RIMM's operating metrics clearly reflected a Co under continued duress, mgmt seemed to ameliorate a tough situation and has slowed RIMM's rate of decline. Overall, mgmt seems to have emphasized revs, ASPs, smartphone units, subscriber net adds, and operating cost controls at the expense of GMs, service ARPU, and tablet sales. FBR expects the same trends to continue through year-end and up to the BB10 launch, when mgmt likely begins emphasizing upgrading corporate customers in its developed markets. FBR reiterates Underperform but raises its target to $6.50 from $6.
icon url

ReturntoSender

10/03/12 9:16 PM

#9941 RE: ReturntoSender #6755

From Briefing.com: 4:20 pm : Equities got off to a slow start as the major averages showed indecision in the early going. After chopping around the flat line during the first hour of trade, the key indices reached their session highs at the midway point. Unable to hold those levels, stocks returned to the middle of the day's range before buyers re-emerged in the final hour. As a result, the S&P 500 added 0.4%.

The consumer discretionary sector led the way as a handful of names outperformed. Family Dollar (FDO 68.56, +2.56) gained 3.9% after reporting in-line earnings and revenues. The management also issued mixed guidance as it sees weaker first quarter results and full-year earnings which are expected to be in-line with estimates.

Online video rental service Netflix (NFLX 62.58, +6.12) jumped 10.8% after Citigroup pointed to a survey which showed an improvement in customer satisfaction.

Elsewhere, DineEquity (DIN 58.40, +1.87) rose by 3.3% after Janney Montgomery Scott upgraded the shares of the restaurant operator from ‘neutral' to ‘buy.'

Homebuilder stocks showed broad strength as the SPDR S&P Homebuilders ETF (XHB 25.38, +0.55) settled higher by 2.2%. Within the group, Standard Pacific (SPF 7.17, +0.60) was the top performer as shares of the homebuilder spiked 9.1%.

The Dow Jones Transportation Average added 1.2% as the vast majority of its components displayed strength. Railroads, CSX (CSX 21.18, +0.48) and Norfolk Southern (NSC 65.60, +0.58) advanced 2.3% and 0.9% respectively after Lazard upgraded the two stocks from ‘underperform' to ‘market perform.'

Airline stocks were broadly higher after a handful of carriers reported positive monthly metrics. In addition, significant weakness in crude oil may have contributed to airline strength. United Continental (UAL 21.14, +1.20) jumped 6.0%, while Delta Airlines (DAL 10.16, +0.39) and Southwest Airlines (LUV 9.14, +0.16) gained 4.0% and 1.8%, respectively.

The financial sector outperformed the broader market, and the SPDR Financial Select Sector ETF (XLF 15.83, +0.14) settled higher by 0.9%. Bank of America (BAC 9.11, +0.18), Citigroup (C 34.06, +0.80), and Wells Fargo (WFC 35.44, +0.62) were the top performing majors as they registered gains between 1.8% and 2.4%.

Elsewhere, Ocwen Financial (OCN 34.88, +5.92) spiked 20.4% after the company announced the acquisition of Homeward Residential from WL Ross & Company for $588 million in cash and $162 million in convertible preferred stock.

MetroPCS (PCS 12.24, -1.33) fell 9.8% after the company confirmed its merger with T-Mobile USA. In addition, PCS announced the plans for a 1-for-2 reverse stock split. Prior to the reverse split, the company will make a cash payment of $1.5 billion—or $4.09 per share—to its shareholders.

Sarepta Therapeutics (SRPT 44.93, +29.94) soared 199.7% after announcing its eteplirsen met the primary endpoints of a trial while achieving significant clinical benefit on a 6-minute walk test. The positive results came after 48 weeks of treatment in phase IIb study focused on patients with duchenne muscular dystrophy.

Crude oil extended yesterday's losses despite inventory data that showed a draw of 0.482 million barrels when a build of 1.5 million was anticipated. Although there wasn't any one item to point to for the weakness, contributing factors included a stronger dollar, reports about the highest crude output levels since December of 1996, and weak economic reports out of Europe and China which signaled demand concerns. The energy component fell off its session high of $90.67 per barrel, and brushed a session low of $87.96 moments before it settled with a 4.0% loss at $88.20.

The September ISM Non-manufacturing Index was reported at 55.1, which was above the 53.0 Briefing.com consensus, and up from August's 53.7 reading.

According to today's ADP National Employment Report, employment in the nonfarm private business sector rose by 162K in September. This was above the 133K increase expected by Briefing.com consensus. In addition, the prior month's increase was revised down by 17k, to reflect an addition of 156k jobs.

In tomorrow's economic releases, Challenger Job Cuts will be reported at 7:30 ET. Initial and continuing claims will hit the wires at 8:30 ET, while factory orders will be released at 10:00 ET. In addition, the Federal Reserve will release the minutes from its September 12 Federal Open Market Committee meeting. Also of note, retailers will release their monthly comparable store sales reports.

Overseas, the Bank of England and the European Central Bank will hold policy meetings.DJ30 +12.25 NASDAQ +15.19 SP500 +5.24 NASDAQ Adv/Vol/Dec 1131/1.63 bln/1315 NYSE Adv/Vol/Dec 1499/666.0 mln/1512

3:35 pm : Crude oil extended yesterday's losses despite inventory data that showed a draw of 0.482 mln barrels when a build of 1.5 mln barrels was anticipated. Although there wasn't any one item to point to for the weakness, contributing factors include a stronger dollar, reports about the highest crude output levels since December of 1996, along with weak economic reports out of Europe and China, which signaled demand concerns. The energy component fell off its floor session high of $90.67 per barrel and brushed a session low of $87.96 per barrel moments before it settled with a 4.0% loss at $88.20 per barrel.

Natural gas trended lower for most of its floor session after falling off its session high of $3.45 per MMBtu. It tumbled to a session low of $3.35 per MMBtu and eventually settled for a 4.0% loss at $3.39 per MMBtu.

Gold traded in positive territory despite an advance by the dollar as both ADP Employment Change and ISM Services data beat expectations. The yellow metal popped to a pit session high of $1784.00 per ounce moments after floor trade opened and settled into a fairly consolidative pattern near the $1781.00 per ounce level by afternoon action. It inched slightly lower as it headed into the close and settled the session with a 0.2% gain at $1779.90 per ounce.

Silver also rallied to a session high of $34.93 per ounce right off the pit open but was unable to hold the momentum. It eventually gave up all of its gains and closed flat at $34.67 per ounce.DJ30 +6.64 NASDAQ +12.65 SP500 +4.16 NASDAQ Adv/Vol/Dec 1139/1376.0 mln/1299 NYSE Adv/Vol/Dec 1432/436 mln/1560

4:45PM Mattson Appoints J. Michael Dodson COO and CFO; announces details of cost-reduction program (MTSN) 0.93 -0.03 : Co appointed J. Michael Dodson, 51, as chief operating officer (COO) in addition to his existing duties as chief financial officer (CFO). Dodson joined Mattson Technology as executive vice president and CFO in October 2011.

Co also announced the plans for finalization of Phase III of its cost-reduction program, which entails a broader reduction in force and the consolidation of all of its manufacturing operations to the corporate headquarters in Fremont, California. The total estimated reduction in annual operating expenses for all three phases of the program is over $20 million. Combined with the ongoing gross margin improvement efforts, the Company's cash flow breakeven point is expected to be reduced to the low $30 million quarterly net sales level by the end of 2012.

4:05PM Integrated Device announces extension of exchange offer expiration date in PLX Technology Transaction (PLXT) (IDTI) 5.79 +0.01 : Co announced that it is extending the expiration date of its exchange offer for all outstanding shares of common stock of PLX Technology (PLXT). The exchange offer was previously scheduled to expire at the end of the day on October 4, 2012.

4:04PM O2Micro lowers Q3 rev guidance on broad-based weakness in co's end markets (OIIM) 3.78 -0.05 : Co issues downside guidance for Q3 (Sep), lowers Q3 (Sep) revs to $22-23 mln from $24.1-26.0 mln vs. $24.92 mln Capital IQ Consensus. In addition, gross margin for Q3 is now expected to be 54.5% to 55.5%. The reduction in anticipated revenue is primarily the result of broad-based weakness in demand in the co's end markets. "O2Micro continues to navigate through broad-based lower demand in all of our end markets. We believe this is the result of weak global economic conditions, coupled with excess inventory corrections by our customers. Additional information will be available when the Company reports its third quarter 2012 results prior to market open on October 31, 2012.

2:38PM Hewlett-Packard: HPQ -11% into the lowest price levels (15.15) seen since Apr. 2003 (HPQ) 15.26 -1.87 :

Kulicke & Soffa Industries (KLIC) announced the appointment of Mui Sung Yeo to its Board of Directors. In addition, Ms. Yeo will serve on the co's Audit Committee.

Integrated Silicon Solution (ISSI) announced it has begun sampling production units of its new 1Gigabit and 2 Gigabit DDR3 devices, the first of ISSI's family of DDR3 SDRAMs.

IBM (IBM) unveiled new technologies designed to help organizations with improved security, the ability to take advantage of cloud computing, and the requirement to manage and analyze vast amounts of data. The new offerings include the most powerful enterprise Power Systems to date, a new high-end disk storage system and key software updates for IBM's newest mainframe computer.

10:51 am S&P Information Technology Index trading higher today and ahead of overalll market

The tech sector is trading higher today, just ahead of gains in the broader market. Semiconductors are showing relative weakness, however, with the SOX trading 0.1% lower. Within the chip index, MKSI (-1.4%) is a notable laggard. Among other major indices, the SPY is trading 0.2% higher today, while the QQQ is up 0.4% and the NASDAQ is trading 0.3% higher on the session. Among tech bellwethers, MSFT (+0.9%) is showing strength, while TXN (-0.6%) is under pressure. In tech earnings, XRTX (-13.7%) posted a Q3 miss and guided Q4 well below consensus. XRTX customer NTAP (-2.3%) is trading lower in sympathy. Also, FIRE (-2.9%) preannounced upside Q3 guidance. In news, FIRE (-2.9%) announced the resignation of its CEO, who was on medical leave. This morning, PCS (-5.8%) confirmed its merger with DTEGY (+1.0%). Among rumors, AAPL (+0.8%) has begun production on its new mini iPad, which it could unveil on October 10th, according to reports. Also, we are hearing AAPL (+0.8%) for P (+1.3%) making the rounds.

In notable analyst upgrades this morning in the tech space, SMTC (+3.3%) was upgraded to Buy at Lazard. Among downgrades, TXN (-0.3%) was downgraded to Sector Perform at Pacific Crest and BofA/Merril downgraded CBEY (-4.3%) to Underperform. There are no notable names in tech scheduled to report quarterly results today after the close.
icon url

ReturntoSender

10/06/12 8:37 PM

#9942 RE: ReturntoSender #6755

From Briefing.com: Weekly Recap - Week ending 05-Oct-12

Dow +34.79 at 13615.4, Nasdaq -13.27 at 3136.19, S&P -0.47 at 1460.93

Equities began the day on a higher note despite mixed jobs data. After reaching session highs within the first hour, the major averages reversed and spent the remainder of the day sliding towards the unchanged level. As a result, the S&P 500 ended flat while the Dow advanced 0.3% to close at its best level in five years.

Nonfarm payrolls were reported at 114K versus the 120K Briefing.com consensus. The prior reading was revised up to 142K from 96K. Meanwhile, nonfarm private payrolls added 104K against the 130K consensus. The unemployment rate was reported at 7.8% versus the 8.1% consensus.

In addition, hourly earnings increased by 0.3% while the expectations called for an uptick of 0.2%. Lastly, average workweek ticked up to 34.5 from 34.4.

The materials sector led the way. Within the group, steel producers outperformed. AK Steel (AKS 4.87, +0.05) and Steel Dynamics (STLD 11.91, +0.18) added 1.0% and 1.5%, respectively.

Telecom stocks were the biggest laggard. However, the underperformance was due to notable weakness in a single stock. Inteliquent (IQNT 7.70, -1.36) fell 15.0% after Robert W. Baird downgraded the stock from ‘outperform' to ‘neutral' and lowered its price target from $15 to $10. Originally, Robert W. Baird upgraded the stock in the spring on the expectation of a financial engineering catalyst. Although that catalyst was achieved, the firm says results have unfortunately deteriorated more than expected and there now appears to be increased material risk to forward estimates.

Other telecom names were generally higher and the iShares Dow Jones US Telecom ETF (IYZ 25.76, +0.16) added 0.6%. Two sector components which have been in the headlines recently showed gains. Leap Wireless (LEAP 6.18, +0.33) and Sprint (S 5.20, +0.11) gained between 2.2% and 5.6%. Earlier, reports suggested that Sprint plans on holding a second meeting to discuss a possible offer for MetroPCS (PCS 12.65, -0.04).

The Dow Jones Transportation Average continued its recent streak of outperformance and settled higher by 0.7%. Within the bellwether complex, 16 out of 20 stocks advanced and trucking stocks were the top performers. Con-Way (CNW 27.98, +0.27), CH Robinson (CHRW 60.31, +0.41), JB Hunt (JBHT 55.20, +0.94), and Landstar (LSTR 48.96, +0.58) all posted gains between 0.7% and 1.7%.

Southwest Airlines (LUV 8.97, -0.13) was the main decliner among transportation stocks, down 1.4%.

Despite weakness in Southwest, other air carriers outperformed. China Eastern Airlines (CEA 16.08, +0.28) advanced 1.8% while United Airlines (UAL 21.07, +0.26) added 1.3%.

Solar stocks were under pressure after Avian Securities downgraded First Solar (FSLR 20.07, -2.48) from ‘positive' to ‘negative.' The downgrade results from reliability issues related to the junction box on modules supplied by First Solar. The company commented on the issue by saying approximately 232,000 modules may develop loose cord plates over time, but the issue is not expected to have a material impact on earnings. As a result, FSLR slid 11.0%.

Other solar stocks also showed weakness as the Guggenheim Solar ETF (TAN 16.52, -0.49) settled lower by 2.9%.

Consumer credit increased by $18.1 billion in August. This follows prior month's reading of a $3.3 billion decrease, and is higher than the $5.0 billion that had been broadly expected among economists polled by Briefing.com.

There is no economic data of note scheduled to be released on Monday or Tuesday of next week. Note that the bond market will be closed on Monday in observance of Columbus Day. The stock market, however, will be open.

Week in Review: Stocks Climb Higher Despite Macroeconomic Headwinds

Monday's session started with an extension of the bullish sentiment observed in overseas action. Following a higher open, U.S. equities got an additional boost from the ISM Index which was reported at 51.5 against the expectations of a 49.7 reading. After rallying to session highs, the Dow held the bulk of its gains, while the S&P 500 and Nasdaq spent the remainder of the session in a slow retreat towards the unchanged line. As a result, the Dow climbed 0.6%, the S&P 500 added 0.3%, and the Nasdaq slipped 0.1%. Healthcare Services Group (HCSG 23.76, +0.22) gained 4.2% after UBS initiated coverage of the stock with a ‘buy' rating.

On Tuesday, the major averages got off to a strong start, but the bullish bias faded shortly after the open. Headlines out of Europe provided another risk-off signal as reports suggested that a Spanish aid request is not imminent. After marking their session highs during the first five minutes of trade, the key indices spent most of the session trending lower. However, a rally in the final hour of trading lifted the S&P 500 and Nasdaq into positive territory while the Dow closed with a small loss of 0.2%. Biotech stocks showed strength and the iShares Nasdaq Biotechnology ETF (IBB 147.18, +0.36) added 1.1%.

Wednesday's session began lower as the major averages showed indecision in the early going. After chopping around the flat line during the first hour of trade, the key indices reached their session highs at the midway point. Unable to hold those levels, stocks returned to the middle of the day's range before buyers re-emerged in the final hour. As a result, the S&P 500 added 0.4%. Netflix (NFLX 66.56, -0.11) jumped 10.8% after Citigroup pointed to a survey which showed an improvement in customer satisfaction.

On Thursday, stocks began the day with a bullish bias. The rally reached session highs 30 minutes after the open when the August factory orders report indicated a 5.2% decrease. The number was not positive in itself, posting its worst reading since January 2009. However, it was better-than-feared as expectations called for a 6.0% pullback. After marking session highs, stocks spent the remainder of the day hovering near those levels. As a result, the S&P 500 closed with a gain of 0.7%. The financial sector was the top performer, and the SPDR Financial Select Sector ETF (XLF 16.06, 0.00) settled higher by 1.5%.
 
Index Started Week Ended Week Change % Change YTD %
DJIA 13437.13 13610.15 173.02 1.3 11.4
Nasdaq 3116.23 3136.19 19.96 0.6 20.4
S&P 500 1440.67 1460.93 20.26 1.4 16.2
Russell 2000 837.45 842.86 5.41 0.6 13.8

O2Micro (OIIM $3.87 +0.00) issued downside guidance for Q3 (Sep), lowered third quarter revenues to $22-23 million from $24.1-26.0 million versus $24.92 mln Capital IQ Consensus. In addition, gross margin for Q3 is now expected to be 54.5% to 55.5%. The reduction in anticipated revenue is primarily the result of broad-based weakness in demand in the co's end markets. "O2Micro continues to navigate through broad-based lower demand in all of our end markets. We believe this is the result of weak global economic conditions, coupled with excess inventory corrections by our customers. Additional information will be available when the Company reports its third quarter 2012 results prior to market open on October 31, 2012.

Sorry I missed getting anything posted on Thursday's news. Always more said on Thursday than Friday but I took a day off. RtS
icon url

ReturntoSender

10/07/12 11:50 AM

#9943 RE: ReturntoSender #6755

InvestmentHouse Weekend Market Summary

http://www.investmenthouse.com/weekendmarketsummary.htm

- Jobs report disconnect garners the headlines, but the market action is the real story.
- Stocks start higher, continuing the rebound move, but the high to low action returns. Jobs report rethink? Syria/Turkey tensions? Just the weekend?
- Jobs creation weak, but a massive household job increase pushes unemployment to 7.8%. What is the disconnect? It started awhile back . .
- California gas at $4.49/gallon. Hope this is not a sign of things to come elsewhere.
- Dollar fails to rally on jobs report, a strange outcome, but bonds act 'right' and sell off.
- After this jobs report some say the Fed and its QE3 are already over. Not according to Bernanke.
- Leaders give back some of the Thursday move.
- Perhaps a bit of pre-weekend, some pre-earnings nerves, and now we see if the market can hold and add to what it started this week.

Jobs data dominates the session, but just what was the message of the market?

Is it real or was it trumped up? Only the BLS workers calling the households to get the information know. What we do know (and of course I have my facts and conclusions below) is that the market jumped on the report of 7.8% unemployment (but only 114,000 non-farm jobs), but it could not hold the move. Did investors decide the unemployment number was so far off the reality and trend of the economic data as to be unbelievable? Could the Fed call an end to QE3 given the unemployment number? Are geopolitical issues with Syria and Turkey lobbing shells at one another too high to stay in the market over the weekend? Will the earnings season start next week disappoint?

Regardless of the reason, that high to low move is something seen when the indices were pulling back in the post-QE3 announcement test. Stocks started to move higher Wednesday and Thursday, gapped upside Friday, then faded back to flat or negative. Volume was mixed; you can argue bids dried up after the initial celebration and the market faded or that sellers came in. With the mixed volume that is problematical.

SP500 and DJ30 tapped at the prior highs and recoiled. NASDAQ never really challenged them. The market, as it has been of late, is somewhat split with techs mostly lagging the move, semiconductors for certain.

SP500 -0.47, -0.03%
NASDAQ -13.27, -0.42%
DJ30 34.79, 0.26%
SP600 -0.17%
SOX -0.37%

OTHER MARKETS

Some of the other markets reacted as you would anticipate on a stronger jobs report. Others did not. As with the overriding question regarding the validity or accuracy of the unemployment numbers, are the other markets buying it?

Dollar. 1.3017 versus 1.3016 euro. A virtual dead heat. The dollar did not do what you would anticipate. It closed slightly higher overall, but it was down against the euro. It did rise against the yen and other currencies that make up the DXY0, but it was not a runaway. Note how the dollar sold off intraday, this even after a supposedly very good unemployment report. Why would this about the case? The dollar should rally if the economy is getting stronger.

It looks as if the dollar market was not buying into a growth story based upon these jobs numbers. Looking at the overall chart of the dollar, it is not pretty. It has a big head formed, and it looks like it is making the apex of a right shoulder. Note that back in late 2011 into April 2012 it formed what would be the left shoulder. It was very choppy and volatile. Frankly, this high on the right shoulder just matches some of the interim peaks in that prior possible shoulder, as I will call it. The dollar could bounce all the way back up near 81.50 after closing at 79.50. That is plausible. But overall, even if it does that, all that puts in is the right shoulder, albeit at a bit higher price. Maybe that would give us a better chance to short the dollar. The dollar looks to have a very toppish pattern still. The action on Friday and response to what was supposedly a good jobs number did nothing for it.

Bonds. 1.73% versus 1.67% 10 year US Treasury. Bonds tanked hard. They continued to tumble after showing some intestinal fortitude and rallying through resistance at the May gap point as well as the August low; they were roughly coincident. They rallied through those, and now it finds itself right back down at those levels. This actually makes sense. Bonds should sell (and yields accordingly rise) if the economy is improving because you do not need them as a safe haven to hide your money in. The theory is that money will be in more demand and rates should rise and make bonds less valuable because you can make more money investing in stocks that are levered to the economic performance.

In the end, bonds made sense and they crashed lower. Our TBT play which is an upside play but really a downside play because it is an ultra short that plays a drop in the bond market to the upside. It jumped nicely. Do not freak out or be disappointed. As of Thursday, the TBT was trading around $15-16. Then you woke up this morning and it is at $65, gapping to the upside. That is because it did a 1-for-4 reverse split that was effective today. It just jumped up the price. You still have the same value in it so, as I said, do not freak out about it.

In short, bonds were behaving as you would anticipate on stronger news.

Gold. 1780.80, -15.70. Gold did sell off on the session. That makes sense as well. Gold would be less needed if there was a belief that the Fed would withdraw some of its stimulus. QE3 was just launched, but all of a sudden we have unemployment down below 7.8%. Certainly the Fed will withdraw some of its stimulus. I will talk about that in just a minute. Gold sold off, but it still held the 10 day EMA on the close. It is still right at the February and then the November 2011 peak. There is still resistance. It is still bumping around there after breaking through it on Thursday. But it is looking strong, holding the 10 day EMA -- indeed, coming off of the low to do so.

Oil. 89.88, -1.83. Oil closed lower. That makes no sense with a stronger economy. Oil should be rallying, but oil is struggling. Wednesday and Thursday were kind of toss-out days. There was the big drop on Wednesday and the big recovery of what was lost on Thursday. Friday was back down. Oil continues to look weak near term, and it could fall further. There is a lot of oil out there. Not only in the tanks, but Saudi Arabia is promising (or maybe threatening with respect to other OPEC members) to produce more if needed.

Then again, there are the tensions in the Mideast. Iran is in turmoil internally. Syria and Turkey are lobbing shells at each other after Turkey gave itself authority to enter Syria for military incursions if necessary. That is an issue that could pop prices to the upside, but it is not. It seems like a lot of oil is trumping, and it is also trumping a supposedly stronger jobs report. Let's face it, even if you take this jobs report at face value as true -- which would be a somewhat foolish thing to do -- it is still at a terrible level. The nonfarms payroll creation is hideous. That is the situation around the globe. Weak economies, all, and they don't need as much oil. There is an understandable reason for oil to show weakness simply because of the quantity available and the quantity of economic output around the world.

Hmmm. Unemployment at (cough, cough) 7.8%. More QE?

I have to ask a question that was being asked all day long on the financial stations: What is Bernanke going to do? What will the Fed do now that the unemployment rate fell below 7.8%? I have Mr. Bernanke pictured here, pondering whether or not he should continue QE3 or even administer QE. Remember that there is still bond buying that could be done out there in addition to the mortgage-backed security purchases. As noted, some said unemployment is already below 8% (indeed, down to 7.8%), so the Fed has done its job. Employment was improved because that is what the Fed and Bernanke said was its primary focus.

First of all, I do believe the Fed knows that this number was out of step with all other numbers economically speaking. Whether you are looking at the nonfarm payrolls, the private payrolls or any other economic data. That includes the regional manufacturing reports that show employment has been decreasing of late rather than increasing. This is a hard one for the Fed to swallow, and that is why Mr. Bernanke may be coughing a little to clear his throat as he ponders what to do.

What about what the Fed itself has said? It just said it last week, so this is really a nonissue, but I have to report on it because some people saying that the Fed should quit or will quit. And obviously that directly affects the stock market. Bernanke expressly stated -- there is no reading between the lines -- that the Fed would continue its monetary policy, its open-market operations WELL after it saw the improvement it was seeking in the economy. We have one number that is an outlier. It does not match any other economic data, and it is by far and away better than anticipated. By the other numbers, so it should be.

Do you think the Fed will buy into that and say its work is done given what Mr. Bernanke just said last week? Of course not. It is preposterous to think that will be the case. So if any of the pullback on Friday was due to the fear of withdrawing QE, that will quickly dissipate. I guarantee that the Fed speakers -- at least those in the majority who favor QE -- will say we are not where we want to be. They will say we cannot trust one report to accurately show the state of the economy, therefore QE is here to stay, and we are even thinking about other ways in which to stimulate the economy.

TECHNICAL SUMMARY

Internals.

Volume. NASDAQ +3%, 1.59B; NASDAQ -10%, 542M. What does that mean? On the NYSE, stocks rallied early and rallied well. They put themselves up near the high hit in early-September, but volume was not there so it was unable to hold the move. It reversed and sold off to negative. But volume did not spike as it sold. So it was not really a rollover, at least one accompanied with high volume. The picture does not look pretty in terms of the chart, but volume did not suggest that there was any major selling.

NASDAQ did bump higher, so that does suggest there was some selling that topped the buying on Thursday. You can see the gap up and the reversal in the chart. It looks something like an engulfing pattern on slightly higher though still below-average volume. That can suggest more testing. Indeed, NASDAQ has room down to its trendline to do a bit more testing, still hold above the 50 day EMA, and still keep the trend in place.

Breadth. NASDAQ -1.2:1; NYSE +1.3:1. Breadth was pretty good to the upside on Thursday, but it was down on NASDAQ. It was hardly anything ugly, but it was a reversal day. Often the market does not catch up by the closing bell on a reversal day, so it does not look as bad as it might have been. NYSE was still positive, so that suggests that the damage or any selling was not that widespread. Indeed, it seems most of it was centered in the technology area.

THE CHARTS

SP500. SP500 rallied nicely. It hit 1471 on the high. It early September, the intraday high was 1474.50. It rallied and that led to the two-week pullback. The SP500 held the trendline over the past week and started to rally back to the upside. This could suggest a reversal. It could. We will have to see how it plays out. Overall the trend remains nicely in place. On the last high, MACD put in a higher high, so the momentum it still there. We may get a pullback early next week. We will have to see how it reacts, but it still looks solid. Earnings will play a role because the season gets underway next week, at least a little bit. The serious, earnest earnings come out the following week, however.

NASDAQ. The NASDAQ gapped to the upside, and it even ran a little bit higher but then reversed. It closed negative, down -0.4%. It was not a huge loss. But look at the low on Thursday at 3132.56 and then the low on Friday at 3130.76. Intraday it took out the low, but on the close it did not. That means it is not a true engulfing day, but it is clear that the sellers came in. They came in with a little more force than the buyers as volume bumped higher. It was still below-average volume, but they won the day for sure. It was a modest rally to the upside, and the NASDAQ was following along. AAPL was not participating on Thursday, and it still rallied. AAPL was downside on Friday, and that brought the NASDAQ down with it. But it is still in an uptrend. It is still holdings that uptrend, and it has room to give before it is in trouble. Indeed, where it closed on Friday still keeps it above the March peaks. It does not look all that impressive near term, but I think it will work through these issues. A lot of it depends on AAPL. It has a market cap that is just too big for the index. It is like the "too big to fail" stock of the NASDAQ. When it does not perform well, NASDAQ catches cold. If GOOG has a little bit of trouble, you know there will be some weakness on the NASDAQ.

SP600/SP400. Small caps were down slightly. Pretty impressive, although they did give back a nice, impressive gain. They were trading near 477 and closed at just over 470. That is a big giveback and is disappointing. But it is holding the up trendline and is still in position to continue higher. Why are we not wringing our hands over this? Because it was a crazy day. There were different interpretations of that jobs report. Some were buying on that low unemployment number early, but others came back later and said that it was bogus and were selling on that. Obviously we had some weekend issues involved with Turkey and Syria shooting at each other. You get the picture. Yes, it pulled back. No, you cannot like that action, but it is still holding the trendline. It still has not made a serious break to the upside yet to try a new move. It leaves itself in position to rally with QE3 still in place. People are going to come around and realize that QE3 is not going anywhere. That will make a difference, we think, in a continued market move.

SOX. Of course SOX was down, but it was down just 0.1%. As with others, it rallied nicely right up to resistance -- those old twin peaks from June and July -- but then it gave up the ship and closed flat on the day. It is working laterally, still a dog. Maybe a market leader to the downside. You always have to watch SOX for that because it can be trouble that way.

DJ30/DJ20. We have to look at the DJ30 industrials and the DJ20 transports relationship because it has been so divergent. As the DJ30 hits new highs, you need to see the transports buck up a bit. The DJ30 had the best gain on the day, up 0.25%. But it, too, gave back a pretty good chunk off of its high. It was bumping up against the highs hit over the past month. It fades back each time it has bumped this level around 13650ish (as a matter of fact today it hit 13645). It has not been able to punch through. It still looks good in a nice uptrend, but it just has not been able to move through. If it cannot, that bodes a fall back in the trend.

That is not devastating for the Dow because it has been in such good shape. But why would it not punch through? Perhaps, drum roll please, it is because the DJ20 transports is not confirming its move higher. As noted on Thursday and many days prior, it is nowhere near a high. It is trading in a nice range, and we do have a good position that we entered on Wednesday. But on Friday it suffered the same problem. It moved through the 50 day EMA, looked super, and then it fell below it. At the end of the day, it managed to recover and hold just over the 50 day EMA. That is a good indication. That puts it almost midway up in the roll. It was there earlier in the day when it crossed 5075. But it is mid-level. It has had three good moves with five up days in a row. It may want to walk laterally a bit before it continues toward the top of the trading range. Remember, we are still looking for it to make a move to challenge that peak near 5200. It may run into some resistance at the 200 day EMA at 5139-5140ish. We can give it that. It is looking good still and is moving well. I also think this was just a response to the weird day of a great unemployment report and then, wait, not that great of a jobless report. Up early and down late.

LEADERSHIP

I won't need to dive into leadership in great detail. We had good moves on Thursday. In financials we have BAC and its brethren. In home builders, KBH was moving well. Looking at retail, there was LULU and ULTA. ULTA actually posted a pretty decent move on Friday, by the way. CONN was up almost 3%. Retail was good. Some were up, some were down. Some were up in the home builders but most of them were down.

Leaders on Wednesday and Thursday were kicked back somewhat on Friday. Was it a major reversal? You can read it that way if you want to. It was the high-to-low. It could lead to a rollover. Again, I just think it was a strange day ahead of a weekend. There were a lot of issues on the table, not to mention earnings coming up. Investors rallied it early, had second thoughts about the jobs report, and also saw what was going in Syria and Turkey. They also saw that there will be earnings, and it was the weekend. They just wanted to take some gains, get out of there, and see what happens next week.

Am I rattled about what happened? Not really. Look at LPX in materials; it posted a nice gain, rising over 3%. That was our buy on the day. While stocks took a little hit on Friday, it did not damage most of them. Of course if they continue to sell, that is never good. But that is always the case. We may just simply see some better positions to enter when this market turns back after a realization that the Fed is here to stay and that the jobs report was not the end of the world for any particular campaign.

That is leadership in a nutshell. Retail, home builders, and financials all look solid on the week. We saw leaders start to head out on Wednesday, and we were buying into those. ULTA, LULU, you know the names. So we will let them show us if they will hold or not. If they give us a nice little pullback, we can take advantage of it because QE3 is still there.

THE ECONOMY

TO VIEW THE ECONOMY SUMMARY VIDEO CLICK THE FOLLOWING LINK:
Economy Summary Video

The Jobs Report.

Nonfarm Payrolls, September (8:30): 114K actual versus 120K expected, 142K prior (revised from 96K)
Nonfarm Private Payrolls, September (8:30): 104K actual versus 130K expected, 97K prior (revised from 103K)

Government workers revised upward the past three months: 18K, 45K, 10K.

Year/Year: less jobs this September than September 2011.

Non-Farm Jobs Pace: 2012 is on track to product LESS jobs than 2011.

At this pace it will take until AFTER the 2016 election to recover to the 2007 level.

Another piece of data shows up hugely outside of historical standards.
A favorite tactic of the BLS in tweaking the jobs data is to take a statistic that is ALWAYS one way for a month and then flip it the opposite direction. With seasonal adjustments and how that work, that has the effect of DRASTICALLY impacting the figures because the 'inverse multiplier' effect of seasonal adjustments when the data does not fit the season so to speak.

In September this happened with the age 20 to 24 workers whose unemployment rate has run at 15%, well above the overall unemployment number.

For the first time in the decades this data has been kept the unadjusted numbers were positive at 101,000. This age group is dominated by those in the last years of college. That is why it drops in September: back to school. Are we to believe they are not going to school as much for the FIRST time in history? To the contrary, as we just learned from the government, student loans are rocketing back up as students seek to STAY in school because there are no jobs (up $14B per the Friday Consumer Credit report). If they leave school, they have to pay. If they stay, they can get loans, stay out of the private sector, something Dan Aykroyd in Ghost Busters told us scholarly types like to do. This is what ALWAYS happens in recessions.

You've never been out of college . . . I've worked in the private sector, they expect results.

The positive read shot the adjust numbers to the highest in decades. No surprise. And of course, that impacted the non-farm payrolls, pushing them higher than they actually were, even at a measly 114,000.

Household Survey:

Unemployment Rate, September (8:30): 7.8% actual versus 8.1% expected, 8.1% prior
Hourly Earnings, September (8:30): 0.3% actual versus 0.2% expected, 0.0% prior
Average Workweek, September (8:30): 34.5 actual versus 34.4 expected, 34.4 prior

873,000 jobs added, the highest since June 1983 when Regan was President and GDP grew 9.4% that quarter (see below).

Unemployed: -456,000 to 12.1M

U6 (total of unemployed, underemployed): STEADY at 14.7%

JOLT (US Job Turnover Level): 4.2M per month. That is the SAME as it was 4 years ago.

The point: On first look, at BEST everything is the same as it was 4 years ago, i.e. no improvement. But, as you likely suspect, it goes beyond that.

And now, the REST of the story (sorry Paul Harvey).

For the past 9 months I have written that the administration would get unemployment below 8% by the election. If not by growth then by distortion. I am not the only one who postulated this; it is a strategy that seemed logical and when you look into the details of the data as we have done, you see a series of abnormal adjustments to the actual data that has, in total, effectively created more workers than there are. In the September jobs report, mission accomplished.

As is the case for this administration, it did not take any chances reaching its goal and started the distortions early this year in order to get to its goal over time. Even so, the big drop in September was too much to be believable and raised red flags everywhere given the media coverage.

Even Jack Walsh, former CEO of GE, tweeted "jobs numbers . . . these Chicago guys will do anything . . . can't debate so change numbers."

The Process.

An early favorite was massive distortion of the birth/death rate, telling us people simply retired (1M people in one month disappeared from the workforce in January). As we reported, however, the FASTEST growing demographic in the workforce is those OVER 55 years of age as they re-enter the workforce to replace devastated savings and retirement accounts.

This move shrank the labor pool so quickly many questioned it. So, the feds then moved in other ways to shrink the labor pool. The reason you shrink the overall work force? By decreasing the denominator in the unemployment equation you divide by a smaller number, thus raising the percentage of the employed even if the number of jobs remains steady or even falls.

So, the BLS then moved into wildly aberrant seasonal adjustments out of step with decades of historical adjustment levels for the months at issue. How wild? In July the seasonal adjustments turned a negative number of non-farm jobs to a positive 163K even as the workforce fell.

The rise of the part-time worker (or is that the conjure of part-time workers?).

Of late the focus is on using part-time jobs for those who want to work full-time but cannot find full time jobs as the 'growth' area in jobs. In acquiring the data for the so-called Household survey where houses are literally called and those answering are asked if they have a job, got a job, what kind of job, etc. These are not hard numbers reported by companies hiring. A worker makes a call, enters the data. No reported record. Get the picture of how loose this data is?

Now consider that the DEFINITION OF WORK UNDER THE WELFARE STATUTE WAS CHANGED BY THE ADMINISTRATION by unilaterally waiving work requirements under 2005 congressional amendments to the 1996 welfare reform (TANF). By waiving those requirements states can now once again consider items such as bed rest, journaling, weight loss promotion, parent-teacher meetings, reading the want ads, and house sitting as work. Why would they do this? To get more federal welfare dollars when those 'jobs' were lost. At the time I said we would see a surge in welfare claims by people who supposedly lost these 'jobs.'

Is this the first step, i.e. calling up people and asking if they started reading the want ads or were trying to lose weight in September and then including them in the jobs report? Did that just create a VAST number of 'new' part-time jobs? 582,000 of the 837,000 jobs said to be created in the household report were part-time. 66%! It looks as if that is so.

Remember this chart? Now in September it shows, even with a shrinking unemployment rate, those unemployed and underemployed is RISING.

The strange unemployment path in this recovery.

The path of unemployment versus jobs in this recovery is not the traditional path. Indeed, unemployment has never done what it has done this time, i.e. a big decline in unemployment during stubbornly tepid jobs growth. Typically in a recovery unemployment rises as people feel things are better (confidence moves up as we have actually seen of late), they move back into the job pool looking for work, but they cannot all find jobs because not that many are being created (and yes, not many jobs have been created this time around as well).

According to the September data, however, it is as if everyone who had left the workforce was notified a job was available and they transitioned from outside the labor pool directly to working at a job without having to search at all for a job. We may like to believe we are efficient, but we are not that efficient. Otherwise there would be no need for headhunters, Monster Jobs, etc.

How big is this distortion? In September it was reported that households responded that 873,000 jobs were added, the highest jump since Reagan. THAT SIMPLY DOES NOT ADD UP: Reagan's recovery was huge. It was real growth (9+% GDP growth at that time) with real, full-time jobs. We are now told that people in September jumped from OUTSIDE the workforce to back to the pool and found a job IMMEDIATELY without looking. This simply does not happen and right there you know there is an error in the numbers.

Huge surge in GDP as the tax cuts took hold. The 1985 'pullback' was to well above trend levels.

Even if you BUY the numbers, they show a terrible problem.

The BIG number in the September household survey is the number of workers who are working but only part-time due to economic conditions. They want a fulltime job but the economy cannot produce them. As noted, that segment rose to 582,000 in September or 66.6% (weird; exactly two-thirds) of the 873,000 household jobs increase.

Let's say we buy that they all got part-time jobs without having to look for them. Okay, so what has the jobs creation range been as I showed two weeks back? Two-thirds at the lowest pay scale end, the burger flippers so to speak. These people want to work but cannot find the jobs they desire. This is survival living, taking whatever job you can. You have to do it to survive, but it is not a job you want.

Notably, I also pointed out the past month after the August jobs report that the total number of people unemployed for all reasons, including those who cannot get full time work because of economic reasons, was growing. In August it was 25.8M. In September when the unemployment rate supposedly fell 0.3 basis points the total number of unemployed and under employed GREW to 26.2M. This is backed up by the U6 number, the government's version of the total unemployment figure: it held steady at 14.7%.

So, if we just assume the 7.8% reading is an indicator of economic health, is it equally economically healthy to create mostly part-time, low pay jobs versus full-time, standard of living increasing jobs through innovation and technology creation? In other words are part-time, low pay-scale jobs with unemployment at 7.8% as good as full-time, higher paying jobs and 7.8% unemployment?

The upshot:

We have spent $1T in stimulus, have put in place multitudinous programs for homeowners, workers, etc. We have altered what qualifies as work under the welfare statutes (new jobs created?). We have accumulated another $6T in debt and learned Friday this year's debt has already topped $1T!

With all of this we still have 26.2M people who either have no job at all and are not looking, trying but cannot find one, or managed to land a low paying part-time job just to survive. And I am not even going into those over 50 losing their jobs; they simply disappear from the workforce forever whether they want to or not as it is extremely difficult to find employment at the high end and low end of our demographics (age 20 to 24 unemployment is 15%).

As a result, this systematic, purposeful, anomalous, and extreme distortion of the underlying employment data the past year has worked to create an 'acceptable' unemployment rate just in time for the election. Our media and the majority of the US citizenry are too complacent, despite the hardships, to understand how this has happened and thus cannot obviously take the next step and ask the question 'why?'

THE MARKET

VIX. The VIX gapped lower and then recovered as the stock market sold off. But look where it held. Lo and behold, it is right at the September and August lows that led to bounces in the market. Not only that, but it was March of 2012 and all the way back to July, April, and May of 2011. It is at an important point again, and it could make a break higher again. That will have many people over the weekend saying that this bounce in the market has run out of steam. If very well could have. There is a correlation between this landing on this support level and bouncing higher, that meaning the market sells lower.

We will have to see how that plays out because the VIX is not the primary indicator. The primary indicator would be the technical picture of the indices, the leadership, and volume versus price. We also have to factor in one of the other "technical" pictures: QE3. It is not really a technical picture, but it is an overlay to all of the action. The Fed will continue with QE3. Maybe on Friday there was a feeling that it would not based on the jobless number, but I think we have debunked that. I think the market will come to that realization as well because Bernanke will keep it going. He will not let what appears to be a single outrider month stall or turn back his promise to deliver a new economy. After all, he answered Senator Schumer's challenge of "Get to work, Mr. Chairman."

VIX: 14.33; -0.22
VXN: 16.48; -0.17
VXO: 13.58; -0.18

Put/Call Ratio (CBOE): 0.94; +0.13

Bulls versus Bears

Bulls: 46.8% versus 51.0% versus 54.2%. Not many believers in the staying power of the move ahead of the past week as stocks tested after QE3's announcement. Now lower than pre-QE3 levels. A little consternation is good. Well below the 60% to 65% bullish levels that flash a warning sign. Back to the level from a couple of months back. Undercut 35%, the threshold for bullishness, in early June. As noted, hit 34% in early June. It did its job and the market is on the rally. Hard drop to 34 from 39.3% as economic reality and a choppy stock market hit. Off the 55+ level hit in late February. That was the highest level since April and May of 2011, the peak of the post-bear market high. 35% is the threshold level suggesting bullishness. To be seriously bearish it needs to get up to the 60% to 65% level.

Bears: 25.5% versus 24.5% versus 24.5% versus 25.5%. A bit more skeptical as well, rising to levels from a month back, but still not at a high level. March and April saw lower lows in the 21% range. On the last run never made it to the 35% that can be a bullish indication, but the bulls were weak enough back in June. Over 35% is the threshold to be really be a good upside indicator. For reference, bearishness hit a 5 year high at 54.4% the last week of October 2008. The move over 50 took bearish sentiment to its highest level since 1995. Extreme negative sentiment. Prior levels for comparison: Bearishness peaked at 37.4% in September 2007. It topped the June 2006 peak (36%) on that run. That June peak eclipsed the March 2006 high (33%) and well above the 2005 highs that spawned new rallies (30% in May 2005, 29.2% in October 2005). That was a huge turn, unlike any seen in recent history.

NASDAQ

Stats: -13.27 points (-0.42%) to close at 3136.19
Volume: 1.59B (+2.98%)

Up Volume: 594.04M (-415.96M)
Down Volume: 990.87M (+411.3M)

A/D and Hi/Lo: Decliners led 1.19 to 1
Previous Session: Advancers led 2.05 to 1

New Highs: 156 (+31)
New Lows: 36 (-2)

SP500/NYSE

Stats: -0.47 points (-0.03%) to close at 1460.93
NYSE Volume: 542M (-10.12%)

A/D and Hi/Lo: Advancers led 1.33 to 1
Previous Session: Advancers led 2.68 to 1

New Highs: 306 (+84)
New Lows: 8 (-4)

DJ30

Stats: +34.79 points (+0.26%) to close at 13610.15
Volume: 106M shares Thursday versus 104M shares Wednesday.

MONDAY

There is some more economic data next week. We cannot get away from it. As seen on Friday, you have to deal with it and all of its imperfections. The big news does not come out until later in the week. Actually, none of it really starts until later in the week. Wednesday will just be a throwaway. No one will care about wholesale inventories and the Treasury budget, although they are important. We have the initial claims on Thursday, and then on Friday we have PPI for September. What are the producers paying? Of course we hear there is no inflation. It was up 1.7% in August, and it is expected to halve that in September. We will see. Then there is the preliminary Michigan Sentiment for October. It was up before, and they expect it to rev even more with this great jobs report. We will see how that goes.

Earnings season will be one of the primary drivers. Not a lot of our plays are reporting next week, so we do not have to worry about specific earnings that much for our specific plays. But it is always important overall. It starts next week, but it does not really get revved up until the following week when the really big names start to report. But we will see some good names out next week, and it will start to influence the trade. Frankly, that was one of the factors on Friday impacting what the market did. We had earnings coming up. We had whether the Fed would remain with its QE3. I think we have answered that. We also had the geopolitical issues with Syria and Turkey lobbing shells at each other on Friday. There was the issue with the jobs and whether it was a true statement and if they were good or bad. In the end, I think everyone dropped back and punted. You have one that was good, and it was an outlier. Another was still cruddy, still in the same old no-growth/modest-growth mode that it has been in. That seems to be more reliable, wouldn't you think? All that added together meant that investors just wanted to drop back, punt, and go home for the weekend. That is exactly what they did.

Next week we will see whether the leaders want to hold up and continue. QE3 is still here. We have had a pullback, we have had a rally, and we are challenging these old levels. It is an important week, no doubt. Will it be able to punch through on SP500 or will it be knocked back? And if it is knocked back, does it just go to the trendline? There are still a lot of good-looking stocks out there moving well, but there is skepticism as well. Remember, when this move started everyone said it would not last. We will have to see if the 1470-1475 level is sold indiscriminately regardless of QE3. Ultimately I do not think that will happen. Ultimately QE3 is here, and it will have more of an impact. The question near term is whether or not there needs to be more of a pullback before a further QE3 run. That is what we will find out next week.

I still see patterns I like. There are a few people nodding in the office and some people are giving me glares as I say that. But there are good patterns out there. We will see if we can find more of them that could give us buys. We will see if everyone finds out after the weekend that there were no major blowups and no bogeyman appeared in the data or from overseas. Frankly, this market has rallied on pathetic economic numbers because it has QE3 in place.

On Friday there was another round of pathetic economic data. You can take that 7.8 or not, but I guarantee you that it was an outrider. It was fabricated, and it was just another way of crunching down the unemployment numbers ahead of the election. People might want to stick pins in there Jon dolls after that statement (or maybe they don't care), but that just seems to be the case. If nothing else, it was a gross outrider that is totally aberrant from all of the data. I think the market will figure that. They will see that the Fed will not pull QE3, and the overlay of QE3 will continue. I have had this on the SP500 chart the entire time I have talked about this, and that makes a lot of sense because it has been the leader to the upside along with the Dow. I could have put it on NASDAQ. It is following along, but it still has room in its uptrend even if it wants to pull back.

We will find out more next week. It will be more interesting with earnings coming. If we get a good move, a few days up, we will probably want to take some gain off the table before the earnings really start to impact the market and impact our stocks. That is just good practice. I am not saying that earnings will stink the place up, although they are not supposed to be great. We have seen a lot of warnings: BBBY, FDX, UPS, NSC, INTC, CAT. The list is lengthy and impressive in the quality of the names.

There will be some issues out there. The question is, will the market forgive them? It is tough out there, but the Fed has our back with QE3.

Have a great weekend!

Support and resistance

NASDAQ: Closed at 3136.19
Resistance:
3197 is the September 2012 post-bear market high
3227 is the April 2000 intraday low
3401 is the May 2000 closing low

Support:
3134 is the March 2012 post-bear market peak: broken, not forgotten.
The 20 day EMA at 3128
3101 is the August 2012 high
3090 is the mid-March interim high
The June up trendline at 3089
The 50 day EMA at 3080
3076 is the late April 2012 high
3042 from 5/2000 low
3026 from 10/2000 low
3024 is the gap point from early May
3000 is the February 2012 post-bear market high
2999 is the bottom of the August 2012 consolidation
2988 is the July 2012 high
2962 is the April 2012 low
2950 is the mid-April closing low
The 200 day SMA at 2946
2942 is the mid-June 2012 high
2910 is the March 2012 low
2900 is the March 2012 low

S&P 500: Closed at 1460.93
Resistance:
1475 is the September 2012 high
1499 from January 2008
1539 from June 2007

Support:
The 20 day EMA at 1445
1440 from November 2007 closing lows
1440 is the June up trendline
1433 from August 2007 closing lows
1425 from May 2008 closing highs
1427 is the August 2012 peak
The 50 day EMA at 1423
1422.38 is the prior post-bear market high (March 2012)
1406 is the early May 2012 peak
1402.22 is the closing low of the August 2012 lateral consolidation
1378 is the February 2012 peak
1375 is the early July 2012 peak
1371 is the May 2011 peak, the post-bear market high
The 200 day SMA at 1365
1363.46 is June 2012 high
1359 is the April 2012 low
1357 is the July 2011 peak
1344 is the February 2011 peak
1340 is the early April 2011 peak
1332 is the early March 2011 peak
1325 is the July 2012 intraday low
1309 is the right shoulder low from June 2012
1295 to 1294 is the April 2011 low and the February 2011 consolidation low (bottom of the trading range)
1293 is the October 2011 peak
1275 is the January 2010 low, early January 2011 peak
1267 is the December 2011 peak
1266 is the June 2012 base low

Dow: Closed at 13,610.15
Resistance:
13,668 from 12-2007 peak
13,692 from 6-2007 peak
14,022 from 7-07 peak

Support:
The 20 day EMA at 13,462
13,331 is the August 2012 post-bear market high
13,297 is the April 2012, prior post bear market high
The 50 day EMA at 13,285
13,058 from the May 2008 peak on that bounce in the selling
13,056 is the February 2012 high
12,971 is the early July 2012 high
The 200 day SMA at 12,899
12,754 is the July intraday peak
12,716 is the April 2012 closing low
12,391 is the February 2011 peak
12,369 is the left shoulder low from May 2012
12,284 is the October 2011 peak
12,258 is the December 2011 peak
12,110 from the March 2007 closing low
12,094 is the April 2011 low
12,035 is the June 2012 base low
The June 2011 low at 11,897 (closing)
11,734 from 11-98 peak
11,717 is the late August 2011 peak

Economic Calendar

October 1 - Monday
- ISM Index, September (10:00): 51.5 actual versus 49.7 expected, 49.6 prior
- Construction Spending, August (10:00): -0.6% actual versus 0.4% expected, -0.4% prior (revised from -0.9%)

October 2 - Tuesday
- Auto Sales, September (14:00): 5.3M prior
- Truck Sales, September (14:00): 6.3M prior

October 3 - Wednesday
- MBA Mortgage Index, 09/29 (7:00): 16.6% actual versus +2.8% prior
- ADP Employment Chang, September (8:15): 162K actual versus 133K expected, 189K prior (revised from 201K)
- ISM Services, September (10:00): 55.1 actual versus 53.0 expected, 53.7 prior
- Crude Inventories, 09/29 (10:30): -0.482M actual versus -2.446M prior

October 4 - Thursday
- Challenger Job Cuts, September (7:30): -70.8% actual versus -36.9% prior
- Initial Claims, 09/29 (8:30): 367K actual versus 365K expected, 363K prior (revised from 359K)
- Continuing Claims, 09/22 (8:30): 3281K actual versus 3273K expected, 3281K prior (revised from 3271K)
- Factory Orders, August (10:00): -5.2% actual versus -6.0% expected, 2.6% prior (revised from 2.8%)
- FOMC Minutes, 09/12 (14:00): Nothing new. One dissenter, but most of the dissenters are not on the panel right now.

October 5 - Friday
- Nonfarm Payrolls, September (8:30): 114K actual versus 120K expected, 142K prior (revised from 96K)
- Nonfarm Private Payrolls, September (8:30): 104K actual versus 130K expected, 97K prior (revised from 103K)
- Unemployment Rate, September (8:30): 7.8% actual versus 8.1% expected, 8.1% prior
- Hourly Earnings, September (8:30): 0.3% actual versus 0.2% expected, 0.0% prior
- Average Workweek, September (8:30): 34.5 actual versus 34.4 expected, 34.4 prior
- Consumer Credit, August (15:00): $18.1B actual versus $5.0B expected, -$2.5B prior (revised from -3.3B)

October 10 - Wednesday
- MBA Mortgage Index, 10/06 (7:00): 16.6% prior
- Wholesale Inventories, August (10:00): 0.6% expected, 0.7% prior
- Treasury Budget, September (14:00): -$62.8B prior

October 11 - Thursday
- Initial Claims, 10/06 (8:30): 370K expected, 367K prior
- Continuing Claims, 09/29 (8:30): 3275K expected, 3281K prior
- Trade Balance, August (8:30): -$43.8B expected, -$42.0B prior
- Export Prices ex-ag., September (8:30): 0.4% prior
- Import Prices ex-oil, September (8:30): -0.2% prior
- Crude Inventories, 10/06 (11:00): -0.482M prior

October 12 - Friday
- PPI, September (8:30): 0.8% expected, 1.7% prior
- Core PPI, September (8:30): 0.2% expected, 0.2% prior
- Michigan Sentiment, Preliminary October (9:55): 78.5 expected, 78.3 prior
icon url

ReturntoSender

10/07/12 2:18 PM

#9944 RE: ReturntoSender #6755

I still remain convinced that we are in the process of making another market top. It is however a process. As bull markets get more mature different sectors become leaders other than those that initially lead out of a bear market. Despite the fire lit by QE3 under the market neither the transports nor the SOX is doing much yet to confirm that this rally is healthy. Even if this quarter's earnings are met with healthy buying (and they just might be) we are getting ever closer to a potential double top for the industrials at 14198.10:


I will be interested to see the action in the semiconductor sector over the next couple of weeks as earnings start to be reported.

RtS
icon url

ReturntoSender

10/08/12 11:29 PM

#9945 RE: ReturntoSender #6755

From Briefing.com: 4:10 pm : Equities began the day on a negative note after the World Bank cut its growth projections for the Asian region. Lacking an additional catalyst, the key indices spent the majority of the session trading near their opening levels. A late-day buying surge briefly lifted the S&P 500 and Dow to their session highs, but the bulk of the move was promptly retraced. As a result, the S&P 500 shed 0.3% and the Nasdaq ended with a loss of 0.8%.

Energy stocks led the broader market. Within the sector, Marathon Petroleum (MPC 57.85, +2.98) advanced 5.4% after announcing the purchase of BP's Texas City Refinery, related logistics, and marketing assets. The base purchase price is said to be $598 million while inventories are estimated at $1.2 billion. Note that today's buying lifted MPC to an all-time high.

Coal stocks were broadly stronger as demonstrated by the Market Vectors Coal ETF (KOL 23.97, +0.18), which added 0.8%. Among individual names, Alpha Natural Resources (ANR 6.78, +0.20) gained 3.0%, while Arch Coal (ACI 6.63, +0.03) and Peabody Energy (BTU 22.63, +0.25) closed higher by 0.5% and 1.1%, respectively.

The technology sector trailed the broader market and the biggest tech component, Apple (AAPL 638.17, -14.42), settled lower by 2.2%. The weakness stemmed from reports which indicated that Apple's supplier, Foxconn is facing labor strikes at its manufacturing plant in China.

As the earnings season nears, guidance cuts continue to put pressure on technology stocks. The latest victim of slumping demand, Oclaro (OCLR 2.38, -0.25), slid 9.5% after lowering its first quarter revenue expectations below consensus. Peers, Finisar (FNSR 13.28, -0.24) and JDS Uniphase (JDSU 10.88, -0.48) lost between 1.8% and 4.2% in sympathy.

Semiconductor producers continued to show weakness ahead of the upcoming earnings season. Earlier, ISI Group downgraded four stocks from ‘buy' to ‘hold.' Of the affected names, Power Integrations (POWI 29.75, -1.34) shed 4.3% while Analog Devices (ADI 39.29, -0.43), Linear Technology (LLTC 32.93, -0.30), and Texas Instruments (TXN 27.99, -0.17) all slid between 0.6% and 1.1%.

Elsewhere in tech, Progress Software (PRGS 18.52, -2.96) fell 13.8% after announcing that its Chief Executive Officer Jay Bhatt will step down, effective December 7, 2012.

The Dow Jones Transportation Average continued to build on its recent strength. After trailing the broader market for an extended period of time, the gap between the bellwether group and the broader market continues to narrow. Today, the complex added 0.2% as Alaska Air (ALK 36.99, +0.47) led transportation stocks with a 1.3% gain. Railroads also showed relative strength as CSX (CSX 21.61, +0.19) and Norfolk Southern (NSC 67.29, +0.39) settled higher by 0.9% and 0.6%, respectively.

Two gun makers rallied on the back of supportive analyst comments. Earlier, the Benchmark Company said that last week's sell-off in Smith & Wesson (SWHC 10.46, +0.24) and Sturm, Ruger & Co (RGR 45.20, +0.55) may have been overdone. The weakness resulted from a slight slowdown in National Instant Criminal Background Checks during the month of September. However, the Benchmark Company notes that handgun background checks were up 23.0%, and that handguns represent the vast majority of sales for both gunsmiths. As a result, the two stocks added between 1.2% and 2.4%.

There is no economic data scheduled to be released tomorrow.DJ30 -26.50 NASDAQ -23.84 SP500 -5.05 NASDAQ Adv/Vol/Dec 853/1.16 bln/1565 NYSE Adv/Vol/Dec 1180/464.4 mln/1792

3:35 pm : Commodities have mostly remained in the red in today's trading session as the dollar index held its gains.

Nov crude oil was in the red all day and fell as low as $88.25. Oil rallied in the morning and pushed into positive territory just for a moment. By the end of today's session, oil was 0.5% lower at $89.43/barrel.

Natural gas futures sold off during the overnight and early morning session. After bottoming out at $3.33. Nov natural gas futures managed to erase all of its losses, ending the day unchanged at $3.40/MMBtu.

Gold futures recovered most of its losses, rising about $10/oz off its LoD of $1768.60, ending the day 0.3% lower at $1775.70/oz. Silver traded in a rather tight consolidated range today, staying around the $34 level. Silver ended today's trading session 1.6% lower at $34.01/oz. Dec copper fell 1.6% to $3.72/lb.DJ30 -18.28 NASDAQ -20.30 SP500 -3.92 NASDAQ Adv/Vol/Dec 946/995.4 mln/1446 NYSE Adv/Vol/Dec 1198/319 mln/1749

9:43AM First Solar partners with Kiran Energy and Mahindra Solar One on 50 MWDC of PV projects in Rajasthan (FSLR) 20.62 +0.55 : Co, Kiran Energy Solar Power Pvt. Ltd. and Mahindra Solar One Pvt. Ltd. have completed an agreement for the supply of First Solar's advanced, thin-film solar modules for two solar photovoltaic (PV) power plants totalling 50 megawatts (MW) DC to be constructed in India's Rajasthan state. First Solar will supply more than 585,000 of its advanced, thin-film solar modules for the two projects of 30 MWDC and 20 MWDC. Construction on both projects is expected to begin this year and be completed in the first quarter of 2013.

Cypress Semiconductor (CY) and Tokyo Electron Device announced an agreement whereby TED will become a distribution partner of Cypress. The agreement includes the entire Cypress product line, including PSoC Programmable System-on-Chip devices, touch-sensing solutions, SRAMs, USB controllers, and more.

AMSC (AMSC) introduced a new class of Amperium superconductor wire for power cable applications with industry-leading performance, pricing and production capacity; this is expected to enable lower cost superconductor power cables and expand the global addressable market for these systems.

10:43 am Information Technology sector trading slightly lower

The tech sector is trading lower today, along with losses in the broader market. Semiconductors are showing relative weakness as well with the SOX trading 0.7% lower. Within the chip index, POWI (-2.9%) is a notable laggard. Among other major indices, the SPY is trading 0.4% lower today, while the QQQ is down 0.6% and the NASDAQ is trading 0.5% lower on the session. Among tech bellwethers, FB (-1.9%) is showing notable weakness, while CSCO (+0.7%) is bucking the trend. In tech earnings, OCLR (-7.2%) issued downside Q1 guidance after the close Friday. Optical related names include: FNSR (-2.1%), JDSU (-2.8%), OPLK (+0.8%), EMKR (-0.7%), and AFOP (-0.6%). In news, PRGS (-11.4%) announced CEO Bhatt will depart in December and GLUU (+3.6%) partnered with Probability PLC for mobile gambling.

In notable analyst upgrades this morning in the tech space, MXIM (+1.1%) was upgraded to Neutral at JP Morgan, SPIL (-0.6%) & UMC (-1.5%) were upgraded at BofA/Merrill and SLAB (+0.6%) was upgraded to Above Average at Caris. Among downgrades, ADTN (-0.4%), RDA (-2.9%) & ISIL (-9.1%) were downgraded at Morgan Stanley, TXN (-0.4%), POWI (-3.0%), LLTC (-1.1%) and ADI (-0.8%) were downgraded at ISI Group, FB (-1.8%) was downgraded to Sell at BTIG Research and TSM (-2.6%) was downgraded to Underperform at BofA/Merrill. There are no notable names in tech scheduled to report quarterly results today after the close.
icon url

ReturntoSender

10/09/12 6:26 PM

#9946 RE: ReturntoSender #6755

From Briefing.com: 4:15 pm : Equities started the day on a mixed note before a broad sell-off sent the major averages to their session lows. The weakness started in the technology sector where a slew of companies lowered their third quarter guidance. After reaching their worst levels of the day, the key indices traded sideways until late day selling coincided with reports the U.S. Attorney in Manhattan filed a civil mortgage fraud lawsuit against Wells Fargo (WFC 35.12, -0.68). The company has since come out and denied any wrongdoing. As a result, the S&P 500 fell 1.0% while the Nasdaq underperformed with a loss of 1.5%.

The technology sector was the biggest laggard. Early weakness resulted from Apple (AAPL 635.85, -2.32) slipping as much as 2.0% intraday. However, shares of the tech giant proved to be resilient as the stock reversed and closed with a loss of 0.4%. Despite the intraday recovery in Apple, the rest of the technology sector was unable to reclaim its losses.

Technology bellwether Intel (INTC 21.90, -0.61) slipped 2.7% after Bernstein downgraded the stock from ‘market perform' to ‘underperform.' It should be noted that today's selling dropped Intel to its 52-week low.

Netflix (NFLX 65.52, -7.99) slid 10.9% after Bank of America/Merrill Lynch downgraded the stock from ‘buy' to ‘underperform' with a $72 price target. The downgrade resulted from valuation questions following the recent rally as well as concerns over the company's domestic streaming business and its international profitability. Today's selling follows yesterday's 10.0% rally which resulted from a Morgan Stanley upgrade.

VASCO Data (VDSI 7.34, -1.60) adds to the list of technology companies who cut their third quarter outlook. The stock sank 17.9% after the company lowered its third quarter and full-year 2012 guidance below consensus. The company commented on the lowered guidance by saying that "the lower than expected order intake in Q3 requires [the company] to lower [its] estimates of full-year revenue and related operating margins."

The energy sector was the top performer as crude oil advanced 3.3%. Within the complex, Gulfport Energy (GPOR 32.65, +2.22) gained 7.3% after reaffirming its 2012 guidance. The company continues to estimate 2012 production to range from 2.9 million to 3.1 million.

Coal stocks were broadly higher and the Market Vectors Coal ETF (KOL 24.35, +0.38) added 1.6%. Among individual coal producers, Alpha Natural Resources (ANR 7.28, +0.50) advanced 7.4% while CONSOL Energy (CNX 33.11, +1.38) and Peabody Energy (BTU 23.93, +1.29) saw gains between 4.3% and 5.7%.

Meanwhile, Penn Virginia (PVA 5.49, -1.04) fell 15.9% after announcing concurrent public offerings of 12 million shares of common stock and $50 million of depositary shares representing convertible preferred equity.

The Dow Jones Transportation Average slid 1.1% to break its recent streak of outperformance. Airlines were among the weakest components as they erased a portion of their recent gains. Delta Air Lines (DAL 9.89, -0.24) slipped 2.4%, while Alaska Air (ALK 36.43, -0.52) and United Continental (UAL 20.49, -0.41) fell between 1.4% and 2.0%. Out of the twenty transportation stocks, only Matson (MATX 21.36, +0.38) advanced. Shares of the shipping company settled higher by 1.8%.

Chinese internet stocks were under pressure after Credit Suisse downgraded Baidu.com (BIDU 106.48, -7.80) from ‘neutral' to ‘underperform.' In addition, the price target was lowered from $118 to $83. As a result of the downgrade, Baidu.com slid 6.8%, and traded at levels last seen in early September.

Other Chinese internet names also declined in sympathy. SINA (SINA 60.36, -0.77), Sohu.com (SOHU 39.58, -1.12), and Youku Tudou (YOKU 19.16, -0.36) all registered losses between 1.2% and 2.8%.

Tomorrow, the MBA Mortgage Index will be reported at 7:00 ET. In addition, the September Treasury Budget and Federal Reserve's September Beige Book will be released at 14:00 ET.

The U.S. Treasury will hold a $21 billion, 10-yr reopening.DJ30 -110.12 NASDAQ -47.33 SP500 -14.40 NASDAQ Adv/Vol/Dec 542/1.59 bln/1935 NYSE Adv/Vol/Dec 694/612.5 mln/2348

3:30 pm : Crude oil extended overnight gains as escalated tension between Turkey and Syria overshadowed the IMF cutting its global growth forecast. The energy component came off its pit session low of $90.08 per barrel and steadily climbed to a session high of $92.91 per barrel before settling with a 3.2% gain at $92.41 per barrel.

Natural gas dipped to a session low of $3.35 per MMBtu in morning action. However, a reversal took prices into positive territory and to a session high of $3.51 per MMBtu as investors reacted to forecasts of a slightly colder turn in computer weather projections. Natural gas lost some steam as it headed into the close but still settled 1.8% higher at $3.46 per MMBtu.

Gold fell into negative territory as a stronger dollar put pressure on the yellow metal. It tumbled to a pit session low of $1762.00 per ounce after trading as high as $1780.20 per ounce in early morning action. Gold eventually settled 0.6% lower at $1765.70 per ounce. Silver also slid to a session low of $33.57 per ounce but managed to erase most of the loss by afternoon action. It closed pit trade at $33.99 per ounce, or 0.1% lower.DJ30 -100.24 NASDAQ -47.30 SP500 -13.30 NASDAQ Adv/Vol/Dec 575/1335.6 mln/1871 NYSE Adv/Vol/Dec 745/381 mln/2294

4:30PM PLX Tech appoints David K. Raun interim president and CEO following resignation of Ralph H. Schmitt (PLXT) 5.55 -0.08 : Co announced that the PLX Board of Directors has appointed David K. Raun interim president and CEO, effective immediately, following the Board's acceptance of the resignation of Ralph H. Schmitt as president and CEO. Raun has held multiple leadership positions at PLX, including his most recent position as senior executive vice president and general manager. Schmitt plans to pursue a leadership role at a different company and will stay on the PLX Board of Directors to help with continuity through the expected acquisition of PLX Technology by IDT.

4:06PM SunPower announces it has invested in Diamond Energy (SPWR) 4.62 -0.03 : Co announces it has invested in Diamond Energy Pty, a privately-owned, alternative energy project developer and clean electricity retailer headquartered in Melbourne, Australia. Aligning with Diamond Energy will allow SunPower to offer more comprehensive and customizable clean energy solutions for customers in Australia. SunPower has acquired a minority stake of approximately 42 percent in Diamond Energy and under terms of the agreement has an option to increase its ownership percentage over time. SunPower will also assume a seat on the company's board of directors.

4:06PM Alcoa beats by $0.03, beats on revs; reaffirms long-term outlook that aluminum demand will double 2010 to 2020 (AA) 9.15 +0.02 : Reports Q3 (Sep) earnings of $0.03 per share, excluding non-recurring items, $0.03 better than the Capital IQ Consensus Estimate of ($0.00); revenues fell 9.1% year/year to $5.83 bln vs the $5.57 bln consensus. Alcoa sees global aluminum demand of 6% in 2012 (down from 7%); reaffirms long-term outlook that aluminum demand will double 2010 to 2020.

Additionally, Alcoa confirmed it has entered into a settlement agreement with Aluminium Bahrain B.S.C. ("Alba") resolving a civil lawsuit that had been pending in the U.S. District Court for the Western District of Pennsylvania since 2008. Without admitting any liability, Alcoa agreed to make a cash payment to Alba of $85 mln payable in two installments. One half was made at settlement and the other half will be made one year later. The settlement amount is within the range Alcoa previously estimated as its reasonably possible losses, which it disclosed in its second quarter 2012 earnings announcement. Alcoa said the settlement with Alba represents the best possible outcome and avoids the time and expense of complex litigation.

Alcoa continued to turn in strong performance in Q3, despite market turbulence. Amidst challenging market conditions, Alcoa's upstream businesses achieved significant performance improvement in Q3, delivering $98 mln of combined sequential operational improvements across the Alumina and Primary Metals segments as higher volume, improved price and mix, and productivity gains more than offset cost headwinds.

In what is traditionally a weaker quarter, Alcoa's midstream and downstream businesses continued to turn in record performance. Global Rolled Products continued to deliver strong profitability despite European weakness, achieving record third quarter ATOI of $98 mln, up 3% sequentially, and 63% YoY. Adjusted EBITDA per metric ton for Global Rolled Products was a third quarter record at $395, and year-to-date record at $405, 72% higher than the 10-year average. Engineered Products and Solutions achieved a record adjusted EBITDA margin of 20%, a third consecutive quarterly record.

2:00PM Alcoa reaches tentative agreement on power contract for Intalco Works (AA) 9.20 +0.08 : Co announced that it has reached a tentative agreement on a long-term power contract with Bonneville Power Administration (BPA) for its Intalco Works aluminum smelter in Ferndale, Washington. The proposed contract, which runs through September 2022, will ensure power supply for the smelter and help sustain the economic impact the plant brings to the region. A 90-day extension to the current contract will be in place while a public comment process on the new contract is conducted, followed by a review by BPA. The contract is expected to be finalized by early December.

11:35AM Alcoa and Alba resolve civil litigation; settlement amount within range Alcoa previously estimated as reasonably possible losses (AA) 9.15 +0.03 : AA agreed to make a cash payment to Alba of $85 mln payable in two installments. One half was made at settlement and the other half will be made one year later. The settlement amount is within the range Alcoa previously estimated as its reasonably possible losses, which it disclosed in its second quarter 2012 earnings announcement. AA recorded a $40 mln charge ($15 mln after-tax and noncontrolling interest) in the third quarter in addition to the $45 mln charge ($18 mln after-tax and noncontrolling interest) it recorded in the second quarter. Alcoa estimates an additional possible after-tax charge of ~$25-30 mln to reflect an agreement between the shareholders of Alcoa World Alumina LLC regarding the cash costs of the settlement of the Alba civil lawsuit; such charge would be recognized in the event that a settlement is reached with the Department of Justice and the Securities and Exchange Commission regarding their investigations. Alcoa and Alba have also resumed a commercial relationship and have entered into an Alumina Price Index-based, long-term alumina supply agreement, demonstrating a mutual desire to work together going forward and the significant value that Alcoa brings to customers in the region through superior quality and optimal logistics of its alumina.

10:21AM Apple drops 10% off all time close high (AAPL) 631.00 -7.08 : The stock is down for the fourth session in a row with it currently hovering just under the 10% loss level off its all time close high at 631 (session low 628.00). Note that its 100 ema is at 627. The next support zone of note if follow through develops is at 621/619 (62% of July-Sep rally, equality with first leg lower off Sep high).

9:40AM Semiconductor Hldrs ETF gaps down for second day in a row, fills late Sep bull gap at 31.25 -- session low 31.21 (SMH) 31.21 -0.33 : Support below is in the 31.11/31.03 area. Weighing on the sector are: INTC -2% (gapped down to new 52-wk low), ALTR -1.1%, LLTC -1%, MCHP -0.9%, BRCM -0.7%, NVDA -0.6%, XLNX -0.4%.

EXFO (EXFO) announced that its MaxTester copper/DSL tester series has been formally approved by three tier-1 North American telecom operators.

Cree (CREE) announced commercial availability of XLamp XB-D color LEDs and XLamp XM-L multi-color LEDs.

9:23AM Super Micro Computer sees Q1 rev at low end of guidance, below consensus (SMCI) 10.64 : Co issues downside guidance for Q1 (Sep), sees Q1 (Sep) revs of ~$270 mln vs. $279.54 mln Capital IQ Consensus Estimate (prior guidance $270-290 mln). Non-GAAP gross margin is expected to be ~13% vs. ests near 16%. The primary cause for the lower gross margin was the steep price drops for hard disk drives and memory. Margins on other products and components were stable to higher. The co anticipates that it will report non-GAAP operating expenses for the quarter in line with those reported for the prior quarter ended June 30, 2012. "Revenue for the quarter was up about 9% from last year and down slightly from our record last quarter despite challenges from a weaker global economy. The big price drops of HDD and memory, particularly late in the quarter, negatively impacted our net profit for the quarter as we adjusted to vendor contracts we entered into in the March quarter."

8:09AM Intersil sees Q3 rev below consensus (ISIL) 7.31 : Co issues downside guidance for Q3 (Sep), sees Q3 (Sep) revs -19% YoY to ~$151 mln vs. $159.74 mln Capital IQ Consensus Estimate. Weakness in the worldwide Personal Computing business was the primary driver of lower revenue in Q3. Intersil exited Q3 with over $300 million in cash and short term investments. Intersil's strong balance sheet and cash flow can continue to support the current dividend policy, even through cyclical industry downturns. Intersil will announce its Q3 financial results on Wednesday, October 24, 2012 at 1:45 p.m. Pacific Time.

CEVA (CEVA) and NXP Software (NXPI) have partnered to deliver an enhanced HD voice processing solution for the smartphone market

DSP Group (DSPG) and SoftAtHome announced that the cos have jointly integrated Digital Enhanced Cordless Technology Ultra Low Energy home security, control and automation solutions. Also, DSP Group and Comigo announced the launch of a jointly-developed home automation solution based on DECT Ultra Low Energy technology.

6:34AM LM Ericsson and STMicroelectronics (STM) comment on speculations regarding ST-Ericsson; says 'Both STMicroelectronics and Ericsson support ST-Ericsson' (ERIC) 8.93 : The two parent companies, together with ST-Ericsson, are currently working with an external advisor in order to ensure the best possible future for ST-Ericsson. Both STMicroelectronics and Ericsson support ST-Ericsson in its transformation work and remain confident that the company has a strategic position in the industry to enable the device ecosystem.

TSMC (TSM) announced that the readiness of 20nm and CoWoS design support within the Open Innovation Platform is demonstrated by the delivery of two foundry-first reference flows supporting 20nm and CoWoS technologies.

AMD (AMD) announced that a cluster of HP (HPQ) ProLiant BL465c Gen8 servers utilizing AMD Opteron 6200 Series processors has achieved the highest VMmark 2.1 score ever posted, representing a 40% increase over the next best score.

Freescale Semiconductor (FSL) announced the Kinetis KW01 wireless microcontroller, expanding its popular Kinetis MCU line with a device ideally suited for wirelessly networked smart energy applications.

Universal Display (PANL $36.64 +1.01) and Duksan Hi-Metal Company announced that the companies have entered into a master services agreement to enhance Universal Display's local presence and expansion in Korea. As the first initiative under the agreement, Duksan will provide manufacturing services for one of Universal Display's host products for certain Korean customers. Universal Display and Duksan will also explore additional areas for collaboration to better serve and support the needs of the growing Korean OLED industry.

Jabil Circuit (JBL $19.77 -1.20) reported fourth quarter earnings of $0.54 per share, $0.04 worse than the Capital IQ Consensus of $0.58, while revenues rose 1.4% year/year to $4.34 billion versus the $4.22 billion consensus. The company issued downside guidance for the first quarter with EPS of $0.51-0.62 versus the $0.67 consensus Estimate; sees Q1 revs of $4.3-4.5 bln vs. $4.51 bln Capital IQ Consensus Estimate. "Results for the fourth quarter were negatively impacted by a challenging new program ramp in our Specialized Services sector...Additionally demand remained weak in most of our business segments." Management also announced that the Jabil Board of Directors has authorized the repurchase of up to $100 million worth of shares of the Company's common stock during the next twelve months.

Yahoo (YHOO $15.77 +0.11) announced that Ken Goldman will join the company as CFO, effective Oct. 22. Goldman joins Yahoo! from Fortinet, a provider of threat management technologies, where he served as CFO. Goldman succeeds Yahoo! CFO Tim Morse, who has been with the company since June 2009. Morse will leave the company later this fall.

Synnex (SNX $34.25 +0.00) reported third quarter earnings of $0.93 per share, $0.01 worse than the consensus of $0.94, while revenues rose 0.2% year/year to $2.58 billion versus the $2.59 bln consensus. The company issued downside guidance for the fourth quarter EPS of $1.02-1.06 versus the $1.18 consensus and revenues of $2.71-2.81 billion versus the $2.85 billion consensus.

Oppenheimer downgrades Texas Instruments (TXN $27.53 -0.30) to Perform from Outperform. While they continue to believe in the co's long-term "core" analog/embedded share gain story, TXN's "non-core" wireless business remains a headwind. Tuesday, TXN articulated a shift in wireless strategy, with plans under way to discontinue wireless (OMAP/connectivity) investment for smartphone/tablet. Wireless (~10% of sales) will likely see revs dwindle over the next several years as the business slowly unwinds, much as the baseband exit created material top-line headwinds. As it is the most broadly diversified co in their universe, they expect challenged global GDP will weigh on the core business near term. With upside likely limited, they are stepping to the sidelines.

10:55 am S&P Info Technology sector trading lower today and behind broader market
The tech sector is trading lower today, trailing narrower losses in the broader market. Semiconductors are showing relative weakness as well with the SOX trading 1.1% lower. Within the chip index, WFR (-2.1%) is a notable laggard. Among other major indices, the SPY is trading 0.2% lower today, while the QQQ is down 1.0% and the NASDAQ is trading 0.7% lower on the session. Among tech bellwethers, INTC (-2.0%) is showing notable weakness.

In tech earnings last night, SCSC (-4.6%) issued downside Q1 guidance. This morning, VDSI (-23.4%) issued downside Q3 guidance and lowered FY12 guidance, ISIL (-0.4%) guided Q3 below consensus, SMCI (-2.9%) reported that it now sees Q1 at the low end of guidance, and ORBK (-10.1%) lowered Q3 rev guidance well below the Street.

Among rumors, FB (+0.1%) will team up with retailers to test 'want button', according to reports.

In notable analyst upgrades this morning in the tech space, ALLT (+3.3%) was upgraded to Buy at Jefferies Among downgrades, INTC (-2.0%) was downgraded to Underperform at Bernstein, BIDU (-4.5%) was downgraded to Underperform at Credit Suisse and PRGS (-3.5%) was downgraded from Buy at Mizuho. ADTN (-0.7%) is the only notable name in tech scheduled to report quarterly results today after the close.

09:25 am Owens Corning shares fall 10% after company lowered its 2012 earnings outlook

Owens Corning (OC) lowered its 2012 earnings outlook, reflecting a weaker environment for its Roofing and Composites businesses. Full-year adjusted. EBIT for the co are now expected to be in the range of $280-310 million (down from $360-420 million) with the primary uncertainty through the remainder of the year attributed to roofing volumes. Preliminary third-quarter adjusted EBIT is $81 million (ests near $124 million). The company previously disclosed late second-quarter weakness in the U.S. roofing shingle market, which persisted early into the third quarter. While there was some improvement through most of the third quarter, shipments weakened following a mid-September price increase and are not expected to improve for the remainder of year. As a result, the company has lowered its Roofing revenue outlook for the full-year, now estimated to be approximately $2 billion.

Pricing improved sequentially in the third quarter on slightly higher asphalt costs. While fixed cost controls continue to be effective, the significant revenue decline in the second half of 2012 will result in margin compression. Despite the market weakness of the second half, the market outlook and competitive environment supports reaffirmation of the company's mid-term guidance of mid-teen or better EBIT margins. 2H12 Composites demand will be impacted by lower global industrial production, particularly in Europe, as well as by the weaker U.S. roofing market. The company's estimate for global glass fiber market demand growth in 2012 has been reduced to approximately three percent, compared to the long-term historical average growth rate of five percent. The co maintains its earlier guidance for the Insulation business of significantly narrowing losses in 2012.
icon url

ReturntoSender

10/10/12 8:33 PM

#9947 RE: ReturntoSender #6755

From Briefing.com: 4:15 pm : Equities got off to a mixed start as the key indices chopped around their respective unchanged lines during the first hour. Sellers took control after traders digested the wholesale inventories data, pushing the major averages to their worst levels. Afternoon trade was mostly quiet as the three averages hovered near session lows. As a result, the S&P 500 finished lower by 0.6%.

Earlier, the Federal Reserve released its September Beige Book. In its report, the twelve Federal Reserve Districts reported that economic activity "expanded modestly since the last report." Residential real estate conditions as well as the nonfinancial services sector also showed modest improvement.

The manufacturing sector was described as mixed but somewhat healthier than what was observed in the last report. Meanwhile, the industrial market was also described as mixed. While the Philadelphia, New York, Cleveland, and Atlanta districts all showed strength, conditions in Richmond deteriorated slightly. The Beige Book also commented on consumer spending by saying it was mostly unchanged since the previous report.

Financials registered the slimmest losses and the SPDR Financial Select Sector ETF (XLF 15.94, -0.01) shed 0.1%. Among the majors, Citigroup (C 35.14, +0.54) and JPMorgan Chase (JPM 41.77, +0.39) were the top performers. The two names registered respective gains of 1.6% and 0.9% after Bank of America/Merrill Lynch resumed coverage of the two stocks with a ‘buy' rating. Note that JPMorgan Chase will report its third quarter earnings before Friday's open.

European financials saw mixed performance as Deutsche Bank (DB 41.17, +0.33) added 0.8% while Spanish Banco Bilbao Vizcaya Argentaria (BBVA 7.59, -0.10) slipped 1.3%.

Energy stocks were the biggest laggard of the session. Chevron (CVX 112.45, -4.91) slid 4.2% after announcing that its third quarter earnings are expected to be substantially lower than results from the previous quarter. Penn Virginia (PVA 5.10, -0.39) and Tesoro (TSO 38.70, -2.29) lost 7.1% and 5.6%, respectively.

The Dow Jones Transportation Average outperformed the broader market with a gain of 0.1%. However, the strength was largely due to FedEx (FDX 89.52, +3.94). The bellwether stock gained 5.2% after announcing a program which targets $1.7 billion in annual profit improvements by the end of fiscal year 2016. In addition, the company reaffirmed its second quarter and full-year 2012 guidance which it had revised down on September 18.

Elsewhere, Alcoa (AA 8.71, -0.42) dipped 4.6% after beating on earnings and revenues. However, the company's third quarter revenue of $5.833 billion represents a 9.1% year-over-year decrease. In addition, AA lowered its 2012 global aluminum demand growth forecast from 7.0% to 6.0%.

Engine maker Cummins (CMI 87.79, -3.05) slid 3.4% after lowering its third quarter and full-year 2012 guidance due to weak demand. Caterpillar (CAT 83.16, -1.59) slipped 1.9% in sympathy.

Ambarella (AMBA 6.06, +0.06) made its public debut today. The producer of video processing semiconductors priced its initial public offering at $6, which was well below the expected price range of $9 to $11. The stock settled higher by 1.0% after shares began trading at $6.66.

August wholesale inventories increased by 0.5%. This was slightly lower than the increase of 0.6% which had been broadly forecast.

Weekly initial and continuing jobless claims, August trade balance, September export prices ex-agriculture, and September import prices ex-oil will all be reported at 8:30 ET.

The U.S. Treasury will look to make it three strong auctions for the week with tomorrow's $13 billion, 30-yr reopening.DJ30 -128.56 NASDAQ -13.24 SP500 -8.92 NASDAQ Adv/Vol/Dec 1121/1.73 bln/1337 NYSE Adv/Vol/Dec 1144/590.8 mln/1890

3:30 pm : Crude oil retreated from its pit session high of $93.66 per barrel set in morning action despite continued tension between Turkey and Syria. The energy component brushed a session low of $91.02 per barrel moments before settling with a 1.3% loss at $91.25 per barrel.

Natural gas dipped to a floor session low of $3.43 per MMBtu but buyers stepped in and took prices as high as $3.51 per MMBtu in afternoon action. However, the momentum faded heading into the close, and natural gas settled at $3.47 per MMBtu, or just 0.3% higher.

Gold chopped around between positive and negative territory during today's pit session. The yellow metal fell as low as $1759.10 per ounce, rallied to a session high of $1769.40 per ounce, and ultimately settled just 70 cents below the breakeven level at $1765.00 per ounce.

Silver inched higher after sliding to a session low of $33.81 per ounce in late morning action. It then closed with a 0.4% gain at $34.12 per ounce, or just below its session high of $34.19 per ounce.DJ30 -131.32 NASDAQ -16.24 SP500 -9.43 NASDAQ Adv/Vol/Dec 1032/1491.3 mln/1384 NYSE Adv/Vol/Dec 1042/410 mln/1977

9:40AM Semiconductor Hldrs lagging sector continues to underperform, notches new two month low of 30.73 (SMH) 30.74 -0.30 : The SMH slipped below its Sep trough to reach its lowest level since later July. The next supports are at 30.64/30.55 (extension target, July gap top, congest) with the July gap bottom just below at 30.50 -- XLNX -2.5%, NVDA -2% ALTR -1.7%, SNDK -1.4%, MRVL -1.4%, BRCM -1%, LRCX -1%, KLAC -0.9%, LLTC -0.8%, MCHP -0.7%.

8:06AM Avnet lowers Q1 guidance (AVT) 28.57 : Co issues downside guidance for Q1 (Sep), lowers adj. EPS to $0.52-0.58 from $0.78-0.88 vs. $0.83 Capital IQ Consensus Estimate; lowers Q1 (Sep) revs to ~$5.85 bln from $5.8-6.4 bln vs. $6.07 bln Capital IQ Consensus. Sales at Electronics Marketing (EM) and Technology Solutions (TS) for the September quarter are expected to be ~$3.65 billion and $2.20 billion, respectively. The revised estimated EPS for Q1 is primarily attributable to the combined negative impacts of 1) lower than expected revenues, most notably at TS, 2) lower gross profit margin in the Western regions at EM associated with the weaker sales environment and 3) a greater than anticipated geographic mix shift in the EM business where better than expected sales in the lower-margin Asia region were more than offset by weaker sales in the higher-margin Western regions.

"It appears the uncertain macroeconomic conditions continue to negatively impact key areas of end demand in our served markets as our overall revenue for the quarter finished weaker than expected, particularly in the Americas region. The shortfall to our expectations was more acute at our TS business, where we experienced a second consecutive quarter of weaker than expected transaction activity at the end of the quarter as customers delayed IT projects. At EM, although overall sales were relatively in line with initial expectations, the lower-margin Asia business had a stronger than expected quarter, which was offset by a pronounced slowdown in the Americas region. This overall shortfall in Avnet's revenue accounted for more than half of the lowered earnings expectations while the regional mix shift and lower gross profit margins at EM accounted for the remainder. As a response to these developments, we are evaluating resource commitments across the portfolio and have identified further expense alignment actions in addition to the expense reductions of $40 - $50 million that we announced in August. We remain steadfastly committed to monitoring market developments and taking actions consistent with the pursuit of our long-term operating goals."

Qualcomm (QCOM) and Semp Toshiba have entered into a 3G and 4G license agreement. Qualcomm has granted Semp Toshiba a royalty-bearing patent license to develop, manufacture and sell 3G WCDMA and TD-SCDMA, and 4G OFDMA subscriber units.

7:20AM Ambarella prices 6 mln share IPO at $6, below the $9-11 expected range (AMBA) :

Cisco (CSCO) and NetApp (NTAP) introduced ExpressPod, a prepackaged and tested solution for growing small and medium-sized organizations; the addition of new storage clustering capabilities to the FlexPod data center platform, and the release of a validated VMware (VMW) solution for Oracle (ORCL) Real Application Cluster on FlexPod.

Cree (CREE $24.83 +0.00) reports F1Q13 results on October 16th after market close. Based on LED demand growth and continued momentum of its lighting business, they expect results to beat Street's estimates. However, revenue guidance could be a tad light due to seasonal slowdown of LED component sales partially offset by growth of lighting sales. They expect a slight beat for F1Q on lighting growth and better LED component sales.

09:12 am Qualcomm downgraded to Neutral at DA Davidson; tgt lowered to $65: . DA Davidson downgrades QCOM to Neutral from Buy and lowers their tgt to $65 from $70. They continue to believe Qualcomm is a market leader and recognize the considerable content in the iPhone 5 and lead in LTE, they would urge a degree of caution regarding the pace of growth. With the iPhone 5 ramp already in progress, they believe the strongest catalyst has passed. They are raising their FY13 ests to reflect the higher dollar content in the iPhone. However, given the combination of mounting competition (BRCM, SPRD, RDA -- all 3 rated Buy and MediaTek) and demand pressure, they are taking a cautious approach in the near term.

10:03 am S&P Information Technology Index trading slightly higher today

The tech sector is trading just higher today, ahead of slight losses in the broader market. Semiconductors are showing relative weakness with the SOX trading 0.3% lower. Within the chip index, NXPI (-4.8%) is a notable laggard. Among other major indices, the SPY is trading 0.2% lower today, while the QQQ is flat and the NASDAQ is trading just lower on the session. Among tech bellwethers, FB (-1.9%) is showing notable weakness after a Bloomberg article out overnight detailing the SEC questioning the company's mobile growth ahead of the IPO.

In tech earnings last night, GLUU (-11.9%) reiterated Q3 guidance and issued cautious commentary on its gaming outlook. This morning, ADTN (+3.9%) posted a Q3 roughly inline with its negative preannouncement, while OCZ (-35.9%) and AVT (-8.9%) issued guidance well below consensus. ARW (-5.8%) is trading lower on the AVT news. In news, OCZ (-35.2%) appointed Ralph Schmitt as CEO and announced its delaying its 10k. Also, NFLX (+3.0%) CEO Hastings stepped down from MSFT (-0.5%) board.

In notable analyst upgrades this morning in the tech space, QLIK (+5.9%) was upgraded to Buy at UBS. Among downgrades, CNQR (-1.2%) was downgraded to Hold at Wunderlich, BAH (-2.7%) was downgraded to Sell at Lazard, SAI (-1.3%) was downgraded to Neutral at Lazard, SAP (-1.1%) was downgraded to Equal Weight at Barclays, and ZNGA (-2.3%) was downgraded to Neutral at Piper. There are no notable names in tech scheduled to report quarterly results today after the close.
icon url

ReturntoSender

10/11/12 1:55 PM

#9948 RE: ReturntoSender #6755

VSH ST Bought 3000 shares@8.88 - I might be early. I might have to hold VSH longer than short term but the stock has always been good to me.


RtS
icon url

ReturntoSender

10/13/12 5:20 PM

#9950 RE: ReturntoSender #6755

From Briefing.com: Weekly Recap - Week ending 12-Oct-12

Dow +2.46 at 13328.85, Nasdaq -5.30 at 3044.11, S&P -4.25 at 1428.59

Today's session got off to a quiet start. The major averages held near their opening levels until the preliminary October University of Michigan Consumer Sentiment Survey registered a reading of 83.1. The survey's best level since September 2007 lifted the major averages to their session highs. However, the exuberance was short-lived as the key indices promptly fell through the unchanged line, to their session lows. The afternoon was generally quiet as the S&P 500 hovered within points of the 1,428 level before settling at 1,428.59, with a loss of 0.3%. Note that today's session punctuated a down week, during which the S&P 500 lost 2.2%.

The financial sector was the biggest laggard of the day. Despite record earnings from two major names, the SPDR Financial Select Sector ETF (XLF 15.81, -0.22) shed 1.4%. JPMorgan Chase (JPM 41.62, -0.48) reported earnings of $1.40 per share against expectations of $1.21. Meanwhile, its revenues were reported at $25.15 billion which was ahead of the expected $24.27 billion. The stock traded higher in initial response to the earnings report, but it settled lower by 1.1%.

Wells Fargo (WFC 34.25, -0.93) slid 2.6% after reporting mixed earnings. WFC exceeded earnings expectations by one cent, while its revenues fell $200 million short of analyst estimates.

Other major financials also showed weakness. Bank of America (BAC 9.12, -0.22) and Morgan Stanley (MS 17.31, -0.55) slipped 2.4% and 3.1%, respectively.

Consumer staple stocks were the top performers of the session. Within the space, Dean Foods (DF 14.94, +0.29) added 2.0% after Stifel Nicolaus upgraded the stock to ‘buy' from ‘hold' with an $18 price target.

Cigarette stocks also showing strength among defensive staple stocks. Philip Morris (PM 91.70, +0.86) and Altria (MO 33.12, +0.41) saw respective gains of 1.0% and 1.3%.

Elsewhere in the space, Monster Beverage (MNST 57.08, +2.64) advanced 4.9% in a rebound from recent weakness.

The Dow Jones Transportation Average outperformed the broader market and settled higher by 0.9%. JB Hunt (JBHT 58.37, +3.58) is the top performer within the space. The freight carrier settled higher by 6.5% after its mixed earnings report showed a top line beat and a slight bottom line miss. Meanwhile, peer CH Robinson (CHRW 59.94, +1.04) added 1.8%. With most transportation stocks on the rise, Overseas Shipholding Group (OSG 5.08, -0.80) was a notable laggard as the shipping stock tumbled 13.6%.

AMD (AMD 2.74, -0.46) slumped 14.4% after the company lowered its third quarter revenue guidance below consensus. Peer Intel (INTC 21.48, -0.20) settled lower by 0.9% while the Market Vectors Semiconductor ETF (SMH 30.50, -0.10) slipped 0.3%.

Overall producer prices rose during September by 1.1%, which was hotter than the 0.8% increase that had been widely forecast. Core producer prices were unchanged which was lower than the Briefing.com consensus call of a 0.2% increase.

The September Treasury Budget showed a $75 billion surplus, which was in-line with expectations.

Next week, the earnings season enters full force as more than 230 companies are scheduled to report their third quarter results.

On Monday, September retail sales, retail sales ex-auto, and the October Empire Manufacturing Index will all be reported at 8:30 ET. In addition, August business inventories will be released at 10:00 ET.

Weekly Review: Markets Cautious Ahead of Third Quarter Earnings

On Monday, equities began the day on a negative note after the World Bank cut its growth projections for the Asian region. Lacking an additional catalyst, the key indices spent the majority of the session trading near their opening levels. A late-day buying surge briefly lifted the S&P 500 and Dow to their session highs, but the bulk of the move was promptly retraced. As a result, the S&P 500 shed 0.3% and the Nasdaq ended with a loss of 0.8%. Marathon Petroleum (MPC 54.30, -0.36) advanced 5.4% after announcing the purchase of BP's Texas City Refinery, related logistics, and marketing assets.

Tuesday's session began on a mixed note before a broad sell-off sent the major averages to their session lows. The weakness started in the technology sector where a slew of companies lowered their third quarter guidance. After reaching their worst levels of the day, the key indices traded sideways until late-day selling coincided with reports the U.S. Attorney in Manhattan filed a civil mortgage fraud lawsuit against Wells Fargo (WFC 34.25, -0.93). The company has since come out and denied any wrongdoing. As a result, the S&P 500 fell 1.0% while the Nasdaq underperformed with a loss of 1.5%.

Wednesday's session got off to a mixed start as the key indices chopped around their respective unchanged lines during the first hour. Sellers took control after traders digested the wholesale inventories data, pushing the major averages to their worst levels. Afternoon trade was mostly quiet as the three averages hovered near session lows. As a result, the S&P 500 finished lower by 0.6%. Alcoa (AA 8.69, -0.08) dipped 4.6% after beating on earnings and revenues. However, the company's third quarter revenue of $5.833 billion represents a 9.1% year-over-year decrease.

On Thursday, equities began the session on a positive note after the weekly initial claims were reported at their lowest level since January 2008. However, the reading of 339,000 may not be entirely comparable to the prior period as one unidentified large state was not included in the total. The early bullish sentiment failed to hold as the major averages reversed during the first hour, and headed for the flat line. As a result, the S&P 500 ended flat. Alpha Natural Resources (ANR 7.88, -0.67) and Arch Coal (ACI 7.62, -0.32) both surged near 16.0%.
Index Started Week Ended Week Change % Change YTD %
DJIA 13610.15 13328.85 -281.30 -2.1 9.1
Nasdaq 3136.19 3044.11 -92.08 -2.9 16.8
S&P 500 1460.93 1428.59 -32.34 -2.2 13.6
Russell 2000 842.86 823.09 -19.77 -2.3 11.1

9:36AM Semiconductor Hldrs rebounds back to positive territory after filling July gap at 30.50 -- session low 30.48 (SMH) 30.64 +0.64 :

9:28AM STMicroelectronics denies the existence of initiatives which can compromise the unity of the company (STM) 5.64 : Co says that following today's media speculations, STM denies the existence of initiatives which can compromise the unity of the Company. The Company will announce its Q3 2012 results as planned on Oct 23, 2012.

ATMI (ATMI) has announced plans to further increase its commitment to the Asia-Pacific microelectronics markets, and South Korea customers in particular, through a new state-of-the-art manufacturing facility to be built in JangAn, Gyeonggi province.

TSMC (TSM) announced that it has taped out the foundry segment's first CoWoS test vehicle using JEDEC Solid State Technology Association's Wide I/O mobile DRAM interface.

6:00AM JA Solar responds to U.S. Department of Commerce's final decision on anti-dumping tariffs on Chinese solar products; says 'we are pleased that the dispute is coming to a close' (JASO) 0.83 : Co responded to the final determination by the U.S. Department of Commerce on imposing anti-dumping duties on China-produced solar products. Pursuant to the DOC's determination, PV cells produced in China by JA Solar will be subject to an antidumping duty of 25.96% and a countervailing duty of 15.24%. Jonathan Pickering, president of JA Solar USA, commented, "We are pleased that the dispute is coming to a close and that the scope of the investigation was not expanded. JA Solar cooperated fully with the DOC during its investigation, and we continue to state our case to the ITC." Mr. Pickering continued, "We remain focused on addressing our customers' need for high-quality, high-performance products, and we're determined to play an active role in the rapid growth of the U.S. market."

5:29AM JinkoSolar Holding comments on U.S. Department of Commerce's final decision on tariffs; believes 'duties are unfair and unfounded' (JKS) 3.79 : Co issues statement on the U.S. Department of Commerce's final determination to impose anti-dumping duties of 25.96% and countervailing duties of 15.24% on co's crystalline silicon photovoltaic cells whether or not assembled into modules from the People's Republic of China. "We believe that these duties are unfair and unfounded. The ruling to impose stiff duties on JinkoSolar products does not reflect the reality of the highly competitive global solar industry and will only hinder the development of the entire PV industry. It will ultimately end up hurting US consumers, slow down the roll-out of green energy and limit job creation. Ill-conceived unilateral trade barriers such as these will reduce solar's competitiveness against other forms of electricity generation. However, the tariffs will not impact our global strategy and we will continue to commit ourselves to promoting the prosperity of the solar industry."

3:45AM LDK Solar responds to the final U.S. DOC determination for Chinese solar cells and modules (LDK) 1.01 : Co announces statement regarding the U.S. Department of Commerce's final determination on October 10th, 2012 to impose countervailing duties of 15.24% and anti-dumping duties of effectively 25.96% on LDK's crystalline silicon photovoltaic modules and cells produced exclusively in China. "We believe that unilateral trade barriers will not make any solar company more competitive, but will make solar power less competitive against other forms of electricity generation. The growth of destructive trade barriers recently from the U.S. represent significant, long-term challenges to the health of the global solar industry and countervail with the industry's aim to make solar power affordable for everyone."

Advanced Micro Devices (AMD $2.95 -0.25) issued downside guidance for the third quarter, seeing revenues down 10% quarter over quarter (lowered from -4 to +2%) to approximately $1.271 billion versus the $1.38 billion Capital IQ Consensus Estimate. The lower than anticipated preliminary revenue results are primarily due to weaker than expected demand across all product lines caused by the challenging macroeconomic environment. The company now expects third quarter gross margin to be approximately 31%, less than the previous expectation of approximately 44% primarily due to an inventory write-down of around $100 million due to lower than anticipated future demand for certain products. Third quarter gross margin was also negatively impacted by weaker than expected demand, which contributed to lower than anticipated average selling prices (ASPs) for the company's Computing Solutions Group products and lower than expected utilization of its back-end manufacturing facilities. Operating expenses for the third quarter are expected to decline approximately 7% quarter over quarter as a result of tightly controlled expenses. AMD will report third quarter 2012 results after market close on Thursday, October 18, 2012.
icon url

ReturntoSender

10/14/12 11:49 AM

#9951 RE: ReturntoSender #6755

InvestmentHouse Weekend Market Summary

http://www.investmenthouse.com/weekendmarketsummary.htm

- There you go again: paradise lost as another gain is thrown away.
- Buyers are hard to come by of late, but sellers have not taken over as indices are still at support.
- Retail rolls over even as consumers spike up their sentiment, food and gas inflation, slowing economic activity be damned.
- Still some solid leadership sectors even after 4 weeks of testing the QE3 fact move.
- PPI: Same old story as energy and food prices jump while other prices deflate, economy stalls. There is a word for this.
- All of those (part-time) jobs push Michigan Sentiment wildly higher.
- Sad state of the world when the Nobel Prize is now given not for deeds but for hope of change: EU wins peace prize.
- Time for QE3 to reassert itself . . . if stocks are going to avoid a deeper test below near support. Earnings will need to help.

Another day of blown gains, but another day of testing support as well.

For the third session NASDAQ and SP500 started higher, and for the second session built good intraday gains. The result, however was the same. The bids faded and stocks fell back to flat.

To many it looks as if the market is ready to roll over given the intraday action. It is certainly not the best, not the low to high intraday action that accompanied the rise into September. But then again, the market is in test mode and as it fades it tends to show this kind of action.

Moreover, while the buyers are losing out each session the sellers are not overwhelming the market. Volumes are overall quite modest, struggling to reach average. On the rally in September, NASDAQ trade was solidly above average on the move. No doubt the sellers are in charge now, but they are not crushing the market lower. The indices are sliding, but volume is not racing higher suggesting it is more a lack of buyers on a pullback versus a lot of funds dumping shares. Thus far the action suggests a good run higher through September on QE promise and finally QE fact, and now a fade to test that run.

The question is, how deep will the test be. SP500 is holding at the 50 day EMA and just over the 38% Fibonacci Retracement of the mid-July to September run. NASDAQ is holding near the 38% level as well as price support. DJ30 remains at the 50 day EMA and the up trendline. SP600 small caps are the most worrisome, but they did close out Friday at the 50% retracement; support, but they have lost some momentum. With the economy as it is, i.e. heading lower still after peaking in 2010, it is not surprising the small caps are struggling more than the other indices even with QE3's $40B/month injected into the financial system.

Nonetheless, the indices are, as I sometimes say, getting down to the lick log.

In other words this is the point where they are going to stop the pullback at this level with this modest, shallower test of near support and resume the move with good momentum, or they are going to falter and test further over time. Of course 'faltering' here does not mean a crash, just a deeper test. The patterns look good, at least for the large cap indices, there are a lot of good-looking stocks even as some sectors roll over, and there is a general belief stocks will fall further. Oh yes, and that $40B/month coming into the market. Not everything is bullish; VIX looks as if it could jump further here, putting in a higher low and building a bottom. As I said, the indices are at the lick log. They are going to make their decision here for either a shorter pullback and renewed upside or a deeper pullback and base. The current combination can yield good upside. Doesn't guarantee it, but we have seen this provide good moves before and we need to be ready for it, particularly given the continuing theme of QE3.

As noted, the action was not the best, tossing another gain into the hamper. Futures were up early but were backtracking as earnings were widely divergent. JPM beat on the top and bottom. WFC, however, missed on the top line as its margins for its mortgages were thinner. Hard to believe given WFC drives a hard line even with long term customers. AMD warned it would miss; not great but nothing new there and hardly going to crash the market on its own. JBHT (trucking) beat on the top but missed on the bottom. Nonetheless it jumped higher.

As you can see, earnings were widely divergent as some beat on the top but missed on earnings while others beat on earnings but missed on revenues. This is doing to be one crazy earnings season and the pre-market showed it with the futures up and down.

PPI screamed higher on food and energy. Otherwise it was flat. Good thing. We might have to start eating computers, televisions, and the other non-core items that the Fed says show there is no inflation.

Stocks still managed to bounce early and on a big beat by overly excited Michigan natives they spiked a bit more. That move enjoyed the half life of Astatine (125 nanoseconds or 0.000000125 seconds) and the market reversed. Within 30 minutes the indices gave up the gain and were negative even more than the early upside move. The action didn't get any better as a double bottom through lunch offered a bounce, but this didn't last either as stocks sold back again into the close.

SP500 -4.25, -0.30%
NASDAQ -5.30, -0.17%
DJ 30 2.46, 0.02%
SP600 -0.85%
SOX -0.53%

OTHER MARKETS

Dollar. 1.2951 versus 1.2932 euro. The dollar was down on the day. After acting as something of a safe haven in the early part of the week due to worries about Europe and the tensions in North Africa and around the Mediterranean, the dollar was enjoying some buying. It started to falter on Thursday and Friday. If you look at the pattern, even though the dollar has bounced a bit further than we thought it would, this is a very bearish pattern. Here is a shoulder spanning March and April, a rally into July, and a fall-over to the exact levels hit in late April and early May before the run started. There is the neckline and the head and shoulders pattern. It looks as if the dollar is now at the apex of the right shoulder (or darn close to it). This is a bearish pattern; there is no way to cut around it. You could say we may get a rally higher, but what do we have? There is the head and shoulders and a sharp selloff. Then there is a bounce, a higher low, and a higher high. That is your downside ABCD pattern. It hit resistance, or close to it, on the high. It does not look too good for the home team known as the greenback.

Bonds. 1.66% versus 1.67% 10 year US Treasury. Bonds continue to look stronger than you would think. But, again, what we had on the week was something of a safe haven trade with worries about Europe and other countries. South Korea cut rates, Brazil cut rates, and there is talk that the People's Bank of China will cut rates over the weekend. People are cutting rates everywhere.

We have QE as well. When others cut rates, even though the US has already announced QE3, it will bolster the dollar, plain and simple. So the dollar bounced on the week. On Friday it bounced through the trendline that started with the July peak. But it was a gap to a doji. This could be an evening star. We could see a gap back down. That said, a little inverted head and shoulders has still formed over the 200 day EMA. So, as unlikely as it seems, bonds could move higher. Why would that be? A safe haven also despite a stronger Michigan Sentiment, despite the Thursday jobless claims that were better than expected, and in spite of the prior Friday's unemployment rate that fell 3BP. The view of the economy just is not that good as per the bond market. Others may spin in any way they want to, but when you look at the bond market, it does not say that things are great. If that is the case, bonds would want to move higher. Moreover, if the economy would continue to weaken, the Fed would be compelled to buy bonds. Maybe that's what is being priced in, even with those three reports being better than expected, at least on the headlines. When you delve into the numbers as we have, they do not look that great, of course.

Gold. 1759.70, -10.90. Gold was down. Gold broke below the 20 day EMA where it has held. Now it looks a little weak near term. Maybe it will pull back some. As the dollar moved higher, it moved lower this past week. The dollar was down on Friday and gold still broke. As a fear index, maybe it has taken a bit out of it. If you think that world banks, including the Fed, will continue with the easy money as they did last week, gold would continue to rally. So the move was a little bit opposite of what you would have anticipated on the day. Overall it is still solid. It is just testing back.

Oil. 91.86, -0.23. Oil was down modestly on the session. It bumped up against the 50 day EMA, still unable to move back up after this pullback. Still a little bearish near term. The only thing that is really keeping it up is the tension in the world. There is Syria and Turkey, Iran inside its own borders, and the whole litany I have talk about before. Basically there is too much oil out there to hold prices higher. But, then again, there is enough worry in the world to keep money moving into oil as a safe haven. There is concern about what is happening in hot spots around the globe.

TECHNICAL SUMMARY

Internals.

Volume. NASDAQ -3.5%, 1.52B; NYSE -8%, 551M. Volume was lower. As the indices gave up a gain, again we can see that the sellers did not just pile on and drive it lower. It was just more of bids running out again. The market started higher, and bids could not hold. They pulled them, the bottom fell, and stocks slumped into the close.

Breadth. NASDAQ -2:1; NYSE -1.7:1. But breadth was not horribly negative. Decliners over advancers on the NYSE even with the small caps dropping -0.85%.

THE CHARTS

I will not spend too much time on the charts as I already discussed them at length.

SP500. SP500 is at the 50 day EMA and sitting right on top of those March 2012 highs. It has a good pullback, and it is in position to move. It is at that licklog. Is it going to bounce here and continue the move with good momentum to the upside, or will it go into a deeper, longer base and take some more time to work its way out?

NASDAQ. NASDAQ is a very similar picture, though not quite as pretty. It has broken its trendline on the week. It broke through the 50 day EMA, but it is holding some support near the 38% Fibonacci retracement, similar to the SP500. Obviously it is a little bit heavier, a bit more under water, but it is still capable of pulling off that ABCD pattern.

SP600. The small caps similarly struggled, and even more so on Friday. They can also put in that ABCD pattern, but they are getting to the point where they have to hold. They are at some support, and this is the true licklog for the small caps.

SOX. SOX sagged further, heading down to that next support level. It is an important one because it is the level that the index gapped through in June and then again in July as it came off of that double bottom. It is coming down to an important level around 364-365. It closed at about 367, so it is right there as well.

DJ30/DJ20. The DJ30 continues to look solid with a second doji at the 50 day EMA and the up trendline. That also puts in right on top of the March and April peaks. Pretty nice, textbook look here. There is a little bit of MACD weakness on the second high that was unable to follow-through. But we have had the selloff, and it is down to a very key level. That is called the licklog. It will have to make up its mind and choose one side of the fence or the other.

The DJ20 had a pretty good day with JBHT and some of the transports moving up on its earnings. Volume was up above average. They broke back higher off of this test of the 10 day EMA and 20 day EMA. It managed to hold the move through the 50 day EMA, though they gave up quite a bit of upside on the day. Just a good bounce, still moving laterally for now.

Overall the indices are hanging in there. They are making it harder for themselves. They are now at a point where they have to show they can move to the upside if they will continue from here.

LEADERSHIP

Big names. The big names are not looking too good. AAPL is struggling. It was down through the 50 day EMA and could not make the move higher. Moreover, it is below that important high from April. It has broken back down into the upper reaches of this April to August base. AMZN had a tough week. It broke through the 50 day EMA and tried to get back through it on Thursday, but it could not. It rolled back over. EBAY did move higher Wednesday through Friday, but it has lower volume. It is showing more weakness, and we are looking for a play to the downside.

Retail. Some retail stocks have come under fire. Not all of them, but some big names have faded. ROST has been in a fade for awhile now. It is heading down to the 200 day EMA. TJX is heading lower as well. TGT is another stock heading lower. What is the important thing about all of these? They are all in the discount sector and not performing that well. Look at the dive DLTR is in. These are not looking good. They have rolled over pretty hard. At the same time, WMT continues to perform well. Does this suggest that the economy is picking up? Does it suggest that things are really improving because the discounters are not doing that well? Or is it an indication that maybe the Christmas season is kind of slow? Earlier in the week we heard that EBAY and AMZN had slow September sales.

Some important stocks still look good in retail, but they need to move higher. LULU has a nice pennant that has shaped up. ULTA looks good at the 50 day EMA, but it had a tough week and fell hard down to that level. They will have to hold up and make their moves. CHS looks pretty good. We have a real tension level here. What will happen with this very important sector? Is it just a victim of its own success and these stocks are coming back, having to sell off to consolidate after a good run in anticipation of the holiday season? Or are they forecasting the holiday season right now with some of them rolling over? That is important.

Industrial. Industrials showed some life this past week. JOY is not bad at all. On the other hand, UTX had a tough week and sold down. CAT is trying to hold support, but it is not a pretty pattern at this point.

Energy. DWSN looks solid. PBR has a great pullback in place. There are some stocks positioning themselves to move to the upside. You have to like that.

Drugs. Drugs continue to set up pretty well. NEOG still has a good pullback underway. SUPN looks solid. Many stocks in the drugs continue to perform well.

Financial. And noted earlier, the banks were pretty good. They came under some pressure on Friday with earnings, but they are doing well. BAC reports next week. JPM was a bit down, but it still looks solid. They do not look bad, per se.

Homebuilders. KBH had a very nice pullback. Homebuilders still look good.

Metals. Metals are down a bit but holding up. FCX looks decent. ZEUS is pretty solid as well.

Surprisingly, some industrials look pretty good. We have some retailers looking good, but they are under pressure. Many retailers are breaking down. We still have some good stocks in good position. They are getting money put their way that can lead to an upside. We have early leaders, big names, and some of the retail fading. They are having a hard time. Are they going to drag the market down or are they just past their time? Are they just pulling back as the overall market tests and looking to give up the leadership, perhaps to these other groups, or put in their bases and come back?

I will say that stocks such as ROST have a ways to go. It does not look like it is just about to turn around. It is at the 200 day EMA, but it probably has to base out some more before it can move back to the upside. COH has already put in some time. Maybe it will move up, but it still has a somewhat bearish near term pattern.

THE ECONOMY

Michigan Sentiment spikes past expectations.

Yahoo! 532,000 new part-time jobs with no benefits! Let's go buy a house, a car . . . for Barbie dolls.

Michigan Sentiment, October (9:55): 83.1 actual versus 78.5 expected, 78.3 prior

Sentiment jumped to the highest since 2007. As Red Buttons used to say at the old Dean Martin Celebrity Roasts, is why? Why is sentiment rising when the economy is falling?

The question is why? Why is this person getting a dinner? When Sophia Lauren's new baby said 'Is that all for me?,' never got a dinner. When first baseman Joe Torre who was too chicken to play catcher because he said 'who wants to be known as chicken catcher Torre,' never got a dinner. When Dolly Parton, who told Mrs. Olson, 'yes they're mountain grown,' never got a dinner.

When incomes are down 8.2% and fell 1.1% in August alone, why is sentiment rising?

When the government reports that unemployment fell but the majority of the new jobs were part-time, bottom tier income level jobs, why is sentiment rising?

When only 10% of the businesses in the recent NFIB survey say they will hire in Q4, the busiest quarter of the year, why is sentiment rising?

When the number of business saying they will lay off workers in Q4 is climbing, why is sentiment rising?

When the fiscal cliff and 'tax-mageddon' are virtually unavoidable at this juncture, why is sentiment rising?

When healthcare costs, instead of going down $2500 in 2012 thanks to Obamacare are UP $2500 and will rise more in 2013, why is sentiment higher?

When food prices are surging as corn, milk, beef, and pork prices jump higher, why is sentiment higher?

When GDP, after the lowest peak in history for a recovery is trending lower again with just 1.25% growth in Q2 and likely lower in Q3 (indeed likely a recession), why is sentiment higher?

When 30,000 drones equipped with infra-red cameras and supersensitive listening devices have been approved by the federal government are about to rob you of every vestige of privacy, why is sentiment higher?

When you can, by virtue of the Defense Authorization Act, be deemed a terrorist threat in the sole discretion of the President or his authorized surrogates and can be taken from your home in the dead of night and whisked away to for indefinite military detention without charge, a hearing or so much as notification to your loved ones, why is sentiment higher?

If you do get fortunate enough to come up with a great idea and make money only to become a targeted '1%'er' simply because you found the American dream, why is sentiment higher?

Okay, I went a bit afield there, but you get the idea: there are very real economic (and some other thrown in for good measure) reasons that sentiment should be despondent. But, we do know that the American spirit is indomitable and it will rise if given half a chance. After 5 years of horrible economic conditions, and even as conditions worsen yet again after a very, very low 'peak' in 2010, US citizens are grasping at some straws of hope that things will once again get better.

Why would sentiment improve? Gasoline prices, after surging to over $5 in California, are seeing a respite of late. Lower prices are an immediately visible improvement that consumers can focus on unlike healthcare cost increases and coming tax increases and benefit cuts.

There is a lot of talk about the housing market bottoming, and as houses are still the largest asset most people have. Indeed even more so now given the massive losses in retirements and savings most households suffered in the financial collapse that were not rebuilt as the Fed inflated the financial markets with QE because most stayed out of the markets. The lag in wealth recovery is also hampered by conservative plays that keep people in cash or bonds yielding negative returns as people are afraid to use stocks as a wealth creation vehicle.

Some credit the stock market with some of the increase in sentiment though as discussed above, many are sitting this one out, not taking advantage of the Fed inflating asset prices to our advantage. Still, there is this imbedded view even with people who are not in the stock market that a rising stock market is a sign of economic health as at least SOMEONE is making money to spend in the economy. I remember as a kid I would hear the stock market reports and when it was rallying I would think that things were probably good in the economy even if I didn't own one penny of a penny stock.

The combination of housing improvement and the recent spate of better data re the ISM, unemployment, and jobless claims, no matter if the data contravenes all of the regional data (the ISM), is really not what it says it is (the unemployment/jobs creation data), and simply the length of time things have been so negative allows Americans to dream of better times.

The Problem: History shows that spending relies on incomes, not sentiment. The issue ahead is the continued decline in wages and drops in disposable income. Incomes are down 8.2% in four years and fell 1.1% in August 2012 alone. Disposable income has trended lower and is now in negative territory. Credit is still hard to come by. Without readily available credit, consumers cannot spend what they don't have as they have done in years past. Sentiment is up for now, but there is a full speed train heading the opposite way on the tracks.

EU awarded the Nobel Prize? For what? Mismanagement? Riots?

Drones, Egypt, Iran, Libya, Syria. Peace. Early Friday in Spain
Obama awarded NP for things he would do EU for what it hopes to do?
You would think they would learn to put it in escrow until performance matched promise.

I suppose Bernie Madoff was not available to receive this year's award given he is incarcerated. Still, the European Union receiving the Nobel Prize? For what? Irresponsible deficit spending, failing to properly screen entrants into the EU in the first place (bogus Greek and other economic numbers were ignored years ago)? Allowing its members to spend into oblivion as they bet others would foot the bill? Creating conditions so bad that riots occur in the streets? Greece unemployment at 30%? One-third of businesses in Athens closing? Spain unemployment over 25%?

I wondered above why sentiment would rise given all the negatives, borrowing from Red Buttons. How about borrowing a bit more? I mean, why does the EU get the glory when we have been just as 'successful' in pursuing peaceful endeavors?

When our Treasury and Federal Reserve artificially inflate asset prices by creating fiat money out of thin air while at the same time destroy the savings and futures of our seniors in order to bail out the government's profligate spending? Never got the Nobel Prize.

When Egyptians rise up and we 'lead from behind' and assist in the overthrow and killing of the only other friendly leader in the region to be replaced by an unfriendly regime to us and Israel? Never got the Nobel Prize.

When the Iranian citizens rose up two years ago and we watched via Twitter and You Tube as the young people were exterminated by the government and all we did was affirm we wanted to talk with the murderers? Never got the Nobel Prize.

When Syria's known thug dictator is slaughtering tens of thousands in its streets while the world stands by and watches? Never got the Nobel Prize.

When we kill US citizens abroad by drone strikes without trial, without due process? Never got a Nobel Prize.

Maybe that is what President Obama's 'pre-emptive' Nobel Prize was for, i.e. all of these 'peace enhancing' actions taken since he has been President.

THE MARKET

VIX. The VIX looks like it wants to make a bounce higher. Note how it broke through a support level. It came back to test it last week and bounced nicely on Friday. This even as the market really did not move significantly lower. It came off of an intraday high, but it did not break lower. This time volatility moved up. As I have been saying all week, it has kind of detached itself from the motions. When the market was up, volatility was higher. When the market was down, volatility was lower. That does not make a lot of sense. But looking at the pattern, it looks as if it is building a base and wants to spike higher. If it does, that means there is some upside in volatility, and that would be downside in the stock market.

VIX: 16.14; +0.55
VXN: 17.84; -0.49
VXO: 15.74; +0.7

Put/Call Ratio (CBOE): 1.05; +0.16

Bulls versus Bears

Bulls: 45.7% versus 46.8% versus 51.0% versus 54.2%. Okay, the bulls continue to fall as the market tests back. There is a pretty healthy skepticism. After all those fund flows we saw this week (10+B in a week) show the distrust. That is not bad for the upside: contrary indicator. Well below the 60% to 65% bullish levels that flash a warning sign. Back to the level from a couple of months back. Undercut 35%, the threshold for bullishness, in early June. As noted, hit 34% in early June. It did its job and the market is on the rally. Hard drop to 34 from 39.3% as economic reality and a choppy stock market hit. Off the 55+ level hit in late February. That was the highest level since April and May of 2011, the peak of the post-bear market high. 35% is the threshold level suggesting bullishness. To be seriously bearish it needs to get up to the 60% to 65% level.

Bears: 25.5% versus 25.5% versus 24.5% versus 24.5% versus 25.5%. No more bears, no less. Still not at a high level. March and April saw lower lows in the 21% range. On the last run never made it to the 35% that can be a bullish indication, but the bulls were weak enough back in June. Over 35% is the threshold to be really be a good upside indicator. For reference, bearishness hit a 5 year high at 54.4% the last week of October 2008. The move over 50 took bearish sentiment to its highest level since 1995. Extreme negative sentiment. Prior levels for comparison: Bearishness peaked at 37.4% in September 2007. It topped the June 2006 peak (36%) on that run. That June peak eclipsed the March 2006 high (33%) and well above the 2005 highs that spawned new rallies (30% in May 2005, 29.2% in October 2005). That was a huge turn, unlike any seen in recent history.

NASDAQ

Stats: -5.3 points (-0.17%) to close at 3044.11
Volume: 1.527B (-3.48%)

Up Volume: 623.28M (-276.3M)
Down Volume: 866.41M (+182.39M)

A/D and Hi/Lo: Decliners led 1.95 to 1
Previous Session: Advancers led 1.52 to 1

New Highs: 40 (-19)
New Lows: 49 (+13)

SP500/NYSE

Stats: -4.25 points (-0.3%) to close at 1428.59
NYSE Volume: 551M (-7.7%)

A/D and Hi/Lo: Decliners led 1.7 to 1
Previous Session: Advancers led 1.94 to 1

New Highs: 98 (-14)
New Lows: 17 (0)

DJ30

Stats: +2.46 points (+0.02%) to close at 13328.85

MONDAY

A big week of data is coming up. We have retail sales on Monday and manufacturing out of New York. That will be important since it is one of the regions that has been down. Industrial production and capacity is on Tuesday. Of course we have the CPI. I guess that is important, but we will never really know about that because the Fed does not think food and energy are something we need to worry about. Housing starts are out on Wednesday. There are also initial claims. What will it be this time? Are we going to see the bounce back? Are we going to see another wild number? Then we have the Philly Fed on Thursday, and it is expected to improve. Existing home sales are out Friday. We have a lot packed in, not to mention a few earnings as well.

Ah, yes, the earnings. A lot more important earnings are coming out. BAC is coming up, but that is just one of many. The floodgates will start opening, and we will see some more reaction. The market was not overly favorable to earnings thus far, but the earnings have been wildly divergent. The interesting thing is they have not been as terrible as expected. One of the interesting features is that there have been beats on the top line. JBHT beat on the top line, and that was important. So while earnings may be lower, if they are showing more sales -- and in key groups such as trucking -- that is a positive for the market.

We have had a pullback into these numbers as the bounce from a couple of weeks ago has been given up and then some. Indeed, earlier in the week SP500 was below that move that started on the actual announcement of QE3. There is enough of a pullback to support. Or if there are topside beats, we could actually see the market rally. It is precarious right now, and that is why we said it is at the licklog. Will it be a situation where QE3 reasserts itself and stocks start to rise? If they want to avoid a deeper test and maybe a longer basing period, that is what they need to do. They will not necessarily do it; it is not a guarantee. With earnings, anything can happen. If another story comes out, then who knows? If something blows up in North Africa or the Middle East or even between Japan and China, then we will have problems once more.

We have a very full plate with a lot of dessert as well. That tends to make people shy away. With earnings we will do what we always do. It is hard to buy into stocks right before their earnings report. We are right in mid month. A lot of companies report at the end of the month and into November. We can still look for some plays on those stocks, but we would prefer to start picking up plays after we get the earnings. If it is in November, no problem. We can make those plays. But for the other ones, it gets problematical. The indices are in a position to run. We could get some good results. They have pulled back into the earnings, and they can make that move. That would be profitable.

We will look for the best. We look for solid plays that are in perfect position to move or that are in very good position to move. Then we can take advantage of them if they do get a nice bump. We would like a run into earnings, then we take some gain and get out of there. Or at least part of the gain. It just depends. We have been successful riding them through results in some situations, but it is always my preference to at least take part of the position off ahead of the results. If we get a boost, that is just some lagniappe.

Suffice it to say we will not be too eager to jump into a bunch of new positions right in the teeth of earnings season. As the results come out, we will get more of a feel for the way stocks are moving. If we get good plays off of the earnings, that is what we will focus on. Of course if there are some good downside setups and the stock is coming into earnings, that is often a good entry point even ahead of the results because the pattern forecasts something that is not great. With the "sell first and ask questions later" mentality right now, that can give you some quick downside moves to make gain, and then you can let them bounce back up.

I will see you on Monday. It is a packed week ahead, and we will take the shots as they set up.

Have a great weekend!

Support and resistance

NASDAQ: Closed at 3044.11
Resistance:
3076 is the late April 2012 high
The 50 day EMA at 3077
3090 is the mid-March interim high
3101 is the August 2012 high
The 20 day EMA at 3102
The June up trendline at 3109
3134 is the March 2012 post-bear market peak: broken, not forgotten.
3197 is the September 2012 post-bear market high
3227 is the April 2000 intraday low
3401 is the May 2000 closing low

Support:
3042 from 5/2000 low
3026 from 10/2000 low
3024 is the gap point from early May
3000 is the February 2012 post-bear market high
2999 is the bottom of the August 2012 consolidation
2988 is the July 2012 high
2962 is the April 2012 low
The 200 day SMA at 2957
2950 is the mid-April closing low
2942 is the mid-June 2012 high
2910 is the March 2012 low
2900 is the March 2012 low

S&P 500: Closed at 1428.59

Resistance:
1440 from November 2007 closing lows
The 20 day EMA at 1442
1446 is the June up trendline
1475 is the September 2012 high
1499 from January 2008
1539 from June 2007

Support:
1433 from August 2007 closing lows
1425 from May 2008 closing highs
1427 is the August 2012 peak
The 50 day EMA at 1426
1422.38 is the prior post-bear market high (March 2012)
1406 is the early May 2012 peak
1402.22 is the closing low of the August 2012 lateral consolidation
1378 is the February 2012 peak
1375 is the early July 2012 peak
1371 is the May 2011 peak, the post-bear market high
The 200 day SMA at 1369
1363.46 is June 2012 high
1359 is the April 2012 low
1357 is the July 2011 peak
1344 is the February 2011 peak
1340 is the early April 2011 peak
1332 is the early March 2011 peak
1325 is the July 2012 intraday low
1309 is the right shoulder low from June 2012
1295 to 1294 is the April 2011 low and the February 2011 consolidation low (bottom of the trading range)
1293 is the October 2011 peak
1275 is the January 2010 low, early January 2011 peak
1267 is the December 2011 peak
1266 is the June 2012 base low

Dow: Closed at 13,328.22
Resistance:
13,331 is the August 2012 post-bear market high
The 20 day EMA at 13,438
13,668 from 12-2007 peak
13,692 from 6-2007 peak
14,022 from 7-07 peak

Support:
The 50 day EMA at 13,307
13,297 is the April 2012, prior post bear market high
13,058 from the May 2008 peak on that bounce in the selling
13,056 is the February 2012 high
12,971 is the early July 2012 high
The 200 day SMA at 12,929
12,754 is the July intraday peak
12,716 is the April 2012 closing low
12,391 is the February 2011 peak
12,369 is the left shoulder low from May 2012
12,284 is the October 2011 peak
12,258 is the December 2011 peak
12,110 from the March 2007 closing low
12,094 is the April 2011 low
12,035 is the June 2012 base low
The June 2011 low at 11,897 (closing)
11,734 from 11-98 peak
11,717 is the late August 2011 peak

Economic Calendar

October 10 - Wednesday
- MBA Mortgage Index, 10/06 (7:00): 16.6% prior
- Wholesale Inventories, August (10:00): 0.6% expected, 0.7% prior
- Treasury Budget, September (14:00): $75.0B expected, -$62.8B prior

October 11 - Thursday
- Initial Claims, 10/06 (8:30): 339K actual versus 370K expected, 369K prior (revised from 367K)
- Continuing Claims, 09/29 (8:30): 3273K actual versus 3275K expected, 3288K prior (revised from 3281K)
- Trade Balance, August (8:30): -$44.2B actual versus -$43.8B expected, -$42.5B prior (revised from -$42.0B)
- Export Prices ex-ag., September (8:30): 0.7% actual versus 0.4% prior
- Import Prices ex-oil, September (8:30): 0.2% actual versus -0.2% prior
- Crude Inventories, 10/06 (11:00): 1.672M actual versus -0.482M prior

October 12 - Friday
- PPI, September (8:30): 1.1% actual versus 0.8% expected, 1.7% prior
- Core PPI, September (8:30): 0.0% actual versus 0.2% expected, 0.2% prior
- Michigan Sentiment, October (9:55): 83.1 actual versus 78.5 expected, 78.3 prior
- Treasury Budget, September (14:00): $75.0B expected, -$62.8B prior
- Treasury Budget, September (15:00): $75.0B actual versus $75.0B expected, -$62.8B prior

October 15 - Monday
- Retail Sales, September (8:30): 0.7% expected, 0.9% prior
- Retail Sales ex-auto, September (8:30): 0.6% expected, 0.8% prior
- Empire Manufacturing, October (8:30): -2.8 expected, -10.4 prior
- Business Inventories, August (10:00): 0.5% expected, 0.8% prior

October 16 - Tuesday
- CPI, September (8:30): 0.5% expected, 0.6% prior
- Core CPI, September (8:30): 0.2% expected, 0.1% prior
- Net Long-Term TIC Fl, August (9:00): $67.0B prior
- Industrial Production, September (9:15): 0.2% expected, -1.2% prior
- Capacity Utilization, September (9:15): 78.3% expected, 78.2% prior
- NAHB Housing Market Index, October (10:00): 42 expected, 40 prior

October 17 - Wednesday
- MBA Mortgage Index, 10/13 (7:00): -1.2% prior
- Housing Starts, September (8:30): 768K expected, 750K prior
- Building Permits, September (8:30): 815K expected, 803K prior
- Crude Inventories, 10/13 (10:30): 1.672M prior

October 18 - Thursday
- Initial Claims, 10/13 (8:30): 360K expected, 339K prior
- Continuing Claims, 10/6 (8:30): 3275K expected, 3273K prior
- Philadelphia Fed, October (10:00): -0.1 expected, -1.9 prior
- Leading Indicators, September (10:00): 0.2% expected, -0.1% prior

October 19 - Friday
- Existing Home Sales, September (10:00): 4.70M expected, 4.82M prior
icon url

ReturntoSender

10/16/12 4:05 PM

#9953 RE: ReturntoSender #6755

KLIC ST Bought 3030 shares@9.65 - I had an order in for 5000 but this is all that filled. KLIC could go lower but I'm betting the rising tide in earnings' season is helpful even to semiconductor stocks.

Some charts:


RtS
icon url

ReturntoSender

10/17/12 6:14 PM

#9955 RE: ReturntoSender #6755

From Briefing.com: 4:20 pm : Stocks began today's session on a negative note after two technology bellwethers reported disappointing earnings. However, the cautious sentiment was short-circuited when today's housing starts report revealed its highest reading since July 2008. The major averages reacted by staging a steady climb to their respective session highs. A brief afternoon stumble followed, but the move was promptly retraced as the S&P 500 returned to its prior level, and closed higher by 0.4%.

The technology sector was the worst performing group in the S&P 500. Intel (INTC 21.79, -0.56) slipped 2.5% despite beating its earnings and revenue expectations. It should be noted this quarter marked the first time Intel reported a decline in year-to-year revenue since the third quarter of 2009. In addition, Sterne Agee lowered its price target for Intel to $20 from $22.

IBM (IBM 200.63, -10.37) slid 4.9% after reporting a slight earnings beat and a revenue miss. Following the earnings release, the stock was downgraded by Janney Montgomery Scott and Societe Generale. Janney Montgomery Scott lowered IBM's rating to ‘buy' from ‘neutral' while Societe Generale downgraded the company to ‘sell' from ‘hold.'

Networking stocks also saw weakness. Cisco Systems (CSCO 18.70, -0.15), F5 Networks (FFIV 97.33, -3.86), and Juniper Networks (JNPR 17.31, -0.17) all lost between 0.8% and 3.8%. Earlier, Cantor Fitzgerald downgraded Cisco to ‘hold' from ‘buy' with a $19.50 price target.

On the upside, Cree (CREE 28.92, +2.73) settled higher by 10.4% after beating on earnings and reporting in-line revenues. In addition, the company issued in-line earnings and revenue guidance for the second quarter.

In M&A news, ASML Holdings (ASML 50.08, -3.50) will acquire Cymer (CYMI 71.45, +23.62) in a cash-and-stock transaction valued at EUR1.95 billion. The total price reflects a 61.0% premium to Cymer's 30-day volume-weighted average price. Following the report, ASML shed 6.6% while Cymer surged 49.4%.

The financial sector was among the top performers of the day. Bank of America (BAC 9.44, -0.02) shed 0.2% after exceeding its earnings expectations. The financial giant reported breakeven earnings for the third quarter, which was $0.06 better than the Capital IQ consensus. Meanwhile, other major financials moved higher. Citigroup (C 38.43, +1.18), Goldman Sachs (GS 124.92, +1.70), and JPMorgan Chase (JPM 43.32, +0.49) all recorded gains between 1.1% and 3.2%.

European financials outperformed their U.S. peers. Banco Bilbao Vizcaya Argentaria (BBVA 8.67, +0.43) and Banco Santander (SAN 7.97, +0.33) settled higher by 5.2% and 4.3%, respectively.

The Dow Jones Transportation Average outperformed the remaining industrials and added 0.6%. Airlines displayed relative strength within the 20-stock complex. Delta Air Lines (DAL 10.19, +0.20) and United Continental (UAL 20.62, +0.27) saw respective gains of 2.0% and 1.3%.

Railroads stocks were mixed following earnings from CSX (CSX 21.19, -0.44). The rail operator slipped 2.0% after its earnings exceeded Capital IQ estimates by $0.01. Meanwhile, the revenues were reported below Capital IQ consensus. Peer Norfolk Southern (NSC 67.21, -0.50) lost 0.7% while Union Pacific (UNP 123.73, +0.33) added 0.3%.

Meanwhile, Overseas Shipholding Group (OSG 3.40, -0.36) sank 9.6% to extend its recent streak of weakness which stemmed from concerns about the company's cash position.

Homebuilder stocks were broadly higher after this morning's housing starts data was reported at its best level since July 2008. The SPDR S&P Homebuilders ETF (XHB 25.88, +0.49) settled higher by 1.9% in response to the report. Meanwhile, KB Home (KBH 16.76, +1.34), Hovnanian Enterprises (HOV 4.13, +0.35), and PulteGroup (PHM 17.44, +0.88) gained between 5.3% and 9.3%.

In today's economic data, the weekly MBA Mortgage Index showed a 4.2% decrease in new mortgage applications during the past week. This follows last week's 1.2% decline.

Separately, housing starts hit an annualized rate of 872,000 units during September. Economists polled by Briefing.com had expected for housing starts to hit an annual rate closer to 815,000. Prior month figures were revised upward to reflect an annual rate of 758,000 housing starts. As for building permits, they increased from the prior month's rate of 801,000 to 894,000 for September. That is above the pace of 815,000 building permits that had been expected among economists polled by Briefing.com.

Tomorrow, weekly initial and continuing claims will be reported at 8:30 ET. In addition, October Philadelphia Fed Survey and September leading indicators will be released at 10:00 ET.DJ30 +5.22 NASDAQ +2.95 SP500 +5.99 NASDAQ Adv/Vol/Dec 1486/1.72 bln/946 NYSE Adv/Vol/Dec 2067/688.3 mln/915

3:30 pm : Crude oil climbed to a floor session high of $92.85 per barrel in early morning action but tumbled on weaker-than-anticipated inventory data that showed a build of 2.86 mln barrels when a build of 1.5 mln barrels was expected. The energy component brushed a session low of $91.53 per barrel and spent the remainder of pit trade working on getting out of negative territory. The effort left crude to settle at $92.04 per barrel, or just 4 cents below the unchanged level.

Natural gas came off its session low of $3.41 per MMBtu and trended higher during morning action. It pulled-back slightly after touching a session high of $3.50 per MMBTu and settled with a 0.9% gain at $3.47 per MMBtu. Precious metals extended yesterday's gains on a weaker dollar as Moody's held Spain's credit rating at Baa3, but placed the country on a negative outlook.

Both gold and silver dropped following strong housing data but recovered earlier gains. Gold came off its pit session low of $1744.00 per ounce and climbed higher to settle with a 0.4% gain at $1753.10 per ounce. Silver also trended higher after dipping to a session low of $32.88 per ounce. It closed with a 0.8% gain at $33.23 per ounce, or just below its session high of $33.30 per ounce.DJ30 +1.98 NASDAQ +4.24 SP500 +6.54 NASDAQ Adv/Vol/Dec 1408/1437.7 mln/1027 NYSE Adv/Vol/Dec 2005/440 mln/956


4:18PM Lam Research beats by $0.12, reports revs in-line (LRCX) 33.57 +0.14 : Reports Q1 (Sep) earnings of $0.53 per share, $0.12 better than the Capital IQ Consensus Estimate of $0.41; revenues rose 33.3% year/year to $906.9 mln vs the $903.61 mln consensus. "Despite a more uncertain industry environment, Lam Research achieved strong financial performance in the September quarter, delivering gross margin and operating profits above the high end of our guidance,"

4:10PM Mellanox Tech beats by $0.25, beats on revs (MLNX) 98.12 -6.80 : Reports Q3 (Sep) earnings of $1.37 per share, excluding non-recurring items, $0.25 better than the Capital IQ Consensus Estimate of $1.12; revenues rose 129.6% year/year to $156.5 mln vs the $152.8 mln consensus and vs prior guidance of $150-155 mln. Non-GAAP operating margin came in at 38.9%. As usual, co does not provide guidance, should guide for Q4 revs on the call at the top of the hour.

1:30PM First Solar confirms it will build 13MW solar power plant for Dubai Electricity & Water Authority (FSLR) 25.60 +1.49 : Co announced it has been selected by the Dubai Electricity & Water Authority (DEWA) to construct a 13 megawatt (MWDC) solar photovoltaic (PV) power plant in Seih Al Dahal, approximately 50 kilometers south of Dubai. Under the terms of the agreement, First Solar will provide engineering, procurement and construction services, as well as its advanced thin-film PV modules. The 13MW solar PV power plant is the first phase of the landmark Mohammad Bin Rashid Al Maktoum Solar Park, named after the leader of the Emirate of Dubai, an AED 12 billion project that is expected to eventually cover 48 square kilometers and produce 1,000MW of clean energy for the nation's capital using both PV and solar thermal technology.

Cypress Semiconductor (CY) announced that Pantech Co. has selected the Gen4 TrueTouch touchscreen controller for its flagship Vega R3 smartphone.

1:14AM Cymer: ASML to acquire Cymer for transaction value of EUR1.95 bln (CYMI) 47.83 : ASML Holding NV (ASML) and Cymer (CYMI) announce they have entered into a definitive agreement under which ASML will acquire all outstanding shares of Cymer in a cash-and-stock transaction currently valued at EUR1.95 bln. The purpose of the acquisition of Cymer is to accelerate the development of Extreme Ultraviolet semiconductor lithography technology. The transaction, which was unanimously approved by the boards of directors of ASML and Cymer, would entitle each Cymer shareholder to receive $20.00 in cash and a fixed ratio of 1.1502 ASML ordinary shares per Cymer share. The total price reflects a premium of 61% over Cymer's 30-day volume-weighted average price. Excluding non-cash purchase price accounting adjustments, the transaction is expected to be accretive to ASML's EPS in the second year after closing.

Intel (INTC $21.29 -1.06) reported third quarter GAAP earnings of $0.58 per share, $0.09 better than the Capital IQ consensus Estimate of $0.49 (non-GAAP $0.60 vs. $0.52 consensus), while revenues fell 5.5% year/year to $13.46 billion versus the $13.2 billion consensus. The company lowered revenue guidance to $12.9-13.5 billion from $13.8-14.8 billion on Sept 7. PC Client Group revenue of $8.6 billion, flat sequentially and down 8 percent year-over-year; Data Center Group revenue of $2.7 billion, down 5 percent sequentially and up 6 percent year-over-year. Co reports Q3 GAAP gross margin of 63.3% vs guidance lowered 100 bps to 62% on Sept 7. The company issued in-line guidance for fourth quarter with revenues of $13.1-14.1 billion versus the $13.74 billion consensus, with gross margin percentage: 57%, and 58% Non-GAAP, both plus or minus a couple of percentage points.

IBM (IBM $201.81 -9.19) reported third quarter earnings of $3.62 per share, $0.01 better than the Capital IQ consensus of $3.61, while revenues fell 5.4% year/year to $24.75 billion versus the $25.36 billion consensus Gross Profit (non-GAAP 48.1% up 12 bps y/y. The company reaffirmed guidance for fiscal year 2012 with EPS of at least $15.10, excluding non-recurring items, vs. $15.15 Capital IQ Consensus Estimate. Segments: Software revenue down 1 percent, up 3 percent adjusting for currency. Services revenue down 5 percent, flat adjusting for currency; Services backlog of $138 billion, up 1 percent. Systems and Technology revenue down 13 percent, down 12 percent adjusting for currency; Growth markets revenue down 1 percent, up 4 percent adjusting for currency; BRIC countries up 4 percent, up 11 percent adjusting for currency; Business analytics revenue up 14 percent year to date; Smarter Planet revenue up more than 20 percent year to date; Cloud revenue year to date has exceeded full-year 2011 revenue. The Americas' third-quarter revenues were $10.4 billion, a decrease of 4 percent from the 2011 period. Revenues from Europe/Middle East/Africa were $7.2 billion, down 9 percent. Asia-Pacific revenues increased 1 percent to $6.5 billion. OEM revenues were $538 million, down 28 percent compared with the 2011 third quarter. Revenues from the company's growth markets decreased 1 percent and 35 countries had double-digit revenue growth, adjusting for currency. Revenues in the BRIC countries — Brazil, Russia, India and China — increased 4 percent. The estimated services backlog at September 30 was $138 billion, up 1 percent year over year at actual rates (up 1 percent, adjusting for currency). Revenues from the Software segment were $5.8 billion, down 1 percent compared with the third quarter of 2011. Software pre-tax income increased 6 percent and pre-tax margin increased to 35.6 percent. Revenues from IBM's key middleware products, which include WebSphere, Information Management, Tivoli, Lotus and Rational products, were $3.6 billion, down 1 percent. Revenues from the Systems and Technology segment totaled $3.9 billion for the quarter, down 13 percent from the third quarter of 2011. Excluding Retail Store Solutions (RSS), revenues were down 11 percent.

Cree (CREE $28.03 +1.96) reported first quarter earnings of $0.27 per share, excluding non-recurring items, $0.01 better than the Capital IQ consensus Estimate of $0.26, while revenues rose 17.4% year/year to $315.8 million versus the $317.6 mln consensus. The company issued in-line guidance for the second quarter with EPS of $0.27-0.31, excluding non-recurring items, versus the $0.30 consensus and revenues of $320-340 million versus the $333.8 million consensus.

Fortinet (FTNT $20.79 -4.01) reported third quarter earnings of $0.14 per share, excluding non-recurring items, in-line with the Capital IQ consensus of $0.14, while revenues rose 17.0% year/year to $136.3 million versus the $136.4 mln consensus.

Linear Tech (LLTC $31.75 -0.81) reported first quarter earnings of $0.45 per share, $0.01 worse than the Capital IQ consensus of $0.46, while revenues rose 1.6% year/year to $335.1 million versus the $334.7 million consensus. Co sees Q2 revs down 5-10% sequentially, versus the consensus expectations for a +1% increase from Q1 revs. This equates to Q2 revenues of $301.6-318.3 million versus the $338.94 million consensus

11:17 am Tech Sector trading lower today following reports from several key names

The tech sector is trading lower today, trailing gains in the broader market. Semiconductors are showing slight relative strength with the SOX trading 0.2% higher. Within the chip index, CREE (+12.3%) is a notable standout. Among other major indices, the SPY is trading 0.4% higher today, while the QQQ is roughly flat and the NASDAQ is trading 0.1% lower on the session. Among tech bellwethers, T (+1.1%) and VZ (+1.1%) are rebounding off of recent losses, while IBM (-4.3%) and INTC (-2.6%) are showing notable weakness following earnings. In tech earnings last night, INTC (-2.6%) reported Q3 results that topped the company's earlier downside preannouncement and IBM (-4.3%) posted a slight Q3 EPS beat, although sales missed the mark once again. Elsewhere, MANH (+6.0%) posted a beat and raise, while FTNT (-17.9%) reported an inline qtr and LLTC (-0.2%) posted a mixed Q1 and guided lower. This morning, ASML (-3.8%) reported a mixed Q3 and guided to the lower end of its previous estimate, APH (+2.3%) posted a modest beat and issued guidance above consensus and CHKP (-12.9%) posted a slight Q3 beat. In news, ASML (-3.8%) announced it will acquire CYMI (+57.3%) for EUR1.95 bln. Among rumors, AAPL (-0.3%) may put its iPad Mini on sale Nov. 2.

In notable analyst upgrades this morning in the tech space, Wunderlich upgraded FTNT (-17.9%) to Buy and Argus upgraded S (+1.2%) to Buy. Among downgrades, AMT (-0.1%) was downgraded to Equal Weight at Barclays, DBD (-0.9%) was downgraded to Underweight at JP Morgan, IBM (-4.3%) was downgraded at Janney and Societe Generale, ADTN (+3.7%) was upgraded from Sell at Goldman, and Cantor downgraded CSCO (-0.9%) to Hold. LRCX (+0.2%), MLNX (-1.7%) and XLNX (+1.2%) are the notable names in tech scheduled to report quarterly results today after the close.

icon url

ReturntoSender

10/18/12 8:18 PM

#9956 RE: ReturntoSender #6755

Briefing.com: 4:15 pm : Stocks opened modestly lower after today's weekly initial claims report missed expectations by 28,000. The early weakness was erased before midday as the major averages rallied to their respective session highs. However, the slim gains were short-lived as disappointing quarterly results from Google (GOOG 695.00, -60.49) hit the wires early and weighed on the markets. The tech-heavy Nasdaq saw the biggest impact, as the index tumbled to fresh session lows before closing with a loss of 1.0%.

Google fell 8.0% after its earnings were reported at $9.03, which fell $1.63 short of the Capital IQ consensus estimate. Meanwhile, revenues came in at $11.87 billion, which represents a shortfall of about $540 million when compared to the Capital IQ analyst forecast. The results were met with heavy selling which took the stock down to its early September levels. In addition, many large tech stocks were also pressured.

A number of other technology components saw weakness following earnings. Mellanox (MLNX 77.98, -20.16) sank 20.5% after reporting its third quarter results. The semiconductor manufacturer beat both top and bottom line expectations, but cautious guidance gave investors cause for concern.

Cypress Semiconductor (CY 10.06, -0.90) slid 8.2% after reporting in-line earnings and lowering guidance below consensus.

Nokia (NOK 2.80, -0.14) slipped 4.8% despite beating on earnings and revenues.

Elsewhere, ASML Holdings (ASML 51.34, +1.26) gained 2.5% despite being downgraded to ‘sector perform' from ‘outperform' by RBC Capital. Note that yesterday ASML announced the acquisition of Cymer (CYMI 74.12, +2.67).

Telecom stocks were the top performing group as investors displayed caution and turned to defensive stocks. As a result of the risk-off trade, major wireless and landline carriers garnered interest. Verizon Communications (VZ 45.78, +1.06) advanced 2.4% after reporting in-line earnings and revenues. It should be noted that during the conference call, management said that capital expenditures will trend lower in 2013. This announcement is similar to sentiment expressed by numerous major companies which also plan to enact savings measures. Peers AT&T (T 36.02, +0.30), MetroPCS (PCS 11.15, +0.20), and Sprint Nextel (S 5.78, +0.05) all registered gains between 0.8% and 1.8%.

The Dow Jones Transportation Average settled higher by 0.2%. Within the complex, Union Pacific (UNP 125.34, +1.61) rose by 1.3% after reporting earnings of $2.19 and revenue of $5.34 billion. The results were mixed as the company's earnings exceeded Capital IQ consensus estimates by $0.02 while revenue fell about $30 million short of the Capital IQ forecast. Peer CSX (CSX 21.36, +0.17) added 0.8% despite being downgraded to ‘hold' from ‘buy' by Deutsche Bank.

Southwest Airlines (LUV 8.98, +0.03) rose by 0.3% after reporting in-line earnings and revenues. Other airlines also outperformed as Alaska Air (ALK 38.17, +0.40), Delta Air Lines (DAL 10.21, +0.02), and JetBlue Airways (JBLU 5.30, +0.04) all gained between 0.2% and 1.1%.

Meanwhile, Overseas Shipholding Group (OSG 3.54, +0.14) was the best performing stock in the transportation average. The shares of the oil tanker operator gained 4.1% after losing nearly 50.0% of their value since last Monday.

In today's economic data, the latest weekly initial jobless claims count totaled 388,000, which was higher than the 360,000 that had been expected by the Briefing.com consensus. The tally was above the revised prior week count of 342,000. As for continuing claims, they fell to 3.252 million from 3.281 million.

Separately, the Philadelphia Fed Survey rose to 5.7 for October. That comes after September's reading of -1.9. Economists polled by Briefing.com had expected that the Survey would improve to a -0.1 reading for the month of October.

Lastly, leading indicators for September increased by 0.6%, which is better than the 0.2% increase that had been widely forecast to follow prior month's decrease of 0.1%.

Tomorrow's economic data is limited to September existing home sales which will be announced at 10:00 ET.DJ30 -8.06 NASDAQ -31.25 SP500 -3.57 NASDAQ Adv/Vol/Dec 792/1.98 bln/1666 NYSE Adv/Vol/Dec 1474/719.2 mln/1538

3:30 pm : A stronger dollar following the release of jobless claims data and the start of the EU Leaders Summit put pressure on precious metals during today's pit trade. Both gold and silver spent their entire sessions in the red, falling as low as $1739.00 per ounce and $32.74 per ounce respectively. Unable to erase much of the loss, gold settled 0.5% lower at $1744.80 per ounce, while silver closed with a 1.1% loss at $32.88 per ounce. a

Crude oil dipped to a session low of $90.66 per barrel moments after floor trade opened. It gained momentum in late morning action and managed to climb into the black. It brushed a session high of $92.59 per barrel and settled just 4 cents below the unchanged level at $92.00 per barrel.

Natural gas slid to a session low of $3.40 per MMBtu following inventory data that showed a build of 51 bcf when a build of 50 bcf was anticipated. However, the move quickly reversed and prices shot into positive territory. Natural gas continued to climb higher as settled with a 3.5% gain at $3.59 per MMBtu.DJ30 -14.74 NASDAQ -27.14 SP500 -3.27 NASDAQ Adv/Vol/Dec 840/1665.4 mln/1577 NYSE Adv/Vol/Dec 1480/479 mln/1520

4:22PM Advanced Micro misses by $0.04, reports revs in-line; guides Q4 revs below consensus; announces restructuring (AMD) 2.62 -0.15 : Reports Q3 (Sep) loss of $0.20 per share, $0.04 worse than the Capital IQ Consensus Estimate of ($0.16); revenues fell 24.9% year/year to $1.27 bln svs the $1.27 bln consensus.

Co issues downside guidance for Q4, sees Q4 revs down 5-13% sequentially, which equates to roughly $1.10-1.21 bln, vs. $1.31 bln consensus.
Restructuring: AMD announced a new restructuring plan, a significant portion of which will be implemented in the fourth quarter of 2012, and will include a workforce reduction and site consolidations. AMD expects that the restructuring actions taken in the fourth quarter of 2012 will result in operational savings, primarily in operating expenses, of approximately $20 million in the fourth quarter of 2012 and approximately $190 million in 2013. The savings will be largely driven through a reduction of AMD's global workforce by approximately 15 percent, which is expected to be largely completed in the fourth quarter of 2012. The company currently estimates it will record a restructuring expense in the fourth quarter of 2012 of approximately $80 million in connection with these actions.
AMD is also putting in place a business model to break even at an operating income level of $1.3 billion of quarterly revenue. The company is targeting to achieve this by the end of the third quarter of 2013.

4:18PM Rambus reports non-GAAP EPS of $0.08, reports revs in-line (RMBS) 4.94 -.04 : Reports Q3 (Sep) earnings of $0.08 per share, may not compare to the Capital IQ Consensus Estimate of ($0.04); revenues fell 42.7% year/year to $57.5 mln vs the $57.87 mln consensus. Co states that restructuring initiatives expected to provide overall net cash savings of $30-$35 mln annually. The company recorded a non-cash charge for the impairment of goodwill and long-lived assets in its Lighting and Display Technology Division of $35.5 mln.

4:09PM Flextronics beats by $0.03, beats on revs; guides Q3 EPS and revenue below consensus (FLEX) : Reports Q2 (Sep) adjusted earnings of $0.26 per share, vs. prior guidance of $0.21-$0.26, and $0.03 better than the Capital IQ Consensus Estimate of $0.23; revenues fell 22.9% year/year to $6.17 bln vs the $6.11 bln consensus. Co issues downside guidance for Q3, sees EPS of $0.18-$0.22 vs $0.26 Capital IQ Consensus Estimate; sees Q3 revs of $5.8-$6.2 bln vs $6.35 bln Capital IQ Consensus Estimate.

4:09PM SanDisk beats by $0.14, beats on revs (SNDK) 42.86 -1.43 : Reports Q3 (Sep) earnings of $0.48 per share, $0.14 better than the Capital IQ Consensus Estimate of $0.34; revenues fell 10.1% year/year to $1.27 bln vs the $1.22 bln consensus. Co also reports Q3 gross margin of 31% vs 44% last year, and Operating margin of 12.9% vs 29.4% last year.

Co says "Our retail business delivered strong results in Q3 and we believe we gained share across all major geographies worldwide on the strength of the SanDisk brand... Our results also reflect a solid recovery in our mobile embedded business and we made good progress toward expanding our SSD product roadmap. We believe we are well positioned to build on our business momentum and improved industry fundamentals to deliver strong sequential growth in the fourth quarter."

4:09PM Marvell announces that Clyde Hosein has resigned as chief financial officer to pursue other opportunities (MRVL) 8.82 -0.17 : Co announced that after four years with Marvell, Clyde Hosein has resigned as chief financial officer to pursue other opportunities. Brad Feller, vice president and corporate controller, will serve as interim chief financial officer during a search for Mr. Hosein's replacement. Mr. Feller has served as Marvell's corporate controller since September 2008.

4:09PM Riverbed Technology beats by $0.03, reports revs in-line (RVBD) 20.66 -0.62 : Reports Q3 (Sep) earnings of $0.28 per share, excluding non-recurring items, $0.03 better than the Capital IQ Consensus Estimate of $0.25; revenues rose 15.2% year/year to $218.6 mln vs the $216.74 mln consensus. Revenue grows 10% sequentially and 15% over prior year. Cash and investments grew by more than $100 million and totaled more than $670 million at September 30, 2012."

4:05PM Marvell lowers Q3 rev to $765-785 mln from $800-850 mln vs $815.58 mln Capital IQ Consensus Estimate (MRVL) 8.83 -0.17 : "The continued slowdown in the global economy during the third quarter is resulting in a weaker PC market than previously anticipated and thus lower demand from our storage HDD customers. Our SSD, networking, and mobile product revenues are tracking to be in line with prior expectations. In addition to the continued weak PC demand patterns, visibility in our other end markets remains low as we head into a seasonally softer fourth quarter."

4:04PM Lattice Semi reports EPS in-line, revs in-line; guides Q4 revs below consensus (LSCC) 3.50 -0.04 : Reports Q3 (Sep) net of breakeven, in-line with the Capital IQ Consensus Estimate consensus of ($0.00); revenues fell 13.2% year/year to $70.9 mln vs the $70.84 mln consensus.

Co issues downside guidance for Q4, sees Q4 revs of $69.5-72.3 vs. $73.78 mln Capital IQ Consensus Estimate. Gross margin percentage is expected to be approximately 51-55%. Total operating expenses are expected to be approximately $43 million, including approximately $5.5 million in restructuring charges.

4:04PM Microsoft reports Q1 results (MSFT) 29.49 -0.09 : Reports Q1 (Sep) non-GAAP earnings of $0.65 per share, $0.02 better than the Capital IQ Consensus Estimate of $0.63; GAAP EPS of $0.53 vs. $0.56 Capital IQ consensus; revenues fell 7.9% year/year to $16.01 bln, may not compare directly to the $16.42 bln consensus. Non-GAAP revs were $17.4 bln, including Revenue deferred for Windows Upgrade Offer, Windows 8 Pre-sales, and Office Offer.

Microsoft reaffirms fiscal year 2013 operating expense guidance of $30.3 billion to $30.9 billion.
These financial results reflect the deferral of $1.36 billion of revenue and $0.13 of diluted earnings per share, due to the Windows Upgrade Offer, pre-sales of Windows 8 to OEMs prior to general availability, and the Office Offer.

12:39PM Google releases Q3 earnings early in 8-K filing; co misses by $1.63, misses on revs (GOOG) 680.00 -75.49 : Reports Q3 (Sep) earnings of $9.03 per share, excluding non-recurring items, $1.63 worse than the Capital IQ Consensus Estimate of $10.66; revenues rose 19.3% year/year to $11.33 bln vs the $11.87 bln consensus.

Paid Clicks -- Aggregate paid clicks, which include clicks related to ads served on Google sites and the sites of Network members, increased ~33% YoY and increased ~6% QoQ.
Cost-Per-Click -- Average cost-per-click, which includes clicks related to ads served on Google sites and the sites of our Network members, decreased ~15% YoY and ~3% QoQ.
Motorola revenues were $2.58 billion ($1.78 billion from the mobile segment and $797 million from the home segment), or 18% of consolidated revenues in the third quarter of 2012.
As of September 30, 2012, cash, cash equivalents, and short-term marketable securities were $45.7 billion

10:45AM Lam Research aggressively extends gap higher start near its Aug close/intraday highs (LRCX) 35.62 +2.04 : Strong run after reporting last night has been extended to its three month close high from Aug at 35.73 (session high 35.70). The Aug intraday peak is at 35.99.

9:02AM Ultratech beats by $0.03, beats on revs (UTEK) 30.38 : Reports Q3 (Sep) earnings of $0.45 per share, $0.03 better than the Capital IQ Consensus Estimate of $0.42; revenues rose 10.2% year/year to $60.5 mln vs the $59.26 mln consensus. "We achieved another quarter of strong financial results, and we believe the outlook for Ultratech remains bright."

8:33AM Jabil Circuit names new CEO (JBL) 17.72 : Co has appointed Mark T. Mondello as CEO, effective March 1. Mondello was also nominated to stand for election to the board of directors at the company's annual meeting of shareholders in January 2013. Mondello, currently the company's COO, will succeed Timothy L. Main as part of a planned and orderly executive succession. The Board anticipates Main will be appointed Chairman of the Board at the co's annual meeting in January 2013. Co also announced that its Chairman of the Board, William D. Morean, will not stand for re-election to the Board at the company's annual meeting of shareholders in January 2013. The Board also announced that it anticipates that current President & Chief Executive Officer Timothy L. Main will be appointed Chairman immediately following Morean's departure. Main will remain President & CEO until March 2013 as part of a planned and orderly executive succession.

8:12AM Cypress Semi completes tender offer for Ramtron (RMTR) (CY) 10.97 :

7:37AM Fairchild Semi beats by $0.08, misses on revs; guides Q4 revs below consensus; co's scheduled backlog is nearly sufficient to achieve the low end of this range (FCS) 12.46 : Reports Q3 (Sep) earnings of $0.25 per share, excluding non-recurring items, $0.08 better than the Capital IQ Consensus Estimate of $0.17; revenues fell 11.0% year/year to $358.8 mln vs the $368.77 mln consensus. Co issues downside guidance for Q4, sees Q4 revs of $330-350 mln vs. $380.07 mln Capital IQ Consensus Estimate.

Co said, "Our current scheduled backlog is nearly sufficient to achieve the low end of this range."


7:10AM Nokia beats by $0.03, beats on revs (NOK) 2.94 : Reports Q3 (Sep) loss of 0.07 per share, 0.03 better than the Capital IQ Consensus Estimate of ( 0.10); revenues fell 19.4% year/year to 7.24 bln vs the 6.97 bln consensus. Nokia Group achieves operating profitability on an underlying basis, with Q3 non-IFRS operating margin of 1.1%. Nokia Siemens Networks non-IFRS operating margin significantly improved q/q and y/y to 9.2% in Q3; Devices & Services Q3 non-IFRS operating margin improved q/q to negative 7.4%. Nokia Group ended Q3 with gross cash of EUR 8.8 billion and net cash of EUR 3.6 billion. Nokia Group Q3 net cash from operating activities of negative EUR 429 million, including cash outflows related to restructuring activities of approximately EUR 390 million.

Outlook
Nokia expects its non-IFRS Devices & Services operating margin in the fourth quarter 2012 to be approximately negative 6%, plus or minus four percentage points. This outlook is based on expectations regarding a number of factors. An expected increase in Devices & Services operating expenses as a result of new product launches, partially offset by expected cost reductions under our restructuring program; and Nokia expects the fourth quarter 2012 to be a challenging quarter in Smart Devices, with a lower-than-normal benefit from seasonality in volumes, primarily due to product transitions and our ramp up plan for our new devices.

Nokia continues to target to reduce its Devices & Services non-IFRS operating expenses to an annualized run rate of approximately EUR 3.0 billion by the end of 2013. Nokia and Nokia Siemens Networks expect Nokia Siemens Networks non-IFRS operating margin in the fourth quarter 2012 to be approximately positive 8%, plus or minus four percentage points.

ST-Ericsson (STM, ERIC) announced that a recent addition to the Samsung (SSNLF) GALAXY smartphone line - the Samsung GALAXY S III mini - is powered by the ST-Ericsson NovaThor ModAp platform.

Mellanox Tech (MLNX $81.74 -16.15) reported third quarter earnings of $1.37 per share, excluding non-recurring items, $0.25 better than the Capital IQ consensus of $1.12, while revenues rose 129.6% year/year to $156.5 million versus the $152.8 million consensus and versus prior guidance of $150-155 million. Non-GAAP operating margin came in at 38.9%. As usual, co does not provide guidance, should guide for Q4 revs on the call at the top of the hour.

Align Tech (ALGN $28.45 -6.96) reported third quarter earnings of $0.28 per share, $0.01 worse than the Capital IQ consensus of $0.29, while revenues rose 8.4% year/year to $136.5 million versus the $140.77 mln consensus. The company issued downside guidance for fourth quarter with EPS of $0.21-0.23 versus the $0.31 Capital IQ Consensus Estimate and revenues of $134.2-137.8 versus the $147.88 million consensus. The discontinuation of Align's distribution relationship with Straumann in Europe and North America, announced in a separate press release today, and the decline in results of operations of the Company's Scanner and CAD/CAM Services reporting unit triggers the risk of impairment of goodwill associated with the acquisition of Cadent. As a result, Align is in the process of conducting step one of a goodwill impairment test as prescribed by GAAP. Any difference between an estimate and the final step two evaluation, would be recorded in the fourth quarter 2012. The Company's evaluation could result in a non-cash impairment charge for a substantial portion of the $135.3 million book value of goodwill which would negatively affect net income although revenue and cash flow from operations would not be impacted. "Q3 is historically a slower period for North American GP Dentists and International doctors due to summer vacations. This year summer seasonality was more pronounced in North America and as a result, we did not see the expected ramp in Invisalign cases for GP Dentists and Orthodontists. This softness has continued through October and is reflected in our Q4 guidance, which despite that slowdown, still projects a healthy annual growth rate for the company overall, with volume growth of at least 16%.

eBay (EBAY $48.41 +0.44) reported third quarter earnings of $0.55 per share, excluding non-recurring items, $0.01 better than the Capital IQ consensus Estimate of $0.54, while revenues rose 14.8% year/year to $3.4 billion versus the $3.4 billion consensus. The company issued in-line guidance for the fourth quarter with EPS of $0.66-0.69, excluding non-recurring items, versus the $0.68 consensus and revenues of $3.85-4.0 billion versus the $3.94 billion consensus. PayPal delivered a strong Q3 performance. It ended the quarter with 117.4 million active registered accounts, a 14% increase over the third quarter of 2011. Revenue increased 23% year over year and net total payment volume (TPV) grew 20% year over year to $35.2 billion. Marketplaces delivered another strong quarter with accelerating user growth. Gross merchandise volume (GMV), excluding vehicles, increased 11% year over year to $16 billion in the third quarter of 2012. Marketplaces revenue increased 9% year over year, driven by strong growth in the United States and Asia Pacific. Active user growth continued to accelerate during the quarter, reaching 10% year over year, the fastest growth since 2007, with 800,000 new users coming from mobile. This helped boost sold items growth, which was up 19% year over year.

Xilinx (XLNX $33.98 +0.02) reported second quarter earnings of GAAP $0.46 per share, $0.05 better than the GAAP Capital IQ Consensus Estimate of $0.41, while revenues fell 2.0% year/year to $543.9 million versus the $548.04 mln consensus. The company sees Q3 revenue down 1-5% sequentially, which equates to roughly $516.7-538.5 million versus the $561.79 million consensus; sees gross margin of ~66%. "Sales from our industry-leading, All Programmable 28-nm products exceeded $20 million during the quarter with sales from all five family members. Our 28-nm product portfolio is the industry's broadest; and design win activity for all five family members continues to be exceptionally strong across a broad base of end markets and applications. This is particularly impressive given the backdrop of a challenging macroeconomic environment."

Nokia (NOK $2.84 -0.10) reported a third quarter loss of €0.07 per share, €0.03 better than the Capital IQ consensus of (€0.10), while revenues fell 19.4% year/year to EUR 7.24 billion versus the €6.97 bln consensus. Nokia Group achieves operating profitability on an underlying basis, with Q3 non-IFRS operating margin of 1.1%. Nokia Siemens Networks non-IFRS operating margin significantly improved q/q and y/y to 9.2% in Q3; Devices & Services Q3 non-IFRS operating margin improved q/q to negative 7.4%. Nokia Group ended Q3 with gross cash of EUR 8.8 billion and net cash of EUR 3.6 billion. Nokia Group Q3 net cash from operating activities of negative EUR 429 million, including cash outflows related to restructuring activities of approximately EUR 390 million. Nokia expects its non-IFRS Devices & Services operating margin in the fourth quarter 2012 to be approximately negative 6%, plus or minus four percentage points. This outlook is based on expectations regarding a number of factors. An expected increase in Devices & Services operating expenses as a result of new product launches, partially offset by expected cost reductions under our restructuring program; and Nokia expects the fourth quarter 2012 to be a challenging quarter in Smart Devices, with a lower-than-normal benefit from seasonality in volumes, primarily due to product transitions and our ramp up plan for our new devices. Nokia continues to target to reduce its Devices & Services non-IFRS operating expenses to an annualized run rate of approximately EUR 3.0 billion by the end of 2013. Nokia and Nokia Siemens Networks expect Nokia Siemens Networks non-IFRS operating margin in the fourth quarter 2012 to be approximately positive 8%, plus or minus four percentage points.

12:20 pm S&P Tech sector long today in line with losses in the overall market

The tech sector is trading lower today, trailing narrower losses in the broader market. Semiconductors are showing relative weakness as well with the SOX trading 0.8% lower. Within the chip index, CRUS (-3.5%) is a notable laggard. Among other major indices, the SPY is trading 0.2% lower today, while the QQQ and the NASDAQ are trading 0.5% lower on the session. Among tech bellwethers, VZ (+1.9%) is showing strength, while FB (-1.9%) is showing notable weakness.

In tech earnings last night, MLNX (-21.2%) posted a Q3 beat, but issued downside guidance. LRCX (+6.3%) and XLNX (-1.0%) reported quarterly beats, but guided below consensus. This morning, NOK (-2.4%) posted a Q3 beat and VZ (+1.9%) reported an inline qtr. Elsewhere, ADS (+2.7%) and NTCT (+6.3%) reported quarterly beats and raised guidance, FCS (+1.4%) posted a mixed Q3 and guided below consensus, and CY (-5.7%) reported an line qtr and guided below consensus. In news, PANW (-5.0%) priced a 4.8 mln shares of common stock at $63.00 per share. VZ (+1.9%) on its conference call said it activated 3.1 mln AAPL (-1.0%) iPhones in the quarter. Among rumors, there is JNPR (+3.0%) takeover chatter making the rounds.

In notable analyst upgrades this morning in the tech space, Macquarie upgraded TIBX (+1.3%) to Outperform. Among downgrades, ASML (+2.8%) was downgraded to Sector Perform from Outperform at RBC and LLTC (-2.1%) was downgraded to Neutral at Nomura. Also of note, BWS Financial initiated ELLI (-5.2%) with a Sell. AMD (-1.8%), FLEX (-1.2%), GOOG (-0.4%), MSFT (-0.5%), and SNDK (-0.3%) are the notable names in tech scheduled to report quarterly results today after the close.
icon url

ReturntoSender

10/21/12 11:39 AM

#9958 RE: ReturntoSender #6755

InvestmentHouse Weekend Market Summary

http://www.investmenthouse.com/weekendmarketsummary.htm

- Key earnings misses augment prior earnings warnings, GOOG surprise, as stocks dive on expiration.
- Earnings reality belies economic data as sales decline and a clear majority of companies miss expectations.
- Tough session but many leaders hold up. Others fell hard to next support and from there they have to try and show Friday was just an expiration thing.
- Existing Home Sales fall as lack of speculative-priced houses show exactly how much the market has healed (or not).
- Hartford Small Business Survey shows more of what we know that does not support the economic report bounces.
- $1+ trillion spent in 2012 on Medicare, Medicaid, and Welfare. More people are on assistance than those working in the private sector.
- Friday just an 'expiration thing' or the start of an October stock market surprise.

Black Monday remembrances, but this was no Black anything.

It was all SP500, DJ30, and somewhat surprisingly, SP400 midcaps, could do to hold their 50 day EMA. They were just at this level to start the week as they had tested and then started what looked to be a solid move off of that support. As techs continued to their acid indigestion over the early Google earnings release and miss, more bile was added as MCD, GE, PH, BHI, CMG, HON and others missed their results.

It is not just a bottom line miss on rising energy and input costs. Oh yes we know there are rising costs as seen in the Philly Fed report on Thursday that mysteriously was positive when all sub-indices were negative, but rising costs the past quarter were expected. The most worrisome aspect is the sales decline leading to revenue misses. Stocks are back in that lousy situation of declining sales experienced as the economy fell into the financial crisis. What is worse, this time they are experiencing rising prices in a nasty profits squeeze. Any wonder they were hoarding money in anticipation of problems to come?

The declining sales underscore the economic decline that started in 2011 and continued into 2012. Sure there was hope that the recovery would continue and indeed the ups were viewed as 'heading in the right direction,' but they were always lower highs followed by slowdowns. Looking back you can see that 2010 was the peak of a weak recovery, and the trend has stumbled lower and lower in action very similar to the 1970's when the US experienced directionless, pathetic, and sporadic ups sandwiched between declines in growth and the stock market.

At this juncture in the earnings season 41% topped expectations while 59% missed. Again, it is the nature of the misses that is the most disturbing: declining sales that comport with what the business surveys and results are showing versus a handful of economic reports of late that have surprised to the upside without any foundation for so doing. The falling unemployment rate? Mostly part-time, lowest pay scale jobs were created, and likely those were 'found' jobs after the change in the definition of work under the 1996 welfare reform act. Weekly jobless claims? Jumped right back up toward 400K after a week when some data from somewhere was missing (that remains the mystery). September retail sales? The unadjusted numbers discussed Thursday show the level of declines seen in September 2007 as the financial crisis unfolded, much worse than expected and requiring a huge adjustment to 'smooth out' the data.

The list goes on, but the idea is simple: earnings expectations that are already lowered are missing their marks on sales, and they show that the economic data is off, or at least the adjustments send it off the true path as the huge decline in September raw sales shows.

Google accidental earnings release epitomized the end of the week.

The question is whether this almost comedy of errors on the week in terms of earnings releases was just a one-time shock exacerbated by the GOOG surprise early release and amplified Friday by expiration, OR is it the start of some hellish 'October Surprise' that sees stocks burn off right before the election as prices correct to make up for the gap between prices near post-bear market highs and the reality of declining sales due to a weakening economy.

Market Action

No doubt this was a tough session. What was a decent fade by NYSE indices on Thursday turned into a Black Monday anniversary blood-letting where it was every stock for itself. Of course this was no black Monday, and I frankly was a bit sick and tired of the analogies all day long. As I said in an alert, I was there at Black Monday, I know Black Monday. Black Monday is not a friend of mine. Friday was no Back Monday. That would take another 2,000 to 3,000 points off the Dow to get into that range.

Every stock for itself on Friday from the opening bell.

Stocks started lower after futures were lower. They fell fast and hard at the open. We watched for a rebound to test the move. It finally showed up - - when the last hour of trade began and after a 27 point plunge on SP500, 66 points on NASDAQ, and 233 points on DJ30. That move lower started at the bell and never came up for air the entire session until that last hour started.

So there was a rip-roaring last hour surge on expiration Friday right? No. It bounced indeed, but NASDAQ recovered a whopping 5 points off the low. 3 points on SP500, 30 points on DJ30. A bit less than impressive on the recovery.

SP500 -24.15, -1.66%
NASDAQ -67.25, -2.19%
DJ30 -205.43, -1.52%
SP600 -1.67%
SOX 3.02%
NASDAQ 100 -2.4%

The move left SP500, DJ30, and SP400 at the 50 day EMA as noted, nursing the possibility of a bounce. Many stocks held up as if there was no selling at all, but some big names broke lower. Most managed to hold a lower support range. If this was an 'expiration thing' coupled with confusion and angst that started on Google's premature earnings release, those stocks at the lower support and the NYSE indices are in position to rebound. Of course, they have to do it again after just making that move starting Monday.

The alternative? The start of an earnings decline that the market missed. That seems unusual as the market typically leads declines by months versus reacting to declines. That would tend to mitigate any major market selloff. Of course the Fed's stimulus has masked the market's typical economic prognostications powers with QE funds pushing into financial instruments versus the economy because business surveys clearly show they are cutting investments and hiring plans right now. Thus while the market anticipated weaker earnings, it anticipated them on rising prices, not necessarily sales misses given the rising consumer sentiment. As I said before, it doesn't matter how good you feel about a purchase you want to make if you don't have the funds (8.2% decline in wages, negative disposable income) and cannot get a loan. Sales fell and that appears to have caught the market looking.

October surprise ahead?

An October surprise selloff ahead of the election? Could be. The inability to hold a modest pullback from the solid Monday to Wednesday bounce off support opens the door for a deeper correction as I stated this past week. Indeed NASDAQ is making such a deeper correction as AAPL and GOOG sell hard. Another Black Monday? No, at least not yet. A selloff similar to pre-2008 election? Not likely either. But a week of downside along the lines of another few hundred points on DJ30 and 35 or so points on SP500 will get everyone's attention. Frankly that might not even happen given the Dow, SP500 and SP400 action at the 50 day EMA Friday.

OTHER MARKETS

Dollar. 1.3045 versus 1.3089 euro. A second day of upside as the dollar defies weakness in the US data (existing home sales -1.7% on Friday). Bouncing back up for a sharp selloff early in the week. Still in a bearish head and shoulders overall but it is trying to bounce.

Bonds. 1.77% versus 1.82% 10 year US Treasury. After gapping below the 200 day SMA Wednesday and selling further Thursday, bonds rebounded Friday. Worry on the economy, weak stock market and that equals safe haven trade. Follow the bouncing ball of late as the tennis match on the economic data continues and the Fed remains the wildcard as to what days it enters and buys bonds and what days it does not.

Gold. 1724.00, -20.70. Sold to the 50 day EMA as the test deepens, but it is still just a test of that strong run off the July low and the breakout in August.

Oil. 90.05, -2.05. Broke through the 50 day EMA intraday after almost two weeks of lateral trade just below that resistance. After the surge it purged, falling sharply away from the 50 day. Lots of oil out there and any signs of economic weakness is a problem. What signs? GE, MCD, PH, BHI, INTC, FDX, UPS . . .

TECHNICAL SUMMARY

Internals.

NASDAQ
Stats: -67.24 points (-2.19%) to close at 3005.62

Volume: 2.205B (+9.38%)

Up Volume: 342.76M (-378.86M)
Down Volume: 1.88B (+560M)

A/D and Hi/Lo: Decliners led 3.96 to 1
Previous Session: Decliners led 2.18 to 1

New Highs: 51 (-48)
New Lows: 84 (+48)

S&P500
Stats: -24.15 points (-1.66%) to close at 1433.19
NYSE Volume: 820M (+26.54%)

Up Volume: 409.62M (-1.8B)
Down Volume: 3.44B (+1.81B)

A/D and Hi/Lo: Decliners led 3.39 to 1
Previous Session: Decliners led 1.04 to 1

New Highs: 127 (-102)
New Lows: 35 (+23)

DJ30

Stats: -205.43 points (-1.52%) to close at 13343.51

Volume: Burst higher on NYSE by 26% and NASDAQ was not a slouch with a 9+% gain to 2.2B shares. Selling on the downside? Well, yes, but it was also expiration. Hard to separate the two, but it was not a great price session and volume was jumping well above average on both exchanges.

Breadth. Somewhat ugly. No, pretty much downright ugly at -4:1 on NASDAQ and -3.4:1 on NYSE. GOOG, MSFT coattails but also IBM, GE, MCD.

THE CHARTS

SP500. Back down to the 50 day EMA on a volume surge. Volume surges at key support are not bad as it shows buyers stepping in to hold the level. Of course with expiration you have to somewhat throw out the volume. Somewhat. SP500 finds itself at the support it bounced from starting Monday. Back at the lick log and much too fast. It gave itself a shot, however, to show that Friday was an expiration thing or was at least amplified by expiration. That of course means SP500 has to hold here and then start back upside.

NASDAQ. Gapped lower, undercut last week's low and the support from August consolidation and the late April peak. NASDAQ is at the next potential support at the early May lower gap point, the early August lateral shelf, and the late February peak. This is a possible support point, but it is going to have to prove it. This is the problem when you have a handful of stocks comprising the majority of the market cap on an index.

SP600/SP400. Fell back through the 50 day EMA but it did hold at last week's lows so we see if the small guys can hold once more. Tough to do with such a quick dive back lower. The midcaps held the 50 day EMA along with SP500 and DJ30, so all in all the NYSE indices, though down, left themselves in a position to bounce.

SOX. Pretty much what you would expect as SOX undercut last week's low. Still above a more important support level from May through July prices, but we are not looking for SOX to lead, at least to the upside.

DJ30/DJ20. Flopped to the 50 day EMA as the Dow continued to feel the heat from INTC, IBM, GE, and others that have disappointed. That puts it back at support and it has to try and rally the troops once more.

DJ20 suffered a sharp reversal at the 200 day SMA. Managed to recover and hold above the 10 day EMA on the close. That keeps it above mid-range in the trading range and as with the other NYSE indices, gives it a shot to bounce. Question is whether it takes the shot or acts as if it has been shot.

LEADERSHIP

Big names. Nothing good from AAPL, GOOG, AMZN, IBM, GE, MCD. That is all you can say.

Homebuilders/Materials. Damn solid given the session as KBH, TOL, BZH et al actually added to the gains. We took some big 500% gain on our October KBH options today, letting them run as long as they would. LPX in materials remained solid.

Industrials. Not bad. Joy held the line. GNRC held up well. TEX faded, but held the 10 day EMA. Not bad given the carnage.

Metals. Took some hits but had some room to give above the 10 day EMA.

Retail. Very mixed bag. CONN, PII held up fine. The eateries were hit on the MCD results, but most were holding support such as YUM. DRI, a play from Thursday, did not. LULU sold through the 50 day EMA on an analyst report questioning its clothing mix. BS so we didn't sell into the panic. ULTA is hanging in as is FOSL. Very mixed, under pressure, but the names appear to be holding.

Financial. Just another day at the office as BAC was flat, JPM sold to the 10 day EMA, MS held the 20 day EMA with a doji.

Energy. Held the line as well. BBG, GPOR, DWSN, PBR all went about their own business.

Miscellaneous. AMT, BCRX, MFRM, NEM, SUPN, TASR all went about their business despite the market selling.

THE MARKET

SENTIMENT INDICATORS

VIX: 17.06; +2.03. VIX surged off the midrange level where it traded for almost a week. Cleared the recent interim peaks and is heading back up toward the 200 day SMA and the August peak. Meaning? With this kind of move in the market VIX attached itself back to the indices. It suggests a test of the August peak at 19ish up to 20.50ish, and that means more stock market selling of course.
VXN: 20.05; +2.44
VXO: 15.91; +1.61

Put/Call Ratio (CBOE): 1.12; +0.24

Bulls versus Bears

Bulls: 45.7% versus 46.8% versus 51.0% versus 54.2%. Okay, the bulls continue to fall as the market tests back. There is a pretty healthy skepticism. After all those fund flows we saw this week (10+B in a week) show the distrust. That is not bad for the upside: contrary indicator. Well below the 60% to 65% bullish levels that flash a warning sign. Back to the level from a couple of months back. Undercut 35%, the threshold for bullishness, in early June. As noted, hit 34% in early June. It did its job and the market is on the rally. Hard drop to 34 from 39.3% as economic reality and a choppy stock market hit. Off the 55+ level hit in late February. That was the highest level since April and May of 2011, the peak of the post-bear market high. 35% is the threshold level suggesting bullishness. To be seriously bearish it needs to get up to the 60% to 65% level.

Bears: 25.5% versus 25.5% versus 24.5% versus 24.5% versus 25.5%. No more bears, no less. Still not at a high level. March and April saw lower lows in the 21% range. On the last run never made it to the 35% that can be a bullish indication, but the bulls were weak enough back in June. Over 35% is the threshold to be really be a good upside indicator. For reference, bearishness hit a 5 year high at 54.4% the last week of October 2008. The move over 50 took bearish sentiment to its highest level since 1995. Extreme negative sentiment. Prior levels for comparison: Bearishness peaked at 37.4% in September 2007. It topped the June 2006 peak (36%) on that run. That June peak eclipsed the March 2006 high (33%) and well above the 2005 highs that spawned new rallies (30% in May 2005, 29.2% in October 2005). That was a huge turn, unlike any seen in recent history.

MONDAY

A slow start to the week in terms of scheduled economic data, but earnings will pour in as investors cautiously eye the Friday close and whether there are reverberations in the week ahead. A bit of a Black Friday, Monday, and Tuesday d j vu experience if only in the minds of traders.

Up to Friday (well Thursday on NASDAQ), the stock market was acting technically solid. Earnings were supposed to be down but stocks rebounded off a 4 week pullback to support. They were not showing indications that earnings would pose a major surprise. Then on Thursday stocks were rallying after a lower open when the Google mistake release occurred. Now it may not have been any different at all if GOOG was released early or at the normal time; after all its miss would have been the same.

That it was another market-related snafu, another unexpected glitch in what by now seems an unending parade of unreliable market mechanisms or downright dishonesty. Knight trading, front-running, best prices for certain 'hidden' customers, the flash crash. Since the financial meltdown, despite the massive number of new rules and regulations put in place the perception of the system has not improved and likely has degenerated.

Thus the manner of the earnings release could very well have added to the reaction. Stocks broke down after the news and NASDAQ never recovered. Friday as more 'name' companies reported top line misses, the selling from Thursday went into crescendo. All the indices sold hard. They managed to land at support, but much lower support than you want to see for a continued move up. Indeed NASDAQ is only holding at modest support and could head down toward the 200 day SMA at 2970.

That could mean a deeper test if SP500, DJ30 and SP400 cannot yet again hold their 50 day EMA this coming week. As noted above, they left themselves a chance to hold and rebound. They will have to prove it, however, after such a quick test back to this support and with NASDAQ so weak.

They have many stocks working in their favor for now as noted in discussing leaders. At the same time longer term rally leaders are in full dives. Perhaps a changing of the guard, but with the big names with big capitalizations falling hard, it is a violent change. It could be that after a bit more downside to start the week a bottom is found, i.e. a reversal Monday after a lower open.

All speculation at this point. SP500, DJ30, SP400 and many leaders are in position to recover as they held support. Until that changes their trends remain in place. Thus we are going to look for stocks we can ride for a rebound if it comes. If they are solid and go about their business even after Thursday and Friday, great. The caveat is to watch for a relief bounce after a hard Thursday and Friday selloff, particularly on NASDAQ. That can be a trap on stocks that rebound from hard selling and then stall below resistance. If that sets up, i.e. a relief bounce, we can look for downside setups as it looks the move is trails off and starts to roll over.

The indices made it hard for themselves, NASDAQ more than others. NASDAQ had lagged anyway and now we see if the NYSE indices can bring drag it back to the upside or if NASDAQ topples them as well.

Have a great weekend!

Support and resistance

NASDAQ: Closed at 3072.87
Resistance:
3076 is the late April 2012 high
The 50 day EMA at 3078
3090 is the mid-March interim high
3037 is the October low
3101 is the August 2012 high
The June up trendline at 3122
3134 is the March 2012 post-bear market peak: broken, not forgotten.
3171 is the October intraday high
3197 is the September 2012 post-bear market high
3227 is the April 2000 intraday low
3401 is the May 2000 closing low

Support:
3042 from 5/2000 low
3026 from 10/2000 low
3024 is the gap point from early May
3000 is the February 2012 post-bear market high
2999 is the bottom of the August 2012 consolidation
2988 is the July 2012 high
The 200 day SMA at 2967
2962 is the April 2012 low
2950 is the mid-April closing low
2942 is the mid-June 2012 high
2910 is the March 2012 low
2900 is the March 2012 low

S&P 500: Closed at 1457.34

Resistance:
1464 is the June up trendline
1463 is the September closing high
1466 is the September closing high
1471 is the October 2012 intraday high
1475 is the September 2012 high
1499 from January 2008
1539 from June 2007

Support:
1440 from November 2007 closing lows
1433 from August 2007 closing lows
The 50 day EMA at 1430
1427 is the August 2012 peak
1425 from May 2008 closing highs and the October 2012 low
1422.38 is the prior post-bear market high (March 2012)
1406 is the early May 2012 peak
1402.22 is the closing low of the August 2012 lateral consolidation
1378 is the February 2012 peak
1375 is the early July 2012 peak
The 200 day SMA at 1373
1371 is the May 2011 peak, the post-bear market high
1363.46 is June 2012 high
1359 is the April 2012 low
1357 is the July 2011 peak
1344 is the February 2011 peak
1340 is the early April 2011 peak
1332 is the early March 2011 peak
1325 is the July 2012 intraday low
1309 is the right shoulder low from June 2012
1295 to 1294 is the April 2011 low and the February 2011 consolidation low (bottom of the trading range)
1293 is the October 2011 peak
1275 is the January 2010 low, early January 2011 peak
1267 is the December 2011 peak
1266 is the June 2012 base low

Dow: Closed at 13,548.94
Resistance:
13,653 is the September 2012 high
13662 is the October 2012 intraday high
13,668 from 12-2007 peak
13,692 from 6-2007 peak
14,022 from 7-07 peak

Support:
13,331 is the August 2012 post-bear market high
The 50 day EMA at 13,339
13,297 is the April 2012, prior post bear market high
13,058 from the May 2008 peak on that bounce in the selling
13,056 is the February 2012 high
12,971 is the early July 2012 high
The 200 day SMA at 12,953
12,754 is the July intraday peak
12,716 is the April 2012 closing low
12,391 is the February 2011 peak
12,369 is the left shoulder low from May 2012
12,284 is the October 2011 peak
12,258 is the December 2011 peak
12,110 from the March 2007 closing low
12,094 is the April 2011 low
12,035 is the June 2012 base low
The June 2011 low at 11,897 (closing)
11,734 from 11-98 peak
11,717 is the late August 2011 peak

Economic Calendar

October 15 - Monday
- Retail Sales, September (8:30): 1.1% actual versus 0.7% expected, 1.2% prior (revised from 0.9%)
- Retail Sales ex-auto, September (8:30): 1.1% actual versus 0.6% expected, 1.0% prior (revised from 0.8%)
- Empire Manufacturing, October (8:30): -6.2 actual versus -2.8 expected, -10.4 prior
- Business Inventories, August (10:00): 0.6% actual versus 0.5% expected, 0.8% prior

October 16 - Tuesday
- CPI, September (8:30): 0.6% actual versus 0.5% expected, 0.6% prior
- Core CPI, September (8:30): 0.1% actual versus 0.2% expected, 0.1% prior
- Net Long-Term TIC Fl, August (9:00): $90.0B actual versus $67.2B prior (revised from $67.0B)
- Industrial Production, September (9:15): 0.4% actual versus 0.3% expected, -1.4% prior (revised from -1.2%)
- Capacity Utilization, September (9:15): 78.3% actual versus 78.3% expected, 78.0% prior (revised from 78.2%)
- NAHB Housing Market , October (10:00): 41 actual versus 42 expected, 40 prior

October 17 - Wednesday
- MBA Mortgage Index, 10/13 (7:00): -4.2% actual versus -1.2% prior
- Housing Starts, September (8:30): 15.0% (872K actual) versus 768K expected, 4.1% prior (758K, revised from 750K)
- Building Permits, September (8:30): 894K actual versus 815K expected, 801K prior (revised from 803K)
- Crude Inventories, 10/13 (10:30): 2.860M actual versus 1.672M prior

October 18 - Thursday
- Initial Claims, 10/13 (8:30): 388K actual versus 360K expected, 342K prior (revised from 339K)
- Continuing Claims, 10/6 (8:30): 3252K actual versus 3275K expected, 3281K prior (revised from 3273K)
- Philadelphia Fed, October (10:00): 5.7 actual versus -0.1 expected, -1.9 prior
- Leading Indicators, September (10:00): 0.6% actual versus 0.2% expected, -0.4% prior (revised from -0.1%)

October 19 - Friday
- Existing Home Sales, September (10:00): 4.75M actual versus 4.70M expected, 4.83M prior (revised from 4.82M)

October 24 - Wednesday
- MBA Mortgage Index, 10/20 (7:00): -4.2% prior
- New Home Sales, September (10:00): 385K expected, 373K prior
- FHFA Housing Price Index, August (10:00): 0.2% prior
- Crude Inventories, 10/20 (10:30): 2.860M prior
- FOMC Rate Decision, October (24:30): 0.25% prior
- FOMC Rate Decision, October (14:15): 0.25% expected, 0.25% prior

October 25 - Thursday
- Initial Claims, 10/20 (8:30): 375K expected, 388K prior
- Continuing Claims, 10/13 (8:30): 3237K expected, 3252K prior
- Durable Orders, September (8:30): 7.4% expected, -13.2% prior
- Durable Orders -ex Transports, September (8:30): 1.0% expected, -1.6% prior
- Pending Home Sales, September (10:00): 2.4% expected, -2.6% prior

October 26 - Friday
- GDP-Adv., Q3 (8:30): 1.9% expected, 1.3% prior
- Chain Deflator-Adv., Q3 (8:30): 2.0% expected, 1.6% prior
- Michigan Sentiment - Final, October (9:55): 83.1 expected, 83.1 prior

icon url

ReturntoSender

10/22/12 6:04 PM

#9959 RE: ReturntoSender #6755

From Briefing.com: 4:20 pm : Stocks got off to a quiet start as mixed quarterly reports continued to pour in. Indecision was apparent in the early going as the major averages traded near their respective unchanged levels. As the day progressed, the S&P 500 and Dow headed lower. However, the final hour brought out bargain-hunters who lifted the major averages near their respective session highs. As a result, the S&P 500 ended unchanged. Meanwhile, the Nasdaq outperformed and settled higher by 0.4%.

Caterpillar (CAT 85.08, +1.22) advanced 1.5% after reporting mixed earnings. The industrial bellwether announced earnings of $2.54 against the Capital IQ consensus estimate of $2.24. However, the company's revenue of $16.45 billion missed the Capital IQ consensus by $470 million. In addition, the company lowered its full-year 2012 earnings and revenue guidance below consensus. Management commented on its cautious outlook by saying "CAT dealers have lowered order rates well below end-user demand to reduce their inventories."

The technology sector was the top performer after posting the largest loss during Friday's sell-off. Apple (AAPL 634.03, +24.19) gained 4.0% ahead of an event scheduled for 13:00 ET tomorrow. At the event, the company is expected to unveil a smaller version of the iPad tablet. The strong gains in Apple supported the Nasdaq throughout the day.

Cirrus Logic (CRUS 39.66, +1.44) rose by 3.8% after Feltl & Co. upgraded the stock to ‘strong buy' on an expectation of an earnings beat.

Elsewhere in tech, Netflix (NFLX 67.88, +2.90) advanced 4.5% after reports indicated the company is considering moving into seven new markets, including Asia.

Also of note, OpenTable (OPEN 46.36, +2.77) gained 6.4% after reports indicated Yahoo! (YHOO 15.77, -0.07) may be interested in purchasing the restaurant reservation service. Note that Yahoo! is scheduled to report its third quarter earnings after today's close.

Philips Electronics (PHG 26.23, +1.63) surged 6.6% after the electronics manufacturer reported a 13.6% year-to-year rise in revenues. The revenue of EUR6.13 billion was ahead of the Capital IQ consensus estimate of EUR5.96. Today's buying has lifted the stock to levels not seen since June of last year.

Utility stocks underperformed the broader market. Avista (AVA 25.54, -0.92), which specializes in generating and delivering electricity, lost 3.5% after the company lowered its third quarter and full-year 2012 earnings guidance below consensus. In addition, the company issued in-line guidance for full-year 2013 as it sees earnings between $1.62 and $1.76. Peer Public Service Enterprise (PEG 32.43, -0.28) slipped 0.9% after Credit Suisse downgraded the stock to ‘underperform' from ‘neutral.'

Elsewhere in utilities, electricity provider The AES Corporation (AES 10.81, -0.23) slid 2.1%.

The Dow Jones Transportation Average trailed the remaining industrials, and closed lower by 0.4%. Overseas Shipholding Group (OSG 1.23, -2.02) sank 62.2% after announcing it is evaluating its strategic options, including a potential filing of Chapter 11 bankruptcy. The company also said that its past financial statements are not to be relied upon, and restatements may be needed. The uncertainty regarding the company's future prompted Dahlman Rose to downgrade the stock to ‘sell' from ‘hold' with a $0.50 price target.

Railroad stocks within the transportation average were mixed. Norfolk Southern (NSC 66.83, +1.19) advanced 1.8%, while CSX (CSX 21.29, +0.19) added 0.9%. Meanwhile, Kansas City Southern (KSU 78.36, -0.07) shed 0.1% after reporting mixed quarterly results. The company's earnings of $0.82 fell $0.03 short of the Capital IQ consensus estimates, while the revenue was reported in-line with Capital IQ analyst expectations. Following the earnings release, the stock received a pair of downgrades. BB&T downgraded the stock to ‘hold' from ‘buy' while BMO Capital lowered the rating on KSU to ‘underperform' from ‘market perform.'

Also of note, FedEx (FDX 91.48, -0.63) and United Parcel Service (UPS 71.56, -0.74) lost 0.7% and 1.2%, respectively. Note that United Parcel Service will report third quarter earnings before tomorrow's open.

Peabody Energy (BTU 28.95, +3.06) reported third quarter earnings of $0.51. This exceeded the Capital IQ consensus estimates by $0.17. In addition, the company's revenues of $2.06 billion also beat the Capital IQ analyst expectations. The company's management issued in-line full-year 2012 guidance and said that "global macroeconomic conditions continue to be constrained due to the sluggish U.S. economy, European recession, and decelerating China growth." Peabody Energy settled higher by 11.8% following the earnings release. Meanwhile, peers Alpha Natural Resources (ANR 9.48, +0.51), Arch Coal (ACI 8.41, +0.50), and James River Coal (JRCC 5.31, +0.31) registered gains between 5.7% and 6.3%.

Monster Beverage (MNST 45.73, -7.58) fell 14.2% after the Food and Drug Administration received death reports citing the popular Monster energy drink. The company has since denied any wrongdoings. Today's selling has dropped the stock to levels not seen since January of this year.

Over the weekend, AMC Networks (AMCX 47.30, +1.77), Cablevision Systems (CVC 18.45, +0.06), and DISH Network (DISH 36.63, +1.16) announced a settlement in the VOOM HD litigation. Per the settlement, DISH Network paid a cash settlement of $700 million to Cablevision and AMC Networks. In addition, DISH has entered into a long-term distribution agreement with AMC to carry AMC, IFC, Sundance Channel, and WE tv. Following the settlement, DISH added 3.3%, AMC Networks gained 3.9%, and Cablevision tacked on 0.3%.

There is no economic data scheduled for tomorrow's release.DJ30 +2.38 NASDAQ +11.34 SP500 +0.62 NASDAQ Adv/Vol/Dec 1221/1.61 bln/1234 NYSE Adv/Vol/Dec 1442/634.5 mln/1535

3:35 pm : Crude oil slid deeper into negative territory as the dollar regained momentum. Also adding to the pressure were reports that TransCanada (TRP) was to restart its Keystone pipeline today. Crude fell off its pit session high of $90.59 per barrel and settled 1.9% lower at $88.70 per barrel, or just above its session low of $88.58 per barrel.

Natural gas tumbled off its session high of $3.64 per MMBtu and after steadily trending lower, it settled at its session low of $3.45 per MMBtu for a 4.7% loss. Precious metals chopped around in positive territory during today's pit trade despite the lack of any U.S. economic data.

Gold brushed a session high of $1730.30 per ounce and settled with a 0.1% gain at $1726.10 per ounce. Silver touched a session high of $32.47 per ounce in morning action but pulled-back slightly in afternoon floor trade. It still managed to book a 0.5% gain as it closed at $32.27 per ounce.DJ30 -48.16 NASDAQ +3.80 SP500 -4.43 NASDAQ Adv/Vol/Dec 1136/1405.3 mln/1303 NYSE Adv/Vol/Dec 1248/426 mln/1726

5:58PM Coherent to replace Peet's Coffee & Tea (PEET), P.H. Glatfelter (GLT) to replace Lawson Products (LAWS) in the S&P SmallCap 600 on Friday, October 26 (COHR) 44.69 -0.11 : Coherent (COHR) will replace Peet's Coffee & Tea (PEET), and P.H. Glatfelter Company (GLT) will replace Lawson Products Inc. (LAWS) in the S&P SmallCap 600 after the close of trading on Friday, October 26. Privately held Joh. A. Benckiser is acquiring Peet's Coffee & Tea in a deal expected to be completed soon pending final approvals. Lawson's low market capitalization is no longer representative of the small-cap market space.

4:33PM Ultra Clean Holdings misses by $0.01, reports revs in-line; guides Q4 EPS below consensus, revs below consensus (UCTT) 4.65 +0.05 : Reports Q3 (Sep) earnings of $0.06 per share, excluding non-recurring items, $0.01 worse than the Capital IQ Consensus Estimate of $0.07; revenues fell 4.2% year/year to $100.9 mln vs the $100.8 mln consensus. Co issues downside guidance for Q4, sees EPS of $0.01-0.05, excluding non-recurring items, vs. $0.06 Capital IQ Consensus Estimate; sees Q4 revs of $94-99 mln vs. $101.8 mln Capital IQ Consensus Estimate.

4:20PM Mellanox Tech executive officers adopt 10b5-1 stock trading plans to sell stock (MLNX) 75.30 -1.71 : Co announced that Eyal Waldman, chairman, president and CEO, and Michael Gray, chief financial officer, have each adopted a stock trading plan to sell a portion of their ordinary shares of the company in an orderly manner.

Under Mr. Waldman's plan, Waldo 2 Holdings, a general partnership of which Mr. Waldman is a general partner, may sell up to 169,123 shares for the benefit of Mr. Waldman subject to satisfaction of certain conditions. If the conditions are met, sales under the plan may commence in January 2013 and would be completed by December 2013. The sales by Mr. Waldman under his plan are intended to diversify his securities holdings and to help meet estate planning goals.
Under his plan, Mr. Gray may sell up to 55,510 shares, subject to satisfaction of certain conditions. If the conditions are met, sales under the plan may commence in December 2012 and would be completed by March 2013. The sales by Mr. Gray under his plan are intended to diversify his securities holdings and to help meet estate planning goals.

4:18PM Western Digital beats by $0.05, beats on revs (WDC) 35.28 +0.40 : Reports Q1 (Sep) earnings of $2.36 per share, excluding non-recurring items, $0.05 better than the Capital IQ Consensus Estimate of $2.31; revenues rose 49.8% year/year to $4.04 bln vs the $3.95 bln consensus. Shipments +8% YoY to 62.5 mln. The co generated $936 million in cash from operations during Q1, ending with total cash and cash equivalents of $3.5 billion. During the quarter, the co utilized $218 million to buy back 5.2 million shares of common stock. "While the macroeconomic environment is dampening near term demand, we remain confident in the continued long-term growth in the creation, storage and management of digital content.

4:15PM Veeco Instruments announces HC SemiTek purchased additional Veeco MOCVD systems for LED production (VECO) 28.88 -0.61 :

4:08PM Yahoo! beats by $0.09, reports revs in-line (YHOO) 15.77 -0.07 : Reports Q3 (Sep) earnings of $0.35 per share, $0.09 better than the Capital IQ Consensus Estimate of $0.26; revenues rose 1.6% year/year to $1.09 bln vs the $1.08 bln consensus. Display revenue ex-TAC was $452 million, flat compared to the third quarter of 2011. GAAP display revenue was $506 million, a 1 percent increase compared to $502 million for the third quarter of 2011. Search revenue ex-TAC was $414 million, an 11 percent increase compared to $374 million for the third quarter of 2011. GAAP search revenue was $473 million, a 1 percent increase compared to $467 million for the third quarter of 2011.

4:06PM Volterra Semi beats by $0.02, misses on revs (VLTR) : Reports Q3 (Sep) earnings of $0.33 per share, excluding non-recurring items, $0.02 better than the Capital IQ Consensus Estimate of $0.31; revenues rose 1.9% year/year to $42.1 mln vs the $44.1 mln consensus.

4:03PM Veeco Instruments beats by $0.03, misses on revs; guides Q4 EPS below consensus, revs below consensus (VECO) 28.88 -0.61 : Reports Q3 (Sep) earnings of $0.34 per share, excluding non-recurring items, $0.03 better than the Capital IQ Consensus Estimate of $0.31; revenues fell 52.6% year/year to $126.9 mln vs the $130.53 mln consensus. Co issues downside guidance for Q4, sees EPS of $0.04-0.16, excluding non-recurring items, vs. $0.34 Capital IQ Consensus Estimate; sees Q4 revs of $100-115 vs. $132.64 mln Capital IQ Consensus Estimate. (Stock is halted)

Synopsys (SNPS) announced that its IC Validator physical verification product has been qualified by United Microelectronics (UMC) for 28-nm physical signoff, with immediate availability of design rule checking and layout-vs.-schematic runsets to UMC customers.

Cymer (CYMI) announced that, given its pending merger with ASML Holding N.V.(ASML) it has canceled the conference call for 3Q12 previously scheduled for Tues, Oct 23, 2012.

Audi and STMicroelectronics (STM) have announced a strategic relationship to drive the pace of automotive innovation by creating advanced semiconductor solutions.

Atmel (ATML) is shipping the maXTouch S Series touchscreen controllers designed for Ultrabook and notebook markets.

Lattice Semiconductor (LSCC) announced the immediate availability of the Control Development Kit for its MachXO2 family of ultra-low density FPGAs, enabling low cost prototyping of complex system control and video interface designs.

icon url

ReturntoSender

10/23/12 6:28 PM

#9960 RE: ReturntoSender #6755

From Briefing.com: 4:20 pm : Equities began the session with an opening sell-off as disappointing earnings combined with Moody's downgrade of five Spanish regions fueled the bearish sentiment. Stocks reached session lows during the first hour before attempting to rebound. The tech-heavy Nasdaq showed intraday resilience, but the attempt to reclaim its early losses was cut short when late-day selling sent the index back near the middle of its range. As a result the Nasdaq ended lower by 0.9% while S&P 500 lost 1.4%.

Stocks in the materials space saw the biggest weakness. Among steel producers, AK Steel (AKS 5.19, -0.32) fell 5.8% despite beating on earnings and reporting revenues in-line with Capital IQ consensus. However, based on current conditions, the company expects to incur a net loss during the fourth quarter. This includes an anticipated non-cash tax expense resulting from an expected change in the company's tax valuation allowance. Other steel producers also traded lower. ArcelorMittal (MT 15.64, -0.92) slid 5.6%, while Cliffs Natural Resources (CLF 43.55, -1.44), Nucor (NUE 40.37, -0.75), and United States Steel (X 21.90, -1.01) all lost between 1.8% and 4.4%.

Chemical producer DuPont (DD 45.25, -4.51) plunged 9.1% after missing earnings and revenue expectations. In addition, the company lowered its full-year 2012 earnings guidance, and announced restructuring plans which aim to cut about 1,500 positions globally. The weak results weighed on other chemical producers. Dow Chemical (DOW 28.55, -1.19) settled lower by 4.0%, while Monsanto (MON 86.93, -1.94) and Mosaic (MOS 53.07, -1.16) both lost near 2.2%.

The technology sector outperformed the broader market. The group's biggest component, Apple (AAPL 613.35, -20.67) dipped 3.3% after unveiling a smaller version of the iPad tablet with a $329 price tag. The company also announced a fourth generation iPad and a new desktop computer.

Looking at technology earnings, Western Digital (WDC 34.43, -0.85) slipped 2.4% despite beating on earnings and revenues. The management remained upbeat about future prospects and said, "While the macroeconomic environment is dampening near term demand, we remain confident in the continued long-term growth in the creation, storage and management of digital content." Peer Seagate (STX 27.80, -0.51) shed 1.8% in sympathy.

Texas Instruments (TXN 27.84, +0.05) tacked on 0.2% after reporting third quarter earnings of $0.52 on revenue of $3.39 billion. While the quarterly results beat expectations, it should be noted that the company issued downside fourth quarter earnings and revenue guidance. The management commented on the outlook by saying "TI revenue grew sequentially and operations were well executed even though the economy and semiconductor market remained weak and likely will get weaker in the fourth quarter."

Xerox (XRX 6.67, -0.36) ended lower by 5.1% after announcing mixed earnings. The business equipment provider reported earnings of $0.25, which was in-line with Capital IQ consensus estimates. However, the revenue of $5.42 billion was short of the $5.5 billion forecast by the Capital IQ consensus. The management commented on the future outlook by saying, "We remain cautious, and we are focused on reducing costs to absorb the impact and improve margins while investing in key areas of growth and delivering strong cash flow."

Elsewhere, Yahoo! (YHOO 16.67, +0.90) advanced 5.7% after its third quarter earnings of $0.35 exceeded Capital IQ consensus estimates by $0.09. The revenues, meanwhile, were reported in-line with Capital IQ analyst expectations. Following the earnings release, Susquehanna upgraded the stock to ‘positive' from ‘neutral.' Note that today's buying has lifted the stock to levels not seen since October of last year.

The Dow Jones Transportation Average outperformed the remaining industrials, and added 0.9%. The strength within the bellwether complex was a result of positive reaction to earnings from a handful of names. Ryder System (R 45.82, +2.39) rose by 5.5% after announcing mixed earnings. The truck lessor reported earnings of $1.28 which was $0.10 better than the Capital IQ consensus estimate. However, the company's revenue of $1.57 billion was below the $1.62 billion Capital IQ forecast. Peer CH Robinson (CHRW 60.98, +1.13) added 1.9%.

United Parcel Service (UPS 73.73, +2.17) advanced 3.0% after reporting mixed earnings. The economic bellwether announced third quarter earnings of $1.06, which was in-line with the Capital IQ consensus. Meanwhile, the company's revenue of $13.07 billion fell short of the $13.31 billion expected by the Capital IQ consensus. In addition, the company issued in-line guidance. Peers FedEx (FDX 91.79, +0.31) and Expeditors International (EXPD 36.28, +0.95) registered gains of 0.3% and 2.7%, respectively.

Luxury retailer Coach (COH 58.15, +3.98) surged 7.4% after beating on earnings, and reporting in-line revenues. The company also announced the repurchase of up to $1.5 billion of its outstanding common stock by June 30, 2015. When commenting on the future outlook, the management said, "We are well positioned for the holiday season and remain confident in our ability to deliver double-digit growth during our planning horizon."

Tomorrow, the weekly MBA Mortgage Index will be reported at 7:00 ET. In addition, September new home sales and the August FHFA Housing Price Index will be released at 10:00 ET. Lastly, the Federal Reserve will release a policy statement at 14:15 ET.

The U.S. Treasury will auction off $35 billion in 5-yr notes.DJ30 -243.31 NASDAQ -26.50 SP500 -20.71 NASDAQ Adv/Vol/Dec 884/1.76 bln/1593 NYSE Adv/Vol/Dec 806/670.9 mln/2236

3:30 pm : Crude oil and precious metals fell deeper into negative territory as a stronger dollar and weakness in the broader market put pressure on prices. The energy component slid off its session high of $87.13 per barrel and brushed a session low of $85.69 per barrel. It eventually settled at $86.67 per barrel for a loss of 2.3%.

Both gold and silver traded in the red in a consolidative pattern. Gold dipped as low as $1705.10 per ounce and eventually settled with a 1.0% loss at $1709.40 per ounce. Silver brushed a session low of $31.74 per ounce and closed at $31.78 per ounce, or 1.5% lower.

On the other hand, natural gas came off its session low of $3.45 per MMBtu and trended higher for most of its floor session. It peaked at $3.56 per MMBTu and settled at $3.53 per MMBtu for a 2.3% gain.DJ30 -226.60 NASDAQ -22.07 SP500 -18.78 NASDAQ Adv/Vol/Dec 886/1492.2 mln/1574 NYSE Adv/Vol/Dec 755/462 mln/2250

5:20PM Dow Chemical announces restructuring program designed to accelerate cost reduction actions; to eliminate ~2400 positions and shut down 20 manufacturing facilities (DOW) 28.55 -1.19 : Co announced a restructuring program designed to accelerate cost reduction actions and advance the next stage of the Company's transformation in the midst of persistently slow macroeconomic growth. These actions will result in a net reduction of approximately 2,400 positions, or five percent of the global workforce. The restructuring also includes the shutdown of approximately 20 manufacturing facilities. Once fully implemented, these actions are expected to result in approximately $500 million of annual operating cost savings by the end of 2014. The Company will take charges totaling approximately $0.50 - $0.60 per share in the fourth quarter of 2012 for asset impairments and write-offs, severance and other costs related to these measures. In addition, Dow will further reduce capital spending and investments for targeted growth programs that are no longer a priority in this environment. These measures are expected to deliver an additional $500 million cash impact. Taken together with the $1.5 billion of measures Dow has already initiated, this will bring the Company's stated cumulative intervention goal to $2.5 billion.

4:49PM Super Micro Computer misses by $0.04, reports revs in-line; guides Q2 EPS below consensus, revs in-line (SMCI) 9.11 -0.13 : Reports Q1 (Sep) earnings of $0.07 per share, excluding non-recurring items, $0.04 worse than the Capital IQ Consensus Estimate of $0.11; revenues rose 9.2% year/year to $270.7 mln vs the $270.03 mln consensus. Gross margin of 12.9%, down from 15.4% in the fourth quarter of fiscal year 2012 and down from 16.0% in the same quarter of last year. Server solutions accounted for 39.5% of net sales compared with 44.6% in the fourth quarter of fiscal year 2012 and 39.4% in the same quarter of last year.

Co issues mixed guidance for Q2, sees EPS of $0.12-0.16 vs. $0.18 Capital IQ Consensus Estimate; sees Q2 revs of $270-295 mln vs. $283.43 mln Capital IQ Consensus Estimate.

4:32PM Celestica beats by $0.06, misses on revs; guides Q4 EPS in-line, revs below consensus (CLS) 7.01 -0.14 : Reports Q3 (Sep) earnings of $0.26 per share, excluding non-recurring items, $0.06 better than the Capital IQ Consensus Estimate of $0.20; revenues fell 13.9% year/year to $1.58 bln vs the $1.65 bln consensus. Co issues in-line EPS guidance for Q4, sees EPS of $0.15-0.21, excluding non-recurring items, vs. $0.20 Capital IQ Consensus Estimate; sees Q4 revs of $1.43-1.53 bln vs. $1.59 bln Capital IQ Consensus Estimate.

4:17PM RF Micro Device beats by $0.05, beats on revs; guides Q3 EPS above consensus, revs above consensus (RFMD) 3.93 +0.13 : Reports Q2 (Sep) earnings of $0.06 per share, excluding non-recurring items, $0.05 better than the Capital IQ Consensus Estimate of $0.01; revenues fell 14.0% year/year to $209.7 mln vs the $197.79 mln consensus. Co issues upside guidance for Q3, sees EPS of $0.06 vs. $0.03 Capital IQ Consensus Estimate; sees Q3 revs of $245 mln vs. $217.54 mln Capital IQ Consensus Estimate.

4:14PM Broadcom beats by $0.02, beats on revs; guides Q4 revs below consensus (BRCM) 33.36 -0.06 : Reports Q3 (Sep) earnings of $0.79 per share, excluding non-recurring items, $0.02 better than the Capital IQ Consensus Estimate of $0.77; revenues rose 8.7% year/year to $2.13 bln vs the $2.09 bln consensus. Co issues downside guidance for Q4, sees Q4 revs of ~$1.95-2.10 bln vs. $2.12 bln Capital IQ Consensus Estimate. Co sees product gross margin for Q4 flat to slightly up from 3Q12

2:11PM Apple confirms introduction of iPad mini; announcement of fourth generation iPad (AAPL) 624.10 -9.93 : Co confirmed in a press release the introduction of the iPad mini, a new iPad design that is 23 percent thinner and 53 percent lighter than the third generation iPad. Co also announced the fourth generation iPad featuring a 9.7-inch Retina display, new Apple-designed A6X chip, FaceTime HD camera and ultrafast wireless performance. Both iPad mini and fourth generation iPad come with iOS 6. iPad mini with Wi-Fi models will be available in black & slate or white & silver on Friday, November 2, for a suggested retail price of $329 (US) for the 16GB model, $429 (US) for the 32GB model and $529 (US) for the 64GB model. The fourth generation iPad with Wi-Fi models will also be available on Friday, November 2, in black or white for a suggested retail price of $499 (US) for the 16GB model, $599 (US) for the 32GB model and $699 (US) for the 64GB model.

1:54PM Apple confirms new iMac, updated Mac mini (AAPL) 627.02 -7.01 : Co confirmed in a press release the new iMac. The new iMac features third generation quad-core Intel Core i5 processors that can be upgraded to Core i7. The latest NVIDIA GeForce processors deliver up to 60 percent faster performance for advanced gaming and graphics intensive apps. Every new iMac now comes standard with 8GB of 1600 MHz memory and a 1TB hard drive, and customers can choose to configure their iMac with up to 32GB of memory and a new 3TB hard drive, or 768GB of flash storage for ultimate performance. With two Thunderbolt and four USB 3.0 ports, the new iMac delivers even greater expandability and support for high-performance peripherals.

Co also updated the Mac mini with third generation dual-core Intel Core i5 and quad-core Intel Core i7 processors that are up to twice as fast and have integrated graphics that are up to 65 percent faster. Mac mini comes standard with 4GB of 1600 MHz memory with support for up to 16GB. Retaining its amazingly compact aluminum design, the new Mac mini now includes four USB 3.0 ports in addition to its Thunderbolt, HDMI, SDXC, Gigabit Ethernet, and FireWire 800 ports.

1:27PM Apple confirms introduction of 13-inch MacBook Pro with Retina display (AAPL) 630.35 -3.78 : Co confirmed in a press release the introduction of the 13-inch MacBook Pro featuring a Retina display and all flash storage in a new compact design. At 0.75 inches and 3.57 pounds, the portable 13-inch MacBook Pro with Retina display is 20 percent thinner and almost a pound lighter than the current 13-inch MacBook Pro. "The new MacBook Pro packs more than 4 million pixels into its 13-inch Retina display, nearly twice the number of pixels in an HD television." The 13-inch MacBook Pro with Retina display features 2.5 GHz Intel Core i5 processors with the option to choose faster 2.9 GHz Intel Core i7 processors, Intel HD Graphics 4000, 8GB of 1600 MHz memory, and up to 768GB of flash storage. Two Thunderbolt and two USB 3.0 ports allow users to connect to multiple displays and high-performance devices, and a new HDMI port offers quick connectivity to an HDTV. The 13-inch MacBook Pro with Retina display also features a FaceTime HD camera, dual microphones, improved speakers, three-stream 802.11n Wi-Fi, Bluetooth 4.0, and a MagSafe 2 power port. The 13-inch MacBook Pro battery delivers up to 7 hours of wireless productivity and can remain in standby for up to 30 days.

12:25PM Intel: INTC +0.25% now the only DIA component in positive territory here @ midday (INTC) 21.51 +0.05 :

3:35AM ARM Holdings reports EPS in-line, beats on revs; sees Q4 revs 'in-line with current market expectations' (ARMH) 28.12 : Reports Q3 (Sep) earnings of GBP0.04 per share, in-line with the Capital IQ Consensus Estimate consensus of GBP0.04; revenues rose 20.3% year/year to GBP144.6 mln vs the GBP139.26 mln consensus. Group order backlog at the end of Q3 2012 was up 6% sequentially and is now at its highest ever level. Co states: "Prospects for order backlog in Q4 2012 look promising, given the strength of the licensing opportunity pipeline."
Outlook
"ARM enters the final quarter of 2012 with record order backlog and a robust opportunity pipeline. This combination points to another strong quarter for licensing revenue in Q4. ARM's Q4 royalty revenue is generated from third quarter chip shipments. Data from our customers suggests a moderate sequential increase in ARM's royalty revenue in Q4. We therefore expect group dollar revenues for the fourth quarter to be in-line with current market expectations." Current Q4 revs estimate is $241.9 mln

Yahoo (YHOO $16.48 +0.71) reported third quarter earnings of $0.35 per share, $0.09 better than the Capital IQ consensus of $0.26, while revenues rose 1.6% year/year to $1.09 billion versus the $1.08 bln consensus. Display revenue ex-TAC was $452 million, flat compared to the third quarter of 2011. GAAP display revenue was $506 million, a 1 percent increase compared to $502 million for the third quarter of 2011. Search revenue ex-TAC was $414 million, an 11 percent increase compared to $374 million for the third quarter of 2011. GAAP search revenue was $473 million, a 1 percent increase compared to $467 million for the third quarter of 2011. Free cash flow was $920 million for the third quarter of 2012, a 273 percent increase compared to $247 million for the same period of 2011. Excluding a payment of $550 million from Alibaba related to a technology and intellectual property license agreement, free cash flow for the third quarter of 2012 was $370 million. Cash, cash equivalents, and investments in marketable debt securities were $9.4 billion at September 30, 2012 compared to $2.5 billion at December 31, 2011, an increase of $6.9 billion. We estimate that we will pay approximately $2.5 billion in taxes related to the Alibaba share repurchase agreement, the majority of which will be paid in the fourth quarter of 2012.

Western Digital (WDC $32.40 -2.88) reported third quarter earnings of $2.36 per share, excluding non-recurring items, $0.05 better than the Capital IQ consensus of $2.31, while revenues rose 49.8% year/year to $4.04 billion versus the $3.95 bln consensus. Shipments +8% YoY to 62.5 mln. The company generated $936 million in cash from operations during Q1, ending with total cash and cash equivalents of $3.5 billion. During the quarter, the co utilized $218 million to buy back 5.2 million shares of common stock. "While the macroeconomic environment is dampening near term demand, we remain confident in the continued long-term growth in the creation, storage and management of digital content.

Ultra Clean Holdings (UCTT $32.50 -2.78) reported third quarter earnings of $0.06 per share, excluding non-recurring items, $0.01 worse than the Capital IQ consensus of $0.07, while revenues fell 4.2% year/year to $100.9 million versus the $100.8 million consensus. The company issued downside guidance for the fourth quarter with EPS of $0.01-0.05, excluding non-recurring items, versus the $0.06 consensus and revenues of $94-99 million versus the $101.8 million consensus.

Texas Instruments (TXN $27.72 -0.57) reported third quarter earnings of $0.52 per share, ex-$0.15 net in favorable one time items, $0.06 better than the Capital IQ consensus Estimate of $0.46, while revenues fell 2.2% year/year to $3.39 billion versus the $3.34 billion consensus. The company on Sept 11 narrowed EPS guidance ex-a $0.07 charge to $0.45-0.49 from $0.41-0.49; company also narrowed rev guidance to $3.27-3.41 billion from $3.21-3.47 billion, Orders were $3.24 billion, up 6% YoY and down 5% QoQ. The company issued downside guidance for the fourth quarter with EPS of $0.29-0.37 versus the $0.42 consensus and revenues of $2.83-3.07 billion versus the $3.23 billion consensus. "TI revenue grew sequentially and operations were well executed even though the economy and semiconductor market remained weak and likely will get weaker in the fourth quarter."

09:56 am Texas Instruments downgraded to Perform at Oppenheimer: . Oppenheimer downgrades TXN to Perform from Outperform. While they continue to believe in the co's long-term "core" analog/embedded share gain story, TXN's "non-core" wireless business remains a headwind. Tuesday, TXN articulated a shift in wireless strategy, with plans under way to discontinue wireless (OMAP/connectivity) investment for smartphone/tablet. Wireless (~10% of sales) will likely see revs dwindle over the next several years as the business slowly unwinds, much as the baseband exit created material top-line headwinds. As it is the most broadly diversified co in their universe, they expect challenged global GDP will weigh on the core business near term. With upside likely limited, they are stepping to the sidelines.

09:55 am Marvell downgraded to Hold at Canaccord Genuity on storage and mobile headwinds: . Canaccord Genuity downgrades MRVL to Hold from Buy and lowers target price at $9 on shrinking HDD TAM and TD- SCDMA share loss. It's lowering its estimates and sees potential for additional revisions. While MRVL is trading near its 52-week low, firm believes further downside is likely as Street consensus estimates move lower. It believes the dividend provides enough support to preclude a SELL rating.

09:54 am Google tgt raised to $850 at Canaccord Genuity;: . Canaccord Genuity raises their GOOG tgt to $850 from $700 on a higher multiple (18x from 16x) and a rollout to FY13 ests. They believe Google stock can continue its recent momentum on the basis of 1) better CPC trends creating an upward bias to revenue estimates in future periods, 2) continued dissipation of MMI-related apprehension and 3) multiple expansion; Buy.

08:52 am Texas Instruments shares fall 2% despite beat on earnings
Texas Instruments (TXN $27.15 -0.64) reported third quarter earnings of $0.52 per share, ex-$0.15 net in favorable one time items, $0.06 better than the Capital IQ consensus Estimate of $0.46, while revenues fell 2.2% year/year to $3.39 billion versus the $3.34 billion consensus. The company on Sept 11 narrowed EPS guidance ex-a $0.07 charge to $0.45-0.49 from $0.41-0.49; company also narrowed rev guidance to $3.27-3.41 billion from $3.21-3.47 billion, Orders were $3.24 billion, up 6% YoY and down 5% QoQ. The company issued downside guidance for the fourth quarter with EPS of $0.29-0.37 versus the $0.42 consensus and revenues of $2.83-3.07 billion versus the $3.23 billion consensus. "TI revenue grew sequentially and operations were well executed even though the economy and semiconductor market remained weak and likely will get weaker in the fourth quarter."

08:51 am Yahoo shares spike 3% following better than expected earnings

Yahoo (YHOO $16.32 +0.55) reported third quarter earnings of $0.35 per share, $0.09 better than the Capital IQ consensus of $0.26, while revenues rose 1.6% year/year to $1.09 billion versus the $1.08 bln consensus. Display revenue ex-TAC was $452 million, flat compared to the third quarter of 2011. GAAP display revenue was $506 million, a 1 percent increase compared to $502 million for the third quarter of 2011. Search revenue ex-TAC was $414 million, an 11 percent increase compared to $374 million for the third quarter of 2011. GAAP search revenue was $473 million, a 1 percent increase compared to $467 million for the third quarter of 2011.

Free cash flow was $920 million for the third quarter of 2012, a 273 percent increase compared to $247 million for the same period of 2011. Excluding a payment of $550 million from Alibaba related to a technology and intellectual property license agreement, free cash flow for the third quarter of 2012 was $370 million. Cash, cash equivalents, and investments in marketable debt securities were $9.4 billion at September 30, 2012 compared to $2.5 billion at December 31, 2011, an increase of $6.9 billion. We estimate that we will pay approximately $2.5 billion in taxes related to the Alibaba share repurchase agreement, the majority of which will be paid in the fourth quarter of 2012.
icon url

ReturntoSender

10/24/12 8:44 PM

#9961 RE: ReturntoSender #6755

From Briefing.com: 4:15 pm : The major averages got off to a strong start, but the bullish bias faded shortly after the open. Headlines out of Europe provided another risk-off signal as reports suggested that a Spanish aid request is not imminent. After marking their session highs during the first five minutes of trade, the key indices spent most of the session trending lower. However, a rally in the final hour of trading lifted the S&P 500 and Nasdaq into positive territory while the Dow closed with a small loss of 0.2%.

The health care sector was the day's top performer. Within the space, biotech stocks showed strength which was reflected by the iShares Nasdaq Biotechnology ETF (IBB 145.18, +1.54) adding 1.1%. Looking at individual names, Amgen (AMGN 86.35, +1.27) traded at its all-time high before closing higher by 1.5%. Meanwhile, Gilead (GILD 69.17, +1.73) also marked a fresh all-time best as the shares gained 2.5%.

On the downside, ArQule (ARQL 2.18, -2.81) fell 56.3%. The weakness followed the company's announcement regarding the discontinuation of Phase 3 MARQUEE clinical trial in non-small cell lung cancer after determination that study would not meet its primary endpoint. As a result of the announcement, Needham downgraded ArQule from ‘buy' to ‘hold.'

Telecom stocks also outperformed as buyout speculation lifted one name to its best level since July 2011. MetroPCS (PCS 13.57, +2.05) spiked 17.8% after a Bloomberg TV report suggested the company may be nearing a deal with Deutsche Telecom/T-Mobile. Peer, Leap Wireless (LEAP 7.59, +0.59) surged 8.4% while Sprint (S 4.90, -0.28) slipped 5.4%.

The materials sector was the weakest performer as steel and aluminum producers were under pressure. AK Steel (AKS 4.79, -0.09), Cliffs Natural Resources (CLF 38.55, -0.33), and United States Steel (X 18.99, -0.32) all posted losses between 0.8% and 1.8%.

Elsewhere in the sector, Mosaic (MOS 55.76, -2.25) slid 3.9% after missing on both earnings and revenues. The company's earnings per share were reported $0.15 below consensus estimates, while revenues fell $180 million short of estimates. In its defense, the company cited longer annual maintenance shut-downs and challenges posed by hurricanes, noting demand for products outpaced Mosaic's ability to produce and deliver.

Wassau Paper (WPP 8.67, -0.49) slid 5.4% after lowering its full-year guidance due to lower profitability at its facility in Brainerd, Minnesota. Other paper names were mixed as Neenah Paper (NP 27.91, -0.67) shed 2.3% while Louisiana-Pacific (LPX 13.00, +0.32) gained 2.5%.

The Dow Jones Transportation Average edged up as it outperformed the remaining industrials. Airline stocks enjoyed their second consecutive day of gains as Delta Airlines (DAL 9.77, +0.30) and JetBlue Airways (JBLU 4.98, +0.11) rose by 3.2% and 2.4%, respectively.

Meanwhile, shipping stocks led the transportation complex. Overseas Shipholding Group (OSG 7.08, +0.59) jumped 9.1% after its joint venture with Euronav secured a new charter deal. Peer, Matson (MATX 20.50, +0.34) added 1.7% on related strength.

Financial stocks showed some relative outperformance. Citigroup (C 33.26, +0.51) was the top performer among the majors. The financial giant gained 1.6% after Keefe Bruyette upgraded shares of Citigroup from ‘market perform' to ‘outperform.' Elsewhere in the sector, JPMorgan Chase (JPM 40.92, -0.05) shed 0.1% after New York Attorney General, Eric Schneiderman announced he would file a lawsuit against the bank over mortgage-backed securities sold by Bear Stearns.

In tomorrow's economic data, the MBA Mortgage Index will be reported at 7:00 ET. In addition, the ADP Employment Change and ISM Services will be released at 8:15 ET and 10:00 ET, respectively.DJ30 -32.75 NASDAQ +6.51 SP500 +1.26 NASDAQ Adv/Vol/Dec 1258/1.57 bln/1192 NYSE Adv/Vol/Dec 1589/596.3 mln/1406

3:30 pm : Crude oil oscillated between positive and negative territory despite a weaker dollar. It touched a pit session high of $92.78 per barrel in afternoon action, but slid back into negative territory as it headed into the close. The energy component settled 0.6% lower at $91.89 per barrel, or just above its session low of $91.82 per barrel.

Natural gas climbed into the black after trading as low as $3.40 per MMBtu in early morning pit action. It inched higher for most of its session and settled with a 1.4% gain at $3.53 per MMBtu.

Precious metals struggled in negative territory without much help from the weak dollar. Gold fell off its overnight session high of $1786.60 per ounce and tumbled as low as $1772.30 per ounce in morning pit action. It settled the choppy session at $1775.80 per ounce, or 0.4% lower. Silver also tumbled to a session low of $34.42 per ounce after trading as high as $35.12 per ounce in overnight action. It eventually settled with a 0.8% loss at $34.67 per ounce.DJ30 -53.33 NASDAQ -1.12 SP500 -1.91 NASDAQ Adv/Vol/Dec 1161/1336.2 mln/1282 NYSE Adv/Vol/Dec 1410/414 mln/1551

6:36PM Tellabs beats by $0.01, misses on revs; guides Q4 revs below consensus (stock halted) (TLAB) 3.16 -0.06 : Reports Q3 (Sep) earnings of $0.02 per share, excluding non-recurring items, $0.01 better than the Capital IQ Consensus Estimate of $0.01; revenues fell 19.8% year/year to $264.4 mln vs the $276.53 mln consensus. Items excluded: pretax charges of $9.8 million, including $5.4 million in equity-based compensation expense, $3.3 million in restructuring and other charges and $1.1 million in intangible asset amortization.

"Starting in the fourth quarter of 2012 and continuing through the fourth quarter of 2013, Tellabs will restructure the business to lower its cost of goods sold and reduce sales, general and administrative expenses by about $20 million annually. The restructuring will affect about 200 employees. Tellabs expects to take a restructuring charge of about $11 million in the fourth quarter of 2012, consisting principally of severance and related costs."

Co issues downside guidance for Q4, sees Q4 revs of $240-260 mln vs. $289.39 mln Capital IQ Consensus Estimate. Gross margin expected to be 40%, plus or minus a point or two, depending on product mix.

6:11PM Silicon Motion beats by $0.08, beats on revs; guides Q4 revs below consensus (SIMO) 14.65 -0.17 : Reports Q3 (Sep) earnings of $0.54 per share, $0.08 better than the Capital IQ Consensus Estimate of $0.46; revenues rose 22.0% year/year to $77.1 mln vs the $74.49 mln consensus.

Co issues downside guidance for Q4, sees Q4 revs down 3-9% sequentially (~$70.2-74.8 mln) vs. $77.43 mln Capital IQ Consensus Estimate. "Our third quarter sales were stronger than expected principally because of accelerated LTE transceiver orders by Samsung. While originally we were anticipating sequential revenue growth in the fourth quarter, we are now anticipating a slight decrease due to some LTE transceiver sales planned for the fourth quarter having been sold in the third quarter. We are expecting modest growth from our card controllers and similar revenue from our eMMC controllers in the fourth quarter. Based on our fourth quarter revenue guidance, our full year revenue should grow 25 to 27%."

5:35PM Plexus beats by $0.03, misses on revs; guides Q1 EPS below consensus, revs below consensus (PLXS) 28.82 -0.17 : Reports Q4 (Sep) earnings of $0.66 per share, excluding non-recurring items, $0.03 better than the Capital IQ Consensus Estimate of $0.63; revenues rose 10.5% year/year to $594.8 mln vs the $603.93 mln consensus. Items excluded: $0.08 per share of stock-based compensation expense and $0.64 for special, non-cash charge related to the valuation allowance for deferred tax assets.

Co issues downside guidance for Q1, sees EPS of $0.50-0.55 vs. $0.65 Capital IQ Consensus Estimate; sees Q1 revs of $550-580 mln vs. $617.01 mln Capital IQ Consensus Estimate. "Looking further ahead, we anticipate that the macro- economic environment will continue to be challenging, making longer-range growth projections exceptionally difficult. Our optimism about longer-term growth is anchored in our strong new wins performance over the past year; that optimism is tempered by our customers' end-market outlook that appears to have deteriorated meaningfully in the past few weeks. With this difficult macro backdrop, we currently anticipate a challenging start to our fiscal year, while we currently expect a better outlook in the second half. We have already initiated certain actions to adjust our cost structure to our near-term lower revenue outlook. We will continue to evaluate other actions to protect our operating performance should the environment degrade further."

4:57PM Ixia announced earlier a $25 mln common stock repurchase program (XXIA) 15.37 : Co announced that its board of directors has authorized the repurchase of up to $25 million of the company's common stock from time to time during the next twelve months on the open market or in privately negotiated transactions.

4:35PM Intersil beats by $0.02, reports revs in-line; guides Q4 EPS below consensus, revs below consensus (ISIL) 6.57 -0.18 : Reports Q3 (Sep) earnings of $0.10 per share, $0.02 better than the Capital IQ Consensus Estimate of $0.08; revenues fell 19.0% year/year to $151.4 mln vs the $152.44 mln consensus.

Co issues downside guidance for Q4, sees EPS of $0.06 vs. $0.09 Capital IQ Consensus Estimate; sees Q4 revs of $138 mln +/- $3 mln vs. $153.28 mln Capital IQ Consensus Estimate. Gross margin is expected to be flat to slightly down

4:35PM MKS Instruments misses by $0.04, misses on revs; guides Q4 EPS below consensus, revs below consensus (MKSI) 23.78 +0.29 : Reports Q3 (Sep) earnings of $0.16 per share, excluding non-recurring items, $0.04 worse than the Capital IQ Consensus Estimate of $0.20; revenues fell 27.3% year/year to $141.5 mln vs the $150.2 mln consensus. Co issues downside guidance for Q4, sees EPS of $(0.07)-0.06, excluding non-recurring items, vs. $0.18 Capital IQ Consensus Estimate; sees Q4 revs of $115-135 mln vs. $148.1 mln Capital IQ Consensus Estimate.

4:33PM TriQuint Semi beats by $0.02, reports revs in-line; guides Q4 EPS below consensus, revs above consensus (TQNT) 5.01 +0.12 : Reports Q3 (Sep) earnings of $0.02 per share, $0.02 better than the Capital IQ Consensus Estimate of ($0.00); revenues fell 7.0% year/year to $200.8 mln vs the $200.35 mln consensus. Co issues mixed guidance for Q4, sees EPS of $0.01-0.03 vs. $0.05 Capital IQ Consensus Estimate; sees Q4 revs of $220-225 mln vs. $219.79 mln Capital IQ Consensus Estimate. "We are expecting ten to twelve percent revenue growth in the fourth quarter with continued strength in each of our major markets but with pressure on gross margins due to planned inventory reductions."

4:31PM Mattson beats by $0.06, beats on revs (MTSN) 0.76 -0.04 : Reports Q3 (Sep) loss of $0.10 per share, excluding non-recurring items, $0.06 better than the Capital IQ Consensus Estimate of ($0.16); revenues fell 54.6% year/year to $20.4 mln vs the $17.5 mln consensus.

4:29PM Cadence Design beats by $0.03, beats on revs; guides Q4 EPS in-line, revs in-line; raises FY12 guidance (CDNS) 12.71 +0.29 : Reports Q3 (Sep) adj. earnings of $0.21 per share, $0.03 better than the Capital IQ Consensus Estimate of $0.18; revenues rose 16.1% year/year to $339 mln vs the $330.17 mln consensus. Co issues in-line guidance for Q4, sees EPS of $0.18-0.20, excluding non-recurring items, vs. $0.19 Capital IQ Consensus Estimate; sees Q4 revs of $335-345 mln vs. $336.41 mln Capital IQ Consensus Estimate. Co issues upside guidance for FY12, raises EPS to $0.75-0.77, excluding non-recurring items, from $0.70-0.74 vs. $0.73 Capital IQ Consensus Estimate; raises rev to $1.315-1.325 bln from $1.295-1.315 bln vs. $1.31 bln Capital IQ Consensus Estimate.

4:26PM Cohu misses by $0.04, misses on revs (COHU) 9.15 -0.13 : Reports Q3 (Sep) loss of $0.03 per share, excluding non-recurring items, $0.04 worse than the Capital IQ Consensus Estimate of $0.01; revenues fell 19.6% year/year to $57.7 mln vs the $61.17 mln consensus.

4:09PM F5 Networks misses by $0.06, reports revs in-line; guides Q1 EPS below consensus, revs below consensus (FFIV) 93.32 -2.21 : Reports Q4 (Sep) earnings of $1.12 per share, $0.06 worse than the Capital IQ Consensus Estimate of $1.18; revenues rose 15.2% year/year to $362.5 mln vs the $366.09 mln consensus. Co issues downside guidance for Q1, sees EPS of $1.14-1.16, excluding non-recurring items, vs. $1.20 Capital IQ Consensus Estimate; sees Q1 revs of $363-370 mln vs. $373.68 mln Capital IQ Consensus Estimate.

4:06PM Ixia reports EPS in-line, beats on revs (XXIA) 15.40 +0.00 : Reports Q3 (Sep) earnings of $0.20 per share, excluding non-recurring items, in-line with the Capital IQ Consensus Estimate consensus of $0.20; revenues rose 41.8% year/year to $109.6 mln vs the $107.3 mln consensus.

4:05PM LSI Logic reports EPS in-line, misses on revs; guides Q4 EPS, revs below consensus (LSI) 6.29 -0.16 : Reports Q3 (Sep) earnings of $0.17 per share, excluding non-recurring items, in-line with the Capital IQ Consensus Estimate consensus of $0.17; revenues rose 14.1% year/year to $624 mln vs the $637.86 mln consensus. Co issues downside guidance for Q4, sees EPS of $0.11-0.17, excluding non-recurring items, vs. $0.17 Capital IQ Consensus Estimate; sees Q4 revs of $570-610 mln vs. $649.08 mln Capital IQ Consensus Estimate.

Marvell (MRVL) announced that over 200 mln smartphones have been shipped by global OEMs and Operators featuring Marvell's advanced mobile technologies since 2007.

7:37AM AT&T beats by $0.02, reports revs in-line (T) 35.10 : Reports Q3 (Sep) earnings of $0.62 per share, $0.02 better than the Capital IQ Consensus Estimate of $0.60; revenues fell 0.1% year/year to $31.46 bln vs the $31.53 bln consensus.

Wireless, wireline data and managed IT services represented 81 percent of total revenues and grew 6.4 percent versus the same quarter a year ago, led by: 18.3 percent growth in wireless data revenues, up more than $1 billion versus the year-earlier quarter; 38.3 percent growth in U-verse revenues; 11.4 percent growth in strategic business services revenues.

-- Wireless revenues up 6.6 percent; wireless service revenues up 4.5 percent; Co saw strongest postpaid wireless subscriber ARPU (average monthly revenues per subscriber) growth in six quarters, up 2.4 percent to $65.20; phone-only ARPU up almost 3 percent; Strong smartphone sales of 6.1 million; postpaid smartphone customer base now 44.5 million, up 1.4 million from second quarter 2012

-- 4.7 million iPhones activated; record sales quarter for Android and Windows smartphones; Best-ever third-quarter postpaid churn 678,000 net increase in total wireless subscribers, including gains in every customer category; Wireless operating income margin of 26.2 percent; EBITDA service margin of 40.8 percent with strong smartphone sales.

-- Wireline consumer revenue growth accelerates, up 2.0 percent versus the year-earlier period, strongest growth in more than four years; 7.4 million total AT&T U-verse subscribers (TV and high speed Internet) in service; almost 200,000 net gain in U-verse TV subscribers and 613,000 net gain in high speed Internet subscribers; Total wireline broadband data ARPU up almost 10 percent year over year.

-- Third-quarter 2012 cash from operating activities totaled $11.5 billion, a record for the company, and capital expenditures totaled $4.9 billion.

-- Free cash flow totaled $6.5 billion, also a record for the company. The company now expects free cash flow to be $18 billion or higher this year, up from previous guidance of $15 to $16 billion.

-- Capital expenditures for the year are now expected to come in at the low end of the $19 to $20 billion range while still meeting network build targets. In fact, the company's LTE deployment is ahead of schedule, already covering more than 135 million POPs.

7:32AM Silicon Labs beats by $0.09, beats on revs; guides Q4 revs above consensus (SLAB) 36.11 : Reports Q3 (Sep) earnings of $0.61 per share, excluding non-recurring items, $0.09 better than the Capital IQ Consensus Estimate of $0.52; revenues rose 25.5% year/year to $149.46 mln vs the $142.67 mln consensus. Co issues upside guidance for Q4, sees Q4 revs of $145-150 mln vs. $142.33 mln Capital IQ Consensus Estimate.

7:21AM Corning beats by $0.02, reports revs in-line (GLW) 13.41 : Reports Q3 (Sep) earnings of $0.34 per share, $0.02 better than the Capital IQ Consensus Estimate of $0.32; revenues fell 1.8% year/year to $2.04 bln vs the $2.02 bln consensus. Corning anticipates price declines in its wholly owned display business and Samsung Corning Precision for Q4 will be slightly higher than the previous two quarters.

The co has the following Q4 expectations:

In Corning's wholly owned display business and Samsung Corning Precision, total glass volume is expected to be consistent to down low-single digit percentage sequentially, depending on the level of normal seasonal inventory correction expected from panel manufacturers. Corning anticipates price declines for the fourth quarter will be slightly higher than the previous two quarters.
Telecommunications segment sales are anticipated to be consistent with third-quarter performance. Normal seasonal declines are expected to be offset by continued demand for optical fiber and cable products in China.
Specialty Materials segment sales are anticipated to be consistent with the record performance of the third quarter. Gorilla Glass sales are expected to remain strong in the fourth quarter.
Environmental Technologies segment sales are expected to be even to down slightly from the previous quarter.
In the Life Sciences segment, Corning forecasts sales to be down about 5% sequentially, driven by normal seasonality.
Corning's tax rate is anticipated to be ~19% in Q4, and for the year in total.
In order to deliver on its plan to grow earnings, co is likely to implement selected cost reductions in the areas of project spending, capital expenditures, and fixed costs, which may include modest headcount reductions. Once the restructuring plan is determined, co anticipates taking a pretax charge of up to $50 mln in Q4.

7:08AM Motorola Solutions beats by $0.11, reports revs in-line; guides Q4 EPS in-line, revs just above consensus (MSI) 49.77 : Reports Q3 (Sep) adj. earnings of $0.84 per share, $0.11 better than the Capital IQ Consensus Estimate of $0.73; revenues rose 3.3% year/year to $2.15 bln vs the $2.15 bln consensus. Co issues guidance for Q4, sees EPS of $0.98-1.03, excluding non-recurring items, vs. $1.01 Capital IQ Consensus Estimate; sees Q4 revs of +6-7% YoY to ~$2.44-2.46 bln vs. $2.42 bln Capital IQ Consensus Estimate. "We had strong revenue and earnings growth, including record performance in our Government segment (+12% YoY)."

7:07AM ATMI beats by $0.07, reports revs in-line (ATMI) 18.05 : Reports Q3 (Sep) earnings of $0.44 per share, $0.07 better than the Capital IQ Consensus Estimate of $0.37; revenues rose 14.5% year/year to $108.8 mln vs the $108.34 mln consensus.

"Consistent with external data points, we anticipate wafer starts to be down seasonally in the fourth quarter, impacting Microelectronics. However, longer term trends remain favorable as customers increase production at advanced nodes. We are investing in a new manufacturing facility in Korea to work more closely with our Asian customers. LifeSciences is on track for a strong finish to the year after the seasonally soft third quarter, with long-term growth driven by the move to high-volume production using single-use technology. Given the macroeconomic uncertainties, we will continue to closely monitor and control our discretionary cost structures in the near term."

6:56AM EMC misses by $0.02, misses on revs; lowers FY12 EPS and rev guidance (EMC) 24.68 : Reports Q3 (Sep) earnings of $0.40 per share, excluding non-recurring items, $0.02 worse than the Capital IQ Consensus Estimate of $0.42; revenues rose 6.0% year/year to $5.28 bln vs the $5.46 bln consensus. In Q3, revenue from EMC's networked storage platforms portfolio3, which includes EMC's high-end and mid-tier storage platform products, grew 2% year over year. Revenue from EMC's high-end Symmetrix storage product portfolio, which includes the company's VMAX systems family, increased 5% compared with the year-ago quarter. Revenue from the company's portfolio of mid-tier storage products4 was flat year over year. EMC expects to repurchase $700 million of the company's common stock in 2012.

Co issues downside guidance for FY12, lowers EPS to $1.68-1.70, excluding non-recurring items, from $1.70 vs. $1.72 Capital IQ Consensus Estimate; lowers FY12 revs to $21.6-21.75 bln from $22 bln vs. $22.04 bln Capital IQ Consensus Estimate.

Integrated Device Technology (IDTI) announced that its wireless power solutions have been selected by Primax Electronics for its wireless charging accessories.

Facebook (FB $24.62 +5.12) reported third quarter earnings of $0.12 per share, $0.01 better than the Capital IQ consensus of $0.11, while revenues rose 32.3% year/year to $1.26 bln vs the $1.22 bln consensus. Key Metrics: Monthly active users (MAUs) were 1.01 billion as of September 30, 2012, an increase of 26% year-over-year, Daily active users (DAUs) were 584 million on average for September 2012, an increase of 28% year-over-year. Mobile MAUs were 604 million as of September 30, 2012, an increase of 61% year-over-year. Revenue from advertising was $1.09 billion, representing 86% of total revenue and a 36% increase from the same quarter last year. Operating margin -- GAAP operating margin was 30% for the third quarter of 2012, compared to 43% for the third quarter of 2011. Excluding share-based compensation and related payroll tax expenses, non-GAAP operating margin was 42% for the third quarter of 2012, compared to 51% for the third quarter of 2011. Mark Zuckerberg said "People who use our mobile products are more engaged, and we believe we can increase engagement even further as we continue to introduce new products and improve our platform. At the same time, we are deeply integrating monetization into our product teams in order to build a stronger, more valuable company."

Netflix (NFLX $56.31 -11.91) reported third quarter earnings of $0.13 per share, $0.09 better than the Capital IQ consensus of $0.04; revenues rose 10.1% year/year to $905 million versus the the $905.02 million consensus. The company issues in-line guidance for fourth quarter with EPS of $(0.23)-0.04 versus ($0.10) consensus and revenues of $919-943 versus the $943.22 million consensus. Domestic Streaming. Subs Q3 25.10 mln vs Guidance of 24.9-25.7 mln (Net adds 1.16 mln vs Guidance of 1.0-1.8 mln adds) Paid Subs Q3 23.8 mln vs Guidance of 23.5-24.1 mln. Revenue Q3 $556 mln vs Guidance of $552-559

Contribution Profit Q3 $91 mln vs Guidance of $85-95 mln Contribution Margin Q3 16.4% vs Guidance of 16.6% "For Q4, we are targeting 17%, an improvement of 60 basis points quarter over quarter and 600 basis points year over year from 10.9% last Q4." Net additions were at the high end of our guidance range, reflecting stronger than forecasted subscriber growth in each of our international markets.... Latin America: The biggest issue holding back much stronger growth is payments. For a variety of reasons, many Latin American broadband households are leery of, or unable to, provide debit/credit cards that can be accepted over the Internet. It will take longer than we had planned to get to profitability in Latin America, but we are confident that this will be a very large and profitable market for us long term. In Q4, as we launched the Nordics, we expect international contribution losses to increase to approximately $113 million (guidance midpoint) as we will have incremental content and marketing expenses but minimal revenue yet from this market. We intend this (Q4) to be our peak quarter of international losses, and expect international losses will decline quarter by quarter next year. Once we've substantially reduced international losses, and with Netflix then being solidly profitable on a global basis, we will launch our next round of international expansion.

Juniper Networks (JNPR $17.60 +0.03) reported third quarter earnings of $0.22 per share, $0.05 better than the Capital IQ consensus of $0.17, while revenues rose 1.1% year/year to $1.12 billion versus the $1.07 bln consensus. The company issued downside guidance for the fourth quarter with EPS of $0.19-0.22 versus the $0.24 consensus and revenues of 1.10-1.13 billion versus $1.15 billion consensus.

Motorola Solutions (MSI $50.07 +0.27) reported third quarter adjusted earnings of $0.84 per share, $0.11 better than the consensus of $0.73, while revenues rose 3.3% year/year to $2.15 billion versus the $2.15 bln consensus. The company issued guidance for fourth quarter with EPS of $0.98-1.03, excluding non-recurring items, versus the $1.01 consensus and revenues of +6-7% YoY to approximately $2.44-2.46 billion versus $2.42 billion consensus. "We had strong revenue and earnings growth, including record performance in our Government segment (+12% YoY)."

Dice Holdings (DHX $8.04 -0.22) reported third quarter earnings of $0.17 per share, $0.05 better than the Capital IQ consensus of $0.12, while revenues rose 2.6% year/year to $48 million versus the $46.97 mln consensus. The company issued upside guidance for fourth quarter with revenues of approximately $51.4 million versus the $49.38 million consensus. Co issues upside guidance for fiscal year 2012 with revenues of approximately $194 million versus the $190.70 million consensus.

08:54 am NetFlix shares fall 16% following disappointing earnings and metrics
Netflix (NFLX $57.00 -11.22) reported third quarter earnings of $0.13 per share, $0.09 better than the Capital IQ consensus of $0.04; revenues rose 10.1% year/year to $905 million versus the the $905.02 million consensus. The company issues in-line guidance for fourth quarter with EPS of $(0.23)-0.04 versus ($0.10) consensus and revenues of $919-943 versus the $943.22 million consensus. Domestic Streaming. Subs Q3 25.10 mln vs Guidance of 24.9-25.7 mln (Net adds 1.16 mln vs Guidance of 1.0-1.8 mln adds) Paid Subs Q3 23.8 mln vs Guidance of 23.5-24.1 mln. Revenue Q3 $556 mln vs Guidance of $552-559 mln Contribution Profit Q3 $91 million versus.

Guidance of $85-95 mln Contribution Margin Q3 16.4% vs Guidance of 16.6% "For Q4, we are targeting 17%, an improvement of 60 basis points quarter over quarter and 600 basis points year over year from 10.9% last Q4." Net additions were at the high end of our guidance range, reflecting stronger than forecasted subscriber growth in each of our international markets.... Latin America: The biggest issue holding back much stronger growth is payments. For a variety of reasons, many Latin American broadband households are leery of, or unable to, provide debit/credit cards that can be accepted over the Internet. It will take longer than we had planned to get to profitability in Latin America, but we are confident that this will be a very large and profitable market for us long term. In Q4, as we launched the Nordics, we expect international contribution losses to increase to approximately $113 million (guidance midpoint) as we will have incremental content and marketing expenses but minimal revenue yet from this market. We intend this (Q4) to be our peak quarter of international losses, and expect international losses will decline quarter by quarter next year. Once we've substantially reduced international losses, and with Netflix then being solidly profitable on a global basis, we will launch our next round of international expansion.

08:51 am Facebook shares soar 25% as earnings are liked by investors

Facebook (FB $24.28 +4.74) reported third quarter earnings of $0.12 per share, $0.01 better than the Capital IQ consensus of $0.11, while revenues rose 32.3% year/year to $1.26 bln vs the $1.22 bln consensus. Key Metrics: Monthly active users (MAUs) were 1.01 billion as of September 30, 2012, an increase of 26% year-over-year, Daily active users (DAUs) were 584 million on average for September 2012, an increase of 28% year-over-year. Mobile MAUs were 604 million as of September 30, 2012, an increase of 61% year-over-year. Revenue from advertising was $1.09 billion, representing 86% of total revenue and a 36% increase from the same quarter last year.

Operating margin -- GAAP operating margin was 30% for the third quarter of 2012, compared to 43% for the third quarter of 2011. Excluding share-based compensation and related payroll tax expenses, non-GAAP operating margin was 42% for the third quarter of 2012, compared to 51% for the third quarter of 2011. Mark Zuckerberg said "People who use our mobile products are more engaged, and we believe we can increase engagement even further as we continue to introduce new products and improve our platform. At the same time, we are deeply integrating monetization into our product teams in order to build a stronger, more valuable company."
icon url

ReturntoSender

10/26/12 2:51 PM

#9962 RE: ReturntoSender #6755

From Briefing.com Yesterday: 4:20 pm : Equities began the session with a bullish bias which failed to hold past the opening minutes. After opening near session highs, the S&P 500 spent the first hour in a steady decline towards the flat line. Once that level was reached, the index spent the remainder of the day trapped in a narrow range before ending with a slim gain of 0.3%.

Technology stocks lagged the broader market. The biggest tech component, Apple (AAPL 609.53, -7.29) slipped 1.2% as investors awaited the company's third quarter earnings report scheduled for this evening. Meanwhile, Microsoft (MSFT 27.88, -0.02) showed little change after the company unveiled its Windows 8 operating system, and launched the Surface tablet at an event in New York.

Elsewhere, F5 Networks (FFIV 83.00, -10.32) fell 11.1% after reporting mixed quarterly results. The company reported fourth quarter earnings of $1.12, which was $0.06 worse than the Capital IQ consensus forecast. Meanwhile, the revenue of $362.5 million was in-line with expectations. The company provided a cloudy outlook on the next quarter as it expects earnings and revenue to fall below consensus. The disappointing earnings report was met with two analyst downgrades and four price target cuts.

Symantec (SYMC 18.54, +1.16) advanced 6.7% after beating on earnings and revenues. The security software company announced second quarter earnings of $0.45 which was $0.07 better than the Capital IQ consensus forecast. Regarding future outlook, the company issued mixed guidance as it expects in-line revenues and earnings below consensus estimates.

Zynga (ZNGA 2.39, +0.26) spiked 12.3% after beating on the top and the bottom line. The social media gaming site reported third quarter revenue of $316.6 million, which was ahead of the expected $307.53 million. In addition, the company issued downside full-year 2012 guidance and announced plans to repurchase up to $200 million of its outstanding Class A common stock. Following the earnings release, Needham upgraded the stock to ‘buy' from ‘hold' with a $4.00 price target.

The Dow Jones Transportation Average outperformed the broader market and ended higher by 0.6%. United Continental (UAL 19.26, -1.01) was one of the weakest performers among the select transportation stocks. Earlier, the air carrier reported third quarter earnings of $1.35 which was $0.20 worse than the Capital IQ consensus estimate. Meanwhile, the airline's revenue was in-line with expectations. Following the earnings report, United Continental lost 5.0%. Peer Delta Air Lines (DAL 9.64, -0.40) slid 4.0% after announcing plans to withdraw older jets from its fleet. In addition, the company is looking to reduce its costs by about $1 billion.


4:37PM Apple (halted, will resume at 16:50) misses by $0.08, reports revs in-line; guides Q1 EPS, revs below consensus ( AAPL) 609.54 -7.29 : Reports Q4 (Sep) earnings of $8.67 per share, $0.08 worse than the Capital IQ Consensus Estimate of $8.75; revenues rose 27.2% year/year to $35.97 bln vs the $35.78 bln consensus.

26.9 mln iPhones sold in Q4 vs Street est of ~25 mln
14 mln iPads sold in Q4 vs Street est of ~17 mln
4.9 mln Macs sold in Q4 vs Street est of ~5 mln
Co reported Q4 gross margins of 40.0% vs Street est of 40.6% and 38.5% guidance.

Co issues downside guidance for Q1, sees EPS of ~$11.75 vs. $15.53 Capital IQ Consensus Estimate; sees Q1 revs of ~52 bln vs. $54.95 bln Capital IQ Consensus Estimate. CO typically guides conservatively.

4:36PM Ingram Micro beats by $0.02; beats on revs; guides Q4 revs ( IM) 15.30 +0.02 : Reports Q3 (Sep) earnings of $0.40 per share, excluding non-recurring items, $0.02 better than the Capital IQ Consensus Estimate of $0.38; revenues rose 1% year/year to $9.0 bln vs the $8.8 bln consensus. Co currently expects 2012 Q4 sales to be relatively flat with the 2011 Q4, which approximates to $9.95 bln vs $9.8 bln consensus

While remaining under pressure, 2012 Q4 gross margin is expected to increase sequentially over the 2012 Q3 in-line with historic seasonality, although the co will not have the gross margin uplift from higher hard disk drive pricing that benefited the 2011 Q4.

4:31PM Freescale Semi beats by $0.09, beats on revs; guides Q4 revs below consensus ( FSL) 8.88 -0.30 : Reports Q3 (Sep) earnings of $0.04 per share, excluding non-recurring items, $0.09 better than the Capital IQ Consensus Estimate of ($0.05); revenues fell 11.6% year/year to $1.01 bln vs the $977.91 mln consensus. Gross margins to decrease approximately 300 basis points on a sequential basis. Co issues downside guidance for Q4, sees Q4 revs of $920-960 mln vs. $997.21 mln Capital IQ Consensus Estimate.

4:26PM Micros Systems beats by $0.04, reports revs in-line; reaffirms FY13 EPS guidance, revs guidance ( MCRS) 48.13 +0.33 : Reports Q1 (Sep) earnings of $0.57 per share, $0.04 better than the Capital IQ Consensus Estimate of $0.53; revenues rose 16.9% year/year to $299.9 mln vs the $298.94 mln consensus.

4:19PM Micrel beats by $0.01, misses on revs; guides Q4 revs below consensus ( MCRL) 9.65 +0.09 : Reports Q3 (Sep) earnings of $0.10 per share, $0.01 better than the Capital IQ Consensus Estimate of $0.09; revenues fell 2.0% year/year to $62.9 mln vs the $63.79 mln consensus. Gross margin was 52.9% compared to 55.2% in the prior quarter.

Co issues downside guidance for Q4, sees Q4 revs flat to down 6%, sequentially, equating to approx $59.13-$62.9 mln vs. $66.25 mln Capital IQ Consensus Estimate. For Q4, gross profit margin is expected to be in the range of approximately 51.0% to 53.0% based on its anticipated product mix and factory utilization rate. In addition, it expects that fourth quarter 2012 GAAP net income will be approximately $0.04 to $0.07 per diluted share.

4:16PM KLA-Tencor misses by $0.05, misses on revs ( KLAC) 47.14 +0.01 : Reports Q1 (Sep) earnings of $0.84 per share, excluding non-recurring items, $0.05 worse than the Capital IQ Consensus Estimate of $0.89; revenues fell 9.4% year/year to $721 mln vs the $739.97 mln consensus.

4:13PM Applied Micro reports EPS in-line, beats on revs ( AMCC) 4.54 +0.07 : Reports Q2 (Sep) loss of $0.16 per share, excluding non-recurring items, in-line with the Capital IQ Consensus Estimate consensus of ($0.16); revenues fell 28.7% year/year to $46.3 mln vs the $45.3 mln consensus.

4:11PM Maxim Integrated beats by $0.04, reports revs in-line; guides Q2 EPS in-line, revs in-line ( MXIM) 26.49 +0.21 : Reports Q1 (Sep) earnings of $0.47 per share, excluding non-recurring items, $0.04 better than the Capital IQ Consensus Estimate of $0.43; revenues fell 2.0% year/year to $623 mln vs the $620.88 mln consensus. The Company's 90 day backlog at the beginning of the second fiscal quarter of 2013 was $400 million. Co issues in-line guidance for Q2, sees EPS of $0.39-0.43, excluding non-recurring items, vs. $0.43 Capital IQ Consensus Estimate; sees Q2 revs of $595-623 mln vs. $622.26 mln Capital IQ Consensus Estimate.

F5 Networks (FFIV $81.80 -11.72) reported fourth quarter earnings of $1.12 per share, $0.06 worse than the Capital IQ consensus of $1.18, while revenues rose 15.2% year/year to $362.5 million versus the $366.09 mln consensus. The company issued downside guidance for the first quarter with EPS of $1.14-1.16, excluding non-recurring items, versus the $1.20 consensus and sees first quarter revs of $363-370 million versus $373.68 million consensus.
icon url

ReturntoSender

10/27/12 5:20 PM

#9963 RE: ReturntoSender #6755

From Briefing.com: Weekly Recap - Week ending 26-Oct-12

Dow +3.53 at 13107.26, Nasdaq +1.83 at 2987.95, S&P -1.03 at 1411.93

Equities showed indecision in the early going after Apple (AAPL 604.00, -5.54) and Amazon (AMZN 238.24, +15.32) delivered disappointing results, while the first reading of the third quarter GDP was reported ahead of expectations. The S&P 500 followed the early choppiness with a late-morning slide into the red. After reaching session lows near 1,403, the index reversed and headed for fresh highs. However, the benchmark average could not hold its best level of the day and settled lower by 0.1%.

The advance GDP reading for the third quarter suggested the economy grew at a 2.0% rate in the second quarter when an increase of 1.9% had been expected among economists polled by Briefing.com. The slight beat comes as government spending contributed 0.7% to the number. The third quarter chain deflator reportedly increased by 2.8%, which was ahead of the 2.0% increase that had been broadly anticipated.

Technology stocks were in the spotlight as the market reacted to earnings from major sector components. Apple shed 0.9% after reporting mixed results. During the fourth quarter, the tech giant earned $8.67 which was $0.08 worse than the Capital IQ consensus estimate. Meanwhile, the company's revenue of $35.97 billion was in-line with expectations. The gross margin guidance, however, was a point of concern as the company expects the number to be near 36.0% in the first quarter, versus the 40.0% expected by analysts. Also note that the company lowered its earnings and revenue guidance below consensus.

Amazon gained 6.9% after reporting its earnings. The online retailer lost $0.23 per share. However, the number may not be comparable to the Capital IQ consensus estimate which forecast a loss of $0.10. The company's revenue of $13.81 billion was largely in-line with expectations, but management issued downside fourth quarter guidance.

Comcast (CMCSA 37.56, +1.20) advanced 3.3% after beating on earnings and revenues. The management commented on the reporting period by saying, "The third quarter continues our momentum. Cable's results show real strength in every part of the business, producing sustainable and profitable growth while we expand our product offerings, deliver more innovation and continue to transform the customer experience."

NetSuite (N 65.40, +8.49) surged 14.9% after the maker of ERP software reported earnings of $0.08 on $79.8 million in revenue. Both numbers came in ahead of the Capital IQ consensus estimates.

Coal stocks were broadly higher after Arch Coal (ACI 8.09, +0.78) and Cloud Peak Energy (CLD 21.20, +2.21) beat on earnings and revenues. During the third quarter, Arch Coal earned $0.20, which was $0.35 ahead of the Capital IQ consensus estimate. In addition, the company's revenue of $1.09 billion was also ahead of expectations. ACI settled higher by 10.7% in reaction to earnings.

Meanwhile, Cloud Peak Energy reported earnings of $0.80, which was $0.32 ahead of the Capital IQ consensus estimate. The company's revenue of $425.9 million was well ahead of the $393.57 million expected by the Capital IQ consensus. Cloud Peak stock surged 11.6%.

Arch Coal and Cloud Peak posted notable gains, and other coal stocks moved higher as well. Alpha Natural Resources (ANR 8.71, +0.28) and James River Coal (JRCC 5.09, +0.29) saw respective gains of 3.3% and 6.0%.

The Dow Jones Transportation Average outperformed the broader market, and added 0.3%. Expeditors International of Washington (EXPD 36.43, +0.65) was the top performer among transportation stocks. The delivery service provider advanced 1.8% after Goldman upgraded the stock to ‘conviction buy' from ‘sell' with a $42 price target.

Railroads also outperformed. Kansas City Southern (KSU 81.25, +1.22) rose by 1.5%, while Norfolk Southern (NSC 62.77, +0.20) and Union Pacific (UNP 123.61, +1.97) gained 0.3% and 1.6%, respectively.

Meanwhile, Overseas Shipholding Group (OSG 1.23, -0.09) was the biggest laggard. The oil tanker shipper dipped 6.8% to continue its recent weakness.

Homebuilder stocks saw general weakness and the SPDR S&P Homebuilders ETF (XHB 25.52, -0.10) settled lower by 0.4%. Among individual builders, Standard Pacific (SPF 6.90, -0.85) slid 11.0% after announcing disappointing quarterly results. During the third quarter, Standard Pacific earned $0.05, which was $0.03 worse than the Capital IQ consensus estimates. The company's revenue of $318.5 million also fell short of the $385.02 million expected by analysts. Peers DR Horton (DHI 20.76, -0.35), Lennar (LEN 37.02, -0.49), and Ryland Group (RYL 33.76, -0.30) all lost between 0.9% and 1.7% in sympathy.

The University of Michigan's final Consumer Sentiment Survey for October rose to 82.6 from the 83.1 that was posted in the preliminary Survey. Many had expected the reading to go unrevised.

Weekly Recap: Stocks Stumble Amid Disappointing Earnings

On Monday, stocks got off to a quiet start as mixed quarterly reports continued to pour in. Indecision was apparent in the early going as the major averages traded near their respective unchanged levels. As the day progressed, the S&P 500 and Dow headed lower. However, the final hour brought out bargain-hunters who lifted the major averages near their respective session highs. As a result, the S&P 500 ended unchanged. Meanwhile, the Nasdaq outperformed and settled higher by 0.4%. Caterpillar (CAT 84.25, +0.72) advanced 1.5% after reporting mixed earnings.

Tuesday's session started with an opening sell-off as disappointing earnings combined with Moody's downgrade of five Spanish regions fueled the bearish sentiment. Stocks reached session lows during the first hour before attempting to rebound. The tech-heavy Nasdaq showed intraday resilience, but the attempt to reclaim its early losses was cut short when late-day selling sent the index back near the middle of its range. As a result the Nasdaq ended lower by 0.9% while S&P 500 lost 1.4%. Stocks in the materials space saw the biggest weakness. Among steel producers, AK Steel (AKS 5.19, -0.02) fell 5.8% despite beating on earnings and reporting revenues in-line with the Capital IQ consensus.

On Wednesday, stocks began the session on an upbeat note, but the bullish sentiment was dispelled in the opening minutes. The S&P 500 and Nasdaq marked their respective highs minutes into the trading day, before sliding back towards the unchanged level. The Dow, however, held its gains a bit longer before recoupling with the other two indices. This afternoon's statement from the Federal Open Market Committee was met with mostly muted reaction, and the S&P 500 finished lower by 0.3%. Buffalo Wild Wings (BWLD 75.87, +1.05) fell 10.5% after missing on both earnings and revenues.

Thursday's session began with a bullish bias which failed to hold past the opening minutes. After opening near session highs, the S&P 500 spent the first hour in a steady decline towards the flat line. Once that level was reached, the index spent the remainder of the day trapped in a narrow range before ending with a slim gain of 0.3%. Casino stocks saw broad strength after Wynn Resorts (WYNN 118.97, -1.46) delivered strong third quarter results and surged 7.3%.
 
Index Started Week Ended Week Change % Change YTD %
DJIA 13343.51 13107.21 -236.30 -1.8 7.3
Nasdaq 3005.62 2987.95 -17.67 -0.6 14.7
S&P 500 1433.19 1411.94 -21.25 -1.5 12.3
Russell 2000 821.00 813.25 -7.75 -0.9 9.8

3:04PM Apple puts together strong recovery off 40 wk average (AAPL) 608.97 -0.57 : Noted in the 12:34 update (chart included) that AAPL was testing support near its 40 wk/200 day averages which had provided important support on several occasions since the 2009 bear market low. The 40 wk average came in at 591 today (session low 591) with it running as high as 610 (last week's low/congest) this afternoon. Initial resistance above the session high (614) is in the 619/620 zone. If some corrective trade develops there is support at 603/602 and 600.

9:26AM Corning announced that it has commenced a cash tender offer for up to $75 million aggregate principal amount of specified series of its outstanding debt (GLW) 12.08 : Tendered debentures will be accepted in the order of the Acceptance Priority Levels set forth in the table above, up to an aggregate principal amount of $75 mln. Under certain circumstances, the Company will accept tendered debentures of one or more of the series on a pro rata basis as further described in the Offer to Purchase.

STMicroelectronics (STM) has collaborated with Microsoft (MSFT) to develop a motion and orientation Human Interface Device sensor solution for the Windows 8 operating system. ST's MEMS sensors and the sensor-hub solution are now ready to ship in high volumes with the release of Windows 8.

9:03AM Cymer beats by $0.24, misses on revs (CYMI) 79.17 : Reports Q3 (Sep) earnings of $0.31 per share, $0.24 better than the Capital IQ Consensus Estimate of $0.07; revenues rose 2.2% year/year to $131.5 mln vs the $148.67 mln consensus. In the third quarter of 2012, the company shipped 27 DUV light sources, of which 17 were ArF immersion and 10 were KrF, and the company installed 24 DUV light sources at chipmaker locations. "Third quarter profitability exceeded our expectations driven by higher gross margin and lower than forecasted operating expenses. Revenue was below our July guidance as deep ultraviolet light source demand softened throughout the quarter. Additionally, customer acceptance of a Display Products Group Gen 4 tool did not occur in the quarter."

8:40AM Chipmos Technology prices underwritten secondary public offering of 2.5 mln of its common shares at $10.10 per share (IMOS) 11.82 : 1.7 mln common shares are being offered by co shareholder ThaiLin Semiconductor, a subsidiary of ChipMOS, and 800K common shares are being offered by co shareholder Siliconware Precision Industries.

7:53AM Arch Coal beats by $0.35, beats on revs (ACI) 7.31 : Reports Q3 (Sep) earnings of $0.20 per share, excluding non-recurring items, $0.35 better than the Capital IQ Consensus Estimate of ($0.15); revenues fell 9.2% year/year to $1.09 bln vs the $1.02 bln consensus.

Arch shipped 37.5 mln tons of coal in Q3 of 2012, a decrease of 6% when compared with Q3 of 2011 but an increase of 19% versus the second quarter of 2012. Looking ahead, we believe global coal markets are in the process of correcting -- with the domestic thermal market building some momentum while metallurgical markets are bottoming out. Because we expect global coal market conditions to remain challenging in 2013, Arch is executing a strategy to successfully navigate this weak market. Our plan is focused on improving operational efficiency, optimizing our asset base and preserving liquidity so we are well positioned to capitalize as the market recovers."

"Strong cost control in the third quarter led to higher cash margins in Arch's western operating regions. In Appalachia, the effect of lower thermal volumes drove third quarter cash costs higher versus the second quarter. In addition, we shipped 2.1 mln tons of metallurgical coal from Appalachia in the third quarter -- 11 percent more than in the second quarter -- and we expect to ship 7.5 mln tons of coal into metallurgical markets during 2012."

7:38AM Multi-Fineline sees Q4 rev towards upper end of guidance; sees EPS below consensus; guides for Q1 rev above consensus with significant QoQ margin rebound (MFLX) 21.40 : Co issues mixed guidance for Q4 (Sep), sees EPS of ~breakeven vs. $0.24 Capital IQ Consensus Estimate; sees Q4 (Sep) revs of ~$200 mln vs. $192.63 mln Capital IQ Consensus Estimate and $180-210 mln prior guidance. Gross margin during the fourth quarter of fiscal 2012 is expected to be ~5.7 percent, below the cp's guidance range, compared to 10.0% for the same period in the prior year.

Co issues upside guidance for Q1 (Dec), sees Q1 (Dec) revs of $260-280 mln vs. $256.70 mln Capital IQ Consensus Estimate, with gross margin to range between 10.0 to 12.0% based on the projected sales volume and anticipated product mix. "Our anticipated fourth quarter revenue results are in line with our expectations reflecting continued solid demand for our flex assemblies for multiple new programs. However, we experienced much lower yields than anticipated due to the complexity of one new program. We also faced tight ramp schedules across the new programs and saw reduced labor efficiency as we continued to expand our headcount to support anticipated future production levels. These factors negatively impacted our gross margin during the quarter. Since quarter-end, yields on this program have recovered, the balance of our new program ramps are proceeding as planned and our labor utilization has improved. We now expect a significant gross margin rebound in 1Q13. In addition, we completed our capacity expansion project in September which positions us to drive record revenues during the first quarter of fiscal 2013, and support the strong demand forecasts we are seeing from our existing and newer customers for the balance of fiscal 2013."

TriQuint Semiconductor (TQNT) is rolling out new processes to more quickly expand its catalog of broad-market products for commercial and defense customers.

Apple (AAPL $611.56 +2.12) reported fourth quarter earnings of $8.67 per share, $0.08 worse than the Capital IQ consensus of $8.75, while revenues rose 27.2% year/year to $35.97 billion versus the $35.78 billion consensus. Key Metrics: 26.9 million iPhones sold in Q4 versus Street estimate of approximately 25 million. 14 million iPads sold in Q4 versus Street estimate of approximately 17 million. 4.9 million Macs sold in Q4 versus Street estimate of approximately 5 million. The company reported Q4 gross margins of 40.0% versus Street estimate of 40.6% and 38.5% guidance. The company issues downside guidance for Q1, sees EPS of approximately $11.75 versus the $15.53 Capital IQ consensus and sees revenues of approximately $52 billion versus the $54.95 bln Capital IQ consensus. THe company typically guides conservatively.

Amazon (AMZN $228.53 +5.61) reported third quarter loss of $0.23 per share, excluding a $0.37 loss due to LivingSocial, which may not compare to the Capital IQ consensus of ($0.10), while revenues rose 26.9% year/year to $13.81 billion versus the $13.91 billion consensus. Company's Q3 operating income ($28) million versus ($350)-($50) million guidance and the ($44) million consensus. The company issued downside guidance for fourth quarter revenues of $20.25-22.75 billion versus $22.85 billion consensus. Amazon (AMZN) sees Q4 operating income of a loss of $490 million to positive $310 million versus the consensus of $368 million.

10:45 am Information Technology Index trading lower today and ahead of the broader market

The tech sector is trading just higher today, ahead of moderate losses in the broader market. Semiconductors are showing relative strength with the SOX trading 0.5% higher. Within the chip index, IDCC (+6.9%) is a notable standout. Among other major indices, the SPY is trading 0.2% lower today, while the QQQ is up 0.2% and the NASDAQ is trading 0.1% lower on the session. Among tech bellwethers, QCOM (+1.9%) is leading the pack, while FB (-1.8%) is once again showing notable weakness. There was another flurry of tech earnings last night, and none were bigger than AAPL (-0.3%), which posted a relatively inline quarter and offered downside guidance. AMZN (+3.2%) was the other big name to report; it reported a slight miss.

Elsewhere, N (+13.4%) posted a beat, IM (+0.7%), CTCT (-24.0%), and FSL (+1.6%) posted beats and lower guides, MXIM (+5.6%) and SYNA (+11.5%) reported beats and guided inline, and KLAC (-0.3%) and CA (-7.8%) reported a miss and issued downside guidance. This morning, ERIC (-5.0%) posted a Q3 revenue shortfall. Among rumors, there was a report out late yesterday that AAPL (-0.3%) was prepping to enter the streaming radio mkt, which would impact P (-2.3%). In notable analyst upgrades this morning in the tech space, SAP (+0.4%) was upgraded to Buy at BofA/Merrill and N (+13.4%) was upgraded to Outperform at Northland. Among downgrades, CTCT (-24.0%) was downgraded at Needham, Lazard and Credit Suisse, FSL (+1.8%) was downgraded to Neutral at Piper, PLXS (-2.1%) was downgraded to Hold at Deutsche Bank, and Feltl & Co. downgraded SYNA (+11.6%) to Sell.
icon url

ReturntoSender

10/28/12 8:46 PM

#9964 RE: ReturntoSender #6755

InvestmentHouse Weekend Market Summary

http://www.investmenthouse.com/weekendmarketsummary.htm

- Stocks wade through a week of less than solid earnings and come out . . still wading.
- Another test of support, another hold. NASDAQ, SP600 still look ready. SP500, DJ30 still look indecisive.
- "Kind of odd" Q3 GDP report hits 2% 3 years and 4 months after the recovery started.
- Dormant federal government spending erupts, adding to GDP (0.7%) for the first time since Q2 2010.
- Japanese 'stimulus' limps in at a measly $9.4B.
- Even more layoffs announced. UBS to lay off one-sixth of workforce, Bloomberg selling a small fraction of terminals. Even with free money the financial sector is not prospering.
- US debt to GDP tops 100% in September.
- Next week crammed full of data, more earnings, jobs, and Halloween.
- Some nice pictures in the market. Let's see if they convert to nice moves, and of course, money in our pockets.

A test, a recovery, status quo heading into the weekend.

It could have been an ugly session. AAPL and AMZN missed. Japan's promised stimulus turned out to be nothing more than a squirt gun trying to put out a high-rise fire; $9.4B? Really? Q3 GDP rose 2%, but it was juiced 0.7% by the sudden appearance of government spending. Take that out and you are back at 1.3%. Thus far, 2012 GDP is trending less than 2011. The US debt to GDP ratio hit 102.4% as of Q3. Not great news.

But despite the recent market weakness and the less than palatable news, the market was not tanking. AMZN and AAPL were apparently forgiven their sins. I suppose if any stocks will be forgiven it would be them.

Futures were down but at 7:00ET started a recovery that took them back close to fair value. As AMZN and AAPL recovered, futures recovered. Of course in this market the open is hardly the end of the story. It has shown a penchant the past several weeks to find a way to losses after starting with gains. Such is the MO of a weak market.

And on Friday after an early bounce off of the open took stocks positive . . they lost the move yet again. By lunch they were negative with NASDAQ below the 200 day SMA, SP600 at the 200 day SMA and SP500 and the Dow even closer to the 1400 and 13,000 levels, respectively, that many are closely watching as support.

Of course that was not the end result. Stocks bounced, NASDAQ recovered the 200 day SMA and the indices closed mixed on the session but basically at the flat line.

SP500 -1.03, -0.07%
NASDAQ 1.83, 0.06%
DJ30 3.53, 0.03%
SP600 -0.43%
SOX 0.49%

In the end there was basically status quo. Another day of testing support by all indices. NASDAQ and SP600 still look very nice for a bounce; they just are having a hard time making it happen. Perhaps it is SP500 and DJ30 holding them back. While holding just over the support many are eyeing, they don't have the same look to their patterns. Either SP500 and DJ30 are holding NASDAQ et al down, or NASDAQ et al just have a failure to launch.

About all you can say is that the indices worked once more at holding support and in so doing they overcame more dissatisfying data and left themselves in position to rebound. Thus far the catalyst to launch a rebound is elusive, but in surviving (at least in terms of holding support in a rather 'normal' test) at support the indices show a bit of backbone with the ability to absorb bad news and not totally collapse.

OTHER MARKETS

Dollar. 1.2937 versus 1.2946 euro. The dollar continued to show resilience, closing the week higher though still stymied just below the 50 day EMA and an overall bearish pattern.

Bonds. 1.76% versus 1.83% versus 1.77% 10 year US Treasury. Goodness gracious the bond bouncing ball continues. After gapping below the 200 day SMA Thursday bonds gapped back above that level Friday. The volatility shows the confusion in the bond market, one of the most manipulated there is right now. Perhaps it can hold the line and break higher from this narrowing pattern. That, of course, would not be a very good indication for the economy, but then again, with all of the manipulation does the bond market indicate anything right now other than whether Europeans are using the US as a safe haven or not?

Gold. 1711.60, -1.40. After breaking the 50 day EMA Tuesday, gold worked laterally Thursday and Friday, tapping at the 50 day on the session highs but showing no inclination to move back through. Okay, it was a good test, fell through the 50 day but is trying to hold at some support at 1700. Expect it to hold most of the prior move but it can test further here.

Oil. 86.28, +0.23. Oil tried to hold as well as it too worked laterally Thursday and Friday after the early week declines. 84 is support and it is reaching that way intraday then rebounding to close. Might try a bounce next week but the pattern looks weak given the high levels of product and the shutting down of business ahead of the fiscal cliff.

TECHNICAL SUMMARY

Internals.

NASDAQ
Stats: +1.83 points (+0.06%) to close at 2987.95
Volume: 1.779B (-3.99%)

Up Volume: 859.69M (-160.31M)
Down Volume: 947.54M (+33M)

A/D and Hi/Lo: Decliners led 1.39 to 1
Previous Session: Advancers led 1.38 to 1

New Highs: 42 (-4)
New Lows: 62 (+4)

S&P500
Stats: -1.03 points (-0.07%) to close at 1411.94
NYSE Volume: 629M (-0.94%)

A/D and Hi/Lo: Decliners led 1.43 to 1
Previous Session: Advancers led 1.48 to 1

New Highs: 96 (-26)
New Lows: 38 (-4)

DJ30

Stats: +3.53 points (+0.03%) to close at 13107.21

Volume: -4% NASDAQ, -1% NYSE. Volume remained above average but was lower as NASDAQ dipped then recovered. High volume all week at the 200 day SMA, and as noted before, that is not bad as it shows buyers stepping in to support the index at that level. Higher volume on NYSE as SP500 tested closer to 1400 and rebounded again. There are buyers stepping in here as well.

Breadth. NASDAQ -1.4:1, NYSE -1.4:1. Lagged the rebound but note that SP600 closed down almost one-half point, so the small caps lagged and there are more small caps than large caps in the market. What does it mean? Not a darn thing; it is tracking the action and is not showing any kind of divergence.

THE CHARTS

SP500. Another day reaching closer to 1400 (1403 on the low) and then rebounding to flat. SP500 is attempting to hold that support and could indeed bounce. The pattern is not as good as NASDAQ, however, as it has those three tops and this is the first drop from those tops. It can always show renewed strength and blow through those with ease, but it has yet to show anything along those lines. Yes holding above 1400 is the first step, but it is also the MINIMUM step it could take. Much more work to be done.

NASDAQ. Another test, reaching below the 200 day SMA this time then rebounding to hold that support. Volume remained solid so it looks to be a good shakeout. Nice pattern and with AAPL and AMZN on the rebound it looks good to bounce.

SP600/SP400. Similar to NASDAQ, SP600 held steadfast at the 200 day SMA all week, tapping at it again on the Friday low and rebounding. Very nice pattern here as well, just needs a catalyst. SP400 midcaps are solid as well, holding over the 200 day SMA with three intraday reaches lower last week, rebounding each time as buyers stepped in.

SOX. Second day of a bounce but all it could do was make a run at the falling 10 day EMA and then fade back from that. Note how the 50 day EMA rallied up to the 200 day in September but never broke it. The 50 day has turned down and now the 10 day, 20 day, and 50 day EMA are all trending down. The 200 day SMA has just edged over this past week. It could be just about to get much uglier for SOX. Of course it has not been a garden of daisies the past two months as it fell from 408 to 360, a slight 12% decline. Still holding at the 78% Fibonacci, however, and if it double bottoms at that level it is a very good technical entry point for an upside move.

DJ30/DJ20. Same as SP500, testing toward 13,000 (13,040 on the low) and rebounding yet again. Holding support, not giving up, but not as nice a picture as NASDAQ.

DJ20 bounced for a second day but could not hold a move over the 50 day EMA. It is making the move higher and as noted Thursday, needs to continue the move from here toward the top of the range near 5225.

LEADERSHIP

Big names. AAPL reached to its 200 day SMA and reversed 13 points. AMZN gapped upside and surged almost 7%. EBAY started back up. IBM is even trying to turn.

Technology. Very mixed bag. SSYS in hardware is surging. RAX is at the 50 day EMA and is showing signs it wants to turn. Some chips are surging; most are not. CYMI holds its explosion upside. SLAB gapped through the 50 day EMA on its results.

Financial. Struggled all week, trying to bounce midweek but ending with a Friday decline. JPM gapped lower and did not recover. BAC is trying to hold at 9.00 support. Regionals are still stronger, e.g. STT.

Industrials. Looking better, bouncing after holding support Thursday. CAT bounced. JOY looks super as it jumps off the 50 day EMA. DE bounced off the 20 day EMA test. GNRC is still surging.

Retail. Wild week for retailers. BWLD imploded. PNRA gapped upside. PII is holding support, trying to bounce. COST rebounded from its selloff but faces the 50 day EMA in a bear flag. LULU is trying to hang on at the 200 day SMA. All over the map.

Homebuilders. Hanging in after a week that showed a bad response to good earnings results. PHM and KBH tested further Friday but managed to recover. LPX held nicely at the 10 day EMA as materials still look solid.

THE ECONOMY

First read Q3 GDP: "Kind of Odd"

That is how Bloomberg reported the 2.0% GDP reading Friday morning.

GDP-Adv., Q3 (8:30): 2.0% actual versus 1.9% expected, 1.3% prior
Chain Deflator-Adv., Q3 (8:30): 2.8% actual versus 2.0% expected, 1.6% prior

There are several notable numbers in the chart.
Inventories down.
Nonresidential investment down (and negative).
Structures down (and negative).
Software and equipment flat, this continuing the quarter after quarter decline from much more substantial levels.
Exports down (and negative).
Imports down (and negative).

The odd part:

Government up (and positive). The 3.7% was spearheaded by a 9.6% gain in government spending. After eight quarters of declines spending suddenly jumps in the last GDP report ahead of the election. It was the biggest gain in that spending in 3 years.

The spending added 0.71% to GDP versus taking out 0.15% in Q2. Remove that and you get a push at 1.3%.

Perhaps the government is already factoring in a GDP construction and repair bounce post-Sandy?

The sad part:

Disposable income fell to 0.8% in the quarter versus 3.1% in Q2.
Business investment negative. No investment, no growth, no jobs.

The trend:

Even with the bump higher to 2%, GDP 2012 is trending lower than 2011, and 2011 is much lower than 2010.

Wall Street Woes. More layoffs announced, financial services not servicing anyone.

Bailouts, buyouts, free money. Even with that help during the financial crisis and indeed continuing even to today, many banks and large firms are unable to make money without the help. I wish I could borrow money for nothing and buy guaranteed assets with part of it and fund my trading with the rest. How cool would that be?

Apparently it is not enough for everyone. UBS announced it will sack 10,000 employees or one-sixth of its workforce. My goodness. As pointed out Thursday, layoffs are surging.

Kimberly Clark (KMB) is dropping 1,600 workers.

Newell Rubbermaid (NWL) announced late Friday it was cutting 10% of its workforce or 2,000 workers.

Bloomberg reports fewer terminal sales.

Bloomberg terminals can do just about everything and they are definitely priced as if they can do just about anything. Still, the big firms all have them, several of them.

There has been a somewhat noticeable decline in sales this year. In 2011 13,763 terminals were sold. Thus far in 2012 a stunning 1,000 have been sold. Unreal.

This is just about the most telling statistic we have seen. This is considered a tool for the financial business and those in the financial business are cutting this from their budget. Talk about a fear of what the future holds. Shockingly low.

THE MARKET

SENTIMENT INDICATORS

VIX: 17.81; -0.31. Holding at the 200 day SMA in a three day test of the Tuesday gap through that level. This pattern still suggests VIX could rise toward those prior highs near 21 and that would indicate a further stock market pullback. This is not the primary indicator you use, but it is certainly one to factor into the equation.
VXN: 19.58; -0.7
VXO: 17.88; +0.34

Put/Call Ratio (CBOE): 0.99; +0.14

Bulls versus Bears

Bulls: 41.5% versus 45.7% . Down from 54.2% five weeks back when the first downleg in this selling started. That is a fairly sharp decline. Not at levels considered bullish (35%), but getting darn close in a hurry. Never came close to the 60% to 65% bullish levels that flash a warning sign. Background: Undercut 35%, the threshold for bullishness, in early June. As noted, hit 34% in early June. It did its job and the market is on the rally. Hard drop to 34 from 39.3% as economic reality and a choppy stock market hit. Off the 55+ level hit in late February. That was the highest level since April and May of 2011, the peak of the post-bear market high. 35% is the threshold level suggesting bullishness. To be seriously bearish it needs to get up to the 60% to 65% level.

Bears: 27.7% versus 25.5%. Hung at 25% for close to two months. Now it is moving up some. Just some. Has to get to 35% to be significantly bearish to suggest an upside rally. March and April saw lower lows in the 21% range. On the last run never made it to the 35% that can be a bullish indication, but the bulls were weak enough back in June. Over 35% is the threshold to be really be a good upside indicator. For reference, bearishness hit a 5 year high at 54.4% the last week of October 2008. The move over 50 took bearish sentiment to its highest level since 1995. Extreme negative sentiment. Prior levels for comparison: Bearishness peaked at 37.4% in September 2007. It topped the June 2006 peak (36%) on that run. That June peak eclipsed the March 2006 high (33%) and well above the 2005 highs that spawned new rallies (30% in May 2005, 29.2% in October 2005). That was a huge turn, unlike any seen in recent history.

MONDAY

The economic data this week is stacked like cordwood. Personal income, Consumer Confidence, Chicago PMI, ISM, Jobs. A few earnings reports, several hundred, will be submitted as well. Then China, Japan, Europe, and frankly stories from anywhere else in the world. Add to that the election countdown and hurricane Sandy and where it will track and ultimately land.

So, just your average week in the markets.

The market setup up, despite all of the data and the intrigue it suggests, is pretty simple. NASDAQ along with the small and midcaps show nice patterns and setups to rebound upside. SP500 and DJ30 are holding support but don't evoke warm upside feelings. They may follow a rally by the growth indices but something has to change for them to lead to the upside.

We are going to be ready for upside plays given the look of NASDAQ and the growth indices. A play on NASDAQ and a play on the Russell 2000 are already on, and we plan to augment them with additional plays on individual stocks. Not all of those are on NASDAQ or the small and mid-cap indices, mind you, but any upside move next week leans heavily on those indices and if they can react upside off of some good looking patterns.

Of course given NASDAQ and company are at important support and that SP500 and DJ30 are at support but don't look all that powerful, some downside is in order as well. If the indices fail at this support, the next major support after the initial break of the trends, then they likely have further to fall as they seek bottom. In that situation having downside ready to go is important. We have some and there are some more we will look at if there is a break.

The good thing about this week is that the indices are at an important level and will need to fish or cut bait. The bad thing about this week is it is before the election, packed with data, and that data is back-end loaded with the jobs report to end the week. Even so, there are great patterns out there, and if they show the right stuff we will pick up some positions.

To those on the East Coast: do not take the storm lightly. Better to be over-prepared for nothing than under-prepared for a calamity. The winds won't be the bad part; the water from rain and the storm surge is what to worry about. If it knocks out power for 5 days have enough supplies (water, food, sanitation) to cover it. If you can early vote, do so.

Have a great weekend!

Support and resistance

NASDAQ: Closed at 2987.95
Resistance:
2988 is the July 2012 high
2999 is the bottom of the August 2012 consolidation
3000 is the February 2012 post-bear market high
3024 is the gap point from early May
3026 from 10/2000 low
3042 from 5/2000 low
The 50 day EMA at 3060
3076 is the late April 2012 high
3090 is the mid-March interim high
3037 is the October low
3101 is the August 2012 high
3134 is the March 2012 post-bear market peak
3171 is the October intraday high
3197 is the September 2012 post-bear market high
3227 is the April 2000 intraday low
3401 is the May 2000 closing low

Support:
The 200 day SMA at 2975
2962 is the April 2012 low
2950 is the mid-April closing low
2942 is the mid-June 2012 high
2910 is the March 2012 low
2900 is the March 2012 low

S&P 500: Closed at 1411.94

Resistance:
1422.38 is the prior post-bear market high (March 2012)
1425 from May 2008 closing highs and the October 2012 low
1427 is the August 2012 peak
The 50 day EMA at 1427
1433 from August 2007 closing lows
1440 from November 2007 closing lows
1464 is the June up trendline
1463 is the September closing high
1466 is the September closing high
1471 is the October 2012 intraday high
1475 is the September 2012 high
1499 from January 2008
1539 from June 2007

Support:
1406 is the early May 2012 peak
1402.22 is the closing low of the August 2012 lateral consolidation
1378 is the February 2012 peak
The 200 day SMA at 1377
1375 is the early July 2012 peak
1371 is the May 2011 peak, the post-bear market high
1363.46 is June 2012 high
1359 is the April 2012 low
1357 is the July 2011 peak
1344 is the February 2011 peak
1340 is the early April 2011 peak
1332 is the early March 2011 peak
1325 is the July 2012 intraday low
1309 is the right shoulder low from June 2012
1295 to 1294 is the April 2011 low and the February 2011 consolidation low (bottom of the trading range)
1293 is the October 2011 peak
1275 is the January 2010 low, early January 2011 peak
1267 is the December 2011 peak
1266 is the June 2012 base low

Dow: Closed at 13,107.21
Resistance:
13,297 is the April 2012, prior post bear market high
The 50 day EMA at 13,303
13,331 is the August 2012 post-bear market high
13,653 is the September 2012 high
13662 is the October 2012 intraday high
13,668 from 12-2007 peak
13,692 from 6-2007 peak
14,022 from 7-07 peak

Support:
13,058 from the May 2008 peak on that bounce in the selling
13,056 is the February 2012 high
The 200 day SMA at 12,976
12,971 is the early July 2012 high
12,754 is the July intraday peak
12,716 is the April 2012 closing low
12,391 is the February 2011 peak
12,369 is the left shoulder low from May 2012
12,284 is the October 2011 peak
12,258 is the December 2011 peak
12,110 from the March 2007 closing low
12,094 is the April 2011 low
12,035 is the June 2012 base low
The June 2011 low at 11,897 (closing)
11,734 from 11-98 peak
11,717 is the late August 2011 peak

Economic Calendar

October 24 - Wednesday
- MBA Mortgage Index, 10/20 (7:00): -12.0% actual versus -4.2% prior
- New Home Sales, September (10:00): 389K actual versus 385K expected, 368K prior (revised from 373K)
- FHFA Housing Price I, August (10:00): 0.7% actual versus 0.1% prior (revised from 0.2%)
- Crude Inventories, 10/20 (10:30): 5.896M actual versus 2.860M prior
- FOMC Rate Decision, October (14:15): 0.25% expected, 0.25% prior and 0.25% now.

October 25 - Thursday
- Initial Claims, 10/20 (8:30): 369K actual versus 375K expected, 392K prior (revised from 388K)
- Continuing Claims, 10/13 (8:30): 3254K actual versus 3237K expected, 3256K prior (revised from 3252K)
- Durable Orders, September (8:30): 9.9% actual versus 8.0% expected, -13.1% prior (revised from -13.2%)
- Durable Orders -ex Transports, September (8:30): 2.0% actual versus 1.0% expected, -2.1% prior (revised from -1.6%)
- Pending Home Sales, September (10:00): 0.3% actual versus 2.4% expected, -2.6% prior

October 26 - Friday
- GDP-Adv., Q3 (8:30): 2.0% actual versus 1.9% expected, 1.3% prior
- Chain Deflator-Adv., Q3 (8:30): 2.8% actual versus 2.0% expected, 1.6% prior
- Michigan Sentiment - Final, October (9:55): 82.6 actual versus 83.1 expected, 83.1 prior

October 29 - Monday
- Personal Income, September (8:30): 0.6% expected, 0.1% prior
- Personal Spending, September (8:30): 0.4% expected, 0.5% prior
- PCE Prices - Core, September (8:30): 0.1% expected, 0.1% prior

October 30 - Tuesday
- Case-Shiller 20-city, August (9:00): 1.7% expected, 1.2% prior
- Consumer Confidence, October (10:00): 72.5 expected, 70.3 prior

October 31 - Wednesday
- MBA Mortgage Index, 10/27 (7:00): -12.0% prior
- ADP Employment Change, October (8:15): 140K expected, 162K prior
- Employment Cost Index, Q3 (8:30): 0.5% expected, 0.5% prior
- Chicago PMI, October (9:45): 50.4 expected, 49.7 prior
- Crude Inventories, 10/27 (10:30): 5.896M prior

November 1 - Thursday
- Challenger Job Cuts, October (7:30): -70.8% prior
- Initial Claims, 10/27 (8:30): 375K expected, 369K prior
- Continuing Claims, 10/20 (8:30): 3249K expected, 3254K prior
- Productivity-Preliminary, Q3 (8:30): 1.6% expected, 2.2% prior
- Unit Labor Costs, Q3 (8:30): 1.1% expected, 1.5% prior
- ISM Index, October (10:00): 51.0 expected, 51.5 prior
- Construction Spending, September (10:00): 0.8% expected, -0.6% prior
- Auto Sales, October (14:00): 5.3M prior
- Truck Sales, October (14:00): 6.3M prior

November 2 - Friday
- Nonfarm Payrolls, October (8:30): 125K expected, 114K prior
- Nonfarm Private Payrolls, October (8:30): 125K expected, 104K prior
- Unemployment Rate, October (8:30): 7.9% expected, 7.8% prior
- Hourly Earnings, October (8:30): 0.2% expected, 0.3% prior
- Average Workweek, October (8:30): 34.5 expected, 34.5 prior
- Factory Orders, September (10:00): 4.5% expected, -5.2% prior
icon url

ReturntoSender

10/29/12 4:57 PM

#9965 RE: ReturntoSender #6755

1:20 pm : U.S. equity markets remain closed as Hurricane Sandy approaches New York City. Note that the markets will also be closed tomorrow.

The European session has now ended, and all key bourses registered losses.

France's CAC settled lower by 0.8% and defensive telecom and utility stocks lagged throughout the session. Alcatel-Lucent and Vivendi lost 3.3% and 1.9%, respectively. Meanwhile, Veolia Environnement fell 4.8% after the company was reported to be looking into a capital increase in order to lower debt. Among the advancers, tire maker Michelin gained 1.3%, and was the top performer on the CAC.

Germany's DAX slipped 0.4%. ThyssenKrupp slid 3.8%, and was the worst performer after the steelmaker asked interested parties to resubmit offers for its American unit after initial bids were deemed too low. Chemical producer Linde gained 2.4% on strong earnings.

In the United Kingdom, the FTSE shed 0.2% and financials showed broad weakness. Insurer Hargreaves lost 4.2% after Citigroup downgraded the stock to ‘sell' from ‘neutral.' Admiral Group and Old Mutual settled lower by 2.1% and 1.6%, respectively. Technology stocks showed strength as ARM Holdings and Sage Group saw respective gains of 1.4% and 1.8%.

Greece's Athens Stock Exchange was a notable outlier as the index lost 6.3%. Earlier, a story out of Germany's Der Spiegel indicated private bondholders may have to face some losses. Financials saw significant pressure as Bank of Spain, National Bank of Greece, and Piraeus bank all lost between 14.9% and 18.6%.

Italy's 10-yr yield added 11 basis points and it currently sits at 5.019%. Meanwhile, Spain's 10-yr benchmark yield edged up six basis points, to 5.656%.

The euro trades near its session low against the dollar as the currency pair trades at 1.2892.

http://finance.yahoo.com/marketupdate/update
icon url

ReturntoSender

10/30/12 11:50 PM

#9966 RE: ReturntoSender #6755

From Briefing.com: 2:25 pm : U.S. equity and treasury markets remain closed today. However, trading on the New York Stock Exchange and Nasdaq is scheduled to resume tomorrow.

Looking at overseas action, European markets closed broadly higher.

In the United Kingdom, the FTSE advanced 1.0%. BP was the top performer as it settled with a gain of 4.2% after reporting strong earnings. Mining stocks also showed strength. Kazakhmys rose by 2.4% and Rio Tinto gained 2.0%. On the downside, United Utilities Group lagged the broader market and ended lower by 2.7%.

In France, the CAC finished higher by 1.5%. Tire maker, Michelin, and steel producer, ArcelorMittal, were the top performers. The two stocks finished higher by 3.3% and 3.2%, respectively. Only three stocks registered losses. Legrand was the weakest performer as the producer of electric equipment slipped 0.3%.

Germany's DAX gained 1.1%. Deutsche Bank added 3.4%, and was the top performer after reporting strong quarterly results. Deutsche Post shed 1.7%, and was the weakest performer. Consumer stocks also saw weakness as Henkel slipped 0.5% and Fresenius SE lost 0.9%.

Note that the ADP Employment Change report has been re-scheduled for November 1 at 8:15 ET. Originally, the report was set to be released tomorrow at 8:15 ET.

5:37PM First Solar postpones Q3 earnings release to after market hours on Thursday, Nov 1 (conference call 4:30 PM EST) (FSLR) 23.97 :

5:29PM Rudolph Tech postpones earnings release to after market hours on Nov 5 (conference call to take place the same day at 4:45 PM EST) (RTEC) 9.48 :

4:32PM Sanmina-SCI beats by $0.12, reports revs in-line; guides Q1 EPS below consensus, revs below consensus; announces restructuring for two facilities (SANM) 7.60 : Reports Q4 (Sep) earnings of $0.46 per share, $0.12 better than the Capital IQ Consensus Estimate of $0.34; revenues fell 7.1% year/year to $1.58 bln vs the $1.59 bln consensus.

Co issues downside guidance for Q1, sees EPS of $0.31-0.37 vs. $0.37 Capital IQ Consensus Estimate; sees Q1 revs of $1.5-1.55 bln vs. $1.6 bln Capital IQ Consensus Estimate.
Sanmina-SCI also announced a restructuring plan which impacts two of its manufacturing facilities. This action will improve the Company's operational cost structure, flexibility and capacity utilization. As a result of this plan, the Company has recorded charges in its fourth quarter of approximately $11.9 million, consisting of severance pay for affected employees and related asset impairments. A total of $9.3 million of such expenses are expected to be cash and $2.6 million are expected to be non-cash in nature. Sanmina-SCI expects to complete the actions being taken under the plan in fiscal 2013. The Company will continue to evaluate its plans and further restructuring actions may occur, which may cause the Company to incur additional restructuring charges relating to this plan.

4:23PM MIPS Tech beats by $0.02, beats on revs (MIPS) 7.24 : Reports Q1 (Sep) loss of $0.01 per share, $0.02 better than the Capital IQ Consensus Estimate of ($0.03); revenues fell 19.2% year/year to $13.9 mln vs the $13.66 mln consensus.

"In the quarter, we released our new interAptiv core to general availability, which contributed to our license and contract revenue. Going forward, we are continuing to explore our options around patent monetization and other opportunities for increasing shareholder value."

4:11PM Silicon Image beats by $0.02, reports revs in-line; guides Q4 revs below consensus (SIMG) 4.60 : Reports Q3 (Sep) earnings of $0.11 per share, $0.02 better than the Capital IQ Consensus Estimate of $0.09; revenues rose 23.8% year/year to $73.9 mln vs the $73.95 mln consensus. Co issues downside guidance for Q4, sees Q4 revs of ~$64-67 mln vs. $71.49 mln Capital IQ Consensus Estimate.

"Earnings growth has been robust in our seasonally strongest quarter. Mobile continues to be our key growth driver as MHL? technology gains momentum across top tier phone and tablet manufacturers. We remain on track with our 60 GHz WirelessHD technology and expect to sample mobile-oriented ICs late this year... "While the 2012 fourth quarter outlook reflects a seasonal decline which is higher than our typical 5-10%, our product revenues in the first quarter of 2013, in a departure from the typical pattern, are expected to be flat to modestly up, compared with our fourth quarter 2012 guidance."

4:08PM Nanometrics beats by $0.12, beats on revs; guides Q4 EPS below consensus, revs below consensus (NANO) 12.96 : Reports Q3 (Sep) earnings of $0.10 per share, excluding non-recurring items, $0.12 better than the Capital IQ Consensus Estimate of ($0.02); revenues fell 24.7% year/year to $43.9 mln vs the $42.68 mln consensus. Co issues downside guidance for Q4, sees EPS of ($0.19)- ($0.12), excluding non-recurring items, vs. ($0.02) Capital IQ Consensus Estimate; sees Q4 revs of $28-32 mln vs. $42.90 mln Capital IQ Consensus Estimate.

4:07PM JDS Uniphase beats by $0.03, misses on revs; guides Q2 revs below consensus (JDSU) : Reports Q1 (Sep) earnings of $0.15 per share, $0.03 better than the Capital IQ Consensus Estimate of $0.12; revenues rose 1.2% year/year to $420.9 mln vs the $426.74 mln consensus. Co issues downside guidance for Q2, sees Q2 revs of $410-430 mln vs. $464.35 mln Capital IQ Consensus Estimate.

4:05PM FEI beats by $0.05, beats on revs; guides Q4 EPS in-line, revs in-line (FEIC) 50.35 : Reports Q3 (Sep) earnings of $0.71 per share, $0.05 better than the Capital IQ Consensus Estimate of $0.66; revenues rose 8.0% year/year to $221.8 mln vs the $216.31 mln consensus.

Co issues in-line guidance for Q4, sees EPS of $0.68-0.76 ex items vs. $0.76 Capital IQ Consensus Estimate; sees Q4 revs of $223-233 mln vs. $229.95 mln Capital IQ Consensus Estimate.
"We had another good quarter, with revenue growth in spite of a normally weak seasonal period and an uncertain economic environment," commented Don Kania, president and CEO. "Margins were as expected and earnings were ahead of our guidance. Bookings growth compared with both last year's third quarter and this year's second quarter was driven by our electronics and natural resources businesses. Bookings growth was also strong in Europe compared with both prior periods. We are looking forward to a seasonally strong fourth quarter for bookings, revenue and earnings."

3:53PM Pericom Semi reports EPS in-line, misses on revs; guides Q2 revs below consensus (PSEM) 7.65 : Reports Q1 (Sep) earnings of $0.10 per share, in-line with the Capital IQ Consensus Estimate consensus of $0.10; revenues $36.7 mln vs the $38.21 mln consensus. On a non-GAAP basis, gross margin was 39.3% in the first quarter, which reflects exclusion of share-based compensation, amortization of intangible assets and amortization of fair value adjustments from the PTI acquisition.

Guidance: Co issues downside guidance for Q2 revs of $30.5-34.5 mln vs. $38.91 mln Capital IQ Consensus Estimate. Co sees Q2 GAAP gross margins are expected to be between 34.8% and 36.8%, and adjusting for share-based compensation, amortization of intangibles and fair value adjustments that are expected to total ~1.7%, non-GAAP gross margins are expected to be in the 36.5% to 38.5% range. Co sees Q2 GAAP operating expenses are expected to be between $12.7-13.1 million, and adjusting for share-based compensation, amortization of intangibles and fair value adjustments that are expected to total ~$1.2 million, non-GAAP operating expenses are expected to be in the range of $11.5-11.9 million.

1:20PM Seagate Tech announced that due to the impact of the storm on the East Coast of the United States, it has moved its fiscal first quarter 2013 financial results release and conference call to October 31, 2012 (STX) 27.90 :

10:55AM IBM authorizes $5 billion for stock repurchase (IBM) 193.27 : IBM expects to request additional share repurchase authorization at the April 2013 board meeting.

Broadcom (BRCM) announced that Huawei has chosen Broadcom's Small Cell Baseband Processor family of solutions for WCDMA small cell access point deployments.

8:05AM Vishay misses by $0.09, misses on revs; guides Q4 revs below consensus (VSH) 8.80 : Reports Q3 (Sep) earnings of $0.15 per share, excluding non-recurring items, $0.09 worse than the Capital IQ Consensus Estimate of $0.24; revenues fell 10.0% year/year to $573 mln vs the $581.78 mln consensus. Co issues downside guidance for Q4, sees Q4 revs of $500-540 mln vs. $571.43 mln Capital IQ Consensus Estimate.

"Over the course of the third quarter many of our end markets deteriorated substantially, in particular computing and consumer, which resulted in unexpectedly low orders from Asian distribution. Nonetheless the operating margin was in line with our business model. Selling, general, and administrative expenses as well as manufacturing fixed costs were kept well under control, while the quarter was burdened by temporary inefficiencies related to the volume drop and an inventory reduction."
"Our current anticipation for the profitability for the full year is substantially lower than previously anticipated, which resulted in a significant shift in the estimated mix of income among our various taxing jurisdictions. As a consequence, our normalized tax rate for the year increased to 33% resulting in a very high effective tax rate for the third quarter impacting EPS."
"Despite fast changes in the economic environment, Vishay is in a position to continue to steadily pursue its Growth Plan. As part of our Growth Plan we continue to actively pursue small to mid-size acquisitions of niche businesses."

8:01AM Advanced Energy announces new $25 mln share repurchase program over the next 12 months (AEIS) 11.78 :

EVault, a Seagate (STX), announced the EVault backup and recovery platform will now take advantage of the Windows Azure cloud platform. In conjunction with this initiative, EVault will be expanding development, sales and marketing collaboration around Windows Azure.

Integrated Device (IDTI) reported second quarter earnings of $0.09 per share, $0.02 better than the Capital IQ consensus of $0.07, while revenues fell 3.5% year/year to $133.4 million versus the $133.06 mln consensus. The company states, "New product revenue increased to over 17 percent of the total, up from 14 percent in the prior quarter, driven by record revenue from Rapid IO switching solutions, continued growth in PCI Express switching, and initial sales from new product categories like enterprise flash controllers, high-speed data converters and wireless power solutions... Customer demand slowed significantly in the month of September for IDT as well as the overall semiconductor sector, and has remained soft in October. Even though we're experiencing cautious ordering patterns from customers due to the uncertain macroeconomic environment, we believe our new product traction and continued focus on cost controls will enable us to reach our fiscal 2014 operating margin targets."

Apple (AAPL) announced executive management changes. Apple also announced that Scott Forstall will be leaving Apple next year and will serve as an advisor to CEO Tim Cook in the interim... Eddy Cue will take on the additional responsibility of Siri and Maps, placing all of online services in one group. Craig Federighi will lead both iOS and OS X. Bob Mansfield will lead a new group, Technologies, which combines all of Apple's wireless teams across the company in one organization.

Baidu.com (BIDU) reported third quarter earnings of $1.37 per share, $0.09 better than the Capital IQ consensus of $1.28, while revenues rose 51.9% year/year to $994.6 million versus the $1000.95 mln consensus. Online marketing revenues for the third quarter of 2012 were RMB6.246 billion ($993.8 million), representing a 49.6% increase from the corresponding period in 2011. Baidu had approximately 390,000 active online marketing customers in the third quarter of 2012, representing a 28.3% increase from the corresponding period in 2011 and a 10.8% increase from the second quarter of 2012. Revenue per online marketing customer for the third quarter was approximately RMB16,000 ($2,546), a 16.8% increase from the corresponding period in 2011 and a 3.2% increase compared to the second quarter of 2012. Traffic acquisition cost (TAC) as a component of cost of revenues was RMB538.2 million ($85.6 million), representing 8.6% of total revenues, as compared to 8.0% in the corresponding period in 2011 and 8.3% in the second quarter of 2012. Bandwidth costs as a component of cost of revenues were RMB266.9 million ($42.5 million), representing 4.3% of total revenues, compared to 4.0% in the corresponding period in 2011. Depreciation costs as a component of cost of revenues were RMB279.9 million ($44.5 million), representing 4.5% of total revenues, compared to 4.2% in the corresponding period in 2011. These increases were mainly due to an increase in network infrastructure capacity. Selling, general and administrative expenses were RMB642.8 million ($102.3 million), representing an increase of 39.7% from the corresponding period in 2011, primarily due to an increase in marketing- and personnel-related expenses. The company issued downside guidance for fourth quarter revenues of $979-1010 million versus the $1.04 billion consensus.

http://finance.yahoo.com/marketupdate/update
icon url

ReturntoSender

10/31/12 6:51 PM

#9967 RE: ReturntoSender #6755

From Briefing.com: 4:20 pm : Equities began the session on a strong note. However, the bullish sentiment failed to hold as major averages began sliding off their highs shortly after the open. The key indices then marked their respective lows in the early afternoon before rallying in the final hour to finish mixed. The S&P 500 finished flat, while Nasdaq lost 0.4%.

Looking at tech companies, the SPDR Technology Select Sector ETF (XLK 28.87, -0.11) slid 0.4%. The biggest sector component, Apple (AAPL 595.32, -8.68), lost 1.4% after announcing the departure of Scott Forstall, who was the company's head of mobile software products.

Seagate Technology (STX 27.33, -0.58) shed 2.1% after reporting disappointing earnings. During the first quarter, the hard drive manufacturer earned $1.45, which was $0.25 worse than the Capital IQ consensus estimate. In addition, the company's revenue of $3.73 billion also fell short of analyst expectations.

Western Union (WU 12.72, -5.20) plunged 29.0% after reporting in-line earnings. However, the company's revenue of $1.42 billion fell short of the $1.47 billion expected by the Capital IQ consensus. In addition, the company announced a 25.0% increase in quarterly dividend to $0.125. Following the earnings release, Western Union received six analyst downgrades.

Facebook (FB 21.11, -0.83) lost 3.5% after another lockup expiry took place.

A handful of names within the software industry made notable moves. Commvault Systems (CVLT 62.37, +8.90) soared 16.6% after beating on the top and the bottom line. During the second quarter, the software company earned $0.38 on $118.2 million in revenue. Both figures were ahead of the Capital IQ consensus estimates. In addition, the Board of Directors authorized a $50 million increase to the existing stock repurchase program.

Elsewhere, JDA Software (JDAS 38.15, +4.23) spiked 12.5% after reports from Reuters indicated JDA is exploring a sale, and has hired JPMorgan as an advisor.

OPNET Technologies (OPNT 42.05, +9.95) surged 31.0% after entering into a definitive agreement to be acquired by Riverbed Technology (RVBD 18.47, -4.15). Per the agreement, Riverbed will pay $43 per share, representing a 34.0% premium to OPNET's Friday closing price.

In other M&A news, Warnaco Group (WRC 70.58, +19.70) will be acquired by PVH (PVH 109.96, +18.46) in a transaction valued at $2.9 billion. Warnaco stockholders will receive $68.43 per share, which represents a 34.0% premium to Warnaco's last closing price. Following the acquisition, PVH issued upside guidance as the company now expects third quarter and full-year earnings near the top range of its prior guidance of $2.28-2.30. Meanwhile, the Capital IQ consensus expects the company to earn $2.29 per share.

The Dow Jones Transportation Average settled higher by 0.7% with trucking stocks leading the complex. Landstar System (LSTR 50.60, +2.47) was the top performer, and settled higher by 5.1% after Goldman initiated coverage of the stock with a ‘neutral' rating. Con-way (CNW 29.11, +1.12) rose by 4.0% after Goldman resumed coverage with a ‘buy' rating. Meanwhile, other freight carriers also saw strength. JB Hunt Transport (JBHT 58.70, +1.54) and CH Robinson (CHRW 60.31, +0.90) advanced 2.7% and 1.5%, respectively.

On the downside, railroads saw general weakness. Norfolk Southern (NSC 61.35, -0.92) and Union Pacific (UNP 123.03, -0.58) shed 1.5% and 0.5%, respectively.

Two automakers moved higher after reporting strong earnings. General Motors (GM 25.50, +2.22) surged 9.5% after reporting earnings of $0.90, which was $0.30 ahead of the Capital IQ consensus estimate. The automaker's revenue of $37.6 billion represented a 4.6% year-over-year decrease, but the figure was ahead of analyst estimates.

Meanwhile, Ford Motor (F 11.16, +0.85) jumped 8.2% after reporting mixed earnings. During the third quarter, the company earned $0.40, which was $0.10 better than the Capital IQ consensus estimate. However, the company's revenue of $30.20 billion fell short of analyst expectations. Regarding the fourth quarter outlook, management said it expects production volume to increase in all regions except Europe. Today's buying has lifted the shares to levels not seen since early May.

The weekly MBA Mortgage Index registered a 4.8% decrease in new mortgage applications over the past week. This follows last week's 12.0% decrease.

Third quarter Employment Cost Index increased by 0.4%, which was slightly worse than the 0.5% increase that was widely forecast. Today's reading follows prior quarter's increase of 0.5%.

October Chicago PMI of 49.9 surprised to the downside as economists surveyed by Briefing.com had generally expected a reading of 50.9 to follow the prior month's 49.7.

Looking at tomorrow's economic data, automakers will be reporting their sales throughout the day and October Challenger Job Cuts will be announced at 7:30 ET. October ADP Employment Change Survey will be released at 8:15 ET. In addition, weekly initial and continuing claims, third quarter unit labor costs and preliminary productivity will all be released at 8:30 ET. Lastly, the ISM Index, construction spending, and consumer confidence will all hit the wires at 10:00 ET.DJ30 -10.75 NASDAQ -10.75 SP500 +0.22 NASDAQ Adv/Vol/Dec 1354/1.76 bln/1131 NYSE Adv/Vol/Dec 1776/852.9 mln/1289

3:30 pm : Crude oil popped to a pit session high of $87.14 per barrel in late morning action. However, the energy component slowly gave up the gain as the dollar index recovered near the unchanged level. It settled at $86.22 per barrel.

Natural gas brushed a floor session high of $3.78 in early morning action but inched lower as the session progressed. It eventually closed at $3.69.

Precious metals advanced higher as pit trade went on. Gold came off its session low of $1716.60 per ounce and popped to a session high of $1726.60 per ounce in late morning action. It settled at $1719.40 per ounce. Silver traded as high as $32.44 per ounce and closed at $32.31 per ounce.DJ30 +9.53 NASDAQ -10.92 SP500 +1.86 NASDAQ Adv/Vol/Dec 1210/1421.2 mln/1251 NYSE Adv/Vol/Dec 1671/510 mln/1384

4:22PM Peregrine Semi beats by $0.07, beats on revs; guides Q4 revs in-line (PSMI) 17.71 -0.23 : Reports Q3 (Sep) non-GAAP earnings of $0.17 per share, $0.07 better than the Capital IQ Consensus Estimate of $0.10; revenues rose 128.6% year/year to $60.58 mln vs the $52.35 mln consensus.

Co issues in-line guidance for Q4, sees Q4 revs of $60-63 mln vs. $61.42 mln Capital IQ Consensus Estimate. Fourth quarter GAAP gross margin is expected to be in the range of 43.0% to 44.5%.

4:18PM Extreme Networks beats by $0.01, misses on revs; guides Q2 EPS in-line, revs in-line (EXTR) 3.26 +0.01 : Reports Q1 (Sep) earnings of $0.04 per share, $0.01 better than the Capital IQ Consensus Estimate of $0.03; revenues fell 3.5% year/year to $76.1 mln vs the $78.57 mln consensus. Co issues in-line guidance for Q2, sees EPS of $0.04-0.07 vs. $0.06 Capital IQ Consensus Estimate; sees Q2 revs of $78-85 mln vs. $83.50 mln Capital IQ Consensus Estimate.

*The company is targeting a quarterly financial model with the goal of achieving non-GAAP gross margin of 56% +/- and for non-GAAP operating income of 10% +/-, at a revenue level in the low $80 million range by the end of fiscal 2013. To help achieve this goal, the company intends to focus on growing its revenue with higher performing and lower cost products as well as further realigning its operating cost structure around this set of products

4:03PM Newport beats by $0.03, misses on revs (NEWP) : Reports Q3 (Sep) earnings of $0.35 per share, $0.03 better than the Capital IQ Consensus Estimate of $0.32; revenues rose 13.8% year/year to $142.9 mln vs the $151.83 mln consensus. "The company noted that it does not see a near-term catalyst for improvement in overall market conditions. As such, the company expects its sales, non-GAAP operating income and non-GAAP net income in the fourth quarter of 2012 to be similar to the third quarter levels."

4:02PM Coherent misses by $0.14, misses on revs (COHR) 45.65 -1.05 : Reports Q4 (Sep) earnings of $0.71 per share, $0.14 worse than the Capital IQ Consensus Estimate of $0.85; revenues fell 9.3% year/year to $188.7 mln vs the $195.3 mln consensus.

Bookings received during the fourth fiscal quarter ended September 29, 2012 of $169.3 million decreased 13.4% from $195.4 million in the same prior year period and decreased by 22.7% compared to bookings of $218.9 million in the immediately preceding quarter.
The book-to-bill ratio was 0.90, resulting in backlog of $352.8 million at September 29, 2012, compared to a backlog of $369.4 million at June 30, 2012 and a backlog of $356.5 million at October 1, 2011.

4:01PM Cirrus Logic beats by $0.08, beats on revs; guides Q3 revs above consensus (CRUS) 40.78 +1.02 : Reports Q2 (Sep) earnings of $0.79 per share, excluding non-recurring items, $0.08 better than the Capital IQ Consensus Estimate of $0.71; revenues rose 90.7% year/year to $193.8 mln vs the $180.69 mln consensus. Co issues upside guidance for Q3, sees Q3 revs of $270-300 mln vs. $233.84 mln Capital IQ Consensus Estimate; GM 50-52%.

Mellanox Technologies (MLNX) announced that Japanese Internet provider Sakura Internet has selected Mellanox InfiniBand technology for its new cloud hosting infrastructure.

8:03AM Seagate Tech misses by $0.25, misses on revs (STX) 27.91 : Reports Q1 (Sep) earnings of $1.45 per share, excluding non-recurring items, $0.25 worse than the Capital IQ Consensus Estimate of $1.70; revenues rose 32.8% year/year to $3.73 bln vs the $3.8 bln consensus.

8:02AM O2Micro misses by $0.02, beats on revs (OIIM) 3.24 : Reports Q3 (Sep) loss of $0.14 per share, $0.02 worse than the Capital IQ Consensus Estimate of ($0.12); revenues fell 28.7% year/year to $22.8 mln vs the $22.49 mln consensus. The gross margin in the third quarter of 2012 was 54.5%. The gross margin was down from 55.7% in the prior quarter and down from 55.5% in the third quarter of 2011. The gross margin remains in our target range and varies primarily with revenue level and product mix.

7:59AM Micron applauds Tokyo District Court submission order (MU) 5.47 : Co applauded the Tokyo District Court's order approving the submission of Elpida Memory Inc.'s reorganization plan to creditors as part of Elpida's corporate reorganization proceedings. Elpida's plan of reorganization calls for Micron to sponsor Elpida's reorganization and provides for the combination of Elpida and Micron. The Tokyo District court also confirmed that a competing plan of reorganization proposed by certain of Elpida's creditors would not be submitted for creditor approval. "Micron is pleased with the Tokyo District Court's order to submit Elpida's plan of reorganization to creditors for approval. This is an important step forward in the reorganization process," said Micron CEO Mark Durcan. "The combination of Micron and Elpida will create the world's second largest memory company with the strongest product portfolio in the industry."

Texas Instruments (TXN) and AllGo Embedded Systems introduced the all-in-one Electronic Tablet Reference Design, allowing developers to get to market with a customized enterprise tablet in as little as three months. The eTAB Reference Design has a total BOM of less than $70 and leverages the Android 4.0 operating system.

Broadcom (BRCM) announced cable innovations to drive new TV and broadband experiences in China, fueling the next phase of next generation broadband.

Seagate Tech (STX $27.13 -0.78) reported first quarter earnings of $1.45 per share, excluding non-recurring items, $0.25 worse than the Capital IQ consensus Estimate of $1.70, while revenues rose 32.8% year/year to $3.73 billion versus the $3.8 billion consensus.

Electronic Arts (EA $11.64 -0.27) reported third quarter earnings of $0.15 per share, $0.05 better than the Capital IQ consensus of $0.10, while revenues rose 4.4% year/year to $1.08 billion versus the $1.08 bln consensus. The company issued downside guidance for Q3, sees EPS of $0.50-0.60 versus the $0.70 consensus and revenues of $1.25-1.35 billion versus $1.39 billion consensus. THe company issued in-line guidance for fiscal year 2013 with EPS of $1.00-1.15 versus the $1.04 consensus and sees revenues of $4.05-4.20 billion versus the $4.13 billion consensus.

Sanmina-SCI (SANM $8.10 +0.50) reported fourth quarter earnings of $0.46 per share, $0.12 better than the Capital IQ consensus of $0.34, while revenues fell 7.1% year/year to $1.58 billion versus the $1.59 bln consensus. The company issued downside guidance for the first quarter with EPS of $0.31-0.37 versus the $0.37 consensus and sees revenues of $1.5-1.55 billion versus the $1.6 billion consensus. Sanmina-SCI also announced a restructuring plan which impacts two of its manufacturing facilities. This action will improve the Company's operational cost structure, flexibility and capacity utilization. As a result of this plan, the Company has recorded charges in its fourth quarter of approximately $11.9 million, consisting of severance pay for affected employees and related asset impairments. A total of $9.3 million of such expenses are expected to be cash and $2.6 million are expected to be non-cash in nature. Sanmina-SCI expects to complete the actions being taken under the plan in fiscal 2013. The Company will continue to evaluate its plans and further restructuring actions may occur, which may cause the Company to incur additional restructuring charges relating to this plan.

Iron Mountain (IRM $33.99 +0.00) reported third quarter earnings of $0.34 per share, excluding non-recurring items, $0.01 worse than the consensus of $0.35, while revenues rose 2.7% year/year to $768.3 million versus the $763.71 million consensus. Co issues guidance for FY12, sees EPS of $1.20-1.28 from prior guidance of $1.20-1.26 vs. $1.30 Capital IQ Consensus Estimate; sees FY12 revs of $2.99-3.02 bln vs. $3.01 bln Capital IQ Consensus Estimate. "Our underlying financial performance for the third quarter reflects the stability of our storage rental business and successful execution of our strategy. Storage rental is the primary driver of revenues, profits and cash flows for the Company and has grown solidly within a 3% to 5% C$ range since 2010 underscoring its durability," Today the Company is reiterating the midpoint of its Adjusted OIBDA outlook while narrowing the range by $20 million. The Company now expects Adjusted OIBDA of between $900 million and $920 million, or (1)% to 2% C$ growth over 2011 excluding an expected negative 3% impact from lower recycled paper revenues.

Take-Two (TTWO $11.26 +0.55) reported second quarter earnings of $0.11 per share, ex items, may not be comparable to the Capital IQ Consensus Estimate of ($0.19), while revenues rose 155.2% year/year to $273.1 million versus the $238.73 mln consensus. The company issued downside guidance for the third quarter with EPS ex items, of $0.45-0.60 versus the $0.69 consensus and sees revenues of $325-3.75 million versus the $447.93 million consensus, Co reported GAAP EPS loss of ($0.15) vs GAAP ($0.29) Capital IQ consensus. "Our business continues to fire on all cylinders, led by terrific early results from 2K's NBA 2K13, and the outlook for our upcoming releases such as BioShock Infinite is stronger than ever. As a result, we continue to expect to deliver revenue growth and Non-GAAP profits in fiscal year 2013. Moreover, with Grand Theft Auto V slated for spring 2013, we are poised to generate substantial revenue and earnings growth in fiscal year 2014."

08:52 am Riverbed Technology downgraded to Neutral from Outperform at Robert W. Baird: . RVBD downgraded to Neutral from Outperform at Robert W. Baird; tgt lowered to $24 from $28. Firm notes they see APM as a logical adjacency for co but the magnitude and timing of this acquisition create integration and disruption risk against valuation and a weak macro-economic backdrop that don't allow much room for error. They continue to maintain a positive, long-term view of Granite and see a C13 replacement cycle opportunity in the core WAN optimization market.

08:51 am MIPS Tech downgraded to Hold at Feltl & Co: . Feltl & Co. downgrades MIPS to Hold from Buy and sets target price at $7. Following earnings results, the firm believes MIPS is focused on some type of patent transaction rather than the sale of the entire co. They believe potential upside from future patent monetization could be short-lived as investors would likely have to refocus on current operating model following "one-time benefit." They also believe patent monetization uncertainty creates a binary situation for investors with potentially more downside risk from current levels than estimated potential upside.

08:59 am Seagate shares fall 3% following miss on earnings
Seagate Tech (STX $27.15 -0.76) reported first quarter earnings of $1.45 per share, excluding non-recurring items, $0.25 worse than the Capital IQ consensus Estimate of $1.70, while revenues rose 32.8% year/year to $3.73 billion versus the $3.8 billion consensus.

icon url

ReturntoSender

11/03/12 1:05 PM

#9970 RE: ReturntoSender #6755

From Briefing.com: Weekly Recap - Week ending 02-Nov-12

Today's session started on a higher note after the nonfarm payrolls report exceeded expectations, and pointed to 171,000 jobs added during October. However, the bullish sentiment faded quickly, and the major averages headed into the red. The S&P 500 crossed its flat line 60 minutes into the session and held just below that level for the remainder of the morning. The afternoon brought out additional sellers as the index headed further into negative territory before ending with a loss of 0.9%. The afternoon weakness was largely driven by Apple (AAPL 576.80, -19.74) which lost 3.3%.

Stocks in the materials space saw the biggest weakness. Looking deeper into the sector, packaging and mining stocks underperformed. Rock-Tenn (RKT 67.49, -7.03) slid 9.4% after reporting mixed earnings. During the fourth quarter, the package manufacturer earned $1.39, which was $0.02 better than the Capital IQ consensus estimate. However, RKT's revenue of $2.35 billion was below analyst expectations. The management commented on the past quarter by saying that a containerboard price hike was implemented, and its full effects are not expected to be realized until the end of the March quarter. Peer AptarGroup (ATR 49.49, -3.64) slumped 6.9% after beating revenue estimates and missing on earnings.

Among miners, Newmont Mining (NEM 48.74, -4.48) lost 8.4% after the company's earnings of $0.86 and revenue of $2.48 fell short of the Capital IQ consensus forecast.

Also of note, steel stocks were broadly weaker. Worthington (WOR 21.43, -1.26), and Cliffs Natural Resources (CLF 36.27, -1.45) saw respective losses of 5.6% and 3.8%.

Consumer discretionary stocks outperformed due to strong earnings from several components. Priceline (PCLN 634.74, +48.64) spiked 8.3% after beating on the top and bottom lines. The travel site operator reported earnings of $12.40, which was $0.58 ahead of the Capital IQ consensus estimate. Meanwhile, the third quarter revenue of $1.71 billion represented a 17.4% year-over-year increase, and was ahead of analyst expectations. Regarding the upcoming quarter, the company expects its earnings to be in-line with expectations. Peer TripAdvisor (TRIP 35.12, +5.71) jumped 19.4% after reporting earnings of $0.46, which was $0.04 ahead of the Capital IQ consensus estimate. The company's revenue was in-line with expectations.

Starbucks (SBUX 50.84, +4.22) rose by 9.1% after reporting mixed earnings. During the fourth quarter, the coffee shop operator earned $0.46, which was $0.01 ahead of the Capital IQ consensus estimate. However, the company's revenue of $3.36 billion did not meet expectations. SBUX management said it continues to target roughly 10-13% revenue growth and it plans to open 1,300 new stores during fiscal-year 2013.

Elsewhere, Ralph Lauren (RL 160.75, +1.71) added 1.1% after beating on earnings and revenue. The company reported earnings of $2.45, which was $0.29 better than the Capital IQ consensus estimate. Revenue of $1.86 billion was also ahead of analyst estimates. In addition, the company anticipates third quarter net revenue below consensus.

Looking at social media stocks, Yelp (YELP 20.51, -3.52) slid 14.7% despite beating on earnings. The company's revenue of $36.4 million was in-line with the September preannouncement, and ahead of the Capital IQ consensus estimate. Regarding fourth quarter revenue, the company expects a top line result between $40 and $40.5 million.

OpenTable (OPEN 45.30, -2.06) slipped 4.4% despite beating on the bottom line. The company's earnings of $0.42 were $0.06 better than the Capital IQ consensus forecast while its revenue $39.74 was in-line with expectations. Following the earnings report, The Benchmark Company raised its price target for OPEN to $52 from $49.

One year ago, Groupon (GRPN 3.83, -0.20) began trading as a public company. Today, the stock fell 5.0% and traded at an all-time low.

Focusing on companies which made their public debut today, Restoration Hardware (RH 31.10, +7.10) settled 29.6% above its initial public offering price of $24.

Two energy stocks also began trading publically today. Southcross Energy Partners (SXE 22.35, +2.35) gained 11.8% after its 9-million share IPO was priced at $20, which was in-line with the expected range. Meanwhile, Delek Logistics Partners (DKL 22.35, +1.35) advanced 6.4% after shares priced at $21, which was at the high end of the expected price range.

In today's economic data, nonfarm private payrolls added 184K against the 130K consensus. The unemployment rate was reported at 7.9%, in-line with expectations.

Hourly earnings were unchanged while the expectations called for an uptick of 0.2%. Meanwhile, the average workweek was reported at 34.4, which was slightly lower than the 34.5 expected by the Briefing.com consensus.

Week in Review: Hurricane Sandy Cancels Two Days of Trade

On Monday and Tuesday, the New York Stock Exchange was closed due to Hurricane Sandy.

Wednesday's session started on a strong note. However, the bullish sentiment failed to hold as major averages began sliding off their highs shortly after the open. The key indices then marked their respective lows in the early afternoon before rallying in the final hour to finish mixed. The S&P 500 finished flat, while Nasdaq lost 0.4%. OPNET Technologies (OPNT 41.71, -0.04) surged 31.0% after entering into a definitive agreement to be acquired by Riverbed Technology (RVBD 18.90, +0.10). Per the agreement, Riverbed will pay $43 per share, representing a 34.0% premium to OPNET's Friday closing price.

On Thursday, equities began the day with a bullish sentiment as the three major averages spent the first 90 minutes on a steady upward climb. After reaching session highs, the S&P 500 leveled off and held its gains into the afternoon before ending with a gain of 1.1%. However, the biggest tech component, Apple (AAPL 576.80, -19.74), underperformed with a gain of just 0.2%.
 
Index Started Week Ended Week Change % Change YTD %
DJIA 13107.21 13093.16 -14.05 -0.1 7.2
Nasdaq 2987.95 2982.13 -5.82 -0.2 14.5
S&P 500 1411.94 1414.20 2.26 0.2 12.5
Russell 2000 813.25 814.37 1.12 0.1 9.9

TranSwitch (TXCC) announced that the co's HDplay TXC-44146 transceiver has been designed into Playvision's high definition video switch targeted for production launch in Dec 2012.

10:42 am S&P Information Technology Index trading lower today, behind the broader market

The tech sector is trading lower today as it underperforms the broader market. Semiconductors are showing relative weakness as well with the SOX trading 0.8% lower. Within the chip index, INTC (+0.7%) is a notable standout. Among other major indices, the SPY is trading flat, while the QQQ is up 0.1%, and the NASDAQ is trading 0.2% lower on the session. Among tech bellwethers, AAPL (-0.8%) is once again showing notable weakness.

An avalanche of tech earnings were reported after yesterday's close. ROVI (+10.0%) beat on earnings, revs, and guided EPS above consensus. LNKD (+2.3%) beat on earnings, revs, and guided revs in-line. ATML (-4.0%), IN (+10.6%) beat on earnings and missed on revs. OPEN (-4.9%), YELP (-11.0%) beat on earnings and guided in-line. SWKS (-11.1%) beat on earnings and guided EPS below consensus. WIT (-1.4%) reported EPS in-line and missed on revs. EQIX (+4.3%) missed on earnings and revs. This morning, SSYS (-8.2%) beat on earnings, revs, and guided EPS above consensus while revs are expected to be in-line. EXLS (-6.1%) beat on earnings, and raised full-year guidance. IT (-4.9%) missed on earnings and narrowed full-year revs guidance in-line. In news, VZ (+0.2%) announces tender offer for 8.95% notes due 2039 and potential partial redemption of certain notes. MVIS (-0.5%) filed for a $25 mln mixed securities shelf offering and filed for an offering of 2.1 mln shares of common stock that may be issued upon the exercise of warrants that were sold in connection with the public offering completed on June 20, 2012. EBAY (+0.2%) is planning on China partnership with Xiu.com, according to reports.

Looking at M&A rumors, Bloomberg discusses that NFLX (+2.0%) valuation may be too high for a sale. In notable analyst upgrades this morning in the tech space, USM (+1.9%) and PCCC (+6.3%) were both upgraded to Market Perform at Raymond James. Among downgrades, ACTV (-44.8%) was downgraded at Barrington Research, Citigroup, Northland Securities, and Raymond James. CYOU (+0.8%), SOHU (-1.9%), TEL (+0.2%) are the notable names in tech scheduled to report quarterly results before Monday's open.
icon url

ReturntoSender

11/04/12 12:00 PM

#9973 RE: ReturntoSender #6755

Leavitt Brothers - State of the Market - They favor the short side but...

http://leavittbrothers.com/blog/index.php/2012/11/04/state-of-the-market-nov-4/
icon url

ReturntoSender

11/04/12 9:57 PM

#9975 RE: ReturntoSender #6755

Seth Klarman Goes Nuts On The Fed In His Latest Investor Letter
Linette Lopez | Oct. 25, 2012, 4:38 PM

http://www.businessinsider.com/seth-klarman-goes-nuts-on-the-fed-2012-10
icon url

ReturntoSender

11/05/12 11:24 PM

#9977 RE: ReturntoSender #6755

From Briefing.com: 4:25 pm : Today's session began on a mixed note. The S&P 500 spent the majority of the day in negative territory as cautious trade took place ahead of tomorrow's Presidential election. However, late afternoon buying drove the benchmark average to a higher finish by 0.2%.

The technology sector outperformed the broader market. The biggest tech component, Apple (AAPL 584.62, +7.82), gained 1.4% after reporting that sales of its iPad 4 and iPad mini have reached three million units during the first three days of sales. Also of note, shortly before the close reports indicated that the company may be considering a switch from Intel (INTC 21.84, +0.01) processors. Following the news, Intel shares surrendered their gains, while AMD (AMD 2.10, 0.00) and ARM Holdings (ARMH 34.08, +0.88) spiked higher.

Netflix (NFLX 78.24, +1.34) added 1.7% after announcing it will issue one right for each current share of outstanding common stock at the close of business on November 2, 2012. The rights will not be exercisable immediately. However, if they do become exercisable, each right will entitle shareholders to buy one one-thousandth of a share of a new series of participating preferred stock at an exercise price of $350 per right. The plan is intended to protect Netflix and its stockholders from efforts to obtain control of company.

In technology earnings, Rogers Corporation (ROG 41.90, +2.67) spiked 6.8% after reporting mixed results. The supplier of communications equipment reported earnings of $0.69, which was $0.05 ahead of the Capital IQ consensus estimate. Meanwhile, the company's revenue of $130.20 million was slightly lower than estimated. However, the strength in the stock is likely related to upbeat guidance as the company expects fourth quarter earnings above analyst estimates while revenue is expected to be in-line with expectations.

On the downside, Ebix (EBIX 19.26, -3.15) fell 14.1% after Bloomberg reports indicated the software company is facing a Securities and Exchange Commission probe focused on its accounting practices. Since the initial report, company officials have issued the following statement: "The Ebix senior management team has not been advised of nor is it aware of any SEC investigation regarding the Company's previous filings. We stand behind the accuracy of our public filings. The Bloomberg article is inaccurate and misleading in many respects and we intend to evaluate all avenues of recourse."

Looking at the financial sector, The SPDR Financial Select Sector ETF (XLF 15.97, -0.03) underperformed the broader market as it settled lower by 0.2%.

Among the majors, Goldman Sachs (GS 124.08, +0.83) and Wells Fargo (WFC 34.02, +0.28) outperformed as the two stocks settled higher by 0.7% and 0.8%, respectively. Meanwhile, Bank of America (BAC 9.75, -0.10) and Citigroup (37.32, -0.28) were the notable laggards as the pair saw respective losses of 1.0% and 0.7%.

Elsewhere, KBW (KBW 17.47, +1.17) announced a merger with Stifel Financial (SF 32.58, +0.67). Per the agreement, KBW shareholders will receive $17.50 per share, which represents a 7.4% premium to KBW's Friday closing price. In addition, Stifel Financial reported its earnings this morning. During the third quarter, the investment brokerage earned $0.60 on $420.08 million in revenue. Both figures were ahead of the Capital IQ consensus estimates.

Also of note, MetLife (MET 34.69, -0.01) has agreed to sell its $70 billion mortgage servicing portfolio to JPMorgan Chase (JPM 42.27, -0.15). The move is aimed at expanding JPMorgan's footprint in the mortgage servicing business, while banks were expected to reduce their exposure in this area. As a result, companies which concentrate on mortgage investment were pressured. Nationstar Mortgage Holdings (NSM 30.20, -2.91) fell 8.8% and Ocwen Financial (OCN 32.95, -2.06) slid 5.9%.

The Dow Jones Transportation Average outperformed the broader market and settled higher by 0.3%. Alaska Air (ALK 40.13, +1.09) was the top performer within the complex after the carrier reported an 8.5% increase in traffic on the back of a 5.1% increase in capacity as compared to October 2011. In addition, Hurricane Sandy did not have a material impact on the company's capacity as 38 flights to and from the East Coast were cancelled. The stock rose by 2.8% following the positive report, and traded at its all-time high. Rival United Continental (UAL 20.25, +0.52) advanced 2.6% after the company's first Dreamliner 787 supplied by Boeing (BA 70.41, +0.36) took flight over the weekend.

Two automakers reported their quarterly results before today's open. Tesla Motors (TSLA 31.50, +2.58) surged 8.9% after reporting mixed earnings. During the third quarter, the automaker registered a loss of $0.92, which was $0.01 below the Capital IQ consensus estimates. Meanwhile, the company's revenue of $50.1 million represents a 13.2% year-over-year decline, but the figure came in ahead of analyst expectations. Lastly, Tesla reaffirmed its full-year 2012 guidance as well as its full-year 2013 gross margin projections and delivery targets. Note that today's buying has lifted the stock to levels not seen since late September.

Elsewhere, Toyota Motor (TM 81.35, +3.55) finished higher by 4.6% after its bottom line exceeded the Capital IQ consensus estimates. The Japanese carmaker reported earnings of JPY81.44, which was JPY8.47 ahead of expectations. Meanwhile, the company's revenue was in-line with analyst estimates. Regarding future outlook, the company raised its full-year 2013 net income guidance and lowered the full-year 2013 revenue expectations.

The October ISM Services index was reported at 54.2, which is below the 55.0 Briefing.com consensus, and down from September's reading of 55.1.

There is no economic data scheduled for tomorrow. However, the U.S. Treasury will auction off $32 billion in 3-yr notes.DJ30 +19.28 NASDAQ +17.53 SP500 +3.06 NASDAQ Adv/Vol/Dec 1481/1.44 bln/973 NYSE Adv/Vol/Dec 1538/600.7 mln/1448

4:24PM Rudolph Tech beats by $0.02, beats on revs (RTEC) : Reports Q3 (Sep) earnings of $0.25 per share, $0.02 better than the Capital IQ Consensus Estimate of $0.23; revenues rose 50.2% year/year to $62.2 mln vs the $60.23 mln consensus.

2:00PM Yahoo! and Samsung (SSNLF) form multi-year partnership to deliver Interactive TV (YHOO) 17.29 +0.18 : The cos announced an expanded multi-year partnership to integrate Yahoo!'s Broadcast Interactivity platform into Samsung 2012 Smart TVs. Yahoo! Broadcast Interactivity will be deployed in Samsung's SyncPlus platform. With this agreement, Samsung Smart TV owners will receive real-time, actionable content that runs alongside and complements TV shows and commercials.

8:32AM Apple announced it sold three million iPads in just three days since the launch of its new iPad mini and fourth generation iPad (AAPL) 576.80 : Apple announced it has sold three million iPads in just three days since the launch of its new iPad mini and fourth generation iPad - double the previous first weekend milestone of 1.5 million Wi-Fi only models sold for the third generation iPad in March.

7:04AM RF Micro Device acquires Amalfi Semiconductor for ~ $47.5 mln; co anticipates the transaction will be accretive to RFMD's P&L within two quarters (RFMD) 4.34 : Co announced a definitive agreement to acquire Amalfi Semiconductor, a fabless semiconductor co specializing in cost effective, high performance RF and mixed-signal ICs for the rapidly growing entry-level smartphone market. Under the terms of the agreement, RFMD will acquire Amalfi with cash on hand for total consideration of approximately $47.5 million, net of cash received. RFMD expects to achieve immediate product and cost synergies and anticipates the transaction will be accretive to RFMD's P&L within two quarters.

AMD (AMD) unveiled its new AMD Opteron 6300 Series server processors based on its next-generation "Piledriver" core architecture.

LDK Solar (LDK $0.86 +0.00) announced that Xingxue Tong has been appointed Chief Executive Officer of co, effective immediately. Xiaofeng Peng will continue to serve as Chairman. Tong currently serves as President, Chief Operating Officer and a director of co. "In light of the continued challenging environment for solar companies, I have determined that I can best serve the company by focusing my time on guiding LDK Solar's strategic direction and developing partner and other key relationships," stated Xiaofeng Peng, Chairman.
icon url

ReturntoSender

11/06/12 6:22 PM

#9978 RE: ReturntoSender #6755

From Briefing.com: 4:20 pm : Equities began the day on a slightly higher note. The early gains were doubled after an erroneous report on the Cincinnati Enquirer Website suggested Mr. Romney had a considerable lead over Mr. Obama in Ohio. The newspaper promptly retracted the claim, and said that the page accidentally showed a template with dummy data. However, the S&P 500 held the bulk of its gains into the late afternoon before ending higher by 0.8%.

The materials sector was among the top performers, and gained 1.1%. Looking at earnings within the space, Martin Marietta (MLM 86.98, +1.97) settled higher by 2.3% after the company's earnings of $1.36 exceeded Capital IQ consensus estimate by $0.08. Martin's revenue of $593.90 million also beat expectations. When commenting on future outlook, management said: "For full year 2012, we anticipate high single-digit volume growth in our nonresidential end-use market, driven primarily by increased energy shipments." Other providers of building materials saw similar strength. Texas Industries (TXI 45.59, +1.15) and Vulcan Materials (VMC 48.48, +1.88) advanced 2.6% and 4.0%, respectively.

Elsewhere, Louisiana-Pacific (LPX 15.70, -0.35) slipped 2.2% after reporting disappointing earnings. The paper producer's earnings of $0.20 were $0.04 worse than the Capital IQ consensus estimate. Meanwhile, the company's revenue of $467.8 also missed analyst expectations. Other paper manufacturers participated in the sector-wide rally. Neenah Paper (NP 26.78, +1.13) advanced 4.4% and International Paper (IP 35.62, +0.25) added 0.7%.

The consumer discretionary sector saw a flurry of earnings this morning. Two providers of satellite television service were among those who reported. DIRECTV (DTV 50.51, -0.15) slipped 0.3% after revealing third quarter earnings of $0.90, which was $0.04 below the Capital IQ consensus. Meanwhile, the company's revenue of $7.42 billion was ahead of the $7.31 billion expected by analysts. Management commented on the quarter by saying: "DIRECTV U.S.' third quarter results reflect successful execution of our long-term strategy to strike a more optimal balance between our top and bottom lines while DIRECTV Latin America continues to profitably increase market share in the rapidly growing Latin America pay-TV market." Peer DISH Network (DISH 36.00, +1.17) rose by 3.4% after reporting a loss of $0.35 on revenue of $3.52 billion. The bottom line may not be comparable to analyst estimates due to high litigation costs, while the top line missed expectations.

Office Depot (ODP 2.99, +0.48) and OfficeMax (OMX 8.33, +0.89) both reported mixed third quarter results. The two office store operators beat on their respective bottom lines, and fell short of the consensus revenue expectations. However, it should be noted that a Bloomberg article discussed a possible merger between the two. As a result of the M&A speculation, Office Depot and OfficeMax settled higher by 19.1% and 12.0%, respectively.

Luxury retailer Fossil (FOSL 84.24, -9.86) lost 10.5% after reporting mixed earnings. During the third quarter, the luxury retailer earned $1.26, which was $0.09 ahead of the Capital IQ consensus estimate. However, the company's revenue of $684.20 million was below analyst expectations. In addition, Fossil guided fourth quarter earnings in-line with expectations, while revenues are expected to show weakness and come in below consensus estimates. The results weighed on other higher-end apparel retailers. Coach (COH 57.75, +0.15), Ralph Lauren (RL 160.44, -0.79), and Macy's (M 41.38, +0.22) were all down around 1.0% at the start of the session before recovering their losses during the late-morning surge.

Utilities have seen considerable weakness in the aftermath of Hurricane Sandy. Since October 31, the SPDR Utilities Select Sector ETF (XLU 35.69, +0.02) is down over 3.0%. Most notably, electricity providers have been pressured as repair costs continue to rise. In addition, the failures in the Northeast are likely to result in calls for more regulatory oversight and better backup systems, which would translate to increased costs for electricity providers.

Today, the sector was the weakest performer, and major electricity providers weighed on the group. Southern Company (SO 44.14, -0.48) slid 1.1% and Edison International (EIX 45.68, -0.34) slipped 0.7%.

The Presidential election is today's headline event and first exit polls are expected after east coast voting ends at 19:00 ET. Hopefully, the results will be counted without issues and the outcome will be known before tomorrow's open.

In tomorrow's economic data, the weekly MBA Mortgage Index will be reported at 7:00 ET. In addition, September consumer credit will be announced at 15:00 ET.

The U.S. Treasury will auction off $24 billion in 10-yr notes.DJ30 +133.24 NASDAQ +12.27 SP500 +11.13 NASDAQ Adv/Vol/Dec 1590/1.73 bln/853 NYSE Adv/Vol/Dec 2138/673.0 mln/872

3:30 pm : Crude oil and precious metals trended higher alongside the equities market as the U.S. votes for a President and the dollar index inched lower. Crude climbed to a session high of $89.22 per barrel in afternoon action. The energy component then pulled-back slightly and settled with a 3.5% gain at $88.60 per barrel.

Gold came off its pit session low of $1688.20 per ounce and climbed as high as $1720.90 per ounce. Even with a slight pull-back heading into the close, the yellow metal closed 1.9% higher at $1714.50 per ounce.

Silver spent morning floor trade near the unchanged line but picked up momentum heading into afternoon action. It brushed a session high of $32.28 per ounce and eventually settled with a 2.9% gain at $32.03 per ounce.

Natural gas spent morning pit trade chopping around just above the breakeven line. However, it gained momentum in late afternoon action and managed to book a 2.0% gain as it closed at $3.62 per MMBtu.DJ30 +126.98 NASDAQ +8.96 SP500 +10.19 NASDAQ Adv/Vol/Dec 1517/1447.9 mln/888 NYSE Adv/Vol/Dec 2084/459 mln/890

4:07PM STEC beats by $0.04, beats on revs; guides Q4 EPS below consensus, revs below consensus (STEC) : Reports Q3 (Sep) loss of $0.24 per share, $0.04 better than the Capital IQ Consensus Estimate of ($0.28); revenues fell 41.9% year/year to $42.1 mln vs the $40.77 mln consensus. Co issues downside guidance for Q4, sees EPS of ($0.35)-($0.31) vs. ($0.22) Capital IQ Consensus Estimate; sees Q4 revs of $36-40 mln vs. $45.32 mln Capital IQ Consensus Estimate.

4:06PM Alterra Capital announces regular dividend and $100 mln share repurchase plan increase (ALTE) 23.88 +0.24 :

4:02PM Plexus announces disengagement with Juniper Networks (JNPR) (PLXS) 27.96 +0.35 : Co announced its disengagement as a supplier to Juniper Networks (JNPR). Plexus was informed of the disengagement on Monday, November 5, 2012. The timing of the transition of Juniper business from Plexus is not yet known, although it is currently expected to occur by the end of our current fiscal year. Commenting on the disengagement, Dean Foate, President and CEO said, "This is very surprising news to us given our recent communications and activities with Juniper, including the recent award of Juniper programs and our collaboration with Juniper on activities to support their competitiveness. Plexus has been an important strategic supplier to Juniper for more than a decade. While this is a significant event for us in the near term, our new business wins of $956 million during fiscal 2012, including in the networking/communications sector, provides us continued optimism in our strategy." Plexus will host a conference call on Wednesday, November 7, 2012, at 8:00 a.m. Eastern Time to discuss the disengagement further.

Shares are scheduled to resume trading at 16:30.

6:37AM MIPS Tech announced earlier it agreed to a sale of patent properties to AST and acquisition by Imagination Technologies for net proceeds of ~ $7.31 per share in cash (MIPS) 7.02 : Co announced it has entered into separate definitive agreements with Bridge Crossing, an acquisition vehicle of Allied Security Trust ("AST"), and Imagination Technologies Group with net proceeds of ~ $7.31 per share in cash to each holder of MIPS common stock. The total value of the transaction represents a 40% premium to the closing price on April 11, 2012, the day prior to the first public rumor of a potential sale of MIPS. Bridge Crossing will acquire 498 of MIPS' total 580 patent assets for gross proceeds of $350 mln. MIPS will retain the remaining 82 patent properties that are directly relevant and key to the MIPS architecture, and will also be granted a royalty-free, perpetual license under all of the patent properties sold to Bridge Crossing. MIPS will also provide a restricted license to Bridge Crossing under the 82 retained patent properties. Subject to consummation of the Bridge Crossing transaction, Imagination will acquire the operating business of MIPS, the 82 aforementioned patent properties, and license rights to all of the remaining patent properties of MIPS for $60 mln. The proceeds of the transactions, which are subject to a holdback of ~ $100 mln to cover tax and other liabilities, will be distributed to MIPS shareholders on a pro-rata basis through a recapitalization of MIPS common stock.

3:26AM LDK Solar and Sumitomo agree to terminate contract (LDK) 0.87 : LDK Solar announces that it has reached an agreement with Japan-based Sumitomo to terminate their long-term solar wafer supply agreement. Under the terms of the agreement, originally signed in Sep 2008, LDK was to supply multicrystalline silicon wafers to Sumitomo over an eight-year period, beginning in 2009 and extending through 2016. As part of the original agreement, Sumitomo made an advanced payment representing a portion of the contract value to LDK. In exchange for LDK's agreement to terminate the supply agreement, Sumitomo has agreed to pay LDK Solar a settlement amount totaling $33.4 mln. LDK is assessing the financial impact on its full year 2012 earnings of the Sumitomo termination and related contract termination charges.


Analog Devices (ADI) introduced a series of non-volatile single-, dual- and quad-channel digital potentiometers that improve component matching in industrial and communication control systems by featuring resistance tolerance of 1%.

icon url

ReturntoSender

11/07/12 8:18 PM

#9979 RE: ReturntoSender #6755

From Briefing.com: 4:30 pm : Stocks began the day firmly in the red after Barack Obama was reelected to a second term as president. Contributing to the bearish sentiment were comments from European Central Bank President Mario Draghi who said that the European debt crisis is starting hurt the German economy. The negative outlook was confirmed by this morning's Eurozone Autumn Forecast, which also pointed to an expected slowdown in the German economy. Further, the country's industrial production report showed a 1.8% month-over-month decrease, while the reading was expected to reflect a more palatable decline of 0.5%. The S&P 500 spent the first two hours of the session in a steady sell-off, before stabilizing near the 1,400 level and ending with a loss of 2.4% on heavy volume.

The financial sector saw the widest losses, and the SPDR Financials Select Sector ETF (XLF 15.61, -0.54) fell 3.3%. Among the majors, Morgan Stanley (MS 16.63, -1.56) and Bank of America (BAC 9.23, -0.71) were two of the weakest names as they settled lower by 8.6% and 7.1%, respectively.

Real estate investment trusts saw relative strength as compared to the remainder of the financial sector. The Vanguard REIT Index ETF (VNQ 64.68, -0.29) shed 0.5%. Looking at individual REITs, American Tower Corporation (AMT 75.24, +1.47) gained 2.0% after AT&T (T 33.63, -1.16) announced plans to modernize and expand its network. Meanwhile, Public Storage (PSA 143.34, +2.31) advanced 1.6%, and healthcare REIT Ventas (VTR 64.12, +0.21) rose by 0.3%.

With crude oil down over 4.5%, energy stocks saw notable weakness. Among major energy producers, Exxon Mobil (XOM 88.18, -2.86), Chevron (CVX 107.51, -2.85), and Anadarko Petroleum (APC 70.41, -2.66) lost between 2.5% and 3.6%.

Providers of energy equipment also underperformed. ION Geophysical (IO 6.39, -0.36) and Basic Energy Services (BAS 9.47, -0.56) closed lower by 5.3% and 5.6%, respectively.

Coal stocks saw broad losses after presidential challenger and coal proponent, Mitt Romney, was denied his bid for the White House. The Market Vectors Coal ETF (KOL 24.45, -1.42) lost 5.5%. Arch Coal (ACI 7.58, -1.08) was one of the weakest performers, and fell 12.5%. Peers Peabody Energy (BTU 26.24, -2.80), CONSOL Energy (CNX 33.28, -2.16), Walter Energy (WLT 34.26, -3.05) saw respective losses of 9.6%, 6.1%, and 8.2%.

The health care sector outperformed the broader market due to strength in hospital operators. During the presidential campaign, the Affordable Care Act was a point of contention, and Mr. Romney threatened to repeal the law if elected. Mr. Obama's reelection bodes well for healthcare stocks which benefit from the law. Community Health Systems (CYH 30.39, +1.71) and Health Management Associates (HMA 8.28, +0.56) gained 6.0% and 7.3%, respectively. Meanwhile, Tenet Healthcare (THC 27.34, +2.39) surged 9.6%.

Homebuilders saw narrower losses than the broader market and the SPDR S&P Homebuilders ETF (XHB 26.43, -0.27) slipped 1.0%. Hovnanian Enterprises (HOV 5.50, +0.19) and Lennar (LEN 39.05, +0.16) rose by 3.6% and 0.4%, respectively.

Elsewhere, gun maker stocks outperformed. Sturm, Ruger & Co (RGR 47.68, +3.04) gained 6.8% and Smith & Wesson (SWHC 10.36, +0.90) soared 9.6%.

The Dow Jones Transportation Average outperformed the remaining industrials. Within the 20-stock complex only United Continental (UAL 20.53, +0.06) traded in the black. The air carrier added 0.3%.

Freight carrier Con-way (CNW 28.56, -1.23) was the biggest laggard among transportation stocks, down 4.1%. Railroads also lagged. Kansas Southern (KSU 79.67, -2.53) and CSX (CSX 20.23, -0.63) both lost near 3.0%.

Looking at earnings, News Corp (NWSA 24.67, +0.39) finished higher by 1.6% after beating on earnings. During the first quarter, the media company earned $0.43 on $8.14 billion in revenue. The company's bottom line exceeded the Capital IQ consensus estimate by $0.05, while the revenue was in-line with expectations.

WellPoint (WLP 57.85, -3.35) slid 5.5% after the health benefits company reported mixed earnings. WLP earned $2.09, which was $0.25 better than the Capital IQ consensus estimate. However, the company's revenue of $15.13 billion was reported below expectations. Following the earnings release, Bank of America/Merrill Lynch downgraded the stock to ‘underperform' from ‘buy.'

In today's economic news, the weekly MBA Mortgage Index showed a 5.0% decrease in new applications. This follows prior week's decline of 4.8%.

Meanwhile, consumer credit increased by $11.4 billion in September. This follows prior month's reading of an $18.1 billion increase, and was higher than the $10.6 billion that had been broadly expected among economists polled by Briefing.com.

Tomorrow, weekly initial and continuing claims and the September trade balance will all be released at 8:30 ET.

The U.S. Treasury will auction off $16 billion in 30-yr bonds.DJ30 -312.95 NASDAQ -74.64 SP500 -33.86 NASDAQ Adv/Vol/Dec 377/2.0 bln/2120 NYSE Adv/Vol/Dec 557/878.1 mln/2550

3:30 pm : Crude oil tumbled deeper into negative territory on broad market weakness and a stronger dollar following the re-election of Barack Obama as the country's President. Inventory data that showed a build of 1.766 mln barrels when a build of 1.8 mln barrels was anticipated did little to change crude's downward trend. The energy component dipped as low as $84.05 per barrel moments before it settled pit trade with a 4.6% loss at $84.50 per barrel.

Similarly, precious metals feel into negative territory alongside the equities market. Gold fell off its session high of $1730.00 per ounce and dipped as low as $1703.00 per ounce. However, buyers stepped in and took prices back to near the unchanged level by afternoon pit trade. Gold settled the session just $0.40 lower at $1714.10 per ounce.

Silver traded as high as $32.28 per ounce in early morning floor action but tumbled to a session low of $31.22 per ounce. It also attempted to erase losses but eventually settled 1.1% lower at $31.67 per ounce.

Natural gas also spent its entire floor session in the red. It brushed a session high of $3.60 per MMBtu and touched a session low of $3.56 per MMBtu before it settled 1.1% lower at $3.58 per MMBtu.DJ30 -239.17 NASDAQ -59.66 SP500 -25.39 NASDAQ Adv/Vol/Dec 362/1662.4 mln/2104 NYSE Adv/Vol/Dec 557/594 mln/2536

4:25PM Novatel Wireless misses by $0.01, misses on revs; guides Q4 EPS below consensus, revs below consensus (NVTL) 1.71 -0.05 : Reports Q3 (Sep) loss of $0.27 per share, excluding non-recurring items, $0.01 worse than the Capital IQ Consensus Estimate of ($0.26); revenues fell 37.3% year/year to $71 mln vs the $78.8 mln consensus. Co issues downside guidance for Q4, sees EPS of ($0.31)-(0.20), excluding non-recurring items, vs. ($0.07) Capital IQ Consensus Estimate; sees Q4 revs of $67-80 mln vs. $106.02 mln Capital IQ Consensus Estimate.

4:25PM Universal Display (halted, will resume at 16:50) misses by $0.17, misses on revs; lowers FY12 rev below consensus (PANL) 28.18 -3.89 : Reports Q3 (Sep) loss of $0.12 per share, $0.17 worse than the Capital IQ Consensus Estimate of $0.05; revenues fell 42.7% year/year to $12.5 mln vs the $19.2 mln consensus. Results for the third quarter of 2012 do not include the recognition of any revenue under a licensing agreement with Samsung Display Co. Ltd. (SDC), under which SDC is obligated to make payments to the Company of $15 million in each of the second and fourth quarters of this year. Had the Company recognized these payments on a pro rata quarterly basis over the year, it would have resulted in an additional $7.5 million of royalty and license fees revenue in the third quarter. The SDC licensing revenue is subject to a royalty fee of 3% payable to the Company's university partners, and 16.5% in South Korean taxes. "Material sales in the quarter were consistent with the first quarter of the year, reflecting what we believe to be a temporary slowdown in industry growth. We believe that a more indicative measure of our continued strong growth and the outlook for OLED technology is the 29 percent growth in year-over-year revenues over the first three quarters of the year despite having only received half of the year's Samsung licensing revenue."

Co issues downside guidance for FY12, lowers FY12 revs to $80-82 mln from $90-110 mln vs. $99.84 mln Capital IQ Consensus Estimate -- with the caveat that the OLED industry is in the early stage of development and commercial adoption, where the delay or acceleration in the introduction of a commercial line or products by a small number of customers could have a material impact on the co's rev opportunities.

4:06PM Qualcomm beats by $0.07, beats on revs; guides Q1 EPS, revs above consensus; guides FY13 EPS, revs above consensus (QCOM) 58.12 -2.25 : Reports Q4 (Sep) earnings of $0.89 per share, excluding non-recurring items, $0.07 better than the Capital IQ Consensus Estimate of $0.82; revenues rose 18.3% year/year to $4.87 bln vs the $4.66 bln consensus. Q4 metrics: MSMM chip shipments: 141 million units, up 11 percent y-o-y and even QoQ. June quarter total reported device sales: ~$46.5 billion, up 19 percent y-o-y and down 3% QoQ. June quarter estimated 3G/4G device shipments: ~210 to 214 million units, at an estimated average selling price of ~$216 to $222 per unit.

Co issues upside guidance for Q1, sees EPS of $1.08-1.16, excluding non-recurring items, vs. $1.01 Capital IQ Consensus Estimate; sees Q1 revs of $5.6-6.1 bln vs. $5.31 bln Capital IQ Consensus Estimate.

Co issues upside guidance for FY13, sees EPS of $4.12-4.32, excluding non-recurring items, vs. $4.14 Capital IQ Consensus Estimate; sees FY13 revs of $23-24 bln vs. $21.73 bln Capital IQ Consensus Estimate.

Maxim Integrated Products (MXIM) announced a partnership with RadioPulse to provide ZigBee communication for smart grid solutions

NXP Semiconductors (NXPI) announced that its secure microcontrollers represent the major share in Germany's eHealthcard deployment.

ANADIGICS (ANAD) is shipping production volumes of its ALT6702, ALT6725, AWC6323 AWC6325, and AWT6624 LTE, CDMA, and WCDMA power amplifiers to Samsung Electronics (SSNLF) for the new Galaxy Note II.

Altera (ALTR) announced the availability of an updated version of its functional safety data package for automotive, industrial, medical and defense applications.

Veredus Laboratories, a majority-owned subsidiary of STMicroelectronics (STM), has launched VereMTB, a multiplexed molecular diagnostic chip capable of fast and accurate detection of Mycobacterium Tuberculosis Complex and its mutations, as well as 9 other clinically relevant non-tubercular mycobacterium.

1:06AM Amkor CEO to retire by the end of next year (AMKR) 4.42 : The co's Board has created a search committee to identify Joyce's replacement. An executive recruiting firm has been retained to conduct an outside search and also to assist with the assessment of internal candidates.

Rackspace (RAX $63.76 -2.32) reported third quarter earnings of $0.19 per share, in-line with the Capital IQ consensus of $0.19, while revenues rose 27.0% year/year to $336 million versus the $335.25 mln consensus.

08:41 am MEMC Elec shares spike 5% following better than expected earnings
MEMC Elec (WFR $2.70 +0.15) reported third quarter earnings of $0.30 per share, excluding non-recurring items, $0.42 better than the Capital IQ consensus of ($0.12), while non-GAAP rev fell 17.5% year/year to $708.9 million versus the $507.96 million consensus. For Q4: Semiconductor Materials rev down 4% to 11% QoQ. Solar energy systems non-GAAP sales volume in the range of 90 MW to 120 MW. Solar energy systems average pricing greater than $3.50/watt

icon url

ReturntoSender

11/08/12 9:04 PM

#9980 RE: ReturntoSender #6755

From Briefing.com: 4:30 pm : Equities began today's session on a slightly higher note. However, the bullish bias was dispelled during the opening hour. After marking its session high at 1,401, the S&P 500 reversed and slid to its 200-day moving average near the 1,380 area. The index followed the move with a seven point bounce, before late-day selling drove the index back below the 200-day moving average. As a result, the benchmark average settled lower by 1.2%.

Crude oil gained 0.6%, but the energy sector was the biggest laggard of the day. The SPDR Energy Select Sector ETF (XLE 69.57, -1.28) lost 1.8%. Among oil and gas stocks, Carrizo (CRZO 21.71, -1.77) dropped 7.5%. Meanwhile, providers of energy equipment also saw broad weakness. Ensco (ESV 55.12, -2.61) slid 4.5% and Diamond Offshore (DO 65.37, -2.41) lost 3.6%.

Yesterday's sell-off in coal stocks saw the Market Vectors Coal ETF (KOL 24.29, -0.16) drop 5.5%. Today, the ETF shed 0.7%. Among individual coal producers, James River Coal (JRCC 3.36, +0.07) outperformed, and settled higher by 2.1%. On the downside, Alpha Natural Resources (ANR 8.15, -0.30) lost 3.6%.

Looking at technology stocks, Apple (AAPL 537.75, -20.25) continued its recent weakness. The biggest tech component ended lower by 3.6%.

In tech earnings, QUALCOMM (QCOM 60.67, +2.54) advanced 4.4% after beating on earnings and revenue. The company's bottom line of $0.89 beat the Capital IQ consensus estimate by $0.07. Meanwhile, the revenue of $4.87 billion was also ahead of expectations. It should be noted that the company guided first quarter and full-year 2013 earnings and revenue above consensus.

Universal Display (PANL 23.12, -5.05) fell 18.0% after reporting disappointing earnings. During the third quarter, the manufacturer of organic LEDs lost $0.12 on $12.5 million in revenue. The company's earnings were $0.17 below expectations, while its revenue also fell short of estimates. In addition, PANL issued downside full-year 2012 revenue guidance.

Utility stocks which have seen considerable weakness since Hurricane Sandy, saw relative strength. PPL (PPL 28.73, +0.43) was the top performer among electricity providers. The stock added 1.5% after the company reported earnings of $0.72, which was $0.05 better than the Capital IQ consensus estimate. However, the revenue of $2.4 billion was below expectations. In addition, the company issued in-line guidance.

Meanwhile, FirstEnergy (FE 42.91, +0.61) advanced 1.4% after beating on earnings. In addition, the company lowered its full-year 2012 earnings guidance in-line with expectations and also guided full-year 2013 earnings in-line with estimates.

Elsewhere, Southern Company (SO 43.26, +0.46) slid 1.1% after RBC Capital Markets upgraded the stock to ‘outperform' from ‘sector perform.'

Looking at the retail industry, the SPDR S&P Retail ETF (XRT 61.24, -1.36) underperformed the broader market and ended lower by 2.2%. Among individual retailers, Kohl's (KSS 51.55, -2.77) lost 5.1% after reporting third quarter earnings of $0.91 on $4.49 billion in revenue. The company's bottom line was $0.04 ahead of Capital IQ estimates, while the revenue was reported in-line with the November 1 preannouncement. However, the company's outlook was a point of concern as the retailer issued downside fourth quarter earnings guidance.

Elsewhere, American Eagle Outfitters (AEO 19.69, -0.90) finished lower by 4.4% and Aeropostale (ARO 12.69, -0.88) dropped 6.5% after Detweiler made cautious comments about the apparel retailer.

Also of note, McDonald's (MCD 85.13, -1.73) stumbled 2.0% after reporting a 1.8% decline in global same-store sales. The figure was below the expected decrease of 1.0%. In addition, this was the first time the fast food giant saw a monthly decline since 2003.

In today's economic data, the latest weekly initial jobless claims count totaled 355,000, which was lower than the 370,000 that had been expected. The tally was below the unrevised prior week count of 363,000. As for continuing claims, they fell to 3.127 million from 3.262 million.

The trade deficit narrowed to $41.5 billion during September after a downwardly revised prior month deficit of $43.8 billion. Economists polled by Briefing.com had expected that the deficit would come in at $45.4 billion.

Tomorrow, October export prices ex-agriculture and import prices ex-oil will be reported at 8:30 ET. In addition, the November Michigan Sentiment and September wholesale inventories will be announced at 9:55 ET and 10:00 ET, respectively.DJ30 -121.41 NASDAQ -41.71 SP500 -17.02 NASDAQ Adv/Vol/Dec 642/1.82 bln/1812 NYSE Adv/Vol/Dec 825/758.6 mln/2238

3:35 pm : Crude oil spent most of its floor session in positive territory despite a stronger dollar index. The energy component slid off its session high of $85.70 per barrel and brushed a session low of $84.22 per barrel. After very choppy action, crude settled 0.7% higher at $85.09 per barrel.

Natural gas came off its session low of $3.53 per MMBtu and popped into the black on bullish inventory data that showed a build of 21 bcf when a build of 25 bcf was expected. It continued to climb higher for the remainder of floor trade and closed at its session high of $3.61 per MMBtu for a 0.8% gain. Precious metals climbed higher in today's pit trade despite a stronger dollar index. The advance came on better-than-expected U.S. weekly initial jobless claims data and Eurozone debt concerns.

Gold came off its session low of $1712.60 per ounce and brushed a session high of $1726.90 per ounce moments before it settled with a 0.7% gain at $1726.00 per ounce. Silver fared even better as it settled 1.8% higher at $32.24 per ounce, or just below its session high of $32.25 per ounce.DJ30 -69.07 NASDAQ -32.48 SP500 -11.02 NASDAQ Adv/Vol/Dec 755/1507.6 mln/1681 NYSE Adv/Vol/Dec 957/513 mln/2059

4:50PM KLA-Tencor announces regular cash dividend and announces an additional 8 million share repurchase authorization (KLAC) 45.66 -1.26 : Co announced that its Board of Directors has declared a quarterly cash dividend of $0.40 per share on its common stock payable on December 3, 2012 to KLA-Tencor stockholders of record as of the close of business on November 19, 2012. KLA-Tencor further announced that its Board of Directors has authorized the repurchase of an additional 8 million shares of the company's outstanding common stock. This 8 million share repurchase authorization is in addition to previous authorizations.

4:27PM Microchip reports EPS in-line, revs in-line; guides DecQ EPS below consensus, revs below consensus (MCHP) 31.88 -0.23 : Reports Q2 (Sep) earnings of $0.48 per share, excluding non-recurring items, in-line with the Capital IQ Consensus Estimate consensus of $0.48; non-GAAP revenues rose 19.7% year/year and 15.7% sequentially to $407.8 mln vs the $407.5 mln consensus. Co issues downside guidance for Q3 (Dec), sees EPS of $0.37-0.41, excluding non-recurring items, vs. $0.49 Capital IQ Consensus Estimate; sees Q3 non-GAAP revs of $396-426 mln vs. $429.6 mln Capital IQ Consensus Estimate.

4:12PM Brooks Automation beats by $0.06, beats on revs; guides Q1 EPS below consensus, revs below consensus (BRKS) 7.23 -0.19 : Reports Q4 (Sep) earnings of $0.08 per share, $0.06 better than the Capital IQ Consensus Estimate of $0.02; revenues fell 8.9% year/year to $119.4 mln vs the $115.97 mln consensus.

Co issues downside guidance for Q1, sees EPS of ($0.15)-($0.07) vs. $0.01 Capital IQ Consensus Estimate; sees Q1 revs of $85-95 mln vs. $114.51 mln Capital IQ Consensus Estimate.

4:03PM Microsemi reports EPS in-line, revs in-line; guides Q1 EPS below consensus, revs below consensus (MSCC) 18.58 -0.09 : Reports Q4 (Sep) earnings of $0.58 per share, excluding non-recurring items, in-line with the Capital IQ Consensus Estimate consensus of $0.58; revenues rose 15.8% year/year to $263.1 mln vs the $265.63 mln consensus. Co issues downside guidance for Q1, sees EPS of $0.50-0.54, excluding non-recurring items, vs. $0.61 Capital IQ Consensus Estimate; sees Q1 revs down 2-6%, which equates to ~$247.3-257.8 mln vs. $271.90 mln Capital IQ Consensus Estimate.

4:02PM Diodes misses by $0.01, reports revs in-line; guides Q4 revs in-line (DIOD) 14.97 -0.49 : Reports Q3 (Sep) earnings of $0.20 per share, $0.01 worse than the Capital IQ Consensus Estimate of $0.21; revenues rose 3.7% year/year to $166.6 mln vs the $166.69 mln consensus. Co issues in-line guidance for Q4, sees Q4 revs of $160-167 mln vs. $165.67 mln Capital IQ Consensus Estimate.

"Gross margin improved moderately in the quarter but remained under pressure primarily due to the effects of the generally weak global economy. Although we are gaining market share for our more advanced packages as supported by the capital investments we made in the second and third quarters, we are still underloaded on our standard packages. The unstable demand environment also caused pricing to weaken in the quarter and product mix to be less favorable than we had anticipated."
Outlook: For Q4, Gross margin is expected to be 25 percent, plus or minus 2 percent. Operating expenses are expected to be 23.5 percent of revenue, plus or minus 1 percent. The anticipated increase in operating expenses over the third quarter is due to the inclusion of PAM and a full quarter of Eris.

9:31AM Verizon to redeem the entire outstanding principal amount of its $750 mln 4.35% Notes, due Feb 15, 2013 (VZ) 43.10 -0.09 : Co announced that it will redeem the entire outstanding principal amount of its $750 million 4.35% Notes, due Feb 15, 2013 and that a subsidiary, Verizon Virginia, will redeem the entire outstanding principal amount of its $1 billion 4.625% Debentures, Series A, due Mar 15, 2013. The redemption date for the Verizon Securities will be Dec 11, 2012 and the redemption date for the Virginia Securities will be Dec 10, 2012. The redemption price for each series of Securities will be equal to the sum of the present values of the remaining scheduled payments of principal and interest on that series of Securities discounted to the applicable redemption date for that series of Securities on a semi-annual basis at the Treasury Rate plus 25 basis points, plus accrued and unpaid interest to the applicable redemption date, and will be payable on the applicable redemption date.

Sanmina-SCI (SANM) and Uros have collaborated to bring a new mobile hotspot device to market called Goodspeed. Sanmina-SCI is providing engineering and manufacturing services at its Haukipudas, Finland facility.

Brolis Semiconductors and Veeco Instruments (VECO) announced that Brolis has received shipment of a Veeco GEN200 Edge Molecular Beam Epitaxy production system for installation at their new epitaxial wafer production facility in Vilnius, Lithuania.

Qualcomm (QCOM $62.81 +4.69) reported fourth quarter earnings of $0.89 per share, excluding non-recurring items, $0.07 better than the Capital IQ consensus of $0.82, while revenues rose 18.3% year/year to $4.87 billion versus the $4.66 billion consensus. Q4 metrics: MSMM chip shipments: 141 million units, up 11 percent y-o-y and even QoQ. June quarter total reported device sales: ~$46.5 billion, up 19 percent y-o-y and down 3% QoQ. June quarter estimated 3G/4G device shipments: approximately 210 to 214 million units, at an estimated average selling price of ~$216 to $222 per unit. THe company issued upside guidance for the first quarter with EPS of $1.08-1.16, excluding non-recurring items, versus the $1.01 consensus and revenues of $5.6-6.1 billion versus the $5.31 billion consensus. Co issued upside guidance for fiscal year 2013 with EPS of $4.12-4.32, excluding non-recurring items, versus the $4.14 consensus and sees revenues of $23-24 billion versus the $21.73 billion consensus.

12:58 pm S&P Information Technology Index trading today, underperforming the S&P

The tech sector is trading lower today as it underperforms the broader market. Semiconductors are showing relative weakness as well with the SOX trading 0.5% lower. Within the chip index, WFR (-5.0%) is a notable laggard. Among other major indices, the SPY is trading 0.4% lower today, while the QQQ and the NASDAQ are both down 0.6%. Among tech bellwethers, AAPL (-2.0%) is once again showing notable weakness. Tech earnings continued rolling in last night. ATVI (-0.5%), QCOM (+6.5%) beat on EPS, revs, and issued upside guidance. CTL (+5.8%) beat on EPS, revs, and guided Q4 EPS above consensus. TRLA (-16.8%) beat on EPS and revs. PANL (-18.1%) missed on EPS, revs, and guided lower.

This morning, MWW (+17.5%) reported earnings which may not be comparable to estimates due to restructuring. EBIX (-5.5%) beat on EPS and revs. WIN (-8.9%) posted a slight EPS miss, but beat on revs. In news, AMZN (-1.1%) announced the launch of Amazon wine. In notable analyst upgrades this morning in the tech space, USM (+0.9%) was upgraded to Outperform at Raymond James. JNPR (+0.3%) was upgraded to Hold at Cantor Fitzgerald with a $21 target. ADTN (+0.1%) was upgraded to Buy at Mizuho with a $22 target. Among downgrades, PANL (-18.2%) was downgraded to Neutral at Wedbush. IQNT (-13.0%) was downgraded to Underperform at Oppenheimer. ADSK (-2.4%) was downgraded to Hold at Jefferies. DLB (+0.9%), GRPN (+2.4%), FLTX (+0.7%), NVDA (+0.8%) are the notable names in tech scheduled to report quarterly results today after the close.

08:48 am Universal Display shares plunge by 26% following worse than expected earnings
Universal Display (PANL $20.83 -7.35) reported third quarter loss of $0.12 per share, $0.17 worse than the Capital IQ consensus of $0.05, while revenues fell 42.7% year/year to $12.5 million versus the $19.2 mln consensus. Results for the third quarter of 2012 do not include the recognition of any revenue under a licensing agreement with Samsung Display Co. Ltd. (SDC), under which SDC is obligated to make payments to the Company of $15 million in each of the second and fourth quarters of this year. Had the Company recognized these payments on a pro rata quarterly basis over the year, it would have resulted in an additional $7.5 million of royalty and license fees revenue in the third quarter. The SDC licensing revenue is subject to a royalty fee of 3% payable to the Company's university partners, and 16.5% in South Korean taxes. "Material sales in the quarter were consistent with the first quarter of the year, reflecting what we believe to be a temporary slowdown in industry growth. We believe that a more indicative measure of our continued strong growth and the outlook for OLED technology is the 29 percent growth in year-over-year revenues over the first three quarters of the year despite having only received half of the year's Samsung licensing revenue." The company issued downside guidance for FY12, lowered fiscal year 2012 revenues of $80-82 million from $90-110 million versus the $99.84 million consensus -- with the caveat that the OLED industry is in the early stage of development and commercial adoption, where the delay or acceleration in the introduction of a commercial line or products by a small number of customers could have a material impact on the company's rev opportunities.
icon url

ReturntoSender

11/10/12 4:50 PM

#9982 RE: ReturntoSender #6755

From Briefing.com: Weekly Recap - Week ending 09-Nov-12

Dow +4.07 at 12815.39, Nasdaq +9.29 at 2904.87, S&P +2.34 at 1379.85

Stocks began the day in the red after equity futures showed considerable pre-market weakness. The S&P 500 spent the opening minutes just below its flat line. However, the benchmark average began climbing after the Washington Post reported that a plan for a middle class tax freeze will be proposed by the president at this afternoon's press conference. In addition, today's preliminary Michigan Consumer Sentiment Survey was reported at 84.9, which was its highest level since July 2009. The S&P 500 continued advancing through the morning and marked its highs ahead of the president's speech. President Obama's statement called for consensus building, and he stated that spending cuts must be combined with new revenue. The remarks failed to inspire investor confidence and the S&P 500 headed back near its flat line before ending with a slim gain of 0.2%. Note that today's close was one point below the 200-day moving average.

Shares of Apple (AAPL 547.06, +9.31) rebounded from recent weakness, and the stock ended higher by 1.7%.

Elsewhere in technology, Kayak Software (KYAK 39.67, +8.63) surged 27.8% after agreeing to be acquired by Priceline (PCLN 625.87, -2.00). Per the agreement, PCLN will pay $40.00 per share of KYAK, representing a 28.9% premium to Kayak's Thursday closing price.

The consumer discretionary sector was a notable underperformer. J.C. Penney (JCP 20.64, -1.05) lost 4.8% after reporting disappointing earnings. The retailer announced a third quarter loss of $0.93, while the Capital IQ consensus called for earnings of $0.02. Meanwhile, the company's revenue of $2.93 billion fell short of the expected $3.29 billion. Also of note, the company reported a same-store sales decrease of 26.0%. The expectations called for a 17.0% decline.

Elsewhere, Groupon (GRPN 2.76, -1.16) slid 29.6% following another round of earnings which failed to please investors. The online coupon site's revenue of $568.6 million fell short of the expected $592.06 million. GRPN is down nearly 90.0% since its initial public offering last year.

For-profit education stocks saw weakness after two names reported disappointing earnings. Career Education (CECO 2.93, -0.48) slid 14.1% after the company reported a third quarter loss of $0.47 on $332.8 million in revenue. CECO's bottom line was $0.04 worse than the Capital IQ consensus estimate while its revenue exceeded estimates. Total new student starts fell 23.0% year-over-year and the company announced plans to eliminate approximately 900 positions.

Elsewhere, Strayer Education (STRA 46.51, -9.66) plunged 17.2%. The company beat their earnings expectations by $0.05, but downside guidance weighed on the stock. Strayer reported a 5.0% decrease in fall 2012 enrollment. Following earnings, Stifel Nicolaus downgraded the stock to ‘hold' from ‘buy.'

The Dow Jones Transportation Average slipped 0.7%. The five airlines which are a part of the average saw broad weakness. JetBlue Airways (JBLU 5.31, -0.09) and Southwest Airlines (LUV 9.06, -0.12) saw respective losses of 1.7% and 1.3%.

Shipper Matson (MATX 22.67, +0.25) was the top performer within the transportation average. The stock trades gained 1.1%. Meanwhile, the other shipping stock, Kirby Group (KEX 53.89, -0.92), was one of the weakest performers in the 20-stock complex and lost 1.7%.

Homebuilders were weaker today and the SPDR S&P Homebuilders ETF (XHB 25.67, -0.29) dipped 1.1%. KB Home (KBH 15.69, -0.54) and PulteGroup (PHM 16.80, -0.57) saw notable losses as the two stocks both slid 3.3%.

Before Monday's open, two homebuilders will report their quarterly results. The Capital IQ consensus estimate expects Beazer Homes (BZH 16.64, -0.36) to report a loss of $1.05 on $336.66 million in revenue. Elsewhere, DR Horton (DHI 20.60, -0.37) is expected to announce earnings of $0.30 on revenue of $1.38 billion.

Wholesale inventories increased by 1.1% in October. That was higher than the increase of 0.4% which had been forecast by the Briefing.com consensus.

Export prices, excluding agriculture, increased by 0.2% in September after they had increased by 0.7% in the prior month. Excluding oil, import prices rose by 0.3%, which follows the 0.2% increase experienced in the prior month.

Week in Review: Stocks Plunge with Presidential Election in the Rear-view Mirror

On Monday, the session began on a mixed note. The S&P 500 spent the majority of the day in negative territory as cautious trade took place ahead of Tuesday's presidential election. However, late afternoon buying drove the benchmark average to a higher finish by 0.2%. Apple (AAPL 547.06, +9.31), gained 1.4% after reporting that sales of its iPad 4 and iPad mini have reached three million units during the first three days of sales. Also of note, shortly before the close reports indicated that the company may be considering a switch from Intel (INTC 20.80, -0.03) processors. Following the news, Intel shares surrendered their gains, while AMD (AMD 2.03, +0.05) and ARM Holdings (ARMH 33.86, +0.04) spiked higher.

Tuesday began on a slightly higher note. The early gains were doubled after an erroneous report on the Cincinnati Enquirer Website suggested Mr. Romney had a considerable lead over Mr. Obama in Ohio. The newspaper promptly retracted the claim, and said that the page accidentally showed a template with dummy data. However, the S&P 500 held the bulk of its gains into the late afternoon before ending higher by 0.8%. Office Depot (ODP 2.86, +0.10) and OfficeMax (OMX 7.97, -0.03) both reported mixed third quarter results. The two office store operators beat on their respective bottom lines, and fell short of the consensus revenue expectations. However, it should be noted that a Bloomberg article discussed a possible merger between the two. As a result of the M&A speculation, Office Depot and OfficeMax soared 19.1% and 12.0%, respectively.

On Wednesday, stocks began the day firmly in the red after Barack Obama was reelected to a second term as president. Contributing to the bearish sentiment were comments from European Central Bank President Mario Draghi who said that the European debt crisis is starting hurt the German economy. The negative outlook was confirmed by this morning's Eurozone Autumn Forecast, which also pointed to an expected slowdown in the German economy. Further, the country's industrial production report showed a 1.8% month-over-month decrease, while the reading was expected to reflect a more palatable decline of 0.5%. The S&P 500 spent the first two hours of the session in a steady sell-off, before stabilizing near the 1,400 level and ending with a loss of 2.4% on heavy volume. The financial sector saw the widest losses, and the SPDR Financials Select Sector ETF (XLF 15.50, +0.02) fell 3.3%. Among the majors, Morgan Stanley (MS 16.61, +0.09) and Bank of America (BAC 9.43, +0.04) were two of the weakest names as they settled lower by 8.6% and 7.1%, respectively.

Equities began Thursday's session on a slightly higher note. However, the bullish bias was dispelled during the opening hour. After marking its session high at 1,401, the S&P 500 reversed and slid to its 200-day moving average near the 1,380 area. The index followed the move with a seven point bounce, before late-day selling drove the index back below the 200-day moving average. As a result, the benchmark average settled lower by 1.2%. Apple (AAPL 547.06, +9.31) continued its recent weakness and ended lower by 3.6%.
Index Started Week Ended Week Change % Change YTD %
DJIA 13093.16 12815.39 -277.77 -2.1 4.9
Nasdaq 2982.13 2904.87 -77.26 -2.6 11.5
S&P 500 1414.20 1379.85 -34.35 -2.4 9.7
Russell 2000 814.37 795.02 -19.35 -2.4 7.3

4:01PM IDT announces extension of exchange offer expiration date in PLX Technology (PLXT) transaction (IDTI) 5.85 +0.12 : Co announced that it is extending the expiration date of its exchange offer for all outstanding shares of common stock of PLX Technology (PLXT). The exchange offer was previously scheduled to expire at the end of the day on Nov 9, 2012, at 12:00 midnight, New York City time. The exchange offer is being extended as the applicable waiting period pursuant to the Hart-Scott-Rodino Antitrust Improvements Act of 1976 has not yet expired or been terminated, and the exchange offer is now set to expire at the end of the day on Dec 10, 2012, at 12:00 midnight, New York City time, unless further extended. Approximately 19.4 million shares, or approximately 43.1% of PLX's outstanding common stock, had been tendered as of 12:00 midnight at the end of the day on November 8, 2012.

2:58PM Verizon prices tender offer for 8.95% notes due 2039 (VZ) 42.61 0.00 : Co announced the pricing of its previously announced tender offer to purchase for cash any and all of its outstanding $1,250,000,000 aggregate principal amount of 8.95% Notes due 2039. For each $1,000 principal amount of Notes validly tendered and accepted, the holders will receive $1,864.63. The Purchase Price represents a yield to maturity equal to 3.75%, which was the yield to maturity of the 3.000% U.S. Treasury reference security due May 15, 2042 plus a fixed spread of 100 basis points.

12:31PM Cascade Microtech establishes $2 mln stock repurchase program (CSCD) 5.17 +0.02 :

8:02AM Skyworks announced that its Board of Directors has authorized the repurchase of up to $200 mln of the co's common stock (SWKS) 20.02 :

HP (HPQ) strengthened its mission-critical Converged Infrastructure portfolio with innovative and enhanced HP Integrity systems, HP-UX software and services to triple performance, boost resiliency and deliver investment protection for critical workloads deployed into the next decade.

NVIDIA (NVDA) reported third quarter earnings of $0.39 per share, $0.03 better than the Capital IQ consensus of $0.36, while revenues rose 12.9% year/year to $1.2 billion versus the $1.19 bln consensus. The company issued downside guidance for the fourth quarter with revenues of $1.025-1.175 billion versus the $1.2 billion consensus. Q3 Non-GAAP gross margin was a record 53.1 percent (co guided for flat Q3 gross margins vs prior quarter or 52%). NVIDIA initiated quarterly dividend of 7.5 cents a share. NVIDIA is authorized, subject to certain specifications, to spend up to an additional $1.24 billion repurchasing shares of its common stock. Outlook: GAAP and non-GAAP gross margins are expected to be flat relative to the prior quarter, 52.9 percent and 53.1 percent, respectively. "Kepler GPUs are winning across the special-purpose PC markets we serve, from gaming to design to supercomputing. And Tegra is powering some of the most innovative tablets, phones and cars in the market."
10:47 am Tech Sector trading higher today and outperforming S&P

The tech sector is trading higher today as it leads the broader market. Semiconductors are showing relative strength as well with the SOX trading 0.9% higher. Within the chip index, TXN (+1.5%) is a notable gainer. Among other major indices, the SPY is trading 0.3% higher today, while the QQQ and the NASDAQ are up 0.6% and 0.5%, respectively. Among tech bellwethers, AAPL (+1.5%) is showing notable strength.

Looking at last night's tech earnings, DLB (-5.0%) beat on EPS and revs, but guided Q1 EPS below consensus. FLTX (-3.3%), beat on EPS, revs and issued upside guidance. NVDA (+1.3%) beat on EPS, and guided Q4 revs below consensus. This morning, CRAY (+8.7%) beat on EPS, revs, and guided higher. In M&A news, KYAK (+26.5%) will be acquired by PCLN (-0.4%) for $40/share. CRAY (+8.7%) will acquire Appro International for $25 million. In news, SWKS (+2.6%) board of directors authorized the repurchase of up to $200 mln of common stock. In notable analyst upgrades this morning in the tech space, CCOI (+1.1%) was upgraded to Market Perform at Bernstein. Among downgrades, SPRD (-10.7%) was downgraded at Canaccord Genuity and JP Morgan. DTSI (-24.8%) was downgraded at Barrington Research, JMP Securities, and Piper Jaffray. CSCO (+0.5%) was downgraded to Neutral at JP Morgan.
icon url

ReturntoSender

11/11/12 4:52 PM

#9983 RE: ReturntoSender #6755

InvestmentHouse Weekend Market Summary

http://investmenthouse2.com/cntdirplus.asp?name=IHDaily&zid=2770189&eeid=XFcqVytdVygELD4ZXlAyUFpZGFAqWg==

- Not much relief in the relief bounce.
- Many news stories but fiscal cliff starting to overshadow them all.
- Fed: Bullard says Operation Twist to end, but the Fed may buy other assets.
- Wholesale Inventories climbing as prices climb.
- Michigan sentiment hits 5 year high just in time for the fiscal cliff posturing.
- Friday has the look of just a pause in the selling, but the midcaps and SP500 may try another relief move to start the week.

Just enough of a bounce to take off the downside pressure - - for the day.

Friday was somewhat of a disappointment. Okay, quite a bit of a disappointment. The market was oversold after two sharp downside sessions, but another strong decline early on could have really set a move back up of some significance.

As it was futures were mixed with NASDAQ higher given AAPL was bouncing in relief after some harsh selling. The selling pressure was escaping slowly with a modest bounce. Toward the open futures improved and stocks continued to recover on the open. Indeed, they put in a solid move into lunch.

That was the apex. Stocks tested into early afternoon, bounced decently, but put in a lower high. The upside had pretty much cashed in for the day. They faded and wandered into the close with the most modest of gains. Hardly an auspicious recovery. Indeed it was not a recovery as SP500, after rallying up through its 200 day SMA intraday, gave it back on the close.

SP500 2.34, 0.17%
NASDAQ 9.29, 0.32%
DJ30 4.07, 0.03%
RUT2000 0.17%
SP400 0.14%
SOX 0.24%

No, in the end it looked more like just a pause in the selling. SP400 looks better than the others as it holds over its 200 day SMA, but it is not an island, just as we found out NASDAQ and the Russell 2000 were not islands either. There could be another bounce to test the selling early in the week, but as noted, it let off some downside pressure Friday without getting that violent reversal.

THE NEWS

There certainly was news to be had. Earnings are still coming and JCP missed, noting a 26% decline in same store sales. Looks as if that turnaround attempt made a 360 versus a 180 degree turn.

China logged its slowest inflation in 33 months. Indeed, its PPI was negative at -2.8% year/year.

As soon as we touted Australia a bit its central bank cut its GDP projection to 2.75% from 3.00%. Not great but twice what we are producing.

Europe was its usual downer. Germany said Greece's next payment may be delayed because votes had to be taken, parliament had to approve it, etc. Sounds as if the Germans are just leading Greece around by the leash in a little 'whose your boss?' display.

Michigan Sentiment came in at a 5 year high at 84.9 (82.6 prior), but how long will it keep improving without jobs and rising incomes? Those are what really drives sentiment longer term. We have seen it rise and fall more than a time or two during this weakest of recoveries. Moreover, with the love fest known as the fiscal cliff negotiations to come, it is probably a pretty good bet that there won't be so many happy people over the holidays as we watch the sausage being made.

Indeed, the fiscal cliff is overshadowing the market, and the realization that the same people were in the same places talking the same line after the election had as much to do with the 5% decline on SP500 than anything else.

The sad thing is, we are going to debate this issue without really getting to the issue. The sides will sit down and talk about revenues, spending cuts, and tax increases because those are the issues they think they understand and can at least talk about without coming to blows.

The President has a line in the sand with respect to taxes. He is bound and determined, ideologically so, to raise taxes on those making $250K or more. Now they already pay over 50% of the taxes right now while almost 50% of tax age citizens pay 0% income tax. The argument I have heard as to why this will work is because the rates he wants are the rates under Clinton, and supposedly raising rates to that level will magically return us to economic nirvana. In the 17 years since, however, much has changed. There are so many differences between then and now.

The early 1990's recession was very shallow; it was over before the election and recovery was underway. It was merely a pause in the great run from the early 1980's. Raising taxes is really never a good thing but Clinton got away with it because he simultaneously slashed capital gains taxes from high levels. He upped the marginal rates, lowered capital rates, and money was still invested in the economy and the 20 year boom continued after a brief respite.

Not the case this time. Capital gains taxes are set to rise 5 times in addition to the marginal rate increases across the board. With an economy already in the dumpster, burdened by $6T new debt in the past four years, running a $1T+ deficit already this year, raising tax rates will be, as the CBO says, automatically recessionary.

The sad truth is, it will do nothing to alleviate the problem. We could confiscate the entire profits of the Fortune 500 companies and run the government for a few weeks. In short, we can tax away everything owned in the country and we could not pay our debt. Yet if you talk about cutting taxes our leaders squeal about 'lost revenues.'

We should do the opposite: cut taxes that place extra burdens on investment capital, on corporations, and yes, in individuals. Don't tax investment capital 2 and 3 times. Then you get more investment capital (remember, if you tax it, it will disappear). Reduce corporate taxes to zero and take out the price of those taxes in the price of the goods and services sold. I talked with a candidate for Congress who asked me if I really believed that would happen. I explained that of course companies would try and maintain their pricing to increase their profit. BUT . . someone who wanted the business, who wanted to enter the market, would come in with lower prices and then the spiral lower would start. Good old competition.

Cutting taxes works. There has never been an instance in US history that tax cuts did not generate MORE revenues than were taken in at the higher rates before the cuts. Kennedy, Reagan, Clinton, and even Bush. The right kinds of cuts, i.e. on capital, corporations, and marginal rates, are the most effective. The argument about 'lost revenues' is blown out of the water by the facts. Yet you still here even the republicans say they want to lower rates but close 'loopholes' so revenues remain the same. Question: if there is no net money left in the pockets of the people and the entrepreneurs, does a tax cut do any good? Hell no. It only simplifies the code. It doesn't bring the all important new investment capital into the economy.

All tax cutters. All produced a lot more revenue after cutting taxes than before.

On top of that, spending must be cut. No one should want to pay one more penny to the government with all of the waste, fraud, and avarice ongoing in the federal government. $365,000 parties for government agencies. Penthouses in Las Vegas during conventions. Two week trips to Hawaii for a one-day seminar on team building. Presidential parties with a $1M price tag. Presidential vacations costing over $1M each. But of course, we are told there is just no fat in the budget to be cut, and that all of these little items I am citing are just so small they don't really impact the equation. With that attitude of course they won't. Just go ahead and spend away because we can't really hope to get it all in control anyway, right?

Nonsense. But of course they will not do what has to be done. As I said earlier today, not a snowball's chance in hell they address the real issues and the real means to alleviate the cliff. Spending must be reined in. I posit that the proposed defense budget cuts could be entirely offset by cutting out fat and waste in our government. It used to be the government employees were paid less then private sector but the tradeoff was job security. Now they are paid more, have better retirements, and you cannot fire them short of them committing a major felony.

Cutting spending is important but just one part. Those taxes are another. Why? We have to grow our way out of this. That means investment capital is needed in an economy that has been sputtering for 6 years. There is damn little money people are willing to invest. On top of that there are hundreds of thousands of new regulations enacted during the past four years. We are now as bad as Europe and the EU in trying to regulate everything. Businesses cannot thrive if they are handcuffed. Oh, and there is more coming. In January the EPA will issue its report on hydraulic fracturing, and you can make book that the EPA will find fracturing is environmentally hazardous and must be controlled by none other than the EPA. So, you expect the bonanza of energy production on private lands to slow and our chances of becoming energy independent to slip from our hands. Hate to sound negative, but that has been the MO of this government, and with four new years it is not going to let up. Indeed it is going to go full bore.

So, we will have fighting and posturing and a deal will ultimately be struck that does not address the problems. Everyone will congratulate themselves about cuts that don't really cut anything because they are going to cut dollars that would not be spent for years and years. They will all praise themselves and most Americans will think they did a bang up job fixing the problem. The ratings agencies will be forced to agree lest they be investigated for downgrading the mighty US. And the same problems will still be there and we will lose our ability to sell bonds and to act as the world's reserve currency, dollars will be dumped, inflation will skyrocket, our standard of living that has declined the past 5 years will fall harder and faster.

Wow. Hard to be happy after that. Sorry for being so morose, but we have a nasty hole we dug and these fellows in DC are not up to the task, at least they have not shown the right stuff yet.

But who knows? Christmas is coming and they may have their brains grow three sizes similar to how the Grinch's heart grew in 'How the Grinch Stole Christmas.'

OTHER MARKETS

Dollar. 1.2718 versus 1.2752. The dollar still looks poised to break higher. Thursday and Friday the dollar tapped the 50 day EMA on the low and rebounded to hold the 200 day SMA on the close. Looks poised to move higher but there is also resistance just over head in a potential left shoulder to a head and shoulders pattern.

Bonds. 1.61% versus 1.62%. After trading in its narrowing range in a quite volatile manner, bonds broke out on the European worries, and frankly on worries about the US economy given the reelection and the fiscal cliff and growth worries.

Gold. 1731.00, +5.00. Gold continued its post-election, Bernanke on the loose, inflation fearing move. It cooled its jets a bit, gapping to a doji Friday. A good run, slowing a bit, likely to test toward the 50 day EMA near 1720.

Oil. 86.07, +0.98. Oil bounced modestly for a second session. Holding near some support but still quite weak.

TECHNICAL SUMMARY

Internals.

NASDAQ
Stats: +9.29 points (+0.32%) to close at 2904.87
Volume: 1.778B (-3.58%)

Up Volume: 869.09M (+478.39M)
Down Volume: 913.5M (-566.5M)

A/D and Hi/Lo: Decliners led 1.01 to 1
Previous Session: Decliners led 2.85 to 1

New Highs: 19 (-12)
New Lows: 123 (+5)

S&P
Stats: +2.34 points (+0.17%) to close at 1379.85
NYSE Volume: 682M (-2.01%)

A/D and Hi/Lo: Decliners led 1.06 to 1
Previous Session: Decliners led 2.74 to 1

New Highs: 203 (-25)
New Lows: 145 (+29)

Stats: +4.07 points (+0.03%) to close at 12815.39

Volume: Volume again traded off the prior session but was still above average on both NASDAQ and NYSE. Distribution selling all week, showing some volume Friday as the indices tried a bounce. Nothing to suggest a turn right now.

Breadth. Finally eased up as you would expect with the indices trading flat. Still, breadth was slightly negative even with the indices slightly positive.

THE CHARTS

SP500. Rallied through the 200 day SMA with a nice move into lunch. Then came the afternoon and it gave it all back, closing below the 200 day SMA. Doji but not necessarily one indicating a turn. Very well could be an interim, continuation doji in the midst of selling, but SP500 is holding at some interim support.

NASDAQ. Holding at some interim support at 2900 NASDAQ showed a hammer doji. It is in the midst of a range of support but not expecting that to necessarily bounce it higher. A big dip needs a test, but the pressure was released a bit Friday as AAPL bounced some.

Russell 2000/SP400. Nice doji at some interim support. Looking for RUT to test the 200 day SMA up near 807 given it acted better than most before it broke.

SP400 is showing a nice doji at the 200 day SMA and is in excellent position to make the break higher. The market could use some leadership from the mid-caps but not sure they can accomplish all the heavy lifting needed. Perhaps for just a test.

SOX. Held up reasonable well Friday after diving lower from the unexpectedly solid upside move. Just over some support at 365 (closed at 369) so we will see if it can provide a bounce.

DJ30/DJ20. Big tight doji at some interim support. Nest support is 12,700 and it did test 12,743 on the low, perhaps close enough. SP400 could use the help.

DJ20 Not performing well at all, not even showing the same doji that the other indices flashed. Just over some interim support and we will see if Monday brings a renewed bounce.

Summary: The bounce attempt was rather weak after those two sharply lower sessions. It did not change the character of the decline, and indeed it may have let the sellers off the hook, i.e. relieving the pressure to rebound without generating any lasting upside.

LEADERSHIP

Big names. AAPL bounced but lost about as much as it gained on the session. A doji and in need of a relief move that would help NASDAQ as well. AMZN gapped to a tight doji and looks rather interesting. EBAY is struggling still but holding up. IBM shows a big tight doji and is now in position to rebound.

Industrials. JOY showed a doji as did many stocks. CAT gapped lower and reversed upside on some volume. Not bad. TEX bounced off the 200 day SMA.

Financial. Some improvement but some damage was done. BAC gapped lower and recovered to flat. No volume. JPM shows a doji but is still the 50 day EMA. MA is holding the 50 day EMA and bounced. V gapped to the 20 day EMA and bounced to a gain. Nicely.

Metals. Struggling. Gapped to a doji below the recent range. AKS still working on the pattern at the 50 day EMA. STLD is holding the 200 day SMA and bouncing. These may develop here.

Retail. Some good, some bad. YUM bounced nicely. ULTA gapped lower. LULU is struggling at the late October highs. KSS dove lower this week. JCP is in huge trouble. Widely divergent, showing issues even with spiking consumer sentiment.

Homebuilders. Slipping. KBH slips a bit. BZH is below the 50 day EMA. TOL slid to a new low from its September peak. Some weakness in an important group.

THE MARKET

SENTIMENT INDICATORS

VIX: 18.61; +0.12
VXN: 19.41; -0.73
VXO: 19.35; +0.42

Put/Call Ratio (CBOE): 1.17; +0.04

Bulls versus Bears

Bulls: 43.6 versus 41.5% versus 45.7% . Bouncing right back up as the market takes some sharp declines on top of a more orderly previous pullback. Will be interesting to see if this confidence that tracks Michigan holds next week. Background: Undercut 35%, the threshold for bullishness, in early June. As noted, hit 34% in early June. It did its job and the market is on the rally. Hard drop to 34 from 39.3% as economic reality and a choppy stock market hit. Off the 55+ level hit in late February. That was the highest level since April and May of 2011, the peak of the post-bear market high. 35% is the threshold level suggesting bullishness. To be seriously bearish it needs to get up to the 60% to 65% level.

Bears: 27.7% versus 27.7% versus 25.5%. Staying at 27.7% again as bears hold a flat line. Has to get to 35% to be significantly bearish to suggest an upside rally. March and April saw lower lows in the 21% range. On the last run never made it to the 35% that can be a bullish indication, but the bulls were weak enough back in June. Over 35% is the threshold to be really be a good upside indicator. For reference, bearishness hit a 5 year high at 54.4% the last week of October 2008. The move over 50 took bearish sentiment to its highest level since 1995. Extreme negative sentiment. Prior levels for comparison: Bearishness peaked at 37.4% in September 2007. It topped the June 2006 peak (36%) on that run. That June peak eclipsed the March 2006 high (33%) and well above the 2005 highs that spawned new rallies (30% in May 2005, 29.2% in October 2005). That was a huge turn, unlike any seen in recent history.

MONDAY

A very interesting week again. Even with the election over there is no letdown in the pressure. Lots of economic data from retail sales to Philly Fed to CPI and more. A few more earnings. The fiscal cliff negotiations. The market trying to regroup after a sharp decline. Oh, and the Fed.

Yes the Fed. All eyes on the cliff for sure. Economic data? Yes a bit, but no one is worried as much about that now because the election is over, the cliff is out there, and the idea is if that is not fixed the data won't matter. In any event any shortcomings can be blamed on Sandy as well as the cliff. Oh, and let's not forget Bush, right?

Back to the Fed. Friday St. Louis Fed president Bullard had some comments but they were not heavily reported. Mr. Bullard said that Operation Twist would likely not be continued. BUT . . . THE Fed 'may' expand QE to buy other assets.

Don't need to Twist, but other asset buys just might happen.

This is not news; Bernanke and the FOMC statement said that other means would be used if necessary, even after things started to recover. What is significant is that Bullard is out there, after a quiet period from the Fed around the election, pushing this line. It is likely prep work for some other kind of asset buys. Bernanke is getting impatient. The Cliff has him worried. He wants to paper over the problem before it arises.

That sets the stage of characters. Election is over. The same players are still in place. The Cliff remains an issue because of the disparate positions and the view that no one received a mandate in the election. The economy is the hapless buffoon stumbling along. The stock market decided to avoid the Christmas rush and sold right after the election. Bernanke is still at the Fed, will stay at the Fed, and has his theories to put to the test.

Fiscal Cliff versus QE. The stock market is the hostage. Clearly the market sold first and will ask questions at some point after Obama won the election and kept the Senate. Investors are worried about the ability to resolve the tax hikes, etc. coming their way.

That said, IF there is anything positive on the Cliff the market can and will rally. The Cliff is resolved (or at least is claimed to be; it won't be because they won't do what is really necessary) and QE is in place and will remain in place. That would be a green light for stocks.

But, it is not close to green yet. The Cliff issue just received its opening remarks late in the week. Obama gave a campaign speech with a baseball bat after Boehner gave some specifics he is willing to work with. It could be very contentious yet again.

That leaves the market watching to see how it turns out but not comfortable it will get resolved. In that scenario the market is somewhat in limbo with a negative overhead even with QE in the pocket. It has had enough of a pullback to bounce. It had enough before NASDAQ and company broke the 200 day SMA. It didn't and now it has a longer term basing pattern to fill out if it is going to continue upside.

So, we don't anticipate any big upside move off of this last decline. Yes there could be a nice relief bounce to test the support just broken (SP500 did that but none of the other have), the relief bounce we have discussed. That is likely to come this week but the question is whether there is more downside first. Friday let the pressure off the selling and thus dulled the snapback chances.

Still, we have some good downside positions in place. We believe there is more downside to come at least as part of a basing process that will prepare the markets for upside again on the shoulders of some more of that QE. With a rebound we still look just for a relief move. It might take a downside session early as we wanted to see Friday to trigger it. When it comes we use it to lighten the upside and prep some more downside.

The problem we have to start the week is the market is basically where it was after two sharp downside days. Many stocks are oversold or need more work to set up for upside or downside plays. Some plays are there for stocks that are in rolling ranges and have managed to hold the bottom of the range in this selling. Those can provide us upside plays (e.g. GOOG). Kind of selective and at this point you have to be. If we see stocks close to bottoming such as GOOG we can look at them as potential bounce plays if we get a selloff to start the week that reverses. That is always a good play, and while it looks too pat to have that happen, it often does.

Have a great weekend!

Support and resistance

NASDAQ: Closed at 2904.87
Resistance:
2942 is the mid-June 2012 high
2950 is the mid-April closing low
2962 is the April 2012 low
2977 to 2980 is the bottom of the late October 2012 consolidation
The 200 day SMA at 2983
2988 is the July 2012 high
2999 is the bottom of the August 2012 consolidation
3000 is the February 2012 post-bear market high
3024 is the gap point from early May
3026 from 10/2000 low
The 50 day EMA at 3033
3042 from 5/2000 low and several other price points
3076 is the late April 2012 high
3090 is the mid-March interim high
3037 is the October low
3101 is the August 2012 high
3134 is the March 2012 post-bear market peak
3171 is the October intraday high
3197 is the September 2012 post-bear market high
3227 is the April 2000 intraday low
3401 is the May 2000 closing low

Support:
2900 is the March 2012 intraday low
2858 is the late July 2011 peak
2847 is the mid-May 2012 low
2842
2838 from the July 2012 lows

S&P 500: Closed at 1377.51

Resistance:
The 200 day SMA at 1381
1402.22 is the closing low of the August 2012 lateral consolidation
1406 is the early May 2012 peak
The 50 day EMA at 1421
1422.38 is the prior post-bear market high (March 2012)
1425 from May 2008 closing highs and the October 2012 low
1427 is the August 2012 peak
1433 from August 2007 closing lows
1440 from November 2007 closing lows
1464 is the June up trendline
1463 is the September closing high
1466 is the September closing high
1471 is the October 2012 intraday high
1475 is the September 2012 high
1499 from January 2008
1539 from June 2007

Support:
1378 is the February 2012 peak
1375 is the early July 2012 peak
1371 is the May 2011 peak, the post-bear market high
1363.46 is June 2012 high
1359 is the April 2012 low
1357 is the July 2011 peak
1344 is the February 2011 peak
1340 is the early April 2011 peak
1332 is the early March 2011 peak
1325 is the July 2012 intraday low
1309 is the right shoulder low from June 2012
1295 to 1294 is the April 2011 low and the February 2011 consolidation low (bottom of the trading range)
1293 is the October 2011 peak
1275 is the January 2010 low, early January 2011 peak
1267 is the December 2011 peak
1266 is the June 2012 base low

Dow: Closed at 12,815.39
Resistance:
The 200 day SMA at 12,992
13,056 is the February 2012 high
13,058 from the May 2008 peak on that bounce in the selling
The 50 day EMA at 13,228
13,297 is the April 2012, prior post bear market high
13,300 to 13,331 is the August 2012 post-bear market high
13,653 is the September 2012 high
13662 is the October 2012 intraday high
13,668 from 12-2007 peak
13,692 from 6-2007 peak
14,022 from 7-07 peak

Support:
12,716 is the April 2012 closing low
12,391 is the February 2011 peak
12,369 is the left shoulder low from May 2012
12,284 is the October 2011 peak
12,258 is the December 2011 peak
12,110 from the March 2007 closing low
12,094 is the April 2011 low
12,035 is the June 2012 base low
The June 2011 low at 11,897 (closing)
11,734 from 11-98 peak
11,717 is the late August 2011 peak

Economic Calendar

November 5 - Monday
- ISM Services, October (10:00): 54.2 actual versus 55.0 expected, 55.1 prior

November 7 - Wednesday
- MBA Mortgage Index, 11/03 (7:00): -5.0% actual versus -4.8% prior
- Crude Inventories, 11/03 (10:30): 1.766M actual versus -2.045M prior
- Consumer Credit, September (15:00): $11.4B actual versus $10.6B expected, $18.4B prior (revised from $18.1B)

November 8 - Thursday
- Initial Claims, 11/03 (8:30): 355K actual versus 370K expected, 363K prior
- Continuing Claims, 10/27 (8:30): 3127K actual versus 3250K expected, 3262K prior (revised from 3263K)
- Trade Balance, September (8:30): -$41.5B actual versus -$45.4B expected, -$43.8B prior (revised from -$44.2B)

November 9 - Friday
- Export Prices ex-ag., October (8:30): 0.2% actual versus 0.7% prior
- Import Prices ex-oil, October (8:30): 0.3% actual versus 0.2% prior
- Michigan Sentiment, November (9:55): 84.9 actual versus 83.0 expected, 82.6 prior
- Wholesale Inventories, September (10:00): 1.1% actual versus 0.4% expected, 0.8% prior (revised from 0.5%)

November 13 - Tuesday
- Treasury Budget, October (14:00): -$113.0B expected, -$98.5B prior

November 14 - Wednesday
- MBA Mortgage Index, 11/10 (7:00): -5.0% prior
- Retail Sales, October (8:30): -0.2% expected, 1.1% prior
- Retail Sales ex-auto, October (8:30): 0.1% expected, 1.1% prior
- PPI, October (8:30): 0.0% expected, 1.1% prior
- Core PPI, October (8:30): 0.1% expected, 0.0% prior
- Business Inventories, September (10:00): 0.6% expected, 0.6% prior
- FOMC Minutes, 10/24 (14:00)

November 15 - Thursday
- Initial Claims, 11/10 (8:30): 388K expected, 355K prior
- Continuing Claims, 11/03 (8:30): 3125K expected, 3127K prior
- CPI, October (8:30): 0.1% expected, 0.6% prior
- Core CPI, October (8:30): 0.1% expected, 0.1% prior
- Empire Manufacturing, November (8:30): -9.3 expected, -6.2 prior
- Philadelphia Fed, November (10:00): -1.0 expected, 5.7 prior
- Crude Inventories, 11/10 (11:00): 1.766M prior

November 16 - Friday
- Net Long-Term TIC Fl, September (9:00): $90.0B prior
- Industrial Production, October (9:15): 0.0% expected, 0.4% prior
- Capacity Utilization, October (9:15): 78.2% expected, 78.3% prior
icon url

ReturntoSender

11/12/12 6:06 PM

#9984 RE: ReturntoSender #6755

From Briefing.com: 4:10 pm : Stocks began today's session on a higher note. However, the S&P 500 followed the early strength with a slide into the red. After hovering near its lows for little over an hour, the index staged a steady climb towards fresh session highs. The benchmark average followed the early afternoon strength with another slide towards its flat line, where it remained until the end of the day. Today's volume was well below average and the bond market was closed in observance of Veterans Day.

High-yielding telecom stocks have been under pressure during the past week. Today, the sector was the top performer. Within the space, Telephone & Data Systems (TDS 23.38, +0.81) advanced 3.6% after Citigroup upgraded the stock to ‘buy' from ‘neutral.'

Elsewhere in telecommunications, AT&T (T 33.87, +0.33) added 1.0% after announcing the company will subsidize the Apple (AAPL 542.83, -4.23) iPad. Meanwhile, Sprint Nextel (S 5.61, +0.06) also saw relative strength as the stock settled higher by 1.1%.

On the downside, Inteliquent (IQNT 2.96, -0.55) fell 15.7% after Morgan Stanley downgraded the stock to ‘equal-weight' from ‘overweight.'

Looking at today's M&A activity, Jefferies Group (JEF 16.27, +2.00) gained 14.0% after confirming plans to merge with Leucadia National (LUK 21.14, -0.66). Per the agreement, Jefferies stockholders will receive 0.81 of a share of LUK for each share of JEF owned. Following the transaction, Jefferies shareholders will hold 35.3% of Leucadia common stock.

In the materials sector, Titanium Metals (TIE 16.50, +4.93) surged 42.6% after being acquired by Precision Castparts (PCP 179.48, +8.15) for $16.50 per share. The purchase price represents a 42.6% premium to TIE's Friday closing price, and the total transaction is valued at approximately $2.9 billion.

In the health care space, biotechnology names led the group higher following positive trial data. Celgene (CELG 75.66, +4.16) surged 5.8% after its Phase III trial of Abraxane in the treatment of pancreatic cancer showed a statistically significant survival benefit.

Meanwhile, Gilead Sciences (GILD 73.92, +8.91) spiked 13.7% after reporting a 100% sustained virologic response rate for an Interferon-free regimen of Sofosbuvir and Ribavirin in treatment of Hepatitis C patients.

Homebuilders were broadly weaker and the SPDR S&P Homebuilders ETF (XHB 25.29, -0.38) shed 1.5%. Earlier, DR Horton (DHI 19.40, -1.20) reported mixed quarterly results. During the fourth quarter, the homebuilder earned $0.30 on $1.3 billion in revenue. The company's bottom line exceeded the Capital IQ consensus estimate by $0.01, while its revenue fell short of expectations. In addition, DHI reported a 61.0% increase in the value of its backlog. The account is currently valued at $1.7 billion, up from $1.0 billion during the same period last year. Shares of DR Horton slid 5.8% after trading higher at the start of the session.

Elsewhere, Beazer Homes (BZH 13.77, -2.87) slumped 17.3% after reporting a fourth quarter loss of $2.57 on $370.9 million in revenue. The company management commented on the quarter by saying, "Operationally, we generated significant growth in orders, closings and backlog, while seeing improving trends in gross margins. From a balance sheet perspective, we added liquidity, improved our book value, extended debt maturities and reduced interest expense. While our community count will likely decrease for much of the year, we are actively investing in a substantial number of new communities, which we expect to deliver closings starting in fiscal year 2014."

The Dow Jones Transportation Average outperformed the remaining industrials. The bellwether complex rose by 0.8% and 17 group components saw gains. Trucking stocks outperformed as Con-way (CNW 28.32, +0.62) and JB Hunt (JBHT 60.04, +1.38) settled higher by 2.2% and 2.4%, respectively. Railroads were also notably stronger. Kansas City Southern (KSU 77.31, +0.40) advanced 0.5% and Union Pacific (UNP 121.77, +1.52) gained 1.3%.

Tomorrow's economic data is limited to the October Treasury Budget, which will be released at 14:00 ET.DJ30 -0.23 NASDAQ -0.61 SP500 +0.15 NASDAQ Adv/Vol/Dec 1122/1.33 bln/1306 NYSE Adv/Vol/Dec 1419/291.9 mln/1549

3:30 pm : Commodities were mixed between the energy, metals and agriculture sectors today.

Dec crude oil was choppy today and traded in an approx. $1 range (~$85.40-86.40). The actual LoD in crude was at $85.33 and by the end of the day crude rose modestly higher from there, ending the day $0.47 higher at $85.56/barrel.

Dec natural gas basically gained steam in early morning trade and continued to extend its gains throughout the day. Dec nat gas ultimately rose as high as $3.59/MMBtu.

Gold pulled-back off its session high of $1738.00 and inched lower into negative territory. It brushed a session low of $1725.20 in early afternoon action but then trended higher for the remainder of floor trade. It managed to erase most of its loss and settled just 10 cents below the unchanged level. Silver followed suit as it fell off its pit session high of $32.67 and brushed a session low of $32.17. Buyers stepped in ahead of the session close and pushed prices back towards the breakeven level such that silver closed just 0.2% lower.

In the ag space, grains fell sharply, led by wheat. Dec corn ended the day 2.7% lower at $7.17/bushel, Dec wheat ended 3.3% lower at $8.58/bu and Jan soybeans finished 3.2% lower at $14.05/buDJ30 +6.68 NASDAQ -0.11 SP500 +0.58 NASDAQ Adv/Vol/Dec 1143/1131.3 mln/1260 NYSE Adv/Vol/Dec 1364/182 mln/1566

4:08PM Verizon announces $8.5 billion in distributions to Verizon and Vodafone by Year-End 2012 (VZ) 42.56 -0.08 :

Co announced that its Board of Representatives has declared distributions aggregating $8.5 billion to its owners, which are payable on or prior to December 31, 2012. The distributions will be paid in one or more tranches, with each tranche paid in proportion to the owners' partnership interests on the payment date.
Verizon Wireless is a joint venture between Verizon Communications Inc., which owns 55 percent of the partnership, and Vodafone Group Plc (VOD), which owns 45 percent of the partnership.

HTC and Apple (AAPL $550.80 +3.76) have reached a global settlement that includes the dismissal of all current lawsuits and a ten-year license agreement. The license extends to current and future patents held by both parties. The terms of the settlement are confidential.

Trina Solar (TSL $3.65 +0.00) announced today the following updates to its previous guidance for the quarter ended September 30, 2012. The Company estimates its solar module shipments in the third quarter of 2012 to be between 375 MW and 385 MW, compared to the Company's previous guidance of between 450 MW and 480 MW. Additionally, for the third quarter of 2012, the Company estimates that overall gross margin, including the impact of a provision for a non-cash inventory write-down and a reversal of prior provisions for anti-dumping and countervailing duties in the United States, to be between 0% and 1.5%, compared to the Company's previous guidance of middle-single digits in percentage terms. The Company will confirm or revise its previous shipment guidance of between 1.75 to 1.8 GW for the full year 2012 during its third quarter 2012 earnings conference call. "Our third quarter sales were adversely impacted by a continued supply-demand imbalance in the global PV industry, high inventory levels and irrational pricing practices by some competitors in the market," said Mr. Jifan Gao, Chairman and CEO of Trina Solar.

Red Hat (RHT $48.34 +0.00) target lowered to $60 from $65 at BMO Capital Markets. The firm notes they worry about the overall weak IT spending backdrop, and they are concerned that continued weakness in the underlying server market could skim off several points of billings growth for co in the coming quarters.

08:48 am Trina Solar shares little changed following lowered shipment guidance
Trina Solar (TSL $3.65 +0.00) announced the following updates to its previous guidance for the quarter ended September 30, 2012. The Company estimates its solar module shipments in the third quarter of 2012 to be between 375 MW and 385 MW, compared to the Company's previous guidance of between 450 MW and 480 MW. Additionally, for the third quarter of 2012, the Company estimates that overall gross margin, including the impact of a provision for a non-cash inventory write-down and a reversal of prior provisions for anti-dumping and countervailing duties (ADCVD) in the United States, to be between 0% and 1.5%, compared to the Company's previous guidance of middle-single digits in percentage terms. The Company will confirm or revise its previous shipment guidance of between 1.75 to 1.8 GW for the full year 2012 during its third quarter 2012 earnings conference call. "Our third quarter sales were adversely impacted by a continued supply-demand imbalance in the global PV industry, high inventory levels and irrational pricing practices by some competitors in the market," said Mr. Jifan Gao, Chairman and CEO of Trina Solar.

08:40 am Apple shares little changed following settlement with HTC
HTC and Apple (AAPL $550.86 +3.80) have reached a global settlement that includes the dismissal of all current lawsuits and a ten-year license agreement. The license extends to current and future patents held by both parties. The terms of the settlement are confidential.
icon url

ReturntoSender

11/13/12 6:18 PM

#9985 RE: ReturntoSender #6755

From Briefing.com: 4:15 pm : Equities began today's session on a lower note. However, the major averages followed the lower open with a steady climb towards session highs. The optimism held the S&P 500 near the 1,385 level for the majority of the session, before late day selling pushed it back into the red. As a result the benchmark average settled lower by 0.4%.

Consumer discretionary stocks outperformed after four retailers reported earnings. Michael Kors (KORS 50.98, +0.40) advanced 0.8% after beating on earnings and revenue. The company reported earnings of $0.49, which was $0.09 better than the Capital IQ consensus estimate. Meanwhile, the revenue of $532.9 million was also ahead of expectations. The company's outlook was mixed as it sees full-year 2013 earnings above consensus, while revenue is forecast to fall short of estimates.

Saks (SKS 9.92, +0.04) added 0.4% after reporting earnings of $0.12, which was in-line with the Capital IQ consensus estimate. However, the company's revenue of $713 million missed expectations. Regarding its outlook, the company said it expects fourth quarter comparable store sales to be relatively flat year-over-year.

TJX (TJX 42.06, +1.09) gained 2.7% after beating on the top line, and reporting earnings in-line with expectations. Note that the company issued downside guidance as it expects fourth quarter earnings to fall below analyst expectations.

Home Depot (HD 63.38, +2.22) rose by 3.6% after reporting upbeat earnings. During the third quarter, the home improvement store operator earned $0.74 on $18.13 billion in revenue. Both figures were ahead of the Capital IQ consensus estimate. In addition to reporting strong earnings, Home Depot raised its guidance as it sees an uptick in the housing recovery. While the management expects strong future results, shares of Home Depot have been pricing in the news for quite some time. The stock has added over 52% since the beginning of this year.

The technology sector underperformed the broader market. Semiconductor shares contributed to the weakness as the PHLX Semiconductor Index settled lower by 1.0%.

Elsewhere in technology, Microsoft (MSFT 27.08, -0.90) lost 3.2% after announcing the departure of Windows and Windows Live President Steven Sinofsky. Following Mr. Sinofsky's departure, Julie Larson-Green will be promoted to lead all Windows software and hardware engineering.

In the materials sector, AK Steel (AKS 4.50, -0.96) issued downside fourth quarter guidance. After reducing its earnings expectations for the current quarter, the company expects to report a loss between $0.34 and $0.39. Meanwhile, the Capital IQ consensus called for a loss of $0.19. In addition to the downside guidance, AK Steel announced a registered offering of 25 million shares of its common stock. Also of note, the company has commenced a private offering of $350 million in senior secured notes. Shares of AK Steel slid 17.6% following the news and other steel producers are seeing mixed performance. United States Steel (X 21.31, -0.22) shed 1.0% while Worthington Industries (WOR 21.93, +0.83) advanced 3.9%.

The October Treasury Budget showed a $120 billion deficit, which was wider than the deficit of $113 billion expected by the Briefing.com consensus.

Looking at tomorrow's economic data, the weekly MBA Mortgage Index will be released at 7:00 ET. In addition, October retail sales, retail sales ex-auto, PPI, and core PPI will all be announced at 8:30 ET. Lastly, September business inventories and the Federal Reserve Open Market Committee minutes will hit the wires at 10:00 ET and 14:00 ET, respectively.DJ30 -58.90 NASDAQ -20.37 SP500 -5.50 NASDAQ Adv/Vol/Dec 805/1.74 bln/1668 NYSE Adv/Vol/Dec 979/676.3 mln/2080

3:30 pm : Commodities began the mixed and ended the day mixed. Natural gas probably the most consistent mover today as it just continued to climb higher and higher.

Dec natural gas futures traded sideways overnight, but gained buying interest around 7:20am ET when nat gas was just below $3.60. The energy component rose as high as $3.74 today and finished the day 5% higher at that high of $3.74.

Crude oil was more choppy and spent almost all session in negative territory. Crude gained steam mid-morning and temporarily surged into positive territory, almost hitting the $86 mark. However, crude rose as high as $85.95.

Precious metals rallied sharply this morning to the current session highs. But from there, both gold and silver slowly inched lower finishing slightly lower.DJ30 -14.63 NASDAQ -12.40 SP500 -1.07 NASDAQ Adv/Vol/Dec 886/1443.4 mln/1547 NYSE Adv/Vol/Dec 1098/466 mln/1939

4:09PM Cisco Systems beats by $0.02, reports revs in-line (CSCO) 16.85 -0.01 : Reports Q1 (Oct) earnings of $0.48 per share, excluding non-recurring items, $0.02 better than the Capital IQ Consensus Estimate of $0.46; revenues rose 5.5% year/year to $11.88 bln vs the $11.78 bln consensus.

Cash flows from operations were $2.5 billion for Q1, compared with $2.3 billion for 1Q12, and compared with $3.1 billion for 4Q12.
Cash and cash equivalents and investments were $45.0 billion at the end of Q1, compared with $48.7 billion at the end of 4Q12.
Cisco repurchased 15 million shares of common stock under the stock repurchase program at an average price of $16.44 per share for an aggregate purchase price of $253 million. The remaining authorized amount for stock repurchases under this program is ~$5.6 billion with no termination date.

Co will guide for Q2 EPS and rev on the conf. call at 4:30.

Plexus (PLXS) announced that it has received ISO 13485 certification at its San Jose, CA facility. ISO 13485 is an international standard containing requirements for establishing and maintaining quality management systems for medical devices.

7:25AM Arch Coal announced it has commenced a private offering of $350 million aggregate principal amount of senior notes due 2019 (ACI) 7.37 : Co also announced that it has launched a $250 million incremental, senior secured term loan due 2018, pursuant to an uncommitted accordion provision in the company's existing revolving credit agreement. Completion of the new term loan offering would reduce the size of the company's revolving credit facility to $350 million from $600 million. Concurrent with the term loan offering, Arch announced that it has commenced a private offering of $350 million in senior unsecured notes due 2019.

Analog Devices (ADI) introduced the industry's smallest isolated DC-to-DC converters.

Xyratex (XRTX) announced that it is working with HP (HPQ) to install its ClusterStor High Performance Computing data storage solution at a U.S. federal government site.

RF Micro Devices (RFMD) announced that RFMD has production released two highly linear gallium nitride RF unmatched power transistors.

12:38AM Microsoft announces leadership changes to drive next wave of products (MSFT) 28.22 : Co announces that Windows and Windows Live President Steven Sinofsky will be leaving the co and that Julie Larson-Green will be promoted to lead all Windows software and hardware engineering. Tami Reller retains her roles as chief financial officer and chief marketing officer and will assume responsibility for the business of Windows. Both executives will report directly to Microsoft CEO Steve Ballmer.

Xerox (XRX $6.45 +0.12) issued guidance for the fourth quarter with EPS of $0.33-0.35, ex-$0.05 restructuring charge, may not be comparable to $0.33 Capital IQ consensus. The company issued in-line guidance for fiscal year 2013 with EPS of $1.09-1.15, excluding non-recurring items, versus the $1.11 consensus and with rev flat to +2% YoY (consensus +1.3%). Through its cash-generating annuity rev, Xerox expects operating cash flow of $2.1 billion to $2.4 billion in 2013. Building on its share repurchase plan, the co's board of directors approved a $1 billion increase to the current authorization. Xerox expects to allocate at least $400 million in cash for share repurchase next year, adding to the $900 million to $1.1 billion in stock buyback planned for this year. In addition, subject to approval from its board of directors, the co will increase its dividend by 35 percent to 5.75 cents per quarter, beginning with the dividend payable on April 30, 2013.

Trina Solar (TSL $3.65 +0.00) target lowered to $4 from $6 at Ardour Capital. Firm notes they are lowering estimates on weak 3Q12 volume and gross margin preannouncement as they highlight weakened European demand, oversupply and global trade war continue to impact the solar industry. They now forecast net losses through 2013, but believe the stock will remain under pressure in the current supply and demand environment.

11:04 am Tech Sector trading near the unchanged mark in early trade
The tech sector is trading lower today, trailing gains in the broader market. Semiconductors are showing relative weakness as well with the SOX trading 0.4% lower. Within the chip index, POWI (-2.5%) is a notable laggard. Among other major indices, the SPY is trading 0.2% higher today, while the QQQ is down 0.2% and the NASDAQ is trading 0.3% lower on the session. Among tech bellwethers, QCOM (+1.3%) is showing strength.

In tech earnings this morning, VOD (-2.3%) slightly missed 1H13 ests and guided to the upper half of its prior range. Also, XRX (+1.7%) guided inline and raised its buyback and dividend. In news, the head of MSFT's (-3.2%) Windows division left the company. FB's (-1.4%) lockup of 1.2 bln shares expires tomorrow. Among rumors, there is chatter of GOOG (-0.3%) for PAY (-2.3%) making the rounds. In notable analyst upgrades this morning in the tech space, SSYS (+1.1%) was upgraded to Overweight at Piper Jaffray, FFIV (+1.8%) was upgraded to Buy at Goldman, and FIO (+3.2%) was upgraded to Buy at Craig Hallum. Among downgrades, SCOR (-2.4%) was downgraded to Underperform at Raymond James. CSCO (-0.5%) is the notable name in tech scheduled to report quarterly results today after the close.
icon url

ReturntoSender

11/14/12 6:03 PM

#9986 RE: ReturntoSender #6755

From Briefing.com: 4:20 pm : Equities began the day on a higher note, but the early strength did not hold past the opening minutes. The S&P 500 marked its session best shortly after the open, and headed lower. The morning slide was accompanied by headlines out of the Middle East, which indicated Israeli forces have killed two top Hamas officials in an operation dubbed "Pillar of Defense." After the first-hour slide, the benchmark average held near the 1,365 level until President Obama held a press conference to further discuss the fiscal cliff. During his remarks, the commander-in-chief said he is "hoping for compromise and hoping for new ideas." The president's statements failed to inspire investor confidence, thus resulting in an afternoon sell-off which saw the S&P 500 settle lower by 1.4%.

Earlier, the Federal Reserve released the minutes from its October meeting. The Committee discussed economic and policy implications from implementing various thresholds that would need to be triggered before the target Federal Funds Rate is increased. Meeting participants deliberated whether such thresholds might usefully replace, or augment the date-based guidance that had been provided in the policy statements since August 2011. Participants generally favored the use of economic variables, in place of, or in conjunction with a calendar date. However, they offered different views on whether quantitative or qualitative thresholds would be most effective. The minutes also indicated that a number of committee members believe the current asset purchasing program will need to be expanded once operation twist ends.

Technology stocks saw narrower losses than the broader market. The relative strength was largely due to a positive quarterly report from Cisco Systems (CSCO 17.66, +0.81), which beat on the bottom line, and reported revenue in-line with expectations. After reporting earnings, Cisco was upgraded at Pacific Crest to ‘outperform' from ‘sector perform.' Other networking shares also benefited from the upbeat earnings. F5 Networks (FFIV 87.50, +0.96), JDS Uniphase (JDSU 11.13, +0.18), and Juniper Networks (JNPR 17.55, +0.20) all gained between 1.1% and 1.6%.

Elsewhere in tech, Advanced Micro Devices (AMD 1.93, -0.16) slid 7.7% after Reuters reported the company has hired JPMorgan Chase to explore its options, which include a possible sale.

Also of note, LinkedIn (LNKD 98.77, -0.49) fell to session lows after Facebook (FB 22.36, +2.50) announced the launch of a jobs page. The move was partially retraced and LinkedIn finished lower by 0.5%. Meanwhile, Facebook settled near its session highs on the day when another 700 million shares held by insiders became available for public trade.

Consumer discretionary stocks traded mostly in-line with the broader market. However, apparel retailers saw strength after Abercrombie & Fitch (ANF 41.92, +10.74) reported strong quarterly results. The company's shares gained 34.5% after beating earnings estimates by $0.27. In addition, the retailer's $1.17 billion in revenue also exceeded expectations. The company topped off the strong report by raising its full-year 2013 earnings guidance above consensus. Abercrombie & Fitch is now above its 200-day moving average, trading at levels last seen in the middle of May.

In the energy sector, coal stocks continued their recent weakness and the Market Vectors Coal ETF (KOL 23.30, -0.48) slid 2.0%. Arch Coal (ACI 6.59, -0.44) lost 6.3% and was a notable laggard. The stock traded at its worst level in a month after testing, and being rejected by its 200-day moving average. Looking at other coal names, Alpha Natural Resources (ANR 7.27, -0.31) slid 4.1% and Peabody Energy (BTU 25.38, -0.84) fell 3.2%.

The Dow Jones Transportation Average underperformed the remaining industrials and lost 2.6%. Airlines saw considerable weakness as Delta Air Lines (DAL 9.56, -0.65) and JetBlue Airways (JBLU 4.97, -0.30) fell 6.4% and 5.8%, respectively.

In today's economic news, the weekly MBA Mortgage Index showed a 12.6% increase in new mortgage applications. This follows the prior week's 5.0% decline.

During September, inventories rose by 0.7%, which was slightly above the 0.6% increase that had been expected by the Briefing.com consensus. This follows prior month's reading of a 0.6% increase.

October retail sales declined by 0.3%, which was slightly worse than the 0.2% decrease that had been broadly expected. The prior month's reading was revised up to show an increase of 1.3%. Excluding autos, retail sales were unchanged, which was below the Briefing.com consensus, which called for a rise of 0.1%.

October producer prices declined by 0.2%, which was cooler than the 0.1% increase that had been widely forecast. Core producer prices slipped 0.2% which was lower than the Briefing.com consensus call of a 0.1% increase.

Tomorrow, weekly initial and continuing claims as well as the October CPI, core CPI, and the Empire Manufacturing Index will all be released at 8:30 ET. Lastly, the November Philadelphia Fed Survey will be reported at 10:00 ET.DJ30 -185.23 NASDAQ -37.08 SP500 -19.04 NASDAQ Adv/Vol/Dec 505/2.03 bln/1962 NYSE Adv/Vol/Dec 331/830.2 mln/2783

3:35 pm : Commodities ended the day mostly higher. Crude oil rallied hard earlier this morning and ultimately rose as high as $86.61/barrel. By the end of the day, Dec crude oil finished almost $1 higher at $86.32/barrel.

Natural gas futures were volatile again, surging higher this morning, but giving up most of those days later in the session. By the time floor trading closed, Dec natural gas finished 3 cents higher at $3.77/MMBtu.

Precious metals also posted a gain. Both Dec gold and Dec silver finished today's session near their session highs. Gold ended $5.60 higher at $1730.00/oz, while Dec silver ended 1% higher at $32.82/oz. Dec copper finished the day 2 cents lower at $3.45/lb.DJ30 -159.40 NASDAQ -30.99 SP500 -16.22 NASDAQ Adv/Vol/Dec 574/1670.0 mln/1885 NYSE Adv/Vol/Dec 380/527 mln/2710

4:42PM Agilent Technologies appoints Ron Nersesian President and Chief Operating Officer; Bill Sullivan Remains CEO (A) 36.14 -0.19 : Co announced that its board of directors has appointed Ron Nersesian Agilent president and chief operating officer, effective immediately. Nersesian has been executive vice president and chief operating officer since Nov 2011. Nersesian will continue to be responsible for Agilent's Chemical Analysis, Life Sciences, Electronic Measurement, and Agilent Order Fulfillment businesses, with the presidents of those groups reporting to him. Nersesian will continue to report to William Sullivan, who remains chief executive officer

4:32PM Texas Instruments to cut 1,700 jobs- co expects annualized savings of about $450 mln by the end of 2013; Total charges will be about $325 mln, most of which will be accounted for in the current quarter; Co's current Q4 outlook did not comprehend these restructuring charges (TXN) 28.76 -0.62 : Co announced it will reduce costs and focus investments in its Wireless business on embedded markets with greater potential for sustainable growth. Cost reductions include the elimination of about 1,700 jobs worldwide.

TI previously outlined intentions to focus its OMAP processors and wireless connectivity solutions on a broader set of embedded applications with long life cycles, instead of its historical focus on the mobile market where large customers are increasingly developing their own custom chips. These changes require fewer resources and less investment. "We have a great opportunity to reshape our OMAP processor and wireless connectivity product lines to concentrate on embedded markets. Momentum is already building with new embedded applications and a broad set of customers, and we are accelerating our efforts in these areas," said Greg Delagi, senior vice president of Embedded Processing.

As a result of these actions, the co expects annualized savings of about $450 million by the end of 2013. Total charges will be about $325 million, most of which will be accounted for in the current quarter. TI's Q4 outlook, published on Oct 22, did not comprehend these restructuring charges.

Micron Technology (MU) and AgigA Tech, a subsidiary of Cypress Semiconductor (CY) have signed an agreement to collaborate to develop and offer nonvolatile DIMM products.

7:08AM Tessera Tech subsidiary DigitalOptics will focus its efforts on its core MEMS camera module business; actions could result in annualized op expense savings of $15-18 million by Q2 2013 (TSRA) 14.08 : Tessera Technologies, announced its wholly owned subsidiary, DigitalOptics Corporation will focus its efforts on its core MEMS camera module business, which targets the large and growing mobile phone market. DOC plans to reduce its workforce - not including those related to manufacturing operations in Zhuhai, China - by up to 40%. These actions could result in annualized operating expense savings of between $15 million and $18 million by the second quarter of 2013. DOC anticipates that the staff reductions and facility dispositions will be spread over the next two to three quarters to ensure continuity in the business as well as compliance with relevant legal requirements. In connection with these actions, the Company expects to incur charges of ~$4 million to$5 million in the fourth quarter of 2012 and $1 million to $2 million in the first quarter of 2013, not including any tax related charges or potential charges associated with the disposition of the Charlotte facility.

6:31AM Universal Display approves program to repurchase up to $50 mln of the co's outstanding shares of common stock over the next twelve months (PANL) 23.65 : The stock repurchase program will be funded using the company's working capital. As of September 30, 2012, the company had cash, cash equivalents and marketable securities of approximately $239 million. As of November 2, 2012, the company had 46,507,390 shares of common stock outstanding.

6:21AM ASML confirmed earlier that none of its creditors has opposed the capital repayment which forms part of the Customer Co-Investment Program announced on July 9, 2012 (ASML) 54.80 : ASML will proceed with the cash capital repayment of EUR 9.18 per ordinary share and the consolidation of outstanding ordinary shares (the reverse stock split) in a ratio of 77 shares for every 100 shares and confirms that the ex-entitlement date will be 26 Nov 2012, the record date will be 28 Nov 2012 and the cash capital repayment will be made on 3 December 2012. Holders of New York shares will receive the cash capital repayment in U.S. dollars at an exchange rate that will be determined on 27 Nov 2012. Shares issued to the three Stichtingen for participating customers under the Customer Co-investment Program will not participate in this Synthetic Buyback.

Research In Motion (RIMM) announced BBM version 7, a free update for the globally popular mobile social network, which will allow customers to make free voice calls to other BBM customers around the world over a Wi-Fi connection

RF Micro Devices (RFMD) announced the availability of the RFFM6903 front end module.

Cisco Systems (CSCO) reported first quarter earnings of $0.48 per share, excluding non-recurring items, $0.02 better than the Capital IQ consensus of $0.46, while revenues rose 5.5% year/year to $11.88 billion versus the $11.78 bln consensus. Cash flows from operations were $2.5 billion for Q1, compared with $2.3 billion for 1Q12, and compared with $3.1 billion for 4Q12. Cash and cash equivalents and investments were $45.0 billion at the end of Q1, compared with $48.7 billion at the end of 4Q12. Cisco repurchased 15 million shares of common stock under the stock repurchase program at an average price of $16.44 per share for an aggregate purchase price of $253 million. The remaining authorized amount for stock repurchases under this program is approximately $5.6 billion with no termination date.

Zynga (ZNGA) reaffirmed its 2012 financial outlook set forth in its press release issued on October 24, 2012 relating to its third quarter 2012 financial results. The company also announced executive appointments: Mark Vranesh, chief accounting officer, has been appointed CFO.

Facebook (FB) Cantor Fitzgerald notes, this morning, 852 million Facebook shares (approximately 35% of outstanding shares) will be available for sale into the public market, consisting of 804 mln shares off lock-up and options to purchase 48.3M shares. Importantly, these shares are primarily from ex-employees and institutions that did not participate in the IPO, not from officers and directors of the company. That said, the firm recommends patient investors take advantage of the market dislocation that's likely to ensue between now and year-end to accumulate the stock.
icon url

ReturntoSender

11/17/12 8:53 PM

#9989 RE: ReturntoSender #6755

From Briefing.com: Weekly Recap - Week ending 16-Nov-12

Dow +45.93 at 12588.31, Nasdaq +16.19 at 2853.13, S&P +6.55 at 1359.88

The major averages began the day on a down note and continued declining for the first two hours of the session. As the S&P 500 reached its lows, Congressional leaders held a press conference regarding the progress of fiscal cliff negotiations. During the public statement, Senator Harry Reid said that officials would not wait until the last day of December, and could agree on the framework for a deal prior to the deadline. The remarks helped the indices surge to session highs, where they spent the majority of the afternoon. The S&P 500 built on its gains and finished higher by 0.5%.

High-yielding telecom stocks continued seeing weakness as the country nears the fiscal cliff. Morning reports indicated the White House is considering a package which would delay the mandatory spending cuts scheduled to go into effect on January 1, 2013. However, this was received as a delay of the decision, rather than a step towards a concrete solution. The telecommunications sector slid 0.6% and AT&T (T 33.14, -0.28), Sprint Nextel (S 5.48, -0.06), and Verizon (VZ 41.40, -0.30) all lost between 0.7% and 1.1%.

Among technology stocks, Apple (AAPL 527.68, +2.06) registered a gain of 0.4% as the stock attempts to recover from recent softness.

A handful of notable technology companies have reported earnings since yesterday's close. Dell (DELL 8.86, -0.70) settled lower by 7.3% after missing on earnings and revenue. During the third quarter, the computer manufacturer saw its top line decline 10.7% year-over-year, to $13.72 billion. In addition, the company issued downside fourth quarter revenue guidance and reaffirmed its full-year 2013 earnings expectations.

Meanwhile, Applied Materials (AMAT 10.15, -0.15) reported strong results, but issued cautious guidance. The semiconductor manufacturer earned $0.06 on $1.65 billion in revenue, which beat the Capital IQ consensus estimates. However, forward guidance was a point of concern as the company expects first quarter earnings and revenue below consensus.

Lastly, Autodesk (ADSK 31.48, +0.98) rose by 3.2% after reporting mixed earnings. The software provider's earnings exceeded estimates by $0.04, while its revenue of $548 million fell short of estimates. Similar to Applied Materials, Autodesk is cautious about its upcoming quarter as it expects earnings and revenue to miss consensus estimates.

Looking at the financial sector, the SPDR Financial Select Sector ETF (XLF 15.28, +0.10) added 0.7%. Even though the proxy ETF traded ahead of the broader market, major financials were mixed. JPMorgan Chase (JPM 39.53, +0.14) added 0.4% after reaching a settlement with the Securities and Exchange Commission regarding Bear Stearns and JPMorgan residential mortgage-backed securities. As part of the settlement, JPMorgan will pay approximately $297 million in penalties. Credit Suisse (CS 21.94, -0.43) was also named in the settlement and will pay approximately $120 million in fines. Looking at other majors, Citigroup (C 34.98, -0.23) slid 0.7% while Wells Fargo (WFC 31.94, +0.37) outperformed with a gain of 1.2%.

The Dow Jones Transportation Average underperformed the industrial average and settled lower by 0.5%. Out of the five airlines which are part of the transportation average, four saw notable losses. Delta Air Lines (DAL 9.33, -0.16) fell 1.7%, and JetBlue Airways (JBLU 4.96, -0.07) lost 1.4%. Meanwhile, Southwest Airlines (LUV 8.93, +0.09) outperformed and added 1.0%. As 17 out of 20 transportation stocks settled lower, two listings connected to the trucking industry saw strength. JB Hunt (JBHT 59.32, +0.22) and Ryder System (R 44.22, +0.45) added 0.4% and 1.0%, respectively.

Casino stocks were broadly stronger after Penn National Gaming (PENN 48.23, +10.62) announced plans to split its real estate and gaming assets into two separate companies. Under the new structure, a newly-established PropCo will be the first real investment trust focused solely on gaming. Penn National surged 28.2% while peers Ameristar Casinos (ASCA 19.52, +2.67), Pinnacle Entertainment (PNK 12.65, +0.84), and Las Vegas Sands (LVS 42.27, +1.71) all gained between 4.2% and 15.9%.

In economic news, the September net long-term TIC flows report indicated a $3.3 billion inflow of foreign capital into U.S. denominated assets. This follows the prior month's $90.0 billion inflow.

Industrial production decreased during October by 0.4%, which was worse than the 0.1% increase that had been expected by the Briefing.com consensus. The reading follows the revised 0.2% increase recorded during the prior month. Capacity utilization hit 77.8%, which was worse than the 78.3% expected by the Briefing.com consensus, and down from the revised prior month reading of 78.2%.

On Monday, investors will digest the October existing home sales report and November NAHB Housing Market Index. Both figures will be reported at 10:00 ET.

Week in Review: Markets Continue Retreating Amid Fiscal Cliff Worries

Stocks began Monday's session on a higher note. However, the S&P 500 followed the early strength with a slide into the red. After hovering near its lows for little over an hour, the index staged a steady climb towards fresh highs. The benchmark average followed the early afternoon strength with another slide towards its flat line, where it remained until the end of the day. The day's volume was well below average and the bond market was closed in observance of Veterans Day. Titanium Metals (TIE 16.61, +0.11) surged 42.6% after being acquired by Precision Castparts (PCP 174.05, -0.23) for $16.50 per share.

On Tuesday, equities started the session on a lower note. However, the major averages followed the lower open with a steady climb towards session highs. The optimism held the S&P 500 near the 1385 level for the majority of the session, before late day selling pushed it back into the red. As a result the benchmark average settled lower by 0.4%. Home Depot (HD 62.12, +0.87) rose by 3.6% after reporting upbeat earnings and issuing upside guidance.

Wednesday's session opened higher, but the early strength did not hold past the opening minutes. The S&P 500 marked its session best shortly after the open, and headed lower. The morning slide was accompanied by headlines out of the Middle East which indicated Israeli forces have killed two top Hamas officials in an operation dubbed "Pillar of Defense." After the first-hour slide, the benchmark average held near the 1365 level until President Obama held a press conference to further discuss the fiscal cliff. During his remarks, the commander-in-chief said he is "hoping for compromise and hoping for new ideas." The president's statements failed to inspire investor confidence, thus resulting in an afternoon sell-off which saw the S&P 500 settle lower by 1.4%. Abercrombie & Fitch (ANF 40.87, -0.88) gained 34.5% after reporting strong quarterly results.

On Thursday, stocks showed indecision in the early going as trade hovered around the flat line for the first 90 minutes. The S&P 500 followed the initial choppiness with a slide to a session low near 1350. The level provided some support for the benchmark index which managed to cross into positive territory before sellers retook control and drove it back down to session lows. However, the average received a considerable bid in the final minutes of the trading day and ended with a loss of 0.2%. Apple (AAPL 527.68, +2.06) slid 2.1% to extend its recent weakness.
Index Started Week Ended Week Change % Change YTD %
DJIA 12815.39 12588.31 -227.08 -1.8 3.0
Nasdaq 2904.87 2853.13 -51.74 -1.8 9.5
S&P 500 1379.85 1359.88 -19.97 -1.4 8.1
Russell 2000 795.02 776.28 -18.74 -2.4 4.8
4:31PM Riverbed Technology reports new equity awards under NASDAQ Marketplace Rule 4350 (RVBD) 16.48 -0.48 : Co announced that, in accordance with NASDAQ Marketplace Rule 4350 (i)(1)(A)(iv), it has granted inducement stock options covering an aggregate of 425,700 shares of common stock and inducement restricted stock unit awards covering an aggregate of 12,200 shares of common stock to 99 non-officer employees

12:41PM Apple aggressively extends to May lows (AAPL) 529.38 +3.76 : Noted in the 11:29 update that AAPL was probing the 50% retracement of the entire 2011-2012 surge at 507. Only one 1 min bar closed below (session low 505.75) with it running aggressively higher amid the cliff comments and a short squeeze. Thus far the rebound has stalled near the May intraday/close lows at 528/530 (session high 530.00). The next short term resistance above is at 534/536.

11:29AM Apple lower for third day in a row sets new session low of 508 in recent trade (AAPL) 509.08 -16.77 : The 50% retracement of the entire 2011 to 2012 surge comes into play at 507 prior to the 500 psych level.

AMD (AMD) supports Nintendo's (NTDOY) Wii U home console as the supplier of custom AMD Radeon HD GPU technology.

8:01AM Dell acquires Gale Technologies; financial terms not disclosed (DELL) 9.56 : Co announces the acquisition of Gale Technologies, a provider of infrastructure automation software that allows organizations to streamline the deployment of on-premise and hybrid clouds for self-service access to infrastructure. Co also announced the formation of its Enterprise Systems & Solutions organization focused on the delivery of converged and enterprise workload topologies and solutions in alignment with Dell's Enterprise vision.

3:39AM LDK Solar receives a Continued Listing Standards Notice from NYSE (LDK) 0.96 : Co announces that it has received a notice from the NYSE that the co did not meet one of the NYSE's continued listing standards as the average closing price of the co's ADS's was $0.99, less than $1.00, per ADS over a consecutive 30-trading-day period as of November 5, 2012.

1:09AM Suntech Power reduces production at Arizona factory (STP) 0.81 : Co announces it will stop two of three production shifts and reduce its workforce at its Goodyear, Arizona, solar panel manufacturing facility. The slowdown in production is due to global oversupply and higher production costs related to recent import tariffs imposed by the U.S. government. The Goodyear facility's annual production throughput will decrease from about 45MW to 15MW, and roughly fifty positions will be eliminated. The decision is in line with co's global restructuring efforts to right-size production capacity and reduce operating expenses by 20% in 2012 and 2013.

Dell (DELL) reported third quarter earnings of $0.39 per share, excluding non-recurring items, $0.01 worse than the Capital IQ consensus of $0.40, while revenues fell 10.7% year/year to $13.72 billion versus the $13.89 billion consensus. Business Units and Regions: Large Enterprise revenue was $4.2 bln in the quarter, an 8% decline. Operating income was $325 mln, or 7.8% of revenue. Public revenue was $3.8 bln, an 11% decrease. Operating income for the quarter was $352 mln, or 9.2% of revenue. Small and Medium Business revenue was $3.3 bln, a 1% decline. Operating income was $349 mln, or 10.6% of revenue. Consumer revenue was $2.5 bln, a 23% decline. Operating loss was $65 mln or minus 2.7% of revenue. Revenue in Americas was down 9%; Asia-Pacific and Japan was down 11%; and EMEA was down 15%. Co issued downside guidance for the fourth quarter with revenues of +2-5% QoQ to approximately $14.0-14.41 versus the $14.45 billion consensus. Co reaffirmed guidance for fiscal year 2013 with EPS of at least $1.70 versus the $1.73 consensus. Dell sees the challenging global macro-economic environment continuing in the fourth quarter, which will continue to impact the company's results.

Applied Materials (AMAT) reported fourth quarter earnings of $0.06 per share, $0.03 better than the Capital IQ consensus of $0.03, while revenues fell 24.4% year/year to $1.65 billion versus the $1.57 bln consensus. The company issued downside guidance for the first quarter with EPS of $0.00-0.06 versus the $0.11 consensus and sees revenues of $1,402-1.650 billion versus the $1.76 billion consensus. "We see improving business conditions entering 2013, with orders projected to increase after bottoming in the fourth quarter." Backlog decreased by $215 million to $1.6 billion and included negative adjustments of $42 million. Gross margin was 38.4 percent on a non-GAAP basis, down from 41.6 percent, reflecting the decrease in net sales. GAAP gross margin was 35.6 percent. Operating expenses were $518 million on a non-GAAP basis, down from $543 million, with the decrease primarily reflecting an adjustment in compensation accruals. GAAP operating expenses were $1.09 billion.

Sina (SINA) reported third quarter earnings of $0.17 per share, $0.06 better than the Capital IQ consensus of $0.11, while revenues rose 17.0% year/year to $152.4 million versus the $149.09 million consensus (non-GAAP +18% to $147.7 mln). The company issued guidance for the fourth quarter with Q4 non-GAAP revs of $132-136 mln, Non-GAAP net revenues and non-GAAP non-advertising revenues exclude the recognition of $4.7 million in deferred license revenue related to SINA's equity investment in CRIC/E-House; may not compare to the GAAP $155.37 mln Capital IQ Consensus Estimate, but does appear to be below expectations. Co sees advertising revenues to be between $110 million and $112 million, representing a year-over-year increase between 6% and 8%, and non-GAAP non-advertising revenues to be between $22 million and $24 million, representing a year-over-year decrease between 4% and 12%. The Company's estimate of non-GAAP non-advertising revenues assumes that MVAS revenues may decline between $8 million to $9 million year over year due to new operator policies to reduce customer complaints. "We are pleased with the initial results of Weibo monetization, as advertising revenues doubled from the previous quarter and we started revenue sharing with application developers. We believe these new initiatives will help us reduce the impact of China's weak macro-economic conditions. As we look forward into 2013, we are preparing to launch Weibo advertising solutions geared toward the small and medium-sized enterprise market, which will open up new opportunities for SINA advertising."
icon url

ReturntoSender

11/18/12 1:33 PM

#9990 RE: ReturntoSender #6755

Amateur Investors Weekend Stock Market Analysis (11/17/12)

http://www.amateur-investor.net/Weekend_Market_Analysis_Nov_17_2012.htm

Overall we could be in the middle stages of a developing Head and Shoulders Top pattern which will take a few more months to complete. The Neckline support area (green line) would coincide with the longer term upward trend line (black line) and June low so look for a possible retest of the mid to upper 1260's at some point. However since we are entering a favorable seasonal period for the market (Thanksgiving through Christmas) it's possible the retest will not occur until sometime in early 2013. Once the Neckline support area is tested then a decent oversold bounce would follow as the 2nd Shoulder develops to complete the pattern in the lower 1400's. Keep in mind we saw a smaller Head and Shoulders Top pattern back in 2011 prior to a 20% drop in the S&P 500.


Meanwhile there has been no panic among investors as neither the Volatility Index or the 5 Day Average of the Put to Call Ratio has risen to levels that have signaled nearing bottoms. So far the 5 Day Average of the VIX hasn't even risen back to the 20 level. Back when the S&P 500 bottomed in June it reached at least the 25 level (point A).


Meanwhile the 5 Day Average of the Put to Call Ratio has risen above the 1.25 level (points B) before bottoms occurred the last three times. Currently the 5 Day Average of the Put to Call Ratio is just above the 1.0 level (point C). Thus there is still quite a bit of complacency among investors as we near the end of the year.

icon url

ReturntoSender

11/19/12 11:25 PM

#9992 RE: ReturntoSender #6755

From Briefing.com: 4:20 pm : Equities began today's session amid optimism regarding a potential fiscal cliff compromise. In addition, headlines out of Europe indicated the next tranche of Greek aid will likely come through before December 5. The positive sentiment lifted the S&P 500 to its session highs during the opening minutes. The benchmark average maintained these levels throughout the day before seeing a final round of buying which ran it to session highs into the close. Meanwhile, the Nasdaq outperformed with a gain of 2.2%.

The materials sector led the market higher. Within the space, two steel producers saw gains despite receiving downgrades. AK Steel (AKS 3.66, +0.09) rose by 2.5% following Longbow's downgrade to ‘neutral' from ‘buy.' Meanwhile, Mechel Steel (MTL 6.09, +0.25) advanced 4.3% after Morgan Stanley downgraded the company to ‘equal-weight' from ‘overweight.'

After seeing considerable pressure during recent market weakness, tech stocks rebounded broadly. The PowerShares QQQ ETF (QQQ 63.78, +1.48) settled higher by 2.4%, after losing more than 10% since September 21. Among technology bellwethers, Apple (AAPL 565.73, +38.05) spiked 7.2% in an attempt to establish support and put a stop to its recent softness.

Also of note, Cisco Systems (CSCO 18.30, +0.31) added 1.7% after announcing its intent to acquire Meraki, a start-up specializing in cloud-networking, for approximately $1.2 billion.

Due to the nature of their business, financials are expected to be highly sensitive to any hints of progress in budget discussions. Today, the SPDR Financial Select Sector ETF (XLF 15.56, +0.28) ended higher by 1.9%. Bank of America (BAC 9.49, +0.37) was the top performer among the majors. The bank shares gained 4.1% after Stifel Nicolaus upgraded the stock to ‘buy' from ‘hold' with an $11 price target. Elsewhere, Citigroup (C 36.10, +1.12) added 3.2% after earlier reports indicated the company will eliminate about 300 sales and trading jobs. Separately, Citigroup has agreed to pay $360 million over a Lehman Brothers dispute.

The exuberance was apparent in European financials as well. Barclays (BCS 15.85, +0.87) advanced 5.8% after Goldman upgraded the stock to ‘buy' from ‘neutral.' Meanwhile, Deutsche Bank (DB 43.25, +1.68) and Credit Suisse (CS 22.92, +0.98) saw respective gains of 4.0% and 4.5%.

This morning, October existing home sales were reported at 4.79 million. The number was an improvement from the prior month, and it beat expectations. In addition, the November NAHB Housing Market Index came in at 46, which was also better-than-expected. The SPDR S&P Homebuilders ETF (XHB 25.39, +0.50) rose by 2.0% as the strong data combined with a broad-market rally translated into outperformance by builders. PulteGroup (PHM 16.01, +0.33), and Lennar (LEN 36.81, +0.68) gained 1.4% and 1.9%, respectively.

Additionally, Lowe's (LOW 33.96, +1.98) surged 6.2% after the home improvement store operator reported third quarter earnings of $0.40 on $12.07 billion in revenue. Both figures were ahead of the Capital IQ consensus estimate, and were followed by in-line full-year earnings guidance.

Tomorrow's economic data includes October housing starts and building permits. Both figures will be reported at 8:30 ET.DJ30 +207.65 NASDAQ +62.94 SP500 +27.01 NASDAQ Adv/Vol/Dec 1950/1.7 bln/523 NYSE Adv/Vol/Dec 2715/710.9 mln/359

3:30 pm : Crude oil extended overnight gains as it inched higher during today's pit trade. It came off its session low of $88.40 per barrel and brushed a session high of $89.80 per barrel as it gained support from strength in the equities market, Middle East conflict, and a weaker dollar index. The energy component pulled-back slightly as it headed into the close and booked a 2.7% gain as it settled at $89.35 per barrel.

Precious metals also advanced on the weaker dollar index and strength in the equities market. Gold rose to a session high of $1735.50 per ounce in late morning action and traded near that level for the remainder of its session. It settled 1.2% higher at $1734.60 per ounce. Silver also trended higher as floor trade progressed. It settled 2.4% higher at $33.15 per ounce, just below its session high of $33.21 per ounce.

Natural gas, on the other hand, struggled in the red for most of its floor session. It climbed to a session high of $3.80 per MMBtu in late morning action but was unable to sustain the momentum and fell back into negative territory. It settled 1.8% lower at $3.72 per MMBtu, or just above its session low of $3.71 per MMBtu.DJ30 +177.37 NASDAQ +56.14 SP500 +23.70 NASDAQ Adv/Vol/Dec 1883/1392.4 mln/570 NYSE Adv/Vol/Dec 2629/1380 mln/414

4:15PM Corning Director discloses buying 170K shares at ~$10.76 on 11/16, worth ~1.8 mln (GLW) 11.05 +0.15

4:13PM Brocade beats by $0.03, beats on revs (BRCD) 5.55 +0.28 : Reports Q4 (Oct) earnings of $0.17 per share, $0.03 better than the Capital IQ Consensus Estimate of $0.14; revenues rose 5.1% year/year to $578 mln vs the $565.95 mln consensus.

Q4 2012 GAAP gross margin was 62.4% and non-GAAP gross margin was 64.8%, compared with 59.5% and 62.9% in Q4 2011, respectively. The year-over-year improvement in gross margin was due to higher revenue, favorable product mix, and lower fixed costs.
"Q4 was an excellent quarter for Brocade and a strong ending for fiscal year 2012 during which we established a number of company records including revenue, net income, and operating cash flow...Our product portfolio across all areas of our business is the strongest it has ever been and we are driving industry transformation in emerging areas of growth including virtualized data centers, cloud computing, and software-defined networking. We believe Brocade is well-positioned for continued growth in fiscal 2013."

4:09PM Agilent beats by $0.06, reports revs in-line; guides Q1 EPS below consensus, revs below consensus; guides FY13 EPS below consensus, revs in-line (A) 37.51 +1.70 : Reports Q4 (Oct) earnings of $0.86 per share, $0.06 better than the Capital IQ Consensus Estimate of $0.80; revenues rose 2.3% year/year to $1.77 bln vs the $1.76 bln consensus.

Co issues downside guidance for Q1, sees EPS of $0.65-0.67 vs. $0.76 Capital IQ Consensus Estimate; sees Q1 revs of $1.68-1.70 bln vs. $1.72 bln Capital IQ Consensus Estimate.
Co issues mixed guidance for FY13, sees EPS of $2.80-3.10 vs. $3.33 Capital IQ Consensus Estimate; sees FY13 revs of $7.0-7.2 bln vs. $7.16 bln Capital IQ Consensus Estimate.

12:03PM Cisco Systems working back toward opening high (CSCO) 18.25 +0.26 : Stock gapped above last week's peak (18.25) but quickly stalled. Limited range trade modestly below followed with it edging back toward the early peak (18.27) again in recent trade. Initial levels of interest above are at its 50 sma (18.33) and its 200 sma (18.37).

Riverbed (RVBD) announced that its Stingray product family is available through the Amazon (AMZN) Web Services Marketplace.

9:12AM PMC-Sierra appoints Steve Geiser VP and CFO (PMCS) 4.79 : Co announced the appointment of Steven Geiser as VP and CFO. Geiser joins the Company effective today and will be responsible for the overall financial direction of the company, reporting to president and CEO Greg Lang. Prior to joining PMC, Geiser held the position of CFO at two early stage companies. Most recently he was chief financial officer at Trilliant Networks.

9:01AM Intel CEO Paul Otellini to retire in May - stock is halted (INTC) 20.19 :

Co announced that the company's president and CEO, Paul Otellini, has decided to retire as an officer and director at the company's annual stockholders' meeting in May, starting an orderly leadership transition over the next six months.
Otellini said "After almost four decades with the company and eight years as CEO, it's time to move on and transfer Intel's helm to a new generation of leadership. I look forward to working with Andy, the board and the management team during the six-month transition period, and to being available as an advisor to management after retiring as CEO."
The board of directors will conduct the process to choose Otellini's successor and will consider internal and external candidates for the job.
In addition, the company also announced that the board has approved the promotion of three senior leaders to the position of executive vice president: Renee James, head of Intel's software business; Brian Krzanich, chief operating officer and head of worldwide manufacturing; and Stacy Smith, chief financial officer and director of corporate strategy.

8:36AM Plexus announces John Nussbaum to retire as Chairman; Dean Foate elected as successor (PLXS) 22.31 : Co announced that John Nussbaum, the non-executive Chairman of the Board of Directors, informed the Board of his intention to retire from the Board effective as of Plexus' 2013 Annual Meeting of Shareholders on February 13, 2013. Consistent with its succession planning, the Board appointed Dean A. Foate, Plexus' President and Chief Executive Officer, to succeed Mr. Nussbaum as Chairman, effective after the 2013 Annual Meeting of Shareholders on February 13, 2013. Mr. Foate joined Plexus in 1984, has been a member of the Board since 2000, and has served as Plexus' President and CEO since 2002.

ModusLink Global Solutions (MLNK) announced Toshiba Electronics Europe GmbH has selected ModusLink's solution center in Brno, Czech Republic to provide on-demand configuration capabilities.

8:04AM SemiLEDs reschedules announcement of fiscal Q4 and year end 2012 financial results to Nov 28 from Nov 20 (LEDS) 1.16 : Co announced that it will postpone the release of its financial results for the Fiscal Fourth Quarter and Year End for 2012, which was scheduled November 20, 2012. The Company will now host a conference call to discuss the Fiscal Fourth Quarter and Year End 2012 Financial Results on Wednesday, November 28, 2012 at 8:00 a.m. Eastern Standard Time (5:00 a.m. Pacific Standard Time, 9:00 p.m. China Standard Time).

4:52AM United Micro restructures executive team; Po-Wen Yen appointed as CEO; former CEO Dr Shih-Wei Sun promoted to vice chairman (UMC) 1.80 : The move is intended to strengthen UMC's competitiveness as Mr. Yen leverages his successful 300mm manufacturing experience, just as the company brings its multi-billion dollar Fab 12A expansion online. Prior to becoming CEO, Po-Wen Yen was UMC's senior vice president responsible for 12-inch operations.

Adobe Systems (ADBE) released its Adobe Digital Index 2012 Online Shopping Forecast focused on the 2012 holiday shopping season in the U.S. and Europe and expects Cyber Monday 2012 online revenue for the retail sector to reach $2 bln, growing by 18% year-over-year.

12:59AM Cisco Systems announces intent to acquire privately held Meraki for ~$1.2 bln (CSCO) 17.99 : Co announces its intent to acquire privately held Meraki. Meraki offers midmarket customers easy-to-deploy on-premise networking solutions that can be centrally managed from the cloud. Cisco will pay ~$1.2 bln in cash and retention-based incentives to acquire the entire business and operations of Meraki. The acquisition is expected to close in the second quarter of Cisco's fiscal year 2013, subject to customary closing conditions, including regulatory review. Meraki's cloud networking solutions will expand Cisco's network offerings by providing scalable solutions for midmarket businesses. The Meraki acquisition will also strengthen Cisco's Unified Access platform, which makes IT more responsive to business innovation by simplifying IT operations and uniting wired and wireless networks, policy and management into one integrated network infrastructure, unlike other competitive offerings.

12:33AM Celestica waives condition to substantial issuer bid (CLS) 7.20 : Co announces that it has waived a condition to its previously announced substantial issuer bid. Co commenced the Offer to purchase for cancellation up to 25 mln of its Shares for an aggregate purchase price not exceeding $175 mln on October 29, 2012. The Offer is being conducted through a "modified Dutch auction" within a price range of not less than $7.00 per Share and not more than $8.00 per Share. Co has not revised the specified price range for tenders pursuant to the Offer.

Cantor Fitzgerald notes, Facebook (FB) seems to be winning the mobile war, with its mobile engagement growth far outpacing that of peers, according to October data from comScore. They say combined smartphone/PC time spent metrics improved sequentially last month, even excluding tablets, likely the fastest growing platform. While many fear a rapid transition to mobile usage, where monetization is still nacent, they view increased mobile engagement as a key strength for Facebook and a longer-term differentiator.

10:26 am S&P Information Technology trading higher along with the broader market

The tech sector is trading higher today, along with gains in the broader market. Semiconductors are showing slight relative weakness with the SOX trading only 1.2% higher. Within the chip index, CRUS (+7.0%) is a notable standout. Among other major indices, the SPY is trading 1.5% higher today, as are both the QQQ and the NASDAQ on the session. Among tech bellwethers, INTC (-1.8%) is showing notable weakness, while AAPL (+4.0%) is a leader.

There were no earnings of note in the tech sector this morning. In news, CSCO (+1.2%) announced intent to acquire privately held Meraki for ~$1.2 bln. ARUN (-3.6%) is under pressure on the news. Elsewhere, INTC (-1.8%) CEO announced his plans to retire. Alibaba plans to purchase a 15-20% stake in SINA's (+10.0%) Weibo. Also, EBAY (+1.8%) is being sued by the Justice department over INTU (-0.8%) agreement, according to reports. Among rumors, PAY (+3.8%) may be an attractive takeover target for GOOG (+1.8%), according to reports. In notable analyst upgrades this morning in the tech space, IFNNY (0.0%) was upgraded to Hold at Jefferies, RMBS (+6.1%) was upgraded to Overweight at JP Morgan, A (+4.1%) was upgraded to Buy at Goldman, SAP (+2.3%) was upgraded to Outperform at William Blair and CSC (+4.8%) was upgraded to Buy at Deutsche Bank. Also, SWKS (+2.6%) was added to US 1 list at BofA/Merrill. There were no notable downgrades in the tech sector this morning. A (+4.1%), NUAN (+2.8%), and BRCD (+1.9%) are the notable names in tech scheduled to report quarterly results today after the close.
icon url

ReturntoSender

11/20/12 5:31 PM

#9993 RE: ReturntoSender #6755

From Briefing.com: 4:15 pm : Equities began the day on a down note after Moody's cut France's sovereign rating to ‘Aa1' from ‘Aaa.' In addition, disappointing earnings from Hewlett-Packard (HPQ 11.71, -1.59) contributed to the cautious sentiment. The major averages managed to break into positive territory by midday, but tumbled to fresh lows as Federal Reserve Chairman Ben Bernanke spoke in front of the Economic Club of New York. During his remarks, Mr. Bernanke commented on the fiscal cliff by saying that if a resolution is not reached, the economy would slide into recession. In such case, the Federal Reserve would be powerless as the Chairman does not believe the Fed has the tools necessary to deal with that eventuality. The S&P 500 followed the early afternoon slide with another climb towards the unchanged level before ending with a gain of 0.1%.


The technology sector lost 0.6% and was the weakest performer of the day. Among tech bellwethers, Apple (AAPL 561.15, -4.58) shed 0.8% after yesterday's rally resulted in a 7.2% gain. Elsewhere, Intel (INTC 19.52, -0.73) fell 3.6%.

Looking at tech earnings, Hewlett-Packard slumped 12.0% after reporting mixed results. During the fourth quarter, the computer assembler earned $1.16, which was $0.01 ahead of the Capital IQ consensus estimate. However, the company's revenue missed expectations after declining 6.7% year-over-year, to $29.96 billion. In addition to the results, investors were drawn to another point of interest in the quarterly report. The report included an $8.8 billion charge related to serious accounting improprieties and misrepresentations by Autonomy Corporation before it came under Hewlett-Packard's control. Following the earnings release, ISI Group downgraded HPQ to ‘neutral' from ‘buy.'

Elsewhere, Agilent Technologies (A 36.28, -1.23) beat on earnings and reported in-line revenue. The stock settled lower by 3.3% after the company issued cautious guidance as it sees first quarter earnings and revenue below analyst expectations.

Also of note, SanDisk (SNDK 36.84, -0.46) slid 1.2% after reports suggested the company may face antitrust claims over some of its NAND drives.

The Dow Jones Transportation Average saw a marginal loss as airlines outperformed. Delta Air Lines (DAL 9.68, +0.13) and Alaska Air (ALK 41.82, +0.29) were the top performing carriers, seeing respective gains of 1.4% and 0.7%. The relative strength in airlines was a by-product of today's action in oil. The energy component settled lower by 2.4% after early headlines out of the Middle East indicated Israel and Hamas are nearing a cease-fire.

On the downside, four railroads within the transportation average underperformed. CSX (CSX 19.52, -0.16) lost 0.8% after Avondale downgraded the stock to ‘market perform' from ‘outperform.' Meanwhile, Norfolk Southern (NSC 56.91, -1.12) was the worst performing rail operator, down 1.9%.

Quick service restaurants were in focus after reporting their quarterly results. Krispy Kreme Doughnuts (KKD 9.31, +1.77) soared 23.5% after beating on earnings and revenue. During the third quarter, the company earned $0.12, which was $0.04 ahead of the Capital IQ consensus estimate. In addition, the revenue of $107.1 million also beat expectations. The earnings report also contained upbeat guidance as the company sees its full-year 2013 and 2014 earnings ahead of analyst expectations. As a result of the strong report, shares of Krispy Kreme were bid to levels not seen since September of last year.

Meanwhile, Bob Evans (BOBE 35.06, -1.28) lost 3.5% after missing on both the top and bottom lines. In the earnings release, the company also indicated it is exploring strategic alternatives for its Mimi's Cafe business segment.

Today's economic data spotlighted housing. October building permits were reported at 866,000. The reading was below the prior month's rate of 890,000, and fell short of the 870,000 expected by the Briefing.com consensus.

On the other hand, housing starts hit an annualized rate of 894,000 units. This number was well ahead of the 840,000 expected by the Briefing.com consensus, and it represented an increase from prior month's reading of 863,000.

Homebuilders and providers of building materials outperformed due to upbeat housing starts data. PulteGroup (PHM 16.75, +0.85) jumped 5.4% and Ryland Homes (RYL 34.28, +1.92) surged 5.9%. Among building material suppliers, Masco (MAS 16.31, +0.87) rose by 5.6% and NCI Building Systems (NCS 11.85, +0.64) rallied 5.7%.

In tomorrow's economic data, the weekly MBA Mortgage Index will be announced at 7:00 ET. In addition, weekly initial and continuing claims will be reported at 8:30 ET. Lastly, the final November Michigan Sentiment and October leading indicators will be reported at 9:55 ET and 10:00 ET, respectively.DJ30 -7.45 NASDAQ +0.61 SP500 +0.93 NASDAQ Adv/Vol/Dec 1159/1.53 bln/1282 NYSE Adv/Vol/Dec 1682/644.5 mln/1347

3:30 pm : Crude oil fell deeper into negative territory on reports that Hamas and Israel have agreed to a ceasefire. A stronger dollar index also put pressure on the energy component. Crude fell as low as $86.17 per barrel in afternoon pit action and settled with a 2.9% loss at $86.76 per barrel.

Precious metals were under pressure during today's pit trade as the stronger dollar index and better-than-expected housing data weighed on prices. Gold opened near the unchanged line and spent morning floor action chopping around just below that level. The yellow metal sold off further in afternoon action and brushed a session low of $1722.50 per ounce moments before settling with a 0.6% loss at $1723.70 per ounce. Silver fell off its session high of $33.19 per ounce and touched a session low of $32.86 per ounce. Like gold, it settled 0.6% lower at $32.96 per ounce.

In contrast, natural gas steadily climbed higher after coming off its session low of $3.74 per MMBtu. It closed with a 2.7% gain at $3.83 per MMBtu, just below its session high of $3.84 per MMBtu.DJ30 -27.13 NASDAQ -7.82 SP500 -2.07 NASDAQ Adv/Vol/Dec 979/1.30 bln/1462 NYSE Adv/Vol/Dec 1449/455.4 mln/1589

4:27PM MIPS Tech announces receipt of unsolicited proposal from CEVA, Inc. (CEVA) (MIPS) 7.04 -0.12 : Co announced that it has received an unsolicited proposal from CEVA, Inc. (CEVA) to acquire all of the outstanding MIPS shares, following the consummation of the proposed patent sale transaction with Bridge Crossing, LLC and the proposed recapitalization, for $75 million in cash. CEVA's proposal is subject to the approval of its board of directors and a brief period of confirmatory due diligence. MIPS had previously announced (on November 5, 2012) that Imagination Technologies Group plc would acquire the outstanding MIPS shares following the consummation of the proposed patent sale transaction with Bridge Crossing and the proposed recapitalization, for $60 million in cash. The MIPS Technologies Board of Directors is evaluating CEVA's proposal and has not made a determination as to whether the proposal is superior to MIPS Technologies' pending transaction with Imagination Technologies. However, the MIPS Technologies Board of Directors believes the CEVA proposal could reasonably be expected to lead to a superior transaction, so it has determined to engage in discussions with CEVA.

Shares are currently halted.

4:00PM Cirrus Logic announces $200 mln share repurchase (CRUS) 30.34 -0.49 : Co announced that its Board of Directors has authorized the repurchase of up to $200 million of the company's common stock. The repurchases will be funded from working capital and anticipated cash from operations.

1:27PM Intel slides to another new 52-wk low of 19.37 (INTC) 19.38 -0.87 : Its two year close/intraday lows from Aug 2011 come into play at 19.19/19.16.

9:52AM General Electric: GE Aviation acquires Morris Technologies and Rapid Quality Manufacturing, terms not disclosed (GE) 20.52 -0.13 : GE Aviation, an operating unit of GE (GE), has acquired the assets of Morris Technologies, and its sister company, Rapid Quality Manufacturing, precision manufacturing companies operating in suburban Cincinnati, Ohio. Terms were not disclosed. The two privately-held companies, with about 130 Cincinnati-area employees, specialize in additive manufacturing, an automated process for creating rapid prototypes and end-use production components.

9:37AM Hewlett-Packard gap down probes its 17 year close low from 2002 at 11.45 then stabilizes -- session low 11.35 (HPQ) 11.70 -1.61 : The 17 year intraday lows from 2002 are at 10.92/10.75.

9:03AM Tellabs will resume repurchase of common shares (TLAB) 2.72 : Tellabs intends to actively repurchase its common stock under an existing Board of Directors authorization, previously announced on Nov. 8, 2007. The company may repurchase up to $224.6 million (about 22.5% of shares outstanding at the Nov. 19, 2012, closing price) under the previously announced repurchase program.

8:07AM Best Buy misses lowered expectations by $0.09, reports revs in-line; lowers FY13 FCF guidance (BBY) 13.75 : Reports Q3 (Oct) earnings of $0.03 per share, excluding non-recurring items, $0.09 worse than the Capital IQ Consensus Estimate of $0.12 (Co on Oct 24 warned about Q3 results, consensus was $0.36 at the time); revenues fell 3.5% year/year to $10.75 bln vs the $10.72 bln consensus.

The Domestic segment revenue was $7.7 bln and declined 4.7% YoY. The Domestic segment revenue decline reflected a 4.0 percent comparable store sales decline and the impact of store closures. Best Buy recorded revenue of $431 mln in its online business, with growth in excess of 10 percent, and registered positive comparable store sales growth in mobile phones, appliances and tablets/eReaders. This growth was more than offset by comparable store sales declines in notebooks, gaming, digital imaging and televisions. The co believes that tablet and notebook comparable store sales were negatively impacted by slower consumer purchasing in anticipation of major product launches. Excluding restructuring charges primarily related to previously announced store closures, the Domestic segment operating income for the three months ended November 3, 2012 declined to $50 mln ($16 mln on a GAAP basis) from $249 mln in the prior-year period. The decline was due to a lower gross profit rate, higher SG&A expense and lower revenue.

Lowers FY13 guidance: The co currently expects to generate free cash flow in the range of $850 mln to $1.05 bln for fiscal 2013. This amount compares with the co's previously communicated range of $1.25 to $1.5 bln that had been provided on August 21, 2012.

The co is planning to announce revenue results for the nine weeks ending January 5, 2013 (fiscal Nov and Dec) on January 11, 2013.

"In line with trends experienced over the last three years, Best Buy's third quarter financial performance was clearly unsatisfactory."

7:39AM Hewlett-Packard continues to drop on disappointing earnings/guidance and disclosure of Autonomy accounting improprieties (HPQ) 13.30 : HPQ now trading -8% around 12.20.

HPQ is a Dow component, and Dow futures have given up around 20 pts on the news, now -15 on the day.... S&P futures have seen a slight downtick as well, now around 3 pts off their highs.

7:38AM Hewlett-Packard beats by $0.01, misses on revs; guides Q1 EPS below consensus; reaffirms FY13 EPS guidance; takes $8.8 bln impairment on Autonomy acquisition upon discovering accounting improprieties (HPQ) 13.30 : Reports Q4 (Oct) earnings of $1.16 per share, excluding non-recurring items, $0.01 better than the Capital IQ Consensus Estimate of $1.15; revenues fell 6.7% year/year to $29.96 bln vs the $30.48 bln consensus.

HP recorded a non-cash charge for the impairment of goodwill and intangible assets within its Software segment of ~$8.8 billion in 4Q12. The majority of this impairment charge is linked to serious accounting improprieties, disclosure failures and outright misrepresentations at Autonomy Corporation plc that occurred prior to HP's acquisition of Autonomy and the associated impact of those improprieties, failures and misrepresentations on the expected future financial performance of the Autonomy business over the long-term. The balance of the impairment charge is linked to the recent trading value of HP stock. There will be no cash impact associated with the impairment charge.

Co issues downside guidance for Q1, sees EPS of $0.68-0.71, excluding non-recurring items, vs. $0.85 Capital IQ Consensus Estimate.

Co reaffirms guidance for FY13, sees EPS of $3.40-3.60, excluding non-recurring items, vs. $3.48 Capital IQ Consensus Estimate.

HP also utilized $124 million of cash during the quarter to repurchase ~7.6 million shares of common stock in the open market.

Q4 Business Group Results

Personal Systems revenue was down 14% YoY with a 3.5% operating margin. Commercial revenue decreased 13%, and Consumer revenue declined 16%. Total units were down 12% with both Desktops and Notebooks units down 12%.

Printing revenue declined 5% YoY with a 17.5% operating margin. Total hardware units were down 20% YoY. Commercial hardware units were down 15% YoY, and Consumer hardware units were down 22% YoY.

Services revenue declined 6% YoY with a 14.2% operating margin. Technology Services revenue was down 4% YoY, Application and Business Services revenue was down 7% YoY, and IT Outsourcing revenue declined 6% YoY.

Enterprise Servers, Storage and Networking (ESSN) revenue declined 9% YoY with an 8.3% operating margin. Networking revenue was up 7%, Industry Standard Servers revenue was down 7%, Business Critical Systems revenue was down 25%, and Storage revenue was down 13% YoY.

Software revenue grew 14% YoY with a 27.2% operating margin, including the results of Autonomy. Software revenue was driven by 9% license growth, 9% support growth, and 48% growth in services.

HP Financial Services revenue grew 1% YoY as a 3% increase in net portfolio assets was offset by an 11% decrease in financing volume. The business delivered a 10.8% operating margin.

Microsemi (MSCC) announced VIZIO has utilized Microsemi's LED backlight driver for its E-Series 60-inch and 70-inch Class Razor LED Smart TVs.

Brocade (BRCD) Reports Q4 (Oct) earnings of $0.17 per share, $0.03 better than the Capital IQ consensus of $0.14, while revenues rose 5.1% year/year to $578 mln vs the $565.95 million consensus. Q4 2012 GAAP gross margin was 62.4% and non-GAAP gross margin was 64.8%, compared with 59.5% and 62.9% in Q4 2011, respectively. The year-over-year improvement in gross margin was due to higher revenue, favorable product mix, and lower fixed costs. "Q4 was an excellent quarter for Brocade and a strong ending for fiscal year 2012 during which we established a number of company records including revenue, net income, and operating cash flow...Our product portfolio across all areas of our business is the strongest it has ever been and we are driving industry transformation in emerging areas of growth including virtualized data centers, cloud computing, and software-defined networking. We believe Brocade is well-positioned for continued growth in fiscal 2013."

Agilent (A) reported fourth quarter earnings of $0.86 per share, $0.06 better than the Capital IQ consensus of $0.80, while revenues rose 2.3% year/year to $1.77 billion versus the $1.76 bln consensus. Co issued downside guidance for the first quarter with EPS of $0.65-0.67 versus the $0.76 consensus and revenues of $1.68-1.70 billion versus the $1.72 billion consensus.

Nuance (NUAN) reported fourth quarter earnings of $0.51 per share, excluding non-recurring items, $0.03 better than the Capital IQ consensus of $0.48, while revenues rose 22.7% year/year to $490.1 million versus the $495.62 mln consensus. "Across our markets, Nuance's ability to deliver customized voice and natural language solutions that understand user intent drove record bookings in fiscal 2012 and continues to drive unprecedented customer interest, positioning us well for growth in fiscal 2013."

Hewlett-Packard (HPQ) reported fourth quarter earnings of $1.16 per share, excluding non-recurring items, $0.01 better than the Capital IQ consensus of $1.15, while revenues fell 6.7% year/year to $29.96 billion versus the $30.48 billion consensus. HP recorded a non-cash charge for the impairment of goodwill and intangible assets within its Software segment of ~$8.8 billion in 4Q12. The majority of this impairment charge is linked to serious accounting improprieties, disclosure failures and outright misrepresentations at Autonomy Corporation plc that occurred prior to HP's acquisition of Autonomy and the associated impact of those improprieties, failures and misrepresentations on the expected future financial performance of the Autonomy business over the long-term. The balance of the impairment charge is linked to the recent trading value of HP stock. There will be no cash impact associated with the impairment charge. HP also utilized $124 million of cash during the quarter to repurchase ~7.6 million shares of common stock in the open market. The company issued downside guidance for the first quarter with EPS of $0.68-0.71, excluding non-recurring items, versus the $0.85 consensus. The company reaffirmed guidance for fiscal year 2013 with EPS of $3.40-3.60, excluding non-recurring items, versus the $3.48 consensus. Personal Systems revenue was down 14% YoY with a 3.5% operating margin. Commercial revenue decreased 13%, and Consumer revenue declined 16%. Total units were down 12% with both Desktops and Notebooks units down 12%. Printing revenue declined 5% YoY with a 17.5% operating margin. Total hardware units were down 20% YoY. Commercial hardware units were down 15% YoY, and Consumer hardware units were down 22% YoY. Services revenue declined 6% YoY with a 14.2% operating margin. Technology Services revenue was down 4% YoY, Application and Business Services revenue was down 7% YoY, and IT Outsourcing revenue declined 6% YoY. Enterprise Servers, Storage and Networking (ESSN) revenue declined 9% YoY with an 8.3% operating margin. Networking revenue was up 7%, Industry Standard Servers revenue was down 7%, Business Critical Systems revenue was down 25%, and Storage revenue was down 13% YoY. Software revenue grew 14% YoY with a 27.2% operating margin, including the results of Autonomy. Software revenue was driven by 9% license growth, 9% support growth, and 48% growth in services. HP Financial Services revenue grew 1% YoY as a 3% increase in net portfolio assets was offset by an 11% decrease in financing volume. The business delivered a 10.8% operating margin.

icon url

ReturntoSender

11/22/12 7:27 PM

#9994 RE: ReturntoSender #6755

From Briefing.com: 4:20 pm : The S&P 500 endured choppy trade during the first two hours of action. The index followed the early indecision with a run to session highs where it spent the majority of the afternoon. The market received some encouraging news from the Middle East where Israel and Hamas have reached a cease-fire agreement. However, the Eurozone remains a concern into the holiday as the next tranche of Greek aid is yet to be approved. Today's trade was confined to a tight range and volume was well below average. As a result, the S&P 500 ended higher by 0.2%.

The technology sector outperformed the broader market and the SPDR Technology Select Sector ETF (XLK 28.39, +0.09) settled higher by 0.3%. Apple (AAPL 561.70, +0.78) has been in focus recently due to the extended weakness observed in the stock during the past two months. Today, the biggest tech component tacked on 0.1% as the shares attempt to establish support in the $550 area.

In notable tech earnings, Salesforce.com (CRM 158.66, +12.76) spiked 8.8% after beating on the top and bottom lines. In addition to the quarterly beat, the cloud computing company issued in-line fourth quarter and full-year earnings and revenue guidance. Peer SAP (SAP 75.23, +0.87) added 1.2%.

Elsewhere, NCI (NCIT 4.58, +0.24) surged 5.5% after the company was awarded multiple task orders as part of its contract with the U.S. Army. The total value of the orders was reported at $27.1 million.

Also of note, Cirrus Logic (CRUS 31.16, +0.82) advanced 2.7% after the company's Board of Directors authorized the repurchase of up to $200 million of the company's common stock.

Industrial bellwether Deere (DE 82.83, -3.16) fell 3.7% after reporting mixed results. During the fourth quarter, the machinery manufacturer earned $1.75, which was $0.13 short of the Capital IQ consensus estimate. However, the company's revenue of $9.05 billion represented a 14.5% year-over-year increase, and beat expectations. Deere's outlook was mostly positive as the company expects full-year 2013 revenue above consensus and net income in-line with expectations.

The Dow Jones Transportation Average added 0.3%. Railroads saw relative weakness yesterday, but displayed strength today. Kansas City Southern (KSU 76.33, +0.69) and Norfolk Southern (NSC 57.03, +0.12) finished higher by 0.9% and 0.2%, respectively.

On the other hand, airlines which outperformed yesterday were among the biggest laggards. JetBlue Airways (JBLU 5.07, +0.05) and Southwest Airlines (LUV 9.24, +0.13) saw respective gains of 1.0% and 1.4%.

Today's choppy price action was reflected in the performance of individual sectors. However, utilities opened as the weakest performing group, and remained there for the duration of the session. Electrical companies have been pressured since Hurricane Sandy, and their shares felt the brunt of today's weakness. The SPDR Utilities Select Sector (XLU 34.18, -0.15) slid 0.4%. Among individual electricity producers, Duke Energy (DUK 60.23, -0.55) and NextEra Energy (NEE 67.25, -0.46) both lost near 0.7%.

The weekly MBA Mortgage Index pointed to a 2.2% decrease in mortgage applications during the past week. Today's reading followed prior week's increase of 12.6%.

The latest weekly initial jobless claims count totaled 410,000, which was lower than the 423,000 that had been expected by the Briefing.com consensus. The tally was below the revised prior week count of 451,000. As for continuing claims, they fell to 3.337 million from 3.367 million.

The University of Michigan's final Consumer Sentiment Survey for November fell to 82.7 from the 84.9 that was posted in the preliminary Survey. The Briefing.com consensus expected the reading to slip to 84.5.

Lastly, leading indicators for October increased by 0.2%, which was in-line with the forecast. Today's reading followed prior month's increase of 0.6%.

Note that equity and bond markets will be closed tomorrow in observance of Thanksgiving. Trading will resume on Friday, but the final session of the week will end at 13:00 ET.DJ30 +48.38 NASDAQ +9.87 SP500 +3.22 NASDAQ Adv/Vol/Dec 1556/1.36 bln/857 NYSE Adv/Vol/Dec 2016/521.9 mln/969

3:30 pm : Commodities displayed some notable volatility today, especially in the oil market. Inventory data came out for oil and for natural gas today. Oil data didn't cause the commodity to do much initially, but sellers began to step in later, cause the Dec contract to fall below the $86.50 mark. Crude recovers those losses with an afternoon rally, to end the day 0.7% higher at $87.41/barrel.

Natural gas futures spiked following inventory, which pushed the December contract as high as $3.91. At the end of today's floor trading session, nat gas closed 2.3% higher at $3.91/MMBtu.

Precious metals ended the day higher, while copper (base metal) slid modest lower. In morning action, gold and silver rallied higher, allowing Dec gold to ended the day up 0.3% at $1723.70/oz and Dec silver up 1% at $33.29. Dec copper lost 2 cents to finish at $3.50/lb.DJ30 +42.82 NASDAQ +7.67 SP500 +1.93 NASDAQ Adv/Vol/Dec 1402/1162.3 mln/994 NYSE Adv/Vol/Dec 1829/370 mln/1144

12:21PM Arch Coal completes senior note and term loan offerings, amends credit facility (ACI) 6.46 +0.06 : Co closed on its previously announced $375 mln senior unsecured notes and $250 mln incremental secured term loan. Under the terms of the credit agreement, the $250 mln incremental term loan will reduce the size of Arch's revolving credit facility to $350 mln from $600 mln. The company intends to use the net proceeds from these financings for general corporate purposes. Following these transactions, Arch has cash and investments of $1.2 bln and total available liquidity of approximately $1.4 bln, on a pro forma basis as of Sept. 30. Co has successfully amended its senior secured revolving credit facility, relaxing the financial maintenance covenants until Dec. 31, 2015. Among other revisions, Arch must adhere to a minimum liquidity covenant that requires the company to maintain available liquidity of at least $450 mln through Dec. 30, 2015.

9:15AM Benchmark Elec appoints Peter Dorflinger as Non-Executive Chairman of the Board (BHE) 15.09 : Co announced its succession plan for Chairman of the Board, appointing current board member Peter G. Dorflinger to serve as non-executive chairman, subject to his re-election as a Company director by shareholders at its annual meeting in May 2013. Mr. Dorflinger, general partner of MAD Capital Partners, has been a director of Benchmark since its initial public offering in 1990. Mr. Dorflinger succeeds Company founder Cary T. Fu, who plans to retire from the Company's Board of Directors on Dec 31, 2012.

7:03AM NXP Semi announces extension of the tender offer for 9 3/4% senior secured notes due 2018 (NXPI) 23.29 : Co announced the extension of the expiration time (of the previously announced tender offer by NXP B.V. for up to $500 mln in cash of outstanding U.S. dollar-denominated 9 3/4% Senior Secured Notes due 2018, jointly and severally issued by NXP B.V. and NXP Funding.

United Microelectronics (UMC) introduced an 80nm SDDI foundry process with the most competitive SDDI SRAM bitcell in the foundry industry.

1:36AM ASM Intl NV reports update on share buy back program; purchased 1 mln of its shares at an average price of EUR27.15 per share. The total number of shares repurchased under this program to date is 1.5 mln shares for a total EUR40.6 mln (ASMI) 34.91 :

Salesforce (CRM) reported third quarter earnings of $0.33 per share, $0.01 better than the Capital IQ consensus of $0.32, while revenues rose 34.9% year/year to $788 million versus the $776.52 mln consensus. The company's non-GAAP results exclude the effects of the $149 million charge related to the establishment of the tax valuation allowance, $26 million related to the quarterly change in the tax valuation allowance, $105 million in stock-based compensation expense, $26 million in amortization of purchased intangibles, and $6 million in net non-cash interest expense related to the company's convertible senior notes. GAAP EPS calculations are based on a basic share count of approximately 142 million shares. The company issued in-line guidance for the fourth quarter with EPS of $0.38-0.40 versus the $0.40 consensus and revenues of $825-830 versus the $829.97 million consensus. The company issued in-line guidance for fiscal year 2013 with EPS of $1.50-1.52 versus the $1.50 consensus and revenues of $3.041-3.046 billion versus the $3.03 billion consensus. The company in-line guidance for fiscal year 2014 sees FY14 revs of $3.80-3.85 bln vs. $3.83 bln Capital IQ Consensus Estimate. Deferred Revenue: Deferred revenue on the balance sheet as of October 31, 2012 was $1.29 billion, an increase of 41% on a year-over-year basis. Current deferred revenue increased by 35% year-over-year to $1.23 billion, benefited in part by longer invoice durations. Non-current deferred revenue increased by 414% year-over-year to $66 million. Unbilled deferred revenue, representing business that is contracted but unbilled and off balance sheet, ended the third quarter at approximately $3 billion, up from approximately $2.8 billion at the end of the fiscal second quarter. Revenues by Geography: Americas $547 million, up 37% y/y; Europe $133 million, up 29% y/y; Asia Pacific $107 million, up 29% year over year.

Cirrus Logic (CRUS) announced that its Board of Directors has authorized the repurchase of up to $200 million of the company's common stock. The repurchases will be funded from working capital and anticipated cash from operations.

ReneSola (SOL) issued in-line guidance for the third quarter with revenues of $200-220 million versus $210.87 million consensus. The company estimates its total solar wafer and module shipments to be in its previously guided range of 510 MW to 530 MW, solar module shipments to be slightly below its previously guided range of 150 MW to 170 MW. The co expects its gross profit margin for the third quarter of 2012 to be in the range of negative 17.5% to negative 18.5% after an inventory write-down of approximately US$31.6 million to reflect current selling prices. For FY12, the co estimates its total solar wafer and module shipments to be close to 2.2 GW, compared to the Company's previously guided range of 2.2 GW to 2.4 GW. The co expects its solar module shipments to increase in the fourth quarter of 2012. The company will report Q3 results this Friday morning.

10:11 am Best Buy target lowered to $14 at RBC: . RBC Capital Mkts lowers their BBY tgt to $14 from $17. They note that in a relatively thin margin business, such as Consumer Electronic Retailing, the business model comes under significant strain when gross margins are falling by 160 bps YoY, like they did this quarter. While they would not buy the stock here as material pricing/competitive issues remain and the co's margin deterioration is of grave concern, they do expect vendors to remain supportive of the co given Best Buy's size and believe that there are a lot of costs that can come out of the operation, especially as their new CFO takes the reigns.

10:29 am Tech sector trading higher today and ahead of overall market

The tech sector is trading higher today, outpacing a flat broader market. Semiconductors are showing relative strength as well with the SOX trading 0.1% higher today. Within the chip index, CRUS (+4.3%) is a notable standout. Among other major indices, the SPY is trading flat, while the QQQ and the NASDAQ are trading 0.1% higher on the session. Among tech bellwethers, GOOG (-1.2%) is showing notable weakness, while FB (+2.9%) is a leader.

In tech earnings last night, CRM (+6.6%) reported a Q3 beat and offered inline guidance. In news, CRUS (+4.2%) announced a $200 mln share repurchase program. Also, MIPS (+5.1%) announced the receipt of unsolicited proposal from CEVA (-3.0%). There were no notable analyst upgrades this morning in the tech space. Among downgrades, HPQ (-0.2%) was downgraded at RBC and Mizuho. There are no notable names in tech scheduled to report quarterly results today after the close.
icon url

ReturntoSender

11/27/12 12:07 AM

#9996 RE: ReturntoSender #6755

FromBriefing.com: 4:15 pm : Equities began the week on a cautious note as uncertainty crept back into the markets. Overseas, the Eurogroup continues to discuss the next tranche of Greek aid. Reports from the talks indicate lawmakers remain split over whether or not haircuts should be applied to the outstanding Greek debt. Additionally, elections in the Spanish region of Catalonia resulted in two-thirds of the vote going to parties which support a referendum on independence. The European news combined with some profit-taking following Friday's rally translated into a downbeat session which saw the S&P 500 slip 0.2%.

The telecom space was the biggest laggard as traders rotated out of high-dividend stocks. The sector is likely to see further weakness until a fiscal cliff resolution is agreed upon. Even if a timely compromise is reached, it remains to be seen what impact the agreement will have on high-yielding stocks. Today, AT&T (T 33.97, -0.39) and Verizon (VZ 43.30, -0.36), which generate respective yields of 5.2% and 4.7%, both lost near 1.1%.

Retailers succumbed to the broad market pressure, and the SPDR S&P 500 Retail ETF (XRT 62.59, -0.61) slid 1.0%. An earlier story by MarketWatch pointed to a 1.8% decrease in Black Friday sales despite a 3.5% uptick in foot traffic. However, it should be noted that two major retailers, Target (TGT 62.77, -1.70) and Wal-Mart (WMT 69.91, -0.29) were closed last year, but opened on Thursday evening this year. Because of this, a portion of sales which would have counted towards Friday's total, were registered on Thursday evening.

The weakness was visible across all retailers as no particular group bore sole responsibility for the decline. Grocery store operators SUPERVALU (SVU 2.63, -0.08) and Safeway (SWY 16.41, -0.55) saw seeing respective losses of 3.0% and 3.2%. Looking at apparel retailers, Macy's (M 39.86, -1.87) lost 4.5% and Aeropostale (ARO 13.77, -0.68) ended lower by 4.7% after Janney Montgomery Scott downgraded the stock to ‘neutral' from ‘buy.'

Last week, the SPDR Financial Select Sector ETF (XLF 15.78, -0.06) gained over 4.0% after a brief test of its 200-day moving average in the $15.08 area. Today, the ETF proxy for financial stocks shed 0.4% and most majors underperformed. Wells Fargo (WFC 32.90, -0.30) and Citigroup (C 35.57, -0.46) were among the biggest laggards as the two lost 0.9% and 1.3%, respectively. Meanwhile, Goldman Sachs (GS 120.94, +0.63) and Morgan Stanley (MS 16.61, +0.18) registered gains and outperformed their peers.

Elsewhere, European financials also saw relative weakness. Deutsche Bank (DB 43.30, -0.57) and Barclays (BCS 15.51, -0.77) lost 1.3% and 4.7%, respectively. Barclays slumped after Qatar Holdings, LLC sold the remainder of the bank's warrants held since the onset of the financial crisis. As a result of the sale, a $1.19 billion Barclays stock offering was triggered. In addition, the Financial Times indicated some investors are calling on management to split up the company.

The utilities sector fell over 7.0% in the aftermath of Superstorm Sandy. Today, the space led the broader market with a gain of 1.3%. Exelon (EXC 29.32, +0.75) gained 2.6% after Deutsche Bank upgraded the stock to ‘buy' from ‘hold.' Looking at other electric utilities, FirstEnergy (FE 41.77, +0.70) rose by 1.7% and PPL Corporation (PPL 28.44, +0.36) added 1.3%.

Technology stocks also managed close in the black. Shares of Apple (AAPL 589.53, +18.03) settled higher by 3.2% as the stock remains in focus after tumbling nearly 20% from its all-time high of $705.07. Earlier, Citigroup initiated coverage of the stock with a ‘buy' rating and a $675 price target.

In other analyst action, Facebook (FB 25.94, +1.94) surged 8.1% after BTIG upgraded the stock to ‘neutral' from ‘sell.'

Also of note, 3D Systems (DDD 46.55, +4.81) spiked 11.5% after unveiling the next generation of its ProJet 3D printers.

Looking at tomorrow's economic data, October durable orders and durable orders ex-transportation will be reported at 8:30 ET. In addition, the September Case-Shiller 20-city Index will be released at 9:00 ET. Lastly, November consumer confidence and September FHFA Housing Price Index will both hit the wires at 10:00 ET.DJ30 -42.31 NASDAQ +9.93 SP500 -2.86 NASDAQ Adv/Vol/Dec 1338/1.54 bln/1124 NYSE Adv/Vol/Dec 1309/633.1 mln/1725

3:30 pm : A slightly higher dollar index and concerns over the U.S. budget and the Greek debt crisis put pressure on crude oil during today's pit trade. The energy component dipped as low as $87.27 per barrel in late morning pit action. Despite inching slightly higher for the remainder of the session, it settled with a 0.6% loss at $87.72 per barrel.

Natural gas traded in negative territory in a fairly consolidative pattern near the $3.74 per MMBtu level. It eventually closed with a 4.4% loss at $3.73 per MMBtu.

Precious metals chopped around in negative territory for most of floor trade as the slightly higher dollar index put pressure on prices. Gold eased off its session high of $1752.30 per ounce and dipped to a session low of $1746.90 per ounce. It ultimately erased most of the loss as it settled just 0.1% lower at $1749.60 per ounce.

Silver brushed a session low of $33.93 per ounce but closed with a one cent gain at $34.13 per ounce after inching higher in afternoon pit action.DJ30 -59.36 NASDAQ +5.37 SP500 5.21 NASDAQ Adv/Vol/Dec 1170/1251.4 mln/1274 NYSE Adv/Vol/Dec 1087/398 mln/1940

4:01PM Aehr Test Systems announces $2 mln in orders from automotive IC manufacturers (AEHR) 0.79 +0.03 : Co announced it has received over $2 million in follow-on production orders for its burn-in and test systems from multiple leading manufacturers of advanced logic integrated circuits (ICs) for automotive applications.

12:46PM Teradyne names Mark Jagiela President (TER) 15.66 -0.27 : Co announced that Mark E. Jagiela has been appointed President of Teradyne, effective January 1, 2013. Mike Bradley will continue as the Company's Chief Executive Officer. Mr. Jagiela, 52, joined Teradyne in 1982. Since 2003, he has served as the President of the Semiconductor Test Division.

Atmel (ATML) announced Samsung (SSNLF) has selected Atmel's AVR UC3L microcontroller with patented ultra-low power picoPower technology as its sensor hub management solution for the Galaxy Note II.

Xilinx (XLNX) introduced new, All Programmable solutions for meeting the challenges of advanced motion control, real-time industrial networking, machine vision and a host of other next-generation industrial automation applications.

ASM Int (ASMI) announced that after its announcement on October 8, 2012 that it would exercise its right to redeem all outstanding 6.5% senior unsecured convertible bonds on November 27, 2012 at their principal amount, together with accrued but unpaid interest, all bondholders exercised their right to convert their Bonds into ordinary shares. As a result of this conversion, outstanding common shares increased with 9,074,396 shares.

12:58AM IBM report shows early promotions drive record online sales for Thanksgiving, fuels Black Friday retail surge (IBM) 193.49 : According to IBM, US shoppers once again took advantage of early promotions this holiday season, driving a 17.4% increase in online sales Thanksgiving Day. This increase set the stage for 20.7% growth on Black Friday. The biggest surge came from mobile consumers, with sales reaching 16.3%, led by the iPad. This data is the result of cloud-based analytics findings from IBM. As part of IBM's Smarter Commerce initiative, the IBM Digital Analytics Benchmark revealed the following trends:

Consumer Spending Increases: Online sales on Thanksgiving grew by 17.4% followed by Black Friday where sales increased 20.7% over last year.
Mobile Shopping: Mobile purchases soared with 24% of consumers using a mobile device to visit a retailer's site, up from 14.3% in 2011. Mobile sales exceeded 16%, up from 9.8% in 2011.
The iPad Factor: The iPad generated more traffic than any other tablet or smartphone, reaching nearly 10% of online shopping. This was followed by iPhone at 8.7% and Android 5.5%. The iPad dominated tablet traffic at 88.3% followed by the Barnes and Noble Nook at 3.1%, Amazon Kindle at 2.4% and the Samsung Galaxy at 1.8%.
Multiscreen Shopping: Consumers shopped in store, online and on mobile devices simultaneously to get the best bargains. Overall 58% of consumers used smartphones compared to 41% who used tablets to surf for bargains on Black Friday.
The Savvy shopper: While consumers spent more overall, they shopped with greater frequency to take advantage of retailer deals and free shipping. This led to a drop in average order value by 4.7% to $181.22. In addition, the average number of items per order decreased 12% to 5.6.

II-VI (IIVI) announced today that it has signed a definitive agreement to purchase the thin film filter business and interleaver product line from Oclaro (OCLR) for $27 million in cash. The thin film filter business and interleaver product line will report within the Company's Photop Technologies business unit and will be included in the Company's Near-Infrared Optics operating segment for financial reporting purposes. The transactions are expected to close on December 3, 2012.

Cantor Fitzgerald says, while consumers remain value sensitive, they appear to be willing to increase their spend despite the macro uncertainty. Over the weekend, they collected multiple data points, all of which show a healthy start to the holiday shopping season, which if sustained could lead to a 15-18% Y/Y growth in e-commerce and support the valuations of several names in the group, particularly Amazon (AMZN) and Google (GOOG).

The Benchmark Company upgraded Broadcom (BRCM) to Buy from Hold. THe firm is taking a more positive stance on the chip group and upgrading Broadcom. The firm says, like most semi device companies, Broadcom is feeling the sluggish global economy. They say while the chip industry should contract ~2% during 2012, BRCM should deliver 3% organic revenue growth despite its large size. They saw as more devices add WiFi, BT, GPS, NFC and/or cellular connectivity, they expect Broadcom's Mobile & Wireless TAM to grow at a 12% CAGR.

09:52 am S&P Information Technology trading near the flat line and ahead of overall market

The tech sector is trading just higher today, outpacing losses in the broader market. Semiconductors are showing relative strength as well with the SOX trading 0.6% higher. Within the chip index, SNDK (+1.9%) is a notable standout. Among other major indices, the SPY is trading 0.4% lower today, while the QQQ and the NASDAQ are trading 0.04% lower on the session. Among tech bellwethers, T (-1.4%) and VZ (-1.4%) are showing notable weakness.

There were no tech earnings of note this morning. In news, SCOR (+0.3%) reported U.S. retail e-commerce spending for the first 23 days of the Nov - Dec holiday season-to-date of $13.7 bln spent online, marking a 16% increase versus the corresponding days last year. In notable analyst upgrades this morning in the tech space, The Benchmark Company upgraded BRCM (+1.0%) to Buy and FB (+4.8%) was upgraded at Bernstein and BTIG. Also, YHOO (+2.3%) was added to Conviction Buy List at Goldman. Among downgrades, VRSN (-1.6%) was downgraded to Equal Weight at First Analysis. There are no notable names in tech scheduled to report quarterly results today after the close.
icon url

ReturntoSender

11/28/12 10:01 PM

#9998 RE: ReturntoSender #6755

From Briefing.com: 4:15 pm : Equities opened lower, but staged a reversal when top lawmakers reiterated their desire to reach a budget agreement. After marking a session low near its 200-day moving average, the S&P 500 reversed 25 handles to session highs. The reversal was aided by comments from House Speaker Boehner who said he is optimistic a deal can be reached in order to avoid going over the fiscal cliff. In addition, the President held a press conference where he reiterated his belief in higher tax rates for top earners. He also stressed that if Congress fails to approve selective tax increases, going over the cliff will result in an across-the-board tax hike. The S&P 500 ended the session with a gain of 0.8%.

The Federal Reserve released its October Beige Book, which pointed to modest growth in seven Districts. Meanwhile, two Districts reported stronger growth while Boston, New York, and Philadelphia saw weak performance. The weakness in New York and Philadelphia was attributed to disruptions caused by Superstorm Sandy. Further, contacts in several regions expressed concerns over the uncertainty surrounding the ongoing budget debate.

Consumer credit was mixed as higher demand for home mortgage loans and auto loans increased consumer lending in some Districts. However, small business loan demand was generally described as weaker to only moderately higher.

Regarding hiring, "most districts reported modest gains while wage and price pressures remained subdued. "

Today's housing data pointed to a 0.3% decrease in October new home sales. The annualized rate of 368,000 fell short of expectations and caused homebuilder stocks to fall to their respective lows. Shares of major builders have enjoyed strong performance since the start of the year, but today's economic data contributed to industry-wide weakness. DR Horton (DHI 19.42, -0.16), PulteGroup (PHM 17.00, -0.11), and Lennar (LEN 38.38, -0.34) all lost between 0.6% and 0.9%.
Despite the weakness in homebuilders, consumer discretionary stocks outperformed after a handful of retailers reported strong earnings. American Eagle Outfitters (AEO 20.77, +1.38) surged 7.1% after beating on top and bottom lines. In addition, the company issued in-line fourth quarter earnings guidance.

PVH (PVH 116.46, +7.17) rose by 6.6% after its third quarter earnings of $2.34 beat the Capital IQ consensus estimate by $0.05. Despite the earnings beat, the company guided fourth quarter earnings below consensus and suggested revenue is expected to come in above analyst expectations. Regarding full-year earnings and revenue, the company expects both figures to be below current expectations.

Express (EXPR 14.15, +1.16) spiked 8.9% following its bottom line beat. In addition, the apparel retailer reported in-line revenue and issued upside fourth quarter earnings guidance.

Movado Group (MOV 35.50, +3.27) soared 10.2% after beating on earnings and revenue. The luxury distributor also raised its full-year earnings guidance in-line with the Capital IQ consensus. Lastly, the company declared a special dividend of $0.75.

Also of note, Green Mountain Coffee Roasters (GMCR 36.86, +7.91) surged 27.3% after reporting strong earnings. During the fourth quarter, the company earned $0.64, which was $0.16 ahead of the Capital IQ consensus estimate. Additionally, the beverage company beat on revenue and issued first quarter and full-year earnings and revenue guidance above consensus.

Elsewhere, Costco Wholesale (COST 102.58, +6.07) gained 6.3% after reporting a 6.0% increase in November comparable store sales. In addition, the wholesaler declared a special cash dividend of $7.00.

Solar stocks saw broad strength after JA Solar (JASO 0.70, +0.05) and Yingli Green Energy (YGE 1.62, +0.19) reported earnings. JA Solar rose by 7.7% after reporting mixed results. During the third quarter, the company recorded a loss of $0.30, which was $0.11 worse than the Capital IQ consensus estimate. However, JASO's revenue of $260.90 million exceeded expectations. Meanwhile, Yingli Green Energy spiked 13.3% after beating on earnings and reporting revenue below consensus. In addition, the company reaffirmed its full-year 2012 shipment guidance. Major solar names all outperformed and the Guggenheim Solar ETF (TAN 14.04, +0.68) rose by 5.1%.

The weekly MBA Mortgage Index reflected a 0.9% decrease in mortgage applications. Today's reading follows the prior week's decrease of 2.2%.

Tomorrow, weekly initial and continuing claims will be reported at 8:30 ET. In addition, the second estimate of third quarter GDP and the GDP deflator will also be announced at 8:30 ET. Lastly, October pending home sales will hit the wires at 10:00 ET.

The U.S. Treasury will auction off $29 billion in 7-yr notes.DJ30 +106.98 NASDAQ +23.99 SP500 +10.99 NASDAQ Adv/Vol/Dec 1505/1.66 bln/946 NYSE Adv/Vol/Dec 2070/711.9 mln/929

3:30 pm : Crude oil traded in negative territory as investors reacted to concerns over the "fiscal cliff". The energy component dipped to a session low of $85.39 per barrel but bounced back slightly following better-than-anticipated inventory data that showed a draw of 0.347 mln barrels when a build of 0.325 mln barrels was expected. It eventually settled with a 0.8% loss at $86.46 per barrel, or just below its session high of $86.54 per barrel.

Natural gas extended overnight losses as it trended lower into the red during today's floor session. It brushed a session low of $3.74 per MMBtu in morning action but managed to inch upwards in afternoon action. It ultimately closed with a 2.3% loss at $3.80 per MMBtu.

Gold sold off sharply from its session high $1735.70 per ounce by about $25, or 1.4%, right as pit trade opened. While there was initial confusion for the drop, Reuters.com pointed out that the fall did not result due to a monetary pause or a "fat finger" trade on the CME. The move was largely driven by large sell orders by funds, given the December contract's rollover to February expiration. The yellow metal dipped even further, brushing a session low of $1705.50 per ounce in morning action. It eventually settled with a 1.6% loss at $1716.20 per ounce. Silver also slid deeper into negative territory as the floor session opened and fell as low as $32.90 per ounce. It recovered most of the earlier loss but still settled 0.9% lower at $33.69 per ounce.DJ30 +100.44 NASDAQ +14.34 SP500 +9.73 NASDAQ Adv/Vol/Dec 1425/1373.5 mln/1010 NYSE Adv/Vol/Dec 1900/478 mln/1072

4:33PM Semtech beats by $0.10, beats on revs; guides Q4 EPS in-line, revs in-line; co reports record cash flow from operations of $55 mln, representing 34% of revs (SMTC) 24.92 -0.01 : Reports Q3 (Oct) earnings of $0.53 per share, excluding non-recurring items, $0.10 better than the Capital IQ Consensus Estimate of $0.43; revenues rose 29.9% year/year to $161 mln vs the $151.72 mln consensus. Co issues in-line guidance for Q4, sees EPS of $0.41-0.45, excluding non-recurring items, vs. $0.42 Capital IQ Consensus Estimate; sees Q4 revs of $146-152 vs. $151.92 mln Capital IQ Consensus Estimate.

4:07PM SunPower: D. E. Shaw Renewable Investments and Bright Plain Renewable Energy announce the acquisition of Kalaeloa Solar Farm from SunPower (SPWR) 4.55 +0.16 : Construction on the project began in July of this year, and is expected to be complete next month. Hawaiian Electric will buy the power produced by the solar farm under a fixed-price contract for 20 years.

Riverbed Technology (RVBD) announced that Riverbed Stingray Traffic Manager is now a certified load balancer for Microsoft (MSFT) Lync 2010.

AMD (AMD) announced a new global distribution agreement with Symmetry Electronics. Symmetry Electronics will immediately begin to promote, sell and support the full line of AMD embedded products.

8:02AM MEMC Elec Closes $314 million (R2.6 Billion) in funding for 58 MW in South Africa solar projects (WFR) 2.82 +0.02 : Co announced that it has closed $314 million (R2.6 Billion) in long-term debt and equity financing for two utility solar projects in Limpopo Province, South Africa. Standard Bank and Futuregrowth Asset Management are the two senior debt providers supporting both projects. The two projects total 58 megawatts MW (AC). Witkop Solar Park and Soutpan Solar Park (28 MW AC) will be the first utility scale solar projects to be implemented in Limpopo Province. Under the terms of the financing agreement, power generated from the two facilities will be purchased by Eskom, the national utility in South Africa, through a 20-year power purchase agreement. The Soutpan Solar Park is expected to interconnect in January of 2014, while the Witkop Solar Park is forecast to interconnect in April of 2014. Construction of both projects is expected to begin in January of 2013.

7:02AM SemiLEDs misses Q4 ests (LEDS) 1.18 : Reports Q4 (Aug) loss of $0.60 per share, excluding non-recurring items, $0.35 worse than the Capital IQ Consensus Estimate of ($0.25); revenues rose 3.8% year/year to $5.5 mln vs the $7.99 mln consensus.

Fourth quarter results reflect the Company's reduction of the carrying amount of its investment in China SemiLEDs to zero, compared to the third quarter ending balance of $8.7 million. The reduction reflects primarily the Company's recognition of its proportionate share of an impairment charge on China SemiLEDs' long-lived assets related to the increased likelihood that shareholders of China SemiLEDs would fail to agree to and implement a restructuring plan for China SemiLEDs.

6:06AM JA Solar misses by $0.11, beats on revs (JASO) 0.65 : Reports Q3 (Sep) loss of $0.30 per share, $0.11 worse than the Capital IQ Consensus Estimate of ($0.19); revenues fell 32.8% year/year to $260.9 mln vs the $230.28 mln consensus. Total shipments in the third quarter of 2012 were 418 MW, above the high end of the co's previously provided guidance of 350 MW to 370 MW, flat from the 418MW shipped in the second quarter of 2012, and a 6.1% decrease from 445 MW in the third quarter of 2011.

Business Outlook
For the fourth quarter of 2012, the co expects total cell and module shipments to be between 380 MW and 420 MW. For the full year 2012, the co now expects total cell and module shipments to be between 1.55-1.65 GW, compared with the previously provided full year guidance of 1.5-1.8 GW.

Analog Devices (ADI) reported fourth quarter earnings of $0.58 per share, $0.01 better than the consensus of $0.57, while revenues fell 3.0% year/year but rose 2% sequentially to $695.0 million versus the $697.5 mln consensus. The company issued downside guidance for the first quarter with EPS of $0.40-0.48 versus the $0.55 consensus and revenues down 6-12%, it is assuming they mean sequentially but it's not entirely clear, which computes to approximately $612-653 mln vs. $687.3 mln Capital IQ Consensus Estimate. Based on YoY, the guidance would be $641-685 million. "Overall orders decreased during the quarter as customers became more cautious and continued to reduce inventories, in many cases to historically low levels. As a result, we began reducing our production levels in the fourth quarter and will reduce them further in the first quarter of fiscal 2013 to keep our inventory at appropriate levels. While this will reduce gross margins in the short term, we believe this should provide significant operating leverage when growth resumes."

Guidewire Software (GWRE) reported first quarter earnings of $0.11 per share, excluding non-recurring items, $0.10 better than the Capital IQ consensus of $0.01, while revenues rose 20.8% year/year to $63.3 million versus the $60.56 mln consensus. "We are reporting revenue and profitability that exceeded our guidance for the first quarter of fiscal year 2013. Term license revenue increased by 67%, contributing to 31% growth in our rolling four-quarter recurring revenue metric. Underlying this strong financial performance is our further penetration into the Tier 1 segment of the market, continued international traction, and multiple go-lives that expand our track record of successful customer deployments. We are pleased with the fact that we continue to see positive returns on the investments we are making in engineering, sales and services."

Symantec (SYMC) target raised to $20 from $17 at FBR Capital. The firm notes while they believe co is slowly getting its arms around its business and will soon take a new strategic direction (announcement expected in late January 2013) with its business, they have concerns regarding competitive and secular headwinds in the co's core security and storage markets and the lack of consistency inherent in the co's near-term profitability profile given the constant digesting of its acquisitions and further investments in the business. They increase price target to reflect the co's new strategic vision, and believes it is appropriate given SYMC's growth rate, profitability, and peer valuations.

icon url

ReturntoSender

11/29/12 6:57 PM

#9999 RE: ReturntoSender #6755

From Briefing.com: 4:25 pm : Today's session started on a positive note after yesterday's comments from House Speaker Boehner were viewed as supportive. However, the Speaker held another press conference today at which he said no "substantive progress" has been made. The S&P 500 responded to Mr. Boehner's remarks by falling back to its flat line. The weakness did not last long, and the benchmark average was able to regain its losses to close higher by 0.4%.

The materials sector was one of the top performers, and producers of building materials outperformed. The space was supported by the October pending home sales data which pointed to a 5.2% increase, well ahead of the 1.0% expected by the Briefing.com consensus. Headwaters (HW 7.64, +0.19), Martin Marietta Materials (MLM 90.79, +3.99), and Vulcan Materials (VMC 51.31, +1.62) all gained between 2.6% and 4.6%.

Steelmakers saw broad strength, and the Market Vectors Steel ETF (SLX 44.34, +0.65) settled higher by 1.5%. Though most major steelmakers registered gains, Cliffs Natural Resources (CLF 28.89, -0.72) was a notable underperformer, down 2.4%.

Tech shares also outperformed, and the SPDR Technology Select Sector ETF (XLK 29.16, +0.14) gained 0.5%. The largest tech component, Apple (AAPL 589.36, +6.42), advanced 1.1% as it attempted to regain its 200-day moving average near $600.

Elsewhere, Intel (INTC 19.53, -0.56) slipped 2.8% after Goldman Sachs lowered its price target for the stock to $16 from $20. Meanwhile, peer Advanced Micro Devices (AMD 2.04, +0.08) settled higher by 4.1% as the company sought to sell its campus in Austin, Texas.

Also of note, Research In Motion (RIMM 11.54, +0.44) spiked 4.0% after Goldman Sachs upgraded the stock to ‘buy' from ‘neutral.' The maker of Blackberry phones has been on a strong run recently, gaining nearly 60% since the start of November.

As the end of the month nears, retailers have begun to report their November same store sales. Out of the 16 companies which have already reported, only four have beaten their estimates. Of those four, Stein Mart (SMRT 8.56, +0.97) led the way with a 12.8% gain. Today's advance occurred after the company reported a 7.1% growth in same store sales on expectations of a 2.3% increase.

On the downside, Kohl's (KSS 45.02, -6.13) sank 12.0% after its same store sales declined by 5.6% on expectations of a 2.1% increase. Like many retailers which missed their estimates, Kohl's blamed the softness on the aftereffects of Superstorm Sandy. As a result of the disappointing data, the SPDR S&P Retail ETF (XRT 63.36, -0.46) shed 0.7%.

Overnight, India's Sensex gained 1.8% after Goldman Sachs upgraded Indian stocks. As a result, the iPath MSCI India Index ETN (INP 58.37, +1.90) was the best performing regional ETN, up 3.4%. Indian stocks listed in the U.S. reflected the strength as they registered broad gains. Among financials, HDFC Bank (HDB 42.85, +2.58) and ICICI Bank (IBN 41.54, +2.76) jumped 6.4% and 7.1%, respectively. Elsewhere, automaker Tata Motors (TTM 25.60, +1.39) surged 5.7% and business technology consultant Infosys (INFY 44.66, +1.22) settled higher by 2.8%.

The Dow Jones Transportation Average added 0.6% as companies specializing in package delivery led the bellwether complex. Expeditors International of Washington (EXPD 37.35, +0.60), FedEx (FDX 90.80, +1.31), and UPS (UPS 73.56, +0.85) all gained between 1.2% and 1.6%. Earlier, Stifel Nicolaus upgraded Expeditors International to ‘buy' from ‘hold.' In addition, morning reports indicated UPS may pursue a network sharing agreement with its rivals in order to save the TNT Express deal.

The latest weekly initial jobless claims count totaled 393,000, which was lower than the 395,000 that had been expected by the Briefing.com consensus. The tally was below the revised prior week count of 416,000. As for continuing claims, they fell to 3.287 million from 3.357 million.

The second estimate of third quarter GDP pointed to growth of 2.7%, up from the 2.0% observed in the preliminary reading. The upwardly revised increase is slightly lower than the 2.8% increase that economists polled by Briefing.com had expected. Also, the third quarter GDP Deflator was revised down, to 2.7%.

In Friday's economic data, October personal income and personal spending as well as core PCE prices will all be released at 8:30 ET. Lastly, November Chicago PMI will be reported at 9:45 ET.DJ30 +36.71 NASDAQ +20.25 SP500 +6.02 NASDAQ Adv/Vol/Dec 1790/1.7 bln/676 NYSE Adv/Vol/Dec 2173/682.5 mln/846

3:30 pm : Jan crude oil rose $1.58 to $88.04/barrel, Jan natural gas fell $0.15 cents to $3.65/MMBtu, Jan heating oil rose 4 cents to $3.06/gallon, and Jan RBOB gasoline rose 4 cents to $2.73/gallon.

Crude oil trended higher for the first time this week, gaining support from a weaker dollar index. The energy component climbed as high as $88.69 per barrel in morning pit action but gave up some of the gain following House Speaker Boehner's comments regarding the fiscal cliff and that no "substantive progress" has been made. Nevertheless, crude booked a 1.8% gain for the session as it closed at $88.04 per barrel.

Precious metals also climbed higher in choppy fashion. Both gold and silver dipped to their respective pit session lows of $1722.80 per ounce and $33.84 per ounce following the release of initial claims data and the second estimate of third quarter GDP but quickly regained momentum. Gold brushed a session high of $1731.20 per ounce and settled for a 0.6% gain at $1729.30 per ounce. Silver popped to a session high of $34.49 per ounce in morning action and eventually closed with a1.9% gain at $34.42 per ounce.

Natural gas, on the other hand, trended lower into negative territory. It tanked to a floor session low of $3.64 per MMBtu following weaker-than-anticipated inventory data. Natural gas was unable to erase much of the loss and settled at $3.65 per MMBtu, or 3.9% lower.DJ30 +15.23 NASDAQ +15.76 SP500 +3.66 NASDAQ Adv/Vol/Dec 1679/1.4 bln/790 NYSE Adv/Vol/Dec 2042/463.5 mln/972

4:21PM OmniVision beats by $0.03, beats on revs; guides Q3 EPS, revs above consensus; co names Raymond Wu President (OVTI) 15.89 +0.21 : Reports Q2 (Oct) earnings of $0.33 per share, excluding non-recurring items, $0.03 better than the Capital IQ Consensus Estimate of $0.30; revenues rose 79.0% year/year to $390.1 mln vs the $375.06 mln consensus.

Co issues upside guidance for Q3, sees EPS of $0.33-0.46, excluding non-recurring items, vs. $0.34 Capital IQ Consensus Estimate; sees Q3 revs of $390-425 mln vs. $363.64 mln Capital IQ Consensus Estimate.

"I am pleased to announce the addition of Raymond Wu to OmniVision's management team. Raymond, one of our co-founders, has agreed to re-join us as our President, effective Dec 1, 2012. During his previous tenure, Raymond's intellect, experience and influence extended to market development, engineering and sales. We are enthused by his return, and with his knowledge of our company and the industry, I expect Raymond to make significant contributions to OmniVision's continued growth in the years to come."

6:57AM LTX-Credence misses by $0.01, misses on revs; guides Q2 EPS in-line, revs in-line (LTXC) 5.66 : Reports Q1 (Oct) earnings of $0.03 per share, excluding non-recurring items, $0.01 worse than the Capital IQ Consensus Estimate of $0.04; revenues rose 27.8% year/year to $43.2 mln vs the $43.75 mln consensus.

Co issues in-line guidance for Q2, sees EPS of ($0.08)-(0.04) vs. ($0.04) Capital IQ Consensus Estimate; sees Q2 revs of $35-39 mln vs. $37.74 mln Capital IQ Consensus Estimate.

Research In Motion (RIMM) announced updates to its developer ecosystem programs, including BlackBerry Dev Alpha test devices, the 10k developer commitment, updated tools and more. These programs continue to drive enthusiasm from the developer community as they build for the BlackBerry 10 platform.

Semtech (SMTC) reported third quarter earnings of $0.53 per share, excluding non-recurring items, $0.10 better than the Capital IQ consensus of $0.43, while revenues rose 29.9% year/year to $161 million versus the $151.72 mln consensus. The company issues in-line guidance for the fourth quarter with EPS of $0.41-0.45, excluding non-recurring items, versus the $0.42 consensus and revenues of $146-152 versus the $151.92 million consensus.

09:26 am Intel: No pickup near term - Maxim: . Maxim notes the silver lining is that demand -- both consumer and enterprise -- is not deteriorating and appears to have stabilized at sub-seasonal levels. Demand visibility -- for the current quarter and 2013 -- remains poor. They are taking a conservative stance with a forecast of low single digit unit declines for PCs in 2013 with continued demand leakage to smartphones and tablets. Long run supply/demand imbalance would translate to further downside risk to their 2013 estimates -- revenues, margins and earnings. Their technical analysis sees additional downside risk to the August 2010 lows of $17.60. Near-term resistance is at 10-week MA of $21.29; Buy.

10:38 am Information Tech sector trading higher today along with the S&P

The tech sector is trading higher today, along with gains in the broader market. Semiconductors are showing inline strength with the SOX trading 0.5% higher. Within the chip index, AMD (+6.6%) is a notable standout. Among other major indices, the SPY is trading 0.4% higher today, while the QQQ is up 0.6% and the NASDAQ is trading 0.5% higher on the session. Among tech bellwethers, AAPL (+1.2%) is a leader, while INTC (-2.1%) is showing notable weakness.

In tech earnings last night, WDAY (-1.7%) posted a beat and raise, while TIVO (-0.7%) reported an inline Q3 and guided inline with consensus. In news, NCR (+1.3%) confirmed an agreement to acquire RTLX (0.0%) for a cash purchase price of $30 per share. Also, VMW (+0.7%) authorized the purchase of up to $250 mln of its stock. In notable analyst upgrades this morning in the tech space, RIMM (+6.7%) was upgraded to Buy at Goldman, MCRS (+2.0%) was upgraded to Buy at Compass Point and PLT (+4.0%) was upgraded to Overweight at JP Morgan. Among downgrades, ATVI (-2.2%) was downgraded to Neutral at Sterne Agee and CREE (-5.2%) was downgraded to Hold at Deutsche Bank. AVGO (+1.6%) and OVTI (+1.3%) are the only notable names in tech scheduled to report quarterly results today after the close.
icon url

ReturntoSender

12/13/12 8:57 PM

#10017 RE: ReturntoSender #6755

From Briefing.com: 4:15 pm : The major averages began the day on a mixed note before selling pressure pushed the key indices to their respective lows. This morning, House Speaker John Boehner addressed the media in Washington. During his remarks, the speaker suggested President Obama is not serious about cutting spending, and the White House is willing to go over the fiscal cliff. Mr. Boehner's remarks had little impact on the markets, which continued pushing to fresh lows. However, a late-afternoon headline indicated Speaker Boehner and President Obama will meet in person at 17:00 ET. The report lifted the S&P 500 off its worst level of the day, but the benchmark index still finished with a loss of 0.6%.

The energy sector underperformed, and the SPDR Energy Select Sector ETF (XLE 71.49, -0.67) lost 0.9%. Looking at notable decliners, Nabors Industries (NBR 13.85, -0.68) fell 4.7% after Jefferies downgraded the stock to ‘Underperform' from ‘Hold.'

Anadarko Petroleum (APC 74.75, -0.79) slid 1.1% despite Jefferies making positive comments about the company. The remarks followed the closing arguments in the court case brought against APC by chemical producer Tronox (TROX 15.58, -0.47).

Elsewhere in energy, coal stocks were mixed. CONSOL Energy (CNX 33.81, -0.44) shed 1.3% while Walter Energy (WLT 36.26, +0.39) advanced 1.1%.

Technology stocks lagged notably and Apple (AAPL 529.69, -9.31) slipped 1.7%. Semiconductor manufacturers also weighed as the PHLX Semiconductor index settled lower by 1.1%. Among individual producers, Cirrus Logic (CRUS 27.41, -1.71) was the biggest laggard, down 5.9%.

Consumer staples outperformed the remaining S&P 500 sectors. Boston Beer (SAM 131.94, +17.71) surged 15.5% after the brewer raised its 2012 earnings expectations as well as the 2013 depletion projections. Following the update, the company sees 2012 earnings between $4.30 and $4.60, while the Capital IQ consensus estimate expects earnings at $4.24 per share.

Elsewhere, B&G Foods (BGS 29.53, +1.06) rose by 3.7% following an upgrade to ‘Outperform' from ‘Sector Perform' at RBC Capital Markets.

Also of note, CVS Caremark (CVS 48.50, +0.96) added 2.0% after raising its dividend by 38% to $0.22 per share. In addition, the company guided full-year earnings above consensus estimates.

Recent strength in defense stocks has lifted the PHLX Defense Sector Index to an all-time high. After reaching fresh highs on Wednesday, the index has been under pressure. Today, the defense index slid 1.0% and 15 of 17 components declined. Aircraft manufacturers Lockheed Martin (LMT 89.99, -1.82) and Embraer (ERJ 25.10, -0.71) were the two weakest performers, down 2.0% and 2.8%, respectively. Earlier, the New York Times reported the Canadian government will reconsider its planned purchase of F-35 fighter jets from Lockheed Martin due to high costs.

In notable news, Best Buy (BBY 14.12, +1.94) spiked 15.9% after CNBC reported company founder Richard Schulze is expected to submit a bid worth between $5 and $6 billion in his attempt to take the company private by week's end. Also of note, Chief Financial Officer Sharon McCollam bought over 100,000 shares on December 10, 2012.

The market received several economic reports today, and the data points were largely in-line with expectations. The latest weekly initial jobless claims count totaled 343,000, which was lower than the 375,000 that had been expected by the Briefing.com consensus. The tally was also below the revised prior week count of 372,000. As for continuing claims, they fell to 3.198 million from 3.221 million.

November retail sales rose by 0.3%, which was slightly worse than the 0.4% increase that had been broadly expected. The prior month's reading pointed to a decrease of 0.3%. Excluding autos, retail sales were unchanged, which was in-line with the Briefing.com consensus.

Overall producer prices declined during November by 0.8%, which was cooler than the 0.5% decrease that had been widely forecast. Core producer prices rose by 0.1%, which was in-line with the Briefing.com consensus.

During October, inventories rose by 0.4%, which was in-line with the Briefing.com consensus. Today's reading follows the prior month's increase of 0.7%.

Tomorrow morning, November CPI and core CPI will be reported at 8:30 ET. Lastly, November industrial production and capacity utilization will be announced at 9:15 ET.DJ30 -74.73 NASDAQ -21.65 SP500 -9.03 NASDAQ Adv/Vol/Dec 929/1.78 bln/1546 NYSE Adv/Vol/Dec 911/663.2 mln/2120

3:30 pm : Crude oil fell after two sessions of gains as renewed concerns over the "fiscal cliff" overshadowed yesterday's Fed announcement. The energy component briefly poked into positive territory and touched a session high of $86.97 per barrel. However, prices quickly tumbled as low as $85.81 per barrel and settled the session 1.0% lower at $85.90 per barrel.

Natural gas extended yesterday's losses, falling to a session low of $3.29 per MMBtu following weaker-than-anticipated inventory data that showed a build of 2 bcf when a draw of 3 to 4 bcf was expected. Despite inching upwards in afternoon pit action, it settled 0.9% lower at $3.35 per MMBtu.

Precious metals fell as yesterday's Fed-related momentum faded and investors reacted to economic data that included better-than-anticipated Jobless Claims and weak Retail Sales. Gold dipped to a session low of $1690.70 per ounce in morning floor action and spent the remainder of the session chopping around just slightly above that level. It eventually settled at $1697.10 per ounce, or 1.2% lower. Silver inched lower into negative territory after sliding off its session high of $32.81 per ounce. It touched a session low of $32.28 per ounce moments before closing with a 4.2% loss at $32.38 per ounce.DJ30 -91.18 NASDAQ -28.63 SP500 -11.24 NASDAQ Adv/Vol/Dec 831/1478.3 mln/1635 NYSE Adv/Vol/Dec 738/424 mln/2275

9:02AM SanDisk announced it has launched a new venture capital initiative to invest in companies aligned with SanDisk's key strategic priorities (SNDK) 43.29 : SanDisk also announced it has made its first investment in WHIPTAIL, a data storage company that designs fast, energy-efficient enterprise infrastructure equipment using flash memory technology. SanDisk will be a strategic investor in WHIPTAIL's $31 million series C round of funding. In addition to SanDisk, some of the investors included in the C series round are Ignition Partners, RRE Ventures and Spring Mountain Capital. Individual investment terms were not disclosed.

8:35AM Research In Motion: U.S. Immigration and Customs enforcement to launch BlackBerry 10 pilot program (RIMM) 13.31 : Co announces that it will begin a pilot program with U.S. Immigration and Customs Enforcement for the new BlackBerry Enterprise Service 10 mobile enterprise management solution and BlackBerry? 10 smartphones in early 2013. ICE will be among the first government organizations to pilot the new BlackBerry 10 solution.

8:00AM Rainmaker appoints Donald Massaro as President and CEO (RMKR) 0.66 : Co announces the appointment of Donald Massaro as President and Chief Executive Officer, and member of the Board effective December 11, 2012. For the last six years, Massaro held the position of CEO of Sendmail, a leader in messaging infrastructure serving the world's largest corporations.

7:05AM Ciena misses by $0.01, reports revs in-line; guides Q1 revs ~in-line (midpoint below consensus) (CIEN) 15.57 : Reports Q4 (Oct) adj. loss of $0.07 per share, $0.01 worse than the Capital IQ Consensus Estimate of ($0.06); revenues rose 2.2% year/year to $465.5 mln vs the $468.03 mln consensus; adj. gross margin +310 bps QoQ -50 bps YoY at 42.7%. Non-U.S. customers contributed 46% of total revenue; one 10%-plus customer represented a total of 11% of revenue.

Co issues guidance for Q1, sees Q1 revs of $435-460 mln vs. $458.51 mln Capital IQ Consensus Estimate, with adj gross margin percentage in the low 40s range.

LDK Solar (LDK) announced that the China International Economic and Trade Arbitration Commission stated that the wafer supply contracts entered into in October 2007 and June 2008 between LDK Solar and Canadian Solar (CSIQ) and its China-based subsidiary affiliate are valid and stated that by virtue of the arbitration proceedings CSIQ shall pay to LDK Solar an amount of ~RMB 248.9 mln, including RMB 60 mln paid as a deposit and additional cash of RMB 188.9 million, to compensate LDK Solar for the loss of profitability.
Suntech Power (STP) and SunSystem S.p.A., a leading Italian solar engineering, procurement and construction company, have signed a contract for Suntech to supply 25 megawatts of polycrystalline solar panels. The Suntech solar panels will power two new photovoltaic projects under construction in Romania that will be grid connected by the end of 2013.

1:43AM MIPS Tech Board determines CEVA's (CEVA) acquisition proposal is superior to acquisition agreement with Imagination (MIPS) 7.84 : Co announces its Board has unanimously determined that a new proposal from CEVA (CEVA) to acquire the co, constitutes a "Superior Proposal" to the merger agreement with Imagination Technologies Group, originally announced on November 5, 2012. MIPS has notified Imagination Technologies that the MIPS Board of Directors intends to effect an adverse recommendation change or terminate the Merger Agreement, but is prepared to continue negotiations if Imagination chooses to adjust the terms of the Merger Agreement. MIPS is obliged to negotiate with Imagination in good faith until the end of the business day on December 14, 2012 to make adjustments to the terms and conditions of the Merger Agreement, such that the CEVA Proposal no longer constitutes a "Superior Proposal."

Lattice Semi (LSCC) issues downside guidance for the fourth quarter with revenues -8 to -6% quarter over quarter to approximately $65.2-66.7 million (from -2 to +2% quarter over quarter) versus the $70.92 million consensus. Gross margin percentage is expected to be ~53% plus or minus 2%. This is unchanged from prior guidance. Total operating expenses are expected to be ~$43 million, including ~$5.5 million in restructuring charges. This is unchanged from prior guidance.

Ciena (CIEN) reported fourth quarter adjusted loss of $0.07 per share, $0.01 worse than the Capital IQ consensus of ($0.06), while revenues rose 2.2% year/year to $465.5 million versus the $468.03 mln consensus; adjusted gross margin +310 bps quarter over quarter -50 bps year over year at 42.7%. Non-U.S. customers contributed 46% of total revenue; one 10%-plus customer represented a total of 11% of revenue. The company issued guidance for the first quarter with revenues $435-460 million versus the $458.51 million consensus, with adjusted gross margin percentage in the low 40s range.

10:57 am S&P Information Tech INdex trading slightly higher today and ahead of the broader market

The tech sector is trading higher today, just ahead of a flat broader market. Semiconductors are showing relative strength as well with the SOX trading 0.4% higher. Within the chip index, IDCC (+2.9%) is a notable standout. Among other major indices, the SPY is trading flat today, while the QQQ and the NASDAQ are trading 0.1% higher on the session. Among tech bellwethers, FB (+3.3%) is showing notable strength, while AAPL (-0.9%) is under pressure.

In tech earnings last night, LSCC (-5.9%) lowered Q4 rev guidance. This morning, CIEN (+3.1%) posted a slight Q4 miss and guided just below consensus at its midpoint. In news, GOOG (+1.3%) released a map app for AAPL (-0.9%) iPhone. Also, S (-0.7%) proposed acquiring CLWR (+13.8%) at a purchase price of $2.90 per. Among rumors, headlines from New York Times just crossed saying YHOO (+0.5%) may look to shake up Board. In notable analyst upgrades this morning in the tech space, AVGO (+0.8%) was upgraded to Buy at Goldman, MCHP (+1.0%) was upgraded to Neutral at Goldman, and RFMD (+7.1%) was upgraded to Overweight at Barclays. Among downgrades, Wunderlich was downgraded ALLT (-14.9%) to Hold, ADI (-0.7%) was downgraded to Neutral at Citigroup, LLTC (-1.2%) was downgraded to Sell at Citigroup, LXK (-6.7%) was downgraded to Sell at Deutsche Bank and IRF (-3.5%) was downgraded to Sell at Goldman. ADBE (-0.9%) and PAY (+0.6%) are two notable names in tech scheduled to report quarterly results today after the close.
icon url

ReturntoSender

12/17/12 11:51 PM

#10020 RE: ReturntoSender #6755

From Briefing.com: 4:20 pm : The major averages registered broad gains during today's session. The S&P 500 followed a modestly higher open with a steady climb to its highs. Shortly before midday, reports out of Washington indicated President Obama and House Speaker Boehner held a 45-minute conversation in an attempt to further the ongoing budget debate. The developments had little effect on the markets as the key indices continued their upward drift. As a result, the S&P 500 finished higher by 1.2%.

The financial sector paced the advance, and the SPDR Financial Select Sector ETF (XLF 16.33, +0.33) gained 2.1%. Weekend reports indicated Speaker Boehner offered to accept a tax hike for top earners if the new revenue is met with spending cuts. However, the White House has rejected the offer. While a deal remains elusive, the presence of discussion between the lawmakers is being received as a positive sign by the market. Among the majors, Goldman Sachs (GS 123.49, +4.13) and Morgan Stanley (MS 18.53, +0.48) both advanced near 3.0%.

Discretionary stocks also outperformed, and homebuilders contributed to the strength. DR Horton (DHI 19.69, +0.95), PulteGroup (PHM 18.04, +0.90), and Toll Brothers (TOL 32.22, +1.37) all gained between 4.4% and 5.3%.

Automakers and manufacturers of auto parts also showed relative strength. Ford Motor (F 11.39, +0.29) and Cooper Tire & Rubber (CTB 25.04, +0.97) finished higher by 2.6% and 4.0%, respectively.

In M&A news, Caribou Coffee (CBOU 16.10, +3.78) will be acquired by Joh. A. Benckiser for $16.00 per share. The transaction carries a total value of approximately $340 million, and the purchase price represents a 29.9% premium to Caribou's Friday closing price.

Among tech shares, Apple (AAPL 518.83, +9.04) was down as much as 1.5% intraday, but after a brief dip near $500, bargain hunters lifted the largest tech component to a gain of 1.8%. Earlier, Citigroup downgraded the stock to ‘Neutral' from ‘Buy.' The move came weeks after the company's November 26 initiation with a ‘Buy.' In addition, three investment banks lowered their price targets for Apple. Canaccord Genuity dropped its target to $750 from $800, Pacific Crest cut its estimate to $565 from $645, and Mizuho slashed its target to $600 from $750. Apple suppliers saw notable losses on Friday, but the group outperformed today. Skyworks Solution (SWKS 20.75, +0.95) advanced 4.8% and Qualcomm (QCOM 62.04, +2.20) rose by 3.7%.

The Dow Jones Transportation Average finished in-line with the remaining industrials. Of the twenty stocks which constitute the transportation complex, seventeen registered gains. Airlines saw broad strength after Dahlman Rose upgraded its outlook on the industry from neutral to bullish. JetBlue Airways (JBLU 5.71, +0.18) and Alaska Air (ALK 43.98, +0.82) outperformed their peers and gained 3.3% and 1.9%, respectively.

On the downside, Con-Way (CNW 27.47, -0.60) lost 2.1% after BB&T Capital Markets downgraded the stock to ‘Underweight' from ‘Hold.' The downgrade comes as BB&T believes Con-Way's consensus estimates are materially too high.

Also of note, Ryder System (R 48.82, -0.78) slipped 1.6% after the company announced Chief Executive Officer Gregory Swienton will retire at the time of the company's annual meeting of shareholders on May 3, 2013.

European markets ended the day on a mixed note. France's CAC and UK's FTSE saw respective losses of 0.1% and 0.2% while Germany's DAX added 0.1%.

In the United Kingdom, Aggreko lost 21.7% and was the weakest performer. The plunge followed cautious comments from the company regarding its 2013 profit expectations. On the upside, International Consolidated Airlines Group led the way with a 3.3% gain. In addition, miners outperformed. Anglo American, Kazakhmys, and Rio Tinto all gained between 1.6% and 3.2%.

In France, financials weighed on the index. BNP Paribas shed 0.7% and Credit Agricole lost 0.9%. On the upside, Alcatel-Lucent (ALU 1.32, +0.08) surged 5.8% to extend its recent strength.

In Germany, carmakers outperformed. Daimler advanced 1.9% after merging its two Mercedes units in China. Also of note, Infineon Technologies rose by 1.6% after the company's Chief Executive Officer said Infineon may make a handful of small-to-medium acquisitions. Drug makers and suppliers of medical products underperformed. Fresenius Medical, Fresenius SE, and Merck (MRK 43.63, +0.09) all lost near 1.0%.

Reviewing today's economic data, the December Empire State Manufacturing Survey registered a reading of -8.1, which was down from the prior month's reading of -5.2, and worse than the reading of 2.0 expected by the Briefing.com consensus.

Meanwhile, the October net long-term TIC flows report indicated a $1.3 billion inflow of foreign capital into U.S. denominated assets. This follows the prior month's $3.3 billion inflow.

Tomorrow, the third quarter current account balance will be reported at 8:30 ET and the December NAHB Housing Market Index will be released at 9:00 ET.

The U.S. Treasury will auction off $35 billion in 5-yr notes.DJ30 +100.38 NASDAQ +39.27 SP500 +16.78 NASDAQ Adv/Vol/Dec 1720/1.85 bln/772 NYSE Adv/Vol/Dec 2042/702.1 mln/1007

3:30 pm : Crude oil extended Friday's gains as the dollar index retreated to new session lows. The energy component came off its pit session low of $86.70 per barrel and traded up to a session high of $87.71 per barrel. However, prices pulled-back heading into the close, and crude settled with a 0.4% loss at $87.13 per barrel.

Natural gas advanced for the first time in eight sessions as it lifted off its session low of $3.32 per MMBtu. Despite retreating from its session high of $3.39 per MMBtu, it booked a 1.2% gain as it closed at $3.36 per MMBtu.

Gold erased overnight losses as it lifted off its pit session low of $1691.30 per ounce following manufacturing data that came in well below estimates. The yellow metal then chopped around the unchanged level for the remainder of the session and settled with a 0.1% gain at $1697.90 per ounce.

Silver traded up to a session high of $32.45 per ounce in morning floor action but lost momentum and slid to a session low of $32.08 per ounce. It managed to erase most of the loss and settled just 0.1% lower at $3.67 per ounce.DJ30 +75.73 NASDAQ +26.31 SP500 +12.23 NASDAQ Adv/Vol/Dec 1539/2661.9 mln/944 NYSE Adv/Vol/Dec 1871/427 mln/1175

4:05PM Cray awarded $39 mln supercomputer contract from the North-German supercomputing alliance (CRAY) 14.83 +0.12 : Co announced it has been awarded a $39 million contract from the North-German Supercomputing Alliance (HLRN) to deliver a distributed Cray XC30 supercomputing system, which will be operated at two sites -- the Zuse Institute Berlin (ZIB) and the High Performance Computing Center at Leibniz University in Hannover, Germany. HLRN is an alliance amongst seven states in Northern Germany -- Berlin, Brandenburg, Bremen, Hamburg, Mecklenburg-Vorpommern, Niedersachsen, and Schleswig-Holstein -- that have combined resources and secured funding from the state governments and the German federal government to acquire the new Cray XC30 systems

Research In Motion (RIMM) announced the BlackBerry 10 Technical Preview program, giving selected enterprise and government customers the opportunity to begin beta testing with BlackBerry Enterprise Service 10 and pre-production BlackBerry 10 smartphones. The mix includes 64 Fortune 500 companies.

ASML (ASML) announces the completion of its share buy back programs announced on January 19 2011, and increased per the announcement on January 18 2012. During the period from Jan 20, 2011 up to and including Nov 22 2012, ASML purchased 36,952,634 of its shares at an average price of EUR30.58 per share.

EVault, a Seagate (STX), announced a partnership with Fujitsu. The strategic partnership enables Fujitsu to expand and enhance its backup and recovery portfolio by bringing to market a series of comprehensive hybrid cloud services that allow customers to leverage cloud backup effectively.

3:43AM MIPS Tech and Imagination agree to revised merger terms providing for $100 mln purchase price (MIPS) 7.77 : Co announces that it entered into a new amendment to its merger agreement with Imagination Technologies Group plc originally announced on Nov 5, 2012. The latest amendment provides for a purchase price of $100 million. As a result of the amendment, the net proceeds to each holder of MIPS common stock, following the consummation of the previously announced proposed patent sale transaction with Bridge Crossing, and proposed recapitalization, has increased to approximately $7.94 per share in cash. The Merger Agreement is otherwise in full force and effect. The amendment follows the submission of a definitive proposal from CEVA (CEVA) to acquire MIPS for $90 mln which was announced on December 12, 2012 to have been determined by the MIPS Board of Directors to be a "Superior Proposal" to the Merger Agreement with Imagination.

1:12AM Apple iPhone 5 first weekend sales in China top 2 mln (AAPL) 509.79 : Co announces it has sold over 2 mln of its new iPhone 5 in China, just three days after its launch on December 14. iPhone 5 will be available in more than 100 countries by the end of December, making it the fastest iPhone rollout ever.

Sterne Agee upgrades ON Semiconductor (ONNN) to Buy from Neutral and sets target price at $9. While ONNN has rebounded 15% off the bottom, they believe multiple catalysts position ONNN for much more upside. They believe rationalizing fab capacity into 1Q13, improving end markets and debt paydowns position ONNN for upside with improving margins. ONNN is closing down three fabs through MarQ. They believe improving margins, top line and FCF all position ONNN for upside.

Clearwire (CLWR) announced that it has entered into a definitive agreement to acquire the approximately 50% stake in CLWR it does not currently own for $2.97/share, equating to a total payment to Clearwire shareholders, other than Sprint, of $2.2 billion. This transaction results in a total Clearwire enterprise value of approximately $10 billion, including net debt and spectrum lease obligations of $5.5 billion. The transaction consideration represents a 128% premium to Clearwire's closing share price the day before the Sprint-SoftBank discussions were first confirmed in the marketplace on October 11, with Clearwire speculated to be a part of that transaction; and, a 40 percent premium to the closing price the day before receipt of Sprint's initial $2.60 per share non-binding indication of interest on November 21. In addition, Clearwire has received commitments from Comcast (CMCSA)., Intel (INTC) and Bright House Networks, who collectively own approximately 13 percent of Clearwire's voting shares, to vote their shares in support of the transaction. SoftBank has provided its consent to the transaction, as required under the terms of its recently announced merger agreement with Sprint. In connection with the transaction, Clearwire and Sprint have entered into agreements that provide up to $800 million of additional financing for Clearwire in the form of exchangeable notes, which will be exchangeable under certain conditions for Clearwire common stock at $1.50 per share, subject to adjustment under certain conditions. Under the financing agreements, Sprint has agreed to purchase $80 million of exchangeable notes per month for up to ten months beginning in January, 2013, with some of the monthly purchases subject to certain funding conditions, including conditions relating to the approval of the proposed merger by Clearwire's shareholders and a network build out plan.

09:30 am Diodes upgraded to Buy at Sterne Agee; tgt $22: . Sterne Agee upgrades DIOD to Buy from Neutral and sets target price at $22. While DIOD has underperformed the Analog group with declining gross margins, they believe gross margins will bottom at current levels. They also say flattish fab capacity in 2013, improving end markets, and product mix position DIOD for improving gross margins and a multiple expansion from current levels.

10:49 am S&P Information Technology Index trading slightly higher
The tech sector is trading higher today, just behind larger gains in the broader market. Semiconductors are showing relative weakness with the SOX trading modestly higher. Within the chip index, RBCN (+3.1%) is a notable standout, while VECO (-1.4%) is a laggard. Among other major indices, the SPY is trading 0.4% higher today, while the QQQ is up 0.1% and the NASDAQ is trading 0.2% higher on the session.

Among tech bellwethers, QCOM (+1.7%) is showing notable strength, while AAPL (-1.1%) is under pressure. There are no tech earnings of note this morning. In news, S (-0.3%) announced it will acquire 100% ownership of CLWR (-12.8%) for $2.97/share and AAPL (-1.3%) announced it has sold over 2 mln of its new iPhone 5 in China, just three days after its launch on December 14. Also, AKAM (-0.2%) announced a CEO succession plan and Elliott Mgmt offered to acquire CPWR (+13.6%) for $11.00 per share in cash. Among rumors, TI (-0.7%) has hired MS (+1.6%) to explore spinoff of fixed line network, according to reports. In notable analyst upgrades this morning in the tech space, Sterne Agee upgraded DIOD (+2.7%) to Buy, INFA (+3.6%) was upgraded to Overweight at Piper Jaffray, and SAP (-0.1%) was upgraded to Mkt Perform at JMP. Among downgrades, AAPL (-1.1%) was downgraded to Neutral at Citigroup and Sterne Agee downgraded TXN (-0.3%) to Underperform. There are no notable names in tech scheduled to report quarterly results today after the close.
icon url

ReturntoSender

12/18/12 11:14 PM

#10021 RE: ReturntoSender #6755

From Briefing.com: 4:10 pm : Stocks registered broad gains during today's session as comments from Washington lawmakers indicated the budget debate is intensifying. Though an agreement remains elusive, the markets welcomed the developments and spent the duration of the day in an upward climb. As a result, the S&P 500 advanced 1.2%.

Apple (AAPL 533.90, +15.07), which has been in focus recently, supported the technology sector and finished higher by 2.9%.

The SPDR Financial Select Sector ETF (XLF 16.57, +0.24) gained over 2.0% yesterday, and the financial sector proxy added another 1.5% today. The space was expected to show heightened sensitivity to hints of progress in the budget debate, and today's developments were received positively by the majors. Goldman Sachs (GS 127.77, +4.28) and Morgan Stanley (MS 19.12, +0.59) outperformed their peers as both saw gains over 3.0%.

Energy stocks were supported by strength in crude oil and the SPDR Energy Select Sector ETF (XLE 73.19, +1.32) settled higher by 1.8%. Prior to the open, Baker Hughes Incorporated (BHI 41.93, +1.29) warned that fourth quarter North American revenue and profit margins will likely be lower than previously expected. Baker Hughes was down as much as 2.0% in pre-market trade, but has seen notable strength since. BHI finished with a gain of 3.2% and peers Halliburton (HAL 34.80, +1.26) and Schlumberger (SLB 71.35, +1.67) rallied 3.8% and 2.4%, respectively.

In addition, coal stocks outperformed following comments from the International Energy Agency, which said it expects coal to eclipse oil as world's top energy source around 2017. CONSOL Energy (CNX 34.29, +0.62) and Walter Energy (BTU 27.37, +0.74) both gained near 2.0%.

In M&A news, Arbitron (ARB 47.03, +8.99) surged 23.6% after agreeing to be acquired by Nielsen (NLSN 30.92, +1.30) for $48 per share. The transaction represents a premium of approximately 26% to Arbitron's closing price on December 17, 2012. Nielsen has secured a financing commitment for the total transaction amount, and the transaction has been approved by the boards of both companies.

The NAHB Housing Market Index for December registered a reading of 47. That is up from the prior month's revised reading of 45, and in-line with expectations among economists polled by Briefing.com.

Homebuilders benefitted from today's rally, and the SPDR S&P Homebuilders ETF (XHB 26.89, +0.55) finished higher by 2.1%. The year-long strength in homebuilder stocks has lifted the ETF to its best level since July 2007. Among individual builder stocks, DR Horton (DHI 20.08, +0.39) and PulteGroup (PHM 18.61, +0.57) rose by 2.0% and 3.2%, respectively.

The current account deficit for the third quarter totaled $107.5 billion, which was wider than the $104.2 billion deficit that had been broadly anticipated. This marks an improvement from the second quarter's $118.1 billion deficit.

The major European averages ended the day on a positive note. France's CAC gained 0.3%, United Kingdom's FTSE rose by 0.4%, and Germany's DAX advanced 0.6%.

In France, Alcatel-Lucent (ALU 1.38, +0.06) continued its recent strength. The producer of communication equipment surged 8.3% as it attempts to lift off all-time lows. The recent strength came after the company secured EUR1.6 billion in financing from Credit Suisse and Goldman Sachs. On the downside, carmaker Renault lost 1.9%.

United Kingdom's FTSE was supported by defense stocks as BAE Systems and Rolls-Royce Holdings finished with respective gains of 2.2% and 2.4%. Rolls-Royce outperformed following the announcement of a $1 billion agreement with Japan's Skymark Airlines.

Germany's DAX outperformed the region partly due to strength in financials. Commerzbank gained 3.7% and Deutsche Bank (DB 44.23, +1.12) finished higher by 1.9%. In addition, insurer Muenchener Re rose by 1.7%. Meanwhile, Adidas lost 1.0% and was the biggest decliner.

Tomorrow morning, FedEx (FDX 92.36, +1.34), General Mills (GIS 41.77, +0.04), and Navistar (NAV 22.85, +0.93) are all scheduled to report. Most notably, the Capital IQ consensus expects economic bellwether FedEx to announce earnings of $1.41 on $10.82 billion in revenue.

Looking at tomorrow's economic data, the weekly MBA Mortgage Index will be reported at 7:00 ET. In addition, November housing starts and building permits will both be released at 8:30 ET.

The U.S. Treasury will auction off $29 billion in 7-yr notes.DJ30 +115.57 NASDAQ +43.93 SP500 +16.43 NASDAQ Adv/Vol/Dec 1795/1.95 bln/708 NYSE Adv/Vol/Dec 2276/820.6 mln/795

3:30 pm : Crude oil extended gains for a third consecutive session as a weaker dollar index and advances in "fiscal cliff" negotiations supported the advance. The energy component slid to a floor session low of $87.68 per barrel in morning action but quickly rebounded to a session high of $88.58 per barrel. It then traded in a rather consolidative pattern and closed the session 0.8% higher at $88.35 per barrel.

Natural gas also extended yesterday's gains and climbed as high as $3.45 per MMBtu. It eventually booked a 1.5% gain as it closed at $3.41 per MMBtu despite slightly pulling back in afternoon floor action.

Precious metals tumbled deeper into negative territory on negotiations over the "fiscal cliff". Gold fell off its session high of $1699.70 per ounce despite weakness in the dollar index and trended lower until it settled with a 1.6% loss at $1670.80 per ounce. Silver spent early morning floor action in positive territory and even touched a session high of $32.54 per ounce before losing momentum. It then plunged to a session low of $31.60 per ounce and settled 1.9% lower at $31.67 per ounce.DJ30 +90.88 NASDAQ +36.33 SP500 +12.78 NASDAQ Adv/Vol/Dec 1690/1601.5 mln/803 NYSE Adv/Vol/Dec 2128/507 mln/906

5:01PM Dell reaches agreement to acquire Credant, a provider of data protection solutions (DELL) 10.56 +0.31 : Co announced it has reached an agreement to acquire Credant Technologies, an industry-leading provider of data protection solutions to control, manage and secure data sent from endpoints to servers, storage and the cloud. The addition of Credant technology strengthens Dell's computing solutions and improves the manageability, reliability and security engineered into its enterprise computing portfolio.

4:32PM Rubicon Tech: Patent allowed for ultra-flat, high-throughput wafer lapping (RBCN) 6.71 +0.21 : Co announced that the United States Patent and Trademark Office (USPTO) has allowed Rubicon's patent application entitled, "Ultra-Flat, High-Throughput Wafer Lapping Process." The patent covers Rubicon's process developed to perform grinding and polishing to achieve consistent, ultra-flat and defect-free surface quality for the high-volume production of large diameter sapphire wafers.

4:07PM Oracle beats by $0.03, beats on revs (ORCL) 32.88 +0.56 : Reports Q2 (Nov) earnings of $0.64 per share, excluding non-recurring items, $0.03 better than the Capital IQ Consensus Estimate of $0.61; revenues rose 3.4% year/year (+5% ex-FX) to $9.11 bln vs the $9.02 bln consensus.

New software licenses and cloud software subscriptions revenues were up 17% to $2.4 bln vs. guidance for +6-16% ex-FX (+5-15% as reported). Software license updates and product support revenues were up 7% to $4.3 bln. Hardware systems products revenues were $734 mln. Non-GAAP operating income was up 9% to $4.3 bln, and non-GAAP operating margin was 47%.

"New software license sales and cloud subscriptions grew 18% in constant currency. Strong organic growth in our software business coupled with a focus on the highly profitable engineered systems segment of our hardware business enabled a Q2 non-GAAP operating margin of 47%. During the last four quarters operating cash flow was more than $13.5 bln -- $10.2 bln of which was returned to our shareholders as we repurchased nearly 350 mln ORCL shares during that same twelve month period. Q2 performance was strong and broad based as all geographies reported double-digit revenue growth in new software license and cloud subscriptions. Applications, middleware and database all had double-digit growth in new software license and cloud subscriptions, with applications leading the pack with growth of over 30%... Already approaching a one bln dollar run rate, our Cloud business will become much bigger over time... Sun has proven to be one of the most strategic and profitable acquisitions we have ever made."

11:49AM Intel reaches as high as 20.85, working up toward its 50 day and Dec high (INTC) 20.84 +0.28 : The rebound last week probed/stalled near its 50 day sma/ema. Today's extension leaves it back just slightly under its 50 sma at 20.87 with the 50 day ema and Dec peak coming into play at 21.03/20.99.

10:01AM Research In Motion: CESG approves BlackBerry 7.1 OS for government use (RIMM) 13.77 -0.15 : Co announced that the BlackBerry 7.1 operating system has been approved for UK government use by CESG, the National Technical Authority for Information Assurance in the UK. The approval enables public sector workers to utilise the enhanced performance and rich functionality of the latest BlackBerry smartphones available in the UK. Working in collaboration with the Parker Aerospace Customer Support Organization, the initial overhaul and recertification work will be performed at Parker's Gas Turbine Fuel Systems Division facility in Devens, Massachusetts.

8:31AM Marvell increases share repurchase program by an additional $500 mln (MRVL) 8.32 : Co announces it has been authorized to repurchase up to an additional $500 mln under its share repurchase program. With this increase, the cumulative total share repurchase authorized will amount to $3.0 bln. As of the end of co's third fiscal quarter of 2013 ended October 27, 2012, co had made ~$2.1 bln in share repurchases under the prior authorization.

United Microelectronics (UMC) announced that it has taped out the foundry industry's first customer product utilizing 55nm small display driver IC process technology. UMC, the world's leading SDDI foundry in both process technology and shipping volume, is now the first foundry to offer a 55nm version of the process to enable Full-HD resolutions for today's smartphones.

icon url

ReturntoSender

12/19/12 11:12 AM

#10022 RE: ReturntoSender #6755

Chart of the Day - The Average Post Election Year Performance

http://www.chartoftheday.com/20121219b.htm?utm_expid=13704437-7&T

Today's chart illustrates how the stock market has performed during the average post-election year. Since 1900, the stock market has tended to underperform from early January to late February and again from early August to early November during the average post-election year. Some parts of the year have, on average, outperformed. The most notable period of outperformance has occurred from late March to late May. In the end, however, the stock market has tended to underperform during the entirety of the post-election year. One theory to support this behavior is that the party in power will tend to make the more difficult economic decisions in the early years of a presidential cycle and then do everything within its power to stimulate the economy during the latter years in order to increase the odds of re-election.

icon url

ReturntoSender

12/20/12 8:03 PM

#10025 RE: ReturntoSender #6755

From Briefing.com: 4:20 pm : The major averages finished higher despite showing indecision in the early part of the session. The fiscal cliff remained the focal point, and investors showed optimism in Washington's ability to get a deal done. Lawmakers from both sides of the aisle continued to exchange jabs, and Speaker Boehner said the President and the Democrats have not done enough to avoid falling off the cliff. Mr. Boehner touted the proposal he put forth, which is expected to face a House of Representatives vote tonight around 19:30 ET. The S&P 500 gained 0.6% ahead of this evening's vote.

The financial sector was the top performing space in the S&P 500 and the SPDR Financial Select Sector ETF (XLF 16.70, +0.23) settled higher by 1.4%. Of the majors, Bank of America (BAC 11.52, +0.33) gained 3.0%, and was the top advancer.

NYSE Euronext (NYX 32.25, +8.20) surged 34.1% after agreeing to be acquired by IntercontinentalExchange (ICE 130.10, +1.79) for $33 per share. The transaction price represents a 37.2% premium to NYSE Euronext's Wednesday close.

On the downside, Discover Financial (DFS 38.41, -1.36) slid 3.4% following mixed earnings. During the fourth quarter, the company earned $1.07, which was $0.04 below the Capital IQ consensus estimate. However, Discover's revenue of $2.00 billion exceeded expectations.

Technology stocks lagged the broader market and Apple (AAPL 521.73, -4.57) lost 0.9%.

Among notable tech earnings, technology consultant Accenture (ACN 69.02, -1.38) slid 2.0% after reporting its quarterly results. While the company beat on earnings, its revenue reflected a slowdown in corporate spending.

On the upside, Jabil Circuit (JBL 19.95, +1.38) surged 7.4% after beating on earnings and revenue. In addition, Jabil issued downside second quarter earnings guidance while revenue is expected to be in-line with analyst estimate.

The health care space was the weakest performer, and a handful of names moved on news. Allscripts Healthcare (MDRX 9.14, -1.54) sank 14.4% after the company concluded the review of its strategic alternatives, and decided against a sale. In addition, Allscripts named Paul Black as its Chief Executive Officer. Mr. Black will replace Glen Tullman, who will resign. Also of note, Lee Shapiro will step down from his current function of president.

Elsewhere, Merck (MRK 42.15, -1.50) shed 3.4% after its trial for TREDAPTIVE yielded disappointing results.

On the upside, The Medicines Company (MDCO 23.71, +1.42) surged 6.4% following the announcement of positive trial results for oritavancin in the treatment of acute bacterial skin and skin structure infections.

The November existing home sales report saw its annualized rate increase to 5.04 million units. An improvement in the sales of existing homes suggests new homes may face an increase in demand as well. Homebuilders responded generally well to the news. MDC Holdings (MDC 36.87, +1.24) advanced 3.5% and DR Horton (DHI 20.10, +0.15) rose by 0.8%.

Elsewhere, KB Homes (KBH 15.60, -1.06) slid 6.4% despite beating on earnings and revenue. During the fourth quarter, the homebuilder earned $0.10, which was $0.04 better than the Capital IQ consensus estimate. Meanwhile, its revenue of $578.2 million also exceeded expectations.

The latest weekly initial jobless claims count totaled 361,000, which was worse than the 345,000 that had been expected by the Briefing.com consensus. The tally was above the revised prior week count of 344,000. As for continuing claims, they rose to 3.225 million from 3.213 million.

The third estimate of third quarter GDP showed growth of 3.1%, which was better than the 2.7% that had been expected by the Briefing.com consensus. However, the third quarter GDP Deflator was left unrevised at 2.7%.

The November Housing Price Index from the FHFA increased by 0.5%, which follows a 0.2% increase observed during the prior month.

The Philadelphia Fed Survey ticked up to +8.1 for December. This comes after November's reading of -10.7. Economists polled by Briefing.com had expected that the Survey would improve to a reading of -1.3.

Also of note, leading indicators for October decreased by 0.2%, which followed the prior month's increase of 0.2%.

European markets ended today's session on a mixed note. The United Kingdom's FTSE shed 0.1% while France's CAC and Germany's DAX both added 0.1%.

In the United Kingdom, Carnival (CCL 36.99, -2.07) was the weakest performer. The cruise-line operator lost 6.1% after reporting disappointing earnings. On the upside, media company ITV gained 3.1%.

In France, financials AXA and Credit Agricole led the index with respective gains of 1.1% and 1.3%. Software company Cap Gemini was the weakest index component, and lost 2.7% following disappointing earnings from Accenture.

German stocks eked out slim gains and drug makers led the way. Bayer and Merck both added near 1.0%. Meanwhile, ThyssenKrupp was the weakest performer. The steelmaker lost 2.1% after railroad Deutsche Bahn filed a lawsuit which named ThyssenKrupp as one of the defendants.

Tomorrow, November personal income, personal spending, core PCE prices, durable orders, and durable orders ex-transportation will all be reported at 8:30 ET. Lastly, the final December Michigan Sentiment Survey will be released at 9:55 ET. Note that quadruple witching will take place tomorrow.DJ30 +59.75 NASDAQ +6.02 SP500 +7.88 NASDAQ Adv/Vol/Dec 1502/1.65 bln/961 NYSE Adv/Vol/Dec 2066/682.6 mln/962

3:35 pm : Following the morning sell-off in precious metals, both gold and silver managed to come back a little and erase some losses. Both still ended the day much lower, but neither closed very close to session lows. By the end of today's session, Feb gold has finished 1.3% lower at $1646.50/oz, while silver ended down 4.3% at $29.80/oz.

Feb crude oil spent the afternoon session in positive territory and rose as high as $90.52/barrel. At the end of the day, crude oil finished today's session up 18 cents at $90.18/barrel.

Natural gas futures posted solid gains today. The energy component was in positive territory all session and rose as high as $3.46/MMBtu. When floor trading closed, nat gas finished up 4.2% at $3.46. Mar copper futures ended the day 2% higher at $3.54/lb.DJ30 +22.84 NASDAQ +2.24 SP500 +4.52 NASDAQ Adv/Vol/Dec 1384/1395.1 mln/1073 NYSE Adv/Vol/Dec 1871/463 mln/1137

4:41PM Research In Motion resumes trading; stock now at $14.94 after hours (RIMM) 14.13 +0.50 :

4:18PM Research In Motion beats by $0.13, beats on revs; announces BB10 launch Jan 30, 2013; CIO to retire; sees operating loss in Q4 (RIMM) 14.12 +0.49 : Reports Q3 (Nov) loss of $0.22 per share, excluding non-recurring items, $0.13 better than the Capital IQ Consensus Estimate of ($0.35); revenues fell 47.2% year/year to $2.73 bln vs the $2.67 bln consensus. The revenue breakdown for the quarter was ~60% for hardware, 36% for service and 4% for software and other revenue. During the quarter, RIM shipped ~6.9 million BlackBerry smartphones and ~255,000 BlackBerry PlayBook tablets.

Outlook:
The co expects that there will be continued pressure on operating results as it gets set to launch its BlackBerry 10 platform in the fourth quarter. The co intends to continue to consider using pricing initiatives on BlackBerry 7 devices and service fees in some markets as a way to maintain our subscriber base and drive more BlackBerry users. The timing of the BlackBerry 10 launch event for January 30, 2013 could also impact sales of current BlackBerry 7 products as some customers may defer purchasing decisions and wait for BlackBerry 10 devices. All these factors are expected to impact unit volumes, subscribers, margins and service fees. In addition, the co will be significantly increasing its marketing spending this quarter as expected, to support the global launch of BlackBerry 10, and the co expects to report an operating loss for the fourth quarter.

RIM also announced today that Robin Bienfait, Chief Information Officer for RIM has made the decision to retire at the end of this year following 6 years of service to the Company. Robin has committed to continue supporting RIM in an advisory capacity to enable a smooth launch and seamless transition.

"During the third quarter, we continued to demonstrate our strong financial position, generating $950 million in cash flow from operations, and increasing our cash position significantly to more than $2.9 billion."

4:41PM SanDisk expands stock repurchase program by $750 mln (SNDK) 44.23 +0.37 : Co announced that its Board of Directors has authorized an additional $750 million for common stock repurchases. This increases the total amount authorized for stock repurchases under the current program to $1.25 billion. The current repurchase program was established on Oct. 27, 2011 and will expire on Oct. 26, 2016. To date under this program, the company has used approximately $234 million for stock repurchases and approximately $1.016 billion remains available.

4:08PM CalAmp beats by $0.01, beats on revs; guides Q4 in-line (CAMP) : Reports Q3 (Nov) earnings of $0.17 per share, $0.01 better than the Capital IQ Consensus Estimate of $0.16; revenues rose 35.1% year/year to $44.3 mln vs the $43.27 mln consensus. Co issues in-line guidance for Q4, sees EPS of $0.14-0.18 vs. $0.18 Capital IQ Consensus Estimate; sees Q4 revs of $44-48 mln vs. $45.54 mln Capital IQ Consensus Estimate. "We expect continued strong customer demand within our key verticals to drive significant year-over-year expansion of revenue and earnings in the fourth quarter of fiscal 2013... We anticipate Wireless Datacom revenue in the fourth quarter will be significantly higher year-over-year and relatively flat on a sequential quarter basis. Satellite revenue in the fourth quarter is expected to be up on a sequential quarter basis but down on a year-over-year basis. We expect that our fourth quarter operating results will be slightly impacted by acquisition-related expenses arising from the Wireless Matrix transaction."

4:05PM Micron misses by $0.07, misses on revs (MU) 6.79 -0.03 : Reports Q1 (Nov) loss of $0.27 per share, $0.07 worse than the Capital IQ Consensus Estimate of ($0.20); revenues fell 12.2% year/year to $1.83 bln vs the $2.01 bln consensus.

Revenues from sales of NAND Flash products were 4 percent lower in the first quarter of fiscal 2013 compared to the fourth quarter of fiscal 2012, due to a 9 percent decrease in sales volume, partially offset by a 5 percent increase in average selling prices. Trade NAND Flash sales volume in the first quarter of fiscal 2013 decreased compared to the fourth quarter of fiscal 2012 primarily as a result of lower production of NAND Flash products.

Revenues from sales of DRAM products in the first quarter of fiscal 2013 were 9 percent lower compared to the fourth quarter of fiscal 2012 primarily due to an 11 percent decrease in average selling prices. Sales of NOR Flash products were relatively unchanged for the first quarter of fiscal 2013 compared to the fourth quarter of fiscal 2012.

The company's consolidated gross margin of 12 percent in the first quarter of fiscal 2013 was up slightly from 11 percent in the fourth quarter of fiscal 2012. Improvements in margin from sales of NAND Flash and NOR Flash products were offset by slight declines in margins from sales of DRAM products. Cash flows from operations for the first quarter of fiscal 2013 were $236 million. During the first quarter of fiscal 2013, the company invested $538 million in capital expenditures and ended the quarter with cash and investments of $2.8 billion.

4:02PM Adobe Systems acquires privately held Behance, an online social media platform that enables creatives to showcase and share their work; terms not disclosed (ADBE) 37.87 -0.22 :

4:01PM CalAmp to acquire Wireless Matrix Corp. (CAMP) 8.58 +0.11 : Co to acquire the operations of Wireless Matrix, a wireless data communications company. CalAmp expects to leverage Wireless Matrix's mobile workforce management and asset tracking applications for customers in its core verticals, while also expanding its turnkey offerings to address new markets. The transaction is expected to be accretive to CalAmp's non-GAAP EPS in FY14 and beyond, and to significantly improve CalAmp's competitive positioning and growth prospects.

Wireless Matrix is a provider of fleet tracking applications and satellite communications services to the utility, oil and gas, rail and municipal verticals. Its SaaS-based high margin recurring revenues account for approximately 85% of their total sales, with total revenues of approximately $30 mln a year. CAMP will make a cash payment of $53 mln.

8:32AM O2Micro receives patent for power source detection topology (OIIM) 3.04 : Co announced that it was issued 17 claims under United States patent number 8,242,742 for its Power Source Detection chargers, systems and methods. This invention, as part of a charger IC, compares a detection voltage to a predetermined reference voltage to identify whether the power source is a USB host or an AC adapter.

3:03AM Atmel establishes strong position in ultra-low power Wi-Fi market with agreement to acquire Ozmo (ATML) 6.17 : Co announces it has entered into a definitive agreement to acquire Ozmo, a provider of ultra-low power Wi-Fi solutions that will expand Atmel's wireless offerings and further enhance developers ability to design smart, connected devices. Financial terms were not disclosed. According to market research data, the overall wireless peripheral market is expected to reach 1 billion units by 2015 with Wi-Fi Direct as the fastest growing segment at over 100% CAGR through 2015. Atmel expects the transaction to close by year end and to be accretive to Atmel's earnings in 2014.

3:00AM PLX Tech and IDT (IDTI) announce termination of proposed transaction; IDT withdraws exchange offer for PLX Technology Shares (PLXT) 3.70 : Integrated Device Technology (IDTI) and PLX Technology (PLXT), a developer of I/O interconnect silicon and complimentary software, today announced that they have mutually agreed to terminate their merger agreement pursuant to which IDT would acquire PLX Technology. Concurrently, IDT also announced that it is withdrawing its related exchange offer to acquire all of the issued and outstanding shares of common stock, of PLX Technology and instructed Computershare, the exchange agent for the exchange offer, to promptly return all previously tendered shares. As of the close of business on December 19, 2012, 21,876,215 shares were previously tendered in the exchange offer. The decision to terminate the merger agreement and withdraw the exchange offer was made in response to a determination by the United States FTC to file an administrative complaint challenging IDT's proposed acquisition of PLX Technology and the absence of a clear path for the parties to complete the proposed transaction.

Jabil Circuit (JBL) reported first quarter core earnings of $0.61 per share, $0.05 better than the Capital IQ consensus of $0.56;, while revenues rose 7.2% year/year to $4.64 billion versus the $4.41 billion consensus. For the second quarter the company sees core EPS of $0.50-0.58 versus the $0.59 consensus and revenues of $4.30-4.50 billion versus the $4.38 billion consensus. "Expectations for [FebQ] are consistent with seasonal patterns of demand...End market demand remains muted in business sectors exposed to government and business spending. Although environmental conditions continue to be uncertain, we maintain our expectation that fiscal 2013 will be another record year for Jabil."

10:56 am S&P Information Tech sector is trading near the flat line today
The tech sector is trading lower today, behind slight gains in the broader market. Semiconductors are showing relative weakness as well with the SOX trading 0.5% higher. Within the chip index, AMD (-2.8%) is a notable laggard. Among other major indices, the SPY is trading 0.1% higher today, while the QQQ is down 0.3% and the NASDAQ is trading 0.1% lower on the session. Among tech bellwethers, GOOG (+0.4%) is showing notable strength, while INTC (-0.6%) is under pressure.

In tech earnings last night, JBL (+7.0%) reported a Q1 beat and guided just below consensus. Elsewhere, ACN (-3.6%) posted a slight beat and raise, while PAYX (-1.5%) reported a slight miss and reaffirmed guidance. In news, ORCL (+0.2%) will acquire ELOQ (+31.1%), a provider of cloud-based marketing automation and revenue performance mgmt software, for $23.50/share. ET (+6.7%) is up on sympathy. Also, ARRS (+4.9%) will acquire GOOG's (+0.4%) Motorola Home Business for $2.35 bln in cash and stock. It's expected to be significantly accretive to ARRIS' Non-GAAP earnings starting in the first full year after closing. In notable analyst upgrades this morning in the tech space, FLIR (+1.8%) was upgraded to Buy at Sterne Agee. Among downgrades, Hudson Securities downgraded RIMM (+1.0%) to Hold and ARRS (+5.0%) was downgraded to Hold at Jefferies. MU (-1.2%), RHT (+0.4%), TIBX (-1.1%), and RIMM (+1.0%) are the notable names in tech scheduled to report quarterly results today after the close.
icon url

ReturntoSender

12/23/12 1:08 PM

#10026 RE: ReturntoSender #6755

From Briefing.com: Weekly Recap - Week ending 21-Dec-12

Dow -120.88 at 13190.84, Nasdaq -29.38 at 3021.01, S&P -13.54 at 1430.15

Equities spent the duration of today's session in the red. The S&P 500 lost 0.9% after House Speaker John Boehner cancelled Thursday's vote on his ‘Plan B' due to a lack of support from his party. In a morning press conference, the Speaker said he is not walking away from negotiations with President Obama. However, an agreement remains distant and the House of Representatives has adjourned until December 27. Upon returning to work, lawmakers will be left with just two business days before the calendar year ends.

The financial sector led yesterday's advance as market participants showed optimism ahead of the scheduled vote on ‘Plan B.' However, the vote never took place, and legislators will be left with just a couple business days when they return to work next Thursday. After adding nearly 4.0% between Monday's open and Thursday's close, The SPDR Financial Select Sector ETF (XLF 16.40, -0.19) lost 1.2%. Among the majors, Bank of America (BAC 11.29, -0.23) and Citigroup (C 39.49, -0.68) were two of the weakest performers as they finished with respective losses of 2.0% and 1.7%.

Looking at tech stocks, the SPDR Technology Select Sector ETF (XLK 28.95, -0.25) settled lower by 1.2% and major sector components registered comparable losses. Apple (AAPL 519.33, -2.40), Google (GOOG 715.63, -6.73), and International Business Machines (IBM 193.42, -1.35) all lost between 0.5% and 0.9%.

In notable earnings, Research In Motion (RIMM 10.91, -3.21) slumped 22.7% after reporting its quarterly results. Although the smartphone maker beat on earnings and revenue, the company's subscriber growth was a point of concern.

Elsewhere, Micron Technology (MU 6.32, -0.47) slid 6.9% after reporting disappointing earnings and revenue.

Utilities traded largely in-line during the first half of the session. However, mid-afternoon buying lifted the SPDR Utilities Select Sector ETF (XLU 35.31, -0.12) well off its lows. The ETF ended with a loss of 0.3% and companies specializing in production of industrial gasses were among the sector leaders. Piedmont (PNY 32.42, +0.25) added 0.8% after reporting earnings and reaffirming guidance in-line with the Capital IQ consensus. Among electricity providers, Entergy (ETR 64.52, +0.11) and FirstEnergy (FE 41.61, +0.07) registered gains following early-session weakness.

Defensive stocks have seen strength throughout the year. As a result, the PHLX Defense Sector Index has gained over 15.0% since January 3. Today, the space shed 0.3%, and registered narrower losses than the broader market. This came after the House of Representatives passed the defense budget bill, which would spare the sector from drastic cuts in the event the country goes over the fiscal cliff. In addition, a late-afternoon report from Reuters indicated the bill was also passed by the Senate, and sent to the President for approval. Looking into the 17-stock defense index, GenCorp (GY 9.00, -0.22) lost 2.4% and was the weakest performer. On the upside, Embraer (ERJ 27.70, +0.15) and Lockheed Martin (LMT 93.13, +0.63) added 0.5% and 0.7%, respectively.

In M&A news, Ameristar Casinos (ASCA 26.50, +4.43) was bought by Pinnacle (PNK 16.20, +2.85) for $26.50 per share, which represents a 20.0% premium to Ameristar's Thursday close. The deal was received well by investors as ASCA and PNK both gained near 20.0%. The strength in shares of Pinnacle was due to expectations of synergies and an improvement in margins.

Today's economic data was plentiful and most figures were reported ahead of expectations. November durable goods orders increased by 0.7%, which was better than the 0.2% increase that had been expected among economists polled by Briefing.com. This comes after the prior month's reading was revised up to reflect an increase of 1.1%. Excluding transportation related items, durable goods orders increased in November by 1.6%, which was better than the 0.2% decrease that had been broadly anticipated. Prior month's reading was revised from +1.8% to +1.9%.

Personal income increased by 0.6% in November, which was ahead of the 0.3% increase expected by the Briefing.com consensus. Personal spending increased by 0.4%, which was ahead of the expected uptick of 0.3%. Core personal consumption expenditures were unchanged, which fell short of the broadly expected reading of +0.1%.

The University of Michigan's final December Consumer Sentiment Survey fell to 72.9 from the 74.5 that was posted in the preliminary Survey. The Briefing.com consensus expected the reading to rise to 74.8.

Week in Review: Stocks Climb Despite Lack of Budget Agreement

On Monday, the major averages registered broad gains during a low-volume session. The S&P 500 followed a modestly higher open with a steady climb to its session high. Shortly before midday, reports out of Washington indicated President Obama and House Speaker Boehner held a 45-minute conversation in an attempt to further the ongoing budget discussions. The developments had little effect on the markets as the key indices continued their upward drift. As a result, the S&P 500 finished higher by 1.2%. Caribou Coffee (CBOU 16.19, -0.08) will be acquired by Joh. A. Benckiser for $16.00 per share. The transaction carries a total value of approximately $340 million, and the purchase price represents a 29.9% premium to Caribou's Friday closing price.

During Tuesday's session, stocks registered broad gains as comments from Washington lawmakers indicated the budget debate is intensifying. Though an agreement remained elusive, the markets welcomed the developments and spent the duration of the day in an upward climb. As a result, the S&P 500 advanced 1.2%. Goldman Sachs (GS 128.44, -1.28) and Morgan Stanley (MS 18.92, -0.35) outperformed their peers as both saw gains over 3.0%.

Wednesday began on a slightly higher note as Tuesday's optimism regarding a fiscal cliff resolution lingered. However, the initial strength quickly faded, and the S&P 500 slipped below its flat line where it spent the remainder of the session. A recurring theme played out in Washington where lawmakers held another round of press conferences with both sides pushing back against the other. Most notably, Speaker Boehner said the House of Representatives will vote on his ‘plan B' on Thursday. The remarks kept the S&P 500 near its lows before a final round of selling dropped the benchmark index to a loss of 0.8%. Oracle (ORCL 33.76, -0.17) gained 3.7% after beating on earnings and revenue.

On Thursday, the major averages finished higher despite showing indecision in the early part of the session. The fiscal cliff remained as the focal point, and investors showed optimism in Washington's ability to get a deal done. Lawmakers from both sides of the aisle continued to exchange jabs, and Speaker Boehner said the President and the Democrats have not done enough to avoid falling off the cliff. Mr. Boehner touted the proposal he put forth, which was expected to face a House of Representatives vote around 19:30 ET. The S&P 500 gained 0.6% ahead of the scheduled vote. NYSE Euronext (NYX 32.25, 0.00) surged 34.1% after agreeing to be acquired by IntercontinentalExchange (ICE 126.25, -3.85) for $33 per share. The transaction price represents a 37.2% premium to NYSE Euronext's Wednesday close.
 
Index Started Week Ended Week Change % Change YTD %
DJIA 13135.01 13190.84 55.83 0.4 8.0
Nasdaq 2971.33 3021.01 49.68 1.7 16.0
S&P 500 1413.58 1430.15 16.57 1.2 13.7
Russell 2000 823.75 847.92 24.17 2.9 14.4


4:04PM O2Micro lowers Q4 rev guidance (OIIM) 3.24 +0.24 : Co issues downside guidance for Q4 (Dec), lowers Q4 (Dec) revs to $16-17 mln from $17-20 mln vs. $18.7 mln Capital IQ Consensus Estimate. The reduction in anticipated revenue for the fourth quarter is primarily the result of broad-based weakness in demand in our end markets, coupled with lower than normal inventories being held in the supply chain.

In addition, gross margin for Q4 is now expected to be 51% to 52% vs. ests just below 52%.

"We believe this is the result of weak global economic conditions, declining global chip sales and excess inventory corrections by our customers at the end of the calendar year. During this difficult period of revenue weakness, the Company will consider expense reduction measures, including our previously announced intentions to evaluate strategic alternatives for our E-Commerce Group."

9:01AM Power Integrations wins patent case filed by Fairchild Semiconductor in China (POWI) 33.73 : Co announced that a Chinese court has ruled in its favor in infringement proceedings filed against it by Fairchild Semiconductor and its System General subsidiary. After more than two years of litigation, the Suzhou Intermediate Court has found that Power Integrations does not infringe any of the patents asserted by Fairchild in the case. The decision follows three previous findings of infringement against Fairchild and its System General (SG) subsidiary in cases brought by Power Integrations.

8:03AM Micron and Elpida announce clearance of transaction by Japan Fair Trade Commission (MU) 6.79 : Co announced that the Japan Fair Trade Commission has cleared Micron's previously announced acquisition of Elpida. Clearance under Japan's Act on Prohibition of Private Monopolization and Maintenance of Fair Trade satisfies one of the conditions necessary for consummation of the transaction. The transaction has also cleared premerger review in the United States, Czech Republic and Korea.

Research In Motion (RIMM) reported a third quarter loss of $0.22 per share, excluding non-recurring items, $0.13 better than the Capital IQ consensus of ($0.35), while revenues fell 47.2% year/year to $2.73 billion versus the $2.67 bln consensus. The revenue breakdown for the quarter was ~60% for hardware, 36% for service and 4% for software and other revenue. During the quarter, RIM shipped ~6.9 million BlackBerry smartphones and ~255,000 BlackBerry PlayBook tablets. Outlook: The company expects that there will be continued pressure on operating results as it gets set to launch its BlackBerry 10 platform in the fourth quarter. The co intends to continue to consider using pricing initiatives on BlackBerry 7 devices and service fees in some markets as a way to maintain our subscriber base and drive more BlackBerry users. The timing of the BlackBerry 10 launch event for January 30, 2013 could also impact sales of current BlackBerry 7 products as some customers may defer purchasing decisions and wait for BlackBerry 10 devices. All these factors are expected to impact unit volumes, subscribers, margins and service fees. In addition, the co will be significantly increasing its marketing spending this quarter as expected, to support the global launch of BlackBerry 10, and the co expects to report an operating loss for the fourth quarter. RIM also announced today that Robin Bienfait, Chief Information Officer for RIM has made the decision to retire at the end of this year following 6 years of service to the Company. Robin has committed to continue supporting RIM in an advisory capacity to enable a smooth launch and seamless transition. "During the third quarter, we continued to demonstrate our strong financial position, generating $950 million in cash flow from operations, and increasing our cash position significantly to more than $2.9 billion." "

Red Hat (RHT) reported third quarter earnings of $0.29 per share, in-line with the Capital IQ consensus of $0.29, while revenues rose 18.5% year/year to $343.6 million versus the $337.95 mln consensus. Subscription revenue for the quarter was $294.2 million, up 19% in U.S. dollars year-over-year, or 22% measured in constant currency. Red Hat Q3 billings $378.8 mln vs expectations for ~$372 million. Third quarter total deferred revenue of $988 million, up 21% YoY. Non-GAAP operating margin was 24.0%. The company also announced that it has entered into a definitive agreement to acquire ManageIQ, a provider of enterprise cloud management and automation solutions for ~$104.0 million in cash. The closing of the transaction is subject to customary closing conditions. "Strong execution, industry leading solutions and our ability to deliver a compelling ROI to our customers, all contributed to continued momentum and strong third quarter revenue growth in the face of a challenging global economic environment. Red Hat is benefiting from our position as a trusted vendor for IT" The company sees Q4 non GAAP EPS of $0.29-0.30 versus the $0.30 Capital IQ consensus and revenues of $347-350 million versus the $350.79 million consensus.

Micron (MU) reported first quarter loss of $0.27 per share, $0.07 worse than the Capital IQ consensus of ($0.20). while revenues fell 12.2% year/year to $1.83 billion versus the $2.01 bln consensus. Revenues from sales of NAND Flash products were 4 percent lower in the first quarter of fiscal 2013 compared to the fourth quarter of fiscal 2012, due to a 9 percent decrease in sales volume, partially offset by a 5 percent increase in average selling prices. Trade NAND Flash sales volume in the first quarter of fiscal 2013 decreased compared to the fourth quarter of fiscal 2012 primarily as a result of lower production of NAND Flash products. Revenues from sales of DRAM products in the first quarter of fiscal 2013 were 9 percent lower compared to the fourth quarter of fiscal 2012 primarily due to an 11 percent decrease in average selling prices. Sales of NOR Flash products were relatively unchanged for the first quarter of fiscal 2013 compared to the fourth quarter of fiscal 2012. The company's consolidated gross margin of 12 percent in the first quarter of fiscal 2013 was up slightly from 11 percent in the fourth quarter of fiscal 2012. Improvements in margin from sales of NAND Flash and NOR Flash products were offset by slight declines in margins from sales of DRAM products. Cash flows from operations for the first quarter of fiscal 2013 were $236 million. During the first quarter of fiscal 2013, the company invested $538 million in capital expenditures and ended the quarter with cash and investments of $2.8 billion.

TIBCO Software (TIBX) sees revenue of $241-245 million versus $239.99 million consensus. The company sees Q1 non-GAAP EPS of $0.17-0.18 versus the $0.21 consensus. The company did not provide 2013 guidance but is striving to achieve 15-20% EPS expansion in the long term.

FBR Capital initiated F5 Networks (FFIV) with a Outperform and price target of $120. The firm views FFIV as more exposed to the threat of software-defined networking and ASIC-based competitors, but less so than many pure-play networkers. While SDN-based competitors and new ASIC-based solutions could eventually pose serious threats to the communications equipment sector, the ability for new platforms and network solutions to deliver a realistic competitive threat is unclear and likely over-hyped. They expect it will be at least 18 months before SDN- and ASIC-based competitors begin to create a credible threat to F5.

08:56 am F5 Networks initiated with a Outperform at FBR Capital; tgt $120: . FBR Capital initiates FFIV with a Outperform and price target of $120. The firm views FFIV as more exposed to the threat of software-defined networking and ASIC-based competitors, but less so than many pure-play networkers. While SDN-based competitors and new ASIC-based solutions could eventually pose serious threats to the communications equipment sector, the ability for new platforms and network solutions to deliver a realistic competitive threat is unclear and likely over-hyped. They expect it will be at least 18 months before SDN- and ASIC-based competitors begin to create a credible threat to F5.

10:54 am S&P Info Tech sector trading lower along with the overall market today
he tech sector is trading lower today, trailing slightly narrower losses in the broader market. Semiconductors are showing relative weakness as well with the SOX trading 1.5% lower. Within the chip index, MU (-8.5%) is a notable laggard. Among other major indices, the SPY is trading 0.8% lower today, while the QQQ and the NASDAQ are trading 1.1% lower on the session. Among tech bellwethers, FB (-1.9%) and MSFT (-1.8%) are showing notable weakness.

In tech earnings last night, RIMM (-14.5%) reported a narrower-than-expected Q3 loss. Elsewhere, MU (-8.7%) posted a miss, CAMP (-3.5%) reported a slight beat and guided inline, RHT (+3.8%) reported a slight beat and TIBX (+3.7%) posted a beat. In news, PGI (+0.4%), PACT (+2.9%), and SNDK (+0.8%) announced stock repurchase programs. In notable analyst upgrades this morning in the tech space, IFNNY (+0.7%) was upgraded to Overweight at JP Morgan. Among downgrades, ELOQ (-0.3%) was downgraded to Neutral at JP Morgan, RIMM (-14.5%) was downgraded at Credit Agricole and National Bank Financial, and MU (-8.5%) was downgraded to Outperform at Credit Agricole.

07:53 am Tibco Software shares spike 3% following beat on EPS
TIBCO Software (TIBX $21.50 +0.76) reported fourth quarter earnings of $0.42 per share, excluding non-recurring items, $0.05 better than the Capital IQ consensus of $0.37, while revenues rose 2.4% year/year to $296.5 million versus the $293.5 million consensus.
icon url

ReturntoSender

12/24/12 5:05 PM

#10028 RE: ReturntoSender #6755

From Briefing.com: 1:10 pm : The major averages spent today's abbreviated session in the red as the lack of progress in the budget debate weighed on sentiment. The S&P 500 hovered near its lows for the duration of the day, and the benchmark index lost 0.2% amid low volume. With the holiday break underway, traders turn their focus to Thursday when lawmakers are scheduled to return to the country's capital.


The energy sector was the weakest performer and coal producers were pressured. Alpha Natural Resources (ANR 9.03, -0.25) lost 2.7% and CONSOL Energy (CNX 32.67, -0.48) slid 1.5%.

Consumer discretionary stocks outperformed the broader market and multiline retailers saw relative strength. J.C. Penney (JCP 19.87, +0.28) settled higher by 1.4% after Oppenheimer said the company's promotional efforts will improve cash generation and will serve as a steady traffic driver for the retailer. Peer Kohl's (KSS 43.46, +0.11) added 0.3%.

Elsewhere, TripAdvisor (TRIP 42.45, +0.28) advanced 0.7% after Needham raised its price target for the stock to $51 from $38.

In the tech space, the SPDR Technology Select Sector ETF (XLK 28.87, -0.08) shed 0.3%. Within the sector, Apple (AAPL 520.17, +0.84) outperformed and added 0.2%.

Elsewhere, Facebook (FB 26.93, +0.67) gained 2.6% after Needham raised its price target for Facebook stock to $33 from $25.

Yahoo! (YHOO 19.65, +0.30) advanced 1.6% following a ‘Buy' recommendation from Needham. In addition, the investment bank raised its target for Yahoo! to $26 from $19 based on valuation.

Microsoft (MSFT 27.06, -0.39) slipped 1.4% after New York Times reported it has not seen an uptick in demand for personal computers following the release of Microsoft's Windows 8 operating system. Computer assemblers Hewlett-Packard (HPQ 14.01, -0.33) and Dell (DELL 10.24, -0.19) both lost near 2.0% on the news.

The Dow Jones Transportation Average shed 0.4% and 18 of 20 components registered losses. Railroads were among the biggest laggards as Norfolk Southern (NSC 61.99, -0.56) and Kansas City Southern (KSU 83.21, -0.61) settled lower by 0.9% and 0.7%, respectively.

Note that equity markets will be closed tomorrow in observance of Christmas Day. Normal trading hours will resume on Wednesday, December 26. Happy holidays!DJ30 -51.76 NASDAQ -8.41 SP500 -3.49 NASDAQ Adv/Vol/Dec 906/604.0 mln/1512 NYSE Adv/Vol/Dec 1187/286.4 mln/1757

10:57 am Tech Sector trading lower in early trade on this short holiday session
The tech sector is trading lower today, just behind narrower losses in the broader market. Semiconductors are showing relative weakness as well with the SOX trading 0.7% lower. Within the chip index, AMD (-2.9%) is a notable laggard. Among other major indices, the SPY is trading 0.3% lower today, while the QQQ and the NASDAQ are trading 0.4% lower on the session. Among tech bellwethers, FB (+1.3%) is showing notable strength, while MSFT (-1.5%) is under pressure. In tech earnings Friday after the close, OIIM (-4.6%) lowered Q4 revenue guidance. In news, PLXT (-1.7%) announced that the PLX board of directors has named David Raun as its president and CEO. Among rumors, DISH (-1.0%) wants more time to fight S (+0.2%)/CLWR (0.0%) deals, according to reports. In notable analyst ratings changes this morning in the tech space, Needham downgraded OIIM (-4.6%) to Hold. There are no notable names in tech scheduled to report quarterly results today after the close.

8:31AM Ixia announces four-year $150 mln revolving credit facility (XXIA) 16.65 : Co announced that it has secured a four-year, $150 million Senior Secured Revolving Credit Facility. The credit facility includes an accordion option, which allows the company to increase the size of the facility by up to $50 million under certain circumstances, extending its total line of credit borrowing capability to $200 million. Bank of America Merrill Lynch served as Sole Lead Arranger and Sole Book Runner, and Bank of America, N.A. acted as the Administrative Agent

Aventa Technologies, provider of manufacturing equipment for emerging alternative energy markets announced that Applied Ventures, LLC, the venture capital arm of Applied Materials (AMAT) has made a strategic investment in its series A financing.

5:37AM PLX Tech Board appoints David Raun as President, CEO (PLXT) 3.54 : Co announced that the PLX board of directors has named David Raun as its president and CEO. The appointment is effective immediately and includes a position on the company's board of directors. Raun had previously been identified by the board in its succession planning, was serving as interim president and CEO, and has held multiple senior executive leadership positions at PLX since 2004.

O2Micro (OIIM) issued downside guidance for the fourth quarter with revenues to $16-17 million from $17-20 million versus $18.7 million consensus. The reduction in anticipated revenue for the fourth quarter is primarily the result of broad-based weakness in demand in our end markets, coupled with lower than normal inventories being held in the supply chain. In addition, gross margin for Q4 is now expected to be 51% to 52% vs. ests just below 52%. "We believe this is the result of weak global economic conditions, declining global chip sales and excess inventory corrections by our customers at the end of the calendar year. During this difficult period of revenue weakness, the Company will consider expense reduction measures, including our previously announced intentions to evaluate strategic alternatives for our E-Commerce Group."

Groupon (GRPN) announced it has acquired CommerceInterface, a provider of web-based channel management technology that helps manufacturers, distributors and retailers succeed at managing their businesses and selling online. Terms of the deal were not disclosed. CommerceInterface will no longer service other retail channels and current customers will have the option to transition to other vendors over the next six months with migration support from the company.

icon url

ReturntoSender

12/26/12 6:15 PM

#10029 RE: ReturntoSender #6755

From Briefing.com: 4:15 pm : Stocks began the day on a positive note, but the early sentiment failed to hold. The key averages slipped to their respective lows during the first two hours of trade, and held there for the remainder of the session. As a result, the benchmark index finished lower by 0.5%.

With only three trading days left in the year, and the budget deadline approaching, elevated volatility in financials can be expected. Today, the SPDR Financial Select Sector ETF (XLF 16.36, 0.00) ended flat, and the majors were mixed. Wells Fargo (WFC 34.33, -0.09) shed 0.3% while Citigroup (C 39.55, +0.17) added 0.4%. Also of note, Bank of America (BAC 11.54, +0.29) outperformed its peers and rose by 2.6%.

Consumer stocks were among the worst performers. In the discretionary space, retailers saw general weakness and the SPDR S&P Retail ETF (XRT 61.09, -1.08) lost 1.7%. The softness followed a report from MasterCard Advisors SpendingPulse, which pointed to a 0.7% increase in holiday sales as compared to last year. The number was a disappointment as the general consensus expected sales to rise by as much as 4.0%. Instead, the modest uptick represented the slowest growth in four years. Among individual retailers and apparel producers, Coach (COH 54.13, -3.39), Gap (GPS 30.40, -0.97), Urban Outfitters (URBN 38.24, -1.06), and Macy's (M 37.13, -0.39) all lost between 1.0% and 6.0%.

Consumer staples were broadly lower with only a handful of names able to resist the sector-wide pressure. Medifast (MED 25.50, -3.86) slumped 13.2% after Chief Financial Officer, Edward Powers, notified the company of his intent to resign. The resignation will become effective no later than January 4 and Mr. Powers will pursue other interests.

On the upside, Inter Parfums (IPAR 19.75, +0.56) rose by 2.9% after the company signed an exclusive license agreement for Alfred Dunhill fragrances. The partnership is set to run for ten years, and Inter Parfums will take over production and distribution of the Alfred Dunhill collection.

The materials sector was a notable outperformer. Earlier, China's new leadership said urban development will be a key portion of future economic reforms. The news was welcomed by the market, and a rise in anticipated demand for steel pushed major producers higher. Cliffs Natural Resources (CLF 36.05, +0.69) and United States Steel (X 24.26, +0.20) saw respective gains of 2.0% and 0.8%.

The volatility index, or VIX, gained 8.1%, and the index settled at 19.30. Today's surge followed a steady climb observed over the course of the past week as investors sought downside protection in the event Washington lawmakers do not strike a budget deal in time. Note that VIX is now at levels not seen since late July.

The October Case-Shiller 20-city Home Price Index rose by 4.3%, while a 3.9% increase had been expected by the Briefing.com consensus. This follows the prior month's increase of 3.0%.

Tomorrow, weekly initial and continuing claims will be reported at 8:30 ET. In addition, November new home sales and December consumer confidence will both be reported at 10:00 ET.DJ30 -24.49 NASDAQ -22.44 SP500 -6.83 NASDAQ Adv/Vol/Dec 891/1.04 bln/1569 NYSE Adv/Vol/Dec 1053/475.6 mln/1957

3:30 pm : Crude oil rallied to a pit session high of $91.30 per barrel in early morning action as the dollar index slipped to session lows. The energy component then traded in a consolidative pattern just below that level and settled with a solid 2.8% gain at $91.05 per barrel.

Natural gas also climbed higher after lifting off its session low of $3.38 per MMBtu. It eventually settled at $3.42 per MMBtu, booking a gain of 1.2%.

Gold lifted off its session low of $1658.90 per ounce and advanced to a session high of $1668.70 per ounce in morning pit action. However, the yellow metal lost momentum once the dollar index reversed back towards the unchanged level. It chopped around just above the break-even line for the remainder of the session and settled 0.1% higher at $1660.50 per ounce.

Silver also rose to a session high of $30.25 per ounce but erased most of the gains by late morning floor action. It eventually closed with a 0.4% gain at $30.03 per ounce.DJ30 -10.02 NASDAQ -17.65 SP500 -4.72 NASDAQ Adv/Vol/Dec 974/846.1 mln/1473 NYSE Adv/Vol/Dec 1146/318 mln/1855

4:01PM BCD Semiconductor bought by DIOD for $8.00/share; DIOD sees deal immidiately accretive to GAAP EPS (BCDS) 3.98 : Diodes (DIOD) has entered into an Agreement and Plan of Merger to acquire BCD (BCDS). At the effective date of the merger, each American Depository Share, which represents six ordinary shares of BCD, will be converted into the right to receive $8.00 in cash, without interest. The aggregate consideration will be ~$151 million. The boards of both cos have approved the transaction, which is still subject to approval by BCD's shareholders, as well as other customary closing conditions and regulatory approvals. The transaction is expected to close late in 1Q13 or early in Q2.

Expected to be immediately accretive to Diodes' GAAP EPS; Strengthens Diodes' analog product portfolio by expanding its standard linear and power management offerings; Broadens Diodes' presence in Asia through BCD's strong local market position in China; Enhances market and margin expansion opportunities by leveraging Diodes' cost-effective manufacturing and packaging capabilities; Expands design and manufacturing capabilities for increased capacity and scale; and Expected to result in revenue, operating and cost synergies.


CalAmp (CAMP) announced As previously announced, co signed a definitive Share Purchase Agreement to acquire substantially all of the operations of Wireless Matrix Corporation. The Agreement can be terminated by mutual consent of the parties or by either party in certain conditions. Upon termination of the Agreement under certain circumstances, the Seller will be obligated to pay CalAmp a termination fee of $3 million, including in the event the Agreement is terminated by Seller to accept another proposal. If the Agreement is terminated due to CalAmp's inability to obtain adequate financing, CalAmp will be obligated to pay the Seller a termination fee of $2 million.
icon url

ReturntoSender

12/27/12 6:33 PM

#10030 RE: ReturntoSender #6755

From Briefing.com: 4:15 pm : The S&P 500 ended the day with minor losses following a volatile session. Equities began the day on a positive note, but comments from Senate Majority Leader Harry Reid caused a quick change in sentiment. Speaking from the Senate floor, Senator Reid said that all signs suggest the country will go over the fiscal cliff. In addition, the senator said the House of Representatives is being run as a "dictatorship" by Speaker Boehner. The comments caused the major averages to fall to their respective lows. However, an afternoon report out of Washington indicated the House of Representatives will reconvene on Sunday, December 30 at 18:30 ET in hopes of approving a budget. In response, the major averages raced off their lows, ending the day little changed after seeing losses of more than 1.0%.

Financial stocks showed the most intraday sensitivity to the headlines, and the sector led the late-morning decline. However, the late-afternoon rally helped the sector recover the bulk of its losses. Among the majors, Bank of America (BAC 11.47, -0.07) shed 0.6% and JPMorgan Chase (JPM 43.63, -0.33) fell 0.8%.

The SPDR Materials Select Sector ETF (XLB 37.29, -0.13) lost 0.4%. Provider of construction materials Headwaters (HW 8.18, -0.31) slipped 3.7% despite being upgraded at Avondale to ‘Market Perform' with a $10 price target.

Elsewhere, steelmakers underperformed. Mechel Steel (MTL 6.72, -0.04) settled lower by 0.6% and United States Steel (X 23.64, -0.62) slid 2.6%. Also of note, AK Steel (AKS 4.38, -0.22) lost 4.8%, and was a notable laggard.

Gold miners saw strength after this morning's developments painted a bullish picture for the yellow metal. Newmont Mining (NEM 45.47, +0.39) and Royal Gold (RGLD 80.10, +1.58) settled higher by 0.9% and 2.0% respectively.

The Dow Jones Transportation Average shed 0.4% and 17 of 20 components declined. Shipping stocks outperformed and Matson (MATX 24.66, +0.07) added 0.3% after signing an agreement to acquire the assets of Reef Shipping in the South Pacific. Meanwhile, peer Kirby (KEX 61.10, +0.20) settled higher by 0.3%.

On the downside, airlines extended their recent weakness. JetBlue Airways (JBLU 5.68, -0.05) and Alaska Air (ALK 43.26, -0.22) declined for a fourth consecutive session and lost 0.9% and 0.5%, respectively.

European markets ended on a mixed note. Germany's DAX added 0.3%, France's CAC settled higher by 0.6%, and the United Kingdom's FTSE finished unchanged.

The United Kingdom's FTSE ended flat, and most stocks saw little change. However, miners outperformed after the Chinese government revealed plans to boost infrastructure spending. Anglo American rose by 2.1% and Eurasian Natural Resources gained 3.7%.

In Germany, financials and carmakers outperformed. Commerzbank gained 1.2% and Deutsche Bank added 0.6%. Among carmakers, BMW advanced 0.8% and Volkswagen finished higher by 0.4%. The two saw strength after Germany's Finance Minister Wolfgang Schaeuble said the country's economy will expand at a "decent" rate next year with exports as the main growth driver.

France's CAC was supported by industrials. Schneider Electric gained 2.3% and Vinci tacked on 1.6%. On the downside, STMicroelectronics lost 1.1%.

Today's economic news was mixed. The latest weekly initial jobless claims count totaled 350,000, which was better than the 375,000 that had been expected by the Briefing.com consensus. The tally was below the revised prior week count of 362,000. As for continuing claims, they fell to 3.206 million from 3.238 million.

The December consumer confidence came in at 65.1, while economists polled by Briefing.com expected a reading of 70.0. This follows the prior month's revised reading of 71.5.

Separately, new home sales in November hit an annualized rate of 377,000, which was up from October's revised rate of 361,000, and worse than the rate of 379,000 that had been broadly expected by the Briefing.com consensus.

Tomorrow, the December Chicago PMI will be reported at 9:45 ET and November pending home sales will be released at 10:00 ET.DJ30 -18.28 NASDAQ -4.25 SP500 -1.74 NASDAQ Adv/Vol/Dec 1066/1.31 bln/1401 NYSE Adv/Vol/Dec 1367/566.7 mln/1682

3:30 pm : Crude oil fell into negative territory and to a pit session low of $90.05 per barrel on lack of progress over fiscal cliff negotiations. The energy component spent afternoon action inching higher but was unable to erase all losses and settled 0.2% lower at $90.86 per barrel.

Natural gas lifted off its session low of $3.36 per MMBtu and climbed towards the unchanged line during morning floor trade. Despite touching a session high of $3.43 per MBMtu, it closed 0.3% lower at $3.41 per MMBtu.

Gold and silver rallied to their respective session highs of $1666.10 per ounce and $30.53 per ounce following remarks by Senator Reid where he said that all signs suggest the country will go over the fiscal cliff.

However, momentum stalled moments later and both metals slightly eased-off the session highs. Despite the dollar index climbing back into positive territory, gold settled 0.2% higher at $1663.80 per ounce while silver booked a 0.7% gain as it closed at $30.24 per ounce.DJ30 -14.75 NASDAQ -3.22 SP500 -1.47 NASDAQ Adv/Vol/Dec 992/1123.90/1473 NYSE Adv/Vol/Dec 1261/398 mln/1765

4:00PM MEMC announces board transition; two members of its Board of Directors, John Marren and William Stevens, will be retiring from the Board, effective Dec 31, 2012 (WFR) 3.08 -0.09 : Co announced that two members of its Board of Directors, John Marren and William Stevens, will be retiring from the Board, effective December 31, 2012. Messrs. Marren and Stevens have each served on the MEMC Board for 11 years. The company also announced that directors Emmanuel (Manny) Hernandez and Marshall Turner have been appointed to succeed the retiring directors as Chairman of the Board and Chairman of the Audit Committee, respectively.

8:02AM Marvell seeks to overturn jury's patent infringement findings (MRVL) 7.40 : Co announced that on December 26, 2012, a jury in Pittsburgh delivered a verdict in a lawsuit brought by Carnegie Mellon University ("CMU") against Marvell and Marvell Semiconductor ("MSI"), Marvell's U.S. operating subsidiary, in the United States District Court for the Western District of Pennsylvania. In the lawsuit, CMU asserted that Marvell infringed two CMU patents claiming a specific technique related to read channel detector technology that is not practiced by any Marvell chips.

Specifically, the patents at issue are U.S. Patent Nos. 6,201,839 and 6,438,180. Marvell and MSI strongly believe the theoretical methods described in these patents cannot practically be built in silicon even using the most advanced techniques available today, let alone with the technology available a decade ago.

Rather, Marvell and MSI use their own patented read channel technology developed in house. Nevertheless, the jury disagreed with Marvell and MSI's position and found that the patents were literally and willfully infringed and valid, and awarded damages in the amount of $1.17 billion.

Diodes (DIOD) has entered into an Agreement and Plan of Merger to acquire BCD (BCDS). At the effective date of the merger, each American Depository Share, which represents six ordinary shares of BCD, will be converted into the right to receive $8.00 in cash, without interest. The aggregate consideration will be approximately $151 million. The boards of both cos have approved the transaction, which is still subject to approval by BCD's shareholders, as well as other customary closing conditions and regulatory approvals. The transaction is expected to close late in 1Q13 or early in Q2. Expected to be immediately accretive to Diodes' GAAP EPS; Strengthens Diodes' analog product portfolio by expanding its standard linear and power management offerings; Broadens Diodes' presence in Asia through BCD's strong local market position in China; Enhances market and margin expansion opportunities by leveraging Diodes' cost-effective manufacturing and packaging capabilities; Expands design and manufacturing capabilities for increased capacity and scale; and Expected to result in revenue, operating and cost synergies.

The Benchmark Company notes, relating to a patent infringement case with Carnegie Mellon University dating back to 2009, a jury found that Marvell (MRVL) infringed on two CMU patents that underlie read channel technology used in HDD silicon. The jury's award calls for Marvell to pay CMU $1.17 billion. The firm says, this most recent jury award is one additional negative for the company in what has clearly been a challenging year for Marvell. They have rated Marvell shares Hold since February 2012; their cautious stance has been mostly a function of Marvell's high exposure to the HDD market, a market they feel is mature and offers little growth opportunity.

LDK Solar (LDK) announced that the China International Economic and Trade Arbitration Commission stated that the wafer equipment supply contract entered into in July 2008 between LDK Solar and JYT Corporation of Beijing is valid and effective through the duration and at terms and conditions related to quantities and prices set forth therein. Under this contract, LDK Solar agreed to purchase furnaces used in the manufacturing of multicrystalline and monocrystalline ingots for installation in its manufacturing facilities in Xinyu City, China. On December 25, 2012 CIETAC stated that by virtue of the arbitration proceedings LDK shall pay to JYT an amount of ~RMB 294 million as well as approximately an additional amount of RMB 3.4 million to cover arbitral fees accrued as a result of this proceeding.

11:10 am S&P Information Tech sector trading lower by 0.6%
The tech sector is trading lower today, in line with losses in the broader market. Semiconductors are showing inline weakness as well with the SOX trading 0.6% lower. Within the chip index, MRVL (-3.6%) is a notable laggard. Among other major indices, the SPY is trading 0.7% lower today, while the QQQ is down 0.7% and the NASDAQ is trading 0.6% lower on the session. Among tech bellwethers, CSCO (-1.6%) is under notable pressure. There were no tech companies to report earnings this morning or last night. In news, BCDS (+94.7%) agreed to be bought by DIOD (+5.0%) for $8.00/share. DIOD sees the deal as immediately accretive to GAAP EPS. Among notable analyst ratings changes this morning in the tech space, MRVL (-3.8%) was downgraded to Mkt Perform at JMP following yesterday's jury award against the Co. There are no notable names in tech scheduled to report quarterly results today after the close.

10:00 am Consumer Discretionary Index higher and outpeforming today
The consumer discretionary group is slightly outperforming the broader market in early trade. The retail group is also in the green with the Retail HOLDRS Trust (RTH) 0.1% and the SPDR S&P Retail ETF (XRT) 0.1%. Other notable mentions: AMZN flat ( Reuters highlights concerns in cloud space following Netflix (NFLX) outage that was blamed on AMZN)... Leaders: SWHC 3.9% (announced that its Board of Directors has authorized an additional $15.0 million for common stock repurchases through June 30, 2013), EXPE 4.2% (outpacing travel peers; Moody's confirmed last night trivago will not affect the Ba1 corporate family rating), TM 1.7% (agrees to fund a settlement of unintended acceleration cases worth up to $1.4 bln, according to attorneys representing Toyota )... Laggards: LVB -6.8% (announces conclusion of evaluation of strategic alternatives; terminated the agreement with the investor group), F -1% (announced it is spending more than $773 mln on new equipment and capacity expansions across six manufacturing facilities in southeast Michigan), Analyst related: DPZ 1.8% (Domino's Pizza target raised to $50 at Oppenheimer), RBA -0.1% ( tgt to $24 from $21 at Jefferies), BKW -0.6% ( initiated with a Neutral at Buckingham Research)
icon url

ReturntoSender

12/29/12 5:10 PM

#10032 RE: ReturntoSender #6755

From Briefing.com: Weekly Recap - Week ending 28-Dec-12Dow -158.20 at 12938.11, Nasdaq -25.60 at 2960.31, S&P -15.67 at 1402.42

Stocks spent today's session in the red as the hope for a timely budget deal becomes more distant. The major averages saw a late-afternoon spike after reports out of Washington indicated President Obama will present a scaled-back budget proposal during his meeting with top lawmakers today. However, shortly after the president began his meeting with lawmakers, further reports indicated no new offer would be made, and President Obama would stand by his original proposal. As a result, the S&P 500 lost 1.1%.

The energy sector was the weakest performer and the SPDR Energy Select Sector ETF (XLE 69.83, -1.24) lost 1.7%. Crude oil slipped to session lows after today's inventory data revealed a smaller-than-expected weekly draw. The energy component settled lower by 0.1%, at $90.79.

Sector leaders saw comparable losses as Exxon Mobil (XOM 85.10, -1.76) and Chevron (CVX 106.45, -2.07) both lost near 2.0%. Looking at news within the space, Carrizo Oil & Gas (CRZO 20.64, -1.17) slid 5.4% following the sale of its interests in the Huntington Field in the United Kingdom's North Sea for $184 million.

The volatility index, or VIX, surged 11.0%. The volatility measure ended at 21.62 after crossing above the 20.00 level yesterday. The move was notable as the VIX has held below 20.00 since late July. At its lowest point, the VIX has flirted with the 13.30 level. However, a steady rise has been observed over the past week as investors seek more downside protection due to the uncertainty resulting from the lack of a budget deal. Today's VIX close marked a six-month high.

The Dow Jones Transportation Average slid 0.9% and outperformed the broader market. JB Hunt (JBHT 58.48, -0.16) and Landstar (LSTR 51.62, -0.12) were among the top performers, losing around 0.2% each. Meanwhile, providers of package delivery services weighed on the index. FedEx (FDX 90.39, -1.11) slid 1.2% and UPS (UPS 72.83, -1.08) lost 1.5%.

Elsewhere, Barnes & Noble (BKS 14.97, +0.62) gained 4.3% after Pearson (PSO 19.28, -0.09) confirmed plans to invest $89.5 million in NOOK Media, LLC, which is a new company consisting of Barnes & Noble's digital businesses. The NOOK e-reader, tablets, the NOOK digital store, as well as the company's 674 college bookstores across the country will all be included under the umbrella of NOOK Media, LLC. Though Barnes & Noble saw notable gains, it should be noted that in addition to announcing the Pearson investment, BKS said today that holiday sales results will miss expectations, and the NOOK business will not meet the company's earlier projections.

Today's economic data revealed a 1.7% increase in pending home sales during the month of November. While the pending sales data does not have a direct impact on homebuilders, strong sales of existing homes bode well for new construction projects. Major homebuilders ticked up in immediate response to the sales data, but were pressured back near their lows. DR Horton (DHI 19.24, -0.24) slid 1.2% and PulteGroup (PHM 17.60, -0.16) finished lower by 0.9%.

The December Chicago PMI reading of 51.6 surprised to the upside as economists surveyed by Briefing.com had generally expected a reading of 51.0 to follow the prior month's 50.4.

Week in Review: Equities Slip as Budget Deal Remains Distant

On Monday, the major averages spent the abbreviated session in the red as the lack of progress in the budget debate weighed on sentiment. The S&P 500 hovered near its lows for the duration of the day, and the benchmark index lost 0.2% amid low volume. Microsoft (MSFT 26.55, -0.41) slipped 1.4% after New York Times reported it has not seen an uptick in demand for personal computers following the release of Microsoft's Windows 8 operating system. Computer assemblers Hewlett-Packard (HPQ 13.68, -0.36) and Dell (DELL 9.97, -0.14) both lost near 2.0% on the news.

Wednesday began on a positive note, but the early sentiment failed to hold. The key averages slipped to their respective lows during the first two hours of trade, and held there for the remainder of the session. As a result, the benchmark S&P 500 index finished lower by 0.5%. Retailers saw general weakness and the SPDR S&P Retail ETF (XRT 60.91, -0.31) lost 1.7%. The softness followed a report from MasterCard Advisors SpendingPulse, which pointed to a 0.7% increase in holiday sales as compared to last year. The number was a disappointment as the general consensus expected sales to rise by as much as 4.0%.

On Thursday, the S&P 500 ended with minor losses following a volatile session. Equities began the day on a positive note, but comments from Senate Majority Leader Harry Reid caused a quick change in sentiment. Speaking from the Senate floor, Senator Reid said that all signs suggest the country will go over the fiscal cliff. In addition, the senator said the House of Representatives is being run as a "dictatorship" by Speaker Boehner. The comments caused the major averages to fall to their respective lows. However, an afternoon report out of Washington indicated the House of Representatives will reconvene on Sunday, December 30 at 18:30 ET in hopes of approving a budget. In response, the major averages raced off their lows, ending the day little changed after seeing losses of more than 1.0%. Financial stocks showed the most intraday sensitivity to the headlines, and the sector led the late-morning decline. However, the late-afternoon rally helped the sector recover the bulk of its losses. Among the majors, Bank of America (BAC 11.36, -0.11) shed 0.6% and JPMorgan Chase (JPM 43.24, -0.39) fell 0.8%.

Index Started Week Ended Week Change % Change YTD %
DJIA 13190.84 12938.11 -252.73 -1.9 5.9
Nasdaq 3021.01 2960.31 -60.70 -2.0 13.6
S&P 500 1430.15 1402.43 -27.72 -1.9 11.5
Russell 2000 847.92 832.10 -15.82 -1.9 12.3

Sigma Designs (SIGM) announced that Microsoft's (MSFT) Smooth Streaming client technology has been integrated into Sigma's multimedia chipset solutions to deliver seamless HD 1080p media content.

Synchronoss Tech (SNCR) announced that it has acquired NewBay, a wholly owned subsidiary of Research in Motion Limited. NewBay is a leader in cloud services, enabling mobile operators and service providers to deliver content experiences across connected devices such as smartphones, tablets, PC's and TV's. NewBay's cloud services are delivered to millions of user and stores billions of media files for live operator services around the world. Synchronoss paid $55.5 million in cash to Research in Motion Limited, and there was no assumption of cash or debt. The transaction closed at the end of the fourth quarter of 2012.

Wunderlich initiated Lsi Logic (LSI) with a Buy and price target of $9. They believe the company is positioned to outperform its peers in 2013 due to: 1) the early move into the NAND Flash solid-state storage (SSS) markets with the company's Flash Storage Processor (FSP) and PCIe Flash Adapters (PFA), which should position LSI to benefit from the strong growth expected in this market; 2) the company's Storage systems and Server markets benefiting from the transition from 6 gig to 12 gig SAS expected to continue in 2013; and 3) design wins with its Axxia SoC solutions transitioning to production in the wireless infrastructure segment and this should help offset the challenging HDD market until a recovery later in 2013.

Wunderlich initiated Marvell (MRVL) with a Hold and price target of $9. The firm notes, The company has a strong tradition of leadership in the storage space that they expect to continue with the transition to SSDs, which has offset some recent headwinds in the HDD market. The uncertainty in the CFO position and lack of visibility for a return to above-market growth preclude the firm from recommending the stock now, which they believe is cheap. They would look for improvement in either of those factors before changing their rating, all else being equal.

08:22 am BCD Semiconductor downgraded to Hold from Buy at Stifel Nicolaus: . Stifel Nicolaus downgrades BCDS to Hold from Buy after Diodes (DIOD) and BCD Semiconductor (BCDS) have announced an agreement for Diodes to acquire BCD for $151mn cash. They believe the merger is a positive development for the analog semiconductor space and the premium (101%) confirms that overall valuation for small cap analog, mixed-signal companies remains too low in relation to intrinsic value. They believe publicly traded, small cap analog mixed signal companies have been trading at exceptionally low multiples relative to their fundamentals due to public market issues such as liquidity/low trading volume, lack of scale, and there being too many such companies vying for investor attention.

10:05 am S&P Information Technology Index is trading lower by 0.7%

Sector Summary: S&P Information Technology Index (-0.7%) trading higher today, ahead of the broader market The tech sector is trading lower today along with losses in the broader market. Semiconductors are showing relative strength, however, with the SOX trading only 0.4% lower. Within the chip index, WFR (+1.6%) is a notable standout. Among other major indices, the SPY is trading 0.6% lower today, while the QQQ and the NASDAQ are trading 0.5% lower on the session. Among tech bellwethers, FB (+2.7%) is under notable pressure. In tech earnings, CALL (+5.6%) guided Q4 revs above consensus. In news last night, SNCR (+4.3%) announced that it has acquired NewBay from RIMM (+1.5%) for $55.5 mln. Among rumors, AAPL (-1.0%) is developing a smart watch according to reports. Among analyst research this morning in the tech space, LSI (+0.7%) was initiated with a Buy at Wunderlich. There are no notable names in tech scheduled to report quarterly results today after the close.
icon url

ReturntoSender

12/30/12 11:20 AM

#10033 RE: ReturntoSender #6755

Amateur Investors Weekend Stock Market Analysis (12/29/12)

http://www.amateur-investor.net/Weekend_Market_Analysis_Dec_29_2012.htm

With only one trading day left in 2012 unless we see an epic one day sell off the S&P 500 is going to finish the year with a positive gain. Even more remarkable is that over the past 10 years the S&P 500 has finished with a positive gain in 8 of those years while 2010 was an even year. Thus in the past 10 years there has only been one down year in 2008 although it was substantial with a 38% loss.


Meanwhile continuing my series on using indicators to time market bottoms this week I will focus on the Mutual Fund Panic Index which was developed by myself based on flows into and out of Mutual Funds on a quarterly basis. This data can be tracked going back to the early 1950's. Basically when the % of outflows reaches -20% or more (points A) the S&P 500 has put in a major bottom followed by a significant rally. The last signal was in March of 2009 which has been followed by a 121% rally in the S&P 500. Other signals occurred with the late 2002 low, late 1987 crash, late 1974 low, early 1970's low and further back in late 1962. All of these signals were followed by at least a 70% rally from the lows.


The chart below is a strategy using the Mutual Fund Panic Index as Buy Signals (red diamonds). Exit points (green triangles) are based on the following three conditions happening at the same time after 2 years has elapsed from the original Buy Signal.

1. The S&P 500 is 9% above its 89 Week Moving Average.
2. The Fed Funds Rate is higher than it was 6 months earlier.
3. The Yield on the 10 Year Bond is higher than it was 6 months earlier.

Using these criteria the lowest return was 40% while the highest return was 227%. Meanwhile the last two [Buy Signals averaged 75%.


The table below summarizes all the Buy and Sell Signals using the Mutual Fund Panic Index.
 
Buy Sell
Signal Closing Signal Closing %
Month Price Month Price Return
Sep-62 56.27 Oct-67 93.30 65.8
Sep-70 84.30 Dec-72 118.05 40.0
Dec-74 68.56 Aug-78 103.29 50.7
Mar-88 258.89 May-97 848.28 227.7
Dec-02 879.82 May-07 1530.62 74.0
Mar-09 797.87 Mar-12 1408.47 76.5
icon url

ReturntoSender

12/30/12 2:02 PM

#10035 RE: ReturntoSender #6755

15-Year Projection Remains on Course $DIA
By Jeffrey A. Hirsch & Christopher Mistal

http://blog.stocktradersalmanac.com/post/15-Year-Projection-Remains-on-Course-DIA

This chart shows our long term outlook through the year 2025. We made our Next Super Boom Forecast first to subscribers in May 2010 for the next 500% that will bring the DJIA up to 38,820. HOWEVER! That forecast includes several years more of sluggish trading and negative market returns. When our Super Boom book came out in April 2011 we created this chart based upon our studies of past seasonal patterns and market cycles.

This chart tracks the projection we made for the DJIA on a monthly basis from April 2011 through December 2025 almost two years ago along with market action since. We are humbled by how closely the market has tracked the projection and will keep tracking it as a reminder of how our long term outlook is holding up and use it to keep our analysis in check should the market veer far off our projection.


Many thanks to Les H for posting this over on the News and Chart Links Thread.

http://www.siliconinvestor.com/readmsg.aspx?msgid=28633148

Personally I think this forecast makes a great deal of sense. Hopefully we all live long enough to profit from the ultimate huge rise that will take place after the stock market makes its final bottom this decade.

RtS

icon url

ReturntoSender

12/31/12 10:38 PM

#10041 RE: ReturntoSender #6755

From Briefing.com: 4:10 pm : Equities began today's session on a slightly lower note after the weekend failed to advance the budget negotiations. The talks have now entered the 11th hour, and the likelihood of a timely, comprehensive agreement remains distant. However, recent reports out of Washington indicated the two sides have made some progress on revenues, but the debate over spending cuts is scheduled to continue. Equities rallied broadly amid low volume and the S&P 500 finished higher by 1.7%. The materials sector outperformed after the Chinese HSBC Manufacturing PMI report beat expectations. The strong PMI reading was received as a positive sign for the country's economy, which in turn would be a positive for the future demand for basic materials. Technology stocks also outperformed and Apple (AAPL 532.17, +22.58) rose by 4.4%.

With 2012 coming to a close, we would like to take a minute and reflect on the year that was.

2012 proved to be a positive year for world equities despite a number of macroeconomic challenges. Markets across the globe registered strong gains as Germany's DAX and Greece's ASE General Index both added over 30%. Domestically, the S&P 500 registered a solid 12% gain, and was slightly outperformed by the Nasdaq and Russell 2000. The renewed worries regarding the weakening fundamentals of the Eurozone persisted into the summer and weighed on market sentiment. However, late-summer efforts from the European Central Bank and the Federal Reserve alleviated some of the fears, and propelled the markets to a strong second-half performance. The rally was cut short after the election, when the market focus turned to the budget debate, which lasted into the New Year. Below we summarize some of the key developments, which contributed to market sentiment.

Central Banks Maintained Accommodative Policy Course, With Diminishing Returns

Taking a look at past QE operations from the Fed, the first QE program saw the S&P gain nearly 70%. During QE II, the index gained 23%. So far, following the announcement of QE III--which was unveiled in September of 2012--the S&P has lost 4% as concerns over the Fiscal Cliff weighed. Taking a look at Fed's actions in 2012:
January 25th - The Fed said it would keep rates low through 2014.
June 20th - The FOMC extended its 'operation twist' program until the end of 2012.
September 13th -- The Federal Reserve announced its decision to increase policy accommodations by purchasing additional agency mortgage-backed securities at a pace of $40 bln per month.
December 12th -- The Fed announced ‘Operation Twist' will be replaced by a Treasury purchasing program with an initial rate of $45 billion per month. The key interest rate was expected to remain at exceptionally low levels until a target unemployment rate of 6.5% is reached.
Looking ahead to 2013, the Fed voters will change at the end of this year and will become slightly more dovish overall.
Incoming voters include, Charles Evans, Eric Rosengren, James Bullard, and Kansas City Fed's Esther George.
Others rotating off include Cleveland Fed President Sandra Pianalto, Atlanta Fed President Dennis Lockhart and San Francisco Fed President John Williams.

Politics Added Volatility to Markets

U.S. Presidential Election
Key indices rallied into the election and the S&P 500 advanced nearly 1% on Election Day, only to fall 6% in the two weeks following.
The loss of optimism post-election was attributed to questions whether a Democratic president and a split Congress can strike a budget deal to avoid going over the fiscal cliff.
Fiscal Cliff Arrived at Year's End
Following the U.S. presidential election, the attention turned to the budget debate. The automatic spending cuts and tax hikes scheduled to take place if no budget agreement is reached became known as the 'Fiscal Cliff.'
The markets maintained their upward bias through the bulk of the debate, but the final week of the year resulted in a sell-off as the likelihood of a timely compromise diminished.

U.S. Stocks Led by Homebuilders and Financials

Housing was a bright spot in the broader economy; as such homebuilders saw robust returns and the SPDR S&P Homebuilders ETF (XHB) surged 49%.
Among major individual builders, Lennar (LEN, +87%), PulteGroup (PHM, +172%), D.R. Horton (DHI, +49%), Standard Pacific (SPF, +119%) all saw outsized gains.
Despite the observed uptrend in housing data, it should be noted that housing starts, new, and pending home sales remain below historical averages entering 2013. In addition, foreclosure rates remain elevated.
Financials Outperformed Despite Debt Worries and some notable trading issues
Financial shares beat the market with the XLF ETF gaining 24% for the year versus a 12% gain in the S&P 500. The better than expected recovery that we discussed in housing contributed to the gains. The financial sector saw strong returns despite a handful of challenges.
JP Morgan London Whale Trade: After the bell on May 10, the U.S. financials were rattled by the news indicating JPMorgan Chase (JPM) had significant mark-to-market losses in its synthetic credit portfolio. It took nearly 5 months for JPM to recover.
Knight Capital (KCG) Trading Glitch and Sale: On August 1st, a trading glitch at KCG caused nearly 150 stocks to behave erratically. Just before the end of the year, KCG and GETCO Holding announced a merger at $3.75 per share in cash. Knight Capital (KCG) shares finished the year lower by 71%.
Investors Focused on the Largest Tech Stock - Apple
With years of strong performance and solid fundamentals, Apple (AAPL) was favored by investors in early 2012, and it had become a top hedge fund holding.
Apple surged nearly 65% through the first three quarters of the year, and marked its all-time high in the $705 area.
After climbing to its all-time high, the stock tumbled 30%, but still managed to finish the year 24% higher.
The notable slide came amid numerous factors including disappointing product launch, stepped up competition and the once-rich profit margins have compressed through the year.

European Markets Saw Strongest Overall Performance

Despite continued uncertainty and ongoing debt problems, broad Euro region equity averages returned more than 15% this year.
The spring reignited worries regarding Greek solvency. Despite the mid-summer uncertainty, the Greek ASE returned 33%, and was the best performing global index.
Concerns about Spain followed Greece; Spain's IBEX fared much worse with a 5% loss on the year.
The country's heavily-strained banking system caused the 10-yr benchmark yield to cross above 7.00% before a bank recapitalization package was approved by the European Central Bank.
The approval of the bank recapitalization combined with ECB's Outright Monetary Transactions helped ease the pressure on yields, which slipped back below 7.00%.

Asian Region Fared Well With Strength in India (+31%), Japan (+22%) and Hong Kong (+23%)

In Japan, Shinzo Abe was elected prime minister on the platform of promoting economic growth and bringing the country out of its economic malaise.
Mr. Abe had previously held the post in 2006. The country's new prime minister vowed to defeat inflation and promised to increase government spending. The Japanese market cheered the plans and the Nikkei registered the bulk of its gains in the final six weeks of the year.

Looking Ahead to 2013

As mentioned in Briefing.com's Market View (published 12/17/2012), A year has made a lot of difference for equity investors in a good way. Unfortunately, we are not as hopeful about the market outlook entering 2013. Once again, we can point to three factors in particular driving our perspective:
Economic growth is decelerating
Fiscal austerity is just beginning in the US and there is too much complacency about its outcome
Earnings growth estimates are too high

Those factors may not conspire to produce a negative return for the stock market in 2013, yet they present real obstacles for achieving another strong gain and raise the importance of managing against downside risk. Fiscal austerity will bite, as we have seen in the eurozone, political friction will persist both here and abroad, and earnings growth is unlikely to measure up to currently high expectations.

2013 is loaded with potential to be a fundamentally disappointing year. That might not translate directly in terms of stock market returns given the Fed's influence, yet investors should take care nonetheless to manage against downside risk.

Wishing you the very best in 2013!

-The Briefing.com TeamDJ30 +166.03 NASDAQ +59.20 SP500 +23.76 NASDAQ Adv/Vol/Dec 2051/1.49 bln/491 NYSE Adv/Vol/Dec 2651/692.2 mln/434

3:30 pm : Crude oil trended higher as investors tracked progress of fiscal cliff negotiations that are nearing the year-end deadline. The energy component rose to a session high of $91.95 per barrel and settled at $91.78 per barrel for a 1.1% gain. Despite today's advance, oil lost about 7.1% over the year.

Natural gas fell deeper into negative territory and closed at its session low of $3.35 per MMBtu with a 3.5% loss. Still, it booked a gain of ~11.3% for the year. Precious metals also advanced during today's pit trade on the last-minute fiscal cliff negotiations.

Gold popped to a session high of $1681.00 per ounce and settled at $1676.00 per ounce for a gain of 1.2%, ending the year about 7% higher.

Silver rallied to a session high of $30.47 per ounce but pulled-back slightly as it headed into the close. Still, it booked a 0.9% gain for the session, and ended the year ~8.3% higher as it closed at $30.25 per ounce.DJ30 +99.42 NASDAQ +46.65 SP500 +16.16 NASDAQ Adv/Vol/Dec 1871/1169.5 mln/649 NYSE Adv/Vol/Dec 2457/403 mln/575

6:01AM JA Solar regains compliance with NASDAQ minimum bid price rule (JASO) 4.16 : Co announced that it has received a letter dated December 27, 2012 from NASDAQ Stock Market notifying the Company that it has regained compliance with the minimum bid price of $1.00 per share requirement for continued listing set forth in NASDAQ Listing Rule 5450.

Cypress Semiconductor (CY) announced that the International Trade Commission has agreed to review the entire Initial Determination issued by Chief Administrative Law Judge Charles Bullock in the pending patent case between Cypress and GSI Technology. Cypress has asserted that GSI SRAMs infringe multiple Cypress patents.
icon url

ReturntoSender

01/02/13 10:36 AM

#10042 RE: ReturntoSender #6755

KLIC shorted another 5000@12.27 - The fiscal cliff deal caused such a pop for the market that I was kind of hoping for a gap and crap. Looks like we will get a bit more of a run than that though. I'm now short 10,000 shares@12.03:


RtS
icon url

ReturntoSender

01/03/13 8:55 PM

#10044 RE: ReturntoSender #6755

From Briefing.com: 4:15 pm : The S&P 500 shed 0.2% after the Federal Reserve released the minutes from its December policy meeting. The markets keyed in on comments from several members who voiced concerns over the duration of the asset purchase program. In addition, some participants "thought that it would probably be appropriate to slow or to stop purchases well before the end of 2013." Traditional safe-haven assets saw some selling in reaction the report. Gold dropped nearly 1.5% to its session low in the 1660.00 area. Meanwhile, Treasuries saw some selling, and the 10-yr yield jumped six basis points to 1.899%, its highest close since May.

Financials were some of the top performers during yesterday's rally. However, the market focus is now turning to the next step in the debate as the country nears the debt ceiling. The special measures currently being undertaken by the Department of Treasury are expected to delay the breach of the ceiling for about two months. Also of note, recent reports have indicated Treasury Secretary Tim Geithner will leave his post by the end of January. In addition, the approval of a tax plan was met with less-than-positive feedback from rating agencies which said more action on the deficit will be needed soon. Among individual financials, Goldman Sachs (GS 130.94, -0.72) and Wells Fargo (WFC 34.76, -0.29) both shed over 0.5%.

Shares of automakers responded to December car sales data. Among the notable movers, Ford Motor (F 13.46, +0.26) rose by 2.0% after the company reported a 5.0% increase in December car sales. Meanwhile, the company's utility vehicles saw 7.0% sales growth. In total, Ford sold nearly 2.2 million vehicles in 2012.

General Motors (GM 29.82, +0.69) sales also grew by 5.0%, and the stock added 2.4% in response to the positive data.

Looking at foreign-based carmakers, Toyota Motor (TM 95.37, -0.62) shed 0.7% despite reporting a 9.0% rise in its December sales. During 2012, Toyota sold almost 2.1 million vehicles.

Consumer discretionary stocks outperformed after retailers reported their December same store sales. Overall, the results were mixed as ten retailers beat the Retail Metrics consensus, while eight fell short of expectations. Among the companies which reported notable beats, Ross Stores (ROST 58.78, +4.34) and Zumiez (ZUMZ 21.22, +1.72) surged 8.0% and 8.8% respectively. Ross Stores saw strength after its sales grew 6.0%, while the general consensus expected an increase of 3.0%. However, Zumiez rallied after the company's December sales slipped by just 1.0%, while analysts expected a 3.5% decline.

Among the names which reported disappointing sales growth, Limited Brands (LTD 44.71, -2.69) slumped 5.7% after its 3.0% monthly sales growth disappointed the market, which expected an uptick of 4.7%.

The Dow Jones Transportation Average settled higher by 0.6%, and the bellwether complex outperformed the broader market. With today's gains, the index has added over 4.5% since Monday's open. In addition, transports ended the session at their best level since July 2011. Among individual components, airlines displayed relative strength as United Continental (UAL 24.93, +0.74) and Delta Air Lines (DAL 12.58, +0.35) both gained near 3.0%.

Trucking stocks underperformed. CH Robinson (CHRW 62.34, -0.82) lost 1.3% and was the biggest laggard.

The market received several economic data points this morning. According to the ADP National Employment Report, employment in the nonfarm private business sector rose by 215K in December. This was above the 140K increase expected by the Briefing.com consensus.

The latest weekly initial jobless claims count totaled 372,000, which was worse than the 365,000 that had been expected by the Briefing.com consensus. The tally was above the revised prior week count of 362,000. As for continuing claims, they rose to 3.245 million from 3.201 million.

The weekly MBA Mortgage Applications decreased by 10.4%, which follows last week's 11.2% downtick.

Elsewhere, December Challenger Job Cuts declined 22.1%, and today's reading follows the prior month's 34.4% increase.

Tomorrow's economic data will be plentiful. At 8:30 ET, December nonfarm payrolls, nonfarm private payrolls, the unemployment rate, hourly earnings, and average workweek will all be reported. Lastly, November factory orders and December ISM services will hit the wires at 10:00 ET.DJ30 -21.19 NASDAQ -11.69 SP500 -3.05 NASDAQ Adv/Vol/Dec 1187/1.69 bln/1290 NYSE Adv/Vol/Dec 1709/707.1 mln/1344

3:30 pm : Crude oil lifted off its session low of $92.62 per barrel set in early morning pit action and crossed the breakeven line despite a stronger dollar index. However, the energy component fell back into the red on the announcement of the FOMC Minutes and settled 0.2% lower at $92.91 per barrel.

Natural gas managed to inch higher and into positive territory, where it briefly brushed a session high of $3.24 per MMBtu. It pulled-back heading into the close and settled 1.2% lower at $3.19 per MMBtu.

Precious metals fell during today's pit trade on pressure from the stronger dollar index. Gold spent its entire session in the red, brushing a session high of $1682.40 per ounce in morning action. It slipped to a session low of $1674.00 per ounce moments before it settled with a 0.8% loss at $1674.50 per ounce.

Silver slid to a session low of $30.69 per ounce despite briefly poking into positive territory in late morning action. It eventually settled at $30.74 per ounce, or 0.8% lower.DJ30 -38.77 NASDAQ -16.95 SP500 -5.21 NASDAQ Adv/Vol/Dec 1163/1400.3 mln/1313 NYSE Adv/Vol/Dec 1683/470 mln/1362

4:36PM Rubicon Tech closes $25 million secured revolving credit facility (RBCN) 6.66 +0.17 : Rubicon currently has no debt. The terms and conditions of the credit facility will be described in the company's filings with the Securities and Exchange Commission.


Advanced Micro (AMD) announced that after a thorough internal and external search the company has appointed Devinder Kumar as senior vice president and chief financial officer, effective Jan. 2, 2013. Kumar will report to Rory Read, AMD president and chief executive officer, and will have responsibility for leading the company's global finance organization. Kumar has been interim CFO since September 2012. He served as corporate controller of the company since 2001 and as senior vice president since 2006.

Mellanox Tech (MLNX) lowered its fourth quarter guidance, now expects revenue of $119-121 million, below the company's previous guidance of $145-150 million and versus Capital IQ consensus of $148.6 million. The shortfall is primarily the result of a weaker demand environment, challenging macroeconomic conditions, and a technical issue associated with FDR 56Gb/s InfiniBand cabling which caused approximately $20 million of FDR deployments to be delayed. The cabling issue has been resolved and is not expected to impact revenue in the future. The company continues to expect its Q4 non-GAAP gross margin to be in the range of 68.5-69.5%.

TESScompany Tech (TESS) expects to report revenue in the range of $200-210 million for the third fiscal quarter, which ended December 30, 2012 versus the $172.25 million single analyst estimate. This third quarter revenue as compared to company's prior year third quarter will reflect a 15-20% increase in company's company markets and represents a 10% decrease in total revenue as a result of the ongoing transition out of company's third party logistics business with a Tier 1 carrier. As previously announced, company expects to be transitioned out of the 3PL relationship with this Tier 1 carrier customer by the end of our fiscal year. Based on company's results in the first half of fiscal 2013, company's expected results for its third quarter and its view of the current business opportunities for our fourth fiscal quarter, it continues to expect that diluted earnings per share for fiscal 2013 will range from $1.90-2.15 versus the $2.26 Capital IQ consensus. The company expects to provide a narrower range of annual diluted earnings per share guidance when it releases its financial results on January 17, 2013.

ScanSource (SCSC) has sued Avanade, a joint venture between Accenture (ACN) and Microsoft (MSFT), for what ScanSource calls a "bait-and-switch," after ScanSource saw Avanade's initial estimate for the installation of enterprise resource planning software system Microsoft Dynamics AX balloon from $17 million to nearly $66 million and from 11 months to three years, with the ERP system still not live. ScanSource's project is believed to be one of the largest global enterprise level Microsoft Dynamics AX implementations to date. "ScanSource contacted with Avanade in 2009 to replace its aging information technology infrastructure with a new company system that would support ScanSource's continued global expansion. Avanade's implementation was originally scheduled to be completed within 11 months. The lawsuit, which was filed in U.S. District court in Atlanta, alleges among other things fraud, tortious misrepresentation and breach of contract, and seeks tens of millions of dollars in damages that ScanSource has incurred and will continues to incur, as a result of Avanade's misconduct."

icon url

ReturntoSender

01/07/13 2:31 PM

#10048 RE: ReturntoSender #6755

Wennerstrom Semi Equipment Stocks on long term daily charts versus the VIX:


http://www.siliconinvestor.com/subject.aspx?subjectid=37144
icon url

ReturntoSender

01/08/13 8:14 PM

#10051 RE: ReturntoSender #6755

From Briefing.com: 4:20 pm : The S&P 500 ended lower by 0.3% after spending the duration of the session in the red. With little economic data of note and below-average volume, the key indices traded in range bound fashion ahead Alcoa's (AA 9.10, 0.00) earnings report, which will kick-off the fourth quarter earnings season.

Consumer discretionary stocks were in focus after Yum! Brands (YUM 65.04, -2.85) reaffirmed its full-year 2012 earnings guidance, but lowered the same-store sales estimates for its China division. As a result of the disappointing outlook, Yum! Brands slid 4.2% and other quick service restaurants traded lower as well. Darden Restaurants (DRI 45.31, -0.23) and Wendy's (WEN 4.74, -0.05) both shed near 0.7%.

Elsewhere in the discretionary sector, Signet Jewelers (SIG 58.70, +4.87) surged 9.1% after the company guided its fourth quarter earnings near the high end of its prior range. In addition, Signet reported a 3.3% increase in holiday sales. Other high-end retailers saw strength as well. Coach (COH 57.33, +1.70) and Zale (ZLC 4.26, +0.08) settled higher by 3.1% and 1.9% respectively.

Also of note, GameStop (GME 23.19, -1.56) fell 6.3% after the company reported disappointing holiday sales. The company expects its fourth quarter earnings per share to be at the low end of its current guidance range. Video game publishers Electronic Arts (EA 13.77, -0.68) and Take-Two Interactive (TTWO 11.78, -0.36) were pressured by the news, and ended lower by 4.7% and 3.1% respectively.

The materials sector advanced as the space resisted the broad market pressure. The sector was supported by Monsanto (MON 98.50, +2.56), which reported upbeat quarterly result this morning. During the first quarter, the chemical producer earned $0.62, which was well ahead of the $0.26 expected by the Capital IQ consensus. In addition, Monsanto's revenue of $2.94 billion was also ahead of expectations.

The Dow Jones Transportation Average slipped 0.4%. Airlines have shown notable strength since the start of December, but major carriers saw mixed performance after Deutsche Bank changed its rating on two carriers. Southwest Airlines (LUV 11.03, +0.12) was a bright spot, gaining 1.1% after being upgraded to ‘Buy' from ‘Hold.' On the downside, JetBlue Airways (JBLU 5.94, -0.03) shed 0.5% after the stock was downgraded to ‘Hold' from ‘Buy.'

Additionally, afternoon reports have indicated an international Japan Airlines flight was forced to return to its gate at Boston Logan International Airport due to a fuel leak. This marks the second time in two days that a Boeing (BA 74.13, -2.00) Dreamliner jet has suffered structural issues. As a result, Boeing lost 2.6%, and settled near its session low.

The telecom sector was the biggest laggard and the iShares Dow Jones US Telecom (IYZ 24.55, -0.38) lost 1.5%. Major carriers AT&T (T 34.35, -0.59) and Verizon Communications (VZ 43.10, -1.07) saw respective losses of 1.7% and 2.4%. The sector underperformed notably despite AT&T reporting having sold over 10 million smartphones during the fourth quarter of 2012. In addition, earlier reports have suggested Verizon Communications may purchase Vodafone's stake in Verizon Wireless. Shares of Vodafone, listed on the FTSE, gained 1.7% in response to the buyout speculation.

According to the Federal Reserve, consumer credit increased by $16 billion in November. This follows the prior month's $14.2 billion increase, and is higher than the $10.6 billion that had been broadly expected among economists polled by Briefing.com.

In tomorrow's economic data, the weekly MBA Mortgage Index will be reported at 7:00 ET.

The U.S. Treasury will reopen $21 billion in 10-yr notes.DJ30 -55.44 NASDAQ -7.00 SP500 -4.74 NASDAQ Adv/Vol/Dec 1161/1.67 bln/1307 NYSE Adv/Vol/Dec 1483/691.6 mln/1500

3:30 pm : Feb crude oil fell off its pit session high of $93.74 per barrel into negative territory ahead of tomorrow's inventory data. A stronger dollar index also put pressure on prices. Despite touching a session low of $92.67 per barrel in morning action, the energy component managed to erase losses and close 0.1% higher at $93.21 per barrel.

Feb natural gas extended yesterday's losses on forecasts of warmer than average weather. It briefly poked into positive territory and brushed a session high of $3.27 per MMBtu in early afternoon action. However, it quickly retreated back to its session low of $3.20 per MMBrtu and eventually closed at $3.22 per MMBtu, or 1.5% lower.

Feb gold trended higher during today's floor trade despite the climb by the dollar index. The yellow metal lifted off its session low of $1651.00 per ounce and traded as high as $1662.70 per ounce. It eventually booked a gain of 1.0% as it closed pit trade at $1662.20 per ounce.

Mar silver rose $0.40 to $30.48/ounceSilver retreated from its session high of $30.59 per ounce and dipped to a session low of $30.18 per ounce in mid-morning floor action. However, momentum picked back up in afternoon action, and silver closed at $30.48 per ounce with a solid 1.3% gain.DJ30 -48.31 NASDAQ -5.64 SP500 -4.42 NASDAQ Adv/Vol/Dec 1133/1345.7 mln/1303 NYSE Adv/Vol/Dec 1423/433 mln/1545

4:44PM Diodes secures $300 mln senior secured revolving credit facility (DIOD) 17.58 -0.41 : Co announced that it has secured a five-year $300 mln revolving senior credit facility. The credit facility bears interest at LIBOR plus 1.50 to 2.25 percent on the drawn amount and also includes an option to increase the size of the credit facility by up to $200 million subject to securing additional lender commitments.

4:11PM Seagate Tech sees Q2 rev at least $3.6 bln vs $3.52 bln Capital IQ Consensus Estimate (See 16:08 post) (STX) 31.40 : Co announced selected preliminary financial results for its fiscal second quarter of 2013, which ended on December 28, 2012. Seagate expects to report Q2 2013 revenue of at least $3.6 bln and gross margin of more than 27%, reflecting unit shipments of ~58 mln and maintaining market share.

These preliminary results compare to the Co's previous expectations for revenue of ~$3.5 bln and gross margin at the lower end of the Co's long-term non-GAAP gross margin range of 27% to 32%. During the quarter the co paid $1.1 bln in share redemptions and dividend payments that included a one-time acceleration of the December 2012 quarter dividend payment.

The Co redeemed ~30 mln ordinary shares and exited December 2012 with 358 mln ordinary shares outstanding. Cash, cash equivalents, restricted cash and short term investments totaled approximately $2.0 bln on December 28, 2012.

4:08PM Alcoa reports EPS in-line, beats on revs; Co ends 2012 in strong liquidity position; record results in mid and downstream (AA) 9.10 -0.01 : Reports Q4 (Dec) earnings of $0.06 per share, in-line with the Capital IQ Consensus Estimate consensus of $0.06; revenues fell 1.5% year/year to $5.9 bln vs the $5.61 bln consensus.

In 2013, Alcoa sees global aluminum demand growth of 7%, up from 6% in 2012 and ahead of the 6.5% rate required to meet the Co's forecast of a doubling in global aluminum demand between 2010 and 2020. Co ends 2012 in strong liquidity position; record results in mid and downstream.

In 2013, Alcoa projects global growth in the aerospace (9-10%), automotive (1-4%), commercial transportation (2-7%), packaging (2-3%), building and construction (4-5%), and industrial gas turbine (3-5%) markets

4:06PM Volterra Semi names Craig Teuscher to the newly created position of COO (VLTR) 15.74 -0.21 : Dr. Teuscher was an original co-founder of Volterra in 1996 and has served in several key executive roles with the company, including as Vice President of Worldwide Sales and Applications Engineering, Senior Vice President of Operations, Manufacturing Engineering and Quality Assurance and most recently as Senior Vice President of Notebook Products Group.

4:05PM Riverbed Technology issues comment regarding USPOT reexamination, 'reexamination requests are often made' (RVBD) 19.90 -0.75 : Co commented on the decision by the United States Patent and Trademark Office (USPTO) to grant reexamination requests for two Riverbed patents, U.S. Pat. Nos. 7,428,573 and 7,849,134. Silver Peak Systems, Inc., which is being sued by Riverbed for infringing both of these patents as well as an additional patent, had earlier announced the USPTO action.

"Reexamination requests are often made, as they were in this instance, by parties accused of infringing the subject patents. And the USPTO has historically granted well over 90% of these reexamination requests, meaning this initial action has become somewhat routine," said Brett Nissenberg, Riverbed's general counsel and senior vice president. "It is not surprising that Silver Peak's announcement today failed to mention that Silver Peak still faces the patent infringement trial this September, and the start of USPTO proceedings will have no bearing on the trial's outcome or the validity of the patents at the trial. Unfortunately, Silver Peak's most creative efforts seem to be concentrated in PR and blogging rather than its products."

Riverbed's lawsuit against Silver Peak, which was originally filed by Riverbed in June 2011 in the United States District Court for the District of Delaware, is scheduled for trial in September 2013. At the trial, Riverbed intends to seek a permanent injunction against Silver Peak's infringement of Riverbed's pioneering technology.

Sigma Designs (SIGM) announced Comtrend has selected Sigma Designs' new G.hn CG5200 family of chipsets for its PowerGrid 9051s Powerline Ethernet Adapter.

Sprint (S) joined with Microsoft (MSFT) to announce the upcoming availability of Windows Phone 8 smartphones on the Sprint nationwide network. Co will bring two initial handsets to customers by summer - one each from Samsung (SSNLF) and HTC.

LTX-Credence (LTXC) announced that Shimane Masuda Electronics has selected the PAx for volume production testing of RF front end devices.

MaxLinear (MXL) announced its MxL584 eight-channel single-chip satellite receiver will power the next-generation AirScreen satellite-to-IP gateway from Inverto Digital Labs.

MaxLinear (MXL) announced that Silicondust USA has selected the MxL603 global TV tuner for use in its latest generation of ATSC and DVB-T2 HDHomeRun products.

Marvell (MRVL) announced that the Marvell ARMADA1500 series System-on-Chip platform will power the NeoTV PRIME with Google TV (GOOG) from NETGEAR (NTGR).

Atmel (ATML) and Celeno Communications are developing integrated solutions for Wi-Fi Direct remote controls intended for next-generation set-top box and video gateway platforms.

Cypress Semiconductor (CY) announced that Leap Motion has selected Cypress's EZ-USB FX3 solution for its 3-D motion sensing and control technology.

8:12AM Ultra Clean lowers Q4 (Dec) revs to ~$88.5-90.0 mln from $94-99 mln vs. $95.7 mln Capital IQ Consensus; co will report Q4 on Feb 19 (UCTT) 5.08 :

DSP Group (DSPG) and ProSyst have jointly integrated DECT Ultra Low Energy home security, control and automation solutions into ProSyst's mBS OSGi technology.

AMD (AMD) launched the AMD Radeon HD 8000M Series of mobile graphics processing units set to deliver discrete graphics performance to a variety of notebook designs, including the incredibly portable ultrathin form factor.

Rambus (RMBS) announced the commencement of a business alliance with the Elite Group, a leading designer and distributor of home goods, lighting, and other consumable products.

Samsung Elect (SSNLF) sees fourth quarter Consolidated sales of approximately KWD56 trln (KWD55-57 trillon) versus the KWD56.5 trillion Capital IQ consensus estimate. The company also sees Consolidated operating profit of approximately KWD8.8 trillion (KWD8.6-9.0 trillion).


Plexus (PLXS) announced that it expects to report revenue and earnings below the guidance provided for the fiscal first quarter of 2013. Revenue is expected to be approximately $531 million (versus the $562.3 million Capital IQ consensus, with diluted earnings per share expected to be in the range of $0.45 to $0.47, excluding any restructuring charges versus the $0.52 consensus Estimate). The original fiscal first quarter guidance was revenue of $550 to $580 million with diluted earnings per share of $0.50 to $0.55, excluding any restructuring charges. Dean Foate, President and CEO, commented, "While manufacturing demand softened across all of our sectors during the quarter, in particular we did not experience the typical demand-pull of products in our Networking/Communications sector in the final few weeks of the quarter. As a consequence, our Networking/Communications sector revenue was substantially below our expectations for the quarter and accounted for the majority of the shortfall to our original guidance."

AU Optronics (AUO) issued downside guidance for the fourth quarter with revenues of NT$99.045 bln versus the NT$103.63 billion consensus. For December 2012, large-sized panel shipments, with applications on desktop monitor, notebook PC, LCD TV and other applications, were nearly 10.38 mln units, a decrease of 3% from the previous month. As for small-and-medium-sized panels, the shipments were around 10.46 million units, down by 20.7% month-over-month.

10:27 am S&P Information Technology index trading slightly lower today and in line with the broader market
The tech sector is trading lower today, just ahead of larger losses in the broader market. Semiconductors are showing relative weakness, however, with the SOX trading 0.5% lower. Within the chip index, HITT (-4.6%) is a notable laggard. Among other major indices, the SPY is trading 0.5% lower today, while both the QQQ and the NASDAQ are down 0.4% on the session. Among tech bellwethers, INTC (+1.3%) is showing notable strength, while T (-1.2%) is under pressure. In tech earnings, PLXS (-4.9%), UCTT (-6.2%), and CY (-8.2%) lowered guidance, while PERI (+20.5%) issued above consensus guidance. In news, T (-1.2%) announced that it sold more than 10 mln smartphones in Q4. Among notable analyst upgrades this morning in the tech space, MKSI (+1.0%) was upgraded to Buy at BofA/Merrill. Also, ERIC (-4.5%) was named the Top Pick for 2013 at Cowen. Among downgrades, UMC (-1.2%) was downgraded to Neutral at Credit Suisse, FIO (-8.0%) and EMC (-1.7%) were downgraded to Market Perform at William Blair, HRS (-2.3%) was downgraded to Underweight at JP Morgan, and HITT (-4.5%) was downgraded to Sell at Goldman. There are no notable names in tech scheduled to report quarterly results today after the close.
icon url

ReturntoSender

01/12/13 6:01 PM

#10055 RE: ReturntoSender #6755

01/11/2013
Rydex Ratio Implies Price Top Near
by Carl Swenlin

http://blogs.decisionpoint.com/chart_spotlight/2013/01/130111cs.html

The Rydex Ratio is one of the sentiment indicators we use. it is calculated by dividing total Money Market plus Bear Assets by total Bull assets in the Rydex fund group. Currently, the Ratio is the extreme bullish end of the normal range, which implies that a price top is likely to arrive soon.

icon url

ReturntoSender

01/22/13 2:31 PM

#10064 RE: ReturntoSender #6755

Here are some charts that may be of value.

Go long when the market breadth charts (check for moving averages) cross below the green lines and the market and sector charts begin to show positive divergences. Consider selling when the market breadth charts are above the red lines and negative divergences show up:


Sector Rotation on Monthly Charts throughout economic cycles based on Fidelity's Chart Expected Rotation:


icon url

ReturntoSender

01/30/13 5:29 PM

#10074 RE: ReturntoSender #6755

KLIC Charts - Over the last couple of years I have made a number of good trades on KLIC mostly short (thanks Jacob) but also long. After KLIC's recent earnings's report and guide down it looks like KLIC should fall quite a bit more to me down towards the 9.12 to 9.41 level. That is unless the market continues to rally beyond the CSCO report on Feb 13th. I consider that unlikely although the DJIA and S&P 500 could test former all time highs before then:

Here are the charts with annotations. The big information is in the Bollinger Bands and Channels on the weekly chart. The 15 minute chart seen first might be useful for a short term trader.


Keep in mind that had KLIC's report (guidance) been good instead of bad that KLIC could be running higher. I trade mostly off technicals, sentiment and market breadth but good fundamentals can kill anyone who shorts too many shares to cover their loss. Losses that can cause margin calls.

RtS
icon url

ReturntoSender

01/30/13 11:27 PM

#10075 RE: ReturntoSender #6755

From Briefing.com: 4:30 pm : Equities began the day on a mixed note, but the slightly bearish bias which persisted throughout the day caused the major averages to end near their lows. The S&P 500 slipped 0.4%, and was the weakest performing index.

Shortly before the open, the Bureau of Economic Analysis said fourth quarter GDP contracted by 0.1%. This fell short of the 1.0% growth forecast by the Briefing.com consensus. While the number was a disappointment on the surface, a 22.2% decline in government defense spending contributed to the miss. Meanwhile, personal consumption expenditures, which account for more than 70% of GDP, rose 2.2%. This was the largest quarterly uptick since a 2.4% increase in consumption was reported during the first quarter of 2012. Additionally, the rise in spending was slightly above its eight-month average rate of change.

Morning trade proved to be largely uneventful as investors anticipated the afternoon policy statement from the Federal Open Market Committee. The pronouncements on the economy, inflation, and inflation expectations were little changed. It was said that growth in economic activity "has paused in recent months," but there didn't appear to be any undue concern about an extended downturn as the "pause" was attributed largely to weather and other transitory factors. The asset purchase program is expected to remain in place until unemployment slips below 6.5% or inflation projections take a turn for the worse.

While the FOMC statement and the GDP reading were in focus today, the market also received earnings from two notable names.

Amazon.com (AMZN 272.76, +12.41) jumped 4.8% after the online merchant reported its operating income well ahead of analyst expectations. The strength in Amazon helped the Nasdaq outperform for the bulk of the day, but the index succumbed to broader market weakness in afternoon trade.

Also of note, Boeing (BA 74.59, +0.94) gained 1.3% after its top and bottom lines came in ahead of the Capital IQ consensus estimates. However, the defense contractor guided its full-year 2013 earnings and revenue below consensus.

Though Boeing outperformed, the industrial space lost 0.9%, and was the worst performing S&P 500 sector.

Elsewhere, the Dow Jones Transportation Average lost 1.5%, and was a notable laggard. The bellwether sector lagged considerably as 17 of its 20 components settled with losses. The four railroads which comprise the transportation average were all down in excess of 1.0% with Union Pacific (UNP 131.17, -3.59) sagging 2.7%.

In addition, trucking stocks were broadly weaker. Con-way (CNW 31.56, -1.06) fell 3.3% while CH Robinson (CHRW 67.14, -0.78), JB Hunt (JBHT 67.19, -0.90), and Landstar (LSTR 58.36, -0.85) lost near 1.5% each. Note that today's underperformance from transportation stocks came after the average rallied more than 8.0% since the start of 2013.

As mentioned earlier, the S&P 500 was pressured by industrials (-0.9%). In addition, energy (-0.7%), materials (-0.6%), and financials (-0.5%) weighed. On the upside, utilities (UNCH) outperformed, and the sector was followed by discretionary (-0.2%) and consumer staples (-0.2%).

The CBOE Volatility Index (VIX 14.27, +0.96) added more than 7.0%, and settled at its highest level since January 7. Looking at the term structure of VIX futures, the front-month contracts received the most notable interest during today's session. In addition, October VIX futures have crept up to 20.00.

Today's floor volume at the New York Stock Exchange was in-line with its 50-day average as just over 700 million shares changed hands.

Looking back at the day's economic data, the weekly MBA Mortgage Index declined by 8.1% to follow last week's uptick of 7.0%.

According to today's ADP National Employment Report, employment in the nonfarm private business sector rose by 192K in January. This was above the 175K increase expected by the Briefing.com consensus. The prior month's reading was revised down to 185K from 215K.

Tomorrow, investors will receive a full slate of economic releases. At 7:30 ET, January Challenger Job Cuts will be announced. At 8:30, weekly initial and continuing claims, December personal income, personal spending, core PCE prices, and fourth quarter employment cost index will all be reported. Finally, the January Chicago PMI will cross the wires at 9:45 ET. In earnings of note, Dow Chemical (DOW 34.61, -0.12) and UPS (UPS 81.23, -0.98) will announce their quarterly results ahead of the open.DJ30 -44.00 NASDAQ -11.35 SP500 -5.88 NASDAQ Adv/Vol/Dec 755/1.94 bln/1722 NYSE Adv/Vol/Dec 990/704.6 mln/1969

3:30 pm :

Crude oil dipped into negative territory and to its session low of $97.34 per barrel following inventory data that showed a build of 5.947 mln barrels when a smaller build of 2.55 mln barrels was anticipated. However, the energy component recovered back into the black as a weaker dollar index gave a boost to prices. It brushed a session high of $97.98 per barrel moments before settling with a 0.4% gain at $97.94 per barrel.
Natural gas rose for the first time following six consecutive sessions of losses. It came off its session low of $3.27 per MMBtu and trended higher to a session high of $3.34 per MMBtu. It settled at $3.34 per MMBtu for a gain of 2.5%.
Gold brushed a session low of $1662.30 per ounce shortly after pit trade opened but rallied moments later on GDP data that fell short of expectations. The yellow metal advanced to a session high of $1682.20 per ounce and held steady, settling the session 1.2% higher at $1680.00 per ounce.
Silver also rose as the dollar index weakened. It lifted from its session low of $31.25 per ounce and brushed a session high of $32.19 per ounce before settling with 3.1% higher at $32.18 per ounce.

6:00PM STMicroelectronics and Ericsson (ERIC) joint venture reports Q4 results (STM) 8.32 -0.07 : ST-Ericsson, a joint venture of STMicroelectronics (STM) and Ericsson (ERIC), reported financial results for the fourth fiscal quarter ending December 31, 2012. Sales in the fourth quarter were approximately flat sequentially, in line with the guidance provided, reflecting growing contribution from NovaThor platform shipments as well as $43 million revenues from IP licensing. NovaThor ModAp shipments grew by 45% sequentially to 10.7 million units. Adjusted operating loss decreased to $133 million as a further result of the execution of the strategic plan announced in April. Since the first quarter 2012 operating losses have been reduced by 55%, decreasing by $164 million.

5:30PM STMicroelectronics misses by $0.04, reports revs in-line (STM) 8.32 -0.07 : Reports Q4 (Dec) loss of $0.11 per share, excluding non-recurring items, $0.04 worse than the Capital IQ Consensus Estimate of ($0.07); revenues fell 1.3% year/year to $2.16 bln vs the $2.15 bln consensus

5:16PM Applied Materials confirms departure of CFO Geroge Davis (AMAT) 12.86 +0.06 : Co announced that George S. Davis, executive vice president and chief financial officer (CFO), will be departing the company effective March 8, 2013. The company expects to name a successor in the coming weeks after a review of both internal and external candidates. Davis will be taking up the position of CFO for Qualcomm Incorporated.

5:00PM Jabil Circuit names William E. Peters to the position of President and William D. Muir, Jr. to COO, effective March 1, 2013 (JBL) 19.10 -0.05 : Co has named William E. Peters to the position of President and William D. Muir, Jr. to Chief Operating Officer, effective March 1, 2013. Bill Peters, Executive Vice President, since 2010, joined Jabil in 1990 as a buyer and shortly thereafter was named Purchasing Manager. Bill Muir, Executive Vice President, since April 2010, joined Jabil in 1992 as a Quality Engineer. As previously announced, current Chief Operating Officer Mark T. Mondello, will assume the Chief Executive Officer role, effective March 1, 2013.

5:00PM Qualcomm: Bill Keitel to retire as Qualcomm Chief Financial Officer, George Davis (AMAT CFO) to replace (QCOM) 63.53 +0.08 : William (Bill) Keitel has decided to retire as Qualcomm executive vice president and chief financial officer. George S. Davis, currently executive vice president and chief financial officer of Applied Materials (AMAT), will replace Mr. Keitel effective March 11, 2013. Keitel will continue as chief financial officer until that time, and will then assist with the transition and serve as special advisor to the CEO for the remainder of the calendar year.

4:35PM MKS Instruments beats by $0.11, beats on revs; guides Q1 EPS in-line, revs in-line (MKSI) 27.55 -0.03 : Reports Q4 (Dec) earnings of $0.10 per share, excluding non-recurring items, $0.11 better than the Capital IQ Consensus Estimate of ($0.01); revenues fell 22.1% year/year to $133.8 mln vs the $125.16 mln consensus.

Co issues in-line guidance for Q1, sees EPS of ($0.06)-$0.08 vs. $0.06 Capital IQ Consensus Estimate; sees Q1 revs of $125-145 mln vs. $128.64 mln Capital IQ Consensus Estimate.

4:33PM Skyworks reports EPS in-line, revs in-line; guides Q2 EPS in-line, revs above consensus (SWKS) 21.56 +0.39 : Reports Q1 (Dec) earnings of $0.54 per share, excluding non-recurring items, in-line with the Capital IQ Consensus Estimate consensus of $0.54; revenues rose 15.2% year/year to $453.7 mln vs the $450.57 mln consensus.

Co issues guidance for Q2, sees EPS of $0.47, excluding non-recurring items, vs. $0.47 Capital IQ Consensus Estimate; sees Q2 revs of ~$420 mln vs. $417.36 mln Capital IQ Consensus Estimate.

Expands operating margin 70 bps QoQ to 25.3 percent on a non-GAAP basis; repurchased 1.9 million shares of common stock

4:24PM Extreme Networks reports EPS in-line, revs in-line; guides Q3 EPS above consensus, revs in-line (EXTR) 3.57 -0.09 : Reports Q2 (Dec) earnings of $0.03 per share, in-line with the Capital IQ Consensus Estimate consensus of $0.03; revenues fell 8.7% year/year to $75.6 mln vs the $75.92 mln consensus. Co issues mixed guidance for Q3, sees EPS of $0.04-0.08, excluding non-recurring items, vs. $0.02 Capital IQ Consensus Estimate; sees Q3 revs of $70-75 mln vs. $70.69 mln Capital IQ Consensus Estimate.

4:24PM MIPS Tech reports EPS in-line, beats on revs (MIPS) 7.87 0.00 : Reports Q2 (Dec) loss of $0.01 per share, excluding non-recurring items, in-line with the Capital IQ Consensus Estimate consensus of ($0.01); revenues fell 4.6% year/year to $14.59 mln vs the $13.83 mln consensus.

4:17PM Silicon Graphics beats by $0.02, reports revs in-line; guides Q3 EPS in-line, revs in-line; Co issued Q2 $0.07-0.10 EPS guidance on Jan 15, and lowered revenue expectations (see below) (SGI) 12.83 -0.53 : Reports Q2 (Dec) earnings of $0.10 per share, excluding non-recurring items, $0.02 better than the Capital IQ Consensus Estimate of $0.08; revenues fell 12.3% year/year to $171.2 mln vs the $170.5 mln consensus.

Co issues upside EPS guidance for Q3, sees EPS of $0.12-0.18, excluding non-recurring items, vs. $0.07 Capital IQ Consensus Estimate; sees Q3 revs of $200-230 mln vs. $210.00 mln Capital IQ Consensus Estimate.

On Jan 15, the co issued EPS guidance and lowered revenue guidance.
Co said," Silicon Graphics sees Q2 adj. EPS $0.07-0.10 vs $0.05 Capital IQ Consensus Estimate; lowers rev to $170-172 mln vs $189.84 mln Capital IQ Consensus."

4:16PM Cohu reports EPS in-line, beats on revs; guides Q1 revs below consensus (COHU) 10.70 : Reports Q4 (Dec) loss of $0.13 per share, in-line with the Capital IQ Consensus Estimate consensus of ($0.13); revenues fell 23.9% year/year to $50.7 mln vs the $48.25 mln consensus. Co issues downside guidance for Q1, sees Q1 revs of $52-57 mln vs. $68.02 mln Capital IQ Consensus Estimate.

Orders were $42.1 million for the fourth quarter of 2012 and $50.1 million for the third quarter of 2012. Orders for semiconductor equipment were $33.7 million in the fourth quarter of 2012 compared to $38.5 million in the third quarter of 2012.

"Fourth quarter results were higher than our guidance and benefited from recurring business in our semiconductor equipment group. Equipment utilization on customer test floors was generally flat during the quarter, limiting the need for new capacity. With the exception of technology-related buys, customers remain cautious and weak macroeconomic conditions are likely to continue to affect business over the near term."

4:15PM Applied Micro beats by $0.02, beats on revs (AMCC) 8.66 -0.36 : Reports Q3 (Dec) loss of $0.10 per share, $0.02 better than the Capital IQ Consensus Estimate of ($0.12); revenues fell 8.2% year/year to $51.7 mln vs the $51.01 mln consensus.

Co states: "In the third quarter we believe we made giant strides in our product development efforts by taping out our 40nm ARM 64-Bit X-Gene server on a chip. We also taped out a test chip for our upcoming 28nm product in January. While we await final benchmarks from the actual silicon, the results from highly correlated simulations indicate that the 40nm chip performance may far exceed our original expectations. In fact, we believe the networking performance of the chip suggests that we may be able to further penetrate into Enterprise class solutions. I am also very pleased with the improvements in our base business, reflected in continued quarter over quarter revenue growth."

4:13PM Facebook beats by $0.02, beats on revs (FB) 31.24 +0.45 : Reports Q4 (Dec) earnings of $0.17 per share, $0.02 better than the Capital IQ Consensus Estimate of $0.15; revenues rose 40.1% year/year to $1.59 bln vs the $1.52 bln consensus.

Mobile revenue represented ~23% of advertising revenue for the fourth quarter of 2012, up from ~14% of advertising revenue in the third quarter of 2012.
Revenue from advertising was $1.33 billion, representing 84% of total revenue and a 41% increase from the same quarter last year. Excluding the impact of year-over-year changes in foreign exchange rates, advertising revenue would have increased by 43%.
Co reported Monthly Average Users increased 25% YoY to 1.06 bln versus 26% YoY growth rate in Q3.
Co reported Daily Average Users increased 28% YoY to 618 mln versus 28% YoY growth rate in Q3.
Co reported Mobile MAU's increased 57% YoY to 680 mln versus 61% YoY growth rate in Q3.

4:12PM Intersil reports EPS in-line, revs in-line; guides Q1 EPS below consensus, revs below consensus (ISIL) 8.66 -0.27 : Reports Q4 (Dec) earnings of $0.06 per share, in-line with the Capital IQ Consensus Estimate consensus of $0.06; revenues fell 17.1% year/year to $137.5 mln vs the $138.19 mln consensus.

Guidance: Co issues downside guidance for Q1, sees EPS of $0.02-0.05 vs. $0.06 Capital IQ Consensus Estimate; sees Q1 revs of $131-138 mln vs. $138.66 mln Capital IQ Consensus Estimate. Gross margin is expected to be ~54%.

Commentary: "As expected, fourth quarter demand continued to be weak, nevertheless we achieved the mid-point of our revenue and non-GAAP earnings guidance. As market conditions remain uncertain, our near term focus will be on earnings, protection of our strong balance sheet and completing our CEO search."

4:11PM Integrated Silicon reports EPS in-line, misses on revs; guides Q2 EPS below consensus, revs below consensus (ISSI) 9.90 +0.18 : Reports Q1 (Dec) earnings of $0.18 per share, excluding non-recurring items, in-line with the Capital IQ Consensus Estimate consensus of $0.18; revenues rose 15.5% year/year to $76.4 mln vs the $78.11 mln consensus. Co issues downside guidance for Q2, sees EPS of $0.14-0.18, excluding non-recurring items, vs. $0.23 Capital IQ Consensus Estimate; sees Q2 revs of $70-75 mln vs. $79.14 mln Capital IQ Consensus Estimate.

4:09PM Qualcomm beats by $0.14, beats on revs; guides Q2 EPS above consensus, revs in-line; raises Fy13 outlook (QCOM) 63.53 +0.08 : Reports Q1 (Dec) earnings of $1.26 per share, excluding non-recurring items, $0.14 better than the Capital IQ Consensus Estimate of $1.12; revenues rose 28.6% year/year to $6.02 bln vs the $5.9 bln consensus.

First Quarter Key Business Metrics MSMTM chip shipments: 182 million units, up 17 percent y-o-y and 29% QoQ. September quarter total reported device sales: ~$53.3 billion, up 29 percent y-o-y and 15 percent QoQ. September quarter estimated 3G/4G device shipments: ~233 to 237 million units, at an estimated average selling price of ~$224 to $230 per unit.

Co issues guidance for Q2, sees EPS of $1.10-1.18, excluding non-recurring items, vs. $1.10 Capital IQ Consensus Estimate; sees Q2 revs of $5.8-6.3 bln vs. $5.89 bln Capital IQ Consensus Estimate.

Co issues guidance for FY13, raises EPS to $4.25-4.45, excluding non-recurring items, from $4.12-4.32 vs. $4.32 Capital IQ Consensus Estimate; raises FY13 revs to $23.4-24.4 bln from $23-24 bln vs. $23.57 bln Capital IQ Consensus Estimate.
4:07PM JDS Uniphase beats by $0.04, beats on revs; guides Q3 revs in-line (JDSU) 12.40 -0.66 : Reports Q2 (Dec) earnings of $0.18 per share, $0.04 better than the Capital IQ Consensus Estimate of $0.14; revenues rose 4.9% year/year to $429.4 mln vs the $422.66 mln consensus. Co issues in-line guidance for Q3, sees Q3 revs of $405-425 mln vs. $414.30 mln Capital IQ Consensus Estimate.

*Non-GAAP gross margin was 48.0%.

*Co states, "JDSU delivered a strong fiscal Q2, with revenue at the top of our guidance range and operating margins exceeding expectations across all three business segments. We are pleased with the progress we've made in aligning our product portfolio with customer spending priorities, resulting in a high percentage of revenue from new products and a positive impact on financial results. We are well-positioned for growth opportunities in 2013."
4:03PM MagnaChip Semi beats by $0.06, reports revs in-line; guides Q1 revs in-line (MX) 16.01 : Reports Q4 (Dec) earnings of $0.77 per share, excluding non-recurring items, $0.06 better than the Capital IQ Consensus Estimate of $0.71; revenues rose 20.6% year/year to $218.1 mln vs the $218.84 mln consensus. Co issues in-line guidance for Q1, sees Q1 revs of $201-209 mln vs. $203.08 mln Capital IQ Consensus Estimate. Gross margin was $74.3 million or 34.1%, as a percent of revenue, for the fourth quarter of 2012.

"I am very pleased that we ended 2012 with revenue of $819.6 million dollars, up 6.1% from 2011 and outpacing the semiconductor industry, which declined 3.0% this year. While the macro environment remained weak, we have successfully aligned with the growing smartphone and tablet PC market, leveraged our strong relationships with blue chip customers, and delivered 30% more new products in 2012 from the previous year."

11:07AM Research In Motion confirms name change to BlackBerry, effective immediately (RIMM) 14.91 -0.74 : As part of the move, the co will now trade as "BBRY" on the NASDAQ. The changes to the co's ticker symbols will be effective at the start of trading on Monday, Feb 4, 2013.

Veeco Instruments (VECO) announced that Philips Innovation Services, a service provider within Royal Philips Electronics (PHG), has recently qualified a NEXUS Physical Vapor Deposition System at its location on the High Tech Campus Eindhoven, Netherlands.

8:04AM O2Micro misses by $0.11, beats on revs (OIIM) 3.21 : Reports Q4 (Dec) loss of $0.35 per share, $0.11 worse than the Capital IQ Consensus Estimate of ($0.24); revenues fell 41.5% year/year to $16.8 mln vs the $16.49 mln consensus; co guided rev to $16-17 mln vs. $18.7 mln on Dec 21.

"Despite these conditions, we remain focused on our progress of shifting the mix of our business to our core strength of high-performance, analog integrated circuits. We also continue to focus on expense management to reach our near-term goal of a return to profitability. We have great confidence in our carefully chosen growth drivers including LED solutions for the general lighting market, battery management solutions targeting multiple markets and power management solutions targeting tablet, smart phone and other markets. We continue to believe that our growth drivers will significantly contribute to revenue and lead to growth in future quarters."

7:34AM Silicon Labs beats by $0.03, beats on revs; guides Q1 revs in-line (SLAB) 43.34 : Reports Q4 (Dec) earnings of $0.61 per share, ex items, $0.03 better than the Capital IQ Consensus Estimate of $0.58; revenues rose 20.4% year/year to $152.5 mln vs the $147.46 mln consensus. Co issues in-line guidance for Q1, sees Q1 revs down 4-8% sequentially calc to ~$140.3-146 mln vs. $141.26 mln Capital IQ Consensus Estimate.

Gross margin improved to 61.6 percent for the quarter.
The company's strong performance in 2012 was driven by high growth in the Broadcast and Broad-based products. Broadcast growth was driven by the rapid adoption of the company's TV tuner products, which represented one third of the TV market in 2012. The Broad-based products, which grew more than 30 percent in 2012, significantly outgrew their end markets as the company added customers and expanded its sales channel.

3:10AM Advanced Semi beats on top and bottom lines (ASX) 4.25 : Reports Q4 EPS of NT$0.58 vs NT$0.53 CIQ est; revs increased 21% YoY to NT$56.01 bln vs NT$52.74 bln CIQ est. Gross margin were 19.6% in 4Q12 and remained the same as 3Q12.

Amazon (AMZN) reported fourth quarter earnings of $0.21 per share, $0.06 worse than the Capital IQ consensus of $0.27. while revenues rose 22.0% year/year to $21.27 billion versus the $22.26 bln consensus. Guidance: the company sees Q1 operating income of ($285)-65 million versus approximately $260 mln estimate; revenues of $15.0-16.6 billion versus the $16.8 billion consensus Estimate. This guidance includes approximately $285 million for stock-based compensation and amortization of intangible assets, and it assumes, among other things, that no additional business acquisitions or investments are concluded and that there are no further revisions to stock-based compensation estimates.

Freescale Semi (FSL) reported fourth quarter loss of $0.15 per share, excluding non-recurring items, $0.03 better than the Capital IQ consensus of ($0.18), while revenues fell 5.5% year/year to $957 million versus the $946.65 million consensus. The company issued upside guidance for the first quarter with revenues of $945-985 million versus the $943.14 million consensus, gross margin to increase 75-100 bps sequentially.

Broadcom (BRCM) reported fourth quarter earnings of $0.76 per share, excluding non-recurring items, $0.02 better than the Capital IQ consensus of $0.74, while revenues rose 14.3% year/year to $2.08 billion versus the $2.06 bln consensus. The company raised dividend 10% to $0.11/share.

QuinStreet (QNST) reported second quarter earnings of $0.13 per share, $0.02 worse than the Capital IQ consensus of $0.15, while revenues fell 20.7% year/year to $71.75 million versus the $77.21 mln consensus. The company issued downside guidance for the third quarter with revenues of $75-80 million versus the $81.93 million consensus Estimate. ""Visibility remains limited due to continued product and market transitions in our core Financial Services and Education verticals. Our current expectation for revenue in the March quarter is in the $75 to $80 million range. Adjusted EBITDA margin will likely be in the mid-teens for the quarter, as we will continue to invest in key initiatives for the long term."

Unisys (UIS) reported fourth quarter GAAP earnings of $1.67 per share (including pension expense), $0.67 better than the Capital IQ consensus of $1.00, while revenues fell 0.6% year/year to $979.3 million versus the $923.9 mln consensus. International revenue grew 6% in Q4, largely offsetting a 10% decline in U.S. revenue. On a constant currency basis, international revenue grew 7% as increases in Europe and Latin America offset declines in Asia Pacific. The co reported an overall fourth-quarter 2012 gross profit margin of 29.2%, up from 28.4% in the year-ago quarter. Q4 services revenue declined 4% (3% on a constant currency basis) from the prior-year quarter. Fourth-quarter 2012 services gross profit margin improved slightly to 20.2% from 20.0% a year ago while services operating profit margin declined to 6.6% from 7.6% a year ago. Fourth-quarter 2012 services order signings declined from year-ago levels. Services backlog at December 31, 2012 was $5.1 billion, an 8% decrease from services backlog at December 31, 2011. Q4 technology revenue grew 16% from the prior-year quarter driven by strong sales of ClearPath software and servers. Reflecting the higher ClearPath sales, fourth-quarter 2012 technology gross profit margin improved to 68.1% from 65.9% in the year-ago quarter and technology operating profit margin improved to 43.9% from 37.7% in the year-ago quarter.
icon url

ReturntoSender

02/03/13 10:51 PM

#10081 RE: ReturntoSender #6755

OT: Super Bowl indicator - Indicates a Bear Market May be Coming.
From Wikipedia, the free encyclopedia

http://en.wikipedia.org/wiki/Super_Bowl_indicator

The Super Bowl Indicator is a superstition that says that the stock market's performance in a given year can be predicted based on the outcome of the Super Bowl of that year. It was "discovered" by Leonard Koppett in the '70s when he realized that it had never been wrong, until that point. This pseudo-macroeconomic concept states that if a team from the American Football Conference (AFC) wins, then it will be a bear market (or down market), but if a team from the National Football Conference (NFC) wins, then it will be a bull market (up market).

Accuracy The indicator has been correct 33 out of 41 times, as measured by the Dow Jones Industrial Average – a success rate of over 80%.[1][2]

LOL! RtS
icon url

ReturntoSender

02/10/13 11:15 PM

#10088 RE: ReturntoSender #6755

Very Overbought Market
by Carl Swenlin

One of the general rules of the stock market is that things will get as good (or bad) as they can get, then prices will start moving in the other direction. This is another way of describing "regression to the mean".

http://blogs.decisionpoint.com/chart_spotlight/2013/02/20130208cs.html

This is the reason that we technicians have our indicators -- so that we can get an idea when conditions have reached extremes that could cause prices to start moving in the opposite direction. One of the indicators I like is the Percent of PMOs (Price Momentum Oscillators) Above Zero because it is smoother and has less noise than other intermediate-term indicators.

The second panel on the chart below shows the PMO for the S&P 500 Index, which is the price index just above it. The bottom panel shows the percentage of individual S&P 500 stocks that have PMOs above the zero line.

Chart

As you can see, the indicator has recently topped at a very overbought level. In similar cases noted on the chart, half were absolute top pickers, and, while the other half announced an internal peak in strength, they arrived well ahead of the price peak. But, even though they were early, the indicator peaks in early 2011 and 2012 were ultimately followed by price declines that sent prices lower than they were when the internals peaked.

While indicators may be topping in very overbought territory, a price top is not guaranteed. Nevertheless, conditions are less than ideal for making new commitments to the long side, and increased caution is warranted.
icon url

ReturntoSender

02/12/13 8:04 PM

#10090 RE: ReturntoSender #6755

From Briefing.com: 4:25 pm: Equities finished the day on a mixed note. The Dow climbed 0.3% and registered its highest close of the year while the S&P 500 added 0.2%, and Nasdaq shed 0.2%. The day got off to a slow start as the major averages spent the entire morning near their respective unchanged levels. However, key indices were able to climb to their highs in afternoon trade as financials paced the advance.

The financial sector led throughout the session, and the S&P 500 Financials Index climbed above 240 for the first time since October 2008. Bank of America (BAC 12.24, +0.38) and Citigroup (C 44.35, +1.20) both gained near 3.0% to support the space.

While financials led throughout the session, defensively-oriented telecommunication stocks spent the day in an upward climb and ended as the second best performing sector.

With no market-moving economic data, traders turned to earnings as several consumer names reported their quarterly results. The discretionary sector outperformed after market participants responded favorably to earnings from Fossil (FOSL 110.65, +3.19) and Michael Kors (KORS 62.00, +5.00). Fossil advanced 3.0% after reporting in-line earnings on better-than-expected revenue. Meanwhile, the company's guidance reflected a recent pattern. Fossil warned against a slowdown in the first quarter, but left its full-year guidance intact. This indicates the company believes the latter part of the year will make up for expected first quarter softness.

Elsewhere, Michael Kors spiked 8.8% after its earnings came in well ahead of expectations.

The discretionary space was supported by upbeat earnings, but quarterly results had the opposite effect on consumer staples. Coca-Cola (KO 37.56, -1.05) settled lower by 2.7% after the beverage giant warned against continued global uncertainty.

As consumer staples held slim losses throughout the day, afternoon trade saw relative weakness from technology stocks. The space was pressured by Apple (AAPL 467.90, -12.03), which lost 2.5%, after Chief Executive Officer Tim Cook did not hint at near-term changes to the company's dividend policy. Elsewhere, Qualcomm (QCOM 65.88, -1.30) dropped 1.9% after JPMorgan Chase downgraded the stock to 'Neutral' from 'Overweight.'

Today's floor volume represented a marked improvement over yesterday's session, but it remained well below average as just over 610 million shares changed hands.

Looking at the S&P 500 sector breakdown, financials (+0.8%) and telecoms (+0.6%) were the clear leaders while technology (-0.5%), health care (-0.2%), and consumer staples (-0.1%) brought up the rear.

Overseas, world leaders are preparing for the G20 summit scheduled to take place in St. Petersburg later this week. Reports from the meetings will be closely watched as recent months have seen a rise in currency commentary. With Japan taking active efforts to weaken the yen and daily remarks from European officials suggesting what the "right" level for the euro should be, the summit is likely to produce some noteworthy quotes.

Investors received just one economic report today and it came in the form of the January Treasury budget. This report pointed to a surplus of $2.88 billion, which was better than the deficit of $2.0 billion expected by the Briefing.com consensus.

Note that President Barack Obama will give the first State of the Union address of his second term at 21:00 ET tonight.

Looking at tomorrow's economic data, weekly MBA Mortgage Index will be reported at 7:00 ET. At 8:30 ET January retail sales, retail sales ex-auto, export prices ex-agriculture, and import prices ex-oil will all be released. Lastly, December business inventories will be announced at 10:00 ET. In notable earnings, Comcast (CMCSA 38.97, +0.33) and Deere (DE 93.97, +0.74) will report their quarterly results prior to the opening bell.

The U.S. Treasury will auction off $24 billion in 10-yr notes.DJ30 +47.46 NASDAQ -5.51 SP500 +2.42 NASDAQ Adv/Vol/Dec 1517/1.70 bln/949 NYSE Adv/Vol/Dec 1935/613.8 mln/1054

3:30 pm :

Mar crude oil traded higher during today's pit trade on OPEC's increased 2013 demand forecast. A weaker dollar index also supported higher prices. The energy component brushed a session high of $97.75 per barrel in afternoon action and settled with a 0.5% gain at $97.48 per barrel.
Mar natural gas fell into negative territory in late morning action and trended lower for the remainder pit trade. It closed 1.5% lower at $3.23 per MMBtu, or just above its session low of $3.22 per MMBtu.
Apr gold inched higher after coming off its session low of $1641.60 per ounce as the dollar index declined. The move came on a statement by the G7 reaffirming their longstanding commitment to market determined exchange rates. In addition, North Korea claimed that it has successfully detonated a nuclear device at an underground site. The yellow metal brushed a session high of $1653.80 per ounce in afternoon pit action and settled with a 70 cent gain at $1649.60 per ounce.
Mar silver also climbed into positive territory after trading as low as $3.71 per ounce in early morning floor action. It eventually settled 0.3% higher at $31.02 per ounce, or slightly below its session high of $31.09 per ounce.

5:28PM STEC responds to nomination of dissident directors for 2013 (STEC) 5.42 +0.05 : Co responded to the joint 13D/A filing notification made by Balch Hill LLC and Potomac Capital Management LLC announcing their slate of seven candidates to replace the entire STEC Board of Directors at the Company's upcoming 2013 annual meeting of shareholders.

"We are disappointed that despite the good faith efforts of our Board of Directors and management to engage in constructive dialogue with Balch Hill and Potomac Capital, they have chosen to discount our 2013 strategic plan to create shareholder value, and instead focus on what we believe is an unnecessary, disruptive and wasteful proxy contest to take control of STEC, all without paying a premium to shareholders," said Mark Moshayedi, STEC's chief executive officer and president. "As a constructive alternative to this unproductive course, our Board has offered to initially interview four of Balch Hill/Potomac nominees, and is committed to formally present two of their nominees in the company's proxy to stand for election to the Board as Director nominees at the 2013 annual meeting of shareholders.

"Management has already taken decisive action during the last few months to achieve cost reductions that are expected to yield savings of $8.8 million annually. Moreover, we continue to implement aggressive measures to reposition the company from an OEM-focused business model to an approach that also derives significant sales from direct enterprise customers, which in our view will create meaningful additional value for STEC's shareholders. In contrast, we believe the dissident slate is committed to advancing a narrow, self-serving agenda to take control of STEC and potentially auction off the company for a price significantly below the company's value, which clearly would not be in the best interests of all STEC shareholders. STEC's Board and management team remain fully committed to creating value for all shareholders through the successful execution of the company's strategy."

The date for the 2013 annual meeting of shareholders has not yet been announced.

4:04PM Rackspace misses by $0.01, reports revs in-line (RAX) 74.98 -0.05 : Reports Q4 (Dec) earnings of $0.21 per share, $0.01 worse than the Capital IQ Consensus Estimate of $0.22; revenues rose 24.6% year/year to $352.9 mln vs the $355.44 mln consensus.

Adjusted EBITDA for the quarter was $130 million, a 6.6% increase compared to the third quarter of 2012 and a 27% increase compared to the fourth quarter of 2011.
The adjusted EBITDA margin for the quarter was 36.8% compared to 36.2% in the previous quarter and 36.1% for the fourth quarter of 2011.
Net income margin for the quarter was 8.5% compared to 8.1% for the previous quarter and 8.8% in the fourth quarter of 2011.

12:58PM Interdigital Comm: Evidentiary hearing commences in ITC investigation of InterDigital complaint against Huawei, Nokia and ZTE (IDCC) 44.26 -0.39 : Co announced that the evidentiary hearing in the United States International Trade Commission investigation of the company's complaint against Huawei Technologies Co., Ltd., FutureWei Technologies, Inc. d/b/a Huawei Technologies (USA) and Huawei Device USA, Inc., Nokia Corporation and Nokia Inc. and ZTE Corporation and ZTE (USA) Inc. involving certain 3G wireless devices has commenced.

Unlike prior cases involving InterDigital, the Office of Unfair Import Investigations Staff (the "Staff") is not participating on all issues in the case, limiting its involvement to two patents from one patent family. On infringement and validity, in its pre-trial position the Staff did not support the company's position on those two patents. Regarding domestic industry issues, the Staff raised questions as to whether the company had demonstrated an adequate connection between its licensing expenditures and these two patents to support the Commission's domestic industry requirement. The Staff is not participating in the investigation as to the other five of the seven patents at issue and therefore has expressed no views at to those patents. As to the requirement that companies license standards-essential patents on a Fair, Reasonable and Non-Discriminatory ("FRAND") basis, the Staff believes Respondents have not demonstrated that the company violated any of its FRAND commitments. The Staff's recommendations are not binding on either the Administrative Law Judge overseeing the proceeding or the Commission. Typically, the Commission's final determination does not fully align with the Staff's pre-trial position.

9:42AM Qualcomm extends gap down start after downgrade as low as 65.72 (QCOM) 65.93 -1.25 : It has thus far been able to hold above its early Feb close low and the Jan range top high are at 65.64/65.53.

9:41AM General Electric and Google (GOOG) announce agreement that will integrate Google Maps data into GE's Smallworld electrical, telecommunications and gas applications (GE) 22.51 +0.06 : A new agreement announced today between GE (GE) and Google (GOOG) will integrate Google Maps data into GE's Smallworld electrical, telecommunications and gas applications. GE, a leading provider of geospatial analytical tools and insight, and Google, a provider of map services with more than 1 billion monthly active users, will help utilities increase productivity based on the ability to visualize and analyze their data with GE's Smallworld product suite.

9:30AM MKS Instruments announces election of Gerald G. Colella to the position of President and Chief Operating Officer (MKSI) 27.89 +0.17 : Mr. Colella previously served as Vice President and Chief Operating Officer.

8:33AM Flextronics announces intention to offer up to an aggregate principal amount of $1 bln of senior notes (FLEX) 6.66 : Co announced its intention to offer up to an aggregate principal amount of $1 billion of senior unsecured notes (the "Notes") to qualified institutional buyers pursuant to Rule 144A under the Securities Act of 1933, as amended, and to non-U.S. persons outside the United States pursuant to Regulation S under the Securities Act, subject to market conditions. Flextronics intends to use the net proceeds from the offering to repay outstanding borrowings under its 2007 term loan facility.

8:31AM O2Micro reports that patent issued for Cell Balancing System to co (OIIM) 3.12 : Co announced that it was issued 14 claims under United States patent number 8,278,876 for its Battery Pack Current Monitoring system. O2Micro's patented system monitors battery packs to protect against high current fault conditions, eliminating the typical, more costly current shunt monitoring method.

7:07AM KVH Industries beats by $0.03, beats on revs; guides Q1 EPS below consensus, revs in-line; guides FY13 EPS below consensus, revs below consensus (limited analyst coverage) (KVHI) 14.90 : Reports Q4 (Dec) earnings of $0.18 per share, $0.03 better than the single Capital IQ Consensus Estimate of $0.15; revenues rose 23.9% year/year to $39.54 mln vs the $37.62 mln consensus.

Co issues guidance for Q1, sees EPS of $0.10-0.15 vs. $0.19 Capital IQ Consensus Estimate; sees Q1 revs of $37-40 mln vs. $39.72 mln Capital IQ Consensus Estimate.

Co issues downside guidance for FY13, sees EPS of $0.37-0.48 vs. $0.59 Capital IQ Consensus Estimate; sees FY13 revs of $151-160 mln vs. $160.09 mln Capital IQ Consensus Estimate.

Guidance Commentary: "For 2013 planning, we expect our mini-VSAT Broadband business to show strong year-over-year growth and the FOG business to benefit from new commercial applications beginning later this year as well as delivering products under the CROWS III program. We remain cautious with respect to expectations for growth in leisure markets, due to ongoing challenges in global economies. We see the potential for a decline in TACNAV product sales in the second half of 2013 as hardware shipments under the Saudi Arabia National Guard program come to an end and we are being cautious with respect to possible defense budget cuts.

icon url

ReturntoSender

02/13/13 12:30 PM

#10091 RE: ReturntoSender #6755

The Baltic Dry Index is not hinting at any kind of growth in Europe just yet. In fact one could argue that as a "leading index" the BDI is suggesting nothing more than foundering. The worst part is the total disconnect between Europe and the United States. Look at this chart of the BDI versus the S&P 500. Trading in different directions just is not natural:


http://en.wikipedia.org/wiki/Baltic_Dry_Index

RtS
icon url

ReturntoSender

02/17/13 12:23 PM

#10095 RE: ReturntoSender #6755

InvestmentHouse Weekend Market Summary:

http://www.investmenthouse.com/weekendmarketsummary.htm

-Stocks tested again, recover again.
- Wal-Mart laments weak February, yet stocks still rebound.
- Will the real economy please stand up?
- New York PMI positive, Industrial Production negative. Michigan sentiment higher, consumer confidence at recession levels. Part time jobs versus real jobs. Real data versus substituted data.
- Greenspan says the stock market causes economic activity: Some new major discovery? No, just how the government calculates the data.
- Recovery versus liquidity bath: This is what you get with liquidity, regulation, and debt.
- Stocks high and trending higher. El-Erian says time to take profits on 'artificially high' prices. Of course they are artificially high, but they can also move higher so take some gains along the ride.

Yet again stocks feel the presence of the underlying money, rally back ahead of long weekend.

In terms of the stock market, Friday was more of the same. After weeks of a slow trend upside that still rides the momentum from the January 2, 2013 launch to the upside that started the third leg off the summer 2011 correction, stocks faced some new yet old challenges.

Industrial production was lower in the US, this on top of the Thursday reports of GDP from Japan (negative for the third quarter) and the EU's official fall into an official recession. On the other hand, the New York PMI turned positive for the first time since August 2012 and the University of Michigan Sentiment statement jumped past expectations at 76.3.

Stocks sorted through the pros and cons through the morning, trading in rather choppy fashion as it has of late, even dipping midmorning toward lunch as has been its MO. Then the afternoon upside began at noon; the return of the bid that seems to occur each day as the new money pressing to get into the market fills in any dip.

The afternoon recovery was well underway when the major news story of the session hit. No HNZ buyout that could be bought the day before by insiders, tippers, and tippees. Bloomberg released Wal-Mart VP emails describing February sales as a 'total disaster,' the worst month this one VP has seen in his 7 years with the chain. A senior executive commented "Where are all the customers? And where's their money?" The feeling was the increased payroll taxes directly impacted the WMT customer.

Stocks plunged on the news with any gains wiped away. As I noted last week, with this bid in the market it appeared it would take a major story to derail it. With hints of better economic data perhaps buoying investors on top of the Fed's money (though quite dubious improvements given the details), the WMT story appeared to dash the 'green economic shoots' theories and hopes.

After a half hour of straight downside, however, the market caught itself . Indeed the indices were never in any danger whatsoever, at most tapping the 10 day EMA on the low. Then came the rebounding into the close. There was not a lot of time given the story broke in the afternoon session, so the indices could not recover all of the losses and only the Dow made it back to positive at the close.

SP500 -1.59%, -0.10%
NASDAQ -6.63, -0.21%
DJ30 8.37, 0.06%
SP400 -0.12%
RUTX -0.07%
SOX -0.60%

Though they didn't turn positive, it was clear the bid was still present as another close shave with reality staved off by the power of liquidity.

OTHER MARKETS

Dollar: 1.3357 versus 1.3342. Off modestly versus the euro Friday on a week that saw dollar gains thanks to an official EU recession and of course more currency wars. The week started with the G7 apparently stating Japan's currency manipulation was no issue, a clarification, then more general undermining currencies. It is, after all, at least in the minds of central banks and spendthrift governments, to pay debts back with devalued currency. Of course that only decimates the citizens' wealth and the country's economy with it, but a government doesn't care as long as it survives; there will always be more people to rule. The point: there are no benevolent governments; that is why we wrote the Constitution the way we did. Even then it has failed to keep the government in check. Watch your wallets!

Bonds: 2.01% versus 2.00% US 10 year treasury. Down on the week overall but recovered to end the week given the European and Japanese economic woes. Still below the 10 day EMA, still weak.

Gold: 1609.10, -26.40. Gold was crushed on the week with an emphasis on Friday as it undercut the recent lows in the pattern, blew up its pullback, and is now hanging on at the August consolidation level.

Oil: 95.86, -1.45. Actually broke harder to the downside. Spent the week rebounding for a routine 20 day EMA after a strong December through January run. Stalled right below the run's peak and then Friday was clocked. Oil has been stronger than it should have been then Friday was upended on news that was not that bad. Definitely interesting again and how it reacts to this sharp Friday decline this coming week tells if it was overdone on this last rotation higher to resistance and wants to trade back down in the 84 to 100ish range.

THE ECONOMY

To Tell the Truth: will the real economy please stand up?

From 1956 to 1968 the game show 'To Tell the Truth' was quite popular. A person of some notoriety and two imposters would answer questions from a panel of 4 celebrities and the celebrities would attempt to determine who the true person was. The answers were varied, degrees of made up to true, nonsense to fact.

Reminds me of our economic data in a way.

Friday the New York PMI was positive for the first time since August, and at 10.04, its best read since May 2012. On the other hand there was industrial production at -0.1% versus 0.2% expected and 0.4% in December. The decline aided by a 5.5% drop in auto production. Recall the oversupply discussed in November and December? That bled into production; had to.

Friday also saw Michigan Preliminary Sentiment for February rise to 76.3. Michigan has run hotter the past three months even as Consumer Confidence has plummeted to recession-esque levels in the mid-fifties.

Thursday initial jobless claims were reported at 341K and the reading was, yet again, trumpeted as some kind of proof the economy is turning. Again, however, the BLS substituted its estimates for the reality of what states report and each time it does that the numbers fall. Then each time it doesn't, they pop right back up to the 365K+ average.

Last week at the State of the Union address the President touted 6 million jobs created. What he did not tout was the facts that, I am sorry to say, make those mostly 6 million jobs not worthy of a US recovery. Over 75% part-time jobs paying the lowest scale ($7 to $13.79). Heck, in this economy even part-time lawyers are paid in some cases only $26/hour. Some would say that is a positive (like the old joke what's black and brown and looks good on a lawyer?: a Doberman; or the one that asks why sharks don't bite lawyers: professional courtesy), but it does underscore how weak the jobs market is.

Then Friday there was Alan Greenspan on CNBC, resurrected from the ashes of his now burned away aura of 'Maestro,' discussing the stock market and the economy. Greenspan covered familiar ground such as the stock market acting as a predictor of economic activity. That is dubious in itself at this point in history given the massive, truly massive, 'unprecedented in the history of the world' kind of stimulus injected into the economy and thus the stock market.

But he went further. After answering a question on the sequestration effects, he made a point to 'add one other thing.' Seems Greenspan longs to relive the glory days where everyone hung on his every convoluted sentence, his every wry 'I know more than you' smirk. Thus he threw out the bomb that stocks not only predict economic activity but they CAUSE economic activity.

Stock prices cause economic activity. Wow.

Recall back after the 2000-2001 collapse the then Fed Chairman's call for data to support even the existence of a wealth effect? His entire attack on the economy and indeed the stock market was promulgated upon the belief that high stock prices caused consumption, and he indeed talked of the 'runaway consumer,' apparently the result of the 'irrational exuberance' surrounding the stock market. Yet after he pulled all liquidity from the economy in early 2000, crashing first the stock market and then the economy (the stock market was indeed predicting the crash to come), he still just wasn't sure of any wealth effect.

Now he is sure. He says that 'the data shows' 6% of the GDP is a result of changes in the stock market. Not sure what that data is; perhaps he was able to piece together an argument to support what was, by his own admission at the time, an unfounded experiment that left the US economy in shambles and a three year dearth of US investment that led to the rise of the tech economies in Asia, India, and elsewhere, with jobs leaving the US never to return. With that kind of disaster laid at your feet by the facts of history, I suppose you had better come up with 'some data' that supports why you ruined the future of so many.

Greenspan's conclusions are utter hogwash: anemic growth, high unemployment, and Wal-Mart sales dropping.

So, according to Mr. Greenspan the rise in stock prices is causing a further rise in the economy on the wings of a wealth effect. Wow. It must not be much of a wealth effect. The stock market as measured by the SP500 is up 128% since the March 2009 low. The economy is limping along AT BEST at 2% growth. In the entire history of the US there has been no 100+% gain in stocks without GDP growing well above the long-term growth trend that used to be considered to be 3% as the bare minimum.

Moreover, what about the jobs discussed above? The majority are part-time as the underemployed employment rate when added to the unemployed produces a number in excess of 14%. Many people lost their retirements in the collapse and the lack of good jobs has prevented many from rebuilding retirement. There is no wealth effect there, particularly with the jobs they are getting paying the minimum wage scale. Sure that is not everyone, but the data show that clearly 75%+ of the jobs are low end, part time hourly work. You DON'T amass a new stock portfolio on those wages, and the only company match you get is in the uniform you wear.

What the heck caused stocks to rally in the first place?

The clincher, the fact that puts all of this nonsense to rest, goes back to just why stocks started to rally in the first place, something that Greenspan's analysis totally ignores. In March of 2009 there was not some perception that the economy would improve dramatically and thus warrant a 128% SP500 surge through early 2013. As noted above, the economy output simply does not warrant that kind of asset value rise.

What triggered that rally and indeed the next 5 rallies in the stock market (and there have been five since March 2009) is quantitative easing, i.e. the free and unbridled printing and placing money into the economy. With little use for that money in terms of real economic investment and thus economic growth (recall that capital investment as recently as December fell 4.3% year/year!!), it all goes into the stock market and other markets. Gold was a runaway winner until margin requirements were such that there is practically no margin buying anymore. Bonds were big winners with the Fed buying bonds for as far as the eye can see. Now, however, with rates rising even as the Fed continues to buy, inflation is showing its head and thus bonds are falling despite Fed buying.

The rally is based upon excess liquidity. Bernanke wanted stock prices to rise. They have. 2% GDP, as noted above, is a pathetic growth rate to underpin a 128% stock price appreciation, and as we know, it is not the driver. It is liquidity.

A Good as it Gets?

Greenspan should know this as well as he has one of the seminal case histories that occurred under his watch. From May 31, 1999 to late March 2000, the NASDAQ gained 107%. Greenspan flooded the economy will billions of dollars ahead of Y2K and the uncertainties that surrounded that date. The economy didn't need the money and no one wanted it as there was no dollar hoarding. So, it all when into the stock market and it zoomed.

In March Greenspan called all of the money back at once. More than that, he clamped down hard on the money supply, fearing he had unleashed an inflationary genie. Stocks had to be sold. Margins raised. More than that, the economy lost not only the money Greenspan pushed into the system, but more as lending restrictions were tightened as well. Stocks crashed and the economy followed.

The sprint higher was fueled by massive excesses in liquidity. There was a GDP kicker added by the excess money as Q4 saw a 7.37% GDP rise. Then the crash when the liquidity was pulled with 1.05% GDP in Q1 2000.

I have said it and many others with many more letters after their name have said it: the 1.5% to 2% GDP growth seen as a best result since the crash is just about the best you can get when you live off of Federal stimulus (recall the 'Recovery Act' that was simply spending on pet projects) and the Federal Reserve's massive liquidity binge without real economic investment and growth to back it up.

What if this is as good as it gets?

Thus as Jack Nicholson queried "What if this is as good as it gets?" in the movie of the same name, the answer is this is as good as it gets until we chart a different course. Better start planning as if that is the case, particularly looking at the index charts from a longer term perspective.

TECHNICAL SUMMARY

INTERNALS

NASDAQ
Stats: -6.63 points (-0.21%) to close at 3192.03
Volume: 1.841B (-3.31%)

Up Volume: 651.73M (-438.27M)
Down Volume: 1.14B (+323.68M)

A/D and Hi/Lo: Decliners led 1.1 to 1
Previous Session: Advancers led 1.12 to 1

New Highs: 200 (+2)
New Lows: 17 (-5)

S&P
Stats: -1.59 points (-0.1%) to close at 1519.79
NYSE Volume: 666.331M (+8.7%)

A/D and Hi/Lo: Decliners led 1.18 to 1
Previous Session: Advancers led 1 to 1

New Highs: 465 (-11)
New Lows: 73 (+13)

DJ30
Stats: +8.37 points (+0.06%) to close at 13981.76

BREADTH: Painfully flat . . . AGAIN.

VOLUME: Expiration Friday saw trade actually decline on NASDAQ. NYSE trade rose from 8.7% up to 42% depending upon which tape you want to use. There was a surge to near 900K on some tapes that took into account late trades. In any event, trade was expiration trade so not of much use.

THE CHARTS

Below is a recap of each index' action on the session but the bigger picture warrants a look. If you peruse weekly charts since March 2009 for any of the indices something pops out at you, something I mentioned last week: the symmetry of this last run with the prior runs.

The big initial QE run into early summer 2010, the QE2 run into May 2011, then the three shorter runs on QE3, Operation Twist, and QE4 the latest rally. Note how the last three are shorter overall and shorter in progression in the series of three.

QE has limited effects with each getting subsequently shorter in duration. That would put the current iteration near its limit. Mohammed Al Erian Friday said that stocks were artificially high at this stage and to take some profits. What do you know.

From our technical perspective the run should be just about over unless there is some other extraneous stimulus. Perhaps the economy jolts to life (dubious) or there is some way to avoid sequestration and a budget deal is struck (even more far-fetched it would appear). The point: technically there is reason to be cautious but at the same time we don't want to time the top so to speak and sell all out.

SP500. Lateral move with doji testing the 10 day EMA intraday continues. Flattening out the past week, showing some churn with higher volume as stocks can make no headway. That is typically a topping sign but volume has not been much higher.

NASDAQ. Still over the 10 day EMA and still rending higher, just slower going as it trades right at to just over the September levels. Still be a bit careful here.

DJ30. WMT pushed up the volume but DJ30 did a masterful job of recovering to hold the 10 day EMA yet again in its lateral consolidation attempt.

DJ20. Doji after pushing to a new all-time high. Might be a bit tired but hardly anything wrong with the pattern.

SP400. Flat Friday with a doji but still trending rather effortlessly up the 10 day EMA.

Russell 2000 small caps: Gapped then reversed to negative. Hasn't done that since mid-December and that led to a modest decline.

SOX. Faded after a very strong Thursday. Trending up the 10 day EMA but some headwinds as it bumps the early April upper gap point.

LEADERSHIP

Big Names. Overall they don't look all that great. AAPL started to fall, AMZN is holding up but could not follow through on its Wednesday surge. GOOG on the other hand looks solid. Mixed back and not providing unified leadership.

Homebuilders. Fell on the session with KBH to the 10 day EMA and TOL as well, but not rolling over just yet.

Financials. Down on the session but they are still trending higher. JPM at the 10 day EMA, C and BAC as well.

Semiconductors. Took a day off but otherwise in good leadership. Some solar stocks actually look interesting again, e.g. FSLR, JASO.

Energy. As with most surging areas, energy faded as well SLB, HAL faded slightly while RIG flopped and gave back all of the Thursday gain. Maybe we will get some buys on these.

Chemicals. Still look solid, e.g. AXLL holding up while MOS and MON pushed higher. AGU on the other hand continued its dive.

Retail. All over the map as you might imagine after WMT's issues, but not too bad. DECK is still in position to continue higher and PNRA might provide a buying opportunity off the 200 day SMA test.

THE MARKET

SENTIMENT INDICATORS

VIX: 12.66; -0.32
VXN: 13.66; -0.75
VXO: 12.08; -0.51

Put/Call Ratio (CBOE): 0.83; -0.08

Bulls versus Bears

An interesting development. Without any decline in the stock market to push it the number of bulls declined. As noted last week they are at a level where the market corrected starting in September but some of the pressure is off.

Bulls: 52.6% versus 54.7% versus 54.3% versus 53.2% versus 51.1% versus 47.8% versus 46.8% versus 45.7% versus 43.6% versus 39.3% versus 37.2% versus 38.3% versus 43.6. Over the September 2012 level. Last time the market hit that level SP500 corrected 9% over the next two months. Background: Undercut 35%, the threshold for bullishness, in early June. As noted, hit 34% in early June. It did its job and the market is on the rally. Hard drop to 34 from 39.3% as economic reality and a choppy stock market hit. Off the 55+ level hit in late February. That was the highest level since April and May of 2011, the peak of the post-bear market high. 35% is the threshold level suggesting bullishness. To be seriously bearish it needs to get up to the 60% to 65% level.

Bears: 21.1% versus 21.1% versus 22.3% versus 22.3% versus 23.4% versus 24.5% versus 24.5% versus 23.4% versus 25.5% versus 27.7% versus 27.7% versus 28.7% versus 27.7%. Summary: Over 35% is the threshold to be really be a good upside indicator. For reference, bearishness hit a 5 year high at 54.4% the last week of October 2008. The move over 50 took bearish sentiment to its highest level since 1995. Extreme negative sentiment. Prior levels for comparison: Bearishness peaked at 37.4% in September 2007. It topped the June 2006 peak (36%) on that run. That June peak eclipsed the March 2006 high (33%) and well above the 2005 highs that spawned new rallies (30% in May 2005, 29.2% in October 2005). That was a huge turn, unlike any seen in recent history.

TUESDAY (Monday closed for Presidents' Day)

Virtually no change in the stock indices as they maintain their trends up near support. Yes they were up and down last week with SP500 bouncing laterally. Yes NASDAQ is bumping at its earlier highs. Same issues as before.

As noted earlier, it was enough for Mr. Al-Erian to say stocks are artificially high (QE) and that central banks will have a hard time maintaining them as their efforts become less effective.

Of course that doesn't mean they go away, just that they are still present. The risk/reward overall is diminished at least in terms of the upside. As noted in the weekly index charts, this is the third in a series of three legs higher based upon new QE announcements. Certainly the market can continue higher from here; money will do that. At the same time you have to factor in how much more it can rise versus how much it will correct when it does get to the point it tests.

There is a big gap from early January on NASDAQ. The other indices didn't gap but the way they trade is not conducive to gaps. In any event, after this run and that gap, we are keeping the QID play just in case.

There are still some upside plays that can yield nice gains if the market continues to run. Some ag chemicals still look good, energy may provide a test, chips remain solid, financials are trying to set up again. If they do set up and take the lead then the market has some solid areas to take it higher. Thus we will be looking at plays in those areas in the event the market finds new strength and continues these moves.

If it cannot then we have some downside plays we take advantage of.

Al-Erian says to take profits now. He is calling a market top and perhaps he knows more than most do; after all he is on television all the time. We prefer to take gain along the way at logical points, letting some run higher. Then if the market runs farther than anyone thinks we can participate in the upside and take some more gain. Then as the market does top we are typically lighter in positions anyway.

So we are keeping reasonable stops on current positions, still picking up some upside but partial positions, not wanting to get too heavy if a top is near but then as any market move continues we can participate in it.

Have a great weekend!

Support and resistance

NASDAQ: Closed at 3192.03

Resistance:
3197 is the September 2012 post-bear market high. Starting to crack.
3227 is the April 2000 intraday low
3401 is the May 2000 closing low

Support:
3171 is the October intraday high
The 20 day EMA at 3162
3134 is the March 2012 post-bear market peak
3130 from some January 2013 lows
The 50 day EMA at 3112
3104-3112 from August and mid-October peaks.
3101 is the August 2012 high
The 2011 up trendline at 3098
3090 is the mid-March interim high
3076 is the late April 2012 high and the 1/2013 low after gapping higher
3062 is the December 2012 prior peak
3042 from 5/2000 low and several other price points
3024 is the gap point from early May
The 200 day SMA at 3005
3000 is the February 2012 post-bear market high
2999 is the bottom of the August 2012 consolidation
2988 is the July 2012 high
2977 to 2980 is the bottom of the late October 2012 consolidation, July 2012 peak
2962 is the April 2012 low
2950 is the mid-April closing low
2942 is the mid-June 2012 high
2900 is the March 2012 intraday low
2858 is the late July 2011 peak
2847 is the mid-May 2012 low
2838 from the July 2012 lows

S&P 500: Closed at 1519.79

Resistance:
1539 from June 2007

Support:
The 20 day EMA at 1504
1499 from January 2008
The 50 day EMA at 1476
1475 is the September 2012 high
1471 is the October 2012 intraday high
1466 is the September 2012 closing peak and rally closing high
1440 from November 2007 closing lows
1434 from early November 2012
1433 from August 2007 closing lows
1427 is the August 2012 peak
1425 from May 2008 closing highs and the October 2012 low
1408 is the late October 2012 range closing low
1406 is the early May 2012 peak
The 200 day SMA at 1406
1402.22 - 1400 is the closing low of the August 2012 lateral consolidation
1378 is the February 2012 peak
1375 is the early July 2012 peak
1371 is the May 2011 peak, the post-bear market high
1363.46 is June 2012 high
1359 is the April 2012 low
1357 is the July 2011 peak
1344 is the February 2011 peak
1340 is the early April 2011 peak
1332 is the early March 2011 peak

Dow: Closed at 13,981.76

Resistance:
14,022 from 7-07 peak

Support:
The 10 day EMA at 13,960
The 20 day EMA at 13,870
13,692 from 6-2007 peak
13,668 from 12-2007 peak
13662 is the October 2012 intraday high
13,653 is the September 2012 high
The 50 day EMA at 13,620
13,557 to 13,662
13,413 from the late September 2012 low
13,300 to 13,331 is the August 2012 post-bear market high
13,297 is the April 2012, prior post bear market high
The 200 day SMA at 13,119
13,058 from the May 2008 peak on that bounce in the selling
13,056 is the February 2012 high
12,716 is the April 2012 closing low
12,524 is a range of support from early 2012 and summertime 2012
12,391 is the February 2011 peak
12,369 is the left shoulder low from May 2012
12,284 is the October 2011 peak
12,258 is the December 2011 peak
12,110 from the March 2007 closing low
12,094 is the April 2011 low
12,035 is the June 2012 base low
The June 2011 low at 11,897 (closing)
11,734 from 11-98 peak
11,717 is the late August 2011 peak

Economic Calendar

February 15 - Friday
- Empire Manufacturing, February (8:30): 10.0 actual versus 0.0 expected, -7.8 prior
- Net Long-Term TIC Fl, December (9:00): $64.2B actual versus $52.4B prior (revised from $52.3B)
- Industrial Production, January (9:15): -0.1% actual versus 0.2% expected, 0.4% prior (revised from 0.3%)
- Capacity Utilization, January (9:15): 79.1% actual versus 78.9% expected, 79.3% prior (revised from 78.8%)
- Michigan Preliminary Sentiment, February (9:55): 76.3 actual versus 73.5 expected, 73.8 prior

February 19 - Tuesday
- NAHB Housing Market Index, February (10:00): 48 expected, 47 prior

February 20 - Wednesday
- MBA Mortgage Index, 02/16 (7:00): -6.4% prior
- Housing Starts, January (8:30): 910K expected, 954K prior
- Building Permits, January (8:30): 918K expected, 903K prior
- PPI, January (8:30): 0.3% expected, -0.2% prior
- Core PPI, January (8:30): 0.1% expected, 0.1% prior
- FOMC Minutes, 1/30 (14:00)

February 21 - Thursday
- Initial Claims, 02/16 (8:30): 358K expected, 341K prior
- Continuing Claims, 02/09 (8:30): 3150K expected, 3114K prior
- CPI, January (8:30): 0.1% expected, 0.0% prior
- Core CPI, January (8:30): 0.2% expected, 0.1% prior
- Existing Home Sales, January (10:00): 4.94M expected, 4.94M prior
- Philadelphia Fed, February (10:00): 1.5 expected, -5.8 prior
- Leading Indicators, January (10:00): 0.3% expected, 0.5% prior
- Natural Gas Inventories, 02/16 (10:30): -157 bcf prior
- Crude Inventories, 02/16 (11:00): 0.560M prior
icon url

ReturntoSender

02/27/13 5:33 PM

#10106 RE: ReturntoSender #6755

From Briefing.com: 4:25 pm : Today's session saw an extension of yesterday's buying as the S&P 500 managed to erase the remainder of its losses from Monday. The broad rally occurred with six of 10 sectors adding in excess of 1.0%. Cyclical stocks led the way with industrials and materials exhibiting relative strength from the start of the session.

Today's economic data provided some support as January pending home sales rose 4.5%, which was ahead of the 1.0% increase that had been expected by the Briefing.com consensus.

In addition to January pending home sales, the market received news of durable goods orders for the same month. Although the headline number fell 5.2%, this was due to a 45.7% drop in defense and nondefense aircraft orders. Excluding transportation, orders rose a solid 1.9% in January.

Industrial shares led throughout the day. This was aided by the strong performance from transportation related stocks, which pushed the Dow Jones Transportation Average to a gain of 2.9%.

Elsewhere in industrials, Joy Global (JOY 63.45, +3.49) jumped 5.8% after its quarterly report beat on earnings and revenue.

Basic materials also finished near the lead after lagging notably in recent sessions. Today, material producers rallied broadly with miners as the lone weak spot. The SPDR Materials Select Sector ETF (XLB 38.42, +0.67) gained 1.8%.

The outperformance of cyclical stocks was also reflected by the consumer discretionary sector where homebuilders climbed on the back of the pending home sales report. Although this report does not have a direct impact on new homes, strong existing sales can be seen as a positive indicator of demand for new properties. The SPDR S&P Homebuilders ETF (XHB 28.37, +0.60) rose 2.2%.

Monday's downturn was sparked by fears that political uncertainty in Italy will upset the recent recovery observed in sovereign debt markets. This expectation caused investors to shun financial shares which exhibit heightened sensitivity to political and market fluctuations. However, today's rebound saw money return to the sector. JPMorgan Chase (JPM 49.28, +1.68) was the best performer among the majors, and the SPDR Financial Select Sector ETF (XLF 17.62, +0.27) gained 1.6%.

As the recent wave of investor fear was leaving the market, Federal Reserve Chairman Ben Bernanke did his best to help chase it away. Earlier today, the Fed Chair concluded his bi-annual, two-day testimony before Congress.

Appearing in front of the House Financial Services Committee, the Chairman continued stressing the benefits of the Fed's asset purchase plan. Today's testimony was largely a carbon copy of yesterday's remarks which confirmed the Federal Reserve's desire to continue its easy-money policy.

Reviewing S&P 500 sector performance, industrials (+1.9%), materials (+1.7%), and financials (+1.6%) settled in the lead while technology (+0.9%), telecoms (+0.9%), and utilities (+0.9%) trailed behind the broader market.

Today's volume was below average as just over 670 million shares changed hands on the floor of the New York Stock Exchange. Notably, today's final tally represented the lowest total since February 14.

Looking at tomorrow's economic news, weekly initial and continuing claims, as well as the second estimate of fourth quarter GDP will all be reported at 8:30 ET. The day's economic data will be topped off with the 9:45 ET release of the February Chicago PMI.DJ30 +175.24 NASDAQ +32.61 SP500 +19.05 NASDAQ Adv/Vol/Dec 1648/1.67 bln/814 NYSE Adv/Vol/Dec 2313/673.3 mln/704

3:30 pm :

Apr crude oil rose to a session high of $93.35 per barrel following better-than-anticipated inventory data that showed a build of 1.13 mln barrels when a build of 2.45 mln barrels was expected. However, prices reversed heading into afternoon action and dipped below the unchanged line to a session low of $92.40 per barrel. The energy component eventually settled 0.2% higher at $92.80 per barrel.
Apr natural gas climbed to a session high of $3.55 per MMBtu but lost momentum heading into afternoon floor trade. It gave up all of its earlier gains as prices fell into negative territory and to a session low of $3.42 per MMBtu. Unable to erase much of the loss, natural gas settled 0.9% lower at $3.43 per MMBtu.
Apr gold fell deeper into negative territory following durable goods orders and pending home sales data released this morning. The yellow metal touched a session high of $1610.50 per ounce shortly after floor trade opened but inched lower for the remainder of the session despite weakness in the dollar index. It brushed a session low of $1592.60 per ounce as it headed into the close and settled with a 1.2% loss at $1595.70 per ounce.
May silver also trended lower in today's floor trade. It pulled-back from its session high of $29.26 per ounce and settled 1.1% lower at $29.00 per ounce, slightly above its session low of $28.86 per ounce.

4:16PM Universal Display misses by $0.02, beats on revs; guides FY13 revs in-line (PANL) : Reports Q4 (Dec) earnings of $0.12 per share, $0.02 worse than the Capital IQ Consensus Estimate of $0.14; revenues rose 50.3% year/year to $28.1 mln vs the $26.4 mln consensus. Co issues in-line guidance for FY13, sees FY13 revs of $110-125 mln vs. $121.46 mln Capital IQ Consensus Estimate.

4:15PM Riverbed Technology appoints Ernie Maddock as Chief Financial Officer (RVBD) 15.75 +0.05 : While at Lam Research, in addition to his chief financial officer role, Maddock held senior roles as vice president of customer support and vice president of global operations.

4:00PM Lattice Semi announces $20 mln stock repurchase program (LSCC) 4.63 +0.03 :

Ixia (XXIA) has developed a network security incident remediation solution with LogRhythm that helps reduce mean time to resolution.

Mad Catz Interactive (MCZ) announced that its forthcoming range of GameSmart headsets will utilize HD-PA components from STMicroelectronics (STM) that incorporate exciting Soundcore R3 technology from Soundchip.

10:47 am S&P Information Tech sector +0.31%
The tech sector is trading higher today, along with gains in the broader market. Semiconductors are showing relative strength as well with the SOX trading 0.9% higher. Within the chip index, STM (+2.9%) is a notable standout. Among other major indices, the SPY is trading 0.6% higher today, as are both the QQQ and the NASDAQ on the session. Among tech bellwethers, GOOG (+1.0%) is showing notable strength, while FB (-2.2%) is under pressure.

In tech earnings last night, AVGO (+2.5%) posted a slight beat and guided lower, VRSK (+9.4%) reported a beat, and TIVO (+2.4%) posted a miss and guided lower. In news, CLWR (-0.9%) announced that it elected to take the $80 mln March draw from S (+0.4%) and has continued discussions with DISH (-0.2%) about its proposal. Also, AAPL (-0.6%) is set to hold its annual shareholder meeting today at 12 ET. Among rumors, VOD (+1.6%) has suspended its plans to put a takeover bid on Kabel Deutschland Holding, according to reports. Among notable analyst upgrades this morning in the tech space, Argus upgraded NOK (+4.2%) to Buy and GOOG (+1.0%) was upgraded to Buy at BofA/Merrill. Among downgrades, VRSN (+0.3%) was downgraded to Neutral at Credit Suisse and Robert W. Baird downgraded INVN (-3.9%) to Neutral. GRPN (+2.5%) is a notable name in tech scheduled to report quarterly results today after the close.

7:00AM LTX-Credence misses by $0.02, misses on revs; guides Q3 EPS below consensus, revs below consensus (LTXC) 6.30 : Reports Q2 (Jan) loss of $0.08 per share, $0.02 worse than the Capital IQ Consensus Estimate of ($0.06); revenues rose 45.4% year/year to $35.02 mln vs the $36.89 mln consensus. Co issues downside guidance for Q3, sees EPS of ($0.10)-(0.05) vs. $0.03 Capital IQ Consensus Estimate; sees Q3 revs of $35-40 mln vs. $43.60 mln Capital IQ Consensus Estimate.

Skyworks Solutions (SWKS) introduced several new backlight LED drivers supporting next-generation smartphones and tablets.

5:56AM Canadian Solar announces new sales agreement for solar pv projects in Tanzania (CSIQ) 4.09 : Co announced a 85 kW sales agreement with Zara Solar, a company from Tanzania specialized in solar PV importing, retail and installations. Including this new order, Canadian Solar will have supplied more than 350 kW of its solar modules to Zara Solar for off-grid PV projects in Tanzania.

Guidewire (GWRE) reported second quarter earnings of $0.21 per share, $0.19 better than the Capital IQ Consensus Estimate of $0.02, while revenues rose 31.0% year/year to $72.2 million versus the $64.26 mln consensus. "Solid broad based bookings in the first half of the year led to revenue in the second quarter that was above the high end of our guidance range, and this outperformance was further accentuated by several customers who made payments earlier than their third quarter due dates. Moreover, with strong customer adoption, including key up-sells of existing customers, several major go-lives, and continued investments in our sales and services organizations, we also continued to make steady progress in our ambition to make PolicyCenter and our full InsuranceSuite the pre-eminent offerings in the market."

TiVo (TIVO) reported fourth quarter loss of GAAP $0.13 per share, $0.01 worse than the GAAP Capital IQ Consensus Estimate of ($0.12), while service & tech revenues rose 31.4% year/year to $65.7 million versus the the $67.49 mln consensus. The company issues downside guidance for the first quarter with Q1 service & tech revs of $60-62 million versus the $72.13 million consensus. "We made significant progress in our business during Fiscal Year 2013, culminating with Adjusted EBITDA profitability, excluding litigation expense for the fourth quarter. We achieved success in five key areas during the last year. First, we drove expanded deployment in our current distribution deals, increasing the total number of TiVo subscriptions by almost one million over the course of Fiscal Year 2013." FY14 Guidance: "For the first quarter of Fiscal Year 2014, TiVo anticipates service and technology revenues in the range of $60 million to $62 million. We expect lower technology revenue in the first quarter as revenue recognition from key MSO projects is expected to occur in the second quarter as opposed to first quarter. This will impact the first quarter negatively but is expected to benefit second quarter technology revenue significantly, making up for first quarter's technology revenue shortfall. TiVo anticipates net loss in the range of ($16) million to ($19) million (versus ($3) mln ests) and an Adjusted EBITDA of ($5) million to ($8) million, which includes $11 million to $12 million of litigation spend. TiVo expects to be profitable on an Adjusted EBITDA basis excluding litigation spend."

LTX-Credence (LTXC) reported second quarter loss of $0.08 per share, $0.02 worse than the Capital IQ consensus of ($0.06), while revenues rose 45.4% year/year to $35.02 million versus the $36.89 million consensus. The company issued downside guidance for the third quarter with EPS of ($0.10)-(0.05) versus the $0.03 consensus; sees Q3 revenues of $35-40 million versus the $43.60 million consensus.

Priceline (PCLN) reported fourth quarter earnings of $6.77 per share, $0.27 better than the Capital IQ consensus of $6.50, while revenues rose 20.2% year/year to $1.19 billion versus the $1.19 billion consensus. Fourth quarter gross travel bookings for the Group, which refers to the total dollar value, generally inclusive of all taxes and fees, of all travel services purchased by its customers, were $6.6 billion, an increase of 32.9% over a year ago. The Priceline Group finished 2012 with a strong 4th quarter showing improving unit growth in hotel room and rental car day reservations," said Jeffery H. Boyd, Chairman and CEO of The Priceline Group. "International gross bookings growth of 43% on a local currency basis in the 4th quarter evidenced the resilience of the business in 2012 despite economic uncertainty in our core European market". Co issues in-line guidance for Q1, sees EPS of $4.90-5.30 vs. $5.16 Capital IQ Consensus Estimate; sees Q1 revs growth in the range of 17-24% (approx $1.214-1.286 billion versus the $1.24 billion consensus. "Looking forward, Mr. Boyd said "The Group's brands are off to a good start in 2013, with greater supply and geographic reach, a new offline marketing experiment for Booking.com in the United States and a new ad campaign for priceline.com". The Priceline Group said it was targeting the following for 1st quarter 2013: Year-over-year increase in total gross travel bookings of approximately 30% - 37% (an increase of approximately 29% - 36% on a local currency basis). Year-over-year increase in international gross travel bookings of approximately 36% - 43% (an increase of approximately 35% - 42% on a local currency basis). Year-over-year increase in domestic gross travel bookings of approximately 5% - 10%. Year-over-year increase in revenue of approximately 17% - 24%. Year-over-year increase in gross profit of approximately 30% - 37%. Adjusted EBITDA of approximately $316 million to $346 million.
08:56 am OpenTable initiated with a Buy at Wunderlich; tgt $68: . Wunderlich initiates OPEN with a Buy and price target of $68. They believe the co has a strong competitive advantage in the U.S. market due to network effects. It also has plenty of opportunity for growth with 49% of all restaurants and 16% of reservation-making seated diners using the service, with much lower penetration rates in its international markets. They expect OpenTable to become a destination platform for diners anywhere. The company should have steady, sustainable growth ahead.

08:56 am EMCOR Group upgraded to Buy at KeyBanc Capital Mkts; tgt $45: . KeyBanc Capital Mkts upgrades EME to Buy from Hold and sets target price at $45 as it sees a sustainable inflection in EME's more cyclical commercial operations (nonres) alongside continued strong execution and cost discipline, and what we consider to be conservatively placed 2013 guidance.

08:33 am Nokia upgraded to Buy at Argus; tgt $6: . Argus upgrades NOK to Buy from Hold and sets target price at $6 on stronger growth prospects in mid-tier and low-end phones and signs of sustainable margin recovery at Nokia Siemens Networks (NSN). Using the forum of the Mobile World Congress in Barcelona, the mobile industry's biggest event of the year, Nokia introduced four new phones. The two Windows Mobile-based smartphones are the Lumia 720, a mid-range phone, and the 520, an entry-level phone.

08:33 am LinkedIn initiated with a Buy at Wunderlich; tgt $195: . Wunderlich initiates LNKD with a Buy and price target of $195. Firm believes LinkedIn has become the marquee platform for companies and professionals to engage with each other and build brands. The company's Recruiter product and broader Talent Solutions platform have become extremely valuable for recruiters. Firm views LinkedIn with a very large competitive moat around its platform given strong network effects, a highly visible revenue stream, and the ability to rapidly innovate with new products.

08:32 am First Solar downgraded to Neutral from Outperform at Robert W. Baird: . Robert W. Baird downgrades FSLR to Neutral from Outperform and lowers their tgt to $25 from $30. They note that while FSLR continues to boast the industry's strongest balance sheet and largest downstream project pipeline, management's commentary suggests greater-than-expected uncertainty for 2013. They are taking a step back for now, but will revisit their position when the company holds its analyst day in April, at which point management is expected to provide more color on full-year guidance expectations.

icon url

ReturntoSender

03/03/13 1:57 PM

#10111 RE: ReturntoSender #6755

icon url

ReturntoSender

03/03/13 2:17 PM

#10112 RE: ReturntoSender #6755

Escalating Optimism and What It Could Mean for March Is the market due for a short-term breather? by Todd Salamone 3/2/2013 9:25:21 AM

Despite the "sequester" standoff in Washington, D.C., the major market indexes edged higher for the second week in row, as Congressional gridlock seems to be par for the proverbial course. And speaking of more of the same, Todd Salamone examines the similarities between the current quarter and a year ago, and explains why the current sentiment backdrop could point to short-term speed bumps. In the same vein, Rocky White tries to gauge what to expect in March, and what escalating optimism could mean for an historically bullish month.

The next hurdle for the SPX
The key level to watch for the market's "fear barometer"
What the past two months could tell us about the future

Finally, we close with a preview of the major economic and earnings events for the week ahead, plus a featured sector to watch.

Notes from the Trading Desk: Potential Short-Term Warning Signs?
By Todd Salamone, Senior V.P. of Research


"The momentum, short-covering potential, round numbers, and a recent surge in buying from institutional players -- evident by record-setting CBOE Market Volatility Index (VIX - 13.02) call buying -- are at the top of the radar for us. On one hand, should the market track higher on the heels of continued short covering, it wouldn't be a major surprise. On the other hand, it wouldn't be a huge surprise if the market stalls or experiences a pullback of note from round-number resistance."

-[url=]Monday Morning Outlook[/url], February 9, 2013


"SPY 5% out-of-the-money (OOTM) put implied volatility is high relative to OOTM call implied volatility ... An option pricing disparity like this has preceded a volatile trading range or correction since 2011 ... a break below the 30-day moving average and 1,500 would likely spell looming turbulence, given the short-term sentiment backdrop has swung toward optimism and a technical breakdown could drive recent buyers out of the market."

-[url=]Monday Morning Outlook[/url], February 23, 2013


"Yesterday's VIX close was more than 50% above recent VIX low of 12.32 ... 50% above prior low capped multiple advances last year"

-SchaeffersResearch.com, February 26, 2013


"Dow 14k again... 12 of 18 trading days have seen 14,000 mark touched since Feb. 1, and only four of 17 closes above 14k"

-[url=]@ToddSalamone on Twitter[/url], February 27, 2013

During the past few weeks, we have emphasized the fact that short-term optimism was fueling a market rally, but as multiple benchmarks approach round-number levels -- particularly 14,000 on the Dow Jones Industrial Average (DJIA - 14,089.66) and 1,500 on the S&P 500 Index (SPX - 1,518.20) -- the market could be due for a pause or pullback.

In impressive fashion, the market has grinded higher, nonetheless, but in a very choppy fashion, with historical volatility on the SPX rising from its Jan. 31 low of 5.54 to its current reading of 12.85. In fact, the SPX just experienced its first notable pullback of the year, a near 3% decline from Feb. 19 to Feb. 25, as European worries began festering again. So far, the sell-off has been short-lived, as an impressive rebound occurred, even ahead of the March 1 automatic spending cuts that are expected to trim gross domestic product (GDP) forecasts.

If the February action in the Dow is indicative of what is on deck in the coming weeks, you can expect a range-bound market. Since first hitting 14,000 on Feb. 1, the Dow has touched the round-number 14,000 level in 13 of 20 trading sessions, as of Friday.


Another theme we have been discussing is how the price action in the first quarter of this year has practically followed the same script from last year's first quarter: a low-volatility uptrend fueled by short covering. In both instances, the SPX found support at uncommon moving averages, such as the 15- and 30-day trendlines. In fact, in late February/early March 2012, the SPX experienced a 2% pullback, somewhat of the magnitude of the pullback we just experienced.

This past week, the SPX closed below its 30-day moving average, which could be an early warning sign of an impending decline. As you can see on the SPX's 2012 chart below, in April, the SPX experienced a significant close below both its 30-day moving average and the round-number 1,400 level, and quickly bounced back during the next three weeks. It took out 1,400, but never exceeded the prior 2012 highs. A correction soon followed.


Similarly, per the 2013 daily chart below, the SPX has quickly bounced back from last week's close below its 30-day moving average and the round-number 1,500 mark. In fact, the SPX has cleared 1,500, but has not yet cleared its 2013 highs. That said, a move above 1,530.94 by the SPX would break the pattern we witnessed in 2012, and likely lead to a continuation move higher. However, if the SPX penetrates below last week's trough at 1,485 -- which happens to be the site of its 40-day moving average -- this could signal more downside if the 2013 market continues to behave in similar fashion to last year's.


The CBOE Market Volatility Index (VIX - 15.36) peak last week is also on our radar. As we observed on Twitter, there were multiple peaks last year in the area that was 50% above the prior low. While this is not a hard-and-fast rule for all VIX advances, of course, the explanation behind this tendency could be "anchoring" that takes place after such pops. In other words, those looking to purchase portfolio insurance might view index put options as too expensive, as conscientious buyers anchor to the percentage increase in portfolio insurance from a previous low. Or, those making bets on higher volatility via the purchase of VIX calls or futures might back off, as they view the 50% volatility pop as "running its course."

If this thinking is prevalent after such VIX pops, the purchase of index put options and volatility futures and call options may suddenly dissipate, removing a coincidental market headwind. With the VIX immediately reversing back below the 50% marker above its 2013 nadir, bulls should be encouraged.

As we look ahead to next week, the VIX is trading in an area that is a 50% retracement of last week's high and the 2013 low. Bulls should be encouraged by the potential downside back to the 2013 low, but be on guard if the VIX experiences another sharp advance through the 50%- above-2013-low area.

The short term is still a toss-up in terms of direction, as traders remain trigger-happy to buy pullbacks and the SPX is still on sound technical footing. But short-term sentiment measures are around levels that have historically preceded trading ranges or pullbacks, as small-caps have noticeably underperformed on the recent snap-back rally, and the S&P 400 MidCap Index (MID - 1,098.15) is back below 1,100. The market tends to be strongest when leadership is coming from the small- and mid-cap groups.

The intermediate-to-longer-term outlook continues to look rosy for bulls, as some skeptics continue to be sidelined by a low VIX, low volume, and retail inflows into equity funds in 2013. Our response to these concerns: Fears of low volume have been voiced since the market bottom in 2009, low volatility can persist for years, and recent inflows into equity funds are peanuts relative to the outflows in prior years.


icon url

ReturntoSender

03/05/13 8:15 PM

#10115 RE: ReturntoSender #6755

From Briefing.com: 4:15 pm : Today began with all eyes turned to the Dow Jones Industrial Average after the blue chip index ended yesterday's session just 37 points below its all-time closing high. However, the anticipation was promptly removed after the bell when equities jumped higher and the Dow marked its fresh all-time best at 14,286.37.

Following the steady climb of the first hour, they key indices leveled off and held the bulk of their gains throughout the afternoon.

In addition to the Dow, the Dow Jones Transportation Average marked an all-time high of its own. The bellwether complex settled higher by 1.5% thanks to outperformance from freight carriers and shipping services. Con-way (CNW 36.07, +1.36) and FedEx (FDX 107.91, +2.11) finished with respective gains of 3.9% and 2.0%.

The notable strength among transportation stocks also contributed to the outperformance of the industrial sector. The SPDR Industrial Select Sector ETF (XLI 41.40, +0.58) settled higher by 1.4% after finishing among yesterday's biggest laggards.

Similarly, the technology sector underperformed yesterday, but finished as today's leader. Applied Materials (AMAT 13.74, +0.17) and Qualcomm (QCOM 67.97, +1.34) both hiked their quarterly dividends which helped support other chipmakers. The broader PHLX Semiconductor Index gained 2.0%.

Although the market finished with broad gains, some pockets of weakness could be spotted.

J.C. Penney (JCP 14.96, -1.78) has been in the news since reporting downbeat quarterly earnings on February 27. Today, shares of the retailer fell 10.6% after reports indicated recent weakness has prompted major investors from exiting the stock. In addition, the New York Post reported the company is facing delays in its court case against Macy's (M 41.72, +0.18).

Though J.C. Penney finished firmly lower, the weakness appeared to have no effect on other retailers. The SPDR S&P Retail ETF (XRT 68.68, +0.76) gained 1.1%.

Walgreen (WAG 40.72, -1.05) was another retailer which missed out on today's rally. The weakness followed disappointing second quarter revenue guidance as well as February comparable store sales which missed expectations.

The relative weakness in Walgreen contributed to the underperformance of consumer staples, which registered the slimmest gains of all 10 sectors.

The CBOE Volatility Index (VIX 13.47, -0.54) fell 3.9% and slid back to levels last seen two weeks ago.

Looking back at the final S&P 500 sector alignment, technology (+1.5%), industrial (+1.4%), and consumer discretionary (+1.0%) stocks outperformed. On the downside, consumer staple (+0.3%), utilities (+0.6%), and materials (+0.6%) trailed behind the broader market.

Trading volume was once again below average as 683 million shares changed hands on the floor of the New York Stock Exchange.

Today's economic data was limited to the February ISM Services Index, which increased from 55.2 in January to 56.0 in February. Today's reading was ahead of the Briefing.com consensus, and put the index at its highest level since February 2012.

Business activity growth was essentially flat as the respective index increased a modest 0.5 points to 56.9 in February. However, the report did not signal impending weakness in the services sector.

Tomorrow, the weekly MBA Mortgage Index will be reported at 7:00 ET. At 8:15 ET, the February ADP Employment Change will cross the wires with January factory orders scheduled for a 10:00 ET release. Lastly, the Federal Reserve will release its March Beige Book at 14:00 ET.DJ30 +125.95 NASDAQ +42.10 SP500 +14.59 NASDAQ Adv/Vol/Dec 1734/1.83 bln/723 NYSE Adv/Vol/Dec 2236/683.0 mln/774

3:30 pm :

Apr crude oil dipped to a session low of $90.02 per barrel as the dollar index recovered into positive territory. However, the energy component gained steam in afternoon floor trade and pushed to a session high of $90.99 per barrel as the dollar index fell back into the red. It eventually settled 0.7% higher at $90.76 per barrel, booking its first gain in four sessions.
Apr natural gas traded higher for most of today's pit trade and advanced to a session high of $3.59 per MMBtu in afternoon floor action. However, it erased all of its earlier gains in the last 20 minutes of pit trade and settled the session flat at $3.53 per MMBtu.
Apr gold rose to a session high of $1585.80 per ounce shortly after pit trade opened but lost momentum in mid-morning action as the dollar index pushed into positive territory. The yellow metal dipped to a session low of $1571.10 per ounce moments before settling 0.2% higher at $1574.80 per ounce, booking its first gain in five sessions.
May silver also pulled-back from its session high of $29.09 per ounce and touched a session low of $28.52per ounce in late afternoon floor trade. It eventually settled 0.4% higher at $28.60 per ounce.

2:47PM NXP Semi announces upsizing and pricing of $500 mln senior unsecured notes offering (NXPI) 32.34 +0.58 : Co announced the upsizing of the previously announced offering by its subsidiaries NXP B.V. and NXP Funding LLC of $300 mln to an offering of $500 mln aggregate principal amount of senior notes due 2023 and also announced the pricing of the offering. The sale of the Unsecured Notes is expected to close on or around March 12, 2013. The Unsecured Notes will bear interest at 5.75% per annum and will mature on March 15, 2023. NXP intends to use the net proceeds of the offering to repay amounts outstanding under its Term Loan B that it entered into on February 16, 2012, and thereby decrease the amount of variable rate debt in its capital structure.

9:02AM Agilent: FDA approves two dako assays as companion diagnostics for Genentech's new breast cancer medicine Kadcyla (A) 42.03 : Dako, an Agilent Technologies Company and worldwide provider of cancer diagnostics, announced it has received approval from the U.S. Food and Drug Administration for the addition of Kadcyla in the labeling of two Dako companion diagnostic assays. Kadcyla (ado-trastuzumab emtansine) is Genentech's (RHHBY) new medicine for patients with HER2-positive metastatic breast cancer who have received prior treatment with Genentech's cancer medicine Herceptin (trastuzumab) and a taxane chemotherapy.

Texas Instruments (TXN) and 4DSP announced their collaboration on a new mezzanine card, the FMC667, for mission critical applications.

8:33AM Xilinx increased its quarterly dividend to $0.25/share from $0.22/share (XLNX) 36.39 :

Vishay Precision Group (VPG) announced that Whistler Technology is distributing the complete line of Vishay Foil Resistors brand Bulk Metal Foil resistors throughout the United Kingdom.
Skyworks Solutions (SWKS) announced that its Silicon-on-insulator switching technology is now being utilized by European, Japanese, Korean and North American car manufacturers for advanced infotainment systems

8:07AM Cree issues Q3 business update; raises Q3 EPS and revs guidance (CREE) 44.72 : Co raises guidance for Q3 (Mar), sees EPS of $0.31-0.36 vs. $0.33 Capital IQ Consensus Estimate and above prior guidance of $0.30-0.35; sees Q3 (Mar) revs of $335-350 mln vs. $335.93 mln Capital IQ Consensus Estimate and above its prior guidance of $325-345 mln.

Additional operational metrics:

The GAAP and non-GAAP gross margin targets remain the same as previously announced with GAAP gross margin targeted to be similar to Q2 and non-GAAP gross margin targeted to be 39.5%
Operating expenses are targeted to be ~$2 mln higher than previously announced, due to higher R&D and marketing costs to support the new product launch.

Cree (CREE) introduced a series of LED bulbs available exclusively at The Home Depot (HD).

HP (HPQ) announced that Teradyne has selected HP FlexNetwork architecture to improve operational efficiency, reduce network downtime and boost design-phase efficiency for new products.

7:32AM Qualcomm increases quarterly dividend by 40% to $0.35/share from $0.25/share; announces new $5 bln stock repurchase program (QCOM) 66.64 : Co announced that its Board of Directors has approved a 40 percent increase in the Company's quarterly cash dividend and, effective immediately, a new $5.0 bln stock repurchase program to replace the prior $4.0 bln stock repurchase program, which had $2.5 bln of repurchase authority remaining. The cash dividend will increase from $0.25 to $0.35 per share of common stock and will be effective for quarterly dividends payable after March 27, 2013.

DSP Group (DSPG) announced that Lightspeed has chosen DSP Group's XceedR DECT CAT-iq 2.0 platform to deliver HD audio for its new classroom audio products, Topcat and Flexcat.

ZTE (ZTCOF) announced a strategic collaboration with Intel (INTC) focused on the Intel Atom Processor Z2580 platform.

Cisco (CSCO) announced that Telenet, a cable TV operator in Belgium, has selected the Cisco Videoscape Snowflake user interface to provide advanced navigation of content and services across their platform.

icon url

ReturntoSender

03/11/13 6:02 PM

#10125 RE: ReturntoSender #6755

From Briefing.com: 4:15 pm : Equities finished today's quiet session near their highs and the S&P 500 gained 0.3%. Including today's advance, the S&P 500 is now less than 10 points away from its highest close of all-time.

The major averages began the day with slim losses. The cautious early trade followed downbeat overseas action where investors responded to disappointing industrial production news out of France and a series of below-consensus data points from China.

The Middle Kingdom reported hotter-than-expected February CPI while the country's industrial production and retail sales growth failed to meet expectations.

The disappointing global data contributed to a lower open in U.S. equities. However, the S&P 500 notched its session low 15 minutes into the day before climbing back into positive territory.

The benchmark index then continued higher as financials, health care, and materials, paced the advance.

The financial sector saw considerable strength from large components. Citigroup (C 47.60, +0.92) was the top performer among the majors while the broader SPDR Financial Select Sector ETF (XLF 18.38, +0.14) gained 0.8%.

Stocks in the materials space also contributed to today's gains. Chemical producers supported the cyclical space and the SPDR Materials Select Sector ETF (XLB 39.81, +0.22) added 0.6%.

Although two growth-oriented sectors led the broader market, the defensive-minded health care stocks also finished among the leaders. Drug makers were some of the strongest components and Merck (MRK 43.66, +0.69) advanced 1.6%.

While the three sectors led the way for the bulk of the session, technology stocks saw some volatility. The tech sector underperformed into the afternoon until Apple (AAPL 437.87, +6.15) spiked to fresh highs on no apparent news. The largest tech stock settled higher by 1.4% after being down as much as 1.5% intraday.

Elsewhere in tech, Dell (DELL 14.37, +0.21) and Icahn Enterprises (IEP 61.20, +0.40) entered into a confidentiality agreement which will give Carl Icahn insight into Dell's books.

On the earnings front, Dick's Sporting Goods (DKS 45.11, -5.49) fell 10.9% after its earnings and revenue fell short of the Capital IQ consensus. Additionally, guidance issued by the company was also below analyst expectations. Investors will gain further insight into recent retail sales when the February retail sales report is released on Wednesday at 8:30 ET.

Today's volume was well below average as 599 million shares changed hands on the floor of the New York Stock Exchange. Today's activity-or lack thereof-put the final tally more than 20% below its 50-day moving average.

The CBOE Volatility Index (VIX 11.78, -0.81) slid below 12.00, and ended at levels not seen since early 2007. With the S&P 500 eyeing fresh all-time highs, the steady decline in VIX suggests complacency is on the rise.

Reviewing S&P 500 sector performance, financials (+0.8%), health care (+0.5%), and materials (+0.4%) led the way. Meanwhile, telecom (-0.2%), energy (UNCH), and consumer staples (+0.1%) rounded out the bottom of the rankings.

Tomorrow's economic data will be limited to the February U.S. Budget with the report set to cross the wires at 14:00 ET. Among earnings of note, Costco (COST 102.44, -0.60) is scheduled to report its quarterly results ahead of the opening bell.DJ30 +50.22 NASDAQ +8.51 SP500 +5.04 NASDAQ Adv/Vol/Dec 1259/1.59 bln/1192 NYSE Adv/Vol/Dec 1603/599.0/1380

3:30 pm :

Apr crude oil lifted off its session low of $90.89 per barrel set in morning floor action and trended higher for the remainder of its session as the dollar index faded to the unchanged line. The energy component picked up momentum heading into the close and settled with a 0.2% gain at $92.06 per barrel.
Apr natural gas trended higher after lifting off its session low of $3.59 per MMBtu set moments after pit trade opened. It broke into the black in late morning action and eventually settled 0.6% higher at $3.65 per MMBtu.
Apr gold pushed into positive territory and to a session high of $1581.20 per ounce in early morning floor trade. It spent the remainder of the session chopping around just above the unchanged line as the dollar index weakened. The yellow metal eventually settled 0.2% higher at $1577.60 per ounce.
May silver spent its entire floor session in negative territory, trading as low as $28.70 per ounce moments after pit trade opened. It settled 0.4% lower at $28.86 per ounce, just below its session high of $28.90 per ounce.

SEACOM has selected Ciena's (CIEN) 6500 Packet-Optical Platform and OneControl Unified Management System for the upgrade of its submarine network across the Southern and Eastern African coastlines.

QLogic (QLGC) announced that its 2600 Series 16Gb Fibre Channel adapters are now available through the EMC Select program for a broad range of EMC storage platforms.

STMicroelectronics (STM) announced that Didier Lamouche, Chief Operating Officer, whose operational role was suspended when he took the assignment as President and Chief Executive Officer at ST-Ericsson in December 2011, has decided to resign from the company effective March 31, 2013 to pursue other opportunities.

10:36 am S&P Information Technology Sector trading lower by -0.55%
The tech sector is trading lower today, trailing narrower losses in the broader market. Semiconductors are showing relative weakness as well with the SOX trading 0.7% lower. Within the chip index, WFR (-2.5%) is a notable laggard. Among other major indices, the SPY is trading 0.1% lower today, while the QQQ and the NASDAQ are trading 0.3% lower on the session. Among tech bellwethers, FB (+2.4%) is showing notable strength, while INTC (-1.4%) is under pressure.

In tech earnings this morning, RENN (-2.6%) posted an inline qtr and guided below consensus. In news, Icahn entered into a confidentiality agreement with DELL (+1.0%). T (-0.4%) confirmed it will launch BBRY (+5.7%) Z10 March 22 For $199.99. ST-Ericsson, a joint venture of STM (-1.5%) and ERIC (+1.2%), announced that Didier Lamouche, president and chief executive officer, has decided to resign from the Company to pursue other opportunities. Among rumors, Bloomberg discussed that CPWR (+0.7%) may be a possible takeover target. Also, we are hearing renewed LNVGY (-3.7%)-for-BBRY (+5.7%) rumor making the rounds. Among notable analyst upgrades this morning in the tech space, ROVI (+0.5%) was upgraded to Overweight at Piper and NXPI (+0.2%) was upgraded to Positive at Susquehanna. Among downgrades, NVDA (-1.4%) was downgraded to Negative at Susquehanna, ADBE (-1.1%) and INTU (-2.1%) were downgraded to Neutral at BofA/Merrill, MANH (-1.8%) was downgraded to Mkt Perform at Raymond James, ALTR (-1.1%) was downgraded to Neutral at UBS, DANG (-2.9%) was downgraded to Neutral at Piper and AAPL (-1.3%) was downgraded to Outperform at Credit Agricole. There are no notable names in tech scheduled to report quarterly results today after the close.

Veeco (VECO) announced that it received a letter from The NASDAQ Stock Market on March 5, 2013 notifying the Company that it is not in compliance with NASDAQ Listing Rule 5250 because its Annual Report on Form 10-K for the year ended December 31, 2012 was not filed on a timely basis with the SEC.

icon url

ReturntoSender

03/12/13 7:59 PM

#10126 RE: ReturntoSender #6755

From Briefing.com: 4:20 pm : The major averages finished today's session on a mixed note. The Dow registered a slightly higher close while the S&P 500 and Nasdaq ended in the red. With today's lower close, the S&P 500 has snapped its streak of seven consecutive winning sessions.

After starting the day on a lower note, the key indices attempted to reclaim their losses. However, selling pressure manifested itself shortly thereafter, and drove equities to session lows.

The morning weakness occurred as sellers targeted cyclical stocks. Financials, industrials, and technology led the decline with financials ending as the weakest group.

The financial sector underperformed amid weakness in major bank names. Morgan Stanley (MS 22.67, -0.43) lost 1.9% while the broader SPDR Financial Select Sector ETF (XLF 18.28, -0.10) slipped 0.5%. Notably, the sector led the morning decline after being one of the top performers year-to-date.

The Dow Jones Transportation Average has also acted as one of the leaders of this year's market rally. Since the start of 2013, the bellwether complex has added more than 15.0%. However, the space trailed behind the broader market today, and settled lower by 0.3%.

Transportation-related stocks also weighed on the industrial sector, which ended as one of the weakest performers. The SPDR Industrial Select Sector ETF (XLI 41.72, -0.24) shed 0.6%.

Elsewhere, the technology sector was pressured by some of its largest components. Apple (AAPL 428.43, -9.44), Google (GOOG 827.61, -7.21), and Oracle (ORCL 35.43, -0.45) all lost between 0.9% and 2.2%.

While large cap tech names lagged, there were some areas of strength. Chipmakers fared relatively well and the PHLX Semiconductor Index rose 0.4%.

With the fourth quarter earnings season drawing to a close, only several notable names have yet to report their results. This morning, Costco (COST 103.75, +1.31) beat on earnings and reported revenue in-line with its March 7 pre-announcement. The relative strength of the retailer contributed to the outperformance of the consumer staples sector.

The defensive trade appeared to be favored today as health care and telecoms finished among the day's leaders. In the health care space, Merck (MRK 45.04, +1.38) added 3.2% after a regulatory body voiced its support for Merck to continue one of its clinical trials.

With equities spending the day in the red, the 10-yr note saw steady buying interest in overnight trade with the bid spilling over into the day session. As a result, 10-yr yield slipped four basis points to 2.02%.

After ending yesterday at its lowest level since early 2007, the CBOE Volatility Index (VIX 12.28, +0.72) jumped over 6.0%.

Trading volume was below average as 622 million shares changed hands on the floor of the New York Stock Exchange.

Looking at tomorrow's economic data, the weekly MBA Mortgage Index will be reported at 7:00 ET. February retail sales, retail sales ex-auto, export prices ex-agriculture, and import prices ex-oil will all be announced at 8:30 ET. Finally, January business inventories will be reported at 10:00 ET and the U.S. Treasury will report its February budget at 14:00 ET.

The U.S. Treasury will also reopen $21 billion in 10-yr notes.DJ30 +2.77 NASDAQ -10.55 SP500 -3.74 NASDAQ Adv/Vol/Dec 1011/1.60 bln/1444 NYSE Adv/Vol/Dec 1244/622.4 mln/1777

3:35 pm : Commodities mostly ended today's session higher with precious metals, copper, natural gas and crude oil ending the day in positive territory. Commodities including heating oil, RBOB gasoline, soybeans and ethanol finished the day in the red.

Apr crude oil rose as high as $93.43/barrel, which was hit one hour after pit trading began, and ended the day up $0.63 at $92.51/barrel. Apr natural gas futures only rose $0.01 to $3.64/Mopped.

Precious metals consolidated in afternoon trade and finished near session highs. Apr gold rose $16.80 to $1591.90/oz and May silver gained $0.20 to $29.17/oz. Mar copper rose $0.05 to $3.55/lb.DJ30 +5.32 NASDAQ -8.98 SP500 -2.98 NASDAQ Adv/Vol/Dec 1031/1405.89 /1404 NYSE Adv/Vol/Dec 1242/424 mln/1761

12:53PM Hewlett-Packard issues statement on ISS recommendation to vote for co's 'Say on Pay' proxy proposal; says 'is pleased that ISS has changed its recommendation' (HPQ) 21.23 +0.20 : Co issued the following statement following Institutional Shareholder Services' (ISS) decision to change its recommendation and encourage shareholders to vote for HP's "Say on Pay" proxy proposal: "HP is pleased that ISS has changed its recommendation to investors and is now supporting the 'Say on Pay' proposal in our proxy statement. We continue to believe that our pay-for-performance program reflects the industry's best practices."

Ciena (CIEN) announced that Ritter Communications has deployed Ciena's packet networking and converged packet optical technologies throughout its regional fiber optic network. Co also announced that the Utah Education Network and the University of Utah have deployed Ciena's 6500 Packet-Optical Platform, equipped with WaveLogic Coherent Optical Processors.

LTX-Credence (LTXC) announced that Texas Instruments (TXN) has selected the LTX-Credence Diamondx tester as its test solution for Cortex-M microcontrollers in a 65nm process.

8:33AM Advanced Micro executes purchase agreement to sell and lease-back austin campus, expected to generate ~$164 million in cash (AMD) 2.59 : Co announced that it has entered into an agreement to sell and lease-back its 'Lone Star Campus' located at 7171 Southwest Parkway in Austin, Texas to 7171 Southwest Parkway Holdings, LP, an affiliate entity of real estate investment company Spear Street Capital. Upon closing, net of all fees, the sale is expected to generate ~$164 mln in cash. The proceeds are expected to be reflected in the company's first quarter 2013 financial statements when reported on Apr. 18, 2013. At closing, AMD will enter into a 12-year lease with an extension option to continue its operations on the campus. The transaction is expected to close on or about Mar. 26, 2013.

Applied Micro Circuits (AMCC) announced significant business traction with coherent optical module suppliers, reporting that eight of the world's largest optical module manufacturers and vertically-integrated 100G systems cos are actively designing solutions based on the AppliedMicro S28032 multiplexer.
Advanced Energy Industries (AEIS) announced that its AE 75TX solar inverters have been selected by First Power and Light for a 147 kW solar energy system at the Mary Switzer Building.

Veeco Instruments (VECO) announced that the Fraunhofer Institute for Applied Solid State Physics IAF has purchased a GEN200 Molecular Beam Epitaxy system.
3S PHOTONICS and Finisar (FNSR) announced their formal agreement to launch a partnership for the development of a new packaging platform for 980nm cooled laser pump modules.

Seagate Technology (STX) announced it is the first hard disk drive manufacturer to ship two bln hard disk drives.

8:07AM Chipmos Technology reports Feb revs declined 5.1% y/y to NT$1,355.3 mln ($45.7 mln) (IMOS) 10.32 : The decline reflects typical seasonality in the industry related to Chinese New Year and normal customer demand patterns. The Company expects to slightly offset this typical softness with continued growth in its LCD driver and mixed-signal businesses.

11:11 am Tech Sector trading lower -0.41% today and behind the overall market
The tech sector is trading lower today, just ahead of larger losses in the broader market. Semiconductors are showing relative strength, however, with the SOX trading 0.4% higher. Within the chip index, MLNX (+6.0%) is a dragging the SOX higher. Among other major indices, the SPY is trading just lower today, while the QQQ is down 0.2% and the NASDAQ is trading 0.3% higher on the session. Among tech bellwethers, QCOM (+0.2%) and TXN (+0.2%) are bucking the trend, while EBAY (-1.1%) is under pressure following its latest comps.

In tech earnings last night, PWRD (-6.4%) posted a slight Q4 miss. In news, CRM (-1.9%) announced a proposed $1 bln offering of convertible senior notes due 2018. CDNS (-3.0%) announced it will acquire Tensilica for ~$380 mln in cash. The deal is expected to be slightly dilutive to non-GAAP EPS in FY13. GLUU (+19.4%) announced the availability of the company's first real-money mobile gambling offering through Probability plc in the UK. Among rumors, we are hearing NCTY () may go private. Also, LNKD (-0.5%) will buy Pulse newsreader for more than $50 mln, according to reports. Among notable analyst upgrades this morning in the tech space, VNTV (+1.9%) was upgraded to Outperform at Raymond James and ISIL (+4.3%) was upgraded to Buy at B. Riley Caris. Among downgrades, RHT (-4.0%) was downgraded to Neutral at Citigroup, DA Davidson downgraded CDNS (-3.0%) to Neutral, AVG (-6.1%) was downgraded to Equal-Weight at Morgan Stanley, INFY (-1.5%) was downgraded to Negative at Susquehanna and PWRD (-6.4%) was downgraded to Neutral at Citigroup. There are no notable names in tech scheduled to report quarterly results today after the close.

08:52 am Xoom initiated with a Buy at Needham; tgt $27: . Needham initiates XOOM with a Buy and price tgt of $27. Xoom is disrupting the legacy cash-to-cash global money transfer mkt, growing substantially faster than the traditional offline players. Firm believes Xoom offers consumers a compelling value proposition with a convenient, fast, and cost effective way to send money to 30 countries. Firm sees Xoom as a multi-year 25-30% revenue growth and margin expansion story that has the potential to deliver sustained upside surprises as it captures share from the legacy players. Despite the almost 50% jump in the stock from the IPO price, firm recommends investors BUY the stock, although it notes it would be more aggressive on pullbacks.

08:52 am Cadence Design downgraded to Neutral at DA Davidson: . DA Davidson downgrades CDNS to Neutral from Buy. Based on Tensilica's trailing 12-month revenue of $44 mln, CDNS is paying ~8x sales net of cash, a premium valuation compared to its closest peer, CEVA, trading at 4x out-year consensus EV/Sales, and higher than the 6x multiple paid for Denali in 2010. Based on Tensilica's 200 employees and an estimated annual all-in cost of $175k to $200k per employee, total operating costs are likely $35-$40 mln. More importantly, this diminishes the likelihood of CDNS initiating a dividend or meaningful stock repurchase program this year (could buy 9% of outstanding), thus removing a potential stock catalyst.

http://finance.yahoo.com/marketupdate/storystocks
icon url

ReturntoSender

03/14/13 8:50 PM

#10128 RE: ReturntoSender #6755

From Briefing.com: 4:25 pm : The major averages ended today's session with modest gains. The S&P 500 advanced 0.6%, and settled within two points of a record close. Meanwhile, the Dow Jones Industrial Average registered its 10th consecutive gain.

After the previous three sessions adhered to the script of early weakness resulting in steady dip buying, today's trade began on the opposite note. The S&P 500 jumped out of the gate and remained in the black for the duration of the day.

While today's start was opposite of that observed in recent days, the result was not. The benchmark index notched session highs shortly before the close, and settled near that level.

The gains were paced by two cyclical sectors. Energy and technology were the top two performers at the start, and they ended in the lead as well.

The energy sector saw broad strength and the SPDR Energy Select Sector ETF (XLE 80.02, +1.08) advanced 1.4% to end at its best level since July 2011. The space outperformed notably even as crude oil registered lesser gains. The energy component ended higher by 0.6%, at $93.08 per barrel.

The technology sector was the other driver of today's action. Major sector components contributed to the outperformance as Apple (AAPL 432.50, +4.15) and International Business Machines (IBM 215.80, +3.74) ended with respective gains of 1.0% and 1.8%.

In addition, chipmakers, which comprise a significant portion of the tech sector, traded ahead of the broader market. The PHLX Semiconductor Index settled higher by 0.5%.

Although growth-oriented sectors ended in the lead, this was not the case with consumer discretionary shares. The group underperformed due to the relative weakness of Amazon.com (AMZN 265.74, -9.36). The online retailer fell 3.4% after JPMorgan Chase downgraded the stock to 'Neutral' from 'Overweight.'

Outside of Amazon.com, remaining discretionary stocks traded in-line with the broader market. Other retailers were unaffected by the stock-specific downgrade and the SPDR S&P Retail ETF (XRT 70.64, +0.45) rose 0.6%.

Today's trade saw all ten S&P 500 sectors end with gains as health care and utilities rounded out the bottom of the rankings.

Health care lagged amid weakness in drug makers after the Food and Drug Administration announced an investigation into several drugs linked to previously-unknown potential side effects. The SPDR Health Care Select Sector ETF (XLV 45.02, +0.04) settled higher by 0.1%.

Trading volume was below average once again as 677 million shares changed hands on the floor of the New York Stock Exchange. Thus far, the average of this week's volume has tracked almost 14% below the 50-day average volume.

With the S&P 500 inching towards record highs, the CBOE Volatility Index (VIX 11.29, -0.54) fell to multi-year lows. Including today's decline, the short-term volatility measure has sunk back to levels last seen in March 2007.

Reviewing today's economic news, weekly initial claims declined 10,000 to 332,000. This was received as a positive sign of life from the labor market after initial claims spent much of last year confined to a range between 350,000-400,000. Today's report marked the third consecutive week which saw a figure outside of that range.

Producer prices rose 0.7% in February. That was up from a 0.2% gain in January and was the strongest monthly increase since rising 1.0% in September 2012. The Briefing.com consensus expected the PPI to increase 0.6%.

Excluding food and energy, core PPI prices rose 0.2% for a second consecutive month. That was exactly what the consensus expected. A large part of the increase in core prices was the result of a strong gain in pharmaceutical preparations.

The current account deficit for the fourth quarter totaled $110.4 billion, which was narrower than the $112.3 billion deficit that had been broadly anticipated.

In tomorrow's economic data, February CPI, core CPI, and the March Empire Manufacturing Index will all be reported at 8:30 ET. Net long-term TIC flows will be announced at 9:00 ET with February industrial production and capacity utilization set for a 9:15 ET release. Lastly, preliminary March Michigan Sentiment will be reported at 9:55 ET.DJ30 +83.86 NASDAQ +13.81 SP500 +8.71 NASDAQ Adv/Vol/Dec 1639/1.61 bln/802 NYSE Adv/Vol/Dec 2006/676.5 mln/986

3:35 pm :

Apr crude oil rose into positive territory moments after pit trade opened and spent most of the session chopping around slightly above the unchanged line. The energy component popped to a session high of $93.18 per barrel as it headed into the close and settled at $93.02 per barrel, or 0.6% higher.
Apr natural gas trended higher during today's pit trade on better-than-anticipated inventory data that showed a draw of 145 bcf when a draw of 134-139 bcf was expected. It lifted from its session low of $3.70 per MMBtu and settled 3.5% higher at $3.81 per MMBtu, just below its session high of $3.82 per MMBtu.
Apr gold began pit trade in negative territory and dipped to a session low of $1575.20 per ounce following economic data that showed initial claims returned to Jan 2008 lows. Despite the initial weakness, the yellow metal inched higher for the remainder of its session as the dollar index weakened. It broke into positive territory in afternoon action and settled 0.2% higher at $1590.60 per ounce.
May silver, on the other hand, did not gain enough momentum to get out of the red. It came off its session low of $28.53 per ounce set in early morning floor trade and settled with a 0.5% loss at $28.81 per ounce, slightly below its session high of $28.89 per ounce. joanna.szklarz: highlight today was definitely nat gas.

4:16PM Interdigital Comm and SII Mobile Communications expand patent license coverage to include 4G (IDCC) 47.33 -0.07 : Co announced that its patent holding subsidiaries have entered into a new agreement with SII Mobile Communications Inc. to extend patent coverage to include 4G technologies, including LTE and LTE-Advanced, as well as products not previously covered under the parties' existing agreement. The patent license agreements now provide SII Mobile Communications with worldwide, non-transferable, non-exclusive, royalty-bearing patent coverage for certain products designed to operate in accordance with 2G, 3G, and 4G wireless technologies. SII Mobile Communications Inc. is a subsidiary of Seiko Instruments Inc. and is headquartered in Japan.

4:10PM STEC misses by $0.03, misses on revs; guides Q1 EPS below consensus, revs below consensus (STEC) : Reports Q4 (Dec) loss of $0.35 per share, $0.03 worse than the Capital IQ Consensus Estimate of ($0.32); revenues fell 39.6% year/year to $35.1 mln vs the $37.91 mln consensus.

Guidance: Co issues downside guidance for Q1, sees EPS of ($0.42)-($0.40) vs. ($0.33) Capital IQ Consensus Estimate; sees Q1 revs of $21-$23 mln vs. $39.25 mln Capital IQ Consensus Estimate.

Commentary: "Although we experienced another very challenging quarter, I am very pleased with the headway that we made towards the successful implementation of our business strategy that is focused on diversifying our customer base ... While the transition from being an OEM-driven company is taking place over time, evidence of our progress includes achieving our first greater-than-10%-of-revenue non-OEM customer, in the second half of 2012. In 2012 and continuing in 2013, we've been executing on our new strategic marketing initiatives and have recruited seasoned personnel with significant Enterprise expertise. I believe that we are now well-positioned to target our key vertical markets. As an organization, we are evolving into a storage systems and solutions provider and away from simply providing components...

4:02PM Suntech Power responds to NYSE inquiries related to unusual trading (STP) 0.65 -0.18 : Co announced that it has been contacted by the New York Stock Exchange, Inc. regarding today's unusual trading activity relating to its American depositary shares. Management of the Company is not aware of undisclosed events that triggered such trading activity. The Company is aware of recent market rumors and third party reports regarding the Company's financial position and other matters. As reported by the Company on March 11, 2013, it has entered into a forbearance agreement with holders of over 60% of its 3% Convertible Notes, for which a principal payment of US$541 million is due on March 15, 2013. The Company does not plan to make such payment and the Company's management is not aware of any pending or planned actions or claims in relation to such non-payment by the trustee or the holders of the Notes. As previously disclosed, the Company plans to continue to work with holders of the Notes with a view to achieving a consensual restructuring.

10:02AM Semiconductor Hldrs ETF continues to display relative strength after gap higher start (SMH) 36.11 +0.38 : The SMH gapped up and extended above its Feb high at 35.99 with it testing/vacillating near its previous 22 month high from March 2012 at 36.17 (session high 36.18) -- ALTR +3.2%, ASML +2%, AMKR +1.8%, KLAC +1.6%, MU +1.4%, XLNX +1.3%, MRVL +1.11%, SNDK =1.1%, TXN +0.9%, LLTC +0.9%, ADI +0.9%.

ANAD -4.5% (announced that it is offering to sell shares of its common stock in an underwritten public offering)

HP (HPQ) announced that Moscow Railways has established new quality and safety levels for its suburban transportation network with a single automated management system based on HP Service Manager software.

Microsemi (MSCC) announced the availability of more than a dozen new devices in its new generation of 1200 volt non-punch through IGBTs which include 25A, 50A and 70A current ratings.

12:26 pm Tech Sector trading higher by +0.5% ahead of the broader market
The tech sector is trading higher today, just ahead of gains in the broader market. Semiconductors are showing relative strength as well with the SOX trading 0.8% higher. Within the chip index, ALTR (+2.9%) is a notable standout. Among other major indices, the SPY is trading 0.3% higher today, as are both the QQQ and the NASDAQ on the session. Among tech bellwethers, EBAY (+3.8%) is showing notable strength, while GOOG (-0.2%) is under a little pressure.

In tech earnings last night, SIGM (+15.4%) posted a mixed qtr, but offered encouraging guidance. This morning, CHL (+1.7%) reported Q4 revenues just shy of estimates. In news, HITT (-1.5%) announced a succession plan for its CEO and reiterated guidance. Among rumors, we are hearing some M&A speculation surrounding RITT (+24.3%). The company also launched a new indoor wireless optical network. Among notable analyst upgrades this morning in the tech space, AAPL (+0.6%) was upgraded to Buy at BTIG, EBAY (+3.6%) was upgraded to Overweight at Evercore, SIGM (+15.4%) was upgraded to Buy at Needham and VMW (+3.0%) was upgraded to Outperform at RBC. Among downgrades, Oppenheimer downgraded DOX (+0.1%) to Perform. There are no notable names in tech scheduled to report quarterly results today after the close.

09:10 am Sigma Designs upgraded to Buy at Needham; tgt $6: . Needham notes SIGM reported F4Q13 revenue in-line with guidance and slightly above its ests. However, EPS was pressured by higher than expected OPEX and an inventory write-down. Importantly, by quarter end, Sigma had completed the actions necessary to achieve its previously announced $45MM cost reduction plan. Accordingly, Co guided for a return to profitability in F1Q14, in-line with mgmt's previously stated goal. Given mgmt's execution on the cost reduction plan, the anticipated return to profitability in F1Q14 and its expectations for sustained profitability, firm is turning positive on SIGM for the first time since 2007 and upgrading to Buy from Hold.

Sigma Designs (SIGM) reported a fourth quarter loss of $0.54 per share, incl items, may not be comparable to the Capital IQ consensus of ($0.25), while revenues rose 24.2% year/year to $44.2 mln vs the $43.43 mln consensus. The company issued in-line guidance for the first quarter with revenues of $49-52 million versus the $51.71 million consensus Estimate. "Moving into Q1 of FY14, based on better visibility into our backlog, we believe revenue will rise sequentially from Q4 levels to between $49-52 million. We expect to see revenue increases in all of our business segments along with improved non-GAAP gross margins to a range of 52-53% driven by higher margin product mix and continued worldwide cost savings. In addition, we expect our proforma operating expenses in Q1 to be between $25.6-26.1 million which includes $2.7 million of depreciation and amortization," said Thinh Tran, CEO of Sigma." "Sigma remains focused on returning to profitability in Q1 FY14 as well as achieving profitable revenue growth throughout the coming fiscal year. By the end of Q4 FY13, the Company had taken the actions required to achieve the $45 million cost reduction plan for fiscal 2014. As a result of these cost reductions and our expected revenue levels, we believe the Company will experience profitability starting in the first quarter. We have restructured our organization from the top to bottom, reducing our headcount by 15.0%. This reduction was principally achieved in our higher cost locations." "We also have sharply reduced our usage of external contract labor in R&D. We are converging on a single SoC platform to deliver our next generation solutions for both set-top box and digital TV markets, which should lead to significant cost efficiencies. In Q4, we achieved $44.2 million in revenue at a 44.0% non-GAAP gross margin. Without a $3.4 million write-down of inventory, non-GAAP gross margin would have been 52.0%, which represents a 3.0% increase above our guidance."

ReneSola (SOL) reported fourth quarter loss of $0.58 per share, $0.18 worse than the Capital IQ two est avg of ($0.40), while revenues rose 63.3% year/year to $306.5 million versus the $255.7 million two est avg. The company issued upside guidance for the first quarter with revenue sof $260-270 million versus the $183.60 million consensus Estimate, with total solar wafer and module shipments to be in the range of 660 MW to 680 MW, with solar module shipments expected to be in the range of 280 MW to 300 MW; and gross margin is expected to be positive. For the full year 2013, the co expects total solar wafer and module shipments to be in the range of 2.7 GW to 2.9 GW (up ~27% YoY at midpoint), with solar module shipments expected to be in the range of 1.4 GW to 1.6 GW. Total solar wafer and module shipments in Q4 2012 were 713.2 megawatts, exceeding Company guidance and representing an increase of 33.9% from 532.8 MW in Q3 2012. "The fast growth of our solar module business, driven by our proprietary Virtus technology, low production costs and global sales teams, contributed to a positive gross margin of 3.3% in the fourth quarter of 2012."
icon url

ReturntoSender

03/17/13 1:01 PM

#10129 RE: ReturntoSender #6755

InvestmentHouse Weekend Market Summary:

http://www.investmenthouse.com/weekendmarketsummary.htm

- The string is broken, no high yet for SP500. Pestilence surely to follow.
- Greenspan says no irrational exuberance. Time to get worried?
- Solid NY PMI, Solid Industrial Production and Capacity, but Michigan Sentiment fades and gets the blame.
- The pullback wasn't much of a pullback even with massive expiration volume.
- May get some better entries this week but saying the trend is over doesn't make it so.

Queue the locusts . . .

You know, last week there were locusts in Egypt and Israel for the first time in decades, rising out of Africa and swarming crops. Maybe that was a foreshadowing of Friday's loss in the stock market that broke the string of upside gains? Of course there is a bit of sarcasm there, but with so much attention on daily gains you would think the failure to make a new gain jeopardizes the rally itself.

The calls for the rally's end have been daily and multitudinous. How long could it go on, how long could those wanting to get in and those who are short endure the move? Maybe they received a bit of a respite Friday as the stock market closed lower for the day. Certainly was not much of a break, however, as the losses were minimal.

SP500 -2.53, -0.16%
NASDAQ -9.86, -0.30%
DJ30 -25.03, -0.17%
SP400 -0.15%
RUTX -0.06%
SOX -1.66%

Ding Dong the streak had ended. Now surely there will be a pullback so everyone can enter and be happy. Ironic, isn't it? Everyone always wants the market to go up, but when it did this time it seemed no one was really happy about it. I read that most hedge funds have underperformed the SP500 this year, caught short literally I suppose, and thus the gnashing of teeth as the market continued moving higher and they had that sinking 'missing the bus' feeling.

But whether they get a modest pullback to use to enter or a deeper and sharper correction post-Friday is very wide open. Indeed it is wide open even if they will get any more pullback than the modest losses Friday showed. The losses were mild and again the small caps were market relative strength leaders. Despite the downside in the market overall, the small cap strength is a longer term positive and belies to a certain extent any notion of a big selloff coming.

Further, much of what we heard ignored some decidedly better economic data on the week. Jobless claims are still not great and are still questionable week to week, but last week's number was not notably misreported and the 365K/week average appears to have been broken. Friday showed some other solid reports as well as the New York PMI beat at 9.2 (6.5 expected); even though lower than the prior 10.0 reading, it is expanding. On top of that Industrial production rose 0.7% versus 0.4% expected (0.0% in January) while capacity jumped to 79.6% from 79.2%, topping expectations.

Who should be blamed for this loss?

No, no, the last report out on the day was the one everyone pointed to and blamed for the loss: Michigan Sentiment preliminary for March dropped to 71.8 when 77.6 was expected and recorded in February. Higher gasoline prices (Thursday's Retail Sales report showed half the gains in retail sales were thanks to higher gasoline prices), higher payroll and Obamacare taxes, and yet, the sequestration and the rather absurd claims made regarding its effect as well as the White House closing are what appear to have spearheaded the decline.

Surely locusts, famine, and plague will follow. Certainly the gloomier blogs were all over the sentiment number, suddenly giving it credence as an economic harbinger that they have never attributed to it before. Industrial production? Not that important. Capacity? No one even cares about that. You get the idea. It was somewhat grim.

But if the pundits are to blame sentiment for the market decline, then should you not blame the causes for that decline? And if you are going to find fault with the causes of the decline, are you not indicting the polices that led to the causes that led to the sentiment decline? Indeed, are you not then indicting the Administration and its policies that fanned higher gasoline prices, the taxes it demanded be increased, and its exaggeration of the sequestration's effects? I don't know about you, but I for one am not going to stand here while these pundits bad mouth the leaders of the United States of America.

Of course that is absurd (in some respects; the blame DOES lie with our leaders and their policies), but it makes the point: sentiment is not to blame for the market fall. It was ripe and faded a bit. Not much of a fade at that.

OTHER MARKETS:

Dollar: 1.3053 versus 1.3008. Stronger overall US data but the dollar weakened and fell to close below the 10 day EMA for the first time this year. Not a major break, but a bit of a change in the steady trend higher.

Bonds: 1.99% versus 2.03% versus 2.02% versus 2.02% versus 2.06% versus 2.05% versus 2.00% versus 1.94% 10 year. Bonds rallied as if the economic data was bad on Friday. Still trending lower but a sharp bounce.

Oil: 93.45, +0.42. 93.03, +0.51. Cracked above the 50 day EMA but nothing definitive. Trying to work back toward 100 and the scale is tipped in that direction, but not decided just yet.

Gold: 1592.60, +1.90. Still bumping its head at the 20 day EMA, unable to move through.

TECHNICAL SUMMARY

INTERNALS

NASDAQ
Stats: -9.86 points (-0.3%) to close at 3249.07
Volume: 2.174B (+32.56%)

Up Volume: 784.99M (-285.01M)
Down Volume: 1.57B (+1.005B)

A/D and Hi/Lo: Decliners led 1.2 to 1
Previous Session: Advancers led 2.02 to 1

New Highs: 226 (-20)
New Lows: 15 (+1)

S&P
Stats: -2.53 points (-0.16%) to close at 1560.7
NYSE Volume: 1.234B (+108.8%)

A/D and Hi/Lo: Decliners led 1.09 to 1
Previous Session: Advancers led 2.13 to 1

New Highs: 514 (-127)
New Lows: 67 (-3)

DJ30
Stats: -25.03 points (-0.17%) to close at 14514.11

BREADTH: Back to flat as you would expect.

VOLUME: Huge volume as it appears the market saved it all up for expiration versus spacing it out during the week. The shorts were waiting until the last minute to see if they could get a better deal. They didn't.

THE CHARTS

SP500. So close to a new high, but was not happening Friday. Modest decline, still trending higher up the 10 day EMA and still room to the upside to the upper channel line. It has done this move before, e.g. in January and February. The big volume spike? Ignore the volume behind the curtain at least for Friday; all expiration as the rally continued and the shorts had to do something.

NASDAQ. Down but also easily holding the trend up the 10 day EMA. Still room to the upside of the channel. Some big names are acting as a drag but some techs are trying to push NASDAQ.

DJ30. Close to bumping the upper channel on Thursday then backed off to close modestly lower Friday. Nice run still in progress despite the horrific 0.17% loss.

SP400. So it took a day off? Still working steadily up the 10 day EMA.

Russell 2000 small caps: Virtually flat with a doji, easily holding the 10 day EMA and still with room to run. The small caps showed leadership to the upside last week as well as relative strength Friday. Good for the market and the economy.

SOX. Busted in the chops but there are still some chips that are looking very good despite the SOX and its domination by a few big names. Even with the 1.66% loss SOX is still trending higher in the middle of its channel.

SUMMARY: A bit of a loss that broke the upside string, but it was indeed just a bit of a loss. The indices are all trending higher though they are in the upper half or higher of their uptrend channels. DJ30 is close and the other large cap indices are closing in. The small and midcaps, however, have some catching up still to do, and they were providing the leadership later in the week so they may finish closing the gap this week. The market is due a test at some point, but based upon the action so far, it is not really showing it is ready to test. I suppose you could try and extrapolate from SOX; it does tend to lead downside, and thus you simply use good stops and don't try to buy everything in the market.

LEADERSHIP

Big names. A flip in this category. AAPL broke upside through its 20 day EMA while AMZN, GOOG struggle for a change.

Technology. A good week though soft Friday. STX, SWI, VSH look good and some more chips such as MLNX and ASML are set up well.

Energy. Some good moves and others setting up , e.g. CRR, DWSN, OII. Still like how MPO is setting up.

Drugs/Healthcare. A good week for many stocks such as CELG while others are setting up, e.g. AMGN, VRTX, SNSS.

If techs decide to start leading this market gets some serious upside going.

THE MARKET

SENTIMENT INDICATORS

VIX: 11.3; 0
VXN: 12.03; -0.3
VXO: 10.97; -0.28

Put/Call Ratio (CBOE): 0.85; +0.12

Bulls versus Bears

Whatever was lower bears and raising bulls the prior week gave up for this week as the bulls surged and bears flopped. Not at extremes on the bulls but moving that was fast while the bears a very near an extreme and that is not good for the market. So in terms of some psychological indicators the market is getting toppy.

Bulls: 50.00% versus 44.2% versus 46.3% versus 48.4% versus 52.6% versus 54.7% versus 54.3% versus 53.2% versus 51.1% versus 47.8% versus 46.8% versus 45.7% versus 43.6% versus 39.3% versus 37.2% versus 38.3% versus 43.6. Over the September 2012 level. Last time the market hit that level SP500 corrected 9% over the next two months. Background: Undercut 35%, the threshold for bullishness, in early June. As noted, hit 34% in early June. It did its job and the market is on the rally. Hard drop to 34 from 39.3% as economic reality and a choppy stock market hit. Off the 55+ level hit in late February. That was the highest level since April and May of 2011, the peak of the post-bear market high. 35% is the threshold level suggesting bullishness. To be seriously bearish it needs to get up to the 60% to 65% level.

Bears: 18.8% versus 21.1% versus 21.1% versus 22.1% versus 21.1% versus 21.1% versus 22.3% versus 22.3% versus 23.4% versus 24.5% versus 24.5% versus 23.4% versus 25.5% versus 27.7% versus 27.7% versus 28.7% versus 27.7%. Summary: Over 35% is the threshold to be really be a good upside indicator. For reference, bearishness hit a 5 year high at 54.4% the last week of October 2008. The move over 50 took bearish sentiment to its highest level since 1995. Extreme negative sentiment. Prior levels for comparison: Bearishness peaked at 37.4% in September 2007. It topped the June 2006 peak (36%) on that run. That June peak eclipsed the March 2006 high (33%) and well above the 2005 highs that spawned new rallies (30% in May 2005, 29.2% in October 2005). That was a huge turn, unlike any seen in recent history.

MONDAY

Lighter on the economic data this week but there are housing starts and existing home sales along with Philly Fed and . . . an FOMC rate decision. After the minutes from the last meeting, you can expect that Wednesday's statements will be closely scrutinized. If anything looks amiss the market is primed to give back ground in its channel.

Ahhh. There it is. I said it. When the market gives back ground here, it does so inside its channel. Look at the index charts: they are all nice steady trends higher. Any selling, unless it is an out and out gutting that drives straight downside, occurs in the context of those channels.

The question you have to know for yourself is whether you let positions or some positions to the upside remain if the market starts to fade further. The channel is not huge but it is big enough to get uncomfortable riding all positions on a test. Typically we keep some of the really strong patterns (as long as they hold up well) and get rid of some that were problematic or had performed but then stumbled. We can pick them up at the bottom of the channel if it holds.

Of course this is not a prediction the indices roll over this week. There are still many great setups out there and sectors that have new stocks on the move whether from energy or chips to healthcare to tech many stocks are still finding money pushed their way and are in accumulation patterns or are breaking higher even as some stocks test. That has been the strength of this move, and we will see if it continues and can keep pushing stocks higher and thus the indices to and through or along their upper channel lines.

If that does not happen we can enter some more downside with some DXD and others to play any channel fade. The irony of the past week is that we banked some very good downside gain even as the market continued upside.

Now if the coming week starts soft we will watch leaders and the emerging stocks and see what kind of entries they provide. If they do not set up then the market likely continues its test. A bit more softness for a day or two won't hurt, and as long as the patterns hold, that kind of dip can lead to some really good entry points as the trend continues. Just because some are jumping on Friday as some kind of tell as to the market's next move, all Friday was for now is a pause in a nice trend higher

Have a great weekend!

Support and resistance

NASDAQ: Closed at 3249.07

Resistance:
3294 is the upper channel line for the November 2012 to present uptrend
3321 from April 2000
3401 is the May 2000 closing low

Support:
3227 is the April 2000 intraday low
3197 is the September 2012 post-bear market high
3171 is the October intraday high
The 50 day EMA at 3162
3156 is the November 2012 up trendline
3134 is the March 2012 post-bear market peak
The 2011 up trendline at 3132
3130 from some January 2013 lows
3104-3112 from August and mid-October peaks.
3101 is the August 2012 high
3090 is the mid-March interim high
3076 is the late April 2012 high and the 1/2013 low after gapping higher
3062 is the December 2012 prior peak
3042 from 5/2000 low and several other price points
The 200 day SMA at 3033
3024 is the gap point from early May
3000 is the February 2012 post-bear market high
2999 is the bottom of the August 2012 consolidation
2988 is the July 2012 high
2977 to 2980 is the bottom of the late October 2012 consolidation, July 2012 peak
2962 is the April 2012 low
2950 is the mid-April closing low
2942 is the mid-June 2012 high
2900 is the March 2012 intraday low
2858 is the late July 2011 peak
2847 is the mid-May 2012 low
2838 from the July 2012 lows

S&P 500: Closed at 1560.70

Resistance:
1576 from October 2007, all-time high
1580 is the upper trendline in the channel

Support:
1556 from July 2007
1539 from June 2007
1531 is the recent high
The November up trendline at 1509
The 50 day EMA at 1507
1499 from January 2008
1475 is the September 2012 high
1471 is the October 2012 intraday high
1466 is the September 2012 closing peak and rally closing high
1440 from November 2007 closing lows
1434 from early November 2012
1433 from August 2007 closing lows
1427 is the August 2012 peak
1425 from May 2008 closing highs and the October 2012 low
The 200 day SMA at 1424
1408 is the late October 2012 range closing low
1406 is the early May 2012 peak
1402.22 - 1400 is the closing low of the August 2012 lateral consolidation
1378 is the February 2012 peak
1375 is the early July 2012 peak
1371 is the May 2011 peak, the post-bear market high
1363.46 is June 2012 high
1359 is the April 2012 low
1357 is the July 2011 peak
1344 is the February 2011 peak
1340 is the early April 2011 peak
1332 is the early March 2011 peak

Dow: Closed at 14,539.14

Resistance:
14,610 is the upper channel line for the trend off the November low.
Now 9.7% above its 200 day SMA, still leaving DJ30 room to run before it gets too top heavy on this run and has to test.

Support:
14,198 from the October 2007 high
14,149 is the February 2013 high
14,022 from 7-07 peak
14,010 from the early February 2013 consolidation
The 50 day EMA at 13,948
13,784 is the late February 2013 closing low
13,692 from 6-2007 peak
13,668 from 12-2007 peak
13662 is the October 2012 intraday high
13,653 is the September 2012 high
13,557 to 13,662
13,413 from the late September 2012 low
13,300 to 13,331 is the August 2012 post-bear market high
13,297 is the April 2012, prior post bear market high
The 200 day SMA at 13,254
13,058 from the May 2008 peak on that bounce in the selling
13,056 is the February 2012 high
12,716 is the April 2012 closing low
12,524 is a range of support from early 2012 and summertime 2012
12,391 is the February 2011 peak
12,369 is the left shoulder low from May 2012
12,284 is the October 2011 peak
12,258 is the December 2011 peak
12,110 from the March 2007 closing low
12,094 is the April 2011 low
12,035 is the June 2012 base low
The June 2011 low at 11,897 (closing)
11,734 from 11-98 peak
11,717 is the late August 2011 peak

Economic Calendar

March 15 - Friday
- CPI, February (8:30): 0.7% actual versus 0.5% expected, 0.0% prior
- Core CPI, February (8:30): 0.2% actual versus 0.2% expected, 0.3% prior
- Empire Manufacturing, March (8:30): 9.2 actual versus 6.5 expected, 10.0 prior
- Net Long-Term TIC Fl, January (9:00): $25.7B actual versus $64.2B prior
- Industrial Production, February (9:15): 0.7% actual versus 0.4% expected, 0.0% prior (revised from -0.1%)
- Capacity Utilization, February (9:15): 79.6% actual versus 79.4% expected, 79.2% prior (revised from 79.1%)
- Michigan Sentiment, March (9:55): 71.8 actual versus 77.6 expected, 77.6 prior

March 18 - Monday
- NAHB Housing Market , March (10:00): 48 expected, 46 prior

March 19 - Tuesday
- Housing Starts, February (8:30): 910K expected, 890K prior
- Building Permits, February (8:30): 924K expected, 904K prior (revised from 925K)

March 20 - Wednesday
- MBA Mortgage Index, 03/16 (7:00): -4.7% prior
- Crude Inventories, 03/16 (10:30): 2.624M prior
- FOMC Rate Decision, March (24:30): 0.25% prior
- FOMC Rate Decision, March (14:00): 0.25% expected, 0.25% prior

March 21 - Thursday
- Initial Claims, 03/16 (8:30): 345K expected, 332K prior
- Continuing Claims, 03/09 (8:30): 3065K expected, 3024K prior
- FHFA Housing Price I, January (9:00): 0.6% prior
- Existing Home Sales, February (10:00): 5.00M expected, 4.92M prior
- Philadelphia Fed, March (10:00): -3.0 expected, -12.5 prior
- Leading Indicators, February (10:00): 0.5% expected, 0.2% prior
- Natural Gas Inventor, 03/16 (10:30): -145 BCF prior
icon url

ReturntoSender

03/18/13 8:51 AM

#10131 RE: ReturntoSender #6755

Good morning. Happy Monday. Hope you had a nice weekend.

http://leavittbrothers.com/blog/index.php/2013/03/18/before-the-open-mar-18-3/

The Asian/Pacific markets closed down across-the-board. Japan and Hong Kong dropped 2% or more; Australia, China, New Zealand and Taiwan dropped more than 1%. Europe is down across-the-board. Austria, France, Germany, Amsterdam and Stockholm are down more than 1%. Futures here in the States point towards a big gap down open for the cash market.

The dollar is up. Oil and copper are down. Gold and silver are up.

The big news out over the weekend was the proposed bailout of Cyprus – a small island country in the Eastern Mediterranean Sea. But the proposed bailout is not just a handout or loan. Instead, upwards of 10% of depositor’s accounts will be confiscated to help pay for the bailout. Imagine that..you’re a citizen of Cyprus, and you wake up Saturday morning to learn the government is taking 10% of the money you have deposited in your bank account. Shocking.

For the record, the amount of money US depositors have lost over the last 5 years due to interest rates being nearly 0% is much greater than 10%. And many people lost a heck of a lot more in the housing market than 10%. Still, it’s shocking. It’s something that wouldn’t surprise you in a country run by a dictator, but a free country?

If Cyprus rejects the bailout offer and defaults, the first first two questions that need to be answered are: who owns their debt and how much leverage is in the system? The first question should be easy to answer; the second may not even be known by those who hold the debt, and the number could potentially be a very scary.

This news is the reason markets all over the world are down.

News trumps the charts, and although Cyprus is a small island country of only 1 million people and is not a big trading partner with the US, it’s hard to say what the ripple effect will be in Europe. Manage your positions wisely, and let’s see what happens this morning. More after the open.
icon url

ReturntoSender

03/18/13 11:28 PM

#10132 RE: ReturntoSender #6755

From Briefing.com: 4:15 pm : The major averages settled firmly lower with the S&P 500 down 0.6%.

Equities began the session amid broad losses after the conditions of a Cypriot bailout put the package in jeopardy of being voted down in the country's parliament. Per the original agreement, Eurozone rescue funds would provide Cyprus with EUR10 billion in recapitalization with a 'stability levy' imposed on all bank accounts expected to raise an additional EUR5.8 billion.

The deposit tax is the main cause for the delay as residents push back against the measure. In addition, global investors viewed this is as a possible precursor to a similar tax being levied on bank accounts elsewhere, should other troubled sovereigns ask for help.

The developments weighed on European markets where peripheral indices trailed behind their core counterparts. In addition, a modest safety bid sent the German 10-yr yield lower by five basis points to 1.41%.

After opening sharply lower, U.S. equities climbed steadily into the afternoon. However, stocks slipped off their best levels of the day when reports indicated the parliamentary vote scheduled for tomorrow has been postponed indefinitely.

The financial sector bore the brunt of today's selling as bank stocks tend to show increased sensitivity in the face of political or economic uncertainty. Morgan Stanley (MS 22.99, -0.60) was the weakest performer among the majors, and the SPDR Financial Select Sector ETF (XLF 18.27, -0.18) lost 1.0%.

Notably, European financials saw wider losses than their U.S. counterparts. Barclays (BCS 18.44, -0.79) and Deutsche Bank (DB 43.02, -1.61) settled lower by 4.1% and 3.6%, respectively.

In addition to financials, other cyclical sectors trailed behind the broader market. However, the technology space was an exception. The growth-oriented sector finished among session leaders with Apple (AAPL 455.72, +12.06) contributing to the relative strength. The largest tech stock advanced 2.7% amid continued speculation the company may hike its quarterly dividend in the near future.

Although a handful of large cap components registered gains, chipmakers ended broadly lower. The PHLX Semiconductor Index, which tracks 30 microchip manufacturers, settled lower by 1.3%.

On the upside, the defensively-oriented telecom space spent the bulk of the day in positive territory. Verizon Communications (VZ 48.75, +0.73) added 1.5% after Citigroup upgraded shares of Verizon to 'Buy' from 'Neutral.' The CBOE Volatility Index (VIX 13.60, +2.30) spiked over 20.0%. The near-term volatility measure has returned to levels last seen at the beginning of the month after sliding to multi-year lows in recent days.

Interestingly, trading volume finished below average as just over 675 million shares changed hands on the floor of the New York Stock Exchange.

In the metals market, gold futures climbed 0.7% to $1603.90 while silver ended little changed at $28.86. Also of note, copper fell 3.0% to its lowest level since November of last year. The weakness was a result of a technical breakdown combined with fears of tighter policy in China after February home sales rose at their fastest pace since December 2011.

Today's economic data was limited to the March NAHB Housing Market Index, which registered a reading of 44. This was lower from the prior month's reading of 46, and also short of the Briefing.com consensus which called for a reading of 48.

Tomorrow's economic news will focus on housing with February housing starts and building permits scheduled to be reported at 8:30 ET.DJ30 -62.05 NASDAQ -11.48 SP500 -8.60 NASDAQ Adv/Vol/Dec 865/1.48 bln/1617 NYSE Adv/Vol/Dec 1170/676.2 mln/1868

3:30 pm : Crude oil traded in negative territory until the late-morning session. Crude fell as low as $91.76/barrel, but recovered all of the overnight/morning losses and ended the day 0.3% higher.

Natural gas futures (continuous contract) came just $0.03 short of hitting its 13-month high of $4.03/MMBtu, which was hit in November 2012. The energy component ultimately sold off in the afternoon session and fell to a new session low.

Gold prices spent the whole session in positive territory, pushing above the $1600 mark and rising as high as $1610.30. By the end of today's session, Apr gold futures finished 0.7% higher. Silver was lagging gold prices today, but still managed to end the day with a small gain. The precious metal spent almost the entire overnight/early morning session in the red and then went on spend the majority of its time in positive territory, putting a session high in of $29.05/oz. At the end of today's session, silver rose three cents to $28.88/oz.DJ30 -40.92 NASDAQ -8.41 SP500 -7.60 NASDAQ Adv/Vol/Dec 894/1225.8 mln/1573 NYSE Adv/Vol/Dec 1182/431 mln/1838

HPQ (22.83 +2.93%): Upgraded to Overweight from Equal-Weight at Morgan Stanley; announced strong momentum of the current HP Indigo Digial Press portfolio

NXPI (30.27 -3.01%): Seeing reports that Samsung will use a Broadcom NFC controller in its Galaxy S4; Samsung had previously used technology from NXP

Riverbed Technology (RVBD) announced that Flughafen Zurich AG deployed Riverbed Cascade Shark and Cascade Pilot to improve network monitoring, configuration, and troubleshooting across 150 national and international networks.

9:04AM TTM Tech signs definitive agreements for SYE and DMC plants (TTMI) 7.89 : The transaction is expected to close by the end of the second quarter of 2013, subject to certain closing conditions between the parties and regulatory approvals. TTM anticipates the transaction will generate approximately $84 million net for TTM, and expects to use about $40 million of the proceeds to repay an intercompany loan to SYE. The negotiated purchase prices valued SYE at 1 billion RMB (approximately $161 million USD) and DMC at 900 million RMB (approximately $145 million USD).

AMD (AMD) announced a collaboration with Aviary to bring an optimized version of its photo editing tool to Windows 8 PCs and tablets powered by AMD accelerated processing units.

8:05AM Suntech Power confirms default with respect to its 3% convertible notes (STP) 0.70 : Co announced that it has received from the trustee of its 3% Convertible Notes a notice of default and acceleration relating to Suntech's non-payment of the principal amount of US$541 million that was due to holders of the Notes on March 15, 2013. Such event of default has also triggered cross-defaults under Suntech's other outstanding debt, including its loans from International Finance Corporation and Chinese domestic lenders.

As previously announced, Suntech has entered into a forbearance agreement with holders of over 60% of the Notes, one of the terms of which is that the forbearing Note holders will cooperate with Suntech in addressing certain legal proceedings that may be initiated against it. Suntech understands that those Note holders have also requested the trustee under the Notes not to take any further action as consensual restructuring discussions continue. Suntech is thus far unaware of any legal proceedings initiated by any Note holders against the Company.

Suntech intends to continue to engage with holders of the Notes and other lenders with a view to achieving a consensual restructuring. Suntech is also continuing its efforts to restructure and increase the cost-efficiency of its operations, maintain business relationships with its existing customers and suppliers, and seek additional sources of capital to meet its ongoing operational requirements and debt repayment obligations.

In addition, Suntech is in discussions with certain of its suppliers and lenders relating to various other claims for non-payment or non-performance, which the Company hopes to resolve in a timely manner. David King, Suntech's CEO, stated, "It is currently a very difficult time for our company and our industry, but the management and board of Suntech are committed to finding a way forward that will take into account the rights and interests of all of its constituents, including shareholders, noteholders, lenders, customers, suppliers and employees. We are currently exploring strategic alternatives with lenders and potential investors, which could help to set us on a path towards longer term success".

NXP Semiconductors (NXPI) introduced a groundbreaking family of programmable AISG transceivers for wireless base stations and antenna line devices such as tower-mounted amplifiers and remote electric tilt antennas.

The main steps agreed upon to split up the JV are the following:

Ericsson will take on the design, development and sales of the LTE multimode thin modem products, including 2G, 3G and 4G multimode
ST will take on the existing ST-Ericsson products, other than LTE multimode thin modems, and related business as well as certain assembly and test facilities
Starting the close down of the remaining parts of ST-Ericsson.

Additional considerations:

The formal transfer of the relevant parts of ST-Ericsson to the parent companies is expected to be completed during the third quarter of 2013, subject to regulatory approvals.
After the split up it is proposed that Ericsson will assume ~1,800 employees and contractors, with the largest concentrations in Sweden, Germany, India and China.
It is also proposed that ST will assume ~950 employees, primarily in France and in Italy, to support ongoing business and new products development within ST.

The agreement is fully in line with ST's financial model target of an operating margin of 10 percent or more and with plans to reduce quarterly net operating expenses to an average quarterly rate in the range of $600-650 mln by the beginning of 2014. In addition, as a result of the agreement, ST expects to incur cash costs, including the covering of ST-Ericsson's ongoing operations during the transition period and its restructuring costs, in the range of ~$350-450 mln, narrower than the range provided at the end of January 2013.

08:53 am Dell shares little changed following response to Carl Icahn
Dell (DELL $14.15 --0.16) disclosed "In a filing co disclosed its response to a letter requesting information that was made available to Carl Icahn. Co writes: "I write on behalf of Dell in reply to your recent correspondence, including the March 11, 2013 "First supplemental demand for records" which seeks "all communications by the Company and its representatives with Icahn Enterprises, L.P., its affiliates and representatives and "all information made available to Icahn." For reasons similar to those stated in the Company's letter to you dated March 12, 2013, by which the Company rejected your original "Demand for records" the Supplemental Demand fails to comply with 8 Del. C. 220.

icon url

ReturntoSender

03/20/13 11:22 PM

#10134 RE: ReturntoSender #6755

From Briefing.com: 4:15 pm : The S&P 500 settled higher by 0.7% after spending the entire session in positive territory.

Equities opened firmly higher amid continued speculation over the future of Cyprus as well as the impact of the parliamentary decision to reject eurozone bailout conditions.

Quiet trade continued into the afternoon as the S&P 500 spent the bulk of the day in a three point range. The benchmark index then climbed to fresh highs before sliding back into the day's range.

The afternoon spike occurred after the Federal Open Market Committee announced its decision to maintain the Fed Funds rate at 0.25% and continue its asset purchase program.

Today's statement from the Federal Reserve was largely in-line with expectations. Regarding economic conditions, the Committee observed a return to "Moderate economic growth following a pause late last year."

The Committee did not show increased concern for inflation levels, and said "Inflation has been running somewhat below the Committee's longer-run objective, apart from temporary variations that largely reflect fluctuations in energy prices. Longer-term inflation expectations have remained stable."

Coinciding with the move to fresh highs was a report out of Nikkei News, which suggested the incoming Bank of Japan Governor Haruhiko Kuroda will call for "bold easing." Although the central bank's dovish stance has been widely-known, this report comes as Mr. Kuroda is expected to formally assume his new role on Thursday. The reports were met with yen weakness as the USD/JPY pair jumped to session highs near 96.00.

Although stocks maintained firm gains throughout the day, sector leadership was mixed. Growth-oriented consumer discretionary shares paced the advance, but defensively-minded consumer staples and health care rounded out the top of the leaderboard.

Discretionary shares outperformed amid strength in homebuilders. Lennar (LEN 43.43, +2.01) and Toll Brothers (TOL 36.55, +2.04) both gained over 4.5% while the broader SPDR S&P Homebuilders ETF (XHB 30.52, +0.72) settled higher by 2.4%.

Elsewhere, the technology space received some support from chipmakers and software companies. The PHLX Semiconductor Index gained 1.2% while software stocks benefitted from the relative strength of Adobe Systems (ADBE 42.46, +1.71). The software publisher gained 4.2% after beating on earnings and revenue. However, the company's second quarter earnings and revenue guidance was on the low end of expectations. In addition, Adobe said its Chief Technology Officer Kevin Lynch is leaving the company to join Apple (AAPL 452.08, -2.41), which shed 0.5%.

On the downside, the industrial sector lagged amid weakness in major sector components. Industrial equipment manufacturers underperformed in the wake of a disappointing global sales report from Caterpillar (CAT 86.94, -1.33) as well as a Wells Fargo downgrade of Deere (DE 87.74, -2.83).

Industrial component FedEx (FDX 99.13, -7.33) endured a rough session and fell 6.9% after missing on the bottom line. The company also guided fourth quarter earnings below consensus due to a slowdown in global revenues. Peer United Parcel Service (UPS 84.03, -1.05) lost 1.2% in sympathy, and the Dow Jones Transportation Average shed 0.4%. Note that both FedEx and UPS are part of the bellwether complex.

Trading volume was below average and largely in-line with Monday's total as 673 million shares changed hands on the floor of the New York Stock Exchange.

Taking a look at the final sector placement, consumer discretionary (+1.2%), consumer staples (+1.0%), and health care (+0.9%) sectors led the broader market while telecom (-0.1%), industrial (+0.1%), and energy (+0.6%) stocks brought up the rear.

Today's economic data was limited to weekly MBA Mortgage Applications, which declined 7.1% to follow last week's decrease of 4.7%.

In tomorrow's economic news, weekly initial and continuing claims will be reported at 8:30 ET. January FHFA Housing Price Index will be announced at 9:00 ET while February existing home sales, leading indicators, and March Philadelphia Fed Survey will all be released at 10:00 ET.DJ30 +55.91 NASDAQ +25.09 SP500 +10.37 NASDAQ Adv/Vol/Dec 1731/1.54 bln/722 NYSE Adv/Vol/Dec 2263/673.1 mln/755

3:35 pm :

May crude oil traded higher as a weaker dollar index and better-than-anticipated inventory data boosted prices. The DoE reported an unexpected draw of 1.314 mln barrels when a build of 2.0 mln barrels was expected. Despite dipping to a session low of $92.47 per barrel in late morning floor trade, the energy component pushed higher as it headed into the close and settled 1.1% higher at $93.52 per barrel, or slightly below its session high of $93.60 per barrel.
Apr natural gas spent pit trade in the red despite its attempt to erase losses. It lifted off its session low of $3.90 per MMBtu and trended higher as the session progressed. It brushed the unchanged line, or session high of $3.97 per MMBtu, as it headed into the close, but ultimately settled with a 0.3% loss at $3.96 per MMBtu.
Apr gold spent its entire floor session in negative territory ahead of the FOMC policy statement which was released today at 14:00 ET. Uncertainty over the future of Cyprus also put pressure on the yellow metal. Gold dipped to a pit session low of $1604.50 per ounce and eventually settled with a 0.3% loss at $1607.50 per ounce.
May silver also chopped around slightly below the unchanged line. It brushed a session low of $28.69 per ounce and settled pit trade 0.2% lower at $28.81 per ounce.

5:15PM Oracle on Conference Call- Q4 Guidance- Sees Non-GAAP EPS in the range of $0.85-0.91, Capital IQ consensus $0.88; Sees revenue growth in the range of -1 to +4%, consensus +4.6% (ORCL) 35.75 +0.07 : Customers knew new products would be launchiung in late March which caused them to hold off on some orders... Sees software license revenue growth in the range of 1%-11%y/y constant currency; hardwarde revenue in the range of -22% to -12% in constant dollars; sees total revenue growth on GAAP and Non-GAAP basis in the range of -1% to +4%; sees Non GAAP EPS growth in the range of $0.85-0.91... GAAP EPS $0.72-0.78

4:05PM Oracle misses by $0.01, misses on revs (ORCL) 35.77 +0.08 : Reports Q3 (Feb) earnings of $0.65 per share, excluding non-recurring items, $0.01 worse than the Capital IQ Consensus Estimate of $0.66; revenues fell 0.9% year/year to $8.96 bln vs the $9.37 bln consensus.

New software licenses and cloud software subscriptions revenues were down 2% to $2.3 billion. Software license updates and product support revenues were up 7% to $4.3 billion.

Hardware systems products revenues were $671 million.

FX adj: total revenues also would have been 1% higher and new software licenses and cloud software subscription revenues would have been 2% higher than reported.

"Our non-GAAP operating margin increased to a Q3 record of 47%, and we expect it to reach an all-time high for the fiscal year. Both operating cash flow and free cash flow were at record levels for a Q3, with operating cash flow of $13.7 billion over the last twelve months. The Oracle Cloud is the most robust and comprehensive cloud platform available with services at the infrastructure (IaaS), platform (PaaS) and application (SaaS) level. In Q3, our SaaS revenue alone grew well over 100% as lots of new customers adopted our Sales, Service, Marketing and Human Capital Management applications in the Cloud. This month we will begin deliveries of servers based on our new SPARC T5 microprocessor: the fastest microprocessor in the world. The new T5 servers can have up to eight microprocessors while our new M5 system can be configured with up to thirty-two microprocessors. The M5 runs the Oracle database 10 times faster than the M9000 it replaces."

4:08PM Jabil Circuit misses by $0.01, reports revs in-line; guides Q3 EPS below consensus, revs below consensus (JBL) 19.47 +0.28 : Reports Q2 (Feb) earnings of $0.53 per share, excluding non-recurring items, $0.01 worse than the Capital IQ Consensus Estimate of $0.54; revenues rose 4.3% year/year to $4.42 bln vs the $4.38 bln consensus.

Co issues downside guidance for Q3, sees EPS of $0.50-0.58, excluding non-recurring items, vs. $0.61 Capital IQ Consensus Estimate; sees Q3 revs of $4.3-4.5 bln vs. $4.52 bln Capital IQ Consensus Estimate.

ADBE (42.3 +3.80%): Beat quarterly EPS by $0.04 ($0.35 vs $0.31 estimate) revs fell ~4% yoy to $1.01 bln vs $985 mln estimate; sees Q2 revs of $0.975-1.025 bln vs $1.016 bln estimate, EPS of $0.29-0.35 vs $0.34 estimate; sees FY13 revs of ~$4.1 bln (in-line), EPS of ~1.45 vs $1.40 estimate; target raised to $46 from $42 at UBS; target raised to $52 from $47 at RBC Capital Markets

Select solar stocks trading lower following STP news: STP -39.4% (confirms group of eight Chinese banks filed a petition for insolvency and restructuring of its Chinese subsidiary Wuxi Suntech Power Holdings; parent co STP has not commenced insolvency proceedings), YGE -1.7%, FSLR -0.5%, SPWR -0.5%, LDK -0.4% .

Trina Solar (TSL) announced a new frame design across its full range of 72-cell monocrystalline and 60-cell polycrystalline modules. The frame thickness has been reduced from 40mm to 35mm, with products becoming immediately available.

AMD (AMD) announced that the SeaMicro SM15000 server is now certified for CDH4, Cloudera's Distribution Including Apache Hadoop Version 4.

SPRD +2.9% (ticking higher, upgraded to Buy from Hold at Jefferies)

8:05AM Suntech Power confirms group of eight Chinese banks filed a petition for insolvency and restructuring of its Chinese subsidiary Wuxi Suntech Power Holdings; parent co STP has not commenced insolvency proceedings (STP) 0.35 : Suntech Power Holdings Co., Ltd., the ultimate parent company of Wuxi Suntech, has not commenced insolvency proceedings, nor have any of the Company's other principal operating subsidiaries.

Co announced that on March 18, 2013, a group of eight Chinese banks filed a petition for insolvency and restructuring of its Chinese subsidiary Wuxi Suntech Power Holdings Co., Ltd. ("Wuxi Suntech") in the Wuxi Municipal Intermediate People's Court in Jiangsu Province, China. Wuxi Suntech today notified the Court that it will not file an objection against the petition. The Company expects that the Court will decide whether or not to accept the petition in the next few days.
Wuxi Suntech is the Company's principal operating subsidiary in China engaged in the manufacture of photovoltaic (PV) cells and PV modules. The Company has additional cell and module production facilities at wholly owned or partially owned subsidiaries in Wuxi, Shanghai and Luoyang and, in the event insolvency and restructuring of Wuxi Suntech is approved by the Court, the Company intends to continue production of solar products to meet customer orders. In addition, management will work with any Court-appointed administrators to ensure all of Suntech's product warranty obligations are met.

12:13 pm S&P Information Technology Index
The tech sector is trading higher today, along with gains in the broader market. Semiconductors are showing relative strength, however, with the SOX trading 0.8% higher. Within the chip index, SPRD (+7.0%) is a notable standout. Among other major indices, the SPY is trading 0.5% higher today, while the QQQ is up 0.2% and the NASDAQ is trading 0.7% higher on the session. Among tech bellwethers, QCOM (+1.6%) is showing notable strength, while FB (-0.6%) is under pressure.

In tech earnings, ADBE (+3.7%) posted a Q1 beat with strong Creative Cloud metrics.

In news, ADBE's (+3.7%) CTO left the company to join AAPL (-1.0%). Also, software IPO MODN (+2.4%) opened for trading at $20.40 after pricing at $15.50.

Among rumors, there are reports out discussing VOD (-0.9%) comments on potential lower debt ratings and acquisition pursuit. Also, we are hearing ORCL (-0.7%) for MLNX (+1.3%) chatter making the rounds.

Among notable analyst upgrades this morning in the tech space, PLCM (+6.1%) was upgraded to Buy at Goldman, SPRD (+7.4%) was upgraded to Buy at Jefferies, BBRY (+5.7%) was upgraded to Overweight at Morgan Stanley and SYNT (+5.0%) was upgraded to Neutral at Susquehanna.

Among downgrades, ZNGA (-4.0%) was downgraded to Neutral at BofA/Merrill, Oppenheimer downgraded SYMC (+1.1%) to Perform and ADBE (+3.7%) was downgraded to Hold at Stifel.

JBL (+0.2%) and ORCL (-0.7%) are the notable names in tech scheduled to report quarterly results today after the close.

08:44 am Adobe Systems downgraded to Hold at Stifel on valuation: . Stifel notes, while it expects the stock to react positively to last night's Q1 results, it's downgrading its rating to Hold from Buy for valuation reasons, as its Fair Value range is now $39-$41/share. While firm believes that Adobe remains well positioned for the ongoing shift of media, advertising and enterprise marketing processes to the Web, at current price levels it views the shares as having limited upside.Adobe's CTO has resigned to pursue other opportunities at AAPL. Adobe will not be replacing him. Firm views this as a negative for Adobe.

Lattice Semi (LSCC) issued upside guidance for the first quarter with revenues of +6-8% sequentially, to approximately $69.8-71.2 million versus the $63.90 million consensus. This compares to prior guidance provided on January 24, 2013 that revenue was expected to decline approximately 2-4% on a sequential basis. GMs Due to the higher expected revenue contribution from the communications and consumer market segments, gross margin percentage is now expected to be at the lower end of the Company's prior guidance of approximately 54% plus or minus 2%. OP-EX Total operating expenses are expected to be approximately $35.5 mln, including approximately $0.5 million restructuring charges. This is unchanged from prior guidance.
icon url

ReturntoSender

03/21/13 8:20 PM

#10135 RE: ReturntoSender #6755

From Briefing.com: 4:15 pm : Equities finished today's session near their lows, and the S&P 500 lost 0.8%.

The major averages began the day in the red with tech stocks driving the early decline. The technology sector underperformed notably after disappointing earnings and cautious revenue guidance from Oracle (ORCL 32.30, -3.47) contributed to selling in several other large cap names. Cisco Systems (CSCO 20.84, -0.83), International Business Machines (IBM 212.26, -2.80), and SAP (SAP 80.72, -2.47) all lost between 1.3% and 3.8%.

In addition to major sector components, chipmakers underperformed as well. The 30-stock PHLX Semiconductor Index fell 1.6%.

Although the sector finished among the day's worst performers, the relative strength of its largest component, Apple (AAPL 452.73, +0.65), prevented the space from logging further losses.

While tech shares pressured the broader market from the opening bell, producers of basic materials declined steadily after France and Germany surprised the market with contractionary manufacturing and services PMI reports. The growth concerns regarding core eurozone economies weighed on the economically-sensitive sector and the SPDR Materials Select Sector ETF (XLB 39.02, -0.68) lost 1.7%.

Notably, today's biggest laggards are also the weakest performing sectors year-to-date. So far this year, the technology space has gained 3.2% while materials are up 3.8%. Meanwhile, the S&P 500 has added nearly 8.5% in 2013.

The Dow Jones Transportation Average was another group which kept the broader market firmly in the red. All 20 components of the bellwether complex settled in the red, and FedEx (FDX 96.50, -2.63) fell 2.7%. Including today's loss, the logistics company is down nearly 10.0% since it reported disappointing earnings ahead of Wednesday's open.

The market attempted an early afternoon rally, but that effort failed as news out of Cyprus provided further headwinds. At the end of the day, the situation remains fluid, but several reports have suggested the country's parliament has taken measures to merge two of its largest banks and impose capital controls in an attempt to stem significant outflows.

The continued uncertainty surrounding Cyprus, and its future in the eurozone, took a toll on financials. Goldman Sachs (GS 145.38, -4.75) was the weakest performer among the majors and the SPDR Financial Select Sector ETF (XLF 18.07, -0.22) dropped 1.2%.

Trading volume was the lowest of the week as just over 650 million shares were traded on the floor of the New York Stock Exchange.

Reviewing today's final sector performance, materials (-1.6%), technology (-1.3%), financials (-1.1%), and industrials (-0.9%) saw the biggest losses while telecom (UNCH), consumer staples (+0.3%), and utilities (-0.5%) withstood the bulk of the selling pressure.

The market received a healthy dose of economic data today. The initial claims level increased by a modest 2,000 from an upwardly revised 334,000 (from 332,000) for the week ending March 9 to 336,000 for the week ending March 16. The Briefing.com consensus expected the initial claims level to increase to 345,000.

Clearly, labor conditions have improved over the last month. For the past four weeks, the initial claims level has held firmly below 350,000. That comes after almost a year where claims had been tightly bounded between 350,000 and 400,000.

The Conference Board's Index of Leading Indicators increased 0.5% in February after increasing an upwardly revised 0.5% (from 0.2%) in January. The Briefing.com consensus expected the index to increase 0.5%.

After two months of negative readings, the Philadelphia Fed's Business Outlook turned positive in March. The index increased from -12.5 in February to 2.0 in March. The Briefing.com consensus expected the index to remain negative and increase to -3.0.

New orders rebounded after contracting in February. The orders index increased to 0.5 in March from -7.8. Unfilled orders, however, remained in a contraction. That index increased from -11.2 to -7.5.

Existing home sales increased 0.8% in February to 4.98 million from an upwardly revised 4.94 million (from 4.92 million) in January. The Briefing.com consensus expected the number of existing home sales to increase to 5.00 million.

There is no economic news scheduled to be released tomorrow.DJ30 -90.24 NASDAQ -31.59 SP500 -12.91 NASDAQ Adv/Vol/Dec 785/1.63 bln/1649 NYSE Adv/Vol/Dec 1053/652.2 mln/1960

3:30 pm :

May crude oil chopped around in negative territory for all of today's floor trade as continued concerns over Cyprus put pressure on prices. The energy component touched a session high of $93.38 per barrel but fell as low as $91.84 per barrel in afternoon action. It eventually settled with a 1.1% loss at $92.48 per barrel.
Apr natural gas fell into negative territory and to a session low of $3.89 per MMBtu as EIA reports showed inventories declined by 62 bcf for the week ending Mar 15 vs expectations for a 70 bcf decline. Prices rose above the $4.00 per MMBtu level in mid-morning action and brushed a session high of $4.03 per MMBtu. However, natural gas pulled-back into the red and settled 0.8% lower at $3.93 per MMbtu.
Both Apr gold and May silver rallied early this morning to their respective session highs of $1616.50 and $29.33 per ounce following initial claims data and basically consolidated near session highs for the remainder of floor trade. Gold settled 0.4% higher at $1613.40 per ounce while silver closed 1.4% higher at $29.22 per ounce.

Broadcom (BRCM) announced that two Chinese equipment manufacturers - SumaVision and ZTE - have adopted Broadcom's C-Data over Cable Interface Standard Ethernet over Coax technology to design products supporting converged services for Internet, television and telecommunications in China.

Texas Instruments (TXN) announced that its SafeTI functional safety hardware development process is now certified as suitable for development of ISO 26262 and IEC 61508 compliant components.

8:04AM Suntech announces that Wuxi Court accepted petition for restructuring of Chinese subsidiary Wuxi Suntech (STP) 0.59 : Co announced that the Wuxi Municipal Intermediate People's Court in Jiangsu Province, China has formally accepted the petition for the insolvency and restructuring of the Company's Chinese subsidiary Wuxi Suntech Power. The Court has appointed an administration committee, consisting of local government representatives and accounting and legal professionals, to administer the restructuring of Wuxi Suntech. The insolvency and restructuring procedure is designed to facilitate an orderly process for both Wuxi Suntech and its creditors. The primary goal is to restructure Wuxi Suntech's debt obligations, while continuing production and operations.

10:49 am S&P Information Technology Index
The tech sector is trading lower today, trailing narrower losses in the broader market. Semiconductors are showing relative weakness as well with the SOX trading 1.0% lower. Within the chip index, STM (-2.6%) is a notable laggard. Among other major indices, the SPY is trading 0.6% lower today, while the QQQ is down 1.0% and the NASDAQ is trading 0.8% lower on the session. Among tech bellwethers, FB (+0.8%) and EBAY (+0.8%) are showing notable strength, while ORCL (-9.3%) is under pressure.

In tech earnings last night, ORCL (-9.3%) posted a Q3 miss and offered cautious guidance. Similarly, JBL (-4.2%) reported a miss and guided lower. Meanwhile, this morning, AVG (+3.8%) guided above its prior range.

In news, HPQ (-0.9%) increased its quarterly dividend by 10%.

Among rumors, there is continued M&A speculation on DELL (+0.3%) with a potential BX (-0.5%) bid. We are also hearing IBM (-1.9%) for RAX (+0.5%) making the rounds.

Among notable analyst upgrades this morning in the tech space, Oppenheimer upgraded YHOO (+3.7%) to Outperform and EA (+2.2%) was upgraded to Buy at Longbow.

Among downgrades, JNPR (-3.0%) and CSCO (-3.4%) were downgraded at FBR, ORCL (-9.3%) was downgraded at Credit Agricole and Evercore, and CHA (-1.4%) was downgraded to Neutral at JP Morgan.

MU (-0.9%) and TIBX (-1.3%) are the notable names in tech scheduled to report quarterly results today after the close.

Last night, Oracle (ORCL) reported Q3 (Feb.) earnings of $0.65 per share, excluding non-recurring items, $0.01 worse than the Capital IQ consensus of $0.66. Revenues fell 0.9% year/year to $8.96 billion vs. the $9.37 billion consensus. New software licenses and cloud software subscriptions revenues were down 2% to $2.3 billion. Software license updates and product support revenues were up 7% to $4.3 billion. Hardware systems products revenues were $671 million. On the conference call, the company issued Q4 guidance of non-GAAP EPS in the range of $0.85-0.91, vs. the consensus of $0.88, and revenue growth in the range of -1 to +4%, vs. the consensus of +4.6%.

Last night, Jabil (JBL) reported Q2 (Feb.) earnings of $0.53 per share, excluding non-recurring items, $0.01 worse than the Capital IQ consensus of $0.54. Revenues rose 4.3% year/year to $4.42 billion vs. the $4.38 billion consensus. The company issued downside guidance for Q3, with EPS of $0.50-0.58, excluding non-recurring items, vs. the $0.61 consensus and revenues of $4.3-4.5 billion vs. the $4.52 billion consensus.

Oppenheimer upgraded Yahoo! (YHOO) to Outperform from Perform and raised its target to $27 from $22. The increase is driven by: 1) a higher current trading value for Yahoo Japan shares; 2) assumption that Alibaba will complete its IPO within the next 12 months at a $77 billion valuation; and 3) now estimate 2013 core EBITDA 2% above the Street on higher search revenues from toolbar/application providers.

FBR Capital downgraded Juniper (JNPR) to Underperform from Market Perform and lowered its target to $15 from $18. FBR believes Juniper will become increasingly more challenged to offset weaker-than-expected routing and switching demand as it works to transition to a more software- and service-centric business model. Looking ahead, FBR sees the potential for additional negative technological trends that could significantly blur the lines between routers, switches, and servers. FBR encourages investors to take profits, and they move to the sidelines as we work to better understand the significant changes occurring across the networking landscape.

AVG Tech (AVG ) issued upside guidance for Q1 (March), with EPS at or above $0.35-0.40 vs. the $0.38 Capital IQ consensus and revenues at or above $95-98 million vs. the $97.01 million consensus. The company reaffirmed guidance for FY13 (Dec.), with EPS of $1.68-1.88 vs. the $1.80 consensus and revenues of $408-420 million vs. the $410.78 million consensus.

09:00 am Cisco Systems downgraded to Underperform at FBR Capital; tgt lowered to $17: . FBR Capital downgrades CSCO to Underperform from Mkt Perform and lowers their tgt to $17 from $22. They believe Cisco will become increasingly more challenged to offset weaker-than-expected routing and switching demand as it works to transition to a more software- and service-centric business model. Looking ahead, they see the potential for additional negative technological trends that could significantly blur the lines between routers, switches AND servers. They encourage investors to take profits, and they move to the sidelines as they work to better understand the significant changes occurring across the networking landscape.
icon url

ReturntoSender

03/27/13 10:53 PM

#10141 RE: ReturntoSender #6755

From Briefing.com: 4:15 pm : The major averages ended the day on a mixed note. The S&P 500 ended lower by 0.1% while Nasdaq added 0.1%.

Although the broader market ended little changed, that did not serve as an accurate portrayal of the day's developments.

The S&P 500 began the session lower by 0.8% as European worries remained at the forefront. The future of the eurozone hangs in the balance with market participants speculating whether or not the European Union will copy the Cypriot playbook next time a troubled nation is in need of emergency assistance.

Further, Italy appears to be headed for another round of elections after Pier Luigi Bersani was unable to form a coalition government. In addition, the Bank of England warned that British banks face a GBP25 billion capital shortfall. Lastly, both France and the United Kingdom reported a 0.3% GDP contraction in their final fourth quarter readings.

The mounting worries resulted in cautious European trade, which saw a safety bid push the German 10-yr yield lower by eight basis points to 1.27%.

In the U.S., bank stocks reflected the uncertainty surrounding the eurozone. While most sectors ended the session well off their lows, banks settled near the bottom of today's range. The SPDR Financial Select Sector ETF (XLF 18.16, -0.09) ended lower by 0.5% and JPMorgan Chase (JPM 47.77, -0.87) was the weakest performer among the majors. Shares of JPMorgan fell 1.8% to close below their 50-day moving average.

Elsewhere, the technology sector trailed behind the broader market, largely due to the underperformance of Apple (AAPL 452.08, -9.06). The largest tech stock sold off throughout the day, and settled lower by 2.0%.

Although Apple weighed on technology, the remainder of the sector displayed some relative strength. Microprocessor manufacturers outperformed and the PHLX Semiconductor Index, which tracks 30 chipmakers, ended with a slim gain of 0.1%.

On the upside, defensively-oriented health care and utilities ended with modest gains. In addition, the energy sector climbed steadily off its opening lows and the SPDR Energy Select Sector ETF (XLE 79.54, +0.26) ended higher by 0.3%.

Even though the broader market ended little changed, a different story was told by currencies and Treasuries.

In the foreign exchange market, the U.S. dollar index climbed in early trade, and held near its highs for the duration of the day. The index ended higher by 0.4% at 83.23. Today's strength was due in large part to weakness in the euro which fell to 1.2770 against the greenback, its lowest level since November.

Meanwhile, the Treasury complex saw an overnight bid which continued into the morning, pushing the 10-yr yield lower by six basis points to 1.85%.

Volume outpaced yesterday's second-lowest total of the year, but today's tally of 596 million remained well below average.

Pending home sales for February fell 0.4%, which was worse than the 2.0% increase forecast by the Briefing.com consensus. Today's reading followed last month's revised drop of 3.8%.

Tomorrow, weekly initial and continuing claims will be reported at 8:30 ET. In addition, the third estimate of fourth quarter GDP and GDP deflator will also be announced at 8:30. Lastly, March Chicago PMI will be released at 9:45 ET.

The U.S. Treasury will auction off $29 billion in 7-yr notes.DJ30 -33.49 NASDAQ +4.04 SP500 -0.92 NASDAQ Adv/Vol/Dec 1158/1.37 bln/1261 NYSE Adv/Vol/Dec 1588/596.3 mln/1407

3:30 pm :

May crude oil erased overnight losses and rose for a fourth consecutive session despite a higher-than-anticipated build in inventories and a stronger dollar index. The energy component dipped to a session low of $95.59 per barrel in early morning floor trade but pushed into positive territory in afternoon action. It settled 0.4% higher at $96.62 per barrel, slightly below its session high of $96.84 per barrel.
May natural gas extended yesterday's gains as it traded above the $4.00 per MBMtu level for its entire pit session. It brushed a session high of $4.10 per MMBtu in afternoon action and settled at $4.07 per MBMtu, or 2.0% higher.
Apr gold trended higher during today's pit trade on weak European business and consumer survey data. The yellow metal lifted off its session low of $1595.20 per ounce and touched a session high of $1607.20 per ounce in mid-morning action. It settled 0.7% higher at $1606.60 per ounce.
May silver spent its entire floor session in the red but managed to erase most of its earlier losses. Despite falling to a session low of $28.08 per ounce as equity markets opened, it climbed higher and settled with a slight 0.1% loss at $28.62 per ounce.

6:34PM TranSwitch announces proposed public offering of common stock and warrants, size not disclosed (TXCC) 0.53 +0.02 : Co announced that it is offering to sell shares of its common stock and warrants to purchase common stock in an underwritten public offering. Maxim Group LLC is acting as the sole manager for the offering. TranSwitch intends to use the net proceeds from the offering for product development, general corporate purposes and working capital.

5:42PM Power Integrations reports appeals decision in patent litigation with Fairchild Semiconductor: court affirms finding of infringement against Fairchild (POWI) 42.73 -0.15 : Co announced a decision from a federal appeals court regarding the company's 2004 patent-infringement lawsuit against Fairchild Semiconductor (FCS). In 2006, Fairchild was found to infringe several Power Integrations patents, resulting in a permanent injunction against more than 100 infringing Fairchild products. The U.S. Court of Appeals yesterday affirmed Fairchild's infringement of Power Integrations' intellectual property rights, supporting the basis for the permanent injunction. The appeals court also identified certain aspects of the case for reconsideration by the district court, including issues surrounding financial damages.

3:05PM Fairchild Semi reports favorable results in lawsuit appeal against Power Integrations (POWI) (FCS) 14.05 +0.05 : Co reported that a federal appeals court vacated almost all of a $12.9 million damages award against the company in its long-running patent litigation against Power Integrations. The appeals court instructed the lower court to conduct further proceedings to determine damages from conduct that Fairchild always agreed occurred, which consisted of approximately $500,000 to $750,000 worth of sales and imports of affected products. Fairchild believes Power Integrations would be entitled to a reasonable royalty on the basis of these direct U.S. sales. Fairchild suspended sales of affected products in the United States in 2007 and offers replacement products that were not accused in the lawsuit. Fairchild and Power Integrations are involved in four other patent lawsuits, including cases in Delaware, California and China.

Sierra Wireless (SWIR) announced a sponsorship program with MedStartr. Sierra Wireless is the preferred provider of wireless communications technology for MedStartr companies.

Marvell (MRVL) announced its ARMADA 1500 Series SoC platform is powering MiiPC, a new concept in Android PCs for families from ZeroDesktop.

Broadcom (BRCM) announced that Indian telecom operator, Idea Cellular, has chosen the BCM21654G for use in its Idea Ivory Android-based smartphone.

6:01AM Spreadtrum Comms announces strategic partnership with Orange (FTE) (SPRD) 19.65 : Co announced that Orange (FTE) has established a strategic partnership with Spreadtrum to use its low-cost mobile platforms for the delivery of a broad portfolio of cost-effective, feature-rich mobile handsets and smartphones to consumers in Orange's European and African markets.

09:26 am Western Digital initiated with a Outperform at RBC Capital Mkts; tgt $55: . RBC Capital Mkts initiates WDC with a Outperform and target of $55. RBC's positive bias is driven by its belief that WDC should be able to sustain its historically superior execution going forward. Assuming the company can achieve its historical 20% multiple premium, relative to STX, it should drive its NTM P/E valuation to 8x (vs. 7x for STX).

Peregrine Semi (PSMI) announced that it has filed a new lawsuit in U.S. District Court alleging the infringement of Peregrine patented intellectual property relating to RFICs and switching technology by RF Micro Devices, Inc. (RFMD). The suit filed in U.S. District Court for the Southern District of California claims that certain RFMD products infringe a newly issued Peregrine patent relating to silicon-on-insulator technology for RFICs. Peregrine seeks, in addition to damages, to permanently enjoin RFMD from further infringement. This new legal action is in addition to an existing lawsuit filed against RFMD in February 2012 and currently pending in U.S. District Court. The new patent, U.S. Patent 8,405,147, concerns Peregrine's HaRP invention that significantly improves the linearity and circuit performance of RF SOI devices. Peregrine believes the HaRP invention is instrumental for RF SOI devices to successfully meet the demanding RF requirements of advanced mobile wireless applications such as 4G LTE.
icon url

ReturntoSender

03/30/13 7:31 PM

#10142 RE: ReturntoSender #6755

From Briefing.com: Weekly Recap - Week ending 29-Mar-13

Dow +52.38 at 14578.54, Nasdaq +11.00 at 3267.52, S&P +6.34 at 1569.19

The major averages ended the last session of the holiday-shortened week with slim gains. The S&P 500 added 0.4%, and notched its highest close of all-time, eclipsing the previous record close set on October 9, 2007.

The day began on a rather uneventful note, but the flat open was followed by a brief stumble which sent the S&P 500 into negative territory after the latest reading of the Chicago PMI missed expectations.

For March, the Purchasing Managers' Index fell to 52.4 from the 56.8 reported in the February report. Meanwhile, the Briefing.com consensus had expected a smaller decline, to 56.5.

The subsequent weakness was quickly bought up, which enabled the benchmark average to spend the rest of the day in a steady upward climb.

Although equities settled with gains, today's advance was paced primarily by defensively-minded groups. Health care and utilities led the broader market for the duration of the session, and ended as the top performing sectors on the day.

Notably, the health care sector ended the month as the top performing group. Further, having gained 15.2% year-to-date, the sector is also the best performer so far in 2013.

Today's other outperformers included industrials and materials. However, their gains were largely the result of rebound trade after the growth-oriented groups saw some weakness over the past two weeks.

The SPDR Materials Select Sector ETF (XLB 39.18, +0.15) settled higher by 0.4%, but even with today's gain, the sector ETF ended the month as the second weakest performer, trailing only behind telecom services.

The weakness of the materials sector is indicative of the persisting growth concerns. These same worries are being reflected by the price of copper futures, which fell 1.1% to $3.405 per pound, to end the quarter at their lowest level since November of last year.

While materials found themselves near the lead, cyclical financials and technology ended as the weakest performers.

Major bank stocks remained under pressure since the first Cypriot bailout proposal was unveiled two weeks ago. Morgan Stanley (MS 21.98, -0.31) was the weakest performer among the majors and the SPDR Financial Select Sector ETF (XLF 18.21, +0.05) registered a slim gain of 0.3% in today's action. However, even with today's gain, the bank sector ETF is down 1.6% since last Monday.

Elsewhere, the technology sector was unable to climb too far above yesterday's close as Apple (AAPL 442.66, -9.42) weighed. The largest tech stock sold off steadily throughout the day before ending lower by 2.1% Also of note, BlackBerry (BBRY 14.44, -0.12) slipped 0.8% after beating on earnings on below-consensus revenue.

Reviewing the final sector performance, utilities (+1.3%), health care (+1.0%), industrials (+0.6%), and materials (+0.5%) led the way. On the downside, energy (-0.3%), financials (+0.2%), and technology (+0.3%) lagged.

Looking back at the day's economic data, the latest weekly initial jobless claims count totaled 357,000. This was higher than the 338,000 that had been expected by the Briefing.com consensus. Today's tally was also above the revised prior week count of 341,000. As for continuing claims, they fell to 3.050 million from 3.077 million.

The third estimate of third quarter GDP showed growth of 0.4%, which was better than the 0.3% that had been expected by the Briefing.com consensus. Meanwhile, the third quarter GDP Deflator was revised up to 1.0%.

Note that equity and bond markets will be closed tomorrow in observance of Good Friday. However, a handful of economic data points will be reported on Friday. February personal income, personal spending and core PCE prices will all be reported at 8:30 ET. Lastly, the final March Michigan Consumer Sentiment Survey will be released at 9:55 ET.

Week in Review: Cyprus Remains in Focus

On Monday, the major averages ended the headline-filled session with modest losses, and the S&P 500 settled lower by 0.3%. Equities began the day amid broad strength with the early gains coming after Cyprus and the Eurogroup agreed on the terms of a rescue package for the island nation. The early gains did not hold past the opening hour after Dutch Finance Minister and Eurogroup head Jeroen Dijsselbloem gave an interview to Reuters in which he explained how the Cypriot bank restructuring may be used as a template for future bailout talks. Growth-oriented sectors were responsible for the bulk of Monday's losses. The industrial space ended as the biggest laggard amid broad weakness. Machinery producers lagged throughout the day, and Caterpillar (CAT 86.97, +0.07) lost 0.9%.

Tuesday ended with firm gains and the S&P 500 settled higher by 0.8%. After starting the day on a positive note, the benchmark average spent the balance of the session in a six-point range. Energy was the only economically-sensitive group which settled among the leaders. Crude oil contributed to the sector strength as the energy component climbed 1.5% to $96.26. Meanwhile, the SPDR Energy Select Sector (XLE 79.31, -0.23) ended higher by 1.1%.

Wednesday's session saw the S&P 500 overcome early losses to close lower by 0.1%. The index began the session lower by 0.8% as European worries remained at the forefront. The future of the eurozone was questioned as market participants speculated whether or not the European Union will copy the Cypriot playbook next time a troubled nation is in need of emergency assistance. Bank stocks reflected the uncertainty surrounding the eurozone. While most sectors ended the session well off their lows, banks settled near the bottom of today's range. The SPDR Financial Select Sector ETF ended lower by 0.5% and JPMorgan Chase (JPM 47.46, -0.31) was the weakest performer among the majors. Shares of JPMorgan fell 1.8% to close below their 50-day moving average.
 
Index Started Week Ended Week Change % Change YTD %
DJIA 14512.03 14578.54 66.51 0.5 11.3
Nasdaq 3245.00 3267.52 22.52 0.7 8.2
S&P 500 1556.89 1569.19 12.30 0.8 10.0
Russell 2000 946.27 951.54 5.27 0.6 12.0


09:58 am Q4 GDP revised higher in Third estimate
Fourth quarter real GDP was revised up in the third estimate to 0.4% growth. That compared favorably to the Briefing.com consensus estimate of 0.3% growth and the first estimate that showed a 0.1% contraction. The GDP deflator was bumped up to 1.0% (Briefing.com consensus +0.9%) from 0.9%.

The upward revision was owed primarily to nonresidential investment, which increased 13.2% in the third estimate versus 9.7% in the second estimate. That bumped up the contribution to real GDP from nonresidential investment to 1.28 percentage points from 0.96 percentage points. Conversely, personal consumption expenditures growth was revised down to 1.8% from 2.1%. That reduced the contribution to real GDP from PCE to 1.28 percentage points from 1.47 percentage points. Small changes were seen in most other areas, including net exports, which contributed 0.33 percentage points versus 0.24 percentage point sin the second estimate. Real final sales of domestic product, which exclude the change in inventories, increased 1.9% versus 2.4% in the third quarter. The upward revision to Q4 GDP was nice to see, but clearly, growth was weak in the fourth quarter. This report won't have any impact on the market given its dated nature and the understanding that first quarter growth is looking much better at this juncture. Our Q1 GDP forecast currently sits at 2.9%.

09:57 am Initial Claims Back in Familiar Territory
Initial claims increased by 16,000 to 357,000 for the week ending March 23 (Briefing.com consensus 338,000). Initial claims had fallen below 350,000 for four weeks straight, so the latest number tips things back into the 350,000-400,000 zone where claims had been for most of the last year. We'll have to see if this is a return to prior form when next week's number is released. For the moment, we aren't going to read too much into it as a sign of weakening labor conditions. It doesn't appear as if the market is either since the S&P futures saw little change after its release. As an aside, the Department of Labor said this week's release reflects the annual revision to the weekly unemployment claims seasonal adjustment factors. Continuing claims for the week ending March 16 decreased 27,000 to 3.05 mln (Briefing.com consensus 3.04 mln).

07:59 am Verient Systems shares spike 6% following better than expected earnings
Verint Systems (VRNT $36.95 +2.12) reported fourth quarter earnings of $0.91 per share, excluding non-recurring items, $0.16 better than the Capital IQ consensus Estimate of $0.75; GAAP revenues rose 8.0% year/year to $229 million versus the $225.96 million consensus. The company issues guidance for fiscal year 2014 with EPS of $2.70-2.80, excluding non-recurring items, versus the $2.80 consensus; with non-GAAP rev +6-7%. "While this is our annual outlook, there are seasonal trends in the enterprise software industry, and therefore we expect Q1 to be down sequentially from Q4 levels both in terms of revenue and profitability. [in line with ests]"

07:46 am Five Below shares plunge 6% following miss on revenues and downside guidance
Five Below (FIVE $36.54 -2.02) reported fourth quarter earnings of $0.39 per share, excluding non-recurring items, $0.01 better than the Capital IQ consensus of $0.38, while revenues rose 38.0% year/year to $173.6 million versus the $170.5 mln consensus. This compares to Jan 15 guidance: adjusted EPS of $0.36-0.38 and revenue of $169-172 million. The company issued downside guidance for the first quarter with EPS of $0.02-0.03, excluding non-recurring items, versus the $0.05 Capital IQ Consensus Estimate and revenues of $92-94 million versus the $94.2 million consensus. The company issued downside guidance for fiscal year 2013 with EPS of $0.62-0.65, excluding non-recurring items, versus the $0.71 consensus and revenues of $516-521 million versus the $533.4 million consensus. Comparable store sales increased by 4.4% in the quarter. "The strong holiday quarter capped a year in which we delivered 41% sales growth and 50% adjusted operating income growth." "As we look to 2013, the planned 60 net store openings include promising new markets in Texas, as well as existing markets that offer significant opportunities for expansion."

07:43 am Blackberry shares soar 7% following beat on earnings
BlackBerry (BBRY $15.66 +1.08) reported fourth quarter earnings of $0.22 per share, excluding non-recurring items, $0.53 better than the Capital IQ Consensus Estimate of ($0.31), while revenues fell 35.9% year/year to $2.68 billion versus the $2.84 bln consensus. The revenue breakdown for the quarter was ~61% for hardware, 36% for service and 3% for software and other revenue. During the quarter, BlackBerry shipped ~6 million BlackBerry smartphones (~1 mln BlackBerry 10 units) and ~370,000 BlackBerry PlayBook tablets. Co reports approximately 76 mln subs. Co issues upside guidance for the first quarter, sees EPS approaching breakeven, excluding non-recurring items, versus the ($0.11) consensus. The company will be increasing its marketing investment in the first quarter of fiscal 2014 in support of the global launch of BlackBerry 10. Including the anticipated 50% sequential increase in marketing spending, the Company believes it will approach breakeven financial results in the first quarter based on its lower cost base, more efficient supply chain, and improved hardware margins. "We have implemented numerous changes at BlackBerry over the past year and those changes have resulted in the Company returning to profitability in the fourth quarter." The co also announced that Mike Lazaridis, having fulfilled the commitment he made to the Board in January 2012, has decided to retire as Vice Chair and a Director of the Company.

07:42 am Red Hat shares fall 5% following slight miss on revenues
Red Hat (RHT $47.50 -2.47) reported fourth quarter earnings of $0.36 per share, excluding non-recurring items, $0.06 better than the Capital IQ consensus Estimate of $0.30, while revenues rose 17.1% year/year to $347.9 million versus the $349.44 mln consensus. "For FY13, the growth drivers in our business remained intact, driving record annual revenue, billings proxy and total backlog up 17%, 14% and over 19% year-over-year, respectively. Within total backlog, the value of customer contracts to be billed in the future and not reflected in our financial statements increased to over $280 mln, or up over 40%, as customers increased their commitments to Red Hat technologies in the data center. We continued to see momentum with large deals in Q4, closing a record number of deals in excess of $5 mln and $10 mln. We now provide solutions to over 90% of Fortune 500 companies as well as tens of thousands of smaller companies. New customer additions coupled with renewing and up-selling our existing customer base enabled us to exceed the billion dollar milestone in both subscription revenue and deferred revenues for the first time."

07:40 am PayChex shares fall 2% following in line revenues
Paychex (PAYX $34.00 -0.76) reported third quarter earnings of $0.40 per share, $0.01 better than the Capital IQ consensus of $0.39, while revenues rose 4.2% year/year to $593.3 million versus the $592.62 million consensus. Total service revenue increased 4% to $582.4 million. Payroll service revenue increased 2% to $393.7 million. Human Resource Services revenue increased 10% to $188.7 million. Operating income and operating income, net of certain items, both increased 7% to $225.0 million and $214.1 million, respectively. Co reaffirms FY13 guidance. FY13 payroll rev growth rate is based upon anticipated client base growth and modest increases in revenue per check. HRS revenue growth is expected to remain in line with our historical organic experience. Revenue growth is expected to be stronger in the fourth quarter. Prior acquisitions are expected to have minimal impact on projected revenue growth rates for fiscal 2013. Low High Payroll service revenue 2 % - 3 % HRS revenue 9 % - 11 % Total service revenue 5 % - 6 % Net income 5 % - 7 %

http://finance.yahoo.com/marketupdate/storystocks
icon url

ReturntoSender

04/03/13 6:14 PM

#10145 RE: ReturntoSender #6755

From Briefing.com: 4:20 pm : The S&P 500 spent today's session in a steady decline before settling lower by 1.1%. Notably, small cap stocks extended their recent weakness as indicated by a 1.7% decline in the Russell 2000. Including today's weakness, the small cap index is down more than 3.0% since Monday's open.

However, the small cap index was not the only casualty of today's selling. Growth-oriented sectors pressured the broader market from the open as financials and energy led to the downside.

The financial sector ended as the biggest laggard. Citigroup (C 42.50, -1.61) was the weakest performer among the majors, and the broader SPDR Financial Select Sector ETF (XLF 17.92, -0.30) fell 1.7%.

Elsewhere, the energy sector was pressured by a notable drop in the price of crude oil. The energy component slid 2.9% to $94.41. In response, the SPDR Energy Select Sector ETF (XLE 77.23, -1.47) lost 1.9%.

Commodity-related stocks in the materials space also finished among the biggest decliners. The SPDR Materials Select Sector ETF (XLB 38.14, -0.32) dropped 0.8%, and the sector ETF is down almost 5.0% since March 14.

The continued global growth concerns were also reflected by the price of copper, which fell 1.5% to $3.327 per pound, its lowest level since early August.

While today's selling weighed on all ten sectors, two groups which were key to the first quarter rally, registered wider losses than the broader market.

The Dow Jones Transportation Average finished lower by 1.3% with airlines leading the decline. Delta Air Lines (DAL 14.56, -0.38) and United Continental (UAL 28.66, -0.72) both lost 2.5%.

Today marked the third consecutive session which saw the bellwether complex end with a loss of at least 1.0%. In addition, the 20-stock group ended the day on its 50-day moving average. The index has not closed below this closely-watched indicator since November 21.

Homebuilders also saw outsized losses and the SPDR S&P Homebuilders ETF (XHB 28.52, -0.83) slid 2.8%. Today's selling also caused the homebuilders ETF to end below its 50-day average, and down 5.0% on the week.

Also of note, the recent saber-rattling out of North Korea continued today with reports indicating the North Korean army has received the approval for a nuclear attack on the United States. Although the headline crossed late this afternoon, defense-related stocks outperformed throughout the session. The PHLX Defense Sector Index ended with a loss of just 0.3%.

Today's volume was well above average as more than 810 million shares changed hands on the floor of the New York Stock Exchange.

Reviewing today's final sector performance, financials (-1.7%), energy (-1.6%), consumer staples (-1.1%), and consumer discretionary (-1.0%) ended as the weakest sectors. Meanwhile, utilities (-0.3%), health care (-0.6%), and industrials (-0.7%) outperformed the broader market.

Looking back at today's economic data, the weekly MBA Mortgage Applications fell 4.0% to follow last week's rise of 7.7%.

According to today's ADP National Employment Report, employment in the nonfarm private business sector rose by 158K in March. This was below the increase of 197K expected by the Briefing.com consensus.

The ISM Non-manufacturing index softened in March, falling from 56.0 in February to 54.4. The Briefing.com consensus expected the index to drop to 55.5.

Tomorrow, March Challenger Job Cuts will be reported at 7:30 ET while initial and continuing claims will be announced at 8:30 ET.

In addition, the Bank of Japan and the European Central Bank are both scheduled to announce their latest interest rate decisions.DJ30 -111.66 NASDAQ -36.26 SP500 -16.56 NASDAQ Adv/Vol/Dec 572/1.76 bln/1891 NYSE Adv/Vol/Dec 649/811.4 mln/2358
3:35 pm : Commodities continued to struggle today, despite weakness in the dollar index.

May crude oil extended losses following the weekly inventory data and ultimately ended the day 2.8% lower at $94.49/barrel. Natural gas futures trended lower for most of the day, finishing 1.8% lower at $3.90/MMBtu.

Precious metals sold off this morning, bottoming early on in the afternoon session. June gold fell as low as $1550.70/oz, while May silver fell as low as $26.74/oz. June gold lost $23 to $1553.30/oz and May silver fell $0.45 to $26.80/oz.

Broadcom (BRCM) and SK Telecom (SKM) announce industry's first 5G WiFi Hotspot Router

9:31AM Microvision announces agreement with electronics display company to incorporate PicoP display technology into a display engine (MVIS) 1.64 +0.04 : Co announced a development agreement with a prominent electronics company to incorporate MicroVision's ground breaking PicoP display technology into a display engine that could enable a variety of new products. Under the agreement MicroVision is supporting the OEM's development of a display engine based on patented PicoP display technology and includes $4.6 million in development fees to MicroVision over the next 13 months. The companies have begun commercial negotiations with the expectation that licensing and component supply agreements would constitute the next stage of engagement leading to the OEM's introduction of commercial products. At the request of MicroVision's OEM customer, its name and other details of the contract are being kept confidential.

8:01AM Cisco Systems announces intent to acquire Ubiquisys, a provider of 3G and long-term evolution small cell technology for approx $310 mln in cash and retention-based incentives (CSCO) 21.22 : Co announced its intent to acquire privately held Ubiquisys, headquartered in Swindon, U.K. Ubiquisys is a provider of intelligent 3G and long-term evolution (LTE) small-cell technologies that provide seamless connectivity across mobile heterogeneous networks for service providers. "Cisco is 'doubling down' on its small cell business to accelerate strong momentum and growth in the mobility market," said Kelly Ahuja, senior vice president and general manager, Cisco Mobility Business Group.

Upon the close of the acquisition, the Ubiquisys employees will be integrated into the Cisco Service Provider Mobility Group, reporting to Partho Mishra, vice president and general manager, Service Provider Small Cell Technology Group. Under the terms of the agreement, Cisco will pay approximately $310 million in cash and retention-based incentives to acquire the entire business and operations of Ubiquisys. The acquisition is expected to close in the fourth quarter of Cisco's fiscal year 2013, subject to customary closing conditions.

Cray (CRAY) announced that the Japan Advanced Institute for Science and Technology has put Japan and Asia's first Cray XC30 supercomputer into production.

3:37AM LDK Solar provides update on purchase agreement for LDK Anhui (LDK) 1.04 : Co announces that it continues to work with the relevant governmental agencies on the review and approval of the purchase agreement for LDK Anhui. The purchase agreement was announced on January 2, 2013, with Shanghai Qianjiang Group. According to the terms of the agreement, Qianjiang Group agreed to purchase all shares of LDK Anhui, located in Hefei City, for ~RMB25 mln and release the guarantee LDK Solar provided to LDK Anhui and its subsidiaries within 12 months, as well as compensate LDK Solar for any loss associated with such guarantee, prior to its release.

10:59 am S&P Information Technology Sector trading slightly higher today
The tech sector is trading lower today, but ahead of larger losses in the broader market. Semiconductors are showing some weakness with the SOX trading 0.4% lower. Within the chip index, CREE (-2.3%) is a notable laggard. Among other major indices, the SPY is trading 0.4% lower today, while the QQQ is down 0.1% and the NASDAQ is trading 0.3% lower on the session. Among tech bellwethers, FB (+3.3%) is showing notable strength, this follows an SEC rule that allows public disclose on social media, while VZ (-0.9%) is under pressure. In tech earnings, ATML (-0.9%) modestly raised guidance last night, along with announcing a CFO appointment.

This morning, MSPD (-11.6%) lowered Q2 guidance. In news, ZNGA (+13.4%) announced ZyngaPlusPoker and ZyngaPlusCasino launching for UK players; the co's first real money games. GLUU (+3.3%) is also trading higher on the news. Elsewhere, VZ (-0.9%) disclosed it is a willing purchaser of the 45% stake VOD (-3.8%) holds in VZW, but does not have any intention to merger with or make an offer for VOD. Among rumors, CVLT (-1.0%) takeover speculation was discussed in a Bloomberg M&A story. Also, strength in NIHD (+20.1%) is being attributed to reports that Nextel Peru sale has been finalized. Among notable analyst upgrades this morning in the tech space, FBR upgraded ATML (-0.9%) to Outperform and SWI (+1.5%) upgraded to Equal-Weight at Morgan Stanley. Among downgrades, LLTC (-0.1%) was downgraded to Neutral at Longbow and Stifel downgraded SQI (-4.6%) to Hold. There are no notable names in tech scheduled to report quarterly results today after the close.

Atmel (ATML) raised bottom end of revenue guidance for the first quarter with revenues of $318-328 million from prior guidance of $311-328 million versus the $320.69 million consensus. The company announced that Steve Skaggs, who currently serves as Atmel's Senior Vice President of Corporate Strategy & Development, has also been appointed interim Chief Financial Officer of Atmel, effective immediately.

Needham initiated Exar (EXAR) with a Buy and price target of $13. The firm says, a new CEO was brought on board in early 2012 and he wasted no time in restructuring the cost model while also bringing on board some hand picked executives to lead Exar into growth areas. They say as a result, Exar has returned to profitability, generated positive FCF and already made its first acquisition in three years as it puts its $200 million cash position to good use. Going forward, mgmt will focus its product development efforts on Data Compression & Security, which offers a higher mix than current GM levels and benefits directly from big data and cloud infrastructure builds.
icon url

ReturntoSender

04/04/13 7:08 PM

#10146 RE: ReturntoSender #6755

From Briefing.com: 4:20 pm : Equities began the day on a mixed note with the S&P 500 climbing out of the gate while Nasdaq slipped into the red, where it spent the majority of today's session.

Although the S&P saw early gains, the index notched its highs within the opening minutes, before sliding into negative territory. However, afternoon buying pulled the S&P out of the red, and the index ended with a gain of 0.4%.

After Wednesday's selloff caused the benchmark average to slide 1.1%, a handful of yesterday's underperformers began among today's leaders. The early leadership did not hold into the afternoon as some defensive sectors began appearing atop the leaderboard.

Counter-cyclical telecoms and utilities climbed throughout the day, and saw the largest gains. In addition, a rebound in financials and materials helped those two groups outperform the broader market.

Although the financial sector ended with firm gains, major components saw mixed performance. Goldman Sachs (GS 142.99, -0.42) shed 0.3% while JPMorgan Chase (JPM 47.49, +0.64) rose 1.4%.

Despite today's gains, financials remain one of the weakest sectors in April. The SPDR Financial Select Sector ETF (XLF 18.08, +0.16) is down 0.7% since April 1.

Elsewhere, the SPDR Materials Select Sector ETF (XLB 38.47, +0.33) climbed 0.9% amid strength in gold miners. The Market Vectors Gold Miners ETF (GDX 35.22, +0.97) advanced 2.8%.

Even though materials finished among today's leaders, the sector is the second weakest performer in April, trailing behind energy. The energy space shed 0.2% during today's session as crude oil slipped 1.3% to $93.25 per barrel.

While financials and materials were able to rebound from yesterday's selloff, that was not the case for the Dow Jones Transportation Average. After losing more than 1.0% in each of the past three sessions, the bellwether complex ended little changed as railroads pressured the 20-stock group. CSX (CSX 23.77, -0.18) and Norfolk Southern (NSC 73.86, -1.30) saw respective losses of 0.8% and 1.7% after an analyst report suggested carriers will report disappointing first quarter rail volume.

On the downside, weakness among major tech names like Apple (AAPL 427.72, -4.27), Google (GOOG 795.07, -11.13), and International Business Machines (IBM 211.31, -1.35) weighed on the sector. Meanwhile, the tech-heavy Nasdaq ended with a gain of just 0.2%.

Despite the broader market ending in positive territory, a safety bid across the Treasury complex sent the 10-yr yield lower by five basis points to 1.76%. Also notable was the 30-yr yield finishing below 3.00% for the first time in 2013.

Today's volume was largely in-line with Monday's total as just over 645 million shares changed hands on the floor of the New York Stock Exchange.

Looking back at the final sector performance, telecom (+1.3%), utilities (+0.9%), financials (+0.9%), and materials (+0.8%) outperformed the broader market. Meanwhile, technology (-0.2%) and energy (-0.1%) settled in the red.

Today's economic data focused on jobs. The initial claims level jumped to 385,000 for the week ending March 30 from 357,000 for the week ending March 23. The Briefing.com consensus expected the initial claims level to fall to 345,000.

The increase in claims was not the result of a sudden softening in labor market conditions. The seasonal adjustments used by the Department of Labor have a difficult time accounting for the Easter holiday. Because the Easter holiday falls on a different date each year, the seasonal adjustments from one year to the next cannot adequately explain seasonal employment fluctuations from Easter-related hiring and firing.

Tomorrow morning will be busy in terms of economic news. March nonfarm payrolls, nonfarm private payrolls, unemployment rate, hourly earnings, average workweek, and February trade balance will all be reported at 8:30 ET. The busy day will be topped off by a 15:00 ET release of February consumer credit.DJ30 +55.76 NASDAQ +6.38 SP500 +6.29 NASDAQ Adv/Vol/Dec 1552/1.42 bln/862 NYSE Adv/Vol/Dec 1836/646.9 mln/1106

3:30 pm :

May crude oil extended yesterday's losses following this morning's jobless claims data. The energy component brushed a session low of $92.12 per barrel in afternoon pit action and eventually settled with a 1.3% loss at $93.25 per barrel.
May natural gas initially popped to a session high of $3.98 per MMBtu on inventory data that showed a draw of 94 bcf when a draw of 91-92 bcf was anticipated but then tumbled into the red and to a session low of $3.86 per MMBtu. Despite the dip, natural gas recovered back into positive territory and settled 1.0% higher at $3.94 per MMBtu.
June gold lifted off its session low of $1543.70 per ounce following the jobless claims data and dovish comments from ECB President Mario Draghi. A slight rally heading into the close helped erase most of earlier losses leaving gold to settle nearly flat at $1552.60 per ounce.
May silver also chopped around slightly below the breakeven level. It dipped to a session low of $26.58 per ounce in morning floor action and settled at $26.75 per ounce, or 0.2% lower.

4:35PM Hewlett-Packard confirms changes to Board of Directors: Raymond J. Lane steps down as chairman, remains director; Ralph V. Whitworth becomes interim chairman (HPQ) 22.30 +0.39 : Co announced changes to its board of directors. Raymond J. Lane has decided to step down as chairman of the board, to be replaced on an interim basis by Ralph V. Whitworth. The board is commencing a search for a permanent nonexecutive board chairman. In addition, John H. Hammergren and G. Kennedy Thompson, after eight and seven years of service to HP stockholders, respectively, have decided to leave the board. Both directors will continue to serve until the May board meeting. The board is commencing a search for two or more new independent directors.

With Lane stepping down as executive chairman, the role of lead independent director, currently held by Rajiv L. Gupta, is no longer necessary and will be eliminated. Gupta will remain on the board and will replace Thompson as chairman of the Audit Committee. Gary M. Reiner will replace Gupta as chairman of the Nominating and Governance Committee. With Hammergren's departure, Whitworth will become chairman of the Finance and Investment Committee.


4:09PM F5 Networks preannounces Q2 results below guidance/consensus (halted, will resume trade at 16:25) (FFIV) 90.42 -0.10 : Co issues downside guidance for Q2 (Mar), sees EPS of $1.06-1.07, excluding non-recurring items, vs. $1.23 Capital IQ Consensus ($1.21-1.24 previous guidance); sees Q2 (Mar) revs of $350.2 mln vs. $376.05 mln Capital IQ Consensus ($370-380 mln previous guidance).

John McAdam, F5 president and chief executive officer, said the revenue shortfall resulted primarily from a slowdown in North American and to a lesser extent EMEA sales, while sales in Japan and Asia-Pacific were essentially in line with the co's expectations. "From a market perspective, Telco bookings were down sharply on both a sequential and year-over-year basis. U.S. Federal sales were also down significantly from the second quarter a year ago. Currently, we are looking into all the factors affecting the quarter's results and we plan to provide more color during our regularly scheduled release and conference call on April 24."

4:07PM ARM Holdings and Cadence (CDNS) confirm partnership to implement Cortex-A57 64-bit Processor on TSMC 16nm FinFET Process (ARMH) 40.37 -0.72 :


4:02PM Aehr Test Systems regains complaince with NASDAQ minimum bid price rule (AEHR) 1.07 -0.02 :


3:05PM Qualcomm extends collaboration with Facebook (FB) to ehance performance of Facebook Home and Facebook for Android (QCOM) 65.70 -0.27 : Co announced that its wholly-owned subsidiary, Qualcomm Technologies, Inc., has been working with Facebook to optimize Facebook Home and Facebook for Android across all Qualcomm Snapdragon processors. These Facebook Home optimizations are designed to enable better overall performance, lower power consumption and improved data efficiency for consumers using Facebook Home and Facebook for Android.

Sierra Wireless (SWIR) announced the launch of the AirLink LS300 intelligent gateway.

STMicroelectronics (STM) has begun working with research partners to develop a pilot line for next-generation MEMS devices augmented with advanced technologies such as piezoelectric or magnetic materials and 3D packaging.

Cryptography Research, a division of Rambus (RMBS), and StarChip SAS have signed a patent license agreement allowing the use of Cryptography Research's patented technology in StarChip products, including the StarChip line of smartcard integrated circuits.

TranSwitch (TXCC) announced a design win with TELES for a new 3G Cellular Broadband Gateway. TranSwitch's Atlanta 2000 gigabit communications processors have been selected by TELES for its CELLX product family.
07:54 am Microsemi shares little changed following reaffirmation of guidance

Microsemi (MSCC 20.96 -0.80) announced the exclusive licensing of its detector log video amplifier (DLVA) technology to Microphase Corporation and exited the market in conjunction with its ongoing facility consolidation plan. Microphase is a provider of microwave and RF solutions for advanced military communications and electronic warfare systems applications. Terms of the transaction were not disclosed. This action has no material effect on Microsemi revenues and is a function of the co's continuing focus on core growth initiatives and improved profitability. The company reaffirmed second quarter revenue guidance -4 to -8% QoQ to approximately $227.8-237.7 million versus the $233 mln consensus. Note: The company previously guided for Q2 EPS of $0.37-0.43 (EPS guidance was not mentioned in the release, consensus $0.40).

NXP Semiconductors N.V. (NXPI) and Cohda Wireless announced that they have signed the CAR 2 CAR Communication Consortium Memorandum of Understanding. The memorandum aims at implementing and deploying harmonized technology for the wireless communication between cars, or between cars and traffic infrastructure, in Europe.
icon url

ReturntoSender

04/07/13 9:14 PM

#10148 RE: ReturntoSender #6755

InvestmentHouse Weekend Market Summary

http://www.investmenthouse.com/weekendmarketsummary.htm

- Jobs report leads to harsh selling, but stocks spend most of the session mounting a recovery.
- Weak jobs trash a lot of good economic will.
- Japan stimulus gone wild, US data send financial markets reeling.
- Earnings season eve and things are disturbing.
- SOX still divergent as growth indices test key support: the next bounce and how it reacts tells the tale.

It keeps coming back.

Remember the kid in your neighborhood the gang didn't want to play with? You always tried to ditch him, went to great lengths to devise schemes to avoid him, but he always showed up, returning from wherever you left him.

To those waiting for a serious correction in this market, it must feel the same way. A lot has been thrown at it, but it is holding up, at least in the large cap arena.

Friday was more of the same. A confluence of bad news: Thursday's jobless claims set the tone. North Korea moving missiles and the US responding with a massive movement of military equipment. Japan's financial markets swinging wildly back and forth in response to massive new monetary stimulus suggest that the country may have finally gone too far, moving past the tipping point. FFIV, an important tech stock, took a blowtorch to its guidance just ahead of earnings season. March jobs limped in at 88K. Despite upward revisions to the prior two months, the key points within the report sadly delineate the serious problems that remain in the US economy in is fifth year of recovery.

Even with some really bad news that gapped stocks sharply lower on the open, virtually at the open stocks started to recover. You could call it short covering but that didn't really occur until late in the day when it was clear the market was not going to roll back over. Then it became a game on the financial stations as to whether the indices would make it to positive and complete the reversal.

They didn't, but nonetheless it was not a bad finish.

SP500 -6.70, -0.43%
NASD -21.12, -0.65%
DJ30 -40.86, -0.28%
SP400 -0.14%
RUTX -0.26%
SOX -0.52%
DJ20 +0.46%

The interesting thing, well one of the interesting things, is that despite the divergence between large caps and the small and growth stocks, the only index that did not hold or recover to a relatively key support level was SOX. Of course SP500 and DJ30, the indices most immune to the recent selling, easily held support. DJ20 transports blew out the 50 day EMA but then raced back up to show a nice shakeout. The remaining indices, while they did bounce and hold support, didn't necessarily save themselves by their recovery. Gave themselves a chance, but didn't ensure things were whistling back to the upside.

OTHER MARKETS

With the US jobs report and the Japanese stimulus gone wild, yes other financial markets were impacted.

Dollar: 1.2999 versus 1.2943 euro. Despite issues in Japan and the continuing European drama, the US dollar was lower Friday on the weak jobs report. It broke the 20 day EMA, closing or otherwise, for the first time since early February. Some confidence in a US recovery waning.

Bonds surging: 1.71% versus 1.76% versus 1.81% 10 year Treasury. 10 basis points in 2 sessions, but that is nothing compared to what Japan is experiencing with its 4+% (400+ BP) swings in one session. Still, the lack of confidence in the world and the US economy was on display Wednesday to Friday with bonds exploding higher. EVEN WITH MASSIVE INTERVENTION BY CENTRAL BANKS, the bond market jumped, some would say out of control. Indeed because of intervention keeping rates lower we are seeing these almost unbelievable breaks upside.

Oil down hard on the week: 92.70, -0.56. After pulling a Sir Robin from Monty Python just shy of the January and February peaks, oil showed it is trying to find support at 92 to 90. Down but bouncing off the low for a second session. Important bounce, but again I point out that the recent rise pretty much matched the 78% retracement of the September to December selloff, and double tops at that level tend to retrace all the way, i.e., back down near 85.

Gold: 1576.00, +23.60. Sold hard early in the week but held support Thursday and reversed. Friday with all of the turmoil it was of course running. It has tested and now it shows just how much upside there is.

THE ECONOMY

Jobs report sets back views of economic recovery.

Doesn't really matter that January and February were revised higher another 61K. It doesn't matter that unemployment fell to 7.6% (indeed the reasons for the fall are the problem). With the US economy supposedly in the fifth year of official recovery from the Great Recession, the March jobs report reveals major systemic issues with the jobs market and the economy, the kind of problems that develop when policies induce behavior that would otherwise not occur in rational markets.

Nonfarm Payrolls, March (8:30): 88K actual versus 192K expected, 268K prior (revised from 236K)

Nonfarm Private Payrolls, March (8:30): 95K actual versus 210K expected, 254K prior (revised from 246K)

Unemployment Rate, March (8:30): 7.6% actual versus 7.7% expected, 7.7% prior

Hourly Earnings, March (8:30): 0.0% actual versus 0.2% expected, 0.1% prior (revised from 0.2%)

Average Workweek, March (8:30): 34.6 actual versus 34.5 expected, 34.5 prior

People leaving the workforce in March in the Fifth year of economic recovery: 677,000

496,000 people leaving the workforce net.

Total number of work age residents not in the workforce: 90M.
US population: 313M
Workforce participation rate: 63.3%, lowest since May 1979

U6 Unemployment (includes people working at less than full employment and want to work full time): 13.8% down from 14.3%!!!

What this shows:

1. People who have worked part-time in hope of finding full time jobs are giving up and deciding they can collect unemployment for 99 weeks, go on disability and collect other government benefits and HAVE AS MUCH DISPOSABLE INCOME AS WHEN THEY WORKED PART TIME.

2. Real unemployment rate is over 11%

3. Jobs quality and disparity plunge and widen

Since January 2009:
+4.02 million jobs for the 55+ age group
-2.8M jobs in all other age demographics.

Ages 22 to 54: -2.2M jobs during this administration.

Let them use spoons!

You can create millions of jobs but if your policies ordain them to be low paying part-time jobs, just how healthy is the economy when measured merely by jobs? It is the old story about Milton Friedman and a communist government project he was shown. When Friedman asked why there were using shovels versus earth moving machines in digging a canal, he was told it was so they could provide more jobs. Milton quipped, why not have them use spoons?

Raising the minimum wage? Those jobs are supposed to be stepping stones to better jobs. Now they are end jobs. No wonder this administration wants the minimum wage raised as its polices turn low paying part-time temporary jobs into permanent jobs.

More people working at worse jobs does not equate to economic health.

Ridiculousness: Japan may have hit the monetary policy tipping point.

In a move that is being described by some as the Bank of Japan president driving around throwing yen out the back of a Toyota, Japan embarked on the biggest monetary stimulus in the world. As shown Thursday, its move dwarfs the US $85B monthly injections.

Of course all is well as a result, right? My word, look at the Japanese bond market. At first it rallied a bit. Then it went berserk, trading a 410BP move in one session. Yen is diving, its bond yields literally exploding. Japan may have finally shown the rest of the world where the tipping point is.

TECHNICAL SUMMARY

INTERNALS

NASDAQ
Stats: +21.12 points (+0.65%) to close at 3203.86
Volume: 1.59B (+9.81%)

Up Volume: 607.67M (-382.35M)
Down Volume: 943.81M (+473.79M)

A/D and Hi/Lo: Decliners led 1.52 to 1
Previous Session: Advancers led 1.88 to 1

New Highs: 47 (+8)
New Lows: 43 (+11)

S&P
Stats: +6.7 points (+0.43%) to close at 1553.28
NYSE Volume: 646M (+11%)

A/D and Hi/Lo: Decliners led 1.14 to 1
Previous Session: Advancers led 1.64 to 1

New Highs: 165 (-13)
New Lows: 67 (-10)

DJ-30
Stats: +40.86 points (+0.28%) to close at 14565.25

BREADTH: With the wild moves in the market you could not take much from the -1.5:1 on NASDAQ and -1.1:1 NYSE.

VOLUME: Volume up about 10% on each exchange as stocks recovered. Of course you cannot take much from that recovery volume rise because it was still lower than on Wednesday when the indices fell hard. More distribution on the week than accumulation. Not a lot of selling days, however, so not necessarily suggesting a lot more selling.

THE CHARTS

SP500. All the way to the November up trendline on the low, turned, and then recovered back to the 50 day EMA. Tried the other side of the tracks, didn't like it. A bit top-heavy, but my goodness, considering all the news this was not bad action and showed buyers still ready to enter.

NASDAQ. Through Thursday NASDAQ sold to the November up trendline that marks the bottom of the channel. Friday NASDAQ gapped below that level but held the 2011 trendline. Reversed to hold the 50 day EMA on the close. A deeper recovery to deeper support, but note that if Friday was the low it still put in a higher low. Not a complete shakeout and recovery. NASDAQ has a rounded top trying to form, MACD is putting in lower highs, big names such as FFIV are struggling. AAPL, on the other hand, wants to bounce. It is trying to hold.

DJ30. Reached to the 20 day EMA, tested, rebounded. Unscathed.

SP400. On the week the midcaps broke the November trendline with some flair. Friday tested the 50 day EMA on the low and rebounded to a modest loss. Good reversal, and can put in its own higher low as well, but not an all clear signal. It is sluggish, trying to put in a rounded top similar to NASDAQ and that needs to be watched over the next bounce attempt off this doji.

Russell 2000 small caps. Harsh week, selling hard Monday to Wednesday, breaking the November lower channel line along the way. Wednesday to Friday it sold to the 50 day EMA, danced around it, managed to rebound Friday to keep it safe. Same story as NASDAQ and S400: put in a higher high on the past bounce but MACD flagged. It broke the trendline and is now at next important support. This does not mean it has to fall. It has dropped some already. The NEXT bounce off of this test of key support tells the tale.

SOX. As with RUTX, a tough week. Down hard to start, breaking the November trendline and then the 50 day EMA. It did NOT recover the 50 day EMA as did the other growth indices. SOX is ahead of the rest of the indices in terms of pattern development. It has a head and shoulders in place. It broke the neckline last week and is in the process of testing that break. Important for the rest of the market how that break plays out.

SUMMARY: Breaks lower all around, but the same strengths (or weaknesses) in the end. SP500, DJ30 held up fine. NASDAQ, SP400, RUTX broke trends but managed to hold an important support. These three are forming rounded tops and the next bounce off the 50 day EMA test will tell their strength in terms of further selling, i.e. if they form a right shoulder and roll over from it. SOX is already there, and as noted Thursday, it led the move lower in the summer and then early fall 2012. That DOES NOT ALWAYS happen as the earlier action in 2012 showed; everything fell together then. Right now, however, it IS diverging as it did in summer and particularly the fall of 2012. Thus after a bounce by NASDAQ, SP400 and RUTX, they could be dragged lower by SOX. That makes this next bounce key.

LEADERSHP

Big Names: AAPL looks ready to bounce back up off of support. GOOG gapped below the 50 day EMA Friday. It needs an immediate recovery. AMZN is ready to bounce back up in its range similar to AAPL. CLX is at the 20 day EMA, slowing and ready to bounce. Indeed, it is not on the report, but if you are interested, the July 85 strike calls with a $3 move to 90 after clearing the 10 day EMA on a bounce lands a 59% gain.

Financial. Not ready to call a reversal. JPM, BAC, C, etc. all gapped lower then reversed with engulfing patterns (lower low, higher close than prior session). Not giving that much contribution to the upside.

Metals. Starting the bounce upside after the selling. FCX showed great volume as it started upside. Not much room to play, however. STLD looks right as well.

Building materials. TREX is trying to hold the 50 day EMA and bounce, but the pattern is a bit treacherous. LPX surged Friday after a 50 day EMA breach, but it too is somewhat treacherous; can pull it off but has to show it. CX gapped to the 50 day EMA as if it was wearing concrete galoshes, but then blasted off to a new rally high. Go figure. This as homebuilders struggling big: TOL, PHM.

Transports. Sold but then found buyers. JBHT, ODFL in trucking. KSU and CSX in rails. Not that powerful, but another test in the trend.

Retail. Some massive moves, e.g. PNRA. Other solid participants are the same: DECK, DLTR, WSM, TJX.

Techs. Clouds grew a bit thicker after FFIV. ADTN was hit. RAX managed to rebound some as did AKAM, but they are still pitiful patterns. Others took hard hits, e.g. SWI and how it bounces tells some tech tales.

Drugs/healthcare. Continues as a hot area and we are playing it and ready to play more with SNSS, CLDX, ACAD.

THE MARKET

SENTIMENT INDICATORS

VIX: 13.92; +0.03
VXN: 15.52; +0.26
VXO: 13.87; +0.33

Put/Call Ratio (CBOE): 1; -0.09

Bulls versus Bears

Bulls jumped but bears were not convinced. This past week shows the bears were a bit more prescient, at least near term. Bulls are still at pretty high levels but not necessarily toppy. Bears are a bit light; that should change after this past week.

Bulls: 52.0% versus 49.5% versus 47.4% versus 50.00% versus 44.2% versus 46.3% versus 48.4% versus 52.6% versus 54.7% versus 54.3% versus 53.2% versus 51.1% versus 47.8% versus 46.8% versus 45.7% versus 43.6% versus 39.3% versus 37.2% versus 38.3% versus 43.6. Over the September 2012 level. Last time the market hit that level SP500 corrected 9% over the next two months. Background: Undercut 35%, the threshold for bullishness, in early June. As noted, hit 34% in early June. It did its job and the market is on the rally. Hard drop to 34 from 39.3% as economic reality and a choppy stock market hit. Off the 55+ level hit in late February. That was the highest level since April and May of 2011, the peak of the post-bear market high. 35% is the threshold level suggesting bullishness. To be seriously bearish it needs to get up to the 60% to 65% level.

Bears: 19.4% versus 19.6% versus 18.6% versus 18.8% versus 21.1% versus 21.1% versus 22.1% versus 21.1% versus 21.1% versus 22.3% versus 22.3% versus 23.4% versus 24.5% versus 24.5% versus 23.4% versus 25.5% versus 27.7% versus 27.7% versus 28.7% versus 27.7%. Summary: Over 35% is the threshold to be really be a good upside indicator. For reference, bearishness hit a 5 year high at 54.4% the last week of October 2008. The move over 50 took bearish sentiment to its highest level since 1995. Extreme negative sentiment. Prior levels for comparison: Bearishness peaked at 37.4% in September 2007. It topped the June 2006 peak (36%) on that run. That June peak eclipsed the March 2006 high (33%) and well above the 2005 highs that spawned new rallies (30% in May 2005, 29.2% in October 2005). That was a huge turn, unlike any seen in recent history.

MONDAY

Not only economic but geopolitical issues are in the spotlight. The US was thought to be cruising, if not in a strong recovery, at least in a recovery that was improving. That jobs report pokes holes in that theory, revealing systemic problems.

What does this mean for the market? The Fed is going nowhere for now, and likely not even in the summer as some Fed officials were saying last week. The FOMC minutes this Wednesday could cause more issues if those thoughts were uttered at the meeting. After all the turmoil maybe those ideas are changing, but it won't change what was said a month ago. Thus that presents some market risk.

Still, most will feel the turmoil means the Fed remains in place. So, liquidity is there as the backstop. That said, how NASDAQ, SP400, RUTX and SOX fare on their next bounce is very important. As noted, SOX is diverging downside from SP500 and DJ30. When it did that in 2012, the overall market followed. Again, how this next bounce fares is key. A rollover of course means more selling, and it also means SP500 and DJ30, despite their strength, are at risk.

At this juncture with the growth indices at support we are willing to play a bounce off of some pretty harsh selling last week. Looking at it as mostly a bounce for now given the patterns and the proximity of earnings season. The market is set to bounce for a week or so, then the story is told as to the next move. Thus we have the mindset of playing a bounce move and then acknowledge we might have to sell out more upside and play more downside.

Doesn't mean it will happen, but we need to be ready given the action in the growth indices and the divergence in SOX. There are still good patterns in sectors such as drugs and healthcare, and those are definitely worth playing because money continues to move to them. There are also bounce plays such as AAPL, NKE, TRIP, etc. that we are looking at for some near term gains. If they continue from there, great. If not, we bank some solid gain on the initial move, and then get out of things deteriorate.

Just being ready, just taking what the market gives.

Have a great weekend!

Support and resistance

NASDAQ: Closed at 3203.86

Resistance:
3207 is the November 2012 up trendline
3227 is the April 2000 intraday low
3321 from April 2000
3339 is the upper channel line for the November 2012 to present uptrend
3401 is the May 2000 closing low

Support:
3197 is the September 2012 post-bear market high
The 50 day EMA at 3194
3171 is the October intraday high
The 2011 up trendline at 3157
3134 is the March 2012 post-bear market peak
3130 from some January 2013 lows
3104-3112 from August and mid-October peaks.
3101 is the August 2012 high
3090 is the mid-March interim high
3076 is the late April 2012 high and the 1/2013 low after gapping higher
3062 is the December 2012 prior peak
The 200 day SMA at 3062
3042 from 5/2000 low and several other price points
3024 is the gap point from early May
3000 is the February 2012 post-bear market high
2999 is the bottom of the August 2012 consolidation
2988 is the July 2012 high
2977 to 2980 is the bottom of the late October 2012 consolidation, July 2012 peak
2962 is the April 2012 low
2950 is the mid-April closing low
2942 is the mid-June 2012 high
2900 is the March 2012 intraday low
2858 is the late July 2011 peak
2847 is the mid-May 2012 low
2838 from the July 2012 lows

S&P 500: Closed at 1553.28

Resistance:
1556 from July 2007
1576 from October 2007, all-time high
1609 is the upper trendline in the channel

Support:
The 20 day EMA at 1553
1539 from June 2007
The November up trendline at 1539
1531 is the recent high
The 50 day EMA at 1529
1499 from January 2008
1475 is the September 2012 high
1471 is the October 2012 intraday high
1466 is the September 2012 closing peak and rally closing high
1440 from November 2007 closing lows
The 200 day SMA at 1441
1434 from early November 2012
1433 from August 2007 closing lows
1427 is the August 2012 peak
1425 from May 2008 closing highs and the October 2012 low
1408 is the late October 2012 range closing low
1406 is the early May 2012 peak
1402.22 - 1400 is the closing low of the August 2012 lateral consolidation
1378 is the February 2012 peak
1375 is the early July 2012 peak
1371 is the May 2011 peak, the post-bear market high
1363.46 is June 2012 high
1359 is the April 2012 low
1357 is the July 2011 peak
1344 is the February 2011 peak
1340 is the early April 2011 peak
1332 is the early March 2011 peak

Dow: Closed at 14,565.25

Resistance:
14,900 is the upper channel line for the trend off the November low.
9.0% above its 200 day SMA, still leaving DJ30 room to run before it gets too top heavy on this run and has to test.

Support:
The 20 day EMA at 14,473
14,198 from the October 2007 high
The 50 day EMA at 14,201
14,149 is the February 2013 high
The November up trendline at 14,052
14,022 from 7-07 peak
14,010 from the early February 2013 consolidation
13,784 is the late February 2013 closing low
13,692 from 6-2007 peak
13,668 from 12-2007 peak
13662 is the October 2012 intraday high
13,653 is the September 2012 high
13,557 to 13,662
13,413 from the late September 2012 low
The 200 day SMA at 13,401
13,300 to 13,331 is the August 2012 post-bear market high
13,297 is the April 2012, prior post bear market high
13,058 from the May 2008 peak on that bounce in the selling
13,056 is the February 2012 high
12,716 is the April 2012 closing low
12,524 is a range of support from early 2012 and summertime 2012

Economic Calendar

April 5 - Friday
- Nonfarm Payrolls, March (8:30): 88K actual versus 192K expected, 268K prior (revised from 236K)
- Nonfarm Private Payrolls, March (8:30): 95K actual versus 210K expected, 254K prior (revised from 246K)
- Unemployment Rate, March (8:30): 7.6% actual versus 7.7% expected, 7.7% prior
- Hourly Earnings, March (8:30): 0.0% actual versus 0.2% expected, 0.1% prior (revised from 0.2%)
- Average Workweek, March (8:30): 34.6 actual versus 34.5 expected, 34.5 prior
- Trade Balance, February (8:30): -$43.0B actual versus -$44.7B expected, -$44.5B prior (revised from -$44.4B)
- Consumer Credit, February (15:00): $18.1B actual versus $14.0B expected, $12.7B prior (revised from $16.2B)

April 9 - Tuesday
- Wholesale Inventories, February (10:00): 0.5% expected, 1.2% prior

April 10 - Wednesday
- MBA Mortgage Index, 04/06 (7:00): -4.0% prior
- Crude Inventories, 04/06 (10:30): 2.707M prior
- Treasury Budget, March (14:00): -$107.0B expected, -$198.2B prior
- FOMC Minutes, 3/20 (14:00)

April 11 - Thursday
- Initial Claims, 04/06 (8:30): 365K expected, 385K prior
- Continuing Claims, 03/30 (8:30): 3058K expected, 3063K prior
- Export Prices ex-ag., March (8:30): 0.6% prior
- Import Prices ex-oil, March (8:30): 0.0% prior
- Natural Gas Inventories, 04/06 (10:30): -94 bcf prior

April 12 - Friday
- Retail Sales, March (8:30): 0.0% expected, 1.1% prior
- Retail Sales ex-auto, March (8:30): 0.0% expected, 1.0% prior
- PPI, March (8:30): -0.1% expected, 0.7% prior
- Core PPI, March (8:30): 0.1% expected, 0.2% prior
- Michigan Sentiment, April Preliminary (9:55): 78.0 expected, 78.6 prior
- Business Inventories, February (10:00): 0.4% expected, 1.0% prior
icon url

ReturntoSender

04/09/13 12:02 AM

#10149 RE: ReturntoSender #6755

From Briefing.com: 4:10 pm : Equities spent the bulk of today's session in negative territory before afternoon buying lifted the major averages out of the red. As a result, the S&P 500 settled higher by 0.6%.

Although stocks finished with gains, leadership was mixed, suggesting a certain level of indecision was present among market participants. Both consumer sectors ended ahead of the broader market with the defensively-oriented staples in the lead.

Staple stocks outperformed amid broad strength in beverage and tobacco producers. Coca-Cola (KO 40.86, +0.78) rose 2.0% and Philip Morris (PM 94.44, +1.72) advanced 1.9%.

Meanwhile, the growth-sensitive discretionary space outperformed on the back of homebuilders as the group rallied broadly. PulteGroup (PHM 19.73, +0.60) gained 3.1% while the broader SPDR S&P Homebuilders ETF (XHB 29.49, +0.58) added 2.0%.

Elsewhere in discretionary shares, quick-service restaurants ended on a mixed note. Yum! Brands (YUM 67.33, +0.36), who owns the KFC brand, was under early pressure amid concerns the Chinese bird flu outbreak will impact KFC sales. However, the stock was able to shake off the early weakness, and end higher by 0.5%.

In addition to consumer stocks, the Dow Jones Transportation Average outperformed, and settled with a gain of 0.9%. While most index components settled in the black, airlines displayed notable strength. Delta Air Lines (DAL 14.93, +0.54) and United Continental (UAL 30.05, +0.78) climbed 3.8% and 2.7%, respectively.

On the downside, the health care sector lagged after outperforming last week. BioCryst Pharmaceuticals (BCRX 1.92, +0.22) was an exception as the stock surged 12.9% after Chinese authorities approved the company's peramivir flu treatment in light of the recent bird flu outbreak.

In M&A news, Lufkin Industries (LUFK 87.96, +24.03) surged 37.6% after the company agreed to be acquired by General Electric (GE 23.12, +0.19) for $3.3 billion or $88.50 per share. The transaction price represents a 38% premium to Lufkin's Friday closing price.

Today's volume was well below average as less than 600 million shares changed hands on the floor of the New York Stock Exchange.

Reviewing the day's final sector performance, consumer staples (+1.1%), consumer discretionary (+1.1%), financials (+1.0%), and utilities (+0.8%) traded ahead of the broader market. Meanwhile, telecom (-0.5%), health care (+0.2%), and technology (+0.4%) lagged.

There was no notable economic data released today.

Tomorrow, February wholesale inventories will be reported at 10:00 ET.

The U.S. Treasury will auction off $32 billion in 3-yr notes.DJ30 +48.23 NASDAQ +18.39 SP500 +9.79 NASDAQ Adv/Vol/Dec 1463/1.28 bln/987 NYSE Adv/Vol/Dec 2069/582.8 mln/933

3:30 pm :

May crude oil dipped into negative territory and to a session low of $92.46 per barrel in late morning action but quickly recovered into the black and trended higher for the remainder of pit trade. It booked a gain of 0.7% as it settled at $93.36 per barrel, slightly below its session high of $93.46 per barrel.
May natural gas began pit trade in the black but lost momentum in mid-morning action. It pulled back from its session high of $4.18 per MMBtu and fell into negative territory. It brushed a session low of $4.05 per MMBtu and eventually settled with a 1.2% loss at $4.08 per MMBtu.
June gold fell during today's floor trade as a stronger dollar index weighed on prices. The yellow metal dipped to a session low of $1566.60 per ounce in late morning action and settled with a 0.2% loss at $1572.60 per ounce.
May silver also chopped around in negative territory for most of its session. It touched a session low of $27.07 per ounce and closed 0.2% lower at $27.16 per ounce.

4:09PM Alcoa beats by $0.03, reports revs in-line; Alcoa reaffirms 2013 aluminum demand growth of 7% (AA) 8.40 +0.16 : Reports Q1 (Mar) earnings of $0.11 per share, excluding non-recurring items, $0.03 better than the Capital IQ Consensus Estimate of $0.08; revenues fell 2.9% year/year to $5.83 bln vs the $5.89 bln consensus.

Alcoa reaffirms 2013 aluminum demand growth of 7%.

"This was a strong quarter led by record profitability in our downstream business, improved results in our midstream business, and remarkable upstream performance in the face of weak metal prices. Our mid and downstream businesses now account for 72% of our total after-tax operating income while our upstream business continues to move down the cost curve."

Continued Growth Across End Markets
Alcoa continues to project 7% global aluminum demand growth in 2013 and essentially balanced alumina and aluminum markets. However, the co sees a slightly tighter market as supply contracts. Co reduced its surplus projection for aluminum from 535,000 metric tons in Q4 to 155,000 metric tons this quarter, driven by curtailments. Alcoa projects global growth this year across the aerospace (9-10%), automotive (1-4%).

Alba Update
Alcoa continues to actively negotiate with the Department of Justice (DOJ) and the Securities and Exchange Commission (SEC) to reach a resolution of their investigations of the Alba matter; however, we have not reached any agreement with either agency. Given the uncertainty regarding whether a settlement can be reached and, if reached, on what terms, we are not able to estimate a range of reasonably possible loss with regard to any such settlement. If a settlement of the government investigations is reached, we believe that the settlement amount would be material to Alcoa's results of operations for the relevant fiscal period. If a settlement cannot be reached, Alcoa will proceed to trial with the DOJ and the SEC and under those circumstances is unable to predict an outcome or to estimate its reasonably possible loss. There can be no assurance that the final outcome of the government's investigations will not have a material adverse effect on Alcoa.

4:04PM Marvell: Greenlight Capital discloses selling shares (MRVL) 10.47 +0.19 : In 2 SEC filings, David Einhorn's Greenlight Capital reported selling MRVL stock. The firm last reported owning 9.7% on Feb. 14.

The 1st filing reported the sale of 1.27 mln shares at $10.09-10.24 on 4/4, worth ~$12.9 mln.
The 2nd filing reported the sale of 430K shares at $10.16 on 4/5, worth ~$4.4 mln. (INSID)

LSI Corp. (LSI) has entered into an expanded original equipment manufacturer relationship with Intel (INTC), whereby LSI Nytro MegaRAID technology will be available as part of the Intel RAID product family.
Altera (ALTR) achieved a significant milestone in transceiver technology by demonstrating the industry's first programmable device with 32-Gbps transceiver capabilities.

09:15 am Juniper Networks upgraded to Buy at Argus on valuation; tgt $22: . Argus upgrades JNPR to Buy from Hold and sets tgt at $22. In its view, the decline in JNPR shares overstates the co's challenges and fails to reflect the EPS recovery now underway after several difficult quarters. JNPR's core routing business has suffered over the past year from weak carrier spending trends, product cycle timing, and internal distractions. However, the spending environment is now improving, Juniper's product cycle is turning, and comparisons will become easier over the next few quarters. JNPR's historical valuation premium to the peer group has reversed, creating an attractive entry point.

09:15 am Flextronics upgraded to Outperform at RBC Capital Mkts; tgt raised to $8: . RBC upgrades FLEX to Outperform from Sector Perform and raises its tgt to $8 from $7 as it believes the Co is positioned to begin surprising on the upside with regard to operating margins and EPS over the next several quarters. As operating margins expand from ~2% to 3%+ over the next 4 quarters firm should see not only EPS growth but also multiple expansion driving stock appreciation.

U Optronics (AUO) reported consolidated March 2013 revenue of NT$37,917 mln, up by 36.7% month-over-month and 20.6% year-over-year. The co's March revenue increased by over NT$10 bln compared to the previous month, which recorded the highest monthly sales over the past 30 months. For the first quarter of 2013, AUO's unaudited consolidated revenues totaled NT$94,244 mln vs NT$91,636 mln CIQ est. For March 2013, Large-sized panel shipments, with applications on desktop monitor, notebook PC, LCD TV and other applications, were around 10.59 mln units, an increase of 34.4% from the previous month. As for small-and-medium-sized panels, the shipments nearly reached 12.39 mln units, up by 33.5% month-over-month.

Needham initiated Perion Network (PERI) with a Buy and price target of $14. The firm expects the uncertainty surrounding Perion's renewal of its agreement with Google (GOOG), as well as the impact of the recent AdSense policy changes on its model, to clear. Ultimately, they believe the company's adjustments to these policy changes, as well as new search and distribution partners could increase Life-Time-Value and decrease customer acquisition costs over time. They also believe Perion has a strong pipeline of product launches and is strongly positioned to expand aggressively into mobile, further its product portfolio on the desktop, and explore new monetization opportunities in its vast and rich data.
icon url

ReturntoSender

04/09/13 4:11 PM

#10150 RE: ReturntoSender #6755

Ka-boom!!!?

Is Jeffrey Gundlach a leading indicator?
DoubleLine's CEO has uncanny knack for predicting where markets are headed; 'ka-boom' scenario a real worrier

http://www.investmentnews.com/article/20130409/FREE/130409941#
icon url

ReturntoSender

04/10/13 9:38 AM

#10152 RE: ReturntoSender #6755

Chart of the Day - COTD - Adjusted Earnings

http://www.chartoftheday.com/20130410.htm?T

With Q2 earnings season just getting underway; today's chart provides some long-term perspective to the current earnings environment by focusing on S&P 500 earnings. Today's chart illustrates the trend of 12-month, as reported, inflation-adjusted S&P 500 earnings from 1900 until today. There are several points of interest... For one, while there have been several major declines over the past 113 years, it is the recent financial crisis which resulted in the greatest plunge in corporate earnings. Also of interest is how earnings have tended to rebound rather sharply following a massive decline (e.g. following the 1920-21 recession, following the Great Depression, and following the financial crisis). It is worth noting, however, that inflation-adjusted earnings are currently lower than where they were 16 months ago.

icon url

ReturntoSender

04/10/13 11:25 PM

#10153 RE: ReturntoSender #6755

From Briefing.com: 4:25 pm : After alternating between gains and losses for 14 straight sessions, the S&P 500 has pulled a hat trick this week. It has now scored gains in every session this week and, boy, the third time was a charm.

The market rallied sharply, bolstered by its confidence in the support of the Federal Reserve and healthy gains in influential leadership groups that helped both the Dow and S&P 500 register all-time intraday highs and closing highs today.

The minutes from the March FOMC meeting were the focal point throughout the session. To begin, they caused a stir after being released early (9:00 a.m. ET) since the Fed discovered they were inadvertently released to 100 Congressional staffers and employees of trade organizations around 2:00 p.m. ET on Tuesday. The matter of their premature release is under investigation, yet the minutes themselves underpinned today's gains.

Several views were expressed in the minutes, but the compilation of those views pointed to a majority view that the Fed should at least start tapering its purchases by the end of the year on the assumption labor market conditions are improved by then. It is important not to forget that what the FOMC decides to do will ultimately be dictated by incoming data. The Fed has been clear on that reminder for a long time. To that end, the minutes also pointed out that a couple of members noted the pace of purchases might appropriately be increased (emphasis our own) if progress toward the committee's economic goals was not maintained.

Our view is that the minutes were supportive for the equity market for the following reasons:

Not many participants want the Fed to stop or to taper purchases without proof that improving economic conditions are sustainable. Therefore, when the time comes it will be against a backdrop of sustained economic improvement that bodes well for consumer and business spending, and earning prospects.
The minutes are working toward reducing the element of surprise for market participants as it relates to future policy decisions.
The March nonfarm payrolls report, out after the FOMC meeting, does not fit with the tapering parameters maintained by Fed Chairman Bernanke, Vice Chairman Dudley, and Fed Governor Yellen who will continue to steer the policy directive.

The debate about the inferences of the FOMC Minutes will persist, yet the equity market certainly did not act as if it feared an earlier-than-expected tapering. The major averages moved steadily higher from the sound of the opening bell before leveling off around 1:00 p.m. ET. From that point on, they held in tight trading ranges that left them in close proximity to their best levels of the day by the time the closing bell rang.

Every sector participated in the advance, although the strongst gains were registered by the technology (+1.8%), health care (+1.7%), and industrial (+1.3%) sectors. Separately, the Dow Jones Transportation Average soared 1.8%. The worst-performing group was the energy sector, which was up "only" 0.5%.

There were some pockets of weakness, like the homebuilders, which failed to ride the coattails of the Taylor Morrison Home IPO (TMHC 23.05, +1.05). Gold ($1558.80, -$27.90) was another laggard after Goldman Sachs cuts its price targets for the yellow metal through 2014. Treasuries, meanwhile, were weak with the 10-year Note dropping 15 ticks, bringing its yield up to 1.81%.

By and large, stock monitors were filled with green figures. Advancers outpaced decliners by a 3-to-1 margin at the NYSE and by a nearly 4-to-1 ratio on the Nasdaq. Per usual, there was a volume spike in the final hour that made lackluster volume totals throughout the day look more respectable at the closing bell. In total, 701 mln shares traded hands at the NYSE. That was slightly ahead of yesterday's total, yet it wasn't heavy at all in the context of the breakout move that was made today.

The moderate volume could be interpreted as a sign of reservations ahead of the first quarter earnings reports, which will start flooding in next week. JPMorgan Chase (JPM) and Wells Fargo (WFC), however, report before the open this Friday.

Results from Bed Bath & Beyond (BBBY) will be in focus on Thursday along with the initial claims report for the week ending April 6, which will be released at 8:30 a.m. ET. The Briefing.com consensus estimate for initial claims is pegged at 365,000.

DJ30 128.78 NASDAQ 59.39 SP500 19.12 NASDAQ Adv/Vol/Dec 1984/1.71 bln/531 NYSE Adv/Vol/Dec 2293/701 mln/731

3:30 pm :

May crude oil extended gains for a third consecutive session despite spending morning pit trade in negative territory. The energy component dipped to a session low of $93.49 per barrel following inventory data. Although crude oil inventories had a smaller than expected build, gasoline inventories showed a build of 1.699 mln gallons while consensus called for a draw of 1.3 mln. Momentum picked up in afternoon floor as crude oil pushed to a session high of $94.80 per barrel. It eventually settled with a 0.4% gain at $94.59 per barrel.
May natural gas trended higher for most of its pit session. It touched a session high of $4.16 per MMBtu in late morning action but pulled-back as it headed into the close. It dipped to a session low of $4.07 per MMBtu moments before settling with a 1.7% gain at $4.09 per MMBtu.
June gold fell deeper into negative territory following a surprise early release of the FOMC Minutes and Goldman Sachs' cut of gold forecasts through 2014. A stronger dollar index also weighed on the yellow metal. Gold pulled back from its session high of $1579.90 per ounce and brushed a session low of $1556.40 per ounce in afternoon action. It settled 1.8% lower at $1558.80 per ounce.
May silver also spent its entire floor session in the red. It touched a session high of $27.87 per ounce in morning action but dipped to a session low of $27.44 per ounce in afternoon pit trade. Silver eventually settled 0.9% lower at $27.64 per ounce.

4:03PM Vishay announces signing of definitive purchase agreement with MCB Industrie S.A.; terms not disclosed (VSH) 12.81 +0.21 :

ANADIGICS (ANAD) announced that its AWL9581 front-end integrated circuit is used in Murata's latest WiFi module.

9:21AM Photronics announces approval to proceed with tender offer to acquire outstanding shares of its majority owned Taiwan Subsidiary, PSMC (PLAB) 6.90 : Co announced that Photronics Semiconductor Mask Corporation, a majority-owned subsidiary of Photronics has obtained approval from the Gretai Securities Market of PSMC's application for the delisting of its stock. Photronics Inc., the majority shareholder of PSMC, has promised to acquire PSMC's total shares currently outstanding at NTD16.30 per share from April 30, 2013 through June 18, 2013, via tender offer

9:06AM First Solar acquires 60 MWAC North Star project from NorthLight Power (FSLR) 39.35 : Co announced that First Solar has acquired the 60 megawattAC (MW) North Star solar project that NorthLight has developed in Fresno County, Calif. NorthLight is a joint venture of Renewable Energy Corporation ASA and Summit Power Group, LLC. Terms of the transaction were not disclosed.

The photovoltaic (PV) solar plant is expected to start construction in 2014 and be completed in 2015, providing up to 410 construction jobs. When fully operational, it will produce enough clean, renewable energy to power over 21,000 average California homes while displacing ~33,000 metric tons of water consumption and 39,000 metric tons of CO2 per year-the equivalent of taking about 7,500 cars off the road each year.

Juniper Networks (JNPR) announced that Belgacom has deployed Juniper Networks T Series Core Routers to ready itself for the future of Internet applications and bandwidth growth.

Semtech (SMTC) is working with Ross Video and has delivered UHD-SDI components so that the co can develop a UHD-SDI capable distribution amplifier.

Select solar names modestly pulling back (JKS reported earnings and FSLR cautious analyst comments): FSLR -2.9% (modestly pulling back, multiple analysts are out this morning suggesting the upside move on yesterday's guidance is overdone), TSL -2.5%, SPWR -2.3%, YGE -1.8%, WFR -1.3%.

11:25 am S&P Tech sector trading higher by +1.55% today
The tech sector is trading higher today, ahead of gains in the broader market. Semiconductors are showing relative strength as well with the SOX trading 1.8% higher. Within the chip index, MU (+5.0%) is a notable standout. Among other major indices, the SPY is trading 1.0% higher today, while the QQQ is up 1.7% and the NASDAQ is trading 1.5% higher on the session. Among tech bellwethers, FB (+4.1%) is showing notable strength.

In tech earnings, SEAC (-5.8%) posted a beat last night, but guided below consensus. This morning, ADTN (+12.0%) posted a Q1 beat. In news, WDAY (-0.6%) is under pressure as its IPO lockup expired today. Among rumors, we are hearing STX (+2.1%) M&A speculation making the rounds. Among notable analyst upgrades this morning in the tech space, IBM (+1.4%) was upgraded to Buy at UBS and SI (+1.5%) was upgraded to Neutral at Exane BNP. Among downgrades, PCCC (-3.5%) was downgraded to Underperform at Raymond James, TEL (-0.4%) was downgraded to Neutral at BofA/Merrill, IDCC (+0.2%) was downgraded to Market Perform at William Blair and NTAP (-0.5%) was downgraded to Neutral at UBS. Also, FTE (+0.8%) was added to the Conviction Sell List at Goldman. There are no notable names in tech scheduled to report quarterly results today after the close.
icon url

ReturntoSender

04/11/13 8:57 PM

#10155 RE: ReturntoSender #6755

From Briefing.com: 4:20 pm : The S&P 500 settled higher by 0.4% after spending the bulk of today's action in the black while the tech-heavy Nasdaq ended flat.

The technology sector was under pressure after the International Data Corporation indicated first-quarter PC shipments plunged 14%. This marked the largest decline on record since IDC began tracking shipments in 1994, and pressured major tech names. Hewlett-Packard (HPQ 20.88, -1.44) fell 6.5% while Intel (INTC 21.82, -0.44) and Microsoft (MSFT 28.94, -1.35) settled with respective losses of 2.0% and 4.4%.

The news also weighed on chipmakers as the PHLX Semiconductor Index shed 0.4%. As a result of the broad sector weakness, the tech space was the only sector which settled in the red. The underperformance also weighed on the Nasdaq, which was unable to break away from its flat line.

Excluding technology, the other nine sectors ended with gains as health care and consumer discretionary stocks paced today's advance.

While the discretionary space saw strength across the board, retailers stood out. The SPDR S&P Retail ETF (XRT 72.97, +1.43) jumped 2.0% despite less-than-stellar same store sales reports from several companies. Although six retailers reported same store sales below the Retail Metrics Consensus, only two settled in the red.

The retail space will be in focus once again tomorrow when the census bureau sheds some light on March retail sales. The Briefing.com consensus expects an unchanged reading to follow February's increase of 1.1%.

Although the broader market ended higher, today's leadership was mixed. Two of the recent leaders, health care and transports, finished with different results. Health care was atop the leaderboard while the Dow Jones Transportation Average lagged.

The 20-stock index ended lower by 0.3% as truckers were stuck in reverse. Con-way (CNW 34.28, -0.58) and JB Hunt (JBHT 74.22, -0.65) both lost near 1.0%. Although the bellwether complex has been one of the top performers year-to-date, the Transportation Average is down 1.5% so far this month.

Notably, the financial sector outperformed intraday, but saw some weakness into the close. JPMorgan Chase (JPM 49.31, +0.06) and Wells Fargo (WFC 37.51, -0.06) ended little changed with the two scheduled to report their first quarter earnings ahead of tomorrow's opening bell.

Volume was below average as 643 million shares changed hands on the floor of the New York Stock Exchange.

Today's economic data was limited to weekly initial claims as well as import and export prices.

After two weeks of elevated initial claims readings, claims settled back down below 350,000 for the week ending April 6. The initial claims level fell to 346,000 from an upwardly revised 388,000 (from 385,000) for the week ending March 30. The Briefing.com consensus expected the initial claims level to fall to 365,000.

The drop in claims does not represent a strengthening in labor conditions.

The Department of Labor has difficulty adjusting the data from the seasonal biases related to the changing Easter holiday. The bump up in claims last week was the result of poor seasonal adjustments accounting for Easter occurring earlier in the year than normal.

Export prices, excluding agriculture, decreased by 0.2% in March after they had increased 0.6% during the prior month. Excluding oil, import prices declined 0.2%, which follows last month's unchanged reading.

Tomorrow, March retail sales, retail sales ex-auto, PPI, and core PPI will all be reported at 8:30 ET. In addition, the preliminary University of Michigan Consumer Sentiment Survey for April as well as February business inventories will be released at 9:55 ET and 10:00 ET, respectively.DJ30 +62.90 NASDAQ +2.91 SP500 +5.64 NASDAQ Adv/Vol/Dec 1188/1.77 bln/1240 NYSE Adv/Vol/Dec 1840/642.8 mln/1168

3:30 pm :

May crude oil fell for the first time in four sessions as weakness came on the International Energy Agency cutting its 2013 global oil demand growth forecast. The energy component pulled back from its session high of $94.51 per barrel set in early morning floor trade and touched a session low of $93.08 per barrel. It booked a 1.2% loss as it settled at $93.44 per barrel.
May natural gas popped into positive territory following inventory data that showed a draw of 14 bcf when a draw of 21 bcf was anticipated. It advanced to a session high of $4.18 per MMBtu but pulled back in afternoon trade, and settled with a 1.2% gain at $4.14 per MMBtu.
June gold fell into negative territory and to a session low of $1555.50 per ounce on jobless claims data released early this morning. However, the yellow metal got a boost from a weaker dollar index and lifted back into the black. It touched a session high of $1568.10 per ounce in mid-morning action and traded slightly below that level for the remainder of the session. It eventually settled 0.4% higher at $1564.70 per ounce.
May silver also lifted off its session low of $27.48 per ounce and spent most of floor trade chopping around slightly above the unchanged line. It settled 0.2% higher at $27.69 per ounce.

1:52PM NVIDIA announces it will return $1 bln this fiscal year to shareholders in the form of stock buybacks and dividend payments, including $100 mln in stock being repurchased this quarter (NVDA) 12.55 -0.28 : This will bring to $1.2 billion the total capital returned to shareholders since the company announced its quarterly dividend program in November 2012. The return of a further $1 billion will largely be through a structured stock repurchase program, which includes the $100 million being repurchased in the current quarter. It also includes the company's quarterly dividend of $0.075 per share, which has amounted to about $50 million a quarter.

EMC Corp. (EMC) announced that TWM Solicitors has chosen EMC technologies to transform its IT infrastructure, power its virtualization strategy and better support its commercial and private law services.

Broadcom (BRCM) today announced that Indian mobile phone brand Karbonn Mobiles has chosen a Broadcom 3G smartphone platform for use in its new Android-based smartphone, the Karbonn Smart A12.

Microsemi (MSCC) achieved National Institute of Standards and Technology algorithmic certification on its U.S.-developed EnforcIT Cryptography Suite of National Security Agency Suite B algorithms.

12:04 pm Technology Sector trading lower and behind the overall market
The tech sector is trading lower today, trailing gains in the broader market. Semiconductors are showing modest weakness with the SOX trading 0.1% lower. Within the chip index, WFR (+4.2%) is a notable standout. Among other major indices, the SPY is trading 0.5% higher today, while the QQQ is down 0.05% and the NASDAQ is trading 0.1% higher on the session. Among tech bellwethers, FB (+1.5%) is showing notable strength, while MSFT (-4.8%) is under pressure. In tech earnings, FTNT (-16.5%) lowered its Q1 guidance last night. FIRE (-3.2%) and PANW (-1.4%) are under pressure in sympathy. This morning, IGTE (-0.4%) posted a Q1 beat. In news, IDC reported that PC shipments dropped precipitously during Q1. PC related names under pressure today include MSFT (-4.8%), HPQ (-6.1%), DELL (-0.5%), NVDA (-2.1%), and INTC (-2.8%). Among rumors, DTEGY (+2.8%) made a 'best and final offer' for PCS (-0.2%), according to reports. Among notable analyst upgrades this morning in the tech space, ADBE (+0.7%) was upgraded to Neutral at Goldman, LCRX (+2.7%) was upgraded to Outperform at Cowen, and SLAB (+4.2%) was upgraded to Overweight at Barclays. Also, NCR (+1.1%) was added to Focus List at JPMorgan. Among downgrades, FTNT (-16.5%) was downgraded at a host of firms, MSFT (-4.8%) was downgraded at Goldman, Hilliard Lyons, and Nomura, BRCM (-1.5%) was downgraded to Underweight at Barclays and LNVGY (-7.4%) was downgraded to Sell at Citigroup. Also there was cautious commentary on BBRY (-4.2%) from a couple firms this morning. There are no notable names in tech scheduled to report quarterly results today after the close
icon url

ReturntoSender

04/16/13 5:31 PM

#10160 RE: ReturntoSender #6755

From Briefing.com: 4:10 pm : Equities climbed steadily throughout the day, and the S&P 500 ended higher by 1.4%.

For the most part, today's session served as a rebound from yesterday's broad-based selling. All ten economic sectors settled in the black, and nine groups ended with gains of at least 1.0%.

The materials sector, which lost nearly 4.0% yesterday, led today's rally as the SPDR Materials Select Sector ETF (XLB 37.99, +0.68) rose 1.8%. Gold miners saw intraday strength, but afternoon weakness in the underlying metal caused the group to slide into the red. Meanwhile, steelmakers acted in support of the sector as the Market Vectors Steel ETF (SLX 40.86, +0.63) rose 1.6%.

While the economically-sensitive materials space ended atop the leaderboard, the defensively-geared consumer staples were not far behind. Staple stocks received some support from Coca-Cola (KO 42.37, +2.28) after the beverage giant narrowly beat the Capital IQ earnings estimate.

The intraday performance of the leaders suggests a defensive trade played some part in today's action. After notching its highs during the opening minutes, the materials sector spent the remainder of the session near those levels. Meanwhile, consumer staples climbed throughout the day before settling on their highs.

A defensive bid also buoyed the health care sector where Johnson & Johnson (JNJ 83.44, +1.73) gained 2.1% after beating on earnings.

With the first quarter earnings season set to heat up in the coming days, Goldman Sachs (GS 144.10, -2.36) was among the handful of companies which reported earnings today. Although Goldman beat on earnings and revenue, its stock shed 1.6% as investors were unimpressed with the quality of the earnings beat. Meanwhile, the broader SPDR Financial Select Sector ETF (XLF 18.36, +0.28) advanced 1.6%.

Yesterday's selling caused significant weakness in homebuilders as well as the Dow Jones Transportation Average. Although the two groups were able to register gains, they remain in the red for the week.

Today's volume was slightly above average as 736 million shares changed hands on the floor of the New York Stock Exchange.

Looking back at the economic data, the number of housing starts increased 7.0% in March from an upwardly revised 968,000 (from 917,000) in February to 1.036 million. That was the first time housing starts exceeded 1.00 million units since 2008. The Briefing.com consensus pegged the number of new housing starts at 930,000. However, the underlying trends were more mixed than the headline implied as multifamily construction, which tends to be highly volatile, made up the entire March gain. Those starts increased by nearly 100,000 from 318,000 in February to an unsustainable 417,000. As a result, multifamily construction is likely to retreat next month.

Industrial production increased 0.4% in March following an upwardly revised 1.1% gain (from 0.7%) in February. The Briefing.com consensus expected production levels to increase 0.3%.

The entire gain in production was due to a 5.3% increase in utilities usage. Colder-than-normal temperatures throughout March drove up heating demand.

Consumer prices fell 0.2% in March after increasing 0.7% in February. The Briefing.com consensus expected prices to decrease 0.1%.

Excluding food and energy, core prices increased 0.1% after rising 0.2% in February. The Briefing.com consensus expected core prices to increase by 0.2% for a second consecutive month.

Only two items of note can be found on tomorrow's economic calendar. The weekly MBA Mortgage Index will be reported at 7:00 ET while the Federal Reserve will release its April Beige Book at 14:00 ET. On the earnings front, Bank of America (BAC 12.28, +0.30) and Mattel (MAT 42.98, -0.04) will report their quarterly results ahead of the opening bell.DJ30 +157.58 NASDAQ +48.14 SP500 +22.21 NASDAQ Adv/Vol/Dec 1926/1.46 bln/555 NYSE Adv/Vol/Dec 2501/743.5 mln/539

3:30 pm :

May crude oil erased most of its early pit trade losses after coming off a session low of $87.60 per barrel. The energy component briefly broke into positive territory and to a session high of $88.94 per barrel in afternoon action but ultimately settled 0.1% lower at $88.69 per barrel.
May natural gas retreated from its session high of $4.19 per MMBtu set in early floor trade and fell into negative territory shortly after equity markets opened. Despite brushing a session low of $4.08 per MMBtu, it recovered back into the black and settled 0.5% higher at $4.16 per MMBtu.
June gold rose after two sessions of sharp losses with a weaker dollar index and broad market strength boosting prices. The yellow metal touched a session high of $1402.70 per ounce as floor trade opened and dipped to a session low of $1371.70 per oune in mid-morning action. It eventually settled at $1387.30 per ounce, or 1.9% higher. Gold sold off here after hours and is now at $1364.40.
May silver spent most of today's floor session in positive territory. It dipped into the red and to a session low of $23.24 per ounce in mid-morning action but quickly recovered back above the unchanged line. It traded in a consolidative pattern near the $23.60 per ounce level in afternoon pit trade and settled with a 1.3% gain at $23.66 per ounce.

4:15PM Intel: Highlights from CFO commentary on first-quarter 2013 results (INTC) 21.92 +0.54 :

"The worldwide PC supply chain saw a continued reduction in inventory levels in the first quarter as customers reduced inventory of older generation PCs ahead of the Haswell launch. In addition, our inventories decreased almost $400M from the fourth quarter."
"Increased demand from our customers allowed us to increase production of Haswell products prior to qualification for sale. The result of this was a higher than anticipated inventory write-off which we expect to get back throughout the rest of the year as the product qualifies for sale in the second quarter and starts shipping to our customers."
"In addition we saw higher than expected excess capacity charges on older generation process technologies. We are taking advantage of the excess capacity on older generation process technologies to take capacity offline and reuse more equipment and space for 14nm and beyond. The result of these actions allows us to lower our capital spending forecast for the year by $1B, down to $12B."
"We are forecasting revenue of $12.9B for the second quarter which is slightly higher than the average seasonal increase as we expect some pipeline inventory replenishment as we launch Haswell and in anticipation of a stronger second half."

4:10PM Intel reports EPS in-line, revs in-line; guides Q2 revs in-line; reaffirms low single digit FY13 rev growth, margin guidance (INTC) 21.92 +0.54 : Reports Q1 (Mar) earnings of $0.40 per share, in-line with the Capital IQ Consensus Estimate consensus of $0.40; revenues fell 2.5% year/year to $12.58 bln vs the $12.6 bln consensus.

PC Client Group revenue of $8.0 billion, down 6.6% sequentially and down 6.0% year-over-year. Data Center Group revenue of $2.6 billion, down 6.9% sequentially and up 7.5% year-over-year. Other Intel Architecture Group revenue of $1.0 billion, down 3.9% sequentially and down 9.0% year-over-year. Gross margin of 56%, down 2%age points sequentially and down 8%age points year-over-year.

Co issues in-line guidance for Q2, sees Q2 revs of $12.4-13.4 bln vs. $12.87 bln Capital IQ Consensus Estimate. Gross margin%age: 58%, plus or minus a couple%age points.

Reaffirms FY13 low single digit rev growth (consensus +0.5%), 60% gross margin (+/- few % pts).

"Amidst market softness, Intel performed well in the first quarter and I'm excited about what lies ahead for the co. We shipped our next generation PC microprocessors, introduced a new family of products for micro-servers and will ship our new tablet and smartphone microprocessors this quarter. We are working with our customers to introduce innovative new products across multiple operating systems. The transition to 14nm technology this year will significantly increase the value provided by Intel architecture and process technology for our customers and in the marketplace."

4:08PM Yahoo! reports Q1 results (YHOO) 23.79 -0.19 : Reports Q1 (Mar) earnings of $0.38 per share excluding stock based compensation expense, $0.35 including $0.03 stock based compensation expense, vs. the Capital IQ Consensus Estimate of $0.25; revenues fell 0.3% year/year to $1.07 bln vs the $1.1 bln consensus.

Display:
GAAP display revenue was $455 million for the first quarter of 2013, an 11 percent decrease compared to $511 million for the first quarter of 2012.
Display revenue ex-TAC was $402 million for the first quarter of 2013, an 11 percent decrease compared to $454 million for the first quarter of 2012.
Price-per-Ad (excluding Korea) decreased approximately 2 percent compared to the first quarter of 2012.
Search:
GAAP search revenue was $425 million for the first quarter of 2013, a 10 percent decrease compared to $470 million for the first quarter of 2012.
Search revenue ex-TAC was $409 million for the first quarter of 2013, a 6 percent increase compared to $384 million for the first quarter of 2012.
Paid Clicks (excluding Korea) increased approximately 16 percent compared to the first quarter of 2012.
Price-per-Click (excluding Korea) decreased approximately 7 percent compared to the first quarter of 2012.
Cash Balance:
Cash, cash equivalents, and investments in marketable debt securities were $5.4 billion as of March 31, 2013 compared to $6 billion as of December 31, 2012, a decrease of $0.6 billion.

4:05PM LDK Solar provides update on the sale of LDK Hefei (LDK) 1.08 -0.04 : Co announced Anhui LDK New Energy Co., Ltd. signed an agreement to sell and transfer all its equity interest in its wholly owned subsidiary, LDK Solar High-Tech (Hefei) Co., Ltd., located in Hefei City of Anhui Province in China, to an affiliate of the Hefei City government, Hefei High Tech Industrial Development Social Service Corporation, for approximately RMB 120 million. Based on the Company's book value, LDK Solar expects to realize a net loss in the range of USD 80 million to USD 90 million for this transaction. Previously, LDK Solar announced a purchase agreement in January 2013 with Shanghai Qianjiang Group, with its consummation subject to relevant governmental approvals. Shanghai Qianjiang Group failed to secure such government approvals by the expiration date of March 30, 2013. "We will do our best to assure a smooth closing of this transaction."

NXP Semiconductors (NXPI) announced with ALIOTH, a Russian government and payment cards solutions provider, the launch of a contactless smart card solution product called SCOne

3:45AM LDK Solar announces partial nonpayment for convertible notes (LDK) 1.12 : Co announces that, due to a temporary cash-flow shortage, LDK Solar was not able to make full payments to the holders of its 4.75% convertible senior notes due 2013 in an aggregate principal amount of $23,793,000, plus interest, otherwise due and payable on their maturity date of April 15, 2013. LDK has, however, privately and individually negotiated with two holders of such convertible notes in the aggregate principal amount of $16,553,000, and reached settlement with them, shortly before the maturity date, through a partial payment in cash and effectively a loan facility to postpone the repayment of the remaining indebtedness.

Red Hat (RHT) announced that its Board of Directors has authorized the repurchase of up to $300 million of Red Hat's common stock from time to time on the open market or in privately negotiated transactions. The new program replaces the previous $300 million repurchase program, the final $179 million of which was completed since February 28, 2013 at an average price of $49.15 per share, inclusive of commissions, for a total of 3.6 million shares. The repurchase program will be funded using Red Hat's working capital. As of February 28, 2013, Red Hat had cash and investments of approximately $1.3 billion.

NETGEAR (NTGR) announced that based on preliminary data available at this time, the Company expects net revenue for the first quarter ended March 31, 2013 to be in the range of $290 million to $295 million (vs $299.99 mln Capital IQ Consensus Estimate), which is an update to the previously estimated range, of $290 million to $305 million provided on February 12, 2013. The Company expects GAAP operating margin for the first quarter to be in the range of 7.5% to 8%, and expects GAAP earnings per diluted share for the first quarter to be between $0.35 and $0.39. The Company expects non-GAAP operating margin for the first quarter to be in the range of 9.5% to 10%, below the previously estimated range of 11% to 12% provided on February 12, 2013. Non-GAAP earnings per diluted share for the first quarter of 2013 is expected to be in the range of $0.45 to $0.50 (vs $0.58 Capital IQ Consensus Estimate). "During the first quarter, we experienced difficulty in the transitioning of our ReadyNAS line, which caused shipments to be lower than demand from our channel partners. We are planning for a full recovery of supply for the second quarter onwards. Lower than planned shipments of the new ReadyNAS resulted in an unfavorable mix of products shipped, which negatively impacted our gross margins," commented Patrick Lo, Chairman and CEO of NETGEAR.
icon url

ReturntoSender

04/21/13 12:48 PM

#10168 RE: ReturntoSender #6755

The stock market isn't the only thing that has set records this spring. Barron's semiannual Big Money poll of professional investors also is setting a record -- for bullishness, that is. In our latest survey, 74% of money managers identify themselves as bullish or very bullish about the prospects for U.S. stocks -- an all-time high for Big Money, going back more than 20 years. What's more, about a third of managers expect the Dow Jones industrials to scale the 16,000 level by the middle of next year, notwithstanding a dismal week of selling that left the blue-chip index at 14,547.51 on Friday.

http://www.businessinsider.com/barrons-money-manager-poll-shows-the-highest-level-of-bullishness-in-20-years-2013-4
icon url

ReturntoSender

04/23/13 11:31 PM

#10170 RE: ReturntoSender #6755

From Briefing.com: 4:10 pm : Equities settled with strong gains as the S&P 500 climbed 1.0%.

Although stocks ended near their highs, an afternoon headline from a hacked Twitter account of the Associated Press suggested two explosions occurred at the White House, sending the S&P lower by 15 points and back to its flat line before returning to session highs. The entire episode unfolded within the matter of five minutes.

Overseas developments primed U.S. equities for an upbeat start to the session. Although economic data from the old continent was largely disappointing, commentary from the region overshadowed the data.

Manufacturing and Services PMI reports from France and Germany came in below 50, a level which indicates contraction. This fueled speculation about a possible European Central Bank rate cut at its upcoming policy meeting. In addition, European Commission President Jose Manuel Barroso was quoted as saying the policy of austerity "has reached its limits."

The talk of further monetary easing combined with Mr. Barroso's comments buoyed European indices, and contributed to an upbeat start to the U.S. session.

Financials and technology led today's advance with bank stocks outperforming notably. The SPDR Financial Select Sector ETF (XLF 18.42, +0.32) settled higher by 1.8% after Discover Financial Services (DFS 44.34, +0.73) and Dow component Travelers (TRV 86.35, +1.77) reported better-than-expected earnings.

Elsewhere, the tech space saw broad gains and Netflix (NFLX 216.99, +42.62) surged 24.4% following its bottom-line beat. Chipmakers also rallied on the back of above-consensus quarterly results from ARM Holdings (ARMH 46.32, +6.08) and Texas Instruments (TXN 35.70, +0.89). Meanwhile, the broader PHLX Semiconductor Index advanced 2.1%. Also of note, the largest tech stock, Apple (AAPL 406.13, +7.46), gained 1.9% ahead of its quarterly report, which will be released this evening.

The discretionary space was another group which displayed considerable strength thanks to retailers and homebuilders. Coach (COH 55.55, +4.96) jumped 9.8% after beating on earnings while the SPDR S&P Retail ETF (XRT 71.56, +0.84) climbed 1.2%.

Also of note, the SPDR S&P Homebuilders ETF (XHB 29.65, +0.74) rose 2.6% after five builders were upgraded at Barclays. In addition, today's economic data contributed to the sector outperformance.

New home sales increased 1.7% in March to 417,000. There was no revision to the February report, which indicated 411,000 new homes were sold. That March number is still down from the recent January peak when 445,000 homes were sold. The Briefing.com consensus expected sales to increase to 415,000.

Inventory levels inched higher, rising from 150,000 in February to 153,000 in March. That represents a 4.4-month supply and is still well below levels considered normal. Like existing homes, new home inventories should trend around a 6.0-month supply when the industry is in good shape.

Tomorrow, the weekly MBA Mortgage Index will be reported at 7:00 ET while March durable orders and durable orders ex-transportation will be announced at 8:30 ET. On the earnings front, Boeing (BA 88.18, +1.24) and Ford Motor (F 13.36, +0.30) will shed light on their first quarter results before the opening bell.

The U.S. Treasury will auction off $35 billion in 5-yr notes.DJ30 +152.29 NASDAQ +35.78 SP500 +16.28 NASDAQ Adv/Vol/Dec 1898/1.63 bln/563 NYSE Adv/Vol/Dec 2424/683.7 mln/607

3:30 pm :

June crude oil erased most of its earlier losses as it lifted off its session low of $88.00 per barrel and trended higher for most of today's floor trade. The energy component touched a session high of $89.30 per barrel in afternoon pit action and eventually settled at $89.16 per barrel, or just 0.1% lower.
May natural gas rose to a session high of $4.32 per MMBtu in late morning action but lost momentum in late afternoon floor trade. It gave up all of its gains and settled 0.5% lower at $4.24 per MMBtu.
June gold traded lower today but held above $1400 per ounce as a stronger dollar pressured prices. The yellow component retreated from its session high of $1423.10 per ounce set at pit trade open and dipped as low as $1404.00 per ounce. It settled at $1409.20 per ounce, booking a loss of 0.9%.
May silver also traded in negative territory during today's floor trade. It pulled-back from its session high of $23.02 per ounce and touched a session low of $22.69 per ounce in morning pit action. It eventually settled 2.3% lower at $22.80 per ounce

4:38PM Apple beats by $0.09, beats on rev; guides Q3 rev, gross margin below consensus; raises buyback 5x to $60 bln; raises quarterly dividend 15% -- stock will resume trade at 16:40 (AAPL) 406.13 +7.46 : Reports Q2 (Mar) earnings of $10.09 per share, $0.09 better than the Capital IQ Consensus Estimate of $10.00; revenues rose 11.3% year/year to $43.6 bln vs the $42.4 bln consensus.

Q2 gross margins of 37.5% vs Street est of 38.5% and 37.5-38.5% guidance

Products: 37.4 mln iPhones sold in Q2 vs Street est of ~35 mln; 19.5 mln iPads sold in Q2 vs Street est of ~18 mln; sold just under 4 million Macs in Q2 vs Street est of ~4 mln.

Co issues downside guidance for Q3, sees Q3 revs of $33.5-35.5 bln vs. $38.44 bln Capital IQ Consensus Estimate; co sees Q3 gross margin between 36-37% vs. ests of ~38.8%.

Co announced that its Board of Directors has authorized a significant increase to the co's program to return capital to shareholders. The co expects to utilize a total of $100 billion of cash under the expanded program by the end of calendar 2015. This represents a $55 billion increase to the program announced last year and translates to an average rate of $30 billion per year from the time of the first dividend payment in August 2012 through December 2015.

As part of this program, the Board has increased its share repurchase authorization to $60 billion from the $10 billion level announced last year. This is the largest single share repurchase authorization in history and is expected to be executed by the end of calendar 2015. Apple also expects to utilize about $1 billion annually to net-share-settle vesting restricted stock units.

Additionally, the Board has approved a 15% increase in the Company's quarterly dividend and today has declared a dividend of $3.05 per common share, payable on May 16, 2013 to shareholders of record as of the close of business on May 13, 2013. Apple is among the largest dividend payers in the world, with annual payments of about $11 billion.

4:30PM Apple more than doubles capital return program: total of $100 bln to be returned to shareholders by end of 2015 (AAPL) 406.13 +7.46 : Co announced that its Board of Directors has authorized a significant increase to the Company's program to return capital to shareholders. The Company expects to utilize a total of $100 billion of cash under the expanded program by the end of calendar 2015. This represents a $55 billion increase to the program announced last year and translates to an average rate of $30 billion per year from the time of the first dividend payment in August 2012 through December 2015.

As part of this program, the Board has increased its share repurchase authorization to $60 billion from the $10 billion level announced last year. This is the largest single share repurchase authorization in history and is expected to be executed by the end of calendar 2015. Apple also expects to utilize about $1 billion annually to net-share-settle vesting restricted stock units. Additionally, the Board has approved a 15% increase in the Company's quarterly dividend and today has declared a dividend of $3.05 per common share, payable on May 16, 2013 to shareholders of record as of the close of business on May 13, 2013. Apple is among the largest dividend payers in the world, with annual payments of about $11 billion.

In conjunction with the expanded return of capital program, the Company plans to borrow and expects to announce more details about this in the near future. The management team and Board of Directors will continue to review each element of the capital return program on an annual basis.

4:28PM Harmonic misses by $0.03, misses on revs; guides Q2 revs below consensus (HLIT) 6.02 +0.13 : Reports Q1 (Mar) loss of $0.02 per share, excluding non-recurring items, $0.03 worse than the Capital IQ Consensus Estimate of $0.01; revenues fell 12.6% year/year to $101.7 mln vs the $113.88 mln consensus. Non-GAAP gross margins and operating expenses for the second quarter of 2013, which will exclude stock-based compensation and the amortization of intangibles, are anticipated to be in the range of 51.5% to 52.5% and $54 million to $55 million, respectively. Co issues downside guidance for Q2, sees Q2 revs of $105-115 mln vs. $123.95 mln Capital IQ Consensus Estimate.

4:14PM Super Micro Computer beats by $0.03, misses on revs (SMCI) 9.90 +0.25 : Reports Q3 (Mar) earnings of $0.23 per share, $0.03 better than the Capital IQ Consensus Estimate of $0.20; revenues rose 15.7% year/year to $278 mln vs the $284.13 mln consensus.

Gross margin for the third quarter was 14.0% compared to 17.0% in the same period a year ago. Non-GAAP gross margin for the third quarter was 14.1% compared to 17.0% in the same period a year ago.

"The typical March quarter seasonality was evident in the lower sequential revenue. However, we are pleased that revenue for the quarter was up 15.8% from last year. Our revenue growth this quarter outpaced the industry's growth and we expect this trend will continue,"

4:06PM Cree reports EPS in-line, beats on revs; guides Q4 EPS in-line, revs in-line (CREE) 57.69 +2.15 : Reports Q3 (Mar) earnings of $0.34 per share, excluding non-recurring items, in-line with the Capital IQ Consensus Estimate consensus of $0.34 and inline with the March 5 guidance of $0.31-0.36, which was raised slightly from the prior guidance of $0.30-0.35. Revenues rose 22.5% year/year to $348.9 mln vs the $343.6 mln consensus and vs March 5 guidance of $335-350 mln. Co issues in-line guidance for Q4 (Jun), sees EPS of $0.34-0.40, excluding non-recurring items, vs. $0.37 Capital IQ Consensus Estimate; sees Q4 revs of $365-385 mln vs. $368.4 mln Capital IQ Consensus Estimate.

Cree is reporting non-GAAP gross margin of 38.8% vs guidance of 39.5%+/-.
Non-GAAP operating margin came in at 12.9% vs 8.6% last year and 13.7% in DecQ.

4:05PM Flextronics announces opening of medical design center in Milan, Italy (FLEX) 6.82 +0.13 : Co announced the opening of its new showcase medical design center located in Milan, Italy. This Design and Industrialization Center, which provides services to customers in the medical industry, is ISO 13485 certified and provides world-class expertise for FDA class II and III medical devices, drug delivery devices, medical equipment and disposables. The Center provides services across design, program management, industrialization and design transfer.

4:03PM AdCare Health Systems announces notice of noncompliance with NYSE MKT listing standards (ADK) 5.86 +0.14 :

4:03PM RF Micro Device beats by $0.01, beats on revs; guides Q1 EPS in-line, revs above consensus (RFMD) 5.45 +0.15 : Reports Q4 (Mar) earnings of $0.06 per share, excluding non-recurring items, $0.01 better than the Capital IQ Consensus Estimate of $0.05; revenues rose 49.3% year/year to $280.6 mln vs the $252.68 mln consensus. The increase in sequential revenue reflected increased adoption of RFMD's best-in-class cellular RF solutions and broad-based growth in high-performance WiFi, broadband/CATV, and standard products applications. On a non-GAAP basis, gross margin totaled 34.4%.

Co issues mixed guidance for Q1, sees EPS of $0.07-0.08, excluding non-recurring items, vs. $0.07 Capital IQ Consensus Estimate; sees Q1 revs of $285-290 mln vs. $267.00 mln Capital IQ Consensus Estimate.

sTec (STEC) announced that its s840 Series Enterprise SAS SSDs have been certified for MSFT's Windows Server 2012, which includes use with Windows Server 2012 Cluster in a Box systems.
Ingram Micro (IM) announced electronic service delivery for select Microsoft Office (MSFT) products including Office 2013 and Windows 8 Pro Pack.
Smith Micro Software (SMSI) announced Getac is offering the QuickLink Mobility connection management solution to enable simple, secure, and reliable wireless network access on select Getac devices.

9:02AM Riverbed Technology appoints David Wu Chief Technology Officer (RVBD) 14.14 : Co announced that David Wu has been appointed Chief Technology Officer. Before joining the Riverbed founding team, Wu was the Director of Engineering at netVmg, acquired by Internap Corporation (INAP).

SunEdison, a subsidiary of MEMC Electronic Materials (WFR), announced that its affiliate, MEMC Singapore, entered into a photovoltaic module manufacturing services agreement with Fox Energy, whereby Fox Energy will manufacture up to 350 megawatts of solar modules for SunEdison.

Skyworks Solutions (SWKS) announced it is supporting Samsung's (SSNLF) GALAXY S 4 smartphone platforms with multiple high-performance analog and front-end solutions

VECO +7.8% (reports Q1 bookings/metrics; shipments declined sharply QoQ in MOCVD and Data Storage),

AIXG +7.4% (following ARMH results and VECO guidance)

7:21AM Celestica beats by $0.01, reports revs in-line; guides Q2 EPS, revs in-line (CLS) 7.65 : Reports Q1 (Mar) earnings of $0.16 per share, excluding non-recurring items, $0.01 better than the Capital IQ Consensus Estimate of $0.15; revenues fell 18.8% year/year to $1.37 bln vs the $1.38 bln consensus, relatively flat after excluding revenue from Research In Motion Limited (BBRY) for the first quarter of 2012.

"Celestica delivered first quarter revenue consistent with our expectations, while achieving profitability at the high end of the guidance range driven through solid execution and disciplined cost management. With the overall economic outlook expected to remain challenging, we continue to focus our efforts on delivering value to our customers through strong operational performance, and on improving our financial performance through productivity improvements and effectively managing our costs and resources, while making the necessary investments to support our longer term objectives."

Co issues in-line guidance for Q2, sees EPS of $0.13-0.19, excluding non-recurring items, vs. $0.16 Capital IQ Consensus Estimate; sees Q2 revs of $1.375-1.475 bln vs. $1.40 bln Capital IQ Consensus Estimate

2:56AM ARM Holdings beats by $0.01, beats on revs; guides Q2 revs in-line (ARMH) 40.24 : Reports Q1 (Mar) earnings of GBP0.05 per share, GBP0.01 better than the Capital IQ Consensus Estimate of GBP0.04; revenues rose 28.5% year/year to GBP170.3 mln vs the GBP160.33 mln consensus. Co issues in-line guidance for Q2, sees Q2 revs of in-line with expectations (qualatative commentary) vs. GBP161.90 mln Capital IQ Consensus Estimate.

Q1 Highlights:

Growth in adoption of ARM technology
22 processor licenses signed across multiple end markets from smartphones and mobile computing to digital TVs and wearable technology
Advanced technology enables higher royalty percentage per chip
9 Cortex-A processor licenses and another ARMv8 architecture license signed3 further partners enabled with ARM's v8 big.LITTLE technology
3 Mali graphics processor licenses signed, including a license for Skrymir, ARM's most advanced graphics processor
POP IP helps optimise ARM processor implementations. ARM signed 2 further POP IP licenses in Q1
Growth in shipments of chips based on ARM processor technology
2.6 billion ARM-based chips shipped, up 35% year-on-year
Strong year-on-year shipment growth across all segments; mobile chips up 25%, embedded up 50% year-on-year
Continued penetration of Mali graphics processors with shipments up more than 5 times year-on-year

Gross margins:
Gross margins in Q1 2013, excluding share-based payments charges of GBP0.5 mln (see below), were 94.3% compared to 95.1% in Q4 2012 and 94.4% in Q1 2012.

License revenues

Total dollar license revenues in Q1 2013 increased by 24% year-on-year to $94.9 mln, representing 36% of group revenues. License revenues comprised $80.8 mln from PD and $14.1 mln from PIPD.
Group order backlog at the end of Q1 2013 was up 5% sequentially.

Royalty revenues

Royalties are recognised one quarter in arrears with royalties in Q1 2013 generated from semiconductor unit shipments in Q4 2012.
Total dollar royalty revenues in Q1 2013 increased year-on-year by 32% to $140.0 mln, representing 53% of group revenues.
Royalty revenues comprised $123.4 mln from PD and $16.6 mln from PIPD.

Outlook
"ARM has made an encouraging start to 2013 with more leading companies choosing to deploy ARM technology in their products and we therefore expect group revenues for the full-year 2013 to be at least in line with current market expectations. Relevant industry data for Q1 2013, being the shipment period for ARM's Q2 royalties, points to a sequential decrease in industry-wide revenues of around 10%. In this context we expect group revenues for the second quarter to be in line with current market expectations." Q2 consensus for revs and EPS calls for GBP161.9 mln.

AMD (AMD) announced the new AMD Embedded G-Series System-on-Chip platform, a single-chip solution based on the AMD next-generation "Jaguar" CPU architecture and AMD Radeon 8000 Series graphics.

11:05 am Technology Sector +1.1% outpacing the broader market
The tech sector is trading higher today, just ahead of gains in the broader market. Semiconductors are showing relative strength as well with the SOX trading 1.4% higher. Within the chip index, VECO (+14.2%) is a notable standout following its announcement of upside metrics. Among other major indices, the SPY is trading 1.0% higher today, while the QQQ is up 1.1% and the NASDAQ is trading 1.0% higher on the session. Among tech bellwethers, TXN (+3.3%) is showing notable strength, while MSFT (-0.2%) is under pressure.

In tech earnings last night, SANM (+12.5%) posted a modest Q3 beat and guided inline, TXN (+3.3%) reported Q1 results at the high end of previous guidance and offered Q2 guidance inline with consensus, NXPI (-1.8%) posted a beat and raise, and STM (+8.8%) reported a miss but offered constructive guidance. This morning, ARMH (+10.2%) and LXK (+12.8%) both posted a beat and offered inline guidance, while XRX (-1.2%) reported a mixed qtr and guided Q2 below consensus and CLS (+3.2%) posted a slight beat and guided inline. In news, AAPL (+1.0%) won a case brought on it by GOOG's (+1.7%) Motorola. In rumors, we are hearing HIMX (-4.4%) may not have won the LCoD design in GOOG (+1.7%) Glass. Among notable analyst upgrades this morning in the tech space, Oppenheimer upgraded VECO (+14.2%) to Outperform and INFA (+4.5%) was upgraded to Neutral at Credit Suisse. Among downgrades, WU (+0.2%) was downgraded to Neutral at Citigroup, RCI (-2.3%) was downgraded to Neutral at Credit Suisse following earnings and CHKP (-0.5%) was downgraded to Sector Perform at Pacific Crest. AAPL (+1.0%), T (+0.3%), BRCM (+0.1%), FTI (+0.7%), JNPR (+2.6%), and VMW (+1.5%) are the notable names in tech scheduled to report quarterly results today after the close.

Volterra Semi (VLTR) reported first quarter earnings of $0.22 per share, excluding non-recurring items, $0.03 worse than the Capital IQ consensus of $0.25, while revenues fell 5.2% year/year to $39.9 million versus the $40.35 million consensus. "Revenue this quarter came in about as expected. We believe the strategic decision we made to de-emphasize our notebook activities is the right one as we focus our resources on significant growth opportunities in cloud servers, new communications equipment applications and energy."

Sanmina (SANM) reported second quarter earnings of $0.30 per share, excluding non-recurring items, $0.01 better than the Capital IQ consensus of $0.29, while revenues fell 2.4% year/year to $1.43 billion versus the $1.42 billion consensus. Cash flow from operations was $64.7 million for the quarter. Co reports Q2 Non-GAAP gross margin of 7.1% versus guidance of 7.0-7.4% and 7.4% in Q2 of 2012. The company issued in-line guidance for Q3, sees EPS of $0.32-0.38, excluding non-recurring items versus the $0.36 Capital IQ Consensus Estimate; sees Q3 revs of $1.45-1.5 billion versus the $1.47 billion consensus. "Our second quarter results were in line with our expectations as we continued to manage through a soft market environment ... We continue to invest in technology and services that enhance the value we provide to our customers around the world. We remain encouraged by new program ramps and increased forecasts from our customers that should drive improvement in the second half of the year."

Texas Instruments (TXN) reported first quarter earnings of $0.32 per share, better than the Capital IQ consensus GAAP Estimate of $0.30, while revenues fell 7.6% year/year to $2.88 billion versus the $2.85 billion consensus. The company on March 7 raised EPS guidance to $0.28-0.32 from $0.24-0.32; revenue to $2.80-2.91 billion from $2.68-2.91 bln. The company issued guidance for the second quarter with EPS of $0.37-0.45 versus the $0.38 GAAP consensus and revenues of $2.93-3.17 billion versus the $3.04 billion consensus. Revenue from legacy wireless products is expected to decline by about $60 million QoQ at the middle of this range. The co previously announced that it is winding down investment in these products for the smartphone and consumer tablet markets. TI will update its second-quarter outlook on June 10, 2013. For the full year of 2013, TI expects ~the following: R&D expense: $1.5 billion, down from the prior estimate of $1.6 billion Capital expenditures: $0.5 billion, unchanged "Our revenue and earnings ended the quarter at the high end of our expected range. Customers continued to operate in a real-time mode, maintaining minimal component inventory and ordering parts as they were needed. Our short product lead times, well-positioned inventory and ready manufacturing capacity allow us to respond rapidly to changes in demand... TI is now firmly rooted in Analog and Embedded Processing, and in the first quarter these segments contributed 77 percent of our revenue -- a full five points more than a year ago... Our business model generates strong cash flow from operations. Free cash flow* for the trailing 12 months was almost $3 billion, up 16 percent compared with a year ago. Further, free cash flow comprised 23 percent of revenue, which is consistent with our target of 20-25 percent. Free cash flow is well in excess of net income, and we expect it to remain so for some time as non-cash expenses are included in net income."

PLX Tech (PLXT) reported first quarter earnings of $0.09 per share, excluding non-recurring items, $0.03 better than the Capital IQ consensus Estimate of $0.06, while revenues rose 6.9% year/year to $26.2 million versus the $26.01 million consensus. The company issued downside guidance for the second quarter with revenues of $25.5-27.5 million versus the $27.42 million consensus.

Netflix (NFLX) reported first quarter earnings of $0.31 per share, excluding non-recurring items, $0.11 better than the Capital IQ Consensus Estimate of $0.20; revenues rose 17.7% year/year to $1.02 billion the $1.02 billion consensus. The company issued in-line guidance for the second quarter with EPS of $0.23-0.48 versus the $0.29 Capital IQ consensus. In Q2, guidance implies net income roughly flat with Q1 (absent the loss on extinguishment of debt). Co had a tax benefit in Q1 related to the retroactive reinstatement of the 2012 R&D tax credit that will not repeat in Q2, so higher sequential operating profit will be partially offset by higher sequential taxes. absent USPS rate increases, NFLX has been able to maintain DVD contribution margin as members and shipment volume decline. Co is anticipate continuing to be able to maintain the margins it sees in the first half of 2013 throughout the full year. Consistent with view last quarter, it does not foresee USPS service changes that will have a material negative impact upon us or our members for the remainder of 2013. With the fundraising, NFLX finished the quarter with a little over $1 billion in cash and equivalents. Market conditions were attractive and it was pleased to add cash to increase reserves and afford the flexibility to invest in additional Originals. NFLX will convert the 2011 TCV $200 million convertible notes tomorrow (April 23rd) into the corresponding 2.3 million shares. NFLX reports diluted EPS as if the debt was converted, so guidance for Q2 EPS already accounts for these shares, and there is no change to cash on hand from this conversion.
icon url

ReturntoSender

04/24/13 9:14 PM

#10171 RE: ReturntoSender #6755

4:15 pm : The major averages ended today's session on a mixed note. The Dow shed 0.3% while Nasdaq and S&P 500 ended flat.

Defensively-oriented groups were among the leaders of the first-quarter market rally. Today, however, three defensive sectors finished firmly lower after top-line results from major components failed to justify the considerable first-quarter gains.

Consumer staples, telecom, and health care sectors all registered losses of at least 1.7%.

Consumer staples lagged after Procter & Gamble (PG 77.12, -4.82) reported revenue below the Capital IQ consensus estimate. In addition, the company issued cautious fourth quarter earnings and revenue guidance.

Elsewhere, telecoms were pressured by AT&T (T 37.04, -1.96) after the carrier missed on revenue. In addition, Citigroup and Morgan Stanley both downgraded the stock.

The top performing sector of the year, health care, declined steadily throughout the day after Amgen (AMGN 104.93, -7.83), Edwards Lifesciences (EW 64.60, -18.21), and Eli Lilly (LLY 56.05, -2.28) all reported below-consensus revenues.

In addition, Amgen's 6.9% decline weighed on biotech companies as iShares Nasdaq Biotech ETF (IBB 169.67, -5.11) settled lower by 2.9%.

The underperformance of biotechnology names kept the Nasdaq near its flat line even as technology stocks displayed relative strength. Apple (AAPL 405.46, -0.67) ended little changed after beating on earnings and revenue. Although the company's results surprised to the upside, its gross margin was reported on the low end of estimates. In addition, Apple lowered its third quarter revenue and gross margin guidance below consensus. Also of note, the company raised its quarterly dividend by 15%. However, the increased capital return program will be funded by taking on debt rather than repatriating its cash, which would be subject to U.S. corporate taxes.

Chipmakers were some of the top performing tech components after Broadcom (BRCM 35.08, +2.11) topped its earnings and revenue estimates. Meanwhile, the broader PHLX Semiconductor Index rose 1.3%.

While the best performing sectors of the first quarter ended firmly lower, three notable Q1 laggards ended in the lead. Energy, industrials, and materials all settled with gains of at least 1.0%.

The economically-sensitive groups were aided by a rebound in commodities. Crude oil ended higher by 2.8% at $91.63 per barrel while copper rose 2.4% to $3.166 per pound, and gold climbed 1.5% to $1429.70 per troy ounce.

Industrials received added support from defense stocks after General Dynamics (GD 71.73, +4.63) beat on earnings. Meanwhile, the broader PHLX Defense Index advanced 1.6%.

Today's volume was right in-line with its 200-day moving average as 706 million shares traded hands on the floor of the New York Stock Exchange.

Durable goods orders continued their streak of sizable up-and-down movements in March. Orders fell 5.7% after increasing a downwardly revised 4.3% (from 5.6%) in February. The Briefing.com consensus expected orders to fall 3.1%.

The wild swings in orders over the last few months have been the result of big moves in aircraft orders. In March, total aircraft orders -- defense and nondefense -- fell 43.5% after increasing 65.0% in February.

Excluding transportation, orders fell 1.4% after dropping a downwardly revised 1.7% (from -0.7%) in February. The consensus expected these orders to remain flat.

The weekly MBA Mortgage Index rose 0.2% to follow last week's increase of 4.8%.

Tomorrow, weekly initial and continuing claims will be reported at 8:30 ET. Among earnings of note, 3M (MMM 107.87, +0.48), Exxon Mobil (XOM 89.43, +0.13), and UPS (UPS 83.50, -0.24) will report their results before the opening bell.

The U.S. Treasury will auction $29 billion in 7-yr notes.DJ30 -43.16 NASDAQ +0.32 SP500 +0.01 NASDAQ Adv/Vol/Dec 1377/1.66 bln/1056 NYSE Adv/Vol/Dec 1971/706.1 mln/1017

3:30 pm :

June crude oil advanced during today's pit trade on bullish inventory data that showed a build of 0.947 mln barrels when a build of 1.8 mln was anticipated. The energy component lifted off its session low of $89.36 per barrel and steadily trended higher. It touched a session high of $91.49 per barrel moments before settling with a 2.5% gain at $91.43 per barrel.
May natural gas, however, fell into negative territory after trading as high as $4.28 per MMBtu in early morning floor trade. Unable to regain momentum, it settled 1.9% lower at its session low of $4.16 per MMBtu.
June gold traded higher during today's floor trade. It touched a session high of $1433.60 per ounce in early morning action but pulled-back slightly as the session progressed. It brushed a session low of $1420.50 per ounce as it headed into the close and settled at $1423.70 per ounce, booking a 1.0% gain.
May silver erased most of its morning pit session gains as it pulled back from its session high of $23.22 per ounce. It eventually settled at $22.84, or 0.2% higher.

4:35PM MKS Instruments beats by $0.03, beats on revs; guides Q2 EPS in-line, revs in-line (MKSI) 26.16 +0.23 : Reports Q1 (Mar) earnings of $0.07 per share, $0.03 better than the Capital IQ Consensus Estimate of $0.04; revenues fell 25.8% year/year to $141.6 mln vs the $137.44 mln consensus.

* Guidance: Co issues in-line guidance for Q2, sees EPS of $0.04-$0.18 vs. $0.14 Capital IQ Consensus Estimate; sees Q2 revs of $145-$165 mln vs. $147.23 mln Capital IQ Consensus Estimate.

* Commentary: "We are encouraged by the improvement we are seeing in the semiconductor market, however, near term we anticipate that business conditions for our other markets will remain challenging. We are optimistic about the longer term recovery, and are continuing to work closely with customers on design wins and make investments to position ourselves for long-term growth."

4:31PM Xilinx beats by $0.03, reports revs in-line; guides Q1 revs in-line (midpoint below consensus) with gross margin upside (XLNX) 36.50 -0.05 : Reports Q4 (Mar) earnings of $0.47 per share, $0.03 better than the Capital IQ Consensus Estimate of $0.44; revenues fell 4.8% year/year to $532.2 mln vs the $529.72 mln consensus. The co achieved a record 66% gross margin in fiscal year 2013, up from 65% in the prior fiscal year. This improvement is a testament to the Company's continued focus on margin expansion projects across our product portfolio. Xilinx continued to demonstrate a strong commitment to returning shareholder value through dividend increase and repurchase activity. Xilinx recently increased its quarterly dividend $0.03 per share to $0.25 per share. During the fiscal year, Xilinx paid its stockholders a record $230 million in dividends and repurchased 6.2 million shares for $198 million.

Co issues guidance for Q1, sees Q1 revs +1-5% QoQ to ~$537.5-558.8 mln vs. $555.70 mln Capital IQ Consensus Estimate. Gross margin is expected to be ~66-67% vs. ests near 66%.

4:24PM Cadence Design beats by $0.01, beats on revs; guides Q2 EPS below consensus, revs above consensus; guides FY13 EPS in-line, revs above consensus (CDNS) 12.72 +0.05 : Reports Q1 (Mar) earnings of $0.21 per share, excluding non-recurring items, $0.01 better than the Capital IQ Consensus Estimate of $0.20; revenues rose 12.2% year/year to $354.26 mln vs the $348.51 mln consensus.

Co issues mixed guidance for Q2, sees EPS of $0.19-0.21, excluding non-recurring items, vs. $0.22 Capital IQ Consensus Estimate; sees Q2 revs of $355-365 mln vs. $354.30 mln Capital IQ Consensus Estimate.
Co issues mixed guidance for FY13, sees EPS of $0.81-0.91, excluding non-recurring items, vs. $0.89 Capital IQ Consensus Estimate; sees FY13 revs of $1.44-1.47 bln vs. $1.44 bln Capital IQ Consensus Estimate.

4:18PM Lam Research beats by $0.08, reports revs in-line (LRCX) 43.03 +0.51 : Reports Q3 (Mar) earnings of $0.44 per share, excluding non-recurring items, $0.08 better than the Capital IQ Consensus Estimate of $0.36; revenues rose 28.2% year/year to $844.9 mln vs the $837.73 mln consensus.

4:18PM Mellanox Tech beats by $0.06, beats on revs (MLNX) 61.83 +0.55 : Reports Q1 (Mar) earnings of $0.10 per share, $0.06 better than the Capital IQ Consensus Estimate of $0.04; revenues fell 6.3% year/year to $83.1 mln vs the $80.92 mln consensus.

"Despite the decline in our financial results over the past two quarters, we believe increased demand will restore growth in coming quarters,"... In the first quarter, our FDR InfiniBand revenue share increased from 39 percent to 50 percent, demonstrating the continued demand for our highest performing InfiniBand products. We expect that our future growth will be driven by the increased adoption of FDR InfiniBand as well our 10/40/56Gb/s Ethernet products."

4:18PM Western Digital beats by $0.34, beats on revs (WDC) : Reports Q3 (Mar) earnings of $2.10 per share, $0.34 better than the Capital IQ Consensus Estimate of $1.76; revenues rose 24.0% year/year to $3.76 bln vs the $3.61 bln consensus. "Strong execution by our HGST and WD subsidiaries drove outstanding results in the March quarter as we continue to capitalize on the secular growth of digital data. Overall industry demand was in line with our expectations. In our business, we saw strength in enterprise, stable performance in client and consumer electronics, and some anticipated seasonal softness in Branded Products."

4:17PM F5 Networks beats by $0.01, reports revs in-line; guides Q3 EPS below consensus, revs below consensus; authorized an additional $200 million for share repurchase program (FFIV) 72.35 +0.02 : Reports Q2 (Mar) earnings of $1.07 per share, excluding non-recurring items, $0.01 better than the Capital IQ Consensus Estimate of $1.06; revenues rose 3.1% year/year to $350.2 mln vs the $350.19 mln consensus.

Co issues downside guidance for Q3, sees EPS of $1.06-1.09, excluding non-recurring items, vs. $1.11 Capital IQ Consensus Estimate; sees Q3 revs of $355-365 mln vs. $366.89 mln Capital IQ Consensus Estimate.
The company also announced today that its board of directors had authorized an additional $200 million for the company's common stock share repurchase program. This new authorization is incremental to the $81.3 million currently in the existing program which was initially authorized in October 2010.

4:08PM Lam Research announces $250 mln share repurchase program (LRCX) 43.03 +0.51 : The program will be funded using the co's existing on-shore cash and on-shore cash generation. As of March 31, 2013 Lam Research had approximately 162 mln shares outstanding, The program will be funded using the co's existing on-shore cash and on-shore cash generation. As of March 31, 2013 Lam Research had approximately 162 mln shares outstanding, $2.5 bln in total gross cash and cash equivalents, short-term investments, and approximately 30% of those cash resources were held domestically. .5 bln in total gross cash and cash equivalents, short-term investments, and approximately 30% of those cash resources were held domestically.

4:08PM Mattson beats by $0.01, misses on revs (MTSN) 1.56 -0.04 : Reports Q1 (Mar) loss of $0.12 per share, $0.01 better than the Capital IQ Consensus Estimate of ($0.13); revenues fell 60.0% year/year to $20.2 mln vs the $20.55 mln consensus. Gross margin in the first quarter of 2013 was lower at 22 percent as compared to the 34 percent gross margin reported in both the first and fourth quarters of 2012, but met expectations based on the unfavorable product mix that included a high composition of low-margin legacy dry strip systems.

4:05PM LSI Logic beats by $0.05, beats on revs; guides Q2 EPS in-line, revs in-line (LSI) 6.35 +0.15 : Reports Q1 (Mar) earnings of $0.17 per share, excluding non-recurring items, $0.05 better than the Capital IQ Consensus Estimate of $0.12; revenues fell 8.6% year/year to $568.6 mln vs the $555.14 mln consensus.

Co issues in-line guidance for Q2, sees EPS of $0.10-0.16, excluding non-recurring items, vs. $0.13 Capital IQ Consensus Estimate; sees Q2 revs of $560-600 mln vs. $581.81 mln Capital IQ Consensus Estimate.

4:03PM Coherent beats by $0.07, reports revs in-line (COHR) 51.77 -0.38 : Reports Q2 (Mar) earnings of $0.84 per share, $0.07 better than the Capital IQ Consensus Estimate of $0.77; revenues rose 3.5% year/year to $200.1 mln vs the $198.18 mln consensus.

* Bookings received during the second fiscal quarter ended March 30, 2013 of $201.8 million increased 10.2% from $183.1 million in the same prior year period and increased by 14.7% compared to bookings of $176.0 million in the immediately preceding quarter.

* Co states: "Demand improved across many of our commercial end markets. We posted record bookings for materials processing including our first volume order for the Highlight 1000FL fiber laser for flatbed cutting, strong orders for the Highlight D-Series direct diode system for additive manufacturing and several orders for Diamond E-1000 lasers to be used in converting. The advanced packaging market continued to build momentum with orders rising sequentially and year-over-year due to rising demand for any layer HDI PCBs for mobile devices and high-end IC substrates..."

Maxim Integrated Products (MXIM) announced it is sampling the MAX14920/MAX14921, high-accuracy, 12/16-channel cell-measurement analog front-ends that lower battery-management electronics costs by up to 35%.

Atmel (ATML) announced Kyocera (KYO) has selected Atmel maXTouch controllers to power the touchscreen in its new Torque E6710.
Marvell (MRVL) announced that MSi LED Lighting has selected the Marvell 88EM8183 deep dimming single-stage AC/DC LED driver integrated circuit to power its new line of LED bulbs they are manufacturing for 3M (MMM).

7:34AM Silicon Labs beats by $0.08, beats on revs; guides Q2 revs below consensus (SLAB) 42.02 : Reports Q1 (Mar) GAAP earnings of $0.46 per share, $0.08 better than the Capital IQ Consensus GAAP Estimate of $0.38; revenues rose 15.7% year/year to $145.4 mln vs the $143.85 mln consensus. Co issues downside guidance for Q2, sees Q2 revs of $140-146 mln vs. $149.04 mln Capital IQ Consensus Estimate, allowing for accelerated declines in legacy handset-related products.

7:15AM ATMI misses by $0.04, reports revs in-line (ATMI) 21.54 : Reports Q1 (Mar) earnings of $0.26 per share, excluding $0.06 in non-recurring items ($0.03 charge, offset by a $0.03 gain), $0.04 worse than the Capital IQ Consensus Estimate of $0.30; revenues rose 7.3% year/year to $99.4 mln vs the $99.46 mln consensus.

"We are becoming more confident in our 2013 growth outlook. Our expectation of modest wafer start growth, with a majority of it occurring during the second and third quarters of the year, seems to be confirmed by customer commentary and industry analysis. While it is clear that advanced devices for mobility applications have momentum, there is commentary that indicates some segments are not as strong. Even with this mix in demand trends for various devices, our focus on the leading edge should allow us to outgrow the market. LifeSciences has begun the year on a strong note, and we expect this will continue throughout the year, with some possible near-term fluctuations associated with customers' ramp patterns for this new technology. As volumes improve, and we maintain our focus on profitability and cash management, we anticipate results will improve through the year."

7:12AM Corning beats by $0.06, misses on revs; raises qrtly dividend to $0.10 from $0.09, announces $2 bln buyback (GLW) 13.13 : Reports Q1 (Mar) earnings of $0.30 per share, $0.06 better than the Capital IQ Consensus Estimate of $0.24; revenues fell 0.3% year/year to $1.81 bln vs the $1.96 bln consensus.

Display Technologies LCD glass price declines in the first quarter were more moderate than fourth-quarter declines, as expected. Corning anticipates second-quarter price declines will be smaller than those reported in the first quarter.
"We also moved decisively in the quarter to hedge the company's translation exposure to the Japanese yen-to-U.S.-dollar exchange rate. The company's economic exposure to further weakening in the yen exchange rate is now capped at 93 Japanese yen to a U.S. dollar."
In the second quarter, Corning expects Display Technologies overall LCD glass share to remain stable and volume to be consistent with the first quarter. Price declines are expected to be smaller than in the first quarter, in the range of a 2% to 3% decline.
Telecommunications segment sales are expected to improve about 20% sequentially, off the seasonally slow first quarter. Specialty Materials segment sales are anticipated to improve by 15% to 20% sequentially as demand for Gorilla Glass increases. Environmental Technologies segment sales are expected to be up slightly sequentially. In the Life Sciences segment, Corning forecasts sales to increase by at least 35% to 40% year over year, due to the acquisition of Discovery Labware.
GLW approved an increase in the company's quarterly common stock dividend. Corning's second quarter dividend will rise to $0.10 per share of common stock held, versus $0.09 per share previously.
GLW board authorized a share repurchase program to acquire up to $2 billion of the company's common stock from time to time through open market or private transactions.

7:10AM Sprint Nextel beats by $0.09, reports revs in-line (S) 7.10 : Reports Q1 (Mar) loss of $0.21 per share, $0.09 better than the Capital IQ Consensus Estimate of ($0.30); revenues rose 0.7% year/year to $8.79 bln vs the $8.73 bln consensus.

Net Additions (Thousands) (415) compared to 1,082 in prior year
End of Period Subscribers (Thousands) 55,211 compared to 56,103 in prior year
Churn 2.09% compared to 2.01% in prior year
ARPU postpaid $62.47 compared to $59.88 in prior year

The company expects 2013 Adjusted OIBDA to be at the high-end of the previous forecast of between $5.2 billion and $5.5 billion excluding the effects of the closing of strategic transactions.

6:54AM EMC misses by $0.01, reports revs in-line; reaffirms FY13 EPS guidance, revs guidance (EMC) 22.36 : Reports Q1 (Mar) earnings of $0.39 per share, excluding non-recurring items, $0.01 worse than the Capital IQ Consensus Estimate of $0.40; revenues rose 5.8% year/year to $5.39 bln vs the $5.42 bln consensus. First-quarter revenue from EMC's Information Storage business grew 3% year over year.

Highlights within this include: revenue from EMC's High-end Storage business3 increased 10% year over year, and revenue from EMC's Emerging Storage business increased 24% year over year. EMC's RSA Information Security business increased revenue 12% year over year, and EMC's Information Intelligence business returned to growth, increasing revenue 7% year over year. EMC's VSPEX reference architecture solutions continued to gain momentum with rapid adoption and increasing popularity with customers and among partners who have sold just under 2,200 VSPEX solutions since their launch in April 2012. Demand for VCE's Vblock systems also showed strong year-over-year growth in the first quarter. Finally, EMC continued to expand its Service Provider Program with first-quarter revenue from service provider partners up over 40% year over year.

Co reaffirms guidance for FY13, sees EPS of $1.85, excluding non-recurring items, vs. $1.86 Capital IQ Consensus Estimate; sees FY13 revs of ~$23.5 bln vs. $23.47 bln Capital IQ Consensus Estimate.

EMC expects to repurchase $1 billion of the company's common stock in 2013.

07:43 am Juniper Networks shares fall 6% following miss on earnings
Juniper Networks (JNPR $16.33 -1.03) reported first quarter earnings of $0.21 per share, excluding non-recurring items and $0.03 pre-tax benefit from the 2012 retroactive application of the renewal of the R&D tax credit, $0.01 worse than the Capital IQ consensus of $0.22, while revenues rose 2.6% year/year to $1.06 billion versus the $1.06 billion consensus. Non-GAAP operating margin for the first quarter of 2013 increased to 15.7%, from 12.0% in the first quarter of 2012 and decreased from 18.2% in the fourth quarter of 2012. The company issues downside guidance for Q2, sees EPS of $0.22-0.26, excluding non-recurring items, versus the $0.26 Capital IQ Consensus Estimate; sees Q2 revs of $1.07-1.10 billion versus the $1.11 billion Capital IQ consensus.

07:41 am Apple shares fall 1% despite beat on earnings and capital return program
Apple (AAPL $402.12 -4.13) reported fourth quarter earnings of $10.09 per share, $0.09 better than the Capital IQ consensus of $10.00, while revenues rose 11.3% year/year to $43.6 billion versus he $42.4 billion consensus. Q2 gross margins of 37.5% vs Street est of 38.5% and 37.5-38.5% guidance Products: 37.4 million iPhones sold in Q2 vs Street est of ~35 million; 19.5 million iPads sold in Q2 vs Street est of ~18 million; sold just under 4 million Macs in Q2 vs Street est of ~4 million. Co issues downside guidance for Q3, sees Q3 revs of $33.5-35.5 billion vs. $38.44 billion Capital IQ Consensus Estimate; co sees Q3 gross margin between 36-37% vs. ests of ~38.8%. The company announced that its Board of Directors has authorized a significant increase to the co's program to return capital to shareholders. The co expects to utilize a total of $100 billion of cash under the expanded program by the end of calendar 2015. This represents a $55 billion increase to the program announced last year and translates to an average rate of $30 billion per year from the time of the first dividend payment in August 2012 through December 2015. As part of this program, the Board has increased its share repurchase authorization to $60 billion from the $10 billion level announced last year. This is the largest single share repurchase authorization in history and is expected to be executed by the end of calendar 2015. Apple also expects to utilize about $1 billion annually to net-share-settle vesting restricted stock units. Additionally, the Board has approved a 15% increase in the Company's quarterly dividend and today has declared a dividend of $3.05 per common share, payable on May 16, 2013 to shareholders of record as of the close of business on May 13, 2013. Apple is among the largest dividend payers in the world, with annual payments of about $11 billion.

Cree (CREE) reported third quarter earnings of $0.34 per share, excluding non-recurring items, in-line with the Capital IQ consensus of $0.34 and inline with the March 5 guidance of $0.31-0.36, which was raised slightly from the prior guidance of $0.30-0.35. Revenues rose 22.5% year/year to $348.9 million versus the $343.6 million consensus and vs March 5 guidance of $335-350 million. Co issues in-line guidance for the fourth quarter with EPS of $0.34-0.40, excluding non-recurring items, versus the $0.37 Capital IQ consensus and revenues of $365-385 million versus the $368.4 million Capital IQ consensus. Cree is reporting non-GAAP gross margin of 38.8% vs guidance of 39.5%+/-. Non-GAAP operating margin came in at 12.9% vs 8.6% last year and 13.7% in DecQ.

Juniper Networks (JNPR) reported first quarter earnings of $0.21 per share, excluding non-recurring items and $0.03 pre-tax benefit from the 2012 retroactive application of the renewal of the R&D tax credit, $0.01 worse than the Capital IQ consensus of $0.22, while revenues rose 2.6% year/year to $1.06 billion versus the $1.06 billion consensus. Non-GAAP operating margin for the first quarter of 2013 increased to 15.7%, from 12.0% in the first quarter of 2012 and decreased from 18.2% in the fourth quarter of 2012. The company issues downside guidance for Q2, sees EPS of $0.22-0.26, excluding non-recurring items, versus the $0.26 Capital IQ Consensus Estimate; sees Q2 revs of $1.07-1.10 billion versus the $1.11 billion Capital IQ consensus. |

Broadcom (BRCM) reported first quarter earnings of $0.65 per share, excluding non-recurring items, $0.09 better than the Capital IQ consensus of $0.56, while revenues rose 9.7% year/year to $2 billion versus the $1.91 billion consensus. "This better-than-expected result was driven by wireless baseband and connectivity chips. Looking forward, we see broad-based sequential growth driven by our industry-leading portfolio of wired and wireless communications platforms." Broadcom sees Q2 revs of $2.1 billion +/- 4% (~$2.02-2.18 billion) versus the $2.05 billion consensus.
icon url

ReturntoSender

04/25/13 11:50 PM

#10172 RE: ReturntoSender #6755

From Briefing.com: 4:10 pm : Equities settled with modest gains as the S&P 500 climbed 0.4% while the Dow added 0.2%.

The S&P was cruising near its highs before a late afternoon headline from German Handelsblatt cited a confidential Bundesbank opinion paper, which strongly opposed the European Central Bank's implementation of Outright Monetary Transactions.

Until the news hit, quarterly earnings were in focus after more than 250 companies covered by Briefing.com reported their results between yesterday's closing bell and today's open.

The Dow underperformed the broader market as two of its largest components weighed. 3M (MMM 104.88, -2.99) lost 2.8% after missing on earnings and revenue. In addition, Exxon Mobil (XOM 88.07, -1.36) shed 1.5% after the company posted a 12.3% year-over-year revenue decline.

The materials sector was a strong performer throughout the day as the SPDR Materials Select Sector ETF (XLB 39.46, +0.43) settled higher by 1.1%. Better-than-expected earnings from Cliffs Natural Resources (CLF 20.95, +2.73) supported other steelmakers as the Market Vectors Steel ETF (SLX 42.06, +0.55) settled higher by 1.3%.

In addition, miners also showed relative strength as precious metals rallied. Gold futures advanced 2.8% to $1462.80 per troy ounce while silver futures spiked 6.2% to $24.25 per troy ounce. Also of note, copper rose 2.8% to $3.247 per pound.

While the materials sector was the clear leader throughout the day, other cyclical groups outperformed as well.

Discretionary stocks were supported by retailers and homebuilders. The SPDR S&P Retail ETF (XRT 73.31, +1.17) added 1.6% while the SPDR S&P Homebuilders ETF (XHB 30.40, +0.42) rose 1.4% on better-than-expected earnings from Ryland Group (RYL 44.94, +3.24) and PulteGroup (PHM 20.79, +1.10). While both builders surpassed bottom-line expectations, revenues proved to be more of a mixed bag as Ryland was able to beat estimates while PulteGroup's top-line fell short of analyst expectations.

Technology stocks showed intraday strength, but the sector sold off into the close as cautious earnings and revenue guidance from Qualcomm (QCOM 62.44, -3.56) weighed.

With most growth-oriented groups contributing to today's advance, defensively-geared sectors lagged behind the broader market. However, the telecom space bucked the trend after reports indicated Verizon Communications (VZ 53.22, +1.42) may be preparing a $100 billion bid to gain full control of Vodafone's (VOD 30.43, +0.84) stake in Verizon Wireless. However, speculation regarding Verizon's attempt to gain full control of Verizon Wireless has circulated before.

Today's economic news was limited to weekly claims data. The initial claims level fell to 339,000 for the week ending April 20 from an upwardly revised 355,000 (from 352,000) for the week ending April 13. The Briefing.com consensus expected the initial claims level to drop to 351,000.

After several weeks of volatility following seasonal adjustment problems associated with the Easter holiday period, the initial claims level has again returned to its previous trend. The Department of Labor announced that the period of large swings in the weekly claims level is ending.

Tomorrow, first-quarter advance GDP will be reported at 8:30 ET while the final April Michigan Sentiment Survey will be released at 9:55 ET.DJ30 +24.50 NASDAQ +20.33 SP500 +6.37 NASDAQ Adv/Vol/Dec 1538/1.86 bln/913 NYSE Adv/Vol/Dec 1950/746.3 mln/1044

3:30 pm :

June crude oil advanced for a second consecutive session on a weaker dollar index and comments that the U.S. believes that Syria has used chemical weapons to some degree. The energy component trended upwards after lifting off a session low of $91.11per barrel and settled with a 2.4% gain at $93.63 per barrel, just below its session high of $93.87 per barrel.
June natural gas rallied to a session high of $4.29 per MBMtu following inventory data that showed a build of 30 bcf when a build of 32 bcf was anticipated. However, prices quickly dropped back towards the breakeven level and were unable to regain momentum. Natural gas eventually settled unchanged at $4.20 per MMBtu.
June gold extended yesterday's gains as a weaker dollar index and data from the IMF showing Russia, Kazakhstan, and other central banks purchased gold in March boosted prices. The yellow metal steadily climbed higher and settled with a 2.7% gain at $1461.90 per ounce, just below its session high of $1464.90 per ounce.
May silver also saw strong buying support during today's floor trade. It lifted off its session low of $23.51 per ounce and advanced as high as $24.25 per ounce. It eventually settled at $24.14 per ounce, booking a solid 5.7% gain.

5:14PM KLA-Tencor issues downside Q4 guidance on the call (KLAC) 55.90 +0.41 : Co issues downside guidance for Q4 (Jun), sees EPS of $0.66-0.86, excluding non-recurring items, vs. $0.97 Capital IQ Consensus Estimate; sees Q4 (Jun) revs of $670-730 mln vs. $763.15 mln Capital IQ Consensus Estimate

4:46PM Micrel beats by $0.02, misses on revs; guides Q2 revs below consensus (MCRL) 9.88 +0.13 : Reports Q1 (Mar) earnings of $0.11 per share, $0.02 better than the Capital IQ Consensus Estimate of $0.09; revenues fell 2.5% year/year to $59.7 mln vs the $61.53 mln consensus.

Gross margin was 52% compared to 50.3% in the prior quarter.

Commentary: "We continue to face macro-economic challenges. At the top line, we saw weakness in the computing and communications end markets. This was partially offset by growth in sales in the consumer end market, where revenues increased nicely on a sequential quarterly basis. Bookings were solid in the quarter with a book to bill ratio of 1:1 driven by strength in the industrial end market. In addition, I was pleased with our operational execution as evidenced by an improved gross margin of 52.0% for the quarter, up sequentially from 50.3%."

Guidance: Co issues downside guidance for Q2, expects revs to increase by 2-6% sequentially, which equates to approx. $60.9-63.3 mln vs. $65.08 mln Capital IQ Consensus Estimate. Gross profit margin is expected to be in the range of 51% to 52%. In addition, the company estimates that second quarter 2013 GAAP net income will be approximately $0.07 to $0.09 per diluted share.

4:44PM Applied Micro beats by $0.01, reports revs in-line (AMCC) 7.27 +0.19 : Reports Q4 (Mar) net of breakeven, $0.01 better than the Capital IQ Consensus Estimate of ($0.01); revenues rose 15.5% year/year to $56.33 mln vs the $55.92 mln consensus. "We met our goal of delivering non-GAAP break-even results. Development progress and initial customer reaction are better than expected. This positions us well to take advantage of the growth we anticipate in the future."

4:43PM Ingram Micro misses by $0.03, beats on revs; guides Q2 revs above consensus (IM) 18.10 +0.34 : Reports Q1 (Mar) earnings of $0.41 per share, excluding non-recurring items, $0.03 worse than the Capital IQ Consensus Estimate of $0.44; revenues rose 18.8% year/year to $10.26 bln vs the $10.11 bln consensus. Co issues upside guidance for Q2, sees Q2 revs of +1-3% q/q (approx $10.36-10.56 bln) vs. $10.24 bln Capital IQ Consensus Estimate.

4:36PM PMC-Sierra misses by $0.01, misses on revs (PMCS) 6.31 -0.01 : Reports Q1 (Mar) earnings of $0.07 per share, excluding non-recurring items, $0.01 worse than the Capital IQ Consensus Estimate of $0.08; revenues fell 5.2% year/year to $125.2 mln vs the $127.81 mln consensus.

"We are encouraged by stronger bookings in the quarter and expect to grow revenues in the second quarter of 2013. Our book-to-bill ratio within the period was greater than one for the second consecutive quarter."

4:35PM Skyworks beats by $0.01, beats on revs; guides Q3 EPS in-line, revs below consensus (SWKS) 22.02 +0.59 : Reports Q2 (Mar) earnings of $0.48 per share, $0.01 better than the Capital IQ Consensus Estimate of $0.47; revenues rose 16.6% year/year to $425.2 mln vs the $420.38 mln consensus.

* Co generates $130.2 mln in cash flow from operations.

Guidance: Co issues mixed guidance for Q3, sees EPS of $0.53 vs. $0.53 Capital IQ Consensus Estimate; sees Q3 revs of $435 mln vs. $444.82 mln Capital IQ Consensus Estimate. Co expects gross margin expansion to the 43.5% to 44% percent range, a 130 to 180 basis point sequential improvement, and operating margin in excess of 25%.

4:31PM Extreme Networks appoints Charles Berger as its President and CEO (EXTR) 3.08 +0.02 : Mr. Berger will be replacing Oscar Rodriguez who has resigned, effective today, from his position and has resigned from the Board of Directors of Extreme Networks. Mr. Berger is joining co following the successful sale of ParAccel, a privately held software analytics company to Actian.

4:27PM CalAmp beats by $0.02, beats on revs; guides Q1 EPS in-line, revs in-line (CAMP) 10.08 +0.21 : Reports Q4 (Feb) earnings of $0.16 per share, $0.02 better than the Capital IQ Consensus Estimate of $0.14; revenues rose 28.6% year/year to $48.39 mln vs the $46.53 mln consensus. Co issues in-line guidance for Q1, sees EPS of $0.11-0.15 vs. $0.14 Capital IQ Consensus Estimate; sees Q1 revs of $50-54 mln vs. $52.04 mln Capital IQ Consensus Estimate.

"We enter fiscal 2014 with continued strong customer demand across most of our key market verticals. In addition, the Wireless Matrix acquisition is expected to accelerate our growth prospects, improve our competitive position and increase our subscription and SaaS-based revenues. We expect the second half of fiscal 2014 to be much stronger than the first half, as some of the recently announced opportunities begin ramping and operating expenses revert to a more normalized level as a result of synergies and expense reductions associated with the Wireless Matrix integration."

4:17PM KLA-Tencor beats on the bottom line, reports revs in-line (KLAC) 55.90 +0.41 : Reports Q3 (Mar) earnings of $1.01 per share, excluding non-recurring items, $0.16 better than the Capital IQ Consensus Estimate of $0.85 (GAAP EPS $0.98 vs. $0.85 consensus); revenues fell 13.3% year/year to $729 mln vs the $726.82 mln consensus.

4:12PM Amkor beats by $0.04, beats on revs; guides Q2 EPS in-line, revs above consensus (AMKR) : Reports Q1 (Mar) earnings of $0.07 per share, $0.04 better than the Capital IQ Consensus Estimate of $0.03; revenues rose 5.0% year/year to $688 mln vs the $672.35 mln consensus. Co issues mixed guidance for Q2, sees EPS of $0.09-0.19 vs. $0.11 Capital IQ Consensus Estimate; sees Q2 revs of $730-780 mln vs. $719.41 mln Capital IQ Consensus Estimate.

4:12PM Freescale Semi beats by $0.06, beats on revs; guides Q2 revs in-line (FSL) 14.56 +0.34 : Reports Q1 (Mar) adjusted loss of $0.03 per share, $0.06 better than the Capital IQ Consensus Estimate of ($0.09); revenues rose 3.3% year/year to $981 mln vs the $966.13 mln consensus.

* Gross margin was 40.6%. Income from operations for the period was $104 million, compared to $56 million in the fourth quarter of 2012 and $168 million in the first quarter of 2012.

* Guidance: Co issues in-line guidance for Q2, sees Q2 revs of $1.0-$1.04 bln vs. $1.01 bln Capital IQ Consensus Estimate. Gross margins to increase approximately 90 to 130 basis points on a sequential basis.

4:09PM Maxim Integrated beats by $0.04, beats on revs; guides Q4 EPS in-line, revs in-line (MXIM) 32.92 +0.22 : Reports Q3 (Mar) earnings of $0.45 per share, excluding non-recurring items, $0.04 better than the Capital IQ Consensus Estimate of $0.41; revenues rose 5.9% year/year to $604.9 mln vs the $596.75 mln consensus.

Co issues in-line guidance for Q4, sees EPS of $0.45-0.49, excluding non-recurring items, vs. $0.47 Capital IQ Consensus Estimate; sees Q4 revs of $610-640 mln vs. $631.69 mln Capital IQ Consensus Estimate.

4:04PM Cirrus Logic misses by $0.15, reports revs in-line; guides Q1 revs below consensus (CRUS) 19.62 +0.55 : Reports Q4 (Mar) earnings of $0.59 per share, excluding non-recurring items, $0.15 worse than the Capital IQ Consensus Estimate of $0.74; revenues rose 87.0% year/year to $206.87 mln vs the $207.68 mln consensus. Gross margin of 40.4 percent, which, as disclosed in its press release on April 16, included an inventory reserve of approximately $20.7 million that resulted in a gross margin decline of slightly more than 10 percent.
Co issues downside guidance for Q1, sees Q1 revs of $150-170 mln vs. $175.09 mln Capital IQ Consensus Estimate; gross margin is expected to be between 50 percent and 52 percent

4:01PM Microsemi beats by $0.03, reports revs in-line; guides Q3 EPS in-line (MSCC) 19.91 +0.03 : Reports Q2 (Mar) earnings of $0.43 per share, excluding non-recurring items, $0.03 better than the Capital IQ Consensus Estimate of $0.40; revenues fell 5.0% year/year to $235.3 mln vs the $232.98 mln consensus. Co issues in-line guidance for Q3, sees EPS of $0.47-0.50 vs. $0.47 Capital IQ Consensus Estimate.

7:20AM Benchmark Elec beats by $0.02, reports revs in-line; guides Q2 EPS in-line, revs in-line (BHE) 17.61 : Reports Q1 (Mar) earnings of $0.22 per share, excluding non-recurring items, $0.02 better than the Capital IQ Consensus Estimate of $0.20; revenues fell 8.6% year/year to $542.44 mln vs the $546.98 mln consensus.

In-line EPS guidance for Q2, sees EPS of $0.25-0.30 vs. $0.28 Capital IQ Consensus Estimate;
Sees Q2 revs of $560-590 mln vs. $585.54 mln Capital IQ Consensus Estimate.

6:26AM Cabot Micro misses by $0.05, misses on revs (CCMP) 33.83 : Reports Q2 (Mar) earnings of $0.40 per share, $0.05 worse than the Capital IQ Consensus Estimate of $0.45; revenues rose 1.1% year/year to $100.36 mln vs the $104.57 mln consensus. The company achieved a gross profit margin of 48.2 percent of revenue in the second fiscal quarter, which represents increases of 210 and 120 basis points on year-over-year and sequential bases, respectively.

Intel's (INTC) McAfee announced the addition of identity and access management solutions to its Security Connected portfolio.

07:54 am F5 Networks shares rise 3% following beat on earnings
F5 Networks (FFIV $74.89 +2.54) reported fourth quarter earnings of $1.07 per share, excluding non-recurring items, $0.01 better than the Capital IQ consensus of $1.06, while revenues rose 3.1% year/year to $350.2 million versus the $350.19 million consensus. The company issues downside guidance for Q3, sees EPS of $1.06-1.09, excluding non-recurring items versus the. $1.11 Capital IQ consensus and revenues of $355-365 million versus the $366.89 million Capital IQ consensus. The company also announced today that its board of directors had authorized an additional $200 million for the company's common stock share repurchase program. This new authorization is incremental to the $81.3 million currently in the existing program which was initially authorized in October 2010.

07:53 am Qualcomm shares fall 6% following in line earnings
Qualcomm (QCOM $62.12 -3.87) reported second quarter earnings of $1.17 per share, excluding non-recurring items, in-line with the Capital IQ consensus of $1.17, while revenues rose 23.9% year/year to $6.12 billion versus the $6.08 billion consensus. Q2 Key Business Metrics MSM chip shipments: 173 million units, up 14 percent y-o-y and down 5 percent sequentially. December quarter total reported device sales: approx $61.1 billion, up 18 percent y-o-y and 15% QoQ. December quarter estimated 3G/4G device shipments: ~279 to 283 million units, at an estimated average selling price of approximately $214 to $220 per unit. The company issued in-line guidance for the third quarter with EPS of f $0.97-1.05, excluding non-recurring items, versus the $1.04 Capital IQ consensus and revenues of $5.8-6.3 billion versus $5.88 billion Capital IQ consensus. The company issued guidance for FY13, raises EPS to $4.40-4.55, excluding non-recurring items, from $4.25-4.45 versus the. $4.53 Capital IQ consensus. The company raised revenues to $24.0-25.0 billion from $23.4-24.4 billion versus the $24.1 bln Capital IQ consensus.

09:13 am Mellanox Tech downgraded to Neutral from Buy at Mizuho: . Mizuho downgrades MLNX to Neutral from Buy and notes that they are reducing their forecasts based on updated guidance. With a lot of bad news behind MLNX, downside risk to shares could be limited. However, upside catalysts in 2Q are unlikely, in their view, and with visibility into the timing of large deals unclear they believe that revisiting the story as new data emerge is a prudent course, particularly with MLNX shares trading at 22x their 2014 EPS estimate versus the 15x peer group average. They are stepping off to the sidelines for now.

09:13 am Coherent upgraded to Buy from Hold at Needham: . Needham upgrades COHR to Buy from Hold on signs of improving demand across several of its major markets. COHR posted FQ2 rev at the high end of guidance, but gross margins fell short of expectations due to manufacturing cost issues in its FPD business. Investors are likely to look beyond this short-term issue and focus on the strength in bookings, which rose 10% y/o/y (1.0 B-T-B). COHR registered higher bookings in microelectronics, OEM components/ instrumentation and materials processing, with only the scientific and gov't market showing weakness. Mgmt guided for F3Q rev to be up 2-8% y/o/y, solidly above Street expectations.

Western Digital (WDC) reported third quarter earnings of $2.10 per share, $0.34 better than the Capital IQ consensus of $1.76, while revenues rose 24.0% year/year to $3.76 billion versus the $3.61 billion consensus. "Strong execution by our HGST and WD subsidiaries drove outstanding results in the March quarter as we continue to capitalize on the secular growth of digital data. Overall industry demand was in line with our expectations. In our business, we saw strength in enterprise, stable performance in client and consumer electronics, and some anticipated seasonal softness in Branded Products."
icon url

ReturntoSender

04/27/13 10:15 PM

#10174 RE: ReturntoSender #6755

From Briefing.com: Weekly Recap - Week ending 26-Apr-13

Dow +11.75 at 14712.55, Nasdaq -10.73 at 3279.25, S&P -2.92 at 1582.24

The major averages entered the weekend on a mixed note as the S&P 500 slipped 0.2% while the Dow Jones Industrial Average added 0.1%.

The final session of the week began on a cautious note as downbeat overseas trade and mixed corporate earnings pressured equity futures. In addition, a disappointing first quarter GDP report contributed to the lower open.

According to the advance report, first quarter GDP grew at an annualized rate of 2.5%. That was up from a 0.4% gain in the final quarter of last year, but below the Briefing.com consensus expectation of a 2.8% gain.

A deeper look into the data sets the tone for a likely severe deceleration in trends during the second quarter.

Just about all of the gains in the first quarter came from consumption and inventories, both of which are likely to experience a pullback over the next three months. Furthermore, government spending, which fell 4.1% in the first quarter after declining 7.1% in Q4 2012, is set to fall by a larger amount during the second quarter as the effects of the sequestration become more pronounced.

With below-consensus growth, the growth-sensitive materials sector was the weakest performer of the day as steelmakers weighed. The Market Vectors Steel ETF (SLX 41.35, -0.71) settled lower by 1.7%. Metal prices also saw a decline as gold slipped 0.4% to $1456.60 per troy ounce while silver declined 1.2% to $23.86 per troy ounce. Also of note, copper futures fell 1.8% to $3.180 per pound.

While the sluggish GDP report weighed on producers of basic materials, the materials sector was the only group which slumped more than 1.0%. Meanwhile, the second weakest sector, financials, ended with a loss of just 0.4%.

Although first quarter economic growth missed expectations, the broader market appeared unconcerned as market participants are well aware of the Federal Reserve's commitment to maintain its accommodative monetary policy for as long as conditions warrant continued easing. As such, the disappointing report resulted in a morning dip, which was met with enough afternoon buying interest to bring the S&P back to its flat line. Those levels held until the final 20 minutes when sellers reemerged and pushed the benchmark average back into the red.

As mentioned earlier, quarterly earnings were in focus this morning. The discretionary sector underperformed as retailers displayed some weakness. Amazon.com (AMZN 254.81, -19.89) lost 7.2% after its above-consensus results were overshadowed by disappointing operating income guidance.

In addition, Starbucks (SBUX 60.00, -0.50) shed 0.8% after its revenue fell short of the Capital IQ consensus estimate. Guidance was also a point of concern as the company lowered its third quarter earnings expectations below consensus.

On the upside, the industrial sector outperformed the broader market as Dow components, Boeing (BA 92.85, +1.18) and General Electric (GE 22.21, +0.26) ended with respective gains of 1.3% and 1.2%. Shares of Boeing rallied following reports indicating Japan will allow the 787 Dreamliner to return to service after the jet experienced battery problems in recent months.

Transportation-related stocks also traded ahead of the broader market. The Dow Jones Transportation Average added 0.1% with airlines providing the leadership. Delta Air Lines (DAL 16.81, +0.52) rose 3.2% after the House of Representatives passed a bill to end sequester-related Federal Aviation Administration furloughs.

Today's economic data also included the University of Michigan Consumer Sentiment Index, which was revised up to 76.4 from 72.3 in the final April reading. That is still down from 78.6 in March and the weakest reading since January. The Briefing.com consensus expected the sentiment index would be essentially unchanged at 72.4.

On Monday, March personal income, personal spending, and core PCE prices will all be reported at 8:30 ET while March pending home sales will be announced at 10:00 ET.

Week in Review: Stocks Attempt to Shake off Recent Weakness

On Monday, the S&P 500 settled higher by 0.5% despite enduring some intraday weakness while the Dow added 0.1%, and the tech-heavy Nasdaq gained 0.9%. Technology stocks led from the start with Microsoft (MSFT 31.79, -0.15) providing considerable support after ValueAct announced a $2 billion stake in the software company. Other tech shares also displayed strength as Apple (AAPL 417.20, +8.82) climbed 2.1%. Although most large tech names ended with gains, IBM (IBM 194.31, +0.36) shed 1.1% to follow Friday's earnings-driven 8.3% drop.

Tuesday's session ended with strong gains as the S&P 500 climbed 1.0%. Financials and technology led the advance with bank stocks outperforming notably. The SPDR Financial Select Sector ETF (XLF 18.56, -0.08) settled higher by 1.8% after Discover Financial Services (DFS 43.92, -0.36) and Dow component Travelers (TRV 85.15, -0.12) reported better-than-expected earnings.

The major averages ended Wednesday's session on a mixed note as the Dow shed 0.3% while Nasdaq and S&P 500 ended flat. Consumer staples lagged after Procter & Gamble (PG 77.10, +0.52) reported revenue below the Capital IQ consensus estimate. In addition, the company issued cautious fourth quarter earnings and revenue guidance. The top performing sector of the year, health care, declined steadily throughout the day after Amgen (AMGN 108.38, -0.28), Edwards Lifesciences (EW 64.17, -1.22), and Eli Lilly (LLY 56.46, +0.03) all reported below-consensus revenues.

Thursday saw equities settle with modest gains. The S&P 500 climbed 0.4% as materials outperformed throughout the session. Miners were among top sector components as precious metals rallied. Gold futures advanced 2.8% to $1462.80 per troy ounce while silver futures spiked 6.2% to $24.25 per troy ounce. Also of note, copper rose 2.8% to $3.247 per pound.
 
Index Started Week Ended Week Change % Change YTD %
DJIA 14547.51 14712.55 165.04 1.1 12.3
Nasdaq 3206.06 3279.26 73.20 2.3 8.6
S&P 500 1555.25 1582.24 26.99 1.7 10.9
Russell 2000 912.50 935.27 22.77 2.5 10.1

10:33 am Technology sector trading -0.2% lower today along with broader market
The tech sector is trading just lower today, along with modest losses in the broader market. Semiconductors are showing relative weakness with the SOX trading 1.1% lower. Within the chip index, KLAC (-9.7%) is a notable laggard. Among other major indices, the SPY is trading 0.2% lower today, while the QQQ is down 0.5% and the NASDAQ is trading 0.4% lower on the session. Among tech bellwethers, FB (+3.3%) is showing notable strength, while MSFT (-1.2%) is under pressure.


Qualcomm (QCOM) reported second quarter earnings of $1.17 per share, excluding non-recurring items, in-line with the Capital IQ consensus of $1.17, while revenues rose 23.9% year/year to $6.12 billion versus the $6.08 billion consensus. Q2 Key Business Metrics MSM chip shipments: 173 million units, up 14 percent y-o-y and down 5 percent sequentially. December quarter total reported device sales: ~$61.1 billion, up 18 percent y-o-y and 15% QoQ. December quarter estimated 3G/4G device shipments: ~279 to 283 million units, at an estimated average selling price of approximately $214 to $220 per unit. The company issued in-line guidance for the third quarter with EPS of f $0.97-1.05, excluding non-recurring items, versus the $1.04 Capital IQ consensus and revenues of $5.8-6.3 billion versus $5.88 billion Capital IQ consensus. The company issued guidance for FY13, raises EPS to $4.40-4.55, excluding non-recurring items, from $4.25-4.45 versus the. $4.53 Capital IQ consensus. The company raised revenues to $24.0-25.0 billion from $23.4-24.4 billion versus the $24.1 bln Capital IQ consensus.

F5 Networks (FFIV) reported fourth quarter earnings of $1.07 per share, excluding non-recurring items, $0.01 better than the Capital IQ consensus of $1.06, while revenues rose 3.1% year/year to $350.2 million versus the $350.19 million consensus. The company issues downside guidance for Q3, sees EPS of $1.06-1.09, excluding non-recurring items versus the. $1.11 Capital IQ consensus and revenues of $355-365 million versus the $366.89 million Capital IQ consensus. The company also announced today that its board of directors had authorized an additional $200 million for the company's common stock share repurchase program. This new authorization is incremental to the $81.3 million currently in the existing program which was initially authorized in October 2010.

Western Digital (WDC) reported third quarter earnings of $2.10 per share, $0.34 better than the Capital IQ consensus of $1.76, while revenues rose 24.0% year/year to $3.76 billion versus the $3.61 billion consensus. "Strong execution by our HGST and WD subsidiaries drove outstanding results in the March quarter as we continue to capitalize on the secular growth of digital data. Overall industry demand was in line with our expectations. In our business, we saw strength in enterprise, stable performance in client and consumer electronics, and some anticipated seasonal softness in Branded Products."
icon url

ReturntoSender

05/01/13 9:24 PM

#10179 RE: ReturntoSender #6755

From Briefing.com: 4:15 pm : Equities ended today's session on their lows as global growth concerns reemerged. The three major indices all lost 0.9%, but the underperformance of small cap stocks was notable as the Russell 2000 slid 2.5%.

Although most markets across the globe were closed in observance of Labor Day, some countries continued reporting their economic data.

China reminded investors of its importance to the global economy as the decline in the country's Manufacturing PMI (50.6 actual, 50.9 prior, 51.0 consensus) along with a disappointing U.S. ISM Index (50.7 actual, 51.3 prior, 51.0 consensus) pressured commodities and commodity-related sectors.

As a result, energy and materials both ended with losses near 1.7%. Crude oil settled lower by 2.7% at $90.95 after today's inventory report revealed that crude stockpiles climbed to 6.696 million barrels, a record high dating back to 1982 when the Energy Information Administration began tracking the data.

Meanwhile, the materials sector declined throughout the day as related metals sold off. Gold futures fell 1.1% to $1455.90 per troy ounce after being down as much as 2.1% intraday. Meanwhile, copper was unable to bounce off its lows as the red metal declined 3.8% to $3.068 per pound.

The relative weakness of gold pressured miners as the Market Vectors Gold Miners ETF (GDX 29.65, -0.71) settled lower by 2.3%. Steelmakers also displayed weakness throughout the day, and the Market Vectors Steel ETF (SLX 41.56, -0.87) slumped 1.9%. Disappointing manufacturing data from China and the U.S. weighed on the group, and Alcoa's (AA 8.43, -0.07) announcement of a possible curtailment of its smelting capacity reflected the sluggish global growth.

Concerns regarding economic health also pressured industrial shares, and specifically, the Dow Jones Transportation Average. The bellwether complex was one of the leaders of the first-quarter market rally. However, the sector underperformed last month, ending April with a loss of 1.2%.

The 20-stock complex kicked off the month on a cautious note as 18 components ended with losses of at least 1.0% while the Transportation Average slid 2.3%.

Stocks saw a brief afternoon bounce when the Federal Open Market Committee released its latest policy statement, which did not contain any groundbreaking news.

As expected, the FOMC maintained its purchasing program at $85 billion per month, and kept its target Federal Funds Rate steady at 0-0.25%. The central bank also reiterated its goal of staying true to the current policy course until the unemployment rate declines to 6.5%.

Today's statement did contain an explicit mention of a possible increase or decrease to the purchase program. However, this wasn't "new" as prior statements from the Fed have already allowed for the possibility of modifications to the program.

Looking back at the day's remaining economic data, total construction spending fell 1.7% in March after increasing an upwardly revised 1.5% (from 1.2%) in February. The Briefing.com consensus expected construction spending to increase 0.5%.

Most of the decline was the result of weaker public construction spending. That sector declined 4.1% in March after increasing 1.5% in February. This drop helps explain why government spending fell substantially in the first quarter GDP report.

Investors will receive a full slate of economic data tomorrow with the April Challenger Job Cuts Report set to kick things off at 7:30 ET. Weekly initial claims, preliminary first quarter productivity, first quarter unit labor costs, and the March trade balance will all be released at 8:30 ET.

Also of note, the European Central Bank will release its latest interest rate decision with many expecting a 25 basis point rate cut from 0.75% to 0.50%.DJ30 -138.85 NASDAQ -29.66 SP500 -14.87 NASDAQ Adv/Vol/Dec 541/1.8 bln/1950 NYSE Adv/Vol/Dec 841/721.1 mln/2182

3:30 pm :

June crude oil extended yesterday's losses as a larger-than-anticipated build in inventories weighed on prices. The Dept of Energy reported that for the week ending Apr 26, crude oil inventories had a build of 6.696 mln barrels when consensus called for a build of 1.05 mln barrels. The energy component dipped to a session low of $90.11per barrel as it headed into afternoon floor trade and eventually settled with a 2.6% loss at $91.00 per barrel.
June natural gas rose to a session high of $4.44 per MMBtu in morning pit action but lost steam as the session progressed. It retreated into negative territory in the last hour of floor trade and settled 0.2% lower at $4.33 per MMBtu.
June gold fell deeper into negative territory in today's floor trade ahead of the FOMC statement. The yellow metal retreated from its session high of $1467.50 per ounce and spent most of afternoon action trading near the $1445 per ounce level. It eventually settled with a 1.8% loss at $1445.70 per ounce. Prices inched higher in electronic trade following the FOMC decision to maintain its monthly asset purchase program at $85 bln but are still down 1.1%.
July silver also traded lower today. It pulled back from its session high of $23.92 per ounce and dipped as low as $23.21 per ounce in late morning action. Unable to erase much of the loss, it settled 3.5% lower at $23.33 per ounce.

5:57PM Texas Instruments prices $1.0 bln in investment grade notes (TXN) 36.41 +0.20 : Co announced the pricing of two series of senior unsecured notes for an aggregate principal amount of $1.0 billion. The notes consist of the following: $500 million of 1.00% notes due May 1, 2018 and $500 million of 2.25% notes due May 1, 2023. TI expects to use the net proceeds of this offering for repayment of outstanding debt. The offering is expected to close May 8, 2013. J.P. Morgan Securities LLC, Morgan Stanley & Co. LLC, Citigroup Global Markets Inc., and Mizuho Securities USA Inc. are serving as joint book-running managers for the offering.

4:47PM Integrated Silicon beats by $0.05, beats on revs; guides JunQ EPS below consensus, revs in-line (ISSI) 8.73 -0.44 : Reports Q2 (Mar) earnings of $0.21 per share, excluding non-recurring items, $0.05 better than the Capital IQ Consensus Estimate of $0.16; revenues rose 20.0% year/year to $75.0 mln vs the $73.0 mln consensus. Co issues guidance for Q3 (Jun), sees EPS of $0.20-0.24, excluding non-recurring items, vs. $0.25 Capital IQ Consensus Estimate; sees Q3 revs of $76-81 mln vs. $78.5 mln Capital IQ Consensus Estimate.

4:30PM AXT misses by $0.01, beats on revs (AXTI) 2.75 -0.12 : Reports Q1 (Mar) loss of $0.08 per share, $0.01 worse than the Capital IQ Consensus Estimate of ($0.07); revenues fell 4.6% year/year to $22.4 mln vs the $20.26 mln consensus.

4:29PM Newport misses by $0.11, misses on revs (NEWP) 14.65 -0.50 : Reports Q1 (Mar) earnings of $0.16 per share, excluding non-recurring items, $0.11 worse than the Capital IQ Consensus Estimate of $0.27; revenues fell 15.6% year/year to $132.6 mln vs the $138.16 mln consensus.

"Based on input from our customers, we expect conditions in several end markets to improve during the course of 2013, resulting in increased sales in the second half of the year. In Q2 of 2013, we expect sales to be slightly higher than Q1 level, based on our current backlog and the anticipated market improvement. As a result, we also expect slight sequential increases in our non-GAAP operating income and non-GAAP earnings per diluted share in the second quarter of 2013. In parallel, our long-term growth initiatives continue to gain momentum, and we are confident that these will enable us to accelerate our growth rate in future years."

4:26PM FormFactor beats by $0.05, beats on revs (FORM) 4.96 +0.01 : Reports Q1 (Mar) loss of $0.13 per share, ex-items, $0.05 better than the Capital IQ Consensus Estimate of ($0.18); revenues rose 51.1% year/year to $52.6 mln vs the $51.68 mln consensus.

"Our overall business improved as we moved through Q1, primarily driven by increased demand for our memory probe cards," said Tom St. Dennis, CEO of FormFactor. "Q1 was also the first full quarter of MicroProbe's contributions to our financial results and we made substantial progress integrating the MicroProbe business, which is helping us capture certain synergies earlier than anticipated."

4:23PM Atmel reports EPS in-line, beats on revs (ATML) 6.48 -0.19 : Reports Q1 (Mar) earnings of $0.03 per share, in-line with the Capital IQ Consensus Estimate consensus of $0.03; revenues fell 8.0% year/year to $329.1 mln vs the $321.24 mln consensus. "Improving business conditions, a healthier backlog, and our strong product portfolio provide us increased confidence moving forward this year," said Steve Laub, Atmel's President and Chief Executive Officer. "We are making good progress enhancing our cost structure which we expect to materially benefit our long-term margin profile."

4:19PM Seagate Tech beats by $0.10, beats on revs (STX) 36.94 +0.24 : Reports Q3 (Mar) earnings of $1.26 per share, $0.10 better than the Capital IQ Consensus Estimate of $1.16; revenues fell 20.8% year/year to $3.53 bln vs the $3.39 bln consensus.

"Seagate's operational results this quarter again reflect strong execution... The continued advancement of cloud, mobile and open source computing are trends that are shifting data volumes toward personal and corporate cloud environments, creating tremendous opportunities for Seagate's leading storage technology portfolio. Looking ahead, our top priorities are focused on the efficiency of our operations, extending our leadership in storage technology innovation and returning value to shareholders."

4:09PM JDS Uniphase misses by $0.01, misses on revs; guides Q4 revs below consensus (JDSU) 12.52 -0.98 : Reports Q3 (Mar) earnings of $0.10 per share, excluding non-recurring items, $0.01 worse than the Capital IQ Consensus Estimate of $0.11; revenues rose 0.5% year/year to $405.3 mln vs the $417.49 mln consensus. Co issues downside guidance for Q4, sees Q4 revs of $420-440 mln vs. $447.23 mln Capital IQ Consensus Estimate.

"The March quarter experienced delayed carrier capex budget releases resulting in lower revenue than expected in our Communications Test and Measurement and Optical Communications businesses. Despite the revenue challenges, the JDSU team delivered solid results in most areas of the business. Our innovation engine and product portfolio align well with our customers' strategic priorities, enabled by healthy cash generation and our strong balance sheet."

8:03AM IPG Photonics misses by $0.03, misses on revs; guides Q2 EPS in-line, revs in-line (IPGP) 63.57 : Reports Q1 (Mar) earnings of $0.67 per share, $0.03 worse than the Capital IQ Consensus Estimate of $0.70; revenues rose 15.2% year/year to $141.9 mln vs the $150.18 mln consensus.

Co issues in-line guidance for Q2, sees EPS of $0.72-0.82 vs. $0.78 Capital IQ Consensus Estimate; sees Q2 revs of $155-165 mln vs. $162.10 mln Capital IQ Consensus Estimate.
"The fundamentals that drive our business remain intact with strong order flow and sequentially improving margins. We are continuing to develop new industry-leading products and applications which should generate future growth. The core materials processing applications continue to drive growth as they gain significant market share from legacy technologies. Our scale, technological and cost advantages drive customer acceptance and make IPG the top choice for many laser processing applications. Our guidance for the second quarter takes into consideration these improving dynamics."

8:02AM O2Micro beats by $0.01, misses on revs (OIIM) 3.42 : Reports Q1 (Mar) loss of $0.17 per share, $0.01 better than the Capital IQ Consensus Estimate of ($0.18); revenues fell 41.8% year/year to $17.3 mln vs the $17.7 mln consensus.

12:52AM Amkor appoints Steve Kelly as CEO (AMKR) 4.24 : Co announces that Stephen Kelley has been appointed to serve as President and Chief Executive Officer and as a director of the co, effective May 8. Kelley succeeds Ken Joyce, who previously announced his intention to retire. Kelley's appointment follows a comprehensive, six month search process conducted by the Board of Directors with the professional assistance of a global executive recruiting firm. Most recently, Kelley served as Chief Executive Officer of Scio Diamond Technology Corporation, an industrial diamond technology company.

Cray (CRAY) reported first quarter loss of $0.23 per share, excluding non-recurring items, $0.01 better than the Capital IQ consensus of ($0.24), while revenues fell 29.2% year/year to $79.5 million vs the $70.33 million consensus. Co issues downside guidance for Q2, sees Q2 revs of "roughly $80 million" vs. $87.50 million Capital IQ Consensus Estimate. Co issues in-line guidance for FY13, sees FY13 revs of "approximately $500 million" vs. $498.17 million Capital IQ Consensus Estimate.
icon url

ReturntoSender

05/02/13 9:18 PM

#10180 RE: ReturntoSender #6755

From Briefing.com: 4:15 pm : Stocks surged as the S&P 500 erased all of yesterday's losses. The benchmark average rose 0.9% while the Nasdaq outperformed with a gain of 1.3%.

In addition to earnings reaction, investors welcomed further easing from the European Central Bank as the ECB cut its key interest rate by 25 basis points to a record low of 0.50%.

The Nasdaq paced today's gains as major components displayed broad strength. Electronic payment processor Visa (V 175.40, +9.38) jumped 5.7% after beating on earnings and revenue.

In addition, social media stocks displayed significant strength after Facebook (FB 28.97, +1.54) and Yelp (YELP 32.22, +6.92) reported above-consensus top-line results.

Tech shares have spent the entire week trading ahead of the broader market. As a result, the sector has added 3.5% since Monday.

Meanwhile, the second best sector of the week, energy, finished the session right behind technology with a significant rebound in crude oil contributing to today's gains. After falling 2.7% yesterday, crude jumped 3.3% to $93.98 per barrel.

The Dow Jones Transportation Average also tried to erase its losses from yesterday's 2.3% slump. However, even as 18 of 20 components advanced, the index was limited to a gain of 1.0%.

Elsewhere, homebuilders piggybacked strong earnings from MDC Holdings (MDC 38.40, +1.43) as the SPDR S&P Homebuilders ETF (XHB 30.48, +0.65) rose 2.2%.

In the Treasury market, the 10-yr note ended little changed with its yield steady at 1.627%.

With equities finishing broadly higher, the CBOE Volatility Index (VIX 13.61, -0.88) returned to last week's lows.

Today's advance occurred on below-average volume as only 677 million shares changed hands on the floor of the New York Stock Exchange.

In today's economic data, the initial claims level dropped from an upwardly revised 342,000 (from 339,000) for the week ending April 20 to 324,000 for the week ending April 27. That was the lowest initial claims reading since January 2008. The Briefing.com consensus expected the initial claims level to increase to 346,000.

The U.S. trade deficit narrowed in March, falling from an upwardly revised $43.6 billion (from $43.0 billion) to $38.8 billion. The Briefing.com consensus pegged the deficit at $43.0 billion.

Export levels fell $1.7 billion in March to $184.3 billion as large declines in foods (-$1.0 billion) and petroleum-based products (-$1.1 billion) outweighed gains in aircraft parts ($0.8 billion) and nonmonetary gold ($0.5 billion).

Meanwhile, imports declined by $6.5 billion to $223.1 billion with most of the drop occurring due to weaker demand for consumer goods (-$3.4 billion).

Also of note, nonfarm business labor productivity increased 0.7% in the preliminary first quarter reading after falling 1.7% (revised from -1.9%) during the fourth quarter. The Briefing.com consensus expected productivity to increase 1.2%. Output levels increased 2.5%, up from a 0.7% fourth quarter gain.

Tomorrow's economic data will focus on jobs as April nonfarm payrolls, nonfarm private payrolls, the unemployment rate, hourly earnings, and average workweek will all be reported at 8:30 ET. In addition, March factory orders and April ISM Services Index will be released at 10:00 ET.DJ30 +130.63 NASDAQ +41.49 SP500 +14.89 NASDAQ Adv/Vol/Dec 1875/1.71 bln/608 NYSE Adv/Vol/Dec 2300/676.7 mln/722

3:30 pm :

June natural gas traded as high as $4.35 per MMBtu in early morning floor action but fell sharply following inventory data that showed a build of 43 bcf when a much smaller build of 28-30 bcf was anticipated. It continued to inch lower for the remainder of the session and settled with a 6.9% loss at $4.03 per MMBtu.
June crude oil, on the other hand, advanced for the first time since Monday as the European Central Bank announced its decision to lower its key interest rate by 25 basis points to a record low of 0.50%. Investors also reacted to weekly initial claims data that showed jobless claims falling to the lowest level since Jan of 2008. The energy component lifted off its session low of $91.26 per barrel and touched a session high of $94.10 per barrel moments before settling with a 3.3% gain at $94.02 per barrel.
June gold rose for the third time this week following the ECB decision. Despite a stronger dollar index, the yellow metal climbed as high as $1473.30 per ounce and spent the remainder of the session trading just below that level. It eventually settled at $1467.50 per ounce, booking a gain of 1.5%.
July silver also traded higher but pulled back from its session high of $24.19 per ounce set moments before equity markets opened. Although it dipped to a session low of $23.69 per ounce in late morning action, silver managed to book a 2.2% gain as it closed at $23.84 per ounce.

4:42PM Emulex beats by $0.01, beats on revs; guides Q4 EPS below consensus, revs above consensus (ELX) 5.94 +0.10 : Reports Q3 (Mar) earnings of $0.14 per share, excluding non-recurring items, $0.01 better than the Capital IQ Consensus Estimate of $0.13; revenues fell 7.1% year/year to $116.8 mln vs the $112.56 mln consensus.

Co issues downside EPS guidance for Q4, sees EPS of $0.11-0.13 vs. $0.16 Capital IQ Consensus Estimate; sees Q4 revs of $118-122 mln vs. $116.90 mln Capital IQ Consensus Estimate.

4:42PM Microchip beats by $0.02, reports revs in-line; guides Q1 EPS above consensus, revs in-line (MCHP) 36.61 0.51 : Reports Q4 (Mar) earnings of $0.49 per share, $0.02 better than the Capital IQ Consensus Estimate of $0.47; revenues rose 26.9% year/year to $430.1 mln vs the $426.96 mln consensus.

Co issues guidance for Q1, sees EPS of $0.50-0.54 vs. $0.49 Capital IQ Consensus Estimate; sees Q1 revs of $438.7-456.0 mln vs. $447.37 mln Capital IQ Consensus Estimate.

4:39PM Sierra Wireless beats by $0.03, beats on revs; guides Q2 EPS in-line, revs above consensus (SWIR) 28.02 +0.12 : Reports Q1 (Mar) loss of $0.02 per share, excluding non-recurring items, $0.03 better than the Capital IQ Consensus Estimate of ($0.05); revenues rose 9.9% year/year to $101.4 mln vs the $100.07 mln consensus.

Co issues in-line guidance for Q2, sees EPS of $0.01-0.04, excluding non-recurring items, vs. $0.04 Capital IQ Consensus Estimate; upside Q2 revs of $107-111 vs. $106.10 mln Capital IQ Consensus Estimate.

4:31PM QLogic beats by $0.01, beats on revs (QLGC) 10.50 +0.11 : Reports Q4 (Mar) earnings of $0.17 per share, $0.01 better than the Capital IQ Consensus Estimate of $0.16; revenues fell 13.5% year/year to $116.9 mln vs the $115.35 mln consensus.

4:27PM Power Integrations misses by $0.03, misses on revs; guides Q2 revs in-line (POWI) 42.00 +1.80 : Reports Q1 (Mar) earnings of $0.47 per share, excluding non-recurring items, $0.03 worse than the Capital IQ Consensus Estimate of $0.50; revenues rose 7.3% year/year to $77.04 mln vs the $79.39 mln consensus.

Co issues in-line guidance for Q2, sees Q2 revs of $79-85 mln vs. $83.11 mln Capital IQ Consensus Estimate.
Q2 non-GAAP gross margin is expected to be between 52 percent and 53 percent.

4:26PM ON Semiconductor beats by $0.03, reports revs in-line; guides Q2 revs in-line (ONNN) 7.91 +0.11 : Reports Q1 (Mar) earnings of $0.10 per share, excluding non-recurring items, $0.03 better than the Capital IQ Consensus Estimate of $0.07; revenues fell 11.2% year/year to $661 mln vs the $665.69 mln consensus.

Co issues in-line guidance for Q2, sees Q2 revs of $675-715 mln vs. $702.60 mln Capital IQ Consensus Estimate. "Backlog levels for the second quarter of 2013 represent ~80 to 85 percent of our anticipated second quarter 2013 revenues. We expect that average selling prices for the second quarter of 2013 will be down ~one to two percent when compared to the first quarter of 2013. The outlook for the second quarter of 2013 includes stock-based compensation expense of ~$10 to $12 million."

4:11PM Rudolph Tech receives customer acceptance of first JetStep system for advanced packaging applications (RTEC) 11.57 +0.30 :

4:10PM TTM Tech beats by $0.03, beats on revs; guides Q2 EPS in-line, revs below consensus (TTMI) 7.09 +0.19 : Reports Q1 (Mar) earnings of $0.13 per share, $0.03 better than the Capital IQ Consensus Estimate of $0.10; revenues rose 8.3% year/year to $325.4 mln vs the $320.73 mln consensus.

"While we experienced normal seasonality during the quarter, we were pleased to realize a year-over-year increase in revenue due to increased sales in our cellular phone and networking end markets. We were also encouraged to see an improvement in the aerospace and defense end market both sequentially and year-over-year, despite current defense budget challenges."

Co issues mixed guidance for Q2, sees EPS of $0.08-0.14 vs. $0.14 Capital IQ Consensus Estimate; sees Q2 revs of $320-340 mln vs. $340.74 mln Capital IQ Consensus Estimate.

4:09PM Semtech announces $400 million credit agreement (SMTC) 31.67 +0.59 : Co announced it has executed a new credit agreement consisting of a senior secured term loan facility in the principal amount of $150 million and a $250 million senior secured revolving credit facility. This new credit agreement replaces the existing $350 million credit facility. Based on current LIBOR rates, the after tax interest rate will be approximately 1.3 percent, which is approximately half the rate associated with the existing facility. Second quarter 2014 GAAP earnings will be impacted by approximately $8.7 million in non-cash costs associated with the early retirement of the existing long term debt.

4:04PM Aehr Test Systems announces $1 mln in orders from leading IC manufacturer (AEHR) 0.93 +0.02 :

3:50PM SunPower beats by $0.12, beats on revs; will guide at analyst day on May 15 (SPWR) 14.99 +2.02 : Reports Q1 (Mar) earnings of $0.22 per share, excluding non-recurring items, $0.12 better than the Capital IQ Consensus Estimate of $0.10; Non-GAAP revenues fell 0.9% year/year to $575 mln vs the $510.05 mln consensus.

Co reported Q1 2013 GAAP gross margin of 9.3% versus 9.2% in Q1 of last year.
Co reported Q1 2013 Non-GAAP gross margin of 22.7% versus 12.7% in Q1 of last year.
"Our results reflect the benefits of our superior solar panel technology combined with strong performance from both our rooftop and ground mount teams...Regionally, North America posted excellent results in all end segments. In our power plant business, we started initial construction of the 579-megawatt antelope Valley Solar Projects for MidAmerican Solar and reached 90 percent completion on the California Valley Solar Ranch project owned by NRG Energy. With installation at CVSR expected to be finished by the end of the second quarter, we are on plan for full project completion by the end of the year. Demand in the residential lease business remained solid and once again exceeded our finance capacity in the first quarter."
SunPower will provide the company's Q2 and FY13 outlook at its Analyst Day to be held on May 15, 2013 at 10:00 a.m. Eastern Time.

Briefing Note: Related Peers Include: JASO, SPWR, TSL, STP, FSLR, LDK, CSIQ, YGE, EMKR, SOL, TAN, JKS, CSUN, DTSI, HOKU, ASTI, WFR

11:43AM Cypress Semi and ASML confirmed earlier that the Japan Fair Trade Commission cleared ASML acquisition of Cymer (CY) 9.90 -0.02 : Clearance of the merger has previously been granted by the U.S. Department of Justice, the U.S. Committee on Foreign Investment in the United States (CFIUS), as well as the Taiwanese, German and Israeli antitrust authorities. Furthermore, Cymer stockholders have approved the merger agreement. Completion of the merger now remains subject to closing conditions and receipt of approval under competition laws in South Korea. Cymer and ASML continue to expect the transaction to close in the first half of 2013.

9:02AM Intel Board elects Brian Krzanich as CEO, Renee James elected President (INTC) 23.99 : Co announced that the board of directors has unanimously elected Brian Krzanich as its next chief executive officer (CEO), succeeding Paul Otellini. Krzanich will assume his new role at the company's annual stockholders' meeting on May 16. Krzanich, Intel's chief operating officer since January 2012, will become the sixth CEO in Intel's history. As previously announced, Otellini will step down as CEO and from the board of directors on May 16. The board of directors elected Renee James, 48, to be president of Intel. She will also assume her new role on May 16, joining Krzanich in Intel's executive office.

Brocade (BRCD) announced testing results performed by ESG Lab for EMC VSPEX Proven Infrastructure solutions enabled with the Brocade VDX Ethernet fabric data center network switches for cloud-optimized configurations of 100 virtual machines and 500 virtual desktop instances.

2K, a publishing label of Take-Two Interactive Software (TTWO), and Firaxis Games announced the availability of Haunted Hollow, their first title to be designed exclusively for Apple's (AAPL) iPad and iPhone.

Brocade (BRCD) sees EPS of $0.15-0.16 versus the previous guidance of $0.14-0.16 (CapIQ consensus $0.15). For revenues company sees $536-541 million, down from previous guidance of $555-575 million (CIQ consensus $565.4 million).The company anticipates that it will report Q2 2013 SAN biz revenue, including product and services, between $373-376 million, which is down approximately 6% to 7% year-over-year and down approximately 10%-11% qtr-over-qtr. SAN product revenue is typically down 5%-8% sequentially, but the lower-than-expected SAN revenue was due to storage demand softness in the overall market which impacted revenue from some of its OEM partners. anticipates that it will report Q2 2013 IP Networking business revenue, including product and services, between $163-$165 million, which is an increase of approximately 14%-15% year-over-year and down approximately 4%-5% qtr-over-qtr "In Q2, we saw lower-than-expected revenue in SAN due to softness in the overall storage market. However, customers continued to increase their purchases of our Gen 5 Fibre Channel SAN portfolio and we made good progress on our IP Networking growth initiatives including solid growth in Ethernet fabrics during the quarter."

Seagate Tech (STX) reported third quarter earnings of $1.26 per share, $0.10 better than the Capital IQ consensus Estimate of $1.16, while revenues fell 20.8% year/year to $3.53 billion versus the $3.39 billion consensus. "Seagate's operational results this quarter again reflect strong execution... The continued advancement of cloud, mobile and open source computing are trends that are shifting data volumes toward personal and corporate cloud environments, creating tremendous opportunities for Seagate's leading storage technology portfolio. Looking ahead, our top priorities are focused on the efficiency of our operations, extending our leadership in storage technology innovation and returning value to shareholders."

icon url

ReturntoSender

05/04/13 4:27 PM

#10182 RE: ReturntoSender #6755

From Briefing.com: Weekly Recap - Week ending 03-May-13

Dow +142.38 at 14973.96, Nasdaq +38.01 at 3378.63, S&P +16.83 at 1614.42

The major averages registered strong gains as the April jobs report boosted stocks at the open. The S&P 500 jumped 1.0% and notched a fresh record close at 1,614.40 while the Dow added 0.9% after peeking above 15,000 in morning action.

On the surface, the employment report for April looked good. Payroll growth surprised to the upside, increasing by 165,000. That was 10,000 more than the 155,000 expected by the Briefing.com consensus. Revisions in March, to 138,000 from 88,000, and February, to 332,000 from 268,000, were strongly positive.

Yet, the underlying details point toward weaker consumption levels as the average workweek dropped to 34.4 hours in April from 34.6 and average hourly earnings increased 0.2%.

The decline in workweek more than offset the increase in payrolls and earnings. Altogether, aggregate wages declined 0.3% in April. That would be the first decline in wages since January.

Cyclical sectors led stocks higher and two recent underperformers, industrials and materials, finished atop the leaderboard.

The industrial space displayed all-around strength, but transportation-related stocks outperformed notably. The Dow Jones Transportation Average ended higher by 2.1% as 18 of 20 components registered gains. Although the index traded ahead of the broader market, it remains 1.0% away from its all-time best.

Elsewhere, the materials sector benefitted from a notable rise in basic metals. Copper made its biggest advance in more than a year by surging 6.5% to $3.306. Steelmakers also contributed to the outperformance of the growth-sensitive sector as the Market Vectors Steel ETF (SLX 42.59, +1.19) gained 2.9%. Meanwhile, the SPDR Materials Select Sector ETF (XLB 39.82, +0.69) ended higher by 1.8%.

The energy space also outperformed as crude oil extended its recent strength and rose 1.6% to $95.47. Since April 17, the energy component has added almost $10.

While most cyclical groups registered gains in excess of 1.0%, the financial sector underperformed. JPMorgan Chase (JPM 47.57, -0.51) slipped 1.1% after the New York Times gained access to confidential government documents alleging the bank engaged in 'manipulative schemes' in the energy market and that its executives gave 'misleading statements' while testifying under oath.

In notable sector earnings, American International Group (AIG 44.52, +2.39) added 5.7% after reporting a bottom-line beat.

Although the April jobs report received most of today's attention, some noteworthy quarterly reports crossed the wires as well. LinkedIn (LNKD 175.59, -26.08) slumped 12.9% after its better-than-expected earnings report included cautious full-year revenue guidance.

On the downside, the defensively-geared telecom and utilities sectors ended with respective losses of 0.2% and 0.4%.

Reviewing today's remaining data, the ISM Non-manufacturing Index declined from 54.4 in March to 53.1 in April. The Briefing.com consensus expected the index to fall to 54.0.

Total factory orders fell 4.0% in March after increasing a downwardly revised 1.9% (from 3.0%) in February. The Briefing.com consensus expected factory orders to fall 2.5%.

Durable goods orders fell 5.8% (from a previously released -5.7%) after increasing 4.3% in March.

There is no notable economic news set to be released on Monday. On Tuesday, March consumer credit will be announced at 15:00 ET.

Week in Review: Technology Leads Stocks Higher

Monday proved to be a one-sided affair as equities climbed throughout the session. As a result, the S&P 500 settled higher by 0.7% while the Nasdaq rose 0.9%. The Nasdaq displayed relative strength from the onset as technology stocks paced today's advance. Major sector components Apple (AAPL 449.98, +4.46), Google (GOOG 845.72, +16.11), and Microsoft (MSFT 33.49, +0.33) all settled with gains of at least 2.5%.

On Tuesday, stocks ended the session on a modestly higher note as the Nasdaq rose 0.7% while the S&P 500 added 0.3%. The Dow Jones Industrial Average, for its part, tacked on 0.1%. The major averages spent the day climbing off their lows after it was revealed that manufacturing activity in the Chicago region in April contracted for the first time since September 2009, falling from 52.4 in March to 49.0. The Briefing.com consensus expected the Chicago PMI to decline to 52.0. Technology stocks paced the late-morning rebound as the sector displayed strength amid reports indicating Apple's $17 billion debt offering received significant investor interest.

Stocks ended Wednesday's session on their lows as global growth concerns reemerged. The three major indices all lost 0.9%, but the underperformance of small cap stocks was notable as the Russell 2000 slid 2.5%. China reminded investors of its importance to the global economy as the decline in the country's Manufacturing PMI (50.6 actual, 50.9 prior, 51.0 consensus) along with a disappointing U.S. ISM Index (50.7 actual, 51.3 prior, 51.0 consensus) pressured commodities and commodity-related sectors. The materials space declined throughout the day as related metals sold off.

Thursday saw the S&P 500 erase all of Wednesday's losses. The benchmark average rose 0.9% while the Nasdaq outperformed with a gain of 1.3%. In addition to earnings reaction, investors welcomed further easing from the European Central Bank as the ECB cut its key interest rate by 25 basis points to a record low of 0.50%. Visa (V 179.54, +4.14) jumped 5.7% after beating on earnings and revenue.
 
Index Started Week Ended Week Change % Change YTD %
DJIA 14712.55 14973.96 261.41 1.8 14.3
Nasdaq 3279.26 3378.63 99.37 3.0 11.9
S&P 500 1582.24 1614.42 32.18 2.0 13.2
Russell 2000 935.27 954.42 19.15 2.0 12.4


This week's top 20 % gainers

Technology: AMD (3.6 +27.24%), YELP (31.13 +26.75%), SPWR (14.9 +25.74%), MDSO (67.59 +24.79%), LOGM (22.1 +22.06%), RATE (15.9 +18.1%), TSL (4.97 +18.04%)
Services: BGFV (19.46 +23.45%), MGAM (24.64 +21.5%), RPXC (15.27 +18.33%), MDCA (17.74 +17.88%)
Healthcare: TXMD (2.94 +27.27%), STAA (8.56 +26.77%), TSRO (29.62 +18.81%), QCOR (34.26 +17.66%)
Consumer Goods: MTOR (6.01 +26.06%)
Basic Materials: NR (10.87 +24.42%), OIS (93.67 +22.98%), CENX (8.68 +17.96%), REGI (11.83 +16.77%)

This week's top 20 % losers

Technology: NTE (8.57 -31.99%), GWAY (12.34 -22.93%), NIHD (7.2 -21.1%), CRAY (16.6 -18%), ACCL (8.37 -16.22%), NUAN (19.65 -14.73%)
Services: DXPE (57.34 -16.96%), KFRC (13.19 -13.65%), CHH (39.79 -12.75%), KKD (12.65 -12.75%)
Industrial Goods: RBC (65.76 -15.39%)
Healthcare: LXRX (2.01 -13.1%), ASTX (5.8 -12.78%)
Financial: MBI (9.8 -14.74%)
Consumer Goods: COT (9.03 -16.16%)
Basic Materials: NBL (113.06 -72.68%), KEG (6.24 -14.39%), ANV (10 -14.36%), HK (6.26 -14.09%), PBF (28.53 -13.42%)

9:01AM Flextronics announces departure of Chief Financial Officer (FLEX) 6.83 : Co announced that effective today, Paul Read, chief financial officer, has decided to leave the co to pursue new opportunities, but will remain available for any necessary transitional activities through the end of the current quarter. Christopher Collier, who has served as an officer of the co since 2005, and chief accounting officer since 2007, has been appointed chief financial officer effective immediately.

07:46 am AIG shares rise 3% following beat on earnings
American Intl (AIG $43.30 +1.17) reported first quarter earnings of $1.34 per share, $0.46 better than the Capital IQ consensus of $0.88. Book value per share, excluding Accumulated other comprehensive income (AOCI), of $59.39, up 12 percent from the prior-year first quarter. AIG Parent liquidity sources amounted to approximately $15.0 billion at March 31, 2013, including $5.5 billion allocated toward future maturities of liabilities and contingent liquidity stress needs of the Direct Investment book and Global Capital Markets.

07:45 am Digital River shares fall 3% following downside guidance
Digital River (DRIV) reported first quarter earnings of $0.33 per share, excluding non-recurring items, $0.13 better than the Capital IQ Consensus Estimate of $0.20; revenues rose 11.0% year/year to $113.7 million versus the $102.61 million consensus. The company issued downside guidance for Q2, sees EPS of $0.01-0.04, excluding non-recurring items, versus the $0.13 Capital IQ Consensus Estimate; sees Q2 revs of $89-92 million vs. $93.35 million Capital IQ Consensus Estimate. The company issued mixed guidance for fiscal year 2013 wit EPS of $0.55-0.65, excluding non-recurring items, versus the $0.78 Capital IQ Consensus Estimate; sees FY13 revenue growth of 2-5%, equates to ~$394-406 million vs. $395.50 million Capital IQ Consensus Estimate.

07:44 am OpenTable shares fall 2% despite better than expected earnings
OpenTable (OPEN $56.70 -0.96) reported first quarter earnings of $0.45 per share, $0.02 better than the Capital IQ Consensus Estimate of $0.43; revenues rose 15.5% year/year to $45.5 million vs the $45.57 million consensus. Installed restaurant base as of March 31, 2013, totaled 20,128, a 13% increase over March 31, 2012. Seated diners totaled 34.3 million, a 24% increase over Q1 2012. Guidance: The company issued in-line guidance for the second quarter with EPS of $0.45-0.49 versus the. $0.47 Capital IQ Consensus Estimate; sees Q2 revs of $44.9-46.2 million vs. $46.66 million Capital IQ Consensus Estimate The company issued in-line guidance for FY13, sees EPS of $1.88-2.02 versus the $1.90 Capital IQ Consensus Estimate; sees FY13 revs of $185.3-190.9 million vs. $189.43 million Capital IQ Consensus Estimate "We're pleased with seated diner growth during the first quarter in both our North America and International business segments," said Matt Roberts, President and CEO of OpenTable. "More than one third of the 34 million diners we seated in North America during the quarter were attributable to mobile, and we're continuing to optimize our mobile products around the globe to further capitalize on the opportunity."

07:43 am LinkedIn shares plunge 9% following downside guidance
LinkedIn (LNKD $180.00 -19.67) reported first quarter earnings of $0.45 per share, excluding non-recurring items, $0.14 better than the Capital IQ consensus of $0.31, while revenues rose 72.3% year/year to $324.7 million versus the $318.04 million consensus; adj. EBITDA $83.4 million vs. $67-69 million vs. $71 million consensus. The company issued downside guidance for Q2, sees Q2 revs of $342-347 million versus the $359.89 million Capital IQ Consensus Estimate; sees Q2 adjusted EBITDA of $77-79 million vs. the approximately $85 million consensus.

The company raised fiscal year 2013 guidance below consensus, raises FY13 rev to $1.43-1.46 billion from $1.41-1.44 vs. $1.50 billion Capital IQ Consensus Estimate; raised FY13 adjusted EBITDA to $330-345 million from $315-330 million vs. the $357 million consensus. Talent Solutions: Revenue from Talent Solutions products totaled $161.0 million, an increase of 90% compared to the fourth quarter of 2011. Talent Solutions revenue represented 53% of total revenue in the fourth quarter of 2012, compared to 51% in the fourth quarter of 2011. Marketing Solutions: Revenue from Marketing Solutions products totaled $83.2 million, an increase of 68% compared to the fourth quarter of 2011. Marketing Solutions revenue represented 27% of total revenue in the fourth quarter of 2012, compared to 30% in the fourth quarter of 2011. Premium Subscriptions: Revenue from Premium Subscriptions products totaled $59.4 million, an increase of 79% compared to the fourth quarter of 2011. Premium Subscriptions represented 20% of total revenue in the fourth quarter of 2012 and 2011.


ON Semiconductor (ONNN) reported first quarter earnings of $0.10 per share, excluding non-recurring items, $0.03 better than the Capital IQ Consensus Estimate of $0.07; revenues fell 11.2% year/year to $661 million vs the $665.69 million consensus. The company issued in-line guidance for Q2, sees Q2 revs of $675-715 million vs. $702.60 million Capital IQ Consensus Estimate. "Backlog levels for the second quarter of 2013 represent ~80 to 85 percent of our anticipated second quarter 2013 revenues. We expect that average selling prices for the second quarter of 2013 will be down ~one to two percent when compared to the first quarter of 2013. The outlook for the second quarter of 2013 includes stock-based compensation expense of ~$10 to $12 million."
icon url

ReturntoSender

05/05/13 11:39 AM

#10183 RE: ReturntoSender #6755

InvestmentHouse Weekend Market Summary

http://www.investmenthouse.com/weekendmarketsummary.htm

- Stocks surge, growth leads.
- Part-time, low pay jobs drive the employment increase as the US jobs market restructures to avoid Obamacare costs.
- Rest of the economy more of the same: Factory Orders flop negative, prior gains revised lower; ISM Services misses.
- Market showing leadership, rotation, and that means more gains should follow.

Jobs credited for sending stocks surging to new highs and new rally highs.

Some went as far as saying the jobs report was 'strong.' At 165K it was above expectations lowered by an ADP report that isn't quite as reflective of the BLS data as it desires, but it was not 'strong.' 165K jobs in reality doesn't keep up with the workforce, or at least it shouldn't. The problem with the US, however, is that so many have left the jobs market 165K jobs can drop the unemployment rate. I will talk more about the shortcomings of the jobs report and other data later.

The important takeaway is that ahead of jobs the futures were basically flat. Jobs came out and futures surged. Stocks surged. They surged early, held the gains, and closed out very near session highs.

SP500 16.83, 1.05%
NASD 38.01, 1.14%
DJ30 142.38, 0.96%
SP400 1.27%
RUTX 1.55%
SOX 0.90%

Volume rose on NYSE to average, faded 1% on NASDAQ but still above average. Not a blowout on volume, but then again volume again good enough. Doesn't seem to be hurting the rally, indeed has not hurt the rally.

We used the rally to bank some gain, e.g. SSO, RAX, but frankly with the market flying and growth stocks taking the lead we let a lot of positions just fly to the upside and will see how far they go. We also picked up some upside on stocks such as AMZN and NOW as well as LEDS, though LEDS came back at us. Overall what a session to the upside with FEIC, CAT, KORS, TRIP, V and many of our plays surging on the session. Again, letting them run with this race higher in the uptrend channel.

OTHER MARKETS

Dollar: 1.3118 versus 1.3064 euro. Big move Thursday then a move back down, at least against the euro Friday. European stock markets surged; maybe they are at a bottom now that the ECB has joined in on the 'flood the streets with money' plan of the US and Japan. The dollar was flat against other currencies.

Bonds: 1.74% versus 1.63% versus 1.63% versus 1.67% versus 1.67% versus 1.67% versus 1.72% versus 1.69% versus 1.70% versus 1.69% versus 1.71% versus 1.69% versus 1.70% versus 1.72% versus 1.69% versus 1.72% versus 1.79% versus 1.81% 10 year Treasury.

Okay right back down, gapping lower and tanking to the 50 day EMA. Bonds should sell in a stronger economy. They were selling Friday though how strong an economy is a open to debate. Some debate.

Oil: 95.61, +1.62. Today in an alert we described oil as Mr. Toad's Wild Ride. Oil dove lower to start April, bottomed mid-month at support. Rallied through Monday, then dove two days on inventories at their highest in over 80 years. Then Thursday they surged again and continued the move Friday back toward 100. The oil market is very decisive in its indecision right now.

Gold: 1464.50, -3.10. Rallied further, clearing the 20 day EMA, but could not finish the move, fading to the close. Still below the 20 day, still unable to punch through, but also still holding up, building a lateral shelf it may try to rally from. Yes the US jobs report was heralded as some kind of great news worth 1% gains on the major indices, but the US, Japan, and now Europe are engaged in massive, unprecedented liquidity production in order to . . . create 165K US jobs. Rather low quality, part-time jobs at that. Money well spent?

THE ECONOMY

Jobs beat expectations, show solid revisions. Also, lower workweek, still record low participation, and poor jobs quality.

THE GOOD: The headlines had everyone cheering on the beat and more importantly the revisions.

Nonfarm Payrolls, April (8:30): 165K actual versus 155K expected, 138K prior (revised from 88K). Services added the bulk of the gains, 185K.

Nonfarm Private Payrolls, April (8:30): 176K actual versus 166K expected, 154K prior (revised from 95K)

Unemployment Rate, April (8:30): 7.5% actual versus 7.6% expected, 7.6% prior

March: 138,000 versus 88,000
February: 332,000 versus 268,000 originally reported

THE BAD: The details, ah the details, show the same problems for a supposedly solid jobs report.

Workforce Participation: 63.3%. If it had held steady since 2007 the unemployment rate would be over 11%. MOREOVER, participation for those 55+ is rising. That means ALL the losses in participation have been in younger age groups.

Average Workweek, April (8:30): 34.4 actual versus 34.6 expected, 34.6 prior

U6: 13.9% versus 13.8% March. 223,000 more in April reported working less than they wanted to because they could not find full time work.

Disability: 1.8M citizens on disability, and they historically NEVER return to the job market.

Share of adults with jobs stubbornly lower since recession started:

Employment to population: 58.2% to 58.7% in the 'recovery,' 58.6% in April.

Even though the US is creating new jobs, it is still 10M jobs light and is NO CLOSER to recovering those lost jobs. Example: Construction lost 2M jobs. It has replaced 200K in this recovery. A long way to go indeed.

Where the jobs are: Still poor quality in the jobs created. The most important sectors still lost jobs (25-54) while the 55+ and 20-24 showed the gains.

Those in the prime of their earning capacity are STILL losing jobs while the economy only adds the lower pay hourly wage jobs.

I sound like a broken record as this is something you have heard from me before, but the jobs quality mix is very poor. Whether this is due solely to a weak economy or in combination with the administration policies such as the healthcare Act is an academic debate. I would argue the weak economy is BECAUSE of the polices. The point is, the jobs created are still low end, low pay positions.

We have reported that the majority of jobs lost since 2007 were mid-tier jobs. The majority created since are low-tier hourly wage jobs in the lowest wage range. Fact is fact.

What Does this Mean? A jobs recovery? Hardly.

Strange job movements = strange government policies.

Temporary workers up again: +30.8K. This is typically viewed as a positive, but as I discussed after the March jobs report, we have seen temp hires up for several years now.

Early on the financial reporters heralded this as good news for the jobs market because it would lead to permanent hiring. It is now clear that temporary hiring IS the end result, not a stepping stone to permanent jobs as it used to be.

Indeed, that is why workforce participation has tumbled and did not improve in April even as the jobs market supposedly improved.

Retail gained 29.3K but the workweek fell from 30.3 to 30.0 month/month.
Retail hours worked fell 1% on higher jobs.

This reflects the overall workweek dropping a huge 0.2 to 34.4 from 34.6. Art Cashin noted this and hoped it might be due to companies hiring more people and thus requiring less overtime. But the workweek is still historically low; people are not overworked in that sense. There is something else causing this.

The facts:
1. The economy is slowing but jobs creation increased. Jobs follow the economy so why are they up?

2. Jobless claims are on the downtrend from 488K five weeks ago to 329K as of the last report. Less layoffs occurring and of course that is a good thing for the jobs market.

3. Temporary jobs jumped again. Combined with the fact that most jobs created in the recovery are low-tier jobs, the bulk of the job creation has been lower pay hourly jobs.

4. Even with job creation increasing, the number of hours worked fell and substantially so. But the historical average workweek is not that high, meaning that workers are not being overworked necessitating new hires. More people working but each working less hours.

The Cause:

The Affordable Healthcare Act applies to companies of a certain number of employees and of certain hours worked per week. If your company fits into the parameters you pay for certain insurance or you pay a penalty.

At first many said that companies would just pay the penalty. Company costs, like water, however, seek their lowest level. Have to in order to survive. Thus if there is a way to do neither, they will do it.

The Result:

STRUCTURAL CHANGES ongoing in the US labor force based upon the healthcare law.

What is really happening is indeed there are more hires, but they are working each employee less due to the healthcare law. The increase in jobs is a move by companies to maintain output with more employees each working fewer hours.

In other words, the increased hiring is due to avoiding the costs of the healthcare law. Now that companies finally understand the impacts of the healthcare law they are adjusting accordingly. They are cutting each employee's hours and picking up incremental hires to keep enough people to service customers but not incur additional costs.

As Nancy Pelosi said in likely the most asinine statement ever made by a legislator (okay, one of the top ten), we have to pass it to know what is in it. They did, now we do.

Ironically, perhaps the healthcare law IS increasing the number of jobs as the proponents claimed, but when you don't grow the economy it is a zero sum game: more employees working fewer hours and at lower wages.

Question: After the structural changes are made, what happens with the jobs market then?

It fades. Companies are just getting the mix of employees to hours at the right ratio to avoid additional healthcare costs. Once done, no need for extra hires unless the economy truly recovers.

Shocking fact working against the economy and thus the jobs market: The number of self-employed persons in the US is at a record low. In history. Period. Most job creation comes from the self-employed that start a business, run it, grow it, hire workers, expand, and hire more workers. This economy is crushing the life out of small businesses as I have reported for the past four years.

Services sees employment decline as the BLS reports services added the majority of new jobs.

ISM Services, April (10:00): 53.1 actual versus 54.0 expected, 54.4 prior

How can the BLS report +185K services jobs in April as the ISM Services private survey shows employment declining to 52.0 versus 53.3, indeed, continuing an ongoing decline in employment?

FACTORY ORDERS, or should that be NON-orders?

Factory Orders, March (10:00): -4.0% actual versus -2.5% expected, 1.9% prior (revised from 3.0%)

Largest drop since 8-2012.

A familiar chart of the economic data: trending lower and lower ever since the 2010 recovery peak. Ah, what a recovery we have in progress.

TECHNICAL SUMMARY

INTERNALS

NASDAQ
Stats: +38.01 points (+1.14%) to close at 3378.63
Volume: 1.716B (-1.27%)

Up Volume: 1.23B (-60M)
Down Volume: 497.87M (+52.05M)

A/D and Hi/Lo: Advancers led 2.76 to 1
Previous Session: Advancers led 3.06 to 1

New Highs: 283 (+159)
New Lows: 21 (-12)

S&P
Stats: +16.83 points (+1.05%) to close at 1614.42
NYSE Volume: 645M (+5.56%)

A/D and Hi/Lo: Advancers led 2.63 to 1
Previous Session: Advancers led 3.01 to 1

New Highs: 948 (+285)
New Lows: 78 (-2)

DJ-30
Stats: +142.38 points (+0.96%) to close at 14973.96

BREADTH: Another solid day even if it was lower than Thursday. 2.75:1 is not bad.

VOLUME: Slightly lower on NASDAQ but still above average; not bad trade. NYSE trade stronger by 5.5% and good to see as the small caps enjoyed a run.

THE CHARTS

SP500. Surging into mid-channel range after that Wednesday test of the November trendline. Solidly trending higher now and showing a nice volume increase on the move.

NASDAQ. Gapped just about to its session high, finding itself in unfamiliar territory already near the upper trendline in its old channel. Techs finally joined in the rally this past couple of weeks and the market is flying.

DJ30. Excellent run to mid-channel as the Dow continues a steady though not market leading move at this point. It did its job leading and holding things together earlier. Now it is quieter as some market rotation takes place. Healthy, normal, good.

SP400. Midcaps continued to recover after a midweek test at the 20 day EMA as a check to see if it still had strength. Not bad, posting another new all-time high.

RUTX. Led the market in terms of percentage move and also set a new high, intraday and closing. A short little inverted head and shoulders is breaking out. No issues, looking better, more than just following along.

SOX. Gapped to a doji but not complaining. Over the March 2012 peak, the April 2011 peak, and moving in on the February 2011 post-bear market high at 474.33 (closed at 450.92). Leadership.

LEADERS

Big Names. AAPL, AMZN, GOOG and MSFT helped lead NASDAQ. MMM gained nicely.

Technology. Some good moves but many faded after strong early moves, e.g. RAX, DDD. Working but not all to the upside Friday, at least after the open. CAMP moved well, ADTN not bad. Some remain in position but did not move Friday, e.g. PRKR, LEDS (ran then ran back). That at least means there are still buys out there.

Drugs, biotech. Still working on a recovery. CELG did fine. Some smaller names were decent, e.g. BDSI, ARRY.

Retail. Some good moves again, e.g. TJX, PCLN, NKE, RUE.

Industrial machinery: CAT surging. TEX has a double bottom bounce going. Interesting.

Materials working: MAS, VMC. LPX may provide a bounce.

THE MARKET

SENTIMENT INDICATORS

VIX: 12.85; -0.74
VXN: 14.66; -0.53
VXO: 12.16; -0.73

Put/Call Ratio (CBOE): 0.9; -0.01

Bulls versus Bears

Big spike in bulls though overall still much lower than recent peaks in April that topped 50. Bears fell to the lowest in over a month. Very low on bears, getting closer to toppy levels on bulls but not there yet.

Bulls: 47.9% versus 44.3% versus 47.4% versus 50.5% versus 52.0% versus 49.5% versus 47.4% versus 50.00% versus 44.2% versus 46.3% versus 48.4% versus 52.6% versus 54.7% versus 54.3% versus 53.2% versus 51.1% versus 47.8% versus 46.8% versus 45.7% versus 43.6% versus 39.3% versus 37.2% versus 38.3% versus 43.6. Has hit a soft patch. Higher then rolling over below the January and February highs. That market hiccup ahead of and to the Jobs Report. Now back up so . . . probably hangs over 50. Background: Undercut 35%, the threshold for bullishness, in early June. As noted, hit 34% in early June. It did its job and the market is on the rally. Hard drop to 34 from 39.3% as economic reality and a choppy stock market hit. Off the 55+ level hit in late February. That was the highest level since April and May of 2011, the peak of the post-bear market high. 35% is the threshold level suggesting bullishness. To be seriously bearish it needs to get up to the 60% to 65% level.

Bears: 18.8% versus 19.6% versus 20.6% versus 20.6% versus 19.4% versus 19.6% versus 18.6% versus 18.8% versus 21.1% versus 21.1% versus 22.1% versus 21.1% versus 21.1% versus 22.3% versus 22.3% versus 23.4% versus 24.5% versus 24.5% versus 23.4% versus 25.5% versus 27.7% versus 27.7% versus 28.7% versus 27.7%. Summary: Over 35% is the threshold to be really be a good upside indicator. For reference, bearishness hit a 5 year high at 54.4% the last week of October 2008. The move over 50 took bearish sentiment to its highest level since 1995. Extreme negative sentiment. Prior levels for comparison: Bearishness peaked at 37.4% in September 2007. It topped the June 2006 peak (36%) on that run. That June peak eclipsed the March 2006 high (33%) and well above the 2005 highs that spawned new rallies (30% in May 2005, 29.2% in October 2005). That was a huge turn, unlike any seen in recent history.

MONDAY

Mercifully less economic data this coming week though earnings remain on tap. May has not been all that bad for stocks thus far with an initial down day followed by two upside sessions. Sell in May? It may still end up that way, but the indices right now look solid and are rallying inside their old channels, at least on the larger indices. With that action it is hard to exit just on the notion that last May was weak and this one may follow suit. Lots of 'mays' there.

No, this market has shown two important aspects. More than that, but two that mean a lot to us: leadership, and the willingness to rotate to new leaders. Those are key to a healthy bull market and they are fundamental.

There is also the ability to hold where absolutely necessary and find buyers. That, of course, is the liquidity helping out. Indeed, we still believe liquidity is why this economy is moving at all and of course why the stock market keeps hitting new highs. The money flood from the US ($85B/month), Japan ($75B/month), and now Europe (charging to hold bank deposits) has US markets, Japanese markets, and this past week, European markets, surging. If the economy cannot use the money, the financial markets get it. Man they are getting a lot of it.

So we are going to look for those areas where money appears to be moving to. Industrials, materials, cyclical, technology . . . areas that were ignored have received money and likely receive more. The market moves still have room to run as long as new leadership continues to emerge, and we intend to continue playing that move.

Have a great weekend!

Support and resistance

NASDAQ: Closed at 3378.63

Resistance:
3414 is the upper channel line for the November 2012 to present uptrend
3401 is the May 2000 closing low

Support:
3321 from April 2000
3296 is the November 2012 up trendline
The 50 day EMA at 3240
3227 is the April 2000 intraday low
3197 is the September 2012 post-bear market high
The 2011 up trendline at 3189
3171 is the October intraday high
3134 is the March 2012 post-bear market peak
3130 from some January 2013 lows
3104-3112 from August and mid-October peaks.
3101 is the August 2012 high
The 200 day SMA at 3098
3090 is the mid-March interim high
3076 is the late April 2012 high and the 1/2013 low after gapping higher
3062 is the December 2012 prior peak
3042 from 5/2000 low and several other price points
3024 is the gap point from early May
3000 is the February 2012 post-bear market high
2999 is the bottom of the August 2012 consolidation
2988 is the July 2012 high
2977 to 2980 is the bottom of the late October 2012 consolidation, July 2012 peak
2962 is the April 2012 low
2950 is the mid-April closing low
2942 is the mid-June 2012 high
2900 is the March 2012 intraday low
2858 is the late July 2011 peak
2847 is the mid-May 2012 low
2838 from the July 2012 lows

S&P 500: Closed at 1614.42

Resistance:
1650 is the upper trendline in the channel

Support:
1598 is the April 2013 high and former all-time high
The November up trendline at 1580
1576 from October 2007, the prior all-time high
The 50 day EMA at 1557
1556 from July 2007
1539 from June 2007
1531 is the recent high
1499 from January 2008
1475 is the September 2012 high
1471 is the October 2012 intraday high
1466 is the September 2012 closing peak and rally closing high
The 200 day SMA at 1464
1440 from November 2007 closing lows
1434 from early November 2012
1433 from August 2007 closing lows
1427 is the August 2012 peak
1425 from May 2008 closing highs and the October 2012 low
1408 is the late October 2012 range closing low
1406 is the early May 2012 peak
1402.22 - 1400 is the closing low of the August 2012 lateral consolidation
1378 is the February 2012 peak
1375 is the early July 2012 peak
1371 is the May 2011 peak, the post-bear market high
1363.46 is June 2012 high
1359 is the April 2012 low
1357 is the July 2011 peak
1344 is the February 2011 peak
1340 is the early April 2011 peak
1332 is the early March 2011 peak

Dow: Closed at 14,971.63

Resistance:
14,888 is the April peak and prior all-time high
15,248 is the upper channel line for the trend off the November low.

Support:
The November up trendline at 14,691
The 50 day EMA at 14,493
14,198 from the October 2007 high
14,149 is the February 2013 high
14,022 from 7-07 peak
14,010 from the early February 2013 consolidation
13,784 is the late February 2013 closing low
13,692 from 6-2007 peak
13,668 from 12-2007 peak
13662 is the October 2012 intraday high
13,653 is the September 2012 high
The 200 day SMA at 13,601
13,557 to 13,662
13,413 from the late September 2012 low
13,300 to 13,331 is the August 2012 post-bear market high
13,297 is the April 2012, prior post bear market high
13,058 from the May 2008 peak on that bounce in the selling
13,056 is the February 2012 high
12,716 is the April 2012 closing low
12,524 is a range of support from early 2012 and summertime 2012

Economic Calendar

May 3 - Friday
- Nonfarm Payrolls, April (8:30): 165K actual versus 155K expected, 138K prior (revised from 88K)
- Nonfarm Private Payrolls, April (8:30): 176K actual versus 166K expected, 154K prior (revised from 95K)
- Unemployment Rate, April (8:30): 7.5% actual versus 7.6% expected, 7.6% prior
- Hourly Earnings, April (8:30): 0.2% actual versus 0.2% expected, 0.0% prior
- Average Workweek, April (8:30): 34.4 actual versus 34.6 expected, 34.6 prior
- Factory Orders, March (10:00): -4.0% actual versus -2.5% expected, 1.9% prior (revised from 3.0%)
- ISM Services, April (10:00): 53.1 actual versus 54.0 expected, 54.4 prior

May 7 - Tuesday
- Consumer Credit, March (15:00): $16.3B expected, $18.1B prior

May 8 - Wednesday
- MBA Mortgage Index, 05/04 (7:00): 1.8% prior
- Crude Inventories, 05/04 (10:30): 6.696M prior

May 9 - Thursday
- Initial Claims, 05/04 (8:30): 336K expected, 324K prior
- Continuing Claims, 04/27 (8:30): 3019K expected, 3019K prior
- Wholesale Inventories, March (10:00): 0.3% expected, -0.3% prior
- Natural Gas Inventories, 05/04 (10:30): 43 bcf prior

May 10 - Friday
- Treasury Budget, April (14:00): +$59.1B prior
icon url

ReturntoSender

05/06/13 11:08 PM

#10184 RE: ReturntoSender #6755

From Briefing.com: 4:10 pm : The major averages ended on a mixed note as the S&P 500 rose 0.2% while the Dow Jones Industrial Average shed five points.

With no economic news of note and two major foreign markets closed (Japan and the United Kingdom), investors reacted to quarterly earnings.

The now-familiar pattern of anemic top-line growth remained in effect as quarterly results from Sysco (SYY 34.33, -0.33) and Tyson Foods (TSN 24.10, -0.83) missed their marks. The results weighed on the third-best performing sector of the year as the SPDR Consumer Staples Select Sector ETF (XLP 40.93, -0.30) ended lower by 0.7%.

Likewise, other defensive sectors also finished in the red with the utilities space as the weakest performer. The SPDR Utilities Select Sector ETF (XLU 40.32, -0.57) settled lower by 1.4%.

On the flip side, six cyclical sectors registered gains as financials, industrials, and technology led the broader market higher.

The financial sector displayed notable strength throughout the day as the SPDR Financial Select Sector ETF (XLF 19.05, +0.20) rose 1.1%. MBIA (MBI 14.29, +4.46) surged 45.4% after the insurer reached a $1.7 billion settlement with Bank of America (BAC 12.88, +0.64). In addition, Bank of America disclosed a 5.0% stake in MBIA.

Elsewhere, the industrial sector received support from transportation-related stocks as 18 of 20 components of the Dow Jones Transportation Average settled with gains. For its part, the bellwether complex added 1.3% to end at a fresh all-time high.

Technology stocks paced the bulk of last week's gains, and the outperformance continued today. Apple (AAPL 460.71, +10.73) climbed 2.4% after Barclays hiked its price target for the stock to $525 from $465. Chipmakers also displayed strength as the PHLX Semiconductor Index added 0.6%.

Although most tech components ended in positive territory, the underperformance of IBM (IBM 202.78, -1.73) weighed on the Dow Jones Industrial Average.

In the Treasury market, the 10-yr note saw some intraday selling as its yield rose two basis points to 1.765%.

Today's volume was well-below average as only 620 million shares changed hands on the floor of the New York Stock Exchange.

Tomorrow's economic data will be limited to the 15:00 ET release of March consumer credit. Among earnings of note, Fossil (FOSL 98.96, +0.70) and OfficeMax (OMX 11.74, +0.15) will report their results ahead of the opening bell.

The U.S. Treasury will auction $32 billion in 3-yr notes.DJ30 -5.07 NASDAQ +14.34 SP500 +3.08 NASDAQ Adv/Vol/Dec 1471/1.47 bln/988 NYSE Adv/Vol/Dec 1812/619.5 mln/1175

3:30 pm :

June crude oil began pit trade in negative territory, trading as low as $94.85 per barrel. However, the energy component gained strength on reports of Israeli air strikes on Syria over the weekend and climbed into the black. It eventually settled 0.5% higher at $96.12 per barrel, just below its session high of $96.24 per barrel.
June natural gas broke into positive territory in morning pit trade and advanced to a session high of $4.06 per MMBtu. The move was short lived, however, as prices retreated back into the red and touched a session low of $3.98 per MMBtu. Despite inching upwards in afternoon action, natural gas settled with a 0.7% loss at $4.01 per MMBtu.
June gold retreated to the unchanged line in early afternoon floor trade after trading as high as $1473.90 per ounce in morning action. However, buyers stepped in ahead of the close and managed to push prices slightly higher. Despite a stronger dollar index, gold booked a 0.3% gain as it settled at $1468.20 per ounce.
July silver pulled back from its session high of $24.18 per ounce set moments after floor trade opened and fell into negative territory. Unable to erase much of the loss, it settled 0.3% lower at $23.95 per ounce. o July corn traded lower ahead of the Weekly Crop Progress Report that will be released later today at 4:00pm ET. Prices slid to a session low of $6.33 per bushel before settling with a 3.8% loss at $6.36 per bushel.

10:08AM Analog Devices signs worldwide distribution agreement with Mouser Electronics (ADI) 45.56 +0.56 : Co announced that it has entered into a worldwide distribution agreement with Mouser Electronics, Inc. Mouser supplies design engineers and buyers with the newest products and leading-edge technologies combined with unsurpassed customer service and worldwide support.

9:42AM Intel subsidiary McAfee to acquire Stonesoft Oyj for equity value of ~$389 mln in cash (INTC) 24.07 +0.11 : McAfee announced the execution of a definitive agreement to initiate a conditional tender offer for the acquisition of Stonesoft Oyj, a leading innovator in next-generation network firewall products, for an aggregate equity value of approximately $389 million in cash. Stonesoft delivers software-based, dynamic, customer-driven, cyber security solutions to secure information flow and simplify security management. McAfee is a wholly owned subsidiary of Intel Corporation (INTC).

9:04AM Analog Devices announced the appointment of Vincent Roche as President and Chief Executive Officer (CEO) and his election to the Board of Directors, effective immediately (ADI) 45.00 : Mr. Roche joined co in 1988. Over his nearly 25-year career at co, he has served in key leadership positions including worldwide sales, strategic marketing, and product management. Mr. Roche was appointed President of co in 2012 and has served as interim CEO since March 29, 2013 following the unexpected death of CEO Jerald Fishman.

Aehr Test Systems (AEHR) has received over $4 mlnin follow-on orders for multiple FOX-1 Parallel Test Systems and WaferPak contactors from a manufacturer of semiconductor memory devices. The orders include 30% down payments to lock in deliveries and a volume pricing agreement.

8:33AM Adobe Systems reaffirms Q2 and FY2013 EPS and rev guidance (ADBE) 47.01 : Co reaffirms guidance for Q2 (May), sees EPS of $0.29-0.35 vs. $0.34 Capital IQ Consensus Estimate; sees Q2 (May) revs of $975 mln - 1.025 bln vs. $1.01 bln Capital IQ Consensus Estimate.

Additional guidance assumptions:

Targeting Creative ARR of ~$340 mln exiting Q2, based on adding slightly more Creative Cloud paid subscriptions than what was achieved in Q1, with a sequential quarterly increase in the net new number of subscriptions through the year to achieve our 1.25 mln subscription target by the end of the fiscal year
Targeting Document Services ARR of ~$80 mln exiting Q2, up from $64 mln exiting Q1
Adding Creative ARR plus Document Services ARR yields a total Digital Media ARR exiting Q2 of ~$420 mln

FY13 Guidance
Co reaffirms guidance for FY13 (Nov), sees EPS of ~$1.45 vs. $1.45 Capital IQ Consensus Estimate; sees FY13 (Nov) revs of $4.1 bln vs. $4.12 bln Capital IQ Consensus Estimate.

Additional assumptions:

Expect to exit FY13 with ~1.25 mln Creative Cloud subscribers
Targeting Adobe Marketing Cloud annual revenue growth of over 20%, based on driving over 25% bookings growth

Cypress Semiconductor (CY) announced that members of its senior management and executive staff will discuss Cypress's business and strategic outlook at multiple investor events in May.

7:51AM NXP announced that its subsidiaries NXP B.V. and NXP Funding LLC intend to offer $500 mln aggregate principal amount of senior notes due 2018 ("Unsecured Notes") (NXPI) 28.02 : The Unsecured Notes will be structurally subordinated to the liabilities, including trade payables, of NXP's subsidiaries that have not guaranteed the Unsecured Notes. In addition, the Unsecured Notes will be effectively subordinated to all secured debt of the issuers and the guarantors, to the extent of the value of the assets securing such debt. NXP intends to use the net proceeds of the offering to repay amounts outstanding under its U.S. dollar denominated floating rate senior secured notes due 2016, and thereby decrease the amount of variable rate debt in its capital structure.

DSP Group (DSPG) announced that Intelbras selected its VoIP chipset solution to drive the co's IP phone and DECT IP phone product lines.

Texas Instruments (TXN) and Continental announced their collaboration on the first 65 nm ARM Cortex safety microcontrollers with Flash technology in volume production.

12:48AM Advanced Micro commences exchange offer for its 7.50% Senior Notes due 2022 for Registered Notes (AMD) 3.60 :

4:13PM First Solar misses by $0.06, beats on revs; reaffirms FY13 EPS guidance, revs guidance (FSLR) 47.69 +1.69 : Reports Q1 (Mar) earnings of $0.69 per share, excluding non-recurring items, $0.06 worse than the Capital IQ Consensus Estimate of $0.75; revenues rose 51.9% year/year to $755 mln vs the $725.99 mln consensus.

Co reaffirms guidance for FY13, sees EPS of $4.00-4.50, excluding non-recurring items, vs. $4.28 Capital IQ Consensus Estimate; sees FY13 revs of $3.8-4.0 bln vs. $3.84 bln Capital IQ Consensus Estimate.

The first quarter of 2013 was impacted by pre-tax restructuring charges of $2 mln (reducing EPS by $0.03), compared to $25 mln (reducing EPS by $0.30) in the fourth quarter of 2012. In both cases the pre-tax charges related to previously announced restructuring actions. The decrease in net sales from the fourth quarter of 2012 was primarily due to less revenue recognition from our systems business projects primarily related to the Topaz project, while the increase over the first quarter of 2012 was primarily due to higher sales volumes for third-party module sales and an increase in revenue from systems projects.

The Company also maintained its full year 2013 financial guidance as issued during the 2013 Analyst Day event held April 9, 2013. "We remain on track for the year and reaffirm our full-year 2013 financial guidance and are focused on achieving our goal of new bookings to shipments ratio of one-to-one."

Conference call to begin at 15:30


4:09PM Peregrine Semi: Judge consolidates cases in patent infringement actions against RF Micro Devices (RFMD) (PSMI) 9.74 -0.11 : Co announced that Judge Irma Gonzalez has consolidated the two lawsuits pending in U.S. District Court that allege the infringement of Peregrine patented intellectual property relating to RFICs and switching technology by RF Micro Devices, Inc. (RFMD). The lawsuits filed in the U.S. District Court for the Southern District of California claim that certain RFMD products infringe Peregrine patents relating to silicon-on-insulator (SOI) technology for RFICs. Peregrine seeks, in addition to damages, to permanently enjoin RFMD from further infringement. Peregrine expects that consolidation of the cases will allow its infringement claims to move more efficiently towards trial and appropriate legal remedy.

Diodes (DIOD) and Fairchild Semi (FCS) were both upgraded to Outperform from Neutral at Robert W. Baird. The firm notes Diodes' lead times as well as supply chain inventories have recently marked a positive inflexion point, with notably 1Q distributor inventory days down YoY for the second consecutive quarter, and Diodes' MOSFET lead times significantly rebounding since late March. They model a sharp EPS recovery for both companies post a 1Q trough. Company-specific catalysts include accretion from BCD and multiple design wins (Fairchild), with the potential for some second-half channel inventory replenishment.
icon url

ReturntoSender

05/07/13 11:17 PM

#10185 RE: ReturntoSender #6755

From Briefing.com: 4:15 pm : Equities settled with modest gains as the S&P 500 rose 0.5% to close at a new all-time high while the Dow notched its first close above 15,000.

Similar to yesterday, earnings shaped the early price action in the absence of notable economic data.

The energy sector charged out of the gate as EOG Resources (EOG 135.69, +9.65) displayed notable strength after beating on revenue. The growth-sensitive sector ended with a solid gain even as crude oil ended lower by 0.7% at $95.47.

Most other cyclical sectors finished ahead of the broader market and the Dow Jones Transportation Average outperformed as well. The bellwether complex advanced 1.6% to a fresh record high as 18 of 20 components settled in the black.

Interestingly, the technology space began the day in-line with the broader market before late morning weakness in large components caused the sector to slip into the red. Apple (AAPL 458.66, -2.05), Cisco (CSCO 20.38, -0.43), and Microsoft (MSFT 33.31, -0.44) all lost between 0.5% and 2.1%.

The technology sector also pressured the Nasdaq, which was unable to climb above its morning highs.

Today's underperformance of the Nasdaq was notable as the index had led stocks higher for more than two weeks. Entering today, the index gained 7.1% since April 19 while the S&P 500 added 4.9% over that time.

Also contributing to the Nasdaq weakness was biotechnology, which lagged after Perrigo (PRGO 116.29, -2.55) missed on earnings and revenue. The broader iShares Nasdaq Biotechnology ETF (IBB 174.52, -1.43) ended lower by 0.8%.

The underperformance of biotech names weighed on the health care sector, which settled with a gain of 0.3%. Meanwhile, other defensive sectors outperformed the broader market and the telecom space ended in the lead.

In the Treasury market, the 10-yr note sold off steadily throughout the day with its yield climbing two basis points to 1.783%.

Even though today's session ended on a positive note, the CBOE Volatility Index (VIX 12.91, +0.25) climbed suggesting a certain measure of downside protection was in demand.

Today's volume was below average as 636 million shares changed hands on the floor of the New York Stock Exchange.

Consumer credit increased by $8.0 billion in March. That was down from an upwardly revised $18.6 billion (from $18.1 billion) in February. The Briefing.com consensus expected consumer credit to increase by $16.3 billion.

That was the first time since September 2012 that consumer credit did not increase by at least $10.0 billion.

Tomorrow, the weekly MBA Mortgage Index will be reported at 7:00 ET.DJ30 +87.31 NASDAQ +3.66 SP500 +8.46 NASDAQ Adv/Vol/Dec 1541/1.65 bln/930 NYSE Adv/Vol/Dec 2307/636.6 mln/747

3:30 pm :

June crude oil fell for the first time in four sessions ahead of tomorrow's inventory data. The energy component advanced to a session high of $96.26 per barrel but quickly reversed and slid to a session low of $94.92 per barrel. Despite trending slightly higher for the remainder floor trade, it settled with a 0.5% loss at $95.62 per barrel.
June natural gas extended yesterday's losses as it pulled back from its session high of $4.00 per MMBtu set in morning floor trade. It continued to trend lower and settled with a 2.2% loss at its session low of $3.92 per MMBtu.
June gold spent its entire floor session in the red, falling as low as $1440.40 per ounce in morning action. The yellow metal fell despite early weakness in the dollar index. Unable to gain much momentum, it settled at $1449.00 per ounce, or 1.3% lower.
July silver also traded in negative territory today, but unlike gold, it was able to erase most of its earlier losses. It lifted off its session low of $23.40 per ounce set in morning floor trade and advanced to the unchanged line in afternoon action. It eventually settled 0.6% lower at $23.81 per ounce.

WD, a Western Digital (WDC) co, and SanDisk (SNDK) announced that the two cos are collaborating to introduce hybrid storage devices that feature flash memory technology from SanDisk hard drive technology from WD.

Riverbed Technology (RVBD) announced a new platform enabling any customer to deliver application delivery controller-as-a-service with the Stingray Services Controller.


STMicroelectronics (STM) and Quantenna Communications have signed a non-exclusive worldwide licensing agreement giving ST the ability to integrate Quantenna IP into its array of systems-on-chips and giving Quantenna the ability to leverage the entire ecosystem of ST's entertainment, networking and security products.
Marvell (MRVL) announced new Marvell Alaska X PHY devices optimized for 10G and 40G optical and copper applications. Co also introduced the Marvell ARMADA 375 System-on-Chip, a dual-core Cortex A9 SoC platform that builds on the ARMADA 370 and ARMADA XP families of embedded ARM processors for business networking applications.

Marvell (MRVL) announced the general availability of new devices within the Prestera CX family of packet processors.

McAfee (INTC) announced today a partnership with Fujitsu (FJTSY) to deliver McAfee Multi-Access worldwide as a preinstall on new Fujitsu consumer and business computers.

2:01AM Advanced Semi reports April net revs of NT$16.72 bln, up 12.4% YoY, down 2.4% sequentially (ASX) 4.39 :

11:15 am Technology Sector trading flat today and behind the broader market

The tech sector is trading just lower today, trailing gains in the broader market. Semiconductors are showing weakness as well with the SOX trading 0.1% lower. Within the chip index, WFR (-3.3%) is a notable standout. Among other major indices, the SPY is trading 0.3% higher today, while the QQQ and the NASDAQ are trading modestly lower on the session. Among tech bellwethers, VZ (+1.0%) is showing notable strength, while CSCO (-1.5%) is under pressure.
icon url

ReturntoSender

05/08/13 9:48 PM

#10186 RE: ReturntoSender #6755

From Briefing.com: 4:15 pm : The S&P 500 settled higher by 0.4% to register its fifth consecutive gain.

That streak appeared to be in jeopardy when stocks began the session on a lower note. However, the three-point slip at the open was enough to entice bargain hunters who sent the benchmark average to a fresh record high.

Cyclical sectors appeared weak during the opening minutes, but most economically-sensitive groups were able to rebound, and finish in the lead.

The materials space displayed strength from the start as industrial metals traded higher after China reported a wider-than-expected trade surplus. Gains in copper were notable as the red metal advanced 1.7% to 3.361 per pound.

Comments from Rio Tinto (RIO 48.55, +1.09) also boosted the materials sector after the company said it expects iron ore demand to remain intact. Elsewhere, steelmakers displayed strength across the board as the Market Vectors Steel ETF (SLX 44.05, +0.84) settled higher by 1.9%.

Technology stocks also finished among the leaders as the sector displayed broad strength to follow yesterday's underperformance. Major components Apple (AAPL 463.84, +5.18), Google (GOOG 873.63, +16.40), and IBM (IBM 204.82, +2.14) ended with gains between 1.1% and 1.9% while high-beta chipmakers ended higher as well. The PHLX Semiconductor Index rose 1.3%.

One of the top performers of the past week, the Dow Jones Transportation Average, began the session with a loss of 0.9% as CH Robinson (CHRW 57.26, -4.30) weighed on the bellwether complex after reporting disappointing earnings. However, the remaining components of the 20-stock index picked up CH Robinson's losses as the index settled higher by 0.2%.

While most cyclical groups finished in the lead, energy and consumer discretionary sectors trailed behind the broader market.

The energy space added just 0.2% even as crude oil climbed 1.0% to $96.54.

Elsewhere, the discretionary sector lagged as homebuilders and retailers weighed. In addition, media stocks were mixed after Dow component Walt Disney (DIS 65.99, -0.08) reported a bottom-line beat. Another Dow component, McDonald's (MCD 100.95, -1.34), also pressured the sector after its comparable sales decreased 0.6% in April.

The CBOE Volatility Index (VIX 12.79, -0.04) ended with a slim loss, but VIX futures settled higher suggesting some downside protection was in demand.

Volume was slightly above average as 730 million shares changed hands on the floor of the New York Stock Exchange.

Today's economic data was limited to the weekly MBA Mortgage Index, which rose 7.0% to follow last week's increase of 1.8%.

Tomorrow, weekly initial claims and March wholesale inventories will be reported at 8:30 ET and 10:00 ET, respectively. In earnings of note, Cooper Tire (CTB 26.34, +0.17) and Dean Foods (DF 19.00, +0.37) will report their results prior to the opening bell.

The U.S. Treasury will auction $16 billion in 30-yr bonds.DJ30 +48.92 NASDAQ +16.64 SP500 +6.73 NASDAQ Adv/Vol/Dec 1428/1.67 bln/1027 NYSE Adv/Vol/Dec 1975/730.0 mln/1026

3:30 pm :

June crude oil rose today as better-than-anticipated inventory data and a weaker dollar index boosted prices. The Department of Energy reported that for the week ending May 3, crude oil inventories had a build of 0.23 mln barrels while consensus called for a build of 1.9 mln barrels. Prices climbed as high as $96.74 per barrel and settled with a 1.0% gain at $96.60 per barrel.
June natural gas spent its entire floor session in positive territory. It dipped to a session low of $3.94 per MMBtu in morning action but climbed to a session high of $3.99 per MMBtu as it headed into the close. Natural gas eventually settled with a 1.5% gain at $3.98 per MMBtu.
June gold traded higher today on support from the weaker dollar index. The yellow metal spent most of pit trade trading in a consolidative pattern near the $1465 per ounce level and popped to a session high of $1475.80 per ounce heading into the close. It settled at $1473.60 per ounce, booking a gain of 1.7%.
July silver pulled-back from its session high of $24.05 per ounce set at floor trade open and dipped into negative territory. It fell as low as $23.64 per ounce but buyers stepped in and took prices back above the break-even level. A slight rally into the close helped silver settle 0.5% higher at $23.92 per ounce.

4:14PM STEC beats by $0.01, reports revs in-line; guides Q2 EPS below consensus, revs in-line (STEC) 3.84 -0.04 : Reports Q1 (Mar) loss of $0.41 per share, excluding non-recurring items, $0.01 better than the Capital IQ Consensus Estimate of ($0.42); revenues fell 56.3% year/year to $22 mln vs the $21.95 mln consensus.

Co issues guidance for Q2, sees EPS of ($0.43)-(0.41), excluding non-recurring items, vs. ($0.39) Capital IQ Consensus Estimate; sees Q2 revs of $23-26 mln vs. $25.47 mln Capital IQ Consensus Estimate.

4:04PM Rackspace misses by $0.02, misses on revs (RAX) 52.08 +2.36 : Reports Q1 (Mar) earnings of $0.19 per share, $0.02 worse than the Capital IQ Consensus Estimate of $0.21; revenues rose 20.2% year/year to $362.2 mln vs the $366.84 mln consensus.

Adjusted EBITDA of $125 mln grew 24% year-over-year and declined 3.6% from Q4 2012.

Net income margin for the quarter was 7.5% compared to 8.5% for the previous quarter and 7.7% in the first quarter of 2012.

"We got off to a slow start for the year. Building a lasting, successful business is our number one priority. However, our immediate focus is on restoring our growth trajectory. We are excited to see the industry momentum behind OpenStack and we are determined to claim the service leadership position in the Open Cloud movement."

4:01PM Microsoft names Corporate Vice President Amy Hood as new CFO (MSFT) 32.99 -0.32 :

Not a lot of semiconductor related news today. It's interesting that I was watching Headline News this morning where they ran a story about how the deficit is being cut. The rate of the increase in our national debt may have slowed but it's still going up:

http://www.usdebtclock.org/

But the story was so convincing that if it were actually true I would be buying stocks now like those who are using margin to make purchases now.

Up, Up, and Away In My Beautiful QE3 Balloon!


RtS
icon url

ReturntoSender

05/13/13 11:27 PM

#10189 RE: ReturntoSender #6755

From Briefing.com: 4:10 pm : Equities ended the day little changed as the Dow Jones Industrial Average shed 0.2% while the Nasdaq added 0.1%. The S&P 500, for its part, ended flat.

Stocks registered losses at the open as Thursday's afternoon rumor turned into a Friday evening headline. According to the Wall Street Journal, the Federal Reserve has begun to map out a plan to slow the pace of its asset purchase program.

However, the article did not provide any additional insight with regards to the timing of actual policy modification. Past comments from the Fed have indicated any changes would likely have to be preceded by a notable improvement in the labor market.

The S&P 500 notched its lows 90 minutes into the session before climbing back to its flat line. The index was able to make a brief appearance in the black, but with declining issues outpacing advancers, the S&P surrendered to the underlying currents.

The Nasdaq outperformed the broader market thanks to the relative strength of biotechnology. The iShares Nasdaq Biotechnology ETF (IBB 183.04, +3.02) continued its recent outperformance by adding 1.7%. Notably, the ETF is higher by 4.9% since last Thursday, and up 33.1% year-to-date.

Biotech names provided support for the health care space, which led throughout the day. Meanwhile, other defensively-oriented groups were mixed. The staples sector registered a slim gain while utilities and telecom ended with modest losses.

The utilities sector shed 0.6% to extend its recent weakness. The high-yielding space is down 4.7% in May.

While defensive groups saw mixed results, cyclical sectors ended generally lower with financials being the exception.

The SPDR Financial Select Sector ETF (XLF 19.31, +0.06) added 0.3% amid the outperformance from most majors. However, the relative strength of U.S. financials was not matched by their European counterparts. Banco Santander (SAN 7.05, -0.15) and Deutsche Bank (DB 46.98, -0.52) settled with respective losses of 2.1% and 1.1%.

Elsewhere, industrial shares lagged throughout the day as transportation-related names displayed weakness. Airlines and truckers pressured the Dow Jones Transportation Average, which lost 0.5%.

In the bond market, Treasuries ended with modest losses as the 10-yr yield rose two basis points to 1.925%.

Looking back at today's economic data, business inventories growth was flat for a second consecutive month in March. The Briefing.com consensus expected business inventories to increase 0.3%.

Inventory growth from manufacturers (0.0%) and merchant wholesalers (0.4%) was known prior to the release. The only new information was that retailer inventories declined 0.5% in March after increasing 0.2% in February.

Retail sales increased 0.1% in April after declining 0.5% in March. The Briefing.com consensus expected retail sales to decline 0.3%. The April employment report showed a 0.3% decline in aggregate wages. The increase in sales was a result of consumers reducing their savings rate. That may work in the short-run, but consumers are expected eventually to increase their savings rate back to 2012 levels. Unless income growth accelerates, retail sales growth will likely decelerate and possibly contract in the long-run.

Tomorrow, export prices ex-agriculture and import prices ex-oil will both be reported at 8:30 ET.DJ30 -26.81 NASDAQ +2.21 SP500 +0.07 NASDAQ Adv/Vol/Dec 1132/1.57 bln/1344 NYSE Adv/Vol/Dec 1188/593.7 mln/1827

3:30 pm :

June crude oil struggled in the red today as a slightly stronger dollar index put pressure on prices. It dipped to a session low of $94.47 per barrel in mid-morning floor action and later touched a session high of $95.68 per barrel. The energy component eventually settled with a 0.9% loss at $95.12 per barrel.
June natural gas climbed to a session high of $3.98 per MMBtu but lost momentum in late morning action. It erased most of the morning's gains as it trended lower for the remainder of its session. It settled with a 0.5% gain at $3.93 per MMBtu, just above its session low of $3.91 per MMBtu.
June gold spent its entire floor session in negative territory following comments from Mario Draghi at G-7 where he said the ECB is considering purchasing asset backed securities. In addition, the yellow metal fell to a session low of $1427.60 per ounce on stronger-than-anticipated retail sales data. It managed to inch slightly higher in afternoon action and settled just 0.1% lower at $1434.60 per ounce.
July silver chopped around between positive and negative territory during today's floor trade. It brushed a session low of $23.57 per ounce in mid-morning action and settled at $23.69 per ounce, booking a 0.2% gain.

Maxim Integrated Products (MXIM) is now shipping the MAX11156, a 12-pin, 18-bit successive approximation register analog-to-digital converter.

09:13 am Cisco Systems upgraded to Mkt Perform at FBR Capital; tgt raised to $19: . FBR upgrades CSCO to Mkt Perform from Underperform and raises its tgt to $19 from $17 as it expects: (1) As a result of SDN overlay solutions gaining more traction than it expected, a portion of the near-term pressure on traditional routing and switching could be pushed out a quarter or two. (2) Competitive threats from SDN based start-ups have declined as Nicira, Big Switch, and Embrane appear to have, for several reasons, become less disruptive. (3) Investor expectations around 2013-2014 service provider capex, in its opinion, has started to moderate. (4) Cisco appears to be gaining momentum with, and is likely to announce significant portions of, its "SDN/NFV-focused" platforms over the next six to eight weeks.

icon url

ReturntoSender

05/14/13 9:30 PM

#10190 RE: ReturntoSender #6755

From Briefing.com: 4:10 pm : The major averages ended near their highs as the S&P 500 rose 1.0%.

Prior to the open, equity futures suggested slim losses at the start of the session. However, futures climbed off their lows as fund manager David Tepper shared his bullish viewpoint during a morning appearance on CNBC.

When the opening bell sounded, stocks were off to the races as financials paved the way higher. Goldman Sachs (GS 154.52, +4.89) was the top performer among the majors while the financial sector advanced 1.7%.

Three growth-sensitive sectors also finished among the leaders despite the relative weakness across the commodity complex. Crude oil fell 1.0% to $94.20, but the energy sector rose 1.3%.

Elsewhere, copper declined 2.1% to $3.289 per pound while gold shed 0.8% to $1423.70 per ounce. The basic materials sector, however, climbed 1.2%.

Industrials also ended in the black as transportation-related names led the way. The Dow Jones Transportation Average jumped 1.9% to a new record high.

The technology sector did not play along with other cyclical groups. Tech shares lagged throughout the day while afternoon weakness displayed by Apple (AAPL 443.86, -10.88) caused the sector to slip off its highs.

The underperformance of technology weighed on the Nasdaq, which trailed behind the other two major indices. However, the relative strength of biotechnology kept the index from falling too far behind the Dow and S&P.

The iShares Nasdaq Biotechnology ETF (IBB 186.18, +3.14) advanced 1.7% to bring its month-to-date gain to 8.1%. Biotechnology also gave a boost to the health care sector, which added 1.0%.

Despite the broader market spending the day near its highs, the CBOE Volatility Index (VIX 12.76, +0.21) also hovered in the black throughout the session. This suggests investors sought some protection against large swings in the market.

Also of note, the Dollar Index added 0.4% to $83.59, its biggest four-day gain since March 2012.

Economic data was limited to export and import prices. Export prices, excluding agriculture, decreased by 0.5% in April after they had decreased 0.2% during the prior month. Excluding oil, import prices declined 0.2%, which follows last month's decline of 0.2%.

Investors will receive a full slate of economic data tomorrow starting with the 7:00 ET release of the weekly MBA Mortgage Index. April PPI, core PPI, and May Empire Manufacturing will all be reported at 8:30 ET while March net long-term TIC flows will be announced at 9:00 ET. At 9:15 ET, April industrial production and capacity utilization will cross the wires. The day will be topped off with the 10:00 ET release of the May NAHB Housing Market Index. Among earnings of note, Deere (DE 93.77, +1.19) and Macy's (M 47.39, +0.51) will report their results before the opening bell.DJ30 +123.57 NASDAQ +23.82 SP500 +16.57 NASDAQ Adv/Vol/Dec 1756/1.74 bln/739 NYSE Adv/Vol/Dec 2035/700.1 mln/982
3:00 pm : The S&P 500 continues to trade near its highs as today's session enters its final hour.

In the foreign exchange market, the Dollar Index trades higher by 0.3%, putting it on track for its fourth day of gains. Hovering near 83.55, the Index is poised to notch its best close since July with the bulk of today's strength coming at the expense of the Australian dollar and the Swiss franc.

The Aussie is lower by 70 pips at .9880 against the greenback as trade breaks down to a fresh 11-month low. Sellers have been in control for the past seven sessions, with the hard currency giving up almost 500 pips over that time.

Elsewhere, the dollar is higher by 70 pips near .9640 versus the franc. Today's bid has fueled a move to the best level since August as the current action tests the 200-week moving average.

4:32PM Photronics misses by $0.01, misses on revs (PLAB) : Reports Q2 (Apr) earnings of $0.08 per share, $0.01 worse than the Capital IQ Consensus Estimate of $0.09; revenues fell 9.2% year/year to $106.7 mln vs the $108.46 mln consensus.

4:29PM TranSwitch hires Needham & Company to evaluate strategic alternatives (TXCC) 0.40 -0.01 : Co announced that it has retained Needham & Company as financial advisor to assist the Board of Directors in evaluating various strategic alternatives available to the Company. "As a result of certain confidential inquiries TranSwitch has received, our Board has concluded that hiring Needham and Company to assist in evaluating all of our alternatives best furthers the interests of our shareholders," stated Dr. M. Ali Khatibzadeh, President and CEO of TranSwitch Corporation.

4:15PM Agilent beats by $0.10, reports revs in-line; guides Q3 EPS below consensus, revs below consensus; lowers top end of FY13 EPS below consensus, lowers FY13 revs below consensus; co authorized an increase of $500 mln to its existing stock repurchase program; initiated a targeted restructuring prorgram, will reduce headcount by 450 (A) 43.97 +0.93 : Reports Q2 (Apr) earnings of $0.77 per share, excluding non-recurring items, $0.10 better than the Capital IQ Consensus Estimate of $0.67; revenues fell 0.1% year/year to $1.73 bln vs the $1.74 bln consensus.

Co issues downside guidance for Q3, sees EPS of $0.60-0.64, excluding non-recurring items, vs. $0.73 Capital IQ Consensus Estimate; sees Q3 revs of $1.63-1.66 bln vs. $1.75 bln Capital IQ Consensus Estimate.

Co issues downside guidance for FY13, lowers top end of EPS to $2.70-2.85 from prior guidance of $2.70-3.00, excluding non-recurring items, vs. $2.88 Capital IQ Consensus Estimate; lowers FY13 revs to $6.75-6.85 bln from prior guidance of $6.9-7.1 bln vs. $6.99 bln Capital IQ Consensus Estimate.

Orders of $1.69 bln were reported in Q2 of 2013.

"We were pleased to have exceeded EPS guidance for the quarter, reflecting our focus on cost control and profitability in the face of the worldwide economic slowdown and the impact of U.S. sequestration. We expect the macroeconomic environment to remain challenging throughout the second half of 2013 and are taking additional actions to strengthen our operating performance."

Stock Repurchase Program: Agilent announced today that its board of directors has authorized an increase of $500 mln to its existing stock repurchase program. Under the increased program, the company is authorized to repurchase up to $1 bln of its common stock, inclusive of amounts repurchased since Nov. 1, 2012. Agilent expects the program to be completed by the end of calendar year 2013.

Targeted Restructuring Program: Agilent also announced today that it has initiated a targeted restructuring program that is expected to reduce Agilent's total headcount by ~450 regular employees, representing ~2 percent of its global workforce. The timing and scope of workforce reductions will vary based on local legal requirements. When completed, the restructuring program is expected to result in an ~$50 mln reduction in annual operating expenses.

12:02PM SMTC Corp announces the appointment of Larry Silber as interin CEO and Clarke Bailey as Executive Chairman, announces departure of co-CEO's Alex Walker and Claude Germain (SMTX) 2.02 -0.06 : Co announces the appointment of Larry Silber as Interim President and CEO and Clarke Bailey as Executive Chairman. By mutual agreement Messrs. Walker and Germain are departing as Officers and Directors of the Company to pursue their Rouge River Capital merchant banking business on a full time basis. Larry Silber joined SMTC's Board as a Director in 2012 and recently served as COO of Hayward Industries, Inc. a privately held equipment manufacturing company with annual revenue in excess of $500 million. Clarke Bailey joined SMTC's Board as a Director in 2011 and has served as the Chairman of its Audit Committee since joining SMTC's Board.

11:59AM DSP Group: Nokomis Capital determines it will support the Starboard slate and return the WHITE proxy card (DSPG) 8.15 +0.08 : Nokomis Capital has determined it will support the Starboard slate and return the WHITE proxy card. Nokomis Capital believes electing the Starboard-nominated directors is in the best long-term interests of shareholders and will be voting all shares under its control accordingly. Nokomis Capital, through the accounts of certain private funds and managed accounts, holds approximately 6.3% of DSP Group, Inc.'s outstanding shares.

8:44AM Altera signed a definitive merger agreement to acquire Enpirion; increases previous guidance for 2013 operating expense by $6 mln (ALTR) 32.81 : Altera's previous guidance for 2013 operating expense is increased by $6 million as a result of today's announcement primarily for selling, general and administrative expenses, including one-time acquisition costs. Research and development expense will be substantially consistent with our previous guidance, as unrelated cost savings will offset the additional research and development expense incurred as a result of this acquisition.

QLogic (QLGC) gained share in the Fibre Channel adapter market in the first quarter of calendar year 2013, according to new data from the Dell'Oro Group Q1 2013 SAN Report and the Crehan Research Q1 2013 Quarterly Market Share Report. With a sequential q/q gain of more than four percentage points, QLogic led its nearest competitor by more than 11 percentage points.

Juniper Networks (JNPR) announced that Yahoo Japan (YHOO) has deployed a Juniper Networks QFX3000-M QFabric System at its new environmentally friendly "Shirakawa Data Center"

8:02AM Suntech Power receives NYSE Notice regarding 2012 annual report (STP) 0.63 : The Company is working diligently to complete these assessments and file restated financials for 2010 and 2011, as well as the 2012 Annual Report, as soon as practicable.

7:56AM NVIDIA enters into accelerated share repurchase agreement with Goldman (NVDA) 14.24 : Co entered into an accelerated share repurchase agreement with Goldman, Sachs & Co. to repurchase a total of $750 million of NVIDIA common stock. NVIDIA will acquire the shares under the ASR Agreement as part of its previously announced intention to return in excess of $1 billion to shareholders in the current fiscal year. Under the ASR Agreement, NVIDIA will pay $750 million and will receive a majority of the shares underlying the ASR Agreement during the second quarter of fiscal year 2014. Any remaining shares to be repurchased under the ASR Agreement, if any, will be based generally on the daily volume-weighted average price of NVIDIA common stock during the term of the ASR Agreement, subject to certain adjustments pursuant to the terms and conditions of the ASR Agreement. At settlement, under certain circumstances, Goldman may be required to deliver additional shares of common stock to NVIDIA, or, under certain circumstances, NVIDIA may be required to deliver shares of its common stock or may elect to make a cash payment to Goldman. Purchases under the ASR Agreement are expected to be completed before the end of October 2013, although the completion date may be accelerated at Goldman's option. The actual number of shares repurchased will be determined at that time.

6:32AM Trina Solar lowers Q1 shipment guidance; sees shipments between 390 MW to 400 MW versus 420 MW to 430 MW prior guidance (TSL) 5.93 :

The Company estimates its solar module shipments in the first quarter of 2013 to be between 390 MW to 400 MW, compared to the Company's previous guidance of 420 MW to 430 MW.
Additionally, for the first quarter of 2013, the Company estimates that overall gross margin to be between 1.0% to 3.0%, in-line with the Company's previous guidance of low single digits in percentage terms.
The Company further expects that its bottom line results in the first quarter of 2013 be impacted by:
An accounts receivables provision reversal of between $10.5 mln to $11.5 mln.
A foreign currency exchange loss between $18.5 mln to $19.5 mln, net of changes in fair value of derivative instruments.
The Company will confirm or revise its previous shipment guidance of between 2.0 to 2.1 GW for the full year 2013 during its first quarter 2013 earnings conference call.

11:32 am Technology Sector trading higher today and behind the broader market
The tech sector is trading higher today, trailing wider gains in the broader market. Semiconductors are showing inline strength as well with the SOX trading 0.4% higher. Within the chip index, CREE (-2.9%) is a notable laggard. Among other major indices, the SPY is trading 0.8% higher today, while the QQQ and the NASDAQ are trading 0.7% higher on the session. Among tech bellwethers, ORCL (+1.4%) is showing notable strength, while INTC (-0.9%) is under pressure.

In tech earnings last night, TTWO (+5.4%) posted a beat and offered inline FY14 guidance. In news, TRMB (-0.8%) announced a CFO departure. This morning, BBRY (-2.9%) unveiled its emerging markets smartphone, the Q5. In rumors, HPQ (+1.1%) says it has not tried to sell Autonomy to SAP (+1.4%), according to reports. In notable analyst upgrades this morning in the tech space, ELX (+2.3%) was upgraded to Neutral from Sell at Goldman, FIO (+3.9%) was upgraded to Buy from Neutral at UBS and AMAT (+1.3%) was upgraded to Outperform at Pacific Crest. Among downgrades, CREE (-2.8%) was downgraded to Neutral from Buy at Sterne Agee, AVG (-2.0%) was downgraded to Neutral at Goldman and National Alliance downgraded TTWO (+5.4%) to Accumulate. A (+0.3%) is the only notable name in tech scheduled to report quarterly results today after the close.
icon url

ReturntoSender

05/15/13 10:09 PM

#10191 RE: ReturntoSender #6755

From Briefing.com: 4:15 pm : The major averages settled with modest gains despite an afternoon stumble. The S&P 500 climbed 0.5% to bring its week-to-date gain to 1.5%.

Equities opened in the red as domestic and foreign economic data reminded investors of a cloudy growth picture. However, the opening strength of defensive sectors quickly overshadowed the early losses, and helped the broader market erase its early weakness.

Consumer staples and utilities outperformed throughout the session as the two sectors settled with respective gains of 1.0% and 0.8%.

The health care space lagged behind its defensively-geared counterparts as biotechnology became the subject of some profit taking following its recent run. The iShares Nasdaq Biotechnology ETF (IBB 184.02, -2.16) settled lower by 1.2%, but is still up 6.7% in May, and higher by 2.1% this week alone.

The underperformance of biotech weighed on the Nasdaq, which trailed the other two major indices throughout the session. In addition, Apple's (AAPL 428.85, -15.01) largest decline in nearly a month also exerted pressure on the Nasdaq as well as the technology sector, which ended with a slim gain. Another large sector component Google (GOOG 915.89, +28.79) rose 3.3% after the company unveiled a music streaming service at its I/O developers conference in San Francisco.

Most other cyclical groups were somewhat shaky as the energy space spent the day in negative territory. Crude oil was down as much as 2.0% before recovering those losses to end little changed at $94.30.

Elsewhere, industrials were pressured by cautious third-quarter revenue guidance from Deere (DE 89.64, -4.13). The machinery manufacturer lost 4.4%, but the relative strength of transportation-related names kept the industrial sector from falling too far behind the broader market.

The Dow Jones Transportation Average rose 0.8% to notch another record high as airlines soared. Southwest Air Lines (LUV 14.34, +0.36) gained 2.6% after hiking its quarterly dividend to $0.04 from $0.01 and announcing a $500 million increase to its share repurchase authorization.

The financial sector was the only growth-sensitive group which remained strong throughout the day. Major banks registered gains across the board as the sector added 0.9%. The group has been the best performer this week, climbing 3.0%.

This morning's economic data was plentiful as April producer prices declined 0.7%, which was cooler than the downtick of 0.5% forecast by the Briefing.com consensus. Meanwhile, core producer prices rose 0.1%, in-line with the Briefing.com consensus.

Industrial production fell 0.5% in April after increasing a downwardly revised 0.3% (from 0.4%) in March. The Briefing.com consensus expected industrial production to decline 0.2%.

Manufacturing production declined 0.4% in April after declining 0.3% in March. The drop was in-line with the weakness reported in nearly all of the regional manufacturing surveys. Durable and nondurable goods manufacturing fell 0.6% and 0.1%, respectively.

The rate of capacity utilization fell to 77.8% from a downwardly revised 78.3% (from 78.5%) in March. That is the lowest level of capacity utilization since January. Manufacturing capacity utilization dropped to 75.9%, which is the first time since November 2012 that the utilization rate slipped below 76%.

Separately, the Empire Manufacturing Survey for May registered a reading of -1.43, which was down from the prior month's reading of 3.1. Economists polled by Briefing.com had expected that the survey would rise to 3.5.

The May NAHB Housing Market Index was unchanged at 44. Today's report was in line with the Briefing.com consensus.

Another busy day of economic data reporting is setting up for tomorrow. Weekly initial claims, April CPI, core CPI, housing starts, and building permits are all scheduled for an 8:30 ET release. This will be topped off by the May Philadelphia Fed Survey, which is set to cross the wires at 10:00 ET.DJ30 +60.44 NASDAQ +9.01 SP500 +8.44 NASDAQ Adv/Vol/Dec 1390/1.76 bln/1081 NYSE Adv/Vol/Dec 1652/742.3 mln/1370

3:30 pm :

June crude oil sold off to a session low of $92.16 per barrel following inventory data that showed a draw of 0.624 mln barrels when a build of 0.375 mln was anticipated. However, the energy component saw a reversal moments later and pushed higher. It erased the earlier losses as it crossed the unchanged line in afternoon floor action and settled 0.1% higher at $94.23 per barrel.
June natural gas traded higher for a third consecutive session, rising as high as $4.08 per MMBtu in morning floor trade. It chopped around for the remainder of the session just below that level and settled with a 1.2% gain at $4.07 per MMBtu.
June gold fell for a fifth consecutive session as a stronger dollar pressured prices. The yellow metal fell below $1400 per ounce after retreating from a session high of $1416.50 per ounce. It dipped to a session low of $1389.00 per ounce and settled at $1396.40 per ounce, booking a loss of 2.0%.
July silver also struggled in the red for its entire session. Prices fell as low as $22.45 per ounce in late morning action despite touching a session high of $23.00 per ounce moments after floor trade opened. Silver eventually settled 3.1% lower at $22.66 per ounce.

6:48PM Amkor announces pricing of $225 mln of its 6.375% senior notes due 2022 (AMKR) 4.52 -0.06 : Co announced that it has priced and increased the size of its previously announced offering to $225 million aggregate principal amount of its 6.375% Senior Notes due 2022. The offering is expected to close on May 20, 2013, subject to satisfaction of customary closing conditions. The Notes will be issued at a premium and priced at 103% to yield 5.951% and will be senior unsecured obligations of the company. Interest will be payable semi-annually at a rate of 6.375% per annum on April 1 and October 1 of each year, commencing on October 1, 2013. The Notes will be issued as additional notes under an indenture dated as of September 21, 2012 pursuant to which Amkor previously issued $300.0 million aggregate principal amount of 6.375% Senior Notes due 2022. The Notes will rank equally with and form a part of a single class of securities with the Existing Notes. "We expect to use the net proceeds of the Notes offering for general corporate purposes, which may include, among other things, capital additions, acquisitions and other investments."

6:29PM JDS Uniphase repurchase 1% senior convertible notes due 2026 at the option of holders (JDSU) 13.36 +0.06 : Co announced that pursuant to the terms of the Indenture governing JDSU's 1% Senior Convertible Notes due 2026 (CUSIP No. 46612J AD 3) (the "Notes"), certain holders of the Notes have surrendered their Notes for purchase by JDSU, exercising their redemption right under the Indenture (the "Put Option"). The Put Option expired at 5:00 p.m., New York City time, on Wednesday, May 15, 2013. At the expiration of the Put Option, $160,576,000 in aggregate principal amount of Notes were validly tendered and not validly withdrawn. The purchase of the Notes tendered will be funded by JDSU's available cash.

5:46PM Seagate Tech announces pricing of $1 bln senior notes offering (STX) 40.61 -0.24 : Co announced the pricing of its previously announced offering of $1.0 billion aggregate principal amount senior notes due 2023. The Notes were priced at 100% of the aggregate principal amount and will bear interest at a rate of 4.75% per annum. The Notes will be issued by Seagate HDD Cayman, an indirect wholly-owned subsidiary of Seagate Technology plc, and guaranteed by Seagate Technology plc. Seagate estimates that the net proceeds from the offering will be approximately $987 million after deducting discounts and estimated offering expenses. Seagate intends to use the net proceeds from the offering of the Notes to replenish cash associated with the recent redemption of the 10% Senior Secured Notes, to retire up to an aggregate amount of $250 million of outstanding senior notes, and for general corporate purposes, which may include, but are not limited to, capital expenditures and other investments in the business, and other repurchases of indebtedness.

4:10PM Cisco Systems beats by $0.02, reports revs in-line (CSCO) 21.21 -0.06 : Reports Q3 (Apr) earnings of $0.51 per share, excluding non-recurring items, $0.02 better than the Capital IQ Consensus Estimate of $0.49; revenues rose 5.4% year/year to $12.22 bln vs the $12.18 bln consensus.

Cash flows from operations were $3.1 bln for the third quarter of fiscal 2013, compared with $3.3 bln for the second quarter of fiscal 2013, and compared with $3.0 bln for the third quarter of fiscal 2012.

Cash and cash equivalents and investments were $47.4 bln at the end of the third quarter of fiscal 2013, compared with $46.4 bln at the end of the second quarter of fiscal 2013, and compared with $48.7 bln at the end of fiscal 2012.

Cisco repurchased ~41 mln shares of common stock under the stock repurchase program at an average price of $20.85 per share for an aggregate purchase price of $860 mln. As of April 27, 2013, Cisco had repurchased and retired 3.8 bln shares of Cisco common stock at an average price of $20.35 per share for an aggregate purchase price of ~$77.7 bln since the inception of the stock repurchase program. The remaining authorized amount for stock repurchases under this program is ~$4.3 bln with no termination date.

"Cisco is executing at a very high level in a slow, but steady economic environment. We are especially pleased with our ninth consecutive record revenue quarter. We are starting to see some good signs in the US and other parts of the world which are encouraging. We have the right products, the right solutions and our customers are coming to us to solve their biggest business problems. The pace of change is increasing and Cisco is well positioned."

4:07PM Mellanox Tech to acquire Kotura at a total cash purchase price of ~ $82 mln; expects transaction to be accretive to full fiscal year 2014 earnings by ~ $0.01 to $0.03 per share on a non-GAAP basis (MLNX) 55.00 +1.82 : Co expects the proposed acquisition of Kotura to enhance its competitiveness and its position as a leading provider of high-performance, end-to-end interconnect solutions for servers and storage systems.

8:46AM Solar names higher, boosted by SPWR guidance and news from several names in group (TAN) : STP +11.1% (Suntech Power Agrees on New Forbearance Agreement with Convertible Note Holders), SPWR +7.1% (guidance), CSIQ +5.8% (Canadian Solar's Partner Romano Wins Eskom Rooftop Project in Johannesburg), TSL +3.5%, FSLR +3.1%

8:26AM TriQuint Semi announces $75 mln stock repurchase program (TQNT) 6.00 :

TXCC +10% (hires Needham & Company to evaluate strategic alternatives)

8:03AM SunPower guides Q2 revs in line; sees EPS above consensus (SPWR) 19.03 :

The company's second quarter 2013 consolidated non-GAAP guidance is as follows:
revenue of $550 million to $600 million (Capital IQ consensus $529 mln)
gross margin of 14-16%
net income per diluted share of $0.05 to $0.15 (Capital IQ consensus -$0.03)
megawatts (MW) recognized in the range of 260 MW to 280 MW.
On a GAAP basis, the company expects revenue of $540 million to $590 million, gross margin of 13-15% and net loss per diluted share of ($0.25) to ($0.15).
For fiscal year 2013:
company expects non-GAAP revenue of $2.5 billion to $2.6 billion (Capital IQ consensus $2.559 bln)
gross margin of 15-17%
net income per diluted share of $0.60 to $0.80 (Capital IQ consensus $0.57)
capital expenditures of $60 million to $80 million
gigawatts (GW) recognized in the range of 1.0 GW to 1.1 GW.
On a GAAP basis, the company expects revenue of $2.6 billion to $2.7 billion, gross margin of 15-17% and net income (loss) per diluted share of ($0.05) to $0.20. SunPower remains committed to reducing its operational expenses by 10 percent compared to 2012 and expects to generate free cash flow, including lease financings, in the range of $100 million to $200 million while continuing to invest in its technology roadmap and manufacturing cost reduction initiatives.

SunPower will provide additional details on the company's second quarter and fiscal year 2013 outlook during its 2013 Analyst Day to be held today, May 15, 2013 starting at 10:00 am Eastern Time.

8:01AM DSP Group files investor presentation; challenges Starboard's claims (DSPG) 8.09 : Co announced that it has filed a presentation with the U.S. Securities and Exchange Commission. The presentation discusses in detail the Company's strategies to improve performance, the superb qualifications of DSP Group's director candidates and the Company's progress in positioning itself for expected growth in its key markets.

Starboard's proxy fight is about seeking to gain a majority on the Company's board of directors. Starboard has already appointed two directors to the DSP Group board, and they have nominated three more candidates for election. Starboard claims that it is merely seeking to ensure that alternative viewpoints are presented to the Board. If this were Starboard's only objective, the activist hedge fund would not have rejected the Company's settlement offer of four of ten seats on the Board, along with significant committees representation and leadership.

In response, Co said its stock performance year-to-date and for the trailing twelve months is significantly better than the performance of the NASDAQ Composite Index and the Philadelphia Semiconductor Index for the same periods.

LSI (LSI) announced that it has moved into the No. 2 position in the enterprise PCIe flash adapter market segment, according to leading market research firms.

3:43AM LDK Solar reports adjustment on FY12 results; takes additional provision for warranty and long-term contract termination penalty of ~$14.8 mln (LDK) 1.37 : Co announces that during the course of the preparation of LDK Solar's 2012 annual report, LDK Solar's management determined that an additional provision for warranty and long-term contract termination penalty of ~$14.8 mln and a reversal of previously recognized gain on restructuring of payables of ~$21.0 mln were required to properly adjust previously announced preliminary unaudited financial results for the fourth quarter ended December 31, 2012.

The additional provision for warranty and long-term contract termination penalty was based on updates in LDK Solar's negotiation with relevant counterparties regarding the settlement plan for the contractual obligations under certain contracts. The reversal of previously recognized gain on restructuring of payables was adjusted to reflect the increased risk of reversal of previously agreed discount, because of recent non-performance of certain contractual terms under a payable restructuring contract.

HP (HPQ) announced the HP SlateBook x2 and the HP Split x2, two detachable PCs that offer the full functionality of a notebook with a removable screen that also is a sleek tablet.

AMD (AMD) launched the AMD Radeon HD 8970M, the world's fastest notebook graphics card.

Agilent (A) reported second quarter earnings of $0.77 per share, excluding non-recurring items, $0.10 better than the Capital IQ Consensus Estimate of $0.67; revenues fell 0.1% year/year to $1.73 billion versus the $1.74 billion consensus. The company issued downside guidance for Q3, sees EPS of $0.60-0.64, excluding non-recurring items, versus the $0.73 Capital IQ consensus and revenues of $1.63-1.66 billion versus the $1.75 billion consensus. The company issued downside guidance for fiscal year 2013 with lowered top top end of EPS to $2.70-2.85 from prior guidance of $2.70-3.00, excluding non-recurring items, versus the $2.88 Capital IQ consensus. The company also lowered fiscal year 2013 revenues to $6.75-6.85 bln from prior guidance of $6.9-7.1 bln versus the $6.99 billion consensus. Orders of $1.69 billion were reported in Q2 of 2013. "We were pleased to have exceeded EPS guidance for the quarter, reflecting our focus on cost control and profitability in the face of the worldwide economic slowdown and the impact of U.S. sequestration. We expect the macroeconomic environment to remain challenging throughout the second half of 2013 and are taking additional actions to strengthen our operating performance." Stock Repurchase Program: Agilent announced today that its board of directors has authorized an increase of $500 mln to its existing stock repurchase program. Under the increased program, the company is authorized to repurchase up to $1 bln of its common stock, inclusive of amounts repurchased since Nov. 1, 2012. Agilent expects the program to be completed by the end of calendar year 2013. Targeted Restructuring Program: Agilent also announced today that it has initiated a targeted restructuring program that is expected to reduce Agilent's total headcount by ~450 regular employees, representing ~2 percent of its global workforce. The timing and scope of workforce reductions will vary based on local legal requirements. When completed, the restructuring program is expected to result in an ~$50 mln reduction in annual operating expenses.

Photronics (PLAB) reported second quarter earnings of $0.08 per share, $0.01 worse than the Capital IQ consensus of $0.09, while revenues fell 9.2% year/year to $106.7 million versus the $108.46 mln consensus.

LDK Solar (LDK) announces that during the course of the preparation of LDK Solar's 2012 annual report, LDK Solar's management determined that an additional provision for warranty and long-term contract termination penalty of approximately $14.8 million and a reversal of previously recognized gain on restructuring of payables of approximately $21.0 million were required to properly adjust previously announced preliminary unaudited financial results for the fourth quarter ended December 31, 2012. The additional provision for warranty and long-term contract termination penalty was based on updates in LDK Solar's negotiation with relevant counterparties regarding the settlement plan for the contractual obligations under certain contracts. The reversal of previously recognized gain on restructuring of payables was adjusted to reflect the increased risk of reversal of previously agreed discount, because of recent non-performance of certain contractual terms under a payable restructuring contract.

10:58 am Technology trading slightly higher and outpacing the broader market
The tech sector is trading higher today, just outpacing the broader market. Semiconductors are showing relative strength as well with the SOX trading 0.9% higher. Within the chip index, WFR (+5.7%) is a notable standout. Among other major indices, the SPY is trading 0.1% lower today, while the QQQ and the NASDAQ are trading 0.1% higher on the session. Among tech bellwethers, GOOG (+2.2%) is showing notable strength, while AAPL (-1.9%) is under pressure.

In tech earnings last night, A (+4.7%) posted a beat and guided below consensus, but increased its repurchase program. Also, XONE (-9.8%) posted a modest operating miss and reaffirmed guidance This morning in tech earnings, CSC (-6.2%) posted a mixed qtr, In news, TXCC (+2.2%) hired Needham & Company to evaluate strategic alternatives. Among IPOs, RKUS (-5.9%) is lower with its lock-up expiring. In rumors, we are hearing CSCO (-0.4%) for RHT (+1.6%) making the rounds. In notable analyst upgrades this morning in the tech space, ELX (-0.5%) was upgraded to Neutral from Sell at Goldman, FIO (+2.0%) was upgraded to Buy from Neutral at UBS and AMAT (+0.6%) was upgraded to Outperform at Pacific Crest. Also, MRIN (+16.9%) was added to short-term buy list at Deutsche Bank, while ORCL (+1.1%) was added to Focus List at Lazard and PANW (-0.2%) and MDR (-1.4%) were removed. Among downgrades, BBRY (+1.0%) was downgraded to Mkt Perform at Bernstein, Oppenheimer downgraded RENN (-5.2%) to Perform, and MOLX (-1.2%) was downgraded to Neutral at Longbow. CSCO (-0.4%) is the only notable name in tech scheduled to report quarterly results today after the close.
icon url

ReturntoSender

05/18/13 10:00 PM

#10193 RE: ReturntoSender #6755

From Briefing.com: Weekly Recap - Week ending 17-May-13

The bulls did their thing again this week, overcoming any concerns about the Fed tapering its asset purchases soon to drive a 2.0% gain in the S&P 500. This week's gain leaves the S&P 500 up 4.3% for the month in what has been a clear decoupling from the "sell in May and go away" couplet.

The week started on a bit of a nervous -- and flat -- note after a weekend article in the Wall Street Journal indicated the Fed has mapped out a strategy for tapering its asset purchases. That view lost its punch, however, with the added indication that the timing of instituting that plan is still uncertain. In brief, the article didn't really tell the market anything it didn't already presume based on prior views communicated in the FOMC Minutes.

Still, the headline itself was enough to cause a pause in the buying action and to overshadow what was a better-than-expected retail sales report for April.

When Tuesday rolled around, buyers were back in action, emboldened by the bullish view of noted hedge fund manager David Tepper of Appaloosa Management. In a CNBC interview before the market opened, Mr. Tepper, who correctly called the market's direction in September 2010, said he is still definitely bullish on the market since all of the evidence in front of him -- an improving economy, attractive valuation, and central bank support -- tells him to be. Mr. Tepper added that the market should not be overly concerned about the Fed tapering and he suggested short sellers will need a shovel to dig out of their graves if the Fed allows the market to party like it's late-1999 again by not tapering its asset purchases.

Market participants took Mr. Tepper's view and rolled with it, rolling over short sellers in the process, on the way to a 1.0% gain in the S&P 500 that day. The influence of that view persisted on Wednesday, as the market padded its gains in the face of a disappointing outlook from Deere & Co. (DE) and weak readings for industrial production in April and the Empire Manufacturing report for May.

Thursday saw a turn in the action, but not until late in the day when the major averages surrendered modest gains that had been posted despite more disappointing economic news that took the form of the weekly initial claims, housing starts, and Philadelphia Fed Index reports.

That battery of reports, while disappointing, joined with a soft CPI report for April to suggest the Fed still has reason to stay on its current policy course. That view facilitated a familiar buy-the-dip trade. However, the major averages retreated on some late profit taking that coincided with a report that San Francisco Fed President Williams said the Fed could perhaps taper its purchases this summer, and maybe even end its program late in the year. That view was pretty much identical to the view he shared in a speech on April 3, so it was a bit of a reach to say those remarks spooked the market. In our estimation, they simply provided a convenient excuse to take some money off the table.

In the same vein, dovish remarks on Friday from Minneapolis Fed President Kocherlakota, who said the FOMC has not yet lowered real interest rate sufficiently, seemed to factor into an afternoon rally that saw the S&P 500 log a tidy 1.0% gain in the final session of the week. Actually, though, the market didn't breakout on Friday until 20 minutes after Mr. Kocherlakota's remarks hit the wires. His views didn't hurt matters, but they weren't the catalyst for the late breakout.

Our sense of things is that the afternoon move on Friday was more of the same with short sellers capitulating in the face of the stock market's resilience to selling interest and bullish participants being further emboldened by the continued leadership of the sectors one would expect to see in a cyclical upturn: financials, energy, industrials, materials, and technology.

The week concluded with the Dow, S&P 500, Russell 2000, S&P 400 Midcap Index, and Dow Jones Transportation Average all achieving new record highs.
Index Started Week Ended Week Change % Change YTD %
DJIA 15118.49 15354.40 235.91 1.6 17.2
Nasdaq 3436.58 3498.97 62.39 1.8 15.9
S&P 500 1633.70 1667.47 33.77 2.1 16.9
Russell 2000 975.16 996.28 21.12 2.2 17.3

4:31PM QLogic President and CEO resigns to pursue other opportunitites; co reaffirms Q1 guidance (QLGC) 9.95 +0.10 : Co announced that Simon Biddiscombe has resigned his positions as president and chief executive officer and also as a director in order to pursue other opportunities. Simon's resignation was effective immediately. The Board has appointed CFO Jean Hu, 49, as CEO on an interim basis. Hu currently serves a senior vice president and chief financial officer. She oversees all company financial matters and will retain her CFO responsibilities during the interim period. The Board will begin an immediate search for a permanent CEO, and the search committee will be led by William M. Zeitler.

The company reaffirms its non-GAAP financial guidance for the first quarter of fiscal year 2014.

4:00PM Veeco Instruments receives NASDAQ notice regarding late form 10-Q filing (VECO) 36.84 +0.30 : As previously announced, this Form 10-Q, as well as the Company's annual report on Form 10-K for the year ended December 31, 2012 and quarterly report on Form 10-Q for the quarter ended September 30, 2012, could not be filed timely because the Company is reviewing the timing of the recognition of revenue and related expenses on the sale of certain of its products. The accounting review was announced on November 15, 2012. The Company does not expect to regain compliance with NASDAQ's requirements for continued listing by May 20, 2013. As a result, the Company intends to request a hearing before the NASDAQ Listing Qualifications Panel to request additional time to regain compliance with NASDAQ's requirements for continued listing and to request that NASDAQ allow the Company's securities to remain listed on The NASDAQ Global Select Market until such time as the hearing process concludes and any resulting exception period expires.

12:40PM Brooks Automation announces selection by Tohoku Medical Mega Bank for multiple automated sample management systems (BRKS) 9.90 +0.10 :

AMD +1.8% (rebounding from yesterdays drop on Goldman downgrade)

Dell (DELL) reported first quarter earnings of $0.21 per share, excluding non-recurring items, $0.14 worse than the Capital IQ consensus of $0.35, while revenues fell 2.4% year/year to $14.07 billion versus the $13.49 billion consensus. Given the company's announcement on Feb. 5 of a definitive merger agreement to take Dell private, the co is not providing an outlook for Q2. Enterprise Solutions Group revenue was $3.1 billion, a 10% increase. Operating income for the quarter was $136 million, a 71% increase. Dell server and networking revenue increased 16% as the company gained share in the calendar first quarter. Dell networking continued to deliver strong growth, with a 24% revenue increase, including a 46% growth in the company's Force10 business. Dell storage revenue declined 10%. Dell Services revenue grew 2% to $2.1 billion driven by an 11% increase in revenue for infrastructure, cloud and security services. Support and deployment revenue increased 2% and applications and business process services declined 15%. Operating income was $370 million, a 10% increase. Dell Software revenue was $295 million, resulting in an operating loss. Dell enhanced its software capabilities during the quarter, investing in additional sales capability and research and development. Consistent with the company's business strategy when it acquired Quest Software, this business is on track to be accretive to earnings in the first quarter of fiscal year 2015. End User Computing revenue was $8.9 billion in the quarter, a 9% decrease. Operating income for the quarter was $224 million, a 65% decrease. Dell desktop and thin-client revenue declined 2%, mobility revenue declined 16%, and software from third parties and peripherals revenue declined 6%.

Aruba Networks (ARUN) reported third quarter earnings of $0.11 per share, $0.01 worse than the Capital IQ consensus of $0.12, while revenues rose 11.5% year/year to $147.1 million versus the $146.17 million consensus.

Brocade (BRCD) reported second quarter earnings of $0.17 per share, excluding non-recurring items, $0.02 better than the Capital IQ consensus Estimate of $0.15, while revenues fell 0.9% year/year to $538.78 million versus the $539.62 million consensus. "Our storage area networking revenues did not meet our original expectations for Q2 due to short-term slowing in the storage market and execution challenges at certain of our large OEM partners. I believe the longer-term market opportunity for our SAN products continues to be favorable, supported by the fact that our Gen 5 (16 Gbps) Fibre Channel products exceeded 50% of our shipments of directors and switches in the quarter," said Lloyd Carney, CEO of Brocade. "Also in Q2, Brocade experienced strong year-over-year growth of our IP networking product sales highlighted by the performances of our Ethernet fabric, routing, and refreshed campus LAN portfolios. We were also able to increase profitability in a challenging environment."

Autodesk (ADSK) reported first quarter earnings of $0.42 per share, excluding non-recurring items, $0.03 worse than the Capital IQ consensus of $0.45, while revenues fell 3% year/year to $570 million versus the $583.4 million consensus. The company issued downside guidance for the second quarter with EPS of $0.39-0.44, excluding non-recurring items, vs. $0.51 Capital IQ Consensus Estimate; sees Q2 revs of $550-570 million versus $597.00 million Capital IQ consensus. The company lowered FY14 guidance for fiscal year 2014 with revenue growth of 3%, which equates to approximately $2.38 billion versus the $2.44 billion Capital IQ Consensus Estimate, down from growth of 6%, which equates to ~$2.45 billion.

Applied Materials (AMAT) reported second quarter earnings of $0.16 per share, ex items, $0.03 better than the Capital IQ consensus of $0.13, while revenues fell 22.3% year/year to $1.97 billion versus the $1.92 billion consensus. The company issued guidance for the third quarter with EPS of $0.16-0.20 versus the $0.19 Capital IQ consensus and revenues of slightly QoQ (Q2 Sales $1.97 billion Q3 Capital IQ consensus: $2.12 billion) Applied generated orders of $2.27 billion, up 7 percent from the prior quarter, with Silicon Systems Group orders up 14 percent from the first quarter and Display orders up 41 percent sequentially. Net sales were $1.97 billion, up 25 percent sequentially. Gross margin was 43.2% on a non-GAAP adjusted basis, up from 39.8 percent in the prior quarter reflecting higher net sales and lower inventory charges. GAAP gross margin was 41.0 percent. For the third quarter of fiscal 2013, Applied expects net sales to be up slightly from the previous quarter. "For the second quarter in a row, Applied had strong order performance of over $2 billion...We are seeing increasing pull from some of our largest strategic customers for our key enabling technologies. We remain committed to driving profitable growth." Guidance Details: Applied expects net sales to be up slightly from the previous quarter. The company expects non-GAAP adjusted EPS to be in the range of $0.16 to $0.20. The non-GAAP adjusted EPS outlook excludes known charges related to completed acquisitions of ~$0.04 per share but does not exclude other non-GAAP adjustments that may arise subsequent to this release.

07:40 am Autodesk shares fall 6% following miss on earnings
Autodesk (ADSK $37.30 -2.48) reported first quarter earnings of $0.42 per share, excluding non-recurring items, $0.03 worse than the Capital IQ consensus of $0.45, while revenues fell 3% year/year to $570 million versus the $583.4 million consensus. The company issued downside guidance for the second quarter with EPS of $0.39-0.44, excluding non-recurring items, vs. $0.51 Capital IQ Consensus Estimate; sees Q2 revs of $550-570 million versus $597.00 million Capital IQ consensus. The company lowered FY14 guidance for fiscal year 2014 with revenue growth of 3%, which equates to approximately $2.38 billion versus the $2.44 billion Capital IQ Consensus Estimate, down from growth of 6%, which equates to approximately $2.45 billion.

07:39 am Applied Materials shares little changed following beat on EPS
Applied Materials (AMAT $14.56 -0.10) reported second quarter earnings of $0.16 per share, ex items, $0.03 better than the Capital IQ consensus of $0.13, while revenues fell 22.3% year/year to $1.97 billion versus the $1.92 billion consensus. The company issued guidance for the third quarter with EPS of $0.16-0.20 versus the $0.19 Capital IQ consensus and revenues of slightly QoQ (Q2 Sales $1.97 billion Q3 Capital IQ consensus: $2.12 billion) Applied generated orders of $2.27 billion, up 7 percent from the prior quarter, with Silicon Systems Group orders up 14 percent from the first quarter and Display orders up 41 percent sequentially. Net sales were $1.97 billion, up 25 percent sequentially. Gross margin was 43.2% on a non-GAAP adjusted basis, up from 39.8 percent in the prior quarter reflecting higher net sales and lower inventory charges. GAAP gross margin was 41.0 percent. For the third quarter of fiscal 2013, Applied expects net sales to be up slightly from the previous quarter. "For the second quarter in a row, Applied had strong order performance of over $2 billion...We are seeing increasing pull from some of our largest strategic customers for our key enabling technologies. We remain committed to driving profitable growth." Guidance Details: Applied expects net sales to be up slightly from the previous quarter. The company expects non-GAAP adjusted EPS to be in the range of $0.16 to $0.20. The non-GAAP adjusted EPS outlook excludes known charges related to completed acquisitions of ~$0.04 per share but does not exclude other non-GAAP adjustments that may arise subsequent to this release.

07:37 am Dell shares little changed following miss on earnings
Dell (DELL) reported first quarter earnings of $0.21 per share, excluding non-recurring items, $0.14 worse than the Capital IQ consensus of $0.35, while revenues fell 2.4% year/year to $14.07 billion versus the $13.49 billion consensus. Given the company's announcement on Feb. 5 of a definitive merger agreement to take Dell private, the co is not providing an outlook for Q2. Enterprise Solutions Group revenue was $3.1 billion, a 10% increase. Operating income for the quarter was $136 million, a 71% increase. Dell server and networking revenue increased 16% as the company gained share in the calendar first quarter. Dell networking continued to deliver strong growth, with a 24% revenue increase, including a 46% growth in the company's Force10 business. Dell storage revenue declined 10%. Dell Services revenue grew 2% to $2.1 billion driven by an 11% increase in revenue for infrastructure, cloud and security services. Support and deployment revenue increased 2% and applications and business process services declined 15%. Operating income was $370 million, a 10% increase. Dell Software revenue was $295 million, resulting in an operating loss. Dell enhanced its software capabilities during the quarter, investing in additional sales capability and research and development. Consistent with the company's business strategy when it acquired Quest Software, this business is on track to be accretive to earnings in the first quarter of fiscal year 2015. End User Computing revenue was $8.9 billion in the quarter, a 9% decrease. Operating income for the quarter was $224 million, a 65% decrease. Dell desktop and thin-client revenue declined 2%, mobility revenue declined 16%, and software from third parties and peripherals revenue declined 6%.
icon url

ReturntoSender

05/19/13 7:54 PM

#10194 RE: ReturntoSender #6755

InvestmentHouse Weekend Market Summary

http://www.investmenthouse.com/weekendmarketsummary.htm

- Just expiration or just more buying? Rally kicks into gear again to close out May options.
- After Thursday's economic data splashed cold water on the hot and heavy rally, Michigan Sentiment, Leading Indicators purportedly reignite the upside.
- Sentiment at levels that prompted prior pullbacks in the rally.
- Letting positions ride higher, but after this run the risk/reward is overall obviously lower. Still opportunity, but you definitely have to pick your shots and know your game plan.

An impressive ramp to the close finished the week with panache as the indices ran to new highs with another melt higher, this one to end expiration.

SP500 17.00, 1.03%
NASD 33.73, 0.97%
DJ30 121.18, 0.80%
SP400 0.98%
RUTX 1.11%
SOX 1.37%

Volume rallied 17% NYSE, down 6% NASD but did rebound late. Expiration? Likely. NASD had solid volume all week. Sign of the retail investor returning? Likely not but it is a nice thought that the networks and a few hopeful bullish commentators recycled from the 1990's keep saying.

No, don't get me wrong. There are some retail investors returning. When NASD caught fire and GOOG, NFLX, PCLN filled in for the massive void left by AAPL's rot, the retail investor got interested. The GOOG/PCLN race higher is interesting, kind of like the McGuire/Sosa home run battle. Hopefully we will not have the sad realization that one of their bats (i.e. earnings reports) was illegally juiced. CL? CLX? PG? No sex appeal even in great gains. Throw out LNKD and GOOG, and then mix in MSFT's 'revival,' and you get the retail interest: 'Look Martha, looks as if GOOG is the new QCOM. Remember QCOM up over $200 in a day on its stock split announcement? Those were the days . . .' Toss in some stock splits from CRM and Whole Foods (Is it now known as Half Foods?) and you get some interest brewing. Maybe they return. We are, however, making great money in the interim.

The economic data was blamed Thursday for the market decline. The economic data Friday was credited with the surge. Whatever works as the analysts play pin the tail on the cause of the rally.

Michigan Sentiment topped expectations with the biggest beat ever:
83.7 versus 77.9 expected versus 76.4 prior.

LEI April: 0.6% versus 0.3% expected, -0.2% prior (revised from -0.1%)

OTHER MARKETS

Dollar stronger: 1.2839 vs 1.2887. Should be given the better data.

Bonds dove, continuing their back and forth action, though the trend is clearly lower: 1.94% versus 1.87%. This is also in line with better data, but it also continues the Japan-induced bond selloff.

Oil rallied even with a stronger dollar: 96.02, +0.86

Gold hammered again: 1358.30, -28.60

Juxtapose the economic data reported with what companies said Friday. ADSK, DELL, JCP, JWN all missed big on earnings. Guidance was not great. As the Q1 earnings season winds down the theme is a weakening of earnings growth and the continuing problem of top line earnings misses. While there are many companies that reported solid results all around, it is clear the economy is still not strong enough to produce top line earnings growth. As a consequence, companies are not feeling great about the future, and that continues one of the major problems in the US: continued lack of investment in business and that means continued weak jobs growth, exacerbated by the changes the healthcare law is pushing down on the labor market. But, don't worry, Michigan Sentiment is super.

Not complaining, just looking at the data and all of the major problems and scandals in the US you have to keep your sense of humor to temper your anger and frustration as to what is going on.

But . . . the market was strong. Very solid. Given given the strength we let positions run. No reason to cut them off. The risk/reward for new plays at this level is still, overall, less than ideal. Many stocks are not in buy points, but some money continues to rotate into new areas, and there are individual very good patterns. BIDU for example. This coming week we will see again if the buyers stay in, and if so, we pick up well-positioned stocks that have good risk/reward, i.e. good upside potential versus small downside based upon support.

Still on the road in the Midwest, seeing some of the US and just how much of a recovery this is. Joplin, Missouri has posted a strong comeback from the tornado and enjoyed spending time at the Art Walk held downtown every third Thursday and enjoying some rather unusual burgers and dogs as Instant Karma.

There is activity, about 1.5% to 2% annual GPD activity and of course that comes from the Fed's $85B/month. The notion from some market 'mavens' and purportedly some on the Fed is that the economy can do well even if QE is removed. Some of those on the Fed, I feel, really believe the Fed may be doing more damage than good with the QE and thus want us to believe the economy can get by without QE. Maybe it can; the government is crowding out so much investment that perhaps if QE ended banks would be forced to lend to make money and the balance in the economy would slowly start to be restored. With the healthcare law's impact on the jobs market, with higher taxes, with so many thousands of new regulations burdening people and business, however, any move recovery would continue to be painfully slow and well below our potential.

That makes for an interesting summer of taper and possible ramifications, but the market was not worried about that Friday.

TECHNICAL SUMMARY

INTERNALS

NASDAQ
Stats: +33.72 points (+0.97%) to close at 3498.97
Volume: 1.806B (-6.52%)

Up Volume: 1.33B (+408.15M)
Down Volume: 462.87M (-547.13M)

A/D and Hi/Lo: Advancers led 2.2 to 1
Previous Session: Decliners led 1.33 to 1

New Highs: 261 (+24)
New Lows: 17 (-10)

S&P
Stats: +17 points (+1.03%) to close at 1667.47
NYSE Volume: 724M (+17.53%)

A/D and Hi/Lo: Advancers led 2.39 to 1
Previous Session: Decliners led 1.55 to 1

New Highs: 697 (+122)
New Lows: 105 (+18)

DJ-30
Stats: +121.18 points (+0.8%) to close at 15354.4

BREADTH: Solid bump but not a huge ramp necessarily matching the index gains. 2.2:1 NASDAQ, 2.4:1 NYSE.

VOLUME: Again mixed and flip-flopped. Down 6.5% NASDAQ, up 17% NYSE. Down on NASDAQ but still solid and above average. Not bad. Note that volume was elevated all week on NASDAQ so even though volume faded Friday the overall trade, whether due to expiration or not, was elevated as the index climbed.

THE CHARTS

SP500. Rising toward that upper channel line, and we are letting the SSO play and indeed other plays continue to rally toward that resistance. Again, this does not mean that the index HAS to turn over there. NASDAQ broke through. As seen in January and February, it can slide up the trendline for weeks. So we let it run and pick specific plays.

NASDAQ. Broke through the upper channel line Tuesday, and after hesitating Thursday, powered higher Friday. Lower trade but still above average volume trade. With GOOG, PCLN and NFLX helping lead it higher, NASDAQ is overcoming the slow days for now.

DJ30. As with SP500, the Dow is heading toward its upper channel line, and looks set to test it. Then we see the reaction. Will SP500 and DJ30 reaching that resistance cause a market pullback, or does the money continue to flow in and keep the index running up that trendline.

SP400. Broke through the November trendline, faded to test Thursday, then rallied back up Friday. Back in the channel again, out where a friend is a friend . . .

RUTX. Still moving up and closing in on the November trendline.

SOX. Quick test of the break of resistance through Monday, then a steady move higher, interrupted by the Thursday weakness, but then right back up Friday. NASDAQ and SOX are a powerful combination for the market rally.

THE MARKET

SENTIMENT INDICATORS

VIX: 12.45; -0.62
VXN: 13.3; -0.42
VXO: 12.24; -0.34

Put/Call Ratio (CBOE): 0.81; -0.18

Bulls versus Bears

Bulls continue to rise toward the September 2012 and February highs that marked peaks in the stock market before a pullback. Normal pullbacks, but pullbacks nonetheless.

Bulls: 54.2% versus 52.1% versus 47.9% versus 44.3% versus 47.4% versus 50.5% versus 52.0% versus 49.5% versus 47.4% versus 50.00% versus 44.2% versus 46.3% versus 48.4% versus 52.6% versus 54.7% versus 54.3% versus 53.2% versus 51.1% versus 47.8% versus 46.8% versus 45.7% versus 43.6% versus 39.3% versus 37.2% versus 38.3% versus 43.6.

Background: Undercut 35%, the threshold for bullishness, in early June. As noted, hit 34% in early June. It did its job and the market is on the rally. Hard drop to 34 from 39.3% as economic reality and a choppy stock market hit. Off the 55+ level hit in late February. That was the highest level since April and May of 2011, the peak of the post-bear market high. 35% is the threshold level suggesting bullishness. To be seriously bearish it needs to get up to the 60% to 65% level.

Bears: 19.8% versus 19.8% versus 18.8% versus 19.6% versus 20.6% versus 20.6% versus 19.4% versus 19.6% versus 18.6% versus 18.8% versus 21.1% versus 21.1% versus 22.1% versus 21.1% versus 21.1% versus 22.3% versus 22.3% versus 23.4% versus 24.5% versus 24.5% versus 23.4% versus 25.5% versus 27.7% versus 27.7% versus 28.7% versus 27.7%.

Summary: Over 35% is the threshold to be really be a good upside indicator. For reference, bearishness hit a 5 year high at 54.4% the last week of October 2008. The move over 50 took bearish sentiment to its highest level since 1995. Extreme negative sentiment. Prior levels for comparison: Bearishness peaked at 37.4% in September 2007. It topped the June 2006 peak (36%) on that run. That June peak eclipsed the March 2006 high (33%) and well above the 2005 highs that spawned new rallies (30% in May 2005, 29.2% in October 2005). That was a huge turn, unlike any seen in recent history.

MONDAY

Not as much data, but Bernanke speaks Wednesday ahead of the FOMC minutes release. Earnings slow way down. The market is . . . on its own.

I have said it many times, to the point of distraction it would seem, but after this run the risk/reward is lower right now for generally buying the market. I mean SP500 and DJ30 are near their upper channel lines. They have to break resistance to keep moving, or at least ride up resistance. They can do it no doubt; seen it before. But, they are not in as good of position to buy, say with some SSO, as they were a month back. Obvious.

That makes this market a bit more problematical right now. It can slide higher along the channel line or break higher as noted, but it is hard to gauge how much more upside there is here. You don't want to cut it off by closing positions, but the question is how much more do you buy here.

Ahhhh. This is now what the TV people call a 'stock pickers market.' As if to get the great returns it is typically not. Anyway, it simply puts a premium on play selection and KNOWING what you want from a play in terms of what you can realistically and logically make on it if it works out. You want to have a good exit point as well; have to keep the requisite amount of upside reward to downside risk. They are out there and we will continue to look at them. We just have to recognize that the market and sentiment is at points in past runs where it topped and faded for a consolidation. With that in mind we can look for and enter new plays and still take advantage of any upside. If the market continues upside then our current positions make us more money and our new ones add to that.

Have a great weekend!

Support and resistance

NASDAQ: Closed at 3498.97

Resistance:
3521 is the August 2000 low.

Support:
3455 is the upper channel line for the November 2012 to present uptrend
3401 is the May 2000 closing low
3343 is the November 2012 up trendline
3321 from April 2000
The 50 day EMA at 3307
3227 is the April 2000 intraday low
The 2011 up trendline at 3203
3197 is the September 2012 post-bear market high
3171 is the October intraday high
3134 is the March 2012 post-bear market peak
3130 from some January 2013 lows
The 200 day SMA at 3125
3104-3112 from August and mid-October peaks.
3101 is the August 2012 high
3090 is the mid-March interim high
3076 is the late April 2012 high and the 1/2013 low after gapping higher
3062 is the December 2012 prior peak
3042 from 5/2000 low and several other price points
3024 is the gap point from early May
3000 is the February 2012 post-bear market high
2999 is the bottom of the August 2012 consolidation
2988 is the July 2012 high
2977 to 2980 is the bottom of the late October 2012 consolidation, July 2012 peak
2962 is the April 2012 low
2950 is the mid-April closing low
2942 is the mid-June 2012 high
2900 is the March 2012 intraday low
2858 is the late July 2011 peak
2847 is the mid-May 2012 low
2838 from the July 2012 lows

S&P 500: Closed at 1667.47

Resistance:
1673 is the upper trendline in the channel

Support:
The November up trendline at 1699
1598 is the April 2013 high and former all-time high
The 50 day EMA at 1597
1576 from October 2007, the prior all-time high
1556 from July 2007
1539 from June 2007
1531 is the recent high
1499 from January 2008
The 200 day SMA at 1478
1475 is the September 2012 high
1471 is the October 2012 intraday high
1466 is the September 2012 closing peak and rally closing high
1440 from November 2007 closing lows
1434 from early November 2012
1433 from August 2007 closing lows
1427 is the August 2012 peak
1425 from May 2008 closing highs and the October 2012 low
1408 is the late October 2012 range closing low
1406 is the early May 2012 peak
1402.22 - 1400 is the closing low of the August 2012 lateral consolidation

Dow: Closed at 15,354.40

Resistance:
15,460 is the upper channel line for the trend off the November low.

Support:
14,888 is the April peak and prior all-time high
The November up trendline at 14,840
The 50 day EMA at 14,714
14,198 from the October 2007 high
14,149 is the February 2013 high
14,022 from 7-07 peak
14,010 from the early February 2013 consolidation
13,784 is the late February 2013 closing low
The 200 day SMA at 13,716
13,692 from 6-2007 peak
13,668 from 12-2007 peak
13662 is the October 2012 intraday high
13,653 is the September 2012 high
13,557 to 13,662
13,413 from the late September 2012 low
13,300 to 13,331 is the August 2012 post-bear market high
13,297 is the April 2012, prior post bear market high
13,058 from the May 2008 peak on that bounce in the selling
13,056 is the February 2012 high
12,716 is the April 2012 closing low
12,524 is a range of support from early 2012 and summertime 2012

Economic Calendar

May 13 - Monday
- Retail Sales, April (8:30): 0.1% actual versus -0.3% expected, -0.5% prior (revised from -0.4%)
- Retail Sales ex-auto, April (8:30): -0.1% actual versus -0.2% expected, -0.4% prior
- Business Inventories, March (10:00): 0.0% actual versus 0.3% expected, 0.0% prior (revised from 0.1%)

May 14 - Tuesday
- Export Prices ex-ag., April (8:30): -0.5% actual versus -0.3% prior (revised from -0.2%)
- Import Prices ex-oil, April (8:30): -0.2% actual versus -0.1% prior (revised from -0.2%)
- MBA Mortgage Index, 05/11 (7:00): -7.3% actual versus 7.0% prior
- PPI, April (8:30): -0.7% actual versus -0.5% expected, -0.6% prior
- Core PPI, April (8:30): 0.1% actual versus 0.1% expected, 0.2% prior
- Empire Manufacturing, May (8:30): -1.4 actual versus 3.5 expected, 3.1 prior
- Net Long-Term TIC Flows, March (9:00): -$13.5B actual versus -$13.3B prior (revised from -$17.8B)
- Industrial Production, April (9:15): -0.5% actual versus -0.2% expected, 0.3% prior (revised from 0.4%)
- Capacity Utilization, April (9:15): 77.8% actual versus 78.3% expected, 78.3% prior (revised from 78.5%)
- NAHB Housing Market Index, May (10:00): 44 actual versus 44 expected, 41 prior (revised from 42)
- Crude Inventories, 05/11 (10:30): -0.624M actual versus 0.230M prior

May 16 - Thursday
- Initial Claims, 05/11 (8:30): 360K actual versus 330K expected, 328K prior (revised from 323K)
- Continuing Claims, 05/04 (8:30): 3009K actual versus 3005K expected, 3013K prior (revised from 3005K)
- CPI, April (8:30): -0.4% actual versus -0.2% expected, -0.2% prior
- Core CPI, April (8:30): 0.1% actual versus 0.2% expected, 0.1% prior
- Housing Starts, April (8:30): 853K actual versus 970K expected, 1021K prior (revised from 1036K)
- Building Permits, April (8:30): 1017K actual versus 950K expected, 890K prior (revised from 902K)
- Philadelphia Fed, May (10:00): -5.2 actual versus 2.5 expected, 1.3 prior
- Natural Gas Inventor, 05/11 (10:30): 99 bcf actual versus 88 bcf prior

May 17 - Friday
- Michigan Sentiment, May (9:55): 83.7 actual versus 78.5 expected, 76.4 prior
- Leading Indicators, April (10:00): 0.6% actual versus 0.3% expected, -0.2% prior (revised from -0.1%)

May 22 - Wednesday
- MBA Mortgage Index, 05/18 (7:00): -7.3% prior
- Existing Home Sales, April (10:00): 4.98M expected, 4.92M prior
- Bernanke Testimony (10:00)
- Crude Inventories, 05/18 (10:30): -0.624M prior
- FOMC Minutes, 5/1 (14:00)

May 23 - Thursday
- Initial Claims, 05/18 (8:30): 348K expected, 360K prior
- Continuing Claims, 05/11 (8:30): 3005K expected, 3009K prior
- FHFA Housing Price Index, March (9:00): 0.7% prior
- New Home Sales, April (10:00): 425K expected, 417K prior
- Natural Gas Inventories, 05/18 (10:30)

May 24 - Friday
- Durable Orders, April (8:30): 1.6% expected, -6.9% prior (revised from -5.8%)
- Durable Goods -ex transports, April (8:30): 0.5% expected, -2.9% prior (revised from -1.5%)
icon url

ReturntoSender

05/21/13 12:11 AM

#10195 RE: ReturntoSender #6755

From Briefing.com: 4:15 pm : The Russell 2000 crosssed the 1,000 level for the first time ever today and the S&P 500 established a new all-time, intraday high. Those were some of the more memorable highlights of what was an otherwise nondescript day of trading.

By and large, there just wasn't a lot of conviction on the part of either buyers or sellers. The major indices spent time on either side of the unchanged line, but never put a whole lot of distance between themselves and that point for most of the day.

The lack of conviction was owed in part to a lack of stirring catalysts. There was some M&A activity, which included Yahoo! (YHOO 6.58, +0.06) buying Tumblr for $1.1 bln in cash, Vista Equity Partners buying Websense (WBSN 24.76, +5.53) for $1.0 bln in cash, and Actavis (ACT 127.13, +1.63) acquiring Warner Chilcott (WCRX 19.60, +0.39) in an $8.5 bln stock deal. Those transactions, though, didn't have market-moving punch.

All there mostly was today was a lot of sparring coming off last week's 2.1% gain in the S&P 500. Nobody got hurt, except perhaps in the precious metals space, which got hit early on chatter of a possible forced liquidation trade that knocked silver prices down close to 4.0%. Silver, however, made a resounding comeback, knocking out short sellers to settle the day up nearly 2.0% at $22.79/oz. That comeback, which was aided by a weakening dollar, helped boost other commodities like gold ($1389.00, +24.30) and oil ($96.71, +0.69).

Gains in both precious metals and industrial metals helped the materials sector outperform early, but it would eventually roll over to end the day relatively flat. In a mixed day of trading, the energy (+1.3%) and consumer staples (-1.0%) sectors were the only economic sectors to move 1.0% or more.

Presumably, some hesitation ahead of Fed Chairman Bernanke's testimony before Congress on Wednesday about the economic outlook played a part in today's mixed market. There was a little gyration around remarks made today by Chicago Fed President Evans on his views about the economy and the Fed's asset purchase program, but the market ultimately did not get too hung up on his remarks.

There aren't any economic releases for the US tomorrow, but there will be a number of retailers (Home Depot, Best Buy, AutoZone, Dick's Sporting Goods, Saks, and TJX Cos.) reporting earnings before the open. What they share could set the tone that helps determine if the Dow Jones Industrial Average is able score a gain for the 19th consecutive Tuesday. DJ30 -19.12 NASDAQ -2.53 SP500 -1.18 NASDAQ Adv/Vol/Dec 1364/1.68 bln/1126 NYSE Adv/Vol/Dec 1724/653 mln/1299

3:30 pm :

June crude oil rose for a fourth consecutive session, gaining support from a weaker dollar index and erasing earlier losses. The energy component lifted off its session low of $95.23 per barrel set moments after floor trade opened and advanced into positive territory by late morning action. It spent afternoon pit trade chopping around near its session high of $97.11 per barrel and eventually settled with a 0.8% gain at $96.76 per barrel.
June natural gas touched a session high of $4.16 per MMBtu in early morning floor trade and traded just below that level until the last hour of floor trade. It then dropped to a session low of $4.06 per MMBtu and settled just 0.7% higher at $4.09 per MMBtu.
June gold began today's floor trade in negative territory. However, prices broke into the black and rallied sharply to a session high of $1397.90 per ounce following reports of a potential U.S. downgrade this year. The yellow metal pulled-back slightly following the pop, but still managed to book a 1.4% gain as it closed at $1384.30 per ounce.
July silver also popped into positive territory and to a session high of $23.24 per ounce in early afternoon pit action. It settled 1.1% higher at $22.61 per ounce despite trading as low as $21.28 per ounce earlier in the session.

Mellanox Technologies (MLNX) announced its InfiniBand solutions were selected by Dutch cloud service provider, Cloud Provider, a cloud hosting and Infrastructure-as-a-Service provider in the Netherlands, as its standard interconnect infrastructure for their enterprise cloud deployments.

Corning (GLW) and Tianma Micro-Electronics Group announced Tianma's selection of Corning Lotus XT Glass for its line of low-temperature polysilicon panels

Xilinx (XLNX) announced that its All Programmable 7 series FPGAs and Zynq-7000 All Programmable SoCs have achieved full PCI Express compliance and are now listed on the PCI-SIG integrator's list.

3:58AM Advanced Semi unit ASE Assembly & Test to acquire shares of Wuxi Tongzhi Microelectronics from Toshiba Semiconductor (ASX) 4.25 : Co announces that in order to strengthen the capability of its Shanghai subsidiary for providing IC assembly and testing services, ASE will procure its wholly-owned subsidiary, ASE Assembly & Test to enter into an equity interests transfer agreement with Toshiba Semiconductor Co. Under the EITA, ASESH will pay RMB70 mln to TSW to acquire 100% shares in Wuxi Tongzhi Microelectronics Co held by TSW.

09:09 am NetApp downgraded to Underperform at Robert W. Baird: . Robert W. Baird downgrades NTAP to Underperform from Neutral. Firm expects an OK quarter and cautious FQ1 outlook but view challenges as more than just macro-economic. Firm believes a tougher competitive landscape and product roadmap uncertainty will create growth and/or margin difficulties. Firm is not advocating a short position in front of the quarter due to the possibility of a positive investor reaction to opex rationalization or shareholder friendly use of cash. Firm recommends investors take profits on recent upside or potential strength.

QLogic (QLGC) announced that Simon Biddiscombe has resigned his positions as president and chief executive officer and also as a director in order to pursue other opportunities. Simon's resignation was effective immediately. The Board has appointed CFO Jean Hu, 49, as CEO on an interim basis. Hu currently serves a senior vice president and chief financial officer. She oversees all company financial matters and will retain her CFO responsibilities during the interim period. The Board will begin an immediate search for a permanent CEO, and the search committee will be led by William M. Zeitler. The company reaffirms its non-GAAP financial guidance for the first quarter of fiscal year 2014.

Dell (DELL) sent a letter to Carl Icahn and Southeastern Asset Management underscoring its need for additional information regarding the proposed leveraged recapitalization transaction submitted to the Board on May 9, 2013. Letter stated 'On behalf of a group formed by various of your affiliates, your representatives have made a number of requests for information, including a request for data room access for a potential lender, to advisors to the Special Committee of the Board of Directors of DELL in connection with the potential transaction outlined in your letter dated May 9, 2013, addressed to the Board of Directors of Dell. As you know, on May 13, 2013 we sent you a letter requesting clarifications and additional materials relating to your proposal. Unless the Board of Directors of Dell determines that your proposal could reasonably be expected to result in a "Superior Proposal" as defined in the Company's existing merger agreement with affiliates of Silver Lake and Michael Dell, we are not permitted to provide you with information or engage in discussions concerning your proposal....Please understand that unless we receive information that is responsive to our May 13 letter, we are not in a position to evaluate whether your proposal meets that standard. Accordingly, neither we nor our representatives are able to respond to your requests and inquiries.'
icon url

ReturntoSender

05/21/13 11:36 PM

#10197 RE: ReturntoSender #6755

From Briefing.com: 4:10 pm : Stocks ended modestly higher as the S&P 500 climbed 0.2%, and the Dow added 0.4% to register its 19th consecutive Tuesday of gains.

The major averages saw little change during morning action, but afternoon buying interest helped lift the indices to session highs. Most cyclical sectors (with the exception of materials and technology) finished among the leaders, but the defensively-geared health care sector settled atop the leaderboard as biotechnology outperformed.

The iShares Nasdaq Biotechnology ETF (IBB 181.54, +1.78) advanced 1.0%, and prevented the Nasdaq from falling too far behind the other two indices as technology displayed relative weakness.

The technology sector spent the bulk of the day in negative territory as major components failed to partake in the broader market advance. Apple (AAPL 439.66, -3.27) shed 0.7% after the company faced Senate Subcommittee questioning regarding its tax practices while Microsoft (MSFT 34.85, -0.23) lost 0.7% after unveiling its newest gaming console.

Although the majority of the first quarter reporting season is in the rearview mirror, retail earnings continued to trickle in. The SPDR S&P Retail ETF (XRT 78.68, +0.57) settled higher by 0.7% after Saks (SKS 13.67, +1.39) and TJX (TJX 51.73, +0.38) exceeded their top-line estimates while AutoZone (AZO 427.84, +18.79) and Home Depot (HD 78.71, +1.95) beat on earnings and revenue.

Dow component Home Depot climbed to a new record high following its earnings beat, but the report did not help homebuilders as the SPDR S&P Homebuilders ETF (XHB 32.06, -0.07) slipped 0.2%.

While most retailers outperformed, those specializing in electronics lagged. Best Buy (BBY 25.64, -1.17) and HHGregg (HGG 13.75, -1.86) ended in the red after both reported below-consensus revenues.

Elsewhere, the financial sector displayed strength from the start. The sector ended with a gain of 0.3% while JPMorgan Chase (JPM 53.02, +0.73) rose 1.4% after shareholders voted overwhelmingly against separating the roles of Chief Executive Officer and Chairman, meaning Jamie Dimon will retain both titles.

Despite the gains in the broader market, the CBOE Volatility Index (VIX 13.33, +0.31) settled in the black as well, suggesting protection received an intraday bid.

Today's volume was slightly below average as 687 million shares changed hands on the floor of the New York Stock Exchange.

After recent weeks produced fresh speculation surrounding the Federal Reserve's readiness to begin tapering its quantitative easing program, investors will look for more cues from Fed Chairman Ben Bernanke when he testifies before Congress at 10:00 ET tomorrow.

With regards to economic data, the weekly MBA Mortgage Index is set to be reported at 7:00 ET while existing home sales for April will be announced at 10:00 ET. The day will be topped off with the 14:00 ET release of Federal Reserve's minutes from its May 1 meeting.DJ30 +52.30 NASDAQ +5.69 SP500 +2.87 NASDAQ Adv/Vol/Dec 1297/1.72 bln/1155 NYSE Adv/Vol/Dec 1633/687.2 mln/1377
3:35 pm : Commodities ended the day mostly lower, with metals, corn, wheat, heating oil, RBOB gasoline all finishing lower.

Natural gas remained strong all session, rising as high as $4.21/MMBtu. At the end of today's, June natural gas ended $0.13 higher at $4.19/MMBtu. Crude oil was in the red for today's floor trading session, breaking below the $96 level (LoD is $95.72/barrel). June natural gas ended $0.13 higher at $4.19/MMBtu and June crude oil gained $0.07 to $96.10/barrel.

Precious metals almost reversed back to the unchanged line, but ultimately ended the day with modest losses. June gold finished $5.90 lower at $1378.40/oz and July silver ended $0.14 lower at $22.47/oz.

4:04PM Analog Devices reports EPS in-line, revs in-line; guides Q3 EPS below consensus, revs below consensus (ADI) 46.56 -0.31 : Reports Q2 (Apr) earnings of $0.52 per share, in-line with the Capital IQ Consensus Estimate consensus of $0.52; revenues fell 2.4% year/year to $659 mln vs the $660.36 mln consensus.

Co issues downside guidance for Q3, sees EPS of $0.51-0.56 vs. $0.57 Capital IQ Consensus Estimate; sees Q3 revs of $655-685 mln vs. $688.16 mln Capital IQ Consensus Estimate.

2:01PM NVIDIA confirmed support for the Microsoft (MSFT) Xbox One game console with its PhysX and APEX software development kits (NVDA) 14.95 +0.19 :

8:26AM EMCORE awarded solar panel manufacturing contract by ATK (ATK) for NASA's Green Propellant Infusion Mission (EMKR) 3.66 : Co announced that it has been awarded a contract by ATK (NYSE:ATK) to design and manufacture solar panels for NASA's Green Propellant Infusion Mission (GPIM) planned for launch in 2015. Solar panels populated with EMCORE's most advanced ZTJ triple-junction solar cells will power a satellite that will carry the GPIM payload. ATK will integrate EMCORE's solar panels into its heritage-designed solar arrays for final flight configuration for the GPIM satellite.

The GPIM project will demonstrate the practical capabilities of AF-M315E, a high-performance green alternative to hydrazine that has traditionally been used to fuel many spacecraft. This innovative, low-toxicity propellant is expected to improve overall vehicle performance. It boasts a higher density than hydrazine, meaning that more can be stored in containers of the same volume, and it delivers a greater thrust per given quantity of fuel.

Atmel (ATML) announced that Secret Labs' recently launched 'AGENT' smart watch is powered by Atmel's SAM4S and tinyAVR microcontrollers.
Altera (ALTR) announced its 28 nm Stratix V GX FPGAs have achieved inclusion on the latest PCI-SIG Integrators List for the PCI Express 3.0 specification.

Select solar related names showing continued strength: RSOL +8.2%, ASTI +7.7%, JASO +4.6%, JKS +3.8%, CSIQ +3.5%, LDK +3.3%, SOL +2.4%, TSL +1.5%, SPWR +1.3%, FSLR +1.3%, WFR +0.7%, .


LED names are seeing early strength: AIXG +5.3%, LEDS +3.4%, CREE +0.5%

Microsemi (MSCC) announced shipment of production-qualified SmartFusion2 system-on-chip field programmable gate arrays. The co also announced the availability of its full-featured SmartFusion2 development kit with support for mainstream industry interfaces.
Xilinx (XLNX) announced that Xilinx and Sumitomo Electric Industries are collaborating to bring smarter solutions to market. These solutions reduce CapEx and OpEx costs through the use of Sumitomo Electric's Gallium Nitride power amplifier transistors and Xilinx SmartCORE IP that result in higher radio unit efficiencies.

NXP Semiconductors (NXPI) announced the availability of its ultra-wideband Doherty reference design using the BLF884P and BLF884PS -- the industry's first wideband Doherty power amplifiers capable of broadband operation

SanDisk (SNDK) announced it has begun customer sampling of flash memory products based on its industry-leading 1Ynm process technology, which represents its second generation 19 nanometer manufacturing technology.

10:35 am Technology trading lower today and behind the broader market
The tech sector is trading lower today, trailing narrower losses in the broader market. Semiconductors are showing inline weakness with the SOX trading 0.2% lower. Within the chip index, AMD (-3.4%) is a notable laggard. Among other major indices, the SPY is trading 0.1% lower today, while the QQQ is down 0.3% and the NASDAQ is trading 0.2% lower on the session. Among tech bellwethers, ORCL (+0.5%) is showing isolated strength, while AAPL (-1.8%) is under pressure.

In tech earnings last night, TIVO (+2.7%) posted upside Q1 EPS with inline guidance. This morning in tech earnings, VOD (+0.3%) posted a slight qtrly beat. In news, CLWR (+4.0%) received a revised offer from S (+1.2%) to acquire the ~50% stake in the co it does not currently own for $3.40 per share (previous offer: $2.97/share). Also, AAPL (-1.8%) is currently at a Senate Subcommittee regarding offshore taxation. In notable analyst upgrades this morning in the tech space, AMT (+1.0%) was upgraded to Outperform from Neutral at Macquarie and CODE (+0.9%) was upgraded to Outperform at Pacific Crest. There were no notable downgrades in tech, however, ARMH (-2.0%) was named a short Research Tactical Idea at Morgan Stanley. ADI (-0.4%), NTAP (-2.0%), and INTU (-0.9%) are the notable names in tech scheduled to report quarterly results today after the close.
icon url

ReturntoSender

05/22/13 8:01 PM

#10198 RE: ReturntoSender #6755

From Briefing.com: 4:15 pm : The S&P 500 settled lower by 0.8% after early strength turned into afternoon weakness.

Today's headline event came in the form of Ben Bernanke's testimony before the Joint Economic Committee. During his remarks, Chairman Bernanke said premature tightening of monetary policy could stall the pace of recovery. This followed weeks of conflicting remarks from FOMC members, which sparked speculation regarding possible changes to the Fed's policy course.

However, those voices were echoed again by the afternoon release of the FOMC minutes from the May 1 meeting. The minutes indicated that some members expressed their willingness to slow asset purchases as early as June, provided economic conditions warrant the change.

Equities spiked at the start of Chairman Bernanke's testimony, but sellers made their presence known this afternoon as the major averages slumped to session lows.

While the afternoon decline occurred around the release of FOMC minutes, the move was isolated to the stock market as the 10-yr yield held near its session high of 2.04%, and the Dollar Index maintained its gain of 0.4% near 84.25.

The utilities and telecom sectors led to the downside as traders continued to dump income-oriented names. Including today's 1.6% decline, the utilities sector is down 5.0% month-to-date.

Elsewhere, the energy space lost 1.2% as crude oil declined 2.1%. The energy component ended at $94.18 per barrel, and weighed on the growth-sensitive sector.

Another commodity-related group, materials, ended among the laggards as steelmakers underperformed. The Market Vectors Steel ETF (SLX 42.61, -0.59) settled lower by 1.4%.

Cyclical sectors felt the brunt of the afternoon weakness. Similarly, the Dow Jones Transportation Average was unable to escape the selling as the bellwether complex settled lower by 1.6%.

Only consumer staples and health care were able to settle near yesterday's closing levels. The health care space was supported, in part, by Pfizer (PFE 29.30, +0.52) after the company announced plans to split off its animal health business Zoetis (ZTS 33.55, +0.51).

The CBOE Volatility Index (VIX 14.08, +0.71) ended near its highest level of the day as today's selloff increased near-term volatility expectations.

Reviewing today's economic data, existing home sales improved modestly in April, but still fell short of the 5.00 million barrier. Sales increased to 4.97 million from an upwardly revised 4.94 million (from 4.92 million) in March. The Briefing.com consensus expected home sales to increase to 4.98 million.

Also of note, the weekly MBA Mortgage Index fell 9.8% after declining 7.3% in the prior week.

Tomorrow, weekly initial claims will be reported at 8:30 ET while the March FHFA Housing Price Index and April new home sales will be released at 9:00 ET and 10:00 ET, respectively.DJ30 -80.41 NASDAQ -38.82 SP500 -13.81 NASDAQ Adv/Vol/Dec 634/2.11 bln/1872 NYSE Adv/Vol/Dec 658/854.7 mln/2381

3:35 pm : Commodities slid lower this afternoon post-FOMC minutes. Crude oil futures slid down near $94 barrel, precious metals and copper sold off and natural gas ended near the unchanged line.

Crude oil was as high as $96.19/barrel, but sold off over $2/barrel and fell as low as $94.02/barrel. June crude oil ended the day $1.85 lower at $94.25/barrel. June natural gas lost $0.01 at $4.18/MMBtu.

Sellers came out in the afternoon, causing gold and silver to extend losses. June gold fell $17 to $1384.30/oz, while July silver fell $0.19 to $22.42/oz. July copper gained two cents to $3.38/lb.DJ30 -110.05 NASDAQ -52.34 SP500 -18.71 NASDAQ Adv/Vol/Dec 604/1872.8 mln/1951 NYSE Adv/Vol/Dec 610/598 mln/2445

5:24PM Analog Devices prices $500 mln 2.875% senior notes offering; announces redemption of 5.00% senior notes due 2014 (ADI) 45.55 -1.01 : Co announced that it has priced an offering of $500 million aggregate principal amount of 2.875% senior unsecured notes due June 1, 2023. The offering is being conducted pursuant to an effective registration statement under the Securities Act of 1933. Analog Devices intends to use approximately $393 million of the net proceeds from this offering to fund the previously announced redemption of $375 million aggregate principal amount of its 5.00% senior unsecured notes due 2014 on June 6, 2013, the redemption date selected by Analog Devices. Analog Devices intends to use the remaining net proceeds for general corporate purposes, which may include repurchases of common stock under its stock repurchase program, acquisitions, dividend payments and capital expenditures. This offering is expected to close on June 3, 2013. The joint book-running managers for the offering are J.P. Morgan Securities LLC, Credit Suisse Securities (USA) LLC and Merrill Lynch, Pierce, Fenner & Smith Incorporated, and the co-managers are Goldman, Sachs & Co., Morgan Stanley & Co. LLC and Wells Fargo Securities, LLC.

4:33PM Semtech reports EPS in-line, beats on revs; guides Q2 EPS in-line, revs in-line (SMTC) 36.33 -0.41 : Reports Q1 (Apr) earnings of $0.46 per share, excluding non-recurring items, in-line with the Capital IQ Consensus Estimate consensus of $0.46; revenues rose 39.3% year/year to $162.4 mln vs the $158.65 mln consensus. Non-GAAP gross profit margin for the first quarter of fiscal year 2014 was 61.6 percent.

Co issues in-line guidance for Q2, sees EPS of $0.50-0.56, excluding non-recurring items, vs. $0.53 Capital IQ Consensus Estimate; sees Q2 revs of $164.0-$172.0 mln vs. $167.46 mln Capital IQ Consensus Estimate. Non-GAAP gross profit margin is expected to be in the range of 61.0% to 61.5%

4:14PM Hewlett-Packard beats by $0.06, misses on revs; guides Q3 EPS above consensus; raises low end of FY13 EPS guidance; raises dividend 10% (HPQ) 21.23 +0.12 : Reports Q2 (Apr) earnings of $0.87 per share, excluding non-recurring items, $0.06 better than the Capital IQ Consensus Estimate of $0.81; revenues fell 10.1% year/year to $27.58 bln vs the $28.03 bln consensus. Upside was "driven by better than expected performance in Enterprise Services and Printing, coupled with the accelerated capture of restructuring savings and improvement in our operations."

HP generated $3.6 billion in cash flow from operations in the second quarter, up 44% from the prior-year period. Inventory ended the quarter at $6.0 billion, down 2 days YoY to 26 days. HP utilized $797 million of cash during the quarter to repurchase ~36.3 million shares of common stock in the open market. HP exited the quarter with $13.6 billion in gross cash.

Co issues upside guidance for Q3, sees EPS of $0.84-0.87, excluding non-recurring items, vs. $0.83 Capital IQ Consensus Estimate.

Co issues upside guidance for FY13, raises EPS to $3.50-3.60, excluding non-recurring items, from $3.40-3.60 vs. $3.45 Capital IQ Consensus Estimate.

HP also today announced that the HP board of directors has declared a regular cash dividend of 14.52 cents per share on the company's common stock, which, as previously announced, reflects a 10% increase in amount compared to the previous quarterly dividend amount.

"After returning more than a billion dollars to shareholders through share repurchases and dividends in the quarter, we improved our operating company net debt position for the fifth successive quarter. By the end of fiscal 2013, we expect our operating company net debt to be below pre-Autonomy levels and approaching our goal of ~zero."

Segment results:

Personal Systems revenue was down 20% YoY with a 3.2% operating margin. Commercial revenue decreased 14%, and Consumer revenue declined 29%. Total units were down 21% with Desktops units down 18% and Notebooks units down 24%.
Printing revenue declined 1% YoY with a strong operating margin of 15.8%. Total hardware units were down 11% YoY. Commercial hardware units were down 5% YoY, and Consumer hardware units were down 13% YoY.
Enterprise Group revenue declined 10% YoY with a 15.9% operating margin. Networking revenue was up 1%, Industry Standard Servers revenue was down 12%, Business Critical Systems revenue was down 37%, Storage revenue was down 13% and Technology Services revenue was down 3% YoY.
Enterprise Services revenue declined 8% YoY with a 2.6% operating margin. Application and Business Services revenue was down 10% YoY, and IT Outsourcing revenue declined 6% YoY.
Software revenue was down 3% YoY with a 19.1% operating margin. Support revenue was up 12% while license revenue was down 23% and services revenue was down 5% YoY.
HP Financial Services revenue was down 9% YoY with a 3% decrease in net portfolio assets and a 24% decrease in financing volume. The business delivered an operating margin of 11.0%.

Axcelis Technologies (ACLS) announced that it has shipped the new Purion M medium current implanter, to a major semiconductor manufacturer located in Asia. The system will be used to develop and manufacture next generation memory and FLASH devices.

ON Semiconductor (ONNN) has collaborated with SRI International and Ball Aerospace & Technologies, a unit of Ball (BLL), to secure funding for the Defense Production Act Title III, Advanced Complementary Metal Oxide Semiconductor Focal Plane Arrays for Visible Sensors for Star Trackers Project.

8:04AM DSP Group announces intent to declassify its Board of Directors, the selection of new Chairman and the proposed adoption of a stock ownership policy (DSPG) 81.9 : Co announced a plan to declassify its Board of Directors, from three classes of directors to a single class, beginning in 2014. The co also announced that as a move to improve corporate governance Eliyahu Ayalon has decided to resign as Chairman of the Board so that role can be filled by a director who qualifies as an independent director under NASDAQ rules. Mr. Ayalon will remain a member of the Board following his resignation as non-executive Chairman, which will become effective upon the election of his successor.

8:03AM SunPower announces intention to offer $300 mln aggregate principal amount of senior convertible debentures (SPWR) 21.00 : Co announced that it proposed to offer $300 million aggregate principal amount of senior convertible debentures, subject to market conditions and other factors. The debentures will mature in June 2018. The interest rate, conversion rate, offering price and other terms will be determined by negotiations between SunPower and the initial purchasers of the debentures.

The debentures will be convertible into shares of SunPower's common stock, par value $0.001 per share. Total Gas & Power USA, SAS, a subsidiary of Total S.A. that owns approximately 65% of SunPower's common stock, has agreed to purchase, and the initial purchasers have agreed to sell to Total Gas & Power USA, SAS, $200 million aggregate principal amount of the debentures (assuming that the full $300 million aggregate principal amount is sold).

SunPower intends to use the proceeds from the offering for general corporate purposes, which may include redeeming or repurchasing some of its outstanding debentures and working capital. The debentures are being offered in a private placement only to qualified institutional buyers and to Total Gas & Power USA, SAS, which is an institutional accredited investor.

6:57AM LTX-Credence misses by $0.02, misses on revs; guides Q4 EPS below consensus, revs below consensus (LTXC) 6.05 : Reports Q3 (Apr) loss of $0.08 per share, excluding non-recurring items, $0.02 worse than the Capital IQ Consensus Estimate of ($0.06); revenues rose 17.9% year/year to $36.3 mln vs the $38.48 mln consensus.

Co issues downside guidance for Q4, sees EPS of ($0.09)-(0.05) vs. $0.05 Capital IQ Consensus; sees Q4 revs of $36-40 mln vs. $45.46 mln Capital IQ Consensus.

"The adoption of Diamondx by new and existing customers is ahead of our expectations. We now have sixteen customers and ~forty applications in either production or development. Changes in the volume ramp of some of our customers' new products have impacted the short term need for additional test capacity. However, we expect sales of Diamondx to accelerate in the back half of the calendar year given current customer forecasts."

1:54AM Atmel confirms appointment of Steve Skaggs as permanent CFO (ATML) 7.51 : Skaggs had been serving as interim Chief Financial Officer since April 2, 2013.

Analog Devices (ADI) reported second quarter earnings of $0.52 per share, in-line with the Capital IQ consensus of $0.52, while revenues fell 2.4% year/year to $659 million versus the $660.36 mln consensus. The company issued downside guidance for the third quarter with EPS of $0.51-0.56 versus the $0.57 Capital IQ consensus and revenues of $655-685 million versus the $688.16 million Capital IQ consensus.

SolarWinds (SWI) through one of its subsidiaries, SolarWinds Worldwide, LLC entered into an Agreement and Plan of Merger and Reorganization with N-able Technologies International, Inc., a Delaware corporation pursuant to which N-able would become a wholly owned subsidiary of SolarWinds. N-able is a Cloud-based remote monitoring and management and service automation software for Managed Service Providers. The acquisition is being entered into for strategic purposes. Pursuant to the Merger Agreement, SolarWinds would pay $120.0 million in cash at closing subject to certain adjustments set forth in the Merger Agreement . The Merger Agreement provides that $12.0 million of the Closing Cash Consideration will be held in escrow as partial security for the indemnification obligations of the equity holders of N-able.

Intuit (INTU) reported third quarter earnings of $2.97 per share, excluding non-recurring items -- co lowered FY13 EPS to $2.92-2.94 from $2.99-3.04 on April 24 -- $0.04 better than the Capital IQ consensus of $2.93, while revenues rose 13.1% year/year to $2.18 billion versus the $2.18 bln consensus; the company lowered revenue guidance to $2.165-2.175 billion from $2.215-2.275 billion on April 24. The company issued downside guidance for fourth quarter with EPS of $0.03-0.07, excluding non-recurring items, versus the $0.11 Capital IQ consensus and revenues of $702-727 million versus the $727.33 million consensus. "We continue to see strong progress delivering on our connected services strategy across our businesses in the third quarter. TurboTax paid units increased 4 percent, and we expect TurboTax revenue growth of about 4 percent for the fiscal year. While it was a challenging tax season overall, we made progress in several key areas, growing new customers including first-time filers and former tax store customers, and significantly increasing mobile adoption. Activity is already well underway for next year, with an intense focus on product and customer experience. It was another strong quarter across our small business division. The team continues to do great work growing customers in what remains a weak environment for small businesses. Each business in this segment delivered double-digit growth this quarter. Intuit repurchased $92 million of its common stock during the third quarter, totaling $292 million for the first nine months of the fiscal year. At the end of the quarter the current authorization had $1.4 billion remaining for stock repurchases through August 2014.

NetApp (NTAP) reported fourth quarter earnings of $0.69 per share, excluding non-recurring items, $0.01 better than the Capital IQ consensus of $0.68, while revenues rose 0.8% year/year to $1.72 billion versus the $1.76 billion consensus. The company issued downside guidance for the first quarter with EPS of $0.45-0.50, excluding non-recurring items, versus the $0.53 Capital IQ consensus and revenues of $1.475-1.575 billion versus the $1.6 billion consensus. "The fourth quarter was highlighted by a continued strong uptake of clustered Data ONTAP, an expansion of our leadership position in Flash, and double digit growth in branded bookings...We are also pleased to announce enhancements to our capital allocation program, reflecting our confidence in our underlying business as well as our commitment to enhancing shareholder value." Share repurchase program and dividend: The Company is increasing its current stock repurchase program, of which $1.4 billion remains outstanding, by an additional $1.6 billion. The Company plans to complete the aggregate $3 billion program over the next 3 years. NetApp intends $2 billion of repurchases to be completed within the next 12 months, of which $1 billion is planned to be completed during the next 4 months. Additionally, NetApp has initiated a quarterly cash dividend of $0.15 per share of the Company's common stock, which it intends to increase over time. The first dividend will be payable on July 23, 2013 to shareholders of record as of the close of business on July 11, 2013. Resource Realignment: The Company has undertaken a realignment of resources and restructuring which includes a global workforce reduction of ~900 employees. The Company expects to recognize an estimated aggregate $50 - $60 mln pretax charge relating to employee severance and other restructuring charges.
icon url

ReturntoSender

05/23/13 7:27 PM

#10199 RE: ReturntoSender #6755

From Briefing.com: 4:15 pm : The major averages ended modestly lower with the S&P 500 shedding 0.3%.

The benchmark average saw an opening loss of 1.2% after Japan's Nikkei tumbled 7.3%. Japanese stocks sold off amid continued volatility in Japanese Government Bond futures as the 10-yr yield spiked almost 16 basis points to 1.002 before the Bank of Japan's JPY2 trillion liquidity injection caused yields to retrace their gains.

Adding insult to injury was news out of China where the HSBC Flash Manufacturing PMI (49.6 actual, 50.5 consensus, 50.4 prior) fell below 50 for the first time in seven months.

All ten sectors began the session with sharp losses before the daylong rebound helped some groups return to yesterday's closing levels.

The utilities sector was the weakest performer, ending lower by 0.8% after a morning flash crash in American Electric Power (AEP 48.28, -0.31) and NextEra Energy (NEE 78.22, -0.94) briefly wiped out more than $33 billion in combined market capitalization.

Meanwhile, other defensively-oriented sectors outperformed the broader market with the telecom space registering a gain.

Cyclical groups were mixed throughout the day as technology and materials made a brief appearance in positive territory.

In the tech sector, major components like Apple (AAPL 442.14, +0.79), Oracle (ORCL 34.23, +0.11), and Cisco Systems (CSCO 23.51, +0.17) held up relatively well while Hewlett-Packard (HPQ 24.86, +3.63) surged 17.2% following its earnings beat on below-consensus revenue. In addition, the computer company guided third quarter earnings above analyst expectations and raised its dividend 10.0% to $0.1452.

Elsewhere, the relative strength in chemical producers overshadowed the weakness of steelmakers as the materials sector ended little changed. Gold miners also outperformed as the yellow metal rose 1.8% to $1391.30 per troy ounce. However, copper fell 1.9% to $3.318 per pound as disappointing Chinese data weighed.

While the Dow and Nasdaq made a couple intraday appearances in positive territory, the S&P was kept from seeing green by the weakness in banks. The financial sector settled lower by 0.6% as most majors registered losses. However, Dow component American Express (AXP 74.69, +0.25) outperformed its peers to end with a gain of 0.3%.

Today's opening losses caused the CBOE Volatility Index (VIX 14.12, +0.30) to spike to 15.11 before the near-term volatility measure returned near session lows as the broader market climbed off its worst levels of the day.

After a one-week shock, the initial claims level dropped back below 350,000. The initial claims level fell to 340,000 for the week ending May 18 from an upwardly revised 363,000 (from 360,000) for the week ending May 11. The Briefing.com consensus expected the initial claims level to fall to 348,000.

Separately, new home sales increased 2.3% to 454,000 in April after a sizable upward revision for March to 444,000 (from 417,000). The Briefing.com consensus pegged new home sales at 425,000.

Inventory levels remain depressed. There is only a 4.1-month supply at current sales rates. During a normal environment, homebuilders try to maintain a 6-month supply. That means construction growth should accelerate from current levels.

Tomorrow, April durable orders and durable orders ex-transportation will be reported at 8:30 ET.DJ30 -12.67 NASDAQ -3.88 SP500 -4.84 NASDAQ Adv/Vol/Dec 1294/1.74 bln/1200 NYSE Adv/Vol/Dec 1251/814.1 mln/1753

3:30 pm :

July crude oil traded in negative territory today following China's HSBC Flash Manufacturing PMI data that showed a first contractionary reading in seven months. The energy component dipped to a session low of $92.21 per barrel in morning action but managed to erase most of the earlier losses as prices rallied to a session high of $94.35 per barrel heading into the close. Crude oil settled just 0.1% lower at $94.14 per barrel.
June natural gas opened floor trade in the red but popped into positive territory following inventory data that showed a build of 89 bcf when a build of 91-92 bcf was anticipated. It pulled-back slightly moments later but picked up momentum in afternoon action. It settled 1.9% higher at $4.26 per MMBtu, just below its session high of $4.27 per MMBtu.
June gold rose for the first time in three sessions as a weaker dollar index and weak China's HSBC Flash Manufacturing PMI data helped support the yellow metal's advance. Although prices dipped to a session low of $1375.20 per ounce in late morning action, gold inched higher for the remainder of the session and settled with a 1.8% gain at $1391.70 per ounce.
July silver spent most of today's pit trade in negative territory, touching a session low of $22.16 per ounce. It picked up momentum heading into afternoon action and managed to erase all of its earlier losses as it settled 0.1% higher at $22.50 per ounce.

4:13PM Marvell beats by $0.05, beats on revs; guides Q2 EPS in-line, revs above consensus (MRVL) 11.31 -0.05 : Reports Q1 (Apr) adj. earnings of $0.19 per share, $0.05 better than the Capital IQ Consensus Estimate of $0.14; revenues fell 5.3% year/year to $734.4 mln vs the $721.55 mln consensus. Non-GAAP gross margin for the first quarter of fiscal 2014 was 54.6 percent, compared to 53.2 percent for the fourth quarter of fiscal 2013 and 54.5 percent for the first quarter of fiscal 2013.

Co issues guidance for Q2, sees EPS of $0.17-0.21, excluding non-recurring items, vs. $0.18 Capital IQ Consensus Estimate; sees Q2 revs of $770-810 mln vs. $762.96 mln Capital IQ Consensus Estimate.

Under the share repurchase program, Marvell repurchased ~20 million shares for a total of $200 million in the first quarter of fiscal 2014. Over the past eleven quarters, Marvell has repurchased and retired ~204 million shares, or about 29 percent, of its outstanding shares.

"Our results in the first quarter were at the high-end of our guidance mainly due to better than normal seasonal demand and share gains in our storage and networking end markets. Starting in the second quarter of fiscal 2014, we expect many of our investments and key initiatives across all of our end markets to produce tangible results. More specifically, we expect growth to be driven by increased traction in areas such as mobile handsets, tablets, connectivity and SSDs."

4:07PM Silicon Labs appoints Bill Bock President, John Hollister CFO (SLAB) 42.90 -0.51 : Co announced that its interim CFO and board member, Bill Bock, will be returning to the management team on a permanent basis as president. John Hollister, the company's vice president of business development, will be promoted to senior vice president and CFO, replacing Mr. Bock in that role. The changes will be effective June 30.

Analyst comments: SANM -3.6% (downgraded to Sell from Hold at Deutsche Bank), ARMH -2.7% (downgraded to Neutral from Outperform at Exane BNP Paribas, FLEX -0.7% (downgraded to Hold from Buy at Deutsche Bank)

7:22AM DSP Group issues 'setting the record straight' white paper on Starboard's May 13, 2013 presentation (DSPG) 7.68 : Co said that it has filed the following White Paper with the SEC that sets the record straight on a number of factually inaccurate statements and misleading data points in Starboard's May 13, 2013 presentation. It states: 'We believe that Starboard's presentation filed on May 13, 2013 contained a large number of factually inaccurate statements and misleading data points in its attempt to gain support for its slate of hand-picked nominees to DSP Group's Board... Starboard's claims that the Company's operating performance has been "abysmal" are entirely false and ignore our recent operating success.... Our growth strategy is working although Starboard will not admit to this fact... Starboard claims that DSP Group's spending on R&D and acquisitions have "destroyed shareholder value." This claim also is false and, as we show below, they use inconsistent and incorrect data to try to make their point.... If Starboard was truly committed to ensuring that "alternative viewpoints are allowed to be introduced and properly considered in the DSP Group's boardroom," they would have accepted the Company's generous offer of two additional Board seats, giving them a total of four of the ten seats, along with significant committee representation, including two of four seats (including chairmanship) on the Compensation Committee and two of five seats (including chairmanship) of a proposed Strategic Committee."

7:20AM DSP Group: Starboard issued earlier open leeter to DSP shareholders; states 'recently announced corporate governance changes are reactionary and do not go far enough' (DSPG) 7.68 : Starboard Value, one of the largest shareholders of DSP Group beneficially owning approximately 10.1% of its outstanding common stock, issued an open letter yesterday after the close to DSP shareholders following the co's recent announcement of proposed corporate governance changes. Letter states 'Earlier this morning, DSP announced its intent to declassify its Board of Directors (the "Board") beginning in 2014, its intent for Patrick Tanguy to replace Eliyahu Ayalon as non-executive Chairman, and its intent to adopt a stock ownership policy for members of the Board. While these actions appear to be a long overdue improvement in corporate governance, the manner in which they were announced clearly demonstrates a failure in corporate governance at DSP and is a cause for great concern.... So it appears that these changes, which have already been publicly announced, were not reviewed and formally approved by the full Board. To be clear, the selection of a new Chairman of the Board should be a decision of the full Board. A well functioning Board should meet and discuss significant changes in corporate governance policy and changes to the leadership of the Board.... As one of the largest shareholders of DSP, our interests are directly aligned with yours. We urge all shareholders to vote on the WHITE proxy card today to support the election of new, truly independent directors, who will represent all of our collective interests on the Board."

AMD (AMD) launched three new additions to its 2013 A-Series and E-Series Mobile Accelerated Processing Unit lineup delivering solutions ideally positioned to address today's evolving PC market with dramatically increased performance and power efficiency, as well as a portfolio of unique user experiences, and superior gaming and graphics

Hewlett-Packard (HPQ) reported second quarter earnings of $0.87 per share, excluding non-recurring items, $0.06 better than the Capital IQ consensus of $0.81, while revenues fell 10.1% year/year to $27.58 billion versus the $28.03 billion consensus. Upside was "driven by better than expected performance in Enterprise Services and Printing, coupled with the accelerated capture of restructuring savings and improvement in our operations." HP generated $3.6 billion in cash flow from operations in the second quarter, up 44% from the prior-year period. Inventory ended the quarter at $6.0 billion, down 2 days YoY to 26 days. HP utilized $797 million of cash during the quarter to repurchase ~36.3 million shares of common stock in the open market. HP exited the quarter with $13.6 billion in gross cash. The company issued upside guidance for the third quarter with EPS of $0.84-0.87, excluding non-recurring items, versus the $0.83 Capital IQ consensus. The company issued upside guidance for fiscal year 2013 with raised EPS to $3.50-3.60, excluding non-recurring items, from $3.40-3.60 versus the $3.45 Capital IQ consensus. HP also today announced that the HP board of directors has declared a regular cash dividend of 14.52 cents per share on the company's common stock, which, as previously announced, reflects a 10% increase in amount compared to the previous quarterly dividend amount. "After returning more than a billion dollars to shareholders through share repurchases and dividends in the quarter, we improved our operating company net debt position for the fifth successive quarter. By the end of fiscal 2013, we expect our operating company net debt to be below pre-Autonomy levels and approaching our goal of ~zero." Segment results: Personal Systems revenue was down 20% YoY with a 3.2% operating margin. Commercial revenue decreased 14%, and Consumer revenue declined 29%. Total units were down 21% with Desktops units down 18% and Notebooks units down 24%. Printing revenue declined 1% YoY with a strong operating margin of 15.8%. Total hardware units were down 11% YoY. Commercial hardware units were down 5% YoY, and Consumer hardware units were down 13% YoY. Enterprise Group revenue declined 10% YoY with a 15.9% operating margin. Networking revenue was up 1%, Industry Standard Servers revenue was down 12%, Business Critical Systems revenue was down 37%, Storage revenue was down 13% and Technology Services revenue was down 3% YoY. Enterprise Services revenue declined 8% YoY with a 2.6% operating margin. Application and Business Services revenue was down 10% YoY, and IT Outsourcing revenue declined 6% YoY. Software revenue was down 3% YoY with a 19.1% operating margin. Support revenue was up 12% while license revenue was down 23% and services revenue was down 5% YoY HP Financial Services revenue was down 9% YoY with a 3% decrease in net portfolio assets and a 24% decrease in financing volume. The business delivered an operating margin of 11.0%.

Semtech (SMTC) reported first quarter earnings of $0.46 per share, excluding non-recurring items, in-line with the Capital IQ consensus of $0.46; revenues rose 39.3% year/year to $162.4 million vs the $158.65 million consensus. Non-GAAP gross profit margin for the first quarter of fiscal year 2014 was 61.6 percent. The company issued in-line guidance for the second quarter with EPS of, $0.50-0.56, excluding non-recurring items, versus the $0.53 Capital IQ consensus and revenues of $164.0-$172.0 million versus the $167.46 million Capital IQ consensus. Non-GAAP gross profit margin is expected to be in the range of 61.0% to 61.5%
icon url

ReturntoSender

05/30/13 11:07 PM

#10203 RE: ReturntoSender #6755

From Briefing.com: 4:10 pm : The major averages settled with modest gains as late afternoon selling took hold following a headline from Nikkei news, indicating Japan plans to impose new foreign exchange margin trading rules. The news caused dollar/yen to slip into the red while also weighing on equities.

Six of ten sectors ended in the black as financials and technology paced the broad market gains.

Most major financials saw gains of at least 1.0% as Morgan Stanley (MS 25.82, +0.84) climbed 3.4% to outperform its peers. Meanwhile, the broader financial sector rose 1.1% to extend its May gain to 7.6%.

Elsewhere, technology shares received support from major components like Apple (AAPL 451.58, +6.63), and Microsoft (MSFT 35.03, +0.15), as well as high-beta chipmakers. The PHLX Semiconductor Index settled higher by 1.5%.

The relative strength of technology contributed to the outperformance of the Nasdaq, with additional support coming from biotech. The Nasdaq Biotechnology ETF (IBB 183.23, +2.16) gained 1.2%.

Biotechnology also constitutes a good portion of the health care sector, which outperformed its defensively-oriented peers, adding 0.7%.

Another defensively-minded group, utilities, was up as much as 2.0% in early action before surrendering the bulk of its gains to settle up 0.2%. The morning rally took place after NV Energy (NVE 23.62, +4.34) agreed to be acquired by Berkshire Hathaway's MidAmerican for $23.75 per share, representing a 23.2% premium to yesterday's closing price. Despite ending in the black, the utilities sector remains the weakest performer of the month, down 9.0%.

Only a handful of names reported their quarterly results this morning. Industrial component Joy Global (JOY 55.61, +0.53) added 1.0% after its above-consensus results overshadowed the machinery manufacturer's cautious full-year guidance.

In retail earnings, Express (EXPR 21.20, +2.41) surged 12.8% after its solid report was coupled with upbeat bottom-line guidance. Meanwhile, the SPDR S&P Retail ETF (XRT 77.79, +0.27) tacked on 0.4%.

Initial claims for the week ending May 25 jumped by 10,000 to 354,000. The Briefing.com consensus expected the claims level to be 340,000. That bumped up the four-week moving average by 6,750 to 347,250.

The second estimate of first quarter GDP produced a small downward revision to 2.4% from 2.5% (Briefing.com consensus +2.5%) while the GDP deflator slipped to 1.1% from 1.2% (Briefing.com consensus +1.2%).

The upshot of the revision was that personal consumption expenditures growth was revised higher to 3.4% from 3.2%. That was the highest growth rate since the fourth quarter of 2010 and it boosted the PCE contribution to GDP growth to 2.4 percentage points from 2.2 percentage points at the first estimate.

Increases in private inventory investment, exports, and imports were less than previously estimated. The lower contribution from the change in private inventories and nonresidential structures were offsetting factors to the uptick in the PCE contribution.

Lastly, pending home sales for April rose 0.3%, which was worse than the 1.5% increase forecast by the Briefing.com consensus. Today's reading follows last month's rise of 1.5%.

Tomorrow, April personal income, personal spending, and core PCE prices will all be announced at 8:30 ET. This will be followed by the 9:45 ET release of the May Chicago PMI while the final Michigan Consumer Sentiment Survey for May will cross the wires at 9:55 ET.DJ30 +21.73 NASDAQ +23.78 SP500 +6.05 NASDAQ Adv/Vol/Dec 1727/1.72 bln/776 NYSE Adv/Vol/Dec 1787/710.6 mln/1212

3:30 pm :

July crude oil began pit trade in negative territory but rose into the black following inventory data that showed crude oil inventories had a build of 3.0 mln barrels when a draw of 0.45 mln was anticipated, while gasoline inventories had a draw of 1.514 mln vs consensus ranging between a draw of 0.5 mln and a build of 0.1 mln. The energy component advanced to a session high of $93.99 per barrel despite trading as low as $91.65 per barrel in early morning action. It eventually settled at $93.66 per barrel, or 0.6% higher.
July natural gas, on the other hand, fell deeper into the red following inventory data that showed a build of 88 bcf vs expectations for a build of 85-90 bcf. It settled 3.8% lower at $4.02 per MMBtu, just above its session low of $4.01 per MMBtu.
Precious metals extended yesterday's gains as a weaker dollar following bearish U.S. economic data that included initial claims and Q1 GDP supported the move higher.
June gold came off its session low of $1398.00 per ounce and advanced as high as $1417.50 per ounce. It settled at $1411.80 per ounce, booking a gain of 1.5%.
July silver rose to a session high of $23.06 per ounce and settled with a 1.1% gain at $22.70 per ounce after pulling-back in afternoon action.

4:31PM MEMC Elec confirms name change to SunEdison and on June 3 will trade under new stock symbol SUNE (WFR) 8.35 +0.73 :

4:21PM OmniVision (halted) beats by $0.10, beats on revs; guides Q1 EPS above consensus, revs above consensus (OVTI) 15.49 +0.43 : Reports Q4 (Apr) earnings of $0.31 per share, excluding non-recurring items, $0.10 better than the Capital IQ Consensus of $0.21; revenues rose 53.9% year/year to $336.2 mln vs the $319.02 mln consensus.

GAAP gross margin for the fourth quarter of fiscal 2013 was 17.5%, as compared to 16.9% for the third quarter of fiscal 2013 and 22.5% for the fourth quarter of fiscal 2012. The sequential increase in fourth quarter gross margin reflected a favorable change in product mix, partially offset by the unfavorable impacts from a decrease in revenues recorded on the sale of previously written-down inventory and an increase in allowance for excess and obsolete inventories.

Co issues upside guidance for Q1, sees EPS of $0.35-0.52, excluding non-recurring items, vs. $0.28 Capital IQ Consensus; sees Q1 revs of $355-390 mln vs. $342.77 mln Capital IQ Consensus Estimate.

4:06PM Mellanox Tech initiates process to delist ordinary shares from Tel Aviv Stock Exchange (MLNX) 55.93 +0.45 :

NVIDIA (NVDA) launched the NVIDIA GeForce GTX 770 GPU for $399.

Solar names seeing continued strength: RSOL +10%, LDK +6.6%, FSLR +5.9% (upgraded to Buy from Neutral at Goldman), JASO +5.7%, STP +5.5%, SPWR +4.9% (upgraded to Neutral from Sell at Goldman), WFR +3.4% ( added to Conviction Buy List at Goldman), CSIQ +3.1%

10:57 am Tech Sector trading higher by +0.6% today
The tech sector is trading higher today, along with gains in the broader market. Semiconductors are showing relative strength with the SOX trading 1.3% higher. Within the chip index, AVGO (+9.7%) is a notable standout. Among other major indices, the SPY is trading 0.6% higher today, while the QQQ is up 0.6% and the NASDAQ is trading 0.7% higher on the session. Among tech bellwethers, FB (+4.4%) is showing notable strength, while T (-0.3%) is under pressure.

In tech earnings last night: AVGO (+9.7%) posted a slight beat and guided inline PWRD (+1.4%) reported a slight beat and guided above consensusIn news, IQNT (+2.5%) declared a special dividend and initial quarterly dividend. DISH (+0.6%) announces tender offer in letter to CLWR (+21.3%) Board; sends off to acquire co for $4.40 per share. EMC (+5.5%) increased its share buyback program to $6 bln and instituted a quarterly dividend. VRNG (+3.5%) enters into a Settlement and License Agreement with MSFT (+0.5%). GLUU (+4.1%) selected Skillz for real-money mobile gaming in the U.S. In notable analyst upgrades this morning in the tech space, FB (+4.4%) was upgraded at Jefferies and BMO, FIO (+5.3%) was upgraded to Outperform at Credit Suisse, Needham upgraded RKUS (+4.3%) to Buy and CHU (+3.2%) and CHL (+1.5%) were upgraded to Neutral at Macquarie. Also, Oppenheimer initiated HIMX (+3.3%) with a Outperform. Among notable downgrades in tech, SMI (-5.2%) was downgraded to Underperform at Bernstein. PANW (+0.4%) and SPLK (-0.7%) are the notable names in tech scheduled to report after the close.

Avago Tech (AVGO) reported second quarter earnings of $0.61 per share, ex items, $0.03 better than the Capital IQ consensus of $0.58, while revenues fell 2.6% year/year to $562 million versus the $557.16 million consensus. The company issued in-line guidance for the third quarter with quarter over quarter rev growth of +6-9% calculating to $595.7-612.6 million versus the $599.03 million consensus. Gross margin was $288 mln, or 51.2 percent of net revenue. This compares with gross margin of $292 mln, or 50.7 percent of net revenue last quarter, and gross margin of $295 mln, or 51.1 percent of net revenue in the same quarter last year. "During the second fiscal quarter, revenues came in at the upper end of our guidance helped by improved resales at our distributors in our industrial business...Looking to the third quarter, we see broad-based improvement across all three of our end markets. We believe that the initial ramp of a product transition at a large smartphone OEM, a recovery in enterprise networking spending, as well as a continued, gradual uptick in industrial end market demand, could drive a sequential growth up to high single digits on a percentage basis." Q3 Guidance Metrics: Co sees Q3 non-GAAP gross margin of 51% plus/minus 1%. Capital expenditures for the third quarter are expected to be approximately $67 million. For the third quarter depreciation is expected to be $24 mln and amortization is expected to be $19 million.

Nuance Communications (NUAN) announced that the Company will host a conference call for investors and analysts to discuss its agreement with Tweddle Group to acquire the Tweddle Connect business. Tweddle Connect is an application and content service delivery platform for in-car infotainment systems, including the acclaimed Toyota Entune and Lexus Enform App Suite.

EMC (EMC) has increased its authorization to repurchase EMC common stock from $1 billion in 2013 to $6 billion over the three-year period ending December 31, 2015. Within this authorization, EMC expects to repurchase $3.5 billion of its common stock by the end of Q2 2014; this amount includes the $500 million EMC has spent on buybacks in 2013 to date. Additionally, the EMC Board has approved the initiation of a quarterly cash dividend to EMC shareholders. The first quarterly dividend of $0.10 per share of common stock will be paid on July 23, 2013 to shareholders of record as of the close of business on July 1, 2013.

Mondelez Int'l (MDLZ) announced that it has signed a global strategic agreement with Google. The deal will focus on mobile search, mobile display and mobile websites.

Needham upgrades Ruckus Wireless (RKUS) to Buy from Hold; tgt $16. They believe the recent pullback in the shares (down >50% from recent highs) provides an attractive entry point. They view Ruckus' competitive differentiation as intact, its enterprise business as unaffected by the bundling tactics of Cisco in the high-end enterprise market, and perhaps most importantly, its opportunity in the high-growth service provider Wi-Fi market as undiminished. As such, and with acknowledgement of pressure from its recent lock up expiration, which they expect could take at least a quarter of solid execution to offset, they recommend the shares for growth oriented investors.
icon url

ReturntoSender

06/02/13 12:59 PM

#10204 RE: ReturntoSender #6755

From Briefing.com: Weekly Recap - Week ending 31-May-13Dow -208.96 at 15115.57, Nasdaq -35.38 at 3455.91, S&P -23.67 at 1630.74

Sector Performance (% change of the day): Financials (-1.57%), Tech (-0.84%), Health Care (-2.17%), Consumer Staples (-1.80%), Consumer Discretionary (-1.09%), Industrials (-1.00%), Energy (-1.99%), Telecom (-1.42%), Materials (-1.51%), Utilities (-0.59%).

Dow -1.4%, S&P 500 -1.4%, Nasdaq -1%, Nasdaq 100 -1%, S&P 400 -0.9%, Russell 2000 -1%

The major averages ended on their lows as afternoon selling caused the S&P 500 to settle lower by 1.4%.

Equities saw losses in the opening minutes of the session as cautious overseas action kept buyers at bay. Contributing to the overseas softness was chatter questioning the strength of tonight's manufacturing PMI report out of China.

Shortly after the open, the key indices were able to erase most of their early losses in reaction to a pair of better-than-expected economic data points.

The Chicago PMI jumped to its highest level since March 2012 as the May print of 58.7 followed April's contractionary reading of 49.0. The large increase was fueled by an improvement in all of the key subcomponents as employment, order backlogs, production, and new orders all posted notable gains.

Separately, the final reading of the May University of Michigan Consumer Sentiment Survey moved up to 84.5, its best level since July 2007. The Briefing.com consensus expected no change from the preliminary reading of 83.7.

The positive surprises gave a brief boost to equities, but failed to spark a sustained rally as the major averages hovered near yesterday's closing levels until late afternoon selling took hold.

All ten sectors settled in the red as two defensive groups, consumer staples and health care, led to the downside. Most staple components registered losses and Dow member Procter & Gamble (PG 76.80, -2.29) fell 2.9%. Consumer staples endured selling pressure throughout the week as the group declined 3.2%, which erased its May gain.

Elsewhere, the health care sector fell 2.2% and trimmed its year-to-date gain to 20.1%, surrendering its spot atop this year's sector leaderboard to financials.

Financials were mixed in early action until afternoon selling splashed the component list with a wide-ranging shade of red, leaving Morgan Stanley (MS 25.90, +0.08) as the lone advancer. Even with today's 1.6% loss, the financial sector ended the week with a gain of 5.9%.

Technology stocks also enjoyed a strong week, but unlike financials, the group held up relatively well through the selloff. The relative strength of major components like Apple (AAPL 449.74, -1.84), IBM (IBM 208.02, -1.34), and Intel (INTC 24.28, +0.07) overshadowed the weakness in biotechnology and chipmakers. The iShares Nasdaq Biotechnology ETF (IBB 179.50, -3.73) fell 2.0% while the PHLX Semiconductor Index shed 1.2%.

Today's afternoon selling caused the CBOE Volatility Index (VIX 16.25, +1.72) to jump to its highest level since April 19 as market participants raised their near-term volatility expectations.

Looking at today's remaining economic data reveals a disappointment in the Personal Income and Spending report for April. Income was flat and spending declined 0.2% while the Briefing.com consensus expected both measures to be up 0.1%. Core PCE was also flat compared to a 0.1% increase in March.

Personal income for March was revised up to 0.3% from 0.2% while spending was revised down to 0.1% from 0.2%.

On Monday, April construction spending and the May ISM Index will be released at 10:00 ET while auto and truck makers will be reporting their May sales throughout the day.

Week in Review: Choppy Week Leaves S&P in the Red

On Monday, equity and bond markets were closed in observance of Memorial Day.

Tuesday ended with solid gains for the major indices as the Dow Jones Industrial Average logged its 20th consecutive advance on a Tuesday. The early action saw nine of ten sectors register gains of at least 1.0%. However, the defensively-geared utilities spent the entire day in negative territory before ending lower by 1.2%. A Deutsche Bank downgrade of Exelon (EXC 31.34, -0.16) weighed on the rate-sensitive sector, which extended its May loss to 7.8%. The health care space was able to outperform other counter-cyclical groups as biotechnology displayed strength. The iShares Nasdaq Biotechnology ETF settled higher by 1.3%.

Wednesday saw the major averages settle with modest losses as the S&P 500 shed 0.7%. Equities slipped out of the gate as sellers drove the major averages to their lows 90 minutes into the session. This marked the return of bargain hunters, who helped the S&P return to its opening levels. However, the relative weakness of several influential groups like energy and health care kept the benchmark average from regaining its flat line.

On Thursday, stocks settled with modest gains as late afternoon selling knocked the major averages from their highs following a headline from Nikkei news, indicating Japan plans to impose new foreign exchange margin trading rules. The news caused dollar/yen to slip into the red while also weighing on equities. Most major financials saw gains of at least 1.0% as Morgan Stanley climbed 3.4% to outperform its peers. Meanwhile, the broader financial sector rose 1.1% to extend its May gain to 7.6%. ..NYSE Adv/Dec 464/2596.
Best and worst performing S&P 500 industry groups for the week:
 
Industry Groups Gain Components
Gold +7.22% NEM
Automobile Manufacturers +6.02% F
Health Care Facilities +5.53% THC
Computer & Electronics Retail +4.91% BBY, GME, RSH
Tires & Rubber +4.05% GT
Investment Banking & Brokerage +3.51% ETFC, GS, MS, SCHW
Life & Health Insurance +3.51% AFL, LNC, MET, PFG, PRU, TMK, UNM
Semiconductor Equipment +3.43% AMAT, KLAC, NVLS, TER, WFR
Computer Storage & Peripherals +3.13% EMC, LXK, NTAP, QLGC, SNDK, WDC
Other Diversified Financial Services +2.50% BAC, C, JPM
Industry Groups Decline Components
Homebuilding -6.13% DHI, LEN, PHM
Household Products -6.07% CL, CLX, KMB, PG
Integrated Telecommunication Services -5.39% CTL, FTR, Q, T, VZ, WIN
Office REITs -5.21% BXP
Residential REITs -5.20% AIV, AVB, EQR
Diversified REITs -5.13% VNO
Industrial REITs -5.08% PLD
Building Products -5.06% MAS
Independent Power Producers & Energy Traders -4.93% AES, CEG, NRG
Agricultural Products -4.87% ADM

Index Started Week Ended Week Change % Change YTD %
DJIA 15303.10 15115.57 -187.53 -1.2 15.3
Nasdaq 3459.14 3455.91 -3.23 -0.1 14.5
S&P 500 1649.60 1630.74 -18.86 -1.1 14.3
Russell 2000 984.28 984.15 -0.13 -0.0 15.9


Power Integrations (POWI) introduced HiperPFS-2, a new family of high-efficiency, active-PFC ICs for offline applications from 100 W to 380 W.

Analyst comments: MLNX -3.1% ( downgraded to Neutral from Buy at UBS)

8:03AM Seagate Tech Announces Early Tender Offer Results and Amends Cash Tender Offer for Outstanding 7.75% Senior Notes Due 2018 and 6.80% Senior Notes Due 2016 (STX) 43.67 : Co announced the early tender results of the cash tender offer announced by its wholly owned subsidiary, Seagate HDD Cayman, on May 16, 2013 to purchase the outstanding 7.75% Senior Notes due 2018 and 6.800% Senior Notes due 2016. As of the previously announced early tender date at 5:00 p.m., New York City time, on May 30, 2013, HDD Cayman had received tenders for an aggregate principal amount of approximately $398 million of the 2018 Notes and an aggregate principal amount of approximately $190 million of the 2016 Notes.

HDD Cayman also announced today that it has increased the aggregate principal amount of notes that it has offered to purchase in the Tender Offer from $250 million to $700 million. In addition, HDD Cayman has announced that it has extended the period during which notes validly tendered are eligible to receive the Early Tender Premium from the previously announced early tender date of May 30, 2013 until June 13, 2013. The Tender Offer will expire at 11:59 p.m., New York City time, on June 13, 2013, unless extended or earlier terminated by HDD Cayman.

07:41 am Omnvision shares soar 22% following better than expected earnings
OmniVision (OVTI $18.90 +3.41) reported fourth quarter earnings of $0.31 per share, excluding non-recurring items, $0.10 better than the Capital IQ consensus of $0.21, while revenues rose 53.9% year/year to $336.2 million versus the $319.02 million consensus. GAAP gross margin for the fourth quarter of fiscal 2013 was 17.5%, as compared to 16.9% for the third quarter of fiscal 2013 and 22.5% for the fourth quarter of fiscal 2012. The sequential increase in fourth quarter gross margin reflected a favorable change in product mix, partially offset by the unfavorable impacts from a decrease in revenues recorded on the sale of previously written-down inventory and an increase in allowance for excess and obsolete inventories. Co issues upside guidance for Q1, sees EPS of $0.35-0.52, excluding non-recurring items, versus the $0.28 Capital IQ Consensus; sees Q1 revs of $355-390 million versus $342.77 million consensus.

Dell (DELL) announced that it has filed definitive proxy materials with the SEC in connection with a Special Meeting to be held on July 18, 2013 to approve a transaction under which Michael Dell, the co's Founder, Chairman and CEO, in partnership with global technology investment firm Silver Lake, will acquire the co for $13.65 per share in cash. The price represents a premium of ~ 37% over the average closing share price during the 90 calendar days ending Jan 11, 2013, the day prior to when rumors regarding the transaction entered the marketplace. The Special Committee of the Board of Directors has also issued an open letter to shareholders recommending that shareholders vote to approve the transaction and outlining the reasons for the recommendation. Letter states "Our analysis led us to conclude unanimously that a sale to the Michael Dell/Silver Lake group for $13.65 per share is the best alternative available -- in a challenging business environment it offers certainty and a very material premium over pre-announcement trading prices. It also shifts very substantial risks to the buying group -- risks that in any leveraged recapitalization would be retained by the stockholders and considerably magnified by leverage and the public nature of the resulting stub."
icon url

ReturntoSender

06/02/13 1:41 PM

#10207 RE: ReturntoSender #6755

InvestmentHouse Weekend Market Summary:

http://www.investmenthouse.com/weekendmarketsummary.htm

- Bad economic news, good economic news. The market gains some ground, loses some more. Familiar? Still in the post-Fed speak slump.
- Last minute end of month portfolio changes turn 0.5% losses into 1% losses.
- Personal spending and income disappoint as reality takes hold.
- Chicago PMI surges from contraction even as respondents still glum, almost morose.
- April Core Retail Sales cut by 2/3 in revisions.
- Americans have regained less than one-half their wealth lost in the recession.
- Best Buy founder hits the nail on the head as he identifies what is wrong with the economy.
- India economy posts its slowest growth in 10 years.
- Europe sets another unemployment record. The wrong way.
- Still in the taper-tantrum fade, but at least Friday helped move it along toward key support.
- New month, new money? A bit more downside then a reversal would be just right. Okay, so we are now quoting fairy tales.

To sell because of taper, or not to sell because of taper?

The Chicago PMI crushed expectations, but it was not enough to hearten a market that is in the throes of a 'to taper or not to taper' trading range/pullback. Or, perhaps it was too much for a market in the 'taper or not' throes. At this juncture, it is a bit difficult to determine what the market likes and what it dislikes. Too strong could be bad for keeping full-strength QE. Too weak could be bad for stocks if the Fed is hell-bound on starting the QE exit in three months as now three Fed officials have suggested.

Of course the difference this time is that it is clear that the Fed will start removing stimulus in August or September. As noted, three have said so, and last time I checked, three is still the charm. Thus the market, whether it is facing it now or not, will have to factor in a reduction in QE of SOME sort. There is discord on the Fed as just what to do, but Bernanke is on the record over a month ago saying removal of stimulus would consist of charging the banks interest. Heaven forbid; interest on borrowed money. How possibly could the banks survive?

That may sound wise-a**, but even with free money gratis the Fed many big banks STILL struggle to turn profits. That is HOW BAD their condition was and why I believe they should have been allowed to collapse via their own dead weight and bad decisions. Know what? They are STILL in bad shape as loan loss reserves have been siphoned off and are now reported as profits on recent quarterly reports. Indeed loss reserves are close to where they were pre-crisis as if no issues could possibly develop again. With the Fed at your back, however, there is NO NEED to change your ways.

But I digress. So yes taper is coming to an end of summer theater near you, but just what will be showing on the marquee, i.e. what kind of QE pullback implemented, is the question. Friday the market was wrestling with its post-Bernanke/Dudley/FOMC taper issues. In the end the resolution was closer. Not there but closer.

Futures were lower even as Japan's Nikkei recovered with a 1.4% gain after dive-bombing over 5% Thursday. As is often the case, however, futures were on the mend as the open approached. Weak Personal Spending numbers relieved fears of any QE take-back anytime soon. As stocks opened they jumped upside and in the first 20 minutes were flat. A quick test and then by midmorning stocks were positive.

That was the last time they were positive for the session. Midmorning proved the recovery peak. Stocks faded into early afternoon, held, then dipped again just before the last hour. SP500 down 0.5%, NASD just negative. A bounce looked promising and carried stocks higher to the last half hour of trade.

Then the bottom dropped. SP500 lost 12 points in the last half hour, HALF of what it lost on the day overall. 1/2% losses turned into 1.4% losses on SP500. Ouch.

SP500 -23.66, -1.43%
NASD -35.29, -1.01%
DJ30 -208.95, -1.36%
SP400 -0.92%
RUTX -0.70%
SOX -1.22%

After hours we heard many spooked journalism majors turned financial anchors querying their imminently informed guests as to what happened. A bunch of pabulum was ladled. It was tapering. It was the weekend. It was the Hindenburg Omen. It was uncertainty. It was the time of the month.

What was it? Well, it WAS the time of the month. It was the end of the damn month and there was some serious position shuffling magnified by an index rebalance. It was not a good finish and volume surged. Was it THE start of THE selling? There were a lot of simultaneous new highs and new lows, something called the 'Hindenburg Omen,' but it is just a possibility. The indices hit new highs, they are struggling with the possibilities of a liquidity drain via the Fed, they are approaching an important test and that will tell the tale for this pullback.

Indeed the first part of next week we could very well see some money put to work. Yes, just because the Fed is talking taper and some are spooked, it does not mean that those running to the market now, late of course, after sitting out four years, are going to turn back now. Thus we could see some early month money come to market next week. The real question is what happens after it is spent.

OTHER MARKETS

Dollar lower: 1.2995 versus 1.3042 euro

Bonds struggled: 2.16% versus 2.13%

Oil fell right back down: 91.7, -1.64

Gold sold off after a rebound: 1393.70, -18.10

THE ECONOMY

Quote of the Day by Jim Rogers: "You are not supposed to take money away from the competent people and give it to the incompetent so that the incompetent can compete with the competent people with their own money."

The data showed a wildly divergent split in the economy. This time it was not just the consumer's feelings, but the Chicago PMI blasted higher even as income and spending faded and retail sales were revised lower.

Personal spending and income disappoint as reality takes hold.

Personal Income, April (8:30): 0.0% actual versus 0.1% expected, 0.3% prior (revised from 0.2%)

Personal Spending, April (8:30): -0.2 actual versus 0.1% expected, 0.1% prior (revised from 0.2%)

It appears the consumer feels the sting of increased payroll taxes after all. Taxes do not rise and go quietly unnoticed.

Just look at disposable income, heading negative again. This is the most telling figure. Jobs restructuring to part-time versus full-time and the resultant less hours worked in order to meet the strictures of the healthcare law.

It may very well be that we continue to see a taper in spending (to use Fed parlance) as the summer doldrums hit.

Chicago PMI leaps out of contraction but those surveyed are not happy.

Chicago PMI, May: 58.7 actual versus 49.3 expected, 49.0 prior (no revisions)

The numbers were good in about every category. Weirdly strong. Statistically massively outside norms (a sigma of 8).

Production: 49.9 to 62.7. Absurd. I don't mean to belittle it and wish it was correct, but it is simply not in sync.

The comments were in stark contrast:
-Three months of declining sales in a core product line though some are hanging in.
-Business activity should be picking up and stronger at this time of year, but is delayed.
-New orders light since March, but sales reps remain optimistic.
-Months start good but end bad.

You make the call. The numbers are the numbers, but the comments are the comments.

Core Retail Sales Revert back in Line.

Perhaps the Chicago PMI will revert. Why do I bring that up? Because in mid-May when April Retail Sales ex-autos fell 0.1%, the core sales (ex-gas as well) rose 0.6% after a prior -0.1% showing and an expected 0.3% gain.

Today the Census Bureau released a revision down to 0.2%, one-third of what was originally reported. What was a big beat is now a miss. Makes you continue to wonder about the validity of data.

The irony of confidence versus reality: Michigan Sentiment hits a six year high similar to Consumer Confidence. This as wealth remains lost, disposable income negative.

Michigan Sentiment - Final, May (9:55): 84.5 actual versus 83.7 expected, 83.7 prior (no revisions)

Michigan Confidence and the Conference Board's Consumer Confidence both soared the past week to multi-year highs (84.5 and 76.2, respectively). It is often said that consumers say one thing and do the other. Perhaps they are feeling, as they have from time to time in this failed recovery, that things have to get better.

Problem is, reality is not matching expectations or more accurately, hope.

As noted earlier, the tax increases are hitting consumers with less take home pay, i.e. less disposable income. Indeed, negative disposable income in April. Moreover, the -0.2% in spending reported Friday was the first time in a year consumers cut their spending.

The Washington Post reported Thursday that according to the St. Louis Fed, US citizens have on average regained LESS THAN HALF of what they lost in the recession. Four years of so-called recovery and less than half of the wealth lost recovered. Shocking.

Indeed the Fed stated "A conclusion that the financial damage of the crisis and recession largely has been repaired is not justified."

$16T lost. $7.2T recovered despite four massive QE gambits from the Fed on top of the $900B in stimulus and TARP. Bang for the buck? Hardly. The right kind of stimulus works. History shows it. The wrong kind exacerbates the problem. History shows it: Great Depression, 1970's, 2008-2013 (and still counting).

Best house in a bad neighborhood?

India just reported its slowest growth in 10 years.

Europe just set another record in unemployment at 12.2% for April.

Our 2.4% in Q1 suggests they should try QE as well, right?

Best Buy Founder Speaks Wisdom.

Friday morning the Best Buy founder Anderson was on CNBC. Sage comments that our leaders should listen to and then try to understand. With their Keynesian backgrounds (if even that), it would be hard to grasp, but it is true wisdom.

In discussing the difficulty startups and small businesses are confronting in this economy, he noted BBY could have been stopped or could have failed many times from many different things during its infancy.

Anderson compared today to then and sees today's environment much more hostile to small business or startups. Today's regulatory schema and higher costs for small businesses creates an environment in which they cannot compete with the larger companies.

This is EXACTLY what we have said about this recovery all along: geared toward the large multinationals and established businesses from the original stimulus to the regulations. Those trying to start a business are hampered by the regulations and resultant costs, the latest being rising employee costs thanks to the Healthcare act and the inability to raise prices: they cannot raise prices but they have rising employment costs that threaten their ability to stay open. They are caught in an unworkable trap, and many have failed and many will fail.

It is axiomatic this scenario is NOT good for the jobs market as no new jobs will be created by the typical jobs engine for the US and recoveries. This only exacerbates the poor jobs situation we currently suffer from and it is not improving.

TECHNICAL SUMMARY

NASDAQ
Stats: -35.38 points (-1.01%) to close at 3455.91
Volume: 1.878B (+6.16%)

Up Volume: 400.36M (-999.64M)
Down Volume: 1.54B (+1.16B)

A/D and Hi/Lo: Decliners led 2.56 to 1
Previous Session: Advancers led 2.19 to 1

New Highs: 125 (-28)
New Lows: 28 (+13)

S&P
Stats: -23.67 points (-1.43%) to close at 1630.74
NYSE Volume: 777M (+22.17%)

A/D and Hi/Lo: Decliners led 5.08 to 1
Previous Session: Advancers led 1.47 to 1

New Highs: 171 (-46)
New Lows: 238 (+121)

DJ30
Stats: -208.96 points (-1.36%) to close at 15115.57

Volume: Jumped 6% NASDAQ and 22% NYSE but a lot of that was a rebalance that occurred on the day and those are manifested late in the session just as this one was.

A/D: Heavily downside on NYSE at -5:1. Now that is negative, but it is starting to get in the realm of extreme, and that is a positive for the upside. If things get bad enough you are ready to bounce; that is the theory. A better signal would be -8:1 or worse.

THE CHARTS:

Still working through the post-Bernanke taper talk but picked up speed downside as measured by the close. The silver lining: the sharp selloff puts stocks in a better position to complete this pullback similar to February . . .

SP500. Diving to the downside but closing in on the November up trendline marking the bottom of the uptrend channel. Huge volume but there was a rebalance. The bottom of the range will tell more of the tale. Note that MAC is solid, hitting a higher high on this higher high in the index, a confirmation that momentum remains good.

NASDAQ. Gave up the upper channel line but it has passed through that line this week as much as fecal matter passes through a goose so it doesn't, in terms of a barrier, mean much right now. It does show NASDAQ continuing to struggle after breaking the channel and hitting a new rally high. Still looks as if it has more to fall, but as with SP500 the MACD is solid and it was much more resilient than the other indices.

SP400. Hanging on at the 20 day EMA as it did all week. Not bad consolidation action but sure looks as if it wants to fall a bit more. 1160 looks likely (closed at 1184).

SOX. Down but still strong, closing above the November up trendline. Good relative strength on the week; very good. Maybe a bit topped out for now, but hard to say it is ready to roll over based upon the pattern other than just saying it is at the 2011 peak and that is acting as some resistance.

LEADERSHIP:

Big Names. AAPL down slightly, holding up very well in a down market. GOOG was fine, closing flat and at the same lows from Wednesday to Friday. A solid pullback. NFLX gapped and held some of the gain. PCLN remains solid.

Energy. Refiners still look good, e.g. MPC, VLO. Service companies are struggling maybe a bit but could form up nicely after a bit more testing, e.g. HAL. Still, there is some worrisome look to a few: SLB, WFT.

Financials. A good week, a strong week on the interest rate rise. Friday was off, giving some back after a very solid run. JPM, BAC. V is at an important level, bumping the 20 day EMA all week.

Retail. Taking it on the chin a bit as some leaders sold. KORS lost 4.3% after a great week to the upside. COST was hammered. TJX is trying to turn back up after a problematic midweek. LULU still looks good as does DECK.

Chips. Still solid, e.g. KLAC, ANAD.

Some sectors to consider as the indices hit new highs the past two weeks:

SP500 versus commodities: Commodities diving since February as SP500 soars starting November. The two started their divergence that same month.

THE MARKET

SENTIMENT INDICATORS

VIX: 16.3; +1.77
VXN: 15.99; +1
VXO: 15.82; +1.7

Put/Call Ratio (CBOE): 1.19; +0.33

Bulls versus Bears

Bears held steady . . . at a low level while builss faded a couple of points. Bulls are still at relative highs that have set off minor selling bouts over the past year, suggesting the market is set for a pullback. BUT . . . the market is in a pullback now.

Bulls: 52.1% versus 54.2% versus 52.1% versus 47.9% versus 44.3% versus 47.4% versus 50.5% versus 52.0% versus 49.5% versus 47.4% versus 50.00% versus 44.2% versus 46.3% versus 48.4% versus 52.6% versus 54.7% versus 54.3% versus 53.2% versus 51.1% versus 47.8% versus 46.8% versus 45.7% versus 43.6% versus 39.3% versus 37.2% versus 38.3% versus 43.6.

Background: Undercut 35%, the threshold for bullishness, in early June. As noted, hit 34% in early June. It did its job and the market is on the rally. Hard drop to 34 from 39.3% as economic reality and a choppy stock market hit. Off the 55+ level hit in late February. That was the highest level since April and May of 2011, the peak of the post-bear market high. 35% is the threshold level suggesting bullishness. To be seriously bearish it needs to get up to the 60% to 65% level.

Bears: 19.8% versus 19.8% versus 19.8% versus 18.8% versus 19.6% versus 20.6% versus 20.6% versus 19.4% versus 19.6% versus 18.6% versus 18.8% versus 21.1% versus 21.1% versus 22.1% versus 21.1% versus 21.1% versus 22.3% versus 22.3% versus 23.4% versus 24.5% versus 24.5% versus 23.4% versus 25.5% versus 27.7% versus 27.7% versus 28.7% versus 27.7%.

Summary: Over 35% is the threshold to be really be a good upside indicator. For reference, bearishness hit a 5 year high at 54.4% the last week of October 2008. The move over 50 took bearish sentiment to its highest level since 1995. Extreme negative sentiment. Prior levels for comparison: Bearishness peaked at 37.4% in September 2007. It topped the June 2006 peak (36%) on that run. That June peak eclipsed the March 2006 high (33%) and well above the 2005 highs that spawned new rallies (30% in May 2005, 29.2% in October 2005). That was a huge turn, unlike any seen in recent history.

MONDAY

Given the commentary to end the week after that last hour nosedive you would likely approach this coming week with a safety harness, flak jacket, helmet, survival kit, extra toilet paper, and extra batteries.

Maybe bad things happen. At least we likely see the result rather quickly given how SP500 closed near its November trendline, ditto DJ30. Always look at the bright side of life . . .

There are still quite a few of solid stocks in good position, e.g. GOOG, AAPL, PCLN, NFLX. Of course that can change with horrifying rapidity in a stock market that suddenly sells off after realizing it has floated on air provided by the Fed for the past 4 years.

It is the start of a new month. New money is going to come to the market. Last month it took a session but it got there. That would be pretty perfect: another downside move to the trendline and then new money to push it back up off support.

There is also the jobs report on Friday to add to the mix: Fed taper speculation, mixed economic data, sharp Friday selloff, and again jobs. Depending upon what happens early in the week, the jobs report will have more or less meaning. If things hold support, then it means more. If stocks are diving it won't matter a damn bit.

This pullback may be different this time around given the Fed and a lot of talk about starting to remove stimulus in three months. All the prior pullbacks since November were with the confidence, more or less, that the Fed was not 'there' yet in terms of removing stimulus. It is 'there' now in terms of deciding it needs to get out of this game.

Indeed, late Friday allegedly embargoed Fed Advisory Panel minutes were released and the language was, for the Fed, shocking:

"There is also concern about the possibility of a breakout of inflation . . and of an unsustainable bubble in equity and fixed-income markets given current prices."

Further:

"Uncertainty exists about how markets will reestablish normal valuations when the Fed withdraws . . . It will likely be difficult to unwind policy accommodation, and the end of monetary easing may be painful for consumers and businesses . . . The Fed may now be perceived as integral to the housing finance system."

Holy crap. This is the Fed. At least it IS cognizant of the issues. Cold comfort for a market mainlining on its stimulus.

Okay, the Fed is on board. I say the next question is how much and what method, but with that statement does it matter? Sure; the Fed won't go all at once. It is, based upon these stated concerns, terrified of screwing up but at the same time it knows that it will likely cause damage. Kind of like the Iranian President who believes the world will come to an end soon and he wants to help it along. He knows damage will be done, but it is for the ultimate greater good. Gracious.

'And when the fire rains down from the sky and destroys the earth, that will be a beautiful wonderment.' Oh yes, and he is the President of a country.

Worrisome words from the Fed, worrisome end to the week. I still don't like the feel of the market here as stated several times the past week. But, alas, that is my gut, my hunch and it can be right or millions of other investors and traders can overpower whatever my gut suggests.

It does, however, appear clear the indices will meet support early on and we will see how they react along with some seriously quality stocks (e.g. GOOG, AAPL, NFLX, PCLN, DDD, PCYC, GMCR). Perhaps it is different this time. We will see soon enough. Keep good stops on current positions and jump on stocks ready to move, up or down.

Have a great weekend!

Support and resistance

NASDAQ: Closed at 3455.91

Resistance:
3485 is the upper channel line for the November 2012 to present uptrend
3521 is the August 2000 low.
3532 is the early May high

Support:
3422 is the prior May 2013 low
3401 is the May 2000 closing low
3389 is the November 2012 up trendline
3371 is the early May 2013 upper gap point
The 50 day EMA at 3358
3321 from April 2000
3227 is the April 2000 intraday low
The 2011 up trendline at 3225
3197 is the September 2012 post-bear market high
3171 is the October intraday high
The 200 day SMA at 3147
3134 is the March 2012 post-bear market peak
3130 from some January 2013 lows
3104-3112 from August and mid-October peaks.
3101 is the August 2012 high
3090 is the mid-March interim high
3076 is the late April 2012 high and the 1/2013 low after gapping higher
3062 is the December 2012 prior peak
3042 from 5/2000 low and several other price points
3024 is the gap point from early May
3000 is the February 2012 post-bear market high
2999 is the bottom of the August 2012 consolidation
2988 is the July 2012 high
2977 to 2980 is the bottom of the late October 2012 consolidation, July 2012 peak
2962 is the April 2012 low
2950 is the mid-April closing low
2942 is the mid-June 2012 high
2900 is the March 2012 intraday low
2858 is the late July 2011 peak
2847 is the mid-May 2012 low
2838 from the July 2012 lows

S&P 500: Closed at 1630.74

Resistance:
1687 is the May high and post-bear market high
1692 is the upper trendline in the channel

Support:
The November up trendline at 1623
The 50 day EMA at 1605
1598 is the April 2013 high and former all-time high
1576 from October 2007, the prior all-time high
1556 from July 2007
1541 is the April 2013 closing low in that pullback inside the uptrend
1539 from June 2007
1531 is the recent high
1499 from January 2008
The 200 day SMA at 1490
1475 is the September 2012 high
1471 is the October 2012 intraday high
1466 is the September 2012 closing peak and rally closing high
1440 from November 2007 closing lows
1434 from early November 2012
1433 from August 2007 closing lows
1427 is the August 2012 peak
1425 from May 2008 closing highs and the October 2012 low
1408 is the late October 2012 range closing low
1406 is the early May 2012 peak
1402.22 - 1400 is the closing low of the August 2012 lateral consolidation

Dow: Closed at 15,21.30

Resistance:
15,542 is the May 2013 high
15,645 is the upper channel line for the trend off the November low.

Support:
The November up trendline at 15,057
14,888 is the April peak and prior all-time high
The 50 day EMA at 14,892
14,198 from the October 2007 high
14,149 is the February 2013 high
14,022 from 7-07 peak
14,010 from the early February 2013 consolidation
The 200 day SMA at 13,816
13,784 is the late February 2013 closing low
13,692 from 6-2007 peak
13,668 from 12-2007 peak
13662 is the October 2012 intraday high
13,653 is the September 2012 high
13,557 to 13,662
13,413 from the late September 2012 low
13,300 to 13,331 is the August 2012 post-bear market high
13,297 is the April 2012, prior post bear market high
13,058 from the May 2008 peak on that bounce in the selling
13,056 is the February 2012 high
12,716 is the April 2012 closing low
12,524 is a range of support from early 2012 and summertime 2012

Economic Calendar

May 28 - Tuesday
- Case-Shiller 20-city, March (9:00): +10.9% actual versus 10.1% expected, 9.3% prior (no revisions)
- Consumer Confidence, May (10:00): 76.2 actual versus 72.5 expected, 68.1 prior (no revisions)

May 29 - Wednesday
- MBA Mortgage Index, 05/25 (7:00): -9.8% prior

May 30 - Thursday
- Initial Claims, 05/25 (8:30): 354K actual versus 340K expected, 344K prior (revised from 340K)
- Continuing Claims, 05/18 (8:30): 2986K actual versus 3000K expected, 2923K prior (revised from 2912K)
- GDP - Second Estimate, Q1 (8:30): 2.4% actual versus 2.5% expected, 2.5% prior (no revisions)
- GDP Deflator - Second Read, Q1 (8:30): 1.1% actual versus 1.2% expected, 1.2% prior (no revisions)
- Pending Home Sales, April (10:00): 0.3% actual versus 1.5% expected, 1.5% prior (no revisions)
- Natural Gas Inventories, 05/25 (10:30): 88 bcf actual versus 89 bcf prior (no revisions)
- Crude Inventories, 05/25 (11:00): +3.0 mln actual versus -0.338M prior (no revisions)

May 31 - Friday
- Personal Income, April (8:30): 0.0% actual versus 0.1% expected, 0.3% prior (revised from 0.2%)
- Personal Spending, April (8:30): -0.2 actual versus 0.1% expected, 0.1% prior (revised from 0.2%)
- PCE Prices - Core, April (8:30): 0.0% actual versus 0.1% expected, 0.1% prior (revised from 0.0%)
- Chicago PMI, May (9:45): 58.7 actual versus 49.3 expected, 49.0 prior (no revisions)
- Michigan Sentiment - Final, May (9:55): 84.5 actual versus 83.7 expected, 83.7 prior (no revisions)

June 3 - Monday
- ISM Index, May (10:00): 50.9 expected, 50.7 prior
- Construction Spending, April (10:00): 1.1% expected, -1.7% prior
- Auto Sales, May (14:00): 5.1M prior
- Truck Sales, May (14:00): 6.8M prior

June 4 - Tuesday
- Trade Balance, April (8:30): -$41.1B expected, -$38.8B prior

June 5 - Wednesday
- MBA Mortgage Index, 06/01 (7:00): -8.8% prior
- ADP Employment Change, May (8:15): 157K expected, 119K prior
- Productivity-Rev., Q1 (8:30): 0.6% expected, 0.7% prior
- Unit Labor Costs, Q1 (8:30): 0.6% expected, 0.5% prior
- Factory Orders, April (10:00): 1.5% expected, -4.9% prior (revised from -4.0%)
- ISM Services, May (10:00): 53.5 expected, 53.1 prior
- Crude Inventories, 06/01 (10:30): 3.0M prior

June 6 - Thursday
- Challenger Job Cuts, May (7:30): -6.0% prior
- Initial Claims, 06/01 (8:30): 347K expected,
- Continuing Claims, 05/25 (8:30): 2960K expected,
- Natural Gas Inventories, 06/01 (10:30): 88 BCF prior

June 7 - Friday
- Nonfarm Payrolls, May (8:30): 164K expected, 165K prior
- Nonfarm Private Payrolls, May (8:30): 174K expected, 176K prior
- Unemployment Rate, May (8:30): 7.5% expected, 7.5% prior
- Hourly Earnings, May (8:30): 0.2% expected, 0.2% prior
- Average Workweek, May (8:30): 34.5 expected, 34.4 prior
- Consumer Credit, April (15:00): $13.5B expected, $8.0B prior
icon url

ReturntoSender

06/03/13 5:43 PM

#10208 RE: ReturntoSender #6755

From Briefing.com: 4:15 pm : The major averages registered modest gains with the Dow Jones Industrial Average leading the way, adding 0.8%. The Nasdaq eked out a gain of 0.2% while the S&P 500 climbed 0.5%.

After showing little change in the opening minutes of today's session, the three indices jumped to their highs in the wake of the May ISM report. Although the reading missed expectations, the disappointing data point was perceived as a sign the Federal Reserve will maintain its current accommodative policy course.

The brief spike was followed by a return to session lows as the Nasdaq and S&P 500 dipped into the red, where they spent most of the afternoon.

However, the Dow never saw red as Merck (MRK 48.45, +1.75) and Intel (INTC 25.24, +0.96) boosted the price-weighted index from the opening bell. Merck rose 3.8% after the company presented the interim results of one of its trials while Intel gained 4.0% following the weekend public debut of its fourth generation processors. Other chipmakers also saw gains as the PHLX Semiconductor Index advanced 0.5%.

Although the tech sector registered a slim gain, the tech-heavy Nasdaq trailed behind the other averages as biotechnology pressured the index throughout the day. The iShares Nasdaq Biotechnology ETF (IBB 177.43, -2.07) fell 1.2%.

While the afternoon rally enabled most sectors to erase their early losses, financials, homebuilders, and transportation-related stocks spectated from the sidelines.

Major financials displayed mixed performance as Bank of America (BAC 13.55, -0.11) fell 0.8% while Goldman Sachs (GS 163.56, +1.48) rose 0.9%. Meanwhile, the financial sector ended little changed.

Elsewhere, the weakness in homebuilders sent the SPDR S&P Homebuilders ETF (XHB 30.63, -0.27) back to its early May levels as the ETF lost 0.9%.

Finally, softness among airlines and truckers pressured the Dow Jones Transportation Average as the bellwether complex ended flat.

The CBOE Volatility Index (VIX 16.20, -0.10) ended in the red after climbing as high as 17.58% intraday.

Today's volume was well above average as 880 million shares changed hands on the floor of the New York Stock Exchange.

Looking at today's economic data, the ISM Manufacturing Index fell to 49.0 in May from 50.7 in April. That was the first contraction in the ISM Index since November 2012, and the lowest reading since June 2009. The Briefing.com consensus expected the index to increase modestly to 50.9.

Separately, construction spending increased 0.4% in April after declining an upwardly revised 0.8% (from -1.7%) in March. The Briefing.com consensus expected construction spending to increase 1.1%.

Residential construction, which was supposed to be a positive contributor to construction spending growth in April, fell 0.1%. The drop was the result of a sharp decline in home improvement spending (-3.2%).

Tomorrow's economic data will be limited to the 8:30 ET release of the April trade balance. The Briefing.com consensus expects a trade deficit of $41 billion to follow the March deficit of $38.8 billion.DJ30 +138.46 NASDAQ +9.46 SP500 +9.68 NASDAQ Adv/Vol/Dec 1459/1.96 bln/1019 NYSE Adv/Vol/Dec 1384/880.0 mln/1694

3:30 pm :

July crude oil steadily climbed higher during today's floor trade as it got support from a slide in the dollar index following data showing the ISM Manufacturing Index contracting for the first time since November 2012. The energy component lifted off its session low of $92.23 per barrel set in early morning floor trade and brushed a session high of $93.68 per barrel. It booked a 1.6% gain as it settled at $93.41 per barrel.
July natural gas climbed to a session high of $4.04 per MMBtu but lost momentum in afternoon floor trade. It erased all of its earlier gains as it settled the session unchanged at $3.98 per MMBtu.
Aug gold gained strength as the dollar index tumbled. The yellow metal took off from its session low of $1390.00 per ounce and rose as high as $1416.50 per ounce. It spent afternoon action trading just below that level and settled with a 1.3% gain at $1412.10 per ounce.
July silver rallied to a session high of $22.92 per ounce in late morning pit action after trading as low as $22.27 per ounce earlier in the session. It eventually settled at $22.73, booking a gain of 2.2%.

1:13PM DSP Group: ISS expresses concern about board leadership at DSP and recommends withholding votes from former Chairman Eliyahu Ayalon (DSPG) 7.93 -0.01 : Starboard Value, one of the largest shareholders of DSP Group, beneficially owning approximately 10.1% of its outstanding common stock, responded to the release of reports by proxy advisory firms Institutional Shareholder Services ("ISS") and Glass Lewis ("Glass Lewis") regarding Starboard's election contest at DSP. "We agree with ISS' concern regarding Board leadership at DSP, particularly the actions of former Chairman Ayalon. We, too, find the actions of the Board's leadership extremely troubling, including the Board's failure, according to ISS, 'to ensure that the two shareholder nominees appointed as part of the settlement in 2012 were also assigned to committees and fully integrated into board discussions.' We believe that despite the Board's recent reactionary actions the Board continues to resist necessary change at DSP. Therefore, we are encouraged that ISS has sought to address 'ongoing board reluctance to embrace a shareholder perspective' by recommending that DSP's shareholders WITHHOLD votes from former Chairman Ayalon at the upcoming annual meeting."

9:52AM Intel bucking the broader market opening weakness as price breaks out above its May range highs along 24.50 on an upgrade (INTC) 25.42 +1.14 :

Cree (CREE) reported it has surpassed a significant milestone in shipping over two million GaN High Electron Mobility Transistors for cellular telecommunications.

sTec (STEC) announced the sTec s3000 storage appliance. The s3000 combines the performance, reliability and endurance of sTec's solid-state drive technology with Microsoft (MSFT) Windows Storage Server 2012 storage clustering, virtualization and management features.

8:32AM Altera raises quarterly dividend to $0.15 from $0.10, new annual yield 1.8% (ALTR) 33.19 :

8:09AM Microchip subsidiary SST and Novocell Semiconductor announce acquisition of Novocell by SST; transaction is expected to be immediately accretive on a non-GAAP basis (MCHP) 36.48 : Co announced that Microchip and SST have signed a definitive agreement to acquire Novocell. The acquisition was approved by the Boards of Directors of each company and is being announced today at the 2013 Design Automation Conference (DAC) in Austin, Texas. The terms of the deal are confidential. The transaction is expected to close in early June 2013 and is expected to be immediately accretive on a non-GAAP basis.


F5 Networks (FFIV 82.40, -0.81) is off by 1.0% after Morgan Stanley downgraded the stock to 'Equal-Weight' from 'Overweight.'

7:47AM SunEdison: MEMC Electonic Materials (formerly WFR) has changed its name to SunEdison, effective today (SUNE) 8.07 :

PMC (PMCS) announced the industry's first low-profile, 24-port, PCIe Gen3 6Gb/s SAS/SATA RAID adapter, enabling new dense architectures for scale-out or space-limited data centers.

ARM (ARMH) announced an optimized IP solution designed to power the 580 million mid-range mobile devices expected over the next two years. The mid-range market is projected to exceed the number of premium smartphones and tablets beginning in 2015.

09:09 am Intel upgraded to Outperform at FBR Capital; tgt raised to $28: . FBR upgrades INTC to Outperform from Mkt Perform and raises its tgt to $28 from $23. On the eve of Computex and the public debut for "Haswell," FBR acknowledges the challenges ahead for Intel in the PC market, but now believes the Co has added more than enough new avenues of growth to replace lost PC units. Additionally, in its discussions with engineers intimately involved in the handset design process, they have unanimously expressed a renewed interest in Intel's mobile SoCs, owing to expected power and performance advancements in the upcoming Silvermont SoCs. Additionally, FBR's comprehensive research into microservers now gives it confidence in the Co's defensibility of the server market.
icon url

ReturntoSender

06/04/13 11:57 PM

#10209 RE: ReturntoSender #6755

From Briefing.com: 4:15 pm : The major averages ended with modest losses as the S&P 500 shed 0.6%.

Equities opened the session on an upbeat note as the Dow Jones Industrial Average appeared poised for its 21st consecutive Tuesday of gains. However, that changed midway through the trading day when the major averages dipped into the red, where they remained until the close.

The afternoon weakness left eight of the ten sectors in the red, but was most noticeable among cyclical groups as energy, financials, and industrials lost between 0.6% and 0.9%.

The energy space trailed behind the broader market from the start, and was unable to hold a gain even as every other sector displayed early strength. The growth-sensitive group was largely unaffected by the swings in crude oil as the energy component traded in a $2.00 range before ending little changed at $93.50 per barrel.

Elsewhere, weakness in all major banks pressured the financial sector, which settled lower by 0.9%.

Another growth-sensitive group, industrials, endured sector-wide selling as defense and transportation stocks retreated. The PHLX Defense Index fell 0.7% while the Dow Jones Transportation Average shed 0.5%.

Discretionary stocks outperformed other growth-oriented sectors, but a large subsector, homebuilders, did not share in the relative strength. Several major builders saw losses of more than 3.0%, and the iShares Dow Jones Home Construction ETF (ITB 23.43, -0.67) fell 2.8%.

Also of note, the technology sector saw some mixed performance as chipmakers advanced while major components lagged. The PHLX Semiconductor Index rose 0.4% while Dow component Microsoft (MSFT 34.99, -0.60) declined 1.7%.

On the upside, the telecom sector spent the entire day in positive territory as two major components, AT&T (T 35.67, +0.60) and Verizon Communications (VZ 48.84, +0.18), settled with respective gains of 1.7% and 0.4%.

In M&A news, Salesforce.com (CRM 37.80, -3.24) acquired ExactTarget (ET 33.69, +11.59) for $33.75 per share. The total transaction is valued at $2.5 billion, and the purchase price represents a 53% premium to ExactTarget's closing price from yesterday.

Today's economic data was limited to the April trade deficit, which widened to $40.3 billion from $37.1 billion. The Briefing.com consensus expected the deficit to come in at $41.0 billion.

Tomorrow, the weekly MBA Mortgage Index will be released at 7:00 ET while May ADP Employment Change will be announced at 8:15 ET. The revised first quarter productivity reading and unit labor costs will be released at 8:30 ET while April factory orders and May ISM Services will be announced at 10:00 ET. The day will be topped off with the 14:00 ET release of the Federal Reserve's Beige Book for June.DJ30 -76.49 NASDAQ -20.11 SP500 -9.04 NASDAQ Adv/Vol/Dec 796/1.77 bln/1680 NYSE Adv/Vol/Dec 1105/786.8 mln/1921

3:30 pm :

Aug gold fell back below $1400 per ounce as the Reserve Bank of India extended import restrictions on the yellow metal to include state-run trading companies and others authorized to directly import gold. A stronger dollar index also put pressure on prices. Gold fell as low as $1388.10 per ounce in late morning action. Unable to erase much of the loss, gold settled 1.0% lower at $1397.40 per ounce.
July silver also struggled in negative territory during today's floor trade. It brushed a session low of $22.23 per ounce and settled at $22.42 per ounce, booking a loss of 1.4%.
July crude oil popped into positive territory and to a session high of $94.41per barrel in late morning action. However, the energy component was unable to hold on to the gain and fell back into the red, settling with a 0.1% loss at $93.33 per ounce.
July natural gas chopped around in a fairly tight range between $3.99 and $4.03 per MMBtu during today's floor trade. It eventually settled at $4.00 per MMBtu, or 0.5% higher.

12:33PM Dell and Oracle (ORCL) expand strategic alliance (DELL) 13.45 0.00 : Today at Dell Enterprise Forum, Dell announced an expanded worldwide alliance with Oracle designed to help customers of all sizes realize the strength of the combined solutions of both companies. The two companies will introduce a new x86 infrastructure offering that combines Dell's hardware with Oracle's software, enabling organizations to deploy and manage applications faster with increased performance, flexibility and value at every scale. As part of the agreement, Oracle has named Dell a preferred x86 partner, and Dell has named Oracle a preferred enterprise infrastructure partner, including Oracle Linux.

9:38AM Semiconductor Hldrs displays early relative strength, pushes slightly above its May high (SMH) 38.94 +0.35 : ALTR +2.3%, TXN +1.9%, AMD +1.9%, ADI +1.6%, XLNX +1.4%, LLTC +1.3%, INTC +1.2%, NVDA +1.2%, MU +1.1%, AMKR +1%, BRCM +1%, KLAC +0.8%, MRVL +0.8%.

9:06AM QLogic announces restructuring plan; expects to achieve annualized cash savings of ~ $20 mln; reaffirms 1Q2014 guidance (QLGC) 9.81 : Co announced it is implementing a restructuring plan designed to streamline business operations with the goal of driving long-term profitable growth. The restructuring plan includes a workforce reduction, the consolidation of several engineering activities, and enhanced product development focus. These restructuring activities are part of an overall plan to deliver greater value to customers and shareholders, while accelerating innovation.

QLogic anticipates the restructuring actions will be substantially completed within the next twelve months. Once fully implemented, the company expects the restructuring actions will achieve annualized cash savings of approximately $20 million, primarily in operating expenses. QLogic has plans to reinvest part of these savings in the development of new products and programs.

The company estimates that it will incur pre-tax GAAP charges between $20 million and $23 million in connection with these restructuring actions, the majority of which will be recorded during the first half of fiscal year 2014. The company reaffirms its previously announced non-GAAP financial guidance for the first quarter of fiscal year 2014.

Broadcom (BRCM) announced that ZTE selected Broadcom's small cell baseband processor family to integrate into its 3G small cell residential access points.

8:02AM AMD Announces Extension of Exchange Offer for Its 7.50% Senior Notes Due 2022 for Registered Notes (AMD) 3.96 : Co announced that its pending offer to exchange any and all of its outstanding 7.50% Senior Notes due 2022, which were issued in a private placement for an equal principal amount of new 7.50% Senior Notes due 2022. Tenders with respect to approximately $499,615,000 aggregate principal amount of the Private Notes, out of a total of $500,000,000 aggregate principal amount eligible to participate in the exchange offer, have been received to date.

STM +4.6% (being attributed to executive comments on order growth)

6:44AM DSP Group: ISS, Glass Lewis and Egan Jones all recommend DSP Group stockholders vote the gold proxy card in support of co's slate of directors (DSPG) 8.23 : Co released the following letter to its stockholders: "We are pleased to inform you that with yesterday's announcement from Egan Jones Proxy Services that it is supporting the Company's slate of nominees, ALL three of the independent proxy advisory services - ISS, Glass Lewis and Egan Jones Proxy Services - have now recommended that stockholders vote the Company's GOLD proxy card... They were not swayed by Starboard's false accusations, misrepresentations and attempts at misdirection, and neither should you be swayed. They based their analyses on the facts. The facts are that Starboard didn't present a plan to grow the Company; their nominees lack the experience and expertise required to successfully compete in our markets and Starboard already has adequate representation on the Board."

08:10 am Microchip Up 4.4% Pre-market After Raising Guidance

Microchip raised first quarter guidance, now forecasting non-GAAP EPS of $0.52-0.56 (raised from $0.50-0.54) vs $0.51 Capital IQ Consensus estimate and sees sales +4-7% sequentially, which equates to ~$447.3-460.2 mln vs $447.8 mln Capital IQ Consensus Estimate (raised from +2-6%).
There will be no conference call associated with this press release. Microchip will be attending the Stephens 2013 Spring Technology Conference on Tuesday, June 4, 2013.
"We have continued to see a very strong bookings and business environment in the June quarter. We have received excellent visibility from our customers, allowing us to build our products in a good mix and meet our customers' requirements for the quarter," said Steve Sanghi, Microchip's President and CEO.

08:55 am Altera upgraded to Buy at Argus: . Argus upgrades ALTR to Buy from Hold. On 6/3/13, Altera announced that it would raise its quarterly dividend by 50%, to $0.15 per common share from a prior $0.10. Firm believes the payout hike, which represents a more shareholder-friendly capital allocation strategy, is well supported by current and future free cash flows. Firm's full-year 2013 earnings est is $1.54 per diluted share. For 2014, its forecast is $1.83 per diluted share. Both estimates are a few percentage points above consensus. Firm's five-year EPS growth rate forecast for ALTR is 11%. In its view, the year-to-date underperformance of ALTR shares creates an opportunity to initiate or add to positions at an attractive level.

FBR upgraded Intel (INTC) to Outperform from Market Perform and raised its target to $28 from $23. On the eve of Computex and the public debut for "Haswell," FBR acknowledges the challenges ahead for Intel in the PC market, but now believes INTC has added more than enough new avenues of growth to replace lost PC units. Additionally, in its discussions with engineers intimately involved in the handset design process, they have unanimously expressed a renewed interest in Intel's mobile SoCs, owing to expected power and performance advancements in the upcoming Silvermont SoCs. Additionally, FBR's comprehensive research into microservers now gives it confidence in the company's defensibility of the server market.

Agilysys (AGYS) announced that it has entered into a definitive agreement to sell its Retail Solutions Group to an affiliate of Clearlake Capital Group, L.P. for total consideration of $34.55 million in cash, subject to customary closing conditions. Following completion of the proposed transaction, expected to occur later this summer, Agilysys' business will be focused exclusively on providing software enabled solutions to the hospitality industry. The Company estimates that, as of the closing, it will have approximately $110 million in cash and cash equivalents, representing approximately $4.90 per common share outstanding, and no debt.
icon url

ReturntoSender

06/10/13 10:54 PM

#10213 RE: ReturntoSender #6755

From Briefing.com: 4:20 pm : Unlike Friday, the stock market didn't provide a lot of trading excitement today. The major indices spent time on either side of the unchanged mark, but were never able to achieve a good deal of separation either way as buyers and sellers alike lacked conviction.

There was some initial excitement when it was announced before the open that Standard & Poor's raised its US outlook to Stable from Negative, citing a lessening of downside risks to its AA+ rating for US sovereign debt. That positive-sounding headline helped stocks get off to a decent start, yet buying efforts soon tapered off as a concurrent rise in long-term interest rates seemed to limit the stock market's enthusiasm for the outlook change.

The yield on the 10-year note moved up to 2.23%, or roughly six basis points higher than where it settled on Friday. The move was striking considering the switch by Standard & Poor's should have been construed as a good thing for the Treasury market. The ensuing weakness, though, seemed to fit with the sense that an improving economic outlook would lessen the safety premium in Treasuries and encourage a rotation into stocks. Nonetheless, not all participants are convinced that the economy will gain steam in coming months; hence, there were some underlying concerns that the jump in rates could retard the recovery as they interfere with the rebound in the housing market. To that end, the SPDR S&P Homebuilders ETF (XHB 30.26, -0.25) dropped 0.8% today.

The S&P Utilities sector, which is another rate-sensitive area, slipped 0.2% and was a relative laggard in the sector rankings. Indicative of today's lackluster trading action, there wasn't a single sector that moved up, or down, more than 1.0%. The big winner was telecom services, which gained 0.8%, while the energy, industrial, and consumer discretionary sectors all tied on the losing end of things with a 0.3% decline.

Apple (AAPL 438.89, -2.92) was the story stock of the day as attention turned to the company's Worldwide Developers Conference. Shares of AAPL traded higher for most of the session, but rolled over late as the announcement of iOS 7 and iRadio were greeted in a ho-hum manner.

Dow component McDonald's (MCD 99.51, +1.23) enjoyed a better fate, having started strong and remaining strong on news its global comparable-store sales increased a better-than-expected 2.6% in May. The gains in McDonald's, though, weren't enough to keep the Dow from incurring a small loss as a drop in higher-priced IBM (IBM 205.02, -1.33) and 3M (MMM 110.81, -0.30) were offsetting influences.

There wasn't any economic data out of the US today, but St. Louis Fed President Bullard did address economic conditions in a speech on the global economy. Mr. Bullard is a voting FOMC member and he walked the party line of providing a little something for everyone in the tapering debate. To wit, he suggested the low rate of inflation could be justification for the Fed to maintain its aggressive asset buying over a longer time frame and then added that an improved labor market could mean the Fed might slow the pace of its asset purchases.

The Wholesale Inventories report for April (Briefing.com consensus +0.2%; prior +0.4%) is the only piece of US data slated for release on Tuesday. It won't be a market mover, so the direction of currencies and interest rates could be dictating factors along with any new insight from Germany's Constitutional Court on the legality of the eurozone's crisis-management measures.

Today's volume was light with just 595 mln shares changing hands at the NYSE.DJ30 -9.53 NASDAQ +4.55 SP500 -0.57 NASDAQ Adv/Vol/Dec 1593/1.5 bln/895 NYSE Adv/Vol/Dec 1333/595 mln/1679

3:30 pm : July crude oil dipped to a session low of $95.19 per barrel in early morning action as initial strength in the dollar index weighed on prices. However, the energy component managed to erase some of the earlier losses once the dollar index began to pull back. It spent afternoon floor action chopping around just below the unchanged level and settled 0.3% lower at $95.80 per barrel. July natural gas rose to a session high of $3.87 per MMBtu in morning action but lost steam and fell into negative territory. It dipped to a session low of $3.78 per MMBtu and eventually settled with a 0.8% loss at $3.80 per MMBtu.
August gold slid into the red and to a session low of $1375.10 per ounce as the S&P revised its U.S. rating to 'Stable' from 'Negative'. However, the yellow metal quickly reversed and recovered into positive territory. It settled 0.2% higher at $1386.00 per ounce, or just below its session high of $1386.60 per ounce. July silver brushed a session low of $21.64 per ounce in early morning action but spent the remainder of floor trade trending higher in choppy fashion. It touched a session high of $21.99 and settled with a 1.0% gain at $21.92 per ounce.

5:26PM Diodes increases Q2 guidance; sees revs of $210-218 mln (raised from $206-218 mln) vs $212.76 mln Capital IQ Consensus Estimate (DIOD) 23.51 -0.01 : Co stated that it is increasing its revenue and gross profit margin guidance for the second quarter of 2013. The revised guidance reflects the expectation that revenue will range between $210 million and $218 million sequentially (vs $212.76 mln Capital IQ Consensus Estimate) versus prior guidance of $206 million to $218 million. GAAP gross profit margin is expected to be 28 percent, plus or minus 2 percent versus prior guidance of 27 percent, plus or minus 2 percent. Non-GAAP gross profit margin, which excludes the BCD inventory valuation adjustment, is expected to be 29.5 percent, plus or minus 2 percent, versus prior guidance of 29.0 percent, plus or minus 2 percent. Diodes maintained its second quarter guidance expectations on the following: GAAP operating expenses of 23.6 percent of revenue, plus or minus 1 percent; non-GAAP operating expenses, excluding amortization of intangible expenses, restructuring expenses, and BCD retention bonus accruals, of 21.3 percent of revenue, plus or minus 1 percent; income tax rate of 14 to 20 percent; and shares used to calculate GAAP EPS of approximately 47 million.

4:31PM Texas Instruments tightens Q2 guidance to the mid-point of prior guidance (TXN) :

4:30PM Texas Instruments: Co revises Q2 EPS to $0.39-0.43 , prior guidance $0.37-0.45 vs. $0.41 GAAP consensus; revises revenue range to $2.99-3.11 bln from $2.93-3.17 bln vs. $3.06 bln consensus (TXN) :

Apple (AAPL 438.89, -2.92) was the story stock of the day as attention turned to the company's Worldwide Developers Conference. Shares of AAPL traded higher for most of the session, but rolled over late as the announcement of iOS 7 and iRadio were greeted in a ho-hum manner.

4:01PM Plexus announces appointment of Todd Kelsey to the position of Chief Operating Officer (PLXS) 29.84 +0.23 : Co announced that Todd Kelsey, 48, is appointed to Executive Vice President and Chief Operating Officer. With his promotion to Chief Operating Officer, Mr. Kelsey assumes leadership responsibilities for all facets of the company's customer-focused Product Realization Value Stream, including: market development, customer services, engineering solutions, manufacturing solutions, supply chain and regional teams. Mr. Kelsey has been with Plexus since 1994, most recently leading our Global Customer Services organization since 2007.

2:59PM Apple confirms iOS7 (AAPL) 443.34 +1.53 : Co unveiled iOS 7, the most significant iOS update since the original iPhone, featuring a stunning new user interface. "iOS 7 is completely redesigned with subtle motion, an elegant color palette and distinct, functional layers that make it feel more alive. The typography has been refined for a cleaner, simpler look, and the use of translucency and motion makes even simple tasks more engaging. iOS 7 has hundreds of great new features, including Control Center, Notification Center, improved Multitasking, AirDrop, enhanced Photos, Safari, Siri and introduces iTunes Radio, a free Internet radio service based on the music you listen to on iTunes." The iOS 7 beta software and SDK are available immediately for iOS Developer Program members at developer.apple.com. iOS 7 will be available as a free software update for iPhone 4 and later, iPad 2 and later, iPad mini and iPod touch (fifth generation) this fall.

2:57PM Apple confirms iTunes Radio (AAPL) 444.87 +3.06 : Co announced iTunes Radio, a free Internet radio service featuring over 200 stations and a catalog of music from the iTunes Store, combined with features only iTunes can deliver. "When you tune into iTunes Radio on your iPhone, iPad, iPod touch, Mac, PC or Apple TV, you'll have access to stations inspired by the music you already listen to, Featured Stations curated by Apple and genre-focused stations that are personalized just for you. iTunes Radio evolves based on the music you play and download. The more you use iTunes Radio and iTunes, the more it knows what you like to listen to and the more personalized your experience becomes. iTunes Radio also gives you access to exclusive "first listen" premieres from top selling artists, Siri integration, plus the ability to tag or buy anything you hear with just one click." iTunes Radio is ad-supported and free for everyone. iTunes Match users get iTunes Radio ad-free, so instead of hearing the occasional ad on iTunes Radio, iTunes Match makes your listening completely ad-free. With iTunes Match, all your music-even songs you've imported from CDs-are stored in iCloud. So iTunes Radio can use information about your entire music collection to make your stations even more personalized. iTunes Match costs $24.99 for a year.

2:08PM Apple confirms updated MacBook Air with all day battery life (AAPL) 445.30 +3.49 : Co today updated MacBook Air with all day battery life, fourth generation Intel Core processors with faster graphics, 802.11ac Wi-Fi and flash storage that is up to 45 percent faster than the previous generation. "The ultimate everyday notebook is now an even better value, with 11-inch models featuring double the storage and 13-inch models starting at a new lower price of $1,099." Apple also introduced completely redesigned AirPort Extreme and AirPort Time Capsule base stations featuring 802.11ac Wi-Fi for up to three times faster performance.

2:07PM Apple confirms next generation Mac Pro (AAPL) 445.34 +3.53 : Co showed a sneak peek into the future of the pro desktop with a first look at the next generation Mac Pro. Designed around a revolutionary unified thermal core, the Mac Pro introduces a completely new pro desktop architecture and design that is optimized for performance inside and out. With next generation Xeon processors, dual workstation-class GPUs, Thunderbolt 2, PCIe-based flash storage, and ultra-fast ECC memory, the new 9.9-inch tall Mac Pro "packs an amazing amount of power into an incredibly small package." The next generation Mac Pro will be available later this year.

2:01PM Microsoft announces Xbox 1 will be released in November for $499.99; announces new Xbox 360 (MSFT) 35.23 -0.45 : Co announced launch details for the next Xbox gaming and entertainment system. Launching in 21 markets around the world in November 2013 Xbox One is, "the ultimate all-in-one entertainment system built for the 21st century living room - introducing a new world of games, music, live TV, movies, sports, apps and Skype, all personalized to your interests and accessible with the sound of your voice." Every Xbox One system sold will include the new Xbox One console - which features a 500GB hard drive,1 Blu-ray player and built-in Wi-Fi - the new Kinect, one Xbox One Wireless Controller and a free 14-day trial of Xbox Live Gold for new members. The Xbox One launch bundle will be available for $499.99 in the U.S., 429 (GBP) in the U.K. and 499 (EUR) in European markets.

Co also announced a new version of the Xbox 360. It is available in multiple value-packed editions for the same prices as the existing console: $199.99 estimated retail price (ERP1) for the 4GB console, $299.99 ERP for the 250GB edition and $299.99 ERP for the 4GB Kinect Bundle.

1:53PM Apple confirms release of a developer preview of OS X Mavericks (AAPL) 446.05 +4.24 : Co released a developer preview of OS X Mavericks, the 10th major release of the world's most advanced operating system. With more than 200 new features, OS X Mavericks brings Maps and iBooks to the Mac, introduces Finder Tags and Tabs, enhances multi-display support for power users, delivers new core technologies for breakthrough power efficiency and performance, and includes an all new version of Safari. The preview release of OS X Mavericks is available to Mac Developer Program members starting today. Mac users will be able to download Mavericks from the Mac App Store this fall.

Cypress Semiconductor (CY) has achieved greater than 99% on-time delivery of its products as a result of an internal program to focus on customer support.

8:01AM Taiwan Semi reports consolidated net sales increased 17% YoY to NT$51.79 bln; an increase of 3.4% sequentially (TSM) 18.69

3:06AM United Micro reports May net sales increased 5.18% YoY to NT$10.86 bln (UMC) 2.19 :

08:55 am RF Micro Device upgraded to Strong Buy at Charter Equity: . Charter Equity upgrades RFMD to Strong Buy from Buy. Firm is highly confident that RFMD has won a dual-band PAD on iPhone 5S and will likely see 70% - 160% increase in content over the iPhone 5. Evidence suggests the architecture of the next iPhone will be the same as the last, but with several bands of LTE added for improved 4G coverage and to better compete with Samsung's Galaxy S4. Total RF content in the new phone will probably increase to about $12.00 versus $9.20 in the iPhone 5.

Canadian Solar (CSIQ $9.36 +0.56) announced that its subsidiary, Canadian Solar Solutions, has entered into an Engineering, Procurement, and Construction (EPC) agreement with Grand Renewable Solar, a solar energy project developed by Samsung Renewable Energy for the construction of a 130 MW utility-scale solar power plant. This EPC agreement is expected to generate revenue of ~ CAD310 million ($301.1 million) for Canadian Solar. Construction of the solar power plant will begin in the third quarter of 2013, with the facilities expected to be fully operational in 2015.
icon url

ReturntoSender

06/16/13 11:04 AM

#10220 RE: ReturntoSender #6755

InvestmentHouse Weekend Market Summary:

http://www.investmenthouse.com/weekendmarketsummary.htm

- After the Thursday surge, stocks fail to follow through upside, instead waiting on Bernanke.
- PPI 'tame,' Michigan Sentiment drops a bit.
- US bonds falling, rates rising, housing market struggling just a bit.
- China cannot sell enough bonds to fund banks.
- Tax credit boosted Q1 earnings.
- Indices still holding support, sporting better internals.
- VIX suggests stocks just might pull off a new bounce.
- Market on hold for Bernanke on Wednesday, but leadership is still solid, ready to move if they get the nod.

There are some crazy things going on in the world that suggest the attempt to push economic recovery via massive monetary policy liquidity is starting to unravel.

That is a dramatic way to start the market wrap, and I am not saying the Friday selling was a result of these issues. Friday had its own problems to deal with, and while the news was nothing devastating, the market did react, e.g. when the Michigan preliminary June sentiment hit (82.7 versus 83 expected and 84.5 for May), the bounce to positive from a generally weak pre-market abruptly ended. Stocks sold hard negative into midmorning.

They tried to bounce into lunch, then a story hit that the IMF was lowering its 2013 US growth forecast. IMF pronouncements are usually only good for some laughs, but the market made a beeline lower into early afternoon, and while stocks bounced to the last hour, once the closing bell was in sight they gave back the bounce and finished right at session lows. Not a major move, just your usual 3-digit swing on the Dow (135 points high to close) as the indices gave up on average roughly half of the Thursday surge.

SP500 -9.63, -0.59%
NASDAQ -21.81, -0.63%
DJ30 -105.90, -0.70%
SP400 -0.36%
RUTX -0.84%
SOX -0.40%

That seems crazy, does it not, given the late Thursday Hilsen-rally sparked by the story that Bernanke was going to calm the markets next week at his FOMC presser. But the article talked of Bernanke calming the markets about interest rates, not QE withdrawal. Maybe the market thought about it overnight and decided the fix might not be in, that Bernanke might surprise the markets next week talking about rates versus massive bond purchases ($85B/month, remember?).

THE NEWS

PPI wasn't bad though a 0.5% spike in PPI from -0.7% is not good for anyone. The core, less food and energy, was a much tamer 0.1%, right in line with expectations and just 1.7% year/year, well below the Fed's 2% limit.

PPI, May (8:30): 0.5% actual versus 0.1% expected, -0.7% prior

Core PPI, May (8:30): 0.1% actual versus 0.1% expected, 0.1% prior

If you don't eat and don't drive, mow the yard, cool the home, or want hot water the core reading was passable news (though it was up from -0.4% in April). For those poor unfortunates who actually require food and drink and are part of the 63.4% of the working age population who have a job you need to get to and smell decently when you do get there (i.e., hot water to shower), then it bites. Only 63.4% of the work capable population working. That is problem enough to cause the market pause, but that is another story.

Industrial Production was flat, up from -0.4%, but it was a miss.
Capacity Utilization fell, 77.6 from 77.7, missing the 77.8 expected.
Not great news, but again, not really market moving. Just more of the same stumble 'recovery' the US citizen has 'enjoyed' the past four years.

Serious Issues

The US data was more of what we have seen again and again: improved to end a year and start a new one, fanning the hope that this year it will be different. Then a weakening of the data as summer moves in. Other stories, however, are worrisome.

US bond rates rising and the ripple effects are already showing up.

The US placed three bond offerings this week and each one required higher than anticipated yields (had to pay more interest to sell them) and the demand as judged by the bid to cover was as weak as we have seen it in this recession.

The rise in rates required to place bond offerings is evident in mortgage rates with the 30 year hitting 4.15% the past week, up from 3.59% in early May. Big run. That pushed US home refinancing down 36% from early May. A 'taper' was expected, but not so quickly. That also makes home purchases less affordable as rates rise. Yes historically rates remain low. BUT so does the economic activity, recovery or no recovery. Low historical rates can appear high if the economic activity does not generate well-paying jobs that can afford to buy even with 'low' rates.

So the US is going to have trouble with rising rates given the weak jobs market, and I don't know how Bernanke will keep rates down without buying even more bonds, something the Fed simply cannot do.

China still trying to outrun the year of the recession dragon.

China is having similar, though much worse, problems. For the first time in 2 years (23 months exactly), the Chinese failed to place all of the bonds offered. 30% was left over. That left its banks in a liquidity crunch and the People's Bank of China (PBOC) having to consider more stimulus to keep the banks afloat to fund the continued building ghost cities and office buildings with no hope of occupancy in an attempt to keep the economy going and hopefully outrun a cascading collapse.

Then there were images of 10,000 Chinese citizens waiting in 'line' (more like a mass blob) to buy gold. What do they realize that other don't (or do, depending upon if you talk to a gold bug)? Hey, I still say take some of your stock market gains and buy some hard assets, including gold and including the good as gold, perhaps better, ammunition. .223, 5.56mm, 9mm, 0.40, 0.45 are all high demand calibers.

Q1 US earnings beats said to be attributable to R&D tax credit (WSJ).

A tax credit that expired at the end of 2011 but was resurrected in early 2013 is credited for raising corporate earnings 10% in Q1 to a fairly solid 6.7%. It helped companies that could not make the sales on the top line bolster earnings through a tax credit. The impact is predicted to wane in the remaining quarters of 2013 and it expires at year end. So was the stronger bottom line, weaker top line pattern in Q1 prevented from being a weaker bottom line, weaker top line pattern thanks to large corporations getting a tax break? The WSJ seems to think so. It will be easy to see in Q2 and on.

MARKETS:

OTHER MARKETS

Dollar mixed: 1.3330 versus 1.3368 euro. Up versus the euro but down against other currencies. The dollar index is at some support and likely tries to rebound here and test the break of the May low.

Bonds steady after a wild ride: 2.13% versus 2.14% versus 2.23% Wednesday. Bouncing back, tapping toward the 20 day EMA on the intraday high but then reversing to close below the 10 day EMA. The 10 day, 20 day, 50 day, and now the 200 day MA are all pointing lower. The failure to break through the 10 day EMA shows a strong trend downside. The bond index bounced to test the March low and looks as if it is failing. PIMCO is unwinding its long bond positions, pressuring bonds further. Hilsenrath said Bernanke will talk about rates at his presser next Wednesday. Thus it is up to Bernanke next week to firm up bonds, if he wants to.

Oil rallied. Again: 97.85, +1.16. Breaking through the March, and May highs, closing in on the January closing high at 97.94. After that it is 100 with the peak from September 2012.

Gold bounced modestly: 1387.70, +9.90. Trying to hang in above 1375, but is not making any headway and is still in a negative pattern.

TECHNICAL SUMMARY

INTERNALS

NASDAQ
Stats: -21.81 points (-0.63%) to close at 3423.56
Volume: 1.443B (-7.74%)

Up Volume: 428.75M (-821.25M)
Down Volume: 1.01B (+690.21M)

A/D and Hi/Lo: Decliners led 2.53 to 1
Previous Session: Advancers led 3.06 to 1

New Highs: 80 (-1)
New Lows: 24 (-18)

S&P
Stats: -9.63 points (-0.59%) to close at 1626.73
NYSE Volume: 577M (-16.01%)

A/D and Hi/Lo: Decliners led 1.22 to 1
Previous Session: Advancers led 4.62 to 1

New Highs: 107 (+10)
New Lows: 90 (-282)

DJ30
Stats: -105.9 points (-0.7%) to close at 15070.18

Volume: Lower and below average on both NYSE, NASDAQ. No heavy selling Friday, just a lack of interested buyers. Higher volume downside sessions still hold the lead in this choppy 4-week pullback. That indicates the sellers dominate but they are not so strong the indices are breaking support. Indeed, the past week on NASDAQ showed a drop to below average volume each session. No heavy selling as it walks laterally at the 50 day EMA. The buyers and the sellers are still fighting, but the sellers are losing their grip on the overall market, and that is a positive for the bounce attempt off of support.

Breadth: Through Wednesday, downside breadth dominated the upside. The previous Friday stocks surged but breadth was barely 2:1 on NYSE; NASDAQ didn't even make it to that level. Thursday a shift started with 3:1 and 4.6:1 breadth on NASDAQ and NYSE, respectively. Friday was noncommittal at -2.5:1 NASDAQ and -1.2:1 NYSE. That in itself, given 0.6% to 0.8% losses on the indices, is better internal action.

THE CHARTS:

Volatility: Yet another day of triple digit DJ30 swings (135 points), showing the volatility is still present. Present, but the decline has for now stalled at key support for several indices.

Position in the pattern: This rally started off the November 2012 low with a bounce that started the trendline. The indices have put together 4 legs to this rally, and typically a run get 4 to 5 legs before it peaks and fades to base out. Thus there can be another bounce in this move. The run started with Fed assurances the QE was continuing, and it struggled in February and April when that assurance was cast in doubt. Same issue now. With Hilsenrath's late Thursday market commentary, whether a fifth leg commences looks as if it is all coming down to what Bernanke tells the markets Wednesday.

DJ30 and SP500. Fell hard to the 50 day EMA Wednesday in a second test of this key support in a week. A bounce Thursday on volume. Friday a test on light trade. Both indices have put themselves in position to make the next run. Note how this episode of selling is longer than prior tests, another change in character but one that has yet to result in a breakdown. Note the last move up was stronger. As volatility increases, the moves increase. The last move upside, if there is another one, is likely a screamer.

NASDAQ. Similar to DJ30, SP500 in the test of the 50 day EMA. Similar in the duration of the pullback. It is taking more this time to firm up support, but thus far it continues to hold the line as well. Lower volume the past week as it works laterally, and that has quelled some of the distribution that often leads to further downside. More of a lateral basing action this past week, and that is better for another upside try.

SP400. Broke the 50 day EMA again on the week, but matched the last low as it puts in a double bottom at the 61% Fibonacci Retracement. A double bottom is good technical action at that level and opens the door for a bounce to the prior high. That is how a trader would trade the move.

RUTX. Basically the same action with a double bottom over the 50 day EMA, but the small caps are showing the double at the 38% Fibonacci retracement, and that indicates more upside momentum as the test is shallower. That makes this test and the bounce really darn interesting.

SOX. Still holding over next support, the 50 day EMA is still rising up to meet it. It looks like a rounded top, but it is not breaking. You cannot count on SOX breaking down, particularly given the action of the other indices, but it is very important to watch because if it does break lower, it tends to lead the rest of the market lower as well.

LEADERSHIP:

Big Names: AMZN is holding its breakout, testing and then bouncing. GOOG moved laterally at the 20 day EMA on the week. PCLN is setting up a nice pennant. AAPL sagged but held its pattern. IBM slumped to the 200 day SMA but it managed to hold. Not a pretty pattern.

Financial. JPM is holding the 20 day EMA, forming a pennant the past three weeks. C is testing the 50 day EMA, holding its gains, but a rather toppy look. V continues its 6 week lateral move, holding the 20 day EMA.

Retail: DECK bounced over the 50 day EMA to end the week. LULU could not bounce. Many leaders are taking a pause with the market, but are holding good patterns: COST, ROST, PNRA, YUM, JWN.

Semiconductors: A volatile week, some holding, others not. Not: TXN, XLNX. Holding: KLAC, SMTC, ANAD, LEDS.

Drugs/Healthcare: Some look great, e.g. THRX, VRX, TSRO. Others are struggling and could crack, e.g. CELG, GILD. Not breaking but have weakened.

Internet: Hanging in rather nicely. YNDX, WWWW, BIDU, SOHU, LNKD.

Still plenty of leadership that can kick in after this test and set the pace for the rest to follow.

SENTIMENT INDICATORS

VIX: 17.15; +0.74. Friday some of the television faces we all know reported volatility (read the VIX) hit a high on the week not seen since late February. True. But to imply that means something major would be wrong. Now I am not saying they were warning a major issue was afoot, but they leave that impression. No, VIX is at the same levels hit in late February and Mid April when the market what? Last suffered pullbacks. It hit these levels and bounced. So, VIX suggests a bounce off of this last test.

What about VIX overall? It is not suggesting any kind of major breakdown. Yes it is higher, but it is still at very low levels and rose as the market sold versus as the market rallied. That is a HUGE difference when using VIX to determine major tops. At a major top VIX will rise as the stock market rises. A strong run coupled with a strong upside VIX trend is a time to, as the late Crocodile Hunter said, not walk, but run! Not there.

VXN: 17.28; +0.15
VXO: 17.26; +0.93

Put/Call Ratio (CBOE): 1.19; +0.21

Bulls versus Bears

Bulls still falling rapidly as the market tests. Bulls are back to the March and late April lows, levels that led to bounces. Bears bounced sharply as well, a much larger percentage move. As bulls peaked at prior peaks the bears bottomed at prior bottoms. They have merged, even more so than the prior convergences the past three months and are closer to the convergence from November 2012. Meaning? They are getting close to the bounce point.

Bulls: 43.8% versus 45.8% versus 52.1% versus 54.2% versus 52.1% versus 47.9% versus 44.3% versus 47.4% versus 50.5% versus 52.0% versus 49.5% versus 47.4% versus 50.00% versus 44.2% versus 46.3% versus 48.4% versus 52.6% versus 54.7% versus 54.3% versus 53.2% versus 51.1% versus 47.8% versus 46.8% versus 45.7% versus 43.6% versus 39.3% versus 37.2% versus 38.3% versus 43.6.

Background: Undercut 35%, the threshold for bullishness, in early June. As noted, hit 34% in early June. It did its job and the market is on the rally. Hard drop to 34 from 39.3% as economic reality and a choppy stock market hit. Off the 55+ level hit in late February. That was the highest level since April and May of 2011, the peak of the post-bear market high. 35% is the threshold level suggesting bullishness. To be seriously bearish it needs to get up to the 60% to 65% level.

Bears: 22.9% versus 20.8% versus 19.8% versus 19.8% versus 19.8% versus 18.8% versus 19.6% versus 20.6% versus 20.6% versus 19.4% versus 19.6% versus 18.6% versus 18.8% versus 21.1% versus 21.1% versus 22.1% versus 21.1% versus 21.1% versus 22.3% versus 22.3% versus 23.4% versus 24.5% versus 24.5% versus 23.4% versus 25.5% versus 27.7% versus 27.7% versus 28.7% versus 27.7%.

Summary: Over 35% is the threshold to be really be a good upside indicator. For reference, bearishness hit a 5 year high at 54.4% the last week of October 2008. The move over 50 took bearish sentiment to its highest level since 1995. Extreme negative sentiment. Prior levels for comparison: Bearishness peaked at 37.4% in September 2007. It topped the June 2006 peak (36%) on that run. That June peak eclipsed the March 2006 high (33%) and well above the 2005 highs that spawned new rallies (30% in May 2005, 29.2% in October 2005). That was a huge turn, unlike any seen in recent history.

MONDAY

A very busy week ahead with a pair of regional manufacturing reports, housing starts, existing home sales, CPI, and of course, the granddaddy of them all, the next FOMC rate decision meeting. A two-day affair (as they all have been since the crisis started so they could fully develop all ideas) with the result issued midmorning Wednesday then the Bernanke presser at noon.

Even with the mouthpiece spewing forth Thursday afternoon that the great one would calm the market's worries, the way he styled it, e.g. calm the masses re interest rates, left open HUGE issues as to just what Bernanke will say. He can calm re interest rates perhaps, but what does that mean toward the biggie, the $85B per month of mortgage buys. Seems one relates to the other, but who knows, other than his hairdresser, what the chairman will say. The Fed had Hilsenrath put this out there ahead of the FOMC meeting trying to head off a market selloff on worries what might come out of that meeting.

The market was already rallying Thursday when Hilsenrath posted the Fed's article. Perhaps the market was going to make a move upside even without the Fed, but now the Fed stepped in, has everyone now excited, and we will never know. It really bites to have markets so damn dependent upon what an agency or one person says. Sure the Fed always has sway, but with these massive mortgage buys and liquidity injections, the market now lives or dies via the Fed. With such a weak economy EVEN WITH MASSIVE LIQUIDITY, it is damn frightening to think what will happen when the Fed pulls back. Maybe those saying the Fed is holding the market back (e.g. Greenspan) will be right, but frankly with so much liquidity in the system the economy should be screaming higher, not screaming at the thought of the Fed pulling the liquidity.

Thus I still, personally, don't like the market at this point. But I have not liked the market at other points in this four year run and in bull runs before this one. That doesn't keep me out of the action. Your worries should heighten your awareness of the market and leadership moves and thus sharpen your actions. Do NOT fall into the trap of second guessing what you are seeing in the individual leadership stocks, in rising stocks, in declining stocks, and yes in the market itself. Channel your concerns into making sure you make good trades versus letting it keep you out of trades because your gut doesn't feel right. Let's face it, when you put fifty large up on a position you are going to have stomach issues no matter what the situation. It is whether you believe in what you are doing and thus are focused on the play versus the result. If you focus on good stocks, good indices, good patterns, good entries and exits, then the result takes care of itself.

Don't get me wrong. The market has to be in the direction, most of the time, with your moves. Thus if there are technical issues with the market overall, that must be factored in, but do it in terms of how much you risk versus changing the parameters of your system. When you start changing parameters that are working for you that is when you start the train rolling that crushes you. If what works for you is not working, then THAT is telling you the market is not right. Abandon that strategy and play another type of pattern, but don't change a working strategy if you don't know exactly why you are changing it and how it will help you. In short, you need to have traded the change before, paper or otherwise, versus just winging it.

So next week is rigged to a certain extent with Bernanke on Wednesday. But rigged which way? The trend suggests it continues; they always do don't they? Leadership still looks good though some good stocks look heavy after this week. I say it often and say it again: if there are a lot of solid stocks still in solid patterns or in solid trends, showing no issues, then the market has what it needs to continue. I have seen so many recovery attempts in bear markets blast off, look solid, but after the initial salvo there are no leaders in position to take the point and thus the rally attempt fails. Leadership is THE key. It is still in this market as of Friday.

Have a great Father's Day! I am a father and there is nothing greater and nothing more challenging. You make a mistake with a trade, you hit your stop point and you are out with a defined loss that you can handle because that is your rule. Make a mistake with a child, and it can be hard to recover. Kudos to all of those dads who find the time, no matter what the economic conditions, the problems, the worries, to stop and take a try at his daughter's hula hoop, make as many of their children's performances as possible, beam with pride with each accomplishment; show their children how to tie on a fishing lure, play a chord on the guitar, operate some power tools, build a birdhouse, find their way in the woods, lay down a bunt, respect other's persons and property, love their mothers, and understand our freedoms and why we have them.

Support and resistance

NASDAQ: Closed at 3423.56

Resistance:
3429 is the November 2012 up trendline
3521 is the upper channel line for the November 2012 to present uptrend
3521 is the August 2000 low.
3532 is the early May high and 2013 high

Support:
3401 is the May 2000 closing low
The 50 day EMA at 3384
3378 is the June 2013 intraday reversal low.
3371 is the early May 2013 upper gap point
3321 from April 2000
The 2011 up trendline at 3244
3227 is the April 2000 intraday low
3197 is the September 2012 post-bear market high
3171 is the October intraday high
The 200 day SMA at 3166
3134 is the March 2012 post-bear market peak
3130 from some January 2013 lows
3104-3112 from August and mid-October peaks.
3101 is the August 2012 high
3090 is the mid-March interim high
3076 is the late April 2012 high and the 1/2013 low after gapping higher
3062 is the December 2012 prior peak
3042 from 5/2000 low and several other price points
3024 is the gap point from early May
3000 is the February 2012 post-bear market high
2999 is the bottom of the August 2012 consolidation
2988 is the July 2012 high
2977 to 2980 is the bottom of the late October 2012 consolidation, July 2012 peak
2962 is the April 2012 low
2950 is the mid-April closing low

S&P 500: Closed at 1626.73

Resistance:
The November up trendline at 1644
1687 is the May high and post-bear market high
1714 is the upper trendline in the channel

Support:
The 50 day EMA at 1613
1598 is the June 2013 intraday reversal low and the April 2013 high and former all-time high
1576 from October 2007, the prior all-time high
1556 from July 2007
1541 is the April 2013 closing low in that pullback inside the uptrend
1539 from June 2007
1531 is the recent high
The 200 day SMA at 1501
1499 from January 2008
1475 is the September 2012 high
1471 is the October 2012 intraday high
1466 is the September 2012 closing peak and rally closing high
1440 from November 2007 closing lows
1434 from early November 2012
1433 from August 2007 closing lows
1427 is the August 2012 peak
1425 from May 2008 closing highs and the October 2012 low
1408 is the late October 2012 range closing low
1406 is the early May 2012 peak
1402.22 - 1400 is the closing low of the August 2012 lateral consolidation

Dow: Closed at 15,069.11

Resistance:
The November up trendline at 15,262
15,542 is the May 2013 high
15,838 is the upper channel line for the trend off the November low.

Support:
The 50 day EMA at 14,969
14,888 is the April peak and prior all-time high
14,198 from the October 2007 high
14,149 is the February 2013 high
14,022 from 7-07 peak
14,010 from the early February 2013 consolidation
The 200 day SMA at 13,913
13,784 is the late February 2013 closing low
13,692 from 6-2007 peak
13,668 from 12-2007 peak
13662 is the October 2012 intraday high
13,653 is the September 2012 high
13,557 to 13,662
13,413 from the late September 2012 low
13,300 to 13,331 is the August 2012 post-bear market high
13,297 is the April 2012, prior post bear market high
13,058 from the May 2008 peak on that bounce in the selling
13,056 is the February 2012 high
12,716 is the April 2012 closing low
12,524 is a range of support from early 2012 and summertime 2012

Economic Calendar

June 11 - Tuesday
- Wholesale Inventories, April (10:00): 0.2% actual versus 0.2% expected, 0.3% prior (revised from 0.4%)

June 12 - Wednesday
- MBA Mortgage Index, 06/08 (7:00): 5.0% actual versus -11.5% prior
- Crude Inventories, 06/08 (10:30): 2.523M actual versus -6.267M prior
- Treasury Budget, May (14:00): -$138.7B actual versus -$139.0B expected, -$124.6B prior

June 13 - Thursday
- Initial Claims, 06/08 (8:30): 334K actual versus 345K expected, 346K prior
- Continuing Claims, 06/01 (8:30): 2973K actual versus 2973K expected, 2971K prior (revised from 2952K)
- Retail Sales, May (8:30): 0.6% actual versus 0.3% expected, 0.1% prior
- Retail Sales ex-auto, May (8:30): 0.3% actual versus 0.3% expected, 0.0% prior (revised from -0.2%)
- Export Prices ex-ag., May (8:30): -0.7% actual versus -0.5% prior
- Import Prices ex-oil, May (8:30): -0.3% actual versus -0.2% prior
- Business Inventories, April (10:00): 0.3% actual versus 0.2% expected, -0.1% prior (revised from 0.0%)
- Natural Gas Inventories, 06/08 (10:30): 95 bcf actual versus 111 bcf prior

June 14 - Friday
- PPI, May (8:30): 0.5% actual versus 0.1% expected, -0.7% prior
- Core PPI, May (8:30): 0.1% actual versus 0.1% expected, 0.1% prior
- Current Account Balance, Q1 (8:30): -$106.1B actual versus -$111.5B expected, -$110.4B prior
- Net Long-Term TIC Fl, April (9:00): -$37.3B actual versus -$13.4B prior (revised from -$13.5B)
- Industrial Production, May (9:15): 0.0% actual versus 0.1% expected, -0.4% prior (revised from -0.5%)
- Capacity Utilization, May (9:15): 77.6% actual versus 77.8% expected, 77.7% prior (revised from 77.8%)
- Michigan Sentiment, June Preliminary (9:55): 82.7 actual versus 83.0 expected, 84.5 May final.

June 17 - Monday
- Empire Manufacturing, June (8:30): 0.8 expected, -1.4 prior
- Net Long-Term TIC Fl, April (9:00): -$13.5B prior
- NAHB Housing Market Index, June (10:00): 45 expected, 44 prior

June 18 - Tuesday
- CPI, May (8:30): 0.2% expected, -0.4% prior
- Core CPI, May (8:30): 0.1% expected, 0.1% prior
- Housing Starts, May (8:30): 950K expected, 853K prior
- Building Permits, May (8:30): 983K expected, 1017K prior

June 19 - Wednesday
- MBA Mortgage Index, 06/15 (7:00): 5.0% prior
- Crude Inventories, 06/15 (10:30): 2.523M prior
- FOMC Rate Decision, June (14:00): 0.25% expected, 0.25% prior

June 20 - Thursday
- Initial Claims, 06/15 (8:30): 340K expected, 334K prior
- Continuing Claims, 06/08 (8:30): 2967K expected, 2973K prior
- Existing Home Sales, May (10:00): 5.00M expected, 4.97M prior
- Philadelphia Fed, June (10:00): -0.2 expected, -5.2 prior
- Leading Indicators, May (10:00): 0.2% expected, 0.6% prior
- Natural Gas Inventories, 06/15 (10:30): 95 bcf prior
icon url

ReturntoSender

06/18/13 10:57 PM

#10222 RE: ReturntoSender #6755

From Briefing.com: 4:20 pm : The major averages ended higher across the board as the S&P 500 advanced 0.8%.

Equities climbed steadily since the opening bell as investors prepared for tomorrow's policy decision from the Federal Reserve. Although chatter in recent weeks has included speculation the Fed would look to taper its asset purchases, today's broad gains suggest investors expect mostly reassuring words from Chairman Bernanke at tomorrow's press conference.

All ten sectors ended with solid gains, but today's rally was predicated on the strength of cyclical names.

The industrial space rose 1.3% amid outperformance in transportation and defensive stocks. The Dow Jones Transportation Average advanced 1.0% as 19 of 20 components registered gains. GATX (GMT 48.05, -0.45) was the lone decliner after Stifel Nicolaus downgraded the stock to 'Hold' from 'Buy.'

With regards to defensive stocks, Dow component General Electric (GE 24.33, +0.56) settled higher by 2.4% after forging a strategic partnership with Accenture (ACN 82.93, +0.48). The broader PHLX Defense Index climbed 1.7%.

Discretionary stocks also made a significant contribution to today's rally as the sector displayed broad strength. The lone pocket of weakness was among homebuilders as the group ended in mixed fashion following today's housing data. New home sales for the month of May hit an annualized rate of 914,000, which was short of the 950,000 expected by the Briefing.com consensus.

Notably, single-family starts increased a minuscule 0.3% in May from 597,000 in April to 599,000. This sector tends to be very stable. The lack of solid rebound after 4.2% decline in April could signal a slowdown in overall construction levels.

Interestingly, the financial space was more tentative in its advance, posting a gain of 0.6%. Today's rise helped the sector erase its month-to-date loss.

Meanwhile, this month's top performer, telecom, was able to build on its strength. The sector ended higher by 1.3% to bring it June return to 4.1%.

Treasuries ended the day little changed as investors stood pat ahead of tomorrow's FOMC meeting. The benchmark 10-yr yield ticked up less than one point to 2.182%.

Consumer prices increased 0.1% in May, which was the first increase since February after prices fell 0.2% in March and 0.4% in April. The Briefing.com consensus expected the CPI to increase 0.2%. Surprisingly, the higher-than-expected food and energy prices from the May PPI did not pass through to consumer prices.

Energy prices increased a modest 0.4% in May after falling 4.3% in April. Gasoline prices, which caused the decline in energy prices in April, were unchanged in May. In contrast, energy prices in the PPI rose 1.3% on a 1.5% increase in gasoline costs. Meanwhile, food prices declined 0.1% in May after increasing 0.2% in April. The food at home category, which includes grocery store purchases, fell by 0.3%. That was the largest monthly decline since July 2009. Dairy product prices fell by 0.8%.

Excluding food and energy, core prices rose 0.2% in May, up from a 0.1% gain in both March and April. The consensus expected these prices to increase 0.1%.

Tomorrow, the weekly MBA Mortgage Index will be reported at 7:00 ET while the FOMC decision is set to cross the wires at 14:00 ET.DJ30 +138.38 NASDAQ +30.05 SP500 +12.77 NASDAQ Adv/Vol/Dec 1729/1.53 bln/749 NYSE Adv/Vol/Dec 2070/646.0 mln/977
3:35 pm : Commodities ended the day mixed with metals ending lower and energy posting gains. Precious metals, however, ended with only modest losses and Aug gold fell $1.62 at $1366.07/oz and July silver ended $0.08 lower at $21.68/oz. July copper lost $0.05 to finish at $3.15.

In the energy patch, July crude oil extended gains, climbing $0.65 in today's pit session to end at $98.46/barrel. July nat gas rose $0.02 to $3.90/MMBtu

4:29PM Adobe Systems sees Q3 revenue in the range of $925 mln-1.025 bln, Capital IQ consensus is $1.01 bln; sees Non-GAAP EPS in the range of $0.29-0.35, Capital IQ consensus $0.35 (ADBE) 43.36 -0.03 : Click here for presentation.

Co reaffirms FY13 revenue of approx $4.1 bln, Capital IQ consensus $4.1 bln; Non-GAAP EPS of approx $1.45, Capital IQ consensus $1.45.

4:12PM Adobe Systems beats by $0.02, reports revs in-line -- ADBE will guide for Q3 and FY13 on its conference call at 17:00. (ADBE) 43.36 -0.03 : Reports Q2 (May) earnings of $0.36 per share, $0.02 better than the Capital IQ Consensus Estimate of $0.34; revenues fell 10.1% year/year to $1.01 bln vs the $1.01 bln consensus (On May 6th, Co reaffirmed Q2 EPS guidance of $0.29-0.35 with revenues of $975 mln - 1.025 bln).

Operating income was $111.3 mln and net income was $76.5 mln on a GAAP basis. Operating income was $247.3 mln and net income was $182.9 mln on a non-GAAP basis. Adobe ended Q2 with 700 thousand paid Creative Cloud subscriptions, an increase of 221K when compared to the number of subscriptions as of the end of Q1 fiscal year 2013. Co also announced that 100 mln downloads all created with Adobe Digital Publishing Suite have been delivered to readers.

3:00PM Intel recommends stockholders reject TRC Capital's 'mini-tender' offer (INTC) 25.59 +0.49 : Co recently learned of an unsolicited "mini-tender offer" made by TRC Capital Corp. to Intel stockholders to purchase up to 4 million shares of Intel common stock at $23.75 per share. TRC Capital's offer price is approximately 4.96 percent below the closing share price of Intel common stock on June 13, 2013 ($24.99), the day before the offer commenced, and the offer is for less than 1 percent of Intel's outstanding shares. Intel does not endorse TRC Capital's mini-tender offer and recommends that Intel stockholders reject the offer and not tender their shares in response to the offer.

8:33AM Mellanox Tech demonstrates 2X growth over a 6 month period for Petascale-Capable Systems on the TOP500 (MLNX) 49.72 : Co announced the number of the TOP500's Petascale-capable systems connected with Mellanox FDR InfiniBand doubled from November 2012 to June 2013. Overall, the number of Mellanox FDR InfiniBand connected systems grew 3.3X from June 2012 to June 2013, and Mellanox FDR InfiniBand accelerates the top four InfiniBand-based systems on the list, showing the increasing demand for higher performance, scalability and efficiency.

8:04AM Veeco Instruments receives stay of suspension pending NASDAQ hearing (VECO) 37.55 : Co received a letter from The NASDAQ Stock Market LLC ("NASDAQ") indicating that the NASDAQ Listing Qualifications Panel (the "Panel") had granted the co's request to extend the stay of suspension of trading in its common stock pending a final determination regarding the co's listing status following a hearing before the Panel. The hearing has been scheduled for June 27, 2013.

At the hearing, the co will request additional time to satisfy the NASDAQ listing requirement that the co be current in its filings with the Securities and Exchange Commission. The Panel typically issues decisions within 30 days of the hearing date; however, there is no requirement that the Panel do so within that time frame. The co will provide an update regarding its continued listing status once a decision on this matter has been issued following the hearing.

Freescale Semiconductor's (FSL) flagship QorIQ T4240 communications processor is now available with AltiVec software libraries provided by Mentor Graphics Corporation.

08:44 am Rambus shares rise 4% following narrowed guidance
Rambus (RMBS $8.91 +0.33) updated its revenue guidance for the quarter ending June 30, 2013, narrowing the range to $56-58 million from the initial range of $53-58 million which was within the range expectations. In addition, subsequent to the Hynix settlement announced last week, the Company will be reversing a prior accrual included in operating expenses, related to previously awarded costs of $8 million in litigation expenses

Microsoft (MSFT) was awarded an indefinite delivery/indefinite quantity contract with a total cumulative face value of $412.24 mln. The minimum guarantee is $5,000, for Microsoft Enterprise Technical Support Services (METSS) necessary to obtain highly trained "Microsoft Blue Badge Cardholder-support". The period of performance is a one-year base period and four one-year option periods for a total period of five years. Performance will predominantly be within the continental United States; however, support services may also be required at multiple overseas locations.

Rambus (RMBS) updated its revenue guidance for the quarter ending June 30, 2013, narrowing the range to $56-58 million from the initial range of $53-58 million. In addition, subsequent to the Hynix settlement announced last week, the Company will be reversing a prior accrual included in operating expenses, related to previously awarded costs of $8 million in litigation expenses.

Needham initiated Fusion IO (FIO) with a Buy and tgt of $20. The firm's positive stance on FIO is based on five main arguments: 1) sentiment seems to have reached a trough after sales lumpiness from FIO's top two customers in F2Q and the sudden departure of the co-founders announced on May 8th; 2) extensive industry checks suggest FIO remains in the pole position within the hyperscale world (and increasingly in traditional data centers); 3) acquisition of NexGen expands the TAM beyond the PCIe world; 4) major new product rollouts later in C13 and into C14 should re-establish FIO as a technology innovator; and 5) believe new leadership has an opportunity to rewrite the narrative of the company.
icon url

ReturntoSender

06/19/13 8:51 AM

#10223 RE: ReturntoSender #6755

COTD - S&P 500 PE Ratio Rising

http://www.chartoftheday.com/20130619.htm?T

Today's chart illustrates the price to earnings ratio (PE ratio) from 1900 to present. Generally speaking, when the PE ratio is high, stocks are considered to be expensive. When the PE ratio is low, stocks are considered to be inexpensive. From 1900 into the mid-1990s, the PE ratio tended to peak in the low to mid-20s (red line) and trough somewhere around seven (green line). The price investors were willing to pay for a dollar of earnings increased during the dot-com boom (late 1990s), surged even higher during the dot-com bust (early 2000s), and spiked to extraordinary levels during the financial crisis (late 2000s). Since the early 2000s, the PE ratio has been trending lower with the very significant but relatively brief exception that was the financial crisis. More recently, the PE ratio has moved significantly higher and is fast approaching the low 20s -- a level around which several stock market rallies stalled (e.g. 1929, several from 1958 to 1972, and 1987).


icon url

ReturntoSender

06/19/13 7:07 PM

#10224 RE: ReturntoSender #6755

From Briefing,com: 4:25 pm : Equities ended on their lows with the S&P 500 down 1.4%.

The S&P entered today's session with a week-to-date gain of 1.5% as investors expected reassuring words from today's Federal Open Market Committee Statement.

Stocks traded with slim losses until this afternoon's FOMC Statement and subsequent comments from Chairman Bernanke sent equities and Treasuries to their lows while also providing a significant boost to the dollar.

Today's Statement was not too different from the last directive released on May 1. However, it did indicate inflation has been running below the longer-run objective while long-term inflation expectations remain stable.

During his remarks, Chairman Bernanke said if conditions continue to improve, the Fed could reduce the pace of purchases later this year with a potential end to purchases coming in the middle of 2014. He also suggested downside risks have diminished since the fall, but the Fed will not sell securities as long as the market remains in normalization stage.

Finally, Mr. Bernanke said that a decline in the unemployment rate to 6.5% will not automatically signal a rate hike. Instead, reaching the target will pave way for that discussion to begin.

The Dollar Index saw the sharpest post-FOMC move as investors dumped other currencies in favor of the greenback. The afternoon bid sent the Index higher by 0.9% and allowed it to regain its 200-day moving average.

Elsewhere, Treasuries fell victim to aggressive selling pressure as a loss of more than one point ran the 10-yr yield up 14 basis points to 2.332%. This marked the highest close since March 2012. Even more notable was today's 17.5 basis point surge in the 5-yr yield, which made for its best close since August 2011.

The sharp spike in rates weighed on rate-sensitive countercyclical sectors as they led equities to the downside. Telecom and utilities saw respective declines of 2.7% and 2.3% while consumer staples and health care lost near 1.8% each.

Meanwhile, most growth-oriented groups held in relatively well through the afternoon selling. Financials and industrials were the two exceptions as both underperformed prior to the FOMC Statement, and lagged behind other cyclical sectors into the close.

Energy and materials outperformed the broader market with respective losses of 1.0% and 0.8%. On a related note, crude oil dipped 0.6% to $98.07 per barrel while copper ticked down 0.6% to $3.14 per pound.

The weekly MBA Mortgage Index declined 3.3% to follow the prior week's increase of 5.0%.

Tomorrow, weekly initial claims will be reported at 8:30 ET while May existing home sales, leading indicators, and June Philadelphia Fed Survey will cross the wires at 10:00 ET.DJ30 -206.04 NASDAQ -38.98 SP500 -22.88 NASDAQ Adv/Vol/Dec 687/1.65 bln/1809 NYSE Adv/Vol/Dec 455/760.1 mln/2595

3:30 pm :

July crude oil retreated into negative territory following inventory data that showed a build of 0.313 mln barrels when a draw of 0.5 mln was anticipated. The energy component dipped to a floor session low of $98.03 per barrel and chopped around below the unchanged line until the release of the FOMC policy directive at 14:00 ET. It then popped to a session high of $98.74 per barrel but ultimately settled 0.2% lower at $98.25 per barrel. Prices fell to a new LoD of $97.57 per barrel in electronic trade and are currently down about 0.5%.
July natural gas trended higher for most of its floor trade. It brushed a session high of $3.98 per MMBtu in early afternoon action after trading as low as $3.94 per MMBtu earlier. Prices pulled back slightly heading into the close, leaving natural gas to settle with a 1.5% gain at $3.96 per MMbtu.
Aug gold inched higher ahead of the FOMC policy statement after lifting off its session low of $1369.50 per ounce. The yellow metal booked a 0.6% gain as it settled at $1373.80 per ounce, just below its session high of $1375.30 per ounce. Gold slid into the red and to a new LoD of $1356.10 per ounce in electronic trade and is currently down ~ 0.6%.
July silver oscillated between positive and negative territory during today's floor trade. Prices dipped to a session low of $21.58 per ounce and touched a session high of $21.75 per ounce in morning action. Ultimately, silver extended losses for a third consecutive session as it settled at $21.61 per ounce, or 0.3% lower. The metal is currently down about 1.2% in electronic trade after dropping to a LoD of $21.31 following the release of the FOMC statement.

4:12PM Jabil Circuit announces reorganization plan (JBL) 19.82 -0.10 : Please see 16:03 for Q3 EPS (beat by 2 cents, beats on revenues) and Q4 guidance (EPS below, revs in line).

From Press Release
In addition to the segment guidance, Jabil announced its intention to realign its global operations to more appropriately reflect current market conditions and customer needs. The company indicated that they began consultation with employees during the third fiscal quarter. Jabil management did not provide specific locations under consideration out of respect for employees, their families and their representatives, and statutory and consultation periods required. The company currently estimates that the realignment could result in approximately $188 million of charges, including the $28 million of charges incurred during the company's third quarter. It is currently estimated that $60 to $70 million will be recorded in Jabil's fourth fiscal quarter of 2013 and the balance during its fiscal years 2014 and 2015. Jabil estimates that the majority of the $140 million cash associated with these actions will be used in fiscal 2014.

4:03PM Jabil Circuit beats by $0.02, beats on revs; guides Q4 EPS below consensus, revs in-line (JBL) 19.82 -0.10 : Reports Q3 (May) earnings of $0.56 per share, $0.02 better than the Capital IQ Consensus Estimate of $0.54; revenues rose 5.1% year/year to $4.47 bln vs the $4.4 bln consensus. Co issues mixed guidance for Q4, sees EPS of $0.50-0.58, excluding non-recurring items, vs. $0.59 Capital IQ Consensus Estimate; sees Q4 revs of $4.55-4.65 bln vs. $4.6 bln Capital IQ Consensus Estimate.l

4:06PM Micron beats by $0.01, beats on revs (MU) 13.97 +0.21 : Reports Q3 (May) GAAP earnings of $0.04 per share, $0.01 better than the Capital IQ Consensus Estimate of $0.03; revenues rose 6.7% year/year to $2.32 bln vs the $2.25 bln consensus.

"As the memory market shows improvement in both DRAM and NAND fundamentals, we continue to focus our efforts on advancing our operational efficiency," said Micron CEO Mark Durcan. "We have also made progress in securing the necessary approvals related to the Elpida acquisition and are optimistic we will be able to close the transaction in our fiscal fourth quarter ending August 29, 2013."

4:06PM Finisar beats by $0.03, reports revs in-line; guides Q1 EPS above consensus, revs in-line (FNSR) 14.52 +0.08 : Reports Q4 (Apr) earnings of $0.20 per share, excluding non-recurring items, $0.03 better than the Capital IQ Consensus Estimate of $0.17; revenues rose 2.1% year/year to $243.4 mln vs the $242.6 mln consensus.

Co issues guidance for Q1, sees EPS of 0.22-0.26, excluding non-recurring items, vs. $0.20 Capital IQ Consensus Estimate; sees Q1 revs of $245-260 mln vs. $248.94 mln Capital IQ Consensus Estimate.

Non-GAAP gross margin increased to 32.2% from 30.7% in the preceding quarter, primarily as the result of favorable product mix.

"I am pleased to report fiscal fourth quarter revenues of $243.4 million, which is $5.1 million, or 2.1%, greater than the prior quarter. Our growth in revenues came primarily from sales of 10G and 100G Ethernet transceivers and transponders for datacom applications. Our favorable product mix in the quarter enabled us to achieve gross margin and earnings per diluted share that exceeded our guidance range."

Outlook Details: The Company indicated that it currently expects revenues for the first quarter of fiscal 2014 to be in the range of $245 to $260 million; GAAP operating margin to in the range of ~5.0% to 6.5%. The Company also noted that during the fourth fiscal quarter of 2013 and during the first week of the first quarter of fiscal 2014, the Company completed the divestment of two non-strategic subsidiaries of Ignis AS, which was acquired by Finisar in May 2012.

10:01AM Apple announces HBO GO and WatchESPN are now available directly on Apple TV (AAPL) 428.79 -2.98 : iTunes users have downloaded more than one billion TV episodes and 380 million movies from iTunes to date, and they are purchasing over 800,000 TV episodes and over 350,000 movies per day. In addition to HBO GO and WatchESPN, three new content providers are also available today on Apple TV including Sky News, Crunchyroll and Qello offering live news, sports and current TV programming.

9:02AM Photronics announces successful completion of tender offer to acquire outstanding shares of its majority-owned Taiwan Subsidiary, PSMC (PLAB) 7.73 : Co announced the successful completion of the tender offer to acquire the outstanding shares of Photronics Semiconductor Mask Corp ("PSMC"), a majority-owned subsidiary of Photronics, Inc. As of the expiration of the offering period on June 18, 2013, a total of 50,259,277 shares were tendered at the offering price of NT$16.30 with the total costs of the transaction of approximately US$28 million. As a result of the transaction, Photronics owns 98% of the outstanding shares of common stock of PSMC.

VTSS +1.1% (announces proposed public offering of ~$30 mln in common stock).

7:03AM Vitesse Semi announces proposed public offering of ~$30 mln in common stock (VTSS) 2.75 : Co announced that it is offering to sell shares of its common stock in an underwritten public offering in an amount of ~$30 million (not including any exercise of a 15% over-allotment option to be granted to the underwriters). Needham & Company, LLC is acting as the sole bookrunning manager of the offering. The offering is expected to price after the close of trading on Wednesday, June 19, 2013. Vitesse intends to use the net proceeds from the offering for working capital and general corporate purposes. A portion of the net proceeds also may be used to repay or restructure indebtedness.

FormFactor (FORM) announced that it has shipped multiple units of Apollo MF100 probe cards to two leading semiconductor foundries. Following an extensive engineering evaluation, the foundries selected the Apollo MF100 to test advanced 28nm System-on-Chip products, utilizing copper pillar packaging technology, in volume production.

10:49 am Tech Sector trading flat today and just ahead of the overall market
The tech sector is trading flat today, ahead of slight losses in the broader market. Semiconductors are showing relative strength with the SOX trading 0.3% higher. Within the chip index, NVDA (+4.0%) is a notable standout. Among other major indices, the SPY is trading 0.03% lower today, while the QQQ is up 0.1% and the NASDAQ is trading flat on the session. Among tech bellwethers, ORCL (+0.5%) is showing notable strength, while VZ (-0.9%) is under pressure.

In notable tech earnings last night, ADBE (+6.5%) posted a slight Q2 EPS beat and guided just below consensus. In news, DISH (+2.1%) terminated its pursuit of S (-3.3%). SFTBY (+2.3%) remains interested in S. NVDA (+4.0%) says it plans to license its GPU cores and visual computing patent portfolio to device manufacturers. Among notable analyst upgrades in tech this morning, ADBE (+6.5%) was upgraded to Buy at BofA/Merrill. In downgrades, BBRY (-3.2%) was downgraded to Underperform at Bernstein, S (-3.3%) was downgraded to Neutral at Macquarie, and Stifel downgraded KLAC (+0.1%) to Hold. JBL (+0.9%), MU (+1.1%) and RHT (-0.1%) are the notable names in tech scheduled to report after the close.

09:12 am KLA-Tencor downgraded to Hold at Stifel: . Stifel downgrades KLAC to Hold from Buy, based primarily on valuation, as the stock has approached its previous target price of $58. Secondly, firm's ests for FY14 (June) are at the high end or above consensus (revenues). Although there is the possibility of some upside to the industry in 2H13 and early 2014, firm does not expect dramatic upward revisions to our estimates at this time.
icon url

ReturntoSender

06/21/13 12:30 PM

#10226 RE: ReturntoSender #6755

Yesterday was a 90% downside day. I had only two stocks up on a screen of about 300 that I watch yesterday. The data can be followed here. Keep in mind we are watching both volume and number of issues:

http://finance.yahoo.com/marketupdate/overview

I do not believe that there has been any other 90% downside days prior to yesterday though for a very long time.

Also while many people would suggest that a 90% downside day washes out the market and leaves it free to rise that may not be true. There can be bunches of 90% downside days before a market bottoms. How do you know the selling is over?

Usually you don't. What I look for is lower highs for the VIX, really negative sentiment like in the Investors Intelligence Poll and improving market breadth. Look at the BPNDX chart here and you will see that the number of stocks with a point and figure buy signal was actually higher at the last couple of major bottoms than when the VIX was hitting its highest highs:


We are so far from truly washed out here that it is funny. The market could go much lower before we see a 90% upside day. That might mean we have bottomed. Why should the market continue higher? The P/E of the S&P 500 is rising. That means that earnings are not rising fast enough to suggest that risk is low for fundamental buyers. I'll be looking eventually for that 90% upside day.

Even two 80% upside days in close succession can signal the all clear for buyers to step back in once sentiment has been so negative that market breadth is improving even as we hit lower lows.

Yesterday was an ugly day but we are barely more than 5% of recent highs for the INDU. This is my chart that I have shared for several years here. You'll note that while we are at the end of my projected rise for the market that if I am right it will be luck as much as anything else. Keep in mind that I do get lucky from time to time:


RtS
icon url

ReturntoSender

06/22/13 11:54 PM

#10228 RE: ReturntoSender #6755


MU (13.77 +1.74%): Mentioned positively at Barron's

ORCL (30.36 -8.57%): Missed quarterly EPS by $0.01 ($0.87 ex items vs $0.88 estimate), revs rose 0.1% yoy to $10.96 bln vs $11.12 bln estimate; sees Q1 EPS of $0.56-0.59 and revs +3-6% in constant currency

07:57 am Oracle shares fall 7% following revenues that were below expectations
Oracle (ORCL $30.84 -2.46) reported fourth quarter earnings of $0.87 per share, excluding non-recurring items, which missed expectations and non-GAAP revenue of 0.1% year/year to $10.96 billion which was below expectations. Q4 new software license and cloud software subscription revenues +1% to $4.0 billion versus the +1-11% guidance. Software license updates and product support revenues were up 6% to $4.4 billion. Hardware systems products revenues were $849 million. GAAP operating income was up 9% to $5.0 billion, and GAAP operating margin was 46%. Non-GAAP operating income was up 1% to $5.6 billion, and non-GAAP operating margin was 51%. "Our annualized SaaS revenue run rate is over $1 billion, making us a strong number two in cloud applications -- we are larger than SAP and Workday combined.

"Furthermore, in Q4 our HCM cloud alone generated more SaaS revenue and added more new Fusion HCM customers than Workday added HCM and ERP customers combined in their most recent quarter. Exadata, Exalogic, Exalytics, SPARC SuperCluster and our other engineered systems grew at a rate of 45% in Q4 as we took considerable market share from our primary competitor -- IBM P-Series -- which declined 32% in their most recent quarter."

Oracle also announced that its Board of Directors declared a quarterly cash dividend of $0.12 per share of outstanding common stock, reflecting a 100% increase over the current quarterly dividend of $0.06. This increased dividend will be paid to stockholders of record as of the close of business on July 12, 2013, with a payment date of August 2, 2013.

Oracle also announced that its Board of Directors authorized the repurchase of up to an additional $12.0 billion of common stock under its existing share repurchase program in future quarters. Oracle also announced that it has applied to list its common stock on the New York Stock Exchange under its current symbol "ORCL", Oracle expects that its common stock will begin trading on the NYSE on July 15, 2013. Oracle sees first quarter EPS of $0.56-0.59 which was within expectations and constant currency growth of 3-6%.

09:02 am Methode Electronics upgraded to Outperform from Neutral at Robert W. Baird: . Robert W. Baird upgrades MEI to Outperform from Neutral and notes that they have waited 18 months for this quarter as the pieces of Methode's transformation fall into place. Cost structure is changed. Legacy products are gone. New business is launching. Methode has turned the corner and they see several years of strong revenue growth and rising margins moving the stock toward the $20 level over time. Ideally, they would like to buy the stock lower; however, that may take the hiccup in results they expected this quarter.


icon url

ReturntoSender

06/24/13 5:16 PM

#10232 RE: ReturntoSender #6755

From Briefing.com: 4:20 pm : The stock market began the week on a fitful note as rising interest rates at home and falling equity markets abroad conspired to keep the major averages in negative territory throughout today's trading. The focal points on those fronts were the 10-yr note yield, which spiked to 2.66% in early action, and China's Shanghai Composite, which plummeted 5.3% overnight.

The drop in China was attributed to a growing sense of angst that a liquidity crisis and credit crunch are brewing there. That notion is predicated on the understanding that the People's Bank of China (PBOC) is purposely backing away from injecting liquidity in an effort to curtail speculative excesses through the lending channel. The PBOC fed this notion by acknowledging today that there is sufficient liquidity in the system and by admonishing Chinese banks to do a better job of cash and risk management.

Whether the PBOC sticks to its guns remains to be seen, but the hardline stance it took today got the week started off on the wrong foot for global markets.

It didn't help matters either that follow-through selling efforts persisted in the Treasury market. The 10-yr note fell more than a point at its worst levels of the morning, sending its yield up to 2.66% or nearly 50 basis points above its cash settlement last Tuesday. Contributing to that selling effort was a warning from the Bank for International Settlements that central banks should end their bond purchases and focus on inflation while letting governments spearhead the economic recovery effort.

Traders wasted little time getting the US stock market on track with its foreign counterparts. Things never got as bad as they did in China, but the Dow, Nasdaq, and S&P 500 were down as many as 248, 62, and 32 points, respectively, at their lows in the morning session. That equated to a 2.0% decline for the S&P 500.

The stock market, however, did show some fight when the Treasury market got off the mat. Remarkably, the 10-year note recouped everything it lost early and traded with modest gains in the afternoon before getting some pushback late in the day. That rebound effort saw the 10-yr yield drop back to 2.53% before it faded into the cash close and settled at 2.55%.

The recovery effort in the stock market seemed to mirror that move. The S&P 500 cuts its losses to single digits and the Dow reclaimed more than 200 points of its early losses by mid-afternoon; however, the market rolled over in the final hour as bonds faded and sellers renewed their profit-taking efforts.

The global growth concerns linked to China and rising interest rates weighed heavily on the cyclical sectors throughout the day. Financials (-1.8%) led the losses and were joined by materials (-1.7%), industrials (-1.7%), energy (-1.5%), and technology (-1.4%) as the worst-perfroming areas. Every sector ended lower today, although the countercyclical sectors were not impacted as much by the selling interest. The utilities sector, for instance, ended with only a negligible loss.

Industrial metals also fared poorly. Copper prices fell 1.8% to $3.04/lb. Crude prices were a notable standout in the commodity complex, rising 1.3% to $94.93/bbl.

The roller-coaster action today left the CBOE Volatility Index on its own roller-coaster ride. It was up 10% at one point, gave that entire gain back, and then finished up 5.6% at 19.96 with the late selloff in stocks.

There wasn't any economic data to trade off today, but that will change tomorrow with a full lineup that includes the April Case-Shiller Home Price Index, May Durable Goods, May New Home Sales, and June Consumer Confidence reports.

Volume was heavy today with 968 mln shares traded at the NYSE. The A/D line reflected the market's negative disposition. Declining issues at the NYSE outnumbered advancing issues by a 7-to-1 margin while at the Nasdaq they led by a 3-to-1 margin. DJ30 -139.84 NASDAQ -36.49 SP500 -19.34 NASDAQ Adv/Vol/Dec 594/1.95 bln/1951 NYSE Adv/Vol/Dec 393/968 mln/2711

3:30 pm : Commodities mostly remained lower in today's session. Crude oil, however, was the outperformer as the energy component rallied back into positive territory and as high as $95.59/barrel. At the end of today's floor trading session, Aug crude oil ended $1.43 higher (or +1.5%) at $95.15/barrel.

Natural gas futures slid lower in today's afternoon session, pulling off its HoD, ending the session one penny lower at $3.76/MMBtu.

Precious metals remained in negative territory for the day with gold falling as low as $1275.10 and silver hitting a LoD of $19.38. Aug gold ended the day $15.30 lower at $1276.90/oz, July silver finished the day $0.45 lower at $19.50/oz. July copper lost eight cents at $3.02/lb.DJ30 -65.08 NASDAQ -22.66 SP500 -11.54 NASDAQ Adv/Vol/Dec 672/1639.8 mln/1861 NYSE Adv/Vol/Dec 561/665 mln/2536

Atmel (ATML) announced the expansion of its CryptoAuthentication portfolio to include the ATECC108 solution with elliptical curve asymmetric key algorithm.

Microsoft (MSFT) announced the release of third-party qualification guidelines for Microsoft's cloud solutions Windows Azure and Microsoft Office 365. Co also announced a new collection of 34 K-12 schools and school districts that have signed on to use Windows 8.

AAPL -1.1% (Wal-Mart has lowered price of AAPL iPhone 5 to $129 from $189, according to reports

8:08AM STEC to be acquired by WDC for $6.85 per share (STEC) 3.59 :

WDC and STEC announced that they have entered into a definitive merger agreement under which STEC will be acquired by HGST, a wholly-owned subsidiary of Western Digital.

STEC will be acquired for approximately $340 million in cash, which equates to $6.85 per share.

Integrated Device Technology (IDTI) announced that it has developed and validated an intelligent, scalable, and distributed power management solution for Intel (INTC) Atom processors, Intel Xeon processors and Intel Core processors.

09:20 am First Solar upgraded to Hold at Maxim Group: . Maxim upgrades FSLR to Hold from Sell. With the Hold rating, firm no longer has a price target on the company. However, its previous $42 price target had established a reasonable fair value for the company in mid-CY14, and firm believes investors should wait for a price in the mid-$30's before considering the company on the long side. Other than having raised $420M in a secondary offering and diluting its shareholders by approximately 10%, firm does not believe much has changed for the company.

11:21 am Technology Sector trading lower by 1.3% just ahead of the broader market
The tech sector is trading lower today, just ahead of larger losses in the broader market. Semiconductors are showing relative weakness with the SOX trading 2.0% lower. Within the chip index, CREE (-5.0%) is a notable laggard. Among other major indices, the SPY is trading 1.6% lower today, while the QQQ is down 1.2% and the NASDAQ is trading 1.3% lower on the session. Among tech bellwethers, MSFT (+0.5%) is showing notable strength, while FB (-3.4%) is under pressure.

There were no notable tech earnings this morning. In a busy M&A morning, VOD (-0.4%) announced its intention to acquire Kabel Deutschland in a transaction delivering Kabel Deutschland shareholders EUR 87 per share in cash. The deal is expected to be accretive to EPS and FCF per share from the first and second full year post completion respectively. KEYN (+46.3%) will be acquired by Thoma Bravo for $20.00 per share. Also, STEC (+87.0%) will to be acquired by WDC (-2.0%) for $6.85 per share. FIO (-1.1%) and OCZ (+8.0%) are showing strength on the deal. Among notable analyst upgrades in tech this morning, AMD (+0.7%) was upgraded to Outperform at FBR, TIBX (-2.9%) was upgraded to Buy at Hilliard Lyons and FXCM (+0.4%) was upgraded to Buy at Citigroup. In downgrades, ROVI (-5.7%) was downgraded to Underperform at Pacific Crest, SPRD (-2.1%) was downgraded to Neutral at Credit Suisse, OTEX (-3.7%) was downgraded to Hold at Paradigm Capital and B. Riley & Co. downgraded RLD (-4.6%) to Neutral. There are no notable names in tech scheduled to report after the close.

Advanced Micro (AMD) upgraded to Outperform from Mkt Perform at FBR Capital; tgt raised to $5.50 from $3. The firm notes the business looks as though it has stabilized for now. Excluding another macro downturn, they think cash levels remain sufficient for the near future, particularly if management can execute on its path toward free cash flow breakeven in 2H13. Additionally, they believe AMD has wisely directed its strategic focus away from the core PC market and toward gaming APUs, microservers, and custom embedded processors. Firm's target is based on an EV/sales multiple of 1.1x given the firm's near-term business dynamics, potential upside surprises, and future abilities to generate cash.
icon url

ReturntoSender

06/29/13 5:16 PM

#10237 RE: ReturntoSender #6755

From Briefing.com: Weekly Recap - Week ending 28-Jun-13

Dow -114.89 at 14909.6, Nasdaq +1.38 at 3403.25, S&P -6.92 at 1606.28

Stocks concluded their down week on a lower note as the S&P 500 shed 0.4%.

Equities slipped out of the gate amid weakness in Treasuries. The 10-yr note sold off into the cash session open before erasing most of its losses. The benchmark 10-yr yield ended higher by two basis points at 2.493%.

A disappointing Chicago PMI report for June (51.6 actual, 55.5 Briefing.com consensus, 58.7 prior) also contributed to the early weakness, but stocks were able to find support shortly thereafter.

Today's session lows coincided with the release of a better-than-expected final University of Michigan Consumer Sentiment Index (84.1 final, 82.7 consensus, 82.7 preliminary).

Stocks spent the following hour in a steady climb, allowing the S&P to erase its opening losses. However, the early buying interest fizzled out after the benchmark average returned to its flat line, where it held until the closing minutes of the session.

The final five minutes of action saw the index return into the red as the small cap Russell 2000 index underwent its annual rebalancing.

The S&P was anchored to its unchanged level for most of the afternoon as financials and technology weighed. The financial sector ended with a loss of 0.7% while the tech space shed 0.4%.

While the tech sector was able to settle above its lows, not all components were as fortunate. Accenture (ACN 71.96, -8.26) tumbled 10.3% after its earnings beat was overshadowed by below-consensus revenue as well as downside fourth quarter revenue guidance. Separately, BlackBerry (BBRY 10.46, -4.02) plunged 27.8% after the company reported disappointing first quarter earnings and revenue. In addition, BB10 shipments of 2.7 million disappointed as investors expected BlackBerry to ship about 3.5 million units of its latest device.

On the flip side, discretionary shares and utilities ended in positive territory. The discretionary sector received a boost from retailers after Finish Line (FINL 21.86, +0.66) surprised to the upside with its earnings and revenue. Meanwhile, homebuilders kept the discretionary space from logging further gains. Most major builders settled in the red while the iShares Dow Jones US Home Construction ETF (ITB 22.38, -0.37) shed 1.6%.

Also of note, a 0.4% advance in utilities extended the sector's weekly gain to 3.0%, placing it atop this week's leaderboard. Meanwhile, the materials sector was the weakest group of the week, ending with a loss of 1.5%. However, gold miners had a strong showing today as the Market Vectors Gold Miners ETF (GDX 24.49, +1.70) surged 7.5%. On a related note, gold futures gained 1.6% to $1230.70 per ounce while silver futures jumped 5.6% to $19.60 per ounce.

Week in Review: S&P 500 Tests 100-Day Moving Average

On Monday, the stock market began the week on a fitful note as rising interest rates at home and falling equity markets abroad conspired to keep the major averages in negative territory throughout the day. The S&P 500 registered its first close below its 100-day moving average this year. Overseas, the drop in China was attributed to a growing sense of angst that a liquidity crisis and credit crunch are brewing there. The growth concerns weighed heavily on the cyclical sectors throughout the day. Financials (-1.8%) led the losses and were joined by materials (-1.7%), industrials (-1.7%), energy (-1.5%), and technology (-1.4%) as the worst-performing areas.

Equities ended Tuesday's session near their highs, but were unable to erase their Monday losses. The S&P 500 climbed 1.0% as all ten sectors ended with gains. The bulk of the advance occurred in the first 90 minutes of the session amid a global rebound. Interestingly, two rate-sensitive sectors vaulted to the top of this month's leaderboard despite the continued climb in Treasury yields. The telecom services sector rose 2.0%, which turned its month-to-date loss to a gain of 1.0%.

Wednesday began on an upbeat note despite some disappointing economic news. The final first quarter GDP reading was revised down to 1.8% from 2.4%. Typically, revisions to GDP in the third estimate are very minor. The large decline in this report was very unusual and caught all economists by surprise. Most of the downward revision came from consumption in services. In the previous estimate, services spending increased 3.1%. That was revised down to 1.7% growth and contributed 0.6 percentage points less to GDP growth. Stocks received this news in stride as sluggish growth suggests the Federal Reserve is less likely to withdraw its support from the markets. To that end, the Treasury complex received an aggressive bid immediately after the GDP revision crossed the wires. The benchmark 10-yr yield ended lower by seven basis points at 2.542%.

On Thursday, the S&P 500 settled higher by 0.6% as nine sectors posted gains. Equities were off to the races at the sound of the opening bell, aided by the personal income report, which pointed to an increase of 0.5% in May. The Briefing.com consensus expected personal income to rise 0.2%. Stocks received a secondary boost from the pending home sales report as May sales rose 6.7% (1.5% consensus). The S&P notched its high of 1620 shortly after the market digested the latest housing data point. However, the index was unable to rise above that level as the 20- and 50-day moving averages served as resistance at the session high.
  
Index Started Week Ended Week Change % Change YTD %
DJIA 14799.40 14909.60 110.20 0.7 13.8
Nasdaq 3357.25 3403.25 46.00 1.4 12.7
S&P 500 1592.43 1606.28 13.85 0.9 12.6
Russell 2000 963.68 977.48 13.80 1.4 15.1


4:24PM This week's biggest % gainers/losers (SCANX) : The following are this week's top 20 percentage gainers and top 20 percentage losers, categorized by sectors (over $300 mln market cap and 100K average daily volume).

This week's top 20 % gainers

Technology: STEC (6.72 +99.11%), KEYN (19.76 +46.91%), AFFX (4.44 +21.49%), CSIQ (10.99 +20.74%), SPRD (26.25 +18.75%), ENPH (7.73 +15.93%), DWRE (42.45 +15.65%)
Services: CRWN (2.47 +32.11%), P (18.4 +21.63%)
Industrial Goods: XONE (61.72 +19.49%), OSIS (64.42 +16.43%)
Healthcare: VHS (20.74 +62.26%), ISIS (26.87 +30.84%), RPTP (9.35 +26.11%), IMMU (5.44 +23.67%), SNTA (4.99 +23.38%), HWAY (17.38 +15.98%)
Financial: HOMB (25.91 +25.45%)
Consumer Goods: WPRT (33.53 +16.19%)
Basic Materials: KIOR (5.71 +46.62%)

This week's top 20 % losers

Technology: DMD (6 -25.49%), EBIX (9.26 -14.36%)
Services: MATX (25 -32.33%), MG (17.58 -18.08%), BKS (15.96 -14.1%), APOL (17.72 -12.42%), PMC (13.86 -12.4%)
Industrial Goods: PGEM (20.09 -14.02%), TREX (47.49 -13.16%)
Healthcare: IDIX (3.61 -32.16%), NLNK (19.72 -12.32%)
Financial: DRE (15.59 -36.65%), NBG (3.45 -32.76%)
Basic Materials: SAND (5.85 -25.46%), WLT (10.4 -19.89%), AVD (23.43 -19.08%), SA (9.43 -15.74%), BVN (14.76 -15.49%), ANV (6.48 -13.15%), GORO (8.71 -12.16%)

9:11AM Suntech Power announces new forbearance agreement with holders of 3% convertible notes (STP) 1.04 : Co announced that it has reached an accord with holders of a majority of the 3% Convertible Senior Notes for a new forbearance agreement that sets forth the next steps in the debt restructuring process. The new forbearance agreement provides further time to implement the restructuring and will expire on August 30, 2013. In particular, the new agreement contemplates an equitization of all major debt claims held by the Bondholders. In addition, the Bondholders will nominate two additional members to the Company's Board of Directors who will provide guidance and assist in the Company's ongoing restructuring efforts.

HP (HPQ) Enterprise Services and its NGEN Alliance Partners, AT&T (T) Government Solutions, IBM Global Business Services Federal, Lockheed Martin (LMT) Services and Northrop Grumman (NOC) Systems announced they have been awarded the U.S. Department of the Navy's Next Generation Enterprise Network contract

Accenture (ACN) reported third quarter earnings of $1.14 per share, excluding non-recurring items, which was better then expected, with revenues rose 0.6% year/year to $7.2 billion which was below expectations. The company issued guidance for Q4 with revenues of $6.7-7.0 billion which was below expectations. For fiscal year 2013 EPS of $4.18-4.22, which was below expectations and compared with its previous guided range of $4.24 to $4.32. The updated ranges for diluted EPS and adjusted EPS reflect the company's revised foreign-exchange assumption for the year, which reduced both ranges by approximately $0.03.

CalAmp (CAMP) reported first quarter earnings of $0.16 per share, excluding non-recurring items, which was better than expected while revenues rose 22.5% year/year to $53.7, which was also better than expected. The company issued guidance for the second quarter with EPS of $0.14-0.18, excluding non-recurring items, which was in line with estimates with revenues of $53-57 million which was in line with expectations. "We're off to a strong start in fiscal 2014." In Q1, Wireless Datacom segment revenue increased 29% YoY driven by continued momentum from Mobile Resource Management (MRM) products and contributions from its Wireless Matrix acquisition that was completed at the beginning of Q1. Wireless Datacom gross margin improved to 39.1% due mainly to higher margin subscription revenue from the Wireless Matrix acquisition. For its Satellite segment, co saw improving margins along with some growth resulting in a meaningful impact to bottom line results.

Hewlett-Packard (HPQ) is being awarded a $321,689,010 indefinite-delivery/indefinite-quantity, firm-fixed-price, fixed-price award fee contract for the Next Generation Enterprise Network (NGEN). The single contract award was based on the HPES Combined Enterprise Services and Transport Services proposal. This contract includes four, one-year options which, if exercised, would bring the evaluated contract cumulative value to $3,454,735,513. Work will be performed at nearly 2,500 Navy and Marine Corps locations worldwide, from major bases to single-user sites, and work is expected to be completed in June 2014. If the options are exercised, the work will continue through June 2018.

Blackberry (BBRY) reported first quarter loss of $0.13 per share, which was below expectations, while revenues rose 9.4% year/year to $3.07 bln, which also missed estimates. Venezuela foreign currency restrictions impact reported GAAP earnings and adjusted earnings by approximately $0.10 per share; "excluding such impact, adjusted earnings in-line with previously provided outlook of approaching breakeven financial results." The company anticipates Q2 operating loss, which was below expectations. "The smartphone market remains highly competitive, making it difficult to estimate units, revenue and levels of profitability. Throughout the remainder of fiscal 2014, the Company will invest in BlackBerry 10 smartphone launches, and the roll out of BlackBerry Enterprise Service 10, to continue to establish the new BlackBerry 10 platform in the marketplace. The Company will also invest resources to evolve BlackBerry Messenger into a leading cross platform mobile social messaging application, and launch other revenue initiatives associated with new services and emerging mobile computing opportunities. Based on the competitive market dynamics and these investments, the company anticipates it will generate an operating loss in the second quarter. The company will also continue to implement the cost savings and process-improving initiatives it started last year, in order to drive greater efficiency throughout the company, and redirect capital from these savings to areas of investment that will drive future revenue growth."

10:27 am Consumer Sentiment Rebounds In Final June Reading
The University of Michigan Consumer Sentiment Index was revised up to 84.1 in the final reading for June from 82.7 in the preliminary reading. That is just below the 81.4 reading in May. The Briefing.com consensus expected the index to remain at 82.7. The recent volatility in the equity markets and higher gasoline prices have not affected consumer sentiment. Instead, consumers focused on the gains in payrolls/employment when viewing the economy.

The Current Conditions Index was revised up to 93.8 in the final reading from 92.1 in the preliminary report. That is down from 98.0 in May. The Expectations Index was revised up from 76.7 to 77.8 in the final reading, which was the strongest reading since October 2012. Overall, consumer sentiment has little impact on consumption. Stronger income growth, not improving sentiment, drives spending behaviors.

07:44 am MolyCorp shares soar 12% following completion of SEC investigation
SEC informed MolyCorp (MCP $6.27 +0.66) that it has completed its investigation of the accuracy of the Molycorp's public disclosures, and it is not recommending that any enforcement action be taken against the Company. The SEC initiated its investigation of Molycorp in August 2012.

07:42 am Nke shares fall 2% despite better than expected EPS
Nike (NKE $61.27 -1.05) reported fourth quarter earnings of $0.76 per share, which was better than expected, while revenues rose 7.4% year/year to $6.70 billion which was in line with estimates. Fourth quarter diluted EPS from continuing operations grew faster than revenue, up 27 percent, mainly as a result of gross margin expansion, a lower effective tax rate and a lower average share count. Ex-FX, NIKE Brand revenues rose 8% with growth across each product type and in every geography except Western Europe and Greater China.

For the fourth quarter, NIKE Brand revenues were higher in Running, Basketball, Men's Training, and Women's Training, offsetting slight declines in Sportswear, Action Sports and Football (Soccer), which reflects comparisons to strong sales in advance of the European Football Championships in 2012. Revenues for Other Businesses grew 10%, including a 1 point reduction from changes in currency exchange rates, as revenues increased for each business during the quarter. Gross margin increased 110 basis points to 43.9%. Gross margin benefited from pricing actions, easing materials costs and favorable comparisons to last year, when gross margin was reduced by higher investments in the Company's digital business and an unanticipated customs assessment in the Emerging Markets geography. The positive impact of these factors was partially offset by higher labor costs, unfavorable changes in FX and higher discounts, particularly in Greater China as the co continues to work with its retailers to optimize marketplace inventory.

As of the end of the quarter, worldwide futures orders for NIKE Brand athletic footwear and apparel, scheduled for delivery from June through November 2013 totaled $12.1 billion, 8% higher than orders reported for the same period last year; futures were +6% last quarter. During Q4, NIKE, Inc. repurchased a total of 4.2 million shares for ~$242 million. For the fiscal year, the co repurchased a total of 33.5 million shares for ~ $1.7 billion. The company sees first quarter revenue growth in mid to high single digits, with EPS 'well above' low double digit growth. The company sees fiscal year 2014 revenue growth at upper end of high single digits, and EPS growth in low double digits. Q1 gross margin is expected to be flat. Revenues for the first half of 2014 are expected to decline year over year.

07:40 am CalAmp shares fall 2% following better than expected earnings
CalAmp (CAMP $14.70 +0.32) reported first quarter earnings of $0.16 per share, excluding non-recurring items, which was better than expected while revenues rose 22.5% year/year to $53.7, which was also better than expected. The company issued guidance for the second quarter with EPS of $0.14-0.18, excluding non-recurring items, which was in line with estimates with revenues of $53-57 million which was in line with expectations. "We're off to a strong start in fiscal 2014." In Q1, Wireless Datacom segment revenue increased 29% YoY driven by continued momentum from Mobile Resource Management (MRM) products and contributions from its Wireless Matrix acquisition that was completed at the beginning of Q1. Wireless Datacom gross margin improved to 39.1% due mainly to higher margin subscription revenue from the Wireless Matrix acquisition. For its Satellite segment, co saw improving margins along with some growth resulting in a meaningful impact to bottom line results.

07:39 am Accenture shares fall 8% following miss on revenues and disappointing guidance
Accenture (ACN $73.65 -6.57) reported third quarter earnings of $1.14 per share, excluding non-recurring items, which was better then expected, with revenues rose 0.6% year/year to $7.2 billion which was below expectations. The company issued guidance for Q4 with revenues of $6.7-7.0 billion which was below expectations. For fiscal year 2013 EPS of $4.18-4.22, which was below expectations and compared with its previous guided range of $4.24 to $4.32. The updated ranges for diluted EPS and adjusted EPS reflect the company's revised foreign-exchange assumption for the year, which reduced both ranges by approximately $0.03.

07:37 am Blackberry shares plunge 17% following Q1 loss
Blackberry (BBRY $12.01 -2.49) reported first quarter loss of $0.13 per share, which was below expectations, while revenues rose 9.4% year/year to $3.07 bln, which also missed estimates. Venezuela foreign currency restrictions impact reported GAAP earnings and adjusted earnings by approximately $0.10 per share; "excluding such impact, adjusted earnings in-line with previously provided outlook of approaching breakeven financial results."

The company anticipates Q2 operating loss, which was below expectations. "The smartphone market remains highly competitive, making it difficult to estimate units, revenue and levels of profitability. Throughout the remainder of fiscal 2014, the Company will invest in BlackBerry 10 smartphone launches, and the roll out of BlackBerry Enterprise Service 10, to continue to establish the new BlackBerry 10 platform in the marketplace. The Company will also invest resources to evolve BlackBerry Messenger into a leading cross platform mobile social massaging application, and launch other revenue initiatives associated with new services and emerging mobile computing opportunities. Based on the competitive market dynamics and these investments, the company anticipates it will generate an operating loss in the second quarter. The company will also continue to implement the cost savings and process-improving initiatives it started last year, in order to drive greater efficiency throughout the company, and redirect capital from these savings to areas of investment that will drive future revenue growth."

02:38 am Blackberry among the handful of companies set to report earnings before the open on Friday (BBRY)

Look for the following companies to report before the open:

BBRY, SJR, FINL, AZZ

02:36 am Nike shares slide after hours following earnings (NKE)
After Hours Gainers:

Companies trading higher in after hours in reaction to earnings: CAMP +1.7%

Companies trading higher in after hours in reaction to news: MCP +8.7% (SEC informed MCP that it has completed its investigation of the accuracy of the Molycorp's public disclosures, and it is not recommending that any enforcement action be taken against the Company), PFE +1.1% (Board authorized new $10 bln share repurchase program), AAMRQ +1.0% (disclosed it entered into a Credit and Guarantee Agreement; provides for $1.05 bln term loan facility and a $1 bln revolving credit facility), FINL +0.5% (announced that Steven Schneider, currently President and COO, will transition to the role of executive vice president of strategic initiatives)

After Hours Losers:

Companies trading lower in after hours in reaction to earnings: ACN -7.0%, NKE -2.6%, VNO -0.2%

Companies trading lower in after hours in reaction to news: CDTI -3.7% (announces underwritten public offering of common stock and warrants, size not disclosed), SPR -2.9% (received contract to supply aircraft structures for four 'operational evaluation' CH-53K heavy life helicopters), UAL -0.8% (co and the Transport Workers Union reach tentative agreement; co estimates that Q2 consolidated system available seat miles to decrease 2.1% yoy)
icon url

ReturntoSender

06/30/13 9:55 PM

#10238 RE: ReturntoSender #6755

InvestmentHouse Weekend Market Summary

http://www.investmenthouse.com/weekendmarketsummary.htm

- Even more Fed-speak, taper appears clearer as market ponders whether the Fed still has its back.
- A day of rest as expected as indices bump next resistance, first test in the recovery attempt.
- China up to end the week, trying to mask growing bad loan and banking problems.
- Chicago PMI hangs onto expansion but posts a precipitous drop from a likely outrider month.
- Michigan Sentiment June Final jumps expectations as hope in the US still springs eternal.
- Important week for the market is highlighted by Independence Day holiday on Thursday and Jobs report Friday.

After three days the market takes a pause at resistance.

Pretty much as expected. After three days of a solid rebound the stock indices started negative, but it took a morning fade in futures from positive in order for the rally to stall. Futures were up, looking pretty good as the rest of the world was not imploding. China actually rebounded 1.7%, a mere pittance given the precipitous decline the prior week. A bit of a bounce a la the US markets? Perhaps, but the new story from China are the bad loans that are pushing yield spreads wider and wider, no small issue for China's financial situation. If you don't think so, recall a little bad loan issue in the US back in 2007 and 2008?

Then there was the negative news. Earnings were not good. BBRY bombed results, missing expected unit sales by 800K. NKE beat the bottom line but suffered just in line top line sales revenues. BBRY was crushed; NKE enjoyed a nice gain after an early hammering on the results.

Funny thing. Earnings, the lifeblood of the stock market, were not the real story on the day. Q2 wrapped on Friday and earnings will be flowing big time in a couple of weeks in a quarter that is hoped to be over 3% GDP-wise.

No, for now the real story that drives the market is the Mr. Bernanke, the FOMC members, and what the parrot saw.

All week investors were peppered with Fed-speak, trying to explain the FOMC statement and Mr. Bernanke's text to the press following the meeting. Friday Bernanke oversaw the next round of commentary, pulling in some new faces, recycling some others from prior in the week.

Mr. Stein of the Fed fraternity came out pre-market with his take on the FOMC statement and the Fed's course of action. Mr. Stein talked the same we could do this, we could do that blather heard all week, more of the same. Then he used an example of say, perhaps starting the taper in September because the Fed isn't focusing on the last few weeks of data ahead of any FOMC meeting, but the data 'SINCE THE INCEPTION OF THE PROGRAM,' i.e. since QE started. One supposes that means since things are substantially better now than then, the Fed can start pulling back.

Okay, thanks. Apparently the market took it that way. Futures that were up were no longer up by the time the opening bell rang. They rolled over with Dow futures off over 60 points by the open.

Manufacturing data not up to snuff but Sentiment continues to hope higher.

Stocks opened and sold. At the top of the first hour Chicago PMI came in at 51.6, still above the 50 threshold level of contraction/expansion, but missing expectations of 55.5 and plummeting from 58.7 in May. Biggest month to month decline in 4 years.

Trying to break the downtrend but struggling after a double top spanning 2003 and 2010 peaks.

Note Unfilled Orders suffered the largest month to month decline since March 1974, falling to 34.4 from 53.1. Of course, it is not shown on this chart but is critical as it means production likely continues to decline from the May peak.

New Orders will need to increase in order to keep the production level and the index in expansion.

Of concern is the jump back higher in Prices Paid close to 60 yet again after a two-month hiatus.

Michigan Sentiment Final managed to pull the market's castanets out of the fire.

Michigan Sentiment, June Final (9:55): 84.1 actual versus 82.7 expected, 84.5 May

Audacity of hope? Expectations continue to lag present conditions.

Hope for a better tomorrow continues. Americans are optimistic by nature. They always hope for a better future for themselves and their children. That economic data that is not tanking (though is pathetic by US historical standards; hope they are not only historical now) is helping hope flourish. Hope, as Andy Dufresne said in 'Shawshank Redemption,' is a good thing.

Yes, when it is realistic hope. Not to be confused with 'hope and change.' Hope so often rhymes with dope, and this Fed liquidity induced recovery might not make it if the Fed peels back the monthly mainlining. Compared to massive buying each month, backing off the buys but keeping a big balance sheet is like substituting pure gasoline not with an ethanol blend, but with Kool-Aid and thinking the vehicle can still run.

Hey, but it all worked for the market. After the dip into the news it seems a Chicago PMI that was at least above 50 no matter what land speed records it set on the drop from the prior month and a 'surely it has to get better than this so let's look ahead to that time' sentiment surge were all the market needed to move back up.

Stocks recovered and rallied into midmorning, held a test over lunch, then legged it higher into the last hour. All looked good heading into the Russell rebalance, but the buy and sell orders on close didn't match up as the sells outnumbered the buys. The resultant fairly precipitous decline pushed SP500 and DJ30 negative on the session.

SP500

Disappointing? Not really. We were not expecting any upside. Indeed, the market gave exactly what we were looking for: a pause, a rest, a shakeout and recovery - - call it what you want - - after three solid upside rebound sessions took the indices to next resistance. Some queried if this action represented an exhaustion gap given SP500 and NASDAQ both gapped to the upside Tuesday through Thursday. It can be viewed as that, but likely only for this short move. Bigger picture SP500 is in a pretty nice ABCD test to the 38% Fibonacci retracement of the run from November to May. That suggests there is still a lot of momentum in the move.

More Fed-Speak: Lacker's reprise

It has the momentum; the question is whether it is enough to overcome the tightening noose of Fed action?

Friday the FOMC designated dissenter (DD) Lacker was talking again. This is Lacker's second public pronouncement of the week on the meaning of the FOMC's position since the statement's release. Wednesday Lacker sounded much more dovish and was branded a faux-dove but really didn't change his stance: he said there would be no change in rates for a long time and made no mention of QE tapering. Lacker bristled at the characterization and came out in defense of his hawk reputation Friday, warning investors to get used to 'falling markets' as they should not be too surprising. Also, prepare for more volatility as the Fed acts over the coming quarters, dropping bits of 'insight' into its policies. That doesn't sound so transparent.

In the end, the Fed-speak to clarify the Fed-speak appeared to conflict itself, leaving many to pine for the days when the Fed didn't try to be so transparent. Now it seems that the words its members utter look like rather transparent attempts to manipulate responses to their supposedly transparent statements.

Through it all the speak can be distilled to this: Taper to start in September. No touching interest rates for a long time. Don't have to; the market is pushing them up on its own. Keeping the balance sheet huge, but now the Fed wonders if just keeping the balance sheet really does control interest rates as Keynes felt (wrongly so as reality is showing).

Again I pose the question asked often of late: If the Fed pulls the QE in part over time, will the economy and thus the market manage to move higher? Heck, will they even manage to hold what they have gained thus far? Bernanke said he wanted to inflate asset prices to bring about a wealth effect. If they were inflated with QE and QE is pared back without economic growth outside what QE creates, it is axiomatic that values fall when the force driving them higher is removed or lessened.

Fed is on taper trail. Fed warns markets will fall. Is that now or later?

In short, if you take away the thing that made stock prices rise and nothing has changed economically, stock prices will fall. Hence Lacker's warning: 'Falling markets should not be too surprising.' They say don't fight the Fed. Lacker is telling you what is going to happen.

The next question is: does it happen now or later? The market sold after taper was mentioned again and it sold hard when the FOMC appeared to inscribe it into the stone of its statement. If the market synthesizes all of the Fed-speak into a belief taper is coming, then the move is likely over, at least to the straight higher, 45 degree incline in stocks as demonstrated in the November to May most recent run. I said when the FOMC came out with its statement and Bernanke's comments that the market had topped. That is a conclusion based upon a familiarity with how the market reacts vis- -vis Fed actions.

But you have to stay open, not biasing your views particularly your actions, based upon just your own views. As pointed out the past week, there are technical reasons the market can continue higher, namely the ABCD pattern at the 38% Fibonacci retracement on SP500.

This test after the 3-day bounce will tell much of the tale as to the 'when' the market will start to factor a taper into prices. It just may be that there is enough hope out there as shown in Michigan Sentiment and Consumer Confidence to keep the technical recovery moving. Unless that hope is backed up by some seriously improving economics (and not just the marginal BS the economy is showing still), any further upside move ultimately falls victim to the Fed's impending taper.

MARKETS:

TECHNICAL SUMMARY

INTERNALS

NASDAQ
Stats: +1.38 points (+0.04%) to close at 3403.25
Volume: 2.514B (+49.31%)

Up Volume: 1.74B (+440M)
Down Volume: 1.83B (+1.461B)

A/D and Hi/Lo: Advancers led 1.02 to 1
Previous Session: Advancers led 3.47 to 1

New Highs: 145 (+21)
New Lows: 38 (+5)

S&P
Stats: -6.92 points (-0.43%) to close at 1606.28
NYSE Volume: 863M (+32.36%)

A/D and Hi/Lo: Advancers led 1.04 to 1
Previous Session: Advancers led 4.77 to 1

New Highs: 123 (+12)
New Lows: 113 (-3)

DJ30
Stats: -114.89 points (-0.76%) to close at 14909.6

CHARTS

SP500 & DJ30: Still almost identical patterns with SP500 again bumping the B point in the ABCD pattern as well as the 50 day SMA and EMA as on Thursday. Unlike Thursday, the indices slipped back to a modest loss. Huge volume, but a rebalance day. Taking the rest we anticipated, and the resolution is key. If the Fed was not now in taper mode I would say the upside had the higher probability of winning out.

NASDAQ: Extended the move but struggled to do so. Gapped lower, recovered through the 50 day SMA, but could not stick the landing. NASDAQ remains at the lower gap point from two weeks back, basically struggling at the same level as SP500. It is also battling something of an island reversal from the gap higher in early May then that gap lower two weeks back. That makes this an extremely important test as well.

RUTX: The small caps paused with a doji at the lower gap point from a couple weeks back. The small caps look better than NASDAQ frankly.

SOX: Up on Friday as it is another index bumping into the gap point from two weeks back. Moved into the gap zone for the second session and then faded, but is holding easily in the range, now moving into the upper half. A very volatile, choppy pattern with a breakout then failure, a breakdown with no follow through, and now back right in the middle. Wild action but it has held the line.

SENTIMENT INDICATORS

VIX: 16.86; 0
VXN: 16.47; -0.25
VXO: 17.24; +0.54

Put/Call Ratio (CBOE): 0.96; -0.06

Bulls and Bears:

The decline from two weeks back caught up with investor confidence two week's back. After rallying the prior week into the teeth of the selling, bulls hit their lowest level since December 2012. Bears hit their highest since January. As such, this indicator is at levels that would produce upside rallies in prior points during the November run. Hate to say it, but this time it could be different given there are now doubts the Fed has the market's back. Thus this indicator may need to get to more traditional levels, e.g. less than 35% for bulls and over 35% for bears.

Bulls: 41.7% versus 46.8% versus 43.8% versus 45.8% versus 52.1% versus 54.2% versus 52.1% versus 47.9% versus 44.3% versus 47.4% versus 50.5%.

Background: Undercut 35%, the threshold for bullishness, in early June. As noted, hit 34% in early June. It did its job and the market is on the rally. Hard drop to 34 from 39.3% as economic reality and a choppy stock market hit. Off the 55+ level hit in late February. That was the highest level since April and May of 2011, the peak of the post-bear market high. 35% is the threshold level suggesting bullishness. To be seriously bearish it needs to get up to the 60% to 65% level.

Bears: 25.0% versus 21.9% versus 22.9% versus 20.8% versus 19.8% versus 19.8% versus 19.8% versus 18.8% versus 19.6% versus 20.6% versus 20.6% versus 19.4% versus 19.6% versus 18.6% versus 18.8% versus 21.1% versus 21.1% versus 22.1% versus 21.1% versus 21.1% versus 22.3% versus 22.3% versus 23.4% versus 24.5% versus 24.5% versus 23.4% versus 25.5% versus 27.7% versus 27.7% versus 28.7% versus 27.7%.

Summary: Over 35% is the threshold to be really be a good upside indicator. For reference, bearishness hit a 5 year high at 54.4% the last week of October 2008. The move over 50 took bearish sentiment to its highest level since 1995. Extreme negative sentiment. Prior levels for comparison: Bearishness peaked at 37.4% in September 2007. It topped the June 2006 peak (36%) on that run. That June peak eclipsed the March 2006 high (33%) and well above the 2005 highs that spawned new rallies (30% in May 2005, 29.2% in October 2005). That was a huge turn, unlike any seen in recent history.

THIS WEEK

An Independence Day shortened week has the market closing at 1:00ET Wednesday and all day Thursday. NYSE rules say it cannot be closed 4 days in a row so Friday the market will be open. No big event typically, but this one has the Jobs Report, and that is enough to get some traders hanging around. Not many, but some.

Midsummer, 1.5 day holiday midweek and that typically equals light volume. Light volume can mean more volatile conditions as a few can push the market a lot. Then when the High Frequency programs get going it can gyrate like a young Elvis.

Time to keep the eyes on the big picture then, and that means SP500 testing the resistance at the B point and 50 day SMA and NASDAQ at the 50 day EMA as well. The rebound was solid in price and breadth, a bit light on trade. Technically just fine in terms of the larger pattern, the ABCD at the 38% Fibonacci retracement.

Of course the market is also dominated by the Fed, and the reverberations of the deluge of comments the past two weeks are still working through stocks.

Those are the two tensions in the stock market: a still solid technical setup longer term versus the impact on the economy and thus earnings of a Fed taper. Perhaps this week will tell the story, but the holiday makes it more problematic.

We have some nice upside positions in place, some nice potential upside plays on one side. We have some nice downside positions in place, some nice potential downside plays on the other. We made money both ways this past week. Likely that won't continues as well as it has, however, because the market is going to make a decision at this key level. When it does, we go with the decision of M and use it to make money.

I said that a test at this level would allow some solid stocks to set up new buys. Those will be key to watch this week because as always the leaders lead, and if they test then blast off again, the market follows. If they test then roll over, as a group of course, the market follows.

Have a great weekend!

Support and resistance

NASDAQ: Closed at 3403.25

Resistance:
The 50 day SMA at 3404
3470 is the November 2012 up trendline
3521 is the August 2000 low.
3532 is the early May high and 2013 high
3560 is the upper channel line for the November 2012 to present uptrend

Support:
The 50 day EMA at 3387
3371 is the early May 2013 upper gap point
3321 from April 2000
3295 is the June 2013 low selloff
The 2011 up trendline at 3265
3227 is the April 2000 intraday low
3197 is the September 2012 post-bear market high
The 200 day SMA at 3182
3171 is the October intraday high
3134 is the March 2012 post-bear market peak
3130 from some January 2013 lows
3104-3112 from August and mid-October peaks.
3101 is the August 2012 high
3090 is the mid-March interim high
3076 is the late April 2012 high and the 1/2013 low after gapping higher
3062 is the December 2012 prior peak
3042 from 5/2000 low and several other price points
3024 is the gap point from early May
3000 is the February 2012 post-bear market high
2999 is the bottom of the August 2012 consolidation
2988 is the July 2012 high
2977 to 2980 is the bottom of the late October 2012 consolidation, July 2012 peak
2962 is the April 2012 low
2950 is the mid-April closing low

S&P 500: Closed at 1606.28

Resistance:
The 50 day EMA at 1611
The 50 day SMA 1622
The November up trendline at 1663
1687 is the May high and post-bear market high
1738 is the upper trendline in the channel

Support:
1576 from October 2007, the prior all-time high
1569.48 is the 78% Fibonacci retracement of the April to May 2013 run
1560 is the June 2013 reversal low
1556 from July 2007
1541 is the April 2013 closing low in that pullback inside the uptrend
1539 from June 2007
1531 is the recent high
The 200 day SMA at 1510
1499 from January 2008
1475 is the September 2012 high
1471 is the October 2012 intraday high
1466 is the September 2012 closing peak and rally closing high
1440 from November 2007 closing lows
1434 from early November 2012
1433 from August 2007 closing lows
1427 is the August 2012 peak
1425 from May 2008 closing highs and the October 2012 low
1408 is the late October 2012 range closing low
1406 is the early May 2012 peak
1402.22 - 1400 is the closing low of the August 2012 lateral consolidation

Dow: Closed at 14,909.60

Resistance:
The 50 day EMA at 14,957
The 50 day SMA at 15,042
The November up trendline at 15,455
15,542 is the May 2013 high

Support:
14,888 is the April peak and prior all-time high
14,844 is the June intraday low
14,551 is the June 2013 intraday low on the selloff
14,198 from the October 2007 high
14,149 is the February 2013 high
14,022 from 7-07 peak
14,010 from the early February 2013 consolidation
The 200 day SMA at 14,004
13,784 is the late February 2013 closing low
13,692 from 6-2007 peak
13,668 from 12-2007 peak
13662 is the October 2012 intraday high
13,653 is the September 2012 high
13,557 to 13,662
13,413 from the late September 2012 low
13,300 to 13,331 is the August 2012 post-bear market high
13,297 is the April 2012, prior post bear market high
13,058 from the May 2008 peak on that bounce in the selling
13,056 is the February 2012 high
12,716 is the April 2012 closing low
12,524 is a range of support from early 2012 and summertime 2012

Economic Calendar

June 25 - Tuesday
- Durable Orders, May (8:30): 3.6% actual versus 3.0% expected, 3.6% prior (revised from 3.5%)
- Durable Goods -ex transports, May (8:30): 0.7% actual versus -0.5% expected, 1.7% prior (revised from 1.5%)
- Case-Shiller 20-city, April (9:00): 12.1% actual versus 10.5% expected, 10.9% prior
- FHFA Housing Price Index, April (9:00): 0.7% actual versus 1.5% prior (revised from 1.3%)
- Consumer Confidence, June (10:00): 81.4 actual versus 75.0 expected, 74.3 prior (revised from 76.2)
- New Home Sales, May (10:00): 476K actual versus 460K expected, 466K prior (revised from 454K)

June 26 - Wednesday
- MBA Mortgage Index, 06/22 (7:00): -3.3% prior
- GDP - Third Estimate, Q1 (8:30): 1.77% versus 2.4% expected, 0.4% Q4
- GDP Deflator - Third, Q1 (8:30): 1.1% expected, 1.1% prior
- Crude Inventories, 06/22 (10:30): 0.313M prior

June 27 - Thursday
- Initial Claims, 06/22 (8:30): 346K actual versus 345K expected, 355K prior (revised from 354K)
- Continuing Claims, 06/15 (8:30): 2965K actual versus 2958K expected, 2966K prior (revised from 2951K)
- Personal Income, May (8:30): 0.5% actual versus 0.2% expected, 0.1% prior (revised from 0.0%)
- Personal Spending, May (8:30): 0.3% actual versus 0.4% expected, -0.3% prior (revised from -0.2%)
- PCE Prices - Core, May (8:30): 0.1% actual versus 0.1% expected, 0.0% prior
- Pending Home Sales, May (10:00): 6.7% actual versus 1.5% expected, -0.5% prior (revised from 0.3%)
- Natural Gas Inventories, 06/22 (10:30): 95 bcf actual versus 91 bcf prior

June 28 - Friday
- Chicago PMI, June (9:45): 51.6 actual versus 55.5 expected, 58.7 prior
- Michigan Sentiment - Final, June (9:55): 84.1 actual versus 82.7 expected, 82.7 prior

July 1 - Monday
- ISM Index, June (10:00): 50.5 expected, 49.0 prior
- Construction Spending, May (10:00): 0.5% expected, 0.4% prior

July 2 - Tuesday
- Factory Orders, May (10:00): 2.0% expected, 1.0% prior
- Auto Sales, June (14:00): 5.3M prior
- Truck Sales, June (14:00): 6.8M prior

July 3 - Wednesday
- MBA Mortgage Index, 06/29 (7:00): -3.0% prior
- Challenger Job Cuts, June (7:30): -41.2% prior
- ADP Employment Change, June (8:15): 150K expected, 135K prior
- Initial Claims, 06/29 (8:30): 348K expected, 346K prior
- Trade Balance, May (8:30): -$40.8B expected, -$40.3B prior
- Continuing Claims, 06/15 (8:30): 2955K expected, 2965K prior
- Trade Balance, May (8:30): -$40.8B expected, -$40.3B prior
- ISM Services, June (10:00): 54.0 expected, 53.7 prior
- Crude Inventories, 06/29 (10:30): 0.018M prior
- Natural Gas Inventories, 06/29 (24:00): 95 bcf prior

July 5 - Friday
- Initial Claims, 06/29 (8:30): 348K expected, 346K prior
- Continuing Claims, 06/15 (8:30): 2955K expected, 2965K prior
- Nonfarm Payrolls, June (8:30): 165K expected, 175K prior
- Nonfarm Private Payrolls, June (8:30): 179K expected, 178K prior
- Unemployment Rate, June (8:30): 7.6% expected, 7.6% prior
- Hourly Earnings, June (8:30): 0.2% expected, 0.0% prior
- Average Workweek, June (8:30): 34.5 expected, 34.5 prior
- Natural Gas Inventories, 06/29 (10:30)
icon url

ReturntoSender

07/06/13 7:55 PM

#10243 RE: ReturntoSender #6755

From Briefing.com: Weekly Recap - Week ending 05-Jul-13

Dow +147.29 at 15135.84, Nasdaq +35.71 at 3479.38, S&P +16.48 at 1631.89

The major averages entered the weekend on a positive note. The S&P 500 settled higher by 1.0% as nine of ten sectors posted gains.

Equities opened in the green after the June nonfarm payrolls report handily beat expectations (195K actual, 166K Briefing.com consensus). However, the details of the report took some shine off the headline number as individuals working part-time for economic reasons increased by 322,000, the number of discouraged workers was up by 206,000 from the year-ago period; the percentage of long-term unemployed workers (i.e. 27 weeks or longer) was still too high at 36.7%; and the U6 unemployment rate, which accounts for unemployed and underemployed workers, rose to 14.3% from 13.8%.

Notably, the better-than-expected headline number gave investors enough reason to believe the Federal Reserve may begin modifying the pace of its asset purchases sooner rather than later. To that end, Treasuries sold off aggressively and spent the remainder of the session on their lows. The benchmark 10-yr yield jumped 22 basis points to end at 2.72%, its highest level since August 2011.

Today's jobs report also gave a notable boost to the dollar, sending the Dollar Index to a three-year high amid all-around greenback strength. In turn, dollar strength pressured industrial and precious metals as copper futures tumbled 3.2% to $3.072 per pound while gold futures slumped 3.1% to $1212.50 per troy ounce.

However, crude oil jumped 1.9% to end on its high at $103.19 per barrel. The energy component rallied throughout the day amid ongoing clashes between the Egyptian army and pro-Morsi crowds following the removal of the former President.

Stocks slid from their morning highs as rate-sensitive sectors weighed on the broader market. The S&P briefly dipped into the red one hour into the session before staging a reversal amid thin volume. The benchmark average managed to close above its 50-day moving average after its previous three attempts were rejected sternly.

The jump in yields contributed to weakness in the utilities sector, which ended lower by 0.5% after spending the entire day in negative territory. Two other rate-sensitive groups, consumer staples (+0.2%) and telecom services (+0.5%) spent some time in the red, but rallied into the close.

Higher rates also exerted pressure on homebuilders and real estate investment trusts. Lennar (LEN 33.93, -1.42) and DR Horton (DHI 20.28, -0.68) ended with respective losses of 4.0% and 3.2% while the broader iShares Dow Jones US Home Construction ETF (ITB 21.97, -0.45) fell 2.0%. Meanwhile, iShares Dow Jones US Real Estate ETF (IYR 65.86, -0.70) ended lower by 1.1%.

On the flip side, the financial sector settled higher by 1.8% after spending the entire session atop the leaderboard.

The industrial sector also registered a strong gain (1.5%) as transportation-related names drove the sector higher. The Dow Jones Transportation Average advanced 1.5% as all 20 components rallied.

The health care sector (+1.3%) also finished among the leaders as biotech companies outperformed. The iShares Nasdaq Biotechnology ETF (IBB 182.22, +3.47) ended higher by 1.9%.

Today's volume was well below average as only 625 million shares changed hands on the floor of the New York Stock Exchange. The final tally was more than 100 million shares below the 200-day average.

Week in Review: Stocks Climb Amid Thin Holiday Volume

This week proved to be a technical affair as the S&P 500 tested its 50-day moving average on Monday and Tuesday. In addition, the benchmark average was not able to hold above its 20-day average and closed below that level on Monday, Tuesday, and Wednesday.

On Monday, the S&P 500 advanced 0.5% to begin the third quarter on an upbeat note. Although the S&P registered a solid gain, the index closed almost 12 points below its session high. Stocks climbed at the open, taking a cue from gains in major markets across the world. Global investors favored equities despite mixed PMI data out of China as the country's Manufacturing PMI declined to 50.10 from 50.80 (50.00 expected) and the HSBC Manufacturing PMI remained in contraction with a downtick to 48.2 from 48.3 (48.3 forecast).

Tuesday's session saw the S&P 500 shed 0.1%. Contributing to the weakness was the situation in Portugal where the country's foreign minister resigned after the finance minister, who constructed the country's EU/IMF bailout, submitted his resignation on Monday. The resignations of two key figures put the spotlight on Prime Minister Pedro Passos Coelho, who said he does not plan to step down. The uncertainty pushed the Portuguese 10-yr yield higher by nine basis points to 6.42%.

Wednesday's shortened session ended with a gain of 0.1% for the S&P 500. In Egypt, President Mohammed Morsi was removed from his post through a military coup after he failed to answer the demands of protesting crowds within the timeframe specified by the country's armed forces. Elsewhere, Portugal returned to headlines after reports indicated two more ministers (agriculture and social security) are set to resign. As a result, the country's benchmark 10-yr yield spiked 85 basis points to 7.31%. In addition Portugal's PSI index fell 5.3%. The concerns regarding the country's future spilled over to other peripheral economies. Italy's 10-yr yield climbed 11 basis points at 4.51% while Spain's benchmark 10-yr yield jumped 14 basis points to 4.70%. Some of the concerns were allayed the following day after Portugal's Prime Minister Pedro Passos Coelho said the ruling coalition had reached an agreement to maintain the current government.
 
Index Started Week Ended Week Change % Change YTD %
DJIA 14909.60 15135.84 226.24 1.5 15.5
Nasdaq 3403.25 3479.38 76.13 2.2 15.2
S&P 500 1606.28 1631.89 25.61 1.6 14.4
Russell 2000 977.48 1005.39 27.91 2.9 18.4


This week's top 20 % gainers

Technology: ZNGA (3.43 +22.14%), ELX (7.66 +20.76%), IL (8.34 +19.47%), GNCMA (9.25 +18.47%), LEAP (7.33 +17.44%), GTAT (4.19 +15.51%)
Services: CVC (19.2 +21.66%), EDG (7.56 +19.42%), ABFS (22.95 +17.95%)
Healthcare: ONXX (136.03 +58.63%), CLDX (21.27 +23.67%), ALNY (37.82 +21.23%), NVAX (2.62 +20.51%), PBYI (55.76 +19.98%), DYAX (3.97 +18.94%), HALO (8.04 +18.67%), OPTR (15.59 +16.5%)
Conglomerates: ACRX (10.29 +16.36%)
Basic Materials: AG (10.8 +24.41%), SAND (5.72 +15.47%)

This week's top 20 % losers

Technology: BBRY (9.55 -35.28%), IDCC (38.62 -14.34%), OIBR (1.54 -12.92%)
Services: NWSA (15.66 -52.73%), GOL (2.78 -13.41%), ARP (19.69 -13.34%)
Industrial Goods: AZZ (36.5 -13.82%)
Healthcare: ACHN (6.19 -22.32%), AMED (11 -18.89%), INSM (10.34 -13.65%), ARNA (7 -11.82%)
Financial: NBG (3.08 -28.68%)
Consumer Goods: MJN (69.33 -12.53%)
Basic Materials: LINE (23.45 -33.94%), LNCO (26.64 -27.48%), ALDW (19.66 -16.35%), BBEP (15.24 -14.44%), ALJ (13.06 -11.58%), YZC (6.96 -11.29%), SID (2.47 -11.03%)

8:03AM Trina Solar received the new IEC 61730-2 standard certification with Class A Fire Safety from TUV Rheinland for its new frameless PDG5 module (TSL) 6.17 :

Samsung Elect (SSNLF) sees second quarter revs of approximately KRW56-58 trillion, which was below expectations. The company sees Q2 operating profit of approximately KRW9.5 trillion.

11:20 am Technology
The tech sector is trading slightly lower today, trailing gains in the broader market. Semiconductors are showing relative strength, however, with the SOX trading 0.8% higher. Within the chip index, SUNE (+2.8%) is a notable standout.

Among other major indices, the SPY is trading 0.7% higher today, while the QQQ is up 0.2% and the NASDAQ is trading 0.4% higher on the session. Among tech bellwethers, TXN (+1.0%) is showing notable strength, while VZ (-1.0%) is under pressure. In notable tech earnings: SSNLF (0.0%) guided to the low end of the prior range. There was no news of note in the sector this morning. Among notable analyst upgrades in tech this morning, IDCC (+2.0%) was upgraded to Buy at M Partners. In downgrades, SAP (-0.7%) was downgraded to Hold at Deutsche Bank and Argus downgraded ELX (-2.1%) to Hold.
icon url

ReturntoSender

07/08/13 10:55 PM

#10246 RE: ReturntoSender #6755

From Briefing.com: 4:10 pm : The S&P 500 settled higher by 0.5% as eight of ten sectors ended in the green.

Stocks registered the bulk of their gains in the opening minutes and the S&P 500 notched its session high within the first hour of action before spending the remainder of the day in a six point range.

The upbeat open was aided by a strong showing in Europe where major averages overlooked disappointing German industrial production data (-1.0% actual, -0.5% expected) and rallied on indications the next tranche of Greek aid will be approved by Eurozone officials.

While most sectors were able to hold their opening gains, technology and telecom services underperformed from the start and pressured the tech-heavy Nasdaq. Chipmakers ended broadly lower after Evercore downgraded Intel (INTC 23.18, -0.88) to 'Underweight' from 'Equal Weight.' Shares of Intel fell 3.6% while the broader PHLX Semiconductor Index slid 2.0%.

Also of note, the largest tech component, Apple (AAPL 415.05, -2.37), shed 0.6% amid reports suggesting the company is reducing its smartphone production. Major Apple suppliers also registered losses as Broadcom (BRCM 33.37, -0.40) and Qualcomm (QCOM 59.99, -0.96) both fell near 1.4%.

Meanwhile, the telecom services sector ended lower by 0.4% after spending the entire session in negative territory.

While the telecom space lagged, other countercyclical sectors settled in mixed fashion. The health care sector (+0.6%) ended just ahead of the broader market; consumer staples (+1.0%) displayed relative strength; and the utilities sector (+1.4%) finished atop the leaderboard.

With regards to cyclical groups, only technology and industrials trailed behind the S&P. The industrial sector was pressured by transportation-related names after Union Pacific (UNP 156.25, -1.23) was downgraded to 'Market Perform' at Avondale. The rail carrier shed 0.8% while the broader Dow Jones Transportation Average added 0.1%.

Elsewhere, the relative strength of retailers provided support to the discretionary sector (+0.9%), and overshadowed the broad losses among homebuilders. The iShares Dow Jones US Home Construction ETF (ITB 21.66, -0.31) slumped 1.4%.

Treasuries were on the receiving end of some overnight safe-haven flows out of Asia with the bid continuing into the U.S. session. As a result, the benchmark 10-yr yield fell 10 basis points to 2.641%.

According to the Federal Reserve, consumer credit increased by $19.6 billion in May. This followed the prior month's increase of $10.9 billion, and was higher than the $13.2 billion that had been broadly expected among economists polled by Briefing.com.

There is no notable economic data scheduled to be released tomorrow.DJ30 +88.85 NASDAQ +5.45 SP500 +8.57 NASDAQ Adv/Vol/Dec 1401/1.46 bln/1093 NYSE Adv/Vol/Dec 1789/906.7 mln/1264
3:35 pm : Aug crude oil erased most of its earlier losses as it broke into positive territory and touched a session high of $103.57 per barrel in early afternoon action after trading as low as $102.27 per barrel earlier in the session. The energy component slipped back into the red and settled 0.1% lower at $103.12 per barrel.

On the other hand, Aug natural gas advanced to a session high of $3.76 per MMBtu in afternoon pit action after trading as low as $3.69 per MMBtu. It eventually settled with a 3.3% gain at $3.74 per MMBtu.

Aug gold spent its entire session in positive territory despite a stronger dollar index. The yellow metal brushed a session high of $1237.40 per ounce moments after floor trade opened and spent afternoon action trading in a consolidative pattern just below that level. It eventually settled at $1235.00 per ounce, or 1.9% higher. Sep silver also rose and although prices pulled back from a session high of $19.26 per ounce set in early morning action, it managed to book a 1.7% gain as it closed at $19.05 per ounce

4:20PM Ixia follow-up: Co lowers rev guidance below consensus (XXIA) 17.74 -0.24 : Co issues downside guidance for Q2 (Jun), sees Q2 (Jun) revs of $114-116 mln vs. $120.39 mln Capital IQ Consensus Estimate, down from prior guidance of $119-122 mln.

Revenue from Ixia's 2012 acquisitions, Anue Systems and BreakingPoint Systems, is expected to be at the high end of the previously given range of $28 million to $32 million.
"We are disappointed with our topline performance this quarter, which was impacted by several factors, including lower than expected revenue from network equipment manufacturers and certain service providers as customers extended review cycles and certain large deals that were pushed into future quarters."
"We did, however, see several positive trends in the quarter. Sales to our two largest customers, AT&T and Cisco, were strong and in line with expectations, and our overall book-to-bill ratio was in excess of one. Additionally, the performance of our 2012 acquisitions, Anue and BreakingPoint, was very encouraging and revenue is expected to register at the high end of our expectations for the second quarter. These indicators give us confidence that our competitive position remains strong although we remain cautious about the near-term spending environment."

4:10PM Alcoa beats by $0.01, reports revs in-line; reaffirms FY13 global aluminum demand growth of 7% (AA) 7.92 +0.11 : Reports Q2 (Jun) earnings of $0.07 per share, $0.01 better than the Capital IQ Consensus Estimate of $0.06; revenues fell 1.9% year/year to $5.85 bln vs the $5.83 bln consensus.

The $45 mln sequential decline was largely due to lower LME prices. Lower prices were partially offset by higher volumes, particularly in the midstream business, productivity savings, and the favorable impact of foreign exchange rates. In second quarter 2013, Alcoa's net loss included $42 mln in charges for the closing of the two Soderberg potlines at its Baie-Comeau smelter in Qu bec, which is part of the 460,000 metric tons of smelting capacity Alcoa has said is under review.

"Our businesses showed remarkable operating performance in the quarter with solid free cash flow...In our value-add businesses we reached another milestone with record profitability in our downstream business while acting decisively to defy the headwinds of falling metal prices in our upstream businesses. We improved our competitive position by actively restructuring, curtailing, and closing facilities and made progress addressing legacy legal issues."

Alcoa continues to project 7 percent global aluminum demand growth in 2013 and essentially balanced alumina and aluminum markets. Alcoa projects global growth this year across the aerospace (9-10 percent), automotive (1-4 percent), commercial transportation (3-8 percent), packaging (1-2 percent), building and construction (4-5 percent), and industrial gas turbine (3-5 percent) end markets.

Engineered Products and Solutions Segment: After-tax operating income (ATOI) in the second quarter was $193 mln, up from $173 mln in first quarter 2013, a 12 percent improvement, and up 23 percent from $157 mln in the second quarter of 2012. Global Rolled Products Segment: ATOI in the second quarter was $79 mln compared to $81 mln in first quarter 2013 and $78 mln in second quarter 2012.

Alcoa remains committed to being free cash flow positive in 2013. In second quarter 2013, the Company generated $228 mln in free cash flow by successfully executing against its annual financial and operational targets to maximize profitability and generate cash. Days working capital, which ultimately equates to cash, was a second quarter record low of 27 days, 6 days lower than second quarter 2012.

Large Cap Gainers

SI (103.21 +2.97%): Reuters reporting that Siemens and Swiss rail company Stadler are considering a joint venture
PCLN (880.06 +2.91%): Upgraded to Overweight from Equal-Weight at Morgan Stanley
DELL (13.4 +2.88%): Institutional Shareholder Services recommended that shareholders vote in favor of proposed sale transaction at $13.65 per share in cash

Large Cap Losers

INTC (23.12 -3.91%): Downgraded to Underweight from Equal Weight at Evercore
REGN (226.74 -2.89%): Bloomberg published article discussing Ohr Pharmaceutical's Squalamine, a potential competitor with Regeneron in the wet age-related macular degeneration market
QCOM (60.05 -1.48%): Removed from Top Picks Live list at Citigroup; trading lower in sympathy with Intel

Mid Cap Gainers

LINE (26.08 +11.22%): Upgraded to Buy from Neutral at BofA/Merrill
TRQ (5.86 +7.33%): Reuters reporting that the Rio Tinto's (RIO) Oyu Tolgoi mine in Mongolia will start exporting copper on Tuesday; TRQ owns a 66% stake in the mine
ATLS (48.39 +4.54%): Upgraded to Outperform from Neutral at Robert W. Baird

Mid Cap Losers

ONNN (8.02 -4.30%): Downgraded to Equal Weight from Overweight at Evercore
CFX (50.72 -4.03%): Downgraded to Hold from Buy at Deutsche Bank
MLNX (47.55 -3.49%): Target lowered to $59 from $65 at Craig Hallum

11:24AM Intel continuous to weaken, slides to minor new session low (INTC) 23.15 -0.91 : Stock has been a drag on the underperforming Semi sector after a downgrade with it extending the breakdown below a two week trade range to 23.14 in recent action. The next area of importance on the downside is at 23.07/23.06 which marks its 200 day ema and the Jan high/breakout point.

9:44AM Intel slumps lower on a downgrade, threatening its 2-week support along the 23.41/23.45 area... (INTC) 23.48 -0.58 : Struggling just below its 50-day sma the last 2-weeks, INTC is poised to break below 2-week support on this morning's downgrade. Next level of interest below lies around its 100-day sma near 22.88/23.00.

9:38AM Semiconductor Hldrs ETF displays relative weakness in early trade (SMH) 38.08 -0.25 : INTC -2%, TSM -1.8%, MU -1.3%, AMD -0.1%.
9:55AM Apple displays relative weakness after the open as price sinks below Friday's low of 415.35 (AAPL) 415.33 -2.09 : Price action stuggled around its "multi-tested" 420-resistance area last week. Note this area has been a crticial "make or break" point for buyers and sellers on multiple occassions for almost 2-years.

Broadcom (BRCM) announced the appointment of Dr. Ting Wei Li as Senior Vice President of Sales for China, Taiwan and Hong Kong and President of Greater China.

Silicom (SILC) announced that one of the world's largest networking security cos has now standardized on additional Silicom's modules for both the current and an additional appliance product line. The co expects that sales of these new wins will ramp up its revs from this customer to ~ $4 mln per year.

Citrix (CTXS) announced it can enable enterprise customers and service providers to deliver mobile apps and Windows Server-based session desktops from Microsoft's (MSFT) Windows Azure cloud platform with the recently announced Citrix XenDesktop 7.

Broadcom (BRCM) announced that Dish TV India has selected Broadcom's systems-on-a-chip to power its upcoming generation of satellite set-top boxes.

10:31 am Technology
The tech sector is trading higher today, but trails wider gains in the broader market. Semiconductors are showing relative weakness with the SOX trading 0.8% lower. Within the chip index, INTC (-3.0%) is a notable laggard.

Among other major indices, the SPY is trading 0.7% higher today, while the QQQ and the NASDAQ are trading 0.3% higher on the session. Among tech bellwethers, GOOG (+1.2%) is showing notable strength, while INTC (-3.0%) is under pressure. In notable tech earnings, CKSW (-8.9%) guided below consensus this morning.In news, Carl Icahn issued a letter to DELL (+2.3%) shareholders, while ISS recommended that shareholders take DELL private. Elsewhere, FB (+2.1%) plans to make Graph Search public today, according to reports.

In M&A, new ZNGA CEO Don Mattrick was considering purchasing ZNGA (-1.9%) while at MSFT (+0.6%), according to reports.Among notable analyst upgrades in tech this morning, CHU (+0.3%) was upgraded to Neutral at HSBC and FISV (+1.3%) was upgraded to Overweight at Barclays.In downgrades, CTSH (+0.7%), LPS (-1.1%), and PAY (-0.5%) were downgraded to Equal Weight at Barclays, INTC (-3.0%) and ONNN (-3.2%) were downgraded to Underweight at Evercore, BBRY (-0.6%) was upgraded to Hold at Desjardins, and BHE (-0.6%), PLXS (-1.2%), and FLEX (-1.0%) were downgraded at Needham. Also of note, QCOM (-0.4%) was removed from Top Picks Live list at Citigroup. There are no notable names in tech scheduled to report after the close.

Exar (EXAR) announced that it has acquired Cadeka Microcircuits. The transaction, which closed on Friday, July 5, 2013, includes $29.0 million in initial consideration to be paid in a combination of cash and stock, and an earn-out against net revenues contributed by Cadeka. With locations in Loveland, Colorado and both Shenzhen and Wuxi, China, Cadeka designs, develops and markets precision analog integrated circuits for use in industrial and high reliability applications.

Avnet (AYT) announced that it has entered into an agreement to acquire MSC Investoren GmbH, a European distributor focused on electronic component distribution, embedded computing technology and display solutions. The agreement details a two-step approach whereby Avnet will acquire a majority interest in MSC Group after regulatory approval has been granted with the intent to acquire the remainder of the company within a short time frame. MSC Group is a recognized value-added distributor that leverages its unique combination of distribution, production and system integration capability to address the emerging customer demand for more complex electronic products. The company generated revenue in excess of $450 mln in the 2012 calendar year, with embedded computer technology (including display solutions) accounting for almost 50% of its sales. This transaction is expected to be immediately accretive to earnings and supports Avnet's long-term return on capital goal

Dell (DELL): The Special Committee of the Board of Directors of Dell announced that ISS, has recommended that Dell shareholders vote for the proposed sale transaction for $13.65 per share in cash. "We are pleased that ISS has recommended, as we have, that Dell shareholders approve the $13.65 per share cash sale transaction. With the assistance of outside advisors over the course of an exhaustive 10-month process, the Committee has thoroughly reviewed Dell's existing business plan as it seeks to transform its business model and various alternatives in support of that transformation. Given the Company's business challenges, intensifying competition and deteriorating industry trends, a sale at $13.65 per share in cash provides the highest value and greatest certainty of any available alternative. We also believe rejection of this transaction would expose Dell and its shareholders to serious risks and uncertainties that will harm the Company's business and erode shareholder value."
icon url

ReturntoSender

07/10/13 7:37 PM

#10247 RE: ReturntoSender #6755

From Briefing.com: 4:15 pm : The major averages ended in mixed fashion as the Dow shed 0.1% while the Nasdaq added 0.5%. For its part, the S&P 500 ended flat.

Equities held their levels into the afternoon as market participants awaited the Minutes from the June 18/19 meeting of the Federal Open Market Committee. Most notably, the Minutes indicated several members judged a reduction in asset purchases would be warranted 'soon.' However, the Fed will continue to look for more evidence suggesting projected acceleration of growth remains on track before tapering.

With regard to Treasury yields, some participants voiced concern about a few institutions being ill-prepared to handle a rapid run-up in rates. In addition, other members said that 'a prolonged period of low interest rates would encourage investors to take on excessive credit or interest rate risk and would distort some asset prices.'

Committee participants also stressed their desire to emphasize the distinction between decisions about slowing bond buying and future rate hikes.

Overall, the Minutes did not provide too much fresh insight. With that in mind, the major averages returned to their earlier levels after spiking to fresh highs immediately after the Minutes crossed the wires.

Energy and financials displayed weakness throughout the day before settling near their lows. The energy sector shed 0.6% despite the continued rise in crude oil, which added 2.4% to $106.04 per barrel. The energy component has rallied steadily since late June, and reports of a well leak off the coast of Louisiana contributed to today's strength.

Elsewhere, major banks registered losses across the board as the financial sector settled lower by 0.6%.

Also of note, the Dow Jones Transportation Average fell 1.0% after jumping 2.3% yesterday.

While most cyclical groups finished in the red, the technology sector outperformed with a gain of 0.5% as most of its top components registered gains. Qualcomm (QCOM 60.46, +1.08) ended higher by 1.8% after providing leadership throughout the session.

Countercyclical consumer staples, health care, and utilities added between 0.1% and 0.7% while the telecom services sector shed 0.4%.

May wholesale inventories decreased 0.5% while the Briefing.com consensus expected an uptick of 0.3%. Today's report followed last month's revised decrease of 0.1%.

Tomorrow, weekly initial claims, June import prices ex-oil, and export prices ex-agriculture will be reported at 8:30 ET. In addition, the Treasury will release its June budget at 14:00 ET.

The U.S. Treasury will auction $13 billion in 30-yr bonds.DJ30 -8.68 NASDAQ +16.50 SP500 +0.30 NASDAQ Adv/Vol/Dec 1427/1.51 bln/1028 NYSE Adv/Vol/Dec 1601/670.4 mln/1395

3:30 pm :

Aug crude oil steadily trended higher as it gained support from a huge drop inventories, reports of a well leak off the coast of Louisiana, and a weaker dollar index. The Dept of Energy reported that inventories for the week ending July 5 declined by 9.874 mln when a much smaller draw of 3.15 mln was anticipated. The energy component lifted off its session low of $104.97 per barrel and settled with a solid 2.9% gain at $106.49 per barrel, slightly below its session high of $106.66 per barrel
Aug natural gas, however, retreated into negative territory after trading as high as $3.73 per MMBtu in early morning action. It dipped to a session low of $3.64 per MMBtu but recovered into the black and eventually settled with a 0.5% gain at $3.68 per MMBtu
Precious metals erased most of their earlier gains as they sold off heading into pit trade close
Aug gold touched a session high of $1260.80 per ounce in morning action but reduced gains to just 0.1% as it settled at $1247.60 per ounce
Sep silver also settled 0.1% higher at $19.16 per ounce despite trading as high as $19.33 per ounce earlier in the session
Both gold and silver rallied to their respective HoD of $1264.50 per ounce and $19.40 per ounce in electronic trade following the 14:00 ET release of the FOMC minutes but have pulled back since.

Large Cap Gainers

DG (53.4 +3.09%): Trading higher following peer FDO's earnings (DLTR also higher).
AMGN (100.7 +2.41%): Amgen, Pfizer (PFE), and Sanofi (SNY) are trying to develop new cholesterol drugs, according to reports.
DB (42.63 +2.35%): Upgraded to Outperform from Neutral at Credit Suisse.

Large Cap Losers

BBY (28.21 -5.11%): Weakness attributed to cautious Cleveland comments.
PNC (74.28 -2.6%): Downgraded to Hold from Buy at Sandler O'Neill.
NFLX (241.76 -2.27%): Initiated with a Neutral at Citigroup; heard Pacific Crest expects solid Q2 but sees risk/reward not favorable at this level.

Mid Cap Gainers

NUS (74.99 +12.65%): Updated Q2 results and raised 2013 guidance; sees FY13 revs of $2.83-2.86 bln vs $2.53 bln Capital IQ Consensus Estimate, EPS of $4.85-5.00 vs $4.29 Capital IQ Consensus Estimate; tgt to $82.50 from $62 at JPMorgan, tgt to $81 from $68 at Wedbush, tgt to $80 from $65 at Deutsche Bank.
PCYC (100.9 +12.71%): Submitted NDA for ibrutinib to the FDA; tgt to $120 from $108 at ROTH.
MDRX (14.47 +8.15%): Co sees Q2 bookings to exceed $200 mln vs. $194 mln last year; backlog +13% to ~$3.1 bln; North Shore-LIJ extended Allscripts outsourcing agreement through 2020.

Mid Cap Losers

RAX (38.47 -7.94%): Trading lower following reports that Amazon.com (AMZN) cut price of its EC2 cloud platform; heard Cowen defending RAX.
P (18.46 -6.06%): BTIG out cautious on Pandora - New/improved Siri holds great promise as iTunes integrates with cars.
NBR (15.17 -5.19%): Co expects Q2 operating results to fall below consensus ests; tgt lowered to $16 from $18 at FBR Capital; downgraded to Underperform at Credit Agricole; removed from Conviction Buy list at Goldman.

9:35AM Hewlett-Packard gaps above June peak to set a new 17 month high after upgrade (HPQ) 26.22 +0.76 :

Cisco (CSCO) announced that the Cisco Aggregation Services Router 9000 Series routing platform has been selected by OVH.com to support the expansion of its Internet Protocol network.

ANADIGICS (ANAD) is shipping production volumes of its AWC6340 HELP power amplifier to Huawei for the new Ascend P6.

8:31AM Western Digital acquires VeloBit, terms not disclosed (WDC) 66.20 : Co has acquired privately held VeloBit, a provider of storage I/O optimization software. VeloBit will be fully integrated into HGST, a wholly owned subsidiary of Western Digital. Financial terms of the transaction were not disclosed. The acquisition builds on HGST's strategy to enhance the overall value of datacenter storage by integrating HGST SSDs with software.

Broadcom (BRCM) announced Broadcom's Near Field Communication and Wi-Fi technology is powering Brother's new NFC printers.

HP (HPQ) -- HP Autonomy announced that its augmented reality platform, Aurasma, has surpassed 20,000 global customers and 6 million active monthly users since its launch in June 2011

Quantum (QTM) expects revenue for the quarter ended June 30, 2013 to be between $147 million and $148 million, which was below estimates. with preliminary results including $15 million in royalty revenue related to the intellectual property agreement entered into with Microsoft Corporation in May 2013.

ADTRAN (ADTN) reported second quarter earnings of $0.21 per share, which was better than expected, while revenues fell 11.8% year/year to $162.2 million, which also topped expectations. "Continuing improvement in our Internetworking and Broadband Access product areas led revenues which exceeded estimates for the quarter. During the quarter we benefited from market share gains, the geographic expansion we began last year and an improved spending environment."

Chipmos Technology (IMOS) issued downside guidance for the second quarter with revenues of $164.9 mln, which was below expectations, but in-line with the Company's guidance in which revenue was expected to increase by approximately 10% to 14%, as compared to the first quarter of 2013. The Company expects gross margin on a consolidated basis for the second quarter of 2013 to be approximately 15.5%, as compared to guidance of approximately 14-18%. Revenue growth and gross margin improvement reflect continued strength in the Company's LCD Driver and bumping businesses, with additional demand for assembly services.
icon url

ReturntoSender

07/22/13 5:39 PM

#10258 RE: ReturntoSender #6755

From Briefing.com: 4:15 pm : The major averages ended today's session with modest gains. The Dow added less than two points while the S&P 500 rose 0.2% to mark its twelfth advance in thirteen sessions.

Last week, the first round of second quarter earnings brought a fair share of top line misses. This week started on a similar note after Dow component McDonald's (MCD 97.58, -2.69) reported an earnings miss on below-consensus revenue. The fast food giant observed a decline in Asian and European same store sales while blaming the disappointing results on consumer uncertainty regarding the economic outlook.

Although McDonald's fell 2.7%, other quick service restaurants held up relatively well. However, the relative weakness of home builders coupled with the underperformance of the largest fast food stock kept the discretionary sector in the red throughout the day.

June existing home sales fell 1.2% from a downwardly revised 5.14 million in May to 5.08 million. The Briefing.com consensus expected existing home sales to increase to 5.28 million.

The drop in home sales does not bode well for the future. It was expected that rising mortgage rates would accelerate demand in the near term as potential buyers aimed to lock in mortgages before rates went even higher. That was supposed to pull sales forward into May, June and July, before a payback period developed in the future. However, that surge has not materialized in the June report.

In addition to discretionary shares, the consumer staples sector lagged, slipping 0.2% after Kimberly-Clark (KMB 97.68, -1.81) reported an earnings beat on below-consensus revenue.

The broader market was kept from registering larger gains by the underperformance of the energy sector, which shed 0.3% while crude oil fell 1.1% to $106.69 per barrel.

However, another commodity-linked sector, materials, finished among the leaders as industrial and precious metals displayed strength. Copper futures added 1.3% to $3.182 per pound and gold futures jumped 3.1% to $1333.00 per troy ounce. The yellow metal returned to its 50-day moving average while gold miners also registered solid gains. The Market Vectors Gold Miners ETF (GDX 27.44, +1.58) spiked 6.1%.

Elsewhere, the outperformance of major bank shares helped the financial sector settle higher by 0.7%.

Also of note, the technology sector rose 0.4% and Google (GOOG 910.54, +13.94) climbed 1.6% to erase its Friday slide caused by disappointing earnings.

Today's participation was limited as only 585 million shares changed hands on the floor of the New York Stock Exchange.

Tomorrow's economic data will be limited to the May FHFA Housing Price Index, which will be released at 9:00 ET.

The U.S. Treasury will auction $35 billion in 2-yr notes.DJ30 +1.81 NASDAQ +12.77 SP500 +3.44 NASDAQ Adv/Vol/Dec 1476/1.46 bln/994 NYSE Adv/Vol/Dec 1715/584.6 mln/1278

3:30 pm :

Sep crude oil fell for the first time in four sessions despite weakness in the dollar index. The energy component pulled back from its session high of $108.60 per barrel and retreated into negative territory. It brushed a session low of $106.55 per barrel and booked a 1.0% loss as it settled at $106.84 per barrel.
Aug natural gas spent its entire floor session in the red. It slipped from a session high of $3.70 per MMBtu to a session low of $3.64 per MBMtu in early morning pit trade and eventually settled with a 2.9% loss at $3.68 per MMBtu.
Aug gold rose for a third consecutive session as it gained support from the weaker dollar index. The yellow metal came off its session low of $1317.90 per ounce and steadily trended higher as the session progressed. It touched a high of $1339.10 per ounce in late afternoon floor trade, its highest level since June 20, and settled with a 3.3% gain at $1335.90 per ounce.
Sep silver also trended higher today, rising as high as $20.58 per ounce. It lifted off its session low of $20.03 per ounce set at pit trade open and settled with a solid 5.4% gain at $20.51 per ounce.

4:33PM Ultra Clean Holdings reports EPS in-line, beats on revs; guides Q3 EPS in-line, revs in-line (UCTT) 6.12 -0.16 : Reports Q2 (Jun) earnings of $0.08 per share, in-line with the Capital IQ Consensus Estimate consensus of $0.08; revenues rose 8.0% year/year to $110.1 mln vs the $107.6 mln consensus.

Co issues in-line guidance for Q3, sees EPS of $0.06-0.12, excluding non-recurring items, vs. $0.09 Capital IQ Consensus Estimate; sees Q3 revs of $103-110 mln vs. $109.22 mln Capital IQ Consensus Estimate.

4:20PM Netflix beats by $0.10, reports revs in-line; guides Q3 EPS in-line (NFLX) 261.96 -2.61 : Reports Q2 (Jun) earnings of $0.49 per share, $0.10 better than the Capital IQ Consensus Estimate of $0.39; revenues rose 20.2% year/year to $1.07 bln vs the $1.07 bln consensus. Co issues in-line guidance for Q3, sees EPS of $0.30-0.56 vs. $0.41 Capital IQ Consensus Estimate.

Netflix: Q2 Performance vs Guidance

Domestic Streaming
Total Subscriptions: 30.9 mln, Guidance 29.40-30.05 mln
Revenue: $697 mln, Guidance $665-673 mln
Contribution Profit: $166 mln, Guidance $139-149 mln
International Streaming
Total Subscriptions: 8.65 mln, Guidance 7.3 to 7.9 mln
Revenue: $177 mln, Guidance $156-170 mln
Contribtution Profit (Loss): ($78 mln), Guidance ($81 mln)-($65 mln)
Domestic DVD
Contribution Profit: $102 mln, Guidance$100-112 mln
Consolidated
Global
Net Income (Loss): $26 mln, Guidance $14-29 mln
EPS: $0.43, Guidance $0.23-0.48

Netflix Q3 Guidance

Domestic Streaming
Total Subscriptions: Guidance 30.50-31.3 mln
Revenue: Guidance $693-701 mln
Contribution Profit: Guidance $161-171 mln
International Streaming
Total Subscriptions: Guidance 8.3-9.0 mln
Revenue: Guidance $170-184 mln
Contribtution Profit (Loss): Guidance ($86 mln)-($70 mln)
Domestic DVD
Contribution Profit: Guidance$96-98 mln
Global
Net Income (Loss): Guidance $18-24 mln
EPS: Guidance $0.30-0.56...

Key Comments from Newsletter

"In Q3, our guidance midpoint implies 130 bps of further margin expansion as we continue to run above our target. For Q4, we anticipate stepping up content spending even more, getting us closer to our 400 bps per year target. We'll keep targeting about 400 basis points of annual improvement into 2014 if we keep growing net additions at 2012/2013 levels".
"Q2 international contribution loss was lower than expected due to slightly higher member growth and lower than anticipated growth in content spending across multiple markets. We plan to grow our international content investments in Q3 slightly ahead of revenues. This growth combined with the losses associated with the launch of the Netherlands results in our guidance reflecting a q/q increase in our combined international contribution loss".
"Free cash flow was +$13 million in Q2, a swing to positive reflecting the relatively fewer content payments in the quarter and strong global profit growth. Our investments in content, including Originals, will continue to weigh on FCF relative to net income and thus our FCF trends".

4:11PM General Electric announces redemption of all of its 6.5% GE Capital InterNotes due August 15, 2048 (GE) 24.86 +0.14 : GE Capital announced that it is calling for redemption all of its outstanding 6.50% GE Capital InterNotes Due August 15, 2048. The redeemed notes will be redeemed on August 22, 2013 at a redemption price of $25.00 per note together with accrued but unpaid interest to but excluding August 22, 2013 of $0.0315972 per note. The trustee for the notes, The Bank of New York Mellon, will act as redemption and paying agent.

4:07PM Volterra Semi misses by $0.03, misses on revs (VLTR) 16.21 +0.09 : Reports Q2 (Jun) earnings of $0.13 per share, excluding non-recurring items, $0.03 worse than the Capital IQ Consensus Estimate of $0.16; revenues fell 21.1% year/year to $34.4 mln vs the $35.57 mln consensus.

"Revenue came in at the low end of guidance as our notebook business declined as expected and we experienced a one quarter inventory correction with a server customer. Q3 orders are stronger at this point than this time last quarter and we are therefore encouraged about our short term outlook and longer term growth opportunities in our server storage, communications and energy businesses."

4:05PM Sanmina beats by $0.05, reports revs in-line; guides Q4 EPS in-line, revs in-line (SANM) 15.26 +0.06 : Reports Q3 (Jun) earnings of $0.40 per share, $0.05 better than the Capital IQ Consensus Estimate of $0.35; revenues fell 3.9% year/year to $1.49 bln vs the $1.47 bln consensus.

Non-GAAP operating income in the third quarter was $49.7 million or 3.3 percent of revenue, compared to $44.1 million or 2.8 percent of revenue in the third quarter fiscal 2012. Cash flow from operations was $66.1 million for the quarter. Inventory turns were 6.9. Cash cycle days were 48.3 days.

Guidance: Co issues in-line guidance for Q4, sees EPS of $0.37-0.43 vs. $0.38 Capital IQ Consensus Estimate; sees Q4 revs of $1.475-1.525 bln vs. $1.51 bln Capital IQ Consensus Estimate.

Large Cap Gainers

ABX (17.77 +7.43%): Strength in gold companies: GG, NEM also higher
UBS (19.22 +3.11%): Reported Q2 operating profit before tax was ~CHF 1,020 and net profit attributable to shareholders was ~CHF 690 mln; co also settled RMBS claims with the FHFA
EMR (60.42 +2.76%): Reported June adjusted trailing 3-month orders growth of 0 to +5%; said comparisons eased and weaker markets began to stabilize, though economic conditions remain uncertain overall

Large Cap Losers

YHOO (27.84 -4.36%): Announced repurchase of 40 mln shares held by Third Point at $29.11 per share; lowers Third Point's stake to ~20 mln shares, representing less than 2% of outstanding common stock; three Third Point affiliated directors to resign
ATVI (14.99 -3.48%): Wall St. Journal reporting that ~61% owner Vivendi is seeking to push the company to declare a $3 bln special dividend
MCD (97.52 -2.74%): Missed quarterly EPS by $0.02 ($1.38 vs $1.40 estimate), revs rose 2.4% yoy to $7.08 bln vs $7.09 bln estimate; global comparable sales increased 1%; global comparable sales for July are expected to be relatively flat

Mid Cap Gainers

KGC (5.55 +8.07%): Strength in gold companies: EGO, RGLD, AUY, AU, GOLD, BVN, GFI, AEM also higher
LII (72.76 +3.94%): Beat quarterly EPS by $0.12 ($1.31 ex items vs $1.19 estimate), revs rose 8.7% yoy to $913.1 mln vs $886.56 mln estimate; raised FY13 EPS guidance to $3.45-3.75 from $3.25-3.55 ex items vs $3.43 estimate, raised FY13 rev guidance to +6-8% (~$3.126-3.214 bln) from +3-6% vs $3.14 bln estimate
TRMB (28.38 +3.20%): Initiated with a Buy at Craig Hallum

Mid Cap Losers

DWA (23.2 -6.83%): Hearing Lazard lowered estimates following disappointing performance of new movie 'Turbo'
ALV (80.55 -1.92%): Downgraded to Neutral from Buy at Buckingham Research; downgraded to Sell from Buy at Danske Bank
PHM (19.02 -1.76%): Weakness in homebuilders following lower than expected June Existing Home Sales: DHI, LEN also lower

12:04PM Microsoft to acquire warehouse and transportation management solutions for Dynamics AX from Blue Horseshoe (MSFT) 31.79 +0.39 : Blue Horseshoe announced a collaboration agreement with Microsoft (MSFT) that includes the acquisition of Blue Horseshoe's Warehousing for AX (WAX) and Transportation for AX (TRAX) solutions. This technology will help Microsoft accelerate its Microsoft Dynamics AX supply chain management roadmap with plans to make the functionality available to the broader Dynamics AX channel partner and customer community.

ARM (ARMH) announced that Entropic (ENTR) has licensed the ARM Mali-400 and Mali-450 Graphics Processing Unit technology and has also entered into a new license agreement for the Cortex-R5 processor.

07:29 am Nokia downgraded to Underperform at Oppenheimer: . Oppenheimer downgraded NOK to Underperform from Perform, reflecting accelerating smartphone competition, potential moderating NSN margins, and rising interest expenses. Mgm't has done well to stabilize NOK's overall business, but this has been more through effective cost cutting (mobile and NSN) than transformative smartphone breakthroughs. More cost cuts are possible, but incremental bottom-line gains will increasingly have to come from meaningful and sustainable smartphone momentum. They believe this will be difficult to achieve with smartphone competition accelerating in 2H13 (new iPhone/Android devices) and mix shifting to value. With smartphones remaining a persistent drag, they expect investors to lose confidence.

Himax Tech (HIMX) announced that it has entered into an agreement with Google (GOOG) pursuant to which Google has agreed to invest in the Company's subsidiary, Himax Display. The purpose of the investment is to fund production upgrades, expand capacity and further enhance production capabilities at HDI's facilities that produce liquid crystal on silicon chips and modules used in applications including head-mounted display such as Google Glass, head-up display and pico-projector products. Under the Agreement, Himax will also invest additional amount in HDI to fund its ongoing capacity expansion. HDI will also use a portion of the proceeds to substantially reduce its loan from Himax. The transaction is expected to close in the third quarter of 2013 subject to regulatory approvals and other closing conditions. Under the Agreement, Google will purchase certain amount of preferred shares in HDI. Upon closing, Google will hold a 6.3% interest in HDI. Google also has an option to make additional investment of preferred shares at the same price within one year from closing. If the option is exercised in full, Google will own a total of up to 14.8% in HDI. Himax Technologies, Inc. holds 81.5% of HDI at present and will remain the major shareholder of HDI after the transaction. Google will join the core group of HDI shareholders including KPCB Holdings, Inc., Khosla Ventures I, L.P. and Intel Capital Corporation.

Smart Tech (SMT) announced that its wholly-owned subsidiary, SMART Technologies ULC, has priced a new four-and-a-half-year senior secured term loan in an aggregate principal amount of $125 million and has received a significant portion of the commitments for a new four-year asset-based loan facility in an aggregate principal amount of $50 million. The proceeds from the financings are intended to be used to refinance certain existing indebtedness, fund transaction costs and for other corporate purposes.Needham lowers their

JDS Uniphase (JDSU) target raised to $18 from $20 at Needham. The firm expects a Tepid Quarter and Guide Out of JDSU. While they think JDSU is executing well on the new product and competitive front, they are concerned about the tepid Telecom spending environment. Accordingly, they are worried that JDSU could post results at the lower end of guidance and offer a tepid conservative guide into the CY3QFY1Q quarter.
icon url

ReturntoSender

07/23/13 5:29 PM

#10259 RE: ReturntoSender #6755

From Briefing.com: 4:15 pm : The major averages ended in mixed fashion as the Dow Jones added 0.1% and the S&P 500 shed 0.2%.

The Dow outperformed the broader market as the relative strength of United Technologies (UTX 105.16, +3.05) provided the price-weighted index with enough support to keep it in positive territory throughout the session. In addition, DuPont (DD 57.12, -0.05) displayed early strength, but ended in the red. Both companies reported bottom-line beats on below-consensus revenue and DuPont announced it will seek strategic alternatives for its Performance Chemical segment.

Although DuPont settled on its lows, the materials sector finished in the lead. The space received support from miners after Freeport-McMoRan (FCX 29.99, +0.84) reported an earnings beat. On a related note, copper futures added 0.9% to $3.213 per pound while gold futures climbed 0.5% to $1342.20 per troy ounce.

The materials sector was closely followed by yesterday's biggest laggard, energy. The growth-oriented space added 0.2% as crude oil rose 0.2% to $107.14 per barrel.

Elsewhere, utilities and telecom services settled with respective gains of 0.3% and 0.4% while the remaining sectors ended in the red.

Financials and technology spent most of the day in negative territory. In the financial sector, major banks displayed little change and insurer Travelers (TRV 82.21, -3.22) fell 3.8% despite beating on earnings.

Tech shares displayed broad weakness, with the largest sector component, Apple (AAPL 418.99, -7.32), sliding 1.7% ahead of its after-hours earnings report. Meanwhile, chipmakers underperformed even after Texas Instruments (TXN 38.93, +1.51) reported a slight earnings beat on an 8.6% year-over-year decline in revenue.

The underperformance of tech names weighed on the Nasdaq, which settled lower by 0.6%. In addition, the index was also pressured by Netflix (NFLX 250.26, -11.70) after the discretionary component reported in-line results, which did not justify the stock's July gain of 24.1%.

Also of note, biotechnology weighed on the Nasdaq and the health care sector. The iShares Nasdaq Biotechnology (IBB 192.35, -3.34) settled lower by 1.7%.

Similar to stocks, Treasuries were confined to a narrow range. The benchmark 10-yr yield ended higher by two basis points at 2.51%.

Today's economic data was limited to the May FHFA Housing Price Index, which increased 0.7% to follow a 0.5% uptick observed during the prior month.

Tomorrow, the weekly MBA Mortgage Index will be reported at 7:00 ET and June new home sales will be announced at 10:00 ET. On the earnings front, AmerisourceBergen (ABC 57.63, -1.36), Boeing (BA 107.79, +0.93), and Ford Motor (F 16.94, -0.10) will report their results before the opening bell.

The U.S. Treasury will auction $35 billion in 5-yr notes.DJ30 +22.19 NASDAQ -21.11 SP500 -3.14 NASDAQ Adv/Vol/Dec 1149/1.55 bln/1324 NYSE Adv/Vol/Dec 1711/623.7 mln/1298

3:30 pm :

Sep crude oil erased earlier losses as it rose into positive territory in late morning action. The energy component lifted from its session low of $105.92 per barrel and touched a session high of $107.34 per barrel. It eventually booked a 0.4% gain as it closed at $107.23 per barrel.
Aug natural gas rallied off its session low of $3.68 per MMBtu set in early morning floor trade. It then traded in a tight range between $3.73 and $3.76 per MMBtu and settled with a 1.6% gain at $3.74 per MMBtu.
Aug gold chopped around in negative territory today, falling as low as $1327.90 per ounce in morning action. However, the yellow metal inched higher as the dollar index weakened and erased most of its earlier losses. It settled just 70 cents lower at $1335.20 per ounce.
Silver also traded in the red but was unable to gain much momentum. It brushed a session high of $20.33 per ounce and eventually settled 1.2% lower at $20.26 per ounce.

4:36PM Apple beats by $0.19, beats on revs; guides Q4 revs towards low end of expectations with in-line gross margin (AAPL) 418.99 -7.32 : Reports Q3 (Jun) earnings of $7.47 per share, $0.19 better than the Capital IQ Consensus Estimate of $7.28; revenues rose 0.9% year/year to $35.32 bln vs the $34.91 bln consensus; Q3 gross margin 36.9% vs Street est of 36.6% and 36-37% guidance.

31.2 mln iPhones sold in Q3 vs Street est of ~26 mln
14.6 mln iPads sold in Q3 vs Street est of ~17 mln
3.8 mln Macs sold in Q3 vs Street est of ~4 mln


Co issues guidance for Q4, sees Q4 revs of $34-37 bln vs. $37.07 bln Capital IQ Consensus; with gross margin 36-37% vs. 36.6% Street est.

4:17PM Altera reports EPS in-line, revs in-line (ALTR) 35.47 -0.09 : Reports Q2 (Jun) earnings of $0.31 per share, in-line with the Capital IQ Consensus Estimate consensus of $0.31; revenues fell 9.3% year/year to $421.8 mln vs the $420.82 mln consensus.

4:12PM Juniper Networks beats by $0.04, beats on revs; guides Q3 EPS in-line, revs in-line; Juniper Networks announces additional $1 bln share repurchase (JNPR) 21.34 +0.59 : Reports Q2 (Jun) earnings of $0.29 per share, excl items, $0.04 better than the Capital IQ Consensus Estimate of $0.25; revenues rose 7.2% year/year to $1.15 bln vs the $1.09 bln consensus.

Co issues in-line guidance for Q3, sees EPS of $0.29-0.32 vs. $0.29 Capital IQ Consensus Estimate; sees Q3 revs of $1.14-1.18 bln vs. $1.14 bln Capital IQ Consensus Estimate.

Juniper's outlook for the September quarter reflects its expectation of good service provider demand and signs of improving enterprise demand. The Company expects its routing and switching businesses to remain strong while the security business continues to stabilize.

4:06PM Juniper Networks announces retirement of CEO (JNPR) 21.34 +0.59 : Company's chief executive officer, Kevin Johnson, will retire once a successor is named and that Johnson will continue to serve in his current capacities while an orderly transition is accomplished.
4:11PM Harmonic beats by $0.03, beats on revs; guides Q3 revs in-line (HLIT) 6.96 -0.14 : Reports Q2 (Jun) earnings of $0.05 per share, $0.03 better than the Capital IQ Consensus Estimate of $0.02; revenues fell 4.1% year/year to $117.1 mln vs the $109.28 mln consensus.

4:10PM Broadcom beats by $0.01, reports revs in-line (BRCM) 31.83 -1.42 : Reports Q2 (Jun) earnings of $0.70 per share, $0.01 better than the Capital IQ Consensus Estimate of $0.69.

"Broadcom delivered solid revenue and gross margins in Q2 with tightly managed sequential growth in operating expenses. This combination of financial discipline and in-line revenue enabled us to deliver non-GAAP earnings per share ahead of First Call consensus," said Scott McGregor, Broadcom's President and Chief Executive Officer. "Looking forward, we see continued growth driven by our industry leading portfolio of wired and wireless communication platforms."

4:10PM AT&T misses by $0.01, reports revs in-line (T) 35.81 +0.23 : Reports Q2 (Jun) earnings of $0.67 per share, excluding non-recurring items, $0.01 worse than the Capital IQ Consensus Estimate of $0.68; revenues rose 1.6% year/year to $32.08 bln vs the $31.83 bln consensus.

Total wireless revenues, which include equipment sales, were up 5.7% year over year to $17.3 billion. Wireless service revenues increased 4.1% in the second quarter, to $15.4 billion. Wireless data revenues increased 19.8% from the year-earlier quarter to $5.4 billion. Second-quarter wireless operating expenses totaled $12.6 billion, up 11.8% versus the year-earlier quarter, and wireless operating income was $4.7 billion, down 7.7% year over year.

AT&T posted a net increase in total wireless subscribers of 632,000 in the second quarter. Subscriber additions for the quarter included postpaid net adds of 551,000, the best second-quarter postpaid net adds in four years and a more than 70% increase from the year-ago quarter. Postpaid net adds include 398,000 postpaid tablets added in the quarter. Connected device net adds were 484,000. Prepaid gained 11,000 subscribers even with declines in session-based tablets. Reseller had a net loss of 414,000 primarily due to losses in low-revenue accounts, but revenues increased almost 30% year over year.

Postpaid phone-only ARPU increased 3.0% versus the year-earlier quarter. Total postpaid subscriber ARPU, which includes high margin but lower-ARPU tablets, increased 1.8%versus the year-earlier quarter. This marked the 18th consecutive quarter AT&T has posted a year-over-year increase in postpaid ARPU. Postpaid data ARPU increased 17.6%versus the year-earlier quarter.

Postpaid churn was 1.02%, up slightly from the year-ago quarter and down slightly from the first quarter of 2013. Total churn increased year over year, due mostly to increases in reseller churn, but was down slightly sequentially.

AT&T's second-quarter wireless operating income margin was 27.1% versus 31.0% in the year-earlier quarter. AT&T's wireless EBITDA service margin was 42.4%, compared with 45.8% in the second quarter of 2012.

During Q2, the co completed its second 300 million share repurchase authorization and began buying back shares under its third 300 million share authorization

4:04PM RF Micro Device beats by $0.02, beats on revs; guides Q2 EPS in-line, revs in-line (RFMD) 5.44 +0.04 : Reports Q1 (Jun) earnings of $0.09 per share, ex items, $0.02 better than the Capital IQ Consensus Estimate of $0.07; revenues rose 44.5% year/year to $293 mln vs the $287.95 mln consensus.

Co issues in-line guidance for Q2, sees EPS of $0.10-0.11 vs. $0.10 Capital IQ Consensus Estimate; sees Q2 revs of $305-310 mln vs. $306.39 mln Capital IQ Consensus Estimate.

On a non-GAAP basis, gross margin expanded by 70 basis points sequentially and 100 basis points year-over-year to 35.1%

"RFMD is capitalizing on the expanding demand for data-rich mobile applications, and our products are at the heart of the high-speed data connections enabling always-on, broadband mobility -- both in the devices and consumer premises equipment, and within the supporting network infrastructure. We are executing on multiple opportunities to increase our dollar content generation-over-generation in the world's leading smartphones, and we are benefiting from increasing participation in the highest volume entry-level platforms and reference designs."

Large Cap Gainers

TI (6.87 +8.36%): Trading higher on peer TEF news: KPN (KKPNY) announced that E-Plus will be sold to Telefonica Deutschland for a consideration of EUR 8.1 bln.
TXN (38.91 +3.98%): Beat on EPS by $0.01, reported revs in-line; guided Q3 EPS, revs in-line; target raised to $40 from $35.50 at Cowen; upgraded to Neutral at Sun Trust Rbsn Humphrey; Cowen raised ests and target to $40 from $35.50.
AMTD (26.99 +3.61%): Beat on EPS by $0.02, beat on revs.

Large Cap Losers

NFLX (248.5 -5.14%): Beat on EPS by $0.10, reported revs in-line; guided Q3 EPS in-line; tgt to $290 from $254; at JPMorgan, to $150 from $130 at Evercore; downgraded to Hold from Buy at Cantor Fitzgerald; tgt $260; downgraded to Sector Perform at Pacific Crest; target raised to $280 from $250 at RBC Capital Mkts; Heard Lazard suggests buying on weakness.
LO (44.17 -4.28%): FDA issued an Advance Notice of Proposed Rulemaking (ANPRM) seeking additional information to help the agency make informed decisions about menthol in cigarettes.
BRCM (31.91 -4.03%): Downgraded to Sector Perform at Pacific Crest; reports earnings after the close.

Mid Cap Gainers

WEN (7.42 +11.08%): Beat on EPS by $0.02, missed on revs; reaffirmed FY13 EPS guidance; announced restructuring/optimization; raised dividend 25% to $0.05.
LXK (38.28 +10.73%): Beat on EPS by $0.08, beat on revs; guided Q3 EPS in-line.
BTU (17.39 +6.56%): Beat on EPS by $0.37, missed on revs; guided Q3 EPS in-line.

Mid Cap Losers

ALGT (94.18 -11.89%): Beat on GAAP EPS by $0.04, reported revs in-line.
STM (8.94 -8.68%): Missed on EPS by $0.06, missed on revs; expects Q3 revs flat qtr/qtr in-line with guidance.
PENN (50.08 -7.22%): Reported Q2 loss of $0.16 per share, may not be comparable to the Capital IQ Consensus Estimate of $0.63, missed on revs; cut EBITDA, EPS and dividend guidance.

12:17PM Power-One stockholders approve acquisition by ABB Ltd (PWER) 6.34 +0.01 : Co announced that at its special meeting of stockholders held today, the stockholders approved the adoption of the merger agreement, pursuant to which ABB (ABB) will acquire Power-One for $6.35 per share of Power-One common stock. The transaction has already received the required antitrust approvals and Power-One and ABB expect to complete the transaction by the end of this week.

Flextronics (FLEX) has created an accelerator business that will provide a broad range of support to early-stage game-changing, disruptive technology companies incorporating hardware and software innovation.

The technology sector is likely to receive some extra attention after Netflix (NFLX 254.41, -7.55), STMicroelectronics (STM 9.20, -0.59), Texas Instruments (TXN 38.80, +1.38), and United Technologies (UTX 103.13, +1.02) reported their quarterly results. Of the four names, only STMicroelectronics came up short on earnings while top line results were more of a mixed bag. Netflix reported in-line revenue and United Technologies saw a 15.9% increase, which fell short of analyst estimates. Meanwhile, STMicroelectronics and Texas Instruments reported year-over-year declines in revenue.

McAfee, a subsidiary of Intel (INTC), announced that the McAfee LiveSafe service is now available for purchase via select retailers, as well as a preinstall on Ultrabooks and PCs.

07:28 am Texas Instruments shares rise 2% following better than expected earnings
Texas Instruments (TXN $38.15 +0.73) reported second quarter earnings of $0.42 per share, excluding a $0.16 gain associated with the transfer of wireless connectivity technology to a customer and higher-than-expected charges associated with previously announced restructuring, which was better than expected, while revenues fell 8.6% year/year to $3.05 billion which was below expectations. "Our revenue ended the quarter as expected, up 6 percent sequentially.

Excluding legacy wireless, revenue grew 8 percent; our positions in industrial and automotive markets were important contributors to the sequential growth in revenue. Additionally, backlog increased, and with it, visibility into the second half improved. "Analog and Embedded Processing are now 78 percent of revenue, 6 points higher than a year ago. Our legacy wireless products declined to less than 5 percent of revenue and should be below 2 percent in the third quarter. Silicon Valley Analog (formerly National Semiconductor) led our Analog growth and is gaining share, one year ahead of plan. The company issued in-line guidance for the third quarter with EPS of $0.49-0.57 which is in line with expectations, with revenues of $3.09-3.35 billion which is also in line with expectations.

07:24 am Sandisk shares rise 4% following better than expected earnings
Sanmina (SANM $15.99 +0.73) reported third quarter earnings of $0.40 per share, which was better than expected, while revenues fell 3.9% year/year to $1.49 billion, which also topped expectations. Non-GAAP operating income in the third quarter was $49.7 million or 3.3 percent of revenue, compared to $44.1 million or 2.8 percent of revenue in the third quarter fiscal 2012. Cash flow from operations was $66.1 million for the quarter. Inventory turns were 6.9. Cash cycle days were 48.3 days. Guidance: The company issued guidance for the fourth quarter with EPS of $0.37-0.43 which is line with expectations with revenues of $1.475-1.525 billion which is also in line with estimates.

3:14 pm Yahoo! downgraded to Hold at Needham: . Needham downgrades YHOO to Hold from Buy, owing to new questions and implied higher risks in the wake of Third Point selling back the bulk of its YHOO shares and its three directors leaving the Board. Firm says Third Point's exit raises important questions relating to "Why Now?", and they say the use of proceeds from Alibaba is less certain. Firm raises their WACC to 11.6% from 9.6% until some of these risks moderate. This results in a DCF value for YHOO of $29/share, within 5% of yesterday's closing price.

PLX Tech (PLXT) reported second quarter earnings of $0.07 per share, excluding non-recurring items, which beat estimates, while revenues rose 7.2% year/year to $26.9 which was slightly ahead of estimates. The company issued guidance for the third quarter with revenues of $25.5-27.5 million which is less than expected.

exas Instruments (TXN) reported second quarter earnings of $0.42 per share, excluding a $0.16 gain associated with the transfer of wireless connectivity technology to a customer and higher-than-expected charges associated with previously announced restructuring, which was better than expected, while revenues fell 8.6% year/year to $3.05 billion which was below expectations. "Our revenue ended the quarter as expected, up 6 percent sequentially. Excluding legacy wireless, revenue grew 8 percent; our positions in industrial and automotive markets were important contributors to the sequential growth in revenue. Additionally, backlog increased, and with it, visibility into the second half improved. "Analog and Embedded Processing are now 78 percent of revenue, 6 points higher than a year ago. Our legacy wireless products declined to less than 5 percent of revenue and should be below 2 percent in the third quarter. Silicon Valley Analog (formerly National Semiconductor) led our Analog growth and is gaining share, one year ahead of plan. The company issued in-line guidance for the third quarter with EPS of $0.49-0.57 which is in line with expectations, with revenues of $3.09-3.35 billion which is also in line with expectations.

On July 22, 2013, the Court of Appeals of the State of Minnesota reversed the decision, which had vacated a $630.4 million final arbitration award and ordered a rehearing of certain claims in the arbitration between Western Digital (WDC) and Seagate Technology (STX). In the arbitration, Seagate alleged, among other things, misappropriation of eight alleged trade secrets by the Company and a now former employee. The District Court confirmed the arbitration award with respect to each of the five trade secret claims that the Company and the former employee had won at the arbitration, and vacated the arbitration award and ordered a rehearing with respect to the three trade secret claims that the Company and the former employee had lost. The Appellate Court reversed the District Court's decision and remanded for entry of an order and judgment confirming the arbitration award. The Company strongly disagrees with the decision of the Minnesota Court of Appeals, believes that the District Court's decision was correct, and will file a petition for review with the Minnesota Supreme Court. If the Minnesota Supreme Court elects not to hear the Company's petition for review or if the Minnesota Supreme Court affirms the Appellate Court decision, the District Court is expected to enter an order and judgment confirming the $630.4 million final arbitration award, plus post-award interest on the $525 million initial award at the statutory rate of 10% from January 24, 2012. No judgment will be entered while the Company is petitioning the Minnesota Supreme Court for review.
icon url

ReturntoSender

07/24/13 1:22 PM

#10260 RE: ReturntoSender #6755

Chart of the Day - COTD - How far this rally has come:

http://www.chartoftheday.com/20130724.htm?T

For some perspective on the post-financial crisis rally, today's chart illustrates how much of the downturn that occurred as a result of the financial crisis has been retraced by each of the five major US stock market indexes. For example, the S&P 500 peaked at 1,565.15 back in October 9, 2007 and troughed at 676.53 back on March 9, 2009. The most recent close for the S&P 500 is 1,692.39 -- it has retraced 114.3% of its financial crisis bear market decline. As today's chart illustrates, each of these five major stock market indices has recouped all losses incurred during the financial crisis (i.e. all are above 100% on today's chart). However, it has been the often overlooked S&P 400 (mid-cap stocks) that has been the star performer. The S&P 400 has recouped over 160% of its financial crisis decline -- a very impressive performance.


icon url

ReturntoSender

07/30/13 5:48 PM

#10267 RE: ReturntoSender #6755

From Briefing.com: 4:10 pm : The S&P 500 ended little changed while the Nasdaq advanced 0.5%.

The S&P notched its high at the open before spending the rest of the session in a steady retreat. The selling intensified during afternoon action, sending the S&P into the red as participants displayed caution ahead of tomorrow's advance second quarter GDP report and the latest policy statement from the Federal Reserve.

Energy and materials lagged from the open, and they finished behind the remaining cyclical sectors. The energy space lost 0.3% as crude oil slipped 1.3% to $103.15 per barrel. Since its July 19th high, the energy component has surrendered almost 5.5%.

Elsewhere, the materials sector opened sharply lower after the largest potash producer, Russia's OAO Uralkali, withdrew from a potash cartel. Potash (POT 31.63, -6.27) and Mosaic (MOS 43.81, -9.15) both lost near 17.0%. Despite opening lower by 1.3%, the broader sector managed to trim its loss to just 0.3%.

Although stocks endured some intraday weakness, the Nasdaq never fell into the red. The outperformance of technology combined with the relative strength of biotechnology helped the index settle in the green. The largest index component, Apple (AAPL 453.32, +5.53), advanced 1.2% with chipmakers also registering comparable gains. The PHLX Semiconductor Index climbed 1.2%.

In addition to technology, industrials and utilities spent the entire day in positive territory. Transportation-related names helped the industrial sector add 0.4% while the utilities space rose 0.3% on the back of solid earnings from NextEra Energy (NEE 86.48, +1.69) and Northeast Utilities (NU 44.57, +0.53).

Today's NYSE trading volume surpassed yesterday's total, but at 678 million shares traded, it remained below its 50-day moving average.

The Conference Board's Consumer Confidence Index weakened a bit in July, dropping from an upwardly revised 82.1 (from 81.4) in June to 80.3. The Briefing.com consensus pegged the index at 81.6.

The slight dip in confidence does not change the overall picture of an improving consumer base. The index likely fell back due to normal volatility after reaching a 5-year high in June. Furthermore, the University of Michigan Consumer Sentiment Index spiked to its highest level since 2007 in July, signaling that the drop in confidence was likely a non-event.

Separately, the May Case-Shiller 20-city Home Price Index rose 12.2% while a 10.5% increase had been expected by the Briefing.com consensus. This followed the previous month's increase of 12.1%.

Tomorrow, the weekly MBA Mortgage Index will be reported at 7:00 ET and the July ADP Employment Change will be released at 8:15 ET. Second quarter GDP will be reported at 8:30 ET and the July Chicago PMI will cross the wires at 9:45 ET. The day will be topped off with the 14:00 ET release of the latest policy statement from the Federal Open Market Committee.DJ30 -1.38 NASDAQ +17.33 SP500 +0.63 NASDAQ Adv/Vol/Dec 1311/1.71 bln/1197 NYSE Adv/Vol/Dec 1525/677.6 mln/1453

3:30 pm :

Sep crude oil fell deeper into negative territory as it was pressured by a stronger dollar index. The energy component retreated from its session high of $103.95 per barrel and settled 1.4% lower at $103.09 per barrel.
Sep natural gas reversed back into negative territory after touching a session high of $3.49 per MMBtu in early morning pit action. It closed 1.2% lower at $3.43 per MMBtu, just above its session low of $3.42 per MMBtu.
Precious metals also traded in the red today.
Aug gold touched a session high of $1328.30 per ounce but slid to a session low of $1316.20 per ounce moments after equity markets opened. It managed to erase some of the loss and settled at $1323.70 per ounce, or 0.4% lower.
Sep silver brushed a session high of $19.84 per ounce in early morning action but pulled-back slightly as the session progressed. It settled at $19.67 per ounce, booking a loss of 1.0%.

4:36PM Nanometrics beats by $0.03, beats on revs; guides Q3 EPS below consensus, revs below consensus (NANO) 15.21 -0.12 : Reports Q2 (Jun) loss of $0.17 per share, excluding non-recurring items, $0.03 better than the Capital IQ Consensus Estimate of ($0.20); revenues fell 35.0% year/year but rose 41% sequentially to $34.6 mln vs the $32.3 mln consensus. Co issues downside guidance for Q3, sees EPS of $(0.14)-(0.03), excluding non-recurring items, vs. $0.04 Capital IQ Consensus Estimate; sees Q3 revs of $36-40 mln vs. $46.4 mln Capital IQ Consensus Estimate.

4:31PM Ultratech announces that it has moved Ultratech/Cambridge NanoTech to Waltham, Mass (UTEK) 29.46 -0.01 : The new facility will expand its operations for next-generation atomic layer deposition (ALD) equipment development and enable leading-edge scientific research. After acquiring the assets of Cambridge NanoTech last December, Ultratech invested in a new facility to enhance ALD development. With this new facility, Ultratech/Cambridge NanoTech now has greatly enhanced its capability to develop innovative process technology for ALD applications.

4:26PM Intersil beats by $0.06, beats on revs; guides Q3 EPS, revs above consensus (ISIL) 9.25 +0.04 : Reports Q2 (Jun) earnings of $0.14 per share, excluding non-recurring items, $0.06 better than the Capital IQ Consensus Estimate of $0.08; revenues fell 11.2% year/year to $144.8 mln vs the $138.35 mln consensus.

Co issues upside guidance for Q3, sees EPS of $0.15-0.18, excluding non-recurring items, vs. $0.09 Capital IQ Consensus Estimate; sees Q3 revs of $146-152 mln vs. $141.63 mln Capital IQ Consensus Estimate.

4:26PM Power Integrations beats by $0.01, reports revs in-line; guides Q3 revs in-line (POWI) 52.07 +0.87 : Reports Q2 (Jun) earnings of $0.61 per share, $0.01 better than the Capital IQ Consensus Estimate of $0.60; revenues rose 15.2% year/year to $87.9 mln vs the $87.46 mln consensus. Co issues in-line guidance for Q3, sees Q3 revs of $89-94 mln vs. $91.11 mln Capital IQ Consensus Estimate.

Guidance Commentary

Non-GAAP gross margin is expected to be approximately 54 percent.
GAAP gross margin is expected to be approximately 53 percent.
Non-GAAP operating expenses are expected to be approximately $28 million, plus or minus $0.5 million.
GAAP operating expenses are expected to be $33 million, plus or minus $0.5 million.

4:22PM Coherent beats by $0.08, beats on revs (COHR) 57.63 -0.40 : Reports Q3 (Jun) earnings of $0.91 per share, excluding non-recurring items, $0.08 better than the Capital IQ Consensus Estimate of $0.83; revenues rose 8.8% year/year to $213.7 mln vs the $207.72 mln consensus.

"There are a number of interesting opportunities as we finish fiscal 2013 and enter fiscal 2014. We expect to see meaningful orders in our laser annealing business as early as the current quarter and extending into fiscal 2014. We shipped a 3 kilowatt fiber laser prototype to a lead customer and the initial test results are positive. The next phase of testing is field deployment qualification, which is the precursor to a volume commercial order. And finally, we have delivered lasers to a number of customers who are developing processes for strengthened glass cutting."

4:20PM MagnaChip Semi beats by $0.12, reports revs in-line; guides Q3 revs below consensus; board approves new $100 mln stock buyback (MX) 17.36 -0.47 : Reports Q2 (Jun) earnings of $0.71 per share, excluding non-recurring items, $0.12 better than the Capital IQ Consensus Estimate of $0.59; revenues rose 6.3% year/year to $215.3 mln vs the $214.91 mln consensus.

Gross margin was $71.0 million or 33.0%, as a percent of revenue, for the second quarter of 2013. This compares to gross margin of $65.7 million or 32.0% for the first quarter of 2013 and $62.9 million or 31.0% for the second quarter of 2012.

Co issues downside guidance for Q3, sees Q3 revs of $215-225 mln vs. $229.34 mln Capital IQ Consensus; Gross margin 33-34%.

board approves new $100 mln stock repurchase program

4:16PM Silicon Image beats by $0.01, beats on revs; guides Q3 revs in-line (SIMG) 5.45 +0.06 : Reports Q2 (Jun) earnings of $0.08 per share, excluding non-recurring items, $0.01 better than the Capital IQ Consensus Estimate of $0.07; revenues rose 15.5% year/year to $73.7 mln vs the $71.91 mln consensus. Co issues in-line guidance for Q3, sees Q3 revs of $78-81 mln vs. $82.64 mln Capital IQ Consensus Estimate.

Gross Margin: approximately 56-57%
GAAP operating expenses: approximately $38 million
Non-GAAP operating expenses: approximately $35 million
Non-GAAP tax rate: approximately 30% of non-GAAP pre-tax income

4:12PM Riverbed Technology -- Earnings Mover -- (RVBD) : Extends after hours slump back near its July low at 15.50.

4:08PM Riverbed Technology beats by $0.01, misses on revs (RVBD) 17.53 +0.21 : Reports Q2 (Jun) earnings of $0.23 per share, excluding non-recurring items, $0.01 better than the Capital IQ Consensus Estimate of $0.22; GAAP rev rose 25.9% year/year to $250 mln vs the $257.72 mln consensus; adj. rev was $255 mln.

"Total non-GAAP revenue increased twenty-eight percent year-over-year, with growth across all major product lines, geographies, and verticals. Riverbed's core revenue, excluding OPNET, grew 7% sequentially to $215 million in the second quarter. Non-GAAP revenue from the acquired OPNET products was $40 million, as we still have work to do integrating the two companies. Our market expanding products outside of WAN optimization and OPNET grew almost 50% compared to last year, and we believe our multi-product strategy to deliver unmatched application performance will allow us to accelerate the company's revenue growth."

4:05PM Anadigics beats by $0.01, beats on revs (ANAD) 2.37 +0.06 : Reports Q2 (Jun) loss of $0.14 per share, $0.01 better than the Capital IQ Consensus Estimate of ($0.15); revenues rose 37.8% year/year to $34.6 mln vs the $31.75 mln consensus.

Commentary: We continue to make operational progress by increasing yields in our manufacturing processes and transitioning our product portfolio to our more efficient ILD technology. For the third quarter, based on current bookings and revenue visibility, we expect continued sales growth in the range of 4 - 8%." Note: Unclear if this is year/year or sequential rev growth guidance. On a sequential basis, this would equate to Q3 revs of about $36-37.4 mln. CapIQ consensus is for Q3 revs of $37.7 mln.

4:05PM Extreme Networks beats by $0.01, beats on revs; guides Q1 EPS in-line, revs in-line (EXTR) 4.06 +0.05 : Reports Q4 (Jun) earnings of $0.07 per share, $0.01 better than the Capital IQ Consensus Estimate of $0.06; revenues fell 9.4% year/year to $79.5 mln vs the $74.61 mln consensus.

Co issues in-line guidance for Q1, sees EPS of $0.02-0.06 vs. $0.05 Capital IQ Consensus Estimate; sees Q1 revs of $72-77 mln vs. $70.63 mln Capital IQ Consensus Estimate.

PMCS (-7%) inline EPS but missed on rev

GLW (-3.2%) beat on both lines; sees Q3 EPS growth y/y

VSH (-4.2%) missed slightly on EPS but rev was inline; guides Q3 inline with est

In rumors, CHL (+0.2%) China Mobile execs met with AAPL (+1.5%) in China, according to reports. Yesterday OLED (+1.2%) shares saw quick drop on increased volume before recovering; move attributed to headlines that Samsung SSNLF may buy OLED specialist Novaled which is a competitor to Universal Display. RBCN (+9.1%) hearing Sterne Agee out positive; discussing potential AAPL (+1.5%) deal and sapphire screens

SNDK (-2.3%) was downgraded by Goldman to Neutral from Buy

Spreadtrum Communications (SPRD) has reached mass production of its first WCDMA baseband chipset, the SC7701B.

Cadence Design Systems (CDNS) announced that MStar Semiconductor has licensed the Tensilica Xtensa DPU for a new SOC design for the home entertainment and home networking market segments.

DSP Group (DSPG) announced that its DECT VoIP chipset has been selected to power Yealink's W52P next-generation advanced DECT IP telephones.

7:26AM Corning beats by $0.01, beats on revs; sees Q3 EPS growth YoY (GLW) 15.39 : Reports Q2 (Jun) core earnings of $0.32 per share, excluding non-recurring items, $0.01 better than the Capital IQ Consensus Estimate of $0.31; revenues rose 11.1% year/year to $2.02 bln vs the $1.98 bln consensus.

Co issues upside guidance for Q3, sees EPS of expects YoY growth (Q3 2012 $0.34) vs. $0.34 Capital IQ Consensus Estimate.

Display Technologies segment core sales were $670 mln, a 21% increase compared with a year ago, and stronger than originally anticipated.

LCD glass price declines were more moderate than in the first quarter and were within the range the company anticipated. Total glass volume from Corning's wholly owned business and Samsung Corning Precision Materials Co., Ltd. increased by a mid- single digit percentage sequentially and about 20% on a year-over-year basis. Year-over-year core earnings for the segment increased approximately 11%.

Core gross margin in the quarter was 43%*, a significant improvement over the second quarter of 2012.

Guidance: In the third quarter, Corning expects to achieve its fourth consecutive quarter of year-over-year earnings growth. (Q3 2012 $0.34 -- cons $0.34). The company also anticipates its LCD glass volume should be consistent to up slightly compared with the strong second quarter performance. Corning expects its volumes in the second half to be driven by global retail TV demand, especially for 50-inch or larger LCD television models.

Third quarter LCD glass price declines are anticipated to be moderate, and consistent with the previous quarter. Specialty Materials segment sales are expected to improve about 10% sequentially. The company expects sales to begin ramping for this new product in the third quarter. Industry market research indicates that touch- enabled notebooks represent the next wave of opportunity for cover glass technologies.Core equity earnings from Dow Corning are expected to be down approximately 50% versus the second quarter due to price pressure and cost in inventories.

Amkor (AMKR $4.25 -0.16) reported second quarter of $0.14 per share, which was better than expected, while revenues rose 8.6% year/year to $746 million which missed expectations. The company issued guidance for the third quarter with EPS of $0.04-0.13 which was below expectations, with revenues $715-765 million which is below expectations

Natl Instruments (NATI) reported second quarter earnings of $0.18 per share, which missed expectations, while revenues rose 1.3% year/year to $296 million which was worse than expected. The company's GAAP EPS was $0.03 below the midpoint of its guidance range and non-GAAP EPS was $0.04 below the midpoint of its guidance range given on April 25, including a $0.01 per share loss on foreign exchange the company did not anticipate. EBITDA, or Earnings Before Interest, Taxes, Depreciation and Amortization, was $35 million, or $0.28 per share for Q2. The company issued guidance for the third quarter with EPS of $0.10-0.22 which was below expectations, with revenues of $265-295 million which is below expectations. For perspective, National Instruments recognized approximately $27 million in revenue from its largest customer in Q3 2012 and the company anticipates recognizing less than $5 million in revenue from this customer in Q3 2013. NI expects gross margins to increase approximately 250 to 300 basis points sequentially in Q3. Looking out to Q4, National Instruments is adjusting its spending plans to reflect the more difficult industry conditions. The company currently expects its total non-GAAP operating expenses will decline sequentially in Q4 and that non-GAAP operating expenses will be approximately $181million, plus or minus $3 million in Q4. National Instruments expects this to result in a significantly improved operating margin in Q4.

Xoom (XOOM) announced an international remittance service for mobile virtual network operators (MVNOs) on the Sprint (S) network. Beginning July 29, MVNOs using the Sprint network can offer Xoom's money transfer service to their subscribers. This agreement allows the MVNO's customers to sign up for Xoom from their mobile phone, and send money to friends and family in Latin America, the Philippines, India, Europe, Canada, Australia and South Africa.

Sourcefire (FIRE) reported second quarter earnings of $0.20 per share, excluding non-recurring items, which was better than expected, whilke revenues rose 28.6% year/year to $65.1 million which topped expectations. The company announced on July 23rd it is being acquired by Cisco (CSCO) for $76/share in cash.
icon url

ReturntoSender

08/01/13 3:11 PM

#10272 RE: ReturntoSender #6755

Short Term to Intermediate Indicators. It's best to be cover shorts and enter long positions on cross overs of green lines. Best to go short on cross overs of the red lines and or exit long positions.

The first set of charts for market timing the SMH are based on using the NASDAQ New Highs and similar indexes are shown here. To go long: First wait for the NASDAQ New Highs to set a new low and reverse itself from an approach of the lower Bollinger Band. To go short: Wait for the NASDAQ new highs and other similar new high indices to set a new high print at, near, or above the upper Bollinger Band. I am also now using the NASDAQ McClellan Oscillator (Ratio Adjusted) $NAMO) to confirm the above - Overbought above 25 - Oversold below -25. These charts do not fully update until after market close.


Short Term Indicators vs. the SMH; any index can be used - The first set of short term indicators I use are based on the put to call ratio. To go long it is best to wait for the put to call ratio to close over 1.0. On the chart below the put to call ratio now updates intraday but it is not always accurate! Intraday reading of the put to call ratio can be found here updated every half hour after the open:

http://www.cboe.com/data/IntraDayVol.aspx

The more days in a row the put to call ratio prints over 1.0 this the more likely the bottom will be a strong one. The link above shows intraday readings of the P/C ratio.

Also closes on the put to call ratio below 0.50 and sometimes a bit above are indicative of a short term top. Watch the simple moving averages as well because periods of too much buying of puts or calls will almost certainly bring about market bottoms and tops respectively. On the CPC/VIX ratio; this is largely a longer term indicator where investors are likely to make more money on the long side once the short-term 21 day sma has crossed above the 200 day sma. The reverse is true as well. An investor will likely make more money on the short side when the 21 day sma crosses below the 200 day sma:


Next I use the VIX, VXO and VXN (Fear Indices) because they can help to refine decision making on tops and bottoms upon reverses from upper or lower Bollinger Bands especially when the index stretches more than 10% above or below its 10 day simple moving average. When a volatility index stretches more than 10% above or below its 10 day sma it will generally reverse direction as will the market in general in the opposite direction.


Also TRIN and TRINQ readings on the 5 and 10 day simple moving averages over 1.5 are bullish while readings below 0.85 are bearish. These readings don't happen often especially with the 10 day sma. They are also early indicators so the market can continue higher or lower for a while but they are reliable for indicating market turns that are about to take place.


These charts simply forewarn of potential trend changes:


icon url

ReturntoSender

08/01/13 11:06 PM

#10274 RE: ReturntoSender #6755

Long Term Market Breadth Indicators for the SOX and market as a whole. Crossing over the green horizontal lines are indicative of oversold conditions that could lead to a rally. Crossing over the red lines is indicative of overbought conditions that could lead to a sell off. In either case the market might recover from these conditions only to head further into oversold or overbought territory. It is therefore important to look for positive or negative divergences. Positive divergences were seen at the last major market bottom in October 2002 where most market breath indicators had improved readings than those seen at the previous bottoms even though the market was actually much lower.


icon url

ReturntoSender

08/02/13 11:00 AM

#10275 RE: ReturntoSender #6755

20 Year Daily Charts of the SOX and its Component Stocks versus the VIX (Fear Index). Note that market bottoms are formed after huge spikes higher in the VIX. On the other hand market tops can take years to form with the VIX staying low for much longer than some people would ever believe that it could:


http://finance.yahoo.com/q/cp?s=^SOX+Components
icon url

ReturntoSender

08/02/13 11:29 AM

#10276 RE: ReturntoSender #6755

Major Market Indices on 6 Month Daily Charts versus the VIX (Fear Index) - Also included are the SOX/SMH and BKX because they are so important to the overall direction of the market. RSI (14) over 70 is overbought. Under 30 is oversold. Fear will generally be low while the market is moving steadily higher. Large spikes in the VIX often correspond with market bottoms.


icon url

ReturntoSender

08/05/13 11:21 PM

#10282 RE: ReturntoSender #6755

From Briefing.com: 4:15 pm : The S&P 500 ended today's quiet session modestly lower with eight of ten sectors settling in the red.

Stocks slipped out of the gate after better-than-expected economic data from China and Great Britain was unable to spark an early bid. In China, the Non-Manufacturing PMI rose to 54.1 from 53.9 while Great Britain's Services PMI posted its best reading since 2006, rising to 60.2 from 56.9.

Equities climbed off their early lows before receiving an additional push following the release of the ISM Non-Manufacturing Index, which posted its best reading since February 2011. The index jumped to 56.0 from 52.2 as business activity and production levels spiked to 60.4 in July from 51.7 in June. Just like the manufacturing report, the jump in production came from a strong gain in new orders (57.7 from 50.8).

Although today's data provided stocks with a boost, the S&P never made it into the green as comments from Dallas Fed President Richard Fisher knocked the key indices off their highs. Mr. Fisher said the Fed's bond buying program may lay the groundwork for misallocation of resources and fuel future inflation. In addition, he said the market could expect a slowdown in asset purchases later in the year if the economy continues to "improve along the lines envisioned by the Committee."

These remarks caused the S&P to return to the middle of its range while the tech-heavy Nasdaq briefly slipped into the red before regaining its flat line during afternoon action. On a related note, the technology sector tacked on 0.2% as the largest sector component, Apple (AAPL 469.45, +6.91), rose 1.5% after an International Trade Commission ban on certain devices made by the company was overturned.

Outside of technology, only the consumer staples sector (+0.1%) managed to eke out an advance. Tyson Foods (TSN 29.69, +1.18) jumped 4.1% after beating on earnings and revenue.

While the outperformance of technology boosted the Nasdaq, the S&P was kept from turning positive as energy, industrials, and discretionary shares weighed.

The energy space shed 0.3% as crude oil endured a volatile session. The energy component was down as much as 1.1% at the open before trimming its loss to 0.4% at $106.49 per barrel.

Elsewhere, industrials lagged amid weakness in transportation companies. The Dow Jones Transportation Average lost 0.8% as 18 of 20 components ended in the red.

Lastly, broad weakness among home builders pressured the discretionary sector. The iShares Dow Jones US Home Construction ETF (ITB 22.38, -0.33) lost 1.5%.

Similar to stocks, Treasuries spent the entire session near their lows. The benchmark 10-yr yield added four basis points to end at 2.65%.

As mentioned earlier, today's volume was well below average as only 533 million shares changed hands on the floor of the New York Stock Exchange. This represented the third lowest total of the year.

Tomorrow, the June trade balance will be reported at 8:30 ET. The U.S. Treasury will auction $32 billion in 3-yr notes.DJ30 -46.23 NASDAQ +3.36 SP500 -2.53 NASDAQ Adv/Vol/Dec 1427/1.43 bln/1068 NYSE Adv/Vol/Dec 1248/533.0 mln/1778

3:30 pm :

Sep crude oil erased most of its earlier losses as it gained support from the strongest reading of the ISM Non-Manufacturing Index since Feb 2011. The energy component climbed off its session low of $105.70 per barrel and brushed a session high of $107.06 per barrel. It settled just 0.3% lower at $106.56 per barrel.
Sep natural gas, on the other hand, pulled back from its session high of $3.36 per MMBtu and fell into negative territory. It brushed a session low of $3.31 per MMBtu and eventually settled with a 0.9% loss at $3.32 per MMBtu.
Precious metals traded in the red following the better-than-anticipated economic data released this morning.
Dec gold retreated from its session high of $1310.20 per ounce and touched a session low of $1296.70 per ounce. Unable to erase much of the loss, it settled 0.6% lower at $1301.90 per ounce.
Sep silver slipped to a session low of $19.52 per ounce moments after pit trade opened. It settled with a 1.0% loss at $19.72 per ounce, slightly below its session high of $19.75 per ounce.

10:17AM Apple: AAPL extends the post EPS up-trend this morning with shares now nearing a test of the 200d exp. moving avg. in play @ 468.70; Session Hod now @ 467.93 (AAPL) 467.92 +5.38 :

6:59AM Canadian Solar: Concord Green Energy to acquire five utility-scale solar power plants from Canadian Solar valued at over $277 mln (CSIQ) 14.11 : Co announced that its subsidiary, Canadian Solar Solutions, has entered into a sales agreement with Concord Pacific's green energy affiliate, Concord Green Energy, whereby Concord will acquire from Canadian Solar five utility-scale solar power plants totaling 49MW (AC) valued at over CAD 290 million ($277 million). Under the agreement, the five utility-scale solar power plants, located in Chesterville, Pefferlaw, Springwater, Sudbury and Wyebridge, Ontario, Canada, are expected to start construction during 2013 and 2014 with commercial operation expected in 2014. Canadian Solar will provide turnkey engineering, procurement and construction services to complete the projects and will provide operations and maintenance services after completion. BowMont Capital and Advisory acted as financial advisor to Concord on the transaction.

6:32AM JA Solar and Jinglong Group secure RMB 550 mln credit facility from Bank of Communications of China (JASO) 8.40 : Co announced that JA Solar and Jinglong Group, a related party of JA Solar, have secured a RMB 550 mln credit facility from the Bank of Communications of China. Of the credit facility, RMB 250 mln ($40.8 mln) will be available to JA Solar and RMB 300 mln ($48.9 mln) will be available to Jinglong Group. JA Solar intends to use the credit facility for working capital and general corporate purposes.

6:05AM Spreadtrum Comms announces extraordinary general meeting (SPRD) 30.00 : Co announced that it has called an extraordinary general meeting of shareholders to be held at 10 a.m., Beijing Standard Time, on Sep 4, 2013. The meeting will be held to consider and vote upon a proposal to approve and authorize the Agreement and Plan of Merger, dated as of July 12, 2013 by and among Tsinghua Unigroup, a limited liability company established under the laws of the People's Republic of China, Spreadtrum Acquisition, an exempted company incorporated under the laws of the Cayman Islands and a wholly owned, indirect, subsidiary of Parent, and the Company, pursuant to which the Merger Sub will be merged with and into the Company, with the Company surviving as a wholly owned subsidiary of Parent, and to approve and authorize the Plan of Merger required to be filed with the Registrar of Companies in the Cayman Islands in order to give effect to the Merger.

Datalink (DTLK) announced that it plans to offer and sell, subject to market and other conditions, 3,300,000 shares of its common stock in an underwritten public offering. Datalink also plans to grant the underwriters a 30-day option to purchase up to an additional 495,000 shares to cover over-allotments, if any.Datalink intends to use the net proceeds from the offering for potential acquisitions of other businesses or technology that will complement its current business model and growth plans, although it has no present commitments or agreements to do so.Any amount of the net proceeds of this offering not used for acquisitions will be used for general corporate purposes. Canaccord Genuity Inc. is acting as sole book-running manager for the offering. Craig-Hallum Capital Group LLC and Needham & Co, LLC are acting as co-managers for the offering.

Needham initiated Perficient (PRFT) with a Buy and price target of $20, as they believe Perficient's strong domain and vertical capabilities, improved account "mining" of its top 50 accounts, and high win rates, combined with the broad pickup in spending on IT services, should lead to improving organic growth trends over 2H FY13 and into FY14. At the same time, they believe Perficient has multiple levers to drive gross and EBITDA margin expansion, which in turn should lead to 15-20% EPS growth.
icon url

ReturntoSender

08/06/13 5:42 PM

#10283 RE: ReturntoSender #6755

From Briefing.com: 4:15 pm : The S&P 500 settled lower by 0.6% as all ten sectors registered losses.

Stocks slipped out of the gate after today's better-than-expected economic data was unable to spark an opening bid.

The June trade deficit narrowed to $34.2 billion from May's downwardly revised $44.1 billion (from $45.0 billion). That was the smallest monthly trade deficit since October 2009. The Briefing.com consensus expected the deficit to fall to $43.4 billion. In the advance estimate for second quarter GDP, the Bureau of Economic Analysis assumed the trade deficit widened slightly in June. This huge downward surprise will likely add at least 0.5 percentage points to second quarter growth.

June exports increased by $4.1 billion to $191.2 billion, representing the largest amount of exports, nominal or real, on record. On the flip side, imports fell by $5.8 billion to $225.4 billion. Nearly the entire decline in imports was due to a drop in petroleum-based demand (-$2.0 billion) and a softening in cell phone imports (-$1.5 billion).

The S&P spent the first 90 minutes of the session in a steady decline as cyclical sectors pressured the index below the 1,700 level with financials, materials, and industrials leading to the downside.

All top-weighted banks ended in the red with Citigroup (C 51.48, -1.39) posting the largest loss among the majors. Meanwhile, the broader sector slid 0.9%.

Elsewhere, the materials space (-1.0%) finished at the bottom of the leaderboard as steelmakers, gold miners, and chemical producers displayed broad weakness. On a related note, gold futures fell 1.5% to $1282.90 per troy ounce while copper futures ended little changed at $3.173 per pound.

Another growth-oriented group, industrials, settled lower by 0.8% due to the underperformance of transportation-related names. The Dow Jones Transportation Average fell 1.3% as 18 of 20 components registered losses. Expeditors International (EXPD 41.21, +0.87) advanced 2.2% after beating on earnings and peer UPS (UPS 87.95, +0.09) tacked on 0.1% in sympathy.

Most cyclical sectors trailed behind the broader market, but technology and discretionary shares outperformed slightly. Although the tech sector ended off its lows, the largest component, Apple (AAPL 465.25, -4.20), slid 0.9%, and the top-weighted Dow component, IBM (IBM 190.99, -4.51), tumbled 2.3%.

In the discretionary space, media and publishing names displayed some strength after Washington Post (WPO 593.00, +24.30) agreed to sell its newspaper publishing business to Jeff Bezos. However, home builders and retailers lagged. The iShares Dow Jones US Home Construction ETF (ITB 21.90, -0.48) lost 2.1% and the SPDR S&P Retail ETF (XRT 81.97, -1.02) slumped 1.2% after American Eagle Outfitters (AEO 17.57, -2.40) issued cautious guidance.

Unlike growth-sensitive sectors, three of four countercyclical groups were able to erase a portion of their losses. Consumer staples, health care, and telecom services shed between 0.1% and 0.5% while the utilities space underperformed with a loss of 0.6%.

Today's volume was well ahead of yesterday, but at 658 million shares traded on the New York Stock Exchange, the final tally came up short of its 50-day moving average, which sits in the 768 million area.

Tomorrow, the weekly MBA Mortgage Index will be reported at 7:00 ET and June consumer credit will be released at 15:00 ET.DJ30 -93.39 NASDAQ -27.18 SP500 -9.77 NASDAQ Adv/Vol/Dec 763/1.49 bln/1734 NYSE Adv/Vol/Dec 760/658.1 mln/2268

3:30 pm :

Sep crude oil erased most of its earlier losses as it gained support from the strongest reading of the ISM Non-Manufacturing Index since Feb 2011. The energy component climbed off its session low of $105.70 per barrel and brushed a session high of $107.06 per barrel. It settled just 0.3% lower at $106.56 per barrel.
Sep natural gas, on the other hand, pulled back from its session high of $3.36 per MMBtu and fell into negative territory. It brushed a session low of $3.31 per MMBtu and eventually settled with a 0.9% loss at $3.32 per MMBtu.
Precious metals traded in the red following the better-than-anticipated economic data released this morning.
Dec gold retreated from its session high of $1310.20 per ounce and touched a session low of $1296.70 per ounce. Unable to erase much of the loss, it settled 0.6% lower at $1301.90 per ounce.
Sep silver slipped to a session low of $19.52 per ounce moments after pit trade opened. It settled with a 1.0% loss at $19.72 per ounce, slightly below its session high of $19.75 per ounce.

4:22PM Spreadtrum Comms beats by $0.11, beats on revs (SPRD) : Reports Q2 (Jun) earnings of $0.95 per share, $0.11 better than the Capital IQ Consensus Estimate of $0.84; revenues rose 60.5% year/year to $277.8 mln vs the $274.03 mln consensus.

Gross margin was 37.8% compared to 37.3% in the prior quarter and 37.1% in 2Q12. Cash flow generated from operations was $47.6 million, compared with $17.4 million in the prior quarter and $16.8 million in 2Q12.

Commentary: "In the second quarter we saw very strong demand for entry-level smartphones based on our single-core smartphone chipsets. We expect this trend to continue well into 2014 as wireless subscribers replace feature phones with their first smartphone. In the second quarter, we increased our market share in midrange handsets as well, having achieved volume shipments of our dual-core smartphone chipsets to both China and global handset makers. Further, we are now shipping our first WCDMA chipset in volume, which expands our addressable market to include global 3G devices..."

4:11PM First Solar misses by $0.17, misses on revs; guides FY13 EPS in-line, revs below consensus; announces GE partnership (FSLR) 46.75 -1.11 : Reports Q2 (Jun) earnings of $0.39 per share, excluding non-recurring items, $0.17 worse than the Capital IQ Consensus Estimate of $0.56; revenues fell 45.7% year/year to $520 mln vs the $729.71 mln consensus. The sequential decrease in net sales is primarily attributable to lower systems business project revenues as well as lower module-only sales volume to third-parties. Compared to the second quarter of 2012, the decrease in net sales is primarily attributable to lower systems business project revenue as initial revenue recognition for AVSR and the sale of Silver State North were both achieved in the second quarter of 2012, partially offset by higher sales volume to third-party module-only customers in the second quarter of 2013. As a previously highlighted possibility, the Company did not complete the sale of the ABW projects in the second quarter of 2013 and such sale is expected to occur in the second half of this year.

Co issues mixed guidance for FY13, sees EPS of $3.75-4.25 vs. $4.17 Capital IQ Consensus Estimate; sees FY13 revs of $3.6-3.8 vs. $3.83 bln Capital IQ Consensus Estimate.
Raises operating expense to $390-410 mln from $380-400 mln
Maintains Operating Cash FLow of $800 mln to $1 bln
Maintains CaqEx of $350-400 mln

The Company also announced the acquisition of all of GE's (NYSE: GE) cadmium telluride (CdTe) solar intellectual property and entered into a technology collaboration agreement with GE, with the intent to advance thin-film solar cells and modules. Under the agreement, First Solar acquired GE's CdTe solar intellectual property, setting a course for advancement of photovoltaic (PV) thin-film solar technology and GE received 1.75 million shares of First Solar stock.

4:06PM First Solar acquires US and Mexico portfolio from Element Power; GE, First Solar announce solar technology and commercial partnership (FSLR) 46.75 -1.11 : Co announced that it has acquired a pipeline of U.S. and Mexico development assets from Element Power. The 1.5 GW pipeline includes geographically diverse projects in various stages of development. Terms of the deal were not disclosed.

In addition, GE (GE) and First Solar announced a technology partnership to advance thin-film solar cells and modules. First Solar has acquired GE's global cadmium telluride (CdTe) solar intellectual property portfolio, setting a course for significant advancement of photovoltaic (PV) thin-film solar technology. GE received 1.75 million shares of First Solar common stock as part of this transaction. GE has agreed to retain the shares for at least three years. Additionally, GE and First Solar have formed a commercial relationship around solar inverter technology. First Solar will continue to purchase inverters from GE Energy Management for use in First Solar's global solar deployments to optimize electrical balance of plant. By combining complementary technologies, the collaboration is expected to lead to an improvement in solar grid integration, more competitive cost structures and a roadmap for combined electrical equipment.

4:06PM Monolithic Power announces $100 mln stock repurchase program (MPWR) 26.31 -0.10 :

Marvell (MRVL) announced that China Mobile's (CHL) first self-branded smartphone, the Android-based M601, is powered by the Marvell ARMADA Mobile PXA988 unified 3G platform.

2:33 pm Tech sector trading lower by 0.71% along with overall market
The tech sector is trading lower today, along with losses in the broader market. Semiconductors are showing slight relative weakness with the SOX trading 0.8% lower. Within the chip index, SUNE (-3.5%) is a notable laggard. Among other major indices, the SPY is trading 0.7% lower today, while the QQQ is down 0.8% and the NASDAQ is trading 0.9% lower on the session. Among tech bellwethers, ORCL (+1.0%) is showing isolated strength, while IBM (-2.4%) is under pressure.

In notable tech earnings last night:

MKTG (+6.3%) reported EPS in-line, beat on revs; guided Q3 EPS below consensus, revs in-line; guided FY13 EPS below consensus, revs above consensus

This morning in earnings:

CTSH (+2.6%) beat by $0.02, beats on revs; guided Q3 EPS in-line, revs above consensus; raised FY13 guidance
DISH (+1.2%) reported Q2 net loss, including $438 mln impairment and missed on revs
CKP (-13.3%) missed by $0.07, missed on revs. and reaffirmed FY13 EPS guidance

In news, RMBS (-1.1%) and Hynix end California antitrust lawsuit under appeal, according to reports. SNE (-5.7%) sent a letter to Third Point; SNE strongly believes that continuing to own 100% of the Company's entertainment businesses is fundamental to Sony's success. Also, VHC (+0.9%) asserted a new patent in its AAPL (-0.8%) lawsuit.

Among notable analyst upgrades in tech this morning, Benchmark Company upgraded ADNC (+5.2%) to Buy and MKTG (+6.0%) was upgraded to Outperform at Credit Suisse.

In downgrades, IBM (-2.3%) was downgraded to Underperform at Credit Suisse and WWWW (-5.4%) was downgraded to Neutral at ROTH Capital.

CSC (-1.3%) and NUAN (-0.6%) are the notable names in tech scheduled to report after the close. TWX (-0.9%) and AVT (-0.9%) report tomorrow before the open.
icon url

ReturntoSender

08/07/13 1:45 PM

#10284 RE: ReturntoSender #6755

Chart of the Day - COTD - Earnings at New Post-Financial Crisis Highs!

http://www.chartoftheday.com/20130807.htm?T

With second-quarter earnings largely in the books (over 85% of S&P 500 corporations have reported), today's chart provides some long-term perspective to the current earnings environment by focusing on 12-month, as reported S&P 500 earnings. Today's chart illustrates how earnings declined over 92% from its Q3 2007 peak to Q1 2009 low which brought inflation-adjusted earnings to near Great Depression lows. Since its Q1 2009 low, S&P 500 earnings have surged to a level that was not that far below its credit bubble peak. After the surge ended in Q4 2011, inflation-adjusted earnings stagnated. However, second-quarter earnings have picked up significantly enough to where inflation-adjusted S&P 500 earnings are now once again making new post-financial crisis highs.


icon url

ReturntoSender

08/07/13 9:54 PM

#10285 RE: ReturntoSender #6755

From Briefing.com: 4:10 pm : The S&P 500 settled lower by 0.4% to register its third consecutive decline. The benchmark index fell to its lows during the first hour of action before spending the remainder of the session in a slow climb.

Stocks sold off at the open after Asian indices endured a downbeat session with Japan's Nikkei falling 4.0% as dollar/yen continued its recent weakness. The pair fell below 97.00 into the Asian close and additional selling during the U.S. session pressured it into the 96.50 area.

The relative strength of most countercyclical sectors helped the benchmark index erase about half of its losses during the afternoon. Health care and telecom services ended little changed while utilities registered a modest gain of 0.5%. For its part, the consumer staples sector (-0.5%) lagged.

Although the S&P was able to trim its losses, the index could not regain its flat line as the underperformance of influential cyclical sectors weighed. Financials and discretionary shares both lost near 0.8%. In addition, the industrial sector outperformed with a loss of 0.2%, but transportation companies lagged notably.

The Dow Jones Transportation Average fell 0.7% as trucking companies led to the downside. CH Robinson (CHRW 56.31, -3.27) tumbled 5.5% after missing on earnings and revenue. Peer YRC Worldwide (YRCW 23.52, -5.06) also endured a rough session after it too reported disappointing results.

Elsewhere, most major bank shares registered losses and Bank of America (BAC 14.53, -0.11) slid 0.8% after the Department of Justice filed a pair of lawsuits alleging the bank has engaged in investor fraud when selling $850 million in residential mortgage-backed securities.

Also of note, the discretionary sector displayed broad weakness with notable losses among home builders and retailers. The iShares Dow Jones US Home Construction ETF (ITB 21.41, -0.49) slumped 2.2% and the SPDR S&P Retail ETF (XRT 80.78, -1.19) lost 1.5%.

Treasuries registered modest gains and the benchmark 10-yr yield fell five basis points to 2.60%.

So far, this week has featured two light-volume sessions and today was not much different. With 629 million shares traded on the floor of the New York Stock Exchange, today's final tally came up short of the 50-day average, which sits near 763 million.

Today's economic news was limited to just two data points. The weekly MBA Mortgage Index ticked up 0.2% to follow seven consecutive contractionary readings, including last week's decline of 3.7%.

Separately, June consumer credit increased by $13.8 billion, which follows the prior month's increase of $17.5 billion, and is higher than the $16.0 billion that had been broadly expected among economists polled by Briefing.com.

Tomorrow, weekly initial claims will be reported at 8:30 ET.

The U.S. Treasury will auction $16 billion in 30-yr bonds.DJ30 -48.07 NASDAQ -11.76 SP500 -6.46 NASDAQ Adv/Vol/Dec 817/1.62 bln/1663 NYSE Adv/Vol/Dec 903/628.8 mln/2098

3:30 pm :

Sep crude oil declined for a fourth consecutive session as investors reacted to inventory data that showed a draw of 1.32 mln barrels when a draw of 1.2-1.5 bln was expected. The energy component slipped to a session low of $104.16 per barrel after trading as high as $105.53 per barrel. It eventually settled with a 0.9% loss at $104.37 per barrel.
Sep natural gas spent its entire session in negative territory. It retreated from its session high of $3.29 per MMBtu and settled 2.1% lower at $3.25 per MMBtu, just above its session low of $3.24 per MMBtu.
Dec gold erased early morning losses as it gained support from a weaker dollar index. The yellow metal came off its session low of $1275.10 per ounce and climbed as high as $1289.00 per ounce. It booked a 0.2% gain as it settled at $1284.70 per ounce.
Sep silver spent afternoon pit trade chopping around near the unchanged level after trading as low as $19.24 per ounce earlier in the session. It eventually settled with a 0.1% loss at $19.50 per ounce.

4:32PM TriQuint Semi acquires CAP Wireless and its Spatium technology; terms not disclosed (TQNT) 7.68 -0.25 :

4:32PM Novatel Wireless misses by $0.09, misses on revs; guides Q3 EPS in-line, revs in-line (NVTL) 3.61 -0.46 : Reports Q2 (Jun) loss of $0.20 per share, excluding non-recurring items, $0.09 worse than the Capital IQ Consensus Estimate of ($0.11); revenues fell 11.1% year/year to $91.12 mln vs the $93.23 mln consensus.

Co issues in-line guidance for Q3, sees EPS of ($0.14)-(0.02), excluding non-recurring items, vs. ($0.08) Capital IQ Consensus Estimate; sees Q3 revs of $90-100 mln vs. $94.83 mln Capital IQ Consensus Estimate. Co sees Q3 non-GAAP gross margin of 21-22%.

4:20PM Rubicon Tech misses by $0.05, misses on revs; guides Q3 EPS below consensus (RBCN) 9.18 -0.22 : Reports Q2 (Jun) loss of $0.26 per share, $0.05 worse than the Capital IQ Consensus Estimate of ($0.21); revenues fell 38.2% year/year to $10.5 mln vs the $10.8 mln consensus.

Co issues downside guidance for Q3, sees EPS of ($0.24) - ($0.20) vs. ($0.11) Capital IQ Consensus Estimate.

"We saw stronger demand for two- and four-inch core from the LED market in the second quarter. Orders were up significantly and pricing for these products increased by approximately 10 percent. This is the first time in two years that sapphire pricing has increased." Changes in market pricing are usually reflected in the Company's financial results in the following quarter due to the lead time on customer orders, therefore, changes in market pricing in the second quarter will be reflected in third quarter financial performance. The Company reported that demand for two- and four-inch core remains robust and that pricing has continued to rise in the third quarter."

Wind River, a subsidiary of Intel (INTC), is working with PATEO to deliver iOS device connectivity for Android-based in-vehicle infotainment systems.
Peregrine Semiconductor (PSMI) and LG Electronics teamed up to develop the high-performance antenna tuning design solution in the LG Optimus G Pro smartphone that was recently introduced to the Korean market.
Ciena (CIEN) is collaborating with CANARIE, Internet2 and StarLight to build the industry's first network that unites all of the key packet, optical and software building blocks required to demonstrate and prove the benefits of software-defined, multi-layer wide area networks.

CIEN +3.3% (following FNSR guidance)

EVault, a Seagate (STX) co, announced that a new strategic partnership with Hitachi Data Systems allows Hitachi TrueNorth partners to deliver cloud-based backup services by leveraging EVault SaaS and EVault Endpoint Protection in select Asia Pacific countries.

Microsoft (MSFT) announced that Meiji Yasuda Life Insurance is deploying ~ 30,000 Windows 8 tablets as new sales devices for its sales personnel under close cooperation between Fujitsu (FJTSY) and Microsoft Japan Co. This is Japan's largest and one of the world's largest deployments of Windows 8 tablets this year.

6:36AM Advanced Semi reported July 2013 revs of NT$17.53 bln, up 11.8% y/y, up 5.6% sequentially (ASX) 4.02 :

6:24AM SunEdison misses by $0.06, beats on revs (SUNE) 9.73 : Reports Q2 (Jun) loss of $0.19 per share, excluding non-recurring items, $0.06 worse than the Capital IQ Consensus Estimate of ($0.13); non-gaap revenues fell 47.3% year/year to $491.6 mln vs the $438.1 mln consensus.

Solar Energy recognized non-GAAP revenue related to 51 MW of solar energy systems, interconnected 22 MW and ended the quarter with 200 MW under construction.

"Business conditions in the second quarter remained challenging, but I am optimistic regarding our prospects for growth through the remainder of this year and into next...Although the semiconductor wafer market continues to be in an extended downturn, our second quarter Solar Materials performance improved. Solar Energy posted sequentially higher non-GAAP sales, pipeline and backlog, and remains well positioned to capture a disproportionate share of the solar market going forward. We remain committed to maintaining a healthy balance sheet, achieving profitability and generating strong returns for our shareholders,"

Solar Energy ended the 2013 second quarter with a project pipeline of 2.9 GW, up 218 MW compared to the prior quarter and unchanged from the year ago period. Backlog at June 30, 2013 was 1.0 GW, an increase of 119 MW compared to the prior quarter.

Q3 Guidance Metrics: Semiconductor Materials revenue between $230 mln and $250 mln. Solar energy systems total non-GAAP sales volume in the range of 60 MW to 100 MW Solar energy systems. MW retained on the balance sheet between 0 MW and 10 MW Fully developed solar energy systems average project pricing between $3.25/watt and $3.50/watt.

FY13 Guidance Metrics: Semiconductor Materials revenue between $940 mln and $980 mln. Solar energy systems total non-GAAP sales volume in the range of 430 MW to 500 MW. Solar energy systems MW retained on the balance sheet between 50 MW and 100 MW Total solar energy systems average project pricing between $3.10/watt and $3.40/watt.

07:57 am First Solar shares fall 7% following miss on EPS
First Solar (FSLR $43.35 -3.40) reported second quarter earnings of $0.39 per share, excluding non-recurring items, which missed expectations, while revenues fell 45.7% year/year to $520 which also missed expectations. The sequential decrease in net sales is primarily attributable to lower systems business project revenues as well as lower module-only sales volume to third-parties.

Compared to the second quarter of 2012, the decrease in net sales is primarily attributable to lower systems business project revenue as initial revenue recognition for AVSR and the sale of Silver State North were both achieved in the second quarter of 2012, partially offset by higher sales volume to third-party module-only customers in the second quarter of 2013. As a previously highlighted possibility, the Company did not complete the sale of the ABW projects in the second quarter of 2013 and such sale is expected to occur in the second half of this year. The company issued guidance for fiscal year 2013 with EPS of $3.75-4.25 which is line with expectations, with revenues of $3.6-3.8 which is below expectations.

Raises operating expense to $390-410 million from $380-400 million. Maintains Operating Cash FLow of $800 million to $1 billion. Maintains CaqEx of $350-400 million. he Company also announced the acquisition of all of GE's (NYSE: GE) cadmium telluride (CdTe) solar intellectual property and entered into a technology collaboration agreement with GE, with the intent to advance thin-film solar cells and modules. Under the agreement, First Solar acquired GE's CdTe solar intellectual property, setting a course for advancement of photovoltaic (PV) thin-film solar technology and GE received 1.75 million shares of First Solar stock.

Other Key Points:

Production was 389 MW up 5% q/q, 5% y/y Capacity Utilization 75%. up 12% y/y
Conversion Efficiency 13.0% up +0.1% q/q and y/y Cost Per Watt $0.67 down $0.02 q/q and $0.05 y/y
Gross Profit 27.0% up 460 bps q/q and 150 bps y/y
Net cash provided by operating activities $222 million compared to $66 million in Q1 and $156 million in prior year
Free Cash Flow $168 million compared to $20 million in Q1 and $148 million in prior year
Inventories steady at$133 million Lowering of EPS guidance due to GE IP acquisition

07:53 am Nuance shares fall 6% following in line revenues
Nuance Communications (NUAN $18.15 -0.18) reported third quarter earnings of $0.34 per share, excluding non-recurring items which was better than expected, while adjusted revenues rose 9.5% year/year to $490.8 million which is in line with expectations.

07:51 am Finisar shares soar 17% following higher than expected guidance
Finisar (FNSR $22.40 +3.27) issued guidance for the first quarter with EPS of $0.30 to $0.31, excluding non-recurring items, which is higher than expected, exceeding the previously estimated range of $0.22 to $0.26; sees first quarter revenues of $266 million which is ahead of consensus compared to guidance of $245 to $260 million. The revenue results are preliminary and subject to adjustment. However, in the absence of material adjustment, first quarter revenues will set a new record for the Company and will be the fourth consecutive quarter of sequential revenue growth. The growth in revenue came primarily from increased sales of 10G, 40G and 100G Ethernet transceivers for datacom applications. Approximately $2 million of the revenue growth over the prior quarter was from products for telecom applications. As a result of these higher than expected revenues, a favorable product mix and increased operating leverage, the Company expects non-GAAP gross margin to be 34.5% to 35%.
icon url

ReturntoSender

08/07/13 11:51 PM

#10286 RE: ReturntoSender #6755

SOX Component Stocks on 6 Month Daily Charts versus the VIX:


http://finance.yahoo.com/q/cp?s=^SOX+Components

icon url

ReturntoSender

08/08/13 8:53 PM

#10287 RE: ReturntoSender #6755

From Briefing.com: 4:10 pm : The S&P 500 settled higher by 0.4% despite enduring a first-hour selloff.

Equities began the session with modest gains after upbeat data from China helped ease some concerns regarding the pace of global growth. The Middle Kingdom reported an increase in exports (+5.1% actual, +3.0% expected) and imports (+10.9% actual, +2.1% forecast) while its trade surplus narrowed to $17.82 billion from $27.10 billion.

Shortly after the start of the session, the S&P notched a high of 1,700.20 before aggressive selling pressured the benchmark index back to its flat line. The slide coincided with notable dollar/yen weakness that sent the pair below 96.00 for the first time since June 19.

The slide in equities and dollar/yen was halted shortly after the first hour of action. Stocks then returned to their highs but the S&P was unable to reclaim the 1,700 level.

The rebound took place as most cyclical sectors outperformed with materials in the lead. The sector advanced 1.5% as the Chinese data underpinned steelmakers and miners. The Market Vectors Steel ETF (SLX 42.29, +1.20) jumped 2.9% and the Market Vectors Gold Miners ETF (GDX 26.00, +2.06) surged 8.6%. On a related note, gold futures rose 2.1% to $1311.80 per troy ounce and copper futures added 2.8% to $3.263 per pound.

Other commodity-related sectors also rallied. Industrials settled higher by 0.4% and Dow component Caterpillar (CAT 83.96, +1.53), which does a good portion of its business in China, climbed 1.9%.

Elsewhere, the energy sector ended with a gain of 0.6% even as crude oil slumped 0.5% to $103.85 per barrel.

Discretionary shares also contributed to the rebound as retailers outperformed. The SPDR S&P Retail ETF (XRT 81.53, +0.75) posted a gain of 0.9% after retailers reported their same store sales for July. L Brands (LTD 60.25, +2.95) added 5.2% after surpassing estimates while Costco (COST 117.39, -1.95) slipped 1.6% after missing expectations.

Although most cyclical sectors registered gains, financials trailed behind the broader market. JPMorgan Chase (JPM 54.83, -0.47) shed 0.9% after the company said it is being investigated by the U.S. Attorney's Office for Eastern District of California over its mortgage-backed securities offerings.

Treasuries were trapped inside of a narrow range and the benchmark 10-yr yield shed two basis points to 2.59%.

In today's economic data, the initial claims level increased from an upwardly revised 328,000 (from 326,000) for the week ending July 27 to 333,000 for the week ending August 3. The Briefing.com consensus expected the initial claims level to increase to 340,000. Even though the claims level increased this week, the headline number is actually a strong positive sign for the labor market.

Throughout July, the initial claims data were distorted by seasonal adjustment problems from the motor vehicle industry. The Department of Labor announced that this week's claims data were unaffected by seasonal biases. That means the initial claims, which were around 350,000 prior to the distortions, actually improved throughout July.

Tomorrow, June wholesale inventories will be reported at 10:00 ET.DJ30 +27.65 NASDAQ +15.12 SP500 +6.57 NASDAQ Adv/Vol/Dec 1494/1.73 bln/1023 NYSE Adv/Vol/Dec 1965/689.4 mln/1035

3:30 pm :

Sep crude oil fell for a fifth consecutive session, dipping below the $103.00 per barrel in morning action. The energy component retreated from its session high of $103.71 per barrel and brushed a session low of $102.22 per barrel. It eventually settled 0.9% lower at $103.40 per barrel.
Sep natural gas slid to a session low of $3.13 per MMBtu following weaker-than-anticipated inventory data that showed a build of 96 bcf when a smaller build of 74-77 bcf was expected. However, natural gas reversed the loss as prices reversed into positive territory. It touched a session high of $3.32 per MMBtu just before settling with a 1.5% gain at $3.30 per MMBtu
Precious metals registered gains as the dollar index fell deeper into negative territory. Furthermore, China reported better-than-expected export and import data while narrowing its trade surplus
Dec gold rose above the $1300 per ounce level after climbing off its session low of $1287.70 per ounce. It touched a session high of $1313.80 per ounce and settled with a 2.0% gain at $1309.90 per ounce
Sep silver rose for the first time in four sessions, touching a session high of $20.30 per ounce. It settled with a solid 3.6% gain at $20.20 per ounce after trading as low as $19.68 per ounce in early morning floor trade

4:33PM Multi-Fineline misses by $0.21, reports revs in-line; expects to return to profitability in Q1 (MFLX) 15.19 +0.09 : Reports Q3 (Jun) loss of $0.77 per share, excluding non-recurring items, $0.21 worse than the Capital IQ Consensus Estimate of ($0.56); revenues fell 19.9% year/year to $136.1 mln vs the $135.93 mln consensus.

"We believe our third quarter results will serve as an inflection point as we anticipate a meaningful sequential improvement in revenue in the fourth quarter with continued momentum into fiscal 2014. As a result, we expect to return to profitability in the first quarter of fiscal 2014, as well as on a full year basis in fiscal 2014. Our customer relationships are strong and we are aggressively pursuing new customer and product opportunities to diversify our revenue streams and support our longer-term growth objectives."

4:26PM Universal Display beats by $0.07, beats on revs; guides FY13 revs in-line (OLED) 29.37 +1.08 : Reports Q2 (Jun) earnings of $0.33 per share, $0.07 better than the Capital IQ Consensus Estimate of $0.26; revenues rose 64.6% year/year to $49.36 mln vs the $37.9 mln consensus.

"Given the rate at which the market is adopting our energy efficient, high-performance UniversalPHOLED materials and technology, we believe the market has achieved a level of sustainable commercial technology adoption that can drive strong top line growth."

Co issues in-line guidance for FY13, sees FY13 revs at high end of $110-125 vs. $118.14 mln Capital IQ Consensus Estimate.


4:12PM Rackspace beats by $0.05, beats on revs (RAX) 46.13 +1.06 : Reports Q2 (Jun) earnings of $0.18 per share, $0.05 better than the Capital IQ Consensus Estimate of $0.13; revenues rose 17.9% year/year to $376 mln vs the $372.15 mln consensus..


Total server count increased to 98,884, up from 94,122 servers at the end of the previous quarter
Adjusted EBITDA of $123 million grew 10% year-over-year and declined 1.5% from Q1 2013
Achieved Adjusted EBITDA margin of 32.8%, compared to 35.1% in Q2 2012 and 34.5% in Q1 2013
Net income of $22 million declined 11% year-over-year and 18.0% from Q1 2013

4:12PM Priceline.com beats by $0.28, reports revs in-line; guides Q3 EPS in-line (PCLN) 933.75 +6.17 :

Reports Q2 (Jun) earnings of $9.70 per share, $0.28 better than the Capital IQ Consensus Estimate of $9.42; revenues rose 26.7% year/year to $1.68 bln vs the $1.66 bln consensus.
The Group's gross profit for the 2nd quarter was $1.38 billion, a 37.8% increase from the prior year.
International operations contributed gross profit in the 2nd quarter of $1.2 billion, a 39.7% increase versus a year ago (approximately 39% on a local currency basis).
Second quarter gross travel bookings for the Group, which refers to the total dollar value, generally inclusive of all taxes and fees, of all travel services purchased by its customers, were $10.1 billion, an increase of 38.0% over a year ago

Co issues in-line guidance for Q3, sees EPS of $15.30-16.30 vs. $15.81 Capital IQ Consensus Estimate.

Year-over-year increase in total gross travel bookings of approximately 27% - 34% (an increase of approximately 25% - 32% on a local currency basis).
Year-over-year increase in international gross travel bookings of approximately 32% - 39% (an increase of approximately 30% - 37% on a local currency basis).
Year-over-year increase in domestic gross travel bookings of approximately 5% - 10%.
Year-over-year increase in revenue of approximately 23% - 30% (approx $2.09-2.217 bln, Capital IQ consensus $2.217 bln)
Year-over-year increase in gross profit of approximately 32% - 39%.
Adjusted EBITDA of approximately $990 million to $1,055 million.

4:01PM Vishay announces amended and restated $640 mln credit facility (VSH) 13.74 -0.14 :


Co announced that it has entered into an amended and restated $640 mln credit facility. The senior secured facility matures on August 8, 2018. The Company's original $528 mln revolving credit facility was scheduled to mature on December 1, 2015. Borrowings under the amended and restated facility will bear interest at LIBOR plus an interest margin. The applicable interest margin is based on Vishay's leverage ratio. Based on Vishay's current leverage ratio, borrowings bear interest at LIBOR plus 1.75%; Vishay is also required to pay a facility fee of 0.35% per annum on the entire commitment amount for a total borrowing cost, also based on current leverage, of LIBOR plus 2.10% for the outstanding amount under the amended and restated credit facility. The interest rate under the original facility was at LIBOR plus 2.25% plus a facility commitment fee of 0.35% per annum on the entire commitment amount for a total of LIBOR plus 2.60% for the outstanding amount.

3:22PM Emulex beats by $0.03, reports revs in-line; guides Q1 EPS, revs below consensus (ELX) 7.82 -0.11 : Reports Q4 (Jun) earnings of $0.15 per share, excluding non-recurring items, $0.03 better than the Capital IQ Consensus Estimate of $0.12; revenues fell 6.7% year/year to $120.4 mln vs the $119.83 mln consensus. Network Connectivity Products (NCP) net revenues of $82.9 million, representing ~69% of total net revenues; Network Visibility Products (NVP), net revenues of $8.3 million, representing 7% of total net revenues; Storage Connectivity Products (SCP) net revenues of $23.0 million, representing 19% of total net revenues; Advanced Technology and other Products (ATP) net revenues of $6.1 million, representing 5% of total net revenues; Non-GAAP gross margins of 65% and GAAP gross margins of 58%

Co issues downside guidance for Q1, sees EPS of $0.09-0.11, excluding non-recurring items, vs. $0.15 Capital IQ Consensus Estimate; sees Q1 revs of $109-113 mln vs. $120.98 mln Capital IQ Consensus Estimate.

Large Cap Gainers

TSLA (157.01 +16.97%): Beat on EPS by $0.22, beat on revs; co will be non-GAAP profitable/will generate positive FCF from ops. in Q3/4; tgt to $160 from $130 at Jefferies; downgraded to Equal Weight from Overweight at Barclays.
TCK (25.32 +7.98%): Strength in metals/miners (NEM, ABX, GG).
LTD (60.17 +5.01%): Reported Jul same store sales +3.0% vs +1.5% Retail Metrics consensus; raised Q2 EPS guidance and reported prelim sales above consensus; tgt raised to $48 from $43 at Canaccord Genuity.

Large Cap Losers

CTL (34.6 -4.92%): Beat on EPS by $0.02, reported revs in-line; guided Q3 EPS in-line, revs in-line; guided FY13 EPS below consensus, revs in-line.
AEG (7.72 -2.46%): Reported that Q2 underlying earnings increased to EUR 478 mln; Q2 Net income of EUR 243 mln impacted by fair value losses.
COST (116.65 -2.25%): Reported July same store sales +4% vs +4.8% Retail Metrics consensus.

Mid Cap Gainers

GRPN (11.12 +27.52%): Reported EPS in-line, revs in-line; guided Q3 EPS below consensus, revs in-line; authorized a $300 mln share repurchase program; appointed Eric Lefkofsky as CEO; tgt to $15 from $9 at Piper Jaffray, to $10 from $7 at JPMorgan; upgraded to Neutral from Sell at UBS; tgt raised to $11; upgraded to Mkt Perform at Raymond James; tgt to $17 from $10 at Deutsche Bank; heard was upgraded to Neutral at BofA/Merrill.
TRQ (4.96 +13.7%): Received a $235 mln advance payment for the Altynalmas Gold transaction and signed a binding term sheet with majority shareholder Rio Tinto (RIO).
SSYS (95.13 +10.41%): Beat on EPS by $0.01, reported revs in-line; guided FY13 EPS below consensus, revs above consensus.

Mid Cap Losers

HK (5.23 -10.9%): Priced 38 mln share offering at $5.10 per share; announced offering of $300 mln senior unsecured notes due 2022.
DF (10.11 -8.26%): Missed on EPS by $0.01, reported revs in-line; guided Q3 EPS below consensus; guided FY13 EPS below consensus.
HSC (24.18 -8.1%): Missed on EPS by $0.04, beat on revs; guided Q3 EPS below consensus; downgraded to Mkt Perform at Raymond James.

12:18PM Microsoft extends to minor new session high in recent trade (MSFT) 33.01 +0.94 : Stock broke above its late July/early Aug range top with the recent upside extension nearing its 50 day ema at 33.10 (session high 33.06). Its 50 sma does not come into play until 33.90.


ANADIGICS (ANAD) announced that the co's AWT6751 and AWT6755 dual-band ProEficient-Plus WCDMA power amplifiers enable wireless connectivity in the new Galaxy Mega by Samsung Electronics (SSNLF)

7:32AM Canadian Solar misses by $0.09, misses on revs (CSIQ) 14.31 :

Reports Q2 (Jun) loss of $0.29 per share, $0.09 worse than the Capital IQ Consensus Estimate of ($0.20); revenues rose 9.2% year/year to $380.4 mln vs the $419.67 mln consensus.
Solar module shipments were 455 MW, compared to 340 MW in the first quarter of 2013. Net revenue from total solutions was 25.7% of total revenue, compared to 19.2% in the first quarter of 2013.
Gross margin was 12.8%, compared to 9.7% in the first quarter of 2013.
Cash, cash equivalents and restricted cash balances at the end of the quarter were $540.6 million, compared to $606.1 million at the end of the first quarter of 2013. Cash flow from operations totaled $40.7 million.
Solar module shipments to Japan were 35.7% of total module shipments, up 95.0% from the first quarter of 2013.
Geography: sales to European markets represented 10.6% of net revenue, sales to America represented 37.8% of net revenue, and sales to Asia and all other markets represented 51.6% of net revenue, compared to 24.7%, 17.9% and 57.4%, respectively, in the first quarter of 2013 and 69.4%, 15.7% and 14.9%, respectively, in the second quarter of 2012.
Accounts receivable turnover was 73 days in the second quarter of 2013 compared to 102 days in the first quarter of 2013. Inventories at the end of the second quarter of 2013 were $218.5 million, compared to $291.3 million at the end of the first quarter of 2013. Inventory turnover was 75 days in the second quarter of 2013 compared to 117 days in the first quarter of 2013.
Outlook: The Company's business outlook is based on management's current views with respect to operating and market conditions, its current order book, and the challenging global financing environment, which continues to result in customer demand uncertainty. Management's views and estimates are subject to change without notice. For the third quarter of 2013, module shipments are expected to be in the range of approximately 410 MW to 430 MW. Gross margin for the quarter is expected to be between 10% and 12%.
For the full year 2013, the Company expects module shipments to be in the range of approximately 1.6 GW to 1.8 GW. The Company expects module shipments to Japan to account for approximately 35%-40% of total module shipments in the third quarter of 2013. The Company expects its module shipments to Europe will remain at the same level as in the second quarter of 2013, as it continues to adopt a conservative approach in response to the uncertainty in trade and solar energy feed-in-tariff policy in that region. The Company views the recent resolution of the trade dispute between the European Union (EU) and China as positive. The Company is in the process of concluding its own undertaking agreement with the EU and is reviewing its business strategy in that region.

6:29AM Trina Solar estimates solar module shipments in 2Q13 to be between 630 MW and 660 MW, compared to the co's previous guidance of 500 MW to 530 MW (TSL) 6.60 : Additionally, for the second quarter of 2013, the co estimates overall gross margin to be between 11.0% and 12.0%, compared to the co's previous guidance of middle single digits in percentage terms. The co further expects its bottom line results in the second quarter of 2013 to be impacted by:


An incremental accounts receivables provision of between $8.0 million and $9.0 million.
A charge between $8.5 million and $9.5 million for certain assets that were ceased to be used during the quarter.

Silicon Graphics (SGI) reported fourth quarter earnings of $0.17 per share, excluding non-recurring items, which is better than expected, while revenues fell 5.0% year/year to $170.5 million which is below expectations. The company issued guidance for the first quarter with EPS of $0.07-0.14, excluding non-recurring items which is below expectations, with revenues of $160-170 million which is below expectations.

iPass (IPAS) announced that it will supply Skype Communications S.a.r.l., Luxembourg-based subsidiary of MSFT with network infrastructure to expand the reach of Skype WiFi services. In addition, co announced that TTNET, a subsidiary of Turk Telekom Group now offers unlimited international Wi-Fi roaming services powered by the iPass Open Mobile Exchange platform.

Fusion-io (FIO) reported fourth quarter loss of $0.03 per share, which is higher than expected, while revenues fell 0.5% year/year to $106.05 million which is below expectations. The company issued guidance for the first quarter with revenues of $80-90 million which is below expectations. Non-GAAP gross margin of approximately 56% to 58%. Non-GAAP operating margin of approximately negative 15% to 25%. The company sees FY14 revenue growth of approximately 20% (calcs to ~$518.88 million which is below consensus). Non-GAAP gross margin in the range of 52% to 54%. Non-GAAP operating margin in the range of 2% to 5%, which includes the full effect of the acquisition of NexGen Storage Systems, Inc."To continue to maintain our market leadership, we will increase our focus on our go-to-market strategy, product portfolio and our partnerships as we help customers around the world unlock the business value in real-time information intelligence."

RealD (RLD) reported first quarter loss of $0.03 per share, which is better than expected, while revenues fell 13.2% year/year to $59.2 million which is better than expected. Estimated box office generated on RealD-enabled screens(1) for the first quarter of fiscal 2014 was $838 million ($431 million domestic, $407 million international). In the first quarter of fiscal 2013, estimated box office generated on RealD-enabled screens was $933 million ($444 million domestic, $489 million international). Eight 3D films were released in the first quarter of fiscal 2014, compared to 10 3D films in the first quarter of fiscal 2013. These figures reflect the number of 3D films released domestically during the periods.International markets generated 55% of license revenue and 27% of product and other revenue in the first quarter of fiscal 2014.
icon url

ReturntoSender

08/12/13 5:45 PM

#10290 RE: ReturntoSender #6755

From Briefing.com: 4:10 pm : Equities ended today's quiet session on a mixed note as the S&P 500 shed 0.1% while the Nasdaq added 0.3%.

Stocks began in the red after Japan's second quarter GDP report (0.6% actual, 0.9% forecast) missed expectations. Another piece of news out of Asia indicated the People's Bank of China could lower the reserve requirement ratio for small to mid-sized banks. Both items were perceived as beneficial to precious metals with Japan's below-consensus growth leaving the door open to further monetary easing while news from China discussed outright easing.

Gold futures advanced 1.8% while silver futures surged 4.6%, causing the precious metals to end at $1335.70 and $21.34 per troy ounce, respectively. In turn, miners rallied broadly as the Market Vectors Gold Miners ETF (GDX 28.01, +1.54) spiked 5.8%. However, the outperformance of miners was not enough to keep the materials sector (-0.2%) out of the red.

Similarly, most other growth-oriented sectors registered losses. Industrials and technology were the only exceptions as the two groups added 0.1% and 0.7%, respectively.

The industrial sector advanced as machinery producers and transportation companies displayed strength. Caterpillar (CAT 86.32, +1.81) rose 2.1%, and the Dow Jones Transportation Average tacked on 0.2%.

Elsewhere, the tech sector ended in the lead, contributing to the outperformance of the Nasdaq. The top-weighted sector (and index) component, Apple (AAPL 467.36, +12.91), settled higher by 2.8% following an International Trade Commission decision to issue an import and sale ban on some Samsung devices after the company infringed on Apple patents.

Remaining in the tech sector, BlackBerry (BBRY 10.78, +1.02) was another notable outperformer after the company said it has begun exploring strategic alternatives.

The solid gains in technology helped the S&P climb off its early lows, but the index was unable to close in the green. However, small caps outperformed as the Russell 2000 advanced 0.5%.

Treasuries were confined to a narrow range and the benchmark 10-yr yield slipped three basis points to 2.61%.

As mentioned earlier, participation was lacking as only 586 million shares changed hands on the floor of the New York Stock Exchange.

Today's economic data was limited to the July Treasury budget, which showed a deficit of $97.6 billion following a deficit of $69.6 billion in July 2012. Since the Treasury data are not seasonally adjusted, the data cannot be compared with the June level. The Briefing.com consensus expected the budget to show a deficit of $96 billion.

The Congressional Budget Office released their budget preview last week and predicted a shortfall of $96 billion. The market is well aware of the CBO's forecast and the reaction to the budget data is limited.

Tomorrow, July retail sales, export prices ex-agriculture, and import prices ex-oil will all be reported at 8:30 ET. The day's data will be topped off with the 10:00 ET release of June business inventories.DJ30 -5.83 NASDAQ +9.84 SP500 -1.95 NASDAQ Adv/Vol/Dec 1431/1.37 bln/1087 NYSE Adv/Vol/Dec 1629/585.8 mln/1384

3:30 pm :

Sep crude oil erased earlier losses as investors reacted to supply concerns in Libya. The energy component climbed into positive territory after trading as low as $105.03 per barrel in morning pit trade. It touched a session high of $106.46 per barrel and settled with a 0.1% gain at $106.11 per barrel.
Sep natural gas advanced to a session high of $3.36 per MMBtu but pulled back in afternoon action. It settled 2.5% higher at $3.31 per MMBtu, just above its session low of $3.30 per MMBtu.
Precious metals rose today despite a stronger dollar index.
Dec gold advanced for a fourth consecutive session, trading as high as $1343.70 per ounce. It settled at $1334.60 per ounce, booking a 1.7% gain.
Sep silver rose from a session low of $20.90 per ounce and settled with a solid 4.6% gain at $21.34 per ounce.

3:04PM Apple working back toward session high at 468.20, its 200 ema is at 468.40 with its six month close high from last week is at 469.45 (AAPL) 468.04 +13.59 : Note that its 200 day sma and six month intraday high from last week come into play at 471.06/471.89.

11:05AM VIX trends lower despite softness in broader market (VXX) 14.53 -0.07 : The VIX (-0.49, 12.92) is trading lower despite weakness in the broad markets. Since the VIX typically trades with an inverse correlation to the equity market, the weakness in both the VIX and equities stood out today.

On Friday, the VIX was trading slightly higher around mid-day, but rose around 4% during the afternoon as the equity market sold off. Equities continued to see weakness this morning and the VIX traded higher at the open as a result. However, the VIX has since given up initial gains and is now lower by 0.56 as equities have rebounded (essentially giving up the late Friday gain in VIX). The VIX is now back where it was mid-day Friday, while the S&P 500 is about 4 points below where it was at that time. With the end of earnings season and summer doldrums setting in, the lower VIX may just be an illustration of expectations for a quiet market over the very near term.

With only four trading days left to expiration, Aug VIX futures are nearly trading at parity with VIX cash, while Sept trades at a healthy 2.2 point premium; term structure has flattened from last week.

11:00AM Agilent and SomaLogic enter agreement to expand access to proteomic technology (A) 46.26 +0.04 : Co and SomaLogic Inc. (a privately held biotechnology company) announced that they have entered into an agreement to expand access to SomaLogic's unbiased protein biomarker discovery platform. The companies will initially place SomaLogic's SOMAscan proteomic assay, which employs custom Agilent microarrays in its workflow, in select academic and contract research centers. Although the SOMAscan assay is already available to researchers directly from SomaLogic as a service, this planned roll-out is aimed at meeting the rapidly growing demand for access to SomaLogic's highly multiplexed, cost-effective proteomic analyses. Terms of the agreement were not disclosed.

Nanometrics (NANO) announced that SK hynix has realized significant process control improvement by deploying the Atlas II platform for optical critical dimension metrology across its memory device production.

Rambus (RMBS) announced that the co's 60 watt equivalent A19 LED bulb has gained provisional ENERGY STAR certification.

SanDisk (SNDK) announced that its strategic investment arm, SanDisk Ventures, has invested in Tegile Systems. Specific financial terms of the investment were not disclosed.

In company-specific news, BlackBerry (BBRY 10.49, +0.73) is higher by 7.5% after the company said it has begun exploring strategic alternatives.

Viking Technology, a division of Sanmina (SANM), announced that SolidFire has selected its SATADIMM SSD as both the cache SSD and boot volume SSD for their storage nodes.

Silicom (SILC) has been awarded two Design Wins from a new customer in the Traffic Management and Policy Enforcement Industry. The co expects the revs from these Design Wins to reach ~ $1 mln per year.

11:04 am Technology
The tech sector is trading higher today, ahead of modest losses in the broader market. Semiconductors are showing strength as well with the SOX trading 0.3% higher. Within the chip index, SUNE (+2.2%) is a notable standout.

Among other major indices, the SPY is trading 0.2% lower today, while the QQQ is up 0.2% and the NASDAQ is trading 0.1% higher on the session. Among tech bellwethers, AAPL (+1.9%) is showing notable strength, while FB (-0.8%) is under pressure.This morning in earnings, PERI (-10.4%) missed by $0.07, missed on revs; guided Q3 revs below consensus; reaffirmed FY13 guidance. In news, BBRY (+5.0%) announced that its Board of Directors has formed a Special Committee to explore strategic alternatives to enhance value and increase scale in order to accelerate BlackBerry 10 deployment. These alternatives could include, among others, possible joint ventures, strategic partnerships or alliances, a sale of the Company or other possible transactions.In rumors, AAPL (+1.9%) will host an iPhone event on Sept. 10, according to reports.

Among notable analyst upgrades in tech this morning, FFIV (+3.4%) was upgraded to Overweight at Barclays, Needham upgraded LNKD (+2.0%) to Buy, Baird upgraded NTAP (+0.5%) to Neutral, and TMUS (+0.1%) was upgraded to Perform at Oppenheimer. In downgrades, BRCM (-0.6%) was downgraded to Neutral at Goldman, JNPR (-1.6%) was downgraded to Sector Perform at RBC, and YOKU (-1.6%) was downgraded to Hold at Deutsche Bank. SINA (+1.4%) is only the notable name in tech scheduled to report after the close.

Needham lowers its Apple (AAPL) tgt to $595 from $710 to reflect a more hostile competitive environment since our previous valuation report in February. The decrease in Apple's fair value extended across all major operating segments. The largest percentage decline-42.3%--was in the Mac segment as the negative impact of tablets on PC sales became increasingly apparent in the first half of the calendar year. The iPad experienced the next largest decline-37.2%--to reflect the decline in the average selling price of iPads as buyers shifted from the 10 inch to the lower margin 8-inch model. The value of the iPhone declined 15.4%, reflecting a more competitive global environment. Expectations for the iPhone are in a sense binary. If Apple continues with a single high-end model, the iPhone's market share is likely to decline further.

Needham upgraded Linkedin (LNKD) to Buy from Hold and sets target price at $280, given several unexploited growth opportunities. They are most encouraged by the roll out of sponsored updates, which should drive incremental advertising revenue, particularly mobile advertising. They believe mobile is critical tool driving further member engagement, which they believe LinkedIn is well positioned. Looking towards the future, they expect improved international monetization and deeper penetration into specific verticals to drive long-term growth.
icon url

ReturntoSender

08/15/13 4:17 PM

#10294 RE: ReturntoSender #6755

AMAT FYQ3 Misses, Q4 View Light, Names Dickerson CEO

http://blogs.barrons.com/techtraderdaily/2013/08/15/amat-fyq3-misses-q4-eps-view-light-names-dickerson-ceo/?mod=yahoobarrons

By Tiernan RayChip equipment maker Applied Materials (AMAT) this afternoon reported fiscal Q3 revenue that missed analysts’ estimates, and named a replacement for its chief executive officer.

Revenue in the three months ended in July fell to $1.98 billion, yielding EPS of 18 cents a share.

Analysts had, on average, been expecting $2.06 billion and 19 cents per share.

For the current quarter, the company projected EPS of 16 cents to 20 cents, below the consensus for 21 cents. The company sees revenue being flat with last quarter, which would be below the average estimate for $2.15 billion.

Separately, the company said it named president Gary Dickerson, age 56, as its new CEO, replacing Mike Splinter, age 62, effective September 1st. Splinter has led the company for the last decade.

Applied shares are down 37 cents, or 2.6%, at $14.95, in late trading.
icon url

ReturntoSender

08/17/13 3:43 PM

#10296 RE: ReturntoSender #6755

From Briefing.com: Weekly Recap - Week ending 16-Aug-13The week in review for the stock market begins with the week in review for the Treasury market. Specifically, it begins with the yield on the 10-yr note sitting at 2.58% when the week began and ending at 2.84% when the week ended. That move was at the root of why the major averages suffered another losing week, highlighted by the Dow, S&P 500, S&P 400 and Russell 2000 all declining in excess of 2.0%.

It wasn't all about interest rates, though. Increasing worries about the escalating violence in Egypt's political battle, uneven economic data, and disappointing earnings outlooks provided by Macy's (M), Cisco (CSCO), Wal-Mart (WMT) and Nordstrom (JWN) all factored into the broad-based weakness.

The basis for the jump in long-term rates was attributed to concerns that the Federal Reserve is going to announce at its September FOMC meeting a decision to taper its asset purchases. Those concerns were driven by stronger-than-expected reports for retail sales and weekly initial claims, the latter of which fell to its lowest level since October 2007.

Notwithstanding the encouraging signs in those reports, other pieces of data were less convincing as it relates to the prospect of the Fed tapering in September. To that end, it was indicated that industrial production was flat in July, led by a 0.1% decline in manufacturing output, that inflation at both the producer and consumer level remained below the Fed's target rate, that single-family housing starts declined 2.2% in July, and that consumer sentiment measured in the University of Michigan consumer sentiment survey slipped to 80.0 in August from 85.1 in July.

The fact that long-term rates continued to rise in the face of those reports, and declarations from Atlanta Fed President Lockhart and St. Louis Fed President Bullard that the Fed needs more data before making a tapering decision next month, proved to be an intriguing development.

To be sure, there were some irreconcilable messages in the similarly weak showings by the stock and bond markets this week. If there is a true tapering trade in Treasuries, that would be based on the recognition that the economy is strengthening -- something that should be viewed as a positive development by the stock market given the favorable implications for corporate profits. Cisco's and Wal-Mart's guidance in particular, though, undercut that macro view, which leads one to wonder if the weakness in Treasuries could also be a function of concerns that the Fed is losing its grip on things.

In the same vein, the stock market is no doubt grappling with the concern that a rise in long-term rates threatens to slow the economic recovery, and an even bigger concern today in thinking the Fed risks playing with economic fire by tapering in September given the inconclusive messages in the data about economic activity. So, one could argue that the stock market was buffeted by weak guidance at the micro level and concerns the macro picture isn't yet strong enough to handle higher interest rates that come either via the Fed's hand or the market's own hand.

Per usual, time will ultimately tell the tale, but insofar as the past week was concerned, the tale of the tape was one of a decidedly weak picture. Every sector lost ground, with the high dividend-yielding utilities sector taking honors as the biggest laggard with a 4.4% decline. The consumer discretionary, consumer staples, and health care sectors followed behind with losses of 3.3%, 3.2%, and 3.1%, respectively.

The technology sector was the relative strength leader, falling only 0.3%. It has Apple (AAPL) to thank for that. Shares of AAPL surged 10.7% on the news that activist investor Carl Icahn reported a large position in the company and recommended to Apple CEO Tim Cook that the company do a large share buyback.

Over the last two weeks, the S&P 500 has declined 3.2%. On the bright side, it still remains up 16.1% year-to-date.
 
Index Started Week Ended Week Change %Change YTD %
DJIA 15425.51 15081.47 -344.04 -2.2 15.1
Nasdaq 3660.11 3602.78 -57.33 -1.6 19.3
S&P 500 1691.42 1655.83 -35.59 -2.1 16.1
Russell 2000 1048.40 1024.30 -24.10 -2.3 20.6

4:46PM This week's biggest % gainers/losers (SCANX) : The following are this week's top 20 percentage gainers and top 20 percentage losers, categorized by sectors (over $300 mln market cap and 100K average daily volume).

This week's top 20 % gainers

Technology: VLTR (22.8 +55.64%), UBNT (29.47 +33.16%), FENG (8.91 +23.33%), OLED (35.46 +23.05%)
Services: DGIT (12.32 +23.96%)
Healthcare: OSIR (19.48 +90.37%), NPSP (23.7 +27.18%), ANAC (10.61 +26.21%)
Financial: EJ (6.07 +41.29%), NOAH (18.37 +35.31%)
Basic Materials: EXK (5.25 +36.32%), MUX (2.52 +31.96%), FSM (4.34 +31.83%), RBY (1.76 +30.3%), SVM (3.77 +29.45%), IAG (6.31 +29.2%), WG (9.47 +27.42%), AG (14.78 +24.65%), SSRI (9.13 +24.2%), CDE (15.92 +22.42%)

This week's top 20 % losers

Technology: SSNI (23.65 -22.84%), CREE (57.12 -22.78%), CSIQ (11.47 -19.21%), YOKU (21.24 -15.59%)
Services: MM (6.93 -25.2%), OWW (9.68 -24.25%), VIPS (39.9 -18.87%), LCC (16.01 -17.18%), NDLS (41.25 -15.78%), GTN (6.69 -14.23%), UAL (30.86 -13.53%), ONE (8.83 -12.84%)
Industrial Goods: CPST (1.16 -18.38%), PGEM (15.78 -16.97%)
Healthcare: DNDN (3.18 -31.37%), SNTA (5.76 -14.24%), SRPT (33.08 -13.05%)
Basic Materials: ALDW (15.73 -18.84%), MCP (6.17 -15.11%), IOC (71.7 -14.47%)

4:22PM End of Day Summary (WRAPX) : The stock market fluttered on Friday, trying to bounce back from Thursday's drubbing while at the same time contending with a further rise in the 10-yr note yield, which hit 2.86% at its highest level of the day. The latter got in the way of rebound efforts as the major indices ended this options expiration day modestly lower.

There was evidence in today's session of participants pressing the buy-the-dip trade that has worked so well for so long. That evidence was seen early on in the outperformance of the homebuilding stocks, which have been hit hard of late. Ultimately, though, the strength in homebuilding stocks faded as the yield on the 10-yr note, and concerns about rising mortgage rates, increased.

The on again-off again showing of the homebuilders was representative of the overall action. There just wasn't a lot of conviction on either the buy side or the sell side.

The S&P 500, for its part, danced above and below its 50-day simple moving average (1657/1656), but closed just below that notable support level due to some closing selling interest. Gains in individual stocks like Boeing (BA 103.47, +0.74), Apple (AAPL 502.33, +4.42), American Express (AXP 75.17, +0.29), and United Continental (UAL 30.86, +0.76) offered a measure of support, but clear-cut sector strength was lacking for the most part today.

The transports were about the only area where buying interest was broad-based and semiconductor stocks fared reasonably well after analysts defended Applied Materials (AMAT 15.62, +0.30) following an otherwise disappointing earnings report and fiscal fourth quarter outlook. The Dow Jones Transportation Average increased 0.6% while the Philadelphia Semiconductor Index rose 0.4%.

Retailers were once again on the soft side after Nordstrom (JWN 56.43, -2.90) and Jos. A. Bank (JOSB 41.00, -3.10) joined the roster of retail companies providing earnings warnings. Those warnings weighed most heavily on the apparel companies.

In terms of interest rates, they started out on a pretty subdued path, but selling picked up noticeably around 12:30 p.m. ET. Soon thereafter, CNBC reported that it had been told by a White House source that chances of Larry Summers being nominated for Fed chairman were two in three. That report presumably triggered increased selling interest with participants concerned that Mr. Summers might be more inclined than Janet Yellen (the current Vice Chairman and other leading candidate) to dial back the Fed's asset purchases more readily than Ms. Yellen would be. The selling pressure took the yield on the 10-yr note as high as 2.86% before it settled at 2.84%.

The continued rise in long-term rates continued to take a toll on the high-dividend yielding utilities (-1.1%) and telecom services (-1.0%) sectors, which were the only sectors to lose at least 1.0% today. For the week, the utilities sector dropped 4.4% while the telecom services sector fell 2.3%.

There was another batch of economic data today that included the Housing Starts and Building Permits report for July, the Productivity report for the second quarter, and the University of Michigan Consumer Sentiment report for August. True to recent form, the economic data was uneven.

Housing starts and building permits were basically in-line with expectations, rising 5.9% and 2.7%, respectively, to an annualized rate of 896,000 and 943,000, yet those increases were driven entirely by multi-family units. Starts and permits for single-family homes were down 2.2% and 1.9% from June.

Second quarter productivity increased 0.9% and unit labor costs rose 1.4%. Both numbers were better than expected and both were promptly ignored by the market given the dated nature of the report.

The University of Michigan Consumer Sentiment report, however, captured some of the market's attention with a disappointing headline print of 80.0. That was down from 85.1 in July which, to be fair, was a six-year high. Still, the pullback in the indexes for current conditions and expectations were downers in terms of the report's overall messaging.

With the options expiration today, volume was the heaviest it has been all week with 835 mln shares traded at the NYSE.

3:32PM Earnings Preview for the week of August 19 - 23 (SUMRX) : Of the companies reporting earnings for the week of August 19 - 23 some of the bigger names include:

Monday:
Pre Market - PACT
After Hours - ANW, BOBE, IRF, CRMT, PWRD
Tuesday:
Pre Market - HD, BBY, TJX, MDT, JCP, DKS, BKS, SKS, TSL
After Hours - ADI, INTU, LZB, TUES, GSM
Wednesday:
Pre Market - TGT, LOW, SPLS, PETM, SJM, AEO, TOL, EV, MSG
After Hours - HPQ, LTD, SNPS, HAIN, SMTC
Thursday:
Pre Market - HRL, DLTR, GME, ANF, PDCO, BONT, TTC, SSI, PLCE, SMRT
After Hours - GPS, MRVL, SCSC, ADSK, ARO, NDSN, MCRS, DLLR
Friday:
Pre Market - FL, ANN

From an individual stock standpoint, Applied Materials (AMAT 15.73, +0.41) and Nordstrom (JWN 57.35, -1.98) have been story stocks. Both companies disappointed with their guidance after reporting quarterly earnings. Applied Materials, however, has managed to hold up thanks to a number of analysts defending its outlook. Nordstrom, and its retailing brethren, haven't been so lucky.

Large Cap Gainers

TMHC (20.91 +4.24%): Strength in home builders following strong housing economic data
GMCR (76.63 +3.65%): To join the NASDAQ-100 Index beginning August 22, 2013, replacing Life Technologies (LIFE)
AMAT (15.82 +3.26%): Missed quarterly EPS by $0.01 ($0.18 ex items vs $0.19 estimate), revs fell 15.7% yoy to $1.98 bln vs $2.06 bln estimate; sees Q4 EPS of $0.16-0.20 ex items vs $0.21 estimate, revs flat at ~$1.975 bln vs $2.14 bln estimate; co provided long term bullish outlook; upgraded to Buy from Neutral at DA Davidson, target $18

Large Cap Losers

IBN (29.72 -5.58%): Weakness in Indian markets, with S&P BSE SENSEX declining 4% and a decline in the rupee
JWN (57.4 -3.25%): Beat quarterly EPS by $0.05 ($0.93 vs $0.88 estimate), revs rose 6.4% yoy to $3.10 bln vs $3.19 bln estimate; sees FY14 EPS of $3.60-3.70 ex items vs $3.78 estimate; sees Q3 same store sales below 2-3% vs +2.2% estimate; downgraded to Neutral from Buy at Sterne Agee
GIS (49.2 -2.67%): Downgraded to Underperform from Hold at Jefferies

Mid Cap Gainers

QIHU (68.47 +9.49%): Marbridge Consulting reporting co's President announced that query share for the company's So.com search engine is approcahing 20%, and expects market share will reach 30% by the end of 2014
AZPN (34.44 +8.23%): Beat quarterly EPS by $0.16 ($0.24 ex items vs $0.08 estimate), revs rose 30.2% yoy to $83.3 mln vs $78.88 mln estimate; sees Q1 EPS of $0.14-0.16 vs $0.13 estimate, revs of $83-86 mln vs $83.7 mln estimate; reaffirmed FY14 rev guidance of $353-363 mln vs $360.63 mln estimate, EPS of $0.60-0.66 vs $0.63 estimate
P (21.18 +6.70%): Upgraded to Buy from Neutral at Goldman, target $27; also mentioned positively at JPMorgan

Mid Cap Losers

BBRY (10.58 -3.47%): Continued volatility surrounding rumors co may go private; yesterday Lenovo's CEO said that Lenovo, rumorerd to have interest in BlackBerry, is focused on itself
IOC (71.81 -3.09%): PNG Industry News reporting that ExxonMobil's exclusive period of negotiations for stake of co's Elk-Antelope field in Papua New Guinea has ended without a deal; co said it would not comment on the report and that negotiations are ongoing
JCP (13.49 -2.46%): Weakness following poor results from Nordstrom (JWN)

10:00AM Alcatel-Lucent announced amendments to Alcatel-Lucent USA Inc.'s senior secured credit facilities (ALU) 2.75 +0.08 : Co announced that its wholly-owned subsidiary, Alcatel-Lucent USA Inc., has entered into amendments to its Senior Secured Credit Facilities announced on January 30, 2013. The amendments have the effect of changing certain covenants governing the Facilities, lowering the interest rate on the $1,750 million 7.25% Senior Secured Term Loan Facility due 2019 to 5.75% and lowering the interest rate on the EUR 300 million 7.50% Senior Secured Term Loan Facility due 2019 to 6.25%. As of August 16, 2013 the principal amount outstanding on the Dollar tranche is $1,741 million and the principal amount outstanding on the Euro tranche is EUR 298 million.

Cisco (CSCO) announced that Shenandoah Telecommunications (SHEN) has updated its dense wavelength division multiplexing fiber-optic network with Cisco's Coherent DWDM technology to support 100 Gigabit per second speeds to its subscribers throughout Virginia, West Virginia and Maryland.

07:39 am Applied Materials shares fall 2% following miss on earnings and disappointing guidance
Applied Materials (AMAT $15.00 -0.32) reported third quarter earnings of $0.18 per share, which was below expectations, while revenues fell 15.7% year/year to $1.98 billion which is also below expectations. The company issued guidance for the fourth quarter with EPS of $0.16-0.20, which is worse than expected, with revenues of approximately flat compared to previous quarter or approximately $1.975 billion which is below expectations.

Applied generated orders of $2.00 billion, down 12 percent from the prior quarter as a seasonal decline in foundry bookings was partially offset by growth in memory and logic orders along with higher bookings in the Display Group and Applied Global Services. Silicon Systems Group orders were $1.20 billion, down 22 percent, due to a decrease in foundry orders, partially offset by increases in memory and logic orders. Net sales of $1.27 billion declined 1 percent. Display orders were $256 million, up 31 percent led by a recovery in TV equipment demand. Gross margin was 42.9 percent on a non-GAAP adjusted basis, down slightly from 43.2 percent in the prior quarter.

"Consumers' appetite for mobile devices and larger TVs is driving healthy demand for our semiconductor and display equipment...We are seeing stronger investment by our memory customers, and our display business booked its highest orders in over two years."

The company announced that its Board of Directors has appointed Gary E. Dickerson as president and chief executive officer (CEO) and Michael R. Splinter as executive chairman of the Board of Directors, effective September 1, 2013. Mr. Dickerson also was elected a member of the Board of Directors, effective at the same time. Mr. Dickerson is currently president of Applied Materials and succeeds Mr. Splinter who has served as the Company's CEO since 2003.

07:38 am Aspen Tech shares spike 14% following better than expected earnings
Aspen Tech (AZPN $36.40 +4.58) reported fourth quarter earnings of $0.24 per share, which is better than expected, while revenues rose 30.2% year/year to $83.3 million which is better than expected. Subscription and software revenue was $65.2 million in the fourth quarter of fiscal 2013, an increase from $45.8 million in the fourth quarter of fiscal 2012. Services & other revenue was $18.0 million in the fourth quarter of fiscal 2013, compared to $18.2 million in the fourth quarter of fiscal 2012.

07:37 am Dell shares little changed following beat on earnings and LBO process continues
Dell (DELL $13.52 -0.18) reported second quarter earnings of $0.25 per share, excluding non-recurring items, which was better than expected, while revenues rose 0.2% year/year to $14.51 billion which was also better than expected. Operating Segments Summary: Enterprise Solutions Group revenue was $3.3 billion, an 8% increase. Operating income for the quarter was $137 million, a 9% decrease. Dell server, networking and peripherals revenue increased 10%, the fifth consecutive quarter of growth for this business, driven by continued strength in hyper-scale data center servers. Dell networking continued to grow, with a 19% revenue increase.

Dell storage revenue declined 7%. Dell Services revenue was $2.1 billion, up 2%, driven by a 3% increase in support and deployment revenue and a 5% increase for infrastructure, cloud and security services revenue. Applications and business process services revenue declined 6%. Total Services operating income was $339 million, a 1% increase. Dell Software revenue was $310 million, and recorded an operating loss. The co is continuing to enhance its software capabilities with investments in this business that increase R&D and sales capacity. End User Computing revenue was $9.1 billion in the quarter, a 5% decrease. Operating income for the quarter was $205 million, a 71% decrease.

Dell desktop and thin client revenue increased 1%, mobility revenue declined 10%, and revenue from software from third parties and peripherals declined 5%. Dell was the only vendor among the top five worldwide to increase PC unit-shipment share both year over year and sequentially in the past two calendar quarters, according to IDC. Given the company's announcement on Feb. 5 of a definitive merger agreement to take Dell private, the co is not providing an outlook.

icon url

ReturntoSender

08/18/13 12:53 PM

#10297 RE: ReturntoSender #6755

InvestmentHouse Fed Set to Taper, Data Tapering as Well (Weekend Newsletter)

http://www.investmenthouse.com/weekendmarketsummary.htm

- Stocks sell modestly, a bit oversold at potential support.
- Fed set to taper, data tapering as well.
- Economic data remains so-so to decent.
- TV economists say 'wait until the second half,' but Consumer data suggests the economy is heading the other direction.
- About time for an oversold bounce but that is likely all it will be so use it accordingly.

Tough week takes indices to next potential support.

The stock indices finished the week with losses, though moderating quite significantly from the Thursday slam lower that broke the back of the consolidation attempt at near support.

SP500 -5.49, -0.33%
NASDAQ -3.34, -0.09%
DJ30 -30.72, -0.20%
SP400 -0.32%
RUTX -0.32%
SOX 0.35%

Tough decline but most of it happened in a couple of sessions. After holding at near support for a week the bottom broke and the damage came in a torrent. Look familiar? This is what happened three weeks back: the indices moved to a new high, tested a bit, then two quick days of selling crashed them back to the pre-breakout levels.

Stocks stair-step higher on the way up, they do the same thing on the way down. The step lower this week just happened to crash some important support. Not everything crashed; of course some solid leaders held the line, e.g. PCLN.

There was damage done, however, and it is very likely that the selling is not over. Sure the indices are now a bit oversold and they will bounce again; they always do in stair-steps, right? As there is some support where they closed out the week the bounce odds are up, particularly if there is some more downside to start next week. That would allow for the old slingshot move when investors panic some as the selling continues.

After this move, however, unless there is some catalyst to change the character, any bounce, whether from the Friday close or after a bit more early week selling, simply sets up more downside. Thus, use a bounce wisely.

THE ACTION

Futures tried to start higher Friday, but as the open approached they crumbled. Overnight China was up 6%! For about 5 minutes. Someone pushed the wrong button, the old 'oh you meant 5000 shares, not 500,000?' Easy come, easy go. by the close China was lower.

Europe took its cue from China, but it waived the spike and just stayed flat all day.

In the US, as noted, futures were higher, rebounding from Thursday's face plant. Hope springs eternal. It sprung for about two hours, peaked, then sprung a leak.

July housing starts were in line and permits beat a bit, but single family homes were the weakest since 11/2012.

Q2 Productivity topped expectations, but Q1 was revised lower by a factor of 3 (-1.7% versus 0.5% previously reported). Kind of a yea!, then ugh.

Labor costs spiked 1.4% versus -0.3% expected.

Not quite awe inspiring or, as seen with better data, not enough to forestall a Fed taper. Thus by the open futures were comfortably (uncomfortably?) negative.

But a lower open led to bids. For an hour. Stocks rallied, matched pre-market futures into midmorning, assisted by a weaker than expected August Preliminary Michigan Sentiment read (80.0 versus 85.1 expected, 85.1 prior). Stocks even rallied after the weaker Michigan number, as those still clinging to the hope of no Fed taper bought the data miss.

Then at 10:00CT, the midmorning bell, stocks peaked. They rolled, sold to session lows even undercutting the pre-market low. It was expiration so there was another obligatory bounce into the last hour but that was sold off hard at the close leaving the indices at session lows.

THE END RESULT

Closed at session lows, relatively modest losses, testing the next support levels on the indices.

DJ30 is down 7 of 10 sessions. SP500 8 of 10. NASDAQ 6 of 10. In May, DJ30's first leg lower before a relief bounce was 10 days in length. SP500 sold 9 sessions and then found a bottom to bounce in a relief move.

DJ30 is at the 50% Fibonacci retracement of the June to early August move. SP500 is at the 50 day SMA and the 38% Fibonacci retracement as well as the mid-June interim peak.

RUTX is showing a tight doji at the 50 day EMA. SP400 is at the 50 day SMA. SOX is at support from the bottom of the May to June trading range, a level that acted as lower support in several prior trading ranges over the past years.

In short, all indices are more or less at a significant support level after 10 days of selling. Indeed SOX is on its second downside leg of its pullback. Down an equal amount of days of other selloffs so a bit oversold, at support levels. Basically primed for a bounce.

It may come right away, it may come after a further selloff to start the week, kind of the move that flushes the near term sellers out and clears the move for a bounce.

As noted above, a selloff is likely not a new bottom to start the next leg. The May to June selling suffered two legs lower, so if this is like that there could easily be another leg. Of course as discussed Thursday, this last rally was the fifth leg since the November low. Five upside runs are about all you get in a move before it breaks down as volatility in the moves jumps. Volatility has jumped in the moves and this looks very much like a typical breakdown.

Again, the indices are oversold near term, getting close to a bounce, but even a bounce likely is just a relief move that sets up more selling. Either a selloff as in June and thus another 2 to 3 weeks of downside, or something more significant related to the Fed starting to pull the QE with what we are told is better data in the economic reports, but data that is not really corroborated in the earnings and outlooks of companies, particularly the retailers and other consumer related stocks.

THE NEWS

It was the best of times, it was the worst of times.

This past week saw more passable economic data in the mainstream monthly reports. Retail sales in line at 0.2%. PPI flat versus a 0.3% price rise anticipated. Initial jobless claims fell to 320K. New York PMI beat at 8.6. Philly Fed was solid at 9.3, Housing starts and permits beat.

Decent but not trending to recovery. Retail sales were inline but a third of June's read. Layoffs are finally slowing but hiring is not surging, and those jobs created are not the breadwinner jobs of past recoveries but the new US style of part-time jobs to get under the 30 hour threshold of the healthcare act.

New York manufacturing was lower than July. Philly manufacturing missed expectations and was less than half of June. Michigan Sentiment for August missed pretty big (80.0 versus 85.1 expected and prior). Industrial production and Capacity utilization missed.

In sum, the numbers are better but not anywhere near surging. The apologists on the financial stations say the data is not bad, that it takes a long time when you have a major collapse, etc.

BS. We suffered mightily in the 1970's with similar issues of gasoline shocks, massive new regulations, the effects of the 1960's massive new social programs. Hell, throw in impressively oppressive inflation and interest rates at 15% to 20%. It was a hell of a lot worse in many ways, yet when the right policies were implemented the economy roared back.

The policies in place now, after four initial years, are being rolled over into another four years unlike in the early 1980's. No pro-entrepreneur, no pro-growth policies to spark new businesses and thus generate new 'breadwinner' jobs as David Stockman calls them. No policies that rewarded investing in new businesses here in the US, that rewarded innovation and new ideas. In the 1980's, the policies implemented sparked massive US investment in R&D and new ideas, resulting in the explosion of the PC era. AAPL, MSFT, CSCO, INTC, DELL, and many, many thousands of companies exploded onto the scene and launched an entire new economy.

Today there are a few new companies that are innovating, but the hurdles to compete are so high, the reward for risk taking so limited that the numbers are a fraction of those in the past. Thus fewer and fewer new companies form in the US, and our companies that were once leaders are now trying to hang on. Indeed, CSCO just announced another 5% (4K) staff layoff to 'restructure' its employment structure, code for lowering its average worker hours to lessen the impact of the healthcare act.

That is what we get now: not companies that are thinking of expanding and increasing the workforce, but the majority, the vast majority, structuring to get through the bad times that are supposedly good times. Some are benefitting, but they are the huge conglomerates that were favored in the stimulus and the tax code changes. They are the equivalent of the French elite in the 'Tale of Two Cities.'

On the other side there are the small businesses that received no stimulus benefits and saw their taxes rise in so many ways: marginal rates, insurance costs spikes, more EPA and other federal agency regulations, less access to markets, less favored tax status. They have been crushed in this 'recovery' and millions have gone under while millions more are fighting a losing battle to keep the doors open and their employees at full time if they can or just keeping their jobs in place.

And let's not forget the consumer side, the reality to counterbalance the economic reports.

We hear from the experts and the clowns in DC that by golly things are just getting better. Slow, but my goodness progress. As noted, that is BS for the most part; this is the worst recovery in the entire modern era of the US.

Then there is the real data, the data the government reports don't cover or ignore. We saw this the past few weeks with reports, really coming to the fore of late.

I am talking about retailers and other consumer oriented companies warning about the future. The TV economists say the second half 2013 will see the recovery, that things are trending in the right direction. The consumer stocks say 'no.'

Sentiment is falling again. Gasoline, the healthcare act, crappy jobs, higher tax burdens, moochers on the system.

Friday saw JWN beat earnings but lower its entire 2014 guidance along with the second half of 2013 same store sales. Trending nicely higher, eh? JOSB warned about the rest of the year on Friday as well. Thursday Wal-Mart cut its sales forecast. Wednesday Macy's missed, noting taxes, gasoline and other drains on the consumer. RL and AEO lowered guidance.

Reports trending higher, recovery underway we are told, yet the companies dealing directly with the consumer are cutting their second half 2013 and 2014 outlooks even as we are told the second half will see a faster recovery. I have to call BS.

Queue the Fed for another grand irony.

And in all of this the Fed is going to taper. It may not have a choice. It is the only market for US treasury sales as for the past six months foreign buyers have conducted a taper of their own, tapering their purchases of US securities each month. As Bill Gross of PIMCO tweeted Friday, 'W/o central bank ck writing we only have ourselves 2sell2.' The Fed is the market, but it knows it has to get out of the market.

Thus, we see the data pumped and polished as best as possible, and when it still comes in just barely passable we are told the trend is good, recovery is imminent, blah, blah, blah. As I have said before, $85B/month and THIS GDP is all we get?

The grand irony is the Fed is set to taper EVEN AS the data in the second half, the supposed breakout period for the economy (how many such 'breakout periods' have we had in this grand recovery?) tapers itself.

Tapering into the taper. How poetic.

THE MARKET

OTHER MARKETS

Dollar: 1.3331 versus 1.3356 versus 13225 versus 1.3265 versus 1.3305 versus 1.3341 versus 1.3384 versus 1.3341 euro. Dollar cannot get up off the mat even as the Fed preps for tapering. Now to be fair the dollar index has set up a short double bottom at support and is primed to bounce back up in its range But, it should be jumping on a taper if everything was great, capiche? (watching 'The Godfather')

Bonds diving further: 2.83% versus 2.77% versus 2.71% versus 2.72% versus 2.62% versus 2.58% versus 2.59% versus 2.60% versus 2.64% versus 2.64% versus 2.60% ten year. Two big gaps lower on the week. Friday sold off further but then reversed off the lows and close to an old support level. Prepping for a relief move. Has the Fed lost control of the bond market? It is damn close.

Oil: 107.46, +0.13. Up on the week but slowing as it approaches the June and July peaks that are coincident with the peak in early 2012. Natural resistance here and slowing modestly.

Gold : 1371.00, +11.30. Gold has reversed. A bounce, a test after hitting the 50 day EMA, then a break through the 50 day EMA Thursday. The next test is a good entry.

TECHNICAL SUMMARY

INTERNALS

NASDAQ
Stats: -3.34 points (-0.09%) to close at 3602.78
Volume: 1.49B (-13.27%). Strangely quiet on expiration.

Up Volume: 721.28M (+520.4M)
Down Volume: 781.43M (-748.57M)

A/D and Hi/Lo: Decliners led 1.19 to 1
Previous Session: Decliners led 4.28 to 1

New Highs: 48 (+12)
New Lows: 32 (-14)

S&P
Stats: -5.49 points (-0.33%) to close at 1655.83
NYSE Volume: 728M (+9.64%)

A/D and Hi/Lo: Decliners led 1.86 to 1
Previous Session: Decliners led 4.45 to 1

New Highs: 67 (+18)
New Lows: 341 (-34)

DJ30
Stats: -30.72 points (-0.2%) to close at 15081.47

CHARTS

See analysis in the market overview of the Friday action.

LEADERSHIP

Some former leaders show clear near term rollovers that suggests more downside even if there is a near term relief bounce. UTX, MMM, GOOG, AMZN, MNKD, JPM.

Other leaders look solid still: LL, PCLN, NFLX, VRX, CLDX, WWWW, KORS, YNDX.

Precious metals are not bad: NG, IAG, NEM. They tested Friday, and if they can put in another couple of days of a test, they will be great.

Steel is not bad. CLF is in a nice test of its last move. STLD is trying to break from a range. MTL looks as if it wants to run again.

Money leaves some areas but it is very encouraging for further upside that the market is showing some beaten down areas looking ready to make an upside break.

SENTIMENT INDICATORS

VIX: 14.37; -0.36. Nothing in the VIX suggests a major selloff is brewing. Now don't put too much into that, or should I say more than is due. You may have heard this discussion before but it is worth a mention again. When the relationship between the VIX and the market changes such that VIX rises as the market rises, THAT is a true negative indication. That occurred in early 2000. It is not occurring now.

You can see SP500 rising since November 2012. Volatility, however, faded and has range-traded since. Volatility jumped up in May and June but as it rallied SP500 faded in a test, the most significant of the run. That is still normal action: market tests, VIX rises. Then on the last strong upside leg in June and July volatility tanked.

There is no rise in volatility as the stock market rises. Thus there is no VIX market top indication right now.

VXN: 14.73; -0.17
VXO: 14.37; -0.49

Put/Call Ratio (CBOE): 0.93; -0.03

Bulls and Bears:

Bulls faded just a bit while bears again held basically steady as both sides wait out the consolidation in the market after that last run. Good break upside Thursday in the midst of the caution.

Bulls: 48.4% versus 51.5% versus 52.1% versus 46.9% versus 43.8% versus 41.7% versus 46.8% versus 43.8% versus 45.8% versus 52.1% versus 54.2% versus 52.1% versus 47.9% versus 44.3% versus 47.4% versus 50.5%.

Background: Undercut 35%, the threshold for bullishness, in early June. As noted, hit 34% in early June. It did its job and the market is on the rally. Hard drop to 34 from 39.3% as economic reality and a choppy stock market hit. Off the 55+ level hit in late February. That was the highest level since April and May of 2011, the peak of the post-bear market high. 35% is the threshold level suggesting bullishness. To be seriously bearish it needs to get up to the 60% to 65% level.

Bears: 19.6% versus 19.6% versus 19.8% versus 22.9% versus 25.0% versus 21.9% versus 22.9% versus 20.8% versus 19.8% versus 19.8% versus 19.8% versus 18.8% versus 19.6% versus 20.6% versus 20.6% versus 19.4% versus 19.6% versus 18.6% versus 18.8% versus 21.1% versus 21.1% versus 22.1% versus 21.1% versus 21.1% versus 22.3% versus 22.3% versus 23.4% versus 24.5% versus 24.5% versus 23.4% versus 25.5% versus 27.7% versus 27.7% versus 28.7% versus 27.7%.

Summary: Over 35% is the threshold to be really be a good upside indicator. For reference, bearishness hit a 5 year high at 54.4% the last week of October 2008. The move over 50 took bearish sentiment to its highest level since 1995. Extreme negative sentiment. Prior levels for comparison: Bearishness peaked at 37.4% in September 2007. It topped the June 2006 peak (36%) on that run. That June peak eclipsed the March 2006 high (33%) and well above the 2005 highs that spawned new rallies (30% in May 2005, 29.2% in October 2005). That was a huge turn, unlike any seen in recent history.

THIS WEEK

Wednesday and Thursday I went into detail about how to handle this market. I talked of two scenarios, a June-like pullback and a deeper pullback. Either one, of course, meant more selling.

Regardless of the scenario that shapes up, it is not a great time to commit a lot of new upside money to the market. Sure there will be good buys from great stocks such as PCLN on Friday. Other leaders look good as noted earlier, e.g. NFLX, LL, VRX . . .

There are stocks turning the corner as well, e.g. steel, homebuilders, precious metals. Some need tests, but they present upside opportunity because they are not in the limelight, i.e. they have not rallied substantially and are thus a target for sellers.

So there is upside possibilities, very real ones. But we are also looking at downside opportunity this week. Now it won't be right away. As noted above, the market likely bounces without a lot more downside given it is stretched two weeks lower; another push lower early in the week likely leads to a rebound. After the rebound more downside positions will present themselves.

On any oversold bounce, some upside leaders will set up and those stocks turning the corner will come off of tests of the initial breaks. On these we can play upside as they are the select, and if they survive the selling they are the ones that will rise well.

Ultimately I am not certain if this is the market top or not. Have my suspicions, but those are just good for the office pool. I want to make money so I do what the market and individual stocks tell me to do. Right now that has been go more into cash, watch for the true strong stocks to show they have the right stuff, and after the test of this initial selloff, look for downside to get into. That means not to start the week but after a relief bounce fails.

Have a great weekend!

Support and resistance

NASDAQ: Closed at 3602.78

Resistance:
3616 is the November 2012 up trendline
The July 2013 intraday high at 3625
3695 is the upper channel line for the November 2012 to present uptrend.
Next major resistance is around 4100 as NASDAQ hits 13 year highs

Support:
The 50 day EMA at 3558
3532 is the May intraday high
3521 is the August 2000 low.
3502 is the May 2013 closing high
The 2011 up trendline at 3333
3295 is the June 2013 low selloff
The 200 day SMA at 3266
3227 is the April 2000 intraday low
3197 is the September 2012 post-bear market high
3171 is the October intraday high

S&P 500: Closed at 1655.83

Resistance:
The 50 day EMA at 1664
1687 is the May high and post-bear market high
The November up trendline at 1734

Support:
1654 is the June 2013 peak
1576 from October 2007, the prior all-time high
1569.48 is the 78% Fibonacci retracement of the April to May 2013 run
1560 is the June 2013 reversal low
1556 from July 2007
The 200 day SMA at 1550
1541 is the April 2013 closing low in that pullback inside the uptrend
1539 from June 2007
1531 is the recent high
1499 from January 2008
1475 is the September 2012 high
1471 is the October 2012 intraday high
1466 is the September 2012 closing peak and rally closing high
1440 from November 2007 closing lows

Dow: Closed at 15,082.16

Resistance:
The 50 day EMA at 15,302
15,318 is the June closing high
15,542 is the May 2013 intraday high

Support:
14,888 is the April peak and prior all-time high
14,844 is the June intraday low
14,551 is the June 2013 intraday low on the selloff (14,659 closing)
The 200 day SMA at 14,338
14,198 from the October 2007 high
14,149 is the February 2013 high
14,022 from 7-07 peak
14,010 from the early February 2013 consolidation

Economic Calendar

August 16 - Friday
- Housing Starts, July (8:30): 896K actual versus 895K expected, 846K prior (revised from 836K)
- Building Permits, July (8:30): 943K actual versus 934K expected, 918K prior (revised from 911K)
- Productivity-Preliminary, Q2 (8:30): 0.9% actual versus 0.0% expected, -1.7% prior (revised from 0.5%)
- Unit Labor Costs, Q2 (8:30): 1.4% actual versus -0.3% expected, -4.2% prior (revised from -4.3%)
- Michigan Sentiment, August Preliminary (9:55): 80.0 actual versus 85.1 expected, 85.1 prior

August 21 - Wednesday
- MBA Mortgage Index, 08/17 (7:00): -4.7% prior
- Existing Home Sales, July (10:00): 5.20M expected, 5.08M prior
- Crude Inventories, 08/17 (10:30): -2.812M prior
- FOMC Minutes, 7/31 (14:00)

August 22 - Thursday
- Initial Claims, 08/17 (8:30): 337K expected, 320K prior
- Continuing Claims, 08/10 (8:30): 2959K expected, 2969K prior
- FHFA Housing Price Index, June (9:00): 0.7% prior
- Leading Indicators, July (10:00): 0.5% expected, 0.0% prior
- Natural Gas Inventor, 08/17 (10:30): 65 bcf prior

August 23 - Friday
- New Home Sales, July (10:00): 490K expected, 497K prior
icon url

ReturntoSender

08/18/13 3:38 PM

#10298 RE: ReturntoSender #6755

Market Breadth is Poor at Market Tops - For years I have been searching for the Holy Grail of Clarity where it concerns helping to determine when an actual market top is forming. After reading this article recently I think perhaps I may have finally found some help in that area:

http://www.financialsense.com/contributors/chris-puplava/hindenburg-omen-imminent-warning-hot-air

Help that I would like to share in the form of some charts. I have always known that market breadth gets poorer as the market gets closer to a market top but I never knew just how much poorer? Would you believe that on average only 6% of the stocks on the DJIA have been hitting new highs at each of the last 14 major tops since 1929? According to the article linked above this is true. I see no reason to disbelieve it. After all everything you read on the Internet is true but then of course I am also a "French Model". LOL

So anyway while I cannot show you charts from every major top since 1929 I can show you how many New Highs and New Lows were seen at the tops in 2000 and 2007. Once you look those charts over it's probably a great idea to ask yourself how do our charts compare to that today or at the most recent highs for the DJIA and Nasdaq?

The 2000 Top Compared to Today:


Now


The 2007 Top


Now


The other interesting occurrence is that at the same time the market makes a Major Market Top the number of New Lows in the market is a lot higher than most people would suspect. This is when the Hindenburg Omen has its most useful sighting. All other sightings when there are still numerous New Highs will generally precede nothing more than normal pullbacks in the market rather than an impending Bear Market.

How many New Lows were there at the 2000 Top compared to Today?


Now


How about the 2007 Top?


Now


icon url

ReturntoSender

08/19/13 5:21 PM

#10300 RE: ReturntoSender #6755

From Briefing.com: 4:25 pm : Today marked the beginning of a new week for the stock market, yet the story played out much the same way it did last week. Long-term rates continued to rise, the stock market continued to sink, and trading volume remained light.

The major averages were mixed and little changed for much of the session, but they broke down in late trading as the technology sector gave up its leadership post and other sectors bowed to selling interest.

There wasn't a specific news catalyst for the late-day breakdown, which led some to conclude it was a function of technical factors at work. Whatever one's view is, it was especially clear today that, outside of some specific stocks, buyers didn't want much to do with the market.

The stocks that benefited were familiar names like Boeing (BA 104.72, +1.25), Johnson & Johnson (JNJ 90.45, +1.08), Google (GOOG 868.65, +8.74), and Apple (AAPL 507.74, +5.41). Intel (INTC 22.28, +0.37) also found itself on the relative strength list following a Piper Jaffray upgrade to Neutral from Underweight and a positive mention in Barron's.

There wasn't a lot of corporate news to chew on today nor were there any economic releases in the US to digest. That helped explain why volume was light with just 640 mln shares trading at the NYSE.

Some distress in emerging markets, namely Indonesia where the Jakarta Composite declined 5.6%, proved to be a deterrent for participants along with the understanding that the minutes for the July 30-31 FOMC meeting will be released on Wednesday while the Kansas City Fed's Jackson Hole Symposium will get underway on Thursday.

Some anxiousness about what might be heard in the minutes and at the symposium kept pressure on the benchmark 10-yr note whose high yield today stopped just short of 2.90% before settling at 2.88%. The latter is up 30 basis points from the start of last week. The move is seen by some as the market discounting the prospect of a tapering announcement at the September 17-18 FOMC meeting, yet some rumblings are starting to be heard that it might also reflect concern that the Fed has lost control of things.

Undoubtedly, the path long-term interest rates take will be key in determining whether the stock market is going to continue to trade lower or whether it is going to show the buy-the-dip moxie it has been known for since the March 2009 lows.

The rate-sensitive financial sector (-1.3%) was a notable laggard all day and a major drag on the broader market along with the energy sector (-1.5%). The latter got clipped by yet another day of losses for ExxonMobil (XOM 86.92, -0.99), which declined for the 18th time in the last 20 sessions. The financial sector was hurt by a report JPMorgan Chase (JPM 51.83, -1.46) is being investigated for its hiring practices in China and a Wall Street Journal article suggesting the sector could fall out of favor in the wake of a tapering decision.

Other rate-sensitive areas like the high dividend-yielding utilities (-0.8%) and telecom services (-0.8%) sectors also underperformed the market. The home building stocks were among the weakest performers today with losses ranging between 3-5%. The iShares US Home Construction ETF (ITB 20.68, -0.67) fell 3.1%.

On the flip side, volatility was a notable area of strength. The CBOE Volatility Index (VIX 15.18, +0.81) surged 5.6% and is now up 28% over the last two weeks. Over the same period the S&P 500 has declined 3.6%.

There are no economic releases out of the US on Tuesday, so the market will be fixated early on the performance of foreign markets, the direction of interest rates, and the earnings results and guidance from Home Depot (HD 75.21, -0.17), Best Buy (BBY 30.73, +0.36), J.C. Penney (JCP 13.22, -0.18) and TJX Cos. (TJX 50.75, +0.27).

[Note: a prior version indicated China is investigating JPMorgan Chase for its hiring practices when it should have read JPMorgan Chase is being investigated for its hiring practices in China. The comment has been edited to correct that error] DJ30 -70.73 NASDAQ -13.69 SP500 -9.77 NASDAQ Adv/Vol/Dec 761/1.39 bln/1777 NYSE Adv/Vol/Dec 580/640 mln/2502
3:30 pm : Sep crude oil fell for the first time in seven sessions, dipping as low as $106.56 per barrel. The energy component briefly climbed into positive territory to a session high of $107.80 per barrel but reversed back into the red. It settled 0.4% lower at $107.07 per barrel.

Natural gas, on the other hand, rose to a session high of $3.50 per MMBtu. Despite slightly pulling-back, it booked a 2.7% gain as it closed at $3.46 per MMBtu.

Dec gold fell for the first time in four sessions as it retreated from a session high of $1375.00 per ounce set in early morning pit trade. It dipped to a session low of $1362.00 per ounce and settled with a 0.4% loss at $1365.80 per ounce.

4:00PM Plexus announces $30 mln share repurchase program (PLXS) 34.24 -0.33 : Co announced that its Board of Directors has approved a new stock repurchase program under which the Company is authorized to repurchase up to $30 million of its common stock during fiscal 2014. The planned repurchase represents approximately 3% of current market capitalization and is expected to be funded with existing cash.

9:01AM Riverbed Technology expands stock repurchase program; increases authorized share repurchase by $200 million; total program now at $500 million (RVBD) 16.63 :

Marvell (MRVL) announced that Yulong Coolpad launched new Android-based Time Division Synchronous Code Division Multiple Access and Wideband Code Division Multiple Access smartphones for China Mobile (CHL) and China Unicom (CHU), with over a billion total subscribers, powered by the Marvell ARMADA Mobile unified quad-core single-chip solution.

HP (HPQ) - HP Autonomy announced Autonomy LinkSite, a hybrid cloud solution that integrates HP Autonomy WorkSite, an on-premises document and email management system with HP Flow CM, HP's public cloud file sharing and collaboration service.

Veeco Instruments (VECO) introduced the GENxplor Molecular Beam Epitaxy Deposition System, the industry's first fully-integrated MBE system for the compound semiconductor R&D market.

7:03AM TranSwitch announces voluntary delisting from NASDAQ (TXCC) 0.34 : Co announced its intention to voluntarily delist its common stock from the NASDAQ Stock Market, in part due to the Company's non-compliance with the minimum closing bid and stockholders' equity requirements for continued listing on The NASDAQ Capital Market.

6:58AM TranSwitch announces agreement to raise $2.5 million in private placement (TXCC) 0.34 : Co announced that it has entered into a securities purchase agreement with Ilex Partners an entity managed by Michael Steinhardt, pursuant to which the Company has agreed to sell an aggregate of ~9.8 mln shares of its common stock for total gross proceeds of $2.5 mln. In connection with the transaction, Ilex agreed to surrender the warrant to purchase common stock it holds in exchange for an additional ~900,000 shares of the Company's common stock. The Company also granted to Ilex the right, for a period ending on the earlier of 180 days or one business day prior to the occurrence of a change of control event, to purchase an additional approximately 9.8 mln shares of its common stock for an additional $2.5 mln.

JA Solar Holdings (JASO) announced that its p-type mono-crystalline silicon solar cells, a new family of high-performance solar cells dubbed "PERCIUM," have surpassed 20% conversion efficiency.

10:40 am Technology Sector +1.5% trading higher today and outpacing the broader market
The tech sector is trading higher today, ahead of gains in the broader market. Semiconductors are showing only modest strength with the SOX trading 0.1% higher. Within the chip index, INTC (+3.3%) is a notable standout. Among other major indices, the SPY is trading 0.1% higher today, while the QQQ is up 0.6% and the NASDAQ is trading 0.4% higher on the session. Among tech bellwethers, INTC (+3.3%) is showing notable strength, while T (-0.6%) is under pressure.

There were no notable tech earnings this morning. In news, Z (-4.7%) announces it has entered into a definitive agreement to acquire StreetEasy, a real estate website in New York City, for $50 mln in cash. Also, RVBD (-0.6%) expanded its stock repurchase program and increased its authorized share repurchase by $200 million. Among notable analyst upgrades in tech this morning, INTC (+3.3%) was upgraded to Neutral at Piper. In downgrades, TRLA (-4.6%) was downgraded to Sector Perform at RBC, RVBD (-0.6%) was downgraded to Mkt Perform at JMP, and JCOM (-0.9%) was downgraded to Neutral at Sidoti. There are no notable names in tech scheduled to report after the close.

NYSE NASDAQ
Advances 813 (19%) 754 (29%)
Declines 3,309 (79%) 1,768 (68%)
Unchanged 74 (2%) 82 (3%)
Up Vol* 548 (17%) 386 (28%)
Down Vol* 2,638 (82%) 956 (69%)
Unch. Vol* 15 (0%) 53 (4%)
New Hi's 45 74
New Lo's 468 73

http://finance.yahoo.com/marketupdate/overview
icon url

ReturntoSender

08/20/13 4:03 PM

#10301 RE: ReturntoSender #6755

FSLR MT bot 1000 shares @ 38.53 - Should be enough support from some longer term moving averages to get a decent bounce from here.


http://finance.yahoo.com/q?s=fslr&ql=1

Plus I think the market will find a bottom soon as well.

RtS


icon url

ReturntoSender

08/20/13 6:17 PM

#10302 RE: ReturntoSender #6755

From Briefing.com: 4:10 pm : The S&P 500 settled higher by 0.4% to snap its streak of four consecutive losses. Small caps outperformed as the Russell 2000 rose 1.5% after registering five declines in a row.

Unaffected by another round of losses across emerging markets, stocks climbed at the open, but gains were limited as the S&P could not retake its 50-day moving average. The benchmark index made a brief midday appearance above the key level before spending the entire afternoon just below it.

A retreat in Treasury yields contributed to the relative strength of equities as the benchmark 10-yr yield fell seven basis points to 2.82%.

The pullback in yields helped rate-sensitive sectors such as telecom services (+0.5%), utilities (+0.8%), and home builders. The iShares Dow Jones US Home Construction ETF (ITB 21.32, +0.64) added 3.1% as most major builders gained between 2.0% and 4.0% apiece.

The relative strength of home builders provided a measure of support to the discretionary sector, which ended atop the leaderboard. In addition, retailers rallied after Best Buy (BBY 34.80, +4.07), Home Depot (HD 74.29, -0.92), TJX Companies (TJX 54.24, +3.49), and Urban Outfitters (URBN 43.19, +3.27) all reported solid results. Meanwhile, J.C. Penney (JCP 14.01, +0.79) advanced 6.0% despite missing on earnings and revenue while Dick's Sporting Goods (DKS 46.64, -3.95) sank 7.8% following its disappointing report. The broader SPDR S&P Retail ETF (XRT 80.14, +1.21) rose 1.5%.

While most cyclical sectors displayed strength, industrials and technology underperformed. The industrial space ended flat as the underperformance of Deere (DE 83.25, -1.27) and Dow component General Electric (GE 23.72, -0.13) overshadowed the relative strength of transportation companies. The Dow Jones Transportation Average settled higher by 0.9% as 18 of 20 components posted gains.

Elsewhere, the tech sector was pressured by its top component, Apple (AAPL 501.07, -6.67), which lost 1.3%.

Today's trading volume was well below average as less than 640 million shares changed hands on the floor of the New York Stock Exchange.

There was no economic data reported today, but tomorrow, the weekly MBA Mortgage Index will be released at 7:00 ET and July existing home sales will be reported at 10:00 ET. Lastly, the Federal Open Market Committee will release the minutes from its July meeting at 14:00 ET.DJ30 -7.75 NASDAQ +24.50 SP500 +6.29 NASDAQ Adv/Vol/Dec 1860/1.24 bln/662 NYSE Adv/Vol/Dec 2357/634.8 mln/716
3:35 pm : Commodities ended the day mixed with crude oil selling off in the afternoon session, gold ending higher, silver ending lower, copper flat and natural gas lower.

Crude oil gained some steam in the morning session and rose as high as $107.00/barrel. However, it was still modestly lower at that level and ultimately reversed lower, selling off by $2.41/barrel to $104.59. By the end of the day, Sept crude was down $2.15 at $104.92/barrel.

Sept natural gas finished 2 cents lower at $3.44/MMBtu.

Precious metals ended today's session mixed with Dec gold up $6.50 to $1372.30/oz and Sept silver down $0.12 to $23.05/oz. Sept copper closed one cent higher at $3.34/lb.

4:13PM Analog Devices beats by $0.03, reports revs in-line; guides Q4 EPS in-line, revs in-line (ADI) 47.85 +0.07 : Reports Q3 (Jul) earnings of $0.57 per share, excluding non-recurring items, $0.03 better than the Capital IQ Consensus Estimate of $0.54; revenues fell 1.3% year/year to $674.2 mln vs the $671.79 mln consensus. Q3 Gross margin was 64.5% of revenue.

Co issues in-line guidance for Q4, sees EPS of $0.55-0.61 vs. $0.59 Capital IQ Consensus Estimate; sees Q4 revs of $675-700 mln vs. $697.35 mln Capital IQ Consensus Estimate. Q4 Gross margin estimated to be approximately 65%.

"By end market, industrial applications totaled 47% of revenue, communications infrastructure was 21% of revenue, and automotive and consumer applications were 18% and 15% of revenue, respectively...Order rates improved across all of our end markets during the third quarter, and we saw the strongest sequential revenue growth from products used in communications infrastructure applications. It appears that customer order rates were in-line with consumption, keeping inventories low."

4:00PM Veeco Instruments Receives NASDAQ Notice Regarding Late Form 10-Q Filing (VECO) 33.32 +0.16 : VECO announced that it received a letter from NASDAQ 8/14/13 notifying co that it is not in compliance with NASDAQ Listing Rule 5250(c)(1) because its Quarterly Report on Form 10-Q for the quarter ended 6/30/13 was not filed on a timely basis with the SEC. As previously announced, the Form 10-Q, as well as co's annual report on Form 10-K for the year ended 12/31/12 and quarterly reports on Form 10-Q for the quarters ended 9/30/12 and 3/31/13, could not be filed timely because co is reviewing the timing of the recognition of revenue and related expenses on the sale of certain of its products. The accounting review was announced on 11/15/12.

Co continues to conduct the review and intends to file its Forms 10-Q and 10-K as soon as reasonably practicable after these accounting matters have been resolved.

Large Cap Gainers

BBY (33.89 +10.28%): Beat on EPS by $0.21, beat on revs.
TJX (53.77 +5.95%): Beat on EPS by $0.03, beat on revs; guided Q3 EPS in-line; raised FY14 EPS guidance, just below consensus; raised FY14 comp guidance.
NLSN (33.94 +4.27%): Upgraded to Outperform from Mkt Perform at Bernstein.

Large Cap Losers

PUK (36.18 -2.19%): Select financial related names showing weakness; AEG and SAN also lower.
MDT (52.89 -2.24%): Reported EPS in-line, revs in-line; reaffirmed FY14 EPS guidance.
TCK (26.64 -1.88%): Downgraded to Hold from Buy at BB&T Capital Markets.

Mid Cap Gainers

URBN (43.99 +10.18%): Beat on EPS by $0.03, missed on revs; reported Q2 Comparable Retail segment net sales +9%; tgt to $40 from $38 at Jefferies, to $48 from $41 at Canaccord; upgraded to Outperform from Neutral at Wedbush.
EA (27.74 +4.4%): Co announced Plants vs. Zombies 2 reached over 16 mln downloads worldwide; #1 on the AAPL App Store in 137 countries worldwide.
ONXX (114.93 +3.55%): Upgraded to Buy from Hold at Maxim Group, price tgt set at $130; OZ Management disclosed 2.04% passive stake in 13G filing out yesterday after the close; down from 5%+ position previously held by firm.

Mid Cap Losers

DKS (47.5 -6.11%): Missed on EPS by $0.03, missed on revs; guided Q3 EPS below consensus; lowered FY14 EPS below consensus; Q2 adjusted same store sales -0.4%; lowered FY14 comp guidance.
RVBD (15.76 -4.72%): Downgraded to Sell from Hold at Deutsche Bank.
Z (81.3 -4.06%): Priced offering of 5,023,486 shares of its Class A common stock (2,523,486 shares by certain existing shareholders) at $82.00 per share.

8:32AM Marvell: Jury finds Marvell does not infringe lake cherokee patents (MRVL) 13.15 : Co announced that a jury in Marshall, Texas delivered a verdict in a lawsuit brought by Lake Cherokee Hard Drive Technologies against Marvell Semiconductor, Marvell's U.S. operating subsidiary, in the United States District Court for the Eastern District of Texas. In the lawsuit, Lake Cherokee asserted that MSI infringed two patents purchased by Lake Cherokee pertaining to certain read channel technology that is not practiced by any Marvell chips. Specifically, the patents at issue are U.S. Patent Nos. 5,844,738 and 5,978,162. The jury unanimously found that Marvell did not infringe these patents.

Analyst comments: RVBD -5.1% (downgraded to Sell from Hold at Deutsche Bank), NOK -3.1% (hearing cautious Bernstein comments; sees upcoming qtr as 'disastrous'), QIHU -2.7% (initiated with a Neutral at Goldman), ZNGA -1.8% (initiated with Sell at Janney), PNRA -0.7% (downgraded to Hold from Buy at Jefferies), WMT -0.1% (downgraded to Neutral at Susquehanna; tgt lowered to $79 from $85).

8:02AM First Solar, Roseville sign contract for Lost Hills PPA (FSLR) 37.09 : Co and the City of Roseville, California announced they have signed a power purchase agreement (PPA) for 32MWAC of solar electricity to be generated at the Lost Hills photovoltaic power plant that First Solar is developing and will construct in Kern County, California. The 10-year PPA is First Solar's first such agreement with a municipal utility, and is effective in 2015. The PPA was approved by the Roseville City Council on July 17, 2013. The Lost Hills project construction could start in early 2014, and is expected to create up to 200 jobs at its peak. Roseville Electric purchased 325,000 MWH of renewable energy for $24 million for 10 years. The contract cost $6.5 million less than similar renewable energy purchase offers in 2012.

TranSwitch (TXCC) announced that the co's Atlanta 80 communication processor has been selected by Rancore Technologies, the technology and development arm of Reliance Jio Infocomm.
Advances & Declines
NYSE NASDAQ
Advances 2,981 (71%) 1,846 (71%)
Declines 1,116 (27%) 661 (26%)
Unchanged 95 (2%) 84 (3%)
Up Vol* 2,371 (72%) 984 (76%)
Down Vol* 883 (27%) 244 (19%)
Unch. Vol* 39 (1%) 60 (5%)
New Hi's 52 74
New Lo's 276 69

icon url

ReturntoSender

08/21/13 6:17 PM

#10303 RE: ReturntoSender #6755

From Briefing.com: 4:20 pm : The S&P 500 settled lower by 0.6% despite making a brief appearance in positive territory following the release of the FOMC minutes.

Although the minutes from the July meeting offered few changes from prior statements, they did indicate broad support for Chairman Bernanke's timeline, which would likely call for tapering as early as September. However, this was coupled with cautious comments regarding the labor market as the minutes noted, "The June employment report showed continued solid gains in payrolls. Nonetheless, the unemployment rate remained elevated, and the continuing low readings on the participation rate and the employment-to-population ratio, together with a high incidence of workers being employed part time for economic reasons, were generally seen as indicating that overall labor market conditions remained weak."

Overall, the minutes did not provide a clear-cut signal regarding the Fed's tapering schedule and the mixed reaction across markets suggests a certain level of uncertainty remains present.

The reaction in Treasuries was consistent with expectations of tapering in the near-term as the benchmark 10-yr yield jumped four basis points to 2.86%. Today's selling had the biggest impact on the belly of the curve as the 5-yr yield jumped more than 6 bps to 1.606%. However, the yield still managed to close just below Monday's two-year high.

Meanwhile, equities sold off in a knee-jerk response, but the S&P followed the slide with a rally to fresh highs before returning into the red just ahead of the close.

All ten sectors registered losses with rate-sensitive telecom services (-1.2%) and utilities (-1.2%) leading to the downside.

Out of the ten sectors, only energy (-0.5%), health care (-0.5%), and technology (-0.1%) outperformed the broader market. The tech sector held up relatively well and despite today's loss, it is the only sector trading with an August gain (0.4%).

The CBOE Volatility Index (VIX 15.93, +1.02) jumped to its highest level since July 5 as participants favored protection against volatility.

Trading volume was the heaviest of the week, but at 658 million shares traded on the NYSE, it remained comfortably below average.

Today's economic data focused on housing. The weekly MBA Mortgage Index remained in a downtrend with today's 4.6% fall marking the thirteenth decline out of the past fifteen readings including last week's 4.7% slide.

In addition, July existing home sales rose 6.5% to 5.39 million from a downwardly revised 5.06 million (from 5.08 million) in June. The Briefing.com consensus expected existing home sales to increase to 5.10 million. Sales are at their highest point since November 2009 when the impending expiration of the homebuyer tax credit pulled forward a large number of existing home purchases. Excluding the stimulus measures, that was the most homes sold since March 2007. The big bump in sales was surprising considering both the Pending Home Sales Index and the Mortgage Bankers Association's Mortgage Purchasing Index declined notably in July and mortgage rates returned to two-year highs.

Tomorrow, weekly initial claims will be reported at 8:30 ET while the June FHFA Housing Price Index and July Leading Indicators will be announced at 9:00 ET and 10:00 ET, respectively.DJ30 -105.44 NASDAQ -13.80 SP500 -9.55 NASDAQ Adv/Vol/Dec 811/1.39 bln/1696 NYSE Adv/Vol/Dec 839/657.5 mln/2211

3:30 pm :

Oct crude oil slipped deeper into negative territory following inventory data that showed a draw of 1.428 mln barrels when a draw of 1.0-1.5 mln barrels was anticipated. A stronger dollar index also put pressure on the energy component. Crude oil touched a session low of $103.50 per barrel after retreating from its session high of $105.07 per barrel. It eventually settled with a 1.2% loss at $103.88 per barrel
Sep natural gas, however, spent its entire floor session in the black but traded in a narrow range between $3.46 and $3.40 per MMBtu. It settled with a 0.6% gain at $3.46 per MMBtu
Precious metals traded lower as investors awaited the 14:00 ET release of the FOMC Minutes and as the stronger dollar pressured prices
Dec gold fell to a session low of $1361.10 per ounce but erased most of the earlier losses, settling 0.1% lower at $1370.00 per ounce
Sep silver brushed a session low of $22.88 per ounce and eventually settled at $22.97 per ounce, or 0.3% lower

5:02PM Photronics announces a product development initiative with Silicon Values BG Partners (PLAB) 7.16 0.00 : Co announced a product development initiative with Silicon Values BG Partners, an early stage Silicon Valley venture capital fund, to adapt Photronics' novel glass structuring platform technology for use in thermal energy capture and processing applications. The initiative includes an investment from Silicon Values BG Partners.

4:33PM Semtech beats by $0.01, reports revs in-line; guides Q3 EPS below consensus, revs below consensus (SMTC) 29.64 : Reports Q2 (Jul) earnings of $0.52 per share, $0.01 better than the Capital IQ Consensus Estimate of $0.51; revenues rose 9.5% year/year to $165.01 mln vs the $165.27 mln consensus.

Co issues downside guidance for Q3, sees EPS of $0.31-0.37, excluding non-recurring items, vs. $0.55 Capital IQ Consensus Estimate; sees Q3 revs of $135-145 mln, excluding non-recurring items, vs. $170.21 mln Capital IQ Consensus Estimate.

"We expect our Q3 results to be negatively impacted by both a reduction in demand and inventory corrections at several of our largest smartphone customers. We anticipate that this weakness will continue through most of the second half. However, we remain confident in our ability to manage through any short term demand fluctuations as we head towards our $1 billion revenue goal."

4:11PM Hewlett-Packard announces leadership changes: Chief Operating Officer Bill Veghte to become executive vice president and general manager of the HP Enterprise Group (HPQ) 25.38 -0.46 : Co announced changes to its executive leadership team that will help the company accelerate its turnaround. Bill Veghte, HP's chief operating officer (COO), will become executive vice president and general manager of the HP Enterprise Group, a role that will now include responsibility for the coordinated development of the company's portfolio of cloud solutions. Dave Donatelli will take on a new role focused on identifying early-stage technologies as he did successfully with 3PAR and 3Com. In a separate organizational move, HP will combine its Marketing and Communications organizations under the leadership of Chief Communications Officer Henry Gomez.

4:10PM Hewlett-Packard reports EPS in-line, revs in-line; narrows FY13 EPS guidance (HPQ) 25.38 -0.46 : Reports Q3 (Jul) earnings of $0.86 per share, excluding non-recurring items, in-line with the Capital IQ Consensus Estimate consensus of $0.86; revenues fell 8.2% year/year to $27.23 bln vs the $27.28 bln consensus.

Personal Systems revenue was down 11% YoY with a 3.0% operating margin. Commercial revenue decreased 3% and Consumer revenue declined 22%. Total units were down 8% with Desktops units down 9% and Notebooks units down 14%.
Printing revenue declined 4% YoY with a 15.6% operating margin. Total hardware units were up 5% with Commercial hardware units up 12% and Consumer hardware units up 2%. Supplies revenue was down 4%.
Enterprise Group revenue declined 9% YoY with a 15.2% operating margin. Networking revenue was flat, Industry Standard Servers revenue was down 11%, Business Critical Systems revenue was down 26%, Storage revenue was down 10% and Technology Services revenue was down 7%.
Enterprise Services revenue declined 9% YoY with a 3.3% operating margin. Application and Business Services revenue was down 11% and Infrastructure Technology Outsourcing revenue declined 7%.
Software revenue was up 1% YoY with a 20.5% operating margin. Support revenue was up 4%, license revenue was flat, professional services revenue was down 11% and SaaS revenue was up 4%.
HP Financial Services revenue was down 6% YoY with a 4% decrease in net portfolio assets and a 9% decrease in financing volume. The business delivered an operating margin of 11.3%.


Co issues in-line guidance for FY13, narrows EPS to $3.53-3.57, excluding non-recurring items, from $3.50-3.60 vs. $3.53 Capital IQ Consensus.

Large Cap Gainers

LOW (46 +4.36%): Beat quarterly Eps by $0.09 ($0.88 vs $0.79 estimate), revs rose 10.3% yoy to $15.71 bln vs $15.07 bln estimate; sees FY14 EPS of $2.10 (raised from $2.05) vs $2.09 estimate, sees FY14 revs +5% (~$53.04 bln, raised from +4% or ~$52.54 bln) vs $52.19 bln estimate; sees FY14 comparable sales +4.5% (raised from prior guidance of +3.5%)
LMT (123.52 +0.91%): CNBC published article stating that cuts to Egyptian military aid are unlikely
V (174.41 +0.69%): Bloomberg reporting that Visa and Mastercard (MA) do not plan to drop antitrust settlement with U.S. merchants over credit card fees

Large Cap Losers

SPLS (14.52 -13.78%): Missed quarterly EPS by $0.02 ($0.16 vs $0.18 estimatE), revs fell 2.2% yoy to $5.31 bln vs $5.37 bln estimate; lowered FY14 EPS to $1.21-1.25 (from $1.30-1.35) vs $1.32 estimate; lowered FY14 rev guidance
IBN (26.57 -4.46%): Continued weakness in Indian markets and the Rupee
TGT (65.62 -3.43%): Reported Q2 EPS of $0.95 (in-line), revs rose 2.0% yoy to $17.12 bln vs $17.27 bln estimate; sees Q3 EPS of $0.80-0.90 and FY14 EPS of $4.70-4.90

Mid Cap Gainers

INCY (34.86 +29.11%): Announced positive results of Phase 2 RECAP trial of ruxolitinib, its oral JAK1 and JAK2 inhibitor, in combination with capecitabine in patients with recurrent or treatment refractory metastatic pancreatic cancer
VE (15.35 +7.79%): Upgraded to Overweight from Equal-Weight at Morgan Stanley
CE (51.29 +4.82%): Signed Memorandum of Understanding to advance the development of synthetic fuel ethanol with PetroChina Company Limited

Mid Cap Losers

AEO (14.79 -9.71%): Reported Q2 EPS of $0.09 (vs $0.10 pre-announcement), revs fell 1.7% yoy to $727.3 mln vs $719 mln estimate and preannouncement of ~$725 mln; sees Q3 EPS of $0.14-0.16 vs $0.35 estimate, revs declining in high single digits vs -4.3% estimate; downgraded to Neutral at Piper Jaffray
PETM (71.9 -4.13%): Beat quarterly EPS by $0.03 ($0.89 vs $0.86 estimate), revs rose 5.3% yoy to $1.71 bln (in-line); comparable store sales +3.4%; issued in-line Q3 guidance
JCP (13.5 -3.64%): Hearing rumors that Bill Ackman may be selling his stake

12:02PM NVIDIA and Ubisoft form gaming alliance (NVDA) 14.90 -0.05 : Co announced an alliance with Ubisoft to offer PC gamers the best gaming experiences possible for Ubisoft's biggest fall titles, including Tom Clancy's Splinter Cell Blacklist, Assassins Creed IV Black Flag and Watch Dogs. NVIDIA's developer technology team is working with Ubisoft's development studios on incorporating graphics technology innovations to create game worlds that deliver new heights of realism and immersion.

LSI Corp. (LSI) has started delivering the Axxia 5500 communication processor family to key OEM customers.

O2Micro International (OIIM) announced the grant of a key Battery Pack Protection patent.

7:02AM JinkoSolar Holding to supply 23MW PV modules to Swinerton builders for California solar farm (JKS) 13.83 : Co announced that it will supply 23MW of Solar PV modules to Swinerton Builders, a leading US Engineering and Construction Company and Clenera, a clean energy finance and management firm. According to terms of the agreement, deliveries will be completed during the 4th quarter of 2013. Swinerton will utilize JinkoSolar's 300W 72 cells high-efficiency PV modules in its construction of the Westland Solar Farms, LLC ground-mounted solar plant in Fresno County, California. When completed, this Utility Scale Solar Farm will provide electricity to PG&E.

EVault, a Seagate company (STX), announced a strategic partnership with Memory World, a distributor of computer memory, digital storage solutions, digital media players and network access storage including both NAS and SAN solutions in Singapore. Memory World was selected to distribute EVault SaaS, EVault Endpoint Protection and EVault Software in Singapore, further expanding EVault's reach in this fast-growing market.

07:43 am Analog Devices shares fall 2% despite beat on earnings and in line guidance
Analog Devices (ADI $46.60 -1.25) reported third quarter earnings of $0.57 per share, excluding non-recurring items, which is better than expected, while revenues fell 1.3% year/year to $674.2 million which is slightly ahead of expectations. Q3 Gross margin was 64.5% of revenue. The company issued in-line guidance for the fourth quarter with EPS of $0.55-0.61 which is in line with estimates with revenues of $675-700 million which is line with expectations.

Q4 Gross margin estimated to be approximately 65%. "By end market, industrial applications totaled 47% of revenue, communications infrastructure was 21% of revenue, and automotive and consumer applications were 18% and 15% of revenue, respectively...Order rates improved across all of our end markets during the third quarter, and we saw the strongest sequential revenue growth from products used in communications infrastructure applications. It appears that customer order rates were in-line with consumption, keeping inventories low."

10:53 am Apple tgt raise details -- to $560 from $500 at UBS; higher 5C price and margin: . UBS raised its AAPL tgt to $560 from $500 after the firm 'rejiggered' its conservative assumptions in its detailed product model for the expected midrange iPhone 5C. Its price assumption increases from $379 to $399 and GMs rise from 32% to 38% on a lower bill of materials, making the 5C accretive to earnings. UBS values Apple on an increased EV/FCF multiple of 6.5x (from 6x) its C14 FCF estimate of $50 bln; on a P/E, its target would be 12x its C2014 EPS estimate of $47.18.

09:06 am Best Buy target raised to $42 at Telsey Advisory Group: . Telsey Advisory Group raises their BBY tgt to $42 from $31. Best Buy delivered a 2Q13 result that exceeded their expectations on every line item, including an impressive (0.4%) domestic comp, which beat their estimate of (2.5%) and the consensus of (0.8%). While the co continues to make good progress toward its target of $725MM in annualized cost savings, they believe a return to positive domestic comps this year would be a favorable, unexpected surprise for investors. CEO Hubert Joly's Renew Blue plan continues to deliver on the cost-cutting initiatives, while also driving e-commerce growth and store productivity metrics that should yield significantly higher earnings in 2014 and beyond.

09:00 am Best Buy target raised to $40 at Stifel: . Stifel raises their BBY tgt to $40 from $30; they believe mgmt is starting to build a track record at finding and executing on past mis- (or lack of) mgmt and such improved visibility warrants a more favorable multiple -- there remain significant pockets of opportunity. They continue to believe other store-within-a-store vendor concepts may happen. Mgmt, product cycle, and vendor support are all improving vs. 2008-2012. They think TV is benefiting (and will continue to) from housing turnover with LED 50"+ having fallen to attractive price points. While this does not mean BBY is a new growth story it does suggest significant opportunities exist -- and 2Q13 showed evidence of exactly that.

07:26 am ViroPharma: Peaking under the hood, a lot not in the stock - Mizuho: . Mizuho remains enthusiastic about VPHM's prospects for longer term Cinryze growth in HAE, with some subcutaneous clarity coming in the next 3-6 months from both ph20 and low volume studies, and non-HAE indications are garnering more attention: PNH, AMR and optic neuritis. They await FDA interaction on maribavir breakthrough status, which could shorten the timeline to a 2015/16 approval. The pipeline is largely not in Street models, the same goes for Meritage's OBS, for which VPHM could exercise option post mid-2014 Phase II data. $30 looks like attractive entry point.

06:48 am NPS Pharm target raised to $28 from $19 at Oppenheimer: . Oppenheimer raises their NPSP tgt to $28 from $19; they conducted a survey of 25 community gastroenterologists to assess their current view on Gattex and the future growth potential for the drug. Their results show that while most docs are aware of Gattex, most of their patients are not. Over the next three years their surveyed physicians plan to increase their Gattex prescriptions significantly, part of which is likely to be driven by increased patient awareness, positive feedback from initial patients, and improved reimbursements.

Micros Systems (MCRS) and PayPal announced a new strategic global collaboration to integrate PayPal into MICROS' widely deployed POS platforms to enable better payments experiences for consumers - whether using a card, online, mobile phone, checking in to pay, or by simply typing in a mobile number and PIN . Central to this collaboration, multiple MICROS hospitality and retail point-of-sale platforms used in hundreds of thousands of merchant locations around the world will soon offer the ability to seamlessly work with the innovative PayPal mobile application.
Advances & Declines
NYSE NASDAQ
Advances 1,066 (26%) 803 (31%)
Declines 2,986 (72%) 1,692 (65%)
Unchanged 116 (3%) 96 (4%)
Up Vol* 831 (25%) 403 (29%)
Down Vol* 2,465 (74%) 978 (70%)
Unch. Vol* 36 (1%) 26 (2%)
New Hi's 46 86
New Lo's 268 53
*in millions
more...
icon url

ReturntoSender

08/22/13 6:05 PM

#10304 RE: ReturntoSender #6755

From Briefing.com: 4:15 pm : The major averages registered gains across the board, but a three-hour halt of all Nasdaq-listed issues prevented normal trading from taking place throughout the afternoon.

Stocks climbed out of the gate after upbeat survey data from China and the eurozone reassured investors. China's HSBC Manufacturing PMI jumped to 50.1 from 47.7 (48.3 expected) while the eurozone Manufacturing PMI improved to 51.3 from 50.3 (50.8 forecast). In addition, the Services PMI reading rose to 51.0 from 49.8 (50.2 expected).

The economic data provided a boost to growth-sensitive sectors as five of six cyclical groups registered gains larger than 1.0%. The technology sector lagged with an advance of 0.5%. The largest sector component, Apple (AAPL 502.96, +0.60), ended little changed and Dow member Hewlett-Packard (HPQ 22.22, -3.16) endured its worst session in two years, falling 12.5%, after reporting in-line results and saying it is unlikely to experience revenue growth in 2014.

Speaking of technology, the tech-heavy Nasdaq fell victim to an early-afternoon glitch that kept all member shares from trading for three full hours. The impact could be felt across other indices as they drifted inside narrow ranges on thin volume.

Once normal trading resumed during the final hour of the day, the major indices rose to fresh highs. The S&P tested its 50-day moving average, but could not settle above that level.

The energy sector finished atop the leaderboard with a gain of 1.4% as crude oil advanced 1.2% to $105.05 per barrel.

Interestingly, the discretionary sector also finished among the leaders despite weakness in the retail space. Recent quarterly reports from retailers have not reflected very well on consumer spending. That theme remained in effect today as Abercrombie & Fitch (ANF 38.53, -8.27) missed on earnings and revenue while guiding third quarter earnings below analyst expectations. The SPDR S&P Retail ETF (XRT 79.14, +0.12) ended little changed, but the discretionary sector climbed 1.1% with home builders contributing to the strength.

Treasuries registered losses as the benchmark 10-yr yield added nearly five basis point to 2.90%.

Trading volume was well below average with only 573 million shares changing hands on the floor of the NYSE as the afternoon Nasdaq halt took a bite out of activity.

Investors received a handful of economic data today. The initial claims level rose to 336,000 for the week ending August 17 from an upwardly revised 323,000 (from 320,000) for the week ending August 10. The Briefing.com consensus expected the initial claims level to increase to 337,000. The upward move in the initial claims level is likely just normal volatility. Over the past four weeks, moving average for initial claims has dropped to its lowest level since November 2007.

Separately, the Conference Board's Index of Leading Indicators increased 0.6% in July after holding flat in June. That was the strongest increase since increasing 0.8% in April. The Briefing.com consensus expected the index to increase 0.5%.

Since eight of the 10 components of the index are known prior to the release, the difference between the actual number and the consensus is typically minor. In this case, a smaller-than-expected decline in manufacturers' new orders of nondefense capital goods excluding aircraft was the likely cause for the small upside surprise.

Lastly, the June FHFA Housing Price Index rose 0.7% to follow last month's 0.8% increase.

Tomorrow's economic data will be limited to July new home sales with the report set to be released at 10:00 ET.DJ30 +66.19 NASDAQ +38.92 SP500 +14.16 NASDAQ Adv/Vol/Dec 1968/891.7 mln/519 NYSE Adv/Vol/Dec 2576/573.2 mln/480

3:35 pm :

Oct crude oil lifted off its session low of $103.80 per barrel moments after equities markets opened. It touched a session high of $105.18 per barrel and settled at $104.99 per barrel, or 1.1% higher
Sep natural gas extended yesterday's gains when a better-than-anticipated inventory build of 57 bcf (consensus called for a build of 66-69 bcf) pushed prices to a session high of $3.56 per MMBtu. It eventually settled with a 2.6% gain at $3.55 per MMBtu
Dec gold and Sep silver rose to their respective session highs of $1381.40 and $23.33 per ounce after data released this morning showed the initial claims level rose to 336,000 for the week ending Aug 17 from an upwardly revised 323,000 for the week ending Aug 10.
However, both metals pulled-back as they headed into afternoon floor trade. Gold settled just 60 cents higher at $1370.60 per ounce while closed at $23.03 per ounce, booking a 0.3% gain.

4:14PM Marvell beats by $0.04, beats on revs; guides Q3 EPS in-line, revs above consensus (MRVL) 12.96 -0.09 : Reports Q2 (Jul) earnings of $0.23 per share, excluding non-recurring items, $0.04 better than the Capital IQ Consensus Estimate of $0.19; revenues fell 1.1% year/year to $807.1 mln vs the $791.3 mln consensus.

Co issues in-line EPS guidance for Q3, sees EPS of $0.23-0.27, excluding non-recurring items, vs. $0.24 Capital IQ Consensus Estimate; sees Q3 revs of $850-890 mln vs. $845.23 mln Capital IQ Consensus Estimate.

4:09PM Micros Systems misses by $0.01, beats on revs; guides FY14 EPS in-line, revs in-line (MCRS) 50.30 +1.03 : Reports Q4 (Jun) earnings of $0.62 per share, excluding non-recurring items, $0.01 worse than the Capital IQ Consensus Estimate of $0.63; revenues rose 8.6% year/year to $328.6 mln vs the $325.14 mln consensus.
Co issues in-line guidance for FY14, sees EPS of 2.46-2.50, excluding non-recurring items, vs. $2.48 Capital IQ Consensus Estimate; sees FY14 revs of 1.295-1.320 bln vs. $1.31 bln Capital IQ Consensus Estimate.

Large Cap Gainers

ING (11.61 +5.26%): Heard upgraded to Overweight at Morgan Stanley.
YHOO (27.8 +2.73%): Co is in talks with Foursquare regarding data partnership, according to reports.
TSLA (153.74 +3.97%): Initiated with a Hold at Stifel; Bloomberg discussed that TSLA plans to add Europe and Asia factories following increased expectations for demand.

Large Cap Losers

HPQ (22.37 -11.86%): Reported EPS in-line, revs in-line; narrowed FY13 EPS guidance; COO Bill Veghte to become executive vice president and general manager of the HP Enterprise Group; CEO Whitman on conf. call said rev growth was unlikely in FY14.
LTD (57.91 -3.24%): Beat on EPS by $0.01, reported revs in-line; guided Q3 EPS below consensus; guided FY14 EPS in-line; tgt raised to $50 from $48 at Canaccord Genuity.
TGT (64.64 -1.31%): Tgt to $75 from $79 at Citigroup and to $71 from $73 at Susquehanna; downgraded to Buy from Strong Buy at ISI Group; downgraded to Underperform from Market Perform at William Blair; downgraded to Neutral from Buy at Janney; tgt lowered to $67 from $72 at Telsey Advisory Group; tgt lowered to $66 at UBS; tgt lowered to $74 at MKM Partners.

Mid Cap Gainers

HAIN (81.63 +11.98%): Beat on EPS by $0.03, beat on revs; guided FY14 EPS above consensus, revs above consensus; announced the appointment of a new CFO with the planned retirement of Ira J. Lamel.
GME (53.15 +11.61%): Beat on EPS by $0.05, beat on revs; guided Q3 above consensus; raised FY14 guidance; upgraded at Monness, Crespi, Hardt.
BTU (17.56 +5.85%): Named Glenn Kellow as President and COO; strength in select coal names.

Mid Cap Losers

ANF (38.14 -18.5%): Missed on EPS by $0.12, missed on revs; guided Q3 EPS below consensus; Q2 comps -10%; heard cautious comments at Citigroup and ISI; downgraded to Neutral at Janney; tgt lowered to $40.
SHLD (39.91 -7.77%): Missed on EPS by $0.34, missed on revs.
GFI (5.65 -8.13%): Reported a net loss from continuing operations for the June 2013 quarter of $129 mln compared with earnings of $27 mln in the March 2013 quarter and $105 mln in the June 2012 quarter; beat on revs; did not declare dividend; co to acquire Barrick's (ABX) Granny Smith, Lawlers and Darlot gold mines in Western Australia.

12:07PM Nasdaq 100 +22 sets new pullback low, not confirmed (TECHX) : Earlier noted the AAPL test of its week low/psych level at 500. The recent penetration (session low 498.20) has led to a new pullback low in the Nasdaq 100. However, this has not been confirmed by the Nasdaq Comp with the Dow/S&P firming.

8:03AM SunEdison announces planned separation of its semiconductor business; expects IPO in early 2014 (SUNE) 6.81 : Co announced that its Board of Directors has unanimously approved an initial public offering of its semiconductor business to create SunEdison Semiconductor, Inc. SunEdison plans to sell a minority ownership interest in the semiconductor business to the public. SunEdison expects to use proceeds from the separation to fund initiatives related to the solar business, to repay existing indebtedness and for general corporate purposes.

SunEdison expects to file a registration statement with the SEC in the third quarter of 2013, with the initial public offering scheduled by early 2014, subject to market conditions. A final decision regarding the amount of interest to be sold to the public at the time of the initial public offering will be determined by SunEdison's Board of Directors at a date to be determined.

07:50 am Hewlett Packard shares fall 6% following in line earnings; CEO says FY14 rev growth unlikely
Hewlett-Packard (HPQ $23.49 -1.89) reported third quarter earnings of $0.86 per share, excluding non-recurring items, which is in line with consensus, while revenues fell 8.2% year/year to $27.23 billion which is line with expectations.

Personal Systems revenue was down 11% YoY with a 3.0% operating margin. Commercial revenue decreased 3% and Consumer revenue declined 22%. Total units were down 8% with Desktops units down 9% and Notebooks units down 14%. Printing revenue declined 4% YoY with a 15.6% operating margin. Total hardware units were up 5% with Commercial hardware units up 12% and Consumer hardware units up 2%. Supplies revenue was down 4%. Enterprise Group revenue declined 9% YoY with a 15.2% operating margin.

Networking revenue was flat, Industry Standard Servers revenue was down 11%, Business Critical Systems revenue was down 26%, Storage revenue was down 10% and Technology Services revenue was down 7%. Enterprise Services revenue declined 9% YoY with a 3.3% operating margin. Application and Business Services revenue was down 11% and Infrastructure Technology Outsourcing revenue declined 7%. Software revenue was up 1% YoY with a 20.5% operating margin. Support revenue was up 4%, license revenue was flat, professional services revenue was down 11% and SaaS revenue was up 4%.

HP Financial Services revenue was down 6% YoY with a 4% decrease in net portfolio assets and a 9% decrease in financing volume. The business delivered an operating margin of 11.3%. The company issued narrowed guidance to EPS of $3.53-3.57 from $3.50-3.60 versus which is in with expectations. The company also announced changes to its executive leadership team that will help the company accelerate its turnaround. Bill Veghte, HP's chief operating officer, will become executive vice president and general manager of the HP Enterprise Group, a role that will now include responsibility for the coordinated development of the company's portfolio of cloud solutions. Dave Donatelli will take on a new role focused on identifying early-stage technologies as he did successfully with 3PAR and 3Com. In a separate organizational move, HP will combine its Marketing and Communications organizations under the leadership of Chief Communications Officer Henry Gomez.

Conference Call Notes:

From macroeconomic standpoint management sees a continued weak enterprise spending environment, challenges in Europe, and softness in China; also seeing acceleration in shift to the cloud and mobility.
The company was able to bring cash conversion cycle down to 18 days versus 27 days in the prior year.
The company lowered operating net debt by $1.7 bln to $1.2 bln; debt is now at pre-Autonomy levels and approaching goal of $0. $3.4 bln U.S. Department of the Navy's Next Generation Enterprise Network contract is being contested, however, the company is confident in the Navy's ultimate selection of HP.
Management sees continued PC market contraction, but relative strength and market share gains in growth markets such the Asia Pacific. Management reiterated that total company year over year revenue growth in 2014 is unlikely but remains confident in the progress of the turnaround plan.
The company spent just $3 mln on repurchasing 168k shares during the quarter; material non-public information prevented buybacks; co plans to ramp up spending on repurchases in Q4; ~$8 bln remains of share repurchase authorization.

Semtech (SMTC) reported second quarter earnings of $0.52 per share, which is better than expected, while revenues rose 9.5% year/year to $165.01 million which is line with expectations. The company issued guidance for the third quarter with EPS of $0.31-0.37, excluding non-recurring items, which is below expectations with revenues of sees Q3 revs of $135-145 million which is below expectations. "We expect our Q3 results to be negatively impacted by both a reduction in demand and inventory corrections at several of our largest smartphone customers. We anticipate that this weakness will continue through most of the second half. However, we remain confident in our ability to manage through any short term demand fluctuations as we head towards our $1 billion revenue goal.

Synopsys (SNPS) reported third quarter earnings of $0.55 per share, excluding non-recurring items,which is better than expected, while revenues rose 8.8% year/year to $482.9 million which is line with estimates. The company issued guidance for the fourth quarter of $0.54-0.56, excluding non-recurring items, which is line with consensus and revenues of $500-510 million which is below expectations.
icon url

ReturntoSender

08/24/13 9:17 PM

#10305 RE: ReturntoSender #6755

From Briefing.com: Weekly Recap - Week ending 23-Aug-13

Dow +46.77 at 15010.51, Nasdaq +19.08 at 3657.79, S&P +6.54 at 1663.50

The major averages registered modest gains and the S&P 500 retook its 50-day moving average. All ten sectors ended in positive territory after a final-hour surge pulled today's underperformers into the green. For the week, the S&P added 0.3%, Nasdaq rose 1.4%, and the Dow shed 0.6%.

Stocks spiked at the open with the technology sector leading the way after Microsoft (MSFT 34.75, +2.36) announced Chief Executive Officer Steve Ballmer will retire from the company within a year. Shares of the software company surged 7.3%, contributing to the outperformance of the Nasdaq, which gained 0.5%.

The S&P followed the opening surge with a brief slip into the red after it was reported that new home sales collapsed in July, falling 13.4% to 394,000 from a downwardly revised 455,000 (from 497,000) in June. The Briefing.com consensus pegged new home sales at 485,000. In terms of percentage, the drop in sales was the largest since May 2010 and brought levels down to their lowest point since October 2012.

Home builders tumbled in reaction to the data and the iShares Dow Jones US Home Construction ETF (ITB 21.07, -0.55) lost 2.5%. This weighed on the discretionary sector, which ended with a razor-thin gain of 0.02%.

Discretionary shares were also pressured by retailers. The SPDR S&P Retail ETF (XRT 78.89, -0.25) lost 0.3% after Aeropostale's (ARO 8.76, -2.22) earnings report continued the recent trend of disappointing results from teen apparel retailers.

Recent weeks have entertained much discussion over when the Federal Reserve will begin cutting back the pace of its asset purchases. While comments from many Fed speakers have suggested the first taper may occur as early as September, their remarks have often included reminders that the Fed intends to remain data-dependent. To that end, today's new home sales report revealed a notable drop-off in sales, which speaks against tapering in the immediate term.

Treasuries, foreign exchange, and precious metals appeared to agree with this assessment as the benchmark 10-yr yield fell seven basis points to 2.82%. The dollar weakened in the wake of the report while gold futures surged 1.9% to $1396.70 per troy ounce. Meanwhile, silver futures spiked 4.3% to $24.04 per troy ounce.

Today's sector leadership was a bit scattered. Three cyclical groups--energy (+0.7%), materials (+0.9%), and technology (+0.6%)--outperformed throughout the day while the remaining three--consumer discretionary (+0.02%), financials (+0.1%), and industrials (+0.1%)--traded in the red until the closing surge.

With regard to countercyclical sectors, rate-sensitive consumer staples (+0.6%), telecom services (+1.4%), and utilities (+0.8%) rallied in reaction to the retreat in yields while health care (+0.2%) lagged.

Today's trading volume was well below average, and with 572 million shares traded at the NYSE, today's total was one million below the tally from yesterday's session that included a three-hour halt of all Nasdaq-listed issues.

On Monday, July durable orders will be reported at 8:30 ET.

Week in Review: Stocks Chop as Rates Climb

Monday marked the beginning of a new week for the stock market, yet the story played out much the same way it did during the prior week. Long-term rates continued to rise, the stock market continued to sink, and trading volume remained light. The major averages were mixed and little changed for much of the session, but they broke down in late trading as the technology sector gave up its leadership post and other sectors bowed to selling interest. There wasn't a specific news catalyst for the late-day breakdown, which led some to conclude it was a function of technical factors at work. Outside of some specific names, buyers didn't want much to do with the market. The stocks that benefited were familiar names like Boeing (BA 105.48, +0.34), Johnson & Johnson (JNJ 88.41, +0.81), Google (GOOG 870.21, -3.50), and Apple (AAPL 501.02, -1.94).

On Tuesday, the S&P 500 settled higher by 0.4% to snap its streak of four consecutive losses. Small caps outperformed as the Russell 2000 rose 1.5% after registering five declines in a row. Unaffected by another round of losses across emerging markets, stocks climbed at the open, but gains were limited as the S&P could not retake its 50-day moving average. The benchmark index made a brief midday appearance above the key level before spending the entire afternoon just below it. A retreat in Treasury yields contributed to the relative strength of equities as the benchmark 10-yr yield fell seven basis points to 2.82%. The pullback in yields helped rate-sensitive sectors such as telecom services (+0.5%), utilities (+0.8%), and home builders. The iShares Dow Jones US Home Construction ETF added 3.1% as most major builders gained between 2.0% and 4.0% apiece.

Wednesday's session saw the S&P 500 settle lower by 0.6% despite making a brief appearance in positive territory following the release of the FOMC minutes. Although the minutes from the July meeting offered few changes from prior statements, they did indicate broad support for Chairman Bernanke's timeline, which would likely call for tapering as early as September. However, this was coupled with cautious comments regarding the labor market as the minutes noted, "The June employment report showed continued solid gains in payrolls. Nonetheless, the unemployment rate remained elevated, and the continuing low readings on the participation rate and the employment-to-population ratio, together with a high incidence of workers being employed part time for economic reasons, were generally seen as indicating that overall labor market conditions remained weak." Overall, the minutes did not provide a clear-cut signal regarding the Fed's tapering schedule and the mixed reaction across markets suggests a certain level of uncertainty remains present. The reaction in Treasuries was consistent with expectations of tapering in the near-term as the benchmark 10-yr yield jumped four basis points to 2.86%. The selling had the biggest impact on the belly of the curve as the 5-yr yield jumped more than 6 bps to 1.606%. However, the yield still managed to close just below Monday's two-year high.

On Thursday, the major averages registered gains across the board, but a three-hour halt of all Nasdaq-listed issues prevented normal trading from taking place throughout the afternoon. Stocks climbed out of the gate after upbeat survey data from China and the eurozone reassured investors. China's HSBC Manufacturing PMI jumped to 50.1 from 47.7 (48.3 expected) while the eurozone Manufacturing PMI improved to 51.3 from 50.3 (50.8 forecast). In addition, the Services PMI reading rose to 51.0 from 49.8 (50.2 expected). The economic data provided a boost to growth-sensitive sectors as five of six cyclical groups registered gains larger than 1.0%. The technology sector lagged with an advance of 0.5%. The largest sector component, Apple, ended little changed and Dow member Hewlett-Packard (HPQ 22.40, +0.18) endured its worst session in two years, falling 12.5%, after reporting in-line results and saying it is unlikely to experience revenue growth in 2014.
Index Started Week Ended Week Change % Change YTD %
DJIA 15081.47 15010.51 -70.96 -0.5 14.5
Nasdaq 3602.78 3657.79 55.01 1.5 21.1
S&P 500 1655.83 1663.50 7.67 0.5 16.6
Russell 2000 1024.30 1038.24 13.94 1.4 22.2

This week's top 20 % gainers

Technology: TSL (9.44 +29.89%), CSIQ (13.16 +18.98%), SOL (4.62 +17.74%), NTES (75.42 +17.18%), QIHU (73.13 +16.5%), YGE (4.28 +15.43%), SUNE (7.83 +14.37%)
Services: TUES (13.9 +26.79%), BBY (35.08 +14.25%), NXST (36.11 +13.8%)
Industrial Goods: TASR (11.39 +16.02%)
Healthcare: INCY (34.76 +30.3%), INSY (30.92 +20.36%), INSM (13.57 +15.21%), CLDX (23.59 +15.15%), CGEN (9.98 +15.03%), XOMA (4.42 +14.5%)
Financial: LTS (1.84 +14.2%)
Basic Materials: PLG (1.19 +13.73%), ALJ (13.01 +13.65%)

This week's top 20 % losers

Technology: TLK (39.09 -14.59%), HPQ (22.4 -14.37%), OIBR (1.6 -13.71%), NTLS (16.28 -11.19%)
Services: LITB (9.86 -49.21%), ANF (38.67 -21.13%), BKS (13.99 -19.31%), SPLS (14.2 -15.9%), ARO (8.75 -12.16%), SSI (19.94 -11.98%)
Industrial Goods: GFA (2.61 -12.78%)
Healthcare: MNKD (5.52 -11.3%)
Financial: IBN (27.67 -13.16%), CYS (7.57 -11.52%), ARR (3.98 -9.6%)
Consumer Goods: TTM (23.61 -9.86%)
Basic Materials: CIE (24.52 -16.67%), ANW (8.65 -15.58%), GFI (5.65 -12.42%), HMY (4.01 -9.7%)

Large Cap Gainers

MSFT (34.08 +5.20%): CEO Steve Ballmer to retire within the next 12 months
FB (39.99 +3.74%): Reiterated with an Overweight rating and $44 price target at JP Morgan; mentioned positively at ITG
PBR (14.85 +3.41%): Brazil's central bank has announced a new $60 bln currency intervention program

Large Cap Losers

LOW (46.85 -1.14%): Weakness following disappointing July New Home Sales data
GPS (41.65 -0.86%): Reported Q2 earnings of $0.64 per share (in-line), revs rose 8.1% yoy to $3.87 bln vs $3.81 bln estimate; comparable store sales +5% vs +4% in prior year; sees FY14 EPS of $2.57-2.65 vs $2.78 estimate
BIDU (138.47 -0.77%): Signed agreement with Renren (RENN) for strategic investment in Nuomi

Mid Cap Gainers

ADSK (39.72 +9.92%): Beat quarterly EPS by $0.03 ($0.45 vs $0.42 estimate), revs fell 1.2% yoy to $561.7 mln vs $560.57 mln estimate; sees Q3 EPS of $0.36-0.40 vs $0.50 estimate, revs of $540-555 mln vs $580.94 mln estimate; upgraded to Buy from Neutral at B. Riley & Co
DAR (20.97 +8.54%): To acquire the Rothsay rendering business from Maple Leaf Foods for ~C$645 mln in cash
EXPE (49.14 +5.75%): Announced strategic marketing agreement with Travelocity

Mid Cap Losers

P (19.17 -11.7%): Beat quarterly EPS by $0.02 ($0.04 vs $0.02 estimate), revs rose 55.4% yoy to $157.4 mln vs $155.71 mln estimate; total listener hours grew 18% to $3.88 bln; sees Q3 EPS of $0.03-0.06 ex items vs $0.08 estimate, revs of $174-179 mln; sees FY14 EPS of $0.00-0.05 ex items vs $0.05 estimate, revs of $640-655 mln; downgraded to Market Perform from Outperform at Raymond James; downgraded to Hold from Buy at Stifel
MRVL (12.23 -5.63%): Beat quarterly EPS by $0.04 ($0.23 ex items vs $0.19 estimate), revs fell 1.1% yoy to $807 mln vs $791.3 mln estimate; sees Q3 EPS of $0.23-0.27 ex items vs $0.24 estimate, revs of $850-890 mln vs $845.23 mln estimate;
DHI (18.63 -3.40%): Weakness in home builders following disappointing July New Home Sales data

12:02PM Netflix pops to new session high of 275.66 to break above the early week multi-year high. (NFLX) 275.01 +5.26

10:02AM Plug Power awarded a $650,000 contract from the U.S. Dep. of Energy to demonstrate the use of hydrogen-based fuel cells to power the refrigeration units in semi-trailer trucks that transport perishable and frozen foods (PLUG) 0.43 +0.01 :

7:31AM Qualcomm signs definitive agreement to sell its North and Latin American transportation and logistics business to Vista Equity Partners for $800 mln in cash (QCOM) 67.13 : Co announced that it has signed a definitive agreement to sell Omnitracs, a subsidiary of Qualcomm, to Vista Equity Partners, a U.S.-based private equity firm. Subject to the terms and conditions of the definitive agreement, Vista will purchase Omnitracs for $800 million in cash. The acquisition will include all of Omnitracs operations in the United States, Canada and Latin America, including Sylectus and FleetRisk Advisors, which were acquired by Omnitracs in 2011.

2:01AM Advanced Micro announces proposed sale and lease-back of Singapore Facility to Sabana Shari'ah Compliant Industrial Real Estate Investment Trust (AMD) 3.63 : Co announces that its Singapore subsidiary has entered into a conditional put-and-call option agreement to sell and lease-back its Singapore facility located at 508 Chai Chee Lane, Singapore 469032 to HSBC Institutional Trust Services, in its capacity as trustee of Sabana Shari'ah Compliant Industrial Real Estate Investment Trust.

The transaction is expected to generate proceeds of ~59 million Singapore dollars ($46 million), net of all fees, which will be reflected in AMD's third quarter 2013 financial statements when reported on Oct. 17, 2013. AMD expects to record a gain of ~$16 million in the third quarter of 2013.

1:42AM Plug Power sells 123 Hydrogen-based GenDrive Fuel cells to Mercedes Benz (PLUG) 0.42 : Co announces that Mercedes-Benz US International has ordered 123 additional hydrogen-based GenDrive fuel cell units to power new forklift trucks for its material handling fleet at a logistics hub now under construction in Tuscaloosa, Alabama.

Microsoft (MSFT $35.13 +2.73) announced that Chief Executive Officer Steve Ballmer has decided to retire as CEO within the next 12 months, upon the completion of a process to choose his successor. In the meantime, Ballmer will continue as CEO and will lead Microsoft through the next steps of its transformation to a devices and services company.

The Board of Directors has appointed a special committee to direct the process. This committee is chaired by John Thompson, the board's lead independent director, and includes Chairman of the Board Bill Gates, Chairman of the Audit Committee Chuck Noski and Chairman of the Compensation Committee Steve Luczo. The special committee is working with Heidrick & Struggles International and will consider both external and internal candidates.

07:36 am Marvell shares rise 1% following better than expected earnings
Marvell (MRVL $13.05 +0.09) reported second quarter earnings of $0.23 per share, excluding non-recurring items, which is better than expected, while revenues fell 1.1% year/year to $807.1 million which is better than expected. The company issued third quarter guidance with EPS of $0.23-0.27, which is line with estimates, with revenues of $850-890 million which is above expectations.

Management expects viral mobile and wireless end markets to grow double digits sequentially. In Q2 storage was better than expected, mobile and wireless was in-line, and networking was below expectations. The company continues to gain share in HDDs and SSDs and remains committed to returning cash to shareholders through dividends and buybacks.

07:35 am AutoDesk shares rise 2% following better than expected earnings
Autodesk (ADSK $36.75 +0.62) reported second quarter earnings of $0.45 per share, which is better than expected, while revenues fell 1.2% year/year to $561.7 million which is in line with expectations. Non-GAAP operating margin decreased by approximately 100 basis points to 24 percent, compared with 25 percent in the second quarter of fiscal 2013. Deferred revenue increased 7 percent to $806 million, compared to the second quarter of fiscal 2013. The company issued guidance for the third quarter with EPS of $0.36-0.40 versus which is below expectations, revenues of $540-555 which is below expectations.

"Our second quarter was marked by strength in our Architecture, Engineering and Construction (AEC) business segment and continued growth in suites," said Carl Bass, Autodesk president and CEO. "Growth in these vital areas was offset by mixed contributions from other parts of the business. On the product side, we strengthened and expanded our leading product portfolio with new desktop, cloud and mobile offerings."

Mentor Graphics (MENT) reported second quarter earnings of $0.26 per share, excluding non-recurring items, which is better than expected, while revenues rose 5.1% year/year to $253.2 million which better than expected. Mentor Graphics increases share repurchase program. The company issued guidance for this third quarter with EPS of $0.19, which is better than expected, with revenues of $260 million which is better than expected. The company raised fiscal year 2014 with EPS of $1.59, excluding non-recurring items, up from $1.55, which is above expectations, with revenues of $1.155 billion which is line with expectations.
icon url

ReturntoSender

08/25/13 6:56 PM

#10306 RE: ReturntoSender #6755

InvestmentHouse Weekend Market Summary - New Home Sales Tumble

http://www.investmenthouse.com/weekendmarketsummary.htm

- Decent end to the week continues the bounce started Tuesday, though some fare better than others in on again, off again bounce.
- New Home sales Tumble in a perhaps not so surprising miss.
- Fed speakers talk out of both sides of the taper.
- Gallup reports higher unemployment.
- New Fed chair faces new normal lower GDP.
- Relief bounce continues, leaders still solid, but the move is still a relief bounce.

Relief bounce continues.

Tuesday the relief bounce was on for all indices, Wednesday it was not. Thursday it was back on. Friday it was on, but more on for some indices than for others.

SP500 6.54, 0.39%
NASDAQ 19.08, 0.52%
DJ30 46.77, 0.31%
SP400 0.14%
RUTX 0.20%
SOX flat

Early in the week and on Thursday, growth indices moved better. Friday the large caps, both NASDAQ and NYSE, were favored. That was not necessarily a good thing for the market even if it suggested the move broadening out. As the larger caps improved the smaller issues didn't look all that good, at least in terms of their index patterns.

SP400 bumped the 10 day EMA with a hangman doji. It is trying to get up to its gap down point from two weeks back, but Friday it was tougher trekking.

Russell 2000 broke through the 20 day EMA and is at the lower gap point from two weeks back. Still looking for a gap fill before this move fizzles. A bit better than the midcaps but just a bit better. At least the bounce is going according to plan.

SOX was rather disappointing. It didn't want to move higher until Thursday as it gapped and ran. Friday it had to come back from losses to close flat. Holding where it needed to but it didn't lead the move higher. It started with its hold of support as the other indices were still falling, but it could not convert that into upside leadership.

NASDAQ was not bad with a gap back into the uptrend. After the 3 hour Thursday hiatus some volume returned as NASDAQ rallied. That works.

SP500 gapped and rallied through the 50 day EMA. Still on the bounce that for SP500 really started Thursday given Wednesday it gave up all of the Tuesday upside and a bit more. Still room to run up to the gap point (lower at 1679 or 16 points).

DJ30 posted its second upside session after a nasty fall the prior two weeks. Definitely relief here.

Overall yes the market is bouncing. The index patterns, however, still suggest nothing more than a relief move. Not a lot of power on the move and that can be okay as it does not shoot its ammo up in a couple of moves. The patterns, however, as noted, just don't scream a major break higher.

Leadership is interesting in its contrast. Still plenty of stocks in good positions to move higher and many that are moving higher. Others are coming up off of selloffs that brought them to key support. We have a few of those stocks on the report for a rally back up in some well defined trading ranges. DO, RL, LPX are a few that are in position to roll back up in ranges. ANSS, ININ, SLB and many others are in position to run higher while others are on good moves.

The leadership versus index pattern dichotomy is indeed curious. Typically when there are many leaders moving the market reflects this. Problem is, the large cap indices are dominated by the big names and those indices move with those names. Thus the irony when those issues are struggling in their businesses and thus stock patterns when our economy the past 5 years has been geared to benefit them. Now THEY are having a hard time and that is hurting the action of the large cap indices.

THUS . . . the action remains a relief bounce until further notice. A relief bounce with A LOT of nice looking upside plays, but a relief bounce all the same. Until the leaders break up the negative of the index patterns will we turn off the 'relief bounce only' sign. The beauty is, if these leaders do change the character of the rebound then we profit handily from that.

The News.

July New Home sales tumbled 13.4% to just 394K annualized, well off the 485K expected and 455K prior (revised down from 497K). Largest drop since May 2010 and now at the lowest since 10/12.

The cause? A confluence of calamities for the economy. The 30 year mortgage hit a 2 year high as the Fed, who wanted a little inflation, is losing control of interest rates. Affordability just tanked and inventories jumped 4.3% to a 5.2 month level up from 4.0 months.

Then there is employment. Gallup reported Friday its rate at 8.6% for August, surging from 7.8% in July. Under-employed is at 17.7%. By the way, the 8.6% rate is the highest since 8.7% in March 2012. Last week more jumped on the 'story' that part-time jobs were the new normal for the US jobs market. The administration denies it is the healthcare act causing it, but with UPS said it had to drop 15K spouses from health insurance in order to save $60M in INCREASED costs since the healthcare law came into effect, it is pretty clear the healthcare law is indeed impacting how jobs are created and manned.

It only makes sense; it is how economics and regulation interact. Remember when Congress passed a bill prescribing fees on ATM transactions? Banks simply switched the fees to debit card usage. Basic economics.

The Fed is still trying to act as if a September taper is something that is still just a possibility. Bullard said there was no need to hurry in a taper. Lockhart, however, said he was 'comfortable' with a September taper if the economic data remained good enough.

You know what? I can guarantee you the economic data will be good enough barring an absolute implosion in the economy. The Fed, mainly Bernanke, is desperate to get out of the QE business. Fear of inflation talk is starting on the Fed as the Wednesday minutes reported. THAT IS ALWAYS the sure indication the Fed is going to end any easy money policy.

Bloomberg could not resist moving into the argument, opining as to the new Fed chairman's predicament of handling the sub-new normal GDP growth of 1.75%. Of course is that the Fed's business? Is the Fed really needed for anything? All it has done in the past fifty years is reduce our currency to a shell of what it once was. A currency is strong and at the 'right level' when your economy is strong, your markets open, your laws just and justly enforced. When that occurs people from all over the world want to put money into your economy and your economy grows, throws off excellent jobs, and your currency is strong and your citizens are happy and prosperous.

Are we there right now? Tens of thousands, yeah verily, hundreds of thousands of new regulations in the past five years, trillions of stimulus dollars (fake money) printed and spent, food stamps paid to 50M people, fewer working age people working now than four years ago, laws not uniformly enforced (healthcare law waived for businesses and Congress but not individuals, DOJ sues Texas for requiring voters to produce ID showing they are who they say so as not to cheapen the vote of each citizen yet the DOJ does not pursue club wielding thugs as voting precincts), etc, etc. The antithesis of what attracts capital. Singapore attracts more capital, new companies, and new money than the US now.

Oh well. I am not feeling well this weekend and this discussion is not helping. It is, however, a discussion that needs to be had because we are going headlong into history as another Rome without any substantive debate other than name calling.

THE MARKET

TECHNICAL SUMMARY

INTERNALS

NASDAQ
Stats: +19.08 points (+0.52%) to close at 3657.79
Volume: 1.488B (+63.16%)

Up Volume: 1.02B (+260.8M)
Down Volume: 440.57M (+277.97M)

A/D and Hi/Lo: Advancers led 1.13 to 1
Previous Session: Advancers led 3.54 to 1

New Highs: 95 (+95)
New Lows: 16 (+16)

S&P
Stats: +6.54 points (+0.39%) to close at 1663.5
NYSE Volume: 533.022M (+2.9%)

A/D and Hi/Lo: Advancers led 2.3 to 1
Previous Session: Advancers led 4.12 to 1

New Highs: 86 (-14)
New Lows: 116 (-71)

DJ30
Stats: +46.77 points (+0.31%) to close at 15010.51

SENTIMENT INDICATORS

VIX: 13.98; -0.78
VXN: 14.62; -0.82
VXO: 13.91; -0.81

Put/Call Ratio (CBOE): 0.81; -0.01

Bulls and Bears:

Bulls faded again, getting back down near the late June levels. Bears rose but are still basically in eh long flat range of the past five months. Not really showing any extremes.

Bulls: 43.3%. Trending lower after holding all around 50 for a month. Back down to the early July, late June levels. 48.4% versus 51.5% versus 52.1% versus 46.9% versus 43.8% versus 41.7% versus 46.8% versus 43.8% versus 45.8% versus 52.1% versus 54.2% versus 52.1% versus 47.9% versus 44.3% versus 47.4% versus 50.5%.

Background: Undercut 35%, the threshold for bullishness, in early June. As noted, hit 34% in early June. It did its job and the market is on the rally. Hard drop to 34 from 39.3% as economic reality and a choppy stock market hit. Off the 55+ level hit in late February. That was the highest level since April and May of 2011, the peak of the post-bear market high. 35% is the threshold level suggesting bullishness. To be seriously bearish it needs to get up to the 60% to 65% level.

Bears: 21.6%. UP from the 20 level held for three weeks, but well below the highs form late June and early July. Not in any position to propel a big upside move. 19.6% versus 19.6% versus 19.8% versus 22.9% versus 25.0% versus 21.9% versus 22.9% versus 20.8% versus 19.8% versus 19.8% versus 19.8% versus 18.8% versus 19.6% versus 20.6% versus 20.6% versus 19.4% versus 19.6% versus 18.6% versus 18.8% versus 21.1% versus 21.1% versus 22.1% versus 21.1% versus 21.1% versus 22.3% versus 22.3% versus 23.4% versus 24.5% versus 24.5% versus 23.4% versus 25.5% versus 27.7% versus 27.7% versus 28.7% versus 27.7%.

Background: Over 35% is the threshold to be really be a good upside indicator. For reference, bearishness hit a 5 year high at 54.4% the last week of October 2008. The move over 50 took bearish sentiment to its highest level since 1995. Extreme negative sentiment. Prior levels for comparison: Bearishness peaked at 37.4% in September 2007. It topped the June 2006 peak (36%) on that run. That June peak eclipsed the March 2006 high (33%) and well above the 2005 highs that spawned new rallies (30% in May 2005, 29.2% in October 2005). That was a huge turn, unlike any seen in recent history.

MONDAY

The index patterns still look weak on the bounce but plenty of leaders look strong. The issue are stocks such as GOOG and AMZN that are lagging and thus holding the indices lower. It could be a money switch back to less well known names. We will see. It will require the less well known leaders we are seeing stepping up. Maybe they cannot move the entire market but can move themselves. If that is the case we make some great money on those leaders. We will be willing to again put some money to work on a continued move but still in the context of a relief bounce.

Have a great weekend!

Support and resistance

NASDAQ: Closed at 3657.79

Resistance:
3716 is the upper channel line for the November 2012 to present uptrend.
Next major resistance is around 4100 as NASDAQ hits 13 year highs

Support:
The July 2013 intraday high at 3625
3634 is the November 2012 up trendline
The 50 day EMA at 3570
3532 is the May intraday high
3521 is the August 2000 low.
3502 is the May 2013 closing high
The 2011 up trendline at 3346
3295 is the June 2013 low selloff
The 200 day SMA at 3282
3227 is the April 2000 intraday low
3197 is the September 2012 post-bear market high
3171 is the October intraday high

S&P 500: Closed at 1663.50

Resistance:
1687 is the May high and post-bear market high
The November up trendline at 1745

Support:
The 50 day EMA at 1661
1654 is the June 2013 peak
1576 from October 2007, the prior all-time high
1569.48 is the 78% Fibonacci retracement of the April to May 2013 run
1560 is the June 2013 reversal low
1556 from July 2007
The 200 day SMA at 1556
1541 is the April 2013 closing low in that pullback inside the uptrend
1539 from June 2007
1531 is the recent high
1499 from January 2008
1475 is the September 2012 high
1471 is the October 2012 intraday high
1466 is the September 2012 closing peak and rally closing high
1440 from November 2007 closing lows

Dow: Closed at 15,010.51

Resistance:
The 50 day EMA at 15,243
15,318 is the June closing high
15,542 is the May 2013 intraday high

Support:
14,888 is the April peak and prior all-time high
14,844 is the June intraday low
14,551 is the June 2013 intraday low on the selloff (14,659 closing)
The 200 day SMA at 14,384
14,198 from the October 2007 high
14,149 is the February 2013 high
14,022 from 7-07 peak
14,010 from the early February 2013 consolidation

Economic Calendar

August 23 - Friday
- w Home Sales, July (10:00): 394K actual versus 485K expected, 455K prior (revised from 497K)

August 26 - Monday
- Durable Orders, July (8:30): -5.0% expected, 3.9% prior (revised from 4.2%)
- Durable Goods -ex tr, July (8:30): 0.6% expected, -0.1% prior (revised from 0.0%)

August 27 - Tuesday
- Case-Shiller 20-city, June (9:00): 12.0% expected, 12.2% prior
- Consumer Confidence, August (10:00): 77.0 expected, 80.3 prior

August 28 - Wednesday
- MBA Mortgage Index, 08/24 (7:00): -4.6% prior
- Pending Home Sales, July (10:00): 0.2% expected, -0.4% prior
- Crude Inventories, 08/24 (10:30): -1.428M prior

August 29 - Thursday
- Initial Claims, 08/24 (8:30): 330K expected, 336K prior
- Continuing Claims, 08/17 (8:30): 2969K expected, 2999K prior
- GDP - Second Estimate, Q2 (8:30): 2.1% expected, 1.7% prior
- GDP Deflator - Second Est., Q2 (8:30): 0.7% expected, 0.7% prior
- Natural Gas Inventories, 08/24 (10:30): 57 bcf prior

August 30 - Friday
- Personal Income, July (8:30): 0.1% expected, 0.3% prior
- Personal Spending, July (8:30): 0.3% expected, 0.5% prior
- PCE Prices - Core, July (8:30): 0.2% expected, 0.2% prior
- Chicago PMI, August (9:45): 53.0 expected, 52.3 prior
- Michigan Sentiment - Final, August (9:55): 80.0 expected, 80.0 prior
icon url

ReturntoSender

08/26/13 5:40 PM

#10307 RE: ReturntoSender #6755

From Briefing.com: 4:10 pm : Equities ended on their lows as the S&P 500 shed 0.4% while the Nasdaq settled flat.

The major averages held modest gains into the final hour of the session when comments from Secretary of State John Kerry regarding the situation in Syria contributed to broad-based selling. Mr. Kerry said additional information about the recent chemical attack is being compiled and will be made public. In addition, President Obama is expected to decide on the next step in the coming days.

The comments injected a bit of uncertainty and the CBOE Volatility Index (VIX 14.92, +0.94) jumped to a session high as downside protection received an afternoon surge in interest. However, the Treasury market did not see much of a safety bid as the complex remained confined to a narrow range. The benchmark 10-yr yield ended lower by two basis points at 2.79%.

The sharp move to session lows was exacerbated by the fact today's session saw very limited participation. With only 546 million shares changing hands on the floor of the New York Stock Exchange, today's total was the lowest since August 5.

Nine of ten sectors ended in the red with countercyclical groups leading to the downside. Consumer staples, telecom services, and utilities lost between 0.8% and 1.3% to continue their recent underperformance. As a result of today's losses, the three sectors are down between 4.0% and 5.3% this month.

The fourth countercyclical group, health care, managed to outperform its defensively-oriented peers and finish in the lead with a gain of 0.1%. The sector was underpinned by biotechnology after Amgen (AMGN 113.75, +8.15) made an offer to acquire Onyx Pharmaceuticals (ONXX 123.49, +6.53) for $125 per share, representing a 5.6% premium to Friday's closing price.

Biotechnology companies also comprise a fair share of the Nasdaq. The iShares Nasdaq Biotechnology ETF (IBB 197.10, +4.05) rose 2.1%, and the relative strength of its components contributed to the outperformance of the Nasdaq.

All cyclical sectors ended in the red. The materials space outperformed, ending flat as gold miners advanced. The Market Vectors Gold Miners ETF (GDX 30.41, +0.27) climbed 0.9% while gold futures added 0.4% to $1401.80 per troy ounce. Meanwhile, silver futures surged 2.2% to $24.27 per troy ounce.

Today's economic data was limited to the July durable orders report. Overall, the report was not very encouraging. New orders for primary metals and machinery were both flat while orders for computers and electronic products declined 3.6%. Furthermore, nondefense capital goods orders, excluding aircraft -- a proxy for business investment -- fell 3.3% after a 1.3% increase in June. The kicker in terms of third quarter GDP implications is that shipments of nondefense capital goods orders, excluding aircraft, declined 1.5%.

Tomorrow, the June Case-Shiller 20-city Index will be reported at 9:00 ET and August Consumer Confidence will be released at 10:00 ET.DJ30 -64.05 NASDAQ -0.22 SP500 -6.72 NASDAQ Adv/Vol/Dec 1137/1.36 bln/1363 NYSE Adv/Vol/Dec 1249/546.2 mln/1785

MRVL (11.95 -1.97%): Reuters reporting that co's patent trial mistrial request has been denied

OCZ Technology Group (OCZ) and Mellanox Technologies (MLNX) have collaborated together to deliver flash I/O storage performance and complete fault tolerance to VMware (VMW) clusters on top of on-host server flash and hard disk drives.

Mellanox Technologies (MLNX) and Micron (MU) announced a collaborative solution to enable higher storage performance and efficiency for virtualized environments using VMware's (VMW) ESXi 5.1.

8:03AM First Solar sells Canadian Power Plants to GE-Alterra Partnership (GE); Terms were not disclosed. (FSLR) 38.97 : Co announced today that it has sold a collection of solar projects in Ontario, Canada, totaling 50 megawatts (MW) AC to an investment partnership led by GE (GE) unit GE Energy Financial Services. Terms were not disclosed. It is the first project transaction between First Solar and GE since their solar technology and commercial partnership was announced Aug. 6. The ABW Partnership raised debt for the acquisition, with The Manufacturers Life Insurance Company serving as agent and lead arranger. First Solar has completed construction of the power plants -- Amherstburg (10MWAC), Belmont (20MWAC) and Walpole (20MWAC) -- and has commissioned and energized them so they are providing power to the grid. First Solar will provide operations and maintenance services under long-term contracts. Output of the power plants will be sold to Ontario Power Authority under its Renewable Energy Standard Offer Program (RESOP), with 20-year power purchase agreements.


Symbol Last Change
Dow 14,946.46 64.05 (0.43%)
Nasdaq 3,657.57 0.22 (0.01%)
S&P 500 1,656.78 6.72 (0.40%)
10-Yr Bond 2.8050% 0.0130
NYSE Volume 0
Nasdaq Volume... 0

Indices: US - World | Most Actives
Advances & Declines
NYSE NASDAQ
Advances 1,701 (40%) 1,132 (44%)
Declines 2,370 (56%) 1,357 (52%)
Unchanged 131 (3%) 100 (4%)
Up Vol* 1,036 (39%) 686 (50%)
Down Vol* 1,573 (59%) 666 (48%)
Unch. Vol* 60 (2%) 22 (2%)
New Hi's 113 136
New Lo's 98 39


*in millions
more...


Most Actives
NYSE LAST CHANGE Nasdaq LAST CHANGE
BAC 14.49 0.55%
VXX 15.29 3.31%
GE 23.61 0.71%
F 16.41 0.24%
AMD 3.58 1.92%
FB 41.34 1.95%
MSFT 34.15 1.73%
CSCO 23.83 0.13%
SIRI 3.66 0.95%
TSLA 164.22 1.47%
icon url

ReturntoSender

08/29/13 7:10 PM

#10310 RE: ReturntoSender #6755

From Briefing.com: 4:20 pm : The S&P 500 added 0.2% as eight of ten sectors posted gains. The session kicked off on a lower note, but still managed to finish in positive territory despite an afternoon stumble.

Prior to the open, investors received the news that second quarter GDP was revised up to 2.5% from 1.7%. The Briefing.com consensus expected the reading to be revised to 2.1%. Real final sales were revised up to 1.9% from 1.3%.

Overall, the upward revision to GDP growth does not suggest that the underlying currents of weak growth are ending. Almost the entire upward revision came from a stronger-than-originally reported trade deficit, which is likely to reverse in the third quarter. That means the increase in GDP pulled potential growth from the third quarter into the second and was not the result of a strengthening economic situation.

Following the report, equity futures and Treasuries fell to their lows while the Dollar Index jumped to its high in a reaction consistent with increased tapering expectations. As the session dragged on, stocks displayed intraday strength, but slipped into the close while Treasuries erased their losses. The benchmark 10-yr yield slipped three basis points to 2.75%. For its part, the Dollar Index held its gains throughout the session, ending near 82.00.

Telecom services finished in the lead as the sector advanced 1.2%. Verizon (VZ 47.82, +1.26) provided considerable support after reports indicated the company has resumed talks with Vodafone (VOD 31.80, +2.39) about acquiring Vodafone's 45.0% stake in Verizon Wireless.

Technology also displayed notable strength as top-weighted components like Google (GOOG 855.43, +6.88) and Microsoft (MSFT 33.55, +0.53) climbed 0.8% and 1.6%, respectively. High-beta chipmakers also rallied as the PHLX Semiconductor Index rose 1.2%.

The outperformance of technology combined with strength among biotechnology companies helped the Nasdaq (+0.8%) finish well-ahead of the broader market. Today's advance helped the tech-heavy index trim its August loss to 0.2%.

Equities slipped during the final hour of action amid comments from St. Louis Fed President Jeffrey Lacker who said, "Conditions for tapering QE have been met." Technical factors may have also played a part in the afternoon retreat as the S&P was pressured back below its 100-day moving average, where it settled.

On the downside, energy (-1.1%) and utilities (-0.5%) were the only two decliners. Weighing on energy shares was crude oil, which tumbled 1.9% to $107.98 per barrel. Meanwhile, high-yielding utilities were unable to catch a bid even as traders moved back into Treasuries. With tomorrow being the final session of the month, the utilities space is poised to finish August behind the remaining nine sectors with a loss of 5.6%.

Participation remained light with trading volume rivaling that of Monday as less than 550 million shares changed hands on the floor of the New York Stock Exchange.

Looking back at today's remaining data, the initial claims level fell to 331,000 for the week ending August 24 from an upwardly revised 337,000 (from 336,000) for the week ending August 17. The Briefing.com consensus expected the initial claims level to drop to 330,000.

It seems that the initial claims level has stabilized at roughly 330,000 following a volatile July when seasonal adjustment biases made it difficult to examine layoff trends. This level signifies a sizable reduction from where claims were at the beginning of the summer and suggests a solid improvement in labor conditions.

Tomorrow, July personal income, personal spending, and core PCE prices will all be reported at 8:30 ET. The August Chicago PMI report will cross the wires at 9:45 ET and the final reading of the August Michigan Consumer Sentiment Survey will be released at 9:55 ET.DJ30 +16.44 NASDAQ +26.95 SP500 +3.21 NASDAQ Adv/Vol/Dec 1801/1.29 bln/711 NYSE Adv/Vol/Dec 1940/547.2 mln/1064

3:30 pm :

A stronger dollar index following better-than-anticipated GDP data and initial claims confirming a strengthening labor market put pressure on crude oil and precious metals
Precious metals traded in negative territory during all of today's floor trade. Dec gold dipped to a session low of $1402.10 per ounce and eventually settled with a 0.4% loss at $1412.60 per ounce. Dec silver pulled back from its session high of $24.49 per ounce and settled 1.3% lower at $24.13 per ounce
Oct crude oil declined for the first time in six sessions. It brushed a session high of $11.07 per barrel in late afternoon pit trade but sold off sharply to a session low of $108.40 per barrel moments before the close. It settled at $108.47 per barrel, booking a 1.5% loss
Natural gas fell from its session high of $3.65 per MMBtu into negative territory following inventory data that showed a build of 67 bcf when a smaller build of 62-63 bcf was anticipated. Despite dropping to a session low of $3.51 per MMBtu, it recovered back into the black and booked a 1.1% gain as it closed at $3.62 per MMBtu.

4:26PM OmniVision - Earnings Mover (OVTI) 18.41 +0.43 : Stock drops about 2.2 pts to $16.20 following earnings/guidance.

4:21PM OmniVision beats by $0.12, reports revs in-line; guides Q2 EPS in-line, revs in-line (OVTI) 18.41 +0.43 : Reports Q1 (Jul) earnings of $0.55 per share, excluding non-recurring items, $0.12 better than the Capital IQ Consensus Estimate of $0.43; revenues rose 44.8% year/year to $373.7 mln vs the $376.39 mln consensus.

Co issues in-line guidance for Q2, sees EPS of $0.36-0.53, excluding non-recurring items, vs. $0.50 Capital IQ Consensus Estimate; sees Q2 revs of $375-410 vs. $407.30 mln Capital IQ Consensus Estimate.

4:08PM Flextronics announces expiration of exchange offers for its 4.625% notes due 2020 and 5.000% notes due 2023 (FLEX) 9.03 +0.13 : The Exchange Offers expired at 11:59 p.m., New York City time, on August 28, 2013. 100% of aggregate principal amount of both series of notes were tendered and not validly withdrawn.

9:48AM Methode Electronics (+40%) surges to 12 year high after beat and raise (MEI) 24.69 +7.06 :

Ciena (CIEN) and Retelit Spa announced the deployment of Ciena's converged packet optical solutions to modernize Retelit's network and improve efficiency, latency and scalability.

Cabot Microelectronics (CCMP) announced that its Novus A7100 Aluminum CMP slurry products have been adopted by several leading edge customers to help enable 28/20 nanometer High-K Metal Gate integration schemes used for advanced logic devices.

09:02 am JA Solar's full year guidance of 1.7-1.9 GW remains unchanged
JA Solar (JASO) reported a Q2 loss of $0.58 per share, just slightly beating expectations. Revenues fell 9.2% year/year to $258.1 mln, also beating expectations.

Q2 Metrics:

Shipments were 463.7 MW, consisting of 253.9 MW of modules and module tolling, and 209.8 MW of cells and cell tolling, above the high end of the Company's previous guidance of 430 MW and an increase of 4.7% from the first quarter of 2013
Gross margin was 8.1%, compared to gross margin of 6.0% in the first quarter of 2013

Business Outlook

For the third quarter of 2013, the co expects total cell and module shipments to be between 450-470 MW
The company's full year guidance of 1.7-1.9 GW remains unchanged

08:56 am Monolithic Power target raised to $34 at Stifel: . Stifel raises their MPWR tgt to $34 from $32 after meeting with mgmt that were upbeat and focused on the co's continuing effort to transform itself from a consumer-centric business to a diversified analog mixed signal semiconductor supplier serving horizontal segments within the auto, communications and industrial end markets. From the discussions, it is apparent to us that MPS continues to experience solid momentum while penetrating new markets, even as it stabilizes its consumer business in 2013. Furthermore, they believe mgmt is very focused on building a successful brand by delivering disruptive solutions across all of its target markets.

Market Summary
[Edit]
streaming quotes: ON
Chart for NASDAQ Composite Index (^IXIC)
Chart for Dow Jones Industrial Average Index (^DJI)
Symbol Last Change
Dow 14,840.95 Up 16.44(0.11%)
Nasdaq 3,620.30 Up 26.95(0.75%)
S&P 500 1,638.17 Up 3.21(0.20%)
10-Yr Bond 2.7510% Down 0.0310
NYSE Volume 0
Nasdaq Volume... 0
Indices: US - World | Most Actives
Advances & Declines
NYSE NASDAQ
Advances 2,527 (61%) 1,787 (69%)
Declines 1,507 (36%) 717 (28%)
Unchanged 126 (3%) 95 (4%)
Up Vol* 1,790 (63%) 968 (74%)
Down Vol* 994 (35%) 332 (25%)
Unch. Vol* 55 (2%) 17 (1%)
New Hi's 39 86
New Lo's 117 34
*in millions
more...
Most Actives
NYSE LAST CHANGE
BAC 14.17 Up 0.35%
VXX 16.86 Up 2.31%
F 16.50 Up 3.00%
VZ 47.82 Up 2.71%
JCP 12.40 Down 2.82%
Nasdaq LAST CHANGE
VOD 31.80 Up 8.13%
FB 41.28 Up 1.81%
MSFT 33.55 Up 1.61%
DELL 13.75 Down 0.22%
INTC 22.06 Down 1.01%
icon url

ReturntoSender

09/02/13 12:42 AM

#10312 RE: ReturntoSender #6755

From Briefing.com: Weekly Recap - Week ending 30-Aug-13

Dow -30.64 at 14810.31, Nasdaq -30.43 at 3589.87, S&P -5.20 at 1632.97

The major averages ended August on a lower note as the S&P 500 shed 0.3% while the Nasdaq fell 0.8%. Small caps endured a rough session with the Russell 2000 falling 1.6%.

With the Labor Day weekend ahead and the likelihood of military action in Syria also looming, participation was very limited before quarterly MSCI rebalancing added more than a 100 million shares to the final volume tally as 768 million shares changed hands on the NYSE floor.

Equities fell to their lows midway through the session when Secretary of State John Kerry commented on the Syrian situation, implying the U.S. will act alone if necessary. The S&P followed its quick slide to lows with a recovery to its prior levels, where it settled.

Eight of ten sectors ended in the red with influential cyclical groups weighing on the broader market. Financials, technology, industrials, and discretionary shares lost between 0.5% and 0.7% with the discretionary sector leading to the downside.

Nearly all discretionary components posted losses. Home builders settled on their lows as the iShares Dow Jones US Home Construction (ITB 20.56, -0.40) fell 1.9%. Retailers also slumped as the SPDR S&P Retail ETF (XRT 77.88, -0.59) lost 0.8%. Big Lots (BIG 35.42, +0.78) bucked the trend among retailers, climbing 2.3% after reporting a bottom-line beat.

Elsewhere, the industrial sector succumbed to the pressure exerted by transportation companies as the Dow Jones Transportation Average fell 1.1%.

On the upside, consumer staples added 0.3% and the weakest sector of the month, utilities, tacked on a slim gain of less than 0.1%.

While buying interest was somewhat scarce, the CBOE Volatility Index (VIX 16.95, +0.14) rose 0.8% as participants demanded some downside protection. The near-term volatility measure ended August at its highest level since early July after starting the month near its 2013 lows.

Treasuries spent the session within a narrow range and the benchmark 10-yr yield slipped one basis points to 2.75%.

Reviewing today's economic data, personal income increased 0.1% in July, down from a 0.3% increase in June and exactly what the Briefing.com consensus expected. Employee compensation fell 0.2% as wages and salaries declined by 0.3%. That pullback was in-line with the July employment report, which showed aggregate earnings down 0.3% in July. The drop in compensation was offset by a 0.7% increase in receipts on assets, which was primarily driven by equity gains.

Spending levels were weak. Consumption grew 0.1% in July after increasing an upwardly revised 0.6% (from 0.5%) in June. The consensus expected personal spending to increase 0.3%.

The Chicago PMI increased to 53.0 in August from 51.6 in July. That was exactly what the Briefing.com consensus expected. Production levels weakened slightly as the index fell from 53.6 in July to 53.0 in August. The drop in production, however, was not related to a pullback in orders. New orders increased in August to 57.2, which is the highest level since May. Order backlogs remained in contraction for a third consecutive month, but improved from 42.9 in July to 46.5 in August.

Lastly, consumer sentiment was revised up to 82.1 in the final reading of the August University of Michigan Consumer Sentiment Index from 80.0 in the preliminary reading. The upward revision still leaves sentiment below the 85.1 reading in July. The Briefing.com consensus expected the Consumer Sentiment Index to remain at 80.0.

Week in Review: Concerns Surrounding Syria Resonate With Markets

On Monday, equities ended on their lows as the S&P 500 shed 0.4% while the Nasdaq settled flat. The major averages held modest gains into the final hour of the session when comments from Secretary of State John Kerry regarding the situation in Syria contributed to broad-based selling. Mr. Kerry said additional information about the recent chemical attack is being compiled and will be made public. The comments raised the expectations for a military operation, a concern participants grappled with throughout the week.

Tuesday saw the major averages settled on their lows after broad-based selling persisted throughout the session. Sellers were in control, reacting to the increased likelihood of U.S. military involvement in Syria. In addition, investors exhibited caution amid news indicating the debt ceiling will be reached in mid-October and that Congress has yet to begin budget negotiations ahead of the new fiscal year, which begins October 1. The S&P 500 fell 1.6% to end below its 100-day moving average for just the second time this year. Small caps endured even more selling as the Russell 2000 lost 2.4%. The Dow Jones Transportation Average fell 2.6% as airlines displayed significant weakness. Delta Air Lines (DAL 19.73, +0.09) and United Continental (UAL 28.46, -0.04) tumbled 5.7% and 7.2%, respectively.

Wednesday's session ended with the S&P 500 adding 0.3% to follow the Tuesday slide. Although the benchmark index advanced, it was unable to retake its 100-day moving average. Eight of ten sectors finished in positive territory with energy leading the way. The sector displayed significant strength, climbing 1.8%, after outperforming in the previous session. On a related note, crude oil rose past $109.40 per barrel to push its quarter-to-date gain to almost 12.0% amid increased tensions in the Middle East.

On Thursday, the S&P 500 added 0.2% as eight of ten sectors posted gains. The session kicked off on a lower note, but still managed to finish in positive territory despite an afternoon stumble. Prior to the open, investors received the news that second quarter GDP was revised up to 2.5% from 1.7%. The Briefing.com consensus expected the reading to be revised to 2.1%. Real final sales were revised up to 1.9% from 1.3%. Overall, the upward revision to GDP growth did not suggest that the underlying currents of weak growth are ending. Almost the entire upward revision came from a stronger-than-originally reported trade deficit, which is likely to reverse in the third quarter. That means the increase in GDP pulled potential growth from the third quarter into the second and was not the result of a strengthening economic situation. Following the report, equity futures and Treasuries fell to their lows while the Dollar Index jumped to its high in a reaction consistent with increased tapering expectations. As the session dragged on, stocks displayed intraday strength, but slipped into the close while Treasuries erased their losses. The benchmark 10-yr yield slipped three basis points to 2.75%. For its part, the Dollar Index held its gains throughout the session, ending near 82.00.
 
Index Started Week Ended Week Change %Change YTD %
DJIA 15010.51 14810.31 -200.20 -1.3 13.0
Nasdaq 3657.79 3589.87 -67.92 -1.9 18.9
S&P 500 1663.50 1632.97 -30.53 -1.8 14.5
Russell 2000 1038.24 1010.90 -27.34 -2.6 19.0

4:31PM Micrel expands clock and timing solutions and MEMS capabilities with acquisition of Discera; expected to be slightly dilutive in 2013 and neutral to slightly accretive in 2014 (MCRL) 9.20 -0.38 : Co announced it has signed a definitive agreement to acquire the business of Discera Inc., a leading provider of silicon timing solutions. The acquisition is intended to complement Micrel's high performance clock and timing products, as well as expand its MEMS (micro-electrical mechanical systems) capabilities. The transaction is expected to close in September of 2013. Micrel expects the acquisition will be slightly dilutive in 2013 and neutral to slightly accretive in 2014 on a GAAP basis.

Large Cap Gainers

CRM (49.74 +13.95%): Beat quarterly EPS by $0.02 ($0.09 vs $0.07 estimate), revs rose 30.7% yoy to $957 mln vs $938.8 mln; sees Q3 EPS of $0.08-0.09 vs $0.08 estimate, revs of $1.05-1.055 bln vs $1.04 bln estimate; sees FY14 EPS of $0.32-0.34 vs $0.32 estimate, revs of $4.00-4.025 vs $3.99 bln estimate; target raised at JP Morgan, Susquehanna, UBS, JMP Securities, Credit Suisse, Stifel, and Canaccord Genuity
TI (6.98 +9.06%): Upgraded to Outperform from Market Perform at Bernstein
APA (84.4 +7.32%): Co and Sinopec launched a global strategic partnership to pursue joint upstream oil and gas projects; upgraded to Outperform from Sector Perform at RBC Capital Markets

Large Cap Losers

NOK (3.87 -3.25%): Downgraded to Reduce from Neutral at Swedbank
TM (120.84 -2.46%): South African automotive industry strike continues; Bloomberg reporting that co and Volkswagen may increase their pay offer to union workers to help resolve the strike
SNY (48.17 -1.97%): Reuters reporting that L'Oreal may sell its stake in the company to fund acquisitions

Mid Cap Gainers

SPLK (54.44 +11.28%): Beat quarterly EPS by $0.02 (-$0.01 vs -$0.03 estimate), revs rose 50.3% yoy to $66.9 mln vs $63.04 mln estimate; sees Q3 revs of $69-71 mln vs $69.46 mln estimate; sees FY14 revs of $275-281 mln vs $274.85 mln estimate; upgraded to Outperform from Market Perform at FBR Capital, target raised to $61 from $48; target raised to $57 from $50 at JP Morgan; target raised to $55 from $50 at Needham
VIPS (43.63 +7.73%): Initiated with an Overweight at JP Morgan
CRI (74.73 +5.25%): Authorized new $400 mln accelerated share repurchase program with JP Morgan

Mid Cap Losers

NTES (71.51 -4.42%): Downgraded to Neutral from Overweight at JP Morgan
STM (7.93 -3.65%): Added to Least Preferred list at Citigroup
YOKU (23.22 -3.09%): Downgraded to Neutral from Overweight at JP Morgan

NVIDIA (NVDA) announced it is working with TWX's Warner Bros. Interactive Entertainment and WB Games Montreal to make Batman: Arkham Origins, the next installment in the blockbuster Batman: Arkham videogame franchise.

08:59 am OmniVision target lowered to $22 at Needham: . Needham lowers their OVTI tgt to $22 from $25 OVTI delivered an inline F1Q14 (July) quarter on the top line (beat on the bottom line due mainly to a one-time tax benefit), but guided F2Q14 (Oct) below expectations as competitive pricing in the low-end of the smartphone market adversely affected blended ASPs; specifically, China and unfavorable mix shift to HD sensors led to lower than expected revenue. While guidance reflects competitive pricing pressure and perhaps a clearing of excess inventory of low-end China featurephones, we believe the company remains well positioned in the CMOS sensor market given its exposure to multiple multi-year secular trends.

08:39 am ReneSola 14% Higher Pre-Market Following Earnings/Guidance Results
ReneSola (SOL) reported a Q2 loss of $0.24 per share, coming in better than expectations; revenues rose 62.0% year/year to $377.4 mln, also beating expectations. Total solar wafer and module shipments in Q2 2013 were 849.3 megawatts, representing an increase of 28.3% from 662.1 MW in Q1 2013.

The company issued upside guidance for Q3, sees Q3 revs of $360-380 mln, which is above expectations.

For Q3, the co expects total solar wafer and module shipments to be in the range of 730 MW to 750 MW, with solar module shipments expected to be in the range of 430 MW to 450 MW. Q3 revenues are expected to be in the range of US$360 million to US$380 million and gross margin is expected to be in the range of 7% to 9%.

For FY13, the co expects total solar wafer and module shipments to be in the range of 2.8 GW to 3.0 GW (up from 2.7-2.9 GW), with solar module shipments expected to be in the range of 1.6 GW to 1.8 GW (up from 1.4-1.6 GW)

In July 2013, the Company's polysilicon production was temporarily impacted by flooding conditions in Sichuan province. Third quarter polysilicon production output is expected to be in the range of 1100 MT to 1300 MT.

Last night after the close, Shanda Games (GAME) reported Q2 (June) earnings of $0.24 per share, $0.04 better than the consensus of $0.20; revenues fell 4.0% year/year to $175.6 million vs the $176.82 million consensus. The company stated that it currently expects its net revenues in the third quarter of 2013 to increase between 3-4% from the second quarter (approx $180-183 million vs. the consensus of $177 million), driven primarily by the successful launch of its mobile game "Million Arthur" in China. Mobile game revenues in the third quarter of 2013 are projected to grow approximately 50% from the second quarter and account for over 10% of total net revenues.

Altera's (ALTR) Board increased its share repurchase authorization by an additional 30 million shares to 41.1 million (or ~13% of the shares outstanding).

In M&A, Vodafone (VOD) confirmed it's in talks with Verizon (VZ) over its VOD's VZ Wireless stake, according to multiple reports.

Methode Electronics (MEI) reported Q1 (July) GAAP earnings of $0.36 per share, $0.16 better than the consensus of $0.20; revenues rose 40.9% year/year to $167.3 million vs the $148.85 million consensus. Consolidated gross margins as a percentage of sales improved to 20.3 percent in the Fiscal 2014 first quarter compared to 18.0 percent in the same period of Fiscal 2013 as a result of increased manufacturing efficiencies related to higher sales and vertical integration in the Automotive segment, as well as favorable raw material commodity pricing and product mix in the Power Products segment, partially offset by increased sales of products with a higher material content in the Interconnect segment. In addition, the company issued upside guidance for FY14, raising EPS to $1.40-1.60 from $1.91-1.11 vs. the $1.06 consensus and raised FY14 revs to $670-700 million from $630-660 million vs. the $653.28 million consensus.
icon url

ReturntoSender

09/03/13 5:33 PM

#10315 RE: ReturntoSender #6755

From Briefing.com: 4:15 pm : The S&P 500 added 0.4% after intraday weakness pressured the benchmark index below its 100-day moving average. Equities displayed broad strength at the open after global indices rallied yesterday while U.S. markets were closed for Labor Day. The early gains did not hold past the initial two hours as late-morning comments from House Speaker John Boehner and Majority Leader Eric Cantor served as a reminder that the option of military action in Syria remains on the table. Both Speaker Boehner and Mr. Cantor said they support the president's "call to action" with U.S. Congress scheduled to debate the issue next week.

Crude oil climbed off its overnight lows as the remarks from the two Congressional leaders provided an additional boost. The energy component rose 0.8% to $108.55 per barrel while the energy sector added 0.6%.

Elsewhere in the commodity complex, metals outperformed. Gold futures advanced 1.2% and silver futures spiked 3.4% to $1412.30 and $24.31 per troy ounce, respectively. In addition, copper jumped 2.4% to $3.312 per pound. As a result, the materials sector finished among the leaders with a gain of 0.6%.

Outside of the two commodity-linked sectors, financials (+0.8%) and discretionary (+0.8%) shares settled in the lead.

The Dow trailed behind the remaining averages as Microsoft (MSFT 31.88, -1.52) and Verizon (VZ 46.01, -1.37) pressured the price-weighted index. Microsoft fell 4.6% after the company agreed to acquire Nokia's (NOK 5.12, +1.22) Devices & Services business and its patents and mapping services for $5.44 billion. Meanwhile, Verizon lost 2.9% after announcing plans to purchase Vodafone's (VOD 32.01, -0.34) 45% stake in Verizon Wireless for $130 billion in cash and stock. The underperformance of Verizon weighed on the telecom services space (-1.8%) which settled behind the remaining nine sectors.

Treasuries slid to their lows in reaction to today's better-than-expected economic data, but ended off their worst levels as a safety bid trickled in during afternoon trade. Investors returned to the complex following the hawkish comments on the situation in the Middle East. After climbing above 2.91% early in the session, the benchmark 10-yr ended up 10 basis points at 2.85%.

Today's participation marked an improvement over most August sessions as nearly 800 million shares changed hands on the floor of the New York Stock Exchange.

The ISM Index for August improved to 55.7 from 55.4 in July. That was better than expected as the Briefing.com consensus estimate called for a modest decline to 53.4. This is encouraging news insomuch as it relates to the outlook for the manufacturing sector, yet some detail below the headline print indicates manufacturers are no more than cautiously optimistic.

The good news is that the new orders index fueled the improvement in August, rising to 63.2 from 58.3. Notwithstanding that pickup, the employment index decelerated to 53.3 from 54.4. In other words, new business prospects are in the pipeline, yet manufacturers aren't ramping up hiring to fill the new orders.

Construction spending increased 0.6% in July after being flat in June. The July number was pretty much in-line with expectations. The data for June, however, improved from the prior report, which showed a 0.6% decline.

Private construction spending was up 0.9% after declining 0.2% in June. That was paced by a pickup in nonresidential spending, which jumped 1.3% after declining 0.9% in June. Private commercial (+1.7%), manufacturing (+2.9%) and lodging (+6.1%) spending increased in July.

Tomorrow, the weekly MBA Mortgage Index will be released at 7:00 ET and the July trade balance will cross the wires at 8:30 ET. In addition, the Federal Reserve will release its September Beige Book at 14:00 ET.DJ30 +23.65 NASDAQ +22.74 SP500 +6.80 NASDAQ Adv/Vol/Dec 1644/1.57 bln/892 NYSE Adv/Vol/Dec 1640/787.1 mln/1365
3:35 pm : The commodities space was higher today despite a stronger dollar index. Strength came on continued tension in the Middle East with reports of an Israeli missle test in Syrian airspace. In addition, U.S. Speaker of the House John Boehner and Majority Leader Eric Cantor both said they support the president's "call to action" in Syria.

Oct crude oil rose for the first time in three sessions after coming off its session low of $107.01 per barrel and breaking into positive territory in morning pit action. It trended higher for the remainder of the session and settled at $108.57 per barrel, booking a gain of 0.7%.

Oct natural gas traded higher in a tight range between $3.64 and $3.68 per MMBtu. It eventually settled with a 2.5% gain at $3.67 per MMBtu.

Dec gold rose after three consecutive sessions of losses. It trended higher after lifting off its session low of $1391.40 per ounce set in early morning floor action and settled with a 1.2% gain at $1412.00 per ounce.

Dec silver outperformed the metals sector as it rose as high as $24.52 per ounce. It consolidated near the $24.45 per ounce level in afternoon pit trade and settled with a solid 4.0% gain at $24.43 per ounce.

4:13PM Freescale Semi announces launch of new financing under senior secured credit facilities (FSL) 14.16 -0.16 : Co announced that Freescale Semiconductor, Inc., its wholly owned indirect subsidiary, is seeking commitments for a new senior secured term loan facility under its existing senior secured credit facilities in an aggregate principal amount of up to $300,000,000. The proceeds from the new term loan are intended to be used to redeem, repurchase or otherwise acquire all of Freescale's outstanding 10.125% senior secured notes due 2018 and a portion of its 9.25% senior secured notes due 2018, and to pay related redemption premiums and fees. Freescale will pay for a portion of its expenses with cash on hand. The foregoing does not constitute a notice of redemption for any outstanding notes. The purposes of the transaction and the application of the proceeds are to extend a portion of Freescale's debt maturities and reduce interest expense. The new term loan facility would be effected as an amendment to Freescale's existing senior secured credit facilities subject to customary conditions.

1:27PM Floor Talk: August Review (TALKX) : August marked the worst month of the year for the major averages. The Dow, Nasdaq, S&P 500, and Russell 2000 all lost between 1.0% and 4.4%. The tech-heavy Nasdaq held up best (-1.0%) while the Dow led to the downside (-4.4%). Despite posting notable losses, the key indices continue to sport year-to-date gains of no less than 13.0%.

Selling interest hit all ten sectors as every group finished the month in the red for just the first time in 2013. The financial sector (-5.1%) endured the worst month while materials (-0.1%) withstood the bulk of the selling.

The month-long weakness took place in the face of several factors that helped cool the rally effort: tapering concerns, rising long-term rates, increased tensions in the Middle East, uneven economic data, uncertainty about the upcoming budget and debt ceiling debates, uncertainty about who the next Fed chairman will be, and technical resistance. Although buying interest wasn't entirely non-existent, investors displayed less willingness to step in at, or near, record levels to push the markets higher.

Rally Leaders Pace the Slide

When the major averages began the latest leg of their current rally in mid-November, a handful of groups set the tone for the broader market. Namely, small caps (Russell 2000), transports (Dow Jones Transportation Average), home builders (ITB), and blue chips (Dow Jones) all registered solid gains, pacing an advance that culminated in record highs for the Dow, S&P 500, and Russell 2000.

In August, the aforementioned groups saw some of their momentum fade. The Dow and Russell 2000 underperformed the remaining indices while the Dow Jones Transportation Average fell 3.3% and the iShares Dow Jones US Home Construction ETF (ITB) tumbled 7.7%.

Overall, though, the August decline weighed the heaviest on countercyclical sectors. The health care, consumer staples, telecom services, and utilities sectors all lost between 3.5% and 5.0%. Cyclical sectors were a bit more mixed as energy (-1.0%), technology (-1.0%), and materials (-0.1%) outperformed the broader market.

Taper Talk Persists

The narrative throughout the month included attempts to handicap the likelihood that the Federal Reserve may lower the pace of its asset purchases as early as mid-September. Unfortunately, the somewhat mixed economic data received during August did not significantly skew the expectations one way or another.

Notably, second quarter GDP growth was revised to 2.5% from 1.7%, but the upward revision did not suggest that the underlying currents of weak growth are ending. Almost the entire revision came from a stronger-than-originally reported trade deficit. Briefing.com believes the increase in GDP pulled potential growth from the third quarter into the second and was not the result of a strengthening economic situation. We expect the improvement in the trade balance to reverse in the third quarter.

Treasuries Continue Slipping

When Federal Reserve Chairman Ben Bernanke first suggested the Fed may begin looking at modifying the pace of its asset purchases, 10-yr Treasury yields began climbing from their May lows of 1.61%. That climb continued through August as yields rose for the fourth month in a row.

Continued taper talk, as well as festering uncertainty about an impending leadership change at the Fed, pressured the bond market throughout the month. Treasuries were on the receiving end of some safe-haven flows during the final week, however, as concerns regarding the situation in Syria contributed to a safety bid. The benchmark 10-yr yield ended the month at 2.75% after climbing as high as 2.92%.

Ships Surrounding Syria Send Shockwaves

On August 26, U.S. Secretary of State John Kerry discussed the recent use of chemical weapons in Syria and said the Assad regime must be held accountable for its violation of an international ban on the use of chemical weapons. Mr. Kerry's comments were followed by similar remarks from President Obama who said the use of such weapons cannot go unanswered. The statements were perceived as setting the stage for military action in Syria.

In response to this new source of uncertainty, and fears a strike in Syria could trigger a broader regional conflict, equity markets retreated while Treasuries and the dollar advanced.

Elevated Volatility Meets Subdued Volume

Volatility was on the rise throughout August as the CBOE Volatility Index (VIX) advanced from 11.83% to 17.01%, a level not seen since July 3. The VIX climbed steadily as general weakness in equities coupled with an uncertain geopolitical outlook sent investors in search of downside protection.

Although the weakness in August was notable, below-average volume observed throughout the month may have exacerbated the magnitude of some of the moves. Going into August, the 20-day average NYSE volume was just under 677 million shares. As a result of 16 low-volume sessions, 20-day volume at the end of August had slumped to 638 million.

Technically Speaking

In addition to a fair share of concerns, the major averages had to contend with several technical levels throughout the month. On August 2, the S&P 500 marked its all-time nominal high at 1,709.67 before slipping to its 20-day moving average (1,690/1,691) three sessions later. The index held that level for about a week until further weakness sent the S&P to its 50-day average (1,657/1,658). Unable to rebound off that key level, the benchmark index slid below its 100-day average (1,637/1,638) for just the second time this year, where it settled for the month.

Uncertainty on the Horizon

Throughout August it appeared as if the market was keeping one eye on September knowing the number of potential risk events that may come into play. Those events are highlighted and discussed in Briefing.com's The Big Picture column from August 29. During September, investors will contend with:

The August jobs report that could factor into the Fed's tapering decision.
The September 17/18 FOMC meeting where a tapering decision could be announced.
The German election on September 22.
The need to reach a budget agreement by October 1 and the debate on raising the debt ceiling, which will be reached in mid-October.
The potential nomination of a new Chairman of the Federal Reserve.

Click here to see a breakdown of monthly index and sector ETF performance

Large Cap Gainers

NOK (5.04 +29.23%): Microsoft (MSFT) to acquire Nokia's Devices & Services business, license Nokia's patents and mapping services for EUR5.44 bln, Risto Siilasmaa will assume an interim CEO role for Nokia; upgraded to Hold from Sell at Deutsche Bank; upgraded to Mkt Perform from Underperform at Bernstein; upgraded to Perform at Oppenheimer; upgraded to Neutral from Underperform at Robert W. Baird; tgt raised to $6 from $3.
TU (33.03 +7.34%): Upgraded to Outperform from Sector Perform at RBC Capital Mkts; upgraded to Outperform from Mkt Perform at BMO Capital Markets.
RCI (42.52 +7.37%): Upgraded to Outperform from Sector Perform at National Bank; heard positive comments at BofA/Merrill following VZ comments related to Canadian entry.

Large Cap Losers

MUR (58.99 -12.5%): Completed the spin-off of its U.S. retail marketing business into an independent public co called Murphy USA (MUSA); upgraded to Sector Outperform at Howard Weil; tgt raised to $76.
HDB (27.4 -5.45%): Weakness in India related names with Sensex down (weakness attributed to potential S&P downgrade); INFY, IBN also lower.
SJR (23.16 -3.86%): Downgraded to Market Perform at BMO Capital Markets.

Mid Cap Gainers

ALU (2.83 +9.69%): Trading higher on NOK deal with MSFT.
EBR (2.26 +6.6%): Brazil names higher after Bovespa jumped 3.7% yesterday; OIBR, SID also higher.
JAH (45.77 +6.57%): Co to acquire Yankee Candle For $1.75 bln - expected to be accretive to Jarden's adj. EPS by ~10%, pre synergies.

Mid Cap Losers

HLF (58.75 -3.7%): Weakness attributed to a WSJ story in which a New Jersey professor (noted for ponzi scheme research) stated there was not enough information released by HLF to determine whether or not it was a ponzi scheme.
MNST (55.17 -3.87%): Heard chatter that Einhorn is short MNST (rumor has been around since January).
SCTY (30.47 -2.78%): Barrons article out cautious on Solar City.

11:51AM Floor Talk (TALKX) : Over the weekend, the tone was set for a positive start for the stock market. President Obama announced he was going to put the decision to strike Syria to a Congressional vote and manufacturing surveys out of China and the eurozone were generally deemed to have offered encouraging signals for a global economic recovery.

Not surprisingly, the major averages started today's session on a strong note, bolstered further by typical first-of-the-month inflows and an encouraging ISM Index for August. The early tide of enthusiasm has waned, however, primarily because the market has been reminded that a strike against Syria hasn't necessarily been canceled, but most likely only deferred.

Selling activity has picked up in the past 30 minutes following headlines that Speaker of the House Boehner has indicated that he supports the president's call to action on Syria. House Majority Leader Cantor has also said the same. Congress is going to start debating the matter on September 9 following its return from recess.

The inference that the president will have the Congressional support to strike Syria once again exposes the risk of a strike leading to a broader regional conflict which, in turn, has cooled off today's rally effort.

The Dow Jones Industrial Average, which was up 123 points at its high today, is now up less than 20 points. The S&P 500, which was up 19 points at its high today, is now up less than eight points. Crude prices have reversed from an earlier bout of weakness and are now up $0.36 at $108.01/bbl and gold prices have extended earlier gains and are now up $10.10 at $1406.20/troy ounce.

Strikingly, though, there has not been any reversal in the Treasury market, which remains pinned on its lows for the day. The 10-yr note is down 29 ticks and its yield has risen to 2.90%. The weak price action in the Treasury market suggests either it fears a Fed tapering strike more than a strike against Syria or that traders there don't think a strike against Syria will lead to a broader conflict.

Pretty much everything in the stock market has backed off earlier highs. Today's volatility is a reminder that uncertainty continues to run high as the month of September begins and important decisions hang in the balance, with Syria just one of them.

Verizon (VZ 45.35, -2.03) is -4.3% after the company agreed to acquire Vodafone's (VOD 32.02, -0.33) 45% stake in Verizon Wireless for $130 billion in cash and stock.

2:01AM ARM Holdings acquires Advanced Display Technology from Cadence (CDNS) (ARMH) 40.53 : ARM (ARMH) and Cadence Design Systems (CDNS) announce that the companies have signed a definitive agreement for the sale and transfer of Cadence PANTA display controller cores to ARM. The agreement enhances the companies' long-standing ecosystem collaboration and strengthens their technical alignment.

Cadence's PANTA family of high-resolution display processor and scaling coprocessor IP cores was co-developed in conjunction with ARM and is targeted at advanced multimedia applications for high-end mobile devices with ultra-low power consumption.

1:38AM Suntech Power provides update on restructuring process (STP) 1.03 : Co announces that following productive discussions with its key stakeholders earlier this week in China, an understanding has been reached with its Creditor Working Group led by Clearwater Capital Partners and Spinnaker Capital Limited for restructuring the Company.

The Company intends to immediately commence preparations for implementing a recapitalization plan that contemplates a scheme of arrangement as part of a holistic restructuring of the Suntech Group. The principal components of the restructuring scheme would include:

identifying the key assets to be retained by the Company to allow it to continue its operations at a rationalized scale
the exchange of outstanding debt into the Company's equity
the setting of maximum debt levels for the Company's operating subsidiaries
the introduction of a new strategic investor that will provide the necessary funding through the purchase of newly issued equity to complete the restructuring process.

This will permit the Company to substantially improve its balance sheet and to be well positioned to continue as a major worldwide supplier in the solar industry.

The Company anticipates entering into a restructuring framework agreement in the next week or so to document the understanding that will allow the Company adequate time to execute the restructuring so long as it progresses the recapitalization plan and complies with the other terms in the restructuring framework agreement.

1:31AM Nokia: Microsoft (MSFT) to acquire Nokia's Devices & Services business, license Nokia's patents and mapping services for EUR5.44 bln, Risto Siilasmaa will assume an interim CEO role for Nokia (NOK) 3.90 : Microsoft and Nokia announce that the boards of directors for both companies have decided to enter into a transaction whereby Microsoft will purchase substantially all of Nokia's Devices & Services business, license Nokia's patents, and license and use Nokia's mapping services. This transaction is expected to be significantly accretive to Nokia earnings.

Under the terms of the agreement, Microsoft will pay EUR 3.79 billion to purchase substantially all of Nokia's Devices & Services business, and EUR 1.65 billion to license Nokia's patents, for a total transaction cost of EUR 5.44 billion in cash. Microsoft will draw upon its overseas cash resources to fund the transaction. The transaction is expected to close in the first quarter of 2014, subject to approval by Nokia's shareholders, regulatory approvals and other closing conditions.

Nokia will retain its patent portfolio and will grant Microsoft a 10-year non-exclusive license to its patents at the time of the closing. Microsoft will grant Nokia reciprocal rights to use Microsoft patents in its HERE services. In addition, Nokia will grant Microsoft an option to extend this mutual patent agreement in perpetuity.In addition, Microsoft will become a strategic licensee of the HERE platform, and will separately pay Nokia for a four-year license. Microsoft will also immediately make available to Nokia EUR 1.5 billion of financing in the form of three EUR 500 million tranches of convertible notes that Microsoft would fund from overseas resources. If Nokia decides to draw down on this financing option, Nokia would pay back these notes to Microsoft from the proceeds of the deal upon closing. The financing is not conditional on the transaction closing.

NOKIA LEADERSHIP CHANGES
Nokia expects that Stephen Elop, Jo Harlow, Juha Putkiranta, Timo Toikkanen, and Chris Weber would transfer to Microsoft at the anticipated closing of the transaction.

Risto Siilasmaa will assume an interim CEO role for Nokia while continuing to serve in his role as Chairman of the Nokia Board of Directors. As part of his interim CEO role, Mr. Siilasmaa will, among other tasks, oversee strategy and have four direct reports: Michael Halbherr, Executive Vice President, HERE; Stephen Elop, Executive Vice President, Devices & Services; Timo Ihamuotila, Nokia CFO and interim President; and Jesper Ovesen, Executive Chairman of the NSN Board of Directors.

ReneSola (SOL) reported Q2 results that were better than anticipated, beating on the bottom line by $0.08, reporting a loss of $0.24 per share, $0.08 better than the consensus of $0.32; revenues rose 62.0% y/y to $377.4 million vs the $367.3 millionconsensus. Total solar wafer and module shipments in Q2 2013 were 849.3 megawatts, representing an increase of 28.3% from 662.1 MW in Q1 2013. In addition, the company issued upside guidance for Q3, seeing revenues of $360-$380 million versus consensus on $356.8 million.

Nuance Communications (NUAN) shares are rising after Carl Icahn converted his ownership of Nuance from a passive 13G filing to an active 13D filing with the SEC. Given the fundamental weakness at Nuance over the past few quarters FBR Capital believes Icahn officially moving to an "active" stake has many potential scenarios for Nuance, including board representation, the removal of the current CEO, a potential split up/divestiture of Nuance's businesses, and the ultimate sale of the company further down the road. The firm noted the company implemented a shareholder rights plan ("poison pill") last week which is activated when a given shareholder acquires over 20% of the co without board approval. Over the last few months the Icahn ownership has put a "floor" on Nuance shares; the firm reiterates its Market Perform rating.

PC-TEL (PCTI) announced that TelExpress agreed to the entry of a Consent Permanent Injunction that, among other things, prohibits TelExpress from using confidential and proprietary PCTEL information made available to them earlier this year by a former PCTEL employee hired by TelExpress. The former employee also agreed to the entry of a Consent Permanent Injunction following his separation from TelExpress. The entry of these orders and other consideration resolves the litigation initiated by PCTEL in April, 2013. The company will not hesitate to take aggressive action when necessary to protect its confidential and proprietary business information.
icon url

ReturntoSender

09/05/13 9:37 AM

#10317 RE: ReturntoSender #6755

CY MT bought 4000 shares at 11.21 - Trying something a little different here based upon the rally that generally occurs prior to earnings season. The $NASI here when it turns positive shows how this effects a stock like CY:


RtS
icon url

ReturntoSender

09/05/13 6:26 PM

#10318 RE: ReturntoSender #6755

From Briefing.com: 4:20 pm : The S&P 500 added 0.1% to register its third consecutive advance. Although stocks finished in positive territory, their gains were capped by Treasury yields hitting their highest levels since July 2011.

Treasuries began displaying weakness overnight as the Asian session got underway. The selling paused briefly during U.S. pre-market action before a slate of better-than-expected economic data lent support to the belief that the Federal Reserve would begin slowing the pace of its asset purchases at the upcoming September 17/18 policy meeting. With the August jobs report scheduled to be released tomorrow, the recent behavior of the Treasury market suggests participants are expecting a strong nonfarm payrolls number (Briefing.com consensus 177,000). The benchmark 10-yr yield rose eight basis points to 2.98%.

Interest rates have been on the rise throughout the quarter, and that has pressured the most rate-sensitive sectors. Consumer staples (-0.1%), telecom services (-0.8%), and utilities (-0.4%) finished at the bottom of today's leaderboard, which widened their third quarter losses. Since the start of July, the three sectors are down 0.5%, 6.2%, and 3.2%, respectively.

Meanwhile, the last countercyclical group, health care, rose 0.2% to maintain its quarter-to-date gain of 5.1%. The sector has been able to outperform other defensive groups thanks to big gains in biotechnology. The iShares Nasdaq Biotechnology ETF (IBB 201.92, +0.54) is higher by 16.1% this quarter.

Cyclical sectors were responsible for today's advance as energy (+0.3%), industrials (+0.3%), and materials (+0.3%) ended in the lead. Notably, the industrial sector received support from transportation companies as the Dow Jones Transportation Average rose 0.6%.

Transports were unperturbed by the increase in their main input cost with crude oil climbing 1.0% to $108.35 per barrel.

Similar to yesterday, financials led early, but surrendered their top spot during afternoon action. Most majors finished ahead of the broader market while real estate investment trusts were pressured by the elevated rates. The Vanguard REIT ETF (VNQ 63.81, -0.68) lost 1.1%.

Participation in today's session was on the light side with only 630 million shares changing hands on the floor of the New York Stock Exchange. This was understandable given the ongoing Rosh Hashanah holiday.

This morning was busy in terms of economic data. The ADP Employment Change report estimates 176,000 private sector jobs were created in August. That was pretty much in-line with expectations, but down slightly from the 198,000 created in July.

Initial claims for the week ending August 31 dropped by 9,000 to 323,000 (Briefing.com consensus 333,000). That brought the 4-week moving average for this series to 328,500, which is the lowest level since October 2007. Continuing claims for the week ending August 24 fell by 43,000 to 2.951 million (Briefing.com consensus 2.977 million). That lowered the 4-week moving average by 18,000 to 2.98 million.

Second quarter productivity was revised up to 2.3% from 0.9% while unit labor costs were revised down to 0.0% from 1.4%. The revisions reflect the improved output in the second quarter and the understanding that corporate profits continue to be helped by labor costs being held in check.

The August ISM Non-manufacturing Index jumped to 58.6 from 56.0. The Briefing.com consensus expected the index to fall to 54.5. The index is at its highest point since it was reformulated in January 2008. When compared to the older methodology, the index is at its highest point since December 2005.

Factory orders fell 2.4% in July after increasing an upwardly revised 1.6% (from 1.5%) in June. The consensus expected factory orders to fall 3.7%. Durable goods orders were revised down modestly from -7.3% in the advance release to -7.4%. The underlying trends were essentially unchanged from the advance report. As expected, most of the decline in durable goods orders came from a 19.4% drop in transportation orders. Orders of defense and nondefense aircraft fell an unrevised 44.3%.

Tomorrow's focus will be on jobs with the August nonfarm payrolls, nonfarm private payrolls, unemployment rate, hourly earnings, and average workweek all set to be reported at 8:30 ET.DJ30 +6.61 NASDAQ +9.74 SP500 +2.00 NASDAQ Adv/Vol/Dec 1508/1.51 bln/988 NYSE Adv/Vol/Dec 1429/630.1 mln/1585

3:30 pm :

Oct crude oil advanced for the second time this week, gaining support from this morning's bullish economic and inventory data. The August ISM Non-manufacturing Index jumped to 58.6 from 56.0, its highest level since it was reformulated in January 2008. In addition, crude oil inventories for the week ending Aug 30 showed a draw of 1.836 mln barrels when a draw of 1.3-2.0 mln barrels was expected. The energy component lifted off its session low of $107.23 per barrel and rose as high as $108.54 per barrel. It eventually settled 1.1% higher at $108.40 per barrel.
Natural gas, on the other hand, sold off sharply into negative territory following inventory data that showed a build of 58 bcf when a smaller build of 54 bcf was anticipated. It brushed a session low of $3.57 per MMBtu after trading as high as $3.72 per MMBtu in early morning pit trade. It settled with a 2.7% loss at $3.58 per MMBtu.
Precious metals extended yesterday's losses as the dollar index advanced following the strong economic data released this morning.
Dec gold brushed a session high of $1400.00 per ounce at pit trade open but quickly slipped into negative territory. Unable to gain much momentum, it settled 1.3% lower at $1372.50 per ounce.
Dec silver also retreated into the red after trading as high as $23.65 per ounce in early morning floor action. It managed to inch higher off of its session low of $23.04 and trimmed losses to 0.8% as it closed at $23.25 per ounce.

4:33PM Aeroflex announces the sale of Aeroflex Test Equipment Services for ~$18.7 mln (ARX) 7.15 +0.13 : Co announced the sale of its Aeroflex Test Equipment Services ("ATES") business to Trescal Limited for approximately $18.7 million. ATES provides calibration and repair services of non-Aeroflex test and measurement equipment in the United Kingdom. ATES was a subsidiary of Aeroflex Limited, a provider of test and measurement equipment to the wireless communications industry. The sale of ATES will allow Aeroflex Limited to enhance its focus on building its core wireless test and measurement equipment business.

4:02PM Finisar reports EPS in-line, revs in-line; guides Q2 EPS above consensus, revs above consensus (FNSR) 22.84 +0.34 : Reports Q1 (Jul) earnings of $0.31 per share, excluding non-recurring items, in-line with the Capital IQ Consensus Estimate consensus of $0.31; revenues rose 20.7% year/year to $266.1 mln vs the $266.04 mln consensus. Co issues upside guidance for Q2, sees EPS of $0.37-0.41 vs. $0.31 Capital IQ Consensus Estimate; sees Q2 revs of $277-292 mln vs. $272.98 mln Capital IQ Consensus Estimate.

3:20PM NVIDIA announces that the NVIDIA Tegra 4 mobile processor is powering the Xiaomi Mi3 phone (NVDA) 14.91 +0.02 :

Large Cap Gainers

IBN (29.99 +11.28%): Select India names trading higher on Reuters.com article discussing rally in the Rupee as the new central bank head Raghuram Rajan is set to introduce new measures; HDB also higher.
TI (7.98 +9.01%): AT&T (T), American Movill (AMX), and Naguib Sawiris have approached key shareholders who want to exit stakes in TI, according to reports.
FAST (48.66 +6.15%): Reported July net sales of $282.2 mln, higher by 7.8% YoY.

Large Cap Losers

NEM (30.51 -3.51%): Downgraded to Equal-Weight from Overweight at Barclays.
DE (83.03 -1.72%): Initiated with an Underweight at Morgan Stanley.
LTD (57.3 -1.44%): Reported Aug same store sales +2.0% vs +2.1% Retail Metrics consensus.

Mid Cap Gainers

LPX (16.89 +10.68%): Co to acquire Ainsworth for ~$1.1 bln; upgraded to Buy from Hold at Deutsche Bank; upgraded to Buy at DA Davidson; tgt raised to $20.
GRPN (10.91 +5.99%): Upgraded to Overweight from Equal-Weight at Morgan Stanley.
OAS (41.66 +5.2%): Announced acquisitions of ~ 161,000 net acres in the Williston Basin and the redetermination of its borrowing base to $1.5 bln.

Mid Cap Losers

CONN (62.31 -8.78%): Missed on EPS by $0.08, beat on revs; reaffirmed FY14 EPS guidance; raised FY14 comp guidance; Aug comps +31% vs. +18% in Q2.
GEF (53.26 -4.71%): Missed on EPS by $0.09, missed on revs.
MSG (55.97 -3.52%): Co and Azoff Music announced they have reached an agreement to create a new music, media, and entertainment company.

ATMI (ATMI) announced that its current Deputy Chief Legal Officer, Patrick J. Shima, will assume the role of Senior Vice President and Chief Legal Officer.

Silicon Frontline Technology announced that Lattice Semiconductor (LSCC) picked Silicon Frontline's ESRA software for fast, full-chip ESD analysis.

Fortune has named Ixia (XXIA) as one of its 100 Fastest Growing Companies.

8:06AM Nuance Communications announced that Samsung's (SSNLF) new GALAXY Gear wearable device and Samsung GALAXY Note 3 integrate Nuance's voice and language capabilities (NUAN) 19.23 : Co announced that Samsung's new GALAXY Gear wearable device and Samsung GALAXY Note 3 integrate Nuance's voice and language capabilities as part of Samsung's expanding lineup of S-Voice powered devices. Today's announcement also marks the first use of Nuance's voice and intelligent systems-based technology into the wearables' category as part of a larger expansion of Nuance Cloud Services.

8:03AM Avago Tech announces its Board of Directors has approved a quarterly, interim cash dividend of $0.23 per ordinary share (AVGO) 38.98 : The dividend is payable on Sep 30, 2013 to shareholders of record at the close of business (5:00 p.m.) Eastern Time on Sep 19, 2013.

7:32AM Celestica's Toronto solar lab receives approval from T V Rheinland PTL to provide testing for certification of solar modules (CLS) 10.95 : Co announced that T V Rheinland PTL has audited and approved Celestica's solar lab in Toronto, Ontario, to provide testing required for certification of solar modules. Celestica's Solar Lab is a state-of-the-art facility, with experience in product testing and analysis, and is capable of carrying out tests for a variety of PV standards, including UL-1703 / ULC-1703 and IEC-61215 /IEC-61730.

It operates independently within the Total Quality Management System at Celestica, ensuring the integrity of test procedures and results. The solar lab's testing capabilities and quality system, aligned with T V Rheinland PTL's existing comprehensive regulatory compliance, testing and certification infrastructure, will decrease time-to-market for local solar customers.

NXP Semiconductors (NXPI) announced the launch of TEF665x and TEF668x, the next generation of its successful family of RFCMOS-based, high-performance AM/FM single-chip car radio tuners.

Sigma Designs (SIGM) reported second quarter earnings of $0.06 per share, which is better than expected, while revenues fell 21.2% year/year to $53.8 million which also beat expectations. The company issues in-line guidance for the third quarter with revenues of $54-58 million which is line with expectations.

Market Summary
[Edit]
streaming quotes: ON
Chart for NASDAQ Composite Index (^IXIC)
Chart for Dow Jones Industrial Average Index (^DJI)
Symbol Last Change
Dow 14,937.48 Up 6.61(0.04%)
Nasdaq 3,658.78 Up 9.74(0.27%)
S&P 500 1,655.08 Up 2.00(0.12%)
10-Yr Bond 2.9790% Up 0.0820
NYSE Volume 0
Nasdaq Volume... 0
Indices: US - World | Most Actives
Advances & Declines
NYSE NASDAQ
Advances 1,986 (47%) 1,496 (58%)
Declines 2,097 (50%) 991 (38%)
Unchanged 101 (2%) 106 (4%)
Up Vol* 1,955 (61%) 1,124 (73%)
Down Vol* 1,210 (38%) 388 (25%)
Unch. Vol* 29 (1%) 17 (1%)
New Hi's 114 148
New Lo's 158 50
*in millions
more...
Most Actives
NYSE LAST CHANGE
NOK 5.49 Up 3.00%
BAC 14.37 Up 0.35%
F 17.30 Up 2.31%
JCP 14.22 Up 5.33%
BSX 11.57 Up 5.86%
Nasdaq LAST CHANGE
MSFT 31.24 Up 0.13%
ASTX 8.55 Up 3.39%
FB 42.66 Up 2.11%
SIRI 3.80 Up 2.98%
BBRY 10.99 Up 2.28%
icon url

ReturntoSender

09/07/13 6:42 PM

#10319 RE: ReturntoSender #6755

From Briefing.com: Weekly Recap - Week ending 06-Sep-13

Dow -14.98 at 14922.5, Nasdaq +1.23 at 3660.01, S&P +0.09 at 1655.17

The S&P 500 eked out the slimmest of gains (+0.09 point) to register its fourth consecutive advance, maintaining its September advance at 1.4%.

Prior to the opening bell, it was reported that August nonfarm payrolls increased by 169,000, which was below the 177,000 expected by the Briefing.com consensus. Private payrolls came in at 152,000 while the consensus expected a reading closer to 180,000. More notably, July nonfarm payrolls were revised down nearly 36% to 104,000 from 162,000 while private payrolls saw a 21% revision to 127,000 from 161,000. The unemployment rate ticked down to 7.3% from 7.4%, but once again, that was the result of a drop in the labor force participation rate to 63.2%. This represents the lowest rate since August 1978. The one bright spot could be found in aggregate income, which increased 0.6%.

A recent stretch of better-than-expected data played into the expectation that the Fed may lower the pace of its asset purchases at the upcoming September 17/18 FOMC meeting. However, today's jobs report painted a more uncertain picture, which sparked a market reaction consistent with lowered expectations of tapering in the near term.

Immediately following the report, crude oil, equity futures, Treasuries, and gold futures jumped to their highs while the Dollar Index (82.15, -0.48) tumbled to its lows. Most notably, the 10-yr note saw its yield slide from 2.96% to 2.87%. However, Treasuries surrendered a portion of their gains intraday with the benchmark 10-yr yield closing at 2.94%.

The opening hour saw the S&P lose its 50-day average (1657/1658) after headlines from the conclusion of the G-20 summit indicated Russian President Vladimir Putin said his country will assist Syria in the event of an external attack. However, Russia and Syria have been allied for years, thus Mr. Putin's comments were not necessarily a "new" development. The ensuing selloff ended as the S&P bounced at its 100-day moving average (1642/1643) and regained its 50-day average in late-morning action.

Stocks slipped from their highs and the S&P once again lost its 50-day average during the final hour after reports from Al-Arabiya indicated another chemical attack has taken place in Damascus. However, the veracity of the reports could not be confirmed as Al-Arabiya attributed the report to an 'unidentified activist.'

With the continued uncertainty surrounding the situation in the Middle East, crude oil climbed throughout the day. The energy component ended higher by 2.0% at $110.54 per barrel, registering its highest close since May 2011.

Elsewhere, gold futures climbed 1.0% to $1.386.70 per troy ounce. This contributed to the strength of miners as the Market Vectors Gold Miners ETF (GDX 28.01, +0.48) advanced 1.7%.

Consumer staples (+0.1%) and utilities (+0.6%) outperformed as the retreat in yields provided the two groups with a measure of support.

Today's participation was somewhat limited as 672 million shares changed hands on the floor of the New York Stock Exchange.

Monday's economic data will be limited to the July consumer credit report, which is scheduled to be released at 15:00 ET.

Week in Review: Stocks and Yields Climb

On Monday, bond and equity markets were closed for Labor Day. Tuesday's session saw the S&P 500 add 0.4% after intraday weakness knocked the index off its high, and below its 100-day moving average. Equities displayed broad strength at the open after global indices rallied on Monday. The early gains did not hold past the initial two hours as late-morning comments from House Speaker John Boehner and Majority Leader Eric Cantor served as a reminder that the option of military action in Syria remains likely. Both Speaker Boehner and Mr. Cantor said they support the president's "call to action" with U.S. Congress scheduled to debate the issue during the week of September 9. Crude oil climbed with the remarks from the two Congressional leaders providing an additional boost. The energy component rose 0.8% to $108.55 per barrel while the energy sector added 0.6%. Commodities were strong all-around as gold futures advanced 1.2% and silver futures spiked 3.4% to $1412.30 and $24.31 per troy ounce, respectively. In addition, copper jumped 2.4% to $3.312 per pound. As a result, the materials sector finished among the leaders with a gain of 0.6%.

The market resumed its climb on Wednesday. The S&P 500 settled higher by 0.8% and regained its 100-day moving average (1640/1641) shortly after the open. The Dow and S&P started the session by chopping around their respective flat lines before the two indices began tracking the Nasdaq, which outperformed with a gain of 1.0%. Morning reports revealing Senator John McCain's tepid support for the first draft of the Syria strike proposal fueled speculation that the whole plan could be in danger of unraveling. That was enough to spark a risk rally with some short-covering activity peppered in after sellers had pressed on anticipating the plan to make its way swiftly through the Senate Foreign Relations Committee. In the end, an afternoon vote containing two McCain amendments passed through the Committee by a 10-7 vote. Stocks slipped from their highs in reaction to the results of the afternoon vote, but still managed to hold the vast majority of their gains. Meanwhile, Treasuries did not reflect much of a safety bid as the complex remained pinned to its lows. The benchmark 10-yr yield ended higher by 5 basis points at 2.894%. More notable was the move in the 2-yr yield, which added four basis points to end at 0.462%, the highest since June 2011.

On Thursday, the S&P 500 added 0.1% to register its third consecutive advance. Although stocks finished in positive territory, their gains were capped by the benchmark 10-yr yield hitting its highest levels since July 2011.Treasuries began displaying weakness overnight as the Asian session got underway. The selling paused briefly during U.S. pre-market action before a slate of better-than-expected economic reports for initial claims, second quarter productivity, factory orders, and ISM Services lent support to the belief that the Federal Reserve would begin slowing the pace of its asset purchases at the upcoming September 17/18 policy meeting. The benchmark 10-yr yield rose eight basis points to 2.98%. The continued rise in interest rates has pressured on the most rate-sensitive sectors. Consumer staples (-0.1%), telecom services (-0.8%), and utilities (-0.4%) finished at the bottom of the Thursday leader board, which widened their third quarter losses. Since the start of July, the three sectors are down 0.5%, 6.2%, and 3.2%, respectively. Meanwhile, the last countercyclical group, health care, maintained its quarter-to-date gain of 5.1% thanks to the continued strength of biotechnology. The iShares Nasdaq Biotechnology ETF (IBB 201.55, -0.37) is higher by 16.1% this quarter. In turn, the relative strength of biotech companies has helped the Nasdaq outperformed the other indices during the third quarter.
 
Index Started Week Ended Week Change %Change YTD %
DJIA 14810.31 14922.50 112.19 0.8 13.9
Nasdaq 3589.87 3660.01 70.14 2.0 21.2
S&P 500 1632.97 1655.17 22.20 1.4 16.1
Russell 2000 1010.90 1029.55 18.65 1.8 21.2

This week's top 20 % gainers

Technology: MEI (25.9 +48.33%), HIMX (8.08 +45.85%), NOK (5.37 +38.29%), HSOL (3.95 +35.59%), YGE (5.59 +35.38%), SFUN (49.53 +34.75%), SOL (5.72 +31.41%), EGAN (13.34 +26.34%), TI (7.93 +22.41%), KONG (14.69 +22.14%)
Services: ZLC (13.84 +19.6%)
Industrial Goods: JKS (18.39 +28.35%), KDN (35.5 +22.54%)
Healthcare: INO (2.43 +27.88%), ASTX (8.73 +25.37%), DYAX (5.02 +20%)
Financial: GCAP (9.72 +31.2%), EJ (8.69 +29.28%), NOAH (14.76 +24.51%)
Basic Materials: MILL (7.07 +24.05%)

This week's top 20 % losers

Technology: OVTI (15.37 -13.57%), BV (9.29 -13.22%), GAME (4 -11.87%), UBNT (33.01 -8.5%)
Services: FRAN (18.05 -23.88%), SHOS (31.4 -17.09%), KKD (18.67 -15.38%), GCO (62.07 -10.38%), BEBE (5.64 -10.02%), DANG (8.09 -9.65%), CONN (53.19 -8.57%), TFM (50.07 -8.44%)
Healthcare: MDXG (4.2 -26.71%), VVUS (10.96 -12.44%)
Financial: WETF (11.34 -8.7%)
Consumer Goods: LF (9.39 -8.37%)
Basic Materials: MTDR (15.7 -11.88%), NG (2.78 -11.56%), PVG (8.12 -9.27%), SAND (6.26 -8.79%)

1:27PM Notable movers of interest (SCANX) : The following are some of today's most notable movers of interest, categorized by market capitalization (large cap over $10 billion and mid cap between $2-10 billion) and ranked by % change (all stocks over 100K average daily volume).
Large Cap Gainers

BSAC (24.78 +5.63%): Hearing upgraded to Buy from Underperform at BofA/Merrill
AMT (72.07 +4.83%): Announced agreement to acquire Global Tower Partners for ~$4.8 bln, expected to be immediately accretive to adjusted funds from operations upon closing
IBN (31.59 +3.74%): Strength in select Indian companies following 1.5% gain in Sensex

Large Cap Losers

GMCR (83.23 -1.94%): Announced it will consolidated all of its Canadian coffee and portion pack production to its Montreal, Quebec facility; expected to affect 2% of total workforce, whose positions will be eliminated
TSLA (167.11 -1.66%): Mentioned cautiously in blog article
ATVI (16.89 -1.63%): Trading lower in sympathy with Electronic Arts (seeing reports that initial sales of "Madden NFL 25" are down compared to last year)

Mid Cap Gainers

PAY (22.96 +10.81%): Beat quarterly EPS by $0.04 ($0.24 ex items vs $0.20 estimate), revs fell 15.2% yoy to $418 mln vs $400.88 mln estimate; sees Q4 EPS of $0.25 ex items vs $0.25 estimate, revs of $418-422 mln vs $412.22 mln estimate
YELP (63.07 +7.06%): Initiated with an Overweight at Barclays
USG (25.23 +5.43%): Upgraded to Buy from Neutral at Sterne Agee

Mid Cap Losers

CONN (52.99 -12.21%): Continued weakness following weak earnings reported yesterday morning
BPL (66.11 -4.27%): Downgraded to Neutral from Overweight at JP Morgan
EA (26.68 -3.61%): Seeing reports that initial sales of "Madden NFL 25" are down compared to last year

12:24PM Nokia to issue convertible bonds of EUR 1.5 billion to Microsoft (MSFT) (NOK) 5.37 -0.12 : Nokia announced that, in connection with its announcement to sell to Microsoft Corporation substantially all of its Devices & Services business, Microsoft had agreed to make available to Nokia EUR 1.5 billion of financing in the form of three EUR 500 million tranches of convertible bonds.
Nokia announces that it has decided to draw down all of this financing and thus Nokia will issue three tranches of senior unsecured convertible bonds, each with a nominal value of EUR 500 million. Nokia intends to use the proceeds of the offering to prepay financing raised for the acquisition of the shares in NSN which was completed in August 2013 and for general corporate purposes.

8:15AM LTX-Credence announces agreement to purchase Dover's (DOV) Multitest and Everett Charles Technologies for $93.5 mln; acquisition to be immediately accretive to earnings (shares halted) (LTXC) 4.20 : Co announced an agreement to acquire the Multitest and Everett Charles Technologies (ECT) businesses of Dover (DOV). LTX-Credence and Dover Printing & Identification, a subsidiary of Dover, have signed a definitive agreement for the acquisition by LTX-Credence of the assets and stock exclusively and primarily related to the Multitest and ECT businesses for a purchase price of $93.5 mln, of which $73.5 mln will be paid in cash through a combination of existing cash-on-hand and bank debt and $20.0 mln will be paid by the issuance of a promissory note by LTX Credence to Dover. Co anticipates that this acquisition will create a combined co with trailing 12-month pro forma revs of ~ $420.0 mln and expects the acquisition to be immediately accretive to LTX-Credence's earnings.

8:06AM LM Ericsson acquires Airvana's EVDO business (ERIC) 12.54 : Co announced it has acquired Airvana Network Solutions' EVDO business. The transaction was structured as a stock purchase. Network Solutions is a Massachusetts-based company and supplier of EVDO software to Ericsson. The two cos will jointly seek dismissal of the lawsuit filed by Airvana in February 2012, against Ericsson in the Supreme Court of the State of New York, USA.

VeriFone (PAY 22.55, +1.83) is +8.8% following its better-than-expected earnings and revenue.
In addition to the aforementioned August nonfarm payrolls, nonfarm private payrolls, unemployment rate, hourly earnings, and the average workweek will all be reported at 8:30 ET.

Beginning Sept. 6, AT&T (T) will offer pre-orders for the Samsung (SSNLF) Galaxy Note 3. The Galaxy Note 3 will be available for $35 per month with AT&T Next or $299.99 with a two-year agreement. For more information or to pre-order, visit www.att.com/galaxynote. Orders will begin shipping around Oct. 1.
T- Mobile US (TMUS) will launch Samsung's (SSNLF) first wearable experience, Galaxy Gear, and the Samsung Galaxy Note 3 nationwide October 2.
Qualcomm (QCOM) announced that its subsidiary, Qualcomm Atheros, launched a new chip family as part of its portfolio of low-power Wi-Fi solutions designed to connect a multitude of devices that comprise the Internet of Everything.
Lexar, a subsidiary of Micron Technology (MU), announced the Lexar JumpDrive V20 USB multipack, a storage solution designed for users who need to stay organized.
Rovi (ROVI) announced STM Holdings has chosen DivX Video Service to power its new video-on-demand service in China. As part of the licensing agreement STM will use DivX Plus Streaming, Rovi's advanced adaptive streaming format with DivX DRM, as well as Rovi TotalCode, a professional quality video encoding solution.

U.S. Cellular (USM) has announced that the Samsung (SSNLF) Galaxy Note 3 will be available for customers in October. This highly-anticipated device builds on the evolution of Samsung's Note category and S Pen experience and will be offered in Jet Black.

1:32 am Tech Sector trading +0.2%, but behind broader marketThe tech sector is trading modestly higher today, trailing wider gains in the broader market. Semiconductors are showing relative weakness as well with the SOX trading only 0.01% higher. Within the chip index, NXPI (-2.4%) is a notable laggard. Among other major indices, the SPY is trading 0.3% higher today, while the QQQ is up 0.3% and the NASDAQ is trading 0.2% higher on the session. Among tech bellwethers, FB (+3.1%) is showing notable strength, while VZ (-0.6%) is showing weakness.

In tech earnings last night:

PAY (+11.0%) beat by $0.04, beat on revs, and guided Q4 EPS in-line, revs above consensus
FNSR (+4.3%) reported EPS in-line, revs in-line; guided Q2 above consensus
SEAC (-1.8%) beat by $0.02, misses on revs; reaffirmed FY14 EPS guidance, guided FY14 revs below consensus
BLOX (+13.0%) beat by $0.05, beats on revs; guided Q1 EPS in-line, revs above consensus; guided FY14 EPS in-line, revs above consensus
AMBA (+13.0%) beat by $0.07, beat on revs
RALY (+2.3%) beat Q2 ests; guided Q3 EPS in-line, revs above consensus; guided FY14 above consensus

In news, reuters reported that the MU (+0.2%) Hynix China plant may re start in two or three weeks.

Among notable analyst upgrades in tech this morning, ERIC (+3.9%) was upgraded to Outperform at Credit Suisse, TMUS (+0.6%) was upgraded to Outperform at William Blair, and EZCH (+3.4%) was upgraded to Buy at Chardan. Also, SPLK (+2.8%) was initiated with a Buy at Canaccord Genuity.

In downgrades, INXN (-4.6%) was downgraded to Perform at Oppenheimer.

08:47 am Finisar target raised to $31 at Stifel on expectation of sustained trends: . Stifel notes FNSR's F1Q14 (July) results provided little surprise given the co's positive pre-announcement on August 6th with rev and pro forma earnings matching expectations. Guidance impressed with FNSR targeting well above consensus F2Q14 (Oct) rev and pro forma EPS. Rev is targeted to increase approx 7% q/q and 23% y/y at the mid-point, off of record levels, once again largely driven by datacom although augmented by the expectation of improving trends in telecom. Mgmt continues to see several drivers of growth for datacom, discussed signs of improving telecom order trends, and appears optimistic on near-to-intermediate business trends. Tgt to $31 from $27.

Finisar (FNSR) reported first quarter earnings of $0.31 per share, excluding non-recurring items, which is in line with estimates, while revenues rose 20.7% year/year to $266.1 million which is in line with expectations. The company issued guidance for the second quarter with EPS of $0.37-0.41 which is above estimates with revenues of $277-292 million which is higher than expected.

VeriFone (PAY) reported third quarter earnings of $0.24 per share, excluding non-recurring items, which is better than expected, while non-GAAP revenue fell 15.2% year/year to $418 million which is higher than expected. The company issued guidance for the fourth quarter with non-GAAP EPS of $0.25 which is line with estimates and non-GAAP revenues of $418-422 million which higher than expected. "Our revenues and earnings exceeded our guidance, cash flow exceeded our expectation, and we paid down $160 million of debt, bolstering our financial position. We are also pleased by the acquisition of ENZ, which extends to New Zealand our payment-as-a-service business model that is thriving in the Nordics under Point and launching in other geographies such as the U.S. In fact, Q3 Services revenues were up 17% from a year ago. And, with our increased investments in R&D and infrastructure, we are making good progress in bringing to market the advanced products to meet customer demand."

Immersion (IMMR) announced that it has entered into a broad multi-year licensing arrangement with Xiaomi, one of the fastest growing smartphone makers in China, and that the recently released Xiaomi Mi3 smartphone uses Immersion's TouchSense technology to add new dimension of engagement in Xiaomi's MIUI interface.
icon url

ReturntoSender

09/08/13 7:00 PM

#10320 RE: ReturntoSender #6755

InvestmentHouse Weekend Market Summary

http://www.investmenthouse.com/weekendmarketsummary.htm

- Jobs report tries to change the status quo, fails.
- Stocks rally on the jobs weakness, then Putin torpedoes the move. At least stocks recovered the sharp losses.
- Jobs weak in number and in quality, unemployment rate masks the true issues.
- Looking for leaders to finish setting up to help SP500, DJ30 join NASDAQ and SOX.

Weak jobs tries to break the market upside, comes up short.

Thursday we opined that a jobs report at the extreme, strong or weak, could work to break the indices from the resistance they had bumped on the week. NASDAQ and SOX rallied nicely to next resistance while the rest of the market rallied, but not much, before hitting low resistance. The odds for a move on Friday were not great, but again, a report that moved investors could move the indices.

Jobs came in weaker than expected. As discussed in detail below, the revisions were killers, undermining the report The unemployment rate dropped two clicks to 7.3%, but that 'gain' was not really a gain based upon WHY it fell.

The market viewed the weakness as a positive, that the Fed might 'taper' its taper plans. Futures jumped, stocks opened higher. Maybe it was going to be a rather bizarre reaction to a weak jobs report that jogged the markets past resistance. Indeed, Rick Santelli, upon release of the numbers and the reaction of the markets, suggested the US was some kind of banana republic given we buy weak data on the hope of more printed money.

Stocks started upside, but as fast as they started they faded. The Fed may be inclined to taper its taper, but there is also the Syria issue and Vladamir Putin at the G-20 told reporters that is Syria was attacked, whoever did the attacking would have to deal with Russia.

Stocks plunged lower. Plunged. For a half hour they sold, but then the switch was thrown and the bids returned. Stocks rallied back up to the early highs and spent the rest of the day, almost, at those levels. A last hour selloff took more air out and closed the indices basically flat with DJ30 and SOX posting modest losses.

SP500 0.09, 0.01%
NASDAQ 1.23, 0.03%
DJ30 -14.98, -0.10%
SP400 0.16%
RUTX 0.08%
SOX -0.41%

So, after it looked as if the jobs report might go ahead and push the indices out of their doldrums ahead of the weekend, well, inertia took over and leaves the indices still to deal with the next resistance. NASDAQ and SOX actually moving well while SP500, DJ30, and SP400 bounced last week but only token bounces to low resistance levels.

THE NEWS

Jobs report disappoints on all fronts even as unemployment falls to 7.3%.

Improving, kind of, for all the wrong reasons. August non-farm payrolls missed expectations by 8K (169K versus 177K), but it was the dad-blamed revisions that hurt:

June: -16K
July: -58K as manufacturing dumped 22K MORE jobs than originally reported.

But, no need to fear. The unemployment rate fell to 7.3% from 7.4%, and that was a beat.

The Administration's Secretary of Labor dutifully pronounced that the 'steady recovery' continued, though, of course, not as fast as our benevolent King-President wants. So, by golly, Congress should go out and pass the President's middle class savior spending package consisting of, of course, road projects, bridge projects, this project, that project, etc.

Those never work. Fix a bridge. Then what do the workers do? That didn't create any lasting jobs. We tried it in 2009 and into 2010. 2010 was the zenith of the recovery and it was pathetic with just a couple of quarters, not even back to back, of 4% GDP growth. The economy has 'cooled' since then, cooling almost to stall speed. But for everyone else in the world looking so crappy we would look crappy. By our own standards (now just historical sadly) our economy is crappy regardless of what other countries are doing.

But Jon, you say, there ARE more jobs. The unemployment rate IS falling. Really?

Unemployment: 7.3% or 11.4%?

The reason the rate fell is the same one: fewer people in the workforce looking for jobs. The participation rate fell to 63.2%, the lowest since our friend Jimmy Carter was destroying the US economy back in August 1978. That is a whopping decrease from 63.4%. Carter would be proud of our current President.

Key stat: 516,000 people LEFT the workforce in August, pushing the total not in the workforce to a staggering 90.5M! We need more food stamps! More college loans to inflate college prices even more so our kids can graduate and go to work at $14.50/hour jobs working 27.4 hours per week! Get to work Mr. President!

Now the Labor Secretary pointed out that the U6 employment number fell to 13.7% from almost 14%. Those are the underemployed due to economic conditions. You know what is going on there? They are giving up, tired of working crappy jobs that pay little and are dead ends. They are opting out, quitting, collecting unemployment and whatever benefits they can. They are pushing the 'left the workforce' stat through the rough as noted above. You cannot be underemployed, at least how the government counts it, if you just stop working.

If you use the historical average of workforce participation at roughly 65%, the unemployment rate would be a whopping 11.4%, up from 11.2% in July. Now, Mr. Labor Secretary, is THAT a trend you feel is a good one to keep in place?

More Jobs: Love those low-pay, low hour jobs.

Our economy has shifted over the past six years from a creator of breadwinner, well-paying jobs to a creator of low-pay, low-skill jobs. The President talks of millions of jobs created and 800K just this year. That isn't even 200K per month. Quite the statistic to brag about.

But it is worse. The jobs the US is creating far and away predominant in the low-pay, and now becoming low-hours worked, sectors. Retail and hospitality make up 70% of that market. That is the burgeoning sector of jobs growth. At approximately $14.50/hour, it is not where you want to spend the prime of your career.

Yet, that is where the bulk of our jobs are created. In August 44K retail jobs dwarfed other sectors. They go to the 50+ age group, the 'Wal-Mart Greeter Generation' as I term it. Damn waste of knowledge and talent, and a damn shame they have to do it. But then again, we all may be doing that before this is over . . .

Lower hours worked.

Not only are the bulk of the jobs low pay, but the bulk are also low hours. The low-wage sectors, the fastest growing mind you, are also logging lower and lower hours worked. In July, the last figures available, the workweek fell to 27.4 hours, the lowest ever recorded for this group. With Obamacare hitting any employers with 50+ employees who work 30 hours or more per week, it behooves employers to cut hours worked and if need be, hire more workers.

That is what has happened. The lion's share of the new jobs created in 2013 are at the low end pay scale and the reason for the hiring 'bonanza' in that segment is they need more workers because they cannot let existing workers log more than 30 hours per week. So, hire more workers and EVERYONE works less hours. In 2013, payrolls are up 3 times the hours worked. There you have it.

Perhaps the delay of the implementation of the employer mandate will reverse this, but I doubt it. It was a one-year reprieve. Why go back to the old ways when you know the law is coming? Just keep in place what you have now and then you are ready without incurring more costs associated with switching back and then having to switch again.

THE MARKET

OTHER MARKETS

Dollar lost ground: 1.3178 versus 1.3121 euro.

Bonds rallied back: 2.92% versus 2.98% 10 year.

Oil rebounded: 110.53, +2.16

Gold recovered: 1386.70, +14.10

INTERNALS

NASDAQ
Stats: +1.23 points (+0.03%) to close at 3660.01
Volume: 1.701B (+11.03%)

Up Volume: 953.69M (-196.31M)
Down Volume: 747.59M (+366M)

A/D and Hi/Lo: Decliners led 1.09 to 1
Previous Session: Advancers led 1.51 to 1

New Highs: 105 (-13)
New Lows: 19 (-3)

S&P
Stats: +0.09 points (+0.01%) to close at 1655.17
NYSE Volume: 615M (+8.66%)

A/D and Hi/Lo: Advancers led 1.63 to 1
Previous Session: Decliners led 1.06 to 1

New Highs: 127 (+13)
New Lows: 110 (-48)

DJ30
Stats: -14.98 points (-0.1%) to close at 14922.5

THE CHARTS

Closed out the week with the gains intact, but unable to really change the needle on the NYSE indices.

SP500: Big doji at the 50 day EMA Friday, still with a rally on the rally but also unable to break the trend lower from early August. Decision time this week for the large caps, i.e. do they follow NASDAQ and SOX higher? Can the latter two lead higher?

NASDAQ: held the 50 day EMA the prior week and rallied off of it last week. Made it to the November trendline on the Friday high, then faded some. Still trending higher, the strongest of the indices, and it is up to NASDAQ to continue the trend higher. Up for a week and usually that means a test to rest, but NASDAQ doesn't really have any room to test and keep things moving higher.

DJ30: a second doji just below the 20 day EMA as DJ30 continues to look very toppy though near term it is building some momentum for a bounce higher.

SP400: Still weak, tapping the 50 day EMA on the Friday high then fading to a big doji. Bounced on the week but remains below resistance and looks like a bear flag, similar to SP500.

RUTX: Trying to improve and bridge to NASDAQ and SOX. Closed over the 50 day EMA after breaking it Thursday. Not bad, working in a lateral range the past three weeks, holding the May high as it does. If it can join upside, that is very good for the market.

SOX: Excellent break higher last week took SOX through the 2011 peak. Friday it tested the move, but managed to hold that key level. Very important to for SOX to hold this general level on a test and then break higher once more. It can still form a head and shoulders as it is right at the May peak that could turn into a left shoulder. Important point indeed.

LEADERSHIP

Energy is picking up, e.g. HAL, SLB, KEG. Not across the board but a big help to SP500.

Internet remain strong: YNDX, LNKD, FB, NTES, SINA.

Techs are working of course: AAPL in a nice base. FNSR is flying in the networking. STX is trying to turn. Chips are aiding as well: AMCC, AFOP, ALTR, BRCM is turning as well.

SENTIMENT INDICATORS

VIX: 15.88; -0.73
VXN: 16.77; -1.12
VXO: 15.57; -0.96

Put/Call Ratio (CBOE): 0.77; +0.02

Bulls and Bears:

After the big decline in bulls and jump in bears, the moved moderated with just 0.1% changes. Taking a breather after starting a serious convergence the prior week.

Bulls: 37.1 versus 38.1% versus 43.3%. Diving below the early July, late June levels. 48.4% versus 51.5% versus 52.1% versus 46.9% versus 43.8% versus 41.7% versus 46.8% versus 43.8% versus 45.8% versus 52.1% versus 54.2% versus 52.1% versus 47.9% versus 44.3% versus 47.4% versus 50.5%.

Background: Last undercut 35%, the threshold for bullishness, in early June 2012.

Bears: 23.7 versus 23.8% versus 21.6%. Finally breaking free from the 20 level that held for three weeks, and now matching the highs from late June and early July. Starting to get there but needs to jump toward 30.

Background: Over 35% is the threshold to be really be a good upside indicator. For reference, bearishness hit a 5 year high at 54.4% the last week of October 2008. The move over 50 took bearish sentiment to its highest level since 1995. Extreme negative sentiment. Prior levels for comparison: Bearishness peaked at 37.4% in September 2007. It topped the June 2006 peak (36%) on that run. That June peak eclipsed the March 2006 high (33%) and well above the 2005 highs that spawned new rallies (30% in May 2005, 29.2% in October 2005). That was a huge turn, unlike any seen in recent history.

MONDAY

Stocks start the week facing resistance brought about by a week of gains. That is typically not a bad scenario in a bull market as the market rallies to resistance, takes a breather, then takes it out.

Right now the market is still split with NASDAQ and SOX leading but facing resistance from their good moves, with NASDAQ continuing as the only index not to break its uptrend. RUTX is in the middle, trying to make it across to the leading indices. SP500, DJ30, and SP400 look weak, bouncing back up but in bear flags. The latter three have a lot to prove. Heck, even NASDAQ has a lot to prove.

With the indices unable to hold initial moves after a weak jobs report, it is somewhat clear investors are accepting the Fed will taper. They are accepting it without tanking the market, at least for now. How DJ30, SP500 and SP400 react this week tells just how enthusiastic that acceptance is.

That still does not guarantee a break higher from this resistance. Even so, we like the patterns that continue to develop in the market. Internet still leads, techs are doing well, chips are stepping up, even some energy and commodities are turning. With leadership forming up the market has a shot because it has fresh legs coming in. AAPL is set to breakout and if it does then the market has a big component to help NASDAQ head upside.

This week we will see some of the plays we have try to finish a test or put in a short test as the indices bump resistance and attempt to work through. We want to see those stocks break upside, and if they do then we, of course, step in. Some pretty bearish index patterns on NYSE and it will take leadership to turn them. Makes for an interesting week.

Have a great weekend!

Support and resistance

NASDAQ: Closed at 3660.01

Resistance:
3680 is the November 2012 up trendline
3694 is the August high and the post-bear market high.
3755 is the upper channel line for the November 2012 to present uptrend.
Next major resistance is around 4100 as NASDAQ hits 13 year highs

Support:
The July 2013 intraday high at 3625
The 50 day EMA at 3586
3532 is the May intraday high
3521 is the August 2000 low.
3502 is the May 2013 closing high
The 2011 up trendline at 3360
The 200 day SMA at 3315
3295 is the June 2013 low selloff
3227 is the April 2000 intraday low
3197 is the September 2012 post-bear market high
3171 is the October intraday high

S&P 500: Closed at 1655.17

Resistance:
The 50 day EMA at 1656
1657 is the late August upper gap point
1687 is the May high and post-bear market high
1710 is the August 2013 peak

Support:
1654 is the June 2013 peak
1627 is the August 2013 low
1576 from October 2007, the prior all-time high
1573 is the June 2013 closing low
1569.48 is the 78% Fibonacci retracement of the April to May 2013 run
The 200 day SMA at 1568
1560 is the June 2013 reversal low
1556 from July 2007
1541 is the April 2013 closing low in that pullback inside the uptrend
1539 from June 2007
1531 is the recent high
1499 from January 2008
1475 is the September 2012 high
1471 is the October 2012 intraday high
1466 is the September 2012 closing peak and rally closing high
1440 from November 2007 closing lows

Dow: Closed at 14,922.50

Resistance:
The 20 day EMA at 15,019
15,050 from the August 2013 interim recovery high
The 50 day EMA at 15,131
15,318 is the June closing high
15,542 is the May 2013 intraday high

Support:
14,888 is the April peak and prior all-time high
14,844 is the June intraday low
14,551 is the June 2013 intraday low on the selloff (14,659 closing)
The 200 day SMA at 14,479
14,198 from the October 2007 high
14,149 is the February 2013 high
14,022 from 7-07 peak
14,010 from the early February 2013 consolidation

Economic Calendar

September 3 - Tuesday
- ISM Index, August (10:00): 55.7 actual versus 53.6 expected, 55.4 prior (no revisions)
- Construction Spending, July (10:00): 0.6% actual versus 0.5% expected, 0.0% prior (revised from -0.6%)

September 4 - Wednesday
- MBA Mortgage Index, 08/31 (7:00): -2.5% prior
- Trade Balance, July (8:30): -$38.2B expected, -$34.2B prior
- Auto Sales, August (14:00): 5.6M prior
- Truck Sales, August (14:00): 6.8M prior

September 5 - Thursday
- Challenger Job Cuts, August (7:30): 56.5% actual versus 2.3% prior
- ADP Employment Change, August (8:15): 176K actual versus 180K expected, 198K prior (revised from 200K)
- Initial Claims, 08/31 (8:30): 323K actual versus 333K expected, 332K prior (revised from 331K)
- Continuing Claims, 08/24 (8:30): 2951K actual versus 2977K expected, 2994K prior (revised from 2989K)
- Productivity-Rev., Q2 (8:30): 2.3% actual versus 1.5% expected, 0.9% prior
- Unit Labor Costs, Q2 (8:30): 0.0% actual versus 1.0% expected, 1.4% prior
- Factory Orders, July (10:00): -2.4% actual versus -3.7% expected, 1.6% prior (revised from 1.5%)
- ISM Services, August (10:00): 58.6 actual versus 54.5 expected, 56.0 prior
- Natural Gas Inventories, 08/31 (10:30): 58 bcf actual versus 67 bcf prior
- Crude Inventories, 08/31 (11:00): -1.836M actual versus 2.986M prior

September 6 - Friday
- Nonfarm Payrolls, August (8:30): 169K actual versus 177K expected, 104K prior (revised from 162K)
- Nonfarm Private Payr, August (8:30): 152K actual versus 180K expected, 127K prior (revised from 161K)
- Unemployment Rate, August (8:30): 7.3% actual versus 7.4% expected, 7.4% prior
- Hourly Earnings, August (8:30): 0.2% actual versus 0.2% expected, 0.0% prior (revised from -0.1%)
- Average Workweek, August (8:30): 34.5 actual versus 34.5 expected, 34.4 prior

September 9 - Monday
- Consumer Credit, July (15:00): $13.0B expected, $13.8B prior

September 10 - Tuesday
- JOLTS - Job Openings, July (10:00): 3.936M prior

September 11 - Wednesday
- MBA Mortgage Index, 09/07 (7:00): 1.3% prior
- Wholesale Inventories, July (10:00): 0.2% expected, -0.2% prior
- Crude Inventories, 09/07 (10:30): -1.836M prior

September 12 - Thursday
- Initial Claims, 09/07 (8:30): 327K expected, 323K prior
- Continuing Claims, 08/31 (8:30): 2975K expected, 2951K prior
- Export Prices ex-ag., August (8:30): 0.0% prior
- Import Prices ex-oil, August (8:30): -0.4% prior
- Natural Gas Inventories, 09/07 (10:30): 58 bcf prior
- Treasury Budget, August (14:00): -$190.5B prior

September 13 - Friday
- Retail Sales, August (8:30): 0.4% expected, 0.2% prior
- Retail Sales ex-auto, August (8:30): 0.3% expected, 0.5% prior
- PPI, August (8:30): 0.2% expected, 0.0% prior
- Core PPI, August (8:30): 0.1% expected, 0.1% prior
- Michigan Sentiment - Preliminary, September (9:55): 82.0 expected, 82.1 prior
- Business Inventories, July (10:00): 0.3% expected, 0.0% prior
icon url

ReturntoSender

09/09/13 11:42 PM

#10321 RE: ReturntoSender #6755

4:10 pm : The S&P 500 settled higher by 1.0% as trade managed to regain its 50-day moving average (1666/1667) for the first time in two weeks.

Equities climbed from the open, bolstered by reassuring economic reports out of China and Japan, headlines suggesting a strike against Syria could possibly be avoided, and the notion that the relatively disappointing employment report on Friday has lowered the probability of a big tapering announcement at the September 17-18 FOMC meeting.

Overnight, China reported a larger-than-expected trade surplus of $28.61 billion as imports grew 7.0% (11.3% expected) and exports increased 7.2% (6.0% forecast). Elsewhere, Japan saw its second quarter GDP revised up to 0.9% quarter-over-quarter from 0.6% and Tokyo received the nod to host the 2020 Olympics.

Growth-sensitive sectors paced the advance with materials ending in the lead. The sector rose 1.5% as steelmakers rallied in reaction to the data from Asia. The Market Vectors Steel ETF (SLX 45.00, +1.21) jumped 2.8%. Fertilizer names also registered solid gains after Russian President Vladimir Putin said the ongoing potash dispute with Belarus needs to be resolved. Mosaic (MOS 44.31, +2.15) ended higher by 5.1%.

Other commodity-related sectors also displayed strength. Industrials (+1.2%) were bolstered by broad gains among transportation companies and machinery producers. The Dow Jones Transportation Average rose 1.4% and Dow component Caterpillar (CAT 85.59, +2.20), who does a significant amount of business in China, advanced 2.6%.

The energy sector (+1.0%) also outperformed even as crude oil fell 1.4% to $109.04 per barrel. Crude futures slid to their lows after reports indicating Russia has urged Syria to put its chemical weapons under international control were followed by headlines suggesting Syria has welcomed the proposal. The reports contributed to some cautious optimism hoping that a diplomatic solution remains within the realm of possibilities.

With regard to other cyclical sectors, technology (+1.3%) displayed strength throughout the day. The largest sector component, Apple (AAPL 506.17, +7.95), gained 1.6% ahead of tomorrow's product refresh. Elsewhere, discretionary shares finished in-line with the S&P, which overshadowed the broad gains among homebuilders. The iShares Dow Jones US Home Construction ETF (ITB 21.78, +0.90) spiked 4.3%.

Countercyclical sectors lagged across the board as consumer staples, health care, telecom services, and utilities added between 0.2% and 0.8%.

Treasuries finished near their highs as participants speculated whether the August employment report was weak enough to prevent the data-dependent Fed from lowering the pace of its asset purchases at the September 17/18 FOMC meeting. The benchmark 10-yr yield ended lower by four basis points at 2.90%.

Participation in today's session was limited as less than 650 million shares changed hands on the floor of the New York Stock Exchange.

According to the Federal Reserve, consumer credit increased by $10.4 billion in July. This followed the prior month's increase of $11.9 billion, and was lower than the $13.0 billion that had been broadly expected among economists polled by Briefing.com.

There is no economic data of note scheduled to be reported tomorrow.DJ30 +140.62 NASDAQ +46.17 SP500 +16.54 NASDAQ Adv/Vol/Dec 1929/1.62 bln/621 NYSE Adv/Vol/Dec 2413/638.7 mln/603

3:30 pm :

Oct crude oil traded lower today following headlines suggesting Syria has welcomed Russia's proposal for Syria to put its chemical weapons under international control. The energy component pulled back from its session high of $110.20 per barrel set at floor trade open and settled with a 0.9% loss at $109.53 per barrel. In electronic trade, crude is selling off and is now just below $109/barrel.
Oct natural gas, on the other hand, traded higher. It picked up momentum as it headed into the close after chopping around near the $3.57 per MMBtu level for most of the session. It settled at its session high of $3.61 per MMBtu, or 2.3% higher.
Dec gold brushed a session high of $1390.90 per ounce but lost momentum in late morning action and spent the remainder of the session chopping around near the unchanged line. It settled 20 cents lower at $1386.50 per ounce despite a weaker dollar index.
Dec silver spent its entire session in negative territory, touching a session low of $23.52 per ounce. Although it traded up to a session high of $23.83 per ounce in late morning action, it pulled back as the session progressed and settled with a 0.8% loss at $23.72 per ounce.

Large Cap Gainers

DAL (21.24 +6.79%): To replace BMC Software (BMC) in the S&P 500
VALE (16.33 +4.51%): Mentioned positively in blog article by Jim Cramer
POT (31.47 +4.31%): Strength in potash companies following reports that Russian President Vladimir Putin said it is necessary to resolve a potash dispute with Belarus; MOS also higher

Large Cap Losers

ESRX (63.93 -2.43%): Announced acquisition of SmartD Medicare prescription drug plan, terms not disclosed
MPC (69.64 -1.71%): Downgraded at Simmons
LNKD (249 -1.67%): Seeing reports that Facebook is testing a "professional skills" section that is similar to LinkedIn

Mid Cap Gainers

MOLX (38.56 +31.42%): To be acquired by Koch Industries for $38.50 per share in cash
ISIS (31.1 +11.39%): Co and Biogen Idec (BIIB) announced that they have entered into a broad, multi-year collaboration to leverage antisense technology to advance the treatment of neurological diseases; BIIB will make an upfront payment of $100 mln
CLF (23.07 +5.58%): Strength following strong year over year growth in China's August exports

Mid Cap Losers

EGO (8.07 -4.21%): Weakness in gold companies: NGD, AEM, GOLD, BVN also lower
CYH (38.1 -3.98%): Downgraded to Neutral from Buy at Citigroup
HFC (43 -1.58%): Downgraded to Equal-Weight from Overweight at Morgan Stanley

9:09AM Freescale Semi announces increase of new term loan facility from $300 mln to $800 mln (FSL) 15.55 : Co announced that Freescale has been advised by the arrangers under its proposed new senior secured term loan facility that they have received sufficient orders to upsize the proposed new term loan facility to $800 million from the original $300 million proposed at the outset of the offering.

The proceeds from the proposed new term loan facility are intended to be used to redeem, repurchase or otherwise acquire all of Freescale's outstanding 10?% senior secured notes due 2018 and a portion of its 9 % senior secured notes due 2018, and to pay related redemption premiums and fees. Freescale will pay for a portion of its expenses with cash on hand. The foregoing does not constitute a notice of redemption for any outstanding notes. The purposes of the transaction and the application of the proceeds are to extend a portion of Freescale's debt maturities and reduce interest expense.

Spansion (CODE) announced that the Spansion FL-S family of Serial Peripheral Interface Flash and the Spansion ML-G1 Series SLC NAND have been qualified as Xilinx (XLNX) Supported Flash Devices for the Zynq-7000 All Programmable SoC family for configuration and data storage.

IXYS (IXYS) announced the release of a reference design and demonstration board for a 200W AC LED Driver with Power Line Interface in collaboration with Echelon (ELON).

Intel's (INTC) McAfee announced its new 2014 line of core PC security suites delivering increased power and performance with a lighter and faster footprint resulting in an improved user experience. The line includes McAfee AntiVirus Plus 2014, McAfee Internet Security 2014 and McAfee Total Protection 2014.

FEI (FEIC) announced that Monash University has ordered a Titan Krios cryo transmission electron microscope and Tecnai T12 TEM for applications in the field of integrated structural biology.

8:01AM Molex Incorporated agrees to Be acquired by Koch Industries for $38.50/share in cash (shares halted) (MOLX) 29.34 :

Co announced that it has entered into a definitive agreement to be acquired by Koch Industries. Under the terms of the agreement, Koch Industries will acquire all of Molex's outstanding shares, including the Common Stock (MOLX), the Class A Common Stock (MOLXA) and the Class B Common Stock, for $38.50/share in cash, for a total equity value of ~ $7.2 bln.
Based on the closing stock prices on September 6, 2013, the purchase price represents a 42% premium to the equity value of Molex's publicly-traded stock, specifically a 31% premium to the Common Stock and a 56% premium to the Class A Common Stock.
The agreement has been approved by both the Molex and the Koch Industries boards of directors. Certain members of the Krehbiel Family and certain executive officers of Molex, owning in the aggregate voting stock representing approximately 32% of the Common Stock and 94% of the Class B Common Stock, have entered into voting agreements with Koch by which they have agreed to vote their stock in support of the transaction.
The transaction is not subject to a financing condition, and the parties are targeting a calendar year-end close, subject to customary closing conditions, including receipt of shareholder and regulatory approvals.

Apple (AAPL 504.30, +6.08) is +1.2% after reports suggested the company may unveil a lower-cost device for the Chinese market at its press event on Tuesday. In addition, FBN Securities raised its target for the stock to $600 from $575.

7:32AM Western Digital acquires Virident for ~$685 mln in cash (WDC) 64.99 : Virident, a provider of server-side flash storage solutions, will be acquired by HGST, a wholly owned subsidiary of WDC. Virident will be acquired for ~$685 million in cash. This represents ~$645 million in enterprise value, net of Virident's estimated cash balance at closing.

Virident solutions enable enterprises to tackle performance-intensive datacenter applications with PCIe-based enterprise flash storage solutions for virtualization, database, cloud computing, and webscale applications.

The acquisition further enhances the value of HGST solutions through Virident's intelligent storage software. The integration with HGST will enable Virident to accelerate its go-to-market efforts by leveraging HGST's strong brand, extensive channel relationships, and global customer reach.

First Solar (FSLR) and BELECTRIC Holding, GmbH announced the launch of a JV that will realize solar energy projects on three continents. The JV, PV Projects GmbH & Co. KG, is based in Germany and will be tasked with developing selected photovoltaic power projects independently acquired or developed by either of the two cos in Europe, North Africa, as well as projects of fewer than 20 megawatts, in the U.S.
Microsoft (MSFT) announces plans to bring Xbox Music to iOS and Android devices, as well as free streaming on Xbox Music via the Web. Co will offer unlimited access to the songs and artists at any time with playback across tablets, PCs, phone and Xbox console for $9.99 per month or $99.99 per year.

Novatel Wireless (NVTL) announces it is implementing restructuring initiatives designed to refine its business operations and capitalize on synergies in its target markets with the goal of driving long-term profitability. In connection with the restructuring plan, Novatel Wireless is making strategic organizational changes across some of its Mobile Computing and Machine-to-Machine business operations that will streamline its research and development resources and consolidate several global manufacturing activities to drive efficiencies. The company anticipates that the restructuring initiatives will be substantially completed within the next 30-45 days. Once fully implemented, Novatel Wireless estimates that the restructuring initiatives will generate annualized, pre-tax savings of $10 to 11 million, which will begin to be realized in the fiscal fourth quarter of 2013. Cost savings will be achieved through the consolidation of one of the company's development sites and certain manufacturing and other activities, which the company expects to result in a headcount reduction of approximately 75 to 80 employees. The company expects to record an associated, pre-tax restructuring charge in its GAAP financial results of ~$3.2-4.6 million in the second half of 2013, the majority of which is expected to occur in the fiscal third quarter.

Hanwha SolarOne (HSOL) reported second quarter of ($0.32) vs. ($0.43) last quarter; rev +6% QoQ to $192.7 million; module shipments 321 MW vs. 330-350 MW guidance. The company sees third quarter module shipments of 300-325 MW; the company lowered fiscal year 2013 module shipment guidance to 1.2-1.4 GW from 1.3-1.5 GW.

Cowen notes, upon recent coverage transfer, it maintains its $550 target and Outperform rating on Apple (AAPL). While there could be a "sell the news" phenomenon this week, firm would buy weakness as Street estimates appear very conservative in '14 and assume iPhone share falls another ~300-400bps y/y. While US uptake of new products could remain somewhat muted in 2H:13 given some recent saturation from 4/4S, firm estimates adding China Mobile (CHL) and DoCoMo alone could conservatively drive ~25-35MM incremental units in '14 on a base of ~150MM units.F2014 revs/EPS of ~$197B/$46.56 are both ~10% above Street, while new F2015 EPS is $58.56 versus Street $52.17.
icon url

ReturntoSender

09/10/13 6:15 PM

#10322 RE: ReturntoSender #6755

From Briefing.com: 4:20 pm : The S&P 500 climbed 0.7% as all ten sectors settled in positive territory.

Stocks registered the bulk of their gains during the opening hour after upbeat economic data from China combined with Syria's agreement to put its chemical weapons under international control lured participants into equities.

In addition to sparking a risk bid, the lowered likelihood of military action against Syria caused a handful of safe-haven assets to slide. Crude oil and gold futures sold off in the morning before spending the remainder of the session near their lows. Gold fell 1.6% to $1364.90 per troy ounce while oil slumped 2.0% to $107.29 per barrel. Treasuries also faced some selling, which sent the benchmark 10-yr yield higher by four basis points to 2.96%.

With the Syrian situation remaining fluid, tonight's presidential address at 21:00 ET is expected to receive significant attention. The speech is likely to focus on finding a diplomatic solution while reserving the right for military action should Syria fail to comply.

The retreat in oil prices weighed on the energy sector, which ended flat. Meanwhile, most other cyclical groups finished ahead of the broader market.

Industrials (+1.4%) ended in the lead thanks to all-around strength. The largest sector member, General Electric (GE 23.87, +0.48) rose 2.1% and transportation companies also rallied across the board. The Dow Jones Transportation Average climbed 1.9% as lower oil prices contributed to the outperformance. Industrials were followed by the financial sector, which gained 1.2%. Goldman Sachs (GS 165.14, +5.65) paced the sector's advance after it was announced the investment bank along with Nike (NKE 66.82, +1.42) and Visa (V 184.59, +6.04) will enter the Dow Jones Industrial Average following next Friday's close. The trio will replace Alcoa (AA 8.06, -0.03), Bank of America (BAC 14.61, +0.13), and Hewlett-Packard (HPQ 22.27, -0.09) in the price-weighted index.

The technology sector (+0.6%) traded in-line with the S&P through the first half of the session, but was pressured by its largest component during afternoon trade. Apple (AAPL 494.64, -11.53) lost 2.3% after its product refresh event was met with investor disappointment.

With regard to countercyclical sectors, consumer staples (+0.1%) and health care (+0.6%) lagged while utilities (+0.7%) ended in-line. The weakest group of the third quarter, telecom services (+1.1%), narrowed its quarter-to-date loss to 5.1% as Verizon (VZ 46.47, +0.56) gained 1.2% after the company's bond offering received significant interest.

Given the lowered likelihood of military involvement in Syria, the CBOE Volatility Index (VIX 14.52, -1.11) registered its first close below 15.00% for the first time since August 26.

Today's session received solid participation as 773 million shares changed hands on the floor of the New York Stock Exchange.

Tomorrow, the weekly MBA Mortgage Index will be reported at 7:00 ET and July wholesale inventories will cross the wires at 10:00 ET.DJ30 +127.94 NASDAQ +22.84 SP500 +12.28 NASDAQ Adv/Vol/Dec 1678/1.76 bln/853 NYSE Adv/Vol/Dec 1996/773.0 mln/1012

3:30 pm : Commodities sold off this morning and most barely climbed off session lows. Syrian headlines helped keep oil prices lower today, which ended near the $107/barrel area. Oct crude oil closed the day 2% lower at $107.39/barrel.

Natural gas prices were volatile this morning, but after whipping back into the red this morning, the energy component remained in the red. Oct nat gas fell 3 cents to $3.58/MMBtu.

Gold and silver spent all day in negative territory. Both precious metals sold off to new session lows in early morning trade and spent the rest of the day inching slowly higher. Dec gold ended the day 1.6% lower at $1364.00/oz, while Dec silver fell 3% to $23.01/oz.

4:32PM Integrated Device announces departure of Chief Financial Officer (IDTI) 9.37 +0.12 : Co announced that Richard D. Crowley, senior vice president and chief financial officer, will be resigning his position with IDT to pursue another executive opportunity. Mr. Crowley will continue to serve as a financial advisor to the Company through September 17, 2013. Co has appointed Brian C. White as chief financial officer effective September 11, 2013. White has more than 25 years of accounting and financial experience, including six years as vice president of finance and treasurer at IDT.

4:31PM Intersil announces appointment of Richard Crowley as Chief Financial Officer (ISIL) 10.089 +0.09 : Co announced the appointment of Richard Crowley as senior vice president and chief financial officer effective September 23. Mr. Crowley brings over 30 years of industry experience to the role and is the latest addition to the Intersil management team leading the transformation of the company.

Crowley has been a CFO at various complex, multinational semiconductor firms since 1998. With over thirty years of increasing financial management responsibility Mr. Crowley has developed a deep understanding of the unique aspects of managing a business in a fast-paced and innovation-oriented industry.
4:30PM Texas Instruments narrows Q3 guidance at mid quarter update; sees GAAP EPS of $0.51-0.55 versus prior guidance of $0.49-0.57 and GAAP Capital IQ consensus of $0.53; sees revs of $3.15-3.29 bln versus prior guidance of $3.09-3.35 bln and $3.225 bln Capital IQ consensus. (TXN)

4:19PM SunEdison announces proposed public offering of 30 mln shares of common stock (SUNE) 8.35 +0.53 : Co announced that it will file a prospectus supplement to a registration statement filed on Form S-3 with the SEC, relating to a proposed underwritten public offering of shares of common stock. The Company will be offering 30,000,000 shares of its common stock. The Company intends to use the net proceeds for general corporate purposes, which it expects to include funding working capital and growth initiatives. Deutsche Bank Securities and Goldman, Sachs & Co. are acting as joint book-running managers for the offering.

3:23PM NXP Semi prices $500 mln 3.5% senior unsecured notes offering (NXPI) 38.97 +0.46 : Co announced today the pricing of the previously announced offering by its subsidiaries NXP B.V. and NXP Funding LLC of USD 500 million aggregate principal amount of senior notes due 2016. The Unsecured Notes will bear interest at 3.5% per annum and will mature on September 15, 2016. Interest on the Unsecured Notes will be payable semi-annually on September 15 and March 15 of each year, beginning on March 15, 2014. NXP intends to use the net proceeds of the offering to repay amounts outstanding under its U.S. dollar denominated 9.75% senior secured notes due 2018 and for general corporate purposes.

2:14PM Apple confirms partnership with NTT DOCOMO to offer iPhone in Japan on Friday, September 20 (AAPL) 502.00 -4.17 : NTT DOCOMO and Apple confirmed that iPhone 5s and the iPhone 5c will be available on the DOCOMO network beginning on Friday, September 20.

2:12PM Apple confirms iPhone 5s, iPhone 5c (AAPL) 504.41 -1.76 : Co confirmed the iPhone 5s featuring an all-new A7 chip, making iPhone 5s the world's first smartphone with 64-bit desktop-class architecture. "iPhone 5s redefines the best smartphone experience in the world with amazing new features all packed into a remarkable thin and light design, including an all-new 8 megapixel iSight camera with True Tone flash and introducing Touch ID, an innovative way to simply and securely unlock your phone with just the touch of a finger. iPhone 5s comes with iOS 7, the most significant iOS update since the original iPhone, engineered for 64-bit technology and featuring hundreds of great new features, including Control Center, Notification Center, improved Multitasking, AirDrop , enhanced Photos, Safari , Siri and iTunes Radio."

iPhone 5s comes in gold, silver or space gray, and will be available in the US for a suggested retail price of $199 (US) for the 16GB model and $299 (US) for the 32GB model and $399 (US) for the 64GB model. iPhone 5s will be available in the US, Australia, Canada, China, France, Germany, Hong Kong, Japan, Puerto Rico, Singapore and the UK on Friday, September 20. A new iPhone 4S 8GB model will also be available for free.

Co also confirmed the iPhone 5c, featuring an all-new design in five colors-blue, green, pink, yellow and white. "iPhone 5c is built on a foundation of features people know and love like the beautiful 4-inch Retina display, blazing fast performance of the A6 chip, and the 8 megapixel iSight camera-all while delivering great battery life. iPhone 5c comes with more LTE bands than any other smartphone in the world, a new FaceTime HD camera, and iOS 7, the most significant iOS update since the original iPhone."

iPhone 5c comes in blue, green, pink, yellow and white and will be available in the US for a suggested retail price of $99 (US) for the 16GB model and $199 (US) for the 32GB model. iPhone 5c will be available in the US, Australia, Canada, China, France, Germany, Hong Kong, Japan, Puerto Rico, Singapore and the UK on Friday, September 20, and customers can pre-order their iPhone 5c beginning Friday, September 13. A new iPhone 4S 8GB model will also be available for free.

Large Cap Gainers

TTM (26.61 +5.85%): Co plans to enter the Indonesian market, according to reports; India names showing strength with Sensex gains.
DAL (22.65 +4.09%): Co to be included into the SPX 500 as of the close of trading today; also strength in airline names (UAL also higher).
MYL (38.11 +4.44%): Upgraded to Outperform from Mkt Perform at Bernstein; GlaxoSmithKline (GSK) unable to recover losses following FDA Draft Guidance for industry on bioequivalence recommendations for Advair (fluticasone propionate).

Large Cap Losers

PVH (124.03 -6.12%): Beat on EPS by $0.01, beat on revs; issued mixed guidance.
CAG (31.18 -7.09%): Lowered FY14 EPS guidance.
GG (27.56 -5.32%): Metals/mining names trading lower (ABX also lower).

Mid Cap Gainers

FIVE (47.8 +16.47%): Beat on EPS by $0.02, beat on revs; guided Q3 EPS in-line, revs slightly below consensus; raised FY14 EPS in-line, raised FY14 revs in-line; Q2 comps +6.6%; tgt to $51 from $40 at Deutsche Bank, to $51 from $45 at Jefferies; tgt raised to $50 from $45 at UBS; upgraded to Neutral from Sell at MKM Partners, tgt raised to $41.
SCTY (34.38 +15.02%): Co and Direct Energy signed multimillion dollar deal to provide solar electricity to businesses.
SBGI (28.92 +7.15%): Tgt raised to $42 at The Benchmark Company; FMR reported new stake of 10.470% in co.

Mid Cap Losers

HDS (21.52 -13.05%): Beat on EPS by $0.03, missed on revs; guided FY13 EPS below consensus, revs below consensus.
URBN (38.12 -10.75%): Trading lower likely due to comments that Q3 retail segment net sales are mid single-digit positive; heard ests lowered at William Blair.
TPX (40.89 -4.35%): Disclosed that it sees 2016 sales target of $3.3 bln versus $3.02 bln Capital IQ consensus; sees FY16 EBITDA target of $550 mln.

Cypress Semiconductor (CY) announced that LSI has selected Cypress's parallel nonvolatile Static Random Access Memories for its new 12Gb/s SAS Host Bus Adapters for high-performance servers, workstations and external storage systems.

Semtech (SMTC) announced its partnership with OmniTek. OmniTek, utilizing Semtech's 6G UHD-SDI Equalizers, is the first broadcast test and measurement supplier to bring to market products featuring a 6G UHD-SDI interface

MSC (AMSC) announced that Consolidated Power Projects has selected AMSC's D-VAR STATCOM solution to connect South Africa's largest wind farm to the electricity grid.

AMD (AMD) disclosed two best-in-class x86 accelerated processing units and central processing units, a first look at a high-performance ARM system-on-chip and a new family of discrete AMD Embedded Radeon graphics processing units expected to launch in 2014.

Cadence Design Systems (CDNS) introduced the Palladium XP II Verification Computing Platform as part of an enhanced System Development Suite, significantly speeding up hardware and software verification.

Market Summary
[Edit]
streaming quotes: ON
Chart for NASDAQ Composite Index (^IXIC)
Chart for Dow Jones Industrial Average Index (^DJI)
Symbol Last Change
Dow 15,191.06 Up 127.94(0.85%)
Nasdaq 3,729.02 Up 22.84(0.62%)
S&P 500 1,683.99 Up 12.28(0.73%)
10-Yr Bond 2.9590% Up 0.0620
NYSE Volume 0
Nasdaq Volume... 0
Indices: US - World | Most Actives
Advances & Declines
NYSE NASDAQ
Advances 2,699 (64%) 1,644 (63%)
Declines 1,416 (34%) 855 (33%)
Unchanged 108 (3%) 101 (4%)
Up Vol* 2,795 (70%) 1,190 (66%)
Down Vol* 1,182 (29%) 601 (33%)
Unch. Vol* 44 (1%) 19 (1%)
New Hi's 293 206
New Lo's 126 27
*in millions
more...
Most Actives
NYSE LAST CHANGE
DAL 22.63 Up 4.00%
BAC 14.61 Up 0.90%
VXX 14.94 Down 3.70%
ALU 3.52 Up 2.33%
F 17.55 Up 1.39%
Nasdaq LAST CHANGE
MU 16.26 Up 4.13%
MSFT 32.39 Up 2.32%
FB 43.60 Down 1.00%
BBRY 10.94 Down 5.12%
DRYS 2.9650 Down 3.89%
more..
icon url

ReturntoSender

09/11/13 8:15 PM

#10323 RE: ReturntoSender #6755

From Briefing.com: 4:15 pm : The major averages ended in mixed fashion as the Nasdaq shed 0.1% while the S&P 500 added 0.3% to register its seventh consecutive advance. For its part, the Dow Jones Industrial Average gained 0.9%.

The key indices diverged at the open with the tech-heavy Nasdaq and S&P 500 starting in negative territory due to significant weakness in the largest tech stock. Apple (AAPL 467.71, -26.93) sank 5.4% after the company's overnight product refresh event in China did not reveal a deal with China Mobile (CHL 55.87, -1.53) as many investors had expected. The underperformance of Apple kept the Nasdaq and the technology sector (-0.5%) in the red throughout the day while the S&P was able to shake off the opening weakness.

Rotten price action in the shares of Apple masked the solid gains in many other large tech names. Cisco Systems (CSCO 24.38, +0.22), Oracle (ORCL 33.02, +0.16), Google (GOOG 896.19, +7.52), and Microsoft (MSFT 32.74, +0.35) added between 0.5% and 1.1%.

Meanwhile, the price-weighted Dow was unaffected by Apple as the largest member of the blue chip index, IBM (IBM 190.70, +4.10), gained 2.2% after saying last night it will be selling its lower margin customer care business process outsourcing services business to Synnex for $505 million. Including IBM, 26 of 30 Dow components ended in the green.

Outside of technology, the financial sector (+0.1%) was the only cyclical group that trailed behind the S&P. Citigroup (C 50.73, -0.36) lost 0.7% after reports from Fox Business News indicated the bank plans to lay off 2,200 employees in its mortgage unit.

The broader market was kept afloat by the relative strength of the remaining growth-sensitive sectors. Energy, industrials, materials, and discretionary shares gained between 0.5% and 0.8% with energy and materials in the lead.

The energy sector added 0.8% as crude oil rose 0.3% to $107.72 per barrel. The other commodity-related space, materials, tacked on 0.6%. Gold miners contributed to the relative strength as the Market Vectors Gold Miners ETF (GDX 26.79, +0.22) climbed 0.8%. However, the underlying metal ended little changed at $1364.20 per troy ounce.

Countercyclical sectors have been a bit shaky in recent days, but ended today's session in mixed fashion. Consumer staples (+0.8%) and health care (+0.7%) outperformed while telecom services (unch) and utilities (-0.9%) lagged.

Treasuries jumped to their highs following today's solid $21 billion 10-yr note reopening. The benchmark 10-yr yield ended lower by six basis points at 2.91%.

Participation in today's session was a bit below average as 657 million shares changed hands on the floor of the New York Stock Exchange.

Last evening, President Obama addressed the nation regarding the situation in Syria. Mr. Obama continued to make a case for a targeted military strike against the Middle Eastern country, but indicated the Russian proposal requiring Syria to put its weapons under international control will also be considered.

July wholesale inventories ticked up 0.1% while the Briefing.com consensus expected an increase of 0.2%. Today's report follows last month's unrevised decrease of 0.2%.

Separately, the weekly MBA Mortgage Index fell 13.5% to its lowest level since November 2008. Today's decline was paced by a 20.2% decrease in the refinance index.

Tomorrow, weekly initial claims, August export prices ex-agriculture and import prices ex-oil will all be reported at 8:30 ET. In addition, the Treasury will release its August budget at 14:00 ET.DJ30 +135.54 NASDAQ -4.01 SP500 +5.14 NASDAQ Adv/Vol/Dec 1206/1.63 bln/1295 NYSE Adv/Vol/Dec 1655/656.9 mln/1345

3:30 pm : Oct crude oil fell below the $107.00 per barrel level following inventory data that showed a draw of 0.219 mln barrels when expectations called for a draw of 1.5-2.1 mln barrels. However, the energy component quickly recovered back into positive territory, advancing to a session high of $108.09 per barrel. It pulled back heading into the close and settled at $107.55 per barrel, or 0.1% higher.

Oct natural gas traded mostly in negative territory today. It climbed to a session high of $3.62 per MMBtu in late afternoon action but retreated back into the red and settled 0.3% lower at $3.57 per MMBtu.

Dec gold chopped around slightly below the breakeven line today following President Obama's speech on Syria. The President has put the Congressional vote on an attack on Syria on hold as he seeks a diplomatic solution. The yellow metal brushed a session low of $1359.20 per ounce and settled just 40 cents lower at $1363.60 per ounce.

Dec silver, on the other hand, traded higher, rising to a session high of $23.23 per ounce. It eventually settled 0.7% higher at $23.17 per ounce.

4:15PM Qualcomm announces new $5 bln stock repurchase program (QCOM) 68.09 -2.00 : Co announced that its Board of Directors has approved, effective immediately, a new $5.0 billion stock repurchase program. This replaces the prior $5.0 billion stock repurchase program announced on March 5, 2013, at which time we had also announced a 40 percent increase in the quarterly cash dividend. Since July 24, 2013, the Company repurchased ~40.1 million shares of common stock for ~$2.7 billion. The new stock repurchase program has no expiration date.

4:13PM Hewlett-Packard confirmed launch of new Chromebook14, the first Chromebook powered by an Intel (INTC) processor based on the Haswell microarchitecture (HPQ) 22.27 0.00 :

Large Cap Gainers

BIDU (147.79 +5.11%): Mentioned positively by Citi analysts who believe search moetization may surprise; peer Chinese search firm QIHU also higher
NOK (5.9 +4.24%): Upgraded to Buy from Neutral at BofA/Merrill; upgraded to Outperform from Sector Perform at RBC Capital Markets, target raised to $7 from $5; upgraded to Buy from Sell at Berenberg
MAR (42.93 +3.17%): Upgraded to Buy from Neutral at UBS

Large Cap Losers

AAPL (466.27 -5.74%): Weakness following announcement of two new iPhones and iOS 7; downgraded to Neutral from Buy at BofA/Merrill; downgraded to Neutral from Outperform at Credit Suisse; downgraded to Neutral from Buy at UBS; target raised to $540 from $460 at Oppenheimer; target raised to $525 from $500 at FBR Capital; target raised to $570 from $500 at Lazard; target raised to $600 from $540 at Telsey Advisory Group
PTR (110.64 -3.38%): Reuters reporting that joint venture partner China Oil & Gas has denied a newspaper report that one of its former executives was being investigated for corruption
NFLX (307.21 -1.87%): Downgraded to Neutral from Buy at BTIG Research after shares exceeded price target

Mid Cap Gainers

LINE (27.28 +10.27%): Co, LinnCo (LNCO), and Berry Petroleum (BRY) announced progress in merger: companies have agreed to set the record dates for their respective unitholder, shareholder, and stockholder meetings as of September 30, 2013
LVLT (25.65 +4.72%): Announced it has expanded its Vyvx broadcast capabilities into South Africa to meet the growing demand for video content
THRX (38.84 +2.78%): FDA Advisory Committee recommended approval of umeclidinium/vilanterol for the treatment of COPD

Mid Cap Losers

RH (69.88 -8.13%): Beat quarterly EPS by $0.06 ($0.49 ex items vs $0.43 estimate), revs rose 30.5% yoy to $382.1 mln vs $379.6 mln estimate; sees Q3 EPS of $0.27-0.29 ex items vs $0.16 estimate, revs of $385-395 mln vs $365.7 mln estimate; sees Q4 EPS of $0.81-0.84 ex items vs $0.82 estimate, revs of $490-500 mln vs $482.8 mln estimate; comparable store sales increased 26% vs 31% in prior year
WLK (102.45 -4.09%): Downgraded to Neutral from Overweight at JP Morgan
UMBF (53.63 -3.14%): Priced an offering of 3.9 mln shares of common stock at $54 per share

9:35AM Cisco Systems sets new high for the week/month of 24.30, its 50 ema comes in at 24.43 (CSCO) 24.32 +0.16 :

9:34AM Apple aggressive gap down start holds above its 200 sma at 463 -- session low 464 (AAPL) 470.00 -24.54 :


LSI (LSI) announced that its 12Gb/s SAS storage solutions will power more than 100 new server models based on today's announced Intel (INTC) Xeon Processor E5-2600 v2 Product Family

Riverbed Technology (RVBD) announced that the Elizabeth Glaser Pediatric AIDS Foundation has deployed Riverbed Steelhead wide area network optimization appliances in 12 of its African offices and in many field offices.


QLogic (QLGC) announced that its FlexSuite adapters are the first to provide fully offloaded, multiprotocol support with PCI Express 3.0 for the new Intel Xeon Processor E5-2600/1600 v2 Product Family.


VDE Americas, a subsidiary of VDE Institute, and First Solar (FSLR) announced the establishment of a strategic relationship that significantly raises the industry bar for technical bankability and risk reduction for PV power plant operators, investors and financial entities.


Broadcom (BRCM) announced that D-Link has selected its StrataGX processor and 5G WiFi Enterprise system-on-a-chip for its new 11AC Wi-Fi enterprise access point.

Peregrine Semiconductor (PSMI) announced the PE42820 and PE42821 single-pole double throw switches for high-power wireless applications.

Cryptography Research, a division of Rambus (RMBS), and ALi Corporation announced they have signed an architecture license agreement for the use of Cryptography Research's differential power analysis countermeasure patents and technologies in ALi's STB solutions.

07:43 am Texas Instruments shares slightly lower following narrowing of Q3 guidance

Texas Instruments (TXN $40.14 -0.17) narrowed third quarter guidance at mid quarter update; sees GAAP EPS of $0.51-0.55 versus prior guidance of $0.49-0.57 with revenues of $3.15-3.29 billion versus prior guidance of $3.09-3.35 billion (both in line with consensus).

On the conference call the company said quarter is tracking with expectations at company level as well as within product lines; had expected that 1H growth in Auto would continue into Q3. The company also said average utilization will be up in Q2 as expected. Orders have been 'solid this quarter, AND backlog has expanded quarter to date so book to bill is greater than 1.

Synnex (SNX) and IBM (IBM) announced a definitive agreement in which SYNNEX will acquire IBM's worldwide customer care business process outsourcing services business for $505 million, consisting of approximately $430 million in cash and $75 million in stock. The acquisition will be branded and fully integrated with Concentrix, a wholly owned subsidiary of SYNNEX. As part of the transaction, SYNNEX will enter into a multi-year agreement with IBM, and Concentrix will become an IBM strategic business partner for global customer care business process outsourcing services.The transaction is expected to close in the coming months, subject to the satisfaction of regulatory requirements and customary closing conditions. After the transaction closes, IBM will have an equity interest in SYNNEX..

Brocade (BRCD) disclosed that on September 4, 2013, it committed to a workforce reduction plan intended to realign resources in connection with its previously announced data center and software-defined networking strategies and cost reduction initiatives. The workforce reduction plan impacts approximately 300 notified employees worldwide. The Company expects to incur aggregate charges of approximately $20 to $25 million for severance and other employee termination costs associated with the workforce reduction plan. All of these charges are expected to be cash expenditures. The Company's current headcount, excluding the notified employees, is approximately 4,180. Additionally, as of September 10, 2013, management approved a related facility consolidation plan and anticipates that it will incur leasehold restructuring and other costs associated with the plan of approximately $10 to $15 million of which approximately 75% is expected to be cash expenditures. The Company expects to recognize the majority of the above mentioned employee termination and facility restructuring costs in the fourth fiscal quarter of 2013.

Market Summary
[Edit]
streaming quotes: ON
Chart for NASDAQ Composite Index (^IXIC)
Chart for Dow Jones Industrial Average Index (^DJI)
Symbol Last Change
Dow 15,326.60 Up 135.54(0.89%)
Nasdaq 3,725.01 Down 4.01 (0.11%)
S&P 500 1,689.13 Up 5.14(0.31%)
10-Yr Bond 2.92% Down 0.0390
NYSE Volume 0
Nasdaq Volume... 0
Indices: US - World | Most Actives
Advances & Declines
NYSE NASDAQ
Advances 2,407 (58%) 1,160 (45%)
Declines 1,657 (40%) 1,306 (51%)
Unchanged 120 (3%) 100 (4%)
Up Vol* 1,996 (59%) 957 (57%)
Down Vol* 1,305 (39%) 688 (41%)
Unch. Vol* 82 (2%) 44 (3%)
New Hi's 254 170
New Lo's 145 26
*in millions
more...
Most Actives
NYSE LAST CHANGE
NOK 5.95 Up 5.12%
BAC 14.65 Up 0.27%
ALU 3.40 Down 3.41%
VXX 14.47 Down 3.18%
GE 24.09 Up 0.92%
Nasdaq LAST CHANGE
FB 45.04 Up 3.30%
MU 16.49 Up 1.41%
INTC 22.81 Down 0.76%
SIRI 3.87 Up 0.52%
MSFT 32.74 Up 1.08%
more..
icon url

ReturntoSender

09/12/13 10:34 PM

#10324 RE: ReturntoSender #6755

From Briefing.com: 4:15 pm : The S&P 500 registered its first September decline, shedding 0.3% as nine of ten sectors ended in the red. After posting gains in each of the past seven sessions, several of this month's top performers fell victim to some profit-taking.

Financials, industrials, and materials led to the downside with losses ranging between 0.5% and 1.0%. The financial sector was pressured by the underperformance of most large banks as investors attempted to gauge the impact of a slowdown in the mortgage industry after US Bank (USB 36.87, +0.19) announced that its mortgage revenue fell roughly 20% in the third quarter. JPMorgan Chase (JPM 52.24, -1.02) was the weakest performer among the majors while the broader sector lost 0.7%.

Elsewhere, the industrial sector slid 0.5% as transportation companies displayed broad weakness. The Dow Jones Transportation Average fell 1.1% as 18 of 20 components ended lower.

Crude oil's continued strength may have also acted as a drag on transports with the energy component advancing 1.0% to $108.67 per barrel.

Although oil settled higher, the rest of the commodity complex did not fare nearly as well. Copper (-1.5%, $3.21/lb), gold (-3.0%, $1323.40/oz t), and silver (-5.5%, $21.91/oz t) futures were pressured throughout the day. Similarly, miners and steelmakers lagged as the Market Vectors Gold Miners ETF (GDX 25.29, -1.50) fell 5.6% and the Market Vectors Steel ETF (SLX 45.30, -0.54) lost 1.2%. The materials sector rounded out the bottom of today's leaderboard with its loss of 1.0%.

While most cyclical sectors trailed behind the broader market, discretionary shares (-0.2%) and technology (-0.1%) outperformed.

The discretionary space finished ahead of the S&P with help from media companies after Dow component Walt Disney (DIS 65.49, +1.55) said it plans to increase the size of its buyback. However, apparel manufacturers lagged after Lululemon (LULU 65.29, -3.73), Vera Bradley (VRA 18.85, -0.60), and Men's Wearhouse (MW 34.08, -4.69) issued profit warnings.

Countercyclical sectors ended mixed as the telecom services space added 1.0% while consumer staples, health care, and utilities lost between 0.2% and 0.3%.

Early afternoon headlines from Washington reminded participants that the U.S. budget situation remains far from solved.

House Speaker John Boehner said that spending reforms must be implemented in order to increase the debt ceiling. The Speaker also commented on Syria, saying that he has doubts about the plan to put Syria's chemical weapons under international control.

The remarks were followed by comments from Senate Majority Leader Harry Reid who said the current direction of House Republicans puts the government on track for a shutdown, and that giving in to the Tea Party is equivalent with rooting for a shutdown.

Treasuries surrendered their gains into the close, and the benchmark 10-yr yield ended little changed at 2.90%.

Volume was a bit below average as 642 million shares traded hands on the floor of the NYSE.

In today's economic data, weekly initial claims fell below the 300,000 level for the first time since March 2006. However, the Department of Labor said the sharp drop was due to computer problems. The initial claims level declined to 292,000 for the week ending September 7 from an unrevised 323,000 for the week ending August 31. The Briefing.com consensus expected the initial claims level to increase to 327,000.

The DoL announced that two states upgraded their computer systems, which resulted in an unexpected drop in claims. It is unknown how long the computer errors will remain in the system and it could affect the data for the next few weeks. It should be reiterated that the DoL does not believe the drop in claims this week signals a change in labor market conditions. Conditions remain better than where they were a few months ago but nowhere near as strong as a sub-300,000 reading would suggest.

Separately, export prices, excluding agriculture, ticked down 0.1% in August after an unchanged prior reading. Excluding oil, import prices declined 0.2%, which follows last month's decline of 0.4%.

The August Treasury Budget showed a deficit of $147.9 billion, down from a deficit of $190.5 billion in August 2012. Since the data are not seasonally adjusted, the data cannot be compared with the July level. The Briefing.com consensus expected the budget to show a deficit of $146.0 billion.

Tomorrow, August retail sales, retail sales ex-auto, PPI, and core PPI will all be reported at 8:30 ET. In addition, the preliminary reading of the September University of Michigan Consumer Sentiment Survey and July business inventories will be released at 9:55 ET and 10:00 ET, respectively.DJ30 -25.96 NASDAQ -9.04 SP500 -5.71 NASDAQ Adv/Vol/Dec 882/1.61 bln/1608 NYSE Adv/Vol/Dec 956/642.3 mln/2042
3:30 pm : Commodities remained mixed today. Metals traded lower and were the worst performing commodities today, while energy traded in positive territory.

Crude oil remained in positive territory all day. Syria remained a focus, while, separately, the International Energy Agency released a bullish report today, for the month of September, helping give crude oil price support. Oct crude oil ended today's pit trading session 1.0% higher at $108.65/barrel Natural gas futures spiked higher, to new session highs, following today's weekly inventory data figures. Prices actually began to spike minutes before the data came out.

Oct nat gas closed today 2.0% higher at $3.64/MMBtu.

Metals were the worst performing commodities today. Both precious metals extended lower and hit new session lows after floor trading closed. Dec gold ended the day down 2.4% at $1330.70/oz, while Dec silver closed 4.3% lower at $22.17/oz. Dec copper lost five cents to $3.21/lb.

Corn and wheat prices dropped sharply to new session lows today, while soybeans spiked to a new session high following the USDA's WASDE report, which came out at 12:00 noon

5:04PM NXP Semi: Selling shareholders commence secondary offering of 25 mln shares of common stock (NXPI) 38.02 -0.79 : Co announced that certain of its principal stockholders, including affiliates of funds managed or advised by Kohlberg Kravis Roberts & Co. L.P., AlpInvest Partners B.V., Apax Partners LLP, Bain Capital Partners, LLC and Silver Lake Technology Management, L.L.C., have commenced a registered secondary offering of 25,000,000 shares of common stock pursuant to NXP's shelf registration statement on Form F-3. NXP will not receive any proceeds from the sale of shares in the offering. Morgan Stanley & Co. LLC is acting as underwriter for the offering.

4:07PM Dell Board approves quarterly cash dividend of $0.08 per share (DELL) 13.85 0.00 : Co announced that on October 22, 2013 a quarterly cash dividend of $0.08 per common share will be payable to all shareholders of record as of the close of business on October 1, 2013. The payment date will not be affected by the date of the closing of the pending transaction with Michael Dell and Silver Lake, which may occur before or after such payment date.

4:02PM Brooks Automation appoints Lindon Roberson as Chief Financial Officer (BRKS) 9.30 -0.12 : Co announced the appointment of Lindon Robertson as Executive Vice President and Chief Financial Officer, effective October 1, 2013. Robertson previously was the Vice President and Chief Financial Officer of Graftech International (GTI).

Large Cap Gainers

ASML (93.14 +4.15%): Reinstated with a Buy at Goldman and added to Conviction Buy list.
WAG (52.41 +3.27%): Added to the Conviction Buy list at Goldman.
ECA (18.06 +3.7%): Upgraded to Outperform from Sector Perform at RBC Capital Markets.

Large Cap Losers

WFT (14.91 -5.27%): Disclosed it is selling 38.5% equity interest in Borets International for $400 mln; downgraded at Wells Fargo, Macquarie, and at Raymond James.
GG (26.34 -5.15%): Weakness in metals/mining stocks; ABX, NEM, MT also lower.
SNY (48.17 -2.11%): Announced decision to withdraw the Lixisenatide New Drug Application in the U.S.

Mid Cap Gainers

P (23.98 +12.16%): Named Brian McAndrews Chief Executive Officer, President and Chairman.
STM (9.01 +5.75%): Introduced two set-top box System-on-Chip families that include devices with UltraHD resolution and HEVC video-decoding support.
SEAS (30.17 +5.31%): Co on pace for record year in 2013; prelim YTD total rev and admissions rev through Aug 2013 increased by ~3% and 4%, respectively, vs same period in 2012.

Mid Cap Losers

LULU (64.38 -6.72%): Beat on EPS by $0.04, reported revs in-line; guided Q3 EPS, revs below consensus; lowered FY14 guidance, below consensus; announced a strategic global alliance for X-STATIC with Noble Biomaterials.

10:25AM Semiconductor Hldrs ETF probing this week's high again (SMH) 38.58 +0.12 : Noted relative strength in the sector after the early slip with the SMH testing Tuesday's high for the second day in a row at 38.58 (session high 38.58). Its multi-year high from July is at 38.72 -- ASML +4.5%, MU +1.2%, LRCX +1.1%, NVDA +1%, KLAC +0.9%, BRCM +0.9%, XLNX +0.5%.

10:15AM Dell stockholders approve merger transaction (DELL) 13.85 0.00 : Co announced that, based on a preliminary vote tally from the special meeting of stockholders, Dell stockholders have approved the proposal in which Michael Dell, Dell's Founder, Chairman and CEO, will acquire Dell in partnership with global technology investment firm Silver Lake Partners. In connection with the transaction, Dell stockholders will receive $13.75 in cash for each share of Dell common stock they hold, plus payment of a special cash dividend of $0.13 per share to stockholders of record as of a date prior to the effective time of the merger, for total consideration of $13.88 per share in cash. The agreement also guarantees the regular quarterly dividend of $0.08 per share for the fiscal third quarter would be paid to holders of record as of a date prior to closing. The total transaction is valued at approximately $24.9 billion.

Ciena (CIEN) announced that Virgin Media Business is deploying Ciena's converged packet optical solutions to provide Data Centre Interconnect services to Redstation, a UK data centre operator and cloud service provider.

Molex (MOLX) has signed definitive agreements as a strategic partner and investor in Vasa Applied Technologies, based in Or Yehuda, Israel.

7:40AM JinkoSolar Holding PV Projects Connected to the Grid Reach 100MW (JKS) 18.62 : Co announced that its 20MW solar PV power plant project in Shaya, Xinjiang Province and 10MW solar PV power project in Gonghe, Qinghai Province have been successfully passed the acceptance inspection conducted by the national grid. The company has so far successfully connected to the grid for more than 100MW of solar PV power projects.

Co states, "We are pleased to announce this milestone and aim to have more than 200MW projects connected to the grid by the end of this year, then have aggregate amount of more than 500MW by the end of 2014, generating approximately 630Gwh of electricity and RMB590 million in revenue in 2014. With favorable government policies, the completion of the Shaya and Gonghe projects marks the beginning of an exciting period where we expect to successfully develop further downstream projects and generate solid returns."

Technicolor and Qualcomm (QCOM) have collaborated to produce a new set-top box, known as SVELTE (Stimulating Video Experience over LTE), featuring LTE technology, terrestrial broadcast and Android OS.

Oracle (ORCL) announced StorageTek Linear Tape File System, Library Edition software. It enables customers to take advantage of tape's low cost per terabyte without the operations and cost overhead of legacy tape management.

Qualcomm (QCOM) announced that its Board of Directors has approved, effective immediately, a new $5.0 billion stock repurchase program. This replaces the prior $5.0 billion stock repurchase program announced on March 5, 2013, at which time we had also announced a 40 percent increase in the quarterly cash dividend. Since July 24, 2013, the Company repurchased ~40.1 million shares of common stock for ~$2.7 billion. The new stock repurchase program has no expiration date.
icon url

ReturntoSender

09/15/13 12:05 AM

#10325 RE: ReturntoSender #6755

From Briefing.com: Weekly Recap - Week ending 13-Sep-13

Dow +75.42 at 15376.06, Nasdaq +6.22 at 3722.18, S&P +4.57 at 1687.99

The S&P 500 added 0.3% to extend its weekly gain to 2.0%. Today's session was very quiet as participants displayed tepid demand for equities ahead of next week's highly-anticipated FOMC meeting where a tapering announcement may occur.

Excluding a brief dip during the opening hour, the major averages were confined to narrow ranges. The early weakness took place after it was reported that the University of Michigan Consumer Sentiment Index dropped to its lowest reading since April (76.8) in the preliminary September reading. That was down from 82.1 in August and well below the consensus expectation of a drop to only 82.0. Typically, consumer sentiment follows trends in employment, equity prices, oil prices, and media reports.

Since the end of August, the Syria debate has caused oil prices to increase; and the most recent August employment gains were much weaker than expected. Equity prices, however, have been moving higher.

Despite the temporary slide into negative territory, the key indices were able to reclaim and hold their early highs into the close.

The Nasdaq (+0.2%) trailed behind the other indices as major tech names lagged. Apple (AAPL 464.90, -7.79), Google (GOOG 889.07, -4.00), and Oracle (ORCL 32.46, -0.33) lost between 0.5% and 1.7%. Intel (INTC 23.44, +0.81) outperformed, gaining 3.6% with a Jefferies upgrade to 'Buy' from 'Hold' contributing to the strength.

Other cyclical sectors ended mixed. Energy (+0.1%), financials (+0.2%), and industrials (+0.2%) lagged; discretionary shares (+0.3%) ended in-line; and materials (+0.7%) outperformed.

In the materials sector, fertilizer names like Mosaic (MOS 45.99, +1.61) and Potash (POT 32.49, +0.71) spiked to highs after reports indicated Russian investor Vladimir Kogan purchased Suleiman Kerimov's stake in Uralkali for $3.7 billion.

Similar to cyclical sectors, defensive groups were mixed. Telecom services (+0.2%) lagged while consumer staples (+0.8%) and utilities (+0.8%), outperformed. For its part, the health care sector (+0.3%) ended in-line with the S&P.

Like other asset classes, Treasuries were very quiet. The benchmark 10-yr note added five ticks and its yield slipped two basis points to 2.89%.

Trading volume was well below average as only 569 million shares changed hands on the floor of the NYSE.

As mentioned earlier, Tuesday and Wednesday of next week will bring the FOMC policy meeting where many expect the Fed to announce a reduction in the size of its asset purchases.

The taper talk began after Fed Chairman Ben Bernanke mentioned, during his June 19 press conference, that barring a downturn in the economy, the Fed could scale back the size of its purchases later in the year. Following the press conference, participants began looking to the September meeting as a possible start date for tapering.

Stocks slumped in the immediate reaction, sending the S&P lower by nearly 5.0% over the course of four days. The market has been quite resilient since then and the S&P notched fresh all-time highs on August 2. Although the S&P 500 has slipped from its record levels, it remains 2.2% above its level at the start of the June 19 session and only 1.3% below its all-time best.

Looking back at today's economic data, the retail sales and PPI reports conveyed a familiar message of modest growth and low inflation. August retail sales came in below expectations (0.2% v. 0.4% Briefing.com consensus), but the July reading was revised higher to reflect an increase of 0.4% (0.2% prior).

Separately, total PPI jumped 0.3% (Briefing.com consensus 0.2%) while core PPI, which excludes food and energy, was flat (Briefing.com consensus 0.1%).

Total business inventories rose 0.4% in July after increasing an upwardly revised 0.1% (from 0.0%) in June. The Briefing.com consensus expected business inventories to increase 0.3%. Manufacturer (0.2%) and merchant wholesaler (0.1%) inventories were known prior to the release. The only new information was that retailer inventories increased 0.8% in July after increasing 0.1% in June.

On Monday, the September Empire Manufacturing survey will be released at 8:30 ET while August industrial production and capacity utilization will be reported at 9:15 ET.

Week in Review: Stocks Climb Ahead of FOMC Meeting

The S&P 500 began the week with a Monday gain of 1.0% as trade managed to regain its 50-day moving average (1666/1667) for the first time in two weeks. Equities climbed from the open, bolstered by reassuring economic reports out of China and Japan, headlines suggesting a strike against Syria could possibly be avoided, and the notion that the relatively disappointing employment report on Friday has lowered the probability of a big tapering announcement at the September 17-18 FOMC meeting. Growth-sensitive sectors paced the advance with materials ending in the lead. The sector rose 1.5% as steelmakers rallied in reaction to the data from Asia. The Market Vectors Steel ETF (SLX 45.15, -0.15) jumped 2.8%. Fertilizer names also registered solid gains after Russian President Vladimir Putin said the ongoing potash dispute with Belarus needs to be resolved. Mosaic ended higher by 5.1%.

Tuesday's session saw the S&P 500 climb 0.7% with all ten sectors settling in positive territory. Stocks registered the bulk of their gains during the opening hour after more upbeat economic data from China combined with Syria's agreement to put its chemical weapons under international control lured participants into equities. Goldman Sachs (GS 164.00, +0.65), Nike (NKE 67.91, -0.17) and Visa (V 189.00, +3.94) posted gains after it was announced the trio will enter the Dow Jones Industrial Average following next Friday's close. The trio will replace Alcoa (AA 8.08, -0.08), Bank of America (BAC 14.49, +0.01), and Hewlett-Packard (HPQ 22.07, +0.11) in the price-weighted index.

The key indices ended Wednesday in mixed fashion as the Nasdaq shed 0.1% while the S&P 500 added 0.3% to register its seventh consecutive advance. The tech sector was pressured by Apple, which sank 5.4% after the company's overnight product refresh event in China did not reveal a deal with China Mobile (CHL 56.15, +0.59) as many investors had expected. The underperformance of Apple kept the Nasdaq and the technology sector (-0.5%) in the red throughout the day while the S&P was able to shake off the opening weakness.

On Thursday, the S&P 500 registered its first September decline, shedding 0.3% as nine of ten sectors ended in the red. Stocks slipped as several of top September performers fell victim to some profit-taking. Financials, industrials, and materials led to the downside with losses ranging between 0.5% and 1.0%. The financial sector was pressured by the underperformance of most large banks as investors attempted to gauge the impact of a slowdown in the mortgage industry after US Bank (USB 37.14, +0.27) announced that its mortgage revenue fell roughly 20% in the third quarter.
 
Index Started Week Ended Week Change %Change YTD %
DJIA 14922.50 15376.06 453.56 3.0 17.3
Nasdaq 3660.01 3722.18 62.17 1.7 23.3
S&P 500 1655.17 1687.99 32.82 2.0 18.4
Russell 2000 1029.55 1053.98 24.43 2.4 24.1

This week's top 20 % gainers

Technology: FIO (14.69 +34.42%), MOLX (38.65 +30.56%), SCTY (34.23 +17.84%), NQ (21.84 +16.44%), NOK (6.41 +15.85%)
Services: BLOX (44.5 +27.19%), P (23.99 +26.29%), SHLD (60.42 +22.66%), FIVE (47.09 +20.38%), SNX (58.78 +19.57%), LQDT (36.02 +19.36%), UEPS (12.58 +15.49%)
Industrial Goods: ERII (6.1 +15.4%)
Healthcare: LCI (17.86 +25.97%)
Consumer Goods: ZQK (6.68 +26.15%)
Basic Materials: MPO (5.48 +27.61%), PVA (6.03 +19.37%), TPLM (8.92 +19.07%), MTL (3.66 +17.92%), AKS (3.97 +15.88%)

This week's top 20 % losers

Technology: SOL (4.24 -24.43%), SSNI (15.75 -17.05%), OLED (33.53 -13.68%), EZCH (23.6 -12.99%), MRIN (12.01 -12.2%)
Services: RLD (6.67 -15.46%), UTIW (14.74 -12.26%)
Industrial Goods: XONE (55.69 -16.59%)
Healthcare: NBIX (10.64 -32.67%), ONVO (5.16 -16.64%), ESC (18.41 -15.19%), AVNR (4.08 -13.37%), MDXG (4.02 -12.8%)
Consumer Goods: MFRM (33.62 -20.99%)
Basic Materials: EGO (7.05 -15.8%), EXK (4.23 -14.23%), RBY (1.4 -12.5%), ALJ (11.14 -12.37%), NSH (20.39 -12.29%), SAND (5.52 -12.25%)

3:06PM Apple set a new session low of 465.01 in recent trade, this week's low from Wednesday is at 464.81 (AAPL) 465.03 -7.66 : Note that its 50 sma is at 464.93 with its 200 sma at 462.16.

Large Cap Gainers

REGN (289.65 +5.87%): Seeing positive analyst commentary in anticipation of Phase 3 data of alirocumab for the treatment of hypercholesterolemia
POT (33 +3.84%): Reuters reporting that Suleiman Kerimov is selling his stake in Uralkali to investor Vladimir Kogan for $3.7 bln; MOS also higher
AET (67.95 +3.42%): Upgraded to Buy from Neutral at BofA/Merrill

Large Cap Losers

ETP (50.59 -1.90%): Priced $1.5 bln senior notes offering
ESV (55.76 -1.68%): Downgraded to Market Perform from Outperform at Bernstein
YHOO (29.24 -1.38%): Seeing reports that Alibaba Group may postpone its potential HK$100 bln listing plan to 2015; YHOO has a 24% stake in the firm

Mid Cap Gainers

ULTA (118.03 +17.84%): Beat quarterly EPS by $0.03 ($0.70 vs $0.67 estimate), revs rose 24.8% yoy to $601 mln vs $588.39 mln estimate; comps +8.4%; sees Q3 EPS of $0.71-0.74 vs $0.76 estimate, revs of $613-623 mln vs $6187 mln estimate
UNFI (69.14 +15.29%): Beat quarterly EPS by $0.05 ($0.65 vs $0.60 estimate), revs rose 22.2% yoy to $1.64 bln vs $1.63 bln estimate; sees FY14 GAAP EPS of $2.40-2.50 vs $2.49 estimate, revs of $6.65-6.78 vs $6.61 estimate; target raised to $68 from $63 at Canaccord Genuity
SWY (28.51 +7.22%): Upgraded to Outperform from Neutral at Credit Suisse

Mid Cap Losers

SSYS (92.97 -4.93%): Priced public offering of 4.5 mln ordinary shares at $93 per share
AXLL (39.42 -3.26%): Downgraded to Neutral from Buy at BofA/Merrill
MYGN (26.19 -2.58%): Hearing that a docton on a conference call with JP Morgan analysts was cautious on co's business prospects

10:55AM Suntech Power appoints new CEO (STP) 1.21 +0.02 : Co announced a change in senior management, with Mr. David King stepping down as CEO and acting CFO and Mr. Zhou Weiping assuming the roles of interim CEO and interim CFO with immediate effect. The board of the Company will first commence a search for a new CFO. Mr. Zhou will retain his roles as President and Director of the Company. Mr. Zhou Weiping, Suntech's CEO, said "We would like to thank David for his service and I'm confident that I will be able to lead the company and, along with all our stakeholders, implement the restructuring plan over the coming months."

Intel (INTC 23.05, +0.42) trades higher by 1.9% after Jefferies upgraded the stock to 'Buy' from 'Hold' and raised the price target to $30 from $27.

August retail sales, retail sales ex-auto, PPI, and core PPI will all be reported at 8:30 ET. In addition, the preliminary reading of the September University of Michigan Consumer Sentiment Survey and July business inventories will be released at 9:55 ET and 10:00 ET, respectively.

7:08AM NXP Semi prices 25 mln share offering by selling shareholders at $37.65 per share (NXPI) 38.02 : Co announced pricing of the previously announced secondary offering of 25 mln shares of its common stock to be sold by certain of its principal stockholders, including affiliates of funds managed or advised by Kohlberg Kravis Roberts & Co. (KKR), AlpInvest Partners B.V., Apax Partners, Bain Capital Partners and Silver Lake Technology Management, pursuant to NXP's shelf registration statement on Form F-3, at a price to the public of $37.65 per share.

Cisco (CSCO) and Innovid, the technology platform delivering immersive video advertising, will showcase advanced second screen and personalized advertising solutions to enable additional monetization opportunities for the service provider industry.

6:06AM LDK Solar engages financial advisor for offshore debt obligations (LDK) 1.53 : Co announces its engagement of Jefferies as financial advisor for strategic advice in connection with LDK Solar's offshore debt obligations, including the USD-Settled 10% Senior Notes due 2014.

2:39AM Emcore intends to offer 2.5 mln shares of common stock in public offering (EMKR) 4.73 :

2:26AM TTM Tech announces closure of MAS plant (TTMI) 9.50 : Co announces that it will cease operations at its Suzhou, China facility and lay off ~600 employees at this facility at or near the end of September 2013. TTM intends to transfer PCB production at MAS to one or more of its facilities located in China, providing an uninterrupted supply of PCBs to customers.

The decision to close the MAS facility was based on the facility's capabilities not being consistent with TTM's advanced technology strategy, and the fact that it has not been profitable.

TTM expects to record, primarily in the third quarter, between $10-20 mln in separation, asset impairment and disposal costs related to this restructuring.

08:09 am Methanex target raised to $58 at Cowen: . Cowen raises their MEOH tgt to $58 from $51. They see the growth in the newer applications of methanol driving market demand and limited global capacity increases keeping prices favorable over the next 2-3 years. They believe MEOH is well positioned to take advantage of these fundamentals

Brooks Automation (BRKS) announced the appointment of Lindon Robertson as Executive Vice President and Chief Financial Officer, effective October 1, 2013. Robertson previously was the Vice President and Chief Financial Officer of Graftech International (GTI).

Dell (DELL) announced that on October 22, 2013 a quarterly cash dividend of $0.08 per common share will be payable to all shareholders of record as of the close of business on October 1, 2013. The payment date will not be affected by the date of the closing of the pending transaction with Michael Dell and Silver Lake
NYSE NASDAQ
Advances 2,534 (61%) 1,473 (58%)
Declines 1,512 (36%) 974 (38%)
Unchanged 140 (3%) 112 (4%)
Up Vol* 1,796 (60%) 818 (57%)
Down Vol* 1,111 (37%) 586 (41%)
Unch. Vol* 63 (2%) 37 (3%)
New Hi's 113 101
New Lo's 113 19
*in millions
more...
Most Actives
NYSE LAST CHANGE
NOK 6.41 Up 0.79%
BAC 14.49 Up 0.07%
VXX 14.48 Down 1.50%
SUNE 7.38 Down 1.73%
AMD 3.83 Up 2.13%
Nasdaq LAST CHANGE
INTC 23.44 Up 3.58%
MU 16.20 Up 0.03%
FB 44.31 Down 0.98%
MSFT 33.03 Up 1.04%
SIRI 3.81 Up 0.93%
more...

icon url

ReturntoSender

09/15/13 10:09 AM

#10326 RE: ReturntoSender #6755

InvestmentHouse Weekend Market Summary:

http://www.investmenthouse.com/weekendmarketsummary.htm

- Market handles Friday the 13th, rumor of Summers to be named next week, less than great data for a modest gain.
- Retail worry: CEO's not seeing 'it' 4 years into the recovery.
- With 95% of wealth going to the upper 1%, no wonder retailers are worried, retail sales weak.
- Plenty of leadership keeps stocks higher overall.
- Still to come: FOMC and taper, more Syria, debt ceiling debate.

Rumor mill, data strike early.

Japan's Nikkei news reported that Obama was ready to name Lawrence Summers Fed Chair as early as this coming week post-FOMC meeting. This 'news' outlet is known to start rumors to see the reaction. In a half hour the US reacted, renouncing any such notion.

There was more. PPI was stronger than expected (0.3% versus 0.2%) though the core was again at 0%. No rise in prices outside of what you need the most: housing, education, food, fuel. So, go ahead and buy another phone, TV, PC and just don't eat, go to work, or have enough education to use the new devices.

Oh, but retail sales showed that no one really wants to buy much of anything.

Retail Sales, August: 0.2% actual versus 0.4% expected, 0.4% prior (revised from 0.2%)

Retail Sales ex-auto, August: 0.1% actual versus 0.3% expected, 0.6% prior (revised from 0.5%)

Retail Sales ex-auto and gas: 0.1%

Indeed, retail CEO's are starting to express concern about this recovery. Friday, Sealed Air's CEO commented that four years into a recovery it doesn't feel like one: "We are in the fourth year of the recovery and it doesn't fell like a recovery. Because it's the first time ever that things, four years with a recovery, are feeling so iffy."

The retail sales don't show any swelling strength, and when you look at how the Administration's policies have impacted wealth distribution, it is no wonder the consumer is just not that strong. 95% of the wealth gain from 2009 to 2012 when to the top 1% of US citizens. Instead of creating solid, high quality traditional jobs as the US economy has always done, the policies from Obamacare to EPA have molded our workforce into a part-time, low-wage, government-dependent mass. Their answer to the changes their policies have wrought: tax the money back from those that received the money thanks to their actions to pay for more of the same programs. What did Einstein say about the definition of insanity?

In any event, even with the glum numbers, the FOMC and taper to come next week, the debt ceiling debate heating up, stocks did just fine Friday, bouncing back modestly after testing Thursday. It won't hurt come Monday that the US and Russia struck a deal on Syria's chemical weapons. Perhaps enough positives to offset the unknowns re the Fed?

Michigan Sentiment - Preliminary, September (9:55): 82.0 expected, 82.1 prior

Maybe they are not unknowns at this point. Most commentators Friday who know anything at all said the Fed HAD to taper or else lose all credibility. $5B would be enough; just to show everyone that yes things were still good enough to taper. The market expects it at this point.

Friday, as noted, it seems stocks had it figured. Stocks started up modestly, gave up the move, but then rose steadily (and slowly) to the close. No frills, just modest gains on lower volume in response to the Thursday weakness. Not bad, not great, just keeping a modest test going just fine.

SP500 4.57, 0.27%
NASDAQ 6.21, 0.17%
DJ30 75.42, 0.49%
SP400 0.22%
RUTX 0.52%
SOX 0.45%

Volume faded 11% on both NASDAQ and NYSE.

THE MARKET

OTHER MARKETS

Dollar: 1.3304 versus 1.3303 euro. Down on the week in a test, but then broke the 200 day SMA. Could not recover it Thursday or Friday despite intraday attempts.

Bonds: 2.89% versus 2.91% 10 year. All week bouncing in a narrow range voer support. Holding the line, waiting on the Fed and how much it will taper.

Oil: 108.21, -0.39. Selling to the 20 day EMA early in the week then walking laterally along that level the rest of the week. Still looks solid enough.

Gold: 1308.80, -21.50. Rough week for gold as it sold below both 50 day MA, unable to keep the nice reversal looking so nice.

STATS AND INTERNALS

NASDAQ
Stats: +6.22 points (+0.17%) to close at 3722.18
Volume: 1.45B (-11.37%)

Up Volume: 837.38M (+360.1M)
Down Volume: 585.65M (-454.35M)

A/D and Hi/Lo: Advancers led 1.51 to 1
Previous Session: Decliners led 1.78 to 1

New Highs: 103 (-28)
New Lows: 16 (+4)

S&P
Stats: +4.57 points (+0.27%) to close at 1687.99
NYSE Volume: 505M (-11.87%)

A/D and Hi/Lo: Advancers led 1.68 to 1
Previous Session: Decliners led 2.03 to 1

New Highs: 113 (-79)
New Lows: 113 (-11)

DJ30
Stats: +75.42 points (+0.49%) to close at 15376.06

THE CHARTS

SP500: Up on the week, closing it out with a sideways move Thursday and Friday. Solid early week, continuing the rally off the lower low in late August. Good run, so far a nice easy test, still a lot of resistance to push through at 1695 to 1700 and then the prior high. Working for now.

NASDAQ: Strong early week move pushed NASDAQ to a new high. Then testing Wednesday to Friday, tapping the November trendline on the low and rebounding. Very solid.

DJ30: Just one day off for the Dow last week, finishing strong. Just below the May closing highs and in prime shape to set up a right shoulder to a head and shoulders pattern. Thus far not showing signs of slowing.

SP400: Gapped upside Tuesday then worked laterally the rest of the week. Filled the gap early August after clearing the May high. Good recovery, but still major resistance from here to 1243, then again the high at 1261.

RUTX: Gapped higher Tuesday along with the other indices, then working laterally to complete the week. Matched the July high and measuring the August high at 1064 (closed at 1054). Nice flag, and that can lead to a nice upside break.

SOX: A nice week as well, gapping upside Tuesday to almost match the July peak, then an easy 1-2-3 test into the weekend. Measuring the move toward the high. Might take a few days to do it, but looks good.

LEADERSHIP

Many sectors are contributing. Telecom, energy, technology, biotech, internet. We are going to look at some more internet, e.g. a new play on YY, still looking at MELI. As for telecom UBNT looks solid.

This fade after the last leg higher is allowing some good movers to set up once more as noted above. Others that are not leaders yet are turning things around after forming rounded bottoms. AGU, FALC and others could provide new support for a continued market move.

Despite the issues facing the market, notably the Fed taper next week, stocks are being accumulated and those not making runs yet can, as noted provide the next wave of upside moves.

SENTIMENT INDICATORS

VIX: 14.16; -0.13
VXN: 14.7; -0.05
VXO: 13.91; 0

Put/Call Ratio (CBOE): 0.77; -0.09

Bulls and Bears:

Bulls improved slightly, bears declined slightly as would be expected with the market gains. Slowing the moves a bit after big breaks.

Bulls: 37.1 versus 38.1% versus 43.3%. Diving below the early July, late June levels. 48.4% versus 51.5% versus 52.1% versus 46.9% versus 43.8% versus 41.7% versus 46.8% versus 43.8% versus 45.8% versus 52.1% versus 54.2% versus 52.1% versus 47.9% versus 44.3% versus 47.4% versus 50.5%.

Background: Last undercut 35%, the threshold for bullishness, in early June 2012.

Bears: 23.7 versus 23.8% versus 21.6%. Finally breaking free from the 20 level that held for three weeks, and now matching the highs from late June and early July. Starting to get there but needs to jump toward 30.

Background: Over 35% is the threshold to be really be a good upside indicator. For reference, bearishness hit a 5 year high at 54.4% the last week of October 2008. The move over 50 took bearish sentiment to its highest level since 1995. Extreme negative sentiment. Prior levels for comparison: Bearishness peaked at 37.4% in September 2007. It topped the June 2006 peak (36%) on that run. That June peak eclipsed the March 2006 high (33%) and well above the 2005 highs that spawned new rallies (30% in May 2005, 29.2% in October 2005). That was a huge turn, unlike any seen in recent history.

MONDAY

FOMC meeting and a decision on the taper amount. $5B minimum, $20B max. Likely in the $5 to $10B/month range. Germany elections. Debt Ceiling debate. More economic data starting off fast with Empire Manufacturing, Industrial Production, Capacity Utilization.

The deal on the Syrian chemical weapons likely helps, but there may be some standing around until Wednesday. Stocks rallied well last week then tapered the move somewhat themselves to end the week with their lateral moves, holding the gains as they rest and test the last run.

The nice thing about waiting around some is it allows some tests to set up better and other stocks to put some touches on their bases. Then if the market likes what it hears, or more accurately, hears what it expects, e.g. $5 or $10B in taper, then the market is set to continue higher and take aim on those prior post-bear market or all-time highs as the case may be.

As good plays continue to develop, we will focus on those and be ready when they make a break. Remember, leaders tend to start their moves ahead of the rest of the market as seen on the last leg higher.

Have a great weekend!

Retail sales for August, Michigan Sentiment September preliminary, and PPI are up for Friday. Then there are the worries about what could happen over the weekend with Syria. There is another issue. The data has been so far off to be virtually meaningless. Is it a smokescreen to confuse the return of decline? The government has no one to blame but itself. If it puts out such divergent and incomplete statistics then investors and others start to wonder.

Support and resistance

NASDAQ: Closed at 3722.18

Resistance:
3773 is the upper channel line for the November 2012 to present uptrend.
Next major resistance is around 4100 as NASDAQ hits 13 year highs

Support:
3694 is the August high and the post-bear market high.
3699 is the November 2012 up trendline
The July 2013 intraday high at 3625
The 50 day EMA at 3610
3573 is the August 2013 low
3532 is the May intraday high
3521 is the August 2000 low.
3502 is the May 2013 closing high
The 2011 up trendline at 3372
The 200 day SMA at 3334
3295 is the June 2013 low selloff
3227 is the April 2000 intraday low
3197 is the September 2012 post-bear market high
3171 is the October intraday high

S&P 500: Closed at 1687.99

Resistance:
1687 is the May high and post-bear market high
1698 to 1700 are the July and August interim highs
1710 is the August 2013 peak

Support:
1685 is the mid-August 2013 upper gap point
The 50 day EMA at 1661
1657 is the late August upper gap point
1654 is the June 2013 peak
1627 is the August 2013 low
1576 from October 2007, the prior all-time high
The 200 day SMA at 1575
1573 is the June 2013 closing low
1569.48 is the 78% Fibonacci retracement of the April to May 2013 run
1560 is the June 2013 reversal low
1556 from July 2007
1541 is the April 2013 closing low in that pullback inside the uptrend
1539 from June 2007
1531 is the recent high
1499 from January 2008
1475 is the September 2012 high
1471 is the October 2012 intraday high
1466 is the September 2012 closing peak and rally closing high
1440 from November 2007 closing lows

Dow: Closed at 15,376.06

Resistance:
15,542 is the May 2013 intraday high
16,659 is the August 2013 peak

Support:
15,318 is the June closing high
The 50 day EMA at 15,154
15,050 from the August 2013 interim recovery high
14,888 is the April peak and prior all-time high
14,844 is the June intraday low
14,762 is the August 2013 low
14,551 is the June 2013 intraday low on the selloff (14,659 closing)
The 200 day SMA at 14,538
14,198 from the October 2007 high
14,149 is the February 2013 high
14,022 from 7-07 peak
14,010 from the early February 2013 consolidation

Economic Calendar

September 9 - Monday
- Consumer Credit, July (15:00): $10.4B actual versus $13.0B expected, $11.9B prior (revised from $13.8B)

September 10 - Tuesday
- JOLTS - Job Openings, July (10:00): 3.689M actual versus 3.869M prior (revised from 3.936M)

September 11 - Wednesday
- MBA Mortgage Index, 09/07 (7:00): -13.5% actual versus 1.3% prior
- Wholesale Inventories, July (10:00): 0.1% actual versus 0.2% expected, -0.2% prior
- Crude Inventories, 09/07 (10:30): -0.219M actual versus -1.836M prior

September 12 - Thursday
- Initial Claims, 09/07 (8:30): 292K actual versus 327K expected, 323K prior
- Continuing Claims, 08/31 (8:30): 2871K actual versus 2975K expected, 2944K prior (revised from 2951K)
- Export Prices ex-ag., August (8:30): -0.1% actual versus -0.2% prior (revised from 0.0%)
- Import Prices ex-oil, August (8:30): -0.2% actual versus -0.4% prior
- Natural Gas Inventories, 09/07 (10:30): 65 bcf actual versus 58 bcf prior
- Treasury Budget, August (14:00): -$147.9B actual versus -$146.0B expected, -$190.5B prior

September 13 - Friday
- Retail Sales, August (8:30): 0.4% expected, 0.2% prior
- Retail Sales ex-auto, August (8:30): 0.3% expected, 0.5% prior
- PPI, August (8:30): 0.2% expected, 0.0% prior
- Core PPI, August (8:30): 0.1% expected, 0.1% prior
- Michigan Sentiment - Preliminary, September (9:55): 82.0 expected, 82.1 prior
- Business Inventories, July (10:00): 0.3% expected, 0.0% prior

September 16 - Monday
- Empire Manufacturing, September (8:30): 9.0 expected, 8.6 prior
- Industrial Production, August (9:15): 0.5% expected, 0.0% prior
- Capacity Utilization, August (9:15): 77.8% expected, 77.6% prior

September 17 - Tuesday
- CPI, August (8:30): 0.2% expected, 0.2% prior
- Core CPI, August (8:30): 0.2% expected, 0.2% prior
- Net Long-Term TIC Flows, July (9:00): -$66.9B prior
- NAHB Housing Market Index, September (10:00): 59 expected, 59 prior

September 18 - Wednesday
- MBA Mortgage Index, 09/14 (7:00): -13.5% prior
- Housing Starts, August (8:30): 910K expected, 896K prior
- Building Permits, August (8:30): 943K expected, 943K prior
- Crude Inventories, 09/14 (10:30): -0.219M prior
- FOMC Rate Decision, September (24:30): 0.25% prior
- FOMC Rate Decision, September (14:00): 0.25% expected, 0.25% prior

September 19 - Thursday
- Initial Claims, 09/14 (8:30): 340K expected, 292K prior
- Continuing Claims, 09/07 (8:30): 2880K expected, 2871K prior
- Current Account Balance, Q2 (8:30): -$100.0B expected, -$106.1B prior
- Existing Home Sales, August (10:00): 5.30M expected, 5.39M prior
- Philadelphia Fed, September (10:00): 9.0 expected, 9.3 prior
- Leading Indicators, August (10:00): 0.6% expected, 0.6% prior
- Natural Gas Inventories, 09/14 (10:30)
icon url

ReturntoSender

09/16/13 11:49 PM

#10327 RE: ReturntoSender #6755

From Briefing.com: 4:10 pm : The S&P 500 added 0.6% after a pair of weekend headlines provided an opening boost to equities. Stocks began the session sharply higher after Larry Summers, who was thought to be the hawkish frontrunner, withdrew his name from consideration to be the next chairman of the Federal Reserve.

In addition, news that Russia and the United States have signed an agreement to decommission Syria's chemical weapons within a year also contributed to the early bid.

With Larry Summers becoming an afterthought in the Fed chair discussion, bonds and equities rallied while the dollar slipped. The benchmark 10-yr note was up close to a point before surrendering most of its gain into the close. The 10-yr yield ended lower by two basis points at 2.87%.

The intraday reversal in Treasuries may have reflected the market's expectation for a $10-$15 billion tapering announcement coming at Wednesday's FOMC press conference.

Nine of ten sectors finished in positive territory while the underperformance of technology (-0.3%) weighed on the Nasdaq. The largest tech stock, Apple (AAPL 450.12, -14.78), settled lower by 3.2% as sellers were in control throughout the session. High-beta chipmakers fared a bit better as the PHLX Semiconductor Index tacked on 0.4%.

Energy (+0.02%) and consumer discretionary (+0.4%) shares lagged while the remaining cyclical sectors outperformed. The energy space ended little changed as crude oil fell 2.0% to $106.08 per barrel after the agreement to dismantle Syria's chemical weapons reduced the likelihood of a military intervention.

Meanwhile, financials (+1.1%), industrials (+1.3%), and materials (+1.1%) held near their highs into the close. The industrial sector was a notable leader as just about all components posted gains. Dow member Boeing (BA 115.67, +4.34) surged 3.9% amid reports indicating the company is nearing a fighter jet deal with South Korea's government. Transports also displayed strength as the Dow Jones Transportation Average advanced 1.1%.

Countercyclical sectors ended mixed as consumer staples (+0.9%), health care (+0.8%), and telecom services (+0.8%) outperformed while utilities (+0.2%) lagged.

Participation was a bit on the light side as 655 million shares changed hands on the floor of the New York Stock Exchange.

With the budget debate heating up once again, President Obama spoke earlier today, reminding once again that he has no plans to negotiate over the debt ceiling.

In today's economic data, the Empire Manufacturing Survey for September registered a reading of 6.3, which was down from the prior month's reading of 8.2. Economists polled by Briefing.com had expected that the survey would improve to 9.0.

Separately, August industrial production increased 0.4% while the Briefing.com consensus expected an uptick of 0.5%. Capacity utilization hit 77.8%, which was in-line with the Briefing.com consensus.

Tomorrow, August CPI and core CPI will be reported at 8:30 ET while July net long-term TIC flows and the September NAHB Housing Market Index will be released at 9:00 ET and 10:00 ET, respectively.

4:34PM NVIDIA appoints Colette Kress as CFO (NVDA) 15.81 +0.01 : Co announced that it has named Colette as executive vice president and chief financial officer. Kress most recently served for three years as senior vice president and chief financial officer at Cisco's Business Technology and Operations Finance organization.

4:30PM Photronics promotes Dr. Peter Kirlin to President (PLAB) 7.76 +0.12 : Co announced the appointment of Dr. Peter Kirlin as President of the Company. Dr. Kirlin has served as the Company's Senior Vice President, US and Europe, since August 2008.

4:01PM Axcelis announces appointment of Kevin Brewer as Chief Financial Officer (ACLS) 2.23 -0.04 : Co announced the appointment of Kevin J. Brewer as executive vice president and chief financial officer. Mr. Brewer, who has served as the company's interim CFO since July, will continue to report directly to Chairman and CEO Mary Puma.

2:23PM Emulex: Starboard delivers letter to Emulex CEO And Board of Directors; states that emulex is deeply undervalued; believes a newly reconstituted board composed of independent directors is required to unlock value (ELX) 8.00 +0.27 : Letter stated "Starboard Value LP, together with its affiliates, currently owns securities representing beneficial ownership of approximately 7.9% of the outstanding shares of Emulex Corporation, making us one of the Company's largest shareholders. We have conducted extensive research on Emulex, its different businesses, and the markets in which those businesses operate. Based on this research, we believe Emulex is extremely undervalued and that clear opportunities exist within the control of management and the Board of Directors of the Company to unlock significant shareholder value."

"After years of underperformance, we believe Emulex's current share price does not properly reflect the value of its underlying assets. Despite the recent concerns about growth, we believe Emulex's core fibre channel HBA product segment is a valuable asset that will continue to generate strong cash flow for years to come. It is time for a significant change at Emulex. Specific changes must be made to address years of dismal operating and share price performance as well as sub-optimal corporate governance."

"We believe a newly reconstituted Board comprised of independent directors and shareholder advocates should be able to evaluate each of Emulex's businesses with a fresh perspective and determine the right strategy to enhance shareholder value. We believe it is critical for the Board to adopt a disciplined framework by which to analyze the current cost structure, strategic positioning, and future capital allocation decisions. In addition, we believe that the Board must set margin targets that imply step-function improvements in profitability across each of its businesses and then use these targets to hold management accountable for performance."

Large Cap Gainers

ABX (18.47 +4.23%): Mentioned positively in Barron's article
CF (201.82 +4.12%): Chairman and CEO Stephen R. Wilson announced he will retire as CEO effective January 1, 2014; W. Anthony Will, Senior Vice President, Manufacturing and Distribution, has been selected to succeed Wilson
BMY (45.22 +3.82%): Upgraded to Overweight from Neutral at JP Morgan, target raised to $52 from $50

Large Cap Losers

QIHU (84.11 -4.27%): Weakness following strategic collaboration between Sohu.com's Sogou and Tencent Holdings; QIHU has been rumored to be a potential acquirer of Sogou
ALTR (37.81 -2.22%): Hearing reiterated with a Reduce rating at Nomura, price target $27
AAPL (454.9 -2.15%): Seeing reports that China Telecom has cut iPhone subsidies

Mid Cap Gainers

ATI (31.43 +9.78%): Kennametal (KMT) to acquire co's Tungsten Materials Business for $605 mln
KS (48.78 +8.06%): Strength in packaging makers following Packaging Corporation of America's (PKG) acquisition of Boise (BZ)
SOHU (68.76 +6.19%): Co, Sogou, and Tencent Holdings announced the establishment of a strategic cooperation

Mid Cap Losers

IAG (5.12 -4.66%): Co's partners in the Yatela Mine in Mali have decided to suspend mining excavation activities
ARCP (12.22 -4.08%): To issue common and series D preferred stock via private placement to series C preferred holders at closing of merger with CapLease
UA (76.29 -2.82%): Downgraded to Neutral from Positive at Susquehanna

Nokia (NOK) unveiled two new ultra-affordable camera phones: the Nokia 108 and the Nokia 108 Dual SIM.

07:27 am EZchip downgraded to Perform at Oppenheimer as firm cuts 2014 estimates: . Oppenheimer downgrades EZCH to Perform from Outperform after they reviewed their 2014 estimate and determined they needed to lower it. Their 2014 estimate is now $1.29, down from $1.43. Moreover, with the Street estimate being $1.54, they expect that to come down as they head into the new year. They note mgmt gives guidance for only one quarter ahead. After reviewing their rev by customer, they now believe JNPR sales will be down 52%, CSCO will be up 36%, and everything else ~15%. While this still seems aggressive, they note it is well below Street. They also note, they estimate that CSCO contributes about 66% of 2014 earnings, up from just a bit above 50% in 2013.

10:39 am Technology
The tech sector is trading higher today, trailing wider gains in the broader market. Semiconductors are showing relative strength, however, with the SOX trading 0.8% higher. Within the chip index, STM (+2.7%) is a notable standout. Among other major indices, the SPY is trading 0.8% higher today, while the QQQ is up 0.4% and the NASDAQ is trading 0.5% higher on the session. Among tech bellwethers, VZ (+1.4%) is showing notable strength, while AAPL (-2.0%) is under pressure.

There were no notable tech earnings this morning. In news, PERI (-12.0%) announced an agreement to combine Conduit's Client Connect business with Perion in an all-stock transaction. The deal is to be immediately accretive. Among M&A in the tech space, QIHU (-2.7%) is lower, potentially related to news that Sohu, Sogou and Tencent Holdings jointly announced the establishment of a strategic cooperation. It was speculated that QIHU may purchase Sogou. In rumors, MU (+2.6%) sees reduced DRAM supplies, according to reports. There were no notable upgrades in the tech space this morning. In downgrades, Oppenheimer downgraded EZCH (-2.1%) to Perform and GIMO (-3.0%) was downgraded to Mkt Perform at Raymond James. OCLR (+0.6%) is the only notable name in tech set to report tonight
icon url

ReturntoSender

09/19/13 12:09 AM

#10328 RE: ReturntoSender #6755

From Briefing.com: 4:20 pm : The S&P 500 jumped 1.2%, closing at a record high of 1,725.52 after the Federal Open Market Committee failed to announce plans to reduce the pace of its asset purchases, as many had expected.

Although the Federal Reserve did not make a tapering announcement, the policy statement did contain updated economic projections. Notably, the forecast for 2013 and 2014 GDP was lowered with the Committee expecting this year's growth between 2.0% and 2.3% (2.3%-2.6% June forecast) and 2014 growth ranging between 2.9% and 3.1% (3.0%-3.5% June projection).

During his press conference, Mr. Bernanke said economic data received since June has not been strong enough to justify scaling back asset purchases just yet. The Fed Chairman also said that recent tightening of financial conditions, as well as the ongoing fiscal uncertainty, played a part in the decision to maintain asset purchases at a pace of $85 billion per month ($40 billion in mortgage-backed securities, $45 billion in Treasuries).

Similar to equities, Treasuries and precious metals welcomed the lack of a tapering announcement. The 10-yr note rallied more than a point, pushing its yield down 14.5 basis points to 2.71%. This marked the lowest close for the benchmark yield since August 12.

Meanwhile, gold spiked 4.4% and silver surged 6.1% to their respective $1366.30 and $23.13 per troy ounce. Miners also received an afternoon boost, and the Market Vectors Gold Miners ETF (GDX 28.25, +2.32) settled higher by 9.0%. On a related note, the materials space ended ahead of the remaining cyclical sectors, posting a gain of 2.3%.

The other commodity-related sector, energy (+1.2%), settled in-line with the S&P even as crude oil surged 2.6% to $108.12 per barrel. Transportation companies appeared largely unaffected by the sharp gain in crude as the Dow Jones Transportation Average climbed 1.5%. FedEx (FDX 116.25, +5.57) spiked 5.1% after reporting an earnings beat and announcing plans to increase its shipping rates by an average of 3.9% next year.

Five of six cyclical sectors ended ahead of the broader market while financials (+1.0%) underperformed. Although major banks fared relatively well, the sharp drop in rates pressured brokerage names like TD Ameritrade (AMTD 26.93, -1.12) and Charles Schwab (SCHW 21.36, -1.28).

Countercyclical sectors ended in mixed fashion as health care (+0.7%) and telecom services (+0.4%) lagged while consumer staples (+1.3%) and utilities (+3.0%) outperformed.

Trading volume reached a one-month high as 820 million shares changed hands on the floor of the New York Stock Exchange.

Today's economic data focused on housing. The weekly MBA Mortgage Index jumped 11.2% to follow its recent string of declines including last week's 13.5% slide.

Separately, housing starts increased 0.9% in August to a seasonally adjusted annual rate of 891,000. That was a bit below the Briefing.com consensus estimate of 910,000, yet that sting was mitigated by the understanding that single-family starts increased a solid 7.0% to 628,000. That was the highest level of single-family starts since February.

Building permits declined 3.8% from July to a seasonally adjusted annual rate of 918,000 (Briefing.com consensus 943,000). That disappointment notwithstanding, the housing starts report carried positive implications for Q3 GDP as the number of units under construction increased 2.2% to 654,000.

Tomorrow, weekly initial claims and the second quarter current account deficit will be reported at 8:30 ET while August existing home sales, August Leading Indicators, and the September Philadelphia Fed Index will all be reported at 10:00 ET.DJ30 +147.21 NASDAQ +37.94 SP500 +20.76 NASDAQ Adv/Vol/Dec 1622/1.78 bln/904 NYSE Adv/Vol/Dec 2644/819.7 mln/443

3:30 pm :

Oct crude oil advanced for the first time in four sessions, gaining support from strong inventory data and the Federal Reserve decision to maintain its current monetary stimulus. The Dept. of Energy reported that for the week ending Sep 13, crude oil inventories had a draw of 4.368 mln barrels when consensus called for a draw of 1.2-1.4 mln barrels. The energy component trended higher after lifting from its session low of $105.60 per barrel. It pushed above the $108.00 per barrel level moments before closing at $108.14 per barrel, or 2.6% higher
Oct natural gas, however, spent its entire session in the red. It slipped to a session low of $3.67 per MMBtu in morning pit action and eventually settled with a 0.8% loss at $3.71 per MMBtu
Dec gold spent most of today's floor trade in negative territory as many investors speculated that the Federal Reserve would announce a modest tapering to the stimulus program. The yellow metal dipped below the $1300 per ounce level but rallied to a session high of $1313.40 per ounce ahead of the close. Unable to hold the gain, it settled 0.1% lower at $1307.40 per ounce
Dec silver also chopped around in the red, slumping to a session low of $21.23 per ounce in late morning action. It managed to inch slightly higher in afternoon pit trade and settled with a 0.9% loss at $21.58 per ounce. The precious metals rallied sharply on the lack of a tapering announcement in electronic trade and continue to push to new HoDs.

4:05PM Oracle beats by $0.03, misses on revs (ORCL) 33.87 +0.61 : Reports Q1 (Aug) earnings of $0.59 per share, excluding non-recurring items, $0.03 better than the Capital IQ Consensus Estimate of $0.56; revenues rose 2.1% year/year to $8.38 bln vs the $8.48 bln consensus; non-GAAP new software licenses and cloud software subscriptions revenue growth +4% vs. +0-8% guidance.

Both GAAP and non-GAAP software license updates and product support revenues were up 7% to $4.4 billion. Hardware systems products revenues were $669 million. Non-GAAP operating income was up 4% to $3.7 billion, and non-GAAP operating margin was 45%.

"Engineered systems had its best ever Q1 in terms of unit sales, growing over 60% compared with the same quarter last year. New software license results were especially strong in the Americas, which saw 15% growth in constant currency. Next week at Oracle OpenWorld, we will announce the In-Memory Option for the Oracle database. Virtually every existing application that runs on top of the Oracle database will run dramatically faster by simply turning on the new In-Memory feature. Our customers don't have to make any changes to their applications whatsoever; they simply flip on the in-memory switch, and the Oracle database immediately starts scanning data at a rate of billions or tens of billions of rows per second."

Large Cap Gainers

ADBE (51.69 +7.37%): Missed quarterly EPS by $0.02 ($0.32 ex items vs $0.34 estimate), revs fell 8.0% yoy to $995 mln vs $1.01 bln estimate; co exited Q3 with ~1 mln paid Creativ eCloud Subscriptions, an increase of 331k over prior quarterl; sees Q4 EPS of $0.28-0.34 vs $0.41 estimate, revs of $1.0-1.05 bln vs $1.08 bln estimate; target raised to $57 from $50 at Macquarie
NOK (6.58 +4.94%): Upgraded to Outperform from Neutral at Credit Suisse
REGN (306.33 +3.27%): Mentioned positively by Jim Cramer; co is scheduled to present Phase 3 data for EYLEA Injection at upcoming Retina Society meeting

Large Cap Losers

CTRX (52.98 -4.30%): Walgreens (WAG) announced it will provide more than 160k eligible employees with employer-sponsored health insurance coverage in 2014; Catamaran is Walgreens' current pharmacy benefit manager; Other health care plan providers seeing weakness: ESRX, CI, HUM, WLP
HTZ (26.57 -2.96%): Co said Hertz Brand U.S. airport volume remains soft in presentation at Citi US and European Industrials Conference
LUK (27.46 -2.10%): Continued weakness following yesterday afternoon's reporting of results for Jefferies subsidiary; Jefferies net earnings decreased 83% to $11.7 million, revenues decreased 30% yoy to $517 mln

Mid Cap Gainers

SOHU (74.38 +9.77%): Announced its majority-owned seach subsidiary Sogou paid a special dividend in the aggregate amount of ~$300.9 mln; the amount received by Sohu Search was ~$161.2 mln
VIPS (53.31 +8.78%): Upgraded to Buy from Hold at Deutsche Bank
NOW (51.13 +3.63%): Upgraded to Overweight from Equal-Weight at Morgan Stanley

Mid Cap Losers

CZR (22.69 -12.50%): Disclosed it has begun a refinancing process for its outstanding mortgage loans; Bloomberg reporting that co is raising $4.85 bln in bonds and loans
TGI (71.04 -9.62%): Announced that it expects to record pre-tax additional program costs during fiscal year 2014 totaling approximately $68.0 million, or $0.83 per diluted share, primarily associated with the 747-8 program
FIVE (45.73 -5.71%): Announced secondary offering of 7.1 mln shares by selling stockholders; Executive Chairman to sell 100k shares

Riverbed Technology (RVBD) has expanded its Whitewater cloud storage appliance family with the addition of new hardware models and upgrades to its operating system.

10:50 am Technology
The tech sector is trading higher today, ahead of modest losses in the broader market. Semiconductors are showing relative weakness with the SOX trading 0.2% lower. Within the chip index, ALTR (-1.5%) is a notable laggard. Among other major indices, the SPY is trading 0.2% lower today, while the QQQ is up 0.2% and the NASDAQ is trading 0.1% higher on the session. Among tech bellwethers, AAPL (+2.0%) is showing notable strength, while VZ (-1.0%) is under pressure.

In tech earnings last night, ADBE (+7.3%) posted a miss and offered downside guidance, but did top the Creative Cloud sub estimates. Elsewhere, AFOP (+7.3%) raised Q3 rev guidance above consensus.

In news, EA (-2.7%) named Andrew Wilson as its next CEO. WDAY (+1.8%) and CRM (+3.7%) announced plans to integrate the entire Salesforce and Workday product line.

Among M&A in the tech space, CIS (+5.0%) entered into a merger agreement for a 'going private' transaction, in which the Parent will acquire the co for $0.5125 per ordinary share of the co or $2.05 per ADS, each representing 4 Shares.

In IPOs, BNFT (hasn't traded yet) priced its upsized 4.935 mln share IPO at $26.50 per share, above the $21.50-24.50 expected range.

In rumors, GTAT (+6.9%) is higher on reports that AAPL (+2.0%) may introduce Sapphire touch screen, which GTAT may supply, for iPhone 6.

Among notable analyst upgrades in tech this morning, CTSH (+2.2%) was upgraded to Overweight at Barclays, NOK (+3.7%) was upgraded to Outperform at Credit Suisse, MKTG (+6.7%) and NOW (+4.2%) were upgraded to Overweight at Morgan Stanley, MXWL (+4.7%) was upgraded to Overweight at Piper, and SNCR (+2.1%) was upgraded to Neutral at Goldman. Also of note, AAPL (+2.0%) saw estimate increases at a couple firms and TSS (+1.0%) was added to Focus List at Citigroup.

In downgrades, INTU (-1.4%) was downgraded to Underweight at Morgan Stanley.

ORCL (+0.1%) is the only notable name in tech scheduled to report after the close.

07:41 am Alliance Fiber Optic shares soar 13% following upside guidance
Alliance Fiber Optic (AFOP $23.00 +2.76) issued upside guidance for the third quarter with revenues of $22 million which ahead of expectations, exceeding the previously stated revenue guidance of $19.5 to $20.5 million provided in the second quarter, 2013 conference call. This revenue level represents a 16% and 78% increase on a sequential and year over year basis respectively.

"With increased demands for datacomm applications, customer orders have been stronger than expected, since the last conference call. We are excited with this development and the opportunity to deliver another record quarterly financial milestones the third quarter. We will continue our capacity expansion efforts to support our customers' growing requirements and to increase AFOP market share in this emerging industry growth cycle," Detailed financial results for the third quarter as well as the outlook for the fourth quarter of 2013 will be provided, when complete third quarter end results are announced on a conference call to be held in October, 2013.
icon url

ReturntoSender

09/19/13 12:13 AM

#10329 RE: ReturntoSender #6755

From Briefing.com: 4:20 pm : The S&P 500 jumped 1.2%, closing at a record high of 1,725.52 after the Federal Open Market Committee failed to announce plans to reduce the pace of its asset purchases, as many had expected.

Although the Federal Reserve did not make a tapering announcement, the policy statement did contain updated economic projections. Notably, the forecast for 2013 and 2014 GDP was lowered with the Committee expecting this year's growth between 2.0% and 2.3% (2.3%-2.6% June forecast) and 2014 growth ranging between 2.9% and 3.1% (3.0%-3.5% June projection).

During his press conference, Mr. Bernanke said economic data received since June has not been strong enough to justify scaling back asset purchases just yet. The Fed Chairman also said that recent tightening of financial conditions, as well as the ongoing fiscal uncertainty, played a part in the decision to maintain asset purchases at a pace of $85 billion per month ($40 billion in mortgage-backed securities, $45 billion in Treasuries).

Similar to equities, Treasuries and precious metals welcomed the lack of a tapering announcement. The 10-yr note rallied more than a point, pushing its yield down 14.5 basis points to 2.71%. This marked the lowest close for the benchmark yield since August 12.

Meanwhile, gold spiked 4.4% and silver surged 6.1% to their respective $1366.30 and $23.13 per troy ounce. Miners also received an afternoon boost, and the Market Vectors Gold Miners ETF (GDX 28.25, +2.32) settled higher by 9.0%. On a related note, the materials space ended ahead of the remaining cyclical sectors, posting a gain of 2.3%.

The other commodity-related sector, energy (+1.2%), settled in-line with the S&P even as crude oil surged 2.6% to $108.12 per barrel. Transportation companies appeared largely unaffected by the sharp gain in crude as the Dow Jones Transportation Average climbed 1.5%. FedEx (FDX 116.25, +5.57) spiked 5.1% after reporting an earnings beat and announcing plans to increase its shipping rates by an average of 3.9% next year.

Five of six cyclical sectors ended ahead of the broader market while financials (+1.0%) underperformed. Although major banks fared relatively well, the sharp drop in rates pressured brokerage names like TD Ameritrade (AMTD 26.93, -1.12) and Charles Schwab (SCHW 21.36, -1.28).

Countercyclical sectors ended in mixed fashion as health care (+0.7%) and telecom services (+0.4%) lagged while consumer staples (+1.3%) and utilities (+3.0%) outperformed.

Trading volume reached a one-month high as 820 million shares changed hands on the floor of the New York Stock Exchange.

Today's economic data focused on housing. The weekly MBA Mortgage Index jumped 11.2% to follow its recent string of declines including last week's 13.5% slide.

Separately, housing starts increased 0.9% in August to a seasonally adjusted annual rate of 891,000. That was a bit below the Briefing.com consensus estimate of 910,000, yet that sting was mitigated by the understanding that single-family starts increased a solid 7.0% to 628,000. That was the highest level of single-family starts since February.

Building permits declined 3.8% from July to a seasonally adjusted annual rate of 918,000 (Briefing.com consensus 943,000). That disappointment notwithstanding, the housing starts report carried positive implications for Q3 GDP as the number of units under construction increased 2.2% to 654,000.

Tomorrow, weekly initial claims and the second quarter current account deficit will be reported at 8:30 ET while August existing home sales, August Leading Indicators, and the September Philadelphia Fed Index will all be reported at 10:00 ET.DJ30 +147.21 NASDAQ +37.94 SP500 +20.76 NASDAQ Adv/Vol/Dec 1622/1.78 bln/904 NYSE Adv/Vol/Dec 2644/819.7 mln/443

3:30 pm :

Oct crude oil advanced for the first time in four sessions, gaining support from strong inventory data and the Federal Reserve decision to maintain its current monetary stimulus. The Dept. of Energy reported that for the week ending Sep 13, crude oil inventories had a draw of 4.368 mln barrels when consensus called for a draw of 1.2-1.4 mln barrels. The energy component trended higher after lifting from its session low of $105.60 per barrel. It pushed above the $108.00 per barrel level moments before closing at $108.14 per barrel, or 2.6% higher
Oct natural gas, however, spent its entire session in the red. It slipped to a session low of $3.67 per MMBtu in morning pit action and eventually settled with a 0.8% loss at $3.71 per MMBtu
Dec gold spent most of today's floor trade in negative territory as many investors speculated that the Federal Reserve would announce a modest tapering to the stimulus program. The yellow metal dipped below the $1300 per ounce level but rallied to a session high of $1313.40 per ounce ahead of the close. Unable to hold the gain, it settled 0.1% lower at $1307.40 per ounce
Dec silver also chopped around in the red, slumping to a session low of $21.23 per ounce in late morning action. It managed to inch slightly higher in afternoon pit trade and settled with a 0.9% loss at $21.58 per ounce. The precious metals rallied sharply on the lack of a tapering announcement in electronic trade and continue to push to new HoDs.

4:05PM Oracle beats by $0.03, misses on revs (ORCL) 33.87 +0.61 : Reports Q1 (Aug) earnings of $0.59 per share, excluding non-recurring items, $0.03 better than the Capital IQ Consensus Estimate of $0.56; revenues rose 2.1% year/year to $8.38 bln vs the $8.48 bln consensus; non-GAAP new software licenses and cloud software subscriptions revenue growth +4% vs. +0-8% guidance.

Both GAAP and non-GAAP software license updates and product support revenues were up 7% to $4.4 billion. Hardware systems products revenues were $669 million. Non-GAAP operating income was up 4% to $3.7 billion, and non-GAAP operating margin was 45%.

"Engineered systems had its best ever Q1 in terms of unit sales, growing over 60% compared with the same quarter last year. New software license results were especially strong in the Americas, which saw 15% growth in constant currency. Next week at Oracle OpenWorld, we will announce the In-Memory Option for the Oracle database. Virtually every existing application that runs on top of the Oracle database will run dramatically faster by simply turning on the new In-Memory feature. Our customers don't have to make any changes to their applications whatsoever; they simply flip on the in-memory switch, and the Oracle database immediately starts scanning data at a rate of billions or tens of billions of rows per second."

Large Cap Gainers

ADBE (51.69 +7.37%): Missed quarterly EPS by $0.02 ($0.32 ex items vs $0.34 estimate), revs fell 8.0% yoy to $995 mln vs $1.01 bln estimate; co exited Q3 with ~1 mln paid Creativ eCloud Subscriptions, an increase of 331k over prior quarterl; sees Q4 EPS of $0.28-0.34 vs $0.41 estimate, revs of $1.0-1.05 bln vs $1.08 bln estimate; target raised to $57 from $50 at Macquarie
NOK (6.58 +4.94%): Upgraded to Outperform from Neutral at Credit Suisse
REGN (306.33 +3.27%): Mentioned positively by Jim Cramer; co is scheduled to present Phase 3 data for EYLEA Injection at upcoming Retina Society meeting

Large Cap Losers

CTRX (52.98 -4.30%): Walgreens (WAG) announced it will provide more than 160k eligible employees with employer-sponsored health insurance coverage in 2014; Catamaran is Walgreens' current pharmacy benefit manager; Other health care plan providers seeing weakness: ESRX, CI, HUM, WLP
HTZ (26.57 -2.96%): Co said Hertz Brand U.S. airport volume remains soft in presentation at Citi US and European Industrials Conference
LUK (27.46 -2.10%): Continued weakness following yesterday afternoon's reporting of results for Jefferies subsidiary; Jefferies net earnings decreased 83% to $11.7 million, revenues decreased 30% yoy to $517 mln

Mid Cap Gainers

SOHU (74.38 +9.77%): Announced its majority-owned seach subsidiary Sogou paid a special dividend in the aggregate amount of ~$300.9 mln; the amount received by Sohu Search was ~$161.2 mln
VIPS (53.31 +8.78%): Upgraded to Buy from Hold at Deutsche Bank
NOW (51.13 +3.63%): Upgraded to Overweight from Equal-Weight at Morgan Stanley

Mid Cap Losers

CZR (22.69 -12.50%): Disclosed it has begun a refinancing process for its outstanding mortgage loans; Bloomberg reporting that co is raising $4.85 bln in bonds and loans
TGI (71.04 -9.62%): Announced that it expects to record pre-tax additional program costs during fiscal year 2014 totaling approximately $68.0 million, or $0.83 per diluted share, primarily associated with the 747-8 program
FIVE (45.73 -5.71%): Announced secondary offering of 7.1 mln shares by selling stockholders; Executive Chairman to sell 100k shares

Riverbed Technology (RVBD) has expanded its Whitewater cloud storage appliance family with the addition of new hardware models and upgrades to its operating system.


10:50 am Technology

The tech sector is trading higher today, ahead of modest losses in the broader market. Semiconductors are showing relative weakness with the SOX trading 0.2% lower. Within the chip index, ALTR (-1.5%) is a notable laggard. Among other major indices, the SPY is trading 0.2% lower today, while the QQQ is up 0.2% and the NASDAQ is trading 0.1% higher on the session. Among tech bellwethers, AAPL (+2.0%) is showing notable strength, while VZ (-1.0%) is under pressure.

In tech earnings last night, ADBE (+7.3%) posted a miss and offered downside guidance, but did top the Creative Cloud sub estimates. Elsewhere, AFOP (+7.3%) raised Q3 rev guidance above consensus.

In news, EA (-2.7%) named Andrew Wilson as its next CEO. WDAY (+1.8%) and CRM (+3.7%) announced plans to integrate the entire Salesforce and Workday product line.

Among M&A in the tech space, CIS (+5.0%) entered into a merger agreement for a 'going private' transaction, in which the Parent will acquire the co for $0.5125 per ordinary share of the co or $2.05 per ADS, each representing 4 Shares.

In IPOs, BNFT (hasn't traded yet) priced its upsized 4.935 mln share IPO at $26.50 per share, above the $21.50-24.50 expected range.

In rumors, GTAT (+6.9%) is higher on reports that AAPL (+2.0%) may introduce Sapphire touch screen, which GTAT may supply, for iPhone 6.

Among notable analyst upgrades in tech this morning, CTSH (+2.2%) was upgraded to Overweight at Barclays, NOK (+3.7%) was upgraded to Outperform at Credit Suisse, MKTG (+6.7%) and NOW (+4.2%) were upgraded to Overweight at Morgan Stanley, MXWL (+4.7%) was upgraded to Overweight at Piper, and SNCR (+2.1%) was upgraded to Neutral at Goldman. Also of note, AAPL (+2.0%) saw estimate increases at a couple firms and TSS (+1.0%) was added to Focus List at Citigroup.

In downgrades, INTU (-1.4%) was downgraded to Underweight at Morgan Stanley.

ORCL (+0.1%) is the only notable name in tech scheduled to report after the close.
07:41 am Alliance Fiber Optic shares soar 13% following upside guidance

Alliance Fiber Optic (AFOP $23.00 +2.76) issued upside guidance for the third quarter with revenues of $22 million which ahead of expectations, exceeding the previously stated revenue guidance of $19.5 to $20.5 million provided in the second quarter, 2013 conference call. This revenue level represents a 16% and 78% increase on a sequential and year over year basis respectively.

"With increased demands for datacomm applications, customer orders have been stronger than expected, since the last conference call. We are excited with this development and the opportunity to deliver another record quarterly financial milestones the third quarter. We will continue our capacity expansion efforts to support our customers' growing requirements and to increase AFOP market share in this emerging industry growth cycle," Detailed financial results for the third quarter as well as the outlook for the fourth quarter of 2013 will be provided, when complete third quarter end results are announced on a conference call to be held in October, 2013.

Market Summary
[Edit]
streaming quotes: ON
Chart for NASDAQ Composite Index (^IXIC)
Chart for Dow Jones Industrial Average Index (^DJI)
Symbol Last Change
Dow 15,676.94 Up 147.21(0.95%)
Nasdaq 3,783.64 Up 37.94(1.01%)
S&P 500 1,725.52 Up 20.76(1.22%)
10-Yr Bond 2.7080% Down 0.1450
NYSE Volume 0
Nasdaq Volume... 0
Indices: US - World | Most Actives
Advances & Declines
NYSE NASDAQ
Advances 3,545 (84%) 1,604 (61%)
Declines 632 (15%) 910 (35%)
Unchanged 61 (1%) 96 (4%)
Up Vol* 3,714 (2225%) 1,303 (73%)
Down Vol* 712 (426%) 451 (25%)
Unch. Vol* 36 (22%) 42 (2%)
New Hi's 568 255
New Lo's 161 44
*in millions
more...
Most Actives
NYSE LAST CHANGE
BAC 14.72 Up 1.13%
VXX 13.65 Down 3.74%
NOK 6.71 Up 7.02%
GE 24.86 Up 1.68%
F 17.62 Up 1.06%
Nasdaq LAST CHANGE
FB 45.23 Up 0.36%
MSFT 33.32 Up 1.18%
SIRI 3.8650 Up 0.13%
MU 17.26 Up 2.52%
INTC 23.90 Up 0.67%
more
icon url

ReturntoSender

09/19/13 5:32 PM

#10330 RE: ReturntoSender #6755

From Briefing.com: 4:20 pm : The major averages ended today's quiet session on a mixed note. The S&P 500 shed 0.2% while the tech-heavy Nasdaq added 0.2%.

After spiking to new record highs yesterday, the Dow, S&P 500 and Russell 2000 spent the entire session in a slow retreat off their opening levels. Seven of ten sectors finished in the red while industrials (+0.1%), technology (+0.2%), and discretionary shares (+0.01%) posted modest gains.

The discretionary sector received support from retailers as the SPDR S&P Retail ETF (XRT 82.82, +0.18) added 0.2%. Meanwhile, homebuilders lagged across the board as rates trended higher. The iShares Dow Jones US Home Construction ETF (ITB 23.12, -0.28) fell 1.2% after jumping 4.8% yesterday.

Elsewhere, the industrial sector displayed relative strength with transports contributing to the gain. The Dow Jones Transportation Average added 0.3%. Dow component Boeing (BA 119.04, +0.64) also outperformed, rising 0.5%, after German airline Lufthansa chose the 777X for its future long-haul fleet.

Also of note, the technology sector ended modestly higher with the top sector component, Apple (AAPL 472.30, +7.62), advancing 1.6%. On the earnings front, Oracle (ORCL 33.89, +0.02) added 0.1% after reporting a bottom-line beat on below-consensus revenue. In addition, the company guided its second quarter earnings and revenue on the low end of consensus expectations.

The outperformance of technology kept the Nasdaq in positive territory through most of the session. However, biotechnology held the index back from additional gains as the iShares Nasdaq Biotechnology ETF (IBB 211.33, +0.14) ended little changed.

Countercyclical sectors lagged across the board as consumer staples, health care, telecom services, and utilities lost between 0.3% and 0.5%.

Treasuries saw some moderate selling following yesterday's aggressive bid. The benchmark 10-yr yield added four basis points to 2.75%.

Despite relatively narrow trading ranges, today's session saw above average participation as 738 million shares traded hands on the floor of the New York Stock Exchange.

In today's economic data, technical problems continued causing biases in the initial claims number. Weekly initial claims increased to 309,000 from an upwardly revised 294,000 (from 292,000). Computer glitches in California and Nevada prevented many claimants from filing for unemployment benefits. Those problems created a backlog of filings, which resulted in a temporarily lower initial claims level. The Department of Labor expects the backlog to be processed over the next week or two before the claims level returns to normal.

When the biases are gone, we expect the initial claims level to settle back to its previous 330,000 trend.

August existing home sales increased to 5.48 million from July's unrevised 5.39 million. The Briefing.com consensus expected sales to slip to 5.30 million. Sales in August were the strongest since February 2007 when 5.79 million existing home sales were sold. Unfortunately, the National Association of Realtors does not believe sales will continue at this level through the fall.

A spike in mortgage rates caught potential buyers by surprise. As a result, buyers rushed into the market to take advantage of relatively low rates before they went higher. This caused a temporary surge in demand and sales were pulled forward.

The Philadelphia Fed's Business Outlook increased to 22.3 in September, its strongest level since March 2011, from 9.3 in August. The Briefing.com consensus expected the index to fall to 9.0.

Separately, the current account deficit for the second quarter totaled $98.9 billion, which was narrower than the $100.0 billion deficit that had been broadly anticipated.

There is no economic data of note on tomorrow's calendar.DJ30 -40.39 NASDAQ +5.74 SP500 -3.18 NASDAQ Adv/Vol/Dec 1137/1.73 bln/1367 NYSE Adv/Vol/Dec 1259/738.5 mln/1765

3:35 pm :

Oct crude oil pulled back from its session high of $108.66 per barrel and slipped into negative territory as reports indicated that Libyan crude oil production is on the road to recovery with the reopening of the El Feel and Sharara oil fields. The energy component brushed a session low of $106.17 per barrel moments before settling with a 1.7% loss at $106.26 per barrel
Oct natural gas popped to a session high of $3.82 per MMBtu on bullish inventory data that showed a build of 46 bcf when a build of 55-56 bcf was anticipated. Prices reversed, however, and fell as low as $3.68 per MMBtu in afternoon floor trade. Natural gas eventually settled with a 0.3% gain at $3.72 per MMBtu
Precious metals held on to yesterday's gains that came on the 14:00 ET FOMC decision to withhold tapering of its stimulus program. The announcement was made after floor trade in gold, silver, and copper had ended and sent Dec gold and Dec silver rallying sharply in yesterday's afternoon electronic trade
Both metals traded in a consolidative fashion today, with gold trading near the $1370.00 per ounce level and silver rising to a session high of $23.44 per ounce in late morning floor action. Gold settled at $1369.10 per ounce and silver settled at $23.29 per ounce, booking respective gains of 4.7% and 7.9% as of yesterday's pit close.

4:36PM Texas Instruments increases quarterly dividend by 7% to $0.30 from $0.28 per share (TXN) 40.80 -0.05 :
Large Cap Gainers

TSLA (177.67 +6.89%): Heard tgt raised to $200 from $160 at Deutsche Bank; heard Northland Securities making positive comments on TSLA.
A (51.39 +4.2%): Co to separate into two public companies; combined its Life Sciences and Diagnostics businesses; upgraded (timing unclear) to Buy from Neutral at Janney.
PSX (58.26 +1.76%): Value investor Eagle Capital's Meryl Witmer discussed her long position in the stock.

Large Cap Losers

ING (11.81 -4.53%): Co has not set final capital levels for planned European insurance unit IPO, according to reports.
CAG (30.75 -4.12%): Reported EPS in-line with preannouncement; missed on revs; guided Q2 EPS below consensus; reaffirmed FY14 EPS guidance (lowered last week).
GIS (48.74 -2.8%): Downgraded to Market Perform from Outperform at Wells Fargo.

Mid Cap Gainers

RAD (4.28 +15.36%): Beat on EPS by $0.07, reported revs in-line; raised FY14 guidance.
GRPN (12.59 +9%): Upgraded to Buy at Stifel; tgt $16.
ISIS (34.2 +7.55%): Reported follow-up data from iSIS-SMN Rx Phase 1 study in children with spinal muscular atrophy; improvements in muscle function continue to be observed up to fourteen months after a single dose.

Mid Cap Losers

PIR (21.04 -10.84%): Missed on EPS by $0.04, missed on revs; lowered FY14 EPS below consensus, guided revs in-line.
CLC (53.25 -7.41%): Beat on EPS by $0.01, missed on revs; guided FY13 EPS below consensus.
BPOP (27.04 -7.05%): Downgraded to Underweight from Equal-Weight at Morgan Stanley; tgt to $25 from $32.

SanDisk (SNDK) announced that the iNAND Extreme embedded flash drive has been optimized to provide advanced digital storage in tablets powered by the new 22nm Intel Atom system-on-a-chip introduced by Intel (INTC) last week.

7:30AM Agilent to separate into two public companies; spinoff is not anticipated to impact co's guidance for fiscal year 2013 (A) 49.32 : Co announced plans to separate into two publicly traded companies: one in life sciences, diagnostics and applied markets (LDA) that will retain the Agilent name, and the other that will be comprised of Agilent's current portfolio of electronic measurement (EM) products. The separation is expected to occur through a tax-free pro rata spinoff of the EM company to Agilent shareholders.

New Agilent's FY13 est revs are $3.9 bln. It is expected that the new Agilent will continue to pay a dividend at least at the present yield. The new EM co's FY13 est revs are $2.9 bln. The EM company initially is not expected to pay a dividend. The spinoff is not anticipated to impact Agilent's guidance for fiscal year 2013. The co is expected to incur one-time charges related to the transaction during the periods preceding the separation, to be quantified at a later date.

Microsemi (MSCC) and Cryptography Research, a division of Rambus (RMBS), announced an agreement under which CRI will provide Microsemi access to CRI's secure semiconductor intellectual property.

7:03AM Veeco Instruments signs agreement to acquire privately held Synos Technology; initial purchase price is $70 mln; expected to be dilutive to Veeco in 2014 and solidly accretive in 2015 (VECO) 35.30 : Co signed an agreement to acquire privately held Synos Technology. Synos designs and manufactures Fast Array Scanning Atomic Layer Deposition systems that are enabling the production of flexible organic light-emitting diode displays for mobile devices. The initial purchase price is $70 million. Synos shareholders will receive additional payments upon the achievement of future performance milestones, with maximum potential consideration for the transaction of $185 million. The merger is scheduled to close in the fourth quarter of 2013. Synos is currently expected to be dilutive to Veeco in 2014 and solidly accretive in 2015.

07:41 am Oracle shares fall 2% following weaker than expected guidance
Oracle (ORCL $33.22 -0.65) reported first quarter earnings of $0.59 per share, excluding non-recurring items, which is better than expected, while revenues rose 2.1% year/year to $8.38 billion which is below expectations.

Non-GAAP new software licenses and cloud software subscriptions revenue growth +4% vs. +0-8% guidance.

Both GAAP and non-GAAP software license updates and product support revenues were up 7% to $4.4 billion. Hardware systems products revenues were $669 million. Non-GAAP operating income was up 4% to $3.7 billion, and non-GAAP operating margin was 45%. Engineered systems had its best ever Q1 in terms of unit sales, growing over 60% compared with the same quarter last year. New software license results were especially strong in the Americas, which saw 15% growth in constant currency. Next week at Oracle OpenWorld, we will announce the In-Memory Option for the Oracle database. Virtually every existing application that runs on top of the Oracle database will run dramatically faster by simply turning on the new In-Memory feature. Our customers don't have to make any changes to their applications whatsoever; they simply flip on the in-memory switch, and the Oracle database immediately starts scanning data at a rate of billions or tens of billions of rows per second."

The company sees Q2 adjusted EPS of $0.64-0.69 which is in line with consensus sees revenue growth of -1% to +2% which is below expectations.

Advances & Declines
NYSE NASDAQ
Advances 1,702 (40%) 1,132 (43%)
Declines 2,403 (57%) 1,362 (52%)
Unchanged 110 (3%) 113 (4%)
Up Vol* 1,489 (37%) 968 (56%)
Down Vol* 2,511 (62%) 751 (43%)
Unch. Vol* 48 (1%) 24 (1%)
New Hi's 525 257
New Lo's 112 41
*in millions
more...
Most Actives
NYSE LAST CHANGE
RAD 4.58 Up 23.45%
BAC 14.61 Down 0.71%
ORCL 33.89 Up 0.06%
NOK 6.69 Down 0.30%
GE 24.46 Down 0.85%
Nasdaq LAST CHANGE
FB 45.98 Up 1.66%
SIRI 3.9650 Up 2.59%
GRPN 12.59 Up 8.96%
ZNGA 3.4710 Up 6.15%
MU 17.16 Down 0.60%
icon url

ReturntoSender

09/23/13 11:10 PM

#10333 RE: ReturntoSender #6755

From Briefing.com: 4:10 pm : The major averages began the week on a lower note as the S&P 500 shed 0.5%. Stocks spent the first half of the session in a steady retreat, but managed to regain a portion of their losses during afternoon action.

Seven of ten sectors finished in the red while technology (+0.3%), telecom services (+0.1%), and utilities (+1.2%) outperformed. The technology sector-and the Nasdaq-received an opening boost from the shares of Apple (AAPL 490.64, +23.23) after the largest sector component reported strong weekend demand for two of its latest devices. As a result of better-than-expected sales, the company said it expects fourth quarter revenue to come in near the top end of analyst estimates. Apple settled higher by 5.0% and component suppliers like Cirrus Logic (CRUS 23.20, +1.19) and Skyworks Solutions (SWKS 25.86, +0.27) also displayed strength.

Elsewhere in technology, BlackBerry (BBRY 8.81, +0.09) rose 1.0% after agreeing to a buyout offer from a consortium led by Toronto-based Fairfax Financial. Per the agreement, BlackBerry shareholders will receive $9.00 per share, which would represent a total transaction value of roughly $4.7 billion.

The outperformance of Apple masked the losses among many other top tech components. Google (GOOG 886.50, -16.61) lost 1.8% and the newest Dow member Visa (V 196.24, -2.59) fell 1.3%. Just like Visa, the other two new Dow additions-Goldman Sachs (GS 165.25, -4.50) and Nike (NKE 68.98, -0.39)-ended in the red.

Goldman Sachs settled behind the remaining Dow components as the financial sector (-1.5%) was the only group that ended with a loss larger than 1.0%. The broad weakness was brought on by a Financial Times report indicating Citigroup (C 49.57, -1.64) is likely to record a significant drop in third quarter trading revenue. Separately, afternoon reports from Reuters revealed that U.S. prosecutors in California are planning to announce charges related to mortgage-backed securities issuance against JPMorgan Chase (JPM 51.46, -1.34).

Also of note, the industrial sector (-0.1%) outperformed as two of its top components, Boeing (BA 117.51, +0.88) and General Electric (GE 24.28, +0.27), both gained near 1.0%. However, transportation companies kept the sector from turning positive as the Dow Jones Transportation Average lost 0.6%.

Countercyclical sectors ended mixed as utilities and telecom services ended ahead of the S&P while health care (-0.7%) lagged and consumer staples (-0.5%) ended in-line.

Treasuries finished near their highs with the benchmark 10-yr yield lower by two basis points at 2.72%.

Trading volume was on the light side as less than 700 million shares changed hands on the floor of the New York Stock Exchange.

In news from overseas, the German federal election saw Chancellor Angela Merkel's CDU receive the most votes, but its former coalition partner, FDP, failed to reach the 5.0% threshold needed to enter parliament. This means Ms. Merkel's party will need to find a different coalition partner. Following the CDU victory, Chancellor Merkel said she does not see the need to change Europe's policy course.

Tomorrow, the July Case-Shiller 20-city Index and July FHFA Housing Price Index will both be reported at 9:00 ET while the September consumer confidence report will cross the wires at 10:00 ET.DJ30 -49.71 NASDAQ -9.44 SP500 -8.07 NASDAQ Adv/Vol/Dec 1085/1.65 bln/1443 NYSE Adv/Vol/Dec 1274/690.1 mln/1726

3:30 pm :

Nov crude oil fell for a third consecutive session, dipping as low as $103.12 per barrel in morning pit trade. It traded slightly above that level for the remainder of the session and settled at $103.58 per barrel, or 1.2% lower
Oct natural gas fell deeper into the red as it pulled back from its session high of $3.67 per MMBtu set in early morning floor action. It closed at its session low of $3.60 per MMBtu, booking a loss of 2.4%
Precious metals also traded lower today, extending Friday's losses
Dec gold brushed a session low of $1317.90 per ounce in morning action and settled with a 0.4% loss at $1327.30 per ounce
Dec silver chopped around slightly below the unchanged line after dipping to a session low of $21.67 per ounce. It eventually settled with a 0.2% loss at $21.87 per ounce.

4:30PM Rambus expands agreement with Freescale Semiconductor (FSL) (RMBS) 8.89 -0.02 : Rambus Inc. (RMBS) announced it has signed an agreement with Freescale Semiconductor (FSL) that expands the relationship between the companies. The agreement extends Freescale's access to Rambus' innovations for memory controllers and serial links. Additionally, the expanded agreement provides Freescale with the ability to collaborate on Rambus' resistive memory technology for embedded applications (eRRAM). The expanded agreement extends the terms of the existing license agreement until 2018. Other terms of the agreement are confidential.

1:31PM BlackBerry enters into letter of intent with consortium led by Fairfax Financial; BBRY shareholders would receive $9/share in cash; During diligence period BBRY is permitted to actively solicit, receive, evaluate and potentially enter into negotiations with parties that offer alternative proposals (shares halted) (BBRY) 8.23 -0.49 : Co announced it has signed a letter of intent agreement under which a consortium to be led by Fairfax Financial Holdings has offered to acquire the company subject to due diligence. The letter of intent contemplates a transaction in which BlackBerry shareholders would receive $9 in cash for each share of BlackBerry share they hold, in a transaction valued at ~ $4.7 bln. The consortium would acquire for cash all of the outstanding shares of BlackBerry not held by Fairfax. Fairfax, which owns ~10 percent of BlackBerry's common shares, intends to contribute the shares of BlackBerry it currently holds into the transaction.

The BlackBerry Board of Directors, acting on the recommendation of a special committee of the board of directors, approved the terms of the LOI under which the consortium, which is seeking financing from BofA Merrill Lynch and BMO Capital Markets, would acquire BlackBerry and take the company private subject to a number of conditions, including due diligence, negotiation and execution of a definitive agreement and customary regulatory approvals.

Diligence is expected to be complete by November 4, 2013. The parties' intention is to negotiate and execute a definitive transaction agreement by such date. During such period, BlackBerry is permitted to actively solicit, receive, evaluate and potentially enter into negotiations with parties that offer alternative proposals. In addition to the consortium and its lenders being satisfied with all aspects of the due diligence to be carried out by them during the Diligence Period and the negotiation and execution of a binding definitive agreement approved by the board of BlackBerry, completion of the transaction will be subject to other customary conditions, including receipt of required regulatory approvals.

If (A) during the Diligence Period (i) BlackBerry enters into any letter of intent or definitive agreement providing for an Alternative Transaction, (ii) BlackBerry ceases to negotiate with the consortium in good faith with a view to entering into the Definitive Agreement by the end of the Diligence Period, or (iii) an Alternative Transaction is publicly proposed or publicly announced and is consummated within 6 months following the end of the Diligence Period, or (B) during the 3 month period following the end of the Diligence Period, BlackBerry enters into any agreement providing for an Alternative Transaction with a person with whom discussions were held before or during the Diligence Period, then BlackBerry shall pay Fairfax a fee of U.S. $0.30 per BlackBerry share, provided, however, that no such fee shall be payable if the consortium shall have reduced the price offered below $9.00/share without the approval of the board of directors of BlackBerry. In the event that a definitive agreement is signed with Fairfax the termination fee will increase to $0.50/share.

In addition to the consortium and its lenders being satisfied with all aspects of the due diligence to be carried out by them during the Diligence Period and the negotiation and execution of a binding definitive agreement approved by the board of BlackBerry, completion of the transaction will be subject to other customary conditions, including receipt of required regulatory approvals. There can be no assurance that due diligence will be satisfactory, that financing will be obtained, that a definitive agreement will be entered into or that the transaction will be consummated.

Large Cap Gainers

AAPL (484.95 +3.75%): Announced it sold a record-breaking 9 mln new iPhone 5s and 5c models, surpassing analyst expectations
AEP (44.59 +1.97%): Upgraded to Outperform from Market Perform at Wells Fargo
EIX (46.71 +1.50%): Nuclear Regulatory Commission confirmed to co's subsidiary, Southern California Edison, that it has identified flaws in how Mitsubishi Heavy Industries used its computer codes to design the failed steam generators at the San Onofre Nuclear Generating Station; the Commission is citing Southern California Edison for failing to ensure that Mitsubishi's modeling and analysis were adequate; no financial penalties were imposed

Large Cap Losers

NFLX (302.56 -3.59%): Trading lower despite co's series House of Cards winning Emmy award for Best Drama Series; mentioned cautiously by analyst at BTIG
BMRN (74.22 -3.55%): Dosed the first patient in the Phase 1/2 trial for BMN 190, a recombinant human tripeptidyl peptidase 1 (rhTPP1) for the treatment of patients with neuronal ceroid lipofuscinosis type 2 (NCL-2), a form of Batten disease; The study will enroll approximately 22 subjects at up to ten clinical sites for a treatment duration of 48 weeks
CTRX (48.01 -3.05%): Downgraded to Equal-Weight from Overweight at Morgan Stanley

Mid Cap Gainers

ISIS (38.27 +6.13%): Reported Phase 2 data on ISIS-APOCIII Rx showing substantial reductions of triglycerides and APOC-III in patients with familial chylomicronemia
ASNA (17.63 +3.83%): Strength ahead of earnings; seeing reports of heavy activity in October $18 call options
SBGI (30.24 +3.46%): Announced it has received a conversion notice with respect to its 3.0% Convertible Senior Notes due 2027; the Notes have an outstanding aggregate principal balance of $5.4 million

Mid Cap Losers

P (24.3 -9.97%): Seeing reports that Apple is paying a penny more per song in royalties to record companies
SEE (27.09 -5.15%): Downgraded to Equal Weight from Overweight at Barclays
GRPN (12.03 -4.83%): Mentioned cautiously at ITG Reearch ahead of Q3 earnings

11:01AM Microsoft unveils Surface 2, Surface Pro 2 and new accessories (MSFT) 32.79 0.00 : Co announced that the Microsoft Surface family of tablets is growing. Two new Surface models - Surface 2 and Surface Pro 2 - along with an expanded portfolio of new Surface accessories, will be available at Microsoft retail stores, http://www.MicrosoftStore.com and select third-party retailers in 22 initial markets, including Australia, Austria, Belgium, Canada, Denmark, Finland, France, Germany, Hong Kong, Ireland, Italy, Luxembourg, the Netherlands, New Zealand, Norway, Portugal, Spain, Sweden, Switzerland, the United Kingdom and the United States on Oct. 22 and China in early November. Additional markets will be announced in the coming months. Customers can pre-order Surface 2 and Surface Pro 2 starting at 8 a.m. EDT on Sept. 24, 2013.

O2Micro International (OIIM) announced a patent grant from the Japanese Patent Office for its Multi-cell Battery Pack Monitoring systems and methods.

8:50AM Apple sees Q4 revenues near the high end of previous guidance; gross margins also near the high end (AAPL) 467.41 : On September 23, 2013, Apple Inc. announced that it has sold over nine million new iPhone 5s and iPhone 5c models, just three days after the launch of the new iPhones on September 20. Apple expects total company revenue for the fourth fiscal quarter to be near the high end of the previously provided range of $34 billion to $37 billion, and expects gross margin to be near the high end of the previously provided range of 36% to 37%.


RFMD (RFMD) has successfully completed a recently announced expansion of its test, tape and reel, and assembly facility, located in Beijing, China.

7:03AM Freescale Semi and Oracle (ORCL) expand relationship to further advance the Internet of Things (FSL) 16.97 : Co and Oracle (ORCL) have agreed to a wide-ranging relationship to help rapidly evolve the Internet of Things (IoT). The collaboration paves the way for joint engineering, marketing and standards initiatives focused on enhancing and leveraging the unique advantages that the Java platform and Freescale processors provide for IoT service providers and equipment OEMs.

Freescale Semi and Oracle are working together to rapidly evolve the IoT with a new, secured service platform that will help standardize and consolidate the delivery and management of IoT services for the home automation, industrial and manufacturing automation markets.

5:07AM Suntech Power announces developments with respect to Global Solar Fund Assets in Brindisi, Italy (STP) 1.30 : Co announces that it received notice that the Court of Brindisi (Italy) issued a ruling to seize additional solar parks constructed by investee companies of Global Solar Fund S.C.A. SICAR. In total, with this new seizure, an aggregate of 37 GSF solar parks have been ordered seized which have a total capacity of approximately 30MW and represent approximately 21% of the aggregate nominal power capacity of solar parks held by GSF.

The Court also ordered the seizure of feed-in-tariffs received by the investee companies of GSF that own the seized solar parks. As consistent with Italian legal proceedings, several people have been served pre-trial detention orders. GSF is currently in the process of reviewing the ruling issued by the Court to determine the next appropriate steps, and the Company is working with GSF to maintain operations while operating in a manner compliant with the Court's ruling.

07:38 am Action Semi trading lower pre-market following lowered Q3 guidance
Action Semi (ACTS) announced that it is lowering its revenue guidance for the third quarter of 2013 based on the Company's preliminary review of its anticipated financial performance. For the third quarter of 2013, company expects to report revenue of approximately $17.0 million (no estimate) and gross margin of ~34% vs previous guidance for the third quarter of 2013 was for revenue in the range of $19.0-21.0 million and gross margin of approximately 34%. The lower revenue guidance was primarily due to overall demand for white-box tablets below market expectations and slower than anticipated adoption of quad-core solutions in emerging markets.

Advances & Declines
NYSE NASDAQ
Advances 1,694 (41%) 1,078 (42%)
Declines 2,314 (56%) 1,429 (55%)
Unchanged 134 (3%) 84 (3%)
Up Vol* 1,151 (34%) 550 (32%)
Down Vol* 2,233 (65%) 1,134 (67%)
Unch. Vol* 49 (1%) 14 (1%)
New Hi's 97 153
New Lo's 93 45
*in millions
more...
Most Actives
NYSE LAST CHANGE
BAC 14.14 Down 2.08%
NOK 6.67 Up 1.37%
RAD 4.83 Up 3.43%
F 17.20 Down 1.09%
GE 24.28 Up 1.12%
Nasdaq LAST CHANGE
BBRY 8.82 Up 1.09%
FB 47.19 Down 0.63%
MSFT 32.74 Down 0.16%
SIRI 3.8590 Down 1.93%
GRPN 11.94 Down 5.58%
icon url

ReturntoSender

09/24/13 9:14 PM

#10334 RE: ReturntoSender #6755

From Briefing.com: 4:15 pm : The S&P 500 settled lower by 0.3%, registering its fourth consecutive loss. Small caps outperformed the benchmark average as the Russell 2000 added 0.2%.

Stocks slipped during the opening hour in reaction to a below-consensus consumer confidence report for September. Gains in the stock market were unable to thwart pessimism in the labor market as the September Consumer Confidence Index fell to 79.7 from an upwardly revised 81.8 (from 81.4) in August. The Briefing.com consensus expected the Consumer Confidence Index to drop to 80.0.

Consumer confidence typically follows changes in equity prices, labor market conditions, gasoline prices, and media reports. While the equity market had a banner month for most of September, concerns about future labor growth weighed more heavily on consumer attitudes.

Despite the opening slip, the S&P recovered swiftly, but was unable to hold the 1,700 level into the close as financials and technology weighed.

The financial sector (-0.6%) underperformed for a second consecutive day with JPMorgan Chase (JPM 50.32, -1.14) leading to the downside. The stock fell 2.2% after The New York Times revealed the Department of Housing and Urban Development sought a $20 billion settlement in a mortgage-backed securities issuance case against the bank. This followed yesterday's reports, which said prosecutors in California are set to announce charges against JPMorgan Chase in this case.

Elsewhere, the technology sector ended lower by 0.3% as many top components lagged while chipmakers rallied. Oracle (ORCL 33.64, -0.30), Microsoft (MSFT 32.46, -0.29), and Visa (V 193.34, -2.90) lost between 0.9% and 1.5% while the PHLX Semiconductor Index advanced 0.7% after Applied Materials (AMAT 17.44, +1.45) announced plans to merge with Tokyo Electron.

Even though the S&P ended in the red, there were some pockets of strength among cyclical sectors like industrials and consumer discretionary.

Industrials (+0.3%) finished in the lead thanks to all-around support. The largest sector component, General Electric (GE 24.32, +0.04) advanced 0.2% and transportation companies also outperformed. The Dow Jones Transportation Average added 0.1%.

Meanwhile, the discretionary sector (+0.1%) saw homebuilders rally after KB Home (KBH 17.76, +0.73) and Lennar (LEN 36.01, +1.47) reported bottom-line beats. Housing stocks also drew strength from continued gains in home prices as the July Case-Shiller 20-city Index rose 12.4% (Briefing.com consensus 12.0%) and the FHFA Housing Price Index improved by 1.0%. The iShares Dow Jones US Home Construction ETF (ITB 22.66, +0.41) gained 1.8%.

Also aiding homebuilders was indirect support from the continued retreat in yields. Treasuries ended near their highs with the 10-yr yield down six basis points at 2.65%. This marked the lowest level for the benchmark yield since mid-August.

Trading volume was a bit below average as 674 million shares changed hands on the floor of the New York Stock Exchange.

Tomorrow, the weekly MBA Mortgage Index will be reported at 7:00 ET; August durable orders will be released at 8:30 ET; and August new home sales will cross at 10:00 ET.

The U.S. Treasury will auction $35 billion in 5-yr notes.DJ30 -66.79 NASDAQ +2.97 SP500 -4.42 NASDAQ Adv/Vol/Dec 1391/1.73 bln/1115 NYSE Adv/Vol/Dec 1644/673.8 mln/1360

3:35 pm :

Nov crude oil fell for a fourth consecutive session as tension eased in the Middle East. Iran has agreed to talks on Thursday over its nuclear program with representatives from six word powers, including the U.S. The energy component fell as low as $103.30 per barrel in morning floor trade and settled with a 0.5% loss at $103.11 per barrel, slightly below its session high of $103.22 per barrel
Oct natural gas registered a third consecutive session of losses as it trended lower in negative territory. It pulled back from its session high of $3.58 per MMBtu and closed 3.1% lower at its session low of $3.49 per MMBtu
Precious metals also struggled in negative territory today as the dollar index traded in the black
Dec gold fell for a third consecutive session, slipping to a session low of $1305.50 per ounce. It managed to erase some of the loss and settled at $1316.70 per ounce, or 0.8% lower
Dec silver slipped to a session low of $21.33 per ounce in morning pit trade and inched slightly higher as the session progressed. It eventually settled at $21.58 per ounce, booking a loss of 1.3%

4:05PM Microsoft to webcast conference call to discuss new reporting segments on Thursday, September 26, 2013 at 9:00 a.m. Pacific Time (MSFT) 32.46 -0.29 :

Large Cap Gainers

AMAT (17.16 +7.32%): Co and Tokyo Electron (TOELY) to merge, creating a new co as a merger of equals with combined market capitalization of ~$29 bln.
FB (49.13 +4.12%): Upgraded to Buy from Neutral at Citigroup.
KMX (51.62 +3.21%): Beat on EPS by $0.06, beat on revs.

Large Cap Losers

RHT (46.99 -11.22%): Beat on EPS by $0.02, reported revs in-line; guided FY14 EPS, revs in-line, Q3 EPS in-line, Q3 revs below ests; billings came in below expectations; target lowered to $58 from $65 at Mizuho; target lowered to $60 at Stifel; downgraded to Neutral from Overweight at Piper Jaffray; downgraded to Sector Perform at Pacific Crest.
CCL (34.96 -6.52%): Beat on EPS by $0.06, reported revs in-line; narrowed FY13 EPS in-line.
ABBV (46.37 -1.55%): Co and Galapagos to co-develop cystic fibrosis therapies.

Mid Cap Gainers

LEN (36.31 +5.12%): Beat on EPS by $0.08, beat on revs.
THG (54.71 +4.41%): Upgraded to Mkt Outperform from Mkt Perform at JMP Securities.
GPOR (63.84 +3.79%): Initiated with a Buy at Goldman.

Mid Cap Losers

ATHN (108.18 -4.91%): Downgraded to Mkt Perform from Outperform at Leerink Swann.
FFIV (86.26 -3.26%): Downgraded to Neutral from Buy at Goldman.
CLMT (28.95 -3.18%): Downgraded to Underperform from Neutral at Credit Suisse; tgt lowered to $31 from $33.

8:03AM Brocade and Aruba (ARUN) collaborate to eliminate Cisco (CSCO) campus lock-in (BRCD) 8.21 : BRCD and ARUN announced a strategic relationship to deliver an open-standards based unified campus network to support secure mobility, the proliferation of mobile devices within campus environments, Bring Your Own Device (BYOD) initiatives and emerging technologies, such as Software-Defined Networking (SDN). The resulting integrated wired and wireless solution provides a best-of-breed approach that enables customers to eliminate vendor lock-in and reduce total cost of ownership by nearly half as compared to equivalent offerings.

Through this relationship, Brocade and Aruba will jointly develop and bring to market solutions across multiple industries, including U.S. federal government. With integrated solutions already deployed worldwide, Brocade and Aruba will collaborate on R&D to bring tighter integration for a simplified and agile wired and wireless campus network.

Brocade and Aruba will also embark on a broader technology initiative to apply SDN principles to campus networks. Utilizing open standards to replace legacy multi-tier network architectures, Brocade and Aruba engineers will work to develop a campus network virtualization solution designed to bring unprecedented performance and operational efficiencies, including: Automated IT operations with zero-touch network expansion Enriched peer-to-peer application experiences, such as MSFT Lync and AAPL AirPlay Reduced acquisition costs compared to premiums associated with CSCO lock-in.

8:03AM Cypress Semi lowers Q3 guidance; seeing greater than expected weakness in mobile handset revenues (CY) 11.44 : Co states, "We are seeing greater than expected weakness in our mobile handset revenues, mainly within Asia, due to a customer push out of certain new handset programs to Q1, as well as order reductions at various end customers in China to balance inventory levels. Unfortunately this is resulting in a negative impact to Q3 revenue that was not anticipated in our original guidance.

"By geography, the weakness is mainly in Asia. By end market, the majority of the weakness is in mobile handsets and to a lesser degree in the PC market. Greater than 70% of our revenue traditionally has come from distributors and the final week of September is our largest week of the quarter, and, as such, our revised revenue estimates could vary significantly.

Lead-times also continue to be near historical lows, reducing revenue visibility for Cypress and our distribution partners.

Consolidated revenue of $184 million to $187 million, lower than prior guidance, Capital IQ consensus $204.7 mln
Non-GAAP gross margins of 53.5% to 54.0%, higher than prior guidance
Non-GAAP operating expenses of $77 million to $78 million, lower than prior guidance
Non-GAAP fully diluted earnings per share of $0.10 to $0.12, lower than prior guidance, Capital IQ consensus $0.18
GAAP loss per basic share of ($0.11) to ($0.09), lower than our prior guidance

7:01AM Xilinx and Analog Devices (ADI) achieve JEDEC JESD204B interoperability (XLNX) 46.60 : Co announced that they have achieved JESD204B interoperability between Xilinx JESD204 LogiCORE IP in the Kintex-7 FPGA and the ADI AD9250 analog-to-digital high-speed data converter. Achieving JESD204B interoperability between logic and data converter devices is a significant milestone in promoting the widespread adoption of this new technology.

6:10AM Applied Materials and Tokyo Electron (TOELY) to merge; creating a new company as a merger of equals with combined market capitalization of ~$29 bln (AMAT) 15.99 : Applied Materials (AMAT) and Tokyo Electron (TOELY) announce a definitive agreement to create a global innovator in semiconductor and display manufacturing technology via an all-stock combination which values the new combined company at ~$29 bln. This combination, which has been unanimously approved by the Boards of both companies, brings together complementary leading technologies and products to create an expanded set of capabilities in precision materials engineering and patterning that are strategically important for customers.

Under the terms of the agreement, Tokyo Electron shareholders will receive 3.25 shares of the new company for every Tokyo Electron share held. Applied Materials shareholders will receive 1 share of the new company for every Applied Materials share held. After the close, Applied Materials shareholders will own ~68% of the new company and Tokyo Electron shareholders ~32%.

The companies expect to achieve $250 mln in annualized run-rate operating synergies by the end of the first full fiscal year and $500 mln in run-rate operating synergies realized in the third full fiscal year. In addition, the new co expects to realize meaningful savings as a result of the new corporate structure. The new company intends to commence a $3.0 bln stock repurchase program targeted to be executed within 12 months following the close of the transaction. On a non-GAAP basis, taking into account the buyback, the transaction is expected to be EPS accretive at the end of the first full fiscal year after transaction close.

Additional highlights of transaction:

Accelerates development of breakthrough products to address future technology inflections and create greater value for shareholders, customers and employees
Tetsuro Higashi to be chairman; Gary Dickerson to be CEO
Combined company to maintain dual listing on NASDAQ and Tokyo Stock Exchange and dual headquarters in Santa Clara, California and Tokyo, Japan

Maxim Integrated Products (MXIM) announced that it has extended by one day the expiration date of the tender offer by its wholly owned subsidiary, Victory Merger Sub, to purchase all of the outstanding shares of Volterra Semiconductor (VLTR) for a price of $23 per share in cash

07:28 am Red Hat shares fall 9% following Q3 revenue guidance that was below expectations
Red Hat (RHT $48.06 -4.87) reported second quarter earnings of $0.35 per share, which is better than expected, while revenues rose 16.1% year/year to $374.4 million which is higher than expected. "These results were driven in particular by strong subscription revenue growth, up 17% in U.S. dollars and 18% in constant currency. The billing proxy, which we define as total revenue plus the change in deferred revenue found on the Statement of Cash Flows, was $376 million, up 8% in U.S. dollars and 9% in constant currency. This billings growth reflects modest IT spending in Europe and the impact of large deal arrangements." The company sees fiscal year 2014 adjusted EPS of $1.36-1.38 and revenues of $1.51-1.52 billion which are both in line with expectations. The company also sees third quarter adjusted EPS of $0.34-0.35 which is in line with estimates with revenues of $381-384 million which is below expectations.

Rambus Inc. (RMBS) announced it has signed an agreement with Freescale Semiconductor (FSL) that expands the relationship between the companies. The agreement extends Freescale's access to Rambus' innovations for memory controllers and serial links. Additionally, the expanded agreement provides Freescale with the ability to collaborate on Rambus' resistive memory technology for embedded applications. The expanded agreement extends the terms of the existing license agreement until 2018. Other terms of the agreement are confidential.

DealerTrack (TRAK) announced an agreement to acquire VINtek, a provider of automotive collateral management, electronic lien and title (ELT) and consumer automotive finance processing services. Total consideration for the transaction is expected to be approximately $53.4 million in cash, subject to standard purchase price adjustments. This transaction is expected to close in the fourth quarter of this year, subject to customary closing conditions. Details of the financial impact of the transaction are expected to be discussed as part of the Dealertrack's third-quarter earnings conference call in early November.

08:09 am Red Hat downgraded to Sector Perform at Pacific Crest following earnings: . Pacific Crest downgrades RHT to Sector Perform from Outperform. Despite better revenue, subscription revenue, operating margin and EPS results, billings suffered due to a weaker European macro and more large deals being off-balance-sheet. Additionally, total revenue guidance disappointed as the company is outsourcing more of its services to partners. The recent declines in billings, while explainable due to the off-balance-sheet component, are likely to weigh on investor confidence in the near to medium term.

08:09 am P.A.M. Transport target raised to $20 at Wunderlich: . Wunderlich raised their PTSI tgt to $20 from $15. Despite regulatory headwinds and a choppy freight environment, PAM Transportation (PTSI) appears primed to deliver strong results again in 3Q13. The co is bucking soft industry trends via improved freight mix and internal execution. The co adroitly sidestepped the negative utilization impact of the new HOS rule and monthly tonnage comps continue to improve as the co diversifies its customer exposure and reduces so-called random freight. With the secular tailwind of a strong automotive sector at its back, they expect PAM to continue outperforming broader TL in the near-term.

08:08 am Catalyst Pharma initiated with a Buy at Maxim Group; tgt $4: . Maxim initiates CPRX with a Buy and price target of $4. The co's lead drug, Firdapse (amifampridine), is in a phase III trial as a first-line treatment for an orphan disease-Lambert-Eaton myasthenic syndrome (LEMS)-with top-line results expected in 2Q14 and an NDA (new drug application) to follow in 2H14. Firm expects the pivotal trial to complete enrollment by 4Q13 and report data in 2Q14. Firdapse is currently approved and used in Europe. Patient experience and multiple prior investigator trials all point to safety and efficacy. Firdapse is a potassium channel blocker. Its active ingredient, amifampridine, is available for LEMS treatment in the United States today through a few compounding pharmacies.
icon url

ReturntoSender

09/25/13 11:06 PM

#10335 RE: ReturntoSender #6755

From Briefing.com: 4:10 pm : The S&P 500 shed 0.3%, extending its losing streak to five sessions. Including today's decline, the benchmark index has surrendered 1.9% since last Thursday.

Stocks endured a sloppy session as the S&P made two unsuccessful attempts at holding the 1,700 level. After opening just above its flat line, the S&P 500 slipped into the red before recovering swiftly with the help of energy (-0.1%) and materials (+0.2%). The financial sector (+0.5%) also fueled this morning's rebound after losing roughly 3.5% during the past four sessions.

The morning recovery placed the S&P above 1,700, but the index could not muster additional strength as consumer staples (-0.8%), health care (-0.8%), technology (-0.3%), and utilities (-0.7%) weighed. The underperformance of these groups briefly pressured the S&P back to its flat line. This retreat was followed by another run to 1,700, but the index slid from this level back to lows after a report from Bloomberg indicated Wal-Mart (WMT 74.65, -1.10) is cutting its orders amid a pile-up in inventories.

Concerns about lackluster sales at the largest retailer were received as a warning regarding the well-being of the broader sector, causing other retailers like Costco (COST 115.41, -0.93), Dollar General (DG 57.00, -1.11), and Target (TGT 63.24, -0.67) to slump to their lows. The affected names were able to regain a portion of their losses after CNBC cited a Wal-Mart official who described the headlines as misleading.

Afternoon action saw the S&P climb off its lows, but the index was unable to regain its flat line.

Commodities ended in mixed fashion as energy fell and metals displayed strength. Crude oil fell 0.8% to $102.31 per barrel while gold added 1.3%, ending at $1333.50 per troy ounce.

Treasuries saw steady demand throughout the session, and the benchmark 10-yr yield fell four basis points to 2.62%.

With the debt ceiling looming, Secretary of Treasury Jack Lew was quoted as saying the spending limit will be reached no later than October 17. The Congressional Budget Office also provided an estimate, expecting the spending ability to be exhausted between October 22 and the end of the month.

Trading volume was below average as 641 million shares changed hands on the floor of the NYSE.

In today's economic data, durable orders increased 0.1% after declining a downwardly revised 8.1% in July. The Briefing.com consensus estimate called for a 0.5% increase. Excluding transportation, durable orders declined 0.1% (+0.9% consensus) following an upwardly revised decline of 0.5% for July. Notwithstanding the headline disappointment, there were some encouraging elements to the report like the 0.9% increase in new orders for machinery, the 2.4% jump in new orders for motor vehicles and parts, and positive business investment data. New home sales managed a modest rebound in August. Sales rose from a downwardly revised 390,000 in July to 421,000 in August. The Briefing.com consensus expected new home sales to increase to 415,000. Even after the uptick, sales were at their second lowest level since December 2012.

New home sales represent the number of newly signed contracts and are much more responsive to changes in interest rates than the existing home sales data. The initial increase in mortgage rates caused a brief spike in sales in June as buyers rushed in to take advantage of relatively low rates before they went higher. That caused a large "payback" period to develop in July where sales fell 14%. The weak rebound in August suggests that buyers are not comfortable at current mortgage rates.

Separately, the MBA Mortgage Index rose 5.5%, posting its second consecutive increase.

Tomorrow, weekly initial claims and the third estimate of second quarter GDP will be reported at 8:30 ET while August pending home sales will be announced at 10:00

4:30PM Western Digital CFO Wolfgang Nickl to resign in November to assume CFO position at ASML in the Netherlands (WDC) 65.43 +0.75 : announced that chief financial officer Wolfgang Nickl is resigning effective Nov. 17, 2013 to become chief financial officer at ASML Holding N.V. (ASML) in the Netherlands. Nickl has served as Western Digital's chief financial officer since August 2010. In joining ASML, Nickl will be returning with his family to his native Europe. The co is in the process of conducting a search for a new chief financial officer.

4:09PM Jabil Circuit beats by $0.02, beats on revs; guides Q1 EPS below consensus, revs below consensus (JBL) 24.00 +0.29 : Reports Q4 (Aug) earnings of $0.56 per share, excluding non-recurring items, $0.02 better than the Capital IQ Consensus Estimate of $0.54; revenues rose 11.0% year/year to $4.81 bln vs the $4.52 bln consensus.

Co issues downside guidance for Q1, sees EPS of $0.50-0.60, excluding non-recurring items, vs. $0.62 Capital IQ Consensus Estimate; sees Q1 revs of $4.35-4.65 bln vs. $4.87 bln Capital IQ Consensus Estimate.

"Delivering record revenues, generating more than a billion dollars of cash flow from operations, and achieving a core return on invested capital of 21 percent are clear highlights of our fiscal year...In addition, we are pleased to return nearly $200 million in capital to shareholders through dividends and share repurchases, while continuing to thoughtfully invest capital back into the business, both organically and acquisitively, with an eye on long-term earnings growth,"

4:04PM JinkoSolar Holding closes follow-on public offering of 4.37 mln ADS (JKS) 19.94 +1.16 : Co announced the closing of its follow-on public offering of 4,370,000 American depositary shares, or ADSs, each representing four ordinary shares at par value US$0.00002 per share, including 570,000 ADSs sold pursuant to the underwriters' full exercise of their option to purchase additional ADSs. The Company received aggregate net proceeds of approximately $67.8 million, after deducting discounts and commissions but before offering expenses.

Credit Suisse Securities (USA) LLC, J.P. Morgan Securities LLC and Jefferies LLC are joint bookrunners for the offering.

Large Cap Gainers

ESRX (63.23 +3.76%): Seeing reports that co was mentioned positively at Morningstar
CF (214.38 +3.08%): Upgraded to Overweight from Neutral at Atlantic Equities
AZO (423 +2.10%): Beat quarterly EPS by $0.09 ($10.42 vs $10.33 estiamte), revs rose 12.0% yoy to $3.1 bln vs $3.09 blne stimate; co repurcahsed 1.3 mln shares of common stock for $560 mln during the quarter at an average price of $428 per share

Large Cap Losers

TSU (23.75 -6.51%): Downgraded to Hold from Buy at Stifel following recent gains in price
BAX (66.89 -6.13%): Resumed with a Neutral rating at JP Morgan
CCL (33.06 -4.30%): Downgraded to Neutral from Buy at BofA/Merrill; downgraded to Underweight from Equal-Weight at Morgan Stanley; downgraded to Reduce from Neutral at Natixis; target lowered to $35 from $39 at UBS

Mid Cap Gainers

ASNA (20.22 +16.74%): Beat quarterly EPS by $0.13 ($0.34 ex items vs $0.21 estimate), revs rose 27.5% yoy to $1.2 bln vs $1.16 bln estimate; sees FY14 EPS of $1.25-1.30 ex items vs $1.37 estimate
CTRP (55.4 +7.87%): Upgraded to Buy from Hold at Deutsche Bank, target raised to $65
AU (13.36 +5.95%): Reported that the Kibali Gold Mine, a joint venture with Randgold Resources (GOLD), has successfully delivered its first gold production early and within budget

Mid Cap Losers

JCP (10.33 -13.19%): Mentioned cautiously at Cleveland Research and at Goldman
CPRT (31.51 -7.55%): Missed quarterly EPS by $0.08 ($0.32 vs $0.40 estimate), revs rose 16.4% yoy to $263.7 mln vs $262.49 mln estimate
FNP (24 -3.42%): Hearing defended at Sterne Agee

Cree (CREE) introduced the new XLamp XQ-E LED family.

Altera (ALTR) announced production availability of its Cyclone V SoCs and engineering sample availability of its Arria V SoCs.

Micron Technology (MU), announced that it is shipping 2GB Hybrid Memory Cube engineering samples.

07:46 am Infosys upgraded to Outperform at Robert W. Baird; tgt raised to $58: . Robert W. Baird upgrades INFY to Outperform from Neutral and raises their tgt to $58 from $46. The upgrade is based on the confluence of potentially conservative Q2 estimates, mildly improving economic data, improving currencies (relative to USD), and compelling valuation. Q2 could beat, as firm models only 1% sequential growth (following +3% in Q1). Q2 sequential growth has averaged 3% better than Q1 growth over the last six years (worst year was 2% better).

07:44 am Applied Materials tgt raised to $21 at Pacific Crest: . Pacific Crest raises its AMAT tgt to $21 from $19. The merger offers higher cash returns, creates new product opportunities, fills knowledge gaps, adds exposure to lithography and cements AMAT as the most important company in the space. While this deal makes sense from a cash-return and cost-synergy standpoint, firm believes the main driver is Mr. Dickerson's desire to deliver the best equipment and to grow revenue through share gains. Nearly all semiconductor process steps will be covered, providing tremendous opportunity for Applied to develop and introduce innovative new products.
icon url

ReturntoSender

09/27/13 6:40 PM

#10338 RE: ReturntoSender #6755

FSLR ST bot 1000 shares@40.53 near the close. I had a limit order in and it filled. The charts below will show how the stock always seems to open high and then falter. I'm going to try some overnight trading with the stock to recoup some of the losses I am to stubborn to book on CY.


RtS
icon url

ReturntoSender

09/29/13 7:50 PM

#10339 RE: ReturntoSender #6755

From Briefing.com: Weekly Recap - Week ending 27-Sep-13

Dow -70.06 at 15258.24, Nasdaq -5.83 at 3781.59, S&P -6.92 at 1691.75

Equities ended the week on a lower note with the S&P 500 shedding 0.4%. The index widened its loss for the week to 1.1% as participants exhibited caution ahead of the weekend given the uncertainty associated with the ongoing budget showdown.

Earlier today, the Senate passed a funding bill that would keep the government running through November 15. The bill passed with a 54-44 vote after the provision to defund Obamacare was removed from the language. However, the bill will now head back to the House of Representatives where the defunding provision originated. President Obama weighed in during the late afternoon, saying it is up to Congress to keep government operating and that the G.O.P. is blocking the process.

Concerns over the budget debate have weighed on sentiment throughout the week, contributing to the weakness in the S&P. Meanwhile, the Nasdaq displayed relative strength and finished the week with a slim gain of 0.2%.

The Nasdaq outperformed today as biotechnology overshadowed the underperformance of the tech sector (-0.6%). The iShares Nasdaq Biotechnology ETF (IBB 210.73, +0.57) added 0.3%, also contributing to the relative strength of the health care sector, which tacked on 0.1%.

Another pocket of relative strength could be found among discretionary shares (+0.1%). Even though homebuilders lagged and the iShares Dow Jones US Home Construction ETF (ITB 22.38, -0.29) lost 1.3%, the sector received support from apparel manufacturers. Dow component Nike (NKE 73.64, +3.30) rallied 4.7%, notching a fresh record high after reporting better-than-expected earnings and above-consensus worldwide futures orders.

Elsewhere, traditional tech companies lagged with top-weighted names like Apple (AAPL 482.75, -3.47), Google (GOOG 876.39, -1.78), and Intel (INTC 22.98, -0.43) posting losses between 0.2% and 1.8%. Microsoft (MSFT 33.27, +0.50) outperformed, climbing 1.5% amid reports Ford (F 17.05, -0.22) Chief Executive Officer Alan Mulally may become the next CEO of the tech company.

On the earnings front, shares of Accenture (ACN 74.09, -1.78) lost 2.4% after the company's cautious first-quarter revenue guidance outweighed its mixed earnings.

The industrial sector (-0.6%) also weighed on the S&P amid broad weakness. Transportation-related names were pressured by airlines with United Continental (UAL 30.91, -3.16) tumbling 9.3%. The broader Dow Jones Transportation Average lost 0.6% even as crude oil posted a modest decline (-0.3% at $102.68/bbl).

Treasuries climbed steadily and the benchmark 10-yr yield slipped two basis points to 2.63%.

Below-average volume plagued the market throughout the week, and today's session saw 647 million shares change hands on the floor of the New York Stock Exchange.

On Monday, the September Chicago PMI will be reported at 9:45 ET.

Week in Review: Budget Battle Weighs on Markets

Monday's session saw the major averages start the week on a lower note as the S&P 500 shed 0.5%. Stocks spent the first half of the session in a steady retreat, but managed to regain a portion of their losses during afternoon action. Concerns about the lack of progress in budget negotiations contributed to the decline with participants keeping one eye on Washington throughout the week. Seven of ten sectors finished in the red while technology (+0.3%), telecom services (+0.1%), and utilities (+1.2%) outperformed. The technology sector-and the Nasdaq-received an opening boost from the shares of Apple after the largest sector component reported strong weekend demand for two of its latest devices. As a result of better-than-expected sales, the company said it expects fourth quarter revenue to come in near the top end of analyst estimates. Apple settled higher by 5.0% and component suppliers like Cirrus Logic (CRUS 22.97, -0.28) and Skyworks Solutions (SWKS 24.77, -0.24) also displayed strength.

On Tuesday, the S&P 500 settled lower by 0.3%, registering its fourth consecutive loss. Small caps outperformed the benchmark average as the Russell 2000 added 0.2%. Stocks slipped during the opening hour in reaction to a below-consensus consumer confidence report for September. Despite the opening slip, the S&P recovered swiftly, but was unable to hold the 1,700 level into the close as financials and technology weighed. The financial sector (-0.6%) underperformed for a second consecutive day with JPMorgan Chase (JPM 52.24, +0.35) leading to the downside. The stock fell 2.2% after The New York Times revealed the Department of Housing and Urban Development sought a $20 billion settlement in a mortgage-backed securities issuance case against the bank.

The S&P 500 shed 0.3% on Wednesday, extending its losing streak to five sessions. Stocks endured a sloppy session as the S&P made two unsuccessful attempts at holding the 1,700 level. After opening just above its flat line, the S&P 500 slipped into the red before recovering swiftly with the help of energy (-0.1%) and materials (+0.2%). The financial sector (+0.5%) also fueled this morning's rebound after losing roughly 3.5% during the past four sessions.

On Thursday, the S&P 500 added 0.4%, snapping its five day losing streak that saw the index surrender almost 2.0%. Although the benchmark average settled in the green, it was unable to maintain all of its early gain or register a close above the 1,700 level. In general, some of the Thursday's price action mirrored that of Wednesday with the S&P making two unsuccessful runs at 1,700. The Nasdaq ended in the lead (+0.7%), benefitting from the outperformance of biotech as the iShares Nasdaq Biotechnology ETF climbed 1.6%.
 
Index Started Week Ended Week Change %Change YTD %
DJIA 15451.09 15258.24 -192.85 -1.2 16.4
Nasdaq 3774.73 3781.59 6.86 0.2 25.2
S&P 500 1709.91 1691.75 -18.16 -1.1 18.6
Russell 2000 1073.82 1074.19 0.37 0.0 26.5

4:38PM This week's biggest % gainers/losers (SCANX) : The following are this week's top 20 percentage gainers and top 20 percentage losers, categorized by sectors (over $300 mln market cap and 100K average daily volume).

This week's top 20 % gainers

Technology: SWIR (16.52 +27.55%), GWAY (20.44 +23.73%), HSOL (4.18 +17.44%), LTXC (6.57 +15.57%)
Services: SSTK (72.87 +20.42%), ASNA (20.01 +17.22%)
Industrial Goods: JKS (22.5 +29.67%), ZOLT (16.7 +27.13%)
Healthcare: MAKO (29.48 +78.57%), PACB (5.59 +64.02%), SRPT (46.79 +26.79%), GERN (3.7 +26.42%), CLDX (36.01 +25.14%), DYAX (6.87 +22.81%), GEVA (62.41 +17.51%), PCRX (47.47 +15.79%)
Financial: GCAP (13.11 +20.27%), HCI (41.66 +15.45%)
Consumer Goods: FN (16.06 +14.2%)
Basic Materials: KIOR (2.65 +64.2%)

This week's top 20 % losers

Technology: BBRY (8.03 -24.43%), CY (9.05 -19.69%), EOPN (22.79 -13.11%)
Services: CRRS (2.3 -43.47%), JCP (9.05 -20.7%), HTZ (22.32 -18.62%), CZR (19.71 -15.83%)
Industrial Goods: XONE (45.08 -17.42%), BRSS (17.44 -14.74%)
Healthcare: BIOS (8.84 -24.38%), CLVS (60.59 -18.24%), ABMD (18.75 -15.43%), INFI (17.01 -14.12%), CVM (1.75 -14%), PTLA (24.61 -13.84%)
Financial: TWGP (6.91 -17.89%)
Basic Materials: SA (10.62 -20.33%), IAG (4.77 -16.58%), NG (2.34 -14.23%), CDE (12.3 -13.55%)

2:38PM Notable movers of interest (SCANX) : The following are some of today's most notable movers of interest, categorized by market capitalization (large cap over $10 billion and mid cap between $2-10 billion) and ranked by % change (all stocks over 100K average daily volume).

Large Cap Gainers

NKE (73.83 +4.96%): Beat quarterly EPS by $0.08 ($0.86 vs $0.78 estimate), revs rose 7.7% yoy to $6.97 mln vs $6.97 mln estimate; upgraded to Buy from Neutral at Sterne Agee; target raised to $74 from $69 at TAG; target raised to $70 from $65 at Janney; downgraded to Hold from Buy at Stifel
MSFT (33.75 +2.99%): Ford CEO Alan Mulally reported to be front runner to become co's next CEO; also seeing reports that China has approved plans to end its ban on video game consoles
MU (17.91 +2.52%): Target raised to $24 from $20 at Stifel

Large Cap Losers

UAL (31.72 -6.90%): Announced Q3 2013 consolidated system available seat miles are expected to decrease 1.1% year over year; downgraded to Neutral from Buy at Buckingham Research
TCK (27.3 -3.87%): Initiated with a Neutral at Citigroup
TS (46.68 -3.71%): Downgraded to Neutral from Buy at BofA/Merrill

Mid Cap Gainers

THO (58.89 +4.36%): Beat quarterly EPS by $0.09 ($1.04 ex items vs $0.95 estimate), revs rose 18.7% yoy to $914 mln vs $913.14 mln estimate
FL (34.17 +4.29%): Trading higher following strong quarterly results from Nike (NKE)
TFSL (11.6 +3.66%): Announced resumption of fourth stock repurchase program, which has 2.156 mln shares remaining

Mid Cap Losers

LL (102.81 -8.99%): Co confirmed search warrants were executed at its corporate offices by the Department of Homeland Security's Immigration and Customs Enforcement and the U.S. Fish and Wildlife Service
JCP (9.53 -8.54%): Announced an offering of 84 mln shares of common stock at $9.65 per share; target range lowered to $4-5 from $6-7 at Wells Fargo; downgraded to Neutral from Buy at Buckingham Research
DXCM (27.1 -7.16%): Trading lower following approval of competitor Medtronic's artificial pancreas device system

9:01AM CalAmp's Mobile Resource Management business undergoing strong international expansion (CAMP) 17.19 : Co announced achievements in its strategic global expansion for its mobile resource management (MRM) portfolio of products and services. CalAmp's market-pacing wireless MRM devices and solutions are used for monitoring and control of remote and mobile assets as well as collecting and reporting business-critical data.

7:08AM BlackBerry reports dismal Q2 results -- in-line with last week's preannouncement, well below consensus (BBRY) 7.95 : Reports Q2 (Aug) loss of $0.47 per share, excluding non-recurring items, in-line with the Capital IQ Consensus of ($0.47); the adjusted loss from continuing operations and adjusted diluted loss per share exclude the impact of the Z10 Inventory Charge of ~$934 mln ($666 million after tax) and pre-tax restructuring charges of ~$72 mln ($51 million after tax) related to the CORE program incurred in the second quarter of fiscal 2014.

Rev fell 45.0% year/year to $1.57 bln vs the $1.63 bln consensus. The revenue breakdown for the quarter was ~49% for hardware, 46% for service and 5% for software and other revenue. During Q2, the co recognized hardware revenue on ~3.7 million BlackBerry smartphones. Most of the units recognized are BlackBerry 7 devices, in part because certain BlackBerry 10 devices that were shipped in the second quarter of fiscal 2014 will not be recognized until those devices are sold through to end customers.

During the quarter, ~5.9 million BlackBerry smartphones were sold through to end customers, which included shipments made prior to the second quarter and which reduced the Company's inventory in the channel.

The total of cash, cash equivalents, short-term and long-term investments was $2.6 billion as of August 31, 2013, compared to $3.1 billion at the end of the previous quarter. Cash flow used in operations in the second quarter was ~$136 million. Uses of cash included intangible asset additions of ~$268 million and capital expenditures of ~$112 million.

"While our company goes through the necessary changes to create the best business model for our hardware business, we continue to see confidence from our customers through the increasing penetration of BES 10, where we now have more than 25,000 commercial and test servers installed to date, up from 19,000 in July 2013. We understand how some of the activities we are going through create uncertainty, but we remain a financially strong company with $2.6 billion in cash and no debt. We are focused on our targeted markets, and are committed to completing our transition quickly in order to establish a more focused and efficient company."

icon url

ReturntoSender

09/29/13 8:33 PM

#10340 RE: ReturntoSender #6755

InvestmentHouse Weekend Market Summary

http://www.investmenthouse.com/weekendmarketsummary.htm

- Nervous ahead of government funding, mixed Fed-speak has investors pausing for the week.

Going to do something a bit different today. A brief market update (not much changed Friday) but then a discussion of how to be more successful in the market. There are issues I see in most all novice or intermediate traders, indeed experienced traders, that a quick refresher will help overcome. But first, the market.

Market pauses ahead of weekend ahead of government funding deadline.

Friday showed a session where investors/traders/fund managers/computer programs contemplated more wrangling over the weekend about a government shutdown ahead of the Tuesday 'deadline.' As if Tuesday is December 21, 2012 when the world was supposed to end. That is okay; wrangling, posturing, and brinkmanship is what we do in a republic versus having edicts issued from on high. Okay, we DO have edicts issued from on high, but we do have a Constitution that prevents that. We just aren't following our Constitution. Sadly, not a new development.

The indices handled it fairly well. Started lower but managed to fight back and recoup much of the losses. SOX was not so sanguine, gapping below the 10 day EMA and the near trendline.

SP500 -6.92, -0.41%
NASDAQ -5.84, -0.15%
DJ30 -70.06, -0.46%
SP400 -0.38%
RUTX -0.39%
SOX -0.79%

Overall, however, it was something like sitting on your hands ahead of the weekend as we listened to more chest beating and faux piousness from our 'leaders' in DC on both sides of the aisle over the government funding. Of course there was also Fed-Speak, and particularly rambling, incoherent Fed-speak at that from Mr. Evans. Evans gave the old 'we may taper in 2013 but we may taper in 2014' misdirection. Just adding more credibility to the Fed all the time!

Perhaps the market is simply riding it out, waiting for a brokered deal. If one doesn't develop it might be time for the market to take that test that pushes NASDAQ from the upper trendline back to the 50 day EMA as in August.

Maybe. Some say a failure to fund leads to a 1.4% decline in Q4 GDP. Of course, starting to get a handle on runaway spending starts putting the US on the path to turning away from an ever surging debtor nation, but that is the big picture that the stock market no longer looks at.

There certainly are still a lot of leaders that look very good indeed, leaders that have thus far weathered the 'horrid' 6 out of 7 days lower on SP500. You have heard it before on the financial stations, if the market is not going up every day something is terribly wrong. Looking at the patterns of the leaders and the indices, I don't see that. SOX is a bit worrisome after Friday with its small gap lower and it tends to lead moves, but again, leadership remains solid.

We ended up not buying anything as a lot of stocks turned off their intraday highs substantially, and frankly, if nothing is done over the weekend, and I doubt it will, there will be the same opportunities next week ahead of the Tuesday deadline.

End result: we plan to hang in and ride through the hot air turbulence emanating from DC the best we can. Leaders are holding up very well, and until that changes character the market is doing what it has to do in the face of the periodic Money Madness in DC. Okay, so it is not periodic but every day when you have a $17T debt, the IRS has $67M missing from what it has already taken from us for the healthcare Act, a food stamp recipient picking up sushi and lobster using his 'SNAP' card. But, of course, there is no room for cuts because as Ms. Pelosi puts it, the cupboard is bare. With that kind of scenario nothing meaningful will happen OTHER THAN a shutdown.

THE MARKETS

OTHER MARKETS
Dollar: 1.3522 versus 1.3483 versus 1.3521 10 year

Bonds: 2.62% versus 2.64% versus 2.61% 10 year

Oil: 102.87, -0.16

Gold bouncing up and down: 1338.50, +14.90

MARKET INTERNALS and STATS

NASDAQ
Stats: -5.83 points (-0.15%) to close at 3781.59
Volume: 1.675B (-6.27%)

Up Volume: 733.34M (-436.66M)
Down Volume: 910.63M (+301.21M)

A/D and Hi/Lo: Decliners led 1.56 to 1
Previous Session: Advancers led 1.47 to 1

New Highs: 104 (-36)
New Lows: 17 (-1)

S&P
Stats: -6.92 points (-0.41%) to close at 1691.75
NYSE Volume: 562.5M (+4.36%)

Up Volume: 786.13M (-823.87M)
Down Volume: 2.13B (+1.01B)

A/D and Hi/Lo: Decliners led 1.97 to 1
Previous Session: Advancers led 1.68 to 1

New Highs: 86 (-58)
New Lows: 86 (+3)

DJ30
Stats: -70.06 points (-0.46%) to close at 15258.24

SENTIMENT INDICATORS

VIX: 15.46; +1.4
VXN: 15.65; +1.29
VXO: 14.68; +1.18

Put/Call Ratio (CBOE): 0.94; +0.24

Bulls and Bears:

Clearly diverging again with bulls running higher and bears falling, just as the market makes a turn for the worse. Similar action in June.

Bulls: 42.3% versus 37.1% versus 37.1% versus 38.1% versus 43.3%. Diving below the early July, late June levels. 48.4% versus 51.5% versus 52.1% versus 46.9% versus 43.8% versus 41.7% versus 46.8% versus 43.8% versus 45.8% versus 52.1% versus 54.2% versus 52.1% versus 47.9% versus 44.3% versus 47.4% versus 50.5%.

Background: Last undercut 35%, the threshold for bullishness, in early June 2012.

Bears: 21.6% versus 22.7% versus 23.7% versus 23.8% versus 21.6%. Finally breaking free from the 20 level that held for three weeks, and now matching the highs from late June and early July. Starting to get there but needs to jump toward 30.

Background: Over 35% is the threshold to be really be a good upside indicator. For reference, bearishness hit a 5 year high at 54.4% the last week of October 2008. The move over 50 took bearish sentiment to its highest level since 1995. Extreme negative sentiment. Prior levels for comparison: Bearishness peaked at 37.4% in September 2007. It topped the June 2006 peak (36%) on that run. That June peak eclipsed the March 2006 high (33%) and well above the 2005 highs that spawned new rallies (30% in May 2005, 29.2% in October 2005). That was a huge turn, unlike any seen in recent history.

MONDAY

Today a quick overview of some points to make you better at your stock investing and trading and perhaps overcome some obstacles that are holding you back.

I often see three main areas that hold people back from becoming a good investor and/or trader in any market, stock or otherwise.

1. Logic: Trying to apply your own logic to what a stock should do versus what the market is telling you a stock should do.

2. Patience: Letting a play come to you versus chasing it. Once in a play, having the patience to let a play work for you as long as all of the reasons for entering the play remain.

3. Money management: Letting winners run: Taking partial profits, having the confidence in your plan to let it work for you. There are other parts that we will discuss in other installments.

Logic

I often see a newer or even experienced investor complain that a stock is not moving versus another stock in a category even though the company in the lagging stock is purportedly a better company.

This is a losing mindset. The market is the aggregation of all investor insight, biases, prejudices, intelligence, etc. It is still dominated short term and even longer term by emotions. Greed is powerful, but fear is the master. Greed causes people to buy late. Fear causes people to panic out of otherwise perfectly good patterns and action.

William O'Neill has a good analogy comparing yellow dresses to red dresses. The yellow dresses are believed to be of less quality by an investor versus the red dresses. The investor cannot believe the market will continue to ignore the red dress maker so he buys the red dress stock. The yellow dress stock, however, simply continues to outperform, rallying while the red dresses go, at best, nowhere.

This also happens after a big selloff. Stocks set up good patterns and start to break higher. Your eyes see it but your gut and weary mind just don't want to believe it. That is when you have to step in and just do it. Back in early 2009 AMZN gapped upside. No one seemed to care; too beat up from the huge market selloff. We saw the gap and played it as AMZN broke higher from the gap. PCLN sold off hard in mid-2010 and many bailed on it, saying the big run was over. We saw it set up at support and when it moved higher we bought into it despite many badmouthing the stock. That was at $188.43, and this past week PCLN broke 1,000, the first stock to break 1K. What about NFLX? HLF? Hated because they could not possibly support the prices, or so the pundits would say. We kept buying NFLX when it told us to do so via its pattern. We made tons of money on NFLX on its runs that were not supposed to happen.

The point: for some reason perhaps unknown to us, the market wants the yellow dresses or is just ready to make a turn. It may make no sense, but buyers want the yellow dress stock. If the market, based upon the patterns and the action, tells you one stock is favored and another is not, don't try to be smarter than the market. Pick your entry when it presents itself. Buy when a stock says 'buy me,' not solely because a stock's fundamentals look good. It has to have a good pattern so we can optimize the use of our funds on stocks that are moving, not sitting. Or even worse, stocks are moving and WE are sitting.

Patience

Investors, particularly traders, want to make money, and they want to make money now. That is good; don't sit on your funds. You have to have your line in the water to catch fish. You have to be on the hunt, gun or bow loaded, for when the prey reveals itself. But, you have to let the play develop.

Don't shoot your gun when your quarry is in the deep woods. Don't cast before you are in position. Wait until the play is ready to buy. Let it show the break you are playing. As I say often, they are just pretty pictures until the move starts. Let it start so you know the pattern is working, the stock saying 'buy me.'

Further, don't be late. Don't chase the bus. If you miss your turn, don't jerk your car across traffic and risk a wreck. Be patient. Often a stock will come back to you or give you a shot to enter after a breakout. If you miss a breakout and let a stock run a bit then move in, you might get a bit more upside but then the stock tests. You can get turned upside down in a routine test of the move if you are not patient. Miss one buy, keep it on the watch list, then when it sets up again, you can still catch a breakout run on the first test, etc.

Let your winners run

When I was learning to trade and invest, I used to roll my eyes and audibly snort every time I heard a mentor or some other expert say let your winners run. What an idiotic concept I would think. Of course you would do that. But I never would.

First, I didn't really know what it meant. 10%? 20%? What is a run? Second, I just didn't have the right mindset to do it. I would pick the right play, get the right entry, then after a strong burst higher started to fade I would get very anxious, particularly with options and their limited life, and sell out. Then after a test the stock would continue higher and double the gain I took. Worse, I would not be right on another trade (you will be wrong many times and still be a great, money making trader) and by not letting my winners run as far as they would, I would eviscerate my profits.

Time and some very good mentors helped me over this. There are many techniques to overcome this problem, but the simplest to me is partial profits. Pick a logical initial target as part of your play selection, based on pattern, Fibonacci, etc. as well as the right risk/reward ratio (more on this another time), and when your stock gets there, take some profit.

SOME profit. A half. A third. Bank it. Then, let the rest of the play run. Typically you have recouped most, all, or in excess of your initial investment. The pressure is off. You can let the stock test and set up again for the next run. As long as the pattern holds up and all signs point to a continued move, you let it work. This also has elements of patience in it as well. BUT, when the initial gains are made, you will be surprised at how easy it becomes to let the rest of your position work for you.

You will also be surprised at just how far your winners will run for you once the pressure is off and you let them run. Then you worry about when to take the next gain. That is at the next logical target in the form of resistance, Fibonacci, etc. that actually acts as some resistance. Take another PART of your gain, then let the rest run. You will let that run until the stock turns and the trend breaks. In other words, just as a stock told you to 'buy me,' it will tell you to now 'sell me.'

Ultimately it is a combination of confidence. Confidence in your play picks, your entries, your targets, your analysis of the ongoing play, confidence in your plan. That way you see 50% to 70% option gains turn into 150%, 200%, 300% option gains. Stock as well. PCLN, NFLX are not typical gains, but you can easily see 20%, 30%, 50% gains on those as well.

Support and resistance

NASDAQ: Closed at 3781.59

Resistance:
3799 is the September 2013 high.
3808 is the upper channel line for the November 2012 to present uptrend.
Next major resistance is around 4100 as NASDAQ hits 13 year highs

Support:
The 10 day EMA at 3761
3742 is the November 2012 up trendline
3694 is the August high and the post-bear market high.
The 50 day EMA at 3663
The July 2013 intraday high at 3625
3573 is the August 2013 low
3532 is the May intraday high
3521 is the August 2000 low.
3502 is the May 2013 closing high
The 2011 up trendline at 3391
The 200 day SMA at 3372
3295 is the June 2013 low selloff
3227 is the April 2000 intraday low
3197 is the September 2012 post-bear market high
3171 is the October intraday high

S&P 500: Closed at 1691.75

Resistance:
1710 is the August 2013 peak.
1730 is the September 2013 peak

Support:
1687 is the May high and post-bear market high
1698 to 1700 are the July and August interim highs
1685 is the mid-August 2013 upper gap point
The 50 day EMA at 1675
1657 is the late August upper gap point
1656 is the December 2012 up trendline
1654 is the June 2013 peak
1627 is the August 2013 low
The 200 day SMA at 1590
1576 from October 2007, the prior all-time high
1573 is the June 2013 closing low
1569.48 is the 78% Fibonacci retracement of the April to May 2013 run
1560 is the June 2013 reversal low
1556 from July 2007
1541 is the April 2013 closing low in that pullback inside the uptrend
1539 from June 2007
1531 is the recent high
1499 from January 2008
1475 is the September 2012 high
1471 is the October 2012 intraday high
1466 is the September 2012 closing peak and rally closing high
1440 from November 2007 closing lows

Dow: Closed at 15,258.24

Resistance:
15,318 is the June closing high
15,542 is the May 2013 intraday high
16,659 is the August 2013 peak

Support:
The 50 day EMA at 15,243
15,050 from the August 2013 interim recovery high
14,888 is the April peak and prior all-time high
14,844 is the June intraday low
14,762 is the August 2013 low
The 200 day SMA at 14,657
14,551 is the June 2013 intraday low on the selloff (14,659 closing)
14,198 from the October 2007 high
14,149 is the February 2013 high
14,022 from 7-07 peak
14,010 from the early February 2013 consolidation

Economic Calendar

September 27 - Friday
- Personal Income, August (8:30): 0.4% actual versus 0.3% expected, 0.2% prior (revised from 0.1%)
- Personal Spending, August (8:30): 0.3% actual versus 0.2% expected, 0.2% prior (revised from 0.1%)
- PCE Prices - Core, August (8:30): 0.2% actual versus 0.1% expected, 0.1% prior
- Michigan Sentiment -, September (9:55): 77.5 actual versus 77.3 expected, 76.8 prior

September 30 - Monday
- Chicago PMI, September (9:45): 53.7 expected, 53.0 prior

October 1 - Tuesday
- ISM Index, September (10:00): 55.1 expected, 55.7 prior
- Construction Spending, August (10:00): 0.4% expected, 0.6% prior
- Auto Sales, September (14:00): 5.6M prior
- Truck Sales, September (14:00): 7.0M prior

October 2 - Wednesday
- MBA Mortgage Index, 09/28 (7:00): 5.5% prior
- ADP Employment Chang, September (8:15): 170K expected, 176K prior
- Crude Inventories, 09/28 (10:30): 2.635M prior

October 3 - Thursday
- Challenger Job Cuts, September (7:30): 56.5% prior
- Initial Claims, 09/28 (8:30): 315K expected, 305K prior
- Continuing Claims, 09/21 (8:30): 2825K expected, 2823K prior
- Factory Orders, August (10:00): 0.3% expected, -2.4% prior
- ISM Services, September (10:00): 57.4 expected, 58.6 prior
- Natural Gas Inventor, 09/28 (10:30): 87 bcf prior

October 4 - Friday
- Nonfarm Payrolls, September (8:30): 183K expected, 169K prior
- Nonfarm Private Payrolls, September (8:30): 180K expected, 152K prior
- Unemployment Rate, September (8:30): 7.3% expected, 7.3% prior
- Hourly Earnings, September (8:30): 0.2% expected, 0.2% prior
- Average Workweek, September (8:30): 34.5 expected, 34.5 prior
icon url

ReturntoSender

09/30/13 6:03 PM

#10341 RE: ReturntoSender #6755

From Briefing.com: 4:15 pm : The S&P 500 fell 0.6% in the final session of the third quarter, trimming its quarterly advance to 4.7%.

Stocks stumbled out of the gate as political uncertainty in Washington and Italy caused participants to reduce their risk exposure.

In Washington, the federal government is on track to shut down at midnight following a game of political ping pong between the House of Representatives and the Senate. The two legislative bodies spent the day exchanging competing bill proposals with the House seeking to make changes to Obamacare while the Senate refused to engage in debate that would jeopardize funding for the health care law.

Overseas, the Italian government is on the ropes after five PDL ministers withdrew their support for the current legislature at the request of party leader Silvio Berlusconi. With the country's future in question, Prime Minister Enrico Letta is expected to appear in front of parliament on Wednesday to seek a new majority. Despite today's developments, Italian 10-yr yield ended little changed at 4.57% after increasing 20 basis points late last week in anticipation of the turmoil.

After notching their lows during the opening minutes, the major averages spent the first-half of the session in a steady climb with the Nasdaq (-0.3%) and Russell 2000 (-0.04%) pacing the rebound. The outperformance of the two indices was a recurring theme throughout the third quarter as the Nasdaq and Russell ended with respective gains of 10.8% and 9.9%.

All ten sectors settled in the red with consumer staples (-1.1%) leading to the downside. Meanwhile, other countercyclical groups ended mixed. Health care (-0.3%) and utilities (-0.1%) outperformed while telecom services (-0.6%) finished in-line.

The S&P 500 struggled with its 50-day moving average (1680) throughout the afternoon, but managed to close just above that level despite weakness among several cyclical sectors. Notably, energy, financials, and technology lost between 0.6% and 0.8% with energy leading to the downside as crude oil fell 0.5% to $102.32 per barrel.

Elsewhere, major financials lagged throughout the day. JPMorgan Chase (JPM 51.69, -0.55) was the weakest performer among the majors while the broader sector lost 0.7%.

Lastly, the technology sector saw some of its top components like Apple (AAPL 476.75, -6.00), Oracle (ORCL 33.17, -0.61), and Visa (V 191.10, -1.95) lose between 1.0% and 1.8%. Chipmakers withstood the bulk of the selling as the PHLX Semiconductor Index ended flat.

Treasuries ended little changed with the benchmark 10-yr yield down at 2.61%.

Trading volume surpassed the 200-day moving average of 728 million as 878 million shares changed hands on the floor of the New York Stock Exchange.

Economic data was limited to the September Chicago PMI report, which increased to 55.7 from 53.0 (Briefing.com consensus 53.7), representing the strongest reading since February. The Production Index improved to 58.0 from 53.0 with the increase completely due to continued strengthening in new orders.

The new orders index increased to 58.9 from 57.2. Another month of accelerating production gains may not be in the cards. Order backlogs have contracted each of the previous four months, putting the index at 46.7. Without a steady supply of backlogs, production gains will completely rely on new orders, and maintaining new orders at their current elevated levels may be difficult.

Tomorrow, August construction spending and the September ISM Index will both be reported at 10:00 ET.

4:03PM Ingram Micro expands supply chain capabilities and solutions offerings with acquisition of CloudBlue (IM) 23.05 +0.20 : IM announced it has acquired Norcross, Ga.-based CloudBlue Technologies (CloudBlue), a leading provider of enterprise IT asset disposition, onsite data destruction and e-waste recycling services to large enterprise customers, retail customers and OEMs. CloudBlue will operate as a wholly owned subsidiary of Ingram Micro. Ken Beyer, former CEO and co-founder of CloudBlue, will continue to lead co as vice president of Ingram Micro and president of CloudBlue, reporting directly to Robert Gifford, Ingram Micro executive vice president, global logistics. Further details of the transaction were not disclosed.

Large Cap Gainers

TI (8.2 +4.46%): Upgraded to Neutral from Underweight at JP Morgan
REGN (313.75 +2.65%): Target raised to $310 from $300 at Oppenheimer
CMG (428.14 +2.18%): Upgraded to Overweight from Equal Weight at Morgan Stanley

Large Cap Losers

MFG (4.28 -2.83%): Bloomberg reporting co has been penalized for dealing with organized crime
UN (37.99 -2.66%): Co said it has seen weakening in the market growth of many emerging countries in the third quarter and now expects underlying sales growth of 3 to 3.5%
PSX (57.17 -2.32%): Weakness in refiners: MPC also lower

Mid Cap Gainers

BPO (19.05 +13.6%): Brookfield Property Partners (BPY) proposed to acquire co for $19.34 per share in cash
SOHU (79.41 +4.78%): Hearing mentioned positively at Credit Agricole
RATE (20.65 +3.30%): Target raised to $23 from $20 at Stifel

Mid Cap Losers

PNRA (158.82 -3.18%): Downgraded to Equal-Weight from Overweight at Morgan Stanley
RKT (101.24 -2.88%): Downgraded to Neutral from Buy at BofA/Merrill
FTR (4.18 -2.68%): Mentioned negatively in blog article

STMicroelectronics (STM) announced that all six of its front-end manufacturing sites have achieved certification to the latest ISO 50001 energy-management standard.

Altera (ALTR) has completed the latest upgrade to its portfolio of IP cores targeting 28 nm FPGAs and SoCs.

AAPL -1.6% (Samsung Elec is offering remedies in EU antitrust probe against Apple, according to reports), TSLA -1.4% (still checking),FB -1.2% (Reuters discusses that Twitter plans to make its IPO filing this week), SPWR -1% (to supply Shimizu with 69 Megawatts of its high efficiency solar panels for Eurus Energy power plant; to Offer Up to $100 Million in Loans for SunPower Residential Solar Systems,

HGST, a Western Digital company (WDC) announced that it is shipping its new Endurastar J4K320 family, a single-platter hard disk drive specifically designed for the automotive infotainment and telematics markets.
NYSE NASDAQ
Advances 1,240 (39%) 1,161 (44%)
Declines 1,836 (58%) 1,390 (53%)
Unchanged 95 (3%) 76 (3%)
Up Vol* 1,007 (30%) 689 (37%)
Down Vol* 2,261 (68%) 1,159 (62%)
Unch. Vol* 39 (1%) 17 (1%)
New Hi's 74 133
New Lo's 88 45
*in millions
more...
Most Actives
NYSE LAST CHANGE
BAC 13.80 Down 0.72%
JCP 8.81 Down 2.71%
ACTV 14.31 Up 25.53%
RAD 4.76 Up 1.28%
F 16.87 Down 1.06%
Nasdaq LAST CHANGE
FB 50.23 Down 1.97%
CSCO 23.43 Up 0.43%
MSFT 33.28 Up 0.03%
ACHN 3.02 Down 58.29%
SIRI 3.88 Down 1.15%
more.
icon url

ReturntoSender

10/01/13 9:01 PM

#10343 RE: ReturntoSender #6755

From Briefing.com: 4:15 pm : The S&P 500 kicked off the fourth quarter on an upbeat note, climbing 0.8%. Stocks made the bulk of their advance during the opening 90 minutes before spending most of the afternoon near their highs. Late afternoon trade saw some profit-taking, but a final-minute surge sent the indices back to their highs as equities appeared unconcerned with the first day of the government shutdown.

All ten sectors posted gains as equities drew strength from typical start-of-quarter inflows. Risk assets also benefited from the rebound in Europe where yesterday's fears of a possible collapse of the Italian government were alleviated by reports indicating about 20 PDL ministers are ready to form a breakaway party supporting Prime Minister Enrico Letta. The fluid situation is expected to become a bit clearer tomorrow when the prime minister appears in front of the parliament.

The Nasdaq was the top performing index of the third quarter (+10.8%) and its relative strength continued into today's session. The index advanced 1.2% with support from its largest component. Apple (AAPL 487.96, +11.21) rose 2.4% after activist investor Carl Icahn said, in a tweet, that he pushed for a $150 billion buyback during his dinner meeting with Chief Executive Officer Tim Cook.

The outperformance of the Nasdaq was also due in part to the relative strength of the tech sector (+1.0%) and biotechnology. The iShares Nasdaq Biotechnology ETF (IBB 213.78, +4.18) climbed 2.0%, contributing to the strength of the health care sector (+1.3%), which ended in the lead.

In the health care space, Dow component Merck (MRK 48.74, +1.13) jumped 2.4% after announcing restructuring plans that include about 8,500 layoffs.

Outside of technology and health care, the discretionary sector (+0.9%) was the only other outperformer. Retailers fared well as Amazon.com (AMZN 320.95, +8.31) advanced 2.7% and the broader SPDR S&P Retail ETF (XRT 82.93, +0.91) added 1.1%.

Elsewhere, commodity-related sectors, energy (+0.5%) and materials (+0.5%), finished in the green even as crude oil and gold registered losses. The underlying commodities fell 0.5% and 2.8% to $101.84 per barrel and $1290.00 per troy ounce, respectively.

Treasuries ended near their lows with the benchmark 10-yr yield rising three basis points to 2.64%.

Trading volume was roughly in-line with the average as 717 million shares traded hands on the floor of the NYSE. Today's economic data was limited to the September ISM Manufacturing Index, which increased to 56.2 from 55.7. This represented the strongest reading since April 2011 while the Briefing.com consensus expected the index to fall to 55.0.

Production levels improved modestly as the related index increased to 62.6 in September from 62.4. After reaching its highest point since April 2011, the new orders index fell from 63.2 in August to a still elevated 60.5 in September.

The August construction spending report was also on today's schedule, but was delayed due to the government shutdown.

Tomorrow, the weekly MBA Mortgage Index will be reported at 7:00 ET and the September ADP Employment Change report will cross the wires at 8:15 ET.DJ30 +62.03 NASDAQ +46.50 SP500 +13.45 NASDAQ Adv/Vol/Dec 1828/1.75 bln/714 NYSE Adv/Vol/Dec 2177/717.0 mln/832

3:35 pm :

Precious metals and crude oil fell today as investors reacted to the first U.S. government shutdown in 17 years. Dec gold fell below the $1300.00 level, selling off sharply in the first 20 minutes of pit trade. It traded near the $1290.00 per ounce level for the remainder of the session and settled with a 3.0% loss at $1285.70 per ounce.
Dec silver slid from its session high of $21.46 per ounce set moments after floor trade opened and brushed a session low of $20.63 per ounce. It inched slightly higher in afternoon pit action and settled at $21.16 per ounce, or 2.6% lower.
Crude oil fell for a third consecutive session, brushing a session low of $101.06 per barrel. It gained momentum as it headed into the close and touched a session high of $102.10 per barrel just before settling with a 0.3% loss at $102.02 per barrel.
Natural gas, on the other hand, spent its entire floor session in positive territory. It pulled back slightly from its session high of $3.65 per MMBtu and settled with a 1.4% gain at $3.61 per MMBtu.

4:45PM Cirrus Logic acquires Acoustic Technologies, terms not disclosed (CRUS) 22.97 +0.31 : Co announced today that it has acquired Acoustic Technologies, Inc. The Mesa, Ariz.,-based firm is a leader in embedded firmware voice processing technology, including noise reduction, echo cancelation and voice enhancement. Acoustic Technologies has approximately 30 employees who have now joined Cirrus Logic.

Large Cap Gainers

TI (8.6 +5.52%): Reinstated with a Buy at Goldman.
WAG (56.15 +4.37%): Reported EPS in-line, revs in-line with preannouncement.
NFLX (321.39 +3.94%): Tgt raised to $370 from $285 at MKM Partners.

Large Cap Losers

NEM (26.93 -4.16%): Co may bid for Glencore's (GLNCY) Las Bambas mine, according to reports; Fitch said gold rebound unlikely; fall to USD1,000 may hit ratings (ABX and GG also lower).
PAYX (39.75 -2.19%): Beat on EPS by $0.01, reported revs in-line; reaffirmed FY14 guidance.
SYMC (24.59 -0.65%): Announced CFO James Beer leaving to become CFO of McKesson (MCK).

Mid Cap Gainers

CREE (67 +11.31%): Upgraded to Buy from Hold at Canaccord Genuity; tgt raised to $80 from $65.
LKQ (33.98 +6.62%): Upgraded to Outperform at Robert W. Baird; tgt raised to $38.
ALU (3.76 +6.52%): Outlined the Shift Plan strategy to accelerate telecommunications to the cloud.

Mid Cap Losers

SLW (23.91 -3.47%): Fitch said gold rebound unlikely; fall to USD1,000 may hit ratings (AUY, AEM, GFI, AU also lower).
RH (62.25 -1.74%): 10% holder CP Home Holdings filed form 144 related to proposed sale of 3,978,731 shares.
VMI (136.06 -2.05%): Downgraded to Mkt Perform from Outperform at William Blair.

Riverbed Technology (RVBD) announced W3 Ltd. is deploying the Riverbed Stingray application delivery controller.

EXFO (EXFO) announced the launch of its new tablet-inspired MaxTester 700B OTDR Series.
Ciena (CIEN) announced that Ritter Communications will deploy Ciena's new packet networking solutions to support growing customer demand for 10 Gigabit Ethernet wholesale transport and Internet services as well as mobile backhaul requirements for Tier 1 mobile operators.

Skyworks Solutions (SWKS) is partnering with Wistron NeWeb, an ODM in Asia and supplier of connected home solutions for a number of branded OEMs. WNC is leveraging Skyworks' power management and ZigBee front-end modules for several of their low-power RF devices.
Unisys (UIS) announced that it is making its IT Service Management as a Service solution available to clients via Microsoft's (MSFT) Windows Azure cloud platform.

AMD (AMD) announced SAPPHIRE Technology as its exclusive global distribution partner for AMD FirePro professional graphics.

Analyst comments: AIXG -3.3% (downgraded to Sell from Hold at Canaccord Genuity), OLED -9.5% (downgraded to Sell from Hold at Canaccord Genuity), FINL -2.7% (downgraded to Sell from Neutral at Goldman), BWLD -1.5% (downgraded to Outperform from Strong Buy at Raymond James), RRGB -1% (downgraded to Outperform from Strong Buy at Raymond James), A -0.4% (Agilent downgraded to Hold from Buy at Stifel)

8:21AM BlackBerry announced that the National Police of Colombia is upgrading their BlackBerry smartphones (BBRY) 7.95 : Co announced that the National Police of Colombia is upgrading their BlackBerry smartphones and migrating to BlackBerry's newest Enterprise Mobility Managementsolution, BlackBerry Enterprise Service 10. The National Police of Colombia selected the BlackBerry solution for its embedded controls that support regulatory compliance in government environments with the highest security requirements. To date, more than 25,000 BlackBerry Enterprise Service 10 commercial and test servers have been installed globally, including within the world's top organizations.

Select solar stocks trading higher: SFUN +3.2%, SOL +2.6%, STP +2.4%, SPWR +2.4%, FSLR +2.2%.

6:28AM Alcatel-Lucent outlines the Shift Plan strategy to accelerate telecommunications to the cloud (ALU) 3.53 : Co announces it will outline how The Shift Plan -- the company's industrial transformation from telecoms generalist to specialist in IP Networking and Ultra-Broadband Access -- will leverage new technologies to accelerate the move to the cloud by service providers. In particular, co will talk about how Alcatel-Lucent is leveraging Network Functions Virtualization (NFV) technology, and how it will help service providers meet the always-connected demands of their customers. NFV enables network services to be deployed on a shared cloud infrastructure instead of dedicated, purpose-built hardware.

In addition, Alcatel-Lucent is moving major parts of its portfolio to the cloud. By doing this heavy lifting, Alcatel-Lucent is both creating a path to NFV technology and giving service providers choices on which key network services to deploy to the cloud.

08:17 am LKQ upgraded to Outperform at Robert W. Baird; tgt raised to $38: . Baird upgrades LKQ to Outperform from Neutral and raises its tgt to $38 from $34 after meeting with key European leaders within the organization. Investors have begun to appreciate the collision strategy in Europe, where alternative part utilization rates are low, but may not appreciate the opportunity to consolidate the mechanical part market as well. Firm considers LKQ a premium mid-cap growth story with the potential to sustain EPS growth near 20%-30% through organic growth, acquisitions, and operating leverage.

08:16 am Agilent downgraded to Hold at Stifel on valuation + lack of NT catalyst post announced spin-off: . Stifel downgrades A to Hold from Buy due to valuation. Additionally, firm sees limited upside potential to shares from current levels given lack of a near-term catalysts post Agilent's announced split into two focused market leaders consisting of the "New Agilent" (inclusive of LDA assets) and a "New Electronic Measurement" company (consisting of EMG assets).

08:16 am Valmont downgraded to Hold at Stifel: . Stifel downgrades VMI to Hold from Buy. After several years of powerful growth in several of Valmont's businesses, firm now believes the uncertainty around continued organic growth and the ability to maintain margins as markets weaken in likely to create a continued overhang on VMI shares for the next few quarters. Firm reduced its 2014 estimates for the following reasons 1) Lower expected revenue growth and margins in Utility, 2) Lower expected revenue growth and margins in Irrigation, 3) Lower expected revenue growth and margins in Coatings.
NYSE NASDAQ
Advances 2,196 (69%) 1,802 (69%)
Declines 855 (27%) 711 (27%)
Unchanged 115 (4%) 94 (4%)
Up Vol* 2,521 (78%) 1,383 (76%)
Down Vol* 685 (21%) 418 (23%)
Unch. Vol* 34 (1%) 7 (0%)
New Hi's 209 205
New Lo's 82 18
*in millions
more...
Most Actives
NYSE LAST CHANGE
BAC 13.90 Up 0.72%
F 17.19 Up 1.90%
JCP 8.75 Down 0.62%
RAD 4.94 Up 3.78%
NOK 6.62 Up 1.71%
Nasdaq LAST CHANGE
FB 50.42 Up 0.38%
MSFT 33.58 Up 0.90%
SIRI 3.9750 Up 2.58%
MU 17.61 Up 0.81%
ZNGA 3.84 Up 4.60%
more...

Market Coverage
icon url

ReturntoSender

10/02/13 5:55 PM

#10344 RE: ReturntoSender #6755

From Briefing.com: 4:20 pm : The S&P 500 settled lower by 0.1% after spending most of the session in a steady climb off its opening low. Sellers were in control early on, but gave way to dip buyers after headlines indicated President Obama would meet with Congressional leaders at the White House early this evening in hopes of bridging some of the gaps that are preventing a budget agreement from being reached.

The Nasdaq (-0.1%) and the S&P were able to regain the bulk of their losses while the Dow (-0.4%) trailed throughout the session.

Six of ten sectors finished in the red with energy (+0.3%) ending in the lead as crude oil advanced 1.8% to $103.89 per barrel.

Another commodity-related sector, materials (+0.2%), also finished ahead of the broader market as steelmakers and miners contributed to the relative strength. The Market Vectors Steel ETF (SLX 45.51, +0.43) and Market Vectors Gold Miners ETF (GDX 24.49, +0.08) added 1.0% and 0.3% respectively. Underlying metals also registered gains as gold and copper futures advanced 2.4% and 1.2% to $1316.70 per troy ounce and $3.31 per pound, respectively.

The technology sector (+0.1%) was another notable outperformer with top components like Apple (AAPL 489.56, +1.60), Cisco Systems (CSCO 23.32, +0.08), and Microsoft (MSFT 33.92, +0.34) adding between 0.3% and 1.0%. The Nasdaq drew some of its strength from those names, but could not break into positive territory as biotechnology weighed. The iShares Nasdaq Biotechnology ETF (IBB 213.18, -0.60) shed 0.3%.

While most sectors were able to distance themselves from their opening lows, industrials (-0.4%) could not muster much strength as defense contractors lagged. The PHLX Defense Index tumbled 0.9% with names like Lockheed Martin (LMT 125.08, -2.42) and United Technologies (UTX 104.98, -2.40) falling 1.9% and 2.2%, respectively.

Treasuries settled near the middle of their range with the benchmark 10-yr yield down three basis points at 2.62%.

Trading volume was a bit below average as 691 million shares changed hands on the floor of the New York Stock Exchange.

In today's economic data, the ADP report indicated the addition of 166,000 new private jobs during September. That was up from August's downwardly revised 159,000 (from 176,000), but a bit below the Briefing.com consensus estimate, which expected the addition of 170,000 jobs.

The ADP report is designed to predict the final BLS private payroll levels. On that account, however, the ADP has not done a good job at predicting the initial payrolls numbers that are released in the Employment Situation Report. The fact that the ADP levels showed trends staying roughly the same over the last few months suggests that the official BLS payrolls will also continue on a flat trend line. The actual payroll gain in September is still unknown, but the ADP data do not suggest a big move up or down from last month's gain of 152,000 jobs.

Separately, the weekly MBA Mortgage Index slipped 0.4% to follow the prior week's increase of 5.5%.

In overseas news of note, Italian markets rallied after Silvio Berlusconi changed his tune and voiced support for Prime Minister Enrico Letta. It appears Mr. Berlusconi made his decision after seeing more than 20 PDL lawmakers ready to shun the party in order to preserve the current government.

Tomorrow, September Challenger Job Cuts will be released at 7:30 ET; weekly initial claims will be reported at 8:30 ET; and the September ISM Services report will cross the wires at 10:00 ET. The August factory orders report will not be released at its scheduled time due to the government shutdown.DJ30 -58.56 NASDAQ -2.96 SP500 -1.13 NASDAQ Adv/Vol/Dec 1002/1.70 bln/1523 NYSE Adv/Vol/Dec 1313/691.2 mln/1661

3:30 pm :

Nov crude oil rose for the first time in four sessions following a Bloomberg report that TransCanada (TRP) expects the expansion of its Keystone Gulf Coast pipeline to be completed by the end of the month. The company expects linefill to start shortly after completion. The move higher came despite weak inventory data that showed crude oil inventories for the week ending Sep 27th had a build of 5.47 mln barrels when a smaller build of 2.4 mln barrels was anticipated. The energy component lifted off its session low of $101.51 per barrel and settled with a 2.0% gain at $104.08 per barrel, slightly below its session high of $104.23 per barrel
Unlike crude oil, Nov natural gas trended lower after pulling back from its session high of $3.64 per MMBtu set moments after pit trade opened. It settled at its session low of $3.54 per MMBtu, or 1.9% lower
Precious metals traded higher today, gaining support from a drop in the dollar index and weaker-than-anticipated ADP employment data. The ADP report showed 166,000 new private jobs were added in September, while the Briefing.com consensus expected the report to show the addition of 170,000 new jobs
Dec gold rose for the first time in three sessions, lifting from its session high of $1297.30 per ounce. It settled 2.7% higher at $1320.70 per ounce, just below its session high of $1324.20 per ounce
Dec silver brushed a session high of $22.04 per ounce in late morning floor action and eventually settled with a 3.6% gain at $21.92 per ounce.

4:11PM CalAmp (+8%) makes new 13 year high in the after hours following upside Q2 results and solid Q3 guidance (EPS in-line, rev above consensus) (CAMP) 18.69 +0.49 :

4:05PM CalAmp beats by $0.03, beats on revs; guides Q3 EPS in-line, revs above consensus (CAMP) 18.69 +0.49 : Reports Q2 (Aug) earnings of $0.19 per share, excluding non-recurring items, $0.03 better than the Capital IQ Consensus of $0.16; revenues rose 33.6% year/year to $58.8 mln vs the $54.82 mln consensus.

Wireless Datacom revenue increased to $47.2 million from $34.2 million in the same period last year, and Satellite revenue was $11.6 million compared to $9.8 million in the second quarter last year.

The consolidated gross margin was 33.7% in the fiscal 2014 second quarter, up from 32.1% in the second quarter last year. The increase in consolidated gross margin reflects the higher proportion of total revenues represented by the Wireless Datacom segment in fiscal 2014 versus the prior year and, within Wireless Datacom, the shift in revenue mix toward higher margin subscription-based revenues associated with the Wireless Matrix acquisition.

Co issues guidance for Q3, sees EPS of $0.19-0.23, excluding non-recurring items, vs. $0.21 Capital IQ Consensus; sees Q3 revs of $59-63 mln vs. $57.85 mln Capital IQ Consensus.

"Our focused execution coupled with continued strong customer demand for our products and services resulted in a 38% year-over-year increase in Wireless Datacom revenue during the second quarter. This growth was driven to a large extent by our Mobile Resource Management (MRM) products business, which benefited from significant channel demand for stolen vehicle recovery products, along with continued strength in fleet management and asset tracking. Our Wireless Networks business, which comprises the remainder of our Wireless Datacom segment, also generated strong year-over-year growth. The acquired operations of Wireless Matrix, along with growth in the Energy vertical, more than offset a year-over-year reduction in Rail revenue resulting from the completion of our Positive Train Control development project in the second quarter last year. In addition, our Satellite segment once again generated meaningful operating cash flow and contributed to our bottom-line profitability. We believe CalAmp's strong momentum exiting the second quarter and healthy pipeline of new opportunities, driven by an expanding network of global channel partners and a robust portfolio of innovative products, provide the Company with a strong tailwind as we enter the second half of fiscal 2014."

4:07PM Cascade Microtech acquires ATT Advanced Temperature Test Systems GmbH; transaction to be accretive to earnings beginning in the fourth quarter of 2013 (CSCD) 9.20 +0.17 : Co has acquired ATT Advanced Temperature Test Systems GmbH, which is headquartered in Munich Germany. ATT Systems provides enhanced thermal solutions for wafer testing over expanded temperatures that typically range from -60 to 300 degrees centigrade. The purchase price for the acquisition includes ~ 8.4 mln Euros in cash (net of ~ 0.4 mln Euros of acquired cash), ~ 1.6 mln shares of Cascade Microtech common stock, and deferred payments of ~ 0.8 mln Euros. "Based upon the unaudited, trailing 12-months' performance of ATT Systems, the purchase price for the company approximates six times EBITDA. Before the effects of purchase accounting, we expect this transaction to be accretive to earnings beginning in the fourth quarter of 2013, and will provide additional support to achieve our success model which includes EBITDAS of greater than 20% of revenue." Going forward, ATT Systems will be reported with Cascade Microtech's Systems segment.

Large Cap Gainers

PCLN (1067.09 +2.78%): Mentioned positively at Susquehanna
VLO (34.65 +2.40%): Upgraded to Buy from Neutral at Citigroup
ABX (18.46 +2.38%): Upgraded to Buy from Hold at Deutsche Bank

Large Cap Losers

LKQ (32.62 -3.00%): Downgraded to Hold from Buy at Wellington Shields
BAX (63.92 -2.53%): Downgraded to Neutral from Outperform at Credit Suisse, target lowered to $73 from $81
GMCR (75.46 -1.97%): Largely followed investor David Einhorn says his firm is still short the stock, believes co will miss on the earnings side at least once over the next year

Mid Cap Gainers

GPN (56.24 +10.93%): Beat quarterly EPS by $0.05 ($1.00 ex items vs $0.95 estimate), revs rose 6.7% yoy to $629.7 mln vs $624.13 mln estimate; sees FY14 EPS of $3.98-4.05 ex items vs $3.97 estimate, revs of $2.51-2.56 bln vs $2.53 bln estimate; announced it intends to enter into an accelerated $100 mln accelerated share repurchase plan
OIBR (2.1 +10.85%): Co and Portugal Telecom (PT) announced they have signed a memorandum of understading setting out the bass for a merger of activities; PT also higher
P (27.16 +6.38%): Announced that September listener hours increased 18% year over year to 1.36 bln, active listeners increased 25% to 72.7 mln

Mid Cap Losers

BBRY (7.53 -4.95%): Disclosed it expects to incur $400 mln in pre-tax charges related recently announced workforce reductions; had previously estimated charges of $100 mln
TGP (42.54 -3.91%): Priced follow-on public offering of 3 mln common units, which represent limited partner interest, at $42.62 per unt
AYI (95.68 -3.27%): target raised to $100 from $78 at Cannaccord Genuinty

ANADIGICS (ANAD) announced that the co's AWL9581 802.11ac front-end integrated circuit, AWT6651 ProEficient power amplifier, and ALT6702 HELP4 PA are enabling wireless connectivity in the new GALAXY Note 3 by Samsung Electronics (SSNLF).

Riverbed Technology (RVBD) announced that the SAP Integration and Certification Center has certified that Riverbed Stingray Traffic Manager version 9 integrates with the SAP NetWeaver 7.0 technology platform.

Axcelis Technologies (ACLS) has received an order for the co's new Purion MTM medium current implanter.

Cirrus Logic (CRUS) announced today that it has acquired a majority interest in MSC Investoren GmbH as the first step of a two part transaction in which Avnet will ultimately acquire the remainder of the company. MSC is a recognized value-add distributor focused on electronic component distribution, embedded computing technology and display solutions, as well as design and manufacturing. MSC leverages its unique combination of distribution, production and system integration capability to address the emerging customer demand for more complex electronic products. In calendar year 2012, MSC generated revenue in excess of $450 million, with embedded computer technology (including display solutions) accounting for almost 50 percent of its sales. Oppenheimer noted that

11:05 am Technology sector
The tech sector is trading just lower today, ahead of larger lossess in the broader market. Semiconductors are showing weakness as well with the SOX trading 0.4% lower. Within the chip index, HITT (-4.0%) is a notable standout. Among other major indices, the SPY is trading 0.6% lower today, while the QQQ is down 0.3% and the NASDAQ is trading 0.4% lower on the session. Among tech bellwethers, AAPL (+0.7%) is showing notable strength, while VZ (-1.1%) is under pressure.

This morning in tech earnings, ADSK (+2.6%) reaffirmed its Q3 guidance and guided Q4 below consensus. In news, PFPT (-3.5%) acquired Sendmail for ~ $23 mln in cash. PFPT co expects Sendmail to have an immaterial impact on rev while widening the co's non-GAAP net loss by ~ $2 mln or $0.06 per share. Also, BBRY (-3.9%) disclosed a $400 mln charge following recent workforce reduction announcement, up from its previous expectation of $100 million. Among M&A in the tech space, TI (0.0%) and OIBR (+9.3%) announced a MOU for merger of activities. In rumors, MSFT (-0.1%) investors want Chairman Bill Gates to step down, according to reports.

Among notable analyst upgrades in tech this morning, STX (+1.5%) was upgraded to Outperform at Pacific Crest. In downgrades, ARMH (-1.2%) was downgraded to Neutral at Natixis, and SPLK (-0.1%) and FARO (-3.4%) were downgraded to Hold at Needham. There are no notable names in tech scheduled to report after the close.
icon url

ReturntoSender

10/03/13 6:10 PM

#10345 RE: ReturntoSender #6755

From Briefing.com: 4:20 pm : The S&P 500 fell 0.9% as the government shutdown continued for the third day without any strong indications a resolution to the stalemate may be on the horizon.

Even though stocks appeared largely unconcerned during the first two days of the shutdown, today's session featured a reminder from the Treasury, saying the consequences of a default could be worse than the events of 2008.

Equities retreated throughout the morning before finding support in the early afternoon following an article in The New York Times indicating Speaker of the House John Boehner told Republicans he would not allow a default to take place. The story was followed by a statement from the Speaker's office, which said this has always been Mr. Boehner's stance.

Thanks to the rebound, the S&P was able to erase a third of its losses, but could not close above its 50-day moving average (1680). The index endured an afternoon slip in reaction to shots fired near the U.S. Capitol. The scare caused a 30-minute lockdown of the Capitol building, and the suspect was reported dead on the scene.

All ten sectors ended in the red with influential groups like consumer discretionary (-1.0%), industrials (-1.1%), and technology (-1.0%) leading to the downside.

Notably, industrials finished near the bottom of the leaderboard for the second consecutive day. Like yesterday, defense contractors weighed on the sector as the PHLX Defense Index fell 1.0%.The largest index component, General Electric (GE 24.10, -0.23), also lost 1.0%.

The Dow Jones Transportation Average also underperformed, slumping 1.1%, even as airlines displayed relative strength. United Continental (UAL 31.65, +0.72) settled higher by 2.3%.

Elsewhere, the technology sector saw its top components, Apple (AAPL 483.41, -6.15), Google (GOOG 876.09, -11.90), and Qualcomm (QCOM 67.11, -0.57), lose between 0.8% and 1.4% while chipmakers outperformed. The PHLX Semiconductor Index shed 0.3%.

Countercyclical groups ended mixed as consumer staples (-0.5%) and telecom services (-0.4%) finished ahead of the S&P while health care (-1.0%) and utilities (-1.2%) lagged.

Treasuries registered modest gains, and the benchmark 10-yr yield slipped two basis points to 2.61%.

Today's trading volume was a bit below average as 703 million shares changed hands on the floor of the NYSE.

The weekly initial claims level increased to 308,000 from an upwardly revised 307,000 (from 305,000) while the Briefing.com consensus expected a rise to 315,000. After a couple weeks of unreliable claims data, the initial claims level has settled at a little over 300,000. This marks a vast improvement from August when claims were around 330,000.

Normally, this level of claims would suggest a strong gain in nonfarm payrolls. However, over the last couple of months, the strengthening in the claims level had no effect on payroll growth. Employers appear to be content with their workforce; hence, we have seen the drop in layoffs, but not a corresponding spike in hiring activity.

Separately, the September ISM Non-Manufacturing Index fell to 54.4 from 58.6 while the Briefing.com consensus expected the index to drop to 57.2. Last month's reading of the ISM Non-Manufacturing Index was the highest since December 2005 and was expected to pullback in September. The size of the pullback; however, was very unusual.

The non-manufacturing index normally lacks significant monthly volatility and moves in a nice smooth trend. September marked a departure as the index dropped by an unusually large 4.2 points. That was the biggest decline since November 2008. The index has moved at least 4.2 points in a single month only nine times since its inception in 1997.

Tomorrow's September nonfarm payrolls report will not be released due to the ongoing government shutdown.

Large Cap Gainers

CHU (16.88 +7.79%): Trading higher following strength in overseas trading.
YNDX (38.34 +1.56%): Initiated with a Buy at Citigroup; tgt $46.
VRX (110.61 +0.74%): Announced approval of Jublia for the treatment of onychomycosis in Canada; co's Bausch + Lomb Receives FDA clearance for novel monthly disposable Contact Lens.

Large Cap Losers

TSLA (168.85 -6.69%): Continued weakness on yesterday's reports of a car fire; NYTimes.com article discussed that TSLA said fire started in battery after crash.
LLY (48.79 -3.46%): Co detailed progress on strategic business goals; reaffirmed its near-term goals of $20 bln in revs and $3 bln in net income through 2014; announced share repurchase plans; single-agent ramucirumab significantly improves overall survival in advanced gastric cancer patients.
VMW (79.61 -3.43%): Upgraded to Outperform from Sector Perform at FBN Securities; tgt raised to $100 from $90.

Mid Cap Gainers

RAD (5.2 +3.69%): Reported Sept comps +1.9% vs +1% Retail Metrics Consensus.
CREE (70.48 +2.76%): Canaccord Genuity confirmed Cree bulb already receiving utility rebates.
PVH (120.39 +2.42%): Sold GH Bass business to G-111 Apparel (GIII); updated Q3 EPS guidance above consensus; reaffirmed FY13 EPS.

Mid Cap Losers

OIBR (1.79 -10.05%): Upgraded to Overweight from Underweight at Barclays.
HLF (68.43 -6.38%): Bill Ackman has converted 40% of his HLF short into long dated puts, according to reports.
EQIX (166.7 -5.08%): Amended senior credit facility.

Texas Instruments (TXN) announced that the Sitara AM335x ARM Cortex-A8 processor has been selected to power the newest Arduino board, the Arduino TRE.

MLNX +3.8% (upgraded to Buy from Hold at Craig Hallum),

Intel (INTC) CEO Brian Krzanich announced a collaboration agreement with Arduino. Krzanich also unveiled the Intel Galileo board, the first product in a new family of Arduino-compatible development boards featuring Intel architecture.

7:00AM Benchmark Elec completes acquisition of the EMS segment Of CTS Corporation (CTS); The total purchase price is ~$75 mln (BHE) 22.81 : BHE announced that the Company has completed an acquisition of the full-service Electronics Manufacturing Solutions segment of CTS (CTS). The acquired business is strategically focused on complex, high-mix and low-volume manufacturing in the Industrial, Aerospace & Defense, Medical, and Communications markets. The business acquired has a footprint of five locations. The total purchase price is ~$75 mln. The transaction is expected to generate annual revenues in excess of $200 mln and be accretive to earnings in 2014.


6:57AM Canadian Solar announces the sale of two utility scale solar power plants to a fund managed by BlackRock (BLK) (CSIQ) 18.56 : Co announced that its subsidiary, Canadian Solar Solutions, entered into an agreement with a fund managed by BlackRock (BLK), whereby BlackRock acquired from Canadian Solar two utility-scale solar power plants totaling 20MW (AC) on September 30th, 2013 at a valuation comparable to other recent project sales completed by Canadian Solar on a per megawatt basis in the Ontario market.

07:47 am CalAmp shares spike 9% following better than expected earnings
CalAmp (CAMP $20.35 +1.66) reported second quarter earnings of $0.19 per share, which is better than expected, while revenues rose 33.6% year/year to $58.8 million which is higher than expected. Wireless Datacom revenue increased to $47.2 million from $34.2 million in the same period last year, and Satellite revenue was $11.6 million compared to $9.8 million in the second quarter last year. The consolidated gross margin was 33.7% in the fiscal 2014 second quarter, up from 32.1% in the second quarter last year.

The increase in consolidated gross margin reflects the higher proportion of total revenues represented by the Wireless Datacom segment in fiscal 2014 versus the prior year and, within Wireless Datacom, the shift in revenue mix toward higher margin subscription-based revenues associated with the Wireless Matrix acquisition. The company issued third quarter guidance with EPS of $0.19-0.23 which is line with expectations with revenues of $59-63 million which is in line with expectations.

"Our focused execution coupled with continued strong customer demand for our products and services resulted in a 38% year-over-year increase in Wireless Datacom revenue during the second quarter. This growth was driven to a large extent by our Mobile Resource Management (MRM) products business, which benefited from significant channel demand for stolen vehicle recovery products, along with continued strength in fleet management and asset tracking. Our Wireless Networks business, which comprises the remainder of our Wireless Datacom segment, also generated strong year-over-year growth. The acquired operations of Wireless Matrix, along with growth in the Energy vertical, more than offset a year-over-year reduction in Rail revenue resulting from the completion of our Positive Train Control development project in the second quarter last year. In addition, our Satellite segment once again generated meaningful operating cash flow and contributed to our bottom-line profitability. We believe CalAmp's strong momentum exiting the second quarter and healthy pipeline of new opportunities, driven by an expanding network of global channel partners and a robust portfolio of innovative products, provide the Company with a strong tailwind as we enter the second half of fiscal 2014."

Advances 659 (21%) 651 (25%)
Declines 2,419 (77%) 1,838 (71%)
Unchanged 84 (3%) 92 (4%)
Up Vol* 642 (20%) 399 (22%)
Down Vol* 2,559 (78%) 1,407 (77%)
Unch. Vol* 77 (2%) 29 (2%)
New Hi's 107 147
New Lo's 99 21
*in millions
more...
Most Actives
NYSE LAST CHANGE
BAC 14.00 Down 0.43%
RAD 5.08 Up 1.40%
JCP 8.41 Down 3.56%
GE 24.10 Down 0.95%
F 16.95 Down 1.51%
Nasdaq LAST CHANGE
FB 49.18 Down 2.18%
MU 18.01 Up 1.98%
SIRI 3.92 Down 1.51%
MSFT 33.86 Down 0.18%
CSCO 23.00 Down 1.35

icon url

ReturntoSender

10/06/13 11:09 AM

#10346 RE: ReturntoSender #6755

From Briefing.com: Weekly Recap - Week ending 04-Oct-13

Dow +76.10 at 15072.58, Nasdaq +33.41 at 3807.75, S&P +11.84 at 1690.5

The S&P 500 advanced 0.7%, ending the week with just a slim loss of 0.1%. Meanwhile, the Nasdaq (+0.9%) outperformed to extend its weekly gain to 0.7%. For its part, the Dow lagged throughout the week and despite today's gain of 0.5%, it ended the week lower by 1.3%.

Equities climbed throughout the session while showing little concern over the lack of progress in the Capitol Hill stalemate. A brief afternoon hiccup ensued after House Speaker John Boehner made the headlines with his "This isn't some damn game!" comment, referencing the shutdown. The Speaker's emphatic remark was made in reaction to an article in The Wall Street Journal, which quoted a senior administration official as saying "We are winning...It doesn't really matter to us [how long the shutdown lasts] because what matters is the end result."

While the end result of the shutdown remains unclear, today's end result for equities was crystal clear. The major averages settled near their highs as all ten sectors registered gains.

The Nasdaq was the top performing index with biotechnology making a significant contribution. The iShares Nasdaq Biotechnology ETF (IBB 212.50, +2.34) finished higher by 1.1%, also giving a boost to the health care sector (+1.1%). Meanwhile, the traditional technology sector (+0.5%) underperformed as top components traded in mixed fashion.

Elsewhere, the materials space (+1.4%) had the best showing as chemical producers and steelmakers climbed. Dow Chemical (DOW 39.99, +1.22) advanced 3.2% and the Market Vectors Steel ETF (SLX 45.43, +0.40) added 0.9%. Miners sat out today's rally as the Market Vectors Gold Miners ETF (GDX 24.19, -0.07) shed 0.3%. On a related note, gold futures slipped 0.5% to $1305.10 per troy ounce.

The other commodity-linked sector-energy (+0.9%)-outperformed throughout the session while crude oil added 0.5% to $103.78 per barrel.

Also of note, the industrial sector (+0.5%) lagged in each of the past two sessions, and that was the case once again today. Transportation companies ended in-line with the sector (Dow Jones Transportation Average +0.5%) while defense contractors kept the group from logging additional gains. The PHLX Defense Index added just 0.3%.

With regards to countercyclical sectors, health care finished among the leaders while the remaining defensive groups-consumer staples, telecom services, and utilities-underperformed with modest gains of 0.2% apiece.

Treasuries spent the session in a steady retreat as the benchmark 10-yr yield increased four basis points to 2.65%

Trading volume was well below average as 597 million shares changed hands on the floor of the NYSE.

On Monday, the August Consumer Credit report will be released at 15:00 ET.

Week in Review: Stocks Chop as Federal Government Shuts

The S&P 500 fell 0.6% on Monday as political uncertainty in Washington caused participants to reduce their risk exposure. In Washington, the federal government headed for a midnight shutdown following a game of political ping pong between the House of Representatives and the Senate. The two legislative bodies spent the day exchanging competing bill proposals with the House seeking to make changes to Obamacare while the Senate refused to engage in debate that would jeopardize funding for the health care law. All ten sectors settled in the red with consumer staples (-1.1%) leading to the downside. Meanwhile, other countercyclical groups ended mixed. Health care (-0.3%) and utilities (-0.1%) outperformed while telecom services (-0.6%) finished in-line.

Tuesday's session saw the S&P 500 start the fourth quarter on an upbeat note, climbing 0.8%. Stocks made the bulk of their advance during the opening 90 minutes before spending most of the afternoon near their highs. Late afternoon trade saw some profit-taking, but a final-minute surge sent the indices back to their highs as equities appeared unconcerned with the first day of the government shutdown. All ten sectors posted gains as equities drew strength from typical start-of-quarter inflows. The Nasdaq was the top performing index of the third quarter (+10.8%) and its relative strength continued into the first session of Q4. The index advanced 1.2% with support from its largest component. Apple (AAPL 483.03, -0.38) rose 2.4% after activist investor Carl Icahn said, in a tweet, that he pushed for a $150 billion buyback during his dinner meeting with Chief Executive Officer Tim Cook.

On Wednesday, the S&P 500 shed 0.1% after spending most of the session in a steady climb off its opening low. Sellers were in control early on, but gave way to dip buyers after headlines indicated President Obama would meet with Congressional leaders at the White House in the evening in hopes of bridging some of the gaps that are preventing a budget agreement from being reached. Six of ten sectors finished in the red with energy (+0.3%) ending in the lead as crude oil advanced 1.8% to $103.89 per barrel.

The S&P 500 fell 0.9% on Thursday as the government shutdown continued for the third day without any strong indications a resolution to the stalemate may be on the horizon. Even though stocks appeared largely unconcerned during the first two days of the shutdown, the Thursday session featured a reminder from the Treasury, saying the consequences of a default could be worse than the events of 2008. Equities retreated throughout the morning before finding support in the early afternoon following an article in The New York Times indicating Speaker of the House John Boehner told Republicans he would not allow a default to take place. The story was followed by a statement from the Speaker's office, which said this has always been Mr. Boehner's stance.
 
Index Started Week Ended Week Change % Change YTD %
DJIA 15258.24 15072.58 -185.66 -1.2 15.0
Nasdaq 3781.59 3807.75 26.16 0.7 26.1
S&P 500 1691.75 1690.50 -1.25 -0.1 18.5
Russell 2000 1074.19 1078.45 4.26 0.4 27.0

4:30PM AXT announces departure of CFO (AXTI) 2.41 +0.02 : Co announced that Raymond A. Low, vice president and chief financial officer, will be resigning his position with AXT to pursue another executive opportunity, effective Oct. 14, 2013. For a transition period, Mr. Low has agreed to continue to support the company as a consultant while the company completes a search to fill the CFO position.

4:27PM This week's biggest % gainers/losers (SCANX) : The following are this week's top 20 percentage gainers and top 20 percentage losers, categorized by sectors (over $300 mln market cap and 100K average daily volume).

This week's top 20 % gainers

Technology: GSAT (1.43 +32%), CSIQ (19.59 +26.85%), ACTV (14.36 +26.83%), CAMP (23.21 +24.2%), HSOL (5 +23.51%), CREE (72.71 +22.86%), BITA (20.48 +19.72%), YGE (7.68 +19.34%), MLNX (39.8 +18.7%)
Services: CRRS (4 +72.69%), VIPS (67.92 +19.41%)
Industrial Goods: MY (2.8 +36.19%)
Healthcare: ZLCS (5.64 +736.84%), RMTI (12.46 +34.74%), OMER (13.14 +32.17%), ZIOP (4.68 +31.45%), LXRX (2.88 +20.43%), SGMO (12.65 +19.76%)
Financial: QIWI (39.08 +24.2%)
Basic Materials: KWK (2.29 +22.4%)

This week's top 20 % losers

Technology: ANGI (16.7 -26.96%), CEVA (13.97 -18.91%), OIBR-C (1.73 -16.44%), NQ (21.7 -11.47%), FLTX (32.8 -11.44%), IMPV (39.51 -11.31%)
Services: JCP (7.86 -19.29%), RSH (3.31 -16.02%), PFMT (9.88 -14.58%), RECN (11.96 -11.93%), HMSY (21.84 -11.17%)
Healthcare: NKTR (10.68 -24.91%), ARNA (4.84 -16.41%), IDIX (4.89 -12.68%)
Financial: WD (12.96 -17.64%), GCAP (11.76 -12.16%), AMBC (17.48 -11.85%)
Consumer Goods: DMND (20.86 -13.73%)
Basic Materials: GORO (5.5 -16.69%), ACI (4.06 -12.58%)

Veeco Instruments (VECO) announced that the University of Nottingham, United Kingdom, purchased two GENxplor R&D Molecular Beam Epitaxy Systems for its School of Physics and Astronomy.

8:01AM Silicon Motion sees Q3 rev at low end of guidance; sees gross margin (non-GAAP) at upper half of guidance (SIMO) 13.15 : Sequential rev growth for Q3 is expected to be at the lower end of the original guidance range that the co issued on July 30, 2013, of down 2.5% to up 2.5% (consensus +0.4%). Gross margin (non-GAAP) is expected to be within the upper half of the co's guidance range of 47 to 49%.

The co will release its full Q3 results after the market closes on Oct 24, 2013. The co will host a conference call on Oct 25, at 8 am ET, to discuss its results.

6:01AM JinkoSolar Holding to Supply 18.5MWp to Lightsource, the UK's largest solar energy generator (JKS) 23.82 : Co announces that it has entered into an agreement with Lightsource Renewable Energy, the UK's largest solar energy generator and asset operator, to supply 18.5MWp of solar PV modules for a solar farm project located in the United Kingdom.

Xyratex (XRTX) reported third quarter earnings of $0.21 per share, excluding non-recurring items, which is better than expected, while revenues fell 21.1% year/year to $217.3 million which is above expectations. The company issued guidance for the fourth quarter with EPS of $(0.04)-0.20, excluding non-recurring items and revenues of $190-220 million which are both in expectations.

Comtech Telecom (CMTL) reported fourth quarter GAAP earnings of $0.28 per share, which is better than expected, while revenues fell 25.2% year/year to $84.4 million which is higher than expected. Backlog as of July 31, 2013 was $189.7 million compared to $153.9 million as of July 31, 2012. During the three months ended July 31, 2013, the Company repurchased 104,149 shares of its common stock at an aggregate cost of approximately $2.7 million. Total bookings for the three and twelve months ended July 31, 2013 were $144.0 million and $355.6 million, respectively, compared to $129.3 million and $434.0 million for the three and twelve months ended July 31, 2012, respectively. The company issued in line guidance for fiscal year 2014 with GAAP EPS to $1.07-1.19 which is line with expectations with revenues of $320-340 million which is line with expectations. "As we look to fiscal 2014, we have seen signs of stabilization in certain of our end-markets and believe that we will achieve modest sales and operating income growth. Most importantly, we believe we are well-positioned for further growth when global business conditions meaningfully improve."

Lexmark (LXK) announced the acquisition of PACSGEAR, a leading provider of connectivity solutions for healthcare providers to capture, manage and share medical images and related documents and integrate them with existing picture archiving and communication systems (PACS) and electronic medical records systems. Lexmark paid a cash purchase price of approximately $54 million.
icon url

ReturntoSender

10/07/13 8:53 PM

#10348 RE: ReturntoSender #6755

From Briefng.com: 4:10 pm : It was a poor start to the week for the equity market and the same thing could be said for politics in Washington. The two were inextricably linked today as stock market participants were put off by some revelations from House Speaker Boehner over the weekend that made it sound as if partisan positions are hardening and not easing the closer we get to the October 17 debt limit deadline.

In particular, Mr. Boehner told ABC's George Stephanopolous that:

the House does not have the votes to pass a clean continuing resolution
the votes are not in the House to pass a clean debt limit increase; and
the US is on a path to default because President Obama won't negotiate over the debt ceiling

Mr. Boehner's viewpoints were decried by his opponents as reckless rhetoric. The bottom-line for the market, however, is that nothing has been done yet with respect to the budget and debt ceiling. That understanding in turn left many participants sticking to the sidelines on concern that a deal may wait until the last minute.

Even though conventional wisdom holds that a deal will get done and that a worst-case scenario will be averted, the market is nonetheless mindful that a similarly-held position in 2011 didn't stop the S&P 500 from falling 17% between July 22 and August 8 that year.

Not surprisingly, volume was on the light side today as the incentive to participate was taken away by Washington's woes.

An absence of buyers paved a path to a sizable decline when the opening bell rang. Shortly after the start of trading, the Dow, Nasdaq, and S&P 500 dropped 152, 34, and 16 points, respectively. They would soon attract some buying interest with the S&P 500 holding support in the 1675/1674 area. The opening losses would eventually be cut in half, but the rebound effort ran out of steam. The major indices were then range-bound for the majority of today's session until they rolled over again in the final hour on a wave of late selling pressure that transpired without a specific news catalyst.

The only sector to escape today's weakness was the telecom services sector (+0.6%). All other sectors traded lower with the growth-sensitive cyclical sectors bearing the brunt of the selling pressure. The consumer discretionary (-1.4%), financial (-1.2%), and materials (-1.2%) sectors were the biggest losers.

In terms of market cap size, the small-cap Russell 2000 (-1.1%) and S&P 400 mid-cap (-1.1%) averages were the hardest hit, although the blue chip averages were not far behind, demonstrating that today's selling was broad-based.

The standout performer today was the CBOE Volatility Index (19.24, +2.50). It surged 15% to a three-month high as participants were positioning for an increase in near-term volatility.

The Consumer Credit report for August was the lone economic release today. The report, which is compiled by the Federal Reserve, showed consumer credit increased $13.6 bln (Briefing.com consensus $11.8 bln) versus a prior increase of $10.4 bln. Like most other consumer credit reports, though, this one was also glossed over given its dated nature and history of seeing large revisions.

The August trade balance report and the JOLTS - Job Openings report were due to be released on Tuesday, but they will be delayed on account of the partial government shutdown which is looking like it will enter its eighth day on Tuesday.
DJ30 -136.34 NASDAQ -37.38 SP500 -14.38 NASDAQ Adv/Vol/Dec 660/1.42 bln/1885 NYSE Adv/Vol/Dec 644/595 mln/2394

3:35 pm :

Nov crude oil traded lower today as production in the Gulf of Mexico resumed after the U.S. National Hurricane Center downgraded Tropical Storm Karen to a Tropical Depression. Prices dipped as low as $101.86 per barrel in early morning pit trade and later brushed a session high of $103.74 per barrel
The energy component pulled back slightly in afternoon floor action and settled 0.7% lower at $103.03 per barrel
Nov natural gas, on the other hand, extended Friday's gains as forecasts called for warmer weather. It lifted from a session low of $3.57 per MMBtu and rose to a session high of $3.66 per MMBtu in late morning action. Natural gas eventually settled with a solid 3.4% gain at $3.63 per MMBtu
Precious metals rose on a weaker dollar index and a continued stalemate over a budget/debt ceiling deal
Dec gold popped to a session high of $1329.50 per ounce shortly after equity markets opened and settled with a 1.1% gain at $1324.90 per ounce
Dec silver came off its session low of $21.91 per ounce and touched a session high of $22.50 per ounce by late morning pit action. It booked a 1.1% gain as it closed at $22.38 per ounce.

Large Cap Gainers

HCP (39.9 +2.18%): Mentioned positively in blog article following termination of CEO Jay Flaherty
AAPL (491.87 +1.83%): Upgraded to Buy from Hold at Jefferies, target raised to $600 from $425
MU (18.7 +1.25%): Target raised to $30 from $19 at Citigroup

Large Cap Losers

PCYC (132.77 -4.89%): Weakness in large cap biotech: REGN, VRTX, AMGN also lower
QIHU (83.69 -2.88%): Weakness in Chinese internet companies: SINA, YOKU, CYOU also lower
SAP (71.6 -2.51%): Reuters reporting that co is discussing bids for all or parts of BlackBerry (BBRY)

Mid Cap Gainers

NBG (5.19 +13.12%): Strength following reports that Greece is planning a swap between bailout loans and a 50 year government bond
BBRY (7.98 +3.77%): Reuters reporting that Google (GOOG), Cisco (CSCO), and SAP (SAP) are discussing bids for all or parts of the company
FNP (25.46 +3.75%): Announced agreement to sell the intellectual property of Juicy Couture to Authentic Brands Group for $195 mln in cash

Mid Cap Losers

DECK (63.97 -5.83%): Mentioned cautiously at OTR Global
INCY (38.47 -4.09%): Hearing mentioned cautiously at Wells Fargo due to potential threat from competitor
GPN (55.13 -3.16%): Downgraded to Equal Weight from Overweight at First Analysis

Linear Technology (LLTC) and PowerbyProxi announced that they have been working in partnership to develop wireless power systems for use in a range of applications and environments. LLTC introduced the LTC4120 integrated circuit that combines a wireless power receiver with a full-featured battery charger to implement the receiver side of a complete wireless power transfer system.

8:05AM Advanced Micro: Verizon (VZ) selects AMD's SeaMicro SM15000 for enterprise class services: Verizon Cloud Compute and Verizon Cloud Storage (AMD) 3.91 : Co announced that Verizon (VZ) is deploying SeaMicro SM15000 servers for its new global cloud platform and cloud-based object storage service, whose public beta was recently announced. Verizon and AMD co-developed additional hardware and software technology on the SM15000 server that provides unprecedented performance and best-in-class reliability backed by enterprise-level service level agreements.

7:51AM Canadian Solar launches financing program targeting fast growing U.S. residential solar market (CSIQ) 19.59 : Co launched the Canadian Solar Residential Financing Program, which targets the fast growing U.S. residential solar market. The new program is designed to make it even easier for residential solar installers and developers to bring more solar projects to completion in the U.S. market. The program is being launched in partnership with Boston, MA based, privately held Admirals Bank.

Veeco Instruments (VECO) announced that the University of Oklahoma will receive the first shipment of Veeco's new GENxplor R&D Molecular Beam Epitaxy System early in the fourth quarter.

SunEdison (SUNE) announced that on September 30, 2013, its wholly owned subsidiary, SunEdison Singapore and Gintech Energy, have terminated a long-term solar wafer supply agreement.

Silicon Labs (SLAB) and MaxLinear (MXL) announced a satisfactory settlement of all litigation between the two companies. MaxLinear has granted Silicon Labs a license to its substantial patent portfolio for the accused Silicon Labs products. Silicon Labs has granted MaxLinear a license to its substantial portfolio of patents for the accused MaxLinear products. As part of the settlement, the two companies have agreed to enter into a three-year covenant not to sue. The companies have also agreed to dismiss all pending cases.

Procera Networks (PKT) announced it has received a first-time multi-million dollar order from a large mobile operator in the Asia Pacific region. This is the third major APAC operator order that Procera has won in five months. This order is the first placed on a multi-year framework contract to provide Procera's leading edge Intelligent Policy Enforcement solutions for deployment throughout this operator's network. The operator is experiencing rapid growth on their network, and will leverage Procera's fine-grained analytics combined with advanced policy creation capabilities to drive new services for their mobile subscribers.
icon url

ReturntoSender

10/08/13 8:23 PM

#10349 RE: ReturntoSender #6755

From Briefing.com: 4:15 pm : It was day eight of the partial government shutdown and it was day two this week in which the major indices fell victim to broad-based selling interest. Once again, the budget/debt ceiling impasse in Washington was largely to blame.

The Nasdaq Composite was the biggest loser today, sliding 2.0% on the back of pronounced weakness in many of the market's favorite momentum stocks. The cracks in leading names like LinkedIn (LNKD 222.59, -14.62), Priceline.com (PCLN 997.60, -44.08), Tesla (TSLA 174.70, -8.37) and Facebook (FB 47.14, -3.38) provided an added cue for buyers to stick mostly to the sidelines.

There were efforts during the day to forge a rebound effort, but they were all short-lived as another day of back-and-forth remarks between Republicans and Democrats that amounted to more of the same entrenched views on reaching a budget agreement and raising the debt limit provided little incentive to commit new money.

Briefly, House Speaker Boehner said he would like the president to sit down and negotiate with the GOP before passing a continuing resolution and raising the debt limit while President Obama said he is open to negotiating after Congress passes a continuing resolution and raises the debt limit.

The major indices finished at their lows for the day as a final wave of selling interest in the last ten minutes completed today's damage.

The utilities (+0.6%) sector was the only sector in the S&P 500 to finish in positive territory. It was only fitting perhaps that the low beta sector outperformed as high beta stocks got hit hard.

Even so, there wasn't a full-on safety trade today. Longer-dated Treasuries and gold prices ended with modest losses while the US Dollar Index was little changed to the upside.

In terms of the Treasury market, the real point of interest was at the front end of the curve. The 4-week bill surged nearly 14 basis points to 0.29% as traders remained leary of the paper with the October 17 debt limit deadline on the near horizon. The 4-week yield is at its highest level since October 2008.

Wal-Mart (WMT 72.89, +1.02), Procter & Gamble (PG 76.35, +0.70), and Coca-Cola (KO 37.28, +0.23) were the only Dow components to finish higher. That helped the Dow Jones Industrial Average show some relative strength versus its counterparts, most of which fell between 1.2% and 2.0%.

The continued weakness in the stock market and the continued impasse in Washington continued to benefit the CBOE Volatility Index (20.48, +1.07), which tacked on another 5.5% after gaining 16% on Monday.

Volume picked up on today's sell-off. 733 mln shares traded at the NYSE versus just 595 mln on Monday. DJ30 -159.71 NASDAQ -75.54 SP500 -20.67 NASDAQ Adv/Vol/Dec 505/2.03 bln/2040 NYSE Adv/Vol/Dec 566/733 mln/2421

3:30 pm :

Nov crude oil traded higher today despite the dollar index recovering into positive territory. It advanced to a session high of $104.08 per barrel in morning floor action and spent the remainder of the session chopping around slightly below that level. It settled at $103.52 per barrel, booking a gain of 0.5%
Nov natural gas rose for a third consecutive session, climbing as high as $3.73 per MMBtu in afternoon pit trade. It settled 2.2% higher at $3.71 per MMBtu
Dec gold climbed to a session high of $1330.80 per ounce after lifting from its session low of $1315.40 per ounce set moments after pit trade opened. The yellow metal pulled-back as the dollar index gained momentum, and settled the session unchanged at $1324.90 per ounce
Dec silver slipped to a session low of $22.11 per ounce in early morning pit trade but erased the early loss and spent the remainder of the session trading slightly above the break-even line. It settled at $22.45 per ounce, booking a gain of 0.3%

4:08PM Alcoa beats by $0.05, beats on revs; reaffirms 2013 forecast for 7% aluminum demand growth (AA) 7.94 -0.03 : Reports Q3 (Sep) earnings of $0.11 per share, excluding non-recurring items, $0.05 better than the Capital IQ Consensus Estimate of $0.06; revenues fell 1.2% year/year to $5.76 bln vs the $5.66 bln consensus. Results were led by continued strength in Engineered Products and Solutions and Global Rolled Products, despite traditional third quarter weakness. Global Primary Products overcame falling metal prices and lower premiums to deliver significant performance improvement through productivity gains.

Alcoa reaffirms its 7% global aluminum demand growth forecast for 2013 and sees essentially balanced alumina and aluminum markets. Alcoa continues to project global growth this year across the aerospace (9-10%), automotive (1-4%), packaging (1-2%), commercial building and construction (4-5%), and industrial gas turbine (3-5%) end markets. In the heavy truck and trailer market, Alcoa is raising its 2013 growth expectation, (5-9%, previously 3-8%), on improvements in the European market and a stronger Chinese market.

During Q3, settlement discussions with the DOJ and the SEC regarding Alba continued, although no settlements were reached.

Large Cap Gainers

MCK (135.02 +4.16%): Co may be in advanced discussions to acquire Celesio for $5.08 bln or more, according to reports.
ED (55.88 +1.99%): Strength in utilities names (PCG, XEL, FE, SO also higher).
CVS (57.42 +1.22%): Initiated with a Buy at Jefferies; tgt $71.

Large Cap Losers

YHOO (32.38 -5.16%): Target raised to $41 from $33 at Stifel.
YNDX (35.48 -5.24%): Co announced it is now offering online stores a new model for listing their products on Yandex.Market.
BMRN (68.43 -5.39%): Announced proposed offering of $300 mln of senior subordinated convertible notes due 2018 and $300 mln senior subordinated convertible notes due 2020.

Mid Cap Gainers

SMI (3.83 +6.63%): Announced that its customers' bank card IC products adopting SMIC's eEEPROM platform have obtained China Union Pay certifications.
FBR (12.26 +4.34%): Upgraded to Buy from Neutral at Goldman.
MNST (53.62 +3.81%): Strength attributed to positive BMO note.

Mid Cap Losers

ACAD (23 -16.55%): Weakness attributed to possible cautious doctor commentary on pimvanserin.
NOW (48.21 -9.46%): Initiated with a Neutral at Janney.
P (24.07 -8.48%): Apple (AAPL) is planning to expand iTunes Radio in UK prior to Pandora, according to reports.

9:02AM Seagate Tech completes private share redemption transaction of 32.7 million shares held by Samsung (SSNLF); Seagate and Samsung reaffirm strategic alignment announced in April 2011 (STX) 45.16 : Following the transaction, Samsung will continue to own approximately 12.5 million shares of Seagate and Dr. Seh-Woong Jeong, Executive Vice President at the Systems LSI Division of Samsung Electronics.

ARM (ARMH) and MediaTek announced that MediaTek has acquired a broad license to Cortex-A50 Series processor cores and the next generation of ARM Mali graphics processing Unit solutions.

10:53 am Technology sector trading lower by -0.7%, behind the broader market
The tech sector is trading lower today, behind narrower losses in the broader market. Semiconductors are showing relative weakness as well with the SOX trading 0.5% lower. Within the chip index, IDCC (-2.1%) is a notable laggard. Among other major indices, the SPY is trading 0.2% lower today, while the QQQ and the NASDAQ are trading 0.7% lower on the session. Among tech bellwethers, FB (-3.7%) is under notable pressure.

In tech earnings last night, CYBE (-7.3%) provided a Q3 warning. Also, OCZ (-5.7%) announced it completed its restatement of financial results. This morning, OCZ (-6.0%) reported Q1 results and Q2 guidance.

In news, NUAN (-0.9%) announced the appointments of Brett Icahn and David Schechter to the Company's Board of Directors. Elsewhere, XRX (-1.2%) was informed by Lynn Blodgett, Executive Vice President of Xerox and President, Xerox Services, that he has received a "Wells notice" from the SEC staff. Also, SSNLF (0.0%) lost its bid for presidential veto of AAPL (-0.3%) import ban.

In rumors, STX (+0.8%) for FIO (+5.4%) is making the rounds.

Among notable analyst upgrades in tech this morning, FNSR (+3.7%) was upgraded to Hold at Jefferies and Chardan upgrades ADNC (+5.1%) to Buy. Also of note, Wunderlich initiated CHTR (+0.6%) with a Buy.

In downgrades, Oppenheimer downgraded CEVA (-1.1%) and AUDC (-4.7%) to Perform, SFTBY (-1.4%) was downgraded to Neutral at Citigroup and KYO (-1.3%) was downgraded to Outperform at Credit Agricole. Also, FDS (-1.5%) was initiated with an Underperform at Raymond James.

ADTN (-1.4%) is the only notable name in tech scheduled to report after the close.

icon url

ReturntoSender

10/09/13 6:09 PM

#10350 RE: ReturntoSender #6755

From Briefing.com: 4:20 pm : The S&P 500 added 0.1%, but was unable to regain its 100-day moving average (1,662) after flirting with that level throughout the afternoon. The tech-heavy Nasdaq underperformed throughout the session, sliding 0.5%.

Equities began the session with slim gains amid reports President Obama was set to nominate Janet Yellen as the next Chairwoman of the Federal Reserve. However, given the expected nature of the announcement, the early boost faded quickly.

The major averages appeared on their way to another losing session, but found support during late-morning trade when the Dow Jones Industrial Average tested its 200-day moving average (14,728) for the first time this year. The price-weighted Dow built the subsequent rebound on the relative strength of top-weighted names like Nike (NKE 70.89, +0.61), IBM (IBM 181.32, +2.60), and Goldman Sachs (GS 154.44, +1.39).

On a related note, the financial sector (+0.3%) finished ahead of the remaining cyclical groups while other growth-sensitive areas were a bit more mixed.

The materials space advanced 0.2% with aluminum manufacturer Alcoa (AA 8.10, +0.16) gaining 2.0% after reporting better-than-expected earnings on a 1.2% decline in revenue. Miners contributed to the sector's strength as the Market Vectors Gold Miners (GDX 23.92, +0.10) added 0.4%.

On the downside, the discretionary sector (-0.4%) lagged throughout the session as quick service restaurants displayed weakness after Yum! Brands (YUM 66.48, -4.82) reported disappointing earnings and made cautious comments about its operating environment going forward.

Elsewhere, much of the Nasdaq underperformance was the result of significant losses among biotechnology. The iShares Nasdaq Biotechnology ETF (IBB 194.50, -4.20) lost 2.1% to extend its week-to-date loss to 8.5%. In turn, this weighed on the health care sector (-0.2%), which was the only countercyclical group ending in negative territory.

Treasuries registered modest losses with the benchmark 10-yr yield rising three basis points to 2.67%.

Trading volume was right in-line with average as 732 million shares changed hands on the floor of the NYSE.

The Minutes from the latest Federal Open Market Committee meeting reflected much of what has already been communicated to the markets by the regional Fed presidents. Once again, several participants took note of tighter financial conditions while others pointed out rising fiscal risks associated with the stalemate in Washington.

Most notably, the Minutes revealed that most FOMC participants expected the Fed to begin scaling back the pace of its asset purchases this year with purchases being concluded in the middle of 2014.

Separately, the weekly MBA Mortgage Index rose 1.3% to follow last week's downtick of 0.4%.

Tomorrow, weekly initial claims will be reported at 8:30 ET while September import/export prices and the September Treasury Budget will not be released due to the partial government shutdown.DJ30 +26.45 NASDAQ -17.06 SP500 +0.95 NASDAQ Adv/Vol/Dec 1093/2.15 bln/1427 NYSE Adv/Vol/Dec 1446/732.2 mln/1531

3:30 pm :

Precious metals traded lower today as the dollar index rose on news that President Obama will nominate Janet Yellen as the next Chair of the Federal Reserve
Dec gold slumped to a session low of $1294.60 per ounce and settled at $1307.10 per ounce, booking a loss of 1.3%
Dec silver dipped as low as $21.75 per ounce in morning floor trade. It eventually settled with a 2.5% loss at $21.89 per ounce
Nov crude oil also fell on the stronger dollar index and on the largest weekly increase in crude oil inventories since Sept 2012. The EIA reported that for the week ending Oct. 4, crude oil inventories had a build of 6.81 mln barrels when a much smaller build of 1.55 mln barrels was anticipated. The energy component retreated from its session high of $103.29 per barrel set at pit trade open and eventually settled 1.8% lower at $101.62 per barrel
Nov natural gas fell for the first time in four sessions, dipping to a session low of $3.67 per MMBtu. It closed at $3.68 per MMBtu, booking a loss of 0.8%.

4:32PM ClickSoftware issues downside Q3 guidance (CKSW) 6.20 +0.20 : Co issues downside guidance for Q3 (Sep), sees EPS of ($0.10), excluding non-recurring items, vs. $0.03 Capital IQ Consensus Estimate; sees Q3 (Sep) revs of $23.2 million vs. $28.25 mln Capital IQ Consensus Estimate.The Company estimates that its cash, cash-equivalents, short and long-term investments were approximately $55.5 million as of September 30, 2013.


"In the short-term, our quarterly results have been impacted due to lower up-front license fees and a smaller initial deployment size, a natural occurrence when shifting to the cloud. Overall the number of new cloud-based customers we signed in the first nine months of 2013 increased by 100% year over year. Among our new cloud customers in the third quarter were a division of one of the world's largest suppliers of high value and complex equipment, and two large utility companies. Over the long-term, the fact that we continue to sign a greater number of deals on an absolute basis will be reflected with a significantly increased recurring revenue stream."

4:18PM Citrix Systems issues downside guidance (CTXS) 66.66 -0.95 : Co issues downside guidance for Q3 (Sep), sees EPS of $0.68-0.69 vs. $0.73 Capital IQ Consensus Estimate; sees Q3 (Sep) revs of $710-712 mln vs. $737.04 mln Capital IQ Consensus Estimate.

"While we are disappointed that we fell short of our expectations this quarter, we remain confident in our strategy and markets,"
"Our focus remains steadfast on helping our customers leverage cloud services and business mobility to improve the security and agility of their IT infrastructure. We will provide more color at our regularly scheduled conference call on October 23."

4:18PM Citrix Systems drops over 8 pts after lowering guidance; stock fell as low as $58.53.. stock is now $58.87 after hours (CTXS) 66.66 -0.95 :

4:15PM Claude Resources announces to voluntarily delist common shares from the NYSE MKT (CGR) 0.22 0.00 : Co announced its intention to voluntarily delist its common shares from the NYSE MKT. The Company's shares will continue to trade on the Toronto Stock Exchange ("TSX"). Based on the general tone of the resource sector and the Company's ongoing pursuit to rationalize its corporate expenditures, the Company has decided to delist its Shares from the NYSE MKT. The Company is confident that the listing of its Shares on the TSX will provide sufficient liquidity to maintain an orderly market for its shares. The delisting of Claude Shares from the NYSE MKT will not change the ownership of U.S. shareholders and U.S. shareholders will be able to trade the Shares through the TSX going forward.

4:15PM Gilead to stop phase 3 study 116 of Idelalisib in chronic Lymphocytic Leukemia early because of positive risk-benefit (GILD) 58.90 -0.48 : GILD announced that its Phase 3 study (Study 116) evaluating idelalisib in previously-treated chronic lymphocytic leukemia (CLL) patients who are not fit for chemotherapy will be stopped early. This DMC recommendation is based on a predefined interim analysis showing highly statistically significant efficacy for the primary endpoint of progression-free survival in patients receiving idelalisib plus rituximab compared to those receiving rituximab alone.

4:10PM Acura Pharma announces settlement of Oxecta patent litigation with Par Pharmaceutical and Impax Laboratories (IPXL) (ACUR) 1.70 -0.03 : Co announced that it has entered into distinct Settlement Agreements with each of Par Pharmaceutical and Impax Laboratories (IPXL), to settle Acura's patent infringement action pending against them in the United States District Court for the District of Delaware. In the suit, Acura alleges that a generic Oxecta product for which each of Par and Impax is separately seeking approval to market in the United States pursuant to an ANDA filing with the FDA infringes a U.S. patent owned by Acura. Par is the first filer of an ANDA for a generic Oxecta product and is entitled to the 180-day first filer exclusivity under applicable law and FDA regulations.

Under the terms of the Settlement Agreement with Par, Par may launch its generic Oxecta product in the U.S., through the grant of a non-exclusive, royalty-bearing license from Acura to Par that would trigger on Jan 1, 2022. Acura currently has Orange Book patents that are due to expire between Nov 2023 and Mar 2025. In certain limited circumstances, Acura's license to Par would become effective prior to Jan 1, 2022. Par is required to pay Acura royalties in the range of 10% to 15% of Par's net profits from the sale of its generic Oxecta product.

Under the Settlement Agreement, Impax may launch its generic Oxecta product in the U.S., through the grant of a non-exclusive, royalty-free license from Acura to Impax that would trigger 180 days following the first sale of a generic Oxecta product in the U.S. by an entity that is entitled to the 180 day first-filer exclusivity under applicable law and FDA regulations (or if no entity is entitled to such 180 day exclusivity period, the date on which a generic Oxecta product is first sold in the U.S. or Nov 27, 2021, whichever date occurs first). In certain circumstances, Acura's license to Impax would become effective prior to such time.

4:10PM Ctrip.com announces proposed offering of $500 mln convertible senior notes (CTRP) 55.11 +1.47 : CTRP today announced that it proposes to offer up to $500 mln in aggregate principal amount of convertible senior notes due 2018. The conversion rate and other terms of the notes have not been finalized and will be determined at the time of pricing of the offering. The notes will be convertible into co's American depositary shares ("ADSs"), each representing as of the date of this press release 0.25 of an ordinary share of Ctrip, at the option of the holders, in integral multiples of $1,000 principal amount, at any time prior to the close of business on the second business day immediately preceding the maturity date.

4:08PM Boeing delivers first next-generation 737-800 to Russia's UTair (BA) 114.47 -0.97 : BA delivered to UTair its first directly purchased Next-Generation 737-800. The airline currently has 40 Next-Generation 737s on order to be delivered in the next several years.

4:08PM NASDAQ announces as of settlement date Sep 30, 2013, short interest in 2,143 NASDAQ Global Market securities totaled 7,096,278,074 shares vs 7,061,571,599 shares in 2,127 Global Market issues reported for prior settlement date of Sep 13, 2013 (NDAQ) 32.06 +0.27 :

Short interest in 546 securities on The NASDAQ Capital MarketSM totaled 489,368,382 shares at the end of the settlement date of September 30, 2013 compared with 486,790,225 shares in 541 securities for the previous reporting period.
This represents 4.22 days average daily volume, compared with the previous reporting period's figure of 5.57.

4:07PM AllianceBernstein announces Sept 30, 2013 Assets Under Management (AUM); preliminary AUM rose 2.1% MoM to $445 bln (AB) 19.80 +0.29 : Co announced that preliminary assets under management increased to $445 billion during September 2013 from $436 billion at the end of August. The 2.1% increase was driven entirely by market appreciation, including the positive impact of foreign exchange movements during the month, as net flows were negative across all three of the firm's distribution channels.

4:07PM Ruby Tuesday misses by $0.31, misses on revs; sees same-restaurant sales to be down high single digits in Q2 (RT) 7.55 +0.31 : Reports Q1 (Aug) loss of $0.36 per share, $0.31 worse than the Capital IQ Consensus Estimate of ($0.05); revenues fell 11.6% year/year to $289.7 mln vs the $298.04 mln consensus. Same-restaurant sales decreased 11.4% at Company-owned Ruby Tuesday restaurants and decreased 8.4% at domestic Ruby Tuesday franchise restaurants

"The first quarter was challenging as the overall economy failed to realize any significant improvements which adversely affected us and the casual dining industry. We are disappointed that our first quarter same-restaurant sales came in below our expectations. However, we made progress during the quarter in our strategy to re-establish Ruby Tuesday as a fun, energetic, and broadly-appealing brand, with the highlight being the August 12 launch of our new pretzel burgers and flatbreads. These items represented the first wave of our core menu transformation and the feedback from our guests has been encouraging as these new food platforms at price points of $5.99 to $9.99 address our guests' desire for innovation, variety, and affordability.
Guidance:
Same-Restaurant Sales -- We anticipate same-restaurant sales to be down high single digits in the second quarter with sequential improvement in the third and fourth quarter, including positive same-restaurant sales in the fourth quarter, reflecting traction from our new menu offerings and marketing campaign which were rolled out in the first quarter
Excess Real Estate -- We expect to generate $10 - $15 million of cash proceeds from the disposition of excess real estate

4:07PM American Spectrum Realty appoints Elisa Grainger as new CFO (AQQ) 2.11 -0.09 : Mrs. Grainger has more than 15 years of experience in finance and accounting with national companies engaged in the management of commercial, residential and self-storage properties. She has worked with equity groups, investors, property managers, accounting personnel, Real Estate Investment Trusts (REITs) and 1031 Tenant-in-Common (TIC) exchanges for both public and private companies.

4:06PM Invesco preliminary Sept AUM of $745.5 bln, an increase of 3.6% month over month (IVZ) 32.16 +0.66 : The increase was primarily due to favorable market returns, positive long-term net flows and increased money market AUM. Both active and passive long-term net flows were positive during the month, while the impact from foreign exchange increased AUM by $6.1 billion. Preliminary average total AUM for the quarter through September 30 were $729.4 billion, and preliminary average active AUM for the quarter through September 30 were $602.7 billion.

4:06PM Carlyle announces preliminary Q3 fund valuations: carry fund valuations increased 4% (CG) 27.13 -0.26 : Co released preliminary performance metrics for its carry funds during the third quarter of 2013. The Carlyle Group preliminary carry fund valuations increased 4% during the third quarter of 2013. Over the past twelve months, Carlyle's carry fund portfolio increased 17%. In comparison, the MSCI All Country World Index (ACWI) increased 8% during the quarter ending September 30, 2013 and has risen 16% over the past 12 months.

4:05PM Aruba Networks announces additional $100 mln share repurchase authorization (ARUN) 18.21 +0.08 :

4:03PM Hub Group guides Q3/FY13 EPS below consensus (HUBG) 37.31 -0.39 : Co issues downside guidance for Q3 (Sep), sees EPS of $0.48 to $0.51 vs. $0.55 Capital IQ Consensus Estimate. Co issues downside guidance for FY13 (Dec), sees EPS of $1.85 to $1.95 vs. $2.02 Capital IQ Consensus Estimate.

Significant factors affecting earnings in the third quarter of 2013 include:

a challenging intermodal pricing environment that resulted in price increases that were lower than anticipated,
unfavorable intermodal traffic mix, including soft demand for freight shipping from the West Coast,
less new business than expected in truck brokerage due to intense competition from asset-based carriers, and
unfavorable business mix in truck brokerage due to a decline in demand for high value-added services.

4:03PM Buckeye Partners commences public offering of 6.5 mln limited partnership units representing limited partner interests (BPL) 64.35 -0.09 : BPL announced that it has commenced a public offering of 6.5 mln limited partnership units representing limited partner interests. Co intends to use the net proceeds from this offering to fund indirectly a portion of the purchase price for the previously announced marine terminals acquisition. Pending such use, co intends to use the net proceeds of the offering to reduce the indebtedness outstanding under its revolving credit facility and for general partnership purposes. Barclays, Morgan Stanley, UBS Investment Bank, Wells Fargo Securities, Deutsche Bank Securities and J.P. Morgan are acting as joint book-running managers of the LP Unit offering.

4:01PM Buckeye Partners to Acquire Liquid Petroleum Products Terminals Network From Hess for $850 Million (BPL) 64.35 -0.10 : Co announces it has signed a definitive agreement with Hess Corporation (HES) to acquire 20 liquid petroleum products terminals with total storage capacity of approximately 39 million barrels for $850 million. The 19 domestic terminals are located primarily in major metropolitan locations along the U.S. East Coast and have approximately 29 million barrels of refined petroleum products storage capacity.

4:01PM Chelsea Therapeutics announces FDA Advisory Committee to review NORTHERA (droxidopa) (CHTP) 2.66 -0.05 : Co announced that the FDA has notified the Company that the New Drug Application (NDA) seeking approval to market NORTHERA (droxidopa), an orally active synthetic precursor of norepinephrine, for the treatment of symptomatic neurogenic orthostatic hypotension (NOH) will be reviewed by the Cardiovascular and Renal Drug Advisory Committee (CRDAC). The meeting is tentatively scheduled for January 14, 2014.

3:30PM Earnings Calendar (SUMRX) : Today after the close look for the following companies to report:

HELE, RELL, RT, VOXX

Tomorrow before the open look for the following companies to report:

HAWK, IGTE, LNN, VAC

3:03PM Kinder Morgan Partners expands Eagle Ford Shale footprint (KMP) 79.42 +0.31 : Co announced it has entered into an agreement with a large Eagle Ford Shale producer to extend the Kinder Morgan Crude and Condensate (KMCC) pipeline farther into the Eagle Ford Shale in South Texas. KMP will invest approximately $74 million to build an 18-mile, 24-inch diameter lateral pipeline northwest from its DeWitt Station to a new facility in Gonzales County, where KMP will construct 300,000 barrels of storage, a pipeline pump station and truck offloading facilities. The lateral will have a capacity of 300,000 barrels per day and will enable Kinder Morgan to batch Eagle Ford crude and condensate from the new Gonzales Station via KMCC to its delivery points on the Houston Ship Channel and/or the soon to be completed Sweeny Lateral pipeline serving the Phillips 66 Sweeny Refinery in Brazoria County, Texas. Including joint ventures and other projects, KMP's planned investments related to Eagle Ford Shale crude and condensates currently total almost $900 million.

2:55PM NYMEX Energy Closing Prices (COMDX) :

Nov crude oil fell $1.90 to $101.62/barrel
Crude oil fell today as weak inventory data and a stronger dollar index pressured prices. The EIA reported that for the week ending Oct. 4, crude oil inventories had a build of 6.81 mln barrels when consensus called for a much smaller build of 1.55 mln barrels. This was the largest weekly increase since Sept 2012. The energy component retreated from its session high of $103.29 set at pit trade open and settled with a 1.8% loss.
Nov natural gas fell 3 cents to $3.68/MMBtu
Natural gas fell for the first time in four sessions, dipping to a session low of $3.67. It closed just above that level, booking a loss of 0.8%.
Nov heating oil fell 1 cent to $3.02/gallon
Nov RBOB gasoline fell 1 cent to $2.62/gallon

2:34PM Stock indices break above afternoon range highs -- Dow +70 and S&P +6.5 set new session highs, Nasdaq Comp -4.6 (TECHX) :

2:31PM Dollar Hits Three-Week High: 10-yr: -03/32..2.650%..USD/JPY: 97.40..EUR/USD: 1.3515 (SUMRX) : The Dollar Index spiked to session highs near 80.55 as the latest FOMC minutes crossed the wires. The minutes provided nothing new, but that did not stop money from moving into the greenback on hopes the Fed would begin tapering its asset purchase program by the end of the year. Today's advance has action threatening its best close in three weeks. Click here to see a daily Dollar Index chart.

EURUSD is -75 pips at 1.3500 as action tests near-term support. These levels will be watched closely as a breach of the 1.3475 area sets up a potential move into 1.3400. Traders remain on the lookout for a German Constitutional Court ruling as to the validity of the ECB's European Stability Mechanism, which is expected to cross the wires in the coming days. Eurozone data is limited to French industrial production. ECB head Mario Draghi will speak tonight at Harvard University.
GBPUSD is -155 pips at 1.5925 as sellers remain in control for the fourth time in five days. The 1.5900 level is setting up as an important level as a breakdown likely means a test of the 50 dma. The Bank of England opines tonight with markets expecting no change to the current 0.50% and GBP375 bln asset purchase program.
USCHF is +80 pips at .9120 as action holds just off the highs. Today's surge has trade testing resistance in the .9100/.9130 area with a close north of there being the best since the middle of September.
USDJPY is +55 pips at 97.40 as action continues its bounce off the 200 dma. Bulls have their sights set on reclaiming the 98.00 area, but both the 50 and 100 dma will look to cap action just above that level. Japanese data includes core machinery orders and Tertiary Industry Activity.
AUDUSD is +15 pips at .9435 amid a rather uneventful trade. The pair has held in just a 30 pip range throughout the U.S. session with trade once again struggling as it approached the .9500 region. Australian data is heavy with MI Inflation Expectations, employment change, and the unemployment rate.
USDCAD is +20 pips at 1.0390 as trade looks likely to see a third day of gains. The three-day win streak has run the pair above both its 50 and 100 dma, and has action on track to close at a one-month high. The late August/early September highs in the 1.0500/1.0550 area are quickly shifting into focus. Canada's New Home Price Index is due out tomorrow.

2:21PM CBOT Agriculture and Ethanol Closing Prices (COMDX) :

Dec corn rose 2 cents to $4.44/bushel
Dec wheat fell 3 cents to $6.90/bushel
Nov soybeans fell 2 cents to $12.87/bushel
Nov ethanol rose 3 cents to $1.72/gallon

2:14PM United Tech increases quarterly dividend 10.1% to $0.589 per share (UTX) 103.12 +0.36 :

2:09PM Minor new session highs for Dow +59 and S&P +5.1, new recovery high Nasdaq Comp -7.4 (TECHX) :

2:03PM Steady to slightly weaker trade after Fed minute headlines are digested -- Dow +38, S&P +2.1, Nasdaq Comp -14 (SPY) :

1:47PM COMEX Metals Closing Prices (COMDX) :

Dec gold fell $17.80 to $1307.10/ounce
Gold spent all of today's floor trade in negative territory while the dollar index rose on news that President Obama will nominate Janet Yellen as the next Chair of the Federal Reserve. The yellow metal slumped to a session low of $1294.60 and settled slightly above the $1300 level, booking a loss of 1.3%.
Dec silver fell $0.56 to $21.89/ounce
Silver also traded in the red, dipping as low as $21.75 in morning floor trade. It eventually settled with a 2.5% loss.
Dec copper fell 6 cent to $3.23/lbs

1:33PM Hewlett-Packard confirms FY14 outlook; provides update on turnaround progress (HPQ) 21.93 +1.18 : Today at HP's 2013 Securities Analyst Meeting, the company's leadership team provided an update on HP's progress executing against its turnaround plan and future strategy.

Co anticipates operating profit dollars to be flat to up year-over-year in fiscal 2014, due to its continued focus on cost savings and operational efficiency. The company estimates non-GAAP diluted EPS for fiscal 2014 to be in the range of $3.55 to $3.75 (vs $3.62 Capital IQ Consensus Estimate). HP estimates GAAP diluted EPS to be in the range of $2.85 to $3.05 for fiscal 2014. Fiscal 2014 non-GAAP diluted EPS estimates exclude after-tax costs related primarily to the amortization of purchased intangible assets and a restructuring charge of approximately $0.8 billion. HP expects to generate approximately $9 billion to $9.5 billion in cash flow from operations in fiscal 2014. After deducting estimated fiscal 2014 capital expenditures, the company anticipates free cash flow of $6 billion to $6.5 billion in fiscal 2014.

HP's president and chief executive officer Meg Whitman reviewed the accomplishments of the past year -- a "fix and rebuild" year -- noting that the multi-year turnaround remains broadly on track. In particular, the company:

Has met or exceeded quarterly non-GAAP diluted earnings per share (EPS) outlook since the turnaround plan began through Q3 of fiscal 2013.
Provided outlook in August that HP expects free cash flow to approach $8 billion by the end of FY13.
Reduced operating company net debt by almost $8 billion over the past 12 months, approaching a goal of zero.
Recommitted to smarter innovation, with research and development (R&D) spending expected to be in excess of $3 billion in fiscal 2013.

Large Cap Gainers

TI (8.79 +6.80%): Reuters reporting that analysts expect the company to sell some assets; TSU trading higher in reaction to the news
HDB (33.09 +3.44%): Strength in Indian stocks: IBN and INFY also higher
T (34.05 +2.84%): Co and GE (GE) announced they have signed a global alliance agreement to allow GE machines to connect to the AT&T network and cloud

Large Cap Losers

YUM (65.41 -8.74%): Missed quarterly EPS by $0.08 ($0.85 ex items vs $0.93 estimate), revs fell 2.9% yoy to $3.47 bln vs $3.53 bln estimate; management said it is now unlikely that China Division same-store sales will be positive for the fourth quarter
FAST (46.58 -6.8%): Missed quarterly EPS by $0.01 ($0.40 vs $0.41 estimate), revs rose 7.0% yoy to $858.4 mln vs $864.21 mln estimate
TSLA (166.46 -4.73%): Hearing that margin requirements are being raised at a major broker for TSLA, QIHU, and SFUN

Mid Cap Gainers

SFUN (47.38 +6.19%): Strength in Chinese internet companies: YY also higher
AA (8.2 +3.26%): Beat quarterly EPS by $0.05 ($0.11 ex items vs $0.06 estimate), revs fell 1.2% yoy to $5.76 bln vs $5.66 bln estimate; reaffirmed 7% global aluminum demand growth forecast for 2013
Q (42.47 +2.14%): Upgraded to Strong Buy from Outperform at Raymond James

Mid Cap Losers

ARIA (5.18 -69.81%): Announced that patient enrollment in all clinical studies of Iclusig is being paused due to safety concerns
SCTY (36.63 -6.08%): To acquire Zep Solar for ~$158 mln in stock
ALNY (53.73 -5.74%): Co and The Medicines Company (MDCO) announced that their strategic alliance has yielded a lead Development Candidate that is a subcutaneously administered RNAi therapeutic (ALN-PCSsc) targeting PCSK9 for the potential treatment of hypercholesterolemia

Semtech (SMTC) has teamed up with IMST for the IM880A radio module featuring Semtech's LoRa long distance technology.

Silicon Labs (SLAB) introduced the industry's most energy-friendly 32-bit microcontrollers (MCUs - EFM32 Zero Gecko MCU Family) based on the ARM (ARMH) Cortex-M0+ processor.

SunPower (SPWR) announced that Erin Mulligan Nelson has been named the co's executive vice president and chief marketing officer.

IBM (IBM) announced that telecommunications service provider Surfline Communications has selected an IBM cloud solution consisting of IBM servers, storage and software to help expand mobile data services in Ghana and across Africa. Also, TienPhong Commercial Joint Stock Bank is using IBM cloud solutions to expand its business operations, drive growth, and deliver a variety of new customer services.

Juniper Networks (JNPR) has received Microsoft (MSFT) Lync qualification for both its wired and wireless campus portfolio.

AMD +0.8% (NVIDIA offers price cuts to compete with AMD, according to reports )

6:53AM BlackBerry and Wi-LAN (WILN) settle all litigations (BBRY) 7.98 : Wi-Lan (WILN) announced that BlackBerry and WiLAN have reached an agreement to dismiss all pending patent litigations between the companies. As part of the agreement, BlackBerry has obtained a license to certain patents in suit in Florida. As a result, all litigations between the companies in Florida will be dismissed with prejudice. In addition, the agreement calls for the dismissal, without prejudice, of all litigation between the companies in Texas. The parties will pursue licensing discussions regarding certain other wireless technologies.

6:05AM Chipmos Technology sees Q3 revs slightly above estimates; in-line with guidance (IMOS) 17.23 : Co issues upside guidance for Q3 (Sep), sees Q3 (Sep) revs of $172.9 mln vs. $172.10 mln Capital IQ Consensus Estimate. This represents a QoQ gain of 3.5%, in-line with co's guidance of +2-6% over Q2.

Callidus Software (CALD) raised third quarter revenue guidance to $28.5-29 million which is ahead of expectations, which is up from $26-27 million; raises FY13 revs to $108.5-109.5 million which is ahead of expectations, from $106-109 million. For the third quarter ended September 30, 2013 management expects: Record total revenue in the range of $28.5 million to $29.0 million. The co had previously provided guidance for third quarter 2013 revenue of $26.0-27.0 million. SaaS revenue growth of 22% to 25% year over year. SaaS billings growth of 32% to 35% year over year. All time record SaaS bookings including two 7-figure annual contracts. Closed two 7-figure license deals during the quarter, which are included in revenue for the quarter. Positive cash flow from operations.

Integrated Device (IDTI) disclosed that on October 2, 2013, it announced a plan to reduce its workforce by approximately 5%, or 90 employees. The Company has taken this action following an assessment of operational and financial considerations. In connection with this reduction in force, the Company expects to record approximately $4.8 million for severance and related costs. During the second quarter of fiscal 2014, IDT accrued approximately $3.9 million and paid $0.6 million in expenses associated with this action. The Company expects to complete this action in the fourth quarter of fiscal 2014.

ON Semiconductor (ONNN) disclosed that on October 6, 2013 it committed to a plan to close its SANYO Semiconductor backend assembly/test facility located in Hanyu, Japan, commonly referred to as "KSS," by the end of the second quarter of 2014. Under the Plan, a majority of the production from KSS will be transferred to other Company-owned manufacturing facilities. This Plan is being undertaken as part of the Company's overall drive for operational efficiencies and is in line with an ongoing strategy aimed at migrating in-house production to large, high volume facilities. The Plan includes the elimination in workforce of approximately 170 full time and 40 contract employees located at the Hanyu site. These actions are expected to take place over the next nine months and are expected to lower certain of the Company's costs, primarily through operational efficiencies. As a result of the Plan, co expects to incur cash charges of approximately $11 million to $16 million.
icon url

ReturntoSender

10/10/13 10:10 PM

#10351 RE: ReturntoSender #6755

From Briefing.com: 4:15 pm : The S&P 500 jumped 2.2%, turning its October loss into a gain of 0.7%. The Nasdaq outperformed, advancing 2.3%, but the tech-heavy index remains lower by 0.3% for the month.

Equities registered the bulk of their gains at the open amid indications the budget stalemate may be getting a bit closer to a resolution. Participants rushed into equities after House Republicans proposed extending the debt limit by six weeks in order to allow for a broader discussion on spending. Currently, the Republican plan does not call for ending the partial government shutdown, which was met with an initial pushback from the White House. However, subsequent reports from the White House suggested President Obama 'may' consider the short-term proposal.

As a result of today's rally, the S&P managed to regain both its 50- and 100-day moving averages.

All ten sectors registered solid gains with financials (+2.9%) ending in the lead. The sector outperformed for the second consecutive session as JPMorgan Chase (JPM 52.52, +1.77) and Wells Fargo (WFC 41.44, +1.08) settled with respective gains of 3.5% and 2.7%. The two banks are scheduled to report their quarterly results ahead of tomorrow's opening bell.

Elsewhere, the industrial sector advanced 2.7% as defense contractors (PHLX Defense Index +3.1%) and transports (DJ Transportation Average +2.3%) rallied.

Also of note, the Nasdaq outperformed as biotech companies rallied after seeing sharp losses earlier in the week. The iShares Nasdaq Biotechnology ETF (IBB 201.47, +6.97) spiked 3.6%, but is still off 5.2% this week.

The relative strength of biotech helped the health care sector (+2.3%) end ahead of the broader market while the remaining countercyclical groups (consumer staples, telecom services, and utilities) underperformed with gains between 1.4% and 1.9%.

Treasuries ended with slim losses as the benchmark 10-yr yield rose three basis points to 2.69%.

Trading volume was in-line with average as 738 million shares changed hands on the floor of the NYSE.

In today's economic data, weekly initial claims increased to 374,000 from 308,000 with much of the increase being attributed to California paring down their sizable backlogs in applications after computer glitches in September impeded the normal processing of initial claims. That resulted in a temporary drop in initial claims. Those claims were finally filed properly this week, which resulted in a large upward spike in claims.

Tomorrow, the preliminary October Michigan Consumer Sentiment Survey will be released at 9:55 ET.DJ30 +323.09 NASDAQ +82.97 SP500 +36.16 NASDAQ Adv/Vol/Dec 2160/1.83 bln/404 NYSE Adv/Vol/Dec 2605/738.0 mln/431
3:35 pm : Commodities ended the day mixed with WTI crude oil down a few cents and nat gas, RBOB, heating oil and copper all higher. Silver ended flat and gold fell $10.

Crude oil futures rallied today and rose as high as $103.57/barrel. Crude fell back below $103/barrel in the final minutes of floor trading and ended the day three cents lower at $103/barrel.

Natural gas traded in positive territory all session today and closed 2.5% higher at $3.72/MMBtu.

Gold ended the day just over $10/oz lower at $1297/oz and silver ended unchanged. In electronic trade, gold fell to a new LoD and is now $1291.40/oz. Silver is at $21.75/oz.

5:07PM ON Semiconductor amends and increases existing revolving credit facility to $800 mln (ONNN) 7.00 +0.17 : Co announced that it has entered into an amended and restated senior revolving credit facility with a group of lenders. The amended and restated facility, which amends the Company's facility entered into in December of 2011, now enables the company to borrow up to $800 million under revolving loans. The new facility has a five year term that expires in October of 2018. Fees and interest expense under the revolving credit facility can vary based on the company's total leverage ratio. The facility is expected to bear interest at LIBOR or base rate plus an applicable rate that varies based on leverage ratio of the company. If the facility is undrawn, there is a yearly commitment fee of 35 basis points, which can vary as well based on the total leverage ratio. Following entry into the Credit Agreement, the Company is borrowing $120 million of the $800 million available under the new Facility, with funding anticipated to occur on or around October 14, 2013. The Company has not identified any specific use of the drawn proceeds and as such intends to use these funds for general corporate purposes.

Large Cap Gainers

LINTA (24.38 +6.65%): Co announced new QVC Group and Liberty digital commerce trackers, Liberty TripAdvisor Holdings spin, and LINTA buyback results.
NFLX (305.24 +5.83%): Initiated with a Buy at Needham.
IVZ (33.76 +4.98%): Reported preliminary Sept AUM of $745.5 bln, an increase of 3.6% month over month.

Large Cap Losers

CTXS (59 -11.49%): Issued downside guidance; sees EPS of $0.68-0.69 vs. $0.73 estimate; sees Q3 (Sep) revs of $710-712 mln vs. $737.04 mln estimate; target lowered to $75 from $80 at Mizuho; tgt lowered to $70 from $81 at Stifel; removed from Conviction Buy List at JP Morgan.
LTD (57.32 -2.85%): Reported Sep same store sales +1.0% vs +2.1% Retail Metrics consensus; announced proposed $500 mln offering of senior notes due 2023.
STJ (54.57 -1.78%): CardioMEMS device has received mixed reaction from FDA.

Mid Cap Gainers

PVR (26.02 +14.07%): Regency Energy Partners (RGP) to acquire PVR Partners for $5.6 bln; consideration to be received by PVR unitholders is valued at $28.68/unit.
QCOR (58.65 +7.42%): Increased quarterly dividend by 20% from $0.25 per share from $0.30 per share.
SSYS (97.74 +5.35%): Upgraded to Overweight from Neutral at JP Morgan.

Mid Cap Losers

RGP (26 -6.58%): Co to acquire PVR Partners (PVR) for $5.6 bln; expected to be slightly dilutive to 2014 DCF, but is not expected to affect anticipated cash distribution growth in 2014.
BKE (49.03 -5.45%): Reported Sep same store sales -4.5% vs +1.5% Retail Metrics consensus.
DGX (59.27 -3.94%): Sees Q3 EPS and revs below consensus.

Apparently MU's report was so difficult to figure out Briefing.com could not even comment on it! LOL ... RtS

icon url

ReturntoSender

10/12/13 5:35 PM

#10352 RE: ReturntoSender #6755

From Briefing.com: Weekly Recap - Week ending 11-Oct-13

Dow +111.04 at 15237.11, Nasdaq +31.13 at 3791.87, S&P +10.64 at 1703.2

The S&P 500 added 0.6% to extend its weekly gain to 0.8%. The Nasdaq outperformed with an advance of 0.8%, but finished the week with a loss of 0.4%.

Stocks climbed amid morning reports indicating a new proposal has been put forth by Republicans that would end the government shutdown and avoid a Treasury default. However, the subsequent White House meeting failed to produce a concrete agreement and Senator Orrin Hatch, who took part in the meeting, said the president expressed some concern over the duration of the proposed debt limit extension. Senator Hatch also said President Obama articulated the need for new revenues to be part of a long-term deficit reduction. In the end, the two sides did not appear to be much closer to an agreement as the shutdown is set to enter its third week.

Even though a solution to the deadlock has yet to be found, equities cheered the mere presence of some form of discussion. All ten sectors registered gains with energy (+1.0%) ending in the lead. The sector posted a solid gain even as crude oil fell 1.0% to $101.92 per barrel.

Meanwhile, the other commodity-related sector-materials--underperformed as miners weighed. The Market Vectors Gold Miners ETF (GDX 23.05, -0.50) fell 2.1% while gold futures tumbled 2.1% to $1269.80 per troy ounce. Most of the decline in gold took place about an hour before the opening bell with the yellow metal falling more than $20 in under two minutes.

Elsewhere among cyclical sectors, discretionary shares (+0.8%) finished ahead of the broader market with homebuilders contributing to the strength. The iShares Dow Jones US Home Construction ETF (ITB 21.91, +0.37) advanced 1.7% as all major builders rallied.

Also of note, the financial sector (+0.6%) ended in-line with the S&P after JPMorgan Chase (JPM 52.51, -0.01) and Wells Fargo (WFC 41.43, -0.01) reported their quarterly results. JPMorgan Chase beat on earnings and revenue while Wells Fargo reported a bottom-line beat on below-consensus revenue.

Treasuries ended unchanged with the benchmark 10-yr yield at 2.69%.

Trading volume was on the light side as 634 million shares changed hands on the floor of the New York Stock Exchange.

Looking back at today's economic data, the University of Michigan Consumer Sentiment Index dropped to 75.2 in the preliminary October reading from 77.5 in September. The Briefing.com consensus expected the index to fall to 74.5.

The drop in the index was most likely due to negative feedback from the government shutdown and the debate over the debt ceiling. If the government reopens soon and the debt ceiling is not breached, consumer sentiment is likely return to its September levels by the end of the month.

There is no economic data scheduled to be reported on Monday.

Week in Review: Stocks Dance to Washington's Tune

On Monday, the S&P 500 fell 0.9% as the equity market began the week on a shaky note and the same thing could have been said for politics in Washington. The two were inextricably linked as stock market participants were put off by some revelations from House Speaker Boehner over the weekend that made it sound as if partisan positions are hardening and not easing the closer we get to the October 17 debt limit deadline. In particular, Mr. Boehner told ABC's George Stephanopolous that: (1) the House does not have the votes to pass a clean continuing resolution; (2) the votes are not in the House to pass a clean debt limit increase; (3) and the US is on a path to default because President Obama won't negotiate over the debt ceiling. Mr. Boehner's viewpoints were decried by his opponents as reckless rhetoric, but the bottom-line for the market, however, was that nothing has been done yet with respect to the budget and debt ceiling. That understanding in turn left many participants sticking to the sidelines on concern that a deal may wait until the last minute.

Tuesday's session saw the S&P 500 continue its slide with a 1.2% retreat. Once again, the budget/debt ceiling impasse in Washington was largely to blame. The Nasdaq Composite was the biggest loser of the day, slumping 2.0% on the back of pronounced weakness in many of the market's favorite momentum stocks. The cracks in leading names like LinkedIn (LNKD 226.62, -0.93), Priceline.com (PCLN 1010.63, -2.56), Tesla (TSLA 178.70, +5.77) and Facebook (FB 49.11, +0.06) provided an added cue for buyers to stick mostly to the sidelines.

The S&P 500 added 0.1% on Wednesday, but was unable to regain its 100-day moving average (1662) after flirting with that level throughout the afternoon. The tech-heavy Nasdaq underperformed throughout the session, sliding 0.5%. Equities began the session with slim gains amid reports President Obama was set to nominate Janet Yellen as the next Chairwoman of the Federal Reserve. However, given the expected nature of the announcement, the early boost faded quickly. The major averages appeared on their way to another losing session, but found support during late-morning trade when the Dow Jones Industrial Average tested its 200-day moving average for the first time this year. The price-weighted Dow built the subsequent rebound on the relative strength of top-weighted names like Nike (NKE 73.46, +0.02), IBM (IBM 186.16, +1.39), and Goldman Sachs (GS 160.00, +1.99).

On Thursday, the S&P 500 jumped 2.2%, turning its October loss into a gain of 0.7%. Equities registered the bulk of their gains at the open amid indications the budget stalemate may be getting a bit closer to a resolution. Participants rushed into risk assets after House Republicans proposed extending the debt limit by six weeks in order to allow for a broader discussion on spending. However, the Republican plan did not call for ending the partial government shutdown, which was met with an initial pushback from the White House. The S&P 500 settled on its high and managed to regain both its 50- and 100-day moving averages even as the day ended without a clear response to the Republican proposal from the White House.
 
Index Started Week Ended Week Change % Change YTD %
DJIA 15072.58 15237.11 164.53 1.1 16.3
Nasdaq 3807.75 3791.87 -15.88 -0.4 25.6
S&P 500 1690.50 1703.20 12.70 0.8 19.4
Russell 2000 1078.45 1084.32 5.87 0.5 27.7


This week's top 20 % gainers

Utilities: PAM (6.36 +15.55%)
Technology: GAME (4.52 +14.07%), CALD (10.38 +13.03%), CAMP (23.78 +12.97%), SMI (3.94 +12.22%), RVLT (4.26 +11.98%)
Services: MW (45.96 +30.4%), OUTR (64.47 +19.99%), BONA (6.84 +19.82%), HZO (14.06 +14.29%), CONN (58.84 +11.39%)
Industrial Goods: XONE (51.63 +18.11%)
Healthcare: TXMD (4.31 +32.48%)
Financial: NBG (4.86 +18.85%), BFR (7.86 +14.76%)
Consumer Goods: BDE (14.5 +14.14%)
Basic Materials: HCLP (29.97 +15.86%), SLCA (31.08 +12.73%), PVA (7.81 +12.56%), PVR (26.3 +11.33%)

This week's top 20 % losers

Technology: CTXS (59.08 -14.69%), EGAN (13 -14.67%)
Services: LRN (19.02 -38.89%), CRRS (3.19 -27.01%), SSW (21.66 -19.64%), LQDT (27.05 -18.21%), RT (6.12 -15.75%)
Healthcare: ARIA (4.26 -70.73%), PBYI (44.52 -24.09%), IDIX (3.72 -22.95%), IMMU (5.41 -20.91%), ACAD (21.49 -18.45%), INSM (13.21 -18.18%), EXAS (10.01 -16.62%), CLDX (27.22 -16.02%), GEVA (57.29 -15.47%)
Consumer Goods: CTB (25.81 -17.65%)
Conglomerates: ACRX (8.8 -16.82%)
Basic Materials: PVG (4.79 -27.71%), FST (5.46 -15.28%)

3:32PM Earnings Preview for the week of October 14 - 18 (SUMRX) : Of the companies reporting earnings for the week of October 14 - 18 some of the bigger names include:

Monday:
Pre Market - KMG
After Hours - PKG, BRO
Tuesday:
Pre Market - C, JNJ, KO, OMC, DPZ
After Hours - INTC, CSX, YHOO, IBKR, LLTC
Wednesday:
Pre Market - BAC, PEP, ABT, USB, PNC, BK, SWK, BLK, GWW, MAT, ASML, STJ, WSO, KEY, NTRS, CMA
After Hours - IBM, AXP, EBAY, KMP, CCK, STLD, SNDK, URI, NE, SLM, ALB, UFPI, XLNX, HNI, EPB
Thursday:
Pre Market - UNH, VZ, PM, GS, UNP, NUE, TSM, DHR, PPG, SVU, BAX, BBT, DOV, DGX, BTU, FITB, BX, SON, APH, ADS
After Hours - GOOG, COF, LVS, SYK, AMD, HUBG, CMG, VMI, ISRG, WERN, CYT, KALU, PBCT
Friday:
Pre Market - GE, SLB, HON, MS, BHI, GPC, IR, PH, TXT, STI, IPG, LH

Large Cap Gainers
INFY (53.45 +6.3%): Reported Q2 earnings of INR 45.96 per share, excluding items, vs INR 45.85 estimate; raised FY14 rev guidance
MPEL (33.8 +3.52%): Upgraded to Outperform from Neutral at Macquarie
PHG (32.73 +2.54%): Upgraded to Buy from Neutral at Goldman
Large Cap Losers
GPS (36.63 -7.69%): Reported September same store sales of -3.0% vs +1.8% Retail Metrics consensus; target lowered to $43 from $51 at Janney
MU (17.24 -6.46%): Reported Q4 earnings of $0.20 per share, excluding non-recurring items; revs rose 44.8% yoy to $2.84 bln vs $2.8 bln estimate; downgraded to Underperform from Market Perform at Wells Fargo
POT (31.16 -1.84%): Sees Q3 EPS of ~$0.41 vs $0.46 estimate; MOS also trading lower

Mid Cap Gainers

SCTY (46.62 +21.64%): Reported that it continues to expect to achieve 278 MW deployed for FY13
SAVE (37.85 +11.13%): Disclosed September 2013 traffic rose 28.8% on a capacity increase of 24.9%; upgraded to Buy from Neutral at Citigroup; target raised to $41 from $38 at Barclays
SWY (33.78 +7.00%): Missed quarterly EPS by $0.06 ($0.10 ex items vs $0.16 estimate), revs rose 1.1% yoy to $8.62 bln vs $8.52 bln estimate; co announced it intends to exit the Chicago market, resulting in cash tax benefit of $400-450 mln; upgraded to Overweight from Neutral at JP Morgan

Mid Cap Losers

NPSP (30.12 -9.14%): Mentioned cautiously by Jim Cramer
FNV (40.59 -4.16%): Weakness in gold companies: RGLD, GFI, AUY, EGO, NGD also lower
URBN (35.43 -2.83%): Weakness following poor same store sales results for peer The Gap (GPS)

IBM (IBM) and Semtech (SMTC) announced a significant advancement in wireless technology, combining IBM software and Semtech hardware to create a system capable of transmitting data up to a distance of 15 km, depending on the environment, with significantly improved ease-of-use.

ONNN -2.9% (amends and increases existing revolving credit facility to $800 mln )

GLW -1.1% (downgraded to Neutral from Overweight at Piper Jaffray)

Micron (MU 17.90, -0.53) is -2.9% following its mixed report. The chipmaker beat on revenue, but its earnings may not be comparable to estimates. Following the report, Wells Fargo downgraded the stock to 'Underperform' from 'Market Perform.'

7:51AM Trina Solar statement on antitrust litigation from Energy Conversion devices; believes lawsuit is without merit (TSL) 16.04 : Co commented on the filing of an antitrust and unfair trade practice lawsuit by Energy Conversion Devices against Trina Solar and other China-based solar manufacturers in the U.S. District Court for the Eastern District of Michigan. The co believes the lawsuit is without merit and will vigorously defend itself against the baseless allegations in the complaint. The co is not in a position to evaluate the potential impact of this lawsuit on its business at this time.

7:00AM SolarCity reports that The Company continues to expect to achieve 278 MW deployed for its current fiscal year 2013 (SCTY) 38.33 : Co announce in the third quarter of 2013, the Company deployed 78 MW. As of September 30, 2013, cumulative energy contracts reached 72,506, and cumulative customers rose to 82,235. Estimated nominal contracted payments remaining were $1,737 mln as of September 30, 2013.

Guidance: The Company continues to expect to achieve 278 MW deployed for its current fiscal year 2013. For its fiscal year 2014, the Company expects to deploy between 475 MW and 525 MW.

NSN and Juniper Networks (JNPR) announced the expansion of their long-term partnership. The agreement now covers secure IP connectivity for high-performance mobile broadband networks via jointly-developed solutions that meet the end-to-end needs of operators.
NXP Semiconductors (NXPI) announced that the SAF5100, the first product from the RoadLINK range, is now available for automotive customer design-in.

07:25 am Micron shares fall 3% following disappointing earnings
Micron (MU $17.95 -0.48) reported fourth quarter earnings of $0.20 per share, excluding non-recurring items ($1.31 in accounting gains -see below), while revenues rose 44.8% year/year to $2.84 bln which is ahead of estimates. For the fourth quarter, the company had net income attributable to Micron shareholders of $1.71 billion, or $1.51 per diluted share, on net sales of $2.8 billion. On July 31, 2013, the company completed its acquisition of Elpida Memory, Inc. and Rexchip Electronics Corporation.

The company's results for the fourth quarter of fiscal 2013 include $1,484 million, or $1.31 per diluted share, in purchase accounting gains relating to the acquisition and the results of operations of Elpida for the month of August. Revenues from sales of DRAM products in the fourth quarter of fiscal 2013 were 50 percent higher compared to the third quarter due to a 42 percent increase in sales volume and a 5 percent increase in average selling prices. Revenues from sales of NAND Flash products were 5 percent higher in the fourth quarter of fiscal 2013 compared to the third quarter primarily due to a 17 percent increase in sales volume offset by an 11 percent decrease in average selling prices.

The company's consolidated gross margin improved to 25 percent in the fourth quarter of fiscal 2013 compared to 24 percent in the third quarter of fiscal 2013. Gross margins for DRAM benefitted from the improved average selling prices. Gross margins for NAND Flash products were unchanged as an 11 percent improvement in manufacturing costs was offset by the decrease in average selling prices.
icon url

ReturntoSender

10/13/13 3:54 PM

#10353 RE: ReturntoSender #6755

InvestmentHouse Weekend Market Summary

http://www.investmenthouse.com/weekendmarketsummary.htm

- Rally extends as the path toward a capitulation is set.
- RUTX, SP400 look really good. The others are differing shades of not bad.
- Leaders look good in some cases, look like oversold bounces in others.
- Market has a deal, will get Yellen, but maybe has stuffed itself a bit too much just ahead of earnings.

Inexorable path toward a bad deal is underway.

There was a show in the early 1990's called 'Northern Exposure.' It was set in small town Alaska (though really in a Canadian town) and had a collection of eccentric nuts (that means beyond eccentric) living there. Every year during the winter the people would eventually get cabin fever and start acting even crazier than usual. Then the ice would break in the river, signaling winter was ending and that the spring would inevitably come. Of course the men would all get naked and run through the town (their version of the running of the bulls). Just your typical Alaskan town.

The running of the bulls in Cicely, after the ice broke. Still freezing temperatures. Hmmm. I bet that took real courage for the men given the shrinkage factor in that weather.

Yes there is a point: The annual (actually more than annual) budgeting 'crisis' is upon us. We have seen some actions in Congress and the White House that some would say is crazy.

A 21-hour non-filibuster. A 3-branch government with checks and balances that require negotiation and compromise, yet the President refuses to negotiate. A House budget defunding an unpopular law (not so crazy in my opinion). The Senate doesn't even vote on it. Then several individual bills funding key parts of government. The Senate doesn't even vote on one. The Senate majority leader asking why should he help a child cancer victim.

The Executive ordering open air memorials and parks not only closed but then barricaded and guarded. The Grand Canyon, only the biggest hole in the earth (according to Clark Griswold in 'Vacation'), is shut.

The House passing more spending bills that the Senate refused to vote on. The Senate refusing to go to conference committee on proposed bills. The Executive ordering roads and bridges on federal lands closed and cancellation of flights of bereaving families to Dover to see the remains of their loved ones, fallen while serving our country. At the same time some House reps complain that there are no towels in the congressional gym.

Then, as in Northern Exposure, the ice breaks. They start to talk. Apparently not because the President has capitulated, but because, as usual, the Boehner-led republicans have Raisinets for testicles. Or, as Bill Murray playing Dr. Venkman in 'Ghostbusters' would say, 'It's true. They have no d**k.'

Once they fear for their reelection chances they suffer the same kind of shrinkage the fellows in Northern Exposure experienced when they run the bulls.

Now, as inexorably as spring comes post ice break, with the republicans rolling over and peeing themselves, we watch the inevitable deal take shape. I call it a deal. It is basically a debt ceiling raise, a reopening of the government, and a promise to talk about budget issues in the future, such as turning some of the sequester items into cuts in entitlements. No change to the status quo. A zero sum deal that changes nothing. Indeed, all it does is simply reinforce the eunuch status of congressional republicans.

A shutdown of the government, defunding the ACA, passing multiple spending bills for nothing but a promise to talk tomorrow? As Clint Eastwood quoted in 'Absolute Power,' tomorrow is promised to no one. Except for foolish republicans.

The irony: the republicans give up the only bargaining chip they have, and a powerful one, the constitutional authority to decide what to fund and what not to fund, for 'talks.' The reason? Because their polling numbers fell overnight. So, in order to salvage reelection they give in. But the people who put them in office are the ones they are infuriating by their lack of cajones. As they found out in the Bush era, playing it safe to preserve your reelection chances ensures your premature retirement from public office.

THE ACTION

But what the hell does the market care about another round of republican hara kiri? Not one damn bit if it means the uncertainty of the debt ceiling debate and the attendant threat of default, social security payment interruptions, mass suicides, congressmen and the Executive branch maybe missing Thanksgiving vacation is gone.

So stocks rallied again. This despite the huge Thursday move. They started a bit softer, sporting a bit of a headache, but turned higher midmorning. A solid rally into lunch, holding the gains to the close. Not the Wednesday rocket launch, but a good follow up.

SP500 10.64, 0.63%
NASDAQ 31.12, 0.83%
DJ30 111.04, 0.73%
SP400 0.89%
RUTX 1.39%
SOX 0.18%

Volume slid on a Friday post big rally. Of course volume was lower on the big rally, but it was good enough. Friday NASDAQ trade was still above average so maybe it was good enough, but NYSE slid below average. A bit questionable, but as noted, likely good enough.

A/D: Breadth was cut in half but was not bad breadth at about 2.8:1 on both NASDAQ and NYSE. After the Wednesday 5 and 6:1 when everything was bought, not bad at all.

SP400, RUTX, and SOX all came close to matching the new highs (post-bear market in SOX' case) hit right before the selling took over.

SP500 and DJ30 continued fairly solid advances as well. SP500 recovered its 2013 trendline. DJ30 recovered its 50 day EMA and is just over the halfway point recovering the ground lost on that rather epic dive to the 200 day SMA.

The indices look pretty good but some stocks have that 1-2-3 bounce look to them, the opposite of the 1-2-3 pullbacks you see on upside moves.

LNKD, MELI, NFLX, PCLN, TRIP, DDD, KIRS, RAX, EDU, GILD, CELG.

Doesn't mean they will automatically roll over, but the moves are less than powerful as volume declines on the rebound from the Tuesday and Wednesday selling. Maybe, as the short end of the bond market is indicating, markets outside of the stock market are not buying a deal yet. Of course we have to mention yet again, the Fed has $85B/month and now Yellen is warming up in the bullpen and her fastball is right down the middle of the plate without any movement.

That gives stocks plenty of reason not to roll over, but even if there is a debt deal, earnings are here and the market has to deal with them after a sharp plunge and solid bounce, but one that leaves the indices somewhat in no man's land as earnings show up.

THE MARKET

OTHER MARKETS:

Dollar lost just a fraction: 1.3544 versus 1.3520 versus 1.3524 euro. Bounced off the lows, but hit the 20 day EMA and stalled the past three sessions.

Bonds lose some ground: 2.69% versus 2.68% versus 2.66% 10 year. Gapped higher then faded to flattish, still, yes still holding the narrow range in the 10 year. The short T-bills, however, spiked their yield on the week but managed a modest recovery and rates dipped Friday off of their recent surge.

Oil: 102.02, -0.99. Volatile Wednesday to Friday, but managed to hold the late September lows. Struggling still.

Gold: 1268.20, -28.40. Hammered lower below the early October low and the early August low. Weak.

MARKET INTERNALS and STATS

NASDAQ
Stats: +31.13 points (+0.83%) to close at 3791.87
Volume: 1.726B (-7.55%)

Up Volume: 1.08B (-650M)
Down Volume: 659.15M (+492.42M)

A/D and Hi/Lo: Advancers led 2.72 to 1
Previous Session: Advancers led 5.14 to 1

New Highs: 160 (+66)
New Lows: 18 (+3)

S&P
Stats: +10.64 points (+0.63%) to close at 1703.2
NYSE Volume: 564M (-14.93%)

A/D and Hi/Lo: Advancers led 2.79 to 1
Previous Session: Advancers led 5.88 to 1

New Highs: 189 (+74)
New Lows: 88 (+4)

DJ30
Stats: +111.04 points (+0.73%) to close at 15237.11

THE CHARTS

NASDAQ: A second day of solid upside after the plunge to the 50 day EMA, the Wednesday doji, and the Thursday gap and run. Back up into the upper half of the uptrend channel. Volume faded but still well above average as it has been for the past month. After a couple of weeks of rather quiet action at the top of the channel, some serious volatility has entered: Big dump lower then a big jump upside. Don't like the volatility, but it is caused by external forces so we can forgive some of it. This week tells the tale on the rebound.

RUTX: The small caps look just about the best of all. Nice test of the lower trendline and then gapped and surged Thursday, posting another good surge Friday into the middle of its channel. Very nice and back in the lead once again.

SP400: Also looking very strong, clearing the late July high and just 5 points from the early October all-time high. Very nice.

SOX: Also back up to the recent highs, just 3 points off the mid-September post-bear market peak. SOX is much more volatile than the other indices the past three weeks, but it is bumping that old high. As with NASDAQ, the coming week tells a lot of the story about this recovery and the range over the past month.

SP500: Solid, solid, moving up through the May peak after taking back the 50 day EMA Thursday. Lower trade Friday but still solid volume Thursday propelled the move higher low with the late July peak just 6 points away. It is working.

DJ30: Moved through the 50 day EMA on the second move off the 200 day SMA doji. Recovered half of the drop. This is the opposite of the usual rate of change; typically the selling occurs fast and sharp after a long, steady rise. This time a long, steady selloff followed by a dramatic surge. Not bad, like it given the DIA calls we picked up, but not convinced the Dow just runs to a new high on this move.

LEADERSHIP

Lots of stocks moved well Friday just as on Thursday. Breadth was not as strong but still plenty solid. Lots of stocks up, but in our view a bifurcation: those that put in really solid, quality moves versus those that were up but sure look as if they are simply rebounding.

Solid: FLIR, SBUX, CRR, SYRG, BEAV, SRCL, CMG, BWLD, VIPS, ININ, HAL,

Good moves on the day but lacking punch overall: PCLN, TRIP, KORS, DDD, EDU, NFLX, LNKD, CRM, CELG, MELI, PII

SENTIMENT INDICATORS

VIX: 15.72; -0.76. Spiked to the June high Wednesday and then the plunge. Gapped lower and sold off Thursday, down to the 50 day EMA on the close.
VXN: 17.19; -1.26
VXO: 14.77; -1.24

Put/Call Ratio (CBOE): 0.95; +0.02

Bulls and Bears:

A little selling and the bulls edged lower, but barely. Bears bounced off the lows from the past three dips. Suggests some selling still to come, but it is also due to some extraneous intervention from the federal government antics.

Bulls: 45.4 versus 46.4% versus 44.3% versus 42.3% versus 37.1% versus 37.1% versus 38.1% versus 43.3%. Backed off a hair form the sharp climb. Still a bit over-baked, but has been higher when selling bouts started in earlier moves.

Background: Last undercut 35%, the threshold for bullishness, in early June 2012.

Bears: 20.6 versus 18.6% versus 20.6% versus 21.6% versus 22.7% versus 23.7% versus 23.8% versus 21.6%. Bounced off the lows from March, April, May and August.

Background: Over 35% is the threshold to be really be a good upside indicator. For reference, bearishness hit a 5 year high at 54.4% the last week of October 2008. The move over 50 took bearish sentiment to its highest level since 1995. Extreme negative sentiment. Prior levels for comparison: Bearishness peaked at 37.4% in September 2007. It topped the June 2006 peak (36%) on that run. That June peak eclipsed the March 2006 high (33%) and well above the 2005 highs that spawned new rallies (30% in May 2005, 29.2% in October 2005). That was a huge turn, unlike any seen in recent history.

MONDAY

No doubt the market was well-pleased as the ice broke in DC. But it really wasn't an ice break: the President, after again a meeting with Harry Reid where Reid convinced him not to negotiate after the republicans started to waiver (likely just as Reid correctly expected), remained frosty. It is more like the republicans are a boat dashing itself against an iceberg.

Analogies aside, the market wanted a deal and will get it. Moreover, $85B will remain in the bank because the Fed will be worried what kind of economic ramifications the shutdown would have. Now that Yellen is nominated there is little reason, after refusing to taper in September when it should have, the FOMC will taper until Yellen takes over. Even then it will take a while for Yellen to get the guts to do it. Or I guess more accurately, get hounded enough to where she has to do it. I seriously think Yellen believes this is the proper role for the Fed in any times, good or bad. She likes easy money. I once saw a bumper sticker that said 'I can't be out of money, I still have checks.' I think it applies to Yellen.

It appears the market gets its cake and will get to eat it as well. Of course even then if you eat too fast you get a stomach ache, and with Tuesday and Wednesday jerk lower followed by the Thursday and Friday jerk back upside, a bit of indigestion may result.

Thus while we did buy on Thursday we were not buying on Friday, not wanting to chase the bus upside just for the reason the market might want to digest a bit early in the week, deal or no deal announcement. It got what it wanted, it stuffed itself, now it has to even out and continue in a more orderly manner. Typically that means taking a bit of a rest, and that is where we get better entries on plays that gapped and ran Thursday and Friday.

That means there are still not a lot of great buys out there BECAUSE many we were watching gapped and ran to end the week. We got some of them with decent entries but if you chase, you louse up your risk/reward odds. Sure you will win some as you get bailed out by a continued strong move, but you also increase the odds of losing and losing more if you buy inflated moves that are well off logical stop points that a stock may quite normally want to test after a big surge.

Further, don't forget earnings. This week they start to really flow though the following is when we get flooded. I don't like buying into earnings in most cases, and it is always a decision whether to hold through earnings or not. If you have a good gain built in and have not taken any off the table ahead of earnings, that is the time to really consider banking at least some profit. If you have a great gain already banked and have thus a smaller position, maybe you take a bit more and let the rest ride. Your risk tolerance and the typical performance of a stock on earnings play a big role. You know that some stocks perform well if they report good results while other stocks, unless the results are outstanding, just don't do well on earnings. That is why earnings are more of a crapshoot than we like. That doesn't mean, however, we cannot hold through the results, it just depends upon what we have done with the position to that time.

On top of the individual performance there is the overall market performance as well. There is a 'theme' for each season and how stocks go into the season matters: up, down, basing. This has been a jerky move down then up and the market, while status quo before all the upheaval, is higher in the range and has just surged. There could be some air to let out but not as much if that quick drop had not occurred.

As more earnings come out we like to counterpunch off the moves, up or down. Gaps higher are good to play off as are gaps lower. If a stock has a good pattern and is not overly altered by earnings, that can be a good entry setup because stocks often suddenly catch fire with a delayed earnings effect. Many more logical (in market terms), pattern-based entries after earnings, entries that stack the odds of success back in your favor.

So even with the rebound Thursday and Friday the number of upside positions that we really like are not that high this week. We do see a lot of those stocks that rallied unconvincingly in the recovery, and while there is $85B out there each month and a deal in the offing, that was quickly re-priced into the market, right? Thus we are also looking at some downside plays that are showing that 1-2-3 bounce back that doesn't change the weak patterns that formed ahead of the bear flag.

In any event, it looks as if there needs to be some more work and some earnings coming out before we get more really good entry points. Patience is one of those virtues discussed last week: patience to let a play set up, patience to enter (but acting quickly when the time comes), and patience to let a play work for you as long as the reasons you entered the play are still valid OR if other valid, superseding reasons emerge. Looks as if we will have to practice a bit of the first kind of patience early this week.

Have a great weekend!

Support and resistance

NASDAQ: Closed at 3791.87

Resistance:
3799 is the September 2013 high.
3843 is the upper channel line for the November 2012 to present uptrend.
Next major resistance is around 4100 as NASDAQ hits 13 year highs

Support:
3787 is the November 2012 up trendline
3694 is the August high and a prior post-bear market high in the recovery.
The 50 day EMA at 3697
The July 2013 intraday high at 3625
3573 is the August 2013 low
3532 is the May intraday high
3521 is the August 2000 low.
3502 is the May 2013 closing high
The 2011 up trendline at 3415
The 200 day SMA at 3410
3295 is the June 2013 low selloff
3227 is the April 2000 intraday low
3197 is the September 2012 post-bear market high
3171 is the October intraday high

S&P 500: Closed at 1703.20

Resistance:
1710 is the August 2013 peak.
1730 is the September 2013 peak

Support:
1698 to 1700 are the July and August interim highs
1687 is the May high and post-bear market high
1685 is the mid-August 2013 upper gap point
The 50 day EMA at 1677
1669 is the December 2012 up trendline
1657 is the late August upper gap point
1654 is the June 2013 peak
1627 is the August 2013 low
The 200 day SMA at 1602
1576 from October 2007, the prior all-time high
1573 is the June 2013 closing low
1569.48 is the 78% Fibonacci retracement of the April to May 2013 run
1560 is the June 2013 reversal low
1556 from July 2007
1541 is the April 2013 closing low in that pullback inside the uptrend
1539 from June 2007
1531 is the recent high
1499 from January 2008
1475 is the September 2012 high
1471 is the October 2012 intraday high
1466 is the September 2012 closing peak and rally closing high
1440 from November 2007 closing lows

Dow: Closed at 15,237.11

Resistance:
15,318 is the June closing high
15,542 is the May 2013 intraday high
16,659 is the August 2013 peak

Support:
The 50 day EMA at 15,175
15,050 from the August 2013 interim recovery high
14,888 is the April peak and prior all-time high
14,844 is the June intraday low
14,762 is the August 2013 low
The 200 day SMA at 14,748
14,551 is the June 2013 intraday low on the selloff (14,659 closing)
14,198 from the October 2007 high
14,149 is the February 2013 high
14,022 from 7-07 peak
14,010 from the early February 2013 consolidation

Economic Calendar

October 7 - Monday
- Consumer Credit, August (15:00): $13.6B actual versus $11.8B expected, $10.4B prior

October 8 - Tuesday
- Trade Balance, August (8:30): -$38.6B expected, -$39.1B prior
- JOLTS - Job Openings, August (10:00): 3.689M prior

October 9 - Wednesday
- MBA Mortgage Index, 10/05 (7:00): 1.3% actual versus -0.4% prior
- Wholesale Inventories, August (10:00): 0.3% expected, 0.1% prior
- Crude Inventories, 10/05 (10:30): 6.807M actual versus 5.472M prior
- FOMC Minutes, 9/18 (14:00)

October 10 - Thursday
- Initial Claims, 10/05 (8:30): 374K actual versus 318K expected, 308K prior
- Continuing Claims, 9/28 (8:30): 2905K actual versus 2903K expected, 2921K prior (revised from 2925K)
- Export Prices ex-ag., September (8:30): -0.1% prior
- Import Prices ex-oil, September (8:30): -0.2% prior
- Natural Gas Inventor, 10/05 (10:30): 90 bcf actual versus 101 bcf prior
- Treasury Budget, September (14:00): +$75.180B prior

October 11 - Friday
- Michigan Sentiment, October (9:55): 75.2 actual versus 74.5 expected, 77.5 prior

October 15 - Tuesday
- Empire Manufacturing, October (8:30): 4.5 expected, 6.3 prior

October 16 - Wednesday
- MBA Mortgage Index, 10/12 (7:00): 1.3% prior
- CPI, September (8:30): 0.1% expected, 0.1% prior
- Core CPI, September (8:30): 0.1% expected, 0.1% prior
- Net Long-Term TIC Fl, August (9:00): $31.1B prior
- NAHB Housing Market , October (10:00): 57 expected, 58 prior

October 17 - Thursday
- Initial Claims, 10/12 (8:30): 330K expected, 374K prior
- Continuing Claims, 10/5 (8:30): 2900K expected, 2905K prior
- Housing Starts, September (8:30): 915K expected, 891K prior
- Building Permits, September (8:30): 932K expected, 918K prior
- Industrial Production, September (9:15): 0.3% expected, 0.4% prior
- Capacity Utilization, September (9:15): 78.0% expected, 77.8% prior
- Philadelphia Fed, October (10:00): 7.0 expected, 22.3 prior
- Natural Gas Inventor, 10/12 (10:30): 90 bcf prior
- Crude Inventories, 10/12 (11:00): 6.807M prior

October 18 - Friday
- Leading Indicators, September (10:00): 0.6% expected, 0.7% prior
icon url

ReturntoSender

10/14/13 9:34 AM

#10354 RE: ReturntoSender #6755

KLIC ST/MT Short Sale 5000 Shares@12.80 - I can't disagree with the reasoning in the Baron's article over the weekend but I have bought stocks that they recommended before that were overbought like KLIC is only to regret it. Therefore I am shorting rather than going long.


KLIC reports on Nov 7th:

http://finance.yahoo.com/q?s=klic&ql=1

RtS
icon url

ReturntoSender

10/14/13 5:51 PM

#10355 RE: ReturntoSender #6755

From Briefing.com: 4:10 pm : Once again, equity indices posted modest gains even as the agreement to end the partial government shutdown and extend the debt ceiling remained elusive. The S&P 500 added 0.4%, extending its year-to-date gain to 19.9%.

Stocks slumped at the open after the weekend ended without any concrete progress in Washington. Despite the opening weakness, dip-buyers were quick to step in, drawing encouragement from late-morning reports indicating a bipartisan meeting was scheduled to take place at the White House at 15:00 ET.

The rebound continued into the afternoon with upbeat quotes from lawmakers providing additional support. On that note, Senate Majority Leader Harry Reid said he is 'very optimistic' that an agreement will be reached this week. Similar remarks were made by Minority Leader Mitch McConnell who said "I share Senator Reid's optimism."

A brief slip ensued during the final 90 minutes of the session when the White House meeting was postponed in order to allow more time for talks. Strikingly, the market did not appear too concerned with the cancellation as the major averages ended the session on their highs.

Eight of ten sectors posted gains while telecom services (-0.7%) and utilities (-0.6%) spent the day in negative territory.

On the upside, the technology sector (+0.5%) fueled much of the session-long rebound as top components rallied. Apple (AAPL 496.04, +3.23), Google (GOOG 876.11, +4.12), and Microsoft (MSFT 34.45, +0.32) settled with gains between 0.5% and 0.9%. Netflix (NFLX 324.36, +23.51) also displayed strength, surging 7.8% after reports indicated the company is exploring making its service available through cable set-top boxes. In addition, the company said it entered into a production deal with Sony (SNE 19.93, -0.03).

The outperformance of tech shares helped the Nasdaq end ahead of the broader market. The index also drew strength from biotechnology as the iShares Nasdaq Biotechnology ETF (IBB 202.30, +1.52) ended higher by 0.8% after weighing on the tech-heavy index in early going.

Elsewhere, the energy sector (+0.6%) displayed relative strength as crude oil added 0.2% to $102.22 per barrel. Meanwhile, other commodities also posted gains. Gold futures rose 0.3% to $1272.50 per troy ounce and copper futures climbed 0.9% to $3.30 per pound.

The Treasury market was closed for Columbus Day, and the holiday had a visible impact on trading volume as only 575 million shares changed hands on the floor of the New York Stock Exchange.

Tomorrow, the October Empire Manufacturing Survey will be released at 8:30 ET.DJ30 +64.15 NASDAQ +23.40 SP500 +6.95 NASDAQ Adv/Vol/Dec 1536/1.44 bln/948 NYSE Adv/Vol/Dec 1714/574.5 mln/1225

3:30 pm :

Nov crude oil erased earlier losses as it pushed into positive territory heading into afternoon pit trade. It touched a session high of 102.62 per barrel after trading as low as $101.06 per barrel in early morning floor action. The energy component eventually settled with a 0.4% gain at $102.39 per barrel
Nov natural gas brushed a session low of $3.76 per MMBtu after pulling back from its session high of $3.84 per MMBtu. However, it quickly recovered back into positive territory and settled at $3.82 per MMBtu, or 1.3% higher
Precious metals traded higher today as the dollar index chopped around in negative territory
Dec gold touched a session high of $1287.40 per ounce but pulled back slightly in afternoon pit action and settled at $1276.60 per ounce, booking a 0.6% gain
Dec silver trended lower after touching a session high of $21.67 per ounce in early morning pit trade. It settled with a 0.5% gain at $21.35 per ounce

4:13PM Teradata cuts Q3 and FY13 guidance below consensus; announces additional $300 mln buyback (TDC) 52.58 -0.37 :

Co sees Q3 revenue to be approximately $665 mln vs $699.42 mln Capital IQ Consensus Estimate; sees Q3 EPS of $0.69-0.70 vs. $0.81 Capital IQ Consensus.
As a result, Teradata is lowering its full-year guidance for 2013 to reflect the preliminary third quarter results and its current expectations for the fourth quarter.
FY13 revenue is now expected to be approximately the same as 2012 full-year reported GAAP revenue (approx $2.66 bln, Capital IQ consensus $2.78 bln).
FY13 EPS for 2013 is expected to be in the approximate range of $2.70 - $2.80, vs. Capital IQ consensus $3.04.

Overalll, the International segment revenue in the third quarter declined approximately 2 percent, and was flat in constant currency, compared to the strong prior-year period when revenue grew 23 percent in constant currency. As it has been throughout 2013, revenue growth was strong in Europe where revenue grew approximately 13 percent, up 11 percent in constant currency in the third quarter. However, revenue was lower than expected in the Asia, Pacific, and Japan markets (APJ) where revenue was down approximately 21 percent, down 10 percent in constant currency, and in the Middle East and Africa markets (MEA), where revenue was down approximately 19 percent, down 12 percent in constant currency.
TDC's Board has authorized an additional $300 million to be utilized to repurchase. TDC now has a total of approximately $509 million authorized for share repurchases under this program.

4:11PM Teradata drops after guiding Q3 revenues and EPS below consensus (TDC) :

4:10PM Analog Devices to sell microphone product line to InvenSense (INVN) for $100 mln in cash (ADI) 47.17 +0.19 : ADI announced that it has signed a definitive agreement to sell the assets of its microphone product line to INVN. INVN will acquire the assets related to analog and digital output microphones, as well as certain support operations, for $100 mln in cash; INVN will also assume certain specified liabilities of ADI related to the MBL. The BOD's of both companies have approved the transaction, which is expected to close by the end of October 2013.

3:15PM Netflix follow-up; confirms it ordered psychological thriller series from 'Damages' creators from Sony Pictures Television (NFLX) 322.30 +21.52 : Co has ordered a new psychological thriller series from "Damages" creators Todd A. Kessler, Daniel Zelman and Glenn Kessler that centers on a family of adult siblings whose secrets and scars are revealed when their black sheep brother returns home. The 13-episode first season, from Sony Pictures Television (SNE), will premiere exclusively for Netflix members to watch instantly in all Netflix territories.

Large Cap Gainers

NFLX (316.85 +5.32%): Tgt to $340 from $290 at JPMorgan; Co in discussions with Comcast (CMCSA) and other cable cos to make service available through set top boxes, according to reports.
LINTA (25.61 +3.6%): Upgraded to Outperform from Market Perform at Wells Fargo.
MT (15.28 +2.52%): Upgraded to Outperform from Neutral at Macquarie; upgraded to Outperform at Mainfirst.

Large Cap Losers

ERIC (12.89 -1.98%): Downgraded to Underweight from Equal Weight at Barclays.
WMB (35.52 -1.74%): Downgraded to Neutral from Buy at ISI Group.
MYL (39.22 -1.73%): Downgraded to Equal-Weight from Overweight at Morgan Stanley.

Mid Cap Gainers

AMD (4.01 +4.83%): Upgraded to Outperform from Neutral at Wedbush; tgt raised to $5.
HSC (26.28 +4.16%): Upgraded to Buy from Hold at BB&T Capital Markets; tgt $32.
PT (4.87 +3.81%): Downgraded to Underweight from Buy at Santander.

Mid Cap Losers

EXPE (47.74 -7.71%): Downgraded to Hold from Buy at Deutsche Bank.
FICO (55.32 -3.51%): Sees Q4 GAAP EPS and revs below consensus; issued downside guidance for FY13.
SPN (25.18 -2.67%): Sees Q3 earnings below consensus; authorized $400 mln share repurchase program.

10:51 am Technology
The tech sector is trading lower today, in line with losses in the broader market. Semiconductors are showing relative strength, however, with the SOX trading 0.1% higher. Within the chip index, AMD (+3.7%) is a notable standout. Among other major indices, the SPY is trading 0.4% lower today, while the QQQ -0.3% and the NASDAQ is trading 0.4% lower on the session. Among tech bellwethers, AAPL (+0.6%) is showing notable strength, while FB (-2.0%) is under pressure.

This morning in earnings, FICO (-4.1%) issued downside Q4 guidance.

Among notable analyst upgrades in tech this morning, ALU (+1.1%) and NOK (-0.5%) were upgraded at Barclays, TSS (+1.1%) was upgraded to Mkt Outperform at JMP, Baird upgrades IRM (+0.8%) to Outperform, AMD (+3.8%) was upgraded to Outperform at Wedbush, and GLUU (+5.5%) & MTSN (+3.6%) were upgraded at B. Riley. In downgrades, IFNNY (-1.9%) was downgraded to Neutral at BofA/Merrill, Pacific Crest downgraded ATML (-1.0%) to Sector Perform, and AVT (-1.2%) & ARW (-2.0%) were downgraded to Hold at Deutsche Bank. There are no notable names in tech scheduled to report after the close.

10:01AM KLA-Tencor breaks above Sep peak at 62.44 to set a new multi-year high of 62.68 (KLAC) 62.63 +0.95 :

9:53AM Intel displays relative strength, edges above Friday's high of 23.26 -- session high 23.29 (INTC) 23.28 +0.02 :

STMicroelectronics (STM) has released its ST2100 STreamPlug System-on-Chip targeting smart-home and smart-energy applications to the world market.

9:17AM Integrated Silicon responds to filing of lawsuit by GSI Tech (GSIT); co intends to vigorously defend itself and believes there is no merit to the claims (ISSI) 11.21 : Co responded to the lawsuit filed by GSI Technology (GSIT) against ISSI and United Memories.

The complaint adding ISSI as a defendant was filed on October 3, 2013 in the United States District Court for the Northern District of California. The complaint alleges that ISSI colluded with UMI to engage in various anticompetitive acts aimed at GSI. ISSI intends to vigorously defend itself and believes there is no merit to the claims.

The court recently denied GSI's request for a preliminary injunction against UMI and ruled that GSI had not shown a likelihood that the design database in question contained any GSI proprietary information. Thereafter, GSI filed an amended complaint adding ISSI as a defendant alongside UMI. This lawsuit arose after Cisco Systems, Inc. awarded a second-source design for a next generation DRAM chip to ISSI over a competing bid by GSI.

According to the Court's ruling denying the request for preliminary injunction, "Cisco (CSCO) informed GSI that it was not selected because GSI lacked experience in DRAM." Furthermore, with regard to UMI's participation in ISSI's winning design bid, the Court's ruling noted that "other factors appear to have weighed into the award of the Atris bid which had more to do with GSI's own shortcomings rather than UMI's participation."

Ixia (XXIA) announced that 6WIND is using Ixia solutions to ensure it delivers the highest performance networking data plane software to its customers.

Mellanox Technologies (MLNX) announced that Mellanox's end-to-end Virtual Protocol Interconnect solution has been chosen by Pensions First to power its multi-tenanted private cloud business intelligence solution, which uses Microsoft (MSFT) Hyper-V Server 2012 R2 and Microsoft Windows Server 2012 R2.

Altera (ALTR) announced the addition of five new low-cost development kits based on its Cyclone V FPGAs.

KLIC +1.1% (Kulicke & Soffa ticking higher following positive Barron's mention)

DSP Group (DSPG) was collaborating with Swissvoice to jointly develop an OTT ULE home automation gateway. DSP Group's DVF99 chipset will be integrated into the Swissvoice home automation OTT gateway.

OmniVision Technologies (OVTI) announced the release of OmniGlass, a new reference design that combines a wearable display and a camera module for the rapidly growing wearable electronics market.

1:34AM Suntech Power provides updates on GSF assets in Brindisi, Italy (STP) 1.48 : Co announces further developments with respect to Global Solar Fund assets in Brindisi, Italy.

On September 23rd, an additional 5.3 MW of solar fields were seized and on October 4th, another 1.9 MW were seized. As of October 9th, in total, 47 sites with a total generating capacity of 37.8 MW have been seized representing approximately 26.9% of GSF's total generating capacity.
On September 30th, the Court of Brindisi agreed to appoint judicial administrators for the 27 sites seized on September 19th. During the judicial administration period, the Court of Brindisi has authorized that such solar fields will continue to operate and receive feed-in-tariffs in accordance with the guidelines provided by the Court.
In relation to the seizures on September 23rd, the relevant Italian subsidiaries of GSF have filed to the competent Court the request for the appointment of a judicial administrator.
In relation to the last seizure on October 4th, the relevant Italian subsidiaries of GSF are evaluating whether to file the request for the appointment of a judicial administrator.

Apple (AAPL) target was raised to $550 from $520 at Mizuho. The firm notes, ahead of earnings on Oct 28, they expect a slight revenue and EPS beat driven primarily by strong iPhone shipments, which could offset any weakness in iPads. For F1Q14, they think distribution expansion of iPhones combined with a refresh of iPads should drive the company's performance. They expect the revenue outlook to be in-line to slightly better than consensus with potential upside to EPS. Lastly, they expect 2014 to be a strong product cycle year.

icon url

ReturntoSender

10/16/13 11:11 PM

#10357 RE: ReturntoSender #6755

From Briefing.com: 4:25 pm : The S&P 500 settled higher by 1.4% with participants rushing into equities as Washington lawmakers appeared to be on the verge of striking a deal that would fund the government through January 15 while extending the debt ceiling until February 7, and maintaining the sequester.

Stocks registered opening gains after it was reported that Senate Majority Leader Harry Reid and Minority Leader Mitch McConnell resumed working on a deal after the House of Representatives failed to vote on its own measure last evening. Equities caught a second wind in reaction to reports indicating House Speaker Boehner would bring the Senate plan for a vote on the House floor. Although the session ended before Congress had a chance to vote, the Senate plan is expected to be approved by both chambers.

All ten sectors posted gains with financials (+2.2%) ending in the lead. The sector received support from Bank of America (BAC 14.56, +0.32) and PNC Financial (PNC 73.87, +1.36) after both banks reported bottom-line beats. Thanks to today's gain, the financial sector extended its October advance to 3.9%.

Outside of financials, only health care and energy hold month-to-date gains larger than 3.0%. The health care sector rose 2.0% today, and received support from shares of Abbott Labs (ABT 35.90, +2.19) after the drug maker beat on earnings. Meanwhile, energy gained 1.4% as crude oil advanced 0.9% to $102.16 per barrel.

Elsewhere, consumer staples (+1.4%) also contributed to the rally as PepsiCo (PEP 82.27, +1.67) ended higher by 2.1% following its earnings beat on in-line revenue.

Although all sectors posted solid gains, industrials (+0.7%) trailed behind the remaining nine groups as defense contractors weighed. The PHLX Defense Index underperformed for the second day in a row, adding 0.1%. Transports, however, kept pace with the S&P as the Dow Jones Transportation Average advanced 1.4%.

With the reduced threat of imminent default, the CBOE Volatility Index (VIX 14.84, -3.82) lost 20.9%, tumbling to its lowest level since late September. Treasuries ended on their highs with the 10-yr yield down six basis points at 2.67%.

Trading volume was just above average as 753 million shares traded hands on the floor of the New York Stock Exchange.

On the economic front, the weekly MBA Mortgage Index ticked up 0.3% to follow last week's increase of 1.3%.

Separately, the October NAHB Housing Market Index fell to 55 from 58. Today's report was below the reading of 57 expected by the Briefing.com consensus.

Also of note, the Federal Reserve released its Beige Book, which did not contain many surprises. The report said economic growth during the period between September and early October continued at a "modest to moderate pace" while employment continued to grow modestly. The report also touched on the budget deadlock, saying the situation contributed to an increase in uncertainty.

Tomorrow, weekly initial claims will be reported at 8:30 ET while September industrial production and capacity utilization will both be released at 9:15 ET. The day's data will be topped off with the 10:00 ET release of the October Philadelphia Fed survey. On the earnings front, Goldman Sachs (GS 162.25, +4.62), UnitedHealth (UNH 75.19, +1.32), and Verizon (VZ 47.25, +0.93) will report their quarterly results before the opening bell.

Today's advance extended the S&P's year-to-date gain to 20.7%. The benchmark index ended the session less than nine points below its all-time high of 1729.86.

S&P 500 +20.7% YTD
DJIA +17.3% YTD
Nasdaq +27.2% YTD
Russell 2000 +28.6% YTD

4:40PM SanDisk beats by $0.27, beats on revs; will guide for Q4 revs on CC at 17:00 (SNDK) 62.94 +0.25 : Reports Q3 (Sep) Non-GAAP earnings of $1.59 per share, $0.27 better than the Capital IQ Consensus Estimate of $1.32; revenues rose 27.7% year/year to $1.63 bln vs the $1.57 bln consensus.

Co reported Q3 Non-GAAP gross margin of 50.1% versus Street expectations of ~47.5% (co guided for margins between 47-48%)
"We delivered outstanding third quarter results driven by our strategy to shift to higher value solutions across our portfolio...Our client and enterprise SSD products continue to gain momentum and our acquisition of SMART Storage Systems expands our presence in enterprise SSDs. With our solid execution, we also delivered strong year over year growth in retail and embedded products."
Co will guide for Q4 revenues on conference call beginning at 17:00 (Capital IQ consensus $1.67 bln)

4:25PM Xilinx beats by $0.06, beats on revs; guides Q3 revs below consensus at midpoint (XLNX) 46.93 +0.56 : Reports Q2 (Sep) earnings of $0.58 per share, excluding a contingent litigation expense of $0.09, $0.06 better than the Capital IQ Consensus Estimate of $0.52; revenues rose 10.1% year/year to $599 mln vs the $588.31 mln consensus.

"Sales from Xilinx's 28-nm products have once again exceeded our expectations, surpassing $80 million in the September quarter. Kintex -7 sales were particularly strong during the quarter, driven by wired and wireless communication applications. Additionally, gross margin was 69.5% in the September quarter, up from 65.5% in the same quarter of the prior year. This is the second consecutive quarter that the Company has reported a record gross margin and a strong testament to our on-going margin expansion efforts."
Guidance:
Co issues downside guidance for Q3, sales are expected to be up 2% to down 2% sequentially, which equates to ~$586.9-610.9 mln vs. $607.73 mln Capital IQ Consensus Estimate.
Gross margin is expected to be approximately 69%.

4:10PM IBM beats by $0.03, misses on revs; reaffirms FY13 and FY15 EPS guidance (IBM) 186.73 +2.07 : Reports Q3 (Sep) earnings of $3.99 per share, excluding non-recurring items, $0.03 better than the Capital IQ Consensus Estimate of $3.96; revenues fell 4.1% year/year to $23.72 bln vs the $24.8 bln consensus.

Revenue:

$23.7 billion, down 4%, down 2% adjusting for currency:
Software revenue up 1%, up 2% adjusting for currency; Key branded middleware up 3%; up 4% adjusting for currency;
Services revenue down 3%, up 1% adjusting for currency; Global Business Services revenue flat, up 5% adjusting for currency;
Services backlog of $141 billion, up 2%, up 6% adjusting for currency;
Systems and Technology revenue down 17%, down 16% adjusting for currency;
System z mainframe revenue up 6%; up 7 percent adjusting for currency;
Growth markets revenue down 9%, down 5 percent adjusting for currency;
Business analytics revenue up 8% year to date; Smarter Planet revenue up more than 20% year to date;
Cloud revenue up more than 70% year to date


Co reaffirms guidance for FY13, sees EPS of at least $16.90, excluding non-recurring items, vs. $16.89 Capital IQ Consensus Estimate.

"We are taking action to improve execution in our growth markets unit and in the elements of our hardware businesses that are under performing. Given these actions, our strategic initiatives and the strength of our model, we are maintaining our view for the full year and remain confident in our ability to achieve at least $20 operating EPS in 2015."

Large Cap Gainers

PXD (212.15 +6.22%): Assumed with an Outperform at R.W. Baird; hearing positively mentioned at Susquehanna
ABT (35.66 +5.79%): Beat quarterly EPS by $0.03 ($0.55 vs $0.52 estimate), revs rose 2.0% yoy to $5.37 bln vs $5.4 bln estimate; reaffirmed FY13 EPS guidance of $1.98-2.04 ex items vs $2.00 estimate; increased quarterly dividend 57%
JNPR (20.92 +4.24%): Upgraded to Buy from Neutral at MKM Partners, target raised to $26 from $24

Large Cap Losers

SWK (77.68 -13.22%): Reported Q3 EPS of $1.39 ex items (in-line), revs rose 9.6% yoy to $2.76 bln vs $2.82 bln estimate; sees FY13 EPS of $4.90-5.00 ex items (lowered from $5.40-5.65) vs $5.44 estimate; downgraded to Neutral from Outperform at R.W. Baird
EXC (28.83 -2.34%): Downgraded to Underweight from Overweight at Morgan Stanley
IVZ (31.78 -1.97%): Downgraded to Neutral from Overweight at JP Morgan; downgraded to Neutral from Buy at Sterne Agee

Mid Cap Gainers

SCTY (50.23 +7.93%): Priced offering of 3.4 mln shares of common stock at $46.54 per share and $200 mln aggregate principal amount of its 2.75% convertible senior notes due 2018
AAP (95.94 +16.29%): Confirmed agreement to acquire General Parts International in all-cash transaction with enterprise value of $2.04 bln; sees Q3 EPS of $1.42, revs of $1.52 bln vs $1.55 bln estimate; reaffirmed FY13 EPS guidance of $5.30-5.45 vs $5.59 estimate
MTG (8.34 +14.88%): Beat quarterly EPS by $0.16 ($0.04 vs -$0.12 estimate), revs fell 16.9% yoy to $254.4 mln vs $259.48 mln estimate

Mid Cap Losers

AEM (23.88 -3.71%): Weakness in gold companies: GOLD, NGD, AUY, FNV also lower
DSW (81.38 -3.12%): Hearing cautiously mentioned at Cleveland Research
ATW (54.64 -2.64%): Downgraded to Underperform from Market Perform at BMO Capital Markets

11:22 am Tech Sector trading higher today but behind the broader market
The tech sector is trading higher today, behind wider gains in the broader market. Semiconductors are showing relative weakness, with the SOX trading only 0.9% higher. Within the chip index, however, RBCN (+4.3%) is a notable standout. Among other major indices, the SPY is trading 1.4% higher today, while the QQQ and the NASDAQ are trading 1.1% higher on the session. Among tech bellwethers, VZ (+1.5%) is showing notable strength, while CSCO (-0.4%) is under pressure.

In tech earnings last night:

INTC (+1.1%) beat Q3 by $0.05, revs in-line and guided Q4 revs in-line
YHOO (+0.5%) posted a missed Q3 and guided lower, but offered strong Alibaba results and noted that it would sell less than expected
LLTC (-2.6%) missed by $0.01, revs in-line, and guided Q2 revs below consensus

This morning in earnings:

VDSI (-1.9%) guided below consensus
ASML (-0.8%) reported mixed results and guided above consensus
WNS (-6.5%) beat by $0.02, revs inline, and guided below consensus

In news, AAPL (+0.3%) cut Q4 iPhone 5C orders by 20%, manufacturers say, according to reports. Also, Warren Buffet, on CNBC this morning, says he has been adding to his IBM (+0.9%) position.

In IPOs, VEEV (+78.5%) priced 13.045 mln share IPO at $20.00 per share, above the revised expected range of $16-18. Also, TWTR, which will list its IPO on NYSE, reported Q3 revenue of $169 mln (104% growth YoY) vs $150.3 mln single est and reported Non-GAAP net loss of ($17.2 mln) vs ($12.7 mln) in the yr ago qtr.

Among notable analyst upgrades in tech this morning, INTC (+1.1%) was upgraded to Buy at B. Riley, VIP (+3.8%) was upgraded to Overweight at Morgan Stanley, YHOO (+0.5%) was upgraded to Outperform at Credit Agricole and S (+3.8%) was upgraded to Outperform at Macquarie. AAPL (+0.3%) was added to short term buy list at Deutsche Bank.

In downgrades, ELLI (-9.8%) was downgraded to Mkt Perform at JMP, CSCO (-0.2%) was downgraded to Neutral at MKM, and SMCI (-2.7%) was downgraded to Hold at Stifel.

IBM (+0.9%), SNDK (+0.7%) and XLNX (+0.8%) are the notable name in tech scheduled to report after the close.

07:29 am Bank of America shares rise 1% following better than expected earnings

QuickLogic (QUIK) is launching a strategic initiative to enable the "Digital Sixth Sense" in mobile devices.

Intel (INTC 23.20, -0.19) is lower by 0.7% after reporting a bottom-line beat and guiding fourth quarter revenue near the lower end of analyst expectations.

Synaptics (SYNA) announced that it is first-to-market with a Microsoft (MSFT) Windows 8.1-certified touchscreen controller with integrated active pen support for smartphone, tablet and notebook PC touchscreens.

Altera (ALTR) announced its SDK for OpenCL is conformant to the OpenCL 1.0 standard and is now included on the Khronos Group list of OpenCL conformant product

Dataram (DRAM) has established two new sales and distribution channels for its line of AMD Radeon Memory products in Canada.

CY +0.5% (ticking higher, Teardown of Samsung Galaxy Note 3 Smartphone Finds Cypress CapSense Controller Implements Touch-Sensing Buttons).

8:01AM First Solar to Build 250MW Power Plant in California for NextEra Energy Resources (FSLR) 43.75 : Co announced it has entered into an agreement to construct a 250 megawatt (MW)AC solar power plant in Riverside County, California, for a subsidiary of NextEra Energy Resources, LLC. The McCoy Solar Energy Project will be located on approximately 2,300 acres of mostly public land provided by the Bureau of Land Management (BLM) approximately 13 miles northwest of Blythe, California.

Under the agreement, First Solar will provide Engineering, Procurement and Construction services, using First Solar's cadmium telluride (CdTe) photovoltaic thin-film modules. The project is located near the 550MWAC Desert Sunlight Solar Farm, jointly owned by a subsidiary of NextEra, GE Energy Financial Services, and Sumitomo Corporation of America, currently under construction by First Solar. An affiliate of NextEra Energy Resources also previously purchased two projects built by First Solar in Canada. Construction is expected to begin in late 2014, with completion in late 2016. The project will provide up to 400 construction jobs at peak operation.

Applied Materials (AMAT) announced new technology systems for manufacturing large size and ultra-high definition LCD and OLED displays that meet consumer demand for greater screen performance, clarity, color and brightness.

Ascent Solar Technologies (ASTI) announced the expansion of its direct retail outlets to 10 locations in the fourth quarter of 2013. Currently, the co has three kiosks in its home state of Colorado; an additional 7 kiosks will be opened in California and Nevada in strategically selected locations

Texas Instruments (TXN) announced the availability of a ZigBee Light Link development kit that simplifies the development and control of wirelessly connected LED lighting products.

Intel (INTC) reported third quarter earnings of $0.58 per share, which is higher than expected, while revenues rose 0.2% year/year to $13.48 billion which is line with expectations. The company issued fourth quarter guidance with revenues of $13.2-14.2 billion which is which is in line with expectations.PC Client Group revenue of $8.4 billion, up 3.5 percent sequentially and down 3.5 percent year-over-year. Data Center Group revenue of $2.9 billion, up 6.2 percent sequentially and up 12.2 percent year-over-year. Intel reports Q3 gross margins of 62.4% versus Street expectations of approximately 60.7% (INTC guided for margins of 61% +/- 200 bps). The company sees Q4 Gross margin percentage: 61 percent, plus or minus a couple of percentage points. "The third quarter came in as expected, with modest growth in a tough environment...We're executing on our strategy to offer an increasingly broad and diverse product portfolio that spans key growth segments, operating systems and form factors. Since August we have introduced more than 40 new products for market segments from the Internet-of-Things to datacenters, with an increasing focus on ultra-mobile devices and 2 in 1 systems." The company on its conference call management highlighted what it called, "important positive trends" The enterprise market for PCs strengthened in Q3 Consumer markets in the US and Europe appear to have bottomed out. Data center business returned to double digit year over year growth due to resumption of growth in the enterprise market and continued growth in cloud, high performance computing, and storage. "Unprecedented" lineup of products coming to market for the holiday season. The company also said inventory levels across the worldwide PC supply chain grew slightly but noted that inventory levels are still being managed well below historical averages.

Yahoo (YHOO) reported third quarter earnings of $0.34 per share, excluding non-recurring items, which is better than expected, while revenues ex-TAC fell 0.7% year/year to $1.08 billion which is line with expectations. Display: GAAP display revenue was $470 million for Q3, a 7% decrease y/y. Display revenue ex-TAC was $421 million for Q3, a 7% decrease y/y. The Number of Ads Sold (excluding Korea) increased ~1% compared to the third quarter of 2012. Price-per-Ad (excluding Korea) decreased approximately 7 percent compared to the third quarter of 2012. Search: GAAP search revenue was $435 million for the third quarter of 2013, an 8% decrease y/y. Search revenue ex-TAC was $426 million for Q3, a 3% increase y/y. Paid Clicks (excluding Korea) increased ~21% compared to the third quarter of 2012. Price-per-Click (excluding Korea) decreased ~4% compared to the third quarter of 2012. Cash Balance: Cash, cash equivalents, and investments in marketable securities were $3.2 billion as of Sept 30, 2013 compared to $6 billion as of December 31, 2012, a decrease of $2.8 billion. During the third quarter of 2013, Yahoo repurchased 59 million shares for $1,685 million and used a net $163 million for acquisitions. "In Q3, we generated free cash flow of $249 million and returned an additional $1.7 billion to shareholders through buybacks. As we exit Q3, we are extremely pleased with the strength of our balance sheet, with nearly $3.2 billion in cash and securities, and we are well positioned with ample liquidity to fund our future investments for growth." The company issued guidance for the third quarter revenues of $1.18-1.22 billion which is below expectations. The company issued guidance for fiscal year 2013 with adjusted operating income guidance to $840-860 million from $900-1.0 billion; lowered fiscal year 2013 to $4.40-4.45 billion from $4.5-4.6 billion which is below consensus. The company announced today that it has entered into an amendment to the share repurchase and preference sale agreement with Alibaba Group Holding Limited. The amendment reduces the maximum number of shares of Alibaba Group that Yahoo is required to sell in connection with a qualified initial public offering (IPO) of Alibaba, from 261.5 million shares to 208 million shares. The original repurchase agreement, entered into in May 2012, provided that in the event Alibaba completed a qualified IPO, Yahoo would sell up to 261.5 million of its 523.6 million ordinary shares of Alibaba, either directly to Alibaba Group or in the qualified IPO. After an IPO, Yahoo has the right to sell its remaining shares at its discretion.

OCZ Tech (OCZ) reported second quarter loss of $0.26 per share, while revenues fell 62.2% year/year to $33.5 million. Due to uncertainties in being able to procure forecasted flash amounts and credit constraints, we will not be providing guidance for the fiscal third quarter of 2014, ending November 30, 2013. It is our belief that at this point we cannot accurately predict the outcome of our efforts to resolve these issues. We continue to engage with interested parties in the various strategic options available to the Company, including additional financing initiatives and strategic alternatives and plan on providing an update to discuss progress regarding flash availability, credit, and our strategic activities when appropriate."

Linear Tech (LLTC) reported first quarter earnings of $0.45 per share, which is below expectations, while revenues rose 1.6% year/year to $340.4 million which is line with expectations. The company issued guidance for the second quarter with revenues of flat to down 4% from Q1 which equates to $326.8-340.4 million which is below expectations. "For our first fiscal quarter, we grew revenue sequentially over the prior quarter by 4% which was at the high end of our guidance and represented a good September quarter for us. " Once again, growth in our major end-markets was lead by Automotive and Industrial. The Automotive end-market represented 19% of bookings in the first quarter, which was a historical high for the Company. We added a full point to operating margin, which is an industry leading 45.9%. Looking ahead, our second fiscal quarter has been challenging over the past three years partially due to the December quarter being a historically slow quarter for the automotive and industrial end-markets. Our book to bill ratio for the first quarter was slightly positive, however, bookings normally weaken the last month of the December quarter due to the holiday period.
icon url

ReturntoSender

10/17/13 8:39 PM

#10358 RE: ReturntoSender #6755

From Briefing.com: 4:20 pm : The major averages ended today's session on a mixed note as the Dow shed just over two points while the S&P 500 added 0.7% to notch a fresh all-time high at 1,733.45.

With the third quarter earnings season heating up, the Dow Jones Industrial Average was victimized by disappointing results from two market-moving names. Goldman Sachs (GS 158.32, -3.93) and IBM (IBM 174.83, -11.90) ended with respective losses of 2.4% and 6.4% after both reported bottom-line beats on light revenue. Goldman Sachs missed top-line estimates by roughly $500 million while IBM reported revenue $1 billion below analyst expectations.

Shares of IBM weighed on the technology sector (-0.2%) while financials (+0.9%) were able to shake off Goldman's weakness with help from American Express (AXP 80.23, +3.91). The Dow component jumped 5.1% following its earnings beat.

Among other notable Dow earnings, UnitedHealth Group (UNH 71.37, -3.82) fell 5.1% after reporting in-line results and Verizon (VZ 48.90, +1.65) gained 3.5% on above-consensus earnings.

Thanks to Verizon's strength, the telecom services sector (+1.9%) ended in the lead while other countercyclical groups-consumer staples (+1.0%), health care (+0.9%), and utilities (+1.6%)-also outperformed the broader market.

Elsewhere, the energy sector added 0.2% despite a 1.6% drop in crude oil. The energy component ended at $100.64 per barrel. Among other commodities, gold futures jumped 2.8% to $1318.60 per troy ounce.

Part of the surge in gold could be attributed to significant greenback weakness. The Dollar Index (79.66, -0.81) ended near its lowest level of the year as global investors perceived the Congressional deal to extend the debt ceiling as a temporary fix, rather than a solution to an issue that is sure to re-emerge in the first months of 2014.

In addition, the need to revisit the debt ceiling battle in a few months means the Federal Reserve will be less likely to taper its asset purchases during the early months of next year.

Treasuries finished near their highs with the 10-yr yield down seven basis points at 2.59%. Notably, the 4-week yield tumbled 12.5 basis points to 0.01% as default fears receded following the deal on Capitol Hill. The short-term yield was trading as high as 0.35% just a few days ago.

Trading volume was a bit above average as 758 million shares changed hands on the floor of the New York Stock Exchange.

On the economic front, computer problems in California kept the initial claims level elevated for a second week in a row. The weekly initial claims level fell to 358,000 from a slightly downwardly revised 373,000 (from 374,000) for the week ending October 5. The Briefing.com consensus expected the initial claims level to fall to 330,000.

Separately, the manufacturing sector in the Philadelphia region remained strong in October. The Philadelphia Fed's Business Outlook Survey fell to 19.8 from 22.3 in September. The Briefing.com consensus expected the index to fall to 7.0. Unlike what happened in the New York Fed's Empire Manufacturing Sector, the manufacturing outlook in the Philly region was not affected by the government shutdown.

There is no economic data scheduled to be reported tomorrow.

DJIA +17.3% YTD
S&P 500 +21.5% YTD
Nasdaq +27.9% YTD
Russell 2000 +29.8% YTD

DJ30 -2.18 NASDAQ +23.71 SP500 +11.61 NASDAQ Adv/Vol/Dec 1719/1.90 bln/822 NYSE Adv/Vol/Dec 2547/758.4 mln/499

3:30 pm :

Commodities traded in a mixed fashion today, while the dollar index slumped as the temporary Congressional deal to extend the debt ceiling gave rise to speculation that a taper to the Federal Reserve asset purchases will be less likely. Adding to the dollar's weakness was a downgrade of U.S. debt by Chinese rating agency Dagong
Dec gold extended yesterday's gains as it got a boost from the weaker dollar index. The yellow metal hit a session high of $1324.20 per ounce and settled at $1322.60 per ounce, booking a 3.2% gain. Dec silver also traded higher, brushing a session high of $22.20 per ounce in early morning pit trade. It eventually settled with a 2.8% gain at $21.97 per ounce.
Nov crude oil, on the other hand, traded in negative territory as investors reacted to a build in stockpiles reported by the API and Genscape, an energy intelligence company. The EIA did not release its scheduled inventory report due to the government shutdown, but the API said that oil stocks at Cushing, Oklahoma rose by 0.291 mln barrels last week.
Genscape reported they rose by 0.837 mln barrels. The energy component brushed a session low of $100.03 per barrel and settled with a 1.6% loss at $100.63 per barrel
Nov natural gas fell for a third consecutive session, brushing a session low of $3.73 per MM

4:20PM Advanced Micro beats by $0.02, beats on revs; guides Q4 revs in-line (AMD) : Reports Q3 (Sep) earnings of $0.04 per share, excluding non-recurring items, $0.02 better than the Capital IQ Consensus Estimate of $0.02; revenues rose 15.1% year/year to $1.46 bln vs the $1.42 bln consensus. Co issues in-line guidance for Q4, sees Q4 revs up 5% sequentially, plus or minus 3% (roughly $1.490-1.578 bln) vs. $1.52 bln Capital IQ Consensus Estimate.

4:16PM Interdigital Comm announces formation of Signal Trust; Trust will monetize InterDigital patents related to cellular infrastructure (IDCC) 37.00 -0.27 : Co announced the establishment of the Signal Trust for Wireless Innovation, which will monetize a large InterDigital patent portfolio related to cellular infrastructure. The more than 500 patents and patent applications being transferred to the Trust focus primarily on 3G and LTE technologies, and were developed by InterDigital's engineers and researchers over more than a decade, with a number of the innovations contributed to the worldwide standards process. As a result, the patent portfolio includes patents for pioneering inventions that the Company believes are used pervasively in the cellular wireless industry. InterDigital will retain licensing and other monetization rights to the transferred patents for a limited period of time enabling companies to conclude agreements with InterDigital during a transition period.

4:11PM Rambus beats by $0.04, beats on revs (RMBS) : Reports Q3 (Sep) earnings of $0.15 per share, $0.04 better than the Capital IQ Consensus Estimate of $0.11; revenues rose 27.5% year/year to $73.3 mln vs the $70.09 mln consensus.

4:10PM Google beats by $0.37, reports revs in-line (GOOG) 888.79 -9.23 : Reports Q3 (Sep) earnings of $10.74 per share, $0.37 better than the Capital IQ Consensus Estimate of $10.37; revenues rose 31.4% year/year to $14.89 bln vs the $14.8 bln consensus.

Revenues and other information

On a consolidated basis, Google Inc. revenues for the quarter ended September 30, 2013 were $14.89 billion, an increase of 12% y/y.
Google segment revenues were $13.77 billion, or 92% of consolidated revenues, in the third quarter of 2013, representing a 19% increase y/y.
Google-owned sites generated segment revenues of $9.39 billion, or 68% of total Google segment revenues. This represents a 22% increase y/y.
Google's partner sites generated segment revenues of $3.15 billion, or 23% of total Google segment revenues.
Google segment revenues from outside of the United States totaled $7.67 billion, representing 56% of total Google segment revenues in the third quarter of 2013, compared to 55% in the second quarter of 2013 and 53% in the third quarter of 2012.
Aggregate paid clicks increased approximately 26% y/y and increased approximately 8% q/q.
Average cost-per-click decreased approximately 8% y/y and decreased approximately 4% q/q.
Traffic acquisition costs increased to $2.97 billion in the third quarter of 2013, compared to $2.77 billion in the third quarter of 2012. TAC as a percentage of advertising revenues was 24% in the third quarter of 2013, compared to 26% in the third quarter of 2012.
Motorola Mobile segment revenues were $1.18 billion, or 8% of consolidated revenues in the third quarter of 2013, compared to $1.78 billion, or 13% of consolidated revenues in the third quarter of 2012.

Operating expenses were $5.04 billion in the third quarter of 2013, or 34% of revenues, compared to $4.61 billion in the third quarter of 2012, or 35% of revenues.

Google segment operating income in the third quarter of 2013 was $4.64 billion, or 34% of Google segment revenues. This compares to segment operating income of $3.95 billion in the third quarter of 2012, or 34% of Google segment revenues.
Motorola Mobile segment operating loss in the third quarter of 2013 was $248 million, or -21% of Motorola Mobile segment revenues. This compares to segment operating loss of $192 million, or -11% of Motorola Mobile segment revenues in the third quarter of 2012.

Net cash provided by operating activities in the third quarter of 2013 totaled $5.08 billion, compared to $4.0 billion in the third quarter of 2012. In the third quarter of 2013, capital expenditures were $2.29 billion, the majority of which was for production equipment, data-center construction, and real estate purchases. Free cash flow was $2.79 billion.

We expect to continue to make significant capital expenditures.A reconciliation of free cash flow to net cash provided by operating activities, the GAAP measure of liquidity, is included at the end of this release.
As of September 30, 2013, cash, cash equivalents, and marketable securities were $56.52 billion.

9:04AM Ultratech misses by $0.32, misses on revs (UTEK) 29.38 : Reports Q3 (Sep) loss of $0.28 per share, $0.32 worse than the Capital IQ Consensus Estimate of $0.04; revenues fell 50.9% year/year to $29.7 mln vs the $42.68 mln consensus.

"Despite recent reports of strengthening in the memory segment of the semiconductor market, we continue to be impacted by the pause in capital equipment spending that is occurring within the logic sector of the market," commented Arthur W. Zafiropoulo, Chairman and Chief Executive Officer of Ultratech. "As we have indicated in the past, the markets that we serve can be volatile, and due to the size of our average unit sale, this volatility can result in significant variability of our near-term results. However, we remain confident in our longer-term view that our leading technology solutions will be key to enabling the industry to make the inevitable and necessary migration to smaller process nodes and larger wafer sizes."

Newisys, a product division of Sanmina (SANM), announced availability of the NDS-1122, an advanced 1U integrated storage server with a capacity of 48TB

8:28AM Gapping down (SCANX) : In reaction to disappointing earnings/guidance: SCSS -26.4% (also downgraded at Keybanc and Piper), IBM -6.3% (IBM downgraded to Neutral from Buy at UBS), USG -5.6%, RDA -5.3%, XLNX -4.6%, EBAY -4.2%, UNH -2.9%, GS -2.5%, BX -1.9%, DGX -1.7%, FLR -0.9%, EWBC -0.9%.

Select financial related names showing weakness following GS results: BCS -1.8%, MS -1.2%, C -0.7%, BAC -0.4%.

Select tech names lower following IBM results: HPQ -1.2% SI -1% , ORCL -0.7% (acquires Compendium; financial terms not disclosed ), MSFT -0.1%

A few names are lower with XLNX/CY: AMD -2.2%, TXN -0.7%, ARMH -1.8%.

Cypress Semiconductor (CY) announced that HUAWEI has selected its TrueTouch controllers to drive the touchscreens in four HUAWEI smartphones.

Analyst comments: SCTY +3.7% (initiated with an Overweight at JPMorgan), AAP +2% (light volume, upgraded to Outperform from Neutral at Wedbush), CLF +1.4% ( upgraded to Market Perform at Cowen), BBY +1% (upgraded to Outperform from Perform at Oppenheimer), DDD +0.9% ( tgt to $61 from $52 at Piper Jaffray)

8:07AM Cypress Semi beats by $0.02, beats on revs (CY) 9.40 : Reports Q3 (Sep) earnings of $0.14 per share, $0.02 better than the Capital IQ Consensus Estimate of $0.12; revenues fell 7.0% year/year to $188.72 mln vs the $185.43 mln consensus.

Q3 revenue declined 2% sequentially and was slightly higher than recently revised guidance. Co was disappointed to lower guidance for Q3, but it experienced unforecasted weakness in the mobile handset market. Gross margins remained strong at 53.8% and operating expenses achieved a 3.5-year low. Co said it would continue to endure volatility and granularity in mobile handset business in the fourth quarter, leading to a sequential decline of 10% to 14% in revenue, consistent with the guidance given in pre-announcement. Despite some delays, design win pipeline remains robust, especially for new TrueTouch Gen5 touchscreen products, and co expects to resume revenue growth in early 2014.

7:39AM Verizon beats by $0.03, reports revs just above consensus (VZ) 47.25 : Reports Q3 (Sep) earnings of $0.77 per share, excluding non-recurring items, $0.03 better than the Capital IQ Consensus of $0.74; revenues rose 4.4% year/year to $30.28 bln vs the $30.15 bln consensus. Consolidated EBITDA grew 16.9% YoY to $11.3 billion; EBITDA margin expanded 400 bps to 37.3%. Cash flow from operating activities totaled $28.4 billion in the first nine months of 2013, a 14.7% YoY increase.

Wireless Financial Highlights

Total revenues were $20.4 billion in third-quarter 2013, up 7.2% year over year. Service revenues in the quarter totaled $17.5 billion, up 8.4% year over year. Retail service revenues grew 8.0% year over year, to $16.8 billion.
Retail postpaid ARPA (average revenue per account) increased 7.1% over third-quarter 2012, to $155.74 per month.
In third-quarter 2013, wireless operating income margin was 33.8%, compared with 31.8% in third-quarter 2012. Segment EBITDA margin on service revenues was 51.1%, up 110 basis points over third-quarter 2012.
Verizon Wireless is on track to deliver 49% to 50% segment EBITDA margin on service revenues for the full year. Through the first three quarters of 2013, segment EBITDA margin on service revenues was 50.4%, with Verizon Wireless maintaining margins of 49% or higher in five of the past six quarters.

Wireless Operational Highlights

Verizon Wireless added 1.1 million net retail connections, including 927,000 retail postpaid net connections, in the third quarter. These additions exclude acquisitions and adjustments. The company expects customer growth to increase sequentially in the fourth quarter.
At the end of the third quarter, the company had 101.2 million retail connections -- a 5.5% increase year over year -- including 95.2 million retail postpaid connections.
Verizon Wireless had 35 million retail postpaid accounts at the end of the third quarter -- an average of 2.7 connections per account. Nearly 42% of retail postpaid accounts are now on a Share Everything Plan, which allows customers to share data among multiple devices.
At the end of the third quarter, smartphones accounted for more than 67% of the Verizon Wireless retail postpaid customer phone base, up from 64%at the end of second-quarter 2013.
Retail postpaid churn was 0.97% in the third quarter, up 6 basis points year over year. Retail churn was 1.28% in the third quarter, up 10 basis points year over year.

Integrated Device Technology (IDTI) announced the third generation of its Universal Frequency Translator family of timing devices for high-performance optical networks, wireless base stations, and 100 Gigabit Ethernet interface applications

6:52AM Taiwan Semi beats by NT$0.01; revs in-line; sees Q4 revs in-line with consensus (TSM) 18.28 : Reports Q3 EPS of NT$2.00 vs NT$1.99 CIQ estimate; revs increased 15% YoY to NT$162.6 bln vs NT$162.8 bln CIQ est.

Margins:
Gross margin for the quarter was 48.5%
operating margin was 36.7%
net profit margin was 32%.
Shipments of 28-nanometer process technology reached 32% of total wafer revenues.
40/45-nanometer accounted for 20% of total wafer revenues.
Advanced technologies, defined as 40/45-nanometers and more advanced technologies, accounted for 52% of total wafer revenues.

Guidance:

Revenue is expected to be between NT$144-147 bln vs NT$145.7 bln CIQ est.
Gross profit margin is expected to be between 44-46%
Operating profit margin is expected to be between 32-34%

07:21 am IBM shares plunge 6% following miss on revenues
IBM (IBM $174 .80 -11.93) reported third quarter earnings of $3.99 per share, excluding non-recurring items, which was better than expected, while revenues fell 4.1% year/year to $23.72 billion which is about $1 billion below expectations.

IBM has posted YoY rev declines six straight quarters and missed rev expectations three straight quarters.

Key branded middleware up 3%; up 4% adjusting for currency; Services revenue down 3%, up 1% adjusting for currency; Global Business Services revenue flat, up 5% adjusting for currency; Services backlog of $141 billion, up 2%, up 6% adjusting for currency; Systems and Technology revenue down 17%, down 16% adjusting for currency; System z mainframe revenue up 6%; up 7 percent adjusting for currency; Growth markets revenue down 9%, down 5 percent adjusting for currency; Business analytics revenue up 8% year to date; Smarter Planet revenue up more than 20% year to date; Cloud revenue up more than 70% year to date The company reaffirmed guidance for fiscal year 2013 with EPS of at least $16.90, excluding non-recurring items versus which is above expectations.

"We are taking action to improve execution in our growth markets unit and in the elements of our hardware businesses that are under performing. Given these actions, our strategic initiatives and the strength of our model, we are maintaining our view for the full year and remain confident in our ability to achieve at least $20 operating EPS in 2015."

Comments from conference call: Have been significantly impacted by depreciation of the yen... N America sales flat y/y, an improvement q/q; APAC down 4%, driven by emerging mkts; Half emerging markets trouble was execution, half China, which was down 22%; Hardware performance in China accounted for all 5 points of decline in emerging mkts; co does not see China recovery until Q1... growth across portfolio... Europe returned to growth for first time since beginning of 2012... solid backlog growth headed into Q4... saw strength in mobile in Webshare... have a strong pipeline in software...
icon url

ReturntoSender

10/19/13 1:45 PM

#10359 RE: ReturntoSender #6755

From Briefing.com: Weekly Recap - Week ending 18-Oct-13

Dow +28.00 at 15399.65, Nasdaq +51.13 at 3914.28, S&P +11.35 at 1744.5

The S&P 500 registered its third consecutive gain, rising 0.7% to extend its weekly advance to 2.4%. However, the Nasdaq (+1.3%) was today's standout as Google (GOOG 1011.41, +122.61) made a significant contribution to the relative strength of the tech-heavy index. Shares of Google surged 13.8% after the company surpassed earnings expectations by 37 cents.

Thanks to Google's surge, the tech sector settled in the lead with a gain of 1.8%. Even though the sector ended sharply higher, some other top members underperformed. Qualcomm (QCOM 68.40, -0.30) shed 0.4% and IBM (IBM 173.78, -1.05) fell 0.6% after plunging 6.4% yesterday. Chipmakers sat out the rally as Intel (INTC 23.88, -0.05) slipped 0.2% while the broader PHLX Semiconductor added 0.3%.

Outside of technology, the industrial sector (+1.1%) was the only group that ended with a gain larger than 1.0%. Top sector component General Electric (GE 25.55, +0.87) jumped 3.5% after beating earnings expectations by a penny on a 1.5% year-over-year decline in revenue. Transports also contributed to the sector's strength as the Dow Jones Transportation Average advanced 1.2%. Kansas City Southern (KSU 117.35, +4.19) was the top index component, rising 3.7% despite reporting a bottom-line miss.

Elsewhere, the energy space (+0.9%) outperformed with Schlumberger (SLB 93.99, +2.56) providing a measure of support after beating on earnings. Crude oil ended with a modest gain of 0.2% at $100.84 per barrel.

Also of note, the financial sector (+0.3%) underperformed even as Morgan Stanley (MS 29.69, +0.76) rose 2.6% after beating on earnings and revenue. JPMorgan Chase (JPM 54.30, +0.09) received a late-afternoon boost off its lows amid reports of the bank reaching a $4 billion settlement with the Federal Housing Finance Agency after the FHFA sought as much as $6 billion in damages. Even though financials lagged, the sector was the top performer of the week, rising 5.1%.

On the downside, the health care space (-0.4%) ended in the red. Intuitive Surgical (ISRG 376.52, -22.61) weighed following its top-line miss while biotechnology underperformed as well. The iShares Nasdaq Biotechnology ETF (IBB 206.78, -1.59) lost 0.8%.

Treasuries ended little changed with the 10-yr yield at 2.59%.

Trading volume was aided by options expiration as nearly 900 million shares changed hands on the floor of the New York Stock Exchange.

September existing home sales will be reported on Monday at 10:00 ET. On the earnings front, McDonald's (MCD 95.20, -0.27), Halliburton (HAL 52.47, +0.75), and SAP (SAP 73.75, +0.86) will report their quarterly results prior to the opening bell.

Week in Review: Equities Notch Fresh Record Highs as Government Shutdown Ends

On Monday, equity indices posted modest gains even as the agreement to end the partial government shutdown and extend the debt ceiling remained elusive. The S&P 500 added 0.4%. Stocks slumped at the open after the weekend ended without any concrete progress in Washington. Despite the opening weakness, dip-buyers were quick to step in, drawing encouragement from late-morning reports indicating a bipartisan meeting was scheduled to take place at the White House at 15:00 ET. The technology sector (+0.5%) fueled much of the session-long rebound as top components rallied. Netflix (NFLX 333.50, +3.40) also displayed strength, surging 7.8% after reports indicated the company is exploring making its service available through cable set-top boxes. The company also said it entered into a production deal with Sony (SNE 19.61, -0.42).

Tuesday saw the S&P 500 settle lower by 0.7% after contradicting headlines from Washington fostered volatile price action throughout the session. Equity indices displayed modest losses at the open, but were able to turn positive by late afternoon. The rebound was predicated on optimism associated with budget talks in Washington after Senate Majority Leader Harry Reid was quoted as saying 'tremendous progress' had been made. Selling pressure intensified during the final 90 minutes of the session amid headlines indicating the Senate has halted its negotiations pending the outcome of the House vote. California Senator Dianne Feinstein weighed in on the situation, saying budget talks have 'all fallen apart.' All ten sectors ended in the red with countercyclical consumer staples (-0.9%) and utilities (-1.4%) leading to the downside. Among staple stocks, Coca-Cola (KO 38.78, +0.23) lost 0.7% following its in-line earnings report.

On Wednesday, the S&P 500 settled higher by 1.4% with participants rushing into equities as Washington lawmakers appeared to be on the verge of striking a deal that would fund the government through January 15 while extending the debt ceiling until February 7, and maintaining the sequester. All ten sectors posted gains with financials (+2.2%) ending in the lead. The sector received support from Bank of America (BAC 14.63, -0.03) and PNC Financial (PNC 75.04, +0.36) after both banks reported bottom-line beats.

The major averages ended Thursday's session on a mixed note as the Dow shed just over two points while the S&P 500 added 0.7% to notch a fresh all-time high at 1,733.45. With the third quarter earnings season heating up, the Dow Jones Industrial Average was victimized by disappointing results from two market-moving names. Goldman Sachs (GS 158.69, +0.37) and IBM ended with respective losses of 2.4% and 6.4% after both reported bottom-line beats on light revenue. Goldman Sachs missed top-line estimates by roughly $500 million while IBM reported revenue $1 billion below analyst expectations. Shares of IBM weighed on the technology sector (-0.2%) while financials (+0.9%) were able to shake off Goldman's weakness with help from American Express (AXP 80.52, +0.29). The Dow component jumped 5.1% following its earnings beat.

DJIA +17.5% YTD
S&P 500 +22.3% YTD
Nasdaq +29.6% YTD
Russell 2000 +31.3% YTD

 
Index Started Week Ended Week Change % Change YTD %
DJIA 15237.11 15399.65 162.54 1.1 17.5
Nasdaq 3791.87 3914.28 122.41 3.2 29.6
S&P 500 1703.20 1744.50 41.30 2.4 22.3
Russell 2000 1084.32 1114.77 30.45 2.8 31.2

This week's top 20 % gainers

Utilities: TGS (2.79 +20.35%)
Technology: PRKR (6.39 +108.05%), SCTY (59.46 +41.12%), BITA (24.32 +29.5%), NQ (24.92 +24.19%)
Services: SAVE (43.05 +27.07%), ENV (35.95 +19.81%), AAP (98.7 +18.91%)
Industrial Goods: MY (3.36 +28.9%), CECE (18.83 +21.18%)
Healthcare: GERN (4.28 +42.57%), INSM (15.25 +25.82%), OPK (11.6 +23.62%), KERX (11.26 +23.43%), ZIOP (4.94 +19.63%)
Financial: NOAH (21.06 +34.87%)
Basic Materials: MPO (6.45 +26.03%), MTDR (21 +21.45%), BVN (13.78 +18.85%)

This week's top 20 % losers

Utilities: ATLS (46.44 -9.35%)
Technology: TDC (42.64 -19.3%), UTEK (25.48 -14.04%), DMD (5.2 -13.23%), SGI (14.5 -12.05%), QTM (1.38 -10.46%), VECO (34.44 -10.05%), CRAY (23.54 -9.33%)
Services: OSTK (26.07 -10.34%), GDOT (20.95 -10.16%)
Industrial Goods: SWK (77.16 -17.6%), FLIR (29.43 -9.97%)
Healthcare: AMRN (2.03 -68.45%), ARIA (2.67 -16.82%), ECYT (11.3 -16.11%), IMMU (4.47 -8.99%)
Consumer Goods: SCSS (18.6 -26.2%), CQB (11.52 -9.87%)
Basic Materials: MCP (5.36 -22.03%), ANW (10.5 -10.47%)

4:18PM Closing Market Summary: Nasdaq Leads Equities Higher (WRAPX) : The S&P 500 registered its third consecutive gain, rising 0.7% to extend its weekly advance to 2.4%. However, the Nasdaq (+1.3%) was today's standout as Google (GOOG 1011.41, +122.61) made a significant contribution to the relative strength of the tech-heavy index. Shares of Google surged 13.8% after the company surpassed earnings expectations by 37 cents.

Thanks to Google's surge, the tech sector settled in the lead with a gain of 1.8%. Even though the sector ended sharply higher, some other top members underperformed. Qualcomm (QCOM 68.40, -0.30) shed 0.4% and IBM (IBM 173.78, -1.05) fell 0.6% after plunging 6.4% yesterday. Chipmakers sat out the rally as Intel (INTC 23.88, -0.05) slipped 0.2% while the broader PHLX Semiconductor added 0.3%.

Outside of technology, the industrial sector (+1.1%) was the only group that ended with a gain larger than 1.0%. Top sector component General Electric (GE 25.55, +0.87) jumped 3.5% after beating earnings expectations by a penny on a 1.5% year-over-year decline in revenue. Transports also contributed to the sector's strength as the Dow Jones Transportation Average advanced 1.2%. Kansas City Southern (KSU 117.35, +4.19) was the top index component, rising 3.7% despite reporting a bottom-line miss.

Elsewhere, the energy space (+0.9%) outperformed with Schlumberger (SLB 93.99, +2.56) providing a measure of support after beating on earnings. Crude oil ended with a modest gain of 0.2% at $100.84 per barrel.

Also of note, the financial sector (+0.3%) underperformed even as Morgan Stanley (MS 29.69, +0.76) rose 2.6% after beating on earnings and revenue. JPMorgan Chase (JPM 54.30, +0.09) received a late-afternoon boost off its lows amid reports of the bank reaching a $4 billion settlement with the Federal Housing Finance Agency after the FHFA sought as much as $6 billion in damages. Even though financials lagged, the sector was the top performer of the week, rising 5.1%.

On the downside, the health care space (-0.4%) ended in the red. Intuitive Surgical (ISRG 376.52, -22.61) weighed following its top-line miss while biotechnology underperformed as well. The iShares Nasdaq Biotechnology ETF (IBB 206.78, -1.59) lost 0.8%.

Treasuries ended little changed with the 10-yr yield at 2.59%.

Trading volume was aided by options expiration as nearly 900 million shares changed hands on the floor of the New York Stock Exchange.

September existing home sales will be reported on Monday at 10:00 ET. On the earnings front, McDonald's (MCD 95.20, -0.27), Halliburton (HAL 52.47, +0.75), and SAP (SAP 73.75, +0.86) will report their quarterly results prior to the opening bell.

Week in Review: Equities Notch Fresh Record Highs as Government Shutdown Ends

On Monday, equity indices posted modest gains even as the agreement to end the partial government shutdown and extend the debt ceiling remained elusive. The S&P 500 added 0.4%. Stocks slumped at the open after the weekend ended without any concrete progress in Washington. Despite the opening weakness, dip-buyers were quick to step in, drawing encouragement from late-morning reports indicating a bipartisan meeting was scheduled to take place at the White House at 15:00 ET. The technology sector (+0.5%) fueled much of the session-long rebound as top components rallied. Netflix (NFLX 333.50, +3.40) also displayed strength, surging 7.8% after reports indicated the company is exploring making its service available through cable set-top boxes. The company also said it entered into a production deal with Sony (SNE 19.61, -0.42).

Tuesday saw the S&P 500 settle lower by 0.7% after contradicting headlines from Washington fostered volatile price action throughout the session. Equity indices displayed modest losses at the open, but were able to turn positive by late afternoon. The rebound was predicated on optimism associated with budget talks in Washington after Senate Majority Leader Harry Reid was quoted as saying 'tremendous progress' had been made. Selling pressure intensified during the final 90 minutes of the session amid headlines indicating the Senate has halted its negotiations pending the outcome of the House vote. California Senator Dianne Feinstein weighed in on the situation, saying budget talks have 'all fallen apart.' All ten sectors ended in the red with countercyclical consumer staples (-0.9%) and utilities (-1.4%) leading to the downside. Among staple stocks, Coca-Cola (KO 38.78, +0.23) lost 0.7% following its in-line earnings report.

On Wednesday, the S&P 500 settled higher by 1.4% with participants rushing into equities as Washington lawmakers appeared to be on the verge of striking a deal that would fund the government through January 15 while extending the debt ceiling until February 7, and maintaining the sequester. All ten sectors posted gains with financials (+2.2%) ending in the lead. The sector received support from Bank of America (BAC 14.63, -0.03) and PNC Financial (PNC 75.04, +0.36) after both banks reported bottom-line beats.

The major averages ended Thursday's session on a mixed note as the Dow shed just over two points while the S&P 500 added 0.7% to notch a fresh all-time high at 1,733.45. With the third quarter earnings season heating up, the Dow Jones Industrial Average was victimized by disappointing results from two market-moving names. Goldman Sachs (GS 158.69, +0.37) and IBM ended with respective losses of 2.4% and 6.4% after both reported bottom-line beats on light revenue. Goldman Sachs missed top-line estimates by roughly $500 million while IBM reported revenue $1 billion below analyst expectations. Shares of IBM weighed on the technology sector (-0.2%) while financials (+0.9%) were able to shake off Goldman's weakness with help from American Express (AXP 80.52, +0.29). The Dow component jumped 5.1% following its earnings beat.

DJIA +17.5% YTD
S&P 500 +22.3% YTD
Nasdaq +29.6% YTD
Russell 2000 +31.3% YTD

4:05PM Dell Board approves special cash dividend of $0.13/share (DELL) 13.83 -0.02 : Co announced that its board of directors has declared the special cash dividend of $0.13 per common share contemplated by the revised definitive merger agreement with affiliates of Michael Dell and Silver Lake Partners. The record date for the special dividend will be the close of business on Oct. 28, 2013.

3:30PM Earnings Preview for the week of October 21 - 25 (SUMRX) : Of the companies reporting earnings for the week of October 21 - 25 some of the bigger names include:

Monday:
Pre Market - HAL, MCD, PHG, MAN, SAP, VFC, SAH, HAS, GCI
After Hours - TXN, DFS, WRB, VMW, NFLX, RCII
Tuesday:
Pre Market - WIT, UTX, NVS, LMT, DAL, DD, EMC, TRV, FCX, KMB, WHR, ITW, CNC, STT, RAI, PNR, R, AKS, ABG, RF
After Hours - AMGN, ACE, CNI, BRCM, STM, FTI, NBR, CLS, JNPR, RHI, UIS, APOL, BCR
Wednesday:
Pre Market - BA, WLP, CAT, GD, NOC, LLY, AEP, BMY, LCC, TMO, NSC, MSI, CMC, FDML, DPS, OCR, CP, ECA, WYN, NLSN, OC, ARG, LO, SLGN, ATI
After Hours - T, AIZ, TEX, ORLY, SYMC, ESV, NXPI, TSCO, RE, FBHS, LRCX, SWFT, TMK, VAR, CCI, CTXS
Thursday:
Pre Market - CAJ, ERIC, F, MCK, BG, DOW, ABB, MMM, IP, AVT, CS, RTN, XRX, CVE, LUV, MO, CL, AN, RCI, XEL, CAM, RS, PCP, GPI, RCL, BLL, CCE, BEN, ALV, WCC, HSY, BSX, EME, CMS, CELG, POT, HOT, PHM, ORI, NBL, UFS, ALK, BMS, SJR, SHPG, FAF, TKR, GG, ZMH
After Hours - BSAC, ESRX, MSFT, AMZN, IM, WDC, CB, PFG, EMN, KBR, NCR, CLF, USTR, FLS, SPN, CINF, CA, FSL, MTW, POL, CERN
Friday:
Pre Market - PG, UPS, ETN, NOV, ABBV, LEA, AON, SHW, DTE, WY, AVY, NWL, COL, SPG, LPNT

1:20PM Adobe Systems displaying some relative strength in the outperforming Software sector IGV in recent trade (ADBE) 52.71 +0.64 : Stock has pushed to a new session high of 52.74 in recent trade leaving it just under this week/Oct high at 52.82. Note that its multi-year high from Sep is modestly above at 52.96.

Large Cap Gainers

CMG (499.07 +13.66%): Missed quarterly EPS by $0.12 ($2.66 vs $2.78 estimate), revs rose 18.0% yoy to $826.9 mln vs $820.24 mln estimate; comps +6.2% vs ~5% estimate, driven by increased traffic; target raised at Lazard and Miller Tabak
GOOG (1001.83 +12.72%): Beat quarterly EPS by $0.37 ($10.74 vs $10.37 estimate), revs rose 31.4% yoy to $14.89 bln vs $14.8 bln estimate; target raised at Jefferies, Deutsche Bank, Credit Suisse, B. Riley, Canaccord, RBC Capital, Bernstein, UBS, Telsey Advisory Group
BHI (56.06 +8.28%): Beat quarterly EPS by $0.03 ($0.81 ex items vs $0.78 estimate), revs rose 8.1% yoy to $5.79 bln vs $5.78 bln estimate; mentioned positively at Cowen

Large Cap Losers

ISRG (380.59 -4.65%): Reported Q3 GAAP EPS of $3.99, revs fell 7.2% yoy to $499 mln vs $525.87 mln estimate; sees FY13 revs in lower half of previously provided range of flat to +7%; downgraded to Underperform from Market Perform at Northland Capital
UNH (68.1 -4.58%): Downgraded to Hold from Buy at Cantor Fitzgerald
GPC (78.21 -3.17%): Missed quarterly EPS by $0.08 ($1.12 vs $1.20 estimate), revs rose 9.2% yoy to $3.69 bln vs $3.76 bln estimate

Mid Cap Gainers

ALGN (56.99 +24.09%): Beat quarterly EPS by $0.10 ($0.40 ex items vs $0.30 estimate), revs rose 20.5% yoy to $164.5 mln vs $158.75 mln estimate; sees Q4 EPS of $0.41-0.43 vs $0.36 estimate, revs of $169.1-173.1 mln vs $164.28 mln estimate
ATHN (128.12 +21.48%): Missed quarterly EPS by $0.02 ($0.29 ex items vs $0.31 estimate), revs rose 43.1% yoy to $151.5 mln vs $154.89 mln estimate; sees FY13 EPS "at or near the low end" of $1.05-1.15 vs $1.03 estimate, revs "close to the mid-point" of $580-615 mln vs $594.53 mln estimate; upgraded to Buy from Neutral at Sterne Agee
FSLR (49.3 +7.24%): Seeing strength on speculation of an activist investor

Mid Cap Losers

AMD (3.59 -12.22%): Beat quarterly EPS by $0.02 ($0.04 ex items vs $0.02 estimate), revs rose 15.1% yoy to $1.46 bln vs $1.42 bln estimate; sees Q4 revs +2-8% (~$1.49-1.58 bln) vs $1.52 bln estimate; downgraded to Neutral from Buy at BofA/Merrill
IPG (15.97 -5.45%): Missed quarterly EPS by $0.01 ($0.17 vs $0.18 estimate), revs rose 1.8% yoy to $1.7 bln vs $1.71 bln estimate; downgraded to Market Perform from Overweight at Albert Fried
PBCT (14.29 -5.18%): Missed quarterly EPS by $0.01 ($0.20 vs $0.21 estimate); net interest margin decreased 3 basis points from prior quarter to 3.30%

11:42 am Technology sector
The tech sector is trading notably higher this morning, ahead of small gains seen in the broader market (SPY +0.47%). Google (GOOG +12.24%) is leading the way on strong third quarter earnings. Chinese internet companies Qihoo (QIHU +5.61%) and Baidu (BIDU +5.01%) are also trading higher. Advanced Micro Devices (AMD -12.22%) is down on weak earnings results.

In tech earnings last night:

ZHNE (+27.40%) reported Q3 GAAP EPS of $0.05 vs -$0.14 last year, revs rose 8% yoy to $31.5 mln
GOOG (+12.24%) beat on EPS and matched analyst estimates on revs; aggregate paid clicks increased approximately 26% yoy
EFII (+1.92%) beat on the top and bottom line
RMBS (-1.04%) is trading lower despite beating by $0.04
AMD (-12.22%) is also lower despite beating by $0.02 ($0.04 ex items vs $0.02 estimate) and reporting revs rose 15.1% yoy to $1.46 bln vs a $1.42 bln estimate

In news, PRKR (+21.73%) continued to see gains following a positive ruling in its patent litigation case against Qualcomm (QCOM). First Solar (FSLR +7.04%) is also higher on activist speculation.

BlackBerry (BBRY +0.73%) again surfaced as a potential target for Lenovo (LNVGY). Iron Mountain (IRM +1.42%) acquired Cornerstone Records Management for $191 million in cash. In upgrades, Cypress Semi (CY +2.58%) was upgraded to Outperform from Sector Perform at Pacific Crest, target $11. Intuit (INTU +1.21%) was upgraded to Buy from Neutral at BofA/Merrill. VMware (VMW +3.76%) was also upgraded to Overweight from Neutral at JP Morgan.

A few notable downgrades are: IBM (IBM -0.26%) downgraded to Hold from Buy at Argus, Fairchild Semi (FCS +0.93%) downgraded to Hold from Buy at Canaccord Genuity, and Advanced Micro (AMD -12.22%) downgraded to Neutral from Buy at BofA/Merrill.

On Monday morning Check Point (CHKP) and SAP (SAP) are scheduled to report earnings.

RFMD (RFMD) unveiled its first power doubler amplifier in a multi-chip module to support the requirements of the new data over cable service interface specification 3

Alpha and Omega Semiconductor (AOSL) release a new dual MOSFET family in the common-drain configuration in both DFN 5x6 and Micro-DFN 3.2x2 packages.

8:02AM SunPower E20/327 solar panels achieve lowest potential induced degradation (SPWR) 31.59 : Co announces that its high-efficiency SunPower E20/327 Solar Panel recently underwent stringent third-party testing for potential induced degradation by PV Evolution Labs. Upon completion, the panels showed power loss of less than 0.2 percent, performing better than any of the others tested. The average degradation of modules that passed this test is ~4-5%.

SunPower earned certificates in all grounding configurations and, when compared against conventional panels that passed, its panels degraded at a rate 20 times lower. Only 50 percent of all panels tested successfully passed the program's criteria. A conventional panel is approximately 240 watts, 15 percent efficient and ~1.6 square meters in size.
4:38PM Celanese beats by $0.04, misses on revs (CE) 53.98 -0.26 : Reports Q3 (Sep) earnings of $1.20 per share, excluding non-recurring items, $0.04 better than the Capital IQ Consensus Estimate of $1.16; revenues rose 1.7% year/year to $1.64 bln vs the $1.66 bln consensus. Co deployed $96 mln of cash, repurchasing approximately 2 million shares at an average price of $48.74.


"Our global teams have done a tremendous job this year of driving earnings growth through Celanese-specific initiatives. As we take our initial view of 2014, we expect earnings growth will continue to be driven by the actions we are taking, not by depending upon increases from the global economy. Celanese-specific initiatives that translate innovation from new products and drive efficiencies through productivity will fuel earnings growth in 2014 at levels consistent with our long-term growth objective."

4:30PM This week's biggest % gainers/losers (SCANX) : The following are this week's top 20 percentage gainers and top 20 percentage losers, categorized by sectors (over $300 mln market cap and 100K average daily volume).

This week's top 20 % gainers

Utilities: TGS (2.79 +20.35%)
Technology: PRKR (6.39 +108.05%), SCTY (59.46 +41.12%), BITA (24.32 +29.5%), NQ (24.92 +24.19%)
Services: SAVE (43.05 +27.07%), ENV (35.95 +19.81%), AAP (98.7 +18.91%)
Industrial Goods: MY (3.36 +28.9%), CECE (18.83 +21.18%)
Healthcare: GERN (4.28 +42.57%), INSM (15.25 +25.82%), OPK (11.6 +23.62%), KERX (11.26 +23.43%), ZIOP (4.94 +19.63%)
Financial: NOAH (21.06 +34.87%)
Basic Materials: MPO (6.45 +26.03%), MTDR (21 +21.45%), BVN (13.78 +18.85%)

This week's top 20 % losers

Utilities: ATLS (46.44 -9.35%)
Technology: TDC (42.64 -19.3%), UTEK (25.48 -14.04%), DMD (5.2 -13.23%), SGI (14.5 -12.05%), QTM (1.38 -10.46%), VECO (34.44 -10.05%), CRAY (23.54 -9.33%)
Services: OSTK (26.07 -10.34%), GDOT (20.95 -10.16%)
Industrial Goods: SWK (77.16 -17.6%), FLIR (29.43 -9.97%)
Healthcare: AMRN (2.03 -68.45%), ARIA (2.67 -16.82%), ECYT (11.3 -16.11%), IMMU (4.47 -8.99%)
Consumer Goods: SCSS (18.6 -26.2%), CQB (11.52 -9.87%)
Basic Materials: MCP (5.36 -22.03%), ANW (10.5 -10.47%)

4:21PM HCI Group increases quarterly dividend 22.2% to $0.275 from $0.225 per share (HCI) 42.11 +0.46 :

4:18PM Closing Market Summary: Nasdaq Leads Equities Higher (WRAPX) : The S&P 500 registered its third consecutive gain, rising 0.7% to extend its weekly advance to 2.4%. However, the Nasdaq (+1.3%) was today's standout as Google (GOOG 1011.41, +122.61) made a significant contribution to the relative strength of the tech-heavy index. Shares of Google surged 13.8% after the company surpassed earnings expectations by 37 cents.

Thanks to Google's surge, the tech sector settled in the lead with a gain of 1.8%. Even though the sector ended sharply higher, some other top members underperformed. Qualcomm (QCOM 68.40, -0.30) shed 0.4% and IBM (IBM 173.78, -1.05) fell 0.6% after plunging 6.4% yesterday. Chipmakers sat out the rally as Intel (INTC 23.88, -0.05) slipped 0.2% while the broader PHLX Semiconductor added 0.3%.

Outside of technology, the industrial sector (+1.1%) was the only group that ended with a gain larger than 1.0%. Top sector component General Electric (GE 25.55, +0.87) jumped 3.5% after beating earnings expectations by a penny on a 1.5% year-over-year decline in revenue. Transports also contributed to the sector's strength as the Dow Jones Transportation Average advanced 1.2%. Kansas City Southern (KSU 117.35, +4.19) was the top index component, rising 3.7% despite reporting a bottom-line miss.

Elsewhere, the energy space (+0.9%) outperformed with Schlumberger (SLB 93.99, +2.56) providing a measure of support after beating on earnings. Crude oil ended with a modest gain of 0.2% at $100.84 per barrel.

Also of note, the financial sector (+0.3%) underperformed even as Morgan Stanley (MS 29.69, +0.76) rose 2.6% after beating on earnings and revenue. JPMorgan Chase (JPM 54.30, +0.09) received a late-afternoon boost off its lows amid reports of the bank reaching a $4 billion settlement with the Federal Housing Finance Agency after the FHFA sought as much as $6 billion in damages. Even though financials lagged, the sector was the top performer of the week, rising 5.1%.

On the downside, the health care space (-0.4%) ended in the red. Intuitive Surgical (ISRG 376.52, -22.61) weighed following its top-line miss while biotechnology underperformed as well. The iShares Nasdaq Biotechnology ETF (IBB 206.78, -1.59) lost 0.8%.

Treasuries ended little changed with the 10-yr yield at 2.59%.

Trading volume was aided by options expiration as nearly 900 million shares changed hands on the floor of the New York Stock Exchange.

September existing home sales will be reported on Monday at 10:00 ET. On the earnings front, McDonald's (MCD 95.20, -0.27), Halliburton (HAL 52.47, +0.75), and SAP (SAP 73.75, +0.86) will report their quarterly results prior to the opening bell.

Week in Review: Equities Notch Fresh Record Highs as Government Shutdown Ends

On Monday, equity indices posted modest gains even as the agreement to end the partial government shutdown and extend the debt ceiling remained elusive. The S&P 500 added 0.4%. Stocks slumped at the open after the weekend ended without any concrete progress in Washington. Despite the opening weakness, dip-buyers were quick to step in, drawing encouragement from late-morning reports indicating a bipartisan meeting was scheduled to take place at the White House at 15:00 ET. The technology sector (+0.5%) fueled much of the session-long rebound as top components rallied. Netflix (NFLX 333.50, +3.40) also displayed strength, surging 7.8% after reports indicated the company is exploring making its service available through cable set-top boxes. The company also said it entered into a production deal with Sony (SNE 19.61, -0.42).

Tuesday saw the S&P 500 settle lower by 0.7% after contradicting headlines from Washington fostered volatile price action throughout the session. Equity indices displayed modest losses at the open, but were able to turn positive by late afternoon. The rebound was predicated on optimism associated with budget talks in Washington after Senate Majority Leader Harry Reid was quoted as saying 'tremendous progress' had been made. Selling pressure intensified during the final 90 minutes of the session amid headlines indicating the Senate has halted its negotiations pending the outcome of the House vote. California Senator Dianne Feinstein weighed in on the situation, saying budget talks have 'all fallen apart.' All ten sectors ended in the red with countercyclical consumer staples (-0.9%) and utilities (-1.4%) leading to the downside. Among staple stocks, Coca-Cola (KO 38.78, +0.23) lost 0.7% following its in-line earnings report.

On Wednesday, the S&P 500 settled higher by 1.4% with participants rushing into equities as Washington lawmakers appeared to be on the verge of striking a deal that would fund the government through January 15 while extending the debt ceiling until February 7, and maintaining the sequester. All ten sectors posted gains with financials (+2.2%) ending in the lead. The sector received support from Bank of America (BAC 14.63, -0.03) and PNC Financial (PNC 75.04, +0.36) after both banks reported bottom-line beats.

The major averages ended Thursday's session on a mixed note as the Dow shed just over two points while the S&P 500 added 0.7% to notch a fresh all-time high at 1,733.45. With the third quarter earnings season heating up, the Dow Jones Industrial Average was victimized by disappointing results from two market-moving names. Goldman Sachs (GS 158.69, +0.37) and IBM ended with respective losses of 2.4% and 6.4% after both reported bottom-line beats on light revenue. Goldman Sachs missed top-line estimates by roughly $500 million while IBM reported revenue $1 billion below analyst expectations. Shares of IBM weighed on the technology sector (-0.2%) while financials (+0.9%) were able to shake off Goldman's weakness with help from American Express (AXP 80.52, +0.29). The Dow component jumped 5.1% following its earnings beat.

DJIA +17.5% YTD
S&P 500 +22.3% YTD
Nasdaq +29.6% YTD
Russell 2000 +31.3% YTD

4:11PM Prudential issues statement regarding final designation as a non-bank systematically important financial institution: 'will not seek to rescind the designation' (PRU) 82.53 +0.27 : Co announced that, after careful review, it will not seek to rescind the designation of the company as a non-bank systemically important financial institution by the Financial Stability Oversight Council (FSOC). The company will continue to work with the Board of Governors of the Federal Reserve System and other regulators to develop regulatory standards that take into account the differences between insurance companies and banks, particularly in the use of capital, and that benefit consumers and preserve competition within the insurance industry.

4:06PM Tech Data receives stay of trading suspension pending NASDAQ hearing (TECD) 50.56 +0.29 : Co announced that it received a letter from The NASDAQ Stock Market stating that the NASDAQ Listing Qualifications Panel (the "Panel") had granted the Company's request to extend the stay of suspension of trading in its common stock pending a final determination regarding the Company's listing status following a hearing before the Panel. The hearing has been scheduled for November 7, 2013. At the hearing, the Company will request additional time to satisfy the NASDAQ listing requirement that the Company be current in its filings with the Securities and Exchange Commission.

4:05PM Dell Board approves special cash dividend of $0.13/share (DELL) 13.83 -0.02 : Co announced that its board of directors has declared the special cash dividend of $0.13 per common share contemplated by the revised definitive merger agreement with affiliates of Michael Dell and Silver Lake Partners. The record date for the special dividend will be the close of business on Oct. 28, 2013.

4:04PM Next Week's Events of Interest : Events and conferences of interest for next week, October 21st-25th, are listed below. For a complete list of next week's events, please see the events calendar.

Monday

Futurecom 2013
Scheduled to appear: ORCL, ALU, ALU, ALU, QCOM, QCOM, ERIC, RKUS, JNPR, ACN, JNPR, EXTR, CIEN, CNSI
PDA Phramaceutical Microbiology Conference
Scheduled to appear: NDZ
PharmAsia Shanghai Summit
Scheduled to appear: CI, SNY, NCI, ABT, MDT, MRK, AZN, AMGN, LLY, CAH, SCR, C, NVS, BAYRY.PK, PFE, BMY, AZN

Tuesday

Aberdeen Group 2013 Chief Service Officer Summit
Scheduled to appear: KSS, PBI, SYK, BERY, CIEN, EMC, PCRFY.PK, XRX
Customer Experience Management in Telecoms: North America Summit
Scheduled to appear: CNSI, CMCSA, EGAN, USM, CTL, RCI, FTR, MTSC, TWC, NTLS, SYKE
Apple (AAPL) iPad Event at 13:00 Eastern

Wednesday

Jefferies 3rd Annual Asia Corporate Access Summit
Scheduled to appear: CCIH
MarkLogic Summit Series 2013: Washington DC
Scheduled to appear: SGI
ROTH Capital Partners Solar Symposium
Scheduled to appear: RSOL, ENPH, CSIQ

Thursday

Silver Summit
Scheduled to appear: EXK, RVM, CA:GPR, MGN, CDE, CA:FVI, CA:SVM, AG, HL, TAHO, PAAS
World Cord Blood Congress Monaco 2013
Scheduled to appear: KOOL
CMS Energy Corp. Investor Day
Scheduled to appear: CMS

Friday

New York Times Global Forum Asia
Scheduled to appear: HPQ
American College of Rheumatology Meeting
Scheduled to appear: CELG, ATRS, SVNT
Mellanox Technologies (MLNX) Analyst Day

3:30PM Earnings Preview for the week of October 21 - 25 (SUMRX) : Of the companies reporting earnings for the week of October 21 - 25 some of the bigger names include:

Monday:
Pre Market - HAL, MCD, PHG, MAN, SAP, VFC, SAH, HAS, GCI
After Hours - TXN, DFS, WRB, VMW, NFLX, RCII
Tuesday:
Pre Market - WIT, UTX, NVS, LMT, DAL, DD, EMC, TRV, FCX, KMB, WHR, ITW, CNC, STT, RAI, PNR, R, AKS, ABG, RF
After Hours - AMGN, ACE, CNI, BRCM, STM, FTI, NBR, CLS, JNPR, RHI, UIS, APOL, BCR
Wednesday:
Pre Market - BA, WLP, CAT, GD, NOC, LLY, AEP, BMY, LCC, TMO, NSC, MSI, CMC, FDML, DPS, OCR, CP, ECA, WYN, NLSN, OC, ARG, LO, SLGN, ATI
After Hours - T, AIZ, TEX, ORLY, SYMC, ESV, NXPI, TSCO, RE, FBHS, LRCX, SWFT, TMK, VAR, CCI, CTXS
Thursday:
Pre Market - CAJ, ERIC, F, MCK, BG, DOW, ABB, MMM, IP, AVT, CS, RTN, XRX, CVE, LUV, MO, CL, AN, RCI, XEL, CAM, RS, PCP, GPI, RCL, BLL, CCE, BEN, ALV, WCC, HSY, BSX, EME, CMS, CELG, POT, HOT, PHM, ORI, NBL, UFS, ALK, BMS, SJR, SHPG, FAF, TKR, GG, ZMH
After Hours - BSAC, ESRX, MSFT, AMZN, IM, WDC, CB, PFG, EMN, KBR, NCR, CLF, USTR, FLS, SPN, CINF, CA, FSL, MTW, POL, CERN
Friday:
Pre Market - PG, UPS, ETN, NOV, ABBV, LEA, AON, SHW, DTE, WY, AVY, NWL, COL, SPG, LPNT

2:53PM NYMEX Energy Closing Prices (COMDX) :

Nov crude oil rose $0.49 to $101.12/barrel
Crude oil traded higher today on strong China GDP data. The country's GDP rose 2.2% q/q vs expectations of 1.9% (the y/y reading came in at 7.8%, as expected). The energy component climbed to a session high of $101.98 in morning pit action but retreated towards the unchanged line. It settled with a 0.5% gain, shaving weekly losses to 0.8%.
Nov natural gas settled unchanged at $3.76/MMBtu
Natural gas fell to a session low of $3.69 but gained momentum in afternoon action. It managed to erase the earlier losses and settled the session unchanged, booking a 0.3% loss for the week.
Nov heating oil rose 5 cents to $3.04/gallon
Nov RBOB gasoline rose 2 cents to $2.67/gallon

2:43PM Further upside extension -- Dow +39, S&P +12, Nasdaq Comp +51 (TECHX) :

2:29PM NRG Energy: Trading resumed following news that co would acquire assets from bankrupt Edison Mission Energy (NRG) 29.15 +1.19 :

2:27PM CBOT Agriculture and Ethanol/ICE Sugar Closing Prices (COMDX) :

Dec corn fell 2 cents to $4.41/bushel
Dec wheat rose 19 cents to $7.05/bushel
Nov soybeans fell 1 cent to $12.91/bushel
Nov ethanol rose 2 cents to $1.81/gallon
Jan sugar (#16 (U.S.)) rose 0.30 of a penny to 22.28 cents/lbs

2:25PM Dollar Hovers Flat: 10-yr: unch..2.595%..USD/JPY: 97.90..1.3675 (SUMRX) : Dollar Hovers Flat: The Dollar Index has erased its early losses and now holds little changed near 79.65. Early selling pressed the Index to 79.50, its lowest level in eight months, but a steady bid over the course of U.S. trade has lifted it back to the flat line. Click here to see a daily Dollar Index chart.

EURUSD is +5 pips at 1.3675 as trade looks for its best close in 11 months. Some early excitement ran the single currency above the 1.3700 level, but those gains have been unable to hold amid a session free of any meaningful news or data. Eurozone data out Monday is limited to German PPI.
GBPUSD is +5 pips at 1.6165 as trade struggles to hold its gains. Early buying ran cable above the 1.6200 level, but sellers stepped in to defend the October highs, and now have action holding just off session lows. The 1.5950/1.6000 area is home to some meaningful support.
USDCHF is -5 pips at .9020 as trade has been locked in a tight 30 pip range. Traders are paying close attention to the .9000 level as support there has held up since the fall of 2012. Bulls will breathe a bit easier if they are able to regain the .9150/.9200 area.
USDJPY is flat at 97.90 as trade lingers in the middle of the day's range. Some overnight buying made for a test of the 50 dma (98.05), but bulls have so far been unable to retake that level. The 97.00 area remains important as support is helped by the 200 dma. Japan's trade balance will cross the wires Sunday evening.
AUDUSD is +40 .9665 as action holds at a four and a half-month high. The hard currency has been boosted by the stronger than expected Q3 Chinese GDP and the appetite for risk.
USDCAD is -5 pips at 1.0290 as trade has been limited to a tight 25 pip range. The pair saw little reaction to this morning's CPI data (0.2% actual v. 0.1% expected), but remains on track for a third straight day of losses. The 1.0250 area looms large as trendline support of the September 2012 lows coincides with the 200 dma. Canada's wholesale sales data is due out Monday.

2:18PM NRG Energy confirms it entered into agreement to acquire Edison Mission Energy for $2.635 bln (stock halted) (NRG) 28.86 +0.90 : Co confirmed it entered into a plan sponsor agreement with Edison Mission Energy (EME), certain of EME's subsidiaries, the unsecured creditors committee, certain of EME's unsecured noteholders, and the parties to the Powerton and Joliet sale leaseback transaction to acquire substantially all of the assets of EME, including its equity interests in certain of its subsidiaries, for an aggregate purchase price of $2,635 million. The aggregate purchase price, which is subject to certain post-closing adjustments, will consist of approximately 12.7 million shares of NRG common stock (valued at $350 million based upon the volume-weighted average trading price of the 20 trading days prior to October 18, 2013) with the balance to be paid in cash on hand. In connection with the transaction, NRG will also assume non-recourse debt of approximately $1,545 million, of which $273 million is associated with assets designated as Non-Core Assets pursuant to the asset purchase agreement.

Strategic Rationale:

Increases NRG's generation portfolio by nearly 8,000 net megawatts (MW), providing additional fuel diversity, geographic diversity, and opportunities to achieve economies of scale
Significantly expands pipeline of assets available to drive growth at NRG Yield (NYLD) through future drop-downs with 1,600 MW of long-term, fully-contracted wind and natural gas assets
Builds off the scaled platform and the best practices from the GenOn combination

Financial Highlights:

Expected full year 2014 Adjusted EBITDA of $330 million (or $140 million of pre-tax income) of which $185 million (or $39 million of pre-tax income) is attributable to assets that are suitable for drop-down to NYLD
Transaction anticipated to be credit neutral to NRG

2:00PM Steady stream of fresh session highs this afternoon -- Dow +28, S&P +11.5, Nasdaq Comp +47 (TECHX) : Bank KBE, Reg Bank KRE which underperformed early in the session have displayed intraday relative strength in recent action along with Internet FDN, Industrial XLI.

1:48PM COMEX Metals Closing Prices (COMDX) :

Dec gold fell $8.40 to $1314.20/ounce
Gold traded in negative territory today, dipping to a session low of $1311.20 in afternoon pit trade. Despite settling 0.6% lower, it booked a 3.6% gain for the week.
Dec silver fell $0.05 to $21.92/ounce
Silver chopped around near the unchanged line. It brushed a session high of $22.05 in morning floor action and eventually settled 0.2% lower, booking a 3.2% weekly gain.
Dec copper settled unchanged at $3.30/lbs

1:20PM Adobe Systems displaying some relative strength in the outperforming Software sector IGV in recent trade (ADBE) 52.71 +0.64 : Stock has pushed to a new session high of 52.74 in recent trade leaving it just under this week/Oct high at 52.82. Note that its multi-year high from Sep is modestly above at 52.96.

1:07PM Dow +13 joins S&P +8.8 and Nasdaq Comp +41 at new session highs (TECHX) :

1:06PM Visa sets new session high of 200.41, its multi-year high from Sep is at 200.86 (V) 200.35 +2.07 :

1:00PM Boeing adjusts production rate for 747-8 program to 1.5 airplanes per month from 1.75 through 2015 due to lower market demand (BA) 121.95 -0.36 : Co announced that it will adjust the production rate for the 747-8 program from 1.75 airplanes to 1.5 airplanes per month through 2015 because of lower market demand for large passenger and freighter airplanes.

"This production adjustment better aligns us with near-term demand while stabilizing our production flow, and better positions the program to offer the 747-8's compelling economics and performance when the market recovers," said Eric Lindblad, vice president and general manager, 747 Program, Boeing Commercial Airplanes. "Although we are making a small adjustment to our production rate, it doesn't change our confidence in the 747-8 or our commitment to the program."

The company expects long-term average growth in the air cargo market to begin returning in 2014, and forecasts global demand for 760 large airplanes (such as the 747-8) over the next 20 years, valued at $280 billion. The first delivery at the new production rate is expected in early 2014. The production rate change is not expected to have a significant financial impact.

12:57PM Midday Market Summary: Stocks Near Highs as Technology Leads (WRAPX) : At midday, the Nasdaq trades with a solid gain of 1.0% while the Dow Jones Industrial Average (+0.1%) has had a difficult time staying above its flat line.

The outperformance of the Nasdaq is largely due to the 13.0% gain in Google (GOOG 1004.28, +115.49) after the company beat its earnings expectations by 37 cents. This has also boosted the technology sector (+1.5%) while some other top tech names lag. eBay (EBAY 50.84, -0.55) and Microsoft (MSFT 34.74, -0.18) hold respective losses of 1.1% and 0.5% while IBM (IBM 173.90, -0.93) is lower by 0.5% as it sees continued weakness following yesterday's earnings-driven 6.4% decline.

Although the largest S&P 500 sector-technology-is the clear leader, two other top-weighted groups-financials and health care-have kept the S&P 500 (+0.5%) from matching the gain in the Nasdaq.

The financial sector is little changed even as Morgan Stanley (MS 29.70, +0.77) trades up 2.6% after beating on earnings and revenue. Even though bank shares lag, the sector remains atop this week's leaderboard with a week-to-date gain of 4.9%.

Elsewhere, the health care sector has been pressured by Intuitive Surgical (ISRG 379.04, -20.09) and companies specializing in biotechnology. Intuitive Surgical holds a loss of 5.0% after missing revenue expectations while the iShares Nasdaq Biotechnology ETF (IBB 204.93, -3.44) trades lower by 1.7% as top components trade broadly lower.

Treasuries are little changed with the 10-yr yield at 2.59%.

12:50PM American Homes 4 Rent prices public offering of 4.4 mln of its 5% Series A Participating Preferred Shares for gross proceeds of ~ $110 mln (AMH) 15.84 +0.02 : The Series A Participating Preferred Shares have an initial liquidation preference of $25 per share that may be increased by an additional amount based on home price appreciation in the Company's top 20 markets as determined by the Federal Housing Finance Agency's House Price Index, subject to certain limitations and conditions.

12:42PM Notable movers of interest (SCANX) : The following are some of today's most notable movers of interest, categorized by market capitalization (large cap over $10 billion and mid cap between $2-10 billion) and ranked by % change (all stocks over 100K average daily volume).

Large Cap Gainers

CMG (499.07 +13.66%): Missed quarterly EPS by $0.12 ($2.66 vs $2.78 estimate), revs rose 18.0% yoy to $826.9 mln vs $820.24 mln estimate; comps +6.2% vs ~5% estimate, driven by increased traffic; target raised at Lazard and Miller Tabak
GOOG (1001.83 +12.72%): Beat quarterly EPS by $0.37 ($10.74 vs $10.37 estimate), revs rose 31.4% yoy to $14.89 bln vs $14.8 bln estimate; target raised at Jefferies, Deutsche Bank, Credit Suisse, B. Riley, Canaccord, RBC Capital, Bernstein, UBS, Telsey Advisory Group
BHI (56.06 +8.28%): Beat quarterly EPS by $0.03 ($0.81 ex items vs $0.78 estimate), revs rose 8.1% yoy to $5.79 bln vs $5.78 bln estimate; mentioned positively at Cowen

Large Cap Losers

ISRG (380.59 -4.65%): Reported Q3 GAAP EPS of $3.99, revs fell 7.2% yoy to $499 mln vs $525.87 mln estimate; sees FY13 revs in lower half of previously provided range of flat to +7%; downgraded to Underperform from Market Perform at Northland Capital
UNH (68.1 -4.58%): Downgraded to Hold from Buy at Cantor Fitzgerald
GPC (78.21 -3.17%): Missed quarterly EPS by $0.08 ($1.12 vs $1.20 estimate), revs rose 9.2% yoy to $3.69 bln vs $3.76 bln estimate

Mid Cap Gainers

ALGN (56.99 +24.09%): Beat quarterly EPS by $0.10 ($0.40 ex items vs $0.30 estimate), revs rose 20.5% yoy to $164.5 mln vs $158.75 mln estimate; sees Q4 EPS of $0.41-0.43 vs $0.36 estimate, revs of $169.1-173.1 mln vs $164.28 mln estimate
ATHN (128.12 +21.48%): Missed quarterly EPS by $0.02 ($0.29 ex items vs $0.31 estimate), revs rose 43.1% yoy to $151.5 mln vs $154.89 mln estimate; sees FY13 EPS "at or near the low end" of $1.05-1.15 vs $1.03 estimate, revs "close to the mid-point" of $580-615 mln vs $594.53 mln estimate; upgraded to Buy from Neutral at Sterne Agee
FSLR (49.3 +7.24%): Seeing strength on speculation of an activist investor

Mid Cap Losers

AMD (3.59 -12.22%): Beat quarterly EPS by $0.02 ($0.04 ex items vs $0.02 estimate), revs rose 15.1% yoy to $1.46 bln vs $1.42 bln estimate; sees Q4 revs +2-8% (~$1.49-1.58 bln) vs $1.52 bln estimate; downgraded to Neutral from Buy at BofA/Merrill
IPG (15.97 -5.45%): Missed quarterly EPS by $0.01 ($0.17 vs $0.18 estimate), revs rose 1.8% yoy to $1.7 bln vs $1.71 bln estimate; downgraded to Market Perform from Overweight at Albert Fried
PBCT (14.29 -5.18%): Missed quarterly EPS by $0.01 ($0.20 vs $0.21 estimate); net interest margin decreased 3 basis points from prior quarter to 3.30%

12:41PM Stock indices edge above mid-morning range, hovering slightly under morning peaks -- Dow +6.1, S&P +7.9, Nasdaq Comp +37 (TECHX) :

12:33PM LRR Energy L.P. increases quarterly cash distribution slightly to $0.4875 from $0.485 (LRE) 17.37 +0.58 :

11:58AM European Markets Closing Prices (SUMRX) : European markets are now closed; stock markets across Europe performed as follows:

UK's FTSE: + 0.7%
Germany's DAX: + 0.6%
France's CAC: + 1.1%
Spain's IBEX: + 0.8%
Portugal's PSI: + 0.1%
Italy's MIB Index: + 0.4%
Irish Ovrl Index: + 0.9%
Greece ATHEX Composite: + 2.4%

11:49AM Stocks/ETFs that traded to new 52 week highs/lows this session- New highs (149) outpacing new lows (1) (SCANX) : Stocks that traded to 52 week highs: ABBV, ABC, AES, AIG, ALL, AMP, AMTD, AMZN, APA, AVGO, BA, BBVA, BBY, BHI, BID, BIDU, BMY, BX, CAH, CBI, CBS, CCE, CE, CELG, CERN, CFN, CHK, CLR, CNO, COF, COLE, COP, CUBE, CXO, D, DDD, DFS, DG, DHR, DLPH, DOW, DRH, DVN, EDU, ELN, FB, FDX, FLR, FLS, FNP, FNSR, FOXA, FTI, GA, GCI, GE, GILD, GNC, GNW, GOOG, HAL, HBAN, HCA, HES, HIG, HOT, HP, IM, ING, INTU, IR, JAH, KAR, KEY, KKR, KLAC, KOG, KR, LCC, LINTA, LNG, LPI, LUV, LVS, LYB, LYV, MCK, MCO, MDT, MGM, MMC, MMM, MPEL, MS, NBL, NFLX, NI, NLSN, NOC, NOK, NWL, NYX, OCR, OXY, P, PAYX, PBI, PFG, PX, PXD, RAD, ROST, SAN, SBAC, SBGI, SBUX, SFUN, SINA, SIRI, SLB, SNDK, SPWR, STX, STZ, SU, SWY, SYK, TEF, TMO, TMUS, TOT, TRW, TSS, TYC, UA, UPS, URI, VNTV, VRSN, WAG, WDC, WFM, WFT, WYNN, XRX, YELP, YNDX, YY, ZMH

Stocks that traded to 52 week lows: NUAN

ETFs that traded to 52 week highs: BJK, CROP, CUT, DIG, DVY, EEB, EFA, EWG, EWI, EWK, EWN, EWO, EWP, EWQ, EWY, EZU, FAN, FDN, GREK, GULF, HAO, IAI, IEO, IGE, IHI, IOO, IWC, IWF, IWM, IXC, IYE, IYF, IYG, IYH, IYM, IYT, IYZ, KCE, KIE, MDY, MES, OIH, PBD, PBW, PMNA, PPH, QQQ, RTH, SDY, SMH, SOCL, SOXX, SPY, TAN, UWM, UYG, UYM, VGK, VTI, XES, XLE, XLF, XLK, XLV, XLY, XOP, XRT

ETFs that traded to 52 week lows: SMN, UUP, VXX, VXZ

Note: To reduce the list of stocks making 52 week highs/lows to a manageable size we have filtered out stocks below $2 bln in market cap and below 1 mln average volume. Without this filter 698 stocks made 52 week highs and 18 stocks made 52 week lows.

11:44AM Financial Select Sector SPDR hovering slightly under its opening session high and its previous multi-year high from July at 20.94/20.93 (XLF) 20.89 +0.02 : A firmer start allowed the XLF to test/fractionally break its July peak at 20.93 (session high 20.94) to reach its highest level since 2008. Insurance KIE and Broker IAI have provided leadership while Bank KBE and Reg Bank KBE have underperformed.

11:16AM Currency Commentary: DXY Hits 8-month Low (SUMRX) :

The Dollar Index slumped to 79.55 overnight, its lowest level in eight months. The DXY has been sliding lower since the resolution of the debt ceiling, showing some of the lasting effects of the political stand off. Also hurting the dollar was the downgrade by China's Dagong which holds influence in Asia.
The euro is flirting with the 1.37 level for the first time since early February. A weak dollar has helped drive buyers into the euro. An improvement in economic data and a belief that Europe will see a rise form its two year economic malaise is also helping the single currency. Finally, Chinese economic data this morning was a positive. China is Europe's largest trading partner so that will also provide a tailwind to the euro.
The pound is pushing back toward the 1.62 level. Sterling hit 1.6260 on October 1. This will be a key resistance level for the markets in coming sessions.
The yen continues to crawl toward its 200 sma (97.14). Yen has pushed back into the 97 area late in the week as the dollar has swooned (FOREX, BONDX).

11:15AM 21st Century Fox: TPG to acquire 21st Century Fox's stake in Phoenix Satellite Television Holdings Limited (FOXA) 34.33 +0.01 : TPG and 21st Century Fox (FOXA) announced that they have entered into a definitive agreement, pursuant to which TPG agreed to acquire the remaining 12.15% stake held by 21CF's wholly owned subsidiary Star Entertainment Holdings Limited in Phoenix Satellite Television Holdings Limited. Upon completion of the sale, 21CF will no longer hold an equity interest in Phoenix and its representatives will step down from the board.

10:22AM Stock indices pause -- S&P +6.1, Nasdaq Comp +33 (SPY) : The S&P paused just shy of 1742 resistance from The Technical Take (session high 1741.24), while Nasdaq Comp held near 3898/3904 (session high 3902).

10:13AM Cormedix to raise $3 mln in concurrent offerings (CRMD) 0.98 -0.01 : Co announced that it has entered a securities purchase agreement with an existing institutional investor pursuant to which it has agreed to sell 150,000 shares of Series C-1 Non-Voting Convertible preferred stock and a warrant to purchase up to 750,000 shares of common stock, and also entered into a separate securities purchase agreement with another existing institutional investor pursuant to which it has agreed to sell 150,000 shares of Series C-2 Non-Voting Convertible preferred stock and a warrant to purchase up to 750,000 shares of common stock, for aggregate gross proceeds of $3 mln.

The net proceeds of the financing will be used for general corporate purposes, including the development and commercialization of Neutrolin, and working capital and capital expenditures. No underwriter or placement agent was used in this transaction.

10:11AM Corporate Resource acquires Cameo Employment Services, terms not disclosed (CRRS) 3.59 +0.14 :

10:06AM Relative sector weakness in Finance XLF, Housing XHB, Biotech IBB, Health XLV (TECHX) :

10:05AM Google hits the $1,000 mark. (GOOG) 1,000 +111.83 : A monster gap up in response to earnings, GOOG is welcomed into the "$1,000 club."

10:03AM Baidu.com edges slightly above its early Oct peak at 161.48 to set a new 52-wk high -- session high 161.79 (BIDU) 161.19 +7.36 :

10:02AM Trimas subsidiary Cequent Performance Products enforces protection of intellectual property rights (TRS) 40.77 +0.52 : Co announced that Cequent Performance Products reached an agreement with Pacific Rim International, LLC that protects Cequent's intellectual property rights for its Bulldog brand 2-speed jack design. Cequent discovered that Pacific Rim sold jacks nearly identical to the patented technology in Cequent's Bulldog jacks, and filed a patent infringement suit against Pacific Rim. Cequent demanded that Pacific Rim stop selling those jacks in the marketplace, and pay Cequent for monetary damages based on the sale of those jacks. In response to Cequent's claims, Pacific Rim agreed to a confidential settlement with Cequent.

9:57AM S&P +7 and Nasdaq Comp +34 run to new session highs, this time joined by lagging Dow +6 (SPY) :

9:45AM Opening Market Summary: Major Averages Open Mixed (WRAPX) : The major averages began the session in mixed fashion. The Nasdaq (+0.6%) and S&P 500 (+0.3%) hover near their opening highs while the Dow Jones Industrial Average (-0.1%) holds a modest loss as 21 of its 30 components trade in negative territory.

Meanwhile, the broader market is being underpinned by three influential sectors as energy, industrials, and technology sport respective gains of 0.6%, 0.8%, and 0.8%. The technology sector is an early leader with Google (GOOG 980.57, +91.77) trading higher by 10.3% after reporting an earnings beat.

Although three cyclical groups have shown early strength, two other growth-oriented sectors-financials and materials-have sat out the opening rally. Both sectors are little changed.

9:43AM Big 4 Oil Service cos (OIH +2%) ripping to multi year highs following strong reports from SLB, BHI (OIH) 50.18 +0.98 : BHI +9%, SLB +3%, HAL +1%, WFT +1%.

9:40AM KMG Chemicals (thinly traded) to close Fremont, California site and shift production to alternate facilities (KMG) 23.56 +0.33 : Co announced that as part of a global restructuring of its Electronic Chemicals operations, the company will close its Fremont, California manufacturing site and shift production primarily to the company's Hollister, California and Pueblo, Colorado facilities. The transfer of production from the Fremont site to other locations will begin by the end of calendar 2013, and all production from the facility is expected to cease by March 31, 2014.

9:34AM Divergent action for stock indices -- Nasdaq Comp +25, S&P +5.5, Dow -23 (TECHX) : Weighing on the Dow in the early going are: HS, MSFT, INTC, AXP, DIS, MCD.

9:27AM Uranium Energy enters into definitive agreements with three institutional investors to purchase an aggregate of up to 3,380,952 Units of the co at a price of $2.10 per Unit (UEC) 2.19 : Co announced that it has entered into definitive agreements with three institutional investors to purchase an aggregate of up to 3,380,952 Units of the Company at a price of $2.10 per Unit for gross proceeds of up to $7.1 mln. Each Unit is comprised of one share of common stock of the Company and 0.55 of one share purchase warrant, each whole warrant exercisable at a price of $2.60 to purchase one share of common stock of the Company for a three year period from the date of issuance. The closing of the Offering is expected to take place on or about October 23, 2013, subject to satisfaction of customary closing conditions.

The Company anticipates that the net proceeds from the Offering will be used to fund exploration and pre-extraction expenditures at the Company's South Texas projects including the Burke Hollow Project and for general corporate and working capital purposes.

9:26AM First Horizon reports EPS in-line; Co continues to unwind from former mortgage business with increased repurchase reserve (FHN) 11.44 : Reports Q3 (Sep) earnings of $0.19 per share, excluding non-recurring items, in-line with the Capital IQ Consensus Estimate consensus of $0.19.

Credit quality

Asset quality continues to improve, with net charge-offs declining 80 percent year over year. Third quarter 2012 included $40 million in net charge-offs associated with the implementation of new regulatory guidance
Overall trends are stable or improving

Capital

Capital ratios remain strong.


"Our bankers are generating very good momentum growing our business and improving credit quality, and we are proud that as a result of their efforts we have regained the top market share in Tennessee," said Bryan Jordan, First Horizon's chairman and CEO. "In capital markets we continue to perform well in a somewhat volatile interest rate environment. I am proud of what our team has accomplished in building our business and, while sometimes frustrating, the progress we continue to make in winding down our national mortgage business

9:26AM Chimerix prices 2,476,995 shares of its common stock at $16.50 by selling shareholders (CMRX) 17.00 :

9:26AM On The Wires (WIRES) :

Medical Marijuana (MJNA) announced that HempMedsPX, a corporate portfolio co of Medical Marijuana and the exclusive master distributor and contracted marketing co for CannaVest and Medical Marijuana, is augmenting their product line with new cannabidiol (CBD)-rich hemp-based products at Cibdex.com.
Ogilvy Public Relations, a unit of Ogilvy & Mather, a WPP (WPPGY) co, announced two new client additions to its New York roster: Altec Lansing, audio electronics manufacturer and Bitdefender, security and anti-virus software creator.
Power Integrations (POWI) introduced the first reference design for a Qualcomm (QCOM) Quick Charge 2.0-enabled charger power supply.
Terreno Realty (TRNO) acquired two industrial properties located in Carlstadt, New Jersey on Oct 17, 2013 for a purchase price of ~ $9.9 mln.
UBS Wealth Management Americas, a division of UBS AG (UBS), announced the relaunch of its equity plan business: UBS Equity Plan Advisory Services (formerly known as Corporate Employee Financial Services or CEFS).
Exactech (EXAC) announced the presentation of scientific posters and presentations regarding its latest advancements for shoulder and knee replacement surgery during the 2013 International Society for Technology in Arthroplasty Annual Congress this week in Palm Beach, FL.
Tyler Technologies (TYL) announced that Shelby County, Tenn., has chosen Tyler's Odyssey court case management system to modernize and streamline court processes.

9:23AM CVR Partners reschedules 3Q2013 earnings release and conference call to Nov.1 (UAN) 18.75 :

9:22AM CVR Energy reschedules 3Q2013 earnings release and conference call to Nov.1 (CVI) 40.81 :

9:22AM CVR Refining reschedules 3Q2013 earnings release and conference call to Nov. 1 (CVRR) 25.29 :

9:15AM S&P futures vs fair value: +4.50. Nasdaq futures vs fair value: +25.20. (WRAPX) : The major averages are poised to register gains at the open as the S&P 500 will look to build on its week-to-date advance of 1.8% after ending yesterday's session at a fresh record high of 1,733.15.

Equity futures have received significant pre-market support from a handful of large names reporting above-consensus earnings. Most notably, Google (GOOG 969.56, +80.77) has soared 9.1% in pre-market action after eclipsing Capital IQ earnings expectations by 37 cents. Given the early strength, shares of Google should provide a significant boost to the technology sector while other growth-sensitive groups are also expected to see opening gains.

Among financials, Capital One (COF 72.50, +0.35) and Morgan Stanley (MS 29.70, +0.77) hold respective pre-market gains of 0.5% and 2.7% after both names beat on earnings and revenue.

Elsewhere, the energy sector should see early support from Schlumberger (SLB 93.27, +1.84) after the company reported a bottom-line beat.

Treasuries have retraced a portion of their overnight move, but they remain in positive territory. The 10-yr yield is down two basis points at 2.57%.

9:08AM Amazon.com announces that the new 7' Kindle Fire HDX is now shipping (AMZN) 310.77 :

9:07AM Knightsbridge Tankers Ltd prices 6 mln share public offering at $9.00 per share (VLCCF) 10.40 :

9:04AM EPR Properties prices public offering of 3.6 mln of its common shares; co will receive ~ $176.8 mln of gross proceeds (EPR) 50.09 :

9:03AM Praxair starts up air separation plant in Brazil (PX) 124.40 : White Martins, the Brazil-based subsidiary of Praxair, has started up a new 800 tons per day air separation plant in the state of Minas Gerais, located in southeastern Brazil. Under a long-term contract, Praxair's new plant will supply industrial gases to ArcelorMittal (MT).

9:03AM TE Connectivity announces that its subsidiary, Tyco Electronics Group has called for redemption its 5.95% Senior Notes due 2014 (TEL) 52.48 :

9:02AM Genuine Parts misses by $0.08, misses on revs (GPC) 80.77 : Reports Q3 (Sep) earnings of $1.12 per share, $0.08 worse than the Capital IQ Consensus Estimate of $1.20; revenues rose 9.2% year/year to $3.69 bln vs the $3.76 bln consensus.

Commentary: Commentary: "...This was especially true in our non-automotive businesses, as the demand patterns across these segments decelerated in the quarter. Fortunately, our Automotive Group performed reasonably well for us and continues to report solid progress in their operations...In the third quarter, sales for the Automotive Group were up 22% for the second consecutive period. This increase includes core North American growth of approximately 5% and the positive impact of the Australasian acquisition. We were pleased by the ongoing positive sales trends in both North America and at GPC Asia Pacific. Sales for Motion Industries, our Industrial Group, were down by 2.5%; and EIS, our Electrical/Electronic Group, showed sales down approximately 5%. S. P. Richards, our Office Products Group, had a 3% sales decrease for the quarter."

9:02AM Cinedigm announced it priced an underwritten public offering of 7,904,340 shares of Class A common stock at a price per share of $1.43 (CIDM) 1.53 :

9:01AM Safeway Board of Directors increases authorized level of the co's stock repurchase program by $2.0 bln (SWY) 33.38 : Through the end of the third quarter of 2013, Safeway had ~ $0.8 billion remaining under its previously authorized stock repurchase program.

9:00AM Tompkins Financial increases cash dividend by 5.3% to $0.40/share (TMP) 47.51 :

9:00AM Fairchild Semi to switch stock exchange listing to NASDAQ on October 31 (FCS) 12.37 : Co announces that it will voluntarily transfer its stock exchange listing from The New York Stock Exchange to the NASDAQ Global Select Market on October 31, 2013. The company's stock will continue to trade under the symbol "FCS". This transfer will be seamless to Fairchild investors.

8:57AM S&P futures vs fair value: +3.70. Nasdaq futures vs fair value: +22.20. (WRAPX) : The S&P 500 futures trade higher by 0.3%.

It was a sea of green across Asia as all of the major bourses, aside from Japan's Nikkei (-0.2%), ended with gains. The overnight enthusiasm came following in-line Chinese Q3 GDP (7.8%), and was supported by an underlying bid following yesterday's reversal on Wall Street. The Shanghai Composite (+0.2%) managed to eke out a small gain, but Hong Kong's Hang Seng was more impressive, posting a 1.1% advance. However, the big winner was India's Sensex (+2.3%) as trade rallied to a three-year high. Meanwhile, Japan's Nikkei (-0.2%) lagged as a strong yen weighed. S&P chimed in overnight, reaffirming its 'AA-' rating while maintaining a negative outlook and saying that a downgrade remains possible if the Japanese government fails to implement reform. Other Chinese data showed fixed asset investment is up 20.2% year-to-date (20.4% expected) and industrial production advanced 10.2% year-over-year (10.1% expected).

In Japan, the Nikkei shed 0.2% as trade continues to struggle near resistance that has been in place since the early summer. Automakers were weak as Toyota gave up 1.0% and Honda Motor shed 0.3%. Elsewhere, financials slightly outperformed as Mitsubishi UFJ Financial ticked up 0.2%.
Hong Kong's Hang Seng finished higher by 1.1% as trade continues to press resistance in the area. Insurer AIA surged 4.4% after the company reported a jump in new business growth. Meranwhile, PC maker Lenovo shed 1.7% on reports it was considering a bid for smartphone maker Blackberry.
In China, the Shanghai Composite added 0.2% as trade held below the 200-day moving average. Brokerage firms outperformed with Industrial Securities gaining 1.2%.

Major European indices hover near their highs as the quiet session continues. In Germany, Angela Merkel's CDU/CSU alliance has agreed to begin coalition talks with SPD, which is reportedly looking to replace the current Finance Minister Wolfgang Schaeuble. Elsewhere, Spanish bad loan ratio rose to a record level of 12.1% in August. Economic data was limited to Spain's industrial new orders, which fell 5.4% year-over-year (4.2% expected, 1.5% previous).

Germany's DAX is higher by 0.2% as health care outperforms. Bayer, Fresenius Medical, and Henkel are all up between 1.1% and 2.0%. SAP is the weakest index member, down 1.4%.
Great Britain's FTSE trades up 0.5% with consumer names in the lead. Reckitt Benckiser and Whitbread are both up near 2.0%. Media names lag with British Sky Broadcasting and ITV down 1.8% and 0.5%, respectively.
In France, the CAC holds a gain of 0.7% as consumer names contribute to the strength. Accor and L'Oreal trade with respective advances of 3.9% and 3.1%.

8:48AM On The Wires (WIRES) :

Worthington Industries (WOR) has finalized its agreement with Nisshin Steel and Marubeni-Itochu Steel forming a JV called Zhejiang Nisshin Worthington Precision Specialty Steel. Located near Shanghai, China, the JV will produce cold rolled strip steel primarily for the automotive industry.
Check Point Software Technologies (CHKP) announced that the Check Point SWG-12600 Secure Web Gateway received a "Performance Verified" rating from Miercom.
The largest tracking solar plant acquired by Southern Company (SO) subsidiary Southern Power in partnership with Turner Renewable Energy, the Spectrum Solar Facility, has begun commercial operation.
Sirius XM Radio (SIRI) announced today's launch of "El Show de Piolin," hosted by Eddie "Piolin" Sotelo.
SED International Holdings (SED) announced that SED International de Colombia has been appointed Microsoft's (MSFT) authorized channel distributor in Colombia for its XBox, hardware and productivity software product families.
Fifth Third Bank (FITB) has extended more than $9.3 bln in new and renewed credit to business customers from July through Sep 2013.
Inter Parfums (IPAR) announced that its subsidiary Inter Parfums USA entered into an agreement to acquire certain assets of the fragrance division of Oscar de la Renta. Terms were not disclosed. Simultaneously, the firms entered into a worldwide and exclusive licensing agreement to create, produce and distribute perfumes and cosmetics under the Oscar de la Renta brand.

8:42AM Alico: 734 Agriculture and Arlon Group purchase majority interest in Alico; transaction values the majority stake at $37 per share (ALCO) 43.00 : 734 Agriculture and Alico announced that 734 Agriculture, a private investment company owned and controlled by Remy W. Trafelet and George R. Brokaw, in partnership with Arlon Group, a global food and agriculture investment firm founded by Continental Grain, have entered into definitive agreements under which an affiliate of 734 Agriculture will acquire ~ 50.5% of Alico's outstanding voting stock from Atlantic Blue Group, a family owned holding company. The all cash transaction values the majority stake in Alico at $37 per share, for a total purchase price of $137.8 mln. The transaction is scheduled to close during the fourth calendar quarter of 2013, subject to limited customary closing conditions.

8:31AM Zuoan Fashion says it is co's policy is not to comment on unusual market activity (ZA) 3.10 : Co announced that, in view of the unusual activity in the Company's stock, the New York Stock Exchange has contacted the Company in accordance with the Exchange's usual practice. The Company stated that its policy is not to comment on unusual market activity.

8:26AM S&P futures vs fair value: +5.30. Nasdaq futures vs fair value: +27.00. (WRAPX) : Equity futures continue to hover near their best levels of pre-market action with Nasdaq (+0.6%) futures in the lead after Google (GOOG 971.50, +82.71) delivered a strong quarterly report.

Overall, investors have responded positively to most earnings reported since yesterday's close. General Electric (GE 25.35, +0.67), Morgan Stanley (MS 29.97, +1.04), and Schlumberger (SLB 93.45, +2.02) hold pre-market gains ranging from 2.2% to 3.5% after all three reported bottom-line beats. Of the three, Morgan Stanley was to only name to surpass its revenue expectations.

Treasuries hold modest gains with the 10-yr yield down two basis points at 2.57%.

8:24AM Gapping down (SCANX) : In reaction to disappointing earnings/guidance: ACTG -17.4%, AMD -9.5%, TXT -6.3%, ISRG -6%, BGS -3.1%, RMBS -2.1%, (light volume), STI -1.9%, HON -0.9%.

Other news: PSDV -47.4% and ALIM -38.7% (receive Complete Response Letter For ILUVIEN), ARIA -29.8% (announces discontinuation of the Phase 3 Epic Trial of Iclusig in Patients with Newly Diagnosed Chronic Myeloid Leukemia), VLCCF -10.6% (announced a public offering of common shares), CIDM -8.5% (intends to offer and sell in an underwritten public offering 7,904,340 registered shares of Class A common stock, to acquire Gaiam's entertainment unit for $51.5 mln), EVEP -5.1% (announces public offering of 5 mln of its common units representing limited partner interests), TAM -5.1% (still checking), CMLP -2.7% (commenced an underwritten public offering of 14,000,000 common units representing limited partner interests), SAP -1.8% and ASML -1.6% (still checking), OMER -0.5% (files for $100 mln mixed securities shelf offering to replace expiring universal shelf registration statement), .

Analyst comments: SWIR -3.5% ( downgraded to Mkt Perform from Outperform at Raymond James), AMRN -2% (downgraded to Neutral from Buy at Citigroup), MPWR -1.7% (downgraded to Market Perform from Outperform at Wells Fargo), IRF -1.6% (downgraded to Market Perform at Wells Fargo), PNRA -1.3% (downgraded to Neutral from Outperform at Wedbush ), BAX -0.5% (downgraded to Market Perform from Outperform at Raymond James, downgraded to Equal-Weight from Overweight at Morgan Stanley)

8:17AM EV Energy Partners prices 5 mln common unit offering at $36.86 per unit (EVEP) 38.45 : Co announced that its public offering of 5,000,000 common units was priced at $36.86 per unit to the public. The Partnership expects the delivery to occur on Oct 23, 2013. In addition, the underwriters have an over-allotment option to purchase up to 750,000 common units.

Assuming no exercise of the over-allotment option, the Partnership expects to receive net proceeds from the offering of ~$181.2 mln, after deducting the underwriting discounts and commissions and estimated offering expenses, and including the Partnership's general partner's proportionate capital contribution.

The Partnership intends to use the net proceeds from the offering, including the proceeds from any exercise of the over-allotment option of common units, to repay borrowings outstanding under its senior secured credit facility. Wells Fargo Securities, Citigroup, J.P. Morgan, Raymond James, RBC Capital Markets, Baird, and Credit Suisse will act as joint book-running managers of the underwritten offering of common units.

8:16AM Gapping up (SCANX) : In reaction to strong earnings/guidance: ZHNE +25.4%, ALGN +16.5%, (also upgraded to Buy from Hold at Cantor Fitzgerald), CPSS +9.8% (light volume), GOOG +9.2%, CMG +7.7%, CPHD +6.8%, ATHN +4.3%, HCA +4.1%, BHI +3.8%, MS +3.2%, PH +3%, (light volume), SLB +2.8%, GE +2.5%, COF +0.5%.

M&A news: WTSL +5.6% (Wet Seal considering sale of the company, according to The Deal story out yesterday), CHK +2.1% (reports that BP and Royal Dutch Shell may be interested in the company ), BBRY +1.2% (late spike on WSJ story suggesting renewed Lenovo (LNVGY) interest).

A few financial related names showing strength: PUK +3.2%, IBN +1.3%, BAC +0.7%, DB +0.6%.

Select mining stocks trading higher: RIO +1.5%, BBL +1.2%, BHP +0.8%, GOLD +0.6%.

Many tech/internet names are higher following GOOG results: QIHU +1.5%, YNDX +1.2%, SOHU +1.1%, BIDU +1%, SINA +0.5%, ASML +-1.6%,

Solar names trading higher: RSOL +3.6%, LDK +3.1%, CSIQ +2.7%, JKS +2.1% (Signs Strategic Agreement for 120MW with the local authority in Electromechanical Industrial Park, Zhenjiang New Area in Jiangsu Province), SPWR +1% (E20/327 Solar Panels Achieve Lowest Potential Induced Degradation),

Other news: ANAC +18.8% (Anacor Pharma announces favorable ruling in its arbitration with Valeant Pharmaceuticals), GAIA +7.1% (Cinedigm to acquire Gaiam's entertainment unit for $51.5 mln), CPE +2.6% (enteres into an agreement with W&T Offshore (WTI) to sell its interests in the Medusa field and Medusa Spar and substantially all of its Gulf of Mexico shelf assets, for total cash consideration of $100 mln), FB +2.3% (sympathy strength with GOOG, still checking for anything additional), CVM +2.3% (receives notification from NYSE Regulation dated Oct 17, 2013 that the co is now considered to have regained compliance with the listing requirements of the NYSE MKT Company Guide, HIMX +2% (still checking), CF +1.5% ( increases quarterly dividend by 150% to $1.00 per share), THC +1.2% (following HCA results), DEO +0.9% (continued strength following earnings), TSLA +0.8% (still checking), OXY +0.4% (announces initial phase of strategic review; Board of Directors authorized pursuing sale of a minority interest in the Middle East/North Africa operations).

Analyst comments: AMZN +2.7% (Amazon.com upgraded to Buy from Neutral at UBS), BTU +2.3% (Peabody Energy upgraded to Outperform from Market Perform at BMO Capital), VMW +2.2% (VMware upgraded to Overweight from Neutral at JPMorgan), UNP +1.2% (Union Pacific upgraded to Buy from Neutral at Goldman), VZ +1% (Verizon upgraded to Buy from Hold at Deutsche Bank), TMUS +0.9% (added to Conviction Buy List at Goldman), INTU +0.5% (Intuit upgraded to Buy from Neutral at BofA/Merrill),

8:13AM On The Wires (WIRES) :

The Ritz-Carlton, Tianjin, a subsidiary of Marriott International (MAR), opened its doors officially today in Tianjin.
Centene (CNC) announced that its subsidiary, Centurion of Minnesota, has executed an agreement with the Minnesota Department of Corrections to provide managed healthcare services to offenders in the state's correctional facilities. Centurion is a JV between Centene and MHM Services.
Under Armour (UA) announced the opening of a new Under Armour Experience at the Jing An Kerry Centre in Shanghai, China.
RFMD (RFMD) unveiled its first power doubler amplifier in a multi-chip module to support the requirements of the new data over cable service interface specification 3.
Alpha and Omega Semiconductor (AOSL) release a new dual MOSFET family in the common-drain configuration in both DFN 5x6 and Micro-DFN 3.2x2 packages.
PTC Therapeutics (PTCT) will hold its first R&D Day on Friday, October 25, 2013 from 8:30 a.m. to 12:00 p.m. ET in New York City.

8:10AM European Markets Update: DAX +0.2%, FTSE +0.4%, CAC +0.7% (SUMRX) : Major European indices hover near their highs as the quiet session continues. In Germany, Angela Merkel's CDU/CSU alliance has agreed to begin coalition talks with SPD, which is reportedly looking to replace the current Finance Minister Wolfgang Schaeuble. Elsewhere, Spanish bad loan ratio rose to a record level of 12.1% in August. Economic data was limited to Spain's industrial new orders, which fell 5.4% year-over-year (4.2% expected, 1.5% previous).

Germany's DAX is higher by 0.2% as health care outperforms. Bayer, Fresenius Medical, and Henkel are all up between 1.1% and 2.0%. SAP is the weakest index member, down 1.4%.
Great Britain's FTSE trades up 0.4% with consumer names in the lead. Reckitt Benckiser and Whitbread are both up near 2.0%. Media names lag with British Sky Broadcasting and ITV down 1.8% and 0.5%, respectively.
In France, the CAC holds a gain of 0.7% as consumer names contribute to the strength. Accor and L'Oreal trade with respective advances of 3.9% and 3.1%.

8:05AM KKR to acquire Avoca Capital; financial terms not disclosed (KKR) 22.01 : Co announced a transaction to acquire Avoca Capital, a European credit investment manager with ~ $8 billion in assets under management. Financial terms of the transaction were not disclosed.

8:04AM Pinnacle announces changes to segment reporting format (PNK) 23.44 : As a result of the acquisition of Ameristar Casinos and the integration of its properties into Pinnacle Entertainment's operations and financial reporting, the Co will make changes to its reportable segment disclosures beginning with the 2013 Q3. The new reportable segments will generally align the Co's external financial reporting segments with its new internal operating segments, which are based on its internal organizational structure, operating decisions, and performance assessment.

The Co's three reportable segments will be comprised of the following:

The Co's South segment will consist of the financial results for the following properties: L'Auberge Lake Charles, Boomtown New Orleans, L'Auberge Baton Rouge, Boomtown Bossier City, and Ameristar Casino Hotel Vicksburg.

The Co's Midwest segment will consist of the financial results for the following properties: River City, Belterra, Ameristar St. Charles, Ameristar Council Bluffs, Ameristar Kansas City, Ameristar East Chicago, and River Downs. Lumiere Place Casino and Hotels will be accounted for as a discontinued operation beginning in the 2013 Q3 and will not be incorporated in the Midwest segment's results.

The Co's West segment will consist of the financial results for the following properties: Ameristar Casino Resort Spa Black Hawk, Cactus Pete's and Horseshu Hotel & Casino.

8:04AM Valeant Pharma announces award In Anacor (ANAC) dispute; co has been ordered to make a one-time payment of $100 mln in damages plus costs and fees to Anacor (VRX) 112.00 : Co announced the interim final award in its previously disclosed arbitration with Anacor Pharmaceuticals (ANAC) to resolve a breach of contract dispute arising out of services provided by Dow Pharmaceutical Sciences prior to its acquisition by Valeant. As a result of the Sep 2013 arbitration hearing, Valeant has been ordered to make a one-time payment of $100 mln in damages plus costs and fees to Anacor. The arbitrator did not grant an injunction or ongoing royalty, which means that, while still subject to regulatory approval, nothing in the arbitrator's order prevents the launch of Jublia (efinaconazole 10% topical solution). As previously disclosed, Anacor had sought an award of at least $215 mln plus injunctive relief.

8:03AM Asian Markets Close: Nikkei -0.2%, Hang Seng +1.1%, Shanghai +0.2% (SUMRX) : It was a sea of green across Asia as all of the major bourses, aside from Japan's Nikkei (-0.2%), ended with gains. The overnight enthusiasm came following the stronger than expected Chinese Q3 GDP (7.8% actual v. 7.5% expected), and was supported by an underlying bid following yesterday's reversal on Wall Street. The Shanghai Composite (+0.2%) managed to eke out a small gain, but Hong Kong's Hang Seng was more impressed, posting a 1.1% advance. However, the big winner was India's Sensex (+2.3%) as trade rallied to a three-year high. Meanwhile, Japan's Nikkei (-0.2%) lagged as a strong yen weighed. S&P chimed in overnight, reaffirming its 'AA-' rating while maintaining a negative outlook and saying that a downgrade remains possible if the Japanese government fails to implement reform. Other Chinese data showed fixed asset investment is up 20.2% YTD (20.4% expected) and industrial advanced 10.2% YoY (10.1% expected). Looking at the currencies...USDCNY fell to a 20-year low of 6.0968; USDINR ticked up to 61.26; USDJPY is weaker at 97.75; AUDUSD is stronger near .9655. In Japan, the Nikkei closed -0.2% as trade continues to struggle near resistance that has been in place since the early summer. Automakers were weak as Toyota gave up 1.0% and Honda Motor shed 0.3%. Elsewhere, financials slightly outperformed as Mitsubishi UFJ Financial ticked up 0.2%.

In Hong Kong, the Hang Seng finished +1.1% as trade continues to press resistance in the area. Insurer AIA surged 4.4% after the co reported a jump in new business growth. Meranwhile, PC maker Lenovo shed 1.7% on reports the co was considering a bid for smartphone maker Blackberry...In China, the Shanghai Composite settled +0.2% as trade held below the 200 dma. Brokerage firms outperformed with Industrial Securities gaining 1.2%.

In India, the Sensex closed +2.3% as trade moved to within 1.7% of all-time highs. Financials led as ICICI Bank and HDFC Bank jumped 4.6% and 3.4%, respectively. Elsewhere, heavyweight Reliance Industries posted a solid 2.9% advance. Click here to see a daily Sensex chart.

In Australia, the ASX finished +0.7% as trade ended at a fresh 40-month high. Financials were higher across the board as Westpac led the way with a 1.1% gain. Meanwhile, miners lagged as BHP Billiton and Rio Tinto slipped 0.1% and 0.4%, respectively.

In Taiwan, the Taiex settled +0.8%...In South Korea, the Kospi closed +0.6%.

In other regional markets...Malaysia +0.1%...Singapore +0.2%...Vietnam +0.3%...Indonesia +0.6%...Philippines +0.7%...Thailand +1.1%

8:03AM KC Southern misses by $0.01, reports revs in-line (KSU) 113.16 : Reports Q3 (Sep) adj. earnings of $1.10 per share, $0.01 worse than the Capital IQ Consensus Estimate of $1.11; revenues rose 7.7% year/year to $621.6 mln vs the $622.4 mln consensus.

Overall, carload volumes were 3% higher than in third quarter 2012. Third quarter revenue growth compared to 2012 was led by a 17% increase in Intermodal. Revenues from Industrial & Consumer, Agriculture & Minerals and Automotive grew by 7%. Revenues from Energy and Chemicals & Petroleum grew by 6% and 3%, respectively, over 2012.

8:02AM SunPower E20/327 solar panels achieve lowest potential induced degradation (SPWR) 31.59 : Co announces that its high-efficiency SunPower E20/327 Solar Panel recently underwent stringent third-party testing for potential induced degradation by PV Evolution Labs. Upon completion, the panels showed power loss of less than 0.2 percent, performing better than any of the others tested. The average degradation of modules that passed this test is ~4-5%.

SunPower earned certificates in all grounding configurations and, when compared against conventional panels that passed, its panels degraded at a rate 20 times lower. Only 50 percent of all panels tested successfully passed the program's criteria. A conventional panel is approximately 240 watts, 15 percent efficient and ~1.6 square meters in size.

8:02AM CEL-SCI Corp receives notification from NYSE Regulation dated Oct 17, 2013 that the co is now considered to have regained compliance with the listing requirements of the NYSE MKT Company Guide (CVM) 0.86 :

8:01AM S&P futures vs fair value: +4.30. Nasdaq futures vs fair value: +24.50. (WRAPX) : U.S. equity futures hold pre-market gains with the S&P 500 futures up 0.3% while Nasdaq (+0.5%) futures outperform as shares of Google (GOOG 976.50, +87.71) contribute to the strength. Google sports a pre-market gain of 9.9% after handily beating earnings expectations.

Reviewing overnight developments:

Asian markets ended mixed. Japan's Nikkei -0.2%, China's Shanghai Composite +0.2%, and Hong Kong's Hang Seng +1.1%.
In regional economic data:
China's GDP rose 2.2% quarter-over-quarter (1.9% expected, 1.7% prior) while the year-over-year reading came in at 7.8%, as expected (7.5% previous). In addition, industrial production increased 10.2% year-over-year (10.1% expected, 10.4% last), retail sales rose 13.3% year-over-year (13.5% forecast, 13.4% previous), and fixed asset investment climbed 20.2% year-over-year (20.3% expected, 20.3% prior).
Japan's foreign bonds buying report pointed to net purchases in the amount of JPY380.70 billion (-JPY2.22 trillion prior).
In news:
Bank of Japan Governor Haruhiko Kuroda spoke overnight, but did not provide too much new insight. The central bank governor said monetary policy has started showing effects on the economy while making progress in correcting yen strength.

Major European indices hover near their highs. Germany's DAX +0.2%, Great Britain's FTSE +0.4%, and France's CAC +0.5%.
Economic data was limited:
Spain's industrial new orders fell 5.4% year-over-year (4.2% expected, 1.5% previous).
Looking at news:
Spanish bad loan ratio rose to a record level of 12.1% in August.
In Germany, Angela Merkel's CDU/CSU alliance has agreed to begin coalition talks with SPD, which is reportedly looking to replace the current Finance Minister Wolfgang Schaeuble.

In U.S. corporate news:

Capital One (COF 72.25, +0.10): +0.1% after beating on earnings and revenue.
Chipotle Mexican Grill (CMG 473.99, +34.92): +7.7% after its above-consensus comparable stores guidance overshadowed its earnings miss.
General Electric (GE 25.35, +0.67): +2.7% after beating earnings expectations by one cent.
Honeywell (HON 85.99, -0.75): -0.9% following its mixed results. The company surpassed earnings estimates by one cent, but reported revenue below analyst expectations.
Intuitive Surgical (ISRG 365.00, -34.13): -8.6% after reporting an earnings beat on below-consensus revenue.
Morgan Stanley (MS 29.75, +0.82): +2.8% after beating on earnings and revenue.
Schlumberger (SLB 94.00, +2.57): +2.8% following its earnings beat.

8:01AM Pfizer reports top-line results from two Lyrica capsules CV Phase 3b studies. The fibromyalgia study, A0081275 met its primary endpoint. Separately, the painful DPN study, A0081269 did not meet its co-primary endpoints (PFE) 30.26 : Co announced top-line results from two phase 3b, placebo-controlled studies with Lyrica (pregabalin) Capsules CV in patients with fibromyalgia (FM) and painful diabetic peripheral neuropathy (DPN), respectively.

The fibromyalgia study, A0081275 met its primary endpoint, showing a reduction in pain associated with fibromyalgia in patients who were treated concurrently with antidepressant therapy for comorbid depression.

Separately, the painful DPN study, A0081269 did not meet its co-primary endpoints by sufficiently reducing DPN pain and DPN pain on walking compared to placebo.

The fibromyalgia study (A0081275) was a multicenter, double-blind, randomized, placebo-controlled, two-way cross-over study of Lyrica in the treatment of FM pain in patients taking concurrent antidepressant therapy for comorbid depression. The study enrolled 197 patients diagnosed with both fibromyalgia and comorbid depression who were taking a stable dose of a single antidepressant medicine (either a selective serotonin reuptake inhibitor or a serotonin--norepinephrine reuptake inhibitor) for their depression for at least three months prior to the study. In each of the two double-blind treatment periods, patients were randomized to receive Lyrica (300 or 450 mg) or placebo twice per day during a six-week treatment phase, followed by a two-week washout period, and then crossed over to the opposite treatment for an additional six weeks.

The study met its primary endpoint, showing a statistically significant greater reduction in fibromyalgia pain in patients receiving Lyrica compared to patients receiving placebo assessed by diary-based, daily pain scores. The safety profile of Lyrica was consistent with previous studies and current product labeling. The most common adverse events in this study included dizziness, somnolence and constipation.

7:51AM IntercontinentalExchange announces ICE Futures Europe reached a daily volume record of 16,034 contracts in ICE Coal futures on Oct 17, 2013; previous volume record was 14,090 contracts on Mar 28, 2013 (ICE) 197.25 : Volume for ICE Coal futures and options also reached a combined record of 21,734 contracts on October 17, 2013, compared with the previous combined record of 19,390 on June 25, 2013. ICE gC Newcastle Coal futures achieved record open interest of 26,941 contracts on October 17, 2013.

7:40AM Parker-Hannifin beats by $0.20, reports revs in-line; raised FY14 EPS above consensus (PH) 106.78 : Reports Q1 (Sep) earnings of $1.67 per share, excluding non-recurring items, $0.20 better than the Capital IQ Consensus Estimate of $1.47; revenues rose 0.5% year/year to $3.23 bln vs the $3.26 bln consensus.

Co raised guidance for FY14, sees EPS of $6.57-7.17, excluding expenses of $0.47/diluted share associated with its previously announced restructuring and an expected gain of $1.68/diluted share associated with a joint venture agreement between Parker Aerospace and GE Aviation to be recorded in the quarter ending Dec 31, 2013, vs. $6.70 Capital IQ Consensus Estimate.

7:35AM Iron Mountain acquires Cornerstone Records Management for ~ $191 mln in cash; expects limited impact on 2013 results and annualized rev of $50 to $55 mln in 2014 with ~ $20 mln in Adjusted OIBDA (IRM) 25.98 : Co has acquired Cornerstone Records Management, growing its core information storage business by adding complementary small and mid-sized organizations to its customer base. The firm purchased Cornerstone for ~ $191 million in cash, subject to certain purchase price adjustments. Co expects limited impact on 2013 results and annualized revenue of $50 to $55 million in 2014 with approximately $20 million in Adjusted OIBDA. Additional Adjusted OIBDA benefits are expected to be realized over time as real estate synergies are achieved.

7:34AM MoSys misses by $0.01; misses on revs (MOSY) 4.26 : Reports Q3 net loss of $0.12 per share, ex-items vs ($0.11) CIQ estimate; revs declined 100K QoQ to $1.0 mln vs $1.4 mln CIQ est

Gross margin for the third quarter of 2013 was 83% compared with 93% in the second quarter of 2013 and 96% for the third quarter of 2012.

7:33AM Cleveland Biolabs transfers laboratory and preclinical services personnel to Buffalo BioLabs (CBLI) 1.57 : Co announces that because of maturation of its development pipeline and a reduced need for certain services, it has transferred laboratory and preclinical services personnel to Buffalo BioLabs, an entity affiliated with one of the co-founders. CBLI has executed a service agreement providing for continued access to this team on an as-needed basis.

7:32AM Aegean Marine Petrol prices public offering of $75 mln of 4.00% convertible senior notes due 2018 (ANW) 10.35 :

7:32AM Caesars Entertainment announces that Oct 21, 2013 is scheduled as the date for the distribution of subscription rights for common stock of Caesars Acquisition (CZR) 20.09 : As previously announced in a press release issued by Caesars on Oct 3, 2013, each stockholder of Caesars as of the close of business on Oct 17, 2013 will be issued, at no charge, one non-transferable subscription right for each whole share of Caesars common stock owned by that stockholder as of the close of business on the Record Date. The subscription rights may not be sold, transferred or assigned and will not be quoted on any stock exchange or market.

7:30AM TransAct Tech announces Ohio Appeals Court's denial of Avery Dennison's (AVY) request for preliminary injunction (TACT) 13.84 : Co announced that the Court of Appeals for the Eleventh Appellate District in Lake County, Ohio, has affirmed the Nov 2012 judgment of the Lake County Court of Common Pleas in TransAct's favor. The earlier Lake County Court of Common Pleas judgment denied Avery Dennison's (AVY) request for a preliminary injunction against TransAct for alleged misappropriation of Avery Dennison trade secrets in connection with the design of the Company's food safety terminals.

7:29AM Morgan Stanley beats by $0.09, beats on revs (MS) 29.75 : Reports Q3 (Sep) earnings of $0.50 per share, $0.09 better than the Capital IQ Consensus Estimate of $0.41; revenues rose 50.0% year/year to $7.93 bln vs the $7.53 bln consensus.

Compensation expense of $4.0 billion was relatively unchanged from a year ago.
Non-compensation expenses of $2.6 billion decreased from $2.8 billion in the prior year primarily due to the absence of non-recurring Wealth Management integration expenses in the prior year quarter.

Institutional Securities

Institutional Securities reported pre-tax income from continuing operations of $371 million compared with a pre-tax loss of $1.9 billion in the third quarter of last year. Net revenues for the current quarter were $3.7 billion compared with $1.5 billion a year ago. DVA resulted in negative revenue of $171 million in the current quarter compared with $2.3 billion a year ago.
Advisory revenues of $275 million declined from $339 million a year ago reflecting lower levels of completed market activity.
Equity underwriting revenues were $236 million compared with $199 million a year ago reflecting increased client activity.
Fixed income underwriting revenues were $481 million compared with $431 million a year ago reflecting growth in investment grade bond and loan fees.
Equity sales and trading net revenues of $1.7 billion increased from $1.3 billion in the prior year quarter reflecting strong performance across products and regions.
Fixed Income & Commodities sales and trading net revenues were $835 million compared with $1.5 billion a year ago. Results reflect lower client activity and market volumes across all products.
Compensation expense for the current quarter of $1.6 billion compared with $1.7 billion in the prior year quarter.
Non-compensation expenses of $1.7 billion were relatively unchanged from a year ago.
Morgan Stanley's average trading Value-at-Risk (VaR) measured at the 95% confidence level was $52 million compared with $61 million in the second quarter of 2013 and $63 million in the third quarter of the prior year.

Wealth Management

Wealth Management reported pre-tax income from continuing operations of $668 million compared with $247 million in the third quarter of last year. The quarter's pre-tax margin was 19%. Net revenues for the current quarter were $3.5 billion compared with $3.2 billion a year ago. Results for the current quarter do not include a noncontrolling interest allocation to Citigroup Inc. (Citi) following the completed acquisition of the Wealth Management Joint Venture, whereas the prior year quarter included a noncontrolling interest allocation to Citi of $9 million.
Asset management fee revenues of $1.9 billion increased 6% from last year's third quarter primarily reflecting an increase in fee based assets and positive flows, partially offset by lower referral fees from Citi.
Compensation expense for the current quarter of $2.0 billion was relatively unchanged from a year ago. Non-compensation expenses of $796 million decreased from $1.0 billion a year ago driven primarily by the absence of non-recurring integration costs reported in the prior year quarter, and continued expense discipline.

Capital

Morgan Stanley's Tier 1 capital ratio under Basel I was approximately 15.3% and Tier 1 common ratio was approximately 12.6% at September 30, 2013.18 At September 30, 2013, book value and tangible book value per common share were $32.13 and $26.96,19 respectively, based on approximately 2.0 billion shares outstanding.

7:29AM Dollar Slips to 79.50: 10-yr: +07/32..2.562%..USD/JPY: 97.70..EUR/USD: 1.3684 (SUMRX) : The Dollar Index continued lower in overnight trade as action fell to the 79.50 level before stabilizing. Today's weakness has the Index trading at its worst level in eight months with trade nearing a test of the critical 79.00 area.

EURUSD is +20 pips at 1.3690 as trade has been limited to a 40 pip range amid the absence of any meaningful news and data out of the region. Today's bid has the single currency testing the February highs while a breakout would produce the best print in 11 months. Click here to see a daily EURUSD chart.
GBPUSD is +45 pips at 1.6205 as trade revisits the early October highs. The current two-day advance has tacked on close to 250 pips and has trade zeroing in on the 1.6300 level. That area remains critical as it has provided a lid on action for the past 26 months.
USDCHF is flat at .9020 as a recent bid has lifted trade off session lows. The ability to hold the .9000 area is of the utmost importance for the bulls as support at the level has been in place since the fall of 2011.
USDJPY is -15 pips at 97.75 as trade slides for a second day. The pair has seen little reaction to S&P reaffirming its 'AA-' rating while maintaining a 'negative' outlook and saying that a downgrade remains possible if the Japanese government fails to implement reform. The 97.00 area remains key as support is helped by the 200 dma.
AUDUSD is +30 pips at .9655 as trade zooms higher for the seventh time in eight days. The recent streak has tacked on almost 250 pips and is setting up a test of the 200 dma (.9760). Today's advance comes after China reported Q3 GDP of 7.8% (7.5% expected). Other Chinese data showed fixed asset investment is up 20.2% YTD (20.4% expected) and industrial advanced 10.2% YoY (10.1% expected). USDCNY fell to a fresh 20-year low of 6.0968.
USDCAD is unchanged at 1.0295 amid a quiet overnight trade as traders await this morning's CPI data. The 1.0250 area remains key as trendline support off the September 2012 lows aids the 200 dma.

7:19AM First Niagara beats by $0.01 (FNFG) 10.93 : Reports Q3 (Sep) earnings of $0.20 per share, $0.01 better than the Capital IQ Consensus Estimate of $0.19.

Additinal metrics:

Net interest margin increased 4 basis points from the second quarter to 3.40%
Fee income declined 4% driven by lower mortgage banking revenues
Average commercial business and real estate loans increased 7% QoQ
Continued momentum in indirect auto loans, which increased by $280 mln
Noninterest-bearing checking balances increase 6% QoQ
Transactional deposits averaged 35% of deposits, up from 31% a year-ago
Continued investment in mobile and digital banking to match evolving consumer banking preferences
NCOs remained flat compared to the prior quarter at 0.33% of average originated loans
Nonperforming originated loans decline 6% QoQ

Credit Quality

The provision for loan losses on originated loans totaled $25.4 mln in the third quarter of 2013, including $12.5 mln to support loan growth and $12.9 mln to cover net charge-offs during the quarter.
At September 30, 2013, nonperforming originated loans comprised 0.89% of originated loans, which equaled a 13 basis point improvement from the prior quarter. Net charge-offs equaled 33 basis points of average originated loans, consistent with the second quarter.

7:15AM Marlin Midstream Partners Board of Directors declared a quarterly cash distribution of $0.23 per unit (FISH) 18.18 : This distribution represents a prorated amount of Marlin's full minimum quarterly distribution of $0.35 per unit for each whole quarter or $1.40 on an annualized basis, based on the number of days between the closing of the Partnership's IPO on July 31, 2013 and the end of the third quarter.

7:12AM Interpublic misses by $0.01, reports revs in-line (IPG) 16.89 : Reports Q3 (Sep) earnings of $0.17 per share, $0.01 worse than the Capital IQ Consensus Estimate of $0.18; revenues rose 1.8% year/year to $1.7 bln vs the $1.71 bln consensus.

During Q3, the co repurchased 6.2 million shares of its common stock at an aggregate cost of $100.2 million and an average price of $16.11 per share.

"We remain on track to deliver against our full-year target of 2-3% organic revenue growth. However, macro conditions in Europe and our results in that region remained more challenging than had been expected at the outset of this year. Investments related to new business wins have also been significant year-to- date. We will continue to drive to our target of 50 basis points of margin expansion for the year, though delivering such a result will depend on very strong performance in the fourth quarter. We are considering targeted year-end cost actions to appropriately position the company for further operating margin expansion in 2014 and beyond."

7:09AM Honeywell beats by $0.01, misses on revs; raises low end of FY13 EPS, lowers FY13 rev guidance (HON) 86.74 : Reports Q3 (Sep) earnings of $1.25 per share, $0.01 better than the Capital IQ Consensus Estimate of $1.24; revenues rose 3.3% year/year to $9.65 bln vs the $9.91 bln consensus.

Co issues guidance for FY13, sees EPS of $4.90-4.95 (from $4.85-4.95) vs. $4.95 Capital IQ Consensus Estimate; lowers FY13 revs to $38.8-39.0 bln from $38.9-39.3 bln vs. $39.17 bln Capital IQ Consensus Estimate. "Despite lower than expected sales in the quarter, primarily related to the delay in closing Intermec and lower Defense & Space sales, strong execution across the portfolio helped drive earnings at the high-end of our guidance range. Our short-cycle businesses, particularly Energy, Safety and Security, and Turbo Technologies, are benefitting from improving end markets, new product introductions, and geographic expansion, while our long-cycle businesses are maintaining a robust backlog, driven by favorable macro trends and strong win rates... Looking ahead to 2014, we are planning for a continued slow growth macro environment, but see a path to strong earnings growth driven by our relentless seed planting in new products and technologies, continued penetration of high growth regions, and growing traction on key process initiatives."

Aerospace: Sales were down (2%) compared with the third quarter of 2012 driven by an (11%) decline in Defense & Space sales as a result of planned ramp downs and program delays, as well as supply chain constraints, partially offset by Commercial growth. Commercial OE sales were up 3% in the quarter driven by continued strong OE build rates and favorable platform mix. Commercial Aftermarket growth of 5% was driven by improved flight hour growth and strong RMU (Repairs, Modifications, and Upgrades) sales. Segment profit was up 3%, and segment margins expanded 110 bps to 20.2%, driven by commercial growth, including productivity net of inflation and commercial excellence, partially offset by lower Defense & Space volume.
ACS: Sales were up 4% reported, 3% organic, compared with the third quarter of 2012, primarily driven by growth in Energy, Safety, and Security due to strong residential end markets, improving commercial retrofit activity, new product introductions, and the favorable impact of acquisitions net of divestitures. Segment profit was up 11% and segment margins expanded 90 bps to 15.3% driven by strong sales conversion, commercial excellence, and productivity net of inflation.
PMT: Sales were up 10% reported, but down (1%) organic, compared with the third quarter of 2012, driven by the favorable impact of the Thomas Russell acquisition, partially offset by challenging global market conditions in Advanced Materials. Segment profit was up 11% and segment margins increased 10 bps to 18.7%, driven by the favorable margin impact of higher UOP licensing and productivity partially offset by inflation and continued investments for growth.
Transporation: Sales were up 6% reported, 5% organic, compared with the third quarter of 2012, driven by strong growth from new platform launches and higher turbo gas penetration in all regions, partially offset by slightly lower European light vehicle production and lower off-highway sales in the U.S. Segment profit was up 23% and segment margins increased 190 bps to 14.0% primarily driven by strong Turbo material productivity and volume leverage, and operational improvements in Friction Materials, partially offset by unfavorable price.

7:03AM JinkoSolar Holding signs strategic agreement for 120MW with the local authority in Electromechanical Industrial Park, Zhenjiang New Area in Jiangsu Province (JKS) 26.00 : Co announced that it has signed a strategic agreement with the local authority in Electromechanical Industrial Park, Zhenjiang New Area, Jiangsu Province, to develop 120 MW distributed PV power plant within 3 years. It will be the largest distributed PV power plant in China upon its completion. With a total investment of more than RMB 1 bln, the project covers an area of ~ 1.2 mln square meters and is designed for commercial and residential rooftop installations in Zhenjiang New Area, Jiangsu Province. JinkoSolar will be responsible for project declaration, investment, EPC, operation and maintenance.

6:35AM General Electric beats by $0.01, reports revs in-line (GE) 24.68 : Reports Q3 (Sep) earnings of $0.36 per share, $0.01 better than the Capital IQ Consensus Estimate of $0.35; revenues fell 1.5% year/year to $35.73 bln vs the $36.05 bln consensus, driven by lower revenues in GE Capital due to planned asset reductions, and a negative FX impact of $132 mln.

"Orders grew 19% with orders growth around the world. Total segment profit grew 12%, Industrial margins grew 120 basis points in the quarter, and we are on track for planned margin expansion of 70 basis points for the year. GE Capital continues to perform well, and we finished the quarter with a Tier 1 common ratio of 11.3%, up 116 basis points.

"Our Industrial strength was broad based, with six of seven businesses growing earnings. As expected, our Power & Water business is strengthening in the second half of the year. Our strategic initiatives are working: growth market orders expanded 22%; service revenues grew 7%; and margins grew significantly, driven by a positive value gap and company-wide simplification efforts. We have reduced Industrial structural costs by ~$1 bln YTD, and will exceed our plan for the year."

Orders for the quarter rose 19% to $25.7 bln. GE's backlog of equipment and services at the end of the quarter was its highest ever at $229 bln, up $6 bln from the second quarter. Infrastructure order pricing was flat for the quarter. The ratio of equipment orders received to sales billed (book-to-bill) was 1.2.

"This quarter we delivered on our major strategic goals for investors. We grew Industrial segment profits 11% with good margin expansion. GE Capital is smaller and stronger; it is returning cash to the parent, while maintaining its profitability. And with a record backlog of $229 bln, we are winning in the market and are well positioned for 2014. Our overall framework for the year is unchanged."

Industrial cash from operating activities (CFOA), excluding NBCUniversal deal-related taxes and pension contributions, was $5.9 bln, up 5% from the year-ago period. Year-to-date total CFOA of $7.8 bln was 27% lower due to NBCU deal-related taxes and the timing of GE Capital dividends. GE ended the quarter with $87 bln of consolidated cash and cash equivalents, and is on track to generate $14 bln to $17 bln of CFOA this year.

GE Capital continues to decrease the size of its portfolio, while focusing on its core businesses. GE Capital earnings rose 13% on positive results from its Real Estate and Consumer businesses. ENI (excluding cash and equivalents) was $385 bln at quarter-end. Volume was up 6% for the quarter, with good returns. General Electric Capital Corporation's (GECC) Tier 1 common ratio rose 116 basis points to 11.3%, and net interest margin was strong at 5%. During the quarter, GECC paid $2 bln in dividends to the parent.

Google (GOOG) beat by $0.37, reports revs in-line; Q3 earnings were $10.74 per share, better than expected; revenues rose 31.4% y/y.

On a consolidated basis, Google revenues for the quarter ended September 30, 2013 were $14.89 billion, an increase of 12% y/y.
Google segment revenues were $13.77 billion, or 92% of consolidated revenues, in the third quarter of 2013, representing a 19% increase y/y.
Google-owned sites generated segment revenues of $9.39 billion, or 68% of total Google segment revenues. This represents a 22% increase y/y.
Google's partner sites generated segment revenues of $3.15 billion, or 23% of total Google segment revenues.
Google segment revenues from outside of the United States totaled $7.67 billion, representing 56% of total Google segment revenues in the third quarter of 2013, compared to 55% in the second quarter of 2013 and 53% in the third quarter of 2012.
Aggregate paid clicks increased approximately 26% y/y and increased approximately 8% q/q.
Average cost-per-click decreased approximately 8% y/y and decreased approximately 4% q/q.
Traffic acquisition costs increased to $2.97 billion in the third quarter of 2013, compared to $2.77 billion in the third quarter of 2012. TAC as a percentage of advertising revenues was 24% in the third quarter of 2013, compared to 26% in the third quarter of 2012.
Motorola Mobile segment revenues were $1.18 billion, or 8% of consolidated revenues in the third quarter of 2013, compared to $1.78 billion, or 13% of consolidated revenues in the third quarter of 2012. Operating expenses were $5.04 billion in the third quarter of 2013, or 34% of revenues, compared to $4.61 billion in the third quarter of 2012, or 35% of revenues.

Google (GOOG) tgt raised earlier to $1100 from $1020 at UBS. Moving from 2H13 to 1H14, firm believes that co's innovation in digital advertising will allow co to produce above digital ad market growth rates. Co is quickly transforming into a digital economy powerhouse by addressing consumer & enterprise needs across technology hardware, software/services/apps, ecommerce and cloud computing. In the coming years, firm expects co to be the main beneficiary of many of the themes (mobile, personalization, social and disruption/innovation) that will drive secular growth in the Internet.

Verizon (VZ): Canccord Genuity notes, solid execution highlighted by wireless strength and wireline improvement. Firm notes once again Verizon demonstrates its US wireless strength in the quarter with solid postpaid subscriber growth in an increasingly competitive market place, while delivering strong margin performance despite the latest iPhone launch in the quarter. With a now fully financed deal to acquire the 45% interest in Verizon Wireless held by Vodafone, they believe Verizon continues to be uniquely positioned to deliver the financial benefits of the combined entity to shareholders. With higher revenue and EBITDA growth rates forecasted for the next few years, firm believes Verizon should continue to trade at a premium to its peers; $50 tgt.

DISH Network (DISH) filed a complaint against Media General, requesting that the Federal Communications Commission immediately require Media General to negotiate in good faith to resolve a blackout that began Oct. 1. In the Complaint, DISH explains how Media General has breached its statutory duty to negotiate in good faith: "Media General's conduct violates the Commission's rules requiring good faith negotiation for retransmission consent rights, because, among other things, Media General failed to respond for 11 days to DISH's last pre-blackout offer." Media General blocked programming from DISH customers in 17 markets after a retransmission contract expired.

icon url

ReturntoSender

10/22/13 10:58 PM

#10361 RE: ReturntoSender #6755

From Briefing.com: 4:10 pm : The S&P 500 (+0.6%) registered its fifth consecutive advance despite seeing some volatility during the first half of the session.

Equity indices opened in positive territory after the September nonfarm payrolls report missed expectations (148K actual, 183K Briefing.com consensus). While the disappointing report underscored the subpar condition of the labor market, participants did not appear too concerned with the news knowing the Federal Reserve has pledged to maintain its loose monetary policy until conditions improve notably.

The market's response to the jobs report was a reflection of the belief that the Fed would not reduce the size of its asset purchases in the immediate term. On that note, Treasuries and gold rallied while the dollar sold off. The 10-yr yield fell nine basis points to a three-month low of 2.52% while gold futures jumped 1.9% to $1340.20 per troy ounce. Elsewhere, the Dollar Index lost 0.6%, ending at its lowest level since early February.

Nine of ten sectors posted gains while technology (-0.2%) underperformed after enduring some late-morning weakness. The tech sector fell from highs to lows during the first 90 minutes of the session as momentum names like Facebook (FB 52.68, -1.18), LinkedIn (LNKD 244.95, -4.84), and Yelp (YELP 69.41, -1.65) sold off. Netflix (NFLX 322.52, -32.47) also displayed weakness, reversing sharply from an earnings-driven gain of almost 10.0%.

Also of note, Apple (AAPL 519.87, -1.49) shed 0.3% after its latest product refresh event was met with a sell-the-news reaction after the stock rallied 5.1% over the past week.

Even though the tech sector briefly pressured the Nasdaq into the red, the S&P was underpinned by several influential groups like consumer discretionary (+0.7%) and energy (+0.7%). Interestingly, the energy sector rallied even as crude oil fell 1.4% to $98.30 per barrel.

Three of four countercyclical sectors outperformed as consumer staples, health care, and utilities advanced 1.4%, 0.9%, and 1.3%, respectively. Trading volume was in-line with average as just over 750 million shares changed hands on the floor of the New York Stock Exchange.

Looking back at today's remaining data, private payrolls added only 126,000 jobs in September after adding an upwardly revised 161,000 (from 152,000) in August. The consensus expected private payrolls to increase by 183,000. Aggregate wages rose 0.2% in September as hourly earnings increased 0.1% and the average workweek remained at 34.5 hours. While that is not as strong as we would like, it is enough to keep consumption spending moving upward. The unemployment rate fell to 7.2% from 7.3%.

The August net long-term TIC flows report indicated an $8.9 billion outflow of foreign capital from U.S. denominated assets. This follows the prior month's $31.1 billion inflow.

Separately, construction spending increased 0.6% in August following a big upward revision (1.4% from 0.6%) in July. The Briefing.com consensus expected construction spending to increase 0.4%.

Tomorrow, the weekly MBA Mortgage Index will be reported at 7:00 ET while September export prices ex-agriculture and import prices ex-oil will be released at 8:30 ET. The day's data will be topped off with the 9:00 ET release of the August FHFA Housing Price Index. On the earnings front, Boeing (BA 122.48, +1.01), Caterpillar (CAT 89.17, +1.47), and WellPoint (WLP 88.43, +0.83) will report their results before the opening bell.DJ30 +75.46 NASDAQ +9.52 SP500 +10.01 NASDAQ Adv/Vol/Dec 1400/1.82 bln/1150 NYSE Adv/Vol/Dec 2222/753.0 mln/814

3:30 pm :

Precious metals rose sharply in early morning pit trade as the dollar index fell on weaker-than-anticipated September nonfarm payrolls data. The report showed that 148K new jobs were added vs the 183K Briefing.com consensus, adding to expectations that the Federal Reserve will not reduce the pace of its asset purchases in the near-term
Dec gold lifted from its session low of $1312.90 per ounce and settled 2.0% higher at $1342.50 per ounce
Dec silver also came off its session low of $22.06 per ounce, rising as high as $22.83 per ounce. It settled at $22.79 per ounce, or 2.3% higher
Nov crude oil, however, extended yesterday's losses despite the weaker dollar index. The energy component pulled back from its session high of $100.30 per barrel and slipped into negative territory in morning floor action. It continued to trend lower and settled 1.4% lower at $98.32 per barrel
Nov natural gas fell deeper into negative territory following inventory data for the week ending Oct 11 that showed a build of 77 bcf when a build of 78-80 bcf was anticipated. It retreated from its session high of $3.65 per MMBtu and brushed a session low of $3.57 per MMBtu moments before settling with a 2.5% loss at $3.58 per MMBtu

4:37PM AT&T will offer AAPL's iPad Air with Wi-Fi + Cellular on Friday, Nov 1, and iPad mini with Retina display with Wi-Fi + Cellular later in November (T) 35.23 +0.01

4:35PM Unisys drops over 5 pts to $20.88 following poor Q3 results (see 16:33 post) (UIS) 26.09 +0.44 :

4:23PM IRobot reports EPS in-line, misses on revs; guides Q4 EPS below consensus, revs below consensus (IRBT) 36.45 +0.35 : Reports Q3 (Sep) earnings of $0.26 per share, in-line with the Capital IQ Consensus Estimate consensus of $0.26; revenues fell 1.4% year/year to $124.5 mln vs the $127.13 mln consensus.

Co issues downside guidance for Q4, sees EPS of $0.06-0.11 vs. $0.19 Capital IQ Consensus Estimate; sees Q4 revs of $124-129 mln vs. $129.20 mln Capital IQ Consensus Estimate.

For 2014, preliminary revenue expectations are for mid-high teen growth, consistent with the financial targets.

4:23PM Corning spkes to 2+ year high after acquiring full ownership of SCP JV from Samsung; sees in-line Q3 results, sees Q4 lower QoQ; authorizes $2 bln share repurchase (GLW) 15.35 : Co issues guidance for Q3 (Sep), sees EPS of $0.33, excluding non-recurring items, vs. $0.32 Capital IQ Consensus Estimate; sees Q3 (Sep) revs of core $2.1 bln vs. $2.1 bln Capital IQ Consensus Estimate.

In the Display Technologies segment, third-quarter LCD glass sequential price declines remained moderate, as expected. LCD glass volume was up slightly sequentially, driven by higher-than-expected demand in the wholly owned business. Sales in all other segments were in line with expectations. Core gross margin was 44%, up nearly two percentage points year over year and up slightly sequentially.

The co expects Q4 results to be lower sequentially, mainly driven by normal seasonality in its Telecommunications, Life Sciences, and Environmental Technologies segments. Adding to the seasonality impact is a significant year-over-year decrease in fiber sales in North America and China, and slower-than-expected construction of the National Broadband Network (NBN) in Australia. In Display Technologies, the co expects moderate sequential price declines and sequential volumes to be down slightly for its LCD glass.

Corning also announced it is obtaining full ownership of Samsung Corning Precision Materials Co., Ltd. (SCP) -- (SSNLF), an unconsolidated equity venture with Samsung Display that manufactures LCD glass in Korea. Samsung Display currently owns 43% of SCP.

Corning's board authorized an additional $2 billion share repurchase program Actions expected to be immediately accretive on fully diluted basis for Corning.
4:19PM Altera beats by $0.03, misses on revs; guides Q4 revs below consensus (ALTR) 37.31 -0.15 : Reports Q3 (Sep) earnings of $0.37 per share, $0.03 better than the Capital IQ Consensus Estimate of $0.34; revenues fell 9.9% year/year to $445.9 mln vs the $451.97 mln consensus.

Year-to-date cash flow from operating activities was $459.4 million. Altera repurchased approximately 161 thousand shares of its common stock during the quarter at a cost of $5.3 million

Guidance: Co issues downside guidance for Q4, sees Q4 revs down 3% to up 1% sequentially, equating to approximately $432.5-$450.36 vs. $474.55 mln Capital IQ Consensus Estimate. Sees Q4 gross margin of 68.5%, plus/minus 0.5%. Sees R&D expense of $110-$111 mln and SG&A of $82-$83 mln.

4:15PM Juniper Networks beats by $0.02, beats on revs; guides Q4 EPS in-line, revs in-line (JNPR) 20.36 -0.49 : Reports Q3 (Sep) earnings of $0.33 per share, excluding non-recurring items, $0.02 better than the Capital IQ Consensus Estimate of $0.31; revenues rose 6.1% year/year to $1.19 bln vs the $1.17 bln consensus. Co reported Operating Margin: 12.2% GAAP; 19.8% non-GAAP, up 0.9 pts from Q2'13

Co issues in-line guidance for Q4, sees EPS of $0.35-0.37, excluding non-recurring items, vs. $0.36 Capital IQ Consensus Estimate; sees Q4 revs of $1.2-1.230 bln vs. $1.23 bln Capital IQ Consensus Estimate. Co sees Q4 Non-GAAP gross margin will be 64.5%, plus or minus 0.5% & Non-GAAP operating expenses will be $510 million to $525 million.

"We delivered our fifth consecutive quarter of year-over-year growth. Our performance reflects our continued ability to execute our strategy with agility in a dynamic macro environment...We continue to see strong demand from our service provider customers and gain traction in the enterprise. It is evidence that our innovative and differentiated product portfolio is aligned with the needs of our customers as they look to build the best networks for their businesses."

4:14PM Super Micro Computer beats by $0.01, beats on revs; guides Q2 EPS in-line, revs in-line (SMCI) 14.26 +0.03 : Reports Q1 (Sep) earnings of $0.22 per share, $0.01 better than the Capital IQ Consensus Estimate of $0.21; revenues rose 14.1% year/year to $309 mln vs the $304.82 mln consensus.

Co issues in-line guidance for Q2, sees EPS of $0.25-0.31 vs. $0.28 Capital IQ Consensus Estimate; sees Q2 revs of $320-350 mln vs. $328.59 mln Capital IQ Consensus Estimate.
"Looking ahead, we are again first to market with the broadest array of new Ivy Bridge solutions in the industry and we will use this position together with our global foundation to take full advantage of the market share opportunities."

4:09PM Broadcom beats by $0.07, reports revs in-line; guides Q4 revs below consensus (BRCM) 27.14 -0.18 : Reports Q3 (Sep) earnings of $0.76 per share, excluding non-recurring items, $0.07 better than the Capital IQ Consensus Estimate of $0.69; revenues rose 0.8% year/year to $2.15 bln vs the $2.13 bln consensus. Co issues downside guidance for Q4, sees Q4 revs of $1.915- 2.03 bln vs. $2.13 bln Capital IQ Consensus Estimate. Product gross margin in Q4 is expected to decline 50-100 bps.

4:06PM Corning and Samsung strengthen Strategic Collaborations; Corning board authorizes additional $2 billion share repurchase program (GLW) 15.35 +0.26 : Corning announces that it is entering into a series of strategic and financial agreements with Samsung Display Co., Ltd., intended to strengthen product and technology collaborations between the two companies. These agreements will allow Corning to extend its leadership in specialty glass and drive earnings growth. Corning expects the transactions to close in the first quarter of 2014.

Transaction Highlights:

Corning obtaining full ownership of Samsung Corning Precision Materials Co., Ltd. (SCP), an unconsolidated equity venture with Samsung Display that manufactures LCD glass in Korea. Samsung Display currently owns 43% of SCP.
After redemption of their interest in SCP, Samsung Display's investment in new convertible preferred shares of Corning with an aggregate face amount of $1.9 billion.
Corning's acquisition of the other shareholders' minority interests in SCP for an expected proportional cash payment.
Samsung Display's additional $400 million investment in Corning by subscribing to new convertible preferred shares.
Using Corning's current share count, Samsung Display's combined investment in Corning would result in approximately 7.4% ownership on an as-converted basis.
A new long-term LCD display glass supply agreement between Corning and Samsung Display through 2023.
A strengthening of the two companies' technology collaborations on strategic product development and commercialization initiatives.
In addition, Corning's board of directors has authorized an additional $2 billion of share repurchases through Dec. 31, 2015, dependent upon the transaction closing.

4:02PM Celestica beats by $0.01, reports revs in-line; guides Q4 EPS in-line, revs below consensus (CLS) 10.49 -0.27 : Reports Q3 (Sep) earnings of $0.22 per share, excluding non-recurring items, $0.01 better than the Capital IQ Consensus Estimate of $0.21; revenues fell 5.3% year/year to $1.49 bln vs the $1.49 bln consensus.

Co issues mixed guidance for Q4, sees EPS of $0.20 to $0.26, excluding non-recurring items, vs. $0.24 Capital IQ Consensus Estimate; sees Q4 revs of $1.4 to $1.5 billion vs. $1.57 bln Capital IQ Consensus Estimate.

2:02PM Apple confirms updated MacBook Pro with Retina display with fourth generation Intel Core processors, faster graphics and longer battery life (AAPL) 519.40 -1.96 : Apple confirms updated MacBook Pro with Retina display with fourth generation Intel Core (INTC) processors, the latest graphics, longer battery life (9h, 2 more than prior), faster flash storage and next generation Wi-Fi starting at lower price of $1299. iWork and iLife are now free with the purchase of every new Mac.

2:01PM Apple confirms the launch of new Mac Pro (AAPL) 519.59 -1.77 : Co confirmed the launch of the all-new Mac Pro. Designed around an innovative unified thermal core, the Mac Pro features the latest Intel (INTC) Xeon processors with up to 12 cores, dual workstation-class GPUs, six Thunderbolt 2 ports, PCIe-based flash storage and ultra-fast ECC memory. The all-new Mac Pro starts at $2,999 and will be available in December.

The new Mac Pro features 4-core, 6-core, 8-core or 12-core Intel Xeon processors running at Turbo Boost speeds up to 3.9 GHz that deliver double the floating point performance of the previous generation Mac Pro.

Large Cap Gainers

WHR (144.95 +10.67%): Beat on EPS by $0.07, missed on revs; raised FY13 EPS guidance in-line.
ILMN (88.55 +8.3%): Beat on EPS by $0.05, beat on revs; guided FY13 EPS above consensus, revs above consensus; target raised to $100 from $86 at Mizuho.
RIG (49.13 +5.5%): Co to replace Dell (DELL) in the S&P 500 after the close of trading Oct 28.

Large Cap Losers

COH (50.26 -7.24%): Beat on EPS by $0.01, missed on revs; N. Am comps down 6.8%; sees FY14 sales growth flat to low single digit in current currency.
ARMH (49.09 -5.2%): Reported in-line earnings with upside rev; guided Q4 rev in-line.
NFLX (338.98 -4.51%): Beat on EPS by $0.03, reported revs in-line; guided Q4 EPS above consensus; upgraded to Equal Weight from Underweight at Evercore; target raised to $360 from $300 at Northland Capital; tgt to $460 from $340 at JPMorgan; heard tgt raised to $450 at Janney.

Mid Cap Gainers

NUS (110.11 +7.22%): Beat on EPS by $0.37, beat on revs; guided Q4 EPS above consensus, revs above consensus.
QEP (32.99 +6.13%): Jana Partners disclosed a 7.5% active stake in co.
LXK (38.34 +7.07%): Beat on EPS by $0.04, beat on revs; guided Q4 EPS in-line.

Mid Cap Losers

ZION (27.69 -7.27%): Downgraded to Neutral from Buy at Citigroup.
AMD (3.16 -6.23%): Downgraded to Underperform from Mkt Perform at Bernstein.
PII (130.01 -4.43%): Beat on EPS by $0.03, beat on revs; raised FY13 EPS in-line, revs in-line.

10:06AM Semiconductor Hldrs ETF lags in early trade (SMH) 41.30 -0.08 : The SMH has slipped back into the red after a minor upticks while the major averages have extended opening gains. Underperforming thus far are: ARMH -5.9%, AMD -4%, TXN -2.4%, CRUS -0.7%, NVDA -0.6%, BRCM -0.4%, INTC -0.3%, ADI -0.2%.

10:01AM Texas Instruments gap down and extension, attempting to stabilize near its 50 sma/ema at 39.76/39.72 -- session low 39.78 (TXN) 39.85 -1.13 :
9:47AM Ultra Clean Holdings (+14%) at 18 month high following beat and raise (UCTT) 8.13 +1.02 :

Ciena (CIEN) announced that Cablevision Argentina is deploying Ciena's 6500 Packet-Optical Platform to upgrade its inter-urban broadband backbone across Argentina

Cypress Semiconductor (CY) and D-Wave Systems announced that D-Wave has successfully transferred its proprietary process technology for building quantum computing microprocessors to Cypress's Wafer Foundry located in Bloomington, Minnesota.

Axcelis Technologies (ACLS) has received a multiple system order for the co's new Purion XE single wafer, high energy implanter.

Finisar (FNSR) introduced its complete XFP-RF transmitter portfolio including the industry's first analog RF-modulated, Small-Form Factor optical transmitter for cable operators' access networks.

DSP Group (DSPG) announced that its DCX DECT SoC and XpandR III multimedia chipset are both powering iiNET's Budii home gateway, home smartphone and tablet.

6:59AM EMC misses by $0.05, misses on revs; lowers FY13 EPS, revs below consensus (EMC) 25.24 : Reports Q3 (Sep) earnings of $0.40 per share, excluding non-recurring items, $0.05 worse than the Capital IQ Consensus Estimate of $0.45; revenues rose 4.9% year/year to $5.54 bln vs the $5.8 bln consensus.

Co issues downside guidance for FY13, lowers EPS to $1.80, excluding non-recurring items, from $1.85 vs. $1.86 Capital IQ Consensus; lowers FY13 revs to $23.25 bln from $23.5 bln vs. $23.45 bln Capital IQ Consensus Estimate. "While our financial results for the third quarter were impacted by a decline in US federal spending and a backend-loaded quarter, we achieved almost all of our strategic and operational goals. We were pleased to see storage demand accelerate in the third quarter excluding US federal, and we think this is an encouraging sign for the storage market overall. Going forward, we remain confident EMC will continue to grow and gain market share."

Nokia (NOK) announced new innovations to design and imaging with six new devices, applications and experiences, including Nokia's first Windows tablet, the Lumia 2520, offers combined LTE and Wi-Fi connectivity and is designed to deliver the best outdoor and indoor readability.

Microsemi (MSCC) unveiled its new miSLIC Series line circuits in booths E21-E22 at the Broadband World Forum tradeshow in Amsterdam. The new fifth-generation telephone line interface solution provides worldwide network operators with the industry's most economical solution for adding two channels of voice to broadband products including residential gateways, DSL integrated access devices, cable embedded multimedia terminal adapters and fiber-to-the-premise solutions.

Ultra Clean Holdings (UCTT $8.00 +0.89) reported third quarter earnings of $0.12 per share, excluding non-recurring items, which is higher than expected, while revenues rose 6.3% year/year to $107.2 million which is lower than expected. The company issued upside guidance for the fourth quarter with EPS of $0.18-0.22, excluding non-recurring items which is higher than expected with revenues of $120-125 million which is higher than expected.

07:28 am Texas Instruments shares fall 3% following earnings
Texas Instruments (TXN $39.70 -1.29) reported third quarter GAAP earnings of $0.56 per share, which is better than expected, while revenues fell 4.3% year/year to $3.24 billion which is higher than consensus. Sept 10 mid-quarter update, the company narrowed Q3 EPS guidance to $0.51-0.55 from $0.49-0.57; co narrowed rev guidance to $3.15-3.29 billion from $3.09-3.35 billion. The company issued downside guidance for the fourth quarter with GAAP EPS of $0.42-0.50 which is below expectations, with revenues of $2.86-3.10 billion which is lower than expected.

"Our revenue in the quarter was up 6 percent sequentially. Excluding the legacy wireless products, revenue grew 10 percent sequentially. Our book-to-bill ratio was 0.97, consistent with an expected seasonal revenue decline in the fourth quarter. Analog and Embedded Processing are now 80 percent of TI's revenue, eight points higher than a year ago. The combined revenue from these two businesses grew 10 percent sequentially and 7 percent from a year ago. Our legacy wireless products declined to less than 2 percent of revenue.

07:26 am Symmetricom shares soar 49% following acquisition by Microsemi (MSCC)
Microsemi Corporation (MSCC $25.56 +0.00) and Symmetricom (SYMM $7.15 +2.38) a worldwide leader in precision time and frequency technologies announced that they have entered into a definitive agreement to acquire Symmetricom, Inc. for $7.18 per share through a cash tender offer, representing a premium of 49 percent based on the average closing price of Symmetricom's shares of common stock during the 90 trading days ended Oct. 18, 2013.

The board of directors of Symmetricom unanimously recommends that Symmetricom's stockholders tender their shares in the tender offer. The total transaction value is approximately $230 million, net of Symmetricom's projected cash balance at closing. Microsemi expects significant synergies from this immediately accretive transaction. Based on current assumptions, Microsemi expects the acquisition to be $0.22 to $0.25 accretive in its first full calendar year ending December 2014. Microsemi reaffirmed its fiscal fourth quarter guidance included in its fiscal third quarter earnings release issued on July 25, 2013. The company previously guided for Q4 revs +2-4% q/q and adjusted EPS of $0.51-0.55.

"This quarter's results demonstrate that our focus on meeting customers' needs is driving sustainable growth across our franchise as we increase loans and households served...This marks the second consecutive quarter that we achieved loan growth and expanded net interest income. At the same time, our asset quality continues to improve and our strong capital levels position us well for the future."
icon url

ReturntoSender

10/23/13 11:35 PM

#10362 RE: ReturntoSender #6755

From Briefing.com: 4:10 pm : The major averages posted losses across the board as the Nasdaq (-0.7%) led to the downside.

Stocks slumped at the open as cautious-sounding headlines from China combined with continued weakness among momentum names conspired to keep equities in the red throughout the session.

Reports out of the Middle Kingdom suggested the largest Chinese banks saw their debt write-offs triple during the first half of the year. Separate headlines indicated the People's Bank of China may tighten monetary policy due to excessive inflation. The liquidity crunch has made its presence known through the overnight Shanghai Interbank Offered Rate (SHIBOR), which jumped 73 basis points to 3.78%.

In addition to the news from China, stocks had to endure continued weakness among momentum names. Shortly after yesterday's close, activist investor Carl Icahn said he halved his stake in Netflix (NFLX 330.24, +7.72) after booking a 457% gain over the course of 14 months. Netflix outperformed today, but other momentum darlings like LinkedIn (LNKD 240.76, -4.19), Tesla (TSLA 164.50, -7.04), and Yelp (YELP 66.04, -3.37) posted losses as some participants may have taken a cue from Mr. Icahn, cashing in on some of this year's top performers.

Chipmakers were also victimized by heavy selling as the PHLX Semiconductor Index tumbled 3.4% after Altera (ALTR 32.30, -5.02) reported disappointing earnings and Broadcom (BRCM 26.36, -0.78) issued cautious guidance.

Even though select tech names displayed significant losses, the broader sector ended in-line with the S&P. Meanwhile, most other cyclical groups underperformed and the industrial sector (unch) was the only cyclical group that ended ahead of the broader market.

Industrials outperformed, building on the relative strength of Boeing (BA 129.02, +6.54), Norfolk Southern (NSC 86.06, +5.46), and Northrop Grumman (NOC 105.56, +4.10) after the three reported better-than-expected earnings. However, the sector could not turn positive due to the underperformance of Caterpillar (CAT 83.76, -5.41), which lost 6.1% after missing on earnings, revenue, and issuing cautious guidance.

Although equity indices spent the entire session in negative territory, only the energy sector (-1.4%) posted a loss exceeding 1.0% as crude oil slid 1.4% to $96.95 per barrel.

Countercyclical sectors outperformed with consumer staples ending in the lead with a modest gain of 0.1%.

Treasuries registered modest gains as the 10-yr yield slipped 2.5 basis points to 2.49%.

Trading volume was a bit below average as less than 710 million shares changed hands on the floor of the New York Stock Exchange.

On the economic front, the weekly MBA Mortgage Index slipped 0.6% to follow last week's uptick of 0.3%.

Separately, the August Housing Price Index from the FHFA increased 0.3%, which followed an increase of 0.8% observed during the prior month.

Lastly, export prices, excluding agriculture, ticked up 0.3% in September after an unchanged prior reading. Excluding oil, import prices rose 0.1%, which followed last month's decline of 0.2%.

Tomorrow, weekly initial claims and the August trade deficit will all be reported at 8:30 ET.DJ30 -54.33 NASDAQ -22.49 SP500 -8.29 NASDAQ Adv/Vol/Dec 1003/1.82 bln/1539 NYSE Adv/Vol/Dec 1359/708.2 mln/1644

3:30 pm :

Precious metals chopped around in negative territory today, with Dec gold and Dec silver falling to respective session lows of $1329.60 and $22.54 per ounce
Unable to gain much momentum, gold settled 0.6% lower at $1334.30 per ounce, while silver settled with a 0.8% loss at $22.61 per ounce
Dec crude oil fell for a third consecutive session following inventory data. The EIA reported that crude oil inventories had a build of 5.25 mln barrels when a smaller build of 2.95 mln barrels was anticipated. The energy component brushed a session low of $96.16 per barrel and settled with a 1.5% loss at $96.87 per barrel
In contrast, Nov natural gas traded higher, advancing to a session high of $3.64 per MMBtu in early afternoon pit trade. It eventually settled with a 1.1% gain at $3.62 per MMBtu

5:05PM Teradyne beats by $0.01, misses on revs; guides Q4 EPS below consensus, revs below consensus (TER) 16.34 -0.33 : Reports Q3 (Sep) earnings of $0.46 per share, excluding non-recurring items, $0.01 better than the Capital IQ Consensus Estimate of $0.45; revenues fell 6.6% year/year to $433 mln vs the $445.66 mln consensus. Bookings in the third quarter of 2013 were $271 million of which $207 million were in Semiconductor Test, $40 million in Wireless Test and $24 million in System Test. Co issues downside guidance for Q4, sees EPS of $0.00-0.07, excluding non-recurring items, vs. $0.24 Capital IQ Consensus Estimate; sees Q4 revs of $260-285 mln vs. $341.57 mln Capital IQ Consensus Estimate.

"Despite industry-wide lower capital spending this year, we've achieved solid operating results and market share momentum through three quarters," said CEO, Mike Bradley. "Consistent with prior years, we're projecting the normal seasonal slowdown in the fourth quarter, but at somewhat higher revenue levels than we experienced at this time last year. We continue to make progress in mobility applications in both Semiconductor Test and LitePoint and will be well-positioned for any expected market growth in 2014."

4:30PM MKS Instruments announces Gerald G. Colella to succeed Leo Berlinghieri as CEO, effective January 1, 2014 (MKSI) 28.86 -0.23 : Co announced Leo Berlinghieri will retire as Chief Executive Officer and a Director of the co at year-end 2013. The Board of Directors has elected Gerald G. Colella, who currently serves as President and Chief Operating Officer, to succeed Mr. Berlinghieri as Chief Executive Officer effective January 1, 2014, at which time Mr. Colella will also become a member of the Board of Directors. Mr. Colella had previously succeeded Mr. Berlinghieri as President in February of this year, and has served as Chief Operating Officer since 2010.

4:26PM MKS Instruments beats by $0.04, beats on revs; guides Q4 EPS in-line, revs above consensus (MKSI) 28.86 -0.23 : Reports Q3 (Sep) earnings of $0.25 per share, excluding non-recurring items, $0.04 better than the Capital IQ Consensus Estimate of $0.21; revenues rose 17.7% year/year to $166.45 mln vs the $164.64 mln consensus.
Co issues guidance for Q4, sees EPS of $0.31-0.41 vs. $0.33 Capital IQ Consensus Estimate; sees Q4 revs of $185-200 mln vs. $179.99 mln Capital IQ Consensus Estimate.

4:23PM Cadence Design reports EPS in-line, revs in-line; guides Q4 EPS in-line, revs in-line (CDNS) 14.51 -0.05 : Reports Q3 (Sep) earnings of $0.21 per share, excluding non-recurring items, in-line with the Capital IQ Consensus Estimate consensus of $0.21; revenues rose 8.3% year/year to $367 mln vs the $367.03 mln consensus.
Co issues in-line guidance for Q4, sees EPS of $0.22-0.24, excluding non-recurring items, vs. $0.23 Capital IQ Consensus Estimate; sees Q4 revs of $370-380 mln vs. $378.57 mln Capital IQ Consensus Estimate.

4:22PM Lam Research beats by $0.10, reports revs in-line; guides Q2 EPS above consensus, revs in-line (LRCX) 52.21 -1.86 : Reports Q1 (Sep) earnings of $0.81 per share, excluding non-recurring items, $0.10 better than the Capital IQ Consensus Estimate of $0.71; revenues rose 11.9% year/year to $1.01 bln vs the $1.01 bln consensus.

Co issues mixed guidance for Q2, sees EPS of $1.02, plus or minus $0.05, excluding non-recurring items, vs. $0.93 Capital IQ Consensus Estimate; sees Q2 revs of $1.1 bln, plus or minus $30 mln, vs. $1.1 bln Capital IQ Consensus Estimate.
Co sees Q2 shipments of approximately $1.125 billion plus or minus $30 million; gross margin of approximately 46.0% plus or minus 1.0%; Operating margin as a percent of revenue of approximately 18.5% plus or minus
1.0%

4:21PM Mellanox Tech misses by $0.03, misses on revs (MLNX) : Reports Q3 (Sep) earnings of $0.29 per share, $0.03 worse than the Capital IQ Consensus Estimate of $0.32; revenues fell 33.5% year/year to $104.1 mln vs the $107.34 mln consensus.

4:19PM LSI Logic beats by $0.01, reports revs in-line; guides Q4 EPS in-line, revs below consensus (LSI) : Reports Q3 (Sep) earnings of $0.17 per share, $0.01 better than the Capital IQ Consensus Estimate of $0.16; revenues fell 2.7% year/year to $607 mln vs the $611.41 mln consensus. Co issues mixed guidance for Q4, sees EPS of $0.13-0.19 vs. $0.17 Capital IQ Consensus Estimate; sees Q4 revs of $580-620 mln vs. $638.42 mln Capital IQ Consensus Estimate.

4:17PM Plexus reports EPS in-line, beats on revs; guides Q1 EPS in-line, revs in-line (PLXS) 38.72 -0.59 : Reports Q4 (Sep) earnings of $0.67 per share, excluding non-recurring items, in-line with the Capital IQ Consensus Estimate consensus of $0.67; revenues fell 4.5% year/year to $567.73 mln vs the $561.51 mln consensus.
Co issues in-line guidance for Q1, sees EPS of $0.57-0.63, excluding non-recurring items, vs. $0.57 Capital IQ Consensus Estimate; sees Q1 revs of $520-550 mln vs. $541.69 mln Capital IQ Consensus Estimate

4:11PM F5 Networks beats by $0.07, beats on revs; guides Q1 EPS in-line, revs above consensus (FFIV) 86.31 -4.34 : Reports Q4 (Sep) earnings of $1.26 per share, excluding non-recurring items, $0.07 better than the Capital IQ Consensus Estimate of $1.19; revenues rose 9.0% year/year to $395.3 mln vs the $384.83 mln consensus.
Co issues mixed guidance for Q1, sees EPS of $1.17-1.20 vs. $1.20 Capital IQ Consensus Estimate; sees Q1 revs of $390-400 mln vs. $389.16 mln Capital IQ Consensus Estimate.

4:08PM FormFactor will accelerate its third quarter earnings announcement and conference call (FORM) 6.17 -0.37 : The earnings announcement will be released at approximately 5:00 a.m. PDT on Thursday, October 24. A conference call to discuss the third quarter results and fourth quarter financial guidance will be held tomorrow, October 24, 2013 at 5:30 a.m. PDT, or 8:30 a.m. EDT.

4:05PM TriQuint Semi beats by $0.06, reports revs in-line; guides Q4 EPS below consensus, revs below consensus (TQNT) 8.31 -0.63 : Reports Q3 (Sep) earnings of $0.16 per share, excluding non-recurring items, $0.06 better than the Capital IQ Consensus Estimate of $0.10; revenues rose 24.9% year/year to $250.8 mln vs the $250.11 mln consensus. Mobile Devices market revenue grew 53% sequentially and 42% over the same period a year ago. Gross margin for the third quarter was 38.0%, up sequentially from 31.3% due to higher revenue and improved factory utilization.

Co issues downside guidance for Q4, sees EPS of $0.12 and $0.14, excluding non-recurring items, vs. $0.19 Capital IQ Consensus Estimate; sees Q4 revs of $260-270 mln vs. $280.59 mln Capital IQ Consensus Estimate.
Fourth quarter revenue is currently 88% booked to the midpoint of this guidance. Non-GAAP gross margin is expected to be between 35% and 36%.

Large Cap Gainers

GLW (17.11 +11.48%): Announced it is entering into a series of strategic and financial agreements with Samsung (SSNLF) intended to strengthen product and technology collaborations between the two companies; Board authorized $2 bln share repurchase; sees Q3 EPS of $0.33 ex items vs $0.32 estimate, revs of $2.1 bln (in-line)
BCR (137.43 +8.24%): Beat quarterly EPS by $0.10 ($1.50 ex items vs $1.40 estimate), revs rose 4.9% yoy to $758.0 mln vs $740.2 mln estimate; upgraded to Overweight from Neutral at Piper Jaffray; upgraded to Neutral from Sell at Goldman
CP (141.32 +7.91%): Beat quarterly EPS by C$0.16 (C$1.88 ex items vs C$1.72 estiamte), revs rose 5.7% yoy to C$1.53 bln vs C$1.52 estimate

Large Cap Losers

ALTR (32.63 -12.57%): Beat quarterly EPS by $0.03 ($0.37 vs $0.34 estimate), revs fell 9.9% yoy to $445.9 mln vs $451.97 mln estimate; sees Q4 revs -3% to +1% (~$432.5-450.36 mln) vs $474.55 mln estimate
FTI (53.41 -7.55%): Missed quarterly EPS by $0.06 ($0.53 ex items vs $0.59 estimate), revs rose 21.5% yoy to $1.72 bln vs $1.74 bln estimate; sees FY13 EPS of $2.00-2.10 vs $2.19 estimate
ARMH (46.4 -6.57%): Downgraded to Neutral from Buy at UBS

Mid Cap Gainers

APOL (25.92 +23.78%): Beat quarterly EPS by $0.30 ($0.55 ex items vs $0.25 estimate), revs fell 15.2% yoy to $845 mln vs $823.87 mln estimate; sees FY14 revs of $2.95-3.05 bln vs $3.22 bln estimate; upgraded to Buy from Hold at Stifel, target $30
MDVN (59.23 +9.91%): Continued strength following positive results from Phase 3 trial of enzalutamide
COLE (14.05 +9.59%): To merget with American Realty Capital Properties (ARCP); Cole stockholders to receive 1.0929 shares of ARCP common stock or $13.82 in cash for each share of Cole common stock

Mid Cap Losers

CREE (61.83 -16.81%): Beat quarterly EPS by $0.01 ($0.39 ex items vs $0.38 estimate), revs rose 23.8% yoy to $391 mln vs $392.18 mln estimate; sees Q2 EPS of $0.36-0.41 ex items vs $0.43 estimate, revs of $400-420 mln vs $414.32 mln estimate; downgraded to Hold from Buy at Needham; downgraded to Underweight from Equal Weight at boutique firm; target lowered to $54 from $66 at Credit Suisse
STM (7.95 -8.52%): Missed quarterly EPS by $0.04 (-$0.03 ex items vs $0.01 estimate), revs fell 7.1% yoy to $2.01 bln vs $2.05 bln estimate; sees Q4 revs flat sequentially plus or minues 3.5% (~$1.94-2.04 bln) vs $2.11 bln estimate
OCR (53.51 -6.83%): Agreed to pay $120 mln to settle allegations of illegal discounts to nursing homes in exchange for patient referrals

10:40AM Semiconductor Hldrs ETF continues to lag, hovering near early Oct gap (SMH) 39.98 -1.35 : The sector has been hit hard this morning in the wake of earnings with the SMH hovering just above the top of its early Oct bull gap at 39.89 (session low 39.93). The bottom of the gap and its 50 ema come into play at 39.72/39.69 -- ALTR -12.9%, BRCM -6.5%, ARMH -6.5%, CRUS -5.8%, XLNX -4.3%, ADI -3.1%, TER -3.1%, SNDK -2.7%, AMAT -2.7%, LLTC -2.6%, LRCX -2.6%, KLAC -2.4%, TXN -2.1%, MU -2.1%, TSM -1.9%, INTC -1.3%, MRVL -1.2%.

9:03AM Samsung Elect announces Galaxy S 4 mini coming to the U.S. next month (SSNLF) 1450.00 : Wireless carriers will announce their specific availability, colors and timing. AT&T (T), Sprint (S), Verizon (VZ) and U.S. Cellular will carry the Galaxy S 4 mini.

Avnet Electronics Marketing, an operating group of Avnet (AVT), has launched a new series of SpeedWay Design Workshops for designers of electronic applications based on the Xilinx (XLNX) Zynq-7000 All Programmable SoC.

Broadcom (BRCM) announced a new C-DOCSIS system-on-a-chip for Chinese operators to scale service deployments for more cost-efficient, competitive offerings

Analyst comments: ARMH -2.7% (downgraded to Neutral from Buy at UBS), COH -1.4% (downgraded to Neutral from Buy at BofA/Merrill, downgraded at Argus), EXC -1.4% (downgraded to Underperform from Hold at Jefferies), BAX -1.1% (downgraded to Market Perform from Outperform at Cowen)

7:11AM ATMI misses by $0.03, misses on revs; sees LifeSciences segment breaking even next Q, and growing profitably thereafter (ATMI) 27.78 : Reports Q3 (Sep) earnings of $0.29 per share, excluding $0.03 in expenses, $0.03 worse than the Capital IQ Consensus Estimate of $0.32; revenues fell 7.9% year/year to $100.2 mln vs the $104.71 mln consensus.

"Third quarter revenues in Microelectronics were impacted by a weak wafer start environment, which is causing some customers to delay purchases, and ongoing headwinds from pricing and customer material efficiency gains.... While we continue to experience an overall lackluster wafer start environment, we remain confident that we are well positioned to realize growth from customers developing and ramping solutions for the advanced nodes," added Neugold. "We continue to make great progress in developing our technologies to address additional opportunities for profitable growth. In LifeSciences, we anticipate achieving breakeven revenue levels in the fourth quarter of 2013, and growing profitably from there. We are on target to achieve additional eVOLV license revenues in the fourth quarter of 2013 and in 2014, with meaningful royalty revenues beginning in the second half of 2014. Throughout 2013 we have taken steps to better align our organization, which will also improve our cost structure. We anticipate the benefit from these actions to begin during the fourth quarter of this year."

7:10AM Motorola Solutions beats by $0.30, reports revs in-line; guides FY13 EPS above consensus, revs in-line (MSI) 60.43 : Reports Q3 (Sep) earnings of $1.32 per share, excluding non-recurring items, $0.30 better than the Capital IQ Consensus Estimate of $1.02; revenues fell 1.9% year/year to $2.11 bln vs the $2.13 bln consensus. Co issues mixed guidance for FY13, sees EPS of $4.63-4.70, excluding non-recurring items, vs. $4.39 Capital IQ Consensus Estimate; sees FY13 revs of approx $8.68 bln vs. $8.7 bln Capital IQ Consensus Estimate.

Government segment sales were $1.5 billion, down 4 percent from the year-ago quarter. GAAP operating earnings were $252 million or 17.2 percent of sales compared to $273 million or 17.9 percent of sales in the year-ago quarter. Non-GAAP operating earnings were $299 million or 20.4 percent of sales compared to $310 million or 20.4 percent of sales in the year-ago quarter.

7:06AM SanDisk to offer $1 bln of convertible senior notes (SNDK) 69.32 : Co announced its intention to offer, subject to market and other conditions, up to $1.0 billion principal amount of Convertible Senior Notes due in 2020 in a private offering to qualified institutional buyers. In addition, the Company expects to grant the initial purchaser for the offering an option to purchase up to an additional $150 million principal amount of notes from the Company to cover over-allotments. The Company intends to use a portion of the net proceeds of the offering to fund the cost of privately negotiated convertible note hedge transactions, which will serve to increase the effective conversion price of the convertible debt.

07:25 am Corning shares soar 24% following in line guidance & taking ownership of SCP JV from Samsung
Corning (GLW $19.00 +3.65) issued guidance for the third quarter with EPS of $0.33, excluding non-recurring items which is line with estimates with revenues of core $2.1 billion which is also in line with expectations. In the Display Technologies segment, third-quarter LCD glass sequential price declines remained moderate, as expected. LCD glass volume was up slightly sequentially, driven by higher-than-expected demand in the wholly owned business.

Sales in all other segments were in line with expectations. Core gross margin was 44%, up nearly two percentage points year over year and up slightly sequentially. The company expects fourth-quarter results to be lower sequentially, mainly driven by normal seasonality in its Telecommunications, Life Sciences, and Environmental Technologies segments. Adding to the seasonality impact is a significant year-over-year decrease in fiber sales in North America and China, and slower-than-expected construction of the National Broadband Network (NBN) in Australia.

In Display Technologies, the company expects moderate sequential price declines and sequential volumes to be down slightly for its LCD glass.

Corning also announced it is obtaining full ownership of Samsung Corning Precision Materials Co., Ltd. (SCP) -- (SSNLF), an unconsolidated equity venture with Samsung Display that manufactures LCD glass in Korea. Samsung Display currently owns 43% of SCP. Corning's board authorized an additional $2 billion share repurchase program Actions expected to be immediately accretive on fully diluted basis for Corning.

07:23 am Broadcom shares fall 9% following disappointing gudiance
Broadcom (BRCM $24.65 -2.49) reported third quarter earnings of $0.76 per share, excluding non-recurring items, while revenues rose 0.8% year/year to $2.15 billion which is higher than expected. The company issued guidance for the fourth quarter with revenues of $1.915- 2.03 billion which is below expectations. Product gross margin in Q4 is expected to decline 50-100 bps.

07:22 am Cree shares plunge 16% following EPS guidance that was below estimates
Cree (CREE $62.45 -11.87) reported first quarter earnings of $0.39 per share, excluding non-recurring items, which is better than expected, while revenues rose 23.8% year/year to $391 million which is line with expectations with adj. GM +170 bps YoY to 39.2%. The company issued guidance for the second quarter with EPS of $0.36-0.41, excluding non-recurring items, which is below expectations with revenues of $400-420 million which is line with expectations.
icon url

ReturntoSender

10/24/13 10:20 PM

#10363 RE: ReturntoSender #6755

From Briefing.com: 4:10 pm : The major averages settled near their highs as the S&P 500 advanced 0.3% while the Dow Jones Industrial Average outperformed with a gain of 0.6%.

Overall, today's session did not generate too much excitement even with investors receiving more than 200 quarterly reports between yesterday's close and today's open. Outside of some choppy action during the first hour, equity indices climbed steadily throughout the session.

The Dow led from the start, keying off 3M's (MMM 123.49, +0.29) better-than-expected earnings. Meanwhile, the broader industrial sector (+0.7%) finished among the leaders as transports contributed to the strength. The Dow Jones Transportation Average gained 0.9% with airlines leading the pack after Alaska Air (ALK 69.68, +2.65) reported strong results.

Elsewhere, the discretionary sector (+1.0%) also provided leadership as homebuilders rallied in reaction to above-consensus earnings and revenue from PulteGroup (PHM 17.85, +1.17). The broader iShares US Home Construction ETF (ITB 23.18, +0.64) jumped 2.8%. In addition to builders, carmakers also underpinned the sector after Ford (F 17.76, +0.24) beat on earnings and issued upbeat guidance.

While five of six cyclical groups ended with solid gains between 0.5% and 1.0%, the financial sector could not make a sustained move into positive territory until the final hour. The group added just 0.1% after spending the entire session just below its flat line.

On the downside, all four countercyclical groups posted losses. Health care ended just below its flat line while consumer staples (-0.2%) and utilities (-0.2%) registered modest declines. The telecom services space (-1.0%) was the weakest sector of the day, pressured by shares of AT&T (T 34.63, -0.65) after the telecom giant reported a one-cent beat on revenue just below analyst estimates.

Treasuries ended modestly lower with the 10-yr yield up 3.5 basis points at 2.52%.

Trading volume was on the light side as just over 715 million shares changed hands on the floor of the New York Stock Exchange.

Today's economic data was limited to weekly initial claims and the August trade balance report. Problems related to glitches from a computer upgrade in California continued to plague the initial claims data and artificially boosted headline levels. The weekly initial claims level fell to 350,000 from an upwardly revised 362,000 (from 358,000). The consensus expected claims to fall to 341,000.

The Department of Labor stated that there was no way to separate the claims from California that were biasing the data from those in the private sector that lost their jobs as a result of the government shutdown. We have no way of determining the true level of layoffs, but it is likely around 310,000 -- 330,000 since overall labor trends have not changed much over the last couple of months.

Separately, the trade deficit widened to $38.8 billion in August from a downwardly revised $38.6 billion reported in July.

Tomorrow, September durable orders will be reported at 8:30 ET, the final reading of the Michigan Consumer Sentiment Survey will cross the wires at 9:55 ET, and August wholesale inventories will be announced at 10:00 ET.

DJIA +18.4% YTD
S&P 500 +22.9% YTD
Nasdaq +30.1% YTD
Russell 2000 +31.7% YTD

DJ30 +95.88 NASDAQ +21.89 SP500 +5.69 NASDAQ Adv/Vol/Dec 1577/1.93 bln/963 NYSE Adv/Vol/Dec 1751/715.8 mln/1276

3:35 pm :

Dec crude oil rose for the first time in four sessions despite prices dipping to a session low of $95.95 per barrel in morning pit trade. The energy component broke into positive territory in early afternoon floor action and settled with a 0.3% gain at $97.12 per barrel
Nov natural gas dipped to a session low of $3.55 per MMBtu on inventory data that showed a build of 87 bcf when a smaller build of 79-82 bcf was anticipated. However, prices quickly jumped higher and erased the earlier losses. Natural gas held the momentum in afternoon floor action and settled 0.3% higher at $3.63 per MMBtu
Precious metals rose higher today as data this morning showed Initial Claims fell to 350K vs 341K Briefing.com consensus
Dec gold climbed as high as $1352.30 per ounce and settled with 1.2% gain at $1350.30 per ounce
Dec silver popped to a session high of $22.91 per ounce and eventually settled at $22.82 per ounce, or 0.9% higher

4:23PM Applied Micro beats by $0.01, reports revs in-line (AMCC) 13.02 -0.34 : Reports Q2 (Sep) earnings of $0.03 per share, excluding non-recurring items, $0.01 better than the Capital IQ Consensus Estimate of $0.02; revenues rose 19.7% year/year to $55.4 mln vs the $55.02 mln consensus.

4:17PM KLA-Tencor beats by $0.03, reports revs in-line; co will guide on CC at 17:00 (KLAC) 63.73 -0.68 : Reports Q1 (Sep) earnings of $0.68 per share, excluding non-recurring items, $0.03 better than the Capital IQ Consensus Estimate of $0.65; revenues fell 8.7% year/year to $658.3 mln vs the $655.77 mln consensus.

"KLA-Tencor delivered solid results for the first quarter of fiscal year 2014, generating revenue and EPS in the upper half of the guided range for the period, and new orders well above the upper end of the range...Our results demonstrate strong operational execution and financial performance as we address our customers' most critical yield challenges at the leading edge. With our market leadership and customer focus, we believe we will benefit from opportunities for continued growth as our customers execute their next-generation technology investments at the leading edge."

Co will guide on conference call beginning at 17:00

4:16PM Western Digital reports EPS in-line, revs in-line (WDC) 70.54 +0.43 : Reports Q1 (Sep) earnings of $2.05 per share, in-line with the Capital IQ Consensus Estimate consensus of $2.05; revenues fell 5.7% year/year to $3.8 bln vs the $3.79 bln consensus.

4:16PM Ingram Micro reports EPS in-line, misses on revs (IM) 23.42 -0.28 : Reports Q3 (Sep) earnings of $0.53 per share, excluding non-recurring items, in-line with the Capital IQ Consensus Estimate consensus of $0.53; revenues rose 12.4% year/year to $10.15 bln vs the $10.52 bln consensus.

Non-GAAP operating income for the 2013 third quarter was $135 million (1.33 percent of total sales). This compares with non-GAAP operating income for the 2012 third quarter of $103 million (1.14 percent of total sales).
For the 2013 fourth quarter, the company currently expects gross margin to be up sequentially by high single digit basis points and worldwide revenue to increase over the 2013 third quarter in-line with historical seasonality.

4:16PM QLogic beats by $0.04, reports revs in-line (QLGC) : Reports Q2 (Sep) earnings of $0.23 per share, $0.04 better than the Capital IQ Consensus Estimate of $0.19; revenues fell 4.5% year/year to $112.6 mln vs the $112.04 mln consensus.

4:12PM Freescale Semi reports EPS in-line, beats on revs; guides Q4 revs below consensus (FSL) 16.42 +0.30 : Reports Q3 (Sep) earnings of $0.20 per share, in-line with the Capital IQ Consensus Estimate consensus of $0.20; revenues rose 7.5% year/year to $1.08 bln vs the $1.07 bln consensus.

GAAP gross margin was 43.6%. It generated Q3 EBITDA of $236 mln.

Guidance: Co issues downside guidance for Q4, sees Q4 revs of $1.03-$1.07 bln vs. $1.08 bln Capital IQ Consensus Estimate. Gross margin is expected to be flat with Q3.

4:06PM Monolithic Power beats by $0.01, reports revs in-line; guides Q4 revs in-line (MPWR) 27.57 -0.48 : Reports Q3 (Sep) earnings of $0.33 per share, excluding non-recurring items, $0.01 better than the Capital IQ Consensus Estimate of $0.32; revenues rose 13.2% year/year to $65.3 mln vs the $65.13 mln consensus.
Co issues in-line guidance for Q4, sees Q4 revs of $61-65 mln vs. $63.79 mln Capital IQ Consensus Estimate.

4:05PM Micros Systems beats by $0.01, beats on revs; reaffirms FY14 EPS guidance, revs guidance (MCRS) 51.80 -0.65 : Reports Q1 (Sep) earnings of $0.50 per share, excluding non-recurring items, $0.01 better than the Capital IQ Consensus Estimate of $0.49; revenues rose 5.0% year/year to $314.72 mln vs the $310.35 mln consensus.

"We are pleased with our revenue growth in this environment, with especially strong growth in the United States and Canada."

Co reaffirms guidance for FY14, sees EPS of $2.46-2.50, excluding non-recurring items, vs. $2.45 Capital IQ Consensus Estimate; sees FY14 revs of $1.295-1.32 bln vs. $1.31 bln Capital IQ Consensus Estimate.

4:04PM Microsoft -- Earnings Mover -- (MSFT) : Jumps more than 4% after reporting back vacillating above its Oct/Aug highs at 35.20 (close 33.72)

4:03PM Lattice Semi beats by $0.02, beats on revs; guides Q4 revs below consensus (LSCC) 4.20 -0.04 : Reports Q3 (Sep) earnings of $0.07 per share, $0.02 better than the Capital IQ Consensus Estimate of $0.05; revenues rose 23.0% year/year to $87.2 mln vs the $84.8 mln consensus. Co issues downside guidance for Q4, sees Q4 revs of approx $79-82 mln vs. $83.52 mln Capital IQ Consensus Estimate. Gross margin percentage is expected to be approximately 53% plus or minus 2%.

3:13PM ARM Holdings: IBM (IBM) announced earlier that it has licensed a broad range of ARM Cortex processors from ARMH (ARMH) 46.71 +0.26 : IBM (IBM) announced that it has licensed a broad range of ARM Cortex processors from ARM Holdings. IBM plans to offer the new microprocessors to its custom-chip clients.

Large Cap Gainers

CTXS (59.51 +6.13%): Beat on EPS by $0.01, reported revs in-line; guided Q4 EPS below consensus, revs below consensus; Board of directors authorized $500 mln increase to share repurchase program; target raised to $83 from $76 at FBR Capital; downgraded to Neutral from Positive at Susquehanna; tgt lowered to $76 from $83 at FBR Capital.
ABB (25.75 +4.68%): Beat on EPS by $0.01, beat on revs.
ALXN (115.29 +5.13%): Beat on EPS by $0.04, beat on revs; raised FY13 guidance above consensus; FDA granted Breakthrough Therapy designation to cPMP replacement therapy for patients with molybdenum cofactor deficiency (MoCD) type A.

Large Cap Losers

CAM (54.13 -13.83%): Missed on EPS by $0.03, missed on revs; guided Q4 EPS below consensus.
SYMC (21.58 -12.35%): Beat on EPS by $0.06, missed on revs; guided Q3 EPS below consensus, revs below consensus; guided FY14 revs below consensus; target lowered to $22 from $26 at FBR Capital; tgt lowered to $26 from $30 at RBC Capital Mkts; upgraded to Buy from Hold at Standpoint Research; downgraded at BofA/Merrill.
XRX (9.76 -9.04%): Beat on EPS by $0.01, missed on revs; guided Q4 EPS below consensus (lowered FY13 EPS guidance).

Mid Cap Gainers

AEM (30.22 +16.86%): Beat on EPS by $0.28, beat on revs; raised 2013 gold production expectations, lower total cash cost expectations; upgraded to Outperform from Mkt Perform at BMO Capital Mkts; initiated with a Hold at Canaccord Genuity; upgraded to Buy from Hold at Desjardins.
GNRC (48.13 +15.01%): Beat on EPS by $0.27, beat on revs; raised FY13 guidance on strong demand and a modest impact from Baldor acquisition.
MDSO (118.8 +15.42%): Beat on EPS by $0.07, reported revs in-line; guided FY13 revs in-line.

Mid Cap Losers

TKR (53.3 -11.36%): Missed on EPS by $0.34, missed on revs; guided FY13 EPS below consensus, revs below consensus.
CVA (18 -11.05%): Beat on EPS by $0.01, reported revs in-line; lowered FY13 EPS below consensus.
AKAM (46.27 -10.8%): Beat on EPS by $0.04, beat on revs; announced new $750 mln share repurchase program; sees Q4 rev in the range of $412-430 mln vs $423 mln consensus; downgraded to Neutral from Outperform at Macquarie.

Smith Micro Software (SMSI) has partnered with In Motion Technology to deliver secure, reliable wireless connectivity for both in-vehicle and hand-held mobile devices used by public safety agencies.

Cree (CREE) introduced two new XLamp LED Arrays to enable high-lumen applications ranging from wallpacks to canopy lighting with one CXA LED family.

International Rectifier (IRF) introduced the IRAM630-1562F Intelligent Power Module featuring Power Factor Correction and inverter stage

Semtech (SMTC) introduced the SX1276/77/78 devices, which integrate Semtech's new LoRa (long range) technology.

8:19AM FormFactor announces the appointment of Mike Slessor as president and as a member of the co's Board of Directors, and CEO Tom St. Dennis as Executive Chairman of the Board (FORM) 6.17 : St. Dennis' new role follows the decision of Carl Everett, current Chairman of the Board, to not run for re-election to the FormFactor Board at the 2014 Annual Meeting of Stockholders. Everett will assume the role of Lead Independent Director. All appointments are effective October 24, 2013.

Since October 2012 Slessor has served as senior vice president and general manager of the company's MicroProbe Product Group.

8:05AM SanDisk prices $1.3 bln principal amount of Convertible Senior Notes due in 2020 (SNDK) 68.24 : The size of the offering of the notes was increased from the previously announced aggregate principal amount of $1.0 bln. The notes were priced at 100% of the aggregate principal amount and will bear interest at a rate of 0.50% per annum.

Xilinx (XLNX) will present and showcase how it is democratizing Smarter Systems with ARM at ARM TechCon 2013.

ARM (ARMH) and Spreadtrum (SPRD) announced a sweeping license agreement providing Spreadtrum with the full range of ARM Artisan physical IP, including POP IP, for the broad range of IC foundry and process varieties of 28nm that ARM supports to deliver the most flexible manufacturing options.

XMOS and Silicon Labs (SLAB) announced a technology partnership that allows XMOS to integrate energy friendly ARM technology into its xCORE multicore microcontrollers to produce the next wave in programmable system-on-chip products.

4:18AM NXP Semi beats by $0.03, misses on revs; guides Q4 EPS in-line, revs in-line (NXPI) 36.03 : Reports Q3 (Sep) earnings of $0.85 per share, $0.03 better than the Capital IQ Consensus Estimate of $0.82; revenues rose 6.8% year/year to $1.25 bln vs the $1.26 bln consensus. Co issues in-line guidance for Q4, sees EPS of $0.85-1.02 vs. $0.91 Capital IQ Consensus Estimate; sees Q4 revs of $1.22-1.29 bln vs. $1.25 bln Capital IQ Consensus Estimate.

08:00 am F5 Networks shares rise 2% following better than expected earnings
F5 Networks (FFIV $88.40 +2.09) reported fourth quarter earnings of $1.26 per share, which is better than expected, while revenues rose 9.0% year/year to $395.3 million which is higher than expected. The company issued guidance for the first quarter with EPS of $1.17-1.20 which is in line with expectations with revenues of $390-400 million which is above expectations.

07:59 am Symantec shares rise 5% following better than expected earnings
Symantec (SYMC $21.65 -2.97) reported second quarter earnings of $0.50 per share, excluding non-recurring items, which is better than expected, while revenues fell 3.6% year/year to $1.64 billion which is below consensus. The company issued guidance for the third quarter with EPS of $0.41-0.43 which is below expectations with revenues of $1.63-1.67 billion which is below expectations.

The company issued downsdie guidance for fiscal year 2014 with revenues down 3-4%, which equates to approximately $6.63-6.70 billion which is below expectations. The company sees non-GAAP EPS to be between -1.0 and 1.5% compared to the prior fiscal year.

07:58 am TriQuint Semi shares plunge 10% following downside guidance
TriQuint Semi (TQNT $7.49 -0.82) reported third quarter earnings of $0.16 per share, excluding non-recurring items, which is better than expected, while revenues rose 24.9% year/year to $250.8 million which is line with consensus. Mobile Devices market revenue grew 53% sequentially and 42% over the same period a year ago.

Gross margin for the third quarter was 38.0%, up sequentially from 31.3% due to higher revenue and improved factory utilization. The company issued downside guidance for the fourth quarter with EPS of $0.12 and $0.14, excluding non-recurring items, which is below expectations with revenues of $260-270 million which is below expectations. Fourth quarter revenue is currently 88% booked to the midpoint of this guidance. Non-GAAP gross margin is expected to be between 35% and 36%.

Symantec (SYMC) reported second quarter earnings of $0.50 per share, excluding non-recurring items, which is better than expected, while revenues fell 3.6% year/year to $1.64 billion which is below consensus. The company issued guidance for the third quarter with EPS of $0.41-0.43 which is below expectations with revenues of $1.63-1.67 billion which is below expectations. The company issued downsdie guidance for fiscal year 2014 with revenues down 3-4%, which equates to approxmately $6.63-6.70 billion which is below expectations. The company sees non-GAAP EPS to be between -1.0 and 1.5% compared to the prior fiscal year.

icon url

ReturntoSender

10/27/13 11:31 AM

#10364 RE: ReturntoSender #6755

InvestmentHouse Weekend Market Summary

http://www.investmenthouse.com/weekendmarketsummary.htm

- Stocks finish out the week with gains and new highs thanks to AMZN, MSFT, and other solid earnings.
- Stocks still hitting highs but some leaders show wear and tear on the week while the defensive utilities rise.
- Internals so-so, NASDAQ volume driven by MSFT, AMZN.
- China inflation fighting weighing on US stocks and Chinese stocks in the US.
- Stockman: US was days away from proving the default threat was but a myth.
- Durables fall without Boeing, capital investment continues its decline.
- Michigan Sentiment hits a year low as citizen's don't like elected officials doing what they were elected to do.
- SOX rebound attempt less than impressive, leaders flagging, market move less lackluster even with much better earnings. Market still top heavy, hasn't given up yet, but worthy of some caution.

Better earnings, more market gains, some trouble comes to town.

Earnings from AMZN (big revenues, bottom line miss) and MSFT (bottom and top line beat) paced a series of top and bottom line beats (SHW, DECK, WDC) and helped push stocks higher once again on the last day of the week.

Not broadly. NASDAQ breadth was negative. NYSE was positive but just 1.4:1. Volume surged 10% and over 2B on NASDAQ, but that was thanks to some big volume on several big issues.

SP500 and NASDAQ hit new highs and new post-bear market highs respectively. At the same time leadership just was not that grand. Some of the stronger market leaders started to roll hard. VIPS, YNDX, SFUN. Not a total rollover by far, but when utilities rise to the leader board on the week the action is shifting from growth to boring. CPN, NRG, GTE, PNG, ITC, GAS, DUK. Some can move decently, but most of the time these are snorers.

Not a rollover of course, just some leaders starting to take a much needed rest and others moving up. That is fine. It is just that some of the ones moving higher are utilities, and those are defensive stocks. Why is money going there? Plenty of areas can move higher, but then again, many areas have moved higher. Perhaps money is just seeking something it feels is left behind while the leaders take a break. More than likely investors were parking money in low beta stocks as they let the leaders test and try to determine the market's next step.

That is fine as well. We likely won't play them, instead waiting for the leaders to finish testing and new ones, more growth-oriented, to set up new patterns.

So stocks started higher Friday, adding to the late week recovery from an early week test of the new highs and post-bear market new highs from a week back. As was the case all week, however, after a start in one direction, the tide reversed. Stocks sold off into lunch, ostensibly on Senator Paul saying he was going to hold up Yellen's confirmation. Perhaps. Didn't matter though because stocks turned and moved back higher into the close. New highs for SP500 and NASDAQ (post-bear market) again. Much rejoicing.

SP500 7.70, 0.44%
NASDAQ 14.40, 0.37%
DJ30 61.07, 0.39%
SP400 0.29%
SOX 0.44%
RUTX -0.04%

No damage of course. The momentum is waning a bit as RUTX faded off a new high but is still of course trending higher. SP400 is moving laterally at the top of its channel. NASDAQ was not bad, but it backed off a gap higher, still holding a post-bear market closing high. On the other hand, SP500 moved to a new high and closed at its session high. DJ30 broke through some resistance and closed out at the session high.

Some leaders showing some high volume selling (SFUN, VIPS, YNDX, YY, JASO). Some just fading modestly (CAMP, FSLR, KORS, PCLN). Others hitting rally highs (AMT, ATK, DDD, AMZN). The indices split but all pretty solid. Good and bad. Yen and yang. Who wins?

Well, not all the indices are solid. SOX broke on Wednesday. It moved to a recovery high Monday and Tuesday, moving just back into its channel. Wednesday it collapsed with a gap and selloff to the 50 day EMA. It held and rebounded Thursday with a gap to a doji that tapped the 20 day EMA on the high. Friday it gapped higher again, hitting the 20 day EMA, again.

SOX is a leader for this market. Has been for at least a year. It doesn't always lead the moves; it hasn't led the upside much of the time, but when it has it was a good indicator. It has led the downside a lot. A lot. Maybe it shakes it off and comes back. The market is still solid. SOX continues to be a very important indicator and it is weak. It is one reason we were not buying a ton on the week. One reason. Another was a lot of stocks were and are extended and need a test to get some good entries again.

How SOX performs off this 50 day EMA dump is very important. If it cannot recover either the market fades with it or a whole new group of leaders will take over. That can be good or that can be bad, i.e. less exciting with slower movers . . . such as utilities. That is why utilities and their move caught our eye. A change in market character should always catch your attention.

THE NEWS

China was the quiet story of the week with big implications.

China seems serious this time, at least for the past three days, at fighting its escalating inflation problem. Midweek the PBOC suspended its liquidity injections into the economy. Interest rates started to jump. A second day. They started to spike. They are still spiking. No tightening in the normal sense, just not adding liquidity. But, in this 'new normal' world of central banks, not adding liquidity is viewed as tightening. The Chinese stock market was bumping the down trendline. Thursday it gapped lower form the trendline. Stocks are rebelling as they have each time the PBOC gets 'tough' for a few days.

Thing is, the PBOC relents and then things are all well, right? No. The stock market is still trending lower. It is as if it knows the PBOC and Chinese government are facing the Kobayashi Maru, the no win scenario: no liquidity and the economic bubbles pop. Keep the liquidity and inflation spikes and the bubbles pop though after a super spike.

Stockman says we were just days away from something important and blew it.

'Hundreds of billions of higher taxes coming' to pay our bills given the republican surrender on the debt deal in October.

David Stockman was no fan of the Bush economic policies. He is even less a fan of the Obama economic policies. He also has general disdain for Congress and is quite disappointed in some of the republicans.

Specifically Stockman said the republicans were just days away from exploding the myth that failure to raise the debt ceiling would result in default and we would be free from that bargaining ploy for good. Instead the republicans did what they always do, snatching defeat from the jaws of victory because they feared for their reelection, didn't hang together, and folded their hand, falling to Reid's (it was Reid not Obama) bluff. If they had hung together the President would have been forced to prioritize payments, would have been constitutionally obligated to pay the interest on the debt, and then there would have been a 'fair fight.' Instead, no matter what position republicans take, Reid knows they will be sold down the river by the republican lightweights. What is new?

September Durable Goods Orders crash without Boeing's airplanes.

Durables with Boeing 3.7%. Without -0.1%. Very narrow gains. Less Boeing, the last three of five are negative. That blows.

Business investment: -1.1%. August was barely positive and much less than the prior positive reads in June and May (1.1% and 2.1%). Turning back downside, not investing in business.

THAT is why you can have bottom line beats again and again even as revenues decline: no investment in your business. Add to that cuts in employment and you get bottom line beats and companies looking great on the bottom line in the new normal that ignores sales.

Michigan Sentiment October, Final misses.

Why? It is easy to blame the shutdown. Maybe it had some impact. There are other issues: healthcare costs are becoming clearer, jobs creation is slower and cloudy.

Here is the key: Look at where the blue line has rolled over. Right at the bottom of the 2000 to 2007 range. Technically hit the wall, and with a continuing rather pathetic economy, it is easy to undermine confidence.

THE MARKET

OTHER MARKETS:

Dollar: 1.3802 versus 1.3803 versus 1.3779 versus 1.3783 versus 1.3682 versus 1.3677 versus 1.3528 versus 1.3524 versus 1.3565 versus 1.3544 versus 1.3520 versus 1.3524 euro. Sold again on the week, a new leg lower.

Bonds: 2.51% versus 2.52% versus 2.49% versus 2.51% versus 2.61% versus 2.59% versus 2.68% versus 2.73% versus 2.69% versus 2.68% versus 2.66% 10 year.
Broke higher on the week again, continuing a two week rise off the initial test of the trend reversal.

Oil: 97.85, +0.74. Bouncing a bit more after a sharp punch lower all week.

Gold: 1352.40, +2.10. Solid upside week, building on the big break higher two weeks back. Strong early in the week, solid to end the week.

MARKET INTERNALS and STATS

NASDAQ
Stats: +14.4 points (+0.37%) to close at 3943.36
Volume: 2.171B (+10.2%)

Up Volume: 1.02B (-60M)
Down Volume: 1.18B (+241.09M)

A/D and Hi/Lo: Decliners led 1.15 to 1
Previous Session: Advancers led 1.65 to 1

New Highs: 240 (+6)
New Lows: 19 (+3)

S&P
Stats: +7.7 points (+0.44%) to close at 1759.77
NYSE Volume: 613M (-4.22%)

A/D and Hi/Lo: Advancers led 1.38 to 1
Previous Session: Advancers led 1.38 to 1

New Highs: 749 (+16)
New Lows: 121 (+1)

DJ30
Stats: +61.07 points (+0.39%) to close at 15570.28

SENTIMENT INDICATORS

VIX: 13.09; -0.11
VXN: 14.91; +0.41
VXO: 11.62; +0.28

Put/Call Ratio (CBOE): 0.93; +0.12

Bulls and Bears:

Well, make a bad debt deal but preserve the myth that you saved a default, all the while solidifying the Fed's $85B/month well, well into 2014 and you have bullish sentiment surge.

Bulls: 49.5 versus 42.3% versus 45.4 versus 46.4% versus 44.3% versus 42.3% versus 37.1% versus 37.1% versus 38.1% versus 43.3%. Backed off a hair form the sharp climb. Still a bit over-baked, but has been higher when selling bouts started in earlier moves.

Background: Last undercut 35%, the threshold for bullishness, in early June 2012.

Bears: 18.5 versus 21.6% versus 20.6% versus 18.6% versus 20.6% versus 21.6% versus 22.7% versus 23.7% versus 23.8% versus 21.6%. Bounced off the lows from March, April, May and August.

Background: Over 35% is the threshold to be really be a good upside indicator. For reference, bearishness hit a 5 year high at 54.4% the last week of October 2008. The move over 50 took bearish sentiment to its highest level since 1995. Extreme negative sentiment. Prior levels for comparison: Bearishness peaked at 37.4% in September 2007. It topped the June 2006 peak (36%) on that run. That June peak eclipsed the March 2006 high (33%) and well above the 2005 highs that spawned new rallies (30% in May 2005, 29.2% in October 2005). That was a huge turn, unlike any seen in recent history.

MONDAY

Stocks rallied well on the debt 'resolution' and the QEternity assurance. They continued the move last week, with some early hesitation, as earnings came in solid midweek to the end of the week.

The indices are for the most part at or near highs sans SOX. Leaders surged with them but many are struggling some. The indices themselves look heavy near term though not in danger of selling. SOX is the worry as it looks weak in how hard it fell. It is at support and trying to bounce so that can still turn out fine. The QE bid has always returned. As with Norm in 'Something About Mary,' it always does . . .

Thing is the indices have run into earnings and in the first two weeks of earnings. They are a bit heavy. Many times after earnings season is here and the news is out and the theme is set, stocks fade from a run. Not always; QE is a powerful offset. But, QE won't completely negate the ebb and flow of market moves. Even in QE stocks have to test.

With leaders extended as well and some turning over and SOX struggling, a test will come. At some point. Then we look for good entries from leaders that faded to support first and held, setting up new moves. In addition, new leaders should turn up if the move is going to resume. Hopefully not utilities . . .

This weekend there are some plays but with the lack of a test after three weeks upside the really great entries in stocks that you like to play are just not that plentiful. New leaders are always welcome, but we like to play leaders that can really take off and make us more than 5%. Sure we settled for some 8% to 10% stock gains on this leg, but that was planned because the stocks were moving into earnings. Different times, different goals. In the 'normal' times with good patterns we look for very solid moves from stocks that can deliver those very solid moves.

We will see if they show up this coming week, but it could take several days of testing first.

Have a great weekend!

SUPPORT AND RESISTANCE

NASDAQ: Closed at 3943.36

Resistance:
Next major resistance is around 4100 as NASDAQ hits 13 year highs

Support:
3888 is the upper channel line for the November 2012 to present uptrend.
The 10 day EMA at 3888
3819 is the early October high
3799 is the September 2013 high.
The 50 day EMA at 3761
3697 is the August high and a prior post-bear market high in the recovery.
The July 2013 intraday high at 3625
3573 is the August 2013 low
3532 is the May intraday high
3521 is the August 2000 low.
3502 is the May 2013 closing high
The 200 day SMA at 3451
The 2011 up trendline at 3437
3295 is the June 2013 low selloff
3227 is the April 2000 intraday low
3197 is the September 2012 post-bear market high
3171 is the October intraday high

S&P 500: Closed at 1752.07

Resistance:
Down to 8.8% over the 200 day SMA, not so extended.

Support:
The 10 day EMA at 1737
1730 is the September 2013 peak
1710 is the August 2013 peak.
1698 to 1700 are the July and August interim highs
The 50 day EMA at 1698
1687 is the May high and post-bear market high
1685 is the mid-August 2013 upper gap point
1684 is the December 2012 up trendline
1657 is the late August upper gap point
1654 is the June 2013 peak
1627 is the August 2013 low
The 200 day SMA at 1617
1576 from October 2007, the prior all-time high
1573 is the June 2013 closing low
1569.48 is the 78% Fibonacci retracement of the April to May 2013 run
1560 is the June 2013 reversal low
1556 from July 2007
1541 is the April 2013 closing low in that pullback inside the uptrend
1539 from June 2007
1531 is the recent high

Dow: Closed at 15,570.28

Resistance:
15,659 is the August 2013 peak
15,696 is the September 2013 peak

Support:
15,542 is the May 2013 intraday high
15,318 is the June closing high
The 50 day EMA at 15,252
15,050 from the August 2013 interim recovery high
14,888 is the April peak and prior all-time high
The 200 day SMA at 14,854
14,844 is the June intraday low
14,762 is the August 2013 low
14,551 is the June 2013 intraday low on the selloff (14,659 closing)
14,198 from the October 2007 high
14,149 is the February 2013 high
14,022 from 7-07 peak
14,010 from the early February 2013 consolidation

Economic Calendar

October 25 - Friday
- Durable Orders, September (8:30): 3.7% actual versus 3.5% expected, 0.2% prior (revised from 0.1%)
- Durable Goods -ex transports, September (8:30): -0.1% actual versus 0.3% expected, -0.4% prior (revised from -0.1%)
- Michigan Sentiment - Final, October (9:55): 73.2 actual versus 74.5 expected, 75.2 prior
- Wholesale Inventories, August (10:00): 0.5% actual versus 0.3% expected, 0.2% prior (revised from 0.1%)

October 28 - Monday
- Industrial Productio, September (9:15): 0.3% expected, 0.4% prior
- Capacity Utilization, September (9:15): 78.0% expected, 77.8% prior
- Pending Home Sales, September (10:00): -1.3% expected, -1.6% prior

October 29 - Tuesday
- Retail Sales, September (8:30): -0.1% expected, 0.2% prior
- Retail Sales ex-auto, September (8:30): 0.3% expected, 0.1% prior
- PPI, September (8:30): 0.2% expected, 0.3% prior
- Core PPI, September (8:30): 0.1% expected, 0.0% prior
- Case-Shiller 20-city, August (9:00): 12.4% expected, 12.0% prior
- Business Inventories, August (10:00): 0.2% expected, 0.4% prior
- Consumer Confidence, October (10:00): 73.1 expected, 79.7 prior

October 30 - Wednesday
- MBA Mortgage Index, 10/26 (7:00): -0.6% prior
- ADP Employment Change, October (8:15): 125K expected, 166K prior
- GDP-Adv., Q3 (8:30): 2.5% prior
- Chain Deflator-Adv., Q3 (8:30): 0.6% prior
- CPI, September (8:30): 0.1% expected, 0.1% prior
- Core CPI, September (8:30): 0.1% expected, 0.1% prior
- Crude Inventories, 10/26 (10:30): 5.246M prior
- FOMC Rate Decision, October (14:15): 0.25% expected, 0.25% prior

October 31 - Thursday
- Challenger Job Cuts, October (7:30): 19.1% prior
- Initial Claims, 10/26 (8:30): 335K expected, 350K prior
- Continuing Claims, 10/19 (8:30): 2850K expected, 2874K prior
- Personal Income, September (8:30): 0.4% prior
- Personal Spending, September (8:30): 0.3% prior
- PCE Prices - Core, September (8:30): 0.2% prior
- Chicago PMI, October (9:45): 55.0 expected, 55.7 prior
- Natural Gas Inventories, 10/26 (10:30): 87 bcf prior

November 1 - Friday
- ISM Index, October (10:00): 55.0 expected, 56.2 prior
- Construction Spending, September (10:00)
- Auto Sales, October (14:00): 5.4M prior
- Truck Sales, October (14:00): 6.5M prior
icon url

ReturntoSender

10/28/13 8:59 PM

#10365 RE: ReturntoSender #6755

From Briefing.com: 4:15 pm : The S&P 500 punctuated an uneventful session with a modest gain, adding 0.1% to extend its October advance to 4.8%.

Stocks alternated between gains and losses through the first two hours of action before the S&P climbed to a fresh record high of 1764.99. Final-hour selling cut the S&P's gain in half, but the index still finished ahead of the Dow (unch) and the tech-heavy Nasdaq (-0.1%), which was challenged by its flat line throughout the session.

Although the third-quarter earnings season is far from being over, today featured just a handful of notable reports. Health care components caught the eye of some participants with Biogen (BIIB 254.43, +2.17) reporting solid results and Merck (MRK 45.35, -1.19) beating bottom-line estimates on below-consensus revenue. Although Merck weighed, the broader health care sector (+0.3%) drew strength from the 6.7% gain in Bristol-Myers Squibb (BMY 52.02, +3.25) after the company announced positive clinical trial data.

Generally speaking, countercyclical sectors followed in health care's lead as consumer staples (+1.2%) and telecom services (+0.4%) outperformed while utilities (-0.2%) lagged.

Meanwhile, cyclical groups were a bit more mixed. Energy (+0.1%) and technology (+0.3%) finished in positive territory while consumer discretionary (-0.2%), financials (-0.2%), industrials (-0.1%), and materials (-0.6%) trailed the S&P.

The technology sector ended among the leaders with its top component, Apple (AAPL 529.88, +3.92), adding 0.7% ahead of its after-hours earnings report. However, the Nasdaq could not build on the relative strength of the sector as momentum names like Facebook (FB 50.23, -1.72), Priceline.com (PCLN 1060.15, -10.70), and Netflix (NFLX 314.00, -14.03) weighed.

Also of note, the industrial space was little changed as defense contractors and transports headed in opposite directions. The PHLX Defense Index shed 0.3% as the second largest component, Boeing (BA 129.88, -1.31), fell 1.0%. On the upside, the Dow Jones Transportation Average rose 0.4% as 12 of 20 members advanced.

Treasuries held inside narrow ranges throughout the session, and the 10-yr yield ended at 2.52%.

Trading volume was in-line with average as just over 730 million shares changed hands on the floor of the New York Stock Exchange.

Today's economic data was limited to September industrial production and pending home sales.

Industrial production increased 0.6% after rising 0.4% in August (Briefing.com consensus +0.3%). That was the largest monthly increase since February.

The headline number is undoubtedly striking for its perceived strength. However, that thought process is actually a misnomer. Rather than coming from manufacturing growth, almost the entire gain came from a 4.4% increase in utilities production. After five consecutive months of declines from cooler-than-normal temperatures, utility production returned to more normal levels as weather conditions reverted to their averages.

Manufacturing growth, which is key for economic growth, increased a very modest 0.1% in September, down from a 0.5% gain in August.

Separately, pending home sales for September tumbled 5.6%, which was worse than the 1.3% decrease forecast by the Briefing.com consensus. Today's reading followed last month's decrease of 1.6%.

Tomorrow, September retail sales and Producer Price Index will be reported at 8:30 ET, August Case-Shiller 20-City Index will cross the wires at 9:00 ET, and August business inventories will be announced at 10:00 ET. Also at 10:00 ET, the October Consumer Confidence report will be released.

Russell 2000 +31.6% YTD
Nasdaq +30.5% YTD
S&P 500 +23.6% YTD
DJIA +18.8% YTD

DJ30 -1.35 NASDAQ -3.23 SP500 +2.34 NASDAQ Adv/Vol/Dec 1257/1.73 bln/1303 NYSE Adv/Vol/Dec 1351/731.8 mln/1622

3:30 pm :

Commodities are mostly lower/mixed by the end of today's trading session
In metals, there wasn't much of a change in price as Dec copper ended the day flat at $3.27/lb, Dec gold lost $0.50 to $1351.90/oz and Dec silver fell $0.21 to $22.52
Crude oil rallied right at the open of pit trading from just under the $97.50/barrel level
In electronic trade here, crude oil extended gains and rose to a new HoD of $98.75/barrel. During crude's floor trading session, it rose $0.84 and finished the day at $98.69/barrel
Natural gas was weak all day and basically continued to extend losses slowly throughout the day

4:37PM Apple beats by $0.32, beats on revs; guides Q1 revs above consensus at midpoint, gross margin just below estimates (AAPL) 529.88 +3.92 : Reports Q4 (Sep) earnings of $8.26 per share, $0.32 better than the Capital IQ Consensus Estimate of $7.94; revenues rose 4.2% year/year to $37.47 bln vs the $36.87 bln consensus and high end of $34-37 bln guidance; gross margin 37% vs Street est of 36.9% and high end of 36-37% guidance.

iPhones sold 33.8 mln in Q4 vs Street est of ~32 mln
iPads 14.1 mln vs Street est of ~14.5 mln
Macs 4.6 mln vs Street est of ~4.5 mln

Co issues mixed guidance for Q1, sees Q1 revs of $55-58 bln vs. $55.73 bln Capital IQ Consensus Estimate; sees gross margin 36.5-37.5% vs. ests just below 38%.
4:33PM Integra beats by $0.02, reports revs in-line; guides FY13 EPS in-line, revs in-line (IART) 43.65 +0.23 : Reports Q3 (Sep) adjusted earnings of $0.72 per share, $0.02 better than the Capital IQ Consensus Estimate of $0.70; revenues rose 1.5% year/year to $213.2 mln vs the $213.92 mln consensus.

IART generated $30.8 mln in cash flow from operations and invested $13.2 mln in capex during the quarter.


Guidance: Co issues in-line guidance for FY13, sees adjusted EPS of $2.50-$2.60 vs. $2.53 Capital IQ Consensus Estimate; sees FY13 revs of $838-$843 mln vs. $841.16 mln Capital IQ Consensus Estimate.

Commentary: "We are tightening our revenue guidance to the bottom end of our previous range, primarily reflecting softness in key private label products and weakness in our spine business ... We have, however, kept a tight control on expenses, and are narrowing our guidance for adjusted earnings per share around our previous midpoint. We are pleased with the strong cash flows the business generated during the quarter."

4:27PM Integrated Device beats by $0.02, reports revs in-line; expands buyback (IDTI) : Reports Q2 (Sep) earnings of $0.10 per share, $0.02 better than the Capital IQ Consensus Estimate of $0.08; revenues fell 6.6% year/year to $124.6 mln vs the $125.05 mln consensus. Co also announces that its Board of Directors has approved an expansion of the previously authorized share repurchase program from approximately $80 million to a total of $150 million.

4:11PM PMC-Sierra reports EPS in-line, misses on revs (PMCS) 6.70 +0.17 : Reports Q3 (Sep) earnings of $0.10 per share, excluding non-recurring items, in-line with the Capital IQ Consensus Estimate consensus of $0.10; revenues fell 2.2% year/year to $128.86 mln vs the $130.24 mln consensus.

4:10PM Seagate Tech misses by $0.01, misses on revs; raises quarterly dividend 13% (STX) 49.85 +0.05 : Reports Q1 (Sep) earnings of $1.29 per share, $0.01 worse than the Capital IQ Consensus Estimate of $1.30; revenues fell 6.5% year/year to $3.49 bln vs the $3.56 bln consensus.

The Board of Directors has approved an increase in the quarterly cash dividend of $0.05 from $0.38 per share in the previous quarter to $0.43 per share this quarter, an increase of ~13%.

4:08PM Sanmina beats by $0.06, reports revs in-line; guides Q1 EPS below consensus, revs below consensus (SANM) 17.15 +0.01 : Reports Q4 (Sep) earnings of $0.46 per share, excluding non-recurring items, $0.06 better than the Capital IQ Consensus Estimate of $0.40; revenues fell 4.7% year/year to $1.5 bln vs the $1.51 bln consensus. Cash flow from operations was $90.0 million in Q4, and $317.9 million for fiscal year 2013.

Co issues downside guidance for Q1, sees EPS of $0.35 to $0.41, excluding non-recurring items, vs. $0.42 Capital IQ Consensus Estimate; sees Q1 revs of $1.425 billion to $1.475 billion vs. $1.53 bln Capital IQ Consensus Estimate.

4:07PM Riverbed Technology beats by $0.03, misses on revs (RVBD) 14.36 +0.47 : Reports Q3 (Sep) earnings of $0.26 per share, excluding non-recurring items, $0.03 better than the Capital IQ Consensus Estimate of $0.23; GAAP revenues rose 19.7% year/year to $261.7 mln; non-GAAP rev +21% to $265 mln; $267.28 mln consensus.

"In a mixed economic environment, which was particularly evident in the government vertical, Riverbed delivered solid third quarter results," said Jerry M. Kennelly, Riverbed chairman and CEO. "Strong margin performance and prudent expense control drove higher profitability in the quarter," continued Kennelly. "We further demonstrated our commitment to driving shareholder value by executing a $50 million stock repurchase during the quarter, continuing our track record of returning a substantial amount of free cash flow to investors in the form of share repurchases."

4:05PM Vishay announces cost reduction programs (VSH) 12.99 -0.05 : The programs primarily focus on a plan to enhance the competitiveness of its MOSFETs segment and a voluntary separation / early retirement offer to certain employees Company-wide. The co also plans to implement two other smaller cost reduction programs concerning the manufacturing of products within its Diodes segment. The programs in total are expected to lower costs by approximately $36 million per year when fully implemented by the first quarter of 2016, at expected cash costs of approximately $26 mln. The project for the MOSFETs segment will extend over a period of approximately two years. The manufacture of wafers for certain critical products will be transferred into a more cost-efficient fab. As a consequence, certain other wafer manufacturing currently occurring in-house will be transferred to third-party foundries. The total cash costs associated with the MOSFETs initiatives, principally severance, are expected to be approximately $10 mln. Once fully implemented, the co anticipates that the MOSFETs programs will result in an annual reduction in variable and fixed manufacturing costs of approximately $23 mln at current volumes.

4:04PM Ingram Micro announces acquisition of Shipwire, terms not disclosed (IM) 23.06 -0.20 : IM announced that it has entered into a definitive agreement pursuant to which it will acquire Shipwire, a leading provider of global fulfillment services for emerging multi-channel brands. Shipwire serves brands from more than 50 countries, selling to buyers across the world from facilities in North America, Europe and Asia. Shipwire will operate as a wholly owned subsidiary of Ingram Micro. Damon Schechter, founder and CEO of Shipwire, will continue to lead the company as president of Shipwire. The acquisition is expected to close before the end of the year.

SunPower (SPWR) and its manufacturing partner, Flextronics (FLEX) announced the production milestone of the 500,000 solar panel manufactured at the Flextronics facility in Milpitas.California.

7:41AM Freescale Semi announced that FSL ts wholly owned indirect subsidiary, plans to offer, subject to market and other conditions, $500 million aggregate principal amount of senior secured notes (FSL) 15.55 : Co announced that its wholly owned indirect subsidiary, plans to offer, subject to market and other conditions, $500 million aggregate principal amount of senior secured notes to extend a portion of its debt maturities and reduce its interest expense. Freescale intends to use the net proceeds from the offering of the Notes to redeem a portion of its outstanding 9 % Senior Secured Notes due 2018 in accordance with the indenture governing those notes and to pay the related premium and fees.

7:06AM Tessera Tech announced that its Tessera, Inc. subsidiary has reached a settlement with Sony Corporation (SNE) (TSRA) 18.73 : Co announced that its Tessera, Inc. subsidiary has reached a settlement with Sony Corporation (SNE) in its breach of contract action against Sony in the United States District Court for the Northern District of California. The terms of the settlement were identified by the court as confidential. The Company intends to provide additional details of the terms of the settlement after the parties enter into a definitive settlement agreement, subject to the terms of such agreement.

3:23AM LDK Solar enters new forbearance arrangement with noteholders (LDK) 1.52 : Co announces that it has entered into a new 30-day forbearance arrangement with holders of a majority in aggregate principal amount of its US$-Settled 10% Senior Notes due 2014. The new forbearance arrangement, which expires on November 26, 2013, relates to the interest payment due under the Notes on August 28, 2013. That interest payment is still unpaid. It is LDK Solar's intention to find a consensual solution to its obligations under the Notes as soon as possible and LDK Solar remains hopeful that it will be able to achieve that goal.
icon url

ReturntoSender

10/29/13 11:16 PM

#10366 RE: ReturntoSender #6755

From Briefing.com: 4:20 pm : The S&P 500 registered its fourth consecutive advance, climbing 0.6% to extend its October gain to 5.4%. The Dow Jones Industrial Average (+0.7%) outperformed the benchmark index while the Nasdaq (+0.3%) lagged after starting the session in-line with the S&P.

The tech-heavy Nasdaq posted a modest advance of 0.3% after the exchange experienced an intraday data dissemination issue that prevented index quotes from being sent out for nearly an hour. However, the issue was isolated to the index while individual components traded normally.

One of the components that contributed to the Nasdaq's underperformance was Apple (AAPL 516.68, -13.20). The largest tech stock lost 2.5% after its below-consensus gross margin guidance overshadowed its earnings beat on above-consensus revenue.

Despite Apple's relative weakness, the technology sector (+0.5%) ended in-line with the broader market, bolstered in part by the 2.7% gain in the shares of IBM (IBM 182.12, +4.77). Big Blue rallied after the company's Board of Directors authorized an additional $15 billion for its share buyback program. Chipmakers also contributed to the sector's strength as the PHLX Semiconductor Index advanced 1.5%.

Outside of technology, consumer discretionary (+0.6%) and energy (+0.7%) were the only other outperformers among cyclical sectors while financials, industrials, and materials ended with gains of 0.3% apiece.

The discretionary sector received support from homebuilders as all major builders posted gains while the iShares Dow Jones US Home Construction ETF (ITB 23.43, +0.32) rose 1.4%. Meanwhile, the energy sector was underpinned by BP (BP 45.90, +2.18) and Valero (VLO 40.21, +0.76) after both reported solid quarterly results.

Among countercyclical groups, utilities (+0.1%) lagged while consumer staples (+0.9%), health care (+0.7%), and telecom services (+1.5%) outperformed. Among earnings of note, Pfizer (PFE 31.25, +0.51) settled higher by 1.7% after beating bottom-line estimates by two cents on in-line revenue.

Treasuries ended on their highs as the 10-yr yield slipped two basis points to 2.50%.

With just two sessions left in October, the S&P is on track to post a solid monthly advance of 5.3%. While the month-to-date gain is impressive, the S&P 500's performance over the past 15 sessions has been even more eye-popping. Since October 8, the index has gained more than 7.0%. Investors will receive the latest policy statement from the Federal Open Market Committee tomorrow, but the markets are expecting the FOMC decision to be a non-event.

Trading volume was on the light side as just over 680 million shares changed hands on the floor of the New York Stock Exchange. Today's economic data was plentiful, but did little to suggest the Federal Reserve will be eager to curtail the pace of its asset purchases in the near term.

The Conference Board's Consumer Confidence Index plummeted in October, falling from an upwardly revised 80.2 (from 79.7) to 71.2 (73.1 Briefing.com consensus). The entire decline in confidence can be attributed to the reaction to the government shutdown and near-default by the U.S. Treasury.

Typically, confidence levels are influenced by equity trends, oil prices, labor conditions, and media reports. Other than the negative media attention on the shutdown, all of the typical components moved in a positive direction in October. If these trends continue in November, the Consumer Confidence Index should slowly return to at least September levels.

Separately, September retail sales declined 0.1% to follow an August increase of 0.2% (-0.1% Briefing.com consensus). The headline decline in retail sales masked an otherwise strong report, especially considering that private payroll growth was much weaker than expected.

The entire decline in sales was the result of a 2.2% drop in motor vehicle demand. Motor vehicle manufacturers already showed that August sales were boosted by calendar effects stemming from an extra weekend and the Labor Day holiday. With those biases removed, sales were set to decline substantially in September, which translated into the 2.2% drop in motor vehicle sales.

Total business inventories increased 0.3% in August after increasing 0.4% in July (+0.2% Briefing.com consensus).

Also of note, September producer prices fell 0.1% after increasing 0.3% in August (+0.2% Briefing.com consensus). That was the first monthly decline since prices fell 0.7% in April.

Food prices unexpectedly declined 1.0% in September after increasing 0.5% in August. A 17.9% drop in fresh and dry vegetables prices contributed to most of the September decline. Those prices increased 26.9% in August.

Tomorrow, the weekly MBA Mortgage Index will be reported at 7:00 ET, October ADP Employment Change will be released at 8:15 ET, and September CPI will cross the wires at 8:30 ET. In addition, the FOMC will release its latest policy statement at 14:15 ET. On the earnings front, General Motors (GM 36.06, +0.26), Comcast (CMCSA 47.71, -0.52), and Exelon (EXC 28.05, -0.02) will report their results ahead of the opening bell.DJ30 +111.42 NASDAQ +12.21 SP500 +9.84 NASDAQ Adv/Vol/Dec 1505/1.81 bln/1040 NYSE Adv/Vol/Dec 1856/682.6 mln/1136

3:30 pm :

Dec gold chopped around in negative territory today as a stronger dollar index pressured prices. The yellow metal brushed a session high of $1352.90 per ounce in late morning pit trade but was unable to sustain the momentum. It settled 0.5% lower at $1345.30 per ounce, slightly above its session low of $1342.40 per ounce
Dec silver spent most of the session trading near the unchanged line after lifting from a session low of$22.38 per ounce set in early morning pit trade. It eventually settled with a 0.1% loss at $22.49 per ounce
Dec crude oil fell for the first time in four sessions as the dollar index advanced. The energy component traded as low as $97.82 per barrel and settled with a 0.4% loss at $98.26 per barrel
Dec natural gas retreated back into negative territory after touching a session high of $3.67 per MMBtu in early morning pit trade. It settled 0.8% lower at $3.63 per MMBtu.

4:51PM Nanometrics beats by $0.02, beats on revs; guides Q4 EPS in-line, revs in-line (NANO) 16.38 -0.49 : Reports Q3 (Sep) loss of $0.06 per share, excluding non-recurring items, $0.02 better than the Capital IQ Consensus Estimate of ($0.08); revenues fell 11.1% year/year to $39.0 mln vs the $38.6 mln consensus. Co issues in-line guidance for Q4, sees EPS of $(0.08)-0.03, excluding non-recurring items, vs. $0.00 Capital IQ Consensus Estimate; sees Q4 revs of $42-47 mln vs. $44.2 mln Capital IQ Consensus Estimate.

4:47PM Rubicon Tech misses by $0.04, beats on revs; guides Q4 EPS below consensus (RBCN) 9.07 -0.10 : Reports Q3 (Sep) loss of $0.26 per share, $0.04 worse than the Capital IQ Consensus Estimate of ($0.22); revenues fell 44.2% year/year to $11.1 mln vs the $10.78 mln consensus. Co issues downside guidance for Q4, sees EPS of ($0.24)-($0.22) vs. ($0.11) Capital IQ Consensus Estimate.

Commenting on the outlook for the fourth quarter of 2013, Mr. Weissman said, "We believe sapphire demand will continue to strengthen and we expect pricing for two and four-inch cores to be higher in the fourth quarter and have added some additional core fabrication capacity. With lower than expected wafer orders from the SoS market, our wafer revenue will be lower in the fourth quarter, offsetting most of the sequential price and volume increases for two and four-inch core. Therefore, we are expecting fourth quarter revenue to be similar to the third quarter (Cap IQ Q4 revenue consensus is $13.7 mln). We are very optimistic about wafer demand next year but it could take another couple of quarters to see a meaningful improvement in wafer orders. Idle plant costs will remain high in the fourth quarter but we will begin to see some reduction in idle plant costs as we have now started the process of re-starting idle crystal growth furnaces.

"With the rising demand for sapphire, pricing has been steadily rising and current market pricing, which will be reflected in our fourth quarter numbers, is now back to approximately break-even for our two and four inch core products. Given the momentum of the LED general lighting market and introduction of new applications for sapphire, we expect pricing to continue to strengthen going into next year." The Company announced the launch of its four and six-inch patterned wafer product ("PSS") and reported that seven tier-one LED chip manufacturers have already requested samples. "We are very pleased with the customer response thus far and believe that PSS will be a strong growth driver for our wafer business," Mr. Parvez said. "While we are a few quarters away from volume production orders, we believe that PSS wafer sales should generate at least $15 million in revenue for us in 2014."

The Company also reported that orders from their major SoS customer are very limited due to excess wafer inventory at the customer. That customer is also introducing new RF chips that will be produced on SoI rather than SoS starting early next year. Therefore future sapphire purchases from that customer will likely be lower than they have been historically.

4:20PM FEI reports EPS in-line, misses on revs; guides Q4 EPS in-line, revs in-line (FEIC) 89.14 : Reports Q3 (Sep) earnings of $0.67 per share, in-line with the Capital IQ Consensus Estimate consensus of $0.67; revenues fell 1.5% year/year to $218.5 mln vs the $221.07 mln consensus.

The gross margin in the third quarter was 47.9%, compared with 47.0% in the third quarter of 2012 and 48.0% the second quarter of 2013. Net bookings in the third quarter were $251.0 million, the highest in any quarter in the company's history. That compares with net bookings of $223.3 million in the third quarter of 2012 and $237.7 million in the second quarter of 2013.

Co issues in-line guidance for Q4, sees EPS of $0.87-0.97 vs. $0.92 Capital IQ Consensus Estimate; sees Q4 revs of $250-260 mln vs. $253.47 mln Capital IQ Consensus Estimate. Q4 bookings are expected to be at least $250 mln.

"Science bookings were particularly strong, up 16% sequentially and 33% compared with last year's third quarter, and were paced by record Life Sciences orders. Within Industry, Electronics bookings were up sequentially for the third quarter in a row. Revenue and earnings were within our expected ranges. Gross margin of 47.9% was up compared with last year's third quarter and keeps us on track toward our mid-2015 goal of 50%. Operating cash flow was again very strong. With our record backlog and continued strong bookings, we expect to exit the year with record fourth quarter revenue and earnings."

4:16PM Spreadtrum Comms announces mass production of WCDMA/HSPA+ smartphone chipset SC7710 (SPRD) 30.42 +0.02 : Co announced that it has achieved mass production of its SC7710 chipset, a single-core WCDMA/HSPA+ smartphone chipset designed for entry level 3G devices shipping globally

4:10PM Ixia beats by $0.01, reports revs in-line (XXIA) 14.56 +0.05 : Reports Q3 (Sep) earnings of $0.18 per share, excluding non-recurring items, $0.01 better than the Capital IQ Consensus Estimate of $0.17; revenues rose 4.3% year/year to $115.4 mln vs the $114.97 mln consensus.

"Anue and BreakingPoint revenue surpassed expectations and grew to $35.2 million, and our revenue from service providers and enterprise customers grew to 53% of our total revenue. We are on track with expanding our go-to-market channels and product portfolio, while at the same time managing our expenses."

4:06PM Ixia to acquire Net Optics for $190 mln in cash; expects the acquisition to be accretive to non-GAAP earnings by the second full quarter after the acquisition closes (XXIA) 14.56 +0.05 :
4:06PM Qiagen beats by $0.01, reports revs in-line; guides Q4 EPS below consensus; reaffirms FY13 EPS guidance, guides FY13 revs above consensus (QGEN) 21.92 +0.03 : Reports Q3 (Sep) earnings of $0.28 per share, $0.01 better than the Capital IQ Consensus Estimate of $0.27; revenues rose 6.4% year/year to $323.8 mln vs the $320.61 mln consensus.

4:05PM TriQuint Semi acknowledges receipt of starboard value letter (TQNT) 7.76 +0.419 : TQNT has issued the following response to the letter received from Starboard Value LP dated Oct 29th, 2013.

TriQuint welcomes constructive input from all shareholders including Starboard Value LP. TriQuint's Board of Directors and management regularly review the business strategy and have taken meaningful steps to increase shareholder value including the sale of underutilized equipment, share buybacks, as well as the withdrawal from unattractive businesses over time.

Given the investments that have been made over the past few years in premium filters combined with a comprehensive suite of complementary products, manufacturing technologies, and packaging options, TriQuint is uniquely positioned to address the current and future trends in the RF industry.

4:04PM Flextronics beats by $0.01, beats on revs; guides Q3 EPS below consensus, revs in-line (FLEX) 8.86 -0.12 : Reports Q2 (Sep) earnings of $0.22 per share, excluding non-recurring items, $0.01 better than the Capital IQ Consensus Estimate of $0.21; revenues rose 3.8% year/year to $6.41 bln vs the $6.28 bln consensus.
Co issues downside EPS guidance for Q3, sees EPS of $0.21-0.25, excluding non-recurring items, vs. $0.26 Capital IQ Consensus Estimate; sees Q3 revs of $6.5-6.9 bln vs. $6.8 bln Capital IQ Consensus Estimate.

4:04PM Cirrus Logic beats by $0.24, beats on revs; guides Q3 revs in-line (CRUS) 24.42 -0.24 : Reports Q2 (Sep) earnings of $0.84 per share, excluding non-recurring items, $0.24 better than the Capital IQ Consensus Estimate of $0.60; revenues fell 1.6% year/year to $190.7 mln vs the $181.43 mln consensus. Co reported Q2 Gross margin of 52 percent.

Co issues in-line guidance for Q3, sees Q3 revs of $200-220 mln vs. $202.93 mln Capital IQ Consensus Estimate. Co said Q3 Gross margin is expected to be between 45 percent and 47 percent.

"Q2 was another great quarter for Cirrus Logic as portable audio continued to be a key driver of our success and we made significant progress on our strategic initiatives...We are especially pleased with the addition of Acoustic Technologies to the Cirrus Logic team as they are expected to accelerate our progress toward our vision of being the preferred supplier of signal processing components."

4:02PM MagnaChip Semi beats by $0.05, reports revs in-line; guides Q4 revs below consensus (MX) 20.95 -0.83 : Reports Q3 (Sep) earnings of $0.76 per share, excluding non-recurring items, $0.05 better than the Capital IQ Consensus Estimate of $0.71; revenues fell 1.8% year/year to $217.8 mln vs the $219.7 mln consensus. Co issues downside guidance for Q4, sees Q4 revs of $193-203 mln vs. $207.8 mln Capital IQ Consensus Estimate.

Large Cap Gainers

NOK (7.32 +8.52%): Beat on EPS by EUR 0.02, missed on revs.
ACT (154.13 +5.67%): Reported EPS in-line, revs in-line; guided Q4 EPS above consensus; raised FY13 revs above consensus; guided FY14 EPS above consensus.
BP (45.84 +4.85%): Beat on EPS by $0.12.

Large Cap Losers

CMI (123 -8.83%): Missed on EPS by $0.17, missed on revs; lowered FY13 rev guidance; downgraded to Neutral at Robert W. Baird.
UBS (19.72 -7.72%): Missed on EPS by $0.03, missed on revs.
STX (47.99 -3.73%): Missed on EPS by $0.01, missed on revs; raised quarterly dividend by 13%; sees Q2 revs of $3.5-3.6 bln vs $3.63 bln consensus; tgt raised to $58 from $53 at Pacific Crest; upgraded to Hold from Sell at Craig-Hallum.

Mid Cap Gainers

JLL (96.77 +13.79%): Beat on EPS by $0.07, beat on revs.
XYL (32.75 +13.2%): Beat on EPS by $0.14, beat on revs; raised and guided FY13 EPS and revs above consensus; upgraded to Buy from Hold at Brean Capital; tgt $44.
PBI (21.43 +11.38%): Beat on EPS by $0.08, missed on revs; guided FY13 EPS in-line.

Mid Cap Losers

DAN (19.42 -14.24%): Missed on EPS by $0.07, missed on revs; lowered FY13 EPS below consensus, revs below consensus.
CVLT (74.88 -9.24%): Beat on EPS by $0.08, beat on revs.
MWV (35.51 -8.41%): Missed on EPS by $0.01, missed on revs; announced agreement with Plum Creek (PCL) to sell its U.S. Forestlands and form a new partnership for its South Carolina Real Estate assets.

Apple (AAPL 525.56, -4.32) is underperforming following its earnings report (although it would be remiss not to add that AAPL gained as much as 10% in the 12 sessions leading up to its report)
IBM (IBM 180.14, +2.79) is outperforming after announcing its Board declared a regular quarterly cash dividend of $0.95 per common share and authorized an additional $15 bln for its stock repurchase program
A rotation into less volatile names that has been fostered by a sense that the market, and higher-beta stocks, seem ripe for a pullback

IBM's performance has helped boost both the price-weighted Dow and the market-cap weighted S&P 500, both of which are hitting new session highs.

11:16AM Dell completes go-private transaction (DELL) 13.86 +0.03 : Co announced the completion of its acquisition by Michael Dell, Dell's Founder, Chairman and CEO, and Silver Lake Partners, a leading global technology investment firm. Under the terms of the merger agreement, Dell stockholders will receive $13.75 in cash for each share of Dell common stock they hold, plus payment of a special cash dividend of $0.13 per share to stockholders of record as of the close of business on Oct. 28, 2013, for total consideration of $13.88 per share in cash. The total transaction is valued at approximately $24.9 billion.

QuickLogic (QUIK) announced that the co's ArcticLink III VX and BX CSSP solutions are now included in Broadcom's (BRCM) Qualified Vendor List for an LVDS-based display bridging application supporting its BCM21663 Dual-core HSPA+ Multimedia Baseband Processor.

9:23AM Integrated Silicon misses by $0.06, misses on revs; guides Q1 EPS below consensus, revs below consensus (ISSI) 11.97 : Reports Q4 (Sep) earnings of $0.20 per share, $0.06 worse than the Capital IQ Consensus Estimate of $0.26; revenues rose 8.1% year/year to $78.4 mln vs the $80.18 mln consensus.

Guidance:

Co issues downside guidance for Q1, sees EPS of $0.17-0.21 vs. $0.27 Capital IQ Consensus Estimate
Co sees Q1 revs of $76-82 mln vs. $82.70 mln Capital IQ Consensus Estimate.
Gross margin for the December quarter is expected to range between 33-34%.
Operating expenses are expected to range between $21.5-22.5 mln.
The Company expects to realize additional gains on the Nanya shares in the December quarter.

Freescale (FSL) is collaborating with ARM (ARMH) and Oracle (ORCL) to add new vertical segment support for 'One Box' IoT gateway platform. The cos also team up on ARM mbed project to streamline development of edge/sensor nodes for the Internet of Things.

Atmel (ATML) has partnered with sensor and sensor fusion software manufacturers, accelerating embedded designers' ability to create smarter, connected devices including mobile sensor hubs, connected devices, wearables and Internet of Things applications.

Altera (ALTR) announced that its Stratix 10 SoC devices, manufactured on Intel's (INTC) 14 nm Tri-Gate process, will incorporate a high-performance, quad-core 64-bit ARM Cortex-A53 processor system.

Juniper Networks (JNPR) announced its flagship QFX5100 family of data center access switches which enable customers to achieve increased network performance, greater operational flexibility and higher availability.

7:27AM Nokia beats by EUR 0.02, misses on revs (NOK) 6.75 : Reports Q3 (Sep) earnings of 0.01 per share, excluding non-recurring items, 0.02 better than the Capital IQ Consensus Estimate of ( 0.01); revenues fell 21.8% year/year to 5.66 bln vs the 5.9 bln consensus.

If Nokia Group would have reported substantially all of its Devices & Services business as discontinued operations in the third quarter 2013 the net sales of its continuing operations would have been EUR 2.9 billion, which is EUR 2.8 billion lower than Nokia Group net sales of EUR 5.7 billion. However, Nokia Group's non-IFRS operating margin of its continuing operations would have been 11.5%, which is 7.7 percentage points higher than the third quarter 2013 non-IFRS operating margin of 3.8%.

- NSN Q3 net sales decreased 7% quarter-on-quarter to EUR 2.6 billion, primarily reflecting seasonality and NSN's strategic focus.
- HERE Q3 net sales decreased 9% quarter-on-quarter to EUR 0.2 billion, primarily due to lower seasonal sales to vehicle customers.
- Devices & Services Q3 net sales increased 6% quarter-on-quarter to EUR 2.9 billion.
- Lumia Q3 volumes increased 19% quarter-on-quarter to 8.8 million units, reflecting our recently broadened Lumia product range and strong customer demand, particularly for the Lumia 520.
- Mobile Phones Q3 volumes increased 4% quarter-on-quarter to 55.8 million units, demonstrating solid performance across the majority of our portfolio due to recently launched devices, particularly the Nokia 105, the Asha 501, and the Nokia 210.

- Nokia Group achieved underlying operating profitability for the fifth consecutive quarter, with a Q3 non-IFRS operating margin of 3.8%, driven by strong performances by Nokia Solutions and Networks (NSN) and HERE.
- Nokia Group ended Q3 with a strong balance sheet and solid cash position, with gross cash of EUR 9.1 billion and net cash of EUR 2.4 billion. Excluding the acquisition of Siemens' stake in NSN for EUR 1.7 billion, Nokia Group net cash was ~flat sequentially. At the end of Q3 NSN's contribution to Nokia Group gross and net cash was EUR 2.7 billion and EUR 1.5 billion, respectively.

6:09AM Cabot Micro beats by $0.11, beats on revs (CCMP) 39.12 : Reports Q4 (Sep) earnings of $0.70 per share, $0.11 better than the Capital IQ Consensus Estimate of $0.59; revenues rose 5.2% year/year to $116.3 mln vs the $112.72 mln consensus. This reflects an increase of 5.1 percent compared to the same quarter last year and an increase of 5.7 percent from the prior quarter, on solid demand for the company's products. The company achieved a gross profit margin of 50.9 percent of revenue in the fourth fiscal quarter, which is the highest level since December 2009.

"We are pleased with our strong financial performance for the quarter and full fiscal year, despite soft semiconductor industry conditions in the first half, and we believe the execution of our long-term strategic initiatives continues to create value for our customers and our shareholders."

Texas Instruments (TXN) announced the release of the Tiva C Series microcontroller platform.

07:48 am Seagate Tech shares fall 5% following miss on earnings/disappointing guidance
Seagate Tech (STX $47.45 -2.40) reported first quarter earnings of $1.29 per share, which missed expectations, while revenues fell 6.5% year/year to $3.49 million which is below expectations. The Board of Directors has approved an increase in the quarterly cash dividend of $0.05 from $0.38 per share in the previous quarter to $0.43 per share this quarter, an increase of ~13%. The company sees second quarter revs of $3.5-3.6 billion which is below expectations.

07:47 am Riverbed shares little changed following better than expected earnings
Riverbed Technology (RVBD $14.35 +0.00) reported third quarter earnings of $0.26 per share, excluding non-recurring items, which is better than expected, while GAAP revenues rose 19.7% year/year to $261.7 million; non-GAAP rev +21% to $265 million.

"In a mixed economic environment, which was particularly evident in the government vertical, Riverbed delivered solid third quarter results," said Jerry M. Kennelly, Riverbed chairman and CEO.

"Strong margin performance and prudent expense control drove higher profitability in the quarter," continued Kennelly. "We further demonstrated our commitment to driving shareholder value by executing a $50 million stock repurchase during the quarter, continuing our track record of returning a substantial amount of free cash flow to invest imatesors in the form of share repurchases." The company issued guidance for the fourth quarter with EPS of $0.26-0.27, which is line with expectations with revenues of $270-276 million which is below expectations."

Apple (AAPL) reported fourth quarter earnings of $8.26 per share, which is better than expected, while revenues rose 4.2% year/year to $37.47 billion which is better than expected, and and high end of $34-37 billion guidance; gross margin 37% versus high end of 36-37% guidance. iPhones sold 33.8 million in Q4 vs Street estimates of ~32 million. iPads 14.1 million vs Street estimates of ~14.5 million. Macs 4.6 million vs Street estimates of ~4.5 million. The company issued mixed guidance for Q1, sees Q1 revs of $55-58 billion which is line with expectations with gross margin 36.5-37.5% versus expectations of just below 38%.

Baird upgraded Apple (AAPL) to Outperform from Neutral and raised its tgt to $620 from $525. Firm had been concerned with the current product cycle, but with better-than-expected results now behind us, firm expects the focus to turn to 2014, which it believes holds more promise. Potential catalysts include a bigger screen iPhone, Apple TV, possible wearable devices and a likely China Mobile (CHL) launch. Additionally, firm also believes gross margins should hold steady in C2014 based on the current product lineup.

Tableau Software (DATA) reported third quarter earnings of $0.08 per share, which is higher than expected, while revenues rose 90.3% year/year to $61.1 million which is higher than expected.Lock up release will take effect on October 31, 2013, and the shares may be sold on or after that date.

Riverbed Technology (RVBD) reported third quarter earnings of $0.26 per share, excluding non-recurring items, which is better than expected, while GAAP revenues rose 19.7% year/year to $261.7 million; non-GAAP rev +21% to $265 million. "In a mixed economic environment, which was particularly evident in the government vertical, Riverbed delivered solid third quarter results," said Jerry M. Kennelly, Riverbed chairman and CEO. "Strong margin performance and prudent expense control drove higher profitability in the quarter," continued Kennelly. "We further demonstrated our commitment to driving shareholder value by executing a $50 million stock repurchase during the quarter, continuing our track record of returning a substantial amount of free cash flow to invest imatesors in the form of share repurchases." The company issued guidance for the fourth quarter with EPS of $0.26-0.27, which is line with expectations with revenues of $270-276 million which is below expectations.

Seagate Tech (STX) reported first quarter earnings of $1.29 per share, which missed expectations, while revenues fell 6.5% year/year to $3.49 million which is below expectations. The Board of Directors has approved an increase in the quarterly cash dividend of $0.05 from $0.38 per share in the previous quarter to $0.43 per share this quarter, an increase of ~13%. The company sees second quarter revs of $3.5-3.6 billion which is below expectations.
icon url

ReturntoSender

10/30/13 7:15 PM

#10367 RE: ReturntoSender #6755

From Briefing.com: 4:10 pm : The S&P 500 registered its first decline in five sessions, losing 0.5%. Small caps faced additional selling pressure as the Russell 2000 fell 1.4%.

Stocks held modest losses into the afternoon, but slid to fresh lows after the Federal Reserve released its latest policy directive, which was little changed from prior statements. Most notably, the directive acknowledged the recent slowdown in the housing sector and noted that fiscal policy is presenting a headwind to growth. In addition, the Committee dropped the reference to "tightening financial conditions" that appeared in the September statement.

While the statement did not throw the market any taper-related curveballs, it may have been perceived to be somewhat hawkish as the Committee did not alter its outlook to account for the impact from the partial government shutdown.

Although stocks slumped in reaction to the release, it should be noted today's weakness occurred after the S&P rallied more than 7.0% over the course of 15 sessions since October 8. Therefore, it is more likely the policy statement served as an excuse for the selling rather than a catalyst.

All ten sectors settled in the red, but their losses were limited to less than 0.8%. Defensive sectors led to the downside, and consumer staples (-0.8%) ended at the bottom of the leaderboard. Meanwhile, utilities (-0.7%) ended among the laggards despite seeing some intraday strength in reaction to above-consensus earnings from Exelon (EXC 28.55, +0.50).

Among cyclical groups, energy (-0.6%) and materials (-0.6%) trailed the S&P while industrials (-0.4%) and technology (-0.2%) outperformed.

Even though the tech sector ended ahead of the broader market, the tech-heavy Nasdaq (-0.6%) lagged as the iShares Nasdaq Biotechnology ETF (IBB 207.25, -4.35) lost 2.1%. With just one more session left in October, the biotech ETF is on track to end the month with a loss of 1.0% after gaining more than 50.0% so far this year.

Treasuries ended lower with the 10-yr yield up three basis points at 2.53%.

Trading volume was well below average as only 697 million shares changed hands on the floor of the New York Stock Exchange.

Looking back at today's economic data, the CPI increased 0.2% in September after ticking up 0.1% in August. The Briefing.com consensus expected headline CPI growth of 0.1%. Energy prices, which fell 0.3% in August, were up 0.8% in September. That was the strongest increase since prices rose 3.4% in June. Food prices were flat in September after increasing 0.1% for the previous two months. Unlike the PPI, there were no large moves in any one sector. Food price movements were generally weak, up or down, across the board.

Excluding food and energy, core CPI increased 0.1% in September for a second consecutive month. That was exactly what the consensus expected.

Separately, according to today's ADP National Employment Report, employment in the nonfarm private business sector rose by 130K in October. This was a bit above the increase of 125K expected by the Briefing.com consensus.

Lastly, the weekly MBA Mortgage Index rose 6.4% to follow last week's decline of 0.6%.

Tomorrow, October Challenger Job Cuts will be released at 7:30 ET and weekly initial claims will be reported at 8:30 ET. The day's data will be topped off with the 9:45 ET release of the Chicago PMI for October.

Russell 2000 +30.2% YTD
Nasdaq +30.2% YTD
S&P 500 +23.6% YTD
DJIA +19.2% YTD

DJ30 -61.59 NASDAQ -21.72 SP500 -8.64 NASDAQ Adv/Vol/Dec 682/1.81 bln/1885 NYSE Adv/Vol/Dec 886/696.7 mln/2139

3:30 pm :

Dec crude oil extended yesterday's losses following a higher-than-expected climb in stockpiles. The EIA reported that for the week ending Oct 25, crude oil had a build of 4.1 mln barrels when consensus called for a smaller build of 2.3 mln barrels. The energy component touched a session low of $96.59 per barrel moments before settling with a 1.6% loss at $96.72 per barrel
Dec gas chopped around between positive and negative territory, with prices trading in a tight range between $3.61 and $3.65 per MMBtu. It eventually settled 0.3% lower at $3.62 per MMBtu
Dec gold traded higher ahead of the 14:00 ET release of the latest policy directive from the FOMC. A slightly weaker dollar index also boosted prices. The yellow metal advanced to a session high of $1359.60 per ounce in morning action and settled with a 0.3% gain at $1348.90 per ounce. Gold gave up the gain in electronic trade as the Fed left its asset purchase unchanged and is currently trading 0.3% lower at $1342.10 per ounce
Dec silver climbed to a session high of $23.09 in early morning pit trade. Prices held steady near the $23.00 per ounce level for most of the session and settled 2.2% higher at $22.98 per ounce. Silver fell to a low of $22.45 per ounce in electronic trade and is currently 0.7% higher at $22.65 per ounce.

4:40PM Intersil beats by $0.03, beats on revs; guides Q4 EPS in-line, revs in-line (ISIL) 10.70 -0.18 : Reports Q3 (Sep) earnings of $0.20 per share, excluding non-recurring items, $0.03 better than the Capital IQ Consensus Estimate of $0.17; revenues rose 0.8% year/year to $152.64 mln vs the $149.13 mln consensus.
Co issues in-line guidance for Q4, sees EPS of $0.16-0.18 vs. $0.16 Capital IQ Consensus Estimate; sees Q4 revs of $142-148 mln vs. $145.43 mln Capital IQ Consensus Estimate.

4:38PM Microchip beats by $0.03, beats on revs; guides DecQ EPS in-line, revs in-line (MCHP) 39.95 -0.35 : Reports Q2 (Sep) non-GAAP earnings of $0.63 per share, $0.03 better than the Capital IQ Consensus Estimate of $0.60; revenues rose 28.5% year/year to $492.7 mln vs the $481.6 mln consensus. Co issues in-line guidance for Q3 (Dec), sees non-GAAP EPS of $0.57-0.63 vs. $0.59 Capital IQ Consensus Estimate; sees Q3 revs of $463.1-492.7 mln vs. $476.8 mln Capital IQ Consensus Estimate.

4:36PM TTM Tech misses by $0.03, misses on revs; guides Q4 EPS below consensus, revs below consensus (TTMI) 9.82 -0.38 : Reports Q3 (Sep) earnings of $0.14 per share, excluding non-recurring items, $0.03 worse than the Capital IQ Consensus Estimate of $0.17; revenues fell 0.1% year/year to $338.7 mln vs the $346.17 mln consensus.

Co issues downside guidance for Q4, sees EPS of $0.18-0.24, excluding non-recurring items, vs. $0.25 Capital IQ Consensus Estimate; sees Q4 revs of $350-370 mln vs. $380.67 mln Capital IQ Consensus Estimate.

Adjusted EBITDA for the third quarter of 2013 was $42.3 million, or 12.5 percent of net sales, compared to adjusted EBITDA of $39.1 million, or 11.6 percent of net sales, for the second quarter of 2013 and $44.5 million, or 13.1 percent of net sales, for the third quarter of 2012.

"Our third quarter revenue and non-GAAP earnings were within our guidance range for the quarter...We were pleased with the robust sequential increase in sales in our cellular phone and computing end markets which was driven by strong seasonal demand for our advanced technology PCBs used in smartphones and tablets."

4:36PM Emulex beats by $0.01, beats on revs; guides Q2 EPS in-line, revs in-line (ELX) : Reports Q1 (Sep) earnings of $0.13 per share, $0.01 better than the Capital IQ Consensus Estimate of $0.12; revenues fell 3.8% year/year to $114.8 mln vs the $112.08 mln consensus. Co issues in-line guidance for Q2, sees EPS of $0.15-0.17 vs. $0.17 Capital IQ Consensus Estimate; sees Q2 revs of $118-124 mln vs. $120.34 mln Capital IQ Consensus Estimate.

4:36PM AXT beats by $0.01, misses on revs (AXTI) 2.20 -0.03 : Reports Q3 (Sep) loss of $0.07 per share, $0.01 better than the Capital IQ Consensus Estimate of ($0.08); revenues fell 13.9% year/year to $20.5 mln vs the $21.2 mln consensus.

4:32PM Skyworks beats by $0.02, reports revs in-line; guides Q1 EPS in-line, revs above consensus (SWKS) 24.48 -0.12 : Reports Q4 (Sep) earnings of $0.64 per share, excluding non-recurring items, $0.02 better that the Capital IQ Consensus Estimate of $0.62; revenues rose 13.3% year/year to $477 mln vs the $474.72 mln consensus.

Co issues in-line EPS guidance for Q1, sees EPS of $0.66, excluding non-recurring items, vs. $0.66 Capital IQ Consensus Estimate; sees Q1 revs of $500 mln vs. $495.44 mln Capital IQ Consensus Estimate.

4:31PM Western Digital Announces 10.87 mln share secondary offering by selling shareholder Hitachi (WDC) 73.21 +0.47 : The co will not receive any of the proceeds from the offering of the shares (including any shares sold pursuant to the underwriters' option to purchase additional shares). Goldman, Sachs & Co. and BofA Merrill Lynch are acting as lead book-running managers and J.P. Morgan Securities LLC is acting as joint book-running manager for the offering.

4:25PM JDS Uniphase beats by $0.01, beats on revs; guides Q2 revs below consensus (JDSU) 14.75 -0.43 : Reports Q1 (Sep) earnings of $0.13 per share, excluding non-recurring items, $0.01 better than the Capital IQ Consensus Estimate of $0.12; revenues rose 1.9% year/year to $429 mln vs the $423.19 mln consensus.
Co issues downside guidance for Q2, sees Q2 revs of $420 to $440 million vs. $456.94 mln Capital IQ Consensus Estimate.

4:22PM Power Integrations beats by $0.05, reports revs in-line; guides Q4 revs in-line (POWI) 51.43 -0.67 : Reports Q3 (Sep) earnings of $0.71 per share, excluding non-recurring items, $0.05 better than the Capital IQ Consensus Estimate of $0.66; revenues rose 17.5% year/year to $91.72 mln vs the $91.7 mln consensus.

Power Integrations received 24 U.S. patents and 37 non-U.S. patents during the quarter and had a total of 586 U.S. patents and 474 non-U.S. patents as of September 30, 2013.

Co issues in-line guidance for Q4, sees Q4 revs of $86-92 mln vs. $90.70 mln Capital IQ Consensus Estimate. Co sees Q4 non-GAAP gross margin of ~54.5% and non-GAAP operating expenses of ~$28-28.5 mln.

"Our fourth-quarter revenues are likely to be modestly lower compared to the third quarter due primarily to seasonal trends. Nevertheless, we are on pace for a double-digit revenue increase in 2013, substantially ahead of the growth rate of the overall analog semiconductor industry. We believe we are well positioned for further growth as we continue to increase our penetration across the broader power supply market while aggressively pursuing emerging opportunities in areas like LED lighting, rapid charging and high power."

4:18PM SunPower beats by $0.19, beats on revs; guides Q4 EPS in-line, revs in-line; guides FY13 EPS in-line, revs in-line (SPWR) 31.85 -1.37 : Reports Q3 (Sep) earnings of $0.44 per share, $0.19 better than the Capital IQ Consensus Estimate of $0.25; revenues rose 1.3% year/year to $657.12 mln vs the $591.89 mln consensus. Co issues in-line guidance for Q4, sees EPS of $0.15-0.35 vs. $0.28 Capital IQ Consensus Estimate; sees Q4 revs of $675-725 mln vs. $722.86 mln Capital IQ Consensus Estimate. Co issues guidance for FY13, sees capital expenditures of $45 million to $55 million and GW recognized in the range of 1.0 GW to 1.03 GW.

4:07PM Coherent beats by $0.17, beats on revs (COHR) 65.33 -0.82 : Reports Q4 (Sep) earnings of $1.03 per share, $0.17 better than the Capital IQ Consensus Estimate of $0.86; revenues rose 12.9% year/year to $213.1 mln vs the $207.09 mln consensus.

Bookings received during the fourth fiscal quarter ended Sept 28, 2013 of $200.3 million increased 18.3% from $169.3 million in the same prior year period and increased by 5.9% compared to bookings of $189.2 million in the immediately preceding quarter.

The book-to-bill ratio was 0.94, and ending backlog shipping in the next 12 months was $285.8 million at September 28, 2013, compared to a backlog of $299.2 million at June 29, 2013 and a backlog of $352.8 million at September 29, 2012.

4:05PM Atmel announces $300 mln addition to stock repurchase program (ATML) 6.58 -0.11 : Co announced that its Board of Directors has authorized an additional $300 mln allocation of funds to its existing $700 mln common stock repurchase program.

4:05PM Mellanox Tech executive officers adopt 10b5-1 stock trading plans (MLNX) 35.56 +0.42 : Co announced that Eyal Waldman, president and CEO, and Jacob Shulman, chief financial officer, have each adopted a stock trading plan to sell a portion of their ordinary shares of the company in an orderly manner.

Large Cap Gainers

RRC (77.73 +4.14%): Beat quarterly EPS by $0.05 ($0.35 ex items vs $0.30 estimate), revs rose 47.4% yoy to $442 mln vs $431.32 mln estimate; co sees FY13 production growth at high end of +20-25% guidance
GILD (72.33 +4.07%): Beat quarterly EPS by $0.04 ($0.52 ex items vs $0.48 estimate), revs rose 14.7% yoy to $2.78 bln vs $2.72 bln estimate; raised FY13 product sales guidance to $10.3-10.4 bln from $10.0-10.2 bln; target raised to $80 from $72 at RBC Capital Markets, to $90 from $85 at BMO Capital Markets; added to Buy list at Deutsche Bank
GM (37.07 +2.80%): Beat quarterly EPS by $0.02 ($0.96 ex items vs $0.94 estimate), revs rose 3.7% yoy to $39 bln vs $38.97 bln estimate

Large Cap Losers

WU (16.86 -12.37%): Beat quarterly EPS by $0.04 ($0.39 vs $0.35 estimate), revs fell 0.9% yoy to $1.41 bln vs $1.4 bln estimate; sees FY13 EPS of $1.38-1.43 vs $1.44 estimate; downgraded to Market Perform from Outperform at Raymond James; upgraded to Buy from Hold at Standpoint Research
TEVA (38.37 -6.46%): Announced that Dr. Jeremy Levin will step down as President and CEO
LNKD (232.14 -6.07%): Beat quarterly EPS by $0.08 ($0.39 ex items vs $0.31 estimate), revs rose 56.0% yoy to $393 mln vs $385.45 mln estimate and $367-373 mln estimate; sees Q4 revs of $415-420 mln vs $439.82 mln estimate; target raised to $280 from $255 at Jefferies, to $270 from $230 at Canaccord Genuity

Mid Cap Gainers

DWA (32.21 +15.78%): Beat quarterly EPS by $0.12 ($0.12 vs $0.00 estimate), revs fell 17.1% yoy to $154.5 mln vs $140.3 mln estimate; upgraded to Buy from Neutral at Ascendiant Capital Markets
SEE (30.88 +8.26%): Beat quarterly EPS by $0.06 ($0.39 ex items vs $0.33 estimate), revs rose 2.0% yoy to $1.94 bln vs $1.93 bln estimate; sees FY13 EPS of $1.25-1.30 ex items vs $1.20 estimate, revs of ~$7.7 bln vs $7.76 bln estimate
AZPN (37.69 +7.13%): Beat quarterly EPS by $0.04 ($0.19 ex items vs $0.15 estimate), revs rose 22.5% yoy to $87.6 mln vs $85.1 mln estimate

Mid Cap Losers

QCOR (59.15 -15.17%): Reported strong Q3 results but noted on conference call that the U.S. Attorney's Office for the Southern District of New York and the Los Angeles officer of the SEC are joining the ongoing investigation by U.S. Attorney's Office in Philadelphia regarding co's promotional claims
DLR (49.34 -14.98%): Missed quarterly core FFO by $0.04 ($1.16 ex items vs $1.20 estimate), revs rose 10.8% yoy to $379.46 mln vs $376.14 mln estimate; sees FY13 core FFO of $4.65-4.67 ex items (lowered from $4.74-4.83) vs $4.80 estimate; downgraded to Equal Weight from Overweight at Evercore; downgraded to Market Perform from Outperform at Raymond James
PRXL (46.72 -14.82%): Missed quarterly EPS by $0.01 ($0.45 vs $0.46 estimate), revs rose 13.8% yoy to $449.2 mln vs $458.53 mln estimate; sees Q2 EPS of $0.46-0.50, revs of $475-480 mln vs $472.89 mln estimate; reaffirmed FY14 guidance

Emulex (ELX) announced the availability of a broad range of I/O connectivity solutions for the new HP ProLiant Gen8 servers, based on the new Intel (INTC) Xeon processor E5-2600 v2 product family. n Vermont is expected to generate ~ 3.1 mln kWh annually.

5:29AM Canadian Solar receives CAD104 mln non-recourse construction loan from Deutsche Bank (CSIQ) 23.95 : Co announces it has signed a financing agreement pursuant to which Deutsche Bank has agreed to provide CAD$104 million in non-recourse, short-term construction financing to Canadian Solar for the construction of solar power projects in Ontario, Canada. The loans are expected to be repaid with the proceeds of the sale of the respective financed projects. The loan facility is intended to support the simultaneous construction of 3 solar power plants, totalling 30 MWac.

Cirrus Logic (CRUS) reported second quarter earnings of $0.84 per share, excluding non-recurring items, which is better than expected, while revenues fell 1.6% year/year to $190.7 million which is higher than expected. The company reported Q2 Gross margin of 52 percent. The company issued in line guidance for the third quarter with revenues of $200-220 million which is in line with expectations. The company said Q3 Gross margin is expected to be between 45 percent and 47 percent. "Q2 was another great quarter for Cirrus Logic as portable audio continued to be a key driver of our success and we made significant progress on our strategic initiatives...We are especially pleased with the addition of Acoustic Technologies to the Cirrus Logic team as they are expected to accelerate our progress toward our vision of being the preferred supplier of signal processing components."
icon url

ReturntoSender

04/24/14 6:42 PM

#10563 RE: ReturntoSender #6755

From Briefing.com: 4:15 pm : The Nasdaq Composite (+0.5%) and S&P 500 (+0.2%) posted modest gains on Thursday, but not before enduring a morning dip into the red, which took place in reaction to reports indicating Russia has commenced military exercises on the Ukrainian border.


The news from Europe knocked the key indices from their early highs, while giving a boost to safe-haven assets like gold futures (+0.5% to $1290.80/ozt), Treasuries (10-yr yield -1 bps to 2.69%), and the Japanese yen (102.30 vs USD); however the morning spike in safety flows was retraced partially, while equities rallied off their lows with the technology sector (+1.1%) setting the pace.

Tech shares (and the Nasdaq) received significant support from the shares of Apple (AAPL 567.77, +43.02), which surged 8.2% after the top-weighted tech company handily beat earnings expectations. In addition, Apple increased its share buyback to $90 billion and announced a 7:1 stock split, which will go into effect on June 2.

Apple notwithstanding, the market heard from several other tech names like Citrix Systems (CTXS 60.00, +4.01), Facebook (FB 60.87, -0.49), F5 Networks (FFIV 105.98, -2.21), and Texas Instruments (TXN 48.47, +2.01), all of which reported better than expected earnings.

Elsewhere, the discretionary sector (+0.5%) was the only other noteworthy pocket of strength, thanks to a boost from homebuilders. DR Horton (DHI 23.13, +1.78) gained 8.3% after reporting above-consensus results, while the broader iShares Dow Jones US Home Construction ETF (ITB 23.90, +0.57) advanced 2.4%. The discretionary space also received significant support from Amazon.com (AMZN 337.15, +12.57), which rallied 3.9% ahead of its after-hours earnings release.

Even though two of the four largest sectors displayed relative strength, that was not the case with the other two top-weighed groups. Health care (-0.2%) and financials (-0.1%) lagged throughout the session, with the relative weakness in health care largely due to the underperformance of biotechnology. The iShares Nasdaq Biotechnology ETF (IBB 229.62, -1.37) lost 0.6%, but managed to close above its 20-day moving average (228.55).

Also of note, the industrial sector (-0.2%) ended among the laggards after several components reported earnings. 3M (MMM 136.65, -1.34) and UPS (UPS 98.64, -0.60) missed expectations, while Caterpillar (CAT 105.28, +1.90) reported well ahead of estimates. For its part, United Continental (UAL 41.53, -4.53) also beat bottom-line estimates, but slumped 9.8%.

Participation remained relatively light as less than 650 million shares changed hands at the NYSE.

Reviewing today's data:

The initial claims level increased to 329,000 for the week ending April 19 from an upwardly revised 305,000 (from 304,000) for the week ending April 12. The Briefing.com consensus expected the claims level to increase to 312,000. A 24,000 increase from the previous week may seem like a lot, but it took place at a time when the Department of Labor normally has difficulty adjusting for the Easter holiday. In all likelihood, the low claims levels at the beginning of the month were a result of seasonal biases and not a change in layoff trends. Claims are likely to stabilize in the 320,000 -- 330,000 range over the next few weeks.
Durable goods orders increased 2.6% in March after increasing a downwardly revised 2.1% (from 2.2%) in February. The Briefing.com consensus expected durable goods orders to increase 2.0%. For the past few months, durable goods orders have been reliant on Boeing for growth. That wasn't necessarily the case in March as demand strengthened across the board. Transportation orders were still important, up 4.0% after increasing 6.7% in February, but were not the sole provider of growth. Durable goods orders excluding transportation increased 2.0% in March, up from a 0.1% increase in February. That was also well above the consensus expectation of a 0.5% gain.

Tomorrow, the final reading of the Michigan Consumer Sentiment survey for April (Briefing.com consensus 82.6) will be released at 9:55 ET.

S&P 500 +1.6% YTD
Dow Jones Industrial Average -0.5% YTD
Nasdaq Composite -0.7% YTD
Russell 2000 -1.5% YTD

DJ30 0.00 NASDAQ +21.37 SP500 +3.22 NASDAQ Adv/Vol/Dec 1131/1.99 bln/1536 NYSE Adv/Vol/Dec 1548/646.0 mln/1470

3:30 pm :

Precious metals began pit trade in the red but rallied sharply into positive territory moments after equity markets opened.
June gold brushed a session low of $1268.50 per ounce in early morning action and popped to a session high of $1299.00 per ounce. It then consolidated near the $1290.00 per ounce level and settled with a 0.5% gain at $1290.80 per ounce.
May silver traded as low as $18.98 per ounce in early morning pit trade and rallied to a session high of $19.91 per ounce. It eventually settled at $19.69 per ounce, or 1.3% higher. June crude oil also traded higher, brushing a session high of $102.37 per barrel. It settled with a 0.5% gain at $101.95 per barrel.
May natural gas touched a session high of $4.79 per MMBtu shortly after inventories were released. However, it retreated into negative territory as investors digested the data which showed a build of 49 bcf vs expectations for a build of 36-42 bcf. The energy component dipped to a session low of $4.67 per MMBtu and settled with a 0.4% loss at $4.71 per MMBtu.

4:30PM Mellanox Tech misses by $0.02, misses on revs (MLNX) 39.68 -0.42 : Reports Q1 (Mar) earnings of $0.10 per share, excluding non-recurring items, $0.02 worse than the Capital IQ Consensus Estimate of $0.12; revenues rose 18.8% year/year to $98.7 mln vs the $102.88 mln consensus; non-GAAP gross margin 68.6%.

4:27PM KLA-Tencor beats by $0.12, beats on revs (KLAC) 67.74 +1.02 : Reports Q3 (Mar) earnings of $1.23 per share, $0.12 better than the Capital IQ Consensus Estimate of $1.11; revenues rose 14.1% year/year to $832 mln vs the $822.47 mln consensus.
"KLA-Tencor delivered solid results for the third quarter of fiscal year 2014, demonstrating our market leadership and strong operational execution," commented Rick Wallace, President and CEO of KLA-Tencor. "Semiconductor device manufacturers are facing enormous challenges in transitioning from planar to 3D transistor structures and in implementing new process technologies at the leading edge such as multi-patterning lithography. Although the semiconductor capital equipment industry is currently experiencing a pause in demand after a strong initial ramp of some of these new technologies, we remain focused on partnering with our customers to address yield issues associated with these ramps."

4:25PM Monolithic Power beats by $0.13, reports revs in-line; guides Q2 revs in-line (MPWR) 38.09 +1.04 : Reports Q1 (Mar) earnings of $0.39 per share, excluding non-recurring items, $0.13 better than the Capital IQ Consensus Estimate of $0.26; revenues rose 16.7% year/year to $60.1 mln vs the $60.2 mln consensus. Co issues in-line guidance for Q2, sees Q2 revs of $65-69 mln vs. $66.1 mln Capital IQ Consensus Estimate.

4:24PM Broadcom beats by $0.05, beats on revs; guides Q2 revs in-line (BRCM) 31.14 +0.73 : Reports Q1 (Mar) earnings of $0.51 per share, $0.05 better than the Capital IQ Consensus Estimate of $0.46; revenues fell 1.0% year/year to $1.98 bln vs the $1.96 bln consensus.

Co issues in-line guidance for Q2, sees Q2 revs of $2.0-2.1 bln vs. $2.07 bln Capital IQ Consensus Estimate.
Non-GAAP product gross margin of up ~75 to ~175 basis points from 1Q14
Broadcom delivered overall results ahead of expectations in the March quarter," said Scott McGregor, Broadcom's President and Chief Executive Officer.
The upside was driven by strength in Broadband and Infrastructure, stronger-than-expected gross margins and continued operating expense discipline.
"In the current quarter, we expect momentum in Infrastructure and Broadband to continue, driven by service provider spending on network build outs and technology upgrades."

4:19PM Applied Micro beats by $0.01, misses on revs (AMCC) 9.79 +0.44 : Reports Q4 (Mar) earnings of $0.01 per share, excluding non-recurring items, $0.01 better than the Capital IQ Consensus Estimate of ($0.00); revenues fell 8.0% year/year to $51.8 mln vs the $52.32 mln consensus.
"We are very excited with the progress we have made to commercialize X-Gene...Design win momentum is strong, and we have purchase orders in-hand. We expect to begin sampling X-Gene 2 later this spring....In addition, our leadership in the OTN / converged Ethernet market has positioned us very well to benefit from the adoption of 100Gbps connectivity within and between data centers.

4:18PM Altera beats by $0.05, beats on revs; guides Q2 revs above consensus (ALTR) : Reports Q1 (Mar) earnings of $0.37 per share, $0.05 better than the Capital IQ Consensus Estimate of $0.32; revenues rose 12.3% year/year to $461.1 mln vs the $437.97 mln consensus.

Co issues upside guidance for Q2, sees Q2 revs up 2-6% sequentially (roughly $470-488 mln) vs. $461.34 mln Capital IQ Consensus Estimate.

"The quarter exceeded our expectations as stronger than anticipated Chinese LTE deployments drove wireless sales."

4:15PM Freescale Semi appoints Dan Durn CFO (FSL) 25.88 +1.08 : FSL announced that it has selected Dan Durn as senior vice president and chief financial officer, replacing current CFO, Alan Campbell, who announced his decision to retire in January of this year.

Durn will assume CFO responsibilities for the company in June 2014.
Campbell completes a 34-year career at Freescale and will remain at co during the transition.
Durn most recently served as chief financial officer and executive vice president of finance and administration at GLOBALFOUNDRIES, the industry's second largest semiconductor foundry.

4:12PM Freescale Semi beats by $0.03, beats on revs; guides Q2 revs above consensus (FSL) 25.88 +1.08 : Reports Q1 (Mar) earnings of $0.27 per share, $0.03 better than the Capital IQ Consensus Estimate of $0.24; revenues rose 14.9% year/year to $1.13 bln vs the $1.09 bln consensus.

GAAP gross margin was 44.8%, EBITDA was $244 mln, and capital expenditures for the quarter were $56 million.

Guidance: Co issues upside guidance for Q2, sees Q2 revs of $1.14-$1.20 bln vs. $1.13 bln Capital IQ Consensus Estimate. Expects gross margin to increase approximately 50-75 basis points on a sequential basis.

4:10PM SunPower beats by $0.17, beats on revs; guides Q2 EPS in-line, revs below consensus; guides FY14 EPS in-line, revs in-line (SPWR) 32.02 +0.54 : Reports Q1 (Mar) earnings of $0.49 per share, $0.17 better than the Capital IQ Consensus Estimate of $0.32; revenues rose 19.0% year/year to $683.7 mln vs the $668.95 mln consensus. Non-GAAP GM was 22.0%.

Co issues mixed guidance for Q2, sees EPS of $0.15-0.35, excluding non-recurring items, vs. $0.30 Capital IQ Consensus Estimate; sees Q2 revs of $575-625 mln vs. $631.73 mln Capital IQ Consensus Estimate. Sees MW recognition of 275-300 MW. GM expected to be 18-20%.
Co issues in-line guidance for FY14, sees EPS of $1.10-1.40, excluding non-recurring items, vs. $1.22 Capital IQ Consensus Estimate; sees FY14 revs of $2.50-2.65 bln vs. $2.56 bln Capital IQ Consensus Estimate. Expects GW recognized in the range of 1.2-1.3 GW. GM between 19-21%. CapEx between $150-170 mln.

4:09PM Microsoft beats by $0.05, reports revs in-line (MSFT) 79.48 +1.53 : Reports Q3 (Mar) earnings of $0.68 per share, $0.05 better than the Capital IQ Consensus Estimate of $0.63; revenues fell 0.4% year/year to $20.4 bln vs $20.0-20.5 bln guidance and the the $20.37 bln consensus.

Devices and Consumer revenue grew 12% to $8.30 bln vs. $7.8-8.1 bln guidance.
Windows OEM revenue grew 4%, driven by strong 19% growth in Windows OEM Pro revenue.
Office 365 Home now has 4.4 million subscribers, adding nearly 1 million subscribers in just three months.
Microsoft sold in 2.0 million Xbox console units, including 1.2 million Xbox One consoles.
Surface revenue grew over 50% to ~$500 million.
Bing U.S. search share grew to 18.6% and search advertising revenue grew 38%.
Commercial revenue grew 7% to $12.23 bln vs. the $1.2-12.4 bln guidance.
Office 365 revenue grew over 100%, and commercial seats nearly doubled, demonstrating strong enterprise momentum for Microsoft's cloud productivity solutions.
Azure revenue grew over 150%, and the company has announced more than 40 new features that make the Azure platform more attractive to cloud application developers.
Windows volume licensing revenue grew 11%, as business customers continue to make Windows their platform of choice.
Lync, SharePoint, and Exchange, our productivity server offerings, collectively grew double-digits.

Microsoft expects to close the acquisition of the Nokia Devices and Services business on April 25, 2014.

"We are making good progress in our consumer services like Bing and Office 365 Home, and our commercial customers continue to embrace our cloud solutions. Both position us well for long-term growth,"

4:08PM Microsemi reports EPS in-line, revs in-line; guides Q3 EPS in-line, revs below consensus (MSCC) 25.61 +0.43 : Reports Q2 (Mar) earnings of $0.51 per share, in-line with the Capital IQ Consensus Estimate consensus of $0.51; revenues rose 22.0% year/year to $287 mln vs the $286.5 mln consensus.

Non-GAAP gross margin was 55.2% and Book-to-Bill ratio was greater than 1:1.

Guidance: Co issues mixed guidance for Q3, sees EPS of $0.55-$0.61 vs. $0.57 Capital IQ Consensus Estimate; sees Q3 revs of $287-$293 mln vs. $296.35 mln Capital IQ Consensus Estimate.

4:05PM CalAmp misses by $0.02, misses on revs; guides MayQ EPS below consensus, revs below consensus (CAMP) 24.63 -0.47 : Reports Q4 (Feb) earnings of $0.20 per share, excluding non-recurring items, $0.02 worse than the Capital IQ Consensus Estimate of $0.22; revenues rose 23.7% year/year to $59.8 mln vs the $61.5 mln consensus. Co issues downside guidance for Q1 (May), sees EPS of $0.17-0.21, excluding non-recurring items, vs. $0.23 Capital IQ Consensus Estimate; sees Q1 revs of $56-60 mln vs. $64.4 mln Capital IQ Consensus Estimate.

Co says Q4 had performance issues on the part of a contract manufacturer that the co inherited with the Navman Wireless product line acquisition. This prevented the co from shipping approximately $2 mln in product orders in Q4.

4:04PM Lattice Semi beats by $0.04, beats on revs; guides Q2 revs above consensus (LSCC) 8.11 +0.00 : Reports Q1 (Mar) earnings of $0.10 per share, $0.04 better than the Capital IQ Consensus Estimate of $0.06; revenues rose 35.7% year/year to $96.6 mln vs the $89.5 mln consensus.

Gross margin was 56.0%, compared to 54.3% in 4Q13 and 53.6% in 1Q13.

Guidance: Co issues upside guidance for Q2, sees Q2 revs flat to up 4% sequentially, equating to approximately $96.6-$100.5 mln vs. $91.15 mln Capital IQ Consensus Estimate. Gross margin percentage is expected to be approximately 55% plus or minus 2%. Total operating expenses are expected to be approximately flat on a sequential basis.

4:04PM Maxim Integrated beats by $0.03, reports revs in-line; guides Q4 EPS in-line, revs in-line (MXIM) : Reports Q3 (Mar) earnings of $0.43 per share, $0.03 better than the Capital IQ Consensus Estimate of $0.40; revenues rose 0.2% year/year to $606 mln vs the $604.83 mln consensus.

Co issues in-line guidance for Q4, sees EPS of $0.45-0.49 vs. $0.46 Capital IQ Consensus Estimate; sees Q4 revs of $635-665 mln vs. $638.82 mln Capital IQ Consensus Estimate.

4:02PM Cirrus Logic beats by $0.09, beats on revs; guides Q1 revs in-line (CRUS) : Reports Q4 (Mar) earnings of $0.41 per share, $0.09 better than the Capital IQ Consensus Estimate of $0.32; revenues fell 27.6% year/year to $149.7 mln vs the $142.72 mln consensus.

Co issues in-line guidance for Q1, sees Q1 revs of $135-155 mln vs. $138.24 mln Capital IQ Consensus Estimate.

4:00PM Trina Solar supplies 36MW of high efficiency modules to large-scale chile solar project (TSL) 13.13 +0.35 : TSL announced it has signed an agreement to supply 36MW of high efficiency TSM-PC14 modules to a large-scale PV project in Chile.

Trina Solar's TSM-PC14 module is IEC certified to 1,000V and is ideal for large-scale installations in areas prone to high temperatures and dry conditions.
The Company expects to complete the shipment in the second quarter of 2014.
Upon completion,the 36MW Trina solar modules are expected to generate approximately 97,000 MWh of solar electricity annually, enough to mitigate 48,600 metric tonnes of CO2 per year, equivalent to taking more than 10,800 cars off the road

12:47PM Notable movers of interest (SCANX) : The following are some of today's most notable movers of interest, categorized by market capitalization (large cap over $10 billion and mid cap between $2-10 billion) and ranked by % change (all stocks over 100K average daily volume).

Large Cap Gainers

ZMH (101.82 +11.34%): Beat on EPS by $0.03, missed on revs; lowered FY14 EPS to reflect share count following acquisition of Biomet; reaffirmed FY14 revs; co to combine with Biomet in transaction valued at $13.35 bln; expected to be double-digit accretive to Zimmer's adjusted diluted earnings per share in the first year; target raised to $122 at Needham.
CTXS (61.57 +9.97%): Beat on EPS by $0.05, beat on revs; guided Q2 EPS below consensus, revs below consensus; raised bottom end of FY14 EPS & revs in line with ests; announced proposed private offering of $1.25 bln Convertible Senior Notes due 2019.
AET (72.61 +5.36%): Beat on EPS by $0.46, beat on revs; raised FY14 EPS above consensus.

Large Cap Losers

XLNX (47.55 -9.29%): Missed on EPS by $0.02, reported revs in-line; guided Q1 revs in-line; downgraded to Neutral from Outperform at Credit Suisse; tgt lowered to $54 from $57 at MKM Partners.
UAL (42.24 -8.29%): Beat on EPS by $0.03, reported revs in-line; sees Q2 capacity flat to +1%; FY15 capacity +0.5-1.5%.
UA (51.2 -5.95%): Beat on EPS by $0.02, beat on revs; raised FY14 guidance; unfavorable mention on yesterday's Mad Money.

Mid Cap Gainers

LRCX (58.21 +11.41%): Beat on EPS by $0.10, reported revs in-line; guided Q4 above consensus; tgt raised to $60 at Cowen.
DHI (22.92 +7.35%): Beat on EPS by $0.04, beat on revs; upgraded to Buy from Neutral at Citigroup.
TQNT (14.29 +7.61%): Beat on EPS by $0.05, reported revs in-line; guided Q2 EPS above consensus, revs above consensus; upgraded to Outperform from Market Perform at Northland Capital; tgt raised to $17.50 from $9; tgt raised to $15 from $13 at Canaccord Genuity.

Mid Cap Losers

IM (26.33 -13.02%): Missed on EPS by $0.05, reported revs in-line, reaffirmed FY rev guidance; selected to provide mobility distribution and supply chain solutions to key Verizon Wireless (VZ) dealers; tgt raised to $35 at Needham.
TCBI (57.08 -11.6%): Missed on EPS by $0.13; downgraded to Mkt Perform at Raymond James.
LOGI (13.56 -8.87%): Beat on EPS by $0.08, beat on revs; guided FY15 revs below consensus.

11:43AM Stocks/ETFs that traded to new 52 week highs/lows this session - New highs (136) outpacing new lows (34) (SCANX) : Stocks that traded to 52 week highs: AA, AAV, ABG, AEP, AGRO, ALGT, AMKR, APH, ARCW, ARCX, ASMI, ASX, ATHL, AVA, AZN, BFR, BIOF, BPO, BWA, BXE, CAM, CAT, CCK, CFR, CHSP, CLCT, CNC, CNOB, CNQ, CNX, CRK, CRZO, CWEI, CXDC, CXO, CXP, DLPH, EDN, EMN, ENBL, EOG, EQT, ERF, ESXB, FN, FNSR, FPP, FTK, FWLT, GAS, GBX, GGAL, GLDC, GMK, GT, HCBK, HMHC, HP, HST, HUBG, IMO, JOY, KED, KEP, KND, LCUT, LSI, LSTR, MAR, MJN, MO, MOD, MPAA, MPET, MRH, MTB, MU, NORD, NS, NSH, NTCT, NVDA, ODFL, OFED, OKE, ORM, PAC, PDS, PHII, PMBC, PPC, PPL, PSX, PTP, PTSI, QTS, RDS.B, RE, RES, RFMD, RHI, RNR, ROIC, RRC, SANM, SCI, SGU, SIAL, SLG, SMLP, SNDK, SPN, SRLP, SU, SUP, SWKS, SYA, SYNA, SYRG, TFSL, TOT, TQNT, TRW, TSLX, TXT, UGI, UHAL, UNT, UTSI, VDSI, VET, VLO, WES, WIN, XEC, ZMH

Stocks that traded to 52 week lows: ACFN, AXR, BCO, CACH, CFFI, CREE, CSLT, CTHR, EGRX, EROC, ESNT, FBR, FLXN, GRVY, HEAR, HERO, ICUI, IGT, IMPV, LPCN, LQDT, MGT, PBPB, PFSI, QDEL, QSII, RAX, STRL, TEU, TGE, UNXL, VHI, VSTM, ZNH

ETFs that traded to 52 week highs: AFK, DBA, DIG, DJP, EWK, GULF, IEO, IGE, IYE, IYK, IYT, JJA, OIH, USCI, XLE, XLP, XOP

ETFs that traded to 52 week lows: none


9:03AM Ultratech misses by $0.02, misses on revs (UTEK) 25.92 : Reports Q1 (Mar) loss of $0.25 per share, $0.02 worse than the Capital IQ Consensus Estimate of ($0.23); revenues fell 47.9% year/year to $31.6 mln vs the $32.98 mln consensus.

Commentary:
"Our revenues for the first quarter of 2014 increased 32 percent sequentially, driven by both our advanced packaging and high-brightness LED businesses...Our customers trust Ultratech to deliver innovative technologies that are critical for the industry to continue to advance, and we are encouraged by the adoption of our laser spike annealing systems for 14 nanometer technology. Based on customer input, increased quote activity and orders in hand, we believe that we are well positioned to have a stronger second half of the year."

Apple (AAPL) reported second quarter earnings of $11.62 per share, which is higher than expected, while revenues rose 4.7% year/year to $45.65 billion which is higher than expected gross margins of 39.3% versus guidance 37-38%... Buybacks added $0.81/share to EPS -- analyst models include buybacks). The company issued guidance for the third quarter with revenues of $36-38 billion which is line with estimates and sees Q3 gross margins of 37-38%. iPhone shipments 43.7 million vs. ~38 million estimates. iPad 16.4 million vs. 19 million estMac 4.13 million vs. 4 million estCo announced that its Board of Directors has authorized another significant increase to the Company's program to return capital to shareholders. The co expects to utilize a total of over $130 billion of cash under the expanded program by the end of calendar 2015. As part of the program, the Board has increased its share repurchase authorization to $90 bln from the $60 bln level announced last year. The Company expects to continue to utilize about $1 billion annually to net-share-settle vesting restricted stock units. Co raises quarterly dividend 8% to $3.29 per common share, payable on May 15, 2014 to shareholders of record as of the close of business on May 12, 2014.The co also plans to increase its dividend on an annual basis. With annual payments of $11 billion, Apple is among the largest dividend payers in the world.Co also announced a 7:1 stock split.
Facebook (FB) reported first quarter earnings of $0.34 per share, which is higher than expected, while revenues rose 71.6% year/year to $2.5 bililon which is higher than expected. Daily active users (DAUs) were 802 million on average for March 2014, an increase of 21% year-over-year. Mobile DAUs were 609 million on average for March 2014, an increase of 43% year-over-year. Monthly active users (MAUs) were 1.28 billion as of March 31, 2014, an increase of 15% year-over-year. Mobile MAUs were 1.01 billion as of March 31, 2014, an increase of 34% year-over-year. Revenue for the first quarter of 2014 totaled $2.50 billion, an increase of 72%, compared with $1.46 billion in the first quarter of 2013. Revenue from advertising was $2.27 billion, an 82% increase from the same quarter last year. Mobile advertising revenue represented approximately 59% of advertising revenue for the first quarter of 2014, up from approximately 30% of advertising revenue in the first quarter of 2013. For the first quarter of 2014, GAAP income from operations was $1.08 billion, up 188% compared to $373 million in the first quarter of 2013. Excluding share-based compensation and related payroll tax expenses, non-GAAP income from operations for the first quarter of 2014 was $1.37 billion, up 144% compared to $563 million for the first quarter of 2013. GAAP operating margin was 43% for the first quarter of 2014, compared to 26% in the first quarter of 2013. Excluding share-based compensation and related payroll tax expenses, non-GAAP operating margin was 55% for the first quarter of 2014, compared to 39% for the first quarter of 2013. CFO Transition Facebook today also announced that David Ebersman has informed the company of his intention to step down as chief financial officer after serving in the position for almost five years. On June 1, 2014, he will be succeeded as CFO by David Wehner, currently Facebook's Vice President, Corporate Finance and Business Planning. Ebersman will remain with the company through September to ensure a seamless transition of his responsibilities. Wehner joined Facebook in November 2012 from Zynga, where he served as CFO.
Fusion-io (FIO) reported third quarter loss of $0.10 per share, which is line with estimates, while revenues rose 14.6% year/year to $100.5 million which is higher than expected. Metrics: Non-GAAP gross margin was 52.4%. Cash used in operations was $18.8 million in fiscal third quarter 2014 and $22.9 million fiscal year-to-date. Inventory was $72.7 million at the end of fiscal third quarter 2014, a decrease of $7.7 million from the prior quarter-end Guidance: The company sees Q4 revs to be in-line to slightly up sequentially. The company sees Non-GAAP gross margin of 52-54% and operating margin of negative 13-17%.
Angie's List (ANGI) reported first quarter loss of $0.06 per share, which is higher than expected, while revenues rose 39.3% year/year to $72.7 million which is in line with estimates Membership revenue in the first quarter of 2014 was $18.3 million, an increase of 25 percent compared to the prior year period. Service provider revenue remains the largest and fastest growing component of total revenue at $54.4 million for the quarter, representing a 45 percent growth rate year-over-year. Service provider revenue includes revenue from advertising contracts and fees from e-commerce transactions. Advertising revenue was $48.1 million in the first quarter of 2014, an increase of 46 percent compared to the prior year period, and e-commerce revenue was $6.3 million, an increase of 34 percent year-over-year. Marketing expense increased 19 percent, or $3.8 million, compared to the prior year period. The company issues upside guidance for the second quarter with revenues of $79.5-80.5 million which is higher than expected.
TriQuint Semi (TQNT) reported first quarter loss of $0.06 per share, which is higher than expected, while revenues fell 3.6% year/year to $177.6 million which is in line with estimates. The company issued guidance for the upside guidance for the second quarter with EPS of $0.06-0.08 which is above estimtes and revenues of $215-225 million which is above estimates.
icon url

ReturntoSender

10/21/14 7:39 PM

#10714 RE: ReturntoSender #6755

From Briefing.com: 4:10 pm : The major averages endured another whipsaw session that ended with a flat finish for the S&P 500 while the Russell 2000 (+1.1%) registered its second consecutive advance. The price-weighted Dow was the weakest performer of the day with a loss of 0.2%.

Equity indices tumbled out of the gate for the second day in a row amid broad-based selling pressure that also weighed on equities in Europe. The S&P 500 marked a session low near the 1,835 level during the first hour, but spiked more than 20 points following comments from St. Louis Fed President James Bullard. Mr. Bullard appeared on Bloomberg TV and said the Fed should consider delaying the end of its Quantitative Easing program, which is set to wind down at the October FOMC meeting.

The market jumped from lows in reaction to the comments, but it is worth noting that Mr. Bullard is not a voting FOMC member this year and only an alternate voter on next year's schedule. The non-voter status did not get in the way of a surge in equities while Minneapolis Fed President (and FOMC voter) Kocherlakota provided a similar view, saying there is more the Fed can do to achieve maximum employment.

The intraday rebound was paced by some of the groups that faced the most aggressive selling in recent days. The energy sector (+1.7%) led the way, trimming its October loss to 9.0%. Crude oil also rallied, climbing 1.0% to $82.61/bbl after recovering from its overnight low near $79.91/bbl. Meanwhile, the other commodity-linked group-materials (+1.0%)-followed not far behind.

Elsewhere, the industrial sector (+0.7%) advanced with help from transport stocks. Delta Air Lines (DAL 33.32, +0.94) jumped 2.9% after beating earnings estimates while the Dow Jones Transportation Average (+1.1%) extended this week's gain to 1.7%.

The three growth-sensitive sectors spent the entire afternoon in the green while other cyclical groups were a bit more reluctant in joining the rebound. Financials settled in-line with the S&P 500, but the sector was weighed down by Goldman Sachs (GS 172.58, -4.66), which fell 2.6% despite reporting better than expected earnings.

Also of note, the discretionary space (+0.2%) was underpinned by major apparel names like Nike (NKE 87.04, +1.86) and V F Corp (VFC 63.98, +1.18) with their strength masking a 19.4% plunge in the shares of Netflix (NFLX 361.70, -86.89). The video streaming service surpassed its earnings estimates, but guided Q4 results below consensus and said its recent price hike has resulted in slower user growth.

On the downside, the technology sector lost 0.6% even as chipmakers rallied broadly, sending the PHLX Semiconductor Index higher by 1.5%. Large cap listings kept the sector in the red with Apple (AAPL 96.26, -1.28) falling 1.3% after refreshing its product lineup during an afternoon press event. Similarly, Google (GOOGL 536.53, -4.20) lost 0.8% ahead of its quarterly report.

Treasuries ended on their lows after a steady slide from early morning highs. The 10-yr yield ticked up two basis points to 2.16%, which represented an 18-bps spike from the low.

Strong participation continued with more than a billion shares changing hands at the NYSE floor.

Economic data included Initial Claims, Industrial Production, Philadelphia Fed Survey, and the NAHB Housing Market Index:

The weekly initial claims level fell to 264,000 from an unrevised 287,000, while the Briefing.com consensus expected an increase to 290,000
The Department of Labor said there were no special factors influencing the report
Industrial production increased 1.0% in September after falling a downwardly revised 0.2% (from -0.1%) while the Briefing.com consensus expected an increase of 0.4%
Manufacturing production did a full 180 degree turnaround. After falling 0.5% in August, production rose 0.5% in September. That gain was in-line with the improvements in the Federal Reserve regional manufacturing surveys and the national ISM production index
The Philadelphia Fed's Business Outlook Survey Dipped to 20.7 in October from 22.5, while the Briefing.com consensus expected a decline to 19.8
Production levels softened as the Shipments Index fell to 16.6 from 21.6 in September
Employment conditions worsened with the Number of Employees Index falling to 12.1 from 21.2
The NAHB Housing Market Index for October fell to 54 from 59, while the Briefing.com consensus expected the reading to hold at 59

Tomorrow, September Housing Starts (Briefing.com consensus 1013K) and Building Permits (consensus 1030K) will be released at 8:30 ET while the preliminary reading of the Michigan Sentiment survey for October (expected 84.0) will cross the wires at 9:55 ET.

Nasdaq Composite +1.0% YTD
S&P 500 +0.8% YTD
Dow Jones Industrial Average -2.8% YTD
Russell 2000 -6.8% YTD

DJ30 -24.50 NASDAQ +2.07 SP500 +0.27 NASDAQ Adv/Vol/Dec 1924/2.15 bln/1052 NYSE Adv/Vol/Dec 2202/1.03 bln/898

3:35 pm :

Crude's LoD of $79.78 was reached in early morning trading on light volume, and futures have since trended higher, rallying as much as 5 points hitting its HoD of $84.83 shortly after lunch.
Futures pulled back slightly following this mornings inventory data that showed inventories had a build of 8.923 mln (consensus called for a build of 2.7 mln), but recovered quickly.
Natural gas sold off sharply to its LoD of $3.744 after data natural gas inventory data showed a build of 94 bcf vs expectations for a build of ~91 bcf.
Nov crude oil closed the day 0.9% higher at $82.51/barrel, while Nov nat gas -0.3% at $3.97/MMBtu.
Despite settling in negative territory, gold trended higher during the pit session after hitting its LoD of $1235.2 ~15min before the US equity market opened.
Dec gold ultimately fell 0.3% at $1241.20/oz, while Dec silver lost 0.2% at $17.43/oz
Copper prices fell below $3/lb, finishing the day 0.9% lower at $2.98/lb

4:13 pm Super Micro Computer beats by $0.08, beats on revs; guides Q2 EPS above consensus, revs in-line (SMCI) : Reports Q1 (Sep) earnings of $0.46 per share, $0.08 better than the Capital IQ Consensus Estimate of $0.38; revenues rose 43.5% year/year to $443.3 mln vs the $418.02 mln consensus.

Co issues mixed guidance for Q2, sees EPS of $0.44-0.50 vs. $0.44 Capital IQ Consensus Estimate; sees Q2 revs of $440-480 mln vs. $449.35 mln Capital IQ Consensus Estimate.

"With 57.7% of our revenue coming from systems based on our Storage, GPU/Xeon Phi, Twin, MicroCloud and Network Switches, we continue to improve margin through a mix of higher value system products...As we ship our latest X10 generation Haswell DP products, a brand new I/O optimized Ultra server architecture and industry-leading hot-swappable NVMe solutions, we are confident our technology innovation will continue to drive our growth momentum into the remainder fiscal 2015."

4:11 pm Broadcom beats by $0.07, beats on revs; guides Q4 revs in-line (BRCM) : Reports Q3 (Sep) earnings of $0.91 per share, $0.07 better than the Capital IQ Consensus Estimate of $0.84; revenues rose 5.3% year/year to $2.26 bln vs the $2.18 bln consensus.

Commentary: "Our strong performance was driven by the Broadband and Connectivity business and diligent expense management. Longer term, the company's renewed focus on its core businesses is expected to produce improved margins and cash flows, enabling increased capital return."

Guidance: Co issues in-line guidance for Q4, sees Q4 revs of $2.00-2.15 bln vs. $2.11 bln Capital IQ Consensus Estimate. Sees Non-GAAP product gross margin of 55%, +/- 75 basis points. Sees Non-GAAP Research & development and selling, general, and administrative expenses down $40-$60 mln from 3Q14.

4:10 pm Yahoo! beats by $0.19, beats on revs (YHOO) : Reports Q3 (Sep) earnings of $0.52 per share, $0.19 better than the Capital IQ Consensus Estimate of $0.33; revenues were unchanged from the year-ago period at $1.09 bln.

Cash, cash equivalents, and marketable securities (excluding Investment in Alibaba Group equity securities) were $12 billion as of September 30, 2014 compared to $5 billion as of December 31, 2013, an increase of $7 billion.
Yahoo estimates that it will pay approximately $3.3 billion in cash taxes in the first quarter of 2015 related to the sale of Alibaba Group shares.
"We are pleased with our performance this quarter, demonstrating results that met or exceeded guidance on key metrics. We ended the quarter with over $12 billion in cash and marketable securities following the sale of 140 million shares of Alibaba stock in the IPO, which resulted in $9.4 billion in pre-tax proceeds," said Ken Goldman, CFO of Yahoo. "In Q3 and Q4 to date, we have bought back approximately $1.6 billion of our stock. Of this amount, we have returned $1.4 billion to shareholders as a part of our commitment to return at least half of the after-tax IPO proceeds. We are hopeful that we will finish the year strong, and we believe that the Company is well positioned for improved performance in 2015."

4:09 pm IRobot beats by $0.14, beats on revs; guides Q4 EPS and revs mid point below consensus (IRBT) : Reports Q3 (Sep) earnings of $0.48 per share, $0.14 better than the Capital IQ Consensus Estimate of $0.34; revenues rose 15.3% year/year to $143.5 mln vs the $134.49 mln consensus.

Co issues downside guidance for Q4, sees EPS of $0.26-0.31 vs. $0.36 Capital IQ Consensus Estimate; sees Q4 revs of $158-167 mln vs. $167.95 mln Capital IQ Consensus Estimate.
Adjusted EBITDA for the third quarter of 2014 was $29.7 million, compared with $17.2 million in the third quarter of 2013.

4:09 pm Cree misses non-GAAP EPS, revs in-line with preannouncement; guides Q2 below consensus (CREE) : Reports Q1 (Sep) earnings of $0.24 per share, excluding non-recurring items, $0.11 worse than the Capital IQ Consensus Estimate of $0.35; revenues rose 9.4% year/year to $427.7 mln vs the $425.39 mln consensus.

Co lowered rev guidance to $428 mln from $440-465 mln on Oct 2; co also said GAAP EPS would be below $0.25-0.30 guidance; it came in at $0.09.

Co issues downside guidance for Q2, sees EPS of $0.20-0.24, excluding non-recurring items, vs. $0.38 Capital IQ Consensus Estimate; sees Q2 revs of $400-420 mln vs. $444.60 mln Capital IQ Consensus Estimate.

"We have good momentum in our Lighting and Power & RF segments, although fiscal Q1 results were below our targeted levels due primarily to lower than expected LED demand."

12:46 pm Notable movers of interest (:SCANX) : The following are some of today's most notable movers of interest, categorized by market capitalization (large cap over $10 billion and mid cap between $2-10 billion) and ranked by % change (all stocks over 100K average daily volume).

Large Cap Gainers
ILMN (179.82 +9.33%): Beat by $0.22, beat on revs; guided FY14 EPS above consensus, revs above consensus; Upgraded at Janney.
HOG (62.02 +6.24%): Beat by $0.09, missed on revs; reaffirmed 2014 shipments, op margin and CapEx guidance.
AAL (37.43 +6.27%): Strength attributed to positive Knighthead's Wagner mention at Robin Hood conference.

Large Cap Losers

CMG (609.98 -6.59%): Beat by $0.31, beat on revs; reiterated 2014 SSS guidance, warned comp improvement will decline in 2015.
KO (40.75 -5.87%): Reported EPS in-line, missed on revs; sees FY14 and FY15 results below long term targets (lowers top line target); expanded restructuring program.
LMT (171.87 -2.09%): Beat by $0.05, missed on revs; guided FY14 ~in-line; FY15 sales below estimates.

Mid Cap Gainers

WAT (106.54 +9.23%): Beat by $0.09, beat on revs; Maxim recommended investors buy shares following the strong results.
SBNY (116.29 +8.68%): Reported Q3 EPS of $1.52 vs. consensus estimates of $1.46; Upgraded to Outperform at Boenning & Scattergood, PT $125.
LXK (42.79 +7.99%): Beat by $0.13, beat on revs; guided Q4 EPS in-line, revs in-line.

Mid Cap Losers

OCN (22.56 -14.09%): Reports out that the NY AG says the co sent backdated letters to mortgage borrowers (ASPS also lower on the news).
XRS (30.45 -9.64%): Beat by $0.04, missed on revs; guided Q3 revs below consensus.
GPK (10.93 -6.62%): Missed by $0.03, missed on revs; adjusted EBITDA increased 8.8% y/y to $190.6 mln

11:47 am Stocks/ETFs that traded to new 52 week highs/lows this session - New highs (65) outpacing new lows (37) (:SCANX) : Stocks that traded to 52 week highs: AAP, AAT, AFSI, AGIO, AHS, AKR, AKRX, ALX, AMRE, ANAC, ARE, AWK, BAH, BPY, BSET, CCI, CHD, CHDN, CLX, CMS, CNSL, CSX, CVGW, DPLO, DPZ, EIX, ELS, ENTA, EXR, FIZZ, FNHC, GPC, HAS, HCT, HNI, HSNI, HTLD, IBCA, ICUI, INN, KITE, KNX, KRC, LB, LSTR, MERC, MIK, MKL, MNST, NLS, NTES, ORC, RCPT, RDI, SFST, SHW, SONC, TE, UHT, UNH, UUU, VAC, VVC, WRB, ZOES

Stocks that traded to 52 week lows: ACUR, ALCS, ARMH, AXU, BGI, BNK, CASS, CFRX, CSGS, DDE, EGAN, EMITF, ENVI, EPAX, ESCR, FIVN, GBSN, GGB, GPRC, IBM, OIBR, OIBR.C, PSTR, PT, QEPM, RNO, SBS, SID, SMLR, STRM, SVT, TAOM, TEAR, VALE, VRNS, WF, XTLB

ETFs that traded to 52 week highs: none

ETFs that traded to 52 week lows: none

8:09 am Axcelis Tech 'Purion XE' High Energy System chosen by leading chipmaker in Asia Pacific region for DRAM manufacturing; scheduled to ship in Q4 (ACLS) : Co announced a new order for the Company's Purion XE single wafer, high energy implanter from a prominent chipmaker in the Asia Pacific region.

The Purion XE will be used in high volume production of DRAM devices.
The system is scheduled to ship in Q4.

7:32 am UTStarcom announced that it has won an expansion of a contract to provide packet optical transport technology to Chunghwa Telecom (CHT) (UTSI) : Co announced that it has won an expansion of a contract originally awarded in 2013 to provide packet optical transport technology to Chunghwa Telecom (CHT).

Through this expanded contract, UTStarcom further strengthens its relationship with Chunghwa, a leading integrated telecommunications service provider in Taiwan, to enhance their mobile backhaul network.
The 4G LTE infrastructure upgrade is part of CHT's continuing effort to utilize the most advanced technologies to launch better and faster broadband service experience for the growing mobile users in Taiwan.

7:04 am Microsemi announces collaboration with Broadcom (BRCM) to expand broadband product portfolio for Next Gen xDSL applications (MSCC) :

Co introduced at the Broadband World Forum (:BBWF) 2014 its new reverse power feed (:RPF) technology, a critical technology for FTTdp and G.fast deployments.
G.fast, the new xDSL standard for 1gbps over copper, has a maximum expected range of 250 meters (m).
In order to achieve the highest data rates with G.fast, shorter loop lengths are required which leads to the need for fiber to the distribution point, or FTTdp.

2:24 am ARM Holdings reports EPS in-line, revs in-line; guides Q4 revs above consensus (ARMH) : Reports Q3 (Sep) earnings of GBP0.06 per share, in-line with the Capital IQ Consensus Estimate of GBP0.06; revenues rose 6.3% year/year to GBP195.5 mln vs the GBP197.23 mln consensus. Co issues upside guidance for Q4, sees Q4 revs of ~$350 mln vs. $345.00 mln Capital IQ Consensus Estimate.

Progress on key growth drivers in Q3

43 processor licences signed across our target markets of mobile computing, enterprise infrastructure, and embedded intelligent devices
7 ARMv8-A processor licences signed, including three more licences for next generation designs
4 Mali multimedia processor licences signed, including another display processor license
5 POP IP licences signed including 4 for Cortex-A53 processors
Growth in shipments of chips based on ARM processor technology
3 billion ARM-based chips shipped, up 19% year-on-year
Strong growth in shipments of microcontrollers and enterprise infrastructure chips

Tuesday was another big day for the Nasdaq Composite (+2.4%), S&P 500 (+2.0%), and the S&P 500 information technology sector (+1.8%). It should have been, too, because the biggest of the bunch -- Apple (AAPL 102.46, +2.71) -- put up some big results for the September quarter and projected even bigger results for the December quarter.

Apple jumped 2.7%, which is a big-time move for a company with a $600 billion market capitalization. Its good earnings news and upbeat guidance, however, were even bigger for many of its suppliers which were shining from Apple's halo effect.

Qualcomm (QCOM 75.00, +1.73), RF Micro Devices (RFMD 10.75, +0.31), Avago Technologies (AVGO 82.38, +4.39), Skyworks Solutions (SWKS 54.70, +2.84), NXP Semiconductor (NXPI 64.64, +3.14), Jabil Circuit (JBL 19.18, +0.56), Flextronics (FLEX 9.18, +0.23), Amphenol (APH 49.67, +1.41) and Texas Instruments (TXN 46.77, +2.36) to name several all gained between 2% and 6% following Apple's report.

Texas Instruments helped its own cause with a better than expected third quarter report and reassuring fourth quarter outlook.

Gains in excess of 2.0% were normal for information technology sector components on Tuesday.

In fact, the only abnormal stock on Tuesday was IBM (IBM 163.23, -5.87). It dropped another 3.5% after shedding 7% on Monday following an earnings report that was every bit as disappointing as Apple's was encouraging.

There are 66 components in the information technology and all of them, except IBM, ended higher on Tuesday. The second worst-performing stock was EMC Corp. (EMC 27.20, +0.25), which gained "only" 0.9%.

It was that kind of day with Apple's report setting a good tone from the get-go. Other supportive factors included the S&P 500 slicing through resistance at the 1900-1905 barrier with ease, speculation that the ECB and People's Bank of China might see their way toward introducing even more stimulus, existing home sales being higher than expected in September, a tapering of Ebola contagion concerns, and quite simply the fear of missing out on further turnaround gains.

The Philadelphia Semiconductor Index has been a poster child for the turnaround trade. Including Tuesday's 3.6% gain, it is up 10.2% over the last six sessions.

Postscript: After the close, Yahoo (YHOO 40.18, +0.90), which gained 2.3% during regular trading in part on speculation that going private might be a possibility for the company, reported third quarter earnings of $0.52 per share that were well ahead of analysts' expectations. Its revenues, excluding traffic acquisition costs, were up 1% from the year-ago period at $1.09 billion.

For the fourth quarter, Yahoo sees revenues, excluding traffic acquisition costs, ranging from $1.14 billion to $1.18 billion, adjusted EBITDA between $340 million and $380 million, and non-GAAP operating income between $190 million and $230 million.

YHOO shares were up 2.6% in after-hours trading as of this post.
icon url

ReturntoSender

08/02/21 11:00 PM

#12614 RE: ReturntoSender #6755


Market Snapshot

https://www.briefing.com/stock-market-update

Dow 34838.16 -97.31 (-0.28%)
Nasdaq 14681.05 +8.39 (0.06%)
SP 500 4387.16 -8.10 (-0.18%)
10-yr Note +1/32 1.215
NYSE Adv 1530 Dec 1730 Vol 835.0 mln
Nasdaq Adv 2159 Dec 2088 Vol 3.7 bln

Industry Watch
Strong: Utilities, Consumer Discretionary, Health Care
Weak: Materials, Industrials, Energy

Moving the Market

-- Stocks fade early gains as long-term rates dropped

-- 10-yr yield settled at 1.17% amid peak growth/inflation expectations

-- Mixed but expansionary manufacturing PMIs for July in the U.S., Asia, and Europe

Stocks fade early gains as Treasury yields drop
02-Aug-21 16:15 ET
Dow -97.31 at 34838.16, Nasdaq +8.39 at 14681.05, S&P -8.10 at 4387.16

[BRIEFING.COM] The S&P 500 (-0.2%), Nasdaq Composite (+0.1%), and Dow Jones Industrial Average (-0.3%) closed mixed and little changed on Monday, with risk sentiment pressured by a noticeable decline in long-term interest rates. The Russell 2000 lost 0.5% after being up 1.4% in early action, while the large-cap indices were up as much as 0.6-0.7% intraday.

The positive start was attributed to several factors: new inflows on the first trading day of the month; the Senate finalized the text of the $1 trillion bipartisan infrastructure bill; Square (SQ 272.38, +25.12, +10.2%) announced a $29 billion, all-stock acquisition of Australian company Afterpay; and July manufacturing activity in Asia and Europe remained in expansionary territory.

In the U.S., the July ISM Manufacturing Index marked the 14th straight month of expansion for the sector, but the index missed expectations and decelerated to 59.5% (Briefing.com consensus 60.7%) from 60.6% in June. The Prices Index of the report decreased to 85.7% from 92.1% while the construction spending report for June also missed expectations.

The 10-yr yield was trading at 1.21% right before the two reports were released at 10:00 a.m. ET, then dropped to 1.15% over the next two hours as the data reinforced expectations for growth/inflation rates to moderate. The 10-yr yield settled the session at 1.17%, or seven basis points below Friday's settlement.

Stocks faded their early gains as long-term rates extended their declines, leaving the S&P 500 sectors mixed after each started in the green. On the downside, the materials (-1.2%), industrials (-0.7%), and energy (-0.7%) sectors lagged while the consumer discretionary (+0.3%) and utilities (+0.8%) sectors outperformed.

The Philadelphia Semiconductor Index (+0.6%) was a pocket of relative strength, as components keyed off ON Semiconductor's (ON 43.64, +4.58, +11.7%) better-than-expected earnings report and upside Q3 guidance. Global Payments (GPN 171.79, -21.62, -11.2%) was a notable earnings loser in the information technology sector (-0.4%).

Separately, Tesla (TSLA 709.67, +22.57, +3.3%) was initiated with an Outperform rating at KGI Securities while Pfizer (PFE 43.96, +1.15, +2.7%) hit a 52-week high on news that its COVID-19 vaccine could receive full FDA approval as soon as next month.

The 2-yr yield decreased one basis point to 0.17%. The U.S. Dollar Index decreased 0.1% to 92.07. WTI crude futures fell 3.5%, or $2.56, to $71.31/bbl amid demand concerns.

Reviewing Monday's economic data:

The July ISM Manufacturing Index checked in at 59.5% (Briefing.com consensus 60.7%), down from 60.6% in June but up from 53.7% a year ago. A number above 50.0% is indicative of expansion. July marked the 14th straight month of expansion for the manufacturing sector, albeit at a slightly slower pace than what was seen in June.
The key takeaway from the report is the acknowledgment that manufacturers and suppliers continue to struggle to meet increasing demand levels due to a range of factors that includes record-long raw material lead times, shortages of basic materials, transportation difficulties, worker absenteeism, and difficulty filling positions.
Total construction spending increased 0.1% m/m in June (Briefing.com consensus +0.5%) following an upwardly revised 0.2% decline (from -0.3%) in May. Total private construction rose 0.4% m/m while total public construction spending fell 1.2%. On a year-over-year basis, total construction spending was up 8.2%.
The key takeaway from the report is the ongoing strength in private residential construction spending, which is a byproduct of strong demand driven by a scarce supply of existing homes for sale.
The final IHS Market Manufacturing PMI for June checked in at 63.4, up from 63.1 in the preliminary reading.

Looking ahead, investors will receive Factory Orders for June on Tuesday.

S&P 500 +16.8% YTD
Dow Jones Industrial Average +13.8% YTD
Nasdaq Composite +13.9% YTD
Russell 2000 +12.2% YTD

Crude futures settle sharply lower
02-Aug-21 15:30 ET
Dow -41.95 at 34893.52, Nasdaq +28.04 at 14700.70, S&P -1.87 at 4393.39

[BRIEFING.COM] The S&P 500 has turned negative with a 0.1% decline in a disappointing session from a price action perspective. The benchmark index was up 0.6% to start the day.

One last look at the S&P 500 sectors shows mixed results after each traded in positive territory in early action. The materials (-0.9%), industrials (-0.5%), and consumer staples (-0.4%) sectors underperform in the red, while the utilities (+0.6%) and consumer discretionary (+0.5%) sectors outperform in the green.

WTI crude futures settled sharply lower by 3.5%, or $2.56, to $71.31/bbl amid demand concerns.
icon url

ReturntoSender

10/12/21 4:22 PM

#12659 RE: ReturntoSender #6755


Market Snapshot

https://www.briefing.com/stock-market-update

Dow 34378.34 -117.72 (-0.34%)
Nasdaq 14465.92 -20.28 (-0.14%)
SP 500 4350.65 -10.54 (-0.24%)
10-yr Note +1/32 1.602
NYSE Adv 1937 Dec 1286 Vol 781.3 mln
Nasdaq Adv 2487 Dec 1735 Vol 4.0 bln

Industry Watch
Strong: Consumer Discretionary, Utilities, Real Estate
Weak: Communication Services, Financials, Information Technology

Moving the Market

-- Waiting for tomorrow's events (earnings, CPI data, FOMC minutes)

-- Influential weakness in the communication services sector

-- Treasury yield curve flattens

Soft session for the large-caps ahead of tomorrow's key events
12-Oct-21 16:15 ET
Dow -117.72 at 34378.34, Nasdaq -20.28 at 14465.92, S&P -10.54 at 4350.65

[BRIEFING.COM] The large-cap indices closed slightly lower on Tuesday in a tame session, as investors adopted a wait-and-see mindset for tomorrow's key events. The S&P 500 (-0.2%), Nasdaq Composite (-0.1%), and Dow Jones Industrial Average (-0.3%) declined between 0.1-0.3%, while the Russell 2000 rose 0.6%.

Those key events will include Q3 earnings results from JPMorgan Chase (JPM 165.36, -1.28, -0.8%), the Consumer Price Index for September, and the FOMC Minutes from the September meeting.

Six of the 11 S&P 500 sectors closed lower, with the laggards being the heavily-weighted communication services (-1.1%), information technology (-0.5%), and health care (-0.5%) sectors. Five sectors closed higher, led by the real estate (+1.3%), consumer discretionary (+0.7%), and utilities (+0.7%) sectors with decent gains.

The financials sector (-0.3%) was pressured by some curve-flattening activity in the Treasury market in which the 2s10s spread narrowed by seven basis points. The 2-yr yield rose four basis points to 0.35%, while the 10-yr yield decreased three basis points to 1.58%. The U.S. Dollar Index increased 0.2% to 94.51.

On a related note, today's $58 bln 3-yr note auction was met with weak demand, but the $38 bln 10-yr note reopening saw stronger demand.

Elsewhere, the Dow Jones Transportation Average (+0.9%) saw relative strength following upside Q3 EPS guidance from Matson (MATX 89.57, +6.90, +8.4%) and upwardly revised Q3 revenue guidance from American Airlines (AAL 20.29, +0.16, +0.8%).

Separately, the NY Fed's September Survey of Consumer Expectations showed that short- and medium-term inflation expectations rose to their highest levels since the inception of the survey in 2013. Fed Vice Chair Clarida (FOMC voter) and Atlanta Fed President Bostic (FOMC voter) also acknowledged the elevated inflation pressures in the economy.

Inflation wasn't so much the story today, though, since longer-dated Treasury yields settled lower and WTI crude futures settled higher by only 0.1%, or $0.09, to $80.62/bbl. That might for tomorrow when investors see how much inflation pressures have seeped into consumer prices.

Reviewing Tuesday's economic data:

Job openings decreased to 10.439 million in August from a revised 11.098 million (from 10.934 million) in July.
The NFIB Small Business Optimism Index for September decreased to 99.1 from 100.1 in August.

Looking ahead, investors will receive the Consumer Price Index for September, the FOMC Minutes from the September meeting, and the weekly MBA Mortgage Applications Index on Wednesday.

S&P 500 +15.8% YTD
Russell 2000 +13.1% YTD
Dow Jones Industrial Average +12.3% YTD
Nasdaq Composite +12.2% YTD

Crude futures settle little changed
12-Oct-21 15:30 ET
Dow -66.96 at 34429.10, Nasdaq -3.91 at 14482.29, S&P -5.24 at 4355.95

[BRIEFING.COM] The S&P 500 continues to trade slightly lower by 0.1% in what's been a very tight-ranged session.

One last look at the sector performances shows real estate (+1.4%), consumer discretionary (+0.8%), and utilities (+0.7%) outperforming with decent gains, while the communication services (-0.9%), health care (-0.4%), and information technology (-0.3%) sectors underperform in negative territory.

WTI crude futures settled higher by 0.1%, or $0.09, to $80.62/bbl.